UNITED STATES
SECURITIES AND EXCHANGE COMMISSION
Washington, D.C. 20549
FORM N-CSR
CERTIFIED SHAREHOLDER REPORT OF REGISTERED
MANAGEMENT INVESTMENT COMPANIES
Investment Company Act file number | 811-04409 |
|
Eaton Vance Municipals Trust |
(Exact name of registrant as specified in charter) |
|
The Eaton Vance Building, 255 State Street, Boston, Massachusetts | 02109 |
(Address of principal executive offices) | (Zip code) |
|
Alan R. Dynner
The Eaton Vance Building, 255 State Street, Boston, Massachusetts 02109 |
(Name and address of agent for service) |
|
Registrant’s telephone number, including area code: | (617) 482-8260 | |
|
Date of fiscal year end: | September 30 | |
|
Date of reporting period: | March 31, 2005 | |
| | | | | | | |
Item 1. Reports to Stockholders

| | | | 
|
Semiannual Report March 31, 2005 | | | |
| | | | |

| | EATON VANCE
NATIONAL
MUNICIPALS
FUND | | |

| | |
IMPORTANT NOTICES REGARDING PRIVACY,
DELIVERY OF SHAREHOLDER DOCUMENTS,
PORTFOLIO HOLDINGS AND PROXY VOTING
Privacy. The Eaton Vance organization is committed to ensuring your financial privacy. Each of the financial institutions identified below has in effect the following policy (“Privacy Policy”) with respect to nonpublic personal information about its customers:
• Only such information received from you, through application forms or otherwise, and information about your Eaton Vance fund transactions will be collected. This may include information such as name, address, social security number, tax status, account balances and transactions.
• None of such information about you (or former customers) will be disclosed to anyone, except as permitted by law (which includes disclosure to employees necessary to service your account). In the normal course of servicing a customer’s account, Eaton Vance may share information with unaffiliated third parties that perform various required services such as transfer agents, custodians and broker/dealers.
• Policies and procedures (including physical, electronic and procedural safeguards) are in place that are designed to protect the confidentiality of such information.
• We reserve the right to change our Privacy Policy at any time upon proper notification to you. Customers may want to review our Policy periodically for changes by accessing the link on our homepage: www.eatonvance.com.
Our pledge of privacy applies to the following entities within the Eaton Vance organization: the Eaton Vance Family of Funds, Eaton Vance Management, Eaton Vance Investment Counsel, Boston Management and Research, and Eaton Vance Distributors, Inc.
In addition, our Privacy Policy only applies to those Eaton Vance customers who are individuals and who have a direct relationship with us. If a customer’s account (i.e. fund shares) is held in the name of a third-party financial adviser/broker-dealer, it is likely that only such adviser’s privacy policies apply to the customer. This notice supersedes all previously issued privacy disclosures.
For more information about Eaton Vance’s Privacy Policy, please call 1-800-262-1122.
Delivery of Shareholder Documents. The Securities and Exchange Commission permits funds to deliver only one copy of shareholder documents, including prospectuses, proxy statements and shareholder reports, to fund investors with multiple accounts at the same residential or post office box address. This practice is often called “householding” and it helps eliminate duplicate mailings to shareholders.
Eaton Vance, or your financial adviser, may household the mailing of your documents indefinitely unless you instruct Eaton Vance, or your financial adviser, otherwise.
If you would prefer that your Eaton Vance documents not be householded, please contact Eaton Vance at 1-800-262-1122, or contact your financial adviser.
Your instructions that householding not apply to delivery of your Eaton Vance documents will be effective within 30 days of receipt by Eaton Vance or your financial adviser.
Portfolio Holdings. Each Eaton Vance Fund and it’s underlying Portfolio will file a schedule of its portfolio holdings on Form N-Q with the SEC for the first and third quarters of each fiscal year. The Form N-Q will be available on the Eaton Vance website www.eatonvance.com, by calling Eaton Vance at 1-800-262-1122 or in the EDGAR database on the SEC’s website at www.sec.gov. Form N-Q may also be reviewed and copied at the SEC’s public reference room in Washington, D.C. (call 1-800-732-0330 for information on the operation of the public reference room).
Proxy Voting. From time to time, funds are required to vote proxies related to the securities held by the funds. The Eaton Vance Funds or their underlying Portfolios (if applicable) vote proxies according to a set of policies and procedures approved by the Funds’ and Portfolios’ Boards. You may obtain a description of these policies and procedures and information on how the Funds or Portfolios voted proxies relating to Portfolio securities during the 12 month period ended June 30, without charge, upon request, by calling
1-800-262-1122. This description is also available on the SEC’s website at www.sec.gov.
Eaton Vance National Municipals Fund as of March 31, 2005
LETTER TO SHAREHOLDERS

Thomas J. Fetter
President
The municipal bond market is a center of capital formation for states, municipalities and, in some cases, private economic initiatives. In this edition of our continuing educational series, we will discuss industrial development revenue (IDR) bonds. IDR bonds have long been used as a financing mechanism by local governments to provide assistance to local employers and encourage job retention and creation within their communities.
IDR bonds finance private activities that benefit the public...
IDR bonds are issued by municipal authorities to finance projects and facilities used by private corporations. Historically, IDR bonds have represented a partnership between the private and public sectors – a source of dedicated funding for companies and a source of job creation in projects beneficial to local communities. The “Private-Activities” provision of the Tax Reform Act of 1986 permits issuance of tax-exempt bonds for specific activities, including pollution control; gas and electric service; water distribution; wastewater systems; solid waste disposal; airports and selected transportation projects; and other industrial projects.
The Act also placed a cap on the dollar amount that may be raised for IDR bonds in each state, limiting the amount to $50 per person/per state/per year, with a $150 million maximum. These limitations provide protection against potential abuse and ensure that tax-exempt IDR bonds will indeed be issued for projects that will benefit the public.
IDR bonds finance utility-related projects and other industrial initiatives...
Typically, IDR bond projects provide financing for manufacturing, processing or utility facilities. Historically, about one-half of these bonds have been issued to finance pollution control facilities for manufacturers and electric utilities. As many utilities and manufacturers have been ordered to comply with stricter environmental and fuel standards, pollution control bonds have helped finance the retrofits of existing plants. Other IDR bonds have served as inducements from state and local issuers to locate plants or build new facilities, in the hope that such construction might generate further economic growth for a community.
IDR bonds are secured by corporate revenues – not those of state or local governments...
IDR bond issues are secured by the credit of the underlying corporation. The municipal issuing authority acts solely as a conduit to permit tax-exempt financing. The corporation pledges to make payments sufficient to meet all debt service obligations. Unlike some revenue issues, IDR bonds are backed by revenues of the entire corporation, not solely by those of the project being financed.
Because IDR bonds are backed by corporate revenues and not by the taxing authority of a state or local jurisdiction, they have historically provided coupon premiums above those of general obligations and other more traditional revenue bonds. Bonds may be either collateralized or unsecured. Collateralized bonds have a lien against the company’s assets, which may provide bond holders enhanced bargaining power in the event of a bankruptcy. Unsecured bonds have no such lien.
While providing new opportunities, IDR bonds require rigorous analysis...
While IDR bonds may provide unusual investment opportunities, they also may entail increased risk and, therefore, demand especially intensive analysis. At Eaton Vance, we have credit analysts and resources dedicated to IDR bond research.
IDR bonds represent a key segment of the municipal bond market and should remain an important source of capital formation. In our view, the experience and resources needed to evaluate these issues further demonstrates the value of professional management. We will continue to look for opportunities in this sector of the municipal market.
| Sincerely, |
| |
| /s/ Thomas J. Fetter | |
| Thomas J. Fetter |
| President |
| May 6, 2005 |
Fund shares are not insured by the FDIC and are not deposits or other obligations of, or guaranteed by, any depository institution. Shares are subject to investment risks, including possible loss of principal invested.
2
MARKET RECAP
The U.S. economy continued to generate moderate growth during the six months ended March 31, 2005. While higher gasoline and energy prices pinched consumers, the weak U.S. dollar raised inflationary concerns and helped push interest rates higher.
After a promising recovery in 2004, slower growth in early 2005...
The nation’s Gross Domestic Product grew by 3.1% in the first quarter of 2005, according to preliminary Commerce Department figures, following a 3.8% rise in the fourth quarter of 2004. Manufacturing activity, which had expanded strongly in the second half of 2004, slackened somewhat in the first quarter of 2005, amid slower industrial production and weakening demand for durable goods.
Consumer spending, which helped fuel the economic recovery over the past year, weakened considerably, as higher fuel costs and rising interest rates on loans and mortgages prompted consumers to tighten their belts. Capital spending also slowed, as businesses curtailed new investments in plants and factories, while reducing the pace of investment in productivity-enhancing equipment and software. Residential construction remained relatively strong, although slightly off the torrid pace set in 2004.
After recovering dramatically in 2004, job creation weakened somewhat in early 2005...
The nation’s labor markets strengthened during the year, although the pace of job creation weakened at the close of the period. Hiring picked up during the year in areas that had suffered large technology sector layoffs. Also, manufacturing, financial services, business services, trucking, shipping, construction, energy, health care, and media also generated new jobs. In the first quarter of 2005, however, employers showed some reticence in hiring practices, as they were forced to cope with unpredictable fuel cost hikes.
Municipal bond yields were 99% of Treasury yields
30-Year AAA-rated | Taxable equivalent yield |
General Obligation (GO) Bonds* | in 35.0% tax bracket |
30-Year Treasury Bond
Principal and interest payments of Treasury securities are guaranteed by the U.S. government.
*GO yields are a compilation of a representative variety of general obligations and are not necessarily representative of the Fund’s yield. Statistics as of March 31, 2005.
Past performance is no guarantee of future results.
Source: Bloomberg, L.P.
The Federal Reserve continued to raise short-term interest rates in 2005...
The Federal Reserve pushed short-term rates higher, suggesting it will continue to raise rates to keep the economy from growing too quickly and, thereby, reviving inflation. Beginning in June 2004, the Fed increased its Federal Funds rate – a key short-term interest rate barometer – on seven occasions, raising that benchmark from 1.00% to 2.75%, including its most recent rate hike in March 2005.
The municipal bond market posted a modest gain for the year, slightly outperforming the Treasury market. For the six months ended March 31, 2005, the Lehman Brothers Municipal Bond Index – an unmanaged index commonly used as a broad measure of municipal bond performance – had a total return of 1.21.%.*
* It is not possible to invest directly in an Index. The Index’s total return does not reflect commissions or expenses that would have been incurred if an investor individually purchased or sold the securities represented in the Index.
3
INVESTMENT UPDATE
The Fund
• During the six months ended March 31, 2005, the Fund’s Class A shares had a total return of 4.07%.(1) This return resulted from an increase in net asset value (NAV) per share to $11.06 on March 31, 2005, from $10.92 on September 30, 2004, and the reinvestment of $0.301 per share in tax-free income.(2)
• Class B shares had a total return of 3.89% during the same period.(1) This return resulted from an increase in NAV per share to $10.32 from $10.19 and the reinvestment of $0.264 per share in tax-free income.(2)
• Class C shares had a total return of 3.75% during the same period.(1) This return resulted from an increase in NAV per share to $9.83 from $9.71 and the reinvestment of $0.242 per share in tax-free income.(2)
• Class I shares had a total return of 4.10% during the same period.(1) This return resulted from an increase in NAV per share to $10.24 from $10.12 and the reinvestment of $0.292 per share in tax-free income.(2)
• Based on the most recent dividends and NAVs per share on March 31, 2005, of $11.06 for Class A, $10.32 for Class B, $9.83 for Class C, and $10.24 for Class I, the Fund’s distribution rates were 5.21% for Class A, 4.46% for Class B, 4.46% for Class C, and 5.47% for Class I.(3) The distribution rates are equivalent to taxable rates of 8.02%, 6.86%, 6.86%, and 8.42%, respectively.(4)
• The SEC 30-day yields at March 31, 2005, were 5.34% for Class A, 4.85% for Class B, 4.85% for Class C, and 5.87% for Class I.(5) The SEC 30-day yields are equivalent to taxable yields of 8.22%, 7.46%, 7.46%, and 9.03%, respectively.(4)
• For comparison, the Lehman Brothers Municipal Bond Index had a total return of 1.21% for the six months ended March 31, 2005.(6)
(1) These returns at net asset value do not include the 4.75% maximum sales charge for Class A shares or the applicable contingent deferred sales charges (CDSC) for Class B and Class C shares. If sales charges were deducted, returns would be lower. Class I shares are offered to certain investors at net asset value.
(2) A portion of the Fund’s income may he subject to federal income and/or alternative minimum tax and state income tax.
(3) The Fund’s distribution rate represents actual distributions paid to shareholders and is calculated by dividing the last distribution per share (annualized) by the net asset value.
(4) Taxable-equivalent figures assume a maximum 35.00% federal income tax rate. A lower rate would result in lower tax-equivalent figures.
(5) The Fund’s SEC yield is calculated by dividing the net investment income per share for the 30-day period by the offering price at the end of the period and annualizing the result.
(6) It is not possible to invest directly in an Index. The Index’s total return does not reflect commissions or expenses that would have been incurred if an investor individually purchased or sold the securities represented in the Index.
Management Discussion

Thomas M. Metzold
Portfolio Manager

Cynthia J. Clemson
Portfolio Manager
• The Fund outperformed its benchmark for the six months ended March 31, 2005. The Fund adheres to an intensive research process to buy, sell, and monitor municipal bond holdings. Management focuses on the creditworthiness of bond issuers, as well as the fundamental credit characteristics of the various sectors and individual issues. We believe that our emphasis on research and monitoring also helped contribute to the Fund’s performance over the six-month period.
• Municipal bond issuers continued to call bonds at a higher rate than the historical norm because of the low interest-rate environment. As a result, management’s ongoing focus on call protection was beneficial for the Fund’s income and overall performance during the period. As low interest rates continue to prompt refundings, call protection remains an important concern for municipal investors.
• The Fund maintained a significant investment in escrowed and prerefunded bonds, which were the Fund’s largest sector weighting at March 31, 2005. These bonds are either pre-refunded to their approaching call dates or escrowed to maturity. Because they are backed by Treasury bonds, escrowed bonds are considered to be of the highest quality, and generally provide an excellent source of income.
• Effective May 30, 2005, Tom Metzold will resume sole portfolio manager duties for the Fund.
The views expressed throughout this report are those of the portfolio managers and are current only through the end of the period of the report as stated on the cover. These views are subject to change at any time based upon market or other conditions, and the investment adviser disclaims any responsibility to update such views. These views may not be relied on as investment advice and, because investment decisions for a fund are based on many factors, may not be relied on as an indication of trading intent on behalf of any Eaton Vance fund.
4
FUND PERFORMANCE
Performance* | | Class A | | Class B | | Class C | | Class I | |
| | | | | | | | | |
Average Annual Total Returns (at net asset value) | | | | | | | | | |
One Year | | 6.36 | % | 5.78 | % | 5.66 | % | 6.57 | % |
Five Years | | 7.87 | | 7.43 | | 7.04 | | 8.08 | |
Ten Years | | 6.92 | | 6.33 | | 6.09 | | N.A. | |
Life of Fund† | | 7.21 | | 6.72 | | 5.28 | | 6.80 | |
| | | | | | | | | |
SEC Average Annual Total Returns (including sales charge or applicable CDSC) | | | | | | | | | |
One Year | | 1.30 | % | 0.78 | % | 4.66 | % | 6.57 | % |
Five Years | | 6.82 | | 7.12 | | 7.04 | | 8.08 | |
Ten Years | | 6.41 | | 6.33 | | 6.09 | | N.A. | |
Life of Fund† | | 6.74 | | 6.72 | | 5.28 | | 6.80 | |
† Inception Dates – Class A: 4/5/94; Class B: 12/19/85; Class C: 12/3/93; Class I: 7/1/99
* Returns at net asset value do not include the 4.75% maximum sales charge for Class A shares or the applicable contingent deferred sales charges (CDSC) for Class B and Class C shares. If sales charges were deducted, returns would be lower. SEC average annual total returns for Class A reflect the maximum 4.75% sales charge. SEC returns for Class B reflect the applicable CDSC based on the following schedule: 5% - 1st and 2nd years; 4% - - 3rd year; 3% - 4th year; 2% - 5th year; 1% - 6th year. SEC 1-Year return for Class C reflects 1% CDSC. Class I shares are offered to certain investors at net asset value.
Past performance is no guarantee of future results. Returns are historical and are calculated by determining the percentage change in net asset value or offering price (as applicable) with all distributions reinvested. Investment return and principal value will fluctuate so that shares, when redeemed, may be worth more or less than their original cost. Performance is for the stated time period only; due to market volatility, the Fund’s current performance may be lower or higher than the quoted return. For performance as of the most recent month-end, please refer to www.eatonvance.com.
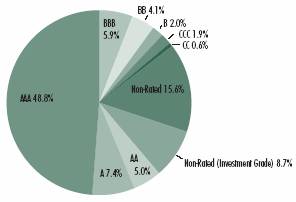
Rating Distribution**
By total investments
Portfolio Statistics**
• Number of Issues: | | 204 | |
• Average Maturity: | | 23.0 years | |
• Average Rating: | | A+ | |
• Average Call: | | 8.9 years | |
• Average Dollar Price: | | $ | 91.03 | |
| | | | |
** Portfolio Statistics and Rating Distribution may not be representative of the Portfolio’s current or future investments due to active management.
5
FUND EXPENSES
Example: As a shareholder of a Fund, you incur two types of costs: (1) transaction costs, including sales charges (loads) on purchases and redemption fees (if applicable); and (2) ongoing costs, including management fees; distribution or service fees; and other Fund expenses. This Example is intended to help you understand your ongoing costs (in dollars) of investing in a Fund and to compare these costs with the ongoing costs of investing in other mutual funds. The Example is based on an investment of $1,000 invested at the beginning of the period and held for the entire period (October 1, 2004 – March 31, 2005).
Actual Expenses: The first section of each table below provides information about actual account values and actual expenses. You may use the information in this line, together with the amount you invested, to estimate the expenses that you paid over the period. Simply divide your account value by $1,000 (for example, an $8,600 account value divided by $1,000 = 8.6), then multiply the result by the number in the first line under the heading entitled “Expenses Paid During Period” to estimate the expenses you paid on your account during this period.
Hypothetical Example for Comparison Purposes: The second section of each table below provides information about hypothetical account values and hypothetical expenses based on a Fund’s actual expense ratio and an assumed rate of return of 5% per year (before expenses), which is not the actual return of the Fund. The hypothetical account values and expenses may not be used to estimate the actual ending account balance or expenses you paid for the period. You may use this information to compare the ongoing costs of investing in the Funds and other funds. To do so, compare this 5% hypothetical example with the 5% hypothetical examples that appear in the shareholder reports of the other funds.
Please note that the expenses shown in the table are meant to highlight your ongoing costs only and do not reflect any transactional costs, such as sales charges (loads) or redemption fees (if applicable). Therefore, the second section of the table is useful in comparing ongoing costs only, and will not help you determine the relative total costs of owning different funds. In addition, if these transactional costs were included, your costs would have been higher.
Eaton Vance National Municipals Fund
| | Beginning Account Value
(10/1/04) | | Ending Account Value
(3/31/04) | | Expenses Paid During Period*
(10/1/04–3/31/05) | |
| | | | | | | |
Actual | | | | | | | |
Class A | | $ | 1,000.00 | | $ | 1,040.70 | | $ | 3.97 | |
Class B | | $ | 1,000.00 | | $ | 1,038.90 | | $ | 7.78 | |
Class C | | $ | 1,000.00 | | $ | 1,037.50 | | $ | 7.77 | |
Class I | | $ | 1,000.00 | | $ | 1,041.00 | | $ | 2.70 | |
| | | | | | | |
Hypothetical | | | | | | | |
(5% return before expenses) | | | | | | | |
Class A | | $ | 1,000.00 | | $ | 1,021.00 | | $ | 3.93 | |
Class B | | $ | 1,000.00 | | $ | 1,017.40 | | $ | 7.70 | |
Class C | | $ | 1,000.00 | | $ | 1,017.30 | | $ | 7.70 | |
Class I | | $ | 1,000.00 | | $ | 1,022.30 | | $ | 2.67 | |
* Expenses are equal to the Fund’s annualized expense ratio of 0.78% for Class A shares, 1.53% for Class B shares, 1.53% for Class C shares and 0.53% for Class I shares, multiplied by the average account value over the period, multiplied by 182/365 (to reflect the one-half year period). The example assumes that the $1,000 was invested at the net asset value per share determined at the close of business on September 30, 2004.
6
Eaton Vance National Municipals Fund as of March 31, 2005
PORTFOLIO OF INVESTMENTS (Unaudited)
| | Tax-Exempt Investments - 99.0% | | | | | | | | |
Principal Amount
(000's omitted) | | Security | | Value | |
| | Cogeneration - 2.7% | | | | | | | | |
| $ | 22,150 | | | Maryland Energy Cogeneration, (AES Warrior Run),
(AMT), 7.40%, 9/1/19 | | $ | 22,602,746 | | |
| | 6,100 | | | Pennsylvania EDA, (Northampton Generating),
(AMT), 6.50%, 1/1/13 | | | 6,153,802 | | |
| | 21,950 | | | Pennsylvania EDA, (Northampton Generating),
(AMT), 6.60%, 1/1/19 | | | 22,404,365 | | |
| | 5,300 | | | Pennsylvania EDA, (Northampton Generating), Junior Liens,
(AMT), 6.875%, 1/1/11 | | | 5,301,802 | | |
| | 5,000 | | | Pennsylvania EDA, (Northampton Generating), Junior Liens,
(AMT), 6.95%, 1/1/21 | | | 4,985,050 | | |
| | | | | | | $ | 61,447,765 | | |
| | Education - 0.2% | | | | | | | | |
| $ | 4,130 | | | California Educational Facilities Authority, (Stanford
University), Variable Rate, 10.199%, 6/1/27(1) | | $ | 4,803,190 | | |
| | | | | | | $ | 4,803,190 | | |
| | Electric Utilities - 4.3% | | | | | | | | |
| $ | 13,000 | | | Brazos River Authority, TX, (Reliant Energy, Inc.),
7.75%, 12/1/18 | | $ | 14,458,470 | | |
| | 9,000 | | | Connecticut Development Authority, (Connecticut Light
and Power), 5.85%, 9/1/28 | | | 9,549,180 | | |
| | 13,000 | | | Connecticut Development Authority, (Western
Massachusetts Electric), 5.85%, 9/1/28 | | | 13,850,850 | | |
| | 2,000 | | | Matagorda County, TX, Navigation District No.1,
(Reliant Energy), 8.00%, 5/1/29 | | | 2,206,620 | | |
| | 5,000 | | | Matagorda County, TX, Navigation District No.1,
(Reliant Energy), (AMT), 5.95%, 5/1/30 | | | 5,051,700 | | |
| | 8,000 | | | North Carolina Municipal Power Agency, (Catawba),
6.50%, 1/1/20 | | | 8,913,920 | | |
| | 5,500 | | | Pennsylvania EDA, (Reliant Energy, Inc.), (AMT),
6.75%, 12/1/36 | | | 5,894,405 | | |
| | 13,800 | | | Pennsylvania EDA, (Reliant Energy, Inc.), (AMT),
6.75%, 12/1/36 | | | 14,789,598 | | |
| | 20,400 | | | Pennsylvania EDA, (Reliant Energy, Inc.), (AMT),
6.75%, 12/1/36 | | | 21,862,884 | | |
| | | | | | | $ | 96,577,627 | | |
| | Escrowed / Prerefunded - 13.7% | | | | | | | | |
| $ | 2,400 | | | Bexar County, TX, Health Facilities, (St. Luke's Lutheran),
Escrowed to Maturity, 7.00%, 5/1/21 | | $ | 3,083,040 | | |
| | 11,195 | | | Colorado Health Facilities Authority, (Liberty Heights),
Escrowed to Maturity, 0.00%, 7/15/22 | | | 4,782,840 | | |
Principal Amount
(000's omitted) | |
Security | |
Value | |
| | Escrowed / Prerefunded (continued) | | | | | | | | |
| $ | 119,070 | | | Colorado Health Facilities Authority, (Liberty Heights),
Escrowed to Maturity, 0.00%, 7/15/24 | | $ | 45,414,489 | | |
| | 215,825 | | | Dawson Ridge, CO, Metropolitan District #1,
Escrowed to Maturity, 0.00%, 10/1/22(2) | | | 91,252,968 | | |
| | 11,175 | | | Dawson Ridge, CO, Metropolitan District #1,
Escrowed to Maturity, 0.00%, 10/1/22 | | | 4,724,902 | | |
| | 4,960 | | | Delaware County, PA, IDA, (Glen Riddle),
Prerefunded to 9/1/05, (AMT), 8.625%, 9/1/25 | | | 5,226,352 | | |
| | 101,555 | | | Illinois Development Finance Authority, (Regency Park),
Escrowed to Maturity, 0.00%, 7/15/23 | | | 41,084,075 | | |
| | 8,390 | | | Louisiana Public Facilities Authority, (General Health
Systems), Prerefunded to 11/1/06, 6.80%, 11/1/16 | | | 8,827,371 | | |
| | 8,235 | | | Louisiana Public Facilities Authority, (Southern Baptist
Hospitals, Inc.), Escrowed to Maturity, 8.00%, 5/15/12 | | | 9,565,529 | | |
| | 5,675 | | | Maricopa County, AZ, IDA, (Place Five and The Greenery),
Escrowed to Maturity, 6.625%, 1/1/27 | | | 6,222,751 | | |
| | 100,000 | | | Mississippi Housing Finance Corp., Single Family,
Escrowed to Maturity, 0.00%, 6/1/15 | | | 64,052,000 | | |
| | 46,210 | | | San Joaquin Hills Transportation Corridor Agency, CA,
Toll Road Bonds, Escrowed to Maturity, 0.00%, 1/1/20 | | | 23,204,814 | | |
| | | | | | | $ | 307,441,131 | | |
| | General Obligations - 6.8% | | | | | | | | |
| $ | 5,000 | | | California, 5.00%, 6/1/34 | | $ | 5,097,600 | | |
| | 16,000 | | | California, 5.25%, 11/1/29 | | | 16,805,280 | | |
| | 20,000 | | | California, 5.25%, 2/1/30 | | | 20,795,200 | | |
| | 9,875 | | | California, 5.50%, 11/1/33 | | | 10,582,149 | | |
| | 14,000 | | | Georgia, 2.00%, 12/1/23 | | | 9,632,000 | | |
| | 19,510 | | | New York, NY, 5.00%, 3/1/19 | | | 20,290,595 | | |
| | 4,735 | | | New York, NY, Variable Rate, 9.438%, 6/1/28(1)(3) | | | 5,410,969 | | |
| | 28,715 | | | North Carolina, 4.00%, 3/1/24 | | | 26,673,363 | | |
| | 16,175 | | | Puerto Rico, Variable Rate, 7.951%, 7/1/29(3)(4) | | | 19,969,493 | | |
| | 10,900 | | | South Carolina, 3.00%, 8/1/21(5) | | | 8,983,780 | | |
| | 10,000 | | | South Carolina, 3.00%, 8/1/22(5) | | | 8,118,300 | | |
| | | | | | | $ | 152,358,729 | | |
| | Health Care - Miscellaneous - 0.4% | | | | | | | | |
| $ | 1,555 | | | Pittsfield Township, MI, EDC, (Arbor Hospice),
7.875%, 8/15/27 | | $ | 1,499,502 | | |
| | 3,072 | | | Tax Revenue Exempt Securities Trust, Community Health
Provider, (Pooled Loan Program Various States Trust
Certificates), 5.50%, 12/1/36 | | | 2,992,965 | | |
| | 3,295 | | | Tax Revenue Exempt Securities Trust, Community Health
Provider, (Pooled Loan Program Various States Trust
Certificates), 5.875%, 12/1/36 | | | 3,306,250 | | |
| | | | | | | $ | 7,798,717 | | |
See notes to financial statements
7
Eaton Vance National Municipals Fund as of March 31, 2005
PORTFOLIO OF INVESTMENTS (Unaudited) CONT'D
Principal Amount
(000's omitted) | |
Security | |
Value | |
| Hospital - 2.2% | | | | | |
| $ | 12,600 | | | California Health Facilities Authority, (Cedars Sinai
Medical Center), Variable Rate, 9.319%, 12/1/34(3)(4) | | $ | 14,668,164 | | |
| | 4,515 | | | Massachusetts HEFA, (Partners Healthcare System),
5.25%, 7/1/29 | | | 4,651,669 | | |
| | 3,500 | | | New Jersey Health Care Facilities Financing Authority,
(Trinitas Hospital), 7.50%, 7/1/30 | | | 3,909,955 | | |
| | 4,000 | | | Oneida County, NY, Industrial Development Agency,
(Elizabeth Medical Center), 6.00%, 12/1/29 | | | 3,741,440 | | |
| | 3,075 | | | Prince George's County, MD, (Greater Southeast
Healthcare System), 6.375%, 1/1/23(6) | | | 297,967 | | |
| | 7,750 | | | Rhode Island HEFA, (St. Joseph Health Services),
5.50%, 10/1/29 | | | 7,263,455 | | |
| | 12,500 | | | Rochester, MN, Health Care Facilities, (Mayo Clinic),
Variable Rate, 8.40%, 11/15/27(3)(4) | | | 14,029,625 | | |
| | | | | | | $ | 48,562,275 | | |
| Housing - 4.0% | | | | | |
| $ | 3,000 | | | ABAG Finance Authority, CA, (Civic Center Drive
Apartments), (AMT), 6.375%, 9/1/32 | | $ | 2,969,130 | | |
| | 7,345 | | | Arkansas Development Finance Authority, MFMR,
(Park Apartments), (AMT), 5.95%, 12/1/28 | | | 5,516,315 | | |
| | 12,900 | | | California Department of Veterans Affairs, Home
Purchase Revenue, 5.20%, 12/1/28 | | | 12,910,578 | | |
| | 6,360 | | | California Statewide Communities Development
Authority, (Corporate Fund for Housing), (AMT),
Variable Rate, 22.39%, 12/1/29(3)(4)(9) | | | 5,966,252 | | |
| | 600 | | | California Statewide Communities Development
Authority, (Corporate Fund for Housing), (AMT),
Variable Rate, 31.314%, 12/1/34(3)(4)(9) | | | 411,558 | | |
| | 16,000 | | | Charter Mac Equity Trust, TN, (AMT),
6.625%, 6/30/09 | | | 17,532,320 | | |
| | 10,770 | | | Florida Capital Projects Financing Authority, Student
Housing Revenue, (Florida University),
7.85%, 8/15/31 | | | 10,691,379 | | |
| | 9,610 | | | Lake Creek, CO, (Affordable Housing Corp.),
6.25%, 12/1/23 | | | 8,803,625 | | |
| | 1,255 | | | Maricopa County, AZ, IDA, (National Health Facilities II),
6.375%, 1/1/19(6) | | | 970,328 | | |
| | 15,215 | | | New Hampshire Housing Finance Authority, Multifamily
Housing, (AMT), 6.20%, 7/1/36 | | | 15,037,137 | | |
| | 10,590 | | | Texas Student Housing Corp., (University of Northern
Texas), 6.85%, 7/1/31 | | | 9,854,736 | | |
| | | | | | | $ | 90,663,358 | | |
| Industrial Development Revenue - 11.7% | | | | | |
| $ | 8,240 | | | Alliance Airport Authority, TX, (American Airlines, Inc.),
(AMT), 7.50%, 12/1/29 | | $ | 5,820,818 | | |
Principal Amount
(000's omitted) | |
Security | |
Value | |
| Industrial Development Revenue (continued) | | | | | |
| $ | 7,150 | | | Austin, TX, (Cargoport Development LLC), (AMT),
8.30%, 10/1/21 | | $ | 7,523,802 | | |
| | 10,260 | | | Bedford County, VA, IDA, (Nekoosa Packaging),
(AMT), 6.55%, 12/1/25 | | | 10,684,456 | | |
| | 2,250 | | | Calhoun County, AR, Solid Waste Disposal,
(Georgia-Pacific Corp.), (AMT), 6.375%, 11/1/26 | | | 2,336,017 | | |
| | 2,000 | | | Camden County, NJ, (Holt Hauling), (AMT),
9.875%, 1/1/21(6) | | | 255,100 | | |
| | 6,050 | | | Carbon County, UT, (Laidlaw Environmental), (AMT),
7.50%, 2/1/10 | | | 6,215,770 | | |
| | 4,000 | | | Courtland, AL, Solid Waste Disposal, (Champion
International Corp.), (AMT), 6.70%, 11/1/29 | | | 4,332,760 | | |
| | 6,430 | | | Dallas-Fort Worth, TX, International Airport Facility,
(American Airlines), 7.25%, 11/1/30 | | | 4,353,946 | | |
| | 55,500 | | | Denver, CO, City and County Special Facilities,
(United Airlines), (AMT), 6.875%, 10/1/32(6) | | | 47,313,750 | | |
| | 3,500 | | | Effingham County, GA, IDA, PCR, (Georgia Pacific
Corp.), 6.50%, 6/1/31 | | | 3,673,845 | | |
| | 11,190 | | | Effingham County, GA, Solid Waste Disposal,
(Fort James), (AMT), 5.625%, 7/1/18 | | | 11,388,622 | | |
| | 6,645 | | | Hardeman County, TN, (Correctional Facilities Corp.),
7.75%, 8/1/17 | | | 6,930,602 | | |
| | 30,000 | | | Houston, TX, Airport System, (Continental Airlines),
(AMT), 6.75%, 7/1/29 | | | 24,841,800 | | |
| | 10,110 | | | Kenton County, KY, Airport, (Delta Airlines), (AMT),
6.125%, 2/1/22 | | | 7,345,218 | | |
| | 1,530 | | | Kenton County, KY, Airport, (Delta Airlines), (AMT),
7.125%, 2/1/21 | | | 1,275,469 | | |
| | 4,870 | | | Kenton County, KY, Airport, (Delta Airlines), (AMT),
7.50%, 2/1/20 | | | 4,230,910 | | |
| | 5,000 | | | McMinn County, TN, (Calhoun Newsprint - Bowater,
Inc.), (AMT), 7.40%, 12/1/22 | | | 5,025,200 | | |
| | 10,000 | | | Michigan Strategic Fund, (S.D. Warren), (AMT),
7.375%, 1/15/22 | | | 10,554,700 | | |
| | 15,000 | | | Michigan Strategic Fund, (S.D. Warren), (AMT),
7.375%, 1/15/22 | | | 15,832,050 | | |
| | 3,500 | | | Michigan Strategic Fund, (S.D. Warren), (AMT),
7.375%, 1/15/22 | | | 3,694,145 | | |
| | 5,025 | | | New Jersey EDA, (American Airlines), (AMT),
7.10%, 11/1/31 | | | 3,562,524 | | |
| | 18,820 | | | New Jersey EDA, (Continental Airlines), (AMT),
6.25%, 9/15/29 | | | 14,545,978 | | |
| | 4,950 | | | New Jersey EDA, (Continental Airlines), (AMT),
9.00%, 6/1/33 | | | 5,069,938 | | |
| | 17,000 | | | New Jersey EDA, (Holt Hauling), 7.75%, 3/1/27(6) | | | 16,250,470 | | |
| | 1,500 | | | New Jersey EDA, (Holt Hauling), 7.90%, 3/1/27(6) | | | 1,433,895 | | |
| | 12,500 | | | New York City, NY, IDA, (American Airlines, Inc.),
(AMT), 8.50%, 8/1/28 | | | 10,158,875 | | |
See notes to financial statements
8
Eaton Vance National Municipals Fund as of March 31, 2005
PORTFOLIO OF INVESTMENTS (Unaudited) CONT'D
Principal Amount
(000's omitted) | |
Security | |
Value | |
| | Industrial Development Revenue (continued) | | | | | | | | |
| $ | 10,000 | | | New York City, NY, IDA, (American Airlines, Inc.-JFK
International Airport), (AMT), 8.00%, 8/1/12 | | $ | 9,016,300 | | |
| | 12,330 | | | Puerto Rico Port Authority, (American Airlines), (AMT),
6.25%, 6/1/26 | | | 8,672,429 | | |
| | 1,000 | | | Puerto Rico Port Authority, (American Airlines), (AMT),
6.30%, 6/1/23 | | | 703,810 | | |
| | 2,952 | | | Savannah, GA, EDA, (Intercat-Savannah), (AMT),
9.00%, 1/1/15 | | | 2,734,512 | | |
| | 1,589 | | | Savannah, GA, EDA, (Intercat-Savannah), (AMT),
9.75%, 7/1/10 | | | 1,526,517 | | |
| | 5,000 | | | Skowhegan, ME, (S.D. Warren), (AMT),
6.65%, 10/15/15 | | | 5,217,850 | | |
| | | | | | | $ | 262,522,078 | | |
| | Insured-Education - 2.4% | | | | | | | | |
| $ | 165 | | | Puerto Rico Industrial Tourist Educational Medical and
Environmental, DRIVERS, (MBIA), Variable Rate,
250.859%, 7/1/33(3)(4) | | $ | 507,585 | | |
| | 22,675 | | | University of California, (MBIA), 4.75%, 5/15/33 | | | 22,849,371 | | |
| | 31,000 | | | University of California, (MBIA), 4.75%, 5/15/37 | | | 31,212,970 | | |
| | | | | | | $ | 54,569,926 | | |
| | Insured-Electric Utilities - 2.5% | | | | | | | | |
| $ | 7,500 | | | Burlington, KS, PCR, (Kansas Gas & Electric Co.),
(MBIA), 5.30%, 6/1/31 | | $ | 7,937,475 | | |
| | 5,500 | | | Intermountain Power Agency, UT, (MBIA), Variable Rate,
15.223%, 7/1/19(1)(3) | | | 7,102,040 | | |
| | 11,000 | | | Memphis, TN, Electric System, (MBIA), Variable Rate,
15.385%, 12/1/17(1)(3) | | | 13,581,920 | | |
| | 10,000 | | | Puerto Rico Electric Power Authority, (CIFG),
5.00%, 7/1/28(5) | | | 10,485,900 | | |
| | 9,700 | | | Puerto Rico Electric Power Authority, (CIFG),
5.00%, 7/1/29(5) | | | 10,154,930 | | |
| | 6,000 | | | Sacramento, CA, Municipal Electric Utility District, (FSA),
Variable Rate, 9.957%, 8/15/28(1)(3) | | | 6,507,240 | | |
| | | | | | | $ | 55,769,505 | | |
| | Insured-Escrowed / Prerefunded - 1.8% | | | | | | | | |
| $ | 20,505 | | | Massachusetts Turnpike Authority, (FGIC), Escrowed to
Maturity, Variable Rate, 7.316%, 1/1/23(3)(4) | | $ | 23,984,904 | | |
| | 9,500 | | | Massachusetts Turnpike Authority, (FGIC), Escrowed to
Maturity, Variable Rate, 7.391%, 1/1/20(3)(4) | | | 10,877,595 | | |
| | 5,000 | | | Umatilla County, OR, School District No. 008R, (MBIA),
Prerefunded to 6/15/09, Variable Rate,
7.806%, 6/15/19(3)(4) | | | 5,817,450 | | |
| | | | | | | $ | 40,679,949 | | |
Principal Amount
(000's omitted) | |
Security | |
Value | |
| | Insured-General Obligations - 2.9% | | | | | | | | |
| $ | 9,900 | | | California, (AMBAC), Variable Rate,
14.158%, 5/1/26(1)(3) | | $ | 12,542,112 | | |
| | 12,000 | | | California, (MBIA), 4.75%, 3/1/31 | | | 12,040,200 | | |
| | 11,665 | | | California, RITES, (AMBAC), Variable Rate,
9.143%, 2/1/28(1)(3) | | | 14,065,890 | | |
| | 5,310 | | | Chester, NJ, Board of Education, (FSA),
4.50%, 3/1/35 | | | 5,152,612 | | |
| | 12,500 | | | Chicago, IL, Board of Education, (FGIC),
0.00%, 12/1/23 | | | 4,844,500 | | |
| | 16,980 | | | Chicago, IL, Board of Education, (FGIC),
0.00%, 12/1/25 | | | 5,836,026 | | |
| | 14,000 | | | Chicago, IL, Board of Education, (FGIC),
0.00%, 12/1/29 | | | 3,847,900 | | |
| | 5,910 | | | Highland Park, NJ, School District, (FSA),
4.50%, 3/1/30 | | | 5,784,058 | | |
| | | | | | | $ | 64,113,298 | | |
| | Insured-Hospital - 0.9% | | | | | | | | |
| $ | 5,070 | | | Maryland HEFA, (Medlantic), (AMBAC), Variable Rate,
10.665%, 8/15/38(1)(3) | | $ | 6,650,015 | | |
| | 8,320 | | | Tyler, TX, Health Facility Development Corp., (East
Texas Medical Center), (FSA), 5.375%, 11/1/27 | | | 8,724,518 | | |
| | 5,000 | | | Wisconsin HEFA, (Ministry Health Care), (MBIA),
5.125%, 2/15/22 | | | 5,215,050 | | |
| | | | | | | $ | 20,589,583 | | |
| | Insured-Lease Revenue / Certificates of
Participation - 0.3% | | | | | | |
| $ | 34,180 | | | Anaheim, CA, Public Financing Authority, (Public
Improvements), (FSA), 0.00%, 9/1/35 | | $ | 6,911,196 | | |
| | | | | | | $ | 6,911,196 | | |
| | Insured-Miscellaneous - 0.8% | | | | | | | | |
| $ | 25,000 | | | Harris County-Houston, TX, Sports Authority, (MBIA),
0.00%, 11/15/41 | | $ | 3,183,750 | | |
| | 15,250 | | | Harris County-Houston, TX, Sports Authority, (MBIA),
5.25%, 11/15/40 | | | 15,694,690 | | |
| | | | | | | $ | 18,878,440 | | |
| | Insured-Special Tax Revenue - 1.4% | | | | | | | | |
| $ | 13,305 | | | Illinois Sports Facility Authority, (AMBAC),
0.00%, 6/15/23 | | $ | 5,443,342 | | |
| | 31,010 | | | Illinois Sports Facility Authority, (AMBAC),
0.00%, 6/15/24 | | | 11,988,776 | | |
| | 10,000 | | | Illinois Sports Facility Authority, (AMBAC),
0.00%, 6/15/25 | | | 3,643,300 | | |
See notes to financial statements
9
Eaton Vance National Municipals Fund as of March 31, 2005
PORTFOLIO OF INVESTMENTS (Unaudited) CONT'D
Principal Amount
(000's omitted) | |
Security | |
Value | |
| | Insured-Special Tax Revenue (continued) | | | | | | | | |
| $ | 9,185 | | | Regional Transportation Authority, LA, (FGIC),
0.00%, 12/1/15 | | $ | 5,650,612 | | |
| | 9,500 | | | Regional Transportation Authority, LA, (FGIC),
0.00%, 12/1/21 | | | 4,129,745 | | |
| | | | | | | $ | 30,855,775 | | |
| | Insured-Transportation - 13.1% | | | | | | | | |
| $ | 18,220 | | | Alameda, CA, Corridor Transportation Authority, (MBIA),
0.00%, 10/1/35 | | $ | 3,581,870 | | |
| | 34,800 | | | Central, TX, Regional Mobility Authority, (FGIC),
5.00%, 1/1/45 | | | 35,239,524 | | |
| | 10,000 | | | Chicago, IL, O'Hare International Airport, (AMBAC),
(AMT), 5.375%, 1/1/32 | | | 10,370,600 | | |
| | 60,355 | | | Clark County, NV, Airport Authority, (FGIC),
5.00%, 7/1/36 | | | 61,560,289 | | |
| | 5,000 | | | Dallas Fort Worth, TX, International Airport, (FGIC),
(AMT), 5.625%, 11/1/21 | | | 5,374,100 | | |
| | 3,335 | | | Dallas Fort Worth, TX, International Airport, (FSA),
(AMT), Variable Rate, 11.259%, 11/1/17(1)(3) | | | 4,081,039 | | |
| | 4,000 | | | Dallas Fort Worth, TX, International Airport, (MBIA),
(AMT), Variable Rate, 11.259%, 11/1/19(1)(3) | | | 4,859,320 | | |
| | 2,500 | | | Dallas-Fort Worth, TX, International Airport, (FGIC),
(AMT), 5.50%, 11/1/20 | | | 2,657,225 | | |
| | 27,480 | | | Florida Department of Transportation, (Turnpike
Revenue), (FSA), 4.50%, 7/1/34 | | | 26,482,476 | | |
| | 3,305 | | | Kansas Turnpike Authority, (AMBAC), Variable Rate,
6.822%, 9/1/17(1)(3) | | | 3,147,351 | | |
| | 3,330 | | | Kansas Turnpike Authority, (AMBAC), Variable Rate,
6.822%, 9/1/18(1)(3) | | | 3,091,339 | | |
| | 12,000 | | | Massachusetts Turnpike Authority, Metropolitan
Highway System, (AMBAC), 5.00%, 1/1/39 | | | 12,183,960 | | |
| | 17,645 | | | Metropolitan Transportation Authority, NY, (AMBAC),
4.50%, 11/15/34 | | | 17,044,541 | | |
| | 13,600 | | | Metropolitan Transportation Authority, NY, (AMBAC),
5.00%, 11/15/33 | | | 14,081,304 | | |
| | 10,370 | | | Metropolitan Transportation Authority, NY, (MBIA),
4.50%, 11/15/35 | | | 10,010,161 | | |
| | 9,500 | | | Metropolitan Transportation Authority, NY, (MBIA),
4.75%, 11/15/29 | | | 9,590,345 | | |
| | 8,940 | | | Metropolitian Transportation Authority, NY, (AMBAC),
4.75%, 11/15/30 | | | 9,010,090 | | |
| | 10,500 | | | North Texas Tollway Authority, (FSA), 4.50%, 1/1/38 | | | 9,891,105 | | |
| | 9,000 | | | Puerto Rico Highway and Transportation Authority,
(FSA), Variable Rate, 9.955%, 7/1/32(1)(3) | | | 9,918,270 | | |
| | 50,000 | | | San Joaquin Hills, CA, Transportation Corridor Agency
Toll, (MBIA), 0.00%, 1/15/35 | | | 10,449,000 | | |
| | 50,000 | | | Texas Turnpike Authority, (AMBAC), 0.00%, 8/15/22 | | | 20,987,500 | | |
Principal Amount
(000's omitted) | |
Security | |
Value | |
| Insured-Transportation (continued) | | | | | |
| $ | 30,000 | | | Texas Turnpike Authority, (AMBAC), 0.00%, 8/15/26 | | $ | 9,910,800 | | |
| | | | | | | $ | 293,522,209 | | |
| Insured-Utilities - 0.5% | | | | | |
| $ | 10,500 | | | Philadelphia, PA, Gas Works Revenue, (FSA),
5.00%, 7/1/28 | | $ | 10,664,955 | | |
| | | | | | | $ | 10,664,955 | | |
| Insured-Water and Sewer - 3.7% | | | | | |
| $ | 11,915 | | | Atlanta, GA, Water and Sewer, (FGIC),
5.00%, 11/1/38 | | $ | 12,111,240 | | |
| | 10,135 | | | California Water Resources, (Central Valley), (FGIC),
Variable Rate, 12.888%, 12/1/28(1)(3) | | | 11,079,582 | | |
| | 10,445 | | | Castaic Lake, CA, Water Agency Certificates of
Participation, (Water System Improvements), (AMBAC),
0.00%, 8/1/21 | | | 4,643,743 | | |
| | 10,965 | | | Colorado Water Resources and Power Development
Authority, (MBIA), 4.50%, 11/15/35 | | | 10,481,882 | | |
| | 8,375 | | | Houston, TX, Water and Sewer System, (FSA),
0.00%, 12/1/28 | | | 2,445,332 | | |
| | 16,445 | | | Jacksonville Electric Authority, FL, Water and Sewer
System, (MBIA), 4.75%, 10/1/30 | | | 16,501,242 | | |
| | 13,750 | | | King County, WA, Sewer Revenue, (MBIA),
4.50%, 1/1/32(7) | | | 13,117,362 | | |
| | 6,050 | | | Loudoun County, VA, Sanitation Authority, (MBIA),
4.50%, 1/1/35 | | | 5,852,105 | | |
| | 7,325 | | | New York City, NY, Municipal Water Finance Authority,
(Water and Sewer System), (AMBAC),
4.50%, 6/15/29 | | | 7,160,700 | | |
| | | | | | | $ | 83,393,188 | | |
| Lease Revenue / Certificates of Participation - 0.6% | | | | | |
| $ | 6,955 | | | Fairfax County, VA, Economic Development Authority,
(School Board Central Administration Building),
4.50%, 4/1/35 | | $ | 6,690,293 | | |
| | 6,330 | | | New Jersey EDA, (School Facilities), Variable Rate,
9.995%, 6/15/28(1)(3) | | | 6,650,298 | | |
| | | | | | | $ | 13,340,591 | | |
| Nursing Home - 2.8% | | | | | |
| $ | 12,185 | | | Bell County, TX, (Riverside Healthcare, Inc. - Normandy
Terrace), 9.00%, 4/1/23(6) | | $ | 6,917,303 | | |
| | 4,665 | | | Delaware County, PA, (Mainline - Haverford Nursing and
Rehabilitation Centers), 9.00%, 8/1/22(6) | | | 4,446,678 | | |
See notes to financial statements
10
Eaton Vance National Municipals Fund as of March 31, 2005
PORTFOLIO OF INVESTMENTS (Unaudited) CONT'D
Principal Amount
(000's omitted) | |
Security | |
Value | |
| | Nursing Home (continued) | | | | | | | | |
| $ | 9,880 | | | Hillsborough County, FL, IDA, (Tampa Bay Retirement
Center), 7.00%, 6/1/25(8) | | $ | 5,540,605 | | |
| | 2,755 | | | Lackawanna County, PA, IDA, (Edella Street Associates),
8.875%, 9/1/14 | | | 2,754,587 | | |
| | 13,250 | | | Massachusetts IFA, (Age Institute of Massachusetts),
8.05%, 11/1/25 | | | 13,266,695 | | |
| | 11,575 | | | Mississippi Business Finance Corp., (Magnolia
Healthcare), 7.99%, 7/1/25 | | | 9,496,362 | | |
| | 11,265 | | | Montgomery, PA, IDA, (Advancement of Geriatric Health
Care Institute), 8.375%, 7/1/23 | | | 10,532,324 | | |
| | 3,500 | | | Orange County, FL, Health Facilities Authority,
(Westminster Community Care), 6.75%, 4/1/34 | | | 3,023,265 | | |
| | 2,235 | | | Westmoreland, PA, (Highland Health Systems, Inc.),
9.25%, 6/1/22 | | | 2,237,123 | | |
| | 3,890 | | | Wisconsin HEFA, (Wisconsin Illinois Senior Housing),
7.00%, 8/1/29 | | | 3,660,957 | | |
| | | | | | | $ | 61,875,899 | | |
| | Other Revenue - 7.6% | | | | | | | | |
| $ | 22,000 | | | California Statewide Communities Development
Authority, (East Valley Tourist Development Authority),
8.25%, 10/1/14 | | $ | 22,412,280 | | |
| | 10,000 | | | California Statewide Communities Development
Authority, (East Valley Tourist Development Authority),
9.25%, 10/1/20 | | | 10,903,500 | | |
| | 1,500 | | | Capital Trust Agency, FL, (Seminole Tribe Convention),
8.95%, 10/1/33 | | | 1,680,000 | | |
| | 26,400 | | | Capital Trust Agency, FL, (Seminole Tribe Convention),
10.00%, 10/1/33 | | | 29,725,608 | | |
| | 7,695 | | | Golden Tobacco Securitization Corp., CA,
5.00%, 6/1/13 | | | 7,708,466 | | |
| | 10,950 | | | Golden Tobacco Securitization Corp., CA, Variable Rate,
7.697%, 6/1/43(3)(4) | | | 12,193,811 | | |
| | 10,000 | | | Golden Tobacco Securitization Corp., CA, Variable Rate,
7.974%, 6/1/33(3)(4) | | | 11,289,600 | | |
| | 11,300 | | | Golden Tobacco Securitization Corp., CA, Variable Rate,
8.224%, 6/1/38(3)(4) | | | 12,868,666 | | |
| | 10,200 | | | Orange County, NC, (Community Activity Corp.),
8.00%, 3/1/24(6) | | | 3,818,370 | | |
| | 9,000 | | | Sandoval County, NM, (Santa Ana Pueblo),
7.75%, 7/1/15 | | | 9,234,540 | | |
| | 10,885 | | | Tobacco Settlement Financing Corp., NJ,
6.75%, 6/1/39 | | | 11,465,824 | | |
| | 20,700 | | | Tobacco Settlement Financing Corp., NJ, Variable Rate,
10.807%, 6/1/39(3)(4)(9) | | | 22,909,104 | | |
| | 13,000 | | | Tobacco Settlement Management Authority, SC,
6.375%, 5/15/28 | | | 13,266,760 | | |
| | | | | | | $ | 169,476,529 | | |
Principal Amount
(000's omitted) | |
Security | |
Value | |
| Senior Living / Life Care - 4.6% | | | | | |
| $ | 11,650 | | | Albuquerque, NM, Retirement Facilities, (La Vida
Liena Retirement Center), 5.75%, 12/15/28 | | $ | 10,999,348 | | |
| | 9,595 | | | Albuquerque, NM, Retirement Facilities, (La Vida Liena
Retirement Center), 6.60%, 12/15/28 | | | 9,391,394 | | |
| | 6,035 | | | Arizona Health Facilities Authority, (Care Institute,
Inc. - Mesa), 7.625%, 1/1/26(8) | | | 4,793,902 | | |
| | 16,415 | | | Bell County, TX, Health Facilities Authority, (Care
Institute, Inc. - Texas), 9.00%, 11/1/24 | | | 15,540,573 | | |
| | 3,060 | | | Chester, PA, IDA, (Senior Life-Choice of Kimberton),
(AMT), 8.50%, 9/1/25 | | | 3,158,746 | | |
| | 11,570 | | | De Kalb County, GA, Private Hospital Authority, (Atlanta,
Inc.), 8.50%, 3/1/25(8) | | | 4,700,544 | | |
| | 6,680 | | | Glen Cove, NY, IDA, (Regency at Glen Cove),
9.50%, 7/1/12(8) | | | 6,643,794 | | |
| | 14,115 | | | Illinois Development Finance Authority, (Care Institute,
Inc. - Illinois), 7.80%, 6/1/25 | | | 14,472,533 | | |
| | 1,600 | | | Kansas City, MO, IDA, (Kingswood United Methodist
Manor), 5.375%, 11/15/09 | | | 1,567,600 | | |
| | 9,345 | | | New Jersey EDA, (Forsgate), (AMT),
8.625%, 6/1/25(8) | | | 5,076,391 | | |
| | 12,150 | | | North Miami, FL, Health Facilities Authority, (Imperial
Club), 6.75%, 1/1/33 | | | 11,193,674 | | |
| | 800 | | | North Miami, FL, Health Facilities Authority, (Imperial
Club), 9.00%, 1/1/12(6) | | | 42,560 | | |
| | 7,915 | | | Roseville, MN, Elder Care Facility, (Care Institute, Inc. -
Roseville), 7.75%, 11/1/23(8) | | | 6,743,738 | | |
| | 12,140 | | | St. Paul, MN, Housing and Redevelopment, (Care
Institute, Inc. - Highland), 8.75%, 11/1/24(8) | | | 8,422,246 | | |
| | | | | | | $ | 102,747,043 | | |
| Special Tax Revenue - 3.5% | | | | | |
| $ | 22,500 | | | Massachusetts Bay Transportation Authority, Sales Tax,
5.00%, 7/1/29 | | $ | 24,166,125 | | |
| | 25,000 | | | Massachusetts Bay Transportation Authority, Sales Tax,
5.00%, 7/1/31 | | | 26,783,750 | | |
| | 6,000 | | | New Jersey EDA, (Cigarette Tax), 5.50%, 6/15/24 | | | 6,250,980 | | |
| | 10,000 | | | New Jersey EDA, (Cigarette Tax), 5.75%, 6/15/29 | | | 10,513,200 | | |
| | 1,815 | | | New Jersey EDA, (Cigarette Tax), 5.75%, 6/15/34 | | | 1,902,701 | | |
| | 3,000 | | | Tri-County, OR, Metropolitan Transportation District,
Variable Rate, 7.40%, 8/1/19(3)(4) | | | 3,261,960 | | |
| | 4,570 | | | University Square, FL, Community Development
District, 6.75%, 5/1/20 | | | 4,802,704 | | |
| | | | | | | $ | 77,681,420 | | |
| Transportation - 3.3% | | | | | |
| $ | 30,845 | | | Port Authority of New York and New Jersey, (AMT),
4.75%, 12/1/34 | | $ | 30,255,861 | | |
See notes to financial statements
11
Eaton Vance National Municipals Fund as of March 31, 2005
PORTFOLIO OF INVESTMENTS (Unaudited) CONT'D
Principal Amount
(000's omitted) | |
Security | |
Value | |
| Transportation (continued) | | | | | |
| $ | 6,200 | | | Port Authority of New York and New Jersey, (AMT),
5.25%, 7/15/34 | | $ | 6,518,494 | | |
| | 36,950 | | | Puerto Rico Highway and Transportation Authority,
5.125%, 7/1/39 | | | 37,919,199 | | |
| | | | | | | $ | 74,693,554 | | |
| Water and Sewer - 0.3% | | | | | |
| $ | 5,480 | | | California Water Resources, (Central Valley), Variable
Rate, 12.232%, 12/1/24(3)(4) | | $ | 6,374,555 | | |
| | | | | | | $ | 6,374,555 | | |
| | Total Tax-Exempt Investments - 99.0%
(identified cost $2,069,794,275) | | | | | $ | 2,218,312,485 | | |
| | Other Assets, Less Liabilities - 1.0% | | | | | $ | 21,541,325 | | |
| | Net Assets - 100.0% | | | | | $ | 2,239,853,810 | | |
AMT - Interest earned from these securities may be considered a tax preference item for purposes of the Federal Alternative Minimum Tax.
AMBAC - AMBAC Financial Group, Inc.
CIFG - CDC IXIS Financial Guaranty North America, Inc.
FGIC - Financial Guaranty Insurance Company
FSA - Financial Security Assurance, Inc.
MBIA - Municipal Bond Insurance Association
At March 31, 2005, the concentration of the Fund's investments in the various states, determined as a percentage of net assets, is as follows:
California 15.1%
Others, representing less than 10% individually 83.9%
The Fund invests primarily in debt securities issued by municipalities. The ability of the issuers of the debt securities to meet their obligations may be affected by economic developments in a specific industry or municipality. In order to reduce the risk associated with such economic developments, at March 31, 2005, 30.7% of the securities in the portfolio of investments are backed by bond insurance of various financial institutions and financial guaranty assurance agencies. The aggregate percentage insured by an individual financial institution ranged from 0.9% to 9.4% of total investments.
(1) Security has been issued as a leveraged inverse floater bond. The stated interest rate represents the rate in effect at March 31, 2005.
(2) Security (or a portion thereof) has been segregated to cover when-issued securities.
(3) Security exempt from registration under Rule 144A of the Securities Act of 1933. These securities may be sold in transactions exempt from registration, normally to qualified institutional buyers. At March 31, 2005, the aggregate value of the securities is $273,817,707 or 12.2% of the Fund's net assets.
(4) Security has been issued as an inverse floater bond. The stated interest rate represents the rate in effect at March 31, 2005.
(5) When-issued security.
(6) Defaulted bond.
(7) Security (or a portion thereof) has been segregated to cover margin requirements on open financial futures contracts.
(8) Security is in default and making only partial interest payments.
(9) Security is subject to a shortfall and forbearance agreement.
See notes to financial statements
12
Eaton Vance National Municipals Fund as of March 31, 2005
FINANCIAL STATEMENTS (Unaudited)
Statement of Assets and Liabilities
As of March 31, 2005
| Assets | | | |
| Investments, at value (identified cost, $2,069,794,275) | | $ | 2,218,312,485 | | |
| Cash | | | 159,437 | | |
| Receivable for investments sold | | | 24,523,211 | | |
| Receivable for Fund shares sold | | | 9,216,998 | | |
| Receivable for open swap contracts | | | 94,788 | | |
| Interest receivable | | | 42,695,849 | | |
| Total assets | | $ | 2,295,002,768 | | |
| Liabilities | | | |
| Payable for when-issued securities | | $ | 37,495,569 | | |
| Dividends payable | | | 4,922,999 | | |
| Payable for Fund shares redeemed | | | 4,711,267 | | |
| Payable for daily variation margin on open financial futures contracts | | | 4,382,825 | | |
| Demand note payable | | | 3,200,000 | | |
| Payable to affiliate for distribution and service fees | | | 53,633 | | |
| Accrued expenses | | | 382,665 | | |
| Total liabilities | | $ | 55,148,958 | | |
| Net assets | | $ | 2,239,853,810 | | |
| Sources of Net Assets | | | |
| Paid-in capital | | $ | 2,125,451,223 | | |
Accumulated distributions in excess of net realized gain (computed on
the basis of identified cost) | | | (46,211,892 | ) | |
| Accumulated undistributed net investment income | | | 996,085 | | |
| Net unrealized appreciation (computed on the basis of identified cost) | | | 159,618,394 | | |
| Total | | $ | 2,239,853,810 | | |
| Class A Shares | | | |
| Net Assets | | $ | 1,891,895,556 | | |
| Shares Outstanding | | | 171,129,363 | | |
Net Asset Value and Redemption Price Per Share
(net assets ÷ shares of beneficial interest outstanding) | | $ | 11.06 | | |
Maximum Offering Price Per Share
(100 ÷ 95.25 of $11.06) | | $ | 11.61 | | |
| Class B Shares | | | |
| Net Assets | | $ | 55,832,580 | | |
| Shares Outstanding | | | 5,410,861 | | |
Net Asset Value, Offering Price and Redemption Price Per Share
(net assets ÷ shares of beneficial interest outstanding) | | $ | 10.32 | | |
| Class C Shares | | | |
| Net Assets | | $ | 281,645,548 | | |
| Shares Outstanding | | | 28,651,621 | | |
Net Asset Value, Offering Price and Redemption Price Per Share
(net assets ÷ shares of beneficial interest outstanding) | | $ | 9.83 | | |
| Class I Shares | | | |
| Net Assets | | $ | 10,480,126 | | |
| Shares Outstanding | | | 1,023,096 | | |
Net Asset Value, Offering Price and Redemption Price Per Share
(net assets ÷ shares of beneficial interest outstanding) | | $ | 10.24 | | |
| On sales of $25,000 or more, the offering price of Class A shares is reduced. | | | | | |
Statement of Operations
For the Six Months Ended
March 31, 2005
| Investment Income | | | |
| Interest | | $ | 65,185,212 | | |
| Total investment income | | $ | 65,185,212 | | |
| Expenses | | | |
| Investment adviser fee | | $ | 4,432,774 | | |
| Trustees' fees and expenses | | | 12,064 | | |
Distribution and service fees
Class A | | | 2,281,729 | | |
| Class B | | | 211,391 | | |
| Class C | | | 1,254,325 | | |
| Transfer and dividend disbursing agent fees | | | 530,348 | | |
| Custodian fee | | | 217,236 | | |
| Legal and accounting services | | | 200,308 | | |
| Printing and postage | | | 79,149 | | |
| Registration fees | | | 70,690 | | |
| Miscellaneous | | | 224,290 | | |
| Total expenses | | $ | 9,514,304 | | |
Deduct -
Reduction of custodian fee | | $ | 128,382 | | |
| Total expense reductions | | $ | 128,382 | | |
| Net expenses | | $ | 9,385,922 | | |
| Net investment income | | $ | 55,799,290 | | |
| Realized and Unrealized Gain (Loss) | | | |
Net realized gain (loss) -
Investment transactions (identified cost basis) | | $ | 27,704,306 | | |
| Financial futures contracts | | | (15,766,808 | ) | |
| Swap contracts | | | (5,160,071 | ) | |
| Net realized gain | | $ | 6,777,427 | | |
Change in unrealized appreciation (depreciation) -
Investments (identified cost basis) | | $ | (3,172,086 | ) | |
| Financial futures contracts | | | 16,809,478 | | |
| Swap contracts | | | 5,148,507 | | |
| Net change in unrealized appreciation (depreciation) | | $ | 18,785,899 | | |
| Net realized and unrealized gain | | $ | 25,563,326 | | |
| Net increase in net assets from operations | | $ | 81,362,616 | | |
See notes to financial statements
13
Eaton Vance National Municipals Fund as of March 31, 2005
FINANCIAL STATEMENTS CONT'D
Statements of Changes in Net Assets
Increase (Decrease)
in Net Assets | | Six Months Ended
March 31, 2005
(Unaudited) | | Year Ended
September 30, 2004 | |
From operations -
Net investment income | | $ | 55,799,290 | | | $ | 114,934,782 | | |
Net realized gain (loss) from investment
transactions, financial futures
contracts and swap contracts | | | 6,777,427 | | | | (28,266,585 | ) | |
Net change in unrealized appreciation
(depreciation) from investments,
financial futures contracts and
swap contracts | | | 18,785,899 | | | | 40,846,946 | | |
| Net increase in net assets from operations | | $ | 81,362,616 | | | $ | 127,515,143 | | |
Distributions to shareholders -
From net investment income
Class A | | $ | (49,710,900 | ) | | $ | (56,954,447 | ) | |
| Class B | | | (982,190 | ) | | | (47,956,488 | ) | |
| Class C | | | (5,867,582 | ) | | | (11,224,331 | ) | |
| Class I | | | (205,665 | ) | | | (245,552 | ) | |
| Total distributions to shareholders | | $ | (56,766,337 | ) | | $ | (116,380,818 | ) | |
Transactions in shares of beneficial interest -
Proceeds from sale of shares
Class A | | $ | 188,895,175 | | | $ | 1,733,873,204 | | |
| Class B | | | 28,192,576 | | | | 97,743,866 | | |
| Class C | | | 65,845,671 | | | | 69,517,814 | | |
| Class I | | | 5,686,746 | | | | 3,754,571 | | |
Net asset value of shares issued to
shareholders in payment of
distributions declared
Class A | | | 23,691,959 | | | | 26,195,534 | | |
| Class B | | | 479,318 | | | | 23,491,317 | | |
| Class C | | | 2,929,207 | | | | 5,353,949 | | |
| Class I | | | 61,988 | | | | 76,490 | | |
Cost of shares redeemed
Class A | | | (111,520,916 | ) | | | (223,765,056 | ) | |
| Class B | | | (2,679,517 | ) | | | (1,659,434,034 | ) | |
| Class C | | | (14,754,350 | ) | | | (51,174,017 | ) | |
| Class I | | | (693,242 | ) | | | (876,409 | ) | |
Net asset value of shares exchanged
Class A | | | 67,086 | | | | - | | |
| Class B | | | (67,086 | ) | | | - | | |
Contingent deferred sales charges
Class B | | | - | | | | 325,260 | | |
Net increase in net assets from
Fund share transactions | | $ | 186,134,615 | | | $ | 25,082,489 | | |
| Net increase in net assets | | $ | 210,730,894 | | | $ | 36,216,814 | | |
Increase (Decrease)
in Net Assets | | Six Months Ended
March 31, 2005
(Unaudited) | | Year Ended
September 30, 2004 | |
| Net Assets | | | | | | | | | |
| At beginning of period | | $ | 2,029,122,916 | | | $ | 1,992,906,102 | | |
| At end of period | | $ | 2,239,853,810 | | | $ | 2,029,122,916 | | |
Accumulated undistributed
net investment income
included in net assets | | | | | | | | | |
| At end of period | | $ | 996,085 | | | $ | 1,963,132 | | |
See notes to financial statements
14
Eaton Vance National Municipals Fund as of March 31, 2005
FINANCIAL STATEMENTS CONT'D
Financial Highlights
| | | Class A | |
| | | Six Months Ended
March 31, 2005 | | Year Ended September 30, | |
| | | (Unaudited)(1) | | 2004(1) | | 2003(1) | | 2002(1)(2) | | 2001 | | 2000(1) | |
| Net asset value - Beginning of period | | $ | 10.920 | | | $ | 10.840 | | | $ | 10.920 | | | $ | 10.550 | | | $ | 10.230 | | | $ | 10.440 | | |
| Income (loss) from operations | | | | | | | | | | | | | | | | | | | | | | | | | |
| Net investment income | | $ | 0.295 | | | $ | 0.654 | | | $ | 0.666 | | | $ | 0.656 | | | $ | 0.618 | | | $ | 0.629 | | |
| Net realized and unrealized gain (loss) | | | 0.146 | | | | 0.079 | | | | (0.105 | ) | | | 0.334 | | | | 0.312 | | | | (0.200 | ) | |
| Total income from operations | | $ | 0.441 | | | $ | 0.733 | | | $ | 0.561 | | | $ | 0.990 | | | $ | 0.930 | | | $ | 0.429 | | |
| Less distributions | | | | | | | | | | | | | | | | | | | | | | | | | |
| From net investment income | | $ | (0.301 | ) | | $ | (0.653 | ) | | $ | (0.641 | ) | | $ | (0.620 | ) | | $ | (0.610 | ) | | $ | (0.639 | ) | |
| Total distributions | | $ | (0.301 | ) | | $ | (0.653 | ) | | $ | (0.641 | ) | | $ | (0.620 | ) | | $ | (0.610 | ) | | $ | (0.639 | ) | |
| Net asset value - End of period | | $ | 11.060 | | | $ | 10.920 | | | $ | 10.840 | | | $ | 10.920 | | | $ | 10.550 | | | $ | 10.230 | | |
| Total Return(3) | | | 4.07 | % | | | 6.94 | % | | | 5.46 | % | | | 9.84 | % | | | 9.33 | % | | | 4.39 | % | |
| Ratios/Supplemental Data | | | | | | | | | | | | | | | | | | | | | | | | | |
| Net assets, end of period (000's omitted) | | $ | 1,891,896 | | | $ | 1,769,191 | | | $ | 236,885 | | | $ | 213,456 | | | $ | 181,600 | | | $ | 174,024 | | |
| Ratios (As a percentage of average daily net assets): | | | | | | | | | | | | | | | | | | | | | | | | | |
| Expenses(4) | | | 0.79 | %(5) | | | 0.79 | % | | | 0.78 | % | | | 0.83 | % | | | 0.83 | % | | | 0.66 | % | |
| Expenses after custodian fee reduction(4) | | | 0.78 | %(5) | | | 0.79 | % | | | 0.78 | % | | | 0.82 | % | | | 0.82 | % | | | 0.65 | % | |
| Net investment income | | | 5.35 | %(5) | | | 6.05 | % | | | 6.29 | % | | | 6.31 | % | | | 5.92 | % | | | 6.23 | % | |
| Portfolio Turnover of the Portfolio(6) | | | - | | | | 44 | % | | | 35 | % | | | 32 | % | | | 20 | % | | | 41 | % | |
| Portfolio Turnover of the Fund | | | 27 | % | | | - | | | | - | | | | - | | | | - | | | | - | | |
(1) Net investment income per share was computed using average shares outstanding.
(2) The Fund, through its investment in the Portfolio, has adopted the provisions of the revised AICPA Audit and Accounting Guide for Investment Companies and began using the interest method to amortize premiums on fixed-income securities. The effect of this change for the year ended September 30, 2002 was to increase net investment income per share by $0.003, decrease net realized and unrealized gains per share by $0.003 and increase the ratio of net investment income to average net assets from 6.28% to 6.31%. Per-share data and ratios for t he periods prior to October 1, 2001 have not been restated to reflect this change in presentation.
(3) Returns are historical and are calculated by determining the percentage change in net asset value with all distributions reinvested. Total return is not computed on an annualized basis.
(4) Includes the Fund's share of the Portfolio's allocated expenses while the Fund was making investments directly into the Portfolio.
(5) Annualized.
(6) Portfolio turnover represents the rate of portfolio activity for the period while the Fund was making investments directly into the Portfolio.
See notes to financial statements
15
Eaton Vance National Municipals Fund as of March 31, 2005
FINANCIAL STATEMENTS CONT'D
Financial Highlights
| | | Class B | |
| | | Six Months Ended
March 31, 2005 | | Year Ended September 30, | |
| | | (Unaudited)(1) | | 2004(1) | | 2003(1) | | 2002(1)(2) | | 2001 | | 2000(1) | |
| Net asset value - Beginning of period | | $ | 10.190 | | | $ | 10.130 | | | $ | 10.190 | | | $ | 9.850 | | | $ | 9.550 | | | $ | 9.740 | | |
| Income (loss) from operations | | | | | | | | | | | | | | | | | | | | | | | | | |
| Net investment income | | $ | 0.234 | | | $ | 0.558 | | | $ | 0.581 | | | $ | 0.572 | | | $ | 0.541 | | | $ | 0.532 | | |
| Net realized and unrealized gain (loss) | | | 0.138 | | | | 0.053 | | | | (0.086 | ) | | | 0.303 | | | | 0.300 | | | | (0.188 | ) | |
| Total income from operations | | $ | 0.372 | | | $ | 0.611 | | | $ | 0.495 | | | $ | 0.875 | | | $ | 0.841 | | | $ | 0.344 | | |
| Less distributions | | | | | | | | | | | | | | | | | | | | | | | | | |
| From net investment income | | $ | (0.242 | ) | | $ | (0.555 | ) | | $ | (0.561 | ) | | $ | (0.540 | ) | | $ | (0.545 | ) | | $ | (0.534 | ) | |
| Total distributions | | $ | (0.242 | ) | | $ | (0.555 | ) | | $ | (0.561 | ) | | $ | (0.540 | ) | | $ | (0.545 | ) | | $ | (0.534 | ) | |
| Contingent deferred sales charges | | $ | - | | | $ | 0.004 | | | $ | 0.006 | | | $ | 0.005 | | | $ | 0.004 | | | $ | - | | |
| Net asset value - End of period | | $ | 10.320 | | | $ | 10.190 | | | $ | 10.130 | | | $ | 10.190 | | | $ | 9.850 | | | $ | 9.550 | | |
| Total Return(3) | | | 3.89 | %(4) | | | 6.25 | % | | | 5.17 | % | | | 9.30 | % | | | 9.06 | % | | | 3.72 | % | |
| Ratios/Supplemental Data | | | | | | | | | | | | | | | | | | | | | | | | | |
| Net assets, end of period (000's omitted) | | $ | 55,833 | | | $ | 29,577 | | | $ | 1,553,297 | | | $ | 1,582,772 | | | $ | 1,525,303 | | | $ | 1,483,566 | | |
| Ratios (As a percentage of average daily net assets): | | | | | | | | | | | | | | | | | | | | | | | | | |
| Expenses(5) | | | 1.54 | %(6) | | | 1.17 | % | | | 1.20 | % | | | 1.25 | % | | | 1.26 | % | | | 1.25 | % | |
| Expenses after custodian fee reduction(5) | | | 1.53 | %(6) | | | 1.17 | % | | | 1.20 | % | | | 1.24 | % | | | 1.25 | % | | | 1.24 | % | |
| Net investment income | | | 4.53 | %(6) | | | 5.44 | % | | | 5.88 | % | | | 5.89 | % | | | 5.49 | % | | | 5.63 | % | |
| Portfolio Turnover of the Portfolio(7) | | | - | | | | 44 | % | | | 35 | % | | | 32 | % | | | 20 | % | | | 41 | % | |
| Portfolio Turnover of the Fund | | | 27 | % | | | - | | | | - | | | | - | | | | - | | | | - | | |
(1) Net investment income per share was computed using average shares outstanding.
(2) The Fund, through its investment in the Portfolio, has adopted the provisions of the revised AICPA Audit and Accounting Guide for Investment Companies and began using the interest method to amortize premiums on fixed-income securities. The effect of this change for the year ended September 30, 2002 was to increase net investment income per share by $0.003, decrease net realized and unrealized gains per share by $0.003 and increase the ratio of net investment income to average net assets from 5.86% to 5.89%. Per-share data and ratios for t he periods prior to October 1, 2001 have not been restated to reflect this change in presentation.
(3) Returns are historical and are calculated by determining the percentage change in net asset value with all distributions reinvested. Total return is not computed on an annualized basis.
(4) Total return reflects an increase of 0.17% due to a change in the timing of the payment and reinvestment of distributions.
(5) Includes the Fund's share of the Portfolio's allocated expenses while the Fund was making investments directly into the Portfolio.
(6) Annualized.
(7) Portfolio turnover represents the rate of portfolio activity for the period while the Fund was making investments directly into the Portfolio.
See notes to financial statements
16
Eaton Vance National Municipals Fund as of March 31, 2005
FINANCIAL STATEMENTS CONT'D
Financial Highlights
| | | Class C | |
| | | Six Months Ended
March 31, 2005 | | Year Ended September 30, | |
| | | (Unaudited)(1) | | 2004(1) | | 2003(1) | | 2002(1)(2) | | 2001 | | 2000(1) | |
| Net asset value - Beginning of period | | $ | 9.710 | | | $ | 9.640 | | | $ | 9.710 | | | $ | 9.380 | | | $ | 9.100 | | | $ | 9.280 | | |
| Income (loss) from operations | | | |
| Net investment income | | $ | 0.225 | | | $ | 0.502 | | | $ | 0.522 | | | $ | 0.515 | | | $ | 0.478 | | | $ | 0.477 | | |
| Net realized and unrealized gain (loss) | | | 0.126 | | | | 0.077 | | | | (0.089 | ) | | | 0.297 | | | | 0.274 | | | | (0.175 | ) | |
| Total income from operations | | $ | 0.351 | | | $ | 0.579 | | | $ | 0.433 | | | $ | 0.812 | | | $ | 0.752 | | | $ | 0.302 | | |
| Less distributions | | | |
| From net investment income | | $ | (0.231 | ) | | $ | (0.509 | ) | | $ | (0.503 | ) | | $ | (0.482 | ) | | $ | (0.472 | ) | | $ | (0.482 | ) | |
| Total distributions | | $ | (0.231 | ) | | $ | (0.509 | ) | | $ | (0.503 | ) | | $ | (0.482 | ) | | $ | (0.472 | ) | | $ | (0.482 | ) | |
| Net asset value - End of period | | $ | 9.830 | | | $ | 9.710 | | | $ | 9.640 | | | $ | 9.710 | | | $ | 9.380 | | | $ | 9.100 | | |
| Total Return(3) | | | 3.75 | %(4) | | | 6.15 | % | | | 4.71 | % | | | 9.02 | % | | | 8.47 | % | | | 3.46 | % | |
| Ratios/Supplemental Data | | | |
| Net assets, end of period (000's omitted) | | $ | 281,646 | | | $ | 224,955 | | | $ | 200,310 | | | $ | 185,439 | | | $ | 136,213 | | | $ | 104,455 | | |
| Ratios (As a percentage of average daily net assets): | | | | | | | | | | | | | | | | | | | | | | | | | |
| Expenses(5) | | | 1.54 | %(6) | | | 1.53 | % | | | 1.53 | % | | | 1.57 | % | | | 1.59 | % | | | 1.58 | % | |
| Expenses after custodian fee reduction(5) | | | 1.53 | %(6) | | | 1.53 | % | | | 1.53 | % | | | 1.56 | % | | | 1.58 | % | | | 1.57 | % | |
| Net investment income | | | 4.58 | %(6) | | | 5.19 | % | | | 5.54 | % | | | 5.56 | % | | | 5.16 | % | | | 5.31 | % | |
| Portfolio Turnover of the Portfolio(7) | | | - | | | | 44 | % | | | 35 | % | | | 32 | % | | | 20 | % | | | 41 | % | |
| Portfolio Turnover of the Fund | | | 27 | % | | | - | | | | - | | | | - | | | | - | | | | - | | |
(1) Net investment income per share was computed using average shares outstanding.
(2) The Fund, through its investment in the Portfolio, has adopted the provisions of the revised AICPA Audit and Accounting Guide for Investment Companies and began using the interest method to amortize premiums on fixed-income securities. The effect of this change for the year ended September 30, 2002 was to increase net investment income per share by $0.003, decrease net realized and unrealized gains per share by $0.003 and increase the ratio of net investment income to average net assets from 5.53% to 5.56%. Per-share data and ratios for t he periods prior to October 1, 2001 have not been restated to reflect this change in presentation.
(3) Returns are historical and are calculated by determining the percentage change in net asset value with all distributions reinvested. Total return is not computed on an annualized basis.
(4) Total return reflects an increase of 0.13% due to a change in the timing of the payment and reinvestment of distributions.
(5) Includes the Fund's share of the Portfolio's allocated expenses while the Fund was making investments directly into the Portfolio.
(6) Annualized.
(7) Portfolio turnover represents the rate of portfolio activity for the period while the Fund was making investments directly into the Portfolio.
See notes to financial statements
17
Eaton Vance National Municipals Fund as of March 31, 2005
FINANCIAL STATEMENTS CONT'D
Financial Highlights
| | | Class I | |
| | | Six Months Ended
March 31, 2005 | | Year Ended September 30, | |
| | | (Unaudited)(1) | | 2004(1) | | 2003(1) | | 2002(1)(2) | | 2001 | | 2000(1) | |
| Net asset value - Beginning of period | | $ | 10.120 | | | $ | 10.050 | | | $ | 10.110 | | | $ | 9.770 | | | $ | 9.460 | | | $ | 9.610 | | |
| Income (loss) from operations | | | |
| Net investment income | | $ | 0.281 | | | $ | 0.623 | | | $ | 0.642 | | | $ | 0.637 | | | $ | 0.604 | | | $ | 0.557 | | |
| Net realized and unrealized gain (loss) | | | 0.131 | | | | 0.078 | | | | (0.086 | ) | | | 0.298 | | | | 0.291 | | | | (0.107 | ) | |
| Total income from operations | | $ | 0.412 | | | $ | 0.701 | | | $ | 0.556 | | | $ | 0.935 | | | $ | 0.895 | | | $ | 0.450 | | |
| Less distributions | | | |
| From net investment income | | $ | (0.292 | ) | | $ | (0.631 | ) | | $ | (0.616 | ) | | $ | (0.595 | ) | | $ | (0.585 | ) | | $ | (0.600 | ) | |
| Total distributions | | $ | (0.292 | ) | | $ | (0.631 | ) | | $ | (0.616 | ) | | $ | (0.595 | ) | | $ | (0.585 | ) | | $ | (0.600 | ) | |
| Net asset value - End of period | | $ | 10.240 | | | $ | 10.120 | | | $ | 10.050 | | | $ | 10.110 | | | $ | 9.770 | | | $ | 9.460 | | |
| Total Return(3) | | | 4.10 | % | | | 7.17 | % | | | 5.84 | % | | | 10.05 | % | | | 9.71 | % | | | 4.96 | % | |
| Ratios/Supplemental Data | | | |
| Net assets, end of period (000's omitted) | | $ | 10,480 | | | $ | 5,400 | | | $ | 2,414 | | | $ | 2,193 | | | $ | 389 | | | $ | 598 | | |
| Ratios (As a percentage of average daily net assets): | | | | | | | | | | | | | | | | | | | | | | | | | |
| Expenses(4) | | | 0.54 | %(5) | | | 0.53 | % | | | 0.53 | % | | | 0.57 | % | | | 0.58 | % | | | 0.57 | % | |
| Expenses after custodian fee reduction(4) | | | 0.53 | %(5) | | | 0.53 | % | | | 0.53 | % | | | 0.56 | % | | | 0.57 | % | | | 0.56 | % | |
| Net investment income | | | 5.49 | %(5) | | | 6.18 | % | | | 6.54 | % | | | 6.60 | % | | | 6.22 | % | | | 5.87 | % | |
| Portfolio Turnover of the Portfolio(6) | | | - | | | | 44 | % | | | 35 | % | | | 32 | % | | | 20 | % | | | 41 | % | |
| Portfolio Turnover of the Fund | | | 27 | % | | | - | | | | - | | | | - | | | | - | | | | - | | |
(1) Net investment income per share was computed using average shares outstanding.
(2) The Fund, through its investment in the Portfolio, has adopted the provisions of the revised AICPA Audit and Accounting Guide for Investment Companies and began using the interest method to amortize premiums on fixed-income securities. The effect of this change for the year ended September 30, 2002 was to increase net investment income per share by $0.003, decrease net realized and unrealized gains per share by $0.003 and increase the ratio of net investment income to average net assets from 6.57% to 6.60%. Per-share data and ratios for t he periods prior to October 1, 2001 have not been restated to reflect this change in presentation.
(3) Returns are historical and are calculated by determining the percentage change in net asset value with all distributions reinvested. Total return is not computed on an annualized basis.
(4) Includes the Fund's share of the Portfolio's allocated expenses while the Fund was making investments directly into the Portfolio.
(5) Annualized.
(6) Portfolio turnover represents the rate of portfolio activity for the period while the Fund was making investments directly into the Portfolio.
See notes to financial statements
18
Eaton Vance National Municipals Fund as of March 31, 2005
NOTES TO FINANCIAL STATEMENTS (Unaudited)
1 Significant Accounting Policies
Eaton Vance National Municipals Fund (the Fund) is a diversified series of Eaton Vance Municipals Trust (the Trust). The Trust is an entity of the type commonly known as a Massachusetts business trust and is registered under the Investment Company Act of 1940, as amended, as an open-end management investment company. The Fund seeks to achieve current income exempt from regular federal income tax and particular state or local income or other taxes by investing primarily in investment grade municipal obligations. The Fund offers four classes of shares. Class A shares are generally sold subject to a sales charge imposed at time of purchase. Class B and Class C shares are sold at net asset value and are subject to a contingent deferred sales charge (see Note 6). The Trustees have adopted a conversion feature pursuant to which Class B shares of the Fund automatically convert to Cl ass A shares eight years after their purchase as described in the Fund's prospectus. In addition, all Class B shares of Eaton Vance National Municipals Fund purchased on or before March 16, 2004 converted to Class A shares of the same Fund on April 8, 2004. Class I shares are sold at net asset value to certain institutional investors. Each class represents a pro rata interest in the Fund, but votes separately on class-specific matters and (as noted below) is subject to different expenses. Realized and unrealized gains and losses are allocated daily to each class of shares based on the relative net assets of each class to the total net assets of the Fund. Net investment income, other than class-specific expenses, is allocated daily to each class of shares based upon the ratio of the value of each class' paid shares to the total value of all paid shares. Each class of shares differs in its distribution plan and certain other class-specific expenses.
On October 1, 2004, the National Municipals Fund received its pro rata share of cash and securities from the National Municipals Portfolio (Portfolio) in a complete liquidation of its interest in the Portfolio. Subsequent to October 1, 2004, the Fund invests directly in securities rather than through the Portfolio and maintains the same investment objective.
The following is a summary of significant accounting policies consistently followed by the Fund in the preparation of its financial statements. The policies are in conformity with accounting principles generally accepted in the United States of America.
A Investment Valuation - Municipal bonds are normally valued on the basis of valuations furnished by a pricing service. Taxable obligations, if any, for which price quotations are readily available are normally valued at the mean between the latest bid and asked prices. Futures contracts listed on commodity exchanges are valued at closing settlement prices. Short-term obligations, maturing in sixty days or less, are valued at amortized cost, which approximates value. Interest rate swaps are normally valued on the basis of calculations furnished by a broker. Investme nts for which valuations or market quotations are unavailable are valued at fair value using methods determined in good faith by or at the direction of the Trustees.
B Income - Interest income is determined on the basis of interest accrued, adjusted for amortization of premium and discount.
C Federal Taxes - The Fund's policy is to comply with the provisions of the Internal Revenue Code applicable to regulated investment companies and to distribute to shareholders each year all of its taxable, if any, and tax-exempt income, including any net realized gain on investments. Accordingly, no provision for federal income or excise tax is necessary. At September 30, 2004, the Fund, for federal income tax purposes, had a capital loss carryover of $24,742,314 which will reduce taxable income arising from future net realized gains on investments, if any, to the extent permitted by the Internal Revenue Code, and thus will reduce the amount of the distributions to shareholders which would otherwise be necessary to relieve the Fund of any liability for federal income or excise tax. A portion of such capital loss carryover was acquired through a Fund Reorganization and may be subject to certain limitations. Such capital loss carryover will expire on September 30, 2009 ($23,042,053) and September 30, 2012 ($1,700,261), respectively. Dividends paid by the Fund from net tax-exempt interest on municipal bonds are not includable by shareholders as gross income for federal income tax purposes because the Fund intends to meet certain requirements of the Internal Revenue Code applicable to regulated investment companies which will enable the Fund to pay exempt-interest dividends. The portion of such interest, if any, earned on private activity bonds issued after August 7, 1986, may be considered a tax preference item to shareholders.
Additionally, at September 30, 2004, the Fund had net capital losses of $41,849,313 attributable to security transactions incurred after October 31, 2003. These capital losses are treated as arising on the first day of the Fund's current taxable year.
D Financial Futures Contracts - Upon the entering of a financial futures contract, the Fund is required to deposit (initial margin) either in cash or securities an amount equal to a certain percentage of the purchase price indicated in the financial futures contract. Subsequent payments are made or received by the Fund (margin maintenance) each day, dependent on the daily fluctuations in the value of the underlying security, and are
19
Eaton Vance National Municipals Fund as of March 31, 2005
NOTES TO FINANCIAL STATEMENTS (Unaudited) CONT'D
recorded for book purposes as unrealized gains or losses by the Fund. The Fund's investment in financial futures contracts is designed for both hedging against anticipated future changes in interest rates and investment purposes. Should interest rates move unexpectedly, the Fund may not achieve the anticipated benefits of the financial futures contracts and may realize a loss.
E Options on Financial Futures Contracts - Upon the purchase of a put option on a financial futures contract by the Fund, the premium paid is recorded as an investment, the value of which is marked-to-market daily. When a purchased option expires, the Fund will realize a loss in the amount of the cost of the option. When the Fund enters into a closing sale transaction, the Fund will realize a gain or loss depending on whether the sales proceeds from the closing sale transaction are greater or less than the cost of the option. When the Fund exercises a put option, se ttlement is made in cash. The risk associated with purchasing put options is limited to the premium originally paid.
F When-issued and Delayed Delivery Transactions - The Fund may engage in when-issued and delayed delivery transactions. The Fund records when-issued securities on trade date and maintain security positions such that sufficient liquid assets will be available to make payments for the securities purchased. Securities purchased on a when-issued or delayed delivery basis are marked-to-market daily and begin earning interest on settlement date.
G Interest Rate Swaps - The Fund may enter into interest rate swap agreements to enhance return, to hedge against fluctuations in securities prices or interest rates or as substitution for the purchase or sale of securities. Pursuant to the agreement, the Fund makes bi-annual payments at a fixed interest rate. In exchange, the Fund receives payments based on the interest rate of a benchmark industry index. During the term of the outstanding swap agreement, changes in the underlying value of the swap are recorded as unrealized gains and losses. The value of the swap is determined by changes in the relationship between two rates of interest. The Fund is exposed to credit loss in the event of non-performance by the swap counterparty. However, the Fund does not anticipate non-performance by the counterparty. Risk may also rise from the unanticipated movements in value of interest rates.
H Legal Fees - Legal fees and other related expenses incurred as part of negotiations of the terms and requirements of capital infusions, or that are expected to result in the restructuring of or a plan of reorganization for an investment are recorded as realized losses. Ongoing expenditures to protect or enhance an investment are treated as operating expenses.
I Other - Investment transactions are accounted for on a trade-date basis.
J Use of Estimates - The preparation of the financial statements in conformity with accounting principles generally accepted in the United States of America requires management to make estimates and assumptions that affect the reported amounts of assets and liabilities at the date of the financial statements and the reported amounts of income and expense during the reporting period. Actual results could differ from those estimates.
K Indemnifications - Under the Trust's organizational documents, its officers and Trustees may be indemnified against certain liabilities and expenses arising out of the performance of their duties to the Fund, and shareholders are indemnified against personal liability for obligations of the Trust. Additionally, in the normal course of business, the Fund enters into agreements with service providers that may contain indemnification clauses. The Fund's maximum exposure under these agreements is unknown as this would involve future claims that my be made against the Fund that have not yet occurred.
L Expenses - The majority of expenses of the Trust are directly identifiable to an individual fund. Expenses which are not readily identifiable to a specific fund are allocated taking into consideration, among other things, the nature and type of expense and the relative size of the funds.
M Expense Reduction - Investors Bank & Trust Company (IBT) serves as custodian of the Fund. Pursuant to the respective custodian agreements, IBT receives a fee reduced by credits which are determined based on the average daily cash balances the Fund maintains with IBT. All credit balances used to reduce the Fund's custodian fees are reported as a reduction of total expenses on the Statement of Operations.
N Interim Financial Statements - The interim financial statements relating to March 31, 2005 and for the six months then ended have not been audited by an independent registered public accounting firm, but in the opinion of the Fund's management reflect all adjustments, consisting only of normal recurring adjustments, necessary for the fair presentation of the financial statements.
20
Eaton Vance National Municipals Fund as of March 31, 2005
NOTES TO FINANCIAL STATEMENTS (Unaudited) CONT'D
2 Distributions to Shareholders
The net income of the Fund is determined daily and substantially all of the net income so determined is declared as a dividend to shareholders of record at the time of declaration. Distributions are declared separately for each class of shares. Distributions are paid monthly. Distributions of allocated realized gains, if any, are made at least annually. Shareholders may reinvest capital gain distributions in additional shares of the same class of the Fund at the net asset value as of the reinvestment date. Distributions are paid in the form of additional shares of the same class or, at the election of the shareholder, in cash. The Fund distinguishes between distributions on a tax basis and a financial reporting basis. Accounting principles generally accepted in the United States of America require that only distributions in excess of tax basis earnings and profits be reported in the financial st atements as a return of capital. Permanent differences between book and tax accounting relating to distributions are reclassified to paid-in capital.
3 Shares of Beneficial Interest
The Fund's Declaration of Trust permits the Trustees to issue an unlimited number of full and fractional shares of beneficial interest (without par value). Such shares may be issued in a number of different series (such as the Fund) and classes. Transactions in Fund shares were as follows:
| Class A | | Six Months Ended
March 31, 2005
(Unaudited) | | Year Ended
September 30, 2004 | |
| Sales | | | 17,047,892 | | | | 158,485,666 | | |
Issued to shareholders electing to
receive payments of distributions
in Fund shares | | | 2,142,584 | | | | 2,420,842 | | |
| Redemptions | | | (10,084,382 | ) | | | (20,733,729 | ) | |
| Exchange from Class B shares | | | 6,055 | | | | - | | |
| Net increase | | | 9,112,149 | | | | 140,172,779 | | |
| Class B | | Six Months Ended
March 31, 2005
(Unaudited) | | Year Ended
September 30, 2004 | |
| Sales | | | 2,728,748 | | | | 9,534,947 | | |
Issued to shareholders electing to
receive payments of distributions
in Fund shares | | | 46,388 | | | | 2,287,326 | | |
| Redemptions | | | (259,587 | ) | | | (162,307,200 | ) | |
| Exchange to Class A shares | | | (6,486 | ) | | | - | | |
| Net increase (decrease) | | | 2,509,063 | | | | (150,484,927 | ) | |
| Class C | | Six Months Ended
March 31, 2005
(Unaudited) | | Year Ended
September 30, 2004 | |
| Sales | | | 6,686,606 | | | | 7,149,700 | | |
Issued to shareholders electing to
receive payments of distributions
in Fund shares | | | 297,684 | | | | 552,354 | | |
| Redemptions | | | (1,500,515 | ) | | | (5,305,191 | ) | |
| Net increase | | | 5,483,775 | | | | 2,396,863 | | |
| Class I | | Six Months Ended
March 31, 2005
(Unaudited) | | Year Ended
September 30, 2004 | |
| Sales | | | 550,863 | | | | 373,492 | | |
Issued to shareholders electing to
receive payments of distributions
in Fund shares | | | 6,044 | | | | 7,572 | | |
| Redemptions | | | (67,390 | ) | | | (87,649 | ) | |
| Net increase | | | 489,517 | | | | 293,415 | | |
4 Investment Adviser Fee and Other Transactions with Affiliates
The investment adviser fee is earned by Boston Management and Research (BMR), a wholly-owned subsidiary of Eaton Vance Management (EVM), as compensation for management and investment advisory services rendered to the Fund. The fee is based upon a percentage of average daily net assets plus a percentage of gross income (i.e., income other than gains from the sale of securities). For the six months ended March 31, 2005, the fee was equivalent to 0.42% of the Fund's average daily net assets for such period and amounted to $4,432,774. Except as to Trustees of the Fund who are not members of EVM's or BMR's organization, officers and Trustees receive remuneration for their services to the Fund out of such investment adviser fee. Eaton Vance Management (EVM) serves as the Administrator of the Fund, but receives no compensation. EVM serves as the sub-transfer agent of the Fund and receives from the transfer agent an aggregate fee based upon the actual expenses incurred by EVM in the performance of those services. For the six months ended March 31, 2005, EVM earned $35,212 in sub-transfer agent fees. The Fund was informed that Eaton Vance Distributors, Inc. (EVD), a subsidiary of EVM and the Fund's principal underwriter, received $188,718, as its portion of the sales charge on sales of Class A shares for the six months ended March 31, 2005.
Trustees of the Fund that are not affiliated with the Investment Adviser may elect to defer receipt of all or a
21
Eaton Vance National Municipals Fund as of March 31, 2005
NOTES TO FINANCIAL STATEMENTS (Unaudited) CONT'D
percentage of their annual fees in accordance with the terms of the Trustees Deferred Compensation Plan. For the six months ended March 31, 2005, no significant amounts have been deferred.
Certain officers and Trustees of the Fund and of the Portfolio are officers of the above organizations.
5 Distribution and Service Plans
The Fund has in effect distribution plans for Class B shares (Class B Plan) and Class C shares (Class C Plan) pursuant to Rule 12b-1 under the Investment Company Act of 1940 and a service plan for Class A shares (Class A Plan), (collectively, the Plans). The Class B and Class C Plans require the Fund to pay EVD amounts equal to 1/365 of 0.75% of the Fund's average daily net assets attributable to Class B and Class C shares for providing ongoing distribution services and facilities to the Fund. The Fund will automatically discontinue payments to EVD during any period in which there are no outstanding Uncovered Distribution Charges, which are equivalent to the sum of (i) 5% and 6.25% of the aggregate amount received by the Fund for the Class B and Class C shares sold, respectively, plus (ii) interest calculated by applying the rate of 1% over the prevailing prime rate to the outstanding balance of Uncovered Distribution Charges of EVD of each respective class reduced by the aggregate amount of contingent deferred sales charges (see Note 6) and daily amounts theretofore paid to EVD by each respective class. The Fund paid or accrued $158,543 and $940,744 for Class B, and Class C shares, respectively, payable to EVD for the six months ended March 31, 2005, representing 0.75% (annualized) of the average daily net assets for Class B and Class C shares. At March 31, 2005, the amount of Uncovered Distribution Charges EVD calculated under the Plans was approximately $2,049,000 and $32,846,000 for Class B and Class C shares.
The Plans authorize the Fund to make payments of service fees to EVD, investment dealers and other persons in amounts not exceeding 0.25% (annualized) of the Fund's average daily net assets attributable to Class A, Class B, and Class C shares for each fiscal year. Service fee payments will be made for personal services and/or the maintenance of shareholder accounts. Service fees are separate and distinct from the sales commissions and distribution fees payable by the Fund to EVD, and, as such are not subject to automatic discontinuance when there are no outstanding Uncovered Distribution Charges of EVD. Service fee payments for the six months ended March 31, 2005 amounted to $2,281,729, $52,848, and $313,581 for Class A, Class B, and Class C shares, respectively.
6 Contingent Deferred Sales Charge
A contingent deferred sales charge (CDSC) generally is imposed on redemptions of Class A shares made within 18 months of purchase, Class B shares made within six years of purchase and on redemptions of Class C shares made within one year of purchase. Class A shares may be subject to a 1% CDSC if redeemed with 18 months of purchase (depending on the circumstances of the purchase). Generally, the CDSC is based upon the lower of the net asset value at date of redemption or date of purchase. No charge is levied on shares acquired by reinvestment of dividends or capital gains distributions. Class A shares purchased at net asset value in amounts of $1 million or more (other than shares purchased in a single transaction of $5 million or more) are subject to a 1% CDSC if redeemed within 18 months of purchase. Class B CDSC is imposed at declining rates that begin at 5% in th e case of redemptions in the first and second year after purchase, declining one percentage point each subsequent year. Class C shares will be subject to a 1% CDSC if redeemed within one year of purchase. No CDSC is levied on shares which have been sold to EVM or its affiliates or to their respective employees or clients and may be waived under certain other limited conditions. CDSC charges are paid to EVD to reduce the amount of Uncovered Distribution Charges calculated under each Fund's Distribution Plan (see Note 5). CDSC charges received when no Uncovered Distribution Charges exist will be credited to the Fund. EVD received approximately $24,000, $78,000 and $16,000 of CDSC paid by shareholders for Class A, Class B and Class C shares, respectively, for the six months ended March 31, 2005.
7 Investments
Purchases and sales of investments, other than U.S. Government securities and short-term obligations, aggregated $774,253,376 and $585,069,132, respectively, for the six months ended March 31, 2005.
8 Federal Income Tax Basis of Unrealized Appreciation (Depreciation)
The cost and unrealized appreciation/depreciation in the value of the investments owned at March 31, 2005, as computed on a federal income tax basis, were as follows:
| Aggregate cost | | $ | 2,061,306,977 | | |
| Gross unrealized appreciation | | $ | 219,795,383 | | |
| Gross unrealized depreciation | | | (62,789,875 | ) | |
| Net unrealized appreciation | | $ | 157,005,508 | | |
22
Eaton Vance National Municipals Fund as of March 31, 2005
NOTES TO FINANCIAL STATEMENTS (Unaudited) CONT'D
9 Line of Credit
The Fund participates with other portfolios and funds managed by BMR and EVM and their affiliates in a $150 million unsecured line of credit agreement with a group of banks. The Fund may temporarily borrow from the line of credit to satisfy redemption requests or settle investment transactions. Interest is charged to each participating portfolio or fund based on its borrowings at an amount above either the Eurodollar rate or federal funds rate. In addition, a fee computed at an annual rate of 0.10% on the daily unused portion of the line of credit is allocated among the participating portfolios and funds at the end of each quarter. At March 31, 2005, the Fund had a balance outstanding pursuant to this line of credit of $3,200,000. The Fund did not have any significant borrowings or allocated fees during the six months ended March 31, 2005.
10 Financial Instruments
The Fund regularly trades in financial instruments with off-balance sheet risk in the normal course of its investing activities to assist in managing exposure to various market risks. These financial instruments include futures contracts and interest rate swap contracts and may involve, to a varying degree, elements of risk in excess of the amounts recognized for financial statement purposes. The notional or contractual amounts of these instruments represent the investment a Fund has in particular classes of financial instruments and does not necessarily represent the amounts potentially subject to risk. The measurement of the risks associated with these instruments is meaningful only when all related and offsetting transactions are considered.
Futures Contracts
Expiration
Date(s) | | Contracts | | Position | | Aggregate
Cost | | Value | | Net Unrealized
Appreciation | |
| 06/05 | | 4,500 U.S. Treasury Bond | | Short | | $ | (509,430,096 | ) | | $ | (501,187,500 | ) | | $ | 8,242,596 | | |
| 06/05 | | 2,500 U.S. Treasury Note | | Short | | | (275,926,875 | ) | | | (273,164,075 | ) | | | 2,762,800 | | |
| | | $ | 11,005,396 | | |
At March 31, 2005, the Fund had entered into an interest rate swap agreement with Merrill Lynch Capital Services whereby the Fund makes bi-annual payments at a fixed rate equal to 5.252% on the notional amount of $125,000,000. In exchange, the Fund receives semi-annual payments at a rate equal to the three month USD-LIBOR on the same notional amount. The effective date of the interest rate swap is July 15, 2005. The value of the contract, which terminates July 15, 2025, is recorded as a receivable for open swap contracts of $94,788 on March 31, 2005.
At March 31, 2005, the Fund had sufficient cash and/or securities to cover commitments under these contracts.
23
Eaton Vance National Municipals Fund
BOARD OF TRUSTEES' ANNUAL APPROVAL OF THE INVESTMENT ADVISORY AGREEMENT
The investment advisory agreement between Eaton Vance National Municipals Fund (the "Fund") and the investment adviser, Boston Management and Research, provides that the advisory agreement will continue in effect from year to year so long as its continuance is approved at least annually (i) by a vote of a majority of the noninterested Trustees of the Fund cast in person at a meeting called for the purpose of voting on such approval and (ii) by the Trustees of the Fund or by vote of a majority of the outstanding interests of the Fund.
In considering the annual approval of the investment advisory agreement between the Fund and the investment adviser, the Special Committee of the Board of Trustees considered information that had been provided throughout the year at regular Board meetings, as well as information furnished to the Special Committee for a series of meetings held in February and March in preparation for a Board meeting held on March 21, 2005 to specifically consider the renewal of the investment advisory agreement. Such information included, among other things, the following:
•An independent report comparing the advisory fees of the Fund with those of comparable funds;
•An independent report comparing the expense ratio of the Fund to those of comparable funds;
•Information regarding Fund investment performance in comparison to a relevant peer group of funds and appropriate indices;
•The economic outlook and the general investment outlook in relevant investment markets;
•Eaton Vance Management's ("Eaton Vance") results and financial condition and the overall organization of the investment adviser;
•The procedures and processes used to determine the fair value of Fund assets and actions taken to monitor and test the effectiveness of such procedures and processes;
•Eaton Vance's management of the relationship with the custodian, subcustodians and fund accountants;
•The resources devoted to compliance efforts undertaken by Eaton Vance on behalf of the funds it manages and the record of compliance with the investment policies and restrictions and with policies on personal securities transactions;
•The quality, nature, cost and character of the administrative and other non-investment management services provided by Eaton Vance and its affiliates; and
•The terms of the advisory agreement and the reasonableness and appropriateness of the particular fee paid by the Fund for the services described therein.
The Special Committee also considered the nature, extent and quality of the management services provided by the investment adviser. In so doing, the Special Committee considered the investment adviser's management capabilities with respect to the types of investments held by the Fund, including information relating to the education, experience and number of investment professionals and other personnel who provide services under the investment advisory agreement. Specifically, the Special Committee considered the investment adviser's 30-person municipal bond team, which includes six portfolio managers and nine credit specialists who provide services to the Fund. The Special Committee noted the investment adviser's extensive in-house research capabilities and experience managing municipal bond funds. The Special Committee evaluated the level of skill required to manage the Fund and concluded that the human resources available at the investment adviser were appropriate to fulfill effectively its duties on behalf of the Fund.
In its review of comparative information with respect to Fund investment performance, the Special Committee concluded that the Fund has performed within a range that the Special Committee deemed
24
Eaton Vance National Municipals Fund
BOARD OF TRUSTEES' ANNUAL APPROVAL OF THE INVESTMENT ADVISORY AGREEMENT CONT'D
competitive. With respect to its review of investment advisory fees, the Special Committee concluded that the fees paid by the Fund are within the range of those paid by comparable funds within the mutual fund industry. In reviewing the information regarding the expense ratio of the Fund, the Special Committee concluded that the Fund's expense ratio is within a range that is competitive with comparable funds ratio.
In addition to the factors mentioned above, the Special Committee reviewed the level of the investment adviser's profits in providing investment management services for each Fund and for all Eaton Vance Funds as a group. The Special Committee also reviewed the level of profits of Eaton Vance and its affiliates in providing administration services for each Fund and for all Eaton Vance Funds as a group. In addition, the Special Committee considered the fiduciary duty assumed by the investment adviser in connection with the services rendered to the Fund and the business reputation of the investment adviser and its financial resources. The Trustees concluded that in light of the services rendered, the profits realized by the investment adviser are not unreasonable. The Special Committee also considered the extent to which the investment adviser appears to be realizing benefits from economies of sca le in managing the Fund, and concluded that the fee breakpoints which are in place and will allow for an equitable sharing of such benefits, when realized, with the shareholders of the Funds.
The Special Committee did not consider any single factor as controlling in determining whether or not to approve the investment advisory agreement. Nor are the items described herein all the matters considered by the Special Committee. In assessing the information provided by Eaton Vance and its affiliates, the Special Committee also took into consideration the benefits to shareholders of investing in a fund that is a part of a large family of funds which provides a large variety of shareholder services.
Based on its consideration of the foregoing factors and conclusions, and such other factors and conclusions as it deemed relevant, and assisted by independent counsel, the Special Committee concluded that the approval of the investment advisory agreement, including the fee structure (described herein), is in the interests of shareholders.
25
Eaton Vance National Municipals Fund
INVESTMENT MANAGEMENT
Eaton Vance National Municipals Fund
Officers
Thomas J. Fetter
President
William H. Ahern, Jr.
Vice President
Craig R. Brandon
Vice President
Cynthia J. Clemson
Vice President
James B. Hawkes
Vice President and Trustee
Robert B. MacIntosh
Vice President
Thomas M. Metzold
Vice President and Portfolio Manager
James L. O'Connor
Treasurer
Alan R. Dynner
Secretary
Paul M. O'Neil
Chief Compliance Officer | | Trustees
Benjamin C. Esty
Samuel L. Hayes, III
William H. Park
Ronald A. Pearlman
Norton H. Reamer
Lynn A. Stout
Ralph F. Verni | |
|
26
This Page Intentionally Left Blank
This Page Intentionally Left Blank
This Page Intentionally Left Blank
Investment Adviser of Eaton Vance National Municipals Fund
Boston Management and Research
The Eaton Vance Building
255 State Street
Boston, MA 02109
Administrator of Eaton Vance National Municipals Fund
Eaton Vance Management
The Eaton Vance Building
255 State Street
Boston, MA 02109
Principal Underwriter
Eaton Vance Distributors, Inc.
The Eaton Vance Building
255 State Street
Boston, MA 02109
(617) 482-8260
Custodian
Investors Bank & Trust Company
200 Clarendon Street
Boston, MA 02116
Transfer Agent
PFPC Inc.
Attn: Eaton Vance Funds
P.O. Bo 9653
Providence, RI 02940-9653
(800) 262-1122
Eaton Vance Municipals Trust
The Eaton Vance Building
255 State Street
Boston, MA 02109
This report must be preceded or accompanied by a current prospectus. Before investing, investors should consider carefully the Fund s investment objective(s), risks, and charges and expenses. The Fund s current prospectus contains this and other information about the Fund and is available through your financial advisor. Please read the prospectus carefully before you invest or send money. For further information please call 1-800-225-6265.

| | | | 
|
Semiannual Report March 31, 2005 | |
| | | | |

| | EATON VANCE
MUNICIPALS
TRUST | | California
Florida
Massachusetts
Mississippi
New York
Ohio
Rhode Island
West Virginia |

| | |
IMPORTANT NOTICES REGARDING PRIVACY,
DELIVERY OF SHAREHOLDER DOCUMENTS,
PORTFOLIO HOLDINGS AND PROXY VOTING
Privacy. The Eaton Vance organization is committed to ensuring your financial privacy. Each of the financial institutions identified below has in effect the following policy (“Privacy Policy”) with respect to nonpublic personal information about its customers:
• Only such information received from you, through application forms or otherwise, and information about your Eaton Vance fund transactions will be collected. This may include information such as name, address, social security number, tax status, account balances and transactions.
• None of such information about you (or former customers) will be disclosed to anyone, except as permitted by law (which includes disclosure to employees necessary to service your account). In the normal course of servicing a customer’s account, Eaton Vance may share information with unaffiliated third parties that perform various required services such as transfer agents, custodians and broker/dealers.
• Policies and procedures (including physical, electronic and procedural safeguards) are in place that are designed to protect the confidentiality of such information.
• We reserve the right to change our Privacy Policy at any time upon proper notification to you. Customers may want to review our Policy periodically for changes by accessing the link on our homepage: www.eatonvance.com.
Our pledge of privacy applies to the following entities within the Eaton Vance organization: the Eaton Vance Family of Funds, Eaton Vance Management, Eaton Vance Investment Counsel, Boston Management and Research, and Eaton Vance Distributors, Inc.
In addition, our Privacy Policy only applies to those Eaton Vance customers who are individuals and who have a direct relationship with us. If a customer’s account (i.e. fund shares) is held in the name of a third-party financial adviser/broker-dealer, it is likely that only such adviser’s privacy policies apply to the customer. This notice supersedes all previously issued privacy disclosures.
For more information about Eaton Vance’s Privacy Policy, please call 1-800-262-1122.
Delivery of Shareholder Documents. The Securities and Exchange Commission permits funds to deliver only one copy of shareholder documents, including prospectuses, proxy statements and shareholder reports, to fund investors with multiple accounts at the same residential or post office box address. This practice is often called “householding” and it helps eliminate duplicate mailings to shareholders.
Eaton Vance, or your financial adviser, may household the mailing of your documents indefinitely unless you instruct Eaton Vance, or your financial adviser, otherwise.
If you would prefer that your Eaton Vance documents not be householded, please contact Eaton Vance at 1-800-262-1122, or contact your financial adviser.
Your instructions that householding not apply to delivery of your Eaton Vance documents will be effective within 30 days of receipt by Eaton Vance or your financial adviser.
Portfolio Holdings. Each Eaton Vance Fund and it’s underlying Portfolio will file a schedule of its portfolio holdings on Form N-Q with the SEC for the first and third quarters of each fiscal year. The Form N-Q will be available on the Eaton Vance website www.eatonvance.com, by calling Eaton Vance at 1-800-262-1122 or in the EDGAR database on the SEC’s website at www.sec.gov. Form N-Q may also be reviewed and copied at the SEC’s public reference room in Washington, D.C. (call 1-800-732-0330 for information on the operation of the public reference room).
Proxy Voting. From time to time, funds are required to vote proxies related to the securities held by the funds. The Eaton Vance Funds or their underlying Portfolios (if applicable) vote proxies according to a set of policies and procedures approved by the Funds’ and Portfolios’ Boards. You may obtain a description of these policies and procedures and information on how the Funds or Portfolios voted proxies relating to Portfolio securities during the 12 month period ended June 30, without charge, upon request, by calling
1-800-262-1122. This description is also available on the SEC’s website at www.sec.gov.
Eaton Vance Municipals Funds as of March 31, 2005
TABLE OF CONTENTS
President’s Letter to Shareholders | 2 |
| |
Market Recap | 3 |
| |
Fund Investment Updates | |
| |
| California | 4 |
| Florida | 6 |
| Massachusetts | 8 |
| Mississippi | 10 |
| New York | 12 |
| Ohio | 14 |
| Rhode Island | 16 |
| West Virginia | 18 |
| |
Disclosure of Fund Expenses | 20 |
| |
Financial Statements | 23 |
| |
Board of Trustees’ Annual Approval of the Investment Advisory Agreements | 81 |
| |
Investment Management | 83 |
1
Eaton Vance Municipals Funds as of March 31, 2005
LETTER TO SHAREHOLDERS

Thomas J. Fetter
President
The municipal bond market is a center of capital formation for states, municipalities and, in some cases, private economic initiatives. In this edition of our continuing educational series, we will discuss industrial development revenue (IDR) bonds. IDR bonds have long been used as a financing mechanism by local governments to provide assistance to local employers and encourage job retention and creation within their communities.
IDR bonds finance private activities that benefit the public...
IDR bonds are issued by municipal authorities to finance projects and facilities used by private corporations. Historically, IDR bonds have represented a partnership between the private and public sectors – a source of dedicated funding for companies and a source of job creation in projects beneficial to local communities. The “Private-Activities” provision of the Tax Reform Act of 1986 permits issuance of tax-exempt bonds for specific activities, including pollution control; gas and electric service; water distribution; wastewater systems; solid waste disposal; airports and selected transportation projects; and other industrial projects.
The Act also placed a cap on the dollar amount that may be raised for IDR bonds in each state, limiting the amount to $50 per person/per state/per year, with a $150 million maximum. These limitations provide protection against potential abuse and ensure that tax-exempt IDR bonds will indeed be issued for projects that will benefit the public.
IDR bonds finance utility-related projects and other industrial initiatives...
Typically, IDR bond projects provide financing for manufacturing, processing or utility facilities. Historically, about one-half of these bonds have been issued to finance pollution control facilities for manufacturers and electric utilities. Because many utilities and manufacturers have been ordered to comply with stricter environmental and fuel standards, pollution control bonds have helped finance the retrofits of existing plants. Other IDR bonds have served as inducements from state and local issuers to locate plants or build new facilities, in the hope that such construction might generate further economic growth for a community.
IDR bonds are secured by corporate revenues – not those of state or local governments...
IDR bond issues are secured by the credit of the underlying corporation. The municipal issuing authority acts solely as a conduit to permit tax-exempt financing. The corporation pledges to makepayments sufficient to meet all debt service obligations. Unlike some revenue issues, IDR bonds are backed by revenues of the entire corporation, not solely by those of the project being financed.
Because IDR bonds are backed by corporate revenues and not by the taxing authority of a state or local jurisdiction, they have historically provided coupon premiums above those of general obligations and other more traditional revenue bonds. Bonds may be either collateralized or unsecured. Collateralized bonds have a lien against the company’s assets, which may provide bond holders enhanced bargaining power in the event of a bankruptcy. Unsecured bonds have no such lien.
While providing new opportunities, IDR bonds require rigorous analysis...
While IDR bonds may provide unusual investment opportunities, they also may entail increased risk and, therefore, demand especially intensive analysis. At Eaton Vance, we have credit analysts and resources dedicated to IDR bond research.
IDR bonds represent a key segment of the municipal bond market and should remain an importantsource of capital formation. In our view, the experience and resources needed to evaluate these issues further demonstrates the value of professional management. We will continue to look for opportunities in this sector of the municipal market.
| Sincerely, |
| |
| /s/ Thomas J. Fetter | |
| Thomas J. Fetter |
| President |
| May 6, 2005 |
Shares of the Funds are not insured by the FDIC and are not deposits or other obligations of, or guaranteed by, any depository institution. Shares are subject to investment risks, including possible loss of principal invested. .
2
Eaton Vance Municipals Funds as of March 31, 2005
MARKET RECAP
The U.S. economy continued to generate moderate growth during the six months ended March 31, 2005. While higher gasoline and energy prices pinched consumers, the weak U.S. dollar raised inflationary concerns and helped push interest rates higher.
After a promising recovery in 2004, slower growth in early 2005...
The nation’s Gross Domestic Product grew by 3.1% in the first quarter of 2005, according to preliminary Commerce Department figures, following a 3.8% rise in the fourth quarter of 2004. Manufacturing activity, which had expanded strongly in the second half of 2004, slackened somewhat in the first quarter of 2005, amid slower industrial production and weakening demand for durable goods.
Consumer spending, which helped fuel the economic recovery over the past year, weakened considerably, as higher fuel costs and rising interest rates on loans and mortgages prompted consumers to tighten their belts. Capital spending also slowed, as businesses curtailed new investments in plants and factories, while reducing the pace of investment in productivity-enhancing equipment and software. Residential construction remained relatively strong, although slightly off the torrid pace set in 2004.
After recovering dramatically in 2004, job creation weakened somewhat in early 2005...
The nation’s labor markets strengthened during the year, although the pace of job creation weakened at the close of the period. Hiring picked up during the year in areas that had suffered large technology sector layoffs. Also, manufacturing, financial services, business services, trucking, shipping, construction, energy, health care, and media also generated new jobs. In the first quarter of 2005, however, employers showed some reticence in hiring practices, as they were forced to cope with unpredictable fuel cost hikes.
Municipal bond yields were 99% of Treasury yields
30-Year AAA-rated | | Taxable equivalent yield |
General Obligation (GO) Bonds* | | in 35.0% tax bracket |
30-Year Treasury Bond
Principal and interest payments of Treasury securities are guaranteed by the U.S. government.
*GO yields are a compilation of a representative variety of general obligations and are not necessarily representative of a Fund's yield. Statistics as of March 31, 2005.
Past performance is no guarantee of future results.
Source: Bloomberg, L.P.
The Federal Reserve continued to raise short-term interest rates in 2005...
The Federal Reserve pushed short-term rates higher, suggesting it will continue to raise rates to keep the economy from growing too quickly and, thereby, reviving inflation. Beginning in June 2004, the Fed increased its Federal Funds rate – a key short-term interest rate barometer – on seven occasions, raising that benchmark from 1.00% to 2.75%, including its most recent rate hike in March 2005.
The municipal bond market posted a modest gain for the year, slightly outperforming the Treasury market. For the six months ended March 31, 2005, the Lehman Brothers Municipal Bond Index – an unmanaged index commonly used as a broad measure of municipal bond performance – had a total return of 1.21%.*
* It is not possible to invest directly in an Index. The Index’s total return does not reflect commissions or expenses that would have been incurred if an investor individually purchased or sold the securities represented in the Index.
3
Eaton Vance California Municipals Fund as of March 31, 2005
INVESTMENT UPDATE
The Fund
• The Fund’s Class A shares had a total return of 1.76% during the six months ended March 31, 2005.(1) This return was the result of a decrease in net asset value (NAV) to $10.79 per share on March 31, 2005, from $10.86 on September 30, 2004, and the reinvestment of $0.261 in dividends.(2)
• The Fund’s Class B shares had a total return of 1.50% during the six months ended March 31, 2005.(1) This return was the result of a decrease in NAV to $9.99 per share on March 31, 2005, from $10.06 on September 30, 2004, and the reinvestment of $0.220 in dividends.(2)
• The Fund’s Class C shares had a total return of 1.42% during the six months ended March 31, 2005.(1) This return was the result of a decrease in NAV to $9.99 per share on March 31, 2005, from $10.06 on September 30, 2004, and the reinvestment of $0.213 in dividends.(2)
• For comparison, the Lehman Brothers Municipal Bond Index had a total return of 1.21% for the six months ended March 31,
2005.(3)
• Based on the Fund’s most recent dividends and NAVs on March 31, 2005, of $10.79 per share for Class A, $9.99 for Class B, and $9.99 for Class C, the Fund’s distribution rates were 4.77%, 4.02%, and 4.02%, respectively.(4) The distribution rates of Class A, Class B, and Class C are equivalent to taxable rates of 8.09%, 6.82%, and 6.82%, respectively.(5)
• The SEC 30-day yields for Class A, Class B, and Class C shares at March 31, 2005, were 4.31%, 3.76%, and 3.76%, respectively.(6) The SEC 30-day yields of Class A, Class B, and Class C are equivalent to taxable yields of 7.31%, 6.38%, and 6.38%,
respectively.(5)
Fund Statistics**
• Number of Issues: | | 83 |
• Average Maturity: | | 18.6 years |
• Average Rating: | | AA- |
• Average Call: | | 9.6 years |
• Average Dollar Price: | | $95.88 |
**Fund Statistics may not be representative of the Fund’s current or future investments and may change due to active management.
Management Discussion

Cynthia J. Clemson
Portfolio Manager
• California’s economy saw a slight improvement during the six-month period, with unemployment dropping to 5.4% in March 2005 from 5.9% in September 2004. Job gains have increased by nearly 130,000 in the past year. The largest job gains were in the construction industry, with other gains in mining, information technology,business services, education, health care, and government. Trade, transportation, and utilities saw declines in employment.
• The Fund continued to emphasize escrowed/pre-refundedbonds, which was one of the largest sector weightings at March 31, 2005. These bonds are either pre-refunded to their approaching call datesor escrowed to maturity. Because they are backed by Treasury bonds, escrowed bonds are considered to be of the highest quality, and generally provide an excellent source of income.
• In the education sector, we were fortunate to acquire some California Education bonds that support Lutheran University. This issue is BBB-rated and came with good call protection and an attractive yield.
• Lease revenue/certificates of participation bonds (COPs) were also among the Fund’s largest sector weightings. COPs are an alternative financing tool employed to finance a wide variety of municipal projects, including recreational facilities, university facilities, and parking facilities.
• Special tax revenue bonds, which are typically non-rated, also constituted significant investments in the Fund. While these issues have solid credit quality, they often carry higher yields than investment-grade bonds of similar credit quality. These bonds are secured by the levy of special assessments – as opposed to property taxes – by local governments. The levies help defray costs on improvements or infrastructures that benefit local property owners.
• Management continued to closely monitor the Fund’s call protection. While the pace of refundings has declined somewhat in the past six months, compared to the preceding year, management believes that call protection remains an important strategic consideration for municipal bond investors.
(1) These returns do not include the 4.75% maximum sales charge for Class A shares or the applicable contingent deferred sales charges (CDSC) for Class B and Class C shares. If sales charges were deducted, returns would be lower.
(2) A portion of the Fund’s income may be subject to federal income and/or alternative minimum tax and state income tax.
(3) It is not possible to invest directly in an Index. The Index’s total return does not reflect commissions or expenses that would have been incurred if an investor individually purchased or sold the securities represented in the Index.
(4) The Fund’s distribution rate represents actual distributions paid to shareholders and is calculated by dividing the last distribution per share (annualized) by the net asset value.
(5) Taxable-equivalent figures assume a maximum combined 41.05% federal and state income tax rate. A lower rate would result in lower tax-equivalent figures.
(6) The Fund’s SEC yield is calculated by dividing the net investment income per share for the 30-day period by the offering price at the end of the period and annualizing the result.
4
Eaton Vance California Municipals Fund as of March 31, 2005
FUND PERFORMANCE
Performance* | | Class A | | Class B | | Class C | |
| | | | | | | |
Average Annual Total Returns (at net asset value) | | | | | | | |
One Year | | 3.35 | % | 2.89 | % | N.A. | |
Five Years | | 6.58 | | 6.28 | | N.A. | |
Ten Years | | 6.06 | | 5.50 | | N.A. | |
Life of Fund† | | 6.19 | | 5.90 | | 2.29 | |
| | | | | | | |
SEC Average Annual Total Returns (including sales charge or applicable CDSC) | | | | | | | |
One Year | | -1.59 | % | -2.04 | % | N.A. | |
Five Years | | 5.55 | | 5.97 | | N.A. | |
Ten Years | | 5.55 | | 5.50 | | N.A. | |
Life of Fund† | | 5.71 | | 5.90 | | 1.29 | |
†Inception date: Class A: 5/27/94; Class B: 12/19/85; Class C: 8/31/04
* Average annual total returns do not include the 4.75% maximum sales charge for Class A shares or the applicable contingent deferred sales charges (CDSC) for Class B and Class C shares. If sales charges were deducted, returns would be lower. SEC average annual total returns for Class A reflect the maximum 4.75% sales charge. SEC returns for Class B reflect applicable CDSC based on the following schedule: 5% - 1st and 2nd years; 4% - 3rd year; 3% - 4th year; 2% - 5th year; 1% - 6th year. SEC return for Class C reflects a 1% CDSC.
Past performance is no guarantee of future results. Returns are historical and are calculated by determining the percentage change in net asset value or offering price (as applicable) with all distributions reinvested. Investment return and principal value will fluctuate so that shares, when redeemed, may be worth more or less than their original cost. Performance is for the stated time period only; due to market volatility, the Fund’s current performance may be lower or higher than the quoted return. For performance as of the most recent month end, please refer to www.eatonvance.com.
Rating Distribution**
By total investments
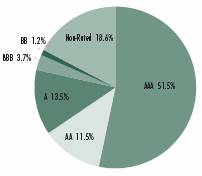
**Rating Distributions may not be representative of the Fund’s current or future investments and may change due to active management.
5
Eaton Vance Florida Municipals Fund as of March 31, 2005
INVESTMENT UPDATE
The Fund
• The Fund’s Class A shares had a total return of 2.19% during the six months ended March 31, 2005.(1) This return was the result of a decrease in net asset value (NAV) to $10.55 per share on March 31, 2005, from $10.58 on September 30, 2004, and the reinvestment of $0.260 in dividends.(2)
• The Fund’s Class B shares had a total return of 1.98% during the six months ended March 31, 2005.(1) This return was the result of a decrease in NAV to $10.81 per share on March 31, 2005, from $10.84 on September 30, 2004, and the reinvestment of $0.244 in dividends.(2)
• For comparison, the Lehman Brothers Municipal Bond Index had a total return of 1.21% for the six months ended March 31,
2005.(3)
• Based on the Fund’s most recent dividends and NAVs on March 31, 2005 of $10.55 per share for Class A and $10.81 for Class B, the Fund’s distribution rates were 4.87% and 4.12%, respectively.(4) The distribution ratesof Class A and Class B are equivalent to taxable rates of 7.49% and 6.34%, respectively.(5)
• The SEC 30-day yields for Class A and Class B shares at March 31, 2005 were 4.26% and 3.72%, respectively.(6) The SEC 30-day yields of Class A and Class B are equivalent to taxable yields of 6.55% and 5.72%, respectively.(5)
Fund Statistics**
• Number of Issues: | | 86 |
• Average Maturity: | | 22.3 years |
• Average Rating: | | AA |
• Average Call: | | 8.2 years |
• Average Dollar Price: | | $100.56 |
**Fund Statistics may not be representative of the Fund’s current or future investments and may change due to active management.
Management Discussion

Cynthia J. Clemson
Portfolio Manager
• Florida’s economic recovery remains among the strongest in the nation. Construction remains one of the strongest industries, driven by residential building, while tourismhas continued to recover from a devastating hurricane season in 2004. A weak dollar has encouraged significant numbers of foreign tourists to vacation in Florida, while strong population growth, including immigrants, retirees, and workers seeking jobs, has fueled the boom. The state’s jobless rate was 4.2% in March 2005, down from 4.5% in September 2004, and well below the national rate of 5.2%.
• Insured* water and sewer bonds, which are backed by water system bill payments, were one of the largest investments for the Fund at March 31, 2005. With the continuing growth in Florida’s population, water and sewer improvements and expansions represent asignificant portion of Florida’s debt offerings.
• Insured* transportation bonds were also among the Fund’s largest sector weightings during the period. The Fund’s investments included bonds for the Florida Turnpike Authority, as well as selected issues for Puerto Rico’s Highway and Transportation Authority.
• Special tax revenue bonds, some of which are issued on a non-rated basis, also constituted significant investments in the Fund. While these issues have solid credit quality, they often carry higher yields than investment-grade bonds of similar credit quality. These bonds are secured by the levy of special assessments – as opposed to property taxes – by local governments. The levies help defray costs on improvements or infrastructures that benefit local property owners.
• Management continued to closely monitor the Fund’s call protection. While the pace of refundings has declined somewhat in the past six months, compared to the preceding year, management believes that call protection remains an important strategicconsideration for municipal bond investors.
* Private insurance does not decrease the risk of loss of principal associated with this investment.
(1) These returns do not include the 4.75% maximum sales charge for Class A shares or the applicable contingent deferred sales charges (CDSC) for Class B shares. If sales charges were deducted, returns would be lower.
(2) A portion of the Fund’s income may be subject to federal income and/or alternative minimum tax and state intangibles tax.
(3) It is not possible to invest directly in an Index. The Index’s total return does not reflect commissions or expenses that would have been incurred if an investor individually purchased or sold the securities represented in the Index.
(4) The Fund’s distribution rate represents actual distributions paid to shareholders and is calculated by dividing the last distribution per share (annualized) by the net asset value.
(5) Taxable-equivalent figures assume a maximum 35.00% federal income tax rate. A lower rate would result in lower tax-equivalent figures.
(6) The Fund’s SEC yield is calculated by dividing the net investment income per share for the 30-day period by the offering price at the end of the period and annualizing the result.
6
Eaton Vance Florida Municipals Fund as of March 31, 2005
FUND PERFORMANCE
Performance* | | Class A | | Class B | |
| | | | | |
Average Annual Total Returns (at net asset value) | | | | | |
One Year | | 2.85 | % | 2.10 | % |
Five Years | | 6.54 | | 5.76 | |
Ten Years | | 5.71 | | 4.88 | |
Life of Fund† | | 6.06 | | 5.93 | |
| | | | | |
SEC Average Annual Total Returns (including sales charge or applicable CDSC) | | | | | |
One Year | | -2.06 | % | -2.79 | % |
Five Years | | 5.50 | | 5.44 | |
Ten Years | | 5.20 | | 4.88 | |
Life of Fund† | | 5.59 | | 5.87 | |
†Inception date: Class A: 4/5/94; Class B: 8/28/90
* Average annual total returns do not include the 4.75% maximum sales charge for Class A shares or the applicable contingent deferred sales charges (CDSC) for Class B shares. If sales charges were deducted, returns would be lower. SEC average annual total returns for Class A reflect the maximum 4.75% sales charge. SEC returns for Class B reflect applicable CDSC based on the following schedule: 5% - 1st and 2nd years; 4% - 3rd year; 3% - 4th year; 2% - 5th year; 1% - 6th year.
Past performance is no guarantee of future results. Returns are historical and are calculated by determining the percentage change in net asset value or offering price (as applicable) with all distributions reinvested. Investment return and principal value will fluctuate so that shares, when redeemed, may be worth more or less than their original cost. Performance is for the stated time period only; due to market volatility, the Fund’s current performance may be lower or higher than the quoted return. For performance as of the most recent month end, please refer to www.eatonvance.com.
Rating Distribution**
By total investments
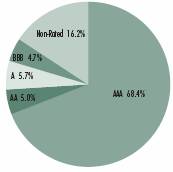
**Rating Distributions may not be representative of the Fund’s current or future investments and may change due to active management.
7
Eaton Vance Massachusetts Municipals Fund as of March 31, 2005
INVESTMENT UPDATE
The Fund
• The Fund’s Class A shares had a total return of 2.03% during the six months ended March 31, 2005.(1) This return was the result of a decrease in net asset value (NAV) to $9.62 per share on March 31, 2005, from $9.66 on September 30, 2004, and the reinvestment of $0.235 in dividends.(2)
• The Fund’s Class B shares had a total return of 1.97% during the six months ended March 31, 2005.(1) This return was the result of a decrease in NAV to $10.73 per share on March 31, 2005, from $10.76 on September 30, 2004, and the reinvestment of $0.241 in dividends.(2)
• The Fund’s Class I shares had a total return of 2.46% during the six months ended March 31, 2005.(1) This return was the result of a decrease in NAV to $9.94 per share on March 31, 2005, from $9.97 on September 30, 2004, and the reinvestment of $0.274 in dividends.(2)
• For comparison, the Lehman Brothers Municipal Bond Index had a total return of 1.21% for the six months ended March 31,
2005.(3)
• Based on the Fund’s most recent dividends and NAVs on March 31, 2005 of $9.62 per share for Class A, $10.73 for Class B, and $9.94 for Class I, the Fund’s distribution rates were 4.75%, 4.00%, and 4.95%, respectively.(4) The distribution rates of Class A, Class B, and Class I are equivalent to taxable rates of 7.72%, 6.50%, and 8.04%, respectively.(5)
• The SEC 30-day yields for Class A, Class B, and Class I shares at March 31, 2005 were 4.20%, 3.65%, and 4.61%, respectively.(6) The SEC 30-day yields of Class A, Class B, and Class I are equivalent to taxable yields of 6.82%, 5.93%, and 7.49%,
respectively.(5)
Fund Statistics**
• Number of Issues: | | 70 |
• Average Maturity: | | 21.8 years |
• Average Rating: | | AA+ |
• Average Call: | | 11.7 years |
• Average Dollar Price: | | $101.53 |
**Fund Statistics may not be representative of the Fund’s current or future investments and may change due to active management.
Management Discussion

Robert B. MacIntosh
Portfolio Manager
• Massachusetts’ economy continued to show solid growth in the past six months, bolstered by strong productivity gains in 2004. Unemployment rose to 4.9% in March 2005, up from 4.6% in September 2004, but still below the national rate of 5.2%. The state’s large technology sector continued to bolster strong productivity rates, but low population growth accounted for more sluggish payroll growth compared to the national average. Leisure and hospitality, professional, scientific, and business services all added jobs during the period, while the information, trade, transportation, and utilities sectors declined.
• Municipal bond issuers continued to call bonds at a higher rate than the historical norm because of the relatively low interest-rate environment. As a result, management’s ongoing focus on call protection was beneficial for the Fund’s income and overall performance during the period. As low interest rates continue to prompt refundings, call protection remains an important concern for municipal investors.
• The Fund added bonds issued by the Massachusetts Bay Transportation Authority, as a large, attractive deal came to market during the period. These investment-grade bonds are backed by either assessments or special taxes. The Fund also added education bonds issued by Boston University that had high investment-grade ratings and came with long call dates.
• Health care, a significant part of the state’s economy, remained an important sector weighting in the Fund, although we reduced exposure to one of the larger hospital holdings, Partners HealthCare System, to reduce risk.
• Management sold some of the Fund’s zero coupon bond holdings, which had performed well over the past several years as interest rates declined. Zero coupon bonds tend to perform well when interest rates are declining. With increasing signs of a potential rise in long-term interest rates, we felt it prudent to take advantage of the significant appreciation that we had seen in the Fund’s zero coupon holdings.
(1) These returns do not include the 4.75% maximum sales charge for Class A shares or the applicable contingent deferred sales charges (CDSC) for Class B shares. If sales charges were deducted, returns would be lower. Class I shares are offered to certain
investors at net asset value.
(2) A portion of the Fund’s income may be subject to federal income and/or alternative minimum tax and state income tax.
(3) It is not possible to invest directly in an Index. The Index’s total return does not reflect commissions or expenses that would have been incurred if an investor individually purchased or sold the securities represented in the Index.
(4) The Fund’s distribution rate represents actual distributions paid to shareholders and is calculated by dividing the last distribution per share (annualized) by the net asset value.
(5) Taxable-equivalent figures assume a maximum combined 38.45% federal and state income tax rate. A lower rate would result in lower tax-equivalent figures.
(6) The Fund’s SEC yield is calculated by dividing the net investment income per share for the 30-day period by the offering price at the end of the period and annualizing the result.
8
Eaton Vance Massachusetts Municipals Fund as of March 31, 2005
FUND PERFORMANCE
Performance* | | Class A | | Class B | | Class I | |
| | | | | | | |
Average Annual Total Returns (at net asset value) | | | | | | | |
One Year | | 3.36 | % | 2.76 | % | 3.87 | % |
Five Years | | 6.78 | | 6.04 | | 7.04 | |
Ten Years | | 5.86 | | 5.12 | | 6.07 | |
Life of Fund† | | 5.05 | | 5.63 | | 5.52 | |
| | | | | | | |
SEC Average Annual Total Returns (including sales charge or applicable CDSC) | | | | | | | |
One Year | | -1.57 | % | -2.17 | % | 3.87 | % |
Five Years | | 5.74 | | 5.72 | | 7.04 | |
Ten Years | | 5.35 | | 5.12 | | 6.07 | |
Life of Fund† | | 4.60 | | 5.63 | | 5.52 | |
†Inception date: Class A: 12/7/93; Class B: 4/18/91; Class I: 6/17/93
* Average annual total returns do not include the 4.75% maximum sales charge for Class A shares or the applicable contingent deferred sales charges (CDSC) for Class B shares. If sales charges were deducted, returns would be lower. Class I shares are offered to certain investors at net asset value. SEC average annual total returns for Class A reflect the maximum 4.75% sales charge. SEC returns for Class B reflect applicable CDSC based on the following schedule: 5% - 1st and 2nd years; 4% - 3rd year; 3% - 4th year; 2% - 5th year; 1% - 6th year.
Past performance is no guarantee of future results. Returns are historical and are calculated by determining the percentage change in net asset value or offering price (as applicable) with all distributions reinvested. Investment return and principal value will fluctuate so that shares, when redeemed, may be worth more or less than their original cost. Performance is for the stated time period only; due to market volatility, the Fund’s current performance may be lower or higher than the quoted return. For performance as of the most recent month end, please refer to www.eatonvance.com.
Rating Distribution**
By total investments
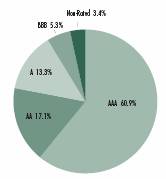
**Rating Distributions may not be representative of the Fund’s current or future investments and may change due to active management.
9
Eaton Vance Mississippi Municipals Fund as of March 31, 2005
INVESTMENT UPDATE
The Fund
• The Fund’s Class A shares had a total return of 1.17% during the six months ended March 31, 2005.(1) This return was the result of a decrease in net asset value (NAV) to $9.61 per share on March 31, 2005, from $9.72 on September 30, 2004, and the reinvestment of $0.224 in dividends.(2)
• The Fund’s Class B shares had a total return of 0.98% during the six months ended March 31, 2005.(1) This return was the result of a decrease in NAV to $9.83 per share on March 31, 2005, from $9.94 on September 30, 2004, and the reinvestment of $0.207 in dividends.(2)
• For comparison, the Lehman Brothers Municipal Bond Index had a total return of 1.21% for the six months ended March 31,
2005.(3)
• Based on the Fund’s most recent dividends and NAVs on March 31, 2005 of $9.61 per share for Class A and $9.83 for Class B, the Fund’s distribution rates were 4.58% and 3.83%, respectively.(4) The distribution rates of Class A and Class B are equivalent to taxable rates of 7.42% and 6.20%, respectively.(5)
• The SEC 30-day yields for Class A and Class B shares at March 31, 2005 were 3.53% and 2.95%, respectively.(6) The SEC 30-day yields of Class A and Class B are equivalent to taxable yields of 5.72% and 4.78%, respectively.(5)
Fund Statistics**
• Number of Issues: | | 50 |
• Average Maturity: | | 16.8 years |
• Average Rating: | | AA+ |
• Average Call: | | 6.8 years |
• Average Dollar Price: | | $101.78 |
**Fund Statistics may not be representative of the Fund’s current or future investments and may change due to active management.
Management Discussion

Craig R. Brandon
Portfolio Manager
• The economy has continued to recover in Mississippi over the past six months, although the state’s unemployment rate of 7.0% in March 2005 (preliminary) was still above the national rate of 5.2%. The most significant employment growth was in the manufacturing sector, which was aided significantly by the Nissan automotive plant located in Jackson. Job gains were also seen in the business services, public education, health care, and leisure and hospitality sectors.
• Because interest rates have been so low for so long, many municipal bond issuers have been calling bonds to refinance at lower rates. While we have always focused on increasing call protection, the Fund was not immune to this trend and some bonds were called, which detracted slightly from performance.
• Higher-yielding bonds outperformed during the period, illustrated by the fact that the spread, or difference on these securities compared to lower-yielding bonds, narrowed during the period. The Fund’s holdings of certain hospital and health care bonds, as well as some industrial development bonds (IDBs), were among the higher-yielding bonds that had solid returns.
• Escrowed/prerefunded bonds remained the Fund’s largest commitments. Prerefunded bonds are prerefunded to their approaching call dates and escrowed bonds are escrowed to maturity. Both types of bonds tend to have attractive coupons and income. Because they are backed by Treasury bonds, escrowed/prerefunded bonds are considered to be of the highest quality.
• Despite low issuance, we were able to acquire some attractive bonds for the Fund to improve call protection, including water and sewer bonds and Mississippi State University bonds. We also added to the Fund’s International Paper industrial revenue bond holdings, which have solid credit ratings and are backed by one of the state’s largest employers.
(1) These returns do not include the 4.75% maximum sales charge for Class A shares or the applicable contingent deferred sales charges (CDSC) for Class B shares. If sales charges were deducted, returns would be lower.
(2) A portion of the Fund’s income may be subject to federal income and/or alternative minimum tax and state income tax.
(3) It is not possible to invest directly in an Index. The Index’s total return does not reflect commissions or expenses that would have been incurred if an investor individually purchased or sold the securities represented in the Index.
(4) The Fund’s distribution rate represents actual distributions paid to shareholders and is calculated by dividing the last distribution per share (annualized) by the net asset value.
(5) Taxable-equivalent figures assume a maximum combined 38.25% federal and state income tax rate. A lower rate would result in
lower tax-equivalent figures.
(6) The Fund’s SEC yield is calculated by dividing the net investment income per share for the 30-day period by the offering price at the end of the period and annualizing the result.
10
Eaton Vance Mississippi Municipals Fund as of March 31, 2005
FUND PERFORMANCE
Performance* | | Class A | | Class B | |
| | | | | |
Average Annual Total Returns (at net asset value) | | | | | |
One Year | | 2.84 | % | 2.18 | % |
Five Years | | 5.85 | | 5.08 | |
Ten Years | | 5.50 | | 4.83 | |
Life of Fund† | | 4.68 | | 4.33 | |
| | | | | |
SEC Average Annual Total Returns (including sales charge or applicable CDSC) | | | | | |
One Year | | -2.06 | % | -2.73 | % |
Five Years | | 4.82 | | 4.75 | |
Ten Years | | 4.98 | | 4.83 | |
Life of Fund† | | 4.23 | | 4.33 | |
†Inception date: Class A: 12/7/93; Class B: 6/11/93
* Average annual total returns do not include the 4.75% maximum sales charge for Class A shares or the applicable contingent deferred sales charges (CDSC) for Class B shares. If sales charges were deducted, returns would be lower. SEC average annual total returns for Class A reflect the maximum 4.75% sales charge. SEC returns for Class B reflect applicable CDSC based on the following schedule: 5% - 1st and 2nd years; 4% - 3rd year; 3% - 4th year; 2% - 5th year; 1% - 6th year.
Past performance is no guarantee of future results. Returns are historical and are calculated by determining the percentage change in net asset value or offering price (as applicable) with all distributions reinvested. Investment return and principal value will fluctuate so that shares, when redeemed, may be worth more or less than their original cost. Performance is for the stated time period only; due to market volatility, the Fund’s current performance may be lower or higher than the quoted return. For performance as of the most recent month end, please refer to www.eatonvance.com.
Rating Distribution**
By total investments
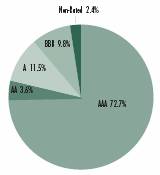
**Rating Distributions may not be representative of the Fund’s current or future investments and may change due to active management.
11
Eaton Vance New York Municipals Fund as of March 31, 2005
INVESTMENT UPDATE
The Fund
• The Fund’s Class A shares had a total return of 1.52% during the six months ended March 31, 2005.(1) This return was the result of a decrease in net asset value (NAV) to $10.70 per share on March 31, 2005, from $10.80 on September 30, 2004, and the reinvestment of $0.263 in dividends.(2)
• The Fund’s Class B shares had a total return of 1.30% during the six months ended March 31, 2005.(1) This return was the result of a decrease in NAV to $11.57 per share on March 31, 2005, from $11.68 on September 30, 2004, and the reinvestment of $0.261 in dividends.(2)
• The Fund’s Class C shares had a total return of 1.23% during the six months ended March 31, 2005.(1) This return was the result of a decrease in NAV to $9.71 per share on March 31, 2005, from $9.80 on September 30, 2004, and the reinvestment of $0.210 in dividends.(2)
• For comparison, the Lehman Brothers Municipal Bond Index had a total return of 1.21% for the six months ended March 31,
2005.(3)
• Based on the Fund’s most recent dividends and NAVs on March 31, 2005 of $10.70 per share for Class A, $11.57 for Class B, and $9.71 for Class C, the Fund’s distribution rates were 4.82%, 4.07%, and 4.06%, respectively.(4) The distribution rates of Class A, Class B, and Class C shares are equivalent to taxable rates of 8.03%, 6.78%, and 6.77%, respectively.(5)
• The SEC 30-day yields for Class A, Class B, and Class C shares at March 31, 2005 were 4.17%, 3.63%, and 3.59%, respectively.(6) The SEC 30-day yields of Class A, Class B, and Class C shares are equivalent to taxable yields of 6.95%, 6.05%, and 5.98%, respectively.(5)
Fund Statistics**
• Number of Issues: | | 81 |
• Average Maturity: | | 20.7 years |
• Average Rating: | | AA- |
• Average Call: | | 11.0 years |
• Average Dollar Price: | | $106.71 |
**Fund Statistics may not be representative of the Fund’s current or future investments and may change due to active management.
Management Discussion

Thomas J. Fetter
Portfolio Manager
• New York’s economy continued to expand during the six-month period, with employment increases in every month through March 2005. Since the state’s recovery began in August 2003, New York has added more than 100,000 jobs in the private sector. In February 2005, the state’s unemployment rate was 5.1%, which was below the national rate of 5.4%.
• Education and health care have led the state’s recovery with additional employment gains in the leisure and hospitality, trade, transportation and utilities, business services, and financial services sectors. Manufacturing has been the only declining sector.
• Management sold some of the Fund’s non-callable bonds with shorter maturities, replacing them with non-callable bonds that have longer maturities. The shorter-maturity bonds were beginning to lose value, and we wanted to protect the Fund’s NAVs from any further price erosion. This strategy was also designed to increase the overall average maturity of the Fund, which can be beneficial during periods of increased municipal refinancings.
• New issuance was generally down in New York, which benefited the muni market because of the more favorable supply-demand dynamics it created (i.e., lower supply; greater demand). However, we took advantage of an issuance of New York State general obligation (GO) bonds. These securities came with attractive 30-year maturities, which we have not seen in some time and felt fortunate to have been able to acquire for the Fund.
• Management continued to emphasize the Fund’s call protection. Faced with the prospect of a faster pace of refundings, management believes that call protection remains an important strategic aspect for municipal bond investors.
(1) These returns do not include the 4.75% maximum sales charge for Class A shares or the applicable contingent deferred sales charges (CDSC) for Class B and Class C shares. If sales charges were deducted, returns would be lower.
(2) A portion of the Fund’s income may be subject to federal income and/or alternative minimum tax and state income tax.
(3) It is not possible to invest directly in an Index. The Index’s total return does not reflect commissions or expenses that would have been incurred if an investor individually purchased or sold the securities represented in the Index.
(4) The Fund’s distribution rate represents actual distributions paid to shareholders and is calculated by dividing the last distribution per share (annualized) by the net asset value.
(5) Taxable-equivalent figures assume a maximum combined 40.01% federal and state income tax rate. A lower rate would result in lower tax-equivalent figures.
(6) The Fund’s SEC yield is calculated by dividing the net investment income per share for the 30-day period by the offering price at the end of the period and annualizing the result.
12
Eaton Vance New York Municipals Fund as of March 31, 2005
FUND PERFORMANCE
Performance* | | Class A | | Class B | | Class C | |
| | | | | | | |
Average Annual Total Returns (at net asset value) | | | | | | | |
One Year | | 3.18 | % | 2.70 | % | 2.51 | % |
Five Years | | 7.04 | | 6.43 | | N.A. | |
Ten Years | | 6.32 | | 5.57 | | N.A. | |
Life of Fund† | | 6.35 | | 6.44 | | 2.48 | |
| | | | | | | |
SEC Average Annual Total Returns (including sales charge or applicable CDSC) | | | | | | | |
One Year | | -1.76 | % | -2.20 | % | 1.53 | % |
Five Years | | 6.00 | | 6.11 | | N.A. | |
Ten Years | | 5.80 | | 5.57 | | N.A. | |
Life of Fund† | | 5.87 | | 6.44 | | 2.48 | |
†Inception date: Class A: 4/15/94; Class B: 8/30/90; Class C: 9/30/03
* Average annual total returns do not include the 4.75% maximum sales charge for Class A shares or the applicable contingent deferred sales charges (CDSC) for Class B and Class C shares. If sales charges were deducted, returns would be lower. SEC average annual total returns for Class A reflect the maximum 4.75% sales charge. SEC returns for Class B reflect applicable CDSC based on the following schedule: 5% - 1st and 2nd years; 4% - 3rd year; 3% - 4th year; 2% - 5th year; 1% - 6th year. SEC 1-Year return for Class C reflects a 1% CDSC.
Past performance is no guarantee of future results. Returns are historical and are calculated by determining the percentage change in net asset value or offering price (as applicable) with all distributions reinvested. Investment return and principal value will fluctuate so that shares, when redeemed, may be worth more or less than their original cost. Performance is for the stated time period only; due to market volatility, the Fund’s current performance may be lower or higher than the quoted return. For performance as of the most recent month end, please refer to www.eatonvance.com.
Rating Distribution**
By total investments
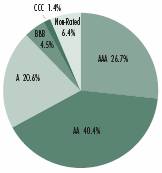
**Rating Distributions may not be representative of the Fund’s current or future investments and may change due to active management.
13
Eaton Vance Ohio Municipals Fund as of March 31, 2005
INVESTMENT UPDATE
The Fund
• The Fund’s Class A shares had a total return of 3.36% during the six months ended March 31, 2005.(1) This return was the result of an increase in net asset value (NAV) to $9.25 per share on March 31, 2005, from $9.18 on September 30, 2004, and the reinvestment of $0.236 in dividends.(2)
• The Fund’s Class B shares had a total return of 3.08% during the six months ended March 31, 2005.(1) This return was the result of an increase in NAV to $10.43 per share on March 31, 2005, from $10.36 on September 30, 2004, and the reinvestment of $0.247 in dividends.(2)
• For comparison, the Lehman Brothers Municipal Bond Index had a total return of 1.21% for the six months ended March 31,
2005.(3)
• Based on the Fund’s most recent dividends and NAVs on March 31, 2005 of $9.25 per share for Class A and $10.43 for Class B, the Fund’s distribution rates were 5.03% and 4.28%, respectively.(4) The distribution rates of Class A and Class B are equivalent to taxable rates of 8.37% and 7.12%, respectively.(5)
• The SEC 30-day yields for Class A and Class B shares at March 31, 2005 were 4.35% and 3.81%, respectively.(6) The SEC 30-day yields of Class A and Class B are equivalent to taxable yields of 7.24% and 6.34%, respectively.(5)
Fund Statistics**
• Number of Issues: | | 69 |
• Average Maturity: | | 22.7 years |
• Average Rating: | | AA- |
• Average Call: | | 7.7 years |
• Average Dollar Price: | | $104.24 |
**Fund Statistics may not be representative of the Fund’s current or future investments and may change due to active management.
Management Discussion

Thomas J. Fetter
Portfolio Manager
• Ohio’s economy has struggled during the past six months, as an increase in the number of people looking for work challenged the state’s employers. The unemployment rate rose to 6.3% in March 2005 from 6.0% in September 2004. Job losses were felt across a range of sectors, including manufacturing,construction, information services, business services, leisure and hospitality, and transportation and utilities. Despite the losses, the state indicated that more Ohioans were seeking jobs, in anticipation of a stronger state economy.
• The Fund performed well during a challenging period of rising interest rates, which affected all fixed-income sectors. As the spread, or difference, between higher-and lower-coupon bonds narrowed, we took advantage of this market dynamic by buying bonds at low valuations and selling them when they appreciated.
• Hospital bonds, a key sector in the Fund, performed well during the period. Management continued to seek bonds in the nursing home industry, as Ohio’s aging population has created a corresponding increase in the need for this specialized health care niche.
• Industrial development revenue bonds (IDRs) remained an important part of the Fund, accounting for 10.0% of net assets at March 31, 2005. However, with continuing struggles in the manufacturing sector, management remained vigilant about the Fund’s IDR holdings. Automotive and airline issues have been particularly affected by increased competition and pressures on earnings.
• Management adjusted the Fund’s coupon structure as market conditions warranted. Management also continued to update call protection, eliminating issues with unfavorable call features in favor of bonds with longer-dated call provisions.
(1) These returns do not include the 4.75% maximum sales charge for Class A shares or the applicable contingent deferred sales charges (CDSC) for Class B shares. If sales charges were deducted, returns would be lower.
(2) A portion of the Fund’s income may be subject to federal income and/or alternative minimum tax and state income tax.
(3) It is not possible to invest directly in an Index. The Index’s total return does not reflect commissions or expenses that would have been incurred if an investor individually purchased or sold the securities represented in the Index.
(4) The Fund’s distribution rate represents actual distributions paid to shareholders and is calculated by dividing the last distribution per share (annualized) by the net asset value.
(5) Taxable-equivalent figures assume a maximum combined 39.88% federal and state income tax rate. A lower rate would result in lower tax-equivalent figures.
(6) The Fund’s SEC yield is calculated by dividing the net investment income per share for the 30-day period by the offering price at
the end of the period and annualizing the result.
14
Eaton Vance Ohio Municipals Fund as of March 31, 2005
FUND PERFORMANCE
Performance* | | Class A | | Class B | |
| | | | | |
Average Annual Total Returns (at net asset value) | | | | | |
One Year | | 4.20 | % | 3.44 | % |
Five Years | | 6.56 | | 5.77 | |
Ten Years | | 5.73 | | 4.96 | |
Life of Fund† | | 4.86 | | 5.54 | |
| | | | | |
SEC Average Annual Total Returns (including sales charge or applicable CDSC) | | | | | |
One Year | | -0.78 | % | -1.50 | % |
Five Years | | 5.53 | | 5.45 | |
Ten Years | | 5.21 | | 4.96 | |
Life of Fund† | | 4.41 | | 5.54 | |
†Inception date: Class A: 12/7/93; Class B: 4/18/91
* Average annual total returns do not include the 4.75% maximum sales charge for Class A shares or the applicable contingent deferred sales charges (CDSC) for Class B shares. If sales charges were deducted, returns would be lower. SEC average annual total returns for Class A reflect the maximum 4.75% sales charge. SEC returns for Class B reflect applicable CDSC based on the following schedule: 5% - - 1st and 2nd years; 4% - 3rd year; 3% - 4th year; 2% - 5th year; 1% - 6th year.
Past performance is no guarantee of future results. Returns are historical and are calculated by determining the percentage change in net asset value or offering price (as applicable) with all distributions reinvested. Investment return and principal value will fluctuate so that shares, when redeemed, may be worth more or less than their original cost. Performance is for the stated time period only; due to market volatility, the Fund’s current performance may be lower or higher than the quoted return. For performance as of the most recent month end, please refer to www.eatonvance.com.
Rating Distribution**
By total investments
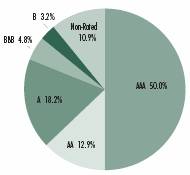
**Rating Distributions may not be representative of the Fund’s current or future investments and may change due to active management.
15
Eaton Vance Rhode Island Municipals Fund as of March 31, 2005
INVESTMENT UPDATE
The Fund
• The Fund’s Class A shares had a total return of 2.01% during the six months ended March 31, 2005.(1) This return was the result of a decrease in net asset value (NAV) to $9.75 per share on March 31, 2005, from $9.78 on September 30, 2004, and the reinvestment of $0.226 in dividends.(2)
• The Fund’s Class B shares had a total return of 1.80% during the six months ended March 31, 2005.(1) This return was the result of a decrease in NAV to $9.97 per share on March 31, 2005, from $10.00 on September 30, 2004, and the reinvestment of $0.210 in dividends.(2)
• For comparison, the Lehman Brothers Municipal Bond Index had a total return of 1.21% for the six months ended March 31, 2005.(3)
• Based on the Fund’s most recent dividends and NAVs on March 31, 2005 of $9.75 per share for Class A and $9.97 for Class B, the Fund’s distribution rates were 4.58% and 3.83%, respectively.(4) The distribution rates of Class A and Class B are equivalent to taxable rates of 7.72% and 6.46%, respectively.(5)
• The SEC 30-day yields for Class A and Class B shares at March 31, 2005 were 4.04% and 3.49%, respectively.(6) The SEC 30-day yields of Class A and Class B are equivalent to taxable yields of 6.81% and 5.88%, respectively.(5)
Fund Statistics**
• Number of Issues: | | 56 |
• Average Maturity: | | 21.0 years |
• Average Rating: | | AA+ |
• Average Call: | | 7.0 years |
• Average Dollar Price: | | $104.64 |
**Fund Statistics may not be representative of the Fund’s current or future investments and may change due to active management.
Management Discussion

Robert B. MacIntosh
Portfolio Manager
• Rhode Island’s unemployment rate continued to decline, falling to 4.5% in March 2005 from 5.0% in September 2004. The state’s unemployment rate has dropped below the national average, which was 5.2% in March.
• During the period, the state’s economy benefited from job gains in a number of sectors, including professional and business services, education, health care, leisure and hospitality, and financial services. Transportation, utilities, and manufacturing have seen net job losses.
• Insured* education bonds represented the Fund’s largest sector weighting at March 31, 2005, including some of Rhode Island’s finest universities. These institutions have demonstrated strong applicant demand and stable revenues, irrespective of the economic environment.
• Insured* general obligations (GOs) were another significant focus for the Fund. Secured by Rhode Island’s various taxing powers – or, for local issuers, by local property taxes – these bonds are deemed the most secure of all municipal debt.
• Insured* special tax revenue bonds were significant investments. Secured by the levy of special assessments, the bonds helped finance improvements that benefited local property owners or users of specific public purpose projects.
• Management continued its efforts to fine-tune coupon structure and improve call protection. These adjustments were part of an ongoing commitment to seek to protect against untimely calls and to help to improve the overall performance characteristics of the Fund. In a period in which bond calls increased due to low interest rates, management’s emphasis on call protection was especially beneficial.
* Private insurance does not decrease the risk of loss of principal associated with this investment.
(1) These returns do not include the 4.75% maximum sales charge for Class A shares or the applicable contingent deferred sales charges (CDSC) for Class B shares. If sales charges were deducted, returns would be lower.
(2) A portion of the Fund’s income may be subject to federal income and/or alternative minimum tax and state income tax.
(3) It is not possible to invest directly in an Index. The Index’s total return does not reflect commissions or expenses that would have been incurred if an investor individually purchased or sold the securities represented in the Index.
(4) The Fund’s distribution rate represents actual distributions paid to shareholders and is calculated by dividing the last distribution
per share (annualized) by the net asset value.
(5) Taxable-equivalent figures assume a maximum combined 40.69% federal and state income tax rate. A lower rate would result in lower tax-equivalent figures.
(6) The Fund’s SEC yield is calculated by dividing the net investment income per share for the 30-day period by the offering price at the end of the period and annualizing the result.
16
Eaton Vance Rhode Island Municipals Fund as of March 31, 2005
FUND PERFORMANCE
Performance* | | Class A | | Class B | |
| | | | | |
Average Annual Total Returns (at net asset value) | | | | | |
One Year | | 3.10 | % | 2.33 | % |
Five Years | | 6.70 | | 5.90 | |
Ten Years | | 5.65 | | 5.04 | |
Life of Fund† | | 4.80 | | 4.52 | |
| | | | | |
SEC Average Annual Total Returns (including sales charge or applicable CDSC) | | | | | |
One Year | | -1.76 | % | -2.59 | % |
Five Years | | 5.66 | | 5.58 | |
Ten Years | | 5.13 | | 5.04 | |
Life of Fund† | | 4.35 | | 4.52 | |
†Inception date: Class A: 12/7/93; Class B: 6/11/93
* Average annual total returns do not include the 4.75% maximum sales charge for Class A shares or the applicable contingent deferred sales charges (CDSC) for Class B shares. If sales charges were deducted, returns would be lower. SEC average annual total returns for Class A reflect the maximum 4.75% sales charge. SEC returns for Class B reflect applicable CDSC based on the following schedule: 5% - 1st and 2nd years; 4% - 3rd year; 3% - 4th year; 2% - 5th year; 1% - 6th year.
Past performance is no guarantee of future results. Returns are historical and are calculated by determining the percentage change in net asset value or offering price (as applicable) with all distributions reinvested. Investment return and principal value will fluctuate so that shares, when redeemed, may be worth more or less than their original cost. Performance is for the stated time period only; due to market volatility, the Fund’s current performance may be lower or higher than the quoted return. For performance as of the most recent month end, please refer to www.eatonvance.com.
Rating Distribution**
By total investments
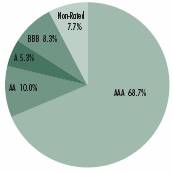
**Rating Distributions may not be representative of the Fund’s current or future investments and may change due to active management.
17
Eaton Vance West Virginia Municipals Fund as of March 31, 2005
INVESTMENT UPDATE
The Fund
• The Fund’s Class A shares had a total return of 1.46% during the six months ended March 31, 2005.(1) This return was the result of a decrease in net asset value (NAV) to $9.73 per share on March 31, 2005, from $9.81 on September 30, 2004, and the reinvestment of $0.223 in dividends.(2)
• The Fund’s Class B shares had a total return of 1.16% during the six months ended March 31, 2005.(1) This return was the result of a decrease in NAV to $9.91 per share on March 31, 2005, from $10.00 on September 30, 2004, and the reinvestment of $0.206 in dividends.(2)
• For comparison, the Lehman Brothers Municipal Bond Index had a total return of 1.21% for the six months ended March 31, 2005.(3)
• Based on the Fund’s most recent dividends and NAVs on March 31, 2005 of $9.73 per share for Class A and $9.91 for Class B, the Fund’s distribution rates were 4.57% and 3.82%, respectively.(4) The distribution rates of Class A and Class B are equivalent to taxable rates of 7.52% and 6.29%, respectively.(5)
• The SEC 30-day yields for Class A and Class B shares at March 31, 2005 were 3.58% and 3.00%, respectively.(6) The SEC 30-day yields of Class A and Class B are equivalent to taxable yields of 5.89% and 4.94% respectively.(5)
Fund Statistics**
• Number of Issues: | | 41 | |
• Average Maturity: | | 21.2 years | |
• Average Rating: | | AA+ | |
• Average Call: | | 7.9 years | |
• Average Dollar Price: | | $101.52 | |
**Fund Statistics may not be representative of the Fund’s current or future investments and may change due to active management.
Management Discussion

Robert B. MacIntosh
Portfolio Manager
• While West Virginia remains one of the lowest-ranking states in terms of new job growth and unemployment rates, the state has seen an increase in employment from 2003 levels in 2004. However, in the past six months, the state’s unemployment rate declined to 5.0% in February 2005 from 5.3% in September 2004.
• West Virginia’s economy continues to be led by the trade, transportation, utilities, and government sectors, which make up approximately one-third of the state’s non-farm employment. While these sectors did not see meaningful job changes during the period, gains were seen in the natural resources and mining, construction, education, health care, and hospitality sectors.
• Insured* water and sewer bonds represented a significant investment for the Fund as of March 31, 2005. Many West Virginia communities have needed to modernize their water facilities. Increased issuance of bonds to finance these projects has provided the Fund with income opportunities.
• In a highly competitive hospital sector, the Fund remained very selective. Management emphasized insured* bonds of institutions it believes have a competitive advantage due to marketable health care services and underlying financial strength.
• Insured* general obligations (GOs) were another significant investment for the Fund, providing a high-quality investment. GOs are often accorded a high credit quality rating, as they are backed by the full faith and credit of the issuer, as represented by the unlimited taxing power of the jurisdiction.
• Management continued to monitor call protection closely, believing that call protection remains an important strategic consideration for municipal bond investors. In a period in which bond calls increased due to low interest rates, management’s emphasis on call protection was especially beneficial.
* Private insurance does not decrease the risk of loss of principal associated with this investment.
(1) These returns do not include the 4.75% maximum sales charge for Class A shares or the applicable contingent deferred sales charges (CDSC) for Class B shares. If sales charges were deducted, returns would be lower.
(2) A portion of the Fund’s income may be subject to federal income and/or alternative minimum tax and state income tax.
(3) It is not possible to invest directly in an Index. The Index’s total return does not reflect commissions or expenses that would have
been incurred if an investor individually purchased or sold the securities represented in the Index.
(4) The Fund’s distribution rate represents actual distributions paid to shareholders and is calculated by dividing the last distribution per share (annualized) by the net asset value.
(5) Taxable-equivalent figures assume a maximum combined 39.23% federal and state income tax rate. A lower rate would result in lower tax-equivalent figures.
(6) The Fund’s SEC yield is calculated by dividing the net investment income per share for the 30-day period by the offering price at the end of the period and annualizing the result.
18
Eaton Vance West Virginia Municipals Fund as of March 31, 2005
FUND PERFORMANCE
Performance* | | Class A | | Class B | |
| | | | | |
Average Annual Total Returns (at net asset value) | | | | | |
One Year | | 1.65 | % | 1.03 | % |
Five Years | | 6.11 | | 5.32 | |
Ten Years | | 5.58 | | 4.84 | |
Life of Fund† | | 4.80 | | 4.35 | |
| | | | | |
SEC Average Annual Total Returns (including sales charge or applicable CDSC) | | | | | |
One Year | | -3.18 | % | -3.83 | % |
Five Years | | 5.07 | | 5.00 | |
Ten Years | | 5.07 | | 4.84 | |
Life of Fund† | | 4.34 | | 4.35 | |
†Inception date: Class A: 12/13/93; Class B: 6/11/93
* Average annual total returns do not include the 4.75% maximum sales charge for Class A shares or the applicable contingent deferred sales charges (CDSC) for Class B shares. If sales charges were deducted, returns would be lower. SEC average annual total returns for Class A reflect the maximum 4.75% sales charge. SEC returns for Class B reflect applicable CDSC based on the following schedule: 5% - 1st and 2nd years; 4% - 3rd year; 3% - - 4th year; 2% - 5th year; 1% - 6th year.
Past performance is no guarantee of future results. Returns are historical and are calculated by determining the percentage change in net asset value or offering price (as applicable) with all distributions reinvested. Investment return and principal value will fluctuate so that shares, when redeemed, may be worth more or less than their original cost. Performance is for the stated time period only; due to market volatility, the Fund’s current performance may be lower or higher than the quoted return. For performance as of the most recent month end, please refer to www.eatonvance.com.
Rating Distribution **
By total investments
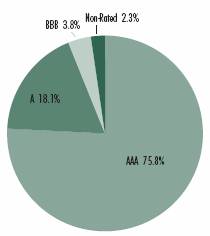
** Rating Distributions may not be representative of the Fund’s current or future investments and may change due to active management.
19
Eaton Vance Municipals Funds as of March 31, 2005
DISCLOSURE OF FUND EXPENSES
Example: As a shareholder of a Fund, you incur two types of costs: (1) transaction costs, including sales charges (loads) on purchases and redemption fees (if applicable); and (2) ongoing costs, including management fees; distribution or service fees; and other Fund expenses. This Example is intended to help you understand your ongoing costs (in dollars) of investing in a Fund and to compare these costs with the ongoing costs of investing in other mutual funds. The Example is based on an investment of $1,000 invested at the beginning of the period and held for the entire period (October 1, 2004 – March 31, 2005).
Actual Expenses: The first section of each table below provides information about actual account values and actual expenses. You may use the information in this line, together with the amount you invested, to estimate the expenses that you paid over the period. Simply divide your account value by $1,000 (for example, an $8,600 account value divided by $1,000 = 8.6), then multiply the result by the number in the first line under the heading entitled “Expenses Paid During Period” to estimate the expenses you paid on your account during this period.
Hypothetical Example for Comparison Purposes: The second section of each table below provides information about hypothetical account values and hypothetical expenses based on a Fund’s actual expense ratio and an assumed rate of return of 5% per year (before expenses), which is not the actual return of the Fund. The hypothetical account values and expenses may not be used to estimate the actual ending account balance or expenses you paid for the period. You may use this information to compare the ongoing costs of investing in the Funds and other funds. To do so, compare this 5% hypothetical example with the 5% hypothetical examples that appear in the shareholder reports of the other funds.
Please note that the expenses shown in the table are meant to highlight your ongoing costs only and do not reflect any transactional costs, such as sales charges (loads) or redemption fees (if applicable). Therefore, the second section of the table is useful in comparing ongoing costs only, and will not help you determine the relative total costs of owing different funds. In addition, if these transactional costs were included, your costs would have been higher.
Eaton Vance California Municipals Fund
| | Beginning Account Value
(10/1/04) | | Ending Account Value
(3/31/05) | | Expenses Paid During Period*
(10/1/04 - 3/31/05) | |
| | | | | | | |
Actual | | | | | | | |
Class A | | $ | 1,000.00 | | $ | 1,017.60 | | $ | 4.38 | |
Class B | | $ | 1,000.00 | | $ | 1,015.00 | | $ | 8.14 | |
Class C | | $ | 1,000.00 | | $ | 1,014.20 | | $ | 8.14 | |
| | | | | | | |
Hypothetical | | | | | | | |
(5% return per year before expenses) | | | | | | | |
Class A | | $ | 1,000.00 | | $ | 1,020.60 | | $ | 4.38 | |
Class B | | $ | 1,000.00 | | $ | 1,016.90 | | $ | 8.15 | |
Class C | | $ | 1,000.00 | | $ | 1,016.90 | | $ | 8.15 | |
* Expenses are equal to the Fund’s annualized expense ratio of 0.87% for Class A shares, 1.62% for Class B shares, and 1.62% for Class C shares multiplied by the average account value over the period, multiplied by 182/365 (to reflect the one-half year period). The Example assumes that the $1,000 was invested at the net asset value per share determined at the close of business on September 30, 2004.
Eaton Vance Florida Municipals Fund
| | Beginning Account Value
(10/1/04) | | Ending Account Value
(3/31/05) | | Expenses Paid During Period*
(10/1/04 - 3/31/05) | |
| | | | | | | |
Actual | | | | | | | |
Class A | | $ | 1,000.00 | | $ | 1,021.90 | | $ | 4.13 | |
Class B | | $ | 1,000.00 | | $ | 1,019.80 | | $ | 7.91 | |
Hypothetical | | | | | | | |
(5% return per year before expenses) | | | | | | | |
Class A | | $ | 1,000.00 | | $ | 1,020.80 | | $ | 4.13 | |
Class B | | $ | 1,000.00 | | $ | 1,017.10 | | $ | 7.90 | |
* Expenses are equal to the Fund’s annualized expense ratio of 0.82% for Class A shares and 1.57% for Class B shares multiplied by the average account value over the period, multiplied by 182/365 (to reflect the one-half year period). The Example assumes that the $1,000 was invested at the net asset value per share determined at the close of business on September 30, 2004.
20
Eaton Vance Massachusetts Municipals Fund
| | Beginning Account Value
(10/1/04) | | Ending Account Value
(3/31/05) | | Expenses Paid During Period*
(10/1/04 - 3/31/05) | |
| | | | | | | |
Actual | | | | | | | |
Class A | | $ | 1,000.00 | | $ | 1,020.30 | | $ | 3.93 | |
Class B | | $ | 1,000.00 | | $ | 1,019.70 | | $ | 7.70 | |
Class I | | $ | 1,000.00 | | $ | 1,024.60 | | $ | 2.93 | |
| | | | | | | | | | |
Hypothetical | | | | | | | |
(5% return per year before expenses) | | | | | | | |
Class A | | $ | 1,000.00 | | $ | 1,021.00 | | $ | 3.93 | |
Class B | | $ | 1,000.00 | | $ | 1,017.30 | | $ | 7.70 | |
Class I | | $ | 1,000.00 | | $ | 1,022.00 | | $ | 2.92 | |
* Expenses are equal to the Fund’s annualized expense ratio of 0.78% for Class A shares, 1.53% for Class B shares, and 0.58% for Class I shares multiplied by the average account value over the period, multiplied by 182/365 (to reflect the one-half year period). The Example assumes that the $1,000 was invested at the net asset value per share determined at the close of business on September 30, 2004.
Eaton Vance Mississippi Municipals Fund
| | Beginning Account Value
(10/1/04) | | Ending Account Value
(3/31/05) | | Expenses Paid During Period*
(10/1/04 - 3/31/05) | |
| | | | | | | |
Actual | | | | | | | |
Class A | | $ | 1,000.00 | | $ | 1,011.70 | | $ | 4.11 | |
Class B | | $ | 1,000.00 | | $ | 1,009.80 | | $ | 7.87 | |
| | | | | | | | | | |
Hypothetical | | | | | | | |
(5% return per year before expenses) | | | | | | | |
Class A | | $ | 1,000.00 | | $ | 1,020.80 | | $ | 4.13 | |
Class B | | $ | 1,000.00 | | $ | 1,017.10 | | $ | 7.90 | |
* Expenses are equal to the Fund’s annualized expense ratio of 0.82% for Class A shares and 1.57% for Class B shares multiplied by the average account value over the period, multiplied by 182/365 (to reflect the one-half year period). The Example assumes that the $1,000 was invested at the net asset value per share determined at the close of business on September 30, 2004.
Eaton Vance New York Municipals Fund
| | Beginning Account Value
(10/1/04) | | Ending Account Value
(3/31/05) | | Expenses Paid During Period*
(10/1/04 - 3/31/05) | |
| | | | | | | |
Actual | | | | | | | |
Class A | | $ | 1,000.00 | | $ | 1,015.20 | | $ | 3.97 | |
Class B | | $ | 1,000.00 | | $ | 1,013.00 | | $ | 7.73 | |
Class C | | $ | 1,000.00 | | $ | 1,012.30 | | $ | 7.68 | |
| | | | | | | | | | |
Hypothetical | | | | | | | |
(5% return per year before expenses) | | | | | | | |
Class A | | $ | 1,000.00 | | $ | 1,021.00 | | $ | 3.98 | |
Class B | | $ | 1,000.00 | | $ | 1,017.30 | | $ | 7.75 | |
Class C | | $ | 1,000.00 | | $ | 1,017.30 | | $ | 7.70 | |
* Expenses are equal to the Fund’s annualized expense ratio of 0.79% for Class A shares, 1.54% for Class B shares, and 1.54% for Class C shares multiplied by the average account value over the period, multiplied by 182/365 (to reflect the one-half year period). The Example assumes that the $1,000 was invested at the net asset value per share determined at the close of business on September 30, 2004.
21
Eaton Vance Ohio Municipals Fund
| | Beginning Account Value | | Ending Account Value | | Expenses Paid During Period* | |
| | (10/1/04) | | (3/31/05) | | (10/1/04 - 3/31/05) | |
| | | | | | | |
Actual | | | | | | | |
Class A | | $ | 1,000.00 | | $ | 1,033.60 | | $ | 4.11 | |
Class B | | $ | 1,000.00 | | $ | 1,030.80 | | $ | 7.90 | |
| | | | | | | |
Hypothetical | | | | | | | |
(5% return per year before expenses) | | | | | | | |
Class A | | $ | 1,000.00 | | $ | 1,020.90 | | $ | 4.08 | |
Class B | | $ | 1,000.00 | | $ | 1,017.20 | | $ | 7.85 | |
* Expenses are equal to the Fund’s annualized expense ratio of 0.81% for Class A shares and 1.56% for Class B shares multiplied by the average account value over the period, multiplied by 182/365 (to reflect the one-half year period). The Example assumes that the $1,000 was invested at the net asset value per share determined at the close of business on September 30, 2004.
Eaton Vance Rhode Island Municipals Fund
| | Beginning Account Value | | Ending Account Value | | Expenses Paid During Period* | |
| | (10/1/04) | | (3/31/05) | | (10/1/04 - 3/31/05) | |
| | | | | | | |
Actual | | | | | | | |
Class A | | $ | 1,000.00 | | $ | 1,020.10 | | $ | 3.68 | |
Class B | | $ | 1,000.00 | | $ | 1,018.00 | | $ | 7.45 | |
| | | | | | | |
Hypothetical | | | | | | | |
(5% return per year before expenses) | | | | | | | |
Class A | | $ | 1,000.00 | | $ | 1,021.30 | | $ | 3.68 | |
Class B | | $ | 1,000.00 | | $ | 1,017.60 | | $ | 7.44 | |
* Expenses are equal to the Fund’s annualized expense ratio of 0.73% for Class A shares and 1.48% for Class B shares multiplied by the average account value over the period, multiplied by 182/365 (to reflect the one-half year period). The Example assumes that the $1,000 was invested at the net asset value per share determined at the close of business on September 30, 2004.
Eaton Vance West Virginia Municipals Fund
| | Beginning Account Value | | Ending Account Value | | Expenses Paid During Period* | |
| | (10/1/04) | | (3/31/05) | | (10/1/04 - 3/31/05) | |
| | | | | | | |
Actual | | | | | | | |
Class A | | $ | 1,000.00 | | $ | 1,014.60 | | $ | 3.87 | |
Class B | | $ | 1,000.00 | | $ | 1,011.60 | | $ | 7.62 | |
| | | | | | | |
Hypothetical | | | | | | | |
(5% return per year before expenses) | | | | | | | |
Class A | | $ | 1,000.00 | | $ | 1,021.10 | | $ | 3.88 | |
Class B | | $ | 1,000.00 | | $ | 1,017.40 | | $ | 7.65 | |
* Expenses are equal to the Fund’s annualized expense ratio of 0.77% for Class A shares and 1.52% for Class B shares multiplied by the average account value over the period, multiplied by 182/365 (to reflect the one-half year period). The Example assumes that the $1,000 was invested at the net asset value per share determined at the close of business on September 30, 2004.
22
Eaton Vance California Municipals Fund as of March 31, 2005
PORTFOLIO OF INVESTMENTS (Unaudited)
| | Tax-Exempt Investments - 99.8% | | | | | | | | |
Principal Amount
(000's omitted) | | Security | | Value | |
| | Education - 4.7% | | | | | | | | |
| $ | 3,500 | | | California Educational Facilities Authority, (Lutheran
University), 5.00%, 10/1/29 | | $ | 3,530,310 | | |
| | 2,500 | | | California Educational Facilities Authority, (Santa Clara
University), 5.25%, 9/1/26 | | | 2,732,350 | | |
| | 4,000 | | | California Educational Facilities Authority, (Stanford
University), 5.25%, 12/1/32 | | | 4,215,840 | | |
| | | | | | | $ | 10,478,500 | | |
| | Escrowed / Prerefunded - 13.8% | | | | | | | | |
| $ | 1,000 | | | Sacramento County, Single Family, (GNMA), (AMT),
Escrowed to Maturity, 8.25%, 1/1/21 | | $ | 1,402,630 | | |
| | 11,285 | | | Sacramento County, Single Family, (GNMA), (AMT),
Escrowed to Maturity, 8.50%, 11/1/16 | | | 15,485,503 | | |
| | 4,600 | | | San Joaquin Hills, Transportation Corridor Agency,
Toll Road Bonds, Escrowed to Maturity, 0.00%, 1/1/14 | | | 3,209,834 | | |
| | 5,765 | | | San Joaquin Hills, Transportation Corridor Agency,
Toll Road Bonds, Escrowed to Maturity, 0.00%, 1/1/26 | | | 2,083,702 | | |
| | 25,975 | | | San Joaquin Hills, Transportation Corridor Agency,
Toll Road Bonds, Escrowed to Maturity, 0.00%, 1/1/27 | | | 8,901,113 | | |
| | | | | | | $ | 31,082,782 | | |
| | General Obligations - 4.7% | | | | | | | | |
| $ | 1,800 | | | California, 5.00%, 6/1/34 | | $ | 1,835,136 | | |
| | 1,000 | | | California, 5.25%, 4/1/30 | | | 1,040,650 | | |
| | 2,250 | | | California, 5.25%, 4/1/34 | | | 2,357,640 | | |
| | 5,000 | | | California, 5.50%, 11/1/33 | | | 5,358,050 | | |
| | | | | | | $ | 10,591,476 | | |
| | Hospital - 8.9% | | | | | | | | |
| $ | 1,000 | | | California Health Facilities Financing Authority, (Catholic
Healthcare West), 5.25%, 7/1/23 | | $ | 1,031,710 | | |
| | 4,000 | | | California Health Facilities Financing Authority, (Marshall
Medical Center), 5.00%, 11/1/33 | | | 4,025,560 | | |
| | 2,250 | | | California Infrastructure and Economic Development,
(Kaiser Hospital), 5.50%, 8/1/31 | | | 2,353,815 | | |
| | 600 | | | California Statewide Communities Development Authority,
(Daughters of Charity Health System), 5.00%, 7/1/39 | | | 594,510 | | |
| | 1,590 | | | California Statewide Communities Development Authority,
(Daughters of Charity Health System), 5.25%, 7/1/30 | | | 1,635,585 | | |
| | 1,850 | | | California Statewide Communities Development Authority,
(Kaiser Permanente), 5.50%, 11/1/32 | | | 1,928,088 | | |
| | 1,500 | | | California Statewide Communities Development Authority,
(Sonoma County Indian Health), 6.40%, 9/1/29 | | | 1,526,520 | | |
Principal Amount
(000's omitted) | |
Security | |
Value | |
| | Hospital (continued) | | | | | | | | |
| $ | 470 | | | Eastern Plumas Health Care District, 7.50%, 8/1/07 | | $ | 479,151 | | |
| | 2,700 | | | San Benito Health Care District, 5.40%, 10/1/20 | | | 2,638,251 | | |
| | 1,000 | | | Torrance Hospital, (Torrance Memorial Medical Center),
5.50%, 6/1/31 | | | 1,044,110 | | |
| | 1,500 | | | Turlock, (Emanuel Medical Center, Inc.),
5.375%, 10/15/34 | | | 1,519,740 | | |
| | 1,250 | | | Washington Township Health Care District, 5.25%, 7/1/29 | | | 1,280,987 | | |
| | | | | | | $ | 20,058,027 | | |
| | Housing - 1.6% | | | | | | | | |
| $ | 1,500 | | | California Statewide Communities Development Authority,
(Corporate Fund for Housing), 6.50%, 12/1/29 | | $ | 1,484,385 | | |
| | 500 | | | California Statewide Communities Development Authority,
(Corporate Fund for Housing), 7.25%, 12/1/34 | | | 491,850 | | |
| | 1,447 | | | Commerce (Hermitage III Senior Apartments),
6.50%, 12/1/29 | | | 1,315,773 | | |
| | 434 | | | Commerce (Hermitage III Senior Apartments),
6.85%, 12/1/29 | | | 392,796 | | |
| | | | | | | $ | 3,684,804 | | |
| | Industrial Development Revenue - 1.9% | | | | | | | | |
| $ | 2,750 | | | California Pollution Control Financing Authority, (Browning
Ferris Industries), (AMT), 5.80%, 12/1/16 | | $ | 2,604,717 | | |
| | 1,700 | | | California Pollution Control Financing Authority, (Solid
Waste Disposal), (AMT), 5.40%, 4/1/25(1) | | | 1,726,792 | | |
| | | | | | | $ | 4,331,509 | | |
| | Insured-Education - 0.6% | | | | | | | | |
| $ | 1,330 | | | Puerto Rico Industrial, Tourist, Educational, Medical and
Environmental, Residual Certificates, (MBIA), Variable Rate,
10.855%, 7/1/33(2)(3) | | $ | 1,418,738 | | |
| | | | | | | $ | 1,418,738 | | |
| | Insured-Electric Utilities - 8.2% | | | | | | | | |
| $ | 4,100 | | | California Pollution Control Financing Authority, (San Diego
Gas and Electric), (MBIA), 5.90%, 6/1/14 | | $ | 4,715,410 | | |
| | 5,000 | | | California Pollution Control Financing Authority, PCR, (Pacific
Gas and Electric), (MBIA), (AMT), 5.35%, 12/1/16 | | | 5,319,500 | | |
| | 3,000 | | | Northern California Power Agency, (MBIA), Variable Rate,
10.33%, 7/1/23(2)(3) | | | 3,368,970 | | |
| | 500 | | | Puerto Rico Electric Power Authority, (FSA), Variable Rate,
10.64%, 7/1/29(2)(3) | | | 599,880 | | |
| | 7,070 | | | Southern California Public Power Authority, (MBIA),
0.00%, 7/1/15 | | | 4,478,209 | | |
| | | | | | | $ | 18,481,969 | | |
See notes to financial statements
23
Eaton Vance California Municipals Fund as of March 31, 2005
PORTFOLIO OF INVESTMENTS (Unaudited) CONT'D
Principal Amount
(000's omitted) | |
Security | |
Value | |
| | Insured-Escrowed / Prerefunded - 2.9% | | | | | | | | |
| $ | 15,000 | | | Foothill/Eastern Corridor Agency, Toll Road Bonds,
Escrowed to Maturity, (FSA), 0.00%, 1/1/28 | | $ | 4,871,550 | | |
| | 1,500 | | | Inland Empire Solid Waste Finance Authority, (FSA), (AMT),
Escrowed to Maturity, 6.25%, 8/1/11 | | | 1,651,575 | | |
| | | | | | | $ | 6,523,125 | | |
| | Insured-General Obligations - 7.6% | | | | | | | | |
| $ | 1,500 | | | California, (AMBAC), 4.25%, 3/1/27 | | $ | 1,405,095 | | |
| | 2,400 | | | California, (AMBAC), 5.00%, 2/1/28(4) | | | 2,564,640 | | |
| | 2,500 | | | California, Residual Certificates, (AMBAC), Variable Rate,
12.275%, 10/1/30(2)(3) | | | 3,085,050 | | |
| | 2,285 | | | Merced Unified School District, (FGIC), 0.00%, 8/1/19 | | | 1,144,077 | | |
| | 3,300 | | | Puerto Rico, (FSA), Variable Rate, 10.84%, 7/1/27(2)(3) | | | 3,969,306 | | |
| | 1,500 | | | San Diego Unified School District, (MBIA), Variable Rate,
11.455%, 7/1/24(2)(3) | | | 2,153,805 | | |
| | 2,950 | | | San Mateo County Community College District, (MBIA),
4.25%, 9/1/29 | | | 2,751,406 | | |
| | | | | | | $ | 17,073,379 | | |
| | Insured-Hospital - 2.1% | | | | | | | | |
| $ | 2,550 | | | California Statewide Communities Development Authority,
(Children's Hospital Los Angeles), (MBIA),
5.25%, 8/15/29 | | $ | 2,655,799 | | |
| | 1,640 | | | California Statewide Communities Development Authority,
(Sutter Health), (FSA), Variable Rate,
12.213%, 8/15/27(2)(3) | | | 2,101,234 | | |
| | | | | | | $ | 4,757,033 | | |
| | Insured-Lease Revenue / Certificates of
Participation - 7.7% | | | | | | | | |
| $ | 11,280 | | | Anaheim Public Financing Authority, (Public Improvements),
(FSA), 0.00%, 9/1/30 | | $ | 2,995,742 | | |
| | 6,500 | | | Anaheim Public Financing Authority, (Public Improvements),
(FSA), 0.00%, 9/1/22 | | | 2,710,760 | | |
| | 5,000 | | | Los Angeles County, (Disney Parking), (AMBAC),
0.00%, 9/1/17 | | | 2,806,650 | | |
| | 5,370 | | | Los Angeles County, (Disney Parking), (AMBAC),
0.00%, 3/1/18 | | | 2,911,829 | | |
| | 13,985 | | | Visalia Unified School District, (MBIA), 0.00%, 12/1/17 | | | 5,973,553 | | |
| | | | | | | $ | 17,398,534 | | |
| | Insured-Transportation - 3.8% | | | | | | | | |
| $ | 5,000 | | | California Infrastructure and Economic Development,
(Bay Area Toll Bridges), (AMBAC), 5.00%, 7/1/33 | | $ | 5,158,200 | | |
| | 1,440 | | | Los Angeles County, Metropolitan Transportation Authority,
(AMBAC), Variable Rate, 9.955%, 7/1/23(2)(3) | | | 1,590,725 | | |
Principal Amount
(000's omitted) | |
Security | |
Value | |
| | Insured-Transportation (continued) | | | | | | | | |
| $ | 1,000 | | | Los Angeles County, Metropolitan Transportation Authority,
(FGIC), 5.25%, 7/1/30 | | $ | 1,052,910 | | |
| | 1,800 | | | San Joaquin Hills, Transportation Corridor Agency, Toll Road
Bonds, (MBIA), 0.00%, 1/15/24 | | | 689,238 | | |
| | | | | | | $ | 8,491,073 | | |
| | Insured-Water and Sewer - 2.4% | | | | | | | | |
| $ | 1,670 | | | California Water Resources, (Central Valley), (FGIC),
Variable Rate, 12.888%, 12/1/28(2)(3) | | $ | 1,825,644 | | |
| | 3,000 | | | San Diego County Water Authority, (FGIC), Variable Rate,
8.903%, 4/22/09(5) | | | 3,597,930 | | |
| | | | | | | $ | 5,423,574 | | |
| | Lease Revenue / Certificates of Participation - 16.5% | | | | | | | | |
| $ | 6,500 | | | California Public Works, (University of California),
5.00%, 6/1/23 | | $ | 6,501,690 | | |
| | 5,000 | | | California Public Works, (University of California),
5.25%, 6/1/20 | | | 5,460,600 | | |
| | 5,115 | | | Los Angeles County, (Disney Parking), 0.00%, 3/1/16 | | | 2,991,354 | | |
| | 1,925 | | | Los Angeles County, (Disney Parking), 0.00%, 3/1/17 | | | 1,059,404 | | |
| | 3,100 | | | Los Angeles County, (Disney Parking), 0.00%, 3/1/20 | | | 1,411,399 | | |
| | 5,770 | | | Los Angeles County, (Marina Del Ray), 6.50%, 7/1/08 | | | 5,816,910 | | |
| | 7,305 | | | Pasadena Parking Facility, 6.25%, 1/1/18 | | | 8,437,421 | | |
| | 5,000 | | | Sacramento City Financing Authority, 5.40%, 11/1/20 | | | 5,427,900 | | |
| | | | | | | $ | 37,106,678 | | |
| | Other Revenue - 1.5% | | | | | | | | |
| $ | 2,500 | | | California Statewide Communities Development Authority,
(East Valley Tourist Development Authority),
8.25%, 10/1/14 | | $ | 2,546,850 | | |
| | 700 | | | Puerto Rico Infrastructure Financing Authority, Variable Rate,
11.609%, 10/1/34(2)(3) | | | 885,682 | | |
| | | | | | | $ | 3,432,532 | | |
| | Special Tax Revenue - 10.9% | | | | | | | | |
| $ | 2,500 | | | Bonita Canyon Public Financing Authority,
5.375%, 9/1/28 | | $ | 2,516,450 | | |
| | 2,550 | | | Brentwood Infrastructure Financing Authority,
6.375%, 9/2/33 | | | 2,627,443 | | |
| | 2,600 | | | Capistrano Unified School District, 5.75%, 9/1/29 | | | 2,680,626 | | |
| | 1,810 | | | Corona Public Financing Authority, 5.80%, 9/1/20 | | | 1,814,797 | | |
| | 1,500 | | | Corona-Norco Unified School District Public Financing
Authority, 6.125%, 9/1/31 | | | 1,539,435 | | |
| | 1,275 | | | Fairfield Improvement Bond Act 1915, (North Cordelia
District), 7.375%, 9/2/18 | | | 1,325,630 | | |
See notes to financial statements
24
Eaton Vance California Municipals Fund as of March 31, 2005
PORTFOLIO OF INVESTMENTS (Unaudited) CONT'D
Principal Amount
(000's omitted) | |
Security | |
Value | |
| | Special Tax Revenue (continued) | | | | | | | | |
| $ | 600 | | | Jurupa Community Services District, (Community Facilities
District No. 16), 5.30%, 9/1/34 | | $ | 601,788 | | |
| | 2,180 | | | Lincoln Public Financing Authority, Improvement Bond
Act 1915, (Twelve Bridges), 6.20%, 9/2/25 | | | 2,297,458 | | |
| | 1,430 | | | Moreno Valley Unified School District, 5.95%, 9/1/34 | | | 1,456,198 | | |
| | 1,050 | | | Murrieta Valley Unified School District, 6.20%, 9/1/35 | | | 1,093,145 | | |
| | 955 | | | Roseville Special Tax, 6.30%, 9/1/25 | | | 1,015,404 | | |
| | 2,300 | | | Santa Margarita Water District, 6.20%, 9/1/20(6) | | | 2,502,308 | | |
| | 1,000 | | | Santaluz Community Facilities District No.2,
6.20%, 9/1/30 | | | 1,017,590 | | |
| | 1,000 | | | Torrance Redevelopment Agency, 5.625%, 9/1/28 | | | 1,010,160 | | |
| | 900 | | | Whittier Public Financing Authority, (Greenleaf Avenue
Redevelopment), 5.50%, 11/1/23 | | | 928,926 | | |
| | | | | | | $ | 24,427,358 | | |
| | Total Tax-Exempt Investments - 99.8%
(identified cost $201,395,434) | | | | | $ | 224,761,091 | | |
| | Other Assets, Less Liabilities - 0.2% | | | | | $ | 518,200 | | |
| | Net Assets - 100.0% | | | | | $ | 225,279,291 | | |
AMBAC - AMBAC Financial Group, Inc.
AMT - Interest earned from these securities may be considered a tax preference item for purposes of the Federal Alternative Minimum Tax.
FGIC - Financial Guaranty Insurance Company
FSA - Financial Security Assurance, Inc.
MBIA - Municipal Bond Insurance Association
The Fund invests primarily in debt securities issued by California municipalities. The ability of the issuers of the debt securities to meet their obligations may be affected by economic developments in a specific industry or municipality. In order to reduce the risk associated with such economic developments, at March 31, 2005, 35.4% of the securities in the portfolio of investments are backed by bond insurance of various financial institutions and financial guaranty assurance agencies. The aggregate percentage insured by an individual financial institution ranged from 3.4% to 14.9% of total investments.
(1) When-issued security.
(2) Security exempt from registration under Rule 144A of the Securities Act of 1933. These securities may be sold in transactions exempt from registration, normally to qualified institutional buyers. At March 31, 2005, the aggregate value of the securities is $20,999,034 or 9.3% of the Fund's net assets.
(3) Security has been issued as a leveraged inverse floater bond. The stated interest rate represents the rate in effect at March 31, 2005.
(4) Security (or a portion thereof) has been segregated to cover margin requirements on open financial futures contracts.
(5) Security has been issued as an inverse floater bond. The stated interest rate represents the rate in effect at March 31, 2005.
(6) Security (or a portion thereof) has been segregated to cover when-issued securities.
See notes to financial statements
25
Eaton Vance Florida Municipals Fund as of March 31, 2005
PORTFOLIO OF INVESTMENTS (Unaudited)
| | Tax-Exempt Investments - 98.8% | | | | | | | | |
Principal Amount
(000's omitted) | | Security | | Value | |
| | Escrowed / Prerefunded - 1.2% | | | | | | | | |
| $ | 615 | | | Florida Mid-Bay Bridge Authority, Escrowed to Maturity,
6.10%, 10/1/22 | | $ | 723,265 | | |
| | 1,675 | | | Florida Mid-Bay Bridge Authority, Escrowed to Maturity,
6.875%, 10/1/22 | | | 2,164,519 | | |
| | | | | | | $ | 2,887,784 | | |
| | General Obligations - 1.0% | | | | | | | | |
| $ | 1,000 | | | Florida, Variable Rate, 7.40%, 7/1/27(1)(2) | | $ | 1,111,080 | | |
| | 2,300 | | | Puerto Rico, 0.00%, 7/1/18 | | | 1,247,635 | | |
| | | | | | | $ | 2,358,715 | | |
| | Health Care-Miscellaneous - 0.7% | | | | | | | | |
| $ | 1,667 | | | Osceola County IDA Community Pooled Loan-93,
7.75%, 7/1/17 | | $ | 1,670,051 | | |
| | | | | | | $ | 1,670,051 | | |
| | Hospital - 9.0% | | | | | | | | |
| $ | 2,795 | | | Cape Canaveral Hospital District, 5.25%, 1/1/28 | | $ | 2,848,245 | | |
| | 1,000 | | | Halifax Medical Center, 7.25%, 10/1/24 | | | 1,103,460 | | |
| | 1,000 | | | Highlands County Health Facilities Authority, (Adventist
Health System), 5.375%, 11/15/35 | | | 1,035,220 | | |
| | 2,750 | | | Jacksonville, EDA, (Mayo Clinic), 5.50%, 11/15/36 | | | 2,901,855 | | |
| | 1,250 | | | Lakeland Hospital System, (Lakeland Regional Health
System), 5.50%, 11/15/32 | | | 1,294,687 | | |
| | 4,000 | | | Orange County Health Facilities Authority, (Adventist
Health System), 5.625%, 11/15/32 | | | 4,249,360 | | |
| | 5,000 | | | Orange County Health Facilities Authority, (Nemours
Foundation), 5.00%, 1/1/35 | | | 5,145,450 | | |
| | 2,500 | | | West Orange Healthcare District, 5.80%, 2/1/31 | | | 2,602,475 | | |
| | | | | | | $ | 21,180,752 | | |
| | Housing - 1.9% | | | | | | | | |
| $ | 1,800 | | | Florida Capital Projects Finance Authority, Student Housing
Revenue, (Florida University), 7.75%, 8/15/20 | | $ | 1,789,380 | | |
| | 120 | | | Florida Capital Projects Finance Authority, Student Housing
Revenue, (Florida University), 9.50%, 8/15/05 | | | 119,917 | | |
| | 75 | | | Florida Housing Finance Authority, 6.35%, 6/1/14 | | | 75,223 | | |
| | 1,130 | | | Florida Housing Finance Authority, (AMT), 6.35%, 7/1/28 | | | 1,154,363 | | |
| | 1,380 | | | Orange County Health System Authority, (Adventist Health
System), (AMT), 6.60%, 4/1/28 | | | 1,395,001 | | |
| | | | | | | $ | 4,533,884 | | |
Principal Amount
(000's omitted) | |
Security | |
Value | |
| Industrial Development Revenue - 2.1% | | | | | |
| $ | 2,696 | | | Broward County IDR, (Lynxs Cargoport), (AMT),
6.75%, 6/1/19 | | $ | 2,483,674 | | |
| | 2,385 | | | Capital Trust Agency, (Fort Lauderdale Project), (AMT),
5.75%, 1/1/32 | | | 2,375,078 | | |
| | | | | | | $ | 4,858,752 | | |
| Insured-Escrowed / Prerefunded - 7.8% | | | | | |
| $ | 9,225 | | | Dade County, (Baptist Hospital of Miami), Escrowed to
Maturity, (MBIA), 5.75%, 5/1/21 | | $ | 10,334,767 | | |
| | 3,835 | | | Dade County, Professional Sports Franchise, Escrowed to
Maturity, (MBIA), 0.00%, 10/1/23 | | | 1,590,336 | | |
| | 5,600 | | | St. Lucie Utility System, Escrowed to Maturity, (FGIC),
6.00%, 10/1/20 | | | 6,605,368 | | |
| | | | | | | $ | 18,530,471 | | |
| Insured-General Obligations - 0.6% | | | | | |
| $ | 900 | | | Puerto Rico, (MBIA), Variable Rate, 11.455%, 7/1/20(1)(3) | | $ | 1,310,319 | | |
| | | | | | | $ | 1,310,319 | | |
| Insured-Health Care Miscellaneous - 0.1% | | | | | |
| $ | 325 | | | Osceola County IDA, Community Provider Pooled Loan
Program, (FSA), 7.75%, 7/1/10 | | $ | 331,636 | | |
| | | | | | | $ | 331,636 | | |
| Insured-Hospital - 8.1% | | | | | |
| $ | 4,000 | | | Coral Gables, Health Facilities Authority, (Baptist Health
System of South Florida), (FSA), 5.00%, 8/15/29 | | $ | 4,122,040 | | |
| | 1,800 | | | Miami-Dade County, Health Facilities Authority, (Miami
Children's Hospital), (AMBAC), 5.125%, 8/15/26 | | | 1,864,674 | | |
| | 9,500 | | | Sarasota County Public Hospital Board, (Sarasota Memorial
Hospital), (MBIA), 5.50%, 7/1/28 | | | 10,690,350 | | |
| | 2,250 | | | South Miami Health Facility Authority Hospital Revenue,
(Baptist Health), (AMBAC), 5.25%, 11/15/33 | | | 2,351,902 | | |
| | | | | | | $ | 19,028,966 | | |
| Insured-Housing - 1.3% | | | | | |
| $ | 3,000 | | | Florida HFA, (Brittany of Rosemont), (AMBAC), (AMT),
6.875%, 8/1/26 | | $ | 3,063,360 | | |
| | | | | | | $ | 3,063,360 | | |
Insured-Lease Revenue / Certificates of
Participation - 1.2% | | | | | |
| $ | 1,250 | | | Puerto Rico Public Finance Corp., (AMBAC), Variable Rate,
7.42%, 6/1/26(1)(2) | | $ | 1,426,937 | | |
See notes to financial statements
26
Eaton Vance Florida Municipals Fund as of March 31, 2005
PORTFOLIO OF INVESTMENTS (Unaudited) CONT'D
Principal Amount
(000's omitted) | |
Security | |
Value | |
| | Insured-Lease Revenue / Certificates of
Participation (continued) | | | | | | | | |
| $ | 1,100 | | | Puerto Rico Public Finance Corp., (AMBAC), Variable Rate,
12.857%, 6/1/24(1)(3) | | $ | 1,405,206 | | |
| | | | | | | $ | 2,832,143 | | |
| | Insured-Special Tax Revenue - 10.4% | | | | | | | | |
| $ | 2,115 | | | Dade County, Residual Certificates, (AMBAC), Variable Rate,
9.915%, 10/1/35(1)(3) | | $ | 2,173,755 | | |
| | 1,500 | | | Jacksonville Excise Tax, (FGIC), (AMT), 0.00%, 10/1/12 | | | 1,084,635 | | |
| | 1,185 | | | Opa-Locka Sales Tax, (FGIC), 7.00%, 1/1/14 | | | 1,201,294 | | |
| | 2,610 | | | Orange County Tourist Development, (AMBAC), Variable Rate,
10.29%, 10/1/30(1)(3) | | | 2,889,218 | | |
| | 2,840 | | | Sunrise Public Facilities, (MBIA), 0.00%, 10/1/14 | | | 1,877,382 | | |
| | 4,000 | | | Sunrise Public Facilities, (MBIA), 0.00%, 10/1/15 | | | 2,501,720 | | |
| | 4,140 | | | Sunrise Public Facilities, (MBIA), 0.00%, 10/1/16 | | | 2,463,590 | | |
| | 2,525 | | | Sunrise Public Facilities, (MBIA), 0.00%, 10/1/17 | | | 1,423,999 | | |
| | 2,000 | | | Tampa Utility Tax, (AMBAC), 0.00%, 10/1/18 | | | 1,067,500 | | |
| | 6,800 | | | Tampa Utility Tax, (AMBAC), 0.00%, 4/1/19 | | | 3,521,924 | | |
| | 5,000 | | | Tampa Utility Tax, (AMBAC), 0.00%, 10/1/19 | | | 2,529,500 | | |
| | 4,000 | | | Tampa Utility Tax, (AMBAC), 0.00%, 10/1/20 | | | 1,919,080 | | |
| | | | | | | $ | 24,653,597 | | |
| | Insured-Transportation - 16.4% | | | | | | | | |
| $ | 6,075 | | | Florida Turnpike Authority, (FSA), 4.50%, 7/1/28 | | $ | 5,916,442 | | |
| | 10,000 | | | Florida Turnpike Authority, Water & Sewer Revenue,
(Department of Transportation), (FGIC), 4.50%, 7/1/27(4) | | | 9,786,000 | | |
| | 2,900 | | | Greater Orlando Aviation Authority, (FGIC), (AMT),
Variable Rate, 9.738%, 10/1/18(1)(3) | | | 3,235,037 | | |
| | 5,500 | | | Miami-Dade County Expressway Authority, (FGIC),
5.00%, 7/1/33 | | | 5,665,935 | | |
| | 2,000 | | | Orlando and Orange County Expressway Authority, (FGIC),
8.25%, 7/1/14 | | | 2,667,580 | | |
| | 1,100 | | | Port Palm Beach District, (Public Improvements), (XLCA),
0.00%, 9/1/22 | | | 469,788 | | |
| | 1,100 | | | Port Palm Beach District, (Public Improvements), (XLCA),
0.00%, 9/1/23 | | | 444,191 | | |
| | 5,000 | | | Puerto Rico Highway and Transportation Authority, (FSA),
4.75%, 7/1/38 | | | 5,105,850 | | |
| | 5,000 | | | Puerto Rico Highway and Transportation Authority, (MBIA),
5.50%, 7/1/36 | | | 5,581,500 | | |
| | | | | | | $ | 38,872,323 | | |
| | Insured-Utilities - 2.0% | | | | | | | | |
| $ | 4,460 | | | Ocala Water, Sewer and Electrical Utility System, (FGIC),
5.00%, 10/1/31 | | $ | 4,624,173 | | |
| | | | | | | $ | 4,624,173 | | |
Principal Amount
(000's omitted) | |
Security | |
Value | |
| Insured-Water and Sewer - 16.3% | | | | | |
| $ | 1,500 | | | Cocoa Water and Sewer, (FGIC), 4.50%, 10/1/26 | | $ | 1,472,625 | | |
| | 5,000 | | | Fort Myers Utility, (FGIC), Variable Rate, 8.40%, 10/1/29(2) | | | 5,820,350 | | |
| | 10,675 | | | Marco Island, Utility System, (MBIA), 5.00%, 10/1/33 | | | 10,999,093 | | |
| | 2,500 | | | Martin County Utilities System, (AMBAC), 5.00%, 10/1/28 | | | 2,586,600 | | |
| | 2,000 | | | Miami Beach, Storm Water, (FGIC), 5.375%, 9/1/30 | | | 2,124,100 | | |
| | 10,525 | | | Sunrise Utility System, (AMBAC), 5.00%, 10/1/28 | | | 11,047,671 | | |
| | 1,000 | | | Tampa Bay Water Utility System, (FGIC), 4.75%, 10/1/27 | | | 1,005,530 | | |
| | 3,375 | | | Tampa Bay Water Utility System, (FGIC), Variable Rate,
6.90%, 10/1/27(1)(2) | | | 3,412,294 | | |
| | | | | | | $ | 38,468,263 | | |
| Nursing Home - 4.3% | | | | | |
| $ | 4,675 | | | Dade County IDA, (Gramercy Park Nursing Care), (FHA),
6.60%, 8/1/23 | | $ | 4,729,324 | | |
| | 2,640 | | | Okaloosa County, Retirement Rental Housing, (Encore
Retirement Partners), 6.125%, 2/1/14 | | | 2,379,828 | | |
| | 3,500 | | | Orange County Health Facilities Authority, (Westminister
Community Care), 6.60%, 4/1/24 | | | 3,068,625 | | |
| | | | | | | $ | 10,177,777 | | |
| Other Revenue - 0.5% | | | | | |
| $ | 1,000 | | | Capital Trust Agency, (Seminole Tribe Convention),
8.95%, 10/1/33 | | $ | 1,120,000 | | |
| | | | | | | $ | 1,120,000 | | |
| Senior Living / Life Care - 3.6% | | | | | |
| $ | 500 | | | Lee County IDA, (Shell Point Village), 5.50%, 11/15/21 | | $ | 504,325 | | |
| | 2,775 | | | Lee County IDA, (Shell Point Village), 5.50%, 11/15/29 | | | 2,754,826 | | |
| | 3,915 | | | North Miami Health Facilities Authority, (Imperial Club),
6.75%, 1/1/33 | | | 3,606,850 | | |
| | 1,750 | | | Plantation Health Facilities Authority, (Covenant Village of
Florida), 5.125%, 12/1/22 | | | 1,716,208 | | |
| | | | | | | $ | 8,582,209 | | |
| Special Tax Revenue - 6.5% | | | | | |
| $ | 1,250 | | | Concorde Estates Community Development District,
5.85%, 5/1/35 | | $ | 1,253,613 | | |
| | 1,000 | | | Fishhawk Community Development District,
6.125%, 5/1/34 | | | 1,010,340 | | |
| | 245 | | | Gateway Service Community Development District, Special
Assessment, 6.50%, 5/1/33 | | | 250,968 | | |
| | 675 | | | Heritage Harbor South, Community Development District,
6.20%, 5/1/35 | | | 690,444 | | |
| | 1,025 | | | Heritage Harbour South Community Development District,
(Capital Improvements), 5.40%, 11/1/08 | | | 1,034,174 | | |
See notes to financial statements
27
Eaton Vance Florida Municipals Fund as of March 31, 2005
PORTFOLIO OF INVESTMENTS (Unaudited) CONT'D
Principal Amount
(000's omitted) | |
Security | |
Value | |
| Special Tax Revenue (continued) | | | | | |
| $ | 500 | | | Heritage Harbour South Community Development District,
(Capital Improvements), 6.50%, 5/1/34 | | $ | 523,515 | | |
| | 1,145 | | | Lexington Oaks Community Development District,
7.20%, 5/1/30 | | | 1,201,002 | | |
| | 395 | | | Longleaf Community Development District, 6.20%, 5/1/09 | | | 382,530 | | |
| | 1,540 | | | Longleaf Community Development District, 6.65%, 5/1/20 | | | 1,414,382 | | |
| | 1,015 | | | Northern Palm Beach County, (Water Control and
Improvements), 6.00%, 8/1/25 | | | 1,036,914 | | |
| | 1,000 | | | Southern Hills Plantation I Community Development District,
5.80%, 5/1/35 | | | 995,430 | | |
| | 1,670 | | | Sterling Hill, Community Development District,
6.20%, 5/1/35 | | | 1,706,506 | | |
| | 3,125 | | | University Square Community Development District,
6.75%, 5/1/20 | | | 3,284,125 | | |
| | 625 | | | Vista Lakes Community Development District,
7.20%, 5/1/32 | | | 669,244 | | |
| | | | | | | $ | 15,453,187 | | |
| Transportation - 1.1% | | | | | |
| $ | 2,385 | | | Florida Mid-Bay Bridge Authority, 6.10%, 10/1/22 | | $ | 2,501,746 | | |
| | | | | | | $ | 2,501,746 | | |
| Water and Sewer - 2.7% | | | | | |
| $ | 6,275 | | | Jacksonville Electric Power Authority, Water and Sewer
Revenue, 5.25%, 10/1/39 | | $ | 6,483,330 | | |
| | | | | | | $ | 6,483,330 | | |
| | Total Tax-Exempt Investments - 98.8%
(identified cost $214,570,595) | | | | | $ | 233,523,438 | | |
| | Other Assets, Less Liabilities - 1.2% | | | | | $ | 2,891,910 | | |
| | Net Assets - 100.0% | | | | | $ | 236,415,348 | | |
AMBAC - AMBAC Financial Group, Inc.
AMT - Interest earned from these securities may be considered a tax preference item for purposes of the Federal Alternative Minimum Tax.
FGIC - Financial Guaranty Insurance Company
FHA - Federal Housing Authority
FSA - Financial Security Assurance, Inc.
MBIA - Municipal Bond Insurance Association
XLCA - XL Capital Assurance, Inc.
The Fund invests primarily in debt securities issued by Florida municipalities. The ability of the issuers of the debt securities to meet their obligations may be affected by economic developments in a specific industry or municipality. In order to reduce the risk associated with such economic developments, at March 31, 2005, 65.0% of the securities in the portfolio of investments are backed by bond insurance of various financial institutions and financial guaranty assurance agencies. The aggregate percentage insured by an individual financial institution ranged from 0.4% to 20.9% of total investments.
(1) Security exempt from registration under Rule 144A of the Securities Act of 1933. These securities may be sold in transactions exempt from registration, normally to qualified institutional buyers. At March 31, 2005, the aggregate value of the securities is $16,963,846 or 7.2% of the Fund's net assets.
(2) Security has been issued as an inverse floater bond. The stated interest rate represents the rate in effect at March 31, 2005.
(3) Security has been issued as a leveraged inverse floater bond. The stated interest rate represents the rate in effect at March 31, 2005.
(4) Security (or a portion thereof) has been segregated to cover margin requirements on open financial futures contracts.
See notes to financial statements
28
Eaton Vance Massachusetts Municipals Fund as of March 31, 2005
PORTFOLIO OF INVESTMENTS (Unaudited)
| | Tax-Exempt Investments - 100.3% | | | | | | | | |
Principal Amount
(000's omitted) | | Security | | Value | |
| | Education - 7.9% | | | | | | | | |
| $ | 2,190 | | | Massachusetts Development Finance Agency, (Belmont Hill
School), 5.00%, 9/1/31 | | $ | 2,238,202 | | |
| | 5,500 | | | Massachusetts Development Finance Agency, (Boston
University), 5.45%, 5/15/59 | | | 5,885,110 | | |
| | 1,000 | | | Massachusetts Development Finance Agency, (Middlesex
School), 5.00%, 9/1/33 | | | 1,019,920 | | |
| | 1,000 | | | Massachusetts Development Finance Agency, (Wheeler
School), 6.50%, 12/1/29 | | | 1,050,230 | | |
| | 1,700 | | | Massachusetts HEFA, (Harvard University),
5.125%, 7/15/37 | | | 1,764,107 | | |
| | 1,000 | | | Massachusetts HEFA, (Massachusetts Institute of Technology),
5.25%, 7/1/30 | | | 1,118,090 | | |
| | 2,000 | | | Massachusetts IFA, (Belmont Hill School), 5.25%, 9/1/28 | | | 2,042,880 | | |
| | 2,000 | | | Massachusetts IFA, (St. Johns High School, Inc.),
5.35%, 6/1/28 | | | 2,026,840 | | |
| | | | | | | $ | 17,145,379 | | |
| | Electric Utilities - 4.4% | | | | | | | | |
| $ | 3,000 | | | Puerto Rico Electric Power Authority, 0.00%, 7/1/17 | | $ | 1,770,840 | | |
| | 13,230 | | | Puerto Rico Electric Power Authority, 0.00%, 7/1/17 | | | 7,744,180 | | |
| | | | | | | $ | 9,515,020 | | |
| | Escrowed / Prerefunded - 10.0% | | | | | | | | |
| $ | 240 | | | Massachusetts Bay Transportation Authority, Sales Tax,
Prerefunded to 7/01/10, 5.50%, 7/1/30 | | $ | 264,336 | | |
| | 20,000 | | | Massachusetts Turnpike Authority, Escrowed to Maturity,
5.00%, 1/1/20 | | | 21,450,400 | | |
| | | | | | | $ | 21,714,736 | | |
| | Hospital - 11.6% | | | | | | | | |
| $ | 1,000 | | | Massachusetts HEFA, (Berkshire Health System),
6.25%, 10/1/31 | | $ | 1,041,720 | | |
| | 3,050 | | | Massachusetts HEFA, (Central New England Health Systems),
6.125%, 8/1/13 | | | 3,050,701 | | |
| | 2,600 | | | Massachusetts HEFA, (Healthcare System-Covenant Health),
6.00%, 7/1/22 | | | 2,775,032 | | |
| | 915 | | | Massachusetts HEFA, (Jordan Hospital), 6.875%, 10/1/15 | | | 915,174 | | |
| | 4,100 | | | Massachusetts HEFA, (Partners Healthcare System),
5.25%, 7/1/29 | | | 4,224,107 | | |
| | 1,000 | | | Massachusetts HEFA, (Partners Healthcare System),
5.75%, 7/1/32 | | | 1,083,180 | | |
| | 4,000 | | | Massachusetts IFA, (Biomedical Research Corp.),
0.00%, 8/1/08 | | | 3,558,120 | | |
Principal Amount
(000's omitted) | |
Security | |
Value | |
| Hospital (continued) | | | | | |
| $ | 9,000 | | | Massachusetts IFA, (Biomedical Research Corp.),
0.00%, 8/1/09 | | $ | 7,656,120 | | |
| | 1,000 | | | Massachusetts IFA, (Biomedical Research Corp.),
0.00%, 8/1/10 | | | 809,720 | | |
| | | | | | | $ | 25,113,874 | | |
| Industrial Development Revenue - 1.1% | | | | | |
| $ | 2,155 | | | Massachusetts IFA, (American Hingham Water Co.), (AMT),
6.60%, 12/1/15 | | $ | 2,272,038 | | |
| | | | | | | $ | 2,272,038 | | |
| Insured-Education - 10.7% | | | | | |
| $ | 2,500 | | | Massachusetts College Building Authority, (XLCA),
5.50%, 5/1/28 | | $ | 2,846,800 | | |
| | 5,000 | | | Massachusetts College Building Authority, (XLCA),
5.50%, 5/1/33 | | | 5,692,350 | | |
| | 6,000 | | | Massachusetts Development Finance Agency, (Boston
University), (XLCA), 5.375%, 5/15/39 | | | 6,540,840 | | |
| | 2,800 | | | Massachusetts Development Finance Agency, (Franklin
W. Olin College), (XLCA), 5.25%, 7/1/33 | | | 2,928,464 | | |
| | 1,000 | | | Massachusetts Development Finance Agency, (Merrimack
College), (MBIA), 5.20%, 7/1/32 | | | 1,043,260 | | |
| | 1,150 | | | Massachusetts HEFA, (Berklee College of Music), (MBIA),
Variable Rate, 7.69%, 10/1/27(1)(2) | | | 1,224,371 | | |
| | 2,000 | | | Massachusetts HEFA, (UMass Worcester Campus), (FGIC),
5.25%, 10/1/31 | | | 2,105,600 | | |
| | 800 | | | University of Massachusetts Building Authority, (AMBAC),
5.125%, 11/1/34 | | | 834,048 | | |
| | | | | | | $ | 23,215,733 | | |
| Insured-Electric Utilities - 1.1% | | | | | |
| $ | 2,000 | | | Puerto Rico Electric Power Authority, RITES, (FSA),
Variable Rate, 9.991%, 7/1/29(1)(3) | | $ | 2,399,520 | | |
| | | | | | | $ | 2,399,520 | | |
| Insured-Escrowed / Prerefunded - 0.1% | | | | | |
| $ | 200 | | | Massachusetts Turnpike Authority, (MBIA), Escrowed to
Maturity, 5.00%, 1/1/20 | | $ | 214,504 | | |
| | | | | | | $ | 214,504 | | |
| Insured-General Obligations - 4.7% | | | | | |
| $ | 960 | | | Ashland, (AMBAC), 4.75%, 5/15/29 | | $ | 968,016 | | |
| | 960 | | | Ashland, (AMBAC), 4.75%, 5/15/33 | | | 962,630 | | |
| | 2,600 | | | Ipswich, (FGIC), 5.00%, 11/15/19 | | | 2,743,676 | | |
See notes to financial statements
29
Eaton Vance Massachusetts Municipals Fund as of March 31, 2005
PORTFOLIO OF INVESTMENTS (Unaudited) CONT'D
Principal Amount
(000's omitted) | |
Security | |
Value | |
| | Insured-General Obligations (continued) | | | | | | | | |
| $ | 3,000 | | | Massachusetts, (AMBAC), Variable Rate,
11.455%, 8/1/30(1)(3) | | $ | 4,434,180 | | |
| | 500 | | | Plymouth, (MBIA), 5.25%, 10/15/20 | | | 540,165 | | |
| | 400 | | | Puerto Rico, (MBIA), Variable Rate,
11.455%, 7/1/20(1)(3) | | | 582,364 | | |
| | | | | | | $ | 10,231,031 | | |
| | Insured-Hospital - 1.6% | | | | | | | | |
| $ | 2,900 | | | Massachusetts HEFA, (The Medical Center of Central
Massachusetts), (AMBAC), Variable Rate,
11.02%, 6/23/22(2) | | $ | 3,416,258 | | |
| | | | | | | $ | 3,416,258 | | |
| | Insured-Lease Revenue / Certificates of
Participation - 3.9% | | | | | | | | |
| $ | 7,500 | | | Massachusetts Development Finance Agency, (MBIA),
5.125%, 2/1/34 | | $ | 7,741,050 | | |
| | 600 | | | Puerto Rico Public Finance Corp., (AMBAC), Variable Rate,
12.857%, 6/1/24(1)(3) | | | 766,476 | | |
| | | | | | | $ | 8,507,526 | | |
| | Insured-Other Revenue - 2.2% | | | | | | | | |
| $ | 2,894 | | | Massachusetts Development Finance Agency,
WGBH Foundation, (AMBAC), Variable Rate,
12.204%, 1/1/42(1)(3) | | $ | 4,561,863 | | |
| | 120 | | | Massachusetts HEFA, (Capital Assets), (MBIA),
7.20%, 7/1/09 | | | 120,442 | | |
| | | | | | | $ | 4,682,305 | | |
| | Insured-Special Tax Revenue - 6.4% | | | | | | | | |
| $ | 1,000 | | | Martha's Vineyard Land Bank, (AMBAC), 4.50%, 5/1/24 | | $ | 998,060 | | |
| | 1,000 | | | Martha's Vineyard Land Bank, (AMBAC), 5.00%, 5/1/29 | | | 1,041,830 | | |
| | 4,620 | | | Martha's Vineyard Land Bank, (AMBAC), 5.00%, 5/1/32 | | | 4,763,867 | | |
| | 2,365 | | | Martha's Vineyard Land Bank, (AMBAC), 5.00%, 5/1/34 | | | 2,451,393 | | |
| | 1,500 | | | Massachusetts State Special Obligation - Convention Center,
(FGIC), 5.25%, 1/1/29 | | | 1,592,220 | | |
| | 3,000 | | | Massachusetts State Special Obligation, (FGIC),
5.00%, 1/1/34 | | | 3,097,440 | | |
| | | | | | | $ | 13,944,810 | | |
| | Insured-Transportation - 6.3% | | | | | | | | |
| $ | 19,000 | | | Massachusetts Turnpike Authority, (MBIA), 0.00%, 1/1/28 | | $ | 6,015,210 | | |
| | 10,750 | | | Massachusetts Turnpike Authority, Metropolitan Highway
System, (MBIA), 0.00%, 1/1/22 | | | 4,801,595 | | |
| | 1,000 | | | Puerto Rico Highway and Transportation Authority, (FSA),
4.75%, 7/1/38 | | | 1,021,170 | | |
Principal Amount
(000's omitted) | |
Security | |
Value | |
| Insured-Transportation (continued) | | | | | |
| $ | 1,000 | | | Puerto Rico Highway and Transportation Authority, (MBIA),
4.75%, 7/1/38 | | $ | 1,021,170 | | |
| | 665 | | | Puerto Rico Highway and Transportation Authority, (MBIA),
Variable Rate, 10.862%, 7/1/36(1)(3) | | | 758,452 | | |
| | | | | | | $ | 13,617,597 | | |
| Insured-Water and Sewer - 1.2% | | | | | |
| $ | 2,500 | | | Massachusetts Water Resources Authority, (MBIA),
5.00%, 8/1/35(4) | | $ | 2,596,750 | | |
| | | | | | | $ | 2,596,750 | | |
| Nursing Home - 2.6% | | | | | |
| $ | 2,400 | | | Massachusetts HEFA, (Christopher House), 6.875%, 1/1/29 | | $ | 2,392,680 | | |
| | 3,225 | | | Massachusetts IFA, (Age Institute of Massachusetts),
8.05%, 11/1/25 | | | 3,229,064 | | |
| | | | | | | $ | 5,621,744 | | |
| Other Revenue - 0.9% | | | | | |
| $ | 1,485 | | | Puerto Rico Infrastructure Financing Authority, Variable Rate,
11.609%, 10/1/34(1)(3) | | $ | 1,878,911 | | |
| | | | | | | $ | 1,878,911 | | |
| Pooled Loans - 1.0% | | | | | |
| $ | 2,000 | | | New England Educational Loan Marketing Corp., (AMT),
6.90%, 11/1/09 | | $ | 2,140,320 | | |
| | | | | | | $ | 2,140,320 | | |
| Senior Living / Life Care - 0.8% | | | | | |
| $ | 1,805 | | | Massachusetts IFA, (Forge Hill), (AMT), 6.75%, 4/1/30 | | $ | 1,703,487 | | |
| | | | | | | $ | 1,703,487 | | |
| Solid Waste - 1.5% | | | | | |
| $ | 3,250 | | | Massachusetts IFA, Resource Recovery, (Ogden Haverhill),
(AMT), 5.60%, 12/1/19 | | $ | 3,322,280 | | |
| | | | | | | $ | 3,322,280 | | |
| Special Tax Revenue - 7.5% | | | | | |
| $ | 1,500 | | | Massachusetts Bay Transportation Authority, Sales Tax,
5.00%, 7/1/30 | | $ | 1,606,485 | | |
| | 6,880 | | | Massachusetts Bay Transportation Authority, Sales Tax,
5.00%, 7/1/31 | | | 7,370,888 | | |
| | 7,000 | | | Massachusetts Bay Transportation Authority, Sales Tax,
5.00%, 7/1/34 | | | 7,237,860 | | |
| | | | | | | $ | 16,215,233 | | |
See notes to financial statements
30
Eaton Vance Massachusetts Municipals Fund as of March 31, 2005
PORTFOLIO OF INVESTMENTS (Unaudited) CONT'D
Principal Amount
(000's omitted) | |
Security | |
Value | |
| Transportation - 2.7% | | | | | |
| $ | 4,330 | | | Massachusetts Bay Transportation Authority, Variable Rate,
7.44%, 3/1/27(1)(2) | | $ | 4,757,068 | | |
| | 1,000 | | | Puerto Rico Highway and Transportation Authority,
5.00%, 7/1/36 | | | 1,023,100 | | |
| | | | | | | $ | 5,780,168 | | |
| Water and Sewer - 10.1% | | | | | |
| $ | 10,545 | | | Boston, IDA, (Harbor Electric Energy Co.), (AMT),
7.375%, 5/15/15(5)(6) | | $ | 10,580,537 | | |
| | 3,220 | | | Massachusetts Water Pollution Abatement Trust,
5.25%, 8/1/25 | | | 3,582,797 | | |
| | 3,000 | | | Massachusetts Water Pollution Abatement Trust,
5.25%, 8/1/33 | | | 3,172,890 | | |
| | 4,165 | | | Massachusetts Water Resources Authority, 5.25%, 12/1/15 | | | 4,568,089 | | |
| | | | | | | $ | 21,904,313 | | |
| | Total Tax-Exempt Investments - 100.3%
(identified cost $202,219,697) | | | | | $ | 217,153,537 | | |
| | Other Assets, Less Liabilities - (0.3)% | | | | | $ | (673,978 | ) | |
| | Net Assets - 100.0% | | | | | $ | 216,479,559 | | |
AMBAC - AMBAC Financial Group, Inc.
AMT - Interest earned from these securities may be considered a tax preference item for purposes of the Federal Alternative Minimum Tax.
FGIC - Financial Guaranty Insurance Company
FSA - Financial Security Assurance, Inc.
MBIA - Municipal Bond Insurance Association
XLCA - XL Capital Assurance, Inc.
The Fund invests primarily in debt securities issued by Massachusetts municipalities. The ability of the issuers of the debt securities to meet their obligations may be affected by economic developments in a specific industry or municipality. In order to reduce the risk associated with such economic developments, at March 31, 2005, 38.1% of the securities in the portfolio of investments are backed by bond insurance of various financial institutions and financial guaranty assurance agencies. The aggregate percentage insured by an individual financial institution ranged from 1.6% to 12.3% of total investments.
(1) Security exempt from registration under Rule 144A of the Securities Act of 1933. These securities may be sold in transactions exempt from registration, normally to qualified institutional buyers. At March 31, 2005, the aggregate value of the securities is $21,363,205 or 9.9% of the Fund's net assets.
(2) Security has been issued as an inverse floater bond. The stated interest rate represents the rate in effect at March 31, 2005.
(3) Security has been issued as a leveraged inverse floater bond. The stated interest rate represents the rate in effect at March 31, 2005.
(4) When-issued security.
(5) Security (or a portion thereof) has been segregated to cover margin requirements on open financial futures contracts.
(6) Security (or a portion thereof) has been segregated to cover when-issued securities.
See notes to financial statements
31
Eaton Vance Mississippi Municipals Fund as of March 31, 2005
PORTFOLIO OF INVESTMENTS (Unaudited)
| | Tax-Exempt Investments - 96.1% | | | | | | | | |
Principal Amount
(000's omitted) | | Security | | Value | |
| | Electric Utilities - 1.4% | | | | | | | | |
| $ | 250 | | | Mississippi Business Finance Corp., (System Energy
Resources, Inc.), 5.90%, 5/1/22 | | $ | 255,947 | | |
| | | | | | | $ | 255,947 | | |
| | Escrowed / Prerefunded - 15.8% | | | | | | | | |
| $ | 2,500 | | | Mississippi Housing Finance Corp., Single Family, Escrowed
to Maturity, 0.00%, 6/1/15 | | $ | 1,601,300 | | |
| | 500 | | | Mississippi State University Educational Building Corp.,
Prerefunded to 6/15/05, 6.15%, 6/15/15 | | | 503,940 | | |
| | 250 | | | Mississippi, Prerefunded to 11/1/11, 5.00%, 11/1/21 | | | 270,162 | | |
| | 470 | | | University of Mississippi Educational Building Corp.,
Prerefunded to 6/1/06, 6.20%, 6/1/16 | | | 498,336 | | |
| | | | | | | $ | 2,873,738 | | |
| | General Obligations - 1.4% | | | | | | | | |
| $ | 250 | | | Puerto Rico, 5.00%, 7/1/34 | | $ | 255,180 | | |
| | | | | | | $ | 255,180 | | |
| | Hospital - 3.9% | | | | | | | | |
| $ | 500 | | | Jones County, (South Central Regional Medical Center),
5.50%, 12/1/17 | | $ | 502,245 | | |
| | 200 | | | Mississippi Hospital Equipment and Facilities Authority,
(Rush Medical Foundation), 6.00%, 1/1/22 | | | 200,542 | | |
| | | | | | | $ | 702,787 | | |
| | Housing - 1.6% | | | | | | | | |
| $ | 155 | | | Mississippi Home Corp., Single Family, (GNMA), (AMT),
6.625%, 4/1/27 | | $ | 158,224 | | |
| | 90 | | | Mississippi Home Corp., Single Family, (GNMA), (AMT),
7.55%, 12/1/27 | | | 91,129 | | |
| | 50 | | | Mississippi Home Corp., Single Family, (GNMA), (AMT),
8.10%, 12/1/24 | | | 50,379 | | |
| | | | | | | $ | 299,732 | | |
| | Industrial Development Revenue - 7.1% | | | | | | | | |
| $ | 200 | | | Lowndes County, (Weyerhaeuser), 6.80%, 4/1/22 | | $ | 239,262 | | |
| | 175 | | | Mississippi Business Finance Corp., (Air Cargo), (AMT),
7.25%, 7/1/34 | | | 177,597 | | |
| | 350 | | | Mississippi Business Finance Corp., (E.I. DuPont deNemours),
(AMT), 7.15%, 5/1/16 | | | 358,925 | | |
| | 200 | | | Warren County, (International Paper), (AMT),
4.40%, 3/1/15 | | | 196,056 | | |
Principal Amount
(000's omitted) | |
Security | |
Value | |
| | Industrial Development Revenue (continued) | | | | | | | | |
| $ | 300 | | | Warren County, (International Paper), (AMT),
6.70%, 8/1/18 | | $ | 327,366 | | |
| | | | | | | $ | 1,299,206 | | |
| | Insured-Bond Bank - 3.4% | | | | | | | | |
| $ | 585 | | | Mississippi Development Bank, (Capital Projects), (AMBAC),
5.00%, 7/1/24 | | $ | 619,644 | | |
| | | | | | | $ | 619,644 | | |
| | Insured-Education - 7.6% | | | | | | | | |
| $ | 750 | | | Jackson State University Educational Building Corp., (FGIC),
5.00%, 3/1/29 | | $ | 771,945 | | |
| | 100 | | | Puerto Rico Industrial, Tourist, Educational, Medical &
Environmental Control Facilities Financing Authority,
(Inter American University), (MBIA), 4.50%, 10/1/29 | | | 99,047 | | |
| | 500 | | | Southern Mississippi University Educational Building Corp.,
(AMBAC), 5.00%, 3/1/21 | | | 520,700 | | |
| | | | | | | $ | 1,391,692 | | |
| | Insured-Electric Utilities - 4.1% | | | | | | | | |
| $ | 350 | | | Puerto Rico Electric Power Authority, (MBIA),
5.00%, 7/1/20 | | $ | 383,554 | | |
| | 100 | | | Puerto Rico Electric Power Authority, (MBIA), Variable Rate,
12.295%, 7/1/16(1)(2) | | | 141,742 | | |
| | 100 | | | Puerto Rico Electric Power Authority, (XLCA),
5.375%, 7/1/16 | | | 112,304 | | |
| | 85 | | | Puerto Rico Electric Power Authority, DRIVERS, (FSA),
Variable Rate, 12.902%, 7/1/29(1)(2) | | | 101,980 | | |
| | | | | | | $ | 739,580 | | |
| | Insured-Escrowed / Prerefunded - 3.9% | | | | | | | | |
| $ | 500 | | | Puerto Rico, (FGIC), Prerefunded to 7/1/12,
5.00%, 7/1/32 | | $ | 542,465 | | |
| | 150 | | | Puerto Rico, (FSA), Prerefunded to 7/1/11,
5.125%, 7/1/30 | | | 163,086 | | |
| | | | | | | $ | 705,551 | | |
| | Insured-General Obligations - 5.8% | | | | | | | | |
| $ | 500 | | | Hinds County, (MBIA), 6.25%, 3/1/11 | | $ | 571,885 | | |
| | 85 | | | Mississippi, (FSA), Variable Rate, 10.665%, 11/1/21(1)(2) | | | 114,311 | | |
| | 100 | | | Puerto Rico, (FSA), 5.125%, 7/1/30 | | | 104,234 | | |
| | 220 | | | Puerto Rico, (FSA), Variable Rate, 10.84%, 7/1/27(1)(2) | | | 264,620 | | |
| | | | | | | $ | 1,055,050 | | |
See notes to financial statements
32
Eaton Vance Mississippi Municipals Fund as of March 31, 2005
PORTFOLIO OF INVESTMENTS (Unaudited) CONT'D
Principal Amount
(000's omitted) | |
Security | |
Value | |
| | Insured-Hospital - 12.0% | | | | | | | | |
| $ | 750 | | | Gulfport, (Gulfport Memorial Hospital), (MBIA),
6.20%, 7/1/18 | | $ | 766,912 | | |
| | 600 | | | Hinds County, (Mississippi Methodist Hospital), (AMBAC),
5.60%, 5/1/12(3) | | | 650,106 | | |
| | 250 | | | Mississippi Hospital Equipment and Facilities Authority,
(Forrest County General Hospital), (FSA), 5.50%, 1/1/27 | | | 265,635 | | |
| | 500 | | | Mississippi Hospital Equipment and Facilities Authority,
(Mississippi Baptist Medical Center), (MBIA),
6.00%, 5/1/13 | | | 511,385 | | |
| | | | | | | $ | 2,194,038 | | |
| | Insured-Lease Revenue / Certificates of
Participation - 5.8% | | | | | | | | |
| $ | 250 | | | Mississippi State University Educational Building Corp.,
Facilities Renovation, (FGIC), 4.50%, 8/1/29 | | $ | 244,022 | | |
| | 500 | | | Mississippi State University Educational Building Corp.,
Facilities Renovation, (MBIA), 5.25%, 8/1/17 | | | 550,360 | | |
| | 200 | | | Puerto Rico Public Finance Corp., (AMBAC), Variable Rate,
12.857%, 6/1/24(1)(2) | | | 255,492 | | |
| | | | | | | $ | 1,049,874 | | |
| | Insured-Special Tax Revenue - 1.0% | | | | | | | | |
| $ | 180 | | | Puerto Rico Infrastructure Financing Authority, (AMBAC),
5.00%, 7/1/28 | | $ | 185,089 | | |
| | | | | | | $ | 185,089 | | |
| | Insured-Transportation - 5.5% | | | | | | | | |
| $ | 250 | | | Mississippi Development Bank, (Mississippi Highway
Construction), (FGIC), 5.00%, 1/1/25 | | $ | 261,268 | | |
| | 350 | | | Puerto Rico Highway and Transportation Authority, (AMBAC),
5.00%, 7/1/28 | | | 359,933 | | |
| | 175 | | | Puerto Rico Highway and Transportation Authority, (MBIA),
4.75%, 7/1/38 | | | 178,705 | | |
| | 200 | | | Puerto Rico Highway and Transportation Authority, (MBIA),
5.00%, 7/1/36 | | | 209,368 | | |
| | | | | | | $ | 1,009,274 | | |
| | Insured-Water and Sewer - 10.4% | | | | | | | | |
| $ | 300 | | | Gautier Utility District, (FGIC), 5.125%, 3/1/19 | | $ | 318,087 | | |
| | 600 | | | Harrison County, Wastewater Management and Solid Waste,
(FGIC), 4.75%, 2/1/27 | | | 602,664 | | |
| | 435 | | | Mississippi Development Bank, (Combined Water & Sewer
System), (AMBAC), 5.00%, 7/1/23 | | | 450,182 | | |
| | 250 | | | Mississippi Development Bank, (Combined Water & Sewer
Systems), (FSA), 5.00%, 9/1/29 | | | 258,433 | | |
Principal Amount
(000's omitted) | |
Security | |
Value | |
| Insured-Water and Sewer (continued) | | | | | |
| $ | 250 | | | Mississippi Development Bank, (Waste Water Treatment),
(FSA), 5.00%, 2/1/28 | | $ | 257,745 | | |
| | | | | | | $ | 1,887,111 | | |
| Nursing Home - 1.3% | | | | | |
| $ | 290 | | | Mississippi Business Finance Corp., (Magnolia Healthcare),
7.99%, 7/1/25 | | $ | 237,922 | | |
| | | | | | | $ | 237,922 | | |
| Solid Waste - 2.7% | | | | | |
| $ | 500 | | | Mississippi Development Bank, (Golden Triangle Solid Waste),
6.00%, 7/1/15 | | $ | 501,725 | | |
| | | | | | | $ | 501,725 | | |
| Transportation - 1.4% | | | | | |
| $ | 250 | | | Puerto Rico Highway and Transportation Authority,
5.00%, 7/1/42 | | $ | 252,760 | | |
| | | | | | | $ | 252,760 | | |
| | Total Tax-Exempt Investments - 96.1%
(identified cost $16,462,800) | | | | | $ | 17,515,900 | | |
| | Other Assets, Less Liabilities - 3.9% | | | | | $ | 711,601 | | |
| | Net Assets - 100.0% | | | | | $ | 18,227,501 | | |
AMBAC - AMBAC Financial Group, Inc.
AMT - Interest earned from these securities may be considered a tax preference item for purposes of the Federal Alternative Minimum Tax.
FGIC - Financial Guaranty Insurance Company
FSA - Financial Security Assurance, Inc.
MBIA - Municipal Bond Insurance Association
XLCA - XL Capital Assurance, Inc.
The Fund invests primarily in debt securities issued by Mississippi municipalities. The ability of the issuers of the debt securities to meet their obligations may be affected by economic developments in a specific industry or municipality. In order to reduce the risk associated with such economic developments, at March 31, 2005, 64.4% of the securities in the portfolio of investments are backed by bond insurance of various financial institutions and financial guaranty assurance agencies. The aggregate percentage insured by an individual financial institution ranged from 0.6% to 19.5% of total investments.
(1) Security exempt from registration under Rule 144A of the Securities Act of 1933. These securities may be sold in transactions exempt from registration, normally to qualified institutional buyers. At March 31, 2005, the aggregate value of the securities is $878,145 or 4.8% of the Fund's net assets.
(2) Security has been issued as a leveraged inverse floater bond. The stated interest rate represents the rate in effect at March 31, 2005.
(3) Security (or a portion thereof) has been segregated to cover margin requirements on open financial futures contracts.
See notes to financial statements
33
Eaton Vance New York Municipals Fund as of March 31, 2005
PORTFOLIO OF INVESTMENTS (Unaudited)
| | Tax-Exempt Investments - 98.9% | | | | | | | | |
Principal Amount
(000's omitted) | |
Security | |
Value | |
| | Cogeneration - 1.1% | | | | | | | | |
| $ | 4,250 | | | Suffolk County IDA, (Nissequogue Cogeneration
Partners Facility), (AMT), 5.50%, 1/1/23 | | $ | 4,088,925 | | |
| | | | | | | $ | 4,088,925 | | |
| | Education - 20.6% | | | | | | | | |
| $ | 8,000 | | | New York Dormitory Authority, (City University),
5.625%, 7/1/16 | | $ | 9,001,760 | | |
| | 8,500 | | | New York Dormitory Authority, (City University),
6.00%, 7/1/20 | | | 9,982,995 | | |
| | 4,325 | | | New York Dormitory Authority, (City University),
7.50%, 7/1/10 | | | 4,811,865 | | |
| | 9,850 | | | New York Dormitory Authority, (State University
Educational Facilities), 5.25%, 5/15/15 | | | 10,687,545 | | |
| | 18,775 | | | New York Dormitory Authority, (State University
Educational Facilities), 5.25%, 5/15/19(1) | | | 20,524,454 | | |
| | 14,680 | | | New York Dormitory Authority, (State University
Educational Facilities), 5.25%, 5/15/21 | | | 16,018,522 | | |
| | 2,000 | | | New York Dormitory Authority, (State University
Educational Facilities), 5.50%, 5/15/19 | | | 2,235,740 | | |
| | | | | | | $ | 73,262,881 | | |
| | Electric Utilities - 8.0% | | | | | | | | |
| $ | 1,500 | | | Long Island Power Authority, Electric System Revenue,
5.00%, 9/1/24 | | $ | 1,547,235 | | |
| | 4,000 | | | Long Island Power Authority, Electric System Revenue,
5.375%, 9/1/25 | | | 4,185,560 | | |
| | 7,200 | | | Long Island Power Authority, Electric System Revenue,
5.50%, 12/1/23 | | | 7,639,848 | | |
| | 2,500 | | | New York Energy Research and Development Authority,
(Brooklyn Union Gas), (AMT), Variable Rate,
10.933%, 7/1/26(2) | | | 2,817,775 | | |
| | 5,000 | | | Puerto Rico Electric Power Authority, 5.125%, 7/1/29 | | | 5,174,700 | | |
| | 2,000 | | | Puerto Rico Electric Power Authority, 5.25%, 7/1/31 | | | 2,098,060 | | |
| | 4,900 | | | Suffolk County, IDA, (Keyspan-Port Jefferson), (AMT),
5.25%, 6/1/27 | | | 5,027,547 | | |
| | | | | | | $ | 28,490,725 | | |
| | Escrowed / Prerefunded - 4.0% | | | | | | | | |
| $ | 3,805 | | | New York Dormitory Authority, (City University),
Escrowed to Maturity, 7.00%, 7/1/09 | | $ | 4,101,029 | | |
| | 8,905 | | | Triborough Bridge and Tunnel Authority,
Escrowed to Maturity, 5.50%, 1/1/17 | | | 10,069,240 | | |
| | | | | | | $ | 14,170,269 | | |
Principal Amount
(000's omitted) | |
Security | |
Value | |
| | General Obligations - 5.8% | | | | | | | | |
| $ | 6,000 | | | New York , 4.50%, 3/15/35 | | $ | 5,794,020 | | |
| | 3,000 | | | New York City, 5.00%, 11/1/28 | | | 3,072,180 | | |
| | 2,250 | | | New York City, 5.25%, 8/15/26 | | | 2,375,122 | | |
| | 5,755 | | | New York City, 5.25%, 9/15/33 | | | 6,013,630 | | |
| | 2,500 | | | New York City, 5.375%, 12/1/26 | | | 2,620,950 | | |
| | 635 | | | New York City, 6.00%, 5/15/30 | | | 700,932 | | |
| | | | | | | $ | 20,576,834 | | |
| | Health Care-Miscellaneous - 0.4% | | | | | | | | |
| $ | 380 | | | New York City IDA, (A Very Special Place),
5.75%, 1/1/29 | | $ | 312,493 | | |
| | 235 | | | Suffolk County Industrial Development Agency,
Civic Facility Revenue, (Alliance of LI), 7.50%, 9/1/15 | | | 255,570 | | |
| | 100 | | | Suffolk County Industrial Development Agency,
Civic Facility Revenue, (Alliance of LI), 7.50%, 9/1/15 | | | 108,753 | | |
| | 290 | | | Suffolk County Industrial Development Agency,
Civic Facility Revenue, (Alliance of LI), 7.50%, 9/1/15 | | | 315,384 | | |
| | 250 | | | Suffolk County Industrial Development Agency,
Civic Facility Revenue, (Alliance of LI), 7.50%, 9/1/15 | | | 271,882 | | |
| | | | | | | $ | 1,264,082 | | |
| | Hospital - 7.0% | | | | | | | | |
| $ | 1,120 | | | Chautauqua County IDA, (Womans Christian Association),
6.35%, 11/15/17 | | $ | 1,135,579 | | |
| | 3,170 | | | Chautauqua County IDA, (Womans Christian Association),
6.40%, 11/15/29 | | | 3,171,395 | | |
| | 3,000 | | | Fulton County IDA, (Nathan Littauer Hospital),
6.00%, 11/1/18 | | | 2,894,610 | | |
| | 910 | | | Nassau County Industrial Development Agency,
(North Shore Health System), 5.875%, 11/1/11 | | | 980,680 | | |
| | 4,500 | | | New York Dormitory Authority, (Lenox Hill Hospital),
5.50%, 7/1/30 | | | 4,635,045 | | |
| | 1,250 | | | New York Dormitory Authority, (Methodist Hospital),
5.25%, 7/1/24 | | | 1,304,337 | | |
| | 2,000 | | | New York Dormitory Authority, (Methodist Hospital),
5.25%, 7/1/33 | | | 2,070,980 | | |
| | 2,750 | | | Oneida County Industrial Development Agency,
(Elizabeth Medical Center), 5.875%, 12/1/29 | | | 2,520,980 | | |
| | 1,000 | | | Oneida County Industrial Development Agency,
(Elizabeth Medical Center), 6.00%, 12/1/29 | | | 935,360 | | |
| | 5,000 | | | Suffolk County Industrial Development Agency,
(Huntington Hospital), 5.875%, 11/1/32 | | | 5,182,750 | | |
| | | | | | | $ | 24,831,716 | | |
| | Housing - 4.5% | | | | | | | | |
| $ | 10,350 | | | New York City Housing Development Corp.,
(Multi-Family Housing), 4.95%, 11/1/33 | | $ | 10,428,142 | | |
See notes to financial statements
34
Eaton Vance New York Municipals Fund as of March 31, 2005
PORTFOLIO OF INVESTMENTS (Unaudited) CONT'D
Principal Amount
(000's omitted) | |
Security | |
Value | |
| Housing (continued) | | | | | |
| $ | 5,730 | | | New York City Housing Development Corp.,
(Multi-Family Housing), (AMT), 5.00%, 11/1/24 | | $ | 5,762,260 | | |
| | | | | | | $ | 16,190,402 | | |
| Industrial Development Revenue - 1.9% | | | | | |
| $ | 3,500 | | | New York City Industrial Development Agency,
(American Airlines, Inc.-JFK International Airport), (AMT),
8.00%, 8/1/12 | | $ | 3,155,705 | | |
| | 1,975 | | | Onondaga County IDA, (Senior Air Cargo) (AMT),
6.125%, 1/1/32 | | | 2,013,789 | | |
| | 1,600 | | | Port Authority of New York and New Jersey,
(Continental Airlines), (AMT), 9.125%, 12/1/15 | | | 1,616,000 | | |
| | | | | | | $ | 6,785,494 | | |
| Insured-Education - 3.3% | | | | | |
| $ | 6,000 | | | New York Dormitory Authority, (New York University),
(AMBAC), 5.50%, 7/1/40 | | $ | 6,920,880 | | |
| | 2,500 | | | New York Dormitory Authority, (New York University),
(MBIA), Variable Rate, 18.675%, 7/1/27(3)(4) | | | 4,730,125 | | |
| | | �� | | | | $ | 11,651,005 | | |
| Insured-Electric Utilities - 0.7% | | | | | |
| $ | 750 | | | Puerto Rico Electric Power Authority, (FSA), Variable Rate,
8.39%, 7/1/29(2)(3) | | $ | 849,878 | | |
| | 1,500 | | | Puerto Rico Electric Power Authority, (FSA), Variable Rate,
10.64%, 7/1/29(3)(4) | | | 1,799,640 | | |
| | | | | | | $ | 2,649,518 | | |
| Insured-Escrowed / Prerefunded - 2.7% | | | | | |
| $ | 5,045 | | | New York City Trust Cultural Resources, (Museum of History),
Prerefunded to 7/1/09, (AMBAC), Variable Rate,
12.109%, 7/1/29(3)(4) | | $ | 6,017,172 | | |
| | 7,755 | | | Triborough Bridge and Tunnel Authority, (MBIA),
Escrowed to Maturity, 0.00%, 1/1/22 | | | 3,617,397 | | |
| | | | | | | $ | 9,634,569 | | |
| Insured-General Obligations - 0.9% | | | | | |
| $ | 700 | | | Jamestown, (AMBAC), 7.10%, 3/15/11 | | $ | 832,370 | | |
| | 675 | | | Jamestown, (AMBAC), 7.10%, 3/15/12 | | | 819,626 | | |
| | 675 | | | Jamestown, (AMBAC), 7.10%, 3/15/13 | | | 828,191 | | |
| | 515 | | | Jamestown, (AMBAC), 7.10%, 3/15/14 | | | 639,743 | | |
| | | | | | | $ | 3,119,930 | | |
Principal Amount
(000's omitted) | |
Security | |
Value | |
| Insured-Hospital - 3.2% | | | | | |
| $ | 4,715 | | | New York Dormitory Authority, (Memorial Sloan-Kettering
Cancer Center), (MBIA), 0.00%, 7/1/27 | | $ | 1,618,094 | | |
| | 17,945 | | | New York Dormitory Authority, (Memorial Sloan-Kettering
Cancer Center), (MBIA), 0.00%, 7/1/30 | | | 5,227,199 | | |
| | 4,445 | | | New York Dormitory Authority, (Montefiore Medical Center),
(FGIC), 5.00%, 8/1/33 | | | 4,582,306 | | |
| | | | | | | $ | 11,427,599 | | |
Insured-Lease Revenue / Certificates of
Participation - 0.5% | | | | | |
| $ | 1,367 | | | Puerto Rico Public Building Authority, (CIFG), Variable Rate,
10.705%, 7/1/36(3)(4) | | $ | 1,681,970 | | |
| | | | | | | $ | 1,681,970 | | |
| Insured-Other Revenue - 1.1% | | | | | |
| $ | 4,000 | | | New York City Trust Cultural Resource, (American Museum
of Natural History, (MBIA), 5.00%, 7/1/44 | | $ | 4,091,600 | | |
| | | | | | | $ | 4,091,600 | | |
| Insured-Solid Waste - 1.3% | | | | | |
| $ | 4,495 | | | Islip Resource Recovery Agency, (MBIA), 6.50%, 7/1/09 | | $ | 4,629,086 | | |
| | | | | | | $ | 4,629,086 | | |
| Insured-Special Tax Revenue - 4.1% | | | | | |
| $ | 8,740 | | | New York Dormitory Authority, (AMBAC),
5.50%, 3/15/25 | | $ | 10,026,965 | | |
| | 2,950 | | | Puerto Rico Infrastructure Financing Authority, (AMBAC),
Variable Rate, 7.089%, 7/1/28(2)(3) | | | 3,116,852 | | |
| | 1,225 | | | Puerto Rico Infrastructure Financing Authority, (AMBAC),
Variable Rate, 10.286%, 7/1/28(3)(4) | | | 1,328,929 | | |
| | | | | | | $ | 14,472,746 | | |
| Insured-Transportation - 3.2% | | | | | |
| $ | 5,415 | | | Metropolitan Transportation Authority, (AMBAC),
5.00%, 11/15/33 | | $ | 5,606,637 | | |
| | 3,165 | | | Monroe County, Airport Authority, (MBIA), (AMT),
Variable Rate, 9.103%, 1/1/19(2)(3) | | | 4,028,475 | | |
| | 1,750 | | | Niagara Frontier Airport Authority, (Buffalo Niagara
International Airport), (MBIA), (AMT), Variable Rate,
8.60%, 4/1/29(2)(3) | | | 1,941,048 | | |
| | | | | | | $ | 11,576,160 | | |
See notes to financial statements
35
Eaton Vance New York Municipals Fund as of March 31, 2005
PORTFOLIO OF INVESTMENTS (Unaudited) CONT'D
Principal Amount
(000's omitted) | |
Security | |
Value | |
| | Insured-Water and Sewer - 0.6% | | | | | | | | |
| $ | 2,000 | | | New York City Municipal Water Finance Authority, (AMBAC),
Prerefunded to 6/15/07, 5.00%, 6/15/38 | | $ | 2,050,600 | | |
| | | | | | | $ | 2,050,600 | | |
| | Lease Revenue / Certificates of Participation - 9.0% | | | | | | | | |
| $ | 27,940 | | | New York Urban Development Corp., 5.70%, 4/1/20 | | $ | 31,980,683 | | |
| | | | | | | $ | 31,980,683 | | |
| | Other Revenue - 1.8% | | | | | | | | |
| $ | 2,000 | | | Albany Industrial Development Agency Civic Facility,
(Charitable Leadership), 5.75%, 7/1/26 | | $ | 2,057,320 | | |
| | 3,500 | | | Puerto Rico Infrastructure Financing Authority, Escrow Fund,
Variable Rate, 11.608%, 10/1/32(3)(4) | | | 4,428,410 | | |
| | | | | | | $ | 6,485,730 | | |
| | Senior Living / Life Care - 1.0% | | | | | | | | |
| $ | 2,670 | | | Glen Cove IDA, (Regency at Glen Cove),
9.50%, 7/1/12(5) | | $ | 2,655,529 | | |
| | 800 | | | Mount Vernon IDA, (Wartburg Senior Housing, Inc. -
Meadowview), 6.20%, 6/1/29 | | | 804,144 | | |
| | | | | | | $ | 3,459,673 | | |
| | Solid Waste - 1.8% | | | | | | | | |
| $ | 6,000 | | | Niagra County, IDA, (American Ref-Fuel Co., LLC), (AMT),
5.45%, 11/15/26 | | $ | 6,440,700 | | |
| | | | | | | $ | 6,440,700 | | |
| | Special Tax Revenue - 1.6% | | | | | | | | |
| $ | 3,700 | | | New York City Transitional Finance Authority,
4.75%, 11/1/23 | | $ | 3,760,421 | | |
| | 1,985 | | | New York City Transitional Finance Authority, (Future Tax),
5.50%, 5/1/25 | | | 2,131,592 | | |
| | | | | | | $ | 5,892,013 | | |
| | Transportation - 7.3% | | | | | | | | |
| $ | 1,500 | | | Metropolitan Transportation Authority, 5.25%, 11/15/31 | | $ | 1,558,590 | | |
| | 3,500 | | | Metropolitan Transportation Authority, 5.25%, 11/15/32 | | | 3,648,855 | | |
| | 2,500 | | | Port Authority of New York and New Jersey,
6.125%, 6/1/94 | | | 2,941,400 | | |
| | 8,250 | | | Port Authority of New York and New Jersey, (AMT),
4.75%, 12/1/34 | | | 8,092,425 | | |
| | 3,800 | | | Port Authority of New York and New Jersey, (AMT),
Variable Rate, 6.531%, 6/15/33(2)(3) | | | 3,643,364 | | |
Principal Amount
(000's omitted) | |
Security | |
Value | |
| Transportation (continued) | | | | | | | |
| $ | 6,000 | | | Puerto Rico Highway and Transportation Authority,
5.00%, 7/1/42 | | $ | 6,066,240 | | |
| | | | | $ | 25,950,874 | | |
| Water and Sewer - 1.5% | | | | | | | |
| $ | 5,250 | | | New York City Municipal Water Finance Authority,
5.00%, 6/15/36 | | $ | 5,386,920 | | |
| | | | | $ | 5,386,920 | | |
Total Tax-Exempt Investments - 98.9%
(identified cost $324,964,858) | | | | $ | 352,242,704 | | |
| Other Assets, Less Liabilities - 1.1% | | | | $ | 3,890,522 | | |
| Net Assets - 100.0% | | | | $ | 356,133,226 | | |
AMBAC - AMBAC Financial Group, Inc.
AMT - Interest earned from these securities may be considered a tax preference item for purposes of the Federal Alternative Minimum Tax.
CIFG - CDC IXIS Financial Guaranty North America, Inc.
FGIC - Financial Guaranty Insurance Company
FSA - Financial Security Assurance, Inc.
MBIA - Municipal Bond Insurance Association
The Fund invests primarily in debt securities issued by New York municipalities. The ability of the issuers of the debt securities to meet their obligations may be affected by economic developments in a specific industry or municipality. In order to reduce the risk associated with such economic developments, at March 31, 2005, 21.9% of the securities in the portfolio of investments are backed by bond insurance of various financial institutions and financial guaranty assurance agencies. The aggregate percentage insured by an individual financial institution ranged from 0.5% to 10.8% of total investments.
(1) Security (or a portion thereof) has been segregated to cover margin requirements on open financial futures contracts.
(2) Security has been issued as an inverse floater bond. The stated interest rate represents the rate in effect at March 31, 2005.
(3) Security exempt from registration under Rule 144A of the Securities Act of 1933. These securities may be sold in transactions exempt from registration, normally to qualified institutional buyers. At March 31, 2005, the aggregate value of the securities is $33,565,863 or 9.4% of the Fund's net assets.
(4) Security has been issued as a leveraged inverse floater bond. The stated interest rate represents the rate in effect at March 31, 2005.
(5) Defaulted bond.
See notes to financial statements
36
Eaton Vance Ohio Municipals Fund as of March 31, 2005
PORTFOLIO OF INVESTMENTS (Unaudited)
| Tax-Exempt Investments - 98.5% | | | | | |
Principal Amount
(000's omitted) | |
Security | |
Value | |
| Cogeneration - 1.4% | | | | | |
| $ | 2,205 | | | Ohio Water Development Authority, Solid Waste Disposal,
(Bay Shore Power), (AMT), 5.875%, 9/1/20 | | $ | 2,206,080 | | |
| | | | | | | $ | 2,206,080 | | |
| Education - 5.9% | | | | | |
| $ | 550 | | | Ohio Higher Educational Facilities Authority,
(Case Western University), 6.50%, 10/1/20 | | $ | 669,663 | | |
| | 5,875 | | | Ohio Higher Educational Facilities Authority, (Oberlin College),
Variable Rate, 7.41%, 10/1/29(1)(2) | | | 6,109,647 | | |
| | 2,500 | | | Ohio Higher Educational Facilities, (Case Western Reserve
University), 5.50%, 10/1/21 | | | 2,739,225 | | |
| | | | | | | $ | 9,518,535 | | |
| Electric Utilities - 1.3% | | | | | |
| $ | 2,000 | | | Clyde, Electric System Revenue, (AMT), 6.00%, 11/15/14 | | $ | 2,096,340 | | |
| | | | | | | $ | 2,096,340 | | |
| General Obligations - 1.4% | | | | | |
| $ | 765 | | | Tuscarawas County Public Library Improvement,
6.90%, 12/1/11 | | $ | 767,073 | | |
| | 1,555 | | | Youngstown, 7.35%, 7/1/05 | | | 1,573,240 | | |
| | | | | | | $ | 2,340,313 | | |
| Hospital - 11.5% | | | | | |
| $ | 1,350 | | | Cuyahoga County, (Cleveland Clinic Health System),
5.50%, 1/1/29 | | $ | 1,422,576 | | |
| | 3,000 | | | Erie County Hospital Facilities, (Firelands Regional
Medical Center), 5.625%, 8/15/32 | | | 3,089,340 | | |
| | 2,070 | | | Highland County, (Township Hospital), 6.75%, 12/1/29 | | | 2,082,068 | | |
| | 1,000 | | | Mahoning County Ohio Hospital Facility, (Forum Health
Obligation Group), 6.00%, 11/15/32 | | | 1,063,950 | | |
| | 3,800 | | | Miami, (Upper Valley Medical Center), 6.375%, 5/15/26 | | | 3,947,896 | | |
| | 4,250 | | | Parma, (Parma Community General Hospital Association),
5.375%, 11/1/29 | | | 4,327,052 | | |
| | 2,500 | | | Richland County Hospital Facilities, (Medcentral
Health Systems), 6.375%, 11/15/30 | | | 2,665,950 | | |
| | | | | | | $ | 18,598,832 | | |
| Housing - 2.6% | | | | | |
| $ | 4,000 | | | Franklin County, (Tuttle Park), (FHA), (AMT),
6.60%, 3/1/36 | | $ | 4,242,520 | | |
| | | | | | | $ | 4,242,520 | | |
Principal Amount
(000's omitted) | |
Security | |
Value | |
| Industrial Development Revenue - 10.0% | | | | | |
| $ | 6,970 | | | Cleveland Airport, (Continental Airlines), (AMT),
5.375%, 9/15/27 | | $ | 5,002,299 | | |
| | 2,890 | | | Dayton, Special Facilities Revenue, (Emery Air Freight),
5.625%, 2/1/18 | | | 3,089,872 | | |
| | 2,500 | | | Ohio Environmental Facilities, (Ford Motor), (AMT),
6.15%, 6/1/30 | | | 2,602,550 | | |
| | 1,000 | | | Ohio Pollution Control, (Standard Oil), 6.75%, 12/1/15 | | | 1,212,740 | | |
| | 4,000 | | | Ohio Sewer and Solid Waste Disposal Facilities,
(Anheuser Busch), (AMT), 6.00%, 7/1/35 | | | 4,267,440 | | |
| | | | | | | $ | 16,174,901 | | |
| Insured-Bond Bank - 1.8% | | | | | |
| $ | 3,000 | | | Cleveland-Cuyahoga County Port Authority, (AMBAC),
4.50%, 8/1/36(3) | | $ | 2,874,900 | | |
| | | | | | | $ | 2,874,900 | | |
| Insured-Education - 3.8% | | | | | |
| $ | 700 | | | Puerto Rico Industrial, Tourist, Educational, Medical and
Environmental, Residual Certificates, (MBIA), Variable Rate,
10.855%, 7/1/33(1)(4) | | $ | 746,704 | | |
| | 1,340 | | | University of Akron, (FGIC), 4.75%, 1/1/26 | | | 1,352,810 | | |
| | 4,000 | | | University of Cincinnati, (FGIC), 5.00%, 6/1/31 | | | 4,105,080 | | |
| | | | | | | $ | 6,204,594 | | |
| Insured-Electric Utilities - 6.5% | | | | | |
| $ | 2,000 | | | Cuyahoga County Utility Systems, (Medical Center Co.),
(MBIA), (AMT), 6.10%, 8/15/15 | | $ | 2,062,940 | | |
| | 4,445 | | | Ohio Air Quality Development Authority, (Ohio Power),
RITES, (AMBAC), Variable Rate, 9.619%, 5/1/26(1)(4) | | | 4,982,623 | | |
| | 3,000 | | | Ohio Municipal Electric Generation Agency, (MBIA),
0.00%, 2/15/26 | | | 1,065,840 | | |
| | 2,500 | | | Ohio Municipal Electric Generation Agency, (MBIA),
0.00%, 2/15/27 | | | 839,850 | | |
| | 4,750 | | | Ohio Municipal Electric Generation Agency, (MBIA),
0.00%, 2/15/28 | | | 1,504,563 | | |
| | | | | | | $ | 10,455,816 | | |
| Insured-Escrowed / Prerefunded - 1.8% | | | | | |
| $ | 495 | | | Cuyahoga County Hospital, (MBIA), Escrowed to Maturity,
5.125%, 1/1/29 | | $ | 506,058 | | |
| | 2,000 | | | University of Akron, (FGIC), Variable Rate,
8.91%, 1/1/29(1)(2) | | | 2,464,400 | | |
| | | | | | | $ | 2,970,458 | | |
See notes to financial statements
37
Eaton Vance Ohio Municipals Fund as of March 31, 2005
PORTFOLIO OF INVESTMENTS (Unaudited) CONT'D
Principal Amount
(000's omitted) | |
Security | |
Value | |
| | Insured-General Obligations - 9.0% | | | | | | | | |
| $ | 1,500 | | | Amherst School District, (FGIC), 5.00%, 12/1/26 | | $ | 1,545,735 | | |
| | 1,250 | | | Athens City School District, (FSA), 6.00%, 12/1/24 | | | 1,409,263 | | |
| | 1,400 | | | Bridgeport Exempt Village School District, (FSA),
4.75%, 12/1/31 | | | 1,392,580 | | |
| | 1,000 | | | Cincinnati City School District, (Classroom Facilities
Construction & Improvement), (FSA), 5.00%, 12/1/31 | | | 1,034,410 | | |
| | 1,500 | | | Hilliard School District, (MBIA), 4.50%, 12/1/28 | | | 1,473,105 | | |
| | 1,895 | | | Jefferson County, (AMBAC), 4.75%, 12/1/29 | | | 1,897,066 | | |
| | 1,500 | | | Lima City School District, (AMBAC), 6.00%, 12/1/22 | | | 1,706,475 | | |
| | 1,300 | | | Minerva Local School District, (Classroom Facility), (MBIA),
5.30%, 12/1/29 | | | 1,375,621 | | |
| | 800 | | | Norwalk City School District, (AMBAC), 4.75%, 12/1/26 | | | 805,104 | | |
| | 1,500 | | | Pickerington Local School District, (FGIC), 0.00%, 12/1/16 | | | 894,555 | | |
| | 1,000 | | | Springfield City School District, (Clark County), (FGIC),
5.20%, 12/1/23 | | | 1,061,810 | | |
| | | | | | | $ | 14,595,724 | | |
| | Insured-Hospital - 3.0% | | | | | | | | |
| $ | 1,000 | | | Akron, Bath, Copley, Joint Township Hospital District,
(Children's Hospital Medical Center), (FSA),
5.25%, 11/15/25 | | $ | 1,057,450 | | |
| | 500 | | | Cuyahoga County Hospital, (Cleveland Clinic), (MBIA),
5.125%, 1/1/29 | | | 511,170 | | |
| | 1,300 | | | Franklin County, (Ohio Health Corp.), (MBIA),
5.00%, 5/15/33 | | | 1,333,072 | | |
| | 1,845 | | | Hamilton County, (Cincinnati Children's Hospital), (FGIC),
5.00%, 5/15/32 | | | 1,897,435 | | |
| | | | | | | $ | 4,799,127 | | |
| | Insured-Lease Revenue / Certificates of
Participation - 2.0% | | | | | | | | |
| $ | 3,000 | | | Marysville Exempt Village School District, (School Facilities),
(MBIA), 5.25%, 12/1/30 | | $ | 3,185,550 | | |
| | | | | | | $ | 3,185,550 | | |
| | Insured-Solid Waste - 1.7% | | | | | | | | |
| $ | 2,620 | | | Central Ohio Solid Waste Authority, (AMBAC),
5.00%, 12/1/25 | | $ | 2,706,041 | | |
| | | | | | | $ | 2,706,041 | | |
| | Insured-Special Tax Revenue - 5.4% | | | | | | | | |
| $ | 3,000 | | | Hamilton County Sales Tax, (AMBAC), 5.25%, 12/1/32 | | $ | 3,156,270 | | |
| | 2,490 | | | Hamilton County Sales Tax, (MBIA), 5.00%, 12/1/27 | | | 2,539,327 | | |
| | 1,350 | | | Puerto Rico Infrastructure Financing Authority, (AMBAC),
Variable Rate, 7.089%, 7/1/28(1)(2) | | | 1,426,356 | | |
Principal Amount
(000's omitted) | |
Security | |
Value | |
| Insured-Special Tax Revenue (continued) | | | | | |
| $ | 1,575 | | | Puerto Rico Infrastructure Financing Authority, (AMBAC),
Variable Rate, 10.286%, 7/1/28(1)(4) | | $ | 1,708,623 | | |
| | | | | | | $ | 8,830,576 | | |
| Insured-Transportation - 6.0% | | | | | |
| $ | 7,000 | | | Ohio Turnpike Commission, (FGIC), 5.50%, 2/15/24 | | $ | 7,984,760 | | |
| | 1,750 | | | Puerto Rico Highway and Transportation Authority, (FSA),
4.75%, 7/1/38 | | | 1,787,048 | | |
| | | | | | | $ | 9,771,808 | | |
| Nursing Home - 6.6% | | | | | |
| $ | 1,305 | | | Cuyahoga County Health Care Facilities, (Maple Care Center)
(GNMA), (AMT), 8.00%, 8/20/16 | | $ | 1,463,179 | | |
| | 1,205 | | | North Canton Health Care Facilities, (St. Luke Lutheran),
(GNMA), 6.10%, 9/20/16 | | | 1,314,992 | | |
| | 6,455 | | | North Canton Health Care Facilities, (St. Luke Lutheran),
(GNMA), 9.55%, 3/20/32 | | | 7,963,340 | | |
| | | | | | | $ | 10,741,511 | | |
| Other Revenue - 2.3% | | | | | |
| $ | 3,000 | | | Puerto Rico Infrastructure Financing Authority, Variable Rate,
11.608%, 10/1/32(1)(4) | | $ | 3,795,780 | | |
| | | | | | | $ | 3,795,780 | | |
| Pooled Loans - 7.1% | | | | | |
| $ | 335 | | | Ohio Economic Development Commission, (Burrows Paper),
(AMT), 7.625%, 6/1/11 | | $ | 336,330 | | |
| | 825 | | | Ohio Economic Development Commission,
(Consolidated Biscuit), (AMT), 7.00%, 12/1/09 | | | 844,313 | | |
| | 2,340 | | | Ohio Economic Development Commission, (J J & W LP),
(AMT), 6.70%, 12/1/14 | | | 2,401,870 | | |
| | 1,050 | | | Ohio Economic Development Commission, (Progress Plastic
Products), (AMT), 7.80%, 12/1/09 | | | 1,075,274 | | |
| | 6,510 | | | Rickenbacker Port Authority Capital Funding (Oasbo),
5.375%, 1/1/32 | | | 6,847,609 | | |
| | | | | | | $ | 11,505,396 | | |
| Senior Living / Life Care - 0.6% | | | | | |
| $ | 1,000 | | | Allen County Lima, (Convalescent Home Foundation),
(GNMA), 6.40%, 1/1/21 | | $ | 1,002,790 | | |
| | 40 | | | Hamilton County Hospital Facilities, (Episcopal
Retirement Home), 6.80%, 1/1/08 | | | 40,135 | | |
| | | | | | | $ | 1,042,925 | | |
See notes to financial statements
38
Eaton Vance Ohio Municipals Fund as of March 31, 2005
PORTFOLIO OF INVESTMENTS (Unaudited) CONT'D
Principal Amount
(000's omitted) | |
Security | |
Value | |
| Special Tax Revenue - 2.3% | | | | | |
| $ | 2,000 | | | Cleveland-Cuyahoga County Port Authority,
7.00%, 12/1/18 | | $ | 2,129,940 | | |
| | 1,415 | | | Cuyahoga County Economic Development, (Shaker Square),
6.75%, 12/1/30 | | | 1,626,755 | | |
| | | | | | | $ | 3,756,695 | | |
| Transportation - 3.2% | | | | | |
| $ | 1,000 | | | Puerto Rico Highway and Transportation Authority,
5.00%, 7/1/42 | | $ | 1,011,040 | | |
| | 3,990 | | | Puerto Rico Highway and Transportation Authority,
5.125%, 7/1/39 | | | 4,094,658 | | |
| | | | | | | $ | 5,105,698 | | |
| Water and Sewer - 1.3% | | | | | |
| $ | 2,000 | | | Ohio Water Development Authority, (Fresh Water
Improvement), 5.00%, 12/1/28 | | $ | 2,072,040 | | |
| | | | | | | $ | 2,072,040 | | |
| | Total Tax-Exempt Investments - 98.5%
(identified cost $147,448,679) | | | | | $ | 159,592,160 | | |
| | Other Assets, Less Liabilities - 1.5% | | | | | $ | 2,436,412 | | |
| | Net Assets - 100.0% | | | | | $ | 162,028,572 | | |
AMBAC - AMBAC Financial Group, Inc.
AMT - Interest earned from these securities may be considered a tax preference item for purposes of the Federal Alternative Minimum Tax.
FGIC - Financial Guaranty Insurance Company
FSA - Financial Security Assurance, Inc.
MBIA - Municipal Bond Insurance Association
The Fund invests primarily in debt securities issued by Ohio municipalities. The ability of the issuers of the debt securities to meet their obligations may be affected by economic developments in a specific industry or municipality. In order to reduce the risk associated with such economic developments, at March 31, 2005, 41.6% of the securities in the portfolio of investments are backed by bond insurance of various financial institutions and financial guaranty assurance agencies. The aggregate percentage insured by an individual financial institution ranged from 4.2% to 13.4% of total investments.
(1) Security exempt from registration under Rule 144A of the Securities Act of 1933. These securities may be sold in transactions exempt from registration, normally to qualified institutional buyers. At March 31, 2005, the aggregate value of the securities is $21,234,133 or 13.1% of the Fund's net assets.
(2) Security has been issued as an inverse floater bond. The stated interest rate represents the rate in effect at March 31, 2005.
(3) Security (or a portion thereof) has been segregated to cover margin requirements on open financial futures contracts.
(4) Security has been issued as a leveraged inverse floater bond. The stated interest rate represents the rate in effect at March 31, 2005.
See notes to financial statements
39
Eaton Vance Rhode Island Municipals Fund as of March 31, 2005
PORTFOLIO OF INVESTMENTS (Unaudited)
| | Tax-Exempt Investments - 97.5% | | | | | | | | |
Principal Amount
(000's omitted) | |
Security | |
Value | |
| | Education - 7.8% | | | | | | | | |
| $ | 500 | | | Rhode Island HEFA, (Brown University), 4.75%, 9/1/33 | | $ | 501,530 | | |
| | 2,105 | | | Rhode Island HEFA, (Brown University), 4.75%, 9/1/37 | | | 2,106,663 | | |
| | 905 | | | Rhode Island HEFA, (Higher Education Facility-Brown
University), 5.00%, 9/1/23 | | | 935,806 | | |
| | 500 | | | Rhode Island HEFA, (Higher Education Facility-Salve Regina),
5.125%, 3/15/32 | | | 511,265 | | |
| | | | | | | $ | 4,055,264 | | |
| | Electric Utilities - 1.9% | | | | | | | | |
| $ | 900 | | | Puerto Rico Electric Power Authority, Variable Rate,
7.70%, 7/1/29(1)(2) | | $ | 962,892 | | |
| | | | | | | $ | 962,892 | | |
| | Escrowed / Prerefunded - 1.9% | | | | | | | | |
| $ | 230 | | | Rhode Island Depositors Economic Protection Corp.,
Escrowed to Maturity, 5.75%, 8/1/21 | | $ | 269,870 | | |
| | 555 | | | Rhode Island Depositors Economic Protection Corp.,
Escrowed to Maturity, 6.375%, 8/1/22 | | | 691,941 | | |
| | | | | | | $ | 961,811 | | |
| | General Obligations - 1.8% | | | | | | | | |
| $ | 225 | | | Puerto Rico, 0.00%, 7/1/16 | | $ | 136,984 | | |
| | 750 | | | Puerto Rico, 5.00%, 7/1/25 | | | 770,070 | | |
| | | | | | | $ | 907,054 | | |
| | Hospital - 5.9% | | | | | | | | |
| $ | 1,000 | | | Rhode Island HEFA, (Hospital Financing-Lifespan
Obligation Group), 6.50%, 8/15/32 | | $ | 1,098,520 | | |
| | 500 | | | Rhode Island HEFA, (Newport Hospital), 5.30%, 7/1/29 | | | 496,715 | | |
| | 725 | | | Rhode Island HEFA, (St. Joseph Health Services),
5.50%, 10/1/29 | | | 679,484 | | |
| | 830 | | | Rhode Island HEFA, (Westerly Hospital), 6.00%, 7/1/14 | | | 798,045 | | |
| | | | | | | $ | 3,072,764 | | |
| | Housing - 2.0% | | | | | | | | |
| $ | 900 | | | Rhode Island Housing and Mortgage Finance Corp., (AMT),
4.90%, 4/1/22 | | $ | 903,726 | | |
| | 135 | | | Rhode Island Housing and Mortgage Finance Corp., (AMT),
7.55%, 10/1/22 | | | 135,155 | | |
| | | | | | | $ | 1,038,881 | | |
Principal Amount
(000's omitted)
Security | | | |
Value | |
| Insured-Education - 20.6% | | | | | | | |
| $ | 2,145 | | | Rhode Island HEFA, (Bryant College), (AMBAC),
5.00%, 12/1/31 | | $ | 2,193,027 | | |
| | 900 | | | Rhode Island HEFA, (Higher Education Facilities-Rhode Island
School of Design), (XLCA), 5.00%, 8/15/23 | | | 935,100 | | |
| | 1,575 | | | Rhode Island HEFA, (Johnson and Wales University), (MBIA),
5.00%, 4/1/29 | | | 1,608,941 | | |
| | 1,000 | | | Rhode Island HEFA, (Providence College), (XLCA),
5.00%, 11/1/24 | | | 1,029,850 | | |
| | 1,000 | | | Rhode Island HEFA, (Rhode Island College), (AMBAC),
5.625%, 9/15/30 | | | 1,095,210 | | |
| | 500 | | | Rhode Island HEFA, (Roger Williams College), (AMBAC),
5.00%, 11/15/24 | | | 515,680 | | |
| | 1,600 | | | Rhode Island HEFA, (School of Design), (MBIA),
5.00%, 6/1/31 | | | 1,642,512 | | |
| | 1,000 | | | Rhode Island HEFA, (University of Rhode Island), (AMBAC),
5.70%, 9/15/30 | | | 1,101,990 | | |
| | 500 | | | Rhode Island HEFA, (University of Rhode Island), (MBIA),
5.50%, 9/15/19 | | | 544,010 | | |
| | | | | $ | 10,666,320 | | |
| Insured-Electric Utilities - 3.0% | | | | | | | |
| $ | 1,250 | | | Puerto Rico Electric Power Authority, (MBIA), 0.00%, 7/1/17 | | $ | 744,062 | | |
| | 300 | | | Puerto Rico Electric Power Authority, (MBIA), Variable Rate,
12.295%, 7/1/16(1)(3) | | | 425,226 | | |
| | 335 | | | Puerto Rico Electric Power Authority, DRIVERS, (FSA),
Variable Rate, 12.902%, 7/1/29(1)(3) | | | 401,920 | | |
| | | | | $ | 1,571,208 | | |
| Insured-Escrowed / Prerefunded - 5.4% | | | | | | | |
| $ | 1,000 | | | North Kingstown, Prerefunded to 10/1/09, (FGIC),
5.875%, 10/1/25(4) | | $ | 1,102,690 | | |
| | 500 | | | Rhode Island Depositors Economic Protection Corp.,
Escrowed to Maturity, (MBIA), 5.80%, 8/1/09 | | | 551,655 | | |
| | 1,000 | | | Rhode Island Depositors Economic Protection Corp.,
Escrowed to Maturity, (MBIA), 5.80%, 8/1/12 | | | 1,134,980 | | |
| | | | | $ | 2,789,325 | | |
| Insured-General Obligations - 5.0% | | | | | | | |
| $ | 1,000 | | | Providence, (FGIC), 5.00%, 1/15/26 | | $ | 1,032,150 | | |
| | 500 | | | Puerto Rico, (FSA), Variable Rate, 10.84%, 7/1/27(1)(3) | | | 601,410 | | |
| | 335 | | | Rhode Island and Providence Plantations, (FGIC),
5.375%, 6/1/19 | | | 362,882 | | |
| | 575 | | | Warwick, (AMBAC), 5.00%, 7/15/21 | | | 603,221 | | |
| | | | | $ | 2,599,663 | | |
See notes to financial statements
40
Eaton Vance Rhode Island Municipals Fund as of March 31, 2005
PORTFOLIO OF INVESTMENTS (Unaudited) CONT'D
Principal Amount
(000's omitted)
Security | | | |
Value | |
| Insured-Hospital - 3.8% | | | | | |
| $ | 1,900 | | | Rhode Island HEFA, (Lifespan), (MBIA), 5.25%, 5/15/26 | | $ | 1,977,368 | | |
| | | | | $ | 1,977,368 | | |
| Insured-Housing - 3.9% | | | | | |
| $ | 1,000 | | | Rhode Island Housing and Mortgage Finance Corp., (Rental
Housing Program), (FSA), (AMT), 5.25%, 10/1/31 | | $ | 1,008,060 | | |
| | 1,000 | | | Rhode Island Housing and Mortgage Finance Corp., (Rental
Housing Program), (FSA), (AMT), 5.55%, 10/1/32 | | | 1,024,100 | | |
| | | | | $ | 2,032,160 | | |
Insured-Lease Revenue / Certificates of
Participation - 4.1% | | | | | |
| $ | 1,000 | | | Providence Redevelopment Agency, (Public Safety Building),
(AMBAC), 5.00%, 4/1/28 | | $ | 1,033,800 | | |
| | 1,050 | | | Rhode Island HEFA, (Higher Education Facilities), (MBIA),
5.00%, 9/15/23 | | | 1,089,176 | | |
| | | | | $ | 2,122,976 | | |
| Insured-Solid Waste - 1.5% | | | | | |
| $ | 750 | | | Rhode Island Resource Recovery Corp., (MBIA), (AMT),
5.00%, 3/1/22 | | $ | 766,013 | | |
| | | | | $ | 766,013 | | |
| Insured-Special Tax Revenue - 7.8% | | | | | |
| $ | 2,300 | | | Convention Center Authority of Rhode Island, (MBIA),
5.25%, 5/15/15 | | $ | 2,509,047 | | |
| | 1,000 | | | Puerto Rico Infrastructure Financing Authority, (AMBAC),
Variable Rate, 7.089%, 7/1/28(1)(2) | | | 1,056,560 | | |
| | 420 | | | Puerto Rico Infrastructure Financing Authority, (AMBAC),
Variable Rate, 10.286%, 7/1/28(1)(3) | | | 455,633 | | |
| | | | | $ | 4,021,240 | | |
| Insured-Transportation - 4.0% | | | | | |
| $ | 1,000 | | | Puerto Rico Highway and Transportation Authority, (FSA),
4.75%, 7/1/38 | | $ | 1,021,170 | | |
| | 1,000 | | | Rhode Island Economic Development Corp. (T.F. Green Airport),
(FSA), (AMT), 5.00%, 7/1/20 | | | 1,025,620 | | |
| | | | | $ | 2,046,790 | | |
| Insured-Water and Sewer - 3.0% | | | | | |
| $ | 1,115 | | | Rhode Island Clean Water Finance Agency, (MBIA),
5.00%, 10/1/28 | | $ | 1,144,113 | | |
| | 350 | | | Rhode Island Clean Water, Water Pollution Control, (MBIA),
5.40%, 10/1/15 | | | 386,180 | | |
| | | | | $ | 1,530,293 | | |
Principal Amount
(000's omitted)
Security | | | |
Value | |
| Nursing Home - 5.4% | | | | | | | |
| $ | 500 | | | Rhode Island HEFA, (Roger Williams Realty), 6.50%, 8/1/29 | | $ | 557,690 | | |
| | 1,275 | | | Rhode Island HEFA, (Steere House), 5.80%, 7/1/20 | | | 1,242,169 | | |
| | 1,000 | | | Rhode Island HEFA, (Tockwotton Home), 6.25%, 8/15/22 | | | 1,004,930 | | |
| | | | | $ | 2,804,789 | | |
| Other Revenue - 3.1% | | | | | | | |
| $ | 900 | | | Puerto Rico Infrastructure Financing Authority,
5.50%, 10/1/40 | | $ | 975,852 | | |
| | 515 | | | Puerto Rico Infrastructure Financing Authority, Variable Rate,
11.608%, 10/1/32(1)(3) | | | 651,609 | | |
| | | | | $ | 1,627,461 | | |
| Special Tax Revenue - 4.0% | | | | | | | |
| $ | 1,500 | | | Providence, Tax Increment, 7.65%, 6/1/16 | | $ | 1,535,805 | | |
| | 500 | | | Tiverton, Obligation Tax Increment, (Mount Hope Bay Village),
6.875%, 5/1/22 | | | 529,005 | | |
| | | | | $ | 2,064,810 | | |
| Transportation - 0.6% | | | | | | | |
| $ | 295 | | | Puerto Rico Highway and Transportation Authority,
5.125%, 7/1/43 | | $ | 301,938 | | |
| | | | | $ | 301,938 | | |
| Water and Sewer - 1.0% | | | | | | | |
| $ | 500 | | | Rhode Island Clean Water, PCR, 5.00%, 10/1/22 | | $ | 520,285 | | |
| | | | | $ | 520,285 | | |
Total Tax-Exempt Investments - 97.5%
(identified cost $47,493,560) | | | | $ | 50,441,305 | | |
| Other Assets, Less Liabilities - 2.5% | | | | $ | 1,273,630 | | |
| Net Assets - 100.0% | | | | $ | 51,714,935 | | |
AMBAC - AMBAC Financial Group, Inc.
AMT - Interest earned from these securities may be considered a tax preference item for purposes of the Federal Alternative Minimum Tax.
FGIC - Financial Guaranty Insurance Company
FSA - Financial Security Assurance, Inc.
MBIA - Municipal Bond Insurance Association
XLCA - XL Capital Assurance, Inc.
See notes to financial statements
41
Eaton Vance Rhode Island Municipals Fund as of March 31, 2005
PORTFOLIO OF INVESTMENTS (Unaudited) CONT'D
The Fund invests primarily in debt securities issued by Rhode Island municipalities. The ability of the issuers of the debt securities to meet their obligations may be affected by economic developments in a specific industry or municipality. In order to reduce the risk associated with such economic developments, at March 31, 2005, 63.7% of the securities in the portfolio of investments are backed by bond insurance of various financial institutions and financial guaranty assurance agencies. The aggregate percentage insured by an individual financial institution ranged from 3.9% to 28.8% of total investments.
(1) Security exempt from registration under Rule 144A of the Securities Act of 1933. These securities may be sold in transactions exempt from registration, normally to qualified institutional buyers. At March 31, 2005, the aggregate value of the securities is $4,555,250 or 8.8% of the Fund's net assets.
(2) Security has been issued as an inverse floater bond. The stated interest rate represents the rate in effect at March 31, 2005.
(3) Security has been issued as a leveraged inverse floater bond. The stated interest rate represents the rate in effect at March 31, 2005.
(4) Security (or a portion thereof) has been segregated to cover margin requirements on open financial futures contracts.
See notes to financial statements
42
Eaton Vance West Virginia Municipals Fund as of March 31, 2005
PORTFOLIO OF INVESTMENTS (Unaudited)
| Tax-Exempt Investments - 99.4% | | | | | | | |
Principal Amount
(000's omitted) Security | | | |
Value | |
| Education - 2.8% | | | | | | | |
| $ | 750 | | | Sheperd College Board of Governors, 5.125%, 12/1/33 | | $ | 762,900 | | |
| | | | | $ | 762,900 | | |
| Electric Utilities - 1.9% | | | | | | | |
| $ | 500 | | | Mason County PCR, (Appalachian Power Co.),
5.50%, 10/1/22 | | $ | 509,150 | | |
| | | | | $ | 509,150 | | |
| Escrowed / Prerefunded - 13.5% | | | | | | | |
| $ | 2,500 | | | Kanawha-Putnam, Single Family, Escrowed to Maturity,
0.00%, 12/1/16 | | $ | 1,482,425 | | |
| | 1,820 | | | West Virginia Health Facilities Authority, (Charleston Area
Medical Center), Escrowed to Maturity, 6.50%, 9/1/23 | | | 2,209,243 | | |
| | | | | $ | 3,691,668 | | |
| Industrial Development Revenue - 1.9% | | | | | | | |
| $ | 500 | | | Braxton County, (Weyerhaeuser), (AMT), 5.80%, 6/1/27 | | $ | 515,885 | | |
| | | | | $ | 515,885 | | |
| Insured-Education - 16.7% | | | | | | | |
| $ | 750 | | | Fairmont College Student Activity Revenue, (FGIC),
5.00%, 6/1/32 | | $ | 772,500 | | |
| | 1,250 | | | Monongalia County Board of Education, (MBIA),
5.00%, 5/1/33 | | | 1,290,437 | | |
| | 455 | | | West Virginia Higher Education Interim Governing Board,
(Marshall University), (FGIC), 5.00%, 5/1/31 | | | 464,423 | | |
| | 500 | | | West Virginia Higher Education Policy Commission, (FGIC),
5.00%, 4/1/29 | | | 516,280 | | |
| | 1,000 | | | West Virginia Higher Education Policy Commission, (FGIC),
5.00%, 4/1/34(1) | | | 1,029,580 | | |
| | 500 | | | West Virginia University, (FGIC), 4.75%, 10/1/35 | | | 500,950 | | |
| | | | | $ | 4,574,170 | | |
| Insured-Electric Utilities - 7.2% | | | | | | | |
| $ | 450 | | | Marshall PCR, (Ohio Power), (MBIA), 5.45%, 7/1/14 | | $ | 455,589 | | |
| | 250 | | | Pleasants County PCR, (Potomac Edison), (AMBAC), (AMT),
5.50%, 4/1/29 | | | 260,232 | | |
| | 1,000 | | | Pleasants County PCR, (West Pennsylvania), (AMBAC), (AMT),
5.50%, 4/1/29 | | | 1,036,410 | | |
| | 150 | | | Puerto Rico Electric Power Authority, (MBIA), Variable Rate,
12.295%, 7/1/16(2)(3) | | | 212,613 | | |
| | | | | $ | 1,964,844 | | |
Principal Amount
(000's omitted)
Security | | | |
Value | |
| Insured-Escrowed / Prerefunded - 1.9% | | | | | |
| $ | 500 | | | West Virginia University System, (Marshall University Library),
(AMBAC), Prerefunded to 4/1/06, 5.75%, 4/1/16 | | $ | 520,445 | | |
| | | | | $ | 520,445 | | |
| Insured-General Obligations - 9.0% | | | | | |
| $ | 250 | | | Ohio County Board of Education, (MBIA), 5.125%, 6/1/18 | | $ | 265,590 | | |
| | 190 | | | Puerto Rico, (FSA), 5.125%, 7/1/30 | | | 198,045 | | |
| | 300 | | | Puerto Rico, (FSA), Variable Rate, 10.84%, 7/1/27(2)(3) | | | 360,846 | | |
| | 500 | | | West Virginia School Building Authority, (AMBAC),
5.60%, 7/1/17 | | | 535,475 | | |
| | 1,700 | | | West Virginia, (FGIC), 0.00%, 11/1/19 | | | 851,207 | | |
| | 250 | | | West Virginia, (FGIC), 5.75%, 11/1/21 | | | 265,380 | | |
| | | | | $ | 2,476,543 | | |
| Insured-Hospital - 11.4% | | | | | |
| $ | 500 | | | Harrison County Building Commission, (Maplewood
Retirement), (AMBAC), 5.25%, 4/1/28 | | $ | 518,120 | | |
| | 500 | | | Randolph County Commission Health System, (Davis Health
System, Inc.), (FSA), 5.20%, 11/1/21 | | | 528,465 | | |
| | 850 | | | West Virginia Health Facilities Authority, (Charleston Area
Medical Center), (MBIA), 5.75%, 9/1/13 | | | 877,438 | | |
| | 1,200 | | | West Virginia Health Facilities Authority, (West Virginia
University Medical Corp.), (MBIA), 6.10%, 1/1/18 | | | 1,203,024 | | |
| | | | | $ | 3,127,047 | | |
Insured-Lease Revenue / Certificates of
Participation - 3.8% | | | | | |
| $ | 500 | | | West Virginia Economic Development Authority, (Correctional
Juvenile and Public), (MBIA), 5.00%, 6/1/26 | | $ | 516,725 | | |
| | 500 | | | West Virginia Economic Development Authority, (West Virginia
University), (AMBAC), 5.00%, 7/15/31 | | | 512,075 | | |
| | | | | $ | 1,028,800 | | |
| Insured-Special Tax Revenue - 5.9% | | | | | |
| $ | 600 | | | Puerto Rico Infrastructure Financing Authority, (AMBAC),
Variable Rate, 7.089%, 7/1/28(2)(4) | | $ | 633,936 | | |
| | 910 | | | Puerto Rico Infrastructure Financing Authority, (AMBAC),
Variable Rate, 10.286%, 7/1/28(2)(3) | | | 987,204 | | |
| | | | | $ | 1,621,140 | | |
See notes to financial statements
43
Eaton Vance West Virginia Municipals Fund as of March 31, 2005
PORTFOLIO OF INVESTMENTS (Unaudited) CONT'D
Principal Amount
(000's omitted)
Security | | | |
Value | |
| Insured-Transportation - 1.0% | | | | | |
| $ | 250 | | | West Virginia Parkways, Economic Development and Tourism
Authority, (FGIC), 5.25%, 5/15/19 | | $ | 277,315 | | |
| | | | | $ | 277,315 | | |
| Insured-Water and Sewer - 15.3% | | | | | |
| $ | 250 | | | Berkeley Public Service District Sewer, (MBIA),
5.75%, 10/1/25 | | $ | 264,298 | | |
| | 500 | | | Crab Orchard - MacArthur Public Service District Sewer System,
(AMBAC), 5.50%, 10/1/25 | | | 526,020 | | |
| | 500 | | | Martinsburg Water and Sewer, (MBIA), 5.00%, 9/1/31 | | | 512,930 | | |
| | 1,000 | | | Parkersburg Waterworks and Sewer, (FSA), 5.80%, 9/1/19 | | | 1,058,390 | | |
| | 750 | | | West Virginia Water Development Authority, (AMBAC),
5.00%, 10/1/28 | | | 777,263 | | |
| | 500 | | | West Virginia Water Development, (Loan Program II),
(AMBAC), 5.00%, 11/1/33 | | | 515,535 | | |
| | 500 | | | West Virginia Water Development, (Loan Program III),
(AMBAC), (AMT), 5.65%, 7/1/40 | | | 524,800 | | |
| | | | | $ | 4,179,236 | | |
| Lease Revenue / Certificates of Participation - 1.5% | | | | | |
| $ | 400 | | | West Virginia Economic Development Authority,
(State Office Building), 5.00%, 10/1/26 | | $ | 408,272 | | |
| | | | | $ | 408,272 | | |
| Transportation - 5.6% | | | | | |
| $ | 1,000 | | | Puerto Rico Highway and Transportation Authority,
5.00%, 7/1/36 | | $ | 1,023,100 | | |
| | 500 | | | Puerto Rico Highway and Transportation Authority,
5.125%, 7/1/43 | | | 511,760 | | |
| | | | | $ | 1,534,860 | | |
Total Tax-Exempt Investments - 99.4%
(identified cost $25,791,954) | | | | $ | 27,192,275 | | |
| Other Assets, Less Liabilities - 0.6% | | | | $ | 152,171 | | |
| Net Assets - 100.0% | | | | $ | 27,344,446 | | |
AMBAC - AMBAC Financial Group, Inc.
AMT - Interest earned from these securities may be considered a tax preference item for purposes of the Federal Alternative Minimum Tax.
FGIC - Financial Guaranty Insurance Company
FSA - Financial Security Assurance, Inc.
MBIA - Municipal Bond Insurance Association
The Fund invests primarily in debt securities issued by West Virginia municipalities. The ability of the issuers of the debt securities to meet their obligations may be affected by economic developments in a specific industry or municipality. In order to reduce the risk associated with such economic developments, at March 31, 2005, 72.7% of the securities in the portfolio of investments are backed by bond insurance of various financial institutions and financial guaranty assurance agencies. The aggregate percentage insured by an individual financial institution ranged from 7.9% to 27.0% of total investments.
(1) Security (or a portion thereof) has been segregated to cover margin requirements on open financial futures contracts.
(2) Security exempt from registration under Rule 144A of the Securities Act of 1933. These securities may be sold in transactions exempt from registration, normally to qualified institutional buyers. At March 31, 2005, the aggregate value of the securities is $2,194,599 or 8.0% of the Fund's net assets.
(3) Security has been issued as a leveraged inverse floater bond. The stated interest rate represents the rate in effect at March 31, 2005.
(4) Security has been issued as an inverse floater bond. The stated interest rate represents the rate in effect at March 31, 2005.
See notes to financial statements
44
Eaton Vance Municipals Funds as of March 31, 2005
FINANCIAL STATEMENTS (Unaudited)
Statements of Assets and Liabilities
As of March 31, 2005
| | | California Fund | | Florida Fund | | Massachusetts Fund | | Mississippi Fund | |
| Assets | | | |
| Investments - | | | | | | | | | | | | | | | | | |
| Identified cost | | $ | 201,395,434 | | | $ | 214,570,595 | | | $ | 202,219,697 | | | $ | 16,462,800 | | |
| Unrealized appreciation | | | 23,365,657 | | | | 18,952,843 | | | | 14,933,840 | | | | 1,053,100 | | |
| Investments, at value | | $ | 224,761,091 | | | $ | 233,523,438 | | | $ | 217,153,537 | | | $ | 17,515,900 | | |
| Cash | | $ | 329,043 | | | $ | - | | | $ | 86,734 | | | $ | 412,194 | | |
| Receivable for investments sold | | | - | | | | 225,000 | | | | 25,000 | | | | 50,261 | | |
| Receivable for Fund shares sold | | | 39,232 | | | | 187,704 | | | | 84,592 | | | | 100,234 | | |
| Interest receivable | | | 2,952,013 | | | | 4,364,679 | | | | 2,881,373 | | | | 229,651 | | |
| Total assets | | $ | 228,081,379 | | | $ | 238,300,821 | | | $ | 220,231,236 | | | $ | 18,308,240 | | |
| Liabilities | | | |
| Payable for Fund shares redeemed | | $ | 232,466 | | | $ | 635,589 | | | $ | 313,296 | | | $ | 1,074 | | |
| Payable for daily variation margin on open financial futures contracts | | | 404,250 | | | | 426,250 | | | | 388,437 | | | | 20,625 | | |
| Demand note payable | | | - | | | | 200,000 | | | | - | | | | - | | |
| Dividends payable | | | 413,457 | | | | 465,107 | | | | 415,454 | | | | 35,729 | | |
| Payable for when-issued securities | | | 1,700,000 | | | | - | | | | 2,581,075 | | | | - | | |
| Due to bank | | | - | | | | 92,499 | | | | - | | | | - | | |
| Payable to affiliate for distribution and service fees | | | 159 | | | | - | | | | - | | | | - | | |
| Accrued expenses | | | 51,756 | | | | 66,028 | | | | 53,415 | | | | 23,311 | | |
| Total liabilities | | $ | 2,802,088 | | | $ | 1,885,473 | | | $ | 3,751,677 | | | $ | 80,739 | | |
| Net Assets | | $ | 225,279,291 | | | $ | 236,415,348 | | | $ | 216,479,559 | | | $ | 18,227,501 | | |
| Sources of Net Assets | | | |
| Paid-in capital | | $ | 203,632,281 | | | $ | 224,292,991 | | | $ | 204,794,103 | | | $ | 17,468,495 | | |
| Accumulated net realized loss (computed on the basis of identified cost) | | | (2,940,646 | ) | | | (9,039,105 | ) | | | (4,186,711 | ) | | | (319,625 | ) | |
| Accumulated undistributed (distributions in excess of) net investment income | | | 213,873 | | | | 1,145,630 | | | | (98,710 | ) | | | (29,420 | ) | |
| Net unrealized appreciation (computed on the basis of identified cost) | | | 24,373,783 | | | | 20,015,832 | | | | 15,970,877 | | | | 1,108,051 | | |
| Total | | $ | 225,279,291 | | | $ | 236,415,348 | | | $ | 216,479,559 | | | $ | 18,227,501 | | |
| Class A Shares | | | |
| Net Assets | | $ | 221,514,500 | | | $ | 191,106,584 | | | $ | 151,784,373 | | | $ | 12,409,620 | | |
| Shares Outstanding | | | 20,528,161 | | | | 18,115,725 | | | | 15,770,725 | | | | 1,291,179 | | |
Net Asset Value and Redemption Price Per Share
(net assets ÷ shares of beneficial interest outstanding) | | $ | 10.79 | | | $ | 10.55 | | | $ | 9.62 | | | $ | 9.61 | | |
Maximum Offering Price Per Share
(100 ÷ 95.25 of net asset value per share) | | $ | 11.33 | | | $ | 11.08 | | | $ | 10.10 | | | $ | 10.09 | | |
| Class B Shares | | | |
| Net Assets | | $ | 2,848,124 | | | $ | 45,308,764 | | | $ | 56,419,910 | | | $ | 5,817,881 | | |
| Shares Outstanding | | | 285,144 | | | | 4,191,170 | | | | 5,258,551 | | | | 591,961 | | |
Net Asset Value, Offering Price and Redemption Price Per Share
(net assets ÷ shares of beneficial interest outstanding) | | $ | 9.99 | | | $ | 10.81 | | | $ | 10.73 | | | $ | 9.83 | | |
| Class C Shares | | | |
| Net Assets | | $ | 916,667 | | | $ | - | | | $ | - | | | $ | - | | |
| Shares Outstanding | | | 91,794 | | | | - | | | | - | | | | - | | |
Net Asset Value, Offering Price and Redemption Price Per Share
(net assets ÷ shares of beneficial interest outstanding) | | $ | 9.99 | | | $ | - | | | $ | - | | | $ | - | | |
| Class I Shares | | | |
| Net Assets | | $ | - | | | $ | - | | | $ | 8,275,276 | | | $ | - | | |
| Shares Outstanding | | | - | | | | - | | | | 832,497 | | | | - | | |
Net Asset Value, Offering Price and Redemption Price Per Share
(net assets ÷ shares of beneficial interest outstanding) | | $ | - | | | $ | - | | | $ | 9.94 | | | $ | - | | |
On sales of $25,000 or more, the offering price of Class A shares is reduced.
See notes to financial statements
45
Eaton Vance Municipals Funds as of March 31, 2005
FINANCIAL STATEMENTS (Unaudited) CONT'D
Statements of Assets and Liabilities
As of March 31, 2005
| | | New York Fund | | Ohio Fund | | Rhode Island Fund | | West Virginia Fund | |
| Assets | | | |
| Investments - | | | | | | | | | | | | | | | | | |
| Identified cost | | $ | 324,964,858 | | | $ | 147,448,679 | | | $ | 47,493,560 | | | $ | 25,791,954 | | |
| Unrealized appreciation | | | 27,277,846 | | | | 12,143,481 | | | | 2,947,745 | | | | 1,400,321 | | |
| Investments, at value | | $ | 352,242,704 | | | $ | 159,592,160 | | | $ | 50,441,305 | | | $ | 27,192,275 | | |
| Cash | | $ | - | | | $ | - | | | $ | 320,654 | | | $ | - | | |
| Receivable for investments sold | | | - | | | | 553,108 | | | | 530,844 | | | | - | | |
| Receivable for Fund shares sold | | | 153,043 | | | | 198,337 | | | | 7,911 | | | | 3,022 | | |
| Interest receivable | | | 5,704,324 | | | | 2,562,495 | | | | 768,068 | | | | 426,633 | | |
| Total assets | | $ | 358,100,071 | | | $ | 162,906,100 | | | $ | 52,068,782 | | | $ | 27,621,930 | | |
| Liabilities | | | |
| Payable for Fund shares redeemed | | $ | 389,894 | | | $ | 110,625 | | | $ | 144,953 | | | $ | 7,073 | | |
| Payable for daily variation margin on open financial futures contracts | | | 825,000 | | | | 137,500 | | | | 92,812 | | | | 51,562 | | |
| Demand note payable | | | 100,000 | | | | 200,000 | | | | - | | | | 100,000 | | |
| Dividends payable | | | 510,931 | | | | 307,671 | | | | 87,264 | | | | 40,368 | | |
| Due to bank | | | 53,246 | | | | 74,717 | | | | - | | | | 51,708 | | |
| Payable to affiliate for distribution and service fees | | | 411 | | | | - | | | | - | | | | - | | |
| Accrued expenses | | | 87,363 | | | | 47,015 | | | | 28,818 | | | | 26,773 | | |
| Total liabilities | | $ | 1,966,845 | | | $ | 877,528 | | | $ | 353,847 | | | $ | 277,484 | | |
| Net Assets | | $ | 356,133,226 | | | $ | 162,028,572 | | | $ | 51,714,935 | | | $ | 27,344,446 | | |
| Sources of Net Assets | | | |
| Paid-in capital | | $ | 322,445,805 | | | $ | 158,875,999 | | | $ | 49,606,783 | | | $ | 26,934,132 | | |
| Accumulated net realized gain (loss) (computed on the basis of identified cost) | | | 5,452,249 | | | | (9,358,455 | ) | | | (1,065,955 | ) | | | (1,102,148 | ) | |
| Accumulated undistributed (distributions in excess of) net investment income | | | (565,117 | ) | | | 141,835 | | | | (18,765 | ) | | | (26,210 | ) | |
| Net unrealized appreciation (computed on the basis of identified cost) | | | 28,800,289 | | | | 12,369,193 | | | | 3,192,872 | | | | 1,538,672 | | |
| Total | | $ | 356,133,226 | | | $ | 162,028,572 | | | $ | 51,714,935 | | | $ | 27,344,446 | | |
| Class A Shares | | | |
| Net Assets | | $ | 349,632,187 | | | $ | 127,049,269 | | | $ | 27,402,777 | | | $ | 18,883,137 | | |
| Shares Outstanding | | | 32,678,497 | | | | 13,737,574 | | | | 2,810,775 | | | | 1,941,168 | | |
Net Asset Value and Redemption Price Per Share
(net assets ÷ shares of beneficial interest outstanding) | | $ | 10.70 | | | $ | 9.25 | | | $ | 9.75 | | | $ | 9.73 | | |
Maximum Offering Price Per Share
(100 ÷ 95.25 of net asset value per share) | | $ | 11.23 | | | $ | 9.71 | | | $ | 10.24 | | | $ | 10.22 | | |
| Class B Shares | | | |
| Net Assets | | $ | 4,264,148 | | | $ | 34,979,303 | | | $ | 24,312,158 | | | $ | 8,461,309 | | |
| Shares Outstanding | | | 368,472 | | | | 3,353,011 | | | | 2,437,618 | | | | 853,479 | | |
Net Asset Value, Offering Price and Redemption Price Per Share
(net assets ÷ shares of beneficial interest outstanding) | | $ | 11.57 | | | $ | 10.43 | | | $ | 9.97 | | | $ | 9.91 | | |
| Class C Shares | | | |
| Net Assets | | $ | 2,236,891 | | | $ | - | | | $ | - | | | $ | - | | |
| Shares Outstanding | | | 230,407 | | | | - | | | | - | | | | - | | |
Net Asset Value, Offering Price and Redemption Price Per Share
(net assets ÷ shares of beneficial interest outstanding) | | $ | 9.71 | | | $ | - | | | $ | - | | | $ | - | | |
On sales of $25,000 or more, the offering price of Class A shares is reduced.
See notes to financial statements
46
Eaton Vance Municipals Funds as of March 31, 2005
FINANCIAL STATEMENTS (Unaudited) CONT'D
Statements of Operations
For the Six Months Ended March 31, 2005
| | | California Fund | | Florida Fund | | Massachusetts Fund | | Mississippi Fund | |
| Investment Income | | | |
| Interest | | $ | 6,532,528 | | | $ | 6,877,550 | | | $ | 5,959,615 | | | $ | 474,636 | | |
| Total investment income | | $ | 6,532,528 | | | $ | 6,877,550 | | | $ | 5,959,615 | | | $ | 474,636 | | |
| Expenses | | | |
| Investment adviser fee | | $ | 538,123 | | | $ | 523,075 | | | $ | 455,786 | | | $ | 13,573 | | |
| Trustees' fees and expenses | | | 5,536 | | | | 5,535 | | | | 5,536 | | | | 65 | | |
| Distribution and service fees | | | | | | | | | | | | | | | | | |
| Class A | | | 282,195 | | | | 193,506 | | | | 148,672 | | | | 11,704 | | |
| Class B | | | 13,363 | | | | 230,826 | | | | 276,027 | | | | 28,542 | | |
| Class C | | | 1,358 | | | | - | | | | - | | | | - | | |
| Legal and accounting services | | | 27,331 | | | | 41,068 | | | | 31,279 | | | | 17,734 | | |
| Printing and postage | | | 8,711 | | | | 12,624 | | | | 10,482 | | | | 1,310 | | |
| Custodian fee | | | 73,083 | | | | 77,038 | | | | 65,802 | | | | 13,488 | | |
| Transfer and dividend disbursing agent fees | | | 48,760 | | | | 83,508 | | | | 52,597 | | | | 5,544 | | |
| Registration fees | | | 700 | | | | 3,850 | | | | 3,500 | | | | 50 | | |
| Miscellaneous | | | 10,934 | | | | 19,837 | | | | 9,474 | | | | 5,573 | | |
| Total expenses | | $ | 1,010,094 | | | $ | 1,190,867 | | | $ | 1,059,155 | | | $ | 97,583 | | |
| Deduct - | | | | | | | | | | | | | | | | | |
| Reduction of custodian fee | | $ | 7,445 | | | $ | 11,063 | | | $ | 8,998 | | | $ | 2,415 | | |
| Reduction of investment adviser fee | | | - | | | | - | | | | 230 | | | | - | | |
| Total expense reductions | | $ | 7,445 | | | $ | 11,063 | | | $ | 9,228 | | | $ | 2,415 | | |
| Net expenses | | $ | 1,002,649 | | | $ | 1,179,804 | | | $ | 1,049,927 | | | $ | 95,168 | | |
| Net investment income | | $ | 5,529,879 | | | $ | 5,697,746 | | | $ | 4,909,688 | | | $ | 379,468 | | |
| Realized and Unrealized Gain (Loss) | | | |
| Net realized gain (loss) - | | | | | | | | | | | | | | | | | |
| Investment transactions (identified cost basis) | | $ | 3,665,683 | | | $ | 1,924,395 | | | $ | 699,055 | | | $ | 3,519 | | |
| Financial futures contracts | | | (2,482,796 | ) | | | (2,269,436 | ) | | | (1,435,364 | ) | | | (106,532 | ) | |
| Net realized gain (loss) | | $ | 1,182,887 | | | $ | (345,041 | ) | | $ | (736,309 | ) | | $ | (103,013 | ) | |
| Change in unrealized appreciation (depreciation) - | | | | | | | | | | | | | | | | | |
| Investments (identified cost basis) | | $ | (4,724,999 | ) | | $ | (2,298,200 | ) | | $ | (1,561,014 | ) | | $ | (199,123 | ) | |
| Financial futures contracts | | | 1,961,531 | | | | 2,068,280 | | | | 1,700,243 | | | | 106,951 | | |
| Net change in unrealized appreciation (depreciation) | | $ | (2,763,468 | ) | | $ | (229,920 | ) | | $ | 139,229 | | | $ | (92,172 | ) | |
| Net realized and unrealized loss | | $ | (1,580,581 | ) | | $ | (574,961 | ) | | $ | (597,080 | ) | | $ | (195,185 | ) | |
| Net increase in net assets from operations | | $ | 3,949,298 | | | $ | 5,122,785 | | | $ | 4,312,608 | | | $ | 184,283 | | |
See notes to financial statements
47
Eaton Vance Municipals Funds as of March 31, 2005
FINANCIAL STATEMENTS (Unaudited) CONT'D
Statements of Operations
For the Six Months Ended March 31, 2005
| | | New York Fund | | Ohio Fund | | Rhode Island Fund | | West Virginia Fund | |
| Investment Income | | | | | | | | | | | | | | | | | |
| Interest | | $ | 9,720,698 | | | $ | 4,786,837 | | | $ | 1,378,693 | | | $ | 740,727 | | |
| Total investment income | | $ | 9,720,698 | | | $ | 4,786,837 | | | $ | 1,378,693 | | | $ | 740,727 | | |
| Expenses | | | | | | | | | | | | | | | | | |
| Investment adviser fee | | $ | 771,526 | | | $ | 340,739 | | | $ | 73,504 | | | $ | 26,904 | | |
| Trustees' fees and expenses | | | 7,102 | | | | 4,752 | | | | 2,925 | | | | 652 | | |
| Distribution and service fees | | | | | | | | | | | | | | | | | |
| Class A | | | 344,322 | | | | 126,902 | | | | 26,873 | | | | 18,886 | | |
| Class B | | | 16,971 | | | | 169,983 | | | | 118,802 | | | | 40,628 | | |
| Class C | | | 7,062 | | | | - | | | | - | | | | - | | |
| Legal and accounting services | | | 30,039 | | | | 31,032 | | | | 20,021 | | | | 17,850 | | |
| Printing and postage | | | 16,311 | | | | 10,304 | | | | 2,871 | | | | 1,960 | | |
| Custodian fee | | | 94,571 | | | | 55,880 | | | | 22,614 | | | | 15,104 | | |
| Transfer and dividend disbursing agent fees | | | 114,942 | | | | 57,247 | | | | 11,785 | | | | 10,382 | | |
| Registration fees | | | 499 | | | | 1,450 | | | | - | | | | 317 | | |
| Miscellaneous | | | 16,446 | | | | 11,160 | | | | 7,012 | | | | 7,024 | | |
| Total expenses | | $ | 1,419,791 | | | $ | 809,449 | | | $ | 286,407 | | | $ | 139,707 | | |
| Deduct - | | | | | | | | | | | | | | | | | |
| Reduction of custodian fee | | $ | 13,376 | | | $ | 16,289 | | | $ | 4,434 | | | $ | 1,823 | | |
| Total expense reductions | | $ | 13,376 | | | $ | 16,289 | | | $ | 4,434 | | | $ | 1,823 | | |
| Net expenses | | $ | 1,406,415 | | | $ | 793,160 | | | $ | 281,973 | | | $ | 137,884 | | |
| Net investment income | | $ | 8,314,283 | | | $ | 3,993,677 | | | $ | 1,096,720 | | | $ | 602,843 | | |
| Realized and Unrealized Gain (Loss) | | | | | | | | | | | | | | | | | |
| Net realized gain (loss) - | | | | | | | | | | | | | | | | | |
| Investment transactions (identified cost basis) | | $ | 8,504,189 | | | $ | 257,939 | | | $ | 126,237 | | | $ | 102,600 | | |
| Financial futures contracts | | | (4,401,576 | ) | | | (1,041,288 | ) | | | (429,201 | ) | | | (223,680 | ) | |
| Net realized gain (loss) | | $ | 4,102,613 | | | $ | (783,349 | ) | | $ | (302,964 | ) | | $ | (121,080 | ) | |
| Change in unrealized appreciation (depreciation) - | | | | | | | | | | | | | | | | | |
| Investments (identified cost basis) | | $ | (10,662,965 | ) | | $ | 1,221,928 | | | $ | (222,574 | ) | | $ | (332,310 | ) | |
| Financial futures contracts | | | 3,464,683 | | | | 747,733 | | | | 387,020 | | | | 213,900 | | |
| Net change in unrealized appreciation (depreciation) | | $ | (7,198,282 | ) | | $ | 1,969,661 | | | $ | 164,446 | | | $ | (118,410 | ) | |
| Net realized and unrealized gain (loss) | | $ | (3,095,669 | ) | | $ | 1,186,312 | | | $ | (138,518 | ) | | $ | (239,490 | ) | |
| Net increase in net assets from operations | | $ | 5,218,614 | | | $ | 5,179,989 | | | $ | 958,202 | | | $ | 363,353 | | |
See notes to financial statements
48
Eaton Vance Municipals Funds as of March 31, 2005
FINANCIAL STATEMENTS (Unaudited) CONT'D
Statements of Changes in Net Assets
For the Six Months Ended March 31, 2005
| Increase (Decrease) in Net Assets | | California Fund | | Florida Fund | | Massachusetts Fund | | Mississippi Fund | |
| From operations - | | | | | | | | | | | | | | | | | |
| Net investment income | | $ | 5,529,879 | | | $ | 5,697,746 | | | $ | 4,909,688 | | | $ | 379,468 | | |
Net realized gain (loss) from investment transactions
and financial futures contracts | | | 1,182,887 | | | | (345,041 | ) | | | (736,309 | ) | | | (103,013 | ) | |
Net change in unrealized appreciation (depreciation)
from investments and financial futures contracts | | | (2,763,468 | ) | | | (229,920 | ) | | | 139,229 | | | | (92,172 | ) | |
| Net increase in net assets from operations | | $ | 3,949,298 | | | $ | 5,122,785 | | | $ | 4,312,608 | | | $ | 184,283 | | |
| Distributions to shareholders - | | | | | | | | | | | | | | | | | |
| From net investment income | | | | | | | | | | | | | | | | | |
| Class A | | $ | (5,419,134 | ) | | $ | (4,754,398 | ) | | $ | (3,611,190 | ) | | $ | (270,067 | ) | |
| Class B | | | (54,078 | ) | | | (1,009,912 | ) | | | (1,198,842 | ) | | | (115,999 | ) | |
| Class C | | | (5,095 | ) | | | - | | | | - | | | | - | | |
| Class I | | | - | | | | - | | | | (210,571 | ) | | | - | | |
| Total distributions to shareholders | | $ | (5,478,307 | ) | | $ | (5,764,310 | ) | | $ | (5,020,603 | ) | | $ | (386,066 | ) | |
| Transactions in shares of beneficial interest - | | | | | | | | | | | | | | | | | |
| Proceeds from sale of shares | | | | | | | | | | | | | | | | | |
| Class A | | $ | 7,046,603 | | | $ | 16,576,409 | | | $ | 11,938,162 | | | $ | 1,595,323 | | |
| Class B | | | 1,782,432 | | | | 2,241,864 | | | | 2,027,922 | | | | 237,014 | | |
| Class C | | | 828,917 | | | | - | | | | - | | | | - | | |
Net asset value of shares issued to shareholders in payment of
distributions declared | | | |
| Class A | | | 2,935,227 | | | | 2,467,768 | | | | 1,831,244 | | | | 115,113 | | |
| Class B | | | 31,255 | | | | 531,050 | | | | 716,396 | | | | 58,893 | | |
| Class C | | | 4,337 | | | | - | | | | - | | | | - | | |
| Class I | | | - | | | | - | | | | 25,373 | | | | - | | |
| Cost of shares redeemed | | | | | | | | | | | | | | | | | |
| Class A | | | (14,855,703 | ) | | | (23,255,502 | ) | | | (7,002,209 | ) | | | (752,297 | ) | |
| Class B | | | (922,547 | ) | | | (6,045,868 | ) | | | (2,748,061 | ) | | | (216,840 | ) | |
| Class I | | | - | | | | - | | | | (44,109 | ) | | | - | | |
| Net asset value of shares exchanged | | | | | | | | | | | | | | | | | |
| Class A | | | - | | | | 2,468,948 | | | | 2,431,920 | | | | 209,876 | | |
| Class B | | | - | | | | (2,468,948 | ) | | | (2,431,920 | ) | | | (209,876 | ) | |
| Net increase (decrease) in net assets from Fund share transactions | | $ | (3,149,479 | ) | | $ | (7,484,279 | ) | | $ | 6,744,718 | | | $ | 1,037,206 | | |
| Net increase (decrease) in net assets | | $ | (4,678,488 | ) | | $ | (8,125,804 | ) | | $ | 6,036,723 | | | $ | 835,423 | | |
| Net Assets | | | | | | | | | | | | | | | | | |
| At beginning of period | | $ | 229,957,779 | | | $ | 244,541,152 | | | $ | 210,442,836 | | | $ | 17,392,078 | | |
| At end of period | | $ | 225,279,291 | | | $ | 236,415,348 | | | $ | 216,479,559 | | | $ | 18,227,501 | | |
Accumulated undistributed
(distributions in excess of) net
investment income included in net assets | | | | | | | | | | | | | | | | | |
| At end of period | | $ | 213,873 | | | $ | 1,145,630 | | | $ | (98,710 | ) | | $ | (29,420 | ) | |
See notes to financial statements
49
Eaton Vance Municipals Funds as of March 31, 2005
FINANCIAL STATEMENTS (Unaudited) CONT'D
Statements of Changes in Net Assets
For the Six Months Ended March 31, 2005
| Increase (Decrease) in Net Assets | | New York Fund | | Ohio Fund | | Rhode Island Fund | | West Virginia Fund | |
| From operations - | | | | | | | | | | | | | | | | | |
| Net investment income | | $ | 8,314,283 | | | $ | 3,993,677 | | | $ | 1,096,720 | | | $ | 602,843 | | |
Net realized gain (loss) from investment transactions
and financial futures contracts | | | 4,102,613 | | | | (783,349 | ) | | | (302,964 | ) | | | (121,080 | ) | |
Net change in unrealized appreciation (depreciation)
from investments and financial futures contracts | | | (7,198,282 | ) | | | 1,969,661 | | | | 164,446 | | | | (118,410 | ) | |
| Net increase in net assets from operations | | $ | 5,218,614 | | | $ | 5,179,989 | | | $ | 958,202 | | | $ | 363,353 | | |
| Distributions to shareholders - | | | | | | | | | | | | | | | | | |
| From net investment income | | | | | | | | | | | | | | | | | |
| Class A | | $ | (8,396,844 | ) | | $ | (3,241,609 | ) | | $ | (620,948 | ) | | $ | (429,834 | ) | |
| Class B | | | (73,122 | ) | | | (782,807 | ) | | | (484,075 | ) | | | (163,148 | ) | |
| Class C | | | (30,083 | ) | | | - | | | | - | | | | - | | |
| Total distributions to shareholders | | $ | (8,500,049 | ) | | $ | (4,024,416 | ) | | $ | (1,105,023 | ) | | $ | (592,982 | ) | |
| Transactions in shares of beneficial interest - | | | | | | | | | | | | | | | | | |
| Proceeds from sale of shares | | | | | | | | | | | | | | | | | |
| Class A | | $ | 30,702,767 | | | $ | 4,820,480 | | | $ | 1,475,018 | | | $ | 1,301,933 | | |
| Class B | | | 1,395,407 | | | | 1,045,831 | | | | 839,498 | | | | 528,360 | | |
| Class C | | | 1,332,515 | | | | - | | | | - | | | | - | | |
Net asset value of shares issued to shareholders in payment of
distributions declared | | | |
| Class A | | | 5,414,678 | | | | 1,772,280 | | | | 277,848 | | | | 256,608 | | |
| Class B | | | 41,963 | | | | 421,104 | | | | 328,894 | | | | 101,720 | | |
| Class C | | | 13,625 | | | | - | | | | - | | | | - | | |
| Cost of shares redeemed | | | | | | | | | | | | | | | | | |
| Class A | | | (18,480,393 | ) | | | (8,139,555 | ) | | | (1,696,531 | ) | | | (1,376,385 | ) | |
| Class B | | | (55,175 | ) | | | (1,803,956 | ) | | | (1,004,353 | ) | | | (458,031 | ) | |
| Class C | | | (26,693 | ) | | | - | | | | - | | | | - | | |
| Net asset value of shares exchanged | | | | | | | | | | | | | | | | | |
| Class A | | | 63,442 | | | | 1,491,563 | | | | 869,614 | | | | 189,887 | | |
| Class B | | | (63,442 | ) | | | (1,491,563 | ) | | | (869,614 | ) | | | (189,887 | ) | |
| Net increase (decrease) in net assets from Fund share transactions | | $ | 20,338,694 | | | $ | (1,883,816 | ) | | $ | 220,374 | | | $ | 354,205 | | |
| Net increase (decrease) in net assets | | $ | 17,057,259 | | | $ | (728,243 | ) | | $ | 73,553 | | | $ | 124,576 | | |
| Net Assets | | | |
| At beginning of period | | $ | 339,075,967 | | | $ | 162,756,815 | | | $ | 51,641,382 | | | $ | 27,219,870 | | |
| At end of period | | $ | 356,133,226 | | | $ | 162,028,572 | | | $ | 51,714,935 | | | $ | 27,344,446 | | |
Accumulated undistributed
(distributions in excess of) net
investment income included in net assets | | | |
| At end of period | | $ | (565,117 | ) | | $ | 141,835 | | | $ | (18,765 | ) | | $ | (26,210 | ) | |
See notes to financial statements
50
Eaton Vance Municipals Funds as of March 31, 2005
FINANCIAL STATEMENTS CONT'D
Statements of Changes in Net Assets
For the Year Ended September 30, 2004
| Increase (Decrease) in Net Assets | | California Fund | | Florida Fund | | Massachusetts Fund | | Mississippi Fund | |
| From operations - | | | | | | | | | | | | | | | | | |
| Net investment income | | $ | 11,763,909 | | | $ | 11,787,202 | | | $ | 9,860,459 | | | $ | 756,210 | | |
Net realized loss from investment transactions
and financial futures contracts | | | (1,415,060 | ) | | | (5,062,538 | ) | | | (2,699,850 | ) | | | (273,574 | ) | |
Net change in unrealized appreciation (depreciation)
from investments and financial futures contracts | | | (482,603 | ) | | | 2,572,400 | | | | 1,976,197 | | | | 25,219 | | |
| Net increase in net assets from operations | | $ | 9,866,246 | | | $ | 9,297,064 | | | $ | 9,136,806 | | | $ | 507,855 | | |
| Distributions to shareholders - | | | | | | | | | | | | | | | | | |
| From net investment income | | | | | | | | | | | | | | | | | |
| Class A | | $ | (6,271,170 | ) | | $ | (5,647,199 | ) | | $ | (4,784,100 | ) | | $ | (346,210 | ) | |
| Class B | | | (5,387,547 | ) | | | (6,164,795 | ) | | | (4,650,542 | ) | | | (413,447 | ) | |
| Class C | | | (126 | ) | | | - | | | | - | | | | - | | |
| Class I | | | - | | | | - | | | | (420,852 | ) | | | - | | |
| Total distributions to shareholders | | $ | (11,658,843 | ) | | $ | (11,811,994 | ) | | $ | (9,855,494 | ) | | $ | (759,657 | ) | |
| Transactions in shares of beneficial interest - | | | | | | | | | | | | | | | | | |
| Proceeds from sale of shares | | | | | | | | | | | | | | | | | |
| Class A | | $ | 215,254,559 | | | $ | 189,078,843 | | | $ | 112,627,613 | | | $ | 10,295,823 | | |
| Class B | | | 7,828,106 | | | | 5,902,620 | | | | 5,318,940 | | | | 522,203 | | |
| Class C | | | 100,800 | | | | - | | | | - | | | | - | | |
| Class I | | | - | | | | - | | | | 777,248 | | | | - | | |
Net asset value of shares issued to shareholders in payment of
distributions declared | | | |
| Class A | | | 3,308,480 | | | | 2,920,160 | | | | 2,449,966 | | | | 141,852 | | |
| Class B | | | 3,222,068 | | | | 3,231,704 | | | | 2,772,611 | | | | 196,117 | | |
| Class C | | | 94 | | | | - | | | | - | | | | - | | |
| Class I | | | - | | | | - | | | | 49,895 | | | | - | | |
| Cost of shares redeemed | | | | | | | | | | | | | | | | | |
| Class A | | | (25,137,336 | ) | | | (20,508,429 | ) | | | (11,680,672 | ) | | | (1,634,783 | ) | |
| Class B | | | (219,778,794 | ) | | | (196,478,322 | ) | | | (110,508,921 | ) | | | (9,622,344 | ) | |
| Class C | | | (4,786 | ) | | | - | | | | - | | | | - | | |
| Class I | | | - | | | | - | | | | (82,080 | ) | | | - | | |
| Contingent deferred sales charges | | | | | | | | | | | | | | | | | |
| Class B | | | 58,813 | | | | - | | | | - | | | | - | | |
| Net increase (decrease) in net assets from Fund share transactions | | $ | (15,147,996 | ) | | $ | (15,853,424 | ) | | $ | 1,724,600 | | | $ | (101,132 | ) | |
| Net increase (decrease) in net assets | | $ | (16,940,593 | ) | | $ | (18,368,354 | ) | | $ | 1,005,912 | | | $ | (352,934 | ) | |
| Net Assets | | | | | | | | | | | | | | | | | |
| At beginning of year | | $ | 246,898,372 | | | $ | 262,909,506 | | | $ | 209,436,924 | | | $ | 17,745,012 | | |
| At end of year | | $ | 229,957,779 | | | $ | 244,541,152 | | | $ | 210,442,836 | | | $ | 17,392,078 | | |
Accumulated undistributed
(distributions in excess of) net
investment income included in net assets | | | | | | | | | | | | | | | | | |
| At end of year | | $ | 162,301 | | | $ | 1,212,194 | | | $ | 12,205 | | | $ | (22,822 | ) | |
See notes to financial statements
51
Eaton Vance Municipals Funds as of March 31, 2005
FINANCIAL STATEMENTS CONT'D
Statements of Changes in Net Assets
For the Year Ended September 30, 2004
| Increase (Decrease) in Net Assets | | New York Fund | | Ohio Fund | | Rhode Island Fund | | West Virginia Fund | |
| From operations - | | | | | | | | | | | | | | | | | |
| Net investment income | | $ | 17,073,666 | | | $ | 8,257,887 | | | $ | 2,284,567 | | | $ | 1,145,945 | | |
Net realized gain (loss) from investment transactions
and financial futures contracts | | | 608,115 | | | | (1,380,642 | ) | | | (398,357 | ) | | | (489,266 | ) | |
Net change in unrealized appreciation (depreciation)
from investments and financial futures contracts | | | (2,552,834 | ) | | | 711,233 | | | | 472,459 | | | | 238,216 | | |
| Net increase in net assets from operations | | $ | 15,128,947 | | | $ | 7,588,478 | | | $ | 2,358,669 | | | $ | 894,895 | | |
| Distributions to shareholders - | | | | | | | | | | | | | | | | | |
| From net investment income | | | | | | | | | | | | | | | | | |
| Class A | | $ | (9,316,679 | ) | | $ | (3,877,225 | ) | | $ | (927,823 | ) | | $ | (497,802 | ) | |
| Class B | | | (9,089,001 | ) | | | (4,641,574 | ) | | | (1,394,721 | ) | | | (621,432 | ) | |
| Class C | | | (20,253 | ) | | | - | | | | - | | | | - | | |
| From net realized gain | | | | | | | | | | | | | | | | | |
| Class A | | | (106,352 | ) | | | - | | | | - | | | | - | | |
| Class B | | | (671,402 | ) | | | - | | | | - | | | | - | | |
| Class C | | | (613 | ) | | | - | | | | - | | | | - | | |
| Total distributions to shareholders | | $ | (19,204,300 | ) | | $ | (8,518,799 | ) | | $ | (2,322,544 | ) | | $ | (1,119,234 | ) | |
| Transactions in shares of beneficial interest - | | | | | | | | | | | | | | | | | |
| Proceeds from sale of shares | | | | | | | | | | | | | | | | | |
| Class A | | $ | 321,162,393 | | | $ | 121,865,745 | | | $ | 18,239,195 | | | $ | 17,065,175 | | |
| Class B | | | 9,069,087 | | | | 4,312,410 | | | | 1,611,714 | | | | 1,298,116 | | |
| Class C | | | 944,804 | | | | - | | | | - | | | | - | | |
Net asset value of shares issued to shareholders in payment of
distributions declared | | | |
| Class A | | | 5,936,040 | | | | 2,091,400 | | | | 417,013 | | | | 305,714 | | |
| Class B | | | 6,874,534 | | | | 2,430,532 | | | | 827,271 | | | | 347,226 | | |
| Class C | | | 8,230 | | | | - | | | | - | | | | - | | |
| Cost of shares redeemed | | | | | | | | | | | | | | | | | |
| Class A | | | (33,111,721 | ) | | | (10,797,206 | ) | | | (3,548,697 | ) | | | (1,835,384 | ) | |
| Class B | | | (317,576,460 | ) | | | (128,904,774 | ) | | | (20,572,813 | ) | | | (16,892,755 | ) | |
| Class C | | | (21,600 | ) | | | - | | | | - | | | | - | | |
| Contingent deferred sales charges | | | | | | | | | | | | | | | | | |
| Class B | | | 74,425 | | | | - | | | | - | | | | - | | |
| Net increase (decrease) in net assets from Fund share transactions | | $ | (6,640,268 | ) | | $ | (9,001,893 | ) | | $ | (3,026,317 | ) | | $ | 288,092 | | |
| Net increase (decrease) in net assets | | $ | (10,715,621 | ) | | $ | (9,932,214 | ) | | $ | (2,990,192 | ) | | $ | 63,753 | | |
| Net Assets | | | |
| At beginning of year | | $ | 349,791,588 | | | $ | 172,689,029 | | | $ | 54,631,574 | | | $ | 27,156,117 | | |
| At end of year | | $ | 339,075,967 | | | $ | 162,756,815 | | | $ | 51,641,382 | | | $ | 27,219,870 | | |
Accumulated undistributed
(distributions in excess of) net
investment income included in net assets | | | |
| At end of year | | $ | (379,351 | ) | | $ | 172,574 | | | $ | (10,462 | ) | | $ | (36,071 | ) | |
See notes to financial statements
52
Eaton Vance Municipals Funds as of March 31, 2005
FINANCIAL STATEMENTS CONT'D
Financial Highlights
| | | California Fund - Class A | |
| | | Six Months Ended
March 31, 2005 | | Year Ended September 30, | |
| | | (Unaudited)(1) | | 2004(1) | | 2003(1) | | 2002(1)(2) | | 2001(1) | | 2000(1) | |
| Net asset value - Beginning of period | | $ | 10.860 | | | $ | 10.920 | | | $ | 11.250 | | | $ | 10.880 | | | $ | 10.270 | | | $ | 10.320 | | |
| Income (loss) from operations | | | | | | | | | | | | | | | | | | | | | | | | | |
| Net investment income | | $ | 0.263 | | | $ | 0.548 | | | $ | 0.542 | | | $ | 0.548 | | | $ | 0.533 | | | $ | 0.536 | | |
| Net realized and unrealized gain (loss) | | | (0.072 | ) | | | (0.078 | ) | | | (0.342 | ) | | | 0.352 | | | | 0.619 | | | | (0.031 | ) | |
| Total income from operations | | $ | 0.191 | | | $ | 0.470 | | | $ | 0.200 | | | $ | 0.900 | | | $ | 1.152 | | | $ | 0.505 | | |
| Less distributions | | | | | | | | | | | | | | | | | | | | | | | | | |
| From net investment income | | $ | (0.261 | ) | | $ | (0.530 | ) | | $ | (0.530 | ) | | $ | (0.530 | ) | | $ | (0.542 | ) | | $ | (0.555 | ) | |
| Total distributions | | $ | (0.261 | ) | | $ | (0.530 | ) | | $ | (0.530 | ) | | $ | (0.530 | ) | | $ | (0.542 | ) | | $ | (0.555 | ) | |
| Net asset value - End of period | | $ | 10.790 | | | $ | 10.860 | | | $ | 10.920 | | | $ | 11.250 | | | $ | 10.880 | | | $ | 10.270 | | |
| Total Return(3) | | | 1.76 | % | | | 4.42 | % | | | 1.89 | % | | | 8.61 | % | | | 11.46 | % | | | 5.17 | % | |
| Ratios/Supplemental Data | | | | | | | | | | | | | | | | | | | | | | | | | |
| Net assets, end of period (000's omitted) | | $ | 221,515 | | | $ | 227,878 | | | $ | 34,753 | | | $ | 24,863 | | | $ | 21,089 | | | $ | 17,617 | | |
| Ratios (As a percentage of average daily net assets): | | | | | | | | | | | | | | | | | | | | | | | | | |
| Expenses(4) | | | 0.87 | %(5) | | | 0.90 | % | | | 0.88 | % | | | 0.91 | % | | | 0.94 | % | | | 0.89 | % | |
| Expenses after custodian fee reduction(4) | | | 0.87 | %(5) | | | 0.90 | % | | | 0.87 | % | | | 0.91 | % | | | 0.91 | % | | | 0.88 | % | |
| Net investment income | | | 4.85 | %(5) | | | 5.09 | % | | | 4.97 | % | | | 5.09 | % | | | 5.00 | % | | | 5.35 | % | |
| Portfolio Turnover of the Portfolio(6) | | | - | | | | 18 | % | | | 21 | % | | | 3 | % | | | 26 | % | | | 13 | % | |
| Portfolio Turnover of the Fund | | | 7 | % | | | - | | | | - | | | | - | | | | - | | | | - | | |
(1) Net investment income per share was computed using average shares outstanding.
(2) The Fund, through its investment in the Portfolio, has adopted the provisions of the revised AICPA Audit and Accounting Guide for Investment Companies and began using the interest method to amortize premiums on fixed-income securities. The effect of this change for the year ended September 30, 2002 was to increase net investment income per share by $0.004, decrease net realized and unrealized gains per share by $0.004 and increase the ratio of net investment income to average net assets from 5.05% to 5.09%. Per-share data and ratios for t he periods prior to October 1, 2001 have not been restated to reflect this change in presentation.
(3) Returns are historical and are calculated by determining the percentage change in net asset value with all distributions reinvested. Total return is not computed on an annualized basis.
(4) Includes the Fund's share of its corresponding Portfolio's allocated expenses while the Fund was making investments directly into the Portfolio.
(5) Annualized.
(6) Portfolio turnover represents the rate of portfolio activity for the period while the Fund was making investments directly into the Portfolio.
See notes to financial statements
53
Eaton Vance Municipals Funds as of March 31, 2005
FINANCIAL STATEMENTS CONT'D
Financial Highlights
| | | California Fund - Class B | |
| | | Six Months Ended
March 31, 2005 | | Year Ended September 30, | |
| | | (Unaudited)(1) | | 2004(1) | | 2003(1) | | 2002(1)(2) | | 2001(1) | | 2000(1) | |
| Net asset value - Beginning of period | | $ | 10.060 | | | $ | 10.110 | | | $ | 10.400 | | | $ | 10.050 | | | $ | 9.490 | | | $ | 9.520 | | |
| Income (loss) from operations | | | |
| Net investment income | | $ | 0.206 | | | $ | 0.483 | | | $ | 0.481 | | | $ | 0.474 | | | $ | 0.450 | | | $ | 0.475 | | |
| Net realized and unrealized gain (loss) | | | (0.072 | ) | | | (0.083 | ) | | | (0.317 | ) | | | 0.327 | | | | 0.572 | | | | (0.024 | ) | |
| Total income from operations | | $ | 0.134 | | | $ | 0.400 | | | $ | 0.164 | | | $ | 0.801 | | | $ | 1.022 | | | $ | 0.451 | | |
| Less distributions | | | |
| From net investment income | | $ | (0.204 | ) | | $ | (0.455 | ) | | $ | (0.459 | ) | | $ | (0.455 | ) | | $ | (0.467 | ) | | $ | (0.487 | ) | |
| Total distributions | | $ | (0.204 | ) | | $ | (0.455 | ) | | $ | (0.459 | ) | | $ | (0.455 | ) | | $ | (0.467 | ) | | $ | (0.487 | ) | |
| Contingent deferred sales charges | | $ | - | | | $ | 0.005 | | | $ | 0.005 | | | $ | 0.004 | | | $ | 0.005 | | | $ | 0.006 | | |
| Net asset value - End of period | | $ | 9.990 | | | $ | 10.060 | | | $ | 10.110 | | | $ | 10.400 | | | $ | 10.050 | | | $ | 9.490 | | |
| Total Return(3) | | | 1.50 | %(4) | | | 4.14 | % | | | 1.73 | % | | | 8.30 | % | | | 11.09 | % | | | 5.06 | % | |
| Ratios/Supplemental Data | | | |
| Net assets, end of period (000's omitted) | | $ | 2,848 | | | $ | 1,983 | | | $ | 212,145 | | | $ | 233,973 | | | $ | 226,303 | | | $ | 220,693 | | |
| Ratios (As a percentage of average daily net assets): | | | | | | | | | | | | | | | | | | | | | | | | | |
| Expenses(5) | | | 1.62 | %(6) | | | 1.10 | % | | | 1.09 | % | | | 1.24 | % | | | 1.26 | % | | | 1.13 | % | |
| Expenses after custodian fee reduction(5) | | | 1.62 | %(6) | | | 1.10 | % | | | 1.08 | % | | | 1.24 | % | | | 1.23 | % | | | 1.12 | % | |
| Net investment income | | | 4.09 | %(6) | | | 4.75 | % | | | 4.79 | % | | | 4.77 | % | | | 4.58 | % | | | 5.13 | % | |
| Portfolio Turnover of the Portfolio(7) | | | - | | | | 18 | % | | | 21 | % | | | 3 | % | | | 26 | % | | | 13 | % | |
| Portfolio Turnover of the Fund | | | 7 | % | | | - | | | | - | | | | - | | | | - | | | | - | | |
(1) Net investment income per share was computed using average shares outstanding.
(2) The Fund, through its investment in the Portfolio, has adopted the provisions of the revised AICPA Audit and Accounting Guide for Investment Companies and began using the interest method to amortize premiums on fixed-income securities. The effect of this change for the year ended September 30, 2002 was to increase net investment income per share by $0.004, decrease net realized and unrealized gains per share by $0.004 and increase the ratio of net investment income to average net assets from 4.73% to 4.77%. Per-share data and ratios for t he periods prior to October 1, 2001 have not been restated to reflect this change in presentation.
(3) Returns are historical and are calculated by determining the percentage change in net asset value with all distributions reinvested. Total return is not computed on an annualized basis.
(4) Total return reflects an increase of 0.18% due to a change in the timing of the payment and reinvestment of distributions.
(5) Includes the Fund's share of its corresponding Portfolio's allocated expenses while the Fund was making investments directly into the Portfolio.
(6) Annualized.
(7) Portfolio turnover represents the rate of portfolio activity for the period while the Fund was making investments directly into the Portfolio.
See notes to financial statements
54
Eaton Vance Municipals Funds as of March 31, 2005
FINANCIAL STATEMENTS CONT'D
Financial Highlights
| | | California Fund - Class C | |
| | | Six Months Ended
March 31, 2005
(Unaudited)(1) | | Year Ended
September 30, 2004(1)(2) | |
| Net asset value - Beginning of period | | $ | 10.060 | | | $ | 10.000 | | |
| Income (loss) from operations | | | |
| Net investment income | | $ | 0.185 | | | $ | 0.033 | | |
| Net realized and unrealized gain (loss) | | | (0.051 | ) | | | 0.062 | | |
| Total income from operations | | $ | 0.134 | | | $ | 0.095 | | |
| Less distributions | | | |
| From net investment income | | $ | (0.204 | ) | | $ | (0.035 | ) | |
| Total distributions | | $ | (0.204 | ) | | $ | (0.035 | ) | |
| Net asset value - End of period | | $ | 9.990 | | | $ | 10.060 | | |
| Total Return(3) | | | 1.42 | %(4) | | | 0.86 | % | |
| Ratios/Supplemental Data | | | |
| Net assets, end of period (000's omitted) | | $ | 917 | | | $ | 96 | | |
| Ratios (As a percentage of average daily net assets): | | | | | | | | | |
| Expenses(5) | | | 1.62 | %(6) | | | 1.65 | %(6) | |
| Expenses after custodian fee reduction(5) | | | 1.62 | %(6) | | | 1.65 | %(6) | |
| Net investment income | | | 3.69 | %(6) | | | 4.24 | %(6) | |
| Portfolio Turnover of the Portfolio(7) | | | - | | | | 18 | % | |
| Portfolio Turnover of the Fund | | | 7 | % | | | - | | |
(1) Net investment income per share was computed using average shares outstanding.
(2) For the period from the start of business, August 31, 2004 to September 30, 2004.
(3) Returns are historical and are calculated by determining the percentage change in net asset value with all distributions reinvested. Total return is not computed on an annualized basis.
(4) Total return reflects an increase of 0.10% due to a change in the timing of the payment and reinvestment of distributions.
(5) Includes the Fund's share of its corresponding Portfolio's allocated expenses while the Fund was making investments directly into the Portfolio.
(6) Annualized.
(7) Portfolio turnover represents the rate of portfolio activity for the period while the Fund was making investments directly into the Portfolio.
See notes to financial statements
55
Eaton Vance Municipals Funds as of March 31, 2005
FINANCIAL STATEMENTS CONT'D
Financial Highlights
| | | Florida Fund - Class A | |
| | | Six Months Ended
March 31, 2005 | | Year Ended September 30, | |
| | | (Unaudited)(1) | | 2004(1) | | 2003(1) | | 2002(1)(2) | | 2001(1) | | 2000(1) | |
| Net asset value - Beginning of period | | $ | 10.580 | | | $ | 10.680 | | | $ | 10.940 | | | $ | 10.630 | | | $ | 10.010 | | | $ | 10.190 | | |
| Income (loss) from operations | | | |
| Net investment income | | $ | 0.257 | | | $ | 0.536 | | | $ | 0.548 | | | $ | 0.572 | | | $ | 0.561 | | | $ | 0.535 | | |
| Net realized and unrealized gain (loss) | | | (0.027 | ) | | | (0.098 | ) | | | (0.259 | ) | | | 0.287 | | | | 0.593 | | | | (0.051 | ) | |
| Total income from operations | | $ | 0.230 | | | $ | 0.438 | | | $ | 0.289 | | | $ | 0.859 | | | $ | 1.154 | | | $ | 0.484 | | |
| Less distributions | | | |
| From net investment income | | $ | (0.260 | ) | | $ | (0.538 | ) | | $ | (0.549 | ) | | $ | (0.549 | ) | | $ | (0.534 | ) | | $ | (0.539 | ) | |
| From net realized gain | | | - | | | | - | | | | - | | | | - | | | | - | | | | (0.125 | ) | |
| Total distributions | | $ | (0.260 | ) | | $ | (0.538 | ) | | $ | (0.549 | ) | | $ | (0.549 | ) | | $ | (0.534 | ) | | $ | (0.664 | ) | |
| Net asset value - End of period | | $ | 10.550 | | | $ | 10.580 | | | $ | 10.680 | | | $ | 10.940 | | | $ | 10.630 | | | $ | 10.010 | | |
| Total Return(3) | | | 2.19 | % | | | 4.18 | % | | | 2.76 | % | | | 8.38 | % | | | 11.76 | % | | | 5.05 | % | |
| Ratios/Supplemental Data | | | |
| Net assets, end of period (000's omitted) | | $ | 191,107 | | | $ | 193,379 | | | $ | 25,996 | | | $ | 21,866 | | | $ | 14,759 | | | $ | 12,558 | | |
| Ratios (As a percentage of average daily net assets): | | | | | | | | | | | | | | | | | | | | | | | | | |
| Expenses(4) | | | 0.83 | %(5) | | | 0.82 | % | | | 0.79 | % | | | 0.86 | % | | | 0.85 | % | | | 0.89 | % | |
| Expenses after custodian fee reduction(4) | | | 0.82 | %(5) | | | 0.82 | % | | | 0.78 | % | | | 0.82 | % | | | 0.79 | % | | | 0.84 | % | |
| Net investment income | | | 4.86 | %(5) | | | 5.09 | % | | | 5.12 | % | | | 5.40 | % | | | 5.38 | % | | | 5.42 | % | |
| Portfolio Turnover of the Portfolio(6) | | | - | | | | 9 | % | | | 23 | % | | | 19 | % | | | 11 | % | | | 12 | % | |
| Portfolio Turnover of the Fund | | | 9 | % | | | - | | | | - | | | | - | | | | - | | | | - | | |
(1) Net investment income per share was computed using average shares outstanding.
(2) The Fund, through its investment in the Portfolio, has adopted the provisions of the revised AICPA Audit and Accounting Guide for Investment Companies and began using the interest method to amortize premiums on fixed-income securities. The effect of this change for the year ended September 30, 2002 was to increase net investment income per share by $0.001, decrease net realized and unrealized gains per share by $0.001 and increase the ratio of net investment income to average net assets from 5.39% to 5.40%. Per share data and ratios for t he periods prior to October 1, 2001 have not been restated to reflect this change in presentation.
(3) Returns are historical and are calculated by determining the percentage change in net asset value with all distributions reinvested. Total return is not computed on an annualized basis.
(4) Includes the Fund's share of its corresponding Portfolio's allocated expenses while the Fund was making investments directly into the Portfolio.
(5) Annualized.
(6) Portfolio turnover represents the rate of Portfolio activity for the period while the Fund was making investments directly into the Portfolio.
See notes to financial statements
56
Eaton Vance Municipals Funds as of March 31, 2005
FINANCIAL STATEMENTS CONT'D
Financial Highlights
| | | Florida Fund - Class B | |
| | | Six Months Ended
March 31, 2005 | | Year Ended September 30, | |
| | | (Unaudited)(1) | | 2004(1) | | 2003(1) | | 2002(1)(2) | | 2001(1) | | 2000(1) | |
| Net asset value - Beginning of period | | $ | 10.840 | | | $ | 10.950 | | | $ | 11.220 | | | $ | 10.900 | | | $ | 10.270 | | | $ | 10.430 | | |
| Income (loss) from operations | | | | | | | | | | | | | | | | | | | | | | | | | |
| Net investment income | | $ | 0.223 | | | $ | 0.469 | | | $ | 0.482 | | | $ | 0.507 | | | $ | 0.495 | | | $ | 0.479 | | |
| Net realized and unrealized gain (loss) | | | (0.028 | ) | | | (0.110 | ) | | | (0.272 | ) | | | 0.293 | | | | 0.603 | | | | (0.046 | ) | |
| Total income from operations | | $ | 0.195 | | | $ | 0.359 | | | $ | 0.210 | | | $ | 0.800 | | | $ | 1.098 | | | $ | 0.433 | | |
| Less distributions | | | | | | | | | | | | | | | | | | | | | | | | | |
| From net investment income | | $ | (0.225 | ) | | $ | (0.469 | ) | | $ | (0.480 | ) | | $ | (0.480 | ) | | $ | (0.468 | ) | | $ | (0.468 | ) | |
| From net realized gain | | | - | | | | - | | | | - | | | | - | | | | - | | | | (0.125 | ) | |
| Total distributions | | $ | (0.225 | ) | | $ | (0.469 | ) | | $ | (0.480 | ) | | $ | (0.480 | ) | | $ | (0.468 | ) | | $ | (0.593 | ) | |
| Net asset value - End of period | | $ | 10.810 | | | $ | 10.840 | | | $ | 10.950 | | | $ | 11.220 | | | $ | 10.900 | | | $ | 10.270 | | |
| Total Return(3) | | | 1.98 | %(4) | | | 3.34 | % | | | 1.93 | % | | | 7.56 | % | | | 10.93 | % | | | 4.38 | % | |
| Ratios/Supplemental Data | | | | | | | | | | | | | | | | | | | | | | | | | |
| Net assets, end of period (000's omitted) | | $ | 45,309 | | | $ | 51,162 | | | $ | 236,914 | | | $ | 254,603 | | | $ | 257,813 | | | $ | 264,028 | | |
| Ratios (As a percentage of average daily net assets): | | | | | | | | | | | | | | | | | | | | | | | | | |
| Expenses(5) | | | 1.58 | %(6) | | | 1.57 | % | | | 1.54 | % | | | 1.61 | % | | | 1.60 | % | | | 1.58 | % | |
| Expenses after custodian fee reduction(5) | | | 1.57 | %(6) | | | 1.57 | % | | | 1.53 | % | | | 1.57 | % | | | 1.54 | % | | | 1.53 | % | |
| Net investment income | | | 4.11 | %(6) | | | 4.26 | % | | | 4.39 | % | | | 4.67 | % | | | 4.64 | % | | | 4.73 | % | |
| Portfolio Turnover of the Portfolio(7) | | | - | | | | 9 | % | | | 23 | % | | | 19 | % | | | 11 | % | | | 12 | % | |
| Portfolio Turnover of the Fund | | | 9 | % | | | - | | | | - | | | | - | | | | - | | | | - | | |
(1) Net investment income per share was computed using average shares outstanding.
(2) The Fund, through its investment in the Portfolio, has adopted the provisions of the revised AICPA Audit and Accounting Guide for Investment Companies and began using the interest method to amortize premiums on fixed-income securities. The effect of this change for the year ended September 30, 2002 was to increase net investment income per share by $0.001, decrease net realized and unrealized gains per share by $0.001 and increase the ratio of net investment income to average net assets from 4.66% to 4.67%. Per share data and ratios for t he periods prior to October 1, 2001 have not been restated to reflect this change in presentation.
(3) Returns are historical and are calculated by determining the percentage change in net asset value with all distributions reinvested. Total return is not computed on an annualized basis.
(4) Total return reflects an increase of 0.18% due to a change in the timing of the payment and reinvestment of distributions.
(5) Includes the Fund's share of its corresponding Portfolio's allocated expenses while the Fund was making investments directly into the Portfolio.
(6) Annualized.
(7) Portfolio turnover represents the rate of portfolio activity for the period while the Fund was making investments directly into the Portfolio.
See notes to financial statements
57
Eaton Vance Municipals Funds as of March 31, 2005
FINANCIAL STATEMENTS CONT'D
Financial Highlights
| | | Massachusetts Fund - Class A | |
| | | Six Months Ended
March 31, 2005 | | Year Ended September 30, | |
| | | (Unaudited)(1) | | 2004(1) | | 2003(1) | | 2002(1)(2) | | 2001(1) | | 2000(1) | |
| Net asset value - Beginning of period | | $ | 9.660 | | | $ | 9.680 | | | $ | 9.850 | | | $ | 9.550 | | | $ | 9.020 | | | $ | 9.110 | | |
| Income (loss) from operations | | | |
| Net investment income | | $ | 0.230 | | | $ | 0.484 | | | $ | 0.492 | | | $ | 0.496 | | | $ | 0.484 | | | $ | 0.478 | | |
| Net realized and unrealized gain (loss) | | | (0.035 | ) | | | (0.020 | ) | | | (0.180 | ) | | | 0.285 | | | | 0.531 | | | | (0.071 | ) | |
| Total income from operations | | $ | 0.195 | | | $ | 0.464 | | | $ | 0.312 | | | $ | 0.781 | | | $ | 1.015 | | | $ | 0.407 | | |
| Less distributions | | | |
| From net investment income | | $ | (0.235 | ) | | $ | (0.484 | ) | | $ | (0.482 | ) | | $ | (0.481 | ) | | $ | (0.485 | ) | | $ | (0.497 | ) | |
| Total distributions | | $ | (0.235 | ) | | $ | (0.484 | ) | | $ | (0.482 | ) | | $ | (0.481 | ) | | $ | (0.485 | ) | | $ | (0.497 | ) | |
| Net asset value - End of period | | $ | 9.620 | | | $ | 9.660 | | | $ | 9.680 | | | $ | 9.850 | | | $ | 9.550 | | | $ | 9.020 | | |
| Total Return(3) | | | 2.03 | % | | | 4.92 | % | | | 3.29 | % | | | 8.48 | % | | | 11.48 | % | | | 4.70 | % | |
| Ratios/Supplemental Data | | | |
| Net assets, end of period (000's omitted) | | $ | 151,784 | | | $ | 143,086 | | | $ | 41,413 | | | $ | 38,857 | | | $ | 26,819 | | | $ | 11,212 | | |
| Ratios (As a percentage of average daily net assets): | | | | | | | | | | | | | | | | | | | | | | | | | |
| Expenses(4) | | | 0.79 | %†(5) | | | 0.81 | % | | | 0.81 | % | | | 0.82 | % | | | 0.84 | % | | | 0.87 | % | |
| Expenses after custodian fee reduction(4) | | | 0.78 | %†(5) | | | 0.81 | % | | | 0.80 | % | | | 0.80 | % | | | 0.80 | % | | | 0.85 | % | |
| Net investment income | | | 4.76 | %†(5) | | | 5.05 | % | | | 5.09 | % | | | 5.21 | % | | | 5.10 | % | | | 5.49 | % | |
| Portfolio Turnover of the Portfolio(6) | | | - | | | | 27 | % | | | 16 | % | | | 10 | % | | | 8 | % | | | 15 | % | |
| Portfolio Turnover of the Fund | | | 7 | % | | | - | | | | - | | | | - | | | | - | | | | - | | |
† The operating expenses of the Fund reflect a reduction of the investment adviser fee. Had such actions not been taken, the ratios would have been the same.
(1) Net investment income per share was computed using average shares outstanding.
(2) The Fund, through its investment in the Portfolio, has adopted the provisions of the revised AICPA Audit and Accounting Guide for Investment Companies and began using the interest method to amortize premiums on fixed-income securities. The effect of this change for the year ended September 30, 2002 was to increase net investment income per share by $0.004, decrease net realized and unrealized gains per share by $0.004 and increase the ratio of net investment income to average net assets from 5.17% to 5.21%. Per-share data and ratios for t he periods prior to October 1, 2001 have not been restated to reflect this change in presentation.
(3) Returns are historical and are calculated by determining the percentage change in net asset value with all distributions reinvested. Total return is not computed on an annualized basis.
(4) Includes the Fund's share of its corresponding Portfolio's allocated expenses while the Fund was making investments directly into the Portfolio.
(5) Annualized.
(6) Portfolio turnover represents the rate of portfolio activity for the period while the Fund was making investments directly into the Portfolio.
See notes to financial statements
58
Eaton Vance Municipals Funds as of March 31, 2005
FINANCIAL STATEMENTS CONT'D
Financial Highlights
| | | Massachusetts Fund - Class B | |
| | | Six Months Ended
March 31, 2005 | | Year Ended September 30, | |
| | | (Unaudited)(1) | | 2004(1) | | 2003(1) | | 2002(1)(2) | | 2001(1) | | 2000(1) | |
| Net asset value - Beginning of period | | $ | 10.760 | | | $ | 10.790 | | | $ | 10.990 | | | $ | 10.660 | | | $ | 10.050 | | | $ | 10.130 | | |
| Income (loss) from operations | | | | | | | | | | | | | | | | | | | | | | | | | |
| Net investment income | | $ | 0.216 | | | $ | 0.461 | | | $ | 0.469 | | | $ | 0.476 | | | $ | 0.461 | | | $ | 0.468 | | |
| Net realized and unrealized gain (loss) | | | (0.024 | ) | | | (0.031 | ) | | | (0.209 | ) | | | 0.311 | | | | 0.608 | | | | (0.088 | ) | |
| Total income from operations | | $ | 0.192 | | | $ | 0.430 | | | $ | 0.260 | | | $ | 0.787 | | | $ | 1.069 | | | $ | 0.380 | | |
| Less distributions | | | | | | | | | | | | | | | | | | | | | | | | | |
| From net investment income | | $ | (0.222 | ) | | $ | (0.460 | ) | | $ | (0.460 | ) | | $ | (0.457 | ) | | $ | (0.459 | ) | | $ | (0.460 | ) | |
| Total distributions | | $ | (0.222 | ) | | $ | (0.460 | ) | | $ | (0.460 | ) | | $ | (0.457 | ) | | $ | (0.459 | ) | | $ | (0.460 | ) | |
| Net asset value - End of period | | $ | 10.730 | | | $ | 10.760 | | | $ | 10.790 | | | $ | 10.990 | | | $ | 10.660 | | | $ | 10.050 | | |
| Total Return(3) | | | 1.97 | %(4) | | | 4.07 | % | | | 2.43 | % | | | 7.61 | % | | | 10.87 | % | | | 3.93 | % | |
| Ratios/Supplemental Data | | | | | | | | | | | | | | | | | | | | | | | | | |
| Net assets, end of period (000's omitted) | | $ | 56,420 | | | $ | 59,036 | | | $ | 160,416 | | | $ | 169,602 | | | $ | 163,028 | | | $ | 157,801 | | |
| Ratios (As a percentage of average daily net assets): | | | | | | | | | | | | | | | | | | | | | | | | | |
| Expenses(5) | | | 1.54 | %†(6) | | | 1.56 | % | | | 1.56 | % | | | 1.57 | % | | | 1.59 | % | | | 1.61 | % | |
| Expenses after custodian fee reduction(5) | | | 1.53 | %†(6) | | | 1.56 | % | | | 1.55 | % | | | 1.55 | % | | | 1.55 | % | | | 1.59 | % | |
| Net investment income | | | 4.02 | %†(6) | | | 4.26 | % | | | 4.35 | % | | | 4.49 | % | | | 4.41 | % | | | 4.74 | % | |
| Portfolio Turnover of the Portfolio(7) | | | - | | | | 27 | % | | | 16 | % | | | 10 | % | | | 8 | % | | | 15 | % | |
| Portfolio Turnover of the Fund | | | 7 | % | | | - | | | | - | | | | - | | | | - | | | | - | | |
† The operating expenses of the Fund reflect a reduction of the investment adviser fee. Had such actions not been taken, the ratios would have been the same.
(1) Net investment income per share was computed using average shares outstanding.
(2) The Fund, through its investment in the Portfolio, has adopted the provisions of the revised AICPA Audit and Accounting Guide for Investment Companies and began using the interest method to amortize premiums on fixed-income securities. The effect of this change for the year ended September 30, 2002 was to increase net investment income per share by $0.004, decrease net realized and unrealized gains per share by $0.004 and increase the ratio of net investment income to average net assets from 4.45% to 4.49%. Per-share data and ratios for t he periods prior to October 1, 2001 have not been restated to reflect this change in presentation.
(3) Returns are historical and are calculated by determining the percentage change in net asset value with all distributions reinvested. Total return is not computed on an annualized basis.
(4) Total return reflects an increase of 0.18% due to a change in the timing of the payment and reinvestment of distributions.
(5) Includes the Fund's share of its corresponding Portfolio's allocated expenses while the Fund was making investments directly into the Portfolio.
(6) Annualized.
(7) Portfolio turnover represents the rate of portfolio activity for the period while the Fund was making investments directly into the Portfolio.
See notes to financial statements
59
Eaton Vance Municipals Funds as of March 31, 2005
FINANCIAL STATEMENTS CONT'D
Financial Highlights
| | | Massachusetts Fund - Class I | |
| | | Six Months Ended
March 31, 2005 | | Year Ended September 30, | |
| | | (Unaudited)(1) | | 2004(1) | | 2003(1) | | 2002(1)(2) | | 2001(1) | | 2000(1) | |
| Net asset value - Beginning of period | | $ | 9.970 | | | $ | 10.000 | | | $ | 10.170 | | | $ | 9.870 | | | $ | 9.310 | | | $ | 9.390 | | |
| Income (loss) from operations | | | |
| Net investment income | | $ | 0.248 | | | $ | 0.521 | | | $ | 0.529 | | | $ | 0.534 | | | $ | 0.518 | | | $ | 0.519 | | |
| Net realized and unrealized gain (loss) | | | (0.025 | ) | | | (0.031 | ) | | | (0.182 | ) | | | 0.281 | | | | 0.559 | | | | (0.079 | ) | |
| Total income from operations | | $ | 0.223 | | | $ | 0.490 | | | $ | 0.347 | | | $ | 0.815 | | | $ | 1.077 | | | $ | 0.440 | | |
| Less distributions | | | |
| From net investment income | | $ | (0.253 | ) | | $ | (0.520 | ) | | $ | (0.517 | ) | | $ | (0.515 | ) | | $ | (0.517 | ) | | $ | (0.520 | ) | |
| Total distributions | | $ | (0.253 | ) | | $ | (0.520 | ) | | $ | (0.517 | ) | | $ | (0.515 | ) | | $ | (0.517 | ) | | $ | (0.520 | ) | |
| Net asset value - End of period | | $ | 9.940 | | | $ | 9.970 | | | $ | 10.000 | | | $ | 10.170 | | | $ | 9.870 | | | $ | 9.310 | | |
| Total Return(3) | | | 2.46 | %(4) | | | 5.04 | % | | | 3.51 | % | | | 8.55 | % | | | 11.87 | % | | | 4.92 | % | |
| Ratios/Supplemental Data | | | |
| Net assets, end of period (000's omitted) | | $ | 8,275 | | | $ | 8,321 | | | $ | 7,608 | | | $ | 8,880 | | | $ | 6,957 | | | $ | 7,259 | | |
| Ratios (As a percentage of average daily net assets): | | | | | | | | | | | | | | | | | | | | | | | | | |
| Expenses(5) | | | 0.59 | %†(6) | | | 0.61 | % | | | 0.61 | % | | | 0.62 | % | | | 0.64 | % | | | 0.68 | % | |
| Expenses after custodian fee reduction(5) | | | 0.58 | %†(6) | | | 0.61 | % | | | 0.60 | % | | | 0.60 | % | | | 0.60 | % | | | 0.66 | % | |
| Net investment income | | | 4.96 | %†(6) | | | 5.23 | % | | | 5.29 | % | | | 5.44 | % | | | 5.36 | % | | | 5.67 | % | |
| Portfolio Turnover of the Portfolio(7) | | | - | | | | 27 | % | | | 16 | % | | | 10 | % | | | 8 | % | | | 15 | % | |
| Portfolio Turnover of the Fund | | | 7 | % | | | - | | | | - | | | | - | | | | - | | | | - | | |
† The operating expenses of the Fund reflect a reduction of the investment adviser fee. Had such actions not been taken, the ratios would have been the same.
(1) Net investment income per share was computed using average shares outstanding.
(2) The Fund, through its investment in the Portfolio, has adopted the provisions of the revised AICPA Audit and Accounting Guide for Investment Companies and began using the interest method to amortize premiums on fixed-income securities. The effect of this change for the year ended September 30, 2002 was to increase net investment income per share by $0.004, decrease net realized and unrealized gains per share by $0.004 and increase the ratio of net investment income to average net assets from 5.40% to 5.44%. Per-share data and ratios for t he periods prior to October 1, 2001 have not been restated to reflect this change in presentation.
(3) Returns are historical and are calculated by determining the percentage change in net asset value with all distributions reinvested. Total return is not computed on an annualized basis.
(4) Total return reflects an increase of 0.22% due to a change in the timing of the payment and reinvestment of distributions.
(5) Includes the Fund's share of its corresponding Portfolio's allocated expenses while the Fund was making investments directly into the Portfolio.
(6) Annualized.
(7) Portfolio turnover represents the rate of portfolio activity for the period while the Fund was making investments directly into the Portfolio.
See notes to financial statements
60
Eaton Vance Municipals Funds as of March 31, 2005
FINANCIAL STATEMENTS CONT'D
Financial Highlights
| | | Mississippi Fund - Class A | |
| | | Six Months Ended
March 31, 2005 | | Year Ended September 30, | |
| | | (Unaudited)(1) | | 2004(1) | | 2003(1) | | 2002(1)(2) | | 2001(1) | | 2000(1) | |
| Net asset value - Beginning of period | | $ | 9.720 | | | $ | 9.840 | | | $ | 10.000 | | | $ | 9.750 | | | $ | 9.310 | | | $ | 9.350 | | |
| Income (loss) from operations | | | |
| Net investment income | | $ | 0.220 | | | $ | 0.455 | | | $ | 0.473 | | | $ | 0.471 | | | $ | 0.469 | | | $ | 0.459 | | |
| Net realized and unrealized gain (loss) | | | (0.106 | ) | | | (0.116 | ) | | | (0.163 | ) | | | 0.249 | | | | 0.441 | | | | (0.023 | ) | |
| Total income from operations | | $ | 0.114 | | | $ | 0.339 | | | $ | 0.310 | | | $ | 0.720 | | | $ | 0.910 | | | $ | 0.436 | | |
| Less distributions | | | |
| From net investment income | | $ | (0.224 | ) | | $ | (0.459 | ) | | $ | (0.470 | ) | | $ | (0.470 | ) | | $ | (0.470 | ) | | $ | (0.476 | ) | |
| Total distributions | | $ | (0.224 | ) | | $ | (0.459 | ) | | $ | (0.470 | ) | | $ | (0.470 | ) | | $ | (0.470 | ) | | $ | (0.476 | ) | |
| Net asset value - End of period | | $ | 9.610 | | | $ | 9.720 | | | $ | 9.840 | | | $ | 10.000 | | | $ | 9.750 | | | $ | 9.310 | | |
| Total Return(3) | | | 1.17 | % | | | 3.54 | % | | | 3.21 | % | | | 7.64 | % | | | 9.98 | % | | | 4.87 | % | |
| Ratios/Supplemental Data | | | |
| Net assets, end of period (000's omitted) | | $ | 12,410 | | | $ | 11,379 | | | $ | 2,727 | | | $ | 1,945 | | | $ | 2,131 | | | $ | 1,269 | | |
| Ratios (As a percentage of average daily net assets): | | | | | | | | | | | | | | | | | | | | | | | | | |
| Expenses(4) | | | 0.85 | %(5) | | | 0.84 | % | | | 0.81 | % | | | 0.90 | % | | | 0.88 | % | | | 1.02 | % | |
| Expenses after custodian fee reduction(4) | | | 0.82 | %(5) | | | 0.83 | % | | | 0.79 | % | | | 0.88 | % | | | 0.83 | % | | | 1.00 | % | |
| Net investment income | | | 4.54 | %(5) | | | 4.70 | % | | | 4.81 | % | | | 4.85 | % | | | 4.88 | % | | | 5.02 | % | |
| Portfolio Turnover of the Portfolio(6) | | | - | | | | 15 | % | | | 11 | % | | | 10 | % | | | 11 | % | | | 4 | % | |
| Portfolio Turnover of the Fund | | | 3 | % | | | - | | | | - | | | | - | | | | - | | | | - | | |
(1) Net investment income per share was computed using average shares outstanding.
(2) The Fund, through its investment in the Portfolio, has adopted the provisions of the revised AICPA Audit and Accounting Guide for Investment Companies and began using the interest method to amortize premiums on fixed-income securities. The effect of this change for the year ended September 30, 2002 was to increase net investment income per share by $0.010, decrease net realized and unrealized gains per share by $0.010 and increase ratio of net investment income to average net assets from 4.75% to 4.85%. Per share data and ratios for the p eriods prior to October 1, 2001 have not been restated to reflect this change in presentation.
(3) Returns are historical and are calculated by determining the percentage change in net asset value with all distributions reinvested. Total return is not computed on an annualized basis.
(4) Includes the Fund's share of its corresponding Portfolio's allocated expenses while the Fund was making investments directly into the Portfolio.
(5) Annualized.
(6) Portfolio turnover represents the rate of portfolio activity for the period while the Fund was making investments directly into the Portfolio.
See notes to financial statements
61
Eaton Vance Municipals Funds as of March 31, 2005
FINANCIAL STATEMENTS CONT'D
Financial Highlights
| | | Mississippi Fund - Class B | |
| | | Six Months Ended
March 31, 2005 | | Year Ended September 30, | |
| | | (Unaudited)(1) | | 2004(1) | | 2003(1) | | 2002(1)(2) | | 2001(1) | | 2000(1) | |
| Net asset value - Beginning of period | | $ | 9.940 | | | $ | 10.060 | | | $ | 10.220 | | | $ | 9.970 | | | $ | 9.530 | | | $ | 9.560 | | |
| Income (loss) from operations | | | |
| Net investment income | | $ | 0.188 | | | $ | 0.393 | | | $ | 0.409 | | | $ | 0.409 | | | $ | 0.407 | | | $ | 0.404 | | |
| Net realized and unrealized gain (loss) | | | (0.107 | ) | | | (0.119 | ) | | | (0.163 | ) | | | 0.247 | | | | 0.444 | | | | (0.023 | ) | |
| Total income from operations | | $ | 0.081 | | | $ | 0.274 | | | $ | 0.246 | | | $ | 0.656 | | | $ | 0.851 | | | $ | 0.381 | | |
| Less distributions | | | |
| From net investment income | | $ | (0.191 | ) | | $ | (0.394 | ) | | $ | (0.406 | ) | | $ | (0.406 | ) | | $ | (0.411 | ) | | $ | (0.411 | ) | |
| Total distributions | | $ | (0.191 | ) | | $ | (0.394 | ) | | $ | (0.406 | ) | | $ | (0.406 | ) | | $ | (0.411 | ) | | $ | (0.411 | ) | |
| Net asset value - End of period | | $ | 9.830 | | | $ | 9.940 | | | $ | 10.060 | | | $ | 10.220 | | | $ | 9.970 | | | $ | 9.530 | | |
| Total Return(3) | | | 0.98 | %(4) | | | 2.79 | % | | | 2.47 | % | | | 6.75 | % | | | 9.13 | % | | | 4.14 | % | |
| Ratios/Supplemental Data | | | |
| Net assets, end of period (000's omitted) | | $ | 5,818 | | | $ | 6,013 | | | $ | 15,018 | | | $ | 15,202 | | | $ | 14,706 | | | $ | 14,356 | | |
| Ratios (As a percentage of average daily net assets): | | | | | | | | | | | | | | | | | | | | | | | | | |
| Expenses(5) | | | 1.60 | %(6) | | | 1.59 | % | | | 1.56 | % | | | 1.65 | % | | | 1.63 | % | | | 1.76 | % | |
| Expenses after custodian fee reduction(5) | | | 1.57 | %(6) | | | 1.58 | % | | | 1.54 | % | | | 1.63 | % | | | 1.58 | % | | | 1.74 | % | |
| Net investment income | | | 3.79 | %(6) | | | 3.93 | % | | | 4.07 | % | | | 4.11 | % | | | 4.15 | % | | | 4.28 | % | |
| Portfolio Turnover of the Portfolio(7) | | | - | | | | 15 | % | | | 11 | % | | | 10 | % | | | 11 | % | | | 4 | % | |
| Portfolio Turnover of the Fund | | | 3 | % | | | - | | | | - | | | | - | | | | - | | | | - | | |
(1) Net investment income per share was computed using average shares outstanding.
(2) The Fund, through its investment in the Portfolio, has adopted the provisions of the revised AICPA Audit and Accounting Guide for Investment Companies and began using the interest method to amortize premiums on fixed-income securities. The effect of this change for the year ended September 30, 2002 was to increase net investment income per share by $0.010, decrease net realized and unrealized gains per share by $0.010 and increase the ratio of net investment income to average net assets from 4.01% to 4.11%. Per share data and ratios for t he periods prior to October 1, 2001 have not been restated to reflect this change in presentation.
(3) Returns are historical and are calculated by determining the percentage change in net asset value with all distributions reinvested. Total return is not computed on an annualized basis.
(4) Total return reflects an increase of 0.17% due to a change in the timing of payment and reinvestment of distributions.
(5) Includes the Fund's share of its corresponding Portfolio's allocated expenses while the Fund was making investments directly into the Portfolio.
(6) Annualized.
(7) Portfolio turnover represents the rate of portfolio activity for the period while the Fund was making investments directly into the Portfolio.
See notes to financial statements
62
Eaton Vance Municipals Funds as of March 31, 2005
FINANCIAL STATEMENTS CONT'D
Financial Highlights
| | | New York Fund - Class A | |
| | | Six Months Ended
March 31, 2005 | | Year Ended September 30, | |
| | | (Unaudited)(1) | | 2004(1) | | 2003(1) | | 2002(1)(2) | | 2001(1) | | 2000(1) | |
| Net asset value - Beginning of period | | $ | 10.800 | | | $ | 10.920 | | | $ | 11.070 | | | $ | 10.610 | | | $ | 9.910 | | | $ | 9.860 | | |
| Income (loss) from operations | | | |
| Net investment income | | $ | 0.257 | | | $ | 0.542 | | | $ | 0.539 | | | $ | 0.543 | | | $ | 0.505 | | | $ | 0.515 | | |
| Net realized and unrealized gain (loss) | | | (0.094 | ) | | | (0.049 | ) | | | (0.165 | ) | | | 0.430 | | | | 0.709 | | | | 0.061 | | |
| Total income from operations | | $ | 0.163 | | | $ | 0.493 | | | $ | 0.374 | | | $ | 0.973 | | | $ | 1.214 | | | $ | 0.576 | | |
| Less distributions | | | |
| From net investment income | | $ | (0.263 | ) | | $ | (0.587 | ) | | $ | (0.518 | ) | | $ | (0.513 | ) | | $ | (0.506 | ) | | $ | (0.526 | ) | |
| From net realized gain | | | - | | | | (0.026 | ) | | | (0.006 | ) | | | - | | | | (0.008 | ) | | | - | | |
| Total distributions | | $ | (0.263 | ) | | $ | (0.613 | ) | | $ | (0.524 | ) | | $ | (0.513 | ) | | $ | (0.514 | ) | | $ | (0.526 | ) | |
| Net asset value - End of period | | $ | 10.700 | | | $ | 10.800 | | | $ | 10.920 | | | $ | 11.070 | | | $ | 10.610 | | | $ | 9.910 | | |
| Total Return(3) | | | 1.52 | % | | | 4.66 | % | | | 3.54 | % | | | 9.49 | % | | | 12.48 | % | | | 6.09 | % | |
| Ratios/Supplemental Data | | | |
| Net assets, end of period (000's omitted) | | $ | 349,632 | | | $ | 335,153 | | | $ | 42,481 | | | $ | 29,817 | | | $ | 20,429 | | | $ | 11,411 | | |
| Ratios (As a percentage of average daily net assets): | | | | | | | | | | | | | | | | | | | | | | | | | |
| Expenses(4) | | | 0.80 | %(5) | | | 0.82 | % | | | 0.80 | % | | | 0.82 | % | | | 0.85 | % | | | 0.83 | % | |
| Expenses after custodian fee reduction(4) | | | 0.79 | %(5) | | | 0.82 | % | | | 0.80 | % | | | 0.82 | % | | | 0.85 | % | | | 0.83 | % | |
| Net investment income | | | 4.77 | %(5) | | | 5.07 | % | | | 4.99 | % | | | 5.11 | % | | | 4.81 | % | | | 5.29 | % | |
| Portfolio Turnover of the Portfolio(6) | | | - | | | | 26 | % | | | 19 | % | | | 7 | % | | | 19 | % | | | 27 | % | |
| Portfolio Turnover of the Fund | | | 23 | % | | | - | | | | - | | | | - | | | | - | | | | - | | |
(1) Net investment income per share was computed using average shares outstanding.
(2) The Fund, through its investment in the Portfolio, has adopted the provisions of the revised AICPA Audit and Accounting Guide for Investment Companies and began using the interest method to amortize premiums on fixed-income securities. The effect of this change for the year ended September 30, 2002 was to increase net investment income per share by $0.002, decrease net realized and unrealized gains per share by $0.002 and increase the ratio of net investment income to average net assets from 5.09% to 5.11%. Per share data and ratios for t he periods prior to October 1, 2001 have not been restated to reflect this change in presentation.
(3) Returns are historical and are calculated by determining the percentage change in net asset value with all distributions reinvested. Total return is not computed on an annualized basis.
(4) Includes the Fund's share of its corresponding Portfolio's allocated expenses while the Fund was making investments directly into the Portfolio.
(5) Annualized.
(6) Portfolio turnover represents the rate of portfolio activity for the period while the Fund was making investments directly into the Portfolio.
See notes to financial statements
63
Eaton Vance Municipals Funds as of March 31, 2005
FINANCIAL STATEMENTS CONT'D
Financial Highlights
| | | New York Fund - Class B | |
| | | Six Months Ended
March 31, 2005 | | Year Ended September 30, | |
| | | (Unaudited)(1) | | 2004(1) | | 2003(1) | | 2002(1)(2) | | 2001(1) | | 2000(1) | |
| Net asset value - Beginning of period | | $ | 11.680 | | | $ | 11.800 | | | $ | 11.950 | | | $ | 11.450 | | | $ | 10.700 | | | $ | 10.640 | | |
| Income (loss) from operations | | | | | | | | | | | | | | | | | | | | | | | | | |
| Net investment income | | $ | 0.232 | | | $ | 0.576 | | | $ | 0.534 | | | $ | 0.502 | | | $ | 0.459 | | | $ | 0.474 | | |
| Net realized and unrealized gain (loss) | | | (0.101 | ) | | | (0.091 | ) | | | (0.181 | ) | | | 0.468 | | | | 0.763 | | | | 0.063 | | |
| Total income from operations | | $ | 0.131 | | | $ | 0.485 | | | $ | 0.353 | | | $ | 0.970 | | | $ | 1.222 | | | $ | 0.537 | | |
| Less distributions | | | | | | | | | | | | | | | | | | | | | | | | | |
| From net investment income | | $ | (0.241 | ) | | $ | (0.584 | ) | | $ | (0.501 | ) | | $ | (0.470 | ) | | $ | (0.464 | ) | | $ | (0.477 | ) | |
| From net realized gain | | | - | | | | (0.026 | ) | | | (0.006 | ) | | | - | | | | (0.008 | ) | | | - | | |
| Total distributions | | $ | (0.241 | ) | | $ | (0.610 | ) | | $ | (0.507 | ) | | $ | (0.470 | ) | | $ | (0.472 | ) | | $ | (0.477 | ) | |
| Contingent deferred sales charges | | $ | - | | | $ | 0.005 | | | $ | 0.004 | | | $ | - | | | $ | - | | | $ | - | | |
| Net asset value - End of period | | $ | 11.570 | | | $ | 11.680 | | | $ | 11.800 | | | $ | 11.950 | | | $ | 11.450 | | | $ | 10.700 | | |
| Total Return(3) | | | 1.30 | %(4) | | | 4.28 | % | | | 3.08 | % | | | 8.70 | % | | | 11.64 | % | | | 5.24 | % | |
| Ratios/Supplemental Data | | | | | | | | | | | | | | | | | | | | | | | | | |
| Net assets, end of period (000's omitted) | | $ | 4,264 | | | $ | 2,984 | | | $ | 307,299 | | | $ | 320,497 | | | $ | 318,217 | | | $ | 323,013 | | |
| Ratios (As a percentage of average daily net assets): | | | | | | | | | | | | | | | | | | | | | | | | | |
| Expenses(5) | | | 1.55 | %(6) | | | 0.93 | % | | | 1.23 | % | | | 1.57 | % | | | 1.61 | % | | | 1.59 | % | |
| Expenses after custodian fee reduction(5) | | | 1.54 | %(6) | | | 0.93 | % | | | 1.23 | % | | | 1.57 | % | | | 1.61 | % | | | 1.59 | % | |
| Net investment income | | | 3.99 | %(6) | | | 4.86 | % | | | 4.58 | % | | | 4.37 | % | | | 4.09 | % | | | 4.54 | % | |
| Portfolio Turnover of the Portfolio(7) | | | - | | | | 26 | % | | | 19 | % | | | 7 | % | | | 19 | % | | | 27 | % | |
| Portfolio Turnover of the Fund | | | 23 | % | | | - | | | | - | | | | - | | | | - | | | | - | | |
(1) Net investment income per share was computed using average shares outstanding.
(2) The Fund, through its investment in the Portfolio, has adopted the provisions of the revised AICPA Audit and Accounting Guide for Investment Companies and began using the interest method to amortize premiums on fixed-income securities. The effect of this change for the year ended September 30, 2002 was to increase net investment income per share by $0.002, decrease net realized and unrealized gains per share by $0.002 and increase the ratio of net investment income to average net assets from 4.35% to 4.37%. Per share data and ratios for t he periods prior to October 1, 2001 have not been restated to reflect this change in presentation.
(3) Returns are historical and are calculated by determining the percentage change in net asset value with all distributions reinvested. Total return is not computed on an annualized basis.
(4) Total return reflects an increase of 0.18% due to a change in the timing of the payment and reinvestment of distributions.
(5) Includes the Fund's share of its corresponding Portfolio's allocated expenses while the Fund was making investments directly into the Portfolio.
(6) Annualized.
(7) Portfolio turnover represents the rate of portfolio activity for the period while the Fund was making investments directly into the Portfolio.
See notes to financial statements
64
Eaton Vance Municipals Funds as of March 31, 2005
FINANCIAL STATEMENTS CONT'D
Financial Highlights
| | | New York Fund - Class C | |
| | | Six Months Ended
March 31, 2005 | | Year Ended September 30, | |
| | | (Unaudited)(1) | | 2004(1) | | 2003(1)(2) | |
| Net asset value - Beginning of period | | $ | 9.800 | | | $ | 10.050 | | | $ | 10.000 | | |
| Income (loss) from operations | | | | | | | | | | | | | |
| Net investment income | | $ | 0.191 | | | $ | 0.407 | | | $ | 0.002 | | |
| Net realized and unrealized gain (loss) | | | (0.080 | ) | | | (0.207 | ) | | | 0.049 | | |
| Total income from operations | | $ | 0.111 | | | $ | 0.200 | | | $ | 0.051 | | |
| Less distributions | | | | | | | | | | | | | |
| From net investment income | | $ | (0.201 | ) | | $ | (0.424 | ) | | $ | (0.001 | ) | |
| From net realized gain | | | - | | | | (0.026 | ) | | | - | | |
| Total distributions | | $ | (0.201 | ) | | $ | (0.450 | ) | | $ | (0.001 | ) | |
| Net asset value - End of period | | $ | 9.710 | | | $ | 9.800 | | | $ | 10.050 | | |
| Total Return(3) | | | 1.23 | %(4) | | | 1.99 | % | | | 0.50 | % | |
| Ratios/Supplemental Data | | | | | | | | | | | | | |
| Net assets, end of period (000's omitted) | | $ | 2,237 | | | $ | 940 | | | $ | 11 | | |
| Ratios (As a percentage of average daily net assets): | | | | | | | | | | | | | |
| Expenses(5) | | | 1.55 | %(6) | | | 1.56 | % | | | 1.89 | %(6) | |
| Expenses after custodian fee reduction(5) | | | 1.54 | %(6) | | | 1.56 | % | | | 1.89 | %(6) | |
| Net investment income | | | 3.90 | %(6) | | | 4.17 | % | | | 6.41 | %(6) | |
| Portfolio Turnover of the Portfolio(7) | | | - | | | | 26 | % | | | 19 | % | |
| Portfolio Turnover of the Fund | | | 23 | % | | | - | | | | - | | |
(1) Net investment income per share was computed using average shares outstanding.
(2) Class C shares commenced operations on September 30, 2003.
(3) Returns are historical and are calculated by determining the percentage change in net asset value with all distributions reinvested. Total return is not computed on an annualized basis.
(4) Total return reflects an increase of 0.10% due to a change in the timing of the payment and reinvestment of distributions.
(5) Includes the Fund's share of its corresponding Portfolio's allocated expenses while the Fund was making investments directly into the Portfolio.
(6) Annualized.
(7) Portfolio turnover represents the rate of portfolio activity for the period while the Fund was making investments directly into the Portfolio.
See notes to financial statements
65
Eaton Vance Municipals Funds as of March 31, 2005
FINANCIAL STATEMENTS CONT'D
Financial Highlights
| | | Ohio Fund - Class A | |
| | | Six Months Ended
March 31, 2005 | | Year Ended September 30, | |
| | | (Unaudited)(1) | | 2004(1) | | 2003 | | 2002(1)(2) | | 2001(1) | | 2000 | |
| Net asset value - Beginning of period | | $ | 9.180 | | | $ | 9.230 | | | $ | 9.290 | | | $ | 9.130 | | | $ | 8.920 | | | $ | 9.120 | | |
| Income (loss) from operations | | | |
| Net investment income | | $ | 0.235 | | | $ | 0.491 | | | $ | 0.499 | | | $ | 0.490 | | | $ | 0.506 | | | $ | 0.506 | | |
| Net realized and unrealized gain (loss) | | | 0.071 | | | | (0.034 | ) | | | (0.077 | ) | | | 0.148 | | | | 0.229 | | | | (0.186 | ) | |
| Total income from operations | | $ | 0.306 | | | $ | 0.457 | | | $ | 0.422 | | | $ | 0.638 | | | $ | 0.735 | | | $ | 0.320 | | |
| Less distributions | | | |
| From net investment income | | $ | (0.236 | ) | | $ | (0.507 | ) | | $ | (0.482 | ) | | $ | (0.478 | ) | | $ | (0.515 | ) | | $ | (0.516 | ) | |
| From net realized gain | | | - | | | | - | | | | - | | | | - | | | | (0.010 | ) | | | (0.004 | ) | |
| Total distributions | | $ | (0.236 | ) | | $ | (0.507 | ) | | $ | (0.482 | ) | | $ | (0.478 | ) | | $ | (0.525 | ) | | $ | (0.520 | ) | |
| Net asset value - End of period | | $ | 9.250 | | | $ | 9.180 | | | $ | 9.230 | | | $ | 9.290 | | | $ | 9.130 | | | $ | 8.920 | | |
| Total Return(3) | | | 3.36 | % | | | 5.07 | % | | | 4.73 | % | | | 7.23 | % | | | 8.43 | % | | | 3.74 | % | |
| Ratios/Supplemental Data | | | |
| Net assets, end of period (000's omitted) | | $ | 127,049 | | | $ | 126,212 | | | $ | 15,612 | | | $ | 14,526 | | | $ | 12,153 | | | $ | 8,052 | | |
| Ratios (As a percentage of average daily net assets): | | | | | | | | | | | | | | | | | | | | | | | | | |
| Expenses(4) | | | 0.83 | %(5) | | | 0.85 | % | | | 0.81 | % | | | 0.84 | % | | | 0.86 | % | | | 0.88 | % | |
| Expenses after custodian fee reduction(4) | | | 0.81 | %(5) | | | 0.85 | % | | | 0.80 | % | | | 0.83 | % | | | 0.85 | % | | | 0.88 | % | |
| Net investment income | | | 5.07 | %(5) | | | 5.38 | % | | | 5.46 | % | | | 5.40 | % | | | 5.50 | % | | | 5.74 | % | |
| Portfolio Turnover of the Portfolio(6) | | | - | | | | 9 | % | | | 15 | % | | | 15 | % | | | 22 | % | | | 28 | % | |
| Portfolio Turnover of the Fund | | | 14 | % | | | - | | | | - | | | | - | | | | - | | | | - | | |
(1) Net investment income per share was computed using average shares outstanding.
(2) The Fund, through its investment in the Portfolio, has adopted the provisions of the revised AICPA Audit and Accounting Guide for Investment Companies and began using the interest method to amortize premiums on fixed-income securities. The effect of this change for the year ended September 30, 2002 was to increase net investment income per share by less than $0.001, decrease net realized and unrealized gains per share by less than $0.001 and increase the ratio of net investment income to average net assets by less than 0.01%. Per-share da ta and ratios for the periods prior to October 1, 2001 have not been restated to reflect this change in presentation.
(3) Returns are historical and are calculated by determining the percentage change in net asset value with all distributions reinvested. Total return is not computed on an annualized basis.
(4) Includes the Fund's share of its corresponding Portfolio's allocated expenses while the Fund was making investments directly into the Portfolio.
(5) Annualized.
(6) Portfolio turnover represents the rate of portfolio activity for the period while the Fund was making investments directly into the Portfolio.
See notes to financial statements
66
Eaton Vance Municipals Funds as of March 31, 2005
FINANCIAL STATEMENTS CONT'D
Financial Highlights
| | | Ohio Fund - Class B | |
| | | Six Months Ended
March 31, 2005 | | Year Ended September 30, | |
| | | (Unaudited)(1) | | 2004(1) | | 2003 | | 2002(1)(2) | | 2001(1) | | 2000 | |
| Net asset value - Beginning of period | | $ | 10.360 | | | $ | 10.430 | | | $ | 10.490 | | | $ | 10.320 | | | $ | 10.080 | | | $ | 10.290 | | |
| Income (loss) from operations | | | | | | | | | | | | | | | | | | | | | | | | | |
| Net investment income | | $ | 0.226 | | | $ | 0.477 | | | $ | 0.489 | | | $ | 0.479 | | | $ | 0.493 | | | $ | 0.495 | | |
| Net realized and unrealized gain (loss) | | | 0.072 | | | | (0.054 | ) | | | (0.081 | ) | | | 0.154 | | | | 0.258 | | | | (0.201 | ) | |
| Total income from operations | | $ | 0.298 | | | $ | 0.423 | | | $ | 0.408 | | | $ | 0.633 | | | $ | 0.751 | | | $ | 0.294 | | |
| Less distributions | | | | | | | | | | | | | | | | | | | | | | | | | |
| From net investment income | | $ | (0.228 | ) | | $ | (0.493 | ) | | $ | (0.468 | ) | | $ | (0.463 | ) | | $ | (0.501 | ) | | $ | (0.500 | ) | |
| From net realized gain | | | - | | | | - | | | | - | | | | - | | | | (0.010 | ) | | | (0.004 | ) | |
| Total distributions | | $ | (0.228 | ) | | $ | (0.493 | ) | | $ | (0.468 | ) | | $ | (0.463 | ) | | $ | (0.511 | ) | | $ | (0.504 | ) | |
| Net asset value - End of period | | $ | 10.430 | | | $ | 10.360 | | | $ | 10.430 | | | $ | 10.490 | | | $ | 10.320 | | | $ | 10.080 | | |
| Total Return(3) | | | 3.08 | %(4) | | | 4.14 | % | | | 4.01 | % | | | 6.30 | % | | | 7.66 | % | | | 3.04 | % | |
| Ratios/Supplemental Data | | | | | | | | | | | | | | | | | | | | | | | | | |
| Net assets, end of period (000's omitted) | | $ | 34,979 | | | $ | 36,545 | | | $ | 157,077 | | | $ | 167,015 | | | $ | 169,811 | | | $ | 174,964 | | |
| Ratios (As a percentage of average daily net assets): | | | | | | | | | | | | | | | | | | | | | | | | | |
| Expenses(5) | | | 1.58 | %(6) | | | 1.60 | % | | | 1.56 | % | | | 1.59 | % | | | 1.62 | % | | | 1.65 | % | |
| Expenses after custodian fee reduction(5) | | | 1.56 | %(6) | | | 1.60 | % | | | 1.55 | % | | | 1.58 | % | | | 1.61 | % | | | 1.65 | % | |
| Net investment income | | | 4.33 | %(6) | | | 4.56 | % | | | 4.73 | % | | | 4.67 | % | | | 4.81 | % | | | 4.96 | % | |
| Portfolio Turnover of the Portfolio(7) | | | - | | | | 9 | % | | | 15 | % | | | 15 | % | | | 22 | % | | | 28 | % | |
| Portfolio Turnover of the Fund | | | 14 | % | | | - | | | | - | | | | - | | | | - | | | | - | | |
(1) Net investment income per share was computed using average shares outstanding.
(2) The Fund, through its investment in the Portfolio, has adopted the provisions of the revised AICPA Audit and Accounting Guide for Investment Companies and began using the interest method to amortize premiums on fixed-income securities. The effect of this change for the year ended September 30, 2002 was to increase net investment income per share by less than $0.001, decrease net realized and unrealized gains per share by less than $0.001 and increase the ratio of net investment income to average net assets by less than 0.01%. Per-share da ta and ratios for the periods prior to October 1, 2001 have not been restated to reflect this change in presentation.
(3) Returns are historical and are calculated by determining the percentage change in net asset value with all distributions reinvested. Total return is not computed on an annualized basis.
(4) Total return reflects an increase of 0.19% due to a change in the timing of the payment and reinvestment of distributions.
(5) Includes the Fund's share of its corresponding Portfolio's allocated expenses while the Fund was making investments directly into the Portfolio.
(6) Annualized.
(7) Portfolio turnover represents the rate of portfolio activity for the period while the Fund was making investments directly into the Portfolio.
See notes to financial statements
67
Eaton Vance Municipals Funds as of March 31, 2005
FINANCIAL STATEMENTS CONT'D
Financial Highlights
| | | Rhode Island Fund - Class A | |
| | | Six Months Ended
March 31, 2005 | | Year Ended September 30, | |
| | | (Unaudited)(1) | | 2004(1) | | 2003(1) | | 2002(1)(2) | | 2001 | | 2000 | |
| Net asset value - Beginning of period | | $ | 9.780 | | | $ | 9.760 | | | $ | 10.010 | | | $ | 9.710 | | | $ | 9.120 | | | $ | 9.070 | | |
| Income (loss) from operations | | | |
| Net investment income | | $ | 0.225 | | | $ | 0.462 | | | $ | 0.472 | | | $ | 0.472 | | | $ | 0.474 | | | $ | 0.471 | | |
| Net realized and unrealized gain (loss) | | | (0.029 | ) | | | 0.028 | | | | (0.253 | ) | | | 0.297 | | | | 0.582 | | | | 0.046 | | |
| Total income from operations | | $ | 0.196 | | | $ | 0.490 | | | $ | 0.219 | | | $ | 0.769 | | | $ | 1.056 | | | $ | 0.517 | | |
| Less distributions | | | |
| From net investment income | | $ | (0.226 | ) | | $ | (0.470 | ) | | $ | (0.469 | ) | | $ | (0.469 | ) | | $ | (0.466 | ) | | $ | (0.467 | ) | |
| Total distributions | | $ | (0.226 | ) | | $ | (0.470 | ) | | $ | (0.469 | ) | | $ | (0.469 | ) | | $ | (0.466 | ) | | $ | (0.467 | ) | |
| Net asset value - End of period | | $ | 9.750 | | | $ | 9.780 | | | $ | 9.760 | | | $ | 10.010 | | | $ | 9.710 | | | $ | 9.120 | | |
| Total Return(3) | | | 2.01 | % | | | 5.13 | % | | | 2.29 | % | | | 8.21 | % | | | 11.80 | % | | | 5.95 | % | |
| Ratios/Supplemental Data | | | |
| Net assets, end of period (000's omitted) | | $ | 27,403 | | | $ | 26,558 | | | $ | 11,701 | | | $ | 10,169 | | | $ | 7,630 | | | $ | 4,245 | | |
| Ratios (As a percentage of average daily net assets): | | | | | | | | | | | | | | | | | | | | | | | | | |
| Expenses(4) | | | 0.74 | %(5) | | | 0.77 | % | | | 0.74 | % | | | 0.75 | % | | | 0.74 | % | | | 0.79 | % | |
| Expenses after custodian fee reduction(4) | | | 0.73 | %(5) | | | 0.77 | % | | | 0.73 | % | | | 0.72 | % | | | 0.69 | % | | | 0.76 | % | |
| Net investment income | | | 4.59 | %(5) | | | 4.74 | % | | | 4.82 | % | | | 4.89 | % | | | 5.01 | % | | | 5.27 | % | |
| Portfolio Turnover of the Portfolio(6) | | | - | | | | 16 | % | | | 19 | % | | | 13 | % | | | 14 | % | | | 15 | % | |
| Portfolio Turnover of the Fund | | | 8 | % | | | - | | | | - | | | | - | | | | - | | | | - | | |
(1) Net investment income per share was computed using average shares outstanding.
(2) The Fund, through its investment in the Portfolio, has adopted the provisions of the revised AICPA Audit and Accounting Guide for Investment Companies and began using the interest method to amortize premiums on fixed-income securities. The effect of this change for the year ended September 30, 2002 was to increase net investment income per share by $0.002, decrease net realized and unrealized gains per share by $0.002 and increase the ratio of net investment income to average net assets from 4.87% to 4.89%. Per-share data and ratios for t he periods prior to October 1, 2001 have not been restated to reflect this change in presentation.
(3) Returns are historical and are calculated by determining the percentage change in net asset value with all distributions reinvested. Total return is not computed on an annualized basis.
(4) Includes the Fund's share of its corresponding Portfolio's allocated expenses while the Fund was making investments directly into the Portfolio.
(5) Annualized.
(6) Portfolio turnover represents the rate of portfolio activity for the period while the Fund was making investments directly into the Portfolio.
See notes to financial statements
68
Eaton Vance Municipals Funds as of March 31, 2005
FINANCIAL STATEMENTS CONT'D
Financial Highlights
| | | Rhode Island Fund - Class B | |
| | | Six Months Ended
March 31, 2005 | | Year Ended September 30, | |
| | | (Unaudited)(1) | | 2004(1) | | 2003(1) | | 2002(1)(2) | | 2001 | | 2000 | |
| Net asset value - Beginning of period | | $ | 10.000 | | | $ | 9.990 | | | $ | 10.250 | | | $ | 9.940 | | | $ | 9.340 | | | $ | 9.280 | | |
| Income (loss) from operations | | | |
| Net investment income | | $ | 0.192 | | | $ | 0.401 | | | $ | 0.409 | | | $ | 0.410 | | | $ | 0.414 | | | $ | 0.414 | | |
| Net realized and unrealized gain (loss) | | | (0.028 | ) | | | 0.016 | | | | (0.262 | ) | | | 0.307 | | | | 0.590 | | | | 0.048 | | |
| Total income from operations | | $ | 0.164 | | | $ | 0.417 | | | $ | 0.147 | | | $ | 0.717 | | | $ | 1.004 | | | $ | 0.462 | | |
| Less distributions | | | |
| From net investment income | | $ | (0.194 | ) | | $ | (0.407 | ) | | $ | (0.407 | ) | | $ | (0.407 | ) | | $ | (0.404 | ) | | $ | (0.402 | ) | |
| Total distributions | | $ | (0.194 | ) | | $ | (0.407 | ) | | $ | (0.407 | ) | | $ | (0.407 | ) | | $ | (0.404 | ) | | $ | (0.402 | ) | |
| Net asset value - End of period | | $ | 9.970 | | | $ | 10.000 | | | $ | 9.990 | | | $ | 10.250 | | | $ | 9.940 | | | $ | 9.340 | | |
| Total Return(3) | | | 1.80 | %(4) | | | 4.25 | % | | | 1.48 | % | | | 7.42 | % | | | 10.96 | % | | | 5.17 | % | |
| Ratios/Supplemental Data | | | |
| Net assets, end of period (000's omitted) | | $ | 24,312 | | | $ | 25,084 | | | $ | 42,930 | | | $ | 44,513 | | | $ | 37,300 | | | $ | 33,316 | | |
| Ratios (As a percentage of average daily net assets): | | | | | | | | | | | | | | | | | | | | | | | | | |
| Expenses(5) | | | 1.49 | %(6) | | | 1.52 | % | | | 1.49 | % | | | 1.50 | % | | | 1.49 | % | | | 1.56 | % | |
| Expenses after custodian fee reduction(5) | | | 1.48 | %(6) | | | 1.52 | % | | | 1.48 | % | | | 1.47 | % | | | 1.44 | % | | | 1.53 | % | |
| Net investment income | | | 3.84 | %(6) | | | 4.00 | % | | | 4.08 | % | | | 4.14 | % | | | 4.25 | % | | | 4.56 | % | |
| Portfolio Turnover of the Portfolio(7) | | | - | | | | 16 | % | | | 19 | % | | | 13 | % | | | 14 | % | | | 15 | % | |
| Portfolio Turnover of the Fund | | | 8 | % | | | - | | | | - | | | | - | | | | - | | | | - | | |
(1) Net investment income per share was computed using average shares outstanding.
(2) The Fund, through its investment in the Portfolio, has adopted the provisions of the revised AICPA Audit and Accounting Guide for Investment Companies and began using the interest method to amortize premiums on fixed-income securities. The effect of this change for the year ended September 30, 2002 was to increase net investment income per share by $0.002, decrease net realized and unrealized gains per share by $0.002 and increase the ratio of net investment income to average net assets from 4.12% to 4.14%. Per-share data and ratios for t he periods prior to October 1, 2001 have not been restated to reflect this change in presentation.
(3) Returns are historical and are calculated by determining the percentage change in net asset value with all distributions reinvested. Total return is not computed on an annualized basis.
(4) Total return reflects an increase of 0.17% due to a change in the timing of the payment and reinvestment of distributions.
(5) Includes the Fund's share of its corresponding Portfolio's allocated expenses while the Fund was making investments directly into the Portfolio.
(6) Annualized.
(7) Portfolio turnover represents the rate of portfolio activity for the period while the Fund was making investments directly into the Portfolio.
See notes to financial statements
69
Eaton Vance Municipals Funds as of March 31, 2005
FINANCIAL STATEMENTS CONT'D
Financial Highlights
| | | West Virginia Fund - Class A | |
| | | Six Months Ended
March 31, 2005 | | Year Ended September 30, | |
| | | (Unaudited)(1) | | 2004(1) | | 2003 | | 2002(1)(2) | | 2001 | | 2000(1) | |
| Net asset value - Beginning of period | | $ | 9.810 | | | $ | 9.880 | | | $ | 10.130 | | | $ | 9.750 | | | $ | 9.290 | | | $ | 9.290 | | |
| Income (loss) from operations | | | |
| Net investment income | | $ | 0.227 | | | $ | 0.462 | | | $ | 0.468 | | | $ | 0.465 | | | $ | 0.479 | | | $ | 0.459 | | |
| Net realized and unrealized gain (loss) | | | (0.084 | ) | | | (0.081 | ) | | | (0.253 | ) | | | 0.380 | | | | 0.448 | | | | 0.020 | | |
| Total income from operations | | $ | 0.143 | | | $ | 0.381 | | | $ | 0.215 | | | $ | 0.845 | | | $ | 0.927 | | | $ | 0.479 | | |
| Less distributions | | | |
| From net investment income | | $ | (0.223 | ) | | $ | (0.451 | ) | | $ | (0.465 | ) | | $ | (0.465 | ) | | $ | (0.467 | ) | | $ | (0.479 | ) | |
| Total distributions | | $ | (0.223 | ) | | $ | (0.451 | ) | | $ | (0.465 | ) | | $ | (0.465 | ) | | $ | (0.467 | ) | | $ | (0.479 | ) | |
| Net asset value - End of period | | $ | 9.730 | | | $ | 9.810 | | | $ | 9.880 | | | $ | 10.130 | | | $ | 9.750 | | | $ | 9.290 | | |
| Total Return(3) | | | 1.46 | % | | | 3.94 | % | | | 2.23 | % | | | 8.97 | % | | | 10.16 | % | | | 5.39 | % | |
| Ratios/Supplemental Data | | | |
| Net assets, end of period (000's omitted) | | $ | 18,883 | | | $ | 18,670 | | | $ | 3,522 | | | $ | 3,517 | | | $ | 2,931 | | | $ | 2,310 | | |
| Ratios (As a percentage of average daily net assets): | | | | | | | | | | | | | | | | | | | | | | | | | |
| Expenses(4) | | | 0.78 | %(5) | | | 0.79 | % | | | 0.73 | % | | | 0.78 | % | | | 0.78 | % | | | 0.91 | % | |
| Expenses after custodian fee reduction(4) | | | 0.77 | %(5) | | | 0.78 | % | | | 0.71 | % | | | 0.77 | % | | | 0.74 | % | | | 0.89 | % | |
| Net investment income | | | 4.63 | %(5) | | | 4.73 | % | | | 4.74 | % | | | 4.78 | % | | | 4.93 | % | | | 5.02 | % | |
| Portfolio Turnover of the Portfolio(6) | | | - | | | | 12 | % | | | 21 | % | | | 19 | % | | | 12 | % | | | 7 | % | |
| Portfolio Turnover of the Fund | | | 11 | % | | | - | | | | - | | | | - | | | | - | | | | - | | |
(1) Net investment income per share was computed using average shares outstanding.
(2) The Fund, through its investment in the Portfolio, has adopted the provisions of the revised AICPA Audit and Accounting Guide for Investment Companies and began using the interest method to amortize premiums on fixed-income securities. The effect of this change for the year ended September 30, 2002 was to increase net investment income per share by $0.003, decrease net realized and unrealized gains per share by $0.003 and increase the ratio of net investment income to average net assets from 4.75% to 4.78%. Per share data and ratios for t he periods prior to October 1, 2001 have not been restated to reflect this change in presentation.
(3) Returns are historical and are calculated by determining the percentage change in net asset value with all distributions reinvested. Total return is not computed on an annualized basis.
(4) Includes the Fund's share of its corresponding Portfolio's allocated expenses while the Fund was making investments directly into the Portfolio.
(5) Annualized.
(6) Portfolio turnover represents the rate of portfolio activity for the period while the Fund was making investments directly into the Portfolio.
See notes to financial statements
70
Eaton Vance Municipals Funds as of March 31, 2005
FINANCIAL STATEMENTS CONT'D
Financial Highlights
| | | West Virginia Fund - Class B | |
| | | Six Months Ended
March 31, 2005 | | Year Ended September 30, | |
| | | (Unaudited)(1) | | 2004(1) | | 2003 | | 2002(1)(2) | | 2001 | | 2000(1) | |
| Net asset value - Beginning of period | | $ | 10.000 | | | $ | 10.080 | | | $ | 10.340 | | | $ | 9.950 | | | $ | 9.480 | | | $ | 9.470 | | |
| Income (loss) from operations | | | | | | | | | | | | | | | | | | | | | | | | | |
| Net investment income | | $ | 0.194 | | | $ | 0.395 | | | $ | 0.402 | | | $ | 0.403 | | | $ | 0.411 | | | $ | 0.402 | | |
| Net realized and unrealized gain (loss) | | | (0.094 | ) | | | (0.087 | ) | | | (0.261 | ) | | | 0.388 | | | | 0.465 | | | | 0.019 | | |
| Total income from operations | | $ | 0.100 | | | $ | 0.308 | | | $ | 0.141 | | | $ | 0.791 | | | $ | 0.876 | | | $ | 0.421 | | |
| Less distributions | | | | | | | | | | | | | | | | | | | | | | | | | |
| From net investment income | | $ | (0.190 | ) | | $ | (0.388 | ) | | $ | (0.401 | ) | | $ | (0.401 | ) | | $ | (0.406 | ) | | $ | (0.411 | ) | |
| Total distributions | | $ | (0.190 | ) | | $ | (0.388 | ) | | $ | (0.401 | ) | | $ | (0.401 | ) | | $ | (0.406 | ) | | $ | (0.411 | ) | |
| Net asset value - End of period | | $ | 9.910 | | | $ | 10.000 | | | $ | 10.080 | | | $ | 10.340 | | | $ | 9.950 | | | $ | 9.480 | | |
| Total Return(3) | | | 1.16 | %(4) | | | 3.09 | % | | | 1.41 | % | | | 8.17 | % | | | 9.41 | % | | | 4.62 | % | |
| Ratios/Supplemental Data | | | | | | | | | | | | | | | | | | | | | | | | | |
| Net assets, end of period (000's omitted) | | $ | 8,461 | | | $ | 8,550 | | | $ | 23,634 | | | $ | 23,701 | | | $ | 21,775 | | | $ | 22,394 | | |
| Ratios (As a percentage of average daily net assets): | | | | | | | | | | | | | | | | | | | | | | | | | |
| Expenses(5) | | | 1.53 | %(6) | | | 1.55 | % | | | 1.48 | % | | | 1.53 | % | | | 1.53 | % | | | 1.62 | % | |
| Expenses after custodian fee reduction(5) | | | 1.52 | %(6) | | | 1.54 | % | | | 1.46 | % | | | 1.52 | % | | | 1.49 | % | | | 1.60 | % | |
| Net investment income | | | 3.88 | %(6) | | | 3.91 | % | | | 3.99 | % | | | 4.05 | % | | | 4.20 | % | | | 4.32 | % | |
| Portfolio Turnover of the Portfolio(7) | | | - | | | | 12 | % | | | 21 | % | | | 19 | % | | | 12 | % | | | 7 | % | |
| Portfolio Turnover of the Fund | | | 11 | % | | | - | | | | - | | | | - | | | | - | | | | - | | |
(1) Net investment income per share was computed using average shares outstanding.
(2) The Fund, through its investment in the Portfolio, has adopted the provisions of the revised AICPA Audit and Accounting Guide for Investment Companies and began using the interest method to amortize premiums on fixed-income securities. The effect of this change for the year ended September 30, 2002 was to increase net investment income per share by $0.003, decrease net realized and unrealized gains per share by $0.003 and increase the ratio of net investment income to average net assets from 4.02% to 4.05%. Per share data and ratios for t he periods prior to October 1, 2001 have not been restated to reflect this change in presentation.
(3) Returns are historical and are calculated by determining the percentage change in net asset value with all distributions reinvested. Total return is not computed on an annualized basis.
(4) Total return reflects an increase of 0.17% due to a change in the timing of payment and reinvestment of distributions.
(5) Includes the Fund's share of its corresponding Portfolio's allocated expenses while the Fund was making investments directly into the Portfolio.
(6) Annualized.
(7) Portfolio turnover represents the rate of portfolio activity for the period while the Fund was making investments directly into the Portfolio.
See notes to financial statements
71
Eaton Vance Municipals Funds as of March 31, 2005
NOTES TO FINANCIAL STATEMENTS (Unaudited)
1 Significant Accounting Policies
Eaton Vance Municipals Trust (the Trust) is an entity of the type commonly known as a Massachusetts business trust and is registered under the Investment Company Act of 1940, as amended, as an open-end management investment company. The Trust presently consists of twenty-eight Funds, eight of which, each non-diversified, are included in these financial statements. They include Eaton Vance California Municipals Fund (California Fund), Eaton Vance Florida Municipals Fund (Florida Fund), Eaton Vance Massachusetts Municipals Fund (Massachusetts Fund), Eaton Vance Mississippi Municipals Fund (Mississippi Fund), Eaton Vance New York Municipals Fund (New York Fund), Eaton Vance Ohio Municipals Fund (Ohio Fund), Eaton Vance Rhode Island Municipals Fund (Rhode Island Fund) and Eaton Vance West Virginia Municipals Fund (West Virginia Fund), (collectively, the Funds). The Funds seek to provide current inco me exempt from regular federal income tax and particular state or local income or other taxes. Each Fund primarily invests in investment grade municipal obligations, but may also invest in lower rated obligations. The Florida Fund, the Mississippi Fund, the Ohio Fund, the Rhode Island Fund and the West Virginia Fund offer two classes of shares. The California Fund, Massachusetts Fund and the New York Fund offer three classes of shares. Class A shares are generally sold subject to a sales charge imposed at time of purchase. Class B shares and Class C shares of California Fund and New York Fund are sold at net asset value and are subject to a declining contingent deferred sales charge (see Note 6). The Trustees have adopted a conversion feature pursuant to which Class B shares of the Funds automatically convert to Class A shares eight years after their purchase as described in each Fund's prospectus. In addition, all Class B shares of Eaton Vance California Fund and Eaton Vance Ne w York Fund purchased on or before March 16, 2004 converted to Class A shares of the same Fund on April 8, 2004. Class B shares acquired through reinvestment of distributions will convert in proportion to shares not acquired through reinvestment. Class I shares of the Massachusetts fund are sold at net asset value. Each class represents a pro rata interest in the Fund, but votes separately on class-specific matters and (as noted below) is subject to different expenses. Realized and unrealized gains and losses are allocated daily to each class of shares based on the relative net assets of each class to the total net assets of the Fund. Net investment income, other than class specific expenses, is allocated daily to each class of shares based upon the ratio of the value of each class' paid shares to the total value of all paid shares. Each class of shares differs in its distributio n plan and certain other class specific expenses.
On October 1, 2004, the California Fund, Florida Fund, Massachusetts Fund, Mississippi Fund, New York Fund, Ohio Fund, Rhode Island Fund, and West Virginia Fund received its pro rata share of cash and securities from the California Municipals Portfolio (California Portfolio), Florida Municipals Portfolio (Florida Portfolio), Massachusetts Municipals Portfolio (Massachusetts Portfolio), Mississippi Municipals Portfolio (Mississippi Portfolio), New York Municipals Portfolio (New York Portfolio), Ohio Municipals Portfolio (Ohio Portfolio), Rhode Island Municipals Portfolio (Rhode Island Portfolio), and West Virginia Municipals Portfolio (West Virginia Portfolio), respectively, in a complete liquidation of its interests in its corresponding Portfolio. Subsequent to October 1, 2004, each Fund invests directly in securities rather than through its corresponding Portfolio and maintains the sa me investment objectives.
The following is a summary of significant accounting policies consistently followed by the Trust in the preparation of its financial statements. The policies are in conformity with accounting principles generally accepted in the United States of America.
A Investment Valuations - Municipal bonds and taxable obligations, if any, are normally valued on the basis of valuations furnished by a pricing service. Financial futures contracts and options on financial futures contracts listed on commodity exchanges are valued at closing settlement prices. Over-the-counter options on financial futures contracts are normally valued at the mean between the latest bid and asked prices. Interest rate swaps are normally valued on the basis of valuations furnished by a broker. Short-term obligations, maturing in sixty days or le ss, are valued at amortized cost, which approximates value. Investments for which valuations or market quotations are unavailable are valued at fair value using methods determined in good faith by or at the direction of the Trustees.
B Income - Interest income is determined on the basis of interest accrued, adjusted for amortization of premium or discount.
C Federal Taxes - Each Fund's policy is to comply with the provisions of the Internal Revenue Code applicable to regulated investment companies and to distribute to shareholders each year all of its taxable, if any, and tax-exempt income, including any net realized
72
Eaton Vance Municipals Funds as of March 31, 2005
NOTES TO FINANCIAL STATEMENTS (Unaudited) CONT'D
gain on investments. Accordingly, no provision for federal income or excise tax is necessary. At September 30, 2004, certain Funds, for federal income tax purposes, had capital loss carryovers which will reduce taxable income arising from future net realized gain on investments, if any, to the extent permitted by the Internal Revenue Code, and thus will reduce the amount of the distributions to shareholders which would otherwise be necessary to relieve the Funds of any liability for federal income or excise tax. The amounts and expiration dates of the capital loss carryovers are as follows:
| Fund | | Amount | | Expires | |
| California | | $ | 663,911 | | | September 30, 2008 | |
|
| | | | 1,155,825 | | | September 30, 2009 | |
|
| | | | 723,504 | | | September 30, 2010 | |
|
| | | | 1,373,331 | | | September 30, 2011 | |
|
| Florida | | | 421,007 | | | September 30, 2009 | |
|
| | | | 3,994,644 | | | September 30, 2010 | |
|
| Massachusetts | | | 2,135 | | | September 30, 2005 | |
|
| | | | 1,741,735 | | | September 30, 2010 | |
|
| | | | 1,430,573 | | | September 30, 2011 | |
|
| | | | 355,911 | | | September 30, 2012 | |
|
| Mississippi | | | 40,090 | | | September 30, 2010 | |
|
| | | | 53,963 | | | September 30, 2011 | |
|
| | | | 20,204 | | | September 30, 2012 | |
|
| Ohio | | | 1,520,480 | | | September 30, 2010 | |
|
| | | | 6,140,842 | | | September 30, 2011 | |
|
| Rhode Island | | | 34,703 | | | September 30, 2005 | |
|
| | | | 184,964 | | | September 30, 2008 | |
|
| | | | 293,745 | | | September 30, 2009 | |
|
| | | | 21,737 | | | September 30, 2010 | |
|
| | | | 90,400 | | | September 30, 2011 | |
|
| West Virginia | | | 170,463 | | | September 30, 2005 | |
|
| | | | 526 | | | September 30, 2008 | |
|
| | | | 171,534 | | | September 30, 2009 | |
|
| | | | 211,865 | | | September 30, 2010 | |
|
Dividends paid by each Fund from net interest on tax-exempt municipal bonds are not includable by shareholders as gross income for federal income tax purposes because each Fund intends to meet certain requirements of the Internal Revenue Code applicable to regulated investment companies which will enable the Funds to pay exempt-interest dividends. The portion of such interest, if any, earned on private activity bonds issued after August 7, 1986 may be considered a tax preference item to shareholders.
Additionally, at September 30, 2004, California Fund, Florida Fund, Massachusetts Fund, Mississippi Fund, New York Fund, Ohio Fund, Rhode Island Fund and West Virginia Fund had net capital losses of $1,474,129, $5,554,435, $1,356,277, $305,354, $1,081,521, $1,534,730, $347,120 and $531,125, respectively, attributable to security transactions incurred after October 31, 2003. These capital losses are treated as arising on the first day of each Fund's taxable year ending September 30, 2005.
D Financial Futures Contracts - Upon the entering of a financial futures contract, a Fund is required to deposit (initial margin) either in cash or securities an amount equal to a certain percentage of the purchase price indicated in the financial futures contract. Subsequent payments are made or received by a Fund (margin maintenance) each day, dependent on the daily fluctuations in the value of the underlying security, and are recorded for book purposes as unrealized gains or losses by a Fund. A Fund's investment in financial futures contracts is designed for both hedging against anticipated future changes in interest rates and investment purposes. Should interest rat es move unexpectedly, a Fund may not achieve the anticipated benefits of the financial futures contracts and may realize a loss.
E Options on Financial Futures Contracts - Upon the purchase of a put option on a financial futures contract by a Fund, the premium paid is recorded as an investment, the value of which is marked-to-market daily. When a purchased option expires, a Fund will realize a loss in the amount of the cost of the option. When a Fund enters into a closing sale transaction, a Fund will realize a gain or loss depending on whether the sales proceeds from the closing sale transaction are greater or less than the cost of the option. When a Fund exercises a put option, settlement is made in cash. The risk associated with purchasing put options is limited to the premium originally paid.
F Interest Rate Swaps - A Fund may enter into interest rate swap agreements to enhance return, to hedge against fluctuations in securities prices or interest rates or as substitution for the purchase or sale of securities. Pursuant to these agreements, the Fund makes bi-annual payments at a fixed interest rate. In exchange, a Fund receives payments based on the interest rate of a benchmark industry index. During the
73
Eaton Vance Municipals Funds as of March 31, 2005
NOTES TO FINANCIAL STATEMENTS (Unaudited) CONT'D
term of the outstanding swap agreement, changes in the underlying value of the swap are recorded as unrealized gains and losses. The value of the swap is determined by changes in the relationship between two rates of interest. The Fund is exposed to credit loss in the event of non-performance by the swap counterparty. However, the Fund does not anticipate non-performance by the counterparty. Risk may also rise from the unanticipated movements in value of interest rates.
G When-issued and Delayed Delivery Transactions - The Funds may engage in when-issued and delayed delivery transactions. The Funds record when-issued securities on trade date and maintain security positions such that sufficient liquid assets will be available to make payments for the securities purchased. Securities purchased on a when-issued or delayed delivery basis are marked-to-market daily and begin earning interest on settlement date.
H Legal Fees - Legal fees and other related expenses incurred as part of negotiations of the terms and requirements of capital infusions, or that are expected to result in the restructuring of or a plan of reorganization for an investment are recorded as realized losses. Ongoing expenditures to protect or enhance an investment are treated as operating expenses.
I Expenses - The majority of expenses of the Trust are directly identifiable to an individual fund. Expenses which are not readily identifiable to a specific fund are allocated taking into consideration, among other things, the nature and type of expense and the relative size of the funds.
J Expense Reduction - Investors Bank & Trust Company (IBT) serves as custodian of the Funds. Pursuant to the respective custodian agreements, IBT receives a fee reduced by credits which are determined based on the average daily cash balances the Funds maintain with IBT. All credit balances used to reduce the Fund's custodian fees are reported as a reduction of total expenses on the Statement of Operations.
K Use of Estimates - The preparation of the financial statements in conformity with accounting principles generally accepted in the United States of America requires management to make estimates and assumptions that affect the reported amounts of assets and liabilities at the date of the financial statements and the reported amounts of income and expense during the reporting period. Actual results could differ from those estimates.
L Indemnifications - Under the Trust's organizational documents, its officers and Trustees may be indemnified against certain liabilities and expenses arising out of the performance of their duties to the Funds and shareholders are indemnified against personal liability for obligations of the Trust. Additionally, in the normal course of business, the Funds enter into agreements with service providers that may contain indemnification clauses. The Funds' maximum exposure under these arrangements is unknown as this would involve future claims that may be made against the Funds that have not yet occurred.
M Other - Investment transactions are accounted for on a trade date basis. Realized gains and losses are computed on the specific identification of the securities sold.
N Interim Financial Statements - The interim financial statements relating to March 31, 2005 and for the six months then ended have not been audited by an independent registered public accounting firm, but in the opinion of the Funds' management reflect all adjustments, necessary for the fair presentation of the financial statements.
2 Distributions to Shareholders
The net income of each Fund is determined daily and substantially all of the net income so determined is declared as a dividend to shareholders of record at the time of declaration. Distributions are declared separately for each class of shares. Distributions are ordinarily paid monthly. Distributions of allocated realized capital gains, if any, are made at least annually. Shareholders may reinvest income and capital gain distributions in additional shares of the same class of the Fund at the net asset value as of the reinvestment date. Distributions are paid in the form of additional shares of the same class or, at the election of the shareholder, in cash. The Funds distinguish between distributions on a tax basis and a financial reporting basis. Accounting principles generally accepted in the United States of America require that only distributions in excess of tax basis earnings and prof its be reported in the financial statements as a return of capital. Permanent differences between book and tax accounting relating to distributions are reclassified to paid-in capital.
74
Eaton Vance Municipals Funds as of March 31, 2005
NOTES TO FINANCIAL STATEMENTS (Unaudited) CONT'D
3 Shares of Beneficial Interest
The Funds' Declaration of Trust permits the Trustees to issue an unlimited number of full and fractional shares of beneficial interest (without par value). Such shares may be issued in a number of different series (such as the Funds) and classes. Transactions in Fund shares were as follows:
| | | California Fund | |
Class A | | Six Months Ended
March 31, 2005
(Unaudited) | | Year Ended
September 30, 2004 | |
| Sales | | | 646,518 | | | | 19,825,738 | | |
Issued to shareholders electing to
receive payments of distributions
in Fund shares | | | 269,896 | | | | 307,754 | | |
| Redemptions | | | (1,363,895 | ) | | | (2,340,066 | ) | |
| Net increase (decrease) | | | (447,481 | ) | | | 17,793,426 | | |
| | | California Fund | |
Class B | | Six Months Ended
March 31, 2005
(Unaudited) | | Year Ended
September 30, 2004 | |
| Sales | | | 176,481 | | | | 770,261 | | |
Issued to shareholders electing to
receive payments of distributions
in Fund shares | | | 3,103 | | | | 316,786 | | |
| Redemptions | | | (91,699 | ) | | | (21,877,983 | ) | |
| Net increase (decrease) | | | 87,885 | | | | (20,790,936 | ) | |
| | | California Fund | |
Class C | | Six Months Ended
March 31, 2005
(Unaudited) | | Year Ended
September 30, 2004(1) | |
| Sales | | | 81,806 | | | | 10,026 | | |
Issued to shareholders electing to
receive payments of distributions
in Fund shares | | | 432 | | | | 9 | | |
| Redemptions | | | - | | | | (479 | ) | |
| Net increase | | | 82,238 | | | | 9,556 | | |
| | | Florida Fund | |
Class A | | Six Months Ended
March 31, 2005
(Unaudited) | | Year Ended
September 30, 2004 | |
| Sales | | | 1,564,835 | | | | 17,501,497 | | |
Issued to shareholders electing to
receive payments of distributions
in Fund shares | | | 232,535 | | | | 277,201 | | |
| Redemptions | | | (2,189,624 | ) | | | (1,936,874 | ) | |
| Exchange from Class B shares | | | 232,511 | | | | - | | |
| Net increase (decrease) | | | (159,743 | ) | | | 15,841,824 | | |
| | | Florida Fund | |
Class B | | Six Months Ended
March 31, 2005
(Unaudited) | | Year Ended
September 30, 2004 | |
| Sales | | | 206,246 | | | | 538,697 | | |
Issued to shareholders electing to
receive payments of distributions
in Fund shares | | | 48,808 | | | | 293,367 | | |
| Redemptions | | | (555,424 | ) | | | (17,742,306 | ) | |
| Exchange to Class A shares | | | (226,798 | ) | | | - | | |
| Net decrease | | | (527,168 | ) | | | (16,910,242 | ) | |
| | | Massachusetts Fund | |
Class A | | Six Months Ended
March 31, 2005
(Unaudited) | | Year Ended
September 30, 2004 | |
| Sales | | | 1,233,613 | | | | 11,510,297 | | |
Issued to shareholders electing to
receive payments of distributions
in Fund shares | | | 189,136 | | | | 256,073 | | |
| Redemptions | | | (721,069 | ) | | | (1,225,646 | ) | |
| Exchange from Class B shares | | | 250,607 | | | | - | | |
| Net increase | | | 952,287 | | | | 10,540,724 | | |
| | | Massachusetts Fund | |
Class B | | Six Months Ended
March 31, 2005
(Unaudited) | | Year Ended
September 30, 2004 | |
| Sales | | | 187,805 | | | | 493,561 | | |
Issued to shareholders electing to
receive payments of distributions
in Fund shares | | | 66,365 | | | | 256,000 | | |
| Redemptions | | | (255,037 | ) | | | (10,127,004 | ) | |
| Exchange to Class A shares | | | (224,692 | ) | | | - | | |
| Net decrease | | | (225,559 | ) | | | (9,377,443 | ) | |
75
Eaton Vance Municipals Funds as of March 31, 2005
NOTES TO FINANCIAL STATEMENTS (Unaudited) CONT'D
| | | Massachusetts Fund | |
Class I | | Six Months Ended
March 31, 2005
(Unaudited) | | Year Ended
September 30, 2004 | |
| Sales | | | - | | | | 76,742 | | |
Issued to shareholders electing to
receive payments of distributions
in Fund shares | | | 2,537 | | | | 5,007 | | |
| Redemptions | | | (4,407 | ) | | | (8,225 | ) | |
| Net increase (decrease) | | | (1,870 | ) | | | 73,524 | | |
| | | Mississippi Fund | |
Class A | | Six Months Ended
March 31, 2005
(Unaudited) | | Year Ended
September 30, 2004 | |
| Sales | | | 163,633 | | | | 1,048,406 | | |
Issued to shareholders electing to
receive payments of distributions
in Fund shares | | | 11,871 | | | | 14,656 | | |
| Redemptions | | | (76,864 | ) | | | (169,326 | ) | |
| Exchange from Class B shares | | | 21,645 | | | | - | | |
| Net increase | | | 120,285 | | | | 893,736 | | |
| | | Mississippi Fund | |
Class B | | Six Months Ended
March 31, 2005
(Unaudited) | | Year Ended
September 30, 2004 | |
| Sales | | | 23,740 | | | | 52,254 | | |
Issued to shareholders electing to
receive payments of distributions
in Fund shares | | | 5,936 | | | | 19,572 | | |
| Redemptions | | | (21,569 | ) | | | (959,053 | ) | |
| Exchange to Class A shares | | | (21,169 | ) | | | - | | |
| Net decrease | | | (13,062 | ) | | | (887,227 | ) | |
| | | New York Fund | |
Class A | | Six Months Ended
March 31, 2005
(Unaudited) | | Year Ended
September 30, 2004 | |
| Sales | | | 2,842,740 | | | | 29,701,216 | | |
Issued to shareholders electing to
receive payments of distributions
in Fund shares | | | 502,160 | | | | 555,548 | | |
| Redemptions | | | (1,713,247 | ) | | | (3,106,679 | ) | |
| Exchange from Class B shares | | | 5,886 | | | | - | | |
| Net increase | | | 1,637,539 | | | | 27,150,085 | | |
| | | New York Fund | |
Class B | | Six Months Ended
March 31, 2005
(Unaudited) | | Year Ended
September 30, 2004 | |
| Sales | | | 119,519 | | | | 770,526 | | |
Issued to shareholders electing to
receive payments of distributions
in Fund shares | | | 3,598 | | | | 580,371 | | |
| Redemptions | | | (4,709 | ) | | | (27,137,667 | ) | |
| Exchange to Class A shares | | | (5,442 | ) | | | - | | |
| Net increase (decrease) | | | 112,966 | | | | (25,786,770 | ) | |
| | | New York Fund | |
Class C | | Six Months Ended
March 31, 2005
(Unaudited) | | Year Ended
September 30, 2004 | |
| Sales | | | 135,817 | | | | 96,144 | | |
Issued to shareholders electing to
receive payments of distributions
in Fund shares | | | 1,392 | | | | 843 | | |
| Redemptions | | | (2,713 | ) | | | (2,210 | ) | |
| Net increase | | | 134,496 | | | | 94,777 | | |
| | | Ohio Fund | |
Class A | | Six Months Ended
March 31, 2005
(Unaudited) | | Year Ended
September 30, 2004 | |
| Sales | | | 518,134 | | | | 13,007,489 | | |
Issued to shareholders electing to
receive payments of distributions
in Fund shares | | | 191,114 | | | | 229,393 | | |
| Redemptions | | | (877,202 | ) | | | (1,183,403 | ) | |
| Exchange from Class B shares | | | 160,889 | | | | - | | |
| Net increase (decrease) | | | (7,065 | ) | | | 12,053,479 | | |
| | | Ohio Fund | |
Class B | | Six Months Ended
March 31, 2005
(Unaudited) | | Year Ended
September 30, 2004 | |
| Sales | | | 99,676 | | | | 415,410 | | |
Issued to shareholders electing to
receive payments of distributions
in Fund shares | | | 40,259 | | | | 231,417 | | |
| Redemptions | | | (172,328 | ) | | | (12,181,291 | ) | |
| Exchange to Class A shares | | | (142,541 | ) | | | - | | |
| Net decrease | | | (174,934 | ) | | | (11,534,464 | ) | |
76
Eaton Vance Municipals Funds as of March 31, 2005
NOTES TO FINANCIAL STATEMENTS (Unaudited) CONT'D
| | | Rhode Island Fund | |
Class A | | Six Months Ended
March 31, 2005
(Unaudited) | | Year Ended
September 30, 2004 | |
| Sales | | | 150,354 | | | | 1,839,665 | | |
Issued to shareholders electing to
receive payments of distributions
in Fund shares | | | 28,319 | | | | 42,798 | | |
| Redemptions | | | (172,257 | ) | | | (365,398 | ) | |
| Exchange from Class B shares | | | 88,471 | | | | - | | |
| Net increase | | | 94,887 | | | | 1,517,065 | | |
| | | Rhode Island Fund | |
Class B | | Six Months Ended
March 31, 2005
(Unaudited) | | Year Ended
September 30, 2004 | |
| Sales | | | 83,617 | | | | 160,842 | | |
Issued to shareholders electing to
receive payments of distributions
in Fund shares | | | 32,770 | | | | 82,458 | | |
| Redemptions | | | (99,702 | ) | | | (2,033,790 | ) | |
| Exchange to Class A shares | | | (86,444 | ) | | | - | | |
| Net decrease | | | (69,759 | ) | | | (1,790,490 | ) | |
| | | West Virginia Fund | |
Class A | | Six Months Ended
March 31, 2005
(Unaudited) | | Year Ended
September 30, 2004 | |
| Sales | | | 132,518 | | | | 1,703,321 | | |
Issued to shareholders electing to
receive payments of distributions
in Fund shares | | | 26,156 | | | | 31,282 | | |
| Redemptions | | | (139,877 | ) | | | (188,090 | ) | |
| Exchange from Class B shares | | | 19,372 | | | | - | | |
| Net increase | | | 38,169 | | | | 1,546,513 | | |
| | | West Virginia Fund | |
Class B | | Six Months Ended
March 31, 2005
(Unaudited) | | Year Ended
September 30, 2004 | |
| Sales | | | 52,837 | | | | 128,738 | | |
Issued to shareholders electing to
receive payments of distributions
in Fund shares | | | 10,177 | | | | 34,334 | | |
| Redemptions | | | (45,585 | ) | | | (1,653,019 | ) | |
| Exchange to Class A shares | | | (19,014 | ) | | | - | | |
| Net decrease | | | (1,585 | ) | | | (1,489,947 | ) | |
(1) Class C shares of the California Fund commenced operations on August 31, 2004.
4 Investment Adviser Fee and Other Transactions with Affiliates
The investment adviser fee is earned by Boston Management and Research (BMR), a wholly-owned subsidiary of Eaton Vance Management (EVM), as compensation for management and investment advisory services rendered to each Fund. The fee is based upon a percentage of average daily net assets plus a percentage of gross income (i.e., income other than gains from the sale of securities). For the six months ended March 31, 2005, each Fund paid advisory fees as follows:
| Fund | | Amount | | Effective Rate* | |
| California | | $ | 538,123 | | | | 0.47 | % | |
| Florida | | | 523,075 | | | | 0.43 | % | |
| Massachusetts | | | 455,786 | | | | 0.42 | % | |
| Mississippi | | | 13,573 | | | | 0.15 | % | |
| New York | | | 771,526 | | | | 0.44 | % | |
| Ohio | | | 340,739 | | | | 0.42 | % | |
| Rhode Island | | | 73,504 | | | | 0.28 | % | |
| West Virginia | | | 26,904 | | | | 0.20 | % | |
* Advisory fees paid as a percentage of average daily net assets (annualized).
BMR has agreed to reduce the investment adviser fee by an amount equal to that portion of commissions paid to broker dealers in execution of Fund portfolio transactions that is consideration for third-party research services. For the six months ended March 31, 2005, BMR waived $230 of its advisory fee for the Massachusetts Fund.
Except as to Trustees of the Funds who are not members of EVM's or BMR's organization, officers and Trustees receive remuneration for their services to the Funds out of such investment adviser fee. Trustees of the Funds that are not affiliated with the Investment Adviser may elect to defer receipt of all or a percentage of their annual fees in accordance with the terms of the Trustees Deferred Compensation Plan. For the six months ended March 31, 2005, no significant amounts have been deferred. EVM serves as the Administrator of each Fund, but received no compensation. EVM serves as the sub-transfer agent of the Funds and receives from the transfer agent an aggregate fee based upon the actual expenses incurred by EVM in the performance of those services. For the six months ended March 31, 2005, EVM earned $3,551, $4,715, $4,400, $495, $7,260, $4,159, $1,207, and $818 in sub-transfer ag ent fees from the California Fund, Florida Fund, Massachusetts Fund, Mississippi Fund, New York Fund, Ohio Fund, Rhode Island Fund, and West Virginia Fund, respectively. The
77
Eaton Vance Municipals Funds as of March 31, 2005
NOTES TO FINANCIAL STATEMENTS (Unaudited) CONT'D
Funds were informed that Eaton Vance Distributors, Inc. (EVD), a subsidiary of EVM and the Funds' principal underwriter, received $7,668, $4,986, $12,628, $1,959, $34,700, $9,513, $1,611, and $2,707 from the California Fund, Florida Fund, Massachusetts Fund, Mississippi Fund, New York Fund, Ohio Fund, Rhode Island Fund, and West Virginia Fund, respectively, as its portion of the sales charge of Class A shares for the six months ended March 31, 2005
Certain officers and Trustees of the Funds are officers of the above organizations.
5 Distribution and Service Plans
Each Fund has in effect a distribution plan for Class B (Class B Plan) pursuant to Rule 12b-1 under the Investment Company Act of 1940 and a service plan for Class A (Class A Plans) (collectively, the Plans). In addition, the California Fund and New York Fund each has in effect a distribution plan for Class C (Class C Plan) pursuant to Rule 12b-1 under the Investment Company Act of 1940. The Plans require the Class B and Class C shares to pay the principal underwriter, EVD, amounts equal to 1/365 of 0.75% (annualized) of each Fund's daily net assets attributable to Class B shares and Class C shares (if applicable) for providing ongoing distribution services and facilities to the Fund. The Funds will automatically discontinue payments to EVD during any period in which there are no outstanding Uncovered Distribution Charges, which are equ ivalent to the sum of (i) 5% (in the case of Class B) and 6.25% (in the case of Class C) of the aggregate amount received by the Fund for each class shares sold, plus (ii) interest calculated by applying the rate of 1% over the prevailing prime rate to the outstanding balance of Uncovered Distribution Charges of EVD reduced by the aggregate amount of contingent deferred sales charges (see Note 6) and amounts theretofore paid to EVD. The amount payable to EVD with respect to each day is accrued on such day as a liability of each Class B and Class C and, accordingly, reduces Class B and Class C net assets. For the six months ended March 31, 2005, California Fund, Florida Fund, Massachusetts Fund, Mississippi Fund, New York Fund, Ohio Fund, Rhode Island Fund and West Virginia Fund, paid $10,020, $182,231, $217,916, $22,533, $13,398, $134,197, $93,791 and $32,075 respectively, to EVD, representing 0.75% (annualized) of each Fund's Class B average daily net assets . For the six months ended March 31, 2005, the California Fund and the New York Fund paid $1,021 and $5,575, respectively to EVD, representing 0.75% (annualized) of the Fund's Class C average daily net assets. At March 31, 2005, the amount of Uncovered Distribution Charges of EVD calculated under the Class B Plans for California Fund, Florida Fund, Massachusetts Fund, Mississippi Fund, New York Fund, Ohio Fund, Rhode Island Fund and West Virginia Fund were approximately $85,000, $1,205,000, $1,200,000, $497,000, $153,000, $423,000, $1,176,000 and $583,000, respectively, and approximately $57,000 and $122,000 calculated under the Class C Plan for California and New York, respectively.
The Plans authorize each Fund to make payments of service fees to EVD, investment dealers and other persons, which service fee payments currently equal 0.20% (annualized), (0.25% (annualized) for the California Fund) of each Fund's average daily net assets attributable to Class A, Class B and, if applicable, Class C shares for each fiscal year. Although there is no present intention to do so, Class A, Class B and, if applicable, Class C shares of each Fund (excepting the California Fund, which is already making such payments) could pay service fees of up to 0.25% annually upon Trustee approval. Service fee payments will be made for personal services and/or the maintenance of shareholder accounts. Service fees are separate and distinct from the sales commissions and distribution fees payable by each Fund to EVD, and as such are not subject to automatic discontinuance when there are no outstanding Uncovered Distribution Charges of EVD. For the six months ended March 31, 2005, California Fund, Florida Fund, Massachusetts Fund, Mississippi Fund, New York Fund, Ohio Fund, Rhode Island Fund and West Virginia Fund paid or accrued service fees to EVD in the amount of $282,195, $193,506, $148,672, $11,704, $344,322, $126,902, $26,873 and $18,886, respectively, for Class A shares, and $3,343, $48,595, $58,111, $6,009, $3,573, $35,786, $25,011 and $8,553, respectively, for Class B shares, and $337 and $1,487 for Class C shares of the California Fund and the New York Fund, respectively.
Certain officers and Trustees of the Funds are officers or directors of the above organization.
6 Contingent Deferred Sales Charge
A contingent deferred sales charge (CDSC) generally is imposed on redemptions of Class A shares made within 18 months of purchase, Class B shares made within six years of purchase and on redemptions of Class C shares made within one year of purchase. Class A shares may be subject to a 1% CDSC if redeemed within 18 months of purchase (depending on the circumstances of purchase). Generally, the CDSC is based upon the lower of the net asset value at date of redemption or date of purchase. No charge is levied on shares acquired by reinvestment of dividends or capital gains distributions. Class B CDSC is imposed at declining rates that begin at
78
Eaton Vance Municipals Funds as of March 31, 2005
NOTES TO FINANCIAL STATEMENTS (Unaudited) CONT'D
5% in the case of redemptions in the first and second year after purchase, declining one percentage point each subsequent year. Class C shares are subject to a 1% CDSC if redeemed within one year of purchase. No CDSC is levied on shares which have been sold to EVD or its affiliates or to their respective employees or clients and may be waived under certain other limited conditions. CDSC received on Class B and Class C redemption charges are paid to EVD to reduce the amount of Uncovered Distribution Charges calculated under each Fund's Class B and, if applicable, Class C Plans (see Note 5). CDSC received on Class B and Class C redemptions when no Uncovered Distribution Charges exist will be credited to the Fund. EVD received approximately $4,000 and $100 of CDSC paid by Class A shareholders of Florida Fund and Rhode Island Fund, respectively, and $4,000, $4 6,000, $42,000, $1,000, $2,000, $26,000, $11,000 and $10,000 of CDSC paid by Class B shareholders of California Fund, Florida Fund, Massachusetts Fund, Mississippi Fund, New York Fund, Ohio Fund, Rhode Island Fund and West Virginia Fund, respectively, for the six months ended March 31, 2005. EVD received approximately $100 of CDSC paid by Class C shareholders of the New York Fund for the six months ended March 31, 2005. EVD did not receive any CDSC paid by Class C shareholders of the California Fund for the six months ended March 31, 2005.
7 Investments
Purchases and sales of investments, other than
U.S. Government securities, purchased option transactions and short-term obligations, for the six months ended March 31, 2005 were as follows:
| California Fund | | | | | |
| Purchases | | $ | 16,134,739 | | |
| Sales | | | 17,610,881 | | |
| Florida Fund | | | | | |
| Purchases | | $ | 21,022,882 | | |
| Sales | | | 27,440,816 | | |
| Massachusetts Fund | | | | | |
| Purchases | | $ | 31,073,811 | | |
| Sales | | | 15,350,528 | | |
| Mississippi Fund | | | | | |
| Purchases | | $ | 1,568,867 | | |
| Sales | | | 602,500 | | |
| New York Fund | | | | | |
| Purchases | | $ | 101,130,393 | | |
| Sales | | | 80,727,332 | | |
| Ohio Fund | | | | | |
| Purchases | | $ | 22,574,579 | | |
| Sales | | | 23,827,527 | | |
| Rhode Island Fund | | | | | |
| Purchases | | $ | 5,084,933 | | |
| Sales | | | 4,134,285 | | |
| West Virginia Fund | | | |
| Purchases | | $ | 3,865,507 | | |
| Sales | | | 2,909,893 | | |
8 Federal Income Tax Basis of Unrealized Appreciation (Depreciation)
The cost and unrealized appreciation (depreciation) in the value of the investments owned by each Fund at March 31, 2005, as computed on a federal income tax basis, were as follows:
| California Fund | | | | | |
| Aggregate Cost | | $ | 200,616,827 | | |
| Gross unrealized appreciation | | $ | 24,634,823 | | |
| Gross unrealized depreciation | | | (490,559 | ) | |
| Net unrealized appreciation | | $ | 24,144,264 | | |
| Florida Fund | | | | | |
| Aggregate Cost | | $ | 214,204,562 | | |
| Gross unrealized appreciation | | $ | 20,635,105 | | |
| Gross unrealized depreciation | | | (1,316,229 | ) | |
| Net unrealized appreciation | | $ | 19,318,876 | | |
| Massachusetts Fund | | | | | |
| Aggregate Cost | | $ | 201,536,138 | | |
| Gross unrealized appreciation | | $ | 16,107,484 | | |
| Gross unrealized depreciation | | | (490,085 | ) | |
| Net unrealized appreciation | | $ | 15,617,399 | | |
79
Eaton Vance Municipals Funds as of March 31, 2005
NOTES TO FINANCIAL STATEMENTS (Unaudited) CONT'D
| Mississippi Fund | | | | | |
| Aggregate Cost | | $ | 16,306,568 | | |
| Gross unrealized appreciation | | $ | 1,270,837 | | |
| Gross unrealized depreciation | | | (61,505 | ) | |
| Net unrealized appreciation | | $ | 1,209,332 | | |
| New York Fund | | | | | |
| Aggregate Cost | | $ | 324,461,846 | | |
| Gross unrealized appreciation | | $ | 28,703,373 | | |
| Gross unrealized depreciation | | | (922,515 | ) | |
| Net unrealized appreciation | | $ | 27,780,858 | | |
| Ohio Fund | | | | | |
| Aggregate Cost | | $ | 147,355,187 | | |
| Gross unrealized appreciation | | $ | 12,414,756 | | |
| Gross unrealized depreciation | | | (177,783 | ) | |
| Net unrealized appreciation | | $ | 12,236,973 | | |
| Rhode Island Fund | | | | | |
| Aggregate Cost | | $ | 47,427,637 | | |
| Gross unrealized appreciation | | $ | 3,036,619 | | |
| Gross unrealized depreciation | | | (22,951 | ) | |
| Net unrealized appreciation | | $ | 3,013,668 | | |
| West Virginia Fund | | | | | |
| Aggregate Cost | | $ | 25,753,251 | | |
| Gross unrealized appreciation | | $ | 1,476,958 | | |
| Gross unrealized depreciation | | | (37,934 | ) | |
| Net unrealized appreciation | | $ | 1,439,024 | | |
9 Line of Credit
The Funds participate with other portfolios and funds managed by BMR and EVM and their affiliates in a $150 million unsecured line of credit agreement with a group of banks. Borrowings will be made by the portfolios or funds solely to facilitate the handling of unusual and/or unanticipated short-term cash requirements. Interest is charged to each participating portfolio or fund based on its borrowings at an amount above either the Eurodollar rate or federal funds rate. In addition, a fee computed at an annual rate of 0.10% on the daily unused portion of the facility is allocated among the participating portfolios and funds at the end of each quarter. At March 31, 2005, the Florida Fund, the New York Fund, the Ohio Fund, and the West Virginia Fund had a balance outstanding pursuant to this line of credit of $200,000, $100,000, $200,000, and $100,000, respectively. The Funds did not have any significant borrowings or allocated fees during the six months ended March 31, 2005.
funds at the end of each quarter. At March 31, 2005, the Florida Fund, the New York Fund, the Ohio Fund, and the West Virginia Fund had a balance outstanding pursuant to this line of credit of $200,000, $100,000, $200,000, and $100,000, respectively. The Funds did not have any significant borrowings or allocated fees during the six months ended March 31, 2005.
10 Overdraft Advances
Pursuant to the custodian agreement between the Funds and IBT, IBT may, in its discretion, advance funds to the Funds to make properly authorized payments. When such payments result in an overdraft by the Funds, the Funds are obligated to repay IBT at the current rate of interest charged by IBT for secured loans, (currently, a rate above federal funds rate). This obligation is payable on demand to IBT. IBT has lien on the Fund's assets to the extent of any overdraft. At March 31, 2005, the Florida Fund, the New York Fund, the Ohio Fund, and the West Virginia Fund had payments due to IBT pursuant to the foregoing arrangement of $92,499, $53,246, $74,717, and $51,708, respectively.
11 Financial Instruments
The Funds regularly trade in financial instruments with off-balance sheet risk in the normal course of their investing activities to assist in managing exposure to various market risks. These financial instruments include futures contracts and interest rate swaps and may involve, to a varying degree, elements of risk in excess of the amounts recognized for financial statement purposes. The notional or contractual amounts of these instruments represent the amounts potentially subject to risk. The measurement of the risks associated with these instruments is meaningful only when all related and offsetting transactions are considered.
A summary of obligations under these financial instruments at March 31, 2005 is as follows:
| Fund | | Expiration
Date | | Contracts | | Position | | Aggregate
Cost | | Value | | Net
Unrealized
Appreciation | |
| California | | 06/05 | | 588 U.S. Treasury Bond | | Short | | $ | (66,496,626 | ) | | $ | (65,488,500 | ) | | $ | 1,008,126 | | |
| Florida | | 06/05 | | 620 U.S. Treasury Bond | | Short | | | (70,115,489 | ) | | | (69,052,500 | ) | | | 1,062,989 | | |
| Massachusetts | | 06/05 | | 565 U.S. Treasury Bond | | Short | | | (63,963,912 | ) | | | (62,926,875 | ) | | | 1,037,037 | | |
| Mississippi | | 06/05 | | 30 U.S. Treasury Bond | | Short | | | (3,396,201 | ) | | | (3,341,250 | ) | | | 54,951 | | |
| New York | | 06/05 | | 1,200 U.S. Treasury Bond | | Short | | | (135,172,443 | ) | | | (133,650,000 | ) | | | 1,522,443 | | |
| Ohio | | 06/05 | | 200 U.S. Treasury Bond | | Short | | | (22,500,712 | ) | | | (22,275,000 | ) | | | 225,712 | | |
| Rhode Island | | 06/05 | | 135 U.S. Treasury Bond | | Short | | | (15,280,752 | ) | | | (15,035,625 | ) | | | 245,127 | | |
| West Virginia | | 06/05 | | 75 U.S. Treasury Bond | | Short | | | (8,491,476 | ) | | | (8,353,125 | ) | | | 138,351 | | |
At March 31, 2005, the Funds had sufficient cash and/or securities to cover margin requirements on open futures contracts.
80
Eaton Vance Municipals Funds
BOARD OF TRUSTEES' ANNUAL APPROVAL OF THE INVESTMENT ADVISORY AGREEMENTS
The investment advisory agreements between each of Eaton Vance California Municipals Fund, Eaton Vance Florida Municipals Fund, Eaton Vance Massachusetts Municipals Fund, Eaton Vance Mississippi Municipals Fund, Eaton Vance New York Municipals Fund, Eaton Vance Ohio Municipals Fund, Eaton Vance Rhode Island Municipals Fund and Eaton Vance West Virginia Municipals Fund (collectively the "Funds" or individually the "Fund"), and the investment adviser, Boston Management and Research, each provide that the advisory agreement will continue in effect from year to year so long as its continuance is approved at least annually (i) by a vote of a majority of the noninterested Trustees of the Fund cast in person at a meeting called for the purpose of voting on such approval and (ii) by the Trustees of the Fund or by vote of a majority of the outstanding interests of the Fund.
In considering the annual approval of the investment advisory agreements between each Fund and the investment adviser, the Special Committee of the Board of Trustees considered information that had been provided throughout the year at regular Board meetings, as well as information furnished to the Special Committee for a series of meetings held in February and March in preparation for a Board meeting held on March 21, 2005 to specifically consider the renewal of the investment advisory agreements. Such information included, among other things, the following:
•An independent report comparing the advisory fees of each Fund with those of comparable funds;
•An independent report comparing the expense ratio of each Fund to those of comparable funds;
•Information regarding Fund investment performance in comparison to relevant peer groups of funds and appropriate indices;
•The economic outlook and the general investment outlook in relevant investment markets;
•Eaton Vance Management's ("Eaton Vance") results and financial condition and the overall organization of the investment adviser;
•The procedures and processes used to determine the fair value of Fund assets and actions taken to monitor and test the effectiveness of such procedures and processes;
•Eaton Vance's management of the relationship with the custodian, subcustodians and fund accountants;
•The resources devoted to compliance efforts undertaken by Eaton Vance on behalf of the funds it manages and the record of compliance with the investment policies and restrictions and with policies on personal securities transactions;
•The quality, nature, cost and character of the administrative and other non-investment management services provided by Eaton Vance and its affiliates; and
•The terms of the advisory agreement and the reasonableness and appropriateness of the particular fee paid by the Fund for the services described therein.
The Special Committee also considered the nature, extent and quality of the management services provided by the investment adviser. In so doing, the Special Committee considered the investment adviser's management capabilities with respect to the types of investments held by each Fund, including information relating to the education, experience and number of investment professionals and other personnel who provide services under the investment advisory agreements. Specifically, the Special Committee considered the investment adviser's 30-person municipal bond team, which includes six portfolio managers and nine credit specialists who provide services to each Fund. The Special Committee noted the investment adviser's extensive in-house research capabilities and experience managing municipal bond funds. The Special Committee evaluated the level of skill required to manage each Fund and concluded that the human
81
Eaton Vance Municipals Funds
BOARD OF TRUSTEES' ANNUAL APPROVAL OF THE INVESTMENT ADVISORY AGREEMENTS CONT'D
resources available at the investment adviser were appropriate to fulfill effectively its duties on behalf of each Fund.
In its review of comparative information with respect to each Fund's investment performance, the Special Committee concluded that the Fund has performed within a range that the Special Committee deemed competitive. With respect to its review of investment advisory fees, the Special Committee concluded that the fees paid by each Fund are within the range of those paid by comparable funds within the mutual fund industry. In reviewing the information regarding the expense ratio of each Fund, the Special Committee concluded that the Fund's expense ratio is within a range that is competitive with comparable funds.
In addition to the factors mentioned above, the Special Committee reviewed the level of the investment adviser's profits in providing investment management services for each Fund and for all Eaton Vance Funds as a group. The Special Committee also reviewed the level of profits of Eaton Vance and its affiliates in providing administration services for each Fund and for all Eaton Vance Funds as a group. In addition, the Special Committee considered the fiduciary duty assumed by the investment adviser in connection with the services rendered to each Fund and the business reputation of the investment adviser and its financial resources. The Trustees concluded that in light of the services rendered, the profits realized by the investment adviser are not unreasonable. The Special Committee also considered the extent to which the investment adviser appears to be realizing benefits from economies of sc ale in managing the Funds, and concluded that the fee breakpoints which are in place will allow for an equitable sharing of such benefits, when realized, with the shareholders of the Funds.
The Special Committee did not consider any single factor as controlling in determining whether or not to approve the investment advisory agreement. Nor are the items described herein all encompassing of the matters considered by the Special Committee. In assessing the information provided by Eaton Vance and its affiliates, the Special Committee also took into consideration the benefits to shareholders of investing in a fund that is a part of a large family of funds which provides a large variety of shareholder services.
Based on its consideration of the foregoing factors and conclusions, and such other factors and conclusions as it deemed relevant, and assisted by the advice of its independent counsel, the Special Committee concluded that the approval of the investment advisory agreements, including the fee structures (described herein), is in the interests of shareholders.
82
Eaton Vance Municipals Funds
INVESTMENT MANAGEMENT
Eaton Vance Municipals Funds
Officers
Thomas J. Fetter
President and Portfolio Manager
of New York and Ohio
Municipals Funds
William H. Ahern, Jr.
Vice President
Craig R. Brandon
Vice President and Portfolio
Manager of Mississippi
Municipals Fund
Cynthia J. Clemson
Vice President and Portfolio
Manager of California and
Florida Municipals Funds
James B. Hawkes
Vice President and Trustee
Robert B. MacIntosh
Vice President and Portfolio
Manager of Massachusetts,
Rhode Island and West Virginia
Municipals Funds
Thomas M. Metzold
Vice President
James L. O'Connor
Treasurer
Alan R. Dynner
Secretary
Paul M. O'Neil
Chief Compliance Officer | | Trustees
Benjamin C. Esty
Samuel L. Hayes, III
William H. Park
Ronald A. Pearlman
Norton H. Reamer
Lynn A. Stout
Ralph F. Verni | |
|
83
This Page Intentionally Left Blank
Fund Investment Adviser
Boston Management and Research
The Eaton Vance Building
255 State Street
Boston, MA 02109
Fund Administrator
Eaton Vance Management
The Eaton Vance Building
255 State Street
Boston, MA 02109
Principal Underwriter
Eaton Vance Distributors, Inc.
The Eaton Vance Building
255 State Street
Boston, MA 02109
(617) 482-8260
Custodian
Investors Bank & Trust Company
200 Clarendon Street
Boston, MA 02116
Transfer Agent
PFPC Inc.
Attn: Eaton Vance Funds
P.O. Box 9653
Providence, RI 02940-9653
(800) 262-1122
Eaton Vance Municipals Trust
The Eaton Vance Building
255 State Street
Boston, MA 02109
This report must be preceded or accompanied by a current prospectus. Before investing, investors should consider carefully the Fund’s investment objective(s), risks, and charges and expenses. The Fund’s current prospectus contains this and other information about the Fund and is available through your financial advisor. Please read the prospectus carefully before you invest or send money. For further information please call 1-800-225-6265.
Item 2. Code of Ethics
The registrant has adopted a code of ethics applicable to its Principal Executive Officer, Principal Financial Officer and Principal Accounting Officer. The registrant undertakes to provide a copy of such code of ethics to any person upon request, without charge, by calling 1-800-262-1122.
Item 3. Audit Committee Financial Expert
The registrant’s Board has designated William H. Park, Samuel L. Hayes, III and Norton H. Reamer, each an independent trustee, as its audit committee financial experts. Mr. Park is a certified public accountant who is the President and Chief Executive Officer of Prizm Capital Management, LLC (investment management firm). Previously, he served as Executive Vice President and Chief Financial Officer of United Asset Management Corporation (“UAM”) (a holding company owning institutional investment management firms). Mr. Hayes is the Jacob H. Schiff Professor of Investment Banking Emeritus of the Harvard University Graduate School of Business Administration. Mr. Reamer is the President, Chief Executive Officer and a Director of Asset Management Finance Corp. (a specialty finance company serving the investment management industry) and is President of Unicorn Corporation (an investment and financial advisory services company). Formerly, Mr. Reamer was Chairman of Hellman, Jordan Management Co., Inc. (an investment management company) and Advisory Director of Berkshire Capital Corporation (an investment banking firm), Chairman of the Board of UAM and Chairman, President and Director of the UAM Funds (mutual funds).
Item 4. Principal Accountant Fees and Services
Not required in this filing
Item 5. Audit Committee of Listed registrants
Not required in this filing.
Item 6. Schedule of Investments
Please see schedule of investments contained in the Report to Stockholders included under Item 1 of this Form N-CSR.
Item 7. Disclosure of Proxy Voting Policies and Procedures for Closed-End Management Investment Companies
Not required in this filing.
Item 8. Purchases of Equity Securities by Closed-End Management Investment Company and Affiliated Purchasers.
Not required in this filing.
Item 9. Submission of Matters to a Vote of Security Holders.
Effective February 7, 2005, the Governance Committee of the Board of Trustees revised the procedures by which a Fund’s shareholders may recommend nominees to the registrant’s Board of Trustees to add the following (highlighted):
The Governance Committee shall, when identifying candidates for the position of Independent Trustee, consider any such candidate recommended by a shareholder of a Fund if such recommendation contains (i)sufficient background information concerning the candidate, including evidence the candidate is willing to serve as an Independent Trustee if selected for the position; and (ii) is received in a sufficiently timely manner (and in any event no later than the date specified for receipt of shareholder proposals in any applicable proxy statement with respect to a Fund). Shareholders shall be directed to address any such recommendations in writing to the attention of the Governance Committee, c/o the Secretary of the Fund. The Secretary shall retain copies of any shareholder recommendations which meet the foregoing requirements for a period of not more than 12 months following receipt. The Secretary shall have no obligation to acknowledge receipt of any shareholder recommendations
Item 10. Controls and Procedures
(a) It is the conclusion of the registrant’s principal executive officer and principal financial officer that the effectiveness of the registrant’s current disclosure controls and procedures (such disclosure controls and procedures having been evaluated within 90 days of the date of this filing) provide reasonable assurance that the information required to be disclosed by the registrant has been recorded, processed, summarized and reported within the time period specified in the Commission’s rules and forms and that the information required to be disclosed by the registrant has been accumulated and communicated to the registrant’s principal executive officer and principal financial officer in order to allow timely decisions regarding required disclosure.
(b) There have been no changes in the registrant’s internal controls over financial reporting during the second fiscal quarter of the period covered by this report that has materially affected, or is reasonably likely to materially affect, the registrant’s internal control over financial reporting.
Item 11. Exhibits
(a)(1) | | Registrant’s Code of Ethics – Not applicable (please see Item 2). |
(a)(2)(i) | | Treasurer’s Section 302 certification. |
(a)(2)(ii) | | President’s Section 302 certification. |
(b) | | Combined Section 906 certification. |
Signatures
Pursuant to the requirements of the Securities Exchange Act of 1934 and the Investment Company Act of 1940, the registrant has duly caused this report to be signed on its behalf by the undersigned, thereunto duly authorized.
Eaton Vance Municipals Trust
By: | /s/ Thomas J. Fetter | |
| Thomas J. Fetter |
| President |
| |
| |
Date: | May 11, 2005 | |
| | | |
Pursuant to the requirements of the Securities Exchange Act of 1934 and the Investment Company Act of 1940, this report has been signed below by the following persons on behalf of the registrant and in the capacities and on the dates indicated.
By: | /s/ James L. O’Connor | |
| James L. O’Connor |
| Treasurer |
| |
| |
Date: | May11, 2005 | |
| |
| |
By: | /s/ Thomas J. Fetter | |
| Thomas J. Fetter |
| President |
| |
| |
Date: | May 11, 2005 | |
| | | | |