UNITED STATES
SECURITIES AND EXCHANGE COMMISSION
Washington, D.C. 20549
FORM N-CSR
CERTIFIED SHAREHOLDER REPORT OF REGISTERED MANAGEMENT
INVESTMENT COMPANIES
Investment Company Act file number: 811-04603
Thrivent Series Fund, Inc.
(Exact name of registrant as specified in charter)
625 Fourth Avenue South
Minneapolis, Minnesota 55415
(Address of principal executive offices) (Zip code)
John L. Sullivan
625 Fourth Avenue South
Minneapolis, Minnesota 55415
(Name and address of agent for service)
Registrant’s telephone number, including area code: (612) 844-5704
Date of fiscal year end: December 31
Date of reporting period: December 31, 2007
Item 1. Report to Stockholders
Table of Contents
| President’s Letter | 1 |
| Economic and Market Review | 2 |
| Portfolio Perspectives | |
| Thrivent Aggressive Allocation Portfolio | 4 |
| Thrivent Moderately Aggressive Allocation Portfolio | 6 |
| Thrivent Moderate Allocation Portfolio | 8 |
| Thrivent Moderately Conservative Allocation Portfolio | 10 |
| Thrivent Technology Portfolio | 12 |
| Thrivent Partner Small Cap Growth Portfolio | 14 |
| Thrivent Partner Small Cap Value Portfolio | 16 |
| Thrivent Small Cap Stock Portfolio | 18 |
| Thrivent Small Cap Index Portfolio | 20 |
| Thrivent Mid Cap Growth Portfolio | 22 |
| Thrivent Mid Cap Growth Portfolio II | 24 |
| Thrivent Partner Mid Cap Value Portfolio | 26 |
| Thrivent Mid Cap Stock Portfolio | 28 |
| Thrivent Mid Cap Index Portfolio | 30 |
| Thrivent Partner International Stock Portfolio | 32 |
| Thrivent Partner All Cap Portfolio | 34 |
| Thrivent Large Cap Growth Portfolio | 36 |
| Thrivent Large Cap Growth Portfolio II | 38 |
| Thrivent Partner Growth Stock Portfolio | 40 |
| Thrivent Large Cap Value Portfolio | 42 |
| Thrivent Large Cap Stock Portfolio | 44 |
| Thrivent Large Cap Index Portfolio | 46 |
| Thrivent Real Estate Securities Portfolio | 48 |
| Thrivent Balanced Portfolio | 50 |
| Thrivent High Yield Portfolio | 52 |
| Thrivent Diversified Income Plus Portfolio | 54 |
| Thrivent Income Portfolio | 56 |
| Thrivent Bond Index Portfolio | 58 |
| Thrivent Limited Maturity Bond Portfolio | 60 |
| Thrivent Mortgage Securities Portfolio | 62 |
| Thrivent Money Market Portfolio | 64 |
| Shareholder Expense Example | 66 |
| Report of Independent Registered | |
| Public Accounting Firm | 69 |
| Schedules of Investments | |
| Thrivent Aggressive Allocation Portfolio | 70 |
| Thrivent Moderately Aggressive Allocation Portfolio | 71 |
| Thrivent Moderate Allocation Portfolio | 72 |
| Thrivent Moderately Conservative Allocation Portfolio . | 73 |
| Thrivent Technology Portfolio | 74 |
| Thrivent Partner Small Cap Growth Portfolio | 76 |
| Thrivent Partner Small Cap Value Portfolio | 79 |
| Thrivent Small Cap Stock Portfolio | 82 |
| Thrivent Small Cap Index Portfolio | 86 |
| Thrivent Mid Cap Growth Portfolio | 94 |
| Thrivent Mid Cap Growth Portfolio II | 97 |
| Thrivent Partner Mid Cap Value Portfolio | 100 |
| Thrivent Mid Cap Stock Portfolio | 103 |
| Thrivent Mid Cap Index Portfolio | 106 |
| Thrivent Partner International Stock Portfolio | 112 |
| Thrivent Partner All Cap Portfolio | 116 |
| Thrivent Large Cap Growth Portfolio | 118 |
| Thrivent Large Cap Growth Portfolio II | 121 |
| Thrivent Partner Growth Stock Portfolio | 124 |
| Thrivent Large Cap Value Portfolio | 127 |
| Thrivent Large Cap Stock Portfolio | 130 |
| Thrivent Large Cap Index Portfolio | 133 |
| Thrivent Real Estate Securities Portfolio | 140 |
| Thrivent Balanced Portfolio | 143 |
| Thrivent High Yield Portfolio | 162 |
| Thrivent Diversified Income Plus Portfolio | 170 |
| Thrivent Income Portfolio | 182 |
| Thrivent Bond Index Portfolio | 192 |
| Thrivent Limited Maturity Bond Portfolio | 203 |
| Thrivent Mortgage Securities Portfolio | 212 |
| Thrivent Money Market Portfolio | 215 |
| Statement of Assets and Liabilities | 220 |
| Statement of Operations | 226 |
| Statement of Changes in Net Assets | 232 |
| Notes to Financial Statements | 238 |
| Financial Highlights | |
| Thrivent Aggressive Allocation Portfolio | 260 |
| Thrivent Moderately Aggressive Allocation Portfolio | 260 |
| Thrivent Moderate Allocation Portfolio | 260 |
| Thrivent Moderately Conservative Allocation Portfolio . | 260 |
| Thrivent Technology Portfolio | 260 |
| Thrivent Partner Small Cap Growth Portfolio | 260 |
| Thrivent Partner Small Cap Value Portfolio | 260 |
| Thrivent Small Cap Stock Portfolio | 260 |
| Thrivent Small Cap Index Portfolio | 262 |
| Thrivent Mid Cap Growth Portfolio | 262 |
| Thrivent Mid Cap Growth Portfolio II | 262 |
| Thrivent Partner Mid Cap Value Portfolio | 262 |
| Thrivent Mid Cap Stock Portfolio | 262 |
| Thrivent Mid Cap Index Portfolio | 262 |
| Thrivent Partner International Stock Portfolio | 262 |
| Thrivent Partner All Cap Portfolio | 264 |
| Thrivent Large Cap Growth Portfolio | 264 |
| Thrivent Large Cap Growth Portfolio II | 264 |
| Thrivent Partner Growth Stock Portfolio | 264 |
| Thrivent Large Cap Value Portfolio | 264 |
| Thrivent Large Cap Stock Portfolio | 264 |
| Thrivent Large Cap Index Portfolio | 264 |
| Thrivent Real Estate Securities Portfolio | 266 |
| Thrivent Balanced Portfolio | 266 |
| Thrivent High Yield Portfolio | 266 |
| Thrivent Diversified Income Plus Portfolio | 266 |
| Thrivent Income Portfolio | 266 |
| Thrivent Bond Index Portfolio | 266 |
| Thrivent Limited Maturity Bond Portfolio | 266 |
| Thrivent Mortgage Securities Portfolio | 268 |
| Thrivent Money Market Portfolio | 268 |
| Additional Information | 270 |
| Board of Directors and Officers | 273 |
| Supplements to the Prospectus | 278 |

Dear Member:
We are pleased to provide you with the Thrivent Series Fund, Inc. annual report for the 12-month period ended December 31, 2007. In this report, you will find detailed information about each investment portfolio in the Thrivent Series Fund, including summaries prepared by each portfolio manager on his or her performance and management strategies for the applicable portfolio and period. In addition, Russ Swansen, Thrivent Financial’s Chief Investment Officer, summarizes the overall market and economic environment over the past year.
Market Ride Grows Bumpier
Our nation’s financial markets ended 2007 on a sour note, with a weak 4th quarter for the stock market. Continued fallout from the sub-prime loan crisis combined with fears of much slower economic growth injected a healthy bout of long-dormant volatility back into stock prices. As it has been several years since we have endured a strong market correction, it may be helpful to review some age-old nuggets of wisdom for market uncertainty.
* Avoid trying to “time” the market. Pulling out of stocks in favor of the money market may help ease some of the anxiety you feel when the market is volatile, but consider the consequences of such action. When, and by what signal, will you put the money back into the stock market? Does a short-term flight to cash really align with your long-term investment goals? Have you weighed the potential gains you may miss out on if the market moves up?
Investors generally have little success in moving in and out of the stock market. If the nation’s very best hedge fund managers struggle in this regard, other investors are unlikely to do any better.
* Keep a long-term perspective. Investors generally enjoyed a favorable stock market from 2003 through 2007 — a historically lengthy bull market. If we see a pullback now and again, it’s important to recognize that volatility is an inherent part of overall investing. Periodic corrections can allow new investors and money to enter into the market and even set the stage for the next expansion.
There is no “free lunch” when it comes to investing. The relatively high returns investors have historically earned on stock investments typically occurred over longer time frames and have, and will likely continue to, come with periodic downturns and volatility.
* Consult with your Thrivent Financial representative. Talk with your representative to get the advice and reassurance you need to stay on track with your financial goals. The media is prone to saturating the airwaves and publications with sensational coverage of market ups and downs.
It’s imperative to get grounded, honest, and dispassionate advice at these times—your Thrivent Financial Representative is always willing to address any questions or concerns. Please don’t hesitate to get in touch.
Our Ongoing Commitment to You
As a member-owned organization, Thrivent Financial for Lutherans is uniquely designed and positioned to serve the financial and fraternal needs of one entity — you, our valued member. Many of you have one thing foremost on your minds at this point in your life — retirement. Our investment management philosophy is squarely focused on sound asset allocation strategies, striving for strong investment performance and meaningful advice that can provide a clear roadmap to your retirement — regardless of current market conditions. Whether saving for that retirement, sharing your success with your church or community, or leaving a legacy to the next generation, we stand ready to assist you each step of the way.
I want to personally wish you the best in 2008. Thank you for continuing to turn to us for your financial solutions. We very much value your business.
Sincerely,

Pamela J. Moret
President and Director
Thrivent Series Fund, Inc.
| 1 |

Stocks and bonds posted mixed returns for the 12-month period ended December 31, 2007. In the first half, moderating economic growth appeared to ease inflation concerns, creating a positive backdrop for the financial markets but also an environment in which high risk categories of financial assets appeared extended. Beginning in early summer there was an increase in investment uncertainty, as an unexpected deterioration in the value of mortgage and asset-backed fixed-income securities roiled the credit markets and ultimately resulted in a significant withdrawal of credit availability from the financial system. This led to significant policy adjustments by central bankers around the globe as they attempted to facilitate the availability of credit and liquidity to the markets. Ultimately, a reduction in targeted short-term rates in the United States was warranted as heightened risks in both the real economy and the financial markets became apparent.
U.S. Economy
The nation’s gross domestic product fell from a 2.1% annual growth rate in the fourth quarter of 2006 to a 0.6% annual rate in the first quarter of 2007, the weakest rate of expansion in four years. Growth rebounded to 3.8% in the second quarter, however, thanks to strong spending by consumers, who were encouraged by employment and income gains and undeterred by high energy prices and deterioration in the housing market. Growth in the third quarter accelerated to a 4.9% annual rate, buttressed by exports and business investment. Current estimates for the fourth quarter 2007 suggest a significant moderation to around a 1% rate of growth.
Housing was a significant drag on the economy during the year. Weak sales, rising inventories, falling prices and much tighter lending standards caused the imbalances in the housing market to worsen over the period. Housing starts have fallen more than 50% since their highs in the beginning of 2006 and reached levels in November 2007 last seen in early 1991.
Increased business spending offset much of the negative impact of the housing slowdown. Global demand also remained strong, particularly from developing economies, and the low valuation of the dollar enhanced the attractiveness of U.S. goods and services in world markets, lifting U.S. exports and moderately improving the U.S. trade position.
Inflation & Monetary Policy
Inflation indicators were mixed during the period. The Consumer Price Index (CPI) rose at a 4.1% annual rate for 2007, compared with a 2.5% rate for all of 2006. The index for energy, which rose 2.9% in all of 2006, advanced at a 17.4% annual rate for 2007. Excluding the volatile prices of food and energy, the core CPI advanced at a 2.4% annual rate in 2007, following a 2.6% rise in all of 2006.
For the Federal Reserve Open Market Committee (FOMC), inflation concerns eventually were trumped by worries that the housing slump and expanding credit crunch might dampen economic growth. On September 18, policymakers cut the federal funds rate by a more-than-expected half-percent to 4.75%, and on October 31 and December 11 they followed with widely anticipated quarter-percent cuts. At their December meeting, policymakers noted that economic growth was slowing due mainly to the housing downturn and some softening in business and consumer spending.
Equity Performance
Stocks gained steadily through late in the first half of 2007, spurred by good corporate profits, a flurry of merger and acquisition activity prompted by low cost and relatively easy credit conditions, and diminishing concerns about higher inflation and interest rates. Price volatility jumped dramatically over the summer and fall of 2007 in response to credit market deterioration and the withdrawal of liquidity from the system. A number of reductions in the fed funds rate in the latter part of the year pushed many investment indexes to or near record highs, but those prices were not held as evidence of widespread consumer and business uncertainty called into question sustained economic growth.
Large-company stocks outperformed small-company issues during the period. The S&P 500 Index of large-company stocks posted a 5.49% total return, while the Russell 2000® Index of small-company stocks recorded a –1.57% return. Growth stocks outperformed value stocks. During the period, the Russell 3000® Growth Index returned 11.55%, while the Russell 3000® Value Index posted a return of –0.94% .
Real estate investment trusts (REITs) lost ground during the period, with the FTSE NAREIT Equity REIT Index declining by –15.69% . Foreign stocks generally continued
| 2 |
to outperform most domestic issues. The Morgan Stanley Capital International Europe, Australasia, Far East (EAFE) Index, boosted by a weakening dollar, posted an 11.63% total return in dollar terms.
Fixed Income Performance
Treasury yields were relatively stable until mid-April, when they spiked as bond investors began to worry about a reacceleration in economic growth and, consequently, started to suspect that the Federal Reserve would not begin cutting rates any time soon. An investor flight to safety, spurred by concerns about sub-prime mortgages and liquidity problems at several large financial institutions, pushed down Treasury yields in the third quarter. The Federal Reserve eased both the federal funds and discount rates later in the period.
A substantial drop in the yields of shorter-maturity Treasury securities helped eliminate the yield curve inversion — an unusual situation in which shorter-term bonds actually pay higher yields than longer-term bonds — that had persisted for much of the last year. A general decline in yields, with a corresponding increase in prices, boosted bonds’ total returns for the period. The Lehman Brothers Aggregate Bond Index of the broad U.S. bond market posted a 6.97% total return, while the Lehman Brothers Government/Corporate 1–3 Year Bond Index registered a 6.84% total return. Below-investment-grade corporate bonds were weaker performers, with the Lehman Brothers U.S. Corporate High Yield Bond Index registering a 1.87% total return.
Outlook
We expect economic growth to remain below average over the next few months, with inflation moderating. Gross domestic product growth should continue at around a 1–2% annual rate, but risks to the forecast are high. We expect energy and commodities prices to moderate and the housing market to begin to stabilize in the second half of 2008. These factors suggest that consumer spending, while not robust, will be sufficient to maintain growth. We expect business spending on new plants and equipment to continue, after a number of years of below-average investing in productive resources.
Dislocations unfolding in the credit markets that began with the unwinding of the housing boom of the last five years have the potential to spill over into the rest of the economy. The risks to the economy are not directly a function of the softness in housing but rather how consumer spending or financial lending behaviors may change in reaction to what is happening in the housing market. With policymakers concerned about both an economic slowdown and the potential for higher inflation, it is uncertain whether the Federal Reserve intends to ease interest rates any time soon, but it is our view that the days of policy-driven tightening are past for the near term.
As always, your best strategy is to work with your Thrivent Financial registered representative to create a plan based on your goals, diversify your portfolio and remain focused on the long term.
| 3 |

The Portfolio’s performance depends upon how its assets are allocated across broad asset categories and applicable sub-classes within such categories. Some broad asset categories and sub-classes may perform below expectations or below the securities markets generally over short or extended periods. In particular, underperformance in the equity markets would have material adverse effect on the Portfolio’s total return given its significant allocation to equity securities. Therefore, a principal risk of investing in the Portfolio is that the allocation strategies used, and the allocation decisions made will not produce the desired results. In addition, the performance of the Portfolio is heavily dependent upon the performance of the underlying portfolios in which the Portfolio invests. As a result, the Portfolio is subject to the same risks as those faced by the underlying portfolios. Those risks include, but are not limited to, market risk, issuer risk, volatility risk, investment adviser risk, as well as credit risk and interest rate risk. These and other risks are described in the Portfolio’s prospectus.
How did the Portfolio perform during the 12-month period ended December 31, 2007?
Thrivent Aggressive Allocation Portfolio earned a return of 9.33% for the 12-month period as compared to the median return for its peer group, the Lipper Multicap Core category, of 5.29% . The Portfolio’s market benchmarks, the S&P 500 Index and the Lehman Brothers Aggregate Bond Index, returned 5.49% and 6.97%, respectively.
What factors influenced the Portfolio’s performance?
For the fiscal year, large-cap stocks generally equaled or outperformed their respective small-capitalization counterparts; growth stocks tended to outperform value stocks; and international stocks provided better returns than many of the domestic indexes, as a result of dollar weakness versus many foreign currencies. Foreign stocks in their local currencies, particularly in the UK and Europe, were generally in line with major U.S. indexes. Emerging markets achieved exceptional returns. In fixed-income markets, returns tended to be skewed towards the higher-quality segments of the markets.
Early in the year, the Portfolio generally had a bias towards large-capitalization and growth-oriented securities, but our risk profile was broadly consistent with our long-term strategic allocations for risk and return. In the second quarter, our analysis of both stock and credit risk premiums suggested that many segments of both fixed-income and equity markets were “priced for perfection,” i.e., expected returns were such that one was not being adequately compensated for the risk on many of the more volatile asset classes. As such, we undertook steps to reduce the risk profile within the respective major asset classes by further reducing our exposure to mid- and small-capitalization securities in the equity segment of the Portfolio. We also further upgraded our positions in growth allocations in the expectation that credit issues in real estate would more significantly impact value-based investment styles, given the proportionately large exposure to financial services that tends to characterize value benchmarks and portfolios. Tactically, these decisions enhanced the Portfolio’s results, especially in the second half of the year, as the scope and breadth of deteriorating housing fundamentals cascaded into fixed-income credit markets, creating a liquidity crisis that ultimately impaired the stock market, particularly small-cap and value-oriented strategies. Investors’ preference for high-quality in fixed-income and
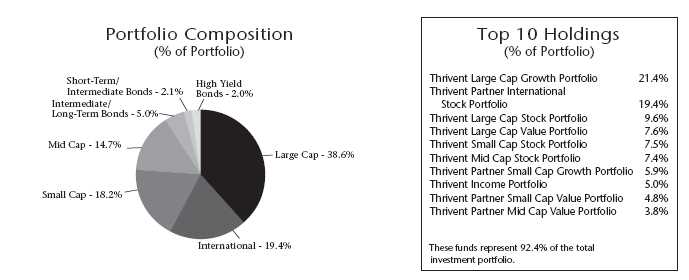
| Quoted Portfolio Composition and Top 10 Holdings are subject to change. |
| 4 |
growth-oriented strategies in stocks resulted in significant spreads in returns versus those strategies most directly impacted by disruptions in the markets.
What is your outlook?
The disruptions in the financial markets, on top of an already cautious and extended consumer sector, have heightened the risk of a serious economic dislocation. This has created an environment of heightened investor uncertainty, higher market volatility and significant corrections in many financial asset prices. As an investor, we are gratified to see more rational pricing of risky financial assets but are cognizant that financial and economic risks remain elevated. We are thoughtfully and judiciously looking for opportunities to reinstate some of the risk positions in the Portfolio that were reduced early last year, as return opportunities are now much more reasonable relative to the risks being borne. In the absence of recession, it appears that low-risk assets are now somewhat overpriced relative to risky assets.
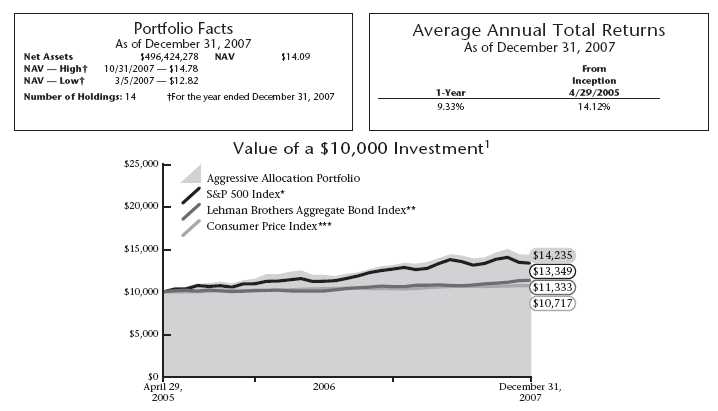
* The S&P 500 Index is an index that represents the average performance of a group of 500 large-capitalization stocks. It is not possible to invest directly in the Index. The performance of the Index does not reflect deductions for fees, expenses or taxes.
** The Lehman Brothers Aggregate Bond Index is an index that measures the performance of U.S. investment grade bonds. It is not possible to invest directly in the Index. The performance of the Index does not reflect deductions for fees, expenses or taxes.
*** The Consumer Price Index is an inflationary indicator that measures the change in the cost of a fixed basket of products and services, including housing, electricity, food and transportation. It is not possible to invest directly in the Index.
Past performance is not an indication of future results. Total investment return and principal value will fluctuate and units, when redeemed, may be worth more or less than their original cost. Current performance may be higher or lower than the performance data quoted. Market volatility can significantly affect short-term performance, and more recent returns may be different from those shown. Call 800-THRIVENT or visit www.thrivent.com for performance results current to the most recent month-end.
1 Annualized total returns represent past performance and reflect changes in share prices, the reinvestment of all dividends and capital gains, and the effects of compounding. Periods of less than one year are not annualized. At various times, the Portfolio’s adviser reimbursed and/or paid non-advisory Portfolio expenses. Had the adviser not done so, the Portfolio’s total returns would have been lower. The returns shown do not reflect charges and expenses imposed on contract holders by the variable accounts. Those charges and expenses reduce the returns received by contract holders as compared to the returns presented.
Investing in a variable product involves risks, including the possible loss of principal. The prospectus contains more complete information on the investment objectives, risks, charges and expenses of the investment company, which investors should read and consider carefully before investing. To obtain a prospectus, contact a registered representative or visit www.thrivent.com.
| 5 |

The Portfolio’s performance depends upon how its assets are allocated across broad asset categories and applicable sub-classes within such categories. Some broad asset categories and sub-classes may perform below expectations or below the securities markets generally over short or extended periods. In particular, underperformance in the equity markets would have material adverse effect on the Portfolio’s total return given its significant allocation to equity securities. Therefore, a principal risk of investing in the Portfolio is that the allocation strategies used, and the allocation decisions made will not produce the desired results. In addition, the performance of the Portfolio is heavily dependent upon the performance of the underlying portfolios in which the Portfolio invests. As a result, the Portfolio is subject to the same risks as those faced by the underlying portfolios. Those risks include, but are not limited to, market risk, issuer risk, volatility risk, investment adviser risk, as well as credit risk and interest rate risk. These and other risks are described in the Portfolio’s prospectus.
How did the Portfolio perform during the 12-month period ended December 31, 2007?
Thrivent Moderately Aggressive Allocation Portfolio earned a return of 7.75% for the 12-month period as compared to the median return of its peer group, the Lipper Mixed-Asset Target Allocation Growth category, of 6.34% . The Portfolio’s market benchmarks, the S&P 500 Index and the Lehman Brothers Aggregate Bond Index, returned 5.49% and 6.97%, respectively.
What factors influenced the Portfolio’s performance?
For the fiscal year, large-cap stocks generally equaled or outperformed their respective small-capitalization counterparts; growth stocks tended to outperform value stocks; and international stocks provided better returns than many of the domestic indexes, as a result of dollar weakness versus many foreign currencies. Foreign stocks in their local currencies, particularly in the UK and Europe, were generally in line with major U.S. indexes. Emerging markets achieved exceptional returns. In fixed-income markets, returns tended to be skewed towards the higher-quality segments of the markets.
Early in the year, the Portfolio generally had a bias towards large-capitalization and growth-oriented securities, but our risk profile was broadly consistent with our long-term strategic allocations for risk and return. In the second quarter, our analysis of both stock and credit risk premiums suggested that many segments of both fixed-income and equity markets were “priced for perfection,” i.e., expected returns were such that one was not being adequately compensated for the risk on many of the more volatile asset classes. As such, we undertook steps to reduce the risk profile within the respective major asset classes by further reducing our exposure to mid- and small-capitalization securities in the equity segment of the Portfolio. We also further upgraded our positions in growth allocations in the expectation that credit issues in real estate would more significantly impact value-based investment styles given the proportionately large exposure to financial services that tends to characterize value benchmarks and portfolios. Tactically, these decisions enhanced the Portfolio’s results, especially in the second half of the year, as the scope and breadth of deteriorating housing fundamentals cascaded into fixed-income credit markets, creating a liquidity crisis that ultimately impaired the stock market, particularly small-cap and value-oriented strategies. Investors’ preference for high- quality in fixed-income and growth-oriented strategies in stocks resulted in significant spreads in returns versus those strategies most directly impacted by disruptions in the markets.

| Quoted Portfolio Composition and Top 10 Holdings are subject to change. |
| 6 |
Our Portfolio had very small exposures to the segments of the market most directly impacted by the financial disruptions, but the contagion effect across fixed-income with any credit exposure did have a limiting impact on fixed-income relative to the highest-quality segments.
What is your outlook?
The disruptions in the financial markets, on top of an already cautious and extended consumer sector, have heightened the risk of a serious economic dislocation. This has created an environment of heightened investor uncertainty, higher market volatility and significant corrections in many financial asset prices. As an investor, we are gratified to see more rational pricing of risky financial assets but are cognizant that financial and economic risks remain elevated. We are thoughtfully and judiciously looking for opportunities to reinstate some of the risk positions in the Portfolio that were reduced early last year, as return opportunities are now much more reasonable relative to the risks being borne. In the absence of recession, it appears that low-risk assets are now somewhat overpriced relative to risky assets.

* The S&P 500 Index is an index that represents the average performance of a group of 500 large-capitalization stocks. It is not possible to invest directly in the Index. The performance of the Index does not reflect deductions for fees, expenses or taxes.
** The Lehman Brothers Aggregate Bond Index is an index that measures the performance of U.S. investment grade bonds. It is not possible to invest directly in the Index. The performance of the Index does not reflect deductions for fees, expenses or taxes.
*** The Consumer Price Index is an inflationary indicator that measures the change in the cost of a fixed basket of products and services, including housing, electricity, food and transportation. It is not possible to invest directly in the Index.
Past performance is not an indication of future results. Total investment return and principal value will fluctuate and units, when redeemed, may be worth more or less than their original cost. Current performance may be higher or lower than the performance data quoted. Market volatility can significantly affect short-term performance, and more recent returns may be different from those shown. Call 800-THRIVENT or visit www.thrivent.com for performance results current to the most recent month-end.
1 Annualized total returns represent past performance and reflect changes in share prices, the reinvestment of all dividends and capital gains, and the effects of compounding. Periods of less than one year are not annualized. At various times, the Portfolio’s adviser reimbursed and/or paid non-advisory Portfolio expenses. Had the adviser not done so, the Portfolio’s total returns would have been lower. The returns shown do not reflect charges and expenses imposed on contract holders by the variable accounts. Those charges and expenses reduce the returns received by contract holders as compared to the returns presented.
Investing in a variable product involves risks, including the possible loss of principal. The prospectus contains more complete information on the investment objectives, risks, charges and expenses of the investment company, which investors should read and consider carefully before investing. To obtain a prospectus, contact a registered representative or visit www.thrivent.com.
| 7 |

The Portfolio’s performance depends upon how its assets are allocated across broad asset categories and applicable sub-classes within such categories. Some broad asset categories and sub-classes may perform below expectations or below the securities markets generally over short or extended periods. In particular, underperformance in the equity markets would have material adverse effect on the Portfolio’s total return given its significant allocation to equity securities. Therefore, a principal risk of investing in the Portfolio is that the allocation strategies used, and the allocation decisions made will not produce the desired results. In addition, the performance of the Portfolio is heavily dependent upon the performance of the underlying portfolios in which the Portfolio invests. As a result, the Portfolio is subject to the same risks as those faced by the underlying portfolios. Those risks include, but are not limited to, market risk, issuer risk, volatility risk, investment adviser risk, as well as credit risk and interest rate risk. These and other risks are described in the Portfolio’s prospectus.
How did the Portfolio perform during the 12-month period ended December 31, 2007?
Thrivent Moderate Allocation Portfolio earned a return of 6.77% as compared to the median return of its peer group, the Lipper Mixed-Asset Target Allocation Moderate category, of 5.69% . The Portfolio’s market benchmarks, the S&P 500 Index and the Lehman Brothers Aggregate Bond Index, returned 5.49% and 6.97%, respectively.
What factors influenced the Portfolio’s performance?
For the fiscal year, large-cap stocks generally equaled or outperformed their respective small-capitalization counterparts; growth stocks tended to outperform value stocks; and international stocks provided better returns than many of the domestic indexes, as a result of dollar weakness versus many foreign currencies. Foreign stocks in their local currencies, particularly in the UK and Europe, were generally in line with major U.S. indexes. Emerging markets achieved exceptional returns. In fixed-income markets, returns tended to be skewed towards the higher-quality segments of the markets.
Early in the year, the Portfolio generally had a bias towards large-capitalization and growth-oriented securities, but our risk profile was broadly consistent with our long-term strategic allocations for risk and return. In the second quarter, our analysis of both stock and credit risk premiums suggested that many segments of both fixed-income and equity markets were “priced for perfection,” i.e., expected returns were such that one was not being adequately compensated for the risk on many of the more volatile asset classes. As such, we undertook steps to reduce the risk profile within the respective major asset classes by further reducing our exposure to mid- and small-capitalization securities in the equity segment of the Portfolio. We also further upgraded our positions in growth allocations in the expectation that credit issues in real estate would more significantly impact value-based investment styles given the proportionately large exposure to financial services that tends to characterize value benchmarks and portfolios. Tactically, these decisions enhanced the Portfolio’s results, especially in the second half of the year, as the scope and breadth of deteriorating housing fundamentals cascaded into fixed-income credit markets, creating a liquidity crisis that ultimately impaired the stock market, particularly small-cap and value-oriented strategies. Investors’ preference for high-quality in fixed-income and growth-oriented strategies in stocks resulted in significant spreads in returns versus those strategies most directly impacted by disruptions in the markets. Our Portfolio had
| Quoted Portfolio Composition and Top 10 Holdings are subject to change. |
| 8 |
very small exposures to the segments of the market most directly impacted by the financial disruptions, but the contagion effect across fixed-income with any credit exposure did have a limiting impact on fixed-income relative to the highest-quality segments.
What is your outlook?
The disruptions in the financial markets, on top of an already cautious and extended consumer sector, have heightened the risk of a serious economic dislocation. This has created an environment of heightened investor uncertainty, higher market volatility and significant corrections in many financial asset prices. As an investor, we are gratified to see more rational pricing of risky financial assets but are cognizant that financial and economic risks remain elevated. We are thoughtfully and judiciously looking for opportunities to reinstate some of the risk positions in the Portfolio that were reduced early last year, as return opportunities are now much more reasonable relative to the risks being borne. In the absence of recession, it appears that low-risk assets are now somewhat overpriced relative to risky assets.
* The S&P 500 Index is an index that represents the average performance of a group of 500 large-capitalization stocks. It is not possible to invest directly in the Index. The performance of the Index does not reflect deductions for fees, expenses or taxes.
** The Lehman Brothers Aggregate Bond Index is an index that measures the performance of U.S. investment grade bonds. It is not possible to invest directly in the Index. The performance of the Index does not reflect deductions for fees, expenses or taxes.
*** The Consumer Price Index is an inflationary indicator that measures the change in the cost of a fixed basket of products and services, including housing, electricity, food and transportation. It is not possible to invest directly in the Index.
Past performance is not an indication of future results. Total investment return and principal value will fluctuate and units, when redeemed, may be worth more or less than their original cost. Current performance may be higher or lower than the performance data quoted. Market volatility can significantly affect short-term performance, and more recent returns may be different from those shown. Call 800-THRIVENT or visit www.thrivent.com for performance results current to the most recent month-end.
1 Annualized total returns represent past performance and reflect changes in share prices, the reinvestment of all dividends and capital gains, and the effects of compounding. Periods of less than one year are not annualized. At various times, the Portfolio’s adviser reimbursed and/or paid non-advisory Portfolio expenses. Had the adviser not done so, the Portfolio’s total returns would have been lower. The returns shown do not reflect charges and expenses imposed on contract holders by the variable accounts. Those charges and expenses reduce the returns received by contract holders as compared to the returns presented.
Investing in a variable product involves risks, including the possible loss of principal. The prospectus contains more complete information on the investment objectives, risks, charges and expenses of the investment company, which investors should read and consider carefully before investing. To obtain a prospectus, contact a registered representative or visit www.thrivent.com.
| 9 |

The Portfolio’s performance depends upon how its assets are allocated across broad asset categories and applicable sub-classes within such categories. Some broad asset categories and sub-classes may perform below expectations or below the securities markets generally over short or extended periods. In particular, underperformance in the equity markets would have material adverse effect on the Portfolio’s total return given its significant allocation to equity securities. Therefore, a principal risk of investing in the Portfolio is that the allocation strategies used, and the allocation decisions made will not produce the desired results. In addition, the performance of the Portfolio is heavily dependent upon the performance of the underlying portfolios in which the Portfolio invests. As a result, the Portfolio is subject to the same risks as those faced by the underlying portfolios. Those risks include, but are not limited to, market risk, issuer risk, volatility risk, investment adviser risk, as well as credit risk and interest rate risk. These and other risks are described in the Portfolio’s prospectus.
How did the Portfolio perform during the 12-month period ended December 31, 2007?
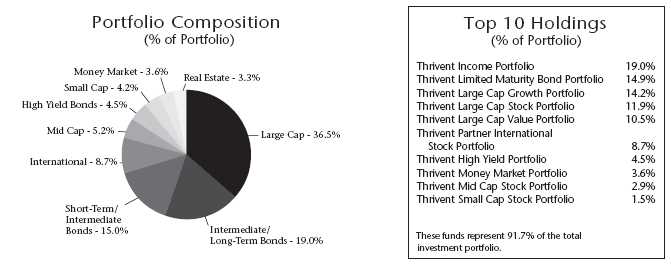
Thrivent Moderately Conservative Allocation Portfolio earned a return of 5.62% as compared to the median return for its peer group, the Lipper Mixed-Asset Target Allocation Conservative category, of 5.76% . The Portfolio’s market benchmarks, the S&P 500 Index and the Lehman Brothers Aggregate Bond Index, returned 5.49% and 6.97%, respectively.
What factors influenced the Portfolio’s performance?
For the fiscal year, large-cap stocks generally equaled or outperformed their respective small-capitalization counterparts; growth stocks tended to outperform value stocks; and international stocks provided better returns than many of the domestic indexes, as a result of dollar weakness versus many foreign currencies. Foreign stocks in their local currencies, particularly in the UK and Europe, were generally in line with major U.S. indexes. Emerging markets achieved exceptional returns. In fixed-income markets, returns tended to be skewed towards the higher-quality segments of the markets.
Early in the year, the Portfolio generally had a bias towards large-capitalization and growth-oriented securities, but our risk profile was broadly consistent with our long-term strategic allocations for risk and return. In the second quarter, our analysis of both stock and credit risk premiums suggested that many segments of both fixed-income and equity markets were “priced for perfection,” i.e., expected returns were such that one was not being adequately compensated for the risk on many of the more volatile asset classes. As such, we undertook steps to reduce the risk profile within the respective major asset classes by further reducing our exposure to mid- and small-capitalization securities in the equity segment of the Portfolio. We also further upgraded our positions in growth allocations in the expectation that credit issues in real estate would more significantly impact value-based investment styles given the proportionately large exposure to financial services that tends to characterize value benchmarks and portfolios. Tactically, these decisions enhanced the Portfolio’s results, especially in the second half of the year, as the scope and breadth of deteriorating housing fundamentals cascaded into fixed-income credit markets, creating a liquidity crisis that ultimately impaired the stock market, particularly small-cap and value-oriented strategies. Investors’ preference for high-quality in fixed-income and growth-oriented strategies in stocks resulted in significant spreads in returns versus those strategies most directly impacted by disruptions in the markets. Our Portfolio had

| Quoted Portfolio Composition and Top 10 Holdings are subject to change. |
| 10 |
very small exposures to the segments of the market most directly impacted by the financial disruptions, but the contagion effect across fixed-income with any credit exposure did have a limiting impact on fixed-income relative to the highest-quality segments.
What is your outlook?
The disruptions in the financial markets, on top of an already cautious and extended consumer sector, have heightened the risk of a serious economic dislocation. This has created an environment of heightened investor uncertainty, higher market volatility and significant corrections in many financial asset prices. As an investor, we are gratified to see more rational pricing of risky financial assets but are cognizant that financial and economic risks remain elevated. We are thoughtfully and judiciously looking for opportunities to reinstate some of the risk positions in the Portfolio that were reduced early last year, as return opportunities are now much more reasonable relative to the risks being borne. In the absence of recession, it appears that low-risk assets are now somewhat overpriced relative to risky assets.
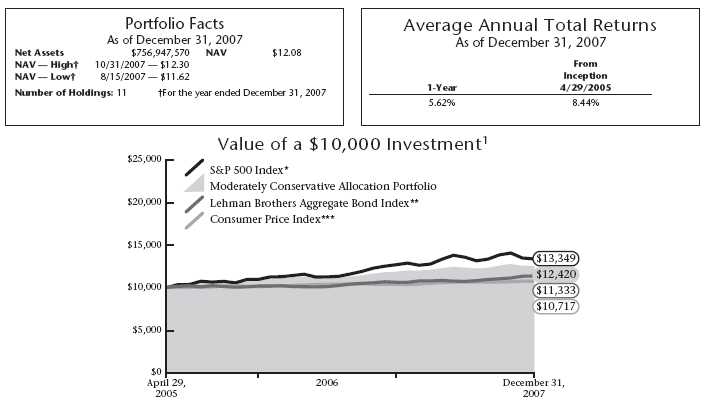
* The S&P 500 Index is an index that represents the average performance of a group of 500 large-capitalization stocks. It is not possible to invest directly in the Index. The performance of the Index does not reflect deductions for fees, expenses or taxes.
** The Lehman Brothers Aggregate Bond Index is an index that measures the performance of U.S. investment grade bonds. It is not possible to invest directly in the Index. The performance of the Index does not reflect deductions for fees, expenses or taxes.
*** The Consumer Price Index is an inflationary indicator that measures the change in the cost of a fixed basket of products and services, including housing, electricity, food and transportation. It is not possible to invest directly in the Index.
Past performance is not an indication of future results. Total investment return and principal value will fluctuate and units, when redeemed, may be worth more or less than their original cost. Current performance may be higher or lower than the performance data quoted. Market volatility can significantly affect short-term performance, and more recent returns may be different from those shown. Call 800-THRIVENT or visit www.thrivent.com for performance results current to the most recent month-end.
1 Annualized total returns represent past performance and reflect changes in share prices, the reinvestment of all dividends and capital gains, and the effects of compounding. Periods of less than one year are not annualized. At various times, the Portfolio’s adviser reimbursed and/or paid non-advisory Portfolio expenses. Had the adviser not done so, the Portfolio’s total returns would have been lower. The returns shown do not reflect charges and expenses imposed on contract holders by the variable accounts. Those charges and expenses reduce the returns received by contract holders as compared to the returns presented.
Investing in a variable product involves risks, including the possible loss of principal. The prospectus contains more complete information on the investment objectives, risks, charges and expenses of the investment company, which investors should read and consider carefully before investing. To obtain a prospectus, contact a registered representative or visit www.thrivent.com.
| 11 |

How did the Portfolio perform during the 12-month period ended December 31, 2007?
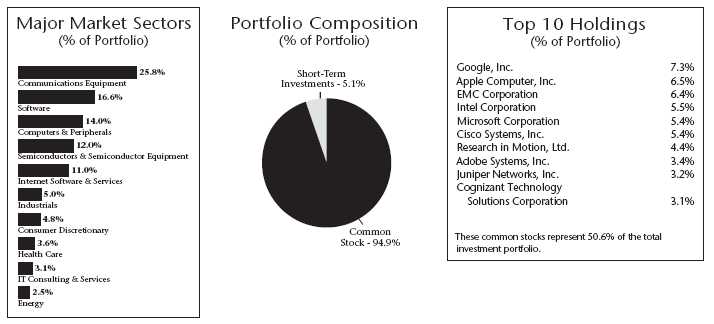
Thrivent Technology Portfolio returned 11.07% for the 12-month period ending December 31, 2007, as compared to the median return of its peer group, the Lipper Science & Technology category, of 19.00% . The Portfolio’s market benchmark, the Chicago Board Options Exchange Goldman Sachs Technology Index (CBOE GSTI) Composite Index, returned 15.39% over the same period.
What factors affected the Portfolio’s performance?
Underperformance relative to the CBOE GSTI Composite Index was partially attributable to the Thrivent Technology Portfolios’ broader capitalization and sector positioning. Roughly 85% of the Technology Portfolio was invested in information technology companies, with another 15% distributed among technology-related names in the health care, telecom services, industrial and consumer sectors. While we expect the Portfolio’s multi-cap focus and broadened sector positioning to increase the prospects of sustainable outperformance over longer periods of time, it was a headwind in a year in which large-cap information technology stocks — which comprise the bulk of the CBOE GTSI Composite Index — lead performance.
While our heavy sector emphasis on networking, storage, and Internet were positive contributors to relative performance in the first three quarters of 2007, a significant portion of that benefit was reversed in the fourth quarter as the credit crisis created significant marketplace concerns about domestic enterprise spending, especially among financial firms that represent the single largest source of industry demand. In networking, Cisco Systems, Juniper Networks, and Ciena still generated moderate excess returns as domestic carriers and international enterprises increased their budgets. EMC Corporation contributed significantly to the Portfolio’s performance, not only due to the strength in its core storage and security businesses, but also the market recognition afforded its VMWare virtualization unit as a result of a partial spin-off. Within the Internet sector, our focus on search advertising holdings Google and aQuantive provided significant gains; the latter as a result of its purchase by Microsoft.
Negative influences on the Portfolio included its de-emphasis of personal communication equipment makers; lack of exposure to electronic retailers; and over exposure to health care. The Portfolio missed the strength in handset manufacturers, especially the new product-driven cycle strength in Research in Motion, which was the single best performer in the CBOE GSTI Composite Index. It also lacked any meaningful exposure to internet retail, most specifically strong performer Amazon.com, where an inflection in operating leverage was missed. Returns from the Portfolio’s health care holdings were strong in absolute terms, but trailed the explosive returns of the information technology sectors and represented a relative detriment to Portfolio
| Quoted Major Market Sectors, Portfolio Composition and Top 10 Holdings are subject to change. |
| The lists of Major Market Sectors and Top 10 Holdings exclude short-term investments and collateral held for securities loaned. |
| The Portfolio Composition chart excludes collateral held for securities loaned. |
| 12 |
performance. The Portfolio’s emphasis on biotechnology within the health care sector was an additional negative relative performance factor.
What is your outlook?
We believe that 2008 will be characterized by moderating domestic economic growth, much lower interest rates, a weak dollar and technology spending in excess of overall economic growth at around 5%, as a result of continued “share” gains vis-à-vis other forms of capital expenditures and its disproportionate ability to satisfy growing productivity and environmental decision factors. These conditions, combined with technology’s greater exposure to faster-growing international markets, should allow for continued market leadership. Despite their overt susceptibility to continued credit-related enterprise spending concerns in the near-term, we remain especially enthusiastic about the longer-term potential for worldwide networking and communication equipment spending to support the communications infrastructure needs of emerging economies, as well as the more robust architectures required by the exploding volumes of video and data transmission in developed markets. We also believe virtualization, mobile internet and internet advertising will be areas of notable investment opportunities in the year ahead.
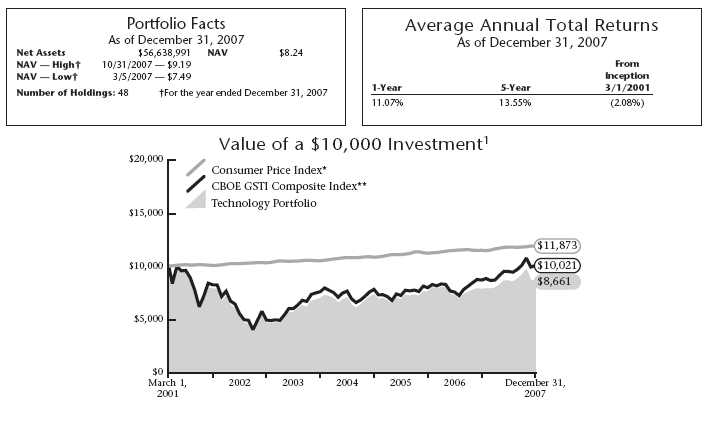
* The Consumer Price Index is an inflationary indicator that measures the change in the cost of a fixed basket of products and services, including housing, electricity, food and transportation. It is not possible to invest directly in the Index.
** The CBOE GSTI Composite Index is a modified capitalization-weighted index of selected technology stocks. It is not possible to invest directly in the Index. The performance of the Index does not reflect deductions for fees, expenses or taxes.
Past performance is not an indication of future results. Total investment return and principal value will fluctuate and units, when redeemed, may be worth more or less than their original cost. Current performance may be higher or lower than the performance data quoted. Market volatility can significantly affect short-term performance, and more recent returns may be different from those shown. Call 800-THRIVENT or visit www.thrivent.com for performance results current to the most recent month-end.
1 Annualized total returns represent past performance and reflect changes in share prices, the reinvestment of all dividends and capital gains, and the effects of compounding. At various times, the Portfolio’s adviser reimbursed and/or paid non-advisory Portfolio expenses. Had the adviser not done so, the Portfolio’s total returns would have been lower. The returns shown do not reflect charges and expenses imposed on contract holders by the variable accounts. Those charges and expenses reduce the returns received by contract holders as compared to the returns presented.
Investing in a variable product involves risks, including the possible loss of principal. The prospectus contains more complete information on the investment objectives, risks, charges and expenses of the investment company, which investors should read and consider carefully before investing. To obtain a prospectus, contact a registered representative or visit www.thrivent.com.
| 13 |

How did the Portfolio perform during the 12-month period ended December 31, 2007?
Thrivent Partner Small Cap Growth Portfolio achieved a return of 8.52% for the 12-month period ended December 31, 2007, as compared to the median return of its peer group, the Lipper Small Cap Growth category, of 9.58% . The Portfolio’s market benchmark, the Russell 2000® Growth Index, achieved a return of 7.05%.
What factors influenced the Portfolio’s performance?
Stock selection was responsible for the value added versus the benchmark Index. Timely Portfolio repositioning also added modestly to returns, as there was a dramatic variance in performance within the small-cap category between growth and the core and value segments. In particular, stock selection in the health care and industrials segments added significantly to results. Additionally, avoiding some of the poor performance in the financial sector and obtaining good returns to holdings in the energy segment were additive. Within the industrial segment, there was particularly strong Portfolio performance in construction and engineering, shipping and electrical equipment industries, all of which are beneficiaries of strong spending and investment from infrastructure and global trade flows. Shaw Group and DryShips Inc were particular standouts . . In health care, holdings in the pharmaceutical, biotechnology and life sciences industries provided a lift to returns in the period. The financial sector of the Portfolio was largely unchanged for the period, which was a much better return than the benchmark sector in the Index. An emphasis on companies less impacted by the misfortunes of the sub-prime, credit and housing markets provided reasonable returns or better protection. In the energy group, our concentration on holdings in the energy equipment and supplies industries resulted in Portfolio performance meaningfully in excess of the Index. We did not have significant exposure to the producers of oil and gas; that group did not perform as well as the equipment companies. Drill-Quip provided a particularly attractive return. Telecommunications services added modestly to the results as our holdings provided much higher returns than the group or the Index. It was not significantly overweighted in the account.
Holdings in the Information Technology sector did not keep pace with the broad market advance or the sector returns within small-cap growth benchmarks. Positions in the software industry provided good returns but were offset by sub-par results to the companies owned in the electrical and communication equipment industries. An underweighted position in the materials sector and lack of exposure in the metals and mining industry caused this segment of the Portfolio to achieve less-than-Index results.

| Quoted Major Market Sectors, Portfolio Composition and Top 10 Holdings are subject to change. |
| The lists of Major Market Sectors and Top 10 Holdings exclude short-term investments and collateral held for securities loaned. |
| The Portfolio Composition chart excludes collateral held for securities loaned. |
| 14 |
What is your outlook?
While the chance of a recession has certainly increased in recent months, we think the economy may keep growing at least modestly in 2008, aided by strong growth in exports. As we see it, slow to moderate economic growth should keep inflation and interest rates subdued, help companies (as measured by the S&P 500) report higher earnings’ growth for all of 2008, and allow stocks in aggregate to keep climbing, notwithstanding some volatility along the way. In an environment where above-average growth becomes scarce, growth stocks become more valuable. This, coupled with the fact that growth stocks remain inexpensive relative to value stocks, should support our style of growth stock investing.

* The Russell 2000® Growth Index is an unmanaged index comprised of companies with a greater than average growth orientation within the Russell 2000® Index. The Russell 2000® Index is comprised of the 2,000 smaller companies in the Russell 3000® Index, which represents the 3,000 largest companies based on market capitalization and is designed to represent the performance of about 98% of the U.S. equity market. It is not possible to invest directly in the Index. The performance of the Index does not reflect deductions for fees, expenses or taxes.
** The Consumer Price Index is an inflationary indicator that measures the change in the cost of a fixed basket of products and services, including housing, electricity, food and transportation. It is not possible to invest directly in the Index.
Past performance is not an indication of future results. Total investment return and principal value will fluctuate and units, when redeemed, may be worth more or less than their original cost. Current performance may be higher or lower than the performance data quoted. Market volatility can significantly affect short-term performance, and more recent returns may be different from those shown. Call 800-THRIVENT or visit www.thrivent.com for performance results current to the most recent month-end.
1 Annualized total returns represent past performance and reflect changes in share prices, the reinvestment of all dividends and capital gains, and the effects of compounding. At various times, the Portfolio’s adviser reimbursed and/or paid non-advisory Portfolio expenses. Had the adviser not done so, the Portfolio’s total returns would have been lower. The returns shown do not reflect charges and expenses imposed on contract holders by the variable accounts. Those charges and expenses reduce the returns received by contract holders as compared to the returns presented.
Investing in a variable product involves risks, including the possible loss of principal. The prospectus contains more complete information on the investment objectives, risks, charges and expenses of the investment company, which investors should read and consider carefully before investing. To obtain a prospectus, contact a registered representative or visit www.thrivent.com.
| 15 |

The Portfolio is exposed to the risks of investing in equity securities of smaller companies, which may include, but are not limited to, lower trading volume and less liquidity than larger, more established companies. Small company stock prices are generally more volatile than large company stock prices. These and other risks are described in the Portfolio’s prospectus.
How did the Portfolio perform during the 12-month period ended December 31, 2007?
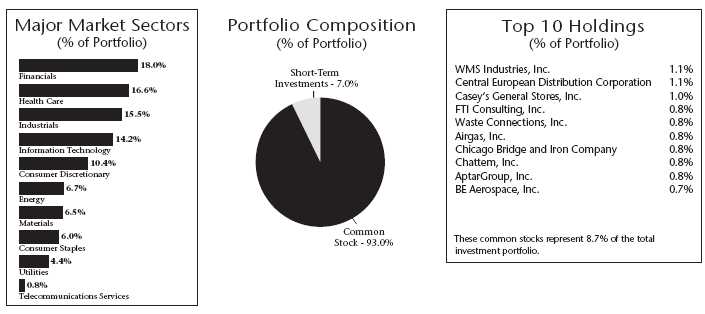
Thrivent Partner Small Cap Value Portfolio achieved a return of –1.03% for the 12-month period ended December 31, 2007, as compared to the median return of its peer group, the Lipper Small Cap Value category, of –6.86% . The Portfolio’s market benchmark, the Russell 2000® Value Index, achieved a return of –9.78%.
What factors influenced the Portfolio’s performance?
Portfolio results relative to the benchmark Index were lifted by a combination of both stock selection and sector emphasis in the period. Within the small-cap value universe, there was a wide disparity of returns across sectors, with unusually poor results in the financial and consumer discretionary sectors and quite good results in the materials, energy and health care segments. Strong stock selection within and a significant underweighting of the poorly performing financial group was the prime positive contributor to the Portfolio’s results versus its benchmark in 2007. The financial segment of the benchmark Index declined in excess of 20% last year, with much of the weakness concentrated in the second half of the year. The Portfolio achieved results in the negative mid-single-digit area over the same period, a significant improvement over the Index. Underweighted positions in real estate investment trusts (REITs), thrifts and commercial banks also significantly contributed to results. In commercial banks, our emphasis on holdings in organizations that were less dependent on credit spreads and mortgage portfolios or construction lending aided returns. The Portfolio emphasized organizations that had significant sources of income outside of those areas and towards more stable sources of income like trust or custody fees. Holdings in the insurance industry also made a significant positive contribution to results, as this group tended to be less impacted by the other disturbances in the financial sector. Stock selection and an overweighted position were the key variables lifting the results in the industrial segment of the Portfolio. Commercial services holdings in the Portfolio were a particular bright spot, with excellent results achieved from FTI Consulting Electrical equipment stocks. provided very strong relative returns; our holdings kept pace with those achieved by the broader group. Kirby Corp. in the marine shipping industry advanced strongly over the period, as did select holdings in the machinery industry. Generally, business spending remained strong in the period, particularly for companies with exposure to infrastructure or export spending. An overweighted position in the energy group was also a positive factor, as the sector provided strong returns in the year.

| Quoted Major Market Sectors, Portfolio Composition and Top 10 Holdings are subject to change. |
| The lists of Major Market Sectors and Top 10 Holdings exclude short-term investments and collateral held for securities loaned. |
| The Portfolio Composition chart excludes collateral held for securities loaned. |
| 16 |
There was a modest negative impact on returns from our underweighting of the Information Technology and consumer staples sectors. Stock selection in both segments was above average, but we did not have as full an allocation as the benchmark, thus modestly limiting our advance.
What is your outlook?
Market conditions are likely to remain volatile, as concern over an economic slowdown grows in the face of continued housing market weakness and as the credit markets continue to grapple with problems arising from sub-prime mortgages. As investors in the small-cap value space, we are mindful of the shift in market leadership from small-cap and value shares to larger, growth-oriented stocks. In this environment, we are focused on three areas — technology shares, which appear to be enjoying a long-awaited revival; small-cap firms that seem relatively insulated from current financial turmoil; and individual stocks that have been hurt by the market’s volatility but whose revenue streams and earnings remain intact.
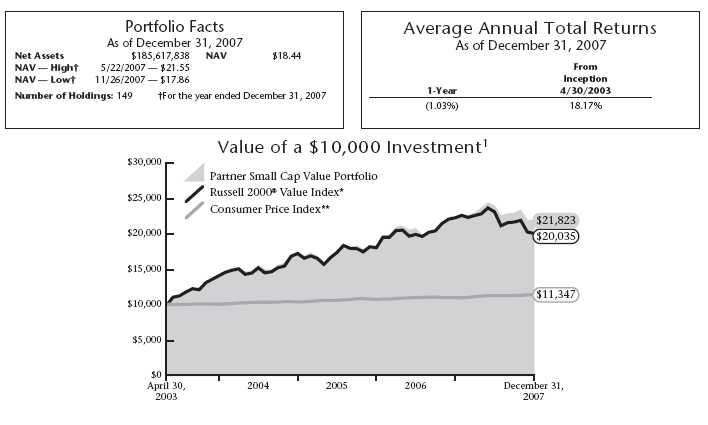
* The Russell 2000® Value Index is an index comprised of companies with a greater than average value orientation within the Russell 2000® Index. It is not possible to invest directly in the Index. The performance of the Index does not reflect deductions for fees, expenses or taxes.
** The Consumer Price Index is an inflationary indicator that measures the change in the cost of a fixed basket of products and services, including housing, electricity, food and transportation. It is not possible to invest directly in the Index.
Past performance is not an indication of future results. Total investment return and principal value will fluctuate and units, when redeemed, may be worth more or less than their original cost. Current performance may be higher or lower than the performance data quoted. Market volatility can significantly affect short-term performance, and more recent returns may be different from those shown. Call 800-THRIVENT or visit www.thrivent.com for performance results current to the most recent month-end.
1 Annualized total returns represent past performance and reflect changes in share prices, the reinvestment of all dividends and capital gains, and the effects of compounding. At various times, the Portfolio’s adviser reimbursed and/or paid non-advisory Portfolio expenses. Had the adviser not done so, the Portfolio’s total returns would have been lower. The returns shown do not reflect charges and expenses imposed on contract holders by the variable accounts. Those charges and expenses reduce the returns received by contract holders as compared to the returns presented.
Investing in a variable product involves risks, including the possible loss of principal. The prospectus contains more complete information on the investment objectives, risks, charges and expenses of the investment company, which investors should read and consider carefully before investing. To obtain a prospectus, contact a registered representative or visit www.thrivent.com.
| 17 |

How did the Portfolio perform during the 12-month period ended December 31, 2007?
Thrivent Small Cap Stock Portfolio returned 6.14% during the 12-month period ended December 31, 2007, as compared to the median return of its peer group, the Lipper Small Cap Core category, of –2.02% . The Portfolio’s market benchmark, the Russell 2000® Index, returned –1.57% .
What factors affected the Portfolio’s performance?
The greatest impact on the Portfolio performance during the period on both an absolute and relative basis was the underweighted position in both the financials and consumer discretionary sectors. Given our concerns regarding the mortgage and housing markets, along with credit quality and interest rate concerns, the Portfolio has been very discriminate in holding both financial and consumer stocks. During the period, elevated defaults within the sub-prime mortgage market caused many stocks within these sectors to perform poorly, driving positive Portfolio performance relative to its benchmark.
Additionally, individual security selection across the Portfolio had a significantly positive impact on performance during the period. In particular, we had solid performance in both the energy and industrials sectors. Given our positive economic outlook during the period, we continued to maintain an overweighted position within the industrials sector, which paid handsome dividends. The Portfolio’s holdings in the construction and engineering industry were major contributors to positive performance, as demand for these services continued to grow.
During the period, strong corporate earnings and ample market liquidity provided an ideal environment for merger and acquisition activity. The Portfolio participated in many deals announced within the past year, with over a dozen of our holdings targeted. Areas which were fertile ground for takeovers within the Portfolio included the health care and technology sectors.
What is your outlook?
Superior stock selection will continue to be the major driver of Portfolio performance going forward. During the past year, we have seen a shift in the market from strong performance in value stocks to those with more growth characteristics. We believe in the current market environment, a continued focus on attractively valued quality companies with a distinct competitive advantage or defensible niche will provide the best opportunity for success.
Our overall outlook on the small-cap market remains cautious and we have positioned the Portfolio accordingly. Our defensive posture is based upon several major concerns regarding the current economic environment, including a
| Quoted Major Market Sectors, Portfolio Composition and Top 10 Holdings are subject to change. |
| The lists of Major Market Sectors and Top 10 Holdings exclude short-term investments and collateral held for securities loaned. |
| The Portfolio Composition chart excludes collateral held for securities loaned. |
| 18 |
continued contraction in the credit markets; a weak housing market; a potential consumer spending slowdown; and possibly an economic recession. Based upon these concerns, we have been and continue to underweight both the financials and the consumer discretionary sectors. Additionally, we have repositioned the Portfolio within both the information technology and industrials sectors, moving from an overweighted to an underweighted position based upon both valuation and fundamental concerns.
Health care stocks remain attractive, due to improving fundamentals, attractive valuations and the strong competitive advantages which many of these companies possess. Accordingly, we are overweighted in the health care sector and the consumer staples and the utilities sectors. The Portfolio is also overweighted in certain segments of the energy sector that we find attractive, particularly the exploration and production industry.
* The Russell 2000® Index is an index comprised of the 2,000 smaller companies in the Russell 3000® Index. It is not possible to invest directly in the Index. The performance of the Index does not reflect deductions for fees, expenses or taxes.
** The Consumer Price Index is an inflationary indicator that measures the change in the cost of a fixed basket of products and services, including housing, electricity, food and transportation. It is not possible to invest directly in the Index.
Past performance is not an indication of future results. Total investment return and principal value will fluctuate and units, when redeemed, may be worth more or less than their original cost. Current performance may be higher or lower than the performance data quoted. Market volatility can significantly affect short-term performance, and more recent returns may be different from those shown. Call 800-THRIVENT or visit www.thrivent.com for performance results current to the most recent month-end.
1 Annualized total returns represent past performance and reflect changes in share prices, the reinvestment of all dividends and capital gains, and the effects of compounding. At various times, the Portfolio’s adviser reimbursed and/or paid non-advisory Portfolio expenses. Had the adviser not done so, the Portfolio’s total returns would have been lower. The returns shown do not reflect charges and expenses imposed on contract holders by the variable accounts. Those charges and expenses reduce the returns received by contract holders as compared to the returns presented.
Investing in a variable product involves risks, including the possible loss of principal. The prospectus contains more complete information on the investment objectives, risks, charges and expenses of the investment company, which investors should read and consider carefully before investing. To obtain a prospectus, contact a registered representative or visit www.thrivent.com.
| 19 |
How did the Portfolio perform during the 12-month period ended December 31, 2007?
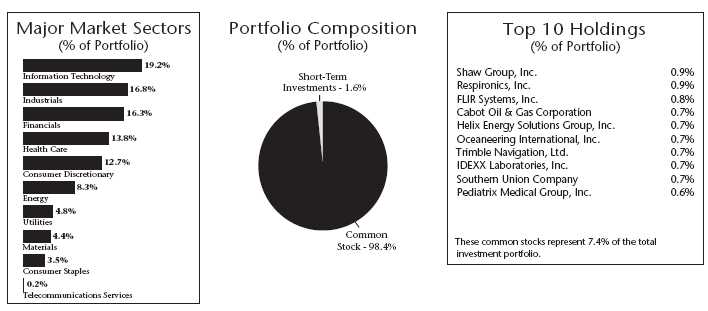
Thrivent Small Cap Index Portfolio earned a total return of –0.51% as compared to the median return of its peer group, the Lipper Small Cap Core category, of –2.02% . The Portfolio’s market benchmark, the S&P SmallCap 600 Index, earned a total return of –0.30% .
What factors affected the Portfolio’s performance?
The Portfolio is managed to virtually replicate the performance of the S&P SmallCap 600 Index. We seek to maintain a fully invested position with limited transactions to minimize costs. As typically occurs with an indexed portfolio, the difference in performance between the benchmark index and the Portfolio itself can be largely attributed to expenses and minor differences in portfolio composition.
Three sectors drove the Portfolio’s performance. Energy stocks benefited from the continued spike in energy costs. Health care companies also enjoyed solid growth. Materials companies performed well, in particular those material companies involved in steel and other commodities. By contrast, stocks of companies that are impacted by credit and financial market liquidity did not perform well. Financial and consumer discretionary stocks were out of favor in 2007, with telecommunication services posting the worst sector return in the Index.
What is your outlook?
The Portfolio will be fully invested to track the performance of the S&P SmallCap 600 Index. This offers individuals an attractive way to take advantage of the growth potential of the broad, diversified marketplace of small-cap stocks.
| Quoted Major Market Sectors, Portfolio Composition and Top 10 Holdings are subject to change. |
| The lists of Major Market Sectors and Top 10 Holdings exclude short-term investments and collateral held for securities loaned. |
| The Portfolio Composition chart excludes collateral held for securities loaned. |
| 20 |
With uncertainty growing over the strength of the U.S. economy and an ongoing inflation threat, investors backed away from riskier segments of the equity markets. Small-cap stocks underperformed large-cap and mid-cap issues. Whether this marks a period of rotation in the markets and a shift to more blue chip names remains to be seen.
Typically, the longer an economic cycle continues, the more investors tend to favor large-cap stocks in the equity marketplace. We still believe there is solid opportunity in the small-cap arena, but the premium return for small stocks is likely to be limited in the future as the cycle continues to mature.
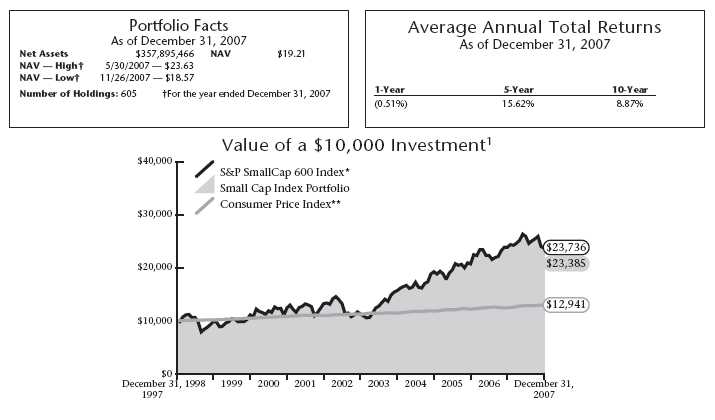
* The S&P SmallCap 600 Index is an unmanaged index that represents the average performance of a group of 600 small capitalization stocks. “S&P SmallCap 600 Index” is a trademark of The McGraw-Hill Companies, Inc. and has been licensed for use by Thrivent Financial for Lutherans. The product is not sponsored, endorsed or promoted by Standard & Poor’s, and Standard & Poor’s makes no representation regarding the advisability of investing in the product. It is not possible to invest directly in the Index. Index funds are subject to the same market risks associated with the stocks in their respective indexes. The performance of the Index does not reflect deductions for fees, expenses or taxes.
** The Consumer Price Index is an inflationary indicator that measures the change in the cost of a fixed basket of products and services, including housing, electricity, food and transportation. It is not possible to invest directly in the Index.
Past performance is not an indication of future results. Total investment return and principal value will fluctuate and units, when redeemed, may be worth more or less than their original cost. Current performance may be higher or lower than the performance data quoted. Market volatility can significantly affect short-term performance, and more recent returns may be different from those shown. Call 800-THRIVENT or visit www.thrivent.com for performance results current to the most recent month-end.
1 Annualized total returns represent past performance and reflect changes in share prices, the reinvestment of all dividends and capital gains, and the effects of compounding. At various times, the Portfolio’s adviser reimbursed and/or paid non-advisory Portfolio expenses. Had the adviser not done so, the Portfolio’s total returns would have been lower. The returns shown do not reflect charges and expenses imposed on contract holders by the variable accounts. Those charges and expenses reduce the returns received by contract holders as compared to the returns presented.
Investing in a variable product involves risks, including the possible loss of principal. The prospectus contains more complete information on the investment objectives, risks, charges and expenses of the investment company, which investors should read and consider carefully before investing. To obtain a prospectus, contact a registered representative or visit www.thrivent.com.
| 21 |

How did the Portfolio perform during the 12-month period ended December 31, 2007?
Thrivent Mid Cap Growth Portfolio achieved a return of 19.92% as compared to the median return of its peer group, the Lipper Mid Cap Growth category, of 16.36% . The Portfolio’s market benchmark, the Russell Midcap® Growth Index, achieved a return of 11.43% for the year.
What factors affected the Portfolio’s performance?
Stock selection across all sectors of the Portfolio helped propel performance over the past year. Stock selection within the industrial sector was particularly strong, as these companies benefited from strong demand from emerging economies. Foster Wheeler LTD, an engineering and construction company, and Precision Castparts Corporation, an aerospace and defense company, did particularly well. The Information Technology sector was also a positive contributor to performance, as enterprise spending in the United States and abroad continued to be quite healthy. The Portfolio’s position in aQuantive, Inc., which was acquired by Microsoft Corporation for a substantial premium, and Navteq, which was slated to be acquired by Nokia Corporation, also contributed positively to performance. Health care equipment and supply companies in the Portfolio did quite well, as many of these companies benefited from product cycles and therefore steadier earnings’ growth.
The Portfolio was significantly underweighted in the consumer sector during most of the period, which helped performance, as these stocks were weak due to the continued deterioration in the U.S. housing market. However, the Portfolio’s position in Coldwater Creek Incorporated, a women’s apparel retailer, hurt performance, as sales did not meet expectations. The Portfolio’s underweighted stance in energy limited performance, as this was a strong sector for most of the period.
What is your outlook?
As we look into 2008, we see several headwinds for the U.S. economy. We believe the housing market deterioration and subsequent credit problems in the mortgage industry, along with high fuel prices, may lead to more problems for the U.S. consumer. We also see potential risk to stocks stemming from a change of administration at the White House in the fall of 2008 and potentially higher taxes that could drag down economic growth further. We believe the Federal Reserve rate cuts may not be able to alleviate the credit woes for the consumer, and may put further pressure on the U.S. dollar and ultimately spur inflation. These problems may begin to adversely impact the job picture in the United States, which is a further risk to economic growth. Ultimately, these head-winds are likely to depress corporate earnings estimates in coming quarters and may cause valuations to compress.

| Quoted Major Market Sectors, Portfolio Composition and Top 10 Holdings are subject to change. |
| The lists of Major Market Sectors and Top 10 Holdings exclude short-term investments and collateral held for securities loaned. |
| The Portfolio Composition chart excludes collateral held for securities loaned. |
| 22 |
With that, we are positioning the Portfolio slightly more conservatively. We continue to look for growth opportunities that can withstand a U.S. economic slowdown. We are finding opportunities in companies with more exposure to international economies and less dependence on the U.S. dollar and consumer. We continue to favor companies that are in front of new product cycles that will foster growth regardless of the underlying economic cycle. Health care remains a target area for us as these stocks have attractive valuation characteristics relative to growth expectations and will likely sustain operating and profit momentum through a period of slowing economic growth.
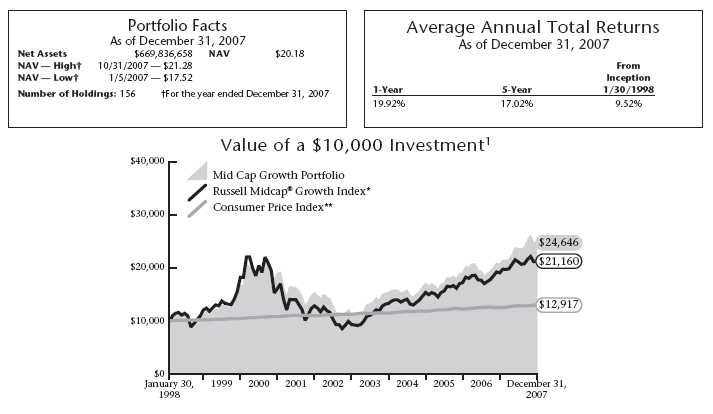
* The Russell Midcap® Growth Index is an index comprised of companies with higher than average price-to-book ratios and higher forecasted growth values within the Russell Midcap® Index. It is not possible to invest directly in the Index. The performance of the Index does not reflect deductions for fees, expenses or taxes.
** The Consumer Price Index is an inflationary indicator that measures the change in the cost of a fixed basket of products and services, including housing, electricity, food and transportation. It is not possible to invest directly in the Index.
Past performance is not an indication of future results. Total investment return and principal value will fluctuate and units, when redeemed, may be worth more or less than their original cost. Current performance may be higher or lower than the performance data quoted. Market volatility can significantly affect short-term performance, and more recent returns may be different from those shown. Call 800-THRIVENT or visit www.thrivent.com for performance results current to the most recent month-end.
1 Annualized total returns represent past performance and reflect changes in share prices, the reinvestment of all dividends and capital gains, and the effects of compounding. At various times, the Portfolio’s adviser reimbursed and/or paid non-advisory Portfolio expenses. Had the adviser not done so, the Portfolio’s total returns would have been lower. The returns shown do not reflect charges and expenses imposed on contract holders by the variable accounts. Those charges and expenses reduce the returns received by contract holders as compared to the returns presented.
Investing in a variable product involves risks, including the possible loss of principal. The prospectus contains more complete information on the investment objectives, risks, charges and expenses of the investment company, which investors should read and consider carefully before investing. To obtain a prospectus, contact a registered representative or visit www.thrivent.com.
| 23 |

How did the Portfolio perform during the 12-month period ended December 31, 2007?
Thrivent Mid Cap Growth Portfolio II achieved a return of 19.80% as compared to the median return of its peer group, the Lipper Mid Cap Growth category, of 16.36% . The Portfolio’s market benchmark, the Russell Midcap® Growth Index, achieved a return of 11.43% .
What factors affected the Fund’s performance?
Stock selection across all sectors of the Portfolio helped propel performance over the past year. Stock selection within the industrial sector was particularly strong, as these companies benefited from strong demand from emerging economies. Foster Wheeler LTD, an engineering and construction company, and Precision Castparts Corporation, an aerospace and defense company, did particularly well. The Information Technology sector was also a positive contributor to performance, as enterprise spending in the United States and abroad continued to be quite healthy. The Portfolio’s position in aQuantive, Inc., which was acquired by Microsoft Corporation for a substantial premium, and Navteq, which was slated to be acquired by Nokia Corporation, also contributed positively to performance. Health care equipment and supply companies in the Portfolio did quite well, as many of these companies benefited from product cycles and therefore steadier earnings’ growth.
The Portfolio was significantly underweighted in the consumer sector during most of the period, which helped performance as these stocks were weak due to the continued deterioration in the U.S. housing market. However, the Portfolio’s position in Coldwater Creek Incorporated, a women’s apparel retailer, hurt performance, as sales did not meet expectations. In addition, the Portfolio’s underweighted stance in energy limited performance, as this was a strong sector for most of the period.
What is your outlook?
As we look into 2008, we see several headwinds for the U.S. economy. We believe the housing market deterioration and subsequent credit problems in the mortgage industry, along with high fuel prices, may lead to more problems for the U.S. consumer. We also see potential risk to stocks stemming from a change of administration at the White House in the fall of 2008 and potentially higher taxes that could drag down economic growth further. We believe the Federal Reserve rate cuts may not be able to alleviate the credit woes for the consumer, and may put further pressure on the U.S. dollar and ultimately spur inflation. These problems may begin to adversely impact the job picture in the U.S., which is a further risk to economic growth. Ultimately, these head-winds are likely to depress corporate earnings estimates in coming quarters and may cause valuations to compress.
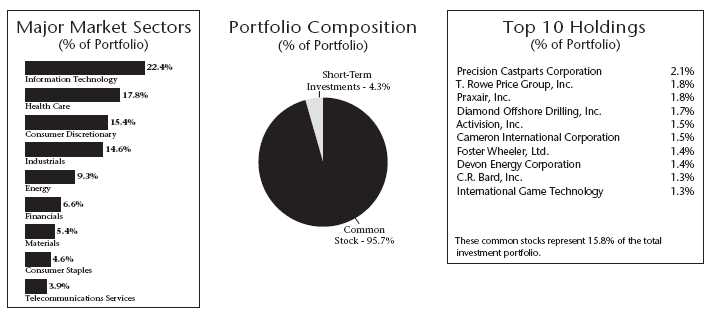
| Quoted Major Market Sectors, Portfolio Composition and Top 10 Holdings are subject to change. |
| The lists of Major Market Sectors and Top 10 Holdings exclude short-term investments and collateral held for securities loaned. |
| The Portfolio Composition chart excludes collateral held for securities loaned. |
| 24 |
With that, we are positioning the Portfolio slightly more conservatively. We continue to look for growth opportunities that can withstand a U.S. economic slowdown. We are finding opportunities in companies with more exposure to international economies and less dependence on the U.S. dollar and consumer. We continue to favor companies that are in front of new product cycles that will foster growth regardless of the underlying economic cycle. Health care remains a target area for us, as these stocks have attractive valuation characteristics relative to growth expectations and will likely sustain operating and profit momentum through a period of slowing economic growth.
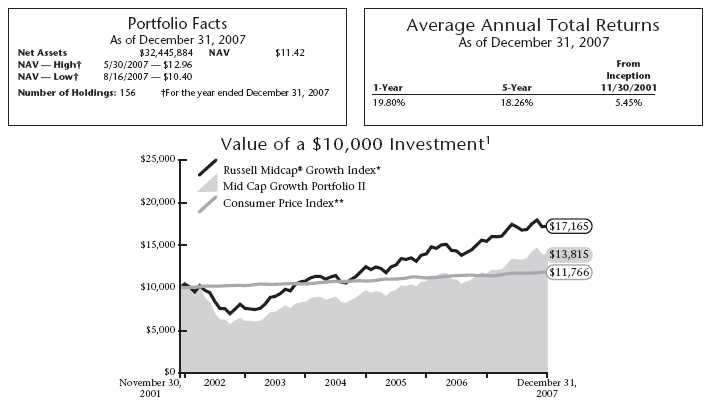
* The Russell Midcap® Growth Index is an index comprised of companies with higher than average price-to-book ratios and higher forecasted growth values within the Russell Midcap® Index. It is not possible to invest directly in the Index. The performance of the Index does not reflect deductions for fees, expenses or taxes.
** The Consumer Price Index is an inflationary indicator that measures the change in the cost of a fixed basket of products and services, including housing, electricity, food and transportation. It is not possible to invest directly in the Index.
Past performance is not an indication of future results. Total investment return and principal value will fluctuate and units, when redeemed, may be worth more or less than their original cost. Current performance may be higher or lower than the performance data quoted. Market volatility can significantly affect short-term performance, and more recent returns may be different from those shown. Call 800-THRIVENT or visit www.thrivent.com for performance results current to the most recent month-end.
1 Annualized total returns represent past performance and reflect changes in share prices, the reinvestment of all dividends and capital gains, and the effects of compounding. At various times, the Portfolio’s adviser reimbursed and/or paid non-advisory Portfolio expenses. Had the adviser not done so, the Portfolio’s total returns would have been lower. The returns shown do not reflect charges and expenses imposed on contract holders by the variable accounts. Those charges and expenses reduce the returns received by contract holders as compared to the returns presented.
Investing in a variable product involves risks, including the possible loss of principal. The prospectus contains more complete information on the investment objectives, risks, charges and expenses of the investment company, which investors should read and consider carefully before investing. To obtain a prospectus, contact a registered representative or visit www.thrivent.com.
| 25 |

How did the Portfolio perform during the 12-month period ended December 31, 2007?
Thrivent Partner Mid Cap Value Portfolio achieved a return of 3.15% for the 12-month period ending December 31, 2007, as compared to the median return of its peer group, the Lipper Mid Cap Value category, of 1.94% . The Portfolio’s benchmark, the Russell Midcap® Value Index, achieved a return of –1.42% .
What factors influenced the Portfolio’s performance?
Stock selection and sector emphasis were both positive factors contributing to Portfolio results in 2007. Benchmark returns for the year were highly skewed to growth-oriented strategies in the period, and sector results were highly variable. In spite of these issues, the Portfolio achieved results in excess of both its benchmark and the median of its peer group. An overweighted position in the strongly performing energy sector and stock selection within the group combined to cause this segment of the Portfolio to add significantly to relative returns. Our emphasis in this sector has been on producing companies domiciled in the United States, like Range Resources and Hess Corp., which both advanced strongly over the year. Within the utility sector, we emphasized companies that produce electricity, such as Entergy Corp and PPL Corp., which both had attractive returns for the period. Within the health care sector, strong stock selection in the biotechnology industry was the key contributing factor. While Information Technology was generally a strong market segment in 2007, its performance was much more muted within the framework of what are considered in the mid-cap value benchmarks. Electronic equipment and software companies in the Portfolio achieved excellent returns.
Materials and financials exposure modestly detracted from results for the period. Financial stocks came under severe stress related to the credit and financial liquidity issues that became evident beginning in the summer. We had modest underweighting to the segment for the year, but our holdings in diversified financial service companies, insurance and real estate investment trusts (REITs) did not provide returns in excess of the benchmark sectors and impeded the Portfolio’s advance. The consumer discretionary sector performed poorly during the period, as investors’ concerns related to real estate cascaded into homebuilding and consumer retail stocks. Our exposure to the group was below the benchmark weight but our stocks performed modestly below the group, offsetting the advantage from the Portfolio weighting decision.
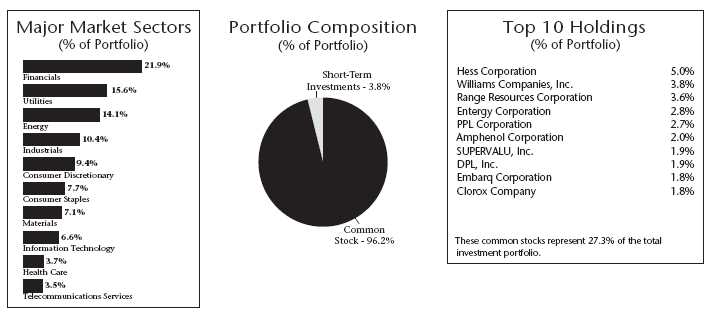
| Quoted Major Market Sectors, Portfolio Composition and Top 10 Holdings are subject to change. |
| The lists of Major Market Sectors and Top 10 Holdings exclude short-term investments and collateral held for securities loaned. |
| The Portfolio Composition chart excludes collateral held for securities loaned. |
| 26 |
What is your outlook?
The recent declines in the broad market have impacted a mix of companies in a similar fashion. We have taken the opportunity to actively reassess our investments by upgrading the quality of the Portfolio’s where we can, while reducing our exposure to businesses where the risk/reward profile is no longer compelling. In the past, our attention to quality companies trading at compelling valuations has led to strong long-term absolute and relative performance.
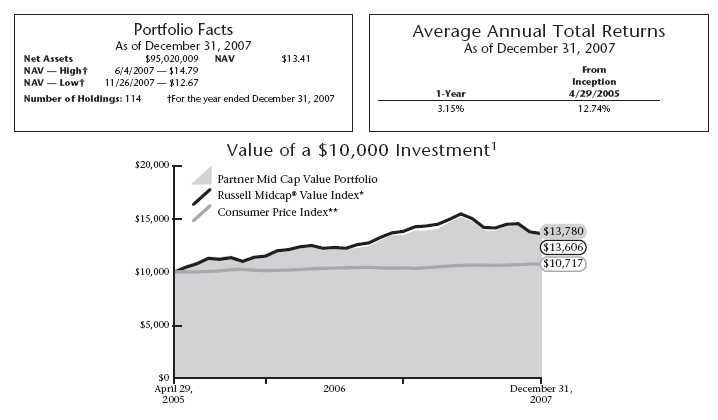
* The Russell Midcap® Value Index is an index comprised of companies with lower than average price-to-book ratios and lower forecasted growth values within the Russell Midcap® Index. It is not possible to invest directly in the Index. The performance of the Index does not reflect deductions for fees, expenses or taxes.
** The Consumer Price Index is an inflationary indicator that measures the change in the cost of a fixed basket of products and services, including housing, electricity, food and transportation. It is not possible to invest directly in the Index.
Past performance is not an indication of future results. Total investment return and principal value will fluctuate and units, when redeemed, may be worth more or less than their original cost. Current performance may be higher or lower than the performance data quoted. Market volatility can significantly affect short-term performance, and more recent returns may be different from those shown. Call 800-THRIVENT or visit www.thrivent.com for performance results current to the most recent month-end.
1 Annualized total returns represent past performance and reflect changes in share prices, the reinvestment of all dividends and capital gains, and the effects of compounding. Periods of less than one year are not annualized. At various times, the Portfolio’s adviser reimbursed and/or paid non-advisory Portfolio expenses. Had the adviser not done so, the Portfolio’s total returns would have been lower. The returns shown do not reflect charges and expenses imposed on contract holders by the variable accounts. Those charges and expenses reduce the returns received by contract holders as compared to the returns presented.
Investing in a variable product involves risks, including the possible loss of principal. The prospectus contains more complete information on the investment objectives, risks, charges and expenses of the investment company, which investors should read and consider carefully before investing. To obtain a prospectus, contact a registered representative or visit www.thrivent.com.
| 27 |

How did the Portfolio perform during the 12-month period ended December 31, 2007?
Thrivent Mid Cap Stock Portfolio achieved a return of 5.70% for the 12-month period ending December 31, 2007, as compared to the median return of its peer group, the Lipper Mid Cap Core category, of 4.31% . The Portfolio’s market benchmark, the Russell Midcap® Index, earned a total return of 5.60% .
What factors affected the Portfolio’s performance?
Strong stock selection within the consumer discretionary sector, combined with a significant overweighted stance in the materials sector, contributed the majority of the outperformance in 2007. DeVry, Inc. led the consumer discretionary sector performance with an impressive return. The company benefited from improving margins and strong university enrollment. Overweighting the materials sector proved beneficial as it provided the second highest return — behind energy — during 2007. The Portfolio’s largest position, Owens-Illinois, Inc., provided a significant return as its management team raised prices, improved margins, and lowered debt levels. Unfortunately, security selection within the industrial sector and underweighting the energy sector somewhat offset the aforementioned outperformance. Within the industrial sector, investments in the airlines were negatively impacted by increasing oil prices. Finally, underweighting the energy sector proved detrimental, as it was the highest returning sector in 2007. Additional information regarding the Portfolio’s energy positioning is discussed in the outlook section below. Overall, 2007 was a solid year for the Portfolio, driven by strong stock selection and favorable sector overweighting.
What is your outlook?
The economy is clearly slowing as the housing bubble unwinds, lending standards are tightening in residential and non-residential markets, and profits are down year-over-year. These factors obviously increase the risk of the economy entering a recession in 2008. However, low inflation, significant corporate and government cash balances and lower interest rates may prevent such a scenario. Given this backdrop, the Portfolio has a defensive bias and continues to avoid cyclical stocks in the energy and industrial sectors. As the economy slows, fewer companies will likely sustain the ability to increase profits. Those companies that achieve profit growth through the slowdown will enjoy premium valuation multiples. Energy is one sector highly correlated to worldwide growth that may see profits decline throughout the year. Although oil prices continue to hit new highs, many factors point to weakening fundamentals. Oil inventories are at sufficient levels and above their 10-year averages. OPEC continues to increase production and still
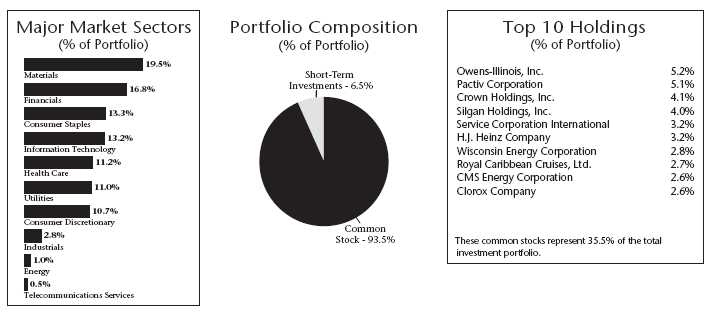
| Quoted Major Market Sectors, Portfolio Composition and Top 10 Holdings are subject to change. |
| The lists of Major Market Sectors and Top 10 Holdings exclude short-term investments and collateral held for securities loaned. |
| The Portfolio Composition chart excludes collateral held for securities loaned. |
| 28 |
maintains excess capacity, which is approaching four million barrels per day — significantly above the level of just a few years ago. Thus, the increase in oil prices seems to belie the underlying fundamentals and is likely being driven more by political unrest and investor speculation than supply and demand. With a slowing worldwide economy, oil prices and energy stocks present undue risk. Information Technology (IT) is another sector susceptible to an economic slowdown. After being significantly overweighted in the IT sector for over one year, the Portfolio is now underweighted. U.S. corporate profits have been negative for two quarters; and IT spending follows corporate profitability with a slight lag. The financial sector is one area providing select value opportunities. Many financial stocks offer excellent relative value if the economy enters a recession and significant upside if a recession is avoided. While the risks of increased delinquencies and foreclosures will remain high throughout 2008, much of this is reflected in current valuations. The Portfolio is taking a diversified approach to the sector to capitalize on the attractive valuations, but to avoid too much risk in any one company.
* The Russell Midcap® Index is an unmanaged index that measures the performance of the smallest 800 securities in the Russell 1000® Index, as ranked by total market capitalization. It is not possible to invest directly in the index. The performance of the Index does not reflect deductions for fees, expenses or taxes.
** The Consumer Price Index is an inflationary indicator that measures the change in the cost of a fixed basket of products and services, including housing, electricity, food and transportation. It is not possible to invest directly in the Index.
Past performance is not an indication of future results. Total investment return and principal value will fluctuate and units, when redeemed, may be worth more or less than their original cost. Current performance may be higher or lower than the performance data quoted. Market volatility can significantly affect short-term performance, and more recent returns may be different from those shown. Call 800-THRIVENT or visit www.thrivent.com for performance results current to the most recent month-end.
1 Annualized total returns represent past performance and reflect changes in share prices, the reinvestment of all dividends and capital gains, and the effects of compounding. At various times, the Portfolio’s adviser reimbursed and/or paid non-advisory Portfolio expenses. Had the adviser not done so, the Portfolio’s total returns would have been lower. The returns shown do not reflect charges and expenses imposed on contract holders by the variable accounts. Those charges and expenses reduce the returns received by contract holders as compared to the returns presented.
Investing in a variable product involves risks, including the possible loss of principal. The prospectus contains more complete information on the investment objectives, risks, charges and expenses of the investment company, which investors should read and consider carefully before investing. To obtain a prospectus, contact a registered representative or visit www.thrivent.com.
| 29 |

How did the Portfolio perform during the 12-month period ended December 31, 2007?
Thrivent Mid Cap Index Portfolio earned a total return of 7.62% as compared to the median return of its peer group, the Lipper Mid Cap Core category, of 4.31% . The Fund’s market benchmark, the S&P Midcap 400 Index, earned a total return of 7.97% .
What factors affected the Portfolio’s performance?
The Portfolio is managed to virtually replicate the performance of the S&P 400 Index. We seek to maintain a fully invested position with limited transactions to minimize costs. As typically occurs with an indexed portfolio, the difference in performance between the benchmark index and the Portfolio itself can be largely attributed to expenses and minor differences in Portfolio composition.
Energy and materials sectors were the best performing groups in the market over the 12-month period. Energy stocks clearly benefited from the continued rise in oil and gas prices. Energy equipment and services stocks represented the strongest industry within the sector. Materials stocks also performed well, due to increased spending on construction materials by businesses. Consumer discretionary and financials, two other prominent sectors in the Index, delivered negative returns for the year. Both consumer discretionary and financial stocks suffered as concern over sub-prime mortgages increased during the latter half of 2007.
What is your outlook?
Mid-cap stocks outperformed both large- and small-cap stocks for the year. Large-cap stocks showed signs of overcoming their extended period of lagging behind the performance of smaller stocks toward the end of the 12-month period. If past economic cycles are any indication, the market may begin to favor large-cap issues in the months ahead. Typically, investors look for higher-quality stocks as economic growth moves past its peak in a given cycle, a factor that could help the Portfolio.
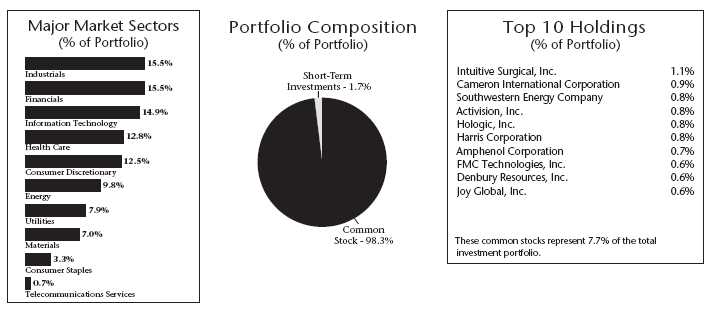
| Quoted Major Market Sectors, Portfolio Composition and Top 10 Holdings are subject to change. |
| The lists of Major Market Sectors and Top 10 Holdings exclude short-term investments and collateral held for securities loaned. |
| The Portfolio Composition chart excludes collateral held for securities loaned. |
| 30 |
In an environment where investors are faced with greater uncertainty about the direction of interest rates and the strength of the domestic economy, mid-cap stocks may offer a relatively safe haven in the equity markets compared to small-cap stocks. While we can anticipate continued volatility from stocks as a whole, those represented in this Index continue to offer a generally positive outlook.
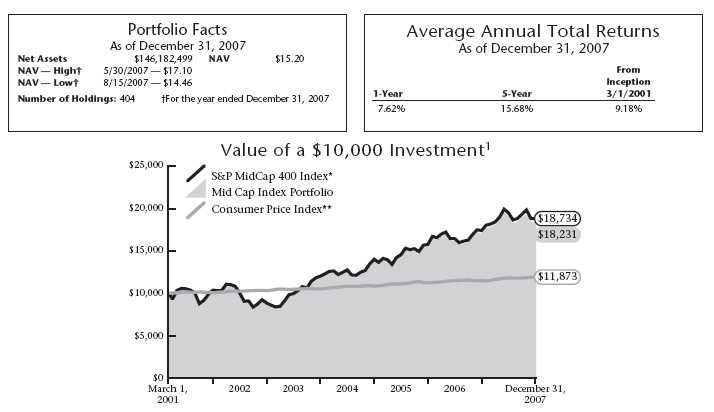
* The S&P MidCap 400 Index is an unmanaged index that represents the average performance of a group of 400 medium capitalization stocks. “S&P MidCap 400 Index” is a trademark of The McGraw-Hill Companies, Inc. and has been licensed for use by Thrivent Financial for Lutherans. The product is not sponsored, endorsed or promoted by Standard & Poor’s, and Standard & Poor’s makes no representation regarding the advisability of investing in the product. Index funds are subject to the same market risks associated with the stocks in their respective indexes. It is not possible to invest directly in the Index. The performance of the Index does not reflect deductions for fees, expenses or taxes.
** The Consumer Price Index is an inflationary indicator that measures the change in the cost of a fixed basket of products and services, including housing, electricity, food and transportation. It is not possible to invest directly in the Index.
Past performance is not an indication of future results. Total investment return and principal value will fluctuate and units, when redeemed, may be worth more or less than their original cost. Current performance may be higher or lower than the performance data quoted. Market volatility can significantly affect short-term performance, and more recent returns may be different from those shown. Call 800-THRIVENT or visit www.thrivent.com for performance results current to the most recent month-end.
1 Annualized total returns represent past performance and reflect changes in share prices, the reinvestment of all dividends and capital gains, and the effects of compounding. At various times, the Portfolio’s adviser reimbursed and/or paid non-advisory Portfolio expenses. Had the adviser not done so, the Portfolio’s total returns would have been lower. The returns shown do not reflect charges and expenses imposed on contract holders by the variable accounts. Those charges and expenses reduce the returns received by contract holders as compared to the returns presented.
Investing in a variable product involves risks, including the possible loss of principal. The prospectus contains more complete information on the investment objectives, risks, charges and expenses of the investment company, which investors should read and consider carefully before investing. To obtain a prospectus, contact a registered representative or visit www.thrivent.com.
| 31 |

How did the Portfolio perform during the 12-month period ended December 31, 2007?
Thrivent Partner International Stock Portfolio achieved a return of 10.57% for the 12-month period ending December 31, 2007, as compared to the median return of its peer group, the Lipper International Funds category, of 12.01% . The Portfolio’s market benchmark, the MSCI EAFE Index, achieved a return of 11.63%.
What factors influenced the Portfolio’s performance?
The main factors limiting performance of the Portfolio versus the benchmark Index were lack of exposure to the strong performance in the materials sector; allocations to the health care sector; and stock selection in the Information Technology segment of the Portfolio. The Portfolio also had moderate underweighting in the energy segment, which also limited the Portfolio’s advance. Within materials, a generally modest underweighting in the metals and mining segment was the key shortfall variable as base metal commodity prices generally advanced in concert with continued strong global demand, particularly from developing countries like China and India. The same could be said for the advance in energy prices over the course of the year, compounded by ongoing geo-political uncertainties. Valuation work did not support a full exposure to these groups and that limited the rise in the accounts. Holdings in the consumer staples sector came around in the latter half of the period as investor uncertainty increased with the ongoing demise of the market for sub-prime mortgage securities in the second half of the period, calling into question the sustainability of growth in the global economy and undermining investor confidence. These types of securities are often considered a haven for investors during times of heightened concerns. Exposures in Japan generally were a modest limiting factor as well, as that market did not perform as well as Euro-based markets, particularly Germany. Consumer discretionary stocks kept pace with the averages in the period and stock selection in the Portfolio was strong relative to the Index, with particularly good results achieved by companies like LG Electronics, Adidas AG, Swatch Group and Sony Corp. An underweighted position in the poorly performing financial sector added to returns. Holdings in the health care/pharmaceutical segment did not provide returns in line with the broad Index, and our emphasis in this group modestly limited the Portfolio’s results. Collectively, stocks held in the Portfolio driven by the assessment of strong valuation support did not provide as much return as companies with a broader growth orientation or more exposed to the cyclically strong segments of global growth.

| International investing has special risks including currency fluctuation and political volatility. |
| Quoted Major Market Sectors, Portfolio Composition and Top 10 Countries are subject to change. |
| The lists of Major Market Sectors and Top 10 Countries exclude short-term investments and collateral held for securities loaned. |
| The Portfolio Composition chart excludes collateral held for securities loaned. |
| 32 |
What is your outlook?
The second half inflection in the prospects for U.S. economic growth — which took place as a result of the weakness in credit markets and securities backed by U.S. sub-prime mortgages — is beginning to have a broader global impact and, in the immediate term, has altered investors’ appetite and preferences for certain risky asset classes. While initial sentiments were that the global economy was decoupling from the challenges faced by the U.S. economy and would sustain attractive growth, investors appear to be reconsidering the plausibility of that position as the year draws to a close. The world financial markets now recognize that the Fed’s rate cuts are not the magic bullets that will restore and prolong economic growth globally. The possibility of slower economic growth in 2008, with potential inflationary pressure, implies a more difficult investment environment despite the fact that longer-term prospects remain favorable. Political risk in emerging nations is also rising. Nevertheless, valuations for most overseas developed market stocks are still reasonable, despite on-going currency volatility. Further merger and acquisition activity by cash-rich corporations and the emergence of proactive sovereign wealth funds should help support share prices.

* The MSCI EAFE Index is a stock index designed to measure the equity performance of developed countries outside of North America. It is not possible to invest directly in the Index. The performance of the Index does not reflect deductions for fees, expenses or taxes.
** The Consumer Price Index is an inflationary indicator that measures the change in the cost of a fixed basket of products and services, including housing, electricity, food and transportation. It is not possible to invest directly in the Index.
Past performance is not an indication of future results. Total investment return and principal value will fluctuate and units, when redeemed, may be worth more or less than their original cost. Current performance may be higher or lower than the performance data quoted. Market volatility can significantly affect short-term performance, and more recent returns may be different from those shown. Call 800-THRIVENT or visit www.thrivent.com for performance results current to the most recent month-end.
1 Annualized total returns represent past performance and reflect changes in share prices, the reinvestment of all dividends and capital gains, and the effects of compounding. At various times, the Portfolio’s adviser reimbursed and/or paid non-advisory Portfolio expenses. Had the adviser not done so, the Portfolio’s total returns would have been lower. The returns shown do not reflect charges and expenses imposed on contract holders by the variable accounts. Those charges and expenses reduce the returns received by contract holders as compared to the returns presented.
Investing in a variable product involves risks, including the possible loss of principal. The prospectus contains more complete information on the investment objectives, risks, charges and expenses of the investment company, which investors should read and consider carefully before investing. To obtain a prospectus, contact a registered representative or visit www.thrivent.com.
| 33 |

How did the Portfolio perform during the 12-month period ended December 31, 2007?
Thrivent Partner All Cap Portfolio achieved a return of 20.37% for the 12-month period ended December 31, 2007, as compared to the median return of its peer group, the Lipper Multi Cap Core category, of 5.29% . The Portfolio’s market benchmark, the Russell 3000® Index, earned a total return of 5.14% .
What factors influenced the Portfolio’s performance?
The excellent returns achieved in the Thrivent Partner All Cap Portfolio were a function of strong stock selection relative to the Russell 3000 Index. Sector allocations, as a matter of Portfolio practice, are generally in line with those of the benchmark Index, thus seldom having a significant impact on results. Industry exposures are varied versus the Index and were a contributing factor to excess returns in 2007. Stock selection across all sectors of the Portfolio provided returns in excess of those earned by the stocks held in sectors in the Index.
The broad financial sector was the most poorly performing component of the Index, declining almost 20% in the period, impacted by deterioration in credit quality in the mortgage- and asset-backed security industries. The Portfolio’s holdings in the financial sector declined less than 1%. The Portfolio’s holdings in this sector emphasized industries like insurance or specialized firms in the banking and capital markets industries, which generally are not dependent on credit and lending in their operations. The consumer discretionary sector, which includes industries like housing, autos and retail — all segments of the economy most impacted by the ongoing deterioration in housing and lending — also provided negative returns in 2007. We concentrated our holdings within this group in companies in which spending or profits are less directly impacted by these issues, such as gaming and media.
All other market sectors achieved positive results, with particular strength in the energy, materials and information technology sectors. The Portfolio’s particular holdings in these segments caused its results to substantially exceed that of the Index. In information technology, an emphasis on computer hardware and peripherals, with positions in companies like Apple and Hewlett-Packard added significant value. In the software segment, our position in Google Inc. also contributed to excess return. In semiconductors, our holdings in Marvell Technologies and Broadcom Corp. did not keep pace with the Portfolio or the sector. Within the energy sector, we emphasized holdings in the equipment and services industries, with positions in companies like Transocean Inc. and Cameron International, both benefit-ing from high levels of spending for new discoveries and enhanced production. Returns from our holdings in the oil and gas production companies were in line with those of the Index. Within the industrials segment, we tended to own companies that will benefit from continued high
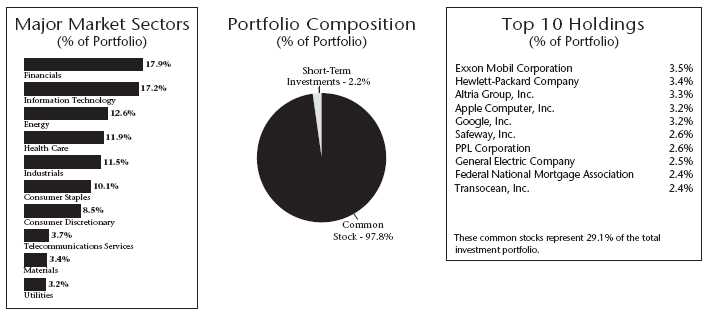
| Quoted Major Market Sectors, Portfolio Composition and Top 10 Holdings are subject to change. |
| The lists of Major Market Sectors and Top 10 Holdings exclude short-term investments and collateral held for securities loaned. |
| The Portfolio Composition chart excludes collateral held for securities loaned. |
| 34 |
levels of investment and capital flows to rebuild, enhance or replace infrastructure around the world; examples include Jacobs Engineering and Shaw Group.
What is your outlook?
The Portfolio is positioned to gain from active stock selection by identifying the best ideas from each of our industry-focused fundamental analysts. Within energy, we continue to favor offshore drilling rig equipment providers, where demand continues to far outstrip supply. Additionally, we are overweighted in the computers and peripherals industry, focusing on personal computer manufacturers such as Apple and Hewlett-Packard. Apple continues to benefit from increased Mac personal computer sales as well, and anticipates sales growth with their iPod® and iPhone products. Hewlett-Packard’s strong market share gains across multiple business lines should result in meaningful earnings’ growth. Within financials, we are bullish on the thrift and mortgage finance industry, maintaining our position in mortgage funding provider Fannie Mae.

* The Russell 3000® Index is an unmanaged index comprised of the 3,000 largest U.S. companies based on market capitalization. It is not possible to invest directly in the Index. The performance of the Index does not reflect deductions for fees, expenses or taxes.
** The Consumer Price Index is an inflationary indicator that measures the change in the cost of a fixed basket of products and services, including housing, electricity, food and transportation. It is not possible to invest directly in the Index.
Past performance is not an indication of future results. Total investment return and principal value will fluctuate and units, when redeemed, may be worth more or less than their original cost. Current performance may be higher or lower than the performance data quoted. Market volatility can significantly affect short-term performance, and more recent returns may be different from those shown. Call 800-THRIVENT or visit www.thrivent.com for performance results current to the most recent month-end.
1 Annualized total returns represent past performance and reflect changes in share prices, the reinvestment of all dividends and capital gains, and the effects of compounding. At various times, the Portfolio’s adviser reimbursed and/or paid non-advisory Portfolio expenses. Had the adviser not done so, the Portfolio’s total returns would have been lower. The returns shown do not reflect charges and expenses imposed on contract holders by the variable accounts. Those charges and expenses reduce the returns received by contract holders as compared to the returns presented.
Investing in a variable product involves risks, including the possible loss of principal. The prospectus contains more complete information on the investment objectives, risks, charges and expenses of the investment company, which investors should read and consider carefully before investing. To obtain a prospectus, contact a registered representative or visit www.thrivent.com.
| 35 |

How did the Portfolio perform during the 12-month period ended December 31, 2007?
Thrivent Large Cap Growth Portfolio earned a total return of 16.75% as compared to the median return of its peer group, the Lipper Large Cap Growth category, of 12.71% . The Portfolio’s market benchmark, the Russell 1000® Growth Index, earned a total return of 11.81% .
What factors affected the Portfolio’s performance?
A solid overall equity environment provided sturdy market returns for the year in growth stocks. Our performance — driven almost entirely by stock selection — produced superior returns to both our benchmark and peer group. The one exception to this was the consumer-related segments, which experienced a slowdown tied to a weakening housing market and slower consumer spending.
Looking at sector-based analysis, numerous sectors provided relative outperformance versus the benchmark, including the energy, financials, health care, industrials, materials, and technology sectors. The technology sector posted the strongest returns, highlighted by overweighted positions in Apple and Research in Motion The energy sector once again. posted strong returns as commodity prices rose. Holdings in Schlumberger and Global SantaFe were the biggest contributors. The materials sector was also a significant contributor, with Monsanto providing a top return for the overall Portfolio. Other notable individual stock contributors were Gilead Sciences and Express Scripts in health care, Foster Wheeler and Deere & Co. in the industrials group, and America Movil in telecommunications.
The two sectors detracting the most from performance for the 12-month period were the consumer staples and utilities sectors. Our underperformance in the consumer staples sector was primarily due to underweighted positions in Coca-Cola Inc, PepsiCo and Proctor & Gamble. We have traditionally not invested in the utilities sector as we find the growth prospects for these companies not compelling. However, the sector’s good performance for the year and our lack of exposure detracted from our relative performance over the period.
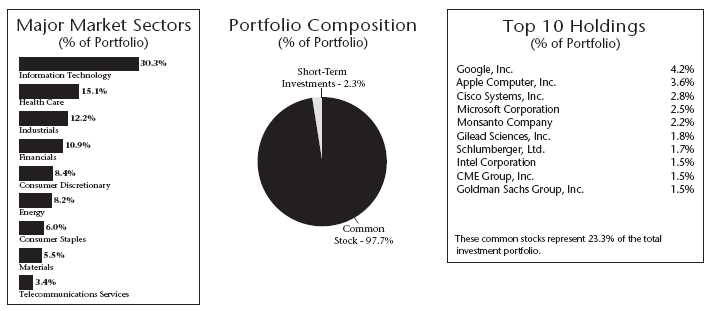
| Quoted Major Market Sectors, Portfolio Composition and Top 10 Holdings are subject to change. |
| The lists of Major Market Sectors and Top 10 Holdings exclude short-term investments and collateral held for securities loaned. |
| The Portfolio Composition chart excludes collateral held for securities loaned. |
| 36 |
What is your outlook?
A slowing economy and relatively attractive valuations for many large-cap growth companies should provide the backdrop for continued strong performance for this asset class in the coming year. We are very concerned about the continued housing market weakness and the effects being felt by the consumer, and therefore have tilted our exposure away from the consumer-related sectors and towards more attractive opportunities in sectors such as materials, health care and segments of industrials.
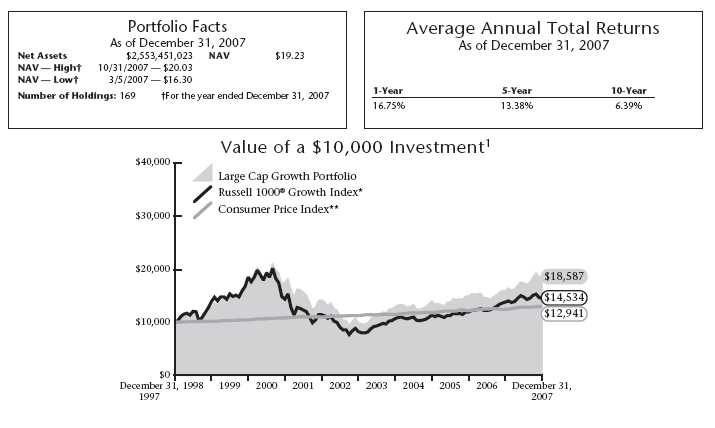
* The Russell 1000® Growth Index is an index comprised of those Russell 1000 companies with higher than average price-to-book ratios and higher forecasted growth values. It is not possible to invest directly in the Index. The performance of the Index does not reflect deductions for fees, expenses or taxes.
** The Consumer Price Index is an inflationary indicator that measures the change in the cost of a fixed basket of products and services, including housing, electricity, food and transportation. It is not possible to invest directly in the Index.
Past performance is not an indication of future results. Total investment return and principal value will fluctuate and units, when redeemed, may be worth more or less than their original cost. Current performance may be higher or lower than the performance data quoted. Market volatility can significantly affect short-term performance, and more recent returns may be different from those shown. Call 800-THRIVENT or visit www.thrivent.com for performance results current to the most recent month-end.
1 Annualized total returns represent past performance and reflect changes in share prices, the reinvestment of all dividends and capital gains, and the effects of compounding. At various times, the Portfolio’s adviser reimbursed and/or paid non-advisory Portfolio expenses. Had the adviser not done so, the Portfolio’s total returns would have been lower. The returns shown do not reflect charges and expenses imposed on contract holders by the variable accounts. Those charges and expenses reduce the returns received by contract holders as compared to the returns presented.
Investing in a variable product involves risks, including the possible loss of principal. The prospectus contains more complete information on the investment objectives, risks, charges and expenses of the investment company, which investors should read and consider carefully before investing. To obtain a prospectus, contact a registered representative or visit www.thrivent.com.
| 37 |

How did the Portfolio perform during the 12-month period ended December 31, 2007?
Thrivent Large Cap Growth Portfolio II earned a total return of 16.47% as compared to the median return of its peer group, the Lipper Large Cap Growth category, of 12.71% . The Portfolio’s market benchmark, the Russell 1000® Growth Index, earned a total return of 11.81% for the year.
What factors affected the Portfolio’s performance?
A solid overall equity environment provided solid market returns for the year in growth stocks. Our performance produced superior returns to both our benchmark and peer group, driven almost entirely by stock selection. The one exception to this was the consumer-related segments, which experienced a slowdown tied to a weakening housing market and slower consumer spending.
Looking at sector-based analysis, numerous sectors provided relative outperformance versus the benchmark, including the energy, financials, health care, industrials, materials, and technology sectors. The technology sector posted the strongest returns, highlighted by overweighted positions in Apple and Research in Motion. The energy sector once again posted strong returns as commodity prices rose yet again. Holdings in Schlumberger and Global SantaFe were the biggest contributors. The materials sector was also a significant contributor, with Monsanto providing a top return for the overall Portfolio. Other notable individual stock contributors were Gilead Sciences and Express Scripts in health care, Foster Wheeler and Deere & Co. in the industrials group, and America Movil in telecommunications.
The two sectors detracting the most from performance for the 12-month period were the consumer staples and utilities sectors. Our underperformance in the consumer staples sector was primarily due to underweighted positions in Coca-Cola Inc., PepsiCo and Proctor & Gamble. We have traditionally not invested in the utilities sector, as we find the growth prospects for these companies not compelling. However, the sector’s good performance for the year and our lack of exposure detracted from our relative performance over the period.
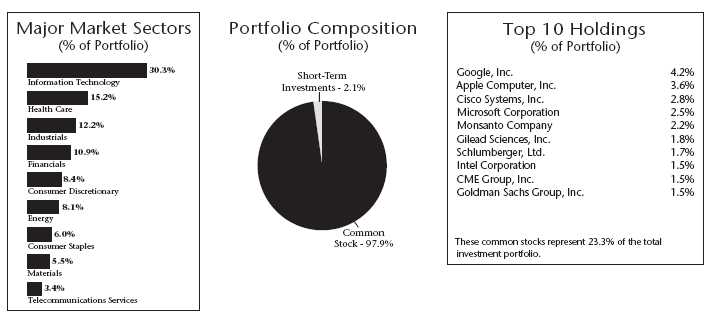
| Quoted Major Market Sectors, Portfolio Composition and Top 10 Holdings are subject to change. |
| The lists of Major Market Sectors and Top 10 Holdings exclude short-term investments and collateral held for securities loaned. |
| The Portfolio Composition chart excludes collateral held for securities loaned. |
| 38 |
What is your outlook?
A slowing economy and relatively attractive valuations for many large-cap growth companies should provide the backdrop for continued strong performance for this asset class in the coming year. We are very concerned about the continued housing market weakness and the effects being felt by the consumer, and therefore have tilted our exposure away from the consumer-related sectors and towards more attractive opportunities in sectors such as materials, health care and segments of industrials.
* The Russell 1000® Growth Index is an index comprised of those Russell 1000 companies with higher than average price-to-book ratios and higher forecasted growth values. It is not possible to invest directly in the Index. The performance of the Index does not reflect deductions for fees, expenses or taxes.
** The Consumer Price Index is an inflationary indicator that measures the change in the cost of a fixed basket of products and services, including housing, electricity, food and transportation. It is not possible to invest directly in the Index.
Past performance is not an indication of future results. Total investment return and principal value will fluctuate and units, when redeemed, may be worth more or less than their original cost. Current performance may be higher or lower than the performance data quoted. Market volatility can significantly affect short-term performance, and more recent returns may be different from those shown. Call 800-THRIVENT or visit www.thrivent.com for performance results current to the most recent month-end.
1 Annualized total returns represent past performance and reflect changes in share prices, the reinvestment of all dividends and capital gains, and the effects of compounding. At various times, the Portfolio’s adviser reimbursed and/or paid non-advisory Portfolio expenses. Had the adviser not done so, the Portfolio’s total returns would have been lower. The returns shown do not reflect charges and expenses imposed on contract holders by the variable accounts. Those charges and expenses reduce the returns received by contract holders as compared to the returns presented.
Investing in a variable product involves risks, including the possible loss of principal. The prospectus contains more complete information on the investment objectives, risks, charges and expenses of the investment company, which investors should read and consider carefully before investing. To obtain a prospectus, contact a registered representative or visit www.thrivent.com.
| 39 |

How did the Portfolio perform during the 12-month period ended December 31, 2007?
Thrivent Partner Growth Stock Portfolio achieved a return of 9.27% for the 12-month period ended December 31, 2007, as compared to the median return of its peer group, the Lipper Large Cap Growth category, of 12.71% . The Portfolio’s market benchmark, the S&P 500/Citigroup Growth Index, achieved a return of 9.25% .
What factors affected the Portfolio’s performance?
For the period, Portfolio returns were in line with those of the benchmark Index. Strong stock selection in telecommunications services, health care and materials were offset by an underweighted position in the strongly performing energy sector and an overweighted position in the poorly performing financial group. Within the telecommunications sector, the Portfolio emphasized holdings in those companies exposed to the expansion and development of wireless communications technology, such as Rogers Communications and Crown Castle International Corp. The allocation to health care, and the stock selection within that sector, lifted overall results. Aetna Inc. and Medco Health Services both provided excellent returns over the course of the year. Exposure to media stocks and a lower exposure to the poor performance of the retail sector also had a positive impact on returns. In materials, the Portfolio maintained exposure to higher commodity prices directly by investing in companies like Freeport McMoRan and BHP Billiton Ltd., as well as indirectly through fertilizer-provider Monsanto, a beneficiary of higher demand for foodstuffs and other cultivated materials.
Lack of exposure to the strong performance of the energy sector was the most significant factor limiting Portfolio returns. The Portfolio maintained an underweighting in this sector over the course of the year; unfortunately, it was the highest-returning of all market segments. Stock selection was in line with that of the group. An overweighting within the financial sector also negatively impacted returns versus the benchmark, as the group had the most significant underperformance in the markets in 2007, following the credit and financial liquidity challenges that surfaced in the second half of the period. Stock selection results in this sector of the Portfolio were better than that achieved by the Index but not of sufficient magnitude to offset the overweighted position in the Portfolio versus the Index.

| Quoted Major Market Sectors, Portfolio Composition and Top 10 Holdings are subject to change. |
| The lists of Major Market Sectors and Top 10 Holdings exclude short-term investments and collateral held for securities loaned. |
| The Portfolio Composition chart excludes collateral held for securities loaned. |
| 40 |
What is your outlook?
After trailing far behind small-cap and value-oriented stocks so far in this decade, large-cap growth stocks finally led the U.S. equity market in 2007. We expect this trend to continue through 2008 for several reasons, including favorable earnings enhanced by large-cap growth companies’ overseas exposure; a weak dollar; financial strength derived from strong free cash flow; record amounts of cash on their balance sheets; and supportive valuations. Although sentiment surrounding technology stocks has improved dramatically, investors remain somewhat negative. We maintain our favorable view of the sector and believe that better fundamentals will drive improvements in sentiment and stock performance. Valuations appear reasonable, and the tailwinds are strong for increasing technology spending. While U.S. equities appear attractive, several risks need to be considered. Rising commodity prices and their potential to induce broader price inflation is of particular concern. With a worsening housing market, issues with the sub-prime lending market, and low savings rates, the health of the American consumer is another risk to near-term equity performance. However, with low unemployment and record levels of household net worth, we do not believe the consumer is in serious jeopardy.
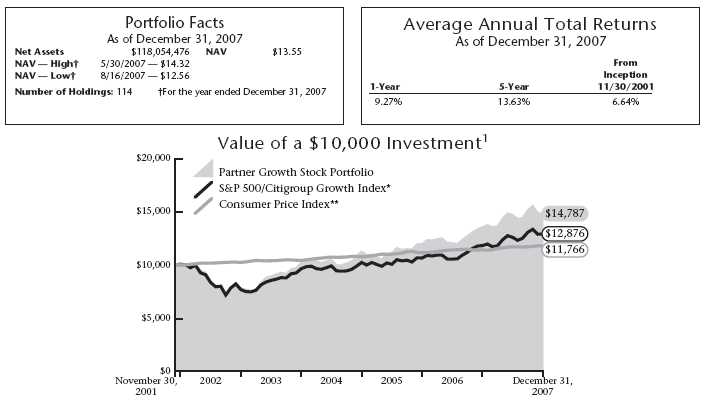
* The S&P 500/Citigroup Growth Index is an unmanaged capitalization-weighted index comprised of securities with higher price-to-book ratios in the S&P 500 Index. The S&P 500/Citigroup Growth Index is designed so that approximately one-half of the S&P 500 Index market capitalization is characterized as “value” and the other half as “growth.” It is not possible to invest directly in the Index. The performance of the Index does not reflect deductions for fees, expenses or taxes.
** The Consumer Price Index is an inflationary indicator that measures the change in the cost of a fixed basket of products and services, including housing, electricity, food and transportation. It is not possible to invest directly in the Index.
Past performance is not an indication of future results. Total investment return and principal value will fluctuate and units, when redeemed, may be worth more or less than their original cost. Current performance may be higher or lower than the performance data quoted. Market volatility can significantly affect short-term performance, and more recent returns may be different from those shown. Call 800-THRIVENT or visit www.thrivent.com for performance results current to the most recent month-end.
1 Annualized total returns represent past performance and reflect changes in share prices, the reinvestment of all dividends and capital gains, and the effects of compounding. At various times, the Portfolio’s adviser reimbursed and/or paid non-advisory Portfolio expenses. Had the adviser not done so, the Portfolio’s total returns would have been lower. The returns shown do not reflect charges and expenses imposed on contract holders by the variable accounts. Those charges and expenses reduce the returns received by contract holders as compared to the returns presented.
Investing in a variable product involves risks, including the possible loss of principal. The prospectus contains more complete information on the investment objectives, risks, charges and expenses of the investment company, which investors should read and consider carefully before investing. To obtain a prospectus, contact a registered representative or visit www.thrivent.com.
| 41 |

How did the Portfolio perform during the 12-month period ending December 31, 2007?
Thrivent Large Cap Value Portfolio provided a return of 4.69% for the 12-month period ending December 31, 2007, as compared to the median return of its peer group, the Lipper Large Cap Value category, of 2.19% . The Portfolio’s market benchmark, the Russell 1000® Value Index, achieved a return of –0.15% over the same period.
What factors influenced the Portfolio’s performance?
Sectors that helped performance the most during the period included financials, industrials and technology. In financials, an underweighted position versus the Russell 1000® Value Index added relative performance. (The Portfolio will typically have a lower weight in this sector than the Index because the Index has over one-third of its value in financials.) In the industrials sector, an overweighting versus the Index helped relative performance. In total, stock selection was the primary source of strong portfolio performance versus the Index.
Highlights in the financial sector included strong performance from positions in State Street Corporation, Bank of New York and Hudson City Bancorp. State Street Corporation and Bank of New York earn fee income from the custody and management of client assets globally. Business has exceeded expectations as the global capital markets have been rising. Hudson City Bankcorp was added later during the period as. the stock price of this savings and loan was tarred with the same brush as more exotic mortgage lenders.
In the industrials sector, the position in Flowserve Corporation, a pumps, valves and seals company, was the largest contributor, appreciating impressively during the period. This position has recently been sold as its valuation appears to be somewhat ahead of business fundamentals. In addition, positions in aerospace defense companies Honeywell and Lockheed Martin contributed meaningfully to performance.
In the technology sector, an overweighting and strong stock selection helped relative performance. Positions in International Business Machines, Hewlett Packard, Hyperion Solutions, a software company that was acquired by Oracle Corporation, and Intel, all were meaningful contributors. All of these positions remain in the Portfolio with the exception of Hyperion Solutions.
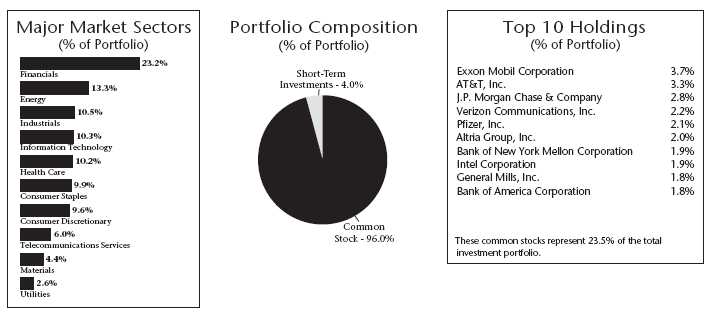
| Quoted Major Market Sectors, Portfolio Composition and Top 10 Holdings are subject to change. |
| The lists of Major Market Sectors and Top 10 Holdings exclude short-term investments and collateral held for securities loaned. |
| The Portfolio Composition chart excludes collateral held for securities loaned. |
| 42 |
Areas that hurt relative performance included energy, consumer staples and utilities. In energy, stock selection was strong; however, it was not good enough to overcome underweighting in the sector versus the benchmark, as this was the strongest area of the market during the period. In the consumer staples sector, not owning Proctor and Gamble hurt relative performance. Lastly, in the utility sector, strong stock selection was not enough to offset an underweighted position versus the benchmark.
What is your outlook?
Our focus is on investing in good companies that are undervalued versus their long-term normal earnings power and growth potential. We are finding value in selected financial, technology and consumer cyclical companies. Recent weakness in the market has provided some attractive investment opportunities for long-term investors.
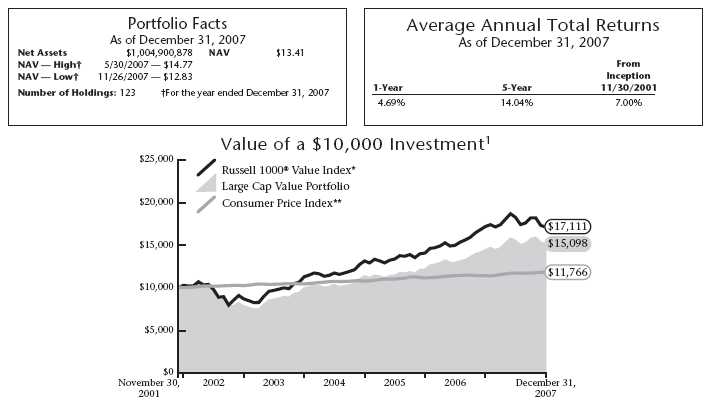
* The Russell 1000® Value Index is an index comprised of companies with lower price-to-book ratios and lower forecasted growth rates within the Russell 1000® Index. It is not possible to invest directly in the Index. The performance of the Index does not reflect deductions for fees, expenses or taxes.
** The Consumer Price Index is an inflationary indicator that measures the change in the cost of a fixed basket of products and services, including housing, electricity, food and transportation. It is not possible to invest directly in the Index.
Past performance is not an indication of future results. Total investment return and principal value will fluctuate and units, when redeemed, may be worth more or less than their original cost. Current performance may be higher or lower than the performance data quoted. Market volatility can significantly affect short-term performance, and more recent returns may be different from those shown. Call 800-THRIVENT or visit www.thrivent.com for performance results current to the most recent month-end.
1 Annualized total returns represent past performance and reflect changes in share prices, the reinvestment of all dividends and capital gains, and the effects of compounding. At various times, the Portfolio’s adviser reimbursed and/or paid non-advisory Portfolio expenses. Had the adviser not done so, the Portfolio’s total returns would have been lower. The returns shown do not reflect charges and expenses imposed on contract holders by the variable accounts. Those charges and expenses reduce the returns received by contract holders as compared to the returns presented.
Investing in a variable product involves risks, including the possible loss of principal. The prospectus contains more complete information on the investment objectives, risks, charges and expenses of the investment company, which investors should read and consider carefully before investing. To obtain a prospectus, contact a registered representative or visit www.thrivent.com.
| 43 |

How did the Portfolio perform during the 12-month period ending December 31, 2007?
Thrivent Large Cap Stock Portfolio earned a total return of 7.57% as compared to the median return of its peer group, the Lipper Large Cap Core category, of 5.13% . The Portfolio’s market benchmark, the S&P 500 Index, earned a return of 5.49% .
What factors affected the Portfolio’s performance?
Stock selection was the primary factor leading to good investment results for the fiscal year. A bias towards large-capitalization sectors was also a contributing factor, as well as a modest tilt towards more growth-oriented industries. Stock selection within the financial sector was the leading contributor to investment results. Underweighted holdings in industry segments like thrifts, mortgage finance and diversified financial services companies — which were most directly exposed to the dislocations in the credit markets created by sub-prime loan issues — was a key component in improved results. Stock selection in real estate investment trusts (REITs) was also a positive factor. Health care holdings had a positive impact on portfolio results, as well. Holdings in health care services company Express Scripts and equipment provider Thermo Fisher Scientific added to returns versus the benchmark Index. Gilead Sciences in the biotechnology industry also provided good returns versus both the industry and the Index. In the materials sector, our holdings in Monsanto benefited from strong markets for agricultural chemicals, while Praxair and Air Products in the industrial gas industry also achieved good results related to strong industrial demand. Holdings in the aerospace and defense segments of the industrial sector provided good returns to the Portfolio. Precision Castparts was a standout performer, as it is benefiting from the strong airline ordering cycle that is underway. The company is a key supplier to aircraft engine manufacturers. In the machinery segment, holdings in Flowserve and Deere & Co. provided excellent results for the year. A position in Google in the Information Technology sector contributed favorably to returns.
Our returns in consumer staples did not keep pace with the group, limited by below-market exposure to companies within the beverage and personal products segments. Consumer discretionary stocks generally came under pressure during the period as the group is considered to be very sensitive to the credit disruptions that were pervasive in the second half of the year. Our holding in Marriott International did not keep pace with the group or the market. An underweighted stance in McDonalds Corp. also limited results as the stock performed well in the period. In the media industry, holdings in both Comcast Corp and. McGraw-Hill Cos. declined over the year and limited the Portfolio’s advance.
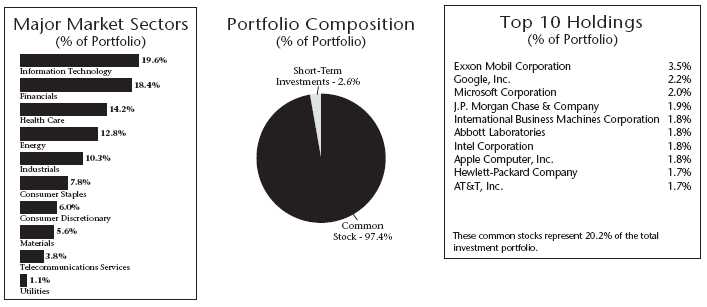
| Quoted Major Market Sectors, Portfolio Composition and Top 10 Holdings are subject to change. |
| The lists of Major Market Sectors and Top 10 Holdings exclude short-term investments and collateral held for securities loaned. |
| The Portfolio Composition chart excludes collateral held for securities loaned. |
| 44 |
What is your outlook?
The equity market is expected to experience an increase of volatility versus that seen over the last few years as the economic cycle matures and risks in the outlook increase. Mid-year 2007 saw an extraordinary level of complacency on the part of investors, who appeared to be willing to accept unusually low expected return premiums for the risks undertaken. By year-end, with the unfolding challenges and dislocations created by the expanding credit and liquidity issues, many asset prices had undergone significant adjustments such that risks, while not at extraordinary levels of improved valuations, were more reasonably priced. Economic and market risks are high for 2008, but policy makers appear to be taking appropriate steps to address the challenges brought on by the deterioration of housing and credit markets, which has cascaded into the financial sector. While a recession in 2008 is possible, the adjustments in the prices of many assets appear to have reasonably discounted this outcome.
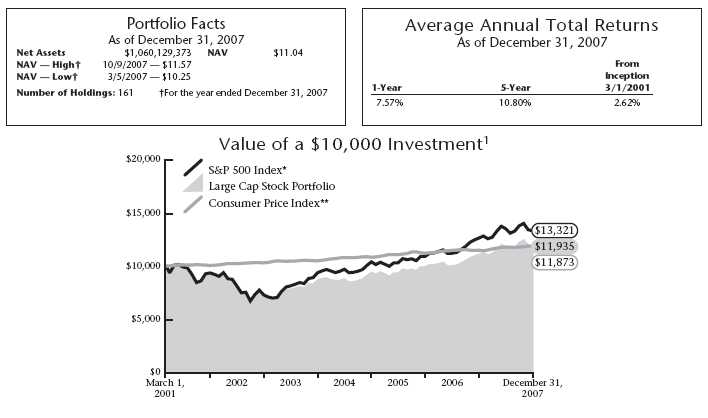
* The S&P 500 Index is an unmanaged index that represents the average performance of a group of 500 large-capitalization stocks. It is not possible to invest directly in the Index. The performance of the Index does not reflect deductions for fees, expenses or taxes.
** The Consumer Price Index is an inflationary indicator that measures the change in the cost of a fixed basket of products and services, including housing, electricity, food and transportation. It is not possible to invest directly in the Index.
Past performance is not an indication of future results. Total investment return and principal value will fluctuate and units, when redeemed, may be worth more or less than their original cost. Current performance may be higher or lower than the performance data quoted. Market volatility can significantly affect short-term performance, and more recent returns may be different from those shown. Call 800-THRIVENT or visit www.thrivent.com for performance results current to the most recent month-end.
1 Annualized total returns represent past performance and reflect changes in share prices, the reinvestment of all dividends and capital gains, and the effects of compounding. At various times, the Portfolio’s adviser reimbursed and/or paid non-advisory Portfolio expenses. Had the adviser not done so, the Portfolio’s total returns would have been lower. The returns shown do not reflect charges and expenses imposed on contract holders by the variable accounts. Those charges and expenses reduce the returns received by contract holders as compared to the returns presented.
Investing in a variable product involves risks, including the possible loss of principal. The prospectus contains more complete information on the investment objectives, risks, charges and expenses of the investment company, which investors should read and consider carefully before investing. To obtain a prospectus, contact a registered representative or visit www.thrivent.com.
| 45 |

How did the Portfolio perform during the 12-month period ended December 31, 2007?
Thrivent Large Cap Index Portfolio earned a total return of 5.17% as compared to the median return of its peer group, the S&P 500 Index Objective category, of 5.13% . The Portfolio’s market benchmark, the S&P 500 Index, earned a total return of 5.49% .
What factors affected the Portfolio’s performance?
The Portfolio is managed to virtually replicate the performance of the S&P 500 Index. We seek to maintain a fully invested position with limited transactions to minimize costs. As typically occurs with an indexed portfolio, the difference in performance between the benchmark index and the Portfolio itself can be largely attributed to expenses and minor differences in portfolio composition.
Energy, materials, and utilities sectors were the best performing groups in the market over the 12-month period. Energy stocks clearly benefited from the continued rise in oil and gas prices. Energy equipment and services stocks represented the strongest industry within the sector. Materials stocks also performed well, due to increased interest in commodities like steel. The biggest sector represented in the Index, financial stocks, along with consumer discretionary, were the only sectors that delivered negative returns for 2007. Financial stocks, such as thrifts, banks, and real estate investment trusts (REITs), suffered as interest rates and concerns over mortgages rose during the latter half of 2007.
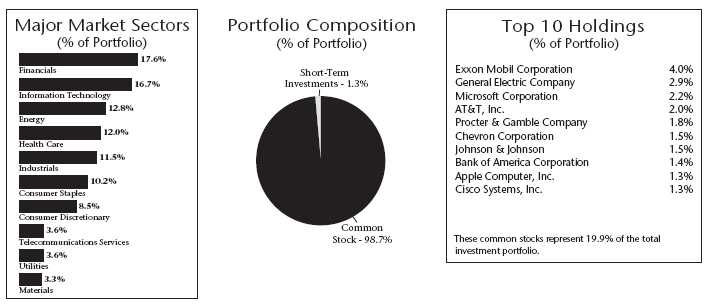
| Quoted Major Market Sectors, Portfolio Composition and Top 10 Holdings are subject to change. |
| The lists of Major Market Sectors and Top 10 Holdings exclude short-term investments and collateral held for securities loaned. |
| The Portfolio Composition chart excludes collateral held for securities loaned. |
| 46 |
What is your outlook?
Large-cap stocks lagged behind mid-cap stocks, but surpassed small-cap stocks for the 12-month period. If past economic cycles are any indication, the market may begin to favor large-cap issues in the months ahead. Typically, investors look for higher-quality stocks as economic growth moves past its peak in a given cycle, a factor that could help the Portfolio.
In an environment where investors are faced with greater uncertainty about the direction of interest rates and the strength of the domestic economy, large company stocks may offer a relatively safe haven in the equity markets. While we can anticipate continued volatility from stocks as a whole, those represented in this Index continue to offer a generally positive outlook.
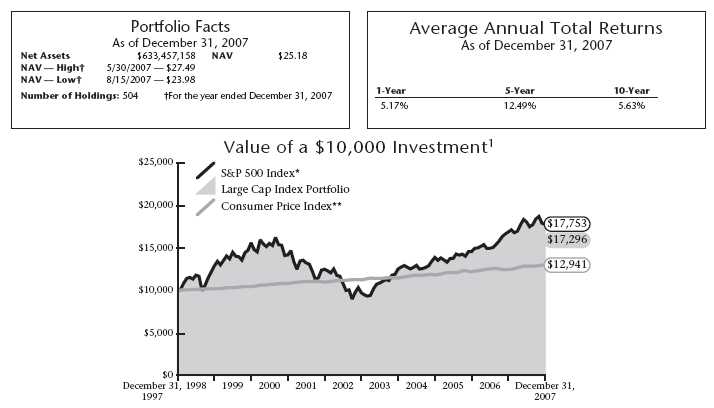
* The S&P 500 Index is an index that represents the average performance of a group of 500 large-capitalization stocks. “S&P 500®” is a trademark of The McGraw-Hill Companies, Inc. and has been licensed for use by Thrivent Financial for Lutherans. The product is not sponsored, endorsed or promoted by Standard & Poor’s, and Standard & Poor’s makes no representation regarding the advisability of investing in the product. It is not possible to invest directly in the Index. Index funds are subject to the same market risks associated with the stocks in their respective indexes. The performance of these Indexes does not reflect deductions for fees, expenses or taxes.
** The Consumer Price Index is an inflationary indicator that measures the change in the cost of a fixed basket of products and services, including housing, electricity, food and transportation. It is not possible to invest directly in the Index.
Past performance is not an indication of future results. Total investment return and principal value will fluctuate and units, when redeemed, may be worth more or less than their original cost. Current performance may be higher or lower than the performance data quoted. Market volatility can significantly affect short-term performance, and more recent returns may be different from those shown. Call 800-THRIVENT or visit www.thrivent.com for performance results current to the most recent month-end.
1 Annualized total returns represent past performance and reflect changes in share prices, the reinvestment of all dividends and capital gains, and the effects of compounding. At various times, the Portfolio’s adviser reimbursed and/or paid non-advisory Portfolio expenses. Had the adviser not done so, the Portfolio’s total returns would have been lower. The returns shown do not reflect charges and expenses imposed on contract holders by the variable accounts. Those charges and expenses reduce the returns received by contract holders as compared to the returns presented.
Investing in a variable product involves risks, including the possible loss of principal. The prospectus contains more complete information on the investment objectives, risks, charges and expenses of the investment company, which investors should read and consider carefully before investing. To obtain a prospectus, contact a registered representative or visit www.thrivent.com.
| 47 |

How did the Portfolio perform during the 12-month period ended December 31, 2007?
Thrivent Real Estate Securities earned a total of –16.81%, net of expenses, as compared to the median return of its peer group, the Lipper Real Estate category, of –15.77% . The Portfolio’s market benchmark, the FTSE NAREIT Equity REIT Index, earned –15.69% .
What factors affected the Portfolio’s performance?
After seven straight years of outperforming the S&P 500 Index, U.S. real estate investment trusts (REITs) were due for a correction. Significant redemption activity from the mutual fund industry negatively impacted the group as it created selling pressure on REIT stocks in general, and in particular for large-capitalization companies that had provided the best returns and liquidity over the last several years.
The best-performing sectors in the Portfolio were health care and industrial property REITs, which provided positive returns for the year. The Portfolio’s international real estate exposure also benefited performance, with a modest decline relative to the more significant decline for U.S. REIT stocks. Property sectors that most significantly detracted from performance were multifamily apartments, office buildings, and lodging properties. The Portfolio had virtually no exposure to homebuilding stocks and mortgage REITs, which both underperformed equity REITs in 2007. The Portfolio’s two largest positive contributors to performance were ProLogis, a U.S. based global REIT that develops and manages warehouse distribution properties worldwide, and Ventas, a U.S. REIT that owns long-term acute care hospitals, skilled nursing facilities, assisted living centers, and health care office properties.
What is your outlook?
As a result of mutual fund outflows and a weakening U.S. economy, downward pressure on REIT stock prices may continue in 2008. With a slowing U.S. economy, demand for most types of commercial real estate space will be negatively impacted. At the margin, fundamental factors are beginning to deteriorate, as evidenced by modestly increasing vacancy rates for office buildings and retail properties. Multifamily apartments are also being impacted by the oversupply of single family housing for sale, and the lodging sector may deteriorate as a result of consumer spending weakness and more stringent corporate travel expenditures. Regional malls are still enjoying high occupancy rates and rising rents, particularly in dominant centers located in major metropolitan markets. Health care properties appear to be somewhat insulated from the slowing economy as a result of their stable demand despite economic conditions.
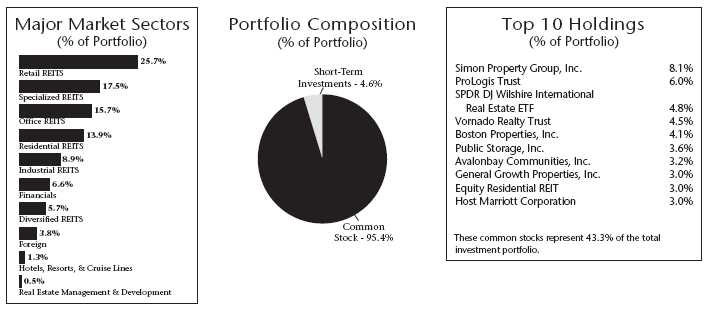
| Quoted Major Market Sectors, Portfolio Composition and Top 10 Holdings are subject to change. |
| The lists of Major Market Sectors and Top 10 Holdings exclude short-term investments and collateral held for securities loaned. |
| The Portfolio Composition chart excludes collateral held for securities loaned. |
| 48 |
We have positioned the Portfolio more defensively, in light of the weakening outlook for the U.S. economy. We believe that large-capitalization REITs with high-quality real estate and experienced management teams are best positioned to weather the difficult market conditions that are likely to persist through most of 2008.
We also plan to increase the Portfolio’s exposure in the more defensive property sectors. Property sectors that are generally considered to be more defensive are health care REITs, net-leased properties, and high quality regional malls.
Property sectors that are less defensive — in which we intend to reduce exposure — are multifamily apartments and lodging, which have the greatest immediate sensitivity to weakening economic conditions. In summary, we expect 2008 to be a challenging year for the U.S. economy, with slower economic growth and reduced leasing demand for commercial real estate. This may provide an attractive buying opportunity for investors willing to look beyond the current weak performance period in order to capture attractive current yield and long-term appreciation potential.
* The FTSE NAREIT Equity REIT Index is an unmanaged capitalization-weighted index of all equity real estate investment trusts. It is not possible to invest directly in this Index. The performance of this Index does not reflect deductions for fees, expenses or taxes.
** The Consumer Price Index is an inflationary indicator that measures the change in the cost of a fixed basket of products and services, including housing, electricity, food and transportation. It is not possible to invest directly in the Index.
Past performance is not an indication of future results. Total investment return and principal value will fluctuate and units, when redeemed, may be worth more or less than their original cost. Current performance may be higher or lower than the performance data quoted. Market volatility can significantly affect short-term performance, and more recent returns may be different from those shown. Call 800-THRIVENT or visit www.thrivent.com for performance results current to the most recent month-end.
1 Annualized total returns represent past performance and reflect changes in share prices, the reinvestment of all dividends and capital gains, and the effects of compounding. At various times, the Portfolio’s adviser reimbursed and/or paid non-advisory Portfolio expenses. Had the adviser not done so, the Portfolio’s total returns would have been lower. The returns shown do not reflect charges and expenses imposed on contract holders by the variable accounts. Those charges and expenses reduce the returns received by contract holders as compared to the returns presented.
Investing in a variable product involves risks, including the possible loss of principal. The prospectus contains more complete information on the investment objectives, risks, charges and expenses of the investment company, which investors should read and consider carefully before investing. To obtain a prospectus, contact a registered representative or visit www.thrivent.com.
| 49 |

How did the Portfolio perform during the 12-month period ended December 31, 2007?
Thrivent Balanced Portfolio returned 5.47% as compared to the median return for its peer group, the Lipper Mixed-Asset Target Allocation Growth category, of 6.34% . The Portfolio’s market benchmarks, the S&P 500 Index and the Lehman Brothers Aggregate Bond Index, returned 5.49% and 6.97%, respectively.
What factors affected the Portfolio’s performance?
We maintained an investment allocation of approximately two-thirds of assets in the equity segment and the remainder in fixed-income securities during the period.
The equity component return was closely aligned with its benchmark, the S&P 500 Index. Within the Portfolio, energy, materials, and utilities were the best performing industry sectors. Energy stocks benefited from the continued rise in oil and gas prices, while materials stocks benefited from the rising cost of commodities. The largest sector represented in the Index, financial stocks, turned in the worst performance — and was one of only two sectors posting negative returns for the year — as increasing mortgage delinquencies and foreclosures caused major losses at banks and other financial institutions. The other negatively performing sector was consumer discretionary, impacted by concerns that the housing market slowdown and tighter credit would curb consumer spending.
The fixed-income component of the Portfolio modestly underperformed the Lehman Aggregate Bond Index mainly due to the floating-rate debt that backs our mortgage securities. We used this debt to back our purchase of Fannie Mae and Freddie Mac mortgage securities through what is called the “dollar-roll” program. In the program, we accept “forward delivery” of securities that haven’t been created yet, agreeing to take physical delivery at a later date. The floating-rate debt we use to back our agreement is all AAA-rated. While this typically low-risk practice has generated additional yield for the Portfolio for many years, the floating-rate securities — backed by higher-quality credit card, auto and other loans — were affected by sub-prime mortgage-related troubles and they lost value.
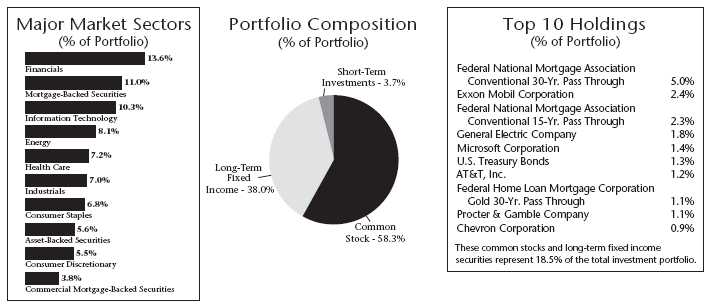
| Quoted Major Market Sectors, Portfolio Composition and Top 10 Holdings are subject to change. |
| Major Market Sectors represent long-term non-government holdings. |
| The list of Top 10 Holdings excludes short-term investments and collateral held for securities loaned. |
| The Portfolio Composition chart excludes collateral held for securities loaned. |
| 50 |
What is your outlook?
We think economic growth will continue to slow in 2008, but we don’t expect a recession. It will take several months for the economy to work off the effects of the credit crunch. The slowdown and continued challenges in the housing and mortgage markets will likely prompt the Federal Reserve to continue easing interest rates, perhaps more aggressively than initially thought.
Large-cap stocks will likely outperform smaller-cap issues in the coming months. We believe that our affected floating-rate securities are fundamentally solid investments and that their value will rebound once the market calms down. We expect that the yield curve will continue to be steep, with longer-maturity bonds paying more than shorter-maturity issues, especially if inflation concerns materialize.
As always, we intend to maintain a well diversified mix of securities in our efforts to track the performance of the S&P 500 Index and the Lehman Aggregate Bond Index.
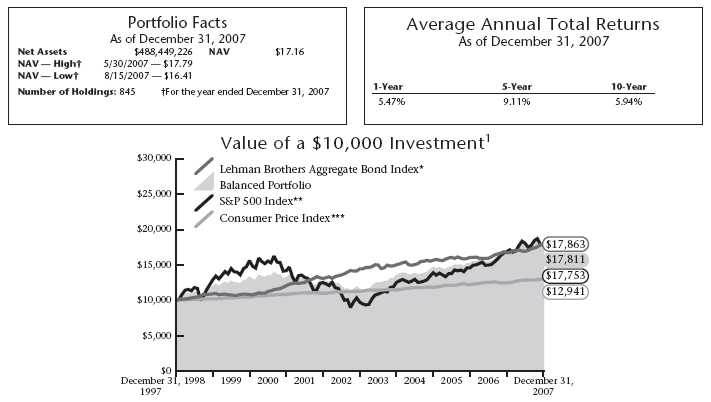
* The Lehman Brothers Aggregate Bond Index is an unmanaged index that measures the performance of U.S. investment grade bonds. It is not possible to invest directly in the Index. The performance of the Index does not reflect deductions for fees, expenses or taxes.
** The S&P 500 Index is an unmanaged index that represents the average performance of a group of 500 large-capitalization stocks. It is not possible to invest directly in the Index. The performance of the Index does not reflect deductions for fees, expenses or taxes.
*** The Consumer Price Index is an inflationary indicator that measures the change in the cost of a fixed basket of products and services, including housing, electricity, food and transportation. It is not possible to invest directly in the Index.
Past performance is not an indication of future results. Total investment return and principal value will fluctuate and units, when redeemed, may be worth more or less than their original cost. Current performance may be higher or lower than the performance data quoted. Market volatility can significantly affect short-term performance, and more recent returns may be different from those shown. Call 800-THRIVENT or visit www.thrivent.com for performance results current to the most recent month-end.
1 Annualized total returns represent past performance and reflect changes in share prices, the reinvestment of all dividends and capital gains, and the effects of compounding. At various times, the Portfolio’s adviser reimbursed and/or paid non-advisory Portfolio expenses. Had the adviser not done so, the Portfolio’s total returns would have been lower. The returns shown do not reflect charges and expenses imposed on contract holders by the variable accounts. Those charges and expenses reduce the returns received by contract holders as compared to the returns presented.
Investing in a variable product involves risks, including the possible loss of principal. The prospectus contains more complete information on the investment objectives, risks, charges and expenses of the investment company, which investors should read and consider carefully before investing. To obtain a prospectus, contact a registered representative or visit www.thrivent.com.
| 51 |

How did the Portfolio perform during the 12-month period ended December 31, 2007?
Thrivent High Yield Portfolio returned 2.75% during the period, outpacing the median return of 2.51% for its Lipper U.S. High Current Yield Funds peer group. During the same period, the Portfolio’s market benchmark, the Lehman Brothers U.S. Corporate High Yield Bond Index, posted a return of 1.87% .
What factors affected the Portfolio’s performance?
The reporting period was characterized by two different types of markets. From January through May, the high-yield bond market was strong. Continued economic growth, a sustained appetite for risk among investors, and low default rates helped fuel investors’ quest for yield, thereby propelling the lowest-quality high-yield bonds to outperform. During these months our underweighted position in the lowest-rated high-yield credits — CCC-rated and distressed/ defaulted credits — held back the Portfolio’s returns relative to the Index.
After May, the high-yield bond market sold off, largely due to investor fears about growing troubles in the sub-prime and other credit markets. The yield premium or “spread” high-yield bonds offered over that of Treasury securities jumped from 2.30% at the end of May to 5.70% at year end, with a simultaneous drop in their prices. Our Portfolio, with its emphasis on higher-quality bonds and essentially no exposure to issuers in the troubled financial sector, outperformed its peer group during these months and for the entire reporting period.
Other factors that enhanced our performance relative to our peer group included our overweighted positions in the metals and mining and packaging sectors. What’s more, our credit selection within these industries — as well as in the cable and gaming sectors — helped the Portfolio’s holdings outperform each sector’s average return during the period. Another positive factor was that we sold most of our holdings in home builders and building materials suppliers and had an underweighted position in this sector as the sell-off accelerated. Our underweighted position in the auto industry, which was a weak performer, also benefited the Portfolio.
Detracting from the Portfolio’s performance was our exposure to retail industry and construction machinery bonds. Further, our performance was diminished by our underweighted position in the aerospace sector, which did well.
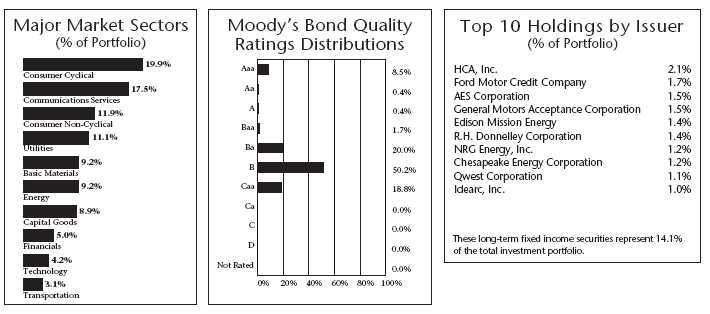
| Quoted Major Market Sectors, Moody’s Bond Quality Ratings Distributions and Top 10 Holdings by Issuer are subject to change. |
| The lists of Major Market Sectors and Top 10 Holdings by Issuer exclude short-term investments and collateral held for securities loaned. |
| 52 |
What is your outlook?
Our outlook for high-yield bonds is cautious and will remain so until it becomes clearer how the economy will perform in 2008. We are concerned about the ongoing troubles in the housing and credit markets, and for that reason we’ll keep a defensive stance.
However, with high-yield bond yield spreads at 5.70% over Treasury securities, and considering the sector’s continued low default rate, the market looks attractively valued. The market appears to be close to compensating investors for the expected increase in the default rate. Also, the current market fear and volatility has provided opportunities to buy bonds at attractive prices. Although we are in a defensive mode, we will take advantage of any opportunities to add value to the Portfolio and enhance shareholder return.

* The Lehman Brothers U.S. Corporate High Yield Bond Index is an index which measures the performance of fixed-rate non-investment grade bonds. It is not possible to invest directly in the Index. The performance of the Index does not reflect deductions for fees, expenses or taxes.
** The Consumer Price Index is an inflationary indicator that measures the change in the cost of a fixed basket of products and services, including housing, electricity, food and transportation. It is not possible to invest directly in the Index.
Past performance is not an indication of future results. Total investment return and principal value will fluctuate and units, when redeemed, may be worth more or less than their original cost. Current performance may be higher or lower than the performance data quoted. Market volatility can significantly affect short-term performance, and more recent returns may be different from those shown. Call 800-THRIVENT or visit www.thrivent.com for performance results current to the most recent month-end.
1 Annualized total returns represent past performance and reflect changes in share prices, the reinvestment of all dividends and capital gains, and the effects of compounding. At various times, the Portfolio’s adviser reimbursed and/or paid non-advisory Portfolio expenses. Had the adviser not done so, the Portfolio’s total returns would have been lower. The returns shown do not reflect charges and expenses imposed on contract holders by the variable accounts. Those charges and expenses reduce the returns received by contract holders as compared to the returns presented.
Investing in a variable product involves risks, including the possible loss of principal. The prospectus contains more complete information on the investment objectives, risks, charges and expenses of the investment company, which investors should read and consider carefully before investing. To obtain a prospectus, contact a registered representative or visit www.thrivent.com.
| 53 |

How did the Portfolio perform during the 12-month period ended December 31, 2007?
Thrivent Diversified Income Plus Portfolio returned –0.98% for the period. This compares with the Portfolio’s primary benchmarks, including the S&P 500 Dividend Aristocrats Index, which returned –2.07%; and the Lehman Brothers Aggregate Bond Index, which returned 6.97% for the same time frame.
What factors affected the Portfolio’s performance?
Detracting from the Portfolio’s performance during the period was the fact that most yield-oriented investments — our main investment focus — provided relatively poor performance.
In the equity portion, our allocation to real estate investment trusts (REITs) was a substantial detractor from the Portfolio’s performance. REIT share prices fell sharply during the period as they corrected from the high valuations reached due to the Equity Office Property acquisition in the first quarter of 2007. Thus REITs dramatically underperformed the rest of the equity market, after several years of above-average returns. Although we meaningfully reduced our position in REITs from the Portfolio’s long-term strategic 11% allocation, having any exposure to these securities was problematic.
Also hurting the Portfolio’s performance was the relatively high allocation to financial stocks, which sharply under-performed the market due to ongoing troubles in the credit markets. As is the case with REITs, the Portfolio focuses on these traditionally high-dividend stocks in pursuing its objective of maximizing income.
Positive contributors to the Portfolio’s performance were our weightings in investment-grade bonds and convertibles. Our position in Treasury securities performed particularly well as investors flocked to their safety when concerns about sub-prime mortgage market fallout grew later in the period. The investment-grade bond portion of the Portfolio is designed to add diversification and support if higher-yield securities falter, and that’s how it worked this period.
Among the Portfolio’s other fixed-income holdings, our high-yield bonds performed substantially better than the Lehman Brothers High Yield Index, one of our primary benchmarks, due to our focus on higher-quality securities within this segment.
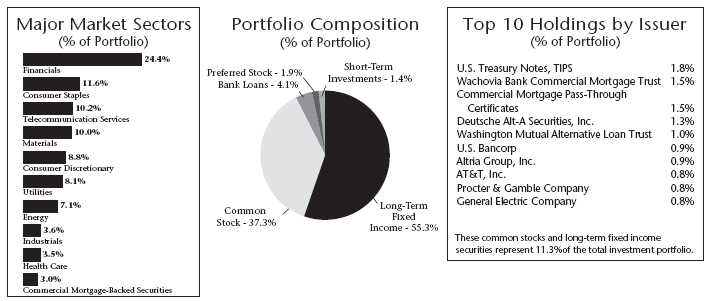
| Quoted Major Market Sectors, Portfolio Composition and Top 10 Holdings are subject to change. |
| Major Market Sectors represent long-term non-government holdings. |
| The list of Top 10 Holdings excludes short-term investments and collateral held for securities loaned. |
| The Portfolio Composition chart excludes collateral held for securities loaned. |
| 54 |
What is your outlook?
We think economic growth will continue to slow in 2008, but we don’t expect a recession. It will take several months for the economy to work off the effects of the credit crunch. The slowdown and continued challenges in the housing and mortgage markets will likely prompt the Federal Reserve to continue easing interest rates, perhaps more aggressively than initially thought. European and other central banks should continue to support the Fed’s efforts.
Considering our outlook, there could be some near-term weakness in REIT and financial stocks and other investments that involve risk. We expect the performance of these investments to turn around by the second or third quarter of 2008, as credit market problems are resolved and value hunters begin buying. In the meantime, we’ll continue to underweight our position in the REIT sector and carefully monitor our financial stock holdings.
The high-yield market has been dramatically re-priced, yet credit problems, higher defaults and possible supply pressures may inhibit this market in the coming year. We’ll continue to be cautious in this sector as well by upgrading quality and assuming a generally defensive posture.
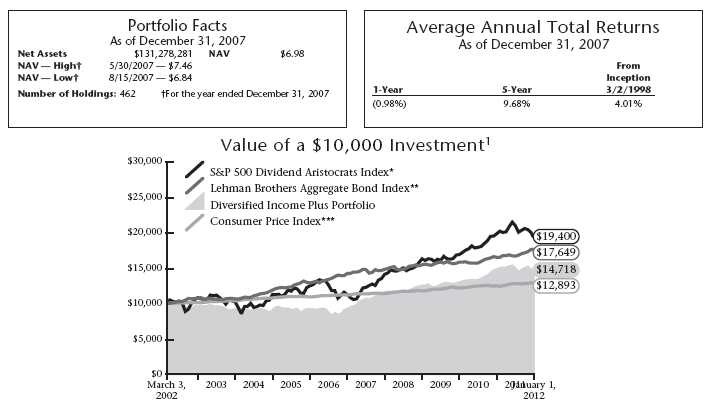
* The S&P 500 Dividend Aristocrats Index is an index which measures the performance of large-capitalization companies within the S&P 500 that have followed a managed dividends policy of consistently increasing dividends every year for at least 25 years. The index portfolio has both capital growth and dividend income characteristics, is equal-weighted and is broadly diversified across sectors. It is not possible to invest directly in the Index. The performance of the Index does not reflect deductions for fees, expenses or taxes.
** The Lehman Brothers Aggregate Bond Index is an index that measures the performance of U.S. investment grade bonds. It is not possible to invest directly in the Index. The performance of the Index does not reflect deductions for fees, expenses or taxes.
*** The Consumer Price Index is an inflationary indicator that measures the change in the cost of a fixed basket of products and services, including housing, electricity, food and transportation. It is not possible to invest directly in the Index.
Past performance is not an indication of future results. Total investment return and principal value will fluctuate and units, when redeemed, may be worth more or less than their original cost. Current performance may be higher or lower than the performance data quoted. Market volatility can significantly affect short-term performance, and more recent returns may be different from those shown. Call 800-THRIVENT or visit www.thrivent.com for performance results current to the most recent month-end.
1 Annualized total returns represent past performance and reflect changes in share prices, the reinvestment of all dividends and capital gains, and the effects of compounding. At various times, the Portfolio’s adviser reimbursed and/or paid non-advisory Portfolio expenses. Had the adviser not done so, the Portfolio’s total returns would have been lower. The returns shown do not reflect charges and expenses imposed on contract holders by the variable accounts. Those charges and expenses reduce the returns received by contract holders as compared to the returns presented.
Investing in a variable product involves risks, including the possible loss of principal. The prospectus contains more complete information on the investment objectives, risks, charges and expenses of the investment company, which investors should read and consider carefully before investing. To obtain a prospectus, contact a registered representative or visit www.thrivent.com.
| 55 |

How did the Portfolio perform during the 12-month period ended December 31, 2007?
Thrivent Income Portfolio returned 3.80% during the period, compared with a median return of 5.30% for its Lipper Corporate Debt Funds BBB-Rated Funds peer group. During the same period, the Portfolio’s market benchmark, the Lehman Brothers Aggregate Bond Index, posted a return of 6.97% .
What factors affected the Portfolio’s performance?
Our underperformance relative to our peer group is attributable to two main factors: About 60% of it was due to our holdings in corporate bonds and 40% was due to the floating-rate debt that backs our mortgage securities.
During the period we held an overweighted position in corporate bonds, which were negatively affected by the liquidity crunch that occurred in August. Within our corporate bond holdings we’ve typically held an overweighted position in the finance sector, which generally has been a high-rated area of the market. But during the second half of this reporting period, the worsening situation with sub-prime mortgage securities hurt the finance sector overall, since finance corporations issue and hold the securities. Two of the finance securities we own, Residential Capital (ResCap) and Countrywide Financial, were hit particularly hard during the period.
In addition, some of the corporate financial sector bonds we held were hybrid securities. These securities are designed to put the bondholder lower in the corporate repayment order in case of bankruptcy — but still ahead of stockholders — in exchange for higher returns. However, they were particularly hard hit by the credit crunch.
We used floating-rate debt to back our purchase of Fannie Mae and Freddie Mac mortgage securities through what is called the “dollar-roll” program. In the program, we accept “forward delivery” of securities that haven’t been created yet, agreeing to take physical delivery at a later date. The floating-rate debt we use to back our agreement is all AAA-rated with maturities of from one to three years and a coupon rate that readjusts between one and three months. While this typically low-risk practice has generated additional yield for the Portfolio for many years, the floating-rate securities — backed by higher-quality credit card, auto and other loans — were affected by sub-prime mortgage-related troubles and they lost value.
What is your outlook?
We think economic growth will continue to slow in 2008, but we don’t expect a recession. It will take several months for the economy to work off the effects of the credit crunch. The slowdown and continued challenges in the housing
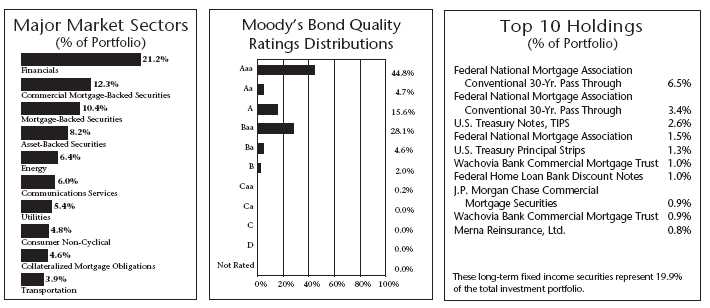
| Quoted Major Market Sectors, Moody’s Bond Quality Ratings Distributions and Top 10 Holdings are subject to change. |
| Major Market Sectors represent long-term non-government holdings. |
| Moody’s Bond Quality Ratings Distributions and the list of Top 10 Holdings exclude short-term investments and collateral held for securities loaned. |
| 56 |
and mortgage markets will likely prompt the Federal Reserve to continue easing interest rates, perhaps more aggressively than initially thought.
We expect that the yield curve will continue to be steep, with longer-maturity bonds paying more than shorter-maturity issues, especially if inflation concerns materialize. We will maintain our current Portfolio posture, not adding risk but not selling adversely affected securities while market prices are down due to investor fears. We believe that our affected corporate and floating-rate securities are fundamentally solid investments and that their value will rebound once the market calms down. As always, we will continue to look for opportunities to add value to the Portfolio and enhance shareholder return.
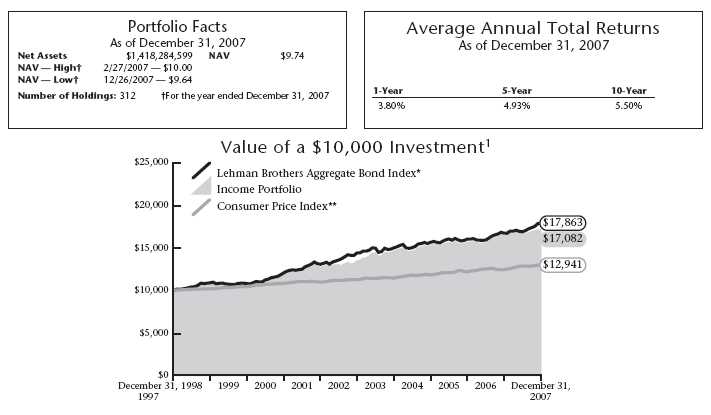
* The Lehman Brothers Aggregate Bond Index is an unmanaged index that measures the performance of U.S. investment grade bonds. It is not possible to invest directly in the Index. The performance of the Index does not reflect deductions for fees, expenses or taxes.
** The Consumer Price Index is an inflationary indicator that measures the change in the cost of a fixed basket of products and services, including housing, electricity, food and transportation. It is not possible to invest directly in the Index.
Past performance is not an indication of future results. Total investment return and principal value will fluctuate and units, when redeemed, may be worth more or less than their original cost. Current performance may be higher or lower than the performance data quoted. Market volatility can significantly affect short-term performance, and more recent returns may be different from those shown. Call 800-THRIVENT or visit www.thrivent.com for performance results current to the most recent month-end.
1 Annualized total returns represent past performance and reflect changes in share prices, the reinvestment of all dividends and capital gains, and the effects of compounding. At various times, the Portfolio’s adviser reimbursed and/or paid non-advisory Portfolio expenses. Had the adviser not done so, the Portfolio’s total returns would have been lower. The returns shown do not reflect charges and expenses imposed on contract holders by the variable accounts. Those charges and expenses reduce the returns received by contract holders as compared to the returns presented.
Investing in a variable product involves risks, including the possible loss of principal. The prospectus contains more complete information on the investment objectives, risks, charges and expenses of the investment company, which investors should read and consider carefully before investing. To obtain a prospectus, contact a registered representative or visit www.thrivent.com.
| 57 |

How did the Portfolio perform during the 12-month period ended December 31, 2007?
Thrivent Bond Index Portfolio posted a total return of 5.69%, compared to the median return of its peer group, the Lipper General Bond category, of 5.75% . The Portfolio’s market benchmark, the Lehman Brothers Aggregate Bond Index (Lehman Index) returned 6.97% .
What factors affected the Portfolio’s performance?
Since the Portfolio’s objective is to track the performance of the Lehman Index, its allocations to various sectors of the broad U.S. fixed-income markets generally mirror those of the Index. The Portfolio underperformed the Lehman Index partly because it incurred operating expenses, whereas none were incurred by the Index.
The main reason the Portfolio underperformed the Lehman Index was due to the floating-rate debt that backs our mortgage securities. We used this debt to back our purchase of Fannie Mae and Freddie Mac mortgage securities through what is called the “dollar-roll” program. In the program, we accept “forward delivery” of securities that haven’t been created yet, agreeing to take physical delivery at a later date. The floating-rate debt we use to back our agreement is all AAA-rated. While this typically low-risk practice has generated additional yield for the Portfolio for many years, the floating-rate securities — backed by higher-quality credit card, auto and other loans — were affected by sub-prime mortgage-related troubles and they lost value.
Concerns about sub-prime mortgage market fallout overshadowed the bond market in the second half of the year, and the lack of answers caused a huge flight to quality. As investors flocked to the safety of government-backed U.S. Treasury securities, the yield spread between Treasury issues and other types of bonds — including investment-grade corporate and mortgage-backed bonds — widened dramatically. With bond yields and prices moving in the opposite direction, Treasury prices rose later in the period and anything with a credit orientation or mortgage-back structure underperformed Treasury securities.

| Quoted Major Market Sectors, Moody’s Bond Quality Ratings Distributions and Top 10 Holdings are subject to change. |
| Major Market Sectors represent long-term non-government holdings. |
| Moody’s Bond Quality Ratings Distributions and the list of Top 10 Holdings exclude short-term investments and collateral held for securities loaned. |
| 58 |
What is your outlook?
We think economic growth will continue to slow in 2008, but we don’t expect a recession. It will take several months for the economy to work off the effects of the credit crunch. The slowdown and continued challenges in the housing and mortgage markets will likely prompt the Federal Reserve to continue easing interest rates, perhaps more aggressively than initially thought.
We expect that the yield curve will continue to be steep, with longer-maturity bonds paying more than shorter-maturity issues, especially if inflation concerns materialize. We believe that our affected floating-rate securities are fundamentally solid investments and that their value will rebound once the market calms down. As always, we intend to maintain a well diversified mix of debt securities in our efforts to track the performance of the Lehman Index.
* The Lehman Brothers Aggregate Bond Index is an unmanaged index that measures the performance of U.S. investment grade bonds. It is not possible to invest directly in the Index. The performance of the Index does not reflect deductions for fees, expenses or taxes.
** The Consumer Price Index is an inflationary indicator that measures the change in the cost of a fixed basket of products and services, including housing, electricity, food and transportation. It is not possible to invest directly in the Index.
Past performance is not an indication of future results. Total investment return and principal value will fluctuate and units, when redeemed, may be worth more or less than their original cost. Current performance may be higher or lower than the performance data quoted. Market volatility can significantly affect short-term performance, and more recent returns may be different from those shown. Call 800-THRIVENT or visit www.thrivent.com for performance results current to the most recent month-end.
1 Annualized total returns represent past performance and reflect changes in share prices, the reinvestment of all dividends and capital gains, and the effects of compounding. At various times, the Portfolio’s adviser reimbursed and/or paid non-advisory Portfolio expenses. Had the adviser not done so, the Portfolio’s total returns would have been lower. The returns shown do not reflect charges and expenses imposed on contract holders by the variable accounts. Those charges and expenses reduce the returns received by contract holders as compared to the returns presented.
Investing in a variable product involves risks, including the possible loss of principal. The prospectus contains more complete information on the investment objectives, risks, charges and expenses of the investment company, which investors should read and consider carefully before investing. To obtain a prospectus, contact a registered representative or visit www.thrivent.com.
| 59 |

How did the Portfolio perform during the 12-month period ended December 31, 2007?
Thrivent Limited Maturity Bond Portfolio returned 4.00% during the period, compared to a median return of 4.90% for its Lipper Short Investment Grade Debt Funds peer group. During the same period, the Portfolio’s market benchmark, the Lehman Brothers Government/Credit 1-3 Year Bond Index, generated a return of 6.84% .
What factors affected the Portfolio’s performance?
Bond yields stayed in a fairly narrow range for the first seven months of the period, and the yield curve was relatively flat with little difference in yields among various maturity lengths. In August, however, fears that sub-prime mortgage troubles were spreading to other sectors of the bond market caused investors to sell riskier securities in favor of safe Treasury issues. The result: Yields on shorter maturities and Treasury securities fell more sharply than yields on longer maturities and bonds with a credit structure.
With growing concerns about how much the housing slump and credit crunch would slow the economy, the Federal Reserve cut the federal funds rate three times for a total of 1.00% and the discount rate four times for a total of 1.50% from August through year end. The yield on the two-year Treasury note fell from 4.86% at the start of the third quarter to 3.05% on December 31.
As investors flocked to the safety of government-backed U.S. Treasury securities, the yield spread between Treasury issues and spread sectors — including investment-grade corporate, mortgage-backed, and asset-backed bonds — widened dramatically. With bond yields and prices moving in the opposite direction, Treasury prices rose and anything with a credit orientation or mortgage-back structure did poorly. Most of the Portfolio’s underperformance relative to its benchmark and peer group was due to its overweighted position in high-quality spread sectors and underweighted position in the government sector.
Our performance benefited during the period from moves to position the Portfolio for a steeper yield curve. We did this by purchasing options on Treasury futures, which enabled us to extend the Portfolio’s duration when interest rates declined significantly. The options’ value grew as rates fell.
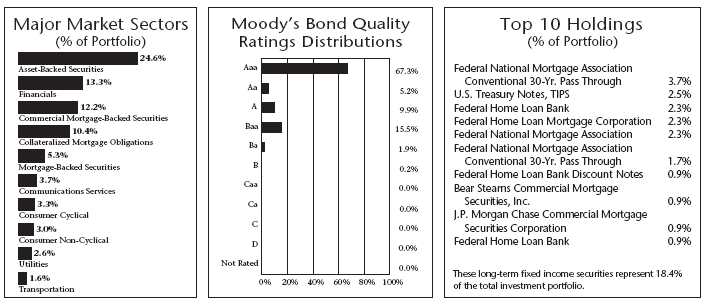
| Quoted Major Market Sectors, Moody’s Bond Quality Ratings Distributions and Top 10 Holdings are subject to change. |
| Major Market Sectors represent long-term non-government holdings. |
| Moody’s Bond Quality Ratings Distributions and the list of Top 10 Holdings exclude short-term investments and collateral held for securities loaned. |
| 60 |
What is your outlook?
We think economic growth will continue to slow in 2008, but we don’t expect a recession. It will take several months for the economy to work off the effects of the credit crunch. The slowdown and continued challenges in the housing and mortgage markets will likely prompt the Federal Reserve to continue easing interest rates, perhaps more aggressively than initially thought.
We expect that the yield curve will continue to be steep, with longer-maturity bonds paying more than shorter-maturity issues, especially if inflation concerns materialize. If the economy enters a recession, the yield curve could become steeper.
We will maintain our overweighted position in spread-sector investments and have a modest underweighting in cash. Within our cash holdings, we will maintain our slightly overweighted position in floating-rate securities. We believe that our spread-sector securities are solid investments and that their value will rebound once the market calms down. As always, we will continue to look for opportunities to add value to the Portfolio and enhance shareholder return.

* The Lehman Brothers Government/Credit 1-3 Year Bond Index is an unmanaged market value weighted performance benchmark for government and corporate fixed-rate debt issues with maturities between one and three years. It is not possible to invest directly in the Index. The performance of the Index does not reflect deductions for fees, expenses or taxes.
** The Consumer Price Index is an inflationary indicator that measures the change in the cost of a fixed basket of products and services, including housing, electricity, food and transportation. It is not possible to invest directly in the Index.
Past performance is not an indication of future results. Total investment return and principal value will fluctuate and units, when redeemed, may be worth more or less than their original cost. Current performance may be higher or lower than the performance data quoted. Market volatility can significantly affect short-term performance, and more recent returns may be different from those shown. Call 800-THRIVENT or visit www.thrivent.com for performance results current to the most recent month-end.
1 Annualized total returns represent past performance and reflect changes in share prices, the reinvestment of all dividends and capital gains, and the effects of compounding. At various times, the Portfolio’s adviser reimbursed and/or paid non-advisory Portfolio expenses. Had the adviser not done so, the Portfolio’s total returns would have been lower. The returns shown do not reflect charges and expenses imposed on contract holders by the variable accounts. Those charges and expenses reduce the returns received by contract holders as compared to the returns presented.
Investing in a variable product involves risks, including the possible loss of principal. The prospectus contains more complete information on the investment objectives, risks, charges and expenses of the investment company, which investors should read and consider carefully before investing. To obtain a prospectus, contact a registered representative or visit www.thrivent.com.
| 61 |

How did the Portfolio perform during the 12-month period ended December 31, 2007?
Thrivent Mortgage Securities Portfolio returned 5.12%, compared to a median return of 4.35% for its Lipper U.S. Mortgage Funds peer group. The Portfolio’s market benchmark, the Lehman Brothers Mortgage-Backed Securities Index, generated a return of 6.90% .
What factors affected the Portfolio’s performance?
Bond yields stayed in a fairly narrow range for the first seven months of the period, and the yield curve was relatively flat among various maturity lengths. In August, however, fears that sub-prime mortgage troubles were spreading to other sectors of the bond market caused investors to begin selling riskier securities in favor of safe Treasury issues.
With growing concerns about how much the housing slump and credit crunch would slow the economy, the Federal Reserve cut the federal funds rate three times for a total of 1.00% and the discount rate four times for a total of 1.50% from August through year-end.
As investors flocked to the safety of government-backed U.S. Treasury securities, the yield spread between Treasury issues and spread sectors — including mortgage-backed bonds — widened dramatically. With bond yields and prices moving in the opposite direction, Treasury prices rose and anything with a credit orientation or mortgage-backed structure did poorly. Mortgage-backed securities, however, generally did better than other spread sectors such as investment-grade corporate and asset-backed bonds.
With the frequency of mortgage delinquencies and defaults increasing throughout the period, the Portfolio benefited from its focus on higher-quality, agency-backed Fannie Mae and Freddie Mac securities.
Detracting from performance was the floating-rate debt that backs our mortgage securities. We used the debt to back our purchase of Fannie Mae and Freddie Mac mortgage securities through what is called the “dollar-roll” program. While this typically low-risk practice has generated additional yield for the Portfolio for many years, our floating-rate securities — backed by higher-quality credit card, auto and other loans — were affected by sub-prime mortgage-related troubles and lost value.
The Portfolio’s performance also was hurt by its allocation to AAA-rated commercial mortgage-backed securities, which also were affected by the credit market turmoil. In addition,
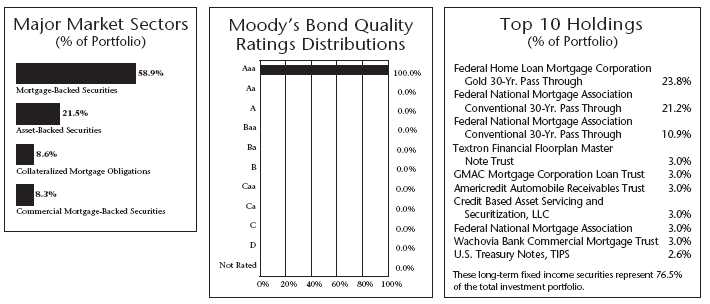
| Quoted Major Market Sectors, Moody’s Bond Quality Ratings Distributions and Top 10 Holdings are subject to change. |
| Major Market Sectors represent long-term non-government holdings. |
| Moody’s Bond Quality Ratings Distributions and the list of Top 10 Holdings exclude short-term investments and collateral held for securities loaned. |
| 62 |
the Portfolio was adversely impacted by the high degree of interest rate volatility that occurred during the period’s second half, since mortgage-backed securities perform best in stable interest rate environments.
What is your outlook?
We think economic growth will continue to slow in 2008, but we don’t expect a recession. It will take several months for the economy to work off the effects of the credit crunch. The slowdown and continued challenges in the housing and mortgage markets will likely prompt the Federal Reserve to continue easing interest rates, perhaps more aggressively than initially thought.
We expect that the yield curve will continue to be steep, with longer-maturity bonds paying more than shorter-maturity issues, especially if inflation concerns materialize. If the economy enters a recession, the yield curve could become steeper.
We will maintain our overweighted position in spread-sector investments and have a modest underweighting in cash. We believe that our spread-sector securities are solid investments and that their value will rebound once the market calms down. As always, we will continue to look for opportunities to add value to the Portfolio and enhance shareholder return.
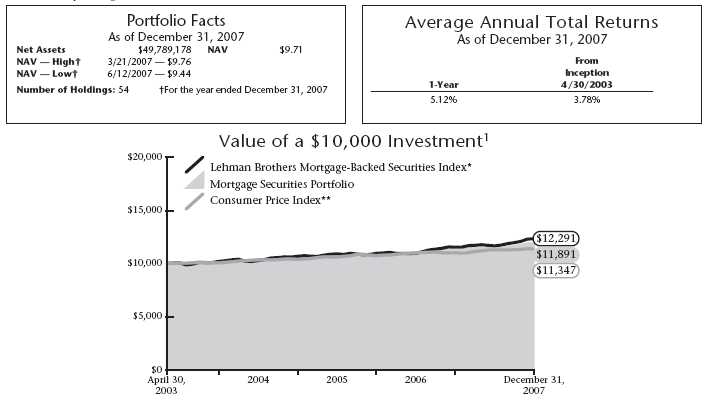
* The Lehman Brothers Mortgage-Backed Securities Index (MBS) is formed by grouping the universe of over 600,000 individual fixed rate U.S. government agency MBS pools into approximately 3,500 generic types of securities. It is not possible to invest directly in this Index. The performance of the Index does not reflect deductions for fees, expenses or taxes.
** The Consumer Price Index is an inflationary indicator that measures the change in the cost of a fixed basket of products and services, including housing, electricity, food and transportation. It is not possible to invest directly in the Index.
Past performance is not an indication of future results. Total investment return and principal value will fluctuate and units, when redeemed, may be worth more or less than their original cost. Current performance may be higher or lower than the performance data quoted. Market volatility can significantly affect short-term performance, and more recent returns may be different from those shown. Call 800-THRIVENT or visit www.thrivent.com for performance results current to the most recent month-end.
1 Annualized total returns represent past performance and reflect changes in share prices, the reinvestment of all dividends and capital gains, and the effects of compounding. At various times, the Portfolio’s adviser reimbursed and/or paid non-advisory Portfolio expenses. Had the adviser not done so, the Portfolio’s total returns would have been lower. The returns shown do not reflect charges and expenses imposed on contract holders by the variable accounts. Those charges and expenses reduce the returns received by contract holders as compared to the returns presented.
Investing in a variable product involves risks, including the possible loss of principal. The prospectus contains more complete information on the investment objectives, risks, charges and expenses of the investment company, which investors should read and consider carefully before investing. To obtain a prospectus, contact a registered representative or visit www.thrivent.com.
| 63 |

How did the Portfolio perform during the 12-month period ended December 31, 2007?
Thrivent Money Market Portfolio produced a 5.17% return during the period, while its peer group, the Lipper Money Market Funds category, reported a median net return of 4.81% .
What factors affected the Portfolio’s performance?
The factor that most influenced money market securities during the period was the “liquidity crunch” that began in August. It was caused by a combination of factors, including fears that troubles in the sub-prime mortgage sector would spread to other types of fixed-income securities, including asset-backed commercial paper. Brokerage firms, banks and money fund managers began trying to reduce their exposure to mortgage-related products at the same time, and the market for short-term securities froze. As investor demand for asset-backed commercial paper plummeted, yields on the securities jumped and their yield “spread” over Treasury securities widened dramatically. (An investor flight to safe Treasury securities depressed Treasury yields at the same time.)
Fortunately, our conservative investment philosophy was rewarded during this market turmoil. Our Portfolio held little exposure to the types of securities that concerned the market and we entered the period with plenty of liquidity. We maintained a defensive Portfolio stance during the summer, focusing less on yield and more on conservative investments and improving liquidity. An added benefit of our conservative strategy was that, when we believed Federal Reserve interest rate easing was more imminent, we were able to extend the Portfolio’s weighted average maturity in high-quality investments during the third quarter. This move benefited us as the Fed cut the federal funds rate three times for a total of 1.00% and the discount rate four times for a total 1.50% through year-end. As short-term Treasury yields fell dramatically in August and September, our longer weighted average maturity boosted our Portfolio value more in response. By the end of the period, we maintained a slightly longer weighted average maturity than our peer group.
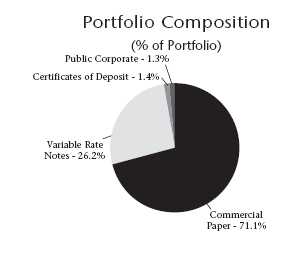
| Quoted Portfolio Composition is subject to change. |
| 64 |
What is your outlook?
Economic growth is slowing and the housing market remains weak, so we believe it’s likely that Federal Reserve policymakers will ease interest rates further. If this occurs, our Portfolio’s longer weighted average maturity should continue to benefit us.
We intend to maintain a slightly longer weighted average maturity in the Portfolio going forward, but will limit the amount of exposure to securities beyond six months in duration. Doing so will likely keep the Portfolio flexible in case signs of economic growth or inflation grow and the market begins to anticipate higher interest rates. As in any interest rate environment, we will continue to focus on our primary objectives of safety and liquidity, while pursuing the optimum risk-adjusted yield.
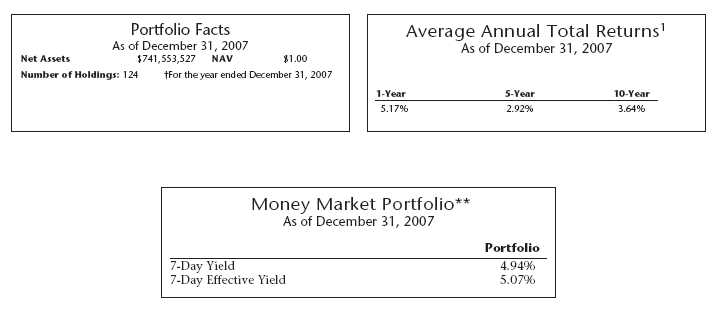
** Seven-day yields of Money Market Portfolio refer to the income generated by an investment in the Portfolio over a specified seven-day period, though they are expressed as annual percentage rates. Effective yields reflect the reinvestment of income. Yields are subject to daily fluctuation and should not be considered an indication of future results.
Past performance is not an indication of future results. Total investment return and principal value will fluctuate and units, when redeemed, may be worth more or less than their original cost. Current performance may be higher or lower than the performance data quoted. Market volatility can significantly affect short-term performance, and more recent returns may be different from those shown. Call 800-THRIVENT or visit www.thrivent.com for performance results current to the most recent month-end.
1 Annualized total returns represent past performance and reflect changes in share prices, the reinvestment of all dividends and capital gains, and the effects of compounding. At various times, the Portfolio’s adviser reimbursed and/or paid non-advisory Portfolio expenses. Had the adviser not done so, the Portfolio’s total returns would have been lower. The returns shown do not reflect charges and expenses imposed on contract holders by the variable accounts. Those charges and expenses reduce the returns received by contract holders as compared to the returns presented.
Investing in a variable product involves risks, including the possible loss of principal. The prospectus contains more complete information on the investment objectives, risks, charges and expenses of the investment company, which investors should read and consider carefully before investing. To obtain a prospectus, contact a registered representative or visit www.thrivent.com.
| 65 |
Shareholder Expense Example
(Unaudited)
As a shareholder of the Thrivent Series Fund, Inc., you incur ongoing costs, including management fees and other Portfolio expenses. This Shareholder Expense Example is intended to help you understand your ongoing costs (in dollars) of investing in a Portfolio and to compare these costs with the ongoing costs of investing in other mutual funds. The Example is based on an investment of $1,000 invested at the beginning of the period and held for the entire period from June 30, 2007 through December 31, 2007. Shares in a Portfolio are currently sold, without sales charges, only to separate accounts of Thrivent Financial for Lutherans and Thrivent Life Insurance Company, which are used to fund benefits of variable life insurance and variable annuity contracts issued by Thrivent Financial for Lutherans and Thrivent Life Insurance Company; and retirement plans sponsored by Thrivent Financial for Lutherans. Expenses associated with these variable contracts and retirement plans are not included in these examples and had these costs been included, your costs would have been higher.
Actual Expenses
In the table below, the first section, labeled “Actual,” provides information about actual account values and actual expenses. You may use the information in this line, together with the amount you invested, to estimate the expenses that you paid over the period. Simply divide your account value by $1,000 (for example, an $8,600 account value divided by $1,000 = 8.6), then multiply the result by the number in the first line under the heading entitled “Expenses Paid During Period” to estimate the expenses you paid.
Hypothetical Example for Comparison Purposes
In the table below, the second section, labeled “Hypothetical,” provides information about hypothetical account values and hypothetical expenses based on the Portfolio’s actual expense ratio and an assumed rate of return of 5% per year before expenses, which is not the Portfolio’s actual return. The hypothetical account values and expenses may not be used to estimate the actual ending account balance or expenses you paid for the period. You may use this information to compare the ongoing costs of investing in the Portfolio and other funds. To do so, compare this 5% hypothetical example with the 5% hypothetical examples that appear in the shareholder reports of the other funds.
| Beginning | Ending | Expenses | |||
| Account | Account | Paid During | Annualized | ||
| Value | Value | Period * | Expense | ||
| 6/30/2007 | 12/31/2007 | 6/30/2007 — 12/31/2007 | Ratio | ||
| Thrivent Aggressive Allocation Portfolio | |||||
| Actual | $1,000 | $1,005 | $0.97 | 0.19% | |
| Hypothetical ** | $1,000 | $1,024 | $0.97 | 0.19% | |
| Thrivent Moderately Aggressive Allocation Portfolio | |||||
| Actual | $1,000 | $1,007 | $0.86 | 0.17% | |
| Hypothetical ** | $1,000 | $1,024 | $0.87 | 0.17% | |
| Thrivent Moderate Allocation Portfolio | |||||
| Actual | $1,000 | $1,012 | $0.87 | 0.17% | |
| Hypothetical ** | $1,000 | $1,024 | $0.87 | 0.17% | |
| Thrivent Moderately Conservative Allocation Portfolio | |||||
| Actual | $1,000 | $1,015 | $0.92 | 0.18% | |
| Hypothetical ** | $1,000 | $1,024 | $0.92 | 0.18% | |
| Thrivent Technology Portfolio | |||||
| Actual | $1,000 | $1,008 | $4.33 | 0.85% | |
| Hypothetical ** | $1,000 | $1,021 | $4.35 | 0.85% | |
| Thrivent Partner Small Cap Growth Portfolio | |||||
| Actual | $1,000 | $990 | $4.99 | 0.99% | |
| Hypothetical ** | $1,000 | $1,020 | $5.07 | 0.99% | |
| Thrivent Partner Small Cap Value Portfolio | |||||
| Actual | $1,000 | $917 | $4.13 | 0.85% | |
| Hypothetical ** | $1,000 | $1,021 | $4.35 | 0.85% | |
| Thrivent Small Cap Stock Portfolio | |||||
| Actual | $1,000 | $979 | $3.61 | 0.72% | |
| Hypothetical ** | $1,000 | $1,022 | $3.69 | 0.72% | |
| 66 |
| Beginning | Ending | Expenses | |||
| Account | Account | Paid During | Annualized | ||
| Value | Value | Period * | Expense | ||
| 6/30/2007 | 12/31/2007 | 6/30/2007 — 12/31/2007 | Ratio | ||
| Thrivent Small Cap Index Portfolio | |||||
| Actual | $1,000 | $918 | $1.90 | 0.39% | |
| Hypothetical ** | $1,000 | $1,023 | $2.00 | 0.39% | |
| Thrivent Mid Cap Growth Portfolio | |||||
| Actual | $1,000 | $1,046 | $2.28 | 0.44% | |
| Hypothetical ** | $1,000 | $1,023 | $2.26 | 0.44% | |
| Thrivent Mid Cap Growth Portfolio II | |||||
| Actual | $1,000 | $1,045 | $3.01 | 0.58% | |
| Hypothetical ** | $1,000 | $1,022 | $2.97 | 0.58% | |
| Thrivent Partner Mid Cap Value Portfolio | |||||
| Actual | $1,000 | $940 | $4.33 | 0.88% | |
| Hypothetical ** | $1,000 | $1,021 | $4.51 | 0.88% | |
| Thrivent Mid Cap Stock Portfolio | |||||
| Actual | $1,000 | $955 | $3.62 | 0.73% | |
| Hypothetical ** | $1,000 | $1,022 | $3.74 | 0.73% | |
| Thrivent Mid Cap Index Portfolio | |||||
| Actual | $1,000 | $964 | $2.14 | 0.43% | |
| Hypothetical ** | $1,000 | $1,023 | $2.20 | 0.43% | |
| Thrivent Partner International Stock Portfolio | |||||
| Actual | $1,000 | $999 | $4.05 | 0.80% | |
| Hypothetical ** | $1,000 | $1,021 | $4.10 | 0.80% | |
| Thrivent Partner All Cap Portfolio | |||||
| Actual | $1,000 | $1,081 | $4.43 | 0.84% | |
| Hypothetical ** | $1,000 | $1,021 | $4.30 | 0.84% | |
| Thrivent Large Cap Growth Portfolio | |||||
| Actual | $1,000 | $1,071 | $2.31 | 0.44% | |
| Hypothetical ** | $1,000 | $1,023 | $2.26 | 0.44% | |
| Thrivent Large Cap Growth Portfolio II | |||||
| Actual | $1,000 | $1,069 | $3.46 | 0.66% | |
| Hypothetical ** | $1,000 | $1,022 | $3.38 | 0.66% | |
| Thrivent Partner Growth Stock Portfolio | |||||
| Actual | $1,000 | $1,007 | $4.12 | 0.81% | |
| Hypothetical ** | $1,000 | $1,021 | $4.15 | 0.81% | |
| Thrivent Large Cap Value Portfolio | |||||
| Actual | $1,000 | $974 | $3.20 | 0.64% | |
| Hypothetical ** | $1,000 | $1,022 | $3.28 | 0.64% | |
| Thrivent Large Cap Stock Portfolio | |||||
| Actual | $1,000 | $1,008 | $3.26 | 0.64% | |
| Hypothetical ** | $1,000 | $1,022 | $3.28 | 0.64% | |
| Thrivent Large Cap Index Portfolio | |||||
| Actual | $1,000 | $985 | $1.81 | 0.36% | |
| Hypothetical ** | $1,000 | $1,024 | $1.85 | 0.36% | |
| Thrivent Real Estate Securities Portfolio | |||||
| Actual | $1,000 | $886 | $4.11 | 0.86% | |
| Hypothetical ** | $1,000 | $1,021 | $4.40 | 0.86% | |
| Thrivent Balanced Portfolio | |||||
| Actual | $1,000 | $1,007 | $1.93 | 0.38% | |
| Hypothetical ** | $1,000 | $1,023 | $1.95 | 0.38% | |
| 67 |
| Beginning | Ending | Expenses | |||
| Account | Account | Paid During | Annualized | ||
| Value | Value | Period * | Expense | ||
| 6/30/2007 | 12/31/2007 | 6/30/2007 — 12/31/2007 | Ratio | ||
| Thrivent High Yield Portfolio | |||||
| Actual | $1,000 | $1,000 | $2.28 | 0.45% | |
| Hypothetical ** | $1,000 | $1,023 | $2.31 | 0.45% | |
| Thrivent Diversified Income Plus Portfolio | |||||
| Actual | $1,000 | $980 | $2.41 | 0.48% | |
| Hypothetical ** | $1,000 | $1,023 | $2.46 | 0.48% | |
| Thrivent Income Portfolio | |||||
| Actual | $1,000 | $1,029 | $2.26 | 0.44% | |
| Hypothetical ** | $1,000 | $1,023 | $2.26 | 0.44% | |
| Thrivent Bond Index Portfolio | |||||
| Actual | $1,000 | $1,049 | $2.02 | 0.39% | |
| Hypothetical ** | $1,000 | $1,023 | $2.00 | 0.39% | |
| Thrivent Limited Maturity Bond Portfolio | |||||
| Actual | $1,000 | $1,020 | $2.25 | 0.44% | |
| Hypothetical ** | $1,000 | $1,023 | $2.26 | 0.44% | |
| Thrivent Mortgage Securities Portfolio | |||||
| Actual | $1,000 | $1,045 | $3.42 | 0.66% | |
| Hypothetical ** | $1,000 | $1,022 | $3.38 | 0.66% | |
| Thrivent Money Market Portfolio | |||||
| Actual | $1,000 | $1,026 | $1.80 | 0.35% | |
| Hypothetical ** | $1,000 | $1,024 | $1.79 | 0.35% | |
* Expenses are equal to the Portfolio’s annualized expense ratio, multiplied by the average account value over the period, multiplied by 185/365 to reflect the one-half year period.
** Assuming 5% total return before expenses
| 68 |

Report of Independent Registered Public Accounting Firm
To the Board of Directors and Shareholders of the Thrivent Series Fund, Inc.:
In our opinion, the accompanying statements of assets and liabilities, including the schedules of investments, and the related statements of operations and of changes in net assets and the financial highlights present fairly, in all material respects, the financial position of each of the thirty-one Funds constituting the Thrivent Series Fund, Inc., (hereafter referred to as the “Funds”) at December 31, 2007, the results of each of their operations, changes in each of their net assets and their financial highlights for each of the periods presented, in conformity with accounting principles generally accepted in the United States of America. These financial statements and financial highlights (hereafter referred to as “financial statements”) are the responsibility of the Funds’ management; our responsibility is to express an opinion on these financial statements based on our audits. We conducted our audits of these financial statements in accordance with the standards of the Public Company Accounting Oversight Board (United States). Those standards require that we plan and perform the audit to obtain reasonable assurance about whether the financial statements are free of material misstatement. An audit includes examining, on a test basis, evidence supporting the amounts and disclosures in the financial statements, assessing the accounting principles used and significant estimates made by management, and evaluating the overall financial statement presentation. We believe that our audits, which included confirmation of securities at December 31, 2007 by correspondence with the custodian and brokers, provide a reasonable basis for our opinion.

February 15, 2008
| 69 |
| Aggressive Allocation Portfolio | |||
| Schedule of Investments as of December 31, 2007 | |||
| Shares | Value | Percentage | |
| Equity Portfolios (90.9%) | |||
| 2,119,095 | Thrivent Partner Small Cap Growth Portfolio # | $29,543,569 | 5.9% |
| 1,279,008 | Thrivent Partner Small Cap Value Portfolio | 23,589,765 | 4.8 |
| 2,400,993 | Thrivent Small Cap Stock Portfolio | 37,174,821 | 7.5 |
| 854,603 | Thrivent Mid Cap Growth Portfolio | 17,248,542 | 3.5 |
| 1,403,621 | Thrivent Partner Mid Cap Value Portfolio | 18,823,400 | 3.8 |
| 2,802,192 | Thrivent Mid Cap Stock Portfolio | 36,861,436 | 7.4 |
| 5,592,662 | Thrivent Partner International Stock Portfolio | 96,519,831 | 19.4 |
| 5,520,951 | Thrivent Large Cap Growth Portfolio | 106,145,253 | 21.4 |
| 2,800,380 | Thrivent Large Cap Value Portfolio | 37,546,375 | 7.6 |
| 4,336,482 | Thrivent Large Cap Stock Portfolio | 47,857,844 | 9.6 |
| Total Equity Portfolios | |||
| (cost $408,400,549) | 451,310,836 | ||
| Debt Portfolios (9.1%) | |||
| 2,031,588 | Thrivent High Yield Portfolio | 9,828,416 | 2.0 |
| 2,544,115 | Thrivent Income Portfolio | 24,782,222 | 5.0 |
| 1,076,087 | Thrivent Limited Maturity Bond Portfolio | 10,586,434 | 2.1 |
| Total Debt Portfolios | |||
| (cost $45,544,323) | 45,197,072 | ||
| Total Investments | |||
| (cost $453,944,872) 100.0% | $496,507,908 | ||
| Other Assets and Liabilities, | |||
| Net (0.0%) | (83,630) | ||
| Total Net Assets 100.0% | $496,424,278 | ||
# Non-income producing security.
Gross unrealized appreciation and depreciation of investments, based on cost for federal income tax purposes, were as follows:
| Gross unrealized appreciation | $43,031,078 | |
| Gross unrealized depreciation | (493,943) | |
| Net unrealized appreciation (depreciation) | $42,537,135 | |
| Cost for federal income tax purposes | $453,970,773 |
| The accompanying Notes to Financial Statements are an integral part of this schedule. |
| 70 |
| Moderately Aggressive Allocation Portfolio | |||
| Schedule of Investments as of December 31, 2007 | |||
| Shares | Value | Percentage | |
| Equity Portfolios (78.0%) | |||
| 3,788,458 | Thrivent Partner Small Cap Growth Portfolio # | $52,817,172 | 3.0% |
| 2,169,917 | Thrivent Partner Small Cap Value Portfolio | 40,021,512 | 2.2 |
| 4,581,481 | Thrivent Small Cap Stock Portfolio | 70,935,529 | 4.0 |
| 1,537,278 | Thrivent Mid Cap Growth Portfolio | 31,027,029 | 1.7 |
| 2,005,604 | Thrivent Partner Mid Cap Value Portfolio | 26,896,355 | 1.5 |
| 5,345,002 | Thrivent Mid Cap Stock Portfolio | 70,310,829 | 4.0 |
| 12,997,881 | Thrivent Partner International Stock Portfolio | 224,321,329 | 12.6 |
| 15,508,663 | Thrivent Large Cap Growth Portfolio | 298,167,996 | 16.7 |
| 19,362,825 | Thrivent Large Cap Value Portfolio | 259,609,011 | 14.6 |
| 23,667,318 | Thrivent Large Cap Stock Portfolio | 261,194,891 | 14.7 |
| 3,020,439 | Thrivent Real Estate Securities Portfolio | 53,577,749 | 3.0 |
| Total Equity Portfolios | |||
| (cost $1,281,709,454) | 1,388,879,402 | ||
| Debt Portfolios (22.0%) | |||
| 16,568,390 | Thrivent High Yield Portfolio | 80,154,556 | 4.5 |
| 23,725,830 | Thrivent Income Portfolio | 231,113,314 | 13.0 |
| 8,227,305 | Thrivent Limited Maturity Bond Portfolio | 80,939,400 | 4.5 |
| Total Debt Portfolios | |||
| (cost $395,193,280) | 392,207,270 | ||
| Total Investments | |||
| (cost $1,676,902,734) 100.0% | $1,781,086,672 | ||
| Other Assets and Liabilities, | |||
| Net (0.0%) | (265,300) | ||
| Total Net Assets 100.0% | $1,780,821,372 | ||
# Non-income producing security.
Gross unrealized appreciation and depreciation of investments, based on cost for federal income tax purposes, were as follows:
| Gross unrealized appreciation | $111,853,057 | |
| Gross unrealized depreciation | (7,672,168) | |
| Net unrealized appreciation (depreciation) | $104,180,889 | |
| Cost for federal income tax purposes | $1,676,905,783 |
| The accompanying Notes to Financial Statements are an integral part of this schedule. |
| 71 |
| Moderate Allocation Portfolio | |||
| Schedule of Investments as of December 31, 2007 | |||
| Shares | Value | Percentage | |
| Equity Portfolios (58.0%) | |||
| 2,303,571 | Thrivent Partner Small Cap Growth Portfolio # | $32,115,462 | 1.5% |
| 1,465,617 | Thrivent Partner Small Cap Value Portfolio | 27,031,554 | 1.2 |
| 2,084,169 | Thrivent Small Cap Stock Portfolio | 32,269,396 | 1.5 |
| 1,060,948 | Thrivent Mid Cap Growth Portfolio | 21,413,225 | 1.0 |
| 2,039,353 | Thrivent Partner Mid Cap Value Portfolio | 27,348,942 | 1.3 |
| 4,869,471 | Thrivent Mid Cap Stock Portfolio | 64,055,455 | 2.9 |
| 10,921,155 | Thrivent Partner International Stock Portfolio | 188,480,571 | 8.7 |
| 15,990,758 | Thrivent Large Cap Growth Portfolio | 307,436,710 | 14.2 |
| 17,034,506 | Thrivent Large Cap Value Portfolio | 228,391,842 | 10.5 |
| 23,301,914 | Thrivent Large Cap Stock Portfolio | 257,162,251 | 11.9 |
| 4,001,898 | Thrivent Real Estate Securities Portfolio | 70,987,263 | 3.3 |
| Total Equity Portfolios | |||
| (cost $1,158,367,581) | 1,256,692,671 | ||
| Debt Portfolios (38.4%) | |||
| 20,145,617 | Thrivent High Yield Portfolio | 97,460,466 | 4.5 |
| 42,251,198 | Thrivent Income Portfolio | 411,568,919 | 19.0 |
| 32,996,418 | Thrivent Limited Maturity Bond Portfolio | 324,615,462 | 14.9 |
| Total Debt Portfolios | |||
| (cost $840,169,012) | 833,644,847 | ||
| Short-Term Investments (3.6%) | |||
| 78,824,377 | Thrivent Money Market Portfolio | 78,824,377 | 3.6 |
| Total Short-Term Investments | |||
| (cost $78,824,377) | 78,824,377 | ||
| Total Investments | |||
| (cost $2,077,360,970) 100.0% | $2,169,161,895 | ||
| Other Assets and Liabilities, | |||
| Net (0.0%) | (301,808) | ||
| Total Net Assets 100.0% | $2,168,860,087 | ||
# Non-income producing security.
Gross unrealized appreciation and depreciation of investments, based on cost for federal income tax purposes, were as follows:
| Gross unrealized appreciation | $105,854,433 | |
| Gross unrealized depreciation | (14,060,468) | |
| Net unrealized appreciation (depreciation) | $91,793,965 | |
| Cost for federal income tax purposes | $2,077,367,930 |
| The accompanying Notes to Financial Statements are an integral part of this schedule. |
| 72 |
| Moderately Conservative Allocation Portfolio | |||
| Schedule of Investments as of December 31, 2007 | |||
| Shares | Value | Percentage | |
| Equity Portfolios (37.9%) | |||
| 1,577,957 | Thrivent Small Cap Stock Portfolio | $24,431,658 | 3.2% |
| 1,274,283 | Thrivent Mid Cap Stock Portfolio | 16,762,554 | 2.2 |
| 2,108,489 | Thrivent Partner International Stock Portfolio | 36,388,944 | 4.8 |
| 3,781,737 | Thrivent Large Cap Growth Portfolio | 72,707,290 | 9.6 |
| 3,958,015 | Thrivent Large Cap Value Portfolio | 53,067,485 | 7.0 |
| 5,355,682 | Thrivent Large Cap Stock Portfolio | 59,105,841 | 7.8 |
| 1,402,943 | Thrivent Real Estate Securities Portfolio | 24,885,963 | 3.3 |
| Total Equity Portfolios | |||
| (cost $264,633,984) | 287,349,735 | ||
| Debt Portfolios (55.3%) | |||
| 5,477,704 | Thrivent High Yield Portfolio | 26,500,038 | 3.5 |
| 11,660,760 | Thrivent Income Portfolio | 113,587,464 | 15.0 |
| 28,300,772 | Thrivent Limited Maturity Bond Portfolio | 278,420,166 | 36.8 |
| Total Debt Portfolios | |||
| (cost $421,588,072) | 418,507,668 | ||
| Short-Term Investments (6.8%) | |||
| 51,192,804 | Thrivent Money Market Portfolio | 51,192,804 | 6.8 |
| Total Short-Term Investments | |||
| (cost $51,192,804) | 51,192,804 | ||
| Total Investments | |||
| (cost $737,414,860) 100.0% | $757,050,207 | ||
| Other Assets and Liabilities, | |||
| Net (0.0%) | (102,637) | ||
| Total Net Assets 100.0% | $756,947,570 | ||
Gross unrealized appreciation and depreciation of investments, based on cost for federal income tax purposes, were as follows:
| Gross unrealized appreciation | $24,826,328 | |
| Gross unrealized depreciation | (5,193,417) | |
| Net unrealized appreciation (depreciation) | $19,632,911 | |
| Cost for federal income tax purposes | $737,417,296 |
| The accompanying Notes to Financial Statements are an integral part of this schedule. |
| 73 |
| Technology Portfolio | ||||||
| Schedule of Investments as of December 31, 2007 | ||||||
| Shares | Common Stock (95.1%) | Value | Shares | Common Stock (95.1%) | Value | |
| Communications Equipment (24.5%) | 21,600 | Hub Group, Inc. # | $574,128 | |||
| 106,600 | Cisco Systems, Inc. # | $2,885,662 | 11,100 | JA Solar Holdings Company, | ||
| 59,300 | Corning, Inc. | 1,422,607 | Ltd. ADR # | 774,891 | ||
| 24,300 | F5 Networks, Inc. # | 693,036 | 4,400 | SunPower Corporation #* | 573,716 | |
| 90,200 | Foundry Networks, Inc. #* | 1,580,304 | Total Industrials | 2,679,689 | ||
| 52,500 | Juniper Networks, Inc. # | 1,743,000 | ||||
| 42,700 | Motorola, Inc. | 684,908 | Internet Software & Services (10.4%) | |||
| 98,750 | OpNext, Inc. # | 873,938 | 20,800 | DealerTrack Holdings, Inc. # | 696,176 | |
| 41,100 | QUALCOMM, Inc. | 1,617,285 | 5,700 | Google, Inc. # | 3,941,436 | |
| 20,900 | Research in Motion, Ltd. # | 2,370,060 | 54,000 | Yahoo!, Inc. #* | 1,256,040 | |
| Total Communications | Total Internet | |||||
| Equipment | 13,870,800 | Software & Services | 5,893,652 | |||
| Computers & Peripherals (13.3%) | IT Consulting & Services (2.9%) | |||||
| 17,600 | Apple Computer, Inc. # | 3,486,208 | 48,600 | Cognizant Technology Solutions | ||
| 22,300 | Data Domain, Inc. #* | 587,382 | Corporation # | 1,649,484 | ||
| 185,800 | EMC Corporation # | 3,442,874 | Total IT Consulting & Services | 1,649,484 | ||
| Total Computers & Peripherals | 7,516,464 | |||||
| Materials (0.6%) | ||||||
| Consumer Discretionary (4.6%) | 2,900 | Monsanto Company | 323,901 | |||
| 11,600 | DIRECTV Group, Inc. # | 268,192 | Total Materials | 323,901 | ||
| 9,300 | International Game Technology | 408,549 | ||||
| 22,700 | Scientific Games Corporation #* | 754,775 | Semiconductors & | |||
| 42,200 | Time Warner, Inc. | 696,722 | Semiconductor Equipment (11.4%) | |||
| 12,500 | WMS Industries, Inc. # | 458,000 | 64,400 | Applied Materials, Inc. | 1,143,744 | |
| Total Consumer Discretionary | 2,586,238 | 57,600 | Broadcom Corporation # | 1,505,664 | ||
| 110,800 | Intel Corporation | 2,953,928 | ||||
| Energy (2.4%) | 82,100 | Teradyne, Inc. # | 848,914 | |||
| 3,000 | Cameco Corporation | 119,430 | Total Semiconductors & | |||
| 32,200 | Willbros Group, Inc. #* | 1,232,938 | Semiconductor Equipment | 6,452,250 | ||
| Total Energy | 1,352,368 | |||||
| Software (15.8%) | ||||||
| Financials (0.7%) | 43,200 | Adobe Systems, Inc. # | 1,845,936 | |||
| 10,900 | Digital Realty Trust, Inc. * | 418,233 | 167,600 | Compuware Corporation # | 1,488,288 | |
| Total Financials | 418,233 | 20,000 | Fair Isaac Corporation * | 643,000 | ||
| 85,600 | Lawson Software, Inc. # | 876,544 | ||||
| Health Care (3.4%) | 81,800 | Microsoft Corporation | 2,912,080 | |||
| 9,100 | Applera Corporation (Celera Group) # | 144,417 | 62,900 | Nuance Communications, Inc. #* | 1,174,972 | |
| 7,000 | Beckman Coulter, Inc. | 509,600 | Total Software | 8,940,820 | ||
| 5,100 | Endo Pharmaceutical Holdings, Inc. # | 136,017 | ||||
| 3,600 | Hospira, Inc. # | 153,504 | Telecommunications Services (0.4%) | |||
| 10,600 | Sepracor, Inc. # | 278,250 | 17,500 | Sprint Nextel Corporation | 229,775 | |
| 10,100 | Shire Pharmaceuticals Group plc ADR | 696,395 | Total Telecommunications | |||
| Total Health Care | 1,918,183 | Services | 229,775 | |||
| Industrials (4.7%) | Total Common Stock | |||||
| 9,800 | Evergreen Solar, Inc. #* | 169,246 | (cost $47,447,272) | 53,831,857 | ||
| 2,200 | First Solar, Inc. # | 587,708 | ||||
| The accompanying Notes to Financial Statements are an integral part of this schedule. |
| 74 |
| Technology Portfolio | ||||||
| Schedule of Investments as of December 31, 2007 | ||||||
| Interest | Maturity | |||||
| Shares | Collateral Held for Securities Loaned (14.7%) | Rate (+) | Date | Value | ||
| 8,345,500 | Thrivent Financial Securities Lending Trust | 5.000% | N/A | $8,345,500 | ||
| Total Collateral Held for Securities Loaned | ||||||
| (cost $8,345,500) | 8,345,500 | |||||
| Interest | Maturity | |||||
| Shares | Short-Term Investments (5.1%) | Rate (+) | Date | Value | ||
| 2,902,355 | Thrivent Money Market Portfolio | 4.930% | N/A | $2,902,355 | ||
| Total Short-Term Investments (at amortized cost) | 2,902,355 | |||||
| Total Investments (cost $58,695,127) 114.9% | $65,079,712 | |||||
| Other Assets and Liabilities, Net (14.9%) | (8,440,721) | |||||
| Total Net Assets 100.0% | $56,638,991 | |||||
# Non-income producing security.
* All or a portion of the security is on loan as discussed in item 2(M) of the Notes to Financial Statements.
+ The interest rate shown reflects the yield, coupon rate or, for securities purchased at a discount, the discount rate at the date of purchase.
Definitions:
ADR — American Depository Receipts, which are certificates for shares of an underlying foreign security’s shares held by an issuing U.S. depository bank.
Gross unrealized appreciation and depreciation of investments, based on cost for federal income tax purposes, were as follows:
| Gross unrealized appreciation | $7,996,117 | |
| Gross unrealized depreciation | (1,932,615) | |
| Net unrealized appreciation (depreciation) | $6,063,502 | |
| Cost for federal income tax purposes | $59,016,210 |
| The accompanying Notes to Financial Statements are an integral part of this schedule. |
| 75 |
| Partner Small Cap Growth Portfolio | ||||||
| Schedule of Investments as of December 31, 2007 | ||||||
| Shares | Common Stock (96.6%) | Value | Shares | Common Stock (96.6%) | Value | |
| Consumer Discretionary (10.9%) | 23,460 | Digital Realty Trust, Inc. * | $900,160 | |||
| 24,300 | AirMedia Group, Inc. ADR #* | $543,834 | 24,320 | Frontier Financial Corporation * | 451,622 | |
| 51,785 | BJ’s Restaurants, Inc. #* | 842,024 | 16,553 | GFI Group, Inc. #* | 1,584,453 | |
| 5,520 | Chipotle Mexican Grill, Inc. #* | 811,826 | 39,391 | Greenhill & Company, Inc. * | 2,618,714 | |
| 4,380 | Deckers Outdoor Corporation # | 679,163 | 18,810 | Investment Technology Group, Inc. # | 895,168 | |
| 13,440 | Fossil, Inc. # | 564,211 | 45,201 | KBW, Inc. #* | 1,156,694 | |
| 23,070 | GSI Commerce, Inc. #* | 449,865 | 49,857 | Signature Bank # | 1,682,674 | |
| 16,910 | Iconix Brand Group, Inc. # | 332,451 | 62,935 | Texas Capital Bancshares, Inc. # | 1,148,564 | |
| 34,220 | Interactive Data Corporation | 1,129,602 | 66,874 | Thomas Weisel Partners | ||
| 16,840 | J. Crew Group, Inc. #* | 811,856 | Group, Inc. #* | 918,180 | ||
| 14,480 | Life Time Fitness, Inc. #* | 719,366 | 32,460 | Waddell & Reed Financial, Inc. | 1,171,481 | |
| 35,380 | LKQ Corporation # | 743,688 | Total Financials | 15,354,281 | ||
| 9,620 | New Oriental Education & | |||||
| Technology Group, Inc. # | 775,276 | Health Care (20.1%) | ||||
| 6,730 | Priceline.com, Inc. #* | 773,008 | 22,060 | Alexion Pharmaceuticals, Inc. # | 1,655,162 | |
| 15,730 | Red Robin Gourmet Burgers, Inc. #* | 503,203 | 157,190 | American Medical Systems | ||
| 172,872 | Shuffle Master, Inc. #* | 2,072,735 | Holdings, Inc. #* | 2,272,967 | ||
| 15,180 | Sotheby’s Holdings, Inc. | 578,358 | 16,050 | AMERIGROUP Corporation # | 585,022 | |
| 5,200 | Strayer Education, Inc. | 887,016 | 27,230 | Angiodynamics, Inc. # | 518,459 | |
| 21,460 | Tempur-Pedic International * | 557,316 | 28,605 | ArthroCare Corporation #* | 1,374,470 | |
| 65,207 | Tractor Supply Company #* | 2,343,540 | 41,670 | BioMarin Pharmaceutical, Inc. #* | 1,475,118 | |
| 16,540 | Under Armour, Inc. #* | 722,302 | 48,015 | Cepheid, Inc. #* | 1,265,195 | |
| 15,352 | Volcom, Inc. #* | 338,205 | 9,380 | Chemed Corporation | 524,154 | |
| 29,770 | WMS Industries, Inc. # | 1,090,773 | 8,240 | Healthways, Inc. #* | 481,546 | |
| Total Consumer Discretionary | 18,269,618 | 16,940 | Hologic, Inc. #* | 1,162,762 | ||
| 13,670 | ICON plc ADR # | 845,626 | ||||
| Consumer Staples (2.2%) | 36,472 | Illumina, Inc. #* | 2,161,331 | |||
| 33,247 | Bare Escentuals, Inc. #* | 806,240 | 30,980 | Immucor, Inc. # | 1,053,010 | |
| 11,870 | Central European Distribution | 33,807 | Integra LifeSciences Holdings | |||
| Corporation #* | 689,410 | Corporation #* | 1,417,528 | |||
| 22,509 | Chattem, Inc. #* | 1,700,330 | 20,290 | InterMune, Inc. #* | 270,466 | |
| 21,560 | Flowers Foods, Inc. | 504,720 | 37,313 | Inverness Medical | ||
| Total Consumer Staples | 3,700,700 | Innovations, Inc. # | 2,096,244 | |||
| 36,840 | K-V Pharmaceutical Company #* | 1,051,414 | ||||
| Energy (5.9%) | 71,413 | Mentor Corporation * | 2,792,248 | |||
| 17,570 | Arena Resources, Inc. # | 732,845 | 2,090 | Meridian Bioscience, Inc. | 62,852 | |
| 10,110 | Bill Barrett Corporation #* | 423,306 | 19,200 | MGI Pharma, Inc. #* | 778,176 | |
| 87,979 | Cal Dive International, Inc. #* | 1,164,842 | 22,029 | NuVasive, Inc. # | 870,586 | |
| 41,010 | Concho Resources, Inc. # | 845,216 | 15,840 | Onyx Pharmaceuticals, Inc. #* | 881,021 | |
| 6,670 | Core Laboratories NV # | 831,882 | 23,550 | PAREXEL International Corporation # | 1,137,465 | |
| 5,820 | Dawson Geophysical Company # | 415,897 | 29,400 | Perrigo Company | 1,029,294 | |
| 58,993 | Dril-Quip, Inc. # | 3,283,550 | 41,610 | Phase Forward, Inc. # | 905,018 | |
| 18,060 | Hornbeck Offshore Services, Inc. #* | 811,797 | 18,310 | Progenics Pharmaceuticals, Inc. #* | 330,862 | |
| 39,150 | Petrohawk Energy Corporation # | 677,686 | 10,940 | Rigel Pharmaceuticals, Inc. # | 277,767 | |
| 18,580 | Willbros Group, Inc. #* | 711,428 | 19,680 | TomoTherapy, Inc. #* | 384,941 | |
| Total Energy | 9,898,449 | 117,740 | Trizetto Group, Inc. #* | 2,045,144 | ||
| 12,550 | United Therapeutics Corporation #* | 1,225,508 | ||||
| Financials (9.2%) | 12,220 | Xenoport, Inc. # | 682,854 | |||
| 74,365 | Cohen & Steers, Inc. * | 2,228,719 | Total Health Care | 33,614,210 | ||
| 39,910 | DiamondRock Hospitality Company | 597,852 | ||||
| The accompanying Notes to Financial Statements are an integral part of this schedule. |
| 76 |
| Partner Small Cap Growth Portfolio | ||||||
| Schedule of Investments as of December 31, 2007 | ||||||
| Shares | Common Stock (96.6%) | Value | Shares | Common Stock (96.6%) | Value | |
| Industrials (16.4%) | 14,450 | EMS Technologies, Inc. # | $436,968 | |||
| 80,104 | AAR Corporation # | $3,046,355 | 5,970 | Equinix, Inc. #* | 603,388 | |
| 36,970 | Actuant Corporation * | 1,257,350 | 76,345 | Euronet Worldwide, Inc. #* | 2,290,350 | |
| 15,980 | Aecom Technology Corporation # | 456,549 | 29,520 | FLIR Systems, Inc. # | 923,976 | |
| 12,090 | American Superconductor | 12,680 | FormFactor, Inc. #* | 419,708 | ||
| Corporation # | 330,541 | 60,060 | Foundry Networks, Inc. # | 1,052,251 | ||
| 10,320 | Bucyrus International, Inc. * | 1,025,705 | 78,978 | Harris Stratex Networks, Inc. # | 1,318,933 | |
| 71,440 | CoStar Group, Inc. # | 3,375,540 | 39,336 | Heartland Payment Systems, Inc. * | 1,054,205 | |
| 41,487 | CRA International, Inc. # | 1,975,196 | 173,510 | Informatica Corporation #* | 3,126,650 | |
| 49,670 | Forward Air Corporation | 1,548,214 | 105,393 | Intermec, Inc. #* | 2,140,532 | |
| 19,340 | FTI Consulting, Inc. #* | 1,192,118 | 20,170 | Jack Henry & Associates, Inc. | 490,938 | |
| 8,940 | Grupo Aeroportuario del Sureste | 111,150 | Macrovision Corporation #* | 2,037,380 | ||
| SAB de CV | 547,307 | 3,400 | Mercadolibre, Inc. # | 251,192 | ||
| 12,520 | Huron Consulting Group, Inc. # | 1,009,488 | 14,870 | MICROS Systems, Inc. # | 1,043,279 | |
| 22,705 | IDEX Corporation | 820,332 | 27,360 | Net 1 UEPS Technology, Inc. # | 803,290 | |
| 15,780 | JA Solar Holdings Company, | 77,960 | NeuStar, Inc. #* | 2,235,893 | ||
| Ltd. ADR # | 1,101,602 | 32,030 | Nuance Communications, Inc. #* | 598,320 | ||
| 46,080 | Ladish Company, Inc. # | 1,990,195 | 92,458 | Omniture, Inc. #* | 3,077,927 | |
| 22,690 | Orbital Sciences Corporation # | 556,359 | 96,876 | Perficient, Inc. # | 1,524,828 | |
| 7,830 | Orion Energy Systems, Inc. # | 146,108 | 7,570 | Sigma Designs, Inc. #* | 417,864 | |
| 13,800 | Perini Corporation # | 571,596 | 20,650 | Silicon Laboratories, Inc. # | 772,930 | |
| 58,462 | Polypore International, Inc. # | 1,023,085 | 8,590 | Synaptics, Inc. # | 353,564 | |
| 19,560 | RBC Bearings, Inc. # | 850,078 | 11,580 | Synchronoss Technologies, Inc. #* | 410,395 | |
| 11,810 | Robbins & Myers, Inc. | 893,190 | 36,220 | Take-Two Interactive Software, Inc. #* | 668,259 | |
| 17,650 | TransDigm Group, Inc. # | 797,250 | 192,640 | ValueClick, Inc. # | 4,218,811 | |
| 10,480 | Triumph Group, Inc. * | 863,028 | 36,620 | Vasco Data Security | ||
| 19,350 | Wabtec Corporation | 666,414 | International, Inc. # | 1,022,430 | ||
| 18,510 | Waste Connections, Inc. # | 571,959 | 64,983 | Veraz Networks, Inc. #* | 313,218 | |
| 12,390 | Woodward Governor Company | 841,900 | 39,869 | ViaSat, Inc. # | 1,372,690 | |
| Total Industrials | 27,457,459 | 20,270 | VistaPrint, Ltd. #* | 868,570 | ||
| 9,950 | Vocus, Inc. # | 343,574 | ||||
| Information Technology (27.8%) | Total Information Technology | 46,608,219 | ||||
| 10,730 | Advent Software, Inc. #* | 580,493 | ||||
| 19,220 | ANSYS, Inc. # | 796,861 | Materials (3.0%) | |||
| 24,390 | Atheros Communications, Inc. #* | 744,871 | 16,030 | Century Aluminum Company # | 864,658 | |
| 57,222 | Avocent Corporation # | 1,333,845 | 4,330 | CF Industries Holdings, Inc. | 476,560 | |
| 38,230 | Brightpoint, Inc. # | 587,213 | 10,720 | Greif, Inc. | 700,766 | |
| 29,620 | Cavium Networks, Inc. #* | 681,852 | 22,900 | H.B. Fuller Company | 514,105 | |
| 41,418 | Coherent, Inc. # | 1,038,349 | 15,390 | Silgan Holdings, Inc. | 799,357 | |
| 16,870 | Comscore, Inc. #* | 550,468 | 20,280 | Terra Industries, Inc. #* | 968,573 | |
| 44,390 | Comtech Group, Inc. # | 715,123 | 16,150 | Zoltek Companies, Inc. #* | 692,350 | |
| 38,700 | Concur Technologies, Inc. # | 1,401,327 | Total Materials | 5,016,369 | ||
| 22,030 | Constant Contact, Inc. #* | 473,645 | ||||
| 25,560 | Data Domain, Inc. #* | 673,250 | ||||
| 38,610 | Double-Take Software, Inc. # | 838,609 | ||||
| The accompanying Notes to Financial Statements are an integral part of this schedule. |
| 77 |
| Partner Small Cap Growth Portfolio | ||||||
| Schedule of Investments as of December 31, 2007 | ||||||
| Shares | Common Stock (96.6%) | Value | Shares | Common Stock (96.6%) | Value | |
| Telecommunications Services (0.8%) | Utilities (0.3%) | |||||
| 15,905 | Cbeyond, Inc. # | $620,136 | 9,100 | ITC Holdings Corporation | $513,422 | |
| 39,450 | Time Warner Telecom, Inc. #* | 800,440 | Total Utilities | 513,422 | ||
| Total Telecommunications | ||||||
| Services | 1,420,576 | Total Common Stock | ||||
| (cost $150,212,327) | 161,853,303 | |||||
| Interest | Maturity | |||
| Shares | Collateral Held for Securities Loaned (42.7%) | Rate (+) | Date | Value |
| 71,604,282 | Thrivent Financial Securities Lending Trust | 5.000% | N/A | $71,604,282 |
| Total Collateral Held for Securities Loaned | ||||
| (cost $71,604,282) | 71,604,282 | |||
| Shares or | ||||
| Principal | Interest | Maturity | ||
| Amount | Short-Term Investments (3.7%) | Rate (+) | Date | Value |
| $3,975,000 | Federal Home Loan Mortgage Corporation | 3.150% | 1/2/2008 | $3,974,652 |
| 2,133,198 | Thrivent Money Market Portfolio | 4.930 | N/A | 2,133,198 |
| Total Short-Term Investments (at amortized cost) | 6,107,850 | |||
| Total Investments (cost $227,924,459) 143.0% | $239,565,435 | |||
| Other Assets and Liabilities, Net (43.0%) | (71,995,498) | |||
| Total Net Assets 100.0% | $167,569,937 | |||
# Non-income producing security.
* All or a portion of the security is on loan as discussed in item 2(M) of the Notes to Financial Statements.
+ The interest rate shown reflects the yield, coupon rate or, for securities purchased at a discount, the discount rate at the date of purchase.
Definitions:
ADR — American Depository Receipts, which are certificates for shares of an underlying foreign security’s shares held by an issuing U.S. depository bank.
Gross unrealized appreciation and depreciation of investments, based on cost for federal income tax purposes, were as follows:
| Gross unrealized appreciation | $20,861,172 | |
| Gross unrealized depreciation | (10,205,511) | |
| Net unrealized appreciation (depreciation) | $10,655,661 | |
| Cost for federal income tax purposes | $228,909,774 |
| The accompanying Notes to Financial Statements are an integral part of this schedule. |
| 78 |
| Partner Small Cap Value Portfolio | ||||||
| Schedule of Investments as of December 31, 2007 | ||||||
| Shares | Common Stock (96.1%) | Value | Shares | Common Stock (96.1%) | Value | |
| Consumer Discretionary (9.2%) | 140,000 | Cedar Shopping Centers, Inc. | $1,432,200 | |||
| 121,000 | Aaron Rents, Inc. | $2,328,040 | 50,500 | Compass Diversified Trust | 752,450 | |
| 65,300 | Building Materials Holding | 43,500 | East West Bancorp, Inc. | 1,054,005 | ||
| Corporation * | 361,109 | 26,000 | Employers Holdings, Inc. | 434,460 | ||
| 40,000 | Cavco Industries, Inc. # | 1,353,600 | 80,100 | First Financial Fund, Inc. * | 880,299 | |
| 38,400 | CSS Industries, Inc. | 1,409,280 | 61,600 | Glacier Bancorp, Inc. * | 1,154,384 | |
| 69,400 | Dixie Group, Inc. # | 573,244 | 79,000 | Hercules Technology Growth | ||
| 42,800 | Dorman Products, Inc. # | 611,612 | Capital, Inc. * | 981,180 | ||
| 34,200 | Drew Industries, Inc. # | 937,080 | 37,100 | Home Bancshares, Inc. * | 777,987 | |
| 53,000 | Fred’s, Inc. * | 510,390 | 42,000 | JMP Group, Inc. | 356,160 | |
| 23,600 | Fuel Systems Solutions, Inc. #* | 337,244 | 74,500 | Kohlberg Capital Corporation | 894,000 | |
| 92,500 | Haverty Furniture Companies, Inc. * | 831,575 | 39,000 | LaSalle Hotel Properties * | 1,244,100 | |
| 70,500 | Journal Register Company * | 124,080 | 2,700 | Markel Corporation # | 1,325,970 | |
| 38,200 | M/I Homes, Inc. * | 401,100 | 67,300 | Max Re Capital, Ltd. * | 1,883,727 | |
| 33,200 | Matthews International Corporation | 1,556,084 | 32,200 | Midland Company | 2,083,018 | |
| 59,200 | Meritage Homes Corporation #* | 862,544 | 28,900 | National Interstate Corporation | 956,590 | |
| 7,600 | Orient Express Hotels, Ltd. | 437,152 | 38,000 | Parkway Properties, Inc. | 1,405,240 | |
| 109,700 | Regent Communications, Inc. # | 168,938 | 17,000 | Piper Jaffray Companies # | 787,440 | |
| 61,400 | Saga Communications, Inc. # | 361,646 | 46,200 | Potlatch Corporation | 2,053,128 | |
| 87,000 | Shiloh Industries, Inc. | 856,950 | 61,000 | ProAssurance Corporation # | 3,350,120 | |
| 47,400 | Stanley Furniture Company, Inc. * | 568,800 | 70,200 | ProCentury Corporation | 1,077,570 | |
| 55,800 | Steak n Shake Company #* | 608,220 | 42,500 | Sandy Spring Bancorp, Inc. * | 1,182,350 | |
| 113,500 | Stein Mart, Inc. * | 537,990 | 45,000 | Seabright Insurance Holdings # | 678,600 | |
| 62,300 | Winnebago Industries, Inc. * | 1,309,546 | 41,000 | Strategic Hotel Capital, Inc. * | 685,930 | |
| Total Consumer Discretionary | 17,046,224 | 37,500 | SVB Financial Group #* | 1,890,000 | ||
| 32,600 | Washington Real Estate | |||||
| Consumer Staples (1.9%) | Investment Trust * | 1,023,966 | ||||
| 155,000 | Alliance One International, Inc. # | 630,850 | 34,800 | Wintrust Financial Corporation * | 1,152,924 | |
| 35,100 | Casey’s General Stores, Inc. | 1,039,311 | Total Financials | 33,899,161 | ||
| 44,000 | Nash Finch Company * | 1,552,320 | ||||
| 21,300 | Winn-Dixie Stores, Inc. #* | 359,331 | Health Care (6.0%) | |||
| Total Consumer Staples | 3,581,812 | 13,700 | Analogic Corporation | 927,764 | ||
| 26,000 | Angiodynamics, Inc. #* | 495,040 | ||||
| Energy (8.6%) | 46,700 | Capital Senior Living Corporation # | 463,731 | |||
| 17,000 | Atwood Oceanics, Inc. #* | 1,704,080 | 107,000 | Momenta Pharmaceuticals, Inc. #* | 763,980 | |
| 24,000 | Carbo Ceramics, Inc. * | 892,800 | 16,800 | Myriad Genetics, Inc. #* | 779,856 | |
| 56,400 | Forest Oil Corporation #* | 2,867,376 | 28,800 | National Healthcare Corporation * | 1,488,960 | |
| 81,000 | Geomet, Inc. #* | 421,200 | 68,100 | Owens & Minor, Inc. | 2,889,483 | |
| 44,900 | Hercules Offshore, Inc. #* | 1,067,712 | 198,700 | Panacos Pharmaceuticals, Inc. #* | 156,973 | |
| 103,000 | Mariner Energy, Inc. # | 2,356,640 | 21,600 | Pharmion Corporation #* | 1,357,776 | |
| 59,900 | TETRA Technologies, Inc. # | 932,643 | 15,600 | Triple-S Management Corporation # | 315,276 | |
| 25,700 | Union Drilling, Inc. # | 405,289 | 35,500 | West Pharmaceutical | ||
| 44,500 | W-H Energy Services, Inc. #* | 2,501,345 | Services, Inc. * | 1,440,945 | ||
| 50,500 | Whiting Petroleum Corporation #* | 2,911,830 | Total Health Care | 11,079,784 | ||
| Total Energy | 16,060,915 | |||||
| Industrials (25.0%) | ||||||
| Financials (18.3%) | 61,400 | Accuride Corporation # | 482,604 | |||
| 90,100 | Ares Capital Corporation * | 1,318,163 | 35,000 | Alaska Air Group, Inc. # | 875,350 | |
| 40,000 | Boston Private Financial | 23,800 | Ameron International Corporation * | 2,193,170 | ||
| Holdings, Inc. * | 1,083,200 | 121,000 | Beacon Roofing Supply, Inc. #* | 1,018,820 | ||
| The accompanying Notes to Financial Statements are an integral part of this schedule. |
| 79 |
| Partner Small Cap Value Portfolio | ||||||
| Schedule of Investments as of December 31, 2007 | ||||||
| Shares | Common Stock (96.1%) | Value | Shares | Common Stock (96.1%) | Value | |
| Industrials — continued | 51,200 | Xyratex, Ltd. # | $808,960 | |||
| 47,000 | Belden, Inc. * | $2,091,500 | 409,600 | Zarlink Semiconductor, Inc. #* | 294,953 | |
| 55,800 | C&D Technologies, Inc. #* | 368,838 | 62,500 | Zygo Corporation # | 778,750 | |
| 21,100 | Cascade Corporation | 980,306 | Total Information Technology | 19,450,398 | ||
| 40,300 | Circor International, Inc. | 1,868,308 | ||||
| 26,000 | Courier Corporation | 858,260 | Materials (9.8%) | |||
| 53,500 | Dollar Thrifty Automotive | 40,900 | Airgas, Inc. | 2,131,299 | ||
| Group, Inc. #* | 1,266,880 | 73,900 | American Vanguard Corporation * | 1,282,165 | ||
| 82,900 | Electro Rent Corporation | 1,231,065 | 69,200 | AptarGroup, Inc. | 2,830,972 | |
| 28,600 | Franklin Electric Company, Inc. * | 1,094,522 | 30,600 | Arch Chemicals, Inc. | 1,124,550 | |
| 38,800 | FTI Consulting, Inc. #* | 2,391,632 | 43,800 | Carpenter Technology Corporation | 3,292,446 | |
| 42,400 | G & K Services, Inc. | 1,590,848 | 30,300 | Chesapeake Corporation | 157,257 | |
| 69,800 | Genesee & Wyoming, Inc. # | 1,687,066 | 10,800 | Deltic Timber Corporation | 556,092 | |
| 28,600 | Genlyte Group, Inc. #* | 2,722,720 | 38,400 | Innospec, Inc. | 658,944 | |
| 67,700 | Gibraltar Industries, Inc. | 1,043,934 | 60,900 | Metal Management, Inc. * | 2,772,777 | |
| 75,100 | Hub Group, Inc. # | 1,996,158 | 20,000 | Minerals Technologies, Inc. | 1,339,000 | |
| 51,000 | IDEX Corporation | 1,842,630 | 81,900 | Myers Industries, Inc. | 1,185,093 | |
| 62,300 | Insituform Technologies, Inc. #* | 922,040 | 1,751 | Vulcan Materials Company | 138,482 | |
| 65,100 | Kirby Corporation # | 3,025,848 | 87,900 | Wausau-Mosinee Paper Corporation | 790,221 | |
| 20,000 | LSI Industries, Inc. | 364,000 | Total Materials | 18,259,298 | ||
| 77,300 | McGrath Rentcorp | 1,990,475 | ||||
| 46,200 | Nordson Corporation | 2,677,752 | Telecommunications Services (1.2%) | |||
| 29,100 | School Specialty, Inc. # | 1,005,405 | 151,500 | Kratos Defense & Security | ||
| 60,300 | Sterling Construction | Solutions, Inc. # | 356,025 | |||
| Company, Inc. #* | 1,315,746 | 126,100 | Premiere Global Services, Inc. # | 1,872,585 | ||
| 41,000 | Universal Forest Products, Inc. | 1,207,860 | Total Telecommunications | |||
| 118,500 | Vitran Corporation, Inc. # | 1,686,255 | Services | 2,228,610 | ||
| 51,000 | Waste Connections, Inc. # | 1,575,900 | ||||
| 45,900 | Woodward Governor Company | 3,118,905 | Utilities (5.6%) | |||
| Total Industrials | 46,494,797 | 46,800 | Black Hills Corporation * | 2,063,880 | ||
| 73,500 | Cleco Corporation * | 2,043,300 | ||||
| Information Technology (10.5%) | 54,700 | El Paso Electric Company #* | 1,398,679 | |||
| 74,000 | Advanced Energy Industries, Inc. # | 967,920 | 30,700 | Empire District Electric Company * | 699,346 | |
| 81,500 | Ariba, Inc. # | 908,725 | 55,300 | Southwest Gas Corporation | 1,646,281 | |
| 24,000 | ATMI, Inc. # | 774,000 | 42,700 | UniSource Energy Corporation | 1,347,185 | |
| 85,209 | Brooks Automation, Inc. # | 1,125,611 | 41,100 | Vectren Corporation | 1,192,311 | |
| 70,800 | Catapult Communications | Total Utilities | 10,390,982 | |||
| Corporation #* | 534,540 | |||||
| 51,200 | Exar Corporation # | 408,064 | ||||
| 120,500 | GSI Group, Inc. # | 1,113,420 | Total Common Stock | |||
| 29,400 | Methode Electronics, Inc. | 483,336 | (cost $164,043,906) | 178,491,981 | ||
| 151,500 | MPS Group, Inc. # | 1,657,410 | ||||
| 53,200 | Nextest Systems Corporation #* | 1,058,148 | ||||
| 120,200 | Palm, Inc. * | 762,068 | Shares | Preferred Stock (0.4%) | Value | |
| 60,900 | Progress Software Corporation # | 2,051,112 | ||||
| 293,000 | Safeguard Scientifics, Inc. #* | 527,400 | 51,400 | National Healthcare Corporation, | ||
| 43,100 | SPSS, Inc. # | 1,547,721 | Convertible | $719,600 | ||
| 75,000 | StarTek, Inc. # | 698,250 | Total Preferred Stock | |||
| 93,500 | TNS, Inc. * | 1,659,625 | (cost $696,375) | 719,600 | ||
| 144,500 | Wind River Systems, Inc. # | 1,290,385 | ||||
| The accompanying Notes to Financial Statements are an integral part of this schedule. |
| 80 |
| Partner Small Cap Value Portfolio | ||||
| Schedule of Investments as of December 31, 2007 | ||||
| Interest | Maturity | |||
| Shares | Collateral Held for Securities Loaned (31.9%) | Rate (+) | Date | Value |
| 59,125,971 | Thrivent Financial Securities Lending Trust | 5.000% | N/A | $59,125,971 |
| Total Collateral Held for Securities Loaned | ||||
| (cost $59,125,971) | 59,125,971 | |||
| Interest | Maturity | |||
| Shares | Short-Term Investments (3.8%) | Rate (+) | Date | Value |
| 6,994,893 | Thrivent Money Market Portfolio | 4.930% | N/A | $6,994,893 |
| Total Short-Term Investments (at amortized cost) | 6,994,893 | |||
| Total Investments (cost $230,861,145) 132.2% | $245,332,445 | |||
| Other Assets and Liabilities, Net (32.2%) | (59,714,607) | |||
| Total Net Assets 100.0% | $185,617,838 | |||
# Non-income producing security.
* All or a portion of the security is on loan as discussed in item 2(M) of the Notes to Financial Statements.
+ The interest rate shown reflects the yield, coupon rate or, for securities purchased at a discount, the discount rate at the date of purchase.
Gross unrealized appreciation and depreciation of investments, based on cost for federal income tax purposes, were as follows:
| Gross unrealized appreciation | $36,787,597 | |
| Gross unrealized depreciation | (22,488,739) | |
| Net unrealized appreciation (depreciation) | $14,298,858 | |
| Cost for federal income tax purposes | $231,033,587 |
| The accompanying Notes to Financial Statements are an integral part of this schedule. |
| 81 |
| Small Cap Stock Portfolio | ||||||
| Schedule of Investments as of December 31, 2007 | ||||||
| Shares | Common Stock (95.7%) | Value | Shares | Common Stock (95.7%) | Value | |
| Consumer Discretionary (10.0%) | 53,600 | Denbury Resources, Inc. # | $1,594,600 | |||
| 76,200 | Aeropostale, Inc. # | $2,019,300 | 28,500 | Dril-Quip, Inc. # | 1,586,310 | |
| 21,500 | Aftermarket Technology | 8,300 | Forest Oil Corporation # | 421,972 | ||
| Corporation # | 586,090 | 26,100 | Helmerich & Payne, Inc. | 1,045,827 | ||
| 28,800 | American Public Education, Inc. # | 1,203,264 | 133,900 | Input/Output, Inc. # | 2,112,942 | |
| 76,300 | Burger King Holdings, Inc. | 2,175,313 | 7,600 | Oil States International, Inc. # | 259,312 | |
| 7,700 | Capella Education Company # | 504,042 | 40,200 | Penn Virginia Corporation | 1,753,926 | |
| 11,400 | Chipotle Mexican Grill, Inc. # | 1,402,770 | 135,997 | Petrohawk Energy Corporation # | 2,354,108 | |
| 37,900 | Crocs, Inc. #* | 1,395,099 | 43,300 | Petroleum Development Corporation # | 2,560,329 | |
| 13,800 | DeVry, Inc. | 717,048 | 34,554 | Range Resources Corporation | 1,774,693 | |
| 38,500 | Fossil, Inc. # | 1,616,230 | 36,400 | Southwestern Energy Company # | 2,028,208 | |
| 95,900 | Fuqi International, Inc. # | 795,970 | 30,300 | Tesco Corporation # | 868,701 | |
| 19,600 | GameStop Corporation # | 1,217,356 | 63,300 | Willbros Group, Inc. #* | 2,423,757 | |
| 48,900 | Hasbro, Inc. | 1,250,862 | Total Energy | 25,810,276 | ||
| 40,600 | Jack in the Box, Inc. # | 1,046,262 | ||||
| 26,400 | Life Time Fitness, Inc. #* | 1,311,552 | Financials (17.8%) | |||
| 91,500 | LKQ Corporation #* | 1,923,330 | 7,500 | Acadia Realty Trust | 192,075 | |
| 16,500 | Matthews International Corporation | 773,355 | 14,350 | Affiliated Managers Group, Inc. #* | 1,685,551 | |
| 8,900 | Men’s Wearhouse, Inc. | 240,122 | 9,600 | Alexandria Real Estate | ||
| 33,600 | Meredith Corporation | 1,847,328 | Equities, Inc. | 976,032 | ||
| 13,900 | Priceline.com, Inc. # | 1,596,554 | 27,600 | Bank of Hawaii Corporation * | 1,411,464 | |
| 35,700 | Red Robin Gourmet Burgers, Inc. #* | 1,142,043 | 43,250 | BioMed Realty Trust, Inc. * | 1,002,102 | |
| 55,700 | Regal Entertainment Group * | 1,006,499 | 13,718 | BOK Financial Corporation | 709,221 | |
| 76,300 | Scientific Games Corporation #* | 2,536,975 | 22,000 | Boston Private Financial | ||
| 6,900 | Tempur-Pedic International * | 179,193 | Holdings, Inc. * | 595,760 | ||
| 138,600 | Texas Roadhouse, Inc. # | 1,532,916 | 11,900 | Camden Property Trust | 572,985 | |
| 27,300 | Vail Resorts, Inc. #* | 1,469,013 | 17,600 | Cash America International, Inc. | 568,480 | |
| 57,900 | Warnaco Group, Inc. # | 2,014,920 | 53,300 | CastlePoint Holdings, Ltd. * | 639,600 | |
| 117,700 | WMS Industries, Inc. #* | 4,312,530 | 30,400 | Cullen/Frost Bankers, Inc. | 1,540,064 | |
| 86,100 | Wolverine World Wide, Inc. | 2,111,172 | 48,200 | Delphi Financial Group, Inc. | 1,700,496 | |
| Total Consumer Discretionary | 39,927,108 | 24,700 | Digital Realty Trust, Inc. * | 947,739 | ||
| 20,800 | Dollar Financial Corporation # | 638,352 | ||||
| Consumer Staples (5.7%) | 37,500 | East West Bancorp, Inc. | 908,625 | |||
| 104,300 | Calavo Growers, Inc. | 1,967,098 | 4,300 | EastGroup Properties, Inc. | 179,955 | |
| 129,200 | Casey’s General Stores, Inc. | 3,825,612 | 48,300 | Endurance Specialty Holdings, Ltd. | 2,015,559 | |
| 72,900 | Central European Distribution | 27,000 | Equity One, Inc. * | 621,810 | ||
| Corporation #* | 4,234,032 | 42,950 | FCStone Group, Inc. #* | 1,976,988 | ||
| 39,500 | Chattem, Inc. #* | 2,983,830 | 64,000 | First Cash Financial | ||
| 54,400 | Corn Products International, Inc. | 1,999,200 | Services, Inc. # | 939,520 | ||
| 86,200 | Elizabeth Arden, Inc. # | 1,754,170 | 9,200 | First Community Bancorp, Inc. * | 379,408 | |
| 73,500 | Flowers Foods, Inc. * | 1,720,635 | 42,800 | First Midwest Bancorp, Inc. | 1,309,680 | |
| 54,500 | Longs Drug Stores Corporation | 2,561,500 | 14,100 | First State Bancorporation | 195,990 | |
| 8,600 | Ralcorp Holdings, Inc. # | 522,794 | 10,400 | FirstFed Financial Corporation #* | 372,528 | |
| 44,500 | United Natural Foods, Inc. #* | 1,411,540 | 15,000 | GFI Group, Inc. # | 1,435,800 | |
| Total Consumer Staples | 22,980,411 | 15,600 | Gramercy Capital Corporation * | 379,236 | ||
| 72,850 | HCC Insurance Holdings, Inc. | 2,089,338 | ||||
| Energy (6.5%) | 19,000 | Hilb, Rogal and Hobbs Company * | 770,830 | |||
| 43,700 | Arena Resources, Inc. # | 1,822,727 | 39,300 | Investment Technology Group, Inc. # | 1,870,287 | |
| 15,200 | Atwood Oceanics, Inc. # | 1,523,648 | 65,400 | Investors Real Estate Trust * | 586,638 | |
| 223,300 | Brigham Exploration Company # | 1,679,216 | 26,500 | iShares Russell 2000 Index Fund * | 2,015,325 | |
| The accompanying Notes to Financial Statements are an integral part of this schedule. |
| 82 |
| Small Cap Stock Portfolio | ||||||
| Schedule of Investments as of December 31, 2007 | ||||||
| Shares | Common Stock (95.7%) | Value | Shares | Common Stock (95.7%) | Value | |
| Financials — continued | 11,700 | Gen-Probe, Inc. # | $736,281 | |||
| 33,000 | iShares Russell Microcap Index Fund * | $1,748,670 | 38,900 | Hansen Medical, Inc. #* | 1,164,666 | |
| 13,500 | Jefferies Group, Inc. | 311,175 | 54,100 | HealthExtras, Inc. # | 1,410,928 | |
| 48,400 | Lexington Corporate Properties Trust * | 703,736 | 12,200 | Healthways, Inc. #* | 712,968 | |
| 26,300 | MF Global, Ltd. # | 827,661 | 14,476 | Hologic, Inc. #* | 993,633 | |
| 92,000 | MFA Mortgage Investments, Inc. * | 851,000 | 28,065 | inVentiv Health, Inc. # | 868,892 | |
| 16,800 | National Financial Partners | 14,100 | Inverness Medical Innovations, Inc. # | 792,138 | ||
| Corporation * | 766,248 | 24,100 | Invitrogen Corporation # | 2,251,181 | ||
| 66,500 | National Retail Properties, Inc. | 1,554,770 | 33,600 | Kendle International, Inc. #* | 1,643,712 | |
| 38,200 | Nationwide Health Properties, Inc. * | 1,199,480 | 40,800 | Kindred Healthcare, Inc. # | 1,019,184 | |
| 57,400 | optionsXpress Holdings, Inc. | 1,941,268 | 43,100 | K-V Pharmaceutical Company #* | 1,230,074 | |
| 55,200 | Philadelphia Consolidated Holding | 35,000 | Magellan Health Services, Inc. # | 1,632,050 | ||
| Corporation # | 2,172,120 | 39,400 | Masimo Corporation #* | 1,554,330 | ||
| 64,400 | Platinum Underwriters Holdings, Ltd. | 2,290,064 | 38,900 | Millennium Pharmaceuticals, Inc. # | 582,722 | |
| 26,900 | PMI Group, Inc. * | 357,232 | 51,200 | NuVasive, Inc. # | 2,023,424 | |
| 18,200 | Portfolio Recovery Associates, Inc. * | 721,994 | 45,000 | Omnicell, Inc. # | 1,211,850 | |
| 43,900 | Potlatch Corporation * | 1,950,916 | 34,600 | Orthofix International NV # | 2,005,762 | |
| 102,800 | PowerShares Zacks Micro Cap | 40,200 | Owens & Minor, Inc. | 1,705,686 | ||
| Portfolio * | 1,568,728 | 29,300 | Pediatrix Medical Group, Inc. # | 1,996,795 | ||
| 28,100 | ProAssurance Corporation # | 1,543,252 | 44,300 | Perrigo Company | 1,550,943 | |
| 44,900 | Prosperity Bancshares, Inc. | 1,319,611 | 34,100 | Pharmaceutical Product | ||
| 41,100 | Raymond James Financial, Inc. | 1,342,326 | Development, Inc. * | 1,376,617 | ||
| 55,800 | Realty Income Corporation * | 1,507,716 | 54,200 | PSS World Medical, Inc. #* | 1,060,694 | |
| 17,400 | Senior Housing Property Trust | 394,632 | 29,600 | Sepracor, Inc. # | 777,000 | |
| 153,800 | Sterling Bancshares, Inc. | 1,716,408 | 54,300 | STERIS Corporation | 1,566,012 | |
| 39,900 | Sterling Financial Corporation * | 669,921 | 97,500 | Sun Healthcare Group, Inc. # | 1,674,075 | |
| 25,900 | Stifel Financial Corporation #* | 1,361,563 | 70,900 | Tercica, Inc. #* | 480,702 | |
| 12,200 | Strategic Hotel Capital, Inc. * | 204,106 | 71,300 | The Spectranetics Corporation #* | 1,093,029 | |
| 35,000 | SVB Financial Group #* | 1,764,000 | 31,600 | Trans1, Inc. #* | 520,452 | |
| 48,200 | Tower Group, Inc. | 1,609,880 | 53,600 | Trizetto Group, Inc. # | 931,032 | |
| 102,700 | UCBH Holdings, Inc. * | 1,454,232 | 2,900 | United Therapeutics Corporation #* | 283,185 | |
| 42,700 | United Bankshares, Inc. * | 1,196,454 | 77,700 | Universal American Financial | ||
| 67,600 | Waddell & Reed Financial, Inc. | 2,439,684 | Corporation #* | 1,988,343 | ||
| 53,603 | Washington Federal, Inc. | 1,131,559 | 24,200 | Varian Medical Systems, Inc. # | 1,262,272 | |
| 27,700 | Westamerica Bancorporation * | 1,234,035 | 40,400 | Varian, Inc. # | 2,638,120 | |
| Total Financials | 71,081,879 | 40,400 | VCA Antech, Inc. # | 1,786,892 | ||
| 26,100 | Ventana Medical Systems, Inc. #* | 2,276,703 | ||||
| Health Care (16.0%) | Total Health Care | 63,784,124 | ||||
| 48,700 | Amedisys, Inc. #* | 2,362,924 | ||||
| 63,800 | AMERIGROUP Corporation # | 2,325,510 | Industrials (14.8%) | |||
| 37,500 | AmSurg Corporation # | 1,014,750 | 21,900 | Baldor Electric Company | 737,154 | |
| 24,200 | Animal Health International, Inc. # | 297,660 | 53,600 | BE Aerospace, Inc. # | 2,835,440 | |
| 67,300 | Applera Corporation (Celera Group) # | 1,068,051 | 13,700 | Belden, Inc. | 609,650 | |
| 25,400 | Beckman Coulter, Inc. | 1,849,120 | 31,000 | CAI International, Inc. # | 326,120 | |
| 38,400 | BioMarin Pharmaceutical, Inc. #* | 1,359,360 | 49,400 | Chicago Bridge and Iron Company | 2,985,736 | |
| 10,700 | Bio-Rad Laboratories, Inc. # | 1,108,734 | 37,500 | Consolidated Graphics, Inc. # | 1,793,250 | |
| 22,900 | Centene Corporation # | 628,376 | 22,000 | Curtiss-Wright Corporation | 1,104,400 | |
| 45,600 | Community Health Systems, Inc. # | 1,680,816 | 30,200 | Deluxe Corporation | 993,278 | |
| 17,900 | Covance, Inc. # | 1,550,498 | 34,900 | Diana Shipping, Inc. * | 1,097,954 | |
| 196,600 | Dexcom, Inc. #* | 1,735,978 | ||||
| The accompanying Notes to Financial Statements are an integral part of this schedule. |
| 83 |
| Small Cap Stock Portfolio | ||||||
| Schedule of Investments as of December 31, 2007 | ||||||
| Shares | Common Stock (95.7%) | Value | Shares | Common Stock (95.7%) | Value | |
| Industrials — continued | 64,600 | Cypress Semiconductor Corporation # | $2,327,538 | |||
| 36,000 | DRS Technologies, Inc. | $1,953,720 | 39,925 | Diodes, Inc. #* | 1,200,545 | |
| 10,400 | Dryships, Inc. * | 804,960 | 88,900 | Epicor Software Corporation # | 1,047,242 | |
| 30,500 | Duff & Phelps Corporation # | 600,240 | 65,452 | FLIR Systems, Inc. # | 2,048,648 | |
| 30,400 | Eagle Bulk Shipping, Inc. * | 807,120 | 18,600 | FormFactor, Inc. #* | 615,660 | |
| 15,650 | Energy Solutions, Inc. # | 422,394 | 94,300 | Foundry Networks, Inc. #* | 1,652,136 | |
| 57,900 | Euroseas, Ltd. | 717,960 | 95,000 | Ingram Micro, Inc. # | 1,713,800 | |
| 26,400 | Flowserve Corporation | 2,539,680 | 135,300 | Insight Enterprises, Inc. # | 2,467,872 | |
| 50,900 | FTI Consulting, Inc. #* | 3,137,476 | 83,200 | Integrated Device Technology, Inc. # | 940,992 | |
| 20,600 | Gardner Denver, Inc. # | 679,800 | 20,400 | Intersil Corporation | 499,392 | |
| 14,000 | General Cable Corporation #* | 1,025,920 | 162,700 | Ixia # | 1,542,396 | |
| 20,700 | Huron Consulting Group, Inc. #* | 1,669,041 | 50,000 | J2 Global Communication, Inc. # | 1,058,500 | |
| 60,400 | IDEX Corporation | 2,182,252 | 139,500 | Lawson Software, Inc. #* | 1,428,480 | |
| 72,000 | Interline Brands, Inc. # | 1,577,520 | 116,000 | Mentor Graphics Corporation # | 1,250,480 | |
| 15,400 | JA Solar Holdings Company, Ltd. ADR # | 1,075,074 | 27,200 | MICROS Systems, Inc. # | 1,908,352 | |
| 3,500 | Jacobs Engineering Group, Inc. #* | 334,635 | 126,700 | Nanometrics, Inc. #* | 1,249,262 | |
| 26,700 | Kaydon Corporation * | 1,456,218 | 143,100 | ON Semiconductor Corporation #* | 1,270,728 | |
| 49,200 | Kirby Corporation # | 2,286,816 | 21,000 | Plexus Corporation # | 551,460 | |
| 30,100 | Ladish Company, Inc. # | 1,300,019 | 45,000 | Progress Software Corporation # | 1,515,600 | |
| 11,200 | Lennox International, Inc. | 463,904 | 172,300 | RF Micro Devices, Inc. # | 983,833 | |
| 40,900 | Manitowoc Company, Inc. | 1,997,147 | 60,000 | ScanSource, Inc. # | 1,941,000 | |
| 15,900 | Middleby Corporation #* | 1,218,258 | 113,300 | SkillSoft Public Limited | ||
| 64,400 | Pall Corporation | 2,596,608 | Company ADR # | 1,083,148 | ||
| 38,900 | Roper Industries, Inc. * | 2,432,806 | 197,900 | Skyworks Solutions, Inc. # | 1,682,150 | |
| 15,300 | Shaw Group, Inc. # | 924,732 | 24,100 | Solera Holdings, Inc. # | 597,198 | |
| 31,413 | Standard Parking Corporation # | 1,523,216 | 51,900 | SPSS, Inc. # | 1,863,729 | |
| 19,900 | Stanley, Inc. # | 637,198 | 44,800 | Sybase, Inc. # | 1,168,832 | |
| 37,800 | Teledyne Technologies, Inc. # | 2,015,874 | 88,400 | TIBCO Software, Inc. #* | 713,388 | |
| 20,800 | UAL Corporation #* | 741,728 | 71,000 | Trimble Navigation, Ltd. # | 2,147,040 | |
| 57,000 | Ultrapetrol Bahamas, Ltd. #* | 969,570 | 34,900 | Varian Semiconductor Equipment | ||
| 38,600 | URS Corporation # | 2,097,138 | Associates, Inc. # | 1,291,300 | ||
| 22,900 | Wabtec Corporation | 788,676 | 31,800 | Verifone Holdings, Inc. #* | 739,350 | |
| 101,350 | Waste Connections, Inc. # | 3,131,715 | 32,400 | ViaSat, Inc. # | 1,115,532 | |
| 11,400 | Woodward Governor Company | 774,630 | 44,800 | Zoran Corporation # | 1,008,448 | |
| Total Industrials | 59,367,027 | Total Information Technology | 54,473,784 | |||
| Information Technology (13.6%) | Materials (6.3%) | |||||
| 13,900 | Anixter International, Inc. #* | 865,553 | 57,700 | Airgas, Inc. | 3,006,747 | |
| 40,694 | Avnet, Inc. # | 1,423,069 | 37,700 | Albemarle Corporation | 1,555,125 | |
| 59,700 | Avocent Corporation # | 1,391,607 | 31,600 | Apex Silver Mines, Ltd. #* | 481,584 | |
| 23,100 | Benchmark Electronics, Inc. # | 409,563 | 70,700 | AptarGroup, Inc. | 2,892,337 | |
| 49,000 | Bluephoenix Solutions, Ltd. #* | 887,880 | 22,600 | Bemis Company, Inc. | 618,788 | |
| 53,300 | Brocade Communications # | 391,222 | 22,643 | Century Aluminum Company # | 1,221,363 | |
| 34,200 | Business Objects SA ADR # | 2,082,780 | 24,700 | Commercial Metals Company | 724,945 | |
| 101,700 | China GrenTech Corporation, | 45,700 | FMC Corporation | 2,492,935 | ||
| Ltd. ADR # | 899,028 | 5,900 | Greif, Inc. | 385,683 | ||
| 131,730 | Compuware Corporation # | 1,169,762 | 44,800 | H.B. Fuller Company | 1,005,760 | |
| 23,900 | Comtech Telecommunications | 188,800 | IAMGOLD Corporation | 1,529,280 | ||
| Corporation # | 1,290,839 | 39,800 | Pactiv Corporation # | 1,059,874 | ||
| 48,300 | Constant Contact, Inc. #* | 1,038,450 | 15,600 | Rock-Tenn Company | 396,396 | |
| The accompanying Notes to Financial Statements are an integral part of this schedule. |
| 84 |
| Small Cap Stock Portfolio | ||||||
| Schedule of Investments as of December 31, 2007 | ||||||
| Shares | Common Stock (95.7%) | Value | Shares | Common Stock (95.7%) | Value | |
| Materials — continued | Utilities (4.2%) | |||||
| 37,100 | RPM International, Inc. | $753,130 | 60,000 | Alliant Energy Corporation | $2,441,400 | |
| 29,700 | Sigma-Aldrich Corporation | 1,621,620 | 29,100 | Chesapeake Utilities Corporation | 926,835 | |
| 29,800 | Silgan Holdings, Inc. | 1,547,812 | 52,800 | Cleco Corporation * | 1,467,840 | |
| 12,500 | streetTRACKS Gold Trust # | 1,029,500 | 45,900 | El Paso Electric Company # | 1,173,663 | |
| 28,800 | Terra Industries, Inc. #* | 1,375,488 | 24,200 | Energen Corporation | 1,554,366 | |
| 19,000 | Texas Industries, Inc. | 1,331,900 | 37,700 | National Fuel Gas Company * | 1,759,836 | |
| Total Materials | 25,030,267 | 41,200 | Northwest Natural Gas Company | 2,004,792 | ||
| 27,500 | Otter Tail Corporation * | 951,500 | ||||
| Telecommunications Services (0.8%) | 76,400 | UGI Corporation | 2,081,900 | |||
| 6,000 | Golden Telecom, Inc. # | 605,700 | 82,900 | Vectren Corporation | 2,404,929 | |
| 104,450 | Iowa Telecommunications | Total Utilities | 16,767,061 | |||
| Services, Inc. * | 1,698,357 | |||||
| 44,700 | Time Warner Telecom, Inc. #* | 906,963 | Total Common Stock | |||
| Total Telecommunications | (cost $339,571,133) | 382,432,957 | ||||
| Services | 3,211,020 | |||||
| Interest | Maturity | |||
| Shares | Collateral Held for Securities Loaned (23.1%) | Rate (+) | Date | Value |
| 92,358,545 | Thrivent Financial Securities Lending Trust | 5.000% | N/A | $92,358,545 |
| Total Collateral Held for Securities Loaned | ||||
| (cost $92,358,545) | 92,358,545 | |||
| Shares or | ||||
| Principal | Interest | Maturity | ||
| Amount | Short-Term Investments (7.1%) | Rate (+) | Date | Value |
| $1,000,000 | Federal National Mortgage Association | 4.030% | 5/16/2008 | $984,700 |
| 27,636,194 | Thrivent Money Market Portfolio | 4.930 | N/A | 27,636,194 |
| Total Short-Term Investments (cost $28,621,068) | 28,620,894 | |||
| Total Investments (cost $460,550,746) 125.9% | $503,412,396 | |||
| Other Assets and Liabilities, Net (25.9%) | (103,557,522) | |||
| Total Net Assets 100.0% | $399,854,874 | |||
# Non-income producing security.
* All or a portion of the security is on loan as discussed in item 2(M) of the Notes to Financial Statements.
+ The interest rate shown reflects the yield, coupon rate or, for securities purchased at a discount, the discount rate at the date of purchase.
Definitions:
ADR — American Depository Receipts, which are certificates for shares of an underlying foreign security’s shares held by an issuing U.S. depository bank.
Gross unrealized appreciation and depreciation of investments, based on cost for federal income tax purposes, were as follows:
| Gross unrealized appreciation | $56,410,455 | |
| Gross unrealized depreciation | (14,975,942) | |
| Net unrealized appreciation (depreciation) | $41,434,513 | |
| Cost for federal income tax purposes | $461,977,883 |
| The accompanying Notes to Financial Statements are an integral part of this schedule. |
| 85 |
| Small Cap Index Portfolio | ||||||
| Schedule of Investments as of December 31, 2007 | ||||||
| Shares | Common Stock (98.9%) | Value | Shares | Common Stock (98.9%) | Value | |
| Consumer Discretionary (12.6%) | 17,900 | K-Swiss, Inc. | $323,990 | |||
| 8,900 | 4Kids Entertainment, Inc. #* | $117,035 | 8,400 | Landry’s Restaurants, Inc. * | 165,480 | |
| 36,275 | Aaron Rents, Inc. | 697,931 | 34,500 | La-Z-Boy, Inc. * | 273,585 | |
| 18,900 | Arbitron, Inc. * | 785,673 | 9,800 | Libbey, Inc. * | 155,232 | |
| 8,100 | Arctic Cat, Inc. | 96,714 | 10,700 | Lithia Motors, Inc. * | 146,911 | |
| 12,300 | Audiovox Corporation # | 152,520 | 49,200 | Live Nation, Inc. # | 714,384 | |
| 7,900 | Bassett Furniture Industries, Inc. | 73,786 | 75,800 | LKQ Corporation #* | 1,593,316 | |
| 14,900 | Big 5 Sporting Goods Corporation | 214,858 | 8,300 | M/I Homes, Inc. * | 87,150 | |
| 10,700 | Blue Nile, Inc. #* | 728,242 | 12,700 | Maidenform Brands, Inc. #* | 171,831 | |
| 17,600 | Bright Horizons Family | 14,500 | Marcus Corporation | 224,025 | ||
| Solutions, Inc. # | 607,904 | 12,500 | MarineMax, Inc. #* | 193,750 | ||
| 29,625 | Brown Shoe Company, Inc. | 449,411 | 35,200 | Men’s Wearhouse, Inc. | 949,696 | |
| 10,200 | Buffalo Wild Wings, Inc. #* | 236,844 | 17,600 | Meritage Homes Corporation #* | 256,432 | |
| 19,700 | Building Materials | 9,700 | Midas, Inc. # | 142,202 | ||
| Holding Corporation * | 108,941 | 20,100 | Monaco Coach Corporation | 178,488 | ||
| 26,500 | Cabela’s, Inc. #* | 399,355 | 9,500 | Monarch Casino & Resort, Inc. # | 228,760 | |
| 19,600 | California Pizza Kitchen, Inc. # | 305,172 | 12,900 | Movado Group, Inc. | 326,241 | |
| 21,000 | Cato Corporation | 328,860 | 15,500 | Multimedia Games, Inc. #* | 129,270 | |
| 19,825 | CEC Entertainment, Inc. # | 514,657 | 3,200 | National Presto Industries, Inc. | 168,512 | |
| 51,700 | Champion Enterprises, Inc. #* | 487,014 | 21,200 | Nautilus Group, Inc. * | 102,820 | |
| 16,800 | Charlotte Russe Holding, Inc. # | 271,320 | 14,900 | O’Charley’s, Inc. | 223,202 | |
| 15,800 | Children’s Place Retail | 10,500 | Oxford Industries, Inc. * | 270,585 | ||
| Stores, Inc. # | 409,694 | 17,400 | P.F. Chang’s China Bistro, Inc. #* | 397,416 | ||
| 23,825 | Christopher & Banks Corporation | 272,796 | 21,600 | Panera Bread Company #* | 773,712 | |
| 36,700 | CKE Restaurants, Inc. * | 484,440 | 13,900 | Papa John’s International, Inc. # | 315,530 | |
| 10,600 | Coachmen Industries, Inc. | 63,070 | 8,300 | Peet’s Coffee & Tea, Inc. #* | 241,281 | |
| 18,700 | Coinstar, Inc. # | 526,405 | 27,800 | Pep Boys - Manny, Moe & Jack * | 319,144 | |
| 3,600 | CPI Corporation | 84,780 | 16,400 | PetMed Express, Inc. # | 198,440 | |
| 55,200 | Crocs, Inc. #* | 2,031,912 | 40,100 | Pinnacle Entertainment, Inc. # | 944,756 | |
| 8,700 | Deckers Outdoor Corporation # | 1,349,022 | 23,500 | Polaris Industries, Inc. * | 1,122,595 | |
| 30,300 | Dress Barn, Inc. #* | 379,053 | 31,912 | Pool Corporation * | 632,815 | |
| 12,200 | Drew Industries, Inc. # | 334,280 | 5,900 | Pre-Paid Legal Services, Inc. #* | 326,565 | |
| 20,050 | Ethan Allen Interiors, Inc. * | 571,425 | 82,400 | Quiksilver, Inc. #* | 706,992 | |
| 28,500 | Finish Line, Inc. | 68,970 | 54,300 | Radio One, Inc. # | 128,691 | |
| 43,000 | Fleetwood Enterprises, Inc. #* | 257,140 | 12,700 | RC2 Corporation # | 356,489 | |
| 31,137 | Fossil, Inc. # | 1,307,131 | 11,300 | Red Robin Gourmet Burgers, Inc. #* | 361,487 | |
| 26,950 | Fred’s, Inc. * | 259,528 | 11,200 | Russ Berrie and Company, Inc. # | 183,232 | |
| 15,200 | Genesco, Inc. # | 574,560 | 12,800 | Ruth’s Chris Steak House, Inc. #* | 114,432 | |
| 15,300 | Group 1 Automotive, Inc. * | 363,375 | 31,350 | Select Comfort Corporation #* | 219,764 | |
| 19,300 | Gymboree Corporation #* | 587,878 | 23,625 | Shuffle Master, Inc. #* | 283,264 | |
| 14,700 | Haverty Furniture Companies, Inc. * | 132,153 | 21,700 | Skechers USA, Inc. # | 423,367 | |
| 20,850 | Hibbett Sports, Inc. # | 416,583 | 4,600 | Skyline Corporation | 135,010 | |
| 29,275 | Hot Topic, Inc. # | 170,380 | 20,800 | Sonic Automotive, Inc. | 402,688 | |
| 38,100 | Iconix Brand Group, Inc. # | 749,046 | 40,752 | Sonic Corporation #* | 892,469 | |
| 10,000 | IHOP Corporation * | 365,800 | 21,800 | Spartan Motors, Inc. * | 166,552 | |
| 40,200 | Jack in the Box, Inc. # | 1,035,954 | 27,800 | Stage Stores, Inc. | 411,440 | |
| 18,900 | JAKKS Pacific, Inc. # | 446,229 | 11,000 | Stamps.com, Inc. #* | 133,980 | |
| 16,730 | Jo-Ann Stores, Inc. # | 218,828 | 8,100 | Standard Motor Products, Inc. * | 66,096 | |
| 12,175 | Joseph A. Bank Clothiers, Inc. #* | 346,379 | 43,500 | Standard Pacific Corporation * | 145,725 | |
| 17,400 | Kellwood Company | 289,536 | 19,117 | Steak n Shake Company #* | 208,375 | |
| The accompanying Notes to Financial Statements are an integral part of this schedule. |
| 86 |
| Small Cap Index Portfolio | ||||||
| Schedule of Investments as of December 31, 2007 | ||||||
| Shares | Common Stock (98.9%) | Value | Shares | Common Stock (98.9%) | Value | |
| Consumer Discretionary — continued | Energy (8.2%) | |||||
| 17,400 | Stein Mart, Inc. * | $82,476 | 18,400 | Atwood Oceanics, Inc. # | $1,844,416 | |
| 15,200 | Sturm, Ruger & Company, Inc. #* | 125,856 | 15,100 | Basic Energy Services, Inc. #* | 331,445 | |
| 15,500 | Superior Industries | 15,900 | Bristow Group, Inc. #* | 900,735 | ||
| International, Inc. * | 281,635 | 65,000 | Cabot Oil & Gas Corporation ‡ | 2,624,050 | ||
| 36,100 | Texas Roadhouse, Inc. # | 399,266 | 13,600 | Carbo Ceramics, Inc. * | 505,920 | |
| 22,500 | Tractor Supply Company #* | 808,650 | 18,100 | Dril-Quip, Inc. # | 1,007,446 | |
| 42,300 | Triarc Companies, Inc. | 370,548 | 7,300 | Gulf Island Fabrication, Inc. | 231,483 | |
| 20,000 | Tuesday Morning Corporation * | 101,400 | 61,214 | Helix Energy Solutions Group, Inc. #* | 2,540,381 | |
| 16,600 | Tween Brands, Inc. #* | 439,568 | 15,400 | Hornbeck Offshore Services, Inc. #* | 692,230 | |
| 9,600 | UniFirst Corporation | 364,800 | 55,200 | Input/Output, Inc. # | 871,056 | |
| 9,700 | Universal Electronic, Inc. # | 324,368 | 9,900 | Lufkin Industries, Inc. | 567,171 | |
| 15,700 | Universal Technical Institute, Inc. #* | 266,900 | 53,400 | Massey Energy Company * | 1,909,050 | |
| 9,800 | Volcom, Inc. #* | 215,894 | 17,800 | Matrix Service Company # | 388,396 | |
| 19,900 | Winnebago Industries, Inc. * | 418,298 | 12,300 | NATO Group, Inc. # | 666,045 | |
| 27,800 | WMS Industries, Inc. # | 1,018,592 | 36,900 | Oceaneering International, Inc. # | 2,485,215 | |
| 35,100 | Wolverine World Wide, Inc. | 860,652 | 17,700 | Patriot Coal Corporation #* | 738,798 | |
| 30,000 | Zale Corporation #* | 481,800 | 25,400 | Penn Virginia Corporation | 1,108,202 | |
| 12,000 | Zumiez, Inc. #* | 292,320 | 10,000 | Petroleum Development Corporation # | 591,300 | |
| Total Consumer Discretionary | 45,163,776 | 33,300 | Pioneer Drilling Company # | 395,604 | ||
| 15,550 | SEACOR Holdings, Inc. # | 1,442,107 | ||||
| Consumer Staples (3.5%) | 42,200 | St. Mary Land & Exploration Company | 1,629,342 | |||
| 59,600 | Alliance One International, Inc. # | 242,572 | 18,800 | Stone Energy Corporation # | 881,908 | |
| 12,100 | Andersons, Inc. * | 542,080 | 10,600 | Superior Well Services, Inc. # | 224,932 | |
| 6,900 | Boston Beer Company, Inc. # | 259,785 | 20,200 | Swift Energy Company # | 891,022 | |
| 33,900 | Casey’s General Stores, Inc. ‡ | 1,003,779 | 49,750 | TETRA Technologies, Inc. # | 774,608 | |
| 48,100 | Central Garden & Pet Company # | 257,816 | 31,100 | Unit Corporation # | 1,438,375 | |
| 12,800 | Chattem, Inc. #* | 966,912 | 20,500 | W-H Energy Services, Inc. # | 1,152,305 | |
| 52,425 | Flowers Foods, Inc. | 1,227,269 | 19,100 | World Fuel Services Corporation | 554,473 | |
| 15,300 | Great Atlantic & Pacific Tea | Total Energy | 29,388,015 | |||
| Company, Inc. # | 479,349 | |||||
| 26,600 | Hain Celestial Group, Inc. # | 851,200 | Financials (16.1%) | |||
| 9,400 | J & J Snack Foods Corporation | 294,032 | 21,600 | Acadia Realty Trust ‡ | 553,176 | |
| 20,900 | Lance, Inc. | 426,778 | 11,300 | Alabama National BanCorporation | 879,253 | |
| 21,200 | Longs Drug Stores Corporation | 996,400 | 11,900 | Anchor BanCorp Wisconsin, Inc. * | 279,888 | |
| 10,500 | Mannatech, Inc. * | 66,360 | 35,300 | Bank Mutual Corporation | 373,121 | |
| 9,100 | Nash Finch Company * | 321,048 | 27,900 | BankAtlantic Bancorp, Inc. * | 114,390 | |
| 23,800 | Performance Food Group Company # | 639,506 | 21,000 | BankUnited Financial Corporation * | 144,900 | |
| 17,300 | Ralcorp Holdings, Inc. # | 1,051,667 | 43,900 | BioMed Realty Trust, Inc. | 1,017,163 | |
| 10,300 | Sanderson Farms, Inc. * | 347,934 | 25,000 | Boston Private Financial | ||
| 14,700 | Spartan Stores, Inc. | 335,895 | Holdings, Inc. * | 677,000 | ||
| 27,400 | Spectrum Brands, Inc. #* | 146,042 | 39,600 | Brookline Bancorp, Inc. * | 402,336 | |
| 20,900 | TreeHouse Foods, Inc. # | 480,491 | 19,100 | Cascade Bancorp * | 265,872 | |
| 28,700 | United Natural Foods, Inc. #* | 910,364 | 19,600 | Cash America International, Inc. | 633,080 | |
| 5,700 | USANA Health Sciences, Inc. #* | 211,356 | 20,100 | Central Pacific Financial Corporation * | 371,046 | |
| 11,370 | WD-40 Company | 431,719 | 33,318 | Chittenden Corporation | 1,186,787 | |
| Total Consumer Staples | 12,490,354 | 31,500 | Colonial Properties Trust * | 712,845 | ||
| 12,000 | Columbia Banking System, Inc. | 356,760 | ||||
| The accompanying Notes to Financial Statements are an integral part of this schedule. |
| 87 |
| Small Cap Index Portfolio | ||||||
| Schedule of Investments as of December 31, 2007 | ||||||
| Shares | Common Stock (98.9%) | Value | Shares | Common Stock (98.9%) | Value | |
| Financials — continued | 29,500 | optionsXpress Holdings, Inc. * | $997,690 | |||
| 20,000 | Community Bank System, Inc. | $397,400 | 10,400 | Parkway Properties, Inc. | 384,592 | |
| 21,900 | Corus Bankshares, Inc. * | 233,673 | 39,000 | Philadelphia Consolidated | ||
| 29,465 | Delphi Financial Group, Inc. | 1,039,525 | Holding Corporation # | 1,534,650 | ||
| 63,500 | DiamondRock Hospitality Company | 951,230 | 11,700 | Piper Jaffray Companies # | 541,944 | |
| 16,975 | Dime Community Bancshares | 216,771 | 10,200 | Portfolio Recovery | ||
| 13,065 | Downey Financial Corporation * | 406,452 | Associates, Inc. * | 404,634 | ||
| 42,200 | East West Bancorp, Inc. | 1,022,506 | 14,500 | Presidential Life Corporation | 253,895 | |
| 16,000 | EastGroup Properties, Inc. | 669,600 | 12,800 | PrivateBancorp, Inc. * | 417,920 | |
| 18,800 | Entertainment Properties Trust | 883,600 | 22,000 | ProAssurance Corporation # | 1,208,240 | |
| 16,900 | Essex Property Trust, Inc. * | 1,647,581 | 25,700 | Prosperity Bancshares, Inc. | 755,323 | |
| 42,100 | Extra Space Storage, Inc. | 601,609 | 21,464 | Provident Bankshares Corporation | 459,115 | |
| 17,250 | Financial Federal Corporation * | 384,502 | 10,800 | PS Business Parks, Inc. | 567,540 | |
| 50,800 | First BanCorp * | 370,332 | 18,000 | Rewards Network, Inc. # | 89,460 | |
| 19,300 | First Cash Financial Services, Inc. # | 283,324 | 13,000 | RLI Corporation | 738,270 | |
| 42,700 | First Commonwealth | 10,900 | Safety Insurance Group, Inc. | 399,158 | ||
| Financial Corporation * | 454,755 | 5,600 | SCPIE Holdings, Inc. # | 153,832 | ||
| 20,600 | First Financial Bancorp * | 234,840 | 35,600 | Selective Insurance Group, Inc. | 818,444 | |
| 8,700 | First Indiana Corporation | 278,400 | 59,500 | Senior Housing Property Trust * | 1,349,460 | |
| 32,612 | First Midwest Bancorp, Inc. | 997,927 | 19,900 | Signature Bank # | 671,625 | |
| 9,200 | FirstFed Financial Corporation #* | 329,544 | 48,600 | South Financial Group, Inc. * | 759,618 | |
| 24,600 | Flagstar Bancorp, Inc. * | 171,462 | 14,500 | Sovran Self Storage, Inc. * | 581,450 | |
| 24,000 | Forestar Real Estate Group, Inc. # | 566,160 | 12,000 | Sterling Bancorp | 163,680 | |
| 17,000 | Franklin Bank Corporation #* | 73,270 | 48,900 | Sterling Bancshares, Inc. | 545,724 | |
| 46,400 | Fremont General Corporation #* | 162,400 | 34,415 | Sterling Financial Corporation | 577,828 | |
| 27,900 | Frontier Financial Corporation * | 518,103 | 12,100 | Stewart Information | ||
| 35,900 | Glacier Bancorp, Inc. * | 672,766 | Services Corporation | 315,689 | ||
| 28,300 | Guaranty Financial Group, Inc. # | 452,800 | 57,200 | Susquehanna Bancshares, Inc. * | 1,054,768 | |
| 16,500 | Hancock Holding Company * | 630,300 | 15,027 | SWS Group, Inc. | 190,386 | |
| 26,500 | Hanmi Financial Corporation | 228,430 | 21,000 | Tanger Factory Outlet | ||
| 24,800 | Hilb, Rogal and Hobbs Company * | 1,006,136 | Centers, Inc. * | 791,910 | ||
| 13,365 | Independent Bank Corporation * | 126,968 | 13,600 | Tower Group, Inc. | 454,240 | |
| 11,000 | Infinity Property & | 19,300 | Tradestation Group, Inc. # | 274,253 | ||
| Casualty Corporation * | 397,430 | 8,300 | Triad Guaranty, Inc. #* | 81,340 | ||
| 39,100 | Inland Real Estate Corporation * | 553,656 | 50,482 | TrustCo Bank Corporation NY * | 500,781 | |
| 29,500 | Investment Technology Group, Inc. # | 1,403,905 | 69,900 | UCBH Holdings, Inc. * | 989,784 | |
| 12,600 | Irwin Financial Corporation | 92,610 | 24,000 | UMB Financial Corporation | 920,640 | |
| 21,900 | Kilroy Realty Corporation | 1,203,624 | 40,200 | Umpqua Holdings Corporation * | 616,668 | |
| 19,400 | Kite Realty Group Trust | 296,238 | 25,800 | United Bankshares, Inc. * | 722,916 | |
| 36,200 | LaBranche & Company, Inc. #* | 182,448 | 26,800 | United Community Banks, Inc. * | 423,440 | |
| 10,500 | LandAmerica Financial Group, Inc. * | 351,225 | 14,900 | United Fire & Casual Company | 433,441 | |
| 42,700 | Lexington Corporate Properties Trust * | 620,858 | 45,300 | Whitney Holding Corporation ‡ | 1,184,595 | |
| 13,600 | LTC Properties, Inc. | 340,680 | 11,800 | Wilshire Bancorp, Inc. | 92,630 | |
| 33,700 | Medical Properties Trust, Inc. * | 343,403 | 15,800 | Wintrust Financial Corporation * | 523,454 | |
| 17,100 | Mid-America Apartment | 11,312 | World Acceptance Corporation #* | 305,198 | ||
| Communities, Inc. * | 731,025 | 24,800 | Zenith National | |||
| 14,600 | Nara Bancorp, Inc. | 170,382 | Insurance Corporation * | 1,109,304 | ||
| 48,100 | National Retail Properties, Inc. | 1,124,578 | Total Financials | 57,697,574 | ||
| 8,400 | Navigators Group, Inc. # | 546,000 | ||||
| The accompanying Notes to Financial Statements are an integral part of this schedule. |
| 88 |
| Small Cap Index Portfolio | ||||||
| Schedule of Investments as of December 31, 2007 | ||||||
| Shares | Common Stock (98.9%) | Value | Shares | Common Stock (98.9%) | Value | |
| Health Care (13.7%) | 9,500 | Molina Healthcare, Inc. #* | $367,650 | |||
| 38,000 | Allscripts Healthcare Solutions, Inc. #* | $737,960 | 16,500 | Noven Pharmaceuticals, Inc. #* | 229,020 | |
| 29,200 | Alpharma, Inc. # | 588,380 | 22,000 | Odyssey Healthcare, Inc. # | 243,320 | |
| 17,533 | Amedisys, Inc. #* | 850,717 | 23,100 | Omnicell, Inc. # | 622,083 | |
| 48,400 | American Medical Systems | 11,800 | Osteotech, Inc. # | 92,276 | ||
| Holdings, Inc. #* | 699,864 | 27,300 | Owens & Minor, Inc. * | 1,158,339 | ||
| 35,600 | AMERIGROUP Corporation # | 1,297,620 | 12,200 | Palomar Medical Technologies, Inc. #* | 186,904 | |
| 20,200 | AMN Healthcare Services, Inc. # | 346,834 | 18,600 | PAREXEL International Corporation # | 898,380 | |
| 20,750 | AmSurg Corporation # | 561,495 | 32,500 | Pediatrix Medical Group, Inc. #‡ | 2,214,875 | |
| 8,900 | Analogic Corporation | 602,708 | 20,400 | PharMerica Corporation #* | 283,152 | |
| 23,100 | ArQule, Inc. # | 133,980 | 12,600 | Pharmnet Development Group # | 494,046 | |
| 18,700 | ArthroCare Corporation #* | 898,535 | 28,300 | Phase Forward, Inc. # | 615,525 | |
| 16,000 | BioLase Technology, Inc. #* | 37,760 | 11,400 | Possis Medical, Inc. # | 166,212 | |
| 9,100 | Bradley Pharmaceuticals, Inc. # | 179,270 | 43,400 | PSS World Medical, Inc. #* | 849,338 | |
| 19,400 | Cambrex Corporation | 162,572 | 44,300 | Regeneron Pharmaceuticals, Inc. # | 1,069,845 | |
| 29,200 | Centene Corporation # | 801,248 | 11,500 | RehabCare Group, Inc. # | 259,440 | |
| 16,000 | Chemed Corporation | 894,080 | 17,000 | Res-Care, Inc. # | 427,720 | |
| 19,150 | CONMED Corporation # | 442,556 | 49,600 | Respironics, Inc. # | 3,247,808 | |
| 30,000 | Cooper Companies, Inc. * | 1,140,000 | 32,400 | Salix Pharmaceuticals, Ltd. #* | 255,312 | |
| 21,500 | Cross Country Healthcare, Inc. # | 306,160 | 29,400 | Savient Pharmaceuticals, Inc. #* | 675,318 | |
| 16,550 | CryoLife, Inc. #* | 131,572 | 23,900 | Sciele Pharma, Inc. #* | 488,755 | |
| 15,000 | Cyberonics, Inc. #* | 197,400 | 37,600 | Sierra Health Services, Inc. # | 1,577,696 | |
| 8,700 | Datascope Corporation | 316,680 | 30,000 | Sunrise Senior Living, Inc. #* | 920,400 | |
| 12,600 | Dionex Corporation # | 1,044,036 | 10,100 | SurModics, Inc. #* | 548,127 | |
| 20,897 | Enzo Biochem, Inc. #* | 266,228 | 23,800 | Symmetry Medical, Inc. # | 414,834 | |
| 18,700 | Gentiva Health Services, Inc. # | 356,048 | 22,300 | Theragenics Corporation # | 79,834 | |
| 15,100 | Greatbatch Technologies, Inc. # | 301,849 | 46,800 | ViroPharma, Inc. #* | 371,592 | |
| 17,100 | Haemonetics Corporation # | 1,077,642 | 5,400 | Vital Signs, Inc. | 276,048 | |
| 24,800 | HealthExtras, Inc. # | 646,784 | Total Health Care | 48,933,728 | ||
| 23,800 | Healthways, Inc. #* | 1,390,872 | ||||
| 46,000 | Hooper Holmes, Inc. # | 79,120 | Industrials (16.7%) | |||
| 8,300 | ICU Medical, Inc. #* | 298,883 | 14,900 | A.O. Smith Corporation | 522,245 | |
| 41,100 | IDEXX Laboratories, Inc. # | 2,409,693 | 13,600 | A.S.V., Inc. #* | 188,360 | |
| 46,875 | Immucor, Inc. # | 1,593,281 | 25,400 | AAR Corporation # | 965,962 | |
| 12,300 | Integra LifeSciences | 29,400 | ABM Industries, Inc. ‡ | 599,466 | ||
| Holdings Corporation #* | 515,739 | 28,400 | Acuity Brands, Inc. ‡ | 1,278,000 | ||
| 21,400 | Invacare Corporation * | 539,280 | 15,800 | Administaff, Inc. ‡ | 446,824 | |
| 21,600 | inVentiv Health, Inc. # | 668,736 | 17,600 | Albany International Corporation * | 652,960 | |
| 8,600 | Kendle International, Inc. #* | 420,712 | 6,500 | Angelica Corporation | 124,150 | |
| 8,200 | Kensey Nash Corporation # | 245,344 | 19,500 | Apogee Enterprises, Inc. | 333,645 | |
| 12,850 | LCA-Vision, Inc. * | 256,614 | 24,650 | Applied Industrial | ||
| 9,700 | LHC Group, Inc. #* | 242,306 | Technologies, Inc. | 715,343 | ||
| 20,400 | LifeCell Corporation #* | 879,444 | 8,300 | Applied Signal Technology, Inc. | 112,714 | |
| 21,600 | Martek Biosciences Corporation #* | 638,928 | 16,800 | Arkansas Best Corporation * | 368,592 | |
| 14,300 | Matria Healthcare, Inc. # | 339,911 | 12,800 | Astec Industries, Inc. # | 476,032 | |
| 9,200 | MedCath Corporation # | 225,952 | 30,700 | Baldor Electric Company | 1,033,362 | |
| 22,700 | Mentor Corporation * | 887,570 | 30,200 | Barnes Group, Inc. * | 1,008,378 | |
| 26,700 | Meridian Bioscience, Inc. | 803,136 | 30,325 | Belden, Inc. * | 1,349,462 | |
| 18,400 | Merit Medical Systems, Inc. # | 255,760 | 17,900 | Bowne & Company, Inc. | 315,040 | |
| 54,000 | MGI Pharma, Inc. #* | 2,188,620 | 36,400 | Brady Corporation ‡ | 1,277,276 | |
| The accompanying Notes to Financial Statements are an integral part of this schedule. |
| 89 |
| Small Cap Index Portfolio | ||||||
| Schedule of Investments as of December 31, 2007 | ||||||
| Shares | Common Stock (98.9%) | Value | Shares | Common Stock (98.9%) | Value | |
| Industrials — continued | 37,600 | Spherion Corporation # | $273,728 | |||
| 33,200 | Briggs & Stratton Corporation * | $752,312 | 8,500 | Standard Register Company | 99,110 | |
| 17,200 | C&D Technologies, Inc. #* | 113,692 | 8,400 | Standex International Corporation | 146,580 | |
| 6,200 | Cascade Corporation | 288,052 | 23,500 | Teledyne Technologies, Inc. # | 1,253,255 | |
| 9,100 | CDI Corporation | 220,766 | 39,106 | Tetra Tech, Inc. # | 840,779 | |
| 18,250 | Ceradyne, Inc. # | 856,472 | 26,600 | Toro Company | 1,448,104 | |
| 33,400 | CLARCOR, Inc. | 1,268,198 | 15,500 | Tredegar Corporation | 249,240 | |
| 8,200 | Consolidated Graphics, Inc. # | 392,124 | 11,200 | Triumph Group, Inc. * | 922,320 | |
| 10,300 | Cubic Corporation | 403,760 | 29,900 | TrueBlue, Inc. # | 432,952 | |
| 29,800 | Curtiss-Wright Corporation | 1,495,960 | 16,700 | United Stationers, Inc. # | 771,707 | |
| 43,400 | EMCOR Group, Inc. # | 1,025,542 | 12,800 | Universal Forest Products, Inc. | 377,088 | |
| 14,500 | EnPro Industries, Inc. # | 444,425 | 11,500 | Valmont Industries, Inc. | 1,024,880 | |
| 19,600 | Esterline Technologies Corporation # | 1,014,300 | 13,800 | Viad Corporation | 435,804 | |
| 20,200 | Forward Air Corporation | 629,634 | 12,800 | Vicor Corporation | 199,552 | |
| 24,600 | Frontier Airlines Holdings, Inc. #* | 129,396 | 9,200 | Volt Information Sciences, Inc. # | 167,992 | |
| 14,300 | G & K Services, Inc. | 536,536 | 20,300 | Wabash National Corporation | 156,107 | |
| 35,800 | Gardner Denver, Inc. # | 1,181,400 | 45,600 | Waste Connections, Inc. # | 1,409,040 | |
| 37,800 | GenCorp, Inc. # | 440,748 | 16,550 | Watsco, Inc. * | 608,378 | |
| 20,000 | Gibraltar Industries, Inc. | 308,400 | 28,400 | Watson Wyatt Worldwide, Inc. | 1,318,044 | |
| 17,630 | Griffon Corporation # | 219,494 | 21,000 | Watts Water Technologies, Inc. * | 625,800 | |
| 28,525 | Healthcare Services Group, Inc. * | 604,160 | 19,800 | Woodward Governor Company | 1,345,410 | |
| 38,448 | Heartland Express, Inc. * | 545,193 | Total Industrials | 59,580,858 | ||
| 11,900 | Heidrick & Struggles International, Inc. | 441,609 | ||||
| 26,100 | Hub Group, Inc. # | 693,738 | Information Technology (19.0%) | |||
| 18,400 | Insituform Technologies, Inc. #* | 272,320 | 17,500 | Actel Corporation # | 239,050 | |
| 36,600 | Interface, Inc. | 597,312 | 81,100 | Adaptec, Inc. # | 274,118 | |
| 16,500 | Kaman Corporation | 607,365 | 23,900 | Advanced Energy Industries, Inc. # | 312,612 | |
| 18,900 | Kaydon Corporation * | 1,030,806 | 17,800 | Agilysys, Inc. | 269,136 | |
| 35,800 | Kirby Corporation # | 1,663,984 | 43,700 | AMIS Holdings, Inc. # | 437,874 | |
| 38,850 | Knight Transportation, Inc. * | 575,368 | 21,300 | Anixter International, Inc. #* | 1,326,351 | |
| 36,100 | Landstar System, Inc. | 1,521,615 | 10,700 | Ansoft Corporation # | 276,595 | |
| 2,800 | Lawson Products, Inc. | 106,176 | 52,400 | ANSYS, Inc. #‡ | 2,172,504 | |
| 42,936 | Lennox International, Inc. * | 1,778,409 | 91,923 | Arris Group, Inc. #* | 917,394 | |
| 7,850 | Lindsay Manufacturing Company * | 554,916 | 22,700 | ATMI, Inc. # | 732,075 | |
| 11,100 | Lydall, Inc. # | 116,772 | 23,313 | Avid Technology, Inc. #* | 660,690 | |
| 20,200 | MagneTek, Inc. # | 86,456 | 68,500 | Axcelis Technologies, Inc. # | 315,100 | |
| 19,300 | Mesa Air Group, Inc. # | 59,637 | 8,600 | Bankrate, Inc. #* | 413,574 | |
| 23,100 | Mobile Mini, Inc. # | 428,274 | 8,000 | Bel Fuse, Inc. | 234,160 | |
| 28,450 | Moog, Inc. # | 1,303,294 | 20,400 | Bell Microproducts, Inc. #* | 122,604 | |
| 24,800 | Mueller Industries, Inc. | 718,952 | 47,950 | Benchmark Electronics, Inc. # | 850,154 | |
| 13,500 | NCI Building Systems, Inc. #* | 388,665 | 11,800 | Black Box Corporation | 426,806 | |
| 19,050 | Old Dominion Freight Line # | 440,246 | 29,600 | Blackbaud, Inc. | 829,984 | |
| 23,700 | On Assignment, Inc. # | 166,137 | 25,400 | Blue Coat Systems, Inc. #* | 834,898 | |
| 21,500 | Regal-Beloit Corporation | 966,425 | 34,300 | Brightpoint, Inc. # | 526,848 | |
| 11,400 | Robbins & Myers, Inc. | 862,182 | 47,507 | Brooks Automation, Inc. # | 627,567 | |
| 11,900 | School Specialty, Inc. # | 411,145 | 16,100 | Cabot Microelectronics Corporation #* | 578,151 | |
| 54,300 | Shaw Group, Inc. #* | 3,281,895 | 20,100 | CACI International, Inc. # | 899,877 | |
| 25,000 | Simpson Manufacturing | 17,900 | Captaris, Inc. # | 77,328 | ||
| Company, Inc. * | 664,750 | 6,200 | Catapult Communications | |||
| 40,900 | SkyWest, Inc. | 1,098,165 | Corporation # | 46,810 | ||
| The accompanying Notes to Financial Statements are an integral part of this schedule. |
| 90 |
| Small Cap Index Portfolio | ||||||
| Schedule of Investments as of December 31, 2007 | ||||||
| Shares | Common Stock (98.9%) | Value | Shares | Common Stock (98.9%) | Value | |
| Information Technology — continued | 51,800 | Microsemi Corporation #* | $1,146,852 | |||
| 26,600 | Checkpoint Systems, Inc. # | $691,068 | 33,500 | MKS Instruments, Inc. # | 641,190 | |
| 36,500 | CIBER, Inc. # | 223,015 | 11,900 | MTS Systems Corporation | 507,773 | |
| 29,000 | Cognex Corporation | 584,350 | 31,000 | Napster, Inc. # | 61,070 | |
| 15,400 | Cohu, Inc. | 235,620 | 23,500 | NETGEAR, Inc. # | 838,245 | |
| 16,100 | Comtech Telecommunications | 18,300 | Network Equipment | |||
| Corporation # | 869,561 | Technologies, Inc. #* | 154,086 | |||
| 28,700 | Concur Technologies, Inc. # | 1,039,227 | 24,800 | Newport Corporation #* | 317,192 | |
| 23,700 | CTS Corporation | 235,341 | 21,500 | Novatel Wireless, Inc. #* | 348,300 | |
| 46,025 | CyberSource Corporation #* | 817,864 | 13,650 | Park Electrochemical Corporation | 385,476 | |
| 20,500 | Cymer, Inc. # | 798,065 | 14,800 | PC TEL, Inc. # | 101,528 | |
| 22,400 | Daktronics, Inc. * | 505,568 | 20,500 | Perficient, Inc. # | 322,670 | |
| 19,900 | DealerTrack Holdings, Inc. # | 666,053 | 17,400 | Pericom Semiconductor Corporation # | 325,380 | |
| 17,200 | Digi International, Inc. # | 244,068 | 18,100 | Phoenix Technologies, Ltd. # | 233,128 | |
| 20,950 | Diodes, Inc. #* | 629,966 | 11,200 | Photon Dynamics, Inc. # | 92,960 | |
| 17,400 | Ditech Networks, Inc. #* | 60,378 | 28,000 | Photronics, Inc. # | 349,160 | |
| 21,700 | DSP Group, Inc. # | 264,740 | 11,800 | Planar Systems, Inc. # | 75,520 | |
| 18,700 | Electro Scientific Industries, Inc. # | 371,195 | 31,100 | Plexus Corporation # | 816,686 | |
| 39,100 | Epicor Software Corporation # | 460,598 | 28,200 | Progress Software Corporation # | 949,776 | |
| 17,800 | EPIQ Systems, Inc. #* | 309,898 | 11,700 | Quality Systems, Inc. * | 356,733 | |
| 32,600 | Exar Corporation #‡ | 259,822 | 17,900 | Radiant Systems, Inc. # | 308,417 | |
| 28,750 | FactSet Research Systems, Inc. | 1,601,375 | 14,800 | RadiSys Corporation # | 198,320 | |
| 11,100 | Faro Technologies, Inc. # | 301,698 | 11,900 | Rogers Corporation # | 516,103 | |
| 24,300 | FEI Company # | 603,369 | 19,600 | Rudolph Technologies, Inc. # | 221,872 | |
| 91,000 | FLIR Systems, Inc. # | 2,848,300 | 17,300 | ScanSource, Inc. # | 559,655 | |
| 15,700 | Gerber Scientific, Inc. # | 169,560 | 38,200 | Secure Computing Corporation # | 366,720 | |
| 15,700 | Gevity HR, Inc. | 120,733 | 8,800 | SI International, Inc. # | 241,736 | |
| 62,500 | Harmonic, Inc. #* | 655,000 | 108,300 | Skyworks Solutions, Inc. # | 920,550 | |
| 17,600 | Hutchinson Technology, Inc. #* | 463,232 | 20,200 | Smith Micro Software, Inc. #* | 171,094 | |
| 58,700 | Informatica Corporation #* | 1,057,774 | 17,400 | Sonic Solutions, Inc. #* | 180,786 | |
| 22,300 | InfoSpace, Inc. * | 419,240 | 12,800 | SPSS, Inc. # | 459,648 | |
| 32,575 | Insight Enterprises, Inc. # | 594,168 | 15,600 | Standard Microsystems Corporation # | 609,492 | |
| 14,400 | Intevac, Inc. # | 209,376 | 7,600 | StarTek, Inc. # | 70,756 | |
| 20,500 | Itron, Inc. #* | 1,967,385 | 14,000 | Stratasys, Inc. #* | 361,760 | |
| 33,100 | J2 Global Communication, Inc. # | 700,727 | 9,200 | Supertex, Inc. #* | 287,868 | |
| 17,800 | JDA Software Group, Inc. # | 364,188 | 21,900 | Sykes Enterprises, Inc. # | 394,200 | |
| 9,500 | Keithley Instruments, Inc. | 91,960 | 30,550 | Symmetricom, Inc. #* | 143,890 | |
| 18,600 | Knot, Inc. #* | 296,484 | 17,300 | Synaptics, Inc. #* | 712,068 | |
| 45,500 | Kopin Corporation # | 143,780 | 11,100 | Synnex Corporation # | 217,560 | |
| 35,800 | Kulicke and Soffa Industries, Inc. #* | 245,588 | 49,550 | Take-Two Interactive | ||
| 15,000 | Littelfuse, Inc. # | 494,400 | Software, Inc. #* | 914,198 | ||
| 12,500 | LoJack Corporation # | 210,125 | 27,400 | Technitrol, Inc. | 783,092 | |
| 17,200 | Manhattan Associates, Inc. # | 453,392 | 44,337 | THQ, Inc. #* | 1,249,860 | |
| 13,100 | ManTech International Corporation # | 574,042 | 8,900 | Tollgrade Communications, Inc. # | 71,378 | |
| 12,400 | MAXIMUS, Inc. | 478,764 | 81,300 | Trimble Navigation, Ltd. # | 2,458,512 | |
| 15,200 | Mercury Computer Systems, Inc. # | 244,872 | 28,400 | TTM Technologies, Inc. # | 331,144 | |
| 25,500 | Methode Electronics, Inc. | 419,220 | 23,400 | Tyler Technologies, Inc. #* | 301,626 | |
| 36,700 | Micrel, Inc. | 310,115 | 15,600 | Ultratech, Inc. # | 176,904 | |
| 27,400 | MICROS Systems, Inc. # | 1,922,384 | 45,300 | United Online, Inc. * | 535,446 | |
| The accompanying Notes to Financial Statements are an integral part of this schedule. |
| 91 |
| Small Cap Index Portfolio | ||||||
| Schedule of Investments as of December 31, 2007 | ||||||
| Shares | Common Stock (98.9%) | Value | Shares | Common Stock (98.9%) | Value | |
| Information Technology — continued | Telecommunications Services (0.1%) | |||||
| 50,975 | Varian Semiconductor Equipment | 30,400 | General Communication, Inc. # | $266,000 | ||
| Associates, Inc. # | $1,886,075 | Total Telecommunications | ||||
| 21,300 | Veeco Instruments, Inc. # | 355,710 | Services | 266,000 | ||
| 17,600 | ViaSat, Inc. # | 605,968 | ||||
| 30,400 | Websense, Inc. #* | 516,192 | Utilities (4.7%) | |||
| 26,700 | Wright Express Corporation # | 947,583 | 17,333 | ALLETE, Inc. | 686,040 | |
| 19,600 | X-Rite, Inc. # | 227,752 | 11,450 | American States Water Company * | 431,436 | |
| Total Information Technology | 67,957,568 | 60,100 | Atmos Energy Corporation | 1,685,204 | ||
| 35,400 | Avista Corporation | 762,516 | ||||
| Materials (4.3%) | 6,900 | Central Vermont Public Service | ||||
| 18,700 | A. Schulman, Inc. | 402,985 | Corporation | 212,796 | ||
| 10,900 | A.M. Castle & Company | 296,371 | 9,100 | CH Energy Group, Inc. * | 405,314 | |
| 14,900 | AMCOL International Corporation | 536,847 | 40,200 | Cleco Corporation * | 1,117,560 | |
| 45,900 | AptarGroup, Inc. ‡ | 1,877,769 | 30,300 | El Paso Electric Company #* | 774,771 | |
| 16,600 | Arch Chemicals, Inc. | 610,050 | 14,500 | Laclede Group, Inc. | 496,480 | |
| 13,600 | Brush Engineered Materials, Inc. # | 505,920 | 18,700 | New Jersey Resources Corporation | 935,374 | |
| 26,200 | Buckeye Technologies, Inc. # | 327,500 | 17,800 | Northwest Natural Gas Company * | 866,148 | |
| 19,700 | Caraustar Industries, Inc. # | 60,873 | 49,600 | Piedmont Natural Gas | ||
| 19,500 | Century Aluminum Company # | 1,051,830 | Company, Inc. * | 1,297,536 | ||
| 13,400 | Chesapeake Corporation | 69,546 | 19,800 | South Jersey Industries, Inc. | 714,582 | |
| 7,200 | Deltic Timber Corporation | 370,728 | 80,432 | Southern Union Company | 2,361,484 | |
| 23,100 | Georgia Gulf Corporation * | 152,922 | 28,500 | Southwest Gas Corporation | 848,445 | |
| 40,300 | H.B. Fuller Company | 904,735 | 71,500 | UGI Corporation | 1,948,375 | |
| 28,400 | Headwaters, Inc. #* | 333,416 | 16,866 | UIL Holdings Corporation | 623,199 | |
| 8,400 | Material Sciences Corporation # | 62,412 | 23,700 | UniSource Energy Corporation | 747,735 | |
| 18,863 | Myers Industries, Inc. | 272,948 | Total Utilities | 16,914,995 | ||
| 10,000 | Neenah Paper, Inc. | 291,500 | ||||
| 20,400 | OM Group, Inc. # | 1,173,816 | Total Common Stock | |||
| 28,400 | OMNOVA Solutions, Inc. # | 125,244 | (cost $261,958,953) | 353,800,663 | ||
| 7,500 | Penford Corporation | 191,925 | ||||
| 62,400 | PolyOne Corporation # | 410,592 | ||||
| 6,800 | Quaker Chemical Corporation | 149,396 | ||||
| 24,875 | Quanex Corporation | 1,291,012 | ||||
| 22,500 | Rock-Tenn Company | 571,725 | ||||
| 15,400 | RTI International Metals, Inc. # | 1,061,522 | ||||
| 10,500 | Schweitzer-Mauduit | |||||
| International, Inc. | 272,055 | |||||
| 18,300 | Texas Industries, Inc. | 1,282,830 | ||||
| 27,800 | Tronox, Inc. | 240,470 | ||||
| 34,000 | Wausau-Mosinee Paper Corporation | 305,660 | ||||
| 14,650 | Zep, Inc. # | 203,196 | ||||
| Total Materials | 15,407,795 | |||||
| The accompanying Notes to Financial Statements are an integral part of this schedule. |
| 92 |
| Small Cap Index Portfolio | ||||
| Schedule of Investments as of December 31, 2007 | ||||
| Interest | Maturity | |||
| Shares | Collateral Held for Securities Loaned (31.2%) | Rate (+) | Date | Value |
| 111,638,911 | Thrivent Financial Securities Lending Trust | 5.000% | N/A | $111,638,911 |
| Total Collateral Held for Securities Loaned | ||||
| (cost $111,638,911) | 111,638,911 | |||
| Shares or | ||||
| Principal | Interest | Maturity | ||
| Amount | Short-Term Investments (1.6%) | Rate (+) | Date | Value |
| $750,000 | Federal National Mortgage Association ‡ | 4.030% | 5/16/2008 | $738,525 |
| 5,078,004 | Thrivent Money Market Portfolio | 4.930 | N/A | 5,078,004 |
| Total Short-Term Investments (cost $5,816,659) | 5,816,529 | |||
| Total Investments (cost $379,414,523) 131.7% | $471,256,103 | |||
| Other Assets and Liabilities, Net (31.7%) | (113,360,637) | |||
| Total Net Assets 100.0% | $357,895,466 | |||
| Number of | Notional | ||||
| Contracts | Expiration | Principal | Unrealized | ||
| Futures | Long/(Short) | Date | Amount | Value | Gain/(Loss) |
| Russell 2000 Index Futures | 12 | March 2008 | $4,579,810 | $4,633,200 | $53,390 |
| Total Futures | $53,390 | ||||
# Non-income producing security.
* All or a portion of the security is on loan as discussed in item 2(M) of the Notes to Financial Statements.
+ The interest rate shown reflects the yield, coupon rate or, for securities purchased at a discount, the discount rate at the date of purchase.
‡ At December 31, 2007, $738,525 of investments were held on deposit with the counterparty and pledged as the initial margin deposit for open financial futures contracts. In addition, $15,325,060 of investments were earmarked as collateral to cover open financial futures contracts.
Gross unrealized appreciation and depreciation of investments, based on cost for federal income tax purposes, were as follows:
| Gross unrealized appreciation | $131,019,100 | |
| Gross unrealized depreciation | (41,798,819) | |
| Net unrealized appreciation (depreciation) | $89,220,281 | |
| Cost for federal income tax purposes | $382,035,822 |
| The accompanying Notes to Financial Statements are an integral part of this schedule. |
| 93 |
| Mid Cap Growth Portfolio | ||||||
| Schedule of Investments as of December 31, 2007 | ||||||
| Shares | Common Stock (94.3%) | Value | Shares | Common Stock (94.3%) | Value | |
| Consumer Discretionary (14.6%) | 86,300 | Southwestern Energy Company # | $4,808,636 | |||
| 26,600 | Abercrombie & Fitch Company | $2,127,202 | 26,686 | Transocean, Inc. # | 3,820,101 | |
| 232,900 | Burger King Holdings, Inc. | 6,639,979 | 87,500 | Ultra Petroleum Corporation #* | 6,256,250 | |
| 28,000 | Central European Media | 49,985 | XTO Energy, Inc. | 2,567,230 | ||
| Enterprises, Ltd. # | 3,247,440 | Total Energy | 58,404,571 | |||
| 38,800 | Chipotle Mexican Grill, Inc. #* | 5,706,316 | ||||
| 367,800 | Coldwater Creek, Inc. #* | 2,460,582 | Financials (6.2%) | |||
| 248,500 | Corinthian Colleges, Inc. # | 3,826,900 | 141,500 | Annaly Capital Management, Inc. * | 2,572,470 | |
| 85,500 | Crocs, Inc. #* | 3,147,255 | 4,600 | CME Group, Inc. | 3,155,600 | |
| 107,200 | DeVry, Inc. | 5,570,112 | 18,200 | IntercontinentalExchange, Inc. # | 3,503,500 | |
| 118,000 | DreamWorks Animation SKG, Inc. # | 3,013,720 | 77,100 | Lazard, Ltd. * | 3,136,428 | |
| 52,400 | Focus Media Holding, Ltd. ADR #* | 2,976,844 | 22,150 | Legg Mason, Inc. | 1,620,272 | |
| 80,400 | GameStop Corporation # | 4,993,644 | 67,300 | Northern Trust Corporation * | 5,153,834 | |
| 122,100 | Hasbro, Inc. * | 3,123,318 | 26,800 | Nymex Holdings, Inc. * | 3,580,748 | |
| 183,400 | International Game Technology * | 8,056,762 | 50,400 | PartnerRe, Ltd. * | 4,159,512 | |
| 56,900 | ITT Educational Services, Inc. # | 4,851,863 | 47,600 | Principal Financial Group, Inc. | 3,276,784 | |
| 59,000 | Kohl’s Corporation #* | 2,702,200 | 188,600 | T. Rowe Price Group, Inc. * | 11,481,968 | |
| 189,300 | Leapfrog Enterprises, Inc. #* | 1,273,989 | Total Financials | 41,641,116 | ||
| 335,600 | Quiksilver, Inc. #* | 2,879,448 | ||||
| 185,900 | Scientific Games Corporation #* | 6,181,175 | Health Care (16.8%) | |||
| 110,500 | Shuffle Master, Inc. #* | 1,324,895 | 156,000 | Advanced Medical Optics, Inc. #* | 3,826,680 | |
| 53,900 | Starwood Hotels & Resorts | 138,900 | Affymetrix, Inc. #* | 3,214,146 | ||
| Worldwide, Inc. | 2,373,217 | 121,200 | Alkermes, Inc. #* | 1,889,508 | ||
| 110,600 | Texas Roadhouse, Inc. # | 1,223,236 | 105,600 | Allscripts Healthcare Solutions, Inc. #* | 2,050,752 | |
| 207,000 | TJX Companies, Inc. | 5,947,110 | 133,000 | Amylin Pharmaceuticals, Inc. #* | 4,921,000 | |
| 23,000 | Under Armour, Inc. #* | 1,004,410 | 90,600 | BioMarin Pharmaceutical, Inc. #* | 3,207,240 | |
| 146,900 | Volcom, Inc. #* | 3,236,207 | 87,800 | C.R. Bard, Inc. | 8,323,440 | |
| 180,500 | WMS Industries, Inc. #* | 6,613,520 | 62,200 | Cephalon, Inc. #* | 4,463,472 | |
| 43,600 | XM Satellite Radio Holdings, Inc. # | 533,664 | 78,750 | Coventry Health Care, Inc. #* | 4,665,938 | |
| 114,100 | Zumiez, Inc. #* | 2,779,476 | 106,800 | Elan Corporation plc ADR # | 2,347,464 | |
| Total Consumer Discretionary | 97,814,484 | 44,600 | Endo Pharmaceutical Holdings, Inc. # | 1,189,482 | ||
| 102,300 | Gen-Probe, Inc. # | 6,437,739 | ||||
| Consumer Staples (4.4%) | 66,500 | Genzyme Corporation # | 4,950,260 | |||
| 41,700 | Andersons, Inc. * | 1,868,160 | 122,000 | Gilead Sciences, Inc. # | 5,613,220 | |
| 100,800 | Clorox Company | 6,569,136 | 80,500 | Hologic, Inc. #* | 5,525,520 | |
| 177,500 | Coca-Cola Enterprises, Inc. | 4,620,325 | 48,200 | Illumina, Inc. #* | 2,856,332 | |
| 156,500 | H.J. Heinz Company | 7,305,420 | 19,800 | Intuitive Surgical, Inc. # | 6,425,100 | |
| 66,300 | Longs Drug Stores Corporation | 3,116,100 | 64,000 | Millipore Corporation # | 4,683,520 | |
| 100,900 | Pepsi Bottling Group, Inc. | 3,981,514 | 130,800 | NuVasive, Inc. #* | 5,169,216 | |
| 42,200 | Whole Foods Market, Inc. * | 1,721,760 | 79,500 | Patterson Companies, Inc. # | 2,699,025 | |
| Total Consumer Staples | 29,182,415 | 114,000 | Pharmaceutical Product | |||
| Development, Inc. * | 4,602,180 | |||||
| Energy (8.7%) | 108,800 | Sepracor, Inc. # | 2,856,000 | |||
| 190,000 | Cameron International Corporation #* | 9,144,700 | 65,200 | Shire Pharmaceuticals Group plc ADR | 4,495,540 | |
| 96,800 | Devon Energy Corporation | 8,606,488 | 155,600 | St. Jude Medical, Inc. # | 6,323,584 | |
| 75,000 | Diamond Offshore Drilling, Inc. * | 10,650,000 | 64,100 | Thermo Electron Corporation # | 3,697,288 | |
| 52,100 | Dril-Quip, Inc. # | 2,899,886 | 93,000 | Thoratec Corporation #* | 1,691,670 | |
| 64,100 | Nabors Industries, Ltd. # | 1,755,699 | 4,900 | Trans1, Inc. # | 80,703 | |
| 51,800 | National Oilwell Varco, Inc. # | 3,805,228 | 99,100 | VCA Antech, Inc. # | 4,383,193 | |
| 236,300 | Petrohawk Energy Corporation # | 4,090,353 | Total Health Care | 112,589,212 | ||
| The accompanying Notes to Financial Statements are an integral part of this schedule. |
| 94 |
| Mid Cap Growth Portfolio | ||||||
| Schedule of Investments as of December 31, 2007 | ||||||
| Shares | Common Stock (94.3%) | Value | Shares | Common Stock (94.3%) | Value | |
| Industrials (13.7%) | 89,400 | Juniper Networks, Inc. # | $2,968,080 | |||
| 33,600 | AGCO Corporation #* | $2,284,128 | 353,600 | Lawson Software, Inc. # | 3,620,864 | |
| 105,800 | BE Aerospace, Inc. # | 5,596,820 | 134,200 | Linear Technology Corporation * | 4,271,586 | |
| 35,200 | C.H. Robinson Worldwide, Inc. * | 1,905,024 | 170,400 | Marvell Technology Group, Ltd. # | 2,382,192 | |
| 21,450 | Energy Solutions, Inc. # | 578,936 | 91,000 | Maxim Integrated Products, Inc. | 2,409,680 | |
| 47,620 | Expeditors International of | 31,900 | McAfee, Inc. # | 1,196,250 | ||
| Washington, Inc. * | 2,127,662 | 90,900 | NAVTEQ Corporation # | 6,872,040 | ||
| 64,400 | Flowserve Corporation | 6,195,280 | 144,400 | Network Appliance, Inc. # | 3,604,224 | |
| 59,600 | Foster Wheeler, Ltd. # | 9,239,192 | 156,100 | Nuance Communications, Inc. #* | 2,915,948 | |
| 45,700 | FTI Consulting, Inc. #* | 2,816,948 | 135,950 | NVIDIA Corporation # | 4,625,019 | |
| 29,200 | Huron Consulting Group, Inc. #* | 2,354,396 | 340,500 | ON Semiconductor Corporation #* | 3,023,640 | |
| 83,300 | ITT Corporation * | 5,501,132 | 124,200 | OpNext, Inc. # | 1,099,170 | |
| 38,100 | Jacobs Engineering Group, Inc. #* | 3,642,741 | 855,600 | RF Micro Devices, Inc. #* | 4,885,476 | |
| 84,750 | Joy Global, Inc. | 5,578,245 | 284,100 | Seagate Technology * | 7,244,550 | |
| 74,500 | KBR, Inc. # | 2,890,600 | 175,600 | Synopsys, Inc. # | 4,553,308 | |
| 85,900 | McDermott International, Inc. # | 5,070,677 | 289,100 | Tellabs, Inc. # | 1,890,714 | |
| 98,700 | Monster Worldwide, Inc. # | 3,197,880 | 163,000 | Western Union Company | 3,957,640 | |
| 96,900 | Precision Castparts Corporation | 13,440,028 | 141,900 | Xilinx, Inc. | 3,103,353 | |
| 59,900 | Rockwell Collins, Inc. | 4,311,003 | Total Information Technology | 141,901,005 | ||
| 54,200 | Roper Industries, Inc. * | 3,389,668 | ||||
| 98,900 | Stericycle, Inc. #* | 5,874,660 | Materials (5.0%) | |||
| 59,400 | Textron, Inc. | 4,235,220 | 69,400 | Air Products and Chemicals, Inc. | 6,844,922 | |
| 130,600 | US Airways Group, Inc. #* | 1,921,126 | 18,300 | Allegheny Technologies, Inc. | 1,581,120 | |
| Total Industrials | 92,151,366 | 193,400 | Bemis Company, Inc. * | 5,295,292 | ||
| 67,400 | Celanese Corporation | 2,852,368 | ||||
| Information Technology (21.2%) | 84,400 | Newmont Mining Corporation | 4,121,252 | |||
| 324,466 | Activision, Inc. # | 9,636,640 | 123,700 | Praxair, Inc. | 10,973,427 | |
| 178,964 | Adobe Systems, Inc. # | 7,647,132 | 63,800 | Titanium Metals Corporation * | 1,687,510 | |
| 89,800 | Akamai Technologies, Inc. #* | 3,107,080 | Total Materials | 33,355,891 | ||
| 31,500 | Amphenol Corporation | 1,460,655 | ||||
| 232,000 | Broadcom Corporation # | 6,064,480 | Telecommunications Services (3.7%) | |||
| 399,100 | Cadence Design Systems, Inc. #* | 6,788,691 | 130,842 | American Tower Corporation # | 5,573,869 | |
| 69,300 | CIENA Corporation #* | 2,363,823 | 148,800 | Clearwire Corporation #* | 2,040,048 | |
| 307,100 | CNET Networks, Inc. #* | 2,806,894 | 762,521 | Level 3 Communications, Inc. #* | 2,318,064 | |
| 39,250 | Constant Contact, Inc. #* | 843,875 | 132,200 | NII Holdings, Inc. # | 6,387,904 | |
| 153,300 | Corning, Inc. | 3,677,667 | 124,200 | SBA Communications Corporation # | 4,202,928 | |
| 59,000 | Dolby Laboratories, Inc. # | 2,933,480 | 207,500 | Time Warner Telecom, Inc. #* | 4,210,175 | |
| 114,400 | Electronic Arts, Inc. #* | 6,682,104 | Total Telecommunications | |||
| 101,700 | Emulex Corporation # | 1,659,744 | Services | 24,732,988 | ||
| 112,700 | F5 Networks, Inc. # | 3,214,204 | ||||
| 39,500 | Fair Isaac Corporation * | 1,269,925 | Total Common Stock | |||
| 79,200 | FormFactor, Inc. #* | 2,621,520 | (cost $555,093,979) | 631,773,048 | ||
| 60,400 | Hittite Microwave Corporation # | 2,884,704 | ||||
| 333,200 | Integrated Device | |||||
| Technology, Inc. # | 3,768,492 | |||||
| 177,700 | Intersil Corporation * | 4,350,096 | ||||
| 262,862 | JDS Uniphase Corporation #* | 3,496,065 | ||||
| The accompanying Notes to Financial Statements are an integral part of this schedule. |
| 95 |
| Mid Cap Growth Portfolio | ||||
| Schedule of Investments as of December 31, 2007 | ||||
| Interest | Maturity | |||
| Shares | Collateral Held for Securities Loaned (17.1%) | Rate (+) | Date | Value |
| 114,798,903 | Thrivent Financial Securities Lending Trust | 5.000% | N/A | $114,798,903 |
| Total Collateral Held for Securities Loaned | ||||
| (cost $114,798,903) | 114,798,903 | |||
| Interest | Maturity | |||
| Shares | Short-Term Investments (5.6%) | Rate (+) | Date | Value |
| 37,185,191 | Thrivent Money Market Portfolio | 4.930% | N/A | $37,185,191 |
| Total Short-Term Investments (at amortized cost) | 37,185,191 | |||
| Total Investments (cost $707,078,073) 117.0% | $783,757,142 | |||
| Other Assets and Liabilities, Net (17.0%) | (113,920,484) | |||
| Total Net Assets 100.0% | $669,836,658 | |||
# Non-income producing security.
* All or a portion of the security is on loan as discussed in item 2(M) of the Notes to Financial Statements.
+ The interest rate shown reflects the yield, coupon rate or, for securities purchased at a discount, the discount rate at the date of purchase.
Definitions:
ADR — American Depository Receipts, which are certificates for shares of an underlying foreign security’s shares held by an issuing U.S. depository bank.
Gross unrealized appreciation and depreciation of investments, based on cost for federal income tax purposes, were as follows:
| Gross unrealized appreciation | $126,109,410 | |
| Gross unrealized depreciation | (49,986,507) | |
| Net unrealized appreciation (depreciation) | $76,122,903 | |
| Cost for federal income tax purposes | $707,634,239 |
| The accompanying Notes to Financial Statements are an integral part of this schedule. |
| 96 |
| Mid Cap Growth Portfolio II | ||||||
| Schedule of Investments as of December 31, 2007 | ||||||
| Shares | Common Stock (95.7%) | Value | Shares | Common Stock (95.7%) | Value | |
| Consumer Discretionary (14.7%) | 4,100 | Southwestern Energy Company # | $228,452 | |||
| 1,300 | Abercrombie & Fitch Company | $103,961 | 1,331 | Transocean, Inc. # | 190,533 | |
| 11,500 | Burger King Holdings, Inc. | 327,865 | 4,300 | Ultra Petroleum Corporation # | 307,450 | |
| 1,400 | Central European Media | 2,416 | XTO Energy, Inc. | 124,099 | ||
| Enterprises, Ltd. # | 162,372 | Total Energy | 2,886,675 | |||
| 1,900 | Chipotle Mexican Grill, Inc. #* | 279,433 | ||||
| 18,200 | Coldwater Creek, Inc. #* | 121,758 | Financials (6.3%) | |||
| 11,900 | Corinthian Colleges, Inc. # | 183,260 | 6,800 | Annaly Capital Management, Inc. | 123,624 | |
| 4,200 | Crocs, Inc. #* | 154,602 | 250 | CME Group, Inc. | 171,500 | |
| 5,300 | DeVry, Inc. | 275,388 | 900 | IntercontinentalExchange, Inc. # | 173,250 | |
| 5,600 | DreamWorks Animation SKG, Inc. # | 143,024 | 3,800 | Lazard, Ltd. | 154,584 | |
| 2,600 | Focus Media Holding, Ltd. ADR #* | 147,706 | 1,095 | Legg Mason, Inc. | 80,099 | |
| 3,800 | GameStop Corporation # | 236,018 | 3,200 | Northern Trust Corporation | 245,056 | |
| 6,000 | Hasbro, Inc. | 153,480 | 1,300 | Nymex Holdings, Inc. * | 173,693 | |
| 8,990 | International Game Technology | 394,931 | 2,500 | PartnerRe, Ltd. | 206,325 | |
| 2,800 | ITT Educational Services, Inc. # | 238,756 | 2,300 | Principal Financial Group, Inc. | 158,332 | |
| 2,900 | Kohl’s Corporation # | 132,820 | 9,400 | T. Rowe Price Group, Inc. | 572,272 | |
| 9,100 | Leapfrog Enterprises, Inc. #* | 61,243 | Total Financials | 2,058,735 | ||
| 16,000 | Quiksilver, Inc. #* | 137,280 | ||||
| 9,000 | Scientific Games Corporation #* | 299,250 | Health Care (17.1%) | |||
| 5,400 | Shuffle Master, Inc. #* | 64,746 | 7,400 | Advanced Medical Optics, Inc. #* | 181,522 | |
| 2,600 | Starwood Hotels & Resorts | 6,800 | Affymetrix, Inc. #* | 157,352 | ||
| Worldwide, Inc. | 114,478 | 6,000 | Alkermes, Inc. #* | 93,540 | ||
| 5,500 | Texas Roadhouse, Inc. # | 60,830 | 5,200 | Allscripts Healthcare Solutions, Inc. # | 100,984 | |
| 10,200 | TJX Companies, Inc. | 293,046 | 6,500 | Amylin Pharmaceuticals, Inc. #* | 240,500 | |
| 1,100 | Under Armour, Inc. #* | 48,037 | 4,300 | BioMarin Pharmaceutical, Inc. #* | 152,220 | |
| 7,200 | Volcom, Inc. #* | 158,616 | 4,400 | C.R. Bard, Inc. | 417,120 | |
| 8,800 | WMS Industries, Inc. # | 322,432 | 3,000 | Cephalon, Inc. # | 215,280 | |
| 2,100 | XM Satellite Radio Holdings, Inc. # | 25,704 | 3,850 | Coventry Health Care, Inc. # | 228,112 | |
| 5,600 | Zumiez, Inc. # | 136,416 | 5,300 | Elan Corporation plc ADR # | 116,494 | |
| Total Consumer Discretionary | 4,777,452 | 2,200 | Endo Pharmaceutical Holdings, Inc. # | 58,674 | ||
| 5,100 | Gen-Probe, Inc. # | 320,943 | ||||
| Consumer Staples (4.4%) | 3,340 | Genzyme Corporation # | 248,630 | |||
| 2,100 | Andersons, Inc. | 94,080 | 6,000 | Gilead Sciences, Inc. # | 276,060 | |
| 4,900 | Clorox Company | 319,333 | 3,900 | Hologic, Inc. # | 267,696 | |
| 8,800 | Coca-Cola Enterprises, Inc. | 229,064 | 2,400 | Illumina, Inc. # | 142,224 | |
| 7,700 | H.J. Heinz Company | 359,436 | 1,000 | Intuitive Surgical, Inc. # | 324,500 | |
| 3,200 | Longs Drug Stores Corporation | 150,400 | 3,200 | Millipore Corporation # | 234,176 | |
| 5,000 | Pepsi Bottling Group, Inc. | 197,300 | 6,300 | NuVasive, Inc. # | 248,976 | |
| 2,000 | Whole Foods Market, Inc. * | 81,600 | 3,900 | Patterson Companies, Inc. # | 132,405 | |
| Total Consumer Staples | 1,431,213 | 5,400 | Pharmaceutical Product | |||
| Development, Inc. | 217,998 | |||||
| Energy (8.9%) | 5,400 | Sepracor, Inc. # | 141,750 | |||
| 9,400 | Cameron International Corporation # | 452,422 | 3,200 | Shire Pharmaceuticals Group plc ADR | 220,640 | |
| 4,800 | Devon Energy Corporation | 426,768 | 7,700 | St. Jude Medical, Inc. # | 312,928 | |
| 3,700 | Diamond Offshore Drilling, Inc. | 525,400 | 3,160 | Thermo Electron Corporation # | 182,269 | |
| 2,500 | Dril-Quip, Inc. # | 139,150 | 4,600 | Thoratec Corporation #* | 83,674 | |
| 3,200 | Nabors Industries, Ltd. # | 87,648 | 250 | Trans1, Inc. # | 4,118 | |
| 2,800 | National Oilwell Varco, Inc. # | 205,688 | 4,900 | VCA Antech, Inc. # | 216,727 | |
| 11,500 | Petrohawk Energy Corporation # | 199,065 | Total Health Care | 5,537,512 | ||
| The accompanying Notes to Financial Statements are an integral part of this schedule. |
| 97 |
| Mid Cap Growth Portfolio II | ||||||
| Schedule of Investments as of December 31, 2007 | ||||||
| Shares | Common Stock (95.7%) | Value | Shares | Common Stock (95.7%) | Value | |
| Industrials (14.0%) | 4,400 | Juniper Networks, Inc. # | $146,080 | |||
| 1,700 | AGCO Corporation # | $115,566 | 17,500 | Lawson Software, Inc. # | 179,200 | |
| 5,200 | BE Aerospace, Inc. # | 275,080 | 6,600 | Linear Technology Corporation * | 210,078 | |
| 1,700 | C.H. Robinson Worldwide, Inc. | 92,004 | 8,440 | Marvell Technology Group, Ltd. # | 117,991 | |
| 1,100 | Energy Solutions, Inc. # | 29,689 | 4,400 | Maxim Integrated Products, Inc. | 116,512 | |
| 2,400 | Expeditors International of | 1,600 | McAfee, Inc. # | 60,000 | ||
| Washington, Inc. | 107,232 | 4,500 | NAVTEQ Corporation # | 340,200 | ||
| 3,200 | Flowserve Corporation | 307,840 | 7,200 | Network Appliance, Inc. # | 179,712 | |
| 2,900 | Foster Wheeler, Ltd. # | 449,558 | 7,400 | Nuance Communications, Inc. #* | 138,232 | |
| 2,300 | FTI Consulting, Inc. #* | 141,772 | 6,700 | NVIDIA Corporation # | 227,934 | |
| 1,400 | Huron Consulting Group, Inc. # | 112,882 | 16,800 | ON Semiconductor Corporation # | 149,184 | |
| 4,100 | ITT Corporation * | 270,764 | 6,200 | OpNext, Inc. # | 54,870 | |
| 1,900 | Jacobs Engineering Group, Inc. # | 181,659 | 42,000 | RF Micro Devices, Inc. # | 239,820 | |
| 4,150 | Joy Global, Inc. | 273,153 | 14,000 | Seagate Technology | 357,000 | |
| 3,500 | KBR, Inc. # | 135,800 | 8,700 | Synopsys, Inc. # | 225,591 | |
| 4,200 | McDermott International, Inc. # | 247,926 | 14,300 | Tellabs, Inc. # | 93,522 | |
| 4,860 | Monster Worldwide, Inc. # | 157,464 | 7,900 | Western Union Company | 191,812 | |
| 4,800 | Precision Castparts Corporation | 665,759 | 7,000 | Xilinx, Inc. | 153,090 | |
| 3,000 | Rockwell Collins, Inc. | 215,910 | Total Information Technology | 6,955,264 | ||
| 2,600 | Roper Industries, Inc. * | 162,604 | ||||
| 4,900 | Stericycle, Inc. # | 291,060 | Materials (5.1%) | |||
| 2,800 | Textron, Inc. | 199,640 | 3,500 | Air Products and Chemicals, Inc. | 345,205 | |
| 6,500 | US Airways Group, Inc. # | 95,615 | 900 | Allegheny Technologies, Inc. | 77,760 | |
| Total Industrials | 4,528,977 | 9,500 | Bemis Company, Inc. | 260,110 | ||
| 3,200 | Celanese Corporation | 135,424 | ||||
| Information Technology (21.4%) | 4,200 | Newmont Mining Corporation | 205,086 | |||
| 15,966 | Activision, Inc. # | 474,190 | 6,300 | Praxair, Inc. | 558,873 | |
| 8,546 | Adobe Systems, Inc. # | 365,171 | 3,200 | Titanium Metals Corporation * | 84,640 | |
| 4,400 | Akamai Technologies, Inc. #* | 152,240 | Total Materials | 1,667,098 | ||
| 1,560 | Amphenol Corporation | 72,337 | ||||
| 11,400 | Broadcom Corporation # | 297,996 | Telecommunications Services (3.8%) | |||
| 19,600 | Cadence Design Systems, Inc. #* | 333,396 | 6,380 | American Tower Corporation # | 271,788 | |
| 3,400 | CIENA Corporation #* | 115,974 | 7,400 | Clearwire Corporation #* | 101,454 | |
| 14,700 | CNET Networks, Inc. #* | 134,358 | 36,597 | Level 3 Communications, Inc. #* | 111,255 | |
| 1,950 | Constant Contact, Inc. #* | 41,925 | 6,500 | NII Holdings, Inc. # | 314,080 | |
| 7,500 | Corning, Inc. | 179,925 | 6,200 | SBA Communications Corporation # | 209,808 | |
| 2,900 | Dolby Laboratories, Inc. # | 144,188 | 10,200 | Time Warner Telecom, Inc. #* | 206,958 | |
| 5,700 | Electronic Arts, Inc. # | 332,937 | Total Telecommunications | |||
| 5,000 | Emulex Corporation # | 81,600 | Services | 1,215,343 | ||
| 5,500 | F5 Networks, Inc. # | 156,860 | ||||
| 1,900 | Fair Isaac Corporation * | 61,085 | Total Common Stock | |||
| 3,900 | FormFactor, Inc. #* | 129,090 | (cost $25,911,430) | 31,058,269 | ||
| 2,900 | Hittite Microwave Corporation # | 138,504 | ||||
| 15,900 | Integrated Device Technology, Inc. # | 179,829 | ||||
| 8,800 | Intersil Corporation | 215,424 | ||||
| 12,587 | JDS Uniphase Corporation #* | 167,407 | ||||
| The accompanying Notes to Financial Statements are an integral part of this schedule. |
| 98 |
| Mid Cap Growth Portfolio II | ||||
| Schedule of Investments as of December 31, 2007 | ||||
| Interest | Maturity | |||
| Shares | Collateral Held for Securities Loaned (7.0%) | Rate (+) | Date | Value |
| 2,273,125 | Thrivent Financial Securities Lending Trust | 5.000% | N/A | $2,273,125 |
| Total Collateral Held for Securities Loaned | ||||
| (cost $2,273,125) | 2,273,125 | |||
| Interest | Maturity | |||
| Shares | Short-Term Investments (4.3%) | Rate (+) | Date | Value |
| 1,395,723 | Thrivent Money Market Portfolio | 4.930% | N/A | $1,395,723 |
| | ||||
| Total Short-Term Investments (at amortized cost) | 1,395,723 | |||
| Total Investments (cost $29,580,278) 107.0% | $34,727,117 | |||
| Other Assets and Liabilities, Net (7.0%) | (2,281,233) | |||
| Total Net Assets 100.0% | $32,445,884 | |||
# Non-income producing security.
* All or a portion of the security is on loan as discussed in item 2(M) of the Notes to Financial Statements.
+ The interest rate shown reflects the yield, coupon rate or, for securities purchased at a discount, the discount rate at the date of purchase.
Definitions:
ADR — American Depository Receipts, which are certificates for shares of an underlying foreign security’s shares held by an issuing U.S. depository bank.
Gross unrealized appreciation and depreciation of investments, based on cost for federal income tax purposes, were as follows:
| Gross unrealized appreciation | $7,155,944 | |
| Gross unrealized depreciation | (2,052,823) | |
| Net unrealized appreciation (depreciation) | $5,103,121 | |
| Cost for federal income tax purposes | $29,623,996 |
| The accompanying Notes to Financial Statements are an integral part of this schedule. |
| 99 |
| Partner Mid Cap Value Portfolio | ||||||
| Schedule of Investments as of December 31, 2007 | ||||||
| Shares | Common Stock (98.1%) | Value | Shares | Common Stock (98.1%) | Value | |
| Consumer Discretionary (9.2%) | 47,296 | DCT Industrial Trust, Inc. * | $440,326 | |||
| 8,620 | BorgWarner, Inc. | $417,294 | 11,994 | Everest Re Group, Ltd. | 1,204,198 | |
| 8,299 | Boyd Gaming Corporation | 282,747 | 10,456 | Genworth Financial, Inc. | 266,105 | |
| 182,598 | Charter Communications, Inc. #* | 213,640 | 29,284 | Highwoods Properties, Inc. * | 860,364 | |
| 10,284 | Fortune Brands, Inc. | 744,150 | 48,532 | Hudson City Bancorp, Inc. | 728,951 | |
| 51,901 | H&R Block, Inc. * | 963,802 | 37,502 | KeyCorp | 879,422 | |
| 32,691 | IAC InterActiveCorp #* | 880,042 | 7,096 | Lazard, Ltd. * | 288,665 | |
| 19,083 | J.C. Penney Company, Inc. | 7,926 | Legg Mason, Inc. | 579,787 | ||
| (Holding Company) | 839,461 | 9,674 | Liberty Property Trust | 278,708 | ||
| 43,193 | Johnson Controls, Inc. | 1,556,676 | 16,641 | M&T Bank Corporation * | 1,357,406 | |
| 7,381 | KB Home * | 159,430 | 9,282 | Mack-Cali Realty Corporation | 315,588 | |
| 30,764 | Mattel, Inc. | 585,747 | 19,654 | Northern Trust Corporation | 1,505,103 | |
| 54,824 | Newell Rubbermaid, Inc. | 1,418,845 | 11,069 | PartnerRe, Ltd. * | 913,525 | |
| 14,107 | Ross Stores, Inc. | 360,716 | 25,833 | Pennsylvania Real Estate | ||
| 12,672 | Tenneco, Inc. # | 330,359 | Investment Trust * | 766,723 | ||
| Total Consumer Discretionary | 8,752,909 | 11,860 | Philadelphia Consolidated | |||
| Holding Corporation # | 466,691 | |||||
| Consumer Staples (7.5%) | 8,105 | RenaissanceRe Holdings, Ltd. | 488,245 | |||
| 12,969 | Campbell Soup Company | 463,382 | 7,641 | Torchmark Corporation | 462,510 | |
| 25,160 | Clorox Company | 1,639,677 | 31,335 | UnumProvident Corporation | 745,460 | |
| 16,337 | Coca-Cola Enterprises, Inc. | 425,252 | 10,071 | Vornado Realty Trust * | 885,744 | |
| 37,468 | ConAgra Foods, Inc. | 891,364 | 15,297 | W.R. Berkley Corporation | 456,004 | |
| 5,110 | General Mills, Inc. | 291,270 | 27,279 | Webster Financial Corporation | 872,110 | |
| 4,755 | Loews Corporation — Carolina Group | 405,602 | 6,283 | Willis Group Holdings, Ltd. | 238,566 | |
| 5,489 | Reynolds American, Inc. * | 362,054 | 5,825 | XL Capital, Ltd. | 293,056 | |
| 19,633 | Safeway, Inc. | 671,645 | Total Financials | 20,438,086 | ||
| 6,575 | Smithfield Foods, Inc. # | 190,149 | ||||
| 48,134 | SUPERVALU, Inc. | 1,805,988 | Health Care (3.6%) | |||
| Total Consumer Staples | 7,146,383 | 4,621 | Coventry Health Care, Inc. # | 273,794 | ||
| 17,270 | Edwards Lifesciences Corporation # | 794,247 | ||||
| Energy (13.8%) | 5,025 | Health Net, Inc. # | 242,708 | |||
| 45,774 | Hess Corporation | 4,616,763 | 34,939 | IMS Health, Inc. | 804,995 | |
| 14,338 | Oil States International, Inc. # | 489,213 | 6,236 | Laboratory Corporation of | ||
| 65,721 | Range Resources Corporation | 3,375,431 | America Holdings # | 471,005 | ||
| 5,370 | Smith International, Inc. | 396,574 | 32,316 | PerkinElmer, Inc. | 840,862 | |
| 12,837 | W-H Energy Services, Inc. # | 721,568 | Total Health Care | 3,427,611 | ||
| 97,960 | Williams Companies, Inc. | 3,505,009 | ||||
| Total Energy | 13,104,558 | Industrials (10.2%) | ||||
| 4,596 | Alliant Techsystems, Inc. #* | 522,841 | ||||
| Financials (21.5%) | 98,130 | Allied Waste Industries, Inc. # | 1,081,393 | |||
| 16,008 | Ambac Financial Group, Inc. * | 412,526 | 4,751 | Chicago Bridge and Iron Company | 287,150 | |
| 32,387 | Apartment Investment & | 10,901 | Cooper Industries, Ltd. | 576,445 | ||
| Management Company * | 1,124,801 | 10,192 | Eaton Corporation | 988,114 | ||
| 13,528 | Assurant, Inc. | 905,023 | 13,054 | JB Hunt Transport Services, Inc. * | 359,638 | |
| 19,886 | Astoria Financial Corporation | 462,747 | 14,562 | KBR, Inc. # | 565,006 | |
| 14,204 | Brandywine Realty Trust | 254,678 | 23,742 | Landstar System, Inc. | 1,000,725 | |
| 5,611 | Camden Property Trust | 270,170 | 17,819 | Lennox International, Inc. | 738,063 | |
| 18,285 | CIT Group, Inc. | 439,389 | 10,399 | Monster Worldwide, Inc. # | 336,928 | |
| 13,812 | Comerica, Inc. | 601,236 | 2,698 | Norfolk Southern Corporation | 136,087 | |
| 15,030 | Commerce Bancshares, Inc. | 674,259 | 15,859 | Parker-Hannifin Corporation | 1,194,341 | |
| The accompanying Notes to Financial Statements are an integral part of this schedule. |
| 100 |
| Partner Mid Cap Value Portfolio | ||||||
| Schedule of Investments as of December 31, 2007 | ||||||
| Shares | Common Stock (98.1%) | Value | Shares | Common Stock (98.1%) | Value | |
| Industrials — continued | Telecommunications Services (3.4%) | |||||
| 14,980 | Rockwell Collins, Inc. | $1,078,111 | 94,327 | Cincinnati Bell, Inc. #* | $448,053 | |
| 17,271 | Ryder System, Inc. | 811,910 | 33,405 | Embarq Corporation | 1,654,550 | |
| Total Industrials | 9,676,752 | 160,574 | Qwest Communications | |||
| International, Inc. #* | 1,125,624 | |||||
| Information Technology (6.5%) | Total Telecommunications Services | 3,228,227 | ||||
| 43,414 | Activision, Inc. # | 1,289,396 | ||||
| 39,421 | Amphenol Corporation | 1,827,952 | Utilities (15.4%) | |||
| 17,552 | Lexmark International, Inc. # | 611,863 | 19,188 | American Electric Power | ||
| 36,135 | Seagate Technology | 921,442 | Company, Inc. | 893,393 | ||
| 23,116 | Tessera Technologies, Inc. # | 961,626 | 17,603 | CMS Energy Corporation * | 305,940 | |
| 34,202 | Xerox Corporation | 553,730 | 3,961 | Constellation Energy Group, Inc. | 406,121 | |
| Total Information Technology | 6,166,009 | 58,231 | DPL, Inc. * | 1,726,549 | ||
| 29,984 | Edison International, Inc. | 1,600,246 | ||||
| Materials (7.0%) | 21,639 | Entergy Corporation | 2,586,293 | |||
| 7,375 | Airgas, Inc. | 384,311 | 17,054 | Equitable Resources, Inc. | 908,637 | |
| 9,978 | Albemarle Corporation | 411,592 | 18,474 | FirstEnergy Corporation | 1,336,409 | |
| 18,773 | Celanese Corporation | 794,473 | 30,959 | PG&E Corporation | 1,334,023 | |
| 27,672 | Commercial Metals Company | 812,173 | 48,963 | PPL Corporation | 2,550,483 | |
| 7,982 | Cytec Industries, Inc. | 491,532 | 2,113 | SCANA Corporation | 89,063 | |
| 29,178 | International Paper Company | 944,784 | 17,341 | Wisconsin Energy Corporation | 844,680 | |
| 18,974 | Nucor Corporation | 1,123,640 | Total Utilities | 14,581,837 | ||
| 13,731 | Rockwood Holdings, Inc. # | 456,144 | ||||
| 8,570 | Rohm and Haas Company | 454,810 | Total Common Stock | |||
| 7,595 | Steel Dynamics, Inc. | 452,434 | (cost $88,867,654) | 93,168,797 | ||
| 2,651 | United States Steel Corporation | 320,532 | ||||
| Total Materials | 6,646,425 | |||||
| The accompanying Notes to Financial Statements are an integral part of this schedule. |
| 101 |
| Partner Mid Cap Value Portfolio | ||||
| Schedule of Investments as of December 31, 2007 | ||||
| Interest | Maturity | |||
| Shares | Collateral Held for Securities Loaned (10.5%) | Rate (+) | Date | Value |
| 9,987,928 | Thrivent Financial Securities Lending Trust | 5.000% | N/A | $9,987,928 |
| Total Collateral Held for Securities Loaned | ||||
| (cost $9,987,928) | 9,987,928 | |||
| Interest | Maturity | |||
| Shares | Short-Term Investments (3.8%) | Rate (+) | Date | Value |
| 3,632,429 | Thrivent Money Market Portfolio | 4.930% | N/A | $3,632,429 |
| Total Short-Term Investments (at amortized cost) | 3,632,429 | |||
| Total Investments (cost $102,488,011) 112.4% | $106,789,154 | |||
| Other Assets and Liabilities, Net (12.4%) | (11,769,145) | |||
| Total Net Assets 100.0% | $95,020,009 | |||
# Non-income producing security.
* All or a portion of the security is on loan as discussed in item 2(M) of the Notes to Financial Statements.
+ The interest rate shown reflects the yield, coupon rate or, for securities purchased at a discount, the discount rate at the date of purchase.
Gross unrealized appreciation and depreciation of investments, based on cost for federal income tax purposes, were as follows:
| Gross unrealized appreciation | $10,205,997 | |
| Gross unrealized depreciation | (6,658,039) | |
| Net unrealized appreciation (depreciation) | $3,547,958 | |
| Cost for federal income tax purposes | $103,241,196 |
| The accompanying Notes to Financial Statements are an integral part of this schedule. |
| 102 |
| Mid Cap Stock Portfolio | ||||||
| Schedule of Investments as of December 31, 2007 | ||||||
| Shares | Common Stock (93.6%) | Value | Shares | Common Stock (93.6%) | Value | |
| Consumer Discretionary (10.0%) | 27,400 | Protective Life Corporation | $1,123,948 | |||
| 16,300 | Apollo Group, Inc. # | $1,143,445 | 53,800 | Rayonier, Inc. REIT * | 2,541,512 | |
| 168,200 | Burger King Holdings, Inc. | 4,795,382 | 40,700 | SEI Investments Company | 1,309,319 | |
| 21,900 | DeVry, Inc. * | 1,137,924 | 78,800 | Strategic Hotel Capital, Inc. * | 1,318,324 | |
| 87,200 | International Game Technology | 3,830,696 | 251,600 | U-Store-It Trust | 2,304,656 | |
| 227,100 | Royal Caribbean Cruises, Ltd. * | 9,638,124 | 71,900 | W.R. Berkley Corporation | 2,143,339 | |
| 202,600 | Scientific Games Corporation #* | 6,736,450 | 42,800 | Westamerica Bancorporation * | 1,906,740 | |
| 828,400 | Service Corporation International | 11,639,020 | 37,700 | Zions Bancorporation * | 1,760,213 | |
| Total Consumer Discretionary | 38,921,041 | Total Financials | 60,935,405 | |||
| Consumer Staples (12.5%) | Health Care (10.5%) | |||||
| 24,100 | Central European Distribution | 40,400 | Advanced Medical Optics, Inc. #* | 991,012 | ||
| Corporation # | 1,399,728 | 82,800 | Applera Corporation (Celera Group) # | 1,314,036 | ||
| 34,900 | Church & Dwight Company, Inc. | 1,887,043 | 32,400 | Beckman Coulter, Inc. | 2,358,720 | |
| 142,900 | Clorox Company | 9,312,793 | 36,400 | BioMarin Pharmaceutical, Inc. #* | 1,288,560 | |
| 161,700 | Coca-Cola Enterprises, Inc. | 4,209,051 | 23,000 | C.R. Bard, Inc. | 2,180,400 | |
| 248,100 | H.J. Heinz Company | 11,581,308 | 29,000 | Cephalon, Inc. #* | 2,081,040 | |
| 88,400 | Kroger Company | 2,361,164 | 42,700 | Community Health Systems, Inc. # | 1,573,922 | |
| 51,400 | McCormick & Company, Inc. | 1,948,574 | 37,800 | Coventry Health Care, Inc. # | 2,239,650 | |
| 165,500 | Safeway, Inc. | 5,661,755 | 22,500 | DaVita, Inc. # | 1,267,875 | |
| 171,800 | TreeHouse Foods, Inc. # | 3,949,682 | 45,800 | Endo Pharmaceutical Holdings, Inc. # | 1,221,486 | |
| 109,400 | UST, Inc. * | 5,995,120 | 31,000 | Hologic, Inc. #* | 2,127,840 | |
| Total Consumer Staples | 48,306,218 | 131,600 | Human Genome Sciences, Inc. #* | 1,373,904 | ||
| 41,300 | ImClone Systems, Inc. # | 1,775,900 | ||||
| Energy (0.9%) | 13,200 | Intuitive Surgical, Inc. # | 4,283,400 | |||
| 94,200 | Willbros Group, Inc. #* | 3,606,918 | 21,200 | Invitrogen Corporation # | 1,980,292 | |
| Total Energy | 3,606,918 | 44,300 | LifePoint Hospitals, Inc. # | 1,317,482 | ||
| 107,700 | Millennium Pharmaceuticals, Inc. #* | 1,613,346 | ||||
| Financials (15.7%) | 26,800 | ResMed, Inc. # | 1,407,804 | |||
| 17,550 | Affiliated Managers Group, Inc. #* | 2,061,423 | 43,200 | Sepracor, Inc. # | 1,134,000 | |
| 79,900 | Ambac Financial Group, Inc. * | 2,059,023 | 23,400 | Shire Pharmaceuticals Group plc ADR | 1,613,430 | |
| 39,500 | Assurant, Inc. | 2,642,550 | 49,800 | STERIS Corporation | 1,436,232 | |
| 21,200 | Bear Stearns Companies, Inc. * | 1,870,900 | 34,200 | Varian Medical Systems, Inc. # | 1,783,872 | |
| 64,900 | Brown & Brown, Inc. | 1,525,150 | 13,000 | Ventana Medical Systems, Inc. # | 1,133,990 | |
| 30,600 | City National Corporation * | 1,822,230 | 54,300 | Vertex Pharmaceuticals, Inc. #* | 1,261,389 | |
| 140,600 | Colonial BancGroup, Inc. | 1,903,724 | Total Health Care | 40,759,582 | ||
| 31,920 | Commerce Bancshares, Inc. | 1,431,931 | ||||
| 44,700 | Cousins Properties, Inc. * | 987,870 | Industrials (2.6%) | |||
| 37,500 | Cullen/Frost Bankers, Inc. | 1,899,750 | 178,300 | Hub Group, Inc. # | 4,739,214 | |
| 21,500 | Eaton Vance Corporation | 976,315 | 91,100 | Stericycle, Inc. #* | 5,411,340 | |
| 25,800 | Endurance Specialty Holdings, Ltd. | 1,076,634 | Total Industrials | 10,150,554 | ||
| 81,400 | Equity One, Inc. * | 1,874,642 | ||||
| 50,400 | General Growth Properties, Inc. | 2,075,472 | Information Technology (12.4%) | |||
| 211,400 | HCC Insurance Holdings, Inc. | 6,062,952 | 659,300 | Atmel Corporation # | 2,848,176 | |
| 80,200 | Jefferies Group, Inc. * | 1,848,610 | 135,900 | Brocade Communications # | 997,506 | |
| 93,400 | MGIC Investment Corporation * | 2,094,962 | 92,800 | Cadence Design Systems, Inc. #* | 1,578,528 | |
| 432,100 | New York Community Bancorp, Inc. * | 7,596,318 | 31,600 | CIENA Corporation #* | 1,077,876 | |
| 33,600 | PartnerRe, Ltd. * | 2,773,008 | 321,700 | Compuware Corporation # | 2,856,696 | |
| 49,400 | Philadelphia Consolidated | 29,500 | Data Domain, Inc. #* | 777,030 | ||
| Holding Corporation # | 1,943,890 | 31,000 | DealerTrack Holdings, Inc. # | 1,037,570 | ||
| The accompanying Notes to Financial Statements are an integral part of this schedule. |
| 103 |
| Mid Cap Stock Portfolio | ||||||
| Schedule of Investments as of December 31, 2007 | ||||||
| Shares | Common Stock (93.6%) | Value | Shares | Common Stock (93.6%) | Value | |
| Information Technology — continued | Telecommunications Services (0.5%) | |||||
| 14,700 | DST Systems, Inc. # | $1,213,485 | 385,100 | Cincinnati Bell, Inc. #* | $1,829,225 | |
| 46,200 | Electronic Arts, Inc. #* | 2,698,542 | Total Telecommunications | |||
| 123,700 | Emulex Corporation # | 2,018,784 | Services | 1,829,225 | ||
| 33,500 | F5 Networks, Inc. # | 955,420 | ||||
| 109,900 | Fair Isaac Corporation * | 3,533,285 | Utilities (10.2%) | |||
| 40,100 | FormFactor, Inc. #* | 1,327,310 | 171,100 | AGL Resources, Inc. | 6,440,204 | |
| 59,600 | Foundry Networks, Inc. # | 1,044,192 | 537,300 | CMS Energy Corporation * | 9,338,274 | |
| 31,200 | Harris Corporation | 1,955,616 | 67,100 | Hawaiian Electric | ||
| 136,000 | Integrated Device Technology, Inc. # | 1,538,160 | Industries, Inc. * | 1,527,867 | ||
| 152,700 | Juniper Networks, Inc. #* | 5,069,640 | 69,100 | Nicor, Inc. * | 2,926,385 | |
| 21,300 | Lam Research Corporation # | 920,799 | 90,500 | SCANA Corporation * | 3,814,575 | |
| 97,100 | McAfee, Inc. # | 3,641,250 | 182,300 | Sierra Pacific Resources | 3,095,454 | |
| 55,600 | NVIDIA Corporation # | 1,891,512 | 86,600 | Vectren Corporation | 2,512,266 | |
| 55,100 | Paychex, Inc. | 1,995,722 | 207,000 | Wisconsin Energy Corporation | 10,082,970 | |
| 35,800 | Polycom, Inc. # | 994,524 | Total Utilities | 39,737,995 | ||
| 115,500 | Synopsys, Inc. # | 2,994,915 | ||||
| 190,100 | Teradyne, Inc. # | 1,965,634 | Total Common Stock | |||
| 106,500 | Wind River Systems, Inc. # | 951,045 | (cost $342,332,073) | 363,023,803 | ||
| Total Information Technology | 47,883,217 | |||||
| Materials (18.3%) | ||||||
| 583,600 | Crown Holdings, Inc. # | 14,969,340 | ||||
| 380,000 | Owens-Illinois, Inc. #* | 18,810,000 | ||||
| 689,597 | Pactiv Corporation # | 18,363,968 | ||||
| 74,200 | Sigma-Aldrich Corporation | 4,051,320 | ||||
| 283,000 | Silgan Holdings, Inc. | 14,699,020 | ||||
| Total Materials | 70,893,648 | |||||
| The accompanying Notes to Financial Statements are an integral part of this schedule. |
| 104 |
| Mid Cap Stock Portfolio | ||||
| Schedule of Investments as of December 31, 2007 | ||||
| Interest | Maturity | |||
| Shares | Collateral Held for Securities Loaned (25.0%) | Rate (+) | Date | Value |
| 97,177,855 | Thrivent Financial Securities Lending Trust | 5.000% | N/A | $97,177,855 |
| Total Collateral Held for Securities Loaned | ||||
| (cost $97,177,855) | 97,177,855 | |||
| Interest | Maturity | |||
| Shares | Short-Term Investments (6.5%) | Rate (+) | Date | Value |
| 25,108,727 | Thrivent Money Market Portfolio | 4.930% | N/A | $25,108,727 |
| Total Short-Term Investments (at amortized cost) | 25,108,727 | |||
| Total Investments (cost $464,618,655) 125.1% | $485,310,385 | |||
| Other Assets and Liabilities, Net (25.1%) | (97,363,871) | |||
| Total Net Assets 100.0% | $387,946,514 | |||
# Non-income producing security.
* All or a portion of the security is on loan as discussed in item 2(M) of the Notes to Financial Statements.
+ The interest rate shown reflects the yield, coupon rate or, for securities purchased at a discount, the discount rate at the date of purchase.
Definitions:
ADR — American Depository Receipts, which are certificates for shares of an underlying foreign security’s shares held by an issuing U.S. depository bank.
REIT — Real Estate Investment Trust, is a company that buys, develops, manages and/or sells real estate assets.
Gross unrealized appreciation and depreciation of investments, based on cost for federal income tax purposes, were as follows:
| Gross unrealized appreciation | $33,722,503 | |
| Gross unrealized depreciation | (13,989,417) | |
| Net unrealized appreciation (depreciation) | $19,733,086 | |
| Cost for federal income tax purposes | $465,577,299 |
| The accompanying Notes to Financial Statements are an integral part of this schedule. |
| 105 |
| Mid Cap Index Portfolio | ||||||
| Schedule of Investments as of December 31, 2007 | ||||||
| Shares | Common Stock (98.6%) | Value | Shares | Common Stock (98.6%) | Value | |
| Consumer Discretionary (12.3%) | 3,000 | Media General, Inc. | $63,750 | |||
| 6,133 | 99 Cents Only Stores #* | $48,819 | 4,160 | Modine Manufacturing Company | 68,682 | |
| 12,800 | Advance Auto Parts, Inc. | 486,272 | 7,070 | Mohawk Industries, Inc. #* | 526,008 | |
| 8,500 | Aeropostale, Inc. # | 225,250 | 6,200 | Netflix, Inc. #* | 165,044 | |
| 27,180 | American Eagle Outfitters, Inc. | 564,529 | 700 | NVR, Inc. # | 366,800 | |
| 7,200 | American Greetings Corporation | 146,160 | 14,600 | O’Reilly Automotive, Inc. # | 473,478 | |
| 7,850 | AnnTaylor Stores Corporation # | 200,646 | 8,900 | Pacific Sunwear of California, Inc. # | 125,579 | |
| 9,230 | ArvinMeritor, Inc. * | 108,268 | 16,300 | PETsMART, Inc. * | 383,539 | |
| 6,070 | Barnes & Noble, Inc. | 209,112 | 7,100 | Phillips-Van Heusen Corporation | 261,706 | |
| 11,310 | Belo Corporation | 197,246 | 5,600 | Regis Corporation | 156,576 | |
| 3,130 | Blyth, Inc. | 68,672 | 8,500 | Rent-A-Center, Inc. #* | 123,420 | |
| 4,210 | Bob Evans Farms, Inc. | 113,375 | 17,160 | Ross Stores, Inc. | 438,781 | |
| 7,500 | Borders Group, Inc. * | 79,875 | 6,700 | Ruby Tuesday, Inc. * | 65,325 | |
| 14,720 | BorgWarner, Inc. | 712,595 | 5,300 | Ryland Group, Inc. * | 146,015 | |
| 7,200 | Boyd Gaming Corporation | 245,304 | 17,950 | Saks, Inc. #* | 372,642 | |
| 13,355 | Brinker International, Inc. | 261,224 | 3,410 | Scholastic Corporation #* | 118,975 | |
| 8,460 | Callaway Golf Company | 147,458 | 8,200 | Scientific Games Corporation # | 272,650 | |
| 11,500 | Career Education Corporation #* | 289,110 | 36,600 | Service Corporation International | 514,230 | |
| 27,700 | CarMax, Inc. #* | 547,075 | 8,420 | Sotheby’s Holdings, Inc. | 320,802 | |
| 3,100 | CBRL Group, Inc. | 100,409 | 1,800 | Strayer Education, Inc. | 307,044 | |
| 14,800 | Charming Shoppes, Inc. # | 80,068 | 4,500 | Thor Industries, Inc. * | 171,045 | |
| 9,000 | Cheesecake Factory, Inc. #* | 213,390 | 6,400 | Timberland Company # | 115,712 | |
| 22,300 | Chico’s FAS, Inc. # | 201,369 | 16,100 | Toll Brothers, Inc. #* | 322,966 | |
| 4,100 | Chipotle Mexican Grill, Inc. #* | 602,987 | 7,800 | Tupperware Corporation | 257,634 | |
| 7,600 | Coldwater Creek, Inc. #* | 50,844 | 14,300 | Urban Outfitters, Inc. # | 389,818 | |
| 8,300 | Collective Brands, Inc. # | 144,337 | 6,080 | Valassis Communications, Inc. #* | 71,075 | |
| 10,700 | Corinthian Colleges, Inc. # | 164,780 | 5,700 | Warnaco Group, Inc. # | 198,360 | |
| 7,520 | DeVry, Inc. | 390,739 | 11,180 | Williams-Sonoma, Inc. * | 289,562 | |
| 10,600 | Dick’s Sporting Goods, Inc. #* | 294,256 | Total Consumer Discretionary | 18,026,099 | ||
| 11,660 | Dollar Tree Stores, Inc. # | 302,227 | ||||
| 3,500 | Entercom Communications Corporation | 47,915 | Consumer Staples (3.2%) | |||
| 19,600 | Foot Locker, Inc. | 267,736 | 10,800 | Alberto-Culver Company | 265,032 | |
| 6,240 | Furniture Brands | 8,240 | BJ’s Wholesale Club, Inc. # | 278,759 | ||
| International, Inc. * | 62,774 | 8,410 | Church & Dwight Company, Inc. | 454,729 | ||
| 18,320 | Gentex Corporation * | 325,546 | 9,500 | Corn Products International, Inc. | 349,125 | |
| 6,100 | Getty Images, Inc. # | 176,900 | 7,250 | Energizer Holdings, Inc. # | 812,942 | |
| 6,900 | Guess ?, Inc. | 261,441 | 7,600 | Hansen Natural Corporation #* | 336,604 | |
| 12,100 | Hanesbrands, Inc. # | 328,757 | 9,330 | Hormel Foods Corporation | 377,678 | |
| 6,100 | Harte-Hanks, Inc. | 105,530 | 7,376 | J.M. Smucker Company | 379,421 | |
| 4,800 | Hovnanian Enterprises, Inc. #* | 34,416 | 2,740 | Lancaster Colony Corporation | 108,778 | |
| 4,070 | International Speedway Corporation | 167,603 | 7,100 | NBTY, Inc. # | 194,540 | |
| 3,800 | ITT Educational Services, Inc. # | 324,026 | 7,610 | PepsiAmericas, Inc. | 253,565 | |
| 5,700 | John Wiley and Sons, Inc. | 244,131 | 4,810 | Ruddick Corporation | 166,763 | |
| 10,000 | Lamar Advertising Company * | 480,700 | 14,800 | Smithfield Foods, Inc. # | 428,016 | |
| 9,800 | Lear Corporation # | 271,068 | 3,542 | Tootsie Roll Industries, Inc. * | 97,119 | |
| 5,190 | Lee Enterprises, Inc. | 76,034 | 3,640 | Universal Corporation | 186,441 | |
| 4,200 | Life Time Fitness, Inc. #* | 208,656 | Total Consumer Staples | 4,689,512 | ||
| 4,500 | M.D.C. Holdings, Inc. | 167,085 | ||||
| 4,100 | Matthews International Corporation | 192,167 | ||||
| The accompanying Notes to Financial Statements are an integral part of this schedule. |
| 106 |
| Mid Cap Index Portfolio | ||||||
| Schedule of Investments as of December 31, 2007 | ||||||
| Shares | Common Stock (98.6%) | Value | Shares | Common Stock (98.6%) | Value | |
| Energy (9.7%) | 27,405 | Fidelity National Financial, Inc. * | $400,387 | |||
| 18,100 | Arch Coal, Inc. | $813,233 | 11,600 | First American Corporation | 395,792 | |
| 4,300 | Bill Barrett Corporation #* | 180,041 | 3,200 | First Community Bancorp, Inc. * | 131,968 | |
| 27,720 | Cameron International Corporation #‡ | 1,334,164 | 13,500 | First Niagara Financial Group, Inc. | 162,540 | |
| 10,400 | Cimarex Energy Company | 442,312 | 10,380 | FirstMerit Corporation | 207,704 | |
| 31,000 | Denbury Resources, Inc. # | 922,250 | 6,670 | Hanover Insurance Group, Inc. | 305,486 | |
| 6,800 | Encore Acquisition Company # | 226,916 | 14,550 | HCC Insurance Holdings, Inc. | 417,294 | |
| 8,278 | Exterran Holdings, Inc. #* | 677,140 | 10,700 | Health Care REIT, Inc. * | 478,183 | |
| 16,500 | FMC Technologies, Inc. # | 935,550 | 7,400 | Highwoods Properties, Inc. * | 217,412 | |
| 11,100 | Forest Oil Corporation # | 564,324 | 5,660 | Horace Mann Educators Corporation | 107,200 | |
| 13,500 | Frontier Oil Corporation | 547,830 | 12,100 | Hospitality Properties Trust | 389,862 | |
| 16,060 | Grant Prideco, Inc. # | 891,491 | 10,200 | IndyMac Bancorp, Inc. * | 60,690 | |
| 13,080 | Helmerich & Payne, Inc. | 524,116 | 14,200 | Jefferies Group, Inc. | 327,310 | |
| 16,600 | Newfield Exploration Company # | 874,820 | 4,700 | Jones Lang LaSalle, Inc. | 334,452 | |
| 3,600 | Overseas Shipholding Group, Inc. | 267,948 | 11,600 | Liberty Property Trust | 334,196 | |
| 19,600 | Patterson-UTI Energy, Inc. | 382,592 | 9,200 | Macerich Company | 653,752 | |
| 15,100 | Pioneer Natural Resources Company | 737,484 | 8,800 | Mack-Cali Realty Corporation | 299,200 | |
| 14,340 | Plains Exploration & | 4,700 | Mercury General Corporation | 234,107 | ||
| Production Company # | 774,355 | 11,800 | Nationwide Health Properties, Inc. * | 370,520 | ||
| 21,120 | Pride International, Inc. # | 715,968 | 41,111 | New York Community Bancorp, Inc. * | 722,731 | |
| 6,500 | Quicksilver Resources, Inc. #* | 387,335 | 29,350 | Old Republic International Corporation | 452,284 | |
| 21,600 | Southwestern Energy Company # | 1,203,552 | 10,280 | PMI Group, Inc. | 136,518 | |
| 10,300 | Superior Energy Services, Inc. # | 354,526 | 5,107 | Potlatch Corporation | 226,955 | |
| 7,000 | Tidewater, Inc. * | 384,020 | 9,070 | Protective Life Corporation | 372,051 | |
| Total Energy | 14,141,967 | 10,220 | Radian Group, Inc. * | 119,370 | ||
| 12,025 | Raymond James Financial, Inc. | 392,736 | ||||
| Financials (15.3%) | 9,908 | Rayonier, Inc. REIT * | 468,054 | |||
| 4,100 | Alexandria Real Estate Equities, Inc. | 416,847 | 13,000 | Realty Income Corporation * | 351,260 | |
| 12,600 | AMB Property Corporation ‡ | 725,256 | 8,800 | Regency Centers Corporation | 567,512 | |
| 9,335 | American Financial Group, Inc. | 269,595 | 16,140 | SEI Investments Company | 519,224 | |
| 14,490 | AmeriCredit Corporation #* | 185,327 | 6,300 | StanCorp Financial Group, Inc. | 317,394 | |
| 11,900 | Arthur J. Gallagher & Company | 287,861 | 4,230 | SVB Financial Group # | 213,192 | |
| 16,193 | Associated Banc-Corp | 438,668 | 48,500 | Synovus Financial Corporation # | 494,215 | |
| 10,570 | Astoria Financial Corporation | 245,964 | 13,920 | TCF Financial Corporation | 249,586 | |
| 6,400 | Bank of Hawaii Corporation | 327,296 | 17,100 | UDR, Inc. * | 339,435 | |
| 6,400 | BRE Properties, Inc. * | 259,392 | 6,600 | Unitrin, Inc. | 316,734 | |
| 14,400 | Brown & Brown, Inc. | 338,400 | 20,475 | W.R. Berkley Corporation | 610,360 | |
| 7,000 | Camden Property Trust | 337,050 | 10,540 | Waddell & Reed Financial, Inc. | 380,389 | |
| 6,500 | Cathay General Bancorp * | 172,185 | 11,227 | Washington Federal, Inc. | 237,002 | |
| 5,320 | City National Corporation * | 316,806 | 6,830 | Webster Financial Corporation | 218,355 | |
| 20,000 | Colonial BancGroup, Inc. | 270,800 | 9,700 | Weingarten Realty Investors | 304,968 | |
| 5,600 | Commerce Group, Inc. | 201,488 | 3,920 | Westamerica Bancorporation * | 174,636 | |
| 4,900 | Cousins Properties, Inc. * | 108,290 | 8,780 | Wilmington Trust Corporation | 309,056 | |
| 7,600 | Cullen/Frost Bankers, Inc. | 385,016 | Total Financials | 22,301,743 | ||
| 18,500 | Duke Realty Corporation | 482,480 | ||||
| 15,700 | Eaton Vance Corporation | 712,937 | Health Care (12.6%) | |||
| 4,800 | Equity One, Inc. | 110,544 | 7,606 | Advanced Medical Optics, Inc. #* | 186,575 | |
| 8,010 | Everest Re Group, Ltd. | 804,204 | 8,700 | Affymetrix, Inc. #* | 201,318 | |
| 7,100 | Federal Realty Investment Trust | 583,265 | 5,670 | Apria Healthcare Group, Inc. # | 122,302 | |
| The accompanying Notes to Financial Statements are an integral part of this schedule. |
| 107 |
| Mid Cap Index Portfolio | ||||||
| Schedule of Investments as of December 31, 2007 | ||||||
| Shares | Common Stock (98.6%) | Value | Shares | Common Stock (98.6%) | Value | |
| Health Care — continued | 4,100 | Alliant Techsystems, Inc. #* | $466,416 | |||
| 7,930 | Beckman Coulter, Inc. | $577,304 | 13,570 | AMETEK, Inc. | 635,619 | |
| 8,500 | Cephalon, Inc. #* | 609,960 | 13,120 | Avis Budget Group, Inc. # | 170,560 | |
| 8,400 | Cerner Corporation #* | 473,760 | 11,700 | BE Aerospace, Inc. # | 618,930 | |
| 8,600 | Charles River Laboratories | 6,160 | Brink’s Company | 367,998 | ||
| International, Inc. # | 565,880 | 7,840 | Carlisle Companies, Inc. | 290,315 | ||
| 12,100 | Community Health Systems, Inc. # | 446,006 | 9,086 | ChoicePoint, Inc. # | 330,912 | |
| 8,110 | Covance, Inc. # | 702,488 | 5,830 | Con-way, Inc. | 242,178 | |
| 19,280 | Dentsply International, Inc. | 867,986 | 8,900 | Copart, Inc. # | 378,695 | |
| 7,120 | Edwards Lifesciences Corporation # | 327,449 | 4,600 | Corporate Executive Board Company | 276,460 | |
| 17,000 | Endo Pharmaceutical Holdings, Inc. # | 453,390 | 6,600 | Crane Company | 283,140 | |
| 6,800 | Gen-Probe, Inc. # | 427,924 | 6,700 | Deluxe Corporation | 220,363 | |
| 30,800 | Health Management Associates, Inc. | 184,184 | 9,100 | Donaldson Company, Inc. | 422,058 | |
| 14,080 | Health Net, Inc. # | 680,064 | 5,200 | DRS Technologies, Inc. | 282,204 | |
| 11,300 | Henry Schein, Inc. # | 693,820 | 7,420 | Dun & Bradstreet Corporation | 657,635 | |
| 7,950 | Hillenbrand Industries, Inc. | 443,054 | 15,960 | Fastenal Company * | 645,103 | |
| 15,900 | Hologic, Inc. #* | 1,091,376 | 6,200 | Federal Signal Corporation | 69,564 | |
| 4,800 | Intuitive Surgical, Inc. # | 1,557,601 | 7,230 | Flowserve Corporation | 695,526 | |
| 5,900 | Invitrogen Corporation # | 551,119 | 6,120 | GATX Corporation | 224,482 | |
| 3,800 | Kindred Healthcare, Inc. # | 94,924 | 8,000 | Graco, Inc. | 298,080 | |
| 6,800 | Kinetic Concepts, Inc. # | 364,208 | 4,560 | Granite Construction, Inc. | 164,981 | |
| 7,300 | LifePoint Hospitals, Inc. # | 217,102 | 10,700 | Harsco Corporation | 685,549 | |
| 10,120 | Lincare Holdings, Inc. # | 355,819 | 7,690 | Herman Miller, Inc. | 249,079 | |
| 7,100 | Medicis Pharmaceutical Corporation * | 184,387 | 5,830 | HNI Corporation * | 204,400 | |
| 40,947 | Millennium Pharmaceuticals, Inc. # | 613,386 | 7,330 | Hubbell, Inc. | 378,228 | |
| 15,420 | Omnicare, Inc. | 351,730 | 10,300 | IDEX Corporation | 372,139 | |
| 4,300 | Par Pharmaceutical Companies, Inc. # | 103,200 | 11,140 | JB Hunt Transport Services, Inc. * | 306,907 | |
| 14,860 | PDL BioPharma, Inc. # | 260,347 | 22,875 | JetBlue Airways Corporation #* | 134,962 | |
| 9,850 | Perrigo Company | 344,848 | 13,650 | Joy Global, Inc. | 898,443 | |
| 13,300 | Pharmaceutical Product | 9,800 | Kansas City Southern, Inc. # | 336,434 | ||
| Development, Inc. | 536,921 | 21,500 | KBR, Inc. # | 834,200 | ||
| 6,900 | Psychiatric Solutions, Inc. # | 224,250 | 3,120 | Kelly Services, Inc. | 58,219 | |
| 9,800 | ResMed, Inc. # | 514,794 | 9,940 | Kennametal, Inc. | 376,328 | |
| 14,150 | Sepracor, Inc. # | 371,438 | 5,840 | Korn/Ferry International # | 109,909 | |
| 8,000 | STERIS Corporation | 230,720 | 5,500 | Lincoln Electric Holdings, Inc. | 391,490 | |
| 5,100 | Techne Corporation # | 336,855 | 10,270 | Manpower, Inc. | 584,363 | |
| 6,800 | Universal Health Services, Inc. | 348,160 | 3,800 | Mine Safety Appliances Company * | 197,106 | |
| 11,610 | Valeant Pharmaceuticals International # | 138,972 | 6,000 | MSC Industrial Direct Company, Inc. | 242,820 | |
| 3,900 | Varian, Inc. # | 254,670 | 5,800 | Navigant Consulting, Inc. #* | 79,286 | |
| 10,700 | VCA Antech, Inc. # | 473,261 | 4,290 | Nordson Corporation | 248,648 | |
| 3,700 | Ventana Medical Systems, Inc. # | 322,751 | 9,400 | Oshkosh Truck Corporation | 444,244 | |
| 16,720 | Vertex Pharmaceuticals, Inc. #* | 388,406 | 12,560 | Pentair, Inc. | 437,214 | |
| 5,300 | Wellcare Health Plans, Inc. # | 224,773 | 21,710 | Quanta Services, Inc. # | 569,670 | |
| Total Health Care | 18,419,482 | 20,400 | Republic Services, Inc. | 639,540 | ||
| 5,548 | Rollins, Inc. | 106,522 | ||||
| Industrials (15.3%) | 11,200 | Roper Industries, Inc. * | 700,448 | |||
| 11,630 | AGCO Corporation #* | 790,607 | 6,660 | SPX Corporation | 684,981 | |
| 11,700 | AirTran Holdings, Inc. #* | 83,772 | 11,100 | Stericycle, Inc. # | 659,340 | |
| 5,140 | Alaska Air Group, Inc. # | 128,551 | 5,040 | Teleflex, Inc. | 317,570 | |
| 5,560 | Alexander & Baldwin, Inc. | 287,230 | 6,500 | Thomas & Betts Corporation # | 318,760 | |
| The accompanying Notes to Financial Statements are an integral part of this schedule. |
| 108 |
| Mid Cap Index Portfolio | ||||||
| Schedule of Investments as of December 31, 2007 | ||||||
| Shares | Common Stock (98.6%) | Value | Shares | Common Stock (98.6%) | Value | |
| Industrials — continued | 10,780 | KEMET Corporation # | $71,471 | |||
| 12,100 | Timken Company | $397,485 | 17,100 | Lam Research Corporation # | 739,233 | |
| 10,295 | Trinity Industries, Inc. * | 285,789 | 6,740 | Macrovision Corporation #* | 123,544 | |
| 9,520 | United Rentals, Inc. # | 174,787 | 20,220 | McAfee, Inc. # | 758,250 | |
| 10,100 | URS Corporation # | 548,733 | 11,370 | Mentor Graphics Corporation # | 122,569 | |
| 6,100 | Wabtec Corporation | 210,084 | 10,800 | Metavante Technologies, Inc. # | 251,856 | |
| 5,800 | Werner Enterprises, Inc. * | 98,774 | 10,500 | MoneyGram International, Inc. * | 161,385 | |
| 7,100 | YRC Worldwide, Inc. #* | 121,339 | 12,860 | MPS Group, Inc. # | 140,688 | |
| Total Industrials | 22,435,169 | 7,275 | National Instruments Corporation | 242,476 | ||
| 23,000 | NCR Corporation # | 577,300 | ||||
| Information Technology (14.7%) | 9,700 | NeuStar, Inc. #* | 278,196 | |||
| 50,400 | 3Com Corporation # | 227,808 | 13,300 | Palm, Inc. * | 84,322 | |
| 4,620 | ACI Worldwide, Inc. # | 87,965 | 14,700 | Parametric Technology Corporation # | 262,395 | |
| 36,988 | Activision, Inc. #‡ | 1,098,544 | 6,140 | Plantronics, Inc. | 159,640 | |
| 8,990 | Acxiom Corporation | 105,453 | 11,520 | Polycom, Inc. # | 320,026 | |
| 14,900 | ADC Telecommunications, Inc. # | 231,695 | 36,840 | RF Micro Devices, Inc. # | 210,356 | |
| 7,480 | ADTRAN, Inc. | 159,922 | 8,090 | Semtech Corporation # | 125,557 | |
| 2,200 | Advent Software, Inc. #* | 119,020 | 7,100 | Silicon Laboratories, Inc. # | 265,753 | |
| 10,000 | Alliance Data Systems Corporation #* | 749,900 | 5,500 | SRA International, Inc. # | 161,975 | |
| 22,600 | Amphenol Corporation | 1,047,962 | 11,380 | Sybase, Inc. # | 296,904 | |
| 15,670 | Arrow Electronics, Inc. # | 615,518 | 18,380 | Synopsys, Inc. #‡ | 476,593 | |
| 57,020 | Atmel Corporation # | 246,326 | 6,980 | Tech Data Corporation # | 263,286 | |
| 19,020 | Avnet, Inc. # | 665,129 | 17,952 | TriQuint Semiconductor, Inc. # | 119,022 | |
| 6,480 | Avocent Corporation # | 151,049 | 12,400 | ValueClick, Inc. # | 271,560 | |
| 17,700 | Broadridge Financial Solutions, LLC | 397,011 | 23,420 | Vishay Intertechnology, Inc. # | 267,222 | |
| 34,080 | Cadence Design Systems, Inc. #‡ | 579,701 | 27,900 | Western Digital Corporation # | 842,859 | |
| 8,375 | CommScope, Inc. #* | 412,112 | 9,750 | Wind River Systems, Inc. # | 87,068 | |
| 10,800 | Cree, Inc. #* | 296,676 | 8,600 | Zebra Technologies Corporation # | 298,420 | |
| 4,670 | CSG Systems International, Inc. # | 68,742 | Total Information Technology | 21,471,880 | ||
| 20,160 | Cypress Semiconductor Corporation # | 726,365 | ||||
| 8,430 | Diebold, Inc. | 244,301 | Materials (7.0%) | |||
| 5,100 | Digital River, Inc. # | 168,657 | 10,390 | Airgas, Inc. | 541,423 | |
| 6,510 | DST Systems, Inc. # | 537,400 | 10,020 | Albemarle Corporation | 413,325 | |
| 5,170 | Dycom Industries, Inc. # | 137,780 | 8,290 | Cabot Corporation | 276,389 | |
| 10,700 | F5 Networks, Inc. # | 305,164 | 6,200 | Carpenter Technology Corporation | 466,054 | |
| 6,350 | Fair Isaac Corporation * | 204,152 | 6,100 | CF Industries Holdings, Inc. | 671,366 | |
| 15,800 | Fairchild Semiconductor | 30,600 | Chemtura Corporation | 238,680 | ||
| International, Inc. # | 227,994 | 5,300 | Cleveland-Cliffs, Inc. * | 534,240 | ||
| 17,700 | Foundry Networks, Inc. # | 310,104 | 15,100 | Commercial Metals Company | 443,185 | |
| 8,800 | Gartner Group, Inc. # | 154,528 | 5,360 | Cytec Industries, Inc. | 330,069 | |
| 10,000 | Global Payments, Inc. | 465,200 | 5,700 | Ferro Corporation | 118,161 | |
| 17,400 | Harris Corporation ‡ | 1,090,632 | 9,600 | FMC Corporation | 523,680 | |
| 4,210 | Imation Corporation | 88,410 | 13,200 | Louisiana-Pacific Corporation | 180,576 | |
| 18,600 | Ingram Micro, Inc. # | 335,544 | 8,760 | Lubrizol Corporation | 474,442 | |
| 24,150 | Integrated Device | 5,320 | Martin Marietta Materials, Inc. * | 705,432 | ||
| Technology, Inc. # | 273,136 | 2,580 | Minerals Technologies, Inc. | 172,731 | ||
| 9,150 | International Rectifier | 9,400 | Olin Corporation | 181,702 | ||
| Corporation #* | 310,826 | 11,800 | Packaging Corporation of America | 332,760 | ||
| 16,600 | Intersil Corporation | 406,368 | 8,200 | Reliance Steel & Aluminum Company | 444,440 | |
| 10,060 | Jack Henry & Associates, Inc. | 244,860 | 15,400 | RPM International, Inc. | 312,620 | |
| The accompanying Notes to Financial Statements are an integral part of this schedule. |
| 109 |
| Mid Cap Index Portfolio | ||||||
| Schedule of Investments as of December 31, 2007 | ||||||
| Shares | Common Stock (98.6%) | Value | Shares | Common Stock (98.6%) | Value | |
| Materials — continued | 9,200 | Energen Corporation | $590,916 | |||
| 5,600 | Scotts Company | $209,552 | 20,250 | Energy East Corporation | 551,002 | |
| 6,130 | Sensient Technologies Corporation | 173,356 | 15,500 | Equitable Resources, Inc. | 825,840 | |
| 12,580 | Sonoco Products Company | 411,114 | 11,050 | Great Plains Energy, Inc. * | 323,986 | |
| 12,200 | Steel Dynamics, Inc. | 726,754 | 10,580 | Hawaiian Electric Industries, Inc. * | 240,907 | |
| 13,700 | Temple-Inland, Inc. | 285,645 | 5,730 | IDACORP, Inc. * | 201,811 | |
| 11,800 | Terra Industries, Inc. #* | 563,568 | 23,125 | MDU Resources Group, Inc. | 638,481 | |
| 12,760 | Valspar Corporation | 287,610 | 10,700 | National Fuel Gas Company * | 499,476 | |
| 1 | Vulcan Materials Company | 69 | 19,770 | Northeast Utilities Service Company | 618,999 | |
| 8,300 | Worthington Industries, Inc. * | 148,404 | 13,740 | NSTAR * | 497,663 | |
| Total Materials | 10,167,347 | 11,790 | OGE Energy Corporation | 427,859 | ||
| 13,100 | ONEOK, Inc. | 586,487 | ||||
| Telecommunications Services (0.7%) | 9,875 | PNM Resources, Inc. | 211,819 | |||
| 31,510 | Cincinnati Bell, Inc. #* | 149,672 | 14,960 | Puget Energy, Inc. | 410,353 | |
| 13,420 | Telephone and Data Systems, Inc. * | 840,092 | 14,930 | SCANA Corporation | 629,300 | |
| Total Telecommunications | 29,700 | Sierra Pacific Resources | 504,306 | |||
| Services | 989,764 | 9,890 | Vectren Corporation | 286,909 | ||
| 11,820 | Westar Energy, Inc. * | 306,611 | ||||
| Utilities (7.8%) | 6,410 | WGL Holdings, Inc. | 209,992 | |||
| 9,780 | AGL Resources, Inc. | 368,119 | 14,870 | Wisconsin Energy Corporation | 724,318 | |
| 14,100 | Alliant Energy Corporation ‡ | 573,729 | Total Utilities | 11,414,058 | ||
| 16,966 | Aqua America, Inc. * | 359,679 | ||||
| 47,880 | Aquila, Inc. #‡ | 178,592 | Total Common Stock | |||
| 4,900 | Black Hills Corporation | 216,090 | (cost $110,004,975) | 144,057,021 | ||
| 14,530 | DPL, Inc. * | 430,814 | ||||
| The accompanying Notes to Financial Statements are an integral part of this schedule. |
| 110 |
| Mid Cap Index Portfolio | ||||
| Schedule of Investments as of December 31, 2007 | ||||
| Interest | Maturity | |||
| Shares | Collateral Held for Securities Loaned (18.4%) | Rate (+) | Date | Value |
| 26,957,577 | Thrivent Financial Securities Lending Trust | 5.000% | N/A | $26,957,577 |
| Total Collateral Held for Securities Loaned | ||||
| (cost $26,957,577) | 26,957,577 | |||
| Shares or | ||||
| Principal | Interest | Maturity | ||
| Amount | Short-Term Investments (1.7%) | Rate (+) | Date | Value |
| $300,000 | Federal National Mortgage Association ‡ | 4.030% | 5/16/2008 | $295,410 |
| 2,210,657 | Thrivent Money Market Portfolio | 4.930 | N/A | 2,210,657 |
| Total Short-Term Investments (cost $2,506,119) | 2,506,067 | |||
| Total Investments (cost $139,468,671) 118.7% | $173,520,665 | |||
| Other Assets and Liabilities, Net (18.7%) | (27,338,166) | |||
| Total Net Assets 100.0% | $146,182,499 | |||
| Number of | Notional | ||||
| Contracts | Expiration | Principal | Unrealized | ||
| Futures | Long/(Short) | Date | Amount | Value | Gain/(Loss) |
| S&P 400 Mini-Futures | 25 | March 2008 | $2,189,949 | $2,162,000 | ($27,949) |
| Total Futures | ($27,949) | ||||
# Non-income producing security.
* All or a portion of the security is on loan as discussed in item 2(M) of the Notes to Financial Statements.
+ The interest rate shown reflects the yield, coupon rate or, for securities purchased at a discount, the discount rate at the date of purchase.
‡ At December 31, 2007, $295,410 of investments were held on deposit with the counterparty and pledged as the initial margin deposit for open financial futures contracts. In addition, $4,974,279 of investments were earmarked as collateral to cover open financial futures contracts.
Definitions:
REIT — Real Estate Investment Trust, is a company that buys, develops, manages and/or sells real estate assets.
Gross unrealized appreciation and depreciation of investments, based on cost for federal income tax purposes, were as follows:
| Gross unrealized appreciation | $42,133,857 | |
| Gross unrealized depreciation | (9,640,241) | |
| Net unrealized appreciation (depreciation) | $32,493,616 | |
| Cost for federal income tax purposes | $141,027,049 |
| The accompanying Notes to Financial Statements are an integral part of this schedule. |
| 111 |
| Partner International Stock Portfolio | ||||||
| Schedule of Investments as of December 31, 2007 | ||||||
| Shares | Common Stock (97.7%) | Value ^ | Shares | Common Stock (97.7%) | Value ^ | |
| Australia (4.3%) | 70,900 | Research In Motion, Ltd. # | $8,085,617 | |||
| 117,375 | Babcock & Brown, Ltd. * | $2,760,904 | 68,900 | Suncor Energy, Inc. # | 7,532,927 | |
| 317,517 | BHP Billiton, Ltd. * | 11,099,657 | Total Canada | 63,534,151 | ||
| 93,705 | Caltex Australia, Ltd. | 1,582,322 | ||||
| 46,822 | Cochlear, Ltd. | 3,061,034 | Denmark (0.6%) | |||
| 112,675 | CSL, Ltd. | 3,569,489 | 23,275 | Carlsberg International AS - B | 2,801,969 | |
| 24,625 | Incitec Pivot, Ltd. * | 2,514,182 | 93,166 | Novo Nordisk AS | 6,081,945 | |
| 79,065 | Leighton Holdings, Ltd. * | 4,183,537 | Total Denmark | 8,883,914 | ||
| 42,641 | Macquarie Group, Ltd. * | 2,852,967 | ||||
| 55,060 | Rio Tinto, Ltd. * | 6,405,249 | Finland (1.2%) | |||
| 404,316 | Seek, Ltd. * | 2,810,190 | 54,237 | Konecranes Oyj | 1,847,468 | |
| 449,700 | Westpac Banking Corporation | 10,935,224 | 407,000 | Nokia Oyj | 15,635,167 | |
| 192,396 | Woolworths, Ltd. | 5,705,642 | Total Finland | 17,482,635 | ||
| 109,174 | WorleyParsons, Ltd. | 4,918,169 | ||||
| Total Australia | 62,398,566 | France (5.7%) | ||||
| 20,034 | Alstom | 4,302,975 | ||||
| Austria (0.3%) | 31,563 | Arkema # | 2,072,960 | |||
| 52,252 | Voestalpine AG | 3,744,666 | 406,200 | Axa SA | 16,194,018 | |
| Total Austria | 3,744,666 | 50,747 | Bouygues SA | 4,216,542 | ||
| 22,265 | Michelin Class B | 2,545,410 | ||||
| Belgium (0.5%) | 21,284 | Nexans SA | 2,659,358 | |||
| 52,546 | InBev NV | 4,368,009 | 124,800 | Schneider Electric SA | 16,902,646 | |
| 24,567 | KBC Groep NV | 3,457,759 | 37,232 | UBISOFT Entertainment SA #* | 3,779,549 | |
| Total Belgium | 7,825,768 | 12,637 | Unibail-Rodamco | 2,769,036 | ||
| 73,096 | Vinci SA | 5,405,631 | ||||
| Bermuda (0.1%) | 473,580 | Vivendi Universal SA | 21,742,515 | |||
| 713,000 | GOME Electrical Appliances | Total France | 82,590,640 | |||
| Holdings, Ltd. | 1,797,798 | |||||
| Total Bermuda | 1,797,798 | Germany (10.3%) | ||||
| 303,313 | Adidas AG | 22,551,011 | ||||
| Brazil (0.9%) | 58,904 | BASF AG | 8,734,619 | |||
| 280,000 | Empresa Brasileira de Aeronautica | 59,184 | Bayer AG | 5,412,169 | ||
| SA ADR * | 12,765,200 | 212,163 | Celesio AG | 13,125,259 | ||
| Total Brazil | 12,765,200 | 36,076 | Continental AG | 4,720,371 | ||
| 24,729 | DaimlerChrysler AG | 2,396,627 | ||||
| Canada (4.4%) | 38,483 | Deutsche Boerse AG | 7,594,839 | |||
| 55,000 | Addax Petroleum Corporation | 2,393,364 | 451,400 | Deutsche Post AG-REG | 15,498,925 | |
| 71,100 | Agrium, Inc. # | 5,162,854 | 65,343 | E.ON AG | 13,890,861 | |
| 144,600 | Barrick Gold Corporation # | 6,120,960 | 51,368 | Fresenius Medical Care AG & Company | 2,758,191 | |
| 347,600 | Bombardier, Inc. # | 2,098,983 | 29,754 | MAN AG | 4,938,477 | |
| 267,757 | CGI Group, Inc. # | 3,144,178 | 1,875 | Porsche AG | 3,786,288 | |
| 117,700 | EnCana Corporation # | 8,049,392 | 20,304 | Q-Cells AG # | 2,881,319 | |
| 34,600 | First Quantum Minerals, Ltd. | 2,982,190 | 20,552 | RWE AG | 2,881,478 | |
| 78,000 | Imperial Oil, Ltd. #* | 4,316,474 | 20,080 | Salzgitter AG | 3,000,930 | |
| 47,700 | Petro-Canada # | 2,573,480 | 53,342 | SGL Carbon AG # | 2,886,200 | |
| 58,300 | Potash Corporation of | 201,164 | Siemens AG | 31,984,164 | ||
| Saskatchewan # | 8,475,650 | Total Germany | 149,041,728 | |||
| 63,900 | Power Corporation * | 2,598,082 | ||||
| The accompanying Notes to Financial Statements are an integral part of this schedule. |
| 112 |
| Partner International Stock Portfolio | ||||||
| Schedule of Investments as of December 31, 2007 | ||||||
| Shares | Common Stock (97.7%) | Value ^ | Shares | Common Stock (97.7%) | Value ^ | |
| Greece (0.9%) | 78,419 | Matsuda Sangyo Company, Ltd. | $1,805,383 | |||
| 103,668 | Alpha Bank AE | $3,753,933 | 255,000 | Matsushita Electric Industrial | ||
| 93,848 | Coca-Cola Hellenic Bottling | Company, Ltd. | 5,225,173 | |||
| Company SA | 4,049,972 | 92,000 | Mitsubishi Corporation | 2,489,951 | ||
| 71,743 | National Bank of Greece SA | 4,919,566 | 1,455,000 | Mitsubishi UFJ Financial | ||
| Total Greece | 12,723,471 | Group, Inc. | 13,720,541 | |||
| 300,000 | Mitsui Osk Lines, Ltd. | 3,792,689 | ||||
| Hong Kong (1.3%) | 785,150 | Mitsui Sumitomo Insurance Company | 7,601,937 | |||
| 298,000 | Esprit Holdings, Ltd. | 4,388,126 | 441,100 | Nikon Corporation * | 15,005,479 | |
| 103,152 | Hengan International Group | 13,500 | Nintendo Company, Ltd. | 7,926,552 | ||
| Company, Ltd. | 458,484 | 513,600 | Nippon Sheet Glass Company | 2,592,674 | ||
| 798,100 | Swire Pacific, Ltd. | 10,936,459 | 921,000 | Nippon Steel Corporation | 5,637,386 | |
| 449,889 | Vtech Holdings, Ltd. | 3,198,606 | 144,968 | Nisshinbo Industries, Inc. * | 1,767,660 | |
| Total Hong Kong | 18,981,675 | 92,500 | Nomura Research Institute, Ltd. | 3,026,172 | ||
| 83,000 | Olympus Corporation | 3,382,666 | ||||
| Italy (3.6%) | 263,000 | Shizuoka Bank, Ltd. * | 2,884,699 | |||
| 241,475 | Enel SPA | 2,871,258 | 251,000 | Sompo Japan Insurance, Inc. | 2,250,901 | |
| 406,200 | Eni SPA | 14,824,162 | 125,500 | Sony Corporation * | 6,837,601 | |
| 548,800 | Finmeccanica SPA | 17,606,932 | 1,165,400 | Sumitomo Corporation | 16,305,551 | |
| 107,903 | Prysmian SPA # | 2,670,031 | 161,000 | Sumitomo Metal Mining | ||
| 1,761,400 | UniCredito Italiano SPA | 14,487,515 | Company, Ltd. * | 2,721,950 | ||
| Total Italy | 52,459,898 | 81,000 | Sumitomo Realty & Development | |||
| Company, Ltd. | 1,980,942 | |||||
| 1,565,100 | Sumitomo Trust and Banking | |||||
| Japan (17.8%) | Company, Ltd. | 10,315,177 | ||||
| 64,000 | Aisin Seiki Company, Ltd. | 2,649,745 | 237,000 | Takeda Pharmaceutical Company, Ltd. | 13,845,741 | |
| 301,000 | Asahi Glass Company, Ltd. * | 3,980,843 | 174,000 | Tanabe Seiyaku Company, Ltd. | 1,616,328 | |
| 697,500 | Bridgestone Corporation * | 12,314,379 | 98,500 | Tokai Rika Company, Ltd. | 3,036,842 | |
| 43,700 | Canon, Inc. * | 2,000,000 | 582,000 | Toshiba Corporation | 4,295,138 | |
| 455 | Central Japan Railway Company | 3,867,515 | 229,700 | Toyota Motor Corporation | 12,233,526 | |
| 225,000 | Chiba Bank, Ltd. | 1,810,433 | 69,500 | Trend Micro, Inc. # | 2,472,023 | |
| 220,600 | Daiichi Sankyo Company, Ltd. | 6,787,618 | 203,500 | Urban Corporation | 2,685,783 | |
| 73,600 | Daikin Industries, Ltd. | 4,105,120 | ||||
| 300,400 | Daito Trust Construction | Total Japan | 257,519,291 | |||
| Company, Ltd. | 16,480,551 | |||||
| 904 | Geo Corporation * | 1,624,536 | Luxembourg (0.3%) | |||
| 85,700 | Hitachi Construction Machinery | 59,250 | Oriflame Cosmetics SA | 3,771,634 | ||
| Company, Ltd. | 2,544,002 | Total Luxembourg | 3,771,634 | |||
| 695,000 | Hitachi, Ltd. | 5,163,399 | ||||
| 47,000 | IBIDEN Company, Ltd. | 3,249,993 | Netherlands (2.8%) | |||
| 281,000 | ITOCHU Corporation | 2,711,549 | 114,956 | Arcelor Mittal | 8,910,771 | |
| 600 | Japan Tobacco, Inc. | 3,547,648 | 104,500 | ASML Holding NV # | 3,299,312 | |
| 54,500 | Joint Corporation * | 1,050,642 | 52,210 | Furgo NV | 4,032,146 | |
| 211,000 | Kawasaki Kisen Kaisha, Ltd. * | 2,048,372 | 69,371 | Heineken NV | 4,479,967 | |
| 568 | KDDI Corporation | 4,202,674 | 363,500 | ING Groep NV | 14,163,267 | |
| 163,600 | Komatsu, Ltd. | 4,387,616 | 39,412 | Koninklijke DSM NV | 1,861,958 | |
| 95,700 | Kyocera Corporation | 8,457,419 | 108,728 | Unilever NV | 3,994,562 | |
| 88,200 | Makita Corporation | 3,687,380 | Total Netherlands | 40,741,983 | ||
| 484,000 | Marubeni Corporation | 3,391,392 | ||||
| The accompanying Notes to Financial Statements are an integral part of this schedule. |
| 113 |
| Partner International Stock Portfolio | ||||||
| Schedule of Investments as of December 31, 2007 | ||||||
| Shares | Common Stock (97.7%) | Value ^ | Shares | Common Stock (97.7%) | Value ^ | |
| Norway (2.2%) | 393,457 | Novartis AG | $21,516,141 | |||
| 174,600 | DnB NOR ASA | $2,655,988 | 28,137 | Phonak Holding AG | 3,158,891 | |
| 793,100 | Norsk Hydro ASA | 11,292,754 | 44,678 | Roche Holding AG | 7,722,953 | |
| 505,075 | Statoil ASA | 15,581,804 | 13,091 | Swatch Group AG | 3,935,319 | |
| 109,900 | Tandberg ASA | 2,269,147 | 177,500 | Swiss Reinsurance Company | 12,556,565 | |
| Total Norway | 31,799,693 | 13,668 | Zurich Financial Services AG | 4,011,196 | ||
| Total Switzerland | 121,163,353 | |||||
| Singapore (3.1%) | ||||||
| 650,000 | Capitaland, Ltd. | 2,796,422 | Taiwan (1.0%) | |||
| 327,000 | City Developments, Ltd. | 3,184,473 | 1,388,004 | Taiwan Semiconductor Manufacturing | ||
| 156,000 | DBS Group Holdings, Ltd. | 2,214,019 | Company, Ltd. ADR * | 13,824,520 | ||
| 1,370,000 | Golden Agri-Resources, Ltd. | 1,995,089 | Total Taiwan | 13,824,520 | ||
| 525,000 | Keppel Land, Ltd. | 2,626,678 | ||||
| 7,390,450 | Singapore Telecommunications, Ltd. | 20,332,337 | United Kingdom (18.5%) | |||
| 847,600 | United Overseas Bank, Ltd. | 11,607,733 | 176,088 | Aggreko plc | 1,848,398 | |
| Total Singapore | 44,756,751 | 154,379 | Anglo American plc | 9,370,258 | ||
| 289,268 | AstraZeneca plc | 12,449,924 | ||||
| South Korea (1.7%) | 174,731 | Autonomy Corporation plc # | 3,071,078 | |||
| 90,500 | LG Electronics, Inc. # | 9,560,930 | 106,414 | BG Group plc | 2,441,316 | |
| 24,534 | Samsung Electronics Company, Ltd. | 14,438,206 | 246,457 | BHP Billiton plc | 7,514,682 | |
| Total South Korea | 23,999,136 | 1,407,300 | British Sky Broadcasting Group plc | 17,309,454 | ||
| 688,701 | Centricia plc | 4,905,213 | ||||
| Spain (5.9%) | 165,502 | Charter plc # | 2,606,854 | |||
| 74,127 | Actividades de Construccion y | 75,551 | Chemring Group plc | 3,068,628 | ||
| Servicios SA | 4,389,792 | 606,571 | GAME GROUP plc | 3,002,671 | ||
| 455,300 | Banco Bilbao Vizcaya Argentaria SA * | 11,083,360 | 882,847 | GlaxoSmithKline plc | 22,419,464 | |
| 131,067 | Banco Santander Central Hispano SA | 2,830,645 | 48,704 | Go-Ahead Group plc | 2,406,932 | |
| 49,560 | Bolsas y Mercados Espanoles | 3,367,609 | 1 | Henderson Group plc | 3 | |
| 121,191 | Grifols SA | 2,720,348 | 115,441 | Imperial Tobacco Group plc | 6,243,350 | |
| 736,000 | Iberdrola SA * | 11,149,539 | 462,403 | International Power plc | 4,167,886 | |
| 63,481 | Industria de Diseno Textil SA (Inditex) | 3,841,065 | 3,180,000 | Kingfisher plc | 9,117,814 | |
| 1,304,103 | Telefonica SA | 42,272,384 | 1,305,200 | Lloyds TSB Group plc | 12,289,508 | |
| 51,067 | Union Fenosa SA | 3,447,045 | 935,000 | Pearson plc | 13,539,448 | |
| Total Spain | 85,101,787 | 307,337 | Petrofac, Ltd. | 3,357,706 | ||
| 125,893 | Punch Taverns plc | 1,915,759 | ||||
| Sweden (1.6%) | 92,147 | Reckitt Benckiser Group plc | 5,354,229 | |||
| 57,600 | Alfa Laval AB | 3,234,208 | 43,207 | Rio Tinto plc | 4,546,849 | |
| 93,000 | Hennes & Mauritz AB | 5,617,721 | 850,900 | Royal Bank of Scotland Group plc | 7,512,275 | |
| 96,500 | Ssab Svenskt Stal AB | 2,604,273 | 182,530 | SABMiller plc | 5,122,393 | |
| 5,063,800 | Telefonaktiebolaget LM Ericsson | 11,852,200 | 196,718 | Shire plc | 4,523,104 | |
| Total Sweden | 23,308,402 | 237,355 | Southern Cross Healthcare, Ltd. | 2,487,645 | ||
| 442,780 | Stagecoach Group plc | 2,487,817 | ||||
| 198,670 | Standard Chartered plc | 7,250,190 | ||||
| Switzerland (8.4%) | 441,064 | Taylor Nelson Sofres plc | 1,819,213 | |||
| 298,238 | ABB, Ltd. | 8,598,353 | 940,901 | Tesco plc | 8,949,609 | |
| 53,455 | Actelion, Ltd. #* | 2,441,768 | 638,302 | Unilever plc | 23,937,468 | |
| 14,000 | Givaudan SA | 13,510,825 | 172,766 | United Business Media plc | 2,229,727 | |
| 61,403 | Julius Baer Holding AG | 5,038,213 | 5,657,187 | Vodafone Group plc | 21,234,720 | |
| 84,224 | Nestle SA | 38,673,129 | 815,550 | William Morrison Supermarkets plc | 5,210,170 | |
| The accompanying Notes to Financial Statements are an integral part of this schedule. |
| 114 |
| Partner International Stock Portfolio | |||||||
| Schedule of Investments as of December 31, 2007 | |||||||
| Shares | Common Stock (97.7%) | Value ^ | Shares | Common Stock (97.7%) | Value ^ | ||
| United Kingdom — continued | United States (0.3%) | ||||||
| 1,072,600 | WPP Group plc | $13,739,912 | 59,954 | iShares MSCI EAFE Index Fund | $4,709,387 | ||
| 98,737 | Xstrata plc | 6,927,902 | Total United States | 4,709,387 | |||
| Total United Kingdom | 266,379,569 | ||||||
| Total Common Stock | |||||||
| (cost $1,203,251,422) | 1,411,305,616 | ||||||
| Interest | Maturity | ||||||
| Shares | Collateral Held for Securities Loaned (8.5%) | Rate (+) | Date | Value | |||
| 122,278,806 | Thrivent Financial Securities Lending Trust | 5.000% | N/A | $122,278,806 | |||
| Total Collateral Held for Securities Loaned | |||||||
| (cost $122,278,806) | 122,278,806 | ||||||
| Shares or | |||||||
| Principal | Interest | Maturity | |||||
| Amount | Short-Term Investments (2.4%) | Rate (+) | Date | Value | |||
| $12,475,000 | Barclays Bank PLC Repurchase Agreement ■ | 4.350% | 1/2/2008 | $12,475,000 | |||
| 15,020,000 | Jupiter Securitization Company, LLC | 4.250 | 1/2/2008 | 15,018,227 | |||
| 6,617,542 | Thrivent Money Market Portfolio | 4.930 | N/A | 6,617,542 | |||
| Total Short-Term Investments (at amortized cost) | 34,110,769 | ||||||
| Total Investments (cost $1,359,640,997) 108.6% | $1,567,695,191 | ||||||
| Other Assets and Liabilities, Net (8.6%) | (123,924,921) | ||||||
| Total Net Assets 100.0% | $1,443,770,270 | ||||||
# Non-income producing security.
* All or a portion of the security is on loan as discussed in item 2(M) of the Notes to Financial Statements.
+ The interest rate shown reflects the yield, coupon rate or, for securities purchased at a discount, the discount rate at the date of purchase.
^ Security is fair valued as discussed in item 2(A) of the Notes to Financial Statements.
■ Repurchase agreement dated December 31, 2007, $12,478,015 maturing January 2, 2008, collateralized by $12,756,022 Federal Home Loan Mortgage Corporation, 6.00% due January 12, 2022.
Definitions:
ADR — American Depository Receipts, which are certificates for shares of an underlying foreign security’s shares held by an issuing U.S. depository bank.
Gross unrealized appreciation and depreciation of investments, based on cost for federal income tax purposes, were as follows:
| Gross unrealized appreciation | $252,425,453 | |
| Gross unrealized depreciation | (53,042,781) | |
| Net unrealized appreciation (depreciation) | $199,382,672 | |
| Cost for federal income tax purposes | $1,368,312,519 |
| The accompanying Notes to Financial Statements are an integral part of this schedule. |
| 115 |
| Partner All Cap Portfolio | ||||||
| Schedule of Investments as of December 31, 2007 | ||||||
| Shares | Common Stock (98.6%) | Value | Shares | Common Stock (98.6%) | Value | |
| Consumer Discretionary (8.4%) | 68,200 | Federal National Mortgage | ||||
| 33,600 | DIRECTV Group, Inc. # | $776,832 | Association | $2,726,636 | ||
| 33,800 | Discovery Holding Company # | 849,732 | 9,400 | Lehman Brothers Holdings, Inc. | 615,136 | |
| 27,800 | Home Depot, Inc. | 748,932 | 21,000 | MF Global, Ltd. # | 660,870 | |
| 15,600 | Liberty Media Corporation — | 7,000 | PartnerRe, Ltd. * | 577,710 | ||
| Capital # | 1,817,244 | 40,500 | People’s United Financial, Inc. * | 720,900 | ||
| 16,100 | Marriott International, Inc. | 550,298 | 15,400 | PNC Financial Services Group, Inc. | 1,011,010 | |
| 9,700 | MGM MIRAGE # | 814,994 | 16,400 | Prudential Financial, Inc. | 1,525,856 | |
| 61,200 | News Corporation | 1,300,500 | 9,600 | Willis Group Holdings, Ltd. | 364,512 | |
| 9,900 | Polo Ralph Lauren Corporation | 611,721 | Total Financials | 20,747,544 | ||
| 31,200 | Royal Caribbean Cruises, Ltd. * | 1,324,128 | ||||
| 33,600 | Walt Disney Company | 1,084,608 | Health Care (11.7%) | |||
| Total Consumer Discretionary | 9,878,989 | 17,400 | Abbott Laboratories | 977,010 | ||
| 17,100 | Adams Respiratory Therapeutics, Inc. #* | 1,021,554 | ||||
| Consumer Staples (10.0%) | 3,100 | AMAG Pharmaceuticals, Inc. #* | 186,403 | |||
| 51,200 | Altria Group, Inc. | 3,869,696 | 37,814 | Auxilium Pharmaceuticals, Inc. # | 1,134,042 | |
| 11,100 | Archer-Daniels-Midland Company | 515,373 | 24,900 | Baxter International, Inc. | 1,445,445 | |
| 39,200 | Avon Products, Inc. | 1,549,576 | 11,000 | Biogen Idec, Inc. # | 626,120 | |
| 40,700 | CVS/Caremark Corporation | 1,617,825 | 4,600 | C.R. Bard, Inc. | 436,080 | |
| 26,950 | Great Atlantic & Pacific Tea | 9,200 | Charles River Laboratories | |||
| Company, Inc. # | 844,344 | International, Inc. # | 605,360 | |||
| 4,600 | Procter & Gamble Company | 337,732 | 8,350 | Medco Health Solutions, Inc. # | 846,690 | |
| 88,400 | Safeway, Inc. | 3,024,164 | 31,000 | Merck & Company, Inc. | 1,801,410 | |
| Total Consumer Staples | 11,758,710 | 26,700 | St. Jude Medical, Inc. # | 1,085,088 | ||
| 60,700 | Theravance, Inc. #* | 1,183,650 | ||||
| Energy (12.4%) | 33,750 | Thermo Electron Corporation # | 1,946,700 | |||
| 7,800 | Diamond Offshore Drilling, Inc. * | 1,107,600 | 4,500 | United Therapeutics Corporation #* | 439,425 | |
| 43,100 | Exxon Mobil Corporation | 4,038,037 | Total Health Care | 13,734,977 | ||
| 14,600 | National Oilwell Varco, Inc. # | 1,072,516 | ||||
| 6,100 | Schlumberger, Ltd. | 600,057 | Industrials (11.4%) | |||
| 48,700 | Southwestern Energy Company # | 2,713,564 | 11,600 | AGCO Corporation #* | 788,568 | |
| 1,900 | Sunoco, Inc. | 137,636 | 13,400 | Deere & Company | 1,247,808 | |
| 11,800 | Tesoro Petroleum Corporation | 562,860 | 9,000 | General Dynamics Corporation | 800,910 | |
| 19,032 | Transocean, Inc. # | 2,724,414 | 76,500 | General Electric Company | 2,835,855 | |
| 11,300 | Valero Energy Corporation | 791,339 | 10,200 | Lockheed Martin Corporation | 1,073,652 | |
| 16,750 | XTO Energy, Inc. | 860,280 | 18,200 | Precision Castparts Corporation | 2,524,340 | |
| Total Energy | 14,608,303 | 13,200 | Raytheon Company | 801,240 | ||
| 13,100 | Shaw Group, Inc. # | 791,764 | ||||
| Financials (17.7%) | 9,700 | Terex Corporation # | 636,029 | |||
| 26,100 | ACE, Ltd. | 1,612,458 | 13,700 | Textron, Inc. | 976,810 | |
| 24,700 | American Express Company | 1,284,894 | 11,400 | United Technologies Corporation | 872,556 | |
| 11,800 | Ameriprise Financial, Inc. | 650,298 | Total Industrials | 13,349,532 | ||
| 22,800 | Annaly Capital Management, Inc. | 414,504 | ||||
| 42,900 | Bank of America Corporation | 1,770,054 | Information Technology (16.9%) | |||
| 29,956 | Bank of New York Mellon Corporation | 1,460,655 | 18,900 | Apple Computer, Inc. # | 3,743,712 | |
| 440 | Berkshire Hathaway, Inc. # | 2,083,840 | 65,100 | Broadcom Corporation # | 1,701,714 | |
| 13,500 | Chubb Corporation * | 736,830 | 94,300 | Cisco Systems, Inc. # | 2,552,701 | |
| 3,100 | CME Group, Inc. * | 2,126,600 | 8,700 | EnerNOC, Inc. #* | 427,170 | |
| 9,700 | Endurance Specialty Holdings, Ltd. | 404,781 | 28,400 | FormFactor, Inc. #* | 940,040 | |
| 5,300 | Google, Inc. # | 3,664,844 | ||||
| The accompanying Notes to Financial Statements are an integral part of this schedule. |
| 116 |
| Partner All Cap Portfolio | |||||||
| Schedule of Investments as of December 31, 2007 | |||||||
| Shares | Common Stock (98.6%) | Value | Shares | Common Stock (98.6%) | Value | ||
| Information Technology — continued | Telecommunications Services (3.7%) | ||||||
| 78,800 | Hewlett-Packard Company | $3,977,824 | 16,000 | American Tower Corporation # | $681,600 | ||
| 23,500 | McAfee, Inc. # | 881,250 | 51,312 | AT&T, Inc. | 2,132,527 | ||
| 26,100 | Microsoft Corporation | 929,160 | 18,900 | Embarq Corporation | 936,117 | ||
| 51,500 | TriQuint Semiconductor, Inc. # | 341,445 | 11,700 | NII Holdings, Inc. # | 565,344 | ||
| 31,000 | Verifone Holdings, Inc. #* | 720,750 | Total Telecommunications | ||||
| Total Information Technology | 19,880,610 | Services | 4,315,588 | ||||
| Materials (3.3%) | Utilities (3.1%) | ||||||
| 11,700 | Albemarle Corporation | 482,625 | 11,400 | ITC Holdings Corporation | 643,188 | ||
| 8,000 | Monsanto Company | 893,520 | 57,900 | PPL Corporation | 3,016,011 | ||
| 5,800 | Mosaic Company # | 547,172 | Total Utilities | 3,659,199 | |||
| 14,300 | Nucor Corporation * | 846,846 | |||||
| 12,700 | Praxair, Inc. | 1,126,617 | Total Common Stock | ||||
| Total Materials | 3,896,780 | (cost $100,408,892) | 115,830,232 | ||||
| Interest | Maturity | ||||||
| Shares | Collateral Held for Securities Loaned (8.4%) | Rate (+) | Date | Value | |||
| 9,928,007 | Thrivent Financial Securities Lending Trust | 5.000% | N/A | $9,928,007 | |||
| Total Collateral Held for Securities Loaned | |||||||
| (cost $9,928,007) | 9,928,007 | ||||||
| Interest | Maturity | ||||||
| Shares | Short-Term Investments (2.2%) | Rate (+) | Date | Value | |||
| 2,625,515 | Thrivent Money Market Portfolio | 4.930% | N/A | $2,625,515 | |||
| Total Short-Term Investments (at amortized cost) | 2,625,515 | ||||||
| Total Investments (cost $112,962,414) 109.2% | $128,383,754 | ||||||
| Other Assets and Liabilities, Net (9.2%) | (10,812,401) | ||||||
| Total Net Assets 100.0% | $117,571,353 | ||||||
# Non-income producing security.
* All or a portion of the security is on loan as discussed in item 2(M) of the Notes to Financial Statements.
+ The interest rate shown reflects the yield, coupon rate or, for securities purchased at a discount, the discount rate at the date of purchase.
Gross unrealized appreciation and depreciation of investments, based on cost for federal income tax purposes, were as follows:
| Gross unrealized appreciation | $18,441,623 | |
| Gross unrealized depreciation | (3,089,921) | |
| Net unrealized appreciation (depreciation) | $15,351,702 | |
| Cost for federal income tax purposes | $113,032,052 |
| The accompanying Notes to Financial Statements are an integral part of this schedule. |
| 117 |
| Large Cap Growth Portfolio | ||||||
| Schedule of Investments as of December 31, 2007 | ||||||
| Shares | Common Stock (97.7%) | Value | Shares | Common Stock (97.7%) | Value | |
| Consumer Discretionary (8.2%) | 125,250 | Suncor Energy, Inc. | $13,618,432 | |||
| 100,050 | Abercrombie & Fitch Company | $8,000,998 | 171,435 | Transocean, Inc. # | 24,540,920 | |
| 308,300 | Aeropostale, Inc. #* | 8,169,950 | 149,400 | Weatherford International, Ltd. # | 10,248,840 | |
| 244,750 | Amazon.com, Inc. #* | 22,673,640 | 112,200 | Willbros Group, Inc. #* | 4,296,138 | |
| 57,300 | Apollo Group, Inc. # | 4,019,595 | 331,054 | XTO Energy, Inc. | 17,002,921 | |
| 335,000 | Best Buy Company, Inc. * | 17,637,750 | Total Energy | 204,794,800 | ||
| 277,700 | Burger King Holdings, Inc. | 7,917,227 | ||||
| 655,600 | Comcast Corporation #* | 11,879,472 | ||||
| 73,100 | Crocs, Inc. #* | 2,690,811 | Financials (10.7%) | |||
| 308,800 | International Game Technology * | 13,565,584 | 237,450 | American Express Company | 12,352,149 | |
| 379,350 | McDonald’s Corporation | 22,347,508 | 241,350 | American International Group, Inc. | 14,070,705 | |
| 146,150 | McGraw-Hill Companies, Inc. | 6,402,832 | 224,700 | Bank of New York Mellon Corporation | 10,956,372 | |
| 112,600 | MGM MIRAGE #* | 9,460,652 | 644,500 | Charles Schwab Corporation * | 16,466,975 | |
| 466,650 | News Corporation | 9,916,312 | 56,100 | CME Group, Inc. * | 38,484,600 | |
| 238,600 | NIKE, Inc. | 15,327,664 | 98,950 | Franklin Resources, Inc. | 11,322,848 | |
| 313,200 | Orbitz Worldwide, Inc. #* | 2,662,200 | 173,050 | Goldman Sachs Group, Inc. | 37,214,402 | |
| 187,500 | Royal Caribbean Cruises, Ltd. | 7,957,500 | 77,850 | IntercontinentalExchange, Inc. #* | 14,986,125 | |
| 163,800 | Target Corporation | 8,190,000 | 386,100 | J.P. Morgan Chase & Company | 16,853,265 | |
| 409,100 | Walt Disney Company | 13,205,748 | 189,900 | Lehman Brothers Holdings, Inc. | 12,427,056 | |
| 68,400 | Wynn Resorts, Ltd. * | 7,669,692 | 239,200 | Morgan Stanley | 12,703,912 | |
| 239,200 | Yum! Brands, Inc. | 9,154,184 | 141,700 | Nymex Holdings, Inc. * | 18,932,537 | |
| 156,850 | Prudential Financial, Inc. | 14,593,324 | ||||
| Total Consumer Discretionary | 208,849,319 | 262,650 | State Street Corporation | 21,327,180 | ||
| 239,900 | T. Rowe Price Group, Inc. * | 14,605,112 | ||||
| Consumer Staples (5.9%) | 108,900 | UBS AG | 5,009,400 | |||
| 235,750 | Altria Group, Inc. | 17,817,985 | Total Financials | 272,305,962 | ||
| 171,900 | Avon Products, Inc. | 6,795,207 | ||||
| 91,100 | Bunge, Ltd. * | 10,604,951 | ||||
| 235,600 | Coca-Cola Company | 14,458,772 | Health Care (14.7%) | |||
| 246,600 | Colgate-Palmolive Company | 19,224,936 | 404,050 | Abbott Laboratories | 22,687,408 | |
| 202,250 | Costco Wholesale Corporation | 14,108,960 | 258,350 | Aetna, Inc. | 14,914,546 | |
| 851,150 | CVS/Caremark Corporation | 33,833,212 | 308,150 | Allergan, Inc. | 19,795,556 | |
| 128,700 | Molson Coors Brewing Company | 6,643,494 | 124,700 | Amgen, Inc. # | 5,791,068 | |
| 346,700 | Safeway, Inc. | 11,860,607 | 416,096 | Baxter International, Inc. | 24,154,373 | |
| 249,950 | Smithfield Foods, Inc. #* | 7,228,554 | 58,300 | Biogen Idec, Inc. # | 3,318,436 | |
| 156,200 | Wal-Mart Stores, Inc. | 7,424,186 | 396,100 | Bristol-Myers Squibb Company | 10,504,572 | |
| 175,900 | Cardinal Health, Inc. | 10,158,225 | ||||
| Total Consumer Staples | 150,000,864 | 240,600 | Celgene Corporation # | 11,118,126 | ||
| 231,000 | Express Scripts, Inc. # | 16,863,000 | ||||
| Energy (8.0%) | 309,500 | Genentech, Inc. # | 20,758,165 | |||
| 215,900 | Cameron International Corporation # | 10,391,267 | 126,165 | Genzyme Corporation # | 9,391,723 | |
| 137,700 | ConocoPhillips | 12,158,910 | 959,800 | Gilead Sciences, Inc. # | 44,160,398 | |
| 179,450 | Devon Energy Corporation | 15,954,900 | 106,300 | Hologic, Inc. #* | 7,296,432 | |
| 254,900 | Halliburton Company | 9,663,259 | 174,200 | Johnson & Johnson | 11,619,140 | |
| 104,000 | Marathon Oil Corporation | 6,329,440 | 432,950 | Merck & Company, Inc. | 25,158,724 | |
| 213,200 | National Oilwell Varco, Inc. # | 15,661,672 | 535,200 | Schering-Plough Corporation | 14,257,728 | |
| 208,100 | Noble Corporation | 11,759,731 | 65,500 | Shire Pharmaceuticals Group plc ADR | 4,516,225 | |
| 98,800 | Petroleo Brasileiro SA ADR | 11,385,712 | 332,150 | St. Jude Medical, Inc. #* | 13,498,576 | |
| 424,750 | Schlumberger, Ltd. | 41,782,658 | ||||
| The accompanying Notes to Financial Statements are an integral part of this schedule. |
| 118 |
| Large Cap Growth Portfolio | ||||||
| Schedule of Investments as of December 31, 2007 | ||||||
| Shares | Common Stock (97.7%) | Value | Shares | Common Stock (97.7%) | Value | |
| Health Care — continued | 868,900 | EMC Corporation # | $16,100,717 | |||
| 407,400 | Teva Pharmaceutical Industries, | 261,100 | F5 Networks, Inc. # | 7,446,572 | ||
| Ltd. ADR | $18,935,952 | 267,550 | Foundry Networks, Inc. #* | 4,687,476 | ||
| 514,208 | Thermo Electron Corporation # | 29,659,517 | 150,352 | Google, Inc. # | 103,965,403 | |
| 419,300 | UnitedHealth Group, Inc. | 24,403,260 | 661,300 | Hewlett-Packard Company | 33,382,424 | |
| 64,250 | WellPoint, Inc. # | 5,636,652 | 1,451,300 | Intel Corporation | 38,691,658 | |
| 124,350 | Zimmer Holdings, Inc. # | 8,225,752 | 52,200 | MasterCard, Inc. * | 11,233,440 | |
| Total Health Care | 376,823,554 | 468,200 | Maxim Integrated Products, Inc. | 12,397,936 | ||
| 95,750 | MEMC Electronic Materials, Inc. # | 8,472,918 | ||||
| Industrials (11.9%) | 1,750,350 | Microsoft Corporation | 62,312,460 | |||
| 243,200 | ABB, Ltd. | 7,004,160 | 459,600 | Motorola, Inc. | 7,371,984 | |
| 106,100 | AGCO Corporation #* | 7,212,678 | 188,000 | Network Appliance, Inc. # | 4,692,480 | |
| 191,100 | Boeing Company | 16,713,606 | 244,200 | Nice Systems, Ltd. ADR # | 8,380,944 | |
| 122,600 | Chicago Bridge and Iron Company | 7,409,944 | 288,450 | Nokia Oyj ADR | 11,073,596 | |
| 229,400 | Danaher Corporation * | 20,127,556 | 271,525 | NVIDIA Corporation # | 9,237,280 | |
| 287,000 | Deere & Company | 26,725,440 | 328,950 | ON Semiconductor Corporation #* | 2,921,076 | |
| 392,550 | Emerson Electric Company | 22,241,883 | 1,141,600 | Oracle Corporation # | 25,777,328 | |
| 75,400 | Energy Solutions, Inc. # | 2,035,046 | 530,600 | QUALCOMM, Inc. | 20,879,110 | |
| 310,250 | Expeditors International of | 293,500 | Research in Motion, Ltd. # | 33,282,900 | ||
| Washington, Inc. * | 13,861,970 | 1,978,200 | RF Micro Devices, Inc. #* | 11,295,522 | ||
| 118,450 | Foster Wheeler, Ltd. # | 18,362,119 | 122,000 | Riverbed Technology, Inc. #* | 3,262,280 | |
| 181,400 | General Dynamics Corporation | 16,142,786 | 211,950 | Seagate Technology * | 5,404,725 | |
| 876,500 | General Electric Company | 32,491,855 | 311,400 | Smith Micro Software, Inc. #* | 2,637,558 | |
| 69,100 | Honeywell International, Inc. | 4,254,487 | 276,637 | Sun Microsystems, Inc. # | 5,015,429 | |
| 112,300 | Manpower, Inc. | 6,389,870 | 260,600 | Western Union Company | 6,327,368 | |
| 145,000 | McDermott International, Inc. # | 8,559,350 | 575,050 | Yahoo!, Inc. #* | 13,375,663 | |
| 309,500 | Northwest Airlines Corporation # | 4,490,845 | Total Information Technology | 756,043,727 | ||
| 98,200 | Oshkosh Truck Corporation * | 4,640,932 | ||||
| 147,350 | Precision Castparts Corporation | 20,437,445 | Materials (5.4%) | |||
| 163,600 | Raytheon Company | 9,930,520 | 126,500 | Agrium, Inc. | 9,134,565 | |
| 209,500 | Textron, Inc. | 14,937,350 | 158,550 | Air Products and Chemicals, Inc. | 15,637,786 | |
| 251,250 | UAL Corporation #* | 8,959,575 | 120,600 | Albemarle Corporation | 4,974,750 | |
| 61,600 | Union Pacific Corporation | 7,738,192 | 168,400 | Freeport-McMoRan Copper & | ||
| 318,900 | United Technologies Corporation | 24,408,606 | Gold, Inc. | 17,250,896 | ||
| Total Industrials | 305,076,215 | 497,500 | Monsanto Company ~ | 55,565,775 | ||
| 74,100 | Mosaic Company # | 6,990,594 | ||||
| Information Technology (29.6%) | 170,500 | Nucor Corporation * | 10,097,010 | |||
| 305,300 | Accenture, Ltd. | 10,999,959 | 81,700 | Potash Corporation of | ||
| 783,650 | Adobe Systems, Inc. # | 33,485,364 | Saskatchewan, Inc. | 11,761,532 | ||
| 456,050 | Apple Computer, Inc. # | 90,334,384 | 72,700 | Praxair, Inc. | 6,449,217 | |
| 423,000 | Broadcom Corporation # | 11,057,220 | Total Materials | 137,862,125 | ||
| 2,580,500 | Cisco Systems, Inc. # | 69,854,135 | ||||
| 1,149,946 | Compuware Corporation # | 10,211,520 | Telecommunications Services (3.3%) | |||
| 563,350 | Corning, Inc. | 13,514,766 | 489,900 | America Movil SA de CV ADR | 30,074,961 | |
| 414,000 | Dell, Inc. # | 10,147,140 | 391,400 | American Tower Corporation # | 16,673,640 | |
| 683,500 | eBay, Inc. # | 22,685,365 | 361,100 | AT&T, Inc. | 15,007,316 | |
| 241,870 | Electronic Arts, Inc. #* | 14,127,627 | 260,850 | NII Holdings, Inc. # | 12,604,272 | |
| The accompanying Notes to Financial Statements are an integral part of this schedule. |
| 119 |
| Large Cap Growth Portfolio | |||||||
| Schedule of Investments as of December 31, 2007 | |||||||
| Shares | Common Stock (97.7%) | Value | Shares | Preferred Stock (<0.1%) | Value | ||
| Telecommunications Services — continued | 23,050 | Federal Home Loan Mortgage | |||||
| 228,000 | Tim Participacoes SA ADR * | $7,968,600 | Corporation # | $602,758 | |||
| 90,750 | Time Warner Telecom, Inc. #* | 1,841,318 | Total Preferred Stock | ||||
| Total Telecommunications | (cost $576,250) | 602,758 | |||||
| Services | 84,170,107 | ||||||
| Total Common Stock | |||||||
| (cost $2,069,338,873) | 2,495,926,673 | ||||||
| Interest | Maturity | ||||||
| Shares | Collateral Held for Securities Loaned (5.3%) | Rate (+) | Date | Value | |||
| 134,097,820 | Thrivent Financial Securities Lending Trust | 5.000% | N/A | $134,097,820 | |||
| Total Collateral Held for Securities Loaned | |||||||
| (cost $134,097,820) | 134,097,820 | ||||||
| Shares or | |||||||
| Principal | Interest | Maturity | |||||
| Amount | Short-Term Investments (2.3%) | Rate (+) | Date | Value | |||
| $10,920,000 | Falcon Asset Securitization Corporation | 4.250% | 1/2/2008 | $10,918,711 | |||
| 12,065,000 | Societe Generale North American | 3.650 | 1/2/2008 | 12,063,777 | |||
| 35,105,032 | Thrivent Money Market Portfolio | 4.930 | N/A | 35,105,032 | |||
| Total Short-Term Investments (at amortized cost) | 58,087,520 | ||||||
| Total Investments (cost $2,262,100,463) 105.3% | $2,688,714,771 | ||||||
| Other Assets and Liabilities, Net (5.3%) | (135,263,748) | ||||||
| Total Net Assets 100.0% | $2,553,451,023 | ||||||
| Number of | Exercise | Expiration | Unrealized | ||
| Call Options Written | Contracts | Price | Date | Value | Gain/(Loss) |
| Monsanto Company | 243 | $125 | January 2008 | ($31,590) | $9,700 |
| Total Call Options Written | $9,700 | ||||
# Non-income producing security.
* All or a portion of the security is on loan as discussed in item 2(M) of the Notes to Financial Statements.
+ The interest rate shown reflects the yield, coupon rate or, for securities purchased at a discount, the discount rate at the date of purchase.
~ All or a portion of the security was earmarked as collateral to cover options.
Definitions:
ADR — American Depository Receipts, which are certificates for shares of an underlying foreign security’s shares held by an issuing U.S. depository bank.
Gross unrealized appreciation and depreciation of investments, based on cost for federal income tax purposes, were as follows:
| Gross unrealized appreciation | $516,238,743 | |
| Gross unrealized depreciation | (101,235,999) | |
| Net unrealized appreciation (depreciation) | $415,002,744 | |
| Cost for federal income tax purposes | $2,273,712,027 |
| The accompanying Notes to Financial Statements are an integral part of this schedule. |
| 120 |
| Large Cap Growth Portfolio II | ||||||
| Schedule of Investments as of December 31, 2007 | ||||||
| Shares | Common Stock (98.0%) | Value | Shares | Common Stock (98.0%) | Value | |
| Consumer Discretionary (8.2%) | 1,700 | Suncor Energy, Inc. | $184,841 | |||
| 1,300 | Abercrombie & Fitch Company | $103,961 | 2,255 | Transocean, Inc. # | 322,803 | |
| 4,100 | Aeropostale, Inc. # | 108,650 | 2,000 | Weatherford International, Ltd. # | 137,200 | |
| 3,300 | Amazon.com, Inc. # | 305,712 | 1,500 | Willbros Group, Inc. # | 57,435 | |
| 800 | Apollo Group, Inc. # | 56,120 | 4,395 | XTO Energy, Inc. | 225,727 | |
| 4,400 | Best Buy Company, Inc. | 231,660 | Total Energy | 2,716,160 | ||
| 3,800 | Burger King Holdings, Inc. | 108,338 | ||||
| 9,000 | Comcast Corporation # | 163,080 | Financials (10.7%) | |||
| 1,000 | Crocs, Inc. #* | 36,810 | 3,250 | American Express Company | 169,065 | |
| 4,100 | International Game Technology | 180,113 | 3,250 | American International Group, Inc. | 189,475 | |
| 5,050 | McDonald’s Corporation | 297,496 | 3,000 | Bank of New York Mellon Corporation | 146,280 | |
| 1,950 | McGraw-Hill Companies, Inc. | 85,430 | 8,650 | Charles Schwab Corporation | 221,008 | |
| 1,500 | MGM MIRAGE # | 126,030 | 750 | CME Group, Inc. | 514,500 | |
| 6,250 | News Corporation | 132,812 | 1,300 | Franklin Resources, Inc. | 148,759 | |
| 3,200 | NIKE, Inc. | 205,568 | 2,300 | Goldman Sachs Group, Inc. | 494,615 | |
| 4,200 | Orbitz Worldwide, Inc. # | 35,700 | 1,000 | IntercontinentalExchange, Inc. # | 192,500 | |
| 2,550 | Royal Caribbean Cruises, Ltd. | 108,222 | 5,200 | J.P. Morgan Chase & Company | 226,980 | |
| 2,150 | Target Corporation | 107,500 | 2,550 | Lehman Brothers Holdings, Inc. | 166,872 | |
| 5,550 | Walt Disney Company | 179,154 | 3,150 | Morgan Stanley | 167,296 | |
| 900 | Wynn Resorts, Ltd. | 100,917 | 1,900 | Nymex Holdings, Inc. * | 253,859 | |
| 3,200 | Yum! Brands, Inc. | 122,464 | 2,100 | Prudential Financial, Inc. | 195,384 | |
| Total Consumer Discretionary | 2,795,737 | 3,500 | State Street Corporation | 284,200 | ||
| 3,150 | T. Rowe Price Group, Inc. | 191,772 | ||||
| Consumer Staples (5.9%) | 1,500 | UBS AG | 69,000 | |||
| 3,150 | Altria Group, Inc. | 238,077 | Total Financials | 3,631,565 | ||
| 2,300 | Avon Products, Inc. | 90,919 | ||||
| 1,200 | Bunge, Ltd. | 139,692 | Health Care (14.9%) | |||
| 3,100 | Coca-Cola Company | 190,247 | 5,350 | Abbott Laboratories | 300,402 | |
| 3,250 | Colgate-Palmolive Company | 253,370 | 3,350 | Aetna, Inc. | 193,396 | |
| 2,700 | Costco Wholesale Corporation | 188,352 | 4,150 | Allergan, Inc. | 266,596 | |
| 11,300 | CVS/Caremark Corporation | 449,175 | 1,660 | Amgen, Inc. # | 77,090 | |
| 1,700 | Molson Coors Brewing Company | 87,754 | 5,600 | Baxter International, Inc. | 325,080 | |
| 4,600 | Safeway, Inc. | 157,366 | 800 | Biogen Idec, Inc. # | 45,536 | |
| 3,400 | Smithfield Foods, Inc. # | 98,328 | 5,350 | Bristol-Myers Squibb Company | 141,882 | |
| 2,100 | Wal-Mart Stores, Inc. | 99,813 | 2,300 | Cardinal Health, Inc. | 132,825 | |
| Total Consumer Staples | 1,993,093 | 3,250 | Celgene Corporation # | 150,182 | ||
| 3,100 | Express Scripts, Inc. # | 226,300 | ||||
| Energy (8.0%) | 4,200 | Genentech, Inc. # | 281,694 | |||
| 2,800 | Cameron International Corporation # | 134,764 | 1,669 | Genzyme Corporation # | 124,240 | |
| 1,800 | ConocoPhillips | 158,940 | 12,800 | Gilead Sciences, Inc. # | 588,928 | |
| 2,350 | Devon Energy Corporation | 208,938 | 1,400 | Hologic, Inc. # | 96,096 | |
| 3,450 | Halliburton Company | 130,790 | 2,330 | Johnson & Johnson | 155,411 | |
| 1,400 | Marathon Oil Corporation | 85,204 | 5,850 | Merck & Company, Inc. | 339,944 | |
| 2,800 | National Oilwell Varco, Inc. # | 205,688 | 7,150 | Schering-Plough Corporation | 190,476 | |
| 2,800 | Noble Corporation | 158,228 | 900 | Shire Pharmaceuticals Group plc ADR | 62,055 | |
| 1,300 | Petroleo Brasileiro SA ADR | 149,812 | 4,450 | St. Jude Medical, Inc. # | 180,848 | |
| 5,650 | Schlumberger, Ltd. | 555,790 | ||||
| The accompanying Notes to Financial Statements are an integral part of this schedule. |
| 121 |
| Large Cap Growth Portfolio II | ||||||
| Schedule of Investments as of December 31, 2007 | ||||||
| Shares | Common Stock (98.0%) | Value | Shares | Common Stock (98.0%) | Value | |
| Health Care — continued | 5,500 | Dell, Inc. # | $134,805 | |||
| 5,450 | Teva Pharmaceutical Industries, | 9,060 | eBay, Inc. # | 300,701 | ||
| Ltd. ADR | $253,316 | 3,150 | Electronic Arts, Inc. # | 183,992 | ||
| 6,798 | Thermo Electron Corporation # | 392,109 | 11,700 | EMC Corporation # | 216,801 | |
| 5,700 | UnitedHealth Group, Inc. | 331,740 | 3,500 | F5 Networks, Inc. # | 99,820 | |
| 900 | WellPoint, Inc. # | 78,957 | 3,600 | Foundry Networks, Inc. # | 63,072 | |
| 1,700 | Zimmer Holdings, Inc. # | 112,455 | 2,000 | Google, Inc. # | 1,382,962 | |
| Total Health Care | 5,047,558 | 8,750 | Hewlett-Packard Company | 441,700 | ||
| 19,300 | Intel Corporation | 514,538 | ||||
| Industrials (11.9%) | 700 | MasterCard, Inc. | 150,640 | |||
| 3,200 | ABB, Ltd. | 92,160 | 6,350 | Maxim Integrated Products, Inc. | 168,148 | |
| 1,400 | AGCO Corporation # | 95,172 | 1,300 | MEMC Electronic Materials, Inc. # | 115,037 | |
| 2,550 | Boeing Company | 223,023 | 23,320 | Microsoft Corporation | 830,192 | |
| 1,650 | Chicago Bridge and Iron Company | 99,726 | 6,200 | Motorola, Inc. | 99,448 | |
| 3,100 | Danaher Corporation * | 271,994 | 2,600 | Network Appliance, Inc. # | 64,896 | |
| 3,700 | Deere & Company | 344,544 | 3,300 | Nice Systems, Ltd. ADR # | 113,256 | |
| 5,150 | Emerson Electric Company | 291,799 | 3,900 | Nokia Oyj ADR | 149,721 | |
| 1,000 | Energy Solutions, Inc. # | 26,990 | 3,700 | NVIDIA Corporation # | 125,874 | |
| 4,150 | Expeditors International of | 4,400 | ON Semiconductor Corporation # | 39,072 | ||
| Washington, Inc. | 185,422 | 15,200 | Oracle Corporation # | 343,216 | ||
| 1,600 | Foster Wheeler, Ltd. # | 248,032 | 7,050 | QUALCOMM, Inc. | 277,418 | |
| 2,400 | General Dynamics Corporation | 213,576 | 3,900 | Research in Motion, Ltd. # | 442,260 | |
| 11,660 | General Electric Company | 432,236 | 26,600 | RF Micro Devices, Inc. #* | 151,886 | |
| 900 | Honeywell International, Inc. | 55,413 | 1,700 | Riverbed Technology, Inc. # | 45,458 | |
| 1,500 | Manpower, Inc. | 85,350 | 2,850 | Seagate Technology | 72,675 | |
| 1,900 | McDermott International, Inc. # | 112,157 | 4,200 | Smith Micro Software, Inc. # | 35,574 | |
| 4,100 | Northwest Airlines Corporation # | 59,491 | 3,750 | Sun Microsystems, Inc. # | 67,988 | |
| 1,300 | Oshkosh Truck Corporation | 61,438 | 3,550 | Western Union Company | 86,194 | |
| 2,000 | Precision Castparts Corporation | 277,400 | 7,650 | Yahoo!, Inc. # | 177,939 | |
| 2,100 | Raytheon Company | 127,470 | Total Information Technology | 10,089,815 | ||
| 2,800 | Textron, Inc. | 199,640 | ||||
| 3,350 | UAL Corporation #* | 119,461 | Materials (5.4%) | |||
| 800 | Union Pacific Corporation | 100,496 | 1,700 | Agrium, Inc. | 122,757 | |
| 4,300 | United Technologies Corporation | 329,122 | 2,100 | Air Products and Chemicals, Inc. | 207,123 | |
| Total Industrials | 4,052,112 | 1,600 | Albemarle Corporation | 66,000 | ||
| 2,250 | Freeport-McMoRan Copper & | |||||
| Information Technology (29.7%) | Gold, Inc. | 230,490 | ||||
| 4,100 | Accenture, Ltd. | 147,723 | 6,650 | Monsanto Company ~ | 742,738 | |
| 10,450 | Adobe Systems, Inc. # | 446,528 | 1,000 | Mosaic Company # | 94,340 | |
| 6,050 | Apple Computer, Inc. # | 1,198,384 | 2,300 | Nucor Corporation | 136,206 | |
| 5,700 | Broadcom Corporation # | 148,998 | 1,100 | Potash Corporation of | ||
| 34,470 | Cisco Systems, Inc. # | 933,103 | Saskatchewan, Inc. | 158,356 | ||
| 15,400 | Compuware Corporation # | 136,752 | 900 | Praxair, Inc. | 79,839 | |
| 7,630 | Corning, Inc. | 183,044 | Total Materials | 1,837,849 | ||
| The accompanying Notes to Financial Statements are an integral part of this schedule. |
| 122 |
| Large Cap Growth Portfolio II | |||||||
| Schedule of Investments as of December 31, 2007 | |||||||
| Shares | Common Stock (98.0%) | Value | Shares | Preferred Stock (<0.1%) | Value | ||
| Telecommunications Services (3.3%) | 300 | Federal Home Loan Mortgage | |||||
| 6,550 | America Movil SA de CV ADR | $402,104 | Corporation # | $7,845 | |||
| 5,150 | American Tower Corporation # | 219,390 | Total Preferred Stock | ||||
| 4,700 | AT&T, Inc. | 195,332 | (cost $7,500) | 7,845 | |||
| 3,550 | NII Holdings, Inc. # | 171,536 | |||||
| 3,000 | Tim Participacoes SA ADR | 104,850 | |||||
| 1,250 | Time Warner Telecom, Inc. # | 25,362 | |||||
| Total Telecommunications | |||||||
| Services | 1,118,574 | ||||||
| Total Common Stock | |||||||
| (cost $26,817,130) | 33,282,463 | ||||||
| Interest | Maturity | ||||||
| Shares | Collateral Held for Securities Loaned (1.0%) | Rate (+) | Date | Value | |||
| 348,149 | Thrivent Financial Securities Lending Trust | 5.000% | N/A | $348,149 | |||
| Total Collateral Held for Securities Loaned | |||||||
| (cost $348,149) | 348,149 | ||||||
| Interest | Maturity | ||||||
| Shares | Short-Term Investments (2.1%) | Rate (+) | Date | Value | |||
| 719,728 | Thrivent Money Market Portfolio | 4.930% | N/A | $719,728 | |||
| Total Short-Term Investments (at amortized cost) | 719,728 | ||||||
| Total Investments (cost $27,892,507) 101.1% | $34,358,185 | ||||||
| Other Assets and Liabilities, Net (1.1%) | (374,285) | ||||||
| Total Net Assets 100.0% | $33,983,900 | ||||||
| Number of | Exercise | Expiration | Unrealized | ||
| Call Options Written | Contracts | Price | Date | Value | Gain/(Loss) |
| Monsanto Company | 4 | $125 | January 2008 | ($520) | $160 |
| Total Call Options Written | $160 | ||||
# Non-income producing security.
* All or a portion of the security is on loan as discussed in item 2(M) of the Notes to Financial Statements.
+ The interest rate shown reflects the yield, coupon rate or, for securities purchased at a discount, the discount rate at the date of purchase.
~ All or a portion of the security was earmarked as collateral to cover options.
Definitions:
ADR — American Depository Receipts, which are certificates for shares of an underlying foreign security’s shares held by an issuing U.S. depository bank.
Gross unrealized appreciation and depreciation of investments, based on cost for federal income tax purposes, were as follows:
| Gross unrealized appreciation | $7,495,321 | |
| Gross unrealized depreciation | (1,109,297) | |
| Net unrealized appreciation (depreciation) | $6,386,024 | |
| Cost for federal income tax purposes | $27,972,161 |
| The accompanying Notes to Financial Statements are an integral part of this schedule. |
| 123 |
| Partner Growth Stock Portfolio | ||||||
| Schedule of Investments as of December 31, 2007 | ||||||
| Shares | Common Stock (97.7%) | Value | Shares | Common Stock (97.7%) | Value | |
| Consumer Discretionary (9.5%) | 9,299 | Erste Bank der oesterreichischen | ||||
| 13,900 | Amazon.com, Inc. #* | $1,287,696 | Sparkassen AG | $656,556 | ||
| 6,800 | B2W Compania Global do Varejo | 271,236 | 9,600 | Franklin Resources, Inc. | 1,098,528 | |
| 13,300 | Bed Bath & Beyond, Inc. # | 390,887 | 3,500 | Goldman Sachs Group, Inc. | 752,675 | |
| 8,100 | EchoStar Communications | 28,900 | Moody’s Corporation * | 1,031,730 | ||
| Corporation # | 305,532 | 6,500 | Morgan Stanley | 345,215 | ||
| 25,509 | Expedia, Inc. #* | 806,595 | 9,400 | Northern Trust Corporation | 719,852 | |
| 5,500 | Harman International | 10,900 | Prudential Financial, Inc. | 1,014,136 | ||
| Industries, Inc. * | 405,405 | 17,400 | Redecard SA | 281,528 | ||
| 19,800 | International Game Technology * | 869,814 | 23,400 | State Street Corporation | 1,900,080 | |
| 15,000 | Kohl’s Corporation #* | 687,000 | Total Financials | 12,769,164 | ||
| 6,500 | Las Vegas Sands Corporation #* | 669,825 | ||||
| 13,600 | Lojas Renner SA | 275,056 | Health Care (16.3%) | |||
| 15,500 | Marriott International, Inc. | 529,790 | 30,200 | Aetna, Inc. | 1,743,446 | |
| 35,100 | McGraw-Hill Companies, Inc. | 1,537,731 | 4,800 | Alcon, Inc. * | 686,592 | |
| 2,200 | MGM MIRAGE #* | 184,844 | 16,800 | Allergan, Inc. | 1,079,232 | |
| 31,800 | Naspers, Ltd. | 752,653 | 9,500 | Becton, Dickinson and Company | 794,010 | |
| 25,600 | Shaw Communications, Inc. * | 606,208 | 5,600 | Celgene Corporation # | 258,776 | |
| 8,200 | Target Corporation | 410,000 | 13,100 | CIGNA Corporation | 703,863 | |
| 31,000 | Yum! Brands, Inc. | 1,186,370 | 17,100 | Covidien, Ltd. | 757,359 | |
| Total Consumer Discretionary | 11,176,642 | 18,500 | Genentech, Inc. # | 1,240,795 | ||
| 33,500 | Gilead Sciences, Inc. # | 1,541,335 | ||||
| Consumer Staples (8.8%) | 7,500 | Humana, Inc. # | 564,825 | |||
| 17,100 | Costco Wholesale Corporation | 1,192,896 | 12,700 | Laboratory Corporation of | ||
| 72,137 | CVS/Caremark Corporation | 2,867,446 | America Holdings # | 959,231 | ||
| 5,309 | Groupe Danone | 475,791 | 10,000 | McKesson Corporation | 655,100 | |
| 7,297 | InBev NV | 606,580 | 9,300 | Medco Health Solutions, Inc. # | 943,020 | |
| 13,000 | PepsiCo, Inc. | 986,700 | 30,400 | Medtronic, Inc. | 1,528,208 | |
| 20,937 | Procter & Gamble Company | 1,537,195 | 10,300 | Merck & Company, Inc. | 598,533 | |
| 7,819 | Reckitt Benckiser Group plc | 454,325 | 2,968 | Roche Holding AG | 513,043 | |
| 25,200 | SYSCO Corporation * | 786,492 | 23,100 | Schering-Plough Corporation | 615,384 | |
| 21,700 | Walgreen Company | 826,336 | 12,500 | St. Jude Medical, Inc. # | 508,000 | |
| 16,800 | Whole Foods Market, Inc. * | 685,440 | 10,500 | Stryker Corporation | 784,560 | |
| Total Consumer Staples | 10,419,201 | 25,400 | WellPoint, Inc. # | 2,228,342 | ||
| 8,700 | Zimmer Holdings, Inc. # | 575,505 | ||||
| Energy (7.4%) | Total Health Care | 19,279,159 | ||||
| 17,300 | Baker Hughes, Inc. | 1,403,030 | ||||
| 9,900 | EOG Resources, Inc. | 883,575 | Industrials (11.8%) | |||
| 12,300 | Exxon Mobil Corporation | 1,152,387 | 27,700 | Danaher Corporation * | 2,430,398 | |
| 7,600 | Murphy Oil Corporation | 644,784 | 6,200 | Deere & Company | 577,344 | |
| 30,400 | Schlumberger, Ltd. | 2,990,448 | 12,900 | Expeditors International of | ||
| 19,926 | Total SA | 1,649,809 | Washington, Inc. * | 576,372 | ||
| Total Energy | 8,724,033 | 5,500 | Fastenal Company * | 222,310 | ||
| 8,600 | Foster Wheeler, Ltd. # | 1,333,172 | ||||
| Financials (10.8%) | 12,700 | General Dynamics Corporation | 1,130,173 | |||
| 10,100 | American Express Company | 525,402 | 124,300 | General Electric Company | 4,607,801 | |
| 8,900 | Assurant, Inc. | 595,410 | 6,600 | Joy Global, Inc. | 434,412 | |
| 2,600 | BlackRock, Inc. | 563,680 | 9,700 | McDermott International, Inc. # | 572,591 | |
| 69,800 | Bovespa Holding SA # | 1,345,022 | 8,334 | Schneider Electric SA | 1,128,739 | |
| 41,000 | Charles Schwab Corporation * | 1,047,550 | 76,000 | Southwest Airlines Company | 927,200 | |
| 1,300 | CME Group, Inc. | 891,800 | Total Industrials | 13,940,512 | ||
| The accompanying Notes to Financial Statements are an integral part of this schedule. |
| 124 |
| Partner Growth Stock Portfolio | ||||||
| Schedule of Investments as of December 31, 2007 | ||||||
| Shares | Common Stock (97.7%) | Value | Shares | Common Stock (97.7%) | Value | |
| Information Technology (23.6%) | Materials (3.3%) | |||||
| 36,600 | Accenture, Ltd. | $1,318,698 | 42,687 | BHP Billiton, Ltd. * | $1,492,238 | |
| 21,400 | Amdocs, Ltd. # | 737,658 | 7,500 | Freeport-McMoRan Copper & Gold, Inc. | 768,300 | |
| 14,900 | Apple Computer, Inc. # | 2,951,392 | 9,900 | Monsanto Company | 1,105,731 | |
| 28,300 | Automatic Data Processing, Inc. | 1,260,199 | 5,700 | Praxair, Inc. | 505,647 | |
| 54,200 | Cisco Systems, Inc. # | 1,467,194 | Total Materials | 3,871,916 | ||
| 47,800 | Corning, Inc. | 1,146,722 | ||||
| 25,000 | Dell, Inc. # | 612,750 | Telecommunications Services (5.5%) | |||
| 19,200 | Electronic Arts, Inc. # | 1,121,472 | 28,600 | America Movil SA de CV ADR | 1,755,754 | |
| 36,000 | EMC Corporation # | 667,080 | 32,200 | American Tower Corporation # | 1,371,720 | |
| 5,500 | Google, Inc. # | 3,803,140 | 35,900 | Crown Castle International | ||
| 58,300 | Hon Hai Precision Industry | Corporation #* | 1,493,440 | |||
| Company, Ltd. | 719,725 | 5,600 | Leap Wireless International, Inc. # | 261,184 | ||
| 13,400 | Infosys Technologies, Ltd. ADR | 607,824 | 11,400 | Metropcs Communications, Inc. #* | 221,730 | |
| 22,500 | Intel Corporation | 599,850 | 29,900 | Rogers Communications, Inc. | 1,352,975 | |
| 28,000 | Juniper Networks, Inc. # | 929,600 | Total Telecommunications | |||
| 58,600 | Marvell Technology Group, Ltd. # | 819,228 | Services | 6,456,803 | ||
| 12,500 | Maxim Integrated Products, Inc. | 331,000 | ||||
| 91,375 | Microsoft Corporation | 3,252,950 | Utilities (0.7%) | |||
| 3,300 | Nintendo Company, Ltd. | 1,937,602 | 40,000 | AES Corporation # | 855,600 | |
| 25,700 | QUALCOMM, Inc. | 1,011,295 | Total Utilities | 855,600 | ||
| 8,953 | TomTom NV # | 676,161 | ||||
| 38,100 | VeriSign, Inc. # | 1,432,941 | ||||
| 17,200 | Yahoo!, Inc. # | 400,072 | Total Common Stock | |||
| (cost $87,678,357) | 115,297,583 | |||||
| Total Information Technology | 27,804,553 | |||||
| The accompanying Notes to Financial Statements are an integral part of this schedule. |
| 125 |
| Partner Growth Stock Portfolio | ||||
| Schedule of Investments as of December 31, 2007 | ||||
| Interest | Maturity | |||
| Shares | Collateral Held for Securities Loaned (9.8%) | Rate (+) | Date | Value |
| 11,623,223 | Thrivent Financial Securities Lending Trust | 5.000% | N/A | $11,623,223 |
| Total Collateral Held for Securities Loaned | ||||
| (cost $11,623,223) | 11,623,223 | |||
| Interest | Maturity | |||
| Shares | Short-Term Investments (2.4%) | Rate (+) | Date | Value |
| 2,824,334 | Thrivent Money Market Portfolio | 4.930% | N/A | $2,824,334 |
| Total Short-Term Investments (at amortized cost) | 2,824,334 | |||
| Total Investments (cost $102,125,914) 109.9% | $129,745,140 | |||
| Other Assets and Liabilities, Net (9.9%) | (11,690,664) | |||
| Total Net Assets 100.0% | $118,054,476 | |||
# Non-income producing security.
* All or a portion of the security is on loan as discussed in item 2(M) of the Notes to Financial Statements.
+ The interest rate shown reflects the yield, coupon rate or, for securities purchased at a discount, the discount rate at the date of purchase.
Definitions:
ADR — American Depository Receipts, which are certificates for shares of an underlying foreign security’s shares held by an issuing U.S. depository bank.
Gross unrealized appreciation and depreciation of investments, based on cost for federal income tax purposes, were as follows:
| Gross unrealized appreciation | $29,604,034 | |
| Gross unrealized depreciation | (2,438,664) | |
| Net unrealized appreciation (depreciation) | $27,165,370 | |
| Cost for federal income tax purposes | $102,579,770 |
| The accompanying Notes to Financial Statements are an integral part of this schedule. |
| 126 |
| Large Cap Value Portfolio | ||||||
| Schedule of Investments as of December 31, 2007 | ||||||
| Shares | Common Stock (95.9%) | Value | Shares | Common Stock (95.9%) | Value | |
| Consumer Discretionary (9.2%) | Financials (22.2%) | |||||
| 97,200 | Best Buy Company, Inc. | $5,117,580 | 53,900 | ACE, Ltd. | $3,329,942 | |
| 82,200 | BorgWarner, Inc. * | 3,979,302 | 143,200 | American International Group, Inc. | 8,348,560 | |
| 107,000 | Carnival Corporation * | 4,760,430 | 425,550 | Bank of America Corporation | 17,558,193 | |
| 78,050 | CBS Corporation | 2,126,862 | 374,684 | Bank of New York Mellon Corporation | 18,269,581 | |
| 199,600 | Chico’s FAS, Inc. # | 1,802,388 | 123,300 | Chubb Corporation * | 6,729,714 | |
| 169,450 | Comcast Corporation #* | 3,094,157 | 543,945 | Citigroup, Inc. | 16,013,741 | |
| 487,500 | Gap, Inc. | 10,374,000 | 67,400 | City National Corporation | 4,013,670 | |
| 159,000 | General Motors Corporation * | 3,957,510 | 24,800 | Everest Re Group, Ltd. | 2,489,920 | |
| 113,360 | Liberty Media Corporation — | 123,175 | Federal Home Loan Mortgage | |||
| Capital # | 13,205,306 | Corporation | 4,196,572 | |||
| 110,000 | McDonald’s Corporation | 6,480,100 | 82,600 | Federal National Mortgage | ||
| 423,200 | News Corporation | 8,671,368 | Association | 3,302,348 | ||
| 49,200 | NIKE, Inc. | 3,160,608 | 31,100 | Goldman Sachs Group, Inc. | 6,688,055 | |
| 104,000 | Omnicom Group, Inc. | 4,943,120 | 31,015 | Hartford Financial Services | ||
| 326,300 | Time Warner, Inc. | 5,387,213 | Group, Inc. | 2,704,198 | ||
| 176,100 | TJX Companies, Inc. | 5,059,353 | 636,100 | Hudson City Bancorp, Inc. * | 9,554,222 | |
| 92,500 | Viacom, Inc. # | 4,062,600 | 623,852 | J.P. Morgan Chase & Company | 27,231,140 | |
| 185,400 | Walt Disney Company | 5,984,712 | 46,800 | Lehman Brothers Holdings, Inc. | 3,062,592 | |
| Total Consumer Discretionary | 92,166,609 | 167,700 | Merrill Lynch & Company, Inc. | 9,002,136 | ||
| 141,500 | Morgan Stanley | 7,515,065 | ||||
| Consumer Staples (9.4%) | 44,900 | PNC Financial Services Group, Inc. | 2,947,685 | |||
| 257,100 | Altria Group, Inc. | 19,431,618 | 189,000 | Principal Financial Group, Inc. * | 13,010,760 | |
| 116,400 | Anheuser-Busch Companies, Inc. * | 6,092,376 | 57,000 | Prudential Financial, Inc. | 5,303,280 | |
| 299,300 | ConAgra Foods, Inc. | 7,120,347 | 24,700 | Simon Property Group, Inc. | 2,145,442 | |
| 123,600 | Costco Wholesale Corporation | 8,622,336 | 90,300 | State Street Corporation | 7,332,360 | |
| 58,600 | Diageo plc ADR | 5,029,638 | 202,800 | Travelers Companies, Inc. | 10,910,640 | |
| 312,300 | General Mills, Inc. | 17,801,100 | 166,700 | U.S. Bancorp * | 5,291,058 | |
| 105,145 | Kimberly-Clark Corporation | 7,290,754 | 204,833 | Wachovia Corporation * | 7,789,799 | |
| 304,700 | Kraft Foods, Inc. | 9,942,361 | 344,500 | Washington Federal, Inc. * | 7,272,395 | |
| 191,700 | Kroger Company | 5,120,307 | 128,713 | Washington Mutual, Inc. * | 1,751,784 | |
| 72,100 | Safeway, Inc. | 2,466,541 | 311,390 | Wells Fargo & Company * | 9,400,864 | |
| 168,800 | Unilever NV ADR | 6,154,448 | Total Financials | 223,165,716 | ||
| Total Consumer Staples | 95,071,826 | |||||
| Health Care (9.8%) | ||||||
| Energy (12.8%) | 238,600 | Abbott Laboratories | 13,397,390 | |||
| 113,240 | Apache Corporation | 12,177,830 | 58,700 | Aetna, Inc. | 3,388,751 | |
| 171,866 | Chevron Corporation | 16,040,254 | 124,700 | Baxter International, Inc. | 7,238,835 | |
| 162,758 | ConocoPhillips | 14,371,531 | 95,600 | Eli Lilly and Company | 5,104,084 | |
| 56,300 | Devon Energy Corporation | 5,005,633 | 99,825 | Johnson & Johnson | 6,658,328 | |
| 381,900 | Exxon Mobil Corporation | 35,780,212 | 154,700 | McKesson Corporation | 10,134,397 | |
| 128,700 | Halliburton Company | 4,879,017 | 109,500 | Merck & Company, Inc. | 6,363,045 | |
| 176,900 | Occidental Petroleum Corporation | 13,619,531 | 58,800 | Novartis AG ADR * | 3,193,428 | |
| 61,600 | Royal Dutch Shell plc ADR | 5,186,720 | 884,400 | Pfizer, Inc. | 20,102,412 | |
| 52,200 | Schlumberger, Ltd. | 5,134,914 | 281,700 | Sanofi-Aventis ADR * | 12,825,801 | |
| 194,500 | Total SA ADR | 16,065,700 | 60,700 | WellPoint, Inc. # | 5,325,211 | |
| Total Energy | 128,261,342 | 111,200 | Wyeth * | 4,913,928 | ||
| Total Health Care | 98,645,610 | |||||
| The accompanying Notes to Financial Statements are an integral part of this schedule. |
| 127 |
| Large Cap Value Portfolio | ||||||
| Schedule of Investments as of December 31, 2007 | ||||||
| Shares | Common Stock (95.9%) | Value | Shares | Common Stock (95.9%) | Value | |
| Industrials (10.1%) | Materials (4.2%) | |||||
| 294,000 | AMR Corporation #* | $4,124,820 | 163,695 | Alcoa, Inc. | $5,983,052 | |
| 52,700 | Armstrong World Industries, Inc. # | 2,113,797 | 91,100 | Dow Chemical Company | 3,591,162 | |
| 130,400 | CSX Corporation | 5,734,992 | 206,000 | E.I. du Pont de Nemours and Company | 9,082,540 | |
| 105,200 | Deere & Company | 9,796,224 | 103,640 | International Paper Company * | 3,355,863 | |
| 145,800 | Emerson Electric Company * | 8,261,028 | 334,300 | MeadWestvaco Corporation | 10,463,590 | |
| 30,700 | General Dynamics Corporation | 2,731,993 | 80,900 | Praxair, Inc. | 7,176,639 | |
| 450,300 | General Electric Company | 16,692,621 | 47,300 | Rohm and Haas Company * | 2,510,211 | |
| 166,200 | Honeywell International, Inc. | 10,232,934 | Total Materials | 42,163,057 | ||
| 128,800 | Lockheed Martin Corporation | 13,557,488 | ||||
| 35,600 | Northrop Grumman Corporation | 2,799,584 | Telecommunications Services (5.8%) | |||
| 198,100 | Republic Services, Inc. | 6,210,435 | 765,123 | AT&T, Inc. | 31,798,512 | |
| 39,000 | Tyco International, Ltd. | 1,546,350 | 259,800 | Time Warner Telecom, Inc. #* | 5,271,342 | |
| 136,600 | United Technologies Corporation | 10,455,364 | 485,555 | Verizon Communications, Inc. | 21,213,898 | |
| 212,700 | Waste Management, Inc. | 6,948,909 | Total Telecommunications | |||
| Total Industrials | 101,206,539 | Services | 58,283,752 | |||
| Information Technology (9.9%) | Utilities (2.5%) | |||||
| 188,300 | Accenture, Ltd. | 6,784,449 | 69,400 | Entergy Corporation | 8,294,688 | |
| 138,200 | Amdocs, Ltd. # | 4,763,754 | 95,800 | Exelon Corporation | 7,821,112 | |
| 677,000 | Amkor Technology, Inc. #* | 5,774,810 | 122,600 | FirstEnergy Corporation | 8,868,884 | |
| 108,440 | Applied Materials, Inc. * | 1,925,894 | Total Utilities | 24,984,684 | ||
| 118,500 | Cisco Systems, Inc. # | 3,207,795 | ||||
| 91,100 | Dell, Inc. # | 2,232,861 | Total Common Stock | |||
| 248,600 | Hewlett-Packard Company | 12,549,328 | (cost $843,319,628) | 963,169,669 | ||
| 669,800 | Intel Corporation | 17,856,868 | ||||
| 145,000 | International Business Machines | |||||
| Corporation | 15,674,500 | |||||
| 300,700 | Microsoft Corporation | 10,704,920 | ||||
| 125,500 | Motorola, Inc. | 2,013,020 | ||||
| 124,690 | Nokia Oyj ADR | 4,786,849 | ||||
| 167,800 | Oracle Corporation # | 3,788,924 | ||||
| 218,800 | Sybase, Inc. #* | 5,708,492 | ||||
| 39,000 | Tyco Electronics, Ltd. | 1,448,070 | ||||
| Total Information Technology | 99,220,534 | |||||
| The accompanying Notes to Financial Statements are an integral part of this schedule. |
| 128 |
| Large Cap Value Portfolio | ||||
| Schedule of Investments as of December 31, 2007 | ||||
| Interest | Maturity | |||
| Shares | Collateral Held for Securities Loaned (9.3%) | Rate (+) | Date | Value |
| 93,704,955 | Thrivent Financial Securities Lending Trust | 5.000% | N/A | $93,704,955 |
| Total Collateral Held for Securities Loaned | ||||
| (cost $93,704,955) | 93,704,955 | |||
| Shares or | ||||
| Principal | Interest | Maturity | ||
| Amount | Short-Term Investments (4.0%) | Rate (+) | Date | Value |
| $36,960,000 | Barclays Bank PLC Repurchase Agreement ■ | 4.350% | 1/2/2008 | $36,960,000 |
| 3,547,866 | Thrivent Money Market Portfolio | 4.930 | N/A | 3,547,866 |
| Total Short-Term Investments (at amortized cost) | 40,507,866 | |||
| Total Investments (cost $977,532,449) 109.2% | $1,097,382,490 | |||
| Other Assets and Liabilities, Net (9.2%) | (92,481,612) | |||
| Total Net Assets 100.0% | $1,004,900,878 | |||
# Non-income producing security.
* All or a portion of the security is on loan as discussed in item 2(M) of the Notes to Financial Statements.
+ The interest rate shown reflects the yield, coupon rate or, for securities purchased at a discount, the discount rate at the date of purchase.
■ Repurchase agreement dated December 31, 2007, $36,968,932 maturing January 2, 2008, collateralized by $37,715,612 Federal Home Loan Bank, 5.125% due August 21, 2008.
Definitions:
ADR — American Depository Receipts, which are certificates for shares of an underlying foreign security’s shares held by an issuing U.S. depository bank.
Gross unrealized appreciation and depreciation of investments, based on cost for federal income tax purposes, were as follows:
| Gross unrealized appreciation | $165,261,537 | |
| Gross unrealized depreciation | (47,589,594) | |
| Net unrealized appreciation (depreciation) | $117,671,943 | |
| Cost for federal income tax purposes | $979,710,547 |
| The accompanying Notes to Financial Statements are an integral part of this schedule. |
| 129 |
| Large Cap Stock Portfolio | ||||||
| Schedule of Investments as of December 31, 2007 | ||||||
| Shares | Common Stock (96.8%) | Value | Shares | Common Stock (96.8%) | Value | |
| Consumer Discretionary (5.8%) | 128,783 | Schlumberger, Ltd. | $12,668,384 | |||
| 141,650 | Best Buy Company, Inc. | $7,457,872 | 36,066 | Suncor Energy, Inc. | 3,921,456 | |
| 48,500 | Carnival Corporation | 2,157,765 | 185,129 | Total SA ADR | 15,291,655 | |
| 92,400 | Chico’s FAS, Inc. # | 834,372 | 50,590 | Transocean, Inc. # | 7,241,958 | |
| 77,182 | Comcast Corporation #* | 1,409,343 | 123,003 | XTO Energy, Inc. | 6,317,408 | |
| 222,000 | Gap, Inc. | 4,724,160 | Total Energy | 132,194,749 | ||
| 110,300 | General Motors Corporation * | 2,745,367 | ||||
| 100,200 | Home Depot, Inc. | 2,699,388 | Financials (17.9%) | |||
| 86,650 | International Game Technology | 3,806,534 | 6,900 | Allstate Corporation | 360,387 | |
| 45,000 | Liberty Media Corporation — Capital # | 5,242,050 | 78,500 | American Express Company | 4,083,570 | |
| 66,800 | McDonald’s Corporation | 3,935,188 | 136,387 | American International Group, Inc. | 7,951,362 | |
| 31,100 | MGM MIRAGE # | 2,613,022 | 40,020 | Ameriprise Financial, Inc. | 2,205,502 | |
| 304,124 | News Corporation | 6,231,501 | 349,700 | Bank of America Corporation | 14,428,622 | |
| 163,276 | News Corporation | 3,469,615 | 251,188 | Bank of New York Mellon Corporation | 12,247,927 | |
| 36,800 | Nordstrom, Inc. | 1,351,664 | 92,074 | Chubb Corporation * | 5,025,399 | |
| 47,200 | Omnicom Group, Inc. | 2,243,416 | 259,174 | Citigroup, Inc. | 7,630,083 | |
| 108,387 | Time Warner, Inc. | 1,789,469 | 85,389 | City National Corporation * | 5,084,915 | |
| 121,935 | TJX Companies, Inc. | 3,503,193 | 16,282 | CME Group, Inc. * | 11,169,452 | |
| 42,100 | Viacom, Inc. # | 1,849,032 | 76,842 | Federal National Mortgage Association | 3,072,143 | |
| 89,450 | Yum! Brands, Inc. | 3,423,252 | 106,700 | Fifth Third Bancorp | 2,681,371 | |
| Total Consumer Discretionary | 61,486,203 | 40,490 | Goldman Sachs Group, Inc. | 8,707,374 | ||
| 296,500 | Hudson City Bancorp, Inc. | 4,453,430 | ||||
| Consumer Staples (7.6%) | 445,108 | J.P. Morgan Chase & Company | 19,428,964 | |||
| 190,896 | Altria Group, Inc. | 14,427,920 | 73,900 | Lehman Brothers Holdings, Inc. | 4,836,016 | |
| 67,772 | Anheuser-Busch Companies, Inc. * | 3,547,186 | 41,400 | Loews Corporation | 2,084,076 | |
| 23,900 | Bunge, Ltd. * | 2,782,199 | 153,784 | Merrill Lynch & Company, Inc. | 8,255,125 | |
| 61,100 | Colgate-Palmolive Company | 4,763,356 | 79,400 | MetLife, Inc. | 4,892,628 | |
| 294,397 | ConAgra Foods, Inc. | 7,003,705 | 165,523 | Morgan Stanley | 8,790,927 | |
| 105,800 | Costco Wholesale Corporation | 7,380,608 | 269,000 | National City Corporation | 4,427,740 | |
| 168,946 | CVS/Caremark Corporation | 6,715,604 | 37,900 | Nymex Holdings, Inc. * | 5,063,819 | |
| 26,600 | Diageo plc ADR | 2,283,078 | 105,044 | Principal Financial Group, Inc. | 7,231,229 | |
| 207,827 | General Mills, Inc. | 11,846,139 | 61,080 | Prudential Financial, Inc. | 5,682,883 | |
| 165,146 | Kraft Foods, Inc. | 5,388,714 | 41,151 | State Street Corporation | 3,341,461 | |
| 87,300 | Kroger Company | 2,331,783 | 60,800 | T. Rowe Price Group, Inc. | 3,701,504 | |
| 92,000 | Procter & Gamble Company | 6,754,640 | 144,056 | Travelers Companies, Inc. | 7,750,213 | |
| 117,600 | Unilever NV ADR | 4,287,696 | 155,099 | Wachovia Corporation | 5,898,415 | |
| 24,100 | Wal-Mart Stores, Inc. | 1,145,473 | 160,300 | Washington Federal, Inc. * | 3,383,933 | |
| Total Consumer Staples | 80,658,101 | 198,099 | Wells Fargo & Company * | 5,980,609 | ||
| Total Financials | 189,851,079 | |||||
| Energy (12.5%) | ||||||
| 72,618 | Apache Corporation | 7,809,340 | Health Care (13.8%) | |||
| 30,315 | Chevron Corporation | 2,829,299 | 330,709 | Abbott Laboratories ‡ | 18,569,310 | |
| 138,730 | ConocoPhillips | 12,249,859 | 90,200 | Aetna, Inc. | 5,207,246 | |
| 83,300 | Devon Energy Corporation | 7,406,203 | 84,410 | Allergan, Inc. | 5,422,498 | |
| 388,065 | Exxon Mobil Corporation | 36,357,809 | 123,133 | Baxter International, Inc. | 7,147,871 | |
| 58,400 | Halliburton Company | 2,213,944 | 77,400 | Cardinal Health, Inc. | 4,469,850 | |
| 83,950 | National Oilwell Varco, Inc. # | 6,166,967 | 44,300 | Eli Lilly and Company | 2,365,177 | |
| 49,350 | Noble Corporation | 2,788,768 | 113,326 | Express Scripts, Inc. # | 8,272,798 | |
| 85,389 | Occidental Petroleum Corporation | 6,574,099 | 358,090 | Gilead Sciences, Inc. # | 16,475,721 | |
| 28,000 | Royal Dutch Shell plc ADR | 2,357,600 | 215,475 | Johnson & Johnson | 14,372,182 | |
| The accompanying Notes to Financial Statements are an integral part of this schedule. |
| 130 |
| Large Cap Stock Portfolio | ||||||
| Schedule of Investments as of December 31, 2007 | ||||||
| Shares | Common Stock (96.8%) | Value | Shares | Common Stock (96.8%) | Value | |
| Health Care — continued | 692,426 | Intel Corporation | $18,460,077 | |||
| 141,794 | McKesson Corporation | $9,288,925 | 172,158 | International Business | ||
| 68,824 | Medtronic, Inc. | 3,459,782 | Machines Corporation | 18,610,280 | ||
| 118,100 | Merck & Company, Inc. | 6,862,791 | 121,950 | Maxim Integrated Products, Inc. | 3,229,236 | |
| 491,515 | Pfizer, Inc. | 11,172,136 | 575,605 | Microsoft Corporation | 20,491,538 | |
| 159,088 | Sanofi-Aventis ADR * | 7,243,277 | 86,600 | Nokia Oyj ADR | 3,324,574 | |
| 83,800 | St. Jude Medical, Inc. # | 3,405,632 | 239,988 | Oracle Corporation # | 5,418,929 | |
| 225,872 | Thermo Electron Corporation # | 13,028,297 | 109,030 | QUALCOMM, Inc. | 4,290,330 | |
| 86,777 | UnitedHealth Group, Inc. | 5,050,421 | 54,050 | Research in Motion, Ltd. # | 6,129,270 | |
| 55,164 | WellPoint, Inc. # | 4,839,538 | 117,675 | Sun Microsystems, Inc. # | 2,133,448 | |
| Total Health Care | 146,653,452 | 105,400 | Sybase, Inc. #* | 2,749,886 | ||
| 125,150 | Yahoo!, Inc. #* | 2,910,989 | ||||
| Industrials (10.0%) | Total Information Technology | 202,155,817 | ||||
| 187,800 | AMR Corporation #* | 2,634,834 | ||||
| 51,982 | Armstrong World Industries, Inc. # | 2,084,998 | Materials (5.4%) | |||
| 11,741 | Caterpillar, Inc. | 851,927 | 55,300 | Agrium, Inc. * | 3,993,213 | |
| 122,238 | CSX Corporation | 5,376,027 | 54,927 | Air Products and Chemicals, Inc. | 5,417,450 | |
| 59,382 | Danaher Corporation * | 5,210,177 | 196,775 | Alcoa, Inc. ‡ | 7,192,126 | |
| 77,038 | Deere & Company | 7,173,779 | 121,357 | E.I. du Pont de Nemours and Company 5,350,630 | ||
| 106,050 | Emerson Electric Company | 6,008,793 | 37,864 | Freeport-McMoRan Copper & | ||
| 16,950 | Energy Solutions, Inc. # | 457,480 | Gold, Inc. | 3,878,788 | ||
| 84,500 | Expeditors International of | 243,496 | MeadWestvaco Corporation | 7,621,425 | ||
| Washington, Inc. * | 3,775,460 | 134,563 | Monsanto Company | 15,029,341 | ||
| 27,900 | Foster Wheeler, Ltd. # | 4,325,058 | 98,559 | Praxair, Inc. | 8,743,169 | |
| 442,190 | General Electric Company | 16,391,983 | Total Materials | 57,226,142 | ||
| 134,328 | Honeywell International, Inc. | 8,270,575 | ||||
| 68,095 | Lockheed Martin Corporation | 7,167,680 | Telecommunications Services (3.7%) | |||
| 61,687 | Precision Castparts Corporation | 8,555,987 | 146,961 | America Movil SA de CV ADR | 9,021,936 | |
| 43,600 | Raytheon Company | 2,646,520 | 87,200 | American Tower Corporation # | 3,714,720 | |
| 79,874 | UAL Corporation #* | 2,848,307 | 423,050 | AT&T, Inc. ‡ | 17,581,958 | |
| 24,396 | Union Pacific Corporation | 3,064,626 | 81,459 | NII Holdings, Inc. #* | 3,936,099 | |
| 159,198 | United Technologies Corporation | 12,185,015 | 244,576 | Time Warner Telecom, Inc. #* | 4,962,447 | |
| 216,474 | Waste Management, Inc. | 7,072,206 | Total Telecommunications | |||
| Total Industrials | 106,101,432 | Services | 39,217,160 | |||
| Information Technology (19.1%) | Utilities (1.0%) | |||||
| 283,356 | Accenture, Ltd. | 10,209,317 | 279,682 | Southern Company | 10,837,678 | |
| 165,003 | Adobe Systems, Inc. # | 7,050,578 | Total Utilities | 10,837,678 | ||
| 64,000 | Amdocs, Ltd. # | 2,206,080 | ||||
| 313,700 | Amkor Technology, Inc. #* | 2,675,861 | Total Common Stock | |||
| 92,324 | Apple Computer, Inc. # | 18,287,538 | (cost $910,046,893) | 1,026,381,813 | ||
| 132,971 | Broadcom Corporation # | 3,475,862 | ||||
| 517,630 | Cisco Systems, Inc. # | 14,012,244 | ||||
| 160,845 | Corning, Inc. | 3,858,672 | ||||
| 79,000 | Dell, Inc. # | 1,936,290 | Shares | Preferred Stock (<0.1%) | Value | |
| 124,167 | eBay, Inc. # | 4,121,103 | ||||
| 198,100 | EMC Corporation # | 3,670,793 | 4,050 | Federal Home Loan Mortgage | ||
| 88,550 | F5 Networks, Inc. # | 2,525,446 | Corporation # | $105,908 | ||
| 32,571 | Google, Inc. # | 22,522,195 | Total Preferred Stock | |||
| 353,710 | Hewlett-Packard Company * | 17,855,281 | (cost $101,250) | 105,908 | ||
| The accompanying Notes to Financial Statements are an integral part of this schedule. |
| 131 |
| Large Cap Stock Portfolio | ||||
| Schedule of Investments as of December 31, 2007 | ||||
| Interest | Maturity | |||
| Shares | Collateral Held for Securities Loaned (6.2%) | Rate (+) | Date | Value |
| 65,208,363 | Thrivent Financial Securities Lending Trust | 5.000% | N/A | $65,208,363 |
| Total Collateral Held for Securities Loaned | ||||
| (cost $65,208,363) | 65,208,363 | |||
| Shares or | ||||
| Principal | Interest | Maturity | ||
| Amount | Short-Term Investments (2.6%) | Rate (+) | Date | Value |
| $3,680,000 | Federal National Mortgage Association ‡ | 4.030% | 5/16/2008 | $3,623,696 |
| 7,685,000 | Jupiter Securitization Company, LLC | 4.250 | 1/2/2008 | 7,684,093 |
| 5,505,000 | Sheffield Receivables Corporation | 4.250 | 1/2/2008 | 5,504,350 |
| 10,589,629 | Thrivent Money Market Portfolio | 4.930 | N/A | 10,589,629 |
| Total Short-Term Investments (cost $27,402,408) | 27,401,768 | |||
| Total Investments (cost $1,002,758,914) 105.6% | $1,119,097,852 | |||
| Other Assets and Liabilities, Net (5.6%) | (58,968,479) | |||
| Total Net Assets 100.0% | $1,060,129,373 | |||
| Number of | Notional | ||||
| Contracts | Expiration | Principal | Unrealized | ||
| Futures | Long/(Short) | Date | Amount | Value | Gain/(Loss) |
| S&P 500 Index Futures | 44 | March 2008 | $16,351,520 | $16,249,200 | ($102,320) |
| Total Futures | ($102,320) | ||||
# Non-income producing security.
* All or a portion of the security is on loan as discussed in item 2(M) of the Notes to Financial Statements.
+ The interest rate shown reflects the yield, coupon rate or, for securities purchased at a discount, the discount rate at the date of purchase.
‡ At December 31, 2007, $3,623,696 of investments were held on deposit with the counterparty and pledged as the initial margin deposit for open financial futures contracts. In addition, $21,629,838 of investments were earmarked as collateral to cover open financial futures contracts.
Definitions:
ADR — American Depository Receipts, which are certificates for shares of an underlying foreign security’s shares held by an issuing U.S. depository bank.
Gross unrealized appreciation and depreciation of investments, based on cost for federal income tax purposes, were as follows:
| Gross unrealized appreciation | $145,305,128 | |
| Gross unrealized depreciation | (36,950,833) | |
| Net unrealized appreciation (depreciation) | $108,354,295 | |
| Cost for federal income tax purposes | $1,010,743,557 |
| The accompanying Notes to Financial Statements are an integral part of this schedule. |
| 132 |
| Large Cap Index Portfolio | ||||||
| Schedule of Investments as of December 31, 2007 | ||||||
| Shares | Common Stock (98.7%) | Value | Shares | Common Stock (98.7%) | Value | |
| Consumer Discretionary (8.4%) | 8,300 | Leggett & Platt, Inc. | $144,752 | |||
| 4,200 | Abercrombie & Fitch Company | $335,874 | 6,700 | Lennar Corporation | 119,863 | |
| 14,900 | Amazon.com, Inc. #* | 1,380,336 | 15,004 | Limited Brands, Inc. | 284,026 | |
| 6,600 | Apollo Group, Inc. # | 462,990 | 4,900 | Liz Claiborne, Inc. | 99,715 | |
| 6,800 | AutoNation, Inc. # | 106,488 | 71,000 | Lowe’s Companies, Inc. | 1,606,020 | |
| 2,200 | AutoZone, Inc. # | 263,802 | 20,968 | Macy’s Group, Inc | 542,442 | |
| 12,800 | Bed Bath & Beyond, Inc. # | 376,192 | 15,100 | Marriott International, Inc. | 516,118 | |
| 17,025 | Best Buy Company, Inc. * | 896,366 | 17,750 | Mattel, Inc. | 337,960 | |
| 4,400 | Big Lots, Inc. #* | 70,356 | 57,500 | McDonald’s Corporation | 3,387,325 | |
| 3,100 | Black & Decker Corporation | 215,915 | 15,900 | McGraw-Hill Companies, Inc. | 696,579 | |
| 4,400 | Brunswick Corporation * | 75,020 | 1,900 | Meredith Corporation | 104,462 | |
| 21,200 | Carnival Corporation | 943,188 | 7,100 | New York Times Company * | 124,463 | |
| 33,272 | CBS Corporation | 906,662 | 13,573 | Newell Rubbermaid, Inc. | 351,269 | |
| 5,900 | Centex Corporation | 149,034 | 112,300 | News Corporation | 2,301,027 | |
| 8,300 | Circuit City Stores, Inc. * | 34,860 | 18,600 | NIKE, Inc. | 1,194,864 | |
| 24,100 | Clear Channel Communications, Inc. | 831,932 | 9,100 | Nordstrom, Inc. | 334,243 | |
| 17,800 | Coach, Inc. # | 544,324 | 13,200 | Office Depot, Inc. # | 183,612 | |
| 149,216 | Comcast Corporation #* | 2,724,676 | 3,800 | OfficeMax, Inc. | 78,508 | |
| 13,400 | D.R. Horton, Inc. * | 176,478 | 15,800 | Omnicom Group, Inc. * | 750,974 | |
| 6,950 | Darden Restaurants, Inc. | 192,584 | 3,000 | Polo Ralph Lauren Corporation | 185,370 | |
| 2,800 | Dillard’s, Inc. * | 52,584 | 10,300 | Pulte Homes, Inc. * | 108,562 | |
| 34,800 | DIRECTV Group, Inc. # | 804,576 | 6,400 | RadioShack Corporation * | 107,904 | |
| 4,500 | E.W. Scripps Company | 202,545 | 3,532 | Sears Holdings Corporation #* | 360,441 | |
| 13,900 | Eastman Kodak Company * | 303,993 | 5,100 | Sherwin-Williams Company | 296,004 | |
| 10,000 | Expedia, Inc. #* | 316,200 | 2,900 | Snap-On, Inc. | 139,896 | |
| 6,900 | Family Dollar Stores, Inc. | 132,687 | 4,100 | Stanley Works | 198,768 | |
| 102,500 | Ford Motor Company #* | 689,825 | 34,275 | Staples, Inc. | 790,724 | |
| 7,500 | Fortune Brands, Inc. | 542,700 | 35,400 | Starbucks Corporation # | 724,638 | |
| 7,700 | GameStop Corporation # | 478,247 | 9,700 | Starwood Hotels & Resorts | ||
| 11,400 | Gannett Company, Inc. | 444,600 | Worldwide, Inc. | 427,091 | ||
| 22,562 | Gap, Inc. | 480,119 | 40,900 | Target Corporation | 2,045,000 | |
| 27,400 | General Motors Corporation * | 681,986 | 6,600 | Tiffany & Company | 303,798 | |
| 8,200 | Genuine Parts Company | 379,660 | 175,550 | Time Warner, Inc. | 2,898,330 | |
| 11,600 | Goodyear Tire & Rubber Company #* | 327,352 | 21,200 | TJX Companies, Inc. | 609,076 | |
| 15,700 | H&R Block, Inc. | 291,549 | 4,400 | VF Corporation | 302,104 | |
| 11,700 | Harley-Davidson, Inc. * | 546,507 | 31,872 | Viacom, Inc. # | 1,399,818 | |
| 2,900 | Harman International Industries, Inc. | 213,759 | 92,447 | Walt Disney Company | 2,984,189 | |
| 9,100 | Harrah’s Entertainment, Inc. | 807,625 | 270 | Washington Post Company | 213,686 | |
| 7,250 | Hasbro, Inc. | 185,455 | 4,300 | Wendy’s International, Inc. | 111,112 | |
| 81,900 | Home Depot, Inc. * | 2,206,386 | 3,658 | Whirlpool Corporation | 298,586 | |
| 8,900 | IAC InterActiveCorp # | 239,588 | 8,772 | Wyndham Worldwide Corporation | 206,668 | |
| 15,300 | International Game Technology * | 672,129 | 24,680 | Yum! Brands, Inc. | 944,504 | |
| 22,967 | Interpublic Group of | Total Consumer Discretionary | 53,050,363 | |||
| Companies, Inc. #* | 186,262 | |||||
| 10,800 | J.C. Penney Company, Inc. | Consumer Staples (10.1%) | ||||
| (Holding Company) | 475,092 | 102,300 | Altria Group, Inc. | 7,731,834 | ||
| 28,800 | Johnson Controls, Inc. | 1,037,952 | 35,600 | Anheuser-Busch Companies, Inc. * | 1,863,304 | |
| 4,300 | Jones Apparel Group, Inc. | 68,757 | 31,168 | Archer-Daniels-Midland Company | 1,447,130 | |
| 3,700 | KB Home | 79,920 | 20,800 | Avon Products, Inc. | 822,224 | |
| 15,300 | Kohl’s Corporation #* | 700,740 | 4,300 | Brown-Forman Corporation | 318,673 | |
| The accompanying Notes to Financial Statements are an integral part of this schedule. |
| 133 |
| Large Cap Index Portfolio | ||||||
| Schedule of Investments as of December 31, 2007 | ||||||
| Shares | Common Stock (98.7%) | Value | Shares | Common Stock (98.7%) | Value | |
| Consumer Staples — continued | 265,408 | Exxon Mobil Corporation | $24,866,079 | |||
| 11,000 | Campbell Soup Company | $393,030 | 42,800 | Halliburton Company | 1,622,548 | |
| 6,800 | Clorox Company | 443,156 | 13,500 | Hess Corporation | 1,361,610 | |
| 96,500 | Coca-Cola Company | 5,922,205 | 34,468 | Marathon Oil Corporation | 2,097,722 | |
| 14,000 | Coca-Cola Enterprises, Inc. | 364,420 | 9,200 | Murphy Oil Corporation | 780,528 | |
| 24,700 | Colgate-Palmolive Company | 1,925,612 | 13,800 | Nabors Industries, Ltd. # | 377,982 | |
| 23,700 | ConAgra Foods, Inc. | 563,823 | 17,300 | National Oilwell Varco, Inc. # | 1,270,858 | |
| 9,500 | Constellation Brands, Inc. # | 224,580 | 13,000 | Noble Corporation | 734,630 | |
| 21,100 | Costco Wholesale Corporation | 1,471,936 | 8,400 | Noble Energy, Inc. | 667,968 | |
| 71,744 | CVS/Caremark Corporation | 2,851,824 | 40,200 | Occidental Petroleum Corporation | 3,094,998 | |
| 6,400 | Dean Foods Company | 165,504 | 12,800 | Peabody Energy Corporation | 788,992 | |
| 5,700 | Estee Lauder Companies, Inc. | 248,577 | 7,300 | Range Resources Corporation | 374,928 | |
| 16,400 | General Mills, Inc. | 934,800 | 5,500 | Rowan Companies, Inc. | 217,030 | |
| 15,400 | H.J. Heinz Company | 718,872 | 58,000 | Schlumberger, Ltd. | 5,705,460 | |
| 8,300 | Hershey Company | 327,020 | 9,700 | Smith International, Inc. | 716,345 | |
| 13,000 | Kellogg Company | 681,590 | 30,704 | Spectra Energy Corporation | 792,777 | |
| 20,492 | Kimberly-Clark Corporation | 1,420,915 | 5,800 | Sunoco, Inc. | 420,152 | |
| 75,152 | Kraft Foods, Inc. | 2,452,210 | 6,700 | Tesoro Petroleum Corporation | 319,590 | |
| 33,000 | Kroger Company | 881,430 | 15,408 | Transocean, Inc. #* | 2,205,667 | |
| 6,400 | McCormick & Company, Inc. | 242,624 | 26,700 | Valero Energy Corporation | 1,869,801 | |
| 6,600 | Molson Coors Brewing Company | 340,692 | 16,300 | Weatherford International, Ltd. # | 1,118,180 | |
| 6,900 | Pepsi Bottling Group, Inc. | 272,274 | 28,900 | Williams Companies, Inc. | 1,034,042 | |
| 78,170 | PepsiCo, Inc. | 5,933,103 | 23,450 | XTO Energy, Inc. | 1,204,392 | |
| 150,860 | Procter & Gamble Company | 11,076,141 | Total Energy | 80,357,273 | ||
| 8,400 | Reynolds American, Inc. * | 554,064 | ||||
| 21,400 | Safeway, Inc. | 732,094 | Financials (17.3%) | |||
| 35,100 | Sara Lee Corporation | 563,706 | 16,000 | ACE, Ltd. | 988,480 | |
| 10,181 | SUPERVALU, Inc. | 381,991 | 23,600 | AFLAC, Inc. ‡ | 1,478,068 | |
| 29,500 | SYSCO Corporation * | 920,695 | 27,682 | Allstate Corporation | 1,445,831 | |
| 13,300 | Tyson Foods, Inc. | 203,889 | 5,000 | Ambac Financial Group, Inc. * | 128,850 | |
| 7,800 | UST, Inc. * | 427,440 | 9,400 | American Capital Strategies, Ltd. * | 309,824 | |
| 48,100 | Walgreen Company * | 1,831,648 | 56,800 | American Express Company ‡ | 2,954,736 | |
| 114,700 | Wal-Mart Stores, Inc. | 5,451,691 | 123,140 | American International Group, Inc. | 7,179,062 | |
| 6,700 | Whole Foods Market, Inc. * | 273,360 | 11,300 | Ameriprise Financial, Inc. | 622,743 | |
| 10,575 | William Wrigley Jr. Company * | 619,166 | 14,225 | Aon Corporation | 678,390 | |
| Total Consumer Staples | 63,999,247 | 4,800 | Apartment Investment & | |||
| Management Company | 166,704 | |||||
| Energy (12.7%) | 4,800 | Assurant, Inc. | 321,120 | |||
| 22,572 | Anadarko Petroleum Corporation | 1,482,755 | 4,000 | Avalonbay Communities, Inc. | 376,560 | |
| 16,020 | Apache Corporation | 1,722,791 | 215,518 | Bank of America Corporation | 8,892,273 | |
| 15,400 | Baker Hughes, Inc. | 1,248,940 | 55,252 | Bank of New York Mellon Corporation | 2,694,088 | |
| 14,300 | BJ Services Company | 346,918 | 26,800 | BB&T Corporation | 821,956 | |
| 22,000 | Chesapeake Energy Corporation | 862,400 | 5,631 | Bear Stearns Companies, Inc. | 496,936 | |
| 102,496 | Chevron Corporation | 9,565,952 | 5,900 | Boston Properties, Inc. | 541,679 | |
| 77,649 | ConocoPhillips | 6,856,407 | 18,973 | Capital One Financial Corporation * | 896,664 | |
| 8,900 | CONSOL Energy, Inc. | 636,528 | 9,600 | CB Richard Ellis Group, Inc. #* | 206,880 | |
| 21,600 | Devon Energy Corporation | 1,920,456 | 45,425 | Charles Schwab Corporation * | 1,160,609 | |
| 34,018 | El Paso Corporation | 586,470 | 18,600 | Chubb Corporation * | 1,015,188 | |
| 7,100 | ENSCO International, Inc. * | 423,302 | 8,138 | Cincinnati Financial Corporation | 321,777 | |
| 11,900 | EOG Resources, Inc. * | 1,062,075 | 9,300 | CIT Group, Inc. | 223,479 | |
| The accompanying Notes to Financial Statements are an integral part of this schedule. |
| 134 |
| Large Cap Index Portfolio | ||||||
| Schedule of Investments as of December 31, 2007 | ||||||
| Shares | Common Stock (98.7%) | Value | Shares | Common Stock (98.7%) | Value | |
| Financials — continued | 12,700 | Principal Financial Group, Inc. | $874,268 | |||
| 242,139 | Citigroup, Inc. | $7,128,572 | 33,900 | Progressive Corporation | 649,524 | |
| 2,600 | CME Group, Inc. | 1,783,600 | 12,500 | ProLogis Trust * | 792,250 | |
| 7,350 | Comerica, Inc. | 319,946 | 22,100 | Prudential Financial, Inc. | 2,056,184 | |
| 9,500 | Commerce Bancorp, Inc. | 362,330 | 6,200 | Public Storage, Inc. | 455,142 | |
| 28,100 | Countrywide Financial Corporation * | 251,214 | 33,677 | Regions Financial Corporation * | 796,461 | |
| 6,000 | Developers Diversified | 4,700 | SAFECO Corporation | 261,696 | ||
| Realty Corporation | 229,740 | 10,800 | Simon Property Group, Inc. | 938,088 | ||
| 23,125 | Discover Financial Services | 348,725 | 25,200 | SLM Corporation | 507,528 | |
| 20,500 | E*TRADE Financial Corporation #* | 72,775 | 17,410 | Sovereign Bancorp, Inc. | 198,474 | |
| 13,200 | Equity Residential REIT | 481,404 | 18,800 | State Street Corporation | 1,526,560 | |
| 32,100 | Federal Home Loan Mortgage | 16,900 | SunTrust Banks, Inc. | 1,056,081 | ||
| Corporation | 1,093,647 | 12,768 | T. Rowe Price Group, Inc. | 777,316 | ||
| 47,500 | Federal National Mortgage | 4,500 | Torchmark Corporation | 272,385 | ||
| Association | 1,899,050 | 31,281 | Travelers Companies, Inc. | 1,682,918 | ||
| 4,400 | Federated Investors, Inc. | 181,104 | 83,785 | U.S. Bancorp * | 2,659,336 | |
| 25,994 | Fifth Third Bancorp * | 653,229 | 17,524 | UnumProvident Corporation | 416,896 | |
| 6,200 | First Horizon National Corporation * | 112,530 | 6,500 | Vornado Realty Trust | 571,675 | |
| 7,900 | Franklin Resources, Inc. | 903,997 | 95,893 | Wachovia Corporation * | 3,646,811 | |
| 11,800 | General Growth Properties, Inc. | 485,924 | 42,253 | Washington Mutual, Inc. *�� | 575,063 | |
| 21,400 | Genworth Financial, Inc. | 544,630 | 163,900 | Wells Fargo & Company | 4,948,141 | |
| 19,300 | Goldman Sachs Group, Inc. | 4,150,465 | 8,700 | XL Capital, Ltd. | 437,697 | |
| 15,300 | Hartford Financial Services Group, Inc. | 1,334,007 | 5,300 | Zions Bancorporation | 247,457 | |
| 25,300 | Host Marriott Corporation | 431,112 | Total Financials | 109,866,055 | ||
| 25,300 | Hudson City Bancorp, Inc. | 380,006 | ||||
| 17,871 | Huntington Bancshares, Inc. | 263,776 | Health Care (11.8%) | |||
| 3,400 | IntercontinentalExchange, Inc. # | 654,500 | 75,000 | Abbott Laboratories | 4,211,250 | |
| 163,093 | J.P. Morgan Chase & Company | 7,119,009 | 24,296 | Aetna, Inc. | 1,402,608 | |
| 7,400 | Janus Capital Group, Inc. | 243,090 | 14,900 | Allergan, Inc. | 957,176 | |
| 19,000 | KeyCorp | 445,550 | 8,200 | AmerisourceBergen Corporation * | 367,934 | |
| 12,300 | Kimco Realty Corporation * | 447,720 | 52,740 | Amgen, Inc. #‡ | 2,449,246 | |
| 6,500 | Legg Mason, Inc. | 475,475 | 8,200 | Applera Corporation (Applied | ||
| 25,700 | Lehman Brothers Holdings, Inc. * | 1,681,808 | Biosystems Group) | 278,144 | ||
| 8,200 | Leucadia National Corporation * | 386,220 | 5,200 | Barr Pharmaceuticals, Inc. # | 276,120 | |
| 13,094 | Lincoln National Corporation | 762,338 | 30,800 | Baxter International, Inc. | 1,787,940 | |
| 21,300 | Loews Corporation | 1,072,242 | 11,800 | Becton, Dickinson and Company | 986,244 | |
| 3,700 | M&T Bank Corporation | 301,809 | 14,200 | Biogen Idec, Inc. # | 808,264 | |
| 25,200 | Marsh & McLennan Companies, Inc. | 667,044 | 65,150 | Boston Scientific Corporation # | 757,694 | |
| 12,600 | Marshall & Ilsley Corporation | 333,648 | 96,100 | Bristol-Myers Squibb Company | 2,548,572 | |
| 6,050 | MBIA, Inc. * | 112,712 | 5,100 | C.R. Bard, Inc. | 483,480 | |
| 41,600 | Merrill Lynch & Company, Inc. | 2,233,088 | 17,575 | Cardinal Health, Inc. | 1,014,956 | |
| 35,900 | MetLife, Inc. | 2,212,158 | 18,700 | Celgene Corporation # | 864,127 | |
| 4,000 | MGIC Investment Corporation * | 89,720 | 13,600 | CIGNA Corporation | 730,728 | |
| 10,400 | Moody’s Corporation * | 371,280 | 7,600 | Coventry Health Care, Inc. # | 450,300 | |
| 51,550 | Morgan Stanley | 2,737,820 | 24,176 | Covidien, Ltd. | 1,070,755 | |
| 30,700 | National City Corporation | 505,322 | 47,900 | Eli Lilly and Company | 2,557,381 | |
| 9,300 | Northern Trust Corporation | 712,194 | 12,200 | Express Scripts, Inc. # | 890,600 | |
| 12,800 | NYSE Euronext | 1,123,456 | 15,200 | Forest Laboratories, Inc. # | 554,040 | |
| 8,400 | Plum Creek Timber Company, Inc. | 386,736 | 12,900 | Genzyme Corporation # | 960,276 | |
| 16,900 | PNC Financial Services Group, Inc. | 1,109,485 | 45,200 | Gilead Sciences, Inc. # | 2,079,652 | |
| The accompanying Notes to Financial Statements are an integral part of this schedule. |
| 135 |
| Large Cap Index Portfolio | ||||||
| Schedule of Investments as of December 31, 2007 | ||||||
| Shares | Common Stock (98.7%) | Value | Shares | Common Stock (98.7%) | Value | |
| Health Care — continued | 6,500 | Equifax, Inc. | $236,340 | |||
| 7,780 | Hospira, Inc. # | $331,739 | 10,300 | Expeditors International of | ||
| 8,200 | Humana, Inc. # | 617,542 | Washington, Inc. | 460,204 | ||
| 9,600 | IMS Health, Inc. | 221,184 | 14,960 | FedEx Corporation | 1,333,983 | |
| 138,940 | Johnson & Johnson | 9,267,298 | 4,300 | Fluor Corporation | 626,596 | |
| 11,800 | King Pharmaceuticals, Inc. # | 120,832 | 19,600 | General Dynamics Corporation | 1,744,204 | |
| 5,500 | Laboratory Corporation of | 490,900 | General Electric Company | 18,197,663 | ||
| America Holdings # | 415,415 | 6,200 | Goodrich Corporation | 437,782 | ||
| 14,042 | McKesson Corporation | 919,891 | 36,275 | Honeywell International, Inc. | 2,233,452 | |
| 13,043 | Medco Health Solutions, Inc. # | 1,322,560 | 20,000 | Illinois Tool Works, Inc. | 1,070,800 | |
| 54,900 | Medtronic, Inc. | 2,759,823 | 13,200 | Ingersoll-Rand Company | 613,404 | |
| 105,700 | Merck & Company, Inc. | 6,142,227 | 8,800 | ITT Corporation * | 581,152 | |
| 2,700 | Millipore Corporation # | 197,586 | 5,800 | Jacobs Engineering Group, Inc. #* | 554,538 | |
| 14,700 | Mylan Laboratories, Inc. * | 206,682 | 6,200 | L-3 Communications Holdings, Inc. | 656,828 | |
| 6,800 | Patterson Companies, Inc. # | 230,860 | 16,800 | Lockheed Martin Corporation | 1,768,368 | |
| 5,800 | PerkinElmer, Inc. | 150,916 | 6,300 | Manitowoc Company, Inc. | 307,629 | |
| 331,753 | Pfizer, Inc. | 7,540,746 | 17,900 | Masco Corporation | 386,819 | |
| 7,700 | Quest Diagnostics, Inc. * | 407,330 | 6,300 | Monster Worldwide, Inc. # | 204,120 | |
| 78,600 | Schering-Plough Corporation | 2,093,904 | 18,800 | Norfolk Southern Corporation | 948,272 | |
| 16,584 | St. Jude Medical, Inc. # | 673,974 | 16,398 | Northrop Grumman Corporation | 1,289,539 | |
| 11,500 | Stryker Corporation | 859,280 | 17,937 | PACCAR, Inc. | 977,208 | |
| 23,000 | Tenet Healthcare Corporation # | 116,840 | 6,100 | Pall Corporation | 245,952 | |
| 20,400 | Thermo Electron Corporation # | 1,176,672 | 8,075 | Parker-Hannifin Corporation | 608,128 | |
| 62,700 | UnitedHealth Group, Inc. | 3,649,140 | 10,600 | Pitney Bowes, Inc. | 403,224 | |
| 6,000 | Varian Medical Systems, Inc. # | 312,960 | 6,700 | Precision Castparts Corporation | 929,290 | |
| 4,900 | Waters Corporation # | 387,443 | 10,400 | R.R. Donnelley & Sons Company | 392,496 | |
| 5,100 | Watson Pharmaceuticals, Inc. # | 138,414 | 20,800 | Raytheon Company | 1,262,560 | |
| 27,700 | WellPoint, Inc. # | 2,430,121 | 7,800 | Robert Half International, Inc. | 210,912 | |
| 65,000 | Wyeth * | 2,872,350 | 7,200 | Rockwell Automation, Inc. * | 496,512 | |
| 11,350 | Zimmer Holdings, Inc. # | 750,802 | 8,000 | Rockwell Collins, Inc. | 575,760 | |
| Total Health Care | 74,802,018 | 3,000 | Ryder System, Inc. | 141,030 | ||
| 35,600 | Southwest Airlines Company | 434,320 | ||||
| Industrials (11.4%) | 5,000 | Terex Corporation # | 327,850 | |||
| 34,600 | 3M Company | 2,917,472 | 12,100 | Textron, Inc. | 862,730 | |
| 14,100 | Allied Waste Industries, Inc. # | 155,382 | 8,300 | Trane, Inc. | 387,693 | |
| 5,300 | Avery Dennison Corporation | 281,642 | 23,976 | Tyco International, Ltd. | 950,648 | |
| 37,560 | Boeing Company | 3,284,998 | 12,800 | Union Pacific Corporation | 1,607,936 | |
| 14,492 | Burlington Northern Santa Fe | 51,000 | United Parcel Service, Inc. | 3,606,720 | ||
| Corporation | 1,206,169 | 48,000 | United Technologies Corporation | 3,673,920 | ||
| 8,200 | C.H. Robinson Worldwide, Inc. | 443,784 | 3,400 | W.W. Grainger, Inc. | 297,568 | |
| 30,800 | Caterpillar, Inc. | 2,234,848 | 24,599 | Waste Management, Inc. | 803,649 | |
| 6,700 | Cintas Corporation | 225,254 | Total Industrials | 71,963,784 | ||
| 8,700 | Cooper Industries, Ltd. | 460,056 | ||||
| 20,400 | CSX Corporation | 897,192 | Information Technology (16.5%) | |||
| 5,000 | Cummins, Inc. | 636,850 | 27,800 | Adobe Systems, Inc. # | 1,187,894 | |
| 12,200 | Danaher Corporation | 1,070,428 | 29,300 | Advanced Micro Devices, Inc. #* | 219,750 | |
| 21,500 | Deere & Company | 2,002,080 | 4,900 | Affiliated Computer Services, Inc. # | 220,990 | |
| 9,700 | Dover Corporation * | 447,073 | 18,715 | Agilent Technologies, Inc. # | 687,589 | |
| 7,100 | Eaton Corporation | 688,345 | 8,100 | Akamai Technologies, Inc. #* | 280,260 | |
| 38,200 | Emerson Electric Company | 2,164,412 | 16,400 | Altera Corporation | 316,848 | |
| The accompanying Notes to Financial Statements are an integral part of this schedule. |
| 136 |
| Large Cap Index Portfolio | ||||||
| Schedule of Investments as of December 31, 2007 | ||||||
| Shares | Common Stock (98.7%) | Value | Shares | Common Stock (98.7%) | Value | |
| Information Technology — continued | 26,950 | NVIDIA Corporation # | $916,839 | |||
| 14,800 | Analog Devices, Inc. | $469,160 | 191,537 | Oracle Corporation # | 4,324,905 | |
| 42,500 | Apple Computer, Inc. # | 8,418,400 | 16,200 | Paychex, Inc. | 586,764 | |
| 66,900 | Applied Materials, Inc. | 1,188,144 | 6,800 | QLogic Corporation # | 96,560 | |
| 11,200 | Autodesk, Inc. # | 557,312 | 79,400 | QUALCOMM, Inc. | 3,124,390 | |
| 25,600 | Automatic Data Processing, Inc. | 1,139,968 | 11,100 | SanDisk Corporation #* | 368,187 | |
| 9,500 | BMC Software, Inc. # | 338,580 | 40,250 | Sun Microsystems, Inc. # | 729,732 | |
| 22,800 | Broadcom Corporation # | 595,992 | 42,124 | Symantec Corporation # | 679,881 | |
| 19,012 | CA, Inc. | 474,349 | 21,300 | Tellabs, Inc. # | 139,302 | |
| 4,257 | CIENA Corporation #* | 145,206 | 8,800 | Teradata Corporation # | 241,208 | |
| 294,700 | Cisco Systems, Inc. # | 7,977,529 | 8,500 | Teradyne, Inc. # | 87,890 | |
| 9,200 | Citrix Systems, Inc. # | 349,692 | 67,900 | Texas Instruments, Inc. | 2,267,860 | |
| 14,100 | Cognizant Technology Solutions | 8,700 | Total System Services, Inc. | 250,995 | ||
| Corporation # | 478,554 | 24,076 | Tyco Electronics, Ltd. | 893,942 | ||
| 8,500 | Computer Sciences Corporation # | 420,495 | 16,900 | Unisys Corporation # | 79,937 | |
| 14,000 | Compuware Corporation # | 124,320 | 10,700 | VeriSign, Inc. # | 402,427 | |
| 6,400 | Convergys Corporation # | 105,344 | 36,380 | Western Union Company | 883,306 | |
| 76,500 | Corning, Inc. | 1,835,235 | 44,900 | Xerox Corporation | 726,931 | |
| 108,800 | Dell, Inc. # | 2,666,688 | 14,400 | Xilinx, Inc. | 314,928 | |
| 55,200 | eBay, Inc. # | 1,832,088 | 65,000 | Yahoo!, Inc. #* | 1,511,900 | |
| 15,300 | Electronic Arts, Inc. # | 893,673 | Total Information Technology | 104,777,934 | ||
| 24,800 | Electronic Data Systems Corporation | 514,104 | ||||
| 101,886 | EMC Corporation # | 1,887,948 | Materials (3.3%) | |||
| 8,300 | Fidelity National Information | 10,500 | Air Products and Chemicals, Inc. | 1,035,615 | ||
| Services, Inc. | 345,197 | 41,164 | Alcoa, Inc. | 1,504,544 | ||
| 7,900 | Fiserv, Inc. # | 438,371 | 4,969 | Allegheny Technologies, Inc. | 429,322 | |
| 11,200 | Google, Inc. # | 7,744,576 | 2,800 | Ashland, Inc. | 132,804 | |
| 125,186 | Hewlett-Packard Company | 6,319,389 | 4,900 | Ball Corporation | 220,500 | |
| 284,000 | Intel Corporation | 7,571,440 | 4,900 | Bemis Company, Inc. | 134,162 | |
| 66,900 | International Business Machines | 45,893 | Dow Chemical Company | 1,809,102 | ||
| Corporation | 7,231,890 | 43,611 | E.I. du Pont de Nemours and Company | 1,922,809 | ||
| 16,100 | Intuit, Inc. # | 508,921 | 4,000 | Eastman Chemical Company | 244,360 | |
| 10,100 | Jabil Circuit, Inc. | 154,227 | 8,600 | Ecolab, Inc. | 440,406 | |
| 10,662 | JDS Uniphase Corporation # | 141,805 | 18,496 | Freeport-McMoRan Copper & Gold, Inc. | 1,894,730 | |
| 25,300 | Juniper Networks, Inc. # | 839,960 | 5,800 | Hercules, Inc. | 112,230 | |
| 8,900 | KLA-Tencor Corporation | 428,624 | 4,000 | International Flavors & Fragrances, Inc. | 192,520 | |
| 4,600 | Lexmark International, Inc. # | 160,356 | 20,771 | International Paper Company | 672,565 | |
| 10,900 | Linear Technology Corporation * | 346,947 | 8,981 | MeadWestvaco Corporation | 281,105 | |
| 34,200 | LSI Corporation # | 181,602 | 26,478 | Monsanto Company | 2,957,328 | |
| 11,100 | MEMC Electronic Materials, Inc. # | 982,239 | 21,948 | Newmont Mining Corporation | 1,071,721 | |
| 10,400 | Microchip Technology, Inc. | 326,768 | 13,900 | Nucor Corporation * | 823,158 | |
| 36,900 | Micron Technology, Inc. #* | 267,525 | 6,500 | Pactiv Corporation # | 173,095 | |
| 390,800 | Microsoft Corporation | 13,912,480 | 8,100 | PPG Industries, Inc. | 568,863 | |
| 6,900 | Molex, Inc. | 188,370 | 15,400 | Praxair, Inc. | 1,366,134 | |
| 110,890 | Motorola, Inc. | 1,778,676 | 6,113 | Rohm and Haas Company | 324,417 | |
| 11,500 | National Semiconductor Corporation * | 260,360 | 7,952 | Sealed Air Corporation | 184,009 | |
| 16,700 | Network Appliance, Inc. # | 416,832 | 6,500 | Sigma-Aldrich Corporation | 354,900 | |
| 17,100 | Novell, Inc. # | 117,477 | 4,300 | Titanium Metals Corporation * | 113,735 | |
| 5,800 | Novellus Systems, Inc. # | 159,906 | 5,800 | United States Steel Corporation | 701,278 | |
| The accompanying Notes to Financial Statements are an integral part of this schedule. |
| 137 |
| Large Cap Index Portfolio | ||||||
| Schedule of Investments as of December 31, 2007 | ||||||
| Shares | Common Stock (98.7%) | Value | Shares | Common Stock (98.7%) | Value | |
| Materials — continued | 28,394 | Dominion Resources, Inc. | $1,347,295 | |||
| 5,300 | Vulcan Materials Company * | $419,177 | 8,000 | DTE Energy Company | 351,680 | |
| 10,100 | Weyerhaeuser Company | 744,774 | 61,208 | Duke Energy Corporation | 1,234,565 | |
| Total Materials | 20,829,363 | 24,004 | Dynegy, Inc. # | 171,389 | ||
| 15,900 | Edison International, Inc. | 848,583 | ||||
| Telecommunications Services (3.6%) | 9,500 | Entergy Corporation | 1,135,440 | |||
| 19,600 | American Tower Corporation # | 834,960 | 32,024 | Exelon Corporation | 2,614,439 | |
| 294,639 | AT&T, Inc. ‡ | 12,245,197 | 14,800 | FirstEnergy Corporation | 1,070,632 | |
| 5,400 | CenturyTel, Inc. | 223,884 | 19,700 | FPL Group, Inc. | 1,333,099 | |
| 16,000 | Citizens Communications Company | 203,680 | 3,815 | Integrys Energy Group, Inc. | 197,197 | |
| 7,501 | Embarq Corporation | 371,525 | 2,300 | Nicor, Inc. | 97,405 | |
| 76,272 | Qwest Communications | 13,409 | NiSource, Inc. | 253,296 | ||
| International, Inc. #* | 534,667 | 9,800 | Pepco Holdings, Inc. | 287,434 | ||
| 138,120 | Sprint Nextel Corporation | 1,813,516 | 17,200 | PG&E Corporation | 741,148 | |
| 140,396 | Verizon Communications, Inc. | 6,133,901 | 5,000 | Pinnacle West Capital Corporation | 212,050 | |
| 23,207 | Windstream Corporation | 302,155 | 18,000 | PPL Corporation | 937,620 | |
| Total Telecommunications | 12,620 | Progress Energy, Inc. | 611,187 | |||
| Services | 22,663,485 | 12,300 | Public Service Enterprise | |||
| Group, Inc. | 1,208,352 | |||||
| Utilities (3.6%) | 8,500 | Questar Corporation | 459,850 | |||
| 32,500 | AES Corporation #* | 695,175 | 12,875 | Sempra Energy | 796,705 | |
| 8,200 | Allegheny Energy, Inc. | 521,602 | 36,800 | Southern Company | 1,426,000 | |
| 10,200 | Ameren Corporation | 552,942 | 10,300 | TECO Energy, Inc. | 177,263 | |
| 19,360 | American Electric Power | 20,405 | Xcel Energy, Inc. | 460,541 | ||
| Company, Inc. | 901,402 | Total Utilities | 22,661,286 | |||
| 15,673 | CenterPoint Energy, Inc. * | 268,478 | ||||
| 11,000 | CMS Energy Corporation * | 191,180 | Total Common Stock | |||
| 13,200 | Consolidated Edison, Inc. | 644,820 | (cost $476,571,929) | 624,970,808 | ||
| 8,900 | Constellation Energy Group, Inc. | 912,517 | ||||
| The accompanying Notes to Financial Statements are an integral part of this schedule. |
| 138 |
| Large Cap Index Portfolio | ||||
| Schedule of Investments as of December 31, 2007 | ||||
| Interest | Maturity | |||
| Shares | Collateral Held for Securities Loaned (7.7%) | Rate (+) | Date | Value |
| 48,959,242 | Thrivent Financial Securities Lending Trust | 5.000% | N/A | $48,959,242 |
| Total Collateral Held for Securities Loaned | ||||
| (cost $48,959,242) | 48,959,242 | |||
| Shares or | ||||
| Principal | Interest | Maturity | ||
| Amount | Short-Term Investments (1.2%) | Rate (+) | Date | Value |
| $1,100,000 | Federal National Mortgage Association ‡ | 4.030% | 5/16/2008 | $1,083,170 |
| 6,871,402 | Thrivent Money Market Portfolio | 4.930 | N/A | 6,871,402 |
| Total Short-Term Investments (cost $7,954,763) | 7,954,572 | |||
| Total Investments (cost $533,485,934) 107.6% | $681,884,622 | |||
| Other Assets and Liabilities, Net (7.6%) | (48,427,464) | |||
| Total Net Assets 100.0% | $633,457,158 | |||
| Number of | Notional | ||||
| Contracts | Expiration | Principal | Unrealized | ||
| Futures | Long/(Short) | Date | Amount | Value | Gain/(Loss) |
| S&P 500 Index Futures | 20 | March 2008 | $7,424,350 | $7,386,000 | ($38,350) |
| Total Futures | ($38,350) | ||||
# Non-income producing security.
* All or a portion of the security is on loan as discussed in item 2(M) of the Notes to Financial Statements.
+ The interest rate shown reflects the yield, coupon rate or, for securities purchased at a discount, the discount rate at the date of purchase.
‡ At December 31, 2007, $1,083,170 of investments were held on deposit with the counterparty and pledged as the initial margin deposit for open financial futures contracts. In addition, $19,107,010 of investments were earmarked as collateral to cover open financial futures contracts.
Definitions:
REIT — Real Estate Investment Trust, is a company that buys, develops, manages and/or sells real estate assets.
Gross unrealized appreciation and depreciation of investments, based on cost for federal income tax purposes, were as follows:
| Gross unrealized appreciation | $200,460,682 | |
| Gross unrealized depreciation | (59,031,217) | |
| Net unrealized appreciation (depreciation) | $141,429,465 | |
| Cost for federal income tax purposes | $540,455,157 |
| The accompanying Notes to Financial Statements are an integral part of this schedule. |
| 139 |
| Real Estate Securities Portfolio | ||||||
| Schedule of Investments as of December 31, 2007 | ||||||
| Shares | Common Stock (95.1%) | Value | Shares | Common Stock (95.1%) | Value | |
| Diversified REITS (5.4%) | Office REITS (15.0%) | |||||
| 15,000 | Colonial Properties Trust * | $339,450 | 49,000 | Alexandria Real Estate Equities, Inc. | $4,981,830 | |
| 65,973 | Liberty Property Trust * | 1,900,682 | 75,800 | BioMed Realty Trust, Inc. * | 1,756,286 | |
| 16,000 | PS Business Parks, Inc. | 840,800 | 140,000 | Boston Properties, Inc. | 12,853,400 | |
| 159,500 | Vornado Realty Trust | 14,028,025 | 124,905 | Brandywine Realty Trust | 2,239,547 | |
| 15,000 | Washington Real Estate | 83,900 | Corporate Office Properties Trust * | 2,642,850 | ||
| Investment Trust * | 471,150 | 82,800 | Digital Realty Trust, Inc. * | 3,177,036 | ||
| Total Diversified REITS | 17,580,107 | 91,500 | Douglas Emmett, Inc. | 2,068,815 | ||
| 77,500 | Duke Realty Corporation * | 2,021,200 | ||||
| Financials (6.3%) | 62,600 | Highwoods Properties, Inc. * | 1,839,188 | |||
| 87,000 | iShares Dow Jones U.S. Real Estate | 46,300 | Kilroy Realty Corporation | 2,544,648 | ||
| Index Fund * | 5,733,300 | 36,000 | Lexington Corporate Properties Trust | 523,440 | ||
| 259,536 | SPDR DJ Wilshire International | 72,000 | Mack-Cali Realty Corporation | 2,448,000 | ||
| Real Estate ETF * | 14,780,575 | 55,575 | Maguire Properties, Inc. * | 1,637,795 | ||
| Total Financials | 20,513,875 | 87,094 | SL Green Realty Corporation * | 8,139,759 | ||
| Total Office REITS | 48,873,794 | |||||
| Foreign (3.7%) | ||||||
| 38,255 | British Land Company plc | 717,319 | Real Estate Management & Development (0.4%) | |||
| 256,750 | Brookfield Properties Corporation * | 4,942,438 | 31,951 | Forest City Enterprises | 1,419,902 | |
| 36,400 | Henderson Land Development | Total Real Estate Management | ||||
| Company, Ltd. | 338,051 | & Development | 1,419,902 | |||
| 80,000 | Hongkong Land Holdings, Ltd. | 391,816 | ||||
| 85,000 | Hopson Development Holdings, Ltd. | 231,828 | Residential REITS (13.2%) | |||
| 27,527 | Land Securities Group plc | 824,846 | 29,400 | American Campus Communities, Inc. | 789,390 | |
| 18,500 | Lend Lease Corporation, Ltd. | 279,345 | 81,590 | Apartment Investment & Management | ||
| 31,100 | Mitsubishi Estate Company, Ltd. | 740,956 | Company * | 2,833,621 | ||
| 37,000 | Mitsui Fudosan Company, Ltd. | 797,959 | 104,800 | Avalonbay Communities, Inc. * | 9,865,872 | |
| 75,000 | Stockland | 550,479 | 68,000 | BRE Properties, Inc. * | 2,756,040 | |
| 27,000 | Sun Hung Kai Properties, Ltd. | 567,096 | 72,200 | Camden Property Trust | 3,476,430 | |
| 3,808 | Unibail-Rodamco | 833,243 | 25,000 | Equity Lifestyle Properties, Inc. | 1,141,750 | |
| 39,100 | Westfield Group | 714,838 | 254,200 | Equity Residential REIT | 9,270,674 | |
| Total Foreign | 11,930,214 | 51,400 | Essex Property Trust, Inc. * | 5,010,986 | ||
| 51,795 | Home Properties, Inc. * | 2,323,006 | ||||
| Hotels, Resorts & Cruise Lines (1.2%) | 34,000 | Mid-America Apartment | ||||
| 92,500 | Starwood Hotels & Resorts | Communities, Inc. * | 1,453,500 | |||
| Worldwide, Inc. | 4,072,775 | 41,300 | Post Properties, Inc. * | 1,450,456 | ||
| Total Hotels, Resorts & | 137,100 | UDR, Inc. * | 2,721,435 | |||
| Cruise Lines | 4,072,775 | Total Residential REITS | 43,093,160 | |||
| Industrial REITS (8.4%) | Retail REITS (24.5%) | |||||
| 113,200 | AMB Property Corporation | 6,515,792 | 30,500 | Acadia Realty Trust * | 781,105 | |
| 115,000 | DCT Industrial Trust, Inc. * | 1,070,650 | 55,000 | CBL & Associates Properties, Inc. | 1,315,050 | |
| 28,600 | EastGroup Properties, Inc. | 1,196,910 | 134,000 | Developers Diversified Realty | ||
| 294,850 | ProLogis Trust * | 18,687,593 | Corporation * | 5,130,860 | ||
| Total Industrial REITS | 27,470,945 | 20,500 | Equity One, Inc. * | 472,115 | ||
| 79,400 | Federal Realty Investment Trust * | 6,522,710 | ||||
| Mortgage REITS (0.3%) | 228,000 | General Growth Properties, Inc. * | 9,389,040 | |||
| 42,800 | iSTAR Financial, Inc. * | 1,114,940 | 30,000 | Glimcher Realty Trust * | 428,700 | |
| Total Mortgage REITS | 1,114,940 | 61,000 | Inland Real Estate Corporation * | 863,760 | ||
| 220,850 | Kimco Realty Corporation * | 8,038,940 | ||||
| The accompanying Notes to Financial Statements are an integral part of this schedule. |
| 140 |
| Real Estate Securities Portfolio | ||||||
| Schedule of Investments as of December 31, 2007 | ||||||
| Shares | Common Stock (95.1%) | Value | Shares | Common Stock (95.1%) | Value | |
| Retail REITS — continued | 75,400 | Health Care REIT, Inc. * | $3,369,626 | |||
| 25,900 | Kite Realty Group Trust | $395,493 | 33,575 | Healthcare Realty Trust, Inc. | 852,469 | |
| 87,100 | Macerich Company * | 6,189,326 | 20,000 | Hersha Hospitality Trust | 190,000 | |
| 62,100 | National Retail Properties, Inc. | 1,451,898 | 55,900 | Hospitality Properties Trust | 1,801,098 | |
| 7,000 | Pennsylvania Real Estate | 542,256 | Host Marriott Corporation * | 9,240,042 | ||
| Investment Trust * | 207,760 | 62,738 | LaSalle Hotel Properties * | 2,001,342 | ||
| 9,000 | Ramco-Gershenson Properties Trust | 192,330 | 95,000 | Nationwide Health | ||
| 24,000 | Realty Income Corporation * | 648,480 | Properties, Inc. * | 2,983,000 | ||
| 84,500 | Regency Centers Corporation | 5,449,405 | 18,000 | Omega Healthcare Investors, Inc. | 288,900 | |
| 289,600 | Simon Property Group, Inc. * | 25,154,654 | 33,800 | Plum Creek Timber Company, Inc. * | 1,556,152 | |
| 50,300 | Tanger Factory Outlet Centers, Inc. * | 1,896,813 | 153,748 | Public Storage, Inc. * | 11,286,641 | |
| 75,300 | Taubman Centers, Inc. * | 3,704,007 | 71,200 | Senior Housing Property Trust | 1,614,816 | |
| 53,100 | Weingarten Realty Investors * | 1,669,464 | 3,400 | Sovran Self Storage, Inc. | 136,340 | |
| Total Retail REITS | 79,901,910 | 82,400 | Strategic Hotel Capital, Inc. * | 1,378,552 | ||
| 50,000 | Sunstone Hotel Investors, Inc. * | 914,500 | ||||
| Specialized REITS (16.7%) | 28,600 | U-Store-It Trust | 261,976 | |||
| 138,400 | Ashford Hospitality Trust * | 995,096 | 160,459 | Ventas, Inc. | 7,260,770 | |
| 101,606 | DiamondRock Hospitality Company | 1,522,058 | Total Specialized REITS | 54,367,908 | ||
| 18,000 | Entertainment Properties Trust * | 846,000 | ||||
| 91,000 | Extra Space Storage, Inc. * | 1,300,390 | Total Common Stock | |||
| 32,000 | FelCor Lodging Trust, Inc. | 498,880 | (cost $288,755,849) | 310,339,530 | ||
| 117,000 | Health Care Property Investors, Inc. | 4,069,260 | ||||
| The accompanying Notes to Financial Statements are an integral part of this schedule. |
| 141 |
| Real Estate Securities Portfolio | ||||
| Schedule of Investments as of December 31, 2007 | ||||
| Interest | Maturity | |||
| Shares | Collateral Held for Securities Loaned (42.9%) | Rate (+) | Date | Value |
| 140,131,373 | Thrivent Financial Securities Lending Trust | 5.000% | N/A | $140,131,373 |
| Total Collateral Held for Securities Loaned | ||||
| (cost $140,131,373) | 140,131,373 | |||
| Principal | Interest | Maturity | ||
| Amount | Short-Term Investments (4.5%) | Rate (+) | Date | Value |
| $14,810,000 | Federal Home Loan Mortgage Corporation | 3.150% | 1/2/2008 | $14,808,704 |
| Total Short-Term Investments (at amortized cost) | 14,808,704 | |||
| Total Investments (cost $443,695,926) 142.5% | $465,279,607 | |||
| Other Assets and Liabilities, Net (42.5%) | (138,852,981) | |||
| Total Net Assets 100.0% | $326,426,626 | |||
* All or a portion of the security is on loan as discussed in item 2(M) of the Notes to Financial Statements.
+ The interest rate shown reflects the yield, coupon rate or, for securities purchased at a discount, the discount rate at the date of purchase.
Definitions:
ETF — Exchange Traded Fund.
REIT — Real Estate Investment Trust, is a company that buys, develops, manages and/or sells real estate assets.
Gross unrealized appreciation and depreciation of investments, based on cost for federal income tax purposes, were as follows:
| Gross unrealized appreciation | $37,089,482 | |
| Gross unrealized depreciation | (16,924,661) | |
| Net unrealized appreciation (depreciation) | $20,164,821 | |
| Cost for federal income tax purposes | $445,114,786 |
| The accompanying Notes to Financial Statements are an integral part of this schedule. |
| 142 |
| Balanced Portfolio | ||||||
| Schedule of Investments as of December 31, 2007 | ||||||
| Shares | Common Stock (63.9%) | Value | Shares | Common Stock (63.9%) | Value | |
| Consumer Discretionary (5.4%) | 2,200 | Jones Apparel Group, Inc. | $35,178 | |||
| 2,100 | Abercrombie & Fitch Company | $167,937 | 1,900 | KB Home | 41,040 | |
| 7,400 | Amazon.com, Inc. #* | 685,536 | 7,700 | Kohl’s Corporation #± | 352,660 | |
| 3,400 | Apollo Group, Inc. # | 238,510 | 4,200 | Leggett & Platt, Inc. | 73,248 | |
| 3,400 | AutoNation, Inc. # | 53,244 | 3,400 | Lennar Corporation | 60,826 | |
| 1,000 | AutoZone, Inc. # | 119,910 | 7,462 | Limited Brands, Inc. | 141,256 | |
| 6,500 | Bed Bath & Beyond, Inc. # | 191,035 | 2,600 | Liz Claiborne, Inc. | 52,910 | |
| 8,475 | Best Buy Company, Inc. * | 446,209 | 35,400 | Lowe’s Companies, Inc. | 800,748 | |
| 2,200 | Big Lots, Inc. #* | 35,178 | 10,500 | Macy’s Group, Inc | 271,635 | |
| 1,700 | Black & Decker Corporation | 118,405 | 7,500 | Marriott International, Inc. | 256,350 | |
| 2,200 | Brunswick Corporation * | 37,510 | 8,825 | Mattel, Inc. | 168,028 | |
| 10,500 | Carnival Corporation | 467,145 | 28,700 | McDonald’s Corporation | 1,690,717 | |
| 16,562 | CBS Corporation | 451,314 | 7,900 | McGraw-Hill Companies, Inc. | 346,099 | |
| 2,900 | Centex Corporation | 73,254 | 1,000 | Meredith Corporation | 54,980 | |
| 4,200 | Circuit City Stores, Inc. | 17,640 | 3,600 | New York Times Company * | 63,108 | |
| 12,000 | Clear Channel Communications, Inc. | 414,240 | 6,726 | Newell Rubbermaid, Inc. | 174,069 | |
| 8,900 | Coach, Inc. #± | 272,162 | 56,100 | News Corporation | 1,149,489 | |
| 74,565 | Comcast Corporation #* | 1,361,557 | 9,400 | NIKE, Inc. | 603,856 | |
| 6,700 | D.R. Horton, Inc. ± | 88,239 | 4,500 | Nordstrom, Inc. | 165,285 | |
| 3,600 | Darden Restaurants, Inc. | 99,756 | 6,600 | Office Depot, Inc. # | 91,806 | |
| 1,400 | Dillard’s, Inc. * | 26,292 | 2,000 | OfficeMax, Inc. | 41,320 | |
| 17,400 | DIRECTV Group, Inc. # | 402,288 | 7,900 | Omnicom Group, Inc. | 375,487 | |
| 2,300 | E.W. Scripps Company | 103,523 | 1,600 | Polo Ralph Lauren Corporation | 98,864 | |
| 6,900 | Eastman Kodak Company * | 150,903 | 5,100 | Pulte Homes, Inc. * | 53,754 | |
| 5,000 | Expedia, Inc. # | 158,100 | 3,200 | RadioShack Corporation * | 53,952 | |
| 3,500 | Family Dollar Stores, Inc. | 67,305 | 1,680 | Sears Holdings Corporation #* | 171,444 | |
| 51,100 | Ford Motor Company #* | 343,903 | 2,600 | Sherwin-Williams Company | 150,904 | |
| 3,700 | Fortune Brands, Inc. | 267,732 | 1,500 | Snap-On, Inc. | 72,360 | |
| 3,800 | GameStop Corporation # | 236,018 | 2,100 | Stanley Works | 101,808 | |
| 5,600 | Gannett Company, Inc. | 218,400 | 17,200 | Staples, Inc. | 396,804 | |
| 11,200 | Gap, Inc. | 238,336 | 17,700 | Starbucks Corporation # | 362,319 | |
| 13,700 | General Motors Corporation | 340,993 | 4,800 | Starwood Hotels & Resorts | ||
| 4,200 | Genuine Parts Company | 194,460 | Worldwide, Inc. | 211,344 | ||
| 5,800 | Goodyear Tire & Rubber Company #* | 163,676 | 20,400 | Target Corporation | 1,020,000 | |
| 7,800 | H&R Block, Inc. | 144,846 | 3,200 | Tiffany & Company | 147,296 | |
| 5,800 | Harley-Davidson, Inc. * | 270,918 | 87,650 | Time Warner, Inc. | 1,447,102 | |
| 1,500 | Harman International | 10,700 | TJX Companies, Inc. | 307,411 | ||
| Industries, Inc. | 110,565 | 2,200 | VF Corporation | 151,052 | ||
| 4,600 | Harrah’s Entertainment, Inc. | 408,250 | 15,862 | Viacom, Inc. # | 696,659 | |
| 3,700 | Hasbro, Inc. ± | 94,646 | 46,087 | Walt Disney Company ± | 1,487,688 | |
| 40,900 | Home Depot, Inc. | 1,101,846 | 140 | Washington Post Company | 110,800 | |
| 4,400 | IAC InterActiveCorp # | 118,448 | 2,300 | Wendy’s International, Inc. | 59,432 | |
| 7,600 | International Game Technology * | 333,868 | 1,859 | Whirlpool Corporation | 151,734 | |
| 11,489 | Interpublic Group of | 4,332 | Wyndham Worldwide Corporation | 102,062 | ||
| Companies, Inc. #* | 93,176 | 12,320 | Yum! Brands, Inc. | 471,486 | ||
| 5,400 | J.C. Penney Company, Inc. | Total Consumer Discretionary | 26,520,165 | |||
| (Holding Company) | 237,546 | |||||
| 14,400 | Johnson Controls, Inc. | 518,976 | ||||
| The accompanying Notes to Financial Statements are an integral part of this schedule. |
| 143 |
| Balanced Portfolio | ||||||
| Schedule of Investments as of December 31, 2007 | ||||||
| Shares | Common Stock (63.9%) | Value | Shares | Common Stock (63.9%) | Value | |
| Consumer Staples (6.6%) | 11,000 | Chesapeake Energy Corporation | $431,200 | |||
| 51,000 | Altria Group, Inc. ± | $3,854,580 | 51,174 | Chevron Corporation | 4,776,069 | |
| 17,800 | Anheuser-Busch Companies, Inc. * | 931,652 | 38,782 | ConocoPhillips | 3,424,451 | |
| 15,541 | Archer-Daniels-Midland Company | 721,569 | 4,400 | CONSOL Energy, Inc. | 314,688 | |
| 10,400 | Avon Products, Inc. ± | 411,112 | 10,700 | Devon Energy Corporation ± | 951,337 | |
| 2,200 | Brown-Forman Corporation | 163,042 | 16,986 | El Paso Corporation | 292,839 | |
| 5,400 | Campbell Soup Company | 192,942 | 3,700 | ENSCO International, Inc. | 220,594 | |
| 3,400 | Clorox Company | 221,578 | 6,000 | EOG Resources, Inc. | 535,500 | |
| 48,200 | Coca-Cola Company ± | 2,958,034 | 132,472 | Exxon Mobil Corporation | 12,411,302 | |
| 7,000 | Coca-Cola Enterprises, Inc. | 182,210 | 21,400 | Halliburton Company | 811,274 | |
| 12,300 | Colgate-Palmolive Company | 958,908 | 6,700 | Hess Corporation | 675,762 | |
| 11,800 | ConAgra Foods, Inc. | 280,722 | 17,222 | Marathon Oil Corporation | 1,048,131 | |
| 4,800 | Constellation Brands, Inc. # | 113,472 | 4,500 | Murphy Oil Corporation | 381,780 | |
| 10,500 | Costco Wholesale Corporation | 732,480 | 6,800 | Nabors Industries, Ltd. # | 186,252 | |
| 35,805 | CVS/Caremark Corporation | 1,423,249 | 8,600 | National Oilwell Varco, Inc. # | 631,756 | |
| 3,300 | Dean Foods Company | 85,338 | 6,500 | Noble Corporation | 367,315 | |
| 2,900 | Estee Lauder Companies, Inc. | 126,469 | 4,200 | Noble Energy, Inc. | 333,984 | |
| 8,100 | General Mills, Inc. | 461,700 | 20,100 | Occidental Petroleum Corporation | 1,547,499 | |
| 7,750 | H.J. Heinz Company | 361,770 | 6,500 | Peabody Energy Corporation | 400,660 | |
| 4,200 | Hershey Company | 165,480 | 3,700 | Range Resources Corporation | 190,032 | |
| 6,600 | Kellogg Company | 346,038 | 2,800 | Rowan Companies, Inc. | 110,488 | |
| 10,180 | Kimberly-Clark Corporation | 705,881 | 29,000 | Schlumberger, Ltd. | 2,852,730 | |
| 37,460 | Kraft Foods, Inc. | 1,222,320 | 4,800 | Smith International, Inc. | 354,480 | |
| 16,500 | Kroger Company | 440,715 | 15,321 | Spectra Energy Corporation | 395,588 | |
| 3,100 | McCormick & Company, Inc. | 117,521 | 2,900 | Sunoco, Inc. | 210,076 | |
| 3,300 | Molson Coors Brewing Company | 170,346 | 3,400 | Tesoro Petroleum Corporation | 162,180 | |
| 3,500 | Pepsi Bottling Group, Inc. | 138,110 | 7,660 | Transocean, Inc. # | 1,096,580 | |
| 39,020 | PepsiCo, Inc. | 2,961,618 | 13,300 | Valero Energy Corporation | 931,399 | |
| 75,292 | Procter & Gamble Company | 5,527,939 | 8,200 | Weatherford International, Ltd. # | 562,520 | |
| 4,200 | Reynolds American, Inc. * | 277,032 | 14,400 | Williams Companies, Inc. | 515,232 | |
| 10,700 | Safeway, Inc. | 366,047 | 11,750 | XTO Energy, Inc. | 603,480 | |
| 17,500 | Sara Lee Corporation | 281,050 | Total Energy | 40,127,984 | ||
| 5,069 | SUPERVALU, Inc. | 190,189 | ||||
| 14,700 | SYSCO Corporation * | 458,787 | Financials (11.3%) | |||
| 6,700 | Tyson Foods, Inc. | 102,711 | 8,000 | ACE, Ltd. | 494,240 | |
| 4,000 | UST, Inc. | 219,200 | 11,800 | AFLAC, Inc. ± | 739,034 | |
| 24,000 | Walgreen Company * | 913,920 | 13,796 | Allstate Corporation ± | 720,565 | |
| 57,300 | Wal-Mart Stores, Inc. ± | 2,723,469 | 2,550 | Ambac Financial Group, Inc. * | 65,714 | |
| 3,300 | Whole Foods Market, Inc. * | 134,640 | 4,600 | American Capital Strategies, Ltd. * | 151,616 | |
| 5,325 | William Wrigley Jr. Company | 311,779 | 28,300 | American Express Company ± | 1,472,166 | |
| Total Consumer Staples | 31,955,619 | 61,502 | American International Group, Inc. ± | 3,585,567 | ||
| 5,540 | Ameriprise Financial, Inc. | 305,309 | ||||
| Energy (8.2%) | 7,050 | Aon Corporation | 336,214 | |||
| 11,236 | Anadarko Petroleum Corporation | 738,093 | 2,400 | Apartment Investment & | ||
| 8,068 | Apache Corporation ± | 867,633 | Management Company | 83,352 | ||
| 7,620 | Baker Hughes, Inc. | 617,982 | 2,400 | Assurant, Inc. | 160,560 | |
| 7,300 | BJ Services Company | 177,098 | 2,100 | Avalonbay Communities, Inc. | 197,694 | |
| The accompanying Notes to Financial Statements are an integral part of this schedule. |
| 144 |
| Balanced Portfolio | ||||||
| Schedule of Investments as of December 31, 2007 | ||||||
| Shares | Common Stock (63.9%) | Value | Shares | Common Stock (63.9%) | Value | |
| Financials — continued | 12,600 | Marsh & McLennan Companies, Inc. | $333,522 | |||
| 107,607 | Bank of America Corporation ± | $4,439,865 | 6,300 | Marshall & Ilsley Corporation | 166,824 | |
| 27,601 | Bank of New York Mellon Corporation | 1,345,825 | 3,000 | MBIA, Inc. * | 55,890 | |
| 13,300 | BB&T Corporation | 407,911 | 20,700 | Merrill Lynch & Company, Inc. | 1,111,176 | |
| 2,778 | Bear Stearns Companies, Inc. | 245,158 | 17,900 | MetLife, Inc. | 1,102,998 | |
| 3,000 | Boston Properties, Inc. | 275,430 | 1,900 | MGIC Investment Corporation | 42,617 | |
| 9,465 | Capital One Financial Corporation | 447,316 | 5,200 | Moody’s Corporation * | 185,640 | |
| 4,800 | CB Richard Ellis Group, Inc. # | 103,440 | 25,690 | Morgan Stanley | 1,364,396 | |
| 22,625 | Charles Schwab Corporation * | 578,069 | 15,300 | National City Corporation | 251,838 | |
| 9,400 | Chubb Corporation * | 513,052 | 4,700 | Northern Trust Corporation ± | 359,926 | |
| 4,051 | Cincinnati Financial Corporation | 160,177 | 6,400 | NYSE Euronext | 561,728 | |
| 4,700 | CIT Group, Inc. | 112,941 | 4,200 | Plum Creek Timber Company, Inc. | 193,368 | |
| 120,889 | Citigroup, Inc. ± | 3,558,972 | 8,400 | PNC Financial Services Group, Inc. | 551,460 | |
| 1,300 | CME Group, Inc. | 891,800 | 6,300 | Principal Financial Group, Inc. | 433,692 | |
| 3,800 | Comerica, Inc. | 165,414 | 16,900 | Progressive Corporation | 323,804 | |
| 4,700 | Commerce Bancorp, Inc. | 179,258 | 6,200 | ProLogis Trust | 392,956 | |
| 13,998 | Countrywide Financial Corporation * | 125,142 | 11,000 | Prudential Financial, Inc. | 1,023,440 | |
| 3,100 | Developers Diversified | 3,200 | Public Storage, Inc. | 234,912 | ||
| Realty Corporation | 118,699 | 16,900 | Regions Financial Corporation * | 399,685 | ||
| 11,495 | Discover Financial Services | 173,345 | 2,400 | SAFECO Corporation | 133,632 | |
| 10,200 | E*TRADE Financial Corporation #* | 36,210 | 5,400 | Simon Property Group, Inc. | 469,044 | |
| 6,600 | Equity Residential REIT ± | 240,702 | 12,600 | SLM Corporation | 253,764 | |
| 16,000 | Federal Home Loan | 8,680 | Sovereign Bancorp, Inc. | 98,952 | ||
| Mortgage Corporation | 545,120 | 9,300 | State Street Corporation | 755,160 | ||
| 23,700 | Federal National Mortgage Association | 947,526 | 8,500 | SunTrust Banks, Inc. | 531,165 | |
| 2,100 | Federated Investors, Inc. | 86,436 | 6,400 | T. Rowe Price Group, Inc. | 389,632 | |
| 12,916 | Fifth Third Bancorp * | 324,579 | 2,300 | Torchmark Corporation | 139,219 | |
| 3,200 | First Horizon National Corporation * | 58,080 | 15,625 | Travelers Companies, Inc. | 840,625 | |
| 4,000 | Franklin Resources, Inc. | 457,720 | 41,821 | U.S. Bancorp ± | 1,327,399 | |
| 6,000 | General Growth Properties, Inc. | 247,080 | 8,758 | UnumProvident Corporation | 208,353 | |
| 10,600 | Genworth Financial, Inc. | 269,770 | 3,200 | Vornado Realty Trust | 281,440 | |
| 9,700 | Goldman Sachs Group, Inc. | 2,085,985 | 47,923 | Wachovia Corporation | 1,822,512 | |
| 7,700 | Hartford Financial Services | 21,081 | Washington Mutual, Inc. * | 286,912 | ||
| Group, Inc. | 671,363 | 81,820 | Wells Fargo & Company | 2,470,146 | ||
| 12,600 | Host Marriott Corporation | 214,704 | 4,400 | XL Capital, Ltd. | 221,364 | |
| 12,600 | Hudson City Bancorp, Inc. | 189,252 | 2,700 | Zions Bancorporation | 126,063 | |
| 8,916 | Huntington Bancshares, Inc. | 131,600 | Total Financials | 54,903,360 | ||
| 1,700 | IntercontinentalExchange, Inc. # | 327,250 | ||||
| 81,398 | J.P. Morgan Chase & Company | 3,553,023 | Health Care (7.6%) | |||
| 3,700 | Janus Capital Group, Inc. | 121,545 | 37,400 | Abbott Laboratories ± | 2,100,010 | |
| 9,500 | KeyCorp | 222,775 | 12,056 | Aetna, Inc. | 695,993 | |
| 6,100 | Kimco Realty Corporation * | 222,040 | 7,400 | Allergan, Inc. | 475,376 | |
| 3,200 | Legg Mason, Inc. | 234,080 | 4,000 | AmerisourceBergen Corporation | 179,480 | |
| 12,800 | Lehman Brothers Holdings, Inc. | 837,632 | 26,352 | Amgen, Inc. # | 1,223,787 | |
| 4,100 | Leucadia National Corporation | 193,110 | 4,000 | Applera Corporation (Applied | ||
| 6,611 | Lincoln National Corporation | 384,901 | Biosystems Group) | 135,680 | ||
| 10,700 | Loews Corporation | 538,638 | 2,600 | Barr Pharmaceuticals, Inc. # | 138,060 | |
| 2,000 | M&T Bank Corporation | 163,140 | ||||
| The accompanying Notes to Financial Statements are an integral part of this schedule. |
| 145 |
| Balanced Portfolio | ||||||
| Schedule of Investments as of December 31, 2007 | ||||||
| Shares | Common Stock (63.9%) | Value | Shares | Common Stock (63.9%) | Value | |
| Health Care — continued | Industrials (7.4%) | |||||
| 15,300 | Baxter International, Inc. | $888,165 | 17,300 | 3M Company | $1,458,736 | |
| 5,900 | Becton, Dickinson and Company | 493,122 | 7,100 | Allied Waste Industries, Inc. # | 78,242 | |
| 7,030 | Biogen Idec, Inc. # | 400,148 | 2,700 | Avery Dennison Corporation | 143,478 | |
| 32,450 | Boston Scientific Corporation # | 377,394 | 18,828 | Boeing Company ± | 1,646,697 | |
| 47,900 | Bristol-Myers Squibb Company ± | 1,270,308 | 7,292 | Burlington Northern | ||
| 2,400 | C.R. Bard, Inc. | 227,520 | Santa Fe Corporation | 606,913 | ||
| 8,675 | Cardinal Health, Inc. | 500,981 | 4,200 | C.H. Robinson Worldwide, Inc. | 227,304 | |
| 9,300 | Celgene Corporation #* | 429,753 | 15,400 | Caterpillar, Inc. | 1,117,424 | |
| 6,700 | CIGNA Corporation ± | 359,991 | 3,300 | Cintas Corporation | 110,946 | |
| 3,750 | Coventry Health Care, Inc. # | 222,188 | 4,300 | Cooper Industries, Ltd. | 227,384 | |
| 12,015 | Covidien, Ltd. | 532,144 | 10,100 | CSX Corporation | 444,198 | |
| 23,900 | Eli Lilly and Company | 1,276,021 | 2,400 | Cummins, Inc. | 305,688 | |
| 6,200 | Express Scripts, Inc. # | 452,600 | 6,100 | Danaher Corporation * | 535,214 | |
| 7,600 | Forest Laboratories, Inc. # | 277,020 | 10,800 | Deere & Company | 1,005,696 | |
| 6,400 | Genzyme Corporation # | 476,416 | 5,000 | Dover Corporation | 230,450 | |
| 22,500 | Gilead Sciences, Inc. # | 1,035,225 | 3,600 | Eaton Corporation | 349,020 | |
| 3,930 | Hospira, Inc. # | 167,575 | 19,100 | Emerson Electric Company | 1,082,206 | |
| 4,100 | Humana, Inc. # | 308,771 | 3,300 | Equifax, Inc. ± | 119,988 | |
| 4,800 | IMS Health, Inc. | 110,592 | 5,200 | Expeditors International of | ||
| 69,406 | Johnson & Johnson | 4,629,380 | Washington, Inc. | 232,336 | ||
| 5,933 | King Pharmaceuticals, Inc. # | 60,754 | 7,440 | FedEx Corporation | 663,425 | |
| 2,700 | Laboratory Corporation of | 2,100 | Fluor Corporation | 306,012 | ||
| America Holdings # | 203,931 | 9,700 | General Dynamics Corporation | 863,203 | ||
| 6,980 | McKesson Corporation | 457,260 | 245,100 | General Electric Company ‡ | 9,085,857 | |
| 6,555 | Medco Health Solutions, Inc. # | 664,677 | 3,200 | Goodrich Corporation | 225,952 | |
| 27,400 | Medtronic, Inc. | 1,377,398 | 18,037 | Honeywell International, Inc. | 1,110,538 | |
| 52,800 | Merck & Company, Inc. | 3,068,208 | 10,000 | Illinois Tool Works, Inc. | 535,400 | |
| 1,400 | Millipore Corporation #* | 102,452 | 6,600 | Ingersoll-Rand Company | 306,702 | |
| 7,300 | Mylan Laboratories, Inc. | 102,638 | 4,400 | ITT Corporation * | 290,576 | |
| 3,300 | Patterson Companies, Inc. # | 112,035 | 2,900 | Jacobs Engineering Group, Inc. #* | 277,269 | |
| 2,900 | PerkinElmer, Inc. | 75,458 | 3,000 | L-3 Communications Holdings, Inc. | 317,820 | |
| 165,651 | Pfizer, Inc. | 3,765,247 | 8,400 | Lockheed Martin Corporation | 884,184 | |
| 3,800 | Quest Diagnostics, Inc. * | 201,020 | 3,100 | Manitowoc Company, Inc. | 151,373 | |
| 39,200 | Schering-Plough Corporation | 1,044,288 | 8,900 | Masco Corporation | 192,329 | |
| 8,280 | St. Jude Medical, Inc. # | 336,499 | 3,100 | Monster Worldwide, Inc. # | 100,440 | |
| 5,800 | Stryker Corporation | 433,376 | 9,400 | Norfolk Southern Corporation | 474,136 | |
| 11,450 | Tenet Healthcare Corporation # | 58,166 | 8,206 | Northrop Grumman Corporation | 645,320 | |
| 10,200 | Thermo Electron Corporation # | 588,336 | 8,850 | PACCAR, Inc. | 482,148 | |
| 31,300 | UnitedHealth Group, Inc. | 1,821,660 | 3,100 | Pall Corporation | 124,992 | |
| 3,000 | Varian Medical Systems, Inc. # | 156,480 | 4,150 | Parker-Hannifin Corporation | 312,536 | |
| 2,400 | Waters Corporation # | 189,768 | 5,300 | Pitney Bowes, Inc. | 201,612 | |
| 2,600 | Watson Pharmaceuticals, Inc. # | 70,564 | 3,400 | Precision Castparts Corporation | 471,580 | |
| 13,800 | WellPoint, Inc. # | 1,210,674 | 5,200 | R.R. Donnelley & Sons Company | 196,248 | |
| 32,400 | Wyeth * | 1,431,756 | 10,500 | Raytheon Company | 637,350 | |
| 5,790 | Zimmer Holdings, Inc. # | 383,008 | 3,900 | Robert Half International, Inc. | 105,456 | |
| Total Health Care | 37,299,353 | 3,700 | Rockwell Automation, Inc. * | 255,152 | ||
| 4,000 | Rockwell Collins, Inc. | 287,880 | ||||
| The accompanying Notes to Financial Statements are an integral part of this schedule. |
| 146 |
| Balanced Portfolio | ||||||
| Schedule of Investments as of December 31, 2007 | ||||||
| Shares | Common Stock (63.9%) | Value | Shares | Common Stock (63.9%) | Value | |
| Industrials — continued | 3,950 | Fiserv, Inc. # | $219,186 | |||
| 1,600 | Ryder System, Inc. | $75,216 | 5,600 | Google, Inc. # | 3,872,288 | |
| 17,780 | Southwest Airlines Company | 216,916 | 62,461 | Hewlett-Packard Company | 3,153,031 | |
| 2,400 | Terex Corporation # | 157,368 | 141,800 | Intel Corporation | 3,780,388 | |
| 6,000 | Textron, Inc. | 427,800 | 33,400 | International Business | ||
| 4,100 | Trane, Inc. | 191,511 | Machines Corporation | 3,610,540 | ||
| 11,915 | Tyco International, Ltd. | 472,430 | 8,100 | Intuit, Inc. # | 256,041 | |
| 6,300 | Union Pacific Corporation | 791,406 | 5,100 | Jabil Circuit, Inc. | 77,877 | |
| 25,400 | United Parcel Service, Inc. | 1,796,288 | 5,300 | JDS Uniphase Corporation # | 70,490 | |
| 23,900 | United Technologies Corporation | 1,829,306 | 12,600 | Juniper Networks, Inc. # | 418,320 | |
| 1,700 | W.W. Grainger, Inc. | 148,784 | 4,500 | KLA-Tencor Corporation | 216,720 | |
| 12,430 | Waste Management, Inc. | 406,088 | 2,200 | Lexmark International, Inc. # | 76,692 | |
| Total Industrials | 35,940,523 | 5,500 | Linear Technology Corporation * | 175,065 | ||
| 17,200 | LSI Corporation # | 91,332 | ||||
| Information Technology (10.7%) | 5,500 | MEMC Electronic Materials, Inc. # | 486,695 | |||
| 13,900 | Adobe Systems, Inc. #± | 593,947 | 5,200 | Microchip Technology, Inc. | 163,384 | |
| 14,600 | Advanced Micro Devices, Inc. #* | 109,500 | 18,400 | Micron Technology, Inc. #* | 133,400 | |
| 2,600 | Affiliated Computer | 195,100 | Microsoft Corporation ± | 6,945,560 | ||
| Services, Inc. # | 117,260 | 3,450 | Molex, Inc. | 94,185 | ||
| 9,363 | Agilent Technologies, Inc. # | 343,997 | 55,321 | Motorola, Inc. | 887,349 | |
| 4,000 | Akamai Technologies, Inc. #* | 138,400 | 5,800 | National Semiconductor Corporation * | 131,312 | |
| 8,100 | Altera Corporation | 156,492 | 8,300 | Network Appliance, Inc. # | 207,168 | |
| 7,300 | Analog Devices, Inc. | 231,410 | 8,500 | Novell, Inc. # | 58,395 | |
| 21,200 | Apple Computer, Inc. #± | 4,199,296 | 3,000 | Novellus Systems, Inc. # | 82,710 | |
| 33,400 | Applied Materials, Inc. | 593,184 | 13,450 | NVIDIA Corporation # | 457,569 | |
| 5,600 | Autodesk, Inc. #± | 278,656 | 95,659 | Oracle Corporation # | 2,159,980 | |
| 12,800 | Automatic Data Processing, Inc. | 569,984 | 8,050 | Paychex, Inc. | 291,571 | |
| 4,800 | BMC Software, Inc. #± | 171,072 | 3,500 | QLogic Corporation # | 49,700 | |
| 11,350 | Broadcom Corporation # | 296,689 | 39,700 | QUALCOMM, Inc. | 1,562,195 | |
| 9,475 | CA, Inc. | 236,401 | 5,500 | SanDisk Corporation #* | 182,435 | |
| 2,114 | CIENA Corporation #* | 72,109 | 20,075 | Sun Microsystems, Inc. # | 363,960 | |
| 147,100 | Cisco Systems, Inc. #± | 3,981,997 | 20,972 | Symantec Corporation # | 338,488 | |
| 4,600 | Citrix Systems, Inc. # | 174,846 | 10,600 | Tellabs, Inc. # | 69,324 | |
| 7,000 | Cognizant Technology Solutions | 4,300 | Teradata Corporation # | 117,863 | ||
| Corporation # | 237,580 | 4,300 | Teradyne, Inc. # | 44,462 | ||
| 4,200 | Computer Sciences Corporation # | 207,774 | 33,900 | Texas Instruments, Inc. | 1,132,260 | |
| 7,000 | Compuware Corporation # | 62,160 | 4,400 | Total System Services, Inc. | 126,940 | |
| 3,200 | Convergys Corporation # | 52,672 | 12,015 | Tyco Electronics, Ltd. | 446,117 | |
| 38,200 | Corning, Inc. | 916,418 | 8,500 | Unisys Corporation # | 40,205 | |
| 54,300 | Dell, Inc. #± | 1,330,893 | 5,300 | VeriSign, Inc. # | 199,333 | |
| 27,500 | eBay, Inc. # | 912,725 | 18,162 | Western Union Company | 440,973 | |
| 7,600 | Electronic Arts, Inc. # | 443,916 | 22,500 | Xerox Corporation | 364,275 | |
| 12,400 | Electronic Data Systems Corporation | 257,052 | 7,100 | Xilinx, Inc. | 155,277 | |
| 50,824 | EMC Corporation # | 941,769 | 32,500 | Yahoo!, Inc. # | 755,950 | |
| 4,100 | Fidelity National Information | Total Information Technology | 52,305,723 | |||
| Services, Inc. | 170,519 | |||||
| The accompanying Notes to Financial Statements are an integral part of this schedule. |
| 147 |
| Balanced Portfolio | ||||||
| Schedule of Investments as of December 31, 2007 | ||||||
| Shares | Common Stock (63.9%) | Value | Shares | Common Stock (63.9%) | Value | |
| Materials (2.1%) | Utilities (2.3%) | |||||
| 5,200 | Air Products and Chemicals, Inc. | $512,876 | 16,200 | AES Corporation # | $346,518 | |
| 20,564 | Alcoa, Inc. | 751,614 | 4,100 | Allegheny Energy, Inc. | 260,801 | |
| 2,381 | Allegheny Technologies, Inc. | 205,718 | 5,100 | Ameren Corporation | 276,471 | |
| 1,500 | Ashland, Inc. | 71,145 | 9,640 | American Electric Power | ||
| 2,600 | Ball Corporation | 117,000 | Company, Inc. | 448,838 | ||
| 2,500 | Bemis Company, Inc. | 68,450 | 7,924 | CenterPoint Energy, Inc. * | 135,738 | |
| 22,877 | Dow Chemical Company ± | 901,811 | 5,600 | CMS Energy Corporation | 97,328 | |
| 21,719 | E.I. du Pont de Nemours and Company | 957,591 | 6,700 | Consolidated Edison, Inc. | 327,295 | |
| 2,000 | Eastman Chemical Company | 122,180 | 4,400 | Constellation Energy Group, Inc. | 451,132 | |
| 4,400 | Ecolab, Inc. | 225,324 | 14,130 | Dominion Resources, Inc. | 670,468 | |
| 9,244 | Freeport-McMoRan Copper & | 4,000 | DTE Energy Company | 175,840 | ||
| Gold, Inc. | 946,955 | 30,542 | Duke Energy Corporation | 616,032 | ||
| 2,900 | Hercules, Inc. ± | 56,115 | 12,009 | Dynegy, Inc. # | 85,744 | |
| 2,000 | International Flavors & | 7,900 | Edison International, Inc. | 421,623 | ||
| Fragrances, Inc. | 96,260 | 4,700 | Entergy Corporation ± | 561,744 | ||
| 10,321 | International Paper Company | 334,194 | 15,974 | Exelon Corporation ± | 1,304,117 | |
| 4,580 | MeadWestvaco Corporation | 143,354 | 7,400 | FirstEnergy Corporation | 535,316 | |
| 13,166 | Monsanto Company | 1,470,511 | 9,900 | FPL Group, Inc. | 669,933 | |
| 10,917 | Newmont Mining Corporation | 533,077 | 2,007 | Integrys Energy Group, Inc. | 103,742 | |
| 7,000 | Nucor Corporation * | 414,540 | 1,200 | Nicor, Inc. | 50,820 | |
| 3,300 | Pactiv Corporation # | 87,879 | 6,734 | NiSource, Inc. | 127,205 | |
| 4,000 | PPG Industries, Inc. | 280,920 | 4,900 | Pepco Holdings, Inc. | 143,717 | |
| 7,700 | Praxair, Inc. | 683,067 | 8,500 | PG&E Corporation | 366,265 | |
| 3,211 | Rohm and Haas Company | 170,408 | 2,500 | Pinnacle West Capital Corporation | 106,025 | |
| 4,028 | Sealed Air Corporation | 93,208 | 9,000 | PPL Corporation | 468,810 | |
| 3,300 | Sigma-Aldrich Corporation | 180,180 | 6,391 | Progress Energy, Inc. | 309,516 | |
| 2,300 | Titanium Metals Corporation * | 60,835 | 6,200 | Public Service Enterprise | ||
| 2,800 | United States Steel Corporation * | 338,548 | Group, Inc. | 609,088 | ||
| 2,700 | Vulcan Materials Company | 213,543 | 4,300 | Questar Corporation | 232,630 | |
| 5,000 | Weyerhaeuser Company | 368,700 | 6,287 | Sempra Energy | 389,040 | |
| Total Materials | 10,406,003 | 18,400 | Southern Company | 713,000 | ||
| 5,200 | TECO Energy, Inc. | 89,492 | ||||
| Telecommunications Services (2.3%) | 10,310 | Xcel Energy, Inc. | 232,697 | |||
| 9,900 | American Tower Corporation # | 421,740 | Total Utilities | 11,326,985 | ||
| 147,079 | AT&T, Inc. ± | 6,112,603 | ||||
| 2,750 | CenturyTel, Inc. | 114,015 | Total Common Stock | |||
| 8,000 | Citizens Communications Company | 101,840 | (cost $219,412,924) | 312,110,010 | ||
| 3,798 | Embarq Corporation | 188,115 | ||||
| 38,018 | Qwest Communications | |||||
| International, Inc. #* | 266,506 | |||||
| 68,969 | Sprint Nextel Corporation | 905,563 | ||||
| 70,070 | Verizon Communications, Inc. | 3,061,358 | ||||
| 11,717 | Windstream Corporation | 152,555 | ||||
| Total Telecommunications | ||||||
| Services | 11,324,295 | |||||
| The accompanying Notes to Financial Statements are an integral part of this schedule. |
| 148 |
| Balanced Portfolio | ||||
| Schedule of Investments as of December 31, 2007 | ||||
| Principal | Interest | Maturity | ||
| Amount | Long-Term Fixed Income (41.4%) | Rate | Date | Value |
| Asset-Backed Securities (5.9%) | ||||
| $2,000,000 | Americredit Automobile Receivables Trust ±†« | 5.332% | 1/6/2008 | $1,977,154 |
| 632,520 | Bear Stearns Asset-Backed Securities, Inc. ±† | 5.105 | 1/25/2008 | 630,862 |
| 873,485 | Bear Stearns Mortgage Funding Trust † | 5.005 | 1/25/2008 | 412,078 |
| 1,908,975 | Countrywide Asset-Backed Certificates ±« | 5.549 | 4/25/2036 | 1,863,348 |
| 750,000 | Countrywide Home Loans Asset-Backed Securities « | 6.085 | 6/25/2021 | 665,900 |
| 2,000,000 | Credit Based Asset Servicing and Securitization, LLC † | 4.975 | 1/25/2008 | 1,967,674 |
| 1,000,000 | Credit Based Asset Servicing and Securitization, LLC | 5.501 | 12/25/2036 | 987,676 |
| 2,500,000 | DaimlerChrysler Master Owner Trust † | 5.078 | 1/15/2008 | 2,498,980 |
| 1,000,000 | Discover Card Master Trust | 5.650 | 3/16/2020 | 998,737 |
| 1,000,000 | First Franklin Mortgage Loan Asset-Backed Certificates † | 4.975 | 1/25/2008 | 972,685 |
| 782,641 | First Horizon ABS Trust †« | 4.995 | 1/25/2008 | 683,039 |
| 1,309,633 | First Horizon ABS Trust †« | 5.025 | 1/25/2008 | 1,071,379 |
| 1,500,000 | Ford Credit Floor Plan Master Owner Trust † | 5.208 | 1/15/2008 | 1,476,150 |
| 2,000,000 | GE Dealer Floorplan Master Note Trust † | 4.989 | 1/20/2008 | 1,999,598 |
| 1,500,000 | GMAC Mortgage Corporation Loan Trust †« | 4.935 | 1/25/2008 | 1,491,346 |
| 2,500,000 | GMAC Mortgage Corporation Loan Trust †« | 4.955 | 1/25/2008 | 2,494,142 |
| 1,210,767 | IndyMac Seconds Asset-Backed Trust †« | 5.035 | 1/25/2008 | 1,136,053 |
| 141,139 | Massachusetts RRB Special Purpose Trust | 3.780 | 9/15/2010 | 140,702 |
| 765,928 | National Collegiate Student Loan Trust † | 4.925 | 1/25/2008 | 766,413 |
| 9,034 | Popular ABS Mortgage Pass-Through Trust † | 4.995 | 1/25/2008 | 9,033 |
| 1,116,328 | Residential Funding Mortgage Securities II †« | 4.995 | 1/25/2008 | 1,099,355 |
| 482,613 | SLM Student Loan Trust † | 5.094 | 1/25/2008 | 482,038 |
| 2,000,000 | Textron Financial Floorplan Master Note Trust † ≤ | 5.324 | 1/13/2008 | 1,999,752 |
| 1,345,458 | Wachovia Asset Securitization, Inc. † ≤ « | 5.005 | 1/25/2008 | 1,229,055 |
| Total Asset-Backed Securities | 29,053,149 | |||
| Basic Materials (0.2%) | ||||
| 250,000 | Alcan, Inc. | 5.000 | 6/1/2015 | 242,181 |
| 225,000 | Alcan, Inc. | 6.125 | 12/15/2033 | 218,314 |
| 550,000 | Weyerhaeuser Company | 6.750 | 3/15/2012 | 577,576 |
| Total Basic Materials | 1,038,071 | |||
| Capital Goods (0.4%) | ||||
| 350,000 | Boeing Capital Corporation | 6.100 | 3/1/2011 | 366,857 |
| 225,000 | Caterpillar, Inc. | 4.500 | 6/15/2009 | 225,082 |
| 800,000 | General Electric Company | 5.000 | 2/1/2013 | 810,178 |
| 300,000 | John Deere Capital Corporation | 7.000 | 3/15/2012 | 326,666 |
| 225,000 | Northrop Grumman Corporation | 7.125 | 2/15/2011 | 239,793 |
| 225,000 | United Technologies Corporation | 6.050 | 6/1/2036 | 231,499 |
| Total Capital Goods | 2,200,075 | |||
| Collateralized Mortgage Obligations (1.7%) | ||||
| 1,792,027 | Chase Mortgage Finance Corporation | 4.577 | 2/25/2037 | 1,773,392 |
| 1,786,942 | J.P. Morgan Mortgage Trust | 5.006 | 7/25/2035 | 1,783,056 |
| 1,408,416 | Merrill Lynch Mortgage Investors, Inc. | 4.875 | 6/25/2035 | 1,410,498 |
| 1,508,231 | Thornburg Mortgage Securities Trust † | 4.955 | 1/25/2008 | 1,499,443 |
| 782,035 | Thornburg Mortgage Securities Trust † | 4.975 | 1/25/2008 | 763,916 |
| 910,570 | Zuni Mortgage Loan Trust † | 4.995 | 1/25/2008 | 870,670 |
| Total Collateralized Mortgage Obligations | 8,100,975 | |||
| The accompanying Notes to Financial Statements are an integral part of this schedule. |
| 149 |
| Balanced Portfolio | ||||
| Schedule of Investments as of December 31, 2007 | ||||
| Principal | Interest | Maturity | ||
| Amount | Long-Term Fixed Income (41.4%) | Rate | Date | Value |
| Commercial Mortgage-Backed Securities (4.0%) | ||||
| $1,000,000 | Banc of America Commercial Mortgage, Inc. | 5.118% | 7/11/2043 | $1,011,690 |
| 2,500,000 | Bear Stearns Commercial Mortgage Securities, Inc. † | 5.178 | 1/15/2008 | 2,402,585 |
| 400,000 | Bear Stearns Commercial Mortgage Securities, Inc. | 3.869 | 2/11/2041 | 395,796 |
| 700,000 | Bear Stearns Commercial Mortgage Securities, Inc. | 5.835 | 9/11/2042 | 701,032 |
| 240,024 | Citigroup Commercial Mortgage Trust † ≤ | 5.098 | 1/15/2008 | 232,072 |
| 75,055 | Commercial Mortgage Pass-Through Certificates † ≤ | 5.128 | 1/15/2008 | 74,681 |
| 2,000,000 | Commercial Mortgage Pass-Through Certificates † ≤ | 5.158 | 1/15/2008 | 1,876,070 |
| 500,000 | Credit Suisse First Boston Mortgage Securities Corporation | 4.829 | 11/15/2037 | 493,688 |
| 2,000,000 | Credit Suisse Mortgage Capital Certificates † ≤ | 5.198 | 1/15/2008 | 1,928,218 |
| 2,000,000 | Crown Castle International Corporation ≤ | 5.245 | 11/15/2036 | 1,996,120 |
| 200,000 | General Electric Commercial Mortgage Corporation | 4.641 | 9/10/2013 | 198,534 |
| 1,500,000 | GMAC Commercial Mortgage Securities, Inc. | 4.547 | 12/10/2041 | 1,487,476 |
| 1,000,000 | Greenwich Capital Commercial Funding Corporation | 5.317 | 6/10/2036 | 1,017,672 |
| 1,000,000 | GS Mortgage Securities Corporation II † | 5.382 | 1/6/2008 | 956,373 |
| 400,000 | J.P. Morgan Chase Commercial Mortgage Securities Corporation | 4.654 | 1/12/2037 | 396,922 |
| 1,500,000 | J.P. Morgan Chase Commercial Mortgage Securities Corporation | 5.336 | 5/15/2047 | 1,494,408 |
| 1,000,000 | LB-UBS Commercial Mortgage Trust | 3.086 | 5/15/2027 | 992,533 |
| 1,444,629 | Nationslink Funding Corporation | 6.316 | 1/20/2031 | 1,453,342 |
| 681,941 | Washington Mutual Asset Securities Corporation ≤ | 3.830 | 1/25/2035 | 672,360 |
| Total Commercial Mortgage-Backed Securities | 19,781,572 | |||
| Communications Services (1.4%) | ||||
| 225,000 | British Telecom plc | 8.625 | 12/15/2010 | 246,904 |
| 225,000 | British Telecom plc | 9.125 | 12/15/2030 | 297,816 |
| 450,000 | Cingular Wireless, Inc. | 6.500 | 12/15/2011 | 473,745 |
| 200,000 | Comcast Corporation | 5.500 | 3/15/2011 | 201,911 |
| 500,000 | Cox Communications, Inc. | 7.750 | 11/1/2010 | 533,322 |
| 115,000 | Cox Communications, Inc. ≤ | 6.450 | 12/1/2036 | 114,098 |
| 225,000 | Deutsche Telekom International Finance BV ± | 8.000 | 6/15/2010 | 240,208 |
| 225,000 | France Telecom SA | 7.750 | 3/1/2011 | 241,836 |
| 450,000 | New Cingular Wireless Services, Inc. ± | 7.875 | 3/1/2011 | 487,335 |
| 500,000 | News America, Inc. | 4.750 | 3/15/2010 | 497,148 |
| 225,000 | News America, Inc. | 6.400 | 12/15/2035 | 227,620 |
| 225,000 | SBC Communications, Inc. | 5.875 | 2/1/2012 | 232,175 |
| 600,000 | Sprint Capital Corporation | 7.625 | 1/30/2011 | 625,259 |
| 450,000 | Sprint Capital Corporation | 6.900 | 5/1/2019 | 447,015 |
| 550,000 | Telecom Italia Capital SA | 5.250 | 11/15/2013 | 543,582 |
| 425,000 | Tele-Communications, Inc. (TCI Group) | 7.875 | 8/1/2013 | 465,758 |
| 1,000,000 | Verizon Global Funding Corporation | 7.250 | 12/1/2010 | 1,071,931 |
| Total Communications Services | 6,947,663 | |||
| Consumer Cyclical (0.4%) | ||||
| 325,000 | AOL Time Warner, Inc. | 6.875 | 5/1/2012 | 342,228 |
| 500,000 | Johnson Controls, Inc. | 7.125 | 7/15/2017 | 548,740 |
| 450,000 | Wal-Mart Stores, Inc. | 7.550 | 2/15/2030 | 519,694 |
| 500,000 | Walt Disney Company | 5.625 | 9/15/2016 | 513,515 |
| Total Consumer Cyclical | 1,924,177 | |||
| The accompanying Notes to Financial Statements are an integral part of this schedule. |
| 150 |
| Balanced Portfolio | ||||
| Schedule of Investments as of December 31, 2007 | ||||
| Principal | Interest | Maturity | ||
| Amount | Long-Term Fixed Income (41.4%) | Rate | Date | Value |
| Consumer Non-Cyclical (0.7%) | ||||
| $225,000 | Boston Scientific Corporation | 7.000% | 11/15/2035 | $198,000 |
| 800,000 | Bunge Limited Finance Corporation | 5.350 | 4/15/2014 | 774,584 |
| 425,000 | Coca-Cola HBC Finance BV | 5.125 | 9/17/2013 | 427,337 |
| 482,000 | General Mills, Inc. | 6.000 | 2/15/2012 | 494,292 |
| 500,000 | Kroger Company | 4.950 | 1/15/2015 | 481,232 |
| 500,000 | WellPoint, Inc. | 5.000 | 12/15/2014 | 478,956 |
| 450,000 | Wyeth | 6.000 | 2/15/2036 | 449,965 |
| Total Consumer Non-Cyclical | 3,304,366 | |||
| Energy (0.3%) | ||||
| 500,000 | Burlington Resources, Inc. | 6.500 | 12/1/2011 | 530,352 |
| 800,000 | Conoco Funding Company | 6.350 | 10/15/2011 | 849,705 |
| 250,000 | PennzEnergy Company | 10.125 | 11/15/2009 | 274,223 |
| Total Energy | 1,654,280 | |||
| Financials (3.1%) | ||||
| 450,000 | Allstate Corporation | 5.000 | 8/15/2014 | 439,966 |
| 250,000 | Associates Corporation of North America ± | 6.250 | 11/1/2008 | 252,318 |
| 225,000 | BAC Capital Trust XI | 6.625 | 5/23/2036 | 218,899 |
| 675,000 | Bank of America Corporation * | 4.750 | 8/15/2013 | 665,142 |
| 1,350,000 | Bank One Corporation ± | 5.900 | 11/15/2011 | 1,401,740 |
| 700,000 | BB&T Corporation | 6.500 | 8/1/2011 | 731,042 |
| 900,000 | BNP Paribas SA ± ≤ | 5.186 | 6/29/2015 | 819,111 |
| 650,000 | CIT Group, Inc. | 4.750 | 12/15/2010 | 616,543 |
| 650,000 | Credit Suisse First Boston USA, Inc. | 3.875 | 1/15/2009 | 644,595 |
| 675,000 | Goldman Sachs Group, Inc. | 6.600 | 1/15/2012 | 714,149 |
| 425,000 | Household Finance Corporation | 4.750 | 5/15/2009 | 423,589 |
| 500,000 | HSBC Finance Corporation | 5.000 | 6/30/2015 | 476,860 |
| 650,000 | Lehman Brothers Holdings, Inc. | 3.950 | 11/10/2009 | 633,575 |
| 450,000 | Merrill Lynch & Company, Inc. | 5.000 | 2/3/2014 | 429,267 |
| 350,000 | MetLife, Inc. | 5.000 | 6/15/2015 | 338,711 |
| 1,100,000 | Morgan Stanley Dean Witter & Company | 6.750 | 4/15/2011 | 1,152,956 |
| 1,230,030 | Preferred Term Securities XXIII, Ltd. † ≤ | 5.191 | 3/24/2008 | 1,179,599 |
| 425,000 | ProLogis Trust | 5.500 | 3/1/2013 | 420,002 |
| 500,000 | Prudential Financial, Inc. | 4.750 | 6/13/2015 | 466,940 |
| 225,000 | Prudential Financial, Inc. | 5.700 | 12/14/2036 | 199,518 |
| 400,000 | Residential Capital Corporation | 8.000 | 4/17/2013 | 246,000 |
| 450,000 | Student Loan Marketing Corporation | 4.000 | 1/15/2010 | 414,463 |
| 450,000 | Union Planters Corporation | 4.375 | 12/1/2010 | 442,179 |
| 425,000 | Wachovia Bank NA | 4.875 | 2/1/2015 | 404,582 |
| 500,000 | Washington Mutual Bank FA | 5.500 | 1/15/2013 | 443,646 |
| 900,000 | Wells Fargo & Company | 4.200 | 1/15/2010 | 894,314 |
| Total Financials | 15,069,706 | |||
| Foreign (1.3%) | ||||
| 450,000 | Export-Import Bank of Korea ± ≤ | 4.125 | 2/10/2009 | 444,002 |
| 1,200,000 | Inter-American Development Bank | 5.375 | 11/18/2008 | 1,212,368 |
| 1,000,000 | Ontario Electricity Financial Corporation | 7.450 | 3/31/2013 | 1,157,989 |
| 95,000 | Pemex Project Funding Master Trust | 9.125 | 10/13/2010 | 104,975 |
| The accompanying Notes to Financial Statements are an integral part of this schedule. |
| 151 |
| Balanced Portfolio | ||||
| Schedule of Investments as of December 31, 2007 | ||||
| Principal | Interest | Maturity | ||
| Amount | Long-Term Fixed Income (41.4%) | Rate | Date | Value |
| Foreign — continued | ||||
| $250,000 | Petro-Canada, Ltd. | 8.600% | 1/15/2010 | $273,854 |
| 500,000 | Province of Newfoundland | 8.650 | 10/22/2022 | 691,648 |
| 600,000 | Province of Quebec | 4.875 | 5/5/2014 | 616,277 |
| 750,000 | Republic of Italy | 4.375 | 6/15/2013 | 769,205 |
| 900,000 | United Mexican States | 5.625 | 1/15/2017 | 912,150 |
| Total Foreign | 6,182,468 | |||
| Mortgage-Backed Securities (11.5%) | ||||
| 6,073 | Federal Home Loan Mortgage Corporation Gold | |||
| 15-Yr. Pass Through | 6.500 | 4/1/2009 | 6,115 | |
| 9,614 | Federal Home Loan Mortgage Corporation Gold | |||
| 15-Yr. Pass Through | 7.500 | 8/1/2010 | 9,872 | |
| 655 | Federal Home Loan Mortgage Corporation Gold | |||
| 15-Yr. Pass Through | 7.000 | 11/1/2010 | 672 | |
| 34,088 | Federal Home Loan Mortgage Corporation Gold | |||
| 15-Yr. Pass Through | 7.000 | 2/1/2011 | 34,990 | |
| 23,825 | Federal Home Loan Mortgage Corporation Gold | |||
| 15-Yr. Pass Through | 6.000 | 5/1/2012 | 24,452 | |
| 4,042 | Federal Home Loan Mortgage Corporation Gold | |||
| 15-Yr. Pass Through | 8.000 | 6/1/2012 | 4,242 | |
| 9,190 | Federal Home Loan Mortgage Corporation Gold | |||
| 15-Yr. Pass Through | 7.000 | 8/1/2012 | 9,562 | |
| 17,048 | Federal Home Loan Mortgage Corporation Gold | |||
| 15-Yr. Pass Through | 6.500 | 11/1/2012 | 17,646 | |
| 14,191 | Federal Home Loan Mortgage Corporation Gold | |||
| 15-Yr. Pass Through | 6.500 | 8/1/2013 | 14,702 | |
| 65,953 | Federal Home Loan Mortgage Corporation Gold | |||
| 15-Yr. Pass Through | 6.000 | 2/1/2014 | 67,464 | |
| 118,907 | Federal Home Loan Mortgage Corporation Gold | |||
| 15-Yr. Pass Through | 5.500 | 4/1/2014 | 120,438 | |
| 49,567 | Federal Home Loan Mortgage Corporation Gold | |||
| 15-Yr. Pass Through | 6.000 | 4/1/2014 | 50,702 | |
| 65,954 | Federal Home Loan Mortgage Corporation Gold | |||
| 15-Yr. Pass Through | 6.000 | 4/1/2014 | 67,564 | |
| 46,926 | Federal Home Loan Mortgage Corporation Gold | |||
| 15-Yr. Pass Through | 6.500 | 6/1/2014 | 48,646 | |
| 40,762 | Federal Home Loan Mortgage Corporation Gold | |||
| 15-Yr. Pass Through | 7.500 | 9/1/2014 | 42,571 | |
| 1,194,094 | Federal Home Loan Mortgage Corporation Gold | |||
| 15-Yr. Pass Through | 5.500 | 12/1/2017 | 1,210,929 | |
| 21,672 | Federal Home Loan Mortgage Corporation Gold | |||
| 30-Yr. Pass Through | 6.500 | 4/1/2024 | 22,512 | |
| 45,153 | Federal Home Loan Mortgage Corporation Gold | |||
| 30-Yr. Pass Through | 9.000 | 11/1/2024 | 48,998 | |
| 2,642 | Federal Home Loan Mortgage Corporation Gold | |||
| 30-Yr. Pass Through | 9.000 | 4/1/2025 | 2,865 | |
| 4,163 | Federal Home Loan Mortgage Corporation Gold | |||
| 30-Yr. Pass Through | 7.000 | 9/1/2025 | 4,377 | |
| The accompanying Notes to Financial Statements are an integral part of this schedule. |
| 152 |
| Balanced Portfolio | ||||
| Schedule of Investments as of December 31, 2007 | ||||
| Principal | Interest | Maturity | ||
| Amount | Long-Term Fixed Income (41.4%) | Rate | Date | Value |
| Mortgage-Backed Securities — continued | ||||
| $5,595 | Federal Home Loan Mortgage Corporation Gold | |||
| 30-Yr. Pass Through | 8.500% | 9/1/2025 | $6,014 | |
| 4,817 | Federal Home Loan Mortgage Corporation Gold | |||
| 30-Yr. Pass Through | 8.000 | 1/1/2026 | 5,158 | |
| 4,066 | Federal Home Loan Mortgage Corporation Gold | |||
| 30-Yr. Pass Through | 6.500 | 5/1/2026 | 4,224 | |
| 10,946 | Federal Home Loan Mortgage Corporation Gold | |||
| 30-Yr. Pass Through | 7.000 | 5/1/2026 | 11,509 | |
| 25,711 | Federal Home Loan Mortgage Corporation Gold | |||
| 30-Yr. Pass Through | 6.000 | 7/1/2026 | 26,295 | |
| 1,349 | Federal Home Loan Mortgage Corporation Gold | |||
| 30-Yr. Pass Through | 7.500 | 7/1/2026 | 1,445 | |
| 1,232 | Federal Home Loan Mortgage Corporation Gold | |||
| 30-Yr. Pass Through | 7.500 | 8/1/2026 | 1,319 | |
| 5,884 | Federal Home Loan Mortgage Corporation Gold | |||
| 30-Yr. Pass Through | 8.000 | 11/1/2026 | 6,294 | |
| 4,215 | Federal Home Loan Mortgage Corporation Gold | |||
| 30-Yr. Pass Through | 7.500 | 1/1/2027 | 4,514 | |
| 10,942 | Federal Home Loan Mortgage Corporation Gold | |||
| 30-Yr. Pass Through | 6.500 | 2/1/2027 | 11,361 | |
| 11,920 | Federal Home Loan Mortgage Corporation Gold | |||
| 30-Yr. Pass Through | 7.000 | 2/1/2027 | 12,530 | |
| 19,627 | Federal Home Loan Mortgage Corporation Gold | |||
| 30-Yr. Pass Through | 8.000 | 3/1/2027 | 20,996 | |
| 8,009 | Federal Home Loan Mortgage Corporation Gold | |||
| 30-Yr. Pass Through | 7.500 | 4/1/2027 | 8,575 | |
| 2,121 | Federal Home Loan Mortgage Corporation Gold | |||
| 30-Yr. Pass Through | 7.000 | 5/1/2027 | 2,229 | |
| 19,942 | Federal Home Loan Mortgage Corporation Gold | |||
| 30-Yr. Pass Through | 8.000 | 6/1/2027 | 21,339 | |
| 8,177 | Federal Home Loan Mortgage Corporation Gold | |||
| 30-Yr. Pass Through | 8.500 | 7/1/2027 | 8,793 | |
| 9,000 | Federal Home Loan Mortgage Corporation Gold | |||
| 30-Yr. Pass Through | 7.000 | 9/1/2027 | 9,461 | |
| 13,890 | Federal Home Loan Mortgage Corporation Gold | |||
| 30-Yr. Pass Through | 8.000 | 10/1/2027 | 14,863 | |
| 11,890 | Federal Home Loan Mortgage Corporation Gold | |||
| 30-Yr. Pass Through | 7.500 | 11/1/2027 | 12,731 | |
| 6,210 | Federal Home Loan Mortgage Corporation Gold | |||
| 30-Yr. Pass Through | 6.500 | 12/1/2027 | 6,448 | |
| 3,501 | Federal Home Loan Mortgage Corporation Gold | |||
| 30-Yr. Pass Through | 7.500 | 12/1/2027 | 3,749 | |
| 50,932 | Federal Home Loan Mortgage Corporation Gold | |||
| 30-Yr. Pass Through | 6.500 | 6/1/2028 | 52,794 | |
| 21,527 | Federal Home Loan Mortgage Corporation Gold | |||
| 30-Yr. Pass Through | 7.000 | 10/1/2028 | 22,630 | |
| 64,793 | Federal Home Loan Mortgage Corporation Gold | |||
| 30-Yr. Pass Through | 6.500 | 11/1/2028 | 67,162 | |
| The accompanying Notes to Financial Statements are an integral part of this schedule. |
| 153 |
| Balanced Portfolio | ||||
| Schedule of Investments as of December 31, 2007 | ||||
| Principal | Interest | Maturity | ||
| Amount | Long-Term Fixed Income (41.4%) | Rate | Date | Value |
| Mortgage-Backed Securities — continued | ||||
| $3,888 | Federal Home Loan Mortgage Corporation Gold | |||
| 30-Yr. Pass Through | 6.500% | 1/1/2029 | $4,030 | |
| 86,587 | Federal Home Loan Mortgage Corporation Gold | |||
| 30-Yr. Pass Through | 6.000 | 3/1/2029 | 88,465 | |
| 43,506 | Federal Home Loan Mortgage Corporation Gold | |||
| 30-Yr. Pass Through | 6.500 | 4/1/2029 | 45,085 | |
| 79,452 | Federal Home Loan Mortgage Corporation Gold | |||
| 30-Yr. Pass Through | 6.000 | 5/1/2029 | 81,176 | |
| 79,123 | Federal Home Loan Mortgage Corporation Gold | |||
| 30-Yr. Pass Through | 7.000 | 5/1/2029 | 83,177 | |
| 32,161 | Federal Home Loan Mortgage Corporation Gold | |||
| 30-Yr. Pass Through | 6.500 | 7/1/2029 | 33,328 | |
| 33,694 | Federal Home Loan Mortgage Corporation Gold | |||
| 30-Yr. Pass Through | 6.500 | 8/1/2029 | 34,916 | |
| 13,277 | Federal Home Loan Mortgage Corporation Gold | |||
| 30-Yr. Pass Through | 7.000 | 9/1/2029 | 13,957 | |
| 18,464 | Federal Home Loan Mortgage Corporation Gold | |||
| 30-Yr. Pass Through | 7.000 | 10/1/2029 | 19,410 | |
| 9,835 | Federal Home Loan Mortgage Corporation Gold | |||
| 30-Yr. Pass Through | 7.500 | 11/1/2029 | 10,521 | |
| 9,384 | Federal Home Loan Mortgage Corporation Gold | |||
| 30-Yr. Pass Through | 7.000 | 1/1/2030 | 9,861 | |
| 63,729 | Federal Home Loan Mortgage Corporation Gold | |||
| 30-Yr. Pass Through | 7.500 | 1/1/2030 | 68,065 | |
| 11,330 | Federal Home Loan Mortgage Corporation Gold | |||
| 30-Yr. Pass Through | 8.000 | 8/1/2030 | 12,134 | |
| 57,114 | Federal Home Loan Mortgage Corporation Gold | |||
| 30-Yr. Pass Through | 6.000 | 3/1/2031 | 58,226 | |
| 228,436 | Federal Home Loan Mortgage Corporation Gold | |||
| 30-Yr. Pass Through | 6.000 | 6/1/2031 | 232,884 | |
| 177,834 | Federal Home Loan Mortgage Corporation Gold | |||
| 30-Yr. Pass Through | 6.000 | 1/1/2032 | 181,296 | |
| 752,951 | Federal Home Loan Mortgage Corporation Gold | |||
| 30-Yr. Pass Through | 6.000 | 10/1/2032 | 766,748 | |
| 6,000,000 | Federal Home Loan Mortgage Corporation Gold | |||
| 30-Yr. Pass Through § | 5.000 | 1/1/2038 | 5,853,750 | |
| 4,050,000 | Federal Home Loan Mortgage Corporation Gold | |||
| 30-Yr. Pass Through § | 6.000 | 1/1/2038 | 4,109,486 | |
| 1,477 | Federal National Mortgage Association Conventional | |||
| 15-Yr. Pass Through | 9.000 | 4/1/2010 | 1,571 | |
| 2,159 | Federal National Mortgage Association Conventional | |||
| 15-Yr. Pass Through | 9.000 | 4/1/2010 | 2,295 | |
| 3,414 | Federal National Mortgage Association Conventional | |||
| 15-Yr. Pass Through | 6.000 | 2/1/2011 | 3,491 | |
| 6,874 | Federal National Mortgage Association Conventional | |||
| 15-Yr. Pass Through | 8.000 | 5/1/2011 | 7,146 | |
| 9,338 | Federal National Mortgage Association Conventional | |||
| 15-Yr. Pass Through | 7.000 | 6/1/2011 | 9,663 | |
| The accompanying Notes to Financial Statements are an integral part of this schedule. |
| 154 |
| Balanced Portfolio | ||||
| Schedule of Investments as of December 31, 2007 | ||||
| Principal | Interest | Maturity | ||
| Amount | Long-Term Fixed Income (41.4%) | Rate | Date | Value |
| Mortgage-Backed Securities — continued | ||||
| $3,370 | Federal National Mortgage Association Conventional | |||
| 15-Yr. Pass Through | 6.500% | 7/1/2011 | $3,470 | |
| 3,496 | Federal National Mortgage Association Conventional | |||
| 15-Yr. Pass Through | 7.500 | 7/1/2011 | 3,595 | |
| 28,970 | Federal National Mortgage Association Conventional | |||
| 15-Yr. Pass Through | 6.500 | 5/1/2012 | 29,997 | |
| 12,040 | Federal National Mortgage Association Conventional | |||
| 15-Yr. Pass Through | 6.500 | 7/1/2012 | 12,467 | |
| 28,490 | Federal National Mortgage Association Conventional | |||
| 15-Yr. Pass Through | 7.000 | 10/1/2012 | 29,667 | |
| 5,777 | Federal National Mortgage Association Conventional | |||
| 15-Yr. Pass Through | 7.000 | 12/1/2012 | 6,015 | |
| 21,855 | Federal National Mortgage Association Conventional | |||
| 15-Yr. Pass Through | 6.500 | 6/1/2013 | 22,649 | |
| 60,139 | Federal National Mortgage Association Conventional | |||
| 15-Yr. Pass Through | 6.000 | 11/1/2013 | 61,656 | |
| 101,702 | Federal National Mortgage Association Conventional | |||
| 15-Yr. Pass Through | 5.500 | 12/1/2013 | 103,111 | |
| 39,384 | Federal National Mortgage Association Conventional | |||
| 15-Yr. Pass Through | 6.000 | 12/1/2013 | 40,450 | |
| 24,262 | Federal National Mortgage Association Conventional | |||
| 15-Yr. Pass Through | 7.500 | 4/1/2015 | 25,259 | |
| 11,950,000 | Federal National Mortgage Association Conventional | |||
| 15-Yr. Pass Through § | 5.000 | 1/1/2023 | 11,961,209 | |
| 6,945 | Federal National Mortgage Association Conventional | |||
| 30-Yr. Pass Through | 10.500 | 8/1/2020 | 8,029 | |
| 6,119 | Federal National Mortgage Association Conventional | |||
| 30-Yr. Pass Through | 9.500 | 4/1/2025 | 6,751 | |
| 1,309 | Federal National Mortgage Association Conventional | |||
| 30-Yr. Pass Through | 7.500 | 9/1/2025 | 1,401 | |
| 4,396 | Federal National Mortgage Association Conventional | |||
| 30-Yr. Pass Through | 8.500 | 11/1/2025 | 4,730 | |
| 3,467 | Federal National Mortgage Association Conventional | |||
| 30-Yr. Pass Through | 7.000 | 1/1/2026 | 3,655 | |
| 14,924 | Federal National Mortgage Association Conventional | |||
| 30-Yr. Pass Through | 6.500 | 2/1/2026 | 15,506 | |
| 5,381 | Federal National Mortgage Association Conventional | |||
| 30-Yr. Pass Through | 7.000 | 3/1/2026 | 5,674 | |
| 8,624 | Federal National Mortgage Association Conventional | |||
| 30-Yr. Pass Through | 6.500 | 4/1/2026 | 8,961 | |
| 1,633 | Federal National Mortgage Association Conventional | |||
| 30-Yr. Pass Through | 8.500 | 5/1/2026 | 1,758 | |
| 3,655 | Federal National Mortgage Association Conventional | |||
| 30-Yr. Pass Through | 7.500 | 7/1/2026 | 3,911 | |
| 19,165 | Federal National Mortgage Association Conventional | |||
| 30-Yr. Pass Through | 7.500 | 8/1/2026 | 20,509 | |
| 2,062 | Federal National Mortgage Association Conventional | |||
| 30-Yr. Pass Through | 8.000 | 8/1/2026 | 2,211 | |
| The accompanying Notes to Financial Statements are an integral part of this schedule. |
| 155 |
| Balanced Portfolio | ||||
| Schedule of Investments as of December 31, 2007 | ||||
| Principal | Interest | Maturity | ||
| Amount | Long-Term Fixed Income (41.4%) | Rate | Date | Value |
| Mortgage-Backed Securities — continued | ||||
| $10,426 | Federal National Mortgage Association Conventional | |||
| 30-Yr. Pass Through | 7.000% | 11/1/2026 | $10,993 | |
| 3,461 | Federal National Mortgage Association Conventional | |||
| 30-Yr. Pass Through | 8.000 | 11/1/2026 | 3,710 | |
| 1,495 | Federal National Mortgage Association Conventional | |||
| 30-Yr. Pass Through | 7.500 | 12/1/2026 | 1,600 | |
| 2,154 | Federal National Mortgage Association Conventional | |||
| 30-Yr. Pass Through | 7.500 | 2/1/2027 | 2,305 | |
| 7,904 | Federal National Mortgage Association Conventional | |||
| 30-Yr. Pass Through | 7.000 | 3/1/2027 | 8,334 | |
| 8,136 | Federal National Mortgage Association Conventional | |||
| 30-Yr. Pass Through | 7.500 | 5/1/2027 | 8,705 | |
| 10,552 | Federal National Mortgage Association Conventional | |||
| 30-Yr. Pass Through | 6.500 | 7/1/2027 | 10,956 | |
| 10,484 | Federal National Mortgage Association Conventional | |||
| 30-Yr. Pass Through | 7.000 | 7/1/2027 | 11,055 | |
| 7,812 | Federal National Mortgage Association Conventional | |||
| 30-Yr. Pass Through | 7.500 | 8/1/2027 | 8,358 | |
| 45,905 | Federal National Mortgage Association Conventional | |||
| 30-Yr. Pass Through | 8.000 | 9/1/2027 | 49,227 | |
| 12,511 | Federal National Mortgage Association Conventional | |||
| 30-Yr. Pass Through | 7.000 | 10/1/2027 | 13,193 | |
| 38,856 | Federal National Mortgage Association Conventional | |||
| 30-Yr. Pass Through | 7.500 | 12/1/2027 | 41,573 | |
| 7,012 | Federal National Mortgage Association Conventional | |||
| 30-Yr. Pass Through | 8.000 | 12/1/2027 | 7,520 | |
| 19,288 | Federal National Mortgage Association Conventional | |||
| 30-Yr. Pass Through | 6.500 | 2/1/2028 | 20,027 | |
| 10,761 | Federal National Mortgage Association Conventional | |||
| 30-Yr. Pass Through | 7.000 | 2/1/2028 | 11,348 | |
| 130,950 | Federal National Mortgage Association Conventional | |||
| 30-Yr. Pass Through | 6.500 | 7/1/2028 | 135,730 | |
| 33,899 | Federal National Mortgage Association Conventional | |||
| 30-Yr. Pass Through | 7.000 | 8/1/2028 | 35,750 | |
| 53,197 | Federal National Mortgage Association Conventional | |||
| 30-Yr. Pass Through | 6.500 | 11/1/2028 | 55,138 | |
| 23,728 | Federal National Mortgage Association Conventional | |||
| 30-Yr. Pass Through | 6.500 | 11/1/2028 | 24,594 | |
| 2,793 | Federal National Mortgage Association Conventional | |||
| 30-Yr. Pass Through | 7.000 | 11/1/2028 | 2,946 | |
| 126,886 | Federal National Mortgage Association Conventional | |||
| 30-Yr. Pass Through | 6.000 | 12/1/2028 | 129,763 | |
| 42,013 | Federal National Mortgage Association Conventional | |||
| 30-Yr. Pass Through | 7.000 | 12/1/2028 | 44,307 | |
| 52,657 | Federal National Mortgage Association Conventional | |||
| 30-Yr. Pass Through | 6.000 | 3/1/2029 | 53,821 | |
| 66,861 | Federal National Mortgage Association Conventional | |||
| 30-Yr. Pass Through | 6.500 | 6/1/2029 | 69,283 | |
| The accompanying Notes to Financial Statements are an integral part of this schedule. |
| 156 |
| Balanced Portfolio | ||||
| Schedule of Investments as of December 31, 2007 | ||||
| Principal | Interest | Maturity | ||
| Amount | Long-Term Fixed Income (41.4%) | Rate | Date | Value |
| Mortgage-Backed Securities — continued | ||||
| $90,373 | Federal National Mortgage Association Conventional | |||
| 30-Yr. Pass Through | 6.000% | 7/1/2029 | $92,371 | |
| 29,024 | Federal National Mortgage Association Conventional | |||
| 30-Yr. Pass Through | 6.500 | 7/1/2029 | 30,076 | |
| 74,985 | Federal National Mortgage Association Conventional | |||
| 30-Yr. Pass Through | 7.500 | 8/1/2029 | 80,159 | |
| 102,240 | Federal National Mortgage Association Conventional | |||
| 30-Yr. Pass Through | 6.000 | 11/1/2029 | 104,500 | |
| 48,100 | Federal National Mortgage Association Conventional | |||
| 30-Yr. Pass Through | 7.000 | 11/1/2029 | 50,731 | |
| 22,199 | Federal National Mortgage Association Conventional | |||
| 30-Yr. Pass Through | 7.000 | 11/1/2029 | 23,413 | |
| 24,077 | Federal National Mortgage Association Conventional | |||
| 30-Yr. Pass Through | 8.500 | 4/1/2030 | 25,901 | |
| 12,371 | Federal National Mortgage Association Conventional | |||
| 30-Yr. Pass Through | 7.500 | 8/1/2030 | 13,205 | |
| 146,137 | Federal National Mortgage Association Conventional | |||
| 30-Yr. Pass Through | 6.500 | 7/1/2031 | 151,118 | |
| 62,757 | Federal National Mortgage Association Conventional | |||
| 30-Yr. Pass Through | 6.500 | 10/1/2031 | 64,896 | |
| 74,271 | Federal National Mortgage Association Conventional | |||
| 30-Yr. Pass Through | 6.500 | 12/1/2031 | 76,802 | |
| 94,223 | Federal National Mortgage Association Conventional | |||
| 30-Yr. Pass Through | 6.500 | 5/1/2032 | 97,409 | |
| 521,592 | Federal National Mortgage Association Conventional | |||
| 30-Yr. Pass Through | 6.500 | 7/1/2032 | 539,226 | |
| 25,900,000 | Federal National Mortgage Association Conventional | |||
| 30-Yr. Pass Through § | 5.500 | 1/1/2038 | 25,867,618 | |
| 1,999 | Government National Mortgage Association | |||
| 15-Yr. Pass Through | 6.500 | 5/15/2009 | 2,029 | |
| 12,929 | Government National Mortgage Association | |||
| 15-Yr. Pass Through | 6.000 | 4/15/2011 | 13,242 | |
| 2,642 | Government National Mortgage Association | |||
| 15-Yr. Pass Through | 6.500 | 6/15/2011 | 2,724 | |
| 3,516 | Government National Mortgage Association | |||
| 15-Yr. Pass Through | 7.500 | 7/15/2011 | 3,640 | |
| 14,854 | Government National Mortgage Association | |||
| 15-Yr. Pass Through | 7.000 | 4/15/2012 | 15,481 | |
| 77,717 | Government National Mortgage Association | |||
| 15-Yr. Pass Through | 6.000 | 7/15/2014 | 79,527 | |
| 4,195 | Government National Mortgage Association | |||
| 30-Yr. Pass Through | 9.500 | 12/15/2024 | 4,627 | |
| 13,180 | Government National Mortgage Association | |||
| 30-Yr. Pass Through | 9.500 | 1/15/2025 | 14,546 | |
| 35,538 | Government National Mortgage Association | |||
| 30-Yr. Pass Through | 9.000 | 3/15/2025 | 38,616 | |
| 2,942 | Government National Mortgage Association | |||
| 30-Yr. Pass Through | 7.500 | 8/15/2025 | 3,142 | |
| The accompanying Notes to Financial Statements are an integral part of this schedule. |
| 157 |
| Balanced Portfolio | ||||
| Schedule of Investments as of December 31, 2007 | ||||
| Principal | Interest | Maturity | ||
| Amount | Long-Term Fixed Income (41.4%) | Rate | Date | Value |
| Mortgage-Backed Securities — continued | ||||
| $14,721 | Government National Mortgage Association | |||
| 30-Yr. Pass Through | 7.000% | 1/15/2026 | $15,635 | |
| 20,583 | Government National Mortgage Association | |||
| 30-Yr. Pass Through | 7.000 | 1/15/2026 | 21,861 | |
| 4,528 | Government National Mortgage Association | |||
| 30-Yr. Pass Through | 6.500 | 3/15/2026 | 4,705 | |
| 19,020 | Government National Mortgage Association | |||
| 30-Yr. Pass Through | 7.000 | 4/15/2026 | 20,201 | |
| 6,793 | Government National Mortgage Association | |||
| 30-Yr. Pass Through | 8.000 | 4/15/2026 | 7,347 | |
| 24,254 | Government National Mortgage Association | |||
| 30-Yr. Pass Through | 6.000 | 5/15/2026 | 24,925 | |
| 6,567 | Government National Mortgage Association | |||
| 30-Yr. Pass Through | 7.000 | 5/15/2026 | 6,974 | |
| 6,039 | Government National Mortgage Association | |||
| 30-Yr. Pass Through | 7.500 | 5/15/2026 | 6,450 | |
| 31,596 | Government National Mortgage Association | |||
| 30-Yr. Pass Through | 7.000 | 6/15/2026 | 33,558 | |
| 7,465 | Government National Mortgage Association | |||
| 30-Yr. Pass Through | 8.500 | 6/15/2026 | 8,121 | |
| 3,231 | Government National Mortgage Association | |||
| 30-Yr. Pass Through | 8.500 | 7/15/2026 | 3,515 | |
| 22,155 | Government National Mortgage Association | |||
| 30-Yr. Pass Through | 8.000 | 9/15/2026 | 23,963 | |
| 8,379 | Government National Mortgage Association | |||
| 30-Yr. Pass Through | 7.500 | 10/15/2026 | 8,949 | |
| 7,362 | Government National Mortgage Association | |||
| 30-Yr. Pass Through | 8.000 | 11/15/2026 | 7,963 | |
| 3,085 | Government National Mortgage Association | |||
| 30-Yr. Pass Through | 8.500 | 11/15/2026 | 3,356 | |
| 4,069 | Government National Mortgage Association | |||
| 30-Yr. Pass Through | 9.000 | 12/15/2026 | 4,423 | |
| 2,591 | Government National Mortgage Association | |||
| 30-Yr. Pass Through | 7.500 | 1/15/2027 | 2,767 | |
| 33,541 | Government National Mortgage Association | |||
| 30-Yr. Pass Through | 7.500 | 4/15/2027 | 35,818 | |
| 8,343 | Government National Mortgage Association | |||
| 30-Yr. Pass Through | 8.000 | 6/20/2027 | 8,989 | |
| 2,614 | Government National Mortgage Association | |||
| 30-Yr. Pass Through | 8.000 | 8/15/2027 | 2,827 | |
| 93,356 | Government National Mortgage Association | |||
| 30-Yr. Pass Through | 6.500 | 10/15/2027 | 96,973 | |
| 33,651 | Government National Mortgage Association | |||
| 30-Yr. Pass Through | 7.000 | 10/15/2027 | 35,733 | |
| 3,347 | Government National Mortgage Association | |||
| 30-Yr. Pass Through | 7.000 | 11/15/2027 | 3,554 | |
| 39,598 | Government National Mortgage Association | |||
| 30-Yr. Pass Through | 7.000 | 11/15/2027 | 42,048 | |
| The accompanying Notes to Financial Statements are an integral part of this schedule. |
| 158 |
| Balanced Portfolio | ||||
| Schedule of Investments as of December 31, 2007 | ||||
| Principal | Interest | Maturity | ||
| Amount | Long-Term Fixed Income (41.4%) | Rate | Date | Value |
| Mortgage-Backed Securities — continued | ||||
| $107,238 | Government National Mortgage Association | |||
| 30-Yr. Pass Through | 7.000% | 7/15/2028 | $113,803 | |
| 17,588 | Government National Mortgage Association | |||
| 30-Yr. Pass Through | 7.500 | 7/15/2028 | 18,776 | |
| 97,100 | Government National Mortgage Association | |||
| 30-Yr. Pass Through | 6.500 | 9/15/2028 | 100,781 | |
| 94,458 | Government National Mortgage Association | |||
| 30-Yr. Pass Through | 6.000 | 12/15/2028 | 97,057 | |
| 71,255 | Government National Mortgage Association | |||
| 30-Yr. Pass Through | 6.500 | 1/15/2029 | 73,948 | |
| 238,932 | Government National Mortgage Association | |||
| 30-Yr. Pass Through | 6.500 | 3/15/2029 | 247,962 | |
| 51,403 | Government National Mortgage Association | |||
| 30-Yr. Pass Through | 6.500 | 4/15/2029 | 53,346 | |
| 29,905 | Government National Mortgage Association | |||
| 30-Yr. Pass Through | 7.000 | 4/15/2029 | 31,730 | |
| 152,269 | Government National Mortgage Association | |||
| 30-Yr. Pass Through | 6.000 | 6/15/2029 | 156,404 | |
| 60,402 | Government National Mortgage Association | |||
| 30-Yr. Pass Through | 7.000 | 6/15/2029 | 64,087 | |
| 4,854 | Government National Mortgage Association | |||
| 30-Yr. Pass Through | 7.500 | 8/15/2029 | 5,180 | |
| 24,455 | Government National Mortgage Association | |||
| 30-Yr. Pass Through | 8.000 | 5/15/2030 | 26,473 | |
| 49,215 | Government National Mortgage Association | |||
| 30-Yr. Pass Through | 7.000 | 9/15/2031 | 52,170 | |
| 94,001 | Government National Mortgage Association | |||
| 30-Yr. Pass Through | 6.500 | 2/15/2032 | 97,457 | |
| Total Mortgage-Backed Securities | 55,990,138 | |||
| Technology (0.1%) | ||||
| 500,000 | International Business Machines Corporation | 7.500 | 6/15/2013 | 561,078 |
| Total Technology | 561,078 | |||
| Transportation (0.3%) | ||||
| 425,000 | CSX Corporation | 5.500 | 8/1/2013 | 423,600 |
| 450,000 | FedEx Corporation | 3.500 | 4/1/2009 | 442,729 |
| 500,000 | Union Pacific Corporation | 6.500 | 4/15/2012 | 528,507 |
| Total Transportation | 1,394,836 | |||
| U.S. Government (9.4%) | ||||
| 300,000 | Codelco, Inc. ≤ | 6.375 | 11/30/2012 | 321,107 |
| 2,000,000 | Federal Home Loan Bank | 4.100 | 6/13/2008 | 1,996,348 |
| 2,000,000 | Federal Home Loan Bank | 4.500 | 10/14/2008 | 2,004,498 |
| 1,000,000 | Federal Home Loan Bank | 3.750 | 8/18/2009 | 1,002,568 |
| 3,000,000 | Federal Home Loan Mortgage Corporation | 5.750 | 4/15/2008 | 3,011,070 |
| 3,800,000 | Federal Home Loan Mortgage Corporation * | 5.125 | 11/17/2017 | 3,965,076 |
| 1,000,000 | Federal National Mortgage Association | 5.250 | 1/15/2009 | 1,012,694 |
| 1,500,000 | Federal National Mortgage Association | 5.625 | 4/17/2028 | 1,609,170 |
| The accompanying Notes to Financial Statements are an integral part of this schedule. |
| 159 |
| Balanced Portfolio | ||||
| Schedule of Investments as of December 31, 2007 | ||||
| Principal | Interest | Maturity | ||
| Amount | Long-Term Fixed Income (41.4%) | Rate | Date | Value |
| U.S. Government — continued | ||||
| $1,000,000 | Federal National Mortgage Association | 7.125% | 1/15/2030 | $1,294,578 |
| 1,000,000 | Resolution Funding Corporation | 8.625 | 1/15/2021 | 1,376,628 |
| 5,400,000 | U.S. Treasury Bonds * | 7.250 | 5/15/2016 | 6,640,315 |
| 925,000 | U.S. Treasury Bonds * | 8.875 | 2/15/2019 | 1,300,853 |
| 650,000 | U.S. Treasury Bonds * | 7.875 | 2/15/2021 | 874,250 |
| 400,000 | U.S. Treasury Bonds * | 7.250 | 8/15/2022 | 519,375 |
| 250,000 | U.S. Treasury Bonds * | 7.625 | 11/15/2022 | 335,723 |
| 625,000 | U.S. Treasury Bonds * | 7.125 | 2/15/2023 | 806,543 |
| 750,000 | U.S. Treasury Bonds * | 6.250 | 8/15/2023 | 897,950 |
| 500,000 | U.S. Treasury Bonds * | 6.875 | 8/15/2025 | 642,890 |
| 1,450,000 | U.S. Treasury Bonds * | 6.125 | 8/15/2029 | 1,773,871 |
| 500,000 | U.S. Treasury Bonds * | 4.500 | 2/15/2036 | 502,539 |
| 3,700,000 | U.S. Treasury Notes * | 6.000 | 8/15/2009 | 3,869,101 |
| 3,000,000 | U.S. Treasury Notes * | 3.625 | 1/15/2010 | 3,034,686 |
| 3,500,000 | U.S. Treasury Notes * | 4.500 | 11/30/2011 | 3,652,579 |
| 2,000,000 | U.S. Treasury Notes * | 4.250 | 8/15/2014 | 2,067,968 |
| 700,000 | U.S. Treasury Notes * | 4.500 | 2/15/2016 | 728,601 |
| 675,000 | U.S. Treasury Notes * | 4.250 | 11/15/2017 | 686,760 |
| Total U.S. Government | 45,927,741 | |||
| Utilities (0.7%) | ||||
| 225,000 | Commonwealth Edison Company | 5.900 | 3/15/2036 | 210,872 |
| 450,000 | Duke Capital Corporation | 7.500 | 10/1/2009 | 469,098 |
| 450,000 | FirstEnergy Corporation | 6.450 | 11/15/2011 | 464,677 |
| 425,000 | Oncor Electric Delivery Company | 6.375 | 1/15/2015 | 435,146 |
| 225,000 | Oneok Partners, LP | 6.650 | 10/1/2036 | 227,516 |
| 300,000 | Progress Energy, Inc. | 7.000 | 10/30/2031 | 327,181 |
| 700,000 | Public Service Company of Colorado | 7.875 | 10/1/2012 | 785,545 |
| 225,000 | Southern California Edison Company | 5.000 | 1/15/2014 | 222,875 |
| 225,000 | Xcel Energy, Inc. | 6.500 | 7/1/2036 | 223,210 |
| Total Utilities | 3,366,120 | |||
| Total Long-Term Fixed Income (cost $200,721,131) | 202,496,415 | |||
| The accompanying Notes to Financial Statements are an integral part of this schedule. |
| 160 |
| Balanced Portfolio | ||||
| Schedule of Investments as of December 31, 2007 | ||||
| Interest | Maturity | |||
| Shares | Collateral Held for Securities Loaned (9.8%) | Rate (+) | Date | Value |
| 47,660,952 | Thrivent Financial Securities Lending Trust | 5.000% | N/A | $47,660,952 |
| Total Collateral Held for Securities Loaned | ||||
| (cost $47,660,952) | 47,660,952 | |||
| Shares or | ||||
| Principal | Interest | Maturity | ||
| Amount | Short-Term Investments (4.1%) | Rate (+) | Date | Value |
| $500,000 | Federal National Mortgage Association ‡ | 4.030% | 5/16/2008 | $492,350 |
| 19,638,879 | Thrivent Money Market Portfolio | 4.930 | N/A | 19,638,879 |
| Total Short-Term Investments (at amortized cost) | 20,131,229 | |||
| Total Investments (cost $487,926,236) 119.2% | $582,398,606 | |||
| Other Assets and Liabilities, Net (19.2%) | (93,949,380) | |||
| Total Net Assets 100.0% | $488,449,226 | |||
| Number of | Notional | ||||
| Contracts | Expiration | Principal | Unrealized | ||
| Futures | Long/(Short) | Date | Amount | Value | Gain/(Loss) |
| S&P 500 Index Futures | 16 | March 2008 | $5,939,480 | $5,908,800 | ($30,680) |
| Total Futures | ($30,680) | ||||
# Non-income producing security.
* All or a portion of the security is on loan as discussed in item 2(M) of the Notes to Financial Statements.
+ The interest rate shown reflects the yield, coupon rate or, for securities purchased at a discount, the discount rate at the date of purchase.
† Denotes variable rate obligations for which the current yield and next scheduled reset date are shown.
§ Denotes investments purchased on a when-issued or delayed delivery basis.
± Designated as cover for long settling trades as discussed in the Notes to Financial Statements.
‡ At December 31, 2007, $492,350 of investments were held on deposit with the counterparty and pledged as the initial margin deposit for open financial futures contracts. In addition, $7,414,000 of investments were earmarked as collateral to cover open financial futures contracts.
≤ Denotes Securities sold under Rule 144A of the Securities Act of 1933, which exempts them from registration. These securities have been determined to be liquid under the guidelines established by the Portfolio’s Board of Directors and may be resold to other dealers in the program or to other qualified institutional buyers. As of December 31, 2007, the value of these investments was $12,886,245 or 2.6% of total net assets.
« All or a portion of the security is insured or guaranteed.
Definitions:
REIT — Real Estate Investment Trust, is a company that buys, develops, manages and/or sells real estate assets.
Gross unrealized appreciation and depreciation of investments, based on cost for federal income tax purposes, were as follows:
| Gross unrealized appreciation | $118,878,008 | |
| Gross unrealized depreciation | (35,034,797) | |
| Net unrealized appreciation (depreciation) | $83,843,211 | |
| Cost for federal income tax purposes | $498,555,395 |
| The accompanying Notes to Financial Statements are an integral part of this schedule. |
| 161 |
| High Yield Portfolio | ||||
| Schedule of Investments as of December 31, 2007 | ||||
| Principal | Interest | Maturity | ||
| Amount | Bank Loans (2.0%)!! | Rate | Date | Value |
| Technology (1.2%) | ||||
| $3,775,538 | First Data Corporation, Term Loan | 7.634% | 9/24/2014 | $3,578,341 |
| 4,649,770 | Flextronics Semiconductor, Ltd., Term Loan | 7.394 | 10/1/2012 | 4,521,902 |
| 1,335,938 | Flextronics Semiconductor, Ltd., Term Loan | 7.455 | 10/1/2012 | 1,302,539 |
| Total Technology | 9,402,782 | |||
| Utilities (0.8%) | ||||
| 6,034,875 | Energy Future Holdings, Term Loan | 8.396 | 10/10/2014 | 5,918,402 |
| Total Utilities | 5,918,402 | |||
| Total Bank Loans (cost $15,598,390) | 15,321,184 | |||
| Principal | Interest | Maturity | ||
| Amount | Long-Term Fixed Income (86.4%) | Rate | Date | Value |
| Basic Materials (8.2%) | ||||
| $2,130,000 | Aleris International, Inc. | 9.000% | 12/15/2014 | $1,778,550 |
| 2,740,000 | Aleris International, Inc. | 10.000 | 12/15/2016 | 2,219,400 |
| 3,035,000 | Arch Western Finance, LLC *‡ | 6.750 | 7/1/2013 | 2,943,950 |
| 1,950,000 | Buckeye Technologies, Inc. | 8.000 | 10/15/2010 | 1,930,500 |
| 2,770,000 | Domtar, Inc. | 7.125 | 8/15/2015 | 2,714,600 |
| 2,525,000 | Drummond Company, Inc. ≤ | 7.375 | 2/15/2016 | 2,341,938 |
| 3,485,000 | FMG Finance, Pty., Ltd. ≤ | 10.625 | 9/1/2016 | 3,990,325 |
| 3,545,000 | Freeport-McMoRan Copper & Gold, Inc. | 8.375 | 4/1/2017 | 3,802,012 |
| 1,640,000 | Georgia-Pacific Corporation * | 8.125 | 5/15/2011 | 1,664,600 |
| 2,115,000 | Georgia-Pacific Corporation ≤ | 7.125 | 1/15/2017 | 2,056,838 |
| 4,160,000 | Graphic Packaging International Corporation * | 9.500 | 8/15/2013 | 4,108,000 |
| 3,475,000 | Griffin Coal Mining Company, Pty., Ltd. ≤ | 9.500 | 12/1/2016 | 3,092,750 |
| 3,490,000 | Huntsman International, LLC | 7.875 | 11/13/2014 | 3,699,400 |
| 1,520,000 | Jefferson Smurfit Corporation | 8.250 | 10/1/2012 | 1,497,200 |
| 4,000,000 | Mosaic Global Holdings, Inc., Convertible ≤ | 7.375 | 12/1/2014 | 4,280,000 |
| 4,860,000 | Nell AF SARL ≤ | 8.375 | 8/15/2015 | 3,924,450 |
| 1,730,000 | NewPage Corporation ≤ | 10.000 | 5/1/2012 | 1,738,650 |
| 4,460,000 | Peabody Energy Corporation | 6.875 | 3/15/2013 | 4,482,300 |
| 1,620,000 | PNA Group, Inc. | 10.750 | 9/1/2016 | 1,522,800 |
| 1,140,000 | PNA Intermediate Holdings Corporation † ≤ | 11.869 | 2/15/2008 | 1,031,700 |
| 2,160,000 | Smurfit-Stone Container Enterprises, Inc. * | 8.000 | 3/15/2017 | 2,087,100 |
| 1,970,000 | Southern Copper Corporation | 7.500 | 7/27/2035 | 2,086,447 |
| 4,210,000 | Terra Capital, Inc. | 7.000 | 2/1/2017 | 4,115,275 |
| Total Basic Materials | 63,108,785 | |||
| Capital Goods (7.9%) | ||||
| 4,830,000 | Allied Waste North America, Inc. ‡ | 7.875 | 4/15/2013 | 4,938,675 |
| 1,530,000 | Ashtead Capital, Inc. ‡ ≤ | 9.000 | 8/15/2016 | 1,354,050 |
| 2,525,000 | Ball Corporation | 6.625 | 3/15/2018 | 2,506,062 |
| 2,505,000 | Berry Plastics Holding Corporation | 8.875 | 9/15/2014 | 2,379,750 |
| 4,240,000 | Case New Holland, Inc. | 7.125 | 3/1/2014 | 4,229,400 |
| 2,150,000 | Crown Americas, Inc. | 7.625 | 11/15/2013 | 2,198,375 |
| 2,150,000 | Crown Americas, Inc. | 7.750 | 11/15/2015 | 2,214,500 |
| 3,400,000 | Da-Lite Screen Company, Inc. | 9.500 | 5/15/2011 | 3,383,000 |
| The accompanying Notes to Financial Statements are an integral part of this schedule. |
| 162 |
| High Yield Portfolio | ||||
| Schedule of Investments as of December 31, 2007 | ||||
| Principal | Interest | Maturity | ||
| Amount | Long-Term Fixed Income (86.4%) | Rate | Date | Value |
| Capital Goods — continued | ||||
| $1,140,000 | General Cable Corporation | 7.125% | 4/1/2017 | $1,117,200 |
| 1,915,000 | Graham Packaging Company, Inc. | 9.875 | 10/15/2014 | 1,761,800 |
| 1,150,000 | Legrand SA | 8.500 | 2/15/2025 | 1,337,850 |
| 3,780,000 | Mueller Water Products, Inc. | 7.375 | 6/1/2017 | 3,378,375 |
| 2,340,000 | Norcraft Companies, LP/Norcraft Finance Corporation * | 9.000 | 11/1/2011 | 2,375,100 |
| 1,630,000 | Owens-Brockway Glass Container, Inc. * | 8.250 | 5/15/2013 | 1,691,125 |
| 5,150,000 | Owens-Illinois, Inc. * | 7.500 | 5/15/2010 | 5,214,375 |
| 3,585,000 | Plastipak Holdings, Inc. ≤ | 8.500 | 12/15/2015 | 3,585,000 |
| 4,125,000 | RBS Global, Inc./Rexnord Corporation | 9.500 | 8/1/2014 | 4,083,750 |
| 4,145,000 | Rental Services Corporation * | 9.500 | 12/1/2014 | 3,709,775 |
| 1,150,000 | SPX Corporation ≤ | 7.625 | 12/15/2014 | 1,173,000 |
| 4,085,000 | TransDigm, Inc. | 7.750 | 7/15/2014 | 4,146,275 |
| 1,110,000 | United Rentals North America, Inc. | 6.500 | 2/15/2012 | 1,007,325 |
| 3,620,000 | United Rentals North America, Inc. | 7.000 | 2/15/2014 | 3,031,750 |
| Total Capital Goods | 60,816,512 | |||
| Communications Services (15.4%) | ||||
| 4,900,000 | American Tower Corporation ‡ ≤ | 7.000 | 10/15/2017 | 4,924,500 |
| 2,840,000 | Block Communications, Inc. ≤ | 8.250 | 12/15/2015 | 2,843,550 |
| 2,900,000 | CCH II, LLC/CCH II Capital Corporation | 10.250 | 10/1/2013 | 2,776,750 |
| 2,540,000 | Centennial Communications Corporation | 8.125 | 2/1/2014 | 2,501,900 |
| 2,790,000 | Charter Communications Holdings II, LLC * | 10.250 | 9/15/2010 | 2,734,200 |
| 5,560,000 | Charter Communications Holdings, LLC ‡ | 8.750 | 11/15/2013 | 5,309,800 |
| 3,420,000 | Citizens Communications Company | 9.250 | 5/15/2011 | 3,702,150 |
| 1,310,000 | Dex Media West, LLC/Dex Media West Finance Company | 9.875 | 8/15/2013 | 1,362,400 |
| 7,925,000 | Idearc, Inc. * | 8.000 | 11/15/2016 | 7,271,188 |
| 3,180,000 | Intelsat Bermuda, Ltd. *† | 8.886 | 1/15/2008 | 3,187,950 |
| 1,640,000 | Intelsat Bermuda, Ltd. | 9.250 | 6/15/2016 | 1,648,200 |
| 3,520,000 | Intelsat Intermediate, Inc. > | Zero Coupon | 2/1/2010 | 2,877,600 |
| 2,510,000 | Intelsat Subsidiary Holding Company, Ltd. | 8.625 | 1/15/2015 | 2,522,550 |
| 2,920,000 | Lamar Media Corporation ≤ | 6.625 | 8/15/2015 | 2,839,700 |
| 1,785,000 | Lamar Media Corporation | 6.625 | 8/15/2015 | 1,735,912 |
| 2,200,000 | Level 3 Financing, Inc. | 12.250 | 3/15/2013 | 2,222,000 |
| 3,970,000 | Level 3 Financing, Inc. * | 9.250 | 11/1/2014 | 3,592,850 |
| 6,430,000 | MetroPCS Wireless, Inc. * | 9.250 | 11/1/2014 | 6,044,200 |
| 1,660,000 | Morris Publishing Group, LLC | 7.000 | 8/1/2013 | 1,205,575 |
| 5,330,000 | NTL Cable plc | 9.125 | 8/15/2016 | 5,276,700 |
| 2,930,000 | Quebecor Media, Inc. ≤ | 7.750 | 3/15/2016 | 2,812,800 |
| 1,270,000 | Qwest Communications International, Inc. * | 7.500 | 2/15/2014 | 1,266,825 |
| 5,530,000 | Qwest Corporation | 7.875 | 9/1/2011 | 5,751,200 |
| 1,650,000 | Qwest Corporation | 7.625 | 6/15/2015 | 1,678,875 |
| 2,460,000 | R.H. Donnelley Corporation * | 6.875 | 1/15/2013 | 2,201,700 |
| 5,465,000 | R.H. Donnelley Corporation | 6.875 | 1/15/2013 | 4,891,175 |
| 2,555,000 | R.H. Donnelley Corporation * | 8.875 | 1/15/2016 | 2,388,925 |
| 4,590,000 | Readers Digest Association, Inc. ≤ | 9.000 | 2/15/2017 | 3,844,125 |
| 1,890,000 | Rural Cellular Corporation † | 8.124 | 3/1/2008 | 1,918,350 |
| 1,780,000 | Rural Cellular Corporation | 9.875 | 2/1/2010 | 1,846,750 |
| 5,140,000 | Time Warner Telecom Holdings, Inc. | 9.250 | 2/15/2014 | 5,255,650 |
| The accompanying Notes to Financial Statements are an integral part of this schedule. |
| 163 |
| High Yield Portfolio | ||||
| Schedule of Investments as of December 31, 2007 | ||||
| Principal | Interest | Maturity | ||
| Amount | Long-Term Fixed Income (86.4%) | Rate | Date | Value |
| Communications Services — continued | ||||
| $6,490,000 | TL Acquisitions, Inc. * ≤ | 10.500% | 1/15/2015 | $6,238,512 |
| 4,590,000 | Umbrella Acquisition * ≤ | 9.750 | 3/15/2015 | 4,182,638 |
| 5,360,000 | Videotron Ltee | 6.875 | 1/15/2014 | 5,246,100 |
| 1,270,000 | Windstream Corporation | 8.625 | 8/1/2016 | 1,333,500 |
| 2,100,000 | Windstream Corporation | 7.000 | 3/15/2019 | 2,000,250 |
| Total Communications Services | 119,437,050 | |||
| Consumer Cyclical (17.6%) | ||||
| 1,980,000 | Allied Security Escrow Corporation ‡ | 11.375 | 7/15/2011 | 1,861,200 |
| 1,205,000 | Beazer Homes USA, Inc. * | 8.625 | 5/15/2011 | 927,850 |
| 3,390,000 | Buhrmann U.S., Inc. | 7.875 | 3/1/2015 | 3,195,075 |
| 3,500,000 | Burlington Coat Factory Warehouse Corporation * | 11.125 | 4/15/2014 | 2,808,750 |
| 3,590,000 | Circus & Eldorado Joint Venture/Silver Legacy | |||
| Capital Corporation | 10.125 | 3/1/2012 | 3,706,675 | |
| 4,320,000 | Claire’s Stores, Inc. * ≤ | 10.500 | 6/1/2017 | 2,311,200 |
| 1,970,000 | Dollarama Group, LP † ≤ | 10.599 | 6/16/2008 | 1,970,000 |
| 3,810,000 | Dollarama Group, LP | 8.875 | 8/15/2012 | 3,886,200 |
| 5,110,000 | Fontainebleau Las Vegas Holdings, LLC ≤ | 10.250 | 6/15/2015 | 4,432,925 |
| 4,050,000 | Ford Motor Credit Company † | 9.693 | 1/15/2008 | 3,982,657 |
| 1,350,000 | Ford Motor Credit Company | 9.750 | 9/15/2010 | 1,288,173 |
| 3,350,000 | Ford Motor Credit Company | 7.375 | 2/1/2011 | 2,999,945 |
| 2,680,000 | Ford Motor Credit Company | 7.000 | 10/1/2013 | 2,238,843 |
| 1,590,000 | Ford Motor Credit Company | 8.000 | 12/15/2016 | 1,350,563 |
| 3,890,000 | Gaylord Entertainment Company | 6.750 | 11/15/2014 | 3,666,325 |
| 2,850,000 | General Motors Corporation * | 7.200 | 1/15/2011 | 2,622,000 |
| 4,040,000 | Group 1 Automotive, Inc. * | 8.250 | 8/15/2013 | 3,898,600 |
| 1,700,000 | Group 1 Automotive, Inc., Convertible > | 2.250 | 6/15/2016 | 1,126,250 |
| 2,460,000 | Hanesbrands, Inc. *† | 8.204 | 6/16/2008 | 2,435,400 |
| 3,650,000 | K. Hovnanian Enterprises, Inc. * | 7.500 | 5/15/2016 | 2,555,000 |
| 5,880,000 | Lear Corporation * | 8.500 | 12/1/2013 | 5,468,400 |
| 4,240,000 | Majestic Star Casino, LLC | 9.500 | 10/15/2010 | 4,006,800 |
| 6,090,000 | MGM MIRAGE | 5.875 | 2/27/2014 | 5,572,350 |
| 810,000 | Mohegan Tribal Gaming Authority | 6.375 | 7/15/2009 | 810,000 |
| 3,510,000 | Mohegan Tribal Gaming Authority | 6.125 | 2/15/2013 | 3,431,025 |
| 3,180,000 | NCL Corporation | 10.625 | 7/15/2014 | 3,160,125 |
| 1,655,000 | Norcraft Holdings, LP/Norcraft Capital Corporation > | Zero Coupon | 9/1/2008 | 1,489,500 |
| 2,800,000 | Perry Ellis International, Inc. | 8.875 | 9/15/2013 | 2,702,000 |
| 3,600,000 | Pokagon Gaming Authority ≤ | 10.375 | 6/15/2014 | 3,870,000 |
| 2,840,000 | Realogy Corporation * ≤ | 10.500 | 4/15/2014 | 2,122,900 |
| 4,945,000 | Rite Aid Corporation * | 8.625 | 3/1/2015 | 3,986,906 |
| 3,510,000 | Sally Holdings, LLC * | 9.250 | 11/15/2014 | 3,474,900 |
| 2,835,000 | Seminole Hard Rock Entertainment † ≤ | 7.491 | 3/15/2008 | 2,707,425 |
| 2,100,000 | Service Corporation International | 6.750 | 4/1/2015 | 2,073,750 |
| 4,340,000 | Shingle Springs Tribal Gaming Authority ≤ | 9.375 | 6/15/2015 | 4,209,800 |
| 5,825,000 | Station Casinos, Inc. | 6.875 | 3/1/2016 | 4,252,250 |
| 3,060,000 | Tenneco, Inc. ≤ | 8.125 | 11/15/2015 | 3,029,400 |
| 6,510,000 | Tunica Biloxi Gaming Authority ≤ | 9.000 | 11/15/2015 | 6,656,475 |
| The accompanying Notes to Financial Statements are an integral part of this schedule. |
| 164 |
| High Yield Portfolio | ||||
| Schedule of Investments as of December 31, 2007 | ||||
| Principal | Interest | Maturity | ||
| Amount | Long-Term Fixed Income (86.4%) | Rate | Date | Value |
| Consumer Cyclical — continued | ||||
| $2,000,000 | Turning Stone Resort Casino Enterprise ≤ | 9.125% | 12/15/2010 | $2,020,000 |
| 4,060,000 | Turning Stone Resort Casino Enterprise ≤ | 9.125 | 9/15/2014 | 4,141,200 |
| 3,515,000 | Universal City Florida Holding Company I/II † | 9.661 | 2/1/2008 | 3,515,000 |
| 4,145,000 | Warnaco, Inc. | 8.875 | 6/15/2013 | 4,217,538 |
| 3,103,000 | WMG Holdings Corporation > | Zero Coupon | 12/15/2009 | 1,985,920 |
| 3,850,000 | Wynn Las Vegas, LLC ≤ | 6.625 | 12/1/2014 | 3,782,625 |
| Total Consumer Cyclical | 135,949,920 | |||
| Consumer Non-Cyclical (10.5%) | ||||
| 1,650,000 | Bausch & Lomb, Inc. * ≤ | 9.875 | 11/1/2015 | 1,674,750 |
| 5,335,000 | Boston Scientific Corporation | 5.450 | 6/15/2014 | 4,908,200 |
| 6,780,000 | Community Health Systems, Inc. | 8.875 | 7/15/2015 | 6,907,125 |
| 4,970,000 | Constellation Brands, Inc. ‡ | 7.250 | 9/1/2016 | 4,659,375 |
| 6,020,000 | HCA, Inc. | 6.750 | 7/15/2013 | 5,357,800 |
| 8,645,000 | HCA, Inc. ‡ | 9.250 | 11/15/2016 | 9,077,250 |
| 3,730,000 | Jarden Corporation * | 7.500 | 5/1/2017 | 3,207,800 |
| 4,185,000 | Jostens Holding Corporation > | Zero Coupon | 12/1/2008 | 3,912,975 |
| 5,900,000 | LVB Acquisition, Inc. ≤ | 10.000 | 10/15/2017 | 6,018,000 |
| 1,080,000 | LVB Acquisition, Inc. ≤ | 11.625 | 10/15/2017 | 1,063,800 |
| 3,240,000 | Michael Foods, Inc. | 8.000 | 11/15/2013 | 3,207,600 |
| 2,840,000 | Pinnacle Foods Finance, LLC | 9.250 | 4/1/2015 | 2,591,500 |
| 2,125,000 | Smithfield Foods, Inc. | 8.000 | 10/15/2009 | 2,146,250 |
| 2,150,000 | Stater Brothers Holdings, Inc. | 8.125 | 6/15/2012 | 2,123,125 |
| 3,410,000 | Sun Healthcare Group, Inc. | 9.125 | 4/15/2015 | 3,435,575 |
| 2,680,000 | SUPERVALU, Inc. | 7.500 | 11/15/2014 | 2,747,000 |
| 3,780,000 | Surgical Care Affiliates, Inc. ≤ | 8.875 | 7/15/2015 | 3,439,800 |
| 2,500,000 | Tenet Healthcare Corporation | 6.375 | 12/1/2011 | 2,275,000 |
| 560,000 | Tenet Healthcare Corporation | 6.500 | 6/1/2012 | 498,400 |
| 2,220,000 | Tenet Healthcare Corporation | 9.875 | 7/1/2014 | 2,114,550 |
| 5,210,000 | Vanguard Health Holding Company II, LLC * | 9.000 | 10/1/2014 | 5,014,625 |
| 3,740,000 | Ventas Realty, LP/Ventas Capital Corporation | 6.500 | 6/1/2016 | 3,665,200 |
| 1,508,000 | Warner Chilcott Corporation | 8.750 | 2/1/2015 | 1,553,240 |
| Total Consumer Non-Cyclical | 81,598,940 | |||
| Energy (8.1%) | ||||
| 3,230,000 | CHC Helicopter Corporation | 7.375 | 5/1/2014 | 3,052,350 |
| 4,290,000 | Chesapeake Energy Corporation | 7.500 | 9/15/2013 | 4,386,525 |
| 1,585,000 | Chesapeake Energy Corporation * | 6.375 | 6/15/2015 | 1,533,488 |
| 2,710,000 | Chesapeake Energy Corporation | 6.250 | 1/15/2018 | 2,601,600 |
| 6,130,000 | Connacher Oil and Gas, Ltd. ≤ | 10.250 | 12/15/2015 | 6,122,338 |
| 3,035,000 | Denbury Resources, Inc. * | 7.500 | 12/15/2015 | 3,065,350 |
| 2,980,000 | Forest Oil Corporation * ≤ | 7.250 | 6/15/2019 | 2,994,900 |
| 3,130,000 | Helix Energy Solutions Group, Inc. ≤ | 9.500 | 1/15/2016 | 3,184,775 |
| 2,135,000 | Hornbeck Offshore Services, Inc. | 6.125 | 12/1/2014 | 2,028,250 |
| 3,900,000 | Key Energy Services, Inc. ≤ | 8.375 | 12/1/2014 | 3,987,750 |
| 2,700,000 | Mariner Energy, Inc. | 8.000 | 5/15/2017 | 2,568,375 |
| 3,670,000 | Newfield Exploration Company | 6.625 | 4/15/2016 | 3,596,600 |
| 4,795,000 | Ocean Rig Norway AS ≤ | 8.375 | 7/1/2013 | 5,094,688 |
| The accompanying Notes to Financial Statements are an integral part of this schedule. |
| 165 |
| High Yield Portfolio | ||||
| Schedule of Investments as of December 31, 2007 | ||||
| Principal | Interest | Maturity | ||
| Amount | Long-Term Fixed Income (86.4%) | Rate | Date | Value |
| Energy — continued | ||||
| $3,590,000 | OPTI Canada, Inc. ≤ | 8.250% | 12/15/2014 | $3,554,100 |
| 3,140,000 | PetroHawk Energy Corporation | 9.125 | 7/15/2013 | 3,304,850 |
| 4,280,000 | Petroplus Finance, Ltd. ≤ | 7.000 | 5/1/2017 | 3,916,200 |
| 3,630,000 | Plains Exploration & Production Company | 7.750 | 6/15/2015 | 3,630,000 |
| 3,800,000 | Western Oil Sands, Inc. | 8.375 | 5/1/2012 | 4,238,163 |
| Total Energy | 62,860,302 | |||
| Financials (4.4%) | ||||
| 2,150,000 | ACE Cash Express, Inc. ‡ ≤ | 10.250 | 10/1/2014 | 2,074,750 |
| 3,840,000 | Countrywide Financial Corporation, Convertible † ≤ | 1.743 | 1/15/2008 | 2,994,432 |
| 1,425,000 | Deluxe Corporation | 7.375 | 6/1/2015 | 1,417,875 |
| 2,050,000 | FTI Consulting, Inc. | 7.625 | 6/15/2013 | 2,101,250 |
| 12,285,000 | General Motors Acceptance Corporation, LLC | 6.875 | 9/15/2011 | 10,509,741 |
| 6,600,000 | Leucadia National Corporation | 7.125 | 3/15/2017 | 6,105,000 |
| 2,750,000 | Merrill Lynch Convertible | Zero Coupon | 3/13/2032 | 2,974,675 |
| 3,850,000 | Nuveen Investment, Inc. ≤ | 10.500 | 11/15/2015 | 3,835,562 |
| 3,300,000 | Residential Capital Corporation | 7.875 | 6/30/2010 | 2,112,000 |
| Total Financials | 34,125,285 | |||
| Technology (2.5%) | ||||
| 650,000 | Avago Technologies Finance Pte † | 10.624 | 3/3/2008 | 658,938 |
| 2,100,000 | Avago Technologies Finance Pte ‡ | 10.125 | 12/1/2013 | 2,197,125 |
| 3,300,000 | First Data Corporation * ≤ | 9.875 | 9/24/2015 | 3,069,000 |
| 2,290,000 | Nortel Networks, Ltd. † ≤ | 9.493 | 1/15/2008 | 2,232,750 |
| 1,600,000 | NXP BV/NXP Funding, LLC † | 7.993 | 1/15/2008 | 1,472,000 |
| 2,760,000 | NXP BV/NXP Funding, LLC * | 9.500 | 10/15/2015 | 2,528,850 |
| 5,205,000 | Seagate Technology HDD Holdings | 6.800 | 10/1/2016 | 5,074,875 |
| 2,180,000 | SunGard Data Systems, Inc. * | 10.250 | 8/15/2015 | 2,229,050 |
| Total Technology | 19,462,588 | |||
| Transportation (2.7%) | ||||
| 3,344,242 | Continental Airlines, Inc. ‡ | 7.875 | 7/2/2018 | 3,185,391 |
| 2,670,000 | Delta Air Lines, Inc. | 7.920 | 11/18/2010 | 2,603,250 |
| 1,825,000 | Hertz Corporation | 8.875 | 1/1/2014 | 1,850,094 |
| 2,955,000 | Hertz Corporation * | 10.500 | 1/1/2016 | 3,058,425 |
| 3,220,000 | Kansas City Southern de Mexico SA de CV | 7.625 | 12/1/2013 | 3,175,725 |
| 2,150,000 | Navios Maritime Holdings, Inc. | 9.500 | 12/15/2014 | 2,198,375 |
| 1,890,000 | Saint Acquistion Corporation ≤ | 12.500 | 5/15/2017 | 975,712 |
| 3,500,000 | Windsor Petroleum Transport Corporation ≤ | 7.840 | 1/15/2021 | 3,922,874 |
| Total Transportation | 20,969,846 | |||
| The accompanying Notes to Financial Statements are an integral part of this schedule. |
| 166 |
| High Yield Portfolio | ||||
| Schedule of Investments as of December 31, 2007 | ||||
| Principal | Interest | Maturity | ||
| Amount | Long-Term Fixed Income (86.4%) | Rate | Date | Value |
| Utilities (9.1%) | ||||
| $1,700,000 | AES Corporation ‡ | 8.875% | 2/15/2011 | $1,772,250 |
| 1,976,000 | AES Corporation ≤ | 8.750 | 5/15/2013 | 2,062,450 |
| 3,300,000 | AES Corporation ≤ | 7.750 | 10/15/2015 | 3,349,500 |
| 3,300,000 | AES Corporation ‡ ≤ | 8.000 | 10/15/2017 | 3,374,250 |
| 2,950,000 | Colorado Interstate Gas Company | 6.800 | 11/15/2015 | 3,070,835 |
| 1,445,000 | Consumers Energy Company | 6.300 | 2/1/2012 | 1,457,840 |
| 3,990,000 | Copano Energy, LLC | 8.125 | 3/1/2016 | 4,019,925 |
| 2,020,000 | Dynegy Holdings, Inc. | 6.875 | 4/1/2011 | 1,949,300 |
| 1,860,000 | Dynegy Holdings, Inc. * | 7.500 | 6/1/2015 | 1,739,100 |
| 2,005,000 | Dynegy Holdings, Inc. | 8.375 | 5/1/2016 | 1,959,888 |
| 1,370,000 | Dynegy Holdings, Inc. | 7.750 | 6/1/2019 | 1,263,825 |
| 2,230,000 | Edison Mission Energy | 7.500 | 6/15/2013 | 2,285,750 |
| 3,710,000 | Edison Mission Energy | 7.000 | 5/15/2017 | 3,645,075 |
| 3,710,000 | Edison Mission Energy | 7.200 | 5/15/2019 | 3,645,075 |
| 2,530,000 | El Paso Corporation | 6.875 | 6/15/2014 | 2,548,277 |
| 2,530,000 | El Paso Corporation | 7.000 | 6/15/2017 | 2,532,624 |
| 1,530,000 | Mirant North America, LLC | 7.375 | 12/31/2013 | 1,533,825 |
| 6,880,000 | NRG Energy, Inc. * | 7.375 | 2/1/2016 | 6,708,000 |
| 3,350,000 | Regency Energy Partners, LP | 8.375 | 12/15/2013 | 3,450,500 |
| 2,160,000 | Reliant Energy Resources Corporation | 6.750 | 12/15/2014 | 2,165,400 |
| 4,890,000 | SemGroup, LP * ≤ | 8.750 | 11/15/2015 | 4,645,500 |
| 2,020,000 | Southern Natural Gas Company | 7.350 | 2/15/2031 | 2,109,207 |
| 2,503,000 | Southern Star Central Corporation | 6.750 | 3/1/2016 | 2,396,622 |
| 3,780,000 | Williams Companies, Inc. | 8.125 | 3/15/2012 | 4,115,475 |
| 2,400,000 | Williams Partners, LP | 7.250 | 2/1/2017 | 2,472,000 |
| Total Utilities | 70,272,493 | |||
| Total Long-Term Fixed Income (cost $690,473,047) | 668,601,721 | |||
| The accompanying Notes to Financial Statements are an integral part of this schedule. |
| 167 |
| High Yield Portfolio | ||||||
| Schedule of Investments as of December 31, 2007 | ||||||
| Shares | Preferred Stock (1.4%) | Value | Shares | Common Stock (<0.1%) | Value | |
| 71,525 | Chevy Chase Preferred Capital | 30 | Pliant Corporation #^ | $0 | ||
| Corporation, Convertible | $3,622,741 | 121,520 | TVMAX Holdings, Inc. # | 12,152 | ||
| 19,000 | Federal Home Loan Mortgage | 9,243 | XO Communications, Inc., Stock | |||
| Corporation # | 496,850 | Warrants # | 1,849 | |||
| 94,000 | Federal National Mortgage | 6,932 | XO Communications, Inc., Stock | |||
| Association # | 2,420,500 | Warrants # | 901 | |||
| 5,040 | NRG Energy, Inc., Convertible | 1,893,528 | 6,932 | XO Communications, Inc., Stock | ||
| 2,850 | Washington Mutual, Convertible # | 2,522,250 | Warrants # | 347 | ||
| Total Preferred Stock | 4,621 | XO Holdings, Inc., Stock Warrants # | 9,565 | |||
| (cost $10,511,250) | 10,955,869 | 80,000 | ZSC Specialty Chemical plc, | |||
| Preferred Stock Warrants #^IJ | 0 | |||||
| 80,000 | ZSC Specialty Chemical plc, Stock | |||||
| Warrants #^IJ | 0 | |||||
| Total Common Stock | ||||||
| (cost $6,566,208) | 24,814 | |||||
| Interest | Maturity | |||
| Shares | Collateral Held for Securities Loaned (12.0%) | Rate (+) | Date | Value |
| 93,306,453 | Thrivent Financial Securities Lending Trust | 5.000% | N/A | $93,306,453 |
| Total Collateral Held for Securities Loaned | ||||
| (cost $93,306,453) | 93,306,453 | |||
| Shares or | ||||
| Principal | Interest | Maturity | ||
| Amount | Short-Term Investments (8.6%) | Rate (+) | Date | Value |
| $1,900,000 | Federal National Mortgage Association | 4.030% | 5/16/2008 | $1,870,930 |
| 14,200,000 | Prudential Funding, LLC | 4.000 | 1/2/2008 | 14,198,422 |
| 50,560,829 | Thrivent Money Market Portfolio | 4.930 | N/A | 50,560,829 |
| Total Short-Term Investments (cost $66,630,511) | 66,630,181 | |||
| Total Investments (cost $883,085,859) 110.4% | $854,840,222 | |||
| Other Assets and Liabilities, Net (10.4%) | (80,257,777) | |||
| Total Net Assets 100.0% | $774,582,445 | |||
| The accompanying Notes to Financial Statements are an integral part of this schedule. |
| 168 |
| High Yield Portfolio | |||||
| Schedule of Investments as of December 31, 2007 | |||||
| Notional | |||||
| Buy/Sell | Termination | Principal | Unrealized | ||
| Swaps and Counterparty | Protection | Date | Amount | Value | Gain/(Loss) |
| Credit Default Swaps | |||||
| GMAC CDS, 5 Year, at 6.80%; | Sell | December 2012 | $2,800,000 | ($52,137) | ($52,137) |
| Bank of America, N.A. | |||||
| GM CDS., 5 Year, at 6.30%; | Sell | December 2012 | 2,800,000 | (73,248) | (73,248) |
| Bank of America, N.A. | |||||
| CDX, N.A., 5 Year, Series 9, at 3.75%; | Sell | December 2012 | 30,500,000 | (1,349,689) | (264,118) |
| Bank of America, N.A. | |||||
| Ford Motor Company, 5 Year, at 6.90%; | Sell | September 2012 | 4,940,000 | (129,439) | (129,439) |
| Bank of America, N.A. | |||||
| Total Swaps | ($1,604,513) | ($518,942) | |||
# Non-income producing security.
* All or a portion of the security is on loan as discussed in item 2(M) of the Notes to Financial Statements.
+ The interest rate shown reflects the yield, coupon rate or, for securities purchased at a discount, the discount rate at the date of purchase.
^ Security is fair valued as discussed in item 2(A) of the Notes to Financial Statements.
> Denotes step coupon bonds for which the current interest rate and next scheduled reset date are shown.
† Denotes variable rate obligations for which the current yield and next scheduled reset date are shown.
‡ At December 31, 2007, $43,349,616 of investments were earmarked as collateral to cover open swap contracts.
≤ Denotes securities sold under Rule 144A of the Securities Act of 1933, which exempts them from registration. These securities have been determined to be liquid under the guidelines established by the Portfolio’s Board of Directors and may be resold to other dealers in the program or to other qualified institutional buyers. As of December 31, 2007, the value of these investments was $171,096,357 or 22.1% of total net assets.
!! The stated interest rate represents the weighted average of all contracts within the bank loan facility. Bank loans generally have rates of interest which are reset either daily, monthly, quarterly or semi-annually by reference to a base lending rate, plus a premium. These base lending rates are primarily the London-Interbank Offered Rate (“LIBOR”), and secondarily the prime rate offered by one or more major United States banks (the “Prime Rate”) and the certificate of deposit (“CD”) rate or other base lending rates used by commercial lenders. Bank loans often require prepayments from excess cash flows or allow the borrower to repay at its election. The rate at which the borrower repays cannot be predicted with accuracy. Therefore, the remaining maturity may be considerably less than the stated maturities shown.
ƒ Denotes restricted securities. Restricted securities are investment securities which cannot be offered for public sale without first being registered under the Securities Act of 1933. The following table indicates the acquisition date and cost of restricted securities High Yield Portfolio owned as of December 31, 2007.
| Acquisition | ||
| Security | Date | Cost |
| ZSC Specialty Chemical plc, Preferred Warrants | 6/24/1999 | $47,568 |
| ZSC Specialty Chemical plc, Stock Warrants | 6/24/1999 | 111,712 |
Gross unrealized appreciation and depreciation of investments, based on cost for federal income tax purposes, were as follows:
| Gross unrealized appreciation | $8,398,193 | |
| Gross unrealized depreciation | (36,975,368) | |
| Net unrealized appreciation (depreciation) | ($28,577,175) | |
| Cost for federal income tax purposes | $883,417,397 |
| The accompanying Notes to Financial Statements are an integral part of this schedule. |
| 169 |
| Diversified Income Plus Portfolio | ||||||
| Schedule of Investments as of December 31, 2007 | ||||||
| Shares | Common Stock (37.5%) | Value | Shares | Common Stock (37.5%) | Value | |
| Consumer Discretionary (1.8%) | 1,400 | Associated Estates Realty Corporation | $13,216 | |||
| 9,000 | Genuine Parts Company | $416,700 | 7,600 | Astoria Financial Corporation | 176,852 | |
| 6,500 | Home Depot, Inc. | 175,110 | 2,800 | Avalonbay Communities, Inc. | 263,592 | |
| 10,600 | Leggett & Platt, Inc. | 184,864 | 25,000 | Bank of America Corporation | 1,031,500 | |
| 11,900 | McDonald’s Corporation | 701,029 | 9,700 | BB&T Corporation | 297,499 | |
| 4,400 | Nordstrom, Inc. | 161,612 | 2,400 | BioMed Realty Trust, Inc. | 55,608 | |
| 2,200 | Polaris Industries, Inc. * | 105,094 | 4,200 | Boston Properties, Inc. | 385,602 | |
| 9,700 | Stanley Works | 470,256 | 4,000 | Brandywine Realty Trust | 71,720 | |
| 2,600 | VF Corporation | 178,516 | 1,700 | BRE Properties, Inc. | 68,901 | |
| Total Consumer Discretionary | 2,393,181 | 2,000 | Camden Property Trust | 96,300 | ||
| 3,000 | Capital Lease Funding, Inc. | 25,260 | ||||
| Consumer Staples (5.4%) | 2,900 | CBL & Associates Properties, Inc. | 69,339 | |||
| 14,700 | Altria Group, Inc. | 1,111,026 | 2,200 | Cedar Shopping Centers, Inc. | 22,506 | |
| 2,800 | Brown-Forman Corporation | 207,508 | 11,300 | Citigroup, Inc. | 332,672 | |
| 12,400 | Clorox Company | 808,108 | 900 | Cogdell Spencer, Inc. | 14,337 | |
| 13,600 | Coca-Cola Company | 834,632 | 1,700 | Colonial Properties Trust | 38,471 | |
| 1,100 | Imperial Tobacco Group plc ADR | 118,008 | 9,200 | Comerica, Inc. | 400,476 | |
| 9,600 | Kimberly-Clark Corporation | 665,664 | 10,500 | Commerce Group, Inc. | 377,790 | |
| 13,900 | Kraft Foods, Inc. | 453,557 | 1,400 | Corporate Office Properties Trust | 44,100 | |
| 4,000 | PepsiCo, Inc. | 303,600 | 1,400 | Cousins Properties, Inc. | 30,940 | |
| 14,700 | Procter & Gamble Company | 1,079,274 | 3,900 | Credicorp, Ltd. | 297,570 | |
| 8,000 | SUPERVALU, Inc. | 300,160 | 7,600 | DCT Industrial Trust, Inc. * | 70,756 | |
| 7,200 | Universal Corporation | 368,784 | 4,900 | Developers Diversified | ||
| 16,100 | Wal-Mart Stores, Inc. | 765,233 | Realty Corporation | 187,621 | ||
| Total Consumer Staples | 7,015,554 | 3,800 | DiamondRock Hospitality Company | 56,924 | ||
| 2,100 | Digital Realty Trust, Inc. | 80,577 | ||||
| Energy (3.6%) | 900 | Douglas Emmett, Inc. | 20,349 | |||
| 8,200 | BP plc ‡ | 599,994 | 5,600 | Duke Realty Corporation | 146,048 | |
| 11,300 | Chevron Corporation ±‡ | 1,054,629 | 800 | EastGroup Properties, Inc. | 33,480 | |
| 21,452 | Energy Income and Growth Fund ± | 526,647 | 1,300 | Education Realty Trust, Inc. | 14,612 | |
| 11,300 | Exxon Mobil Corporation | 1,058,697 | 1,200 | Entertainment Properties Trust | 56,400 | |
| 5,500 | Holly Corporation | 279,895 | 500 | Equity Lifestyle Properties, Inc. | 22,835 | |
| 34,028 | Kayne Anderson MLP | 1,500 | Equity One, Inc. | 34,545 | ||
| Investment Company | 998,381 | 10,500 | Equity Residential REIT | 382,935 | ||
| 5,200 | Sasol, Ltd. ADR | 257,244 | 900 | Essex Property Trust, Inc. | 87,741 | |
| Total Energy | 4,775,487 | 2,700 | Extra Space Storage, Inc. | 38,583 | ||
| 9,700 | Federal Home Loan | |||||
| Mortgage Corporation | 330,479 | |||||
| Financials (16.4%) | 1,900 | Federal Realty Investment Trust | 156,085 | |||
| 600 | Acadia Realty Trust | 15,366 | 2,500 | FelCor Lodging Trust, Inc. | 38,975 | |
| 600 | Agree Realty Corporation | 18,060 | 48,116 | Fiduciary/Claymore MLP | ||
| 900 | Alexandria Real Estate Equities, Inc. | 91,503 | Opportunity Fund | 1,004,662 | ||
| 3,500 | AMB Property Corporation | 201,460 | 2,300 | First Industrial Realty Trust, Inc. * | 79,580 | |
| 900 | American Campus Communities, Inc. | 24,165 | 700 | First Potomac Realty Trust | 12,103 | |
| 3,200 | American Financial Realty Trust | 25,664 | 3,000 | Franklin Street Properties Corporation * | 44,400 | |
| 2,200 | American International Group, Inc. | 128,260 | 9,100 | General Growth Properties, Inc. | 374,738 | |
| 700 | American Land Lease, Inc. | 13,881 | 1,400 | Getty Realty Corporation | 37,352 | |
| 3,500 | Apartment Investment & | 900 | Gladstone Commercial Corporation | 15,786 | ||
| Management Company | 121,555 | 3,400 | Glimcher Realty Trust * | 48,586 | ||
| 32,800 | Arthur J. Gallagher & Company | 793,432 | 2,100 | GMH Communities Trust | 11,592 | |
| 6,600 | Ashford Hospitality Trust ‡ | 47,454 | ||||
| The accompanying Notes to Financial Statements are an integral part of this schedule. |
| 170 |
| Diversified Income Plus Portfolio | ||||||
| Schedule of Investments as of December 31, 2007 | ||||||
| Shares | Common Stock (37.5%) | Value | Shares | Common Stock (37.5%) | Value | |
| Financials — continued | 2,400 | Regency Centers Corporation | $154,776 | |||
| 2,000 | Hartford Financial Services Group, Inc. | $174,380 | 22,629 | Regions Financial Corporation * | 535,176 | |
| 8,100 | Health Care Property Investors, Inc. | 281,718 | 400 | Saul Centers, Inc. | 21,372 | |
| 3,400 | Health Care REIT, Inc. * | 151,946 | 3,600 | Senior Housing Property Trust | 81,648 | |
| 1,100 | Healthcare Realty Trust, Inc. | 27,929 | 8,400 | Simon Property Group, Inc. | 729,624 | |
| 2,000 | Hersha Hospitality Trust | 19,000 | 2,035 | SL Green Realty Corporation | 190,191 | |
| 2,100 | Highwoods Properties, Inc. * | 61,698 | 800 | Sovran Self Storage, Inc. * | 32,080 | |
| 1,400 | Home Properties, Inc. * | 62,790 | 2,500 | Strategic Hotel Capital, Inc. * | 41,825 | |
| 5,900 | Hospitality Properties Trust | 190,098 | 1,500 | Sun Communities, Inc. * | 31,605 | |
| 19,300 | Host Marriott Corporation | 328,872 | 2,300 | Sunstone Hotel Investors, Inc. | 42,067 | |
| 13,600 | HRPT Properties Trust * | 105,128 | 900 | Tanger Factory Outlet Centers, Inc. | 33,939 | |
| 8,000 | HSBC Holdings plc ADR | 669,680 | 1,100 | Taubman Centers, Inc. | 54,109 | |
| 2,400 | Inland Real Estate Corporation * | 33,984 | 20,930 | Tortoise Energy | ||
| 2,600 | Investors Real Estate Trust * | 23,322 | Infrastructure Corporation | 697,167 | ||
| 2,900 | J.P. Morgan Chase & Company | 126,585 | 17,303 | Tortoise North American | ||
| 900 | Kilroy Realty Corporation | 49,464 | Energy Corporation | 429,983 | ||
| 9,522 | Kimco Realty Corporation * | 346,601 | 36,400 | U.S. Bancorp * | 1,155,336 | |
| 900 | Kite Realty Group Trust | 13,743 | 5,200 | UDR, Inc. | 103,220 | |
| 1,200 | LaSalle Hotel Properties | 38,280 | 700 | Universal Health Realty Income Trust | 24,808 | |
| 4,400 | Lexington Corporate Properties Trust * | 63,976 | 900 | Urstadt Biddle Properties | 13,950 | |
| 4,200 | Liberty Property Trust | 121,002 | 3,100 | U-Store-It Trust | 28,396 | |
| 2,900 | Lincoln National Corporation | 168,838 | 5,100 | Ventas, Inc. | 230,775 | |
| 600 | LTC Properties, Inc. | 15,030 | 5,700 | Vornado Realty Trust | 501,315 | |
| 2,600 | Macerich Company | 184,756 | 1,900 | Washington Real Estate | ||
| 3,300 | Mack-Cali Realty Corporation | 112,200 | Investment Trust * | 59,679 | ||
| 1,600 | Maguire Properties, Inc. | 47,152 | 3,400 | Weingarten Realty Investors | 106,896 | |
| 3,500 | Medical Properties Trust, Inc. * | 35,665 | 26,000 | Wells Fargo & Company | 784,940 | |
| 16,900 | Mercury General Corporation | 841,789 | Total Financials | 21,517,274 | ||
| 1,000 | Mid-America Apartment | |||||
| Communities, Inc. | 42,750 | Health Care (3.4%) | ||||
| 1,300 | Mission West Properties, Inc. | 12,363 | 11,600 | Abbott Laboratories ‡ | 651,340 | |
| 1,700 | Monmouth Real Estate Investment | 6,700 | Bristol-Myers Squibb Company | 177,684 | ||
| Corporation | 13,770 | 13,900 | Eli Lilly and Company | 742,121 | ||
| 6,500 | National City Corporation | 106,990 | 15,900 | Johnson & Johnson | 1,060,530 | |
| 3,200 | National Retail Properties, Inc. | 74,816 | 2,700 | Medtronic, Inc. | 135,729 | |
| 3,700 | Nationwide Health Properties, Inc. * | 116,180 | 10,400 | Merck & Company, Inc. | 604,344 | |
| 3,200 | Omega Healthcare Investors, Inc. | 51,360 | 3,500 | Meridian Bioscience, Inc. | 105,280 | |
| 700 | One Liberty Properties, Inc. | 12,859 | 35,000 | Pfizer, Inc. | 795,550 | |
| 600 | Parkway Properties, Inc. | 22,188 | 3,200 | Teva Pharmaceutical Industries, Ltd. ADR | 148,736 | |
| 2,000 | Pennsylvania Real Estate | Total Health Care | 4,421,314 | |||
| Investment Trust | 59,360 | |||||
| 6,600 | Plum Creek Timber Company, Inc. | 303,864 | Industrials (3.4%) | |||
| 1,400 | Post Properties, Inc. * | 49,168 | 3,500 | 3M Company | 295,120 | |
| 1,300 | Potlatch Corporation | 57,772 | 4,400 | Avery Dennison Corporation ‡ | 233,816 | |
| 9,500 | ProLogis Trust | 602,110 | 6,300 | Briggs & Stratton Corporation | 142,758 | |
| 400 | PS Business Parks, Inc. | 21,020 | 13,300 | Caterpillar, Inc. | 965,048 | |
| 4,456 | Public Storage, Inc. | 327,115 | 1,900 | Expeditors International of | ||
| 700 | Ramco-Gershenson Properties Trust | 14,959 | Washington, Inc. | 84,892 | ||
| 3,100 | Rayonier, Inc. REIT | 146,444 | 7,600 | General Dynamics Corporation | 676,324 | |
| 4,400 | Realty Income Corporation * | 118,888 | 28,700 | General Electric Company | 1,063,909 | |
| The accompanying Notes to Financial Statements are an integral part of this schedule. |
| 171 |
| Diversified Income Plus Portfolio | ||||||
| Schedule of Investments as of December 31, 2007 | ||||||
| Shares | Common Stock (37.5%) | Value | Shares | Preferred Stock (1.9%) | Value | |
| Industrials — continued | Financials (1.1%) | |||||
| 26,600 | Masco Corporation | $574,826 | 13,800 | Bank of America Corporation | $326,646 | |
| 2,600 | Raytheon Company | 157,820 | 13,000 | Citigroup Capital VIII | 273,650 | |
| 9,400 | Tomkins plc ADR | 131,130 | 12,000 | HSBC USA, Inc. | 264,120 | |
| 2,400 | United Technologies Corporation | 183,696 | 13,000 | MetLife, Inc. | 283,920 | |
| Total Industrials | 4,509,339 | 14,000 | Santander Finance Preferred SA | |||
| Unipersonal # | 308,700 | |||||
| Information Technology (0.8%) | Total Financials | 1,457,036 | ||||
| 5,000 | International Business Machines | |||||
| Corporation | 540,500 | U.S. Government (0.4%) | ||||
| 8,700 | Linear Technology Corporation * | 276,921 | 9,700 | Federal Home Loan Mortgage | ||
| 5,300 | Paychex, Inc. | 191,966 | Corporation # | 253,655 | ||
| Total Information Technology | 1,009,387 | 12,000 | Federal National Mortgage Association # | 309,000 | ||
| Total U.S. Government | 562,655 | |||||
| Materials (1.0%) | ||||||
| 1,200 | Broken Hill Proprietary, Ltd. | 84,048 | Utilities (0.4%) | |||
| 1,900 | Martin Marietta Materials, Inc. * | 251,940 | 10,400 | CenterPoint Energy, Inc., | ||
| 4,600 | Nucor Corporation | 272,412 | Convertible ± | 333,632 | ||
| 6,000 | PPG Industries, Inc. | 421,380 | 520 | NRG Energy, Inc., Convertible | 195,364 | |
| 4,000 | Sonoco Products Company | 130,720 | Total Utilities | 528,996 | ||
| 2,200 | Vulcan Materials Company | 173,998 | ||||
| Total Materials | 1,334,498 | Total Preferred Stock | ||||
| (cost $2,609,680) | 2,548,687 | |||||
| Telecommunications Services (1.2%) | ||||||
| 8,500 | America Movil SA de CV ADR | 521,815 | ||||
| 26,300 | AT&T, Inc. ±‡ | 1,093,025 | ||||
| Total Telecommunications | ||||||
| Services | 1,614,840 | |||||
| Utilities (0.5%) | ||||||
| 9,900 | Atmos Energy Corporation ‡ | 277,596 | ||||
| 3,700 | Huaneng Power International, | |||||
| Inc. ADR | 152,810 | |||||
| 5,400 | Progress Energy, Inc. | 261,522 | ||||
| Total Utilities | 691,928 | |||||
| Total Common Stock | ||||||
| (cost $51,771,050) | 49,282,802 | |||||
| The accompanying Notes to Financial Statements are an integral part of this schedule. |
| 172 |
| Diversified Income Plus Portfolio | ||||
| Schedule of Investments as of December 31, 2007 | ||||
| Principal | Interest | Maturity | ||
| Amount | Bank Loans (4.1%)!! | Rate | Date | Value |
| Basic Materials (0.3%) | ||||
| $401,875 | Domtar Corporation, Term Loan | 6.403% | 3/7/2014 | $384,920 |
| Total Basic Materials | 384,920 | |||
| Capital Goods (0.3%) | ||||
| 260,839 | Allied Waste North America, Inc., Term Loan § ≠ | 6.358 | 3/28/2014 | 248,830 |
| 156,826 | Allied Waste North America, Inc., Term Loan § ≠ | 6.621 | 3/28/2014 | 149,606 |
| Total Capital Goods | 398,436 | |||
| Communications Services (0.7%) | ||||
| 447,739 | Idearc, Inc., Term Loan § ≠ | 6.830 | 11/17/2014 | 425,522 |
| 447,750 | Windstream Corporation, Term Loan | 6.714 | 7/17/2013 | 438,947 |
| Total Communications Services | 864,469 | |||
| Consumer Cyclical (0.3%) | ||||
| 68,472 | Hertz Corporation, Term Loan | 6.660 | 12/21/2012 | 66,966 |
| 379,623 | Hertz Corporation, Term Loan | 6.894 | 12/21/2012 | 371,134 |
| Total Consumer Cyclical | 438,100 | |||
| Consumer Non-Cyclical (1.3%) | ||||
| 448,875 | Biomet, Inc., Term Loan | 7.858 | 3/25/2015 | 443,884 |
| 450,000 | BSC International Holdings, Ltd., Term Loan § ≠ | 5.830 | 4/21/2011 | 428,625 |
| 4,880 | CHS/Community Health Systems, Inc., Term Loan § ≠ | 7.331 | 7/25/2014 | 4,693 |
| 436,181 | CHS/Community Health Systems, Inc., Term Loan | 7.331 | 7/25/2014 | 419,506 |
| 397,975 | SUPERVALU, Inc., Term Loan | 6.396 | 6/2/2012 | 388,674 |
| Total Consumer Non-Cyclical | 1,685,382 | |||
| Financials (0.3%) | ||||
| 447,739 | Solar Capital Corporation, Term Loan | 6.898 | 2/28/2014 | 431,634 |
| Total Financials | 431,634 | |||
| Technology (0.3%) | ||||
| 333,234 | Flextronics Semiconductor, Ltd., Term Loan | 7.394 | 10/1/2014 | 324,070 |
| 95,742 | Flextronics Semiconductor, Ltd., Term Loan | 7.455 | 10/1/2014 | 93,349 |
| Total Technology | 417,419 | |||
| Utilities (0.6%) | ||||
| 428,925 | Energy Future Holdings, Term Loan | 8.396 | 10/10/2014 | 420,647 |
| 132,012 | NRG Energy, Inc., Term Loan | 6.480 | 2/1/2013 | 125,026 |
| 285,929 | NRG Energy, Inc., Term Loan | 6.580 | 2/1/2013 | 272,133 |
| Total Utilities | 817,806 | |||
| Total Bank Loans (cost $5,531,681) | 5,438,166 | |||
| The accompanying Notes to Financial Statements are an integral part of this schedule. |
| 173 |
| Diversified Income Plus Portfolio | ||||
| Schedule of Investments as of December 31, 2007 | ||||
| Principal | Interest | Maturity | ||
| Amount | Long-Term Fixed Income (55.4%) | Rate | Date | Value |
| Asset-Backed Securities (2.5%) | ||||
| $1,000,000 | Citibank Credit Card Issuance Trust ‡ | 5.650% | 9/20/2019 | $1,001,001 |
| 500,000 | Discover Card Master Trust | 5.650 | 3/16/2020 | 499,368 |
| 650,000 | GAMUT Reinsurance, Ltd. † ≤ | 11.960 | 1/31/2008 | 654,095 |
| 250,000 | GAMUT Reinsurance, Ltd. † ≤ | 19.960 | 1/31/2008 | 249,725 |
| 400,000 | Merna Re, Ltd. † ≤ | 6.580 | 3/31/2008 | 395,160 |
| 400,000 | Merna Re, Ltd. † ≤ | 7.580 | 3/31/2008 | 396,680 |
| Total Asset-Backed Securities | 3,196,029 | |||
| Basic Materials (4.5%) | ||||
| 110,000 | Aleris International, Inc. | 9.000 | 12/15/2014 | 91,850 |
| 80,000 | Aleris International, Inc. | 10.000 | 12/15/2016 | 64,800 |
| 160,000 | Arch Western Finance, LLC ‡ | 6.750 | 7/1/2013 | 155,200 |
| 78,000 | Buckeye Technologies, Inc. | 8.000 | 10/15/2010 | 77,220 |
| 430,000 | Chemtura Corporation | 6.875 | 6/1/2016 | 404,200 |
| 220,000 | Domtar, Inc. | 7.875 | 10/15/2011 | 224,675 |
| 220,000 | Domtar, Inc. | 5.375 | 12/1/2013 | 198,550 |
| 130,000 | Domtar, Inc. | 7.125 | 8/15/2015 | 127,400 |
| 130,000 | Drummond Company, Inc. ≤ | 7.375 | 2/15/2016 | 120,575 |
| 450,000 | FMG Finance, Pty., Ltd. ≤ | 10.625 | 9/1/2016 | 515,250 |
| 510,000 | Freeport-McMoRan Copper & Gold, Inc. ± | 8.375 | 4/1/2017 | 546,975 |
| 90,000 | Georgia-Pacific Corporation * | 8.125 | 5/15/2011 | 91,350 |
| 570,000 | Georgia-Pacific Corporation ≤ | 7.125 | 1/15/2017 | 554,325 |
| 200,000 | Glencore Funding, LLC ≤ | 6.000 | 4/15/2014 | 201,171 |
| 210,000 | Graphic Packaging International Corporation | 9.500 | 8/15/2013 | 207,375 |
| 240,000 | Griffin Coal Mining Company, Pty., Ltd. ≤ | 9.500 | 12/1/2016 | 213,600 |
| 170,000 | Huntsman International, LLC | 7.875 | 11/13/2014 | 180,200 |
| 80,000 | Jefferson Smurfit Corporation | 8.250 | 10/1/2012 | 78,800 |
| 320,000 | Mosaic Global Holdings, Inc., Convertible ≤ | 7.375 | 12/1/2014 | 342,400 |
| 430,000 | Novelis, Inc. | 7.250 | 2/15/2015 | 404,200 |
| 450,000 | Peabody Energy Corporation | 5.875 | 4/15/2016 | 423,000 |
| 430,000 | Smurfit-Stone Container Enterprises, Inc. * | 8.000 | 3/15/2017 | 415,488 |
| 250,000 | Terra Capital, Inc. | 7.000 | 2/1/2017 | 244,375 |
| Total Basic Materials | 5,882,979 | |||
| Capital Goods (3.5%) | ||||
| 440,000 | Allied Waste North America, Inc. * | 6.875 | 6/1/2017 | 429,000 |
| 70,000 | Ashtead Capital, Inc. * ≤ | 9.000 | 8/15/2016 | 61,950 |
| 130,000 | Ball Corporation | 6.625 | 3/15/2018 | 129,025 |
| 150,000 | Berry Plastics Holding Corporation | 8.875 | 9/15/2014 | 142,500 |
| 450,000 | Bombardier, Inc. ≤ | 6.750 | 5/1/2012 | 455,625 |
| 380,000 | Case New Holland, Inc. ± | 7.125 | 3/1/2014 | 379,050 |
| 100,000 | Crown Americas, Inc. | 7.625 | 11/15/2013 | 102,250 |
| 100,000 | Crown Americas, Inc. | 7.750 | 11/15/2015 | 103,000 |
| 480,000 | Da-Lite Screen Company, Inc. ± | 9.500 | 5/15/2011 | 477,600 |
| 64,000 | Invensys plc ≤ | 9.875 | 3/15/2011 | 67,596 |
| 650,000 | L-3 Communications Corporation | 5.875 | 1/15/2015 | 627,250 |
| 400,000 | L-3 Communications Corporation, Convertible | 3.000 | 8/1/2035 | 483,500 |
| 100,000 | Legrand SA | 8.500 | 2/15/2025 | 116,335 |
| 140,000 | Mueller Water Products, Inc. | 7.375 | 6/1/2017 | 125,125 |
| The accompanying Notes to Financial Statements are an integral part of this schedule. |
| 174 |
| Diversified Income Plus Portfolio | ||||
| Schedule of Investments as of December 31, 2007 | ||||
| Principal | Interest | Maturity | ||
| Amount | Long-Term Fixed Income (55.4%) | Rate | Date | Value |
| Capital Goods — continued | ||||
| $70,000 | Owens-Brockway Glass Container, Inc. | 8.250% | 5/15/2013 | $72,625 |
| 210,000 | Owens-Illinois, Inc. * | 7.500 | 5/15/2010 | 212,625 |
| 190,000 | Plastipak Holdings, Inc. ≤ | 8.500 | 12/15/2015 | 190,000 |
| 140,000 | Rental Services Corporation | 9.500 | 12/1/2014 | 125,300 |
| 110,000 | TransDigm, Inc. | 7.750 | 7/15/2014 | 111,650 |
| 270,000 | United Rentals North America, Inc. | 7.000 | 2/15/2014 | 226,125 |
| Total Capital Goods | 4,638,131 | |||
| Collateralized Mortgage Obligations (2.3%) | ||||
| 1,781,970 | Deutsche Alt-A Securities, Inc. ±† | 5.633 | 1/25/2008 | 1,701,347 |
| 1,365,935 | Washington Mutual Alternative Loan Trust † | 5.538 | 1/25/2008 | 1,290,595 |
| Total Collateralized Mortgage Obligations | 2,991,942 | |||
| Commercial Mortgage-Backed Securities (3.0%) | ||||
| 2,000,000 | Commercial Mortgage Pass-Through Certificates † ≤ | 5.208 | 1/15/2008 | 1,912,804 |
| 2,000,000 | Wachovia Bank Commercial Mortgage Trust † ≤ | 5.148 | 1/15/2008 | 1,951,734 |
| Total Commercial Mortgage-Backed Securities | 3,864,538 | |||
| Communications Services (8.0%) | ||||
| 460,000 | American Tower Corporation ‡ | 7.125 | 10/15/2012 | 472,650 |
| 370,000 | American Tower Corporation ‡ ≤ | 7.000 | 10/15/2017 | 371,850 |
| 120,000 | Centennial Communications Corporation | 8.125 | 2/1/2014 | 118,200 |
| 210,000 | Charter Communications Operating, LLC ≤ | 8.000 | 4/30/2012 | 202,650 |
| 175,000 | Citizens Communications Company | 9.250 | 5/15/2011 | 189,438 |
| 430,000 | Citizens Communications Company ± | 6.250 | 1/15/2013 | 416,562 |
| 450,000 | CSC Holdings, Inc. | 7.625 | 4/1/2011 | 448,875 |
| 70,000 | Dex Media West, LLC/Dex Media West Finance Company | 9.875 | 8/15/2013 | 72,800 |
| 450,000 | DIRECTV Holdings, LLC | 6.375 | 6/15/2015 | 432,000 |
| 860,000 | Echostar DBS Corporation ± | 6.625 | 10/1/2014 | 855,700 |
| 530,000 | Idearc, Inc. | 8.000 | 11/15/2016 | 486,275 |
| 60,000 | Intelsat Bermuda, Ltd. | 9.250 | 6/15/2016 | 60,300 |
| 410,000 | Intelsat Intermediate, Inc. > | Zero Coupon | 2/1/2010 | 335,175 |
| 150,000 | Intelsat Subsidiary Holding Company, Ltd. | 8.625 | 1/15/2015 | 150,750 |
| 430,000 | Interpublic Group of Companies, Inc. | 6.250 | 11/15/2014 | 365,500 |
| 90,000 | Lamar Media Corporation | 6.625 | 8/15/2015 | 87,525 |
| 430,000 | Level 3 Financing, Inc. | 9.250 | 11/1/2014 | 389,150 |
| 430,000 | Liberty Media Corporation * | 5.700 | 5/15/2013 | 398,357 |
| 115,000 | Morris Publishing Group, LLC | 7.000 | 8/1/2013 | 83,519 |
| 200,000 | News America, Inc. ≤ | 6.650 | 11/15/2037 | 206,295 |
| 280,000 | NTL Cable plc | 9.125 | 8/15/2016 | 277,200 |
| 250,000 | Quebecor Media, Inc. ≤ | 7.750 | 3/15/2016 | 240,000 |
| 200,000 | Qwest Communications International, Inc. | 7.250 | 2/15/2011 | 200,000 |
| 60,000 | Qwest Communications International, Inc. | 7.500 | 2/15/2014 | 59,850 |
| 470,000 | Qwest Corporation | 7.875 | 9/1/2011 | 488,800 |
| 200,000 | R.H. Donnelley Corporation * | 6.875 | 1/15/2013 | 179,000 |
| 310,000 | R.H. Donnelley Corporation | 6.875 | 1/15/2013 | 277,450 |
| 110,000 | R.H. Donnelley Corporation | 8.875 | 1/15/2016 | 102,850 |
| 400,000 | Rogers Cable, Inc. | 6.750 | 3/15/2015 | 420,760 |
| 575,000 | Rogers Wireless Communications, Inc. | 7.500 | 3/15/2015 | 628,811 |
| The accompanying Notes to Financial Statements are an integral part of this schedule. |
| 175 |
| Diversified Income Plus Portfolio | ||||
| Schedule of Investments as of December 31, 2007 | ||||
| Principal | Interest | Maturity | ||
| Amount | Long-Term Fixed Income (55.4%) | Rate | Date | Value |
| Communications Services — continued | ||||
| $85,000 | Rural Cellular Corporation | 9.875% | 2/1/2010 | $88,188 |
| 200,000 | Time Warner Cable, Inc. | 5.850 | 5/1/2017 | 200,494 |
| 200,000 | Time Warner Telecom Holdings, Inc. | 9.250 | 2/15/2014 | 204,500 |
| 140,000 | Valor Telecommunications Enterprises, LLC | 7.750 | 2/15/2015 | 147,813 |
| 420,000 | Videotron Ltee | 6.875 | 1/15/2014 | 411,075 |
| 300,000 | Windstream Corporation | 8.625 | 8/1/2016 | 315,000 |
| 130,000 | Windstream Corporation | 7.000 | 3/15/2019 | 123,825 |
| Total Communications Services | 10,509,187 | |||
| Consumer Cyclical (6.4%) | ||||
| 180,000 | American Casino & Entertainment Properties, LLC | 7.850 | 2/1/2012 | 185,535 |
| 240,000 | Beazer Homes USA, Inc. * | 8.625 | 5/15/2011 | 184,800 |
| 360,000 | Buhrmann U.S., Inc. | 7.875 | 3/1/2015 | 339,300 |
| 180,000 | Circus & Eldorado Joint Venture/Silver Legacy | |||
| Capital Corporation | 10.125 | 3/1/2012 | 185,850 | |
| 430,000 | Corrections Corporation of America ± | 6.250 | 3/15/2013 | 423,550 |
| 102,000 | Dollarama Group, LP † ≤ | 10.599 | 6/16/2008 | 102,000 |
| 180,000 | Dollarama Group, LP | 8.875 | 8/15/2012 | 183,600 |
| 160,000 | Ford Motor Credit Company † | 9.693 | 1/15/2008 | 157,340 |
| 70,000 | Ford Motor Credit Company | 9.750 | 9/15/2010 | 66,794 |
| 130,000 | Ford Motor Credit Company | 7.000 | 10/1/2013 | 108,601 |
| 90,000 | Ford Motor Credit Company | 8.000 | 12/15/2016 | 76,447 |
| 220,000 | Gaylord Entertainment Company | 6.750 | 11/15/2014 | 207,350 |
| 430,000 | General Motors Corporation * | 7.200 | 1/15/2011 | 395,600 |
| 190,000 | Hanesbrands, Inc. *† | 8.204 | 6/16/2008 | 188,100 |
| 190,000 | Harrah’s Operating Company, Inc. | 5.625 | 6/1/2015 | 138,700 |
| 430,000 | Host Marriott, LP | 6.375 | 3/15/2015 | 419,250 |
| 190,000 | K. Hovnanian Enterprises, Inc. | 7.500 | 5/15/2016 | 133,000 |
| 430,000 | Lear Corporation | 8.500 | 12/1/2013 | 399,900 |
| 180,000 | Majestic Star Casino, LLC | 9.500 | 10/15/2010 | 170,100 |
| 300,000 | MGM MIRAGE | 5.875 | 2/27/2014 | 274,500 |
| 430,000 | MGM MIRAGE * | 7.625 | 1/15/2017 | 424,625 |
| 210,000 | Pokagon Gaming Authority ≤ | 10.375 | 6/15/2014 | 225,750 |
| 430,000 | Rite Aid Corporation | 7.500 | 3/1/2017 | 378,938 |
| 650,000 | Royal Caribbean Cruises, Ltd. * | 7.250 | 6/15/2016 | 638,972 |
| 220,000 | Seminole Hard Rock Entertainment † ≤ | 7.491 | 3/15/2008 | 210,100 |
| 130,000 | Service Corporation International | 6.750 | 4/1/2015 | 128,375 |
| 330,000 | Station Casinos, Inc. | 6.875 | 3/1/2016 | 240,900 |
| 220,000 | Tenneco, Inc. ≤ | 8.125 | 11/15/2015 | 217,800 |
| 100,000 | TRW Automotive, Inc. ≤ | 7.000 | 3/15/2014 | 92,000 |
| 260,000 | Tunica Biloxi Gaming Authority ≤ | 9.000 | 11/15/2015 | 265,850 |
| 200,000 | Turning Stone Resort Casino Enterprise ≤ | 9.125 | 12/15/2010 | 202,000 |
| 130,000 | Turning Stone Resort Casino Enterprise ≤ | 9.125 | 9/15/2014 | 132,600 |
| 180,000 | Universal City Florida Holding Company I/II † | 9.661 | 2/1/2008 | 180,000 |
| 150,000 | Warnaco, Inc. | 8.875 | 6/15/2013 | 152,625 |
| 235,000 | WMG Holdings Corporation > | Zero Coupon | 12/15/2009 | 150,400 |
| 430,000 | Wynn Las Vegas, LLC ≤ | 6.625 | 12/1/2014 | 422,475 |
| Total Consumer Cyclical | 8,403,727 | |||
| The accompanying Notes to Financial Statements are an integral part of this schedule. |
| 176 |
| Diversified Income Plus Portfolio | ||||
| Schedule of Investments as of December 31, 2007 | ||||
| Principal | Interest | Maturity | ||
| Amount | Long-Term Fixed Income (55.4%) | Rate | Date | Value |
| Consumer Non-Cyclical (4.6%) | ||||
| $400,000 | Archer-Daniels-Midland Company, Convertible ಠ| 0.875% | 2/15/2014 | $482,500 |
| 730,000 | Boston Scientific Corporation ‡ | 5.450 | 6/15/2014 | 671,600 |
| 380,000 | Community Health Systems, Inc. | 8.875 | 7/15/2015 | 387,125 |
| 520,000 | Constellation Brands, Inc. ± | 7.250 | 9/1/2016 | 487,500 |
| 200,000 | Coventry Health Care, Inc. | 5.950 | 3/15/2017 | 196,102 |
| 430,000 | Delhaize Group, Inc. | 6.500 | 6/15/2017 | 439,902 |
| 200,000 | Fisher Scientific International, Inc., Convertible | 3.250 | 3/1/2024 | 312,750 |
| 190,000 | Genzyme Corporation, Convertible | 1.250 | 12/1/2023 | 218,975 |
| 480,000 | HCA, Inc. | 9.250 | 11/15/2016 | 504,000 |
| 190,000 | Jarden Corporation | 7.500 | 5/1/2017 | 163,400 |
| 160,000 | Michael Foods, Inc. | 8.000 | 11/15/2013 | 158,400 |
| 460,000 | Smithfield Foods, Inc. | 8.000 | 10/15/2009 | 464,600 |
| 320,000 | Stater Brothers Holdings, Inc. | 8.125 | 6/15/2012 | 316,000 |
| 560,000 | SUPERVALU, Inc. | 7.500 | 11/15/2014 | 574,000 |
| 210,000 | Teva Pharmaceutical Finance Company, Convertible | 1.750 | 2/1/2026 | 233,100 |
| 470,000 | Ventas Realty, LP/Ventas Capital Corporation | 6.500 | 6/1/2016 | 460,600 |
| Total Consumer Non-Cyclical | 6,070,554 | |||
| Energy (3.2%) | ||||
| 160,000 | CHC Helicopter Corporation | 7.375 | 5/1/2014 | 151,200 |
| 510,000 | Chesapeake Energy Corporation ‡ | 6.375 | 6/15/2015 | 493,425 |
| 140,000 | Chesapeake Energy Corporation | 6.250 | 1/15/2018 | 134,400 |
| 400,000 | Chesapeake Energy Corporation, Convertible | 2.750 | 11/15/2035 | 468,000 |
| 220,000 | Connacher Oil and Gas, Ltd. ≤ | 10.250 | 12/15/2015 | 219,725 |
| 155,000 | Denbury Resources, Inc. | 7.500 | 12/15/2015 | 156,550 |
| 210,000 | Forest Oil Corporation ≤ | 7.250 | 6/15/2019 | 211,050 |
| 130,000 | Hornbeck Offshore Services, Inc. | 6.125 | 12/1/2014 | 123,500 |
| 310,000 | Newfield Exploration Company | 6.625�� | 4/15/2016 | 303,800 |
| 460,000 | Ocean Rig Norway AS ≤ | 8.375 | 7/1/2013 | 488,750 |
| 190,000 | OPTI Canada, Inc. ≤ | 8.250 | 12/15/2014 | 188,100 |
| 200,000 | PetroHawk Energy Corporation | 9.125 | 7/15/2013 | 210,500 |
| 300,000 | Petroplus Finance, Ltd. ≤ | 7.000 | 5/1/2017 | 274,500 |
| 220,000 | Plains Exploration & Production Company | 7.750 | 6/15/2015 | 220,000 |
| 440,000 | Tesoro Corporation | 6.500 | 6/1/2017 | 435,600 |
| 150,000 | Western Oil Sands, Inc. | 8.375 | 5/1/2012 | 167,296 |
| Total Energy | 4,246,396 | |||
| Financials (5.8%) | ||||
| 400,000 | American International Group, Inc. ‡ | 6.250 | 3/15/2037 | 357,768 |
| 200,000 | AXA SA * ≤ | 6.463 | 12/14/2018 | 180,094 |
| 200,000 | BBVA Bancomer SA ‡ ≤ | 6.008 | 5/17/2022 | 192,560 |
| 210,000 | Capital One Capital III ‡ | 7.686 | 8/15/2036 | 170,764 |
| 210,000 | Capital One Capital IV | 6.745 | 2/17/2037 | 156,161 |
| 400,000 | Countrywide Financial Corporation, Convertible † ≤ | 1.743 | 1/15/2008 | 311,920 |
| 430,000 | Deluxe Corporation | 5.125 | 10/1/2014 | 364,425 |
| 300,000 | FTI Consulting, Inc. | 7.625 | 6/15/2013 | 307,500 |
| 670,000 | General Motors Acceptance Corporation, LLC | 6.875 | 9/15/2011 | 573,181 |
| 220,000 | Goldman Sachs Group, Inc., Convertible | 1.000 | 3/7/2012 | 244,081 |
| 440,000 | J.P. Morgan Chase Capital XX | 6.550 | 9/29/2036 | 397,006 |
| The accompanying Notes to Financial Statements are an integral part of this schedule. |
| 177 |
| Diversified Income Plus Portfolio | ||||
| Schedule of Investments as of December 31, 2007 | ||||
| Principal | Interest | Maturity | ||
| Amount | Long-Term Fixed Income (55.4%) | Rate | Date | Value |
| Financials — continued | ||||
| $400,000 | Lehman Brothers Holdings, Inc. | 7.000% | 9/27/2027 | $405,981 |
| 360,000 | Leucadia National Corporation | 7.125 | 3/15/2017 | 333,000 |
| 630,000 | Lincoln National Corporation | 7.000 | 5/17/2016 | 632,534 |
| 200,000 | Mitsubishi UFG Capital Finance, Ltd. | 6.346 | 7/25/2016 | 189,427 |
| 210,000 | ProLogis Trust | 5.625 | 11/15/2016 | 194,741 |
| 420,000 | Rabobank Capital Funding Trust ≤ | 5.254 | 10/21/2016 | 375,913 |
| 400,000 | Residential Capital Corporation | 8.000 | 4/17/2013 | 246,000 |
| 420,000 | Royal Bank of Scotland Group plc ≤ | 6.990 | 10/5/2017 | 418,737 |
| 420,000 | Student Loan Marketing Corporation | 4.500 | 7/26/2010 | 385,223 |
| 420,000 | Swiss RE Capital I, LP ≤ | 6.854 | 5/25/2016 | 412,684 |
| 420,000 | Wachovia Capital Trust III | 5.800 | 3/15/2011 | 375,291 |
| 695,000 | Washington Mutual Preferred Funding ≤ | 6.665 | 12/15/2016 | 410,050 |
| Total Financials | 7,635,041 | |||
| Mortgage-Backed Securities (0.8%) | ||||
| 1,000,000 | Federal National Mortgage Association Conventional | |||
| 30-Yr. Pass Through § | 6.500 | 1/1/2038 | 1,027,812 | |
| Total Mortgage-Backed Securities | 1,027,812 | |||
| Technology (1.8%) | ||||
| 26,000 | Avago Technologies Finance Pte † | 10.624 | 3/3/2008 | 26,358 |
| 130,000 | Avago Technologies Finance Pte ‡ | 10.125 | 12/1/2013 | 136,012 |
| 430,000 | First Data Corporation ≤ | 9.875 | 9/24/2015 | 399,900 |
| 430,000 | Flextronics International, Ltd. | 6.250 | 11/15/2014 | 409,575 |
| 80,000 | NXP BV/NXP Funding, LLC † | 7.993 | 1/15/2008 | 73,600 |
| 140,000 | NXP BV/NXP Funding, LLC * | 9.500 | 10/15/2015 | 128,275 |
| 430,000 | Sanmina-SCI Corporation * | 6.750 | 3/1/2013 | 374,100 |
| 370,000 | Seagate Technology HDD Holdings | 6.800 | 10/1/2016 | 360,750 |
| 430,000 | Sungard Data Systems, Inc. | 4.875 | 1/15/2014 | 377,325 |
| Total Technology | 2,285,895 | |||
| Transportation (1.0%) | ||||
| 216,016 | Continental Airlines, Inc. ± | 7.875 | 7/2/2018 | 205,755 |
| 400,000 | Continental Airlines, Inc. | 6.903 | 4/19/2022 | 360,000 |
| 140,000 | Delta Air Lines, Inc. | 7.920 | 11/18/2010 | 136,500 |
| 60,000 | Hertz Corporation | 8.875 | 1/1/2014 | 60,825 |
| 100,000 | Hertz Corporation | 10.500 | 1/1/2016 | 103,500 |
| 150,000 | Kansas City Southern de Mexico SA de CV | 7.625 | 12/1/2013 | 147,938 |
| 335,015 | Piper Jaffray Equipment Trust Securities ≤ | 6.750 | 4/1/2011 | 321,615 |
| Total Transportation | 1,336,133 | |||
| U.S. Government (1.8%) | ||||
| 2,272,138 | U.S. Treasury Notes, TIPS * | 2.000 | 7/15/2014 | 2,347,581 |
| Total U.S. Government | 2,347,581 | |||
| The accompanying Notes to Financial Statements are an integral part of this schedule. |
| 178 |
| Diversified Income Plus Portfolio | ||||
| Schedule of Investments as of December 31, 2007 | ||||
| Principal | Interest | Maturity | ||
| Amount | Long-Term Fixed Income (55.4%) | Rate | Date | Value |
| Utilities (6.2%) | ||||
| $70,000 | AES Corporation * | 8.875% | 2/15/2011 | $72,975 |
| 293,000 | AES Corporation ‡ ≤ | 8.750 | 5/15/2013 | 305,819 |
| 430,000 | AES Corporation ‡ ≤ | 7.750 | 10/15/2015 | 436,450 |
| 320,000 | CMS Energy Corporation, Convertible | 2.875 | 12/1/2024 | 428,000 |
| 350,000 | Colorado Interstate Gas Company | 6.800 | 11/15/2015 | 364,336 |
| 70,000 | Consumers Energy Company | 6.300 | 2/1/2012 | 70,622 |
| 210,000 | Copano Energy, LLC | 8.125 | 3/1/2016 | 211,575 |
| 110,000 | Dynegy Holdings, Inc. | 6.875 | 4/1/2011 | 106,150 |
| 100,000 | Dynegy Holdings, Inc. | 7.500 | 6/1/2015 | 93,500 |
| 120,000 | Dynegy Holdings, Inc. | 8.375 | 5/1/2016 | 117,300 |
| 40,000 | Dynegy Holdings, Inc. | 7.750 | 6/1/2019 | 36,900 |
| 120,000 | Edison Mission Energy | 7.500 | 6/15/2013 | 123,000 |
| 130,000 | Edison Mission Energy | 7.750 | 6/15/2016 | 133,900 |
| 200,000 | Edison Mission Energy | 7.000 | 5/15/2017 | 196,500 |
| 200,000 | Edison Mission Energy | 7.200 | 5/15/2019 | 196,500 |
| 250,000 | El Paso Corporation ± | 6.875 | 6/15/2014 | 251,806 |
| 250,000 | El Paso Corporation | 7.000 | 6/15/2017 | 250,259 |
| 620,000 | Enterprise Products Operating, LP * | 8.375 | 8/1/2016 | 634,781 |
| 160,000 | Illinois Power Company ≤ | 6.125 | 11/15/2017 | 161,648 |
| 430,000 | Intergen NV ≤ | 9.000 | 6/30/2017 | 452,575 |
| 430,000 | Kinder Morgan Finance Company ulc | 5.700 | 1/5/2016 | 389,236 |
| 70,000 | Mirant North America, LLC | 7.375 | 12/31/2013 | 70,175 |
| 540,000 | NRG Energy, Inc. * | 7.375 | 2/1/2016 | 526,500 |
| 110,000 | Pacific Energy Partners, LP/Pacific Energy Finance Corporation | 7.125 | 6/15/2014 | 114,470 |
| 150,000 | Pacific Energy Partners, LP/Pacific Energy Finance Corporation | 6.250 | 9/15/2015 | 150,262 |
| 430,000 | Regency Energy Partners, LP | 8.375 | 12/15/2013 | 442,900 |
| 105,000 | Reliant Energy Resources Corporation | 6.750 | 12/15/2014 | 105,262 |
| 430,000 | Sabine Pass LNG LP | 7.500 | 11/30/2016 | 410,650 |
| 360,000 | SemGroup, LP ≤ | 8.750 | 11/15/2015 | 342,000 |
| 430,000 | Sierra Pacific Power Company ≤ | 6.000 | 5/15/2016 | 426,235 |
| 80,000 | Southern Natural Gas Company | 7.350 | 2/15/2031 | 83,533 |
| 110,000 | Southern Star Central Corporation | 6.750 | 3/1/2016 | 105,325 |
| 230,000 | Williams Companies, Inc. | 8.125 | 3/15/2012 | 250,412 |
| 120,000 | Williams Partners, LP | 7.250 | 2/1/2017 | 123,600 |
| Total Utilities | 8,185,156 | |||
| Total Long-Term Fixed Income (cost $74,814,651) | 72,621,101 | |||
| Interest | Maturity | |||
| Shares | Collateral Held for Securities Loaned (7.8%) | Rate (+) | Date | Value |
| 10,240,727 | Thrivent Financial Securities Lending Trust | 5.000% | N/A | $10,240,727 |
| Total Collateral Held for Securities Loaned | ||||
| (cost $10,240,727) | 10,240,727 | |||
| The accompanying Notes to Financial Statements are an integral part of this schedule. |
| 179 |
| Diversified Income Plus Portfolio | ||||
| Schedule of Investments as of December 31, 2007 | ||||
| Shares or | ||||
| Principal | Interest | Maturity | ||
| Amount | Short-Term Investments (1.8%) | Rate (+) | Date | Value |
| $650,000 | Federal Home Loan Mortgage Corporation | 3.150% | 1/2/2008 | $649,943 |
| 450,000 | Federal National Mortgage Association ‡ | 4.030 | 5/16/2008 | 443,115 |
| 1,238,981 | Thrivent Money Market Portfolio | 4.930 | N/A | 1,238,981 |
| Total Short-Term Investments (cost $2,332,118) | 2,332,039 | |||
| Total Investments (cost $147,299,907) 108.5% | $142,463,522 | |||
| Other Assets and Liabilities, Net (8.5%) | (11,185,241) | |||
| Total Net Assets 100.0% | $131,278,281 | |||
| Number of | Notional | ||||
| Contracts | Expiration | Principal | Unrealized | ||
| Futures | Long/(Short) | Date | Amount | Value | Gain/(Loss) |
| 5-Yr. U.S. Treasury Bond Futures | 28 | March 2008 | $3,060,835 | $3,087,875 | $27,040 |
| 10-Yr. U.S. Treasury Bond Futures | (5) | March 2008 | (563,236) | (566,953) | (3,717) |
| S&P 500 Mini-Futures | 11 | March 2008 | 809,383 | 812,460 | 3,077 |
| Total Futures | $26,400 | ||||
| The accompanying Notes to Financial Statements are an integral part of this schedule. |
| 180 |
| Diversified Income Plus Portfolio | |||||
| Schedule of Investments as of December 31, 2007 | |||||
| Notional | |||||
| Buy/Sell | Termination | Principal | Unrealized | ||
| Swaps and Counterparty | Protection | Date | Amount | Value | Gain/(Loss) |
| Credit Default Swaps | |||||
| LCDX, N.A. Index Series 9, | Sell | December 2012 | $2,000,000 | ($62,862) | ($35,787) |
| 5 Year, at 2.25%; | |||||
| J.P. Morgan Chase and Co. | |||||
| Ford Motor Company, 5 Year, at 6.90% | Sell | September 2012 | 370,000 | (9,695) | (9,695) |
| Banc of America | |||||
| Total Swaps | ($72,557) | ($45,482) | |||
# Non-income producing security.
* All or a portion of the security is on loan as discussed in item 2(M) of the Notes to Financial Statements.
+ The interest rate shown reflects the yield, coupon rate or, for securities purchased at a discount, the discount rate at the date of purchase.
> Denotes step coupon bonds for which the current interest rate and next scheduled reset date are shown.
† Denotes variable rate obligations for which the current yield and next scheduled reset date are shown.
§ Denotes investments purchased on a when-issued or delayed delivery basis.
± Designated as cover for long settling trades as discussed in the Notes to Financial Statements.
‡ At December 31, 2007, $443,115 of investments were held on deposit with the counterparty and pledged as the initial margin deposit for open financial futures contracts. In addition, $5,756,976 and $2,297,912 of investments were earmarked as collateral to cover open financial futures contracts and swap contracts, respectively.
≤ Denotes securities sold under Rule 144A of the Securities Act of 1933, which exempts them from registration. These securities have been determined to be liquid under the guidelines established by the Portfolio’s Board of Directors and may be resold to other dealers in the program or to other qualified institutional buyers. As of December 31, 2007, the value of these investments was $18,186,886 or 13.9% of total net assets.
≠ All or a portion of the loan is unfunded as discussed in item 2(U) of the Notes to Financial Statements.
!! The stated interest rate represents the weighted average of all contracts within the bank loan facility. Bank loans generally have rates of interest which are reset either daily, monthly, quarterly or semi-annually by reference to a base lending rate, plus a premium. These base lending rates are primarily the London-Interbank Offered Rate (“LIBOR”), and secondarily the prime rate offered by one or more major United States banks (the “Prime Rate”) and the certificate of deposit (“CD”) rate or other base lending rates used by commercial lenders. Bank loans often require prepayments from excess cash flows or allow the borrower to repay at its election. The rate at which the borrower repays cannot be predicted with accuracy. Therefore, the remaining maturity may be considerably less than the stated maturities shown.
Definitions:
ADR — American Depository Receipts, which are certificates for shares of an underlying foreign security’s shares held by an issuing U.S. depository bank.
REIT — Real Estate Investment Trust, is a company that buys, develops, manages and/or sells real estate assets. TIPS — Treasury Inflation Protected Security.
Gross unrealized appreciation and depreciation of investments, based on cost for federal income tax purposes, were as follows:
| Gross unrealized appreciation | $2,163,577 | |
| Gross unrealized depreciation | (7,274,142) | |
| Net unrealized appreciation (depreciation) | ($5,110,565) | |
| Cost for federal income tax purposes | $147,574,087 |
| The accompanying Notes to Financial Statements are an integral part of this schedule. |
| 181 |
| Income Portfolio | ||||
| Schedule of Investments as of December 31, 2007 | ||||
| Principal | Interest | Maturity | ||
| Amount | Long-Term Fixed Income (103.0%) | Rate | Date | Value |
| Asset-Backed Securities (8.4%) | ||||
| $4,076,261 | Bear Stearns Mortgage Funding Trust †~ | 5.005% | 1/25/2008 | $1,923,029 |
| 5,846,353 | Capitalsource Commercial Loan Trust †~ | 5.079 | 1/20/2008 | 5,848,890 |
| 7,000,000 | Citibank Credit Card Issuance Trust | 5.650 | 9/20/2019 | 7,007,007 |
| 5,000,000 | Credit Based Asset Servicing and Securitization, LLC †‡ | 4.975 | 1/25/2008 | 4,919,185 |
| 10,000,000 | DaimlerChrysler Master Owner Trust ±† | 5.078 | 1/15/2008 | 9,995,920 |
| 12,000,000 | Discover Card Master Trust ‡ | 5.650 | 3/16/2020 | 11,984,844 |
| 11,055,729 | Federal Home Loan Mortgage Corporation ±† | 4.905 | 1/25/2008 | 10,888,165 |
| 4,500,000 | First Franklin Mortgage Loan Asset-Backed Certificates ±† | 4.955 | 1/25/2008 | 4,346,708 |
| 8,500,000 | Ford Credit Floor Plan Master Owner Trust †~ | 5.208 | 1/15/2008 | 8,364,850 |
| 936,216 | GE Commercial Loan Trust †‡ ≤ | 5.259 | 1/19/2008 | 933,136 |
| 10,000,000 | GE Dealer Floorplan Master Note Trust †‡ | 4.989 | 1/20/2008 | 9,997,990 |
| 11,500,000 | GMAC Mortgage Corporation Loan Trust †‡« | 4.935 | 1/25/2008 | 11,433,656 |
| 10,000,000 | GMAC Mortgage Corporation Loan Trust †« | 4.955 | 1/25/2008 | 9,976,570 |
| 737,352 | GMAC Mortgage Corporation Loan Trust †« | 4.965 | 1/25/2008 | 724,594 |
| 2,421,534 | IndyMac Seconds Asset-Backed Trust †‡« | 5.035 | 1/25/2008 | 2,272,106 |
| 12,250,000 | Merna Re, Ltd. ±† ≤ | 6.580 | 3/31/2008 | 12,101,775 |
| 40,835 | Popular ABS Mortgage Pass-Through Trust ±† | 4.995 | 1/25/2008 | 40,828 |
| 6,697,967 | Residential Funding Mortgage Securities II †~« | 4.995 | 1/25/2008 | 6,596,131 |
| Total Asset-Backed Securities | 119,355,384 | |||
| Basic Materials (1.5%) | ||||
| 4,710,000 | Alcan, Inc. | 5.000 | 6/1/2015 | 4,562,690 |
| 1,500,000 | Freeport-McMoRan Copper & Gold, Inc. †‡ | 8.394 | 4/1/2008 | 1,522,500 |
| 7,300,000 | Glencore Funding, LLC ±‡ | 6.000 | 4/15/2014 | 7,342,734 |
| 4,400,000 | Lubrizol Corporation | 5.500 | 10/1/2014 | 4,368,404 |
| 3,500,000 | Precision Castparts Corporation ± | 5.600 | 12/15/2013 | 3,705,247 |
| Total Basic Materials | 21,501,575 | |||
| Capital Goods (2.2%) | ||||
| 6,700,000 | Caterpillar Financial Services Corporation ~ | 5.850 | 9/1/2017 | 6,891,600 |
| 2,400,000 | CRH America, Inc. ‡ | 6.000 | 9/30/2016 | 2,347,181 |
| 3,429,000 | Goodrich Corporation | 6.800 | 7/1/2036 | 3,664,137 |
| 1,805,000 | Lockheed Martin Corporation ± | 6.150 | 9/1/2036 | 1,866,857 |
| 5,250,000 | Oakmont Asset Trust ± ≤ | 4.514 | 12/22/2008 | 5,233,499 |
| 1,800,000 | Owens Corning, Inc. | 7.000 | 12/1/2036 | 1,624,077 |
| 3,845,967 | Systems 2001 Asset Trust, LLC ≤ | 6.664 | 9/15/2013 | 3,961,346 |
| 5,500,000 | United Technologies Corporation | 4.875 | 5/1/2015 | 5,425,150 |
| Total Capital Goods | 31,013,847 | |||
| Collateralized Mortgage Obligations (4.7%) | ||||
| 9,518,314 | Banc of America Mortgage Securities, Inc. ‡ | 4.802 | 9/25/2035 | 9,446,308 |
| 5,000,000 | Citigroup Mortgage Loan Trust, Inc. ±‡ | 5.536 | 3/25/2036 | 4,998,350 |
| 4,454,926 | Deutsche Alt-A Securities, Inc. †~ | 5.633 | 1/25/2008 | 4,253,367 |
| 4,279,014 | HomeBanc Mortgage Trust ‡ | 5.988 | 4/25/2037 | 4,320,876 |
| 8,934,712 | J.P. Morgan Mortgage Trust ‡ | 5.006 | 7/25/2035 | 8,915,279 |
| 7,042,082 | Merrill Lynch Mortgage Investors, Inc. ~ | 4.875 | 6/25/2035 | 7,052,490 |
| 6,032,925 | Thornburg Mortgage Securities Trust † | 4.955 | 1/25/2008 | 5,997,771 |
| 5,820,837 | Wachovia Mortgage Loan Trust, LLC | 5.572 | 5/20/2036 | 5,847,438 |
| 8,195,611 | Washington Mutual Alternative Loan Trust † | 5.538 | 1/25/2008 | 7,743,571 |
| The accompanying Notes to Financial Statements are an integral part of this schedule. |
| 182 |
| Income Portfolio | ||||
| Schedule of Investments as of December 31, 2007 | ||||
| Principal | Interest | Maturity | ||
| Amount | Long-Term Fixed Income (103.0%) | Rate | Date | Value |
| Collateralized Mortgage Obligations — continued | ||||
| $1,340,497 | Washington Mutual Mortgage Pass-Through Certificates † | 5.155% | 1/25/2008 | $1,259,544 |
| 3,224,520 | Washington Mutual Mortgage Pass-Through Certificates | 4.835 | 9/25/2035 | 3,200,629 |
| 4,097,566 | Zuni Mortgage Loan Trust † | 4.995 | 1/25/2008 | 3,918,015 |
| Total Collateralized Mortgage Obligations | 66,953,638 | |||
| Commercial Mortgage-Backed Securities (12.7%) | ||||
| 4,219,699 | Banc of America Commercial Mortgage, Inc. ~ | 4.037 | 11/10/2039 | 4,181,490 |
| 3,000,000 | Banc of America Commercial Mortgage, Inc. ~ | 5.118 | 7/11/2043 | 3,035,070 |
| 10,000,000 | Banc of America Large Loan Trust †‡ ≤ | 5.138 | 1/15/2008 | 9,664,590 |
| 5,000,000 | Banc of America Large Loan Trust †‡ ≤ | 5.238 | 1/15/2008 | 4,870,015 |
| 3,000,000 | Bear Stearns Commercial Mortgage Securities, Inc. †‡ | 5.178 | 1/15/2008 | 2,883,102 |
| 600,061 | Citigroup Commercial Mortgage Trust † ≤ | 5.098 | 1/15/2008 | 580,179 |
| 12,500,000 | Citigroup Commercial Mortgage Trust ±† ≤ | 5.168 | 1/15/2008 | 11,948,412 |
| 10,000,000 | Commercial Mortgage Pass-Through Certificates †‡ ≤ | 5.208 | 1/15/2008 | 9,564,020 |
| 300,218 | Commercial Mortgage Pass-Through Certificates † ≤ | 5.128 | 1/15/2008 | 298,725 |
| 2,000,000 | Commercial Mortgage Pass-Through Certificates †‡ ≤ | 5.158 | 1/15/2008 | 1,876,070 |
| 7,500,000 | Credit Suisse Mortgage Capital Certificates †~ ≤ | 5.198 | 1/15/2008 | 7,230,818 |
| 10,000,000 | Crown Castle International Corporation ~ ≤ | 5.245 | 11/15/2036 | 9,980,600 |
| 10,750,000 | Greenwich Capital Commercial Funding Corporation | 5.867 | 12/10/2049 | 10,797,246 |
| 13,000,000 | J.P. Morgan Chase Commercial Mortgage Securities | 5.882 | 2/15/2051 | 13,447,031 |
| 5,500,000 | J.P. Morgan Chase Commercial Mortgage Securities | |||
| Corporation ‡ | 4.302 | 1/15/2038 | 5,425,079 | |
| 9,954,834 | J.P. Morgan Chase Commercial Mortgage Securities | |||
| Corporation ‡ | 5.284 | 5/15/2047 | 9,975,580 | |
| 10,000,000 | J.P. Morgan Chase Commercial Mortgage Securities | |||
| Corporation ‡ | 5.336 | 5/15/2047 | 9,962,720 | |
| 11,500,000 | J.P. Morgan Chase Commercial Mortgage Securities | |||
| Corporation ~ | 6.007 | 6/15/2049 | 11,899,418 | |
| 6,000,000 | Merrill Lynch Mortgage Trust | 4.747 | 5/12/2043 | 5,745,564 |
| 8,625,000 | Merrill Lynch Mortgage Trust ~ | 5.442 | 1/12/2044 | 8,469,172 |
| 15,000,000 | Wachovia Bank Commercial Mortgage Trust † ≤ | 5.148 | 1/15/2008 | 14,638,005 |
| 7,700,000 | Wachovia Bank Commercial Mortgage Trust | 4.390 | 2/15/2036 | 7,596,674 |
| 13,000,000 | Wachovia Bank Commercial Mortgage Trust | 5.765 | 7/15/2045 | 13,339,690 |
| 2,727,765 | Washington Mutual Asset Securities Corporation ≤ | 3.830 | 1/25/2035 | 2,689,440 |
| Total Commercial Mortgage-Backed Securities | 180,098,710 | |||
| Communications Services (6.2%) | ||||
| 1,225,000 | AT&T Corporation ~ | 8.000 | 11/15/2031 | 1,504,389 |
| 2,100,000 | AT&T, Inc. ~ | 6.500 | 9/1/2037 | 2,195,924 |
| 3,075,000 | British Telecom plc ‡~ | 9.125 | 12/15/2030 | 4,070,147 |
| 1,700,000 | Comcast Corporation | 5.900 | 3/15/2016 | 1,710,355 |
| 2,600,000 | Comcast Corporation ~ | 6.300 | 11/15/2017 | 2,697,570 |
| 5,400,000 | Comcast Corporation | 5.875 | 2/15/2018 | 5,383,730 |
| 6,000,000 | Cox Communications, Inc. ~ | 4.625 | 6/1/2013 | 5,740,260 |
| 1,230,000 | Cox Communications, Inc. ‡ | 5.450 | 12/15/2014 | 1,205,441 |
| 4,550,000 | Idearc, Inc. ~ | 8.000 | 11/15/2016 | 4,174,625 |
| 5,000,000 | Intelsat Intermediate, Inc. > ‡ | Zero Coupon | 2/1/2010 | 4,087,500 |
| 3,850,000 | New Cingular Wireless Services, Inc. ~ | 8.125 | 5/1/2012 | 4,280,888 |
| 1,350,000 | New Cingular Wireless Services, Inc. ~ | 8.750 | 3/1/2031 | 1,749,577 |
| The accompanying Notes to Financial Statements are an integral part of this schedule. |
| 183 |
| Income Portfolio | ||||
| Schedule of Investments as of December 31, 2007 | ||||
| Principal | Interest | Maturity | ||
| Amount | Long-Term Fixed Income (103.0%) | Rate | Date | Value |
| Communications Services — continued | ||||
| $2,140,000 | News America, Inc. | 6.400% | 12/15/2035 | $2,164,922 |
| 2,275,000 | News America, Inc. ≤ | 6.650 | 11/15/2037 | 2,346,608 |
| 4,815,000 | Rogers Cable, Inc. | 5.500 | 3/15/2014 | 4,744,171 |
| 3,555,000 | Rogers Cable, Inc. | 6.750 | 3/15/2015 | 3,739,501 |
| 510,000 | Rogers Cable, Inc. | 8.750 | 5/1/2032 | 640,939 |
| 3,000,000 | Rogers Wireless Communications, Inc. | 6.375 | 3/1/2014 | 3,090,474 |
| 3,200,000 | Rogers Wireless Communications, Inc. ‡ | 7.500 | 3/15/2015 | 3,499,472 |
| 4,600,000 | Sprint Capital Corporation | 6.900 | 5/1/2019 | 4,569,484 |
| 5,450,000 | Telecom Italia Capital SA | 5.250 | 11/15/2013 | 5,386,398 |
| 2,750,000 | Telecom Italia Capital SA | 5.250 | 10/1/2015 | 2,679,185 |
| 4,400,000 | Telefonica Emisones SAU | 6.221 | 7/3/2017 | 4,571,565 |
| 3,500,000 | Time Warner Cable, Inc. * | 5.850 | 5/1/2017 | 3,508,638 |
| 1,850,000 | Time Warner Entertainment Company, LP | 8.375 | 3/15/2023 | 2,179,106 |
| 4,555,000 | Verizon Communications, Inc. * | 5.550 | 2/15/2016 | 4,603,884 |
| 1,835,000 | Verizon Communications, Inc. | 5.500 | 4/1/2017 | 1,843,540 |
| Total Communications Services | 88,368,293 | |||
| Consumer Cyclical (2.0%) | ||||
| 6,500,000 | D.R. Horton, Inc. ‡ | 5.375 | 6/15/2012 | 5,636,456 |
| 2,300,000 | Federated Retail Holdings, Inc. | 5.350 | 3/15/2012 | 2,240,881 |
| 3,150,000 | Ford Motor Credit Company ± | 6.625 | 6/16/2008 | 3,104,104 |
| 1,200,000 | JC Penney & Company, Inc. ± | 7.950 | 4/1/2017 | 1,299,343 |
| 490,000 | JC Penney Corporation, Inc. | 5.750 | 2/15/2018 | 460,264 |
| 2,140,000 | JC Penney Corporation, Inc. * | 6.375 | 10/15/2036 | 1,912,334 |
| 4,200,000 | McDonald’s Corporation | 5.800 | 10/15/2017 | 4,348,588 |
| 4,100,000 | Nissan Motor Acceptance Corporation ~ ≤ | 5.625 | 3/14/2011 | 4,222,467 |
| 2,600,000 | Station Casinos, Inc. | 6.875 | 3/1/2016 | 1,898,000 |
| 3,025,000 | Walmart Stores, Inc. ± | 5.875 | 4/5/2027 | 2,975,066 |
| Total Consumer Cyclical | 28,097,503 | |||
| Consumer Non-Cyclical (4.9%) | ||||
| 5,800,000 | Abbott Laboratories ‡ | 5.150 | 11/30/2012 | 5,927,873 |
| 1,200,000 | AmerisourceBergen Corporation ~ | 5.625 | 9/15/2012 | 1,216,970 |
| 3,000,000 | AmerisourceBergen Corporation ~ | 5.875 | 9/15/2015 | 2,943,579 |
| 2,070,000 | Archer-Daniels-Midland Company | 6.450 | 1/15/2038 | 2,151,359 |
| 8,300,000 | AstraZeneca plc ‡ | 5.400 | 9/15/2012 | 8,580,938 |
| 3,325,000 | Baxter International, Inc. ~ | 5.900 | 9/1/2016 | 3,454,805 |
| 6,000,000 | Bunge Limited Finance Corporation ‡ | 5.350 | 4/15/2014 | 5,809,380 |
| 6,500,000 | Cargill, Inc. ~ ≤ | 5.600 | 9/15/2012 | 6,606,535 |
| 3,600,000 | Community Health Systems, Inc. | 8.875 | 7/15/2015 | 3,667,500 |
| 3,500,000 | General Mills, Inc. ‡ | 5.650 | 9/10/2012 | 3,557,110 |
| 3,800,000 | Johnson & Johnson Company ‡ | 5.950 | 8/15/2037 | 4,100,975 |
| 2,500,000 | Kroger Company ‡ | 6.400 | 8/15/2017 | 2,614,782 |
| 1,600,000 | Safeway, Inc. | 6.350 | 8/15/2017 | 1,667,626 |
| 3,000,000 | Schering-Plough Corporation | 6.000 | 9/15/2017 | 3,108,093 |
| 6,000,000 | Tesco plc ≤ | 5.500 | 11/15/2017 | 5,984,208 |
| 6,750,000 | Wyeth ‡ | 6.950 | 3/15/2011 | 7,192,192 |
| 1,425,000 | Wyeth | 5.950 | 4/1/2037 | 1,428,781 |
| Total Consumer Non-Cyclical | 70,012,706 | |||
| The accompanying Notes to Financial Statements are an integral part of this schedule. |
| 184 |
| Income Portfolio | ||||
| Schedule of Investments as of December 31, 2007 | ||||
| Principal | Interest | Maturity | ||
| Amount | Long-Term Fixed Income (103.0%) | Rate | Date | Value |
| Energy (6.6%) | ||||
| $4,145,000 | Apache Corporation ~ | 5.250% | 4/15/2013 | $4,242,627 |
| 6,850,000 | CenterPoint Energy Resources Corporation ‡ | 6.125 | 11/1/2017 | 6,971,170 |
| 1,550,000 | Consolidated Natural Gas Company | 5.000 | 12/1/2014 | 1,490,037 |
| 4,800,000 | Enterprise Products Operating, LP ± | 5.600 | 10/15/2014 | 4,790,371 |
| 4,000,000 | Enterprise Products Operating, LP ‡ | 6.300 | 9/15/2017 | 4,092,632 |
| 4,500,000 | EOG Resources, Inc. | 5.875 | 9/15/2017 | 4,613,535 |
| 2,700,000 | Magellan Midstream Partners, LP | 6.450 | 6/1/2014 | 2,898,347 |
| 2,900,000 | Marathon Oil Corporation | 6.000 | 10/1/2017 | 2,953,169 |
| 1,100,000 | Nexen, Inc. ‡ | 5.650 | 5/15/2017 | 1,085,467 |
| 3,075,000 | Nexen, Inc. ‡ | 6.400 | 5/15/2037 | 3,069,840 |
| 3,250,000 | Oneok Partners, LP | 6.850 | 10/15/2037 | 3,371,345 |
| 3,250,000 | Plains All American Pipeline, LP/PAA Finance | |||
| Corporation ± | 6.650 | 1/15/2037 | 3,270,784 | |
| 2,500,000 | Premcor Refining Group, Inc. ± | 6.125 | 5/1/2011 | 2,610,698 |
| 2,800,000 | Premcor Refining Group, Inc. ± | 6.750 | 5/1/2014 | 2,877,837 |
| 8,350,000 | Ras Laffan Liquefied Natural Gas Company, Ltd. II ≤ | 5.298 | 9/30/2020 | 8,104,176 |
| 3,000,000 | Southern Natural Gas Company ≤ | 5.900 | 4/1/2017 | 2,950,701 |
| 3,600,000 | Southern Star Central Corporation | 6.750 | 3/1/2016 | 3,447,000 |
| 3,000,000 | Transcontinental Gas Pipe Corporation | 8.875 | 7/15/2012 | 3,390,000 |
| 900,000 | Transcontinental Gas Pipe Corporation | 6.400 | 4/15/2016 | 923,625 |
| 5,400,000 | Transocean, Inc. | 6.000 | 3/15/2018 | 5,385,593 |
| 3,500,000 | Valero Energy Corporation | 6.125 | 6/15/2017 | 3,556,928 |
| 1,200,000 | Valero Energy Corporation | 6.625 | 6/15/2037 | 1,208,488 |
| 8,400,000 | Western Oil Sands, Inc. | 8.375 | 5/1/2012 | 9,368,570 |
| 3,100,000 | XTO Energy, Inc. | 5.300 | 6/30/2015 | 3,086,016 |
| 3,100,000 | XTO Energy, Inc. | 6.250 | 8/1/2017 | 3,252,269 |
| Total Energy | 93,011,225 | |||
| Financials (21.9%) | ||||
| 2,250,000 | American Express Bank FSB ‡ | 6.000 | 9/13/2017 | 2,262,539 |
| 2,800,000 | American Express Centurion Bank ‡ | 5.550 | 10/17/2012 | 2,849,168 |
| 4,000,000 | American Express Company ~ | 6.150 | 8/28/2017 | 4,105,096 |
| 3,800,000 | American International Group, Inc. ~ | 6.250 | 3/15/2037 | 3,398,792 |
| 3,900,000 | AXA SA ‡ ≤ | 6.463 | 12/14/2018 | 3,511,841 |
| 1,030,000 | BAC Capital Trust XI | 6.625 | 5/23/2036 | 1,002,071 |
| 3,800,000 | BAC Capital Trust XIV ~ | 5.630 | 3/15/2012 | 3,372,158 |
| 3,000,000 | Bank of America Corporation ~ | 6.000 | 9/1/2017 | 3,065,016 |
| 600,000 | Bank of America Corporation | 5.750 | 12/1/2017 | 601,376 |
| 3,800,000 | Bear Stearns Companies, Inc. ‡ | 6.400 | 10/2/2017 | 3,671,408 |
| 3,350,000 | BNP Paribas SA ~ ≤ | 5.186 | 6/29/2015 | 3,048,912 |
| 1,115,000 | Capital One Capital III | 7.686 | 8/15/2036 | 906,677 |
| 6,000,000 | Capmark Financial Group, Inc. ‡ ≤ | 6.300 | 5/10/2017 | 4,472,778 |
| 6,400,000 | CIT Group, Inc. ~ | 7.625 | 11/30/2012 | 6,487,078 |
| 1,900,000 | Citigroup Capital XXI | 8.300 | 12/21/2037 | 1,983,963 |
| 3,800,000 | Citigroup, Inc. ~ | 6.000 | 8/15/2017 | 3,876,904 |
| 3,000,000 | Corestates Capital Trust I ± ≤ | 8.000 | 12/15/2026 | 3,105,960 |
| 7,250,000 | Countrywide Financial Corporation | 5.800 | 6/7/2012 | 5,296,118 |
| 14,175,000 | Countrywide Financial Corporation, Convertible †~ ≤ | 1.743 | 1/15/2008 | 11,053,665 |
| 1,800,000 | Coventry Health Care, Inc. ‡ | 5.875 | 1/15/2012 | 1,829,909 |
| The accompanying Notes to Financial Statements are an integral part of this schedule. |
| 185 |
| Income Portfolio | ||||
| Schedule of Investments as of December 31, 2007 | ||||
| Principal | Interest | Maturity | ||
| Amount | Long-Term Fixed Income (103.0%) | Rate | Date | Value |
| Financials — continued | ||||
| $1,500,000 | Coventry Health Care, Inc. ‡ | 6.125% | 1/15/2015 | $1,505,224 |
| 1,500,000 | Coventry Health Care, Inc. ‡ | 5.950 | 3/15/2017 | 1,470,766 |
| 3,600,000 | Credit Agricole SA ‡ ≤ | 6.637 | 5/31/2017 | 3,339,904 |
| 4,200,000 | Endurance Specialty Holdings, Ltd. | 6.150 | 10/15/2015 | 4,111,380 |
| 2,500,000 | ERP Operating, LP ±~ | 5.125 | 3/15/2016 | 2,325,995 |
| 2,375,000 | General Electric Capital Corporation ~ | 5.720 | 8/22/2011 | 2,389,689 |
| 5,000,000 | General Electric Capital Corporation ± | 4.375 | 3/3/2012 | 4,946,090 |
| 2,800,000 | General Electric Capital Corporation ± | 5.625 | 9/15/2017 | 2,872,733 |
| 4,500,000 | General Electric Capital Corporation * | 6.375 | 11/15/2017 | 4,646,169 |
| 1,300,000 | General Electric Capital Corporation | 6.150 | 8/7/2037 | 1,381,158 |
| 5,150,000 | General Motors Acceptance Corporation, LLC ± | 6.875 | 9/15/2011 | 4,405,794 |
| 7,200,000 | General Motors Acceptance Corporation, LLC ‡ | 6.000 | 12/15/2011 | 6,038,496 |
| 6,500,000 | Goldman Sachs Group, Inc. ~ | 6.600 | 1/15/2012 | 6,876,994 |
| 5,500,000 | Goldman Sachs Group, Inc. ‡ | 5.125 | 1/15/2015 | 5,402,925 |
| 1,300,000 | Goldman Sachs Group, Inc. | 6.750 | 10/1/2037 | 1,273,711 |
| 4,000,000 | HSBC Capital Funding, LP/Jersey Channel Islands ≤ | 9.547 | 6/30/2010 | 4,371,932 |
| 1,220,000 | HSBC Holdings plc ± | 6.500 | 5/2/2036 | 1,186,054 |
| 3,250,000 | International Lease Finance Corporation | 5.750 | 6/15/2011 | 3,290,762 |
| 5,185,000 | iStar Financial, Inc. ~ | 5.850 | 3/15/2017 | 4,261,790 |
| 2,800,000 | J.P. Morgan Chase & Company ‡ | 5.750 | 1/2/2013 | 2,853,354 |
| 4,410,000 | J.P. Morgan Chase Bank NA | 5.875 | 6/13/2016 | 4,443,340 |
| 8,250,000 | Keybank National Association | 5.500 | 9/17/2012 | 8,387,132 |
| 3,500,000 | Lehman Brothers Holdings, Inc. | 5.250 | 2/6/2012 | 3,463,208 |
| 5,500,000 | Lehman Brothers Holdings, Inc. ~ | 6.000 | 7/19/2012 | 5,600,287 |
| 2,800,000 | Lehman Brothers Holdings, Inc. | 7.000 | 9/27/2027 | 2,841,868 |
| 2,840,000 | Liberty Property, LP ~ | 5.500 | 12/15/2016 | 2,657,172 |
| 5,980,000 | Lincoln National Corporation ‡ | 7.000 | 5/17/2016 | 6,004,058 |
| 1,350,000 | Merrill Lynch & Company, Inc. ‡ | 6.110 | 1/29/2037 | 1,192,306 |
| 6,730,000 | Mitsubishi UFG Capital Finance, Ltd. | 6.346 | 7/25/2016 | 6,374,212 |
| 2,400,000 | Morgan Stanley ~ | 4.000 | 1/15/2010 | 2,359,963 |
| 1,750,000 | Morgan Stanley ‡ | 6.250 | 8/28/2017 | 1,779,055 |
| 4,500,000 | Morgan Stanley | 5.950 | 12/28/2017 | 4,496,792 |
| 3,630,000 | Morgan Stanley * | 6.250 | 8/9/2026 | 3,543,410 |
| 7,150,000 | Nationwide Health Properties, Inc. ‡ | 6.250 | 2/1/2013 | 7,419,920 |
| 5,740,140 | Preferred Term Securities XXIII, Ltd. ±† ≤ | 5.191 | 3/24/2008 | 5,504,794 |
| 2,670,000 | ProLogis ± | 5.500 | 4/1/2012 | 2,660,754 |
| 2,600,000 | ProLogis ± | 5.625 | 11/15/2015 | 2,487,074 |
| 2,900,000 | Prudential Financial, Inc. | 6.000 | 12/1/2017 | 2,888,040 |
| 1,095,000 | Prudential Financial, Inc. ± | 5.900 | 3/17/2036 | 996,049 |
| 1,120,000 | Prudential Financial, Inc. | 5.700 | 12/14/2036 | 993,158 |
| 2,400,000 | QBE Capital Funding II, LP ≤ | 6.797 | 6/1/2017 | 2,298,161 |
| 3,750,000 | RBS Capital Trust I ~ | 5.512 | 9/30/2014 | 3,447,375 |
| 2,500,000 | Regency Centers, LP ± | 5.875 | 6/15/2017 | 2,415,852 |
| 4,785,000 | Reinsurance Group of America, Inc. | 5.625 | 3/15/2017 | 4,813,485 |
| 6,800,000 | Residential Capital Corporation * | 8.000 | 4/17/2013 | 4,182,000 |
| 7,775,000 | Residential Capital, LLC ‡ | 8.000 | 6/1/2012 | 4,781,625 |
| 6,000,000 | Resona Bank, Ltd. ≤ | 5.850 | 4/15/2016 | 5,577,912 |
| 1,300,000 | Santander Perpetual SA Unipersonal ≤ | 6.671 | 10/24/2017 | 1,303,494 |
| 3,500,000 | Simon Property Group, LP | 4.600 | 6/15/2010 | 3,479,220 |
| The accompanying Notes to Financial Statements are an integral part of this schedule. |
| 186 |
| Income Portfolio | ||||
| Schedule of Investments as of December 31, 2007 | ||||
| Principal | Interest | Maturity | ||
| Amount | Long-Term Fixed Income (103.0%) | Rate | Date | Value |
| Financials — continued | ||||
| $2,100,000 | Simon Property Group, LP | 5.375% | 6/1/2011 | $2,073,431 |
| 2,280,000 | Simon Property Group, LP | 5.750 | 12/1/2015 | 2,214,459 |
| 4,700,000 | SLM Corporation | 5.400 | 10/25/2011 | 4,283,561 |
| 3,660,000 | SMFG Preferred Capital GBP 1, Ltd. ≤ | 6.078 | 1/25/2017 | 3,371,665 |
| 6,630,000 | Student Loan Marketing Corporation ‡ | 4.500 | 7/26/2010 | 6,081,023 |
| 4,200,000 | Swiss RE Capital I, LP ≤ | 6.854 | 5/25/2016 | 4,126,844 |
| 995,000 | Travelers Companies, Inc. ~ | 6.250 | 6/15/2037 | 963,769 |
| 3,000,000 | Travelers Property Casualty Corporation | 5.000 | 3/15/2013 | 2,998,110 |
| 2,500,000 | UnitedHealth Group, Inc. ≤ | 6.500 | 6/15/2037 | 2,509,692 |
| 3,800,000 | UnitedHealth Group, Inc. ≤ | 6.000 | 11/15/2017 | 3,850,517 |
| 3,825,000 | Wachovia Bank NA | 4.875 | 2/1/2015 | 3,641,239 |
| 1,275,000 | Wachovia Bank NA | 6.600 | 1/15/2038 | 1,281,400 |
| 3,585,000 | Wachovia Capital Trust III | 5.800 | 3/15/2011 | 3,203,377 |
| 3,650,000 | Wachovia Corporation ± | 5.300 | 10/15/2011 | 3,658,114 |
| 1,720,000 | Washington Mutual Bank FA | 5.125 | 1/15/2015 | 1,456,855 |
| 1,340,000 | Washington Mutual Preferred Funding ≤ | 6.665 | 12/15/2016 | 790,600 |
| 7,400,000 | Washington Mutual Preferred Funding II ≤ | 6.895 | 6/15/2012 | 4,366,000 |
| 6,000,000 | WellPoint, Inc. ± | 5.000 | 12/15/2014 | 5,747,466 |
| 2,000,000 | Wells Fargo & Company | 5.625 | 12/11/2017 | 2,001,222 |
| 4,600,000 | Willis North America, Inc. ± | 6.200 | 3/28/2017 | 4,589,875 |
| Total Financials | 310,453,284 | |||
| Foreign (0.3%) | ||||
| 3,900,000 | Pemex Finance, Ltd. | 9.030 | 2/15/2011 | 4,124,250 |
| Total Foreign | 4,124,250 | |||
| Mortgage-Backed Securities (10.7%) | ||||
| 6,500,000 | Federal National Mortgage Association Conventional | |||
| 30-Yr. Pass Through §~ | 5.500 | 1/1/2038 | 6,491,875 | |
| 94,000,000 | Federal National Mortgage Association Conventional | |||
| 30-Yr. Pass Through § | 6.000 | 1/1/2038 | 95,439,333 | |
| 48,000,000 | Federal National Mortgage Association Conventional | |||
| 30-Yr. Pass Through § | 6.500 | 1/1/2038 | 49,334,976 | |
| Total Mortgage-Backed Securities | 151,266,184 | |||
| Technology (0.6%) | ||||
| 6,500,000 | IBM International Group Capital, LLC | 5.050 | 10/22/2012 | 6,621,452 |
| 2,250,000 | International Business Machines Corporation | 5.700 | 9/14/2017 | 2,325,964 |
| Total Technology | 8,947,416 | |||
| Transportation (4.0%) | ||||
| 2,800,000 | Burlington Northern Santa Fe Corporation ‡ | 7.000 | 12/15/2025 | 3,011,910 |
| 648,047 | Continental Airlines, Inc. ~ | 7.875 | 7/2/2018 | 617,265 |
| 3,250,000 | Continental Airlines, Inc. ~ | 5.983 | 4/19/2022 | 3,037,418 |
| 6,500,000 | Delta Air Lines, Inc. ‡ | 7.111 | 9/18/2011 | 6,500,000 |
| 2,000,000 | FedEx Corporation ± | 3.500 | 4/1/2009 | 1,967,684 |
| 3,706,811 | FedEx Corporation ‡ | 6.845 | 1/15/2019 | 4,192,811 |
| 3,409,033 | FedEx Corporation | 6.720 | 1/15/2022 | 3,634,697 |
| 2,750,000 | Hertz Corporation ‡ | 8.875 | 1/1/2014 | 2,787,812 |
| The accompanying Notes to Financial Statements are an integral part of this schedule. |
| 187 |
| Income Portfolio | ||||
| Schedule of Investments as of December 31, 2007 | ||||
| Principal | Interest | Maturity | ||
| Amount | Long-Term Fixed Income (103.0%) | Rate | Date | Value |
| Transportation — continued | ||||
| $5,850,000 | Kansas City Southern de Mexico SA de CV ‡ ≤ | 7.375% | 6/1/2014 | $5,689,125 |
| 10,200,000 | Northwest Airlines, Inc. ‡ | 6.841 | 4/1/2011 | 10,113,963 |
| 4,522,705 | Piper Jaffray Equipment Trust Securities ± ≤ | 6.750 | 4/1/2011 | 4,341,796 |
| 11,000,000 | Union Pacific Corporation | 5.450 | 1/31/2013 | 11,095,931 |
| Total Transportation | 56,990,412 | |||
| U.S. Government (9.4%) | ||||
| 14,000,000 | Federal Home Loan Bank Discount Notes * | 4.625 | 10/10/2012 | 14,409,234 |
| 5,000,000 | Federal Home Loan Mortgage Corporation * | 4.625 | 10/25/2012 | 5,148,610 |
| 5,000,000 | Federal Home Loan Mortgage Corporation * | 5.000 | 12/14/2018 | 5,026,160 |
| 22,500,000 | Federal National Mortgage Association * | 5.300 | 2/22/2011 | 22,510,058 |
| 6,000,000 | U.S. Treasury Bonds * | 6.250 | 8/15/2023 | 7,183,596 |
| 5,600,000 | U.S. Treasury Notes * | 4.625 | 8/31/2011 | 5,862,500 |
| 3,775,000 | U.S. Treasury Notes * | 4.250 | 11/15/2014 | 3,894,445 |
| 1,645,000 | U.S. Treasury Notes * | 4.250 | 11/15/2017 | 1,673,659 |
| 36,852,970 | U.S. Treasury Notes, TIPS * | 2.000 | 7/15/2014 | 38,076,599 |
| 12,750,000 | U.S. Treasury Principal Strips * | Zero Coupon | 2/15/2013 | 10,652,459 |
| 38,000,000 | U.S. Treasury Principal Strips ‡ | Zero Coupon | 11/15/2022 | 19,098,040 |
| Total U.S. Government | 133,535,360 | |||
| U.S. Municipals (1.3%) | ||||
| 5,900,000 | California Infrastructure & Economic Bank Revenue | |||
| Bonds ÷~ | 5.000 | 7/1/2036 | 6,441,797 | |
| 4,500,000 | Little Rock, Arkansas Sewer Revenue Bonds | 5.000 | 10/1/2037 | 4,704,480 |
| 6,500,000 | Missouri Joint Municipal Electric Utility Commission | |||
| Revenue Bonds (Power Project) | 5.000 | 1/1/2032 | 6,752,785 | |
| Total U.S. Municipals | 17,899,062 | |||
| Utilities (5.6%) | ||||
| 3,000,000 | Baltimore Gas & Electric Company ~ | 5.900 | 10/1/2016 | 3,013,092 |
| 2,500,000 | Carolina Power & Light, Inc. ‡ | 5.150 | 4/1/2015 | 2,479,848 |
| 3,950,000 | Cleveland Electric Illuminating Company ± ≤ | 7.430 | 11/1/2009 | 4,120,996 |
| 1,775,000 | Cleveland Electric Illuminating Company ± | 5.700 | 4/1/2017 | 1,733,280 |
| 2,930,000 | Commonwealth Edison Company | 5.400 | 12/15/2011 | 2,961,081 |
| 3,500,000 | Commonwealth Edison Company ‡ | 7.500 | 7/1/2013 | 3,736,817 |
| 1,500,000 | Commonwealth Edison Company | 6.150 | 9/15/2017 | 1,545,771 |
| 2,500,000 | DTE Energy Company ‡ | 6.375 | 4/15/2033 | 2,510,018 |
| 1,500,000 | Exelon Corporation ~ | 6.750 | 5/1/2011 | 1,567,732 |
| 3,500,000 | Exelon Corporation ± | 4.900 | 6/15/2015 | 3,294,610 |
| 3,600,000 | Illinois Power Company ≤ | 6.125 | 11/15/2017 | 3,637,087 |
| 3,000,000 | ITC Holdings Corporation ≤ | 5.875 | 9/30/2016 | 3,008,013 |
| 2,400,000 | MidAmerican Energy Holdings Company ‡ | 6.125 | 4/1/2036 | 2,394,283 |
| 3,350,000 | MidAmerican Energy Holdings Company | 6.500 | 9/15/2037 | 3,498,358 |
| 2,800,000 | Nevada Power Company * | 6.750 | 7/1/2037 | 2,894,343 |
| 6,450,000 | NiSource Finance Corporation | 7.875 | 11/15/2010 | 6,842,289 |
| 2,800,000 | NiSource Finance Corporation ‡ | 6.400 | 3/15/2018 | 2,793,703 |
| 2,000,000 | NRG Energy, Inc. | 7.250 | 2/1/2014 | 1,950,000 |
| 1,500,000 | NRG Energy, Inc. | 7.375 | 2/1/2016 | 1,462,500 |
| The accompanying Notes to Financial Statements are an integral part of this schedule. |
| 188 |
| Income Portfolio | ||||
| Schedule of Investments as of December 31, 2007 | ||||
| Principal | Interest | Maturity | ||
| Amount | Long-Term Fixed Income (103.0%) | Rate | Date | Value |
| Utilities — continued | ||||
| $1,550,000 | Ohio Edison Company ± | 6.875% | 7/15/2036 | $1,601,967 |
| 1,662,471 | Power Contract Financing, LLC ± ≤ | 6.256 | 2/1/2010 | 1,697,782 |
| 2,977,415 | Power Receivables Finance, LLC ± ≤ | 6.290 | 1/1/2012 | 3,108,421 |
| 1,075,000 | Progress Energy, Inc. ± | 7.000 | 10/30/2031 | 1,172,397 |
| 4,800,000 | PSEG Power, LLC ± | 5.000 | 4/1/2014 | 4,599,893 |
| 2,270,000 | PSI Energy, Inc. ± | 5.000 | 9/15/2013 | 2,222,098 |
| 2,770,000 | Southwestern Public Service Company | 6.000 | 10/1/2036 | 2,603,465 |
| 1,345,000 | TXU Corporation | 5.550 | 11/15/2014 | 1,073,556 |
| 2,900,000 | Union Electric Company ± | 6.400 | 6/15/2017 | 3,039,255 |
| 1,300,000 | Virginia Electric and Power Company | 5.950 | 9/15/2017 | 1,340,040 |
| 1,300,000 | Virginia Electric and Power Company | 6.350 | 11/30/2037 | 1,333,108 |
| Total Utilities | 79,235,803 | |||
| Total Long-Term Fixed Income (cost $1,476,483,104) | 1,460,864,652 | |||
| Shares | Preferred Stock (0.4%) | Value | ||
| 44,000 | Federal Home Loan Mortgage Corporation # | $1,150,600 | ||
| 160,000 | Federal National Mortgage Association # | 4,120,000 | ||
| Total Preferred Stock | ||||
| (cost $5,130,900) | 5,270,600 | |||
| Strike | Expiration | |||
| Contracts | Options Purchased (0.2%) | Price | Date | Value |
| 2,125 | Call on U.S. Treasury Bond Futures | $113 | 2/22/2008 | $3,320,312 |
| Total Options Purchased (cost $4,057,156) | 3,320,312 | |||
| Interest | Maturity | |||
| Shares | Collateral Held for Securities Loaned (9.3%) | Rate (+) | Date | Value |
| 132,421,350 | Thrivent Financial Securities Lending Trust | 5.000% | N/A | $132,421,350 |
| Total Collateral Held for Securities Loaned | ||||
| (cost $132,421,350) | 132,421,350 | |||
| The accompanying Notes to Financial Statements are an integral part of this schedule. |
| 189 |
| Income Portfolio | ||||
| Schedule of Investments as of December 31, 2007 | ||||
| Shares or | ||||
| Principal | Interest | Maturity | ||
| Amount | Short-Term Investments (6.1%) | Rate (+) | Date | Value |
| $36,040,000 | Barclays Bank PLC Repurchase Agreement ■ | 4.350% | 1/2/2008 | $36,040,000 |
| 15,000,000 | Cofco Capital Company | 4.900 | 1/10/2008 | 14,981,625 |
| 11,270,000 | ED&F Man Treasury Management plc | 4.600 | 1/7/2008 | 11,261,360 |
| 600,000 | Federal National Mortgage Association ‡ | 4.030 | 5/16/2008 | 590,820 |
| 23,481,154 | Thrivent Money Market Portfolio | 4.930 | N/A | 23,481,154 |
| Total Short-Term Investments (cost $86,355,063) | 86,354,959 | |||
| Total Investments (cost $1,704,447,573) 119.0% | $1,688,231,873 | |||
| Other Assets and Liabilities, Net (19.0%) | (269,947,274) | |||
| Total Net Assets 100.0% | $1,418,284,599 | |||
| Number of | Notional | ||||
| Contracts | Expiration | Principal | Unrealized | ||
| Futures | Long/(Short) | Date | Amount | Value | Gain/(Loss) |
| 5-Yr. U.S. Treasury Bond Futures | 875 | March 2008 | $95,631,967 | $96,496,094 | $864,127 |
| 10-Yr. U.S. Treasury Bond Futures | (995) | March 2008 | (112,089,490) | (112,823,677) | (734,187) |
| 20-Yr. U.S. Treasury Bond Futures | (435) | March 2008 | (51,165,901) | (50,623,125) | 542,776 |
| EURO Foreign Exchange Currency Futures | (57) | March 2008 | (10,460,640) | (10,395,375) | 65,265 |
| Total Futures | $737,981 | ||||
| Number of | Exercise | Expiration | Unrealized | ||
| Call Options Written | Contracts | Price | Date | Value | Gain/(Loss) |
| Federal National Mortgage Association | 6.50 | $99.92 | January 2008 | ($6,906) | $18,992 |
| Conventional 30-Yr. Pass Through | |||||
| Total Call Options Written | $18,992 | ||||
| The accompanying Notes to Financial Statements are an integral part of this schedule. |
| 190 |
| Income Portfolio | |||||
| Schedule of Investments as of December 31, 2007 | |||||
| Notional | |||||
| Buy/Sell | Termination | Principal | Unrealized | ||
| Swaps and Counterparty | Protection | Date | Amount | Value | Gain/(Loss) |
| Credit Default Swaps | |||||
| LCDX North America, 5 Year, | Sell | December 2012 | $16,000,000 | ($502,901) | ($84,055) |
| Series 9, at 2.25%; | |||||
| J.P. Morgan Chase and Co. | |||||
| Total Swaps | ($502,901) | ($84,055) | |||
# Non-income producing security.
* All or a portion of the security is on loan as discussed in item 2(M) of the Notes to Financial Statements.
+ The interest rate shown reflects the yield, coupon rate or, for securities purchased at a discount, the discount rate at the date of purchase
> Denotes step coupon bonds for which the current interest rate and next scheduled reset date are shown.
† Denotes variable rate obligations for which the current yield and next scheduled reset date are shown.
§ Denotes investments purchased on a when-issued or delayed delivery basis.
± Designated as cover for long settling trades as discussed in the Notes to Financial Statements.
‡ At December 31, 2007, $1,759,030 of investments were held on deposit with the counterparty and pledged as the initial margin deposit for open financial futures contracts. In addition, $284,009,226 and $23,826,029 of investments were earmarked as collateral to cover open financial futures contracts and swap contracts, respectively.
~ All or a portion of the security was earmarked as collateral to cover options.
÷ Denotes securities that have been pre-refunded or escrowed to maturity. Under such an arrangement, money is deposited into an irrevocable escrow account and is used to purchase U.S. Treasury securities or government agency securities with maturing principals and interest earnings sufficient to pay all debt service requirements of the pre-refunded bonds.
≤ Denotes securities sold under Rule 144A of the Securities Act of 1933, which exempts them from registration. These securities have been determined to be liquid under the guidelines established by the Portfolio’s Board of Directors and may be resold to other dealers in the program or to other qualified institutional buyers. As of December 31, 2007, the value of these investments was $217,993,216 or 15.4% of total net assets.
« All or a portion of the security is insured or guaranteed.
■ Repurchase agreement dated December 31, 2007, $36,048,710 maturing January 2, 2008, collateralized by $36,734,005 Federal Home Loan Bank, 5.05% due November 19, 2012.
Definitions:
TIPS — Treasury Inflation Protected Security.
Gross unrealized appreciation and depreciation of investments, based on cost for federal income tax purposes, were as follows:
| Gross unrealized appreciation | $19,809,358 | |
| Gross unrealized depreciation | (36,214,181) | |
| Net unrealized appreciation (depreciation) | ($16,404,823) | |
| Cost for federal income tax purposes | $1,704,636,696 |
| The accompanying Notes to Financial Statements are an integral part of this schedule. |
| 191 |
| Bond Index Portfolio | ||||
| Schedule of Investments as of December 31, 2007 | ||||
| Principal | Interest | Maturity | ||
| Amount | Long-Term Fixed Income (120.4%) | Rate | Date | Value |
| Asset-Backed Securities (16.3%) | ||||
| $2,000,000 | Americredit Automobile Receivables Trust ±†« | 5.332% | 1/6/2008 | $1,977,154 |
| 632,520 | Bear Stearns Asset-Backed Securities, Inc. ±† | 5.105 | 1/25/2008 | 630,862 |
| 873,485 | Bear Stearns Mortgage Funding Trust † | 5.005 | 1/25/2008 | 412,078 |
| 2,386,218 | Countrywide Asset-Backed Certificates ±« | 5.549 | 4/25/2036 | 2,329,185 |
| 750,000 | Countrywide Home Loans Asset-Backed Securities « | 6.085 | 6/25/2021 | 665,900 |
| 2,500,000 | Credit Based Asset Servicing and Securitization, LLC ±† | 4.975 | 1/25/2008 | 2,459,592 |
| 1,250,000 | Credit Based Asset Servicing and Securitization, LLC ± | 5.501 | 12/25/2036 | 1,234,595 |
| 2,500,000 | DaimlerChrysler Master Owner Trust ±† | 5.078 | 1/15/2008 | 2,498,980 |
| 1,200,000 | Discover Card Master Trust | 5.650 | 3/16/2020 | 1,198,484 |
| 1,500,000 | First Franklin Mortgage Loan Asset-Backed Certificates † | 4.975 | 1/25/2008 | 1,459,028 |
| 1,956,602 | First Horizon ABS Trust †« | 4.995 | 1/25/2008 | 1,707,597 |
| 1,637,041 | First Horizon ABS Trust ±†« | 5.025 | 1/25/2008 | 1,339,224 |
| 1,500,000 | Ford Credit Floor Plan Master Owner Trust † | 5.208 | 1/15/2008 | 1,476,150 |
| 2,000,000 | GE Dealer Floorplan Master Note Trust ±† | 4.989 | 1/20/2008 | 1,999,598 |
| 3,000,000 | GMAC Mortgage Corporation Loan Trust ±†« | 4.935 | 1/25/2008 | 2,982,693 |
| 2,500,000 | GMAC Mortgage Corporation Loan Trust ±†« | 4.955 | 1/25/2008 | 2,494,142 |
| 42,875 | Green Tree Financial Corporation ± | 6.330 | 11/1/2029 | 43,399 |
| 1,614,356 | IndyMac Seconds Asset-Backed Trust †« | 5.035 | 1/25/2008 | 1,514,738 |
| 282,278 | Massachusetts RRB Special Purpose Trust ± | 3.780 | 9/15/2010 | 281,404 |
| 765,928 | National Collegiate Student Loan Trust † | 4.925 | 1/25/2008 | 766,413 |
| 9,034 | Popular ABS Mortgage Pass-Through Trust † | 4.995 | 1/25/2008 | 9,033 |
| 1,488,437 | Residential Funding Mortgage Securities II †« | 4.995 | 1/25/2008 | 1,465,807 |
| 482,613 | SLM Student Loan Trust † | 5.094 | 1/25/2008 | 482,038 |
| 2,000,000 | Textron Financial Floorplan Master Note Trust ±† ≤ « | 5.324 | 1/13/2008 | 1,999,752 |
| 1,793,944 | Wachovia Asset Securitization, Inc. † ≤ | 5.005 | 1/25/2008 | 1,638,739 |
| Total Asset-Backed Securities | 35,066,585 | |||
| Basic Materials (0.7%) | ||||
| 500,000 | Alcan, Inc. ± | 5.200 | 1/15/2014 | 502,630 |
| 275,000 | Alcan, Inc. | 6.125 | 12/15/2033 | 266,828 |
| 300,000 | Codelco, Inc. ± ≤ | 6.375 | 11/30/2012 | 321,107 |
| 27,000 | Dow Chemical Company | 7.375 | 11/1/2029 | 29,698 |
| 300,000 | Potash Corporation of Saskatchewan, Inc. ± | 7.750 | 5/31/2011 | 325,628 |
| Total Basic Materials | 1,445,891 | |||
| Capital Goods (1.4%) | ||||
| 975,000 | Boeing Capital Corporation ± | 6.100 | 3/1/2011 | 1,021,960 |
| 275,000 | Caterpillar, Inc. ± | 4.500 | 6/15/2009 | 275,100 |
| 800,000 | General Electric Company ± | 5.000 | 2/1/2013 | 810,178 |
| 350,000 | John Deere Capital Corporation ± | 7.000 | 3/15/2012 | 381,110 |
| 27,000 | Lockheed Martin Corporation | 6.150 | 9/1/2036 | 27,925 |
| 200,000 | Northrop Grumman Corporation ± | 7.125 | 2/15/2011 | 213,149 |
| 275,000 | United Technologies Corporation | 6.050 | 6/1/2036 | 282,944 |
| Total Capital Goods | 3,012,366 | |||
| The accompanying Notes to Financial Statements are an integral part of this schedule. |
| 192 |
| Bond Index Portfolio | ||||
| Schedule of Investments as of December 31, 2007 | ||||
| Principal | Interest | Maturity | ||
| Amount | Long-Term Fixed Income (120.4%) | Rate | Date | Value |
| Collateralized Mortgage Obligations (4.9%) | ||||
| $2,240,034 | Chase Mortgage Finance Corporation | 4.577% | 2/25/2037 | $2,216,740 |
| 2,233,678 | J.P. Morgan Mortgage Trust | 5.006 | 7/25/2035 | 2,228,820 |
| 1,760,521 | Merrill Lynch Mortgage Investors, Inc. | 4.875 | 6/25/2035 | 1,763,123 |
| 1,508,231 | Thornburg Mortgage Securities Trust † | 4.955 | 1/25/2008 | 1,499,443 |
| 1,955,089 | Thornburg Mortgage Securities Trust † | 4.975 | 1/25/2008 | 1,909,789 |
| 910,570 | Zuni Mortgage Loan Trust † | 4.995 | 1/25/2008 | 870,670 |
| Total Collateralized Mortgage Obligations | 10,488,585 | |||
| Commercial Mortgage-Backed Securities (11.3%) | ||||
| 700,000 | Banc of America Commercial Mortgage, Inc. ± | 5.118 | 7/11/2043 | 708,183 |
| 2,500,000 | Bear Stearns Commercial Mortgage Securities, Inc. ±† | 5.178 | 1/15/2008 | 2,402,585 |
| 400,000 | Bear Stearns Commercial Mortgage Securities, Inc. ± | 3.869 | 2/11/2041 | 395,796 |
| 1,000,000 | Bear Stearns Commercial Mortgage Securities, Inc. | 5.835 | 9/11/2042 | 1,001,474 |
| 300,030 | Citigroup Commercial Mortgage Trust † ≤ | 5.098 | 1/15/2008 | 290,090 |
| 75,055 | Commercial Mortgage Pass-Through Certificates ±† ≤ | 5.128 | 1/15/2008 | 74,681 |
| 2,500,000 | Commercial Mortgage Pass-Through Certificates ±† ≤ | 5.158 | 1/15/2008 | 2,345,088 |
| 972,200 | Credit Suisse First Boston Mortgage Securities Corporation ± | 3.861 | 3/15/2036 | 964,392 |
| 500,000 | Credit Suisse First Boston Mortgage Securities Corporation | 4.829 | 11/15/2037 | 493,688 |
| 2,500,000 | Credit Suisse Mortgage Capital Certificates † ≤ | 5.198 | 1/15/2008 | 2,410,272 |
| 2,000,000 | Crown Castle International Corporation ± ≤ | 5.245 | 11/15/2036 | 1,996,120 |
| 800,000 | General Electric Commercial Mortgage Corporation ± | 4.641 | 9/10/2013 | 794,134 |
| 500,000 | GMAC Commercial Mortgage Securities, Inc. | 4.547 | 12/10/2041 | 495,826 |
| 1,000,000 | Greenwich Capital Commercial Funding Corporation ± | 5.317 | 6/10/2036 | 1,017,672 |
| 1,000,000 | Greenwich Capital Commercial Funding Corporation | 5.867 | 12/10/2049 | 1,004,395 |
| 2,000,000 | GS Mortgage Securities Corporation II † | 5.382 | 1/6/2008 | 1,912,746 |
| 500,000 | J.P. Morgan Chase Commercial Mortgage Securities | |||
| Corporation ± | 4.654 | 1/12/2037 | 496,153 | |
| 1,500,000 | J.P. Morgan Chase Commercial Mortgage Securities | |||
| Corporation | 5.336 | 5/15/2047 | 1,494,408 | |
| 1,000,000 | LB-UBS Commercial Mortgage Trust ± | 3.086 | 5/15/2027 | 992,533 |
| 700,000 | LB-UBS Commercial Mortgage Trust | 4.786 | 10/15/2029 | 692,187 |
| 750,000 | LB-UBS Commercial Mortgage Trust | 4.553 | 7/15/2030 | 743,075 |
| 342,149 | Nationslink Funding Corporation ± | 6.316 | 1/20/2031 | 344,213 |
| 1,193,397 | Washington Mutual Asset Securities Corporation ≤ | 3.830 | 1/25/2035 | 1,176,630 |
| Total Commercial Mortgage-Backed Securities | 24,246,341 | |||
| Communications Services (2.9%) | ||||
| 27,000 | BellSouth Corporation | 6.875 | 10/15/2031 | 28,786 |
| 200,000 | British Telecom plc ± | 8.625 | 12/15/2010 | 219,470 |
| 302,000 | British Telecom plc | 9.125 | 12/15/2030 | 399,735 |
| 400,000 | Cingular Wireless, Inc. ± | 6.500 | 12/15/2011 | 421,107 |
| 225,000 | Comcast Corporation ± | 5.500 | 3/15/2011 | 227,150 |
| 500,000 | Cox Communications, Inc. ± | 7.750 | 11/1/2010 | 533,322 |
| 135,000 | Cox Communications, Inc. ≤ | 6.450 | 12/1/2036 | 133,941 |
| 200,000 | Deutsche Telekom International Finance BV | 8.000 | 6/15/2010 | 213,518 |
| 200,000 | France Telecom SA ± | 7.750 | 3/1/2011 | 214,965 |
| 700,000 | New Cingular Wireless Services, Inc. ± | 7.875 | 3/1/2011 | 758,076 |
| 275,000 | News America, Inc. | 6.400 | 12/15/2035 | 278,203 |
| 275,000 | SBC Communications, Inc. | 5.875 | 2/1/2012 | 283,770 |
| The accompanying Notes to Financial Statements are an integral part of this schedule. |
| 193 |
| Bond Index Portfolio | ||||
| Schedule of Investments as of December 31, 2007 | ||||
| Principal | Interest | Maturity | ||
| Amount | Long-Term Fixed Income (120.4%) | Rate | Date | Value |
| Communications Services — continued | ||||
| $700,000 | Sprint Capital Corporation ± | 7.625% | 1/30/2011 | $729,469 |
| 550,000 | Sprint Capital Corporation ± | 6.900 | 5/1/2019 | 546,351 |
| 800,000 | Telecom Italia Capital SA ± | 5.250 | 10/1/2015 | 779,399 |
| 425,000 | Tele-Communications, Inc. (TCI Group) ± | 7.875 | 8/1/2013 | 465,758 |
| 27,000 | Verizon Global Funding Corporation | 7.750 | 12/1/2030 | 31,667 |
| Total Communications Services | 6,264,687 | |||
| Consumer Cyclical (0.8%) | ||||
| 425,000 | AOL Time Warner, Inc. | 6.875 | 5/1/2012 | 447,529 |
| 27,000 | AOL Time Warner, Inc. | 7.625 | 4/15/2031 | 29,879 |
| 27,000 | DaimlerChrysler North American Holdings Corporation | 8.500 | 1/18/2031 | 34,052 |
| 27,000 | Target Corporation | 7.000 | 7/15/2031 | 27,658 |
| 527,000 | Wal-Mart Stores, Inc. | 7.550 | 2/15/2030 | 608,619 |
| 500,000 | Walt Disney Company ± | 5.625 | 9/15/2016 | 513,515 |
| Total Consumer Cyclical | 1,661,252 | |||
| Consumer Non-Cyclical (1.7%) | ||||
| 275,000 | Boston Scientific Corporation | 7.000 | 11/15/2035 | 242,000 |
| 600,000 | Bunge Limited Finance Corporation | 5.350 | 4/15/2014 | 580,938 |
| 475,000 | Coca-Cola HBC Finance BV ± | 5.125 | 9/17/2013 | 477,612 |
| 400,000 | Genentech, Inc. ± | 4.400 | 7/15/2010 | 402,498 |
| 482,000 | General Mills, Inc. ± | 6.000 | 2/15/2012 | 494,292 |
| 27,000 | Kellogg Company | 7.450 | 4/1/2031 | 31,049 |
| 27,000 | Kraft Foods, Inc. | 6.500 | 11/1/2031 | 26,484 |
| 500,000 | Kroger Company ± | 4.950 | 1/15/2015 | 481,232 |
| 475,000 | Safeway, Inc. ± | 4.125 | 11/1/2008 | 469,892 |
| 550,000 | Wyeth | 6.000 | 2/15/2036 | 549,957 |
| Total Consumer Non-Cyclical | 3,755,954 | |||
| Energy (1.6%) | ||||
| 500,000 | Anadarko Finance Company ± | 6.750 | 5/1/2011 | 528,657 |
| 27,000 | Anadarko Finance Company | 7.500 | 5/1/2031 | 30,357 |
| 500,000 | Burlington Resources, Inc. ± | 6.500 | 12/1/2011 | 530,352 |
| 1,000,000 | Conoco Funding Company ± | 6.350 | 10/15/2011 | 1,062,131 |
| 27,000 | Conoco, Inc. | 6.950 | 4/15/2029 | 30,837 |
| 27,000 | Devon Financing Corporation, ULC | 7.875 | 9/30/2031 | 32,655 |
| 475,000 | Duke Capital Corporation ± | 7.500 | 10/1/2009 | 495,159 |
| 275,000 | Oneok Partners, LP | 6.650 | 10/1/2036 | 278,074 |
| 500,000 | Valero Energy Corporation ± | 4.750 | 6/15/2013 | 484,793 |
| Total Energy | 3,473,015 | |||
| Financials (9.4%) | ||||
| 27,000 | Abbey National plc | 7.950 | 10/26/2029 | 32,016 |
| 500,000 | AIG SunAmerica Global Financing VI ± ≤ | 6.300 | 5/10/2011 | 519,428 |
| 500,000 | Allstate Corporation ± | 5.000 | 8/15/2014 | 488,851 |
| 250,000 | Associates Corporation of North America ± | 6.250 | 11/1/2008 | 252,318 |
| 27,000 | AXA SA | 8.600 | 12/15/2030 | 33,107 |
| 275,000 | BAC Capital Trust XI | 6.625 | 5/23/2036 | 267,543 |
| 650,000 | Bank of America Corporation ± | 4.750 | 8/15/2013 | 640,507 |
| The accompanying Notes to Financial Statements are an integral part of this schedule. |
| 194 |
| Bond Index Portfolio | ||||
| Schedule of Investments as of December 31, 2007 | ||||
| Principal | Interest | Maturity | ||
| Amount | Long-Term Fixed Income (120.4%) | Rate | Date | Value |
| Financials — continued | ||||
| $1,800,000 | Bank One Corporation ± | 5.900% | 11/15/2011 | $1,868,987 |
| 600,000 | BB&T Corporation ± | 6.500 | 8/1/2011 | 626,608 |
| 1,100,000 | BNP Paribas SA ± ≤ | 5.186 | 6/29/2015 | 1,001,135 |
| 725,000 | CIT Group, Inc. ± | 4.750 | 12/15/2010 | 687,683 |
| 590,000 | Citigroup, Inc. ± | 5.000 | 9/15/2014 | 562,178 |
| 250,000 | Citigroup, Inc. ± | 4.700 | 5/29/2015 | 236,387 |
| 725,000 | Credit Suisse First Boston USA, Inc. ± | 3.875 | 1/15/2009 | 718,971 |
| 950,000 | Goldman Sachs Group, Inc. ± | 6.600 | 1/15/2012 | 1,005,099 |
| 500,000 | Household Finance Corporation ± | 4.750 | 5/15/2009 | 498,340 |
| 650,000 | Household Finance Corporation ± | 6.375 | 11/27/2012 | 668,423 |
| 350,000 | HSBC Finance Corporation ± | 5.000 | 6/30/2015 | 333,802 |
| 850,000 | International Lease Finance Corporation ± | 5.875 | 5/1/2013 | 864,073 |
| 775,000 | Lehman Brothers Holdings, Inc. ± | 3.950 | 11/10/2009 | 755,417 |
| 185,000 | Marsh & McLennan Companies, Inc. | 5.750 | 9/15/2015 | 179,076 |
| 475,000 | Merrill Lynch & Company, Inc. ± | 5.000 | 2/3/2014 | 453,115 |
| 500,000 | MetLife, Inc. ± | 5.000 | 6/15/2015 | 483,874 |
| 1,250,000 | Morgan Stanley Dean Witter & Company ± | 6.750 | 4/15/2011 | 1,310,178 |
| 1,230,030 | Preferred Term Securities XXIII, Ltd. † ≤ | 5.191 | 3/24/2008 | 1,179,599 |
| 500,000 | ProLogis Trust ± | 5.500 | 3/1/2013 | 494,120 |
| 275,000 | Prudential Financial, Inc. | 5.700 | 12/14/2036 | 243,856 |
| 500,000 | Residential Capital Corporation | 8.000 | 4/17/2013 | 307,500 |
| 500,000 | Student Loan Marketing Corporation ± | 4.000 | 1/15/2010 | 460,514 |
| 550,000 | Union Planters Corporation ± | 4.375 | 12/1/2010 | 540,441 |
| 500,000 | Wachovia Bank NA ± | 4.875 | 2/1/2015 | 475,979 |
| 500,000 | Washington Mutual Bank FA | 5.500 | 1/15/2013 | 443,646 |
| 500,000 | WellPoint, Inc. ± | 5.000 | 12/15/2014 | 478,956 |
| 1,100,000 | Wells Fargo & Company ± | 4.200 | 1/15/2010 | 1,093,050 |
| Total Financials | 20,204,777 | |||
| Foreign (2.1%) | ||||
| 250,000 | African Development Bank ± | 6.875 | 10/15/2015 | 281,702 |
| 550,000 | Export-Import Bank of Korea ± ≤ | 4.125 | 2/10/2009 | 542,669 |
| 27,000 | Hydro-Quebec | 8.400 | 1/15/2022 | 36,560 |
| 350,000 | Inter-American Development Bank | 5.375 | 11/18/2008 | 353,607 |
| 95,000 | Pemex Project Funding Master Trust | 9.125 | 10/13/2010 | 104,975 |
| 250,000 | Province of Nova Scotia ± | 7.250 | 7/27/2013 | 283,708 |
| 400,000 | Province of Quebec | 4.875 | 5/5/2014 | 410,852 |
| 400,000 | Province of Quebec | 7.500 | 7/15/2023 | 500,045 |
| 600,000 | Republic of Italy ± | 6.000 | 2/22/2011 | 642,554 |
| 200,000 | Republic of Italy | 4.375 | 6/15/2013 | 205,121 |
| 1,100,000 | United Mexican States ± | 5.625 | 1/15/2017 | 1,114,850 |
| Total Foreign | 4,476,643 | |||
| Mortgage-Backed Securities (34.2%) | ||||
| 5,974 | Federal Home Loan Mortgage Corporation Gold | |||
| 15-Yr. Pass Through | 7.500 | 12/1/2009 | 6,091 | |
| 9,080 | Federal Home Loan Mortgage Corporation Gold | |||
| 15-Yr. Pass Through | 7.000 | 1/1/2011 | 9,320 | |
| The accompanying Notes to Financial Statements are an integral part of this schedule. |
| 195 |
| Bond Index Portfolio | ||||
| Schedule of Investments as of December 31, 2007 | ||||
| Principal | Interest | Maturity | ||
| Amount | Long-Term Fixed Income (120.4%) | Rate | Date | Value |
| Mortgage-Backed Securities — continued | ||||
| $7,335 | Federal Home Loan Mortgage Corporation Gold | |||
| 15-Yr. Pass Through | 6.500% | 10/1/2012 | $7,592 | |
| 6,146 | Federal Home Loan Mortgage Corporation Gold | |||
| 15-Yr. Pass Through | 6.500 | 1/1/2013 | 6,367 | |
| 11,323 | Federal Home Loan Mortgage Corporation Gold | |||
| 15-Yr. Pass Through | 6.000 | 9/1/2013 | 11,600 | |
| 22,834 | Federal Home Loan Mortgage Corporation Gold | |||
| 15-Yr. Pass Through | 5.500 | 3/1/2014 | 23,128 | |
| 33,938 | Federal Home Loan Mortgage Corporation Gold | |||
| 15-Yr. Pass Through | 6.000 | 4/1/2014 | 34,766 | |
| 10,737 | Federal Home Loan Mortgage Corporation Gold | |||
| 15-Yr. Pass Through | 7.000 | 10/1/2014 | 11,190 | |
| 19,351 | Federal Home Loan Mortgage Corporation Gold | |||
| 15-Yr. Pass Through | 6.500 | 3/1/2016 | 20,051 | |
| 31,081 | Federal Home Loan Mortgage Corporation Gold | |||
| 15-Yr. Pass Through | 6.000 | 6/1/2016 | 31,838 | |
| 41,543 | Federal Home Loan Mortgage Corporation Gold | |||
| 15-Yr. Pass Through | 6.000 | 9/1/2016 | 42,554 | |
| 342,966 | Federal Home Loan Mortgage Corporation Gold | |||
| 15-Yr. Pass Through | 7.000 | 6/1/2017 | 356,486 | |
| 597,047 | Federal Home Loan Mortgage Corporation Gold | |||
| 15-Yr. Pass Through | 5.500 | 12/1/2017 | 605,464 | |
| 5,117 | Federal Home Loan Mortgage Corporation Gold | |||
| 30-Yr. Pass Through | 6.500 | 4/1/2024 | 5,316 | |
| 8,547 | Federal Home Loan Mortgage Corporation Gold | |||
| 30-Yr. Pass Through | 7.000 | 5/1/2024 | 8,984 | |
| 1,385 | Federal Home Loan Mortgage Corporation Gold | |||
| 30-Yr. Pass Through | 7.500 | 8/1/2025 | 1,483 | |
| 16,151 | Federal Home Loan Mortgage Corporation Gold | |||
| 30-Yr. Pass Through | 8.500 | 11/1/2025 | 17,359 | |
| 2,654 | Federal Home Loan Mortgage Corporation Gold | |||
| 30-Yr. Pass Through | 8.000 | 1/1/2026 | 2,842 | |
| 4,563 | Federal Home Loan Mortgage Corporation Gold | |||
| 30-Yr. Pass Through | 7.000 | 4/1/2027 | 4,797 | |
| 4,888 | Federal Home Loan Mortgage Corporation Gold | |||
| 30-Yr. Pass Through | 7.500 | 7/1/2027 | 5,235 | |
| 7,108 | Federal Home Loan Mortgage Corporation Gold | |||
| 30-Yr. Pass Through | 7.000 | 8/1/2027 | 7,472 | |
| 5,071 | Federal Home Loan Mortgage Corporation Gold | |||
| 30-Yr. Pass Through | 7.500 | 10/1/2027 | 5,430 | |
| 6,465 | Federal Home Loan Mortgage Corporation Gold | |||
| 30-Yr. Pass Through | 7.000 | 5/1/2028 | 6,796 | |
| 27,227 | Federal Home Loan Mortgage Corporation Gold | |||
| 30-Yr. Pass Through | 6.000 | 8/1/2028 | 27,825 | |
| 13,487 | Federal Home Loan Mortgage Corporation Gold | |||
| 30-Yr. Pass Through | 6.500 | 2/1/2029 | 13,980 | |
| 26,937 | Federal Home Loan Mortgage Corporation Gold | |||
| 30-Yr. Pass Through | 6.000 | 3/1/2029 | 27,521 | |
| The accompanying Notes to Financial Statements are an integral part of this schedule. |
| 196 |
| Bond Index Portfolio | ||||
| Schedule of Investments as of December 31, 2007 | ||||
| Principal | Interest | Maturity | ||
| Amount | Long-Term Fixed Income (120.4%) | Rate | Date | Value |
| Mortgage-Backed Securities — continued | ||||
| $11,104 | Federal Home Loan Mortgage Corporation Gold | |||
| 30-Yr. Pass Through | 7.000% | 7/1/2029 | $11,672 | |
| 19,619 | Federal Home Loan Mortgage Corporation Gold | |||
| 30-Yr. Pass Through | 7.500 | 10/1/2029 | 20,988 | |
| 9,904 | Federal Home Loan Mortgage Corporation Gold | |||
| 30-Yr. Pass Through | 7.500 | 11/1/2029 | 10,595 | |
| 19,164 | Federal Home Loan Mortgage Corporation Gold | |||
| 30-Yr. Pass Through | 6.500 | 5/1/2031 | 19,818 | |
| 77,668 | Federal Home Loan Mortgage Corporation Gold | |||
| 30-Yr. Pass Through | 6.000 | 6/1/2031 | 79,180 | |
| 31,281 | Federal Home Loan Mortgage Corporation Gold | |||
| 30-Yr. Pass Through | 7.000 | 6/1/2031 | 32,820 | |
| 73,382 | Federal Home Loan Mortgage Corporation Gold | |||
| 30-Yr. Pass Through | 6.000 | 7/1/2031 | 74,811 | |
| 17,190 | Federal Home Loan Mortgage Corporation Gold | |||
| 30-Yr. Pass Through | 7.000 | 9/1/2031 | 18,036 | |
| 54,772 | Federal Home Loan Mortgage Corporation Gold | |||
| 30-Yr. Pass Through | 6.500 | 10/1/2031 | 56,641 | |
| 387,178 | Federal Home Loan Mortgage Corporation Gold | |||
| 30-Yr. Pass Through | 6.000 | 1/1/2032 | 394,716 | |
| 24,481 | Federal Home Loan Mortgage Corporation Gold | |||
| 30-Yr. Pass Through | 7.000 | 5/1/2032 | 25,647 | |
| 369,484 | Federal Home Loan Mortgage Corporation Gold | |||
| 30-Yr. Pass Through | 6.500 | 7/1/2032 | 381,984 | |
| 264,985 | Federal Home Loan Mortgage Corporation Gold | |||
| 30-Yr. Pass Through | 6.500 | 10/1/2032 | 273,950 | |
| 514,692 | Federal Home Loan Mortgage Corporation Gold | |||
| 30-Yr. Pass Through | 6.000 | 11/1/2032 | 524,123 | |
| 7,000,000 | Federal Home Loan Mortgage Corporation Gold | |||
| 30-Yr. Pass Through § | 5.000 | 1/1/2038 | 6,829,375 | |
| 14,700,000 | Federal Home Loan Mortgage Corporation Gold | |||
| 30-Yr. Pass Through § | 6.000 | 1/1/2038 | 14,915,914 | |
| 3,706 | Federal National Mortgage Association Conventional | |||
| 15-Yr. Pass Through | 6.000 | 4/1/2011 | 3,790 | |
| 763 | Federal National Mortgage Association Conventional | |||
| 15-Yr. Pass Through | 7.500 | 7/1/2011 | 790 | |
| 4,003 | Federal National Mortgage Association Conventional | |||
| 15-Yr. Pass Through | 8.000 | 7/1/2012 | 4,191 | |
| 6,774 | Federal National Mortgage Association Conventional | |||
| 15-Yr. Pass Through | 6.500 | 12/1/2012 | 7,014 | |
| 19,584 | Federal National Mortgage Association Conventional | |||
| 15-Yr. Pass Through | 6.500 | 6/1/2013 | 20,296 | |
| 26,738 | Federal National Mortgage Association Conventional | |||
| 15-Yr. Pass Through | 6.000 | 12/1/2013 | 27,412 | |
| 16,100,000 | Federal National Mortgage Association Conventional | |||
| 15-Yr. Pass Through § | 5.000 | 1/1/2023 | 16,115,102 | |
| 6,945 | Federal National Mortgage Association Conventional | |||
| 30-Yr. Pass Through | 10.500 | 8/1/2020 | 8,029 | |
| The accompanying Notes to Financial Statements are an integral part of this schedule. |
| 197 |
| Bond Index Portfolio | ||||
| Schedule of Investments as of December 31, 2007 | ||||
| Principal | Interest | Maturity | ||
| Amount | Long-Term Fixed Income (120.4%) | Rate | Date | Value |
| Mortgage-Backed Securities — continued | ||||
| $6,890 | Federal National Mortgage Association Conventional | |||
| 30-Yr. Pass Through | 8.000% | 12/1/2024 | $7,373 | |
| 10,389 | Federal National Mortgage Association Conventional | |||
| 30-Yr. Pass Through | 7.000 | 10/1/2025 | 10,953 | |
| 33,507 | Federal National Mortgage Association Conventional | |||
| 30-Yr. Pass Through | 6.500 | 11/1/2025 | 34,812 | |
| 1,475 | Federal National Mortgage Association Conventional | |||
| 30-Yr. Pass Through | 8.500 | 12/1/2025 | 1,588 | |
| 7,438 | Federal National Mortgage Association Conventional | |||
| 30-Yr. Pass Through | 7.500 | 1/1/2026 | 7,961 | |
| 9,466 | Federal National Mortgage Association Conventional | |||
| 30-Yr. Pass Through | 6.500 | 5/1/2026 | 9,835 | |
| 5,924 | Federal National Mortgage Association Conventional | |||
| 30-Yr. Pass Through | 8.000 | 9/1/2026 | 6,350 | |
| 5,390 | Federal National Mortgage Association Conventional | |||
| 30-Yr. Pass Through | 7.500 | 2/1/2027 | 5,767 | |
| 3,869 | Federal National Mortgage Association Conventional | |||
| 30-Yr. Pass Through | 7.000 | 3/1/2027 | 4,079 | |
| 10,685 | Federal National Mortgage Association Conventional | |||
| 30-Yr. Pass Through | 6.500 | 8/1/2027 | 11,094 | |
| 1,380 | Federal National Mortgage Association Conventional | |||
| 30-Yr. Pass Through | 7.500 | 11/1/2027 | 1,477 | |
| 11,958 | Federal National Mortgage Association Conventional | |||
| 30-Yr. Pass Through | 9.000 | 11/1/2027 | 13,028 | |
| 4,364 | Federal National Mortgage Association Conventional | |||
| 30-Yr. Pass Through | 7.000 | 1/1/2028 | 4,602 | |
| 76,269 | Federal National Mortgage Association Conventional | |||
| 30-Yr. Pass Through | 7.500 | 2/1/2028 | 81,602 | |
| 12,569 | Federal National Mortgage Association Conventional | |||
| 30-Yr. Pass Through | 6.000 | 5/1/2028 | 12,854 | |
| 5,429 | Federal National Mortgage Association Conventional | |||
| 30-Yr. Pass Through | 6.500 | 9/1/2028 | 5,627 | |
| 19,050 | Federal National Mortgage Association Conventional | |||
| 30-Yr. Pass Through | 7.000 | 10/1/2028 | 20,090 | |
| 47,209 | Federal National Mortgage Association Conventional | |||
| 30-Yr. Pass Through | 7.500 | 11/1/2028 | 50,519 | |
| 96,969 | Federal National Mortgage Association Conventional | |||
| 30-Yr. Pass Through | 6.000 | 12/1/2028 | 99,168 | |
| 10,950 | Federal National Mortgage Association Conventional | |||
| 30-Yr. Pass Through | 7.000 | 12/1/2028 | 11,548 | |
| 14,475 | Federal National Mortgage Association Conventional | |||
| 30-Yr. Pass Through | 6.500 | 2/1/2029 | 15,003 | |
| 50,424 | Federal National Mortgage Association Conventional | |||
| 30-Yr. Pass Through | 6.000 | 3/1/2029 | 51,567 | |
| 23,557 | Federal National Mortgage Association Conventional | |||
| 30-Yr. Pass Through | 7.000 | 3/1/2029 | 24,845 | |
| 62,399 | Federal National Mortgage Association Conventional | |||
| 30-Yr. Pass Through | 6.500 | 4/1/2029 | 64,660 | |
| The accompanying Notes to Financial Statements are an integral part of this schedule. |
| 198 |
| Bond Index Portfolio | ||||
| Schedule of Investments as of December 31, 2007 | ||||
| Principal | Interest | Maturity | ||
| Amount | Long-Term Fixed Income (120.4%) | Rate | Date | Value |
| Mortgage-Backed Securities — continued | ||||
| $9,717 | Federal National Mortgage Association Conventional | |||
| 30-Yr. Pass Through | 6.500% | 8/1/2029 | $10,069 | |
| 14,997 | Federal National Mortgage Association Conventional | |||
| 30-Yr. Pass Through | 7.500 | 8/1/2029 | 16,032 | |
| 21,968 | Federal National Mortgage Association Conventional | |||
| 30-Yr. Pass Through | 7.000 | 10/1/2029 | 23,170 | |
| 12,600 | Federal National Mortgage Association Conventional | |||
| 30-Yr. Pass Through | 7.500 | 12/1/2029 | 13,470 | |
| 8,701 | Federal National Mortgage Association Conventional | |||
| 30-Yr. Pass Through | 8.000 | 4/1/2030 | 9,289 | |
| 5,508 | Federal National Mortgage Association Conventional | |||
| 30-Yr. Pass Through | 7.500 | 12/1/2030 | 5,879 | |
| 103,322 | Federal National Mortgage Association Conventional | |||
| 30-Yr. Pass Through | 6.000 | 5/1/2031 | 105,387 | |
| 203,325 | Federal National Mortgage Association Conventional | |||
| 30-Yr. Pass Through | 6.500 | 4/1/2032 | 210,199 | |
| 188,447 | Federal National Mortgage Association Conventional | |||
| 30-Yr. Pass Through | 6.500 | 5/1/2032 | 194,818 | |
| 99,389 | Federal National Mortgage Association Conventional | |||
| 30-Yr. Pass Through | 7.000 | 5/1/2032 | 104,636 | |
| 625,846 | Federal National Mortgage Association Conventional | |||
| 30-Yr. Pass Through | 6.500 | 7/1/2032 | 647,005 | |
| 324,492 | Federal National Mortgage Association Conventional | |||
| 30-Yr. Pass Through | 6.500 | 8/1/2032 | 335,463 | |
| 29,400,000 | Federal National Mortgage Association Conventional | |||
| 30-Yr. Pass Through § | 5.500 | 1/1/2038 | 29,363,251 | |
| 4,971 | Government National Mortgage Association | |||
| 15-Yr. Pass Through | 6.500 | 6/15/2009 | 5,047 | |
| 25,837 | Government National Mortgage Association | |||
| 15-Yr. Pass Through | 7.000 | 9/15/2013 | 26,931 | |
| 5,881 | Government National Mortgage Association | |||
| 30-Yr. Pass Through | 7.500 | 3/15/2023 | 6,272 | |
| 5,042 | Government National Mortgage Association | |||
| 30-Yr. Pass Through | 7.000 | 1/15/2024 | 5,352 | |
| 4,321 | Government National Mortgage Association | |||
| 30-Yr. Pass Through | 9.000 | 9/15/2024 | 4,693 | |
| 6,722 | Government National Mortgage Association | |||
| 30-Yr. Pass Through | 8.000 | 6/15/2025 | 7,267 | |
| 2,009 | Government National Mortgage Association | |||
| 30-Yr. Pass Through | 8.000 | 9/15/2026 | 2,173 | |
| 9,407 | Government National Mortgage Association | |||
| 30-Yr. Pass Through | 7.500 | 3/15/2027 | 10,045 | |
| 8,552 | Government National Mortgage Association | |||
| 30-Yr. Pass Through | 7.500 | 10/15/2027 | 9,132 | |
| 8,428 | Government National Mortgage Association | |||
| 30-Yr. Pass Through | 7.000 | 11/15/2027 | 8,949 | |
| 14,654 | Government National Mortgage Association | |||
| 30-Yr. Pass Through | 7.000 | 1/15/2028 | 15,551 | |
| The accompanying Notes to Financial Statements are an integral part of this schedule. |
| 199 |
| Bond Index Portfolio | ||||
| Schedule of Investments as of December 31, 2007 | ||||
| Principal | Interest | Maturity | ||
| Amount | Long-Term Fixed Income (120.4%) | Rate | Date | Value |
| Mortgage-Backed Securities — continued | ||||
| $14,789 | Government National Mortgage Association | |||
| 30-Yr. Pass Through | 6.500% | 7/15/2028 | $15,350 | |
| 13,820 | Government National Mortgage Association | |||
| 30-Yr. Pass Through | 7.000 | 8/15/2028 | 14,666 | |
| 51,834 | Government National Mortgage Association | |||
| 30-Yr. Pass Through | 7.500 | 11/15/2028 | 55,336 | |
| 12,452 | Government National Mortgage Association | |||
| 30-Yr. Pass Through | 6.500 | 12/15/2028 | 12,924 | |
| 61,092 | Government National Mortgage Association | |||
| 30-Yr. Pass Through | 6.500 | 3/15/2029 | 63,401 | |
| 13,579 | Government National Mortgage Association | |||
| 30-Yr. Pass Through | 6.500 | 4/15/2029 | 14,092 | |
| 14,657 | Government National Mortgage Association | |||
| 30-Yr. Pass Through | 8.000 | 10/15/2030 | 15,867 | |
| 18,986 | Government National Mortgage Association | |||
| 30-Yr. Pass Through | 7.500 | 1/15/2031 | 20,248 | |
| 7,413 | Government National Mortgage Association | |||
| 30-Yr. Pass Through | 7.000 | 4/15/2031 | 7,858 | |
| 34,473 | Government National Mortgage Association | |||
| 30-Yr. Pass Through | 6.500 | 6/15/2031 | 35,741 | |
| 26,501 | Government National Mortgage Association | |||
| 30-Yr. Pass Through | 7.000 | 9/15/2031 | 28,092 | |
| 351,014 | Government National Mortgage Association | |||
| 30-Yr. Pass Through | 6.500 | 1/15/2032 | 363,921 | |
| 49,267 | Government National Mortgage Association | |||
| 30-Yr. Pass Through | 6.500 | 4/15/2032 | 51,078 | |
| Total Mortgage-Backed Securities | 73,553,437 | |||
| Technology (0.2%) | ||||
| 500,000 | International Business Machines Corporation ± | 4.250 | 9/15/2009 | 503,184 |
| Total Technology | 503,184 | |||
| Transportation (0.7%) | ||||
| 500,000 | CSX Corporation ± | 5.500 | 8/1/2013 | 498,353 |
| 475,000 | FedEx Corporation ± | 3.500 | 4/1/2009 | 467,325 |
| 500,000 | Union Pacific Corporation ± | 7.000 | 2/1/2016 | 541,310 |
| Total Transportation | 1,506,988 | |||
| U.S. Government (30.7%) | ||||
| 3,000,000 | Federal Home Loan Bank | 4.100 | 6/13/2008 | 2,994,522 |
| 500,000 | Federal Home Loan Bank | 4.500 | 10/14/2008 | 501,124 |
| 3,000,000 | Federal Home Loan Bank * | 4.875 | 2/9/2010 | 3,078,462 |
| 500,000 | Federal Home Loan Bank * | 4.500 | 11/15/2012 | 511,911 |
| 850,000 | Federal Home Loan Bank | 4.500 | 9/16/2013 | 868,908 |
| 1,050,000 | Federal Home Loan Mortgage Corporation | 6.000 | 6/15/2011 | 1,128,156 |
| 1,000,000 | Federal Home Loan Mortgage Corporation * | 5.125 | 7/15/2012 | 1,051,113 |
| 3,200,000 | Federal Home Loan Mortgage Corporation * | 5.125 | 11/17/2017 | 3,339,011 |
| 1,000,000 | Federal Home Loan Mortgage Corporation * | 5.000 | 12/14/2018 | 1,005,232 |
| 700,000 | Federal Home Loan Mortgage Corporation | 6.750 | 3/15/2031 | 877,132 |
| The accompanying Notes to Financial Statements are an integral part of this schedule. |
| 200 |
| Bond Index Portfolio | |||||||
| Schedule of Investments as of December 31, 2007 | |||||||
| Principal | Interest | Maturity | |||||
| Amount | Long-Term Fixed Income (120.4%) | Rate | Date | Value | |||
| U.S. Government — continued | |||||||
| $1,600,000 | Federal National Mortgage Association | 5.250% | 1/15/2009 | $1,620,310 | |||
| 2,000,000 | Federal National Mortgage Association | 6.125 | 3/15/2012 | 2,172,876 | |||
| 500,000 | Federal National Mortgage Association | 5.960 | 9/11/2028 | 564,674 | |||
| 100,000 | Federal National Mortgage Association | 6.250 | 5/15/2029 | 117,365 | |||
| 200,000 | Resolution Funding Corporation | 8.125 | 10/15/2019 | 262,203 | |||
| 250,000 | Tennessee Valley Authority ± | 6.000 | 3/15/2013 | 271,782 | |||
| 4,200,000 | U.S. Treasury Bonds * | 7.250 | 5/15/2016 | 5,164,690 | |||
| 400,000 | U.S. Treasury Bonds * | 8.875 | 2/15/2019 | 562,531 | |||
| 290,000 | U.S. Treasury Bonds * | 7.625 | 11/15/2022 | 389,438 | |||
| 1,000,000 | U.S. Treasury Bonds * | 6.250 | 8/15/2023 | 1,197,266 | |||
| 260,000 | U.S. Treasury Bonds * | 7.500 | 11/15/2024 | 352,219 | |||
| 8,675,000 | U.S. Treasury Bonds * | 5.250 | 11/15/2028 | 9,544,530 | |||
| 2,000,000 | U.S. Treasury Notes * | 5.500 | 5/15/2009 | 2,065,000 | |||
| 8,000,000 | U.S. Treasury Notes * | 6.000 | 8/15/2009 | 8,365,624 | |||
| 2,000,000 | U.S. Treasury Notes * | 3.625 | 1/15/2010 | 2,023,124 | |||
| 2,945,000 | U.S. Treasury Notes * | 5.000 | 2/15/2011 | 3,109,967 | |||
| 4,500,000 | U.S. Treasury Notes * | 4.500 | 11/30/2011 | 4,696,173 | |||
| 500,000 | U.S. Treasury Notes * | 4.375 | 8/15/2012 | 521,797 | |||
| 2,500,000 | U.S. Treasury Notes * | 4.250 | 8/15/2014 | 2,584,960 | |||
| 3,175,000 | U.S. Treasury Notes * | 4.500 | 2/15/2016 | 3,304,727 | |||
| 400,000 | U.S. Treasury Notes * | 4.625 | 2/15/2017 | 418,188 | |||
| 600,000 | U.S. Treasury Notes * | 4.500 | 5/15/2017 | 621,890 | |||
| 825,000 | U.S. Treasury Notes * | 4.250 | 11/15/2017 | 839,373 | |||
| Total U.S. Government | 66,126,278 | ||||||
| Utilities (1.5%) | |||||||
| 400,000 | CenterPoint Energy Houston Electric, LLC ± | 5.600 | 7/1/2023 | 386,661 | |||
| 275,000 | Commonwealth Edison Company | 5.900 | 3/15/2036 | 257,733 | |||
| 475,000 | FirstEnergy Corporation ± | 6.450 | 11/15/2011 | 490,493 | |||
| 27,000 | FirstEnergy Corporation | 7.375 | 11/15/2031 | 29,625 | |||
| 27,000 | National Rural Utilities Cooperative Finance | 8.000 | 3/1/2032 | 32,608 | |||
| 475,000 | Oncor Electric Delivery Company ± | 6.375 | 1/15/2015 | 486,340 | |||
| 400,000 | Progress Energy, Inc. ± | 7.000 | 10/30/2031 | 436,241 | |||
| 600,000 | Public Service Company of Colorado | 7.875 | 10/1/2012 | 673,324 | |||
| 225,000 | Southern California Edison Company ± | 5.000 | 1/15/2014 | 222,875 | |||
| 275,000 | Xcel Energy, Inc. | 6.500 | 7/1/2036 | 272,812 | |||
| Total Utilities | 3,288,712 | ||||||
| Total Long-Term Fixed Income (cost $257,431,445) | 259,074,695 | ||||||
| The accompanying Notes to Financial Statements are an integral part of this schedule. |
| 201 |
| Bond Index Portfolio | ||||
| Schedule of Investments as of December 31, 2007 | ||||
| Interest | Maturity | |||
| Shares | Collateral Held for Securities Loaned (25.7%) | Rate (+) | Date | Value |
| 55,206,278 | Thrivent Financial Securities Lending Trust | 5.000% | N/A | $55,206,278 |
| Total Collateral Held for Securities Loaned | ||||
| (cost $55,206,278) | 55,206,278 | |||
| Interest | Maturity | |||
| Shares | Short-Term Investments (10.0%) | Rate (+) | Date | Value |
| 21,567,103 | Thrivent Money Market Portfolio | 4.930% | N/A | $21,567,103 |
| Total Short-Term Investments (at amortized cost) | 21,567,103 | |||
| Total Investments (cost $334,204,826) 156.1% | $335,848,076 | |||
| Other Assets and Liabilities, Net (56.1%) | (120,631,448) | |||
| Total Net Assets 100.0% | $215,216,628 | |||
* All or a portion of the security is on loan as discussed in item 2(M) of the Notes to Financial Statements.
+ The interest rate shown reflects the yield, coupon rate or, for securities purchased at a discount, the discount rate at the date of purchase.
† Denotes variable rate obligations for which the current yield and next scheduled reset date are shown.
§ Denotes investments purchased on a when-issued or delayed delivery basis.
± Designated as cover for long settling trades as discussed in the Notes to Financial Statements.
≤ Denotes securities sold under Rule 144A of the Securities Act of 1933, which exempts them from registration. These securities have been determined to be liquid under the guidelines established by the Portfolio’s Board of Directors and may be resold to other dealers in the program or to other qualified institutional buyers. As of December 31, 2007, the value of these investments was $15,629,251 or 7.3% of total net assets.
« All or a portion of the security is insured or guaranteed.
Gross unrealized appreciation and depreciation of investments, based on cost for federal income tax purposes, were as follows:
| Gross unrealized appreciation | $4,864,402 | |
| Gross unrealized depreciation | (3,328,545) | |
| Net unrealized appreciation (depreciation) | $1,535,857 | |
| Cost for federal income tax purposes | $334,312,219 |
| The accompanying Notes to Financial Statements are an integral part of this schedule. |
| 202 |
| Limited Maturity Bond Portfolio | ||||
| Schedule of Investments as of December 31, 2007 | ||||
| Principal | Interest | Maturity | ||
| Amount | Long-Term Fixed Income (100.4%) | Rate | Date | Value |
| Asset-Backed Securities (24.7%) | ||||
| $3,000,000 | Americredit Automobile Receivables Trust †‡« | 5.332% | 1/6/2008 | $2,965,731 |
| 7,112,611 | Americredit Automobile Receivables Trust « | 3.430 | 7/6/2011 | 7,048,583 |
| 948,780 | Bear Stearns Asset-Backed Securities, Inc. †‡ | 5.105 | 1/25/2008 | 946,293 |
| 9,000,000 | BMW Vehicle Lease Trust ‡ | 4.590 | 8/15/2013 | 9,010,809 |
| 7,000,000 | Capital Auto Receivables Asset Trust ~ | 5.380 | 7/15/2010 | 7,067,312 |
| 8,250,000 | Carmax Auto Owner Trust † | 5.428 | 1/15/2008 | 8,221,554 |
| 8,250,000 | Chase Funding Issuance Trust | 4.960 | 9/17/2012 | 8,383,864 |
| 1,471,016 | Chase Manhattan Auto Owner Trust | 4.840 | 7/15/2009 | 1,470,697 |
| 655,804 | CIT Equipment Collateral ‡ | 4.420 | 5/20/2009 | 655,700 |
| 7,000,000 | Citibank Credit Card Issuance Trust ‡ | 4.850 | 2/10/2011 | 7,041,433 |
| 5,000,000 | CNH Equipment Trust † | 5.628 | 1/15/2008 | 4,993,755 |
| 8,500,000 | CNH Equipment Trust ‡ | 4.400 | 5/16/2011 | 8,470,088 |
| 4,772,437 | Countrywide Asset-Backed Certificates ‡« | 5.549 | 4/25/2036 | 4,658,371 |
| 5,000,000 | Countrywide Asset-Backed Certificates ‡ | 5.683 | 10/25/2036 | 4,927,720 |
| 4,500,000 | Countrywide Home Loans Asset-Backed Securities ‡« | 6.085 | 6/25/2021 | 3,995,397 |
| 3,500,000 | CPL Transition Funding, LLC | 5.560 | 1/15/2012 | 3,569,640 |
| 241,796 | CPS Auto Trust ‡« | 4.520 | 3/15/2010 | 241,828 |
| 5,500,000 | Credit Acceptance Auto Dealer Loan Trust ~≤« | 5.320 | 10/15/2012 | 5,528,677 |
| 5,000,000 | Credit Based Asset Servicing and Securitization, LLC | 5.501 | 12/25/2036 | 4,938,380 |
| 5,564,443 | DaimlerChrysler Auto Trust ‡ | 5.330 | 8/8/2010 | 5,582,255 |
| 7,000,000 | DaimlerChrysler Auto Trust ‡ | 5.000 | 2/8/2012 | 7,061,985 |
| 3,000,000 | DaimlerChrysler Master Owner Trust †‡ | 5.078 | 1/15/2008 | 2,998,776 |
| 5,633,387 | Drive Auto Receivables Trust ‡≤« | 5.300 | 7/15/2011 | 5,633,984 |
| 6,551,543 | Federal Home Loan Mortgage Corporation † | 4.905 | 1/25/2008 | 6,452,246 |
| 215,069 | First Franklin Mortgage Loan Asset-Backed Certificates ~≤ | 5.500 | 3/25/2036 | 186,332 |
| 1,153,731 | First Horizon ABS Trust †« | 4.995 | 1/25/2008 | 1,037,312 |
| 3,500,000 | Ford Credit Auto Owner Trust | 5.150 | 11/15/2011 | 3,534,573 |
| 1,560,360 | GE Commercial Loan Trust †~≤ | 5.259 | 1/19/2008 | 1,555,227 |
| 3,000,000 | GE Dealer Floorplan Master Note Trust †‡ | 4.989 | 1/20/2008 | 2,999,397 |
| 1,330,012 | GE Equipment Small Ticket, LLC ~≤ | 4.380 | 7/22/2009 | 1,328,985 |
| 7,000,000 | GMAC Mortgage Corporation Loan Trust †~« | 4.935 | 1/25/2008 | 6,959,617 |
| 3,000,000 | GMAC Mortgage Corporation Loan Trust ±†‡« | 4.955 | 1/25/2008 | 2,992,971 |
| 2,027,718 | GMAC Mortgage Corporation Loan Trust †‡« | 4.965 | 1/25/2008 | 1,992,633 |
| 5,500,000 | GMAC Mortgage Corporation Loan Trust ±« | 5.750 | 10/25/2036 | 4,968,650 |
| 8,500,000 | Harley Davidson Motorcycle Trust ±† | 5.378 | 1/15/2008 | 8,459,702 |
| 3,500,000 | Harley Davidson Motorcycle Trust ‡ | 5.240 | 1/15/2012 | 3,515,428 |
| 1,940,981 | Harley Davidson Motorcycle Trust ± | 3.200 | 5/15/2012 | 1,915,420 |
| 6,500,000 | Household Home Equity Loan Trust ~ | 5.320 | 3/20/2036 | 6,382,636 |
| 3,500,000 | Household Home Equity Loan Trust ‡ | 5.660 | 3/20/2036 | 3,430,847 |
| 418,162 | John Deere Owner Trust ‡ | 3.980 | 6/15/2009 | 417,977 |
| 7,500,000 | Merna Re, Ltd. ±†≤ | 6.580 | 3/31/2008 | 7,409,250 |
| 7,000,000 | Mortgage Equity Conversion Asset Trust †≤ | 3.780 | 1/25/2008 | 6,704,688 |
| 7,000,000 | Mortgage Equity Conversion Asset Trust †≤ | 3.800 | 1/25/2008 | 6,711,250 |
| 2,023,020 | Nissan Auto Receivables Owner Trust | 4.740 | 9/15/2009 | 2,021,076 |
| 6,000,000 | Nissan Auto Receivables Owner Trust | 5.030 | 5/16/2011 | 6,054,546 |
| 545,531 | Nomura Asset Acceptance Corporation † | 5.005 | 1/25/2008 | 515,049 |
| 1,252,013 | PG&E Energy Recovery Funding, LLC | 3.870 | 6/25/2011 | 1,243,553 |
| 421,605 | Popular ABS Mortgage Pass-Through Trust | 4.000 | 12/25/2034 | 416,218 |
| 4,665,000 | Renaissance Home Equity Loan Trust | 5.608 | 5/25/2036 | 4,623,999 |
| The accompanying Notes to Financial Statements are an integral part of this schedule. |
| 203 |
| Limited Maturity Bond Portfolio | ||||
| Schedule of Investments as of December 31, 2007 | ||||
| Principal | Interest | Maturity | ||
| Amount | Long-Term Fixed Income (100.4%) | Rate | Date | Value |
| Asset-Backed Securities — continued | ||||
| $1,737,036 | Residential Asset Securities Corporation | 5.010% | 4/25/2033 | $1,721,875 |
| 7,000,000 | Santander Drive Auto Receivables Trust « | 5.050 | 9/15/2011 | 7,023,128 |
| 723,919 | SLM Student Loan Trust † | 5.094 | 1/25/2008 | 723,056 |
| 3,000,000 | Textron Financial Floorplan Master Note Trust †≤ | 5.324 | 1/13/2008 | 2,999,628 |
| 2,159,288 | USAA Auto Owner Trust | 4.830 | 4/15/2010 | 2,159,096 |
| 2,242,430 | Wachovia Asset Securitization, Inc. †≤« | 5.005 | 1/25/2008 | 2,048,424 |
| 6,000,000 | Wachovia Auto Loan Owner Trust ≤ | 5.230 | 8/22/2011 | 6,009,996 |
| 9,000,000 | Washington Mutual Master Note Trust †≤ | 5.058 | 1/15/2008 | 8,953,983 |
| Total Asset-Backed Securities | 240,881,600 | |||
| Basic Materials (0.4%) | ||||
| 2,400,000 | Lubrizol Corporation ‡ | 4.625 | 10/1/2009 | 2,410,210 |
| 1,500,000 | Monsanto Company ‡ | 4.000 | 5/15/2008 | 1,495,023 |
| Total Basic Materials | 3,905,233 | |||
| Capital Goods (1.5%) | ||||
| 1,000,000 | Caterpillar Financial Services Corporation | 4.850 | 12/7/2012 | 1,001,727 |
| 3,400,000 | Goodrich Corporation ± | 7.500 | 4/15/2008 | 3,419,805 |
| 2,500,000 | John Deere Capital Corporation ‡ | 4.400 | 7/15/2009 | 2,510,672 |
| 1,700,000 | John Deere Capital Corporation ~ | 5.350 | 1/17/2012 | 1,740,630 |
| 2,500,000 | Oakmont Asset Trust ಠ| 4.514 | 12/22/2008 | 2,492,142 |
| 3,400,000 | Textron Financial Corporation | 5.125 | 11/1/2010 | 3,467,364 |
| Total Capital Goods | 14,632,340 | |||
| Collateralized Mortgage Obligations (10.4%) | ||||
| 2,776,175 | Banc of America Mortgage Securities, Inc. ‡ | 4.802 | 9/25/2035 | 2,755,173 |
| 3,299,333 | Bear Stearns Adjustable Rate Mortgage Trust ‡ | 4.625 | 8/25/2010 | 3,250,773 |
| 4,480,068 | Chase Mortgage Finance Corporation ‡ | 4.577 | 2/25/2037 | 4,433,480 |
| 86,496 | Citigroup Mortgage Loan Trust, Inc. ± | 4.922 | 8/25/2035 | 86,293 |
| 5,000,000 | Citigroup Mortgage Loan Trust, Inc. ‡ | 5.536 | 3/25/2036 | 4,998,350 |
| 4,059,578 | Countrywide Home Loans, Inc. ‡ | 5.360 | 3/20/2036 | 4,009,052 |
| 3,958,025 | Countrywide Home Loans, Inc. ‡ | 5.846 | 9/20/2036 | 3,930,082 |
| 6,236,896 | Deutsche Alt-A Securities, Inc. †‡ | 5.633 | 1/25/2008 | 5,954,713 |
| 2,976,705 | HomeBanc Mortgage Trust ± | 5.988 | 4/25/2037 | 3,005,827 |
| 1,939,637 | Impac CMB Trust ±† | 5.125 | 1/25/2008 | 1,908,925 |
| 1,334,230 | Impac CMB Trust ±† | 5.185 | 1/25/2008 | 1,316,131 |
| 6,447,957 | J.P. Morgan Alternative Loan Trust | 5.795 | 3/25/2036 | 6,411,475 |
| 5,360,827 | J.P. Morgan Mortgage Trust ‡ | 5.006 | 7/25/2035 | 5,349,168 |
| 3,873,145 | Merrill Lynch Mortgage Investors, Inc. ± | 4.875 | 6/25/2035 | 3,878,870 |
| 2,765,012 | Residential Accredit Loans, Inc. | 5.602 | 9/25/2035 | 2,741,025 |
| 2,737,124 | Thornburg Mortgage Securities Trust † | 4.975 | 1/25/2008 | 2,673,705 |
| 3,527,780 | Wachovia Mortgage Loan Trust, LLC | 5.572 | 5/20/2036 | 3,543,902 |
| 7,011,800 | Washington Mutual Alternative Loan Trust † | 5.538 | 1/25/2008 | 6,625,056 |
| 4,898,172 | Washington Mutual Alternative Loan Trust † | 5.708 | 1/25/2008 | 4,657,855 |
| 1,914,996 | Washington Mutual Mortgage Pass-Through Certificates † | 5.155 | 1/25/2008 | 1,799,349 |
| 5,236,629 | Washington Mutual Mortgage Pass-Through Certificates † | 5.668 | 1/25/2008 | 5,011,618 |
| 2,257,164 | Washington Mutual Mortgage Pass-Through Certificates | 4.835 | 9/25/2035 | 2,240,441 |
| 5,552,999 | Washington Mutual, Inc. † | 5.528 | 1/25/2008 | 5,293,570 |
| 5,021,307 | Washington Mutual, Inc. † | 5.608 | 1/25/2008 | 4,796,917 |
| The accompanying Notes to Financial Statements are an integral part of this schedule. |
| 204 |
| Limited Maturity Bond Portfolio | ||||
| Schedule of Investments as of December 31, 2007 | ||||
| Principal | Interest | Maturity | ||
| Amount | Long-Term Fixed Income (100.4%) | Rate | Date | Value |
| Collateralized Mortgage Obligations — continued | ||||
| $8,500,000 | Wells Fargo Mortgage Backed Securities Trust | 3.540% | 9/25/2034 | $8,393,996 |
| 1,002,464 | Wells Fargo Mortgage Backed Securities Trust | 4.950 | 3/25/2036 | 991,330 |
| 1,713,390 | Wells Fargo Mortgage Backed Securities Trust | 5.093 | 3/25/2036 | 1,705,261 |
| Total Collateralized Mortgage Obligations | 101,762,337 | |||
| Commercial Mortgage-Backed Securities (12.2%) | ||||
| 4,761,193 | American Home Mortgage Assets †‡ | 5.708 | 1/25/2008 | 4,579,858 |
| 5,135,000 | Banc of America Commercial Mortgage, Inc. | 5.001 | 9/10/2010 | 5,126,173 |
| 1,173,225 | Banc of America Commercial Mortgage, Inc. ~ | 4.037 | 11/10/2039 | 1,162,601 |
| 6,000,000 | Banc of America Large Loan Trust †~≤ | 5.138 | 1/15/2008 | 5,798,754 |
| 7,000,000 | Banc of America Large Loan Trust †~≤ | 5.238 | 1/15/2008 | 6,818,021 |
| 4,000,000 | Bear Stearns Commercial Mortgage Securities, Inc. †‡ | 5.178 | 1/15/2008 | 3,844,136 |
| 9,300,000 | Bear Stearns Commercial Mortgage Securities, Inc. ~ | 3.869 | 2/11/2041 | 9,202,248 |
| 8,162,085 | Bear Stearns Commercial Mortgage Securities, Inc. | 5.422 | 9/11/2042 | 8,226,810 |
| 240,024 | Citigroup Commercial Mortgage Trust ±†≤ | 5.098 | 1/15/2008 | 232,072 |
| 8,000,000 | Commercial Mortgage Pass-Through Certificates †‡≤ | 5.208 | 1/15/2008 | 7,651,216 |
| 90,066 | Commercial Mortgage Pass-Through Certificates †≤ | 5.128 | 1/15/2008 | 89,618 |
| 6,500,000 | Crown Castle International Corporation ಠ| 5.245 | 11/15/2036 | 6,487,390 |
| 780,159 | Federal Home Loan Mortgage Corporation Multifamily | |||
| Structured Pass Through | 5.487 | 4/25/2010 | 780,793 | |
| 2,602,208 | General Electric Commercial Mortgage Corporation ~ | 4.591 | 7/10/2045 | 2,583,663 |
| 1,912,360 | J.P. Morgan Chase Commercial Mortgage Securities | |||
| Corporation ± | 2.790 | 1/12/2039 | 1,875,377 | |
| 9,100,000 | J.P. Morgan Chase Commercial Mortgage Securities | |||
| Corporation ‡ | 5.198 | 12/15/2044 | 9,120,038 | |
| 576,391 | LB-UBS Commercial Mortgage Trust | 3.323 | 3/15/2027 | 574,390 |
| 4,260,000 | LB-UBS Commercial Mortgage Trust | 4.207 | 11/15/2027 | 4,232,706 |
| 8,000,000 | LB-UBS Commercial Mortgage Trust | 4.567 | 6/15/2029 | 7,978,272 |
| 5,560,000 | LB-UBS Commercial Mortgage Trust | 4.187 | 8/15/2029 | 5,520,329 |
| 2,385,407 | LB-UBS Commercial Mortgage Trust ± | 4.741 | 9/15/2040 | 2,373,875 |
| 8,000,000 | TIAA Real Estate CDO, Ltd. | 5.817 | 8/15/2039 | 8,155,256 |
| 8,250,000 | Wachovia Bank Commercial Mortgage Trust | 3.894 | 11/15/2035 | 8,168,977 |
| 5,730,000 | Wachovia Bank Commercial Mortgage Trust | 3.958 | 12/15/2035 | 5,676,132 |
| 2,795,959 | Washington Mutual Asset Securities Corporation ≤ | 3.830 | 1/25/2035 | 2,756,676 |
| Total Commercial Mortgage-Backed Securities | 119,015,381 | |||
| Communications Services (3.8%) | ||||
| 2,800,000 | Ameritech Capital Funding Corporation | 6.250 | 5/18/2009 | 2,880,564 |
| 2,000,000 | British Telecom plc ‡~ | 8.625 | 12/15/2010 | 2,194,698 |
| 3,100,000 | Comcast Cable Communications, Inc. ‡ | 6.200 | 11/15/2008 | 3,125,225 |
| 2,100,000 | Comcast Cable Communications, LLC ‡ | 6.875 | 6/15/2009 | 2,159,999 |
| 1,760,000 | Cox Communications, Inc. ‡ | 7.875 | 8/15/2009 | 1,841,342 |
| 1,400,000 | Cox Communications, Inc. ‡ | 4.625 | 1/15/2010 | 1,389,139 |
| 2,450,000 | GTE Corporation ‡ | 7.510 | 4/1/2009 | 2,520,930 |
| 1,954,000 | News America Holdings, Inc. | 7.375 | 10/17/2008 | 1,985,098 |
| 1,000,000 | Qwest Corporation | 5.625 | 11/15/2008 | 995,000 |
| 2,620,000 | Rogers Cable, Inc. | 7.875 | 5/1/2012 | 2,866,956 |
| 2,500,000 | SBC Communications, Inc. ± | 4.125 | 9/15/2009 | 2,484,102 |
| 2,400,000 | Sprint Capital Corporation | 6.125 | 11/15/2008 | 2,402,974 |
| The accompanying Notes to Financial Statements are an integral part of this schedule. |
| 205 |
| Limited Maturity Bond Portfolio | ||||
| Schedule of Investments as of December 31, 2007 | ||||
| Principal | Interest | Maturity | ||
| Amount | Long-Term Fixed Income (100.4%) | Rate | Date | Value |
| Communications Services — continued | ||||
| $2,400,000 | Telecom Italia Capital SA | 4.000% | 11/15/2008 | $2,369,009 |
| 1,400,000 | Telecom Italia Capital SA | 6.200 | 7/18/2011 | 1,438,819 |
| 1,000,000 | Telefonos de Mexico SA de CV | 4.500 | 11/19/2008 | 995,100 |
| 2,400,000 | Time Warner Cable, Inc. | 5.400 | 7/2/2012 | 2,404,824 |
| 2,500,000 | Time Warner Entertainment Company, LP | 7.250 | 9/1/2008 | 2,533,552 |
| Total Communications Services | 36,587,331 | |||
| Consumer Cyclical (3.4%) | ||||
| 3,100,000 | Centex Corporation ‡ | 4.750 | 1/15/2008 | 3,098,765 |
| 2,700,000 | CVS Caremark Corporation †‡ | 5.441 | 3/1/2008 | 2,671,040 |
| 2,800,000 | CVS Corporation ~ | 4.000 | 9/15/2009 | 2,747,430 |
| 2,100,000 | D.R. Horton, Inc. ± | 8.000 | 2/1/2009 | 2,041,227 |
| 2,500,000 | DaimlerChrysler North American Holdings Corporation †‡ | 5.441 | 2/1/2008 | 2,495,192 |
| 1,750,000 | Ford Motor Credit Company ‡ | 6.625 | 6/16/2008 | 1,724,502 |
| 2,100,000 | May Department Stores Company ‡ | 4.800 | 7/15/2009 | 2,088,085 |
| 2,800,000 | Nissan Motor Acceptance Corporation | 4.625 | 3/8/2010 | 2,825,592 |
| 1,367,000 | Ryland Group, Inc. | 5.375 | 6/1/2008 | 1,358,888 |
| 4,277,621 | SLM Private Credit Student Loan Trust † | 5.001 | 3/15/2008 | 4,257,084 |
| 2,000,000 | Walmart Stores, Inc. | 5.000 | 4/5/2012 | 2,045,164 |
| 5,400,000 | Walt Disney Company †~ | 5.294 | 1/16/2008 | 5,344,283 |
| Total Consumer Cyclical | 32,697,252 | |||
| Consumer Non-Cyclical (3.1%) | ||||
| 1,400,000 | Abbott Laboratories ‡ | 5.150 | 11/30/2012 | 1,430,866 |
| 1,375,000 | AstraZeneca plc ‡ | 5.400 | 9/15/2012 | 1,421,541 |
| 2,500,000 | Baxter International, Inc. | 5.196 | 2/16/2008 | 2,500,332 |
| 3,400,000 | Bunge Limited Finance Corporation ‡ | 4.375 | 12/15/2008 | 3,377,550 |
| 3,500,000 | Cadbury Schweppes plc ≤ | 3.875 | 10/1/2008 | 3,478,797 |
| 2,000,000 | Fortune Brands, Inc. ‡ | 5.125 | 1/15/2011 | 1,995,942 |
| 3,500,000 | General Mills, Inc. ~ | 6.378 | 10/15/2008 | 3,529,936 |
| 2,750,000 | Kellogg Company ‡ | 5.125 | 12/3/2012 | 2,773,028 |
| 1,950,000 | Kroger Company ± | 6.375 | 3/1/2008 | 1,953,438 |
| 2,800,000 | Miller Brewing Company ±≤ | 4.250 | 8/15/2008 | 2,787,820 |
| 1,350,000 | PepsiCo, Inc. | 4.650 | 2/15/2013 | 1,359,065 |
| 1,100,000 | Safeway, Inc. | 6.500 | 11/15/2008 | 1,107,776 |
| 2,000,000 | Wyeth | 4.375 | 3/1/2008 | 1,998,598 |
| Total Consumer Non-Cyclical | 29,714,689 | |||
| Energy (1.5%) | ||||
| 1,000,000 | Enterprise Products Operating, LP ‡ | 4.625 | 10/15/2009 | 998,427 |
| 2,430,000 | KeySpan Corporation ± | 4.900 | 5/16/2008 | 2,428,506 |
| 2,500,000 | Oneok, Inc. | 5.510 | 2/16/2008 | 2,500,841 |
| 2,100,000 | Premcor Refining Group, Inc. | 6.125 | 5/1/2011 | 2,192,986 |
| 3,400,000 | Sempra Energy | 7.950 | 3/1/2010 | 3,632,757 |
| 1,350,000 | Transocean, Inc. | 5.250 | 3/15/2013 | 1,352,992 |
| 1,350,000 | Western Oil Sands, Inc. | 8.375 | 5/1/2012 | 1,505,663 |
| Total Energy | 14,612,172 | |||
| The accompanying Notes to Financial Statements are an integral part of this schedule. |
| 206 |
| Limited Maturity Bond Portfolio | ||||
| Schedule of Investments as of December 31, 2007 | ||||
| Principal | Interest | Maturity | ||
| Amount | Long-Term Fixed Income (100.4%) | Rate | Date | Value |
| Financials (13.4%) | ||||
| $2,000,000 | Abbey National plc >‡ | 6.700% | 6/15/2008 | $1,956,452 |
| 2,000,000 | American Express Centurion Bank | 5.200 | 11/26/2010 | 2,026,408 |
| 2,700,000 | American Express Credit Corporation †~ | 5.405 | 1/2/2008 | 2,635,138 |
| 3,455,000 | American Express Credit Corporation †~ | 5.386 | 1/4/2008 | 3,374,222 |
| 2,000,000 | American General Finance Corporation †‡ | 5.329 | 1/18/2008 | 2,000,000 |
| 1,400,000 | BAC Capital Trust XIV ‡ | 5.630 | 3/15/2012 | 1,242,374 |
| 3,400,000 | Bank of New York Mellon Corporation | 4.950 | 11/1/2012 | 3,399,963 |
| 2,000,000 | Capital One Bank ±‡ | 4.875 | 5/15/2008 | 1,988,496 |
| 1,650,000 | Capmark Financial Group, Inc. ಠ| 5.875 | 5/10/2012 | 1,306,081 |
| 2,400,000 | CIT Group, Inc. | 5.200 | 11/3/2010 | 2,318,393 |
| 1,000,000 | CIT Group, Inc. | 7.625 | 11/30/2012 | 1,013,606 |
| 700,000 | Corestates Capital Trust I ‡) | 8.000 | 12/15/2026 | 724,724 |
| 6,400,000 | Countrywide Financial Corporation, Convertible †~≤ | 1.743 | 1/15/2008 | 4,990,720 |
| 2,400,000 | Countrywide Home Loans, Inc. ‡ | 4.125 | 9/15/2009 | 1,760,446 |
| 2,100,000 | Credit Suisse First Boston USA, Inc. †‡ | 5.276 | 3/10/2008 | 2,099,700 |
| 1,400,000 | Developers Diversified Realty Corporation ‡ | 4.625 | 8/1/2010 | 1,363,499 |
| 2,500,000 | Donaldson, Lufkin & Jenrette, Inc. ‡ | 6.500 | 4/1/2008 | 2,507,178 |
| 1,000,000 | First Chicago Corporation ‡ | 6.375 | 1/30/2009 | 1,019,124 |
| 3,600,000 | First Union Corporation ‡ | 6.300 | 4/15/2008 | 3,606,545 |
| 2,100,000 | General Electric Capital Corporation ‡ | 5.200 | 2/1/2011 | 2,154,646 |
| 2,800,000 | General Motors Acceptance Corporation, LLC ‡ | 6.875 | 8/28/2012 | 2,346,299 |
| 6,500,000 | Goldman Sachs Group, Inc. †~ | 4.964 | 3/25/2008 | 6,396,072 |
| 2,100,000 | Goldman Sachs Group, Inc. ~ | 4.500 | 6/15/2010 | 2,093,093 |
| 2,100,000 | Hartford Financial Services Group, Inc. ‡ | 5.550 | 8/16/2008 | 2,104,845 |
| 2,800,000 | International Lease Finance Corporation ~ | 3.300 | 1/23/2008 | 2,798,386 |
| 2,050,000 | International Lease Finance Corporation ‡ | 5.750 | 6/15/2011 | 2,075,711 |
| 1,500,000 | iSTAR Financial, Inc. ‡ | 4.875 | 1/15/2009 | 1,448,202 |
| 1,400,000 | iSTAR Financial, Inc. ‡ | 5.125 | 4/1/2011 | 1,247,992 |
| 1,600,000 | J.P. Morgan Chase & Company ‡ | 5.600 | 6/1/2011 | 1,651,054 |
| 2,100,000 | John Hancock Global Funding II ‡ | 3.750 | 9/30/2008 | 2,085,264 |
| 2,500,000 | KeyCorp ‡ | 4.700 | 5/21/2009 | 2,494,162 |
| 3,500,000 | Lehman Brothers Holdings E-Capital Trust I †~ | 5.685 | 2/19/2008 | 3,288,201 |
| 2,000,000 | Lehman Brothers Holdings, Inc. ‡ | 3.500 | 8/7/2008 | 1,972,792 |
| 1,700,000 | Lehman Brothers Holdings, Inc. | 5.250 | 2/6/2012 | 1,682,130 |
| 1,200,000 | Lincoln National Corporation ‡ | 5.650 | 8/27/2012 | 1,231,790 |
| 6,500,000 | Merrill Lynch & Company, Inc. †‡ | 5.098 | 2/5/2008 | 6,334,114 |
| 3,500,000 | Mizuho Preferred Capital Company, LLC ಠ| 8.790 | 6/30/2008 | 3,530,866 |
| 1,000,000 | Monumental Global Funding II ಠ| 3.850 | 3/3/2008 | 998,003 |
| 6,500,000 | Morgan Stanley †‡ | 5.523 | 1/15/2008 | 6,416,319 |
| 1,350,000 | Morgan Stanley * | 5.250 | 11/2/2012 | 1,349,550 |
| 1,400,000 | Morgan Stanley Dean Witter & Company ‡ | 6.750 | 4/15/2011 | 1,467,399 |
| 6,300,000 | Nations Bank Capital Trust IV ± | 8.250 | 4/15/2027 | 6,542,550 |
| 2,370,000 | Pacific Life Global Funding ≤ | 3.750 | 1/15/2009 | 2,342,219 |
| 2,500,000 | Premium Asset Trust †≤ | 5.393 | 1/15/2008 | 2,499,832 |
| 1,400,000 | Pricoa Global Funding I ≤ | 4.350 | 6/15/2008 | 1,393,365 |
| 2,000,000 | Protective Life Secured Trust | 4.000 | 10/7/2009 | 2,006,462 |
| 1,050,000 | Residential Capital Corporation | 7.500 | 2/22/2011 | 653,625 |
| 2,400,000 | SLM Corporation | 4.000 | 1/15/2009 | 2,312,083 |
| 1,725,000 | Tokai Preferred Capital Company, LLC ≤ | 9.980 | 6/30/2008 | 1,747,822 |
| 2,000,000 | UnitedHealth Group, Inc. ≤ | 5.500 | 11/15/2012 | 2,029,666 |
| The accompanying Notes to Financial Statements are an integral part of this schedule. |
| 207 |
| Limited Maturity Bond Portfolio | ||||
| Schedule of Investments as of December 31, 2007 | ||||
| Principal | Interest | Maturity | ||
| Amount | Long-Term Fixed Income (100.4%) | Rate | Date | Value |
| Financials — continued | ||||
| $1,400,000 | UnumProvident Corporation | 5.997% | 5/15/2008 | $1,403,626 |
| 700,000 | Wachovia Capital Trust III | 5.800 | 3/15/2011 | 625,485 |
| 1,400,000 | Wachovia Corporation | 6.375 | 2/1/2009 | 1,410,310 |
| 1,605,000 | Wachovia Corporation | 6.150 | 3/15/2009 | 1,614,752 |
| 1,400,000 | Washington Mutual Preferred Funding II ≤ | 6.895 | 6/15/2012 | 826,000 |
| 2,500,000 | Washington Mutual, Inc. | 4.000 | 1/15/2009 | 2,354,118 |
| 2,000,000 | Wells Fargo & Company † | 5.091 | 3/17/2008 | 1,986,144 |
| Total Financials | 130,248,018 | |||
| Mortgage-Backed Securities (5.4%) | ||||
| 16,000,000 | Federal National Mortgage Association Conventional | |||
| 30-Yr. Pass Through § | 6.000 | 1/1/2038 | 16,244,992 | |
| 35,000,000 | Federal National Mortgage Association Conventional | |||
| 30-Yr. Pass Through § | 6.500 | 1/1/2038 | 35,973,421 | |
| Total Mortgage-Backed Securities | 52,218,413 | |||
| Technology (0.5%) | ||||
| 2,000,000 | International Business Machines Corporation ± | 4.950 | 3/22/2011 | 2,043,154 |
| 700,000 | Sun Microsystems, Inc. | 7.650 | 8/15/2009 | 727,097 |
| 2,100,000 | Xerox Corporation ‡ | 5.500 | 5/15/2012 | 2,134,896 |
| Total Technology | 4,905,147 | |||
| Transportation (1.6%) | ||||
| 1,375,000 | Delta Air Lines, Inc. ‡ | 7.111 | 9/18/2011 | 1,375,000 |
| 1,300,000 | FedEx Corporation ± | 3.500 | 4/1/2009 | 1,278,995 |
| 3,125,000 | Norfolk Southern Corporation ‡ | 6.200 | 4/15/2009 | 3,190,831 |
| 2,400,000 | Northwest Airlines, Inc. ‡ | 6.841 | 4/1/2011 | 2,379,756 |
| 4,800,000 | Petro Stopping Centers, LP/Petro Financial Corporation | 9.000 | 2/15/2012 | 5,016,000 |
| 1,150,000 | Union Pacific Corporation | 6.125 | 1/15/2012 | 1,198,858 |
| 800,000 | Union Pacific Corporation | 5.450 | 1/31/2013 | 806,977 |
| Total Transportation | 15,246,417 | |||
| U.S. Government (15.9%) | ||||
| 8,000,000 | Federal Home Loan Bank | 4.100 | 6/13/2008 | 7,985,392 |
| 22,000,000 | Federal Home Loan Bank * | 4.250 | 11/20/2009 | 22,267,366 |
| 9,000,000 | Federal Home Loan Bank | 3.750 | 1/8/2010 | 9,032,355 |
| 7,000,000 | Federal Home Loan Bank * | 4.875 | 2/9/2010 | 7,183,078 |
| 9,000,000 | Federal Home Loan Bank | 3.625 | 12/17/2010 | 9,001,179 |
| 9,000,000 | Federal Home Loan Bank Discount Notes * | 4.625 | 10/10/2012 | 9,263,079 |
| 2,000,000 | Federal Home Loan Mortgage Corporation ‡ | 4.625 | 8/15/2008 | 2,003,530 |
| 5,000,000 | Federal Home Loan Mortgage Corporation * | 4.750 | 11/3/2009 | 5,102,935 |
| 22,000,000 | Federal Home Loan Mortgage Corporation * | 4.125 | 11/30/2009 | 22,222,288 |
| 4,000,000 | Federal National Mortgage Association * | 4.000 | 9/2/2008 | 3,992,396 |
| 22,000,000 | Federal National Mortgage Association * | 3.875 | 12/10/2009 | 22,125,554 |
| 5,000,000 | Federal National Mortgage Association * | 5.300 | 2/22/2011 | 5,002,235 |
| 5,000,000 | Federal National Mortgage Association * | 5.125 | 4/15/2011 | 5,224,525 |
| 23,552,650 | U.S. Treasury Notes, TIPS * | 2.000 | 7/15/2014 | 24,334,669 |
| Total U.S. Government | 154,740,581 | |||
| The accompanying Notes to Financial Statements are an integral part of this schedule. |
| 208 |
| Limited Maturity Bond Portfolio | ||||
| Schedule of Investments as of December 31, 2007 | ||||
| Principal | Interest | Maturity | ||
| Amount | Long-Term Fixed Income (100.4%) | Rate | Date | Value |
| Utilities (2.6%) | ||||
| $2,700,000 | Carolina Power & Light, Inc. ±‡ | 5.950% | 3/1/2009 | $2,743,057 |
| 2,500,000 | CenterPoint Energy, Inc. ± | 5.875 | 6/1/2008 | 2,502,292 |
| 900,000 | Cleveland Electric Illuminating Company ≤ | 7.430 | 11/1/2009 | 938,961 |
| 3,500,000 | Commonwealth Edison Company ‡ | 3.700 | 2/1/2008 | 3,495,026 |
| 3,100,000 | Dominion Resources, Inc. ‡ | 4.125 | 2/15/2008 | 3,095,307 |
| 675,000 | DPL, Inc. ±≤ | 6.250 | 5/15/2008 | 677,510 |
| 2,100,000 | Niagara Mohawk Power Corporation | 7.750 | 10/1/2008 | 2,141,828 |
| 1,000,000 | Pacific Gas & Electric Company ‡ | 3.600 | 3/1/2009 | 989,188 |
| 470,118 | Power Receivables Finance, LLC ≤ | 6.290 | 1/1/2012 | 490,803 |
| 359,000 | Texas-New Mexico Power Company | 6.125 | 6/1/2008 | 358,169 |
| 2,000,000 | Virginia Electric & Power Company | 4.500 | 12/15/2010 | 1,992,974 |
| 1,360,000 | Virginia Electric and Power Company | 5.100 | 11/30/2012 | 1,365,845 |
| 5,000,000 | Yorkshire Power Finance, Ltd. | 6.496 | 2/25/2008 | 5,006,258 |
| Total Utilities | 25,797,218 | |||
| Total Long-Term Fixed Income (cost $982,534,883) | 976,964,129 | |||
| Shares | Preferred Stock (0.3%) | Value | ||
| 19,500 | Federal Home Loan Mortgage Corporation # | $509,925 | ||
| 100,500 | Federal National Mortgage Association # | 2,587,875 | ||
| Total Preferred Stock (cost $3,015,750) | 3,097,800 | |||
| Strike | Expiration | |||
| Contracts | Options Purchased (0.1%) | Price | Date | Value |
| 880 | Call on U.S. Treasury Bond Futures | $113 | 2/22/2008 | $1,375,000 |
| Total Options Purchased (cost $1,680,140) | 1,375,000 | |||
| Interest | Maturity | |||
| Shares | Collateral Held for Securities Loaned (13.3%) | Rate (+) | Date | Value |
| 129,554,563 | Thrivent Financial Securities Lending Trust | 5.000% | N/A | $129,554,563 |
| Total Collateral Held for Securities Loaned | ||||
| (cost $129,554,563) | 129,554,563 | |||
| The accompanying Notes to Financial Statements are an integral part of this schedule. |
| 209 |
| Limited Maturity Bond Portfolio | ||||
| Schedule of Investments as of December 31, 2007 | ||||
| Shares or | ||||
| Principal | Interest | Maturity | ||
| Amount | Short-Term Investments (3.8%) | Rate (+) | Date | Value |
| $3,730,000 | ED&F Man Treasury Management plc | 4.600% | 1/7/2008 | $3,727,140 |
| 700,000 | Federal National Mortgage Association ‡ | 4.030 | 5/16/2008 | 689,290 |
| 19,350,000 | Societe Generale North American | 3.650 | 1/2/2008 | 19,348,038 |
| 13,111,425 | Thrivent Money Market Portfolio | 4.930 | N/A | 13,111,425 |
| Total Short-Term Investments (cost $36,876,015) | 36,875,893 | |||
| Total Investments (cost $1,153,661,351) 117.9% | $1,147,867,385 | |||
| Other Assets and Liabilities, Net (17.9%) | (174,058,176) | |||
| Total Net Assets 100.0% | $973,809,209 | |||
| Number of | Notional | ||||
| Contracts | Expiration | Principal | Unrealized | ||
| Futures | Long/(Short) | Date | Amount | Value | Gain/(Loss) |
| 2-Yr. U.S. Treasury Bond Futures | 275 | March 2008 | $57,624,043 | $57,818,750 | $194,707 |
| 5-Yr. U.S. Treasury Bond Futures | (50) | March 2008 | (5,478,754) | (5,514,063) | (35,309) |
| 10-Yr. U.S. Treasury Bond Futures | (865) | March 2008 | (97,447,281) | (98,082,895) | (635,614) |
| EURO Foreign Exchange Currency Futures | (12) | March 2008 | (2,202,240) | (2,188,500) | 13,740 |
| Total Futures | ($462,476) | ||||
| The accompanying Notes to Financial Statements are an integral part of this schedule. |
| 210 |
| Limited Maturity Bond Portfolio | |||||||
| Schedule of Investments as of December 31, 2007 | |||||||
| Notional | |||||||
| Fund | Fund | Buy/Sell | Termination | Principal | Unrealized | ||
| Swaps and Counterparty | Receives | Pays | Protection | Date | Amount | Value | Gain/(Loss) |
| Credit Default Swaps | |||||||
| LCDX, N.A. Index Series 9, | N/A | N/A | Sell | December 2012 | $10,200,000 | ($320,599) | ($29,899) |
| 5 Year, at 2.25%; | |||||||
| J.P. Morgan Chase and Co. | |||||||
| Interest Rate Swaps | |||||||
| Bank of America, N.A., 2 Year | 5.275% | 3 Month LIBOR | N/A | May 2009 | 24,000,000 | 435,996 | 435,996 |
| Bank of America, N.A., 2 Year | 5.306 | 3 Month LIBOR | N/A | June 2009 | 30,000,000 | 609,392 | 609,392 |
| Total Swaps | $724,789 | $1,015,489 | |||||
# Non-income producing security.
* All or a portion of the security is on loan as discussed in item 2(M) of the Notes to Financial Statements.
+ The interest rate shown reflects the yield, coupon rate or, for securities purchased at a discount, the discount rate at the date of purchase.
> Denotes step coupon bonds for which the current interest rate and next scheduled reset date are shown.
† Denotes variable rate obligations for which the current yield and next scheduled reset date are shown.
§ Denotes investments purchased on a when-issued or delayed delivery basis.
± Designated as cover for long settling trades as discussed in the Notes to Financial Statements.
‡ At December 31, 2007, $989,188 of investments were held on deposit with the counterparty and pledged as the initial margin deposit for open financial futures contracts. In addition, $189,783,926 and $69,693,431 of investments were earmarked as collateral to cover open financial futures contracts and swap contracts, respectively.
~ All or a portion of the security was earmarked as collateral to cover options.
≤ Denotes securities sold under Rule 144A of the Securities Act of 1933, which exempts them from registration. These securities have been determined to be liquid under the guidelines established by the Portfolio’s Board of Directors and may be resold to other dealers in the program or to other qualified institutional buyers. As of December 31, 2007, the value of these investments was $118,159,505 or 12.1% of total net assets.
« All or a portion of the security is insured or guaranteed.
Definitions:
TIPS — Treasury Inflation Protected Security.
Gross unrealized appreciation and depreciation of investments, based on cost for federal income tax purposes, were as follows:
| Gross unrealized appreciation | $5,813,303 | |
| Gross unrealized depreciation | (11,692,095) | |
| Net unrealized appreciation (depreciation) | ($5,878,792) | |
| Cost for federal income tax purposes | $1,153,746,177 |
| The accompanying Notes to Financial Statements are an integral part of this schedule. |
| 211 |
| Mortgage Securities Portfolio | ||||
| Schedule of Investments as of December 31, 2007 | ||||
| Principal | Interest | Maturity | ||
| Amount | Long-Term Fixed Income (132.5%) | Rate | Date | Value |
| Asset-Backed Securities (28.5%) | ||||
| $2,000,000 | Americredit Automobile Receivables Trust ±†« | 5.332% | 1/6/2008 | $1,977,154 |
| 2,000,000 | Credit Based Asset Servicing and Securitization, LLC ±†‡ | 4.975 | 1/25/2008 | 1,967,674 |
| 782,641 | First Horizon ABS Trust ±†« | 4.995 | 1/25/2008 | 683,039 |
| 1,309,633 | First Horizon ABS Trust ±†« | 5.025 | 1/25/2008 | 1,071,379 |
| 1,500,000�� | Ford Credit Floor Plan Master Owner Trust ±† | 5.208 | 1/15/2008 | 1,476,150 |
| 2,000,000 | GMAC Mortgage Corporation Loan Trust ±†« | 4.955 | 1/25/2008 | 1,995,314 |
| 1,000,000 | MBNA Credit Card Master Note Trust ±†~ | 5.138 | 1/15/2008 | 999,605 |
| 744,219 | Residential Funding Mortgage Securities II †~« | 4.995 | 1/25/2008 | 732,903 |
| 482,613 | SLM Student Loan Trust ±† | 5.094 | 1/25/2008 | 482,038 |
| 2,000,000 | Textron Financial Floorplan Master Note Trust ±†≤ | 5.324 | 1/13/2008 | 1,999,752 |
| 896,972 | Wachovia Asset Securitization, Inc. ±†)« | 5.005 | 1/25/2008 | 819,370 |
| Total Asset-Backed Securities | 14,204,378 | |||
| Collateralized Mortgage Obligations (11.4%) | ||||
| 793,193 | Banc of America Mortgage Securities, Inc. ± | 4.802 | 9/25/2035 | 787,192 |
| 110,369 | Credit Suisse First Boston Mortgage Securities Corporation ±† | 5.235 | 1/25/2008 | 108,420 |
| 382,397 | GSAA Home Equity Trust ± | 4.316 | 11/25/2034 | 371,304 |
| 646,545 | Impac CMB Trust ±† | 5.125 | 1/25/2008 | 636,308 |
| 1,109,128 | Merrill Lynch Mortgage Investors, Inc. ‡ | 4.875 | 6/25/2035 | 1,110,767 |
| 329,394 | MLCC Mortgage Investors, Inc. ±† | 5.195 | 1/25/2008 | 329,013 |
| 101,478 | National Collegiate Student Loan Trust ±† | 4.935 | 1/25/2008 | 101,489 |
| 1,508,231 | Thornburg Mortgage Securities Trust ±† | 4.955 | 1/25/2008 | 1,499,443 |
| 721,774 | Wells Fargo Mortgage Backed Securities Trust ± | 4.950 | 3/25/2036 | 713,757 |
| Total Collateralized Mortgage Obligations | 5,657,693 | |||
| Commercial Mortgage-Backed Securities (10.9%) | ||||
| 60,044 | Commercial Mortgage Pass-Through Certificates ±†≤ | 5.128 | 1/15/2008 | 59,745 |
| 500,000 | Greenwich Capital Commercial Funding Corporation ± | 5.867 | 12/10/2049 | 502,198 |
| 400,000 | J.P. Morgan Chase Commercial Mortgage | |||
| Securities Corporation ± | 4.302 | 1/15/2038 | 394,551 | |
| 1,000,000 | J.P. Morgan Chase Commercial Mortgage | |||
| Securities Corporation ± | 6.007 | 6/15/2049 | 1,034,732 | |
| 1,000,000 | LB-UBS Commercial Mortgage Trust ±~ | 4.553 | 7/15/2030 | 990,767 |
| 500,000 | TIAA Real Estate CDO, Ltd. ± | 5.817 | 8/15/2039 | 509,704 |
| 2,000,000 | Wachovia Bank Commercial Mortgage Trust ±†≤ | 5.148 | 1/15/2008 | 1,951,734 |
| Total Commercial Mortgage-Backed Securities | 5,443,431 | |||
| Mortgage-Backed Securities (78.1%) | ||||
| 15,500,000 | Federal Home Loan Mortgage Corporation Gold | |||
| 30-Yr. Pass Through § | 6.000 | 1/1/2038 | 15,727,666 | |
| 1,925,980 | Federal National Mortgage Association ± | 6.000 | 8/1/2024 | 1,963,775 |
| 14,000,000 | Federal National Mortgage Association Conventional | |||
| 30-Yr. Pass Through § ~ | 5.500 | 1/1/2038 | 13,982,500 | |
| 7,000,000 | Federal National Mortgage Association Conventional | |||
| 30-Yr. Pass Through § | 6.500 | 1/1/2038 | 7,194,684 | |
| Total Mortgage-Backed Securities | 38,868,625 | |||
| The accompanying Notes to Financial Statements are an integral part of this schedule. |
| 212 |
| Mortgage Securities Portfolio | ||||
| Schedule of Investments as of December 31, 2007 | ||||
| Principal | Interest | Maturity | ||
| Amount | Long-Term Fixed Income (132.5%) | Rate | Date | Value |
| U.S. Government (3.6%) | ||||
| $100,000 | U.S. Treasury Notes ‡ | 4.875% | 4/30/2011 | $105,328 |
| 1,662,540 | U.S. Treasury Notes, TIPS ± | 2.000 | 7/15/2014 | 1,717,741 |
| Total U.S. Government | 1,823,069 | |||
| Total Long-Term Fixed Income (cost $65,893,246) | 65,997,196 | |||
| Strike | Expiration | |||
| Contracts | Options Purchased (0.1%) | Price | Date | Value |
| 20 | Call on U.S. Treasury Bond Futures | $113 | 2/22/2008 | $31,250 |
| Total Options Purchased (cost $38,185) | 31,250 | |||
| Shares or | ||||
| Principal | Interest | Maturity | ||
| Amount | Short-Term Investments (41.7%) | Rate (+) | Date | Value |
| $2,200,000 | Amsterdam Funding Corporation ‡ | 5.050% | 1/7/2008 | $2,198,148 |
| 888,000 | Bank of Scotland plc ± | 5.000 | 1/28/2008 | 884,670 |
| 1,700,000 | Barton Capital, LLC ± | 5.700 | 1/11/2008 | 1,697,308 |
| 900,000 | Bryant Park Funding, LLC ± | 5.200 | 1/22/2008 | 897,270 |
| 1,750,000 | Chariot Funding, LLC ± | 5.550 | 1/10/2008 | 1,747,572 |
| 750,000 | Charta, LLC ± | 4.850 | 1/7/2008 | 749,394 |
| 800,000 | DnB NORBank ASA ± | 5.000 | 1/25/2008 | 797,333 |
| 1,000,000 | Falcon Asset Securitization Corporation ± | 5.900 | 1/3/2008 | 999,672 |
| 1,640,000 | Jupiter Securitization Company, LLC | 4.250 | 1/2/2008 | 1,639,806 |
| 1,481,000 | Kitty Hawk Funding Corporation ± | 5.150 | 1/23/2008 | 1,476,339 |
| 2,000,000 | Park Avenue Receivables Corporation ± | 5.250 | 1/28/2008 | 1,992,125 |
| 1,000,000 | Sheffield Receivables Corporation ± | 5.950 | 1/11/2008 | 998,347 |
| 780,000 | Societe Generale North American ± | 4.500 | 1/31/2008 | 777,075 |
| 559,000 | Thames Asset Global Securitization, Inc. ± | 4.700 | 1/9/2008 | 558,416 |
| 870 | Thrivent Money Market Portfolio | 4.930 | N/A | 870 |
| 500,000 | Victory Receivables Corporation ~ | 5.550 | 1/18/2008 | 498,690 |
| 1,800,000 | Victory Receivables Corporation ± | 5.250 | 1/28/2008 | 1,792,912 |
| 1,050,000 | Yorktown Capital, LLC ± | 5.600 | 1/17/2008 | 1,047,387 |
| Total Short-Term Investments (at amortized cost) | 20,753,334 | |||
| Total Investments (cost $86,684,765) 174.3% | $86,781,780 | |||
| Other Assets and Liabilities, Net (74.3%) | (36,992,602) | |||
| Total Net Assets 100.0% | $49,789,178 | |||
| The accompanying Notes to Financial Statements are an integral part of this schedule. |
| 213 |
| Mortgage Securities Portfolio | |||||
| Schedule of Investments as of December 31, 2007 | |||||
| Number of | Notional | ||||
| Contracts | Expiration | Principal | Unrealized | ||
| Futures | Long/(Short) | Date | Amount | Value | Gain/(Loss) |
| 5-Yr. U.S. Treasury Bond Futures | 20 | March 2008 | $2,186,311 | $2,205,625 | $19,314 |
| Total Futures | $19,314 | ||||
| Number of | Exercise | Expiration | Unrealized | ||
| Call Options Written | Contracts | Price | Date | Value | Gain/(Loss) |
| Federal National Mortgage Association | 4 | $108.78 | January 2008 | ($1,500) | $19,750 |
| Conventional 30-Yr. Pass Through | |||||
| Total Call Options Written | $19,750 | ||||
+ The interest rate shown reflects the yield, coupon rate or, for securities purchased at a discount, the discount rate at the date of purchase.
† Denotes variable rate obligations for which the current yield and next scheduled reset date are shown.
§ Denotes investments purchased on a when-issued or delayed delivery basis.
± Designated as cover for long settling trades as discussed in the Notes to Financial Statements.
‡ At December 31, 2007, $105,328 of investments were held on deposit with the counterparty and pledged as the initial margin deposit for open financial futures contracts. In addition, $4,396,055 of investments were earmarked as collateral to cover open financial futures contracts.
~ All or a portion of the security was earmarked as collateral to cover options.
≤ Denotes securities sold under Rule 144A of the Securities Act of 1933, which exempts them from registration. These securities have been determined to be liquid under the guidelines established by the Portfolio’s Board of Directors and may be resold to other dealers in the program or to other qualified institutional buyers. As of December 31, 2007, the value of these investments was $4,830,601 or 9.7% of total net assets.
« All or a portion of the security is insured or guaranteed.
Definitions:
TIPS — Treasury Inflation Protected Security.
Gross unrealized appreciation and depreciation of investments, based on cost for federal income tax purposes, were as follows:
| Gross unrealized appreciation | $722,983 | |
| Gross unrealized depreciation | (637,216) | |
| Net unrealized appreciation (depreciation) | $85,767 | |
| Cost for federal income tax purposes | $86,696,013 |
| The accompanying Notes to Financial Statements are an integral part of this schedule. |
| 214 |
| Money Market Portfolio | ||||
| Schedule of Investments as of December 31, 2007 | ||||
| Principal | Interest | Maturity | ||
| Amount | Certificates of Deposit (1.4%) | Rate (+) | Date | Value |
| $2,500,000 | Deutsche Bank AG | 5.410% | 6/9/2008 | $2,500,000 |
| 8,130,000 | Royal Bank of Scotland plc NY | 4.990 | 3/26/2008 | 8,130,000 |
| Total Certificates of Deposit | 10,630,000 | |||
| Principal | Interest | Maturity | ||
| Amount | Commercial Paper (70.7%) | Rate (+) | Date | Value |
| Asset-Backed Commercial Paper (1.3%) | ||||
| $9,780,000 | GOVCO, Inc. « | 4.620% | 6/24/2008 | $9,560,358 |
| Total Asset-Backed Commercial Paper | 9,560,358 | |||
| Banking — Domestic (6.2%) | ||||
| 3,260,000 | Barclays US Funding Corporation | 4.675 | 5/29/2008 | 3,196,921 |
| 8,200,000 | Central America Bank « | 5.100 | 4/15/2008 | 8,078,025 |
| 4,800,000 | UBS Finance Corporation | 5.460 | 2/6/2008 | 4,773,792 |
| 4,850,000 | UBS Finance Corporation | 5.335 | 2/19/2008 | 4,814,781 |
| 4,930,000 | UBS Finance Corporation | 5.295 | 2/27/2008 | 4,888,668 |
| 4,900,000 | UBS Finance Corporation | 5.315 | 2/29/2008 | 4,857,318 |
| 3,230,000 | UBS Finance Corporation | 5.250 | 3/17/2008 | 3,194,201 |
| 900,000 | UBS Finance Delaware, LLC | 5.210 | 1/30/2008 | 896,223 |
| 6,480,000 | Variable Funding Capital Company, LLC « | 4.880 | 2/13/2008 | 6,442,229 |
| 4,900,000 | Variable Funding Capital Company, LLC « | 4.870 | 2/20/2008 | 4,866,857 |
| Total Banking — Domestic | 46,009,015 | |||
| Banking — Foreign (5.2%) | ||||
| 6,485,000 | Bank of Ireland | 4.600 | 3/31/2008 | 6,410,422 |
| 4,670,000 | Bank of Scotland plc | 4.800 | 3/25/2008 | 4,617,696 |
| 2,600,000 | DnB NORBank ASA | 4.850 | 1/4/2008 | 2,598,949 |
| 6,400,000 | DnB NORBank ASA | 4.790 | 2/25/2008 | 6,353,165 |
| 3,250,000 | DnB NORBank ASA | 4.950 | 4/17/2008 | 3,202,184 |
| 10,700,000 | DnB NORBank ASA | 4.673 | 5/2/2008 | 10,530,549 |
| 4,870,000 | ICICI Bank, Ltd. « | 4.950 | 7/7/2008 | 4,744,110 |
| Total Banking — Foreign | 38,457,075 | |||
| Brokerage (1.1%) | ||||
| 8,130,000 | Morgan Stanley | 5.410 | 3/17/2008 | 8,037,147 |
| Total Brokerage | 8,037,147 | |||
| Consumer Non-Cyclical (3.5%) | ||||
| 8,230,000 | Nestle Capital Corporation | 5.240 | 1/17/2008 | 8,210,833 |
| 4,940,000 | Nestle Capital Corporation | 5.230 | 1/25/2008 | 4,922,776 |
| 6,590,000 | Nestle Capital Corporation | 5.140 | 2/14/2008 | 6,548,601 |
| 6,560,000 | Nestle Finance France SA | 5.180 | 1/7/2008 | 6,554,336 |
| Total Consumer Non-Cyclical | 26,236,546 | |||
| The accompanying Notes to Financial Statements are an integral part of this schedule. |
| 215 |
| Money Market Portfolio | ||||
| Schedule of Investments as of December 31, 2007 | ||||
| Principal | Interest | Maturity | ||
| Amount | Commercial Paper (70.7%) | Rate (+) | Date | Value |
| Finance (31.9%) | ||||
| $8,900,000 | Bryant Park Funding, LLC « | 5.300% | 2/21/2008 | $8,833,176 |
| 8,350,000 | Bryant Park Funding, LLC « | 5.120 | 3/17/2008 | 8,259,746 |
| 9,600,000 | Charta, LLC « | 4.820 | 2/25/2008 | 9,529,306 |
| 1,625,000 | Grampian Funding, LLC « | 5.250 | 1/11/2008 | 1,622,630 |
| 9,750,000 | Grampian Funding, LLC « | 5.100 | 2/11/2008 | 9,693,369 |
| 4,840,000 | Grampian Funding, LLC « | 4.740 | 4/4/2008 | 4,780,097 |
| 6,480,000 | Grampian Funding, LLC « | 5.120 | 4/7/2008 | 6,390,605 |
| 8,250,000 | Kitty Hawk Funding Corporation « | 5.200 | 2/19/2008 | 8,191,608 |
| 7,150,000 | Kitty Hawk Funding Corporation « | 4.900 | 2/27/2008 | 7,094,528 |
| 2,450,000 | Kitty Hawk Funding Corporation « | 5.400 | 3/19/2008 | 2,421,335 |
| 3,245,000 | NATC California, LLC « | 5.100 | 1/10/2008 | 3,240,863 |
| 3,890,000 | Nieuw Amsterdam Receivables Corporation « | 5.235 | 1/11/2008 | 3,884,343 |
| 3,900,000 | Nieuw Amsterdam Receivables Corporation « | 5.140 | 1/15/2008 | 3,892,204 |
| 9,600,000 | Nieuw Amsterdam Receivables Corporation « | 4.840 | 2/15/2008 | 9,541,920 |
| 6,400,000 | Nieuw Amsterdam Receivables Corporation « | 4.770 | 2/29/2008 | 6,349,968 |
| 4,430,000 | Old Line Funding Corporation « | 4.830 | 1/10/2008 | 4,424,651 |
| 3,250,000 | Old Line Funding Corporation « | 5.200 | 1/18/2008 | 3,242,019 |
| 9,900,000 | Old Line Funding Corporation « | 5.050 | 3/19/2008 | 9,791,678 |
| 6,500,000 | Old Line Funding, LLC « | 5.500 | 2/27/2008 | 6,443,396 |
| 8,200,000 | Ranger Funding Company, LLC « | 5.000 | 2/21/2008 | 8,141,917 |
| 9,800,000 | Ranger Funding Company, LLC « | 5.190 | 3/18/2008 | 9,691,212 |
| 2,798,000 | Ranger Funding Company, LLC « | 5.200 | 4/8/2008 | 2,758,393 |
| 8,100,000 | Regency Markets No.1, LLC « | 5.180 | 1/15/2008 | 8,083,683 |
| 10,495,000 | Regency Markets No.1, LLC « | 5.070 | 1/22/2008 | 10,463,963 |
| 9,750,000 | Sheffield Receivables Corporation « | 5.300 | 3/12/2008 | 9,648,085 |
| 9,700,000 | Solitaire Funding, LLC « | 4.910 | 1/29/2008 | 9,662,957 |
| 9,860,000 | Thames Asset Global Securitization, Inc. « | 5.800 | 3/12/2008 | 9,747,213 |
| 6,450,000 | Thames Asset Global Securitization, Inc. « | 5.150 | 3/14/2008 | 6,382,642 |
| 8,110,000 | Thames Asset Global Securitization, Inc. « | 5.250 | 4/4/2008 | 7,998,825 |
| 5,330,000 | Three Pillars, Inc. « | 5.180 | 1/17/2008 | 5,317,729 |
| 9,712,000 | Thunder Bay Funding, Inc. « | 5.350 | 4/21/2008 | 9,551,792 |
| 6,400,000 | Triple A-1 Funding Corporation « | 5.050 | 1/28/2008 | 6,375,760 |
| 8,655,000 | Triple A-1 Funding Corporation « | 5.500 | 1/31/2008 | 8,615,331 |
| 6,440,000 | Victory Receivables Corporation « | 4.860 | 2/8/2008 | 6,406,963 |
| Total Finance | 236,473,907 | |||
| Insurance (21.5%) | ||||
| 3,500,000 | Aquinas Funding, LLC « | 5.200 | 1/30/2008 | 3,485,340 |
| 8,090,000 | Aquinas Funding, LLC « | 5.700 | 3/28/2008 | 7,978,560 |
| 5,820,000 | Aquinas Funding, LLC « | 5.120 | 4/4/2008 | 5,742,193 |
| 2,650,000 | Cooperative Association of Tractor Dealers, Inc. « | 5.210 | 1/29/2008 | 2,639,261 |
| 2,700,000 | Cooperative Association of Tractor Dealers, Inc. « | 5.210 | 1/30/2008 | 2,688,668 |
| 1,000,000 | Cooperative Association of Tractor Dealers, Inc. « | 5.400 | 2/6/2008 | 994,600 |
| 991,000 | Cooperative Association of Tractor Dealers, Inc. « | 5.200 | 2/8/2008 | 985,560 |
| 3,630,000 | Cooperative Association of Tractor Dealers, Inc. « | 5.200 | 2/12/2008 | 3,607,978 |
| 3,245,000 | Cooperative Association of Tractor Dealers, Inc. « | 5.200 | 3/19/2008 | 3,208,439 |
| 2,727,000 | Cooperative Association of Tractor Dealers, Inc. « | 5.150 | 3/28/2008 | 2,693,060 |
| 2,425,000 | Cooperative Association of Tractor Dealers, Inc. « | 5.900 | 5/28/2008 | 2,366,180 |
| 1,650,000 | Cooperative Association of Tractor Dealers, Inc. « | 5.900 | 5/30/2008 | 1,609,438 |
| The accompanying Notes to Financial Statements are an integral part of this schedule. |
| 216 |
| Money Market Portfolio | ||||
| Schedule of Investments as of December 31, 2007 | ||||
| Principal | Interest | Maturity | ||
| Amount | Commercial Paper (70.7%) | Rate (+) | Date | Value |
| Insurance — continued | ||||
| $1,000,000 | Cooperative Association of Tractor Dealers, Inc. « | 5.500% | 6/25/2008 | $973,111 |
| 9,745,000 | Curzon Funding, LLC « | 5.150 | 1/22/2008 | 9,715,725 |
| 1,000,000 | Curzon Funding, LLC « | 5.100 | 3/4/2008 | 991,075 |
| 4,800,000 | Curzon Funding, LLC « | 4.850 | 4/24/2008 | 4,726,280 |
| 9,745,000 | Monument Gardens, LLC « | 5.130 | 1/22/2008 | 9,715,838 |
| 6,490,000 | Monument Gardens, LLC « | 5.750 | 1/25/2008 | 6,465,122 |
| 4,880,000 | Monument Gardens, LLC « | 5.100 | 3/18/2008 | 4,826,767 |
| 4,862,000 | Monument Gardens, LLC « | 4.780 | 4/28/2008 | 4,785,824 |
| 9,720,000 | Nyala Funding, LLC « | 5.200 | 1/15/2008 | 9,700,344 |
| 4,850,000 | Nyala Funding, LLC « | 5.100 | 3/25/2008 | 4,792,285 |
| 9,740,000 | Nyala Funding, LLC « | 5.300 | 3/26/2008 | 9,618,115 |
| 6,485,000 | Nyala Funding, LLC « | 5.100 | 4/15/2008 | 6,388,536 |
| 9,537,000 | Perry III Funding « | 5.120 | 1/29/2008 | 9,499,021 |
| 3,200,000 | Perry III Funding « | 6.500 | 2/6/2008 | 3,179,200 |
| 8,415,000 | Perry III Funding « | 6.500 | 2/14/2008 | 8,348,147 |
| 5,000,000 | Perry III Funding « | 6.500 | 2/20/2008 | 4,954,861 |
| 6,520,000 | Perry III Funding « | 6.550 | 2/21/2008 | 6,459,500 |
| 8,215,000 | Swiss RE Financial Products Company | 5.300 | 1/28/2008 | 8,182,345 |
| 8,090,000 | Swiss RE Financial Products Company | 5.250 | 3/11/2008 | 8,007,414 |
| Total Insurance | 159,328,787 | |||
| Total Commercial Paper | 524,102,835 | |||
| Interest | Maturity | |||
| Shares | Other (<0.1%) | Rate(+) | Date | Value |
| 5,000 | Barclays Prime Money Market Fund | 4.880% | N/A | $5,000 |
| 8,000 | Primary Fund Institutional Class | 5.130 | N/A | 8,000 |
| Total Other | 13,000 | |||
| Principal | Interest | Maturity | ||
| Amount | Variable Rate Notes (27.4%)† | Rate (+) | Date | Value |
| Banking — Domestic (6.0%) | ||||
| $3,250,000 | Bank of New York Company, Inc. | 5.243% | 1/10/2008 | $3,250,000 |
| 2,600,000 | Bank of New York Company, Inc. | 4.925 | 1/28/2008 | 2,600,164 |
| 6,500,000 | Fifth Third Bancorp | 4.896 | 1/23/2008 | 6,500,000 |
| 3,250,000 | HSBC USA, Inc. | 5.028 | 1/15/2008 | 3,250,000 |
| 6,310,000 | Rabobank Nederland NV/NY | 4.849 | 2/15/2008 | 6,310,000 |
| 6,700,000 | Royal Bank of Canada NY | 5.215 | 1/2/2008 | 6,700,000 |
| 6,200,000 | Svenska Handelsbanken AB | 4.922 | 1/22/2008 | 6,200,000 |
| 4,136,000 | Wells Fargo & Company | 5.275 | 1/3/2008 | 4,140,990 |
| 5,775,000 | Wells Fargo & Company | 5.108 | 1/15/2008 | 5,775,000 |
| Total Banking — Domestic | 44,726,154 | |||
| The accompanying Notes to Financial Statements are an integral part of this schedule. |
| 217 |
| Money Market Portfolio | ||||
| Schedule of Investments as of December 31, 2007 | ||||
| Principal | Interest | Maturity | ||
| Amount | Variable Rate Notes (27.4%)† | Rate (+) | Date | Value |
| Banking — Foreign (6.0%) | ||||
| $3,440,000 | Bank of Ireland | 4.959% | 1/22/2008 | $3,440,000 |
| 4,050,000 | BNP Paribas SA | 4.896 | 1/28/2008 | 4,050,000 |
| 7,810,000 | BNP Paribas SA | 4.845 | 2/7/2008 | 7,810,000 |
| 6,000,000 | DnB NORBank ASA | 4.865 | 1/25/2008 | 6,000,000 |
| 9,520,000 | HBOS Treasury Services plc | 5.240 | 1/7/2008 | 9,520,000 |
| 3,140,000 | Royal Bank of Canada | 5.222 | 1/7/2008 | 3,140,000 |
| 4,000,000 | Royal Bank of Scotland plc | 4.942 | 1/22/2008 | 4,000,000 |
| 6,320,000 | Svenska Handelsbanken AB | 5.174 | 1/14/2008 | 6,320,000 |
| Total Banking — Foreign | 44,280,000 | |||
| Basic Industry (1.3%) | ||||
| 9,380,000 | BASF Finance Europe NV | 5.170 | 1/22/2008 | 9,380,000 |
| Total Basic Industry | 9,380,000 | |||
| Brokerage (5.2%) | ||||
| 11,000,000 | Goldman Sachs Group, Inc. | 5.084 | 1/25/2008 | 11,000,000 |
| 4,000,000 | Lehman Brothers Holdings, Inc. | 5.260 | 1/3/2008 | 3,999,267 |
| 5,000,000 | Lehman Brothers Holdings, Inc. | 4.976 | 1/22/2008 | 5,002,316 |
| 5,000,000 | Merrill Lynch & Company, Inc. | 5.028 | 1/15/2008 | 5,000,000 |
| 5,000,000 | Merrill Lynch & Company, Inc. | 5.036 | 1/24/2008 | 5,000,000 |
| 8,900,000 | Merrill Lynch & Company, Inc. | 4.980 | 2/22/2008 | 8,900,000 |
| Total Brokerage | 38,901,583 | |||
| Consumer Cyclical (0.9%) | ||||
| 6,240,000 | American Honda Finance Corporation | 5.111 | 3/11/2008 | 6,240,000 |
| Total Consumer Cyclical | 6,240,000 | |||
| Finance (4.3%) | ||||
| 2,580,000 | Kordsa, Inc. « | 5.090 | 1/3/2008 | 2,580,000 |
| 12,980,000 | Union Hamilton Special Funding, LLC « | 5.210 | 3/21/2008 | 12,980,000 |
| 16,270,000 | Union Hamilton Special Funding, LLC « | 5.143 | 3/28/2008 | 16,269,999 |
| Total Finance | 31,829,999 | |||
| The accompanying Notes to Financial Statements are an integral part of this schedule. |
| 218 |
| Money Market Portfolio | ||||
| Schedule of Investments as of December 31, 2007 | ||||
| Principal | Interest | Maturity | ||
| Amount | Variable Rate Notes (27.4%) † | Rate (+) | Date | Value |
| Insurance (3.7%) | ||||
| $5,675,000 | Allstate Life Global Funding II « | 5.313% | 1/8/2008 | $5,675,000 |
| 5,775,000 | Allstate Life Global Funding II « | 5.088 | 1/15/2008 | 5,775,000 |
| 9,440,000 | ING Verzekeringen NV | 5.206 | 1/4/2008 | 9,440,000 |
| 6,500,000 | MBIA Global Funding, LLC « | 5.321 | 1/23/2008 | 6,500,000 |
| Total Insurance | 27,390,000 | |||
| Total Variable Rate Notes | 202,747,736 | |||
| Total Investments (at amortized cost) 99.5% | $737,493,571 | |||
| Other Assets and Liabilities, Net 0.5% | 4,059,956 | |||
| Total Net Assets 100.0% | $741,553,527 | |||
+ The interest rate shown reflects the yield, coupon rate or, for securities purchased at a discount, the discount rate at the date of purchase.
† Denotes variable rate obligations for which the current yield and next scheduled reset date are shown.
« Denotes investments that benefit from credit enhancements or liquidity support provided by a third party or institution.
Cost for federal income tax purposes is $737,493,571.
| The accompanying Notes to Financial Statements are an integral part of this schedule. |
| 219 |
| Thrivent Series Fund, Inc. | Thrivent Series Fund, Inc. | ||||||||||
| Statement of Assets and Liabilities | Statement of Assets and Liabilities — continued | ||||||||||
| Moderately | Moderately | Partner | Partner | ||||||||
| Aggressive | Aggressive | Moderate | Conservative | Small Cap | Small Cap | Small Cap | Small Cap | Mid Cap | Mid Cap | ||
| Allocation | Allocation | Allocation | Allocation | Technology | Growth | Value | Stock | Index | Growth | Growth | |
| As of December 31, 2007 | Portfolio | Portfolio | Portfolio | Portfolio | Portfolio | Portfolio | Portfolio | Portfolio | Portfolio | Portfolio | Portfolio II |
| Assets | |||||||||||
| Investments at cost | $453,944,872 | $1,676,902,734 | $2,077,360,970 | $737,414,860 | $58,695,127 | $227,924,459 | $230,861,145 | $460,550,746 | $379,414,523 | $707,078,073 | $29,580,278 |
| Investments in securities at market value | — | — | — | — | 53,831,857 | 165,827,955 | 179,211,581 | 383,417,657 | 354,539,188 | 631,773,048 | 31,058,269 |
| Investments in affiliates at market value | 496,507,908 | 1,781,086,672 | 2,169,161,895 | 757,050,207 | 11,247,855 | 73,737,480 | 66,120,864 | 119,994,739 | 116,716,915 | 151,984,094 | 3,668,848 |
| Investments at Market Value | 496,507,908 | 1,781,086,672 | 2,169,161,895 | 757,050,207 | 65,079,712 | 239,565,435 | 245,332,445 | 503,412,396 | 471,256,103 | 783,757,142 | 34,727,117 |
| Cash | — | — | — | — | — | 1,383 | — | — | — | 28,289 | 1,372 |
| Dividends and interest receivable | — | — | — | — | 15,769 | 90,579 | 312,632 | 518,405 | 527,650 | 416,495 | 18,952 |
| Prepaid expenses | 1,531 | 2,924 | 3,302 | 1,720 | 1,005 | 1,106 | 1,205 | 1,604 | 1,598 | 1,937 | 972 |
| Receivable for investments sold | 8,381 | 33,439 | — | — | — | 307,916 | — | 3,662,576 | 499,962 | 550,056 | 27,954 |
| Receivable for fund shares sold | 347,709 | 2,288,782 | 2,281,464 | 1,739,759 | 5,494 | 109,229 | 91,331 | 267,400 | 30,869 | 288,520 | 915 |
| Total Assets | 496,865,529 | 1,783,411,817 | 2,171,446,661 | 758,791,686 | 65,101,980 | 240,075,648 | 245,737,613 | 507,862,381 | 472,316,182 | 785,042,439 | 34,777,282 |
| Liabilities | |||||||||||
| Accrued expenses | 9,195 | 11,017 | 11,579 | 9,451 | 10,763 | 13,608 | 13,677 | 28,775 | 39,745 | 40,769 | 9,423 |
| Payable for investments purchased | 55,762 | 2,250,616 | 1,870,592 | 1,081,354 | — | 707,042 | 769,491 | 15,362,660 | 2,511,541 | — | — |
| Payable upon return of collateral for securities loaned | — | — | — | — | 8,345,500 | 71,604,282 | 59,125,971 | 92,358,545 | 111,638,911 | 114,798,903 | 2,273,125 |
| Payable for fund shares redeemed | 300,328 | 71,605 | 410,872 | 658,405 | 70,553 | 49,410 | 81,528 | 25,586 | 109,403 | 130,754 | 37,295 |
| Payable for variation margin | — | — | — | — | — | — | — | — | 10,665 | — | — |
| Payable to affiliate | 75,966 | 257,207 | 293,531 | 94,906 | 36,173 | 131,369 | 129,108 | 231,941 | 110,451 | 235,355 | 11,555 |
| Total Liabilities | 441,251 | 2,590,445 | 2,586,574 | 1,844,116 | 8,462,989 | 72,505,711 | 60,119,775 | 108,007,507 | 114,420,716 | 115,205,781 | 2,331,398 |
| Net Assets | |||||||||||
| Capital stock (beneficial interest) | 435,287,217 | 1,609,211,833 | 1,992,170,520 | 708,892,563 | 44,049,750 | 146,407,445 | 160,470,209 | 310,257,333 | 206,194,839 | 519,763,675 | 22,180,315 |
| Accumulated undistributed net investment income/(loss) | 6,892,200 | 33,851,966 | 52,367,256 | 21,491,535 | (5,692) | (4,375) | 1,237,819 | 2,650,294 | 4,127,633 | 2,286,448 | 55,507 |
| Accumulated undistributed net realized gain/(loss) | 11,681,825 | 33,573,635 | 32,521,386 | 6,928,125 | 6,210,348 | 9,525,891 | 9,438,510 | 44,085,597 | 55,678,024 | 71,107,466 | 5,063,223 |
| Net unrealized appreciation/(depreciation) on: | |||||||||||
| Investments | — | — | — | — | 6,384,585 | 11,640,976 | 14,471,300 | 42,861,650 | 91,841,580 | 76,679,069 | 5,146,839 |
| Affiliated investments | 42,563,036 | 104,183,938 | 91,800,925 | 19,635,347 | — | — | — | — | — | — | — |
| Futures contracts | — | — | — | — | — | — | — | — | 53,390 | — | — |
| Total Net Assets | $496,424,278 | $1,780,821,372 | $2,168,860,087 | $756,947,570 | $56,638,991 | $167,569,937 | $185,617,838 | $399,854,874 | $357,895,466 | $669,836,658 | $32,445,884 |
| Shares of beneficial interest outstanding | 35,230,798 | 132,105,494 | 169,128,214 | 62,683,694 | 6,870,827 | 12,019,393 | 10,063,989 | 25,825,280 | 18,627,474 | 33,187,999 | 2,840,354 |
| Net asset value per share | $14.09 | $13.48 | $12.82 | $12.08 | $8.24 | $13.94 | $18.44 | $15.48 | $19.21 | $20.18 | $11.42 |
| The accompanying Notes to Financial Statements are an integral part of this schedule. | The accompanying Notes to Financial Statements are an integral part of this schedule. |
| 220 | 221 |
| Thrivent Series Fund, Inc. | Thrivent Series Fund, Inc. | ||||||||||
| Statement of Assets and Liabilities — continued | Statement of Assets and Liabilities — continued | ||||||||||
| Partner | |||||||||||
| Partner | International | Partner | Large Cap | Large Cap | Partner | Large Cap | Large Cap | Large Cap | |||
| Mid Cap Value | Mid Cap Stock | Mid Cap Index | Stock | All Cap | Growth | Growth | Growth Stock | Value | Stock | Index | |
| As of December 31, 2007 | Portfolio | Portfolio | Portfolio | Portfolio | Portfolio | Portfolio | Portfolio II | Portfolio | Portfolio | Portfolio | Portfolio |
| Assets | |||||||||||
| Investments at cost | $102,488,011 | $464,618,655 | $139,468,671 | $1,359,640,997 | $112,962,414 | $2,262,100,463 | $27,892,507 | $102,125,914 | $977,532,449 | $1,002,758,914 | $533,485,934 |
| Investments in securities at market value | 93,168,797 | 363,023,803 | 144,352,431 | 1,438,798,843 | 115,830,232 | 2,519,511,919 | 33,290,308 | 115,297,583 | 1,000,129,669 | 1,043,299,860 | 626,053,978 |
| Investments in affiliates at market value | 13,620,357 | 122,286,582 | 29,168,234 | 128,896,348 | 12,553,522 | 169,202,852 | 1,067,877 | 14,447,557 | 97,252,821 | 75,797,992 | 55,830,644 |
| Investments at Market Value | 106,789,154 | 485,310,385 | 173,520,665 | 1,567,695,191 | 128,383,754 | 2,688,714,771 | 34,358,185 | 129,745,140 | 1,097,382,490 | 1,119,097,852 | 681,884,622 |
| Cash | 3,990 | — | 1,350 | 27,339(a) | — | 149,498 | 2,006 | — | 4,512 | 40,964 | — |
| Dividends and interest receivable | 192,913 | 332,512 | 117,605 | 1,663,792 | 177,577 | 1,955,209 | 25,558 | 99,605 | 1,152,386 | 778,330 | 953,084 |
| Prepaid expenses | 1,033 | 1,554 | 1,179 | 3,162 | 1,080 | 4,556 | 978 | 1,106 | 2,216 | 2,287 | 2,016 |
| Receivable for investments sold | 70,210 | 708,125 | 659,841 | 1,540,499 | 905,986 | 17,678,074 | 240,507 | 220,479 | — | 18,605,854 | 544,113 |
| Receivable for fund shares sold | 67,782 | 186,694 | 2,568 | 894,640 | 135,883 | 1,101,136 | 1,201 | 41,851 | 698,578 | 698,128 | 34,344 |
| Receivable for forward contracts | — | — | — | 6,020,445 | — | — | — | — | — | — | — |
| Total Assets | 107,125,082 | 486,539,270 | 174,303,208 | 1,577,845,068 | 129,604,280 | 2,709,603,244 | 34,628,435 | 130,108,181 | 1,099,240,182 | 1,139,223,415 | 683,418,179 |
| Liabilities | |||||||||||
| Accrued expenses | 11,624 | 24,929 | 16,843 | 95,570 | 10,864 | 161,752 | 10,946 | 15,450 | 38,278 | 45,875 | 64,913 |
| Notes payable and other debt | — | — | — | — | — | — | — | 220(b) | — | — | — |
| Payable for investments purchased | 2,043,772 | 1,097,842 | 1,062,778 | 4,474,557 | 1,987,480 | 20,723,309 | 267,957 | 294,949 | — | 13,082,854 | 560,220 |
| Payable upon return of collateral for securities loaned | 9,987,928 | 97,177,855 | 26,957,577 | 122,278,806 | 9,928,007 | 134,097,820 | 348,149 | 11,623,223 | 93,704,955 | 65,208,363 | 48,959,242 |
| Payable for fund shares redeemed | 383 | 64,355 | 27,193 | 228,110 | 29,544 | 212,982 | 4,635 | 47,429 | 56,156 | 107,515 | 150,136 |
| Payable for forward contracts | — | — | — | 6,067,197 | — | — | — | — | — | — | — |
| Open options written, at value | — | — | — | — | — | 31,590 | 520 | — | — | — | — |
| Payable for variation margin | — | — | 9,000 | — | — | — | — | — | — | 89,310 | 43,510 |
| Payable to affiliate | 61,366 | 227,775 | 47,318 | 930,558 | 77,032 | 924,768 | 12,328 | 72,434 | 539,915 | 560,125 | 183,000 |
| Total Liabilities | 12,105,073 | 98,592,756 | 28,120,709 | 134,074,798 | 12,032,927 | 156,152,221 | 644,535 | 12,053,705 | 94,339,304 | 79,094,042 | 49,961,021 |
| Net Assets | |||||||||||
| Capital stock (beneficial interest) | 87,588,005 | 338,726,720 | 96,006,943 | 1,043,967,620 | 85,958,146 | 3,060,645,837 | 23,554,789 | 80,684,384 | 845,643,025 | 877,856,594 | 426,401,053 |
| Accumulated undistributed net investment income/(loss) | 960,793 | 2,764,937 | 1,849,565 | 26,642,912 | 649,572 | 1,445,555 | 133,875 | 663,134 | 15,127,143 | 12,493,400 | 11,347,356 |
| Accumulated undistributed net realized gain/(loss) | 2,170,068 | 25,763,127 | 14,301,946 | 165,095,596 | 15,542,295 | (935,264,377) | 3,829,398 | 9,087,683 | 24,280,669 | 53,542,761 | 47,348,411 |
| Net unrealized appreciation/(depreciation) on: | |||||||||||
| Investments | 4,301,143 | 20,691,730 | 34,051,994 | 208,054,194 | 15,421,340 | 426,614,308 | 6,465,678 | 27,619,226 | 119,850,041 | 116,338,938 | 148,398,688 |
| Written option contracts | — | — | — | — | — | 9,700 | 160 | — | — | — | — |
| Futures contracts | — | — | (27,949) | — | — | — | — | — | — | (102,320) | (38,350) |
| Foreign currency forward contracts | — | — | — | (46,752) | — | — | — | — | — | — | — |
| Foreign currency transactions | — | — | — | 56,700 | — | — | — | 49 | — | — | — |
| Total Net Assets | $95,020,009 | $387,946,514 | $146,182,499 | $1,443,770,270 | $117,571,353 | $2,553,451,023 | $33,983,900 | $118,054,476 | $1,004,900,878 | $1,060,129,373 | $633,457,158 |
| Shares of beneficial interest outstanding | 7,085,414 | 29,491,495 | 9,616,892 | 83,656,707 | 9,041,758 | 132,813,307 | 2,841,254 | 8,711,686 | 74,950,149 | 96,060,372 | 25,161,620 |
| Net asset value per share | $13.41 | $13.15 | $15.20 | $17.26 | $13.00 | $19.23 | $11.96 | $13.55 | $13.41 | $11.04 | $25.18 |
| (a) Includes foreign currency holdings of $23,695 (cost $23,203) | |||||||||||
| (b) Includes foreign currency holdings of $1 (cost $1) | |||||||||||
| The accompanying Notes to Financial Statements are an integral part of this schedule. | The accompanying Notes to Financial Statements are an integral part of this schedule. |
| 222 | 223 |
| Thrivent Series Fund, Inc. | Thrivent Series Fund, Inc. | ||||||||
| Statement of Assets and Liabilities — continued | Statement of Assets and Liabilities — continued | ||||||||
| Real Estate | Diversified | Limited | Mortgage | ||||||
| Securities | Balanced | High Yield | Income Plus | Income | Bond Index | Maturity Bond | Securities | Money Market | |
| As of December 31, 2007 | Portfolio | Portfolio | Portfolio | Portfolio | Portfolio | Portfolio | Portfolio | Portfolio | Portfolio |
| Assets | |||||||||
| Investments at cost | $443,695,926 | $487,926,236 | $883,085,859 | $147,299,907 | $1,704,447,573 | $334,204,826 | $1,153,661,351 | $86,684,765 | $737,493,571 |
| Investments in securities at market value | 325,148,234 | 515,098,775 | 710,972,940 | 130,983,814 | 1,532,329,369 | 259,074,695 | 1,005,201,397 | 86,780,910 | 737,493,571 |
| Investments in affiliates at market value | 140,131,373 | 67,299,831 | 143,867,282 | 11,479,708 | 155,902,504 | 76,773,381 | 142,665,988 | 870 | — |
| Investments at Market Value | 465,279,607 | 582,398,606 | 854,840,222 | 142,463,522 | 1,688,231,873 | 335,848,076 | 1,147,867,385 | 86,781,780 | 737,493,571 |
| Cash | 4,828 | — | 44,346 | — | 4,576 | — | 6,260 | 6,054 | 358 |
| Dividends and interest receivable | 2,843,830 | 1,931,030 | 13,617,442 | 1,322,531 | 14,128,483 | 1,790,621 | 7,049,171 | 87,016 | 940,374 |
| Prepaid expenses | 1,496 | 1,766 | 2,260 | 1,131 | 2,712 | 1,284 | 2,057 | 1,012 | 1,877 |
| Receivable for investments sold | 1,848,560 | 1,242,074 | 972,630 | 5,223,244 | — | 1,940,469 | 9,515,192 | 992,321 | — |
| Receivable for fund shares sold | 192,306 | 70,240 | 395,817 | 133,961 | 939,824 | 37,162 | 825,873 | 16,051 | 14,841,146 |
| Swap agreements, at value | — | — | — | — | — | — | 1,045,388 | — | — |
| Receivable for forward contracts | 290,812 | — | — | — | — | — | — | — | — |
| Receivable for variation margin | — | — | — | 6,765 | — | — | — | 6,562 | — |
| Total Assets | 470,461,439 | 585,643,716 | 869,872,717 | 149,151,154 | 1,703,307,468 | 339,617,612 | 1,166,311,326 | 87,890,796 | 753,277,326 |
| Liabilities | |||||||||
| Distributions payable | — | — | — | — | — | — | — | — | 7 |
| Accrued expenses | 22,875 | 61,071 | 44,640 | 14,037 | 58,271 | 25,801 | 33,866 | 10,369 | 34,984 |
| Notes payable and other debt | — | — | — | 33,950 | — | — | — | — | — |
| Payable for investments purchased | 3,149,234 | 48,930,109 | — | 7,445,994 | 151,012,344 | 68,992,281 | 61,852,169 | 38,015,078 | — |
| Payable upon return of collateral for securities loaned | 140,131,373 | 47,660,952 | 93,306,453 | 10,240,727 | 132,421,350 | 55,206,278 | 129,554,563 | — | — |
| Payable for fund shares redeemed | 206,218 | 363,786 | 71,812 | 12,372 | 104,193 | 111,369 | 61,631 | 50,517 | 11,479,541 |
| Payable for variation margin | — | — | — | 4,565 | — | — | — | — | — |
| Payable for forward contracts | 292,591 | — | — | — | — | — | — | — | — |
| Open options written, at value | — | — | — | — | 6,906 | — | — | 1,500 | — |
| Swap agreements, at value | — | — | 1,604,513 | 72,557 | 502,901 | — | 320,599 | — | — |
| Payable for variation margin | — | 33,200 | — | — | 397,016 | — | 329,057 | — | — |
| Payable to affiliate | 232,522 | 144,075 | 262,854 | 47,723 | 507,300 | 63,291 | 343,585 | 22,519 | 209,267 |
| Mortgage dollar roll deferred revenue | — | 1,297 | — | 948 | 12,588 | 1,964 | 6,647 | 1,635 | — |
| Total Liabilities | 144,034,813 | 97,194,490 | 95,290,272 | 17,872,873 | 285,022,869 | 124,400,984 | 192,502,117 | 38,101,618 | 11,723,799 |
| Net Assets | |||||||||
| Capital stock (beneficial interest) | 272,611,698 | 375,765,571 | 1,691,963,050 | 138,476,416 | 1,441,838,199 | 219,175,490 | 986,249,259 | 51,555,392 | 741,553,527 |
| Accumulated undistributed net investment income/(loss) | 6,180,400 | 14,650,464 | 2,411,996 | 6,919,937 | 688,369 | 8,303 | 256,650 | — | 3,442 |
| Accumulated undistributed net realized gain/(loss) | 26,051,406 | 3,591,501 | (891,028,022) | (9,262,605) | (8,699,187) | (5,610,415) | (7,455,747) | (1,902,293) | (3,442) |
| Net unrealized appreciation/(depreciation) on: | |||||||||
| Investments | 21,583,681 | 94,472,370 | (28,245,637) | (4,836,385) | (16,215,700) | 1,643,250 | (5,793,966) | 97,015 | — |
| Written option contracts | — | — | — | — | 18,992 | — | — | 19,750 | — |
| Futures contracts | — | (30,680) | — | 26,400 | 737,981 | — | (462,476) | 19,314 | — |
| Swap agreements | — | — | (518,942) | (45,482) | (84,055) | — | 1,015,489 | — | — |
| Foreign currency forward contracts | (1,780) | — | — | — | — | — | — | — | — |
| Foreign currency transactions | 1,221 | — | — | — | — | — | — | — | — |
| Total Net Assets | $326,426,626 | $488,449,226 | $774,582,445 | $131,278,281 | $1,418,284,599 | $215,216,628 | $973,809,209 | $49,789,178 | $741,553,527 |
| Shares of beneficial interest outstanding | 18,399,030 | 28,464,995 | 160,111,210 | 18,797,543 | 145,598,995 | 20,919,494 | 98,985,543 | 5,126,167 | 741,553,527 |
| Net asset value per share | $17.74 | $17.16 | $4.84 | $6.98 | $9.74 | $10.29 | $9.84 | $9.71 | $1.00 |
| The accompanying Notes to Financial Statements are an integral part of this schedule. | The accompanying Notes to Financial Statements are an integral part of this schedule. |
| 224 | 225 |
| Thrivent Series Fund, Inc. | Thrivent Series Fund, Inc. | ||||||||||
| Statement of Operations | Statement of Operations — continued | ||||||||||
| Moderately | Moderately | Partner | Partner | ||||||||
| Aggressive | Aggressive | Moderate | Conservative | Small Cap | Small Cap | Small Cap | Small Cap | Mid Cap | Mid Cap | ||
| Allocation | Allocation | Allocation | Allocation | Technology | Growth | Value | Stock | Index | Growth | Growth | |
| For the Year Ended December 31, 2007 | Portfolio | Portfolio | Portfolio | Portfolio | Portfolio | Portfolio | Portfolio | Portfolio | Portfolio | Portfolio | Portfolio II |
| Investment Income | |||||||||||
| Dividends | $— | $— | $— | $— | $242,495 | $446,685 | $2,260,554 | $3,829,995 | $4,780,703 | $3,272,452 | $159,135 |
| Taxable interest | — | — | — | — | 10,548 | 137,189 | 4,656 | 749,724 | 83,246 | 494,826 | — |
| Income from securities loaned | — | — | — | — | 17,628 | 249,071 | 170,811 | 355,697 | 570,220 | 832,113 | 33,894 |
| Income from affiliated investments | 5,688,094 | 29,339,412 | 49,411,213 | 21,019,496 | 127,744 | 112,690 | 335,858 | 820,072 | 328,171 | 720,378 | 60,136 |
| Foreign dividend tax withholding | — | — | — | — | (5,908) | — | — | (1,959) | (1,622) | (6,778) | (324) |
| Total Investment Income | 5,688,094 | 29,339,412 | 49,411,213 | 21,019,496 | 392,507 | 945,635 | 2,771,879 | 5,753,529 | 5,760,718 | 5,312,991 | 252,841 |
| Expenses | |||||||||||
| Adviser fees | 649,523 | 1,962,370 | 2,316,121 | 867,327 | 409,228 | 592,173 | 360,988 | 2,805,060 | 1,371,229 | 2,684,443 | 293,092 |
| Sub-Adviser fees | — | — | — | — | — | 804,372 | 1,082,965 | — | — | — | — |
| Accounting and pricing fees | 27,996 | 53,004 | 60,996 | 32,004 | 18,959 | 26,867 | 27,783 | 39,892 | 48,526 | 57,039 | 19,033 |
| Administrative service fees | 129,911 | 440,969 | 525,869 | 178,608 | 16,369 | 41,896 | 54,148 | 124,849 | 124,623 | 201,333 | 9,770 |
| Audit and legal fees | 17,653 | 27,606 | 30,551 | 19,035 | 13,824 | 14,564 | 15,330 | 18,615 | 19,049 | 21,961 | 13,528 |
| Custody fees | 3,988 | 3,988 | 3,988 | 3,988 | 3,678 | 41,359 | 14,327 | 43,611 | 42,726 | 27,006 | 11,008 |
| Insurance expenses | 5,925 | 11,077 | 12,542 | 6,650 | 3,970 | 4,353 | 4,740 | 6,370 | 6,444 | 7,860 | 3,837 |
| Printing and postage expenses | 1,254 | 4,272 | 5,018 | 1,681 | 142 | 404 | 501 | 1,079 | 1,092 | 1,722 | 85 |
| SEC and state registration expenses | — | — | — | — | 3 | — | — | — | 2 | 44 | — |
| Directors’ fees | 3,772 | 3,772 | 3,772 | 3,772 | 3,896 | 4,588 | 8,603 | 15,349 | 16,152 | 22,477 | 3,805 |
| Other expenses | 6,563 | 8,065 | 8,454 | 6,903 | 6,986 | 7,036 | 7,266 | 8,860 | 9,867 | 10,702 | 6,996 |
| Total Expenses Before Reimbursement | 846,585 | 2,515,123 | 2,967,311 | 1,119,968 | 477,055 | 1,537,612 | 1,576,651 | 3,063,685 | 1,639,710 | 3,034,587 | 361,154 |
| Less: | |||||||||||
| Reimbursement from adviser | (205,346) | (535,306) | (484,299) | (87,089) | (10,126) | (148,754) | (26,858) | (64,890) | (21,375) | (57,236) | (167,602) |
| Custody earnings credit | — | — | — | — | (14) | (581) | (5,455) | (2,476) | (7,797) | (565) | (16) |
| Total Net Expenses | 641,239 | 1,979,817 | 2,483,012 | 1,032,879 | 466,915 | 1,388,277 | 1,544,338 | 2,996,319 | 1,610,538 | 2,976,786 | 193,536 |
| Net Investment Income/(Loss) | 5,046,855 | 27,359,595 | 46,928,201 | 19,986,617 | (74,408) | (442,642) | 1,227,541 | 2,757,210 | 4,150,180 | 2,336,205 | 59,305 |
| Realized and Unrealized Gains/(Losses) | |||||||||||
| Net realized gains/(losses) on: | |||||||||||
| Investments | — | — | — | — | 6,988,361 | 10,702,887 | 9,538,439 | 46,234,435 | 59,920,465 | 116,434,341 | 5,141,938 |
| Affiliated investments | 1,829,105 | 6,312,317 | 9,897,644 | 1,864,584 | — | — | — | — | — | — | — |
| Distributions of realized capital gains from | |||||||||||
| affiliated investments | 11,700,013 | 33,763,662 | 28,074,498 | 6,572,703 | — | — | — | — | — | — | — |
| Written option contracts | — | — | — | — | — | — | — | — | — | 13,651 | 772 |
| Futures contracts | — | — | — | — | — | — | — | (322,354) | (1,098,705) | — | — |
| Foreign currency transactions | — | — | — | — | — | — | — | 4 | — | (32) | (2) |
| Change in net unrealized appreciation/(depreciation) on: | |||||||||||
| Investments | — | — | — | — | (1,643,496) | (786,204) | (12,594,945) | (21,979,231) | (61,486,232) | 2,203,691 | 596,425 |
| Affiliated investments | 16,297,862 | 28,688,911 | 17,542,705 | 1,063,171 | — | — | — | — | — | — | — |
| Futures contracts | — | — | — | — | — | — | — | — | 67,350 | — | — |
| Net Realized and Unrealized Gains/(Losses) | 29,826,980 | 68,764,890 | 55,514,847 | 9,500,458 | 5,344,865 | 9,916,683 | (3,056,506) | 23,932,854 | (2,597,122) | 118,651,651 | 5,739,133 |
| Net Increase/(Decrease) in Net Assets Resulting | |||||||||||
| From Operations | $34,873,835 | $96,124,485 | $102,443,048 | $29,487,075 | $5,270,457 | $9,474,041 | $(1,828,965) | $26,690,064 | $1,553,058 | $120,987,856 | $5,798,438 |
| The accompanying Notes to Financial Statements are an integral part of this schedule. | The accompanying Notes to Financial Statements are an integral part of this schedule. |
| 226 | 227 |
| Thrivent Series Fund, Inc. | Thrivent Series Fund, Inc. | ||||||||||
| Statement of Operations — continued | Statement of Operations — continued | ||||||||||
| Partner | |||||||||||
| Partner | International | Partner | Large Cap | Large Cap | Partner | Large Cap | Large Cap | Large Cap | |||
| Mid Cap Value | Mid Cap Stock | Mid Cap Index | Stock | All Cap | Growth | Growth | Growth Stock | Value | Stock | Index | |
| For the Year Ended December 31, 2007 | Portfolio | Portfolio | Portfolio | Portfolio | Portfolio | Portfolio | Portfolio II | Portfolio | Portfolio | Portfolio | Portfolio |
| Investment Income | |||||||||||
| Dividends | $1,479,217 | $4,282,417 | $2,286,192 | $42,454,259 | $1,431,382 | $23,844,584 | $339,284 | $1,541,188 | $19,461,223 | $16,008,545 | $13,294,996 |
| Taxable interest | 9,274 | 499,740 | 15,522 | 1,708,559 | — | 1,839,031 | — | — | 896,714 | 1,889,497 | 200,556 |
| Income from securities loaned | 22,031 | 199,057 | 112,781 | 970,007 | 22,837 | 480,865 | 4,699 | 33,843 | 303,479 | 170,309 | 132,278 |
| Income from affiliated investments | 140,376 | 661,750 | 125,075 | 337,228 | 92,025 | 472,400 | 21,476 | 137,564 | 438,183 | 832,411 | 253,757 |
| Foreign dividend tax withholding | (94) | — | — | (2,794,586) | — | (170,599) | (2,482) | (42,226) | (152,451) | (114,322) | — |
| Total Investment Income | 1,650,804 | 5,642,964 | 2,539,570 | 42,675,467 | 1,546,244 | 26,466,281 | 362,977 | 1,670,369 | 20,947,148 | 18,786,440 | 13,881,587 |
| Expenses | |||||||||||
| Adviser fees | 193,721 | 2,677,658 | 561,465 | 6,678,474 | 376,323 | 9,809,652 | 278,058 | 480,446 | 5,414,948 | 5,828,054 | 2,108,355 |
| Sub-Adviser fees | 387,441 | — | — | 5,037,423 | 635,599 | — | — | 480,446 | — | — | — |
| Accounting and pricing fees | 21,432 | 33,688 | 29,439 | 140,199 | 21,349 | 147,065 | 19,072 | 25,630 | 52,556 | 57,005 | 61,491 |
| Administrative service fees | 23,246 | 118,969 | 48,125 | 438,881 | 31,955 | 735,724 | 10,427 | 36,033 | 270,747 | 287,867 | 208,003 |
| Audit and legal fees | 15,086 | 18,065 | 15,279 | 32,041 | 14,415 | 44,673 | 13,586 | 14,691 | 23,576 | 24,351 | 22,942 |
| Custody fees | 41,773 | 40,642 | 18,872 | 410,711 | 19,578 | 91,131 | 31,513 | 37,206 | 35,394 | 57,276 | 50,645 |
| Insurance expenses | 4,042 | 6,104 | 4,688 | 12,561 | 4,265 | 18,553 | 3,861 | 4,380 | 8,734 | 9,072 | 8,197 |
| Printing and postage expenses | 225 | 1,073 | 424 | 3,984 | 286 | 6,458 | 88 | 322 | 2,517 | 2,659 | 1,796 |
| SEC and state registration expenses | — | — | — | 83 | — | — | — | — | — | — | — |
| Directors’ fees | 3,772 | 14,477 | 6,487 | 43,677 | 3,816 | 74,362 | 3,808 | 3,938 | 27,615 | 29,499 | 24,725 |
| Other expenses | 6,752 | 8,434 | 7,852 | 12,846 | 6,980 | 19,779 | 7,009 | 7,100 | 10,403 | 10,878 | 11,330 |
| Total Expenses Before Reimbursement | 697,490 | 2,919,110 | 692,631 | 12,810,880 | 1,114,566 | 10,947,397 | 367,422 | 1,090,192 | 5,846,490 | 6,306,661 | 2,497,484 |
| Less: | |||||||||||
| Reimbursement from adviser | (11,103) | (52,579) | (8,655) | (954,610) | (220,246) | (37,625) | (140,763) | (130,964) | (35,224) | (66,113) | (15,598) |
| Custody earnings credit | (95) | (417) | (1,056) | (1,236) | (124) | (2,004) | (43) | (243) | (4,543) | (1,886) | (2,496) |
| Total Net Expenses | 686,292 | 2,866,114 | 682,920 | 11,855,034 | 894,196 | 10,907,768 | 226,616 | 958,985 | 5,806,723 | 6,238,662 | 2,479,390 |
| Net Investment Income/(Loss) | 964,512 | 2,776,850 | 1,856,650 | 30,820,433 | 652,048 | 15,558,513 | 136,361 | 711,384 | 15,140,425 | 12,547,778 | 11,402,197 |
| Realized and Unrealized Gains/(Losses) | |||||||||||
| Net realized gains/(losses) on: | |||||||||||
| Investments | 2,366,071 | 26,512,336 | 16,200,946 | 188,581,156 | 15,629,818 | 256,044,783 | 3,932,271 | 9,658,754 | 25,706,355 | 55,001,376 | 53,624,485 |
| Written option contracts | — | — | — | — | — | 1,675,771 | 24,534 | — | — | — | — |
| Futures contracts | — | — | 82,311 | — | — | — | — | — | — | 2,772,010 | (552,311) |
| Foreign currency transactions | — | — | — | (618,438) | — | (11) | — | (43,948) | — | (1) | — |
| Change in net unrealized appreciation/(depreciation) on: | |||||||||||
| Investments | (1,986,968) | (7,031,481) | (5,795,006) | (74,633,886) | 3,206,997 | 106,468,812 | 1,219,579 | 209,733 | (4,276,476) | (4,176,566) | (27,445,912) |
| Written option contracts | — | — | — | — | — | 9,700 | 160 | — | — | — | — |
| Futures contracts | — | — | 26,511 | — | — | — | — | — | — | (64,260) | (61,695) |
| Foreign currency forward contracts | — | — | — | (46,368) | — | — | — | 468 | — | — | — |
| Foreign currency transactions | — | — | — | 32,657 | — | — | — | (116) | — | — | — |
| Net Realized and Unrealized Gains/(Losses) | 379,103 | 19,480,855 | 10,514,762 | 113,315,121 | 18,836,815 | 364,199,055 | 5,176,544 | 9,824,891 | 21,429,879 | 53,532,559 | 25,564,567 |
| Net Increase/(Decrease) in Net Assets Resulting | |||||||||||
| From Operations | $1,343,615 | $22,257,705 | $12,371,412 | $144,135,554 | $19,488,863 | $379,757,568 | $5,312,905 | $10,536,275 | $36,570,304 | $66,080,337 | $36,966,764 |
| The accompanying Notes to Financial Statements are an integral part of this schedule. | The accompanying Notes to Financial Statements are an integral part of this schedule. |
| 228 | 229 |
| Thrivent Series Fund, Inc. | Thrivent Series Fund, Inc. | ||||||||
| Statement of Operations — continued | Statement of Operations — continued | ||||||||
| Real Estate | Diversified | Limited | Mortgage | ||||||
| Securities | Balanced | High Yield | Income Plus | Income | Bond Index | Maturity Bond | Securities | Money Market | |
| For the Year Ended December 31, 2007 | Portfolio | Portfolio | Portfolio | Portfolio | Portfolio | Portfolio | Portfolio | Portfolio | Portfolio |
| Investment Income | |||||||||
| Dividends | $7,960,510 | $6,615,429 | $586,058 | $2,011,548 | $— | $— | $— | $— | $— |
| Taxable interest | 233,811 | 9,191,937 | 62,616,113 | 5,321,313 | 72,163,119 | 10,733,556 | 40,918,824 | 2,873,647 | 36,776,943 |
| Income from mortgage dollar rolls | — | 137,440 | — | 17,763 | 784,580 | 230,016 | 325,580 | 186,870 | — |
| Income from securities loaned | 219,269 | 146,310 | 383,967 | 90,365 | 317,995 | 168,103 | 130,268 | — | — |
| Income from affiliated investments | 284,265 | 639,759 | 638,550 | 329,215 | 633,866 | 694,780 | 664,495 | 42 | — |
| Foreign dividend tax withholding | (45,595) | — | — | (314) | — | — | — | — | — |
| Total Investment Income | 8,652,260 | 16,730,875 | 64,224,688 | 7,769,890 | 73,899,560 | 11,826,455 | 42,039,167 | 3,060,559 | 36,776,943 |
| Expenses | |||||||||
| Adviser fees | 2,813,530 | 1,711,238 | 3,040,411 | 537,689 | 5,033,030 | 786,100 | 3,194,467 | 268,686 | 2,732,577 |
| Accounting and pricing fees | 37,003 | 72,490 | 79,436 | 40,693 | 91,418 | 46,634 | 61,173 | 24,344 | 51,112 |
| Administrative service fees | 105,507 | 158,624 | 228,031 | 40,327 | 377,477 | 67,380 | 239,585 | 16,121 | 204,943 |
| Audit and legal fees | 18,348 | 20,752 | 24,574 | 14,570 | 27,765 | 16,313 | 22,128 | 13,885 | 20,568 |
| Custody fees | 31,086 | 66,108 | 27,984 | 26,921 | 45,120 | 18,284 | 31,418 | 12,407 | 26,458 |
| Insurance expenses | 5,943 | 7,200 | 9,152 | 4,415 | 10,830 | 5,154 | 8,078 | 4,006 | 7,436 |
| Printing and postage expenses | 922 | 1,325 | 1,773 | 399 | 3,523 | 556 | 2,198 | 134 | 1,866 |
| SEC and state registration expenses | — | — | — | — | 40 | — | 34 | — | 2,755 |
| Directors’ fees | 13,500 | 20,224 | 25,052 | 4,033 | 37,419 | 10,436 | 24,513 | 3,832 | 21,825 |
| Other expenses | 11,571 | 10,544 | 9,755 | 7,666 | 10,514 | 6,177 | 8,050 | 5,272 | 7,738 |
| Total Expenses Before Reimbursement | 3,037,410 | 2,068,505 | 3,446,168 | 676,713 | 5,637,136 | 957,034 | 3,591,644 | 348,687 | 3,077,278 |
| Less: | |||||||||
| Reimbursement from adviser | (22,664) | (41,676) | (50,377) | (26,053) | (50,175) | (48,256) | (52,753) | (3) | (683,144) |
| Custody earnings credit | (3,668) | (3,298) | (15,193) | (4,135) | (8,746) | (3,742) | (9,220) | (923) | (2,136) |
| Total Net Expenses | 3,011,078 | 2,023,531 | 3,380,598 | 646,525 | 5,578,215 | 905,036 | 3,529,671 | 347,761 | 2,391,998 |
| Net Investment Income/(Loss) | 5,641,182 | 14,707,344 | 60,844,090 | 7,123,365 | 68,321,345 | 10,921,419 | 38,509,496 | 2,712,798 | 34,384,945 |
| Realized and Unrealized Gains/(Losses) | |||||||||
| Net realized gains/(losses) on: | |||||||||
| Investments | 27,200,999 | 21,521,189 | 8,409,131 | 1,048,183 | 5,880,360 | 89,080 | (88,861) | (114,310) | (3,442) |
| Written option contracts | — | — | — | 8,437 | 475,001 | — | 181,289 | 41,172 | — |
| Futures contracts | — | 330,847 | 108,658 | 194,008 | (2,113,398) | — | (3,201,621) | 73,401 | — |
| Foreign currency transactions | (58,217) | — | — | — | (5,957) | — | (2,253) | — | — |
| Swap agreements | — | — | (330,459) | (228,535) | (1,735,754) | — | (1,343,325) | (50,488) | — |
| Change in net unrealized appreciation/(depreciation) on: | |||||||||
| Investments | (90,530,887) | (7,534,362) | (45,030,833) | (10,010,001) | (22,683,795) | 1,232,483 | (3,665,526) | (79,688) | — |
| Written option contracts | — | — | — | — | 18,992 | — | — | 19,750 | — |
| Futures contracts | — | (65,190) | — | (4,469) | 559,423 | — | (521,201) | 19,314 | — |
| Foreign currency forward contracts | (1,780) | — | — | — | — | — | — | — | — |
| Foreign currency transactions | 1,221 | — | — | — | 671 | — | 403 | — | — |
| Swap agreements | — | — | (518,942) | (45,482) | (112,385) | — | 1,005,179 | — | — |
| Net Realized and Unrealized Gains/(Losses) | (63,388,664) | 14,252,484 | (37,362,445) | (9,037,859) | (19,716,842) | 1,321,563 | (7,635,916) | (90,849) | (3,442) |
| Net Increase/(Decrease) in Net Assets Resulting | |||||||||
| From Operations | $(57,747,482) | $28,959,828 | $23,481,645 | $(1,914,494) | $48,604,503 | $12,242,982 | $30,873,580 | $2,621,949 | $34,381,503 |
| The accompanying Notes to Financial Statements are an integral part of this schedule. | The accompanying Notes to Financial Statements are an integral part of this schedule. |
| 230 | 231 |
| Thrivent Series Fund, Inc. | Thrivent Series Fund, Inc. | |||||||||||
| Statement of Changes in Net Assets | Statement of Changes in Net Assets — continued | |||||||||||
| Aggressive Allocation | Moderately Aggressive | Moderate Allocation | Moderately Conservative | Technology | Partner Small Cap | |||||||
| Portfolio | Allocation Portfolio | Portfolio | Allocation Portfolio | Portfolio | Growth Portfolio | |||||||
| For the periods ended | 12/31/2007 | 12/31/2006 | 12/31/2007 | 12/31/2006 | 12/31/2007 | 12/31/2006 | 12/31/2007 | 12/31/2006 | 12/31/2007 | 12/31/2006 | 12/31/2007 | 12/31/2006 |
| Operations | ||||||||||||
| Net investment income/(loss) | $5,046,855 | $1,876,282 | $27,359,595 | $10,290,713 | $46,928,201 | $18,313,918 | $19,986,617 | $8,576,523 | $(74,408) | $(125,845) | $(442,642) | $(385,962) |
| Net realized gains/(losses) on: | ||||||||||||
| Investments | — | — | — | — | — | — | — | — | 6,988,361 | 1,226,671 | 10,702,887 | 6,930,764 |
| Affiliated investments | 1,829,105 | 472,927 | 6,312,317 | 2,107,242 | 9,897,644 | 4,194,101 | 1,864,584 | 2,072,132 | — | — | — | — |
| Distributions of realized capital gains from affiliated investments | 11,700,013 | 1,885,375 | 33,763,662 | 5,090,802 | 28,074,498 | 7,157,572 | 6,572,703 | 2,072,722 | — | — | — | — |
| Change in net unrealized appreciation/(depreciation) on: | ||||||||||||
| Investments | — | — | — | — | — | — | — | — | (1,643,496) | 548,896 | (786,204) | 3,145,234 |
| Affiliated investments | 16,297,862 | 23,353,619 | 28,688,911 | 67,274,310 | 17,542,705 | 63,964,841 | 1,063,171 | 15,565,217 | — | — | — | — |
| Net Change in Net Assets Resulting | ||||||||||||
| From Operations | 34,873,835 | 27,588,203 | 96,124,485 | 84,763,067 | 102,443,048 | 93,630,432 | 29,487,075 | 28,286,594 | 5,270,457 | 1,649,722 | 9,474,041 | 9,690,036 |
| Distributions to Shareholders | ||||||||||||
| From net investment income | (2,527,875) | (254) | (11,999,419) | (8,356) | (20,474,750) | (10,934) | (9,226,416) | (9,026) | — | — | — | — |
| From net realized gains | (1,708,150) | (451) | (5,496,139) | — | (9,193,702) | — | (3,496,569) | — | (1,732,497) | (804,350) | (6,970,287) | (306,119) |
| Total Distributions to Shareholders | (4,236,025) | (705) | (17,495,558) | (8,356) | (29,668,452) | (10,934) | (12,722,985) | (9,026) | (1,732,497) | (804,350) | (6,970,287) | (306,119) |
| Capital Stock Transactions | 132,166,053 | 234,228,998 | 638,371,973 | 740,970,279 | 822,049,982 | 849,257,149 | 305,249,244 | 259,923,468 | (253,085) | (7,318,944) | 57,621,162 | 33,314,554 |
| Net Increase/(Decrease) in Net Assets | 162,803,863 | 261,816,496 | 717,000,900 | 825,724,990 | 894,824,578 | 942,876,647 | 322,013,334 | 288,201,036 | 3,284,875 | (6,473,572) | 60,124,916 | 42,698,471 |
| Net Assets, Beginning of Period | 333,620,415 | 71,803,919 | 1,063,820,472 | 238,095,482 | 1,274,035,509 | 331,158,862 | 434,934,236 | 146,733,200 | 53,354,116 | 59,827,688 | 107,445,021 | 64,746,550 |
| Net Assets, End of Period | $496,424,278 | $333,620,415 | $1,780,821,372 | $1,063,820,472 | $2,168,860,087 | $1,274,035,509 | $756,947,570 | $434,934,236 | $56,638,991 | $53,354,116 | $167,569,937 | $107,445,021 |
| Partner Small Cap Value | Small Cap Stock | Small Cap Index | Mid Cap Growth | Mid Cap Growth | Partner Mid Cap Value | |||||||
| Portfolio | Portfolio | Portfolio | Portfolio | Portfolio II | Portfolio | |||||||
| For the periods ended | 12/31/2007 | 12/31/2006 | 12/31/2007 | 12/31/2006 | 12/31/2007 | 12/31/2006 | 12/31/2007 | 12/31/2006 | 12/31/2007 | 12/31/2006 | 12/31/2007 | 12/31/2006 |
| Operations | ||||||||||||
| Net investment income/(loss) | $1,227,541 | $731,308 | $2,757,210 | $1,240,608 | $4,150,180 | $3,287,951 | $2,336,205 | $2,845,528 | $59,305 | $152,804 | $964,512 | $433,414 |
| Net realized gains/(losses) on: | ||||||||||||
| Investments | 9,538,439 | 8,563,335 | 46,234,435 | 21,926,259 | 59,920,465 | 42,948,546 | 116,434,341 | 118,155,298 | 5,141,938 | 5,085,536 | 2,366,071 | 658,908 |
| Written option contracts | — | — | — | — | — | — | 13,651 | 148,119 | 772 | 6,492 | — | — |
| Futures contracts | — | — | (322,354) | 1,127,068 | (1,098,705) | (25,970) | — | — | — | — | — | — |
| Foreign currency transactions | — | — | 4 | — | — | — | (32) | — | (2) | — | — | — |
| Change in net unrealized appreciation/(depreciation) on: | ||||||||||||
| Investments | (12,594,945) | 16,810,900 | (21,979,231) | 17,873,645 | (61,486,232) | 17,537,840 | 2,203,691 | (63,202,347) | 596,425 | (2,323,447) | (1,986,968) | 5,148,722 |
| Futures contracts | — | — | — | — | 67,350 | 49,285 | — | — | — | — | — | — |
| Net Change in Net Assets Resulting | ||||||||||||
| From Operations | (1,828,965) | 26,105,543 | 26,690,064 | 42,167,580 | 1,553,058 | 63,797,652 | 120,987,856 | 57,946,598 | 5,798,438 | 2,921,385 | 1,343,615 | 6,241,044 |
| Distributions to Shareholders | ||||||||||||
| From net investment income | (615,484) | (245,502) | (1,255,527) | (393,228) | (2,602,454) | (3,387,052) | (2,797,022) | (776,730) | (151,556) | (63,381) | — | (412,610) |
| From net realized gains | (8,696,064) | (4,957,416) | (24,156,432) | (21,622,774) | (43,516,538) | (12,406,769) | (26,785,497) | — | (5,117,206) | (398,560) | (371,536) | (496,498) |
| Total Distributions to Shareholders | (9,311,548) | (5,202,918) | (25,411,959) | (22,016,002) | (46,118,992) | (15,793,821) | (29,582,519) | (776,730) | (5,268,762) | (461,941) | (371,536) | (909,108) |
| Capital Stock Transactions | 33,136,468 | 36,478,829 | (8,092,437) | 96,341,517 | (37,288,688) | (81,904,164) | (76,449,575) | (149,761,729) | 212,010 | (8,985,118) | 39,102,596 | 28,366,726 |
| Net Increase/(Decrease) in Net Assets | 21,995,955 | 57,381,454 | (6,814,332) | 116,493,095 | (81,854,622) | (33,900,333) | 14,955,762 | (92,591,861) | 741,686 | (6,525,674) | 40,074,675 | 33,698,662 |
| Net Assets, Beginning of Period | 163,621,883 | 106,240,429 | 406,669,206 | 290,176,111 | 439,750,088 | 473,650,421 | 654,880,896 | 747,472,757 | 31,704,198 | 38,229,872 | 54,945,334 | 21,246,672 |
| Net Assets, End of Period | $185,617,838 | $163,621,883 | $399,854,874 | $406,669,206 | $357,895,466 | $439,750,088 | $669,836,658 | $654,880,896 | $32,445,884 | $31,704,198 | $95,020,009 | $54,945,334 |
| The accompanying Notes to Financial Statements are an integral part of this schedule. | The accompanying Notes to Financial Statements are an integral part of this schedule. |
| 232 | 233 |
| Thrivent Series Fund, Inc. | Thrivent Series Fund, Inc. | |||||||||||
| Statement of Changes in Net Assets — continued | Statement of Changes in Net Assets — continued | |||||||||||
| Mid Cap | Mid Cap | Partner International | Partner All Cap | Large Cap Growth | Large Cap Growth | |||||||
| Stock Portfolio | Index Portfolio | Stock Portfolio | Portfolio | Portfolio | Portfolio II | |||||||
| For the periods ended | 12/31/2007 | 12/31/2006 | 12/31/2007 | 12/31/2006 | 12/31/2007 | 12/31/2006 | 12/31/2007 | 12/31/2006 | 12/31/2007 | 12/31/2006 | 12/31/2007 | 12/31/2006 |
| Operations | ||||||||||||
| Net investment income/(loss) | $2,776,850 | $3,788,354 | $1,856,650 | $1,845,424 | $30,820,433 | $17,813,775 | $652,048 | $467,578 | $15,558,513 | $12,364,942 | $136,361 | $218,087 |
| Net realized gains/(losses) on: | ||||||||||||
| Investments | 26,512,336 | 27,891,869 | 16,200,946 | 8,814,852 | 188,581,156 | 101,356,430 | 15,629,818 | 13,995,068 | 256,044,783 | 129,262,855 | 3,932,271 | 2,239,445 |
| Written option contracts | — | — | — | — | — | — | — | — | 1,675,771 | 1,538,579 | 24,534 | 27,736 |
| Futures contracts | — | — | 82,311 | 80,501 | — | — | — | — | — | — | — | — |
| Foreign currency transactions | — | — | — | — | (618,438) | (175,402) | — | — | (11) | — | — | — |
| Change in net unrealized appreciation/(depreciation) on: | ||||||||||||
| Investments | (7,031,481) | 5,640,390 | (5,795,006) | 4,866,436 | (74,633,886) | 111,812,792 | 3,206,997 | (1,545,231) | 106,468,812 | 4,895,989 | 1,219,579 | (66,913) |
| Written option contracts | — | — | — | — | — | — | — | — | 9,700 | (40,721) | 160 | (905) |
| Futures contracts | — | — | 26,511 | (44,436) | — | — | — | — | — | — | — | — |
| Foreign currency forward contracts | — | — | — | — | (46,368) | 836 | — | — | — | — | — | — |
| Foreign currency transactions | — | — | — | — | 32,657 | 5,157 | — | — | — | — | — | — |
| Net Change in Net Assets Resulting | ||||||||||||
| From Operations | 22,257,705 | 37,320,613 | 12,371,412 | 15,562,777 | 144,135,554 | 230,813,588 | 19,488,863 | 12,917,415 | 379,757,568 | 148,021,644 | 5,312,905 | 2,417,450 |
| Distributions to Shareholders | ||||||||||||
| From net investment income | (3,442,513) | (928,850) | (1,542,576) | (1,645,094) | (20,042,187) | (15,477,487) | (469,104) | (388,596) | (26,284,570) | (11,608,717) | (217,804) | (231,923) |
| From net realized gains | (28,823,966) | (19,188,784) | (9,057,618) | (7,254,836) | (47,186,402) | — | (10,483,224) | — | — | — | (2,106,701) | (52,741) |
| Total Distributions to Shareholders | (32,266,479) | (20,117,634) | (10,600,194) | (8,899,930) | (67,228,589) | (15,477,487) | (10,952,328) | (388,596) | (26,284,570) | (11,608,717) | (2,324,505) | (284,664) |
| Capital Stock Transactions | 34,113,195 | 122,411,425 | (15,343,402) | (18,440,951) | 25,063,082 | 70,562,243 | 12,490,951 | 1,813,945 | (131,675,891) | (179,786,394) | (4,935,596) | (8,801,805) |
| Net Increase/(Decrease) in Net Assets | 24,104,421 | 139,614,404 | (13,572,184) | (11,778,104) | 101,970,047 | 285,898,344 | 21,027,486 | 14,342,764 | 221,797,107 | (43,373,467) | (1,947,196) | (6,669,019) |
| Net Assets, Beginning of Period | 363,842,093 | 224,227,689 | 159,754,683 | 171,532,787 | 1,341,800,223 | 1,055,901,879 | 96,543,867 | 82,201,103 | 2,331,653,916 | 2,375,027,383 | 35,931,096 | 42,600,115 |
| Net Assets, End of Period | $387,946,514 | $363,842,093 | $146,182,499 | $159,754,683 | $1,443,770,270 | $1,341,800,223 | $117,571,353 | $96,543,867 | $2,553,451,023 | $2,331,653,916 | $33,983,900 | $35,931,096 |
| Partner Growth Stock | Large Cap Value | Large Cap Stock | Large Cap Index | Real Estate Securities | Balanced | |||||||
| Portfolio | Portfolio | Portfolio | Portfolio | Portfolio | Portfolio | |||||||
| For the periods ended | 12/31/2007 | 12/31/2006 | 12/31/2007 | 12/31/2006 | 12/31/2007 | 12/31/2006 | 12/31/2007 | 12/31/2006 | 12/31/2007 | 12/31/2006 | 12/31/2007 | 12/31/2006 |
| Operations | ||||||||||||
| Net investment income/(loss) | $711,384 | $627,996 | $15,140,425 | $10,542,905 | $12,547,778 | $10,374,268 | $11,402,197 | $11,845,066 | $5,641,182 | $4,394,985 | $14,707,344 | $16,421,891 |
| Net realized gains/(losses) on: | ||||||||||||
| Investments | 9,658,754 | 6,111,401 | 25,706,355 | 36,325,437 | 55,001,376 | 13,803,001 | 53,624,485 | 59,003,051 | 27,200,999 | 20,725,128 | 21,521,189 | 25,712,548 |
| Futures contracts | — | — | — | — | 2,772,010 | 977,405 | (552,311) | 1,270,813 | — | — | 330,847 | 820,342 |
| Foreign currency transactions | (43,948) | (9,056) | — | — | (1) | — | — | — | (58,217) | (32,185) | — | — |
| Change in net unrealized appreciation/(depreciation) on: | ||||||||||||
| Investments | 209,733 | 7,398,126 | (4,276,476) | 63,646,425 | (4,176,566) | 58,967,851 | (27,445,912) | 33,168,863 | (90,530,887) | 66,655,948 | (7,534,362) | 20,606,275 |
| Futures contracts | — | — | — | — | (64,260) | (38,060) | (61,695) | 41,640 | — | — | (65,190) | 119,410 |
| Foreign currency forward contracts | 468 | (97) | — | — | — | — | — | — | (1,780) | — | — | — |
| Foreign currency transactions | (116) | (22) | — | — | — | — | — | — | 1,221 | — | — | — |
| Net Change in Net Assets Resulting | ||||||||||||
| From Operations | 10,536,275 | 14,128,348 | 36,570,304 | 110,514,767 | 66,080,337 | 84,084,465 | 36,966,764 | 105,329,433 | (57,747,482) | 91,743,876 | 28,959,828 | 63,680,466 |
| Distributions to Shareholders | ||||||||||||
| From net investment income | (621,984) | (237,101) | (10,416,269) | (6,466,754) | (10,350,750) | (4,877,166) | (11,629,702) | (12,463,075) | (4,518,187) | (4,184,991) | (16,298,675) | (17,844,453) |
| From net realized gains | (5,894,305) | (2,713,317) | (36,284,324) | (13,282,920) | (15,366,693) | (8,534,756) | (28,177,160) | — | (20,759,334) | (12,678,039) | — | — |
| Total Distributions to Shareholders | (6,516,289) | (2,950,418) | (46,700,593) | (19,749,674) | (25,717,443) | (13,411,922) | (39,806,862) | (12,463,075) | (25,277,521) | (16,863,030) | (16,298,675) | (17,844,453) |
| Capital Stock Transactions | (2,635,601) | (14,871,673) | 243,337,040 | 166,400,530 | 190,502,412 | 156,175,673 | (91,003,663) | (160,828,999) | 41,563,213 | 18,396,156 | (90,341,172) | (143,240,068) |
| Net Increase/(Decrease) in Net Assets | 1,384,385 | (3,693,743) | 233,206,751 | 257,165,623 | 230,865,306 | 226,848,216 | (93,843,761) | (67,962,641) | (41,461,790) | 93,277,002 | (77,680,019) | (97,404,055) |
| Net Assets, Beginning of Period | 116,670,091 | 120,363,834 | 771,694,127 | 514,528,504 | 829,264,067 | 602,415,851 | 727,300,919 | 795,263,560 | 367,888,416 | 274,611,414 | 566,129,245 | 663,533,300 |
| Net Assets, End of Period | $118,054,476 | $116,670,091 | $1,004,900,878 | $771,694,127 | $1,060,129,373 | $829,264,067 | $633,457,158 | $727,300,919 | $326,426,626 | $367,888,416 | $488,449,226 | $566,129,245 |
| The accompanying Notes to Financial Statements are an integral part of this schedule. | The accompanying Notes to Financial Statements are an integral part of this schedule. |
| 234 | 235 |
| Thrivent Series Fund, Inc. | Thrivent Series Fund, Inc. | |||||||||||
| Statement of Changes in Net Assets — continued | Statement of Changes in Net Assets — continued | |||||||||||
| High Yield | Diversified Income | Income | Bond Index | Limited Maturity Bond | Mortgage Securities | |||||||
| Portfolio | Plus Portfolio | Portfolio | Portfolio | Portfolio | Portfolio | |||||||
| For the periods ended | 12/31/2007 | 12/31/2006 | 12/31/2007 | 12/31/2006 | 12/31/2007 | 12/31/2006 | 12/31/2007 | 12/31/2006 | 12/31/2007 | 12/31/2006 | 12/31/2007 | 12/31/2006 |
| Operations | ||||||||||||
| Net investment income/(loss) | $60,844,090 | $67,400,467 | $7,123,365 | $6,000,473 | $68,321,345 | $51,314,501 | $10,921,419 | $11,754,959 | $38,509,496 | $24,151,658 | $2,712,798 | $3,083,874 |
| Net realized gains/(losses) on: | ||||||||||||
| Investments | 8,409,131 | 11,497,803 | 1,048,183 | 1,721,189 | 5,880,360 | (9,882,895) | 89,080 | (3,992,644) | (88,861) | (1,514,323) | (114,310) | (1,628,788) |
| Written option contracts | — | — | 8,437 | — | 475,001 | 341,467 | — | — | 181,289 | 49,500 | 41,172 | 65,313 |
| Futures contracts | 108,658 | 85,830 | 194,008 | 41,698 | (2,113,398) | 2,254,846 | — | — | (3,201,621) | (142,359) | 73,401 | 50,737 |
| Foreign currency transactions | — | — | — | — | (5,957) | (234) | — | — | (2,253) | 21 | — | — |
| Swap agreements | (330,459) | — | (228,535) | — | (1,735,754) | 15,253 | — | — | (1,343,325) | 2,174 | (50,488) | — |
| Change in net unrealized appreciation/(depreciation) on: | ||||||||||||
| Investments | (45,030,833) | 3,621,368 | (10,010,001) | 4,432,420 | (22,683,795) | 9,129,401 | 1,232,483 | 1,636,347 | (3,665,526) | 1,965,503 | (79,688) | 1,180,031 |
| Written option contracts | — | — | — | — | 18,992 | — | — | — | — | — | 19,750 | 6,328 |
| Futures contracts | — | 66,785 | (4,469) | 38,992 | 559,423 | 430,129 | — | — | (521,201) | 131,435 | 19,314 | — |
| Foreign currency transactions | — | — | — | — | 671 | (671) | — | — | 403 | (403) | — | — |
| Swap agreements | (518,942) | — | (45,482) | — | (112,385) | 28,330 | — | — | 1,005,179 | 10,310 | — | — |
| Net Change in Net Assets Resulting | ||||||||||||
| From Operations | 23,481,645 | 82,672,253 | (1,914,494) | 12,234,772 | 48,604,503 | 53,630,127 | 12,242,982 | 9,398,662 | 30,873,580 | 24,653,516 | 2,621,949 | 2,757,495 |
| Distributions to Shareholders | ||||||||||||
| From net investment income | (61,327,393) | (67,173,264) | (2,651,827) | (3,423,713) | (66,556,877) | (51,060,201) | (10,947,777) | (11,775,809) | (37,803,391) | (23,958,814) | (2,676,830) | (3,061,441) |
| From net realized gains | — | — | — | — | — | (5,778,101) | — | — | — | — | — | — |
| Total Distributions to Shareholders | (61,327,393) | (67,173,264) | (2,651,827) | (3,423,713) | (66,556,877) | (56,838,302) | (10,947,777) | (11,775,809) | (37,803,391) | (23,958,814) | (2,676,830) | (3,061,441) |
| Capital Stock Transactions | (34,592,829) | 28,876,444 | 27,772,312 | 5,309,199 | 354,474,528 | 160,636,788 | (23,891,866) | (32,167,929) | 315,111,257 | 210,857,949 | (7,995,833) | (8,782,181) |
| Net Increase/(Decrease) in Net Assets | (72,438,577) | 44,375,433 | 23,205,991 | 14,120,258 | 336,522,154 | 157,428,613 | (22,596,661) | (34,545,076) | 308,181,446 | 211,552,651 | (8,050,714) | (9,086,127) |
| Net Assets, Beginning of Period | 847,021,022 | 802,645,589 | 108,072,290 | 93,952,032 | 1,081,762,445 | 924,333,832 | 237,813,289 | 272,358,365 | 665,627,763 | 454,075,112 | 57,839,892 | 66,926,019 |
| Net Assets, End of Period | $774,582,445 | $847,021,022 | $131,278,281 | $108,072,290 | $1,418,284,599 | $1,081,762,445 | $215,216,628 | $237,813,289 | $973,809,209 | $665,627,763 | $49,789,178 | $57,839,892 |
| Money Market | ||||||||||||
| Portfolio | ||||||||||||
| For the periods ended | 12/31/2007 | 12/31/2006 | ||||||||||
| Operations | ||||||||||||
| Net investment income/(loss) | $34,384,945 | $23,138,704 | ||||||||||
| Net realized gains/(losses) on: | ||||||||||||
| Investments | (3,442) | — | ||||||||||
| Net Change in Net Assets Resulting | ||||||||||||
| From Operations | 34,381,503 | 23,138,704 | ||||||||||
| Distributions to Shareholders | ||||||||||||
| From net investment income | (34,544,766) | (23,015,583) | ||||||||||
| Total Distributions to Shareholders | (34,544,766) | (23,015,583) | ||||||||||
| Capital Stock Transactions | 151,133,817 | 216,771,334 | ||||||||||
| Net Increase/(Decrease) in Net Assets | 150,970,554 | 216,894,455 | ||||||||||
| Net Assets, Beginning of Period | 590,582,973 | 373,688,518 | ||||||||||
| Net Assets, End of Period | $741,553,527 | $590,582,973 | ||||||||||
| The accompanying Notes to Financial Statements are an integral part of this schedule. | The accompanying Notes to Financial Statements are an integral part of this schedule. |
| 236 | 237 |
THRIVENT SERIES FUND, INC.
NOTES TO FINANCIAL STATEMENTS
December 31, 2007
(1) ORGANIZATION
Thrivent Series Fund, Inc. (the “Fund”), a company organized under the laws of Minnesota, is registered under the Investment Company Act of 1940 (the “1940 Act”). The Fund is divided into thirty-one separate series (each a “Portfolio” and, collectively, the “Portfolios”), each with its own investment objective and policies. The Fund consists of four asset allocation portfolios, nineteen equity portfolios, two hybrid portfolios, five fixed-income portfolios, and one money market portfolio. The assets of each Portfolio are segregated and each has a separate class of capital stock.
Shares in the Fund are currently sold, without sales charges, only to separate accounts of Thrivent Financial for Lutherans (“Thrivent Financial”) and Thrivent Life Insurance Company (“Thrivent Life” or the “Adviser”), which are used to fund benefits of variable life insurance and variable annuity contracts issued by Thrivent Financial and Thrivent Life; and retirement plans sponsored by Thrivent Financial.
Under the Fund’s organizational documents, its officers and directors are indemnified against certain liabilities arising out of the performance of their duties to the Fund. In addition, in the normal course of business, the Fund enters into contracts with service providers and others that provide general damage clauses. The Fund’s maximum exposure under these contracts is unknown, as this would involve future claims that may be made against the Fund. However, based on experience, the Fund expects the risk of loss to be remote.
(2) SIGNIFICANT ACCOUNTING POLICIES
(A) Valuation of Investments — Securities traded on U.S. or foreign securities exchanges or included in a national market system are valued at the official closing price at the close of each business day unless otherwise stated below. Over-the-counter securities and listed securities for which no price is readily available are valued at the current bid price considered best to represent the value at that time. Security prices are based on quotes that are obtained from an independent pricing service approved by the Board of Directors. The pricing service, in determining values of fixed-income securities, takes into consideration such factors as current quotations by broker/dealers, coupon, maturity, quality, type of issue, trading characteristics, and other yield and risk factors it deems relevant in determining valuations. Securities which cannot be valued by the approved pricing service are valued using valuations obtained from dealers that make markets in the securities. Exchange listed options and futures contracts are valued at the last quoted sales price. Mutual funds are valued at their net asset value at the close of each business day.
For all Portfolios, other than Money Market Portfolio, short-term securities with maturities of 60 days or less are valued at amortized cost. Securities held by Money Market Portfolio are valued on the basis of amortized cost (which approximates market value), whereby a portfolio security is valued at its cost initially and thereafter valued to reflect a constant amortization to maturity of any discount or premium. The market values of the securities held in Money Market Portfolio are determined once per week using prices supplied by the Fund’s independent pricing service. Money Market Portfolio and the Fund’s investment adviser follow procedures necessary to maintain a constant net asset value of $1.00 per share.
All securities for which market values are not readily available or deemed unreliable are appraised at fair value as determined in good faith under the direction of the Board of Directors. As of December 31, 2007, three securities in High Yield Portfolio were valued at fair value representing less than 0.01% of High Yield Portfolio’s net assets.
Fair Valuation of International Securities — Because many foreign markets close before the U.S. markets, events may occur between the close of the foreign market and the close of the U.S. markets that could have a material impact on the valuation of foreign securities. The Portfolios, under the supervision of the Board of Directors, evaluate the impacts of these events and may adjust the valuation of foreign securities to reflect the fair value as of the close of the U.S. markets. The Board of Directors has authorized the Fund’s investment adviser to make fair valuation determinations pursuant to policies approved by the Board of Directors.
(B) Foreign Currency Translation — The accounting records of each Portfolio are maintained in U.S. dollars. Securities and other assets and liabilities that are denominated in foreign currencies are translated into U.S. dollars at the daily closing rates of exchange.
Foreign currency amounts related to the purchase or sale of securities and income and expenses are translated at the exchange rate on the transaction date. Net realized and unrealized currency gains and losses are recorded from sales of foreign currency, exchange gains or losses between the trade date and settlement dates on securities transactions, and other translation gains or losses on dividends, interest income and foreign withholding taxes. The Portfolios do not
| 238 |
THRIVENT SERIES FUND, INC.
Notes to Financial Statements
As of December 31, 2007
separately report the effect of changes in foreign exchange rates from changes in market prices on securities held. Such changes are included in net realized and unrealized gain or loss from investments.
For federal income tax purposes, the Portfolios treat the effect of changes in foreign exchange rates arising from actual foreign currency transactions and the changes in foreign exchange rates between the trade date and settlement date as ordinary income.
(C) Foreign Currency Contracts — In connection with purchases and sales of securities denominated in foreign currencies, all Portfolios except Money Market Portfolio may enter into forward currency contracts. Additionally, the Portfolios may enter into such contracts to hedge certain other foreign currency denominated investments. These contracts are recorded at market value and the related realized and unrealized foreign exchange gains and losses are included in the Statement of Operations. In the event that counterparties fail to settle these forward contracts, the Portfolios could be exposed to foreign currency fluctuations. Foreign currency contracts are valued daily and unrealized appreciation or depreciation is recorded daily as the difference between the contract exchange rate and the closing forward rate applied to the face amount of the contract. A realized gain or loss is recorded at the time a forward contract is closed. During the year ended December 31, 2007, Small Cap Stock Portfolio, Mid Cap Growth Portfolio, Mid Cap Growth Portfolio II, Partner International Stock Portfolio, Large Cap Growth Portfolio, Large Cap Growth Portfolio II, Partner Growth Stock Portfolio, Large Cap Stock Portfolio, Real Estate Securities Portfolio, Income Portfolio and Limited Maturity Bond Portfolio engaged in this type of investment.
(D) Foreign Denominated Investments — Foreign denominated assets and currency contracts may involve more risks than domestic transactions including currency risk, political and economic risk, regulatory risk, and market risk. Certain Portfolios may also invest in securities of companies located in emerging markets. Future economic or political developments could adversely affect the liquidity or value, or both, of such securities.
(E) Federal Income Taxes — No provision has been made for income taxes because each Portfolios’ policy is to qualify as regulated investment companies under the Internal Revenue Code and distribute substantially all taxable income on a timely basis. It is also the intention of the Portfolios to distribute an amount sufficient to avoid imposition of any federal excise tax. The Portfolios, accordingly, anticipate paying no federal taxes and no federal tax provision was recorded. Each Portfolio is treated as a separate taxable entity for federal income tax purposes.
(F) Income and Expenses — Estimated expenses are accrued daily. The Portfolios are charged for those expenses that are directly attributable to them. Expenses that are not directly attributable to a Portfolio are allocated among all appropriate Portfolios in proportion to their respective net assets, number of shareholder accounts or other reasonable basis.
Interest income is accrued daily and is determined on the basis of interest or discount earned on all debt securities, including accretion of market discount and original issue discount and amortization of premium. Paydown gains and losses on mortgage- and asset-backed securities are recorded as components of interest income. Dividend income is recorded on the ex-dividend date. For preferred stock payment-in-kind securities, income is recorded on the ex-dividend date in the amount of the value received.
(G) Custody Earnings Credit — The Portfolios have a deposit arrangement with the custodian whereby interest earned on uninvested cash balances is used to pay a portion of custodian fees. This deposit arrangement is an alternative to overnight investments.
(H) Distributions to Shareholders — Dividends from net investment income, if available, are declared and paid to each shareholder as a dividend. Dividend and capital gain distributions are recorded on the ex-dividend date. With the exception of Money Market Portfolio, net realized gains from securities transactions, if any, are paid at least annually for all Portfolios after the close of the Portfolios’ fiscal year. Any Portfolio subject to excise taxes would require an additional distribution prior to the close of the fiscal year.
Dividends are declared and reinvested daily for High Yield Portfolio, Income Portfolio, Bond Index Portfolio, Limited Maturity Bond Portfolio and Mortgage Securities Portfolio; declared daily and reinvested monthly for Money Market Portfolio; and declared and reinvested at least annually for all other Portfolios.
(I) Options — All Portfolios, with the exception of Money Market Portfolio, may buy put and call options and write put and covered call options. The Portfolios intend to use such derivative instruments as hedges to facilitate buying or selling securities or to provide protection against adverse movements in security prices or interest rates. The Portfolios may also enter into options contracts to protect
| 239 |
THRIVENT SERIES FUND, INC.
Notes to Financial Statements
As of December 31, 2007
(2) SIGNIFICANT ACCOUNTING POLICIES — continued
against adverse foreign exchange rate fluctuations. Option contracts are valued daily and unrealized appreciation or depreciation is recorded. A Portfolio will realize a gain or loss upon expiration or closing of the option transaction. When an option is exercised, the proceeds upon sale for a written call option or the cost of a security for purchased put and call options is adjusted by the amount of premium received or paid. The writer of an option bears the market risk of an unfavorable change in the price of the security underlying the written option. Risks of loss may exceed amounts recognized on the Statement of Assets and Liabilities. During the year ended December 31, 2007, Mid Cap Growth Portfolio, Mid Cap Growth Portfolio II, Large Cap Growth Portfolio, Large Cap Growth Portfolio II, Diversified Income Plus Portfolio, Income Portfolio, Limited Maturity Bond Portfolio and Mortgage Securities Portfolio engaged in this type of investment.
(J) Financial Futures Contracts — Certain Portfolios may use futures contracts to manage the exposure to interest rate and market fluctuations. Gains or losses on futures contracts can offset changes in the yield of securities. When a futures contract is opened, cash or other investments equal to the required initial margin deposit are held on deposit with and pledged to the broker. Additional securities held by the Portfolios may be earmarked as collateral for open futures contracts. The futures contract’s daily change in value (variation margin) is either paid to or received from the broker, and is recorded as an unrealized gain or loss. When the contract is closed, the realized gain or loss is recorded equal to the difference between the value of the contract when opened and the value of the contract when closed. Futures contracts involve, to varying degrees, risk of loss in excess of the variation margin disclosed in the Statement of Assets and Liabilities. During the year ended December 31, 2007, Small Cap Stock Portfolio, Small Cap Index Portfolio, Mid Cap Index Portfolio, Large Cap Stock Portfolio, Large Cap Index Portfolio, Balanced Portfolio, High Yield Portfolio, Diversified Income Plus Portfolio, Income Portfolio, Limited Maturity Bond Portfolio and Mortgage Securities Portfolio engaged in this type of investment.
(K) Swap Agreements — Certain Portfolios enter into swap transactions, which involve swapping one or more investment characteristics of a security or a basket of securities with another party. Such transactions include market risk, risk of default by the other party to the transaction, risk of imperfect correlation and manager risk and may involve commissions or other costs. Swap transactions generally do not involve delivery of securities, other underlying assets or principal. Accordingly, the risk of loss with respect to swap transactions is generally limited to the net amount of payments that the Portfolio is contractually obligated to make, or in the case of the counterparty defaulting, the net amount of payments that the Portfolio is contractually entitled to receive. Risks of loss may exceed amounts recognized on the Statement of Assets and Liabilities. If there is a default by the counterparty, the Portfolio may have contractual remedies pursuant to the agreements related to the transaction. The contracts are valued daily and unrealized appreciation or depreciation is recorded. Periodic payments and receipts and payments received or made as a result of a credit event or termination of the contract are recognized as realized gains or losses on the Statement of Operations. Collateral, in the form of cash or securities, may be required to be held with the Fund’s custodian, or third party, in connection with these agreements.
Credit Default Swaps — A credit default swap is an agreement between two parties to exchange the credit risk of a particular issuer, basket of securities or reference entity. In a credit default swap transaction, a buyer pays periodic fees in return for payment by the seller which is contingent upon an adverse credit event occurring in the underlying issuer or reference entity. The seller collects periodic fees from the buyer and profits if the credit of the underlying issuer or reference entity remains stable or improves while the swap is outstanding, but the seller in a credit default swap contract would be required to pay the amount of credit loss, determined as specified in the agreement, to the buyer in the event of an adverse credit event in the reference entity. A buyer of a credit default swap is said to buy protection whereas a seller of a credit default swap is said to sell protection. The Portfolios may be either the protection seller or the protection buyer. During the year ended December 31, 2007, High Yield Portfolio, Diversified Income Plus Portfolio, Income Portfolio and Limited Maturity Bond Portfolio engaged in this type of investment.
Total Rate of Return Swaps — A total rate of return swap is an agreement in which one party makes payments based on a set rate, either fixed or variable, while the other party makes payments based on the return of an underlying asset plus any capital gains and losses over the payment period. The underlying asset is typically an index, loan or a basket of assets. Total rate of return swaps provide the Portfolios with
| 240 |
THRIVENT SERIES FUND, INC.
Notes to Financial Statements
As of December 31, 2007
the additional flexibility of gaining exposure to a market or securities index by using the most cost-effective vehicle available. During the year ended December 31, 2007, Diversified Income Plus Portfolio, Income Portfolio, Limited Maturity Bond Portfolio and Mortgage Securities Portfolio engaged in this type of investment.
Interest Rate Swaps — An interest rate swap is an agreement between two parties to exchange cash flows based on the difference between two interest rates. Typically, one party pays a fixed-rate for a specific period while the other pays a variable-rate based on an underlying index for the same period. Interest rate swaps allow the Portfolios to manage exposure to interest rate fluctuations. During the year ended December 31, 2007, Limited Maturity Bond Portfolio engaged in this type of investment.
(L) Mortgage Dollar Roll Transactions — Certain Portfolios enter into dollar roll transactions on securities issued or to be issued by the Government National Mortgage Association, Federal National Mortgage Association and Federal Home Loan Mortgage Corporation, in which the Portfolios sell mortgage securities and simultaneously agree to repurchase similar (same type, coupon, and maturity) securities at a later date at an agreed upon price. During the period between the sale and repurchase, the Portfolios forgo principal and interest paid on the mortgage securities sold. The Portfolios are compensated from negotiated fees paid by brokers offered as an inducement to the Portfolios to roll over their purchase commitments. These fees are recognized over the roll period and are included in Income from mortgage dollar rolls in the Statement of Operations. During the year ended December 31, 2007, Balanced Portfolio, Diversified Income Plus Portfolio, Income Portfolio, Bond Index Portfolio, Limited Maturity Bond Portfolio and Mortgage Securities Portfolio engaged in this type of transaction.
(M) Securities Lending — The Fund had previously entered into a Securities Lending Agreement with State Street Bank and Trust Company (“State Street Bank”) and, as of April 27, 2007, entered into a similar agreement with Dresdner Bank AG (each, an “Agreement”). Each Agreement authorizes the applicable lender to lend securities to authorized borrowers on behalf of the Portfolios. Pursuant to each Agreement, all loaned securities are collateralized by cash equal to at least 102% of the value of the loaned securities. All cash collateral received is invested in Thrivent Financial Securities Lending Trust. Amounts earned on investments in Thrivent Financial Securities Lending Trust, net of rebates and other securities lending expenses, are included in Income from securities loaned on the Statement of Operations. As payment for its services, each lender receives a portion of the fee income and earnings on the collateral. By investing any cash collateral it receives in these transactions, a Portfolio could realize additional gains or losses. If the borrower fails to return the securities and the invested collateral has declined in value, the Portfolio could lose money. The Agreement with State Street Bank granted and transferred to State Street Bank a lien upon collateralized assets in the possession of State Street Bank.
As of December 31, 2007, all Portfolios except Aggressive Allocation Portfolio, Moderately Aggressive Allocation Portfolio, Moderate Allocation Portfolio, Moderately Conservative Allocation Portfolio, Mortgage Securities Portfolio and Money Market Portfolio had securities on loan with Dresdner Bank AG. The value of securities on loan are as follows:
| Securities | ||
| Portfolio | on Loan | |
| Technology | $ 8,010,371 | |
| Partner Small Cap Growth | 68,748,243 | |
| Partner Small Cap Value | 56,616,226 | |
| Small Cap Stock | 89,038,520 | |
| Small Cap Index | 107,206,733 | |
| Mid Cap Growth | 109,433,247 | |
| Mid Cap Growth II | 2,165,145 | |
| Partner Mid Cap Value | 9,635,685 | |
| Mid Cap Stock | 94,151,873 | |
| Mid Cap Index | 25,867,161 | |
| Partner International Stock | 116,313,147 | |
| Partner All Cap | 9,650,968 | |
| Large Cap Growth | 130,217,826 | |
| Large Cap Growth II | 339,909 | |
| Partner Growth Stock | 11,245,216 | |
| Large Cap Value | 90,513,864 | |
| Large Cap Stock | 63,181,458 | |
| Large Cap Index | 47,354,418 | |
| Real Estate Securities | 137,420,690 | |
| Balanced | 46,281,062 | |
| High Yield | 89,121,698 | |
| Diversified Income Plus | 9,692,301 | |
| Income | 125,601,928 | |
| Bond Index | 53,844,911 | |
| Limited Maturity Bond | 124,682,863 | |
(N) When-Issued and Delayed Delivery Transactions — Certain Portfolios may purchase or sell securities on a when-issued or delayed delivery basis. These transactions involve a commitment by a Portfolio to purchase or sell securities for a predetermined price or yield, with payment
| 241 |
THRIVENT SERIES FUND, INC.
Notes to Financial Statements
As of December 31, 2007
(2) SIGNIFICANT ACCOUNTING POLICIES — continued
and delivery taking place beyond the customary settlement period. When delayed delivery purchases are outstanding, a Portfolio will designate liquid assets in an amount sufficient to meet the purchase price. When purchasing a security on a delayed delivery basis, a Portfolio assumes the rights and risks of ownership of the security, including the risk of price and yield fluctuations, and takes such fluctuations into account when determining its net asset value. A Portfolio may dispose of a delayed delivery transaction after it is entered into, and may sell when-issued securities before they are delivered, which may result in a capital gain or loss. When a Portfolio has sold a security on a delayed delivery basis, a Portfolio does not participate in future gains and losses with respect to the security.
(O) Treasury Inflation Protected Securities — Certain Portfolios may invest in treasury inflation protected securities (TIPS). These securities are fixed income securities whose principal value is periodically adjusted to the rate of inflation. The interest rate is generally fixed at issuance. Interest is paid based on the principal value, which is adjusted for inflation. Any increase in the principal amount will be included as taxable interest in the Statement of Operations and received upon maturity or sale of the security. During the year ended December 31, 2007, Diversified Income Plus Portfolio, Income Portfolio, Limited Maturity Bond Portfolio and Mortgage Securities Portfolio engaged in this type of investment.
(P) Repurchase Agreements — Each Portfolio may engage in repurchase agreement transactions in pursuit of its investment objective. A repurchase agreement consists of a purchase and a simultaneous agreement to resell an investment for later delivery at an agreed upon price and rate of interest. The Portfolio must take possession of collateral either directly or through a third-party custodian. If the original seller of a security subject to a repurchase agreement fails to repurchase the security at the agreed upon time, the Portfolio could incur a loss due to a drop in the market value of the security during the time it takes the Portfolio to either sell the security or take action to enforce the Portfolio seller’s agreement to repurchase the security. Also, if a defaulting original seller filed for bankruptcy or became insolvent, disposition of such security might be delayed by pending court action. The Portfolio may only enter into repurchase agreements with banks and other recognized financial institutions such as broker/dealers that are found by the Portfolios’ investment adviser (or a subadviser) to be creditworthy. During the year ended December 31, 2007, Mid Cap Growth Portfolio, Partner International Stock Portfolio, Large Cap Growth Portfolio, Large Cap Value Portfolio, Large Cap Stock Portfolio, High Yield Portfolio, Income Portfolio and Limited Maturity Bond Portfolio engaged in this type of investment.
(Q) Equity-Linked Structured Securities — Certain portfolios may invest in equity-linked structured notes. Equity-linked structured notes are debt securities which combine the characteristics of common stock and the sale of an option. The return component is based upon the performance of a single equity security, a basket of equity securities, or an equity index and the sale of an option which is recognized as income. There is no guaranteed return of principal with these securities. The appreciation potential of these securities may be limited by a maximum payment or call right and can be influenced by many unpredictable factors. During the year ended December 31, 2007, High Yield Portfolio and Diversified Income Plus Portfolio engaged in this type of investment.
(R) Credit Risk — The Portfolios may be susceptible to credit risk to the extent the issuer or counterparty defaults on its payment obligation. The Portfolios’ policy is to monitor the creditworthiness of the issuers. Interest receivables on defaulted securities are monitored for the ability to collect payments in default and adjusted accordingly.
(S) Accounting Estimates — The preparation of financial statements in conformity with accounting principles generally accepted in the United States of America require management to make estimates and assumptions that affect the reported amounts of assets and liabilities and disclosure of contingent assets and liabilities at the date of the financial statements and the reported amounts of income and expenses during the reporting period. Actual results could differ from those estimates.
(T) Loss Contingencies — High Yield Portfolio received a dividend in the amount of $59,063 from Global Crossings on November 1, 2001, within 90 days of Global Crossings’ filing for bankruptcy. A preference action was filed on June 24, 2005, and it is reasonably possible that the Portfolio will be required to surrender the dividend back to the bankruptcy estate. This loss contingency has not been accrued as a liability because the amount to be surrendered and the likelihood of the loss can not be reasonably estimated.
| 242 |
THRIVENT SERIES FUND, INC.
Notes to Financial Statements
As of December 31, 2007
(U) Unfunded Loan Commitment — Certain Portfolios may enter into loan commitments, all or a portion of which may be unfunded. The Portfolio is obligated to fund these commitments at the borrower’s discretion.
(V) Recent Accounting Pronouncements — In June 2006, the Financial Accounting Standards Board (FASB) issued FASB Interpretation No. 48 — Accounting for Uncertainty in Income Taxes (FIN 48), an interpretation of FASB Statement 109 that requires additional tax disclosures and the tax effects of certain income tax positions, whether on previously filed tax returns or those expected to be taken on future returns. These positions must meet a more likely than not standard that, based on the technical merits, they have a more than 50 percent likelihood of being sustained upon examination. In evaluating whether a tax position has met the more-likely-than-not recognition threshold, management of the Fund must presume that the position will be examined by the appropriate taxing authority that has full knowledge of all relevant information. The Portfolios adopted the provisions of FIN 48 on June 29, 2007, the extended required implementation date set by the U.S. Securities and Exchange Commission for mutual funds.
FIN 48 requires management of the Fund to analyze all open tax years, as defined by statute of limitations, for all major jurisdictions. Open tax years are those that are open for exam by taxing authorities. Major jurisdictions for the Portfolios include Federal, Minnesota, Wisconsin as well as certain foreign countries. As of December 31, 2007, open Federal and Minnesota tax years include the tax years ended December 31, 2004 through 2007. Additionally, as of December 31, 2007, the December 31, 2003 tax year is open for Wisconsin. The Portfolios have no examinations in progress and none are expected at this time.
As of December 31, 2007, management of the Fund has reviewed all open tax years and major jurisdictions and concluded that the adoption of FIN 48 resulted in no effect to the Portfolio’s tax liability, financial position or results of operations. There is no tax liability resulting from unrecognized tax benefits related to uncertain income tax positions taken or expected to be taken in future tax returns. The Portfolios are also not aware of any tax positions for which it is reasonably possible that the total amounts of unrecognized tax benefits will significantly change in the next 12 months.
Additionally, in September 2006, the FASB issued FASB statement No. 157 — Fair Value Measurements (FAS 157). The objective of the statement is to improve the consistency and comparability of fair value measurements used in financial reporting. FAS 157 defines fair value, establishes a framework for measuring fair value in generally accepted accounting principles, and expands disclosures about fair value measurements. FAS 157 is effective for fiscal years beginning after November 15, 2007. Management of the Fund is currently evaluating the impact that FAS 157 will have on the Fund’s financial statements.
(W) Other — For financial statement purposes, investment security transactions are accounted for on the trade date. Realized gains and losses from investment transactions are determined on a specific cost identification basis, which is the same basis used for federal income tax purposes.
(3) FEES AND COMPENSATION PAID TO AFFILIATES
(A) Investment Advisory Fees — Each Portfolio pays Thrivent Financial, the Fund’s investment adviser, a fee for its advisory services. The fees are accrued daily and paid monthly. The annual rates of fees as a percent of average daily net assets were as follows:
| $0 to | $200 to | $250 to | $500 to | $750 to | $1,000 to | $1,500 to | $2,000 to | $2,500 to | Over | |
| Portfolio (M - Millions) | $200M | $250M | $500M | $750M | $1,000M | $1,500M | $2,000M | $2,500M | $5,000M | $5,000M |
| Aggressive Allocation | 0.15% | 0.15% | 0.15% | 0.125% | 0.125% | 0.125% | 0.125% | 0.125% | 0.125% | 0.125% |
| Moderately Aggressive | ||||||||||
| Allocation | 0.15% | 0.15% | 0.15% | 0.125% | 0.125% | 0.125% | 0.125% | 0.125% | 0.125% | 0.125% |
| Moderate Allocation | 0.15% | 0.15% | 0.15% | 0.125% | 0.125% | 0.125% | 0.125% | 0.125% | 0.125% | 0.125% |
| Moderately Conservative | ||||||||||
| Allocation | 0.15% | 0.15% | 0.15% | 0.125% | 0.125% | 0.125% | 0.125% | 0.125% | 0.125% | 0.125% |
| Technology | 0.75% | 0.75% | 0.75% | 0.75% | 0.75% | 0.75% | 0.75% | 0.75% | 0.75% | 0.75% |
| Partner Small Cap | ||||||||||
| Growth | 1.00% | 1.00% | 1.00% | 0.90% | 0.90% | 0.90% | 0.90% | 0.90% | 0.90% | 0.90% |
| Partner Small Cap | ||||||||||
| Value | 0.80% | 0.80% | 0.80% | 0.80% | 0.80% | 0.80% | 0.80% | 0.80% | 0.80% | 0.80% |
| 243 |
THRIVENT SERIES FUND, INC.
Notes to Financial Statements
As of December 31, 2007
(3) FEES AND COMPENSATION PAID TO AFFILIATES — continued
| $0 to | $200 to | $250 to | $500 to | $750 to | $1,000 to | $1,500 to | $2,000 to | $2,500 to | Over | |
| Portfolio (M - Millions) | $200M | $250M | $500M | $750M | $1,000M | $1,500M | $2,000M | $2,500M | $5,000M | $5,000M |
| Small Cap Stock | 0.70% | 0.65% | 0.65% | 0.65% | 0.65% | 0.60% | 0.60% | 0.60% | 0.55% | 0.525% |
| Small Cap Index | 0.35% | 0.35% | 0.30% | 0.25% | 0.25% | 0.20% | 0.15% | 0.10% | 0.10% | 0.10% |
| Mid Cap Growth | 0.40% | 0.40% | 0.40% | 0.40% | 0.40% | 0.40% | 0.40% | 0.40% | 0.40% | 0.40% |
| Mid Cap Growth II | 0.90% | 0.90% | 0.90% | 0.80% | 0.80% | 0.80% | 0.80% | 0.80% | 0.80% | 0.80% |
| Partner Mid Cap Value | 0.75% | 0.75% | 0.70% | 0.70% | 0.70% | 0.70% | 0.70% | 0.70% | 0.70% | 0.70% |
| Mid Cap Stock | 0.70% | 0.65% | 0.65% | 0.65% | 0.65% | 0.60% | 0.60% | 0.60% | 0.55% | 0.525% |
| Mid Cap Index | 0.35% | 0.35% | 0.30% | 0.25% | 0.25% | 0.20% | 0.15% | 0.10% | 0.10% | 0.10% |
| Partner International | ||||||||||
| Stock | 0.85% | 0.85% | 0.85% | 0.80% | 0.80% | 0.75% | 0.70% | 0.70% | 0.70% | 0.70% |
| Partner All Cap | 0.95% | 0.95% | 0.95% | 0.90% | 0.90% | 0.90% | 0.90% | 0.90% | 0.90% | 0.90% |
| Large Cap Growth | 0.40% | 0.40% | 0.40% | 0.40% | 0.40% | 0.40% | 0.40% | 0.40% | 0.40% | 0.40% |
| Large Cap Growth II | 0.80% | 0.80% | 0.80% | 0.70% | 0.70% | 0.70% | 0.70% | 0.70% | 0.70% | 0.70% |
| Partner Growth Stock | 0.80% | 0.80% | 0.80% | 0.70% | 0.70% | 0.70% | 0.70% | 0.70% | 0.70% | 0.70% |
| Large Cap Value | 0.60% | 0.60% | 0.60% | 0.60% | 0.60% | 0.60% | 0.60% | 0.60% | 0.60% | 0.60% |
| Large Cap Stock | 0.65% | 0.65% | 0.65% | 0.575% | 0.55% | 0.475% | 0.475% | 0.475% | 0.45% | 0.425% |
| Large Cap Index | 0.35% | 0.35% | 0.30% | 0.25% | 0.25% | 0.20% | 0.15% | 0.10% | 0.10% | 0.10% |
| Real Estate Securities | 0.80% | 0.80% | 0.80% | 0.75% | 0.75% | 0.75% | 0.75% | 0.75% | 0.75% | 0.75% |
| Balanced | 0.35% | 0.35% | 0.30% | 0.30% | 0.30% | 0.30% | 0.30% | 0.30% | 0.30% | 0.30% |
| High Yield | 0.40% | 0.40% | 0.40% | 0.40% | 0.40% | 0.40% | 0.40% | 0.40% | 0.40% | 0.40% |
| Diversified Income Plus | 0.40% | 0.40% | 0.40% | 0.40% | 0.40% | 0.40% | 0.40% | 0.40% | 0.40% | 0.40% |
| Income | 0.40% | 0.40% | 0.40% | 0.40% | 0.40% | 0.40% | 0.40% | 0.40% | 0.40% | 0.40% |
| Bond Index | 0.35% | 0.35% | 0.30% | 0.25% | 0.25% | 0.20% | 0.15% | 0.10% | 0.10% | 0.10% |
| Limited Maturity Bond | 0.40% | 0.40% | 0.40% | 0.40% | 0.40% | 0.40% | 0.40% | 0.40% | 0.40% | 0.40% |
| Mortgage Securities | 0.50% | 0.50% | 0.50% | 0.50% | 0.50% | 0.50% | 0.50% | 0.50% | 0.50% | 0.50% |
| Money Market | 0.40% | 0.40% | 0.40% | 0.40% | 0.40% | 0.40% | 0.40% | 0.40% | 0.40% | 0.40% |
The following subadvisory fees are charged as part of the total investment advisory fees stated in the table above. The subadvisory fees are borne directly by the Adviser and do not increase the overall fees paid by the Portfolio.
The Adviser has entered into subadvisory agreements with Turner Investment Partners, Inc. (Turner) and Transamerica Investment Management, LLC (Transamerica) for the performance of subadvisory services for Partner Small Cap Growth Portfolio. The fee payable is equal to 0.65% and 0.50% of average daily net assets subadvised by Turner and Transamerica, respectively.
The Adviser has entered into a subadvisory agreement with T. Rowe Price Associates, Inc. for the performance of subadvisory services for Partner Small Cap Value Portfolio. The fee payable is equal to 0.60% of average daily net assets.
The Adviser has entered into a subadvisory agreement with Goldman Sachs Asset Management, LP (Goldman Sachs) for the performance of subadvisory services for Partner Mid Cap Value Portfolio. The fee payable is equal to 0.50% of average daily net assets for the first $250 million and 0.45% for assets over $250 million. Thrivent Partner Mid Cap Value Fund will be included in determining breakpoints for the assets managed by Goldman Sachs.
The Adviser paid T. Rowe Price International, Inc. (Price International) an annual subadvisory fee for the performance of subadvisory services for Partner International Stock Portfolio until the termination of the subadvisory agreement on February 28, 2007. The fee payable was equal to 0.75% of the first $20 million, 0.60% of the next $30 million, and 0.50% of the next $150 million of average daily net assets, with the fee for all of the assets sub-advised by Price International 0.50% and 0.45% when assets exceed $200 million and $500 million, respectively. Thrivent Partner International Stock Fund was included in determining breakpoints for the assets managed by Price International.
Effective February 28, 2007, the Adviser entered into a subadvisory agreement with Principal Global Investors, LLC (Principal) in addition to the existing subadvisory agreement with Mercator Asset Management, LP (Mercator) for the performance of subadvisory services for Partner International Stock Portfolio. The fee payable is equal to 0.35% of the first $500 million of average daily net assets subadvised by
| 244 |
THRIVENT SERIES FUND, INC.
Notes to Financial Statements
As of December 31, 2007
Principal, 0.30% of the next $500 million and 0.25% when assets exceed $1 billion. For average daily net assets sub-advised by Mercator, the fee payable is equal to 0.75% of the first $25 million, 0.60% of the next $25 million, 0.55% of the next $25 million, 0.50% of the next $225 million, 0.40% of the next $200 million and 0.20% when assets exceed $500 million. Thrivent Partner International Stock Fund is included in determining breakpoints for the assets managed by Principal and Mercator.
The Adviser has entered into a subadvisory agreement with Pyramis Global Advisors, LLC (Pyramis Advisors) for the performance of subadvisory services for Partner All Cap Portfolio. Pyramis Advisors is a wholly owned subsidiary of Fidelity Management & Research Company (FMR Corp). The fee payable is equal to 0.60% of average daily net assets for the first $100 million, 0.55% for the next $400 million, 0.50% for the next $250 million and 0.45% for assets over $750 million.
The Adviser has entered into a subadvisory agreement with T. Rowe Price Associates, Inc. for the performance of subadvisory services for Partner Growth Stock Portfolio. The fee payable is equal to 0.40% of average daily net assets for the first $500 million and 0.35% for assets over $500 million.
The Adviser has agreed to the following voluntary expense reimbursements of average daily net assets: Partner Small Cap Growth Portfolio, 0.10%; Mid Cap Growth Portfolio II, 0.50%; Partner International Stock Portfolio, 0.08%; Partner All Cap Portfolio, 0.20%; Large Cap Growth Portfolio II, 0.40%; Partner Growth Stock Portfolio, 0.10%; and Money Market Portfolio, 0.10% . These voluntary reimbursements may be discontinued at any time.
Each equity, hybrid and fixed income Portfolio may invest in Money Market Portfolio, subject to certain limitations. During the year ended December 31, 2007, all the Portfolios invested in Money Market Portfolio. These related-party transactions are subject to the same terms as non-related party transactions except that, to avoid duplicate investment advisory fees, Thrivent Financial reimburses an amount equal to the smaller of the amount of the advisory fee for that Portfolio or the amount of the advisory fee which is charged to the Portfolio for its investment in Money Market Portfolio.
(B) Other Expenses — The Fund has entered into an agreement with the Adviser to provide accounting personnel and services. For the year ended December 31, 2007, the Adviser received aggregate fees for accounting personnel and services of $1,347,000 from the Fund.
The Fund has entered into an agreement with the Adviser to provide certain administrative personnel and services. For the year ended December 31, 2007, the Adviser received aggregate fees for administrative personnel and services of $5,496,319 from the Fund.
Each Director is eligible to participate in a deferred compensation plan with respect to fees received from the Fund. Participants in the plan may designate their deferred Director’s fees as if invested in any one of the portfolios of Thrivent Mutual Funds. The value of each Director’s deferred compensation account will increase or decrease as if it were invested in shares of the selected portfolios of Thrivent Mutual Funds. The deferred fees remain in the appropriate fund until distribution in accordance with the plan. The deferred fee liability is an unsecured liability.
Those Directors not participating in the above plan received $214,423 in fees from the Fund for the year ended December 31, 2007. No remuneration has been paid by the Fund to any of the officers or affiliated Directors of the Fund. In addition, the Fund reimbursed unaffiliated Directors for reasonable expenses incurred in relation to attendance at the meetings and industry conferences.
Certain officers and non-independent directors of the Fund are officers and directors of Thrivent Financial and Thrivent Life; however, they receive no compensation from the Fund.
(C) Indirect Expenses — Some Portfolios invest in other mutual funds. Fees and expenses of those underlying funds are not included in the Portfolio’s expense ratio. The Portfolio indirectly bears its proportionate share of the annualized weighted average expense ratio for the underlying funds in which it invests.
(4) TAX INFORMATION
Distributions are based on amounts calculated in accordance with the applicable federal income tax regulations, which may differ from accounting principles generally accepted in the United States of America. To the extent that these differences are permanent in nature, such amounts are reclassified within the capital accounts based on their federal tax-basis treatment; temporary differences do not require reclassifications.
| 245 |
THRIVENT SERIES FUND, INC.
Notes to Financial Statements
As of December 31, 2007
(4) TAX INFORMATION — continued
On the Statement of Assets and Liabilities, as a result of permanent book-to-tax differences, reclassification adjustments were made as follows [Increase (Decrease)]:
| Accumulated | Accumulated | ||
| Net Investment | Net Realized | ||
| Portfolio | Income/(Loss) | Gain/(Loss) | Capital Stock |
| Aggressive Allocation | $ 1,847,191 | $(1,847,191) | $ — |
| Moderately Aggressive | |||
| Allocation | 6,494,217 | (6,494,217) | — |
| Moderate Allocation | 5,440,901 | (5,440,901) | — |
| Moderately Conservative | |||
| Allocation | 1,506,764 | (1,506,764) | — |
| Technology | 72,375 | (72,375) | — |
| Partner Small Cap Growth | 466,692 | (480,963) | 14,271 |
| Partner Small Cap Value | (145,081) | 144,680 | 401 |
| Small Cap Stock | (80,829) | 80,829 | — |
| Small Cap Index | (309,764) | 309,764 | — |
| Mid Cap Growth | 6,082 | 16,812 | (22,894) |
| Mid Cap Growth II | 558 | 584 | (1,142) |
| Partner Mid Cap Value | (1,873) | 1,873 | — |
| Mid Cap Stock | (247,205) | 247,205 | — |
| Mid Cap Index | (157,063) | 157,063 | — |
| Partner International | |||
| Stock | 2,641,143 | (2,641,143) | — |
| Large Cap Growth | 13,094 | 1,784 | (14,878) |
| Large Cap Growth II | 217 | 23 | (240) |
| Partner Growth Stock | (43,948) | 43,948 | — |
| Large Cap Value | (36,697) | 36,697 | — |
| Large Cap Stock | (64,954) | 64,954 | — |
| Large Cap Index | (140,683) | 140,683 | — |
| Real Estate Securities | 324,269 | (324,269) | — |
| Balanced | (84,482) | 84,482 | — |
| High Yield | 67,691 | (67,691) | — |
| Diversified Income Plus | (164,746) | 164,746 | — |
| Income | (1,730,591) | 1,730,591 | — |
| Bond Index | (5,945) | 5,945 | — |
| Limited Maturity Bond | (641,589) | 641,589 | — |
| Mortgage Securities | (50,664) | 50,664 | — |
At December 31, 2007, the components of distributable earnings on a tax basis were as follows:
| Undistributed | Undistributed | |
| Ordinary | Long-Term | |
| Portfolio | Income | Capital Gain |
| Aggressive Allocation | $ 7,522,467 | $ 11,081,215 |
| Moderately Aggressive | ||
| Allocation | 36,926,896 | 30,505,510 |
| Moderate Allocation | 56,128,055 | 28,771,303 |
| Moderately Conservative | ||
| Allocation | 22,275,656 | 6,150,196 |
| Undistributed | Undistributed | |
| Ordinary | Long-Term | |
| Portfolio | Income | Capital Gain |
| Technology | $ 3,332,052 | $ 3,199,379 |
| Partner Small Cap Growth | 252,055 | 10,259,151 |
| Partner Small Cap Value | 2,743,717 | 8,113,720 |
| Small Cap Stock | 2,668,921 | 45,512,734 |
| Small Cap Index | 4,867,337 | 57,644,475 |
| Mid Cap Growth | 37,867,300 | 69,747,933 |
| Mid Cap Growth II | 2,135,048 | 3,031,665 |
| Partner Mid Cap Value | 2,363,838 | 2,496,628 |
| Mid Cap Stock | 13,022,982 | 25,202,278 |
| Mid Cap Index | 1,947,941 | 15,744,863 |
| Partner International Stock | 74,954,313 | 137,985,494 |
| Partner All Cap | 8,014,489 | 8,251,446 |
| Large Cap Growth | 1,585,074 | — |
| Large Cap Growth II | 1,770,521 | 2,279,418 |
| Partner Growth Stock | 1,631,126 | 8,594,847 |
| Large Cap Value | 19,955,024 | 30,194,567 |
| Large Cap Stock | 36,261,678 | 44,068,268 |
| Large Cap Index | 11,741,130 | 53,940,417 |
| Real Estate Securities | 12,748,417 | 21,501,293 |
| Balanced | 16,022,709 | 12,868,243 |
| High Yield | 1,975,917 | — |
| Diversified Income Plus | 6,943,102 | — |
| Income | 648,078 | — |
| Bond Index | 27,420 | — |
| Limited Maturity Bond | 252,215 | — |
| Mortgage Securities | 4,679 | — |
| Money Market | 26,199 | — |
At December 31, 2007, the following Portfolios had accumulated net realized capital loss carryovers expiring as follows:
| Capital Loss | Expiration | |||
| Portfolio | Carryover | Year | ||
| Mid Cap Growth | $22,824,794 | 2009 | ||
| 10,809,135 | 2010 | |||
| ———————— | ||||
| $33,633,929 | ||||
| ============= | ||||
| Partner International Stock | $9,506,834 | 2009 | ||
| 2,858,197 | 2010 | |||
| ———————— | ||||
| $12,365,031 | ||||
| ============= | ||||
| Large Cap Growth | $790,945 | 2009 | ||
| 724,177,948 | 2010 | |||
| 198,356,425 | 2011 | |||
| ———————— | ||||
| $ 923,325,318 | ||||
| ============= | ||||
| 246 |
THRIVENT SERIES FUND, INC.
Notes to Financial Statements
As of December 31, 2007
| Capital Loss | Expiration | |||
| Portfolio | Carryover | Year | ||
| High Yield | $ 8,880,573 | 2008 | ||
| 288,927,133 | 2009 | |||
| 184,350,285 | 2010 | |||
| 364,926,135 | 2011 | |||
| 30,516,064 | 2012 | |||
| 10,993,224 | 2013 | |||
| 560,014 | 2014 | |||
| ———————— | ||||
| $ 889,153,428 | ||||
| ============= | ||||
| Diversified Income Plus | $ 1,538,097 | 2008 | ||
| 3,470,883 | 2009 | |||
| 2,850,377 | 2010 | |||
| ———————— | ||||
| $ 7,859,357 | ||||
| ============= | ||||
| Income | $ 2,110,858 | 2014 | ||
| ============= | ||||
| Bond Index | $ 440,902 | 2012 | ||
| 800,730 | 2013 | |||
| 4,157,673 | 2014 | |||
| 103,719 | 2015 | |||
| ———————— | ||||
| $ 5,503,024 | ||||
| ============= | ||||
| Limited Maturity Bond | $ 2,108,299 | 2013 | ||
| 1,181,750 | 2014 | |||
| 889,583 | 2015 | |||
| ———————— | ||||
| $ 4,179,632 | ||||
| ============= | ||||
| Mortgage Securities | $ 67,164 | 2012 | ||
| 192,822 | 2013 | |||
| 1,618,680 | 2014 | |||
| ———————— | ||||
| $ 1,878,666 | ||||
| ============= | ||||
| Money Market | $ 3,442 | 2015 | ||
| ============= | ||||
To the extent that these Portfolios realize future net capital gains, taxable distributions will be reduced by any unused capital loss carryovers as permitted by the Internal Revenue Code.
The following capital loss carryovers were utilized during 2007: Mid Cap Growth Portfolio, $11,412,398; Partner International Stock Portfolio, $5,311,383; Large Cap Growth Portfolio, $248,010,641; Balanced Portfolio, $5,789,747; High Yield Portfolio, $5,773,135; Diversified Income Plus Portfolio, $2,560,884; Income Portfolio, $7,417,377; Mortgage Securities Portfolio, $24,066.
The following Portfolios deferred, on a tax basis, the following post-October 2007 losses:
| Post-October | ||||
| Portfolio | Loss | |||
| Mid Cap Growth | $ 32 | |||
| Mid Cap Growth II | 2 | |||
| Partner Mid Cap Value | 972,664 | |||
| Mid Cap Stock | 8,723,345 | |||
| Partner International Stock | 117,410 | |||
| Large Cap Growth | 11 | |||
| Partner Growth Stock | 15,083 | |||
| Large Cap Value | 8,536,819 | |||
| Large Cap Stock | 6,379,066 | |||
| Real Estate Securities | 584,623 | |||
| High Yield | 1,590,206 | |||
| Diversified Income Plus | 1,159,788 | |||
| Limited Maturity Bond | 1,515,202 | |||
These amounts are deferred for tax purposes and deemed to occur in the next fiscal year.
| 247 |
THRIVENT SERIES FUND, INC.
Notes to Financial Statements
As of December 31, 2007
(4) TAX INFORMATION — continued
The tax character of distributions paid during the years ended December 31, 2007 and 2006 was as follows:
| Ordinary Income | Long-Term Capital Gain | ||||
| Portfolio | 2007 | 2006 | 2007 | 2006 | |
| Aggressive Allocation | $ 2,926,982 | $705 | $ 1,309,043 | $ — | |
| Moderately Aggressive Allocation | 13,819,491 | 8,356 | 3,676,067 | — | |
| Moderate Allocation | 23,641,224 | 10,934 | 6,027,228 | — | |
| Moderately Conservative Allocation | 10,511,324 | 9,026 | 2,211,661 | — | |
| Technology | — | — | 1,732,497 | 804,350 | |
| Partner Small Cap Growth | — | — | 6,970,287 | 306,119 | |
| Partner Small Cap Value | 2,750,761 | 3,741,037 | 6,560,787 | 1,461,881 | |
| Small Cap Stock | 1,730,614 | 3,402,486 | 23,681,345 | 18,613,516 | |
| Small Cap Index | 3,047,945 | 3,554,066 | 43,071,047 | 12,239,755 | |
| Mid Cap Growth | 9,950,328 | 776,730 | 19,632,191 | — | |
| Mid Cap Growth II | 950,204 | 63,381 | 4,318,558 | 398,560 | |
| Partner Mid Cap Value | 270,773 | 602,855 | 100,763 | 306,253 | |
| Mid Cap Stock | 19,151,592 | 9,146,311 | 13,114,887 | 10,971,323 | |
| Mid Cap Index | 1,575,726 | 2,715,183 | 9,024,468 | 6,184,747 | |
| Partner International Stock | 20,042,187 | 15,477,487 | 47,186,402 | — | |
| Partner All Cap | 1,219,402 | 388,596 | 9,732,926 | — | |
| Large Cap Growth | 26,284,570 | 11,608,717 | — | — | |
| Large Cap Growth II | 1,030,065 | 231,923 | 1,294,440 | 52,741 | |
| Partner Growth Stock | 1,291,652 | 440,010 | 5,224,637 | 2,510,408 | |
| Large Cap Value | 19,527,987 | 7,201,349 | 27,172,606 | 12,548,325 | |
| Large Cap Stock | 11,787,487 | 9,388,410 | 13,929,956 | 4,023,512 | |
| Large Cap Index | 11,629,702 | 12,463,075 | 28,177,160 | — | |
| Real Estate Securities | 9,482,349 | 10,947,027 | 15,795,172 | 5,916,003 | |
| Balanced | 16,298,675 | 17,844,453 | — | — | |
| High Yield | 61,327,393 | 67,173,264 | — | — | |
| Diversified Income Plus | 2,651,827 | 3,423,713 | — | — | |
| Income | 66,556,877 | 52,955,037 | — | 3,883,265 | |
| Bond Index | 10,947,777 | 11,775,809 | — | — | |
| Limited Maturity Bond | 37,803,391 | 23,958,814 | — | — | |
| Mortgage Securities | 2,676,830 | 3,061,441 | — | — | |
| Money Market | 34,544,766 | 23,015,583 | — | — | |
| 248 |
THRIVENT SERIES FUND, INC.
Notes to Financial Statements
As of December 31, 2007
(5) SECURITY TRANSACTIONS
(A) Purchases and Sales of Investment Securities — For the year ended December 31, 2007, the cost of purchases and the proceeds from sales of investment securities other than U.S. Government and short-term securities were as follows:
| In thousands | |||
| Portfolio | Purchases | Sales | |
| Aggressive Allocation | $ 217,581 | $ 69,471 | |
| Moderately Aggressive Allocation | 966,033 | 262,398 | |
| Moderate Allocation | 1,173,294 | 288,546 | |
| Moderately Conservative Allocation | 386,268 | 68,128 | |
| Technology | 76,517 | 80,760 | |
| Partner Small Cap Growth | 180,211 | 132,490 | |
| Partner Small Cap Value | 74,369 | 50,239 | |
| Small Cap Stock | 487,961 | 523,159 | |
| Small Cap Index | 64,144 | 138,915 | |
| Mid Cap Growth | 513,551 | 633,009 | |
| Mid Cap Growth II | 25,275 | 30,740 | |
| Partner Mid Cap Value | 104,304 | 63,360 | |
| Mid Cap Stock | 800,487 | 798,288 | |
| Mid Cap Index | 30,731 | 53,446 | |
| Partner International Stock | 1,602,649 | 1,613,250 | |
| Partner All Cap | 179,129 | 177,080 | |
| Large Cap Growth | 3,908,831 | 4,030,971 | |
| Large Cap Growth II | 53,434 | 60,381 | |
| Partner Growth Stock | 64,501 | 72,726 | |
| Large Cap Value | 521,528 | 321,963 | |
| Large Cap Stock | 1,223,157 | 1,037,300 | |
| Large Cap Index | 34,247 | 147,299 | |
| Real Estate Securities | 267,882 | 240,554 | |
| Balanced | 34,978 | 112,670 | |
| High Yield | 496,272 | 579,102 | |
| Diversified Income Plus | 194,240 | 159,748 | |
| Income | 984,273 | 595,773 | |
| Bond Index | 22,877 | 34,083 | |
| Limited Maturity Bond | 558,622 | 275,720 | |
| Mortgage Securities | 8,326 | 12,848 | |
Purchases and Sales of U.S. Government Securities were:
| In thousands | |||
| Portfolio | Purchases | Sales | |
| Balanced | $ 634,238 | $ 649,888 | |
| Diversified Income Plus | 54,792 | 52,888 | |
| Income | 2,358,782 | 2,359,471 | |
| Bond Index | 873,944 | 889,450 | |
| Limited Maturity Bond | 825,918 | 734,293 | |
| Mortgage Securities | 521,610 | 532,356 | |
(B) Investments in Restricted Securities — High Yield Portfolio owns restricted securities that were purchased in private placement transactions without registration under the Securities Act of 1933 and are not liquid. Unless such securities subsequently become registered, they generally may be resold only in privately negotiated transactions with a limited number of purchasers. For High Yield Portfolio, the aggregate value of restricted securities was $0 at December 31, 2007. The Portfolio has no right to require registration of unregistered securities.
(C) Investments in High-Yielding Securities — High Yield Portfolio invests primarily in high-yielding fixed-income securities. Each of the other Portfolios, except Money Market Portfolio, may also invest in high-yielding securities. These securities will typically be in the lower rating categories or will be non-rated and generally will involve more risk than securities in the higher rating categories. Lower rated or unrated securities are more likely to react to developments affecting market risk and credit risk than are more highly rated securities, which react primarily to movements in the general level of interest rates.
(D) Investments in Options and Futures Contracts — The movement in the price of the security underlying an option or futures contract may not correlate perfectly with the movement in the prices of the portfolio securities being hedged. A lack of correlation could render the Portfolio’s hedging strategy unsuccessful and could result in a loss to the Portfolio. In the event that a liquid secondary market would not exist, the Portfolio could be prevented from entering into a closing transaction which could result in additional losses to the Portfolio.
(E) Written Option Contracts — The number of contracts and premium amounts associated with call option contracts written during the year ended December 31, 2007, were as follows:
| Mid Cap Growth | |||
| Number of | Premium | ||
| Contracts | Amount | ||
| Balance at January 1, 2007 | — | $— | |
| Opened | 156 | 102,102 | |
| Closed | — | — | |
| Expired | (53) | (13,651) | |
| Exercised | (103) | (88,451) | |
| Balance at December 31, 2007 | — | $ — | |
| 249 |
THRIVENT SERIES FUND, INC.
Notes to Financial Statements
As of December 31, 2007
| (5) SECURITY TRANSACTIONS — continued | |||
| Mid Cap Growth II | |||
| Number of | Premium | ||
| Contracts | Amount | ||
| Balance at January 1, 2007 | — | $ — | |
| Opened | 9 | 5,925 | |
| Closed | — | — | |
| Expired | (3) | (773) | |
| Exercised | (6) | (5,152) | |
| Balance at December 31, 2007 | — | $— | |
| Large Cap Growth | |||
| Number of | Premium | ||
| Contracts | Amount | ||
| Balance at January 1, 2007 | — | $ — | |
| Opened | 30,710 | 5,466,865 | |
| Closed | (18,302) | (3,363,607) | |
| Expired | (8,538) | (1,157,916) | |
| Exercised | (3,627) | (904,052) | |
| Balance at December 31, 2007 | 243 | $ 41,290 | |
| Large Cap Growth II | |||
| Number of | Premium | ||
| Contracts | Amount | ||
| Balance at January 1, 2007 | — | $— | |
| Opened | 447 | 79,591 | |
| Closed | (263) | (48,999) | |
| Expired | (126) | (16,692) | |
| Exercised | (54) | (13,220) | |
| Balance at December 31, 2007 | 4 | $ 680 | |
| Diversified Income Plus | |||
| Number of | Premium | ||
| Contracts | Amount | ||
| Balance at January 1, 2007 | — | $ — | |
| Opened | 13.5 | 24,434 | |
| Closed | — | — | |
| Expired | (4.5) | (8,438) | |
| Exercised | (9) | (15,996) | |
| Balance at December 31, 2007 | — | $— | |
| Income | |||
| Number of | Premium | ||
| Contracts | Amount | ||
| Balance at January 1, 2007 | — | $— | |
| Opened | 343.5 | 793,125 | |
| Closed | (50) | (101,563) | |
| Expired | (175) | (379,297) | |
| Exercised | (112) | (286,367) | |
| Balance at December 31, 2007 | 6.5 | $25,898 | |
| Limited Maturity Bond | |||
| Number of | Premium | ||
| Contracts | Amount | ||
| Balance at January 1, 2007 | — | $ — | |
| Opened | 196 | 318,789 | |
| Closed | (35) | (39,648) | |
| Expired | (86) | (145,742) | |
| Exercised | (75) | (133,399) | |
| Balance at December 31, 2007 | — | $— | |
| Mortgage Securities | |||
| Number of | Premium | ||
| Contracts | Amount | ||
| Balance at January 1, 2007 | — | $ — | |
| Opened | 43 | 155,156 | |
| Closed | — | — | |
| Expired | (16) | (41,172) | |
| Exercised | (23) | (92,734) | |
| Balance at December 31, 2007 | 4 | $ 21,250 | |
| 250 |
THRIVENT SERIES FUND, INC.
Notes to Financial Statements
As of December 31, 2007
(6) INVESTMENTS IN AFFILIATES
Affiliated issuers, as defined under the 1940 Act, include those in which the Portfolio’s holdings of an issuer represent 5% or more of the outstanding voting securities of an issuer, or any affiliated mutual fund. A summary of transactions for the year ended December 31, 2007, in Money Market Portfolio, is as follows:
| Gross | Gross | Balance of | Dividend Income | ||
| Purchases and | Sales and | Shares Held at | Value | Year ended | |
| Portfolio | Additions | Reductions | December 31, 2007 | December 31, 2007 | December 31, 2007 |
| Aggressive Allocaton | $ 19,244,519 | $ 22,605,286 | — | $ — | $ 301,475 |
| Moderately Aggressive Allocation | 92,199,365 | 113,602,300 | — | — | 1,926,102 |
| Moderate Allocation | 126,606,991 | 143,720,275 | 78,824,377 | 78,824,377 | 6,400,151 |
| Moderately Conservative Allocation | 61,330,827 | 60,323,478 | 51,192,804 | 51,192,804 | 3,073,441 |
| Technology | 41,603,727 | 39,371,650 | 2,902,355 | 2,902,355 | 127,744 |
| Partner Small Cap Growth | 38,468,339 | 38,317,478 | 2,133,199 | 2,133,199 | 112,690 |
| Partner Small Cap Value | 41,718,761 | 39,574,842 | 6,994,893 | 6,994,893 | 335,858 |
| Small Cap Stock | 141,070,629 | 120,192,783 | 27,636,194 | 27,636,194 | 820,072 |
| Small Cap Index | 80,549,800 | 75,809,585 | 5,078,004 | 5,078,004 | 328,171 |
| Mid Cap Growth | 154,330,378 | 132,761,049 | 37,185,191 | 37,185,191 | 720,378 |
| Mid Cap Growth II | 11,322,764 | 10,842,824 | 1,395,723 | 1,395,723 | 60,136 |
| Partner Mid Cap Value | 44,739,003 | 42,971,868 | 3,632,429 | 3,632,429 | 140,376 |
| Mid Cap Stock | 141,441,669 | 129,237,876 | 25,108,727 | 25,108,727 | 661,750 |
| Mid Cap Index | 32,221,859 | 33,218,738 | 2,210,657 | 2,210,657 | 125,075 |
| Partner International Stock | 220,748,691 | 225,973,453 | 6,617,542 | 6,617,542 | 337,228 |
| Partner All Cap | 47,075,975 | 45,454,371 | 2,625,515 | 2,625,515 | 92,025 |
| Large Cap Growth | 101,989,956 | 81,555,369 | 35,105,032 | 35,105,032 | 472,400 |
| Large Cap Growth II | 10,576,092 | 10,559,233 | 719,728 | 719,728 | 21,476 |
| Partner Growth Stock | 29,457,138 | 29,174,218 | 2,824,334 | 2,824,334 | 137,564 |
| Large Cap Value | 97,741,827 | 104,864,597 | 3,547,866 | 3,547,866 | 438,183 |
| Large Cap Stock | 123,684,035 | 123,937,146 | 10,589,629 | 10,589,629 | 832,411 |
| Large Cap Index | 85,557,705 | 88,197,880 | 6,871,402 | 6,871,402 | 253,757 |
| Real Estate Securities | 74,779,209 | 89,456,170 | — | — | 284,265 |
| Balanced | 149,401,943 | 145,439,156 | 19,638,879 | 19,638,879 | 639,759 |
| High Yield | 110,599,968 | 74,522,224 | 50,560,829 | 50,560,829 | 638,550 |
| Diversified Income Plus | 30,338,459 | 31,255,932 | 1,238,982 | 1,238,982 | 329,215 |
| Income | 71,025,344 | 61,795,986 | 23,481,154 | 23,481,154 | 633,866 |
| Bond Index | 39,020,892 | 26,130,803 | 21,567,103 | 21,567,103 | 694,780 |
| Limited Maturity Bond | 176,643,436 | 178,972,787 | 13,111,425 | 13,111,425 | 664,495 |
| Mortgage Securities | 43 | — | 870 | 870 | 42 |
| Total Value and Dividend Income | $442,794,843 | $21,603,435 | |||
| 251 |
THRIVENT SERIES FUND, INC.
Notes to Financial Statements
As of December 31, 2007
(6) INVESTMENTS IN AFFILIATES — continued
A summary of transactions for the year ended December 31, 2007, in Thrivent Financial Securities Lending Trust, is as follows:
| Gross | Gross | Balance of | |||
| Purchases and | Sales and | Shares Held at | Value | ||
| Portfolio | Additions | Reductions | December 31, 2007 | December 31, 2007 | |
| Technology | $ 81,836,782 | $ 84,328,888 | 8,345,500 | $ 8,345,500 | |
| Partner Small Cap Growth | 161,803,718 | 117,942,031 | 71,604,282 | 71,604,282 | |
| Partner Small Cap Value | 164,913,223 | 148,087,657 | 59,125,971 | 59,125,971 | |
| Small Cap Stock | 336,996,549 | 346,125,081 | 92,358,545 | 92,358,545 | |
| Small Cap Index | 268,672,585 | 270,884,711 | 111,638,911 | 111,638,911 | |
| Mid Cap Growth | 636,616,518 | 689,061,449 | 114,798,903 | 114,798,903 | |
| Mid Cap Growth II | 19,731,735 | 25,445,451 | 2,273,125 | 2,273,125 | |
| Partner Mid Cap Value | 100,443,885 | 98,840,861 | 9,987,928 | 9,987,928 | |
| Mid Cap Stock | 473,396,880 | 430,260,203 | 97,177,855 | 97,177,855 | |
| Mid Cap Index | 113,927,471 | 123,428,509 | 26,957,577 | 26,957,577 | |
| Partner International Stock | 1,058,488,937 | 1,215,660,532 | 122,278,806 | 122,278,806 | |
| Partner All Cap Growth | 118,254,700 | 123,983,594 | 9,928,007 | 9,928,007 | |
| Large Cap Growth | 2,311,672,488 | 2,299,003,752 | 134,097,820 | 134,097,820 | |
| Large Cap Growth II | 36,364,107 | 40,928,857 | 348,149 | 348,149 | |
| Partner Growth Stock | 125,837,279 | 119,793,388 | 11,623,223 | 11,623,223 | |
| Large Cap Value | 985,748,858 | 911,435,173 | 93,704,955 | 93,704,955 | |
| Large Cap Stock | 443,482,089 | 410,559,999 | 65,208,363 | 65,208,363 | |
| Large Cap Index | 428,644,452 | 390,434,345 | 48,959,242 | 48,959,242 | |
| Real Estate Securities | 648,663,651 | 543,133,244 | 140,131,373 | 140,131,373 | |
| Balanced | 229,431,334 | 227,938,106 | 47,660,952 | 47,660,952 | |
| High Yield | 466,942,135 | 523,110,757 | 93,306,453 | 93,306,453 | |
| Diversified Income Plus | 86,821,517 | 104,042,500 | 10,240,727 | 10,240,727 | |
| Income | 497,515,159 | 500,083,417 | 132,421,350 | 132,421,350 | |
| Bond Index | 158,879,692 | 157,197,027 | 55,206,278 | 55,206,278 | |
| Limited Maturity Bond | 308,855,077 | 237,887,159 | 129,554,563 | 129,554,563 | |
| Total Value | $1,688,938,858 | ||||
| 252 |
THRIVENT SERIES FUND, INC.
Notes to Financial Statements
As of December 31, 2007
A summary of transactions for the Thrivent Allocation Portfolios for the year ended December 31, 2007, in the following Thrivent Portfolios, is as follows:
| Gross | Gross | Balance of | Dividend Income | ||
| Purchases and | Sales and | Shares Held at | Value | January 1, 2007 — | |
| Portfolio | Additions | Reductions | December 31, 2007 | December 31, 2007 | December 31, 2007 |
| Aggressive Allocation | |||||
| Partner Small Cap Growth | $ 9,838,681 | $ 2,561,859 | 2,119,095 | $ 29,543,569 | $— |
| Partner Small Cap Value | 11,846,151 | 8,910,373 | 1,279,008 | 23,589,765 | 90,388 |
| Small Cap Stock | 18,345,706 | 4,419,975 | 2,400,993 | 37,174,821 | 82,363 |
| Mid Cap Growth | 6,212,677 | 6,054,801 | 854,603 | 17,248,542 | 83,152 |
| Partner Mid Cap Value | 7,877,703 | 4,525,867 | 1,403,621 | 18,823,400 | — |
| Mid Cap Stock | 19,821,444 | 176,106 | 2,802,192 | 36,861,436 | 190,372 |
| Partner International Stock | 32,342,337 | 15,683,621 | 5,592,662 | 96,519,831 | 1,293,701 |
| Large Cap Growth | 33,837,314 | 4,732,544 | 5,520,951 | 106,145,253 | 1,005,480 |
| Large Cap Value | 14,810,592 | 182,982 | 2,800,380 | 37,546,375 | 347,990 |
| Large Cap Stock | 20,032,598 | 234,521 | 4,336,482 | 47,857,844 | 372,423 |
| Real Estate Securities | — | 276,727 | — | — | — |
| High Yield | 8,688,536 | 10,203,572 | 2,031,588 | 9,828,416 | 769,099 |
| Income | 21,255,679 | 2,939,287 | 2,544,115 | 24,782,222 | 861,493 |
| Limited Maturity Bond | 12,671,195 | 8,568,699 | 1,076,087 | 10,586,434 | 290,158 |
| Money Market | 19,244,519 | 22,605,286 | — | — | 301,475 |
| Total Value and Dividend Income | $496,507,908 | $5,688,094 | |||
| Moderately Aggressive Allocation | |||||
| Partner Small Cap Growth | 21,223,155 | 1,116,860 | 3,788,458 | 52,817,172 | — |
| Partner Small Cap Value | 25,292,307 | 15,554,122 | 2,169,917 | 40,021,512 | 142,142 |
| Small Cap Stock | 44,180,409 | 15,600,425 | 4,581,481 | 70,935,529 | 160,356 |
| Mid Cap Growth | 13,497,515 | 11,605,533 | 1,537,278 | 31,027,029 | 90,083 |
| Partner Mid Cap Value | 11,748,685 | 11,461,567 | 2,005,604 | 26,896,355 | — |
| Mid Cap Stock | 61,223,417 | 25,871,996 | 5,345,002 | 70,310,829 | 660,888 |
| Partner International Stock | 98,985,729 | 50,083,331 | 12,997,881 | 224,321,329 | 3,035,007 |
| Large Cap Growth | 118,731,396 | 18,068,676 | 15,508,663 | 298,167,996 | 2,776,064 |
| Large Cap Value | 125,137,146 | 345,572 | 19,362,825 | 259,609,011 | 2,202,976 |
| Large Cap Stock | 111,079,582 | 6,718,016 | 23,667,318 | 261,194,891 | 2,222,978 |
| Real Estate Securities | 43,554,607 | 6,378,896 | 3,020,439 | 53,577,749 | 353,181 |
| High Yield | 86,496,301 | 63,221,185 | 16,568,390 | 80,154,556 | 3,929,591 |
| Income | 148,057,517 | 9,449,057 | 23,725,830 | 231,113,314 | 8,806,299 |
| Limited Maturity Bond | 56,825,438 | 26,922,587 | 8,227,305 | 80,939,400 | 3,033,745 |
| Money Market | 92,199,365 | 113,602,300 | — | — | 1,926,102 |
| Total Value and Dividend Income | $1,781,086,672 | $29,339,412 | |||
| 253 |
THRIVENT SERIES FUND, INC.
Notes to Financial Statements
As of December 31, 2007
(6) INVESTMENTS IN AFFILIATES — continued
| Gross | Gross | Balance of | Dividend Income | ||
| Purchases and | Sales and | Shares Held at | Value | January 1, 2007 — | |
| Portfolio | Additions | Reductions | December 31, 2007 | December 31, 2007 | December 31, 2007 |
| Moderate Allocation | |||||
| Partner Small Cap Growth | $ 32,105,300 | $ — | 2,303,571 | $ 32,115,462 | $ — |
| Partner Small Cap Value | 28,441,159 | — | 1,465,617 | 27,031,554 | — |
| Small Cap Stock | 31,730,307 | 63,580,173 | 2,084,169 | 32,269,396 | 238,681 |
| Mid Cap Growth | 20,076,528 | 698,452 | 1,060,948 | 21,413,225 | 69,392 |
| Partner Mid Cap Value | 27,058,955 | 5,042 | 2,039,353 | 27,348,942 | — |
| Mid Cap Stock | 34,984,705 | 45,684,281 | 4,869,471 | 64,055,455 | 584,170 |
| Partner International Stock | 87,991,898 | 48,506,658 | 10,921,155 | 188,480,571 | 2,562,547 |
| Large Cap Growth | 121,728,703 | 19,844,823 | 15,990,758 | 307,436,710 | 2,870,509 |
| Large Cap Value | 116,791,445 | 50,424 | 17,034,506 | 228,391,842 | 1,814,426 |
| Large Cap Stock | 114,419,378 | 4,822,991 | 23,301,914 | 257,162,251 | 2,077,697 |
| Real Estate Securities | 56,330,315 | 18,197,629 | 4,001,898 | 70,987,263 | 525,383 |
| High Yield | 104,616,573 | 75,237,628 | 20,145,617 | 97,460,466 | 4,742,445 |
| Income | 229,438,342 | 11,851,998 | 42,251,198 | 411,568,919 | 16,547,122 |
| Limited Maturity Bond | 167,580,939 | 65,551 | 32,996,418 | 324,615,462 | 10,978,690 |
| Money Market | 126,606,991 | 143,720,275 | 78,824,377 | 78,824,377 | 6,400,151 |
| Total Value and Dividend Income | $2,169,161,895 | $49,411,213 | |||
| Moderately Conservative Allocation | |||||
| Small Cap Stock | 12,204,291 | 734,039 | 1,577,957 | 24,431,658 | 48,722 |
| Mid Cap Stock | 12,585,713 | 12,785,147 | 1,274,283 | 16,762,554 | 190,681 |
| Partner International Stock | 18,071,146 | 9,429,589 | 2,108,489 | 36,388,944 | 475,344 |
| Large Cap Growth | 29,553,512 | 6,139,540 | 3,781,737 | 72,707,290 | 681,881 |
| Large Cap Value | 27,669,689 | 21,517 | 3,958,015 | 53,067,485 | 411,398 |
| Large Cap Stock | 29,006,731 | 2,051,303 | 5,355,682 | 59,105,841 | 449,804 |
| Real Estate Securities | 20,277,952 | 6,770,594 | 1,402,943 | 24,885,963 | 178,197 |
| High Yield | 27,512,487 | 19,934,197 | 5,477,704 | 26,500,038 | 1,378,186 |
| Income | 66,153,437 | 1,692,994 | 11,660,760 | 113,587,464 | 4,377,625 |
| Limited Maturity Bond | 143,232,973 | 8,568,725 | 28,300,772 | 278,420,166 | 9,754,217 |
| Money Market | 61,330,827 | 60,323,478 | 51,192,804 | 51,192,804 | 3,073,441 |
| Total Value and Dividend Income | $757,050,207 | $21,019,496 | |||
| 254 |
THRIVENT SERIES FUND, INC.
Notes to Financial Statements
As of December 31, 2007
(7) SECURITY TRANSACTIONS WITH AFFILIATED FUNDS
The Portfolios are permitted to purchase or sell securities from or to certain other Portfolios under specified conditions outlined in procedures adopted by the Board of Directors. The procedures have been designed to ensure that any purchase or sale of securities by the Portfolio from or to another portfolio or fund that is or could be considered an affiliate by virtue of having a common investment adviser (or affiliated investment advisers), common Directors and/ or common officers complies with Rule 17a-7 of the 1940 Act. Further, as defined under the procedures, each transaction is effected at the current market price. Pursuant to these procedures, during the year ended December 31, 2007, the Portfolios engaged in purchases and sales of securities of $44,358,165 and $49,646,945, respectively.
(8) SHARES OF BENEFICIAL INTEREST
The shares of each Portfolio have equal rights and privileges with all shares of that Portfolio. Shares in the Portfolio are currently sold only to separate accounts of Thrivent Financial, Thrivent Life Insurance Company and retirement plans sponsored by Thrivent Financial.
Authorized capital stock consists of ten billion shares as follows:
| Shares | Par | ||
| Portfolio | Authorized | Value | |
| Aggressive Allocation | 125,000,000 | $0.01 | |
| Moderately Aggressive Allocation | 125,000,000 | 0.01 | |
| Moderate Allocation | 125,000,000 | 0.01 | |
| Moderately Conservative Allocation | 125,000,000 | 0.01 | |
| Technology | 125,000,000 | 0.01 | |
| Partner Small Cap Growth | 125,000,000 | 0.01 | |
| Partner Small Cap Value | 125,000,000 | 0.01 | |
| Small Cap Stock | 150,000,000 | 0.01 | |
| Small Cap Index | 200,000,000 | 0.01 | |
| Mid Cap Growth | 400,000,000 | 0.01 | |
| Mid Cap Growth II | 125,000,000 | 0.01 | |
| Partner Mid Cap Value | 125,000,000 | 0.01 | |
| Mid Cap Stock | 125,000,000 | 0.01 | |
| Mid Cap Index | 150,000,000 | 0.01 | |
| Partner International Stock | 400,000,000 | 0.01 | |
| Partner All Cap | 125,000,000 | 0.01 | |
| Large Cap Growth | 1,000,000,000 | 0.01 | |
| Large Cap Growth II | 125,000,000 | 0.01 | |
| Partner Growth Stock | 125,000,000 | 0.01 | |
| Large Cap Value | 200,000,000 | 0.01 | |
| Large Cap Stock | 400,000,000 | 0.01 | |
| Large Cap Index | 200,000,000 | 0.01 | |
| Real Estate Securities | 150,000,000 | 0.01 | |
| Balanced | 400,000,000 | 0.01 | |
| High Yield | 1,000,000,000 | 0.01 | |
| Diversified Income Plus | 200,000,000 | 0.01 | |
| Income | 1,000,000,000 | 0.01 | |
| Bond Index | 200,000,000 | 0.01 | |
| Limited Maturity Bond | 200,000,000 | 0.01 | |
| Mortgage Securities | 125,000,000 | 0.01 | |
| Money Market | 2,000,000,000 | 0.01 | |
| 255 |
THRIVENT SERIES FUND, INC.
Notes to Financial Statements
As of December 31, 2007
(8) SHARES OF BENEFICIAL INTEREST — continued Transactions in shares of beneficial interest were as follows:
| Portfolios | ||||||
| Moderately Aggressive | ||||||
| Aggressive Allocation | Allocation | Moderate Allocation | ||||
| Year Ended December 31, 2007 | Shares | Amount | Shares | Amount | Shares | Amount |
| Sold | 11,263,297 | $ 155,305,591 | 49,054,322 | $ 651,007,278 | 64,569,209 | $ 817,843,870 |
| Dividends and distributions reinvested | 298,960 | 4,236,025 | 1,291,185 | 17,495,558 | 2,318,790 | 29,668,452 |
| Redeemed | (1,965,843) | (27,375,563) | (2,253,776) | (30,130,863) | (1,999,561) | (25,462,340) |
| Net Change | 9,596,414 | $ 132,166,053 | 48,091,731 | $ 638,371,973 | 64,888,438 | $ 822,049,982 |
| Year Ended December 31, 2006 | ||||||
| Sold | 20,190,642 | $ 244,344,760 | 63,267,853 | $ 747,345,075 | 74,388,680 | $ 853,499,160 |
| Dividends and distributions reinvested | 59 | 705 | 719 | 8,356 | 967 | 10,934 |
| Redeemed | (833,039) | (10,116,467) | (528,072) | (6,383,152) | (364,081) | (4,252,945) |
| Net Change | 19,357,662 | $ 234,228,998 | 62,740,500 | $ 740,970,279 | 74,025,566 | $ 849,257,149 |
| Portfolios | ||||||
| Moderately Conservative | ||||||
| Allocation | Technology | Partner Small Cap Growth | ||||
| Year Ended December 31, 2007 | Shares | Amount | Shares | Amount | Shares | Amount |
| Sold | 26,385,207 | $ 316,043,720 | 1,644,515 | $ 13,700,767 | 4,713,003 | $ 66,000,948 |
| Dividends and distributions reinvested | 1,061,717 | 12,722,985 | 212,077 | 1,732,497 | 491,415 | 6,970,287 |
| Redeemed | (1,960,724) | (23,517,461) | (1,941,831) | (15,686,349) | (1,096,289) | (15,350,073) |
| Net Change | 25,486,200 | $ 305,249,244 | (85,239) | $ (253,085) | 4,108,129 | $ 57,621,162 |
| Year Ended December 31, 2006 | ||||||
| Sold | 24,414,181 | $ 270,558,250 | 1,225,212 | $ 9,229,797 | 3,878,555 | $ 50,503,375 |
| Dividends and distributions reinvested | 826 | 9,026 | 104,196 | 804,350 | 23,363 | 306,119 |
| Redeemed | (959,956) | (10,643,808) | (2,321,126) | (17,353,091) | (1,337,444) | (17,494,940) |
| Net Change | 23,455,051 | $ 259,923,468 | (991,718) | $ (7,318,944) | 2,564,474 | $ 33,314,554 |
| Portfolios | ||||||
| Partner Small Cap Value | Small Cap Stock | Small Cap Index | ||||
| Year Ended December 31, 2007 | Shares | Amount | Shares | Amount | Shares | Amount |
| Sold | 3,842,026 | $ 75,075,073 | 6,673,393 | $ 105,231,025 | 518,783 | $ 11,020,921 |
| Dividends and distributions reinvested | 453,569 | 9,311,548 | 1,588,635 | 25,411,959 | 2,167,755 | 46,118,992 |
| Redeemed | (2,593,763) | (51,250,153) | (8,792,993) | (138,735,421) | (4,465,216) | (94,428,601) |
| Net Change | 1,701,832 | $ 33,136,468 | (530,965) | $ (8,092,437) | (1,778,678) | $ (37,288,688) |
| Year Ended December 31, 2006 | ||||||
| Sold | 3,193,245 | $ 57,784,031 | 9,926,411 | $ 148,338,462 | 654,454 | $ 13,348,254 |
| Dividends and distributions reinvested | 297,485 | 5,202,918 | 1,492,155 | 22,016,002 | 782,147 | 15,793,821 |
| Redeemed | (1,445,158) | (26,508,120) | (4,904,777) | (74,012,947) | (5,432,410) | (111,046,239) |
| Net Change | 2,045,572 | $ 36,478,829 | 6,513,789 | $ 96,341,517 | (3,995,809) | $ (81,904,164) |
| 256 |
THRIVENT SERIES FUND, INC.
Notes to Financial Statements
As of December 31, 2007
| Portfolios | ||||||
| Mid Cap Growth | Mid Cap Growth II | Partner Mid Cap Value | ||||
| Year Ended December 31, 2007 | Shares | Amount | Shares | Amount | Shares | Amount |
| Sold | 3,249,754 | $ 62,197,640 | 303,001 | $ 3,433,049 | 4,487,166 | $ 60,675,050 |
| Dividends and distributions reinvested | 1,527,928 | 29,582,519 | 480,201 | 5,268,762 | 25,317 | 371,536 |
| Redeemed | (8,817,483) | (168,229,734) | (730,985) | (8,489,801) | (1,634,745) | (21,943,990) |
| Net Change | (4,039,801) | $ (76,449,575) | 52,217 | $ 212,010 | 2,877,738 | $ 39,102,596 |
| Year Ended December 31, 2006 | ||||||
| Sold | 2,773,532 | $ 46,954,507 | 153,375 | $ 1,678,406 | 3,420,179 | $ 41,671,095 |
| Dividends and distributions reinvested | 45,302 | 776,730 | 41,646 | 461,941 | 69,785 | 909,108 |
| Redeemed | (11,702,626) | (197,492,966) | (1,014,358) | (11,125,465) | (1,133,233) | (14,213,477) |
| Net Change | (8,883,792) | $ (149,761,729) | (819,337) | $ (8,985,118) | 2,356,731 | $ 28,366,726 |
| Portfolios | ||||||
| Mid Cap Stock | Mid Cap Index | Partner International Stock | ||||
| Year Ended December 31, 2007 | Shares | Amount | Shares | Amount | Shares | Amount |
| Sold | 9,259,801 | $ 127,211,109 | 576,653 | $ 9,092,400 | 14,492,955 | $ 248,378,419 |
| Dividends and distributions reinvested | 2,289,881 | 32,266,479 | 657,018 | 10,600,194 | 3,889,418 | 67,228,589 |
| Redeemed | (9,182,728) | (125,364,393) | (2,232,287) | (35,035,996) | (16,935,224) | (290,543,926) |
| Net Change | 2,366,954 | $ 34,113,195 | (998,616) | $ (15,343,402) | 1,447,149 | $ 25,063,082 |
| Year Ended December 31, 2006 | ||||||
| Sold | 10,789,241 | $ 137,707,129 | 618,940 | $ 8,977,573 | 21,187,302 | $ 310,963,553 |
| Dividends and distributions reinvested | 1,605,404 | 20,117,634 | 619,039 | 8,899,930 | 1,092,819 | 15,477,487 |
| Redeemed | (2,765,542) | (35,413,338) | (2,508,212) | (36,318,454) | (17,548,113) | (255,878,797) |
| Net Change | 9,629,103 | $ 122,411,425 | (1,270,233) | $ (18,440,951) | 4,732,008 | $ 70,562,243 |
| Portfolios | ||||||
| Partner All Cap | Large Cap Growth | Large Cap Growth II | ||||
| Year Ended December 31, 2007 | Shares | Amount | Shares | Amount | Shares | Amount |
| Sold | 1,375,057 | $ 17,191,190 | 18,173,866 | $ 327,249,242 | 229,272 | $ 2,636,876 |
| Dividends and distributions reinvested | 901,886 | 10,952,328 | 1,397,103 | 26,284,570 | 205,416 | 2,324,505 |
| Redeemed | (1,257,975) | (15,652,567) | (26,878,171) | (485,209,703) | (860,420) | (9,896,977) |
| Net Change | 1,018,968 | $ 12,490,951 | (7,307,202) | $ (131,675,891) | (425,732) | $ (4,935,596) |
| Year Ended December 31, 2006 | ||||||
| Sold | 1,426,305 | $ 15,744,226 | 21,811,334 | $ 345,605,039 | 197,124 | $ 2,068,620 |
| Dividends and distributions reinvested | 35,776 | 388,596 | 729,424 | 11,608,717 | 27,075 | 284,664 |
| Redeemed | (1,292,889) | (14,318,877) | (34,005,785) | (537,000,150) | (1,064,904) | (11,155,089) |
| Net Change | 169,192 | $ 1,813,945 | (11,465,027) | $ (179,786,394) | (840,705) | $ (8,801,805) |
| 257 |
THRIVENT SERIES FUND, INC.
Notes to Financial Statements
As of December 31, 2007
(8) SHARES OF BENEFICIAL INTEREST — continued
| Portfolios | ||||||
| Partner Growth Stock | Large Cap Value | Large Cap Stock | ||||
| Year Ended December 31, 2007 | Shares | Amount | Shares | Amount | Shares | Amount |
| Sold | 919,198 | $ 12,472,567 | 20,633,683 | $ 281,729,618 | 24,986,081 | $ 272,621,495 |
| Dividends and distributions reinvested | 479,590 | 6,516,289 | 3,332,852 | 46,700,593 | 2,318,056 | 25,717,443 |
| Capital contribution from adviser | — | — | — | — | — | 787,819 |
| Redeemed | (1,603,480) | (21,624,457) | (6,189,367) | (85,093,171) | (9,898,451) | (108,624,345) |
| Net Change | (204,692) | $ (2,635,601) | 17,777,168 | $ 243,337,040 | 17,405,686 | $ 190,502,412 |
| Year Ended December 31, 2006 | ||||||
| Sold | 687,371 | $8,364,117 | 18,999,023 | $ 235,883,469 | 27,772,140 | $ 273,325,925 |
| Dividends and distributions reinvested | 248,097 | 2,950,418 | 1,658,271 | 19,749,674 | 1,394,664 | 13,411,922 |
| Redeemed | (2,171,642) | (26,186,208) | (7,147,503) | (89,232,613) | (13,152,828) | (130,562,174) |
| Net Change | (1,236,174) | $ (14,871,673) | 13,509,791 | $ 166,400,530 | 16,013,976 | $ 156,175,673 |
| Portfolios | ||||||
| Large Cap Index | Real Estate Securities | Balanced | ||||
| Year Ended December 31, 2007 | Shares | Amount | Shares | Amount | Shares | Amount |
| Sold | 607,207 | $ 15,626,706 | 6,544,568 | $ 129,952,520 | 740,173 | $ 12,683,917 |
| Dividends and distributions reinvested | 1,531,434 | 39,806,862 | 1,146,586 | 25,277,521 | 944,517 | 16,298,676 |
| Redeemed | (5,698,881) | (146,437,231) | (5,334,208) | (113,666,828) | (6,972,610) | (119,323,765) |
| Net Change | (3,560,240) | $ (91,003,663) | 2,356,946 | $ 41,563,213 | (5,287,920) | $ (90,341,172) |
| Year Ended December 31, 2006 | ||||||
| Sold | 691,346 | $ 16,066,541 | 4,268,377 | $ 87,573,901 | 620,704 | $ 9,756,199 |
| Dividends and distributions reinvested | 551,969 | 12,463,075 | 907,776 | 16,863,030 | 1,162,263 | 17,844,453 |
| Capital contribution from adviser | — | — | — | 180,068 | — | — |
| Redeemed | (8,173,756) | (189,358,615) | (4,253,297) | (86,220,843) | (10,892,307) | (170,840,720) |
| Net Change | (6,930,441) | $ (160,828,999) | 922,856 | $ 18,396,156 | (9,109,340) | $ (143,240,068) |
| Portfolios | ||||||
| High Yield | Diversified Income Plus | Income | ||||
| Year Ended December 31, 2007 | Shares | Amount | Shares | Amount | Shares | Amount |
| Sold | 46,461,806 | $ 230,542,045 | 6,612,794 | $ 48,025,036 | 46,904,581 | $ 458,441,743 |
| Dividends and distributions reinvested | 12,170,460 | 61,271,776 | 362,450 | 2,651,827 | 6,791,583 | 66,556,877 |
| Redeemed | (64,416,970) | (326,406,650) | (3,217,824) | (22,904,551) | (17,395,475) | (170,524,092) |
| Net Change | (5,784,704) | $ (34,592,829) | 3,757,420 | $ 27,772,312 | 36,300,689 | $ 354,474,528 |
| Year Ended December 31, 2006 | ||||||
| Sold | 38,855,737 | $ 194,598,413 | 3,545,527 | $ 24,172,724 | 33,046,392 | $ 323,375,361 |
| Dividends and distributions reinvested | 13,430,063 | 67,173,264 | 524,198 | 3,423,713 | 5,811,528 | 56,838,302 |
| Redeemed | (46,522,259) | (232,895,233) | (3,397,543) | (22,287,238) | (22,458,305) | (219,576,875) |
| Net Change | 5,763,541 | $ 28,876,444 | 672,182 | $ 5,309,199 | 16,399,615 | $ 160,636,788 |
| 258 |
THRIVENT SERIES FUND, INC.
Notes to Financial Statements
As of December 31, 2007
| Portfolios | ||||||
| Bond Index | Limited Maturity Bond | Mortgage Securities | ||||
| Year Ended December 31, 2007 | Shares | Amount | Shares | Amount | Shares | Amount |
| Sold | 1,328,880 | $ 13,540,803 | 38,335,963 | $ 378,763,273 | 335,708 | $ 3,242,280 |
| Dividends and distributions reinvested | 1,074,621 | 10,947,777 | 3,824,293 | 37,803,392 | 277,329 | 2,676,830 |
| Redeemed | (4,748,169) | (48,380,446) | (10,272,253) | (101,455,408) | (1,441,305) | (13,914,943) |
| Net Change | (2,344,668) | $ (23,891,866) | 31,888,003 | $ 315,111,257 | (828,268) | $ (7,995,833) |
| Year Ended December 31, 2006 | ||||||
| Sold | 1,222,750 | $ 12,433,116 | 29,524,176 | $ 292,189,829 | 462,329 | $ 4,461,916 |
| Dividends and distributions reinvested | 1,160,306 | 11,775,809 | 2,422,268 | 23,958,814 | 317,173 | 3,061,441 |
| Redeemed | (5,558,654) | (56,376,854) | (10,631,303) | (105,290,694) | (1,689,128) | (16,305,538) |
| Net Change | (3,175,598) | $ (32,167,929) | 21,315,141 | $ 210,857,949 | (909,626) | $ (8,782,181) |
| Portfolio | ||||||
| Money Market | ||||||
| Year Ended December 31, 2007 | Shares | Amount | ||||
| Sold | 2,557,010,814 | $2,557,010,814 | ||||
| Dividends and distributions reinvested | 34,539,698 | 34,539,698 | ||||
| Redeemed | (2,440,416,695) | (2,440,416,695) | ||||
| Net Change | 151,133,817 | $ 151,133,817 | ||||
| Year Ended December 31, 2006 | ||||||
| Sold | 1,054,405,961 | $1,054,405,961 | ||||
| Dividends and distributions reinvested | 23,015,583 | 23,015,583 | ||||
| Redeemed | (860,650,210) | (860,650,210) | ||||
| Net Change | 216,771,334 | $ 216,771,334 | ||||
| 259 |
| Thrivent Series Fund, Inc. | Thrivent Series Fund, Inc. | ||||||||||||||
| Financial Highlights | Financial Highlights — continued | ||||||||||||||
| F O R A S H A R E O U T S T A N D I N G T H R O U G H O U T E A C H P E R I O D(a) | R A T I O S / S U P P L E M E N T A L D A T A | ||||||||||||||
| Ratios to Average | |||||||||||||||
| Net Assets Before Expenses | |||||||||||||||
| Less Distributions | Ratio to Average Net | Waived, Credited or Paid | |||||||||||||
| Income from Investment Operations | from | Assets(d) | Indirectly(d) | ||||||||||||
| Net Asset | Net Realized | Net | Net Asset | ||||||||||||
| Value, | Net | and Unrealized | Total from | Net | Realized | Value, | Net Assets | Net | Net | Portfolio | |||||
| Beginning | Investment | Gain/(Loss) on | Investment | Investment | Gain on | Total | End of | Total | End of Period | Investment | Investment | Turnover | |||
| of Period | Income/(Loss) | Investments(b) | Operations | Income | Investments | Distributions | Period | Return(c) | (in millions) | Expenses | Income/(Loss) | Expenses | Income/(Loss) | Rate | |
| AGGRESSIVE ALLOCATION PORTFOLIO | |||||||||||||||
| Year Ended 12/31/2007 | $13.01 | $0.13 | $1.09 | $1.22 | $(0.08) | $(0.06) | $(0.14) | $14.09 | 9.33% | $496.4 | 0.15% | 1.17% | 0.20% | 1.12% | 16% |
| Year Ended 12/31/2006 | 11.44 | 0.07 | 1.50 | 1.57 | — | — | — | 13.01 | 13.77% | 333.6 | 0.04% | 0.88% | 0.20% | 0.72% | 8% |
| Year Ended 12/31/2005 (e) | 10.00 | — | 1.44 | 1.44 | — | — | — | 11.44 | 14.45% | 71.8 | 0.10% | 0.11% | 0.37% | (0.16)% | 7% |
| MODERATELY AGGRESSIVE ALLOCATION PORTFOLIO | |||||||||||||||
| Year Ended 12/31/2007 | 12.66 | 0.18 | 0.80 | 0.98 | (0.11) | (0.05) | (0.16) | 13.48 | 7.74% | 1,780.8 | 0.13% | 1.86% | 0.17% | 1.82% | 18% |
| Year Ended 12/31/2006 | 11.19 | 0.12 | 1.35 | 1.47 | — | — | — | 12.66 | 13.15% | 1,063.8 | 0.05% | 1.58% | 0.18% | 1.44% | 14% |
| Year Ended 12/31/2005 (e) | 10.00 | 0.02 | 1.19 | 1.21 | (0.02) | — | (0.02) | 11.19 | 12.12% | 238.1 | 0.10% | 0.69% | 0.24% | 0.55% | 4% |
| MODERATE ALLOCATION PORTFOLIO | |||||||||||||||
| Year Ended 12/31/2007 | 12.22 | 0.24 | 0.58 | 0.82 | (0.15) | (0.07) | (0.22) | 12.82 | 6.75% | 2,168.9 | 0.14% | 2.68% | 0.17% | 2.65% | 18% |
| Year Ended 12/31/2006 | 10.96 | 0.18 | 1.08 | 1.26 | — | — | — | 12.22 | 11.52% | 1,274.0 | 0.08% | 2.29% | 0.18% | 2.19% | 19% |
| Year Ended 12/31/2005 (e) | 10.00 | 0.04 | 0.96 | 1.00 | (0.04) | — | (0.04) | 10.96 | 9.98% | 331.2 | 0.12% | 1.29% | 0.22% | 1.19% | 4% |
| MODERATELY CONSERVATIVE ALLOCATION PORTFOLIO | |||||||||||||||
| Year Ended 12/31/2007 | 11.69 | 0.27 | 0.39 | 0.66 | (0.20) | (0.07) | (0.27) | 12.08 | 5.59% | 756.9 | 0.17% | 3.36% | 0.19% | 3.34% | 13% |
| Year Ended 12/31/2006 | 10.68 | 0.23 | 0.78 | 1.01 | — | — | — | 11.69 | 9.53% | 434.9 | 0.15% | 2.94% | 0.20% | 2.89% | 19% |
| Year Ended 12/31/2005 (e) | 10.00 | 0.06 | 0.68 | 0.74 | (0.06) | — | (0.06) | 10.68 | 7.40% | 146.7 | 0.17% | 2.12% | 0.27% | 2.02% | 5% |
| TECHNOLOGY PORTFOLIO | |||||||||||||||
| Year Ended 12/31/2007 | 7.67 | (0.01) | 0.85 | 0.84 | — | (0.27) | (0.27) | 8.24 | 11.08% | 56.6 | 0.86% | (0.14)% | 0.87% | (0.15)% | 147% |
| Year Ended 12/31/2006 | 7.53 | (0.02) | 0.26 | 0.24 | — | (0.10) | (0.10) | 7.67 | 3.26% | 53.4 | 0.88% | (0.23)% | 0.89% | (0.24)% | 133% |
| Year Ended 12/31/2005 | 7.28 | (0.02) | 0.29 | 0.27 | (0.02) | — | (0.02) | 7.53 | 3.72% | 59.8 | 0.86% | (0.33)% | 0.88% | (0.34)% | 47% |
| Year Ended 12/31/2004 | 6.94 | 0.02 | 0.32 | 0.34 | — | — | — | 7.28 | 4.85% | 56.6 | 0.73% | 0.35% | 0.90% | 0.18% | 59% |
| Year Ended 12/31/2003 | 4.59 | (0.01) | 2.36 | 2.35 | — | — | — | 6.94 | 51.36% | 41.2 | 0.73% | (0.36)% | 1.17% | (0.80)% | 68% |
| PARTNER SMALL CAP GROWTH PORTFOLIO | |||||||||||||||
| Year Ended 12/31/2007 | 13.58 | (0.04) | 1.21 | 1.17 | — | (0.81) | (0.81) | 13.94 | 8.52% | 167.6 | 0.99% | (0.32)% | 1.10% | (0.42)% | 98% |
| Year Ended 12/31/2006 | 12.11 | (0.05) | 1.57 | 1.52 | — | (0.05) | (0.05) | 13.58 | 12.59% | 107.4 | 0.99% | (0.42)% | 1.12% | (0.55)% | 113% |
| Year Ended 12/31/2005 | 12.33 | (0.06) | 0.50 | 0.44 | — | (0.66) | (0.66) | 12.11 | 3.96% | 64.7 | 0.99% | (0.60)% | 1.17% | (0.78)% | 104% |
| Year Ended 12/31/2004 | 11.07 | (0.07) | 1.33 | 1.26 | — | — | — | 12.33 | 11.32% | 53.9 | 1.00% | (0.69)% | 1.19% | (0.88)% | 255% |
| Year Ended 12/31/2003 | 7.70 | (0.04) | 3.41 | 3.37 | — | — | — | 11.07 | 43.83% | 40.1 | 1.00% | (0.57)% | 1.28% | (0.85)% | 52% |
| PARTNER SMALL CAP VALUE PORTFOLIO | |||||||||||||||
| Year Ended 12/31/2007 | 19.57 | 0.11 | (0.21) | (0.10) | (0.07) | (0.96) | (1.03) | 18.44 | (1.03)% | 185.6 | 0.86% | 0.68% | 0.87% | 0.66% | 29% |
| Year Ended 12/31/2006 | 16.82 | 0.08 | 3.45 | 3.53 | (0.04) | (0.74) | (0.78) | 19.57 | 21.50% | 163.6 | 0.86% | 0.52% | 0.88% | 0.51% | 25% |
| Year Ended 12/31/2005 | 16.56 | 0.07 | 0.71 | 0.78 | (0.04) | (0.48) | (0.52) | 16.82 | 4.89% | 106.2 | 0.88% | 0.51% | 0.89% | 0.49% | 37% |
| Year Ended 12/31/2004 | 13.73 | 0.07 | 2.95 | 3.02 | — | (0.19) | (0.19) | 16.56 | 22.26% | 77.5 | 0.80% | 0.51% | 0.99% | 0.32% | 106% |
| Year Ended 12/31/2003 (f) | 10.00 | 0.01 | 4.15 | 4.16 | (0.01) | (0.42) | (0.43) | 13.73 | 41.55% | 19.8 | 0.80% | 0.12% | 1.69% | (0.77)% | 54% |
| SMALL CAP STOCK PORTFOLIO | |||||||||||||||
| Year Ended 12/31/2007 | 15.43 | 0.10 | 0.88 | 0.98 | (0.05) | (0.88) | (0.93) | 15.48 | 6.14% | 399.9 | 0.72% | 0.66% | 0.74% | 0.65% | 126% |
| Year Ended 12/31/2006 | 14.62 | 0.05 | 1.78 | 1.83 | (0.02) | (1.00) | (1.02) | 15.43 | 12.79% | 406.7 | 0.73% | 0.33% | 0.74% | 0.32% | 94% |
| Year Ended 12/31/2005 | 14.74 | 0.02 | 1.16 | 1.18 | (0.01) | (1.29) | (1.30) | 14.62 | 8.81% | 290.2 | 0.74% | 0.20% | 0.76% | 0.19% | 113% |
| Year Ended 12/31/2004 | 12.34 | 0.01 | 2.56 | 2.57 | — | (0.17) | (0.17) | 14.74 | 20.94% | 216.8 | 0.76% | 0.06% | 0.78% | 0.04% | 93% |
| Year Ended 12/31/2003 | 8.81 | — | 3.53 | 3.53 | — | — | — | 12.34 | 40.19% | 156.9 | 0.69% | 0.00% | 0.82% | (0.13)% | 122% |
(a) All per share amounts have been rounded to the nearest cent.
(b) The amount shown may not correlate with the change in aggregate gains and losses of portfolio securities due to the timing of sales and redemptions of fund shares.
(c) Total investment return assumes dividend reinvestment and does not reflect any deduction for sales charges. Not annualized for periods less than one year.
(d) Computed on an annualized basis for periods less than one year.
(e) Since inception, April 29, 2005.
(f) Since inception, April 30, 2003.
| The accompanying Notes to Financial Statements are an integral part of this schedule. | The accompanying Notes to Financial Statements are an integral part of this schedule. |
| 260 | 261 |
| Thrivent Series Fund, Inc. | Thrivent Series Fund, Inc. | ||||||||||||||
| Financial Highlights — continued | Financial Highlights — continued | ||||||||||||||
| F O R A S H A R E O U T S T A N D I N G T H R O U G H O U T E A C H P E R I O D(a) | R A T I O S / S U P P L E M E N T A L D A T A | ||||||||||||||
| Ratios to Average | |||||||||||||||
| Net Assets Before Expenses | |||||||||||||||
| Less Distributions | Ratio to Average Net | Waived, Credited or Paid | |||||||||||||
| Income from Investment Operations | from | Assets(d) | Indirectly(d) | ||||||||||||
| Net Asset | Net Realized | Net | Net Asset | ||||||||||||
| Value, | Net | and Unrealized | Total from | Net | Realized | Value, | Net Assets | Net | Net | Portfolio | |||||
| Beginning | Investment | Gain/(Loss) on | Investment | Investment | Gain on | Total | End of | Total | End of Period | Investment | Investment | Turnover | |||
| of Period ) | Income/(Loss | Investments(b) | Operations | Income | Investments | Distributions | Period | Return(c) | (in millions) | Expenses | Income/(Loss) | Expenses | Income/(Loss) | Rate | |
| SMALL CAP INDEX PORTFOLIO | |||||||||||||||
| Year Ended 12/31/2007 | $21.55 | $0.24 | $(0.11) | $0.13 | $(0.14) | $(2.33) | $(2.47) | $19.21 | (0.50)% | $357.9 | 0.39% | 1.00% | 0.39% | 0.99% | 16% |
| Year Ended 12/31/2006 | 19.41 | 0.17 | 2.64 | 2.81 | (0.14) | (0.53) | (0.67) | 21.55 | 14.72% | 439.8 | 0.39% | 0.71% | 0.39% | 0.71% | 14% |
| Year Ended 12/31/2005 | 19.26 | 0.15 | 1.18 | 1.33 | (0.13) | (1.05) | (1.18) | 19.41 | 7.32% | 473.7 | 0.39% | 0.75% | 0.39% | 0.75% | 14% |
| Year Ended 12/31/2004 | 15.83 | 0.13 | 3.36 | 3.49 | (0.06) | — | (0.06) | 19.26 | 22.10% | 485.9 | 0.34% | 0.80% | 0.39% | 0.75% | 21% |
| Year Ended 12/31/2003 | 11.52 | 0.07 | 4.29 | 4.36 | (0.05) | — | (0.05) | 15.83 | 38.16% | 394.8 | 0.40% | 0.52% | 0.40% | 0.52% | 15% |
| MID CAP GROWTH PORTFOLIO | |||||||||||||||
| Year Ended 12/31/2007 | 17.59 | 0.08 | 3.38 | 3.46 | (0.08) | (0.79) | (0.87) | 20.18 | 19.92% | 669.8 | 0.44% | 0.35% | 0.45% | 0.34% | 80% |
| Year Ended 12/31/2006 | 16.21 | 0.08 | 1.32 | 1.40 | (0.02) | — | (0.02) | 17.59 | 8.63% | 654.9 | 0.45% | 0.40% | 0.45% | 0.40% | 149% |
| Year Ended 12/31/2005 | 14.57 | 0.02 | 1.62 | 1.64 | — | — | — | 16.21 | 11.27% | 747.5 | 0.45% | 0.11% | 0.45% | 0.11% | 135% |
| Year Ended 12/31/2004 | 13.08 | — | 1.49 | 1.49 | — | — | — | 14.57 | 11.36% | 784.9 | 0.45% | 0.00% | 0.46% | (0.01)% | 150% |
| Year Ended 12/31/2003 | 9.63 | — | 3.45 | 3.45 | — | — | — | 13.08 | 35.92% | 478.8 | 0.40% | (0.03)% | 0.44% | (0.07)% | 79% |
| MID CAP GROWTH PORTFOLIO II | |||||||||||||||
| Year Ended 12/31/2007 | 11.37 | 0.03 | 2.13 | 2.16 | (0.06) | (2.05) | (2.11) | 11.42 | 19.80% | 32.4 | 0.59% | 0.18% | 1.11% | (0.33)% | 81% |
| Year Ended 12/31/2006 | 10.60 | 0.06 | 0.85 | 0.91 | (0.02) | (0.12) | (0.14) | 11.37 | 8.60% | 31.7 | 0.39% | 0.44% | 1.11% | (0.28)% | 147% |
| Year Ended 12/31/2005 | 9.53 | 0.02 | 1.05 | 1.07 | — | — | — | 10.60 | 11.22% | 38.2 | 0.39% | 0.17% | 1.10% | (0.54)% | 136% |
| Year Ended 12/31/2004 | 8.19 | — | 1.34 | 1.34 | — | — | — | 9.53 | 16.41% | 38.4 | 0.47% | (0.04)% | 1.16% | (0.73)% | 227% |
| Year Ended 12/31/2003 | 5.96 | (0.03) | 2.26 | 2.23 | — | — | — | 8.19 | 37.34% | 30.5 | 0.90% | (0.47)% | 1.34% | (0.91)% | 105% |
| PARTNER MID CAP VALUE PORTFOLIO | |||||||||||||||
| Year Ended 12/31/2007 | 13.06 | 0.14 | 0.28 | 0.42 | — | (0.07) | (0.07) | 13.41 | 3.16% | 95.0 | 0.89% | 1.24% | 0.90% | 1.23% | 85% |
| Year Ended 12/31/2006 | 11.48 | 0.10 | 1.70 | 1.80 | (0.10) | (0.12) | (0.22) | 13.06 | 15.72% | 54.9 | 0.96% | 1.07% | 0.98% | 1.05% | 57% |
| Year Ended 12/31/2005 (e) | 10.00 | 0.04 | 1.51 | 1.55 | (0.04) | (0.03) | (0.07) | 11.48 | 15.44% | 21.2 | 1.25% | 0.88% | 1.49% | 0.63% | 30% |
| MID CAP STOCK PORTFOLIO | |||||||||||||||
| Year Ended 12/31/2007 | 13.41 | 0.08 | 0.76 | 0.84 | (0.12) | (0.98) | (1.10) | 13.15 | 5.70% | 387.9 | 0.72% | 0.70% | 0.74% | 0.69% | 215% |
| Year Ended 12/31/2006 | 12.82 | 0.13 | 1.51 | 1.64 | (0.05) | (1.00) | (1.05) | 13.41 | 13.41% | 363.8 | 0.73% | 1.26% | 0.75% | 1.24% | 184% |
| Year Ended 12/31/2005 | 11.66 | 0.05 | 1.76 | 1.81 | (0.02) | (0.63) | (0.65) | 12.82 | 16.37% | 224.2 | 0.76% | 0.62% | 0.78% | 0.60% | 124% |
| Year Ended 12/31/2004 | 10.04 | 0.02 | 1.70 | 1.72 | — | (0.10) | (0.10) | 11.66 | 17.24% | 111.7 | 0.68% | 0.26% | 0.82% | 0.12% | 126% |
| Year Ended 12/31/2003 | 7.60 | 0.02 | 2.44 | 2.46 | (0.02) | — | (0.02) | 10.04 | 32.28% | 73.4 | 0.68% | 0.31% | 1.01% | (0.02)% | 85% |
| MID CAP INDEX PORTFOLIO | |||||||||||||||
| Year Ended 12/31/2007 | 15.05 | 0.20 | 1.00 | 1.20 | (0.15) | (0.90) | (1.05) | 15.20 | 7.63% | 146.2 | 0.43% | 1.16% | 0.43% | 1.15% | 20% |
| Year Ended 12/31/2006 | 14.43 | 0.18 | 1.20 | 1.38 | (0.14) | (0.62) | (0.76) | 15.05 | 9.81% | 159.8 | 0.43% | 1.10% | 0.43% | 1.10% | 11% |
| Year Ended 12/31/2005 | 13.34 | 0.14 | 1.44 | 1.58 | (0.07) | (0.42) | (0.49) | 14.43 | 12.34% | 171.5 | 0.43% | 1.08% | 0.44% | 1.07% | 19% |
| Year Ended 12/31/2004 | 11.53 | 0.08 | 1.74 | 1.82 | — | (0.01) | (0.01) | 13.34 | 15.75% | 135.4 | 0.45% | 0.77% | 0.46% | 0.76% | 23% |
| Year Ended 12/31/2003 | 8.65 | 0.06 | 2.95 | 3.01 | (0.06) | (0.07) | (0.13) | 11.53 | 34.80% | 76.2 | 0.36% | 0.88% | 0.64% | 0.60% | 25% |
| PARTNER INTERNATIONAL STOCK PORTFOLIO | |||||||||||||||
| Year Ended 12/31/2007 | 16.32 | 0.36 | 1.37 | 1.73 | (0.24) | (0.55) | (0.79) | 17.26 | 10.57% | 1,443.8 | 0.81% | 2.11% | 0.88% | 2.04% | 113% |
| Year Ended 12/31/2006 | 13.63 | 0.23 | 2.67 | 2.90 | (0.21) | — | (0.21) | 16.32 | 21.50% | 1,341.8 | 0.89% | 1.51% | 0.89% | 1.51% | 50% |
| Year Ended 12/31/2005 | 12.12 | 0.17 | 1.48 | 1.65 | (0.14) | — | (0.14) | 13.63 | 13.71% | 1,055.9 | 0.94% | 1.58% | 0.94% | 1.58% | 46% |
| Year Ended 12/31/2004 | 10.62 | 0.13 | 1.52 | 1.65 | (0.15) | — | (0.15) | 12.12 | 15.65% | 721.0 | 0.94% | 1.18% | 0.94% | 1.18% | 63% |
| Year Ended 12/31/2003 | 8.23 | 0.11 | 2.41 | 2.52 | (0.13) | — | (0.13) | 10.62 | 31.27% | 420.7 | 0.85% | 1.28% | 0.96% | 1.17% | 26% |
(a) All per share amounts have been rounded to the nearest cent.
(b) The amount shown may not correlate with the change in aggregate gains and losses of portfolio securities due to the timing of sales and redemptions of fund shares.
(c) Total investment return assumes dividend reinvestment and does not reflect any deduction for sales charges. Not annualized for periods less than one year.
(d) Computed on an annualized basis for periods less than one year.
(e) Since inception, April 29, 2005.
| The accompanying Notes to Financial Statements are an integral part of this schedule. | The accompanying Notes to Financial Statements are an integral part of this schedule. |
| 262 | 263 |
| Thrivent Series Fund, Inc. | Thrivent Series Fund, Inc. | ||||||||||||||
| Financial Highlights — continued | Financial Highlights — continued | ||||||||||||||
| F O R A S H A R E O U T S T A N D I N G T H R O U G H O U T E A C H P E R I O D(a) | R A T I O S / S U P P L E M E N T A L D A T A | ||||||||||||||
| Ratios to Average | |||||||||||||||
| Net Assets Before Expenses | |||||||||||||||
| Less Distributions | Ratio to Average Net | Waived, Credited or Paid | |||||||||||||
| Income from Investment Operations | from | Assets(d) | Indirectly(d) | ||||||||||||
| Net Asset | Net Realized | Net | Net Asset | ||||||||||||
| Value, | Net | and Unrealized | Total from | Net | Realized | Value, | Net Assets | Net | Net | Portfolio | |||||
| Beginning | Investment | Gain/(Loss) on | Investment | Investment | Gain on | Total | End of | Total | End of Period | Investment | Investment | Turnover | |||
| of Period | Income/(Loss) | Investments(b) | Operations | Income | Investments | Distributions | Period | Return(c) | (in millions) | Expenses | Income/(Loss) | Expenses | Income/(Loss) | Rate | |
| PARTNER ALL CAP PORTFOLIO | |||||||||||||||
| Year Ended 12/31/2007 | $12.03 | $0.07 | $2.28 | $2.35 | $(0.06) | $(1.32) | $(1.38) | $13.00 | 20.37% | $117.6 | 0.84% | 0.61% | 1.05% | 0.41% | 169% |
| Year Ended 12/31/2006 | 10.47 | 0.06 | 1.55 | 1.61 | (0.05) | — | (0.05) | 12.03 | 15.47% | 96.5 | 0.85% | 0.51% | 1.05% | 0.31% | 162% |
| Year Ended 12/31/2005 | 8.89 | 0.05 | 1.58 | 1.63 | (0.05) | — | (0.05) | 10.47 | 18.33% | 82.2 | 0.95% | 0.62% | 1.08% | 0.49% | 150% |
| Year Ended 12/31/2004 | 7.83 | 0.04 | 1.03 | 1.07 | (0.01) | — | (0.01) | 8.89 | 13.64% | 59.7 | 0.95% | 0.55% | 1.13% | 0.37% | 172% |
| Year Ended 12/31/2003 | 6.35 | 0.02 | 1.47 | 1.49 | (0.01) | — | (0.01) | 7.83 | 23.52% | 48.6 | 0.95% | 0.26% | 1.12% | 0.09% | 163% |
| LARGE CAP GROWTH PORTFOLIO | |||||||||||||||
| Year Ended 12/31/2007 | 16.64 | 0.12 | 2.67 | 2.79 | (0.20) | — | (0.20) | 19.23 | 16.75% | 2,553.5 | 0.44% | 0.63% | 0.45% | 0.63% | 163% |
| Year Ended 12/31/2006 | 15.67 | 0.09 | 0.96 | 1.05 | (0.08) | — | (0.08) | 16.64 | 6.72% | 2,331.7 | 0.45% | 0.54% | 0.45% | 0.53% | 141% |
| Year Ended 12/31/2005 | 14.76 | 0.08 | 0.95 | 1.03 | (0.12) | — | (0.12) | 15.67 | 7.01% | 2,375.0 | 0.45% | 0.50% | 0.45% | 0.50% | 111% |
| Year Ended 12/31/2004 | 13.78 | 0.11 | 0.94 | 1.05 | (0.07) | — | (0.07) | 14.76 | 7.68% | 2,448.2 | 0.45% | 0.79% | 0.45% | 0.79% | 104% |
| Year Ended 12/31/2003 | 10.62 | 0.07 | 3.15 | 3.22 | (0.06) | — | (0.06) | 13.78 | 30.49% | 2,478.8 | 0.40% | 0.56% | 0.42% | 0.54% | 101% |
| LARGE CAP GROWTH PORTFOLIO II | |||||||||||||||
| Year Ended 12/31/2007 | 11.00 | 0.06 | 1.71 | 1.77 | (0.08) | (0.73) | (0.81) | 11.96 | 16.47% | 34.0 | 0.65% | 0.39% | 1.06% | (0.01)% | 156% |
| Year Ended 12/31/2006 | 10.37 | 0.07 | 0.63 | 0.70 | (0.06) | (0.01) | (0.07) | 11.00 | 6.78% | 35.9 | 0.40% | 0.57% | 1.03% | (0.07)% | 132% |
| Year Ended 12/31/2005 | 9.77 | 0.06 | 0.62 | 0.68 | (0.08) | — | (0.08) | 10.37 | 7.08% | 42.6 | 0.40% | 0.55% | 1.00% | (0.05)% | 113% |
| Year Ended 12/31/2004 | 9.08 | 0.08 | 0.61 | 0.69 | — | — | — | 9.77 | 7.56% | 43.9 | 0.38% | 0.87% | 1.08% | 0.17% | 177% |
| Year Ended 12/31/2003 | 7.40 | 0.01 | 1.68 | 1.69 | (0.01) | — | (0.01) | 9.08 | 22.75% | 39.1 | 0.80% | 0.10% | 1.26% | (0.36)% | 261% |
| PARTNER GROWTH STOCK PORTFOLIO | |||||||||||||||
| Year Ended 12/31/2007 | 13.08 | 0.08 | 1.14 | 1.22 | (0.07) | (0.68) | (0.75) | 13.55 | 9.28% | 118.1 | 0.80% | 0.59% | 0.91% | 0.48% | 55% |
| Year Ended 12/31/2006 | 11.86 | 0.07 | 1.45 | 1.52 | (0.02) | (0.28) | (0.30) | 13.08 | 13.17% | 116.7 | 0.79% | 0.55% | 0.90% | 0.44% | 39% |
| Year Ended 12/31/2005 | 11.21 | 0.02 | 0.68 | 0.70 | (0.05) | — | (0.05) | 11.86 | 6.32% | 120.4 | 0.90% | 0.23% | 0.90% | 0.22% | 42% |
| Year Ended 12/31/2004 | 10.19 | 0.07 | 0.95 | 1.02 | — | — | — | 11.21 | 9.95% | 107.4 | 0.80% | 0.64% | 0.92% | 0.52% | 33% |
| Year Ended 12/31/2003 | 7.79 | 0.02 | 2.40 | 2.42 | (0.02) | — | (0.02) | 10.19 | 31.05% | 69.7 | 0.80% | 0.26% | 0.96% | 0.10% | 41% |
| LARGE CAP VALUE PORTFOLIO | |||||||||||||||
| Year Ended 12/31/2007 | 13.50 | 0.19 | 0.48 | 0.67 | (0.17) | (0.59) | (0.76) | 13.41 | 4.70% | 1,004.9 | 0.64% | 1.68% | 0.65% | 1.67% | 37% |
| Year Ended 12/31/2006 | 11.78 | 0.18 | 1.97 | 2.15 | (0.14) | (0.29) | (0.43) | 13.50 | 18.72% | 771.7 | 0.64% | 1.65% | 0.65% | 1.64% | 43% |
| Year Ended 12/31/2005 | 11.14 | 0.14 | 0.63 | 0.77 | (0.13) | — | (0.13) | 11.78 | 7.02% | 514.5 | 0.65% | 1.53% | 0.65% | 1.52% | 53% |
| Year Ended 12/31/2004 | 9.76 | 0.13 | 1.25 | 1.38 | — | — | — | 11.14 | 14.13% | 351.2 | 0.66% | 1.52% | 0.66% | 1.52% | 51% |
| Year Ended 12/31/2003 | 7.74 | 0.09 | 2.02 | 2.11 | (0.09) | — | (0.09) | 9.76 | 27.08% | 220.4 | 0.60% | 1.41% | 0.68% | 1.33% | 32% |
| LARGE CAP STOCK PORTFOLIO | |||||||||||||||
| Year Ended 12/31/2007 | 10.54 | 0.12 | 0.68 | 0.80 | (0.12) | (0.18) | (0.30) | 11.04 | 7.57% | 1,060.1 | 0.65% | 1.31% | 0.66% | 1.30% | 114% |
| Year Ended 12/31/2006 | 9.62 | 0.13 | 0.99 | 1.12 | (0.07) | (0.13) | (0.20) | 10.54 | 11.95% | 829.3 | 0.67% | 1.45% | 0.68% | 1.44% | 77% |
| Year Ended 12/31/2005 | 9.28 | 0.07 | 0.42 | 0.49 | (0.08) | (0.07) | (0.15) | 9.62 | 5.31% | 602.4 | 0.71% | 0.95% | 0.72% | 0.94% | 60% |
| Year Ended 12/31/2004 | 8.56 | 0.10 | 0.62 | 0.72 | — | — | — | 9.28 | 8.49% | 442.9 | 0.72% | 1.16% | 0.73% | 1.15% | 68% |
| Year Ended 12/31/2003 | 7.08 | 0.04 | 1.48 | 1.52 | (0.04) | — | (0.04) | 8.56 | 21.36% | 282.4 | 0.64% | 0.80% | 0.77% | 0.67% | 33% |
| LARGE CAP INDEX PORTFOLIO | |||||||||||||||
| Year Ended 12/31/2007 | 25.32 | 0.49 | 0.87 | 1.36 | (0.44) | (1.06) | (1.50) | 25.18 | 5.17% | 633.5 | 0.36% | 1.64% | 0.36% | 1.64% | 5% |
| Year Ended 12/31/2006 | 22.31 | 0.43 | 2.94 | 3.37 | (0.36) | — | (0.36) | 25.32 | 15.36% | 727.3 | 0.36% | 1.59% | 0.36% | 1.59% | 7% |
| Year Ended 12/31/2005 | 21.63 | 0.35 | 0.67 | 1.02 | (0.34) | — | (0.34) | 22.31 | 4.75% | 795.3 | 0.35% | 1.54% | 0.35% | 1.54% | 7% |
| Year Ended 12/31/2004 | 19.79 | 0.34 | 1.73 | 2.07 | (0.23) | — | (0.23) | 21.63 | 10.56% | 831.9 | 0.32% | 1.70% | 0.37% | 1.65% | 6% |
| Year Ended 12/31/2003 | 15.68 | 0.24 | 4.10 | 4.34 | (0.23) | — | (0.23) | 19.79 | 28.21% | 725.0 | 0.36% | 1.42% | 0.36% | 1.42% | 1% |
(a) All per share amounts have been rounded to the nearest cent.
(b) The amount shown may not correlate with the change in aggregate gains and losses of portfolio securities due to the timing of sales and redemptions of fund shares.
(c) Total investment return assumes dividend reinvestment and does not reflect any deduction for sales charges. Not annualized for periods less than one year.
(d) Computed on an annualized basis for periods less than one year.
| The accompanying Notes to Financial Statements are an integral part of this schedule. | The accompanying Notes to Financial Statements are an integral part of this schedule. |
| 264 | 265 |
| Thrivent Series Fund, Inc. | Thrivent Series Fund, Inc. | ||||||||||||||
| Financial Highlights — continued | Financial Highlights — continued | ||||||||||||||
| F O R A S H A R E O U T S T A N D I N G T H R O U G H O U T E A C H P E R I O D(a) | R A T I O S / S U P P L E M E N T A L D A T A | ||||||||||||||
| Ratios to Average | |||||||||||||||
| Net Assets Before Expenses | |||||||||||||||
| Less Distributions | Ratio to Average Net | Waived, Credited or Paid | |||||||||||||
| Income from Investment Operations | from | Assets(d) | Indirectly(d) | ||||||||||||
| Net Asset | Net Realized | Net | Net Asset | ||||||||||||
| Value, | Net | and Unrealized | Total from | Net | Realized | Value, | Net Assets | Net | Net | Portfolio | |||||
| Beginning | Investment | Gain/(Loss) on | Investment | Investment | Gain on | Total | End of | Total | End of Period | Investment | Investment | Turnover | |||
| of Period | Income/(Loss) | Investments(b) | Operations | Income | Investments | Distributions | Period | Return(c) | (in millions) | Expenses | Income/(Loss) | Expenses | Income/(Loss) | Rate | |
| REAL ESTATE SECURITIES PORTFOLIO | |||||||||||||||
| Year Ended 12/31/2007 | $22.93 | $0.32 | $(3.84) | $(3.52) | $(0.30) | $(1.37) | $(1.67) | $17.74 | (16.80)% | $326.4 | 0.86% | 1.60% | 0.86% | 1.60% | 71% |
| Year Ended 12/31/2006 | 18.16 | 0.29 | 5.65 | 5.94 | (0.29) | (0.88) | (1.17) | 22.93 | 34.18% | 367.9 | 0.84% | 1.41% | 0.86% | 1.40% | 69% |
| Year Ended 12/31/2005 | 17.04 | 0.26 | 1.80 | 2.06 | (0.24) | (0.70) | (0.94) | 18.16 | 13.25% | 274.6 | 0.86% | 1.88% | 0.87% | 1.87% | 83% |
| Year Ended 12/31/2004 | 12.66 | 0.37 | 4.07 | 4.44 | — | (0.06) | (0.06) | 17.04 | 35.19% | 175.0 | 0.79% | 2.60% | 0.90% | 2.49% | 119% |
| Year Ended 12/31/2003 (e) | 10.00 | 0.20 | 2.80 | 3.00 | (0.20) | (0.14) | (0.34) | 12.66 | 30.02% | 51.8 | 0.80% | 4.87% | 1.11% | 4.56% | 45% |
| BALANCED PORTFOLIO | |||||||||||||||
| Year Ended 12/31/2007 | 16.77 | 0.57 | 0.35 | 0.92 | (0.53) | — | (0.53) | 17.16 | 5.46% | 488.4 | 0.38% | 2.78% | 0.39% | 2.77% | 121% |
| Year Ended 12/31/2006 | 15.48 | 0.50 | 1.22 | 1.72 | (0.43) | — | (0.43) | 16.77 | 11.41% | 566.1 | 0.38% | 2.72% | 0.39% | 2.72% | 127% |
| Year Ended 12/31/2005 | 15.28 | 0.42 | 0.16 | 0.58 | (0.38) | — | (0.38) | 15.48 | 3.92% | 663.5 | 0.37% | 2.52% | 0.38% | 2.52% | 130% |
| Year Ended 12/31/2004 | 14.45 | 0.37 | 0.78 | 1.15 | (0.32) | — | (0.32) | 15.28 | 8.09% | 748.7 | 0.33% | 2.54% | 0.37% | 2.50% | 119% |
| Year Ended 12/31/2003 | 12.75 | 0.33 | 1.78 | 2.11 | (0.41) | — | (0.41) | 14.45 | 17.17% | 721.1 | 0.36% | 2.49% | 0.36% | 2.49% | 69% |
| HIGH YIELD PORTFOLIO | |||||||||||||||
| Year Ended 12/31/2007 | 5.11 | 0.40 | (0.26) | 0.14 | (0.41) | — | (0.41) | 4.84 | 2.71% | 774.6 | 0.45% | 8.00% | 0.45% | 8.00% | 69% |
| Year Ended 12/31/2006 | 5.01 | 0.40 | 0.10 | 0.50 | (0.40) | — | (0.40) | 5.11 | 10.31% | 847.0 | 0.45% | 8.00% | 0.45% | 7.99% | 66% |
| Year Ended 12/31/2005 | 5.22 | 0.41 | (0.21) | 0.20 | (0.41) | — | (0.41) | 5.01 | 4.04% | 802.6 | 0.45% | 8.05% | 0.45% | 8.04% | 53% |
| Year Ended 12/31/2004 | 5.14 | 0.42 | 0.08 | 0.50 | (0.42) | — | (0.42) | 5.22 | 10.14% | 884.5 | 0.45% | 8.21% | 0.45% | 8.21% | 71% |
| Year Ended 12/31/2003 | 4.40 | 0.44 | 0.73 | 1.17 | (0.43) | — | (0.43) | 5.14 | 28.00% | 851.5 | 0.40% | 9.22% | 0.43% | 9.19% | 86% |
| DIVERSIFIED INCOME PLUS PORTFOLIO | |||||||||||||||
| Year Ended 12/31/2007 | 7.19 | 0.34 | (0.41) | (0.07) | (0.14) | — | (0.14) | 6.98 | (0.99)% | 131.3 | 0.48% | 5.30% | 0.50% | 5.28% | 168% |
| Year Ended 12/31/2006 | 6.54 | 0.42 | 0.48 | 0.90 | (0.25) | — | (0.25) | 7.19 | 14.19% | 108.1 | 0.51% | 6.62% | 0.52% | 6.60% | 170% |
| Year Ended 12/31/2005 | 6.80 | 0.49 | (0.26) | 0.23 | (0.49) | — | (0.49) | 6.54 | 3.62% | 94.0 | 0.49% | 7.46% | 0.51% | 7.44% | 66% |
| Year Ended 12/31/2004 | 6.74 | 0.46 | 0.06 | 0.52 | (0.46) | — | (0.46) | 6.80 | 8.02% | 105.1 | 0.49% | 6.89% | 0.51% | 6.87% | 91% |
| Year Ended 12/31/2003 | 5.81 | 0.50 | 0.93 | 1.43 | (0.50) | — | (0.50) | 6.74 | 25.41% | 76.0 | 0.41% | 7.86% | 0.59% | 7.68% | 96% |
| INCOME PORTFOLIO | |||||||||||||||
| Year Ended 12/31/2007 | 9.90 | 0.53 | (0.17) | 0.36 | (0.52) | — | (0.52) | 9.74 | 3.77% | 1,418.3 | 0.44% | 5.43% | 0.45% | 5.43% | 228% |
| Year Ended 12/31/2006 | 9.95 | 0.51 | 0.01 | 0.52 | (0.51) | (0.06) | (0.57) | 9.90 | 5.42% | 1,081.8 | 0.45% | 5.22% | 0.45% | 5.22% | 303% |
| Year Ended 12/31/2005 | 10.23 | 0.47 | (0.24) | 0.23 | (0.47) | (0.04) | (0.51) | 9.95 | 2.31% | 924.3 | 0.45% | 4.70% | 0.45% | 4.69% | 259% |
| Year Ended 12/31/2004 | 10.20 | 0.44 | 0.03 | 0.47 | (0.44) | — | (0.44) | 10.23 | 4.74% | 985.1 | 0.45% | 4.36% | 0.45% | 4.36% | 207% |
| Year Ended 12/31/2003 | 9.83 | 0.45 | 0.37 | 0.82 | (0.45) | — | (0.45) | 10.20 | 8.51% | 1,067.1 | 0.40% | 4.47% | 0.42% | 4.45% | 251% |
| BOND INDEX PORTFOLIO | |||||||||||||||
| Year Ended 12/31/2007 | 10.22 | 0.50 | 0.07 | 0.57 | (0.50) | — | (0.50) | 10.29 | 5.66% | 215.2 | 0.40% | 4.86% | 0.43% | 4.84% | 331% |
| Year Ended 12/31/2006 | 10.30 | 0.48 | (0.08) | 0.40 | (0.48) | — | (0.48) | 10.22 | 4.04% | 237.8 | 0.41% | 4.70% | 0.42% | 4.69% | 352% |
| Year Ended 12/31/2005 | 10.52 | 0.44 | (0.22) | 0.22 | (0.44) | — | (0.44) | 10.30 | 2.18% | 272.4 | 0.40% | 4.19% | 0.41% | 4.18% | 360% |
| Year Ended 12/31/2004 | 10.58 | 0.43 | (0.02) | 0.41 | (0.43) | (0.04) | (0.47) | 10.52 | 3.91% | 275.6 | 0.40% | 3.99% | 0.41% | 3.98% | 349% |
| Year Ended 12/31/2003 | 10.66 | 0.42 | (0.05) | 0.37 | (0.45) | — | (0.45) | 10.58 | 3.59% | 244.7 | 0.34% | 3.90% | 0.41% | 3.83% | 213% |
| LIMITED MATURITY BOND PORTFOLIO | |||||||||||||||
| Year Ended 12/31/2007 | 9.92 | 0.47 | (0.08) | 0.39 | (0.47) | — | (0.47) | 9.84 | 3.98% | 973.8 | 0.44% | 4.82% | 0.45% | 4.81% | 128% |
| Year Ended 12/31/2006 | 9.92 | 0.44 | — | 0.44 | (0.44) | — | (0.44) | 9.92 | 4.57% | 665.6 | 0.44% | 4.49% | 0.45% | 4.48% | 137% |
| Year Ended 12/31/2005 | 10.09 | 0.37 | (0.17) | 0.20 | (0.37) | — | (0.37) | 9.92 | 1.96% | 454.1 | 0.45% | 3.70% | 0.46% | 3.69% | 267% |
| Year Ended 12/31/2004 | 10.21 | 0.29 | (0.10) | 0.19 | (0.29) | (0.02) | (0.31) | 10.09 | 1.89% | 316.2 | 0.46% | 2.84% | 0.46% | 2.84% | 219% |
| Year Ended 12/31/2003 | 10.16 | 0.29 | 0.15 | 0.44 | (0.29) | (0.10) | (0.39) | 10.21 | 4.48% | 218.8 | 0.40% | 2.85% | 0.46% | 2.79% | 255% |
(a) All per share amounts have been rounded to the nearest cent.
(b) The amount shown may not correlate with the change in aggregate gains and losses of portfolio securities due to the timing of sales and redemptions of fund shares.
(c) Total investment return assumes dividend reinvestment and does not reflect any deduction for sales charges. Not annualized for periods less than one year.
(d) Computed on an annualized basis for periods less than one year.
(e) Since inception, April 30, 2003.
| The accompanying Notes to Financial Statements are an integral part of this schedule. | The accompanying Notes to Financial Statements are an integral part of this schedule. |
| 266 | 267 |
| Thrivent Series Fund, Inc. | Thrivent Series Fund, Inc. | ||||||||||||||
| Financial Highlights — continued | Financial Highlights — continued | ||||||||||||||
| F O R A S H A R E O U T S T A N D I N G T H R O U G H O U T E A C H P E R I O D(a) | R A T I O S | / S U P P L E M E N T A L | D A T A | ||||||||||||
| Ratios to Average | |||||||||||||||
| Net Assets Before Expenses | |||||||||||||||
| Less Distributions | Ratio to Average Net | Waived, Credited or Paid | |||||||||||||
| Income from Investment Operations | from | Assets(d) | Indirectly(d) | ||||||||||||
| Net Asset | Net Realized | Net | Net Asset | ||||||||||||
| Value, | Net | and Unrealized | Total from | Net | Realized | Value, | Net Assets | Net | Net | Portfolio | |||||
| Beginning | Investment | Gain/(Loss) on | Investment | Investment | Gain on | Total | End of | Total | End of Period | Investment | Investment | Turnover | |||
| of Period | Income/(Loss) ) | Investments(b | Operations | Income | Investments | Distributions | Period | Return(c) | (in millions) | Expenses | Income/(Loss) | Expenses | Income/(Loss) | Rate | |
| MORTGAGE SECURITIES PORTFOLIO | |||||||||||||||
| Year Ended 12/31/2007 | $9.71 | $0.49 | $(0.01) | $0.48 | $(0.48) | $— | $(0.48) | $9.71 | 5.09% | $49.8 | 0.65% | 5.05% | 0.65% | 5.05% | 731% |
| Year Ended 12/31/2006 | 9.75 | 0.48 | (0.04) | 0.44 | (0.48) | — | (0.48) | 9.71 | 4.71% | 57.8 | 0.62% | 5.01% | 0.62% | 5.01% | 740% |
| Year Ended 12/31/2005 | 9.99 | 0.43 | (0.24) | 0.19 | (0.43) | — | (0.43) | 9.75 | 2.00% | 66.9 | 0.61% | 4.40% | 0.62% | 4.39% | 703% |
| Year Ended 12/31/2004 | 9.99 | 0.40 | — | 0.40 | (0.39) | (0.01) | (0.40) | 9.99 | 4.02% | 57.4 | 0.49% | 4.02% | 0.63% | 3.88% | 684% |
| Year Ended 12/31/2003 (e) | 10.00 | 0.19 | (0.01) | 0.18 | (0.19) | — | (0.19) | 9.99 | 1.85% | 27.9 | 0.50% | 2.94% | 0.79% | 2.65% | 921% |
| MONEY MARKET PORTFOLIO | |||||||||||||||
| Year Ended 12/31/2007 | 1.00 | 0.05 | — | 0.05 | (0.05) | — | (0.05) | 1.00 | 5.14% | 741.6 | 0.35% | 5.03% | 0.45% | 4.93% | N/A |
| Year Ended 12/31/2006 | 1.00 | 0.05 | — | 0.05 | (0.05) | — | (0.05) | 1.00 | 4.85% | 590.6 | 0.35% | 4.80% | 0.45% | 4.70% | N/A |
| Year Ended 12/31/2005 | 1.00 | 0.03 | — | 0.03 | (0.03) | — | (0.03) | 1.00 | 2.86% | 373.7 | 0.46% | 2.85% | 0.46% | 2.85% | N/A |
| Year Ended 12/31/2004 | 1.00 | 0.01 | — | 0.01 | (0.01) | — | (0.01) | 1.00 | 0.97% | 323.2 | 0.46% | 1.00% | 0.47% | 0.99% | N/A |
| Year Ended 12/31/2003 | 1.00 | 0.01 | — | 0.01 | (0.01) | — | (0.01) | 1.00 | 0.84% | 289.3 | 0.40% | 0.84% | 0.45% | 0.79% | N/A |
(a) All per share amounts have been rounded to the nearest cent.
(b) The amount shown may not correlate with the change in aggregate gains and losses of portfolio securities due to the timing of sales and redemptions of fund shares.
(c) Total investment return assumes dividend reinvestment and does not reflect any deduction for sales charges. Not annualized for periods less than one year.
(d) Computed on an annualized basis for periods less than one year.
(e) Since inception, April 30, 2003.
| The accompanying Notes to Financial Statements are an integral part of this schedule. | The accompanying Notes to Financial Statements are an integral part of this schedule. |
| 268 | 269 |
| Additional Information |
| (unaudited) |
Proxy Voting
The policies and procedures that the Fund uses to determine how to vote proxies relating to portfolio securities are attached to the Fund’s Statement of Additional Information. You may request a free copy of the Statement of Additional Information or the report of how the Fund voted proxies relating to portfolio securities during the most recent 12-month period ended June 30 by calling 1-800-847-4836. You also may review the Statement of Additional Information or the report of how the Fund voted proxies relating to portfolio securities during the most recent 12-month period ended June 30 at the Thrivent Financial web site (www.thrivent. com) or the SEC web site (www.sec.gov).
Quarterly Schedule of Portfolio Holdings
The Fund files its Schedule of Portfolio Holdings on Form N-Q with the SEC for the first and third quarters of each fiscal year. You may request a free copy of the Fund’s Forms N-Q by calling 1-800-847-4836. The Fund’s Forms N-Q also are available on the Thrivent Financial web site (www.thrivent. com) or the SEC web site (www.sec.gov). You also may review and copy the Forms N-Q for the Fund at the SEC’s Public Reference Room in Washington, DC. You may get information about the operation of the Public Reference Room by calling 1-800-SEC-0330.
Board Approval of Investment Advisory Agreements and Subadvisory Agreements
Both the Investment Company Act of 1940 and the terms of the Investment Advisory and Subadvisory Agreements of the Thrivent Series Fund, Inc. (the “Fund”) require that these agreements be approved annually by a majority of the Board of Directors, including a majority of the Independent Directors.
At its meeting on November 6, 2007, the Board of Directors of the Portfolios of the Fund voted unanimously to renew the existing Investment Advisory Agreement between the Fund and Thrivent Financial for Lutherans (the “Adviser”) for all of the Portfolios of the Fund. The Board also unanimously approved the Subadvisory Agreements for each of the Portfolios for which there is an investment subadviser (each a “Subadviser”). The Adviser and Subadvisers are referred to, collectively, as the “Advisory Organizations.” In connection with its reapproval of the agreements with the Advisory Organizations, the Board considered the following factors:
1. The nature, extent and quality of the services provided by the Advisory Organizations;
2. The performance of the Portfolios;
3. The costs of services provided and profits realized by the Adviser;
4. The extent to which economies of scale may be realized as the Portfolios grow; and
5. Whether the breakpoint levels reflect these economies of scale for the benefit of shareholders.
In connection with the renewal process, the Contracts Committee of the Board (consisting of each of the Independent Directors of the Fund) met on July 10, August 28, and November 6, 2007, to consider information relevant to the renewal process. The Independent Directors also retained the services of Management Practice, Inc. (“MPI”) as an independent consultant to assist them in the compilation, organization and evaluation of relevant information. This information included statistical comparisons of the advisory fees, total operating expenses, and performance of each of the Portfolios in comparison to a peer group of comparable investment companies; detailed information prepared by Portfolio management with respect to the cost of services provided to the Portfolios and fees charged, including effective advisory fees that take into account breakpoints and fee waivers by the Adviser; profit realized by the Adviser and its affiliates that provide services to the Portfolios; and information regarding the types of services furnished to the Portfolios, the personnel providing the services, staff additions, systems improvements and plans for further hiring. The Board also received reports from the Adviser’s investment management staff with respect to the performance of the Portfolios. In addition to its review of the information presented to the Board during the contract renewal process and throughout the year, the Board also considered knowledge gained from discussions with Portfolio Management.
| 270 |
| Additional Information |
| (unaudited) |
The Independent Directors were represented by independent counsel throughout the review process and during private sessions of the Independent Directors to consider reapproval of the agreements. The Directors also received a memorandum from independent counsel summarizing their responsibilities under the Investment Company Act of 1940 in reviewing and approving the Advisory Agreement and the Subadvisory Agreements. The Contract Committee’s and Board’s consideration of the factors listed above and the information provided to it are discussed below.
Nature, Extent and Quality of Services
At each of the Board’s regular quarterly meetings during 2007, management presented information describing the services furnished to the Portfolios by the Adviser and, as appropriate, the Subadvisers. During these meetings, management reported on the investment management, portfolio trading, and compliance functions provided to the Portfolios under the Advisory and Subadvisory Agreements. During the renewal process, the Board considered the specific services provided under the Advisory Agreement as compared to the services provided by other mutual fund investment advisers under similar investment advisory agreements. The Board also considered information relating to the investment experience and educational backgrounds of the Adviser’s portfolio managers and those of the Subadvisers.
The Board received reports at each of its quarterly meetings from the Adviser’s Chief Investment Officer and from the Directors of Equity and Fixed Income Investments. In addition, the Board had, over the past year, met with a majority of the portfolio managers of both the Adviser and each of the Subadvisers, which gave the Board an opportunity to evaluate the managers’ abilities, experience, and the quality of services they provide to the Portfolios. Information was also presented to the Board describing the portfolio compliance functions performed by the Adviser and the Adviser’s oversight of Subadvisers to the Fund. The Independent Directors also received quarterly reports from the Fund’s Chief Compliance Officer.
The Board also considered other benefits to the Adviser and its affiliates derived from its relationship with the Fund. The Board reviewed with the Adviser each of these arrangements and the reasonableness of the costs relative to the services performed.
The Adviser also reviewed with the Board the Adviser’s ongoing program to enhance portfolio management capabilities, including recruitment of personnel, the addition of several research analysts, and investment in systems technology to improve trading, portfolio compliance, and investment reporting functions. The Board viewed these actions as a significant factor in approving the current Advisory Agreement as they demonstrated the Adviser’s commitment to provide the Portfolios with quality service and competitive investment performance.
Performance of the Portfolios
The Board received regular monthly performance reports, which included both the absolute and relative investment performance of each Portfolio. In addition, in connection with each of its regular quarterly meetings, the Board received more extensive information on the performance of each Portfolio, including absolute performance, relative performance rankings within each Portfolio’s Lipper peer group and performance as compared to benchmark index returns. The Board considered investment performance for each Portfolio over the one-, three- and five-year periods. When evaluating investment performance the Board placed emphasis on longer term performance and on the trend of performance, focusing particularly upon the three-year performance record.
For the three-year period ended September 28, 2007, 87% of the internally managed Portfolios and 60% of the subadvised Portfolios performed at or above the median of their respective Lipper peer groups. For the one-year period ending September 28, 2007, 79% of the internally managed Portfolios and 50% of the subadvised Portfolios performed at or above the median of their respective Lipper peer groups. No Portfolio ranked in the bottom quartile of its Lipper peer groups for the three-year period, although two Portfolios were in the bottom quartile for the one-year period ended September 28, 2007. The Board concluded that the performance of the individual Portfolios was either satisfactory compared to their peer groups of funds or that the Adviser had taken appropriate actions to improve performance.
| 271 |
| Additional Information |
| (unaudited) |
Cost of Services and Profitability to the Advisory Organization
The Board considered both the contractual and effective advisory fees for each of the Portfolios. They noted that 68% of the Portfolios, representing 85% of total Fund assets, had contractual advisory fees at or below the medians of their peer groups. The Board also considered advisory fees after the voluntary and contractual fee waivers and expense reimbursements provided by the Adviser for several of the Portfolios, noting that 81% of the Portfolios, representing 89% of total Fund assets, had effective advisory fees at or below the medians of their peer groups and that no Portfolio had effective advisory fees in the highest quartile of fees. In addition, the Board reviewed information prepared by MPI comparing each Portfolio’s overall expense ratio with the expense ratio of its peer group of funds. The Board also considered the profitability of the Adviser both overall and on a Portfolio-by-Portfolio basis.
The Board considered the allocations of the Adviser’s costs to the Portfolios. The internal audit department of the Adviser conducted a review of such allocations and reported to the Board regarding the reasonableness and consistency of these allocations. The Board was satisfied with the results of this review.
From its review of the MPI data and expense and profit information provided by the Adviser, the Board concluded that the profits earned by the Adviser from the Advisory Agreements were reasonable, particularly in light of the expense reimbursements and waivers in effect. On the basis of this information and review, the Board concluded that the advisory fees charged to the Portfolios for investment management services were reasonable.
With respect to fees paid to Subadvisers under the Subadvisory Agreements, the Directors considered that those contracts had been negotiated at arm’s length between the Adviser and each Subadviser and that the markup for additional services provided by the Adviser was reasonable. The Board also was informed of any separate arrangements for unrelated services between a Subadviser and the Adviser or its affiliates.
Economies of Scale and Breakpoints
The Directors considered whether economies of scale might be realized as a Portfolio’s assets increase. Because of differences between Portfolios as to management style and cost, it is difficult to generalize as to whether or to what extent economies in the advisory function may be realized as a Portfolio’s assets increase. Typically, expected economies of scale, where they exist, are shared through the use of fee breakpoints and/or fee waivers by the Adviser.
The Directors considered information provided by the Adviser related to the breakpoints in the Advisory Agreement and fee waivers provided by the Adviser. The Adviser explained that its general goal with respect to fee waivers, expense reimbursements and breakpoints was that the overall expense ratio for each Portfolio should be at or below the median expense ratio of its peer group. In connection with their review of fee breakpoints and economies of scale, the Directors noted that all of the Portfolios had net operating expenses at or below the medians of their peer groups. The Board also noted that while some Portfolios were increasing in assets and other were decreasing in assets, the Portfolios overall were not experiencing significant asset growth.
Based on the factors discussed above, the Contracts Committee unanimously recommended approval of the Advisory Agreement and the Subadvisory Agreements and the Board, including all of the Independent Directors voting separately, approved each of the agreements.
| 272 |
Board of Directors and Officers
The following table provides information about the Directors and Officers of the Funds. Each Director oversees each of 31 series of the Fund and also serves as:
• Trustee of Thrivent Mutual Funds, a registered investment company consisting of 29 series, which offer Class A, Class B, and Institutional Class shares.
• Trustee of Thrivent Financial Securities Lending Trust, a registered investment company consisting of one portfolio that serves as a cash collateral fund for a securities lending program sponsored by Thrivent Financial.
The 31 series of the Fund, 29 portfolios of Thrivent Mutual Funds, Inc., and Thrivent Financial Securities Lending Trust are referred to herein as the “Fund Complex.” The Statement of Additional Information includes additional information about the Directors and is available, without charge, by calling 1-800-847-4836.
Interested Director1
| Number of | ||||
| Position | Portfolios in | Principal | ||
| with Fund | Fund Complex | Occupation | Other | |
| Name, Address, | and Length | Overseen | During the | Directorships |
| and Age | of Service2 | by Director | Past 5 Years | Held by Director |
| Pamela J. Moret | President since 2002 | 61 | Executive Vice President, | Director, Minnesota |
| 625 Fourth Avenue South | and Director | Marketing and Products, | Public Radio; Director, | |
| Minneapolis, MN | since 2004 | Thrivent Financial | Luther Seminary | |
| Age 51 | since 2002 | |||
| Independent Directors3 | ||||
| Number of | ||||
| Position | Portfolios in | Principal | ||
| with Fund | Fund Complex | Occupation | Other | |
| Name, Address, | and Length | Overseen | During the | Directorships |
| and Age | of Service2 | by Director | Past 5 Years | Held by Director |
| F. Gregory Campbell | Director since 1992 | 61 | President, Carthage | Director, JohnsonFamily |
| 625 Fourth Avenue South | College | Funds, Inc., an investment | ||
| Minneapolis, MN | company consisting of | |||
| Age 68 | four portfolios; Director, | |||
| Kenosha Hospital and | ||||
| Medical Center Board; | ||||
| Prairie School Board; United | ||||
| Health Systems Board | ||||
| Herbert F. Eggerding, Jr. | Lead Director | 61 | Management consultant to | None |
| 625 Fourth Avenue South | since 2003 and | several privately | ||
| Minneapolis, MN | Director since 1990 | owned companies | ||
| Age 70 | ||||
| Noel K. Estenson | Director since 1997 | 61 | Retired | None |
| 625 Fourth Avenue South | ||||
| Minneapolis, MN | ||||
| Age 69 | ||||
| 273 |
| Board of Directors and Officers | ||||
| Independent Directors3 — continued | ||||
| Number of | ||||
| Position | Portfolios in | Principal | ||
| with Fund | Fund Complex | Occupation | Other | |
| Name, Address, | and Length | Overseen | During the | Directorships |
| and Age | of Service2 | by Director | Past 5 Years | Held by Director |
| Richard L. Gady | Director since 1987 | 61 | Retired; previously Vice | Director, International |
| 625 Fourth Avenue South | President, Public Affairs | Agricultural Marketing | ||
| Minneapolis, MN | and Chief Economist, | Association | ||
| Age 64 | ConAgra, Inc. (agribusiness) | |||
| Richard A. Hauser | Director since 2004 | 61 | Vice President and Assistant | Director, The Washington |
| 625 Fourth Avenue South | General Counsel, Boeing | Hospital Center | ||
| Minneapolis, MN | Company since 2007; | |||
| Age 64 | President, National Legal | |||
| Center for the Public | ||||
| Interest from 2004 to 2007; | ||||
| General Counsel, U.S. | ||||
| Department of Housing | ||||
| and Urban Development | ||||
| from 2001 to 2004; Partner, | ||||
| Baker & Hosteller from | ||||
| 1986 to 2001 | ||||
| Connie M. Levi | Director since 1993 | 61 | Retired | None |
| 625 Fourth Avenue South | ||||
| Minneapolis, MN | ||||
| Age 68 | ||||
| Douglas D. Sims | Director since 2006 | 61 | Retired; previously Chief | Director, Keystone |
| 625 Fourth Avenue South | Executive Officer of | Neighborhood Company; | ||
| Minneapolis, MN | CoBank from 1994 | Director, Center for | ||
| Age 61 | to 2006 | Corporate Excellence | ||
| Edward W. Smeds | Chairman and | 61 | Retired | Chairman, Carthage |
| 625 Fourth Avenue South | Director since 1999 | College Board | ||
| Minneapolis, MN | ||||
| Age 71 | ||||
| 274 |
| Board of Directors and Officers | ||||
| Independent Directors3 — continued | ||||
| Number of | ||||
| Position | Portfolios in | Principal | ||
| with Fund | Fund Complex | Occupation | Other | |
| Name, Address, | and Length | Overseen | During the | Directorships |
| and Age | of Service2 | by Director | Past 5 Years | Held by Director |
| Constance L. Souders | Director since 2007 | 61 | Retired, previously | None |
| 625 Fourth Avenue South | Director from 1983 to | |||
| Minneapolis, MN | 2007, Executive Vice | |||
| Age 57 | President from 2001 to | |||
| 2007, AML Compliance | ||||
| Officer from 2003 to 2007, | ||||
| Chief Financial Officer | ||||
| from 2000 to 2005, Chief | ||||
| Administrative Officer from | ||||
| 2000 to 2005 and Treasurer | ||||
| from 1992 to 2005 of | ||||
| Harbor Capital Advisors, | ||||
| Inc.; Director from 1992 to | ||||
| 2007, President from 2000 to | ||||
| 2007 and AML Compliance | ||||
| Officer from 2003 to 2007 | ||||
| of Harbor Services Group, | ||||
| Inc.; Director from 1992 | ||||
| to 2007, Executive Vice | ||||
| President from 2001 to 2007, | ||||
| Chief Compliance Officer | ||||
| from 2004 to 2007, AML | ||||
| Compliance Officer from | ||||
| 2003 to 2007, Supervisory | ||||
| Registered Principal from | ||||
| 2000 to 2007, Interim | ||||
| President from 2002 to | ||||
| 2003, Treasurer from 2000 | ||||
| to 2005 and Secretary from | ||||
| 2000 to 2005 of Harbor | ||||
| Funds Distributors, Inc.; Vice | ||||
| President from 2000 to 2007, | ||||
| Chief Financial Officer from | ||||
| 2000 to 2005 and Treasurer | ||||
| from 1992 to 2005 of | ||||
| Harbor Funds | ||||
| 275 |
| Board of Directors and Officers | ||
| Executive Officers | ||
| Position with Fund | ||
| Name, Address, | and Length | |
| and Age | of Service2 | Principal Occupation During the Past 5 Years |
| Pamela J. Moret | President since 2002 | Executive Vice President, Marketing and Products, Thrivent |
| 625 Fourth Avenue South | Financial since 2002 | |
| Minneapolis, MN | ||
| Age 51 | ||
| David S. Royal | Secretary and Chief | Vice President — Asset Management, Thrivent Financial |
| 625 Fourth Avenue South | Legal Officer since 2006 | since 2006; Partner, Kirkland & Ellis LLP from 2004 to 2006; |
| Minneapolis, MN | Associate, Skadden, Arps, Slate, Meagher & Flom LLP from | |
| Age 36 | 1997 to 2004 | |
| Katie S. Kloster | Vice President and | Vice President and Controller of Thrivent Financial from |
| 625 Fourth Avenue South | Investment Company and | 2001 to 2004 |
| Minneapolis, MN | Investment Adviser | |
| Age 42 | Chief Compliance Officer | |
| since 2004 | ||
| Gerard V. Vaillancourt | Treasurer and Principal | Vice President, Mutual Fund Accounting since 2006; Head of |
| 625 Fourth Avenue South | Accounting Officer | Mutual Fund Accounting, Thrivent Financial from 2005 to |
| Minneapolis, MN | since 2005 | 2006; Director, Fund Accounting Administration, Thrivent |
| Age 40 | Financial from 2002 to 2005 | |
| Russell W. Swansen | Vice President since 2004 | Senior Vice President and Chief Investment Officer, Thrivent |
| 625 Fourth Avenue South | Financial since 2004; Managing Director, Colonade Advisors, | |
| Minneapolis, MN | LLC from 2001 to 2003 | |
| Age 50 | ||
| Janice M. Guimond 625 | Vice President since 2005 | Vice President, Investment Operations, Thrivent Financial |
| Fourth Avenue South | since 2004; Manager of Portfolio Reporting, Thrivent Financial | |
| Minneapolis, MN | from 2003 to 2004; Independent Consultant 2001 to 2003 | |
| Age 43 | ||
| Karl D. Anderson | Vice President since 2006 | Vice President, Products, Thrivent Financial |
| Fourth Avenue South | ||
| Minneapolis, MN | ||
| Age 46 | ||
| Brian W. Picard | Vice President | Director, FSO Compliance Corp. BCM, Thrivent Financial |
| 4321 North Ballard Road | Anti-Money Laundering | since 2006; Manager, Field and Securities Compliance, |
| Appleton, WI | Officer since 2006 | Thrivent Financial from 2002 to 2006 |
| Age 37 | ||
| Kenneth L. Kirchner | Assistant Vice President | Director, Mutual Fund Operations, Thrivent Financial since |
| 4321 North Ballard Road | since 2004 | 2004; Manager, Shareholder Services, Thrivent Financial from |
| Appleton, WI | 2003 to 2004 | |
| Age 41 | ||
| 276 |
| Board of Directors and Officers | ||
| Executive Officers — continued | ||
| Position with Fund | ||
| Name, Address, | and Length | |
| and Age | of Service2 | Principal Occupation During the Past 5 Years |
| Mark D. Anema | Assistant Vice President | Vice President, Accumulation and Retirement Income |
| 625 Fourth Avenue South | since 2007 | Solutions, Thrivent Financial since 2007; Vice President, |
| Minneapolis, MN | Strategic Planning, Thrivent Financial from 2004 to 2007; | |
| Age 46 | Insurance Practice Engagement Manager, McKinsey and | |
| Company from 1999 to 2004 | ||
| James M. Odland | Assistant Secretary | Vice President, Office of the General Counsel, Thrivent |
| 625 Fourth Avenue South | since 2006 | Financial since 2005; Senior Securities Counsel, Allianz Life |
| Minneapolis, MN | Insurance Company from January 2005 to August 2005; | |
| Age 52 | Vice President and Chief Legal Officer, Woodbury Financial | |
| Services, Inc. from 2003 to 2005; Vice President and Group | ||
| Counsel, Corporate Practice Group, American Express | ||
| Financial Advisors, Inc. from 2001 to 2003 | ||
| John L. Sullivan | Assistant Secretary | Senior Counsel, Thrivent Financial since 2007; Senior |
| 625 Fourth Avenue South | since 2007 | Counsel, Division of Investment Management of the |
| Minneapolis, MN | SEC from 2000 to 2007 | |
| Age 37 | ||
| Todd J. Kelly | Assistant Treasurer | Director, Fund Accounting Operations, Thrivent Financial |
| 4321 North Ballard Road | since 1999 | |
| Appleton, WI | ||
| Age 38 | ||
| Sarah L. Bergstrom | Assistant Treasurer | Director, Fund Accounting Administration, Thrivent Financial |
| 625 Fourth Avenue South | since 2007 | since 2007; Manager, Fund Accounting Administration, |
| Minneapolis, MN | Thrivent Financial from 2005 to 2007; Manager, Mutual | |
| Age 30 | Fund Tax Reporting, Thrivent Financial from 2004 to 2005; | |
| Supervisor, Mutual Fund Tax Reporting, Thrivent Financial | ||
| from 2002 to 2004 | ||
1 “Interested person” of the Fund as defined in 1940 Act by virtue of positions with Thrivent Financial. Ms. Moret is considered an interested person because of her principal occupation with Thrivent Financial.
2 Each Director serves an indefinite term until her or his successor is duly elected and qualified. Officers serve at the discretion of the board until their successors are duly appointed and qualified.
3 The Directors other than Ms. Moret are not “interested persons” of the Fund and are referred to as “Independent Directors.”
| 277 |
Thrivent Series Fund, Inc.
Supplement to Prospectus dated May 1, 2007
With respect to Thrivent Income Portfolio
The “Portfolio Management” section of the prospectus is amended. The description under Thrivent Income Portfolio is deleted and replaced with the following:
Paul J. Ocenasek, CFA and Kent L. White, CFA serve as portfolio co-managers of Thrivent Income Portfolio.
Mr. Ocenasek has been with Thrivent since 1987 and has been a portfolio manager since 1997.
Mr. White has been with Thrivent since 1999. Before serving as portfolio co-manager, he was, since 2004, an Investment Grade Research Manager. Prior to that position, Mr. White was a Senior Investment Grade Research Analyst.
The date of this Supplement is February 29, 2008
Please include this Supplement with your Prospectus
| 278 |
Thrivent Series Fund, Inc.
Supplement to Prospectus dated May 1, 2007
With respect to Thrivent Diversified Income Plus Portfolio
The “Portfolio Management” section of the prospectus is amended. The description under Thrivent Diversified Income Plus Portfolio is deleted and replaced with the following:
Mark L. Simenstad, CFA, Kevin R. Brimmer, FSA, David R. Spangler, CFA and Stephen D. Lowe, CFA serve as portfolio co-managers of the Thrivent Diversified Income Plus Portfolio.
Mr. Simenstad is Vice President of Fixed Income Mutual Funds and Separate Accounts and has been with Thrivent Financial since 1997.
Mr. Brimmer has been a portfolio manager since 2002 and previously managed Thrivent Financial’s asset liability management department. He has been with Thrivent Financial since 1985.
Mr. Spangler has been a portfolio manager since 2007 and was previously the Director of Investment Product Management of Thrivent Financial from 2002 to 2006. In addition, Mr. Spangler was Vice President of Mutual Funds Products Development at Wells Fargo Funds Management, LLC from 2000 to 2002.
Mr. Lowe has been a senior portfolio manager of the high yield portion of Thrivent Financial’s general account since 2005. Prior to this position, he was, since 2004, a high yield research manager and, since 2002, an associate portfolio manager of the high yield portion of the general account. He has been with Thrivent Financial since 1997.
The date of this Supplement is February 29, 2008
Please include this Supplement with your Prospectus
| 279 |
This page intentionally left blank.
| 280 |
Item 2. Code of Ethics
As of the end of the period covered by this report, registrant has adopted a code of ethics (as defined in Item 2 of Form N-CSR) applicable to registrant’s Principal Executive Officer, Principal Financial Officer, and Principal Accounting Officer. No waivers were granted to such code of ethics during the period covered by this report. A copy of this code of ethics is filed as an exhibit to this Form N-CSR.
Item 3. Audit Committee Financial Expert
Registrant’s Board of Directors has determined that Herbert F. Eggerding, Jr., an independent director, is the Audit Committee Financial Expert.
Item 4. Principal Accountant Fees and Services
(a) Audit Fees
The aggregate fees billed by registrant’s independent public accountants, PricewaterhouseCoopers LLP (“PwC”), for each of the last two complete fiscal years and the fiscal period covered by this report for professional services rendered in connection with the audit of registrant’s annual financial statements or services that are normally provided by the accountant in connection with statutory and regulatory filings or engagements were $320,000 for the year ended December 31, 2006 and $481,087 for the year ended December 31, 2007.
(b) Audit-Related Fees
The aggregate fees PwC billed to registrant for each of the last two fiscal years for assurance and other services which are reasonably related to the performance of registrant’s audit and are not reported under Item 4(a) were $0 for the fiscal year ended December 31, 2006 and $0 for the fiscal year ended December 31, 2007. The aggregate fees PwC billed to registrant’s investment adviser and any entity controlling, controlled by, or under common control with registrant’s investment adviser for assurance and other services directly related to the operations and financial reporting of registrant were $0 for the year ended December 31, 2006 and $0 for the year ended December 31, 2007.
(c) Tax Fees
The aggregate tax fees PwC billed to registrant for each of the last two fiscal years for tax compliance, tax advice, and tax planning services were $92,110 for the year ended December 31, 2006 and $91,375 for the year ended December 31, 2007. The aggregate tax fees PwC billed to registrant’s investment adviser and any entity controlling, controlled by, or under common control with registrant’s investment adviser for services directly related to the operations and financial reporting of registrant were $0 for the year ended December 31, 2006 and $0 for the year ended December 31, 2007.
(d) All Other Fees
The aggregate fees PwC billed to registrant for each of the last two fiscal years for products and services provided other than the services reported in paragraphs (a) through (c) of this item were $0 for the year ended December 31, 2006 and $18,174 for the year ended December 31, 2007. The aggregate fees PwC billed to registrant’s
investment adviser and any entity controlling, controlled by, or under common control with registrant’s investment adviser for products and services provided other than the services reported in paragraphs (a) through (c) of this item were $0 for the year ended December 31, 2006 and $0 for the year ended December 31, 2007.
(e) Registrant’s audit committee charter, adopted in August 2004, provides that the audit committee (comprised of the independent directors of registrant) is responsible for pre-approval of all auditing services performed for the registrant. The audit committee reports to the Board of Directors (“Board”) regarding its approval of the engagement of the auditor and the proposed fees for the engagement, and the majority of the Board (including the members of the Board who are independent directors) must approve the auditor at an in-person meeting. The audit and compliance committee also is responsible for pre-approval (subject to the de minimis exceptions for non-audit services described in Section 10A(i)(1)(B) of the Securities Exchange Act of 1934, as amended) of all non-auditing services performed for the registrant or for any service affiliate of registrant. Registrant’s audit committee charter also permits a designated member of the audit committee to pre-approve, between meetings, one or more non-audit service projects, subject to ratification by the audit and compliance committee at the next meeting of the audit and compliance committee. Registrant’s audit committee pre-approved all fees described above which PwC billed to registrant.
(f) Less than 50% of the hours billed by PwC for auditing services to registrant for the fiscal year ended December 31, 2007, were for work performed by persons other than full-time, permanent employees of PwC.
(g) The aggregate non-audit fees billed by PwC to registrant and to registrant’s investment adviser and any entity controlling, controlled by, or under common control with registrant’s investment adviser for the fiscal years ending December 31, 2006 and December 31, 2007 were $6,500 and $1,582, respectively.
(h) Registrant’s audit committee has considered the non-audit services provided to the registrant and registrant’s investment adviser and any entity controlling, controlled by, or under common control with registrant’s investment adviser as described above and determined that these services do not compromise PwC’s independence.
Item 5. Audit Committee of Listed Registrants
Not applicable.
Item 6. Schedule of Investments
Registrant’s Schedule of Investments is included in the report to shareholders filed under Item 1.
Item 7. Disclosure of Proxy Voting Policies and Procedures for Closed-End Management Investment Companies
Not applicable.
Item 8. Purchases of Equity Securities by Closed-End Management Investment Company and Affiliated Purchasers.
Not applicable.
Item 9. Submission of Matters to a Vote of Security Holders
There have been no material changes to the procedures by which shareholders may recommend nominees to registrant’s board of trustees.
Item 10. Controls and Procedures
(a)(i) Registrant’s President and Treasurer have concluded that registrant’s disclosure controls and procedures (as defined in Rule 30a-3(c) under the Investment Company Act) are effective, based on their evaluation of these controls and procedures as of a date within 90 days of the filing date of this report.
(a)(ii) Registrant’s President and Treasurer are aware of no change in registrant’s internal control over financial reporting (as defined in Rule 30a-3(d) under the Investment Company Act) that occurred during registrant’s most recent fiscal quarter that has materially affected, or is reasonably likely to materially affect, registrant’s internal control over financial reporting.
Item 11. Exhibits
(a) The code of ethics pursuant to Item 2 is attached hereto.
(b) Certifications pursuant to Rules 30a-2(a) and 30a-2(b) under the Investment Company Act of 1940 are attached hereto.
SIGNATURES
Pursuant to the requirements of the Securities Exchange Act of 1934 and the Investment Company Act of 1940, the registrant has duly caused this report to be signed on its behalf by the undersigned, thereunto duly authorized.
| Date: February 28, 2008 | THRIVENT SERIES FUND, INC. | ||
| By: | /s/ Pamela J. Moret | ||
| Pamela J. Moret | |||
| President | |||
Pursuant to the requirements of the Securities Exchange Act of 1934 and the Investment Company Act of 1940, this report has been signed below by the following persons on behalf of the registrant and in the capacities and on the dates indicated.
| Date: February 28, 2008 | By: | /s/ Pamela J. Moret | |
| Pamela J. Moret | |||
| President | |||
| Date: February 28, 2008 | By: | /s/ Gerard V. Vaillancourt | |
| Gerard V. Vaillancourt | |||
| Treasurer | |||