Table of Contents
UNITED STATES
SECURITIES AND EXCHANGE COMMISSION
Washington, D.C. 20549
FORM N-CSR
CERTIFIED SHAREHOLDER REPORT OF REGISTERED MANAGEMENT INVESTMENT COMPANIES
Investment Company Act file number: 811-4603
Thrivent Series Fund, Inc.
(Exact name of registrant as specified in charter)
625 Fourth Avenue South
Minneapolis, Minnesota 55415
(Address of principal executive offices) (Zip code)
John L. Sullivan
625 Fourth Avenue South
Minneapolis, Minnesota 55415
(Name and address of agent for service)
Registrant’s telephone number, including area code: (612) 844-5704
Date of fiscal year end: December 31
Date of reporting period: December 31, 2008
Table of Contents
| Item 1. | Report to Stockholders |
Table of Contents

Thrivent Financial for Lutherans*
Thrivent Series Fund, Inc.
Annual Report
December 31, 2008
Go Paperless.
Sign into MyThrivent at Thrivent.com. Enroll in eDelivery and you can receive this document electronically.
23572AR R2-09
Thrivent.com
Table of Contents
| 2 | ||
Portfolio Perspectives | ||
| 4 | ||
| 6 | ||
| 8 | ||
| 10 | ||
| 12 | ||
| 14 | ||
| 16 | ||
| 18 | ||
| 20 | ||
| 22 | ||
| 24 | ||
| 26 | ||
| 28 | ||
| 30 | ||
| 32 | ||
| 34 | ||
| 36 | ||
| 38 | ||
| 40 | ||
| 42 | ||
| 44 | ||
| 46 | ||
| 48 | ||
| 50 | ||
| 52 | ||
| 54 | ||
| 56 | ||
| 58 | ||
| 60 | ||
| 62 | ||
| 64 | ||
| 66 | ||
| 68 | ||
| 70 | ||
| 72 | ||
| 74 | ||
| 76 | ||
| 78 | ||
| 80 | ||
| 82 | ||
| 84 | ||
| 86 | ||
| 90 | ||
Schedules of Investments | ||
| 91 | ||
| 93 | ||
| 95 | ||
| 97 | ||
| 99 | ||
| 101 | ||
| 103 | ||
| 106 | ||
| 109 | ||
| 112 | ||
| 115 | ||
| 118 | ||
| 121 | ||
| 125 | ||
| 132 | ||
| 134 | ||
| 137 | ||
| 140 | ||
| 143 | ||
| 148 | ||
| 155 | ||
| 159 | ||
| 161 | ||
| 163 | ||
| 165 | ||
| 168 | ||
| 170 | ||
| 173 | ||
| 176 | ||
| 179 | ||
| 182 | ||
| 188 | ||
| 192 | ||
| 203 | ||
| 210 | ||
| 220 | ||
| 223 | ||
| 231 | ||
| 238 | ||
| 247 | ||
| 250 | ||
| 254 | ||
| 262 | ||
| 270 | ||
| 283 | ||
| 300 | ||
| 314 | ||
| 317 | ||
| 322 | ||
Table of Contents

Economic and Market Review
Stocks and most types of bonds generally posted negative returns during the 12 months ended December 31, 2008. Credit market troubles that started in sub-prime mortgages in 2007 spread far and wide during the year, culminating in a global liquidity crisis that affected many of the world’s investment markets. This led to major policy adjustments by central bankers around the globe as they attempted to facilitate the availability of credit and liquidity to the markets. Over the period, the U.S. Federal Reserve lowered targeted short-term rates by more than 4 percentage points to virtually zero as heightened risks in both the real economy and the financial markets became apparent.
U.S. Economy
The current recession has turned into one of the longest economic downturns in post-war history. Although the nation’s Gross Domestic Product (GDP) grew modestly during the first half of the year, it deteriorated at a rapid clip late in the year as the worsening credit crunch, declining housing and investment values, rising unemployment and somber economic news weighed on consumer and business spending. GDP growth increased 0.9% in the first quarter and rose 2.8% in the second quarter after the tax rebates arguably provided a boost to consumer spending. The economy contracted -0.5% in the third quarter and declined at a rate of -3.8% in the fourth quarter.1
The prospects for the U.S. housing market remain grim. The housing sector continues to be hurt by falling prices due to the massive amount of excess supply, rising mortgage delinquencies and record levels of foreclosures. On the positive side, government efforts to drive mortgage rates lower appear to be working. Conventional mortgage rates have plunged over the past two months to the lowest level since 1971; however, rates on jumbo loans have not come down as much. Sales of existing homes nationwide fell 8.6% to 4.49 million units annually in November 2008 from 4.91 million units in October, and were 10.6% below the 5.02 million unit pace of November 2007.2
Besides the hit to household wealth from the unprecedented decline in home values and equity prices, consumers have been restrained by the large continued reductions in payrolls. In December, the number of unemployed persons increased by 632,000 to 11.1 million and the unemployment rate rose to 7.2%. From December 2007 through the end of 2008, the ranks of unemployed grew by 3.6 million and the unemployment rate rose by 2.3 percentage points.3
Inflation & Monetary Policy
Inflation eased markedly in the second half of 2008, arguably preventing the downturn in economic growth from being even greater. Much of the deceleration resulted from the extraordinary collapse in energy prices since early summer. The Consumer Price Index (CPI) rose at a 0.1% annual rate for the 12 months ended December 31, 2008, compared with a 4.1% rate for all of 2007. The index for energy, which rose 17.4% in 2007, declined at a 21.3% annual rate during the 12-month period. Excluding the volatile prices of food and energy, the core CPI advanced at a 1.8% annual rate during the period, compared to a 2.4% increase for all of 2007.
The prospects for an economic recovery depend, in part, on the relative success or failure of ongoing and prospective stimulus applied by the government. The Federal Open Market Committee (FOMC) slashed the federal funds target rate to virtually zero during the year and has taken additional steps to unfreeze capital markets.
Equity Performance
Stock prices pulled back sharply for much of 2008—for some indexes to five-year lows in October 2008—due to worries about troubles in the credit, housing, job and consumer markets and the growing potential for a severe recession.
Small-company stocks outperformed large-company issues during the period. The Russell 2000® Index of small-company stocks posted a -33.79% total return, while the S&P 500 Index of large-company stocks recorded a -36.99% return. Value stocks modestly outperformed growth stocks during the period. The Russell 1000® Value Index returned -36.85%, while the Russell 1000® Growth Index posted a return of -38.44%.
Major market foreign stocks underperformed most domestic issues in dollar terms. The Morgan Stanley Capital International Europe, Australasia, Far East (EAFE) Index posted a -43.06% total return in dollar terms.
Fixed Income Performance
The worsening credit crisis hurt all areas of the bond market except U.S. Treasury and government agency securities during the period. An investor flight to safety pushed U.S. Treasury bond prices up, driving Treasury yields down. Mortgage- and asset-backed bonds, high-yield bonds, bank loans and corporate bonds all suffered price declines as liquidity drained out of the market and the outlook for the economy worsened. Late in the period, the situation
2
Table of Contents
intensified with the failure and subsequent federal takeover or forced sale of a number of large financial institutions. Fannie Mae, Freddie Mac, Lehman Brothers, Washington Mutual, Wachovia, Merrill Lynch and AIG all were casualties of the crisis that overtook the financial industry.
The yield curve steepened during the period as yields on shorter-maturity Treasuries (or Treasury securities) fell more than yields of longer-dated bonds. The six-month Treasury yield fell from 3.49% to 0.27%, the five-year yield declined from 3.45% to 1.55%, the 10-year yield fell from 4.04% to 2.25%, and the 30-year Treasury yield declined from 4.45% to 2.69%.
The Barclays Capital (formerly Lehman Brothers) Aggregate Bond Index of the broad U.S. bond market posted a 5.24% total return for the 12-month period, while the Barclays Capital Government/Corporate 1-3 Year Bond Index registered a 4.97% total return. Below-investment-grade corporate bonds were among the weakest performers, with the Barclays Capital U.S. Corporate High Yield Bond Index registering a -26.16% total return.
Outlook
Economic activity will likely remain sluggish at least until mid-2009. Eventually, the unprecedented amount of government stimulus in the system—in the form of low interest rates and other liquidity programs—should begin to spur faster growth. Until then, the Federal Reserve will likely keep short-term interest rates low.
The mortgage crisis that started in 2007 has spread from the consumer through the banking system and has impacted the broader economy. Rapidly increasing unemployment, very weak consumer spending, and business spending cutbacks are now the primary risks to the economy. The support from exports that U.S. corporations have enjoyed is also now in jeopardy as global growth slows and the U.S. dollar strengthens. Helping to offset these risks somewhat, the U.S. and foreign governments around the world have initiated financial-system rescue plans that may begin to show signs of returning some liquidity to the credit markets.
On a Personal Note
My colleague, Pam Moret, has recently taken on a new role at Thrivent Financial and will no longer serve as the President of Thrivent Series Fund, Inc. I, along with all of us at Thrivent Series Fund, Inc., want to thank Pam for her years of dedicated service to our members. Her tenure saw tremendous improvement in investment performance, innovative product design and lower expenses for our shareholders. Her leadership and integrity set a standard for the position. It’s a standard I will work to build upon as I assume the position of President of Thrivent Series Fund, Inc., in addition to maintaining my current role as Chief Investment Officer of Thrivent Financial.
I look forward to using this forum in future publications to share thoughts and insight on the markets and investment strategies, along with updates on your Thrivent mutual funds. Until then, thank you for continuing to turn to us for your financial options.
| Sincerely, |
 |
| Russell W. Swansen |
| President and Chief Investment Officer |
| Thrivent Series Fund, Inc. |
1 | U.S. Department of Commerce, Bureau of Economic Analysis |
2 | National Association of Realtors |
3 | U.S. Department of Labor, Bureau of Labor Statistics |
Investing in a variable product involves risks, including the possible loss of principal. The prospectus contains more complete information on the investment objectives, risks, charges and expenses of the investment company, which investors should read and consider carefully before investing. To obtain a prospectus, contact a registered representative of visit www.thrivent.com.
3
Table of Contents
The Portfolio’s performance depends upon how its assets are allocated across broad asset categories and applicable sub-classes within such categories. Some broad asset categories and sub-classes may perform below expectations or below the securities markets generally over short or extended periods. In particular, underperformance in the equity markets would have material adverse effect on the Portfolio’s total return given its significant allocation to equity securities. Therefore, a principal risk of investing in the Portfolio is that the allocation strategies used, and the allocation decisions made will not produce the desired results. In addition, the performance of the Portfolio is heavily dependent upon the performance of the underlying portfolios in which the Portfolio invests. As a result, the Portfolio is subject to the same risks as those faced by the underlying portfolios. These and other risks are described in the Portfolio’s prospectus.
How did the Portfolio perform during the 12-month period ended December 31, 2008?
Thrivent Aggressive Allocation Portfolio earned a return of -37.23%, as compared to the median return for its peer group, the Lipper Multi Cap Core category, of -38.54%. The Portfolio’s market benchmarks, the S&P 500 Index and the Barclays Capital (formerly Lehman Brothers) Aggregate Bond Index, earned returns of -36.99% and 5.24%, respectively.
What factors affected the Portfolio’s performance?
Equity indexes and non-government debt markets fell across the globe over the course of the fiscal year as the events that began in the housing and sub-prime debt markets cascaded across the financial industry, ultimately creating a credit crisis unlike anything seen in the modern era of finance.
U.S. equity indexes generally performed better than non-U.S. equities. On domestic exchanges, small-cap stocks outperformed large-cap stocks over the full year.
The Portfolio’s return was modestly below that of the S&P 500 Index. The Portfolio had broad exposure across most of the major equity asset classes and a moderate allocation to fixed income. We did not own any Treasury obligations in the fixed-income segment of the account, but instead owned portfolios with exposure to both high-yield and investment grade credits, segments which underperformed the benchmark fixed-income Index. In the equity segment, we underweighted relative to our target for international exposure, as we felt the dollar was underpriced versus the euro and British pound. For much of the period, we were also underweighted in our strategic allocation target for real estate investment trusts (REITs). Both of these factors mitigated the Portfolio’s decline versus our strategic allocation.
What is your outlook?
Significant risks remain for both the real economy and the financial markets. Policymakers are operating in uncharted waters in terms of both fiscal and monetary policy. We believe that the steps that have been taken
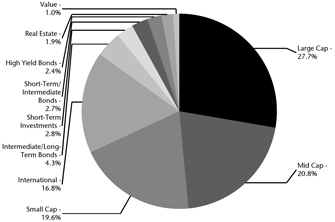
Portfolio Composition
(% of Portfolio)
Top 10 Holdings
(% of Net Assets)
Thrivent Partner International Stock Portfolio | 16.2 | % | |
Thrivent Mid Cap Stock Portfolio | 10.7 | % | |
Thrivent Large Cap Growth Portfolio II | 10.6 | % | |
Thrivent Small Cap Stock Portfolio | 9.5 | % | |
Thrivent Large Cap Value Portfolio | 9.1 | % | |
Thrivent Large Cap Stock Portfolio | 7.9 | % | |
Thrivent Partner Small Cap Growth Portfolio | 7.2 | % | |
Thrivent Mid Cap Growth Portfolio II | 6.4 | % | |
Thrivent Income Portfolio | 4.2 | % | |
Thrivent Partner Mid Cap Value Portfolio | 3.7 | % |
The shares of these Funds represent 85.5% of the total net assets of the portfolio.
Quoted Portfolio Composition and Top 10 Holdings are subject to change.
The list of Top 10 Holdings excludes short-term investments.
4
Table of Contents
will be successful but that volatility will remain at elevated levels and the economic recovery will unfold slowly, most likely not until the second half of 2009. Under this scenario, we believe there is a reasonable chance the cyclical bottom in equity prices did occur around levels seen in late November 2008. We are generally positioned at our long-term strategic allocations, which would suggest a moderately bullish stance for risk assets. We expect the markets to retest those levels over the course of 2009 but that we should not exceed them by a meaningful margin.
Portfolio Facts
As of December 31, 2008
Net Assets | $354,309,920 | |
NAV | $8.51 | |
NAV - High† | 1/2/2008 - $13.94 | |
NAV - Low† | 11/20/2008 - $6.94 | |
Number of Holdings: 18 |
| † | For the year ended December 31, 2008 |
Average Annual Total Returns1
As of December 31, 2008
1-Year | From Inception 4/29/2005 | ||
(37.23%) | (3.02 | %) |
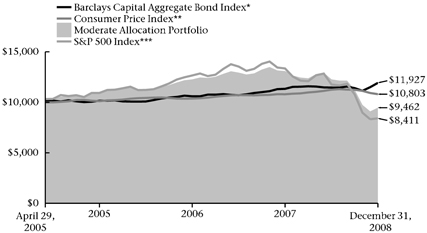
Value of a $10,000 Investment1
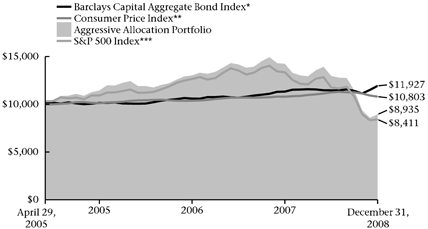
| * | The Barclays Capital Aggregate Bond Index is an index that measures the performance of U. S. investment grade bonds. It is not possible to invest directly in the Index. The performance of the Index does not reflect deductions for fees, expenses or taxes. |
| ** | The Consumer Price Index is an inflationary indicator that measures the change in the cost of a fixed basket of products and services, including housing, electricity, food and transportation. It is not possible to invest directly in the Index. |
*** | The S&P 500 Index is an index that represents the average performance of a group of 500 widely held, publicly traded stocks. It is not possible to invest directly in the Index. The performance of the Index does not reflect deductions for fees, expenses or taxes. “S&P 500®” is a trademark of The McGraw-Hill Companies, Inc. and has been licensed for use by Thrivent Financial for Lutherans. The product is not speonseored, endorsed or promoted by Standard & Poor’s, and Standard & Poor’s makes no representation regarding the advisability of investing in the product. |
Past performance is not an indication of future results. Total investment return and principal value will fluctuate and units, when redeemed, may be worth more or less than their original cost. Current performance may be higher or lower than the performance data quoted. Market volatility can significantly affect short-term performance, and more recent returns may be different from those shown. Call 800-THRIVENT or visit www.thrivent.com for performance results current to the most recent month-end.
1 | Annualized total returns represent past performance and reflect changes in share prices, the reinvestment of all dividends and capital gains, and the effects of compounding. Periods of less than one year are not annualized. At various times, the Portfolio’s adviser reimbursed and/or paid non-advisory Portfolio expenses. Had the adviser not done so, the Portfolio’s total returns would have been lower. The returns shown do not reflect charges and expenses imposed on contract holders by the variable accounts. Those charges and expenses reduce the returns received by contract holders as compared to the returns presented. |
Investing in a variable product involves risks, including the possible loss of principal. The prospectus contains more complete information on the investment objectives, risks, charges and expenses of the investment company, which investors should read and consider carefully before investing. To obtain a prospectus, contact a registered representative or visit www.thrivent.com.
5
Table of Contents
| Thrivent Moderately Aggressive Allocation Portfolio |  |  | |||
| Russell W. Swansen, David C. Francis, CFA, and Mark L. Simenstad, CFA, Portfolio Co-Managers |
Thrivent Moderately Aggressive Allocation Portfolio seeks long-term capital growth by implementing an asset allocation strategy. The Portfolio’s performance depends upon how its assets are allocated across broad asset categories and applicable sub-classes within such categories. Some broad asset categories and sub-classes may perform below expectations or below the securities markets generally over short or extended periods. In particular, underperformance in the equity markets would have material adverse effect on the Portfolio’s total return given its significant allocation to equity securities. Therefore, a principal risk of investing in the Portfolio is that the allocation strategies used, and the allocation decisions made will not produce the desired results. In addition, the performance of the Portfolio is heavily dependent upon the performance of the underlying portfolios in which the Portfolio invests. As a result, the Portfolio is subject to the same risks as those faced by the underlying portfolios. These and other risks are described in the Portfolio’s prospectus.
How did the Portfolio perform during the 12 -month period ended December 31, 2008?
Thrivent Moderately Aggressive Allocation Portfolio earned a return of -33.40%, as compared to the median return for its peer group, the Lipper Mixed Asset Target Allocation Growth category, of -30.92%. The Portfolio’s market benchmarks, the S&P 500 Index and the Barclays Capital (formerly Lehman Brothers) Aggregate Bond Index, earned returns of -36.99% and 5.24%, respectively.
What factors affected the Portfolio’s performance?
Equity indexes and non-government debt markets fell across the globe over the course of the fiscal year as the events that began in the housing and sub-prime debt markets cascaded across the financial industry, ultimately creating a credit crisis unlike anything seen in the modern era of finance. U.S. equity indexes generally performed better than non-U.S. equities. On domestic exchanges, small-cap stocks outperformed large-cap stocks over the full year.
The Portfolio had broad exposure across most of the major equity asset classes and a moderate allocation to fixed income. We did not own any Treasury obligations in the fixed-income segment of the account, but instead owned portfolios with exposure to both high-yield and investment grade credits, segments which underperformed the benchmark fixed-income Index. In the equity segment, we underweighted relative to our target for international exposure, as we felt the dollar was underpriced versus the euro and British pound. For much of the period, we were also underweighted in our strategic allocation target for real estate investment trusts (REITs). Both of these factors mitigated the Portfolio’s decline versus our strategic allocation.
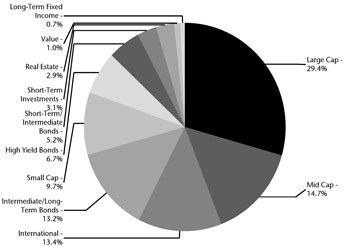
Portfolio Composition
(% of Portfolio)
Top 10 Holdings
(% of Net Assets)
Thrivent Income Portfolio | 13.1 | % | |
Thrivent Large Cap Value Portfolio | 11.8 | % | |
Thrivent Partner International Stock Portfolio | 11.4 | % | |
Thrivent Large Cap Stock Portfolio | 9.1 | % | |
Thrivent Mid Cap Stock Portfolio | 9.0 | % | |
Thrivent Large Cap Growth Portfolio II | 8.5 | % | |
Thrivent High Yield Portfolio | 6.7 | % | |
Thrivent Limited Maturity Bond Portfolio | 5.2 | % | |
Thrivent Small Cap Stock Portfolio | 4.4 | % | |
Thrivent Partner Mid Cap Value Portfolio | 3.4 | % |
The shares of these Funds represent 82.6% of the total net assets of the portfolio.
Quoted Portfolio Composition and Top 10 Holdings are subject to change.
The list of Top 10 Holdings excludes short-term investments.
6
Table of Contents
What is your outlook?
Significant risks remain for both the real economy and the financial markets. Policymakers are operating in uncharted waters in terms of both fiscal and monetary policy. We believe that the steps that have been taken will be successful but that volatility will remain at elevated levels and the economic recovery will unfold slowly, most likely not until the second half of 2009.
Under this scenario, we believe there is a reasonable chance the cyclical bottom in equity prices did occur around levels seen in late November 2008. We are generally positioned at our long-term strategic allocations, which would suggest a moderately bullish stance for risk assets. We expect the markets to retest those levels over the course of 2009 but that we should not exceed them by a meaningful margin.
Portfolio Facts
As of December 31, 2008
Net Assets | $1,354,565,116 | |
NAV | $8.64 | |
NAV - High† | 5/16/2008 - $13.39 | |
NAV - Low† | 11/20/2008 - $7.22 | |
Number of Holdings: 28 |
| † | For the year ended December 31, 2008 |
Average Annual Total Returns1
As of December 31, 2008
1-Year | From Inception 4/29/2005 | ||
(33.40%) | (2.52 | %) |
Value of a $10,000 Investment1
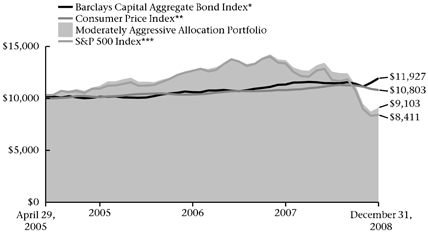
| * | The Barclays Captial Aggregate Bond Index is an index that measures the performance of U.S. investment grade bonds. It is not possible to invest directly in the Index. The performance of the Index does not reflect deductions for fees, expenses or taxes. |
| ** | The Consumer Price Index is an inflationary indicator that measures the change in the cost of a fixed basket of products and services, including housing, electricity, food and transportation. It is not possible to invest directly in the Index. |
*** | The S&P 500 Index is an index that represents the average performance of a group of 500 widely held, publicly traded stocks. It is not possible to invest directly in the Index. The performance of the Index does not reflect deductions for fees, expenses or taxes. “S&P 500®” is a trademark of The McGraw-Hill Companies , Inc. and has been licensed for use by Thrivent Financial for Lutherans. The product is not speonseored, endorsed or promoted by Standard & Poor’s, and Standard & Poor’s makes no representation regarding the advisability of investing in the product. |
Past performance is not an indication of future results. Total investment return and principal value will fluctuate and units, when redeemed, may be worth more or less than their original cost. Current performance may be higher or lower than the performance data quoted. Market volatility can significantly affect short-term performance, and more recent returns may be different from those shown. Call 800-THRIVENT or visit www.thrivent.com for performance results current to the most recent month-end.
1 | Annualized total returns represent past performance and reflect changes in share prices, the reinvestment of all dividends and capital gains, and the effects of compounding. Periods of less than one year are not annualized. At various times, the Portfolio’s adviser reimbursed and/or paid non-advisory Portfolio expenses. Had the adviser not done so, the Portfolio’s total returns would have been lower. The returns shown do not reflect charges and expenses imposed on contract holders by the variable accounts. Those charges and expenses reduce the returns received by contract holders as compared to the returns presented. |
Investing in a variable product involves risks, including the possible loss of principal. The prospectus contains more complete information on the investment objectives, risks, charges and expenses of the investment company, which investors should read and consider carefully before investing. To obtain a prospectus, contact a registered representative or visit www.thrivent.com.
7
Table of Contents
The Portfolio’s performance depends upon how its assets are allocated across broad asset categories and applicable sub-classes within such categories. Some broad asset categories and sub-classes may perform below expectations or below the securities markets generally over short or extended periods. In particular, underperformance in the equity markets would have material adverse effect on the Portfolio’s total return given its significant allocation to equity securities. Therefore, a principal risk of investing in the Portfolio is that the allocation strategies used, and the allocation decisions made will not produce the desired results. In addition, the performance of the Portfolio is heavily dependent upon the performance of the underlying portfolios in which the Portfolio invests. As a result, the Portfolio is subject to the same risks as those faced by the underlying portfolios. These and other risks are described in the Portfolio’s prospectus.
How did the Portfolio perform during the 12-month period ended December 31, 2008?
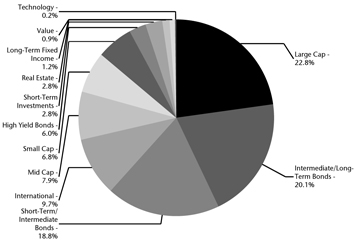
Thrivent Moderate Allocation Portfolio earned a return of -27.74%, as compared to the median return for its peer group, the Lipper Mixed Asset Target Allocation Moderate category, of -25.08%. The Portfolio’s market benchmarks, the S&P 500 Index and the Barclays Capital (formerly Lehman Brothers) Aggregate Bond Index, earned returns of -36.99% and 5.24%, respectively.
What factors affected the Portfolio’s performance?
Equity indexes and non-government debt markets fell across the globe over the course of the fiscal year as the events that began in the housing and sub-prime debt markets cascaded across the financial industry, ultimately creating a credit crisis unlike anything seen in the modern era of finance.
U.S. equity indexes generally performed better than non-U.S. equities. On domestic exchanges, small-cap stocks outperformed large-cap stocks over the full year.
The Portfolio had broad exposure across most of the major equity asset classes and a moderate allocation to fixed income. We did not own any Treasury obligations in the fixed-income segment of the account, but instead owned portfolios with exposure to both high yield and investment grade credits, segments which underperformed the benchmark fixed-income Index. In the equity segment, we under weighted relative to our target for international exposure, as we felt the dollar was underpriced versus the euro and British pound. For much of the period, we were also underweighted in our strategic allocation target for real estate investment trusts (REITs). Both of these factors mitigated the Portfolio’s decline versus our strategic allocation. Performance of the underlying Portfolios versus each of their respective benchmarks was mixed in the equity segment of the account and largely neutral for the year.
What is your outlook?
Significant risks remain for both the real economy and the financial markets. Policymakers are operating in uncharted waters in terms of both fiscal and monetary
Portfolio Composition
(% of Portfolio)
Top 10 Holdings
(% of Net Assets)
Thrivent Income Portfolio | 20.0 | % | |
Thrivent Limited Maturity Bond Portfolio | 18.6 | % | |
Thrivent Large Cap Value Portfolio | 10.4 | % | |
Thrivent Partner International Stock Portfolio | 7.9 | % | |
Thrivent Large Cap Growth Portfolio II | 6.2 | % | |
Thrivent Large Cap Stock Portfolio | 6.1 | % | |
Thrivent High Yield Portfolio | 6.0 | % | |
Thrivent Mid Cap Stock Portfolio | 5.2 | % | |
Thrivent Real Estate Securities Portfolio | 2.7 | % | |
Thrivent Partner Small Cap Value Portfolio | 2.6 | % |
The shares of these Funds represent 85.7% of the total net assets of the portfolio.
Quoted Portfolio Composition and Top 10 Holdings are subject to change.
The list of Top 10 Holdings excludes short-term investments.
8
Table of Contents
policy. We believe that the steps that have been taken will be successful but that volatility will remain at elevated levels and the economic recovery will unfold slowly, most likely not until the second half of 2009. Under this scenario, we believe there is a reasonable chance the cyclical bottom in equity prices did occur around levels seen in late November 2008. We are
generally positioned at our long-term strategic allocations, which would suggest a moderately bullish stance for risk assets, both in the fixed-income and equity markets. We expect the markets to retest those levels over the course of 2009 but that we should not exceed them by a meaningful margin.
Portfolio Facts
As of December 31, 2008
Net Assets | $1,811,558,413 | |
NAV | $8.92 | |
NAV - High† | 5/16/2008 - $12.79 | |
NAV - Low† | 11/20/2008 - $7.72 | |
Number of Holdings: 29 |
| † | For the year ended December 31, 2008 |
Average Annual Total Returns1
As of December 31, 2008
1-Year | From Inception 4/29/2005 | ||
(27.74%) | (1.49 | %) |
Value of a $10,000 Investment1
| * | The Barclays Capital Aggregate Bond Index is an index that measures the performance of U.S. investment grade bonds. It is not possible to invest directly in the Index. The performance of the Index does not reflect deductions for fees, expenses or taxes. |
| ** | The Consumer Price Index is an inflationary indicator that measures the change in the cost of a fixed basket of products and services, including housing, electricity, food and transportation. It is not possible to invest directly in the Index. |
*** | The S&P 500 Index is an index that represents the average performance of a group of 500 widely held, publicly traded stocks. It is not possible to invest directly in the Index. The performance of the Index does not reflect deductions for fees, expenses or taxes. “S&P 500®” is a trademark of The McGraw-Hill Companies, Inc. and has been licensed for use by Thrivent Financial for Lutherans. The product is not speonseored, endorsed or promoted by Standard & Poor’s, and Standard & Poor’s makes no representation regarding the advisability of investing in the product. |
Past performance is not an indication of future results. Total investment return and principal value will fluctuate and
units, when redeemed, may be worth more or less than their original cost. Current performance may be higher or lower
than the performance data quoted. Market volatility can significantly affect short-term performance, and more recent
returns may be different from those shown. Call 800-THRIVENT or visit www.thrivent.com for performance results
current to the most recent month-end.
1 | Annualized total returns represent past performance and reflect changes in share prices, the reinvestment of all dividends and capital gains, and the effects of compounding. Periods of less than one year are not annualized. At various times, the Portfolio’s adviser reimbursed and/or paid non-advisory Portfolio expenses. Had the adviser not done so, the Portfolio’s total returns would have been lower. The returns shown do not reflect charges and expenses imposed on contract holders by the variable accounts. Those charges and expenses reduce the returns received by contract holders as compared to the returns presented. |
Investing in a variable product involves risks, including the possible loss of principal. The prospectus contains more
complete information on the investment objectives, risks, charges and expenses of the investment company, which
investors should read and consider carefully before investing. To obtain a prospectus, contact a registered representative
or visit www.thrivent.com.
9
Table of Contents
| Thrivent Moderately Conservative Allocation Portfolio | | ||
| Russell W. Swansen, David C. Francis, CFA, and Mark L. Simenstad, CFA, Portfolio Co-Managers |
Thrivent Moderately Conservative Allocation Portfolio seeks long-term capital growth while providing reasonable stability of principal by implementing an asset allocation strategy. The Portfolio’s performance depends upon how its assets are allocated across broad asset categories and applicable sub-classes within such categories. Some broad asset categories and sub-classes may perform below expectations or below the securities markets generally over short or extended periods. In particular, underperformance in the equity markets would have material adverse effect on the Portfolio’s total return given its significant allocation to equity securities. Therefore, a principal risk of investing in the Portfolio is that the allocation strategies used, and the allocation decisions made will not produce the desired results. In addition, the performance of the Portfolio is heavily dependent upon the performance of the underlying portfolios in which the Portfolio invests. As a result, the Portfolio is subject to the same risks as those faced by the underlying portfolios. These and other risks are described in the Portfolio’s prospectus.
How did the Portfolio perform during the 12-month period ended December 31, 2008?
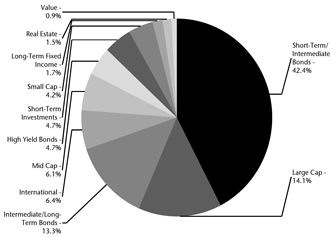
Thrivent Moderately Conservative Allocation Portfolio earned a return of -20.61%, as compared to the median return for its peer group, the Lipper Mixed Asset Target Allocation Conservative category, of -18.02%. The Portfolio’s market benchmarks, the S&P 500 Index and the Barclays Capital (formerly Lehman Brothers) Aggregate Bond Index, earned returns of -36.99% and 5.24%, respectively.
What factors affected the Portfolio’s performance?
Equity indexes and non-government debt markets fell across the globe over the course of the fiscal year as the events that began in the housing and sub-prime debt markets cascaded across the financial industry, ultimately creating a credit crisis unlike anything seen in the modern era of finance.
U.S. equity indexes generally performed better than non-U.S. equities. On domestic exchanges, small-cap stocks outperformed large-cap stocks over the full year.
The Portfolio had broad exposure across most of the major equity asset classes and a moderate allocation to fixed income. We did not own any Treasury obligations in the fixed-income segment of the account, but instead owned portfolios with exposure to both high-yield and investment grade credits, segments which underperformed the benchmark fixed-income Index. In the equity segment, we underweighted relative to our target for international exposure, as we felt the dollar was underpriced versus the euro and British pound. For much of the period, we were also underweighted in our strategic allocation target for real estate investment trusts (REITs). Both of these factors mitigated the Portfolio’s decline versus our strategic allocation. Performance of the underlying Portfolios versus each of their respective benchmarks was mixed in the equity segment of the account and largely neutral for the year.
What is your outlook?
Significant risks remain for both the real economy and the financial markets. Policymakers are operating in uncharted waters in terms of both fiscal and monetary policy. We believe that the steps that have been taken
Portfolio Composition
(% of Net Portfolio)
Top 10 Holdings (% of Net Assets)
Thrivent Limited Maturity Bond Portfolio | 42.3 | % | |
Thrivent Income Portfolio | 13.3 | % | |
Thrivent Large Cap Value Portfolio | 8.1 | % | |
Thrivent High Yield Portfolio | 4.7 | % | |
Thrivent Partner International Stock Portfolio | 4.2 | % | |
Thrivent Mid Cap Stock Portfolio | 4.1 | % | |
Thrivent Large Cap Growth Portfolio II | 3.9 | % | |
Thrivent Small Cap Stock Portfolio | 2.5 | % | |
Thrivent Partner Worldwide Allocation Portfolio | 2.2 | % | |
Thrivent Large Cap Stock Portfolio | 2.1 | % |
The shares of these Funds represent 87.4% of the total net assets of the portfolio.
Quoted Portfolio Composition and Top 10 Holdings are subject to change.
The list of Top 10 Holdings excludes short-term investments.
10
Table of Contents
will be successful but that volatility will remain at elevated levels and the economic recovery will unfold slowly, most likely not until the second half of 2009. Under this scenario, we believe there is a reasonable chance the cyclical bottom in equity prices did occur around levels seen in late November 2008. We are generally positioned at our long-term strategic allocations, which would suggest a moderately bullish stance for risk assets, both in the fixed-income and equity markets. We expect the markets to retest those levels over the course of 2009 but that we should not exceed them by a meaningful margin.
Portfolio Facts
As of December 31, 2008
Net Assets | $714,755,880 | |
NAV | $9.27 | |
NAV - High† | 5/19/2008 - $12.08 | |
NAV - Low† | 11/20/2008 - $8.36 | |
Number of Holdings: 26 |
| † | For the year ended December 31, 2008 |
Average Annual Total Returns1
As of December 31, 2008
1-Year | From Inception 4/29/2005 | ||
(20.61%) | (0.38 | %) |
Value of a $10,000 Investment1
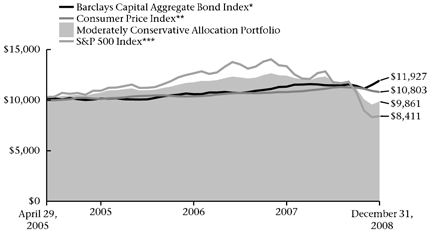
| * | The Barclays Capital Aggregate Bond Index is an index that measures the performance of U.S. investment grade bonds. It is not possible to invest directly in the Index. The performance of the Index does not reflect deductions for fees, expenses or taxes. |
| ** | The Consumer Price Index is an inflationary indicator that measures the change in the cost of a fixed basket of products and services, including housing, electricity, food and transportation. It is not possible to invest directly in the Index. |
*** | The S&P 500 Index is an index that represents the average performance of a group of 500 widely held, publicly traded stocks. It is not possible to invest directly in the Index. The performance of the Index does not reflect deductions for fees, expenses or taxes. “S&P 500®” is a trademark of The McGraw-Hill Companies, Inc. and has been licensed for use by Thrivent Financial for Lutherans. The product is not speonseored, endorsed or promoted by Standard & Poor’s, and Standard & Poor’s makes no representation regarding the advisability of investing in the product. |
Past performance is not an indication of future results. Total investment return and principal value will fluctuate and units, when redeemed, may be worth more or less than their original cost. Current performance may be higher or lower than the performance data quoted. Market volatility can significantly affect short-term performance, and more recent returns may be different from those shown. Call 800-THRIVENT or visit www.thrivent.com for performance results current to the most recent month-end.
1 | Annualized total returns represent past performance and reflect changes in share prices, the reinvestment of all dividends and capital gains, and the effects of compounding. Periods of less than one year are not annualized. At various times, the Portfolio’s adviser reimbursed and/or paid non-advisory Portfolio expenses. Had the adviser not done so, the Portfolio’s total returns would have been lower. The returns shown do not reflect charges and expenses imposed on contract holders by the variable accounts. Those charges and expenses reduce the returns received by contract holders as compared to the returns presented. |
Investing in a variable product involves risks, including the possible loss of principal. The prospectus contains more complete information on the investment objectives, risks, charges and expenses of the investment company, which investors should read and consider carefully before investing. To obtain a prospectus, contact a registered representative or visit www.thrivent.com.
11
Table of Contents

How did the Portfolio perform during the 12-month period ended December 31, 2008?
Thrivent Technology Portfolio earned a total return of -48.32%, as compared to the median return of its peer group, the Lipper Science and Technology category, of - -45.41%. The Portfolio’s market benchmark, the S&P North American Technology Sector Index, earned a return of -43.33%.
What factors influenced the Portfolio’s performance?
The negative absolute returns in the sector reflected the ongoing impact of the credit crisis and the global recession-inducing decline in actual and expected spending by both enterprises and consumers. The magnitude of the declines, while perhaps overdone in some instances, reflects the more pernicious demand-driven nature of the economic decline versus the supply-driven setbacks of the last twenty years–which suggests recovery could be slower and further out than originally hoped. As in 2007, the Portfolio’s pursuit of a broader capitalization and sector profile was a headwind to performance in 2008. While we believe the Portfolio’s multi-cap focus and broadened sector positioning increases the prospects of sustainable outperformance over longer periods of time, the broad performance of these additional sectors of exposure lagged behind the Index in 2008.
The almost sole factor responsible for the poor relative performance of the Portfolio in 2008 was its significantly overweighted position in alternative energy companies. While we were positioned to benefit from favorable tax and legislative developments for the sector—which did happen—the expected positive impact was overwhelmed by the spending freeze that resulted from the credit crisis, as well as the historic drop in oil prices–factors whose impact and importance we underestimated.
Within the information technology (IT) industries included in the S&P North American Technology Sector Index, the Portfolio
actually outperformed the Index. Our heaviest industry weightings, application software and storage, were solid contributors to relative performance, though by no means able to escape the negative returns that marked every industry in the IT sector. EMC Corporation remains the Portfolio’s largest position and was a positive contributor to its relative performance.
Major Market Sectors
(% of Net Assets)

Portfolio Composition
(% of Net Portfolio )

Top 10 Holdings
(% of Net Assets)
EMC Corporation | 10.8 | % | |
Cisco Systems, Inc. | 5.2 | % | |
FormFactor, Inc. | 4.8 | % | |
Teradyne, Inc. | 4.4 | % | |
Oracle Corporation | 4.1 | % | |
Atmel Corporation | 3.9 | % | |
Financial Select Sector SPDR Fund | 3.9 | % | |
Google, Inc. | 3.8 | % | |
Yahoo!, Inc. | 3.7 | % | |
SPDR KBW Bank ETF | 3.7 | % |
These securities represent 48.3% of the total net assets of the portfolio.
Quoted Major Market Sectors, Portfolio Composition and Top 10 Holdings are subject to change.
The lists of Major Market Sectors and Top 10 Holdings exclude short-term investments and collateral held for securities loaned.
The Portfolio Composition chart excludes collateral held for securities loaned.
12
Table of Contents
What is your outlook?
We believe that 2009 will be characterized by negative domestic economic growth, declining interest rates, a stronger dollar and technology spending in excess of overall economic growth, but below 2008 and below trend. These conditions, combined with technology’s growing share of overall capital expenditures, generally lean inventories and disciplined spending patterns over the previous cycle, should still allow for relative market leadership in 2009, especially as credit conditions improve. We would expect better relative trends in enterprise spending versus consumer spending, thus our belief that storage, virtualization, mobile internet and alternative energy are areas of notable investment opportunities in the year ahead. Further, we believe the semiconductor sector especially stands out for its revaluation opportunities despite the current difficult demand environment.
Portfolio Facts
As of December 31, 2008
Net Assets | $24,317,266 | |
NAV | $3.63 | |
NAV - High† | 1/2/2008 - $8.11 | |
NAV - Low† | 11/20/2008 - $2.97 | |
Number of Holdings: 40 |
| † | For the year ended December 31, 2008 |
Average Annual Total Returns1
As of December 31, 2008
| 1-Year | 5-Year | From Inception 3/1/2001 | |||||
| (48.32 | %) | (8.41 | %) | (9.74 | %) |
Value of a $10,000 Investment1
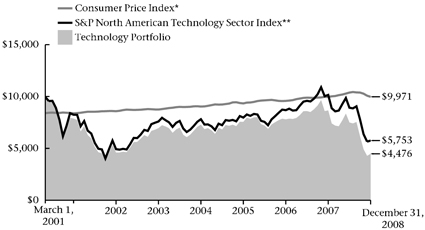
| * | The Consumer Price Index is an inflationary indicator that measures the change in the cost of a fixed basket of products and services, including housing, electricity, food and transportation. It is not possible to invest directly in the Index. |
| ** | The S&P North American Technology Sector Index is a modified capitalization-weighted index of selected technology stocks. It is not possible to invest directly in the Index. The performance of the Index does not reflect deductions for fees, expenses or taxes. The S&P North American Technology Sector Index is the new name for the index formerly known as the CBOE GSTI Composite Index. The S&P North American Technology Sector Index assumes the prior history and is compiled going forward using the same methodology of the CBOE GSTI Composite Index. |
Past performance is not an indication of future results. Total investment return and principal value will fluctuate and units, when redeemed, may be worth more or less than their original cost. Current performance may be higher or lower than the performance data quoted. Market volatility can significantly affect short-term performance, and more recent returns may be different from those shown. Call 800-THRIVENT or visit www.thrivent.com for performance results current to the most recent month-end.
1 | Annualized total returns represent past performance and reflect changes in share prices, the reinvestment of all dividends and capital gains, and the effects of compounding. Periods of less than one year are not annualized. At various times, the Portfolio’s adviser reimbursed and/or paid non-advisory Portfolio expenses. Had the adviser not done so, the Portfolio’s total returns would have been lower. The returns shown do not reflect charges and expenses imposed on contract holders by the variable accounts. Those charges and expenses reduce the returns received by contract holders as compared to the returns presented. |
Investing in a variable product involves risks, including the possible loss of principal. The prospectus contains more complete information on the investment objectives, risks, charges and expenses of the investment company, which investors should read and consider carefully before investing. To obtain a prospectus, contact a registered representative or visit www.thrivent.com.
13
Table of Contents
 | Thrivent Partner Healthcare Portfolio |
Subadvised by Sectoral Asset Management, Inc.
Thrivent Partner Healthcare Portfolio seeks long-term capital growth.
The Portfolio’s investments are concentrated in issuers in the health care industry; therefore, the Portfolio is more vulnerable to price changes in the securities of issuers in this industry and factors specific to this industry than a more broadly diversified fund. In addition, as a non-diversified fund, the Portfolio is susceptible to the risk that events affecting a particular issuer will significantly affect the Portfolio’s performance. These and other risks are described in the Portfolio’s prospectus.
How did the Portfolio perform during the 8-month period ended December 31, 2008?
Thrivent Partner Healthcare Portfolio earned a return of -10.48% from its inception date of April 30, 2008, through December 31, 2008. Over the same period, the Portfolio’s market benchmark, the MSCI World Healthcare Index, earned a return of -14.47%.
What factors affected the Portfolio’s performance?
Industry selection contributed 5.3% to outperformance while stock selection detracted -1.8% from outperformance. For equities, 2008 was one of the worst years for quite some time. The annual performance of the MSCI World Index was -42%, the S&P 500 Index dropped -37% and the Nasdaq Composite Index was down -41%. Health care, although negative, continued the outperformance that began in July 2007, the start of the sub-prime and economic crisis. Since that time, the MSCI World Healthcare Index is down -22%, significantly outperforming the MSCI World Index (-44%) and the S&P 500 Index (-42%). Health care’s relative outperformance is attributable to its defensive characteristics, as well as the fact that valuations in the sector were not lofty going into the economic crisis.
We believe that the health care sector will continue to outperform in these difficult markets owing to its defensive characteristics and relatively attractive valuations. The financial results in the third quarter of 2008 provided evidence that growth in the industry is largely independent of economic cycle. In the pharmaceuticals area, we believe the greatest likelihood for outperformance is with companies that hold limited near-mid-term patent expirations, strong research and development productivity and a focus on emerging pharmaceutical markets. In biotech, earnings growth remains at approximately 20% per year. We believe valuations are attractive at the current levels and there will likely be more acquisitions by large pharmaceuticals to enrich their pipelines. Medical technology is expected to slowly recover in 2009, led by manufacturers with reimbursed devices, while manufacturers exposed to elective procedures or to capital expenses budgets are expected to remain under pressure until signs of an economic turnaround become visible.
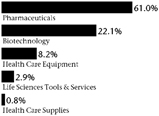
Major Market Sectors
(% of Net Assets)
Portfolio Composition
(% of Net Portfolio )

Top 10 Holdings
(% of Net Assets)
Wyeth | 8.2% | |
Roche Holding AG | 8.0% | |
Schering-Plough Corporation | 6.8% | |
Merck & Company, Inc. | 6.3% | |
Bristol-Myers Squibb Company | 4.8% | |
Novartis AG | 4.6% | |
Abbott Laboratories | 4.3% | |
Celgene Corporation | 4.1% | |
Genzyme Corporation | 4.1% | |
Amgen, Inc. | 4.0% |
These securities represent 55.2% of the total net assets of the portfolio.
Quoted Major Market Sectors, Portfolio Composition and Top 10 Holdings are subject to change.
The lists of Major Market Sectors and Top 10 Holdings exclude short-term investments and collateral held for securities loaned.
The Portfolio Composition chart excludes collateral held for securities loaned.
14
Table of Contents
What is your outlook?
While we expect health care relative outperformance to continue, absolute performance will in large part depend on the overall equity market environment. The industry’s fundamentals are strong and valuations are quite attractive. Finally, support for the sector is likely to continue if economic growth concerns linger.
Portfolio Facts
As of December 31, 2008
Net Assets | $7,135,398 | |
NAV | $8.94 | |
NAV - High† | 8/5/2008 - $11.04 | |
NAV - Low† | 11/20/2008 - $7.67 | |
Number of Holdings: 36 |
| † | For the year ended December 31, 2008 |
Average Annual Total Returns1
As of December 31, 2008
From Inception |
| (10.48%) |
Value of a $10,000 Investment1
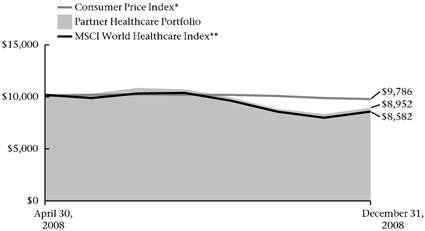
| * | The Consumer Price Index is an inflationary indicator that measures the change in the cost of a fixed basket of products and services, including housing, electricity, food and transportation. It is not possible to invest directly in the Index. |
| ** | The MSCI World Healthcare Index is a capitalization-weighted index of selected health care stocks from around the world. It is not possible to invest directly in the Index. The performance of the Index does not reflect deductions for fees, expenses or taxes. |
Past performance is not an indication of future results. Total investment return and principal value will fluctuate and units, when redeemed, may be worth more or less than their original cost. Current performance may be higher or lower than the performance data quoted. Market volatility can significantly affect short-term performance, and more recent returns may be different from those shown. Call 800-THRIVENT or visit www.thrivent.com for performance results current to the most recent month-end.
1 | Annualized total returns represent past performance and reflect changes in share prices, the reinvestment of all dividends and capital gains, and the effects of compounding. Periods of less than one year are not annualized. At various times, the Portfolio’s adviser reimbursed and/or paid non-advisory Portfolio expenses. Had the adviser not done so, the Portfolio’s total returns would have been lower. The returns shown do not reflect charges and expenses imposed on contract holders by the variable accounts. Those charges and expenses reduce the returns received by contract holders as compared to the returns presented |
Investing in a variable product involves risks, including the possible loss of principal. The prospectus contains more complete information on the investment objectives, risks, charges and expenses of the investment company, which investors should read and consider carefully before investing. To obtain a prospectus, contact a registered representative or visit www.thrivent.com.
15
Table of Contents
 | Thrivent Partner Natural Resources Portfolio |
Subadvised by BlackRock Investment Management, LLC
Thrivent Partner Natural Resources Portfolio seeks long-term capital growth. The Portfolio’s investments are concentrated in issuers in the natural resources industry; therefore, the Portfolio is more vulnerable to price changes in the securities of issuers in this industry and factors specific to this industry than a more broadly diversified fund. In addition, as a non-diversified fund, the Portfolio is susceptible to the risk that events affecting a particular issuer will significantly affect the Portfolio’s performance. These and other risks are described in the Portfolio’s prospectus.
How did the Portfolio perform during the 8-month period ended December 31, 2008?
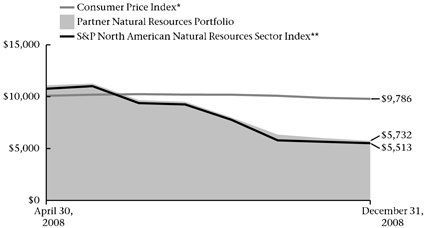
Thrivent Partner Natural Resources Portfolio earned a return of -42.68% since its inception on April 30, 2008, through December 31, 2008. Over the same period, the Portfolio’s market benchmark, the S&P North American Natural Resources Sector Index, earned a return of -44.87%.
What factors affected the Portfolio’s performance?
Absolute returns were down substantially for the annual period due to a global recession, multiple bank failures and the resulting volatile market conditions. Concerns about waning natural resources demand—as a result of a global economic slowdown—initiated corrective action in the stocks that was likely exacerbated by credit concerns, overall deleveraging and several instances of forced liquidation by hedge funds. Crude oil prices fell sharply from their highs of above $145 per barrel in June to finish the year slightly above $44 per barrel, as the market focused on the potential for sustained demand destruction. Current energy prices are discounting annual global Gross Domestic Product (GDP) contraction of -2.0%—a far worse scenario than what the broad market priced in.
On a relative basis, the Portfolio benefited from strong sub-industry allocation, while security selection hindered return comparisons. This result is consistent with the top-down, macro-oriented approach used by the portfolio manager. Specifically, an underweighted stance in metals and mining stocks generated positive relative returns, as many of these stocks were hurt by a combination of the credit crisis and the inability to quickly adjust supply to falling demand. Additionally, our decision to turn defensive as the economy began to roll over contributed to outperformance, as the Portfolio’s relatively high cash position added alpha. By far, the greatest detractor from performance was the Portfolio’s underweighted position in the integrated oil and gas segment—most notably in Exxon Mobil Corp.
What is your outlook?
Given the supply outlook for many commodities, stabilization in demand would likely contribute to a strong run-up in prices. However, the energy sector—mainly due to the Organization of Petroleum Exporting
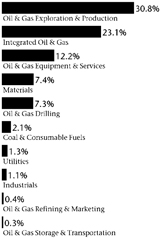
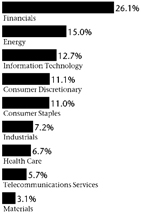
Major Market Sectors
(% of Net Assets)
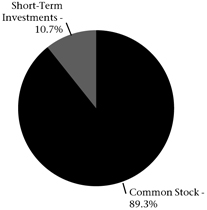
Portfolio Composition
(% of Portfolio)
Top 10 Holdings
(% of Net Assets)
EOG Resources, Inc. | 4.8 | % | |
Devon Energy Corporation | 4.8 | % | |
Chevron Corporation | 4.1 | % | |
Apache Corporation | 3.8 | % | |
Exxon Mobil Corporation | 3.3 | % | |
Transocean, Ltd. | 2.9 | % | |
Occidental Petroleum Corporation | 2.8 | % | |
EnCana Corporation | 2.4 | % | |
National Oilwell Varco, Inc. | 2.3 | % | |
Murphy Oil Corporation | 2.2 | % |
These securities represent 33.4% of the total net assets of the portfolio.
Quoted Major Market Sectors, Portfolio Composition and Top 10 Holdings are subject to change.
The lists of Major Market Sectors and Top 10 Holdings exclude short-term investments and collateral held for securities loaned.
The Portfolio Composition chart excludes collateral held for securities loaned.
16
Table of Contents
Countries (OPEC)—is able to adjust supply faster than most other natural resources segments. In the current downturn, energy producers across industries have reacted quickly to rising inventory levels and lower prices by significantly reducing their plans for future production. Across industries, capital expenditures have been slashed and exploration and development projects have been cancelled. While not having an immediate effect, as we enter the second half of the year and get into 2010, production cuts by the industry and, in the case of oil, by OPEC, should bring supply in line with lower demand levels. In the event that demand reaccelerates, it will take considerably longer to boost supplies, likely resulting in considerably higher prices. The Portfolio remains positioned accordingly.
Portfolio Facts
As of December 31, 2008
Net Assets | $6,594,032 | |
NAV | $5.72 | |
NAV - High† | 5/20/2008 - $11.61 | |
NAV - Low† | 11/20/2008 - $4.88 | |
Number of Holdings: 101 |
| † | For the year ended December 31, 2008 |
Average Annual Total Returns1
As of December 31, 2008
From Inception |
| (42.68%) |
Value of a $10,000 Investment1
| * | The Consumer Price Index is an inflationary indicator that measures the change in the cost of a fixed basket of products and services, including housing, electricity, food and transportation. It is not possible to invest directly in the Index. |
| ** | The S&P North American Natural Resources Sector Index is an index of selected U.S. traded natural resource related stocks. The product is not sponsored, endorsed or promoted by Standard & Poor’s, and Standard & Poor’s makes no representation regarding the advisability of investing in the product. It is not possible to invest directly in the Index. The performance of the Index does not reflect deductions for fees, expenses or taxes. |
Past performance is not an indication of future results. Total investment return and principal value will fluctuate and units, when redeemed, may be worth more or less than their original cost. Current performance may be higher or lower than the performance data quoted. Market volatility can significantly affect short-term performance, and more recent returns may be different from those shown. Call 800-THRIVENT or visit www.thrivent.com for performance results current to the most recent month-end.
1 | Annualized total returns represent past performance and reflect changes in share prices, the reinvestment of all dividends and capital gains, and the effects of compounding. Periods of less than one year are not annualized. At various times, the Portfolio’s adviser reimbursed and/or paid non-advisory Portfolio expenses. Had the adviser not done so, the Portfolio’s total returns would have been lower. The returns shown do not reflect charges and expenses imposed on contract holders by the variable accounts. Those charges and expenses reduce the returns received by contract holders as compared to the returns presented |
Investing in a variable product involves risks, including the possible loss of principal. The prospectus contains more complete information on the investment objectives, risks, charges and expenses of the investment company, which investors should read and consider carefully before investing. To obtain a prospectus, contact a registered representative or visit www.thrivent.com.
17
Table of Contents
 | Thrivent Partner Emerging Markets Portfolio |
Subadvised by Aberdeen Asset Management Investment Services Limited
Thrivent Partner Emerging Markets Portfolio seeks long-term capital growth.
Foreign investments, as compared to domestic ones, involve additional risks, including currency fluctuations, different accounting standards, and greater political, economic and market instability. These risks are magnified when the portfolio invests in emerging markets, which may be of relatively small size and less liquid than domestic markets. These and other risks are described in the Portfolio’s prospectus.
How did the Portfolio perform during the 8-month period ended December 31, 2008?
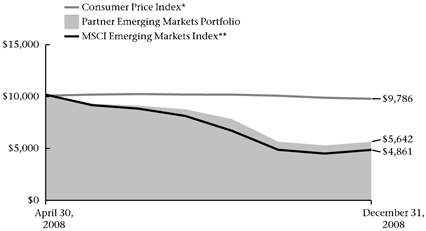
Thrivent Partner Emerging Markets Portfolio earned a return of -43.58% for the period since its inception on April 30, 2008, through December 31, 2008. The Portfolio’s market benchmark, the MSCI Emerging Markets Index, earned a return of -51.79%.
What factors affected the Portfolio’s performance?
Both asset allocation and stock selection were contributors to the relatively better performance versus the benchmark. The outperformance reflected our investment style, which focuses on companies with robust business models and strong balance sheets. Overall, emerging market equities fell more than their developed counterparts as it became obvious that they remained highly reliant on the West.
Our underweighted stance to Russia, which was one of the worst-performing markets, a position in better-performing Hong Kong, and an overweighted position to Mexico contributed most to relative returns. We believe that Hong Kong offers listed companies that have diversified, regional business activities, particularly those that provide an exposure to China, albeit with better standards of accounting and transparency, while Mexico offers both well-run companies and relative value, particularly among mid-cap stocks. On the other hand, Russia is skewed towards commodity firms and mobile telephone companies, which, in our opinion, do not offer high-quality exposure to the consumer.
In stock selection, South Africa and Taiwan added most to performance. Well-managed, attractively priced companies like South African retailers Truworths and Massmart held up well as they continued to benefit from domestic consumer spending, while defensive businesses, such as Taiwan Mobile, also outperformed as investors sought companies with strong balance sheets and attractive dividend yields against the backdrop of weak economic and earnings outlooks.
What is your outlook?
Looking ahead, we expect markets to remain volatile, buffeted by poor economic data and deteriorating corporate earnings. While governments have pumped vast amounts of liquidity into the financial system, confidence remains fragile and lending tight. Stimulus programs may also take time to kick in. But investors should begin to look through this period of weakness, attracted by valuations and emerging markets’ long-term prospects.
Major Market Sectors
(% of Net Assets)
Portfolio Composition
(% of Portfolio)

Top 10 Countries
(% of Net Assets)
Brazil | 14.2 | % | |
Mexico | 10.6 | % | |
Hong Kong | 9.4 | % | |
India | 8.9 | % | |
South Korea | 6.6 | % | |
South Africa | 6.4 | % | |
Thailand | 5.4 | % | |
Taiwan | 4.9 | % | |
Israel | 4.7 | % | |
Turkey | 4.1 | % |
Investments in securities in these countries represent 75.2% of the total net assets of the portfolio.
Quoted Major Market Sectors, Portfolio Composition and Top 10 Countries are subject to change.
The lists of Major Market Sectors and Top 10 Countries exclude short-term investments and collateral held for securities loaned.
The Portfolio Composition chart excludes collateral held for securities loaned.
18
Table of Contents
We believe that this crisis will present opportunities for well-managed companies to strengthen their competitive positions. These are the companies in which we seek to invest, those with dominant market positions and strong balance sheets. Thus, we are confident that the long-term outlook is positive for our Portfolio.
As bottom-up stock pickers, our global allocation strategy is a function of where we can find good quality companies with attractive valuations. To this end, we will maintain our overweighted positions to Mexico and Thailand, as well as our non-benchmark position in Hong Kong, while remaining underweighted to China, Russia and Taiwan. By sector, we will keep our underweighted stances in cyclical/export-dependent companies, favoring companies that are benefitting from domestic consumption.
Portfolio Facts
As of December 31, 2008
Net Assets | $5,329,265 | |
NAV | $5.59 | |
NAV - High† | 5/16/2008 - $10.42 | |
NAV - Low† | 11/20/2008 - $4.48 | |
Number of Holdings: 43 |
| † | For the year ended December 31, 2008 |
Average Annual Total Returns1
As of December 31, 2008
From Inception |
| (43.58%) |
Value of a $10,000 Investment1
| * | The Consumer Price Index is an inflationary indicator that measures the change in the cost of a fixed basket of products and services, including housing, electricity, food and transportation. It is not possible to invest directly in the Index. |
| ** | The MSCI Emerging Markets Index is a modified capitalization-weighted index of selected emerging economies from around the world. It is not possible to invest directly in the Index. The performance of the Index does not reflect deductions for fees, expenses or taxes. |
Past performance is not an indication of future results. Total investment return and principal value will fluctuate and units, when redeemed, may be worth more or less than their original cost. Current performance may be higher or lower than the performance data quoted. Market volatility can significantly affect short-term performance, and more recent returns may be different from those shown. Call 800-THRIVENT or visit www.thrivent.com for performance results current to the most recent month-end.
1 | Annualized total returns represent past performance and reflect changes in share prices, the reinvestment of all dividends and capital gains, and the effects of compounding. Periods of less than one year are not annualized. At various times, the Portfolio’s adviser reimbursed and/or paid non-advisory Portfolio expenses. Had the adviser not done so, the Portfolio’s total returns would have been lower. The returns shown do not reflect charges and expenses imposed on contract holders by the variable accounts. Those charges and expenses reduce the returns received by contract holders as compared to the returns presented |
Investing in a variable product involves risks, including the possible loss of principal. The prospectus contains more complete information on the investment objectives, risks, charges and expenses of the investment company, which investors should read and consider carefully before investing. To obtain a prospectus, contact a registered representative or visit www.thrivent.com.
19
Table of Contents

How did the Portfolio perform during the 12-month period ended December 31, 2008?
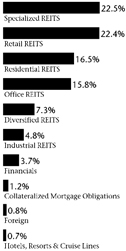
Thrivent Real Estate Securities Portfolio earned a return of -37.24%, as compared to the median return for its peer group, the Lipper Real Estate Variable Account category, of -39.87%. The Portfolio’s market benchmark, the FTSE NAREIT Equity REIT Index, earned a return of -37.73%.
What factors affected the Portfolio’s performance?
REIT stocks were impacted primarily by the following three factors during 2008. First, the U.S. economy weakened during the year, resulting in job losses, followed by rising vacancy rates and downward pressure on rental rates for all property types (office, industrial, retail, multifamily, health care, self storage, and lodging). Second, commercial real estate lenders demanded much higher interest rates for real estate debt investments, which also negatively affected commercial real estate values and REIT equity valuations. Third, publicly traded REITs were negatively impacted by the overall stock market declines, higher credit costs in all debt instruments, and the general flight from risky assets.
The best performing sectors in the Portfolio were multifamily, health care, and self storage REITs. The worst performing property sectors were industrial, lodging, regional malls, and shopping centers. The Portfolio’s underweighted allocations to lodging and shopping centers were the most significant positive contributors to sector performance relative to the benchmark Index.
What is your outlook?
As a result of the weakening U.S. economy, we expect commercial real estate vacancy rates to rise in 2009. All property sectors will likely be affected. Lodging and multifamily properties are expected to experience the most immediate impact due to their short-term income streams.
The U.S. government’s economic stimulus efforts and significant support of the banking/financial system have helped stabilize the financial markets. An improvement in the U.S. economy during 2009 now appears more likely than during the financial crisis in 2008.
Major Market Sectors
(% of Net Assets)
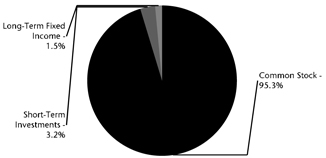
Portfolio Composition
(% of Portfolio)
Top 10 Holdings
(% of Net Assets)
Simon Property Group, Inc. | 7.7 | % | |
Public Storage, Inc. | 5.8 | % | |
Vornado Realty Trust | 5.2 | % | |
Boston Properties, Inc. | 4.4 | % | |
Equity Residential REIT | 4.4 | % | |
AvalonBay Communities, Inc. | 3.4 | % | |
Federal Realty Investment Trust | 3.1 | % | |
Ventas, Inc. | 3.1 | % | |
Health Care Property Investors, Inc. | 2.8 | % | |
Regency Centers Corporation | 2.7 | % |
These securities represent 42.6% of the total net assets of the portfolio.
Quoted Major Market Sectors, Portfolio Composition and Top 10 Holdings are subject to change.
The lists of Major Market Sectors and Top 10 Holdings exclude short-term investments and collateral held for securities loaned.
The Portfolio Composition chart excludes collateral held for securities loaned.
20
Table of Contents
We believe that health care properties, which have long-term leases and benefit from stable demand as a result of the aging population, will perform well in this environment. In addition, class A office properties in the Washington, D.C. area, San Francisco, and coastal southern California should remain in demand through the current downturn. We have positioned the Portfolio in a well-diversified collection of other REITs that we believe offer great value and significant upside potential from current price levels.
Portfolio Facts
As of December 31, 2008
Net Assets | $197,419,707 | |
NAV | $9.34 | |
NAV - High† | 5/5/2008 - $19.80 | |
NAV - Low† | 11/20/2008 - $6.67 | |
Number of Holdings: 88 |
| † | For the year ended December 31, 2008 |
Average Annual Total Returns1
As of December 31, 2008
1-Year | 5-Year | From Inception 4/30/2003 | ||||
| (37.24%) | 1.41 | % | 6.04 | % |
Value of a $10,000 Investment1
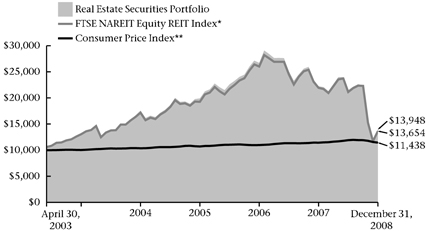
| * | The FTSE NAREIT Equity REIT Index is an unmanaged capitalization-weighted index of all equity real estate investment trusts. It is not possible to invest directly in this Index. The performance of this Index does not reflect deductions for fees, expenses or taxes. |
| ** | The Consumer Price Index is an inflationary indicator that measures the change in the cost of a fixed basket of products and services, including housing, electricity, food and transportation. It is not possible to invest directly in the Index. |
Past performance is not an indication of future results. Total investment return and principal value will fluctuate and units, when redeemed, may be worth more or less than their original cost. Current performance may be higher or lower than the performance data quoted. Market volatility can significantly affect short-term performance, and more recent returns may be different from those shown. Call 800-THRIVENT or visit www.thrivent.com for performance results current to the most recent month-end.
1 | Annualized total returns represent past performance and reflect changes in share prices, the reinvestment of all dividends and capital gains, and the effects of compounding. Periods of less than one year are not annualized. At various times, the Portfolio’s adviser reimbursed and/or paid non-advisory Portfolio expenses. Had the adviser not done so, the Portfolio’s total returns would have been lower. The returns shown do not reflect charges and expenses imposed on contract holders by the variable accounts. Those charges and expenses reduce the returns received by contract holders as compared to the returns presented. |
Investing in a variable product involves risks, including the possible loss of principal. The prospectus contains more complete information on the investment objectives, risks, charges and expenses of the investment company, which investors should read and consider carefully before investing. To obtain a prospectus, contact a registered representative or visit www.thrivent.com.
21
Table of Contents
| Thrivent Partner Utilities Portfolio |
Subadvised by BlackRock Investment Management, LLC
Thrivent Partner Utilities Portfolio seeks capital appreciation and current income.
The Portfolio’s investments are concentrated in issuers in the utilities industry; therefore, the Portfolio is more vulnerable to price changes in the securities of issuers in this industry and factors specific to this industry than a more broadly diversified fund. The Portfolio is also subject to the risks of investing in foreign (including emerging market) stocks. These and other risks are described in the Portfolio’s prospectus.
How did the Portfolio perform during the 8 -month period ended December 31, 2008?
Thrivent Partner Utilities Portfolio earned a return of -29.57% for the period since its inception of April 30, 2008, through December 31, 2008. The Portfolio’s custom benchmark, which comprises 70% S&P Utilities Index and 30% S&P Telecommunications Services Index, earned a return of -24.36%.
What factors affected the Portfolio’s performance?
Absolute returns were down substantially for the annual period due to a global recession, multiple bank failures and the resulting volatile market conditions. While large utilities and telecommunications stocks are often viewed as defensive areas of the market, the stocks still found themselves caught in the selling barrage, which affected all sectors of the economy and all asset classes within the financial markets. As a defensive industry, however, utilities and telecommunications did manage to outperform the broader market on a relative basis, benefiting mainly from attractive dividend yields amidst a substantially lower interest rate environment.
The Portfolio underperformed for the period since its April 30, 2008, inception through December 31, 2008. Global recession fears prompted demand concerns across the board, leading investors to sell first and ask questions later. As the economy continued to weaken throughout the year and concerns over demand turned into true demand weakness, our selection within electric utilities dramatically hurt relative performance as larger, slower-growth, more defensive companies within this segment held up relatively well. By contrast, an overweighted position in electric utility holding E.ON AG also detracted from relative returns. The benchmark has outsized positions in Verizon and AT&T (diversified telecom companies) and, while we are positive on these companies and own the stocks, we are underweighted on a relative basis. We became increasingly defensive throughout the period, however, as it became clearer that a deep recession was imminent. We built up cash positions and reduced the Portfolio’s allocation to non-U.S. companies. These position decisions generated positive relative returns.
What is your outlook?
Looking ahead, we remain defensive, but also realize that valuations are extremely attractive. We have built up cash positions and reduced international exposure in an effort to limit further downside risk within the Portfolio amid a very volatile market environment.
Major Market Sectors
(% of Net Assets)
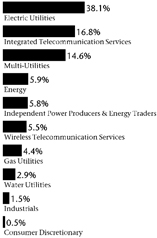
Portfolio Composition
(% of Portfolio)
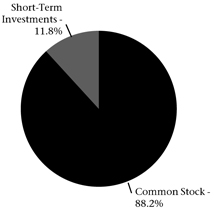
Top 10 Holdings
(% of Net Assets)
Verizon Communications, Inc. | 4.7 | % | |
AT&T, Inc. | 4.6 | % | |
FPL Group, Inc. | 4.4 | % | |
Public Service Enterprise Group, Inc. | 4.3 | % | |
Southern Company | 3.9 | % | |
NRG Energy, Inc. | 3.7 | % | |
Exelon Corporation | 3.6 | % | |
Entergy Corporation | 3.4 | % | |
PPL Corporation | 3.1 | % | |
FirstEnergy Corporation | 2.8 | % |
These securities represent 38.5% of the total net assets of the portfolio.
Quoted Major Market Sectors, Portfolio Composition and Top 10 Holdings are subject to change.
The lists of Major Market Sectors and Top 10 Holdings exclude short-term investments and collateral held for securities loaned.
The Portfolio Composition chart excludes collateral held for securities loaned.
22
Table of Contents
However, we are ready to opportunistically put cash to work, as, we believe, stocks with favorable fundamentals are unfairly punished due to market conditions. As an example of this strategy, we recently added Qwest Communications to the Portfolio on extreme price weakness. This purchase has already generated strong performance on both a relative and absolute basis. We continue to be defensive, while searching for opportunities to add high-quality companies with solid long-term prospects, trading at low valuations, to the Portfolio.
Portfolio Facts
As of December 31, 2008
Net Assets | $4,352,051 | |
NAV | $6.93 | |
NAV - High† | 6/5/2008 - $10.32 | |
NAV - Low† | 10/27/2008 - $6.18 | |
Number of Holdings: 83 |
| † | For the year ended December 31, 2008 |
Average Annual Total Returns1
As of December 31, 2008
From Inception |
| (29.57%) |
Value of a $10,000 Investment1
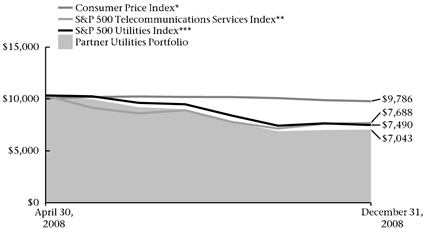
| * | The Consumer Price Index is an inflationary indicator that measures the change in the cost of a fixed basket of products and services, including housing, electricity, food and transportation. It is not possible to invest directly in the Index. |
| ** | The S&P 500 Telecommunications Services Index is a capitalization-weighted index of telecommunications sector securities. The product is not sponsored, endorsed or promoted by Standard & Poor’s, and Standard & Poor’s makes no representation regarding the advisability of investing in the product. It is not possible to invest directly in this Index. The performance of this Index does not reflect deductions for fees, expenses or taxes. |
| *** | The S&P 500 Utilities Index is a capitalization-weighted index of utilities sector securities. The product is not sponsored, endorsed or promoted by Standard & Poor’s, and Standard & Poor’s makes no representation regarding the advisability of investing in the product. It is not possible to invest directly in this Index. The performance of this Index does not reflect deductions for fees, expenses or taxes. |
Past performance is not an indication of future results. Total investment return and principal value will fluctuate and units, when redeemed, may be worth more or less than their original cost. Current performance may be higher or lower than the performance data quoted. Market volatility can significantly affect short-term performance, and more recent returns may be different from those shown. Call 800-THRIVENT or visit www.thrivent.com for performance results current to the most recent month-end.
1 | Annualized total returns represent past performance and reflect changes in share prices, the reinvestment of all dividends and capital gains, and the effects of compounding. Periods of less than one year are not annualized. At various times, the Portfolio’s adviser reimbursed and/or paid non-advisory Portfolio expenses. Had the adviser not done so, the Portfolio’s total returns would have been lower. The returns shown do not reflect charges and expenses imposed on contract holders by the variable accounts. Those charges and expenses reduce the returns received by contract holders as compared to the returns presented. |
Investing in a variable product involves risks, including the possible loss of principal. The prospectus contains more complete information on the investment objectives, risks, charges and expenses of the investment company, which investors should read and consider carefully before investing. To obtain a prospectus, contact a registered representative or visit www.thrivent.com.
23
Table of Contents
 | Thrivent Partner Small Cap Growth Portfolio |
Subadvised by Turner Investment Partners, Inc.
Thrivent Partner Small Cap Growth Portfolio seeks long-term capital growth by investing primarily in a diversified portfolio of common stocks of U.S. small capitalization companies. The Portfolio is exposed to the risks of investing in equity securities of smaller companies, which may include, but are not limited to, lower trading volume and less liquidity than larger, more established companies. Small company stock prices are generally more volatile than large company stock prices. These and other risks are described in the Portfolio’s prospectus.
How did the Portfolio perform during the 12-month period ended December 31, 2008?
Thrivent Partner Small Cap Growth Portfolio earned a return of -43.23%, as compared to the median return for its peer group, the Lipper Small Cap Growth category, of -40.90%. The Portfolio’s market benchmark, the Russell 2000® Growth Index, earned a return of -38.54%.
What factors affected the Portfolio’s performance?
The portfolio management strategy used in this account avoids meaningful sector variations from the benchmark Index, although exposure at the industry and company level may and will be different than that of the Index. Return variations from the benchmark were most significantly impacted by poor security selection over the reporting period. Specifically, security selection within three broad sectors had the most limiting impact on relative performance: information technology (IT), health care and consumer discretionary. Better-than- average selection in the energy and utility sectors mitigated some of the effects, but was not sufficient to offset them totally. Within IT, semiconductors, internet software and services and telecom most impacted performance. Atheros Communications Inc, Cavium Networks Inc. and Verigy Ltd. provided disappointing returns. Internet service and software companies Ariba Inc., ComScore Inc. and Omniture Inc. also did not perform up to the Index. In health care, the Portfolio’s holdings in the providers and services industry, on average, lagged behind the performance of the benchmark. An underexposure to the biotechnology industry, which performed above average, also limited Portfolio returns. In the consumer discretionary sector, holdings in the apparel and luxury goods industries underperformed as the negative wealth effect of declining real estate and financial markets significantly impacted discretionary consumer spending.
Portfolio holdings in the energy and utility sectors provided better-than-benchmark returns, but the cumulative effect of these holdings was not sufficient to offset sub-par results in other areas of the Portfolio. In the energy sector, our holdings with exposure to oil and gas production, such as Petrohawk Energy and Concho Resources, provided good relative returns. Our position in ITC Holdings in the utility sector also added modestly to results, as it outperformed both the sector and the broader Index over the year.
Major Market Sectors
(% of Net Assets)
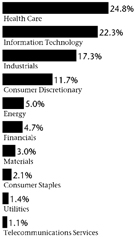
Portfolio Composition
(% of Portfolio)
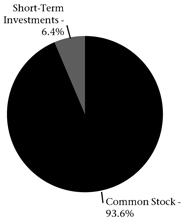
Top 10 Holdings
(% of Net Assets)
WMS Industries, Inc. | 1.9 | % | |
Amedisys, Inc. | 1.9 | % | |
Thoratec Corporation | 1.8 | % | |
Haemonetics Corporation | 1.8 | % | |
Huron Consulting Group, Inc. | 1.7 | % | |
Interactive Data Corporation | 1.7 | % | |
Wright Medical Group, Inc. | 1.6 | % | |
ITC Holdings Corporation | 1.4 | % | |
Deckers Outdoor Corporation | 1.4 | % | |
NuVasive, Inc. | 1.3 | % |
These securities represent 16.5% of the total net assets of the portfolio.
Quoted Major Market Sectors, Portfolio Composition and Top 10 Holdings are subject to change.
The lists of Major Market Sectors and Top 10 Holdings exclude short-term investments and collateral held for securities loaned.
The Portfolio Composition chart excludes collateral held for securities loaned.
24
Table of Contents
What is your outlook?
Our focus remains on owning stocks that we believe have superior earnings prospects. With that in mind, the expected earnings growth of the Portfolio remains at a premium to that of the benchmark Index. Additionally, the price-earnings-to-growth rate for the Portfolio (PEG ratio) is similar to the strategy’s performance benchmark. As is our custom, we continue to hold the Portfolio’s sector weightings to be similar to those of the benchmark Index, thereby allowing stock selection to be a key driver of performance for the Portfolio.
Portfolio Facts
As of December 31, 2008
Net Assets | $112,460,922 | |
NAV | $7.45 | |
NAV - High† | 1/2/2008 - $13.77 | |
NAV - Low† | 11/20/2008 - $5.96 | |
Number of Holdings: 114 |
| † | For the year ended December 31, 2008 |
Average Annual Total Returns1
As of December 31, 2008
1-Year | 5- Year | From Inception 11/30/2001 | ||||
| (43.23%) | (4.30 | %) | (1.65 | %) |
Value of a $10,000 Investment1
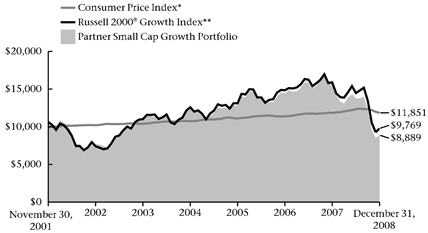
| * | The Consumer Price Index is an inflationary indicator that measures the change in the cost of a fixed basket of products and services, including housing, electricity, food and transportation. It is not possible to invest directly in the Index. |
** | The Russell 2000® Growth Index is an index comprised of small capitalization companies with a greater than average growth orientation. It is not possible to invest directly in the Index. The performance of the Index does not reflect deductions for fees, expenses or taxes. |
Past performance is not an indication of future results. Total investment return and principal value will fluctuate and units, when redeemed, may be worth more or less than their original cost. Current performance may be higher or lower than the performance data quoted. Market volatility can significantly affect short-term performance, and more recent returns may be different from those shown. Call 800-THRIVENT or visit www.thrivent.com for performance results current to the most recent month-end.
1 | Annualized total returns represent past performance and reflect changes in share prices, the reinvestment of all dividends and capital gains, and the effects of compounding. Periods of less than one year are not annualized. At various times, the Portfolio’s adviser reimbursed and/or paid non-advisory Portfolio expenses. Had the adviser not done so, the Portfolio’s total returns would have been lower. The returns shown do not reflect charges and expenses imposed on contract holders by the variable accounts. Those charges and expenses reduce the returns received by contract holders as compared to the returns presented. |
Investing in a variable product involves risks, including the possible loss of principal. The prospectus contains more complete information on the investment objectives, risks, charges and expenses of the investment company, which investors should read and consider carefully before investing. To obtain a prospectus, contact a registered representative or visit www.thrivent.com.
25
Table of Contents
 | Thrivent Partner Small Cap Value Portfolio |
Subadvised by T. Rowe Price Associates, Inc.
Thrivent Partner Small Cap Value Portfolio seeks long-term growth of capital by investing primarily in a diversified portfolio of smaller capitalization common stocks and securities convertible into small company stocks.
The Portfolio is exposed to the risks of investing in equity securities of smaller companies, which may include, but are not limited to, lower trading volume and less liquidity than larger, more established companies. Small company stock prices are generally more volatile than large company stock prices. These and other risks are described in the Portfolio’s prospectus.
How did the Portfolio perform during the 12-month period ended December 31, 2008?
Thrivent Partner Small Cap Value Portfolio earned a return of -27.05%, as compared to the median return for its peer group, the Lipper Small Cap Value category, of -32.76%. The Portfolio’s market benchmark, the Russell 2000® Value Index, earned a return of -28.92%.
What factors affected the Portfolio’s performance?
Sector emphasis in the Portfolio detracted somewhat from better-than-average stock selection, although in both cases absolute results were severely impacted by the negative market environment that persisted throughout the year. Consumer discretionary stocks were an area of particular weakness for the markets, severely underperforming the broad averages. Stocks in the Portfolio achieved results more in line with the broad indexes and this aided returns significantly. Aaron Rents, Inc. and Corinthian Colleges Inc. were particularly good performers for the period. The information technology sector was another group in which stocks held in the Portfolio bettered the results of those in the benchmark Index. Our holdings in the health care sector dramatically outperformed both the broad Index as well as those that are represented in the sector holdings of the Index. Biotechnology companies Momenta Pharmaceutical and Myriad Genetics both realized strong positive returns for the Portfolio.
The financial sector was an area of sub-par performance for the Portfolio. Although our underweighted stance in the poorly performing group was a mitigating factor, stock selection was particularly disappointing. Holdings in the commercial banking, insurance and capital markets groups were the main factor in offsetting some of the better returns achieved elsewhere in the Portfolio. An overweighting of stocks in the energy sector was also a limiting factor for performance. Although the sector performed well in the early part of the period, an unprecedented decline in oil prices in the second half caused the sector to come under severe pressure in both the equipment and production sides of the business.
What is your outlook?
While remaining aware of the substantial challenges that exist for the financial system and the economy and the headwinds they have created for corporate profits, we are
Major Market Sectors
(% of Net Assets)
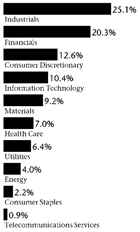
Portfolio Composition
(% of Portfolio)
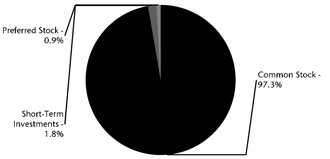
Top 10 Holdings
(% of Net Assets)
ProAssurance Corporation | 2.4 | % | |
Aaron Rents, Inc. | 2.4 | % | |
Owens & Minor, Inc. | 1.8 | % | |
AptarGroup, Inc. | 1.7 | % | |
Cleco Corporation | 1.5 | % | |
Alaska Air Group, Inc. | 1.4 | % | |
Beacon Roofing Supply, Inc. | 1.3 | % | |
Mariner Energy, Inc. | 1.2 | % | |
Genesee & Wyoming, Inc. | 1.2 | % | |
East West Bancorp, Inc. | 1.2 | % |
These securities represent 16.1% of the total net assets of the portfolio.
Quoted Major Market Sectors, Portfolio Composition and Top 10 Holdings are subject to change.
The lists of Major Market Sectors and Top 10 Holdings exclude short-term investments and collateral held for securities loaned.
The Portfolio Composition chart excludes collateral held for securities loaned.
26
Table of Contents
optimistic on two fronts. First, the steep drop in stock prices has provided rare opportunities to invest in strong companies at value prices. Second, we feel confident that policy actions taken by world governments will help avert worst-case scenarios for the global economy. We expect the U.S. economy to bottom out in the latter half of 2009 and proceed to expand in 2010.
Portfolio Facts
As of December 31, 2008
Net Assets | $167,930,800 | |
NAV | $12.07 | |
NAV - High† | 6/5/2008 - $20.09 | |
NAV - Low† | 11/20/2008 - $9.87 | |
Number of Holdings: 157 |
| † | For the year ended December 31, 2008 |
Average Annual Total Returns1
As of December 31, 2008
1-Year | 5-Year | From Inception | ||||
| (27.05%) | 2.38 | % | 8.54 | % |
Value of a $10,000 Investment1
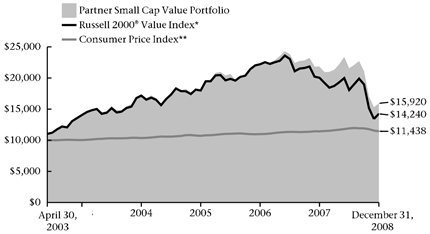
* | The Russell 2000® Value Index measures the performance of small cap value stocks. It is not possible to invest directly in the Index. The performance of the Index does not reflect deductions for fees, expenses or taxes. |
| ** | The Consumer Price Index is an inflationary indicator that measures the change in the cost of a fixed basket of products and services, including housing, electricity, food and transportation. It is not possible to invest directly in the Index. |
Past performance is not an indication of future results. Total investment return and principal value will fluctuate and units, when redeemed, may be worth more or less than their original cost. Current performance may be higher or lower than the performance data quoted. Market volatility can significantly affect short-term performance, and more recent returns may be different from those shown. Call 800-THRIVENT or visit www.thrivent.com for performance results current to the most recent month-end.
1 | Annualized total returns represent past performance and reflect changes in share prices, the reinvestment of all dividends and capital gains, and the effects of compounding. Periods of less than one year are not annualized. At various times, the Portfolio’s adviser reimbursed and/or paid non-advisory Portfolio expenses. Had the adviser not done so, the Portfolio’s total returns would have been lower. The returns shown do not reflect charges and expenses imposed on contract holders by the variable accounts. Those charges and expenses reduce the returns received by contract holders as compared to the returns presented. |
Investing in a variable product involves risks, including the possible loss of principal. The prospectus contains more complete information on the investment objectives, risks, charges and expenses of the investment company, which investors should read and consider carefully before investing. To obtain a prospectus, contact a registered representative or visit www.thrivent.com.
27
Table of Contents

How did the Portfolio perform during the 12-month period ending December 31, 2008?
Thrivent Small Cap Stock Portfolio earned a return of -37.52%, as compared to the median return of its peer group, the Lipper Small Cap Core category, of -34.13%. The Portfolio’s market benchmark, the Russell 2000® Index, earned a return of -33.79%.
What factors affected the Portfolio’s performance?
During the period, the financial markets saw unprecedented volatility due, in large part, to the weaknesses of both the housing and credit markets. The impact of this crisis reverberated throughout all financial markets, resulting in significant losses on an absolute basis for most asset classes, including small cap stocks. There was literally no place to hide as all sectors had negative returns for the period, although defensive sectors such as utilities, consumer staples, financials and health care performed better than the economically sensitive sectors of energy, materials, industrials and information technology (IT). As the crisis unfolded, massive governmental intervention in the markets ensued. Given our concerns regarding the deteriorating credit environment and an over-levered consumer, the Portfolio was underweighted in the financials sector, which resulted in negative relative performance as the massive government intervention stabilized and supported the sector.
Additionally, our economically sensitive holdings detracted from Portfolio performance during the period as the market recognized the potential for a global economic slowdown. On the positive side, the Portfolio benefited from superior security selection within the consumer discretionary space, particularly within the media, restaurants and specialty retail industries.
What is your outlook?
We remain concerned regarding the worldwide economic outlook, as the credit crisis continues to roil the financial markets and many of the world’s largest economies have entered a recession. Deflationary forces will likely continue to push down valuations on almost all assets, including real estate, stocks, bonds, commodities and oil. We expect increased job losses and a higher unemployment rate going forward, along with declining wage growth. Therefore, the outlook for consumer spending remains bleak, which translates into weak economic growth.
Major Market Sectors
(% of Net Assets)
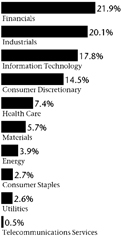
Portfolio Composition
(% of Portfolio)
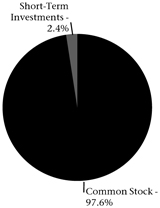
Top 10 Holdings
(% of Net Assets)
WMS Industries, Inc. | 0.7 | % | |
Regal-Beloit Corporation | 0.7 | % | |
URS Corporation | 0.7 | % | |
Platinum Underwriters Holdings, Ltd. | 0.6 | % | |
Amerisafe, Inc. | 0.6 | % | |
Oil States International, Inc. | 0.6 | % | |
Aspen Insurance Holdings, Ltd. | 0.6 | % | |
Kaydon Corporation | 0.6 | % | |
Hanover Insurance Group, Inc. | 0.6 | % | |
Aaron Rents, Inc. | 0.6 | % |
These securities represent 6.3% of the total net assets of the portfolio.
Quoted Major Market Sectors, Portfolio Composition and Top 10 Holdings are subject to change.
The lists of Major Market Sectors and Top 10 Holdings exclude short-term investments and collateral held for securities loaned.
The Portfolio Composition chart excludes collateral held for securities loaned.
28
Table of Contents
However, due to the massive fiscal and monetary stimulus that has been or will be pumped into the financial system, as well as due to the equity markets’ apparent willingness to discount an economic recovery in the face of deteriorating fundamentals, the Portfolio is positioned more aggressively than in recent history. Currently, the Portfolio is positioned with an overweighted stance in the consumer discretionary, industrials, information technology and materials sectors, while underweighted in the financials, health care and consumer staples sectors. Given our longer-term concerns, we are closely monitoring economic and market data points for signs of further market downside, and will move to a less economically sensitive and more defensive Portfolio positioning as conditions warrant.
Portfolio Facts
As of December 31, 2008
Net Assets | $288,059,725 | |
NAV | $8.49 | |
NAV - High† | 1/2/2008 - $15.29 | |
NAV - Low† | 11/20/2008 - $7.01 | |
Number of Holdings: 280 |
| † | For the year ended December 31, 2008 |
Average Annual Total Returns1
As of December 31, 2008
1-Year | 5-Year | From Inception 3/1/2001 | ||||
| (37.52%) | (0.31 | %) | 2.57 | % |
Value of a $10,000 Investment1
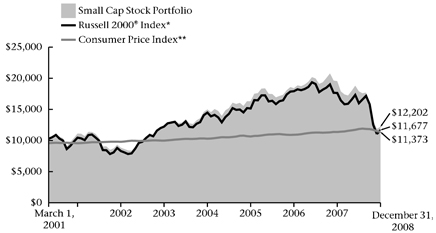
* | The Russell 2000® Index measures the performance of small cap stocks. It is not possible to invest directly in the Index. The performance of the Index does not reflect deductions for fees, expenses or taxes. |
| ** | The Consumer Price Index is an inflationary indicator that measures the change in the cost of a fixed basket of products and services, including housing, electricity, food and transportation. It is not possible to invest directly in the Index. |
Past performance is not an indication of future results. Total investment return and principal value will fluctuate and units, when redeemed, may be worth more or less than their original cost. Current performance may be higher or lower than the performance data quoted. Market volatility can significantly affect short-term performance, and more recent returns may be different from those shown. Call 800-THRIVENT or visit www.thrivent.com for performance results current to the most recent month-end.
1 | Annualized total returns represent past performance and reflect changes in share prices, the reinvestment of all dividends and capital gains, and the effects of compounding. Periods of less than one year are not annualized. At various times, the Portfolio’s adviser reimbursed and/or paid non-advisory Portfolio expenses. Had the adviser not done so, the Portfolio’s total returns would have been lower. The returns shown do not reflect charges and expenses imposed on contract holders by the variable accounts. Those charges and expenses reduce the returns received by contract holders as compared to the returns presented. |
Investing in a variable product involves risks, including the possible loss of principal. The prospectus contains more complete information on the investment objectives, risks, charges and expenses of the investment company, which investors should read and consider carefully before investing. To obtain a prospectus, contact a registered representative or visit www.thrivent.com.
29
Table of Contents

How did the Portfolio perform during the 12-month period ended December 31, 2008?
Thrivent Small Cap Index Portfolio earned a total return of -31.07%, as compared to the median return of its peer group, the Lipper Small Cap Core category, of -34.13%. The Portfolio’s market benchmark, the S&P SmallCap 600 Index, earned a return of - 31.08%.
What factors affected the Portfolio’s performance?
The Portfolio is managed to virtually replicate the performance of the S&P SmallCap 600 Index, a prime measure of small stock performance. We seek to maintain a fully invested position with limited transactions to minimize costs. As typically occurs with an Index fund, the difference in performance between the benchmark Index and the Portfolio itself can be largely attributed to expenses and minor differences in portfolio composition.
Small-cap stocks outperformed both mid-cap stocks and large-cap stocks for the last 12 months. No sectors in the benchmark index sported a positive return. Utilities and consumer staples had the least negative returns. The stocks of materials firms and telecommunication services were the weakest performers, posting the most negative returns. Market participants re-evaluated the economic stress in the global economic system and growth expectations were diminished.
What is your outlook?
The Portfolio will remain fully invested in stocks designed to track the performance of the S&P SmallCap 600 Index. This offers individuals an attractive way to take advantage of the growth potential of the broad, diversified marketplace of small-cap stocks.
Small-cap companies, particularly those exposed to the domestic markets and U.S. consumers, have had a more challenging operating environment relative to mid-cap companies. Policy actions have been undertaken to forestall any lasting impact from the ongoing unwinding of the excesses in housing that occurred last cycle. The financial markets appear to be resolving some of the uncertainty and ambiguity that has surrounded the fixed income markets and led to the severe credit contraction.
Major Market Sectors
(% of Net Assets)
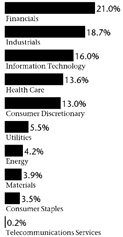
Portfolio Composition
(% of Portfolio)
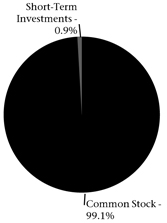
Top 10 Holdings
(% of Net Assets)
Piedmont Natural Gas Company, Inc. | 0.7 | % | |
Itron, Inc. | 0.7 | % | |
Atmos Energy Corporation | 0.7 | % | |
Senior Housing Property Trust | 0.6 | % | |
Watson Wyatt Worldwide, Inc. | 0.6 | % | |
Landstar System, Inc. | 0.6 | % | |
Immucor, Inc. | 0.6 | % | |
ProAssurance Corporation | 0.5 | % | |
CLARCOR, Inc. | 0.5 | % | |
New Jersey Resources Corporation | 0.5 | % |
These securities represent 6.0% of the total net assets of the portfolio.
Quoted Major Market Sectors, Portfolio Composition and Top 10 Holdings are subject to change.
The lists of Major Market Sectors and Top 10 Holdings exclude short-term investments and collateral held for securities loaned.
The Portfolio Composition chart excludes collateral held for securities loaned.
30
Table of Contents
It is possible that a new cycle may be starting. Typically, as a new economic cycle starts, investors begin to favor smaller-cap issues. At the same time, we are realistic in our expectations that the premium return to the small cap sector is likely to be reduced in the future as the economic cycle continues.
Portfolio Facts
As of December 31, 2008
Net Assets | $192,193,621 | |
NAV | $10.54 | |
NAV - High† | 6/5/2008 - $19.62 | |
NAV - Low† | 11/20/2008 - $8.15 | |
Number of Holdings: 603 |
| † | For the year ended December 31, 2008 |
Average Annual Total Returns1
As of December 31, 2008
1-Year | 5-Year | 10-Year | |||||
| (31.07 | %) | 0.61 | % | 4.88 | % |
Value of a $10,000 Investment1
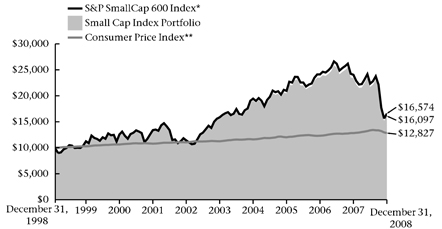
| * | The S&P SmallCap 600 Index is an index that represents the average performance of a group of 600 small capitalization stocks. The product is not sponsored, endorsed or promoted by Standard & Poor’s, and Standard & Poor’s makes no representation regarding the advisability of investing in the product. It is not possible to invest directly in the Index. The performance of the Index does not reflect deductions for fees, expenses and taxes. |
| ** | The Consumer Price Index is an inflationary indicator that measures the change in the cost of a fixed basket of products and services, including housing, electricity, food and transportation. It is not possible to invest directly in the Index. |
Past performance is not an indication of future results. Total investment return and principal value will fluctuate and units, when redeemed, may be worth more or less than their original cost. Current performance may be higher or lower than the performance data quoted. Market volatility can significantly affect short-term performance, and more recent returns may be different from those shown. Call 800-THRIVENT or visit www.thrivent.com for performance results current to the most recent month-end.
1 | Annualized total returns represent past performance and reflect changes in share prices, the reinvestment of all dividends and capital gains, and the effects of compounding. Periods of less than one year are not annualized. At various times, the Portfolio’s adviser reimbursed and/or paid non-advisory Portfolio expenses. Had the adviser not done so, the Portfolio’s total returns would have been lower. The returns shown do not reflect charges and expenses imposed on contract holders by the variable accounts. Those charges and expenses reduce the returns received by contract holders as compared to the returns presented |
Investing in a variable product involves risks, including the possible loss of principal. The prospectus contains more complete information on the investment objectives, risks, charges and expenses of the investment company, which investors should read and consider carefully before investing. To obtain a prospectus, contact a registered representative or visit www.thrivent.com.
31
Table of Contents

How did the Portfolio perform during the 12-month period ended December 31, 2008?
Thrivent Mid Cap Growth Portfolio II earned a return of -42.71%, as compared to the median return of its peer group, the Lipper Mid Cap Growth category, of -45.41%. The Portfolio’s market benchmark, the Russell Midcap® Growth Index, earned a return of -44.32%.
What factors affected the Portfolio’s performance?
Over the fiscal year, the global financial markets have been buffeted by the severe credit crisis that now is impairing growth not only in the United States, but in global economies as well.
Although the Portfolio outperformed its benchmark and peers, it too suffered a significant decline. We had been concerned about economic instability and had held a modest but not insignificant position in cash over the period, which was a positive factor for Portfolio results. The Portfolio’s underweighted position in the financial sector was another contributor to performance; in addition, stock selection was better than average.
Stock selection in the consumer sector helped performance. In particular, educational services companies performed well as they benefited from increased student enrollment due to the difficult job market. Stock selection in the telecom services area was a drag on performance over the past twelve months as many of these companies rely on debt markets to finance their growth.
What is your outlook?
As we look at investing in this market, we still come back to the fact that despite all the problems with our system right now, we believe the United States still has more transparency in its financial system than any other nation on the globe. We believe policymakers are taking the right steps to shore up the banking system, and we have seen encouraging signs that the short-term money market and commercial paper markets have stabilized. We are also seeing encouraging signs in the bond market. Corporate bond spreads are narrowing, which means that investors are beginning to move out slightly on the risk curve. We believe these are all important steps in repairing the damaged financial system.
Major Market Sectors
(% of Net Assets)
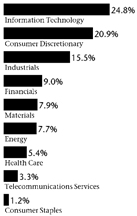
Portfolio Composition
(% of Portfolio)
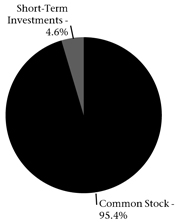
Top 10 Holdings
(% of Net Assets)
Pactiv Corporation | 3.8 | % | |
WMS Industries, Inc. | 3.1 | % | |
Burger King Holdings, Inc. | 2.9 | % | |
F5 Networks, Inc. | 2.6 | % | |
DeVry, Inc. | 2.6 | % | |
Sunoco, Inc. | 2.3 | % | |
TD Ameritrade Holding Corporation | 2.3 | % | |
Activision Blizzard, Inc. | 2.3 | % | |
Ryanair Holdings plc | 2.3 | % | |
Owens-Illinois, Inc. | 2.2 | % |
These securities represent 26.4% of the total net assets of the portfolio.
Quoted Major Market Sectors, Portfolio Composition and Top 10 Holdings are subject to change.
The lists of Major Market Sectors and Top 10 Holdings exclude short-term investments and collateral held for securities loaned.
The Portfolio Composition chart excludes collateral held for securities loaned.
32
Table of Contents
While we do not believe we are fully through the credit unwind and subsequent recession in the U.S. economy, we do believe it is time to begin positioning the Portfolio toward early cycle stocks that will benefit from a turn in the U.S. economy over the course of the next eighteen months. With that as our base assumption, we are positioning the Portfolio toward stocks that have compelling valuations, trough margins, potential product cycles and above all, healthy balance sheets.
While we believe the emerging markets will, over the course of time, continue to grow and be an ever bigger factor in global supply and demand equations, we think that it will be the United States that comes out of the quagmire first. However, in the next 12 to 24 months, these emerging areas may be good places once again to look for growth ideas.
Portfolio Facts
As of December 31, 2008
Net Assets | $80,770,879 | |
NAV | $5.65 | |
NAV - High† | 6/5/2008 - $11.35 | |
NAV - Low† | 11/20/2008 - $4.34 | |
Number of Holdings: 79 |
| † | For the year ended December 31, 2008 |
Average Annual Total Returns1
As of December 31, 2008
1-Year | 5-Year | From Inception 11/30/2001 | |||||
| (42.71 | %) | (0.71 | %) | (3.24 | %) |
Value of a $10,000 Investment1
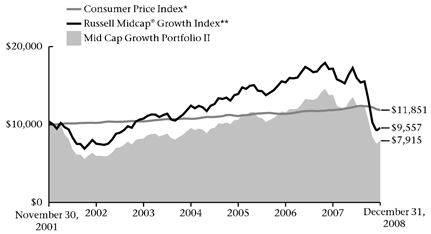
| * | The Consumer Price Index is an inflationary indicator that measures the change in the cost of a fixed basket of products and services, including housing, electricity, food and transportation. It is not possible to invest directly in the Index. |
** | The Russell Midcap® Growth Index measures the performance of mid cap growth stocks. It is not possible to invest directly in the Index. The performance of the Index does not reflect deductions for fees, expenses or taxes. |
Past performance is not an indication of future results. Total investment return and principal value will fluctuate and units, when redeemed, may be worth more or less than their original cost. Current performance may be higher or lower than the performance data quoted. Market volatility can significantly affect short-term performance, and more recent returns may be different from those shown. Call 800-THRIVENT or visit www.thrivent.com for performance results current to the most recent month-end.
1 | Annualized total returns represent past performance and reflect changes in share prices, the reinvestment of all dividends and capital gains, and the effects of compounding. Periods of less than one year are not annualized. At various times, the Portfolio’s adviser reimbursed and/or paid non-advisory Portfolio expenses. Had the adviser not done so, the Portfolio’s total returns would have been lower. The returns shown do not reflect charges and expenses imposed on contract holders by the variable accounts. Those charges and expenses reduce the returns received by contract holders as compared to the returns presented. |
Investing in a variable product involves risks, including the possible loss of principal. The prospectus contains more complete information on the investment objectives, risks, charges and expenses of the investment company, which investors should read and consider carefully before investing. To obtain a prospectus, contact a registered representative or visit www.thrivent.com.
33
Table of Contents
How did the Portfolio perform during the 12-month period ended December 31, 2009?
Thrivent Mid Cap Growth Portfolio earned a return of -41.13%, as compared to the median return of its peer group, the Lipper Mid Cap Growth category, of -45.41%. The Portfolio’s market benchmark, the Russell Midcap® Growth Index, earned a return of -44.32%.
What factors affected the Portfolio’s performance?
Over the fiscal year, the global financial markets have been buffeted by the severe credit crisis that now is impairing growth not only in the United States, but in global economies as well.
Although the Portfolio outperformed its benchmark and peers, it too suffered a significant decline. We had been concerned about economic instability and had held a modest but not insignificant position in cash over the period, which was a positive factor for Portfolio results. The Portfolio’s underweighted position in the financial sector was another contributor to performance; in addition, stock selection was better than average. An underweighted holding in the poorly-performing industrial sector was constructive for Portfolio returns relative to the benchmark.
Stock selection in the consumer sector helped performance. In particular, educational services companies performed well as they benefited from increased student enrollment due to the difficult job market. Stock selection in the telecom services area was a drag on performance over the past twelve months as many of these companies rely on debt markets to finance their growth.
What is your outlook?
As we look at investing in this market, we still come back to the fact that despite all the problems with our system right now, we believe the United States still has more transparency in its financial system than any other nation on the globe. We believe policymakers are taking the right steps to shore up the banking system, and we have seen encouraging signs that the short-term money market and commercial paper markets have stabilized. We are also seeing encouraging signs in the bond market. Corporate bond spreads are narrowing, which means that investors are beginning to move out slightly on the risk curve. We believe these are all important steps in repairing the damaged financial system.
Major Market Sectors
(% of Net Assets)
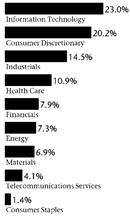
Portfolio Composition
(% of Portfolio)
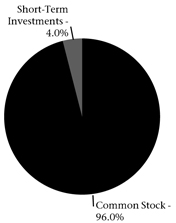
Top 10 Holdings
(% of Net Assets)
DeVry, Inc. | 2.1 | % | |
Burger King Holdings, Inc. | 2.0 | % | |
T. Rowe Price Group, Inc. | 2.0 | % | |
WMS Industries, Inc. | 1.9 | % | |
Pactiv Corporation | 1.9 | % | |
Owens-Illinois, Inc. | 1.9 | % | |
F5 Networks, Inc. | 1.8 | % | |
Activision Blizzard, Inc. | 1.8 | % | |
Myriad Genetics, Inc. | 1.7 | % | |
TD Ameritrade Holding Corporation | 1.6 | % |
These securities represent 18.7% of the total net assets of the portfolio.
Quoted Major Market Sectors, Portfolio Composition and Top 10 Holdings are subject to change.
The lists of Major Market Sectors and Top 10 Holdings exclude short-term investments and collateral held for securities loaned.
The Portfolio Composition chart excludes collateral held for securities loaned.
34
Table of Contents
While we continue to monitor all of these issues closely, these problems will ultimately be priced into stocks. We are optimistic that over the course of time, many of these headwinds will turn into tailwinds. While we do not believe we are fully through the credit unwind and subsequent recession in the U.S. economy, we do believe it is time to begin positioning the Portfolio toward early cycle stocks that will benefit from a turn in the U.S. economy over the course of the next eighteen months.
With that as our base assumption, we are positioning the Portfolio toward stocks that have compelling valuations, trough margins, potential product cycles and above all, healthy balance sheets.
While we believe the emerging markets will, over the course of time, continue to grow and be an ever bigger factor in global supply and demand equations, we think that it will be the United States that comes out of the quagmire first. However, in the next 12 to 24 months, these emerging areas may be good places once again to look for growth ideas.
Portfolio Facts
As of December 31, 2008
Net Assets | $275,101,796 | |
NAV | $9.55 | |
NAV - High† | 6/5/2008 - $20.01 | |
NAV - Low† | 11/20/2008 - $7.63 | |
Number of Holdings: 118 |
| † | For the year ended December 31, 2008 |
Average Annual Total Returns1
As of December 31, 2008
1-Year | 5-Year | 10-Year | ||||
| (41.13%) | (1.01 | %) | 2.66 | % |
Value of a $10,000 Investment1
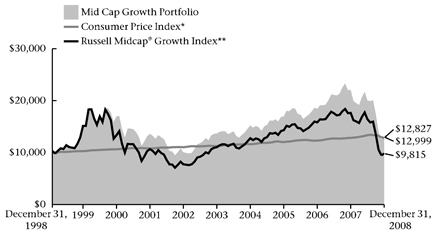
| * | The Consumer Price Index is an inflationary indicator that measures the change in the cost of a fixed basket of products and services, including housing, electricity, food and transportation. It is not possible to invest directly in the Index. |
** | The Russell Midcap® Growth Index measures the performance of mid cap growth stocks. It is not possible to invest directly in the Index. The performance of the Index does not reflect deductions for fees, expenses or taxes. |
Past performance is not an indication of future results. Total investment return and principal value will fluctuate and units, when redeemed, may be worth more or less than their original cost. Current performance may be higher or lower than the performance data quoted. Market volatility can significantly affect short-term performance, and more recent returns may be different from those shown. Call 800-THRIVENT or visit www.thrivent.com for performance results current to the most recent month-end.
1 | Annualized total returns represent past performance and reflect changes in share prices, the reinvestment of all dividends and capital gains, and the effects of compounding. Periods of less than one year are not annualized. At various times, the Portfolio’s adviser reimbursed and/or paid non-advisory Portfolio expenses. Had the adviser not done so, the Portfolio’s total returns would have been lower. The returns shown do not reflect charges and expenses imposed on contract holders by the variable accounts. Those charges and expenses reduce the returns received by contract holders as compared to the returns presented. |
Investing in a variable product involves risks, including the possible loss of principal. The prospectus contains more complete information on the investment objectives, risks, charges and expenses of the investment company, which investors should read and consider carefully before investing. To obtain a prospectus, contact a registered representative or visit www.thrivent.com.
35
Table of Contents

How did the Portfolio perform during the 12-month period ended December 31, 2008?
Thrivent Partner Mid Cap Value Portfolio earned a return of -35.05%, as compared to the median return for its peer group, the Lipper Mid Cap Value category, of -38.77%. The Portfolio’s market benchmark, the Russell Midcap® Value Index, earned a return of -38.44%.
What factors affected the Portfolio’s performance?
Results were good, compared the benchmark Index, but absolute returns were disappointing as equities suffered a severe correction. This was related to the ongoing disruptions to the capital markets and the economy from credit losses and capital shortfalls that have significantly impaired not only the price, but the availability, of credit to the global economic system. These effects have cascaded and a severe economic contraction appears to be underway as this report is being prepared. A moderate cash position in the Portfolio was the most significant contributing factor to better-than-Index results. Given the magnitude of the decline, even a small cash position provided significant value for shareholders.
Underweighted stances and good stock selection in both the consumer discretionary and financial sectors also were significant factors in good relative results. In the financial sector, our holdings in Hudson City Bancorp, Inc., Astoria Financial Corp. and People’s United Financial in the thrifts and mortgage finance industries actually advanced as their positions as highly disciplined, niche vendors of financial products was rewarded. In the consumer discretionary sector, H&R Block provided excellent returns on the diversified services industry, while in the media group, our holding in Viacom, Inc. advanced over the year.
Holdings in the information technology sector offset some of the better returns as results from stock selection in the group were sub-par. Shares of our holdings in the energy sector generally did not keep pace with the group and the sector underperformed the market for the year. The group performed well in the first half, but an extremely sharp correction in energy prices and commodities in general occurred in the second half of the year.
Major Market Sectors
(% of Net Assets)

Portfolio Composition
(% of Portfolio)

Top 10 Holdings
(% of Net Assets)
Entergy Corporation | 3.2 | % | |
W.R. Berkley Corporation | 2.7 | % | |
PPL Corporation | 2.5 | % | |
H&R Block, Inc. | 2.4 | % | |
Range Resources Corporation | 2.2 | % | |
Amphenol Corporation | 2.0 | % | |
Air Products and Chemicals, Inc. | 2.0 | % | |
Laboratory Corporation of America Holdings | 2.0 | % | |
EOG Resources, Inc. | 1.8 | % | |
DPL, Inc. | 1.8 | % |
These securities represent 22.6% of the total net assets of the portfolio.
Quoted Major Market Sectors, Portfolio Composition and Top 10 Holdings are subject to change.
The lists of Major Market Sectors and Top 10 Holdings exclude short-term investments and collateral held for securities loaned.
The Portfolio Composition chart excludes collateral held for securities loaned.
36
Table of Contents
What is your outlook?
Looking into 2009, we are cautious on companies led by unseasoned and untested management teams. We are also concerned that looming earnings disappointments will support market volatility at elevated levels. While we do not expect a swift end to corporate weakness, we do see prospects in select companies that are poised to benefit from an environment of lower competition, higher pricing and improved market share. As such, we are excited to find ourselves in a unique market rich with newly-discounted opportunities for fundamental stock pickers. We believe our consistent, disciplined approach to identifying these high-quality, cash-generative businesses will enable our portfolios to achieve consistent, strong and competitive returns over time.
Portfolio Facts
As of December 31, 2008
Net Assets | $123,336,824 | |
NAV | $8.25 | |
NAV - High† | 6/5/2008 - $14.01 | |
NAV - Low† | 11/20/2008 - $6.78 | |
Number of Holdings: 114 |
| † | For the year ended December 31, 2008 |
Average Annual Total Returns1
As of December 31, 2008
1-Year | From Inception 4/29/2005 | ||
| (35.05%) | (2.97 | %) |
Value of a $10,000 Investment1

| * | The Consumer Price Index is an inflationary indicator that measures the change in the cost of a fixed basket of products and services, including housing, electricity, food and transportation. It is not possible to invest directly in the Index. |
** | The Russell Midcap® Value Index is an index comprised of mid-cap companies with lower than average price-to-book ratios and lower forecasted growth values. It is not possible to invest directly in the Index. The performance of the Index does not reflect deductions for fees, expenses or taxes. |
Past performance is not an indication of future results. Total investment return and principal value will fluctuate and units, when redeemed, may be worth more or less than their original cost. Current performance may be higher or lower than the performance data quoted. Market volatility can significantly affect short-term performance, and more recent returns may be different from those shown. Call 800-THRIVENT or visit www.thrivent.com for performance results current to the most recent month-end.
1 | Annualized total returns represent past performance and reflect changes in share prices, the reinvestment of all dividends and capital gains, and the effects of compounding. Periods of less than one year are not annualized. At various times, the Portfolio’s adviser reimbursed and/or paid non-advisory Portfolio expenses. Had the adviser not done so, the Portfolio’s total returns would have been lower. The returns shown do not reflect charges and expenses imposed on contract holders by the variable accounts. Those charges and expenses reduce the returns received by contract holders as compared to the returns presented. |
Investing in a variable product involves risks, including the possible loss of principal. The prospectus contains more complete information on the investment objectives, risks, charges and expenses of the investment company, which investors should read and consider carefully before investing. To obtain a prospectus, contact a registered representative or visit www.thrivent.com.
37
Table of Contents

How did the Portfolio perform during the 12-month period ended December 31, 2008?
Thrivent Mid Cap Stock Portfolio earned a total return of -40.75%, as compared to the median return of its peer group, the Lipper Mid Cap Core Category, of -37.21%. The Portfolio’s market benchmark, the Russell Midcap® Index, earned a return of -41.46%.
What factors affected the Portfolio’s performance?
The Portfolio slightly outperformed its benchmark in what has been one of the worst years ever for the financial markets. While no sector was positive on an absolute basis, the financials, materials, consumer staples and information technology (IT) sectors all provided relative outperformance. This positive relative performance was offset by the energy, industrial and utility sectors.
Security selection within the insurance and commercial bank sectors led the financial performance. Decent container volumes, significant price increases and cost management benefited Silgan Holdings, Inc. which provided the majority of the materials sector outperformance. Overweighting the consumer staples sector proved beneficial. These contributions were offset by poor timing within the energy, industrial and utility sectors. Being underweighted in the energy and utility sectors for much of the first half of the year weighed on performance as commodity prices hit all-time highs. Neutralizing these sectors at the middle of year failed to recapture that underperformance when the commodity prices plummeted.
What is your outlook?
The U.S. economic slowdown has been fast and furious, and the implications appear to be spreading to Europe and Asia quickly. In this uncertain environment, valuation based on metrics, including cash levels, book values, and normalized earnings, is arguably the ballast providing safety and opportunity. Information technology, materials and financials are some attractive sectors. Even though information technology (IT) spending levels continue to fall, the technology sector offers, in our opinion, many compelling characteristics–attractive valuations, strong balance sheets and cash flows, and restrained corporate IT spending during the past few years. The valuation support should offer
Major Market Sectors
(% of Net Assets)
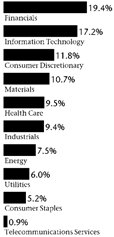
Portfolio Composition
(% of Portfolio)
Top 10 Holdings
(% of Net Assets)
HCC Insurance Holdings, Inc. | 3.7 | % | |
W.R. Berkley Corporation | 3.2 | % | |
Compuware Corporation | 1.9 | % | |
Silgan Holdings, Inc. | 1.8 | % | |
Albemarle Corporation | 1.8 | % | |
Crown Holdings, Inc. | 1.7 | % | |
Dollar Tree, Inc. | 1.5 | % | |
FormFactor, Inc. | 1.5 | % | |
Atmel Corporation | 1.5 | % | |
TreeHouse Foods, Inc. | 1.5 | % |
These securities represent 20.1% of the total net assets of the portfolio.
Quoted Major Market Sectors, Portfolio Composition and Top 10 Holdings are subject to change.
The lists of Major Market Sectors and Top 10 Holdings exclude short-term investments and collateral held for securities loaned.
The Portfolio Composition chart excludes collateral held for securities loaned.
38
Table of Contents
downside protection, and the restrained spending should create pent-up demand when the cycle eventually turns. While the slowing economy has resulted in less volume growth lately, declining raw material costs should offer significant margin leverage in 2009. While still underweighted in the industrial and consumer discretionary sectors, selective positions have been added to the Portfolio. Both sectors continue to face material headwinds. A slowing economy, a weak job market and a significant tightening of credit should all limit discretionary purchases, and as the consumer delevers his/her balance sheet, spending may decline for many quarters. However, attractive valuations, combined with significant fiscal stimulus, are providing selective opportunities within these sectors.
Portfolio Facts
As of December 31, 2008
Net Assets | $379,883,030 | |
NAV | $7.08 | |
NAV - High† | 1/2/2008 - $12.92 | |
NAV - Low† | 11/20/2008 - $5.74 | |
Number of Holdings: 130 |
| † | For the year ended December 31, 2008 |
Average Annual Total Returns1
As of December 31, 2008
1-Year | 5-Year | From Inception 3/1/2001 | ||||
| (40.75%) | (0.63 | %) | (0.26 | %) |
Value of a $10,000 Investment1
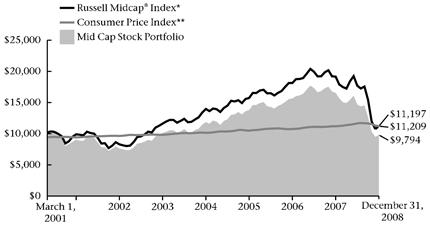
* | The Russell Midcap® Index is an index that measures the performance of the smallest 800 securities in the Russell 1000® Index, as ranked by total market capitalization. It is not possible to invest directly in the index. The performance of the Index does not reflect deductions for fees, expenses or taxes. |
| ** | The Consumer Price Index is an inflationary indicator that measures the change in the cost of a fixed basket of products and services, including housing, electricity, food and transportation. It is not possible to invest directly in the Index. |
Past performance is not an indication of future results. Total investment return and principal value will fluctuate and units, when redeemed, may be worth more or less than their original cost. Current performance may be higher or lower than the performance data quoted. Market volatility can significantly affect short-term performance, and more recent returns may be different from those shown. Call 800-THRIVENT or visit www.thrivent.com for performance results current to the most recent month-end.
1 | Annualized total returns represent past performance and reflect changes in share prices, the reinvestment of all dividends and capital gains, and the effects of compounding. Periods of less than one year are not annualized. At various times, the Portfolio’s adviser reimbursed and/or paid non-advisory Portfolio expenses. Had the adviser not done so, the Portfolio’s total returns would have been lower. The returns shown do not reflect charges and expenses imposed on contract holders by the variable accounts. Those charges and expenses reduce the returns received by contract holders as compared to the returns presented |
Investing in a variable product involves risks, including the possible loss of principal. The prospectus contains more complete information on the investment objectives, risks, charges and expenses of the investment company, which investors should read and consider carefully before investing. To obtain a prospectus, contact a registered representative or visit www.thrivent.com.
39
Table of Contents

How did the Portfolio perform during the 12-month period ended December 31, 2008?
Thrivent Mid Cap Index Portfolio earned a total return of -36.29%, as compared to the median return of its peer group, the Lipper Mid Cap Core category, of -37.21%. The Portfolio’s market benchmark, the S&P MidCap 400 Index, earned a return of -36.24%.
What factors affected the Portfolio’s performance?
Because the Portfolio is designed to invest in a way that reflects its benchmark Index, the S&P MidCap 400 Index, the only changes made to the Portfolio are done to reconcile with any alterations in the composition of the Index itself. As typically occurs with an Index fund, the difference in performance between the benchmark Index and the Portfolio can be largely attributed to expenses and minor differences in portfolio composition.
Mid-caps outperformed large-cap stocks, but underperformed small-cap stocks. All sectors in the benchmark Index posted negative returns. Utilities and consumer staples posted the least negative returns, bolstered by being defensive in nature. Energy and telecommunication services underperformed the most due to severe selling pressure as market participants re- evaluated stress in the global economic system and lowered growth expectations. The energy sector was also impacted by lower energy demand brought on by lessened consumer and corporate activity.
What is your outlook?
The Portfolio will remain fully invested in a way that tracks the performance of the S&P MidCap 400 Index. This is an attractive way for individuals to take advantage of the investment potential of the broad, diversified marketplace for mid-cap stocks.
Mid- and small-cap companies, particularly those exposed to the domestic markets and U.S. consumers, outperformed their large-cap counterparts. Policy actions have been undertaken to forestall any lasting impact from the ongoing unwinding of the excesses in housing that occurred last cycle. Additionally, the financial markets appear to be resolving some of the uncertainty and ambiguity that has surrounded the fixed-income markets and that led to the severe credit contraction.
Major Market Sectors
(% of Net Assets)
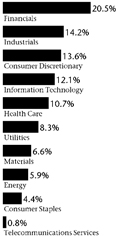
Portfolio Composition
(% of Portfolio)
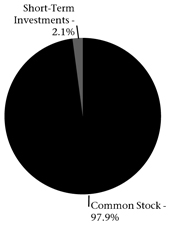
Top 10 Holdings
(% of Net Assets)
Everest Re Group, Ltd. | 0.7 | % | |
Vertex Pharmaceuticals, Inc. | 0.7 | % | |
Health Care REIT, Inc. | 0.6 | % | |
W.R. Berkley Corporation | 0.6 | % | |
New York Community Bancorp, Inc. | 0.6 | % | |
O’Reilly Automotive, Inc. | 0.6 | % | |
Martin Marietta Materials, Inc. | 0.6 | % | |
MDU Resources Group, Inc. | 0.6 | % | |
SAIC, Inc. | 0.6 | % | |
Church & Dwight Company, Inc. | 0.6 | % |
These securities represent 6.2% of the total net assets of the portfolio.
Quoted Major Market Sectors, Portfolio Composition and Top 10 Holdings are subject to change.
The lists of Major Market Sectors and Top 10 Holdings exclude short-term investments and collateral held for securities loaned.
The Portfolio Composition chart excludes collateral held for securities loaned.
40
Table of Contents
As mentioned six months ago, it is possible that a transition may be taking place. Typically, as a new economic cycle starts, investors begin to favor mid- and small-cap issues. We believe that attractive opportunities are available in the mid-cap marketplace in the months ahead. At the same time, we are realistic in our expectations that the premium return to the mid-cap sector is likely to be reduced in the future as the economic cycle continues.
Portfolio Facts
As of December 31, 2008
Net Assets | $75,140,296 | |
NAV | $8.31 | |
NAV - High† | 6/5/2008 - $15.97 | |
NAV - Low† | 11/20/2008 - $6.43 | |
Number of Holdings: 403 |
| † | For the year ended December 31, 2008 |
Average Annual Total Returns1
As of December 31, 2008
1-Year | 5-Year | From Inception 3/1/2001 | ||||
| (36.29%) | (0.42 | %) | 1.93 | % |
Value of a $10,000 Investment1

| * | The S&P MidCap 400 Index is an index that represents the average performance of a group of 400 medium capitalization stocks. The product is not sponsored, endorsed or promoted by Standard & Poor’s, and Standard & Poor’s makes no representation regarding the advisability of investing in the product. It is not possible to invest directly in the Index. The performance of the Index does not reflect deductions for fees, expenses or taxes. |
| ** | The Consumer Price Index is an inflationary indicator that measures the change in the cost of a fixed basket of products and services, including housing, electricity, food and transportation. It is not possible to invest directly in the Index. |
Past performance is not an indication of future results. Total investment return and principal value will fluctuate and units, when redeemed, may be worth more or less than their original cost. Current performance may be higher or lower than the performance data quoted. Market volatility can significantly affect short-term performance, and more recent returns may be different from those shown. Call 800-THRIVENT or visit www.thrivent.com for performance results current to the most recent month-end.
1 | Annualized total returns represent past performance and reflect changes in share prices, the reinvestment of all dividends and capital gains, and the effects of compounding. Periods of less than one year are not annualized. At various times, the Portfolio’s adviser reimbursed and/or paid non-advisory Portfolio expenses. Had the adviser not done so, the Portfolio’s total returns would have been lower. The returns shown do not reflect charges and expenses imposed on contract holders by the variable accounts. Those charges and expenses reduce the returns received by contract holders as compared to the returns presented. |
Investing in a variable product involves risks, including the possible loss of principal. The prospectus contains more complete information on the investment objectives, risks, charges and expenses of the investment company, which investors should read and consider carefully before investing. To obtain a prospectus, contact a registered representative or visit www.thrivent.com.
41
Table of Contents

How did the Portfolio perform during the 8-month period ended December 31, 2008?
Thrivent Partner Worldwide Allocation Portfolio earned a return of -39.09% from its inception date of April 30, 2008, through December 31, 2008. Over the same period, the Portfolio’s market benchmark, the MSCI All Country World Index ex-USA, earned a return of return of -43.38%.
What factors affected the Portfolio’s performance?
Allocations were the most significant factor for the relatively better results achieved in the Portfolio versus the benchmark Index. An underweighted stance in the financial sector, a moderate cash position, and an allocation of approximately 10% to emerging market debt, were the major factors for the Portfolio’s outperformance of the benchmark. Financial shares are a significant component of non-U.S. indexes and the Portfolio had an average exposure of less than half of that in the Index. Given the severe declines in the indexes, a moderate position in short-term securities achieved a positive return. An allocation of Portfolio assets to emerging market debt also aided results. Although the decline in debt prices was significant, it was not as severe as the declines achieved in either developed or emerging market equity prices. Shares of health care related companies were also overweighted in the Portfolio and this sector declined much less significantly than the broader averages. Materials companies declined quite significantly but the Portfolio was underweighted in the sector and each factor offset the other. Holdings in the emerging markets segment of the Portfolio also performed better than both the emerging market indexes and the developed market Index over the relevant time period.
Major Market Sectors
(% of Net Assets)
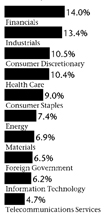
Portfolio Composition
(% of Portfolio)

Top 10 Countries
(% of Net Assets)
Japan | 18.0 | % | |
United Kingdom | 13.2 | % | |
Switzerland | 6.9 | % | |
France | 5.9 | % | |
Germany | 4.2 | % | |
Brazil | 3.6 | % | |
Spain | 3.4 | % | |
Netherlands | 2.9 | % | |
Italy | 2.6 | % | |
Australia | 2.5 | % |
Investments in securities in these countries represent 63.2% of the total net assets of the portfolio.
Quoted Major Market Sectors, Portfolio Composition and Top 10 Holdings are subject to change.
The lists of Major Market Sectors and Top 10 Holdings exclude short-term investments and collateral held for securities loaned.
The Portfolio Composition chart excludes collateral held for securities loaned.
42
Table of Contents
What is your outlook?
The decline in global equity prices has resulted in many companies trading at prices that are less than the intrinsic value of their business. That said, undervaluation in and of itself is not a reason for a security to go up. Prospects for an economic recovery must take hold so that investors can have confidence in earnings. Recognizing the difficulty in predicting the timing of such a recovery, we are moving deliberately but cautiously. We believe the efforts by governments and central banks to stimulate economic growth will eventually succeed but that the pace of recovery is likely to be sub-par versus past economic recoveries.
Portfolio Facts
As of December 31, 2008
Net Assets | $105,901,531 | |
NAV | $6.03 | |
NAV - High† | 5/16/2008 - $10.33 | |
NAV - Low† | 11/20/2008 - $5.01 | |
Number of Holdings: 373 |
| † | For the year ended December 31, 2008 |
Average Annual Total Returns1
As of December 31, 2008
From Inception |
| (39.09%) |
Value of a $10,000 Investment1
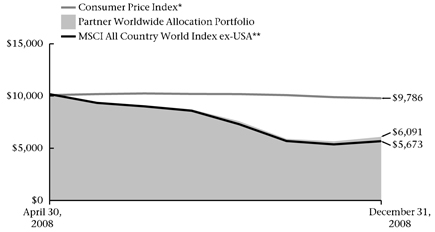
| * | The Consumer Price Index is an inflationary indicator that measures the change in the cost of a fixed basket of products and services, including housing, electricity, food and transportation. It is not possible to invest directly in the Index. |
| ** | The MSCI All Country World Index ex-USA is an unmanaged market capitalization-weighted index that is designed to represent the performance of developed and emerging stock markets throughout the world. It is not possible to invest directly in the Index. The performance of the Index does not reflect deductions for fees, expenses or taxes. |
Past performance is not an indication of future results. Total investment return and principal value will fluctuate and units, when redeemed, may be worth more or less than their original cost. Current performance may be higher or lower than the performance data quoted. Market volatility can significantly affect short-term performance, and more recent returns may be different from those shown. Call 800-THRIVENT or visit www.thrivent.com for performance results current to the most recent month-end.
1 | Annualized total returns represent past performance and reflect changes in share prices, the reinvestment of all dividends and capital gains, and the effects of compounding. Periods of less than one year are not annualized. At various times, the Portfolio’s adviser reimbursed and/or paid non-advisory Portfolio expenses. Had the adviser not done so, the Portfolio’s total returns would have been lower. The returns shown do not reflect charges and expenses imposed on contract holders by the variable accounts. Those charges and expenses reduce the returns received by contract holders as compared to the returns presented. |
Investing in a variable product involves risks, including the possible loss of principal. The prospectus contains more complete information on the investment objectives, risks, charges and expenses of the investment company, which investors should read and consider carefully before investing. To obtain a prospectus, contact a registered representative or visit www.thrivent.com.
43
Table of Contents

How did the Portfolio perform during the 12-month period ended December 31, 2008?
Thrivent Partner International Stock Portfolio earned a return of -41.10%, as compared to the median return for its peer group, the Lipper International Core category, of - -43.08%. The Portfolio’s market benchmark, the MSCI Europe, Australasia and Far East (MSCI EAFE) Index, earned -43.06%.
What factors affected the Portfolio’s performance?
An underweighted position in the poorly performing financial sector was a key reason that the Portfolio bested the return of the benchmark Index. Financial stocks, even at severely lower prices than existed a year ago, still represent almost a quarter of the benchmark Index. In addition, stock selection within the group was modestly better than average. Both of these factors combined to have a constructive effect on relative results. An overweighted stance in the health care sector was also helpful, as the group performed better than the Index. Pharmaceutical companies tend to have more stable earnings and revenue streams and were an attractive alternative for investors during the market turmoil in the second half of the year. Likewise for the consumer staples group, another sector that tends to perform better in periods of market and/or economic weakness; we overweighted our positions in that group. Nestle S.A. was a meaningful holding in the food products industry and provided excellent relative results. A modest cash position also mitigated the decline in the broader Portfolio that occurred over the fiscal year.
The cyclically sensitive industrials sector offset some of the positives mentioned above. Security selection within the group was sub-par, the group underperformed the broader Index and we were moderately overweighted to the group. Global growth was not expected to slow as much owing to the organic growth still evident in the emergence of the middle class consumers in developing nations. While this is true, the slowdown in the global economies was sufficient to slow investment growth even in the emerging economies. The sharp fall-off in energy and commodity prices was a factor not only in the slowdown in some emerging economies, but also weakened performance to holdings in the energy sector. For the full period, the group outperformed the broader benchmark, but it accomplished this with extraordinarily strong returns in the first half and weak returns in the latter part of the year. The Portfolio was underweighted in the group, and our lack of significant exposure to defensive global integrated companies such as Royal Dutch and BP, PLC caused our holdings to lag behind the group and the Index.
Major Market Sectors
(% of Net Assets)
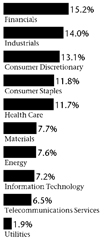
Portfolio Composition
(% of Portfolio)
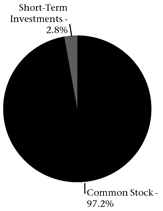
Top 10 Countries
(% of Net Assets)
Japan | 23.3 | % | |
United Kingdom | 19.2 | % | |
Switzerland | 11.6 | % | |
France | 8.0 | % | |
Germany | 5.4 | % | |
Spain | 5.2 | % | |
Italy | 4.0 | % | |
Australia | 2.7 | % | |
Netherlands | 2.7 | % | |
Canada | 2.7 | % |
Investments in securities in these countries represent 84.8% of the total net assets of the portfolio.
Quoted Major Market Sectors, Portfolio Composition and Top 10 Holdings are subject to change.
The lists of Major Market Sectors and Top 10 Holdings exclude short-term investments and collateral held for securities loaned.
The Portfolio Composition chart excludes collateral held for securities loaned.
44
Table of Contents
What is your outlook?
The decline in global equity prices has resulted in many companies trading at prices that are less than the intrinsic value of their business. That said, undervaluation in and of itself is not a reason for a security to go up. Prospects for an economic recovery must take hold so that investors can have confidence in earnings. Recognizing the difficulty in predicting the timing of such a recovery, we are moving deliberately but cautiously. We believe the efforts by governments and central banks to stimulate economic growth will eventually succeed but that the pace of recovery is likely to be sub-par versus past economic recoveries.
Portfolio Facts
As of December 31, 2008
Net Assets | $778,125,454 | |
NAV | $8.18 | |
NAV - High† | 5/16/2008 - $17.34 | |
NAV - Low† | 11/20/2008 - $6.79 | |
Number of Holdings: 229 |
| † | For the year ended December 31, 2008 |
Average Annual Total Returns1
As of December 31, 2008
1-Year | 5-Year | 10-Year | ||||
| (41.10%) | 0.80 | % | 0.02 | % |
Value of a $10,000 Investment1
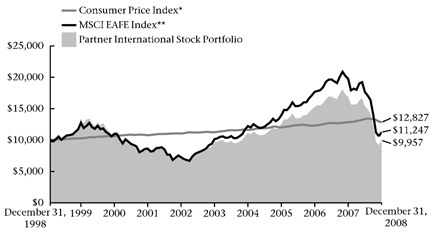
| * | The Consumer Price Index is an inflationary indicator that measures the change in the cost of a fixed basket of products and services, including housing, electricity, food and transportation. It is not possible to invest directly in the Index. |
| ** | The MSCI EAFE Index measures the performance of stocks in developed countries outside of North America. It is not possible to invest directly in the Index. The performance of the Index does not reflect deductions for fees, expenses or taxes. |
Past performance is not an indication of future results. Total investment return and principal value will fluctuate and units, when redeemed, may be worth more or less than their original cost. Current performance may be higher or lower than the performance data quoted. Market volatility can significantly affect short-term performance, and more recent returns may be different from those shown. Call 800-THRIVENT or visit www.thrivent.com for performance results current to the most recent month-end.
1 | Annualized total returns represent past performance and reflect changes in share prices, the reinvestment of all dividends and capital gains, and the effects of compounding. Periods of less than one year are not annualized. At various times, the Portfolio’s adviser reimbursed and/or paid non-advisory Portfolio expenses. Had the adviser not done so, the Portfolio’s total returns would have been lower. The returns shown do not reflect charges and expenses imposed on contract holders by the variable accounts. Those charges and expenses reduce the returns received by contract holders as compared to the returns presented. |
Investing in a variable product involves risks, including the possible loss of principal. The prospectus contains more complete information on the investment objectives, risks, charges and expenses of the investment company, which investors should read and consider carefully before investing. To obtain a prospectus, contact a registered representative or visit www.thrivent.com.
45
Table of Contents
How did the Portfolio perform during the 8-month period ended December 31, 2008?
Thrivent Partner Socially Responsible Stock Portfolio earned a return of -34.98% from its inception date of April 30, 2008, through December 31, 2008. Over the same period, the Portfolio’s market benchmark, the S&P 500 Index, earned a return of -33.65%.
What factors affected the Portfolio’s performance?
Decisions about overweighting or underweighting the various economic sectors were a net contributor to relative performance. Out lack of exposure to the telecom services sector and modest underweighting of consumer staples detracted from performance. This was more than offset, however, by underweighting the troubled financials sector and overweighting the defensive and outperforming health care sector.
Stock selection had a positive impact on performance and was most pronounced in the energy, financials and health care sectors. Our holdings within the financials sector substantially outperformed the average. Our emphasis on high-quality socially responsible companies meant that we avoided virtually all of the stocks that became worthless or nearly worthless.
The positive contribution in financials, however, was more than offset by less productive choices in energy and health care. Within energy, our holdings Smith International, EOG Resources and FMC Technologies each were significant contributors through mid-summer while oil and natural gas prices were high. At this point, we reduced the size of our positions, but not by enough. During the second half of the calendar year, as oil prices fell, the only way to outperform was to own the large integrated energy companies such as Exxon Mobil and Chevron. We did not own these stocks.
A similar story exists within health care. While we correctly overweighted this defensive sector, our stocks lagged. Our large holdings in Novartis and Labcorp performed much better than average. These stocks, however, could not overcome poor performances by Medtronic, Stryker, Intuitive Surgical and Coventry Healthcare. Coventry, a managed care company, was a true disappointment that we failed to anticipate. Medtronic, Stryker and Intuitive Surgical were hurt more by fear of an earnings shortfall than actual deterioration in fundamentals. We continue to expect all three of these stocks to outperform. Large-cap defensive pharmaceutical stocks, which have been major laggards over the past few years, substantially outperformed the health care sector. Our exposure there was limited to Novartis.
Major Market Sectors
(% of Net Assets)
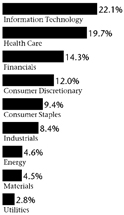
Portfolio Composition
(% of Portfolio)
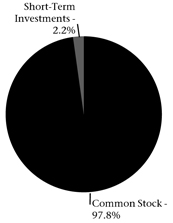
Top 10 Holdings
(% of Net Assets)
CVS/Caremark Corporation | 4.4 | % | |
Cisco Systems, Inc. | 3.9 | % | |
Staples, Inc. | 3.8 | % | |
Kohl’s Corporation | 3.8 | % | |
Hewlett-Packard Company | 3.6 | % | |
Novartis AG ADR | 3.6 | % | |
Google, Inc. | 3.3 | % | |
Stryker Corporation | 3.2 | % | |
Apple, Inc. | 3.1 | % | |
Laboratory Corporation of America Holdings | 3.0 | % |
These securities represent 35.7% of the total net assets of the portfolio.
Quoted Major Market Sectors, Portfolio Composition and Top 10 Holdings are subject to change.
The lists of Major Market Sectors and Top 10 Holdings exclude short-term investments and collateral held for securities loaned.
The Portfolio Composition chart excludes collateral held for securities loaned.
46
Table of Contents
What is your outlook?
The near-term outlook for the economy, and hence the market, remains exceptionally uncertain. We believe, however, that there are reasons to be more positive regarding the quarters ahead. The massive stimulus, low mortgage rates, a modest thawing in the credit markets and low valuations form the basis for this view. Because we believe that the worst may have passed, we have begun the process of positioning the Portfolio for a recovery. This has entailed reductions in our late-cycle industrials holdings, the beginnings of a shift from a defensive consumer posture to an offensive one and an increase in financials. We are doing this gradually, since the timing of the market’s agreement with this strategy is highly uncertain. Some of our shifts have already worked well while others have proven premature. We look forward to better returns in 2009 and believe that we are well-positioned to outperform in the year ahead.
Portfolio Facts
As of December 31, 2008
Net Assets | $3,200,720 | |
NAV | $6.48 | |
NAV - High† | 6/5/2008 - $10.36 | |
NAV - Low† | 11/20/2008 - $5.54 | |
Number of Holdings: 48 |
| † | For the year ended December 31, 2008 |
Average Annual Total Returns1
As of December 31, 2008
From Inception |
| (34.98%) |
Value of a $10,000 Investment1
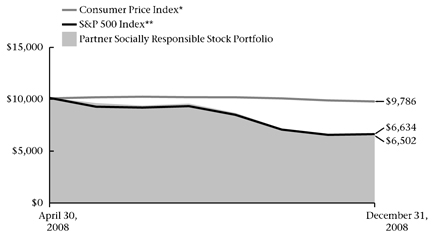
| * | The Consumer Price Index is an inflationary indicator that measures the change in the cost of a fixed basket of products and services, including housing, electricity, food and transportation. It is not possible to invest directly in the Index. |
** | The S&P 500 Index is an index that represents the average performance of a group of 500 widely held, publicly traded stocks. It is not possible to invest directly in the Index. The performance of the Index does not reflect deductions for fees, expenses or taxes. “S&P 500®” is a trademark of The McGraw-Hill Companies , Inc. and has been licensed for use by Thrivent Financial for Lutherans. The product is not speonseored, endorsed or promoted by Standard & Poor’s, and Standard & Poor’s makes no representation regarding the advisability of investing in the product. |
Past performance is not an indication of future results. Total investment return and principal value will fluctuate and
units, when redeemed, may be worth more or less than their original cost. Current performance may be higher or lower
than the performance data quoted. Market volatility can significantly affect short-term performance, and more recent
returns may be different from those shown. Call 800-THRIVENT or visit www.thrivent.com for performance results current to the most recent month-end.
1 | Annualized total returns represent past performance and reflect changes in share prices, the reinvestment of all dividends and capital gains, and the effects of compounding. Periods of less than one year are not annualized. At various times, the Portfolio’s adviser reimbursed and/or paid non-advisory Portfolio expenses. Had the adviser not done so, the Portfolio’s total returns would have been lower. The returns shown do not reflect charges and expenses imposed on contract holders by the variable accounts. Those charges and expenses reduce the returns received by contract holders as compared to the returns presented. |
Investing in a variable product involves risks, including the possible loss of principal. The prospectus contains more
complete information on the investment objectives, risks, charges and expenses of the investment company, which
investors should read and consider carefully before investing. To obtain a prospectus, contact a registered representative or visit www.thrivent.com.
47
Table of Contents
 | Thrivent Partner All Cap Growth Portfolio |
Subadvised by Calamos Advisors LLC
Thrivent Partner All Cap Growth Portfolio seeks long-term capital growth.
Stocks are subject to the basic market risk that a particular security, or securities in general, may decrease in value over short or even extended time periods. In addition, the Portfolio is exposed to the risks of investing in small- and mid-cap stocks, which generally are more volatile and less liquid than large-cap stocks. These and other risks are described in the Portfolio’s prospectus.
How did the Portfolio perform during the 8-month period ended December 31, 2008?
Thrivent Partner All Cap Growth Portfolio earned a return of -46.57% from its inception date of April 30, 2008, through December 31, 2008. The Portfolio’s market benchmark, the Russell 3000® Growth Index, earned a return of -31.30%.
What factors affected the Portfolio’s performance?
Strong relative security selection within financials added the most value during the quarter. Selection within the capital markets industry was positive. The entire sector struggled amid the overwhelming financial crisis, yet we found select opportunities within the asset management industry, as well as diversified insurance firms. An underweighted position to materials added to performance, as this was one of the worst-performing sectors within the benchmark. An overweighted position to industrials was additive. We focused on companies within industrials that are positioned to benefit from the global infrastructure build-out.
Security selection within the energy sector was the most significant detractor during the quarter. Specifically, holdings within the energy equipment and services industry performed poorly. The sector suffered large losses due to a quick and severe drop in oil and natural gas prices. Energy was the worst performing sector within the Index. An underweighted position to consumer staples detracted from relative returns. Many investors gravitated toward the perceived safety of this defensive sector during the period, as it was one of the top performers. Stock selection and an overweight position to information technology hurt performance. IT suffered throughout 2008, as some of the more notable and liquid names sold-off as a result of hedge fund redemptions and panic selling. However, fundamentals still appear solid and we continue to believe this sector will provide attractive long-term growth opportunities. We continue to favor the more traditional growth sectors that we believe are poised to take advantage of increased consumer confidence during normal and stable conditions.
What is your outlook?
We have emphasized companies with strong balance sheets that do not need to access the capital markets to grow or sustain their stock price—characteristics that became even more important as credit markets froze.
Major Market Sectors
(% of Net Assets)
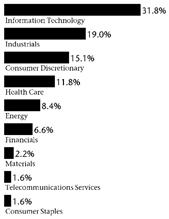
Portfolio Composition
(% of Portfolio)
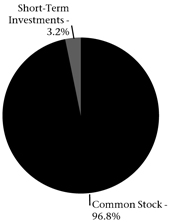
Top 10 Holdings
(% of Net Assets)
Gilead Sciences, Inc. | 4.4 | % | |
| NIKE, Inc. | 4.2 | % | |
| Google, Inc. | 4.0 | % | |
| Apple, Inc. | 3.8 | % | |
| Amazon.com, Inc. | 2.4 | % | |
| United Technologies Corporation | 2.2 | % | |
| Coach, Inc. | 1.9 | % | |
| Jacobs Engineering Group, Inc. | 1.9 | % | |
| T. Rowe Price Group, Inc. | 1.9 | % | |
| W.W. Grainger, Inc. | 1.7 | % |
These securities represent 28.4% of the total net assets of the portfolio.
Quoted Major Market Sectors, Portfolio Composition and Top 10 Holdings are subject to change.
The lists of Major Market Sectors and Top 10 Holdings exclude short-term investments and collateral held for securities loaned.
The Portfolio Composition chart excludes collateral held for securities loaned.
48
Table of Contents
We are also investing in leading global business with competitive products/services, which we believe are well positioned to benefit from the expansion of free markets and emerging market growth. These include Apple, Google, Nike and Gilead Sciences, to name a few. We believe these companies should weather an economic storm very well, thanks to their high return on capital businesses, strong balance sheets and strong market positions.
Portfolio Facts
As of December 31, 2008
Net Assets | $2,409,777 | |
NAV | $5.34 | |
NAV - High† | 5/16/2008 - $10.45 | |
NAV - Low† | 11/20/2008 - $4.38 | |
Number of Holdings: 85 |
| † | For the year ended December 31, 2008 |
Average Annual Total Returns1
As of December 31, 2008
From Inception |
| (46.57%) |
Value of a $10,000 Investment1
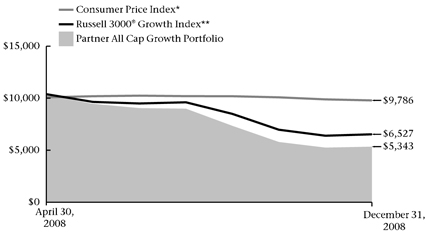
| * | The Consumer Price Index is an inflationary indicator that measures the change in the cost of a fixed basket of products and services, including housing, electricity, food and transportation. It is not possible to invest directly in the Index. |
** | The Russell 3000® Growth Index is an index that measures the performance of the broad growth segment of U.S. equities. It is not possible to invest directly in the Index. The performance of the Index does not reflect deductions for fees, expenses or taxes. |
Past performance is not an indication of future results. Total investment return and principal value will fluctuate and
units, when redeemed, may be worth more or less than their original cost. Current performance may be higher or lower
than the performance data quoted. Market volatility can significantly affect short-term performance, and more recent
returns may be different from those shown. Call 800-THRIVENT or visit www.thrivent.com for performance results
current to the most recent month-end.
1 | Annualized total returns represent past performance and reflect changes in share prices, the reinvestment of all dividends and capital gains, and the effects of compounding. Periods of less than one year are not annualized. At various times, the Portfolio’s adviser reimbursed and/or paid non-advisory Portfolio expenses. Had the adviser not done so, the Portfolio’s total returns would have been lower. The returns shown do not reflect charges and expenses imposed on contract holders by the variable accounts. Those charges and expenses reduce the returns received by contract holders as compared to the returns presented. |
Investing in a variable product involves risks, including the possible loss of principal. The prospectus contains more
complete information on the investment objectives, risks, charges and expenses of the investment company, which
investors should read and consider carefully before investing. To obtain a prospectus, contact a registered
representative or visit www.thrivent.com.
49
Table of Contents
 | Thrivent Partner All Cap Value Portfolio |
Subadvised by OppenheimerFunds, Inc.
Thrivent Partner All Cap Value Portfolio seeks long-term capital growth.
Stocks are subject to the basic market risk that a particular security, or securities in general, may decrease in value over short or even extended time periods. In addition, the Portfolio is exposed to the risks of investing in small- and mid-cap stocks, which generally are more volatile and less liquid than large-cap stocks. The Portfolio is also subject to the risks of investing in foreign (including emerging market) stocks. These and other risks are described in the Portfolio’s prospectus.
How did the Portfolio perform during the 8 -month period ended December 31, 2008?
Thrivent Partner All Cap Value Portfolio earned a return of -44.21% since its inception on April 30, 2008, through December 31, 2008. Over the same period, the Portfolio’s market benchmark, the Russell 3000® Value Index, earned a return of -30.29%.
What factors affected the Portfolio’s performance?
Widespread uncertainty created an environment in which investors became increasingly risk-averse, and selling pressure mounted on stocks and most sectors of the bond market. As the value of those assets declined, highly leveraged institutional investors, such as hedge funds, were faced with redemption requests and demands for additional collateral for their margin loans. To raise cash for these needs, institutional investors were forced to sell their more liquid and creditworthy investments, and most financial assets suffered steep declines. U.S. government securities, which benefited from the flight to quality, were a notable exception.
The United States and other governments responded aggressively to the crisis. The Federal Reserve Board and other central banks implemented an unprecedented, coordinated reduction of short-term interest rates. The U.S. Treasury created the Temporary Guarantee Program for Money Market Funds, which will purchase financial instruments from eligible money market funds should the need arise. In December, in an attempt to stimulate economic growth, the Fed reduced its target for U.S. short-term interest rates to between 0% and 0.25%, the lowest level in history. Although these measures restored a degree of confidence to the financial system and markets began to operate more freely by year-end, the financial crisis had a chilling effect on the U.S. and global economies.
Many of the Portfolio’s poorer performing holdings were in the financials sector, leading us to reduce our allocation to financial stocks by period end. Energy stocks also tumbled during the reporting period as oil prices plummeted. In particular, Portfolio performance was hurt by positions in Exxon Mobil Corp. and Hess Corp., both of which we exited.
In terms of individual stock contributors, within the materials sector, the Portfolio gained performance by exiting its position and taking profits in FMC Corp. before the stock price declined significantly later in the reporting period. During the reporting period, we built up a position in another materials stock, Mosaic Co., whose stock weathered the credit market storm and economic downturn relatively well.
Major Market Sectors
(% of Net Assets)
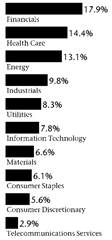
Portfolio Composition
(% of Portfolio)
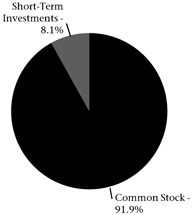
Top 10 Holdings
(% of Net Assets)
Chevron Corporation | 4.5 | % | |
| Lubrizol Corporation | 4.5 | % | |
| Everest Re Group, Ltd. | 4.4 | % | |
| Devon Energy Corporation | 4.2 | % | |
| PG&E Corporation | 3.4 | % | |
| Julius Baer Holding AG | 3.4 | % | |
| Wyeth | 3.0 | % | |
| QUALCOMM, Inc. | 2.9 | % | |
| Kroger Company | 2.9 | % | |
| AT&T, Inc. | 2.9 | % |
These securities represent 36.1% of the total net assets of the portfolio.
Quoted Major Market Sectors, Portfolio Composition and Top 10 Holdings are subject to change.
The lists of Major Market Sectors and Top 10 Holdings exclude short-term investments and collateral held for securities loaned.
The Portfolio Composition chart excludes collateral held for securities loaned.
50
Table of Contents
What is your outlook?
Regardless of the broader market environment, we follow a consistent investment strategy. We are long-term investors and do not in general rebalance due to current market conditions. We focus on companies that exhibit leadership within their market sector. Specifically, by employing a disciplined, research-driven stock selection process, we seek to find value in companies with a competitive edge within their marketplace.
Portfolio Facts
As of December 31, 2008
Net Assets | $2,461,308 | |
NAV | $5.47 | |
NAV - High† | 5/16/2008 - $10.25 | |
NAV - Low† | 11/20/2008 - $4.44 | |
Number of Holdings: 46 |
| † | For the year ended December 31, 2008 |
Average Annual Total Returns1
As of December 31, 2008
From Inception |
| (44.21%) |
Value of a $10,000 Investment1
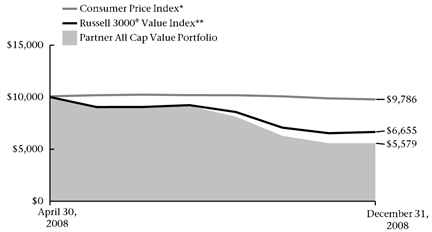
| * | The Consumer Price Index is an inflationary indicator that measures the change in the cost of a fixed basket of products and services, including housing, electricity, food and transportation. It is not possible to invest directly in the Index. |
** | The Russell 3000® Value Index is an index that measures the performance of the broad value segment of U.S. equities. It is not possible to invest directly in the Index. The performance of the Index does not reflect deductions for fees, expenses or taxes. |
Past performance is not an indication of future results. Total investment return and principal value will fluctuate and units, when redeemed, may be worth more or less than their original cost. Current performance may be higher or lower than the performance data quoted. Market volatility can significantly affect short-term performance, and more recent returns may be different from those shown. Call 800-THRIVENT or visit www.thrivent.com for performance results current to the most recent month-end.
1 | Annualized total returns represent past performance and reflect changes in share prices, the reinvestment of all dividends and capital gains, and the effects of compounding. Periods of less than one year are not annualized. At various times, the Portfolio’s adviser reimbursed and/or paid non-advisory Portfolio expenses. Had the adviser not done so, the Portfolio’s total returns would have been lower. The returns shown do not reflect charges and expenses imposed on contract holders by the variable accounts. Those charges and expenses reduce the returns received by contract holders as compared to the returns presented. |
Investing in a variable product involves risks, including the possible loss of principal. The prospectus contains more complete information on the investment objectives, risks, charges and expenses of the investment company, which investors should read and consider carefully before investing. To obtain a prospectus, contact a registered representative or visit www.thrivent.com.
51
Table of Contents
 | Thrivent Partner All Cap Portfolio |
Subadvised by Pyramis Global Advisors, LLC, an affiliate of Fidelity Investments, Inc.
Thrivent Partner All Cap Portfolio seeks long-term growth of capital.
Stocks are subject to the basic market risk that a particular security, or securities in general, may decrease in value over short or even extended time periods. These and other risks are described in the Portfolio’s prospectus.
How did the Portfolio perform during the 12-month period ended December 31, 2008?
Thrivent Partner All Cap Portfolio earned a return of -42.91%, as compared to the median return for its peer group, the Lipper Multi-Cap Core Category, of -38.54%. The Portfolio’s market benchmark, the Russell 3000® Index, earned a return of -37.31%.
What factors affected the Portfolio’s performance?
We generally do not alter sector exposures when compared to the benchmark indexes, preferring to use security and industry selection as the primary source of return variation versus the benchmark. For the latest fiscal year, results from security selection and industry allocations detracted from Portfolio results versus the benchmark Index. Specifically, holdings in the energy, industrials and consumer staples sectors did not keep pace with their respective sectors and—in the cases of industrials and energy, stocks in the Portfolio also underperformed the broader Index. In the industrial group, machinery stocks like Bucyrus International, Deere and Co., Joy Global Inc. and Navistar International all corrected sharply, particularly in the second half, as energy and commodity prices fell with the accelerating slowdown of global demand. Industrial conglomerates General Electric and Textron also fell sharply, as both have exposure not only to weakening industrial demand but also have significant financial subsidiaries with exposure to the challenges in the capital and credit markets. Holdings in railroad companies Norfolk and Southern and Union Pacific mitigated some of these declines as both stocks advanced over the period. Energy shares also fell sharply in the second half of the year. Demand for energy, particularly oil, was declining in both the United States and Europe and slowing dramatically in the emerging economies. Prices fell from levels that were unrealistically extended on the upside in the first half of the year.
Weakness was evident across most Portfolio holdings in both the equipment and production industries. In the consumer staples group, our position in Great Atlantic and Pacific Tea Co., a food retailer, proved particularly disappointing, falling significantly over the year. In the food products industry, Bunge Ltd. also declined sharply with the fall-off in commodity prices in the second half. A modest cash position provided some level of protection in the decline, but cash holdings in the portfolio were generally quite low for the year.
Major Market Sectors
(% of Net Assets)
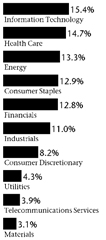
Portfolio Composition
(% of Portfolio)
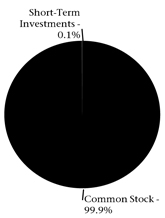
Top 10 Holdings
(% of Net Assets)
Exxon Mobil Corporation | 7.7 | % | |
Nuance Communications, Inc. | 3.3 | % | |
QUALCOMM, Inc. | 2.9 | % | |
Wal-Mart Stores, Inc. | 2.9 | % | |
Philip Morris International, Inc. | 2.6 | % | |
Apple, Inc. | 2.4 | % | |
3M Company | 2.3 | % | |
Coca-Cola Company | 2.0 | % | |
Chevron Corporation | 1.9 | % | |
Bristol-Myers Squibb Company | 1.7 | % |
These securities represent 29.7% of the total net assets of the portfolio.
Quoted Major Market Sectors, Portfolio Composition and Top 10 Holdings are subject to change.
The lists of Major Market Sectors and Top 10 Holdings exclude short-term investments and collateral held for securities loaned. The Portfolio Composition chart excludes collateral held for securities loaned.
52
Table of Contents
What is your outlook?
The macro environment has deteriorated and corporate earnings growth remains at risk. This has led us to be more pessimistic about a near-term recovery, especially in consumer-related industries. Generally, we have moved the Portfolio to a more defensive posture by increasing our diversification while still maintaining a similar level of active management. Within financials, we have slowly begun to cover our underweighted stance in banks. We have added incremental exposure to both the larger commercial banks, as well as selected strong regional players, especially those with strong core deposits and capital positions. Additionally we continue to maintain some exposure to agribusiness, as we believe there are positive long-term secular trends in the demand for grain and other agricultural products.
Portfolio Facts
As of December 31, 2008
Net Assets | $56,153,236 | |
NAV | $6.10 | |
NAV - High† | 1/3/2008 - $12.85 | |
NAV - Low† | 11/20/2008 - $5.04 | |
Number of Holdings: 118 |
| † | For the year ended December 31, 2008 |
Average Annual Total Returns1
As of December 31, 2008
1-Year | 5-Year | From Inception 11/30/2001 | ||||
| (42.91%) | 1.31 | % | (2.46 | %) |
Value of a $10,000 Investment1
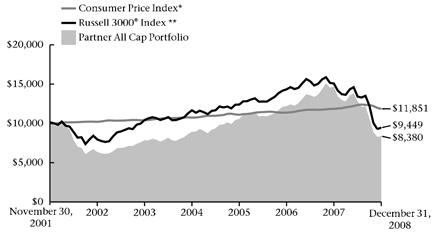
| * | The Consumer Price Index is an inflationary indicator that measures the change in the cost of a fixed basket of products and services, including housing, electricity, food and transportation. It is not possible to invest directly in the Index. |
** | The Russell 3000® Index is an index comprised of the 3,000 largest U.S. companies based on market capitalization. It is not possible to invest directly in the Index. The performance of the Index does not reflect deductions for fees, expenses or taxes. |
Past performance is not an indication of future results. Total investment return and principal value will fluctuate and units, when redeemed, may be worth more or less than their original cost. Current performance may be higher or lower than the performance data quoted. Market volatility can significantly affect short-term performance, and more recent returns may be different from those shown. Call 800-THRIVENT or visit www.thrivent.com for performance results current to the most recent month-end.
1 | Annualized total returns represent past performance and reflect changes in share prices, the reinvestment of all dividends and capital gains, and the effects of compounding. Periods of less than one year are not annualized. At various times, the Portfolio’s adviser reimbursed and/or paid non-advisory Portfolio expenses. Had the adviser not done so, the Portfolio’s total returns would have been lower. The returns shown do not reflect charges and expenses imposed on contract holders by the variable accounts. Those charges and expenses reduce the returns received by contract holders as compared to the returns presented. |
Investing in a variable product involves risks, including the possible loss of principal. The prospectus contains more complete information on the investment objectives, risks, charges and expenses of the investment company, which investors should read and consider carefully before investing. To obtain a prospectus, contact a registered representative or visit www.thrivent.com.
53
Table of Contents

How did the Portfolio perform during the 12-month period ended December 31, 2009?
Thrivent Large Cap Growth Portfolio II earned a return of -41.92%, as compared to the median return of its peer group, the Lipper Large Cap Growth category, of -41.52%. The Portfolio’s market benchmark, the Russell 1000® Growth Index, earned a return of -38.44%.
What factors affected the Portfolio’s performance?
An unprecedented financial market collapse, coupled with the onset of negative GDP growth, drove stock prices to one of their worst performances on record. While we had been cautious entering the year with regard to the housing market, the fallout from its decline had a far greater impact than we anticipated. Our performance suffered in comparison to both our benchmark and peer group, largely due to poor asset allocation on a sector basis, primarily in the more cyclical segments of the economy.
Looking at sector-based analysis, the health care sector was both a positive contributor on a stock selection and allocation basis. As it is less susceptible to fluctuations in economic growth, this sector did not experience as extreme a decline in equity values. Strong performance in overweighted positions Gilead Sciences, Inc. and Baxter International, Inc. added to the positive stock selection contribution for the year.
An overweighted posture in some of the more economically sensitive sectors, such as materials, energy and financials, was a driving factor in our negative returns, while stock selection detracted in the technology, telecommunication services and industrials sectors. Stocks that detracted the most from performance included Transocean, Freeport-McMoran Copper, Bank of America and U.S. Steel.
What is your outlook?
We believe the stock market is appropriately factoring a deep recession that will continue through most of 2009. Our posture has been trending towards the more aggressive, as we believe a difficult environment is more than priced in the value of the stocks, specifically in the more economically sensitive sectors. However, in order for the market to begin a sustainable rebound, the confidence of our financial markets must be restored,
Major Market Sectors
(% of Net Assets)

Portfolio Composition
(% of Portfolio)
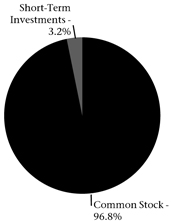
Top 10 Holdings
(% of Net Assets)
Gilead Sciences, Inc. | 6.4 | % | |
McDonald’s Corporation | 4.4 | % | |
Microsoft Corporation | 3.5 | % | |
Google, Inc. | 3.3 | % | |
J.P. Morgan Chase & Company | 3.0 | % | |
Baxter International, Inc. | 3.0 | % | |
Apple, Inc. | 2.9 | % | |
Monsanto Company | 2.6 | % | |
QUALCOMM, Inc. | 2.6 | % | |
Abbott Laboratories | 2.4 | % |
These securities represent 34.1% of the total net assets of the portfolio.
Quoted Major Market Sectors, Portfolio Composition and Top 10 Holdings are subject to change.
The lists of Major Market Sectors and Top 10 Holdings exclude short-term investments and collateral held for securities loaned. The Portfolio Composition chart excludes collateral held for securities loaned.
54
Table of Contents
something that is still lacking. We have increased our exposure to those sectors that are beginning to react to the changing supply and demand environment and therefore have more exposure to consumer discretionary, technology and materials sectors. Our ownership in health care has declined as relative valuation coupled with some impact from the economic headwinds makes this sector less appealing to us.
Portfolio Facts
As of December 31, 2008
Net Assets | $308,985,225 | |
NAV | $5.85 | |
NAV - High† | 1/3/2008 - $11.87 | |
NAV - Low† | 11/20/2008 - $4.86 | |
Number of Holdings: 70 |
| † | For the year ended December 31, 2008 |
Average Annual Total Returns1
As of December 31, 2008
1-Year | 5-Year | From Inception 11/30/2001 | ||||
| (41.92%) | (3.61 | %) | (3.85 | %) |
Value of a $10,000 Investment
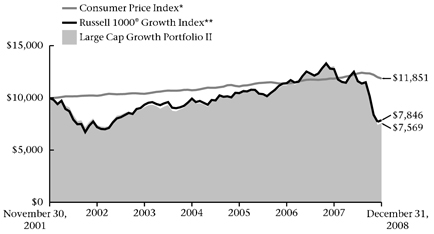
| * | The Consumer Price Index is an inflationary indicator that measures the change in the cost of a fixed basket of products and services, including housing, electricity, food and transportation. It is not possible to invest directly in the Index. |
** | The Russell 1000® Growth Index measures the performance of large cap growth stocks. It is not possible to invest directly in the Index. The performance of the Index does not reflect deductions for fees, expenses or taxes. |
Past performance is not an indication of future results. Total investment return and principal value will fluctuate and units, when redeemed, may be worth more or less than their original cost. Current performance may be higher or lower than the performance data quoted. Market volatility can significantly affect short-term performance, and more recent returns may be different from those shown. Call 800-THRIVENT or visit www.thrivent.com for performance results current to the most recent month-end.
1 | Annualized total returns represent past performance and reflect changes in share prices, the reinvestment of all dividends and capital gains, and the effects of compounding. Periods of less than one year are not annualized. At various times, the Portfolio’s adviser reimbursed and/or paid non-advisory Portfolio expenses. Had the adviser not done so, the Portfolio’s total returns would have been lower. The returns shown do not reflect charges and expenses imposed on contract holders by the variable accounts. Those charges and expenses reduce the returns received by contract holders as compared to the returns presented. |
Investing in a variable product involves risks, including the possible loss of principal. The prospectus contains more complete information on the investment objectives, risks, charges and expenses of the investment company, which investors should read and consider carefully before investing. To obtain a prospectus, contact a registered representative or visit www.thrivent.com.
55
Table of Contents
How did the Portfolio perform during the 12-month period ended December 31, 2008?
Thrivent Large Cap Growth Portfolio earned a return of -42.00%, as compared to the median return of its peer group, the Lipper Large Cap Growth category, of -40.18%. The Portfolio’s market benchmark, the Russell 1000® Growth Index, earned a return of -38.44%.
What factors affected the Portfolio’s performance?
An unprecedented financial market collapse, coupled with the onset of negative GDP growth, drove stock prices to one of their worst performances on record. While we had been cautious entering the year with regard to the housing market, the fallout from its decline had a far greater impact than we anticipated. Our performance suffered in comparison to both our benchmark and peer group, largely due to poor asset allocation on a sector basis, primarily in the more cyclical segments of the economy.
Looking at sector-based analysis, an overweighted posture in some of the more economically sensitive sectors, such as materials, energy and financials, was a driving factor in our negative returns, while stock selection detracted in the technology,
telecommunication services and industrials sectors. Stocks that detracted the most from performance included Transocean, Freeport-McMoran Copper, Bank of America and U.S. Steel.
The health care sector was both a positive contributor on a stock selection and allocation basis. As it is less susceptible to fluctuations in economic growth, this sector did not experience as extreme a decline in equity values. Strong performance in overweighted positions in Gilead Sciences and Baxter International added to the positive stock selection contribution for the year.
What is your outlook?
We believe the stock market is appropriately factoring a deep recession that will continue through most of 2009. Our posture has been trending towards the more aggressive, as we believe a difficult environment is more than priced into the value of stocks, specifically in the more economically sensitive sectors. However, in order for the market to begin a sustainable rebound, the confidence of our financial markets must be restored,
Major Market Sectors
(% of Net Assets)
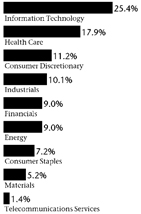
Portfolio Composition
(% of Portfolio)
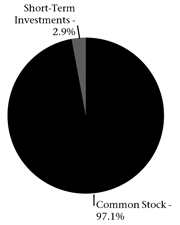
Top 10 Holdings
(% of Net Assets)
Gilead Sciences, Inc. | 4.0 | % | |
Google, Inc. | 3.0 | % | |
Microsoft Corporation | 2.8 | % | |
McDonald’s Corporation | 2.7 | % | |
Apple, Inc. | 2.4 | % | |
Monsanto Company | 2.2 | % | |
Wal-Mart Stores, Inc. | 2.1 | % | |
QUALCOMM, Inc. | 2.1 | % | |
Baxter International, Inc. | 2.0 | % | |
Cisco Systems, Inc. | 2.0 | % |
These securities represent 25.3% of the total net assets of the portfolio.
Quoted Major Market Sectors, Portfolio Composition and Top 10 Holdings are subject to change.
The lists of Major Market Sectors and Top 10 Holdings exclude short-term investments and collateral held for securities loaned.
The Portfolio Composition chart excludes collateral held for securities loaned.
56
Table of Contents
something that is still lacking. We have increased our exposure to those sectors that are beginning to react to the changing supply and demand environment and therefore have more exposure to consumer discretionary, technology and materials sectors. Our ownership in health care has declined as relative valuation coupled with some impact from the economic headwinds makes this sector less appealing to us.
Portfolio Facts
As of December 31, 2008
Net Assets | $844,538,875 | |
NAV | $10.96 | |
NAV - High† | 1/3/2008 - $19.07 | |
NAV - Low† | 11/20/2008 - $9.21 | |
Number of Holdings: 124 |
| † | For the year ended December 31, 2008 |
Average Annual Total Returns1
As of December 31, 2008
1-Year | 5-Year | 10-Year | ||||
| (42.00%) | (3.59 | %) | (1.73 | %) |
Value of a $10,000 Investment1
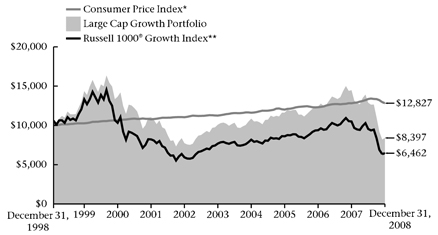
| * | The Consumer Price Index is an inflationary indicator that measures the change in the cost of a fixed basket of products and services, including housing, electricity, food and transportation. It is not possible to invest directly in the Index. |
** | The Russell 1000® Growth Index measures the performance of large cap growth stocks. It is not possible to invest directly in the Index. The performance of the Index does not reflect deductions for fees, expenses or taxes. |
Past performance is not an indication of future results. Total investment return and principal value will fluctuate and units, when redeemed, may be worth more or less than their original cost. Current performance may be higher or lower than the performance data quoted. Market volatility can significantly affect short-term performance, and more recent returns may be different from those shown. Call 800-THRIVENT or visit www.thrivent.com for performance results current to the most recent month-end.
1 | Annualized total returns represent past performance and reflect changes in share prices, the reinvestment of all dividends and capital gains, and the effects of compounding. Periods of less than one year are not annualized. At various times, the Portfolio’s adviser reimbursed and/or paid non-advisory Portfolio expenses. Had the adviser not done so, the Portfolio’s total returns would have been lower. The returns shown do not reflect charges and expenses imposed on contract holders by the variable accounts. Those charges and expenses reduce the returns received by contract holders as compared to the returns presented |
Investing in a variable product involves risks, including the possible loss of principal. The prospectus contains more complete information on the investment objectives, risks, charges and expenses of the investment company, which investors should read and consider carefully before investing. To obtain a prospectus, contact a registered representative or visit www.thrivent.com.
57
Table of Contents
Thrivent Partner Growth Stock Portfolio
 | Subadvised by T. Rowe Price Associates, Inc.
Thrivent Partner Growth Stock Portfolio seeks long-term growth of capital and secondarily, to increase dividend income by investing primarily in a diversified portfolio of common stocks of well-established growth companies.
Large-cap stocks are subject to the basic market risk that a particular security, or securities in general, may decrease in value over short or even extended time periods. These and other risks are described in the Portfolio’s prospectus. |
How did the Portfolio perform during the 12-month period ended December 31, 2008?
Thrivent Partner Growth Stock Portfolio earned a return of -42.13%, as compared to the median return for its peer group, the Lipper Large Cap Growth category, of -41.52%. The Portfolio’s market benchmark, the S&P 500/Citigroup Growth Index, earned -35.08%.
What factors affected the Portfolio’s performance?
Stock selection across a number of sectors was the primary cause of the underperformance versus the benchmark Index. Holdings in the energy sector had the most significant impact in terms of limiting results. Energy shares advanced strongly in the first half but fell even more sharply in the latter part of the year, as the combination of cumulative demand reduction in major economies and an acceleration in global demand slowdown from emerging markets, combined with the financial crisis, seriously undermined what had become a very unusual surge in energy and commodity prices. Exposure to Petrobras, Total S.A. and Suncor Energy, each of which performed poorly versus the group and the Index, was a major factor. In addition, an underexposure to the better-performing global majors Exxon Mobil and Chevron limited results. In health care, holdings in the pharmaceutical industry generally did not keep pace with the group. A holding in the better- performing Wyeth offset some of the impact of the other holdings. Health care services companies Aetna, Cigna and WellPoint performed poorly, reflecting some concern about the outlook for their respective businesses in the face of new policies likely to emerge in the health care sector.
Mitigating some of the weakness in these health care holdings were good results to the Portfolio’s positions in biotechnology shares, which were overweighted. In consumer discretionary, our holdings in the travel and leisure group showed disappointing results as the weakness in consumer spending accelerated in the second half. Holdings in internet retail companies, an area that generally has performed better in times of slowdowns, succumbed to the pervasive weakness. An overweighted stance in Amazon Inc. and Expedia Inc. both limited Portfolio results. An underweighted position in the better-performing stocks in the consumer staples area also negatively impacted results. A modest cash position versus the benchmark was a moderating factor for results.
Major Market Sectors
(% of Net Assets)
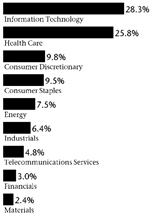
Portfolio Composition
(% of Portfolio)
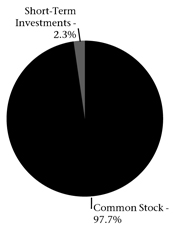
Top 10 Holdings
(% of Net Assets)
Apple, Inc. | 3.6 | % | |
Danaher Corporation | 3.5 | % | |
Gilead Sciences, Inc. | 3.5 | % | |
Amazon.com, Inc. | 3.4 | % | |
Google, Inc. | 3.0 | % | |
Medco Health Solutions, Inc. | 2.8 | % | |
Microsoft Corporation | 2.6 | % | |
Genentech, Inc. | 2.2 | % | |
Exxon Mobil Corporation | 2.2 | % | |
QUALCOMM, Inc. | 2.1 | % |
These securities represent 28.9% of the total net assets of the portfolio.
Quoted Major Market Sectors, Portfolio Composition and Top 10 Holdings are subject to change.
The lists of Major Market Sectors and Top 10 Holdings exclude short-term investments and collateral held for securities loaned.
The Portfolio Composition chart excludes collateral held for securities loaned.
58
Table of Contents
What is your outlook?
The worsening credit crisis and declining commodity prices led to another quarter of negative performance in the S&P 500 Index. All sectors produced negative returns. The financials and materials sectors were the worst performers. Traditionally defensive sectors such as utilities, health care, and consumer staples continued to perform relatively well. Telecommunication services was by far the best performing sector, barely dipping into negative territory. We believe that market fears and indiscriminate selling due to forced liquidations can lead to prices becoming disconnected from fundamentals, presenting significant buying opportunities.
Portfolio Facts
As of December 31, 2008
Net Assets | $52,093,962 | |
NAV | $6.96 | |
NAV - High† | 1/3/2008 - $13.40 | |
NAV - Low† | 11/20/2008 - $5.81 | |
Number of Holdings: 98 |
| † | For the year ended December 31, 2008 |
Average Annual Total Returns1
As of December 31, 2008
1-Year | 5-Year | From Inception 11/30/2001 | ||||
(42.13%) | (3.50 | %) | (2.17 | %) |
Value of a $10,000 Investment1
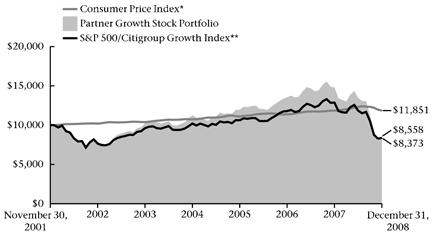
| * | The Consumer Price Index is an inflationary indicator that measures the change in the cost of a fixed basket of products and services, including housing, electricity, food and transportation. It is not possible to invest directly in the Index. |
| ** | The S&P 500/Citigroup Growth Index is a capitalization-weighted index comprised of highest price-to-book ratio securities in the S&P 500 Index. The S&P 500/Citigroup Growth Index is designed so that approximately one-half of the S&P 500 Index market capitalization is characterized as “value” and the other half as “growth.” The product is not sponsored, endorsed or promoted by Standard & Poor’s, and Standard & Poor’s makes no representation regarding the advisability of investing in the product. It is not possible to invest directly in the Index. The performance of the Index does not reflect deductions for fees, expenses or taxes. |
Past performance is not an indication of future results. Total investment return and principal value will fluctuate and
units, when redeemed, may be worth more or less than their original cost. Current performance may be higher or lower
than the performance data quoted. Market volatility can significantly affect short-term performance, and more recent
returns may be different from those shown. Call 800-THRIVENT or visit www.thrivent.com for performance results
current to the most recent month-end.
1 | Annualized total returns represent past performance and reflect changes in share prices, the reinvestment of all dividends and capital gains, and the effects of compounding. Periods of less than one year are not annualized. At various times, the Portfolio’s adviser reimbursed and/or paid non-advisory Portfolio expenses. Had the adviser not done so, the Portfolio’s total returns would have been lower. The returns shown do not reflect charges and expenses imposed on contract holders by the variable accounts. Those charges and expenses reduce the returns received by contract holders as compared to the returns presented. |
Investing in a variable product involves risks, including the possible loss of principal. The prospectus contains more
complete information on the investment objectives, risks, charges and expenses of the investment company, which
investors should read and consider carefully before investing. To obtain a prospectus, contact a registered
representative or visit www.thrivent.com.
59
Table of Contents

How did the Portfolio perform during the 12-month period ended December 31, 2008?
Thrivent Large Cap Value Portfolio earned a return of -34.33%, as compared to the median return of its peer group, the Lipper Large Cap Value category, of -36.64%. The Portfolio’s market benchmark, the Russell 1000® Value Index, earned a return of -36.85%.
What factors affected the Portfolio’s performance?
Investors have seen the economy slowing over the last year. By the end of October any optimism that a recession could be avoided had disappeared. Indeed, investors appear to now be anticipating a severe, global recession.
Stock selection accounted for the Portfolio’s relative outperformance. Stock selection was strongest in the financial services, technology and consumer staples sectors. In the financial services sector, the decision to sell AIG benefited the Portfolio significantly relative to the benchmark and peers. Our research suggested that AIG had unquantifiable credit exposure, primarily through its mortgage insurance and credit default swap books of business. If we can’t understand it or value it, we generally avoid it. Minimal exposure to mortgage-related stocks also aided performance. The largest position in the thrift and mortgage industry, a savings and loan called Hudson City Bancorp, appreciated considerably, which significantly helped performance significantly as well.
In the technology sector, positions in Accenture, International Business Machines and Sybase were the primary contributors to strong relative performance. In the consumer staples sector, the significant position in General Mills appreciated strongly during the period.
Areas that hurt performance included the energy and materials sectors. In energy, the bulk of the pain was due to the position in Nabors Industries (drilling rigs). This position has been increased as the worst appears to be reflected in the shares, valuation is attractive and eventually drilling activity should recover. In materials, positions in companies that participate in the chemicals industry hurt performance and have been reduced.
What is your outlook?
Economic forecasting is not an area where we have consistently added value. Therefore our focus is on stock selection. Our stock selection is of course guided by valuation. Currently we are finding the most attractive
Major Market Sectors
(% of Net Assets)
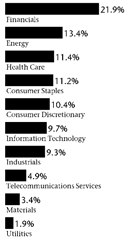
Portfolio Composition
(% of Portfolio)
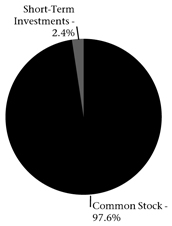
Top 10 Holdings
(% of Net Assets)
Exxon Mobil Corporation | 3.7 | % | |
J.P. Morgan Chase & Company | 3.3 | % | |
AT&T, Inc. | 2.8 | % | |
International Business Machines Corporation | 2.8 | % | |
Wal-Mart Stores, Inc. | 2.6 | % | |
Wells Fargo & Company | 2.5 | % | |
Chevron Corporation | 2.4 | % | |
General Electric Company | 2.1 | % | |
Abbott Laboratories | 2.1 | % | |
Johnson & Johnson | 2.0 | % |
These securities represent 26.3% of the total net assets of the portfolio.
Quoted Major Market Sectors, Portfolio Composition and Top 10 Holdings are subject to change.
The lists of Major Market Sectors and Top 10 Holdings exclude short-term investments and collateral held for securities loaned.
The Portfolio Composition chart excludes collateral held for securities loaned.
60
Table of Contents
valuations in the banking and consumer cyclical areas of the market, where we have now overweighted the Portfolio. While valuations are attractive, a major risk to these areas of the market is that any recession is long and these companies suffer accordingly. Our approach is to manage this risk with our position sizes and also to purchase the shares when the valuations are exceedingly low compared to how we expect them to perform at the lowest part of the economic cycle. Our emphasis on quality companies that are well positioned to survive and prosper in the ultimate recovery also helps to mitigate the risk of this strategy.
Portfolio Facts
As of December 31, 2008
Net Assets | $664,094,715 | |
NAV | $8.10 | |
NAV - High† | 5/19/2008 - $13.31 | |
NAV - Low† | 11/20/2008 -$6.88 | |
Number of Holdings: 108 |
| † | For the year ended December 31, 2008 |
Average Annual Total Returns1
As of December 31, 2008
1-Year | 5-Year | From Inception 11/30/2001 | ||||
| (34.33%) | (0.06 | %) | (0.12 | %) |
Value of a $10,000 Investment1

| * | The Consumer Price Index is an inflationary indicator that measures the change in the cost of a fixed basket of products and services, including housing, electricity, food and transportation. It is not possible to invest directly in the Index. |
** | The Russell 1000® Value Index measures the performance of large cap value stocks. It is not possible to invest directly in the Index. The performance of the Index does not reflect deductions for fees, expenses or taxes. |
Past performance is not an indication of future results. Total investment return and principal value will fluctuate and units, when redeemed, may be worth more or less than their original cost. Current performance may be higher or lower than the performance data quoted. Market volatility can significantly affect short-term performance, and more recent returns may be different from those shown. Call 800-THRIVENT or visit www.thrivent.com for performance results current to the most recent month-end.
1 | Annualized total returns represent past performance and reflect changes in share prices, the reinvestment of all dividends and capital gains, and the effects of compounding. Periods of less than one year are not annualized. At various times, the Portfolio’s adviser reimbursed and/or paid non-advisory Portfolio expenses. Had the adviser not done so, the Portfolio’s total returns would have been lower. The returns shown do not reflect charges and expenses imposed on contract holders by the variable accounts. Those charges and expenses reduce the returns received by contract holders as compared to the returns presented. |
Investing in a variable product involves risks, including the possible loss of principal. The prospectus contains more complete information on the investment objectives, risks, charges and expenses of the investment company, which investors should read and consider carefully before investing. To obtain a prospectus, contact a registered representative or visit www.thrivent.com.
61
Table of Contents
How did the Portfolio perform during the 12-month period ended December 31, 2008?
Thrivent Large Cap Stock Portfolio earned a return of -37.68%, as compared to the median return for its peer group, the Lipper Large Cap Core category, of -38.27%. The Portfolio’s market benchmark, the S&P 500 Index, earned -36.99%.
What factors affected the Portfolio’s performance?
Stock selection was a modest positive versus the benchmark, while sector and industry allocations detracted from performance. The latter was modestly greater than the former, resulting in net performance that slightly trailed the benchmark Index. That said, returns were extremely disappointing for all but the most conservative investment categories, particularly in the second half of period. Outperformance of the particularly weak financial index sector was the primary contributor to stock selection results. In particular, the Portfolio’s holdings in the insurance, thrifts and capital markets groups generally performed better than their Index counterparts. A modest cash position also helped support returns versus negative stock returns. In the information technology sector, IT services companies Accenture Ltd. and Automatic Data Processing Inc. fared better than the group and the Index.
The materials sector provided disappointing results versus both the Index and the group within the Index. Commodities and the shares of commodity based companies sold off sharply in the second half, as demand weakened in the face of prices that advanced too strongly in the first half and the severe and unexpected slowdown in the economy. In the energy sector, exposure to both equipment and production companies that were more moderately geared to the fluctuations in energy prices than the major global diversified and integrated oil companies was a factor in our performance versus the benchmarks. The Portfolio’s holding in the retail sector performed poorly. Holdings in the hotels, restaurant and leisure category performed better and offset the weakness in the retail category.
What is your outlook?
We expect the extraordinary weakness in the capital markets is behind us for this cycle. It is expected that the recovery from the events of the last eighteen months will
Major Market Sectors
(% of Net Assets)
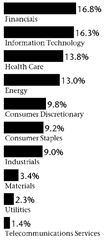
Portfolio Composition
(% of Portfolio)
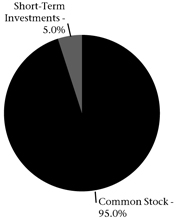
Top 10 Holdings
(% of Net Assets)
Exxon Mobil Corporation | 4.4 | % | |
International Business Machines Corporation | 2.9 | % | |
J.P. Morgan Chase & Company | 2.8 | % | |
Abbott Laboratories | 2.7 | % | |
Johnson & Johnson | 2.5 | % | |
Gilead Sciences, Inc. | 2.5 | % | |
Wal-Mart Stores, Inc. | 2.4 | % | |
McDonald’s Corporation | 2.4 | % | |
Wells Fargo & Company | 2.2 | % | |
Southern Company | 2.0 | % |
These securities represent 26.8% of the total net assets of the portfolio.
Quoted Major Market Sectors, Portfolio Composition and Top 10 Holdings are subject to change.
The lists of Major Market Sectors and Top 10 Holdings exclude short-term investments and collateral held for securities loaned.
The Portfolio Composition chart excludes collateral held for securities loaned.
62
Table of Contents
be volatile and laborious but the seeds of recovery appear to have taken root. That said, some markets still remain open largely as a result of government intervention. Capital markets, particularly fixed income, must show they will function without government involvement before equity markets will be able to advance on a sustained basis. We believe that is the most likely outcome but risks remain. Equities have staged a meaningful rally off the November lows but at the end of 2008 are only back to the area in which they settled following the October collapse. We think a reasonable objective for the remainder of 2009 is movement towards the levels of last summer, which provides an attractive rate of return for the next fiscal year.
Portfolio Facts
As of December 31, 2008
Net Assets | $497,399,691 | |
NAV | $6.11 | |
NAV - High† | 1/3/2008 - $10.92 | |
NAV - Low† | 11/20/2008 - $5.18 | |
Number of Holdings: 160 |
| † | For the year ended December 31, 2008 |
Average Annual Total Returns1
As December 31, 2008
1-Year | 5-Year | From Inception 3/1/2001 | ||||
| (37.68%) | (3.03 | %) | (3.70 | %) |
Value of a $10,000 Investment1
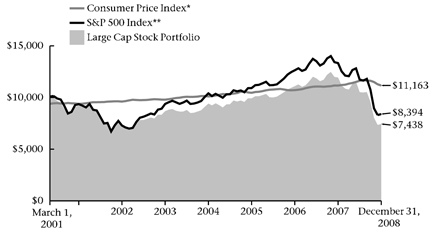
| * | The Consumer Price Index is an inflationary indicator that measures the change in the cost of a fixed basket of products and services, including housing, electricity, food and transportation. It is not possible to invest directly in the Index. |
** | The S&P 500 Index is an index that represents the average performance of a group of 500 widely held, publicly traded stocks. “S&P 500®” is a trademark of The McGraw-Hill Companies, Inc. and has been licensed for use by Thrivent Financial for Lutherans. The product is not sponsored, endorsed or promoted by Standard & Poor’s and Standard & Poor’s makes no representation regarding the advisability of investing in the product. It is not possible to invest directly in the Index. The performance of the Index does not reflect deductions for fees, expenses or taxes. |
Past performance is not an indication of future results. Total investment return and principal value will fluctuate and units, when redeemed, may be worth more or less than their original cost. Current performance may be higher or lower than the performance data quoted. Market volatility can significantly affect short-term performance, and more recent returns may be different from those shown. Call 800-THRIVENT or visit www.thrivent.com for performance results current to the most recent month-end.
1 | Annualized total returns represent past performance and reflect changes in share prices, the reinvestment of all dividends and capital gains, and the effects of compounding. Periods of less than one year are not annualized. At various times, the Portfolio’s adviser reimbursed and/or paid non-advisory Portfolio expenses. Had the adviser not done so, the Portfolio’s total returns would have been lower. The returns shown do not reflect charges and expenses imposed on contract holders by the variable accounts. Those charges and expenses reduce the returns received by contract holders as compared to the returns presented. |
Investing in a variable product involves risks, including the possible loss of principal. The prospectus contains more complete information on the investment objectives, risks, charges and expenses of the investment company, which investors should read and consider carefully before investing. To obtain a prospectus, contact a registered representative or visit www.thrivent.com.
63
Table of Contents
How did the Portfolio perform during the 12-month period ended December 31, 2008?
Thrivent Large Cap Index Portfolio earned a total return of -37.12%, as compared to the median return of its peer group, the Lipper S&P 500 Index Objective category, of -37.21%. The Portfolio’s market benchmark, the S&P 500 Index, earned a return of -36.99%.
What factors affected the Portfolio’s performance?
The Portfolio’s holdings are aligned with those of the S&P 500 Index. As typically occurs in an index fund, the difference in performance between the benchmark Index and the Portfolio itself can largely be attributed to expenses and minor differences in portfolio composition.
All benchmark Index sectors posted negative returns for the year. Consumer staples and health care were the best relative performing groups over the past 12 months, posting the least negative returns. These sectors are the most defensive and held up the best in an extremely challenging environment. Financials and materials delivered the most negative returns for the 12-month period. Financial stocks were negatively impacted early in the period by continued deterioration in credit quality and ongoing write-downs of securities that became difficult to value, given the environment of heightened risk aversion and poor liquidity and price discovery mechanisms. Materials came under selling pressure in 2008 as consumers and corporations re-evaluated the chances for economic growth in the global economic system.
What is your outlook?
Large-cap stocks underperformed both mid- and small-cap stocks, reversing last year’s trend. This is not typically the case in a severe market downturn. However, all stock segments (large, mid and small) posted negative returns. There are signs that a rotation in market
Major Market Sectors
(% of Net Assets)
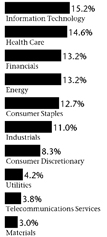
Portfolio Composition
(% of Portfolio)
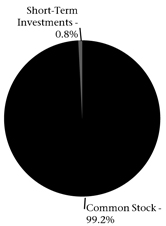
Top 10 Holdings
(% of Net Assets)
Exxon Mobil Corporation | 5.1 | % | |
Procter & Gamble Company | 2.3 | % | |
General Electric Company | 2.1 | % | |
AT&T, Inc. | 2.1 | % | |
Johnson & Johnson | 2.1 | % | |
Chevron Corporation | 1.9 | % | |
Microsoft Corporation | 1.9 | % | |
Wal-Mart Stores, Inc. | 1.6 | % | |
Pfizer, Inc. | 1.5 | % | |
J.P. Morgan Chase & Company | 1.5 | % |
These securities represent 22.1% of the total net assets of the portfolio.
Quoted Major Market Sectors, Portfolio Composition and Top 10 Holdings are subject to change.
The lists of Major Market Sectors and Top 10 Holdings exclude short-term investments and collateral held for securities loaned.
The Portfolio Composition chart excludes collateral held for securities loaned.
64
Table of Contents
leadership could be underway. As a generalization, this type of environment tends to favor mid- and small-cap companies. We believe that the dollar is as low as it should get and that risk levels are coming down. Our view is that as we enter a new cycle, mid- and small-cap companies should outperform their large-cap counterparts.
Policy actions have been undertaken to forestall any lasting impact from the ongoing unwinding of the excesses in housing that occurred last cycle. Additionally, the financial markets appear to be resolving some of the uncertainty and ambiguity that has surrounded the fixed-income markets and that led to the severe credit contraction.
Portfolio Facts
As of December 31, 2008
Net Assets | $319,711,313 | |
NAV | $13.72 | |
NAV - High† | 1/2/2008 - $24.82 | |
NAV - Low† | 11/20/2008 - $11.41 | |
Number of Holdings: 506 |
| † | For the year ended December 31, 2008 |
Average Annual Total Returns1
As of December 31, 2008
1-Year | 5-Year | 10-Year | ||||
| (37.12%) | (2.45 | %) | (1.64 | %) |
Value of a $10,000 Investment1
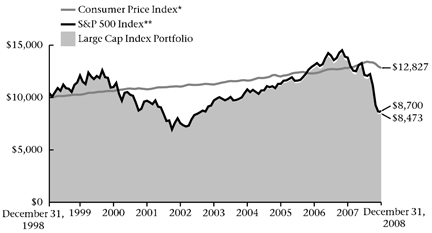
| * | The Consumer Price Index is an inflationary indicator that measures the change in the cost of a fixed basket of products and services, including housing, electricity, food and transportation. It is not possible to invest directly in the Index. |
** | The S&P 500 Index is an index that represents the average performance of a group of 500 widely held, publicly traded stocks. “S&P 500®” is a trademark of The McGraw-Hill Companies, Inc. and has been licensed for use by Thrivent Financial for Lutherans. The product is not sponsored, endorsed or promoted by Standard & Poor’s and Standard & Poor’s makes no representation regarding the advisability of investing in the product. It is not possible to invest directly in the Index. The performance of the Index does not reflect deductions for fees, expenses or taxes. |
Past performance is not an indication of future results. Total investment return and principal value will fluctuate and units, when redeemed, may be worth more or less than their original cost. Current performance may be higher or lower than the performance data quoted. Market volatility can significantly affect short-term performance, and more recent returns may be different from those shown. Call 800-THRIVENT or visit www.thrivent.com for performance results current to the most recent month-end.
1 | Annualized total returns represent past performance and reflect changes in share prices, the reinvestment of all dividends and capital gains, and the effects of compounding. Periods of less than one year are not annualized. At various times, the Portfolio’s adviser reimbursed and/or paid non-advisory Portfolio expenses. Had the adviser not done so, the Portfolio’s total returns would have been lower. The returns shown do not reflect charges and expenses imposed on contract holders by the variable accounts. Those charges and expenses reduce the returns received by contract holders as compared to the returns presented. |
Investing in a variable product involves risks, including the possible loss of principal. The prospectus contains more complete information on the investment objectives, risks, charges and expenses of the investment company, which investors should read and consider carefully before investing. To obtain a prospectus, contact a registered representative or visit www.thrivent.com.
65
Table of Contents

How did the Portfolio perform during the 8-month period ending December 31, 2008?
Thrivent Equity Income Plus Portfolio earned a return of -29.58% during the period from its inception on April 30, 2008, through December 31, 2008. The Portfolio’s market benchmark, the S&P 500 Index, earned a return of -30.72% for the same period.
What factors affected the Portfolio’s Performance?
2008 marked one of the most volatile and difficult markets in history, with the S&P 500 Index exhibiting its worst annual loss in more than 70 years. Within the broader market, dividend-paying stocks outperformed non-payers. For the year, the Portfolio performed well relative to the broader market and to its peer group.
Contributing to the Portfolio’s performance was an overall positioning on high-quality firms exhibiting strong operating performance and an ability to pay and grow dividends. At the sector and security level, security selection was the major contributor to outperformance, with a small underperformance due to sector allocations.
Stock selection was strong in health care, with financials and materials contributing a majority of the relative outperformance.
The Portfolio’s “buy-write” options strategy added value by generating premiums and moderating volatility. However, the Portfolio’s exposure to real estate investment trusts (REITs) and preferred equity detracted from performance, as both asset classes underperformed the overall market for the period. REITs underperformed due to historic tightening of credit and recognition of the domestic and international economic downturn. The preferred market was hurt by its heavy reliance on financials, which were the period’s worst-performing sector.
What is your outlook?
With the market down nearly 23% in the fourth quarter alone, history suggests that there are now pockets of opportunity in U.S. equities. We approach 2009 with caution and a continuation of a more conservative approach to Portfolio positioning, which emphasizes dividend coverage, improving operating performance,
Major Market Sectors
(% of Net Assets)
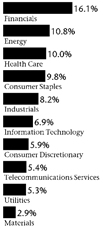
Portfolio Composition
(% of Portfolio)
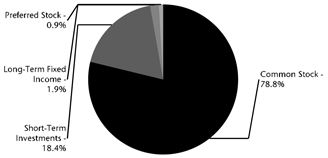
Top 10 Holdings
(% of Net Assets)
Exxon Mobil Corporation | 2.2 | % | |
Chevron Corporation | 2.0 | % | |
AT&T, Inc. | 2.0 | % | |
J.P. Morgan Chase & Company | 1.4 | % | |
Pfizer, Inc. | 1.4 | % | |
ConocoPhillips | 1.3 | % | |
Wells Fargo & Company | 1.2 | % | |
General Electric Company | 1.2 | % | |
Johnson & Johnson | 1.2 | % | |
Abbott Laboratories | 1.2 | % |
These securities represent 15.1% of the total net assets of the portfolio.
Quoted Major Market Sectors, Portfolio Composition and Top 10 Holdings are subject to change.
The lists of Major Market Sectors and Top 10 Holdings exclude short-term investments and collateral held for securities loaned.
The Portfolio Composition chart excludes collateral held for securities loaned.
66
Table of Contents
and quality balance sheets, in addition to attractive valuations. At the sector level, we continue to overweight consumer staples, health care and telecom services. However, as markets bottom and begin to anticipate an economic turnaround, early cyclical sectors can perform well on a relative basis, and at that time the Portfolio will most likely position with emphasis on the financials, consumer discretionary and technology sectors.
Portfolio Facts
As of December 31, 2008
Net Assets | $41,351,464 | |
NAV | $6.89 | |
NAV - High† | 5/19/2008 - $10.23 | |
NAV - Low† | 11/20/2008 - $5.96 | |
Number of Holdings: 205 | ||
| † | For the year ended December 31, 2008 |
Average Annual Total Returns1
As of December 31, 2008
From Inception 4/30/2008 | ||
| (29.58%) |
Value of a $10,000 Investment1
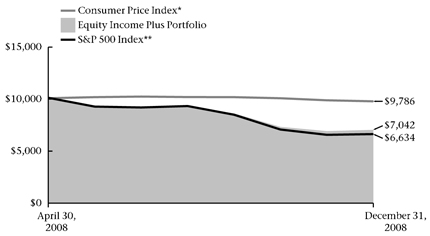
| * | The Consumer Price Index is an inflationary indicator that measures the change in the cost of a fixed basket of products and services, including housing, electricity, food and transportation. It is not possible to invest directly in the Index. |
** | The S&P 500 Index is an index that represents the average performance of a group of 500 widely held, publicly traded stocks. “S&P 500®” is a trademark of The McGraw-Hill Companies, Inc. and has been licensed for use by Thrivent Financial for Lutherans. The product is not sponsored, endorsed or promoted by Standard & Poor’s and Standard & Poor’s makes no representation regarding the advisability of investing in the product. It is not possible to invest directly in the Index. The performance of the Index does not reflect deductions for fees, expenses or taxes. |
Past performance is not an indication of future results. Total investment return and principal value will fluctuate and units, when redeemed, may be worth more or less than their original cost. Current performance may be higher or lower than the performance data quoted. Market volatility can significantly affect short-term performance, and more recent returns may be different from those shown. Call 800-THRIVENT or visit www.thrivent.com for performance results current to the most recent month-end.
1 | Annualized total returns represent past performance and reflect changes in share prices, the reinvestment of all dividends and capital gains, and the effects of compounding. Periods of less than one year are not annualized. At various times, the Portfolio’s adviser reimbursed and/or paid non-advisory Portfolio expenses. Had the adviser not done so, the Portfolio’s total returns would have been lower. The returns shown do not reflect charges and expenses imposed on contract holders by the variable accounts. Those charges and expenses reduce the returns received by contract holders as compared to the returns presented. |
Investing in a variable product involves risks, including the possible loss of principal. The prospectus contains more complete information on the investment objectives, risks, charges and expenses of the investment company, which investors should read and consider carefully before investing. To obtain a prospectus, contact a registered representative or visit www.thrivent.com.
67
Table of Contents
How did the Portfolio perform during the 12-month period ended December 31, 2008?
Thrivent Balanced Portfolio earned a total return of -26.06%. The Portfolio’s market benchmarks, the S&P 500 Index and the Barclays Capital (formerly Lehman Brothers) Aggregate Bond Index, returned -36.99% and 5.24%, respectively.
What factors affected the Portfolio’s performance?
We maintained an investment allocation of approximately two-thirds of assets in the equity segment and the remainder in fixed-income securities during the period.
The equity component return was closely aligned with its benchmark, the S&P 500 Index. Within the Portfolio, consumer staples and health care were the best performing industry sectors. The financial sector—with many banks, insurance companies and investment firms still writing off troubled mortgage securities—did worst, followed by materials and information technology.
The fixed-income component of the Portfolio underperformed the Barclays Capital Aggregate Bond Index mainly due to the floating-rate debt that backs our mortgage securities. We used this debt to back our purchase of Fannie Mae and Freddie Mac mortgage securities through what is called the “dollar-roll” program. In the program, we accept “forward delivery” of securities that haven’t been created yet, agreeing to take physical delivery at a later date. The floating-rate debt we use to back our agreement is all AAA-rated. While this typically low-risk practice generated additional yield for the Portfolio for many years, the floating-rate securities were affected by continued credit market troubles and they lost value.
What is your outlook?
We expect the recession to continue at least through mid-2009. However, the unprecedented amount of government stimulus in the system, along with large stimulus programs planned for early 2009, could begin to spur growth as early as the second half.
Major Market Sectors
(% of Net Assets)
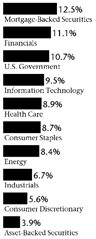
Portfolio Composition
(% of Portfolio)
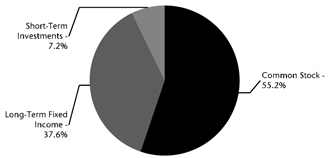
Top 10 Holdings
(% of Net Assets)
Federal National Mortgage Association Conventional 30-Yr. Pass Through | 6.2 | % | |
Exxon Mobil Corporation | 3.1 | % | |
Federal Home Loan Mortgage Corporation | 1.6 | % | |
Federal National Mortgage Association Conventional 15-Yr. Pass Through | 1.5 | % | |
Procter & Gamble Company | 1.4 | % | |
U.S. Treasury Notes | 1.4 | % | |
AT&T, Inc. | 1.3 | % | |
General Electric Company | 1.3 | % | |
Federal Home Loan Mortgage Corporation Gold 30-Yr. Pass Through | 1.3 | % | |
Johnson & Johnson | 1.3 | % |
These securities represent 20.4% of the total net assets of the portfolio.
Quoted Major Market Sectors, Portfolio Composition and Top 10 Holdings are subject to change.
The lists of Major Market Sectors and Top 10 Holdings exclude short-term investments and collateral held for securities loaned.
The Portfolio Composition chart excludes collateral held for securities loaned.
68
Table of Contents
We don’t expect a meaningful turnaround in the stock market until the credit crisis eases and economic growth resumes. The yield curve will likely remain steep and credit spreads will likely remain wide in the near future, but spreads should tighten later in the year as the securities markets begin to discount the recovery. We also believe that our affected floating-rate securities are fundamentally solid investments and that their value should rebound once the market calms down.
As always, we intend to maintain a well-diversified mix of securities in our efforts to track the performance of the benchmark Indexes.
Portfolio Facts
As of December 31, 2008
Net Assets | $280,020,870 | |
NAV | $11.75 | |
NAV - High† | 1/2/2008 - $17.04 | |
NAV - Low† | 11/20/2008 - $10.30 | |
Number of Holdings: 799 |
| † | For the year ended December 31, 2008 |
Average Annual Total Returns1
As of December 31, 2008
| 1-Year | 5-Year | 10-Year | ||||
| (26.06%) | (0.49 | %) | 1.00 | % |
Value of a $10,000 Investment1
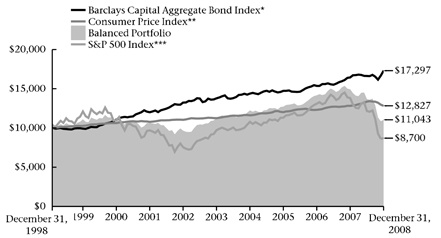
| * | The Barclays Capital Aggregate Bond Index is an index that measures the performance of U.S. investment grade bonds. It is not possible to invest directly in the Index. The performance of the Index does not reflect deductions for fees, expenses or taxes. |
| ** | The Consumer Price Index is an inflationary indicator that measures the change in the cost of a fixed basket of products and services, including housing, electricity, food and transportation. It is not possible to invest directly in the Index. |
*** | The S&P 500 Index is an index that represents the average performance of a group of 500 widely held, publicly traded stocks. “S&P 500®” is a trademark of The McGraw-Hill Companies, Inc. and has been licensed for use by Thrivent Financial for Lutherans. The product is not sponsored, endorsed or promoted by Standard & Poor’s and Standard & Poor’s makes no representation regarding the advisability of investing in the product. It is not possible to invest directly in the Index. The performance of the Index does not reflect deductions for fees, expenses or taxes. |
Past performance is not an indication of future results. Total investment return and principal value will fluctuate and units, when redeemed, may be worth more or less than their original cost. Current performance may be higher or lower than the performance data quoted. Market volatility can significantly affect short-term performance, and more recent returns may be different from those shown. Call 800-THRIVENT or visit www.thrivent.com for performance results current to the most recent month-end.
1 | Annualized total returns represent past performance and reflect changes in share prices, the reinvestment of all dividends and capital gains, and the effects of compounding. Periods of less than one year are not annualized. At various times, the Portfolio’s adviser reimbursed and/or paid non-advisory Portfolio expenses. Had the adviser not done so, the Portfolio’s total returns would have been lower. The returns shown do not reflect charges and expenses imposed on contract holders by the variable accounts. Those charges and expenses reduce the returns received by contract holders as compared to the returns presented. |
Investing in a variable product involves risks, including the possible loss of principal. The prospectus contains more complete information on the investment objectives, risks, charges and expenses of the investment company, which investors should read and consider carefully before investing. To obtain a prospectus, contact a registered representative or visit www.thrivent.com.
69
Table of Contents

How did the Portfolio perform during the 12-month period ended December 31, 2008?
Thrivent High Yield Portfolio earned a total return of -21.19%, as compared to the median return of its peer group, the Lipper U.S. High Current Yield Portfolios category, of -24.98%. The Portfolio’s market benchmark, the Barclays Capital (formerly Lehman Brothers) U.S. Corporate High Yield Bond Index, earned a return of -26.16%.
What factors affected the Portfolio’s performance?
The high-yield bond market sold off sharply through the year as investors worried about growing troubles in the credit markets and a massive de-leveraging of the U.S. financial system. The sector’s only relief came during the last month of December, with the government bailout of the U.S. auto makers and GMAC, which compose nearly 6% of the high-yield market.
The yield premium or “spread” high-yield bonds offered over that of Treasury securities started the year at 5.70%, peaked at 19.71% in mid-December, then ended the 12-month period at 16.69%. This was the most significant spread widening the high-yield market has ever witnessed, and as yields on securities increased, their prices declined. Spreads became much wider during 2008 than those seen in either of the last two recessions of 1990-1991 and 2000-2001.
The Portfolio outperformed its peer group during this challenging period mainly due to our emphasis on higher-quality bonds. Other factors that enhanced our performance relative to our peer group included our overweighted positions in recession-resistant industries such as health care and wireless, and our underweighted positions in recession-prone industries such as autos (-32.33%), retail (-29.33%), building materials (-39.43%) and banking (-67.65%).
Detracting from the Portfolio’s performance was our overweighted position in the gaming sector (-42% during the period), though the Portfolio’s gaming sector holdings were down less than the sector overall during the period.
What is your outlook?
We expect the current recession to continue at least through mid-2009. However, the unprecedented amount of government stimulus in the system, along with large stimulus programs planned for early 2009, could begin to spur growth as early as the second half.
Major Market Sectors
(% of Net Assets)
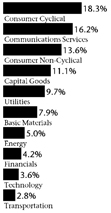
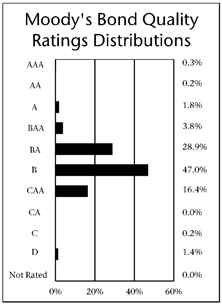
Top 10 Holdings
(% of Net Assets)
Intelsat Subsidiary Holding Company, Ltd. | 1.2 | % | |
Centennial Communications Corporation | 1.1 | % | |
Omnicare, Inc. | 1.0 | % | |
Texas Competitive Electric Holdings Company, LLC | 1.0 | % | |
MGM MIRAGE | 1.0 | % | |
HCA, Inc., Term Loan | 1.0 | % | |
Biomet, Inc. | 0.9 | % | |
DIRECTV Holdings, LLC | 0.9 | % | |
TransDigm, Inc. | 0.9 | % | |
General Motors Acceptance Corporation, LLC | 0.9 | % |
These securities represent 9.9% of the total net assets of the portfolio.
Quoted Major Market Sectors, Moody’s Bond Quality Ratings Distributions and Top 10 Holdings are subject to change.
Moody’s Bond Quality Ratings Distributions exclude collateral held for securities loaned.
The lists of Major Market Sectors and Top 10 Holdings exclude short-term investments and collateral held for securities loaned.
70
Table of Contents
We remain concerned about the threats to growth posed by continued problems in the housing and credit markets, softening consumer demand and rising unemployment. In a recession, high-yield bonds typically perform poorly. With slow or no economic growth, we expect default rates in high-yield bonds to increase significantly over the next year or two. For these reasons, we will keep a defensive stance.
With high-yield bond yield spreads so wide, however, the market appears to have priced in the expected increase in defaults—and, we think, may be overcompensating investors at current yields. For suitable investors, we believe that now is a good time to add some exposure to high-yield bonds.
Portfolio Facts
As of December 31, 2008
Net Assets | $597,219,792 | |
NAV | $3.48 | |
NAV - High† | 1/2/2008 - $4.83 | |
NAV - Low† | 12/16/2008 - $3.23 | |
Number of Holdings: 233 |
| † | For the year ended December 31, 2008 |
Average Annual Total Returns1
As of December 31, 2008
1-Year | 5-Year | 10-Year | ||||
| (21.19%) | 0.46 | % | 0.12 | % |
Value of a $10,000 Investment1
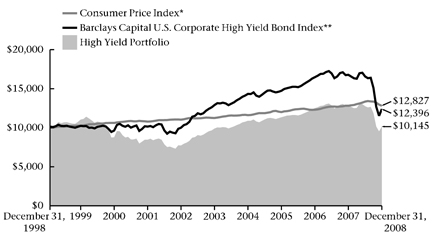
| * | The Consumer Price Index is an inflationary indicator that measures the change in the cost of a fixed basket of products and services, including housing, electricity, food and transportation. It is not possible to invest directly in the Index. |
| ** | The Barclays Capital U.S. Corporate High Yield Bond Index is an index which measures the performance of fixed-rate non-investment grade bonds. It is not possible to invest directly in the Index. The performance of the Index does not reflect deductions for fees, expenses or taxes. |
| Past performance is not an indication of future results. Total investment return and principal value will fluctuate and units, when redeemed, may be worth more or less than their original cost. Current performance may be higher or lower than the performance data quoted. Market volatility can significantly affect short-term performance, and more recent returns may be different from those shown. Call 800-THRIVENT or visit www.thrivent.com for performance results current to the most recent month-end |
1 | Annualized total returns represent past performance and reflect changes in share prices, the reinvestment of all dividends and capital gains, and the effects of compounding. Periods of less than one year are not annualized. At various times, the Portfolio’s adviser reimbursed and/or paid non-advisory Portfolio expenses. Had the adviser not done so, the Portfolio’s total returns would have been lower. The returns shown do not reflect charges and expenses imposed on contract holders by the variable accounts. Those charges and expenses reduce the returns received by contract holders as compared to the returns presented. |
| Investing in a variable product involves risks, including the possible loss of principal. The prospectus contains more complete information on the investment objectives, risks, charges and expenses of the investment company, which investors should read and consider carefully before investing. To obtain a prospectus, contact a registered representative or visit www.thrivent.com. |
71
Table of Contents
|
| Thrivent Diversified Income Plus Portfolio |
|
| ||||
| Mark L. Simenstad, CFA, Kevin R. Brimmer, FSA, David R. Spangler, CFA and Paul J. Ocenasek, CFA, Portfolio Co-Managers |
Thrivent Diversified Income Plus Portfolio seeks to maximize income while maintaining prospects for capital appreciation by investing primarily in a diversified portfolio of income-producing securities.
The Portfolio may invest in debt or equity securities. Debt securities include high-yield, high-risk securities commonly known as “junk bonds.” High-yield securities are subject to greater price fluctuations and increased risk of loss of principal than investment grade bonds. Equity securites include securities of REITs, which are subject to the risk that changes in real estate values or economic downturns can have a negative effect on issuers in the real estate industry. These and other risks are described in the Portfolio’s Prospectus.
How did the Portfolio perform during the 12-month period ended December 31, 2008?
Thrivent Diversified Income Plus Portfolio returned -23.30%. This compares with the Portfolio’s primary benchmarks, including the S&P 500 Dividend Aristocrats Index, which registered a -21.55% total return, and the Barclays Capital (formerly Lehman Brothers) Aggregate Bond Index, which returned 5.24%.
What factors affected the Portfolio’s performance?
In the Portfolio’s equity portion, our investments in real estate investment trusts (REITs) detracted from our overall performance. REIT share prices fell sharply, as the FTSE NAREIT Equity REIT Index posted a -37.73% return for the 12-month period. During the period, however, we reduced our position in REITs from 7% of the Portfolio’s value (already reduced previously from the Portfolio’s long-term strategic 11% allocation) to 3% of assets.
On the Portfolio’s fixed-income side, our holdings of mortgage-backed, corporate and high-yield bonds all experienced price declines as investors continued to seek out the safety of Treasury securities. Our high-yield bonds performed substantially better than the Barclays Capital (formerly Lehman Brothers) High Yield Index, which posted a -26.16% return for the 12-month period, due to our focus on higher-quality securities within this segment. Still, any exposure to these securities was problematic.
Major Market Sectors
(% of Net Assets)
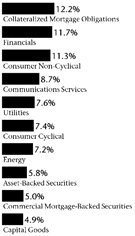
Portfolio Composition
(% of Portfolio)
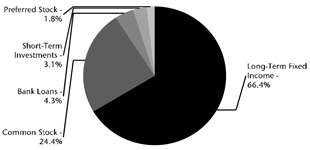
Top 10 Holdings
(% of Net Assets)
Wachovia Bank Commercial Mortgage Trust | 1.7 | % | |
Commercial Mortgage Pass- Through Certificates | 1.6 | % | |
Bear Stearns Adjustable Rate Mortgage Trust | 1.5 | % | |
Americredit Automobile Receivables Trust | 1.3 | % | |
J.P. Morgan Chase Commercial Mortgage Securities Corporation | 1.2 | % | |
MASTR Alternative Loans Trust | 1.2 | % | |
Washington Mutual Mortgage Pass-Through Certificates | 1.1 | % | |
Deutsche Alt-A Securities, Inc. | 1.0 | % | |
Residential Asset Mortgage Products, Inc. | 1.0 | % | |
Citimortgage Alternative Loan Trust | 0.9 | % |
These securities represent 12.5% of the total net assets of the portfolio.
Quoted Major Market Sectors, Portfolio Composition and Top 10 Holdings are subject to change.
The lists of Major Market Sectors and Top 10 Holdings exclude short-term investments and collateral held for securities loaned.
The Portfolio Composition chart excludes collateral held for securities loaned.
72
Table of Contents
What is your outlook?
We expect the current recession to continue at least through mid-2009. However, the unprecedented amount of government stimulus in the system, along with large stimulus programs planned for early 2009, could begin to spur growth as soon as the second half. With all of our investment sectors beaten down over the last year, we are seeing significant opportunities in most of these areas going forward. For example, returns for select high-yield, mortgage-backed and bank loan securities, along with preferred and convertible stocks, could rival that of equities for some time. We will remain cautious on REITs, and stay at the low end of our overall allocation to equities.
Also, we intend to hold our securities affected by the credit crunch and not sell at discount levels. As always we will continue to monitor the economy and markets carefully, adding value to the Portfolio whenever possible.
Portfolio Facts
As of December 31, 2008
Net Assets | $75,005,121 | |
NAV | $5.01 | |
NAV - High† | 5/19/2008 - $7.08 | |
NAV - Low† | 11/20/2008 - $4.62 | |
Number of Holdings: 471 |
| † | For the year ended December 31, 2008 |
Average Annual Total Returns1,2
As of December 31, 2008
1-Year | 5-Year | 10-Year | ||||
(23.30%) | (0.60 | %) | 1.55 | % |
Value of a $10,000 Investment1
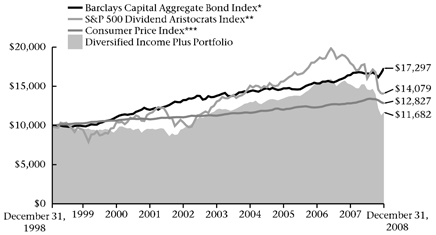
| * | The Barclays Capital Aggregate Bond Index is an index that measures the performance of U.S. investment grade bonds. It is not possible to invest directly in the Index. The performance of the Index does not reflect deductions for fees, expenses or taxes. |
| ** | The S&P 500 Dividend Aristocrats Index is an index which measures the performance of large-capitalization companies within the S&P 500 that have followed a managed dividends policy of consistently increasing dividends every year for at least 25 years. The index portfolio has both capital growth and dividend income characteristics, is equal-weighted and is broadly diversified across sectors. The product is not sponsored, endorsed or promoted by Standard & Poor’s, and Standard & Poor’s makes no representation regarding the advisability of investing in the product. It is not possible to invest directly in the Index. The performance of the Index does not reflect deductions for fees, expenses or taxes. |
| *** | The Consumer Price Index is an inflationary indicator that measures the change in the cost of a fixed basket of products and services, including housing, electricity, food and transportation. It is not possible to invest directly in the Index. |
| Past performance is not an indication of future results. Total investment return and principal value will fluctuate and units, when redeemed, may be worth more or less than their original cost. Current performance may be higher or lower than the performance data quoted. Market volatility can significantly affect short-term performance, and more recent returns may be different from those shown. Call 800-THRIVENT or visit www.thrivent.com for performance results current to the most recent month-end. |
1 | Annualized total returns represent past performance and reflect changes in share prices, the reinvestment of all dividends and capital gains, and the effects of compounding. Periods of less than one year are not annualized. At various times, the Portfolio’s adviser reimbursed and/or paid non-advisory Portfolio expenses. Had the adviser not done so, the Portfolio’s total returns would have been lower. The returns shown do not reflect charges and expenses imposed on contract holders by the variable accounts. Those charges and expenses reduce the returns received by contract holders as compared to the returns presented. |
2 | Prior to July 3, 2006, the Portfolio invested primarily in “junk bonds”. |
| Investing in a variable product involves risks, including the possible loss of principal. The prospectus contains more complete information on the investment objectives, risks, charges and expenses of the investment company, which investors should read and consider carefully before investing. To obtain a prospectus, contact a registered representative or visit www.thrivent.com. |
73
Table of Contents
How did the Portfolio perform during the 8-month period ended December 31, 2008?
Thrivent Partner Socially Responsible Bond Portfolio earned a total return of 2.68% period from its inception on April 30, 2008, until December 31, 2008. The Portfolio’s market benchmark, the Barclays Capital (formerly Lehman Brothers) U.S. Credit Index, earned a return of -3.49%.
What factors affected the Portfolio’s performance?
The primary drivers of strong relative outperformance were the Portfolio’s high allocation to AAA-rated securities in a period when lower quality credits significantly underperformed high-quality issues. An underweighted stance in credit (41% for the Portfolio/82% for the Index at year-end) and overweighted stance to agency debt (27% Portfolio/18% Index at year-end) also benefited returns.
The Portfolio’s short relative duration somewhat offset these positives. Our strategy has been to reduce duration as Treasury yields rally and to increase duration as yields rise. Following a drop in yields to near historic lows, we believed that the risk was higher for a sharp sell-off in Treasuries than for a continued rally. Accordingly, our duration hedging strategies shortened the Portfolio duration from 3.5 on September 30, 2008, to near 1 toward year-end. This clearly was premature, as Treasuries rallied strongly on the Federal Reserve’s cut in the target rate to a range of zero to 0.25% and its announcement that it may consider buying Treasury securities in addition to agency mortgage-back securities in order to bring mortgage rates down.
Major Market Sectors
(% of Net Assets)
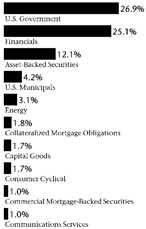
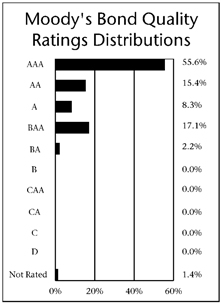
Top 10 Holdings
(% of Net Assets)
U.S. Department of Housing & Urban Development | 15.4 | % | |
Federal Home Loan Mortgage Corporation | 11.5 | % | |
Giants Stadium, LLC | 6.6 | % | |
Giants Stadium, LLC | 4.4 | % | |
Toll Road Investors Partnership II, LP | 1.9 | % | |
Georgetown University | 1.5 | % | |
Australia & New Zealand Banking Group, Ltd. | 1.4 | % | |
Household Automotive Trust | 1.4 | % | |
Wachovia Capital Trust III | 1.3 | % | |
Capital Auto Receivables Asset Trust | 1.1 | % |
These securities represent 46.5% of the total net assets of the portfolio.
Quoted Major Market Sectors, Moody’s Bond Quality Ratings Distributions and Top 10 Holdings are subject to change.
Moody’s Bond Quality Ratings Distributions exclude collateral held for securities loaned.
The lists of Major Market Sectors and Top 10 Holdings exclude short-term investments and collateral held for securities loaned.
74
Table of Contents
What is your outlook?
We continue to maintain the short relative duration in anticipation of higher rates resulting from record new Treasury issuance in 2009. Credit prices should begin to improve as several broad programs initiated by the Fed and Treasury continue to unfreeze markets.
Portfolio Facts
As of December 31, 2008
Net Assets | $6,816,331 | |
NAV | $10.02 | |
NAV - High† | 9/9/2008 - $10.13 | |
NAV - Low† | 10/17/2008 - $9.64 | |
Number of Holdings: 65 |
| † | For the year ended December 31, 2008 |
Average Annual Total Returns1
As of December 31, 2008
| From Inception |
4/30/2008 |
2.68% |
Value of a $10,000 Investment1
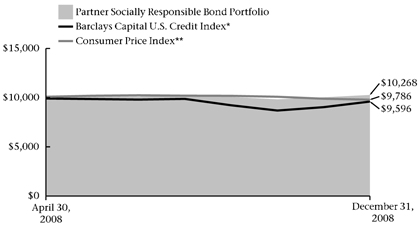
| * | The Barclays Capital U.S. Credit Index is an index comprised of both corporate and non-corporate sectors. The corporate sectors are Industrial, Utility and Finance, which include both U.S. and non-U.S. corporations. The non-corporate sectors are Sovereign, Supranational, Foreign Agency, and Foreign Local Government. It is not possible to invest directly in the Index. The performance of the Index does not reflect deductions for fees, expenses or taxes. |
| ** | The Consumer Price Index is an inflationary indicator that measures the change in the cost of a fixed basket of products and services, including housing, electricity, food and transportation. It is not possible to invest directly in the Index. |
| Past performance is not an indication of future results. Total investment return and principal value will fluctuate and units, when redeemed, may be worth more or less than their original cost. Current performance may be higher or lower than the performance data quoted. Market volatility can significantly affect short-term performance, and more recent returns may be different from those shown. Call 800-THRIVENT or visit www.thrivent.com for performance results current to the most recent month-end. |
1 | Annualized total returns represent past performance and reflect changes in share prices, the reinvestment of all dividends and capital gains, and the effects of compounding. Periods of less than one year are not annualized. At various times, the Portfolio’s adviser reimbursed and/or paid non-advisory Portfolio expenses. Had the adviser not done so, the Portfolio’s total returns would have been lower. The returns shown do not reflect charges and expenses imposed on contract holders by the variable accounts. Those charges and expenses reduce the returns received by contract holders as compared to the returns presented. |
| Investing in a variable product involves risks, including the possible loss of principal. The prospectus contains more complete information on the investment objectives, risks, charges and expenses of the investment company, which investors should read and consider carefully before investing. To obtain a prospectus, contact a registered representative or visit www.thrivent.com. |
75
Table of Contents
 |
Stephen D. Lowe, CFA, Portfolio Manager
Thrivent Income Portfolio seeks a high level of income over the longer term while providing reasonable safety of capital through investment primarily in readily marketable intermediate and long-term fixed income securities.
The Portfolio is subject to interest rate risk, credit risk related to a company’s underlying financial position and volatility risk, which may result in overall price fluctuations over short or even extended time periods. These and other risks are described in the Portfolio’s prospectus. |
How did the Portfolio perform during the 12-month period ended December 31, 2008?
Thrivent Income Portfolio earned a total return of -10.85%, as compared to the median return of its peer group, the Lipper Corporate Debt Funds BBB-Rated Funds category, of -7.87%. The Portfolio’s market benchmark, the Barclays Capital (formerly Lehman Brothers) Aggregate Bond Index, earned a return of 5.24%.
What factors affected the Portfolio’s performance?
The Portfolio has continued to be negatively impacted by very illiquid floating-rate securities that were used to support the forward purchase of mortgage securities. These securities have been the single largest source of negative return contribution over the past year as the traditional demand for these securities has all but evaporated. The Portfolio was also negatively impacted by both an overweighted position and security selection in the commercial mortgage-backed securities sector. Finally, an underweighted position in U.S. Treasury securities had a negative impact.
Most of the positive return attribution for the Portfolio was generated from our high-yield and investment-grade corporate bond holdings and our convertible bond holdings. This was attributable primarily to the defensive, up-in-quality bias of the Portfolio’s holdings in these sectors. Being underweighted in a number of the large financial failures such as Fannie Mae, AIG, and Washington Mutual also helped performance relative to our peer group.
What is your outlook?
We continue to expect a prolonged period of significant economic weakness as the world’s economies struggle through one of the first synchronized global recessions in decades. Rising unemployment, very weak consumer spending, and business spending cutbacks are now the primary risks to the economy. The support from exports that U.S. corporations have enjoyed is also now in jeopardy as global growth slows. Helping to offset these risks somewhat, the U.S. government and governments around the world have initiated financial-system rescue plans and aggressive fiscal and monetary stimulus measures that may begin to show signs of stabilizing the economy and returning some liquidity to the credit markets.
Major Market Sectors
(% of Net Assets)
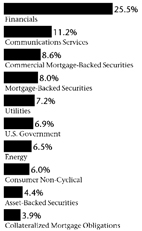
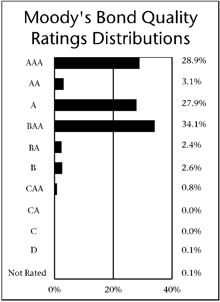
Top 10 Holdings
(% of Net Assets)
Federal National Mortgage Association Conventional 30-Yr. Pass Through | 6.2 | % | |
Federal National Mortgage Association | 1.2 | % | |
Federal Home Loan Mortgage Corporation | 1.2 | % | |
Merna Re, Ltd. | 1.0 | % | |
Federal National Mortgage Association Conventional 30-Yr. Pass Through | 0.9 | % | |
Federal National Mortgage Association Conventional 30-Yr. Pass Through | 0.9 | % | |
U.S. Treasury Notes | 0.9 | % | |
Wachovia Bank Commercial Mortgage Trust | 1.0 | % | |
Discover Card Master Trust | 0.8 | % | |
Morgan Stanley | 0.8 | % |
These securities represent 14.9% of the total net assets of the portfolio.
Quoted Major Market Sectors, Moody’s Bond Quality Ratings Distributions and Top 10 Holdings are subject to change.
Moody’s Bond Quality Ratings Distributions exclude collateral held for securities loaned.
The lists of Major Market Sectors and Top 10 Holdings exclude short-term investments and collateral held for securities loaned.
76
Table of Contents
We are much less concerned about inflation at this point in the economic cycle, but need to stay vigilant due to the very large amount of stimulus mentioned above that is in the pipeline. Given this outlook, with downside risks to growth and minimal inflation concerns, we continue to maintain a neutral to slightly long bias to duration and the Treasury curve.
The overall Portfolio continues to have a defensive posture at the moment, but with investment-grade credit spreads at historical wide levels and valuations in the high-yield market looking attractive, we have begun to carefully add to our exposure to both these assets.
Portfolio Facts
As of December 31, 2008
Net Assets | $1,097,103,028 | |
NAV | $8.20 | |
NAV - High† | 1/23/2008 - $9.88 | |
NAV - Low† | 11/24/2008 - $7.73 | |
Number of Holdings: 327 |
| † | For the year ended December 31, 2008 |
Average Annual Returns1
As of December 31, 2008
1-Year | 5-Year | 10-Year | ||||
| (10.85%) | 0.89 | % | 3.36 | % |
Value of a $10,000 Investment1
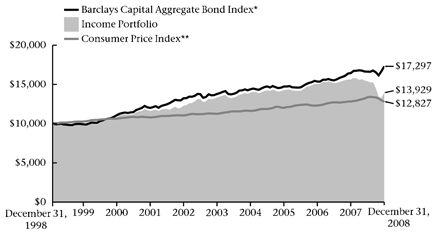
| * | The Barclays Capital Aggregate Bond Index is an index that measures the performance of U.S. investment grade bonds. It is not possible to invest directly in the Index. The performance of the Index does not reflect deductions for fees, expenses or taxes. |
| ** | The Consumer Price Index is an inflationary indicator that measures the change in the cost of a fixed basket of products and services, including housing, electricity, food and transportation. It is not possible to invest directly in the Index. |
Past performance is not an indication of future results. Total investment return and principal value will fluctuate and units, when redeemed, may be worth more or less than their original cost. Current performance may be higher or lower than the performance data quoted. Market volatility can significantly affect short-term performance, and more recent returns may be different from those shown. Call 800-THRIVENT or visit www.thrivent.com for performance results current to the most recent month-end.
1 | Annualized total returns represent past performance and reflect changes in share prices, the reinvestment of all dividends and capital gains, and the effects of compounding. Periods of less than one year are not annualized. At various times, the Portfolio’s adviser reimbursed and/or paid non-advisory Portfolio expenses. Had the adviser not done so, the Portfolio’s total returns would have been lower. The returns shown do not reflect charges and expenses imposed on contract holders by the variable accounts. Those charges and expenses reduce the returns received by contract holders as compared to the returns presented. |
Investing in a variable product involves risks, including the possible loss of principal. The prospectus contains more complete information on the investment objectives, risks, charges and expenses of the investment company, which investors should read and consider carefully before investing. To obtain a prospectus, contact a registered representative or visit www.thrivent.com.
77
Table of Contents
 |
Michael G. Landreville, CFA, Portfolio Manager
Thrivent Bond Index Portfolio strives for investment results similar to the total return of the Barclays Capital Aggregate Bond Index by investing primarily in bonds and other debt securities included in the Index.
The Portfolio is subject to interest rate risk, credit risk related to a company’s underlying financial position, and prepayment and extension risk, which may result in overall price fluctuations over short or even extended time periods. While the Portfolio attempts to closely track the Barclays Capital Aggregate Bond Index, it does not duplicate the composition of the Index. Individuals may not invest directly in any index. Index portfolios are subject to the same market risks associated with the securities in their respective indexes. These and other risks are described in the Portfolio’s prospectus. |
How did the Portfolio perform during the 12-month period ended December 31, 2008?
Thrivent Bond Index Portfolio posted a total return of -0.82%, compared to a 5.24% total return for the Portfolio’s benchmark, the Barclays Capital (formerly Lehman Brothers) Aggregate Bond Index.
What factors affected the Portfolio’s performance?
The main reason the Portfolio underperformed the benchmark Index was due to the floating-rate debt that backs our mortgage securities. We used this debt to back our purchase of Fannie Mae and Freddie Mac mortgage securities through what is called the “dollar-roll” program. In the program, we accept “forward delivery” of securities that haven’t been created yet, agreeing to take physical delivery at a later date. The floating-rate debt we use to back our agreement is all AAA-rated. While this practice generated additional yield for the Portfolio for many years, the floating-rate securities were affected by credit market liquidity troubles and they lost value.
Concerns about the housing and credit markets overshadowed the bond market throughout 2008, and the lack of resolution sustained investors’ flight to quality. As investors sought the safety of government-backed U.S. Treasury securities, the yield spread between Treasury issues and other types of bonds—including investment-grade corporate and mortgage-backed bonds—widened dramatically. With their prices falling, securities with a credit orientation or mortgage-backed structure significantly underperformed Treasury securities.
Major Market Sectors
(% of Net Assets)
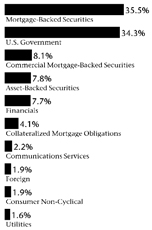
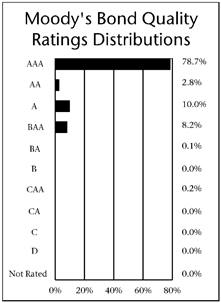
Top 10 Holdings
(% of Net Assets)
Federal National Mortgage Association Conventional 30-Yr. Pass Through | 17.3 | % | |
| Federal Home Loan Mortgage Corporation Gold 30-Yr. Pass Through | 6.3 | % | |
| Federal National Mortgage Association Conventional 15-Yr. Pass Through | 4.8 | % | |
| Federal Home Loan Mortgage Corporation Gold 30-Yr. Pass Through | 4.1 | % | |
| U.S. Treasury Bonds | 3.4 | % | |
| U.S. Treasury Bonds | 3.2 | % | |
| U.S. Treasury Notes | 2.8 | % | |
| U.S. Treasury Notes | 2.1 | % | |
| Federal Home Loan Mortgage Corporation | 2.1 | % | |
| U.S. Treasury Notes | 1.8 | % |
These securities represent 47.9% of the total net assets of the portfolio.
Quoted Major Market Sectors, Moody’s Bond Quality Ratings Distributions and Top 10 Holdings are subject to change.
Moody’s Bond Quality Ratings Distributions exclude collateral held for securities loaned.
The lists of Major Market Sectors and Top 10 Holdings exclude short-term investments and collateral held for securities loaned.
78
Table of Contents
What is your outlook?
We expect the current recession to continue at least through mid-2009. However, the unprecedented amount of government stimulus in the system, along with large stimulus programs planned for early 2009, could begin to spur growth as early as the second half. To foster economic activity, the Federal Reserve will likely keep short-term interest rates at current record-low levels at least through the first half. Non-government bonds are compensating investors for a high level of risk, with some investment-grade bonds now offering yields of about 7% or higher.
We believe that our affected floating-rate securities are fundamentally solid investments and that their value should rebound once the market calms down. As always, we intend to maintain a well diversified mix of debt securities in our efforts to track the performance of the benchmark Index.
Portfolio Facts
As of December 31, 2008
Net Assets | $174,649,020 | |
NAV | $9.72 | |
NAV - High† | 1/23/2008 - $10.49 | |
NAV - Low† | 11/24/2008 - $9.30 | |
Number of Holdings: 296 |
| † | For the year ended December 31, 2008 |
Average Annual Total Returns1
As of December 31, 2008
| 1-Year | 5-Year | 10-Year | ||
| (0.82%) | 2.97% | 4.60% |
Value of a $10,000 Investment1
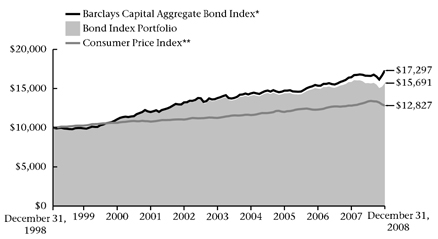
| * | The Barclays Capital Aggregate Bond Index is an index that measures the performance of U.S. investment grade bonds. It is not possible to invest directly in the Index. The performance of the Index does not reflect deductions for fees, expenses or taxes. |
| ** | The Consumer Price Index is an inflationary indicator that measures the change in the cost of a fixed basket of products and services, including housing, electricity, food and transportation. It is not possible to invest directly in the Index. |
Past performance is not an indication of future results. Total investment return and principal value will fluctuate and units, when redeemed, may be worth more or less than their original cost. Current performance may be higher or lower than the performance data quoted. Market volatility can significantly affect short-term performance, and more recent returns may be different from those shown. Call 800-THRIVENT or visit www.thrivent.com for performance results current to the most recent month-end.
1 | Annualized total returns represent past performance and reflect changes in share prices, the reinvestment of all dividends and capital gains, and the effects of compounding. Periods of less than one year are not annualized. At various times, the Portfolio’s adviser reimbursed and/or paid non-advisory Portfolio expenses. Had the adviser not done so, the Portfolio’s total returns would have been lower. The returns shown do not reflect charges and expenses imposed on contract holders by the variable accounts. Those charges and expenses reduce the returns received by contract holders as compared to the returns presented. |
Investing in a variable product involves risks, including the possible loss of principal. The prospectus contains more complete information on the investment objectives, risks, charges and expenses of the investment company, which investors should read and consider carefully before investing. To obtain a prospectus, contact a registered representative or visit www.thrivent.com.
79
Table of Contents

How did the Portfolio perform during the 12-month period ended December 31, 2008?
Thrivent Limited Maturity Bond Portfolio earned a total return of -6.46%, as compared to the median return for its peer group, the Lipper Short Investment Grade Debt Portfolios category, of -0.28%. The Portfolio’s market benchmark, the Barclays Capital (formerly Lehman Brothers) Government/Credit 1-3 Year Bond Index, earned a return of 4.97%.
What factors affected the Portfolio’s performance?
Our underweighting of Treasury securities, which outperformed other fixed-income categories as investors rushed to safety throughout the year, is the main reason for our underperformance relative to the peer group and benchmark index. Although we maintained a diversified portfolio of high-quality mortgage-backed, asset-backed agency and corporate bonds, these securities generally experienced a drop in prices and a rise in yields as the credit crisis worsened throughout the year. The benchmark Index, in contrast, is composed of more than 80% Treasury and government agency securities.
Most of the Portfolio’s negative performance occurred during the second half of the year. The failures or forced sale of several large financial institutions—including Fannie Mae, Freddie Mac, Lehman Brothers, Washington Mutual, Wachovia, Merrill Lynch and AIG—escalated investors’ flight to safety.
With the economy in recession and the housing, credit and job markets worsening, the Federal Reserve Open Market Committee cut short-term interest rates repeatedly, with the federal funds target rate dropping from 4.25% at the start of the year to a range of zero to 0.25% on December 16, 2008.
Our relative performance benefited from moves to position the Portfolio for a steeper yield curve and purchase of options on Treasury futures, which enabled us to extend the Portfolio’s duration when interest rates declined significantly. The options’ value grew as rates fell. The Portfolio’s relative performance also benefited from our overweighted position in agency securities.
Major Market Sectors
(% of Net Assets)
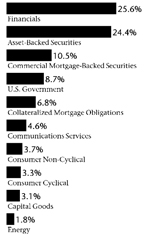
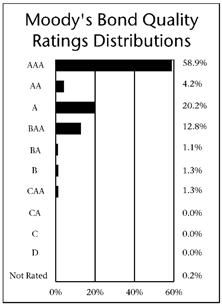
Top 10 Holdings
(% of Net Assets)
U.S. Treasury Notes, TIPS | 3.9 | % | |
| U.S. Treasury Notes | 2.0 | % | |
| Goldman Sachs Group, Inc. | 1.1 | % | |
| Regions Bank | 1.1 | % | |
| Bank of America Corporation | 1.1 | % | |
| Keybank National Association | 1.1 | % | |
| J.P. Morgan Chase & Company | 1.1 | % | |
| HSBC USA, Inc. | 1.1 | % | |
| Federal National Mortgage Association | 1.1 | % | |
| Suntrust Bank | 1.1 | % |
These securities represent 14.7% of the total net assets of the portfolio.
Quoted Major Market Sectors, Moody’s Bond Quality Ratings Distributions and Top 10 Holdings are subject to change.
Moody’s Bond Quality Ratings Distributions exclude collateral held for securities loaned.
The lists of Major Market Sectors and Top 10 Holdings exclude short-term investments and collateral held for securities loaned.
80
Table of Contents
What is your outlook?
We expect the current recession to continue at least through mid-2009. However, the unprecedented amount of government stimulus in the system, along with large stimulus programs planned for early 2009, could begin to spur growth as early as the second half.
We expect the yield curve to remain steep and credit spreads to remain wide in the near future, but spreads should tighten later in the year as the securities markets begin to discount the recovery. Non-government bonds with shorter maturities are compensating investors for a high level of risk, with many short-term investment-grade bonds now offering yields of about 7% or higher.
We will maintain our overweighted position in spread-sector investments and will add to these holdings as attractive opportunities arise. We believe that our spread-sector securities are solid investments and that their value should rebound as the market calms down.
Portfolio Facts
As of December 31, 2008
Net Assets | $925,939,520 | |
NAV | $8.79 | |
NAV - High† | 1/23/2008 - $9.93 | |
NAV - Low† | 11/24/2008 - $8.62 | |
Number of Holdings: 281 |
| † | For the year ended December 31, 2008 |
Average Annual Total Returns1
As of December 31, 2008
1-Year | 5-Year | From Inception 11/30/2001 | ||||
| (6.46%) | 1.11 | % | 2.12 | % |
Value of a $10,000 Investment1
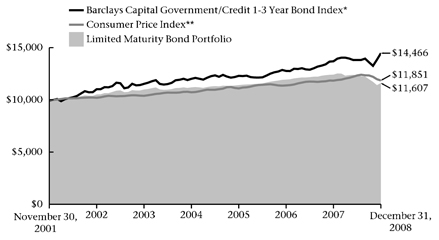
| * | The Barclays Capital Government/Credit 1-3 Year Bond Index is an index that measures the performance of government and corporate fixed-rate debt securities with maturities of 1-3 years. It is not possible to invest directly in the Index. The performance of the Index does not reflect deductions for fees, expenses or taxes. |
| ** | The Consumer Price Index is an inflationary indicator that measures the change in the cost of a fixed basket of products and services, including housing, electricity, food and transportation. It is not possible to invest directly in the Index. |
Past performance is not an indication of future results. Total investment return and principal value will fluctuate and units, when redeemed, may be worth more or less than their original cost. Current performance may be higher or lower than the performance data quoted. Market volatility can significantly affect short-term performance, and more recent returns may be different from those shown. Call 800-THRIVENT or visit www.thrivent.com for performance results current to the most recent month-end.
1 | Annualized total returns represent past performance and reflect changes in share prices, the reinvestment of all dividends and capital gains, and the effects of compounding. Periods of less than one year are not annualized. At various times, the Portfolio’s adviser reimbursed and/or paid non-advisory Portfolio expenses. Had the adviser not done so, the Portfolio’s total returns would have been lower. The returns shown do not reflect charges and expenses imposed on contract holders by the variable accounts. Those charges and expenses reduce the returns received by contract holders as compared to the returns presented. |
Investing in a variable product involves risks, including the possible loss of principal. The prospectus contains more complete information on the investment objectives, risks, charges and expenses of the investment company, which investors should read and consider carefully before investing. To obtain a prospectus, contact a registered representative or visit www.thrivent.com.
81
Table of Contents

How did the Portfolio perform during the 12 -month period ended December 31, 2008?
Thrivent Mortgage Securities Portfolio earned a total return of -4.96%, as compared to the median return of its peer group, the Lipper U.S. Mortgage Funds category, of - -0.36%. The Portfolio’s market benchmark, the Barclays Capital (formerly Lehman Brothers) Mortgage-Backed Securities Index, earned a return of 8.34%.
What factors affected the Portfolio’s performance?
With the economy in recession and the housing, credit and job markets worsening, the Federal Reserve Open Market Committee cut short-term interest rates repeatedly, with the federal funds target rate dropping from 4.25% at the start of the year to a range of zero to
0.25% on December 16, 2008. The government also undertook other extraordinary measures to inject liquidity into the financial system.
As investors flocked to the safety of government-backed U.S. Treasury securities throughout the year, the yield spread between Treasury issues and spread sectors—including mortgage-backed bonds—widened dramatically. Securities with a mortgage-backed
structure or underlying collateral relating to real estate did poorly. Their performance worsened in the second half as numerous financial institutions and hedge funds were forced to liquidate large numbers of mortgage securities.
A major factor in the Portfolio’s relative underperformance was the floating-rate debt that backs our mortgage securities. We used the debt to back our purchase of Fannie Mae and Freddie Mac mortgage securities through what is called the “dollar-roll” program. While this typically low-risk practice generated additional yield for the Portfolio for many years, our floating-rate securities were affected by the liquidity crunch and lost value.
The Portfolio’s performance also was hurt by its allocation to AAA-rated non-agency residential mortgage-backed securities and AAA-rated commercial mortgage-backed securities, which also were affected by the credit market turmoil. The benchmark Index, in contrast, is composed entirely of agency-or government- backed issues.
Major Market Sectors
(% of Net Assets)
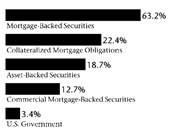
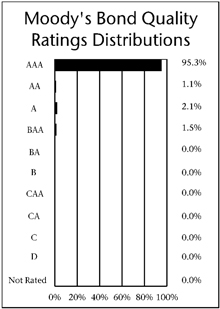
Top 10 Holdings
(% of Net Assets)
Federal National Mortgage Association Conventional 30-Yr. Pass Through | 37.9 | % | |
Federal Home Loan Mortgage Corporation Gold 30-Yr. Pass Through | 11.7 | % | |
Federal National Mortgage Association Conventional 30-Yr. Pass Through | 8.8 | % | |
Federal National Mortgage Association | 4.8 | % | |
Ford Credit Floor Plan Master Owner Trust | 4.1 | % | |
Americredit Automobile Receivables Trust | 3.6 | % | |
Thornburg Mortgage Securities Trust | 3.6 | % | |
Wachovia Bank Commercial Mortgage Trust | 3.6 | % | |
U.S. Treasury Notes, TIPS | 3.1 | % | |
LB-UBS Commercial Mortgage Trust | 2.6 | % |
These securities represent 83.8% of the total net assets of the portfolio.
Quoted Major Market Sectors, Moody’s Bond Quality Ratings Distributions and Top 10 Holdings are subject to change.
Moody’s Bond Quality Ratings Distributions exclude collateral held for securities loaned.
The lists of Major Market Sectors and Top 10 Holdings exclude short-term investments and collateral held for securities loaned.
82
Table of Contents
What is your outlook?
We expect the current recession to continue at least through mid-2009. However, the unprecedented amount of government stimulus in the system, along with large stimulus programs planned for early 2009, could begin to spur growth as early as the second half.
We expect that agency-backed mortgage securities will be a safe haven and benefit as the Federal Reserve continues to buy them. We will maintain our overweighted position in non-agency securities relative to agency issues, which have benefited from large Federal Reserve and Treasury purchases. We believe that our spread-sector securities have attractive valuations on a historical basis and their value should rebound once the market calms down.
Portfolio Facts
As of December 31, 2008
Net Assets | $35,166,757 | |
NAV | $8.82 | |
NAV - High† | 1/22/2008 - $9.85 | |
NAV - Low† | 11/20/2008 - $8.59 | |
Number of Holdings: 57 |
| † | For the year ended December 31, 2008 |
Average Annual Total Returns1
As of December 31, 2008
1-Year | 5-Year | From Inception 4/30/2003 | ||||
| (4.96%) | 2.10 | % | 2.18 | % |
Value of a $10,000 Investment1

| * | The Barclays Capital Mortgage-Backed Securities Index (MBS) is formed by grouping the universe of over 600,000 individual fixed-rate U.S. government agency MBS pools into approximately 3,500 generic types of securities. It is not possible to invest directly in this Index. The performance of the Index does not reflect deductions for fees, expenses or taxes. |
| ** | The Consumer Price Index is an inflationary indicator that measures the change in the cost of a fixed basket of products and services, including housing, electricity, food and transportation. It is not possible to invest directly in the Index. |
Past performance is not an indication of future results. Total investment return and principal value will fluctuate and units, when redeemed, may be worth more or less than their original cost. Current performance may be higher or lower than the performance data quoted. Market volatility can significantly affect short-term performance, and more recent returns may be different from those shown. Call 800-THRIVENT or visit www.thrivent.com for performance results current to the most recent month-end.
1 | Annualized total returns represent past performance and reflect changes in share prices, the reinvestment of all dividends and capital gains, and the effects of compounding. Periods of less than one year are not annualized. At various times, the Portfolio’s adviser reimbursed and/or paid non-advisory Portfolio expenses. Had the adviser not done so, the Portfolio’s total returns would have been lower. The returns shown do not reflect charges and expenses imposed on contract holders by the variable accounts. Those charges and expenses reduce the returns received by contract holders as compared to the returns presented. |
Investing in a variable product involves risks, including the possible loss of principal. The prospectus contains more complete information on the investment objectives, risks, charges and expenses of the investment company, which investors should read and consider carefully before investing. To obtain a prospectus, contact a registered representative or visit www.thrivent.com.
83
Table of Contents

How did the Portfolio perform during the 12-month period ended December 31, 2008?
Thrivent Money Market Portfolio earned a total return of 2.95%, as compared to the median return of its peer group, the Lipper Money Market Portfolios category, of 2.24%.
What factors affected the Portfolio’s performance?
With the economy in recession and the housing, credit and job markets worsening, the Federal Reserve Open Market Committee cut short-term interest rates repeatedly, with the federal funds target rate dropping from 4.25% at the start of the year to a range of zero to
0.25% on December 16, 2008. The government also undertook other extraordinary measures to inject liquidity into the financial system and support liquidity across other sectors of the market, including money market securities.
One factor benefitting our relative performance was that we had little exposure through most of the period to the types of securities that had liquidity problems. Also, we purchased some longer-dated (three to six months) securities at attractive prices throughout the year, enabling us to extend the Portfolio’s weighted average maturity in high-quality investments.
To reduce the Portfolio’s overall credit risk while extending our weighted average maturity, we increased our allocation to agency-backed securities from 5% to 30% of the Portfolio’s value. At year-end, agency securities composed approximately 25% of the Portfolio’s value.
The Portfolio also benefited from its holdings of LIBOR (London Interbank Offered Rate)-based floaters, which reset at high rates during the period because of the disruption in the European banking system and the subsequent increase in LIBOR rates.
Money market securities in general were affected by several federal programs initiated during the period to boost market liquidity and investor confidence. One is the U.S. Treasury Temporary Guarantee Program for Money Market Funds, which protects the value of shares in participating funds (held by investors as of September 19, 2008) from dropping below $1.00. Thrivent Money Market Portfolio is a participant in this program, which is currently slated to last through April 30, 2009. In addition, several other programs provide federal funding and backing to enhance liquidity of money market securities.
Portfolio Composition
(% of Portfolio)
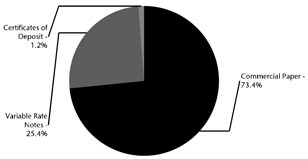
Quoted Portfolio Composition is subject to change.
84
Table of Contents
What is your outlook?
With all of the federal backstops in place, we expect money market liquidity and credit quality to further improve and yields to continue falling. The Federal Reserve will most likely work to keep short-term interest rates at current record-low levels at least through the first half of this year in an attempt to stabilize and/or improve prospects for economic growth.
We continue to manage the Portfolio conservatively as we prepare for the possibility that interest rates and Portfolio flows may change unexpectedly. As in any economic environment, we will continue to focus on our primary objectives of safety and liquidity, while pursuing the optimum risk-adjusted yield.
Portfolio Facts
As of December 31, 2008
Net Assets | $683,446,527 | |
NAV | $1.00 | |
Number of Holdings: 110 |
| † | For the year ended December 31, 2008 |
Average Annual Total Returns1
As of December 31, 2008
1-Year | 5-Year | 10-Year | |||||
| 2.95 | % | 3.35 | % | 3.41 | % |
Money Market Portfolio Yields *
As of December 31, 2008
| Portfolio | |||
7-Day Yield | 1.67 | % | |
7-Day Effective Yield | 1.68 | % |
| * | Seven-day yields of Thrivent Money Market Portfolio refer to the income generated by an investment in the Portfolio over a specified seven-day period, though they are expressed as annual percentage rates. Effective yields reflect the reinvestment of income. Yields are subject to daily fluctuation and should not be considered an indication of future results. |
Past performance is not an indication of future results. Total investment return and principal value will fluctuate and units, when redeemed, may be worth more or less than their original cost. Current performance may be higher or lower than the performance data quoted. Market volatility can significantly affect short-term performance, and more recent returns may be different from those shown. Call 800-THRIVENT or visit www.thrivent.com for performance results current to the most recent month-end.
1 | Annualized total returns represent past performance and reflect changes in share prices, the reinvestment of all dividends and capital gains, and the effects of compounding. Periods of less than one year are not annualized. At various times, the Portfolio’s adviser reimbursed and/or paid non-advisory Portfolio expenses. Had the adviser not done so, the Portfolio’s total returns would have been lower. The returns shown do not reflect charges and expenses imposed on contract holders by the variable accounts. Those charges and expenses reduce the returns received by contract holders as compared to the returns presented. |
Investing in a variable product involves risks, including the possible loss of principal. The prospectus contains more complete information on the investment objectives, risks, charges and expenses of the investment company, which investors should read and consider carefully before investing. To obtain a prospectus, contact a registered representative or visit www.thrivent.com.
85
Table of Contents
(Unaudited)
As a shareholder of the Thrivent Series Fund, Inc., you incur ongoing costs, including management fees and other Portfolio expenses. This Shareholder Expense Example is intended to help you understand your ongoing costs (in dollars) of investing in a Portfolio and to compare these costs with the ongoing costs of investing in other mutual funds. The Example is based on an investment of $1,000 invested at the beginning of the period and held for the entire period from July 1, 2008 through December 31, 2008. Shares in a Portfolio are currently sold, without sales charges, only to separate accounts of Thrivent Financial for Lutherans and Thrivent Life Insurance Company, which are used to fund benefits of variable life insurance and variable annuity contracts issued by Thrivent Financial for Lutherans and Thrivent Life Insurance Company; and retirement plans sponsored by Thrivent Financial for Lutherans. Expenses associated with these variable contracts and retirement plans are not included in these examples and had these costs been included, your costs would have been higher.
Actual Expenses
In the table below, the first section, labeled “Actual,” provides information about actual account values and actual expenses. You may use the information in this line, together with the amount you invested, to estimate the expenses that you paid over the period. Simply divide your account value by $1,000 (for example, an $8,600 account value divided by $1,000 = 8.6), then multiply the result by the number in the first line under the heading entitled “Expenses Paid During Period” to estimate the expenses you paid.
Hypothetical Example for Comparison Purposes
In the table below, the second section, labeled “Hypothetical,” provides information about hypothetical account values and hypothetical expenses based on the Portfolio’s actual expense ratio and an assumed rate of return of 5% per year before expenses, which is not the Portfolio’s actual return. The hypothetical account values and expenses may not be used to estimate the actual ending account balance or expenses you paid for the period. You may use this information to compare the ongoing costs of investing in the Portfolio and other funds. To do so, compare this 5% hypothetical example with the 5% hypothetical examples that appear in the shareholder reports of the other funds.
| Beginning Account Value 7/1/2008 | Ending Account Value 12/31/2008 | Expenses Paid During Period 7/1/2008 - 12/31/2008* | Annualized Expense Ratio | |||||||||
Thrivent Aggressive Allocation Portfolio | ||||||||||||
Actual | $ | 1,000 | $ | 689 | $ | 0.84 | 0.20 | % | ||||
Hypothetical** | $ | 1,000 | $ | 1,024 | $ | 1.00 | 0.20 | % | ||||
Thrivent Moderately Aggressive Allocation Portfolio | ||||||||||||
Actual | $ | 1,000 | $ | 725 | $ | 0.74 | 0.17 | % | ||||
Hypothetical** | $ | 1,000 | $ | 1,024 | $ | 0.87 | 0.17 | % | ||||
Thrivent Moderate Allocation Portfolio | ||||||||||||
Actual | $ | 1,000 | $ | 771 | $ | 0.75 | 0.17 | % | ||||
Hypothetical** | $ | 1,000 | $ | 1,024 | $ | 0.86 | 0.17 | % | ||||
Thrivent Moderately Conservative Allocation Portfolio | ||||||||||||
Actual | $ | 1,000 | $ | 829 | $ | 0.84 | 0.18 | % | ||||
Hypothetical** | $ | 1,000 | $ | 1,024 | $ | 0.92 | 0.18 | % | ||||
Thrivent Technology Portfolio | ||||||||||||
Actual | $ | 1,000 | $ | 598 | $ | 3.69 | 0.92 | % | ||||
Hypothetical** | $ | 1,000 | $ | 1,021 | $ | 4.66 | 0.92 | % | ||||
Thrivent Partner Healthcare Portfolio | ||||||||||||
Actual | $ | 1,000 | $ | 868 | $ | 6.52 | 1.39 | % | ||||
Hypothetical** | $ | 1,000 | $ | 1,018 | $ | 7.05 | 1.39 | % | ||||
Thrivent Partner Natural Resources Portfolio | ||||||||||||
Actual | $ | 1,000 | $ | 509 | $ | 4.50 | 1.19 | % | ||||
Hypothetical** | $ | 1,000 | $ | 1,019 | $ | 6.02 | 1.19 | % | ||||
86
Table of Contents
| Beginning Account Value 7/1/2008 | Ending Account Value 12/31/2008 | Expenses Paid During Period 7/1/2008 - 12/31/2008* | Annualized Expense Ratio | |||||||||
Thrivent Partner Emerging Markets Portfolio | ||||||||||||
Actual | $ | 1,000 | $ | 605 | $ | 6.04 | 1.50 | % | ||||
Hypothetical** | $ | 1,000 | $ | 1,018 | $ | 7.59 | 1.50 | % | ||||
Thrivent Real Estate Securities Portfolio | ||||||||||||
Actual | $ | 1,000 | $ | 649 | $ | 3.52 | 0.85 | % | ||||
Hypothetical** | $ | 1,000 | $ | 1,021 | $ | 4.31 | 0.85 | % | ||||
Thrivent Partner Utilities Portfolio | ||||||||||||
Actual | $ | 1,000 | $ | 706 | $ | 3.83 | 0.89 | % | ||||
Hypothetical** | $ | 1,000 | $ | 1,021 | $ | 4.54 | 0.89 | % | ||||
Thrivent Partner Small Cap Growth Portfolio | ||||||||||||
Actual | $ | 1,000 | $ | 646 | $ | 4.03 | 0.97 | % | ||||
Hypothetical** | $ | 1,000 | $ | 1,020 | $ | 4.94 | 0.97 | % | ||||
Thrivent Partner Small Cap Value Portfolio | ||||||||||||
Actual | $ | 1,000 | $ | 739 | $ | 3.74 | 0.86 | % | ||||
Hypothetical** | $ | 1,000 | $ | 1,021 | $ | 4.35 | 0.86 | % | ||||
Thrivent Small Cap Stock Portfolio | ||||||||||||
Actual | $ | 1,000 | $ | 682 | $ | 3.10 | 0.73 | % | ||||
Hypothetical** | $ | 1,000 | $ | 1,021 | $ | 3.73 | 0.73 | % | ||||
Thrivent Small Cap Index Portfolio | ||||||||||||
Actual | $ | 1,000 | $ | 743 | $ | 1.85 | 0.42 | % | ||||
Hypothetical** | $ | 1,000 | $ | 1,023 | $ | 2.15 | 0.42 | % | ||||
Thrivent Mid Cap Growth Portfolio II | ||||||||||||
Actual | $ | 1,000 | $ | 633 | $ | 2.14 | 0.52 | % | ||||
Hypothetical** | $ | 1,000 | $ | 1,023 | $ | 2.65 | 0.52 | % | ||||
Thrivent Mid Cap Growth Portfolio | ||||||||||||
Actual | $ | 1,000 | $ | 649 | $ | 1.83 | 0.44 | % | ||||
Hypothetical** | $ | 1,000 | $ | 1,023 | $ | 2.24 | 0.44 | % | ||||
Thrivent Partner Mid Cap Value Portfolio | ||||||||||||
Actual | $ | 1,000 | $ | 673 | $ | 3.50 | 0.83 | % | ||||
Hypothetical** | $ | 1,000 | $ | 1,021 | $ | 4.22 | 0.83 | % | ||||
Thrivent Mid Cap Stock Portfolio | ||||||||||||
Actual | $ | 1,000 | $ | 669 | $ | 3.01 | 0.72 | % | ||||
Hypothetical** | $ | 1,000 | $ | 1,022 | $ | 3.64 | 0.72 | % | ||||
Thrivent Mid Cap Index Portfolio | ||||||||||||
Actual | $ | 1,000 | $ | 663 | $ | 1.93 | 0.46 | % | ||||
Hypothetical** | $ | 1,000 | $ | 1,023 | $ | 2.34 | 0.46 | % | ||||
Thrivent Partner Worldwide Allocation Portfolio | ||||||||||||
Actual | $ | 1,000 | $ | 650 | $ | 4.14 | 1.00 | % | ||||
Hypothetical** | $ | 1,000 | $ | 1,020 | $ | 5.07 | 1.00 | % | ||||
Thrivent Partner International Stock Portfolio | ||||||||||||
Actual | $ | 1,000 | $ | 648 | $ | 3.40 | 0.82 | % | ||||
Hypothetical** | $ | 1,000 | $ | 1,021 | $ | 4.17 | 0.82 | % | ||||
Thrivent Partner Socially Responsible Stock Portfolio | ||||||||||||
Actual | $ | 1,000 | $ | 675 | $ | 4.13 | 0.98 | % | ||||
Hypothetical** | $ | 1,000 | $ | 1,020 | $ | 4.97 | 0.98 | % | ||||
Thrivent Partner All Cap Growth Portfolio | ||||||||||||
Actual | $ | 1,000 | $ | 565 | $ | 3.93 | 1.00 | % | ||||
Hypothetical** | $ | 1,000 | $ | 1,020 | $ | 5.08 | 1.00 | % | ||||
87
Table of Contents
| Beginning Account Value 7/1/2008 | Ending Account Value 12/31/2008 | Expenses Paid During Period 7/1/2008 - 12/31/2008* | Annualized Expense Ratio | |||||||||
Thrivent Partner All Cap Value Portfolio | ||||||||||||
Actual | $ | 1,000 | $ | 608 | $ | 3.96 | 0.98 | % | ||||
Hypothetical** | $ | 1,000 | $ | 1,020 | $ | 4.97 | 0.98 | % | ||||
Thrivent Partner All Cap Portfolio | ||||||||||||
Actual | $ | 1,000 | $ | 653 | $ | 3.65 | 0.88 | % | ||||
Hypothetical** | $ | 1,000 | $ | 1,021 | $ | 4.46 | 0.88 | % | ||||
Thrivent Large Cap Growth Portfolio II | ||||||||||||
Actual | $ | 1,000 | $ | 652 | $ | 2.38 | 0.57 | % | ||||
Hypothetical** | $ | 1,000 | $ | 1,022 | $ | 2.91 | 0.57 | % | ||||
Thrivent Large Cap Growth Portfolio | ||||||||||||
Actual | $ | 1,000 | $ | 652 | $ | 1.84 | 0.44 | % | ||||
Hypothetical** | $ | 1,000 | $ | 1,023 | $ | 2.25 | 0.44 | % | ||||
Thrivent Partner Growth Stock Portfolio | ||||||||||||
Actual | $ | 1,000 | $ | 637 | $ | 3.44 | 0.84 | % | ||||
Hypothetical** | $ | 1,000 | $ | 1,021 | $ | 4.25 | 0.84 | % | ||||
Thrivent Large Cap Value Portfolio | ||||||||||||
Actual | $ | 1,000 | $ | 743 | $ | 2.81 | 0.64 | % | ||||
Hypothetical** | $ | 1,000 | $ | 1,022 | $ | 3.26 | 0.64 | % | ||||
Thrivent Large Cap Stock Portfolio | ||||||||||||
Actual | $ | 1,000 | $ | 708 | $ | 2.90 | 0.67 | % | ||||
Hypothetical** | $ | 1,000 | $ | 1,022 | $ | 3.43 | 0.67 | % | ||||
Thrivent Large Cap Index Portfolio | ||||||||||||
Actual | $ | 1,000 | $ | 715 | $ | 1.68 | 0.39 | % | ||||
Hypothetical** | $ | 1,000 | $ | 1,023 | $ | 1.98 | 0.39 | % | ||||
Thrivent Equity Income Plus Portfolio | ||||||||||||
Actual | $ | 1,000 | $ | 765 | $ | 3.51 | 0.79 | % | ||||
Hypothetical** | $ | 1,000 | $ | 1,021 | $ | 4.02 | 0.79 | % | ||||
Thrivent Balanced Portfolio | ||||||||||||
Actual | $ | 1,000 | $ | 807 | $ | 1.76 | 0.39 | % | ||||
Hypothetical** | $ | 1,000 | $ | 1,023 | $ | 1.97 | 0.39 | % | ||||
Thrivent High Yield Portfolio | ||||||||||||
Actual | $ | 1,000 | $ | 795 | $ | 1.96 | 0.43 | % | ||||
Hypothetical** | $ | 1,000 | $ | 1,023 | $ | 2.21 | 0.43 | % | ||||
Thrivent Diversified Income Plus Portfolio | ||||||||||||
Actual | $ | 1,000 | $ | 799 | $ | 2.33 | 0.51 | % | ||||
Hypothetical** | $ | 1,000 | $ | 1,023 | $ | 2.62 | 0.51 | % | ||||
Thrivent Partner Socially Responsible Bond Portfolio | ||||||||||||
Actual | $ | 1,000 | $ | 1,020 | $ | 3.45 | 0.68 | % | ||||
Hypothetical** | $ | 1,000 | $ | 1,022 | $ | 3.45 | 0.68 | % | ||||
Thrivent Income Portfolio | ||||||||||||
Actual | $ | 1,000 | $ | 904 | $ | 2.10 | 0.44 | % | ||||
Hypothetical** | $ | 1,000 | $ | 1,023 | $ | 2.23 | 0.44 | % | ||||
Thrivent Bond Index Portfolio | ||||||||||||
Actual | $ | 1,000 | $ | 1,000 | $ | 1.95 | 0.39 | % | ||||
Hypothetical** | $ | 1,000 | $ | 1,023 | $ | 1.97 | 0.39 | % | ||||
Thrivent Limited Maturity Bond Portfolio | ||||||||||||
Actual | $ | 1,000 | $ | 940 | $ | 2.13 | 0.44 | % | ||||
Hypothetical** | $ | 1,000 | $ | 1,023 | $ | 2.22 | 0.44 | % | ||||
88
Table of Contents
| Beginning Account Value 7/1/2008 | Ending Account Value 12/31/2008 | Expenses Paid During Period 7/1/2008 - 12/31/2008* | Annualized Expense Ratio | |||||||||
Thrivent Mortgage Securities Portfolio | ||||||||||||
Actual | $ | 1,000 | $ | 967 | $ | 3.36 | 0.68 | % | ||||
Hypothetical** | $ | 1,000 | $ | 1,022 | $ | 3.45 | 0.68 | % | ||||
Thrivent Money Market Portfolio | ||||||||||||
Actual | $ | 1,000 | $ | 1,012 | $ | 1.87 | 0.37 | % | ||||
Hypothetical** | $ | 1,000 | $ | 1,023 | $ | 1.88 | 0.37 | % | ||||
| * | Expenses are equal to the Fund’s annualized expense ratio, multiplied by the average account value over the period, multiplied by 184/366 to reflect the one-half year period. |
| ** | Assuming 5% total return before expenses. |
89
Table of Contents

| PricewaterhouseCoopers LLP | ||
225 South Sixth Street Suite 1400 Minneapolis, MN 55402 Telephone (612) 596 6000 |
Report of Independent Registered Public Accounting Firm
To the Board of Directors and Shareholders of the Thrivent Series Fund, Inc.:
In our opinion, the accompanying statements of assets and liabilities, including the schedules of investments, and the related statements of operations and of changes in net assets and the financial highlights present fairly, in all material respects, the financial position of each of the forty-one Funds constituting the Thrivent Series Fund, Inc., (hereafter referred to as the “Funds”) at December 31, 2008, and the results of each of their operations, the changes in each of their net assets and the financial highlights for each of the periods presented, in conformity with accounting principles generally accepted in the United States of America. These financial statements and financial highlights (hereafter referred to as “financial statements”) are the responsibility of the Funds’ management. Our responsibility is to express an opinion on these financial statements based on our audits. We conducted our audits of these statements in accordance with the standards of the Public Company Accounting Oversight Board (United States). Those standards require that we plan and perform the audit to obtain reasonable assurance about whether the financial statements are free of material misstatement. An audit includes examining, on a test basis, evidence supporting the amounts and disclosures in the financial statements, assessing the accounting principles used and significant estimates made by management, and evaluating the overall financial statement presentation. We believe that our audits, which included confirmation of securities at December 31, 2008 by correspondence with the custodian and brokers, provide a reasonable basis for our opinion.

February 17, 2009
90
Table of Contents
Aggressive Allocation Portfolio
Schedule of Investments as of December 31, 2008
Shares | Mutual Funds (97.0%) | Value | |||
| Equity Mutual Funds (87.7%) | |||||
| 731,064 | Thrivent Real Estate Securities Portfolio | $ | 6,831,279 | ||
| 3,414,178 | Thrivent Partner Small Cap Growth Portfolio | 25,422,654 | |||
| 847,080 | Thrivent Partner Small Cap Value Portfolio | 10,222,302 | |||
| 3,973,755 | Thrivent Small Cap Stock Portfolio | 33,717,707 | |||
| 4,018,834 | Thrivent Mid Cap Growth Portfolio II | 22,699,981 | |||
| 1,585,940 | Thrivent Partner Mid Cap Value Portfolio | 13,078,930 | |||
| 5,320,737 | Thrivent Mid Cap Stock Portfolio | 37,675,608 | |||
| 368,098 | Thrivent Partner Worldwide Allocation Portfolio | 2,219,334 | |||
| 7,010,977 | Thrivent Partner International Stock Portfolio | 57,328,763 | |||
| 6,393,744 | Thrivent Large Cap Growth Portfolio II | 37,423,862 | |||
| 3,995,817 | Thrivent Large Cap Value Portfolio | 32,366,920 | |||
| 4,597,561 | Thrivent Large Cap Stock Portfolio | 28,077,766 | |||
| 522,604 | Thrivent Equity Income Plus Portfolio | 3,601,214 | |||
| Total Equity Mutual Funds | 310,666,320 | ||||
| Fixed Income Mutual Funds (9.3%) | |||||
| 2,424,200 | Thrivent High Yield Portfolio | 8,443,730 | |||
| 1,845,599 | Thrivent Income Portfolio | 15,131,694 | |||
| 1,083,673 | Thrivent Limited Maturity Bond Portfolio | 9,528,194 | |||
| Total Fixed Income Mutual Funds | 33,103,618 | ||||
Total Mutual Funds (cost $519,737,482) | 343,769,938 | ||||
| Shares or Principal Amount | Short-Term Investments (2.9%)a | Value | |||
Federal National Mortgage Association Discount Notes | |||||
| 2,600,000 | 0.417%, 5/14/2009b | 2,596,036 | |||
| 7,615,610 | Thrivent Money Market Portfolio | 7,615,610 | |||
| Total Short-Term Investments (at amortized cost) | 10,211,646 | ||||
Total Investments (cost $529,949,128) 99.9% | $ | 353,981,584 | |||
| Other Assets and Liabilities, Net 0.1% | 328,336 | ||||
| Total Net Assets 100.0% | $ | 354,309,920 | |||
| a | The interest rate shown reflects the yield, coupon rate or, for securities purchased at a discount, the discount rate at the date of purchase. |
| b | At December 31, 2008, $2,596,036 of investments were held on deposit with the counterparty and pledged as the initial margin deposit for open financial futures contracts. |
Gross unrealized appreciation and depreciation of investments, based on cost for federal income tax purposes, were as follows:
Gross unrealized appreciation | $ | 196,910 | ||
Gross unrealized depreciation | (176,164,454 | ) | ||
Net unrealized appreciation (depreciation) | $ | (175,967,544 | ) | |
Cost for federal income tax purposes | $ | 529,949,128 |
The following table is a summary of the inputs used, as of December 31, 2008, in valuing the Aggressive Allocation Portfolio’s assets carried at fair value as discussed in item 2(A) of the Notes to Financial Statements.
Level | Investments in Securities | Other Financial Instruments* | ||||
Level 1 | $ | 351,385,548 | $ | 668,975 | ||
Level 2 | 2,596,036 | — | ||||
Level 3 | — | — | ||||
Totals (Level 1,2,3) | $ | 353,981,584 | $ | 668,975 | ||
| * | Other Financial Instruments include Futures, Forwards, Written Options and Swap agreements. |
The accompanying Notes to Financial Statements are an integral part of this schedule.
91
Table of Contents
Aggressive Allocation Portfolio
Schedule of Investments as of December 31, 2008
Futures | Number of Contracts Long/(Short) | Expiration Date | Notional Principal Amount | Value | Unrealized Gain/(Loss) | ||||||||
E-Mini MSCI EAFE Index Futures | 15 | March 2009 | $ | 897,826 | $ | 950,100 | $ | 52,274 | |||||
Russell 2000 Index Mini-Futures | 163 | March 2009 | 7,703,828 | 8,115,770 | 411,942 | ||||||||
S&P 400 Index Mini-Futures | 89 | March 2009 | 4,594,621 | 4,781,080 | 186,459 | ||||||||
S&P 500 Index Futures | 15 | March 2009 | 3,357,075 | 3,375,375 | 18,300 | ||||||||
Total Futures | $ | 668,975 | |||||||||||
Investment in Affiliates
Affiliated issuers, as defined under the Investment Company Act of 1940, include those in which the Portfolio’s holdings of an issuer represent 5% or more of the outstanding voting securities of an issuer, or any affiliated mutual fund.
A summary of transactions for the fiscal year to date, in Aggressive Allocation Portfolio, is as follows:
Portfolio | Value December 31, 2007 | Gross Purchases and Additions | Gross Sales and Reductions | Balance of Shares Held at December 31, 2008 | Value December 31, 2008 | Income Earned January 1, 2008 - December 31, 2008 | |||||||||||
Real Estate Securities | $ | — | $ | 13,709,896 | $ | 1,840,174 | 731,064 | $ | 6,831,279 | $ | 579,973 | ||||||
Partner Small Cap Growth | 29,543,568 | 16,014,505 | 712,581 | 3,414,178 | 25,422,654 | 3,165 | |||||||||||
Partner Small Cap Value | 23,589,765 | 3,084,981 | 10,893,689 | 847,080 | 10,222,302 | 199,569 | |||||||||||
Small Cap Stock | 37,174,821 | 21,561,135 | 1,140,726 | 3,973,755 | 33,717,707 | 432,894 | |||||||||||
Mid Cap Growth II | — | 29,212,671 | 486,648 | 4,018,834 | 22,699,981 | 32,768 | |||||||||||
Mid Cap Growth | 17,248,542 | 8,143,482 | 13,025,644 | — | — | 89,717 | |||||||||||
Partner Mid Cap Value | 18,823,400 | 3,259,301 | 946,836 | 1,585,940 | 13,078,930 | 276,354 | |||||||||||
Mid Cap Stock | 36,861,436 | 30,702,660 | 2,481,526 | 5,320,737 | 37,675,608 | 582,020 | |||||||||||
Partner Worldwide Allocation | — | 3,475,666 | 1,176,259 | 368,098 | 2,219,334 | 22,424 | |||||||||||
Partner International Stock | 96,519,831 | 20,327,151 | 3,199,783 | 7,010,977 | 57,328,763 | 4,161,803 | |||||||||||
Large Cap Growth II | — | 38,534,603 | 759,620 | 6,393,744 | 37,423,862 | 38,152 | |||||||||||
Large Cap Growth | 106,145,254 | 4,221,119 | 79,660,045 | — | — | 79,201 | |||||||||||
Large Cap Value | 37,546,375 | 15,886,301 | 1,785,818 | 3,995,817 | 32,366,920 | 1,602,403 | |||||||||||
Large Cap Stock | 47,857,844 | 7,160,661 | 5,314,040 | 4,597,561 | 28,077,766 | 1,208,226 | |||||||||||
Equity Income Plus Portfolio | — | 5,281,119 | 70,042 | 522,604 | 3,601,214 | 77,075 | |||||||||||
High Yield | 9,828,416 | 1,990,275 | 233,438 | 2,424,200 | 8,443,730 | 884,381 | |||||||||||
Income | 24,782,222 | 3,694,806 | 10,398,141 | 1,845,599 | 15,131,694 | 1,049,211 | |||||||||||
Limited Maturity Bond | 10,586,434 | 1,602,535 | 1,568,891 | 1,083,673 | 9,528,194 | 447,364 | |||||||||||
Money Market | — | 34,916,944 | 27,301,334 | 7,615,610 | 7,615,610 | 48,200 | |||||||||||
Total Value and Income Earned | 496,507,908 | 351,385,548 | 11,814,900 | ||||||||||||||
The accompanying Notes to Financial Statements are an integral part of this schedule.
92
Table of Contents
Moderately Aggressive Allocation Portfolio
Schedule of Investments as of December 31, 2008
Shares | Mutual Funds (96.1%) | Value | |||
| Equity Mutual Funds (71.1%) | |||||
| 4,186,586 | Thrivent Real Estate Securities Portfolio | $ | 39,120,717 | ||
| 4,488,584 | Thrivent Partner Small Cap Growth Portfolio | 33,422,897 | |||
| 3,170,598 | Thrivent Partner Small Cap Value Portfolio | 38,261,829 | |||
| 6,964,577 | Thrivent Small Cap Stock Portfolio | 59,095,132 | |||
| 5,544,769 | Thrivent Mid Cap Growth Portfolio II | 31,319,073 | |||
| 5,578,028 | Thrivent Partner Mid Cap Value Portfolio | 46,000,879 | |||
| 17,274,824 | Thrivent Mid Cap Stock Portfolio | 122,321,299 | |||
| 4,484,268 | Thrivent Partner Worldwide Allocation Portfolio | 27,036,551 | |||
| 18,829,936 | Thrivent Partner International Stock Portfolio | 153,972,385 | |||
| 19,702,085 | Thrivent Large Cap Growth Portfolio II | 115,320,245 | |||
| 19,659,278 | Thrivent Large Cap Value Portfolio | 159,244,087 | |||
| 20,297,228 | Thrivent Large Cap Stock Portfolio | 123,957,202 | |||
| 1,920,052 | Thrivent Equity Income Plus Portfolio | 13,230,889 | |||
| Total Equity Mutual Funds | 962,303,185 | ||||
| Fixed Income Mutual Funds (25.0%) | |||||
| 25,995,872 | Thrivent High Yield Portfolio | 90,546,222 | |||
| 21,700,404 | Thrivent Income Portfolio | 177,917,275 | |||
| 8,039,389 | Thrivent Limited Maturity Bond Portfolio | 70,686,329 | |||
| Total Fixed Income Mutual Funds | 339,149,826 | ||||
| Total Mutual Funds (cost $1,909,376,117) | 1,301,453,011 | ||||
| Principal Amount | Long-Term Fixed Income (0.7%) | Value | |||
| Asset-Backed Securities (<0.1%) | |||||
Merrill Lynch Alternative Note Asset Trust | |||||
| 824,186 | 6.000%, 3/25/2037 | 446,040 | |||
| Total Asset-Backed Securities | 446,040 | ||||
| Collateralized Mortgage Obligations (0.6%) | |||||
Citigroup Mortgage Loan Trust, Inc. | |||||
| 1,074,103 | 5.500%, 11/25/2035 | 677,752 | |||
Citimortgage Alternative Loan Trust | |||||
| 3,271,651 | 5.750%, 4/25/2037 | 1,871,784 | |||
Countrywide Alternative Loan Trust | |||||
| 848,248 | 6.000%, 1/25/2037 | 580,002 | |||
Countrywide Home Loans | |||||
| 3,366,057 | 5.750%, 4/25/2037 | 2,332,617 | |||
Deutsche Alt-A Securities, Inc. | |||||
| 856,224 | 5.500%, 10/25/2021 | 624,777 | |||
| 1,411,974 | 6.000%, 10/25/2021 | 1,127,981 | |||
J.P. Morgan Mortgage Trust | |||||
| 824,785 | 6.040%, 10/25/2036 | 575,231 | |||
MASTR Alternative Loans Trust | |||||
| 746,848 | 6.500%, 7/25/2034 | 641,122 | |||
| Total Collateralized Mortgage Obligations | 8,431,266 | ||||
| Commercial Mortgage-Backed Securities (0.1%) | |||||
Greenwich Capital Commercial Funding Corporation | |||||
| 1,350,000 | 5.867%, 8/10/2017 | 685,856 | |||
| Total Commercial Mortgage- Backed Securities | 685,856 | ||||
Total Long-Term Fixed Income (cost $11,521,418) | 9,563,162 | ||||
| Shares or Principal Amount | Short-Term Investments (3.1%)a | Value | |||
Federal National Mortgage Association Discount Notes | |||||
| 13,800,000 | 0.408%, 5/14/2009b | 13,779,404 | |||
| 28,319,832 | Thrivent Money Market Portfolio | 28,319,832 | |||
| Total Short-Term Investments (at amortized cost) | 42,099,236 | ||||
Total Investments (cost $1,962,996,771) 99.9% | $ | 1,353,115,409 | |||
| Other Assets and Liabilities, Net 0.1% | 1,449,707 | ||||
| Total Net Assets 100.0% | $ | 1,354,565,116 | |||
| a | The interest rate shown reflects the yield, coupon rate or, for securities purchased at a discount, the discount rate at the date of purchase. |
| b | At December 31, 2008, $13,779,404 of investments were held on deposit with the counterparty and pledged as the initial margin deposit for open financial futures contracts. |
Gross unrealized appreciation and depreciation of investments, based on cost for federal income tax purposes, were as follows:
Gross unrealized appreciation | $ | 58,762 | ||
Gross unrealized depreciation | (609,935,985 | ) | ||
Net unrealized appreciation (depreciation) | $ | (609,877,223 | ) | |
Cost for federal income tax purposes | $ | 1,962,992,632 |
The accompanying Notes to Financial Statements are an integral part of this schedule.
93
Table of Contents
Moderately Aggressive Allocation Portfolio
Schedule of Investments as of December 31, 2008
The following table is a summary of the inputs used, as of December 31, 2008, in valuing the Moderately Aggressive Allocation Portfolio’s assets carried at fair value as discussed in item 2(A) of the Notes to Financial Statements.
Level | Investments in Securities | Other Financial Instruments* | ||||
Level 1 | $ | 1,329,772,843 | $ | 3,785,056 | ||
Level 2 | 23,342,566 | — | ||||
Level 3 | — | — | ||||
Totals (Level 1,2,3) | $ | 1,353,115,409 | $ | 3,785,056 | ||
| * | Other Financial Instruments include Futures, Forwards, Written Options and Swap agreements. |
Futures | Number of Contracts Long/(Short) | Expiration Date | Notional Principal Amount | Value | Unrealized Gain/(Loss) | ||||||||
E-Mini MSCI EAFE Index Futures | 451 | March 2009 | $ | 26,994,628 | $ | 28,566,340 | $ | 1,571,712 | |||||
Russell 2000 Index Mini-Futures | 412 | March 2009 | 19,472,253 | 20,513,480 | 1,041,227 | ||||||||
S&P 400 Index Mini-Futures | 542 | March 2009 | 27,980,723 | 29,116,240 | 1,135,517 | ||||||||
S&P 500 Index Futures | 30 | March 2009 | 6,714,150 | 6,750,750 | 36,600 | ||||||||
Total Futures | $ | 3,785,056 | |||||||||||
Investment in Affiliates
Affiliated issuers, as defined under the Investment Company Act of 1940, include those in which the Portfolio’s holdings of an issuer represent 5% or more of the outstanding voting securities of an issuer, or any affiliated mutual fund.
A summary of transactions for the fiscal year to date, in Moderately Aggressive Allocation Portfolio, is as follows:
Portfolio | Value December 31, 2007 | Gross Purchases and Additions | Gross Sales and Reductions | Balance of Shares Held at December 31, 2008 | Value December 31, 2008 | Income Earned January 1, 2008 - December 31, 2008 | |||||||||||
Real Estate Securities | $ | 53,577,749 | $ | 26,219,399 | $ | 8,156,950 | 4,186,586 | $ | 39,120,717 | $ | 3,806,948 | ||||||
Partner Small Cap Growth | 52,817,171 | 13,960,355 | 4,822,541 | 4,488,584 | 33,422,897 | 4,161 | |||||||||||
Partner Small Cap Value | 40,021,512 | 19,854,609 | 2,979,858 | 3,170,598 | 38,261,829 | 570,089 | |||||||||||
Small Cap Stock | 70,935,529 | 39,749,302 | 6,341,012 | 6,964,577 | 59,095,132 | 878,835 | |||||||||||
Mid Cap Growth II | — | 38,325,233 | 298 | 5,544,769 | 31,319,073 | 63,184 | |||||||||||
Mid Cap Growth | 31,027,029 | 18,672,813 | 25,681,565 | — | — | 176,734 | |||||||||||
Partner Mid Cap Value | 26,896,355 | 45,949,874 | 2,480,397 | 5,578,028 | 46,000,879 | 760,197 | |||||||||||
Mid Cap Stock | 70,310,829 | 136,200,711 | 4,082,037 | 17,274,824 | 122,321,299 | 1,653,082 | |||||||||||
Partner Worldwide Allocation | — | 31,959,266 | — | 4,484,268 | 27,036,551 | 273,175 | |||||||||||
Partner International Stock | 224,321,329 | 79,351,186 | 2,105,756 | 18,829,936 | 153,972,385 | 10,988,303 | |||||||||||
Large Cap Growth II | — | 115,915,019 | 1,192 | 19,702,085 | 115,320,245 | 117,565 | |||||||||||
Large Cap Growth | 298,167,995 | 17,704,249 | 218,703,302 | — | — | 219,251 | |||||||||||
Large Cap Value | 259,609,011 | 30,596,422 | 29,710,162 | 19,659,278 | 159,244,087 | 7,985,983 | |||||||||||
Large Cap Stock | 261,194,892 | 35,815,905 | 65,043,756 | 20,297,228 | 123,957,202 | 6,051,618 | |||||||||||
Equity Income Plus Portfolio | — | 19,112,492 | 1,852 | 1,920,052 | 13,230,889 | 283,174 | |||||||||||
High Yield | 80,154,556 | 43,757,561 | 792,575 | 25,995,872 | 90,546,222 | 8,972,438 | |||||||||||
Income | 231,113,314 | 36,393,131 | 55,326,870 | 21,700,404 | 177,917,275 | 11,658,125 | |||||||||||
Limited Maturity Bond | 80,939,401 | 12,223,174 | 14,215,845 | 8,039,389 | 70,686,329 | 3,386,422 | |||||||||||
Money Market | — | 126,874,265 | 98,554,433 | 28,319,832 | 28,319,832 | 153,819 | |||||||||||
Total Value and Income Earned | 1,781,086,672 | 1,329,772,843 | 58,003,103 | ||||||||||||||
The accompanying Notes to Financial Statements are an integral part of this schedule.
94
Table of Contents
Schedule of Investments as of December 31, 2008
| Shares | Mutual Funds (95.4%) | Value | |||
| Equity Mutual Funds (50.8%) | |||||
| 1,174,827 | Thrivent Technology Portfolio | $ | 4,269,555 | ||
| 5,285,922 | Thrivent Real Estate Securities Portfolio | 49,393,237 | |||
| 3,773,219 | Thrivent Partner Small Cap Growth Portfolio | 28,096,145 | |||
| 3,841,113 | Thrivent Partner Small Cap Value Portfolio | 46,353,405 | |||
| 5,571,836 | Thrivent Small Cap Stock Portfolio | 47,277,589 | |||
| 2,188,443 | Thrivent Mid Cap Growth Portfolio II | 12,361,202 | |||
| 4,427,619 | Thrivent Partner Mid Cap Value Portfolio | 36,513,686 | |||
| 13,276,801 | Thrivent Mid Cap Stock Portfolio | 94,011,700 | |||
| 5,073,189 | Thrivent Partner Worldwide Allocation Portfolio | 30,587,271 | |||
| 17,509,805 | Thrivent Partner International Stock Portfolio | 143,177,677 | |||
| 19,186,010 | Thrivent Large Cap Growth Portfolio II | 112,299,552 | |||
| 23,142,641 | Thrivent Large Cap Value Portfolio | 187,460,023 | |||
| 18,211,262 | Thrivent Large Cap Stock Portfolio | 111,217,996 | |||
| 2,395,526 | Thrivent Equity Income Plus Portfolio | 16,507,327 | |||
| Total Equity Mutual Funds | 919,526,365 | ||||
| Fixed Income Mutual Funds (44.6%) | |||||
| 31,106,614 | Thrivent High Yield Portfolio | 108,347,447 | |||
| 44,161,281 | Thrivent Income Portfolio | 362,069,509 | |||
| 38,404,764 | Thrivent Limited Maturity Bond Portfolio | 337,673,887 | |||
| Total Fixed Income Mutual Funds | 808,090,843 | ||||
| Total Mutual Funds (cost $2,381,815,270) | 1,727,617,208 | ||||
| Principal Amount | Long-Term Fixed Income (1.2%) | Value | |||
| Asset-Backed Securities (0.1%) | |||||
| Merrill Lynch Alternative Note Asset Trust | |||||
| 1,923,100 | 6.000%, 3/25/2037 | 1,040,760 | |||
| Total Asset-Backed Securities | 1,040,760 | ||||
| Collateralized Mortgage Obligations (1.0%) | |||||
| Citigroup Mortgage Loan Trust, Inc. | |||||
| 2,506,240 | 5.500%, 11/25/2035 | 1,581,422 | |||
| Citimortgage Alternative Loan Trust | |||||
| 7,478,060 | 5.750%, 4/25/2037 | 4,278,363 | |||
| Countrywide Alternative Loan Trust | |||||
| 1,979,244 | 6.000%, 1/25/2037 | 1,353,338 | |||
| Countrywide Home Loans | |||||
| 7,573,629 | 5.750%, 4/25/2037 | 5,248,389 | |||
| Deutsche Alt-A Securities, Inc. | |||||
| 1,997,856 | 5.500%, 10/25/2021 | 1,457,812 | |||
| 3,246,650 | 6.000%, 10/25/2021 | 2,593,645 | |||
| J.P. Morgan Mortgage Trust | |||||
| 1,924,499 | 6.040%, 10/25/2036 | 1,342,205 | |||
| MASTR Alternative Loans Trust | |||||
| 1,734,614 | 6.500%, 7/25/2034 | 1,489,058 | |||
| Total Collateralized Mortgage Obligations | 19,344,232 | ||||
| Commercial Mortgage-Backed Securities (0.1%) | |||||
| Greenwich Capital Commercial Funding Corporation | |||||
| 3,150,000 | 5.867%, 8/10/2017 | 1,600,329 | |||
| Total Commercial Mortgage- Backed Securities | 1,600,329 | ||||
Total Long-Term Fixed Income (cost $26,490,895) | 21,985,321 | ||||
| Shares or Principal Amount | Short-Term Investments (2.8%)a | Value | |||
| Federal National Mortgage Association Discount Notes | |||||
| 22,900,000 | 0.408%, 5/14/2009b | 22,865,813 | |||
| 28,065,946 | Thrivent Money Market Portfolio | 28,065,946 | |||
| Total Short-Term Investments (at amortized cost) | 50,931,759 | ||||
Total Investments (cost $2,459,237,924) 99.4% | $ | 1,800,534,288 | |||
| Other Assets and Liabilities, Net 0.6% | 11,024,125 | ||||
| Total Net Assets 100.0% | $ | 1,811,558,413 | |||
| a | The interest rate shown reflects the yield, coupon rate or, for securities purchased at a discount, the discount rate at the date of purchase. |
| b | At December 31, 2008, $22,865,813 of investments were held on deposit with the counterparty and pledged as the initial margin deposit for open financial futures contracts. |
Gross unrealized appreciation and depreciation of investments, based on cost for federal income tax purposes, were as follows:
Gross unrealized appreciation | $ | 135,941 | ||
Gross unrealized depreciation | (658,839,577 | ) | ||
Net unrealized appreciation (depreciation) | $ | (658,703,636 | ) | |
Cost for federal income tax purposes | $ | 2,459,237,924 |
The accompanying Notes to Financial Statements are an integral part of this schedule.
95
Table of Contents
Moderate Allocation Portfolio
Schedule of Investments as of December 31, 2008
The following table is a summary of the inputs used, as of December 31, 2008, in valuing the Moderate Allocation Portfolio’s assets carried at fair value as discussed in item 2(A) of the Notes to Financial Statements.
Level | Investments in Securities | Other Financial Instruments* | ||||
Level 1 | $ | 1,755,683,154 | $ | 6,249,875 | ||
Level 2 | 44,851,134 | — | ||||
Level 3 | — | — | ||||
Totals (Level 1,2,3) | $ | 1,800,534,288 | $ | 6,249,875 | ||
| * | Other Financial Instruments include Futures, Forwards, Written Options and Swap agreements. |
Futures | Number of Contracts Long/(Short) | Expiration Date | Notional Principal Amount | Value | Unrealized Gain/(Loss) | ||||||||
E-Mini MSCI EAFE Index Futures | 578 | March 2009 | $ | 34,596,220 | $ | 36,610,520 | $ | 2,014,300 | |||||
Russell 2000 Index Mini-Futures | 794 | March 2009 | 37,526,624 | 39,533,260 | 2,006,636 | ||||||||
S&P 400 Index Mini-Futures | 962 | March 2009 | 49,663,201 | 51,678,640 | 2,015,439 | ||||||||
S&P 500 Index Futures | 175 | March 2009 | 39,165,875 | 39,379,375 | 213,500 | ||||||||
Total Futures | $ | 6,249,875 | |||||||||||
Investment in Affiliates
Affiliated issuers, as defined under the Investment Company Act of 1940, include those in which the Portfolio’s holdings of an issuer represent 5% or more of the outstanding voting securities of an issuer, or any affiliated mutual fund.
A summary of transactions for the fiscal year to date, in Moderate Allocation Portfolio, is as follows:
Portfolio | Value December 31, 2007 | Gross Purchases and Additions | Gross Sales and Reductions | Balance of Shares Held at December 31, 2008 | Value December 31, 2008 | Income Earned January 1, 2008 - December 31, 2008 | |||||||||||
Technology | $ | — | $ | 6,861,195 | $ | — | 1,174,827 | $ | 4,269,555 | $ | — | ||||||
Real Estate Securities | 70,987,263 | 32,060,063 | 11,609,023 | 5,285,922 | 49,393,237 | 4,902,389 | |||||||||||
Partner Small Cap Growth | 32,115,462 | 19,689,035 | 1,508,213 | 3,773,219 | 28,096,145 | 3,498 | |||||||||||
Partner Small Cap Value | 27,031,554 | 45,001,719 | 3,054,532 | 3,841,113 | 46,353,405 | 625,302 | |||||||||||
Small Cap Stock | 32,269,396 | 46,079,305 | 345,653 | 5,571,836 | 47,277,589 | 601,720 | |||||||||||
Mid Cap Growth II | — | 12,523,266 | 1,794 | 2,188,443 | 12,361,202 | 17,128 | |||||||||||
Mid Cap Growth | 21,413,225 | 8,669,314 | 15,494,474 | — | — | 106,716 | |||||||||||
Partner Mid Cap Value | 27,348,942 | 36,966,863 | 5,496,401 | 4,427,619 | 36,513,686 | 661,648 | |||||||||||
Mid Cap Stock | 64,055,455 | 96,690,725 | 2,603,921 | 13,276,801 | 94,011,700 | 1,355,599 | |||||||||||
Partner Worldwide Allocation | — | 36,724,742 | — | 5,073,189 | 30,587,271 | 309,052 | |||||||||||
Partner International Stock | 188,480,571 | 91,116,368 | 1,142,884 | 17,509,805 | 143,177,677 | 10,147,798 | |||||||||||
Large Cap Growth II | — | 112,912,464 | 19,733 | 19,186,010 | 112,299,552 | 114,485 | |||||||||||
Large Cap Growth | 307,436,710 | 31,516,695 | 240,777,997 | — | — | 220,933 | |||||||||||
Large Cap Value | 228,391,842 | 76,306,627 | 3,399,038 | 23,142,641 | 187,460,023 | 9,436,368 | |||||||||||
Large Cap Stock | 257,162,251 | 46,713,239 | 88,092,563 | 18,211,262 | 111,217,996 | 5,793,512 | |||||||||||
Equity Income Plus Portfolio | — | 23,842,996 | 4,107 | 2,395,526 | 16,507,327 | 353,297 | |||||||||||
High Yield | 97,460,466 | 57,641,806 | 6,218,960 | 31,106,614 | 108,347,447 | 11,083,313 | |||||||||||
Income | 411,568,919 | 79,309,341 | 59,953,657 | 44,161,281 | 362,069,509 | 23,096,069 | |||||||||||
Limited Maturity Bond | 324,615,462 | 61,533,773 | 8,815,032 | 38,404,764 | 337,673,887 | 15,866,840 | |||||||||||
Money Market | 78,824,377 | 181,698,002 | 232,456,433 | 28,065,946 | 28,065,946 | 1,098,761 | |||||||||||
Total Value and Income Earned | 2,169,161,895 | 1,755,683,154 | 85,794,428 | ||||||||||||||
The accompanying Notes to Financial Statements are an integral part of this schedule.
96
Table of Contents
Moderately Conservative Allocation Portfolio
Schedule of Investments as of December 31, 2008
Shares | Mutual Funds (93.5%) | Value | |||
Equity Mutual Funds (33.2%) | |||||
| 1,165,987 | Thrivent Real Estate Securities Portfolio | $ | 10,895,334 | ||
| 997,966 | Thrivent Partner Small Cap Value Portfolio | 12,043,151 | |||
| 2,124,373 | Thrivent Small Cap Stock Portfolio | 18,025,517 | |||
| 1,742,711 | Thrivent Partner Mid Cap Value Portfolio | 14,371,785 | |||
| 4,112,845 | Thrivent Mid Cap Stock Portfolio | 29,122,644 | |||
| 2,594,988 | Thrivent Partner Worldwide Allocation Portfolio | 15,645,703 | |||
| 3,646,384 | Thrivent Partner International Stock Portfolio | 29,816,480 | |||
| 4,833,126 | Thrivent Large Cap Growth Portfolio II | 28,289,254 | |||
| 7,139,107 | Thrivent Large Cap Value Portfolio | 57,828,193 | |||
| 2,410,588 | Thrivent Large Cap Stock Portfolio | 14,721,702 | |||
| 889,988 | Thrivent Equity Income Plus Portfolio | 6,132,818 | |||
Total Equity Mutual Funds | 236,892,581 | ||||
Fixed Income Mutual Funds (60.3%) | |||||
| 9,697,135 | Thrivent High Yield Portfolio | 33,776,091 | |||
| 11,574,911 | Thrivent Income Portfolio | 94,900,381 | |||
| 34,396,471 | Thrivent Limited Maturity Bond Portfolio | 302,430,975 | |||
Total Fixed Income Mutual Funds | 431,107,447 | ||||
Total Mutual Funds (cost $858,743,993) | 668,000,028 | ||||
Principal | Long-Term Fixed Income (1.7%) | Value | |||
Asset-Backed Securities (0.1%) | |||||
Merrill Lynch Alternative Note Asset Trust | |||||
| 1,043,968 | 6.000%, 3/25/2037 | 564,984 | |||
Total Asset-Backed Securities | 564,984 | ||||
Collateralized Mortgage Obligations (1.5%) | |||||
Citigroup Mortgage Loan Trust, Inc. | |||||
| 1,360,530 | 5.500%, 11/25/2035 | 858,486 | |||
Citimortgage Alternative Loan Trust | |||||
| 4,112,933 | 5.750%, 4/25/2037 | 2,353,100 | |||
Countrywide Alternative Loan Trust | |||||
| 1,074,447 | 6.000%, 1/25/2037 | 734,669 | |||
Countrywide Home Loans | |||||
| 4,207,572 | 5.750%, 4/25/2037 | 2,915,771 | |||
Deutsche Alt-A Securities, Inc. | |||||
| 1,084,551 | 5.500%, 10/25/2021 | 791,383 | |||
| 1,782,474 | 6.000%, 10/25/2021 | 1,423,962 | |||
J.P. Morgan Mortgage Trust | |||||
| 1,044,728 | 6.040%, 10/25/2036 | 728,626 | |||
MASTR Alternative Loans Trust | |||||
| 987,766 | 6.500%, 7/25/2034 | 847,936 | |||
Total Collateralized Mortgage Obligations | 10,653,933 | ||||
Commercial Mortgage-Backed Securities (0.1%) | |||||
Greenwich Capital Commercial Funding Corporation | |||||
| 1,710,000 | 5.867%, 8/10/2017 | 868,750 | |||
Total Commercial Mortgage-Backed Securities | 868,750 | ||||
Total Long-Term Fixed Income (cost $14,553,198) | 12,087,667 | ||||
Shares or | Short-Term Investments (4.7%)a | Value | |||
Federal National Mortgage Association Discount Notes | |||||
| 10,000,000 | 0.412%, 5/14/2009b | 9,984,965 | |||
| 23,837,188 | Thrivent Money Market Portfolio | 23,837,188 | |||
Total Short-Term Investments (at amortized cost) | 33,822,153 | ||||
Total Investments (cost $907,119,344) 99.9% | $ | 713,909,848 | |||
Other Assets and Liabilities, Net 0.1% | 846,032 | ||||
Total Net Assets 100.0% | $ | 714,755,880 | |||
| a | The interest rate shown reflects the yield, coupon rate or, for securities purchased at a discount, the discount rate at the date of purchase. |
| b | At December 31, 2008, $9,984,965 of investments were held on deposit with the counterparty and pledged as the initial margin deposit for open financial futures contracts. |
Gross unrealized appreciation and depreciation of investments, based on cost for federal income tax purposes, were as follows:
Gross unrealized appreciation | $ | 76,325 | ||
Gross unrealized depreciation | (193,285,821 | ) | ||
Net unrealized appreciation (depreciation) | $ | (193,209,496 | ) | |
Cost for federal income tax purposes | $ | 907,119,344 | ||
The accompanying Notes to Financial Statements are an integral part of this schedule.
97
Table of Contents
Moderately Conservative Allocation Portfolio
Schedule of Investments as of December 31, 2008
The following table is a summary of the inputs used, as of December 31, 2008, in valuing the Moderately Conservative Allocation Portfolio’s assets carried at fair value as discussed in item 2(A) of the Notes to Financial Statements.
Level | Investments in Securities | Other Financial Instruments* | ||||
Level 1 | $ | 691,837,216 | $ | 1,531,482 | ||
Level 2 | 22,072,632 | — | ||||
Level 3 | — | — | ||||
Totals (Level 1,2,3) | $ | 713,909,848 | $ | 1,531,482 | ||
| * | Other Financial Instruments include Futures, Forwards, Written Options and Swap agreements. |
Futures | Number of Contracts Long/(Short) | Expiration Date | Notional Principal Amount | Value | Unrealized Gain/(Loss) | ||||||||
E-Mini MSCI EAFE Index Futures | 172 | March 2009 | $ | 10,295,069 | $ | 10,894,480 | $ | 599,411 | |||||
Russell 2000 Index Mini-Futures | 286 | March 2009 | 13,517,147 | 14,239,941 | 722,794 | ||||||||
S&P 400 Index Mini-Futures | 37 | March 2009 | 1,910,123 | 1,987,640 | 77,517 | ||||||||
S&P 500 Index Futures | 108 | March 2009 | 24,170,940 | 24,302,700 | 131,760 | ||||||||
Total Futures | $ | 1,531,482 | |||||||||||
Investment in Affiliates
Affiliated issuers, as defined under the Investment Company Act of 1940, include those in which the Portfolio’s holdings of an issuer represent 5% or more of the outstanding voting securities of an issuer, or any affiliated mutual fund.
A summary of transactions for the fiscal year to date, in Moderately Conservative Allocation Portfolio, is as follows:
Portfolio | Value December 31, 2007 | Gross Purchases and Additions | Gross Sales and Reductions | Balance of Shares Held at December 31, 2008 | Value December 31, 2008 | Income Earned January 1, 2008 - December 31, 2008 | |||||||||||
Real Estate Securities | $ | 24,885,963 | $ | 13,045,402 | $ | 16,058,667 | 1,165,987 | $ | 10,895,334 | $ | 1,316,346 | ||||||
Partner Small Cap Value | — | 17,447,172 | 49,332 | 997,966 | 12,043,151 | 165,997 | |||||||||||
Small Cap Stock | 24,431,658 | 7,939,637 | 573,998 | 2,124,373 | 18,025,517 | 259,973 | |||||||||||
Partner Mid Cap Value | — | 20,489,841 | 49,332 | 1,742,711 | 14,371,785 | 165,719 | |||||||||||
Mid Cap Stock | 16,762,554 | 30,360,984 | 838,532 | 4,112,845 | 29,122,644 | 437,033 | |||||||||||
Partner Worldwide Allocation | — | 20,463,213 | — | 2,594,988 | 15,645,703 | 158,083 | |||||||||||
Partner International Stock | 36,388,944 | 22,222,463 | 799,520 | 3,646,384 | 29,816,480 | 2,111,652 | |||||||||||
Large Cap Growth II | — | 28,404,473 | 60,530 | 4,833,126 | 28,289,254 | 28,840 | |||||||||||
Large Cap Growth | 72,707,290 | 12,122,171 | 62,751,383 | — | — | 54,000 | |||||||||||
Large Cap Value | 53,067,485 | 39,601,455 | 1,441,801 | 7,139,107 | 57,828,193 | 2,898,403 | |||||||||||
Large Cap Stock | 59,105,841 | 13,171,572 | 38,921,658 | 2,410,588 | 14,721,702 | 908,857 | |||||||||||
Equity Income Plus Portfolio | — | 8,886,276 | 24,666 | 889,988 | 6,132,818 | 131,257 | |||||||||||
High Yield | 26,500,038 | 20,577,327 | 1,038,540 | 9,697,135 | 33,776,091 | 3,344,517 | |||||||||||
Income | 113,587,464 | 27,122,067 | 26,989,096 | 11,574,911 | 94,900,381 | 6,372,278 | |||||||||||
Limited Maturity Bond | 278,420,166 | 67,361,556 | 7,968,506 | 34,396,471 | 302,430,975 | 14,110,968 | |||||||||||
Money Market | 51,192,804 | 140,937,892 | 168,293,508 | 23,837,188 | 23,837,188 | 1,055,943 | |||||||||||
Total Value and Income Earned | 757,050,207 | 691,837,216 | 33,519,866 | ||||||||||||||
The accompanying Notes to Financial Statements are an integral part of this schedule.
98
Table of Contents
Schedule of Investments as of December 31, 2008
| Shares | Common Stock (94.4%) | Value | ||||
| Communications Equipment (9.3%) | ||||||
| 78,450 | Cisco Systems, Inc.a | $ | 1,278,735 | |||
| 14,200 | Polycom, Inc.a | 191,842 | ||||
| 22,293 | QUALCOMM, Inc. | 798,758 | ||||
| Total Communications Equipment | 2,269,335 | |||||
| Computers & Peripherals (16.1%) | ||||||
| 9,556 | Apple, Inc.a | 815,605 | ||||
| 249,829 | EMC Corporationa | 2,615,710 | ||||
| 5,757 | International Business Machines Corporation | 484,509 | ||||
| Total Computers & Peripherals | 3,915,824 | |||||
| Electronic Equipment, Instruments & Components (3.2%) | ||||||
| 324,301 | China High Speed Transmission Equipment Group Company, Ltd. | 395,721 | ||||
| 76,239 | Comverge, Inc.a,b | 373,571 | ||||
| Total Electronic Equipment, Instruments & Components | 769,292 | |||||
| Financials (8.4%) | ||||||
| 74,794 | Financial Select Sector SPDR Fund | 943,900 | ||||
| 16,300 | First Trust Global Wind Energy ETF | 204,076 | ||||
| 40,700 | SPDR KBW Bank ETFb | 890,923 | ||||
| Total Financials | 2,038,899 | |||||
| Health Care (4.0%) | ||||||
| 2,200 | Alcon, Inc. | 196,218 | ||||
| 13,489 | BioMarin Pharmaceutical, Inc.a,b | 240,104 | ||||
| 8,100 | Novartis AG ADR | 403,056 | ||||
| 1,700 | Roche Holding AG ADR | 130,135 | ||||
| Total Health Care | 969,513 | |||||
| Industrials (6.3%) | ||||||
| 14,262 | American Superconductor Corporationa,b | 232,613 | ||||
| 4,235 | First Solar, Inc.a | 584,261 | ||||
| 213,257 | Hansen Transmissions International NVa | 353,262 | ||||
| 38 | Japan Wind Development Company, Ltd. | 113,518 | ||||
| 33,529 | Polypore International, Inc.a | 253,479 | ||||
| Total Industrials | 1,537,133 | |||||
| Internet Software & Services (7.5%) | ||||||
| 3,025 | Google, Inc.a | 930,641 | ||||
| 73,600 | Yahoo!, Inc.a | 897,920 | ||||
| Total Internet Software & Services | 1,828,561 | |||||
| Semiconductors & Semiconductor Equipment (21.3%) | ||||||
| 36,400 | ASML Holding NV ADRb | 657,748 | ||||
| 305,100 | Atmel Corporationa | 954,963 | ||||
| 79,185 | FormFactor, Inc.a | 1,156,101 | ||||
| 17,800 | International Rectifier Corporationa | 240,300 | ||||
| 23,600 | Lam Research Corporationa | 502,208 | ||||
| 23,000 | MEMC Electronic Materials, Inc.a | 328,440 | ||||
| 54,300 | PMC-Sierra, Inc.a | 263,898 | ||||
| 254,239 | Teradyne, Inc.a | 1,072,889 | ||||
| Total Semiconductors & Semiconductor Equipment | 5,176,547 | |||||
| Software (16.5%) | ||||||
| 25,000 | BMC Software, Inc.a | 672,750 | ||||
| 33,400 | Check Point Software Technologies, Ltd.a | 634,266 | ||||
| 19,757 | Citrix Systems, Inc.a | 465,672 | ||||
| 10,900 | McAfee, Inc.a | 376,813 | ||||
| 56,300 | Oracle Corporationa | 998,199 | ||||
| 7,269 | Quest Software, Inc.a | 91,517 | ||||
| 41,900 | Synopsys, Inc.a | 775,988 | ||||
| Total Software | 4,015,205 | |||||
| Telecommunications Services (1.8%) | ||||||
| 22,100 | NTT DoCoMo, Inc. ADR | 433,602 | ||||
| Total Telecommunications Services | 433,602 | |||||
Total Common Stock (cost $26,716,117) | 22,953,911 | |||||
| Shares | Collateral Held for Securities Loaned (9.5%) | Value | ||||
| 2,295,165 | Thrivent Financial Securities Lending Trust | 2,295,165 | ||||
| Total Collateral Held for Securities Loaned (cost $2,295,165) | 2,295,165 | |||||
| Shares | Short-Term Investments (5.4%) | Value | ||||
| 1,319,500 | Thrivent Money Market Portfolio | 1,319,500 | ||||
| Total Short-Term Investments (at amortized cost) | 1,319,500 | |||||
Total Investments (cost $30,330,782) 109.3% | $ | 26,568,576 | ||||
| Other Assets and Liabilities, Net (9.3%) | (2,251,310 | ) | ||||
| Total Net Assets 100.0% | $ | 24,317,266 | ||||
| a | Non-income producing security. |
| b | All or a portion of the security is on loan as discussed in item 2(M) of the Notes to Financial Statements. |
Definitions:
| ADR - | American Depositary Receipt, which are certificates for an underlying foreign security’s shares held by an issuing U.S. depository bank. |
| ETF - | Exchange Traded Fund. |
The accompanying Notes to Financial Statements are an integral part of this schedule.
99
Table of Contents
Technology Portfolio
Schedule of Investments as of December 31, 2008
Gross unrealized appreciation and depreciation of investments, based on cost for federal income tax purposes, were as follows:
Gross unrealized appreciation | $ | 1,019,165 | ||
Gross unrealized depreciation | (8,001,390 | ) | ||
Net unrealized appreciation (depreciation) | $ | (6,982,225 | ) | |
Cost for federal income tax purposes | $ | 33,550,801 | ||
The following table is a summary of the inputs used, as of December 31, 2008, in valuing the Technology Portfolio’s assets carried at fair value as discussed in item 2(A) of the Notes to Financial Statements.
Level | Investments in Securities | Other Financial Instruments* | ||||
Level 1 | $ | 25,706,075 | $ | — | ||
Level 2 | 862,501 | — | ||||
Level 3 | — | — | ||||
Totals (Level 1,2,3) | $ | 26,568,576 | $ | — | ||
| * | Other Financial Instruments include Futures, Forwards, Written Options and Swap agreements. |
Investment in Affiliates
Affiliated issuers, as defined under the Investment Company Act of 1940, include those in which the Portfolio’s holdings of an issuer represent 5% or more of the outstanding voting securities of an issuer, or any affiliated mutual fund.
A summary of transactions for the fiscal year to date, in Technology Portfolio, is as follows:
Portfolio | Value December 31, 2007 | Gross Purchases and Additions | Gross Sales and Reductions | Balance of Shares Held at December 31, 2008 | Value December 31, 2008 | Income Earned January 1, 2008 - December 31, 2008 | |||||||||||
Money Market | $ | 2,902,355 | $ | 40,927,482 | $ | 42,510,337 | 1,319,500 | $ | 1,319,500 | $ | 60,733 | ||||||
Thrivent Financial Securities Lending Trust | 8,345,500 | 60,806,286 | 66,856,621 | 2,295,165 | 2,295,165 | 143,563 | |||||||||||
Total Value and Income Earned | 11,247,855 | 3,614,665 | 204,296 | ||||||||||||||
The accompanying Notes to Financial Statements are an integral part of this schedule.
100
Table of Contents
Schedule of Investments as of December 31, 2008
| Shares | Common Stock (95.0%) | Value | |||
| Biotechnology (22.1%) | |||||
| 4,400 | Affymax, Inc.a | $ | 43,956 | ||
| 2,800 | Alexion Pharmaceuticals, Inc.a | 101,332 | |||
| 5,000 | Amgen, Inc.a | 288,750 | |||
| 690 | Basilea Pharmaceuticaa | 97,934 | |||
| 5,300 | Celgene Corporationa | 292,984 | |||
| 4,390 | Genzyme Corporationa | 291,364 | |||
| 4,700 | InterMune, Inc.a | 49,726 | |||
| 5,091 | Momenta Pharmaceuticals, Inc.a | 59,056 | |||
| 1,990 | Myriad Genetics, Inc.a | 131,858 | |||
| 10,200 | Progenics Pharmaceuticals, Inc.a | 105,162 | |||
| 3,850 | Vertex Pharmaceuticals, Inc.a | 116,963 | |||
Total Biotechnology | 1,579,085 | ||||
| Health Care Equipment (8.2%) | |||||
| 6,600 | Given Imaging, Ltd.a | 54,648 | |||
| 6,800 | St. Jude Medical, Inc.a | 224,128 | |||
| 4,900 | Stryker Corporation | 195,755 | |||
| 3,167 | Varian Medical Systems, Inc.a | 110,972 | |||
Total Health Care Equipment | 585,503 | ||||
| Health Care Supplies (0.8%) | |||||
| 7,000 | Align Technology, Inc.a | 61,250 | |||
Total Health Care Supplies | 61,250 | ||||
| Life Sciences Tools & Services (2.9%) | |||||
| 2,700 | Illumina, Inc.a | 70,335 | |||
| 3,200 | Luminex Corporationa | 68,352 | |||
| 3,400 | Sequenom, Inc.a | 67,456 | |||
Total Life Sciences Tools & Services | 206,143 | ||||
| Pharmaceuticals (61.0%) | |||||
| 5,700 | Abbott Laboratories | 304,209 | |||
| 3,400 | Allergan, Inc. | 137,088 | |||
| 14,900 | Bristol-Myers Squibb Company | 346,425 | |||
| 11,492 | Dr. Reddy’s Laboratories, Ltd. ADR | 112,622 | |||
| 28,100 | Hikma Pharmaceuticals plc | 143,037 | |||
| 14,700 | Merck & Company, Inc. | 446,880 | |||
| 3,700 | Nichi-iko Pharmaceutical Company, Ltd. | 114,392 | |||
| 6,500 | Novartis AG | 325,513 | |||
| 4,640 | Novo Nordisk A/S ADR | 238,450 | |||
| 800 | Richter Gedeon Nyrt | 119,802 | |||
| 3,710 | Roche Holding AG | 574,344 | |||
| 28,500 | Schering-Plough Corporation | 485,355 | |||
| 3,340 | Shire Pharmaceuticals Group plc ADR | 149,565 | |||
| 3,700 | Stada Arzneimittel AG | 106,279 | |||
| 3,800 | Teva Pharmaceutical Industries, Ltd. ADR | 161,766 | |||
| 15,600 | Wyeth | 585,156 | |||
Total Pharmaceuticals | 4,350,883 | ||||
Total Common Stock (cost $7,323,192) | 6,782,864 | ||||
Shares | Short-Term Investments (4.9%) | Value | |||
| 348,090 | Thrivent Money Market Portfolio | 348,090 | |||
Total Short-Term Investments (at amortized cost) | 348,090 | ||||
Total Investments (cost $7,671,282) 99.9% | $ | 7,130,954 | |||
Other Assets and Liabilities, Net 0.1% | 4,444 | ||||
Total Net Assets 100.0% | $ | 7,135,398 | |||
| a | Non-income producing security. |
Definitions:
| ADR - | American Depositary Receipt, which are certificates for an underlying foreign security’s shares held by an issuing U.S. depository bank. |
Gross unrealized appreciation and depreciation of investments, based on cost for federal income tax purposes, were as follows:
Gross unrealized appreciation | $ | 234,123 | ||
Gross unrealized depreciation | (776,239 | ) | ||
Net unrealized appreciation (depreciation) | $ | (542,116 | ) | |
Cost for federal income tax purposes | $ | 7,673,070 |
The following table is a summary of the inputs used, as of December 31, 2008, in valuing the Partner Healthcare Portfolio’s assets carried at fair value as discussed in item 2(A) of the Notes to Financial Statements.
Level | Investments in Securities | Other Financial Instruments* | ||||
Level 1 | $ | 5,649,653 | $ | — | ||
Level 2 | 1,481,301 | — | ||||
Level 3 | — | — | ||||
Totals (Level 1,2,3) | $ | 7,130,954 | $ | — | ||
| * | Other Financial Instruments include Futures, Forwards, Written Options and Swap agreements. |
The accompanying Notes to Financial Statements are an integral part of this schedule.
101
Table of Contents
Partner Healthcare Portfolio
Schedule of Investments as of December 31, 2008
Investment in Affiliates
Affiliated issuers, as defined under the Investment Company Act of 1940, include those in which the Portfolio’s holdings of an issuer represent 5% or more of the outstanding voting securities of an issuer, or any affiliated mutual fund.
A summary of transactions for the fiscal year to date, in Partner Healthcare Portfolio, is as follows:
Portfolio | Value April 30, 2008† | Gross Purchases and Additions | Gross Sales and Reductions | Balance of Shares Held at December 31, 2008 | Value December 31, 2008 | Income Earned April 30, 2008 - December 31, 2008 | |||||||||||
Money Market | $ | — | $ | 2,689,776 | $ | 2,341,686 | 348,090 | $ | 348,090 | $ | 2,998 | ||||||
Total Value and Income Earned | — | 348,090 | 2,998 | ||||||||||||||
| † | Partner Healthcare Portfolio was incepted on 4/30/2008. |
The accompanying Notes to Financial Statements are an integral part of this schedule.
102
Table of Contents
Partner Natural Resources Portfolio
Schedule of Investments as of December 31, 2008
| Shares | Common Stock (86.0%) | Value | |||
| Coal & Consumable Fuels (2.1%) | |||||
| 700 | Arch Coal, Inc. | $ | 11,403 | ||
| 1,700 | CONSOL Energy, Inc. | 48,586 | |||
| 200 | Patriot Coal Corporationa | 1,250 | |||
| 3,400 | Peabody Energy Corporation | 77,350 | |||
Total Coal & Consumable Fuels | 138,589 | ||||
| Industrials (1.1%) | |||||
| 1,200 | Aegean Marine Petroleum Network, Inc. | 20,352 | |||
| 3,000 | Saipem SPA | 51,166 | |||
Total Industrials | 71,518 | ||||
| Integrated Oil & Gas (23.1%) | |||||
| 900 | BP plc ADR | 42,066 | |||
| 3,600 | Chevron Corporation | 266,292 | |||
| 4,300 | Coastal Energy Companya | 5,190 | |||
| 2,400 | ConocoPhillips | 124,320 | |||
| 300 | Eni SPA | 14,346 | |||
| 2,700 | Exxon Mobil Corporation | 215,541 | |||
| 1,700 | Hess Corporation | 91,188 | |||
| 1,100 | Husky Energy, Inc. | 27,507 | |||
| 3,600 | Marathon Oil Corporation | 98,496 | |||
| 3,300 | Murphy Oil Corporation | 146,355 | |||
| 3,100 | Occidental Petroleum Corporation | 185,969 | |||
| 2,500 | Petroleo Brasileiro SA ADR | 61,225 | |||
| 5,600 | Suncor Energy, Inc. | 107,600 | |||
| 2,400 | Total SA ADR | 132,720 | |||
Total Integrated Oil & Gas | 1,518,815 | ||||
| Materials (7.4%) | |||||
| 200 | Alcoa, Inc. | 2,252 | |||
| 1,400 | Alumina, Ltd. | 1,410 | |||
| 1,700 | Aluminum Corporation of China, Ltd. | 22,967 | |||
| 1,200 | Barrick Gold Corporation | 43,461 | |||
| 2,200 | BHP Billiton, Ltd. | 46,737 | |||
| 3,400 | Companhia Vale do Rio Doce ADR | 41,174 | |||
| 700 | E.I. du Pont de Nemours and Company | 17,710 | |||
| 8,400 | Eldorado Gold Corporationa | 65,662 | |||
| 1,400 | First Quantum Minerals, Ltd. | 19,971 | |||
| 3,400 | Goldcorp, Inc. | 105,732 | |||
| 2,000 | HudBay Minerals, Inc.a | 4,958 | |||
| 200 | Intrepid Potash, Inc.a | 4,154 | |||
| 1,700 | Newcrest Mining, Ltd. | 40,465 | |||
| 100 | Newmont Mining Corporation | 4,070 | |||
| 300 | Praxair, Inc. | 17,808 | |||
| 2,200 | Southern Copper Corporation | 35,332 | |||
| 1,700 | Votorantim Celulose e Papel SA ADRa | 13,481 | |||
Total Materials | 487,344 | ||||
| Oil & Gas Drilling (7.3%) | |||||
| 1,400 | Diamond Offshore Drilling, Inc. | 82,516 | |||
| 2,400 | Helmerich & Payne, Inc. | 54,600 | |||
| 400 | Hercules Offshore, Inc.a | 1,900 | |||
| 2,900 | Nabors Industries, Ltd.a | 34,713 | |||
| 4,000 | Noble Corporation | 88,240 | |||
| 1,400 | Pride International, Inc.a | 22,372 | |||
| 400 | Rowan Companies, Inc. | 6,360 | |||
| 4,000 | Transocean, Ltd.a | 189,000 | |||
Total Oil & Gas Drilling | 479,701 | ||||
| Oil & Gas Equipment & Services (12.2%) | |||||
| 1,100 | Acergy SA | 6,358 | |||
| 2,400 | Baker Hughes, Inc. | 76,968 | |||
| 2,200 | BJ Services Company | 25,674 | |||
| 5,000 | Cameron International Corporationa | 102,500 | |||
| 700 | Complete Production Services, Inc.a | 5,705 | |||
| 2,700 | Dresser-Rand Group, Inc.a | 46,575 | |||
| 600 | Dril-Quip, Inc.a | 12,306 | |||
| 1,900 | FMC Technologies, Inc.a | 45,277 | |||
| 4,700 | Halliburton Company | 85,446 | |||
| 6,100 | National Oilwell Varco, Inc.a | 149,084 | |||
| 800 | Oil States International, Inc.a | 14,952 | |||
| 1,700 | Schlumberger, Ltd. | 71,961 | |||
| 1,900 | Smith International, Inc. | 43,491 | |||
| 700 | Technip SA | 21,882 | |||
| 1,100 | Tesco Corporationa | 7,854 | |||
| 900 | Trican Well Service, Ltd. | 5,803 | |||
| 7,600 | Weatherford International, Ltd.a | 82,232 | |||
Total Oil & Gas Equipment & Services | 804,068 | ||||
| Oil & Gas Exploration & Production (30.8%) | |||||
| 600 | Addax Petroleum Corporation | 10,250 | |||
| 1,400 | Anadarko Petroleum Corporation | 53,970 | |||
| 3,400 | Apache Corporation | 253,402 | |||
| 2,400 | Cabot Oil & Gas Corporation | 62,400 | |||
| 2,100 | Canadian Natural Resources, Ltd. | 82,928 | |||
| 900 | Carrizo Oil & Gas, Inc.a | 14,490 | |||
| 200 | Cimarex Energy Company | 5,356 | |||
| 700 | CNOOC, Ltd. | 66,668 | |||
| 1,200 | Compton Petroleum Corporationa | 904 | |||
| 6,800 | Connacher Oil & Gas, Ltd.a | 4,076 | |||
| 5,000 | Crew Energy, Inc.a | 21,466 | |||
| 900 | Denbury Resources, Inc.a | 9,828 | |||
| 4,800 | Devon Energy Corporation | 315,408 | |||
| 3,400 | EnCana Corporation | 156,876 | |||
| 4,800 | EOG Resources, Inc. | 319,584 | |||
| 1,200 | Forest Oil Corporationa | 19,788 | |||
| 1,200 | Iteration Energy, Ltd.a | 1,332 | |||
| 400 | Mariner Energy, Inc.a | 4,080 | |||
| 1,700 | Newfield Exploration Companya | 33,575 | |||
| 2,700 | Nexen, Inc. | 46,914 | |||
| 200 | Niko Resources, Ltd. | 6,884 | |||
| 1,500 | Noble Energy, Inc. | 73,830 | |||
| 1,900 | Pan Orient Energy Corporationa | 5,187 | |||
| 600 | Paramount Resources, Ltd.a | 3,339 | |||
| 2,200 | Petro-Canada | 47,618 | |||
| 800 | Pioneer Natural Resources Company | 12,944 | |||
| 3,400 | ProEx Energy, Ltd.a | 30,847 | |||
| 3,700 | Range Resources Corporation | 127,243 | |||
| 1,800 | SandRidge Energy, Inc.a | 11,070 | |||
| 1,200 | Southwestern Energy Companya | 34,764 | |||
| 14,200 | Talisman Energy, Inc. | 140,102 | |||
| 4,200 | TriStar Oil & Gas, Ltd.a | 38,819 | |||
| 5,800 | TUSK Energy Corporationa | 4,322 | |||
| 2,400 | UTS Energy Corporationa | 1,555 | |||
The accompanying Notes to Financial Statements are an integral part of this schedule.
103
Table of Contents
Partner Natural Resources Portfolio
Schedule of Investments as of December 31, 2008
| Shares | Common Stock (86.0%) | Value | |||
| Oil & Gas Exploration & Production (30.8%) - continued | |||||
| 300 | XTO Energy, Inc. | $ | 10,581 | ||
Total Oil & Gas Exploration & Production | 2,032,400 | ||||
| Oil & Gas Refining & Marketing (0.4%) | |||||
| 1,200 | Valero Energy Corporation | 25,968 | |||
Total Oil & Gas Refining & Marketing | 25,968 | ||||
| Oil & Gas Storage & Transportation (0.3%) | |||||
| 1,500 | Williams Companies, Inc. | 21,720 | |||
Total Oil & Gas Storage & Transportation | 21,720 | ||||
| Utilities (1.3%) | |||||
| 2,600 | Equitable Resources, Inc. | 87,230 | |||
Total Utilities | 87,230 | ||||
Total Common Stock (cost $9,952,908) | 5,667,353 | ||||
| Shares | Short-Term Investments (10.3%) | Value | |||
| 680,495 | Thrivent Money Market Portfolio | 680,495 | |||
Total Short-Term Investments (at amortized cost) | 680,495 | ||||
Total Investments (cost $10,633,403) 96.3% | $ | 6,347,848 | |||
Other Assets and Liabilities, Net 3.7% | 246,184 | ||||
Total Net Assets 100.0% | $ | 6,594,032 | |||
| a | Non-income producing security. |
Definitions:
| ADR - | American Depositary Receipt, which are certificates for an underlying foreign security’s shares held by an issuing U.S. depository bank. |
Gross unrealized appreciation and depreciation of investments, based on cost for federal income tax purposes, were as follows:
Gross unrealized appreciation | $ | 6,178 | ||
Gross unrealized depreciation | (4,293,469 | ) | ||
Net unrealized appreciation (depreciation) | $ | (4,287,291 | ) | |
Cost for federal income tax purposes | $ | 10,635,139 |
The following table is a summary of the inputs used, as of December 31, 2008, in valuing the Partner Natural Resources Portfolio’s assets carried at fair value as discussed in item 2(A) of the Notes to Financial Statements.
Level | Investments in Securities | Other Financial Instruments* | ||||
Level 1 | $ | 6,208,070 | ($2,272 | ) | ||
Level 2 | 139,778 | — | ||||
Level 3 | — | — | ||||
Totals (Level 1,2,3) | $ | 6,347,848 | ($2,272 | ) | ||
| * | Other Financial Instruments include Futures, Forwards, Written Options and Swap agreements. |
The accompanying Notes to Financial Statements are an integral part of this schedule.
104
Table of Contents
Partner Natural Resources Portfolio
Schedule of Investments as of December 31, 2008
Foreign Currency Forward Contracts | Contracts to Deliver/Receive | Settlement Date | Value on Settlement Date | Value | Unrealized Gain/(Loss) | ||||||||
Purchases | |||||||||||||
Australian Dollar | 12,136 | 1/2/2009 - 1/6/2009 | $ | 8,478 | $ | 8,461 | ($17 | ) | |||||
Canadian Dollar | 206,268 | 1/2/2009 - 1/6/2009 | 169,198 | 167,087 | (2,111 | ) | |||||||
EURO | 7,099 | 1/2/2009 - 1/6/2009 | 10,012 | 9,868 | (144 | ) | |||||||
Total Foreign Currency Forward Contracts Purchases | $ | 187,688 | $ | 185,416 | ($2,272 | ) | |||||||
Net Unrealized Gain/(Loss) on Foreign Currency Forward Contracts | ($2,272 | ) | |||||||||||
Investment in Affiliates
Affiliated issuers, as defined under the Investment Company Act of 1940, include those in which the Portfolio’s holdings of an issuer represent 5% or more of the outstanding voting securities of an issuer, or any affiliated mutual fund.
A summary of transactions for the fiscal year to date, in Partner Natural Resources Portfolio, is as follows:
Portfolio | Value April 30, 2008† | Gross Purchases and Additions | Gross Sales and Reductions | Balance of Shares Held at December 31, 2008 | Value December 31, 2008 | Income Earned April 30, 2008 - December 31, 2008 | |||||||||||
Money Market | $ | — | $ | 1,850,569 | $ | 1,170,074 | 680,495 | $ | 680,495 | $ | 8,955 | ||||||
Total Value and Income Earned | — | 680,495 | 8,955 | ||||||||||||||
| † | Partner Natural Resources Portfolio was incepted on 4/30/2008. |
The accompanying Notes to Financial Statements are an integral part of this schedule.
105
Table of Contents
Partner Emerging Markets Portfolio
Schedule of Investments as of December 31, 2008
| Shares | Common Stock (98.6%) | Valuea | |||
| Brazil (14.2%) | |||||
| 13,300 | Banco Bradesco SA ADR | $ | 131,271 | ||
| 15,700 | Companhia Vale do Rio Doce SP ADR | 167,205 | |||
| 14,300 | Lojas Renner SA | 96,090 | |||
| 7,700 | Petroleo Brasileiro SA ADR | 157,157 | |||
| 5,000 | Souza Cruz SA | 94,554 | |||
| 5,000 | Ultrapar Participacoes SA | 108,962 | |||
Total Brazil | 755,239 | ||||
| Chile (2.5%) | |||||
| 3,800 | Banco Santander Chile SA ADR | 133,114 | |||
Total Chile | 133,114 | ||||
| China (2.9%) | |||||
| 175,000 | PetroChina Company, Ltd. | 155,514 | |||
Total China | 155,514 | ||||
| Hong Kong (9.4%) | |||||
| 20,000 | China Mobile, Ltd. | 202,922 | |||
| 48,000 | Hang Lung Group, Ltd. | 146,632 | |||
| 22,000 | Swire Pacific, Ltd., Class A | 152,399 | |||
Total Hong Kong | 501,953 | ||||
| Hungary (3.9%) | |||||
| 1,400 | Richter Gedeon Nyrt | 209,654 | |||
Total Hungary | 209,654 | ||||
| India (8.9%) | |||||
| 6,400 | Grasim Industries, Ltd. | 160,243 | |||
| 4,400 | ICICI Bank, Ltd. ADR | 84,700 | |||
| 3,500 | Infosys Technologies, Ltd. ADR | 85,995 | |||
| 15,500 | Satyam Computer Services, Ltd. ADR b | 140,120 | |||
Total India | 471,058 | ||||
| Indonesia (1.6%) | |||||
| 85,000 | PT Astra International Tbk | 83,538 | |||
Total Indonesia | 83,538 | ||||
| Israel (4.7%) | |||||
| 5,400 | Check Point Software Technologies, Ltd.c | 102,546 | |||
| 3,500 | Teva Pharmaceutical Industries, Ltd. ADR | 148,995 | |||
Total Israel | 251,541 | ||||
| Luxembourg (2.2%) | |||||
| 5,500 | Tenaris SA ADR | 115,390 | |||
Total Luxembourg | 115,390 | ||||
| Malaysia (3.2%) | |||||
| 45,000 | Bumiputra-Commerce Holdings Berhad | 76,237 | |||
| 38,000 | Public Bank Berhad | 96,344 | |||
Total Malaysia | 172,581 | ||||
| Mexico (10.6%) | |||||
| 115,000 | Consorcio ARA SAB de CV | 43,597 | |||
| 6,600 | Fomento Economico Mexicano SAB de CV ADR | 198,858 | |||
| 2,400 | Grupo Aeroportuario del Sureste SAB de CV ADR | 89,712 | |||
| 70,000 | Grupo Financiero Banorte SA de CV ADR | 126,367 | |||
| 50,500 | Organizacion Soriana SAB de CVc | 104,111 | |||
Total Mexico | 562,645 | ||||
| Philippines (2.9%) | |||||
| 515,000 | Ayala Land, Inc. | 71,640 | |||
| 102,000 | Bank of the Philippine Islands | 85,212 | |||
Total Philippines | 156,852 | ||||
| Russia (2.0%) | |||||
| 3,337 | LUKOIL ADR | 108,003 | |||
Total Russia | 108,003 | ||||
| South Africa (6.4%) | |||||
| 22,500 | Massmart Holdings, Ltd. | 206,310 | |||
| 36,500 | Truworths International, Ltd. | 135,042 | |||
Total South Africa | 341,352 | ||||
| South Korea (6.6%) | |||||
| 7,800 | Busan Bankc | 36,996 | |||
| 1,773 | Samsung Electronics Company, Ltd. GDR | 187,054 | |||
| 330 | Shinsegae Company, Ltd.c | 128,209 | |||
Total South Korea | 352,259 | ||||
| Taiwan (4.9%) | |||||
| 66,000 | Taiwan Mobile Company, Ltd. | 98,210 | |||
| 116,000 | Taiwan Semiconductor Manufacturing Company, Ltd. | 158,280 | |||
Total Taiwan | 256,490 | ||||
| Thailand (5.4%) | |||||
| 50,000 | PTT Exploration & Production Public Company, Ltd. | 154,006 | |||
| 42,000 | Siam Cement Public Company, Ltd. | 133,039 | |||
Total Thailand | 287,045 | ||||
| Turkey (4.1%) | |||||
| 42,000 | Akbank TAS | 132,324 | |||
| 4,200 | BIM Birlesik Magazalar AS | 88,336 | |||
Total Turkey | 220,660 | ||||
| United Kingdom (2.2%) | |||||
| 9,307 | Standard Chartered plc | 119,097 | |||
Total United Kingdom | 119,097 | ||||
Total Common Stock (cost $9,245,907) | 5,253,985 | ||||
The accompanying Notes to Financial Statements are an integral part of this schedule.
106
Table of Contents
Partner Emerging Markets Portfolio
Schedule of Investments as of December 31, 2008
| Shares | Short-Term Investments (1.3%) | Value | |||
| 71,414 | Thrivent Money Market Portfolio | $ | 71,414 | ||
Total Short-Term Investments (at amortized cost) | 71,414 | ||||
Total Investments (cost $9,317,321) 99.9% | $ | 5,325,399 | |||
Other Assets and Liabilities, Net 0.1% | 3,866 | ||||
Total Net Assets 100.0% | $ | 5,329,265 | |||
| a | Security is fair valued as discussed in item 2(A) of the Notes to Financial Statements. |
| b | Subsequent to December 31, 2008, the security became involved in class action litigation and its value decreased significantly. The Portfolio sold its position by January 9, 2009, receiving proceeds of $18,425. |
| c | Non-income producing security. |
Definitions:
| ADR - | American Depositary Receipt, which are certificates for an underlying foreign security’s shares held by an issuing U.S. depository bank. |
| GDR - | Global Depository Receipts, which are certificates for shares of an underlying foreign security’s shares held by an issuing depository bank from more than one country. |
Gross unrealized appreciation and depreciation of investments, based on cost for federal income tax purposes, were as follows:
Gross unrealized appreciation | $ | 13,320 | ||
Gross unrealized depreciation | (4,005,952 | ) | ||
Net unrealized appreciation (depreciation) | $ | (3,992,632 | ) | |
Cost for federal income tax purposes | $ | 9,318,031 | ||
The following table is a summary of the inputs used, as of December 31, 2008, in valuing the Partner Emerging Markets Portfolio’s assets carried at fair value as discussed in item 2(A) of the Notes to Financial Statements.
Level | Investments in Securities | Other Financial Instruments* | ||||
Level 1 | $ | 2,086,326 | $ | — | ||
Level 2 | 3,239,073 | — | ||||
Level 3 | — | — | ||||
Totals (Level 1,2,3) | $ | 5,325,399 | $ | — | ||
| * | Other Financial Instruments include Futures, Forwards, Written Options and Swap agreements. |
The accompanying Notes to Financial Statements are an integral part of this schedule.
107
Table of Contents
Partner Emerging Markets Portfolio
Schedule of Investments as of December 31, 2008
Investment in Affiliates
Affiliated issuers, as defined under the Investment Company Act of 1940, include those in which the Portfolio’s holdings of an issuer represent 5% or more of the outstanding voting securities of an issuer, or any affiliated mutual fund.
A summary of transactions for the fiscal year to date, in Partner Emerging Markets Portfolio, is as follows:
Portfolio | Value April 30, 2008† | Gross Purchases and Additions | Gross Sales and Reductions | Balance of Shares Held at December 31, 2008 | Value December 31, 2008 | Income Earned April 30, 2008 - December 31, 2008 | |||||||||||
Money Market | $ | — | $ | 1,646,196 | $ | 1,574,782 | 71,414 | $ | 71,414 | $ | 1,821 | ||||||
Total Value and Income Earned | — | 71,414 | 1,821 | ||||||||||||||
| † | Partner Emerging Markets Portfolio was incepted on 4/30/2008. |
The accompanying Notes to Financial Statements are an integral part of this schedule.
108
Table of Contents
Real Estate Securities Portfolio
Schedule of Investments as of December 31, 2008
| Shares | Common Stock (94.7%) | Value | |||
| Diversified REITS (7.3%) | |||||
| 48,265 | Colonial Properties Trust | $ | 402,047 | ||
| 104,294 | Liberty Property Trust | 2,381,032 | |||
| 12,800 | PS Business Parks, Inc. | 571,648 | |||
| 170,337 | Vornado Realty Trust | 10,279,838 | |||
| 24,500 | Washington Real Estate Investment Trusta | 693,350 | |||
Total Diversified REITS | 14,327,915 | ||||
| Financials (3.7%) | |||||
| 2,800 | Financial Select Sector SPDR Fund | 35,336 | |||
| 34,088 | iShares Cohen & Steers Realty Majors Index Fund | 1,506,008 | |||
| 130,604 | iShares Dow Jones U.S. Real Estate Index Fund | 4,862,387 | |||
| 31,188 | SPDR DJ Wilshire International Real Estate ETFa | 844,571 | |||
Total Financials | 7,248,302 | ||||
| Foreign (0.8%) | |||||
| 214,000 | Brookfield Properties Corporation | 1,654,220 | |||
Total Foreign | 1,654,220 | ||||
| Hotels, Resorts & Cruise Lines (0.7%) | |||||
| 74,020 | Starwood Hotels & Resorts Worldwide, Inc. | 1,324,958 | |||
Total Hotels, Resorts & Cruise Lines | 1,324,958 | ||||
| Industrial REITS (4.8%) | |||||
| 118,863 | AMB Property Corporation | 2,783,771 | |||
| 196,153 | DCT Industrial Trust, Inc.a | 992,534 | |||
| 25,200 | EastGroup Properties, Inc. | 896,616 | |||
| 25,100 | First Potomac Realty Trust | 233,430 | |||
| 327,350 | ProLogis Trust | 4,546,892 | |||
Total Industrial REITS | 9,453,243 | ||||
| Mortgage REITS (0.2%) | |||||
| 24,300 | Annaly Capital Management, Inc. | 385,641 | |||
| 7,000 | MFA Mortgage Investments, Inc. | 41,230 | |||
Total Mortgage REITS | 426,871 | ||||
| Office REITS (15.8%) | |||||
| 53,000 | Alexandria Real Estate Equities, Inc. | 3,198,020 | |||
| 90,007 | BioMed Realty Trust, Inc. | 1,054,882 | |||
| 159,000 | Boston Properties, Inc. | 8,745,000 | |||
| 133,685 | Brandywine Realty Trust | 1,030,711 | |||
| 88,530 | Corporate Office Properties Trusta | 2,717,871 | |||
| 117,375 | Digital Realty Trust, Inc.a | 3,855,769 | |||
| 113,600 | Douglas Emmett, Inc.a | 1,483,616 | |||
| 133,000 | Duke Realty Corporationa | 1,457,680 | |||
| 67,300 | Highwoods Properties, Inc. | 1,841,328 | |||
| 26,000 | HRPT Properties Trust | 87,620 | |||
| 51,815 | Kilroy Realty Corporation | 1,733,730 | |||
| 36,489 | Lexington Corporate Properties Trust | 182,445 | |||
| 81,875 | Mack-Cali Realty Corporation | 2,005,937 | |||
| 72,393 | SL Green Realty Corporationa | 1,874,979 | |||
Total Office REITS | 31,269,588 | ||||
| Residential REITS (16.5%) | |||||
| 54,350 | American Campus Communities, Inc. | 1,113,088 | |||
| 99,457 | Apartment Investment & Management Companya | 1,148,728 | |||
| 112,000 | AvalonBay Communities, Inc. | 6,784,960 | |||
| 67,000 | BRE Properties, Inc.a | 1,874,660 | |||
| 80,000 | Camden Property Trust | 2,507,200 | |||
| 23,700 | Equity Lifestyle Properties, Inc. | 909,132 | |||
| 289,388 | Equity Residential REIT | 8,629,550 | |||
| 51,300 | Essex Property Trust, Inc. | 3,937,275 | |||
| 45,000 | Home Properties, Inc.a | 1,827,000 | |||
| 42,412 | Mid-America Apartment Communities, Inc.a | 1,576,030 | |||
| 44,575 | Post Properties, Inc. | 735,488 | |||
| 115,500 | UDR, Inc.a | 1,592,745 | |||
Total Residential REITS | 32,635,856 | ||||
| Retail REITS (22.4%) | |||||
| 36,015 | Acadia Realty Trust | 513,934 | |||
| 63,797 | CBL & Associates Properties, Inc.a | 414,681 | |||
| 131,800 | Developers Diversified Realty Corporation | 643,184 | |||
| 15,075 | Equity One, Inc.a | 266,827 | |||
| 98,000 | Federal Realty Investment Trust | 6,083,840 | |||
| 280,907 | General Growth Properties, Inc.a | 362,370 | |||
| 38,000 | Inland Real Estate Corporation | 493,240 | |||
| 268,050 | Kimco Realty Corporation | 4,899,954 | |||
| 111,516 | Macerich Companya | 2,025,131 | |||
| 94,000 | National Retail Properties, Inc.a | 1,615,860 | |||
| 30,950 | Realty Income Corporationa | 716,492 | |||
| 113,000 | Regency Centers Corporation | 5,277,100 | |||
| 285,500 | Simon Property Group, Inc. | 15,168,615 | |||
| 54,200 | Tanger Factory Outlet Centers, Inc.a | 2,039,004 | |||
| 91,000 | Taubman Centers, Inc. | 2,316,860 | |||
| 62,800 | Weingarten Realty Investorsa | 1,299,332 | |||
Total Retail REITS | 44,136,424 | ||||
| Specialized REITS (22.5%) | |||||
| 94,400 | DiamondRock Hospitality Companya | 478,608 | |||
| 32,970 | Entertainment Properties Trusta | 982,506 | |||
| 103,500 | Extra Space Storage, Inc. | 1,068,120 | |||
| 197,200 | Health Care Property Investors, Inc.a | 5,476,244 | |||
| 84,500 | Health Care REIT, Inc.a | 3,565,900 | |||
| 50,075 | Healthcare Realty Trust, Inc.a | 1,175,761 | |||
| 50,000 | Hospitality Properties Trust | 743,500 | |||
| 565,056 | Host Hotels & Resorts, Inc. | 4,277,474 | |||
| 53,038 | LaSalle Hotel Propertiesa | 586,070 | |||
| 9,000 | LTC Properties, Inc. | 182,520 | |||
| 115,000 | Nationwide Health Properties, Inc.a | 3,302,800 | |||
| 64,000 | Omega Healthcare Investors, Inc. | 1,022,080 | |||
| 43,071 | Plum Creek Timber Company, Inc. | 1,496,287 | |||
| 144,648 | Public Storage, Inc. | 11,499,516 | |||
| 9,300 | Rayonier, Inc. REIT | 291,555 | |||
| 111,156 | Senior Housing Property Trust | 1,991,915 | |||
| 40,947 | Sunstone Hotel Investors, Inc. | 253,462 | |||
The accompanying Notes to Financial Statements are an integral part of this schedule.
109
Table of Contents
Real Estate Securities Portfolio
Schedule of Investments as of December 31, 2008
| Shares | Common Stock (94.7%) | Value | ||||
| Specialized REITS (22.5%) - continued | ||||||
| 181,759 | Ventas, Inc. | $ | 6,101,650 | |||
Total Specialized REITS | 44,495,968 | |||||
Total Common Stock (cost $287,270,225) | 186,973,345 | |||||
| Principal Amount | Long-Term Fixed Income (1.5%) | Value | ||||
| Asset-Backed Securities (0.2%) | ||||||
Residential Funding Mortgage Securities | ||||||
| 462,799 | 4.470%, 7/25/2018b | 422,318 | ||||
Total Asset-Backed Securities | 422,318 | |||||
| Collateralized Mortgage Obligations (1.2%) | ||||||
Commercial Mortgage Acceptance Corporation | ||||||
| 388,583 | 7.030%, 6/15/2031 | 387,149 | ||||
Countrywide Home Loans, Inc. | ||||||
| 413,601 | 5.528%, 3/20/2036 | 346,960 | ||||
| 364,810 | Deutsche Alt-A Securities Mortgage Loan Trust | 347,337 | ||||
Deutsche Alt-A Securities, Inc. | ||||||
| 389,748 | 5.888%, 6/25/2036 | 313,150 | ||||
Impac Secured Assets Corporation | ||||||
| 386,651 | 0.581%, 1/26/2009c | 357,137 | ||||
J.P. Morgan Alternative Loan Trust | ||||||
| 611,832 | 0.551%, 1/25/2009c | 572,410 | ||||
Total Collateralized Mortgage Obligations | 2,324,143 | |||||
| Commercial Mortgage-Backed Securities (0.1%) | ||||||
| 139,756 | Banc of America Commercial Mortgage, | 138,478 | ||||
Total Commercial Mortgage- Backed Securities | 138,478 | |||||
Total Long-Term Fixed Income (cost $2,966,794) | 2,884,939 | |||||
| Shares | Collateral Held for Securities Loaned (14.4%) | Value | ||||
| 28,447,323 | Thrivent Financial Securities Lending Trust | 28,447,323 | ||||
Total Collateral Held for Securities Loaned (cost $28,447,323) | 28,447,323 | |||||
| Shares | Short-Term Investments (3.2%) | Value | ||||
| 6,360,905 | Thrivent Money Market Portfolio | 6,360,905 | ||||
Total Short-Term Investments (at amortized cost) | 6,360,905 | |||||
Total Investments (cost $325,045,247) 113.8% | $ | 224,666,512 | ||||
Other Assets and Liabilities, Net (13.8%) | (27,246,805 | ) | ||||
Total Net Assets 100.0% | $ | 197,419,707 | ||||
| a | All or a portion of the security is on loan as discussed in item 2(M) of the Notes to Financial Statements. |
| b | All or a portion of the security is insured or guaranteed. |
| c | Denotes variable rate obligations for which the current yield and next scheduled reset date are shown. |
Definitions:
| REIT - | Real Estate Investment Trust, is a company that buys, develops, manages and/or sells real estate assets. |
| ETF - | Exchange Traded Fund. |
Gross unrealized appreciation and depreciation of investments, based on cost for federal income tax purposes, were as follows:
Gross unrealized appreciation | $ | 2,422,701 | ||
Gross unrealized depreciation | (103,307,253 | ) | ||
Net unrealized appreciation (depreciation) | $ | (100,884,552 | ) | |
Cost for federal income tax purposes | $ | 325,551,064 |
The following table is a summary of the inputs used, as of December 31, 2008, in valuing the Real Estate Securities Portfolio’s assets carried at fair value as discussed in item 2(A) of the Notes to Financial Statements.
Level | Investments in Securities | Other Financial Instruments* | ||||
Level 1 | $ | 221,781,573 | $ | — | ||
Level 2 | 2,884,939 | — | ||||
Level 3 | — | — | ||||
Totals (Level 1,2,3) | $ | 224,666,512 | $ | — | ||
| * | Other Financial Instruments include Futures, Forwards, Written Options and Swap agreements. |
The accompanying Notes to Financial Statements are an integral part of this schedule.
110
Table of Contents
Real Estate Securities Portfolio
Schedule of Investments as of December 31, 2008
Investment in Affiliates
Affiliated issuers, as defined under the Investment Company Act of 1940, include those in which the Portfolio’s holdings of an issuer represent 5% or more of the outstanding voting securities of an issuer, or any affiliated mutual fund.
A summary of transactions for the fiscal year to date, in Real Estate Securities Portfolio, is as follows:
Portfolio | Value December 31, 2007 | Gross Purchases and Additions | Gross Sales and Reductions | Balance of Shares Held at December 31, 2008 | Value December 31, 2008 | Income Earned January 1, 2008 - December 31, 2008 | |||||||||||
Money Market | $ | — | $ | 83,184,639 | $ | 76,823,734 | 6,360,905 | $ | 6,360,905 | $ | 258,695 | ||||||
Thrivent Financial Securities Lending Trust | 140,131,373 | 624,714,553 | 736,398,603 | 28,447,323 | 28,447,323 | 731,956 | |||||||||||
Total Value and Income Earned | 140,131,373 | 34,808,228 | 990,651 | ||||||||||||||
The accompanying Notes to Financial Statements are an integral part of this schedule.
111
Table of Contents
Schedule of Investments as of December 31, 2008
| Shares | Common Stock (96.4%) | Value | |||
| Consumer Discretionary (0.5%) | |||||
| 600 | Vivendi Universal SA | $ | 19,556 | ||
| Total Consumer Discretionary | 19,556 | ||||
| Electric Utilities (38.1%) | |||||
| 2,800 | AES Tiete SA | 17,830 | |||
| 2,400 | Allegheny Energy, Inc. | 81,264 | |||
| 2,300 | American Electric Power Company, Inc. | 76,544 | |||
| 5,500 | British Energy Group plc | 61,635 | |||
| 500 | CEZ | 21,271 | |||
| 1,900 | Companhia Energetica de Minas Gerais ADR | 26,106 | |||
| 600 | CP&L Energy, Inc. | 23,442 | |||
| 2,800 | DPL, Inc. | 63,952 | |||
| 8,000 | Duke Energy Corporation | 120,080 | |||
| 1,300 | E.ON AG | 51,047 | |||
| 1,000 | Edison International, Inc. | 32,120 | |||
| 1,100 | Energias do Brasil SA | 10,661 | |||
| 1,800 | Entergy Corporation | 149,634 | |||
| 2,800 | Exelon Corporation | 155,708 | |||
| 2,500 | FirstEnergy Corporation | 121,450 | |||
| 3,800 | FPL Group, Inc. | 191,254 | |||
| 2,100 | ITC Holdings Corporation | 91,728 | |||
| 1,600 | Northeast Utilities | 38,496 | |||
| 200 | Pepco Holdings, Inc. | 3,552 | |||
| 4,400 | PPL Corporation | 135,036 | |||
| 4,600 | Southern Company | 170,200 | |||
| 1,600 | Tractebel Energia SA | 12,727 | |||
| Total Electric Utilities | 1,655,737 | ||||
| Energy (5.9%) | |||||
| 200 | CONSOL Energy, Inc. | 5,716 | |||
| 600 | Devon Energy Corporation | 39,426 | |||
| 1,600 | El Paso Corporation | 12,528 | |||
| 500 | EOG Resources, Inc. | 33,290 | |||
| 945 | GDF Suez | 46,907 | |||
| 600 | Range Resources Corporation | 20,634 | |||
| 200 | RWE AG | 17,763 | |||
| 700 | Southwestern Energy Companya | 20,279 | |||
| 1,000 | Spectra Energy Corporation | 15,740 | |||
| 3,100 | Williams Companies, Inc. | 44,888 | |||
| Total Energy | 257,171 | ||||
| Gas Utilities (4.4%) | |||||
| 5,500 | Centrica plc | 21,175 | |||
| 1,600 | Equitable Resources, Inc. | 53,680 | |||
| 800 | New Jersey Resources Corporation | 31,480 | |||
| 2,100 | Questar Corporation | 68,649 | |||
| 700 | UGI Corporation | 17,094 | |||
| Total Gas Utilities | 192,078 | ||||
| Independent Power Producers & Energy Traders (5.8%) | |||||
| 700 | Constellation Energy Group, Inc. | 17,563 | |||
| 16,400 | Dynegy, Inc.a | 32,800 | |||
| 5,200 | International Power plc | 18,121 | |||
| 7,000 | NRG Energy, Inc.a | 163,310 | |||
| 700 | Ormat Technologies, Inc. | 22,309 | |||
| Total Independent Power Producers & Energy Traders | 254,103 | ||||
| Industrials (1.5%) | |||||
| 4,400 | Iberdrola SA | 41,015 | |||
| 1,100 | Quanta Services, Inc.a | 21,780 | |||
| Total Industrials | 62,795 | ||||
| Information Technology (0.4%) | |||||
| 300 | Itron, Inc.a | 19,122 | |||
| Total Information Technology | 19,122 | ||||
| Integrated Telecommunication Services (16.8%) | |||||
| 7,000 | AT&T, Inc. | 199,500 | |||
| 1,700 | Deutsche Telekom AG | 25,703 | |||
| 1,200 | France Telecom SA | 33,447 | |||
| 3,800 | Frontier Communications Corporation | 33,212 | |||
| 900 | Global Village Telecom Holding SAa | 9,791 | |||
| 2,100 | Koninklijke (Royal) KPN NV | 30,530 | |||
| 26,100 | Qwest Communications International, Inc. | 95,004 | |||
| 3,600 | Telefonica SA | 81,258 | |||
| 6,000 | Verizon Communications, Inc. | 203,400 | |||
| 2,100 | Windstream Corporation | 19,320 | |||
| Total Integrated Telecommunication Services | 731,165 | ||||
| Multi-Utilities (14.6%) | |||||
| 400 | Ameren Corporation | 13,304 | |||
| 6,800 | CMS Energy Corporation | 68,680 | |||
| 1,200 | Consolidated Edison, Inc. | 46,716 | |||
| 2,000 | Dominion Resources, Inc. | 71,680 | |||
| 400 | Electricite de France | 23,265 | |||
| 1,800 | National Grid plc | 17,787 | |||
| 900 | NSTAR | 32,841 | |||
| 2,600 | PG&E Corporation | 100,646 | |||
| 6,400 | Public Service Enterprise Group, Inc. | 186,688 | |||
| 700 | Sempra Energy | 29,841 | |||
| 1,000 | Wisconsin Energy Corporation | 41,980 | |||
| Total Multi-Utilities | 633,428 | ||||
| Water Utilities (2.9%) | |||||
| 100 | American States Water Company | 3,298 | |||
| 1,100 | American Water Works Company, Inc. | 22,968 | |||
| 1,600 | Aqua America, Inc. | 32,944 | |||
| 600 | California Water Service Group | 27,858 | |||
| 1,900 | Cia de Saneamento de Minas Gerais | 15,326 | |||
| 700 | Companhia de Saneamento Basico do Estado de Sao Paulo | 8,333 | |||
| 3,400 | Northumbrian Water Group plc | 11,638 | |||
| 250 | Suez Environnement SAa | 4,222 | |||
| 10 | Suez Lyonnaise des Eaux | 485 | |||
| Total Water Utilities | 127,072 | ||||
| Wireless Telecommunication Services (5.5%) | |||||
| 1,500 | America Movil SA de CV ADR | 46,485 | |||
| 1,100 | American Tower Corporationa | 32,252 | |||
| 900 | Manitoba Telecom Services, Inc. | 26,231 | |||
The accompanying Notes to Financial Statements are an integral part of this schedule.
112
Table of Contents
Partner Utilities Portfolio
Schedule of Investments as of December 31, 2008
| Shares | Common Stock (96.4%) | Value | ||||
| Wireless Telecommunication Services (5.5%) - continued | ||||||
| 900 | Rogers Communications, Inc. | $ | 27,072 | |||
| 1,900 | SBA Communications Corporationa | 31,008 | ||||
| 3,800 | Vodafone Group plc ADR | 77,672 | ||||
| Total Wireless Telecommunication Services | 240,720 | |||||
Total Common Stock (cost $5,316,967) | 4,192,947 | |||||
| Shares | Short-Term Investments (12.9%) | Value | ||||
| 562,032 | Thrivent Money Market Portfolio | 562,032 | ||||
| Total Short-Term Investments (at amortized cost) | 562,032 | |||||
| Total Investments (cost $5,878,999) 109.3% | $ | 4,754,979 | ||||
| Other Assets and Liabilities, Net (9.3%) | (402,928 | ) | ||||
| Total Net Assets 100.0% | $ | 4,352,051 | ||||
| a | Non-income producing security. |
Definitions:
| ADR - | American Depositary Receipt, which are certificates for an underlying foreign security’s shares held by an issuing U.S. depository bank. |
Gross unrealized appreciation and depreciation of investments, based on cost for federal income tax purposes, were as follows:
Gross unrealized appreciation | $ | 53,666 | ||
Gross unrealized depreciation | (1,207,768 | ) | ||
Net unrealized appreciation (depreciation) | $ | (1,154,102 | ) | |
Cost for federal income tax purposes | $ | 5,909,081 |
The following table is a summary of the inputs used, as of December 31, 2008, in valuing the Partner Utilities Portfolio’s assets carried at fair value as discussed in item 2(A) of the Notes to Financial Statements.
Level | Investments in Securities | Other Financial Instruments* | ||||
Level 1 | $ | 4,228,154 | ($55 | ) | ||
Level 2 | 526,825 | — | ||||
Level 3 | — | — | ||||
Totals (Level 1,2,3) | $ | 4,754,979 | ($55 | ) | ||
| * | Other Financial Instruments include Futures, Forwards, Written Options and Swap agreements. |
The accompanying Notes to Financial Statements are an integral part of this schedule.
113
Table of Contents
Partner Utilities Portfolio
Schedule of Investments as of December 31, 2008
Foreign Currency Forward Contracts | Contracts to Deliver/Receive | Settlement Date | Value on Settlement Date | Value | Unrealized Gain/(Loss) | |||||||||
Purchases | ||||||||||||||
Brazilian Real | 19,180 | 1/2/2009 - 1/6/2009 | $ | 8,041 | $ | 8,225 | $ | 184 | ||||||
British Pound | 3,727 | 1/2/2009 - 1/6/2009 | 5,408 | 5,358 | (50 | ) | ||||||||
EURO | 17,742 | 1/2/2009 - 1/6/2009 | 24,851 | 24,662 | (189 | ) | ||||||||
| Total Foreign Currency Forward Contracts Purchases | $ | 38,300 | $ | 38,245 | ($55 | ) | ||||||||
Net Unrealized Gain/(Loss) on Foreign Currency Forward Contracts | ($55 | ) | ||||||||||||
Investment in Affiliates
Affiliated issuers, as defined under the Investment Company Act of 1940, include those in which the Portfolio’s holdings of an issuer represent 5% or more of the outstanding voting securities of an issuer, or any affiliated mutual fund.
A summary of transactions for the fiscal year to date, in Partner Utilities Portfolio, is as follows:
Portfolio | Value April 30, 2008† | Gross Purchases and Additions | Gross Sales and Reductions | Balance of Shares Held at December 31, 2008 | Value December 31, 2008 | Income Earned April 30, 2008 - December 31, 2008 | |||||||||||
Money Market | $ | — | $ | 2,454,343 | $ | 1,892,311 | 562,032 | $ | 562,032 | $ | 4,125 | ||||||
Total Value and Income Earned | — | 562,032 | 4,125 | ||||||||||||||
| † | Partner Utilities Portfolio was incepted on 4/30/2008. |
The accompanying Notes to Financial Statements are an integral part of this schedule.
114
Table of Contents
Partner Small Cap Growth Portfolio
Schedule of Investments as of December 31, 2008
| Shares | Common Stock (93.4%) | Value | |||
| Consumer Discretionary (11.7%) | |||||
| 25,480 | Aeropostale, Inc.a | $ | 410,228 | ||
| 32,510 | Buckle, Inc.b | 709,368 | |||
| 20,820 | Capella Education Companya | 1,223,383 | |||
| 93,890 | Centex Corporation | 998,990 | |||
| 57,470 | Collective Brands, Inc.a | 673,548 | |||
| 77,020 | D.R. Horton, Inc. | 544,531 | |||
| 19,980 | Deckers Outdoor Corporationa,b | 1,595,803 | |||
| 75,840 | Hibbett Sports, Inc.a | 1,191,446 | |||
| 78,710 | Interactive Data Corporation | 1,940,989 | |||
| 28,680 | Scientific Games Corporationa | 503,047 | |||
| 89,710 | Texas Roadhouse, Inc.a | 695,253 | |||
| 41,740 | True Religion Apparel, Inc.a | 519,246 | |||
| 80,130 | WMS Industries, Inc.a | 2,155,497 | |||
| Total Consumer Discretionary | 13,161,329 | ||||
| Consumer Staples (2.1%) | |||||
| 25,130 | Flowers Foods, Inc. | 612,167 | |||
| 33,290 | Green Mountain Coffee Roasters, Inc.a,b | 1,288,323 | |||
| 23,750 | United Natural Foods, Inc.a | 423,225 | |||
| Total Consumer Staples | 2,323,715 | ||||
| Energy (5.0%) | |||||
| 41,460 | Arena Resources, Inc.a | 1,164,611 | |||
| 16,760 | Carbo Ceramics, Inc. | 595,483 | |||
| 27,980 | Carrizo Oil & Gas, Inc.a | 450,478 | |||
| 39,970 | Complete Production Services, Inc.a | 325,755 | |||
| 39,780 | Concho Resources, Inc.a | 907,780 | |||
| 22,960 | Core Laboratories NVb | 1,374,386 | |||
| 27,260 | Goodrich Petroleum Corporationa,b | 816,437 | |||
| Total Energy | 5,634,930 | ||||
| Financials (4.7%) | |||||
| 52,340 | Dime Community Bancshares | 696,122 | |||
| 22,710 | Eaton Vance Corporation | 477,137 | |||
| 14,410 | Greenhill & Company, Inc.b | 1,005,386 | |||
| 22,470 | Home Properties, Inc.b | 912,282 | |||
| 31,930 | PrivateBancorp, Inc.b | 1,036,448 | |||
| 12,960 | Stifel Financial Corporationa | 594,216 | |||
| 14,020 | Tanger Factory Outlet Centers, Inc.b | 527,432 | |||
| Total Financials | 5,249,023 | ||||
| Health Care (24.8%) | |||||
| 37,890 | Acorda Therapeutics, Inc.a | 777,124 | |||
| 39,230 | Alexion Pharmaceuticals, Inc.a | 1,419,734 | |||
| 51,090 | Amedisys, Inc.a,b | 2,112,061 | |||
| 29,840 | Auxilium Pharmaceuticals, Inc.a | 848,650 | |||
| 15,440 | Chemed Corporation | 614,049 | |||
| 19,510 | Cougar Biotechnology, Inc.a,b | 507,260 | |||
| 68,080 | Eclipsys Corporationa | 966,055 | |||
| 50,690 | Endo Pharmaceutical Holdings, Inc.a | 1,311,857 | |||
| 35,110 | Haemonetics Corporationa | 1,983,715 | |||
| 54,320 | ICON plc ADRa | 1,069,561 | |||
| 19,580 | Immucor, Inc.a | 520,436 | |||
| 21,780 | Myriad Genetics, Inc.a | 1,443,143 | |||
| 43,310 | NuVasive, Inc.a,b | 1,500,691 | |||
| 33,150 | Onyx Pharmaceuticals, Inc.a | 1,132,404 | |||
| 30,120 | OSI Pharmaceuticals, Inc.a | 1,176,186 | |||
| 11,750 | Owens & Minor, Inc. | 442,387 | |||
| 85,780 | PAREXEL International Corporationa | 832,924 | |||
| 20,400 | Perrigo Companyb | 659,124 | |||
| 42,780 | Psychiatric Solutions, Inc.a,b | 1,191,423 | |||
| 64,010 | Thoratec Corporationa | 2,079,685 | |||
| 18,200 | United Therapeutics Corporationa | 1,138,410 | |||
| 36,640 | West Pharmaceutical Services, Inc.b | 1,383,893 | |||
| 88,810 | Wright Medical Group, Inc.a,b | 1,814,388 | |||
| 37,560 | Xenoport, Inc.a | 942,005 | |||
| Total Health Care | 27,867,165 | ||||
| Industrials (17.3%) | |||||
| 42,210 | Aecom Technology Corporationa | 1,297,113 | |||
| 14,130 | Clean Harbors, Inc.a | 896,407 | |||
| 36,870 | Diana Shipping, Inc. | 470,461 | |||
| 21,330 | ESCO Technologies, Inc.a | 873,464 | |||
| 30,980 | Genesee & Wyoming, Inc.a | 944,890 | |||
| 34,080 | Huron Consulting Group, Inc.a | 1,951,762 | |||
| 124,160 | Kforce, Inc.a | 953,549 | |||
| 33,180 | Landstar System, Inc. | 1,275,107 | |||
| 83,450 | Mobile Mini, Inc.a,b | 1,203,349 | |||
| 51,030 | Navigant Consulting, Inc.a,b | 809,846 | |||
| 44,470 | Orbital Sciences Corporationa,b | 868,499 | |||
| 35,750 | RBC Bearings, Inc.a | 725,010 | |||
| 23,480 | Teledyne Technologies, Inc.a | 1,046,034 | |||
| 47,540 | Tetra Tech, Inc.a | 1,148,091 | |||
| 34,440 | UAL Corporation | 379,529 | |||
| 13,270 | Valmont Industries, Inc. | 814,247 | |||
| 37,020 | Wabtec Corporation | 1,471,545 | |||
| 33,180 | Waste Connections, Inc.a | 1,047,493 | |||
| 14,700 | Watsco, Inc.b | 564,480 | |||
| 16,100 | Watson Wyatt Worldwide, Inc. | 769,902 | |||
| Total Industrials | 19,510,778 | ||||
| Information Technology (22.3%) | |||||
| 82,680 | Ariba, Inc.a,b | 596,123 | |||
| 85,340 | AsiaInfo Holdings, Inc.a | 1,010,426 | |||
| 81,010 | Atheros Communications, Inc.a | 1,159,253 | |||
| 67,050 | Cavium Networks, Inc.a,b | 704,695 | |||
| 68,500 | Comscore, Inc.a | 873,375 | |||
| 11,820 | Comtech Telecommunications Corporationa | 541,592 | |||
| 42,150 | Concur Technologies, Inc.a | 1,383,363 | |||
| 39,700 | F5 Networks, Inc.a | 907,542 | |||
| 84,410 | Fairchild Semiconductor International, Inc.a | 412,765 | |||
| 62,269 | Gartner, Inc.a | 1,110,256 | |||
| 79,320 | Interwoven, Inc.a | 999,432 | |||
| 14,500 | Itron, Inc.a | 924,230 | |||
| 50,970 | Microsemi Corporationa | 644,261 | |||
| 45,460 | Net 1 UEPS Technology, Inc.a | 622,802 | |||
| 109,640 | Novellus Systems, Inc.a | 1,352,958 | |||
| 99,690 | Omniture, Inc.a,b | 1,060,702 | |||
| 76,610 | Plexus Corporationa | 1,298,539 | |||
| 253,890 | PMC-Sierra, Inc.a | 1,233,905 | |||
| 71,160 | Polycom, Inc.a | 961,372 | |||
| 38,570 | Semtech Corporationa | 434,684 | |||
| 51,724 | Sybase, Inc.a | 1,281,203 | |||
| 26,050 | Synaptics, Inc.a,b | 431,388 | |||
| 55,570 | TiVo, Inc.a | 397,881 | |||
| 42,260 | Ultratech, Inc.a | 505,430 | |||
The accompanying Notes to Financial Statements are an integral part of this schedule.
115
Table of Contents
Partner Small Cap Growth Portfolio
Schedule of Investments as of December 31, 2008
Shares | Common Stock (93.4%) | Value | ||||
| Information Technology (22.3%) - continued | ||||||
| 50,090 | Varian Semiconductor Equipment Associates, Inc.a | $ | 907,631 | |||
| 43,480 | Verigy, Ltd.a | 418,278 | ||||
| 53,050 | VistaPrint, Ltd.a,b | 987,260 | ||||
| 60,940 | Vocus, Inc.a,b | 1,109,717 | ||||
| 54,350 | Websense, Inc.a | 813,620 | ||||
| Total Information Technology | 25,084,683 | |||||
| Materials (3.0%) | ||||||
| 12,170 | Compass Minerals International, Inc. | 713,892 | ||||
| 20,830 | Greif, Inc. | 696,347 | ||||
| 33,650 | Koppers Holdings, Inc. | 727,513 | ||||
| 40,630 | Olin Corporation | 734,590 | ||||
| 12,640 | Schnitzer Steel Industries, Inc. | 475,896 | ||||
| Total Materials | 3,348,238 | |||||
| Telecommunications Services (1.1%) | ||||||
| 28,250 | Leap Wireless International, Inc.a,b | 759,642 | ||||
| 18,350 | NTELOS Holdings Corporation | 452,511 | ||||
| Total Telecommunications Services | 1,212,153 | |||||
| Utilities (1.4%) | ||||||
| 37,040 | ITC Holdings Corporationb | 1,617,907 | ||||
| Total Utilities | 1,617,907 | |||||
| Total Common Stock (cost $125,685,799) | 105,009,921 | |||||
Shares | Collateral Held for Securities Loaned (17.1%) | Value | ||||
| 19,195,880 | Thrivent Financial Securities Lending Trust | 19,195,880 | ||||
| Total Collateral Held for Securities Loaned (cost $19,195,880) | 19,195,880 | |||||
| Shares or Principal Amount | Short-Term Investments (6.4%)c | Value | ||||
Federal National Mortgage Association Discount Notes | ||||||
| 700,000 | 0.400%, 5/14/2009d | 698,972 | ||||
| 6,507,240 | Thrivent Money Market Portfolio | 6,507,240 | ||||
| Total Short-Term Investments (at amortized cost) | 7,206,212 | |||||
Total Investments (cost $152,087,891) 116.9% | $ | 131,412,013 | ||||
| Other Assets and Liabilities, Net (16.9%) | (18,951,091 | ) | ||||
| Total Net Assets 100.0% | $ | 112,460,922 | ||||
| a | Non-income producing security. |
| b | All or a portion of the security is on loan as discussed in item 2(M) of the Notes to Financial Statements. |
| c | The interest rate shown reflects the yield, coupon rate or, for securities purchased at a discount, the discount rate at the date of purchase. |
| d | At December 31, 2008, $698,972 of investments were held on deposit with the counterparty and pledged as the initial margin deposit for open financial futures contracts. |
Definitions:
| ADR - | American Depositary Receipt, which are certificates for an underlying foreign security’s shares held by an issuing U.S. depository bank. |
Gross unrealized appreciation and depreciation of investments, based on cost for federal income tax purposes, were as follows:
Gross unrealized appreciation | $ | 3,301,065 | ||
Gross unrealized depreciation | (26,029,562 | ) | ||
Net unrealized appreciation (depreciation) | $ | (22,728,497 | ) | |
Cost for federal income tax purposes | $ | 154,140,510 |
The following table is a summary of the inputs used, as of December 31, 2008, in valuing the Partner Small Cap Growth Portfolio’s assets carried at fair value as discussed in item 2(A) of the Notes to Financial Statements.
Level | Investments in Securities | Other Financial Instruments* | ||||
Level 1 | $ | 130,713,041 | $ | 541,568 | ||
Level 2 | 698,972 | — | ||||
Level 3 | — | — | ||||
Totals (Level 1,2,3) | $ | 131,412,013 | $ | 541,568 | ||
| * | Other Financial Instruments include Futures, Forwards, Written Options and Swap agreements. |
The accompanying Notes to Financial Statements are an integral part of this schedule.
116
Table of Contents
Partner Small Cap Growth Portfolio
Schedule of Investments as of December 31, 2008
Futures | Number of Contracts Long/ (Short) | Expiration Date | Notional Principal Amount | Value | Unrealized Gain/ (Loss) | ||||||||
Russell 2000 Index Mini-Futures | 114 | March 2009 | $ | 5,134,493 | $ | 5,676,061 | $ | 541,568 | |||||
Total Futures | $ | 541,568 | |||||||||||
Investment in Affiliates
Affiliated issuers, as defined under the Investment Company Act of 1940, include those in which the Portfolio’s holdings of an issuer represent 5% or more of the outstanding voting securities of an issuer, or any affiliated mutual fund.
A summary of transactions for the fiscal year to date, in Partner Small Cap Growth Portfolio, is as follows:
Portfolio | Value December 31, 2007 | Gross Purchases and Additions | Gross Sales and Reductions | Balance of Shares Held at December 31, 2008 | Value December 31, 2008 | Income Earned January 1, 2008 - December 31, 2008 | |||||||||||
Money Market | $ | 2,133,198 | $ | 102,785,637 | $ | 98,411,595 | 6,507,240 | $ | 6,507,240 | $ | 172,005 | ||||||
Thrivent Financial Securities Lending Trust | 71,604,282 | 185,885,789 | 238,294,191 | 19,195,880 | 19,195,880 | 688,096 | |||||||||||
Total Value and Income | 73,737,480 | 25,703,120 | 860,101 | ||||||||||||||
The accompanying Notes to Financial Statements are an integral part of this schedule.
117
Table of Contents
Partner Small Cap Value Portfolio
Schedule of Investments as of December 31, 2008
| Shares | Common Stock (97.1%) | Value | |||
| Consumer Discretionary (12.6%) | |||||
| 153,300 | Aaron Rents, Inc. | $ | 4,080,846 | ||
| 49,700 | Cavco Industries, Inc.a | 1,336,433 | |||
| 73,000 | Corinthian Colleges, Inc.a | 1,195,010 | |||
| 39,000 | Courier Corporation | 698,100 | |||
| 45,400 | CSS Industries, Inc. | 805,396 | |||
| 76,500 | Dixie Group, Inc.a | 117,045 | |||
| 60,400 | Dorman Products, Inc.a | 797,280 | |||
| 95,200 | Drew Industries, Inc.a,b | 1,142,400 | |||
| 68,000 | Fred’s, Inc. | 731,680 | |||
| 80,000 | Haverty Furniture Companies, Inc.b | 746,400 | |||
| 49,600 | M/I Homes, Inc.b | 522,784 | |||
| 65,000 | MarineMax, Inc.a,b | 220,350 | |||
| 40,000 | Matthews International Corporation | 1,467,200 | |||
| 80,000 | Men’s Wearhouse, Inc.b | 1,083,200 | |||
| 80,000 | Meritage Homes Corporationa,b | 973,600 | |||
| 103,000 | Orient Express Hotels, Ltd.b | 788,980 | |||
| 69,200 | Pool Corporationb | 1,243,524 | |||
| 72,100 | Saga Communications, Inc.a | 118,965 | |||
| 141,000 | Shiloh Industries, Inc. | 423,000 | |||
| 51,200 | Stanley Furniture Company, Inc.b | 405,504 | |||
| 68,000 | Steak n Shake Companya,b | 404,600 | |||
| 154,500 | Stein Mart, Inc.a,b | 174,585 | |||
| 47,900 | Steven Madden, Ltd.a | 1,021,228 | |||
| 108,000 | Winnebago Industries, Inc.b | 651,240 | |||
Total Consumer Discretionary | 21,149,350 | ||||
| Consumer Staples (2.2%) | |||||
| 260,000 | Alliance One International, Inc.a | 764,400 | |||
| 45,300 | Casey’s General Stores, Inc. | 1,031,481 | |||
| 42,000 | Nash Finch Company | 1,885,380 | |||
Total Consumer Staples | 3,681,261 | ||||
| Energy (4.0%) | |||||
| 13,300 | Atwood Oceanics, Inc.a | 203,224 | |||
| 45,400 | Carbo Ceramics, Inc. | 1,613,062 | |||
| 65,900 | Hercules Offshore, Inc.a,b | 313,025 | |||
| 195,000 | Mariner Energy, Inc.a | 1,989,000 | |||
| 175,000 | NGAS Resources, Inc.a,b | 287,000 | |||
| 57,300 | TETRA Technologies, Inc.a | 278,478 | |||
| 61,000 | Whiting Petroleum Corporationa | 2,041,060 | |||
Total Energy | 6,724,849 | ||||
| Financials (19.8%) | |||||
| 190,000 | Ares Capital Corporationb | 1,202,700 | |||
| 66,000 | Cascade Bancorpb | 445,500 | |||
| 131,500 | Cedar Shopping Centers, Inc. | 931,020 | |||
| 125,605 | East West Bancorp, Inc.b | 2,005,912 | |||
| 37,000 | Employers Holdings, Inc. | 610,500 | |||
| 120,000 | First Opportunity Fund, Inc. | 610,800 | |||
| 89,200 | Glacier Bancorp, Inc. | 1,696,584 | |||
| 71,000 | Gladstone Capital Corporationb | 574,390 | |||
| 69,300 | Hatteras Financial Corporation | 1,843,380 | |||
| 119,000 | Hercules Technology Growth Capital, Inc.b | 942,480 | |||
| 61,800 | Home Bancshares, Inc.b | 1,665,510 | |||
| 20,000 | iShares Russell 2000 Value Fund | 983,400 | |||
| 58,200 | JMP Group, Inc.b | 323,010 | |||
| 115,000 | Kite Realty Group Trust | 639,400 | |||
| 61,000 | LaSalle Hotel Propertiesb | 674,050 | |||
| 4,050 | Markel Corporationa | 1,210,950 | |||
| 93,500 | Max Re Capital, Ltd. | 1,654,950 | |||
| 95,700 | Meadowbrook Insurance Group, Inc. | 616,308 | |||
| 58,300 | National Interstate Corporationb | 1,041,821 | |||
| 36,000 | Parkway Properties, Inc. | 648,000 | |||
| 158,800 | PennantPark Investment Corporation | 573,268 | |||
| 36,000 | Piper Jaffray Companiesa | 1,431,360 | |||
| 61,500 | Potlatch Corporation | 1,599,615 | |||
| 75,500 | ProAssurance Corporationa | 3,984,890 | |||
| 47,000 | Provident Bankshares Corporationb | 454,020 | |||
| 37,000 | Redwood Trust, Inc.b | 551,670 | |||
| 53,000 | Sandy Spring Bancorp, Inc. | 1,156,990 | |||
| 54,000 | Seabright Insurance Holdingsa | 633,960 | |||
| 120,000 | Strategic Hotel Capital, Inc.b | 201,600 | |||
| 48,500 | SVB Financial Groupa,b | 1,272,155 | |||
| 51,500 | Wintrust Financial Corporation | 1,059,355 | |||
Total Financials | 33,239,548 | ||||
| Health Care (6.5%) | |||||
| 18,500 | Analogic Corporation | 504,680 | |||
| 42,200 | Angiodynamics, Inc.a | 577,718 | |||
| 7,000 | Atrion Corporation | 679,700 | |||
| 402,000 | Lexicon Pharmaceuticals, Inc.a,b | 562,800 | |||
| 103,000 | Momenta Pharmaceuticals, Inc.a,b | 1,194,800 | |||
| 33,500 | National Healthcare Corporationb | 1,696,440 | |||
| 81,100 | Owens & Minor, Inc. | 3,053,415 | |||
| 68,200 | Triple-S Management Corporationa,b | 784,300 | |||
| 50,800 | West Pharmaceutical Services, Inc.b | 1,918,716 | |||
Total Health Care | 10,972,569 | ||||
| Industrials (25.1%) | |||||
| 27,000 | A.O. Smith Corporation | 797,040 | |||
| 129,700 | Accuride Corporationa | 29,831 | |||
| 83,000 | Alaska Air Group, Inc.a | 2,427,750 | |||
| 29,000 | Ameron International Corporation | 1,824,680 | |||
| 52,900 | Applied Industrial Technologies, Inc. | 1,000,868 | |||
| 33,500 | Astec Industries, Inc.a | 1,049,555 | |||
| 155,000 | Beacon Roofing Supply, Inc.a,b | 2,151,400 | |||
| 55,700 | Belden, Inc.b | 1,163,016 | |||
| 72,000 | C&D Technologies, Inc.a,b | 225,360 | |||
| 32,000 | Cascade Corporation | 955,520 | |||
| 47,000 | Circor International, Inc. | 1,292,500 | |||
| 93,700 | Comfort Systems USA, Inc. | 993,220 | |||
| 66,800 | Dollar Thrifty Automotive Group, Inc.a,b | 72,812 | |||
| 99,600 | Electro Rent Corporation | 1,111,536 | |||
| 16,200 | Franklin Electric Company, Inc.b | 455,382 | |||
| 22,900 | FTI Consulting, Inc.a | 1,023,172 | |||
| 59,000 | G & K Services, Inc. | 1,192,980 | |||
| 65,600 | Genesee & Wyoming, Inc.a | 2,000,800 | |||
| 83,800 | Gibraltar Industries, Inc. | 1,000,572 | |||
| 48,500 | Greenbrier Companies, Inc.b | 333,195 | |||
| 64,000 | Hub Group, Inc.a | 1,697,920 | |||
| 60,500 | IDEX Corporation | 1,461,075 | |||
| 85,000 | Insituform Technologies, Inc.a | 1,673,650 | |||
| 40,800 | Kaman Corporation | 739,704 | |||
| 190,000 | Kforce, Inc.a | 1,459,200 | |||
The accompanying Notes to Financial Statements are an integral part of this schedule.
118
Table of Contents
Partner Small Cap Value Portfolio
Schedule of Investments as of December 31, 2008
| Shares | Common Stock (97.1%) | Value | ||||
| Industrials (25.1%) - continued | ||||||
| 66,500 | Kirby Corporationa | $ | 1,819,440 | |||
| 89,000 | McGrath Rentcorp | 1,901,040 | ||||
| 58,900 | Navigant Consulting, Inc.a | 934,743 | ||||
| 52,000 | Nordson Corporationb | 1,679,080 | ||||
| 25,913 | School Specialty, Inc.a,b | 495,456 | ||||
| 78,000 | Sterling Construction Company, Inc.a | 1,446,120 | ||||
| 49,000 | Universal Forest Products, Inc. | 1,318,590 | ||||
| 147,500 | Vitran Corporation, Inc.a | 914,500 | ||||
| 52,500 | Waste Connections, Inc.a | 1,657,425 | ||||
| 81,000 | Woodward Governor Company | 1,864,620 | ||||
Total Industrials | 42,163,752 | |||||
| Information Technology (10.4%) | ||||||
| 202,900 | Acme Packet, Inc.a,b | 1,067,254 | ||||
| 130,000 | Advanced Energy Industries, Inc.a | 1,293,500 | ||||
| 121,100 | Ariba, Inc.a,b | 873,131 | ||||
| 37,000 | ATMI, Inc.a | 570,910 | ||||
| 101,500 | Brooks Automation, Inc.a | 589,715 | ||||
| 28,000 | Cabot Microelectronics Corporationa | 729,960 | ||||
| 68,000 | Catapult Communications Corporationa | 446,760 | ||||
| 53,000 | Cymer, Inc.a | 1,161,230 | ||||
| 163,000 | GSI Group, Inc.a | 93,269 | ||||
| 45,000 | Littelfuse, Inc.a | 747,000 | ||||
| 77,000 | Methode Electronics, Inc. | 518,980 | ||||
| 205,400 | MPS Group, Inc.a | 1,546,662 | ||||
| 131,000 | Palm, Inc.a,b | 402,170 | ||||
| 91,000 | Progress Software Corporationa | 1,752,660 | ||||
| 760,000 | Safeguard Scientifics, Inc.a | 524,400 | ||||
| 67,100 | SPSS, Inc.a | 1,809,016 | ||||
| 38,000 | Standard Microsystems Corporationa | 620,920 | ||||
| 80,400 | StarTek, Inc.a | 357,780 | ||||
| 92,300 | Symyx Technologies, Inc.a | 548,262 | ||||
| 69,000 | Synnex Corporationa,b | 781,770 | ||||
| 84,000 | Vignette Corporationa | 790,440 | ||||
| 53,300 | Xyratex, Ltd.a | 157,235 | ||||
| 403,900 | Zarlink Semiconductor, Inc.a,b | 98,753 | ||||
Total Information Technology | 17,481,777 | |||||
| Materials (9.2%) | ||||||
| 45,400 | Airgas, Inc. | 1,770,146 | ||||
| 66,000 | AMCOL International Corporationb | 1,382,700 | ||||
| 99,400 | American Vanguard Corporationb | 1,162,980 | ||||
| 81,800 | AptarGroup, Inc. | 2,882,632 | ||||
| 62,500 | Arch Chemicals, Inc. | 1,629,375 | ||||
| 61,000 | Carpenter Technology Corporation | 1,252,940 | ||||
| 26,471 | Clearwater Paper Corporationa,b | 222,092 | ||||
| 13,800 | Deltic Timber Corporation | 631,350 | ||||
| 57,900 | Innospec, Inc. | 341,031 | ||||
| 25,400 | Minerals Technologies, Inc. | 1,038,860 | ||||
| 143,000 | Myers Industries, Inc.b | 1,144,000 | ||||
| 170,000 | Wausau Paper Corporation | 1,944,800 | ||||
Total Materials | 15,402,906 | |||||
| Telecommunications Services (0.9%) | ||||||
| 395,000 | Kratos Defense & Security Solutions, Inc.a | 553,000 | ||||
| 120,000 | Premiere Global Services, Inc.a | 1,033,200 | ||||
Total Telecommunications Services | 1,586,200 | |||||
| Utilities (6.4%) | ||||||
| 76,000 | Black Hills Corporation | 2,048,960 | ||||
| 108,500 | Cleco Corporationb | 2,477,055 | ||||
| 66,300 | El Paso Electric Companya | 1,199,367 | ||||
| 43,000 | Empire District Electric Companyb | 756,800 | ||||
| 67,200 | Southwest Gas Corporation | 1,694,784 | ||||
| 43,000 | UniSource Energy Corporation | 1,262,480 | ||||
| 49,000 | Vectren Corporation | 1,225,490 | ||||
Total Utilities | 10,664,936 | |||||
Total Common Stock (cost $221,074,965) | 163,067,148 | |||||
| Shares | Preferred Stock (1.0%) | Value | ||||
| Financials (0.5%) | ||||||
| 820 | East West Bancorp, Inc. | 883,550 | ||||
Total Financials | 883,550 | |||||
| Health Care (0.5%) | ||||||
| 55,300 | National Healthcare Corporation, Convertible | 726,089 | ||||
Total Health Care | 726,089 | |||||
Total Preferred Stock (cost $1,560,341) | 1,609,639 | |||||
| Shares | Collateral Held for Securities Loaned (16.0%) | Value | ||||
| 26,942,036 | Thrivent Financial Securities Lending Trust | 26,942,036 | ||||
Total Collateral Held for Securities Loaned (cost $26,942,036) | 26,942,036 | |||||
| Shares | Short-Term Investments (1.7%) | Value | ||||
| 2,927,734 | Thrivent Money Market Portfolio | 2,927,734 | ||||
Total Short-Term Investments (at amortized cost) | 2,927,734 | |||||
Total Investments (cost $252,505,076) 115.8% | $ | 194,546,557 | ||||
Other Assets and Liabilities, Net (15.8%) | (26,615,757 | ) | ||||
Total Net Assets 100.0% | $ | 167,930,800 | ||||
| a | Non-income producing security. |
| b | All or a portion of the security is on loan as discussed in item 2(M) of the Notes to Financial Statements. |
The accompanying Notes to Financial Statements are an integral part of this schedule.
119
Table of Contents
Partner Small Cap Value Portfolio
Schedule of Investments as of December 31, 2008
Gross unrealized appreciation and depreciation of investments, based on cost for federal income tax purposes, were as follows:
Gross unrealized appreciation | $ | 10,442,616 | ||
Gross unrealized depreciation | (69,255,481 | ) | ||
Net unrealized appreciation (depreciation) | $ | (58,812,865 | ) | |
Cost for federal income tax purposes | $ | 253,359,422 |
The following table is a summary of the inputs used, as of December 31, 2008, in valuing the Partner Small Cap Value Portfolio’s assets carried at fair value as discussed in item 2(A) of the Notes to Financial Statements.
Level | Investments in Securities | Other Financial Instruments* | ||||
Level 1 | $ | 193,663,007 | $ | — | ||
Level 2 | 883,550 | — | ||||
Level 3 | — | — | ||||
Totals (Level 1,2,3) | $ | 194,546,557 | $ | — | ||
| * | Other Financial Instruments include Futures, Forwards, Written Options and Swap agreements. |
Investment in Affiliates
Affiliated issuers, as defined under the Investment Company Act of 1940, include those in which the Portfolio’s holdings of an issuer represent 5% or more of the outstanding voting securities of an issuer, or any affiliated mutual fund.
A summary of transactions for the fiscal year to date, in Partner Small Cap Value Portfolio, is as follows:
Portfolio | Value December 31, 2007 | Gross Purchases and Additions | Gross Sales and Reductions | Balance of Shares Held at December 31, 2008 | Value December 31, 2008 | Income Earned January 1, 2008 - December 31, 2008 | |||||||||||
Money Market | $ | 6,994,893 | $ | 45,374,989 | $ | 49,442,148 | 2,927,734 | $ | 2,927,734 | $ | 200,603 | ||||||
Thrivent Financial Securities Lending Trust | 59,125,971 | 196,692,296 | 228,876,231 | 26,942,036 | 26,942,036 | 584,582 | |||||||||||
Total Value and Income Earned | 66,120,864 | 29,869,770 | 785,185 | ||||||||||||||
The accompanying Notes to Financial Statements are an integral part of this schedule.
120
Table of Contents
Schedule of Investments as of December 31, 2008
| Shares | Common Stock (97.1%) | Value | |||
| Consumer Discretionary (14.5%) | |||||
| 52,700 | 99 Cents Only Storesa | $ | 576,011 | ||
| 64,600 | Aaron Rents, Inc. | 1,719,652 | |||
| 18,700 | American Public Education, Inc.a | 695,453 | |||
| 15,100 | Apollo Group, Inc.a | 1,156,962 | |||
| 232,800 | ArvinMeritor, Inc.b | 663,480 | |||
| 62,600 | Bally Technologies, Inc.a | 1,504,278 | |||
| 38,400 | BorgWarner, Inc. | 835,968 | |||
| 41,800 | Burger King Holdings, Inc. | 998,184 | |||
| 68,900 | Career Education Corporationa | 1,236,066 | |||
| 77,500 | Carter’s, Inc.a | 1,492,650 | |||
| 52,500 | CEC Entertainment, Inc.a | 1,273,125 | |||
| 7,200 | Deckers Outdoor Corporationa,b | 575,064 | |||
| 39,400 | Dollar Tree, Inc.a | 1,646,920 | |||
| 12,900 | Family Dollar Stores, Inc. | 336,303 | |||
| 74,500 | Fred’s, Inc. | 801,620 | |||
| 115,200 | Gentex Corporation | 1,017,216 | |||
| 184,800 | Hot Topic, Inc.a | 1,713,096 | |||
| 67,800 | Interactive Data Corporation | 1,671,948 | |||
| 75,200 | Jack in the Box, Inc.a | 1,661,168 | |||
| 98,100 | Lennar Corporation | 850,527 | |||
| 58,200 | Meritage Homes Corporationa,b | 708,294 | |||
| 56,100 | Monro Muffler Brake, Inc. | 1,430,550 | |||
| 43,500 | O’Reilly Automotive, Inc.a | 1,337,190 | |||
| 31,400 | Panera Bread Companya,b | 1,640,336 | |||
| 37,300 | Penn National Gaming, Inc.a | 797,474 | |||
| 46,200 | PetMed Express, Inc.a | 814,506 | |||
| 19,800 | Priceline.com, Inc.a | 1,458,270 | |||
| 121,000 | Pulte Homes, Inc. | 1,322,530 | |||
| 52,600 | Red Robin Gourmet Burgers, Inc.a | 885,258 | |||
| 39,500 | Ross Stores, Inc. | 1,174,335 | |||
| 299,200 | Shuffle Master, Inc.a,b | 1,484,032 | |||
| 16,200 | Steiner Leisure, Ltd.a | 478,224 | |||
| 3,300 | Strayer Education, Inc. | 707,553 | |||
| 75,400 | Toll Brothers, Inc.a | 1,615,822 | |||
| 25,700 | Tractor Supply Companya | 928,798 | |||
| 19,400 | Tupperware Corporation | 440,380 | |||
| 77,400 | WMS Industries, Inc.a | 2,082,060 | |||
Total Consumer Discretionary | 41,731,303 | ||||
| Consumer Staples (2.7%) | |||||
| 32,842 | Calavo Growers, Inc.b | 377,683 | |||
| 6,000 | Chattem, Inc.a,b | 429,180 | |||
| 27,700 | Diamond Foods, Inc. | 558,155 | |||
| 41,000 | Fresh Del Monte Produce, Inc.a | 919,220 | |||
| 37,000 | Green Mountain Coffee Roasters, Inc.a,b | 1,431,900 | |||
| 24,600 | J.M. Smucker Company | 1,066,656 | |||
| 31,300 | Nash Finch Company | 1,405,057 | |||
| 57,300 | Omega Protein Corporationa | 229,773 | |||
| 44,300 | Pantry, Inc.a | 950,235 | |||
| 7,700 | Ralcorp Holdings, Inc.a | 449,680 | |||
Total Consumer Staples | 7,817,539 | ||||
| Energy (3.9%) | |||||
| 32,800 | Forest Oil Corporationa | 540,872 | |||
| 72,300 | Frontier Oil Corporation | 913,149 | |||
| 224,800 | Global Industries, Ltd.a,b | 784,552 | |||
| 26,100 | Oceaneering International, Inc.a | 760,554 | |||
| 94,400 | Oil States International, Inc.a | 1,764,336 | |||
| 20,900 | Penn Virginia Corporation | 542,982 | |||
| 84,497 | Petrohawk Energy Corporationa | 1,320,688 | |||
| 39,800 | Petroleum Development Corporationa | 957,986 | |||
| 36,000 | Range Resources Corporation | 1,238,040 | |||
| 51,500 | Union Drilling, Inc.a | 267,285 | |||
| 20,800 | Whiting Petroleum Corporationa | 695,968 | |||
| 39,100 | World Fuel Services Corporation | 1,446,700 | |||
Total Energy | 11,233,112 | ||||
| Financials (21.9%) | |||||
| 42,600 | American Campus Communities, Inc. | 872,448 | |||
| 27,900 | American Capital Agency Corporation | 595,944 | |||
| 46,500 | American Financial Group, Inc. | 1,063,920 | |||
| 91,300 | Amerisafe, Inc.a | 1,874,389 | |||
| 72,400 | Aspen Insurance Holdings, Ltd. | 1,755,700 | |||
| 55,200 | Bank of the Ozarks, Inc.b | 1,636,128 | |||
| 49,800 | Brown & Brown, Inc. | 1,040,820 | |||
| 58,600 | Cathay General Bancorpb | 1,391,750 | |||
| 40,200 | Community Bank System, Inc. | 980,478 | |||
| 53,600 | Corporate Office Properties Trust | 1,645,520 | |||
| 11,700 | Delphi Financial Group, Inc. | 215,748 | |||
| 106,700 | East West Bancorp, Inc. | 1,703,999 | |||
| 61,200 | Fidelity National Financial, Inc. | 1,086,300 | |||
| 83,400 | First Cash Financial Services, Inc.a | 1,589,604 | |||
| 59,700 | First Commonwealth Financial Corporationb | 739,086 | |||
| 27,100 | First Midwest Bancorp, Inc. | 541,187 | |||
| 83,200 | First Niagara Financial Group, Inc. | 1,345,344 | |||
| 48,000 | FirstMerit Corporation | 988,320 | |||
| 22,400 | Glacier Bancorp, Inc. | 426,048 | |||
| 40,200 | Hanover Insurance Group, Inc. | 1,727,394 | |||
| 18,700 | Harleysville Group, Inc. | 649,451 | |||
| 53,000 | Hatteras Financial Corporation | 1,409,800 | |||
| 63,300 | HCC Insurance Holdings, Inc. | 1,693,275 | |||
| 49,500 | Home Bancshares, Inc. | 1,334,025 | |||
| 30,500 | Infinity Property & Casualty Corporation | 1,425,265 | |||
| 102,200 | Inland Real Estate Corporation | 1,326,556 | |||
| 91,800 | Investors Real Estate Trust | 983,178 | |||
| 55,100 | IPC Holdings, Ltd. | 1,647,490 | |||
| 36,700 | iShares Russell Microcap Index Fundb | 1,168,895 | |||
| 164,000 | MFA Mortgage Investments, Inc. | 965,960 | |||
| 374,600 | MGIC Investment Corporationb | 1,303,608 | |||
| 58,200 | National Penn Bancshares, Inc. | 844,482 | |||
| 100,700 | Nelnet, Inc. | 1,443,031 | |||
| 66,100 | NewAlliance Bancshares, Inc. | 870,537 | |||
| 160,700 | Ocwen Financial Corporationa | 1,475,226 | |||
| 34,900 | Old National Bancorp | 633,784 | |||
| 15,200 | PartnerRe, Ltd. | 1,083,304 | |||
| 52,000 | Platinum Underwriters Holdings, Ltd. | 1,876,160 | |||
| 29,100 | Portfolio Recovery Associates, Inc.a,b | 984,744 | |||
| 26,600 | ProAssurance Corporationa | 1,403,948 | |||
| 388,900 | Radian Group, Inc.b | 1,431,152 | |||
| 20,000 | RenaissanceRe Holdings, Ltd. | 1,031,200 | |||
| 24,100 | RLI Corporation | 1,473,956 | |||
| 59,518 | Santander BanCorp | 743,380 | |||
| 34,448 | Senior Housing Property Trust | 617,308 | |||
| 111,300 | South Financial Group, Inc.b | 480,816 | |||
| 105,000 | Sterling Financial Corporationb | 924,000 | |||
The accompanying Notes to Financial Statements are an integral part of this schedule.
121
Table of Contents
Small Cap Stock Portfolio
Schedule of Investments as of December 31, 2008
| Shares | Common Stock (97.1%) | Value | |||
| Financials (21.9%) - continued | |||||
| 21,150 | Stifel Financial Corporationa | $ | 969,728 | ||
| 72,100 | SWS Group, Inc. | 1,366,295 | |||
| 60,000 | Tower Group, Inc. | 1,692,600 | |||
| 235,100 | UCBH Holdings, Inc.b | 1,617,488 | |||
| 24,000 | Umpqua Holdings Corporationb | 347,280 | |||
| 30,100 | United Bankshares, Inc.b | 999,922 | |||
| 21,500 | United Fire & Casualty Company | 668,005 | |||
| 36,400 | Washington Real Estate Investment Trustb | 1,030,120 | |||
Total Financials | 63,136,096 | ||||
| Health Care (7.4%) | |||||
| 19,600 | Alexion Pharmaceuticals, Inc.a | 709,324 | |||
| 57,000 | AMERIGROUP Corporationa | 1,682,640 | |||
| 40,700 | ArthroCare Corporationa,b | 194,139 | |||
| 48,976 | BioMarin Pharmaceutical, Inc.a,b | 871,773 | |||
| 6,000 | Bio-Rad Laboratories, Inc.a | 451,860 | |||
| 16,400 | Cephalon, Inc.a,b | 1,263,456 | |||
| 9,900 | Chemed Corporation | 393,723 | |||
| 23,200 | Emergency Medical Services Corporationa | 849,352 | |||
| 44,800 | Greatbatch, Inc.a | 1,185,408 | |||
| 19,800 | Haemonetics Corporationa | 1,118,700 | |||
| 83,200 | Healthspring, Inc.a | 1,661,504 | |||
| 41,600 | HMS Holding Corporationa | 1,311,232 | |||
| 27,500 | ICU Medical, Inc.a | 911,350 | |||
| 14,100 | Lincare Holdings, Inc.a | 379,713 | |||
| 8,900 | Martek Biosciences Corporationa | 269,759 | |||
| 20,200 | Masimo Corporationa | 602,566 | |||
| 16,800 | Myriad Genetics, Inc.a,b | 1,113,168 | |||
| 7,300 | NuVasive, Inc.a,b | 252,945 | |||
| 22,700 | Owens & Minor, Inc. | 854,655 | |||
| 82,600 | Par Pharmaceutical Companies, Inc.a | 1,107,666 | |||
| 62,500 | PSS World Medical, Inc.a,b | 1,176,250 | |||
| 21,400 | Shire Pharmaceuticals Group plc ADR | 958,292 | |||
| 8,000 | United Therapeutics Corporationa | 500,400 | |||
| 20,300 | West Pharmaceutical Services, Inc.b | 766,731 | |||
| 40,200 | Wright Medical Group, Inc.a,b | 821,286 | |||
Total Health Care | 21,407,892 | ||||
| Industrials (20.1%) | |||||
| 68,300 | AAON, Inc. | 1,426,104 | |||
| 79,500 | AAR Corporationa | 1,463,595 | |||
| 22,200 | Actuant Corporation | 422,244 | |||
| 37,400 | Acuity Brands, Inc. | 1,305,634 | |||
| 28,900 | Aecom Technology Corporationa | 888,097 | |||
| 38,800 | Alaska Air Group, Inc.a | 1,134,900 | |||
| 11,300 | Allegiant Travel Companya,b | 548,841 | |||
| 40,400 | Applied Industrial Technologies, Inc. | 764,368 | |||
| 39,700 | Astec Industries, Inc.a | 1,243,801 | |||
| 53,600 | Beacon Roofing Supply, Inc.a | 743,968 | |||
| 25,700 | Brady Corporation | 615,515 | |||
| 84,900 | Briggs & Stratton Corporationb | 1,493,391 | |||
| 22,000 | Carlisle Companies, Inc. | 455,400 | |||
| 58,200 | Comfort Systems USA, Inc. | 616,920 | |||
| 54,000 | Consolidated Graphics, Inc.a | 1,222,560 | |||
| 83,500 | Continental Airlines, Inc.a,b | 1,508,010 | |||
| 42,400 | Cubic Corporation | 1,153,280 | |||
| 26,100 | Curtiss-Wright Corporation | 871,479 | |||
| 139,100 | Delta Air Lines, Inc.a | 1,594,086 | |||
| 67,900 | EMCOR Group, Inc.a | 1,522,997 | |||
| 10,100 | EnPro Industries, Inc.a | 217,554 | |||
| 30,400 | Esterline Technologies Corporationa | 1,151,856 | |||
| 59,100 | General Cable Corporationa | 1,045,479 | |||
| 11,300 | Genesee & Wyoming, Inc.a | 344,650 | |||
| 82,000 | Geo Group, Inc.a | 1,478,460 | |||
| 37,700 | Gorman-Rupp Company | 1,173,224 | |||
| 38,400 | Granite Construction, Inc.b | 1,686,912 | |||
| 92,900 | Griffon Corporationa | 866,757 | |||
| 18,700 | Huron Consulting Group, Inc.a | 1,070,949 | |||
| 47,700 | IDEX Corporation | 1,151,955 | |||
| 73,800 | Insituform Technologies, Inc.a | 1,453,122 | |||
| 27,600 | Jacobs Engineering Group, Inc.a | 1,327,560 | |||
| 27,800 | JB Hunt Transport Services, Inc.b | 730,306 | |||
| 50,900 | Kaydon Corporation | 1,748,415 | |||
| 35,800 | Knight Transportation, Inc. | 577,096 | |||
| 35,100 | Ladish Company, Inc.a | 486,135 | |||
| 17,400 | Landstar System, Inc. | 668,682 | |||
| 34,200 | Lennox International, Inc. | 1,104,318 | |||
| 7,400 | Moog, Inc.a | 270,618 | |||
| 10,300 | MSC Industrial Direct Company, Inc. | 379,349 | |||
| 38,800 | Navigant Consulting, Inc.a | 615,756 | |||
| 153,400 | Oshkosh Corporation | 1,363,726 | |||
| 14,000 | Pentair, Inc. | 331,380 | |||
| 52,900 | Regal-Beloit Corporationb | 2,009,671 | |||
| 14,700 | Roper Industries, Inc. | 638,127 | |||
| 47,300 | Shaw Group, Inc.a | 968,231 | |||
| 53,600 | Simpson Manufacturing Company, Inc.b | 1,487,936 | |||
| 74,900 | Sterling Construction Company, Inc.a | 1,388,646 | |||
| 33,000 | Teledyne Technologies, Inc.a | 1,470,150 | |||
| 56,400 | Terex Corporationa | 976,848 | |||
| 80,900 | Tredegar Corporation | 1,470,762 | |||
| 118,100 | UAL Corporationb | 1,301,462 | |||
| 46,600 | URS Corporationa | 1,899,882 | |||
| 17,000 | Watsco, Inc.b | 652,800 | |||
| 21,300 | Watson Wyatt Worldwide, Inc. | 1,018,566 | |||
| 18,800 | Woodward Governor Company | 432,776 | |||
Total Industrials | 57,955,306 | ||||
| Information Technology (17.8%) | |||||
| 316,800 | Adaptec, Inc.a | 1,045,440 | |||
| 58,100 | Akamai Technologies, Inc.a | 876,729 | |||
| 31,700 | ANSYS, Inc.a | 884,113 | |||
| 22,800 | Arrow Electronics, Inc.a | 429,552 | |||
| 104,500 | AsiaInfo Holdings, Inc.a | 1,237,280 | |||
| 201,800 | Atmel Corporationa | 631,634 | |||
| 88,100 | Avocent Corporationa | 1,577,871 | |||
| 65,500 | Benchmark Electronics, Inc.a,b | 836,435 | |||
| 196,661 | BigBand Networks, Inc.a | 1,085,569 | |||
| 25,400 | BMC Software, Inc.a | 683,514 | |||
| 42,400 | Cabot Microelectronics Corporationa | 1,105,368 | |||
| 9,900 | CACI International, Inc.a | 446,391 | |||
| 81,000 | Cogent, Inc.a | 1,099,170 | |||
| 137,242 | Compuware Corporationa | 926,383 | |||
| 28,000 | Comtech Telecommunications Corporationa | 1,282,960 | |||
| 81,700 | CSG Systems International, Inc.a | 1,427,299 | |||
The accompanying Notes to Financial Statements are an integral part of this schedule.
122
Table of Contents
Small Cap Stock Portfolio
Schedule of Investments as of December 31, 2008
| Shares | Common Stock (97.1%) | Value | ||||
| Information Technology (17.8%) - continued | ||||||
| 61,900 | DTS, Inc.a,b | $ | 1,135,865 | |||
| 163,000 | EarthLink, Inc.a | 1,101,880 | ||||
| 47,100 | EMS Technologies, Inc.a | 1,218,477 | ||||
| 85,200 | EPIQ Systems, Inc.a | 1,423,692 | ||||
| 55,900 | F5 Networks, Inc.a | 1,277,874 | ||||
| 108,405 | FormFactor, Inc.a,b | 1,582,713 | ||||
| 35,300 | Hittite Microwave Corporationa | 1,039,938 | ||||
| 45,400 | Informatica Corporationa | 623,342 | ||||
| 8,316 | Itron, Inc.a | 530,062 | ||||
| 135,100 | Knot, Inc.a | 1,124,032 | ||||
| 34,600 | Lam Research Corporationa | 736,288 | ||||
| 53,400 | Loral Space & Communications, Inc.a | 775,902 | ||||
| 60,300 | Mercadolibre, Inc.a | 989,523 | ||||
| 103,000 | Methode Electronics, Inc. | 694,220 | ||||
| 85,500 | MKS Instruments, Inc.a | 1,264,545 | ||||
| 70,000 | Monolithic Power Systems, Inc.a | 882,700 | ||||
| 43,500 | NCI, Inc.a | 1,310,655 | ||||
| 218,300 | ON Semiconductor Corporationa | 742,220 | ||||
| 62,100 | Parametric Technology Corporationa | 785,565 | ||||
| 29,900 | Perot Systems Corporationa | 408,733 | ||||
| 76,600 | Plexus Corporationa | 1,298,370 | ||||
| 102,869 | PMC-Sierra, Inc.a | 499,943 | ||||
| 83,500 | QLogic Corporationa | 1,122,240 | ||||
| 30,400 | Rogers Corporationa | 844,208 | ||||
| 198,200 | S1 Corporationa | 1,563,798 | ||||
| 31,700 | Shanda Interactive Entertainment, Ltd.a | 1,025,812 | ||||
| 35,800 | Skyworks Solutions, Inc.a | 198,332 | ||||
| 29,300 | Solera Holdings, Inc.a | 706,130 | ||||
| 60,600 | Sybase, Inc.a | 1,501,062 | ||||
| 70,200 | Sykes Enterprises, Inc.a | 1,342,224 | ||||
| 54,300 | Synopsys, Inc.a | 1,005,636 | ||||
| 177,100 | TeleCommunication Systems, Inc.a | 1,521,289 | ||||
| 96,600 | TIBCO Software, Inc.a | 501,354 | ||||
| 31,600 | Transmeta Corporationa,b | 575,120 | ||||
| 30,500 | Trimble Navigation, Ltd.a | 659,105 | ||||
| 48,500 | Varian Semiconductor Equipment Associates, Inc.a | 878,820 | ||||
| 96,500 | Zoran Corporationa | 659,095 | ||||
Total Information Technology | 51,126,472 | |||||
| Materials (5.7%) | ||||||
| 18,600 | Airgas, Inc. | 725,214 | ||||
| 12,600 | AptarGroup, Inc. | 444,024 | ||||
| 14,200 | Bemis Company, Inc. | 336,256 | ||||
| 50,900 | Carpenter Technology Corporation | 1,045,486 | ||||
| 45,800 | Eagle Materials, Inc. | 843,178 | ||||
| 26,700 | FMC Corporation | 1,194,291 | ||||
| 24,200 | Greif, Inc. | 809,006 | ||||
| 37,200 | Pactiv Corporationa | 925,536 | ||||
| 49,200 | Pan American Silver Corporationa | 839,844 | ||||
| 28,800 | Rock-Tenn Company | 984,384 | ||||
| 13,600 | Royal Gold, Inc. | 669,256 | ||||
| 22,600 | RPM International, Inc. | 300,354 | ||||
| 30,500 | Schweitzer-Mauduit International, Inc. | 610,610 | ||||
| 49,700 | Scotts Miracle-Gro Company | 1,477,084 | ||||
| 13,200 | SPDR Gold Trusta | 1,142,460 | ||||
| 137,600 | Steel Dynamics, Inc. | 1,538,368 | ||||
| 31,900 | Texas Industries, Inc.b | 1,100,550 | ||||
| 129,100 | Wausau Paper Corporation | 1,476,904 | ||||
Total Materials | 16,462,805 | |||||
| Telecommunications Services (0.5%) | ||||||
| 10,800 | CenturyTel, Inc.b | 295,164 | ||||
| 49,300 | NTELOS Holdings Corporation | 1,215,738 | ||||
Total Telecommunications Services | 1,510,902 | |||||
| Utilities (2.6%) | ||||||
| 66,000 | Aqua America, Inc.b | 1,358,940 | ||||
| 44,900 | Avista Corporation | 870,162 | ||||
| 26,900 | El Paso Electric Companya | 486,621 | ||||
| 31,600 | IDACORP, Inc. | 930,620 | ||||
| 41,500 | Mirant Corporationa | 783,105 | ||||
| 31,300 | New Jersey Resources Corporation | 1,231,655 | ||||
| 13,000 | Piedmont Natural Gas Company, Inc.b | 411,710 | ||||
| 10,400 | South Jersey Industries, Inc. | 414,440 | ||||
| 38,100 | UGI Corporation | 930,402 | ||||
Total Utilities | 7,417,655 | |||||
Total Common Stock (cost $284,783,941) | 279,799,082 | |||||
| Shares | Collateral Held for Securities Loaned (9.8%) | Value | ||||
| 28,172,401 | Thrivent Financial Securities Lending Trust | 28,172,401 | ||||
Total Collateral Held for Securities Loaned (cost $28,172,401) | 28,172,401 | |||||
| Shares or Principal Amount | Short-Term Investments (2.4%)c | Value | ||||
| 1,000,000 | Federal National Mortgage Association Discount Notes 0.400%, 5/14/2009 | 998,532 | ||||
| 5,893,633 | Thrivent Money Market Portfolio | 5,893,633 | ||||
Total Short-Term Investments (at amortized cost) | 6,892,165 | |||||
Total Investments (cost $319,848,507) 109.3% | $ | 314,863,648 | ||||
Other Assets and Liabilities, Net (9.3%) | (26,803,923 | ) | ||||
Total Net Assets 100.0% | $ | 288,059,725 | ||||
| a | Non-income producing security. |
| b | All or a portion of the security is on loan as discussed in item 2(M) of the Notes to Financial Statements. |
| c | The interest rate shown reflects the yield, coupon rate or, for securities purchased at a discount, the discount rate at the date of purchase. |
The accompanying Notes to Financial Statements are an integral part of this schedule.
123
Table of Contents
Small Cap Stock Portfolio
Schedule of Investments as of December 31, 2008
Definitions:
| ADR - | American Depositary Receipt, which are certificates for an underlying foreign security’s shares held by an issuing U.S. depository bank. |
Gross unrealized appreciation and depreciation of investments, based on cost for federal income tax purposes, were as follows:
Gross unrealized appreciation | $ | 17,366,129 | ||
Gross unrealized depreciation | (37,569,939 | ) | ||
Net unrealized appreciation (depreciation) | ($20,203,810 | ) | ||
Cost for federal income tax purposes | $ | 335,067,458 |
The following table is a summary of the inputs used, as of December 31, 2008, in valuing the Small Cap Stock Portfolio’s assets carried at fair value as discussed in item 2(A) of the Notes to Financial Statements.
Level | Investments in Securities | Other Financial Instruments* | ||||
Level 1 | $ | 313,865,116 | $ | — | ||
Level 2 | 998,532 | — | ||||
Level 3 | — | — | ||||
Totals (Level 1,2,3) | $ | 314,863,648 | $ | — | ||
| * | Other Financial Instruments include Futures, Forwards, Written Options and Swap agreements. |
Investment in Affiliates
Affiliated issuers, as defined under the Investment Company Act of 1940, include those in which the Portfolio’s holdings of an issuer represent 5% or more of the outstanding voting securities of an issuer, or any affiliated mutual fund.
A summary of transactions for the fiscal year to date, in Small Cap Stock Portfolio, is as follows:
Portfolio | Value December 31, 2007 | Gross Purchases and Additions | Gross Sales and Reductions | Balance of Shares Held at December 31, 2008 | Value December 31, 2008 | Income Earned January 1, 2008 - December 31, 2008 | |||||||||||
Money Market | $ | 27,636,194 | $ | 181,532,263 | $ | 203,274,824 | 5,893,633 | $ | 5,893,633 | $ | 611,359 | ||||||
Thrivent Financial Securities Lending Trust | 92,358,545 | 309,291,999 | 373,478,143 | 28,172,401 | 28,172,401 | 1,095,235 | |||||||||||
Total Value and Income Earned | 119,994,739 | 34,066,034 | 1,706,594 | ||||||||||||||
The accompanying Notes to Financial Statements are an integral part of this schedule.
124
Table of Contents
Schedule of Investments as of December 31, 2008
| Shares | Common Stock (99.6%) | Value | |||
| Consumer Discretionary (13.0%) | |||||
| 7,000 | 4Kids Entertainment, Inc.a | $ | 13,720 | ||
| 31,175 | Aaron Rents, Inc. | 829,878 | |||
| 10,300 | AH Belo Corporation | 22,454 | |||
| 15,400 | Arbitron, Inc. | 204,512 | |||
| 7,000 | Arctic Cat, Inc.b | 33,530 | |||
| 11,900 | ATC Technology Corporationa | 174,097 | |||
| 10,900 | Audiovox Corporationa | 54,609 | |||
| 6,800 | Bassett Furniture Industries, Inc. | 22,780 | |||
| 12,600 | Big 5 Sporting Goods Corporation | 65,646 | |||
| 8,500 | Blue Nile, Inc.a,b | 208,165 | |||
| 24,625 | Brown Shoe Company, Inc. | 208,574 | |||
| 51,100 | Brunswick Corporationb | 215,131 | |||
| 13,650 | Buckle, Inc.b | 297,843 | |||
| 10,300 | Buffalo Wild Wings, Inc.a,b | 264,195 | |||
| 23,000 | Cabela’s, Inc.a,b | 134,090 | |||
| 14,100 | California Pizza Kitchen, Inc.a | 151,152 | |||
| 8,200 | Capella Education Companya | 481,832 | |||
| 32,800 | Carter’s, Inc.a | 631,728 | |||
| 17,200 | Cato Corporation | 259,720 | |||
| 13,225 | CEC Entertainment, Inc.a | 320,706 | |||
| 45,400 | Champion Enterprises, Inc.a | 25,424 | |||
| 12,300 | Charlotte Russe Holding, Inc.a | 79,827 | |||
| 14,000 | Children’s Place Retail Stores, Inc.a | 303,520 | |||
| 20,725 | Christopher & Banks Corporation | 116,060 | |||
| 31,800 | CKE Restaurants, Inc.b | 276,024 | |||
| 16,500 | Coinstar, Inc.a | 321,915 | |||
| 13,100 | Cracker Barrel Old Country Store, Inc. | 269,729 | |||
| 48,400 | Crocs, Inc.a,b | 60,016 | |||
| 7,600 | Deckers Outdoor Corporationa,b | 607,012 | |||
| 9,000 | DineEquity, Inc.b | 104,040 | |||
| 26,200 | Dress Barn, Inc.a,b | 281,388 | |||
| 11,300 | Drew Industries, Inc.a,b | 135,600 | |||
| 17,033 | E.W. Scripps Companyb | 37,643 | |||
| 16,750 | Ethan Allen Interiors, Inc.b | 240,697 | |||
| 31,993 | Finish Line, Inc. | 179,161 | |||
| 25,937 | Fossil, Inc.a | 433,148 | |||
| 23,350 | Fred’s, Inc. | 251,246 | |||
| 11,200 | Genesco, Inc.a,b | 189,504 | |||
| 13,600 | Group 1 Automotive, Inc.b | 146,472 | |||
| 16,900 | Gymboree Corporationa | 440,921 | |||
| 10,900 | Haverty Furniture Companies, Inc.b | 101,697 | |||
| 16,550 | Hibbett Sports, Inc.a,b | 260,001 | |||
| 36,000 | Hillenbrand, Inc. | 600,480 | |||
| 25,475 | Hot Topic, Inc.a | 236,153 | |||
| 23,000 | HSN, Inc.a | 167,210 | |||
| 33,900 | Iconix Brand Group, Inc.a,b | 331,542 | |||
| 23,000 | Interval Leisure Group, Inc.a | 123,970 | |||
| 33,100 | Jack in the Box, Inc.a | 731,179 | |||
| 16,100 | JAKKS Pacific, Inc.a | 332,143 | |||
| 14,830 | Jo-Ann Stores, Inc.a | 229,717 | |||
| 10,575 | Joseph A. Bank Clothiers, Inc.a,b | 276,536 | |||
| 15,700 | K-Swiss, Inc. | 178,980 | |||
| 7,300 | Landry’s Restaurants, Inc.b | 84,680 | |||
| 30,100 | La-Z-Boy, Inc.b | 65,317 | |||
| 9,700 | Lithia Motors, Inc.b | 31,622 | |||
| 45,500 | Live Nation, Inc.a,b | 261,170 | |||
| 55,200 | Liz Claiborne, Inc. | 143,520 | |||
| 8,200 | M/I Homes, Inc.b | 86,428 | |||
| 11,000 | Maidenform Brands, Inc.a | 111,650 | |||
| 12,400 | Marcus Corporation | 201,252 | |||
| 10,800 | MarineMax, Inc.a | 36,612 | |||
| 30,100 | Men’s Wearhouse, Inc.b | 407,554 | |||
| 17,800 | Meritage Homes Corporationa,b | 216,626 | |||
| 8,200 | Midas, Inc.a | 86,018 | |||
| 6,700 | Monarch Casino & Resort, Inc.a | 78,055 | |||
| 10,600 | Movado Group, Inc. | 99,534 | |||
| 13,500 | Multimedia Games, Inc.a | 32,130 | |||
| 2,800 | National Presto Industries, Inc. | 215,600 | |||
| 13,100 | Nautilus Group, Inc.a | 28,951 | |||
| 17,200 | NutriSystem, Inc.b | 250,948 | |||
| 12,500 | O’Charley’s, Inc. | 25,000 | |||
| 44,200 | OfficeMax, Inc. | 337,688 | |||
| 8,000 | Oxford Industries, Inc.b | 70,160 | |||
| 13,900 | P.F. Chang’s China Bistro, Inc.a,b | 291,066 | |||
| 17,800 | Panera Bread Companya,b | 929,872 | |||
| 12,600 | Papa John’s International, Inc.a | 232,218 | |||
| 7,000 | Peet’s Coffee & Tea, Inc.a | 162,750 | |||
| 26,000 | Pep Boys - Manny, Moe & Jack | 107,380 | |||
| 6,900 | Perry Ellis International, Inc.a | 43,746 | |||
| 13,800 | PetMed Express, Inc.a | 243,294 | |||
| 34,900 | Pinnacle Entertainment, Inc.a,b | 268,032 | |||
| 18,800 | Polaris Industries, Inc.b | 538,620 | |||
| 27,912 | Pool Corporationb | 501,579 | |||
| 4,500 | Pre-Paid Legal Services, Inc.a | 167,805 | |||
| 74,000 | Quiksilver, Inc.a | 136,160 | |||
| 10,100 | RC2 Corporationa | 107,767 | |||
| 9,100 | Red Robin Gourmet Burgers, Inc.a | 153,153 | |||
| 30,800 | Ruby Tuesday, Inc.a | 48,048 | |||
| 9,900 | Russ Berrie and Company, Inc.a | 29,403 | |||
| 11,300 | Ruth’s Chris Steak House, Inc.a | 15,594 | |||
| 32,425 | Shuffle Master, Inc.a,b | 160,828 | |||
| 19,400 | Skechers USA, Inc.a | 248,708 | |||
| 4,000 | Skyline Corporation | 79,960 | |||
| 16,400 | Sonic Automotive, Inc.b | 65,272 | |||
| 35,152 | Sonic Corporationa | 427,800 | |||
| 19,100 | Spartan Motors, Inc.b | 90,343 | |||
| 22,200 | Stage Stores, Inc. | 183,150 | |||
| 8,300 | Stamps.com, Inc.a | 81,589 | |||
| 7,000 | Standard Motor Products, Inc. | 24,220 | |||
| 53,900 | Standard Pacific Corporationa,b | 95,942 | |||
| 16,717 | Steak n Shake Companya,b | 99,466 | |||
| 14,900 | Stein Mart, Inc.a,b | 16,837 | |||
| 11,400 | Sturm, Ruger & Company, Inc.a | 68,058 | |||
| 13,600 | Superior Industries International, Inc.b | 143,072 | |||
| 29,900 | Texas Roadhouse, Inc.a | 231,725 | |||
| 23,300 | Ticketmaster Entertainment, Inc.a | 149,586 | |||
| 18,500 | Tractor Supply Companya,b | 668,590 | |||
| 10,700 | True Religion Apparel, Inc.a | 133,108 | |||
| 17,900 | Tuesday Morning Corporationa | 29,177 | |||
| 14,500 | Tween Brands, Inc.a | 62,640 | |||
| 8,400 | UniFirst Corporation | 249,396 | |||
| 8,200 | Universal Electronic Inc.a | 133,004 | |||
| 12,600 | Universal Technical Institute, Inc.a,b | 216,342 | |||
| 9,300 | Volcom, Inc.a | 101,370 | |||
| 17,000 | Winnebago Industries, Inc.b | 102,510 | |||
| 29,100 | WMS Industries, Inc.a | 782,790 | |||
| 28,500 | Wolverine World Wide, Inc. | 599,640 | |||
| 18,600 | Zale Corporationa,b | 61,938 | |||
The accompanying Notes to Financial Statements are an integral part of this schedule.
125
Table of Contents
Small Cap Index Portfolio
Schedule of Investments as of December 31, 2008
| Shares | Common Stock (99.6%) | Value | |||
| Consumer Discretionary (13.0%) - continued | |||||
| 11,800 | Zumiez, Inc.a,b | $ | 87,910 | ||
Total Consumer Discretionary | 24,905,290 | ||||
| Consumer Staples (3.5%) | |||||
| 51,900 | Alliance One International, Inc.a | 152,586 | |||
| 10,600 | Andersons, Inc.b | 174,688 | |||
| 5,900 | Boston Beer Company, Inc.a | 167,560 | |||
| 7,400 | Cal-Maine Foods, Inc.b | 212,380 | |||
| 29,600 | Casey’s General Stores, Inc. | 673,992 | |||
| 41,500 | Central Garden & Pet Companya | 244,850 | |||
| 11,000 | Chattem, Inc.a,b | 786,830 | |||
| 47,700 | Darling International, Inc.a | 261,873 | |||
| 9,600 | Diamond Foods, Inc. | 193,440 | |||
| 17,700 | Great Atlantic & Pacific Tea Company, Inc.a,b | 110,979 | |||
| 10,100 | Green Mountain Coffee Roasters, Inc.a,b | 390,870 | |||
| 23,500 | Hain Celestial Group, Inc.a | 448,615 | |||
| 8,200 | J & J Snack Foods Corporation | 294,216 | |||
| 18,400 | Lance, Inc. | 422,096 | |||
| 9,200 | Mannatech, Inc.b | 22,540 | |||
| 7,500 | Nash Finch Company | 336,675 | |||
| 10,100 | Sanderson Farms, Inc. | 349,056 | |||
| 12,800 | Spartan Stores, Inc. | 297,600 | |||
| 18,300 | TreeHouse Foods, Inc.a,b | 498,492 | |||
| 25,000 | United Natural Foods, Inc.a,b | 445,500 | |||
| 9,670 | WD-40 Company | 273,564 | |||
Total Consumer Staples | 6,758,402 | ||||
| Energy (4.2%) | |||||
| 32,400 | Atwood Oceanics, Inc.a | 495,072 | |||
| 13,600 | Basic Energy Services, Inc.a | 177,344 | |||
| 16,900 | Bristow Group, Inc.a,b | 452,751 | |||
| 11,900 | Carbo Ceramics, Inc. | 422,807 | |||
| 17,500 | Dril-Quip, Inc.a | 358,925 | |||
| 8,400 | Gulf Island Fabrication, Inc. | 121,044 | |||
| 23,700 | Holly Corporation | 432,051 | |||
| 13,500 | Hornbeck Offshore Services, Inc.a | 220,590 | |||
| 52,100 | Input/Output, Inc.a | 178,703 | |||
| 8,700 | Lufkin Industries, Inc. | 300,150 | |||
| 15,200 | Matrix Service Companya | 116,584 | |||
| 11,900 | NATCO Group, Inc.a | 180,642 | |||
| 29,000 | Oil States International, Inc.a | 542,010 | |||
| 24,300 | Penn Virginia Corporation | 631,314 | |||
| 8,600 | Petroleum Development Corporationa | 207,002 | |||
| 25,300 | PetroQuest Energy, Inc.a,b | 171,028 | |||
| 29,200 | Pioneer Drilling Companya | 162,644 | |||
| 11,650 | SEACOR Holdings, Inc.a | 776,472 | |||
| 36,200 | St. Mary Land & Exploration Company | 735,222 | |||
| 20,300 | Stone Energy Corporationa | 223,706 | |||
| 9,700 | Superior Well Services, Inc.a | 97,000 | |||
| 17,900 | Swift Energy Companya,b | 300,899 | |||
| 43,650 | TETRA Technologies, Inc.a | 212,139 | |||
| 17,000 | World Fuel Services Corporation | 629,000 | |||
Total Energy | 8,145,099 | ||||
| Financials (21.0%) | |||||
| 18,900 | Acadia Realty Trust | 269,703 | |||
| 3,900 | American Physicians Capital, Inc. | 187,590 | |||
| 10,200 | Amerisafe, Inc.a | 209,406 | |||
| 10,600 | Anchor BanCorp Wisconsin, Inc.b | 29,256 | |||
| 28,200 | Bank Mutual Corporation | 325,428 | |||
| 4,840 | BankAtlantic Bancorp, Inc.b | 28,072 | |||
| 46,800 | BioMed Realty Trust, Inc. | 548,496 | |||
| 37,200 | Boston Private Financial Holdings, Inc. | 254,448 | |||
| 34,100 | Brookline Bancorp, Inc. | 363,165 | |||
| 16,400 | Cascade Bancorpb | 110,700 | |||
| 16,900 | Cash America International, Inc. | 462,215 | |||
| 26,000 | Cedar Shopping Centers, Inc. | 184,080 | |||
| 16,800 | Central Pacific Financial Corporation | 168,672 | |||
| 28,000 | Colonial Properties Trustb | 233,240 | |||
| 10,600 | Columbia Banking System, Inc. | 126,458 | |||
| 19,100 | Community Bank System, Inc. | 465,849 | |||
| 18,200 | Corus Bankshares, Inc.b | 20,202 | |||
| 24,065 | Delphi Financial Group, Inc. | 443,759 | |||
| 52,600 | DiamondRock Hospitality Company | 266,682 | |||
| 15,375 | Dime Community Bancshares | 204,488 | |||
| 37,100 | East West Bancorp, Inc. | 592,487 | |||
| 14,700 | EastGroup Properties, Inc. | 523,026 | |||
| 19,100 | Entertainment Properties Trust | 569,180 | |||
| 49,800 | Extra Space Storage, Inc. | 513,936 | |||
| 14,950 | Financial Federal Corporation | 347,886 | |||
| 44,200 | First BanCorpb | 492,388 | |||
| 15,000 | First Cash Financial Services, Inc.a | 285,900 | |||
| 42,900 | First Commonwealth Financial Corporationb | 531,102 | |||
| 18,600 | First Financial Bancorp | 230,454 | |||
| 12,200 | First Financial Bankshares, Inc.b | 673,562 | |||
| 28,412 | First Midwest Bancorp, Inc. | 567,388 | |||
| 34,200 | Flagstar Bancorp, Inc.a | 24,282 | |||
| 20,900 | Forestar Real Estate Group, Inc.a | 198,968 | |||
| 31,100 | Franklin Street Properties Corporation | 458,725 | |||
| 27,500 | Frontier Financial Corporationb | 119,900 | |||
| 34,900 | Glacier Bancorp, Inc.b | 663,798 | |||
| 10,500 | Greenhill & Company, Inc.b | 732,585 | |||
| 63,600 | Guaranty Financial Group, Inc.a,b | 165,996 | |||
| 13,900 | Hancock Holding Companyb | 631,894 | |||
| 21,700 | Hanmi Financial Corporation | 44,702 | |||
| 7,800 | Home Bancshares, Inc. | 210,210 | |||
| 18,800 | Home Properties, Inc.b | 763,280 | |||
| 8,400 | Independent Bank Corporation/MA | 219,744 | |||
| 11,165 | Independent Bank Corporation/MIb | 24,116 | |||
| 8,400 | Infinity Property & Casualty Corporation | 392,532 | |||
| 33,700 | Inland Real Estate Corporation | 437,426 | |||
| 25,200 | Investment Technology Group, Inc.a | 572,544 | |||
| 11,100 | Irwin Financial Corporationa | 14,319 | |||
| 19,300 | Kilroy Realty Corporation | 645,778 | |||
| 19,900 | Kite Realty Group Trust | 110,644 | |||
| 30,700 | LaBranche & Company, Inc.a | 147,053 | |||
| 23,900 | LaSalle Hotel Propertiesb | 264,095 | |||
| 42,800 | Lexington Corporate Properties Trust | 214,000 | |||
| 13,500 | LTC Properties, Inc. | 273,780 | |||
| 38,700 | Medical Properties Trust, Inc.b | 244,197 | |||
The accompanying Notes to Financial Statements are an integral part of this schedule.
126
Table of Contents
Small Cap Index Portfolio
Schedule of Investments as of December 31, 2008
| Shares | Common Stock (99.6%) | Value | |||
| Financials (21.0%) - continued | |||||
| 16,400 | Mid-America Apartment Communities, Inc.b | $ | 609,424 | ||
| 13,000 | Nara Bancorp, Inc. | 127,790 | |||
| 23,200 | National Financial Partners | 70,528 | |||
| 46,600 | National Penn Bancshares, Inc. | 676,166 | |||
| 45,600 | National Retail Properties, Inc.b | 783,864 | |||
| 7,800 | Navigators Group, Inc.a | 428,298 | |||
| 38,700 | Old National Bancorp | 702,792 | |||
| 24,800 | optionsXpress Holdings, Inc.b | 331,328 | |||
| 9,000 | Parkway Properties, Inc. | 162,000 | |||
| 23,000 | Pennsylvania Real Estate Investment Trustb | 171,350 | |||
| 8,700 | Piper Jaffray Companiesa | 345,912 | |||
| 9,000 | Portfolio Recovery Associates, Inc.a,b | 304,560 | |||
| 25,700 | Post Properties, Inc. | 424,050 | |||
| 12,600 | Presidential Life Corporation | 124,614 | |||
| 16,000 | PrivateBancorp, Inc.b | 519,360 | |||
| 19,500 | ProAssurance Corporationa | 1,029,210 | |||
| 24,000 | Prosperity Bancshares, Inc. | 710,160 | |||
| 19,664 | Provident Bankshares Corporationb | 189,954 | |||
| 8,800 | PS Business Parks, Inc. | 393,008 | |||
| 15,800 | Rewards Network, Inc.a | 40,922 | |||
| 10,400 | RLI Corporation | 636,064 | |||
| 13,700 | S&T Bancorp, Inc.b | 486,350 | |||
| 9,600 | Safety Insurance Group, Inc. | 365,376 | |||
| 30,700 | Selective Insurance Group, Inc. | 703,951 | |||
| 66,700 | Senior Housing Property Trust | 1,195,264 | |||
| 20,600 | Signature Banka | 591,014 | |||
| 43,100 | South Financial Group, Inc.b | 186,192 | |||
| 12,900 | Sovran Self Storage, Inc.b | 464,400 | |||
| 10,600 | Sterling Bancorp | 148,718 | |||
| 42,700 | Sterling Bancshares, Inc. | 259,616 | |||
| 30,315 | Sterling Financial Corporationb | 266,772 | |||
| 10,500 | Stewart Information Services Corporation | 246,645 | |||
| 14,900 | Stifel Financial Corporationa | 683,165 | |||
| 50,200 | Susquehanna Bancshares, Inc.b | 798,682 | |||
| 15,926 | SWS Group, Inc. | 301,798 | |||
| 18,400 | Tanger Factory Outlet Centers, Inc.b | 692,208 | |||
| 3,900 | Tompkins Financial Corporation | 226,005 | |||
| 11,900 | Tower Group, Inc. | 335,699 | |||
| 18,700 | Tradestation Group, Inc.a | 120,615 | |||
| 44,282 | TrustCo Bank Corporation NYb | 421,122 | |||
| 64,700 | UCBH Holdings, Inc.b | 445,136 | |||
| 17,100 | UMB Financial Corporation | 840,294 | |||
| 35,000 | Umpqua Holdings Corporationb | 506,450 | |||
| 22,000 | United Bankshares, Inc.b | 730,840 | |||
| 23,774 | United Community Banks, Inc.b | 322,851 | |||
| 13,100 | United Fire & Casualty Company | 407,017 | |||
| 12,500 | Urstadt Biddle Properties | 199,125 | |||
| 37,400 | Whitney Holding Corporation | 598,026 | |||
| 11,400 | Wilshire Bancorp, Inc. | 103,512 | |||
| 13,900 | Wintrust Financial Corporation | 285,923 | |||
| 9,412 | World Acceptance Corporationa,b | 185,981 | |||
| 21,700 | Zenith National Insurance Corporation | 685,069 | |||
| Total Financials | 40,388,956 | ||||
| Health Care (13.6%) | |||||
| 12,700 | Abaxis, Inc.a,b | 203,581 | |||
| 6,300 | Air Methods Corporationa | 100,737 | |||
| 15,733 | Amedisys, Inc.a,b | 650,402 | |||
| 42,700 | American Medical Systems Holdings, Inc.a,b | 383,873 | |||
| 30,800 | AMERIGROUP Corporationa | 909,216 | |||
| 19,000 | AMN Healthcare Services, Inc.a | 160,740 | |||
| 18,250 | AmSurg Corporationa | 425,955 | |||
| 7,800 | Analogic Corporation | 212,784 | |||
| 16,500 | ArQule, Inc.a,b | 69,630 | |||
| 15,500 | ArthroCare Corporationa,b | 73,935 | |||
| 17,100 | Cambrex Corporationa | 79,002 | |||
| 22,300 | Catalyst Health Solutions, Inc.a | 543,005 | |||
| 25,000 | Centene Corporationa | 492,750 | |||
| 13,000 | Chemed Corporation | 517,010 | |||
| 16,950 | CONMED Corporationa | 405,783 | |||
| 26,200 | Cooper Companies, Inc. | 429,680 | |||
| 4,700 | Corvel Corporationa | 103,306 | |||
| 18,000 | Cross Country Healthcare, Inc.a | 158,220 | |||
| 16,350 | CryoLife, Inc.a | 158,759 | |||
| 33,200 | Cubist Pharmaceuticals, Inc.a | 802,112 | |||
| 13,500 | Cyberonics, Inc.a,b | 223,695 | |||
| 7,900 | Datascope Corporation | 412,696 | |||
| 10,500 | Dionex Corporationa | 470,925 | |||
| 31,800 | Eclipsys Corporationa | 451,242 | |||
| 18,997 | Enzo Biochem, Inc.a | 92,895 | |||
| 16,800 | Gentiva Health Services, Inc.a | 491,568 | |||
| 13,300 | Greatbatch, Inc.a | 351,918 | |||
| 14,700 | Haemonetics Corporationa | 830,550 | |||
| 29,000 | Healthspring, Inc.a | 579,130 | |||
| 19,600 | Healthways, Inc.a | 225,008 | |||
| 14,600 | HMS Holding Corporationa | 460,192 | |||
| 7,400 | ICU Medical, Inc.a,b | 245,236 | |||
| 41,075 | Immucor, Inc.a | 1,091,773 | |||
| 11,500 | Integra LifeSciences Holdings Corporationa,b | 409,055 | |||
| 18,800 | Invacare Corporation | 291,776 | |||
| 19,300 | inVentiv Health, Inc.a | 222,722 | |||
| 7,700 | Kendle International, Inc.a | 198,044 | |||
| 6,800 | Kensey Nash Corporationa | 131,988 | |||
| 5,500 | Landauer, Inc. | 403,150 | |||
| 10,850 | LCA-Vision, Inc. | 44,594 | |||
| 8,600 | LHC Group, Inc.a | 309,600 | |||
| 23,500 | Magellan Health Services, Inc.a | 920,260 | |||
| 19,300 | Martek Biosciences Corporationa,b | 584,983 | |||
| 11,500 | MedCath Corporationa | 120,060 | |||
| 19,600 | Mentor Corporationb | 606,228 | |||
| 23,500 | Meridian Bioscience, Inc. | 598,545 | |||
| 16,300 | Merit Medical Systems, Inc.a | 292,259 | |||
| 8,200 | Molina Healthcare, Inc.a | 144,402 | |||
| 7,100 | MWI Veterinary Supply, Inc.a | 191,416 | |||
| 16,300 | Natus Medical, Inc.a | 211,085 | |||
| 14,600 | Noven Pharmaceuticals, Inc.a | 160,600 | |||
| 19,200 | Odyssey Healthcare, Inc.a | 177,600 | |||
| 18,200 | Omnicell, Inc.a | 222,222 | |||
| 10,500 | Osteotech, Inc.a | 17,745 | |||
| 24,100 | Owens & Minor, Inc. | 907,365 | |||
| 10,600 | Palomar Medical Technologies, Inc.a | 122,218 | |||
| 20,100 | Par Pharmaceutical Companies, Inc.a | 269,541 | |||
| 32,200 | PAREXEL International Corporationa | 312,662 | |||
| 26,600 | Pediatrix Medical Group, Inc.a | 843,220 | |||
The accompanying Notes to Financial Statements are an integral part of this schedule.
127
Table of Contents
Small Cap Index Portfolio
Schedule of Investments as of December 31, 2008
| Shares | Common Stock (99.6%) | Value | |||
| Health Care (13.6%) - continued | |||||
| 17,700 | PharMerica Corporationa | $ | 277,359 | ||
| 25,000 | Phase Forward, Inc.a | 313,000 | |||
| 35,200 | PSS World Medical, Inc.a,b | 662,464 | |||
| 36,600 | Regeneron Pharmaceuticals, Inc.a | 671,976 | |||
| 10,600 | RehabCare Group, Inc.a | 160,696 | |||
| 15,000 | Res-Care, Inc.a | 225,300 | |||
| 28,000 | Salix Pharmaceuticals, Ltd.a,b | 247,240 | |||
| 27,500 | Savient Pharmaceuticals, Inc.a | 159,225 | |||
| 8,900 | SurModics, Inc.a,b | 224,903 | |||
| 20,900 | Symmetry Medical, Inc.a | 166,573 | |||
| 19,400 | Theragenics Corporationa | 22,698 | |||
| 45,800 | ViroPharma, Inc.a | 596,316 | |||
| 19,000 | West Pharmaceutical Services, Inc.b | 717,630 | |||
| 12,200 | Zoll Medical Corporationa | 230,458 | |||
| Total Health Care | 26,196,486 | ||||
| Industrials (18.7%) | |||||
| 13,200 | A.O. Smith Corporationb | 389,664 | |||
| 22,500 | AAR Corporationa | 414,225 | |||
| 25,700 | ABM Industries, Inc. | 489,585 | |||
| 28,300 | Actuant Corporation | 538,266 | |||
| 23,500 | Acuity Brands, Inc. | 820,385 | |||
| 12,800 | Administaff, Inc. | 276,992 | |||
| 15,600 | Albany International Corporation | 199,680 | |||
| 16,300 | Apogee Enterprises, Inc. | 168,868 | |||
| 21,250 | Applied Industrial Technologies, Inc. | 402,050 | |||
| 7,500 | Applied Signal Technology, Inc. | 134,550 | |||
| 14,800 | Arkansas Best Corporation | 445,628 | |||
| 11,400 | Astec Industries, Inc.a | 357,162 | |||
| 5,400 | Axsys Technologies, Inc.a | 296,244 | |||
| 26,900 | Baldor Electric Company | 480,165 | |||
| 25,100 | Barnes Group, Inc. | 363,950 | |||
| 27,025 | Belden, Inc.b | 564,282 | |||
| 15,800 | Bowne & Company, Inc. | 92,904 | |||
| 30,400 | Brady Corporation | 728,080 | |||
| 29,000 | Briggs & Stratton Corporationb | 510,110 | |||
| 15,400 | C&D Technologies, Inc.a,b | 48,202 | |||
| 5,000 | Cascade Corporation | 149,300 | |||
| 7,500 | CDI Corporation | 97,050 | |||
| 15,250 | Ceradyne, Inc.a | 309,728 | |||
| 10,000 | Circor International, Inc. | 275,000 | |||
| 29,600 | CLARCOR, Inc. | 982,128 | |||
| 6,600 | Consolidated Graphics, Inc.a | 149,424 | |||
| 9,100 | Cubic Corporation | 247,520 | |||
| 26,200 | Curtiss-Wright Corporation | 874,818 | |||
| 38,100 | EMCOR Group, Inc.a | 854,583 | |||
| 11,800 | EnPro Industries, Inc.a | 254,172 | |||
| 17,200 | Esterline Technologies Corporationa | 651,708 | |||
| 16,900 | Forward Air Corporationb | 410,163 | |||
| 11,100 | G & K Services, Inc. | 224,442 | |||
| 30,100 | Gardner Denver, Inc.a | 702,534 | |||
| 28,600 | GenCorp, Inc.a | 105,248 | |||
| 29,700 | Geo Group, Inc.a | 535,491 | |||
| 15,800 | Gibraltar Industries, Inc. | 188,652 | |||
| 28,330 | Griffon Corporationa | 264,319 | |||
| 25,125 | Healthcare Services Group, Inc. | 400,241 | |||
| 32,548 | Heartland Express, Inc. | 512,956 | |||
| 9,600 | Heidrick & Struggles International, Inc. | 206,784 | |||
| 21,900 | Hub Group, Inc.a | 581,007 | |||
| 14,200 | II-VI, Inc.a | 271,078 | |||
| 16,200 | Insituform Technologies, Inc.a | 318,978 | |||
| 32,800 | Interface, Inc. | 152,192 | |||
| 16,100 | John Bean Technologies Corporation | 131,537 | |||
| 14,900 | Kaman Corporation | 270,137 | |||
| 19,900 | Kaydon Corporationb | 683,565 | |||
| 31,100 | Kirby Corporationa | 850,896 | |||
| 33,350 | Knight Transportation, Inc.b | 537,602 | |||
| 30,500 | Landstar System, Inc. | 1,172,115 | |||
| 2,500 | Lawson Products, Inc. | 57,125 | |||
| 27,436 | Lennox International, Inc. | 885,908 | |||
| 7,050 | Lindsay Manufacturing Company | 224,120 | |||
| 9,800 | Lydall, Inc.a | 56,350 | |||
| 17,900 | MagneTek, Inc.a | 42,960 | |||
| 20,300 | Mobile Mini, Inc.a,b | 292,726 | |||
| 24,850 | Moog, Inc.a | 908,764 | |||
| 21,600 | Mueller Industries, Inc. | 541,728 | |||
| 11,600 | NCI Building Systems, Inc.a | 189,080 | |||
| 16,050 | Old Dominion Freight Line, Inc.a | 456,783 | |||
| 20,900 | On Assignment, Inc.a | 118,503 | |||
| 34,200 | Orbital Sciences Corporationa,b | 667,926 | |||
| 21,975 | Quanex Building Products Corporation | 205,906 | |||
| 18,800 | Regal-Beloit Corporation | 714,212 | |||
| 20,200 | Robbins & Myers, Inc. | 326,634 | |||
| 9,400 | School Specialty, Inc.a,b | 179,728 | |||
| 21,800 | Simpson Manufacturing Company, Inc.b | 605,168 | |||
| 33,200 | SkyWest, Inc. | 617,520 | |||
| 30,100 | Spherion Corporationa | 66,521 | |||
| 7,400 | Standard Register Company | 66,082 | |||
| 7,300 | Standex International Corporation | 144,832 | |||
| 20,900 | Teledyne Technologies, Inc.a | 931,095 | |||
| 34,906 | Tetra Tech, Inc.a | 842,980 | |||
| 20,700 | Toro Companyb | 683,100 | |||
| 11,300 | Tredegar Corporation | 205,434 | |||
| 9,600 | Triumph Group, Inc. | 407,616 | |||
| 25,200 | TrueBlue, Inc.a | 241,164 | |||
| 13,700 | United Stationers, Inc.a,b | 458,813 | |||
| 9,800 | Universal Forest Products, Inc. | 263,718 | |||
| 10,200 | Valmont Industries, Inc. | 625,872 | |||
| 12,000 | Viad Corporation | 296,880 | |||
| 11,500 | Vicor Corporation | 76,015 | |||
| 7,500 | Volt Information Sciences, Inc.a | 54,225 | |||
| 18,000 | Wabash National Corporation | 81,000 | |||
| 16,450 | Watsco, Inc.b | 631,680 | |||
| 24,800 | Watson Wyatt Worldwide, Inc. | 1,185,936 | |||
| 17,000 | Watts Water Technologies, Inc. | 424,490 | |||
| Total Industrials | 35,864,954 | ||||
| Information Technology (16.0%) | |||||
| 15,100 | Actel Corporationa | 176,972 | |||
| 71,100 | Adaptec, Inc.a | 234,630 | |||
| 19,100 | Advanced Energy Industries, Inc.a | 190,045 | |||
| 13,300 | Agilysys, Inc. | 57,057 | |||
| 17,400 | Anixter International, Inc.a,b | 524,088 | |||
| 71,623 | Arris Group, Inc.a,b | 569,403 | |||
| 18,700 | ATMI, Inc.a | 288,541 | |||
| 17,813 | Avid Technology, Inc.a | 194,340 | |||
| 60,100 | Axcelis Technologies, Inc.a | 30,651 | |||
| 8,100 | Bankrate, Inc.a,b | 307,800 | |||
The accompanying Notes to Financial Statements are an integral part of this schedule.
128
Table of Contents
Small Cap Index Portfolio
Schedule of Investments as of December 31, 2008
| Shares | Common Stock (99.6%) | Value | |||
| Information Technology (16.0%) - continued | |||||
| 6,800 | Bel Fuse, Inc. | $ | 144,160 | ||
| 37,950 | Benchmark Electronics, Inc.a,b | 484,621 | |||
| 10,300 | Black Box Corporation | 269,036 | |||
| 25,200 | Blackbaud, Inc. | 340,200 | |||
| 22,700 | Blue Coat Systems, Inc.a,b | 190,680 | |||
| 30,000 | Brightpoint, Inc.a | 130,500 | |||
| 37,007 | Brooks Automation, Inc.a | 215,011 | |||
| 13,600 | Cabot Microelectronics Corporationa | 354,552 | |||
| 17,400 | CACI International, Inc.a | 784,566 | |||
| 4,700 | Catapult Communications Corporationa | 30,879 | |||
| 22,600 | Checkpoint Systems, Inc.a | 222,384 | |||
| 31,200 | CIBER, Inc.a | 150,072 | |||
| 23,100 | Cognex Corporation | 341,880 | |||
| 13,600 | Cohu, Inc. | 165,240 | |||
| 14,400 | Comtech Telecommunications Corporationa | 659,808 | |||
| 24,700 | Concur Technologies, Inc.a | 810,654 | |||
| 20,400 | CSG Systems International, Inc.a | 356,388 | |||
| 19,700 | CTS Corporation | 108,547 | |||
| 40,525 | CyberSource Corporationa | 485,895 | |||
| 17,300 | Cymer, Inc.a | 379,043 | |||
| 84,400 | Cypress Semiconductor Corporationa | 377,268 | |||
| 20,000 | Daktronics, Inc.b | 187,200 | |||
| 23,200 | DealerTrack Holdings, Inc.a | 275,848 | |||
| 14,900 | Digi International, Inc.a | 120,839 | |||
| 18,950 | Diodes, Inc.a | 114,837 | |||
| 15,700 | DSP Group, Inc.a | 125,914 | |||
| 15,800 | Electro Scientific Industries, Inc.a | 107,282 | |||
| 8,900 | EMS Technologies, Inc.a | 230,243 | |||
| 34,900 | Epicor Software Corporationa,b | 167,520 | |||
| 20,700 | EPIQ Systems, Inc.a,b | 345,897 | |||
| 25,100 | Exar Corporationa | 167,417 | |||
| 9,800 | Faro Technologies, Inc.a | 165,228 | |||
| 21,600 | FEI Companya | 407,376 | |||
| 9,000 | Forrester Research, Inc.a | 253,890 | |||
| 14,100 | Gerber Scientific, Inc.a | 72,051 | |||
| 14,400 | Gevity HR, Inc. | 21,744 | |||
| 55,400 | Harmonic, Inc.a,b | 310,794 | |||
| 14,300 | Heartland Payment Systems, Inc.b | 250,250 | |||
| 11,200 | Hittite Microwave Corporationa | 329,952 | |||
| 13,400 | Hutchinson Technology, Inc.a,b | 46,632 | |||
| 51,100 | Informatica Corporationa | 701,603 | |||
| 20,100 | InfoSpace, Inc. | 151,755 | |||
| 26,675 | Insight Enterprises, Inc.a | 184,058 | |||
| 10,000 | Integral Systems, Inc.a | 120,500 | |||
| 26,000 | Intermec, Inc.a | 345,280 | |||
| 26,800 | Interwoven, Inc.a | 337,680 | |||
| 12,800 | Intevac, Inc.a | 64,896 | |||
| 20,100 | Itron, Inc.a | 1,281,174 | |||
| 25,500 | J2 Global Communication, Inc.a | 511,020 | |||
| 16,000 | JDA Software Group, Inc.a | 210,080 | |||
| 8,000 | Keithley Instruments, Inc. | 29,200 | |||
| 16,800 | Knot, Inc.a,b | 139,776 | |||
| 39,600 | Kopin Corporationa | 80,784 | |||
| 31,300 | Kulicke and Soffa Industries, Inc.a,b | 53,210 | |||
| 12,700 | Littelfuse, Inc.a | 210,820 | |||
| 10,200 | LoJack Corporationa | 42,024 | |||
| 14,100 | Manhattan Associates, Inc.a | 222,921 | |||
| 10,700 | MAXIMUS, Inc. | 375,677 | |||
| 13,300 | Mercury Computer Systems, Inc.a | 83,923 | |||
| 22,100 | Methode Electronics, Inc. | 148,954 | |||
| 28,100 | Micrel, Inc. | 205,411 | |||
| 46,800 | MICROS Systems, Inc.a | 763,776 | |||
| 47,200 | Microsemi Corporationa | 596,608 | |||
| 28,600 | MKS Instruments, Inc.a | 422,994 | |||
| 9,900 | MTS Systems Corporation | 263,736 | |||
| 20,600 | NETGEAR, Inc.a | 235,046 | |||
| 17,200 | Network Equipment Technologies, Inc.a | 49,536 | |||
| 21,000 | Newport Corporationa | 142,380 | |||
| 17,700 | Novatel Wireless, Inc.a | 82,128 | |||
| 11,950 | Park Electrochemical Corporationb | 226,572 | |||
| 10,700 | PC TEL, Inc. | 70,299 | |||
| 18,900 | Perficient, Inc.a | 90,342 | |||
| 15,000 | Pericom Semiconductor Corporationa | 82,200 | |||
| 16,800 | Phoenix Technologies, Ltd.a | 58,800 | |||
| 22,900 | Plexus Corporationa | 388,155 | |||
| 23,300 | Progress Software Corporationa | 448,758 | |||
| 10,500 | Quality Systems, Inc.b | 458,010 | |||
| 16,100 | Radiant Systems, Inc.a | 54,257 | |||
| 13,400 | RadiSys Corporationa | 74,102 | |||
| 10,600 | Rogers Corporationa | 294,362 | |||
| 17,900 | Rudolph Technologies, Inc.a | 63,187 | |||
| 15,400 | ScanSource, Inc.a | 296,758 | |||
| 96,600 | Skyworks Solutions, Inc.a | 535,164 | |||
| 16,300 | Smith Micro Software, Inc.a | 90,628 | |||
| 15,500 | Sonic Solutions, Inc.a,b | 27,280 | |||
| 10,600 | SPSS, Inc.a | 285,776 | |||
| 13,000 | Standard Microsystems Corporationa | 212,420 | |||
| 6,800 | StarTek, Inc.a | 30,260 | |||
| 11,800 | Stratasys, Inc.a,b | 126,850 | |||
| 7,500 | Supertex, Inc.a | 180,075 | |||
| 19,400 | Sykes Enterprises, Inc.a | 370,928 | |||
| 25,950 | Symmetricom, Inc.a | 102,502 | |||
| 19,600 | Synaptics, Inc.a,b | 324,576 | |||
| 11,000 | Synnex Corporationa | 124,630 | |||
| 45,150 | Take-Two Interactive Software, Inc.a | 341,334 | |||
| 17,800 | Taleo Corporationa | 139,374 | |||
| 24,000 | Technitrol, Inc. | 83,520 | |||
| 38,500 | Tekelec, Inc.a | 513,590 | |||
| 39,037 | THQ, Inc.a | 163,565 | |||
| 7,800 | Tollgrade Communications, Inc.a | 37,284 | |||
| 85,000 | TriQuint Semiconductor, Inc.a | 292,400 | |||
| 25,000 | TTM Technologies, Inc.a,b | 130,250 | |||
| 17,200 | Tyler Technologies, Inc.a | 206,056 | |||
| 13,700 | Ultratech, Inc.a | 163,852 | |||
| 47,700 | United Online, Inc. | 289,539 | |||
| 42,275 | Varian Semiconductor Equipment Associates, Inc.a,b | 766,023 | |||
| 18,800 | Veeco Instruments, Inc.a | 119,192 | |||
| 15,900 | ViaSat, Inc.a | 382,872 | |||
| 26,200 | Websense, Inc.a | 392,214 | |||
| 22,500 | Wright Express Corporationa | 283,500 | |||
| Total Information Technology | 30,654,231 | ||||
The accompanying Notes to Financial Statements are an integral part of this schedule.
129
Table of Contents
Small Cap Index Portfolio
Schedule of Investments as of December 31, 2008
| Shares | Common Stock (99.6%) | Value | ||||
| Materials (3.9%) | ||||||
| 15,300 | A. Schulman, Inc. | $ | 260,100 | |||
| 9,700 | A.M. Castle & Company | 105,051 | ||||
| 13,100 | AMCOL International Corporation | 274,445 | ||||
| 14,600 | Arch Chemicals, Inc. | 380,622 | ||||
| 10,700 | Balchem Corporation | 266,537 | ||||
| 11,900 | Brush Engineered Materials, Inc.a | 151,368 | ||||
| 22,600 | Buckeye Technologies, Inc.a | 82,264 | ||||
| 31,500 | Calgon Carbon Corporationa,b | 483,840 | ||||
| 21,400 | Century Aluminum Companya | 214,000 | ||||
| 6,600 | Clearwater Paper Corporationa | 55,374 | ||||
| 6,200 | Deltic Timber Corporation | 283,650 | ||||
| 25,300 | Eagle Materials, Inc. | 465,773 | ||||
| 17,500 | Georgia Gulf Corporationb | 18,725 | ||||
| 28,300 | H.B. Fuller Companyb | 455,913 | ||||
| 24,600 | Headwaters, Inc.a | 166,050 | ||||
| 16,463 | Myers Industries, Inc. | 131,704 | ||||
| 8,600 | Neenah Paper, Inc. | 76,024 | ||||
| 7,200 | NewMarket Corporation | 251,352 | ||||
| 5,300 | Olympic Steel, Inc. | 107,961 | ||||
| 17,700 | OM Group, Inc.a | 373,647 | ||||
| 6,600 | Penford Corporation | 66,792 | ||||
| 54,000 | PolyOne Corporationa | 170,100 | ||||
| 6,400 | Quaker Chemical Corporation | 105,280 | ||||
| 22,200 | Rock-Tenn Company | 758,796 | ||||
| 13,400 | RTI International Metals, Inc.a,b | 191,754 | ||||
| 9,000 | Schweitzer-Mauduit International, Inc. | 180,180 | ||||
| 4,300 | Stepan Company | 202,057 | ||||
| 16,000 | Texas Industries, Inc.b | 552,000 | ||||
| 28,500 | Wausau Paper Corporation | 326,040 | ||||
| 12,650 | Zep, Inc. | 244,272 | ||||
| Total Materials | 7,401,671 | |||||
| Telecommunications Services (0.2%) | ||||||
| 51,900 | FairPoint Communications, Inc.b | 170,232 | ||||
| 25,800 | General Communication, Inc.a | 208,722 | ||||
| Total Telecommunications Services | 378,954 | |||||
| Utilities (5.5%) | ||||||
| 15,533 | ALLETE, Inc. | 501,250 | ||||
| 10,150 | American States Water Company | 334,747 | ||||
| 53,100 | Atmos Energy Corporation | 1,258,470 | ||||
| 31,800 | Avista Corporation | 616,284 | ||||
| 6,700 | Central Vermont Public Service Corporation | 159,862 | ||||
| 9,300 | CH Energy Group, Inc.b | 477,927 | ||||
| 35,200 | Cleco Corporationb | 803,616 | ||||
| 26,200 | El Paso Electric Companya | 473,958 | ||||
| 12,900 | Laclede Group, Inc. | 604,236 | ||||
| 24,650 | New Jersey Resources Corporation | 969,977 | ||||
| 15,500 | Northwest Natural Gas Companyb | 685,565 | ||||
| 42,700 | Piedmont Natural Gas Company, Inc.b | 1,352,309 | ||||
| 17,400 | South Jersey Industries, Inc.b | 693,390 | ||||
| 25,700 | Southwest Gas Corporation | 648,154 | ||||
| 14,766 | UIL Holdings Corporation | 443,423 | ||||
| 20,700 | UniSource Energy Corporation | 607,752 | ||||
Total Utilities | 10,630,920 | |||||
Total Common Stock (cost $224,801,031) | 191,324,963 | |||||
| Shares | Collateral Held for Securities Loaned (23.1%) | Value | ||||
| 44,468,815 | Thrivent Financial Securities Lending Trust | 44,468,815 | ||||
Total Collateral Held for Securities Loaned (cost $44,468,815) | 44,468,815 | |||||
| Shares or Principal Amount | Short-Term Investments (0.8%)c | Value | ||||
| 600,000 | Federal National Mortgage Association Discount Notes 0.400%, 5/14/2009d | 599,119 | ||||
| 968,867 | Thrivent Money Market Portfolio | 968,867 | ||||
Total Short-Term Investments | 1,567,986 | |||||
Total Investments | $ | 237,361,764 | ||||
Other Assets and Liabilities, Net (23.5%) | (45,168,143 | ) | ||||
Total Net Assets 100.0% | $ | 192,193,621 | ||||
| a | Non-income producing security. |
| b | All or a portion of the security is on loan as discussed in item 2(M) of the Notes to Financial Statements. |
| c | The interest rate shown reflects the yield, coupon rate or, for securities purchased at a discount, the discount rate at the date of purchase. d At December 31, 2008, $599,119 of investments were held on deposit with the counterparty and pledged as the initial margin deposit for open financial futures contracts. |
Gross unrealized appreciation and depreciation of investments, based on cost for federal income tax purposes, were as follows:
Gross unrealized appreciation | $ | 38,423,542 | ||
Gross unrealized depreciation | (74,943,123 | ) | ||
Net unrealized appreciation (depreciation) | $ | (36,519,581 | ) | |
Cost for federal income tax purposes | $ | 273,881,345 |
The accompanying Notes to Financial Statements are an integral part of this schedule.
130
Table of Contents
Small Cap Index Portfolio
Schedule of Investments as of December 31, 2008
The following table is a summary of the inputs used, as of December 31, 2008, in valuing the Small Cap Index Portfolio’s assets carried at fair value as discussed in item 2(A) of the Notes to Financial Statements.
Level | Investments in Securities | Other Financial Instruments* | ||||
Level 1 | $ | 236,762,645 | $ | 103,236 | ||
Level 2 | 599,119 | — | ||||
Level 3 | — | — | ||||
Totals (Level 1,2,3) | $ | 237,361,764 | $ | 103,236 | ||
| * | Other Financial Instruments include Futures, Forwards, Written Options and Swap agreements. |
Futures | Number of Contracts Long/(Short) | Expiration Date | Notional Principal Amount | Value | Unrealized Gain/(Loss) | ||||||||
Russell 2000 Index Mini-Futures | 45 | March 2009 | $ | 2,137,314 | $ | 2,240,550 | $ | 103,236 | |||||
Total Futures | $ | 103,236 | |||||||||||
Investment in Affiliates
Affiliated issuers, as defined under the Investment Company Act of 1940, include those in which the Portfolio’s holdings of an issuer represent 5% or more of the outstanding voting securities of an issuer, or any affiliated mutual fund.
A summary of transactions for the fiscal year to date, in Small Cap Index Portfolio, is as follows:
Portfolio | Value December 31, 2007 | Gross Purchases and Additions | Gross Sales and Reductions | Balance of Shares Held at December 31, 2008 | Value December 31, 2008 | Income Earned January 1, 2008 - December 31, 2008 | |||||||||||
Money Market | $ | 5,078,004 | $ | 57,663,691 | $ | 61,772,828 | 968,867 | $ | 968,867 | $ | 91,700 | ||||||
Thrivent Financial Securities | |||||||||||||||||
Lending Trust | 111,638,911 | 255,580,954 | 322,751,050 | 44,468,815 | 44,468,815 | 1,241,878 | |||||||||||
Total Value and Income Earned | 116,716,915 | 45,437,682 | 1,333,578 | ||||||||||||||
The accompanying Notes to Financial Statements are an integral part of this schedule.
131
Table of Contents
Schedule of Investments as of December 31, 2008
Shares | Common Stock (95.7%) | Value | |||
| Consumer Discretionary (20.9%) | |||||
| 38,500 | Bed Bath & Beyond, Inc.a | $ | 978,670 | ||
| 99,700 | Burger King Holdings, Inc. | 2,380,836 | |||
| 14,500 | Central European Media Enterprises, Ltd.a,b | 314,940 | |||
| 249,000 | Chico’s FAS, Inc.a,b | 1,040,820 | |||
| 260,200 | Coldwater Creek, Inc.a | 741,570 | |||
| 57,500 | Corinthian Colleges, Inc.a,b | 941,275 | |||
| 35,900 | DeVry, Inc. | 2,061,019 | |||
| 25,600 | Discovery Communications, Inc.a | 362,496 | |||
| 25,600 | Discovery Communications, Inc., Class Ca | 342,784 | |||
| 80,400 | Gentex Corporation | 709,932 | |||
| 129,100 | Goodyear Tire & Rubber Companya | 770,727 | |||
| 44,500 | Jack in the Box, Inc.a | 983,005 | |||
| 118,300 | Leapfrog Enterprises, Inc.a | 414,050 | |||
| 35,900 | Marvel Entertainment, Inc.a | 1,103,925 | |||
| 97,700 | Quiksilver, Inc.a | 179,768 | |||
| 16,900 | Toll Brothers, Inc.a | 362,167 | |||
| 91,900 | WMS Industries, Inc.a | 2,472,110 | |||
| 94,600 | Zumiez, Inc.a,b | 704,770 | |||
| Total Consumer Discretionary | 16,864,864 | ||||
| Consumer Staples (1.2%) | |||||
| 41,300 | Pepsi Bottling Group, Inc. | 929,663 | |||
| Total Consumer Staples | 929,663 | ||||
| Energy (7.7%) | |||||
| 37,100 | Dril-Quip, Inc.a | 760,921 | |||
| 29,500 | Forest Oil Corporationa | 486,455 | |||
| 27,600 | Oil States International, Inc.a | 515,844 | |||
| 51,400 | Petrohawk Energy Corporationa | 803,382 | |||
| 43,000 | Sunoco, Inc. | 1,868,780 | |||
| 40,400 | Ultra Petroleum Corporationa | 1,394,204 | |||
| 48,300 | Willbros Group, Inc.a | 409,101 | |||
| Total Energy | 6,238,687 | ||||
| Financials (9.0%) | |||||
| 72,100 | Hudson City Bancorp, Inc. | 1,150,716 | |||
| 12,000 | Intercontinental Exchange, Inc.a | 989,280 | |||
| 31,200 | Lazard, Ltd. | 927,888 | |||
| 12,600 | Northern Trust Corporation | 656,964 | |||
| 47,100 | T. Rowe Price Group, Inc.b | 1,669,224 | |||
| 130,500 | TD Ameritrade Holding Corporationa | 1,859,625 | |||
| Total Financials | 7,253,697 | ||||
| Health Care (5.4%) | |||||
| 81,200 | Amylin Pharmaceuticals, Inc.a,b | 881,020 | |||
| 18,000 | Beckman Coulter, Inc. | 790,920 | |||
| 26,600 | Myriad Genetics, Inc.a,b | 1,762,516 | |||
| 20,900 | Shire Pharmaceuticals Group plc ADR | 935,902 | |||
| Total Health Care | 4,370,358 | ||||
| Industrials (15.5%) | |||||
| 140,300 | AMR Corporationa | 1,497,001 | |||
| 64,200 | BE Aerospace, Inc.a | 493,698 | |||
| 31,900 | C.H. Robinson Worldwide, Inc. | 1,755,457 | |||
| 67,600 | Delta Air Lines, Inc.a | 774,696 | |||
| 15,900 | Flowserve Corporation | 818,850 | |||
| 17,600 | Foster Wheeler, Ltd.a | 411,488 | |||
| 33,300 | JB Hunt Transport Services, Inc.b | 874,791 | |||
| 52,260 | Monster Worldwide, Inc.a | 631,824 | |||
| 15,600 | Precision Castparts Corporation | 927,888 | |||
| 59,300 | Quanta Services, Inc.a | 1,174,140 | |||
| 62,900 | Ryanair Holdings plca | 1,829,132 | |||
| 15,900 | Stericycle, Inc.a | 828,072 | |||
| 13,900 | SunPower Corporationa,b | 514,300 | |||
| Total Industrials | 12,531,337 | ||||
| Information Technology (24.8%) | |||||
| 213,032 | Activision Blizzard, Inc.a | 1,840,596 | |||
| 49,187 | Akamai Technologies, Inc.a | 742,232 | |||
| 63,800 | ASML Holding NV ADR | 1,152,866 | |||
| 72,100 | Broadcom Corporationa | 1,223,537 | |||
| 92,200 | F5 Networks, Inc.a | 2,107,692 | |||
| 66,700 | FormFactor, Inc.a | 973,820 | |||
| 43,600 | Hittite Microwave Corporationa | 1,284,456 | |||
| 167,900 | Marvell Technology Group, Ltd.a | 1,119,893 | |||
| 71,700 | Mercadolibre, Inc.a,b | 1,176,597 | |||
| 61,000 | NETAPP, Inc.a | 852,170 | |||
| 50,200 | Nuance Communications, Inc.a | 520,072 | |||
| 185,400 | NVIDIA Corporationa | 1,496,178 | |||
| 59,600 | Omniture, Inc.a | 634,144 | |||
| 115,500 | PMC-Sierra, Inc.a | 561,330 | |||
| 47,300 | Polycom, Inc.a | 639,023 | |||
| 96,200 | Seagate Technology | 426,166 | |||
| 48,500 | Synaptics, Inc.a,b | 803,160 | |||
| 67,800 | Synopsys, Inc.a | 1,255,656 | |||
| 31,400 | VeriSign, Inc.a | 599,112 | |||
| 26,100 | VMware, Inc.a | 618,309 | |||
| Total Information Technology | 20,027,009 | ||||
| Materials (7.9%) | |||||
| 42,100 | Celanese Corporation | 523,303 | |||
| 66,100 | Owens-Illinois, Inc.a | 1,806,513 | |||
| 123,200 | Pactiv Corporationa | 3,065,216 | |||
| 86,000 | Steel Dynamics, Inc. | 961,480 | |||
| Total Materials | 6,356,512 | ||||
| Telecommunications Services (3.3%) | |||||
| 77,100 | Clearwire Corporationa,b | 380,103 | |||
| 39,300 | NII Holdings, Inc.a,b | 714,474 | |||
| 47,300 | SBA Communications Corporationa | 771,936 | |||
| 98,800 | TW Telecom, Inc.a | 836,836 | |||
Total Telecommunications Services | 2,703,349 | ||||
Total Common Stock (cost $93,343,262) | 77,275,476 | ||||
| Shares | Collateral Held for Securities Loaned (6.7%) | Value | |||
| 5,387,577 | Thrivent Financial Securities | ||||
Lending Trust | 5,387,577 | ||||
Total Collateral Held for Securities Loaned (cost $5,387,577) | 5,387,577 | ||||
The accompanying Notes to Financial Statements are an integral part of this schedule.
132
Table of Contents
Mid Cap Growth Portfolio II
Schedule of Investments as of December 31, 2008
| Shares | Short-Term Investments (4.5%) | Value | ||||
| 3,679,661 | Thrivent Money Market Portfolio | $ | 3,679,661 | |||
| Total Short-Term Investments (at amortized cost) | 3,679,661 | |||||
| Total Investments (cost $102,410,500) 106.9% | $ | 86,342,714 | ||||
| Other Assets and Liabilities, Net (6.9%) | (5,571,835 | ) | ||||
| Total Net Assets 100.0% | $ | 80,770,879 | ||||
| a | Non-income producing security. |
| b | All or a portion of the security is on loan as discussed in item 2(M) of the Notes to Financial Statements. |
Definitions:
| ADR - | American Depositary Receipt, which are certificates for an underlying foreign security’s shares held by an issuing U.S. depository bank. |
Gross unrealized appreciation and depreciation of investments, based on cost for federal income tax purposes, were as follows:
Gross unrealized appreciation | $ | 1,598,859 | ||
Gross unrealized depreciation | (18,215,898 | ) | ||
Net unrealized appreciation (depreciation) | $ | (16,617,039 | ) | |
Cost for federal income tax purposes | $ | 102,959,753 |
The following table is a summary of the inputs used, as of December 31, 2008, in valuing the Mid Cap Growth Portfolio II’s assets carried at fair value as discussed in item 2(A) of the Notes to Financial Statements.
Level | Investments in Securities | Other Financial Instruments* | ||||
Level 1 | $ | 86,342,714 | $ | — | ||
Level 2 | — | — | ||||
Level 3 | — | — | ||||
Totals (Level 1,2,3) | $ | 86,342,714 | $ | — | ||
| * | Other Financial Instruments include Futures, Forwards, Written Options and Swap agreements. |
Investment in Affiliates
Affiliated issuers, as defined under the Investment Company Act of 1940, include those in which the Portfolio’s holdings of an issuer represent 5% or more of the outstanding voting securities of an issuer, or any affiliated mutual fund.
A summary of transactions for the fiscal year to date, in Mid Cap Growth Portfolio II, is as follows:
Portfolio | Value December 31, 2007 | Gross Purchases and Additions | Gross Sales and Reductions | Balance of Shares Held at December 31, 2008 | Value December 31, 2008 | Income Earned January 1, 2008 - December 31, 2008 | |||||||||||
Money Market | $ | 1,395,723 | $ | 24,105,846 | $ | 21,821,908 | 3,679,661 | $ | 3,679,661 | $ | 43,392 | ||||||
Thrivent Financial Securities Lending Trust | 2,273,125 | 47,129,330 | 44,014,878 | 5,387,577 | 5,387,577 | 77,691 | |||||||||||
Total Value and Income Earned | 3,668,848 | 9,067,238 | 121,083 | ||||||||||||||
The accompanying Notes to Financial Statements are an integral part of this schedule.
133
Table of Contents
Schedule of Investments as of December 31, 2008
| Shares | Common Stock (96.2%) | Value | |||
| Consumer Discretionary (20.2%) | |||||
| 72,400 | Bed Bath & Beyond, Inc.a | $ | 1,840,408 | ||
| 234,800 | Burger King Holdings, Inc. | 5,607,024 | |||
| 33,300 | Central European Media Enterprises, Ltd.a,b | 723,276 | |||
| 557,700 | Chico’s FAS, Inc.a | 2,331,186 | |||
| 734,900 | Coldwater Creek, Inc.a,b | 2,094,465 | |||
| 195,200 | Corinthian Colleges, Inc.a,b | 3,195,424 | |||
| 102,600 | DeVry, Inc. | 5,890,266 | |||
| 91,150 | Discovery Communications, Inc.a | 1,290,684 | |||
| 91,150 | Discovery Communications, Inc., Class Ca | 1,220,499 | |||
| 214,400 | Gentex Corporation | 1,893,152 | |||
| 306,300 | Goodyear Tire & Rubber Companya | 1,828,611 | |||
| 38,600 | Guess?, Inc. | 592,510 | |||
| 92,500 | Harley-Davidson, Inc.b | 1,569,725 | |||
| 80,500 | Hasbro, Inc. | 2,348,185 | |||
| 110,600 | International Game Technology | 1,315,034 | |||
| 37,800 | ITT Educational Services, Inc.a,b | 3,590,244 | |||
| 98,100 | Jack in the Box, Inc.a | 2,167,029 | |||
| 292,700 | Leapfrog Enterprises, Inc.a | 1,024,450 | |||
| 84,900 | Marvel Entertainment, Inc.a | 2,610,675 | |||
| 281,000 | Quiksilver, Inc.a | 517,040 | |||
| 242,000 | Texas Roadhouse, Inc.a,b | 1,875,500 | |||
| 55,400 | Toll Brothers, Inc.a | 1,187,222 | |||
| 31,100 | VF Corporation | 1,703,347 | |||
| 199,200 | WMS Industries, Inc.a | 5,358,480 | |||
| 240,800 | Zumiez, Inc.a,b | 1,793,960 | |||
Total Consumer Discretionary | 55,568,396 | ||||
| Consumer Staples (1.4%) | |||||
| 57,100 | Green Mountain Coffee Roasters, Inc.a,b | 2,209,770 | |||
| 72,700 | Pepsi Bottling Group, Inc. | 1,636,477 | |||
| Total Consumer Staples | 3,846,247 | ||||
Energy (7.3%) | |||||
| 56,500 | Cameron International Corporationa | 1,158,250 | |||
| 25,600 | Diamond Offshore Drilling, Inc. | 1,508,864 | |||
| 133,600 | Dril-Quip, Inc.a | 2,740,136 | |||
| 104,400 | Forest Oil Corporationa | 1,721,556 | |||
| 78,400 | Oil States International, Inc.a | 1,465,296 | |||
| 143,900 | Petrohawk Energy Corporationa | 2,249,157 | |||
| 91,700 | Sunoco, Inc. | 3,985,282 | |||
| 113,700 | Ultra Petroleum Corporationa | 3,923,787 | |||
| 167,600 | Willbros Group, Inc.a,b | 1,419,572 | |||
Total Energy | 20,171,900 | ||||
| Financials (7.9%) | |||||
| 183,400 | Hudson City Bancorp, Inc. | 2,927,064 | |||
| 23,900 | IntercontinentalExchange, Inc.a | 1,970,316 | |||
| 98,300 | Lazard, Ltd. | 2,923,442 | |||
| 158,700 | New York Community Bancorp, Inc. | 1,898,052 | |||
| 35,700 | Northern Trust Corporation | 1,861,398 | |||
| 157,600 | T. Rowe Price Group, Inc.b | 5,585,344 | |||
| 309,500 | TD Ameritrade Holding Corporationa | 4,410,375 | |||
Total Financials | 21,575,991 | ||||
| Health Care (10.9%) | |||||
| 101,200 | Amylin Pharmaceuticals, Inc.a,b | 1,098,020 | |||
| 38,000 | Beckman Coulter, Inc. | 1,669,720 | |||
| 134,700 | BioMarin Pharmaceutical, Inc.a,b | 2,397,660 | |||
| 47,200 | C.R. Bard, Inc. | 3,977,072 | |||
| 17,400 | Cephalon, Inc.a,b | 1,340,496 | |||
| 33,900 | Express Scripts, Inc.a | 1,863,822 | |||
| 38,700 | Genzyme Corporationa | 2,568,519 | |||
| 118,500 | Hologic, Inc.a | 1,548,795 | |||
| 81,400 | Illumina, Inc.a,b | 2,120,470 | |||
| 52,500 | Millipore Corporationa | 2,704,800 | |||
| 70,100 | Myriad Genetics, Inc.a | 4,644,826 | |||
| 64,000 | Shire Pharmaceuticals Group plc ADR | 2,865,920 | |||
| 33,200 | Waters Corporationa | 1,216,780 | |||
Total Health Care | 30,016,900 | ||||
| Industrials (14.5%) | |||||
| 395,900 | AMR Corporationa,b | 4,224,253 | |||
| 166,600 | BE Aerospace, Inc.a | 1,281,154 | |||
| 72,600 | C.H. Robinson Worldwide, Inc. | 3,995,178 | |||
| 176,200 | Delta Air Lines, Inc.a | 2,019,252 | |||
| 51,220 | Expeditors International of Washington, Inc. | 1,704,089 | |||
| 46,900 | Flowserve Corporation | 2,415,350 | |||
| 60,200 | Foster Wheeler, Ltd.a | 1,407,476 | |||
| 17,200 | FTI Consulting, Inc.a | 768,496 | |||
| 103,300 | JB Hunt Transport Services, Inc.b | 2,713,691 | |||
| 29,150 | Joy Global, Inc. | 667,244 | |||
| 142,700 | Monster Worldwide, Inc.a,b | 1,725,243 | |||
| 83,300 | Pentair, Inc. | 1,971,711 | |||
| 46,800 | Precision Castparts Corporation | 2,783,664 | |||
| 170,800 | Quanta Services, Inc.a | 3,381,840 | |||
| 22,600 | Rockwell Collins, Inc. | 883,434 | |||
| 25,600 | Roper Industries, Inc. | 1,111,296 | |||
| 122,200 | Ryanair Holdings plca,b | 3,553,576 | |||
| 49,200 | Stericycle, Inc.a | 2,562,336 | |||
| 21,300 | SunPower Corporationa,b | 788,100 | |||
Total Industrials | 39,957,383 | ||||
| Information Technology (23.0%) | |||||
| 576,932 | Activision Blizzard, Inc.a | 4,984,692 | |||
| 118,039 | Akamai Technologies, Inc.a | 1,781,209 | |||
| 124,100 | ASML Holding NV ADRb | 2,242,487 | |||
| 252,200 | Broadcom Corporationa | 4,279,834 | |||
| 57,000 | Electronic Arts, Inc.a | 914,280 | |||
| 219,200 | F5 Networks, Inc.a | 5,010,912 | |||
| 165,800 | FormFactor, Inc.a | 2,420,680 | |||
| 93,000 | Hewitt Associates, Inc.a | 2,639,340 | |||
| 88,900 | Hittite Microwave Corporationa | 2,618,994 | |||
| 138,500 | Intersil Corporation | 1,272,815 | |||
| 526,900 | Marvell Technology Group, Ltd.a | 3,514,423 | |||
| 119,400 | Maxim Integrated Products, Inc. | 1,363,548 | |||
| 185,699 | Mercadolibre, Inc.a,b | 3,047,321 | |||
| 108,500 | Molex, Inc. | 1,572,165 | |||
| 193,900 | NETAPP, Inc.a | 2,708,783 | |||
| 82,900 | Nuance Communications, Inc.a | 858,844 | |||
| 468,350 | NVIDIA Corporationa | 3,779,584 | |||
| 200,300 | Omniture, Inc.a,b | 2,131,192 | |||
| 324,200 | PMC-Sierra, Inc.a | 1,575,612 | |||
| 112,300 | Polycom, Inc.a | 1,517,173 | |||
| 742,400 | RF Micro Devices, Inc.a,b | 579,072 | |||
| 323,400 | Seagate Technology | 1,432,662 | |||
| 96,900 | Synaptics, Inc.a,b | 1,604,664 | |||
The accompanying Notes to Financial Statements are an integral part of this schedule.
134
Table of Contents
Mid Cap Growth Portfolio
Schedule of Investments as of December 31, 2008
Shares | Common Stock (96.2%) | Value | ||||
| Information Technology (23.0%) - continued | ||||||
| 164,800 | Synopsys, Inc.a | $ | 3,052,096 | |||
| 376,400 | Tellabs, Inc.a | 1,550,768 | ||||
| 96,400 | Tyco Electronics, Ltd. | 1,562,644 | ||||
| 84,600 | VeriSign, Inc.a | 1,614,168 | ||||
| 70,200 | VMware, Inc.a | 1,663,038 | ||||
Total Information Technology | 63,293,000 | |||||
| Materials (6.9%) | ||||||
| 46,700 | Albemarle Corporationb | 1,041,410 | ||||
| 82,500 | Bemis Company, Inc. | 1,953,600 | ||||
| 107,900 | Celanese Corporation | 1,341,197 | ||||
| 186,100 | Owens-Illinois, Inc.a | 5,086,113 | ||||
| 212,000 | Pactiv Corporationa | 5,274,560 | ||||
| 100,200 | Rockwood Holdings, Inc.a | 1,082,160 | ||||
| 183,700 | Steel Dynamics, Inc. | 2,053,766 | ||||
| 32,100 | United States Steel Corporation | 1,194,120 | ||||
Total Materials | 19,026,926 | |||||
| Telecommunications Services (4.1%) | ||||||
| 97,942 | American Tower Corporationa | 2,871,659 | ||||
| 111,500 | Clearwire Corporationa,b | 549,695 | ||||
| 137,100 | NII Holdings, Inc.a | 2,492,478 | ||||
| 169,500 | SBA Communications Corporationa,b | 2,766,240 | ||||
| 286,400 | TW Telecom, Inc.a | 2,425,808 | ||||
Total Telecommunications Services | 11,105,880 | |||||
Total Common Stock (cost $403,938,396) | 264,562,623 | |||||
| Shares | Collateral Held for Securities Loaned (12.5%) | Value | ||||
| 34,543,185 | Thrivent Financial Securities Lending Trust | 34,543,185 | ||||
Total Collateral Held for Securities Loaned (cost $34,543,185) | 34,543,185 | |||||
| Shares | Short-Term Investments (4.1%) | Value | ||||
| 11,178,760 | Thrivent Money Market Portfolio | 11,178,760 | ||||
Total Short-Term Investments | 11,178,760 | |||||
Total Investments | $ | 310,284,568 | ||||
Other Assets and Liabilities, Net (12.8%) | (35,182,772 | ) | ||||
Total Net Assets 100.0% | $ | 275,101,796 | ||||
| a | Non-income producing security. |
| b | All or a portion of the security is on loan as discussed in item 2(M) of the Notes to Financial Statements. |
Definitions:
| ADR - | American Depositary Receipt, which are certificates for an underlying foreign security’s shares held by an issuing U.S. depository bank. |
Gross unrealized appreciation and depreciation of investments, based on cost for federal income tax purposes, were as follows:
Gross unrealized appreciation | $ | 10,271,802 | ||
Gross unrealized depreciation | (158,866,619 | ) | ||
Net unrealized appreciation (depreciation) | $ | (148,594,817 | ) | |
Cost for federal income tax purposes | $ | 458,879,385 |
The following table is a summary of the inputs used, as of December 31, 2008, in valuing the Mid Cap Growth Portfolio’s assets carried at fair value as discussed in item 2(A) of the Notes to Financial Statements.
Level | Investments in Securities | Other Financial Instruments* | ||||
Level 1 | $ | 310,284,568 | $ | — | ||
Level 2 | — | — | ||||
Level 3 | — | — | ||||
Totals (Level 1,2,3) | $ | 310,284,568 | $ | — | ||
| * | Other Financial Instruments include Futures, Forwards, Written Options and Swap agreements. |
The accompanying Notes to Financial Statements are an integral part of this schedule.
135
Table of Contents
Mid Cap Growth Portfolio
Schedule of Investments as of December 31, 2008
Investment in Affiliates
Affiliated issuers, as defined under the Investment Company Act of 1940, include those in which the Portfolio’s holdings of an issuer represent 5% or more of the outstanding voting securities of an issuer, or any affiliated mutual fund.
A summary of transactions for the fiscal year to date, in Mid Cap Growth Portfolio, is as follows:
Portfolio | Value December 31, 2007 | Gross Purchases and Additions | Gross Sales and Reductions | Balance of Shares Held at December 31, 2008 | Value December 31, 2008 | Income Earned January 1, 2008 - December 31, 2008 | |||||||||||
Money Market | $ | 37,185,191 | $ | 158,578,336 | $ | 184,584,767 | 11,178,760 | $ | 11,178,760 | $ | 684,004 | ||||||
Thrivent Financial Securities | |||||||||||||||||
Lending Trust | 114,798,903 | 515,760,055 | 596,015,773 | 34,543,185 | 34,543,185 | 1,029,240 | |||||||||||
Total Value and Income Earned | 151,984,094 | 45,721,945 | 1,713,244 | ||||||||||||||
The accompanying Notes to Financial Statements are an integral part of this schedule.
136
Table of Contents
Partner Mid Cap Value Portfolio
Schedule of Investments as of December 31, 2008
| Shares | Common Stock (98.4%) | Value | |||
| Consumer Discretionary (13.0%) | |||||
| 8,710 | AutoZone, Inc.a | $ | 1,214,784 | ||
| 15,023 | BorgWarner, Inc. | 327,051 | |||
| 50,802 | DISH Network Corporationa | 563,394 | |||
| 36,590 | Fortune Brands, Inc. | 1,510,435 | |||
| 127,984 | H&R Block, Inc. | 2,907,796 | |||
| 12,588 | J.C. Penney Company, Inc. | 247,984 | |||
| 43,471 | Johnson Controls, Inc. | 789,433 | |||
| 38,840 | Kohl’s Corporationa | 1,406,008 | |||
| 13,288 | M.D.C. Holdings, Inc. | 402,626 | |||
| 49,945 | Mattel, Inc. | 799,120 | |||
| 107,864 | Newell Rubbermaid, Inc. | 1,054,910 | |||
| 2,086 | NVR, Inc.a,b | 951,738 | |||
| 28,313 | Ross Stores, Inc. | 841,745 | |||
| 51,982 | TJX Companies, Inc. | 1,069,270 | |||
| 103,260 | Viacom, Inc.a | 1,968,136 | |||
Total Consumer Discretionary | 16,054,430 | ||||
| Consumer Staples (6.7%) | |||||
| 33,348 | Campbell Soup Company | 1,000,773 | |||
| 32,615 | Clorox Company | 1,812,089 | |||
| 31,767 | Coca-Cola Enterprises, Inc. | 382,157 | |||
| 86,752 | ConAgra Foods, Inc. | 1,431,408 | |||
| 6,050 | Energizer Holdings, Inc.a | 327,547 | |||
| 3,188 | General Mills, Inc. | 193,671 | |||
| 9,564 | Herbalife, Ltd. | 207,348 | |||
| 22,810 | Kroger Company | 602,412 | |||
| 9,391 | Lorillard, Inc. | 529,183 | |||
| 10,949 | Reynolds American, Inc. | 441,354 | |||
| 38,309 | Safeway, Inc. | 910,605 | |||
| 33,448 | SUPERVALU, Inc. | 488,341 | |||
Total Consumer Staples | 8,326,888 | ||||
| Energy (7.6%) | |||||
| 35,167 | Dril-Quip, Inc.a | 721,275 | |||
| 32,877 | EOG Resources, Inc. | 2,188,951 | |||
| 46,351 | Newfield Exploration Companya | 915,432 | |||
| 80,098 | Range Resources Corporation | 2,754,570 | |||
| 52,348 | Smith International, Inc. | 1,198,246 | |||
| 110,710 | Williams Companies, Inc. | 1,603,081 | |||
Total Energy | 9,381,555 | ||||
| Financials (27.3%) | |||||
| 10,330 | Alexandria Real Estate Equities, Inc. | 623,312 | |||
| 56,570 | Annaly Capital Management, Inc. | 897,766 | |||
| 29,150 | Aon Corporation | 1,331,572 | |||
| 17,550 | Arch Capital Group, Ltd.a | 1,230,255 | |||
| 21,982 | Assurant, Inc. | 659,460 | |||
| 48,278 | CIT Group, Inc.b | 219,182 | |||
| 32,002 | Commerce Bancshares, Inc. | 1,406,488 | |||
| 10,950 | Essex Property Trust, Inc. | 840,412 | |||
| 27,087 | Everest Re Group, Ltd. | 2,062,404 | |||
| 59,710 | Fifth Third Bancorp | 493,205 | |||
| 19,580 | Franklin Resources, Inc. | 1,248,812 | |||
| 60,560 | Health Care Property Investors, Inc. | 1,681,751 | |||
| 41,228 | Hudson City Bancorp, Inc. | 657,999 | |||
| 49,208 | Huntington Bancshares, Inc.b | 376,933 | |||
| 82,428 | Invesco, Ltd.b | 1,190,260 | |||
| 13,713 | Lazard, Ltd. | 407,825 | |||
| 31,108 | Lincoln National Corporation | 586,075 | |||
| 12,433 | M&T Bank Corporationb | 713,778 | |||
| 55,482 | Marsh & McLennan Companies, Inc. | 1,346,548 | |||
| 41,820 | Nasdaq OMX Group, Inc.a | 1,033,372 | |||
| 26,607 | Northern Trust Corporation | 1,387,289 | |||
| 21,468 | PartnerRe, Ltd. | 1,530,024 | |||
| 82,784 | People’s United Financial, Inc. | 1,476,039 | |||
| 17,857 | Principal Financial Group, Inc. | 403,032 | |||
| 110,396 | Progressive Corporation | 1,634,965 | |||
| 15,860 | RenaissanceRe Holdings, Ltd. | 817,742 | |||
| 70,552 | SLM Corporationa | 627,913 | |||
| 42,239 | Synovus Financial Corporationb | 350,584 | |||
| 15,261 | Torchmark Corporation | 682,167 | |||
| 44,233 | UnumProvident Corporation | 822,734 | |||
| 108,060 | W.R. Berkley Corporation | 3,349,860 | |||
| 63,660 | Willis Group Holdings, Ltd. | 1,583,861 | |||
Total Financials | 33,673,619 | ||||
| Health Care (8.3%) | |||||
| 13,380 | Becton, Dickinson and Company | 915,058 | |||
| 25,530 | Charles River Laboratories International, Inc.a | 668,886 | |||
| 9,041 | Coventry Health Care, Inc.a | 134,530 | |||
| 21,340 | Edwards Lifesciences Corporationa | 1,172,633 | |||
| 9,644 | Health Net, Inc.a | 105,023 | |||
| 68,133 | IMS Health, Inc. | 1,032,896 | |||
| 41,468 | Kinetic Concepts, Inc.a,b | 795,356 | |||
| 37,969 | Laboratory Corporation of America Holdingsa | 2,445,583 | |||
| 8,180 | Patterson Companies, Inc.a | 153,375 | |||
| 31,026 | PerkinElmer, Inc. | 431,572 | |||
| 37,200 | WellPoint, Inc.a | 1,567,236 | |||
| 18,851 | Zimmer Holdings, Inc.a | 761,958 | |||
Total Health Care | 10,184,106 | ||||
| Industrials (6.5%) | |||||
| 9,194 | Alliant Techsystems, Inc.a,b | 788,478 | |||
| 21,713 | Cooper Industries, Ltd. | 634,671 | |||
| 11,961 | Eaton Corporation | 594,581 | |||
| 10,052 | Ingersoll-Rand Company | 174,402 | |||
| 49,166 | Landstar System, Inc. | 1,889,449 | |||
| 8,094 | Lennox International, Inc. | 261,355 | |||
| 18,637 | Parker-Hannifin Corporation | 792,818 | |||
| 87,398 | Republic Services, Inc. | 2,166,597 | |||
| 10,530 | Ryder System, Inc.b | 408,353 | |||
| 37,160 | Southwest Airlines Company | 320,319 | |||
Total Industrials | 8,031,023 | ||||
| Information Technology (7.2%) | |||||
| 120,307 | Activision Blizzard, Inc.a | 1,039,453 | |||
| 103,534 | Amphenol Corporation | 2,482,745 | |||
| 18,833 | Autodesk, Inc.a | 370,068 | |||
| 48,950 | CA, Inc. | 907,044 | |||
| 68,478 | CommScope, Inc.a | 1,064,148 | |||
| 12,520 | Hewitt Associates, Inc.a | 355,318 | |||
| 79,505 | Iron Mountain, Inc.a | 1,966,159 | |||
| 31,160 | KLA-Tencor Corporation | 678,976 | |||
Total Information Technology | 8,863,911 | ||||
| Materials (4.7%) | |||||
| 48,760 | Air Products and Chemicals, Inc. | 2,451,165 | |||
| 40,464 | Albemarle Corporation | 902,347 | |||
The accompanying Notes to Financial Statements are an integral part of this schedule.
137
Table of Contents
Partner Mid Cap Value Portfolio
Schedule of Investments as of December 31, 2008
| Shares | Common Stock (98.4%) | Value | ||||
| Materials (4.7%) - continued | ||||||
| 14,470 | Ecolab, Inc. | $ | 508,621 | |||
| 9,330 | Nucor Corporation | 431,046 | ||||
| 129,720 | Steel Dynamics, Inc. | 1,450,270 | ||||
Total Materials | 5,743,449 | |||||
| Telecommunications Services (1.3%) | ||||||
| 30,600 | Embarq Corporation | 1,100,376 | ||||
| 242,950 | Sprint Nextel Corporationa | 444,599 | ||||
Total Telecommunications Services | 1,544,975 | |||||
| Utilities (15.8%) | ||||||
| 56,283 | American Electric Power Company, Inc. | 1,873,098 | ||||
| 73,773 | CMS Energy Corporation | 745,107 | ||||
| 95,763 | DPL, Inc. | 2,187,227 | ||||
| 61,888 | Edison International, Inc. | 1,987,843 | ||||
| 47,203 | Entergy Corporation | 3,923,985 | ||||
| 31,031 | Equitable Resources, Inc. | 1,041,090 | ||||
| 38,062 | FirstEnergy Corporation | 1,849,052 | ||||
| 54,256 | PG&E Corporation | 2,100,250 | ||||
| 100,648 | PPL Corporation | 3,088,887 | ||||
| 17,713 | Sempra Energy | 755,105 | ||||
Total Utilities | 19,551,644 | |||||
Total Common Stock (cost $154,842,186) | 121,355,600 | |||||
| Shares | Collateral Held for Securities Loaned (3.7%) | Value | ||||
| 4,605,487 | Thrivent Financial Securities Lending Trust | 4,605,487 | ||||
Total Collateral Held for Securities Loaned (cost $4,605,487) | 4,605,487 | |||||
| Shares | Short-Term Investments (1.6%) | Value | ||||
| 1,933,759 | Thrivent Money Market Portfolio | 1,933,759 | ||||
Total Short-Term Investments | 1,933,759 | |||||
Total Investments | $ | 127,894,846 | ||||
Other Assets and Liabilities, Net (3.7%) | (4,558,022 | ) | ||||
Total Net Assets 100.0% | $ | 123,336,824 | ||||
| a | Non-income producing security. |
| b | All or a portion of the security is on loan as discussed in item 2(M) of the Notes to Financial Statements. |
Gross unrealized appreciation and depreciation of investments, based on cost for federal income tax purposes, were as follows:
Gross unrealized appreciation | $ | 2,517,501 | ||
Gross unrealized depreciation | (39,188,775 | ) | ||
Net unrealized appreciation (depreciation) | $ | (36,671,274 | ) | |
Cost for federal income tax purposes | $ | 164,566,120 |
The following table is a summary of the inputs used, as of December 31, 2008, in valuing the Partner Mid Cap Value Portfolio’s assets carried at fair value as discussed in item 2(A) of the Notes to Financial Statements.
Level | Investments in Securities | Other Financial Instruments* | ||||
Level 1 | $ | 127,894,846 | $ | — | ||
Level 2 | — | — | ||||
Level 3 | — | — | ||||
Totals (Level 1,2,3) | $ | 127,894,846 | $ | — | ||
| * | Other Financial Instruments include Futures, Forwards, Written Options and Swap agreements. |
The accompanying Notes to Financial Statements are an integral part of this schedule.
138
Table of Contents
Partner Mid Cap Value Portfolio
Schedule of Investments as of December 31, 2008
Investment in Affiliates
Affiliated issuers, as defined under the Investment Company Act of 1940, include those in which the Portfolio’s holdings of an issuer represent 5% or more of the outstanding voting securities of an issuer, or any affiliated mutual fund.
A summary of transactions for the fiscal year to date, in Partner Mid Cap Value Portfolio, is as follows:
Portfolio | Value December 31, 2007 | Gross Purchases and Additions | Gross Sales and Reductions | Balance of Shares Held at December 31, 2008 | Value December 31, 2008 | Income Earned January 1, 2008 - December 31, 2008 | |||||||||||
Money Market | $ | 3,632,429 | $ | 71,786,435 | $ | 73,485,105 | 1,933,759 | $ | 1,933,759 | $ | 167,926 | ||||||
Thrivent Financial Securities Lending Trust | 9,987,928 | 114,063,836 | 119,446,277 | 4,605,487 | 4,605,487 | 79,108 | |||||||||||
Total Value and Income Earned | 13,620,357 | 6,539,246 | 247,034 | ||||||||||||||
The accompanying Notes to Financial Statements are an integral part of this schedule.
139
Table of Contents
Schedule of Investments as of December 31, 2008
| Shares | Common Stock (97.6%) | Value | |||
| Consumer Discretionary (11.8%) | |||||
| 86,400 | Advance Auto Parts, Inc. | $ | 2,907,360 | ||
| 90,300 | Autoliv, Inc. | 1,937,838 | |||
| 111,200 | Burger King Holdings, Inc. | 2,655,456 | |||
| 204,600 | Career Education Corporationa | 3,670,524 | |||
| 114,700 | Darden Restaurants, Inc. | 3,232,246 | |||
| 138,500 | Dollar Tree, Inc.a | 5,789,300 | |||
| 79,200 | Guess?, Inc. | 1,215,720 | |||
| 86,100 | Kohl’s Corporationa | 3,116,820 | |||
| 85,000 | McGraw-Hill Companies, Inc. | 1,971,150 | |||
| 126,500 | PetSmart, Inc. | 2,333,925 | |||
| 157,400 | Ross Stores, Inc. | 4,679,502 | |||
| 121,400 | Scientific Games Corporationa | 2,129,356 | |||
| 52,800 | TJX Companies, Inc. | 1,086,096 | |||
| 128,300 | Toll Brothers, Inc.a | 2,749,469 | |||
| 191,900 | WMS Industries, Inc.a | 5,162,110 | |||
Total Consumer Discretionary | 44,636,872 | ||||
| Consumer Staples (5.2%) | |||||
| 39,400 | Church & Dwight Company, Inc. | 2,211,128 | |||
| 58,300 | J.M. Smucker Company | 2,527,888 | |||
| 103,700 | Kroger Company | 2,738,717 | |||
| 90,200 | Molson Coors Brewing Company | 4,412,584 | |||
| 39,900 | Ralcorp Holdings, Inc.a | 2,330,160 | |||
| 205,400 | TreeHouse Foods, Inc.a,b | 5,595,096 | |||
Total Consumer Staples | 19,815,573 | ||||
| Energy (7.5%) | |||||
| 60,000 | Dril-Quip, Inc.a | 1,230,600 | |||
| 273,400 | Forest Oil Corporationa | 4,508,366 | |||
| 107,500 | Holly Corporation | 1,959,725 | |||
| 76,900 | National Oilwell Varco, Inc.a | 1,879,436 | |||
| 179,300 | Petrohawk Energy Corporationa | 2,802,459 | |||
| 91,400 | Range Resources Corporation | 3,143,246 | |||
| 154,700 | Southwestern Energy Companya | 4,481,659 | |||
| 262,900 | TETRA Technologies, Inc.a | 1,277,694 | |||
| 112,100 | Weatherford International, Ltd.a | 1,212,922 | |||
| 175,600 | Willbros Group, Inc.a | 1,487,332 | |||
| 133,200 | XTO Energy, Inc. | 4,697,964 | |||
Total Energy | 28,681,403 | ||||
| Financials (19.4%) | |||||
| 83,571 | Commerce Bancshares, Inc. | 3,672,946 | |||
| 87,400 | Cousins Properties, Inc.b | 1,210,490 | |||
| 33,300 | Cullen/Frost Bankers, Inc. | 1,687,644 | |||
| 125,700 | Duke Realty Corporationb | 1,377,672 | |||
| 42,500 | Eaton Vance Corporation | 892,925 | |||
| 94,600 | Endurance Specialty Holdings, Ltd. | 2,888,138 | |||
| 160,300 | Equity One, Inc.b | 2,837,310 | |||
| 175,800 | Fidelity National Financial, Inc. | 3,120,450 | |||
| 70,700 | Hanover Insurance Group, Inc. | 3,037,979 | |||
| 526,900 | HCC Insurance Holdings, Inc. | 14,094,575 | |||
| 78,800 | Lazard, Ltd. | 2,343,512 | |||
| 230,700 | Marshall & Ilsley Corporationb | 3,146,748 | |||
| 453,000 | MGIC Investment Corporationb | 1,576,440 | |||
| 425,300 | New York Community Bancorp, Inc. | 5,086,588 | |||
| 65,800 | PartnerRe, Ltd. | 4,689,566 | |||
| 107,300 | Rayonier, Inc. REIT | 3,363,855 | |||
| 265,300 | U-Store-It Trust | 1,180,585 | |||
| 392,300 | W.R. Berkley Corporation | 12,161,300 | |||
| 53,900 | Westamerica Bancorporationb | 2,756,985 | |||
| 104,600 | Zions Bancorporationb | 2,563,746 | |||
Total Financials | 73,689,454 | ||||
| Health Care (9.5%) | |||||
| 65,500 | Beckman Coulter, Inc. | 2,878,070 | |||
| 93,300 | BioMarin Pharmaceutical, Inc.a,b | 1,660,740 | |||
| 55,300 | C.R. Bard, Inc. | 4,659,578 | |||
| 165,600 | Celera Corporationa,b | 1,843,128 | |||
| 47,400 | Charles River Laboratories International, Inc.a | 1,241,880 | |||
| 211,200 | Community Health Systems, Inc.a | 3,079,296 | |||
| 76,900 | Coventry Health Care, Inc.a | 1,144,272 | |||
| 36,400 | Henry Schein, Inc.a | 1,335,516 | |||
| 136,100 | Hologic, Inc.a | 1,778,827 | |||
| 119,600 | Kinetic Concepts, Inc.a,b | 2,293,928 | |||
| 28,200 | NuVasive, Inc.a,b | 977,130 | |||
| 56,400 | Shire Pharmaceuticals Group plc ADR | 2,525,592 | |||
| 28,600 | United Therapeutics Corporationa | 1,788,930 | |||
| 103,600 | Varian Medical Systems, Inc.a | 3,630,144 | |||
| 56,700 | Varian, Inc.a | 1,900,017 | |||
| 112,500 | Vertex Pharmaceuticals, Inc.a | 3,417,750 | |||
Total Health Care | 36,154,798 | ||||
| Industrials (9.4%) | |||||
| 30,000 | Alliant Techsystems, Inc.a,b | 2,572,800 | |||
| 156,400 | Continental Airlines, Inc.a,b | 2,824,584 | |||
| 49,900 | Eaton Corporation | 2,480,529 | |||
| 88,700 | IDEX Corporation | 2,142,105 | |||
| 91,600 | Masco Corporation | 1,019,508 | |||
| 264,500 | Oshkosh Corporation | 2,351,405 | |||
| 81,800 | Pall Corporation | 2,325,574 | |||
| 44,900 | Parker-Hannifin Corporation | 1,910,046 | |||
| 235,200 | Polypore International, Inc.a | 1,778,112 | |||
| 73,700 | Rockwell Automation, Inc. | 2,376,088 | |||
| 91,000 | Rockwell Collins, Inc. | 3,557,190 | |||
| 71,000 | Roper Industries, Inc. | 3,082,110 | |||
| 146,500 | Shaw Group, Inc.a | 2,998,855 | |||
| 34,100 | SPX Corporation | 1,382,755 | |||
| 79,600 | Tyco International, Ltd. | 1,719,360 | |||
| 68,300 | WESCO International, Inc.a | 1,313,409 | |||
Total Industrials | 35,834,430 | ||||
| Information Technology (17.2%) | |||||
| 179,300 | Akamai Technologies, Inc.a | 2,705,637 | |||
| 212,000 | ASML Holding NV ADRb | 3,830,840 | |||
| 1,822,200 | Atmel Corporationa | 5,703,486 | |||
| 119,600 | Broadcom Corporationa | 2,029,612 | |||
| 138,400 | Check Point Software Technologies, Ltd.a | 2,628,216 | |||
| 279,200 | CIENA Corporationa,b | 1,870,640 | |||
| 1,082,800 | Compuware Corporationa | 7,308,900 | |||
| 78,400 | Electronic Arts, Inc.a | 1,257,536 | |||
| 183,500 | EMC Corporationa | 1,921,245 | |||
| 195,400 | F5 Networks, Inc.a | 4,466,844 | |||
| 392,600 | FormFactor, Inc.a | 5,731,960 | |||
| 95,600 | Intersil Corporation | 878,564 | |||
| 116,100 | Juniper Networks, Inc.a | 2,032,911 | |||
| 89,800 | Lam Research Corporationa,b | 1,910,944 | |||
| 71,100 | McAfee, Inc.a | 2,457,927 | |||
| 109,300 | Paychex, Inc. | 2,872,404 | |||
| 596,800 | PMC-Sierra, Inc.a | 2,900,448 | |||
| 191,500 | Polycom, Inc.a | 2,587,165 | |||
The accompanying Notes to Financial Statements are an integral part of this schedule.
140
Table of Contents
Mid Cap Stock Portfolio
Schedule of Investments as of December 31, 2008
| Shares | Common Stock (97.6%) | Value | ||||
| Information Technology (17.2%) - continued | ||||||
| 657,500 | Teradyne, Inc.a | $ | 2,774,650 | |||
| 404,100 | TIBCO Software, Inc.a | 2,097,279 | ||||
| 136,600 | Xilinx, Inc. | 2,434,212 | ||||
| 141,000 | Zebra Technologies Corporationa | 2,856,660 | ||||
Total Information Technology | 65,258,080 | |||||
| Materials (10.7%) | ||||||
| 301,500 | Albemarle Corporation | 6,723,450 | ||||
| 134,505 | Ball Corporation | 5,594,063 | ||||
| 19,000 | CF Industries Holdings, Inc. | 934,040 | ||||
| 197,800 | Commercial Metals Company | 2,347,886 | ||||
| 336,200 | Crown Holdings, Inc.a | 6,455,040 | ||||
| 154,100 | Owens-Illinois, Inc.a | 4,211,553 | ||||
| 233,400 | Packaging Corporation of America | 3,141,564 | ||||
| 113,997 | Pactiv Corporationa | 2,836,245 | ||||
| 146,000 | Silgan Holdings, Inc. | 6,980,260 | ||||
| 140,800 | Steel Dynamics, Inc. | 1,574,144 | ||||
Total Materials | 40,798,245 | |||||
| Telecommunications Services (0.9%) | ||||||
| 770,600 | Cincinnati Bell, Inc.a,b | 1,487,258 | ||||
| 56,000 | Telephone and Data Systems, Inc. | 1,778,000 | ||||
Total Telecommunications Services | 3,265,258 | |||||
| Utilities (6.0%) | ||||||
| 90,500 | Alliant Energy Corporation | 2,640,790 | ||||
| 134,000 | DPL, Inc. | 3,060,560 | ||||
| 27,600 | Entergy Corporation | 2,294,388 | ||||
| 71,800 | Equitable Resources, Inc. | 2,408,890 | ||||
| 38,000 | FirstEnergy Corporation | 1,846,040 | ||||
| 62,400 | National Fuel Gas Company | 1,954,992 | ||||
| 264,200 | NV Energy, Inc. | 2,612,938 | ||||
| 93,100 | Pepco Holdings, Inc. | 1,653,456 | ||||
| 96,900 | Portland General Electric Company | 1,886,643 | ||||
| 93,700 | UGI Corporation | 2,288,154 | ||||
Total Utilities | 22,646,851 | |||||
Total Common Stock | 370,780,964 | |||||
| Shares | Collateral Held for Securities Loaned (6.9%) | Value | ||||
| 26,343,474 | Thrivent Financial Securities Lending Trust | 26,343,474 | ||||
Total Collateral Held for Securities Loaned (cost $26,343,474) | 26,343,474 | |||||
Shares | Short-Term Investments (<0.1%) | Value | ||||
| 13,558 | Thrivent Money Market Portfolio | 13,558 | ||||
Total Short-Term Investments | 13,558 | |||||
Total Investments | $ | 397,137,996 | ||||
Other Assets and Liabilities, Net (4.5%) | (17,254,966 | ) | ||||
Total Net Assets 100.0% | $ | 379,883,030 | ||||
| a | Non-income producing security. |
| b | All or a portion of the security is on loan as discussed in item 2(M) of the Notes to Financial Statements. |
Definitions:
| ADR - | American Depositary Receipt, which are certificates for an underlying foreign security’s shares held by an issuing U.S. depository bank. |
| REIT - | Real Estate Investment Trust, is a company that buys, develops, manages and/or sells real estate assets. |
Gross unrealized appreciation and depreciation of investments, based on cost for federal income tax purposes, were as follows:
Gross unrealized appreciation | $ | 11,886,936 | ||
Gross unrealized depreciation | (130,444,720 | ) | ||
Net unrealized appreciation (depreciation) | $ | (118,557,784 | ) | |
Cost for federal income tax purposes | $ | 515,695,780 | ||
The following table is a summary of the inputs used, as of December 31, 2008, in valuing the Mid Cap Stock Portfolio’s assets carried at fair value as discussed in item 2(A) of the Notes to Financial Statements.
Level | Investments in Securities | Other Financial Instruments* | ||||
Level 1 | $ | 397,137,996 | $ | — | ||
Level 2 | — | — | ||||
Level 3 | — | — | ||||
Totals (Level 1,2,3) | $ | 397,137,996 | $ | — | ||
| * | Other Financial Instruments include Futures, Forwards, Written Options and Swap agreements. |
The accompanying Notes to Financial Statements are an integral part of this schedule.
141
Table of Contents
Mid Cap Stock Portfolio
Schedule of Investments as of December 31, 2008
Investment in Affiliates
Affiliated issuers, as defined under the Investment Company Act of 1940, include those in which the Portfolio’s holdings of an issuer represent 5% or more of the outstanding voting securities of an issuer, or any affiliated mutual fund.
A summary of transactions for the fiscal year to date, in Mid Cap Stock Portfolio, is as follows:
Portfolio | Value December 31, 2007 | Gross Purchases and Additions | Gross Sales and Reductions | Balance of Shares Held at December 31, 2008 | Value December 31, 2008 | Income Earned January 1, 2008 - December 31, 2008 | |||||||||||
Money Market | $ | 25,108,727 | $ | 211,581,314 | $ | 236,676,483 | 13,558 | $ | 13,558 | $ | 517,839 | ||||||
Thrivent Financial Securities Lending Trust | 97,177,855 | 327,425,031 | 398,259,412 | 26,343,474 | 26,343,474 | 597,425 | |||||||||||
Total Value and Income Earned | 122,286,582 | 26,357,032 | 1,115,264 | ||||||||||||||
The accompanying Notes to Financial Statements are an integral part of this schedule.
142
Table of Contents
Schedule of Investments as of December 31, 2008
Shares | Common Stock (97.1%) | Value | |||
| Consumer Discretionary (13.6%) | |||||
| 5,233 | 99 Cents Only Storesa | $ | 57,197 | ||
| 10,400 | Advance Auto Parts, Inc. | 349,960 | |||
| 7,300 | Aeropostale, Inc.a | 117,530 | |||
| 22,780 | American Eagle Outfitters, Inc. | 213,221 | |||
| 5,100 | American Greetings Corporation | 38,607 | |||
| 6,450 | AnnTaylor Stores Corporationa | 37,217 | |||
| 8,430 | ArvinMeritor, Inc.b | 24,025 | |||
| 4,170 | Barnes & Noble, Inc.b | 62,550 | |||
| 11,510 | Belo Corporation | 17,956 | |||
| 2,830 | Blyth, Inc. | 22,187 | |||
| 3,310 | Bob Evans Farms, Inc. | 67,623 | |||
| 12,720 | BorgWarner, Inc. | 276,914 | |||
| 6,500 | Boyd Gaming Corporation | 30,745 | |||
| 11,355 | Brinker International, Inc. | 119,682 | |||
| 4,460 | Brink’s Home Security Holdings, Inc.a | 97,763 | |||
| 7,260 | Callaway Golf Company | 67,445 | |||
| 8,100 | Career Education Corporationa,b | 145,314 | |||
| 24,500 | CarMax, Inc.a,b | 193,060 | |||
| 6,700 | Cheesecake Factory, Inc.a | 67,670 | |||
| 19,800 | Chico’s FAS, Inc.a | 82,764 | |||
| 3,600 | Chipotle Mexican Grill, Inc.a,b | 223,128 | |||
| 5,600 | Coldwater Creek, Inc.a | 15,960 | |||
| 7,000 | Collective Brands, Inc.a | 82,040 | |||
| 9,400 | Corinthian Colleges, Inc.a,b | 153,878 | |||
| 6,720 | DeVry, Inc. | 385,795 | |||
| 9,300 | Dick’s Sporting Goods, Inc.a | 131,223 | |||
| 9,960 | Dollar Tree, Inc.a,b | 416,328 | |||
| 8,500 | DreamWorks Animation SKG, Inc.a | 214,710 | |||
| 17,200 | Foot Locker, Inc. | 126,248 | |||
| 5,140 | Furniture Brands International, Inc. | 11,359 | |||
| 15,620 | Gentex Corporation | 137,925 | |||
| 6,600 | Guess?, Inc. | 101,310 | |||
| 10,300 | Hanesbrands, Inc.a,b | 131,325 | |||
| 4,600 | Harte-Hanks, Inc. | 28,704 | |||
| 6,000 | Hovnanian Enterprises, Inc.a,b | 10,320 | |||
| 3,070 | International Speedway Corporation | 88,201 | |||
| 3,400 | ITT Educational Services, Inc.a,b | 322,932 | |||
| 5,700 | J. Crew Group, Inc.a | 69,540 | |||
| 4,700 | John Wiley and Sons, Inc. | 167,226 | |||
| 8,400 | Lamar Advertising Companya | 105,504 | |||
| 3,800 | Life Time Fitness, Inc.a,b | 49,210 | |||
| 15,700 | LKQ Corporationa | 183,062 | |||
| 4,100 | M.D.C. Holdings, Inc. | 124,230 | |||
| 5,400 | Marvel Entertainment, Inc.a | 166,050 | |||
| 3,300 | Matthews International Corporation | 121,044 | |||
| 3,860 | Modine Manufacturing Company | 18,798 | |||
| 6,170 | Mohawk Industries, Inc.a | 265,125 | |||
| 4,500 | Netflix, Inc.a,b | 134,505 | |||
| 600 | NVR, Inc.a | 273,750 | |||
| 14,800 | O’Reilly Automotive, Inc.a,b | 454,952 | |||
| 7,800 | Pacific Sunwear of California, Inc.a | 12,402 | |||
| 14,000 | PetSmart, Inc. | 258,300 | |||
| 5,600 | Phillips-Van Heusen Corporation | 112,728 | |||
| 4,400 | Priceline.com, Inc.a,b | 324,060 | |||
| 4,700 | Regis Corporation | 68,291 | |||
| 7,400 | Rent-A-Center, Inc.a | 130,610 | |||
| 14,160 | Ross Stores, Inc. | 420,977 | |||
| 4,800 | Ryland Group, Inc. | 84,816 | |||
| 16,050 | Saks, Inc.a | 70,299 | |||
| 3,010 | Scholastic Corporation | 40,876 | |||
| 7,100 | Scientific Games Corporationa | 124,534 | |||
| 28,600 | Service Corporation International | 142,142 | |||
| 7,420 | Sotheby’s Holdings, Inc.b | 65,964 | |||
| 1,500 | Strayer Education, Inc. | 321,615 | |||
| 4,000 | Thor Industries, Inc.b | 52,720 | |||
| 5,200 | Timberland Companya | 60,060 | |||
| 14,300 | Toll Brothers, Inc.a | 306,449 | |||
| 6,800 | Tupperware Corporation | 154,360 | |||
| 4,000 | Under Armour, Inc.a,b | 95,360 | |||
| 12,500 | Urban Outfitters, Inc.a | 187,250 | |||
| 5,100 | Warnaco Group, Inc.a | 100,113 | |||
| 46,514 | Wendy’s/Arby’s Group, Inc.b | 229,779 | |||
| 9,680 | Williams-Sonoma, Inc. | 76,085 | |||
Total Consumer Discretionary | 10,243,602 | ||||
| Consumer Staples (4.4%) | |||||
| 9,400 | Alberto-Culver Company | 230,394 | |||
| 6,440 | BJ’s Wholesale Club, Inc.a | 220,634 | |||
| 7,710 | Church & Dwight Company, Inc. | 432,685 | |||
| 8,200 | Corn Products International, Inc. | 236,570 | |||
| 6,350 | Energizer Holdings, Inc.a | 343,789 | |||
| 8,600 | Flowers Foods, Inc. | 209,496 | |||
| 8,100 | Hansen Natural Corporationa | 271,593 | |||
| 7,630 | Hormel Foods Corporation | 237,140 | |||
| 2,240 | Lancaster Colony Corporation | 76,832 | |||
| 6,000 | NBTY, Inc.a | 93,900 | |||
| 6,310 | PepsiAmericas, Inc. | 128,472 | |||
| 6,200 | Ralcorp Holdings, Inc.a | 362,080 | |||
| 4,410 | Ruddick Corporation | 121,937 | |||
| 13,100 | Smithfield Foods, Inc.a,b | 184,317 | |||
| 2,841 | Tootsie Roll Industries, Inc.b | 72,758 | |||
| 2,740 | Universal Corporation | 81,844 | |||
Total Consumer Staples | 3,304,441 | ||||
| Energy (5.9%) | |||||
| 15,700 | Arch Coal, Inc. | 255,753 | |||
| 4,000 | Bill Barrett Corporationa,b | 84,520 | |||
| 9,100 | Cimarex Energy Company | 243,698 | |||
| 5,000 | Comstock Resources, Inc.a | 236,250 | |||
| 27,300 | Denbury Resources, Inc.a | 298,116 | |||
| 5,800 | Encore Acquisition Companya | 148,016 | |||
| 7,078 | Exterran Holdings, Inc.a,b | 150,762 | |||
| 13,700 | FMC Technologies, Inc.a | 326,471 | |||
| 10,700 | Forest Oil Corporationa | 176,443 | |||
| 11,500 | Frontier Oil Corporation | 145,245 | |||
| 10,300 | Helix Energy Solutions Group, Inc.a | 74,572 | |||
| 11,580 | Helmerich & Payne, Inc. | 263,445 | |||
| 9,700 | Mariner Energy, Inc.a | 98,940 | |||
| 14,500 | Newfield Exploration Companya | 286,375 | |||
| 6,000 | Oceaneering International, Inc.a | 174,840 | |||
| 2,700 | Overseas Shipholding Group, Inc. | 113,697 | |||
| 7,000 | Patriot Coal Corporationa,b | 43,750 | |||
| 17,200 | Patterson-UTI Energy, Inc. | 197,972 | |||
| 11,839 | Plains Exploration & Production Companya | 275,138 | |||
| 19,020 | Pride International, Inc.a | 303,940 | |||
| 12,500 | Quicksilver Resources, Inc.a | 69,625 | |||
The accompanying Notes to Financial Statements are an integral part of this schedule.
143
Table of Contents
Mid Cap Index Portfolio
Schedule of Investments as of December 31, 2008
| Shares | Common Stock (97.1%) | Value | |||
| Energy (5.9%) - continued | |||||
| 8,500 | Superior Energy Services, Inc.a | $ | 135,405 | ||
| 5,600 | Tidewater, Inc. | 225,512 | |||
| 5,200 | Unit Corporationa | 138,944 | |||
Total Energy | 4,467,429 | ||||
| Financials (20.5%) | |||||
| 4,500 | Affiliated Managers Group, Inc.a,b | 188,640 | |||
| 3,500 | Alexandria Real Estate Equities, Inc. | 211,190 | |||
| 10,800 | AMB Property Corporation | 252,936 | |||
| 8,235 | American Financial Group, Inc. | 188,417 | |||
| 12,890 | AmeriCredit Corporationa,b | 98,480 | |||
| 15,800 | Apollo Investment Corporationb | 147,098 | |||
| 10,400 | Arthur J. Gallagher & Company | 269,464 | |||
| 13,993 | Associated Banc-Corpb | 292,873 | |||
| 8,970 | Astoria Financial Corporation | 147,826 | |||
| 7,900 | BancorpSouth, Inc. | 184,544 | |||
| 5,200 | Bank of Hawaii Corporation | 234,884 | |||
| 5,600 | BRE Properties, Inc. | 156,688 | |||
| 12,700 | Brown & Brown, Inc. | 265,430 | |||
| 5,800 | Camden Property Trust | 181,772 | |||
| 5,400 | Cathay General Bancorpb | 128,250 | |||
| 4,420 | City National Corporation | 215,254 | |||
| 23,000 | Colonial BancGroup, Inc.b | 47,610 | |||
| 7,245 | Commerce Bancshares, Inc. | 318,418 | |||
| 4,900 | Cousins Properties, Inc.b | 67,865 | |||
| 6,500 | Cullen/Frost Bankers, Inc. | 329,420 | |||
| 16,300 | Duke Realty Corporation | 178,648 | |||
| 12,700 | Eaton Vance Corporation | 266,827 | |||
| 3,700 | Equity One, Inc.b | 65,490 | |||
| 2,900 | Essex Property Trust, Inc. | 222,575 | |||
| 6,710 | Everest Re Group, Ltd. | 510,899 | |||
| 6,500 | Federal Realty Investment Trust | 403,520 | |||
| 23,405 | Fidelity National Financial, Inc. | 415,439 | |||
| 10,200 | First American Corporation | 294,678 | |||
| 13,000 | First Niagara Financial Group, Inc. | 210,210 | |||
| 8,980 | FirstMerit Corporation | 184,898 | |||
| 20,000 | Fulton Financial Corporation | 192,400 | |||
| 5,670 | Hanover Insurance Group, Inc. | 243,640 | |||
| 12,550 | HCC Insurance Holdings, Inc. | 335,713 | |||
| 11,400 | Health Care REIT, Inc.b | 481,080 | |||
| 7,000 | Highwoods Properties, Inc. | 191,520 | |||
| 4,460 | Horace Mann Educators Corporation | 40,987 | |||
| 10,400 | Hospitality Properties Trust | 154,648 | |||
| 13,400 | Jefferies Group, Inc.b | 188,404 | |||
| 3,800 | Jones Lang LaSalle, Inc. | 105,260 | |||
| 10,900 | Liberty Property Trust | 248,847 | |||
| 8,300 | Macerich Companyb | 150,728 | |||
| 7,300 | Mack-Cali Realty Corporation | 178,850 | |||
| 4,000 | Mercury General Corporation | 183,960 | |||
| 10,900 | Nationwide Health Properties, Inc.b | 313,048 | |||
| 38,311 | New York Community Bancorp, Inc. | 458,200 | |||
| 25,650 | Old Republic International Corporation | 305,748 | |||
| 8,700 | Omega Healthcare Investors, Inc. | 138,939 | |||
| 2,700 | PacWest Bancorp | 72,630 | |||
| 8,280 | PMI Group, Inc. | 16,146 | |||
| 4,307 | Potlatch Corporation | 112,025 | |||
| 7,770 | Protective Life Corporation | 111,500 | |||
| 10,625 | Raymond James Financial, Inc.b | 182,006 | |||
| 8,608 | Rayonier, Inc. REIT | 269,861 | |||
| 11,500 | Realty Income Corporationb | 266,225 | |||
| 7,700 | Regency Centers Corporation | 359,590 | |||
| 7,900 | Reinsurance Group of America, Inc. | 338,278 | |||
| 14,640 | SEI Investments Company | 229,994 | |||
| 6,500 | SL Green Realty Corporation | 168,350 | |||
| 5,400 | StanCorp Financial Group, Inc. | 225,558 | |||
| 3,530 | SVB Financial Groupa | 92,592 | |||
| 31,500 | Synovus Financial Corporationb | 261,450 | |||
| 12,820 | TCF Financial Corporation | 175,121 | |||
| 15,100 | UDR, Inc. | 208,229 | |||
| 5,500 | Unitrin, Inc. | 87,670 | |||
| 13,200 | Valley National Bancorp | 267,300 | |||
| 15,275 | W.R. Berkley Corporation | 473,525 | |||
| 9,440 | Waddell & Reed Financial, Inc. | 145,942 | |||
| 9,627 | Washington Federal, Inc. | 144,020 | |||
| 5,730 | Webster Financial Corporation | 78,959 | |||
| 8,600 | Weingarten Realty Investorsb | 177,934 | |||
| 3,120 | Westamerica Bancorporationb | 159,588 | |||
| 7,480 | Wilmington Trust Corporationb | 166,355 | |||
Total Financials | 15,383,063 | ||||
| Health Care (10.7%) | |||||
| 5,806 | Advanced Medical Optics, Inc.a | 38,378 | |||
| 8,400 | Affymetrix, Inc.a | 25,116 | |||
| 6,830 | Beckman Coulter, Inc. | 300,110 | |||
| 2,100 | Bio-Rad Laboratories, Inc.a | 158,151 | |||
| 7,500 | Cerner Corporationa,b | 288,375 | |||
| 7,400 | Charles River Laboratories International, Inc.a | 193,880 | |||
| 10,300 | Community Health Systems, Inc.a | 150,174 | |||
| 6,910 | Covance, Inc.a | 318,067 | |||
| 6,120 | Edwards Lifesciences Corporationa | 336,294 | |||
| 12,900 | Endo Pharmaceutical Holdings, Inc.a | 333,852 | |||
| 5,900 | Gen-Probe, Inc.a | 252,756 | |||
| 27,700 | Health Management Associates, Inc.a | 49,583 | |||
| 11,480 | Health Net, Inc.a | 125,017 | |||
| 9,800 | Henry Schein, Inc.a | 359,562 | |||
| 6,950 | Hill-Rom Holdings, Inc.b | 114,397 | |||
| 28,300 | Hologic, Inc.a | 369,881 | |||
| 6,500 | IDEXX Laboratories, Inc.a | 234,520 | |||
| 3,300 | Kindred Healthcare, Inc.a | 42,966 | |||
| 6,100 | Kinetic Concepts, Inc.a | 116,998 | |||
| 5,800 | LifePoint Hospitals, Inc.a | 132,472 | |||
| 8,120 | Lincare Holdings, Inc.a | 218,672 | |||
| 5,200 | Masimo Corporationa | 155,116 | |||
| 6,200 | Medicis Pharmaceutical Corporation | 86,180 | |||
| 11,420 | Omnicare, Inc.b | 317,019 | |||
| 8,550 | Perrigo Companyb | 276,250 | |||
| 12,900 | Pharmaceutical Product Development, Inc. | 374,229 | |||
| 6,100 | Psychiatric Solutions, Inc.a | 169,885 | |||
| 8,300 | ResMed, Inc.a | 311,084 | |||
| 12,050 | Sepracor, Inc.a | �� | 132,309 | ||
| 6,500 | STERIS Corporation | 155,285 | |||
| 4,200 | Techne Corporation | 270,984 | |||
| 6,100 | Thoratec Corporationa | 198,189 | |||
| 2,500 | United Therapeutics Corporationa | 156,375 | |||
The accompanying Notes to Financial Statements are an integral part of this schedule.
144
Table of Contents
Mid Cap Index Portfolio
Schedule of Investments as of December 31, 2008
| Shares | Common Stock (97.1%) | Value | |||
| Health Care (10.7%) - continued | |||||
| 5,500 | Universal Health Services, Inc. | $ | 206,635 | ||
| 8,910 | Valeant Pharmaceuticals Internationala,b | 204,039 | |||
| 3,200 | Varian, Inc.a | 107,232 | |||
| 9,300 | VCA Antech, Inc.a | 184,884 | |||
| 16,520 | Vertex Pharmaceuticals, Inc.a | 501,877 | |||
| 4,600 | Wellcare Health Plans, Inc.a | 59,156 | |||
Total Health Care | 8,025,949 | ||||
| Industrials (14.2%) | |||||
| 10,030 | AGCO Corporationa | 236,608 | |||
| 13,200 | AirTran Holdings, Inc.a | 58,608 | |||
| 3,940 | Alaska Air Group, Inc.a | 115,245 | |||
| 4,660 | Alexander & Baldwin, Inc. | 116,780 | |||
| 3,600 | Alliant Techsystems, Inc.a | 308,736 | |||
| 11,670 | AMETEK, Inc. | 352,551 | |||
| 11,100 | BE Aerospace, Inc.a | 85,359 | |||
| 4,560 | Brink’s Company | 122,573 | |||
| 8,200 | Bucyrus International, Inc. | 151,864 | |||
| 6,640 | Carlisle Companies, Inc. | 137,448 | |||
| 2,300 | Clean Harbors, Inc.a | 145,912 | |||
| 5,030 | Con-way, Inc. | 133,798 | |||
| 6,900 | Copart, Inc.a | 187,611 | |||
| 3,700 | Corporate Executive Board Company | 81,622 | |||
| 13,800 | Corrections Corporation of Americaa | 225,768 | |||
| 5,300 | Crane Company | 91,372 | |||
| 5,700 | Deluxe Corporation | 85,272 | |||
| 8,400 | Donaldson Company, Inc. | 282,660 | |||
| 5,300 | Federal Signal Corporation | 43,513 | |||
| 5,600 | FTI Consulting, Inc.a | 250,208 | |||
| 5,420 | GATX Corporation | 167,857 | |||
| 6,500 | Graco, Inc.b | 154,245 | |||
| 3,560 | Granite Construction, Inc. | 156,391 | |||
| 9,200 | Harsco Corporation | 254,656 | |||
| 5,890 | Herman Miller, Inc. | 76,747 | |||
| 4,930 | HNI Corporationb | 78,091 | |||
| 6,230 | Hubbell, Inc. | 203,596 | |||
| 9,100 | IDEX Corporation | 219,765 | |||
| 8,940 | JB Hunt Transport Services, Inc.b | 234,854 | |||
| 20,675 | JetBlue Airways Corporationa | 146,792 | |||
| 11,850 | Joy Global, Inc. | 271,246 | |||
| 10,000 | Kansas City Southern, Inc.a | 190,500 | |||
| 17,800 | KBR, Inc. | 270,560 | |||
| 3,120 | Kelly Services, Inc. | 40,591 | |||
| 8,040 | Kennametal, Inc. | 178,408 | |||
| 5,040 | Korn/Ferry Internationala | 57,557 | |||
| 4,800 | Lincoln Electric Holdings, Inc. | 244,464 | |||
| 8,570 | Manpower, Inc. | 291,294 | |||
| 3,200 | Mine Safety Appliances Companyb | 76,512 | |||
| 4,900 | MSC Industrial Direct Company, Inc.b | 180,467 | |||
| 5,100 | Navigant Consulting, Inc.a,b | 80,937 | |||
| 3,690 | Nordson Corporationb | 119,150 | |||
| 8,300 | Oshkosh Corporation | 73,787 | |||
| 10,960 | Pentair, Inc. | 259,423 | |||
| 21,710 | Quanta Services, Inc.a | 429,858 | |||
| 4,648 | Rollins, Inc. | 84,036 | |||
| 9,800 | Roper Industries, Inc. | 425,418 | |||
| 9,200 | Shaw Group, Inc.a | 188,324 | |||
| 5,960 | SPX Corporation | 241,678 | |||
| 4,340 | Teleflex, Inc. | 217,434 | |||
| 10,400 | Terex Corporationa | 180,128 | |||
| 6,100 | Thomas & Betts Corporationa | 145,851 | |||
| 9,300 | Timken Company | 182,559 | |||
| 8,695 | Trinity Industries, Inc. | 137,033 | |||
| 6,698 | United Rentals, Inc.a,b | 61,086 | |||
| 9,200 | URS Corporationa | 375,084 | |||
| 5,300 | Wabtec Corporation | 210,675 | |||
| 8,700 | Waste Connections, Inc.a | 274,659 | |||
| 4,800 | Werner Enterprises, Inc. | 83,232 | |||
| 6,100 | Woodward Governor Company | 140,422 | |||
| 6,700 | YRC Worldwide, Inc.a,b | 19,229 | |||
Total Industrials | 10,638,104 | ||||
| Information Technology (12.1%) | |||||
| 45,500 | 3Com Corporationa | 103,740 | |||
| 3,920 | ACI Worldwide, Inc.a | 62,328 | |||
| 7,690 | Acxiom Corporation | 62,366 | |||
| 13,200 | ADC Telecommunications, Inc.a | 72,204 | |||
| 6,080 | ADTRAN, Inc. | 90,470 | |||
| 1,800 | Advent Software, Inc.a,b | 35,946 | |||
| 7,100 | Alliance Data Systems Corporationa | 330,363 | |||
| 9,800 | ANSYS, Inc.a | 273,322 | |||
| 13,070 | Arrow Electronics, Inc.a | 246,239 | |||
| 50,020 | Atmel Corporationa | 156,563 | |||
| 16,520 | Avnet, Inc.a,b | 300,829 | |||
| 4,880 | Avocent Corporationa | 87,401 | |||
| 15,700 | Broadridge Financial Solutions, Inc. | 196,878 | |||
| 29,580 | Cadence Design Systems, Inc.a | 108,263 | |||
| 7,674 | CommScope, Inc.a | 119,254 | |||
| 9,700 | Cree, Inc.a,b | 153,939 | |||
| 7,230 | Diebold, Inc. | 203,091 | |||
| 4,000 | Digital River, Inc.a | 99,200 | |||
| 4,410 | DST Systems, Inc.a,b | 167,492 | |||
| 4,470 | Dycom Industries, Inc.a | 36,743 | |||
| 8,700 | F5 Networks, Inc.a,b | 198,882 | |||
| 4,600 | FactSet Research Systems, Inc.b | 203,504 | |||
| 5,350 | Fair Isaac Corporationb | 90,201 | |||
| 14,000 | Fairchild Semiconductor International, Inc.a | 68,460 | |||
| 6,500 | Gartner, Inc.a | 115,895 | |||
| 8,800 | Global Payments, Inc. | 288,552 | |||
| 3,410 | Imation Corporation | 46,274 | |||
| 18,300 | Ingram Micro, Inc.a | 245,037 | |||
| 18,950 | Integrated Device Technology, Inc.a | 106,309 | |||
| 7,950 | International Rectifier Corporationa | 107,325 | |||
| 13,800 | Intersil Corporation | 126,822 | |||
| 9,460 | Jack Henry & Associates, Inc. | 183,619 | |||
| 13,700 | Lam Research Corporationa | 291,536 | |||
| 9,200 | Lender Processing Services, Inc. | 270,940 | |||
| 9,240 | Macrovision Solutions Corporationa | 116,886 | |||
| 2,400 | ManTech International Corporationa | 130,056 | |||
| 10,470 | Mentor Graphics Corporationa | 54,130 | |||
| 9,900 | Metavante Technologies, Inc.a | 159,489 | |||
| 3,700 | Mettler-Toledo International, Inc.a | 249,380 | |||
| 10,360 | MPS Group, Inc.a | 78,011 | |||
The accompanying Notes to Financial Statements are an integral part of this schedule.
145
Table of Contents
Mid Cap Index Portfolio
Schedule of Investments as of December 31, 2008
| Shares | Common Stock (97.1%) | Value | ||||
| Information Technology (12.1%) - continued | ||||||
| 6,375 | National Instruments Corporation | $ | 155,295 | |||
| 17,300 | NCR Corporationa | 244,622 | ||||
| 12,400 | Palm, Inc.a,b | 38,068 | ||||
| 12,900 | Parametric Technology Corporationa | 163,185 | ||||
| 5,340 | Plantronics, Inc. | 70,488 | ||||
| 9,320 | Polycom, Inc.a | 125,913 | ||||
| 31,440 | RF Micro Devices, Inc.a,b | 24,523 | ||||
| 22,300 | SAIC, Inc.a | 434,404 | ||||
| 6,790 | Semtech Corporationa | 76,523 | ||||
| 5,100 | Silicon Laboratories, Inc.a | 126,378 | ||||
| 4,600 | SRA International, Inc.a | 79,350 | ||||
| 8,880 | Sybase, Inc.a | 219,958 | ||||
| 15,880 | Synopsys, Inc.a | 294,098 | ||||
| 5,480 | Tech Data Corporationa | 97,763 | ||||
| 13,100 | Trimble Navigation, Ltd.a | 283,091 | ||||
| 9,600 | ValueClick, Inc.a | 65,664 | ||||
| 21,420 | Vishay Intertechnology, Inc.a | 73,256 | ||||
| 24,400 | Western Digital Corporationa | 279,380 | ||||
| 7,550 | Wind River Systems, Inc.a | 68,176 | ||||
| 6,900 | Zebra Technologies Corporationa | 139,794 | ||||
Total Information Technology | 9,097,868 | |||||
| Materials (6.6%) | ||||||
| 8,890 | Airgas, Inc. | 346,621 | ||||
| 10,020 | Albemarle Corporation | 223,446 | ||||
| 7,400 | AptarGroup, Inc. | 260,776 | ||||
| 7,300 | Ashland, Inc. | 76,723 | ||||
| 7,290 | Cabot Corporation | 111,537 | ||||
| 4,800 | Carpenter Technology Corporation | 98,592 | ||||
| 27,900 | Chemtura Corporation | 39,060 | ||||
| 12,500 | Cliffs Natural Resources, Inc. | 320,125 | ||||
| 12,500 | Commercial Metals Company | 148,375 | ||||
| 5,160 | Cytec Industries, Inc. | 109,495 | ||||
| 4,900 | Ferro Corporation | 34,545 | ||||
| 8,100 | FMC Corporation | 362,313 | ||||
| 3,700 | Greif, Inc. | 123,691 | ||||
| 10,800 | Louisiana-Pacific Corporation | 16,848 | ||||
| 7,360 | Lubrizol Corporation | 267,831 | ||||
| 4,520 | Martin Marietta Materials, Inc.b | 438,802 | ||||
| 1,980 | Minerals Technologies, Inc. | 80,982 | ||||
| 8,400 | Olin Corporation | 151,872 | ||||
| 11,500 | Packaging Corporation of America | 154,790 | ||||
| 7,000 | Reliance Steel & Aluminum Company | 139,580 | ||||
| 14,100 | RPM International, Inc. | 187,389 | ||||
| 4,900 | Scotts Miracle-Gro Company | 145,628 | ||||
| 5,430 | Sensient Technologies Corporation | 129,668 | ||||
| 10,980 | Sonoco Products Company | 254,297 | ||||
| 17,800 | Steel Dynamics, Inc. | 199,004 | ||||
| 12,000 | Temple-Inland, Inc.b | 57,600 | ||||
| 11,200 | Terra Industries, Inc. | 186,704 | ||||
| 11,160 | Valspar Corporation | 201,884 | ||||
| 6,700 | Worthington Industries, Inc.b | 73,834 | ||||
Total Materials | 4,942,012 | |||||
| Telecommunications Services (0.8%) | ||||||
| 26,710 | Cincinnati Bell, Inc.a | 51,550 | ||||
| 8,600 | NeuStar, Inc.a | 164,518 | ||||
| 11,820 | Telephone and Data Systems, Inc. | 375,285 | ||||
Total Telecommunications Services | 591,353 | |||||
| Utilities (8.3%) | ||||||
| 8,480 | AGL Resources, Inc. | �� | 265,848 | |||
| 12,100 | Alliant Energy Corporation | 353,078 | ||||
| 15,166 | Aqua America, Inc.b | 312,268 | ||||
| 4,300 | Black Hills Corporation | 115,928 | ||||
| 12,730 | DPL, Inc. | 290,753 | ||||
| 7,900 | Energen Corporation | 231,707 | ||||
| 13,163 | Great Plains Energy, Inc. | 254,441 | ||||
| 9,880 | Hawaiian Electric Industries, Inc. | 218,743 | ||||
| 5,030 | IDACORP, Inc. | 148,133 | ||||
| 20,225 | MDU Resources Group, Inc. | 436,456 | ||||
| 8,800 | National Fuel Gas Company | 275,704 | ||||
| 17,170 | Northeast Utilities | 413,110 | ||||
| 11,740 | NSTAR | 428,393 | ||||
| 26,400 | NV Energy, Inc. | 261,096 | ||||
| 10,290 | OGE Energy Corporation | 265,276 | ||||
| 11,600 | ONEOK, Inc. | 337,792 | ||||
| 9,675 | PNM Resources, Inc. | 97,524 | ||||
| 14,560 | Puget Energy, Inc. | 397,051 | ||||
| 13,700 | Southern Union Company | 178,648 | ||||
| 11,900 | UGI Corporation | 290,598 | ||||
| 8,990 | Vectren Corporation | 224,840 | ||||
| 12,320 | Westar Energy, Inc. | 252,683 | ||||
| 5,610 | WGL Holdings, Inc. | 183,391 | ||||
Total Utilities | 6,233,461 | |||||
Total Common Stock (cost $91,832,071) | 72,927,282 | |||||
| Shares | Collateral Held for Securities Loaned (12.7%) | Value | ||||
| 9,562,918 | Thrivent Financial Securities Lending Trust | 9,562,918 | ||||
Total Collateral Held for Securities Loaned (cost $9,562,918) | 9,562,918 | |||||
| Shares or Principal Amount | Short-Term Investments (2.1%)c | Value | ||||
Federal National Mortgage Association Discount Notes | ||||||
| 300,000 | 0.417%, 5/14/2009d | 299,543 | ||||
| 1,291,295 | Thrivent Money Market Portfolio | 1,291,295 | ||||
Total Short-Term Investments (at amortized cost) | 1,590,838 | |||||
Total Investments (cost $102,985,827) 111.9% | $ | 84,081,038 | ||||
Other Assets and Liabilities, Net (11.9%) | (8,940,742 | ) | ||||
Total Net Assets 100.0% | $ | 75,140,296 | ||||
| a | Non-income producing security. |
The accompanying Notes to Financial Statements are an integral part of this schedule.
146
Table of Contents
Mid Cap Index Portfolio
Schedule of Investments as of December 31, 2008
| b | All or a portion of the security is on loan as discussed in item 2(M) of the Notes to Financial Statements. |
| c | The interest rate shown reflects the yield, coupon rate or, for securities purchased at a discount, the discount rate at the date of purchase. |
| d | At December 31, 2008, $299,543 of investments were held on deposit with the counterparty and pledged as the initial margin deposit for open financial futures contracts. |
Definitions:
REIT - Real Estate Investment Trust, is a company that buys, develops, manages and/or sells real estate assets.
Gross unrealized appreciation and depreciation of investments, based on cost for federal income tax purposes, were as follows:
Gross unrealized appreciation | $ | 8,325,217 | ||
Gross unrealized depreciation | (28,917,319 | ) | ||
Net unrealized appreciation (depreciation) | $ | (20,592,102 | ) | |
Cost for federal income tax purposes | $ | 104,673,140 |
The following table is a summary of the inputs used, as of December 31, 2008, in valuing the Mid Cap Index Portfolio’s assets carried at fair value as discussed in item 2(A) of the Notes to Financial Statements.
Level | Investments in Securities | Other Financial Instruments* | ||||
Level 1 | $ | 83,781,495 | $ | 52,579 | ||
Level 2 | 299,543 | — | ||||
Level 3 | — | — | ||||
Totals (Level 1,2,3) | $ | 84,081,038 | $ | 52,579 | ||
| * | Other Financial Instruments include Futures, Forwards, Written Options and Swap agreements. |
Futures | Number of Contracts Long/(Short) | Expiration Date | Notional Principal Amount | Value | Unrealized Gain/(Loss) | ||||||||
S&P 400 Index Mini-Futures | 30 | March 2009 | $ | 1,559,021 | $ | 1,611,600 | $ | 52,579 | |||||
Total Futures | $ | 52,579 | |||||||||||
Investment in Affiliates
Affiliated issuers, as defined under the Investment Company Act of 1940, include those in which the Portfolio’s holdings of an issuer represent 5% or more of the outstanding voting securities of an issuer, or any affiliated mutual fund.
A summary of transactions for the fiscal year to date, in Mid Cap Index Portfolio, is as follows:
Portfolio | Value December 31, 2007 | Gross Purchases and Additions | Gross Sales and Reductions | Balance of Shares Held at December 31, 2008 | Value December 31, 2008 | Income Earned January 1, 2008 - December 31, 2008 | |||||||||||
Money Market | $ | 2,210,657 | $ | 25,574,535 | $ | 26,493,897 | 1,291,295 | $ | 1,291,295 | $ | 40,055 | ||||||
Thrivent Financial Securities Lending Trust | 26,957,577 | 66,440,242 | 83,834,901 | 9,562,918 | 9,562,918 | 300,440 | |||||||||||
Total Value and Income Earned | 29,168,234 | 10,854,213 | 340,495 | ||||||||||||||
The accompanying Notes to Financial Statements are an integral part of this schedule.
147
Table of Contents
Partner Worldwide Allocation Portfolio
Schedule of Investments as of December 31, 2008
Shares | Common Stock (82.8%) | Valuea | ||
| Australia (2.5%) | ||||
| 85,315 | AJ Lucas Group, Ltd. | 281,296 | ||
| 24,102 | Ansell, Ltd. | 211,030 | ||
| 81,010 | Asciano Group | 86,234 | ||
| 26,215 | BHP Billiton, Ltd. | 556,919 | ||
| 13,987 | Campbell Brothers, Ltd. | 172,646 | ||
| 28,568 | Centennial Coal Company, Ltd. | 66,934 | ||
| 9,848 | CSL, Ltd. | 232,235 | ||
| 5,557 | Leighton Holdings, Ltd. | 107,979 | ||
| 24,489 | OneSteel, Ltd. | 42,347 | ||
| 19,757 | Origin Energy, Ltd. | 222,830 | ||
| 10,683 | QBE Insurance Group, Ltd. | 193,078 | ||
| 12,756 | Sonic Healthcare, Ltd. | 129,959 | ||
| 35,521 | United Group, Ltd. | 205,743 | ||
| 7,193 | Westpac Banking Corporation | 86,271 | ||
| Total Australia | 2,595,501 | |||
| Austria (0.3%) | ||||
| 4,366 | Intercell AGb | 137,321 | ||
| 2,505 | OMV AG | 66,561 | ||
| 2,964 | Verbund - Oesterreichische Elektrizitaetswirtschafts-AG | 137,049 | ||
| Total Austria | 340,931 | |||
| Belgium (0.3%) | ||||
| 546 | Colruyt SA | 117,328 | ||
| 3,602 | EVS Broadcast Equipment SA | 128,604 | ||
| 1,053 | Group Bruxelles Lambert SA | 84,357 | ||
| Total Belgium | 330,289 | |||
| Brazil (2.7%) | ||||
| 45,000 | Banco Bradesco SA ADR | 444,150 | ||
| 6,700 | Companhia Vale do Rio Doce ADR | 81,137 | ||
| 51,000 | Companhia Vale do Rio Doce SP ADR | 543,150 | ||
| 20,300 | Empresa Brasileira de Aeronautica SA ADR | 329,063 | ||
| 50,100 | Lojas Renner SA | 336,650 | ||
| 28,000 | Petroleo Brasileiro SA ADR | 571,480 | ||
| 10,500 | Souza Cruz SA | 198,563 | ||
| 15,000 | Ultrapar Participacoes SA | 337,350 | ||
| Total Brazil | 2,841,543 | |||
| Canada (1.6%) | ||||
| 7,600 | Alimentation Couche-Tard, Inc. | 88,898 | ||
| 12,900 | CGI Group, Inc.b | 100,316 | ||
| 6,024 | Enbridge, Inc.b | 193,041 | ||
| 8,700 | EnCana Corporation | 401,420 | ||
| 300 | Fairfax Financial Holdings, Ltd.b | 94,775 | ||
| 15 | Gildan Activewear, Inc.b | 172 | ||
| 13,097 | Groupe Aeroplan, Inc. | 92,087 | ||
| 2,500 | Metro, Inc. | 74,929 | ||
| 2,600 | Potash Corporation of Saskatchewan, Inc. | 188,581 | ||
| 3,800 | Shoppers Drug Mart Corporation | 147,905 | ||
| 11,600 | Sino-Forest Corporationb | 92,744 | ||
| 2,000 | Toronto-Dominion Bank | 70,393 | ||
| 12,300 | Viterra, Inc.b | 94,654 | ||
| 12,456 | Yellow Pages Income Fund | 67,502 | ||
| Total Canada | 1,707,417 | |||
| Cayman Islands (0.1%) | ||||
| 11,109 | Subsea 7, Inc.b | 66,047 | ||
| Total Cayman Islands | 66,047 | |||
| Chile (0.3%) | ||||
| 8,700 | Banco Santander Chile SA ADR | 304,761 | ||
| Total Chile | 304,761 | |||
| China (0.5%) | ||||
| 550,000 | PetroChina Company, Ltd. | 488,756 | ||
| Total China | 488,756 | |||
| Denmark (0.7%) | ||||
| 2,240 | ALK-Abello A/S | 221,348 | ||
| 5,900 | Novo Nordisk AS | 304,342 | ||
| 3,364 | Vestas Wind Systemsb | 197,959 | ||
| Total Denmark | 723,649 | |||
| Finland (0.4%) | ||||
| 6,389 | Fortum Oyj | 138,866 | ||
| 17,312 | Nokia Oyj | 271,664 | ||
| Total Finland | 410,530 | |||
| France (5.9%) | ||||
| 3,171 | Alstom | 188,974 | ||
| 33,300 | Axa SA | 747,435 | ||
| 11,800 | Cap Gemini SA | 456,268 | ||
| 6,600 | Compagnie de Saint-Gobain | 311,850 | ||
| 1,785 | Eurazeo | 83,948 | ||
| 2,477 | Eurofins Scientific | 123,070 | ||
| 3,978 | Eutelsat Communicationsb | 93,955 | ||
| 7,827 | GDF Suez | 388,508 | ||
| 1,436 | Hermes International | 201,044 | ||
| 7,483 | Orpeab | 270,946 | ||
| 2,755 | Rubis | 174,447 | ||
| 8,900 | Schneider Electric SA | 662,639 | ||
| 2,472 | Sechilienne SA | 110,743 | ||
| 3,490 | Societe Generale | 177,058 | ||
| 1,724 | Stallergenes | 92,280 | ||
| 3,742 | Teleperformance | 104,741 | ||
| 6,471 | Total SA | 355,769 | ||
| 3,948 | UBISOFT Entertainment SAb | 77,458 | ||
| 657 | Vallourec SA | 74,701 | ||
| 2,640 | Vilmorin & Cie | 270,190 | ||
| 38,870 | Vivendi Universal SA | 1,266,928 | ||
| Total France | 6,232,952 | |||
| Germany (4.2%) | ||||
| 6,600 | Adidas AG | 251,589 | ||
| 3,480 | Bayer AG | 202,774 | ||
| 12,100 | Bayerische Motoren Werke AG | 371,532 | ||
| 36,400 | Deutsche Post AG-REG | 615,653 | ||
| 2,313 | Fresenius SE | 135,739 | ||
| 20,535 | GEA Group AG | 356,594 | ||
| 3,536 | Krones AG | 154,732 | ||
| 11,340 | Morphosys AGb | 303,718 | ||
| 2,776 | RWE AG | 246,555 | ||
| 9,542 | SAP AG | 346,250 | ||
| 13,707 | Siemens AG | 1,031,907 | ||
| 2,731 | Vossloh AG | 305,734 | ||
| 787 | Wacker Chemie AG | 84,274 | ||
| Total Germany | 4,407,051 | |||
The accompanying Notes to Financial Statements are an integral part of this schedule.
148
Table of Contents
Partner Worldwide Allocation Portfolio
Schedule of Investments as of December 31, 2008
Shares | Common Stock (82.8%) | Valuea | ||
| Greece (0.4%) | ||||
11,248 | Alpha Bank AE | 105,232 | ||
5,858 | Greek Organization of Football Prognostics SA | 168,584 | ||
14,703 | Marfin Investment Group SAb | 59,439 | ||
4,600 | Public Power Corporation SA | 73,927 | ||
| Total Greece | 407,182 | |||
| Hong Kong (1.8%) | ||||
54,000 | BOC Hong Kong (Holdings), Ltd. | 61,807 | ||
12,000 | Cheung Kong Holdings, Ltd. | 114,475 | ||
55,500 | China Mobile, Ltd. | 563,109 | ||
140,000 | Hang Lung Group, Ltd. | 427,678 | ||
8,300 | Hang Seng Bank, Ltd. | 109,582 | ||
32,000 | Hutchison Whampoa, Ltd. | 161,543 | ||
33,000 | Swire Pacific, Ltd., Class A | 228,598 | ||
145,000 | Swire Pacific, Ltd., Class B | 193,374 | ||
| Total Hong Kong | 1,860,166 | |||
| Hungary (0.4%) | ||||
3,000 | Richter Gedeon Nyrt | 449,259 | ||
| Total Hungary | 449,259 | |||
| Indonesia (0.4%) | ||||
440,000 | PT Astra International Tbk | 432,434 | ||
| Total Indonesia | 432,434 | |||
| Israel (0.5%) | ||||
13,000 | Check Point Software Technologies, Ltd.b | 246,870 | ||
7,500 | Teva Pharmaceutical Industries, Ltd. ADR | 319,275 | ||
| Total Israel | 566,145 | |||
| Italy (2.6%) | ||||
22,293 | Ansaldo STS SPA | 315,935 | ||
22,582 | Davide Campari - Milano SPA | 156,530 | ||
22,920 | Enel SPA | 147,639 | ||
36,200 | Eni SPA | 871,100 | ||
36,772 | Finmeccanica SPA | 569,557 | ||
11,863 | Istituto Finanziario Industriale SPAb | 81,610 | ||
4,413 | Lottomatica SPA | 109,845 | ||
32,788 | Terna-Rete Elettrica Nationale SPA | 108,199 | ||
166,400 | Unicredit SPA | 423,054 | ||
| Total Italy | 2,783,469 | |||
| Japan (18.0%) | ||||
8,700 | Aeon Delight Company, Ltd. | 252,314 | ||
3,000 | Astellas Pharmaceutical, Inc. | 122,797 | ||
10,000 | Bank of Kyoto, Ltd. | 112,075 | ||
15,600 | Bridgestone Corporation | 233,994 | ||
2,800 | Canon, Inc. | 88,717 | ||
9,900 | Capcom Company, Ltd. | 223,969 | ||
22,900 | Culture Convenience Club Company, Ltd. | 235,096 | ||
88 | CyberAgent, Inc. | 54,536 | ||
10,000 | Daihatsu Motor Company, Ltd. | 88,368 | ||
18,600 | Daiichi Sankyo Company, Ltd. | 439,860 | ||
12,900 | Daiseki Company, Ltd. | 244,103 | ||
24,600 | Daito Trust Construction Company, Ltd. | 1,291,362 | ||
40 | East Japan Railway Companya | 304,477 | ||
2,900 | FamilyMart Company, Ltd. | 125,943 | ||
1,494 | Fast Retailing Company, Ltd. | 219,219 | ||
29,300 | Fuji Oil Company, Ltd. | 415,073 | ||
50,100 | GMO Internet, Inc.b | 258,215 | ||
28,000 | Godo Steel, Ltd. | 78,735 | ||
2,700 | Hisamitsu Pharmaceutical Company, Inc. | 110,370 | ||
9,000 | Hitachi Metals, Ltd. | 41,859 | ||
56,000 | Hitachi, Ltd. | 217,331 | ||
3,200 | Hogy Medical Company, Ltd. | 219,166 | ||
3,900 | Honda Motor Company, Ltd. | 83,065 | ||
7,600 | Hosiden Corporation | 120,114 | ||
24,000 | ITOCHU Corporation | 121,082 | ||
70 | Japan Tobacco, Inc. | 231,864 | ||
8,000 | Kao Corporation | 243,003 | ||
32 | KDDI Corporation | 228,489 | ||
4,000 | KONAMI Corporation | 103,700 | ||
44,000 | Kureha Corporation | 220,135 | ||
3,900 | Kurita Water Industries, Ltd. | 105,431 | ||
2,700 | Lawson, Inc. | 155,713 | ||
24,000 | Maeda Corporation | 97,451 | ||
3,963 | Mars Engineering Corporation | 133,872 | ||
41,000 | Marubeni Corporation | 156,971 | ||
35,000 | Mitsubishi Electric Corporation | 219,336 | ||
16,000 | Mitsubishi Estate Company, Ltd. | 264,302 | ||
7,000 | Mitsubishi Logistics Corporation | 88,748 | ||
119,800 | Mitsubishi UFJ Financial Group, Inc. | 752,961 | ||
14,000 | Mitsui & Company, Ltd. | 143,925 | ||
16,000 | Mitsui Fudosan Company, Ltd. | 266,756 | ||
27,200 | Mitsui Sumitomo Insurance Group Holdings, Inc. | 864,992 | ||
14,300 | Nichi-iko Pharmaceutical Company, Ltd. | 442,108 | ||
1,000 | Nintendo Company, Ltd. | 382,151 | ||
13,000 | Nippon Yusen Kabushiki Kaisha | 80,142 | ||
4,800 | NPC, Inc. | 244,662 | ||
22,000 | Oji Paper Company, Ltd. | 129,342 | ||
272 | Rakuten, Inc.b | 173,181 | ||
25,000 | Sanyo Special Steel Company, Ltd. | 74,180 | ||
8,600 | Seven & I Holdings Company, Ltd. | 295,596 | ||
28 | Seven Bank, Ltd. | 107,022 | ||
3,000 | Shimano, Inc. | 118,100 | ||
16,000 | Shin-Etsu Chemical Company, Ltd. | 738,424 | ||
48,000 | Shinsei Bank, Ltd. | 75,971 | ||
11,000 | Softbank Corporation | 199,773 | ||
99 | So-net M3, Inc. | 339,254 | ||
3,000 | Square ENIX Holdings Company, Ltd. | 96,803 | ||
9,537 | Sugi Pharmacy Company, Ltd. | 254,944 | ||
95,700 | Sumitomo Corporation | 848,790 | ||
158,100 | Sumitomo Trust and Banking Company, Ltd. | 934,567 | ||
10,000 | Suruga Bank, Ltd. | 99,346 | ||
8,100 | Sysmex Corporation | 295,186 | ||
2,300 | T&D Holdings, Inc. | 97,350 | ||
13,800 | Takeda Pharmaceutical Company, Ltd. | 719,287 | ||
8,700 | Tokio Marine Holdings, Inc. | 257,776 | ||
10,300 | Tokyo Electric Power Company, Inc. | 343,832 | ||
6,507 | Toyo Seikan Kaisha, Ltd. | 112,792 | ||
3,000 | Toyo Suisan Kaisha, Ltd. | 86,449 | ||
The accompanying Notes to Financial Statements are an integral part of this schedule.
149
Table of Contents
Partner Worldwide Allocation Portfolio
Schedule of Investments as of December 31, 2008
Shares | Common Stock (82.8%) | Valuea | ||
| Japan (18.0%) - continued | ||||
38,000 | Toyo Tire & Rubber Company, Ltd. | 69,438 | ||
23,100 | Toyota Motor Corporation | 763,647 | ||
9,100 | Tsumura & Company | 337,773 | ||
10,800 | Unicharm Petcare Corporation | 401,675 | ||
17,000 | Yokohama Rubber Company, Ltd. | 85,310 | ||
| Total Japan | 19,184,360 | |||
| Luxembourg (0.4%) | ||||
2,053 | Oriflame Cosmetics SA | 59,971 | ||
16,000 | Tenaris SA ADR | 335,680 | ||
| Total Luxembourg | 395,651 | |||
| Malaysia (0.5%) | ||||
120,000 | Bumiputra-Commerce Holdings Berhad | 203,299 | ||
135,000 | Public Bank Berhad | 342,276 | ||
| Total Malaysia | 545,575 | |||
| Mexico (1.4%) | ||||
172,000 | Consorcio ARA SAB de CV | 65,206 | ||
16,500 | Fomento Economico Mexicano SAB de CV ADR | 497,145 | ||
6,000 | Grupo Aeroportuario del Sureste SAB de CV ADR | 224,280 | ||
231,500 | Grupo Financiero Banorte SA de CV ADR | 417,915 | ||
138,000 | Organizacion Soriana SAB de CVb | 284,500 | ||
| Total Mexico | 1,489,046 | |||
| Netherlands (2.3%) | ||||
2,492 | Furgo NV | 71,628 | ||
3,233 | Gemalto NVb | 81,336 | ||
14,654 | Imtech NV | 247,288 | ||
33,500 | ING Groep NV | 368,696 | ||
20,673 | Koninklijke (Royal) Ahold NV | 254,748 | ||
22,981 | Koninklijke (Royal) KPN NV | 334,106 | ||
2,263 | Koninklijke Boskalis Westminster NV | 52,796 | ||
3,203 | Koninklijke DSM NV | 82,193 | ||
1,865 | Koninklijke Vopak NV | 70,678 | ||
15,128 | Qiagen NVb | 267,562 | ||
15,924 | Reed Elsevier NV | 189,326 | ||
8,698 | Ten Cate NV | 195,637 | ||
9,227 | Unilever NV | 223,643 | ||
| Total Netherlands | 2,439,637 | |||
| Norway (1.2%) | ||||
100 | DnB NOR ASA | 397 | ||
80,200 | Norsk Hydro ASA | 326,767 | ||
10,550 | Seadrill, Ltd. | 85,982 | ||
40,300 | StatoilHydro ASA | 674,009 | ||
6,600 | Tandberg ASA | 72,735 | ||
46,086 | Tomra Systems ASA | 157,848 | ||
| Total Norway | 1,317,738 | |||
| Philippines (0.4%) | ||||
1,800,000 | Ayala Land, Inc. | 250,391 | ||
210,000 | Bank of the Philippine Islands | 175,436 | ||
| Total Philippines | 425,827 | |||
| Portugal (0.1%) | ||||
18,116 | Jeronimo Martins SGPS SA | 100,615 | ||
| Total Portugal | 100,615 | |||
| Russia (0.3%) | ||||
9,726 | LUKOIL ADR | 314,786 | ||
| Total Russia | 314,786 | |||
| Singapore (1.6%) | ||||
213,000 | Parkway Holdings, Ltd. | 184,586 | ||
551,992 | Raffles Education Corporation, Ltd. | 218,605 | ||
59,200 | Singapore Airlines, Ltd. | 465,588 | ||
349,000 | Singapore Telecommunications, Ltd. | 621,892 | ||
200,000 | SMRT Corporation, Ltd. | 230,067 | ||
| Total Singapore | 1,720,738 | |||
| South Africa (0.7%) | ||||
51,000 | Massmart Holdings, Ltd. | 467,636 | ||
86,000 | Truworths International, Ltd. | 318,182 | ||
| Total South Africa | 785,818 | |||
| South Korea (1.4%) | ||||
10,000 | Busan Bankb | 47,431 | ||
500 | Samsung Electronics Company, Ltd. | 182,295 | ||
2,100 | Samsung Electronics Company, Ltd. GDRc | 375,967 | ||
1,100 | Shinsegae Company, Ltd.b | 427,363 | ||
5,695 | SODIFF Advanced Materials Company, Ltd.b | 251,056 | ||
3,894 | Taewoong Company, Ltd. | 240,383 | ||
| Total South Korea | 1,524,495 | |||
| Spain (3.4%) | ||||
31,300 | Banco Bilbao Vizcaya Argentaria SA | 387,818 | ||
786 | Construcciones y Auxiliar de Ferrocarriles SA | 279,478 | ||
4,507 | Grifols SA | 78,970 | ||
3,189 | Grupo Ferrovial SA | 88,956 | ||
88,772 | Iberdrola SA | 827,502 | ||
22,833 | Mapfre SA | 77,868 | ||
7,502 | Prosegur Cia de Seguridad SA | 249,681 | ||
71,834 | Telefonica SA | 1,621,407 | ||
| Total Spain | 3,611,680 | |||
| Sweden (1.3%) | ||||
16,000 | Atlas Copco AB | 140,775 | ||
7,998 | Elekta AB | 80,481 | ||
17,101 | Getinge AB | 207,508 | ||
7,851 | Investor AB | 119,751 | ||
3,925 | Modern Times Group AB | 85,929 | ||
8,449 | Nordea Bank AB | 60,221 | ||
38,700 | Sandvik AB | 248,579 | ||
10,888 | SSAB Svenskt Stal AB | 90,780 | ||
42,100 | Telefonaktiebolaget LM Ericsson | 328,204 | ||
| Total Sweden | 1,362,228 | |||
| Switzerland (6.9%) | ||||
684 | Acino Holding AG | 148,819 | ||
3,680 | Actelion, Ltd.b | 208,173 | ||
13,900 | Adecco SA | 475,831 | ||
The accompanying Notes to Financial Statements are an integral part of this schedule.
150
Table of Contents
Partner Worldwide Allocation Portfolio
Schedule of Investments as of December 31, 2008
| Shares | Common Stock (82.8%) | Valuea | ||
| Switzerland (6.9%) - continued | ||||
| 1,927 | Burckhardt Compression Holding AG | 275,901 | ||
| 1,048 | Meyer Burger Technology AGb | 122,632 | ||
| 50,878 | Nestle SA | 2,014,576 | ||
| 36,709 | Novartis AG | 1,838,350 | ||
| 1,080 | Pargesa Holding SA | 72,175 | ||
| 3,792 | Roche Holding AG | 587,039 | ||
| 4,198 | Schulthess Group AG | 166,523 | ||
| 15,500 | Swiss Reinsurance Company | 758,931 | ||
| 5,642 | Temenos Group AGb | 76,136 | ||
| 9,680 | UBS AGb | 140,831 | ||
| 186 | Vetropack Holding AG | 219,979 | ||
| 736 | Zurich Financial Services AG | 160,794 | ||
Total Switzerland | 7,266,690 | |||
| Taiwan (1.5%) | ||||
| 130,000 | Taiwan Mobile Company, Ltd. | 193,444 | ||
| 332,962 | Taiwan Semiconductor Manufacturing Company, Ltd. | 454,320 | ||
| 114,431 | Taiwan Semiconductor Manufacturing Company, Ltd. | |||
ADR | 904,004 | |||
Total Taiwan | 1,551,768 | |||
| Thailand (0.8%) | ||||
| 117,000 | PTT Exploration & Production Public Company, Ltd. | 360,373 | ||
| 161,000 | Siam Cement Public Company, Ltd. | 509,981 | ||
Total Thailand | 870,354 | |||
| Turkey (0.7%) | ||||
| 154,000 | Akbank TAS | 485,188 | ||
| 11,000 | BIM Birlesik Magazalar AS | 231,356 | ||
Total Turkey | 716,544 | |||
| United Kingdom (13.2%) | ||||
| 14,985 | Aggreko plc | 97,830 | ||
| 10,312 | Amlin plc | 53,603 | ||
| 9,671 | Anglo American plc | 225,702 | ||
| 17,800 | AstraZeneca plc | 728,236 | ||
| 6,247 | Autonomy Corporation plcb | 86,932 | ||
| 7,685 | Aveva Group plc | 63,996 | ||
| 51,132 | Babcock International Group plc | 352,512 | ||
| 44,551 | BAE Systems plc | 242,459 | ||
| 16,445 | Balfour Beatty plc | 79,555 | ||
| 31,078 | BG Group plc | 430,186 | ||
| 17,270 | BHP Billiton plc | 334,977 | ||
| 70,326 | BP Amoco plc | 542,900 | ||
| 15,973 | British American Tobacco plc | 416,702 | ||
| 95,700 | British Sky Broadcasting Group plc | 675,843 | ||
| 53,390 | Cable & Wireless plc | 120,744 | ||
| 61,091 | Carillion plc | 220,323 | ||
| 2,952 | Chemring Group plc | 83,466 | ||
| 39,377 | Cobham plc | 117,706 | ||
| 23,582 | Compass Group plc | 117,622 | ||
| 16,041 | Croda International plc | 121,942 | ||
| 4,119 | Diageo plc | 57,877 | ||
| 29,082 | Dignity plc | 252,217 | ||
| 14,187 | FirstGroup plc | 89,722 | ||
| 31,711 | GAME GROUP plc | 58,758 | ||
| 68,164 | GlaxoSmithKline plc | 1,267,743 | ||
| 38,604 | Group 4 Securicor plc | 114,963 | ||
| 34,923 | HMV Group plc | 55,219 | ||
| 16,489 | IG Group Holdings plc | 61,890 | ||
| 11,449 | Imperial Tobacco Group plc | 305,827 | ||
| 15,295 | Inmarsat plc | 105,059 | ||
| 35,573 | International Power plc | 123,966 | ||
| 6,611 | Intertek Group plc | 75,497 | ||
| 27,591 | John Wood Group plc | 75,291 | ||
| 146,800 | Kingfisher plc | 289,189 | ||
| 75,900 | Pearson plc | 715,414 | ||
| 10,574 | Petrofac, Ltd. | 52,932 | ||
| 71,639 | PV Crystalox Solar plc | 103,611 | ||
| 6,541 | Reckitt Benckiser Group plc | 245,107 | ||
| 5,473 | Rio Tinto plc | 121,651 | ||
| 27,639 | Rotork plc | 318,697 | ||
| 8,680 | Royal Dutch Shell plc, Class A | 228,060 | ||
| 8,897 | Royal Dutch Shell plc, Class B | 225,535 | ||
| 37,508 | Stagecoach Group plc | 77,152 | ||
| 33,515 | Standard Chartered plc | 428,876 | ||
| 31,552 | Tesco plc | 164,297 | ||
| 18,911 | Tullett Prebon plc | 37,936 | ||
| 14,838 | Ultra Electronics Holdings | 243,954 | ||
| 45,409 | Unilever plc | 1,043,076 | ||
| 487,300 | Vodafone Group plc | 997,861 | ||
| 34,533 | VT Group plc | 279,020 | ||
| 88,200 | WPP plc | 515,745 | ||
| 12,801 | Xstrata plc | 119,788 | ||
Total United Kingdom | 13,965,166 | |||
| United States (1.1%) | ||||
| 3,066 | iShares MSCI EAFE Index Fund | 137,571 | ||
| 1,428 | Synthes, Inc. | 181,070 | ||
| 71,000 | WisdomTree India Earnings Fund | 805,851 | ||
Total United States | 1,124,492 | |||
| Total Common Stock (cost $108,679,251) | 87,661,290 | |||
| Principal Amount | Long-Term Fixed Income (7.7%) | Valuea | ||
| Argentina (0.2%) | ||||
Argentina Bonos | ||||
| 380,000 | 7.000%, 10/3/2015 | 110,390 | ||
Republic of Argentina International Bond | ||||
| 660,000 | 1.330%, 3/31/2009d | 125,400 | ||
Total Argentina | 235,790 | |||
| Bermuda (0.1%) | ||||
Digicel Group, Ltd. | ||||
| 100,000 | 8.875%, 1/15/2015 | 65,000 | ||
Total Bermuda | 65,000 | |||
| Brazil (0.9%) | ||||
Federative Republic of Brazil International Bond | ||||
| 880,000 | 6.000%, 1/17/2017 | 908,600 | ||
Independencia International, Ltd. | ||||
| 70,000 | 9.875%, 5/15/2015e | 38,500 | ||
Total Brazil | 947,100 | |||
The accompanying Notes to Financial Statements are an integral part of this schedule.
151
Table of Contents
Partner Worldwide Allocation Portfolio
Schedule of Investments as of December 31, 2008
| Principal Amount | Long-Term Fixed Income (7.7%) | Valuea | ||
| Colombia (0.1%) | ||||
Colombia Government International Bond | ||||
| 110,000 | 7.375%, 9/18/2037 | 107,800 | ||
Total Colombia | 107,800 | |||
| Dominican Republic (0.1%) | ||||
Dominican Republic International Bond | ||||
| 163,947 | 9.040%, 1/23/2018 | 101,647 | ||
Total Dominican Republic | 101,647 | |||
| Ecuador (0.1%) | ||||
Republic of Ecuador International Bond | ||||
| 220,000 | 10.000%, 8/15/2030f | 57,200 | ||
Total Ecuador | 57,200 | |||
| Indonesia (0.3%) | ||||
Indonesia Government International Bond | ||||
| 170,000 | 8.500%, 10/12/2035 | 142,650 | ||
| 300,000 | 6.625%, 2/17/2037 | 215,628 | ||
Total Indonesia | 358,278 | |||
| Ireland (0.1%) | ||||
VIP Finance Ireland, Ltd. | ||||
| 100,000 | 9.125%, 4/30/2018e | 54,000 | ||
| 130,000 | 9.125%, 4/30/2018 | 67,871 | ||
Total Ireland | 121,871 | |||
| Kazakhstan (0.1%) | ||||
KazMunaiGaz Finance Sub BV | ||||
| 100,000 | 8.375%, 7/2/2013e | 78,000 | ||
Total Kazakhstan | 78,000 | |||
| Lebanon (0.2%) | ||||
Lebanon Government International Bond | ||||
| 207,000 | 4.000%, 12/31/2017 | 163,530 | ||
Total Lebanon | 163,530 | |||
| Malaysia (0.2%) | ||||
Malaysia Government International Bond | ||||
| 180,000 | 7.500%, 7/15/2011 | 195,148 | ||
Total Malaysia | 195,148 | |||
| Mexico (1.0%) | ||||
Mexican Bonos | ||||
| 5,500,000 | 10.000%, 12/5/2024g | 456,211 | ||
Mexico Government International Bond | ||||
| 200,000 | 5.950%, 3/19/2019 | 200,000 | ||
| 260,000 | 7.500%, 4/8/2033 | 297,050 | ||
| 80,000 | 6.750%, 9/27/2034 | 84,400 | ||
United Mexican States | ||||
| 40,000 | 6.050%, 1/11/2040 | 38,800 | ||
Total Mexico | 1,076,461 | |||
| Netherlands (0.6%) | ||||
Kazkommerts International BV | ||||
| 190,000 | 8.000%, 11/3/2015 | 87,400 | ||
Majapahit Holding BV | ||||
| 200,000 | 7.750%, 10/17/2016 | 110,059 | ||
| 740,000 | 7.875%, 6/29/2037 | 347,000 | ||
TuranAlem Finance BV | ||||
| 140,000 | 8.000%, 3/24/2014 | 58,800 | ||
Total Netherlands | 603,259 | |||
| Panama (0.1%) | ||||
Panama Government International Bond | ||||
| 170,000 | 6.700%, 1/26/2036 | 153,000 | ||
Total Panama | 153,000 | |||
| Peru (0.2%) | ||||
Peru Government International Bond | ||||
| 290,000 | 6.550%, 3/14/2037 | 258,825 | ||
Total Peru | 258,825 | |||
| Philippines (0.7%) | ||||
Republic of the Philippines Government International Bond | ||||
| 410,000 | 10.625%, 3/16/2025 | 475,600 | ||
| 200,000 | 9.500%, 2/2/2030 | 224,000 | ||
Total Philippines | 699,600 | |||
| Russia (0.9%) | ||||
Russian Federation International Bond | ||||
| 1,127,000 | 7.500%, 3/31/2030 | 982,923 | ||
Total Russia | 982,923 | |||
| South Africa (0.2%) | ||||
Republic of South Africa International Bond | ||||
| 40,000 | 6.500%, 6/2/2014 | 37,800 | ||
| 220,000 | 5.875%, 5/30/2022 | 181,500 | ||
Total South Africa | 219,300 | |||
| South Korea (0.1%) | ||||
Republic of Korea International Bond | ||||
| 100,000 | 5.625%, 11/3/2025 | 89,359 | ||
Total South Korea | 89,359 | |||
| Trinidad & Tobago (0.1%) | ||||
National Gas Company of Trinidad & Tobago, Ltd. | ||||
| 170,000 | 6.050%, 1/15/2036e | 121,693 | ||
Total Trinidad & Tobago | 121,693 | |||
| Turkey (0.6%) | ||||
Republic of Turkey International Bond | ||||
| 540,000 | 6.750%, 4/3/2018 | 513,000 | ||
| 70,000 | 7.000%, 3/11/2019 | 68,023 | ||
| 110,000 | 7.250%, 3/5/2038 | 92,400 | ||
Total Turkey | 673,423 | |||
The accompanying Notes to Financial Statements are an integral part of this schedule.
152
Table of Contents
Partner Worldwide Allocation Portfolio
Schedule of Investments as of December 31, 2008
| Principal Amount | Long-Term Fixed Income (7.7%) | Valuea | |||
| Ukraine (0.2%) | |||||
Ukraine Government International Bond | |||||
| 100,000 | 6.875%, 3/4/2011 | 52,000 | |||
| 100,000 | 7.650%, 6/11/2013 | 43,000 | |||
| 100,000 | 6.580%, 11/21/2016 | 35,000 | |||
| 100,000 | 6.750%, 11/14/2017e | 36,604 | |||
Total Ukraine | 166,604 | ||||
| Uruguay (0.2%) | |||||
Uruguay Government International Bond | |||||
| 290,000 | 7.625%, 3/21/2036 | 243,600 | |||
Total Uruguay | 243,600 | ||||
| Venezuela (0.4%) | |||||
Petroleos de Venezuela SA | |||||
| 30,000 | 5.250%, 4/12/2017 | 10,800 | |||
| 240,000 | 5.375%, 4/12/2027 | 70,200 | |||
| 370,000 | 5.500%, 4/12/2037 | 104,525 | |||
Venezuela Government International Bond | |||||
| 210,000 | 6.000%, 12/9/2020 | 78,225 | |||
| 130,000 | 9.000%, 5/7/2023 | 52,000 | |||
| 90,000 | 9.250%, 5/7/2028 | 37,800 | |||
| 200,000 | 9.375%, 1/13/2034 | 92,000 | |||
| 80,000 | 7.000%, 3/31/2038 | 29,000 | |||
Total Venezuela | 474,550 | ||||
Total Long-Term Fixed Income (cost $9,750,517) | 8,193,961 | ||||
Shares | Preferred Stock (0.6%) | Valuea | |||
| South Korea (0.6%) | |||||
| 3,200 | Samsung Electronics Company, Ltd. | 664,953 | |||
Total South Korea | 664,953 | ||||
Total Preferred Stock (cost $995,870) | 664,953 | ||||
| Shares or Principal Amount | Short-Term Investments (8.8%)h | Value | |||
Federal National Mortgage Association Discount Notes | |||||
| 500,000 | 0.374%, 5/14/2009i | 499,315 | |||
| 8,811,716 | Thrivent Money Market Portfolio | 8,811,716 | |||
| Total Short-Term Investments (at amortized cost) | 9,311,031 | ||||
Total Investments (cost $128,736,669) 99.9% | $ | 105,831,235 | |||
Other Assets and Liabilities, Net 0.1% | 70,296 | ||||
Total Net Assets 100.0% | $ | 105,901,531 | |||
| a | Security is fair valued as discussed in item 2(A) of the Notes to Financial Statements. |
| b | Non-income producing security. |
| c | Denotes securities sold under Rule 144A of the Securities Act of 1933, which exempts them from registration. These securities have been deemed liquid and may be resold to other dealers in the program or to other qualified institutional buyers. As of December 31, 2008, the value of these investments was $375,967 or 0.4% of total net assets. |
| d | Denotes step coupon bonds for which the current interest rate and next scheduled reset date are shown. |
| e | Denotes restricted securities. Restricted securities are investment securities which have been deemed illiquid and cannot be offered for public sale without first being registered under the Securities Act of 1933. The following table indicates the acquisition date and cost of restricted securities Partner Worldwide Allocation Portfolio owned as of December 31, 2008. |
Security | Acquisition Date | Cost | |||
Independencia International, Ltd. | 5/8/2008 | $ | 69,138 | ||
KazMunaiGaz Finance Sub BV | 6/24/2008 | 99,499 | |||
National Gas Company of Trinidad & Tobago, Ltd. | 6/6/2008 | 158,128 | |||
Ukraine Government International Bond | 9/8/2008 | 84,850 | |||
VIP Finance Ireland, Ltd. | 5/2/2008 | 101,046 | |||
| f | Defaulted security. |
| g | Principal amount is displayed in Mexican Pesos. |
| h | The interest rate shown reflects the yield, coupon rate or, for securities purchased at a discount, the discount rate at the date of purchase. |
| i | At December 31, 2008, $499,315 of investments were held on deposit with the counterparty and pledged as the initial margin deposit for open financial futures contracts. |
Definitions:
| ADR | - | American Depositary Receipt, which are certificates for an underlying foreign security’s shares held by an issuing U.S. depository bank. | ||
| GDR | - | Global Depository Receipts, which are certificates for shares of an underlying foreign security’s shares held by an issuing depository bank from more than one country. | ||
Gross unrealized appreciation and depreciation of investments, based on cost for federal income tax purposes, were as follows:
Gross unrealized appreciation | $ | 1,820,252 | ||
Gross unrealized depreciation | (25,646,420 | ) | ||
Net unrealized appreciation (depreciation) | $ | (23,826,168 | ) | |
Cost for federal income tax purposes | $ | 129,657,403 |
The following table is a summary of the inputs used, as of December 31, 2008, in valuing the Partner Worldwide Allocation Portfolio’s assets carried at fair value as discussed in item 2(A) of the Notes to Financial Statements.
Level | Investments in Securities | Other Financial Instruments* | ||||
Level 1 | $ | 17,580,103 | $ | 156,846 | ||
Level 2 | 87,946,655 | — | ||||
Level 3 | 304,477 | — | ||||
Totals (Level 1,2,3) | $ | 105,831,235 | $ | 156,846 | ||
The accompanying Notes to Financial Statements are an integral part of this schedule.
153
Table of Contents
Partner Worldwide Allocation Portfolio
Schedule of Investments as of December 31, 2008
The following table is a reconciliation of assets in which significant unobservable inputs (Level 3) were used in determining fair value for the Partner Worldwide Allocation Portfolio as discussed in item 2(A) of the Notes to Financial Statements.
| Investments in Securities | Other Financial Instruments* | ||||||
Value April 30, 2008 | $ | — | $ | — | |||
Accrued Discounts/Premiums | — | — | |||||
Realized Gain/(Loss) | (410 | ) | — | ||||
Change in Unrealized Gain/(Loss) | 6,734 | — | |||||
Net Purchases/Sales | 298,153 | — | |||||
Transfers In and/or Out of Level 3 | — | — | |||||
Value December 31, 2008 | $ | 304,477 | $ | — | |||
| * | Other Financial Instruments include Futures, Forwards, Written Options and Swap agreements. |
Futures | Number of Contracts Long/(Short) | Expiration Date | Notional Principal Amount | Value | Unrealized Gain/ (Loss) | |||||||||
E-Mini MSCI EAFE Index Futures | 46 | March 2009 | $ | 2,766,007 | $ | 2,913,640 | $ | 147,633 | ||||||
Total Futures | $ | 147,633 | ||||||||||||
Foreign Currency Forward Contracts | Contracts to Deliver/Receive | Settlement Date | Value on Settlement Date | Value | Unrealized Gain/ (Loss) | |||||||||
Purchases | ||||||||||||||
British Pound | 17,851 | 1/2/2009 - 1/5/2009 | $ | 25,811 | $ | 25,666 | ($145 | ) | ||||||
Chinese Renminbi Yuan | 515,000 | 2/3/2009 | 74,304 | 75,103 | 799 | |||||||||
EURO | 43,735 | 1/2/2009 - 1/6/2009 | 61,534 | 60,792 | (742 | ) | ||||||||
Japanese Yen | 13,284,702 | 1/5/2009 - 1/7/2009 | 147,139 | 146,549 | (590 | ) | ||||||||
Total Foreign Currency Forward Contracts Purchases | $ | 308,788 | $ | 308,110 | ($678 | ) | ||||||||
Sales | ||||||||||||||
Japanese Yen | 3,697,983 | 1/5/2009 - 1/7/2009 | $ | 40,938 | $ | 40,794 | $ | 144 | ||||||
Mexican Peso | 6,081,775 | 2/13/2009 | 443,520 | 433,769 | 9,751 | |||||||||
Norwegian Krone | 25,398 | 1/2/2009 - 1/6/2009 | 3,623 | 3,627 | (4 | ) | ||||||||
Total Foreign Currency Forward Contracts Sales | $ | 488,081 | $ | 478,190 | $ | 9,891 | ||||||||
Net Unrealized Gain/(Loss) on Foreign Currency Forward Contracts | $ | 9,213 | ||||||||||||
Investment in Affiliates
Affiliated issuers, as defined under the Investment Company Act of 1940, include those in which the Portfolio’s holdings of an issuer represent 5% or more of the outstanding voting securities of an issuer, or any affiliated mutual fund.
A summary of transactions for the fiscal year to date, in Partner Worldwide Allocation Portfolio, is as follows:
Portfolio | Value April 30, 2008† | Gross Purchases and Additions | Gross Sales and Reductions | Balance of Shares Held at December 31, 2008 | Value December 31, 2008 | Income Earned April 30, 2008 - December 31, 2008 | |||||||||||
Money Market | $ | — | $ | 28,831,868 | $ | 20,020,152 | 8,811,716 | $ | 8,811,716 | $ | 70,067 | ||||||
Total Value and Income Earned | — | 8,811,716 | 70,067 | ||||||||||||||
| † | Partner Worldwide Allocation Portfolio was incepted on 4/30/2008. |
The accompanying Notes to Financial Statements are an integral part of this schedule.
154
Table of Contents
Partner International Stock Portfolio
Schedule of Investments as of December 31, 2008
| Shares | Common Stock (97.2%) | Valuea | |||
| Australia (2.7%) | |||||
| 1,001,084 | Asciano Group | $ | 1,065,645 | ||
| 322,639 | BHP Billiton, Ltd. | 6,854,240 | |||
| 337,195 | Centennial Coal Company, Ltd. | 790,033 | |||
| 122,323 | CSL, Ltd. | 2,884,616 | |||
| 69,014 | Leighton Holdings, Ltd. | 1,341,017 | |||
| 325,654 | OneSteel, Ltd. | 563,123 | |||
| 245,395 | Origin Energy, Ltd. | 2,767,695 | |||
| 131,350 | QBE Insurance Group, Ltd. | 2,373,943 | |||
| 158,437 | Sonic Healthcare, Ltd. | 1,614,162 | |||
| 88,597 | Westpac Banking Corporation | 1,062,608 | |||
Total Australia | 21,317,082 | ||||
| Austria (0.3%) | |||||
| 31,887 | OMV AG | 847,284 | |||
| 36,816 | Verbund - Oesterreichische Elektrizitaetswirtschafts-AG | 1,702,282 | |||
Total Austria | 2,549,566 | ||||
| Belgium (0.3%) | |||||
| 6,781 | Colruyt SA | 1,457,147 | |||
| 12,579 | Group Bruxelles Lambert SA | 1,007,719 | |||
Total Belgium | 2,464,866 | ||||
| Brazil (0.7%) | |||||
| 83,900 | Companhia Vale do Rio Doce ADR | 1,016,029 | |||
| 290,700 | Empresa Brasileira de Aeronautica SA ADRb | 4,712,247 | |||
Total Brazil | 5,728,276 | ||||
| Canada (2.7%) | |||||
| 94,200 | Alimentation Couche-Tard, Inc. | 1,101,861 | |||
| 160,757 | CGI Group, Inc.c | 1,250,115 | |||
| 72,513 | Enbridge, Inc.c | 2,323,705 | |||
| 107,700 | EnCana Corporation | 4,969,293 | |||
| 2,800 | Fairfax Financial Holdings, Ltd.c | 884,568 | |||
| 36 | Gildan Activewear, Inc.c | 414 | |||
| 157,494 | Groupe Aeroplan, Inc. | 1,107,370 | |||
| 30,500 | Metro, Inc. | 914,135 | |||
| 32,900 | Potash Corporation of Saskatchewan, Inc. | 2,386,283 | |||
| 46,800 | Shoppers Drug Mart Corporation | 1,821,580 | |||
| 143,200 | Sino-Forest Corporationc | 1,144,904 | |||
| 25,100 | Toronto-Dominion Bankb | 883,431 | |||
| 151,400 | Viterra, Inc.c | 1,165,087 | |||
| 149,827 | Yellow Pages Income Fund | 811,942 | |||
Total Canada | 20,764,688 | ||||
| Cayman Islands (0.1%) | |||||
| 137,501 | Subsea 7, Inc.c | 817,487 | |||
Total Cayman Islands | 817,487 | ||||
| Denmark (0.8%) | |||||
| 71,066 | Novo Nordisk AS | 3,665,825 | |||
| 41,779 | Vestas Wind Systemsc | 2,458,537 | |||
Total Denmark | 6,124,362 | ||||
| Finland (0.6%) | |||||
| 79,364 | Fortum Oyj | 1,724,992 | |||
| 208,738 | Nokia Oyj | 3,275,568 | |||
Total Finland | 5,000,560 | ||||
| France (8.0%) | |||||
| 38,215 | Alstom | 2,277,404 | |||
| 377,900 | Axa SA | 8,482,159 | |||
| 149,000 | Cap Gemini SA | 5,761,354 | |||
| 83,500 | Compagnie de Saint-Gobain | 3,945,381 | |||
| 21,512 | Eurazeo | 1,011,701 | |||
| 49,405 | Eutelsat Communicationsc | 1,166,882 | |||
| 94,381 | GDF Suezb | 4,684,782 | |||
| 17,840 | Hermes Internationalb | 2,497,647 | |||
| 103,400 | Schneider Electric SA | 7,698,514 | |||
| 42,133 | Societe Generale | 2,137,526 | |||
| 46,470 | Teleperformance | 1,300,727 | |||
| 77,982 | Total SA | 4,287,373 | |||
| 49,038 | UBISOFT Entertainment SAc | 962,103 | |||
| 7,632 | Vallourec SA | 867,758 | |||
| 456,204 | Vivendi Universal SA | 14,869,499 | |||
Total France | 61,950,810 | ||||
| Germany (5.4%) | |||||
| 110,500 | Adidas AG | 4,212,210 | |||
| 43,224 | Bayer AG | 2,518,588 | |||
| 144,300 | Bayerische Motoren Werke AG | 4,430,756 | |||
| 420,200 | Deutsche Post AG-REG | 7,107,069 | |||
| 28,438 | Fresenius SE | 1,668,888 | |||
| 78,557 | GEA Group AG | 1,364,155 | |||
| 34,165 | RWE AG | 3,034,426 | |||
| 118,517 | SAP AG | 4,300,615 | |||
| 168,339 | Siemens AG | 12,673,115 | |||
| 9,768 | Wacker Chemie AG | 1,045,984 | |||
Total Germany | 42,355,806 | ||||
| Greece (0.6%) | |||||
| 139,706 | Alpha Bank AE | 1,307,029 | |||
| 72,763 | Greek Organization of Football Prognostics SA | 2,093,995 | |||
| 181,691 | Marfin Investment Group SAc | 734,518 | |||
| 56,614 | Public Power Corporation SA | 909,853 | |||
Total Greece | 5,045,395 | ||||
| Hong Kong (0.7%) | |||||
| 641,000 | BOC Hong Kong (Holdings), Ltd. | 733,674 | |||
| 141,000 | Cheung Kong Holdings, Ltd. | 1,345,087 | |||
| 103,200 | Hang Seng Bank, Ltd. | 1,362,508 | |||
| 400,000 | Hutchison Whampoa, Ltd. | 2,019,282 | |||
Total Hong Kong | 5,460,551 | ||||
| Italy (4.0%) | |||||
| 284,684 | Enel SPA | 1,833,786 | |||
| 419,100 | Eni SPA | 10,085,023 | |||
| 686,168 | Finmeccanica SPA | 10,627,974 | |||
| 143,034 | Istituto Finanziario Industriale SPAc | 983,980 | |||
| 54,812 | Lottomatica SPA | 1,364,342 | |||
| 407,247 | Terna-Rete Elettrica Nationale SPA | 1,343,904 | |||
| 1,887,400 | Unicredit SPA | 4,798,519 | |||
Total Italy | 31,037,528 | ||||
| Japan (23.3%) | |||||
| 38,100 | Astellas Pharmaceutical, Inc. | 1,559,521 | |||
| 122,000 | Bank of Kyoto, Ltd. | 1,367,311 | |||
| 315,100 | Bridgestone Corporation | 4,726,377 | |||
| 34,500 | Canon, Inc. | 1,093,118 | |||
| 1,083 | CyberAgent, Inc. | 671,159 | |||
The accompanying Notes to Financial Statements are an integral part of this schedule.
155
Table of Contents
Partner International Stock Portfolio
Schedule of Investments as of December 31, 2008
| Shares | Common Stock (97.2%) | Valuea | |||
| Japan (23.3%) - continued | |||||
| 122,000 | Daihatsu Motor Company, Ltd. | $ | 1,078,090 | ||
| 261,500 | Daiichi Sankyo Company, Ltd. | 6,184,047 | |||
| 279,500 | Daito Trust Construction Company, Ltd. | 14,672,177 | |||
| 489 | East Japan Railway Company | 3,722,232 | |||
| 36,700 | FamilyMart Company, Ltd. | 1,593,825 | |||
| 17,530 | Fast Retailing Company, Ltd. | 2,572,227 | |||
| 349,000 | Godo Steel, Ltd. | 981,373 | |||
| 33,200 | Hisamitsu Pharmaceutical Company, Inc. | 1,357,142 | |||
| 110,000 | Hitachi Metals, Ltd. | 511,607 | |||
| 690,000 | Hitachi, Ltd. | 2,677,834 | |||
| 47,200 | Honda Motor Company, Ltd. | 1,005,298 | |||
| 93,600 | Hosiden Corporation | 1,479,297 | |||
| 303,000 | ITOCHU Corporation | 1,528,663 | |||
| 845 | Japan Tobacco, Inc. | 2,798,929 | |||
| 96,000 | Kao Corporation | 2,916,033 | |||
| 400 | KDDI Corporation | 2,856,119 | |||
| 49,700 | KONAMI Corporation | 1,288,470 | |||
| 47,700 | Kurita Water Industries, Ltd. | 1,289,506 | |||
| 33,500 | Lawson, Inc. | 1,931,990 | |||
| 292,000 | Maeda Corporation | 1,185,653 | |||
| 509,000 | Marubeni Corporation | 1,948,736 | |||
| 432,000 | Mitsubishi Electric Corporation | 2,707,237 | |||
| 199,000 | Mitsubishi Estate Company, Ltd. | 3,287,258 | |||
| 89,000 | Mitsubishi Logistics Corporation | 1,128,366 | |||
| 1,354,100 | Mitsubishi UFJ Financial Group, Inc. | 8,510,719 | |||
| 173,000 | Mitsui & Company, Ltd. | 1,778,504 | |||
| 193,000 | Mitsui Fudosan Company, Ltd. | 3,217,742 | |||
| 386,545 | Mitsui Sumitomo Insurance Group Holdings, Inc. | 12,292,585 | |||
| 12,200 | Nintendo Company, Ltd. | 4,662,251 | |||
| 157,000 | Nippon Yusen Kabushiki Kaisha | 967,864 | |||
| 265,000 | Oji Paper Company, Ltd. | 1,557,977 | |||
| 3,374 | Rakuten, Inc.c | 2,148,206 | |||
| 311,000 | Sanyo Special Steel Company, Ltd. | 922,805 | |||
| 103,200 | Seven & I Holdings Company, Ltd. | 3,547,147 | |||
| 342 | Seven Bank, Ltd. | 1,307,193 | |||
| 37,400 | Shimano, Inc. | 1,472,314 | |||
| 200,200 | Shin-Etsu Chemical Company, Ltd. | 9,239,544 | |||
| 574,000 | Shinsei Bank, Ltd. | 908,481 | |||
| 135,400 | Softbank Corporation | 2,459,025 | |||
| 37,400 | Square ENIX Holdings Company, Ltd. | 1,206,805 | |||
| 1,084,600 | Sumitomo Corporation | 9,619,623 | |||
| 1,863,700 | Sumitomo Trust and Banking Company, Ltd. | 11,016,788 | |||
| 122,000 | Suruga Bank, Ltd. | 1,212,023 | |||
| 28,700 | T&D Holdings, Inc. | 1,214,753 | |||
| 154,900 | Takeda Pharmaceutical Company, Ltd. | 8,073,746 | |||
| 108,300 | Tokio Marine Holdings, Inc. | 3,208,867 | |||
| 126,800 | Tokyo Electric Power Company, Inc. | 4,232,806 | |||
| 78,935 | Toyo Seikan Kaisha, Ltd. | 1,368,252 | |||
| 35,000 | Toyo Suisan Kaisha, Ltd. | 1,008,574 | |||
| 450,000 | Toyo Tire & Rubber Company, Ltd. | 822,295 | |||
| 274,600 | Toyota Motor Corporation | 9,077,815 | |||
| 206,000 | Yokohama Rubber Company, Ltd. | 1,033,761 | |||
Total Japan | 180,208,060 | ||||
| Luxembourg (0.1%) | |||||
| 26,131 | Oriflame Cosmetics SAb | 763,321 | |||
Total Luxembourg | 763,321 | ||||
| Netherlands (2.7%) | |||||
| 30,952 | Furgo NV | 889,653 | |||
| 40,152 | Gemalto NVc | 1,010,146 | |||
| 390,600 | ING Groep NV | 4,298,880 | |||
| 256,765 | Koninklijke (Royal) Ahold NV | 3,164,056 | |||
| 285,439 | Koninklijke (Royal) KPN NV | 4,149,816 | |||
| 28,803 | Koninklijke Boskalis Westminster NV | 671,982 | |||
| 39,421 | Koninklijke DSM NV | 1,011,586 | |||
| 23,738 | Koninklijke Vopak NV | 899,599 | |||
| 197,784 | Reed Elsevier NV | 2,351,524 | |||
| 114,600 | Unilever NV | 2,777,656 | |||
Total Netherlands | 21,224,898 | ||||
| Norway (1.7%) | |||||
| 100 | DnB NOR ASA | 397 | |||
| 923,700 | Norsk Hydro ASA | 3,763,529 | |||
| 128,000 | Seadrill, Ltd. | 1,043,200 | |||
| 469,875 | StatoilHydro ASA | 7,858,557 | |||
| 83,800 | Tandberg ASA | 923,511 | |||
| 10 | Yara International ASA | 220 | |||
Total Norway | 13,589,414 | ||||
| Portugal (0.2%) | |||||
| 225,013 | Jeronimo Martins SGPS SA | 1,249,707 | |||
Total Portugal | 1,249,707 | ||||
| Singapore (1.6%) | |||||
| 704,600 | Singapore Airlines, Ltd. | 5,541,438 | |||
| 3,780,650 | Singapore Telecommunications, Ltd. | 6,736,842 | |||
Total Singapore | 12,278,280 | ||||
| South Korea (1.0%) | |||||
| 22,334 | Samsung Electronics Company, Ltd. | 8,142,761 | |||
Total South Korea | 8,142,761 | ||||
| Spain (5.2%) | |||||
| 423,800 | Banco Bilbao Vizcaya Argentaria SAb | 5,251,020 | |||
| 55,987 | Grifols SA | 980,979 | |||
| 38,453 | Grupo Ferrovial SA | 1,072,632 | |||
| 1,066,952 | Iberdrola SA | 9,945,761 | |||
| 321,973 | Mapfre SA | 1,098,038 | |||
| 985,862 | Telefonica SA | 22,252,470 | |||
Total Spain | 40,600,900 | ||||
| Sweden (1.8%) | |||||
| 198,600 | Atlas Copco AB | 1,747,366 | |||
| 98,348 | Elekta AB | 989,635 | |||
| 94,656 | Investor AB | 1,443,777 | |||
| 48,125 | Modern Times Group AB | 1,053,583 | |||
| 103,983 | Nordea Bank AB | 741,152 | |||
| 488,600 | Sandvik AB | 3,138,402 | |||
The accompanying Notes to Financial Statements are an integral part of this schedule.
156
Table of Contents
Partner International Stock Portfolio
Schedule of Investments as of December 31, 2008
| Shares | Common Stock (97.2%) | Valuea | ||||
| Sweden (1.8%) - continued | ||||||
| 131,279 | SSAB Svenskt Stal AB | $ | 1,094,553 | |||
| 505,700 | Telefonaktiebolaget LM Ericsson | 3,942,350 | ||||
Total Sweden | 14,150,818 | |||||
| Switzerland (11.6%) | ||||||
| 45,708 | Actelion, Ltd.c | 2,585,645 | ||||
| 175,900 | Adecco SA | 6,021,485 | ||||
| 11,650 | Givaudan SA | 9,205,346 | ||||
| 659,030 | Nestle SA | 26,095,086 | ||||
| 477,846 | Novartis AG | 23,930,056 | ||||
| 13,018 | Pargesa Holding SA | 869,975 | ||||
| 47,095 | Roche Holding AG | 7,290,765 | ||||
| 181,300 | Swiss Reinsurance Company | 8,877,041 | ||||
| 69,439 | Temenos Group AGb,c | 937,042 | ||||
| 119,240 | UBS AGc | 1,734,783 | ||||
| 9,149 | Zurich Financial Services AG | 1,998,788 | ||||
Total Switzerland | 89,546,012 | |||||
| Taiwan (1.3%) | ||||||
| 1,298,237 | Taiwan Semiconductor Manufacturing Company, Ltd. ADR | 10,256,072 | ||||
Total Taiwan | 10,256,072 | |||||
| United Kingdom (19.2%) | ||||||
| 186,124 | Aggreko plc | 1,215,118 | ||||
| 127,021 | Amlin plc | 660,272 | ||||
| 118,850 | Anglo American plc | 2,773,725 | ||||
| 202,600 | AstraZeneca plc | 8,288,801 | ||||
| 76,886 | Autonomy Corporation plcc | 1,069,926 | ||||
| 94,588 | Aveva Group plc | 787,671 | ||||
| 184,840 | Babcock International Group plc | 1,274,320 | ||||
| 553,347 | BAE Systems plc | 3,011,464 | ||||
| 202,563 | Balfour Beatty plc | 979,933 | ||||
| 374,715 | BG Group plc | 5,186,853 | ||||
| 208,458 | BHP Billiton plc | 4,043,336 | ||||
| 865,523 | BP Amoco plc | 6,681,638 | ||||
| 196,576 | British American Tobacco plc | 5,128,245 | ||||
| 1,309,700 | British Sky Broadcasting Group plc | 9,249,250 | ||||
| 657,087 | Cable & Wireless plc | 1,486,028 | ||||
| 36,668 | Chemring Group plc | 1,036,769 | ||||
| 484,620 | Cobham plc | 1,448,634 | ||||
| 290,225 | Compass Group plc | 1,447,578 | ||||
| 50,906 | Diageo plc | 715,297 | ||||
| 174,609 | FirstGroup plc | 1,104,267 | ||||
| 372,191 | GAME GROUP plc | 689,637 | ||||
| 893,127 | GlaxoSmithKline plc | 16,610,750 | ||||
| 475,110 | Group 4 Securicor plc | 1,414,878 | ||||
| 413,027 | HMV Group plc | 653,064 | ||||
| 197,129 | IG Group Holdings plc | 739,907 | ||||
| 140,905 | Imperial Tobacco Group plc | 3,763,875 | ||||
| 188,236 | Inmarsat plc | 1,292,969 | ||||
| 437,802 | International Power plc | 1,525,666 | ||||
| 82,119 | Intertek Group plc | 937,786 | ||||
| 339,564 | John Wood Group plc | 926,612 | ||||
| 2,977,300 | Kingfisher plc | 5,865,131 | ||||
| 870,000 | Pearson plc | 8,200,390 | ||||
| 134,609 | Petrofac, Ltd. | 673,839 | ||||
| 80,573 | Reckitt Benckiser Group plc | 3,019,269 | ||||
| 67,969 | Rio Tinto plc | 1,510,778 | ||||
| 61,462 | Rotork plc | 708,700 | ||||
| 104,617 | Royal Dutch Shell plc, Class A | 2,748,727 | ||||
| 107,222 | Royal Dutch Shell plc, Class B | 2,718,028 | ||||
| 465,880 | Stagecoach Group plc | 958,286 | ||||
| 87,384 | Standard Chartered plc | 1,118,214 | ||||
| 391,890 | Tesco plc | 2,040,645 | ||||
| 240,737 | Tullett Prebon plc | 482,928 | ||||
| 615,874 | Unilever plc | 14,147,038 | ||||
| 5,264,487 | Vodafone Group plc | 10,780,276 | ||||
| 998,000 | WPP plc | 5,835,753 | ||||
| 157,541 | Xstrata plc | 1,474,226 | ||||
Total United Kingdom | 148,426,497 | |||||
| United States (0.6%) | ||||||
| 54,381 | iShares MSCI EAFE Index Fund | 2,440,076 | ||||
| 17,737 | Synthes, Inc. | 2,249,051 | ||||
Total United States | 4,689,127 | |||||
Total Common Stock (cost $990,531,633) | 755,742,844 | |||||
| Shares | Collateral Held for Securities Loaned (1.7%) | Value | ||||
| 13,420,165 | Thrivent Financial Securities Lending Trust | 13,420,165 | ||||
Total Collateral Held for Securities Loaned (cost $13,420,165) | 13,420,165 | |||||
| Shares | Short-Term Investments (2.8%) | Value | ||||
| 21,861,973 | Thrivent Money Market Portfolio | 21,861,973 | ||||
Total Short-Term Investments (at amortized cost) | 21,861,973 | |||||
Total Investments (cost $1,025,813,771) 101.7% | $ | 791,024,982 | ||||
Other Assets and Liabilities, Net (1.7%) | (12,899,528 | ) | ||||
Total Net Assets 100.0% | $ | 778,125,454 | ||||
| a | Security is fair valued as discussed in item 2(A) of the Notes to Financial Statements. |
| b | All or a portion of the security is on loan as discussed in item 2(M) of the Notes to Financial Statements. |
| c | Non-income producing security. |
Definitions:
| ADR - | American Depositary Receipt, which are certificates for an underlying foreign security’s shares held by an issuing U.S. depository bank. |
Gross unrealized appreciation and depreciation of investments, based on cost for federal income tax purposes, were as follows:
Gross unrealized appreciation | $ | 30,236,793 | ||
Gross unrealized depreciation | (271,433,674 | ) | ||
Net unrealized appreciation (depreciation) | $ | (241,196,881 | ) | |
Cost for federal income tax purposes | $ | 1,032,221,863 |
The accompanying Notes to Financial Statements are an integral part of this schedule.
157
Table of Contents
Partner International Stock Portfolio
Schedule of Investments as of December 31, 2008
The following table is a summary of the inputs used, as of December 31, 2008, in valuing the Partner International Stock Portfolio’s assets carried at fair value as discussed in item 2(A) of the Notes to Financial Statements.
Level | Investments in Securities | Other Financial Instruments* | ||||
Level 1 | $ | 74,471,250 | $ | — | ||
Level 2 | 712,831,500 | — | ||||
Level 3 | 3,722,232 | — | ||||
Totals (Level 1,2,3) | $ | 791,024,982 | $ | — | ||
The following table is a reconciliation of assets in which significant unobservable inputs (Level 3) were used in determining fair value for the Partner International Stock Portfolio as discussed in item 2(A) of the Notes to Financial Statements.
| Investments in Securities | Other Financial Instruments* | ||||||
Value December 31, 2007 | $ | — | $ | — | |||
Accrued Discounts/Premiums | — | — | |||||
Realized Gain/(Loss) | (6,646 | ) | — | ||||
Change in Unrealized Gain/(Loss) | 175,672 | — | |||||
Net Purchases/Sales | 3,553,206 | — | |||||
Transfers In and/or Out of Level 3 | — | — | |||||
Value December 31, 2008 | $ | 3,722,232 | $ | — | |||
| * | Other Financial Instruments include Futures, Forwards, Written Options and Swap agreements. |
Investment in Affiliates
Affiliated issuers, as defined under the Investment Company Act of 1940, include those in which the Portfolio’s holdings of an issuer represent 5% or more of the outstanding voting securities of an issuer, or any affiliated mutual fund.
A summary of transactions for the fiscal year to date, in Partner International Stock Portfolio, is as follows:
Portfolio | Value December 31, 2007 | Gross Purchases and Additions | Gross Sales and Reductions | Balance of Shares Held at December 31, 2008 | Value December 31, 2008 | Income Earned January 1, 2008 - December 31, 2008 | |||||||||||
Money Market | $ | 6,617,542 | $ | 217,467,750 | $ | 202,223,319 | 21,861,973 | $ | 21,861,973 | $ | 548,457 | ||||||
Thrivent Financial Securities Lending Trust | 122,278,806 | 806,225,654 | 915,084,295 | 13,420,165 | 13,420,165 | 1,612,504 | |||||||||||
Total Value and Income Earned | 128,896,348 | 35,282,138 | 2,160,961 | ||||||||||||||
The accompanying Notes to Financial Statements are an integral part of this schedule.
158
Table of Contents
Partner Socially Responsible Stock Portfolio
Schedule of Investments as of December 31, 2008
Shares | Common Stock (97.8%) | Value | |||
Consumer Discretionary (12.0%) | |||||
| 1,000 | Best Buy Company, Inc. | $ | 28,110 | ||
| 3,400 | Kohl’s Corporationa | 123,080 | |||
| 2,700 | Omnicom Group, Inc. | 72,684 | |||
| 6,900 | Staples, Inc. | 123,648 | |||
| 1,100 | Target Corporation | 37,983 | |||
Total Consumer Discretionary | 385,505 | ||||
Consumer Staples (9.4%) | |||||
| 4,900 | CVS/Caremark Corporation | 140,826 | |||
| 1,350 | Procter & Gamble Company | 83,457 | |||
| 3,300 | SYSCO Corporation | 75,702 | |||
Total Consumer Staples | 299,985 | ||||
Energy (4.6%) | |||||
| 1,400 | EOG Resources, Inc. | 93,212 | |||
| 1,200 | FMC Technologies, Inc.a | 28,596 | |||
| 1,100 | Smith International, Inc. | 25,179 | |||
Total Energy | 146,987 | ||||
Financials (14.3%) | |||||
| 2,100 | AFLAC, Inc. | 96,264 | |||
| 2,800 | Bank of New York Mellon Corporation | 79,324 | |||
| 4,200 | Charles Schwab Corporation | 67,914 | |||
| 300 | Goldman Sachs Group, Inc. | 25,317 | |||
| 4,200 | SEI Investments Company | 65,982 | |||
| 800 | SunTrust Banks, Inc. | 23,632 | |||
| 1,150 | T. Rowe Price Group, Inc. | 40,756 | |||
| 1,100 | Wells Fargo & Company | 32,428 | |||
| 1,000 | Zions Bancorporation | 24,510 | |||
Total Financials | 456,127 | ||||
Health Care (19.7%) | |||||
| 1,700 | Coventry Health Care, Inc.a | 25,296 | |||
| 1,300 | Dentsply International, Inc. | 36,712 | |||
| 270 | Intuitive Surgical, Inc.a | 34,287 | |||
| 1,500 | Laboratory Corporation of America Holdingsa | 96,615 | |||
| 2,000 | Medtronic, Inc. | 62,840 | |||
| 2,300 | Novartis AG ADR | 114,448 | |||
| 1,600 | Pharmaceutical Product Development, Inc. | 46,416 | |||
| 2,000 | St. Jude Medical, Inc.a | 65,920 | |||
| 2,600 | Stryker Corporation | 103,870 | |||
| 1,300 | Varian Medical Systems, Inc.a | 45,552 | |||
Total Health Care | 631,956 | ||||
Industrials (8.4%) | |||||
| 450 | C.H. Robinson Worldwide, Inc. | 24,764 | |||
| 1,100 | Danaher Corporation | 62,271 | |||
| 650 | Deere & Company | 24,908 | |||
| 1,950 | Emerson Electric Company | 71,390 | |||
| 550 | Fastenal Company | 19,167 | |||
| 1,200 | United Parcel Service, Inc. | 66,192 | |||
Total Industrials | 268,692 | ||||
Information Technology (22.1%) | |||||
| 1,150 | Apple, Inc.a | 98,153 | |||
| 7,700 | Cisco Systems, Inc.a | 125,510 | |||
| 340 | Google, Inc.a | 104,601 | |||
| 3,200 | Hewlett-Packard Company | 116,128 | |||
| 5,800 | Intel Corporation | 85,028 | |||
| 3,400 | Microsoft Corporation | 66,096 | |||
| 1,100 | Nokia Oyj ADR | 17,160 | |||
| 2,650 | QUALCOMM, Inc. | 94,949 | |||
Total Information Technology | 707,625 | ||||
Materials (4.5%) | |||||
| 1,400 | Air Products and Chemicals, Inc. | 70,378 | |||
| 2,100 | Ecolab, Inc. | 73,815 | |||
Total Materials | 144,193 | ||||
Utilities (2.8%) | |||||
| 2,700 | Questar Corporation | 88,263 | |||
Total Utilities | 88,263 | ||||
Total Common Stock (cost $4,599,960) | 3,129,333 | ||||
Shares | Short-Term Investments (2.2%) | Value | |||
| 69,852 | Thrivent Money Market Portfolio | 69,852 | |||
Total Short-Term Investments (at amortized cost) | 69,852 | ||||
Total Investments (cost $4,669,812) 100.0% | $ | 3,199,185 | |||
Other Assets and Liabilities, Net 0.0% | 1,535 | ||||
Total Net Assets 100.0% | $ | 3,200,720 | |||
| a | Non-income producing security. |
Definitions:
| ADR | - | American Depositary Receipt, which are certificates for an underlying foreign security’s shares held by an issuing U.S. depository bank. |
Gross unrealized appreciation and depreciation of investments, based on cost for federal income tax purposes, were as follows:
Gross unrealized appreciation | $ | 9,356 | ||
Gross unrealized depreciation | (1,479,983 | ) | ||
Net unrealized appreciation (depreciation) | $ | (1,470,627 | ) | |
Cost for federal income tax purposes | $ | 4,669,812 |
The following table is a summary of the inputs used, as of December 31, 2008, in valuing the Partner Socially Responsible Stock Portfolio’s assets carried at fair value as discussed in item 2(A) of the Notes to Financial Statements.
Level | Investments in Securities | Other Financial Instruments* | ||||
Level 1 | $ | 3,199,185 | $ | — | ||
Level 2 | — | — | ||||
Level 3 | — | — | ||||
Totals (Level 1,2,3) | $ | 3,199,185 | $ | — | ||
| * | Other Financial Instruments include Futures, Forwards, Written Options and Swap agreements. |
The accompanying Notes to Financial Statements are an integral part of this schedule.
159
Table of Contents
Partner Socially Responsible Stock Portfolio
Schedule of Investments as of December 31, 2008
Investment in Affiliates
Affiliated issuers, as defined under the Investment Company Act of 1940, include those in which the Portfolio’s holdings of an issuer represent 5% or more of the outstanding voting securities of an issuer, or any affiliated mutual fund.
A summary of transactions for the fiscal year to date, in Partner Socially Responsible Stock Portfolio, is as follows:
Portfolio | Value April 30, 2008† | Gross Purchases and Additions | Gross Sales and Reductions | Balance of Shares Held at December 31, 2008 | Value December 31, 2008 | Income Earned April 30, 2008 - December 31, 2008 | |||||||||||
Money Market | $ | — | $ | 576,886 | $ | 507,034 | 69,852 | $ | 69,852 | $ | 1,591 | ||||||
Total Value and Income Earned | — | 69,852 | 1,591 | ||||||||||||||
| † | Partner Socially Responsible Stock Portfolio was incepted on 4/30/2008. |
The accompanying Notes to Financial Statements are an integral part of this schedule.
160
Table of Contents
Partner All Cap Growth Portfolio
Schedule of Investments as of December 31, 2008
Shares | Common Stock (98.1%) | Value | |||
Consumer Discretionary (15.1%) | |||||
| 1,125 | Amazon.com, Inc.a | $ | 57,690 | ||
| 2,200 | Coach, Inc.a | 45,694 | |||
| 1,625 | GameStop Corporationa | 35,198 | |||
| 575 | Guess?, Inc. | 8,826 | |||
| 1,550 | LKQ Corporationa | 18,073 | |||
| 2,000 | NIKE, Inc. | 102,000 | |||
| 325 | Panera Bread Companya | 16,978 | |||
| 300 | Priceline.com, Inc.a | 22,095 | |||
| 140 | Strayer Education, Inc. | 30,017 | |||
| 775 | Urban Outfitters, Inc.a | 11,609 | |||
| 600 | WMS Industries, Inc.a | 16,140 | |||
| Total Consumer Discretionary | 364,320 | ||||
Consumer Staples (1.6%) | |||||
| 725 | Avon Products, Inc. | 17,422 | |||
| 450 | Coca-Cola Company | 20,371 | |||
| Total Consumer Staples | 37,793 | ||||
Energy (8.4%) | |||||
| 375 | Apache Corporation | 27,949 | |||
| 700 | Cameron International Corporationa | 14,350 | |||
| 525 | ENSCO International, Inc. | 14,905 | |||
| 900 | Halliburton Company | 16,362 | |||
| 1,300 | National Oilwell Varco, Inc.a | 31,772 | |||
| 725 | Noble Corporation | 15,994 | |||
| 550 | Noble Energy, Inc. | 27,071 | |||
| 1,050 | Smith International, Inc. | 24,034 | |||
| 650 | Transocean, Ltd.a | 30,712 | |||
| Total Energy | 203,149 | ||||
Financials (6.6%) | |||||
| 850 | Aon Corporation | 38,828 | |||
| 235 | BlackRock, Inc. | 31,525 | |||
| 160 | CME Group, Inc. | 33,298 | |||
| 633 | Knight Capital Group, Inc.a | 10,223 | |||
| 1,250 | T. Rowe Price Group, Inc. | 44,300 | |||
| Total Financials | 158,174 | ||||
Health Care (11.8%) | |||||
| 1,000 | BioMarin Pharmaceutical, Inc.a | 17,800 | |||
| 260 | C.R. Bard, Inc. | 21,908 | |||
| 500 | Celgene Corporationa | 27,640 | |||
| 800 | Dentsply International, Inc. | 22,592 | |||
| 500 | Gen-Probe, Inc.a | 21,420 | |||
| 2,050 | Gilead Sciences, Inc.a | 104,837 | |||
| 125 | Intuitive Surgical, Inc.a | 15,874 | |||
| 450 | Stryker Corporation | 17,977 | |||
| 260 | Techne Corporation | 16,775 | |||
| 475 | Waters Corporationa | 17,409 | |||
| Total Health Care | 284,232 | ||||
Industrials (19.0%) | |||||
| 525 | AGCO Corporationa | 12,385 | |||
| 500 | AMETEK, Inc. | 15,105 | |||
| 600 | Bucyrus International, Inc. | 11,112 | |||
| 325 | Dun & Bradstreet Corporation | 25,090 | |||
| 555 | Expeditors International of Washington, Inc. | 18,465 | |||
| 625 | Fastenal Company | 21,781 | |||
| 200 | First Solar, Inc.a | 27,592 | |||
| 550 | Fluor Corporation | 24,678 | |||
| 450 | FTI Consulting, Inc.a | 20,106 | |||
| 500 | General Dynamics Corporation | 28,795 | |||
| 1,200 | Honeywell International, Inc. | 39,396 | |||
| 925 | Jacobs Engineering Group, Inc.a | 44,493 | |||
| 475 | Parker-Hannifin Corporation | 20,207 | |||
| 350 | Precision Castparts Corporation | 20,818 | |||
| 325 | SunPower Corporationa | 12,025 | |||
| 975 | United Technologies Corporation | 52,260 | |||
| 525 | W.W. Grainger, Inc. | 41,391 | |||
| 550 | Wabtec Corporation | 21,862 | |||
| Total Industrials | 457,561 | ||||
Information Technology (31.8%) | |||||
| 800 | Accenture, Ltd. | 26,232 | |||
| 2,050 | Altera Corporation | 34,255 | |||
| 525 | Amphenol Corporation | 12,590 | |||
| 775 | ANSYS, Inc.a | 21,615 | |||
| 1,075 | Apple, Inc.a | 91,751 | |||
| 200 | Baidu.com, Inc. ADRa | 26,114 | |||
| 1,400 | Broadcom Corporationa | 23,758 | |||
| 1,350 | Cisco Systems, Inc.a | 22,005 | |||
| 1,700 | Dell, Inc.a | 17,408 | |||
| 600 | Dolby Laboratories, Inc.a | 19,656 | |||
| 2,050 | eBay, Inc.a | 28,618 | |||
| 300 | FactSet Research Systems, Inc. | 13,272 | |||
| 850 | FLIR Systems, Inc.a | 26,078 | |||
| 310 | Google, Inc.a | 95,372 | |||
| 1,300 | Juniper Networks, Inc.a | 22,763 | |||
| 900 | Linear Technology Corporation | 19,908 | |||
| 600 | McAfee, Inc.a | 20,742 | |||
| 975 | MEMC Electronic Materials, Inc.a | 13,923 | |||
| 1,500 | NETAPP, Inc.a | 20,955 | |||
| 800 | Nintendo Company, Ltd. ADR | 38,200 | |||
| 2,000 | Nokia Oyj ADR | 31,200 | |||
| 2,350 | Nuance Communications, Inc.a | 24,346 | |||
| 1,900 | Parametric Technology Corporationa | 24,035 | |||
| 950 | QUALCOMM, Inc. | 34,038 | |||
| 825 | Research in Motion, Ltd.a | 33,479 | |||
| 1,150 | Trimble Navigation, Ltd.a | 24,851 | |||
| Total Information Technology | 767,164 | ||||
Materials (2.2%) | |||||
| 700 | CF Industries Holdings, Inc. | 34,412 | |||
| 325 | Praxair, Inc. | 19,292 | |||
| Total Materials | 53,704 | ||||
Telecommunications Services (1.6%) | |||||
| 1,200 | America Movil SA de CV ADR | 37,188 | |||
| Total Telecommunications Services | 37,188 | ||||
| Total Common Stock (cost $3,785,165) | 2,363,285 | ||||
The accompanying Notes to Financial Statements are an integral part of this schedule.
161
Table of Contents
Partner All Cap Growth Portfolio
Schedule of Investments as of December 31, 2008
Shares | Short-Term Investments (3.2%) | Value | ||||
| 77,149 | Thrivent Money Market Portfolio | $ | 77,149 | |||
| Total Short-Term Investments (at amortized cost) | 77,149 | |||||
| �� | ||||||
| Total Investments (cost $3,862,314) 101.3% | $ | 2,440,434 | ||||
| Other Assets and Liabilities, Net (1.3%) | (30,657 | ) | ||||
| Total Net Assets 100.0% | $ | 2,409,777 | ||||
| a | Non-income producing security. |
Definitions:
| ADR | - | American Depositary Receipt, which are certificates for an underlying foreign security’s shares held by an issuing U.S. depository bank. |
Gross unrealized appreciation and depreciation of investments, based on cost for federal income tax purposes, were as follows:
Gross unrealized appreciation | $ | 21,928 | ||
Gross unrealized depreciation | (1,443,808 | ) | ||
Net unrealized appreciation (depreciation) | $ | (1,421,880 | ) | |
Cost for federal income tax purposes | $ | 3,862,314 |
The following table is a summary of the inputs used, as of December 31, 2008, in valuing the Partner All Cap Growth Portfolio’s assets carried at fair value as discussed in item 2(A) of the Notes to Financial Statements.
Level | Investments in Securities | Other Financial Instruments* | ||||
Level 1 | $ | 2,440,434 | $ | — | ||
Level 2 | — | — | ||||
Level 3 | — | — | ||||
Totals (Level 1,2,3) | $ | 2,440,434 | $ | — | ||
| * | Other Financial Instruments include Futures, Forwards, Written Options and Swap agreements. |
Investment in Affiliates
Affiliated issuers, as defined under the Investment Company Act of 1940, include those in which the Portfolio’s holdings of an issuer represent 5% or more of the outstanding voting securities of an issuer, or any affiliated mutual fund.
A summary of transactions for the fiscal year to date, in Partner All Cap Growth Portfolio, is as follows:
Portfolio | Value April 30, 2008† | Gross Purchases and Additions | Gross Sales and Reductions | Balance of Shares Held at December 31, 2008 | Value December 31, 2008 | Income Earned April 30, 2008 - December 31, 2008 | |||||||||||
Money Market | $ | — | $ | 1,319,074 | $ | 1,241,925 | 77,149 | $ | 77,149 | $ | 1,541 | ||||||
Total Value and Income Earned | — | 77,149 | 1,541 | ||||||||||||||
| † | Partner All Cap Growth Portfolio was incepted on 4/30/2008. |
The accompanying Notes to Financial Statements are an integral part of this schedule.
162
Table of Contents
Partner All Cap Value Portfolio
Schedule of Investments as of December 31, 2008
Shares | Common Stock (92.5%) | Value | ||||
Consumer Discretionary (5.6%) | ||||||
2,280 | Cablevision Systems New York Group | $ | 38,395 | |||
3,220 | Cinemark Holdings, Inc. | 23,925 | ||||
2,606 | Goodyear Tire & Rubber Companya | 15,558 | ||||
1,840 | Liberty Global, Inc.a | 27,931 | ||||
1,460 | Time Warner Cable, Inc.a | 31,317 | ||||
| Total Consumer Discretionary | 137,126 | |||||
Consumer Staples (6.1%) | ||||||
2,730 | Kroger Company | 72,099 | ||||
640 | Molson Coors Brewing Company | 31,309 | ||||
840 | PepsiCo, Inc. | 46,007 | ||||
| Total Consumer Staples | 149,415 | |||||
Energy (13.1%) | ||||||
703 | Alpha Natural Resources, Inc.a | 11,381 | ||||
4,344 | Capital Product Partners, LP | 33,883 | ||||
1,500 | Chevron Corporation | 110,955 | ||||
1,590 | Devon Energy Corporation | 104,479 | ||||
3,080 | Petroleo Brasileiro SA ADR | 62,863 | ||||
| Total Energy | 323,561 | |||||
Financials (17.9%) | ||||||
550 | Assurant, Inc. | 16,500 | ||||
3,050 | Bank of America Corporation | 42,944 | ||||
1,030 | Credit Suisse Group | 29,108 | ||||
1,420 | Everest Re Group, Ltd. | 108,119 | ||||
1,190 | J.P. Morgan Chase & Company | 37,521 | ||||
2,174 | Julius Baer Holding AG | 84,254 | ||||
3,100 | Morgan Stanley | 49,724 | ||||
2,590 | National Financial Partners | 7,873 | ||||
7,250 | SLM Corporationa | 64,525 | ||||
| Total Financials | 440,568 | |||||
Health Care (14.4%) | ||||||
1,120 | Abbott Laboratories | 59,775 | ||||
2,260 | Aetna, Inc. | 64,410 | ||||
2,290 | Orexigen Therapeutics, Inc.a | 12,778 | ||||
3,540 | Schering-Plough Corporation | 60,286 | ||||
660 | Thermo Fisher Scientific, Inc.a | 22,486 | ||||
1,430 | WellPoint, Inc.a | 60,246 | ||||
1,980 | Wyeth | 74,270 | ||||
| Total Health Care | 354,251 | |||||
Industrials (9.8%) | ||||||
7,820 | Aircastle, Ltd. | 37,379 | ||||
11,428 | Genesis Lease, Ltd. | 32,341 | ||||
830 | Goodrich Corporation | 30,727 | ||||
2,140 | Navistar International Corporationa | 45,753 | ||||
3,210 | Tyco International, Ltd. | 69,336 | ||||
450 | United Parcel Service, Inc. | 24,822 | ||||
| Total Industrials | 240,358 | |||||
Information Technology (7.8%) | ||||||
1,630 | Lam Research Corporationa | 34,686 | ||||
2,020 | QUALCOMM, Inc. | 72,377 | ||||
1,240 | Research in Motion, Ltd.a | 50,319 | ||||
1,890 | Varian Semiconductor Equipment Associates, Inc.a | 34,247 | ||||
| Total Information Technology | 191,629 | |||||
Materials (6.6%) | ||||||
3,030 | Lubrizol Corporation | 110,262 | ||||
1,540 | Mosaic Company | 53,284 | ||||
| Total Materials | 163,546 | |||||
Telecommunications Services (2.9%) | ||||||
2,500 | AT&T, Inc. | 71,250 | ||||
| Total Telecommunications Services | 71,250 | |||||
Utilities (8.3%) | ||||||
1,840 | American Electric Power Company, Inc. | 61,235 | ||||
1,080 | Exelon Corporation | 60,059 | ||||
2,180 | PG&E Corporation | 84,388 | ||||
| Total Utilities | 205,682 | |||||
| Total Common Stock (cost $3,275,122) | 2,277,386 | |||||
Shares | Short-Term Investments (8.2%) | Value | ||||
201,541 | Thrivent Money Market Portfolio | 201,541 | ||||
| Total Short-Term Investments (at amortized cost) | 201,541 | |||||
| Total Investments (cost $3,476,663) 100.7% | $ | 2,478,927 | ||||
| Other Assets and Liabilities, Net (0.7%) | (17,619 | ) | ||||
| Total Net Assets 100.0% | $ | 2,461,308 | ||||
| a | Non-income producing security. |
Definitions:
| ADR - | American Depositary Receipt, which are certificates for an underlying foreign security’s shares held by an issuing U.S. depository bank. |
Gross unrealized appreciation and depreciation of investments, based on cost for federal income tax purposes, were as follows:
Gross unrealized appreciation | $ | 29,454 | ||
Gross unrealized depreciation | (1,052,372 | ) | ||
Net unrealized appreciation (depreciation) | $ | (1,022,918 | ) | |
Cost for federal income tax purposes | $ | 3,501,845 |
The accompanying Notes to Financial Statements are an integral part of this schedule.
163
Table of Contents
Partner All Cap Value Portfolio
Schedule of Investments as of December 31, 2008
The following table is a summary of the inputs used, as of December 31, 2008, in valuing the Partner All Cap Value Portfolio’s assets carried at fair value as discussed in item 2(A) of the Notes to Financial Statements.
Level | Investments in Securities | Other Financial Instruments* | ||||
Level 1 | $ | 2,394,673 | $ | — | ||
Level 2 | 84,254 | — | ||||
Level 3 | — | — | ||||
Totals (Level 1,2,3) | $ | 2,478,927 | $ | — | ||
| * | Other Financial Instruments include Futures, Forwards, Written Options and Swap agreements. |
Investment in Affiliates
Affiliated issuers, as defined under the Investment Company Act of 1940, include those in which the Portfolio’s holdings of an issuer represent 5% or more of the outstanding voting securities of an issuer, or any affiliated mutual fund.
A summary of transactions for the fiscal year to date, in Partner All Cap Value Portfolio, is as follows:
Portfolio | Value April 30, 2008† | Gross Purchases and Additions | Gross Sales and Reductions | Balance of Shares Held at December 31, 2008 | Value December 31, 2008 | Income Earned April 30, 2008 - December 31, 2008 | |||||||||||
Money Market | $ | — | $ | 1,589,391 | $ | 1,387,850 | 201,541 | $ | 201,541 | $ | 900 | ||||||
Total Value and Income Earned | — | 201,541 | 900 | ||||||||||||||
| † | Partner All Cap Value Portfolio was incepted on 4/30/2008. |
The accompanying Notes to Financial Statements are an integral part of this schedule.
164
Table of Contents
Schedule of Investments as of December 31, 2008
| Shares | Common Stock (99.6%) | Value | |||
| Consumer Discretionary (8.2%) | |||||
| 11,100 | Abercrombie & Fitch Company | $ | 256,077 | ||
| 23,990 | Coach, Inc.a | 498,272 | |||
| 27,110 | Comcast Corporation | 457,617 | |||
| 26,890 | DIRECTV Group, Inc.a | 616,050 | |||
| 21,560 | Lowe’s Companies, Inc. | 463,971 | |||
| 29,850 | Macy’s, Inc | 308,947 | |||
| 12,010 | Polo Ralph Lauren Corporationb | 545,374 | |||
| 26,830 | Staples, Inc. | 480,794 | |||
| 21,470 | Tiffany & Company | 507,336 | |||
| 22,250 | Time Warner Cable, Inc.a | 477,263 | |||
Total Consumer Discretionary | 4,611,701 | ||||
| Consumer Staples (12.9%) | |||||
| 16,250 | Alberto-Culver Company | 398,288 | |||
| 9,800 | Altria Group, Inc. | 147,588 | |||
| 6,280 | Avon Products, Inc. | 150,908 | |||
| 3,300 | Bunge, Ltd.b | 170,841 | |||
| 5,440 | Clorox Company | 302,246 | |||
| 25,290 | Coca-Cola Company | 1,144,878 | |||
| 28,610 | Coca-Cola Enterprises, Inc. | 344,178 | |||
| 2,830 | Kimberly-Clark Corporation | 149,254 | |||
| 19,930 | Kraft Foods, Inc. | 535,121 | |||
| 15,630 | Pepsi Bottling Group, Inc. | 351,831 | |||
| 33,330 | Philip Morris International, Inc. | 1,450,188 | |||
| 10,820 | SUPERVALU, Inc. | 157,972 | |||
| 4,700 | SYSCO Corporation | 107,818 | |||
| 26,960 | Tyson Foods, Inc. | 236,170 | |||
| 28,760 | Wal-Mart Stores, Inc. | 1,612,286 | |||
Total Consumer Staples | 7,259,567 | ||||
| Energy (13.3%) | |||||
| 14,690 | Chevron Corporation | 1,086,619 | |||
| 53,960 | Exxon Mobil Corporation | 4,307,627 | |||
| 8,120 | Goodrich Petroleum Corporationa,b | 243,194 | |||
| 49,900 | Nexen, Inc. | 877,242 | |||
| 22,090 | Southwestern Energy Companya | 639,947 | |||
| 9,120 | XTO Energy, Inc. | 321,663 | |||
Total Energy | 7,476,292 | ||||
| Financials (12.8%) | |||||
| 13,200 | ACE, Ltd. | 698,544 | |||
| 8,570 | Annaly Capital Management, Inc. | 136,006 | |||
| 47,220 | Bank of America Corporation | 664,858 | |||
| 29,616 | Bank of New York Mellon Corporation | 839,021 | |||
| 200 | Berkshire Hathaway, Inc.a | 642,800 | |||
| 1,710 | BlackRock, Inc.b | 229,396 | |||
| 5,040 | Chubb Corporation | 257,040 | |||
| 2,290 | CME Group, Inc. | 476,572 | |||
| 21,960 | Interactive Brokers Group, Inc.a | 392,864 | |||
| 2,200 | IntercontinentalExchange, Inc.a | 181,368 | |||
| 14,430 | MetLife, Inc. | 503,030 | |||
| 6,500 | PartnerRe, Ltd. | 463,255 | |||
| 12,730 | People’s United Financial, Inc. | 226,976 | |||
| 14,140 | PNC Financial Services Group, Inc. | 692,860 | |||
| 14,600 | SunTrust Banks, Inc. | 431,284 | |||
| 11,450 | Wells Fargo & Company | 337,546 | |||
Total Financials | 7,173,420 | ||||
| Health Care (14.7%) | |||||
| 10,070 | Allergan, Inc. | 406,022 | |||
| 5,980 | AmerisourceBergen Corporation | 213,247 | |||
| 10,980 | Amgen, Inc.a,b | 634,095 | |||
| 3,970 | Baxter International, Inc. | 212,752 | |||
| 800 | Biogen Idec, Inc.a | 38,104 | |||
| 37,780 | Boston Scientific Corporationa | 292,417 | |||
| 41,640 | Bristol-Myers Squibb Company | 968,130 | |||
| 7,860 | Celgene Corporationa | 434,501 | |||
| 3,600 | Covidien, Ltd. | 130,464 | |||
| 1,810 | Express Scripts, Inc.a | 99,514 | |||
| 11,250 | Gilead Sciences, Inc.a | 575,325 | |||
| 10,950 | Johnson & Johnson | 655,139 | |||
| 4,120 | Medco Health Solutions, Inc.a | 172,669 | |||
| 23,720 | Mylan Laboratories, Inc.a | 234,591 | |||
| 54,260 | Pfizer, Inc. | 960,945 | |||
| 37,750 | Schering-Plough Corporation | 642,882 | |||
| 7,170 | Thermo Fisher Scientific, Inc.a | 244,282 | |||
| 15,770 | UnitedHealth Group, Inc. | 419,482 | |||
| 5,690 | Valeant Pharmaceuticals Internationala,b | 130,301 | |||
| 7,340 | Waters Corporationa | 269,011 | |||
| 12,680 | WellPoint, Inc.a | 534,208 | |||
Total Health Care | 8,268,081 | ||||
| Industrials (11.0%) | |||||
| 22,570 | 3M Company | 1,298,678 | |||
| 9,160 | Caterpillar, Inc. | 409,177 | |||
| 12,440 | Deere & Company | 476,701 | |||
| 64,155 | Delta Air Lines, Inc.a | 735,216 | |||
| 3,450 | General Dynamics Corporation | 198,685 | |||
| 35,880 | General Electric Company | 581,256 | |||
| 18,750 | Manitowoc Company, Inc. | 162,375 | |||
| 8,310 | Norfolk Southern Corporation | 390,986 | |||
| 12,290 | Raytheon Company | 627,282 | |||
| 4,860 | Union Pacific Corporation | 232,308 | |||
| 9,600 | United Parcel Service, Inc. | 529,536 | |||
| 15,010 | Waste Management, Inc. | 497,431 | |||
Total Industrials | 6,139,631 | ||||
| Information Technology (15.4%) | |||||
| 16,020 | Apple, Inc.a | 1,367,307 | |||
| 31,250 | BMC Software, Inc.a | 840,937 | |||
| 14,890 | Broadcom Corporationa | 252,683 | |||
| 36,070 | Electronic Arts, Inc.a | 578,563 | |||
| 11,050 | EMC Corporationa | 115,694 | |||
| 9,470 | Hewlett-Packard Company | 343,666 | |||
| 4,660 | International Business Machines Corporation | 392,186 | |||
| 11,850 | MEMC Electronic Materials, Inc.a | 169,218 | |||
| 34,080 | Micron Technology, Inc.a | 89,971 | |||
| 31,890 | Microsoft Corporation | 619,942 | |||
| 179,770 | Nuance Communications, Inc.a,b | 1,862,417 | |||
| 24,860 | NVIDIA Corporationa | 200,620 | |||
| 45,830 | QUALCOMM, Inc. | 1,642,089 | |||
| 4,960 | SanDisk Corporationa | 47,616 | |||
| 9,100 | Yahoo!, Inc.a | 111,020 | |||
Total Information Technology | 8,633,929 | ||||
| Materials (3.1%) | |||||
| 7,830 | Albemarle Corporation | 174,609 | |||
| 2,310 | Cliffs Natural Resources, Inc. | 59,159 | |||
| 12,120 | Dow Chemical Company | 182,891 | |||
The accompanying Notes to Financial Statements are an integral part of this schedule.
165
Table of Contents
Partner All Cap Portfolio
Schedule of Investments as of December 31, 2008
| Shares | Common Stock (99.6%) | Value | ||||
| Materials (3.1%) - continued | ||||||
| 9,170 | Ecolab, Inc. | $ | 322,325 | |||
| 3,810 | Monsanto Company | 268,034 | ||||
| 3,330 | Mosaic Company | 115,218 | ||||
| 4,310 | Nalco Holding Companyb | 49,737 | ||||
| 5,360 | Nucor Corporation | 247,632 | ||||
| 4,830 | Praxair, Inc. | 286,709 | ||||
| 1,100 | United States Steel Corporation | 40,920 | ||||
Total Materials | 1,747,234 | |||||
| Telecommunications Services (3.9%) | ||||||
| 16,960 | American Tower Corporationa | 497,268 | ||||
| 18,382 | AT&T, Inc. | 523,887 | ||||
| 37,500 | NII Holdings, Inc.a,b | 681,750 | ||||
| 76,280 | Qwest Communications International, Inc.b | 277,659 | ||||
| 13,150 | SBA Communications Corporationa,b | 214,608 | ||||
Total Telecommunications Services | 2,195,172 | |||||
| Utilities (4.3%) | ||||||
| 20,420 | American Electric Power Company, Inc. | 679,578 | ||||
| 31,960 | CMS Energy Corporationb | 322,796 | ||||
| 14,720 | Mirant Corporationa | 277,766 | ||||
| 16,180 | PG&E Corporation | 626,328 | ||||
| 13,410 | PPL Corporation | 411,553 | ||||
| 3,030 | Public Service Enterprise Group, Inc. | 88,385 | ||||
Total Utilities | 2,406,406 | |||||
Total Common Stock (cost $65,719,200) | 55,911,433 | |||||
| Shares | Collateral Held for Securities Loaned (4.7%) | Value | ||||
| 2,623,789 | Thrivent Financial Securities Lending Trust | 2,623,789 | ||||
Total Collateral Held for Securities Loaned (cost $2,623,789) | 2,623,789 | |||||
| Shares | Short-Term Investments (0.1%) | Value | ||||
| 71,709 | Thrivent Money Market Portfolio | 71,709 | ||||
Total Short-Term Investments (at amortized cost) | 71,709 | |||||
Total Investments (cost $68,414,698) 104.4% | $ | 58,606,931 | ||||
Other Assets and Liabilities, Net (4.4%) | (2,453,695 | ) | ||||
Total Net Assets 100.0% | $ | 56,153,236 | ||||
| a | Non-income producing security. |
| b | All or a portion of the security is on loan as discussed in item 2(M) of the Notes to Financial Statements. |
Gross unrealized appreciation and depreciation of investments, based on cost for federal income tax purposes, were as follows:
Gross unrealized appreciation | $ | 2,254,594 | ||
Gross unrealized depreciation | (13,371,761 | ) | ||
Net unrealized appreciation (depreciation) | $ | (11,117,167 | ) | |
Cost for federal income tax purposes | $ | 69,724,098 |
The following table is a summary of the inputs used, as of December 31, 2008, in valuing the Partner All Cap Portfolio’s assets carried at fair value as discussed in item 2(A) of the Notes to Financial Statements.
Level | Investments in Securities | Other Financial Instruments* | ||||
Level 1 | $ | 58,606,931 | $ | — | ||
Level 2 | — | — | ||||
Level 3 | — | — | ||||
Totals (Level 1,2,3) | $ | 58,606,931 | $ | — | ||
| * | Other Financial Instruments include Futures, Forwards, Written Options and Swap agreements. |
The accompanying Notes to Financial Statements are an integral part of this schedule.
166
Table of Contents
Partner All Cap Portfolio
Schedule of Investments as of December 31, 2008
Investment in Affiliates
Affiliated issuers, as defined under the Investment Company Act of 1940, include those in which the Portfolio’s holdings of an issuer represent 5% or more of the outstanding voting securities of an issuer, or any affiliated mutual fund.
A summary of transactions for the fiscal year to date, in Partner All Cap Portfolio, is as follows:
Portfolio | Value December 31, 2007 | Gross Purchases and Additions | Gross Sales and Reductions | Balance of Shares Held at December 31, 2008 | Value December 31, 2008 | Income Earned January 1, 2008 - December 31, 2008 | |||||||||||
Money Market | $ | 2,625,515 | $ | 45,751,395 | $ | 48,305,201 | 71,709 | $ | 71,709 | $ | 33,283 | ||||||
Thrivent Financial Securities Lending Trust | 9,928,007 | 78,235,878 | 85,540,096 | 2,623,789 | 2,623,789 | 53,183 | |||||||||||
Total Value and Income Earned | 12,553,522 | 2,695,498 | 86,466 | ||||||||||||||
The accompanying Notes to Financial Statements are an integral part of this schedule.
167
Table of Contents
Schedule of Investments as of December 31, 2008
| Shares | Common Stock (96.3%) | Value | |||
| Consumer Discretionary (11.6%) | |||||
| 97,050 | Amazon.com, Inc.a | $ | 4,976,724 | ||
| 328,600 | Comcast Corporation | 5,546,768 | |||
| 112,400 | Guess?, Inc. | 1,725,340 | |||
| 221,700 | Lowe’s Companies, Inc. | 4,770,984 | |||
| 220,350 | McDonald’s Corporation | 13,703,567 | |||
| 144,000 | Staples, Inc. | 2,580,480 | |||
| 93,800 | WMS Industries, Inc.a | 2,523,220 | |||
| Total Consumer Discretionary | 35,827,083 | ||||
| Consumer Staples (6.1%) | |||||
| 71,150 | General Mills, Inc. | 4,322,363 | |||
| 27,800 | Lorillard, Inc. | 1,566,530 | |||
| 144,550 | Philip Morris International, Inc. | 6,289,370 | |||
| 119,900 | Wal-Mart Stores, Inc. | 6,721,594 | |||
| Total Consumer Staples | 18,899,857 | ||||
| Energy (10.0%) | |||||
| 55,550 | Devon Energy Corporation | 3,650,191 | |||
| 45,397 | Holly Corporation | 827,587 | |||
| 103,367 | Occidental Petroleum Corporation | 6,200,986 | |||
| 234,200 | Petroleo Brasileiro SA ADR | 5,735,558 | |||
| 78,955 | Transocean, Ltd.a,b | 3,730,624 | |||
| 65,300 | Ultra Petroleum Corporationa | 2,253,503 | |||
| 298,950 | Weatherford International, Ltd.a | 3,234,639 | |||
| 146,700 | XTO Energy, Inc. | 5,174,109 | |||
Total Energy | 30,807,197 | ||||
| Financials (10.9%) | |||||
| 189,350 | Bank of America Corporation | 2,666,048 | |||
| 121,200 | Charles Schwab Corporation | 1,959,804 | |||
| 35,500 | Franklin Resources, Inc. | 2,264,190 | |||
| 55,350 | IntercontinentalExchange, Inc.a | 4,563,054 | |||
| 293,800 | J.P. Morgan Chase & Company | 9,263,514 | |||
| 158,250 | Marsh & McLennan Companies, Inc. | 3,840,728 | |||
| 109,950 | Nasdaq OMX Group, Inc.a | 2,716,864 | |||
| 211,900 | Wells Fargo & Company | 6,246,812 | |||
Total Financials | 33,521,014 | ||||
| Health Care (17.1%) | |||||
| 141,600 | Abbott Laboratories | 7,557,192 | |||
| 52,710 | Aetna, Inc. | 1,502,235 | |||
| 171,300 | Baxter International, Inc. | 9,179,967 | |||
| 384,150 | Gilead Sciences, Inc.a | 19,645,431 | |||
| 138,800 | Medco Health Solutions, Inc.a | 5,817,108 | |||
| 88,850 | St. Jude Medical, Inc.a | 2,928,496 | |||
| 186,048 | Thermo Fisher Scientific, Inc.a | 6,338,655 | |||
Total Health Care | 52,969,084 | ||||
| Industrials (8.6%) | |||||
| 71,150 | Danaher Corporation | 4,027,802 | |||
| 84,950 | Deere & Company | 3,255,284 | |||
| 552,250 | Delta Air Lines, Inc.a | 6,328,785 | |||
| 88,800 | Emerson Electric Company | 3,250,968 | |||
| 17,750 | First Solar, Inc.a | 2,448,790 | |||
| 69,900 | Foster Wheeler, Ltd.a | 1,634,262 | |||
| 50,250 | Union Pacific Corporation | 2,401,950 | |||
| 61,450 | United Technologies Corporation | 3,293,720 | |||
Total Industrials | 26,641,561 | ||||
| Information Technology (26.9%) | |||||
| 94,450 | Accenture, Ltd. | 3,097,016 | |||
| 68,100 | Adobe Systems, Inc.a | 1,449,849 | |||
| 103,700 | Apple, Inc.a | 8,850,795 | |||
| 253,150 | CIENA Corporationa | 1,696,105 | |||
| 407,670 | Cisco Systems, Inc.a | 6,645,021 | |||
| 91,850 | Dell, Inc.a | 940,544 | |||
| 47,400 | Electronic Arts, Inc.a | 760,296 | |||
| 384,700 | EMC Corporationa | 4,027,809 | |||
| 33,000 | Google, Inc.a | 10,152,450 | |||
| 305,300 | Intel Corporation | 4,475,698 | |||
| 46,950 | International Business Machines Corporation | 3,951,312 | |||
| 403,500 | Marvell Technology Group, Ltd.a | 2,691,345 | |||
| 31,150 | MasterCard, Inc. | 4,452,269 | |||
| 376,102 | Micron Technology, Inc.a | 992,909 | |||
| 551,220 | Microsoft Corporation | 10,715,717 | |||
| 70,650 | Nokia Oyj ADR | 1,102,140 | |||
| 28,100 | NVIDIA Corporationa | 226,767 | |||
| 225,640 | Oracle Corporationa | 4,000,597 | |||
| 226,393 | QUALCOMM, Inc. | 8,111,661 | |||
| 42,300 | Research in Motion, Ltd.a | 1,716,534 | |||
| 63,100 | SanDisk Corporationa | 605,760 | |||
| 186,800 | Symantec Corporationa | 2,525,536 | |||
| Total Information Technology | 83,188,130 | ||||
| Materials (4.4%) | |||||
| 73,200 | Freeport-McMoRan Copper & Gold, Inc. | 1,789,008 | |||
| 116,850 | Monsanto Company | 8,220,397 | |||
| 49,100 | Potash Corporation of Saskatchewan, Inc. | 3,595,102 | |||
Total Materials | 13,604,507 | ||||
| Telecommunications Services (0.7%) | |||||
| 66,400 | Verizon Communications, Inc. | 2,250,960 | |||
| Total Telecommunications Services | 2,250,960 | ||||
Total Common Stock (cost $302,660,469) | |||||
| 297,709,393 | |||||
Shares | Collateral Held for Securities Loaned (0.1%) | Value | |||
| 211,680 | Thrivent Financial Securities Lending Trust | 211,680 | |||
Total Collateral Held for Securities Loaned (cost $211,680) | 211,680 | ||||
| Shares | Short-Term Investments (3.2%) | Value | |||
| 9,917,185 | Thrivent Money Market Portfolio | 9,917,185 | |||
| Total Short-Term Investments (at amortized cost) | 9,917,185 | ||||
Total Investments (cost $312,789,334) 99.6% | $ | 307,838,258 | |||
| Other Assets and Liabilities, Net 0.4% | 1,146,967 | ||||
| Total Net Assets 100.0% | $ | 308,985,225 | |||
The accompanying Notes to Financial Statements are an integral part of this schedule.
168
Table of Contents
Large Cap Growth Portfolio II
Schedule of Investments as of December 31, 2008
| a | Non-income producing security. |
| b | All or a portion of the security is on loan as discussed in item 2(M) of the Notes to Financial Statements. |
Definitions:
ADR | - | American Depositary Receipt, which are certificates for an underlying foreign security’s shares held by an issuing U.S. depository bank. |
Gross unrealized appreciation and depreciation of investments, based on cost for federal income tax purposes, were as follows:
Gross unrealized appreciation | $ | 4,237,906 | ||
Gross unrealized depreciation | (9,909,525 | ) | ||
Net unrealized appreciation (depreciation) | $ | (5,671,619 | ) | |
Cost for federal income tax purposes | $ | 313,509,877 |
The following table is a summary of the inputs used, as of December 31, 2008, in valuing the Large Cap Growth Portfolio II’s assets carried at fair value as discussed in item 2(A) of the Notes to Financial Statements.
Level | Investments in Securities | Other Financial Instruments* | ||||
Level 1 | $ | 307,838,258 | $ | — | ||
Level 2 | — | — | ||||
Level 3 | — | — | ||||
Totals (Level 1,2,3) | $ | 307,838,258 | $ | — | ||
| * | Other Financial Instruments include Futures, Forwards, Written Options and Swap agreements. |
Investment in Affiliates
Affiliated issuers, as defined under the Investment Company Act of 1940, include those in which the Portfolio’s holdings of an issuer represent 5% or more of the outstanding voting securities of an issuer, or any affiliated mutual fund.
A summary of transactions for the fiscal year to date, in Large Cap Growth Portfolio II, is as follows:
Portfolio | Value December 31, 2007 | Gross Purchases and Additions | Gross Sales and Reductions | Balance of Shares Held at December 31, 2008 | Value December 31, 2008 | Income Earned January 1, 2008 - December 31, 2008 | |||||||||||
Money Market | $ | 719,728 | $ | 23,295,759 | $ | 14,098,302 | 9,917,185 | $ | 9,917,185 | $ | 21,900 | ||||||
Thrivent Financial Securities | |||||||||||||||||
Lending Trust | 348,149 | 5,239,891 | 5,376,360 | 211,680 | 211,680 | 2,298 | |||||||||||
Total Value and Income Earned | 1,067,877 | 10,128,865 | 24,198 | ||||||||||||||
The accompanying Notes to Financial Statements are an integral part of this schedule.
169
Table of Contents
Schedule of Investments as of December 31, 2008
| Shares | Common Stock (96.4%) | Value | |||
| Consumer Discretionary (11.2%) | |||||
| 207,950 | Amazon.com, Inc.a | $ | 10,663,676 | ||
| 552,350 | Comcast Corporation | 9,323,668 | |||
| 130,700 | Discovery Communications, Inc.a | 1,850,712 | |||
| 202,000 | Guess?, Inc. | 3,100,700 | |||
| 102,500 | J.C. Penney Company, Inc. | 2,019,250 | |||
| 111,900 | Kohl’s Corporationa | 4,050,780 | |||
| 425,600 | Lowe’s Companies, Inc. | 9,158,912 | |||
| 368,700 | McDonald’s Corporation | 22,929,453 | |||
| 303,400 | Regal Entertainment Groupb | 3,097,714 | |||
| 434,500 | SPDR S&P Homebuilders ETF | 5,200,965 | |||
| 282,900 | Staples, Inc. | 5,069,568 | |||
| 114,300 | Starwood Hotels & Resorts Worldwide, Inc. | 2,045,970 | |||
| 49,600 | Target Corporation | 1,712,688 | |||
| 149,100 | Walt Disney Company | 3,383,079 | |||
| 193,555 | WMS Industries, Inc.a | 5,206,630 | |||
| 86,700 | Wynn Resorts, Ltd.a,b | 3,663,942 | |||
| 73,550 | Yum! Brands, Inc. | 2,316,825 | |||
| Total Consumer Discretionary | 94,794,532 | ||||
| Consumer Staples (7.2%) | |||||
| 135,300 | Avon Products, Inc. | 3,251,259 | |||
| 190,500 | Coca-Cola Company | 8,623,935 | |||
| 364,000 | CVS/Caremark Corporation | 10,461,360 | |||
| 141,400 | General Mills, Inc. | 8,590,050 | |||
| 42,600 | Lorillard, Inc. | 2,400,510 | |||
| 237,600 | Philip Morris International, Inc. | 10,337,976 | |||
| 309,750 | Wal-Mart Stores, Inc. | 17,364,585 | |||
| Total Consumer Staples | 61,029,675 | ||||
| Energy (9.0%) | |||||
| 81,600 | Devon Energy Corporation | 5,361,936 | |||
| 137,800 | EOG Resources, Inc. | 9,174,724 | |||
| 262,700 | Halliburton Company | 4,775,886 | |||
| 119,650 | Holly Corporationb | 2,181,220 | |||
| 228,250 | Occidental Petroleum Corporation | 13,692,718 | |||
| 386,450 | Petroleo Brasileiro SA ADR | 9,464,160 | |||
| 175,485 | Transocean, Ltd.a,b | 8,291,666 | |||
| 140,200 | Ultra Petroleum Corporationa | 4,838,302 | |||
| 682,600 | Weatherford International, Ltd.a | 7,385,732 | |||
| 310,250 | XTO Energy, Inc. | 10,942,517 | |||
| Total Energy | 76,108,861 | ||||
| Financials (9.0%) | |||||
| 80,500 | ACE, Ltd. | 4,260,060 | |||
| 295,950 | Bank of America Corporation | 4,166,976 | |||
| 21,300 | BlackRock, Inc.b | 2,857,395 | |||
| 330,650 | Charles Schwab Corporation | 5,346,610 | |||
| 49,700 | Franklin Resources, Inc. | 3,169,866 | |||
| 106,750 | IntercontinentalExchange, Inc.a | 8,800,470 | |||
| 440,050 | J.P. Morgan Chase & Company | 13,874,777 | |||
| 139,912 | Lazard, Ltd. | 4,160,983 | |||
| 239,751 | Marsh & McLennan Companies, Inc. | 5,818,757 | |||
| 82,200 | Morgan Stanley | 1,318,488 | |||
| 172,950 | Nasdaq OMX Group, Inc.a | 4,273,594 | |||
| 102,150 | Travelers Companies, Inc. | 4,617,180 | |||
| 459,950 | Wells Fargo & Company | 13,559,326 | |||
| Total Financials | 76,224,482 | ||||
| Health Care (17.9%) | |||||
| 269,400 | Abbott Laboratories | 14,377,878 | |||
| 111,563 | Aetna, Inc. | 3,179,546 | |||
| 56,400 | Allergan, Inc. | 2,274,048 | |||
| 72,900 | Amgen, Inc.a | 4,209,975 | |||
| 314,496 | Baxter International, Inc. | 16,853,841 | |||
| 148,050 | Celgene Corporationa | 8,184,204 | |||
| 138,050 | Genentech, Inc.a | 11,445,725 | |||
| 43,200 | Genzyme Corporationa | 2,867,184 | |||
| 662,200 | Gilead Sciences, Inc.a | 33,864,908 | |||
| 14,250 | Intuitive Surgical, Inc.a | 1,809,608 | |||
| 55,200 | Laboratory Corporation of America Holdingsa | 3,555,432 | |||
| 246,400 | Medco Health Solutions, Inc.a | 10,326,624 | |||
| 89,600 | Medtronic, Inc. | 2,815,232 | |||
| 156,850 | St. Jude Medical, Inc.a | 5,169,776 | |||
| 82,500 | Stryker Corporation | 3,295,875 | |||
| 221,450 | Teva Pharmaceutical Industries, Ltd. ADR | 9,427,126 | |||
| 292,758 | Thermo Fisher Scientific, Inc.a | 9,974,265 | |||
| 207,250 | Wyeth | 7,773,947 | |||
| Total Health Care | 151,405,194 | ||||
| Industrials (10.1%) | |||||
| 174,850 | ABB, Ltd. ADRb | 2,624,498 | |||
| 351,100 | BE Aerospace, Inc.a | 2,699,959 | |||
| 59,900 | Caterpillar, Inc. | 2,675,733 | |||
| 146,650 | Danaher Corporation | 8,301,857 | |||
| 138,950 | Deere & Company | 5,324,564 | |||
| 1,098,725 | Delta Air Lines, Inc.a,b | 12,591,388 | |||
| 172,100 | Emerson Electric Company | 6,300,581 | |||
| 87,000 | Expeditors International of Washington, Inc. | 2,894,490 | |||
| 28,700 | FedEx Corporation | 1,841,105 | |||
| 32,900 | First Solar, Inc.a | 4,538,884 | |||
| 72,450 | Fluor Corporation | 3,250,832 | |||
| 83,050 | Foster Wheeler, Ltd.a | 1,941,709 | |||
| 117,100 | General Dynamics Corporation | 6,743,789 | |||
| 100,000 | Honeywell International, Inc. | 3,283,000 | |||
| 106,400 | JB Hunt Transport Services, Inc. | 2,795,128 | |||
| 94,000 | Raytheon Company | 4,797,760 | |||
| 128,800 | Union Pacific Corporation | 6,156,640 | |||
| 124,500 | United Technologies Corporation | 6,673,200 | |||
| Total Industrials | 85,435,117 | ||||
| Information Technology (25.4%) | |||||
| 136,879 | Accenture, Ltd. | 4,488,262 | |||
| 840,062 | ADC Telecommunications, Inc.a,b | 4,595,139 | |||
| 174,150 | Adobe Systems, Inc.a | 3,707,654 | |||
| 239,500 | Apple, Inc.a | 20,441,325 | |||
| 145,800 | Broadcom Corporationa | 2,474,226 | |||
| 529,000 | CIENA Corporationa,b | 3,544,300 | |||
| 1,018,350 | Cisco Systems, Inc.a | 16,599,105 | |||
| 153,900 | Dell, Inc.a | 1,575,936 | |||
| 101,450 | Electronic Arts, Inc.a | 1,627,258 | |||
| 840,600 | EMC Corporationa | 8,801,082 | |||
| 139,600 | FormFactor, Inc.a | 2,038,160 | |||
| 83,152 | Google, Inc.a | 25,581,713 | |||
| 303,500 | Hewlett-Packard Company | 11,014,015 | |||
| 675,900 | Intel Corporation | 9,908,694 | |||
| 121,500 | International Business Machines Corporation | 10,225,440 | |||
| 1,032,950 | Marvell Technology Group, Ltd.a | 6,889,776 | |||
| 64,800 | MasterCard, Inc. | 9,261,864 | |||
The accompanying Notes to Financial Statements are an integral part of this schedule.
170
Table of Contents
Large Cap Growth Portfolio
Schedule of Investments as of December 31, 2008
| Shares | Common Stock (96.4%) | Value | ||||
| Information Technology (25.4%) - continued | ||||||
| 630,100 | Micron Technology, Inc.a | $ | 1,663,464 | |||
| 1,234,350 | Microsoft Corporation | 23,995,764 | ||||
| 55,032 | Nice Systems, Ltd. ADRa | 1,236,569 | ||||
| 183,650 | Nokia Oyj ADR | 2,864,940 | ||||
| 61,300 | NVIDIA Corporationa | 494,691 | ||||
| 486,300 | Oracle Corporationa | 8,622,099 | ||||
| 481,844 | QUALCOMM, Inc. | 17,264,471 | ||||
| 115,200 | Research in Motion, Ltd.a | 4,674,816 | ||||
| 172,100 | SanDisk Corporationa | 1,652,160 | ||||
| 283,950 | Symantec Corporationa | 3,839,004 | ||||
| 96,600 | Visa, Inc. | 5,066,670 | ||||
| Total Information Technology | 214,148,597 | |||||
| Materials (5.2%) | ||||||
| 162,950 | Freeport-McMoRan Copper & Gold, Inc. | 3,982,498 | ||||
| 257,450 | Monsanto Company | 18,111,608 | ||||
| 101,850 | Owens-Illinois, Inc.a | 2,783,560 | ||||
| 128,300 | Pactiv Corporationa | 3,192,104 | ||||
| 95,050 | Potash Corporation of Saskatchewan, Inc. | 6,959,561 | ||||
| 82,500 | Praxair, Inc. | 4,897,200 | ||||
| 324,800 | Steel Dynamics, Inc. | 3,631,264 | ||||
| Total Materials | 43,557,795 | |||||
| Telecommunications Services (1.4%) | ||||||
| 137,500 | America Movil SA de CV ADR | 4,261,125 | ||||
| 135,200 | American Tower Corporationa | 3,964,064 | ||||
| 97,200 | Verizon Communications, Inc. | 3,295,080 | ||||
| Total Telecommunications Services | 11,520,269 | |||||
Total Common Stock (cost $1,022,729,988) | 814,224,522 | |||||
| Shares | Collateral Held for Securities Loaned (2.7%) | Value | ||||
| 23,002,052 | Thrivent Financial Securities Lending Trust | 23,002,052 | ||||
Total Collateral Held for Securities Loaned (cost $23,002,052) | 23,002,052 | |||||
| Shares or Principal Amount | Short-Term Investments (2.9%)c | Value | ||||
Federal Home Loan Bank Discount Notes | ||||||
| 15,000,000 | 0.130%, 1/26/2009 | 14,998,646 | ||||
| 9,280,189 | Thrivent Money Market Portfolio | 9,280,189 | ||||
Total Short-Term Investments (at amortized cost) | 24,278,835 | |||||
Total Investments (cost $1,070,010,875) 102.0% | $ | 861,505,409 | ||||
| Other Assets and Liabilities, Net (2.0%) | (16,966,534 | ) | ||||
| Total Net Assets 100.0% | $ | 844,538,875 | ||||
| a | Non-income producing security. |
| b | All or a portion of the security is on loan as discussed in item 2(M) of the Notes to Financial Statements. |
| c | The interest rate shown reflects the yield, coupon rate or, for securities purchased at a discount, the discount rate at the date of purchase. |
Definitions:
| ADR - | American Depositary Receipt, which are certificates for an underlying foreign security’s shares held by an issuing U.S. depository bank. |
| ETF - | Exchange Traded Fund. |
Gross unrealized appreciation and depreciation of investments, based on cost for federal income tax purposes, were as follows:
Gross unrealized appreciation | $ | 52,668,576 | ||
Gross unrealized depreciation | (271,555,934 | ) | ||
Net unrealized appreciation (depreciation) | $ | (218,887,358 | ) | |
Cost for federal income tax purposes | $ | 1,080,392,767 |
The following table is a summary of the inputs used, as of December 31, 2008, in valuing the Large Cap Growth Portfolio’s assets carried at fair value as discussed in item 2(A) of the Notes to Financial Statements.
Level | Investments in Securities | Other Financial Instruments* | ||||
Level 1 | $ | 846,506,763 | $ | — | ||
Level 2 | 14,998,646 | — | ||||
Level 3 | — | — | ||||
Totals (Level 1,2,3) | $ | 861,505,409 | $ | — | ||
| * | Other Financial Instruments include Futures, Forwards, Written Options and Swap agreements. |
The accompanying Notes to Financial Statements are an integral part of this schedule.
171
Table of Contents
Large Cap Growth Portfolio
Schedule of Investments as of December 31, 2008
Investment in Affiliates
Affiliated issuers, as defined under the Investment Company Act of 1940, include those in which the Portfolio’s holdings of an issuer represent 5% or more of the outstanding voting securities of an issuer, or any affiliated mutual fund.
A summary of transactions for the fiscal year to date, in Large Cap Growth Portfolio, is as follows:
Portfolio | Value December 31, 2007 | Gross Purchases and Additions | Gross Sales and Reductions | Balance of Shares Held at December 31, 2008 | Value December 31, 2008 | Income Earned January 1, 2008 - December 31, 2008 | |||||||||||
Money Market | $ | 35,105,032 | $ | 199,698,138 | $ | 225,522,981 | 9,280,189 | $ | 9,280,189 | $ | 521,781 | ||||||
Thrivent Financial Securities Lending Trust | 134,097,820 | 1,967,605,431 | 2,078,701,199 | 23,002,052 | 23,002,052 | 1,318,497 | |||||||||||
Total Value and Income Earned | 169,202,852 | 32,282,241 | 1,840,278 | ||||||||||||||
The accompanying Notes to Financial Statements are an integral part of this schedule.
172
Table of Contents
Partner Growth Stock Portfolio
Schedule of Investments as of December 31, 2008
| Shares | Common Stock (97.5%) | Value | |||
| Consumer Discretionary (9.8%) | |||||
| 34,800 | Amazon.com, Inc.a | $ | 1,784,544 | ||
| 22,909 | Expedia, Inc.a | 188,770 | |||
| 45,400 | McGraw-Hill Companies, Inc. | 1,052,826 | |||
| 8,700 | NIKE, Inc. | 443,700 | |||
| 2,700 | Priceline.com, Inc.a | 198,855 | |||
| 25,400 | Shaw Communications, Inc.b | 449,072 | |||
| 12,100 | TJX Companies, Inc. | 248,897 | |||
| 300 | Wynn Resorts, Ltd.a,b | 12,678 | |||
| 23,600 | Yum! Brands, Inc. | 743,400 | |||
| Total Consumer Discretionary | 5,122,742 | ||||
| Consumer Staples (9.5%) | |||||
| 10,200 | Coca-Cola Company | 461,754 | |||
| 12,800 | Costco Wholesale Corporation | 672,000 | |||
| 17,637 | CVS/Caremark Corporation | 506,888 | |||
| 8,724 | Groupe Danone | 527,101 | |||
| 14,563 | Nestle SA | 576,640 | |||
| 18,900 | PepsiCo, Inc. | 1,035,153 | |||
| 14,337 | Procter & Gamble Company | 886,313 | |||
| 12,800 | SYSCO Corporation | 293,632 | |||
| Total Consumer Staples | 4,959,481 | ||||
| Energy (7.5%) | |||||
| 900 | Baker Hughes, Inc. | 28,863 | |||
| 9,500 | Cameron International Corporationa | 194,750 | |||
| 4,400 | Chevron Corporation | 325,468 | |||
| 6,300 | EOG Resources, Inc. | 419,454 | |||
| 14,500 | Exxon Mobil Corporation | 1,157,535 | |||
| 21,700 | Petroleo Brasileiro SA ADR | 442,897 | |||
| 24,000 | Schlumberger, Ltd. | 1,015,920 | |||
| 13,600 | Smith International, Inc. | 311,304 | |||
| Total Energy | 3,896,191 | ||||
| Financials (3.0%) | |||||
| 1,600 | BlackRock, Inc. | 214,640 | |||
| 4,500 | Franklin Resources, Inc. | 287,010 | |||
| 3,500 | Goldman Sachs Group, Inc. | 295,365 | |||
| 13,900 | Moody’s Corporationb | 279,251 | |||
| 3,900 | Northern Trust Corporation | 203,346 | |||
| 7,300 | Redecard SA | 80,450 | |||
| 5,700 | State Street Corporation | 224,181 | |||
| Total Financials | 1,584,243 | ||||
| Health Care (25.8%) | |||||
| 17,100 | Aetna, Inc. | 487,350 | |||
| 4,200 | Alcon, Inc. | 374,598 | |||
| 15,800 | Allergan, Inc. | 637,056 | |||
| 5,500 | Amgen, Inc.a | 317,625 | |||
| 7,100 | Baxter International, Inc. | 380,489 | |||
| 7,900 | Becton, Dickinson and Company | 540,281 | |||
| 6,200 | Celgene Corporationa | 342,736 | |||
| 14,800 | Covidien, Ltd. | 536,352 | |||
| 6,500 | Dentsply International, Inc. | 183,560 | |||
| 26,700 | Elan Corporation plc ADRa | 160,200 | |||
| 12,100 | Express Scripts, Inc.a | 665,258 | |||
| 14,000 | Genentech, Inc.a | 1,160,740 | |||
| 35,500 | Gilead Sciences, Inc.a | 1,815,470 | |||
| 2,600 | Humana, Inc.a | 96,928 | |||
| 800 | Intuitive Surgical, Inc.a | 101,592 | |||
| 9,000 | McKesson Corporation | 348,570 | |||
| 34,800 | Medco Health Solutions, Inc.a | 1,458,468 | |||
| 28,500 | Medtronic, Inc. | 895,470 | |||
| 3,560 | Novo Nordisk AS | 183,637 | |||
| 11,400 | St. Jude Medical, Inc.a | 375,744 | |||
| 8,600 | Stryker Corporation | 343,570 | |||
| 5,700 | Teva Pharmaceutical Industries, Ltd. ADR | 242,649 | |||
| 22,300 | WellPoint, Inc.a | 939,499 | |||
| 22,100 | Wyeth | 828,971 | |||
| Total Health Care | 13,416,813 | ||||
| Industrials (6.4%) | |||||
| 32,400 | Danaher Corporation | 1,834,164 | |||
| 10,400 | Deere & Company | 398,528 | |||
| 15,600 | Expeditors International of Washington, Inc. | 519,012 | |||
| 2,000 | General Dynamics Corporation | 115,180 | |||
| 2,100 | Union Pacific Corporation | 100,380 | |||
| 6,700 | United Parcel Service, Inc. | 369,572 | |||
| Total Industrials | 3,336,836 | ||||
| Information Technology (28.3%) | |||||
| 28,000 | Accenture, Ltd. | 918,120 | |||
| 7,900 | Adobe Systems, Inc.a | 168,191 | |||
| 21,800 | Apple, Inc.a | 1,860,630 | |||
| 23,100 | Autodesk, Inc.a | 453,915 | |||
| 19,000 | Automatic Data Processing, Inc. | 747,460 | |||
| 6,700 | Broadcom Corporationa | 113,699 | |||
| 45,200 | Cisco Systems, Inc.a | 736,760 | |||
| 21,500 | Dell, Inc.a | 220,160 | |||
| 12,200 | Dolby Laboratories, Inc.a | 399,672 | |||
| 9,100 | Electronic Arts, Inc.a | 145,964 | |||
| 18,300 | EMC Corporationa | 191,601 | |||
| 8,800 | Fiserv, Inc.a | 320,056 | |||
| 5,100 | Google, Inc.a | 1,569,015 | |||
| 16,400 | Intel Corporation | 240,424 | |||
| 24,500 | Juniper Networks, Inc.a | 428,995 | |||
| 64,000 | Marvell Technology Group, Ltd.a | 426,880 | |||
| 50 | MasterCard, Inc. | 7,147 | |||
| 11,300 | McAfee, Inc.a | 390,641 | |||
| 68,575 | Microsoft Corporation | 1,333,098 | |||
| 1,900 | Nintendo Company, Ltd. | 726,088 | |||
| 30,400 | QUALCOMM, Inc. | 1,089,232 | |||
| 11,200 | Research in Motion, Ltd.a | 454,496 | |||
| 11,600 | Salesforce.com, Inc.a | 371,316 | |||
| 44,000 | Tencent Holdings, Ltd. | 285,900 | |||
| 32,000 | VeriSign, Inc.a | 610,560 | |||
| 100 | Visa, Inc. | 5,245 | |||
| 34,900 | Western Union Company | 500,466 | |||
| Total Information Technology | 14,715,731 | ||||
| Materials (2.4%) | |||||
| 15,187 | BHP Billiton, Ltd. | 322,637 | |||
| 3,400 | Monsanto Company | 239,190 | |||
| 11,900 | Praxair, Inc. | 706,384 | |||
| Total Materials | 1,268,211 | ||||
| Telecommunications Services (4.8%) | |||||
| 30,900 | American Tower Corporationa | 905,988 | |||
| 46,700 | Crown Castle International Corporationa | 820,986 | |||
| 10,300 | Leap Wireless International, Inc.a,b | 276,967 | |||
The accompanying Notes to Financial Statements are an integral part of this schedule.
173
Table of Contents
Partner Growth Stock Portfolio
Schedule of Investments as of December 31, 2008
| Shares | Common Stock (97.5%) | Value | ||||
| Telecommunications Services (4.8%) - continued | ||||||
| 33,700 | MetroPCS Communications, Inc.a,b | $ | 500,445 | |||
| Total Telecommunications Services | 2,504,386 | |||||
Total Common Stock (cost $60,073,440) | 50,804,634 | |||||
| Shares | Collateral Held for Securities Loaned (1.5%) | Value | ||||
| 779,005 | Thrivent Financial Securities Lending Trust | 779,005 | ||||
Total Collateral Held for Securities Loaned (cost $779,005) | 779,005 | |||||
| Shares | Short-Term Investments (2.4%) | Value | ||||
| 1,223,771 | Thrivent Money Market Portfolio | 1,223,771 | ||||
Total Short-Term Investments (at amortized cost) | 1,223,771 | |||||
Total Investments (cost $62,076,216) 101.4% | $ | 52,807,410 | ||||
| Other Assets and Liabilities, Net (1.4%) | (713,448 | ) | ||||
| Total Net Assets 100.0% | $ | 52,093,962 | ||||
| a | Non-income producing security. |
| b | All or a portion of the security is on loan as discussed in item 2(M) of the Notes to Financial Statements. |
Definitions:
| ADR | - American Depositary Receipt, which are certificates for an underlying foreign security’s shares held by an issuing U.S. depository bank. |
Gross unrealized appreciation and depreciation of investments, based on cost for federal income tax purposes, were as follows:
Gross unrealized appreciation | $ | 4,027,897 | ||
Gross unrealized depreciation | (13,540,626 | ) | ||
Net unrealized appreciation (depreciation) | $ | (9,512,729 | ) | |
Cost for federal income tax purposes | $ | 62,320,139 |
The following table is a summary of the inputs used, as of December 31, 2008, in valuing the Partner Growth Stock Portfolio’s assets carried at fair value as discussed in item 2(A) of the Notes to Financial Statements.
Level | Investments in Securities | Other Financial Instruments* | ||||
Level 1 | $ | 50,185,407 | $ | — | ||
Level 2 | 2,622,003 | — | ||||
Level 3 | — | — | ||||
Totals (Level 1,2,3) | $ | 52,807,410 | $ | — | ||
| * | Other Financial Instruments include Futures, Forwards, Written Options and Swap agreements. |
The accompanying Notes to Financial Statements are an integral part of this schedule.
174
Table of Contents
Partner Growth Stock Portfolio
Schedule of Investments as of December 31, 2008
Investment in Affiliates
Affiliated issuers, as defined under the Investment Company Act of 1940, include those in which the Portfolio’s holdings of an issuer represent 5% or more of the outstanding voting securities of an issuer, or any affiliated mutual fund.
A summary of transactions for the fiscal year to date, in Partner Growth Stock Portfolio, is as follows:
Portfolio | Value December 31, 2007 | Gross Purchases and Additions | Gross Sales and Reductions | Balance of Shares Held at December 31, 2008 | Value December 31, 2008 | Income Earned January 1, 2008 - December 31, 2008 | |||||||||||
Money Market | $ | 2,824,334 | $ | 20,102,299 | $ | 21,702,862 | 1,223,771 | $ | 1,223,771 | $ | 40,274 | ||||||
Thrivent Financial Securities Lending Trust | 11,623,223 | 52,745,971 | 63,590,189 | 779,005 | 779,005 | 40,601 | |||||||||||
Total Value and Income Earned | 14,447,557 | 2,002,776 | 80,875 | ||||||||||||||
The accompanying Notes to Financial Statements are an integral part of this schedule.
175
Table of Contents
Schedule of Investments as of December 31, 2008
Shares | Common Stock (97.5%) | Value | |||
| Consumer Discretionary (10.4%) | |||||
| 288,200 | BorgWarner, Inc. | $ | 6,274,114 | ||
| 502,650 | Comcast Corporation | 8,484,732 | |||
| 334,700 | Home Depot, Inc. | 7,704,794 | |||
| 118,100 | McDonald’s Corporation | 7,344,639 | |||
| 37,800 | Nordstrom, Inc. | 503,118 | |||
| 169,600 | Omnicom Group, Inc. | 4,565,632 | |||
| 75,300 | Sherwin-Williams Company | 4,499,175 | |||
| 121,600 | SPDR S&P Homebuilders ETF | 1,455,552 | |||
| 184,900 | Staples, Inc. | 3,313,408 | |||
| 350,500 | Time Warner, Inc. | 3,526,030 | |||
| 187,100 | Toll Brothers, Inc.a | 4,009,553 | |||
| 239,000 | Viacom, Inc.a,b | 4,555,340 | |||
| 199,200 | Walt Disney Company | 4,519,848 | |||
| 185,000 | Whirlpool Corporation | 7,649,750 | |||
| 117,000 | Winnebago Industries, Inc.b | 705,510 | |||
| Total Consumer Discretionary | 69,111,195 | ||||
| Consumer Staples (11.2%) | |||||
| 276,200 | Altria Group, Inc. | 4,159,572 | |||
| 123,600 | Costco Wholesale Corporation | 6,489,000 | |||
| 232,500 | CVS/Caremark Corporation | 6,682,050 | |||
| 88,400 | General Mills, Inc. | 5,370,300 | |||
| 116,900 | Kimberly-Clark Corporation | 6,165,306 | |||
| 327,300 | Kraft Foods, Inc. | 8,788,005 | |||
| 276,200 | Philip Morris International, Inc. | 12,017,462 | |||
| 129,900 | Procter & Gamble Company | 8,030,418 | |||
| 299,700 | Wal-Mart Stores, Inc. | 16,801,182 | |||
| Total Consumer Staples | 74,503,295 | ||||
| Energy (13.4%) | |||||
| 83,940 | Apache Corporation | 6,256,048 | |||
| 218,866 | Chevron Corporation | 16,189,518 | |||
| 174,058 | ConocoPhillips | 9,016,205 | |||
| 77,800 | Devon Energy Corporation | 5,112,238 | |||
| 309,199 | Exxon Mobil Corporation | 24,683,356 | |||
| 190,000 | Halliburton Company | 3,454,200 | |||
| 742,700 | Nabors Industries, Ltd.a | 8,890,119 | |||
| 114,600 | Occidental Petroleum Corporation | 6,874,854 | |||
| 66,200 | Royal Dutch Shell plc ADR | 3,504,628 | |||
| 63,600 | Total SA ADR | 3,517,080 | |||
| 58,200 | Valero Energy Corporation | 1,259,448 | |||
| Total Energy | 88,757,694 | ||||
| Financials (21.9%) | |||||
| 151,500 | ACE, Ltd. | 8,017,380 | |||
| 77,100 | AFLAC, Inc. | 3,534,264 | |||
| 142,100 | Ameriprise Financial, Inc. | 3,319,456 | |||
| 457,250 | Bank of America Corporation | 6,438,080 | |||
| 225,300 | Capital One Financial Corporation | 7,184,817 | |||
| 132,400 | Chubb Corporation | 6,752,400 | |||
| 659,195 | Citigroup, Inc. | 4,423,198 | |||
| 26,600 | Everest Re Group, Ltd. | 2,025,324 | |||
| 197,100 | Fidelity National Financial, Inc. | 3,498,525 | |||
| 86,300 | Goldman Sachs Group, Inc. | 7,282,857 | |||
| 33,315 | Hartford Financial Services Group, Inc. | 547,032 | |||
| 393,852 | Hudson City Bancorp, Inc. | 6,285,878 | |||
| 696,852 | J.P. Morgan Chase & Company | 21,971,744 | |||
| 406,000 | KeyCorp | 3,459,120 | |||
| 89,200 | Merrill Lynch & Company, Inc. | 1,038,288 | |||
| 107,300 | MetLife, Inc. | 3,740,478 | |||
| 151,900 | Morgan Stanley | 2,436,476 | |||
| 170,363 | PHH Corporationa | 2,168,721 | |||
| 97,000 | Principal Financial Group, Inc. | 2,189,290 | |||
| 170,550 | State Street Corporation | 6,707,732 | |||
| 553,200 | Synovus Financial Corporationb | 4,591,560 | |||
| 217,800 | Travelers Companies, Inc. | 9,844,560 | |||
| 798,533 | Wachovia Corporation | 4,423,873 | |||
| 467,100 | Washington Federal, Inc.b | 6,987,816 | |||
| 559,390 | Wells Fargo & Company | 16,490,817 | |||
| Total Financials | 145,359,686 | ||||
| Health Care (11.4%) | |||||
| 256,300 | Abbott Laboratories | 13,678,731 | |||
| 63,000 | Aetna, Inc. | 1,795,500 | |||
| 133,900 | Baxter International, Inc. | 7,175,701 | |||
| 222,700 | Bristol-Myers Squibb Company | 5,177,775 | |||
| 61,400 | iShares Nasdaq Biotechnology Index Fundb | 4,362,470 | |||
| 226,925 | Johnson & Johnson | 13,576,923 | |||
| 166,100 | McKesson Corporation | 6,433,053 | |||
| 117,600 | Merck & Company, Inc. | 3,575,040 | |||
| 524,900 | Pfizer, Inc. | 9,295,979 | |||
| 107,200 | Sanofi-Aventis ADR | 3,447,552 | |||
| 65,200 | WellPoint, Inc.a | 2,746,876 | |||
| 119,500 | Wyeth | 4,482,445 | |||
| Total Health Care | 75,748,045 | ||||
| Industrials (9.3%) | |||||
| 169,000 | AMR Corporationa | 1,803,230 | |||
| 61,500 | Caterpillar, Inc. | 2,747,205 | |||
| 107,100 | Eaton Corporation | 5,323,941 | |||
| 52,500 | FedEx Corporation | 3,367,875 | |||
| 863,500 | General Electric Company | 13,988,700 | |||
| 178,600 | Honeywell International, Inc. | 5,863,438 | |||
| 99,600 | Lockheed Martin Corporation | 8,374,368 | |||
| 329,400 | Republic Services, Inc. | 8,165,826 | |||
| 198,900 | Tyco International, Ltd. | 4,296,240 | |||
| 146,800 | United Technologies Corporation | 7,868,480 | |||
| Total Industrials | 61,799,303 | ||||
| Information Technology (9.7%) | |||||
| 202,300 | Accenture, Ltd. | 6,633,417 | |||
| 148,500 | Amdocs, Ltd.a | 2,716,065 | |||
| 254,700 | Automatic Data Processing, Inc. | 10,019,898 | |||
| 185,000 | Corning, Inc. | 1,763,050 | |||
| 55,700 | F5 Networks, Inc.a | 1,273,302 | |||
| 216,800 | Intel Corporation | 3,178,288 | |||
| 218,000 | International Business Machines Corporation | 18,346,880 | |||
| 143,900 | Lam Research Corporationa | 3,062,192 | |||
| 133,890 | Nokia Oyj ADR | 2,088,684 | |||
| 190,850 | Oracle Corporationa | 3,383,770 | |||
| 415,950 | Taiwan Semiconductor Manufacturing Company, Ltd. ADR | 3,286,005 | |||
| 1,188,150 | Teradyne, Inc.a | 5,013,993 | |||
| 257,400 | Texas Instruments, Inc. | 3,994,848 | |||
| Total Information Technology | 64,760,392 | ||||
| Materials (3.4%) | |||||
| 175,795 | Alcoa, Inc. | 1,979,451 | |||
The accompanying Notes to Financial Statements are an integral part of this schedule.
176
Table of Contents
Large Cap Value Portfolio
Schedule of Investments as of December 31, 2008
Shares | Common Stock (97.5%) | Value | ||||
| Materials (3.4%) - continued | ||||||
215,100 | E.I. du Pont de Nemours and Company | $ | 5,442,030 | |||
359,100 | MeadWestvaco Corporation | 4,018,329 | ||||
86,900 | Praxair, Inc. | 5,158,384 | ||||
231,200 | Rockwood Holdings, Inc.a | 2,496,960 | ||||
107,800 | Weyerhaeuser Company | 3,299,758 | ||||
| Total Materials | 22,394,912 | |||||
| Telecommunications Services (4.9%) | ||||||
644,123 | AT&T, Inc. | 18,357,505 | ||||
279,100 | TW Telecom, Inc.a | 2,363,977 | ||||
351,155 | Verizon Communications, Inc. | 11,904,155 | ||||
| Total Telecommunications Services | 32,625,637 | |||||
| Utilities (1.9%) | ||||||
74,500 | Entergy Corporation | 6,193,185 | ||||
131,700 | FirstEnergy Corporation | 6,397,986 | ||||
| Total Utilities | 12,591,171 | |||||
| Total Common Stock (cost $821,617,773) | 647,651,330 | |||||
Shares | Collateral Held for Securities Loaned (1.8%) | Value | ||||
11,994,350 | Thrivent Financial Securities Lending Trust | 11,994,350 | ||||
| Total Collateral Held for Securities Loaned (cost $11,994,350) | 11,994,350 | |||||
Shares | Short-Term Investments (2.5%) | Value | ||||
16,598,217 | Thrivent Money Market Portfolio | 16,598,217 | ||||
Total Short-Term Investments (at amortized cost) | 16,598,217 | |||||
Total Investments (cost $850,210,340) 101.8% | $ | 676,243,897 | ||||
| Other Assets and Liabilities, Net (1.8%) | (12,149,182 | ) | ||||
| Total Net Assets 100.0% | $ | 664,094,715 | ||||
| a | Non-income producing security. |
| b | All or a portion of the security is on loan as discussed in item 2(M) of the Notes to Financial Statements. |
Definitions:
| ADR | - | American Depositary Receipt, which are certificates for an underlying foreign security’s shares held by an issuing U.S. depository bank. | ||
| ETF | - | Exchange Traded Fund. | ||
Gross unrealized appreciation and depreciation of investments, based on cost for federal income tax purposes, were as follows:
Gross unrealized appreciation | $ | 33,417,501 | ||
Gross unrealized depreciation | (208,502,926 | ) | ||
Net unrealized appreciation (depreciation) | $ | (175,085,425 | ) | |
Cost for federal income tax purposes | $ | 851,329,322 |
The following table is a summary of the inputs used, as of December 31, 2008, in valuing the Large Cap Value Portfolio’s assets carried at fair value as discussed in item 2(A) of the Notes to Financial Statements.
Level | Investments in Securities | Other Financial Instruments* | ||||
Level 1 | $ | 676,243,897 | $ | — | ||
Level 2 | — | — | ||||
Level 3 | — | — | ||||
Totals (Level 1,2,3) | $ | 676,243,897 | $ | — | ||
| * | Other Financial Instruments include Futures, Forwards, Written Options and Swap agreements. |
The accompanying Notes to Financial Statements are an integral part of this schedule.
177
Table of Contents
Large Cap Value Portfolio
Schedule of Investments as of December 31, 2008
Investment in Affiliates
Affiliated issuers, as defined under the Investment Company Act of 1940, include those in which the Portfolio’s holdings of an issuer represent 5% or more of the outstanding voting securities of an issuer, or any affiliated mutual fund.
A summary of transactions for the fiscal year to date, in Large Cap Value Portfolio, is as follows:
Portfolio | Value December 31, 2007 | Gross Purchases and Additions | Gross Sales and Reductions | Balance of Shares Held at December 31, 2008 | Value December 31, 2008 | Income Earned January 1, 2008 - December 31, 2008 | |||||||||||
Money Market | $ | 3,547,866 | $ | 213,803,691 | $ | 200,753,340 | 16,598,217 | $ | 16,598,217 | $ | 391,845 | ||||||
Thrivent Financial Securities Lending Trust | 93,704,955 | 1,043,905,089 | 1,125,615,694 | 11,994,350 | 11,994,350 | 754,848 | |||||||||||
Total Value and Income Earned | 97,252,821 | 28,592,567 | 1,146,693 | ||||||||||||||
The accompanying Notes to Financial Statements are an integral part of this schedule.
178
Table of Contents
Schedule of Investments as of December 31, 2008
Shares | Common Stock (95.0%) | Value | |||
| Consumer Discretionary (9.8%) | |||||
61,550 | Amazon.com, Inc.a | $ | 3,156,284 | ||
100,600 | BorgWarner, Inc. | 2,190,062 | |||
375,932 | Comcast Corporation | 6,345,732 | |||
50,000 | Goodyear Tire & Rubber Companya | 298,500 | |||
70,900 | Guess?, Inc. | 1,088,315 | |||
216,700 | Home Depot, Inc. | 4,988,434 | |||
140,750 | Lowe’s Companies, Inc. | 3,028,940 | |||
190,200 | McDonald’s Corporation | 11,828,538 | |||
41,100 | Nordstrom, Inc.b | 547,041 | |||
60,000 | Omnicom Group, Inc. | 1,615,200 | |||
37,500 | Pulte Homes, Inc. | 409,875 | |||
26,400 | Sherwin-Williams Company | 1,577,400 | |||
42,900 | SPDR S&P Homebuilders ETF | 513,513 | |||
155,850 | Staples, Inc. | 2,792,832 | |||
89,987 | Time Warner, Inc. | 905,269 | |||
66,100 | Toll Brothers, Inc.a | 1,416,523 | |||
84,100 | Viacom, Inc.a | 1,602,946 | |||
64,300 | Whirlpool Corporationb | 2,658,805 | |||
40,000 | Winnebago Industries, Inc.b | 241,200 | |||
59,450 | WMS Industries, Inc.a | 1,599,205 | |||
| Total Consumer Discretionary | 48,804,614 | ||||
| Consumer Staples (9.2%) | |||||
145,981 | Altria Group, Inc. | 2,198,474 | |||
43,000 | Costco Wholesale Corporation | 2,257,500 | |||
82,100 | CVS/Caremark Corporation | 2,359,554 | |||
72,927 | General Mills, Inc. | 4,430,315 | |||
8,125 | J.M. Smucker Company | 352,300 | |||
41,300 | Kimberly-Clark Corporation | 2,178,162 | |||
141,246 | Kraft Foods, Inc. | 3,792,455 | |||
17,800 | Lorillard, Inc. | 1,003,030 | |||
196,396 | Philip Morris International, Inc. | 8,545,190 | |||
103,628 | Procter & Gamble Company | 6,406,283 | |||
39,800 | Sara Lee Corporation | 389,642 | |||
213,050 | Wal-Mart Stores, Inc. | 11,943,583 | |||
| Total Consumer Staples | 45,856,488 | ||||
| Energy (13.0%) | |||||
44,318 | Apache Corporation | 3,303,021 | |||
155,230 | ConocoPhillips | 8,040,914 | |||
61,250 | Devon Energy Corporation | 4,024,737 | |||
276,665 | Exxon Mobil Corporation | 22,086,167 | |||
67,300 | Halliburton Company | 1,223,514 | |||
27,231 | Holly Corporation | 496,421 | |||
261,300 | Nabors Industries, Ltd.a | 3,127,761 | |||
105,900 | Occidental Petroleum Corporation | 6,352,941 | |||
147,650 | Petroleo Brasileiro SA ADR | 3,615,948 | |||
23,200 | Royal Dutch Shell plc ADR | 1,228,208 | |||
21,629 | Total SA ADR | 1,196,084 | |||
48,290 | Transocean, Ltd.a,b | 2,281,703 | |||
41,100 | Ultra Petroleum Corporationa | 1,418,361 | |||
20,400 | Valero Energy Corporation | 441,456 | |||
227,800 | Weatherford International, Ltd.a | 2,464,796 | |||
91,450 | XTO Energy, Inc. | 3,225,441 | |||
| Total Energy | 64,527,473 | ||||
| Financials (16.8%) | |||||
53,500 | ACE, Ltd. | 2,831,220 | |||
27,300 | AFLAC, Inc. | 1,251,432 | |||
6,900 | Allstate Corporation | 226,044 | |||
20,000 | American Express Company | 371,000 | |||
84,620 | Ameriprise Financial, Inc. | 1,976,723 | |||
393,000 | Bank of America Corporation | 5,533,440 | |||
79,100 | Capital One Financial Corporation | 2,522,499 | |||
76,400 | Charles Schwab Corporation | 1,235,388 | |||
76,474 | Chubb Corporation | 3,900,174 | |||
247,374 | Citigroup, Inc. | 1,659,880 | |||
67,400 | Fidelity National Financial, Inc. | 1,196,350 | |||
22,400 | Franklin Resources, Inc. | 1,428,672 | |||
30,600 | Goldman Sachs Group, Inc. | 2,582,334 | |||
140,800 | Hudson City Bancorp, Inc. | 2,247,168 | |||
34,900 | IntercontinentalExchange, Inc.a | 2,877,156 | |||
438,108 | J.P. Morgan Chase & Company | 13,813,545 | |||
225,000 | KeyCorp | 1,917,000 | |||
41,400 | Loews Corporation | 1,169,550 | |||
100,600 | Marsh & McLennan Companies, Inc. | 2,441,562 | |||
36,300 | Marshall & Ilsley Corporationb | 495,132 | |||
31,884 | Merrill Lynch & Company, Inc. | 371,130 | |||
36,550 | MetLife, Inc. | 1,274,133 | |||
66,400 | Morgan Stanley | 1,065,056 | |||
70,200 | Nasdaq OMX Group, Inc.a | 1,734,642 | |||
58,300 | PHH Corporationa | 742,159 | |||
34,344 | Principal Financial Group, Inc. | 775,144 | |||
33,958 | Prudential Financial, Inc. | 1,027,569 | |||
8,987 | Reinsurance Group of America, Inc. | 384,823 | |||
58,350 | State Street Corporation | 2,294,906 | |||
245,200 | Synovus Financial Corporationb | 2,035,160 | |||
119,756 | Travelers Companies, Inc. | 5,412,971 | |||
282,799 | Wachovia Corporation | 1,566,706 | |||
162,500 | Washington Federal, Inc. | 2,431,000 | |||
369,349 | Wells Fargo & Company | 10,888,409 | |||
| Total Financials | 83,680,077 | ||||
| Health Care (13.8%) | |||||
250,359 | Abbott Laboratories | 13,361,660 | |||
30,811 | Aetna, Inc. | 878,113 | |||
107,883 | Baxter International, Inc. | 5,781,450 | |||
77,400 | Bristol-Myers Squibb Company | 1,799,550 | |||
242,440 | Gilead Sciences, Inc.a | 12,398,382 | |||
21,500 | iShares Nasdaq Biotechnology Index Fundb | 1,527,575 | |||
210,175 | Johnson & Johnson | 12,574,770 | |||
117,894 | McKesson Corporation | 4,566,035 | |||
84,300 | Medco Health Solutions, Inc.a | 3,533,013 | |||
171,815 | Pfizer, Inc. | 3,042,844 | |||
37,288 | Sanofi-Aventis ADR | 1,199,182 | |||
56,050 | St. Jude Medical, Inc.a | 1,847,408 | |||
117,372 | Thermo Fisher Scientific, Inc.a | 3,998,864 | |||
47,164 | WellPoint, Inc.a | 1,987,019 | |||
| Total Health Care | 68,495,865 | ||||
| Industrials (9.0%) | |||||
58,800 | AMR Corporationa | 627,396 | |||
33,741 | Caterpillar, Inc. | 1,507,210 | |||
43,032 | Danaher Corporation | 2,436,042 | |||
52,000 | Deere & Company | 1,992,640 | |||
350,725 | Delta Air Lines, Inc.a | 4,019,308 | |||
38,000 | Eaton Corporation | 1,888,980 | |||
51,800 | Emerson Electric Company | 1,896,398 | |||
18,800 | FedEx Corporation | 1,206,020 | |||
The accompanying Notes to Financial Statements are an integral part of this schedule.
179
Table of Contents
Large Cap Stock Portfolio
Schedule of Investments as of December 31, 2008
Shares | Common Stock (95.0%) | Value | ||||
| Industrials (9.0%) - continued | ||||||
11,150 | First Solar, Inc.a | $ | 1,538,254 | |||
44,050 | Foster Wheeler, Ltd.a | 1,029,889 | ||||
465,239 | General Electric Company | 7,536,872 | ||||
111,628 | Honeywell International, Inc. | 3,664,747 | ||||
35,495 | Lockheed Martin Corporation | 2,984,420 | ||||
117,800 | Republic Services, Inc. | 2,920,262 | ||||
69,300 | Tyco International, Ltd. | 1,496,880 | ||||
31,892 | Union Pacific Corporation | 1,524,438 | ||||
119,068 | United Technologies Corporation | 6,382,045 | ||||
| Total Industrials | 44,651,801 | |||||
| Information Technology (16.3%) | ||||||
151,306 | Accenture, Ltd. | 4,961,324 | ||||
41,900 | Adobe Systems, Inc.a | 892,051 | ||||
53,100 | Amdocs, Ltd.a | 971,199 | ||||
65,424 | Apple, Inc.a | 5,583,938 | ||||
88,600 | Automatic Data Processing, Inc. | 3,485,524 | ||||
152,150 | CIENA Corporationa,b | 1,019,405 | ||||
248,430 | Cisco Systems, Inc.a | 4,049,409 | ||||
97,000 | Corning, Inc. | 924,410 | ||||
56,600 | Dell, Inc.a | 579,584 | ||||
28,850 | Electronic Arts, Inc.a | 462,754 | ||||
234,250 | EMC Corporationa | 2,452,597 | ||||
19,600 | F5 Networks, Inc.a | 448,056 | ||||
20,871 | Google, Inc.a | 6,420,963 | ||||
305,826 | Intel Corporationb | 4,483,409 | ||||
172,008 | International Business Machines Corporation | 14,476,193 | ||||
51,300 | Lam Research Corporationa | 1,091,664 | ||||
254,550 | Marvell Technology Group, Ltd.a | 1,697,849 | ||||
19,650 | MasterCard, Inc. | 2,808,575 | ||||
237,320 | Micron Technology, Inc.a | 626,525 | ||||
346,900 | Microsoft Corporation | 6,743,736 | ||||
43,550 | Nokia Oyj ADRb | 679,380 | ||||
17,700 | NVIDIA Corporationa | 142,839 | ||||
206,388 | Oracle Corporationa | 3,659,259 | ||||
142,664 | QUALCOMM, Inc. | 5,111,651 | ||||
26,650 | Research in Motion, Ltd.a | 1,081,457 | ||||
39,850 | SanDisk Corporationa | 382,560 | ||||
117,900 | Symantec Corporationa | 1,594,008 | ||||
141,450 | Taiwan Semiconductor Manufacturing Company, Ltd. ADR | 1,117,455 | ||||
406,350 | Teradyne, Inc.a | 1,714,797 | ||||
90,900 | Texas Instruments, Inc. | 1,410,768 | ||||
| Total Information Technology | 81,073,339 | |||||
| Materials (3.4%) | ||||||
104,175 | Alcoa, Inc. | 1,173,011 | ||||
74,957 | E.I. du Pont de Nemours and Company | 1,896,412 | ||||
46,114 | Freeport-McMoRan Copper & Gold, Inc.b | 1,127,026 | ||||
122,896 | MeadWestvaco Corporation | 1,375,206 | ||||
71,813 | Monsanto Company | 5,052,045 | ||||
30,400 | Potash Corporation of Saskatchewan, Inc. | 2,225,888 | ||||
31,559 | Praxair, Inc. | 1,873,342 | ||||
81,700 | Rockwood Holdings, Inc.a | 882,360 | ||||
37,400 | Weyerhaeuser Company | 1,144,814 | ||||
| Total Materials | 16,750,104 | |||||
| Telecommunications Services (1.4%) | ||||||
130,000 | AT&T, Inc. | 3,705,000 | ||||
203,176 | TW Telecom, Inc.a | 1,720,901 | ||||
42,600 | Verizon Communications, Inc. | 1,444,140 | ||||
| Total Telecommunications Services | 6,870,041 | |||||
| Utilities (2.3%) | ||||||
39,500 | DTE Energy Company | 1,408,965 | ||||
279,682 | Southern Company | 10,348,234 | ||||
| Total Utilities | 11,757,199 | |||||
Total Common Stock (cost $582,377,173) | 472,467,001 | |||||
Shares | Collateral Held for Securities Loaned (1.8%) | Value | ||||
9,071,777 | Thrivent Financial Securities Lending Trust | 9,071,777 | ||||
| Total Collateral Held for Securities Loaned (cost $9,071,777) | 9,071,777 | |||||
Shares or | Short-Term Investments (5.0%)c | Value | ||||
| Federal National Mortgage Association Discount Notes | ||||||
2,000,000 | 0.400%, 5/14/2009d | 1,997,063 | ||||
23,020,086 | Thrivent Money Market Portfolio | 23,020,086 | ||||
Total Short-Term Investments (at amortized cost) | 25,017,149 | |||||
Total Investments (cost $616,466,099) 101.8% | $ | 506,555,927 | ||||
| Other Assets and Liabilities, Net (1.8%) | (9,156,236 | ) | ||||
| Total Net Assets 100.0% | $ | 497,399,691 | ||||
| a | Non-income producing security. |
| b | All or a portion of the security is on loan as discussed in item 2(M) of the Notes to Financial Statements. |
| c | The interest rate shown reflects the yield, coupon rate or, for securities purchased at a discount, the discount rate at the date of purchase. |
| d | At December 31, 2008, $1,997,063 of investments were held on deposit with the counterparty and pledged as the initial margin deposit for open financial futures contracts. |
Definitions:
| ADR | - | American Depositary Receipt, which are certificates for an underlying foreign security’s shares held by an issuing U.S. depository bank. | ||
| ETF | - | Exchange Traded Fund. | ||
The accompanying Notes to Financial Statements are an integral part of this schedule.
180
Table of Contents
Large Cap Stock Portfolio
Schedule of Investments as of December 31, 2008
Gross unrealized appreciation and depreciation of investments, based on cost for federal income tax purposes, were as follows:
Gross unrealized appreciation | $ | 24,798,452 | ||
Gross unrealized depreciation | (149,888,720 | ) | ||
Net unrealized appreciation (depreciation) | $ | (125,090,268 | ) | |
Cost for federal income tax purposes | $ | 631,646,195 |
The following table is a summary of the inputs used, as of December 31, 2008, in valuing the Large Cap Stock Portfolio’s assets carried at fair value as discussed in item 2(A) of the Notes to Financial Statements.
Level | Investments in Securities | Other Financial Instruments* | ||||
Level 1 | $ | 504,558,864 | $ | 68,315 | ||
Level 2 | 1,997,063 | — | ||||
Level 3 | — | — | ||||
Totals (Level 1,2,3) | $ | 506,555,927 | $ | 68,315 | ||
| * | Other Financial Instruments include Futures, Forwards, Written Options and Swap agreements. |
Futures | Number of Contracts Long/(Short) | Expiration Date | Notional Principal Amount | Value | Unrealized Gain/(Loss) | ||||||||
S&P 500 Index Futures | 57 | March 2009 | $ | 12,758,110 | $ | 12,826,425 | $ | 68,315 | |||||
Total Futures | $ | 68,315 | |||||||||||
Investment in Affiliates
Affiliated issuers, as defined under the Investment Company Act of 1940, include those in which the Portfolio’s holdings of an issuer represent 5% or more of the outstanding voting securities of an issuer, or any affiliated mutual fund.
A summary of transactions for the fiscal year to date, in Large Cap Stock Portfolio, is as follows:
Portfolio | Value December 31, 2007 | Gross Purchases and Additions | Gross Sales and Reductions | Balance of Shares Held at December 31, 2008 | Value December 31, 2008 | Income Earned January 1, 2008 - December 31, 2008 | |||||||||||
Money Market | $ | 10,589,629 | $ | 334,154,857 | $ | 321,724,400 | 23,020,086 | $ | 23,020,086 | $ | 521,263 | ||||||
Thrivent Financial Securities Lending Trust | 65,208,363 | 612,111,741 | 668,248,327 | 9,071,777 | 9,071,777 | 515,419 | |||||||||||
Total Value and Income Earned | 75,797,992 | 32,091,863 | 1,036,682 | ||||||||||||||
The accompanying Notes to Financial Statements are an integral part of this schedule.
181
Table of Contents
Schedule of Investments as of December 31, 2008
| Shares | Common Stock (99.2%) | Value | |||
| Consumer Discretionary (8.3%) | |||||
| 3,600 | Abercrombie & Fitch Company | $ | 83,052 | ||
| 12,900 | Amazon.com, Inc.a | 661,512 | |||
| 4,200 | Apollo Group, Inc.a | 321,804 | |||
| 4,400 | AutoNation, Inc.a,b | 43,472 | |||
| 1,600 | AutoZone, Inc.a | 223,152 | |||
| 10,400 | Bed Bath & Beyond, Inc.a | 264,368 | |||
| 13,525 | Best Buy Company, Inc. | 380,188 | |||
| 3,400 | Big Lots, Inc.a | 49,266 | |||
| 2,500 | Black & Decker Corporation | 104,525 | |||
| 17,600 | Carnival Corporation | 428,032 | |||
| 27,472 | CBS Corporation | 224,996 | |||
| 5,100 | Centex Corporation | 54,264 | |||
| 13,100 | Coach, Inc.a | 272,087 | |||
| 116,115 | Comcast Corporation | 1,960,021 | |||
| 11,200 | D.R. Horton, Inc. | 79,184 | |||
| 5,650 | Darden Restaurants, Inc. | 159,217 | |||
| 22,000 | DIRECTV Group, Inc.a,b | 504,020 | |||
| 10,900 | Eastman Kodak Company | 71,722 | |||
| 8,500 | Expedia, Inc.a | 70,040 | |||
| 5,700 | Family Dollar Stores, Inc. | 148,599 | |||
| 96,311 | Ford Motor Companya,b | 220,552 | |||
| 6,100 | Fortune Brands, Inc. | 251,808 | |||
| 6,600 | GameStop Corporationa | 142,956 | |||
| 9,300 | Gannett Company, Inc.b | 74,400 | |||
| 18,762 | Gap, Inc. | 251,223 | |||
| 24,600 | General Motors Corporationb | 78,720 | |||
| 6,500 | Genuine Parts Company | 246,090 | |||
| 9,800 | Goodyear Tire & Rubber Companya | 58,506 | |||
| 13,700 | H&R Block, Inc. | 311,264 | |||
| 9,400 | Harley-Davidson, Inc. | 159,518 | |||
| 2,400 | Harman International Industries, Inc. | 40,152 | |||
| 5,050 | Hasbro, Inc. | 147,308 | |||
| 68,300 | Home Depot, Inc. | 1,572,266 | |||
| 11,800 | International Game Technology | 140,302 | |||
| 19,267 | Interpublic Group of Companies, Inc.a | 76,297 | |||
| 8,900 | J.C. Penney Company, Inc. | 175,330 | |||
| 23,900 | Johnson Controls, Inc. | 434,024 | |||
| 3,400 | Jones Apparel Group, Inc. | 19,924 | |||
| 3,100 | KB Homeb | 42,222 | |||
| 12,200 | Kohl’s Corporationa | 441,640 | |||
| 6,300 | Leggett & Platt, Inc. | 95,697 | |||
| 5,700 | Lennar Corporation | 49,419 | |||
| 11,004 | Limited Brands, Inc. | 110,480 | |||
| 59,100 | Lowe’s Companies, Inc. | 1,271,832 | |||
| 16,868 | Macy’s, Inc. | 174,584 | |||
| 11,900 | Marriott International, Inc. | 231,455 | |||
| 14,550 | Mattel, Inc. | 232,800 | |||
| 44,900 | McDonald’s Corporation | 2,792,331 | |||
| 12,600 | McGraw-Hill Companies, Inc. | 292,194 | |||
| 1,500 | Meredith Corporation | 25,110 | |||
| 4,700 | New York Times Companyb | 34,451 | |||
| 11,273 | Newell Rubbermaid, Inc. | 110,250 | |||
| 92,700 | News Corporation | 842,643 | |||
| 15,800 | NIKE, Inc. | 805,800 | |||
| 6,500 | Nordstrom, Inc. | 86,515 | |||
| 11,100 | Office Depot, Inc.a | 33,078 | |||
| 12,600 | Omnicom Group, Inc. | 339,192 | |||
| 2,300 | Polo Ralph Lauren Corporation | 104,443 | |||
| 8,700 | Pulte Homes, Inc. | 95,091 | |||
| 5,100 | RadioShack Corporation | 60,894 | |||
| 3,700 | Scripps Networks Interactive | 81,400 | |||
| 2,332 | Sears Holdings Corporationa,b | 90,645 | |||
| 4,000 | Sherwin-Williams Company | 239,000 | |||
| 2,400 | Snap-On, Inc. | 94,512 | |||
| 3,200 | Stanley Works | 109,120 | |||
| 28,675 | Staples, Inc. | 513,856 | |||
| 29,600 | Starbucks Corporationa | 280,016 | |||
| 7,400 | Starwood Hotels & Resorts Worldwide, Inc. | 132,460 | |||
| 30,300 | Target Corporationb | 1,046,259 | |||
| 5,000 | Tiffany & Company | 118,150 | |||
| 144,650 | Time Warner, Inc. | 1,455,179 | |||
| 16,700 | TJX Companies, Inc. | 343,519 | |||
| 3,600 | VF Corporation | 197,172 | |||
| 24,672 | Viacom, Inc.a | 470,248 | |||
| 74,547 | Walt Disney Company | 1,691,471 | |||
| 270 | Washington Post Company | 105,368 | |||
| 3,057 | Whirlpool Corporation | 126,407 | |||
| 7,172 | Wyndham Worldwide Corporation | 46,977 | |||
| 2,400 | Wynn Resorts, Ltd.a,b | 101,424 | |||
| 18,680 | Yum! Brands, Inc. | 588,420 | |||
Total Consumer Discretionary | 26,607,885 | ||||
| Consumer Staples (12.7%) | |||||
| 83,000 | Altria Group, Inc. | 1,249,980 | |||
| 25,768 | Archer-Daniels-Midland Companyb | 742,892 | |||
| 17,100 | Avon Products, Inc. | 410,913 | |||
| 4,025 | Brown-Forman Corporation | 207,247 | |||
| 8,300 | Campbell Soup Company | 249,083 | |||
| 5,600 | Clorox Company | 311,136 | |||
| 80,200 | Coca-Cola Company | 3,630,654 | |||
| 12,800 | Coca-Cola Enterprises, Inc. | 153,984 | |||
| 20,300 | Colgate-Palmolive Company | 1,391,362 | |||
| 18,100 | ConAgra Foods, Inc. | 298,650 | |||
| 7,900 | Constellation Brands, Inc.a | 124,583 | |||
| 17,400 | Costco Wholesale Corporation | 913,500 | |||
| 57,844 | CVS/Caremark Corporation | 1,662,437 | |||
| 6,300 | Dean Foods Companya | 113,211 | |||
| 10,300 | Dr. Pepper Snapple Group, Inc.a | 167,375 | |||
| 4,700 | Estee Lauder Companies, Inc. | 145,512 | |||
| 13,400 | General Mills, Inc. | 814,050 | |||
| 12,700 | H.J. Heinz Company | 477,520 | |||
| 6,700 | Hershey Company | 232,758 | |||
| 4,851 | J.M. Smucker Company | 210,339 | |||
| 10,200 | Kellogg Company | 447,270 | |||
| 16,592 | Kimberly-Clark Corporation | 875,062 | |||
| 59,152 | Kraft Foods, Inc. | 1,588,231 | |||
| 26,300 | Kroger Company | 694,583 | |||
| 6,800 | Lorillard, Inc. | 383,180 | |||
| 5,300 | McCormick & Company, Inc. | 168,858 | |||
| 6,100 | Molson Coors Brewing Company | 298,412 | |||
| 5,500 | Pepsi Bottling Group, Inc. | 123,805 | |||
| 62,570 | PepsiCo, Inc. | 3,426,959 | |||
| 81,500 | Philip Morris International, Inc. | 3,546,065 | |||
| 120,338 | Procter & Gamble Company | 7,439,295 | |||
| 6,900 | Reynolds American, Inc. | 278,139 | |||
| 17,300 | Safeway, Inc. | 411,221 | |||
| 28,600 | Sara Lee Corporation | 279,994 | |||
| 8,581 | SUPERVALU, Inc. | 125,283 | |||
The accompanying Notes to Financial Statements are an integral part of this schedule.
182
Table of Contents
Large Cap Index Portfolio
Schedule of Investments as of December 31, 2008
| Shares | Common Stock (99.2%) | Value | |||
| Consumer Staples (12.7%) - continued | |||||
| 24,100 | SYSCO Corporation | $ | 552,854 | ||
| 12,200 | Tyson Foods, Inc. | 106,872 | |||
| 6,000 | UST, Inc. | 416,280 | |||
| 39,900 | Walgreen Company | 984,333 | |||
| 90,100 | Wal-Mart Stores, Inc. | 5,051,006 | |||
| 5,700 | Whole Foods Market, Inc.b | 53,808 | |||
Total Consumer Staples | 40,758,696 | ||||
| Energy (13.2%) | |||||
| 18,472 | Anadarko Petroleum Corporation | 712,096 | |||
| 13,420 | Apache Corporation | 1,000,193 | |||
| 12,400 | Baker Hughes, Inc. | 397,668 | |||
| 11,800 | BJ Services Company | 137,706 | |||
| 4,200 | Cabot Oil & Gas Corporation | 109,200 | |||
| 8,900 | Cameron International Corporationa | 182,450 | |||
| 21,800 | Chesapeake Energy Corporation | 352,506 | |||
| 81,896 | Chevron Corporation | 6,057,847 | |||
| 60,049 | ConocoPhillips | 3,110,538 | |||
| 7,300 | CONSOL Energy, Inc. | 208,634 | |||
| 17,800 | Devon Energy Corporation | 1,169,638 | |||
| 28,318 | El Paso Corporation | 221,730 | |||
| 5,800 | ENSCO International, Inc. | 164,662 | |||
| 10,000 | EOG Resources, Inc. | 665,800 | |||
| 205,108 | Exxon Mobil Corporation | 16,373,772 | |||
| 36,000 | Halliburton Company | 654,480 | |||
| 11,400 | Hess Corporation | 611,496 | |||
| 28,368 | Marathon Oil Corporation | 776,148 | |||
| 3,500 | Massey Energy Company | 48,265 | |||
| 7,700 | Murphy Oil Corporation | 341,495 | |||
| 11,500 | Nabors Industries, Ltd.a | 137,655 | |||
| 16,800 | National Oilwell Varco, Inc.a | 410,592 | |||
| 10,700 | Noble Corporation | 236,042 | |||
| 7,000 | Noble Energy, Inc. | 344,540 | |||
| 32,600 | Occidental Petroleum Corporation | 1,955,674 | |||
| 10,700 | Peabody Energy Corporation | 243,425 | |||
| 4,800 | Pioneer Natural Resources Company | 77,664 | |||
| 6,300 | Range Resources Corporation | 216,657 | |||
| 4,600 | Rowan Companies, Inc. | 73,140 | |||
| 48,200 | Schlumberger, Ltd. | 2,040,306 | |||
| 8,900 | Smith International, Inc. | 203,721 | |||
| 13,800 | Southwestern Energy Companya | 399,786 | |||
| 24,604 | Spectra Energy Corporation | 387,267 | |||
| 4,800 | Sunoco, Inc. | 208,608 | |||
| 5,600 | Tesoro Petroleum Corporation | 73,752 | |||
| 20,800 | Valero Energy Corporation | 450,112 | |||
| 27,400 | Weatherford International, Ltd.a | 296,468 | |||
| 23,300 | Williams Companies, Inc. | 337,384 | |||
| 23,250 | XTO Energy, Inc. | 820,027 | |||
Total Energy | 42,209,144 | ||||
| Financials (13.2%) | |||||
| 18,700 | AFLAC, Inc. | 857,208 | |||
| 21,582 | Allstate Corporation | 707,026 | |||
| 8,400 | American Capital, Ltd. | 27,216 | |||
| 46,700 | American Express Company | 866,285 | |||
| 108,340 | American International Group, Inc.b | 170,094 | |||
| 8,800 | Ameriprise Financial, Inc. | 205,568 | |||
| 10,925 | Aon Corporation | 499,054 | |||
| 4,124 | Apartment Investment & Management Companyb | 47,632 | |||
| 4,800 | Assurant, Inc. | 144,000 | |||
| 3,200 | AvalonBay Communities, Inc. | 193,856 | |||
| 202,273 | Bank of America Corporation | 2,848,004 | |||
| 46,252 | Bank of New York Mellon Corporation | 1,310,319 | |||
| 22,200 | BB&T Corporationb | 609,612 | |||
| 4,900 | Boston Properties, Inc. | 269,500 | |||
| 15,773 | Capital One Financial Corporation | 503,001 | |||
| 9,000 | CB Richard Ellis Group, Inc.a | 38,880 | |||
| 37,725 | Charles Schwab Corporation | 610,013 | |||
| 14,400 | Chubb Corporation | 734,400 | |||
| 6,638 | Cincinnati Financial Corporation | 192,967 | |||
| 14,200 | CIT Group, Inc.b | 64,468 | |||
| 219,739 | Citigroup, Inc. | 1,474,449 | |||
| 2,700 | CME Group, Inc. | 561,897 | |||
| 6,150 | Comerica, Inc. | 122,078 | |||
| 4,900 | Developers Diversified Realty Corporation | 23,912 | |||
| 19,325 | Discover Financial Services | 184,167 | |||
| 22,800 | E*TRADE Financial Corporationa,b | 26,220 | |||
| 11,000 | Equity Residential REIT | 328,020 | |||
| 3,600 | Federated Investors, Inc. | 61,056 | |||
| 23,294 | Fifth Third Bancorp | 192,408 | |||
| 8,291 | First Horizon National Corporation | 87,636 | |||
| 6,100 | Franklin Resources, Inc. | 389,058 | |||
| 17,400 | Genworth Financial, Inc. | 49,242 | |||
| 17,800 | Goldman Sachs Group, Inc. | 1,502,142 | |||
| 12,100 | Hartford Financial Services Group, Inc. | 198,682 | |||
| 10,100 | Health Care Property Investors, Inc. | 280,477 | |||
| 21,100 | Host Hotels & Resorts, Inc.b | 159,727 | |||
| 21,100 | Hudson City Bancorp, Inc. | 336,756 | |||
| 14,771 | Huntington Bancshares, Inc.b | 113,146 | |||
| 2,900 | IntercontinentalExchange, Inc.a | 239,076 | |||
| 15,600 | Invesco, Ltd.b | 225,264 | |||
| 150,448 | J.P. Morgan Chase & Company | 4,743,625 | |||
| 6,400 | Janus Capital Group, Inc. | 51,392 | |||
| 19,900 | KeyCorp | 169,548 | |||
| 9,200 | Kimco Realty Corporation | 168,176 | |||
| 5,800 | Legg Mason, Inc. | 127,078 | |||
| 7,100 | Leucadia National Corporationa | 140,580 | |||
| 10,294 | Lincoln National Corporation | 193,939 | |||
| 14,600 | Loews Corporation | 412,450 | |||
| 3,200 | M&T Bank Corporationb | 183,712 | |||
| 20,700 | Marsh & McLennan Companies, Inc. | 502,389 | |||
| 10,500 | Marshall & Ilsley Corporationb | 143,220 | |||
| 7,650 | MBIA, Inc.a,b | 31,136 | |||
| 64,500 | Merrill Lynch & Company, Inc. | 750,780 | |||
| 31,932 | MetLife, Inc. | 1,113,150 | |||
| 7,900 | Moody’s Corporationb | 158,711 | |||
| 42,750 | Morgan Stanley | 685,710 | |||
| 5,400 | Nasdaq OMX Group, Inc.a | 133,434 | |||
| 82,000 | National City Corporation | 148,420 | |||
| 8,900 | Northern Trust Corporation | 464,046 | |||
| 10,600 | NYSE Euronext | 290,228 | |||
| 14,100 | People’s United Financial, Inc. | 251,403 | |||
The accompanying Notes to Financial Statements are an integral part of this schedule.
183
Table of Contents
Large Cap Index Portfolio
Schedule of Investments as of December 31, 2008
Shares | Common Stock (99.2%) | Value | ||
| Financials (13.2%) - continued | ||||
| 6,800 | Plum Creek Timber Company, Inc. | $ 236,232 | ||
| 14,000 | PNC Financial Services Group, Inc. | 686,000 | ||
| 10,400 | Principal Financial Group, Inc. | 234,728 | ||
| 27,300 | Progressive Corporation | 404,313 | ||
| 10,700 | ProLogis Trust | 148,623 | ||
| 17,000 | Prudential Financial, Inc. | 514,420 | ||
| 5,100 | Public Storage, Inc. | 405,450 | ||
| 27,877 | Regions Financial Corporationb | 221,901 | ||
| 9,100 | Simon Property Group, Inc. | 483,483 | ||
| 18,800 | SLM Corporationa | 167,320 | ||
| 22,010 | Sovereign Bancorp, Inc.a | 65,590 | ||
| 17,400 | State Street Corporation | 684,342 | ||
| 14,200 | SunTrust Banks, Inc. | 419,468 | ||
| 10,468 | T. Rowe Price Group, Inc.b | 370,986 | ||
| 3,500 | Torchmark Corporation | 156,450 | ||
| 23,481 | Travelers Companies, Inc. | 1,061,341 | ||
| 70,685 | U.S. Bancorp | 1,767,832 | ||
| 13,424 | UnumProvident Corporation | 249,686 | ||
| 5,500 | Vornado Realty Trust | 331,925 | ||
| 87,093 | Wachovia Corporation | 482,495 | ||
| 152,800 | Wells Fargo & Company | 4,504,544 | ||
| 13,400 | XL Capital, Ltd.b | 49,580 | ||
| 4,700 | Zions Bancorporationb | 115,197 | ||
Total Financials | 42,079,549 | |||
| Health Care (14.6%) | ||||
| 62,500 | Abbott Laboratories | 3,335,625 | ||
| 18,496 | Aetna, Inc. | 527,136 | ||
| 12,400 | Allergan, Inc. | 499,968 | ||
| 6,300 | AmerisourceBergen Corporation | 224,658 | ||
| 42,640 | Amgen, Inc.a | 2,462,460 | ||
| 25,000 | Baxter International, Inc. | 1,339,750 | ||
| 9,900 | Becton, Dickinson and Company | 677,061 | ||
| 11,700 | Biogen Idec, Inc.a | 557,271 | ||
| 60,550 | Boston Scientific Corporationa | 468,657 | ||
| 79,800 | Bristol-Myers Squibb Company | 1,855,350 | ||
| 4,100 | C.R. Bard, Inc. | 345,466 | ||
| 14,475 | Cardinal Health, Inc. | 498,953 | ||
| 18,400 | Celgene Corporationa | 1,017,152 | ||
| 2,800 | Cephalon, Inc.a | 215,712 | ||
| 11,000 | CIGNA Corporation | 185,350 | ||
| 6,100 | Coventry Health Care, Inc.a | 90,768 | ||
| 20,276 | Covidien, Ltd. | 734,802 | ||
| 4,200 | DaVita, Inc.a | 208,194 | ||
| 6,100 | Dentsply International, Inc. | 172,264 | ||
| 40,300 | Eli Lilly and Company | 1,622,881 | ||
| 9,900 | Express Scripts, Inc.a | 544,302 | ||
| 12,100 | Forest Laboratories, Inc.a | 308,187 | ||
| 10,900 | Genzyme Corporationa | 723,433 | ||
| 37,000 | Gilead Sciences, Inc.a | 1,892,180 | ||
| 6,480 | Hospira, Inc.a | 173,794 | ||
| 6,800 | Humana, Inc.a | 253,504 | ||
| 7,400 | IMS Health, Inc. | 112,184 | ||
| 1,500 | Intuitive Surgical, Inc.a,b | 190,485 | ||
| 111,840 | Johnson & Johnson | 6,691,387 | ||
| 10,000 | King Pharmaceuticals, Inc.a | 106,200 | ||
| 4,400 | Laboratory Corporation of America Holdingsa | 283,404 | ||
| 7,043 | Life Technologies Corporationa | 164,172 | ||
| 11,042 | McKesson Corporation | 427,657 | ||
| 19,986 | Medco Health Solutions, Inc.a | 837,613 | ||
| 45,000 | Medtronic, Inc. | 1,413,900 | ||
| 85,200 | Merck & Company, Inc. | 2,590,080 | ||
| 2,300 | Millipore Corporationa | 118,496 | ||
| 12,300 | Mylan Laboratories, Inc.a,b | 121,647 | ||
| 3,700 | Patterson Companies, Inc.a | 69,375 | ||
| 4,800 | PerkinElmer, Inc. | 66,768 | ||
| 271,853 | Pfizer, Inc. | 4,814,517 | ||
| 6,400 | Quest Diagnostics, Inc. | 332,224 | ||
| 65,500 | Schering-Plough Corporation | 1,115,465 | ||
| 13,784 | St. Jude Medical, Inc.a | 454,321 | ||
| 9,700 | Stryker Corporation | 387,515 | ||
| 16,800 | Tenet Healthcare Corporationa | 19,320 | ||
| 16,900 | Thermo Fisher Scientific, Inc.a | 575,783 | ||
| 48,700 | UnitedHealth Group, Inc. | 1,295,420 | ||
| 5,100 | Varian Medical Systems, Inc.a | 178,704 | ||
| 4,000 | Waters Corporationa | 146,600 | ||
| 4,300 | Watson Pharmaceuticals, Inc.a | 114,251 | ||
| 20,500 | WellPoint, Inc.a | 863,665 | ||
| 53,600 | Wyeth | 2,010,536 | ||
| 9,050 | Zimmer Holdings, Inc.a | 365,801 | ||
Total Health Care | 46,802,368 | |||
| Industrials (11.0%) | ||||
| 27,900 | 3M Company | 1,605,366 | ||
| 4,300 | Avery Dennison Corporation | 140,739 | ||
| 29,460 | Boeing Company | 1,257,058 | ||
| 11,292 | Burlington Northern Santa Fe Corporation | 854,917 | ||
| 6,900 | C.H. Robinson Worldwide, Inc. | 379,707 | ||
| 24,300 | Caterpillar, Inc. | 1,085,481 | ||
| 5,300 | Cintas Corporation | 123,119 | ||
| 7,000 | Cooper Industries, Ltd. | 204,610 | ||
| 15,900 | CSX Corporation | 516,273 | ||
| 8,100 | Cummins, Inc. | 216,513 | ||
| 10,400 | Danaher Corporation | 588,744 | ||
| 17,200 | Deere & Company | 659,104 | ||
| 7,500 | Dover Corporation | 246,900 | ||
| 2,200 | Dun & Bradstreet Corporation | 169,840 | ||
| 6,700 | Eaton Corporation | 333,057 | ||
| 30,900 | Emerson Electric Company | 1,131,249 | ||
| 5,100 | Equifax, Inc. | 135,252 | ||
| 8,600 | Expeditors International of Washington, Inc. | 286,122 | ||
| 5,300 | Fastenal Companyb | 184,705 | ||
| 12,460 | FedEx Corporation | 799,309 | ||
| 2,300 | Flowserve Corporation | 118,450 | ||
| 7,300 | Fluor Corporation | 327,551 | ||
| 15,700 | General Dynamics Corporation | 904,163 | ||
| 423,500 | General Electric Company | 6,860,700 | ||
| 5,000 | Goodrich Corporation | 185,100 | ||
| 29,275 | Honeywell International, Inc. | 961,098 | ||
| 15,900 | Illinois Tool Works, Inc. | 557,295 | ||
| 12,871 | Ingersoll-Rand Company | 223,312 | ||
| 7,400 | ITT Corporation | 340,326 | ||
| 4,900 | Jacobs Engineering Group, Inc.a | 235,690 | ||
| 4,900 | L-3 Communications Holdings, Inc. | 361,522 | ||
| 13,400 | Lockheed Martin Corporation | 1,126,672 | ||
| 5,300 | Manitowoc Company, Inc. | 45,898 | ||
| 14,600 | Masco Corporation | 162,498 | ||
| 5,000 | Monster Worldwide, Inc.a | 60,450 | ||
| 14,900 | Norfolk Southern Corporation | 701,045 | ||
| 13,198 | Northrop Grumman Corporation | 594,438 | ||
The accompanying Notes to Financial Statements are an integral part of this schedule.
184
Table of Contents
Large Cap Index Portfolio
Schedule of Investments as of December 31, 2008
Shares | Common Stock (99.2%) | Value | |||
| Industrials (11.0%) - continued | |||||
| 14,537 | PACCAR, Inc.b | $ | 415,758 | ||
| 4,800 | Pall Corporation | 136,464 | |||
| 6,575 | Parker-Hannifin Corporation | 279,700 | |||
| 8,400 | Pitney Bowes, Inc. | 214,032 | |||
| 5,600 | Precision Castparts Corporation | 333,088 | |||
| 8,300 | R.R. Donnelley & Sons Company | 112,714 | |||
| 16,600 | Raytheon Company | 847,264 | |||
| 13,020 | Republic Services, Inc. | 322,766 | |||
| 6,300 | Robert Half International, Inc. | 131,166 | |||
| 5,800 | Rockwell Automation, Inc. | 186,992 | |||
| 6,400 | Rockwell Collins, Inc. | 250,176 | |||
| 2,300 | Ryder System, Inc.b | 89,194 | |||
| 29,800 | Southwest Airlines Company | 256,876 | |||
| 3,500 | Stericycle, Inc.a | 182,280 | |||
| 9,800 | Textron, Inc. | 135,926 | |||
| 18,976 | Tyco International, Ltd. | 409,882 | |||
| 20,400 | Union Pacific Corporation | 975,120 | |||
| 40,100 | United Parcel Service, Inc. | 2,211,916 | |||
| 38,300 | United Technologies Corporation | 2,052,880 | |||
| 2,700 | W.W. Grainger, Inc. | 212,868 | |||
| 19,799 | Waste Management, Inc. | 656,139 | |||
Total Industrials | 35,097,474 | ||||
| Information Technology (15.2%) | |||||
| 21,400 | Adobe Systems, Inc.a | 455,606 | |||
| 24,600 | Advanced Micro Devices, Inc.a,b | 53,136 | |||
| 4,000 | Affiliated Computer Services, Inc.a | 183,800 | |||
| 14,015 | Agilent Technologies, Inc.a | 219,054 | |||
| 6,900 | Akamai Technologies, Inc.a | 104,121 | |||
| 12,000 | Altera Corporation | 200,520 | |||
| 7,100 | Amphenol Corporation | 170,258 | |||
| 11,800 | Analog Devices, Inc. | 224,436 | |||
| 35,800 | Apple, Inc.a | 3,055,530 | |||
| 54,100 | Applied Materials, Inc. | 548,033 | |||
| 9,200 | Autodesk, Inc.a | 180,780 | |||
| 20,400 | Automatic Data Processing, Inc. | 802,536 | |||
| 7,600 | BMC Software, Inc.a | 204,516 | |||
| 17,900 | Broadcom Corporationa | 303,763 | |||
| 15,912 | CA, Inc. | 294,849 | |||
| 3,657 | CIENA Corporationa | 24,502 | |||
| 236,100 | Cisco Systems, Inc.a | 3,848,430 | |||
| 7,400 | Citrix Systems, Inc.a | 174,418 | |||
| 11,800 | Cognizant Technology Solutions Corporationa | 213,108 | |||
| 6,200 | Computer Sciences Corporationa | 217,868 | |||
| 10,000 | Compuware Corporationa | 67,500 | |||
| 5,000 | Convergys Corporationa | 32,050 | |||
| 62,600 | Corning, Inc. | 596,578 | |||
| 69,700 | Dell, Inc.a | 713,728 | |||
| 43,200 | eBay, Inc.a | 603,072 | |||
| 13,000 | Electronic Arts, Inc.a | 208,520 | |||
| 82,286 | EMC Corporationa | 861,534 | |||
| 7,700 | Fidelity National Information Services, Inc. | 125,279 | |||
| 6,500 | Fiserv, Inc.a | 236,405 | |||
| 5,200 | FLIR Systems, Inc.a | 159,536 | |||
| 9,600 | Google, Inc.a | 2,953,440 | |||
| 5,500 | Harris Corporation | 209,275 | |||
| 98,686 | Hewlett-Packard Company | 3,581,315 | |||
| 224,200 | Intel Corporation | 3,286,772 | |||
| 54,100 | International Business Machines Corporation | 4,553,056 | |||
| 13,000 | Intuit, Inc.a | 309,270 | |||
| 8,500 | Jabil Circuit, Inc. | 57,375 | |||
| 8,962 | JDS Uniphase Corporationa | 32,711 | |||
| 21,200 | Juniper Networks, Inc.a | 371,212 | |||
| 6,900 | KLA-Tencor Corporation | 150,351 | |||
| 3,200 | Lexmark International, Inc.a | 86,080 | |||
| 9,000 | Linear Technology Corporationb | 199,080 | |||
| 26,100 | LSI Corporationa | 85,869 | |||
| 2,900 | MasterCard, Inc.b | 414,497 | |||
| 6,200 | McAfee, Inc.a | 214,334 | |||
| 9,000 | MEMC Electronic Materials, Inc.a | 128,520 | |||
| 7,400 | Microchip Technology, Inc.b | 144,522 | |||
| 30,900 | Micron Technology, Inc.a,b | 81,576 | |||
| 308,500 | Microsoft Corporation | 5,997,240 | |||
| 5,700 | Molex, Inc. | 82,593 | |||
| 91,390 | Motorola, Inc. | 404,858 | |||
| 7,900 | National Semiconductor Corporation | 79,553 | |||
| 13,400 | NETAPP, Inc.a | 187,198 | |||
| 14,000 | Novell, Inc.a | 54,460 | |||
| 4,000 | Novellus Systems, Inc.a | 49,360 | |||
| 21,650 | NVIDIA Corporationa | 174,716 | |||
| 157,937 | Oracle Corporationa | 2,800,223 | |||
| 13,000 | Paychex, Inc. | 341,640 | |||
| 5,200 | QLogic Corporationa | 69,888 | |||
| 66,700 | QUALCOMM, Inc. | 2,389,861 | |||
| 4,300 | Salesforce.com, Inc.a | 137,643 | |||
| 9,100 | SanDisk Corporationa | 87,360 | |||
| 29,750 | Sun Microsystems, Inc.a | 113,645 | |||
| 33,624 | Symantec Corporationa | 454,597 | |||
| 16,100 | Tellabs, Inc.a | 66,332 | |||
| 7,100 | Teradata Corporationa | 105,293 | |||
| 6,900 | Teradyne, Inc.a | 29,118 | |||
| 52,200 | Texas Instruments, Inc. | 810,144 | |||
| 8,000 | Total System Services, Inc. | 112,000 | |||
| 18,376 | Tyco Electronics, Ltd. | 297,875 | |||
| 7,900 | VeriSign, Inc.a | 150,732 | |||
| 28,780 | Western Union Company | 412,705 | |||
| 34,900 | Xerox Corporation | 278,153 | |||
| 11,100 | Xilinx, Inc. | 197,802 | |||
| 55,900 | Yahoo!, Inc.a | 681,980 | |||
Total Information Technology | 48,509,690 | ||||
| Materials (3.0%) | |||||
| 8,400 | Air Products and Chemicals, Inc. | 422,268 | |||
| 4,600 | AK Steel Holding Corporation | 42,872 | |||
| 32,264 | Alcoa, Inc. | 363,293 | |||
| 3,969 | Allegheny Technologies, Inc. | 101,329 | |||
| 3,900 | Ball Corporation | 162,201 | |||
| 4,100 | Bemis Company, Inc. | 97,088 | |||
| 2,300 | CF Industries Holdings, Inc. | 113,068 | |||
| 37,193 | Dow Chemical Company | 561,242 | |||
| 36,311 | E.I. du Pont de Nemours and Company | 918,668 | |||
| 3,000 | Eastman Chemical Company | 95,130 | |||
| 6,800 | Ecolab, Inc. | 239,020 | |||
| 15,196 | Freeport-McMoRan Copper & Gold, Inc. | 371,390 | |||
| 3,200 | International Flavors & Fragrances, Inc. | 95,104 | |||
| 17,171 | International Paper Company | 202,618 | |||
| 6,981 | MeadWestvaco Corporation | 78,117 | |||
The accompanying Notes to Financial Statements are an integral part of this schedule.
185
Table of Contents
Large Cap Index Portfolio
Schedule of Investments as of December 31, 2008
Shares | Common Stock (99.2%) | Value | ||||
| Materials (3.0%) - continued | ||||||
| 22,078 | Monsanto Company | $ | 1,553,187 | |||
| 18,248 | Newmont Mining Corporation | 742,694 | ||||
| 12,600 | Nucor Corporation | 582,120 | ||||
| 5,600 | Owens-Illinois, Inc.a | 153,048 | ||||
| 5,300 | Pactiv Corporationa | 131,864 | ||||
| 6,700 | PPG Industries, Inc. | 284,281 | ||||
| 12,400 | Praxair, Inc. | 736,064 | ||||
| 5,113 | Rohm and Haas Company | 315,932 | ||||
| 6,452 | Sealed Air Corporation | 96,393 | ||||
| 5,100 | Sigma-Aldrich Corporation | 215,424 | ||||
| 3,500 | Titanium Metals Corporationb | 30,835 | ||||
| 4,600 | United States Steel Corporation | 171,120 | ||||
| 4,400 | Vulcan Materials Companyb | 306,152 | ||||
| 8,600 | Weyerhaeuser Company | 263,246 | ||||
Total Materials | 9,445,768 | |||||
| Telecommunications Services (3.8%) | ||||||
| 15,900 | American Tower Corporationa | 466,188 | ||||
| 237,639 | AT&T, Inc.b | 6,772,712 | ||||
| 4,100 | CenturyTel, Inc.b | 112,053 | ||||
| 5,801 | Embarq Corporation | 208,604 | ||||
| 12,600 | Frontier Communications Corporation | 110,124 | ||||
| 59,072 | Qwest Communications International, Inc.b | 215,022 | ||||
| 115,120 | Sprint Nextel Corporationa,b | 210,670 | ||||
| 114,496 | Verizon Communications, Inc. | 3,881,414 | ||||
| 17,807 | Windstream Corporation | 163,824 | ||||
Total Telecommunications Services | 12,140,611 | |||||
| Utilities (4.2%) | ||||||
| 27,200 | AES Corporationa | 224,128 | ||||
| 6,900 | Allegheny Energy, Inc. | 233,634 | ||||
| 8,600 | Ameren Corporation | 286,036 | ||||
| 16,360 | American Electric Power Company, Inc. | 544,461 | ||||
| 13,973 | CenterPoint Energy, Inc. | 176,339 | ||||
| 9,200 | CMS Energy Corporation | 92,920 | ||||
| 11,100 | Consolidated Edison, Inc. | 432,123 | ||||
| 7,200 | Constellation Energy Group, Inc. | 180,648 | ||||
| 23,394 | Dominion Resources, Inc. | 838,441 | ||||
| 6,600 | DTE Energy Company | 235,422 | ||||
| 51,008 | Duke Energy Corporation | 765,630 | ||||
| 20,404 | Dynegy, Inc.a | 40,808 | ||||
| 13,200 | Edison International, Inc. | 423,984 | ||||
| 7,700 | Entergy Corporation | 640,101 | ||||
| 5,300 | Equitable Resources, Inc. | 177,815 | ||||
| 26,524 | Exelon Corporation | 1,474,999 | ||||
| 12,300 | FirstEnergy Corporation | 597,534 | ||||
| 16,400 | FPL Group, Inc. | 825,412 | ||||
| 3,115 | Integrys Energy Group, Inc. | 133,883 | ||||
| 1,900 | Nicor, Inc.b | 66,006 | ||||
| 11,109 | NiSource, Inc. | 121,866 | ||||
| 8,800 | Pepco Holdings, Inc. | 156,288 | ||||
| 14,600 | PG&E Corporation | 565,166 | ||||
| 4,100 | Pinnacle West Capital Corporation | 131,733 | ||||
| 15,200 | PPL Corporation | 466,488 | ||||
| 10,620 | Progress Energy, Inc. | 423,207 | ||||
| 20,500 | Public Service Enterprise Group, Inc. | 597,985 | ||||
| 7,000 | Questar Corporation | 228,830 | ||||
| 4,500 | SCANA Corporation | 160,200 | ||||
| 9,875 | Sempra Energy | 420,971 | ||||
| 31,200 | Southern Company | 1,154,400 | ||||
| 8,600 | TECO Energy, Inc. | 106,210 | ||||
| 4,800 | Wisconsin Energy Corporation | 201,504 | ||||
| 18,205 | Xcel Energy, Inc. | 337,703 | ||||
Total Utilities | 13,462,875 | |||||
Total Common Stock (cost $392,732,101) | 317,114,060 | |||||
Shares | Collateral Held for Securities Loaned (2.5%) | Value | ||||
| 7,915,380 | Thrivent Financial Securities Lending Trust | 7,915,380 | ||||
Total Collateral Held for Securities Loaned (cost $7,915,380) | 7,915,380 | |||||
| Shares or Principal Amount | Short-Term Investments (0.8%)c | Value | ||||
Federal National Mortgage Association Discount Notes | ||||||
| 1,000,000 | 0.405%, 5/14/2009d | 998,516 | ||||
| 1,750,233 | Thrivent Money Market Portfolio | 1,750,233 | ||||
Total Short-Term Investments (cost $2,748,748) | 2,748,749 | |||||
Total Investments (cost $403,396,229) 102.5% | $ | 327,778,189 | ||||
Other Assets and Liabilities, Net (2.5%) | (8,066,876 | ) | ||||
Total Net Assets 100.0% | $ | 319,711,313 | ||||
| a | Non-income producing security. |
| b | All or a portion of the security is on loan as discussed in item 2(M) of the Notes to Financial Statements. |
| c | The interest rate shown reflects the yield, coupon rate or, for securities purchased at a discount, the discount rate at the date of purchase. |
| d | At December 31, 2008, $998,516 of investments were held on deposit with the counterparty and pledged as the initial margin deposit for open financial futures contracts. |
Definitions:
REIT - Real Estate Investment Trust, is a company that buys, develops, manages and/or sells real estate assets.
Gross unrealized appreciation and depreciation of investments, based on cost for federal income tax purposes, were as follows:
Gross unrealized appreciation | $ | 57,485,731 | ||
Gross unrealized depreciation | (150,592,448 | ) | ||
Net unrealized appreciation (depreciation) | $ | (93,106,717 | ) | |
Cost for federal income tax purposes | $ | 420,884,906 |
The accompanying Notes to Financial Statements are an integral part of this schedule.
186
Table of Contents
Large Cap Index Portfolio
Schedule of Investments as of December 31, 2008
The following table is a summary of the inputs used, as of December 31, 2008, in valuing the Large Cap Index Portfolio’s assets carried at fair value as discussed in item 2(A) of the Notes to Financial Statements.
Level | Investments in Securities | Other Financial Instruments* | ||||
Level 1 | $ | 326,779,673 | $ | 17,315 | ||
Level 2 | 998,516 | — | ||||
Level 3 | — | — | ||||
Totals (Level 1,2,3) | $ | 327,778,189 | $ | 17,315 | ||
| * | Other Financial Instruments include Futures, Forwards, Written Options and Swap agreements. |
Futures | Number of Contracts Long/(Short) | Expiration Date | Notional Principal Amount | Value | Unrealized Gain/(Loss) | ||||||||
S&P 500 Index Futures | 12 | March 2009 | $ | 2,682,985 | $ | 2,700,300 | $ | 17,315 | |||||
Total Futures | $ | 17,315 | |||||||||||
Investment in Affiliates
Affiliated issuers, as defined under the Investment Company Act of 1940, include those in which the Portfolio’s holdings of an issuer represent 5% or more of the outstanding voting securities of an issuer, or any affiliated mutual fund.
A summary of transactions for the fiscal year to date, in Large Cap Index Portfolio, is as follows:
Portfolio | Value December 31, 2007 | Gross Purchases and Additions | Gross Sales and Reductions | Balance of Shares Held at December 31, 2008 | Value December 31, 2008 | Income Earned January 1, 2008 - December 31, 2008 | |||||||||||
Money Market | $ | 6,871,402 | $ | 88,966,961 | $ | 94,088,130 | 1,750,233 | $ | 1,750,233 | $ | 164,096 | ||||||
Thrivent Financial Securities Lending Trust | 48,959,242 | 387,437,538 | 428,481,400 | 7,915,380 | 7,915,380 | 316,804 | |||||||||||
Total Value and Income Earned | 55,830,644 | 9,665,613 | 480,900 | ||||||||||||||
The accompanying Notes to Financial Statements are an integral part of this schedule.
187
Table of Contents
Schedule of Investments as of December 31, 2008
| Shares | Common Stock (78.5%) | Value | |||
| Consumer Discretionary (5.9%) | |||||
| 4,200 | Black & Decker Corporation | $ | 175,602 | ||
| 18,400 | CBS Corporation | 150,696 | |||
| 18,400 | Gannett Company, Inc. | 147,200 | |||
| 5,000 | Genuine Parts Company | 189,300 | |||
| 11,800 | Home Depot, Inc. | 271,636 | |||
| 7,800 | Johnson Controls, Inc. | 141,648 | |||
| 12,600 | KB Home | 171,612 | |||
| 7,400 | Mattel, Inc. | 118,400 | |||
| 5,400 | McDonald’s Corporation | 335,826 | |||
| 14,700 | Men’s Wearhouse, Inc. | 199,038 | |||
| 4,500 | NIKE, Inc. | 229,500 | |||
| 3,100 | VF Corporation | 169,787 | |||
| 5,900 | Walt Disney Company | 133,871 | |||
Total Consumer Discretionary | 2,434,116 | ||||
| Consumer Staples (9.8%) | |||||
| 13,500 | Altria Group, Inc. | 203,310 | |||
| 7,600 | Coca-Cola Company | 344,052 | |||
| 2,700 | Colgate-Palmolive Company | 185,058 | |||
| 6,400 | ConAgra Foods, Inc. | 105,600 | |||
| 3,800 | Costco Wholesale Corporation | 199,500 | |||
| 6,900 | CVS/Caremark Corporation | 198,306 | |||
| 2,400 | Diageo plc ADR | 136,176 | |||
| 5,700 | General Mills, Inc. | 346,275 | |||
| 5,200 | Kimberly-Clark Corporation | 274,248 | |||
| 10,600 | Kraft Foods, Inc. | 284,610 | |||
| 3,600 | Lorillard, Inc. | 202,860 | |||
| 6,100 | McCormick & Company, Inc. | 194,346 | |||
| 3,500 | Molson Coors Brewing Company | 171,220 | |||
| 8,700 | Philip Morris International, Inc. | 378,537 | |||
| 6,808 | Procter & Gamble Company | 420,870 | |||
| 7,100 | Wal-Mart Stores, Inc. | 398,026 | |||
Total Consumer Staples | 4,042,994 | ||||
| Energy (10.8%) | |||||
| 2,200 | Apache Corporation | 163,966 | |||
| 5,200 | BP plc ADR | 243,048 | |||
| 11,400 | Chevron Corporationa | 843,258 | |||
| 10,400 | ConocoPhillipsa | 538,720 | |||
| 2,600 | Devon Energy Corporation | 170,846 | |||
| 11,400 | Exxon Mobil Corporationa | 910,062 | |||
| 8,300 | Halliburton Company | 150,894 | |||
| 11,800 | Marathon Oil Corporation | 322,848 | |||
| 4,300 | Occidental Petroleum Corporation | 257,957 | |||
| 25,600 | Precision Drilling Corporation | 214,784 | |||
| 4,800 | Royal Dutch Shell plc ADR | 254,112 | |||
| 4,800 | Total SA ADR | 265,440 | |||
| 6,900 | Valero Energy Corporation | 149,316 | |||
Total Energy | 4,485,251 | ||||
| Financials (13.7%) | |||||
| 500 | Acadia Realty Trust | 7,135 | |||
| 1,600 | ACE, Ltd. | 84,672 | |||
| 4,000 | AFLAC, Inc. | 183,360 | |||
| 200 | Alexandria Real Estate Equities, Inc. | 12,068 | |||
| 500 | AMB Property Corporation | 11,710 | |||
| 400 | American Campus Communities, Inc. | 8,192 | |||
| 239 | Apartment Investment & Management Company | 2,760 | |||
| 400 | AvalonBay Communities, Inc. | 24,232 | |||
| 24,800 | Bank of America Corporation | 349,184 | |||
| 11,100 | Bank of New York Mellon Corporation | 314,463 | |||
| 8,000 | BB&T Corporation | 219,680 | |||
| 400 | BioMed Realty Trust, Inc. | 4,688 | |||
| 650 | Boston Properties, Inc. | 35,750 | |||
| 500 | Brandywine Realty Trust | 3,855 | |||
| 200 | BRE Properties, Inc. | 5,596 | |||
| 300 | Brookfield Asset Management, Inc. | 4,581 | |||
| 950 | Brookfield Properties Corporation | 7,343 | |||
| 300 | Camden Property Trust | 9,402 | |||
| 3,100 | Chubb Corporation | 158,100 | |||
| 20,800 | Citigroup, Inc. | 139,568 | |||
| 500 | Colonial Properties Trust | 4,165 | |||
| 300 | Corporate Office Properties Trust | 9,210 | |||
| 1,400 | Cullen/Frost Bankers, Inc. | 70,952 | |||
| 1,200 | DCT Industrial Trust, Inc. | 6,072 | |||
| 600 | DiamondRock Hospitality Company | 3,042 | |||
| 500 | Digital Realty Trust, Inc. | 16,425 | |||
| 500 | Douglas Emmett, Inc. | 6,530 | |||
| 400 | Duke Realty Corporation | 4,384 | |||
| 150 | Entertainment Properties Trust | 4,470 | |||
| 1,050 | Equity Residential REIT | 31,311 | |||
| 250 | Essex Property Trust, Inc. | 19,188 | |||
| 3,100 | Everest Re Group, Ltd. | 236,034 | |||
| 500 | Extra Space Storage, Inc. | 5,160 | |||
| 500 | Federal Realty Investment Trust | 31,040 | |||
| 450 | Forest City Enterprises | 3,015 | |||
| 9,400 | Glacier Bancorp, Inc. | 178,788 | |||
| 1,400 | Goldman Sachs Group, Inc. | 118,146 | |||
| 700 | Health Care Property Investors, Inc. | 19,439 | |||
| 300 | Health Care REIT, Inc. | 12,660 | |||
| 250 | Healthcare Realty Trust, Inc. | 5,870 | |||
| 200 | Highwoods Properties, Inc. | 5,472 | |||
| 200 | Home Properties, Inc. | 8,120 | |||
| 2,300 | Host Hotels & Resorts, Inc. | 17,411 | |||
| 9,900 | Hudson City Bancorp, Inc. | 158,004 | |||
| 17,700 | J.P. Morgan Chase & Company | 558,081 | |||
| 13,200 | KeyCorp | 112,464 | |||
| 150 | Kilroy Realty Corporation | 5,019 | |||
| 1,050 | Kimco Realty Corporation | 19,194 | |||
| 400 | LaSalle Hotel Properties | 4,420 | |||
| 400 | Liberty Property Trust | 9,132 | |||
| 12,300 | Lincoln National Corporation | 231,732 | |||
| 400 | Macerich Company | 7,264 | |||
| 400 | Mack-Cali Realty Corporation | 9,800 | |||
| 4,500 | MetLife, Inc. | 156,870 | |||
| 150 | Mid-America Apartment Communities, Inc. | 5,574 | |||
| 500 | National Retail Properties, Inc. | 8,595 | |||
| 500 | Nationwide Health Properties, Inc. | 14,360 | |||
| 12,000 | Old Republic International Corporation | 143,040 | |||
| 400 | Omega Healthcare Investors, Inc. | 6,388 | |||
| 700 | One Liberty Properties, Inc. | 6,160 | |||
| 3,130 | People’s United Financial, Inc. | 55,808 | |||
| 150 | Plum Creek Timber Company, Inc. | 5,211 | |||
The accompanying Notes to Financial Statements are an integral part of this schedule.
188
Table of Contents
Equity Income Plus Portfolio
Schedule of Investments as of December 31, 2008
| Shares | Common Stock (78.5%) | Value | |||
| Financials (13.7%) - continued | |||||
| 1,500 | PNC Financial Services Group, Inc. | $ | 73,500 | ||
| 300 | Post Properties, Inc. | 4,950 | |||
| 1,600 | ProLogis Trust | 22,224 | |||
| 500 | Public Storage, Inc. | 39,750 | |||
| 500 | Regency Centers Corporation | 23,350 | |||
| 9,900 | Regions Financial Corporation | 78,804 | |||
| 500 | Senior Housing Property Trust | 8,960 | |||
| 1,200 | Simon Property Group, Inc. | 63,756 | |||
| 300 | SL Green Realty Corporation | 7,770 | |||
| 4,000 | SPDR DJ Wilshire International Real Estate ETF | 108,320 | |||
| 5,500 | T. Rowe Price Group, Inc. | 194,920 | |||
| 300 | Tanger Factory Outlet Centers, Inc. | 11,286 | |||
| 400 | Taubman Centers, Inc. | 10,184 | |||
| 3,300 | Travelers Companies, Inc. | 149,160 | |||
| 16,100 | U.S. Bancorp | 402,661 | |||
| 300 | UDR, Inc. | 4,137 | |||
| 700 | Ventas, Inc. | 23,499 | |||
| 650 | Vornado Realty Trust | 39,227 | |||
| 250 | Weingarten Realty Investors | 5,173 | |||
| 16,300 | Wells Fargo & Company | 480,524 | |||
Total Financials | 5,672,514 | ||||
| Health Care (10.0%) | |||||
| 9,400 | Abbott Laboratoriesa | 501,678 | |||
| 4,700 | AstraZeneca plc | 192,841 | |||
| 3,600 | Baxter International, Inc. | 192,924 | |||
| 15,600 | Bristol-Myers Squibb Company | 362,700 | |||
| 10,000 | CIGNA Corporation | 168,500 | |||
| 6,200 | Eli Lilly and Company | 249,674 | |||
| 8,700 | Johnson & Johnson | 520,521 | |||
| 4,300 | McKesson Corporation | 166,539 | |||
| 5,500 | Medtronic, Inc. | 172,810 | |||
| 9,000 | Merck & Company, Inc. | 273,600 | |||
| 31,800 | Pfizer, Inc. | 563,178 | |||
| 6,100 | Sanofi-Aventis ADR | 196,176 | |||
| 2,200 | Teva Pharmaceutical Industries, Ltd. ADR | 93,654 | |||
| 6,600 | UnitedHealth Group, Inc. | 175,560 | |||
| 7,800 | Wyeth | 292,578 | |||
Total Health Care | 4,122,933 | ||||
| Industrials (8.2%) | |||||
| 4,300 | 3M Company | 247,422 | |||
| 5,900 | Boeing Companya | 251,753 | |||
| 6,200 | Caterpillar, Inc. | 276,954 | |||
| 4,200 | Danaher Corporation | 237,762 | |||
| 7,600 | Emerson Electric Company | 278,236 | |||
| 3,600 | General Dynamics Corporation | 207,324 | |||
| 30,100 | General Electric Company | 487,620 | |||
| 4,000 | Hubbell, Inc. | 130,720 | |||
| 2,900 | Illinois Tool Works, Inc. | 101,645 | |||
| 11,400 | Masco Corporation | 126,882 | |||
| 9,000 | Republic Services, Inc. | 223,110 | |||
| 12,100 | Trinity Industries, Inc. | 190,696 | |||
| 8,100 | Tyco International, Ltd. | 174,960 | |||
| 4,800 | United Technologies Corporation | 257,280 | |||
| 5,700 | Waste Management, Inc. | 188,898 | |||
Total Industrials | 3,381,262 | ||||
| Information Technology (6.9%) | |||||
| 8,500 | Accenture, Ltd. | 278,715 | |||
| 10,900 | Automatic Data Processing, Inc. | 428,806 | |||
| 7,300 | Broadcom Corporationb | 123,881 | |||
| 9,000 | Hewlett-Packard Company | 326,610 | |||
| 19,700 | Intel Corporation | 288,802 | |||
| 4,800 | International Business Machines Corporation | 403,968 | |||
| 6,200 | Microchip Technology, Inc. | 121,086 | |||
| 11,600 | Microsoft Corporation | 225,504 | |||
| 25,300 | Motorola, Inc. | 112,079 | |||
| 11,800 | Nokia Oyj ADR | 184,080 | |||
| 9,300 | Paychex, Inc. | 244,404 | |||
| 10,400 | SanDisk Corporationb | 99,840 | |||
Total Information Technology | 2,837,775 | ||||
| Materials (2.9%) | |||||
| 2,100 | Air Products and Chemicals, Inc. | 105,567 | |||
| 6,200 | Bemis Company, Inc. | 146,816 | |||
| 6,700 | Dow Chemical Company | 101,103 | |||
| 9,500 | E.I. du Pont de Nemours and Company | 240,350 | |||
| 2,200 | Vulcan Materials Company | 153,076 | |||
| 27,020 | Wausau Paper Corporation | 309,109 | |||
| 100 | Weyerhaeuser Company | 3,061 | |||
| 12,100 | Worthington Industries, Inc. | 133,342 | |||
Total Materials | 1,192,424 | ||||
| Telecommunications Services (5.4%) | |||||
| 3,800 | America Movil SA de CV ADR | 117,762 | |||
| 29,800 | AT&T, Inc. | 849,300 | |||
| 3,300 | CenturyTel, Inc. | 90,189 | |||
| 53,000 | Qwest Communications International, Inc. | 192,920 | |||
| 6,100 | Shenandoah Telecommunications Company | 171,105 | |||
| 14,200 | Verizon Communications, Inc. | 481,380 | |||
| 7,500 | Vodafone Group plc ADR | 153,301 | |||
| 22,000 | Windstream Corporation | 202,400 | |||
Total Telecommunications Services | 2,258,357 | ||||
| Utilities (4.9%) | |||||
| 6,400 | Atmos Energy Corporation | 151,680 | |||
| 14,700 | Black Hills Corporation | 396,312 | |||
| 2,100 | Entergy Corporation | 174,573 | |||
| 3,100 | FirstEnergy Corporation | 150,598 | |||
| 4,000 | FPL Group, Inc. | 201,320 | |||
| 37,000 | Korea Electric Power Corporation ADR | 429,570 | |||
| 20,800 | PNM Resources, Inc. | 209,664 | |||
| 5,500 | Progress Energy, Inc. | 219,175 | |||
| 2,400 | Southern Company | 88,800 | |||
Total Utilities | 2,021,692 | ||||
Total Common Stock (cost $40,569,295) | 32,449,318 | ||||
The accompanying Notes to Financial Statements are an integral part of this schedule.
189
Table of Contents
Equity Income Plus Portfolio
Schedule of Investments as of December 31, 2008
| Principal Amount | Long-Term Fixed Income (1.9%) | Value | ||||
| Financials (1.9%) | ||||||
American International Group, Inc. | ||||||
| $ | 150,000 | 8.175%, 5/15/2038c | $ | 58,354 | ||
Bank of America Corporation | ||||||
| 100,000 | 8.000%, 1/30/2018 | 71,929 | ||||
Citigroup Capital XXI | ||||||
| 100,000 | 8.300%, 12/21/2037 | 77,124 | ||||
Citigroup, Inc. | ||||||
| 45,000 | 8.400%, 4/30/2018 | 29,713 | ||||
J.P. Morgan Chase & Company | ||||||
| 150,000 | 7.900%, 4/30/2018 | 124,774 | ||||
MetLife, Inc. | ||||||
| 125,000 | 7.875%, 12/15/2037c | 78,420 | ||||
Prudential Financial, Inc. | ||||||
| 100,000 | 8.875%, 6/15/2038 | 64,423 | ||||
Wells Fargo Capital XIII | ||||||
| 325,000 | 7.700%, 3/26/2013 | 268,226 | ||||
Total Financials | 772,963 | |||||
Total Long-Term Fixed Income (cost $979,588) | 772,963 | |||||
| Shares | Preferred Stock (0.9%) | |||||
| Financials (0.5%) | ||||||
| 1,700 | Bank of America Corporation, 8.200% | 34,425 | ||||
| 6,000 | U.S. Bancorp, 7.875% | 160,200 | ||||
| 1,565 | Wells Fargo & Company, 8.000% | 34,368 | ||||
Total Financials | 228,993 | |||||
| Utilities (0.4%) | ||||||
| 5,995 | Xcel Energy, Inc., 7.600% | 149,455 | ||||
Total Utilities | 149,455 | |||||
Total Preferred Stock (cost $388,186) | 378,448 | |||||
| Shares or Principal Amount | Short-Term Investments (18.3%)d | |||||
Federal National Mortgage Association Discount Notes | ||||||
| 600,000 | 0.400%, 5/14/2009e | 599,119 | ||||
| 6,999,027 | Thrivent Money Market Portfolio | 6,999,027 | ||||
Total Short-Term Investments (at amortized cost) | 7,598,146 | |||||
Total Investments (cost $49,535,215) 99.6% | $ | 41,198,875 | ||||
Other Assets and Liabilities, Net 0.4% | 152,589 | |||||
Total Net Assets 100.0% | $ | 41,351,464 | ||||
| a | All or a portion of the security was earmarked to cover options. |
| b | Non-income producing security. |
| c | Denotes securities sold under Rule 144A of the Securities Act of 1933, which exempts them from registration. These securities have been deemed liquid and may be resold to other dealers in the program or to other qualified institutional buyers. As of December 31, 2008, the value of these investments was $136,774 or 0.3% of total net assets. |
| d | The interest rate shown reflects the yield, coupon rate or, for securities purchased at a discount, the discount rate at the date of purchase. |
| e | At December 31, 2008, $599,119 of investments were held on deposit with the counterparty and pledged as the initial margin deposit for open financial futures contracts. |
Definitions:
ADR | - | American Depositary Receipt, which are certificates for an underlying foreign security’s shares held by an issuing U.S. depository bank. | ||
REIT | - | Real Estate Investment Trust, is a company that buys, develops, manages and/or sells real estate assets. | ||
ETF | - | Exchange Traded Fund. | ||
Gross unrealized appreciation and depreciation of investments, based on cost for federal income tax purposes, were as follows:
Gross unrealized appreciation | $ | 648,888 | ||
Gross unrealized depreciation | (9,490,129 | ) | ||
Net unrealized appreciation (depreciation) | $ | (8,841,241 | ) | |
Cost for federal income tax purposes | $ | 50,040,116 |
The following table is a summary of the inputs used, as of December 31, 2008, in valuing the Equity Income Plus Portfolio’s assets carried at fair value as discussed in item 2(A) of the Notes to Financial Statements.
Level | Investments in Securities | Other Financial Instruments* | ||||
Level 1 | $ | 39,826,793 | $ | 135,907 | ||
Level 2 | 1,372,082 | — | ||||
Level 3 | — | — | ||||
Totals (Level 1,2,3) | $ | 41,198,875 | $ | 135,907 | ||
| * | Other Financial Instruments include Futures, Forwards, Written Options and Swap agreements. |
The accompanying Notes to Financial Statements are an integral part of this schedule.
190
Table of Contents
Equity Income Plus Portfolio
Schedule of Investments as of December 31, 2008
Futures | Number of Contracts Long/(Short) | Expiration Date | Notional Principal Amount | Value | Unrealized Gain/(Loss) | ||||||||||
S&P 500 Index Mini-Futures | 114 | March 2009 | $ | 4,996,151 | $ | 5,130,570 | $ | 134,419 | |||||||
Total Futures | $ | 134,419 | |||||||||||||
Call Options Written | Number of Contracts | Exercise Price | Expiration Date | Value | Unrealized Gain/(Loss) | ||||||||||
S&P 500 Index Mini-Futures | 50 | $ | 940.00 | January 2009 | ($25,250 | ) | $ | 1,488 | |||||||
Total Call Options Written | ($25,250 | ) | $ | 1,488 | |||||||||||
Investment in Affiliates
Affiliated issuers, as defined under the Investment Company Act of 1940, include those in which the Portfolio’s holdings of an issuer represent 5% or more of the outstanding voting securities of an issuer, or any affiliated mutual fund.
A summary of transactions for the fiscal year to date, in Equity Income Plus Portfolio, is as follows:
Portfolio | Value April 30, 2008† | Gross Purchases and Additions | Gross Sales and Reductions | Balance of Shares Held at December 31, 2008 | Value December 31, 2008 | Income Earned April 30, 2008 - December 31, 2008 | |||||||||||
Money Market | $ | — | $ | 14,977,599 | $ | 7,978,572 | 6,999,027 | $ | 6,999,027 | $ | 70,993 | ||||||
Total Value and Income Earned | — | 6,999,027 | 70,993 | ||||||||||||||
| † | Equity Income Plus Portfolio was incepted on 4/30/2008. |
The accompanying Notes to Financial Statements are an integral part of this schedule.
191
Table of Contents
Schedule of Investments as of December 31, 2008
| Shares | Common Stock (60.6%) | Value | |||
| Consumer Discretionary (5.1%) | |||||
| 1,900 | Abercrombie & Fitch Company | $ | 43,833 | ||
| 6,900 | Amazon.com, Inc.a | 353,832 | |||
| 2,200 | Apollo Group, Inc.a | 168,564 | |||
| 2,400 | AutoNation, Inc.a,b | 23,712 | |||
| 900 | AutoZone, Inc.a | 125,523 | |||
| 5,600 | Bed Bath & Beyond, Inc.a | 142,352 | |||
| 7,275 | Best Buy Company, Inc. | 204,500 | |||
| 1,800 | Big Lots, Inc.a | 26,082 | |||
| 1,300 | Black & Decker Corporation | 54,353 | |||
| 9,400 | Carnival Corporation | 228,608 | |||
| 14,762 | CBS Corporation | 120,901 | |||
| 2,700 | Centex Corporation | 28,728 | |||
| 7,000 | Coach, Inc.a | 145,390 | |||
| 62,065 | Comcast Corporation | 1,047,657 | |||
| 6,000 | D.R. Horton, Inc. | 42,420 | |||
| 3,000 | Darden Restaurants, Inc. | 84,540 | |||
| 11,700 | DIRECTV Group, Inc.a,b | 268,047 | |||
| 5,800 | Eastman Kodak Companyb | 38,164 | |||
| 4,600 | Expedia, Inc.a | 37,904 | |||
| 3,100 | Family Dollar Stores, Inc. | 80,817 | |||
| 51,488 | Ford Motor Companya,b | 117,908 | |||
| 3,300 | Fortune Brands, Inc. | 136,224 | |||
| 3,500 | GameStop Corporationa | 75,810 | |||
| 5,000 | Gannett Company, Inc. | 40,000 | |||
| 10,000 | Gap, Inc. | 133,900 | |||
| 13,100 | General Motors Corporationb | 41,920 | |||
| 3,500 | Genuine Parts Company | 132,510 | |||
| 5,300 | Goodyear Tire & Rubber Companya | 31,641 | |||
| 7,400 | H&R Block, Inc. | 168,128 | |||
| 5,100 | Harley-Davidson, Inc. | 86,547 | |||
| 1,300 | Harman International Industries, Inc. | 21,749 | |||
| 2,700 | Hasbro, Inc. | 78,759 | |||
| 36,500 | Home Depot, Inc. | 840,230 | |||
| 6,300 | International Game Technology | 74,907 | |||
| 10,289 | Interpublic Group of Companies, Inc.a | 40,744 | |||
| 4,700 | J.C. Penney Company, Inc. | 92,590 | |||
| 12,800 | Johnson Controls, Inc. | 232,448 | |||
| 1,800 | Jones Apparel Group, Inc. | 10,548 | |||
| 1,700 | KB Homeb | 23,154 | |||
| 6,500 | Kohl’s Corporationa | 235,300 | |||
| 3,400 | Leggett & Platt, Inc. | 51,646 | |||
| 3,100 | Lennar Corporation | 26,877 | |||
| 5,862 | Limited Brands, Inc. | 58,854 | |||
| 31,600 | Lowe’s Companies, Inc. | 680,032 | |||
| 9,000 | Macy’s, Inc | 93,150 | |||
| 6,400 | Marriott International, Inc. | 124,480 | |||
| 7,825 | Mattel, Inc. | 125,200 | |||
| 24,000 | McDonald’s Corporation | 1,492,560 | |||
| 6,700 | McGraw-Hill Companies, Inc. | 155,373 | |||
| 800 | Meredith Corporation | 13,392 | |||
| 2,600 | New York Times Companyb | 19,058 | |||
| 6,026 | Newell Rubbermaid, Inc. | 58,934 | |||
| 49,600 | News Corporation | 450,864 | |||
| 8,400 | NIKE, Inc. | 428,400 | |||
| 3,500 | Nordstrom, Inc. | 46,585 | |||
| 6,000 | Office Depot, Inc.a | 17,880 | |||
| 6,800 | Omnicom Group, Inc. | 183,056 | |||
| 1,300 | Polo Ralph Lauren Corporation | 59,033 | |||
| 4,700 | Pulte Homes, Inc. | 51,371 | |||
| 2,700 | RadioShack Corporation | 32,238 | |||
| 2,000 | Scripps Networks Interactive | 44,000 | |||
| 1,280 | Sears Holdings Corporationa,b | 49,754 | |||
| 2,200 | Sherwin-Williams Company | 131,450 | |||
| 1,300 | Snap-On, Inc. | 51,194 | |||
| 1,800 | Stanley Works | 61,380 | |||
| 15,300 | Staples, Inc. | 274,176 | |||
| 15,800 | Starbucks Corporationa | 149,468 | |||
| 4,000 | Starwood Hotels & Resorts Worldwide, Inc. | 71,600 | |||
| 16,200 | Target Corporationb | 559,386 | |||
| 2,700 | Tiffany & Company | 63,801 | |||
| 77,350 | Time Warner, Inc. | 778,141 | |||
| 8,900 | TJX Companies, Inc. | 183,073 | |||
| 1,900 | VF Corporation | 104,063 | |||
| 13,162 | Viacom, Inc.a | 250,868 | |||
| 39,887 | Walt Disney Company | 905,036 | |||
| 130 | Washington Post Company | 50,733 | |||
| 1,658 | Whirlpool Corporation | 68,558 | |||
| 3,732 | Wyndham Worldwide Corporation | 24,445 | |||
| 1,400 | Wynn Resorts, Ltd.a,b | 59,164 | |||
| 9,920 | Yum! Brands, Inc. | 312,480 | |||
Total Consumer Discretionary | 14,242,697 | ||||
| Consumer Staples (7.8%) | |||||
| 44,400 | Altria Group, Inc. | 668,664 | |||
| 13,741 | Archer-Daniels-Midland Companyb | 396,153 | |||
| 9,100 | Avon Products, Inc. | 218,673 | |||
| 2,125 | Brown-Forman Corporation | 109,416 | |||
| 4,500 | Campbell Soup Company | 135,045 | |||
| 3,000 | Clorox Company | 166,680 | |||
| 42,900 | Coca-Cola Company | 1,942,083 | |||
| 6,900 | Coca-Cola Enterprises, Inc. | 83,007 | |||
| 10,800 | Colgate-Palmolive Company | 740,232 | |||
| 9,700 | ConAgra Foods, Inc. | 160,050 | |||
| 4,200 | Constellation Brands, Inc.a | 66,234 | |||
| 9,300 | Costco Wholesale Corporation | 488,250 | |||
| 30,905 | CVS/Caremark Corporation | 888,210 | |||
| 3,400 | Dean Foods Companya | 61,098 | |||
| 5,500 | Dr. Pepper Snapple Group, Inc.a | 89,375 | |||
| 2,500 | Estee Lauder Companies, Inc. | 77,400 | |||
| 7,200 | General Mills, Inc. | 437,400 | |||
| 6,850 | H.J. Heinz Company | 257,560 | |||
| 3,600 | Hershey Company | 125,064 | |||
| 2,555 | J.M. Smucker Company | 110,785 | |||
| 5,500 | Kellogg Company | 241,175 | |||
| 8,880 | Kimberly-Clark Corporationb | 468,331 | |||
| 31,660 | Kraft Foods, Inc. | 850,071 | |||
| 14,000 | Kroger Company | 369,740 | |||
| 3,700 | Lorillard, Inc. | 208,495 | |||
| 2,900 | McCormick & Company, Inc. | 92,394 | |||
| 3,300 | Molson Coors Brewing Company | 161,436 | |||
| 3,000 | Pepsi Bottling Group, Inc. | 67,530 | |||
| 33,420 | PepsiCo, Inc. | 1,830,413 | |||
| 43,600 | Philip Morris International, Inc. | 1,897,036 | |||
| 64,379 | Procter & Gamble Company | 3,979,910 | |||
| 3,700 | Reynolds American, Inc. | 149,147 | |||
| 9,200 | Safeway, Inc. | 218,684 | |||
| 15,200 | Sara Lee Corporation | 148,808 | |||
| 4,569 | SUPERVALU, Inc. | 66,708 | |||
The accompanying Notes to Financial Statements are an integral part of this schedule.
192
Table of Contents
Balanced Portfolio
Schedule of Investments as of December 31, 2008
Shares | Common Stock (60.6%) | Value | |||
Consumer Staples (7.8%) - continued | |||||
| 12,900 | SYSCO Corporation | $ | 295,926 | ||
| 6,600 | Tyson Foods, Inc. | 57,816 | |||
| 3,300 | UST, Inc. | 228,954 | |||
| 21,300 | Walgreen Company | 525,471 | |||
| 48,200 | Wal-Mart Stores, Inc. | 2,702,092 | |||
| 3,100 | Whole Foods Market, Inc.b | 29,264 | |||
| Total Consumer Staples | 21,810,780 | ||||
Energy (8.1%) | |||||
| 9,836 | Anadarko Petroleum Corporation | 379,178 | |||
| 7,168 | Apache Corporation | 534,231 | |||
| 6,620 | Baker Hughes, Inc. | 212,303 | |||
| 6,300 | BJ Services Company | 73,521 | |||
| 2,300 | Cabot Oil & Gas Corporation | 59,800 | |||
| 4,800 | Cameron International Corporationa | 98,400 | |||
| 11,600 | Chesapeake Energy Corporation | 187,572 | |||
| 43,774 | Chevron Corporation | 3,237,963 | |||
| 32,082 | ConocoPhillips | 1,661,848 | |||
| 3,900 | CONSOL Energy, Inc. | 111,462 | |||
| 9,500 | Devon Energy Corporation | 624,245 | |||
| 15,186 | El Paso Corporation | 118,906 | |||
| 3,100 | ENSCO International, Inc. | 88,009 | |||
| 5,400 | EOG Resources, Inc. | 359,532 | |||
| 109,672 | Exxon Mobil Corporation | 8,755,116 | |||
| 19,200 | Halliburton Company | 349,056 | |||
| 6,100 | Hess Corporation | 327,204 | |||
| 15,122 | Marathon Oil Corporation | 413,738 | |||
| 1,900 | Massey Energy Company | 26,201 | |||
| 4,200 | Murphy Oil Corporation | 186,270 | |||
| 6,200 | Nabors Industries, Ltd.a | 74,214 | |||
| 9,000 | National Oilwell Varco, Inc.a | 219,960 | |||
| 5,700 | Noble Corporation | 125,742 | |||
| 3,800 | Noble Energy, Inc. | 187,036 | |||
| 17,400 | Occidental Petroleum Corporation | 1,043,826 | |||
| 5,700 | Peabody Energy Corporation | 129,675 | |||
| 2,600 | Pioneer Natural Resources Company | 42,068 | |||
| 3,400 | Range Resources Corporation | 116,926 | |||
| 2,500 | Rowan Companies, Inc. | 39,750 | |||
| 25,800 | Schlumberger, Ltd. | 1,092,114 | |||
| 4,800 | Smith International, Inc. | 109,872 | |||
| 7,400 | Southwestern Energy Companya | 214,378 | |||
| 13,221 | Spectra Energy Corporation | 208,099 | |||
| 2,600 | Sunoco, Inc. | 112,996 | |||
| 3,000 | Tesoro Petroleum Corporation | 39,510 | |||
| 11,100 | Valero Energy Corporation | 240,204 | |||
| 14,600 | Weatherford International, Ltd.a | 157,972 | |||
| 12,400 | Williams Companies, Inc. | 179,552 | |||
| 12,350 | XTO Energy, Inc. | 435,584 | |||
| Total Energy | 22,574,033 | ||||
Financials (8.0%) | |||||
| 10,000 | AFLAC, Inc. | 458,400 | |||
| 11,496 | Allstate Corporation | 376,609 | |||
| 4,500 | American Capital, Ltd.b | 14,580 | |||
| 25,000 | American Express Company | 463,750 | |||
| 58,002 | American International Group, Inc.b | 91,063 | |||
| 4,740 | Ameriprise Financial, Inc. | 110,726 | |||
| 5,850 | Aon Corporation | 267,228 | |||
| 2,224 | Apartment Investment & Management Company | 25,687 | |||
| 2,600 | Assurant, Inc. | 78,000 | |||
| 1,700 | AvalonBay Communities, Inc. | 102,986 | |||
| 108,202 | Bank of America Corporationb | 1,523,484 | |||
| 24,701 | Bank of New York Mellon Corporation | 699,779 | |||
| 11,900 | BB&T Corporation | 326,774 | |||
| 2,700 | Boston Properties, Inc. | 148,500 | |||
| 8,365 | Capital One Financial Corporation | 266,760 | |||
| 4,900 | CB Richard Ellis Group, Inc.a | 21,168 | |||
| 20,125 | Charles Schwab Corporation | 325,421 | |||
| 7,700 | Chubb Corporation | 392,700 | |||
| 3,551 | Cincinnati Financial Corporation | 103,228 | |||
| 7,900 | CIT Group, Inc. | 35,866 | |||
| 117,489 | Citigroup, Inc. | 788,351 | |||
| 1,400 | CME Group, Inc. | 291,354 | |||
| 3,300 | Comerica, Inc. | 65,505 | |||
| 2,600 | Developers Diversified Realty Corporation | 12,688 | |||
| 10,395 | Discover Financial Services | 99,064 | |||
| 12,200 | E*TRADE Financial Corporationa,b | 14,030 | |||
| 5,900 | Equity Residential REIT | 175,938 | |||
| 2,000 | Federated Investors, Inc. | 33,920 | |||
| 12,516 | Fifth Third Bancorp | 103,382 | |||
| 4,501 | First Horizon National Corporation | 47,576 | |||
| 3,300 | Franklin Resources, Inc. | 210,474 | |||
| 9,300 | Genworth Financial, Inc. | 26,319 | |||
| 9,500 | Goldman Sachs Group, Inc. | 801,705 | |||
| 6,400 | Hartford Financial Services Group, Inc. | 105,088 | |||
| 5,500 | Health Care Property Investors, Inc. | 152,735 | |||
| 11,300 | Host Hotels & Resorts, Inc. | 85,541 | |||
| 11,300 | Hudson City Bancorp, Inc. | 180,348 | |||
| 7,916 | Huntington Bancshares, Inc.b | 60,637 | |||
| 1,500 | IntercontinentalExchange, Inc.a | 123,660 | |||
| 8,400 | Invesco, Ltd.b | 121,296 | |||
| 80,424 | J.P. Morgan Chase & Company | 2,535,769 | |||
| 3,500 | Janus Capital Group, Inc. | 28,105 | |||
| 10,600 | KeyCorp | 90,312 | |||
| 5,000 | Kimco Realty Corporation | 91,400 | |||
| 3,100 | Legg Mason, Inc. | 67,921 | |||
| 3,900 | Leucadia National Corporationa | 77,220 | |||
| 5,511 | Lincoln National Corporation | 103,827 | |||
| 7,900 | Loews Corporation | 223,175 | |||
| 1,700 | M&T Bank Corporation | 97,597 | |||
| 11,000 | Marsh & McLennan Companies, Inc. | 266,970 | |||
| 5,700 | Marshall & Ilsley Corporationb | 77,748 | |||
| 4,100 | MBIA, Inc.a,b | 16,687 | |||
| 34,500 | Merrill Lynch & Company, Inc. | 401,580 | |||
| 17,066 | MetLife, Inc. | 594,921 | |||
| 4,200 | Moody’s Corporationb | 84,378 | |||
| 22,890 | Morgan Stanley | 367,156 | |||
| 3,000 | Nasdaq OMX Group, Inc.a | 74,130 | |||
| 43,900 | National City Corporation | 79,459 | |||
| 4,800 | Northern Trust Corporation | 250,272 | |||
| 5,700 | NYSE Euronext | 156,066 | |||
| 7,600 | People’s United Financial, Inc. | 135,508 | |||
The accompanying Notes to Financial Statements are an integral part of this schedule.
193
Table of Contents
Balanced Portfolio
Schedule of Investments as of December 31, 2008
Shares | Common Stock (60.6%) | Value | |||
Financials (8.0%) - continued | |||||
| 3,600 | Plum Creek Timber Company, Inc. | $ | 125,064 | ||
| 7,500 | PNC Financial Services Group, Inc. | 367,500 | |||
| 5,500 | Principal Financial Group, Inc. | 124,135 | |||
| 14,600 | Progressive Corporation | 216,226 | |||
| 5,700 | ProLogis Trust | 79,173 | |||
| 9,100 | Prudential Financial, Inc. | 275,366 | |||
| 2,800 | Public Storage, Inc. | 222,600 | |||
| 14,900 | Regions Financial Corporationb | 118,604 | |||
| 4,800 | Simon Property Group, Inc. | 255,024 | |||
| 10,000 | SLM Corporationa | 89,000 | |||
| 11,780 | Sovereign Bancorp, Inc.a | 35,104 | |||
| 9,300 | State Street Corporation | 365,769 | |||
| 7,700 | SunTrust Banks, Inc. | 227,458 | |||
| 5,600 | T. Rowe Price Group, Inc. | 198,464 | |||
| 1,900 | Torchmark Corporation | 84,930 | |||
| 12,525 | Travelers Companies, Inc. | 566,130 | |||
| 37,821 | U.S. Bancorp | 945,903 | |||
| 7,158 | UnumProvident Corporation | 133,139 | |||
| 3,000 | Vornado Realty Trust | 181,050 | |||
| 46,523 | Wachovia Corporation | 257,737 | |||
| 81,720 | Wells Fargo & Company | 2,409,106 | |||
| 7,200 | XL Capital, Ltd.b | 26,640 | |||
| 2,500 | Zions Bancorporationb | 61,275 | |||
| Total Financials | 22,517,918 | ||||
Health Care (8.9%) | |||||
| 33,400 | Abbott Laboratories | 1,782,558 | |||
| 9,856 | Aetna, Inc. | 280,896 | |||
| 6,600 | Allergan, Inc. | 266,112 | |||
| 3,400 | AmerisourceBergen Corporation | 121,244 | |||
| 22,852 | Amgen, Inc.a | 1,319,703 | |||
| 13,300 | Baxter International, Inc. | 712,747 | |||
| 5,300 | Becton, Dickinson and Company | 362,467 | |||
| 6,230 | Biogen Idec, Inc.a | 296,735 | |||
| 32,350 | Boston Scientific Corporationa | 250,389 | |||
| 42,700 | Bristol-Myers Squibb Company | 992,775 | |||
| 2,200 | C.R. Bard, Inc. | 185,372 | |||
| 7,675 | Cardinal Health, Inc. | 264,557 | |||
| 9,800 | Celgene Corporationa | 541,744 | |||
| 1,500 | Cephalon, Inc.a,b | 115,560 | |||
| 5,900 | CIGNA Corporation | 99,415 | |||
| 3,150 | Coventry Health Care, Inc.a | 46,872 | |||
| 10,815 | Covidien, Ltd. | 391,936 | |||
| 2,300 | DaVita, Inc.a | 114,011 | |||
| 3,300 | Dentsply International, Inc. | 93,192 | |||
| 21,500 | Eli Lilly and Company | 865,805 | |||
| 5,300 | Express Scripts, Inc.a | 291,394 | |||
| 6,500 | Forest Laboratories, Inc.a | 165,555 | |||
| 5,800 | Genzyme Corporationa | 384,946 | |||
| 19,800 | Gilead Sciences, Inc.a | 1,012,572 | |||
| 3,530 | Hospira, Inc.a | 94,675 | |||
| 3,600 | Humana, Inc.a | 134,208 | |||
| 4,000 | IMS Health, Inc. | 60,640 | |||
| 800 | Intuitive Surgical, Inc.a | 101,592 | |||
| 59,806 | Johnson & Johnson | 3,578,193 | |||
| 5,333 | King Pharmaceuticals, Inc.a | 56,636 | |||
| 2,400 | Laboratory Corporation of America Holdingsa | 154,584 | |||
| 3,737 | Life Technologies Corporationa | 87,109 | |||
| 5,880 | McKesson Corporation | 227,732 | |||
| 10,710 | Medco Health Solutions, Inc.a | 448,856 | |||
| 24,100 | Medtronic, Inc. | 757,222 | |||
| 45,600 | Merck & Company, Inc. | 1,386,240 | |||
| 1,200 | Millipore Corporationa | 61,824 | |||
| 6,600 | Mylan Laboratories, Inc.a,b | 65,274 | |||
| 2,000 | Patterson Companies, Inc.a | 37,500 | |||
| 2,600 | PerkinElmer, Inc. | 36,166 | |||
| 145,451 | Pfizer, Inc. | 2,575,937 | |||
| 3,500 | Quest Diagnostics, Inc. | 181,685 | |||
| 35,000 | Schering-Plough Corporation | 596,050 | |||
| 7,380 | St. Jude Medical, Inc.a | 243,245 | |||
| 5,200 | Stryker Corporation | 207,740 | |||
| 8,950 | Tenet Healthcare Corporationa | 10,293 | |||
| 9,000 | Thermo Fisher Scientific, Inc.a | 306,630 | |||
| 26,000 | UnitedHealth Group, Inc. | 691,600 | |||
| 2,700 | Varian Medical Systems, Inc.a | 94,608 | |||
| 2,200 | Waters Corporationa | 80,630 | |||
| 2,300 | Watson Pharmaceuticals, Inc.a,b | 61,111 | |||
| 10,900 | WellPoint, Inc.a | 459,217 | |||
| 28,700 | Wyeth | 1,076,537 | |||
| 4,790 | Zimmer Holdings, Inc.a | 193,612 | |||
| Total Health Care | 25,025,903 | ||||
Industrials (6.7%) | |||||
| 14,900 | 3M Company | 857,346 | |||
| 2,300 | Avery Dennison Corporation | 75,279 | |||
| 15,728 | Boeing Company | 671,114 | |||
| 5,992 | Burlington Northern Santa Fe Corporation | 453,654 | |||
| 3,700 | C.H. Robinson Worldwide, Inc. | 203,611 | |||
| 13,000 | Caterpillar, Inc. | 580,710 | |||
| 2,900 | Cintas Corporation | 67,367 | |||
| 3,800 | Cooper Industries, Ltd. | 111,074 | |||
| 8,600 | CSX Corporation | 279,242 | |||
| 4,300 | Cummins, Inc. | 114,939 | |||
| 5,600 | Danaher Corporation | 317,016 | |||
| 9,200 | Deere & Company | 352,544 | |||
| 4,100 | Dover Corporation | 134,972 | |||
| 1,200 | Dun & Bradstreet Corporation | 92,640 | |||
| 3,600 | Eaton Corporation | 178,956 | |||
| 16,500 | Emerson Electric Company | 604,065 | |||
| 2,800 | Equifax, Inc. | 74,256 | |||
| 4,600 | Expeditors International of Washington, Inc. | 153,042 | |||
| 2,800 | Fastenal Companyb | 97,580 | |||
| 6,640 | FedEx Corporation | 425,956 | |||
| 1,300 | Flowserve Corporation | 66,950 | |||
| 3,900 | Fluor Corporation | 174,993 | |||
| 8,400 | General Dynamics Corporation | 483,756 | |||
| 226,500 | General Electric Company | 3,669,300 | |||
| 2,700 | Goodrich Corporation | 99,954 | |||
| 15,637 | Honeywell International, Inc. | 513,363 | |||
| 8,500 | Illinois Tool Works, Inc. | 297,925 | |||
| 6,943 | Ingersoll-Rand Company | 120,461 | |||
| 4,000 | ITT Corporation | 183,960 | |||
| 2,600 | Jacobs Engineering Group, Inc.a | 125,060 | |||
| 2,600 | L-3 Communications Holdings, Inc. | 191,828 | |||
| 7,100 | Lockheed Martin Corporation | 596,968 | |||
| 2,900 | Manitowoc Company, Inc. | 25,114 | |||
| 7,800 | Masco Corporation | 86,814 | |||
| 2,700 | Monster Worldwide, Inc.a | 32,643 | |||
| 7,900 | Norfolk Southern Corporation | 371,695 | |||
| 7,106 | Northrop Grumman Corporation | 320,054 | |||
The accompanying Notes to Financial Statements are an integral part of this schedule.
194
Table of Contents
Balanced Portfolio
Schedule of Investments as of December 31, 2008
Shares | Common Stock (60.6%) | Value | |||
Industrials (6.7%) - continued | |||||
| 7,750 | PACCAR, Inc. | $ | 221,650 | ||
| 2,600 | Pall Corporation | 73,918 | |||
| 3,550 | Parker-Hannifin Corporation | 151,017 | |||
| 4,500 | Pitney Bowes, Inc. | 114,660 | |||
| 3,000 | Precision Castparts Corporation | 178,440 | |||
| 4,500 | R.R. Donnelley & Sons Company | 61,110 | |||
| 8,900 | Raytheon Company | 454,256 | |||
| 7,005 | Republic Services, Inc. | 173,654 | |||
| 3,400 | Robert Half International, Inc. | 70,788 | |||
| 3,100 | Rockwell Automation, Inc. | 99,944 | |||
| 3,500 | Rockwell Collins, Inc. | 136,815 | |||
| 1,200 | Ryder System, Inc. | 46,536 | |||
| 15,880 | Southwest Airlines Company | 136,886 | |||
| 1,900 | Stericycle, Inc.a | 98,952 | |||
| 5,200 | Textron, Inc. | 72,124 | |||
| 10,115 | Tyco International, Ltd. | 218,484 | |||
| 10,900 | Union Pacific Corporation | 521,020 | |||
| 21,400 | United Parcel Service, Inc. | 1,180,424 | |||
| 20,500 | United Technologies Corporation | 1,098,800 | |||
| 1,400 | W.W. Grainger, Inc. | 110,376 | |||
| 10,530 | Waste Management, Inc. | 348,964 | |||
| Total Industrials | 18,775,019 | ||||
Information Technology (9.3%) | |||||
| 11,400 | Adobe Systems, Inc.a | 242,706 | |||
| 13,200 | Advanced Micro Devices, Inc.a,b | 28,512 | |||
| 2,200 | Affiliated Computer Services, Inc.a | 101,090 | |||
| 7,463 | Agilent Technologies, Inc.a | 116,647 | |||
| 3,700 | Akamai Technologies, Inc.a | 55,833 | |||
| 6,500 | Altera Corporation | 108,615 | |||
| 3,800 | Amphenol Corporation | 91,124 | |||
| 6,300 | Analog Devices, Inc. | 119,826 | |||
| 19,100 | Apple, Inc.a | 1,630,185 | |||
| 28,900 | Applied Materials, Inc. | 292,757 | |||
| 4,900 | Autodesk, Inc.a | 96,285 | |||
| 11,000 | Automatic Data Processing, Inc. | 432,740 | |||
| 4,100 | BMC Software, Inc.a | 110,331 | |||
| 9,550 | Broadcom Corporationa | 162,064 | |||
| 8,575 | CA, Inc. | 158,895 | |||
| 2,014 | CIENA Corporationa | 13,494 | |||
| 126,300 | Cisco Systems, Inc.a | 2,058,690 | |||
| 4,000 | Citrix Systems, Inc.a | 94,280 | |||
| 6,300 | Cognizant Technology Solutions Corporationa | 113,778 | |||
| 3,300 | Computer Sciences Corporationa | 115,962 | |||
| 5,400 | Compuware Corporationa | 36,450 | |||
| 2,700 | Convergys Corporationa | 17,307 | |||
| 33,500 | Corning, Inc. | 319,255 | |||
| 37,300 | Dell, Inc.a | 381,952 | |||
| 23,100 | eBay, Inc.a | 322,476 | |||
| 7,000 | Electronic Arts, Inc.a | 112,280 | |||
| 43,924 | EMC Corporationa | 459,884 | |||
| 4,100 | Fidelity National Information Services, Inc. | 66,707 | |||
| 3,550 | Fiserv, Inc.a | 129,113 | |||
| 2,900 | FLIR Systems, Inc.a | 88,972 | |||
| 5,100 | Google, Inc.a | 1,569,015 | |||
| 3,000 | Harris Corporation | 114,150 | |||
| 52,761 | Hewlett-Packard Company | 1,914,697 | |||
| 119,900 | Intel Corporation | 1,757,734 | |||
| 28,900 | International Business Machines Corporation | 2,432,224 | |||
| 7,000 | Intuit, Inc.a | 166,530 | |||
| 4,600 | Jabil Circuit, Inc. | 31,050 | |||
| 4,800 | JDS Uniphase Corporationa | 17,520 | |||
| 11,300 | Juniper Networks, Inc.a | 197,863 | |||
| 3,700 | KLA-Tencor Corporation | 80,623 | |||
| 1,700 | Lexmark International, Inc.a | 45,730 | |||
| 4,800 | Linear Technology Corporation | 106,176 | |||
| 14,000 | LSI Corporationa | 46,060 | |||
| 1,500 | MasterCard, Inc. | 214,395 | |||
| 3,400 | McAfee, Inc.a | 117,538 | |||
| 4,800 | MEMC Electronic Materials, Inc.a | �� | 68,544 | ||
| 4,000 | Microchip Technology, Inc.b | 78,120 | |||
| 16,500 | Micron Technology, Inc.a,b | 43,560 | |||
| 165,000 | Microsoft Corporation | 3,207,600 | |||
| 3,050 | Molex, Inc. | 44,194 | |||
| 48,821 | Motorola, Inc. | 216,277 | |||
| 4,300 | National Semiconductor Corporation | 43,301 | |||
| 7,200 | NETAPP, Inc.a | 100,584 | |||
| 7,500 | Novell, Inc.a | 29,175 | |||
| 2,200 | Novellus Systems, Inc.a | 27,148 | |||
| 11,550 | NVIDIA Corporationa | 93,209 | |||
| 84,459 | Oracle Corporationa | 1,497,458 | |||
| 6,950 | Paychex, Inc. | 182,646 | |||
| 2,800 | QLogic Corporationa | 37,632 | |||
| 35,700 | QUALCOMM, Inc. | 1,279,131 | |||
| 2,300 | Salesforce.com, Inc.a | 73,623 | |||
| 4,900 | SanDisk Corporationa | 47,040 | |||
| 15,875 | Sun Microsystems, Inc.a | 60,642 | |||
| 17,972 | Symantec Corporationa | 242,981 | |||
| 8,600 | Tellabs, Inc.a | 35,432 | |||
| 3,800 | Teradata Corporationa | 56,354 | |||
| 3,700 | Teradyne, Inc.a | 15,614 | |||
| 27,900 | Texas Instruments, Inc. | 433,008 | |||
| 4,300 | Total System Services, Inc. | 60,200 | |||
| 9,815 | Tyco Electronics, Ltd. | 159,101 | |||
| 4,200 | VeriSign, Inc.a | 80,136 | |||
| 15,362 | Western Union Company | 220,291 | |||
| 18,600 | Xerox Corporation | 148,242 | |||
| 6,000 | Xilinx, Inc. | 106,920 | |||
| 29,900 | Yahoo!, Inc.a | 364,780 | |||
| Total Information Technology | 25,942,458 | ||||
Materials (1.8%) | |||||
| 4,500 | Air Products and Chemicals, Inc. | 226,215 | |||
| 2,500 | AK Steel Holding Corporation | 23,300 | |||
| 17,264 | Alcoa, Inc. | 194,393 | |||
| 2,081 | Allegheny Technologies, Inc. | 53,128 | |||
| 2,100 | Ball Corporation | 87,339 | |||
| 2,200 | Bemis Company, Inc. | 52,096 | |||
| 1,300 | CF Industries Holdings, Inc. | 63,908 | |||
| 19,877 | Dow Chemical Company | 299,944 | |||
| 19,419 | E.I. du Pont de Nemours and Company | 491,301 | |||
| 1,600 | Eastman Chemical Company | 50,736 | |||
| 3,700 | Ecolab, Inc. | 130,055 | |||
| 8,144 | Freeport-McMoRan Copper & Gold, Inc. | 199,039 | |||
| 1,700 | International Flavors & Fragrances, Inc. | 50,524 | |||
| 9,221 | International Paper Company | 108,808 | |||
| 3,780 | MeadWestvaco Corporation | 42,298 | |||
The accompanying Notes to Financial Statements are an integral part of this schedule.
195
Table of Contents
Balanced Portfolio
Schedule of Investments as of December 31, 2008
| Shares | Common Stock (60.6%) | Value | |||
| Materials (1.8%) - continued | |||||
| 11,766 | Monsanto Company | $ | 827,738 | ||
| 9,717 | Newmont Mining Corporation | 395,482 | |||
| 6,700 | Nucor Corporation | 309,540 | |||
| 3,100 | Owens-Illinois, Inc.a | 84,723 | |||
| 2,900 | Pactiv Corporationa | 72,152 | |||
| 3,600 | PPG Industries, Inc. | 152,748 | |||
| 6,600 | Praxair, Inc. | 391,776 | |||
| 2,711 | Rohm and Haas Company | 167,513 | |||
| 3,428 | Sealed Air Corporation | 51,214 | |||
| 2,800 | Sigma-Aldrich Corporation | 118,272 | |||
| 1,900 | Titanium Metals Corporationb | 16,739 | |||
| 2,500 | United States Steel Corporation | 93,000 | |||
| 2,300 | Vulcan Materials Companyb | 160,034 | |||
| 4,600 | Weyerhaeuser Company | 140,806 | |||
Total Materials | 5,054,821 | ||||
| Telecommunications Services (2.3%) | |||||
| 8,600 | American Tower Corporationa | 252,152 | |||
| 127,079 | AT&T, Inc. | 3,621,751 | |||
| 2,250 | CenturyTel, Inc.b | 61,493 | |||
| 3,098 | Embarq Corporation | 111,404 | |||
| 6,800 | Frontier Communications Corporation | 59,432 | |||
| 31,518 | Qwest Communications International, Inc.b | 114,726 | |||
| 61,569 | Sprint Nextel Corporationa,b | 112,671 | |||
| 61,270 | Verizon Communications, Inc. | 2,077,053 | |||
| 9,517 | Windstream Corporation | 87,556 | |||
Total Telecommunications Services | 6,498,238 | ||||
| Utilities (2.6%) | |||||
| 14,600 | AES Corporationa | 120,304 | |||
| 3,700 | Allegheny Energy, Inc. | 125,282 | |||
| 4,600 | Ameren Corporation | 152,996 | |||
| 8,740 | American Electric Power Company, Inc. | 290,867 | |||
| 7,424 | CenterPoint Energy, Inc. | 93,691 | |||
| 4,900 | CMS Energy Corporation | 49,490 | |||
| 6,000 | Consolidated Edison, Inc. | 233,580 | |||
| 3,900 | Constellation Energy Group, Inc. | 97,851 | |||
| 12,530 | Dominion Resources, Inc. | 449,075 | |||
| 3,600 | DTE Energy Company | 128,412 | |||
| 27,242 | Duke Energy Corporation | 408,902 | |||
| 11,009 | Dynegy, Inc.a | 22,018 | |||
| 7,100 | Edison International, Inc. | 228,052 | |||
| 4,100 | Entergy Corporation | 340,833 | |||
| 2,900 | Equitable Resources, Inc. | 97,295 | |||
| 14,174 | Exelon Corporation | 788,216 | |||
| 6,600 | FirstEnergy Corporation | 320,628 | |||
| 8,800 | FPL Group, Inc. | 442,904 | |||
| 1,707 | Integrys Energy Group, Inc. | 73,367 | |||
| 1,000 | Nicor, Inc.b | 34,740 | |||
| 5,934 | NiSource, Inc. | 65,096 | |||
| 4,700 | Pepco Holdings, Inc. | 83,472 | |||
| 7,800 | PG&E Corporation | 301,938 | |||
| 2,200 | Pinnacle West Capital Corporation | 70,686 | |||
| 8,100 | PPL Corporation | 248,589 | |||
| 5,691 | Progress Energy, Inc. | 226,786 | |||
| 11,000 | Public Service Enterprise Group, Inc. | 320,870 | |||
| 3,800 | Questar Corporation | 124,222 | |||
| 2,500 | SCANA Corporation | 89,000 | |||
| 5,287 | Sempra Energy | 225,385 | |||
| 16,700 | Southern Company | 617,900 | |||
| 4,600 | TECO Energy, Inc. | 56,810 | |||
| 2,600 | Wisconsin Energy Corporation | 109,148 | |||
| 9,710 | Xcel Energy, Inc. | 180,121 | |||
Total Utilities | 7,218,526 | ||||
Total Common Stock (cost $195,248,213) | 169,660,393 | ||||
| Principal Amount | Long-Term Fixed Income (41.3%) | Value | |||
| Asset-Backed Securities (3.9%) | |||||
Americredit Automobile Receivables Trust | |||||
| 1,450,705 | 1.956%, 1/6/2009c,d | 1,281,563 | |||
Bear Stearns Mortgage Funding Trust | |||||
| 700,557 | 0.611%, 1/26/2009d | 127,110 | |||
Countrywide Asset-Backed Certificates | |||||
| 1,208,584 | 5.549%, 4/25/2036c | 1,003,321 | |||
Countrywide Home Loans Asset-Backed Securities | |||||
| 750,000 | 6.085%, 6/25/2021c | 321,832 | |||
Credit Based Asset Servicing and Securitization, LLC | |||||
| 744,580 | 0.581%, 1/26/2009d | 714,301 | |||
| 703,915 | 5.501%, 12/25/2036 | 583,957 | |||
Discover Card Master Trust | |||||
| 1,000,000 | 5.650%, 3/16/2020 | 757,255 | |||
First Franklin Mortgage Loan Asset-Backed Certificates | |||||
| 702,004 | 0.581%, 1/26/2009d | 663,328 | |||
First Horizon ABS Trust | |||||
| 713,909 | 0.601%, 1/26/2009c,d | 423,055 | |||
| 1,194,864 | 0.631%, 1/26/2009c,d | 562,433 | |||
Ford Credit Floor Plan Master Owner Trust | |||||
| 1,500,000 | 1.375%, 1/15/2009d | 1,448,132 | |||
GMAC Mortgage Corporation Loan Trust | |||||
| 1,304,426 | 0.541%, 1/26/2009c,d | 452,914 | |||
| 2,125,668 | 0.651%, 1/26/2009c,d | 1,121,384 | |||
IndyMac Seconds Asset-Backed Trust | |||||
| 812,657 | 0.641%, 1/26/2009c,d | 349,504 | |||
Residential Funding Mortgage Securities II | |||||
| 290,054 | 0.601%, 1/26/2009c,d | 278,264 | |||
SLM Student Loan Trust | |||||
| 234,712 | 3.545%, 1/26/2009d | 233,676 | |||
Wachovia Asset Securitization, Inc. | |||||
| 1,279,034 | 0.611%, 1/26/2009c,d,e | 484,517 | |||
Total Asset-Backed Securities | 10,806,546 | ||||
| Basic Materials (<0.1%) | |||||
Alcan, Inc. | |||||
| 225,000 | 6.125%, 12/15/2033 | 137,480 | |||
Total Basic Materials | 137,480 | ||||
The accompanying Notes to Financial Statements are an integral part of this schedule.
196
Table of Contents
Balanced Portfolio
Schedule of Investments as of December 31, 2008
| Principal Amount | Long-Term Fixed Income (41.3%) | Value | ||||
| Capital Goods (0.2%) | ||||||
John Deere Capital Corporation | ||||||
| $ | 300,000 | 7.000%, 3/15/2012 | $ | 311,140 | ||
United Technologies Corporation | ||||||
| 225,000 | 6.050%, 6/1/2036 | 236,671 | ||||
Total Capital Goods | 547,811 | |||||
| Collateralized Mortgage Obligations (2.0%) | ||||||
Chase Mortgage Finance Corporation | ||||||
| 1,584,362 | 4.567%, 2/25/2037 | 1,287,885 | ||||
J.P. Morgan Mortgage Trust | ||||||
| 1,550,609 | 5.005%, 7/25/2035 | 995,857 | ||||
Merrill Lynch Mortgage Investors, Inc. | ||||||
| 1,268,501 | 4.870%, 6/25/2035 | 880,556 | ||||
Thornburg Mortgage Securities Trust | ||||||
| 1,241,376 | 0.561%, 1/26/2009d | 1,218,818 | ||||
| 605,996 | 0.581%, 1/26/2009d | 502,410 | ||||
Zuni Mortgage Loan Trust | ||||||
| 737,438 | 0.601%, 1/26/2009d | 699,048 | ||||
| Total Collateralized Mortgage Obligations | 5,584,574 | |||||
| Commercial Mortgage-Backed Securities (3.8%) | ||||||
Banc of America Commercial Mortgage, Inc. | ||||||
| 1,000,000 | 5.118%, 7/11/2043 | 927,816 | ||||
Bear Stearns Commercial Mortgage Securities, Inc. | ||||||
| 2,500,000 | 1.345%, 1/15/2009d,e | 1,896,367 | ||||
| 700,000 | 5.835%, 9/11/2042 | 317,160 | ||||
Citigroup Commercial Mortgage Trust | ||||||
| 10,527 | 1.265%, 1/15/2009d,f | 9,121 | ||||
Commercial Mortgage Pass-Through Certificates | ||||||
| 75,055 | 1.295%, 1/15/2009d,f | 67,114 | ||||
| 2,000,000 | 1.325%, 1/15/2009d,e | 1,156,168 | ||||
Credit Suisse First Boston Mortgage Securities Corporation | ||||||
| 500,000 | 4.829%, 11/15/2037 | 412,189 | ||||
Credit Suisse Mortgage Capital Certificates | ||||||
| 2,000,000 | 1.365%, 1/15/2009d,f | 1,292,152 | ||||
General Electric Commercial Mortgage Corporation | ||||||
| 200,000 | 4.641%, 9/10/2013 | 179,336 | ||||
GMAC Commercial Mortgage Securities, Inc. | ||||||
| 1,500,000 | 4.547%, 12/10/2041 | 1,354,956 | ||||
Greenwich Capital Commercial Funding Corporation | ||||||
| 1,000,000 | 5.317%, 6/10/2036 | 831,943 | ||||
GS Mortgage Securities Corporation II | ||||||
| 1,000,000 | 2.006%, 1/6/2009d,f | 661,485 | ||||
J.P. Morgan Chase Commercial Mortgage Securities Corporation | ||||||
| 400,000 | 4.654%, 1/12/2037 | 346,878 | ||||
| 1,500,000 | 5.336%, 5/15/2047 | 1,125,265 | ||||
LB-UBS Commercial Mortgage Trust | ||||||
| 23,833 | 3.086%, 5/15/2027 | 23,781 | ||||
| Total Commercial Mortgage-Backed Securities | 10,601,731 | |||||
| Communications Services (1.0%) | ||||||
AT&T, Inc. | ||||||
| 200,000 | 6.400%, 5/15/2038 | 214,236 | ||||
British Telecom plc | ||||||
| 225,000 | 9.125%, 12/15/2030 | 239,162 | ||||
Cingular Wireless, Inc. | ||||||
| 450,000 | 6.500%, 12/15/2011 | 451,798 | ||||
Cox Communications, Inc. | ||||||
| 115,000 | 6.450%, 12/1/2036f | 99,996 | ||||
France Telecom SA | ||||||
| 225,000 | 7.750%, 3/1/2011 | 236,768 | ||||
News America, Inc. | ||||||
| 225,000 | 6.400%, 12/15/2035 | 207,958 | ||||
SBC Communications, Inc. | ||||||
| 225,000 | 5.875%, 2/1/2012 | 229,267 | ||||
Telecom Italia Capital SA | ||||||
| 550,000 | 5.250%, 11/15/2013 | 419,375 | ||||
Tele-Communications, Inc. (TCI Group) | ||||||
| 425,000 | 7.875%, 8/1/2013 | 436,992 | ||||
Time Warner Cable, Inc. | ||||||
| 200,000 | 7.300%, 7/1/2038 | 207,774 | ||||
| Total Communications Services | 2,743,326 | |||||
| Consumer Cyclical (0.5%) | ||||||
Johnson Controls, Inc. | ||||||
| 500,000 | 7.125%, 7/15/2017 | 405,948 | ||||
Wal-Mart Stores, Inc. | ||||||
| 450,000 | 7.550%, 2/15/2030 | 543,015 | ||||
Walt Disney Company | ||||||
| 500,000 | 5.625%, 9/15/2016 | 518,794 | ||||
Total Consumer Cyclical | 1,467,757 | |||||
| Consumer Non-Cyclical (0.9%) | ||||||
Boston Scientific Corporation | ||||||
| 225,000 | 7.000%, 11/15/2035 | 166,500 | ||||
Bunge Limited Finance Corporation | ||||||
| 800,000 | 5.350%, 4/15/2014 | 573,932 | ||||
Coca-Cola HBC Finance BV | ||||||
| 425,000 | 5.125%, 9/17/2013 | 415,016 | ||||
GlaxoSmithKline Capital, Inc. | ||||||
| 200,000 | 6.375%, 5/15/2038 | 225,967 | ||||
Kellogg Company | ||||||
| 400,000 | 4.250%, 3/6/2013 | 387,357 | ||||
Philip Morris International, Inc. | ||||||
| 200,000 | 6.375%, 5/16/2038 | 208,013 | ||||
The accompanying Notes to Financial Statements are an integral part of this schedule.
197
Table of Contents
Balanced Portfolio
Schedule of Investments as of December 31, 2008
| Principal Amount | Long-Term Fixed Income (41.3%) | Value | ||||
| Consumer Non-Cyclical (0.9%) - continued | ||||||
Wyeth | ||||||
| $ | 450,000 | 6.000%, 2/15/2036 | $ | 482,808 | ||
Total Consumer Non-Cyclical | 2,459,593 | |||||
| Energy (0.3%) | ||||||
Burlington Resources, Inc. | ||||||
| 500,000 | 6.500%, 12/1/2011 | 510,622 | ||||
Energy Transfer Partners, LP | ||||||
| 300,000 | 6.700%, 7/1/2018 | 252,867 | ||||
Petro-Canada | ||||||
| 200,000 | 6.800%, 5/15/2038 | 150,927 | ||||
Total Energy | 914,416 | |||||
| Financials (3.1%) | ||||||
BAC Capital Trust XI | ||||||
| 225,000 | 6.625%, 5/23/2036b | 207,914 | ||||
Bank One Corporation | ||||||
| 750,000 | 5.900%, 11/15/2011 | 752,409 | ||||
BB&T Corporation | ||||||
| 700,000 | 6.500%, 8/1/2011 | 708,533 | ||||
BNP Paribas SA | ||||||
| 900,000 | 5.186%, 6/29/2015f | 510,558 | ||||
Chubb Corporation | ||||||
| 400,000 | 6.500%, 5/15/2038 | 381,862 | ||||
CIGNA Corporation | ||||||
| 300,000 | 6.350%, 3/15/2018 | 267,735 | ||||
CIT Group, Inc. | ||||||
| 650,000 | 4.750%, 12/15/2010 | 572,172 | ||||
General Electric Capital Corporation | ||||||
| 500,000 | 3.000%, 12/9/2011 | 516,925 | ||||
| 225,000 | 5.875%, 1/14/2038 | 220,244 | ||||
Goldman Sachs Group, Inc. | ||||||
| 675,000 | 6.600%, 1/15/2012 | 665,999 | ||||
HSBC Finance Corporation | ||||||
| 500,000 | 5.000%, 6/30/2015 | 443,819 | ||||
HSBC Holdings plc | ||||||
| 200,000 | 6.800%, 6/1/2038 | 211,348 | ||||
J.P. Morgan Chase & Company | ||||||
| 500,000 | 3.125%, 12/1/2011 | 519,450 | ||||
Merrill Lynch & Company, Inc. | ||||||
| 450,000 | 5.000%, 2/3/2014 | 436,284 | ||||
MetLife, Inc. | ||||||
| 150,000 | 5.000%, 6/15/2015 | 140,504 | ||||
Preferred Term Securities XXIII, Ltd. | ||||||
| 1,219,057 | 2.196%, 3/23/2009d,e | 510,175 | ||||
ProLogis Trust | ||||||
| 425,000 | 5.500%, 3/1/2013 | 246,478 | ||||
Prudential Financial, Inc. | ||||||
| 225,000 | 5.700%, 12/14/2036 | 140,234 | ||||
Student Loan Marketing Corporation | ||||||
| 450,000 | 4.000%, 1/15/2010 | 407,337 | ||||
Union Planters Corporation | ||||||
| 450,000 | 4.375%, 12/1/2010 | 422,598 | ||||
Wachovia Bank NA | ||||||
| 425,000 | 4.875%, 2/1/2015 | 406,895 | ||||
Washington Mutual Bank FA | ||||||
| 500,000 | 5.500%, 1/15/2013 | 50 | ||||
Total Financials | 8,689,523 | |||||
| Foreign (1.4%) | ||||||
Codelco, Inc. | ||||||
| 300,000 | 6.375%, 11/30/2012f | 305,222 | ||||
Kreditanstalt fuer Wiederaufbau | ||||||
| 400,000 | 3.750%, 6/27/2011 | 416,188 | ||||
Pemex Project Funding Master Trust | ||||||
| 95,000 | 9.125%, 10/13/2010 | 99,988 | ||||
Province of Newfoundland | ||||||
| 500,000 | 8.650%, 10/22/2022 | 805,715 | ||||
Province of Quebec | ||||||
| 600,000 | 4.875%, 5/5/2014 | 623,575 | ||||
Republic of Italy | ||||||
| 750,000 | 4.375%, 6/15/2013 | 773,741 | ||||
United Mexican States | ||||||
| 900,000 | 5.625%, 1/15/2017b | 900,000 | ||||
Total Foreign | 3,924,429 | |||||
| Mortgage-Backed Securities (12.5%) | ||||||
Federal Home Loan Mortgage Corporation Gold 15-Yr. Pass Through | ||||||
| 833 | 6.500%, 4/1/2009 | 836 | ||||
| 4,415 | 7.500%, 8/1/2010 | 4,565 | ||||
| 20,811 | 7.000%, 2/1/2011 | 21,319 | ||||
| 15,565 | 6.000%, 5/1/2012 | 16,139 | ||||
| 3,226 | 8.000%, 6/1/2012 | 3,409 | ||||
| 6,249 | 7.000%, 8/1/2012 | 6,508 | ||||
| 12,674 | 6.500%, 11/1/2012 | 13,167 | ||||
| 12,006 | 6.500%, 8/1/2013 | 12,473 | ||||
| 46,301 | 6.000%, 2/1/2014 | 48,010 | ||||
| 83,884 | 5.500%, 4/1/2014 | 87,173 | ||||
| 34,980 | 6.000%, 4/1/2014 | 36,271 | ||||
| 47,349 | 6.000%, 4/1/2014 | 49,096 | ||||
| 36,724 | 6.500%, 6/1/2014 | 38,154 | ||||
| 29,252 | 7.500%, 9/1/2014 | 30,668 | ||||
| 971,352 | 5.500%, 12/1/2017 | 1,005,341 | ||||
Federal Home Loan Mortgage Corporation Gold 30-Yr. Pass Through | ||||||
| 20,144 | 6.500%, 4/1/2024 | 21,153 | ||||
| 42,382 | 9.000%, 11/1/2024 | 46,692 | ||||
| 2,229 | 9.000%, 4/1/2025 | 2,454 | ||||
| 3,534 | 7.000%, 9/1/2025 | 3,697 | ||||
| 5,154 | 8.500%, 9/1/2025 | 5,560 | ||||
| 4,092 | 8.000%, 1/1/2026 | 4,342 | ||||
| 3,294 | 6.500%, 5/1/2026 | 3,453 | ||||
| 9,700 | 7.000%, 5/1/2026 | 10,147 | ||||
| 18,002 | 6.000%, 7/1/2026 | 18,697 | ||||
| 1,316 | 7.500%, 7/1/2026 | 1,391 | ||||
| 954 | 7.500%, 8/1/2026 | 1,008 | ||||
| 3,213 | 8.000%, 11/1/2026 | 3,410 | ||||
| 3,618 | 7.500%, 1/1/2027 | 3,823 | ||||
| 8,950 | 6.500%, 2/1/2027 | 9,383 | ||||
| 10,204 | 7.000%, 2/1/2027 | 10,739 | ||||
| 19,213 | 8.000%, 3/1/2027 | 20,391 | ||||
| 7,107 | 7.500%, 4/1/2027 | 7,506 | ||||
| 2,072 | 7.000%, 5/1/2027 | 2,180 | ||||
| 17,282 | 8.000%, 6/1/2027 | 18,339 | ||||
| 7,072 | 8.500%, 7/1/2027 | 7,629 | ||||
| 7,559 | 7.000%, 9/1/2027 | 7,956 | ||||
| 11,526 | 8.000%, 10/1/2027 | 12,230 | ||||
| 10,497 | 7.500%, 11/1/2027 | 11,087 | ||||
The accompanying Notes to Financial Statements are an integral part of this schedule.
198
Table of Contents
Balanced Portfolio
Schedule of Investments as of December 31, 2008
| Principal Amount | Long-Term Fixed Income (41.3%) | Value | ||||
| Mortgage-Backed Securities (12.5%) - continued | ||||||
| $ | 4,645 | 6.500%, 12/1/2027 | $ | 4,870 | ||
| 3,426 | 7.500%, 12/1/2027 | 3,619 | ||||
| 44,268 | 6.500%, 6/1/2028 | 46,357 | ||||
| 21,067 | 7.000%, 10/1/2028 | 22,172 | ||||
| 63,337 | 6.500%, 11/1/2028 | 66,326 | ||||
| 1,699 | 6.500%, 1/1/2029 | 1,779 | ||||
| 74,098 | 6.000%, 3/1/2029 | 76,776 | ||||
| 35,894 | 6.500%, 4/1/2029 | 37,565 | ||||
| 68,289 | 6.000%, 5/1/2029 | 70,756 | ||||
| 76,425 | 7.000%, 5/1/2029 | 80,434 | ||||
| 30,548 | 6.500%, 7/1/2029 | 31,971 | ||||
| 19,691 | 6.500%, 8/1/2029 | 20,608 | ||||
| 11,748 | 7.000%, 9/1/2029 | 12,364 | ||||
| 15,703 | 7.000%, 10/1/2029 | 16,527 | ||||
| 9,502 | 7.500%, 11/1/2029 | 10,021 | ||||
| 9,208 | 7.000%, 1/1/2030 | 9,677 | ||||
| 33,465 | 7.500%, 1/1/2030 | 35,519 | ||||
| 9,453 | 8.000%, 8/1/2030 | 10,028 | ||||
| 49,819 | 6.000%, 3/1/2031 | 51,557 | ||||
| 195,358 | 6.000%, 6/1/2031 | 202,174 | ||||
| 150,179 | 6.000%, 1/1/2032 | 155,418 | ||||
| 631,951 | 6.000%, 10/1/2032 | 653,405 | ||||
| 3,500,000 | 5.000%, 1/1/2038g | 3,576,563 | ||||
| 3,050,000 | 6.000%, 1/1/2038g | 3,141,500 | ||||
Federal National Mortgage Association Conventional 15-Yr. Pass Through | ||||||
| 545 | 9.000%, 4/1/2010 | 580 | ||||
| 1,290 | 9.000%, 4/1/2010 | 1,375 | ||||
| 1,109 | 6.000%, 2/1/2011 | 1,154 | ||||
| 4,448 | 8.000%, 5/1/2011 | 4,660 | ||||
| 6,040 | 7.000%, 6/1/2011 | 6,251 | ||||
| 1,897 | 6.500%, 7/1/2011 | 1,971 | ||||
| 1,863 | 7.500%, 7/1/2011 | 1,925 | ||||
| 20,466 | 6.500%, 5/1/2012 | 21,272 | ||||
| 3,710 | 6.500%, 7/1/2012 | 3,856 | ||||
| 22,145 | 7.000%, 10/1/2012 | 22,958 | ||||
| 4,680 | 7.000%, 12/1/2012 | 4,852 | ||||
| 13,544 | 6.500%, 6/1/2013 | 14,081 | ||||
| 41,277 | 6.000%, 11/1/2013 | 43,031 | ||||
| 78,268 | 5.500%, 12/1/2013 | 81,422 | ||||
| 33,837 | 6.000%, 12/1/2013 | 35,232 | ||||
| 17,936 | 7.500%, 4/1/2015 | 18,744 | ||||
| 4,000,000 | 5.000%, 1/1/2023g | 4,105,000 | ||||
Federal National Mortgage Association Conventional 30-Yr. Pass Through | ||||||
| 6,274 | 10.500%, 8/1/2020 | 7,197 | ||||
| 5,936 | 9.500%, 4/1/2025 | 6,582 | ||||
| 1,085 | 7.500%, 9/1/2025 | 1,152 | ||||
| 3,759 | 8.500%, 11/1/2025 | 4,057 | ||||
| 2,530 | 7.000%, 1/1/2026 | 2,679 | ||||
| 8,588 | 6.500%, 2/1/2026 | 8,994 | ||||
| 4,632 | 7.000%, 3/1/2026 | 4,906 | ||||
| 7,349 | 6.500%, 4/1/2026 | 7,696 | ||||
| 1,594 | 8.500%, 5/1/2026 | 1,720 | ||||
| 2,432 | 7.500%, 7/1/2026 | 2,581 | ||||
| 16,838 | 7.500%, 8/1/2026 | 17,870 | ||||
| 1,935 | 8.000%, 8/1/2026 | 2,050 | ||||
| 9,831 | 7.000%, 11/1/2026 | 10,412 | ||||
| 3,009 | 8.000%, 11/1/2026 | 3,189 | ||||
| 661 | 7.500%, 12/1/2026 | 701 | ||||
| 1,945 | 7.500%, 2/1/2027 | 2,064 | ||||
| 6,446 | 7.000%, 3/1/2027 | 6,828 | ||||
| 6,091 | 7.500%, 5/1/2027 | 6,461 | ||||
| 9,666 | 6.500%, 7/1/2027 | 10,122 | ||||
| 10,237 | 7.000%, 7/1/2027 | 10,841 | ||||
| 4,079 | 7.500%, 8/1/2027 | 4,326 | ||||
| 39,504 | 8.000%, 9/1/2027 | 41,838 | ||||
| 12,092 | 7.000%, 10/1/2027 | 12,806 | ||||
| 38,034 | 7.500%, 12/1/2027 | 40,344 | ||||
| 6,857 | 8.000%, 12/1/2027 | 7,262 | ||||
| 18,413 | 6.500%, 2/1/2028 | 19,282 | ||||
| 10,452 | 7.000%, 2/1/2028 | 11,069 | ||||
| 110,422 | 6.500%, 7/1/2028 | 115,564 | ||||
| 32,544 | 7.000%, 8/1/2028 | 34,429 | ||||
| 47,296 | 6.500%, 11/1/2028 | 49,499 | ||||
| 16,959 | 6.500%, 11/1/2028 | 17,749 | ||||
| 2,272 | 7.000%, 11/1/2028 | 2,404 | ||||
| 111,855 | 6.000%, 12/1/2028 | 115,932 | ||||
| 34,763 | 7.000%, 12/1/2028 | 36,777 | ||||
| 41,863 | 6.000%, 3/1/2029 | 43,350 | ||||
| 52,856 | 6.500%, 6/1/2029 | 55,317 | ||||
| 77,916 | 6.000%, 7/1/2029 | 80,683 | ||||
| 18,960 | 6.500%, 7/1/2029 | 19,843 | ||||
| 65,194 | 7.500%, 8/1/2029 | 69,052 | ||||
| 78,326 | 6.000%, 11/1/2029 | 81,107 | ||||
| 21,578 | 7.000%, 11/1/2029 | 22,829 | ||||
| 29,525 | 7.000%, 11/1/2029 | 31,238 | ||||
| 20,612 | 8.500%, 4/1/2030 | 22,280 | ||||
| 12,165 | 7.500%, 8/1/2030 | 12,879 | ||||
| 128,408 | 6.500%, 7/1/2031 | 134,388 | ||||
| 54,035 | 6.500%, 10/1/2031 | 56,551 | ||||
| 63,062 | 6.500%, 12/1/2031 | 65,998 | ||||
| 79,753 | 6.500%, 5/1/2032 | 83,217 | ||||
| 442,897 | 6.500%, 7/1/2032 | 462,135 | ||||
| 16,900,000 | 5.500%, 1/1/2039g | 17,322,500 | ||||
Government National Mortgage Association 15-Yr. Pass Through | ||||||
| 553 | 6.500%, 5/15/2009 | 569 | ||||
| 9,211 | 6.000%, 4/15/2011 | 9,711 | ||||
| 1,625 | 6.500%, 6/15/2011 | 1,713 | ||||
| 1,567 | 7.500%, 7/15/2011 | 1,643 | ||||
| 7,440 | 7.000%, 4/15/2012 | 7,837 | ||||
| 67,103 | 6.000%, 7/15/2014 | 70,808 | ||||
Government National Mortgage Association 30-Yr. Pass Through | ||||||
| 4,088 | 9.500%, 12/15/2024 | 4,514 | ||||
| 6,904 | 9.500%, 1/15/2025 | 7,652 | ||||
| 34,620 | 9.000%, 3/15/2025 | 37,189 | ||||
| 2,862 | 7.500%, 8/15/2025 | 3,035 | ||||
| 13,083 | 7.000%, 1/15/2026 | 13,860 | ||||
| 18,064 | 7.000%, 1/15/2026 | 19,136 | ||||
| 11,763 | 7.000%, 4/15/2026 | 12,461 | ||||
| 6,493 | 8.000%, 4/15/2026 | 6,911 | ||||
| 18,588 | 6.000%, 5/15/2026 | 19,282 | ||||
| 6,385 | 7.000%, 5/15/2026 | 6,764 | ||||
| 5,881 | 7.500%, 5/15/2026 | 6,235 | ||||
| 26,170 | 7.000%, 6/15/2026 | 27,724 | ||||
| 7,286 | 8.500%, 6/15/2026 | 7,826 | ||||
The accompanying Notes to Financial Statements are an integral part of this schedule.
199
Table of Contents
Balanced Portfolio
Schedule of Investments as of December 31, 2008
| Principal Amount | Long-Term Fixed Income (41.3%) | Value | |||||
| Mortgage-Backed Securities (12.5%) - continued | |||||||
| $ | 2,673 | 8.500%, 7/15/2026 | $ | 2,871 | |||
| 18,566 | 8.000%, 9/15/2026 | 19,762 | |||||
| 5,654 | 7.500%, 10/15/2026 | 5,994 | |||||
| 2,839 | 8.000%, 11/15/2026 | 3,022 | |||||
| 2,969 | 8.500%, 11/15/2026 | 3,189 | |||||
| 3,450 | 9.000%, 12/15/2026 | 3,718 | |||||
| 29,661 | 7.500%, 4/15/2027 | 31,432 | |||||
| 6,791 | 8.000%, 6/20/2027 | 7,223 | |||||
| 1,299 | 8.000%, 8/15/2027 | 1,386 | |||||
| 76,146 | 6.500%, 10/15/2027 | 79,974 | |||||
| 27,887 | 7.000%, 10/15/2027 | 29,549 | |||||
| 1,313 | 7.000%, 11/15/2027 | 1,391 | |||||
| 38,438 | 7.000%, 11/15/2027 | 40,729 | |||||
| 91,608 | 7.000%, 7/15/2028 | 96,993 | |||||
| 17,229 | 7.500%, 7/15/2028 | 18,257 | |||||
| 78,981 | 6.500%, 9/15/2028 | 83,016 | |||||
| 88,478 | 6.000%, 12/15/2028 | 91,864 | |||||
| 55,212 | 6.500%, 1/15/2029 | 58,032 | |||||
| 232,621 | 6.500%, 3/15/2029 | 244,505 | |||||
| 33,968 | 6.500%, 4/15/2029 | 35,703 | |||||
| 19,858 | 7.000%, 4/15/2029 | 21,015 | |||||
| 139,386 | 6.000%, 6/15/2029 | 144,590 | |||||
| 59,039 | 7.000%, 6/15/2029 | 62,479 | |||||
| 24,062 | 8.000%, 5/15/2030 | 25,643 | |||||
| 44,886 | 7.000%, 9/15/2031 | 47,464 | |||||
| 76,710 | 6.500%, 2/15/2032 | 80,628 | |||||
Total Mortgage-Backed Securities | 35,008,795 | ||||||
| Technology (0.2%) | |||||||
International Business Machines Corporation | |||||||
| 500,000 | 7.500%, 6/15/2013 | 565,127 | |||||
Total Technology | 565,127 | ||||||
| Transportation (0.1%) | |||||||
Union Pacific Corporation | |||||||
| 250,000 | 6.500%, 4/15/2012 | 256,666 | |||||
Total Transportation | 256,666 | ||||||
| U.S. Government (10.7%) | |||||||
Federal Farm Credit Bank | |||||||
| 1,000,000 | 5.375%, 7/18/2011 | 1,096,641 | |||||
Federal Home Loan Banks | |||||||
| 1,000,000 | 3.625%, 5/29/2013b | 1,048,206 | |||||
Federal Home Loan Mortgage Corporation | |||||||
| 3,800,000 | 5.125%, 11/17/2017b | 4,402,889 | |||||
Federal National Mortgage Association | |||||||
| 1,500,000 | 5.625%, 4/17/2028 | 1,869,589 | |||||
Resolution Funding Corporation | |||||||
| 1,000,000 | 8.625%, 1/15/2021 | 1,524,867 | |||||
U.S. Treasury Bonds | |||||||
| 1,400,000 | 7.250%, 5/15/2016b | 1,874,578 | |||||
| 500,000 | 6.875%, 8/15/2025b | 760,234 | |||||
| 500,000 | 4.500%, 2/15/2036 | 664,297 | |||||
U.S. Treasury Notes | |||||||
| 2,000,000 | 3.625%, 1/15/2010 | 2,069,922 | |||||
| 2,750,000 | 4.375%, 12/15/2010 | 2,953,456 | |||||
| 3,500,000 | 4.500%, 11/30/2011b | 3,855,194 | |||||
| 3,000,000 | 2.875%, 1/31/2013b | 3,220,548 | |||||
| 1,000,000 | 2.000%, 11/30/2013 | 1,025,938 | |||||
| 2,000,000 | 4.250%, 8/15/2014 | 2,298,750 | |||||
| 700,000 | 4.500%, 2/15/2016 | 824,032 | |||||
| 375,000 | 4.250%, 11/15/2017 | 436,846 | |||||
Total U.S. Government | 29,925,987 | ||||||
| Utilities (0.7%) | |||||||
Commonwealth Edison Company | |||||||
| 225,000 | 5.900%, 3/15/2036 | 187,115 | |||||
Oncor Electric Delivery Company | |||||||
| 425,000 | 6.375%, 1/15/2015 | 407,093 | |||||
Oneok Partners, LP | |||||||
| 225,000 | 6.650%, 10/1/2036 | 174,336 | |||||
Progress Energy, Inc. | |||||||
| 300,000 | 7.000%, 10/30/2031 | 277,939 | |||||
Public Service Company of Colorado | |||||||
| 400,000 | 7.875%, 10/1/2012 | 420,665 | |||||
Southern California Edison Company | |||||||
| 225,000 | 5.000%, 1/15/2014 | 229,024 | |||||
Xcel Energy, Inc. | |||||||
| 225,000 | 6.500%, 7/1/2036 | 206,577 | |||||
Total Utilities | 1,902,749 | ||||||
Total Long-Term Fixed Income (cost $125,211,663) | 115,536,510 | ||||||
| Shares | Collateral Held for Securities Loaned (5.9%) | Value | |||||
| 16,513,429 | Thrivent Financial Securities Lending Trust | 16,513,429 | |||||
Total Collateral Held for Securities Loaned (cost $16,513,429) | 16,513,429 | ||||||
| Shares or Principal Amount | Short-Term Investments (7.8%)h | Value | |||||
| 9,000,000 | Federal Home Loan Bank Discount Notes 0.010%, 1/6/2009 | 8,999,988 | |||||
| 950,000 | Federal National Mortgage Association Discount Notes 0.411%, 5/14/2009i | 948,572 | |||||
| 12,047,152 | Thrivent Money Market Portfolio | 12,047,152 | |||||
Total Short-Term Investments (at amortized cost) | 21,995,712 | ||||||
Total Investments (cost $358,969,017) 115.6% | $ | 323,706,044 | |||||
Other Assets and Liabilities, Net (15.6%) | (43,685,174 | ) | |||||
Total Net Assets 100.0% | $ | 280,020,870 | |||||
| a | Non-income producing security. |
The accompanying Notes to Financial Statements are an integral part of this schedule.
200
Table of Contents
Balanced Portfolio
Schedule of Investments as of December 31, 2008
| b | All or a portion of the security is on loan as discussed in item 2(M) of the Notes to Financial Statements. |
| c | All or a portion of the security is insured or guaranteed. |
| d | Denotes variable rate obligations for which the current yield and next scheduled reset date are shown. |
| e | Denotes restricted securities. Restricted securities are investment securities which have been deemed illiquid and cannot be offered for public sale without first being registered under the Securities Act of 1933. The following table indicates the acquisition date and cost of restricted securities Balanced Portfolio owned as of December 31, 2008. |
Security | Acquisition Date | Cost | |||
Bear Stearns Commercial Mortgage Securities, Inc. | 3/30/2007 | $ | 2,500,000 | ||
Commercial Mortgage Pass- Through Certificates | 10/18/2006 | $ | 2,000,000 | ||
Preferred Term Securities XXIII, Ltd. | 9/14/2006 | $ | 1,219,057 | ||
Wachovia Asset Securitization, Inc. | 3/16/2007 | $ | 1,279,034 | ||
| f | Denotes securities sold under Rule 144A of the Securities Act of 1933, which exempts them from registration. These securities have been deemed liquid and may be resold to other dealers in the program or to other qualified institutional buyers. As of December 31, 2008, the value of these investments was $2,945,648 or 1.1% of total net assets. |
| g | Denotes investments purchased on a when-issued or delayed delivery basis. |
| h | The interest rate shown reflects the yield, coupon rate or, for securities purchased at a discount, the discount rate at the date of purchase. |
| i | At December 31, 2008, $948,572 of investments were held on deposit with the counterparty and pledged as the initial margin deposit for open financial futures contracts. |
| Definitions: | ||
| REIT - | Real Estate Investment Trust, is a company that buys, develops, manages and/or sells real estate assets. | |
Gross unrealized appreciation and depreciation of investments, based on cost for federal income tax purposes, were as follows:
Gross unrealized appreciation | $ | 47,969,703 | ||
Gross unrealized depreciation | (91,576,281 | ) | ||
Net unrealized appreciation (depreciation) | $ | (43,606,578 | ) | |
Cost for federal income tax purposes | $ | 367,312,622 |
The following table is a summary of the inputs used, as of December 31, 2008, in valuing the Balanced Portfolio’s assets carried at fair value as discussed in item 2(A) of the Notes to Financial Statements.
Level | Investments in Securities | Other Financial Instruments* | ||||
Level 1 | $ | 198,220,974 | $ | 43,920 | ||
Level 2 | 124,974,895 | — | ||||
Level 3 | 510,175 | — | ||||
Totals (Level 1,2,3) | $ | 323,706,044 | $ | 43,920 | ||
The following table is a reconciliation of assets in which significant unobservable inputs (Level 3) were used in determining fair value for the Balanced Portfolio as discussed in item 2(A) of the Notes to Financial Statements.
| Investments in Securities | Other Financial Instruments* | ||||||
Value December 31, 2007 | $ | 1,996,120 | $ | — | |||
Accrued Discounts/Premiums | — | — | |||||
Realized Gain/(Loss) | (20,703 | ) | — | ||||
Change in Unrealized Gain/(Loss) | (654,570 | ) | — | ||||
Net Purchases/Sales | (1,990,271 | ) | — | ||||
Transfers In and/or Out of Level 3 | 1,179,599 | — | |||||
Value December 31, 2008 | $ | 510,175 | $ | — | |||
| * | Other Financial Instruments include Futures, Forwards, Written Options and Swap agreements. |
The accompanying Notes to Financial Statements are an integral part of this schedule.
201
Table of Contents
Balanced Portfolio
Schedule of Investments as of December 31, 2008
Futures | Number of Contracts Long/(Short) | Expiration Date | Notional Principal Amount | Value | Unrealized Gain/(Loss) | ||||||||
S&P 500 Index Futures | 36 | March 2009 | $ | 8,056,980 | $ | 8,100,900 | $ | 43,920 | |||||
Total Futures | $ | 43,920 | |||||||||||
Investment in Affiliates
Affiliated issuers, as defined under the Investment Company Act of 1940, include those in which the Portfolio’s holdings of an issuer represent 5% or more of the outstanding voting securities of an issuer, or any affiliated mutual fund.
A summary of transactions for the fiscal year to date, in Balanced Portfolio, is as follows:
Portfolio | Value December 31, 2007 | Gross Purchases and Additions | Gross Sales and Reductions | Balance of Shares Held at December 31, 2008 | Value December 31, 2008 | Income Earned January 1, 2008 - December 31, 2008 | |||||||||||
Money Market | $ | 19,638,879 | $ | 82,656,792 | $ | 90,248,519 | 12,047,152 | $ | 12,047,152 | $ | 570,950 | ||||||
Thrivent Financial Securities | |||||||||||||||||
Lending Trust | 47,660,952 | 149,704,490 | 180,852,013 | 16,513,429 | 16,513,429 | 383,942 | |||||||||||
Total Value and Income Earned | 67,299,831 | 28,560,581 | 954,892 | ||||||||||||||
The accompanying Notes to Financial Statements are an integral part of this schedule.
202
Table of Contents
Schedule of Investments as of December 31, 2008
| Principal Amount | Bank Loans (4.8%)a | Value | ||
| Basic Materials (0.3%) | ||||
Lyondell Chemical Company, Term Loan | ||||
| 2,766,937 | 3.961%, 12/20/2013b | 1,282,005 | ||
| 1,687,239 | 7.000%, 12/20/2014b | 759,258 | ||
Total Basic Materials | 2,041,263 | |||
| Communications Services (0.6%) | ||||
Alltel Communications, Inc., Term Loan | ||||
| 3,482,368 | 4.371%, 5/15/2015 | 3,424,909 | ||
Total Communications Services | 3,424,909 | |||
| Consumer Cyclical (1.3%) | ||||
Blockbuster, Inc., Term Loan | ||||
| 1,150,000 | 6.244%, 8/20/2011 | 678,500 | ||
Ford Motor Company, Term Loan | ||||
| 12,007,944 | 5.000%, 12/16/2013 | 4,813,144 | ||
General Motors Corporation, Term Loan | ||||
| 5,180,000 | 2.375%, 11/29/2013c,d | 2,335,299 | ||
Total Consumer Cyclical | 7,826,943 | |||
| Consumer Non-Cyclical (1.4%) | ||||
CHS/Community Health Systems, Inc., Term Loan | ||||
| 162,809 | 1.801%, 7/25/2014c,d | 126,747 | ||
| 3,183,391 | 4.445%, 7/25/2014 | 2,478,270 | ||
HCA, Inc., Term Loan | ||||
| 7,351,247 | 3.709%, 11/18/2013 | 5,736,031 | ||
Total Consumer Non-Cyclical | 8,341,048 | |||
| Technology (0.4%) | ||||
Flextronics Semiconductor, Ltd., Term Loan | ||||
| 2,395,430 | 6.155%, 10/1/2014 | 1,509,121 | ||
| 688,342 | 7.069%, 10/1/2014 | 532,914 | ||
Total Technology | 2,042,035 | |||
| Utilities (0.8%) | ||||
Energy Future Holdings, Term Loan | ||||
| 6,966,837 | 5.582%, 10/10/2014 | 4,801,335 | ||
Total Utilities | 4,801,335 | |||
Total Bank Loans (cost $38,180,938) | 28,477,533 | |||
| Principal Amount | Long-Term Fixed Income (87.0%) | Value | ||
| Asset-Backed Securities (0.4%) | ||||
Countrywide Home Loans Asset- Backed Securities | ||||
| 2,600,513 | 0.581%, 1/26/2009e,f | 2,133,032 | ||
Total Asset-Backed Securities | 2,133,032 | |||
| Basic Materials (7.6%) | ||||
Aleris International, Inc. | ||||
| 2,130,000 | 9.000%, 12/15/2014b | 127,800 | ||
Arch Western Finance, LLC | ||||
| 3,535,000 | 6.750%, 7/1/2013 | 3,075,450 | ||
Domtar, Inc. | ||||
| 3,520,000 | 7.125%, 8/15/2015 | 2,288,000 | ||
Drummond Company, Inc. | ||||
| 2,525,000 | 7.375%, 2/15/2016g | 1,224,625 | ||
FMG Finance, Pty., Ltd. | ||||
| 5,735,000 | 10.625%, 9/1/2016g | 3,326,300 | ||
Freeport-McMoRan Copper & Gold, Inc. | ||||
| 2,880,000 | 8.250%, 4/1/2015h | 2,448,000 | ||
| 4,295,000 | 8.375%, 4/1/2017 | 3,521,900 | ||
Georgia-Pacific Corporation | ||||
| 1,640,000 | 8.125%, 5/15/2011h | 1,541,600 | ||
| 2,115,000 | 7.125%, 1/15/2017g,h | 1,776,600 | ||
Graphic Packaging International Corporation | ||||
| 5,160,000 | 9.500%, 8/15/2013h | 3,560,400 | ||
Griffin Coal Mining Company, Pty., Ltd. | ||||
| 3,475,000 | 9.500%, 12/1/2016g | 1,164,125 | ||
Jefferson Smurfit Corporation | ||||
| 1,520,000 | 8.250%, 10/1/2012b | 258,400 | ||
Momentive Performance Materials, Inc. | ||||
| 2,880,000 | 9.750%, 12/1/2014 | 1,224,000 | ||
Mosaic Global Holdings, Inc., Convertible | ||||
| 3,450,000 | 7.375%, 12/1/2014g | 2,829,000 | ||
NewPage Corporation | ||||
| 2,430,000 | 10.000%, 5/1/2012h | 1,069,200 | ||
Peabody Energy Corporation | ||||
| 5,210,000 | 6.875%, 3/15/2013 | 4,936,475 | ||
Rock-Tenn Company | ||||
| 850,000 | 9.250%, 3/15/2016i | 790,500 | ||
Ryerson, Inc. | ||||
| 2,300,000 | 12.000%, 11/1/2015g | 1,420,250 | ||
Smurfit-Stone Container Enterprises, Inc. | ||||
| 2,160,000 | 8.000%, 3/15/2017b,h | 410,400 | ||
Southern Copper Corporation | ||||
| 1,970,000 | 7.500%, 7/27/2035 | 1,473,954 | ||
Steel Dynamics, Inc. | ||||
| 5,420,000 | 7.750%, 4/15/2016g | 3,753,350 | ||
Terra Capital, Inc. | ||||
| 4,210,000 | 7.000%, 2/1/2017 | 3,094,350 | ||
Total Basic Materials | 45,314,679 | |||
| Capital Goods (11.1%) | ||||
Allied Waste North America, Inc. | ||||
| 4,830,000 | 7.875%, 4/15/2013 | 4,588,500 | ||
Ashtead Capital, Inc. | ||||
| 1,530,000 | 9.000%, 8/15/2016g | 787,950 | ||
Ball Corporation | ||||
| 2,525,000 | 6.625%, 3/15/2018 | 2,259,875 | ||
BE Aerospace, Inc. | ||||
| 5,750,000 | 8.500%, 7/1/2018 | 5,175,000 | ||
Berry Plastics Holding Corporation | ||||
| 1,800,000 | 8.875%, 9/15/2014 | 783,000 | ||
Case New Holland, Inc. | ||||
| 2,900,000 | 7.125%, 3/1/2014 | 2,059,000 | ||
Crown Americas, Inc. | ||||
| 2,150,000 | 7.625%, 11/15/2013 | 2,128,500 | ||
The accompanying Notes to Financial Statements are an integral part of this schedule.
203
Table of Contents
High Yield Portfolio
Schedule of Investments as of December 31, 2008
Principal Amount | Long-Term Fixed Income (87.0%) | Value | ||
| Capital Goods (11.1%) - continued | ||||
| 2,150,000 | 7.750%, 11/15/2015 | 2,139,250 | ||
DRS Technologies, Inc. | ||||
| 3,400,000 | 6.625%, 2/1/2016 | 3,400,000 | ||
Graham Packaging Company, Inc. | ||||
| 3,515,000 | 9.875%, 10/15/2014h | 2,161,725 | ||
L-3 Communications Corporation | ||||
| 5,000,000 | 6.125%, 1/15/2014h | 4,537,500 | ||
| 3,970,000 | 6.375%, 10/15/2015 | 3,711,950 | ||
Legrand SA | ||||
| 1,150,000 | 8.500%, 2/15/2025 | 1,005,938 | ||
Leucadia National Corporation | ||||
| 6,600,000 | 7.125%, 3/15/2017 | 4,900,500 | ||
Mueller Water Products, Inc. | ||||
| 1,780,000 | 7.375%, 6/1/2017 | 1,210,400 | ||
Norcraft Companies, LP/Norcraft Finance Corporation | ||||
| 2,340,000 | 9.000%, 11/1/2011 | 1,989,000 | ||
Owens-Brockway Glass Container, Inc. | ||||
| 1,630,000 | 8.250%, 5/15/2013 | 1,605,550 | ||
Owens-Illinois, Inc. | ||||
| 5,750,000 | 7.800%, 5/15/2018h | 5,117,500 | ||
Plastipak Holdings, Inc. | ||||
| 3,495,000 | 8.500%, 12/15/2015g | 2,341,650 | ||
RBS Global, Inc./Rexnord Corporation | ||||
| 3,125,000 | 9.500%, 8/1/2014 | 2,328,125 | ||
Rental Services Corporation | ||||
| 2,400,000 | 9.500%, 12/1/2014 | 1,320,000 | ||
SPX Corporation | ||||
| 4,020,000 | 7.625%, 12/15/2014g | 3,497,400 | ||
TransDigm, Inc. | ||||
| 6,585,000 | 7.750%, 7/15/2014 | 5,399,700 | ||
United Rentals North America, Inc. | ||||
| 2,260,000 | 6.500%, 2/15/2012 | 1,785,400 | ||
| Total Capital Goods | 66,233,413 | |||
| Commercial Mortgage-Backed Securities (0.3%) | ||||
Greenwich Capital Commercial Funding Corporation | ||||
| 4,000,000 | 5.867%, 8/10/2017 | 2,032,164 | ||
| Total Commercial Mortgage- Backed Securities | 2,032,164 | |||
| Communications Services (15.6%) | ||||
American Tower Corporation | ||||
| 5,900,000 | 7.000%, 10/15/2017g | 5,251,000 | ||
Centennial Communications Corporation | ||||
| 6,950,000 | 9.633%, 1/1/2009f | 6,741,500 | ||
| 3,940,000 | 8.125%, 2/1/2014 | 3,999,100 | ||
Charter Communications Operating, LLC | ||||
| 5,750,000 | 8.375%, 4/30/2014g | 4,398,750 | ||
Citizens Communications Company | ||||
| 4,170,000 | 9.250%, 5/15/2011 | 3,961,500 | ||
CSC Holdings, Inc. | ||||
| 3,450,000 | 8.500%, 6/15/2015g | 3,036,000 | ||
Dex Media West, LLC/Dex Media West Finance Company | ||||
| 1,310,000 | 9.875%, 8/15/2013 | 311,125 | ||
DIRECTV Holdings, LLC | ||||
| 5,780,000 | 7.625%, 5/15/2016 | 5,606,600 | ||
EchoStar DBS Corporation | ||||
| 4,220,000 | 7.125%, 2/1/2016 | 3,523,700 | ||
Idearc, Inc. | ||||
| 3,605,000 | 8.000%, 11/15/2016h | 270,375 | ||
Intelsat Subsidiary Holding Company, Ltd. | ||||
| 7,740,000 | 8.875%, 1/15/2015g | 7,043,400 | ||
Intelsat, Ltd. | ||||
| 6,170,000 | Zero Coupon, 2/1/2010g,j | 4,689,200 | ||
Level 3 Financing, Inc. | ||||
| 3,450,000 | 12.250%, 3/15/2013h | 2,087,250 | ||
Mediacom, LLC/Mediacom Capital Corporation | ||||
| 5,770,000 | 9.500%, 1/15/2013 | 4,356,350 | ||
MetroPCS Wireless, Inc. | ||||
| 4,550,000 | 9.250%, 11/1/2014h | 4,072,250 | ||
Nextel Communications, Inc. | ||||
| 1,730,000 | 6.875%, 10/31/2013 | 735,250 | ||
NTL Cable plc | ||||
| 5,330,000 | 9.125%, 8/15/2016 | 3,944,200 | ||
Quebecor Media, Inc. | ||||
| 3,430,000 | 7.750%, 3/15/2016 | 2,315,250 | ||
Qwest Communications International, Inc. | ||||
| 1,270,000 | 7.500%, 2/15/2014 | 908,050 | ||
Qwest Corporation | ||||
| 5,530,000 | 7.875%, 9/1/2011 | 5,087,600 | ||
| 1,650,000 | 7.625%, 6/15/2015 | 1,353,000 | ||
R.H. Donnelley Corporation | ||||
| 4,605,000 | 6.875%, 1/15/2013h | 621,675 | ||
Sprint Capital Corporation | ||||
| 1,750,000 | 8.375%, 3/15/2012 | 1,400,000 | ||
Time Warner Telecom Holdings, Inc. | ||||
| 5,890,000 | 9.250%, 2/15/2014 | 4,829,800 | ||
TL Acquisitions, Inc. | ||||
| 4,890,000 | 10.500%, 1/15/2015g | 2,004,900 | ||
Videotron Ltee | ||||
| 5,360,000 | 6.875%, 1/15/2014 | 4,743,600 | ||
Videotron, Ltd. | ||||
| 860,000 | 9.125%, 4/15/2018g | 799,800 | ||
Virgin Media Finance plc | ||||
| 2,840,000 | 8.750%, 4/15/2014 | 2,130,000 | ||
Windstream Corporation | ||||
| 1,270,000 | 8.625%, 8/1/2016 | 1,123,950 | ||
| 2,100,000 | 7.000%, 3/15/2019 | 1,617,000 | ||
| Total Communications Services | 92,962,175 | |||
| Consumer Cyclical (17.0%) | ||||
AutoNation, Inc. | ||||
| 2,840,000 | 7.000%, 4/15/2014h | 2,073,200 | ||
Beazer Homes USA, Inc. | ||||
| 1,205,000 | 8.625%, 5/15/2011h | 638,650 | ||
Blockbuster, Inc. | ||||
| 3,450,000 | 9.000%, 9/1/2012h | 1,673,250 | ||
The accompanying Notes to Financial Statements are an integral part of this schedule.
204
Table of Contents
High Yield Portfolio
Schedule of Investments as of December 31, 2008
| Principal Amount | Long-Term Fixed Income (87.0%) | Value | ||
| Consumer Cyclical (17.0%) - continued | ||||
Bon-Ton Stores, Inc. | ||||
| 4,600,000 | 10.250%, 3/15/2014 | 552,000 | ||
Boyd Gaming Corporation | ||||
| 5,180,000 | 6.750%, 4/15/2014h | 3,263,400 | ||
Circus & Eldorado Joint Venture/Silver Legacy Capital Corporation | ||||
| 4,110,000 | 10.125%, 3/1/2012 | 2,630,400 | ||
Dollarama Group, LP | ||||
| 1,970,000 | 8.073%, 6/15/2009f | 1,250,950 | ||
| 5,760,000 | 8.875%, 8/15/2012 | 4,320,000 | ||
Firekeepers Development Authority | ||||
| 6,050,000 | 13.875%, 5/15/2015g | 3,751,000 | ||
Fontainebleau Las Vegas Holdings, LLC | ||||
| 6,820,000 | 10.250%, 6/15/2015g | 664,950 | ||
Ford Motor Credit Company | ||||
| 2,880,000 | 7.375%, 10/28/2009 | 2,529,277 | ||
| 2,880,000 | 9.750%, 9/15/2010 | 2,303,983 | ||
| 5,180,000 | 7.375%, 2/1/2011 | 3,939,193 | ||
| 2,680,000 | 7.000%, 10/1/2013 | 1,851,684 | ||
Gaylord Entertainment Company | ||||
| 2,240,000 | 6.750%, 11/15/2014 | 1,388,800 | ||
Group 1 Automotive, Inc. | ||||
| 5,160,000 | 8.250%, 8/15/2013 | 3,457,200 | ||
Hanesbrands, Inc. | ||||
| 2,460,000 | 5.698%, 6/15/2009f | 1,734,300 | ||
Host Hotels & Resorts, LP | ||||
| 3,460,000 | 6.875%, 11/1/2014 | 2,664,200 | ||
KB Home | ||||
| 3,960,000 | 6.250%, 6/15/2015 | 2,415,600 | ||
Lear Corporation | ||||
| 5,180,000 | 8.500%, 12/1/2013 | 1,605,800 | ||
MGM MIRAGE | ||||
| 6,310,000 | 13.000%, 11/15/2013g,h | 6,010,275 | ||
| 2,300,000 | 7.500%, 6/1/2016h | 1,457,625 | ||
Mohegan Tribal Gaming Authority | ||||
| 2,850,000 | 8.000%, 4/1/2012h | 1,738,500 | ||
Norcraft Holdings, LP/Norcraft Capital Corporation | ||||
| 1,655,000 | 9.750%, 9/1/2012 | 1,232,975 | ||
Perry Ellis International, Inc. | ||||
| 2,800,000 | 8.875%, 9/15/2013 | 1,680,000 | ||
Pinnacle Entertainment, Inc. | ||||
| 3,450,000 | 8.250%, 3/15/2012h | 2,622,000 | ||
| 1,720,000 | 7.500%, 6/15/2015h | 997,600 | ||
Pokagon Gaming Authority | ||||
| 4,773,000 | 10.375%, 6/15/2014g | 4,104,780 | ||
Pulte Homes, Inc. | ||||
| 1,150,000 | 7.875%, 8/1/2011 | 994,750 | ||
| 2,850,000 | 5.200%, 2/15/2015 | 1,938,000 | ||
Rite Aid Corporation | ||||
| 6,505,000 | 8.625%, 3/1/2015h | 2,244,225 | ||
Sally Holdings, LLC | ||||
| 4,010,000 | 9.250%, 11/15/2014h | 3,448,600 | ||
Seminole Hard Rock Entertainment | ||||
| 3,370,000 | 4.496%, 3/16/2009f,g | 1,710,275 | ||
Service Corporation International | ||||
| 2,100,000 | 6.750%, 4/1/2015 | 1,659,000 | ||
Shingle Springs Tribal Gaming Authority | ||||
| 6,350,000 | 9.375%, 6/15/2015g | 3,175,000 | ||
Speedway Motorsports, Inc. | ||||
| 4,465,000 | 6.750%, 6/1/2013 | 3,214,800 | ||
Tunica Biloxi Gaming Authority | ||||
| 6,510,000 | 9.000%, 11/15/2015i | 5,142,900 | ||
Turning Stone Resort Casino Enterprise | ||||
| 2,000,000 | 9.125%, 12/15/2010i | 1,680,000 | ||
| 4,060,000 | 9.125%, 9/15/2014i | 3,085,600 | ||
Universal City Development Services | ||||
| 1,730,000 | 11.750%, 4/1/2010 | 1,115,850 | ||
Universal City Florida Holding Company I/II | ||||
| 4,855,000 | 7.943%, 2/1/2009f | 2,087,650 | ||
Vail Resorts, Inc. | ||||
| 2,360,000 | 6.750%, 2/15/2014 | 1,758,200 | ||
Warnaco, Inc. | ||||
| 4,145,000 | 8.875%, 6/15/2013 | 3,771,950 | ||
| Total Consumer Cyclical | 101,578,392 | |||
| Consumer Non-Cyclical (12.2%) | ||||
Biomet, Inc. | ||||
| 5,900,000 | 10.000%, 10/15/2017g,h | 5,664,000 | ||
| 2,310,000 | 11.625%, 10/15/2017h | 1,975,050 | ||
Boston Scientific Corporation | ||||
| 6,085,000 | 5.450%, 6/15/2014 | 5,172,250 | ||
Community Health Systems, Inc. | ||||
| 4,680,000 | 8.875%, 7/15/2015 | 4,305,600 | ||
Constellation Brands, Inc. | ||||
| 4,970,000 | 7.250%, 9/1/2016h | 4,696,650 | ||
DaVita, Inc. | ||||
| 5,155,000 | 7.250%, 3/15/2015 | 4,897,250 | ||
HCA, Inc. | ||||
| 6,020,000 | 6.750%, 7/15/2013 | 3,792,600 | ||
| 3,480,000 | 9.625%, 11/15/2016 | 2,714,400 | ||
Jarden Corporation | ||||
| 3,730,000 | 7.500%, 5/1/2017h | 2,545,725 | ||
Michael Foods, Inc. | ||||
| 3,240,000 | 8.000%, 11/15/2013 | 2,786,400 | ||
Omnicare, Inc. | ||||
| 7,480,000 | 6.875%, 12/15/2015 | 6,133,600 | ||
Pinnacle Foods Finance, LLC | ||||
| 3,720,000 | 9.250%, 4/1/2015h | 2,399,400 | ||
Select Medical Corporation | ||||
| 1,700,000 | 8.834%, 3/15/2009f,h | 884,000 | ||
| 3,945,000 | 7.625%, 2/1/2015 | 2,090,850 | ||
Stater Brothers Holdings, Inc. | ||||
| 2,150,000 | 8.125%, 6/15/2012 | 1,945,750 | ||
Sun Healthcare Group, Inc. | ||||
| 3,410,000 | 9.125%, 4/15/2015 | 2,983,750 | ||
SUPERVALU, Inc. | ||||
| 2,680,000 | 7.500%, 11/15/2014 | 2,197,600 | ||
Surgical Care Affiliates, Inc. | ||||
| 3,780,000 | 8.875%, 7/15/2015i | 2,305,800 | ||
Tenet Healthcare Corporation | ||||
| 2,500,000 | 6.375%, 12/1/2011 | 1,931,250 | ||
| 560,000 | 6.500%, 6/1/2012 | 425,600 | ||
Vanguard Health Holding Company II, LLC | ||||
| 4,810,000 | 9.000%, 10/1/2014 | 4,016,350 | ||
The accompanying Notes to Financial Statements are an integral part of this schedule.
205
Table of Contents
High Yield Portfolio
Schedule of Investments as of December 31, 2008
| Principal Amount | Long-Term Fixed Income (87.0%) | Value | ||
| Consumer Non-Cyclical (12.2%) - continued | ||||
| Ventas Realty, LP/Ventas Capital Corporation | ||||
| 4,490,000 | 6.500%, 6/1/2016 | 3,288,925 | ||
| Visant Holding Corporation | ||||
| 4,685,000 | 10.250%, 12/1/2013 | 3,466,900 | ||
| Total Consumer Non-Cyclical | 72,619,700 | |||
| Energy (5.0%) | ||||
| Chesapeake Energy Corporation | ||||
| 2,290,000 | 7.500%, 9/15/2013 | 1,969,400 | ||
| 4,150,000 | 6.250%, 1/15/2018 | 3,071,000 | ||
| Connacher Oil and Gas, Ltd. | ||||
| 3,440,000 | 10.250%, 12/15/2015g | 1,376,000 | ||
| Denbury Resources, Inc. | ||||
| 3,035,000 | 7.500%, 12/15/2015 | 2,154,850 | ||
| Forest Oil Corporation | ||||
| 4,130,000 | 7.250%, 6/15/2019 | 3,014,900 | ||
| Helix Energy Solutions Group, Inc. | ||||
| 3,450,000 | 9.500%, 1/15/2016g | 1,828,500 | ||
| Hornbeck Offshore Services, Inc. | ||||
| 2,135,000 | 6.125%, 12/1/2014 | 1,387,750 | ||
| Key Energy Services, Inc. | ||||
| 3,900,000 | 8.375%, 12/1/2014 | 2,574,000 | ||
| Newfield Exploration Company | ||||
| 3,900,000 | 6.625%, 4/15/2016 | 3,100,500 | ||
| OPTI Canada, Inc. | ||||
| 1,760,000 | 8.250%, 12/15/2014 | 950,400 | ||
| PetroHawk Energy Corporation | ||||
| 3,690,000 | 9.125%, 7/15/2013 | 2,988,900 | ||
| Plains Exploration & Production Company | ||||
| 3,630,000 | 7.750%, 6/15/2015 | 2,740,650 | ||
| Southwestern Energy Company | ||||
| 3,450,000 | 7.500%, 2/1/2018g | 3,018,750 | ||
| Total Energy | 30,175,600 | |||
| Financials (3.1%) | ||||
| Bank of America Corporation | ||||
| 3,660,000 | 8.125%, 5/15/2018 | 2,737,680 | ||
| Countrywide Financial Corporation | ||||
| 2,880,000 | 6.250%, 5/15/2016h | 2,734,583 | ||
| Deluxe Corporation | ||||
| 1,425,000 | 7.375%, 6/1/2015 | 855,000 | ||
| FTI Consulting, Inc. | ||||
| 2,050,000 | 7.625%, 6/15/2013 | 1,775,812 | ||
| General Motors Acceptance Corporation, LLC | ||||
| 6,512,000 | 6.875%, 9/15/2011g | 5,335,021 | ||
| Lender Processing Services, Inc. | ||||
| 720,000 | 8.125%, 7/1/2016 | 641,700 | ||
| Morgan Stanley | ||||
| 2,900,000 | 4.233%, 2/17/2009f | 2,699,311 | ||
| Nuveen Investments, Inc. | ||||
| 2,870,000 | 10.500%, 11/15/2015g | 634,988 | ||
| Rouse Company, LP | ||||
| 2,900,000 | 3.625%, 3/15/2009 | 1,203,500 | ||
| Total Financials | 18,617,595 | |||
| Technology (3.2%) | ||||
| Amkor Technology, Inc. | ||||
| 2,880,000 | 7.750%, 5/15/2013 | 1,641,600 | ||
| Avago Technologies Finance Pte | ||||
| 650,000 | 7.703%, 3/2/2009f | 517,563 | ||
| 4,440,000 | 10.125%, 12/1/2013 | 3,379,950 | ||
| First Data Corporation | ||||
| 2,870,000 | 9.875%, 9/24/2015 | 1,736,350 | ||
| Freescale Semiconductor, Inc. | ||||
| 2,900,000 | 8.875%, 12/15/2014 | 1,276,000 | ||
| 4,030,000 | 9.125%, 12/15/2014h | 926,900 | ||
| Nortel Networks, Ltd. | ||||
| 5,740,000 | 9.003%, 1/15/2009b,f | 1,435,000 | ||
| NXP BV/NXP Funding, LLC | ||||
| 1,600,000 | 7.503%, 1/15/2009f | 532,000 | ||
| 4,990,000 | 9.500%, 10/15/2015 | 948,100 | ||
| Seagate Technology HDD Holdings | ||||
| 4,805,000 | 6.800%, 10/1/2016 | 2,498,600 | ||
| SunGard Data Systems, Inc. | ||||
| 1,730,000 | 9.125%, 8/15/2013 | 1,496,450 | ||
| 4,430,000 | 10.250%, 8/15/2015h | 2,923,800 | ||
| Total Technology | 19,312,313 | |||
| Transportation (2.8%) | ||||
| Continental Airlines, Inc. | ||||
| 2,968,889 | 7.875%, 7/2/2018 | 1,662,578 | ||
| Delta Air Lines, Inc. | ||||
| 2,670,000 | 7.920%, 11/18/2010 | 1,775,550 | ||
| Hertz Corporation | ||||
| 1,825,000 | 8.875%, 1/1/2014 | 1,122,375 | ||
| Kansas City Southern de Mexico SA de CV | ||||
| 3,220,000 | 7.625%, 12/1/2013 | 2,640,400 | ||
| 1,130,000 | 7.375%, 6/1/2014 | 924,566 | ||
| Kansas City Southern Railway Company | ||||
| 580,000 | 13.000%, 12/15/2013 | 581,450 | ||
| Navios Maritime Holdings, Inc. | ||||
| 3,300,000 | 9.500%, 12/15/2014 | 1,831,500 | ||
| United Air Lines, Inc. | ||||
| 2,989,794 | 7.730%, 7/1/2010 | 2,795,457 | ||
| Windsor Petroleum Transport Corporation | ||||
| 3,500,000 | 7.840%, 1/15/2021i | 3,414,176 | ||
| Total Transportation | 16,748,052 | |||
| Utilities (8.7%) | ||||
| AES Corporation | ||||
| 1,616,000 | 8.750%, 5/15/2013g | 1,551,360 | ||
| 3,800,000 | 7.750%, 10/15/2015 | 3,192,000 | ||
| 3,800,000 | 8.000%, 10/15/2017 | 3,116,000 | ||
| Copano Energy, LLC | ||||
| 3,990,000 | 8.125%, 3/1/2016 | 2,892,750 | ||
| Dynegy Holdings, Inc. | ||||
| 2,020,000 | 6.875%, 4/1/2011 | 1,767,500 | ||
| 5,035,000 | 8.375%, 5/1/2016h | 3,574,850 | ||
| Edison Mission Energy | ||||
| 2,230,000 | 7.500%, 6/15/2013 | 2,040,450 | ||
| 3,710,000 | 7.000%, 5/15/2017 | 3,227,700 | ||
| 3,710,000 | 7.200%, 5/15/2019 | 3,042,200 | ||
| El Paso Corporation | ||||
| 860,000 | 12.000%, 12/12/2013h | 842,800 | ||
| 2,530,000 | 6.875%, 6/15/2014 | 2,042,507 | ||
The accompanying Notes to Financial Statements are an integral part of this schedule.
206
Table of Contents
High Yield Portfolio
Schedule of Investments as of December 31, 2008
| Principal Amount | Long-Term Fixed Income (87.0%) | Value | ||||
| Utilities (8.7%) - continued | ||||||
| 2,530,000 | 7.000%, 6/15/2017h | 1,979,991 | ||||
| Ferrellgas Partners, LP | ||||||
| 3,460,000 | 6.750%, 5/1/2014g | 2,387,400 | ||||
| NRG Energy, Inc. | ||||||
| 5,580,000 | 7.375%, 2/1/2016 | 5,189,400 | ||||
| Regency Energy Partners, LP | ||||||
| 3,350,000 | 8.375%, 12/15/2013 | 2,294,750 | ||||
| SemGroup, LP | ||||||
| 4,890,000 | 8.750%, 11/15/2015g,k | 171,150 | ||||
| Southern Star Central Corporation | ||||||
| 2,503,000 | 6.750%, 3/1/2016 | 2,077,490 | ||||
| Texas Competitive Electric Holdings Company, LLC | ||||||
| 8,620,000 | 10.250%, 11/1/2015g | 6,120,200 | ||||
| Williams Companies, Inc. | ||||||
| 2,940,000 | 7.625%, 7/15/2019 | 2,296,875 | ||||
| Williams Partners, LP | ||||||
| 2,400,000 | 7.250%, 2/1/2017 | 1,896,000 | ||||
| Total Utilities | 51,703,373 | |||||
Total Long-Term Fixed Income (cost $708,722,606) | 519,430,488 | |||||
| Shares | Preferred Stock (1.3%) | Value | ||||
| Financials (1.1%) | ||||||
| 3,400 | Bank of America Corporation, Convertible, 7.250% | 2,210,000 | ||||
| 34,340 | Citigroup, Inc., Convertible, 6.500% | 961,176 | ||||
| 86,177 | Credit Suisse NY, Convertible, Zero Couponl,m | 1,010,856 | ||||
| 91,000 | Merrill Lynch & Company, Inc., 8.625% | 1,799,980 | ||||
| 1,381 | Preferred Blocker, Inc., 9.000%g | 434,670 | ||||
| Total Financials | 6,416,682 | |||||
| Utilities (0.2%) | ||||||
| 5,040 | NRG Energy, Inc., Convertible, 5.750% | 1,102,853 | ||||
| Total Utilities | 1,102,853 | |||||
Total Preferred Stock (cost $10,683,726) | 7,519,535 | |||||
| Shares | Common Stock (<0.1%) | Value | ||||
| Consumer Discretionary (<0.1%) | ||||||
| 121,520 | TVMAX Holdings, Inc.l,n | 0 | ||||
| Total Consumer Discretionary | 0 | |||||
| Materials (<0.1%) | ||||||
| 30 | Pliant Corporationb,l,n | 0 | ||||
| 80,000 | ZSC Specialty Chemical plc, Preferred Stock Warrantsi,l,n | 0 | ||||
| 80,000 | ZSC Specialty Chemical plc, Stock Warrantsi,l,n | 0 | ||||
| Total Materials | 0 | |||||
| Telecommunications Services (<0.1%) | ||||||
| 4,621 | XO Holdings, Inc.l | 762 | ||||
| 9,243 | XO Holdings, Inc., Class A Stock Warrantsl | 37 | ||||
| 6,932 | XO Holdings, Inc., Class B Stock Warrantsl | 28 | ||||
| 6,932 | XO Holdings, Inc., Class C Stock Warrantsl | 2 | ||||
| Total Telecommunications Services | 829 | |||||
Total Common Stock (cost $6,566,208) | 829 | |||||
| Shares | Collateral Held for Securities Loaned (8.3%) | Value | ||||
| 49,481,715 | Thrivent Financial Securities Lending Trust | 49,481,715 | ||||
Total Collateral Held for Securities Loaned (cost $49,481,715) | 49,481,715 | |||||
| Shares or Principal Amount | Short-Term Investments (3.3%)o | Value | ||||
| Federal Home Loan Bank Discount Notes | ||||||
| 10,184,000 | 0.130%, 1/26/2009 | 10,183,081 | ||||
| Federal National Mortgage Association Discount Notes | ||||||
| 3,750,000 | 0.409%, 5/14/2009p | 3,744,388 | ||||
| 6,177,798 | Thrivent Money Market Portfolio | 6,177,798 | ||||
| Total Short-Term Investments (at amortized cost) | 20,105,267 | |||||
Total Investments (cost $833,740,460) 104.7% | $ | 625,015,367 | ||||
| Other Assets and Liabilities, Net (4.7%) | (27,795,575 | ) | ||||
| Total Net Assets 100.0% | $ | 597,219,792 | ||||
| a | The stated interest rate represents the weighted average of all contracts within the bank loan facility as discussed in item 2(U) in the Notes to Financial Statements. |
| b | Subsequent to December 31, 2008, the company has entered into bankruptcy and the security has decreased in value. |
| c | All or a portion of the loan is unfunded as discussed in item 2(U) of the Notes to Financial Statements. |
| d | Denotes investments purchased on a when-issued or delayed delivery basis. |
| e | All or a portion of the security is insured or guaranteed. |
| f | Denotes variable rate obligations for which the current yield and next scheduled reset date are shown. |
| g | Denotes securities sold under Rule 144A of the Securities Act of 1933, which exempts them from registration. These securities have been deemed liquid and may be resold to other dealers in the program or to other qualified institutional buyers. As of December 31, 2008, the value of these investments was $97,282,619 or 16.3% of total net assets. |
| h | All or a portion of the security is on loan as discussed in item 2(M) of the Notes to Financial Statements. |
The accompanying Notes to Financial Statements are an integral part of this schedule.
207
Table of Contents
High Yield Portfolio
Schedule of Investments as of December 31, 2008
| i | Denotes restricted securities. Restricted securities are investment securities which have been deemed illiquid and cannot be offered for public sale without first being registered under the Securities Act of 1933. The following table indicates the acquisition date and cost of restricted securities High Yield Portfolio owned as of December 31, 2008. |
Security | Acquisition Date | Cost | |||
Rock-Tenn Company | 2/28/2008 | $ | 844,050 | ||
Surgical Care Affiliates, Inc. | 6/21/2007 | 3,780,000 | |||
Tunica Biloxi Gaming Authority | 11/8/2005 | 6,523,209 | |||
Turning Stone Resort Casino Enterprise | 5/1/2007 | 2,019,941 | |||
Turning Stone Resort Casino Enterprise | 9/8/2006 | 4,117,813 | |||
Windsor Petroleum Transport Corporation | 4/15/1998 | 2,874,757 | |||
ZSC Specialty Chemical plc, Preferred Stock Warrants | 6/24/1999 | 47,567 | |||
ZSC Specialty Chemical plc, Stock Warrants | 6/24/1999 | 111,712 | |||
| j | Denotes step coupon bonds for which the current interest rate and next scheduled reset date are shown. |
| k | In bankruptcy. |
| l | Non-income producing security. |
| m | These securities are Equity-Linked Structured Securities as discussed in item 2(Q) of the Notes to Financial Statements. |
| n | Security is fair valued as discussed in item 2(A) of the Notes to Financial Statements. |
| o | The interest rate shown reflects the yield, coupon rate or, for securities purchased at a discount, the discount rate at the date of purchase. |
| p | At December 31, 2008, $3,295,061 of investments were pledged as collateral with the custodian under the agreement between the counterparty, the custodian and the fund for open swap contracts. |
Gross unrealized appreciation and depreciation of investments, based on cost for federal income tax purposes, were as follows:
Gross unrealized appreciation | $ | 2,171,330 | ||
Gross unrealized depreciation | (211,252,699 | ) | ||
Net unrealized appreciation (depreciation) | $ | (209,081,369 | ) | |
Cost for federal income tax purposes | $ | 834,096,736 |
The following table is a summary of the inputs used, as of December 31, 2008, in valuing the High Yield Portfolio’s assets carried at fair value as discussed in item 2(A) of the Notes to Financial Statements.
Level | Investments in Securities | Other Financial Instruments* | |||||
Level 1 | $ | 61,734,351 | $ | — | |||
Level 2 | 558,397,362 | (1,181,418 | ) | ||||
Level 3 | 4,883,654 | — | |||||
Totals (Level 1,2,3) | $ | 625,015,367 | ($1,181,418 | ) | |||
The following table is a reconciliation of assets in which significant unobservable inputs (Level 3) were used in determining fair value for the High Yield Portfolio as discussed in item 2(A) of the Notes to Financial Statements.
| Investments in Securities | Other Financial Instruments* | ||||||
Value December 31, 2007 | $ | 2,974,675 | $ | — | |||
Accrued Discounts/Premiums | (9,144 | ) | — | ||||
Realized Gain/(Loss) | (22,434 | ) | — | ||||
Change in Unrealized Gain/(Loss) | (3,192,501 | ) | — | ||||
Net Purchases/Sales | (667,735 | ) | — | ||||
Transfers In and/or Out of Level 3 | 5,800,793 | — | |||||
Value December 31, 2008 | $ | 4,883,654 | $ | — | |||
| * | Other Financial Instruments include Futures, Forwards, Written Options and Swap agreements. |
The accompanying Notes to Financial Statements are an integral part of this schedule.
208
Table of Contents
High Yield Portfolio
Schedule of Investments as of December 31, 2008
Credit Default Swaps and Counterparty | Buy/Sell Protection1 | Termination Date | Notional Principal Amount2 | Upfront Payments Received (Made) | Value3 | Unrealized Gain/(Loss) | ||||||||||||
LCDX, Series 10, 5 Year, at 3.25%; J.P. Morgan Chase and Co. | Sell | 6/20/2013 | $ | 8,330,000 | $ | 583,844 | ($ | 1,729,124 | ) | ($ | 1,181,418 | ) | ||||||
Total Credit Default Swaps | ($ | 1,729,124 | ) | ($ | 1,181,418 | ) | ||||||||||||
| 1 | As the buyer of protection, High Yield Portfolio pays periodic fees in return for payment by the seller which is contingent upon an adverse credit event occurring in the underlying issuer or reference entity. As the seller of protection, High Yield Portfolio collects periodic fees from the buyer and profits if the credit of the underlying issuer or reference entity remains stable or improves while the swap is outstanding, but the seller in a credit default swap contract would be required to pay the amount of credit loss, determined as specified in the agreement, to the buyer in the event of an adverse credit event in the reference entity. |
| 2 | The maximum potential amount of future payments High Yield Portfolio could be required to make as the seller or receive as the buyer of protection. |
| 3 | The market value for credit indices (CDX or LCDX) serve as an indicator of the current status of the payment/performance risk and represent the liability or profit for the credit default swap contract had the contract been closed as of the reporting date. In the case when protection has been sold, the market value of the swap will increase when the swap spread declines representing an improvement in the reference entity’s credit worthiness. The market value of the swap will decrease when the swap spread increases representing a deterioration in the reference entity’s credit worthiness. |
Investment in Affiliates
Affiliated issuers, as defined under the Investment Company Act of 1940, include those in which the Portfolio’s holdings of an issuer represent 5% or more of the outstanding voting securities of an issuer, or any affiliated mutual fund.
A summary of transactions for the fiscal year to date, in High Yield Portfolio, is as follows:
Portfolio | Value December 31, 2007 | Gross Purchases and Additions | Gross Sales and Reductions | Balance of Shares Held at December 31, 2008 | Value December 31, 2008 | Income Earned January 1, 2008 - December 31, 2008 | |||||||||||
Money Market | $ | 50,560,829 | $ | 105,418,575 | $ | 149,801,606 | 6,177,798 | $ | 6,177,798 | $ | 954,482 | ||||||
Thrivent Financial Securities Lending Trust | 93,306,453 | 331,114,655 | 374,939,393 | 49,481,715 | 49,481,715 | 496,727 | |||||||||||
Total Value and Income Earned | 143,867,282 | 55,659,513 | 1,451,209 | ||||||||||||||
The accompanying Notes to Financial Statements are an integral part of this schedule.
209
Table of Contents
Diversified Income Plus Portfolio
Schedule of Investments as of December 31, 2008
Principal Amount | Bank Loans (4.2%)a | Value | ||
| Basic Materials (0.4%) | ||||
Graphic Packaging International, Inc., Term Loan | ||||
| 399,908 | 6.683%, 5/16/2014 | 298,431 | ||
| Total Basic Materials | 298,431 | |||
| Capital Goods (0.4%) | ||||
Owens-Brockway Glass Container, Inc., Term Loan | ||||
| 400,000 | 2.695%, 6/14/2013 | 330,000 | ||
| Total Capital Goods | 330,000 | |||
| Communications Services (0.9%) | ||||
Charter Communications Operating, LLC, Term Loan | ||||
| 398,995 | 8.500%, 3/6/2014 | 312,465 | ||
Windstream Corporation, Term Loan | ||||
| 398,988 | 6.050%, 7/17/2013 | 337,743 | ||
| Total Communications Services | 650,208 | |||
| Consumer Non-Cyclical (1.3%) | ||||
CHS/Community Health Systems, Inc., Term Loan | ||||
| 19,462 | 1.801%, 7/25/2014b,c | 15,151 | ||
| 380,538 | 4.445%, 7/25/2014 | 296,249 | ||
Constellation Brands, Inc., Term Loan | ||||
| 400,000 | 3.511%, 6/5/2013 | 353,200 | ||
HCA, Inc., Term Loan | ||||
| 398,982 | 3.709%, 11/18/2013 | 311,318 | ||
| Total Consumer Non-Cyclical | 975,918 | |||
| Utilities (1.2%) | ||||
Energy Future Holdings, Term Loan | ||||
| 797,980 | 5.582%, 10/10/2014 | 549,944 | ||
NRG Energy, Inc., Term Loan | ||||
| 267,539 | 2.675%, 2/1/2013 | 233,093 | ||
| 131,666 | 2.959%, 2/1/2013 | 114,714 | ||
| Total Utilities | 897,751 | |||
Total Bank Loans (cost $3,324,450) | 3,152,308 | |||
| Principal Amount | Long-Term Fixed Income (65.6%) | Value | ||
| Asset-Backed Securities (5.8%) | ||||
Americredit Automobile Receivables Trust | ||||
| 1,000,000 | 5.490%, 7/6/2012d | 940,931 | ||
GAMUT Reinsurance, Ltd. | ||||
| 650,000 | 10.465%, 2/2/2009e,f | 590,135 | ||
| 250,000 | 18.465%, 2/2/2009e,f | 190,000 | ||
GMAC Mortgage Corporation Loan Trust | ||||
| 675,000 | 6.180%, 5/25/2036d | 536,113 | ||
Merna Re, Ltd. | ||||
| 400,000 | 4.209%, 3/30/2009e,f | 360,960 | ||
| 400,000 | 3.209%, 3/31/2009e,f | 361,160 | ||
Residential Asset Mortgage Products, Inc. | ||||
| 1,138,873 | 4.547%, 12/25/2034 | 787,595 | ||
Residential Funding Mortgage Securities | ||||
| 617,065 | 4.470%, 7/25/2018d | 563,091 | ||
| Total Asset-Backed Securities | 4,329,985 | |||
| Basic Materials (2.6%) | ||||
Airgas, Inc. | ||||
| 100,000 | 7.125%, 10/1/2018e | 85,500 | ||
Aleris International, Inc. | ||||
| 110,000 | 9.000%, 12/15/2014g | 6,600 | ||
Arch Western Finance, LLC | ||||
| 160,000 | 6.750%, 7/1/2013 | 139,200 | ||
Cascades, Inc. | ||||
| 100,000 | 7.250%, 2/15/2013 | 51,000 | ||
Chemtura Corporation | ||||
| 160,000 | 6.875%, 6/1/2016 | 81,600 | ||
Domtar, Inc. | ||||
| 130,000 | 7.125%, 8/15/2015 | 84,500 | ||
Drummond Company, Inc. | ||||
| 130,000 | 7.375%, 2/15/2016e | 63,050 | ||
FMG Finance, Pty., Ltd. | ||||
| 230,000 | 10.625%, 9/1/2016e | 133,400 | ||
Georgia-Pacific Corporation | ||||
| 90,000 | 8.125%, 5/15/2011h | 84,600 | ||
| 340,000 | 7.125%, 1/15/2017e | 285,600 | ||
Graphic Packaging International Corporation | ||||
| 110,000 | 9.500%, 8/15/2013 | 75,900 | ||
Griffin Coal Mining Company, Pty., Ltd. | ||||
| 240,000 | 9.500%, 12/1/2016e | 80,400 | ||
Invista | ||||
| 110,000 | 9.250%, 5/1/2012e | 77,000 | ||
Jefferson Smurfit Corporation | ||||
| 80,000 | 8.250%, 10/1/2012g | 13,600 | ||
Nalco Company | ||||
| 205,000 | 8.875%, 11/15/2013 | 173,225 | ||
NOVA Chemicals Corporation | ||||
| 100,000 | 6.500%, 1/15/2012 | 41,500 | ||
Novelis, Inc. | ||||
| 220,000 | 7.250%, 2/15/2015 | 127,600 | ||
Peabody Energy Corporation | ||||
| 200,000 | 5.875%, 4/15/2016 | 170,000 | ||
Smurfit-Stone Container Enterprises, Inc. | ||||
| 160,000 | 8.000%, 3/15/2017g,h | 30,400 | ||
Terra Capital, Inc. | ||||
| 120,000 | 7.000%, 2/1/2017 | 88,200 | ||
Vedanta Resources plc | ||||
| 105,000 | 8.750%, 1/15/2014e | 63,000 | ||
| Total Basic Materials | 1,955,875 | |||
| Capital Goods (4.5%) | ||||
Alliant Tech Systems, Convertible | ||||
| 350,000 | 2.750%, 9/15/2011 | 343,875 | ||
Allied Waste North America, Inc. | ||||
| 440,000 | 6.875%, 6/1/2017 | 409,200 | ||
The accompanying Notes to Financial Statements are an integral part of this schedule.
210
Table of Contents
Diversified Income Plus Portfolio
Schedule of Investments as of December 31, 2008
Principal Amount | Long-Term Fixed Income (65.6%) | Value | ||
| Capital Goods (4.5%) - continued | ||||
BE Aerospace, Inc. | ||||
| 100,000 | 8.500%, 7/1/2018 | 90,000 | ||
Bombardier, Inc. | ||||
| 160,000 | 6.750%, 5/1/2012e | 142,000 | ||
| �� | Case New Holland, Inc. | |||
| 210,000 | 7.125%, 3/1/2014 | 149,100 | ||
Crown Americas, Inc. | ||||
| 100,000 | 7.625%, 11/15/2013 | 99,000 | ||
| 100,000 | 7.750%, 11/15/2015 | 99,500 | ||
L-3 Communications Corporation | ||||
| 330,000 | 5.875%, 1/15/2015 | 297,000 | ||
Legrand SA | ||||
| 100,000 | 8.500%, 2/15/2025 | 87,473 | ||
Leucadia National Corporation | ||||
| 360,000 | 7.125%, 3/15/2017 | 267,300 | ||
Mueller Water Products, Inc. | ||||
| 140,000 | 7.375%, 6/1/2017 | 95,200 | ||
Owens Corning, Inc. | ||||
| 185,000 | 6.500%, 12/1/2016 | 133,978 | ||
Owens-Brockway Glass Container, Inc. | ||||
| 70,000 | 8.250%, 5/15/2013 | 68,950 | ||
Owens-Illinois, Inc. | ||||
| 210,000 | 7.500%, 5/15/2010 | 207,900 | ||
RBS Global, Inc./Rexnord Corporation | ||||
| 210,000 | 9.500%, 8/1/2014 | 156,450 | ||
SPX Corporation | ||||
| 205,000 | 7.625%, 12/15/2014e | 178,350 | ||
Terex Corporation | ||||
| 205,000 | 8.000%, 11/15/2017 | 174,250 | ||
Texas Industries, Inc. | ||||
| 100,000 | 7.250%, 7/15/2013e | 77,250 | ||
TransDigm, Inc. | ||||
| 110,000 | 7.750%, 7/15/2014 | 90,200 | ||
United Rentals North America, Inc. | ||||
| 270,000 | 7.000%, 2/15/2014 | 164,700 | ||
USG Corporation | ||||
| 120,000 | 8.000%, 1/15/2018 | 75,900 | ||
| Total Capital Goods | 3,407,576 | |||
| Collateralized Mortgage Obligations (12.2%) | ||||
Bear Stearns Adjustable Rate Mortgage Trust | ||||
| 1,412,390 | 4.625%, 8/25/2010f | 1,080,995 | ||
Citigroup Mortgage Loan Trust, Inc. | ||||
| 879,831 | 5.500%, 11/25/2035 | 555,168 | ||
Citimortgage Alternative Loan Trust | ||||
| 1,121,709 | 5.750%, 4/25/2037 | 641,755 | ||
Countrywide Alternative Loan Trust | ||||
| 565,498 | 6.000%, 1/25/2037 | 386,668 | ||
Deutsche Alt-A Securities, Inc. | ||||
| 1,683,483 | 3.026%, 1/1/2009f | 719,950 | ||
| 535,140 | 5.500%, 10/25/2021 | 390,485 | ||
First Horizon ABS Trust | ||||
| 826,164 | 5.848%, 8/25/2037 | 551,018 | ||
J.P. Morgan Alternative Loan Trust | ||||
| 374,743 | 0.541%, 1/25/2009f | 330,157 | ||
J.P. Morgan Mortgage Trust | ||||
| 427,833 | 6.500%, 1/25/2035 | 294,536 | ||
| 879,771 | 6.040%, 10/25/2036 | 613,580 | ||
MASTR Alternative Loans Trust | ||||
| 1,097,669 | 6.500%, 5/25/2034 | 920,328 | ||
| 465,157 | 6.500%, 7/25/2034 | 399,308 | ||
Washington Mutual Alternative Loan Trust | ||||
| 1,312,581 | 3.006%, 1/1/2009f | 481,380 | ||
Washington Mutual Mortgage Pass-Through Certificates | ||||
| 977,456 | 5.871%, 8/25/2046 | 837,259 | ||
Wells Fargo Mortgage Backed Securities Trust | ||||
| 1,812,095 | 6.030%, 9/25/2036 | 405,301 | ||
| 908,366 | 6.000%, 7/25/2037 | 589,870 | ||
| Total Collateralized Mortgage Obligations | 9,197,758 | |||
| Commercial Mortgage-Backed Securities (5.0%) | ||||
Commercial Mortgage Pass- Through Certificates | ||||
| 2,000,000 | 1.375%, 1/15/2009f,i | 1,194,976 | ||
Greenwich Capital Commercial Funding Corporation | ||||
| 750,000 | 5.867%, 8/10/2017 | 381,031 | ||
J.P. Morgan Chase Commercial Mortgage Securities Corporation | ||||
| 1,250,000 | 5.336%, 5/15/2047 | 937,721 | ||
Wachovia Bank Commercial Mortgage Trust | ||||
| 2,000,000 | 1.315%, 1/15/2009f,i | 1,253,561 | ||
| Total Commercial Mortgage- Backed Securities | 3,767,289 | |||
| Communications Services (6.4%) | ||||
American Tower Corporation | ||||
| 70,000 | 7.000%, 10/15/2017e,h | 62,300 | ||
Centennial Communications Corporation | ||||
| 120,000 | 8.125%, 2/1/2014 | 121,800 | ||
Charter Communications Operating, LLC | ||||
| 100,000 | 8.000%, 4/30/2012e | 82,000 | ||
| 200,000 | 8.375%, 4/30/2014e | 153,000 | ||
Cincinnati Bell, Inc. | ||||
| 205,000 | 7.250%, 7/15/2013 | 180,400 | ||
Cricket Communications, Inc. | ||||
| 205,000 | 9.375%, 11/1/2014 | 184,500 | ||
CSC Holdings, Inc. | ||||
| 450,000 | 7.625%, 4/1/2011 | 424,125 | ||
Dex Media West, LLC/Dex Media West Finance Company | ||||
| 100,000 | 8.500%, 8/15/2010 | 60,500 | ||
| 70,000 | 9.875%, 8/15/2013 | 16,625 | ||
DIRECTV Holdings, LLC | ||||
| 165,000 | 6.375%, 6/15/2015 | 152,213 | ||
The accompanying Notes to Financial Statements are an integral part of this schedule.
211
Table of Contents
Diversified Income Plus Portfolio
Schedule of Investments as of December 31, 2008
Principal Amount | Long-Term Fixed Income (65.6%) | Value | ||
| Communications Services (6.4%) - continued | ||||
| 210,000 | 7.625%, 5/15/2016 | 203,700 | ||
EchoStar DBS Corporation | ||||
| 215,000 | 6.625%, 10/1/2014 | 179,525 | ||
Intelsat Subsidiary Holding Company, Ltd. | ||||
| 160,000 | 8.500%, 1/15/2013e | 148,000 | ||
| 205,000 | 8.875%, 1/15/2015e | 186,550 | ||
Interpublic Group of Companies, Inc. | ||||
| 205,000 | 6.250%, 11/15/2014 | 91,225 | ||
Lamar Media Corporation | ||||
| 100,000 | 7.250%, 1/1/2013h | 79,750 | ||
| 90,000 | 6.625%, 8/15/2015 | 65,025 | ||
Liberty Media Corporation | ||||
| 220,000 | 5.700%, 5/15/2013 | 144,227 | ||
Liberty Media Corporation, Convertible | ||||
| 400,000 | 3.125%, 3/30/2023 | 287,000 | ||
Mediacom Broadband, LLC | ||||
| 210,000 | 8.500%, 10/15/2015 | 136,762 | ||
News America, Inc. | ||||
| 200,000 | 6.650%, 11/15/2037 | 197,952 | ||
Nextel Communications, Inc. | ||||
| 100,000 | 7.375%, 8/1/2015 | 42,000 | ||
NTL Cable plc | ||||
| 170,000 | 9.125%, 8/15/2016 | 125,800 | ||
Quebecor Media, Inc. | ||||
| 250,000 | 7.750%, 3/15/2016 | 168,750 | ||
Qwest Communications International, Inc. | ||||
| 200,000 | 7.250%, 2/15/2011 | 174,000 | ||
Qwest Corporation | ||||
| 250,000 | 7.875%, 9/1/2011 | 230,000 | ||
R.H. Donnelley Corporation | ||||
| 200,000 | 6.875%, 1/15/2013 | 27,000 | ||
| 200,000 | 8.875%, 10/15/2017 | 30,000 | ||
R.H. Donnelley, Inc. | ||||
| 4,000 | 11.750%, 5/15/2015e | 980 | ||
Sprint Capital Corporation | ||||
| 210,000 | 8.375%, 3/15/2012 | 168,000 | ||
Sprint Nextel Corporation | ||||
| 145,000 | 6.000%, 12/1/2016 | 102,225 | ||
Time Warner Cable, Inc. | ||||
| 200,000 | 5.850%, 5/1/2017 | 182,711 | ||
Videotron Ltee | ||||
| 210,000 | 6.875%, 1/15/2014 | 185,850 | ||
Windstream Corporation | ||||
| 200,000 | 8.625%, 8/1/2016 | 177,000 | ||
| Total Communications Services | 4,771,495 | |||
| Consumer Cyclical (5.9%) | ||||
AutoNation, Inc. | ||||
| 100,000 | 7.000%, 4/15/2014h | 73,000 | ||
Beazer Homes USA, Inc. | ||||
| 240,000 | 8.625%, 5/15/2011 | 127,200 | ||
Best Buy Company, Inc., Convertible | ||||
| 300,000 | 2.250%, 1/15/2022 | 267,750 | ||
Centex Corporation | ||||
| 400,000 | 7.500%, 1/15/2012 | 324,000 | ||
Circus & Eldorado Joint Venture/Silver Legacy Capital Corporation | ||||
| 180,000 | 10.125%, 3/1/2012 | 115,200 | ||
Corrections Corporation of America | ||||
| 230,000 | 6.250%, 3/15/2013 | 213,900 | ||
D.R. Horton, Inc. | ||||
| 200,000 | 6.500%, 4/15/2016 | 126,000 | ||
Dollarama Group, LP | ||||
| 102,000 | 8.073%, 6/15/2009f | 64,770 | ||
| 180,000 | 8.875%, 8/15/2012 | 135,000 | ||
Ford Motor Credit Company | ||||
| 165,000 | 7.375%, 10/28/2009 | 144,906 | ||
| 130,000 | 7.000%, 10/1/2013 | 89,821 | ||
| 90,000 | 8.000%, 12/15/2016 | 58,623 | ||
Goodyear Tire & Rubber Company | ||||
| 100,000 | 8.625%, 12/1/2011 | 83,000 | ||
Host Hotels & Resorts, LP | ||||
| 330,000 | 6.375%, 3/15/2015 | 245,850 | ||
KB Home | ||||
| 220,000 | 6.250%, 6/15/2015 | 134,200 | ||
Lear Corporation | ||||
| 205,000 | 8.500%, 12/1/2013 | 63,550 | ||
Levi Strauss & Company | ||||
| 100,000 | 9.750%, 1/15/2015 | 74,000 | ||
MGM MIRAGE | ||||
| 230,000 | 13.000%, 11/15/2013e,h | 219,075 | ||
| 205,000 | 6.625%, 7/15/2015h | 125,050 | ||
Pinnacle Entertainment, Inc. | ||||
| 210,000 | 8.250%, 3/15/2012 | 159,600 | ||
Pokagon Gaming Authority | ||||
| 196,000 | 10.375%, 6/15/2014e | 168,560 | ||
Pulte Homes, Inc. | ||||
| 305,000 | 7.875%, 8/1/2011 | 263,825 | ||
Rite Aid Corporation | ||||
| 100,000 | 10.375%, 7/15/2016 | 73,500 | ||
| 160,000 | 7.500%, 3/1/2017 | 104,000 | ||
Royal Caribbean Cruises, Ltd. | ||||
| 120,000 | 7.250%, 6/15/2016 | 65,400 | ||
Service Corporation International | ||||
| 130,000 | 6.750%, 4/1/2015 | 102,700 | ||
Tenneco, Inc. | ||||
| 220,000 | 8.125%, 11/15/2015 | 101,200 | ||
TRW Automotive, Inc. | ||||
| 100,000 | 7.000%, 3/15/2014e,h | 53,000 | ||
Tunica Biloxi Gaming Authority | ||||
| 260,000 | 9.000%, 11/15/2015i | 205,400 | ||
Turning Stone Resort Casino Enterprise | ||||
| 130,000 | 9.125%, 9/15/2014i | 98,800 | ||
Universal City Florida Holding Company I/II | ||||
| 180,000 | 7.943%, 2/1/2009f | 77,400 | ||
Warnaco, Inc. | ||||
| 150,000 | 8.875%, 6/15/2013 | 136,500 | ||
Wynn Las Vegas Capital Corporation | ||||
| 210,000 | 6.625%, 12/1/2014 | 158,550 | ||
| Total Consumer Cyclical | 4,453,330 | |||
The accompanying Notes to Financial Statements are an integral part of this schedule.
212
Table of Contents
Diversified Income Plus Portfolio
Schedule of Investments as of December 31, 2008
Principal Amount | Long-Term Fixed Income (65.6%) | Value | ||
| Consumer Non-Cyclical (7.0%) | ||||
Amgen, Inc., Convertible | ||||
| 300,000 | 0.375%, 2/1/2013 | 285,375 | ||
Aramark Corporation | ||||
| 200,000 | 8.500%, 2/1/2015 | 181,000 | ||
Biomet, Inc. | ||||
| 310,000 | 10.000%, 10/15/2017e | 297,600 | ||
Boston Scientific Corporation | ||||
| 365,000 | 5.450%, 6/15/2014 | 310,250 | ||
Community Health Systems, Inc. | ||||
| 280,000 | 8.875%, 7/15/2015 | 257,600 | ||
Constellation Brands, Inc. | ||||
| 205,000 | 7.250%, 9/1/2016 | 193,725 | ||
Coventry Health Care, Inc. | ||||
| 200,000 | 5.950%, 3/15/2017 | 104,269 | ||
DaVita, Inc. | ||||
| 210,000 | 6.625%, 3/15/2013 | 199,500 | ||
Dean Foods Company | ||||
| 100,000 | 7.000%, 6/1/2016 | 85,000 | ||
Del Monte Corporation | ||||
| 100,000 | 8.625%, 12/15/2012 | 97,000 | ||
Fisher Scientific International, Inc. Convertible | ||||
| 200,000 | 3.250%, 3/1/2024 | 224,250 | ||
FMC Finance III SA | ||||
| 200,000 | 6.875%, 7/15/2017 | 187,000 | ||
HCA, Inc. | ||||
| 380,000 | 9.250%, 11/15/2016 | 348,650 | ||
Invitrogen Corporation, Convertible | ||||
| 300,000 | 2.000%, 8/1/2023 | 280,875 | ||
Jarden Corporation | ||||
| 190,000 | 7.500%, 5/1/2017 | 129,675 | ||
Medtronic, Inc., Convertible | ||||
| 300,000 | 1.625%, 4/15/2013 | 264,750 | ||
Michael Foods, Inc. | ||||
| 160,000 | 8.000%, 11/15/2013 | 137,600 | ||
Omega Healthcare Investors, Inc. | ||||
| 100,000 | 7.000%, 4/1/2014 | 81,000 | ||
Omnicare, Inc. | ||||
| 200,000 | 6.875%, 12/15/2015 | 164,000 | ||
Smithfield Foods, Inc. | ||||
| 100,000 | 7.000%, 8/1/2011 | 71,000 | ||
Stater Brothers Holdings, Inc. | ||||
| 210,000 | 8.125%, 6/15/2012 | 190,050 | ||
SUPERVALU, Inc. | ||||
| 340,000 | 7.500%, 11/15/2014 | 278,800 | ||
Tenet Healthcare Corporation | ||||
| 200,000 | 6.500%, 6/1/2012 | 152,000 | ||
| 200,000 | 7.375%, 2/1/2013 | 142,500 | ||
Teva Pharmaceutical Finance Company, Convertible | ||||
| 300,000 | 1.750%, 2/1/2026 | 329,625 | ||
Tyson Foods, Inc. | ||||
| 200,000 | 7.350%, 4/1/2016 | 148,000 | ||
Visant Corporation | ||||
| 100,000 | 7.625%, 10/1/2012 | 82,000 | ||
| Total Consumer Non-Cyclical | 5,223,094 | |||
| Energy (3.9%) | ||||
Cameron International Corporation, Convertible | ||||
| 300,000 | 2.500%, 6/15/2026 | 296,250 | ||
Chesapeake Energy Corporation | ||||
| 320,000 | 6.375%, 6/15/2015 | 252,800 | ||
| 140,000 | 6.250%, 1/15/2018 | 103,600 | ||
Chesapeake Energy Corporation, Convertible | ||||
| 300,000 | 2.750%, 11/15/2035 | 189,375 | ||
Cie Generale de Geophysique Veritas | ||||
| 200,000 | 7.500%, 5/15/2015 | 124,000 | ||
Connacher Oil and Gas, Ltd. | ||||
| 220,000 | 10.250%, 12/15/2015e | 88,000 | ||
Denbury Resources, Inc. | ||||
| 155,000 | 7.500%, 12/15/2015 | 110,050 | ||
Forest Oil Corporation | ||||
| 210,000 | 7.250%, 6/15/2019 | 153,300 | ||
Hornbeck Offshore Services, Inc. | ||||
| 130,000 | 6.125%, 12/1/2014 | 84,500 | ||
Newfield Exploration Company | ||||
| 135,000 | 6.625%, 4/15/2016 | 107,325 | ||
OPTI Canada, Inc. | ||||
| 190,000 | 8.250%, 12/15/2014 | 102,600 | ||
PetroHawk Energy Corporation | ||||
| 200,000 | 9.125%, 7/15/2013 | 162,000 | ||
Petroplus Finance, Ltd. | ||||
| 140,000 | 7.000%, 5/1/2017e | 85,400 | ||
Pioneer Natural Resources Company | ||||
| 200,000 | 6.650%, 3/15/2017 | 142,720 | ||
Plains Exploration & Production Company | ||||
| 220,000 | 7.750%, 6/15/2015 | 166,100 | ||
PNM Resources, Inc. | ||||
| 100,000 | 9.250%, 5/15/2015 | 79,500 | ||
Pride International, Inc. | ||||
| 95,000 | 7.375%, 7/15/2014 | 88,350 | ||
Sandridge Energy, Inc. | ||||
| 205,000 | 8.000%, 6/1/2018e | 113,775 | ||
Tesoro Corporation | ||||
| 200,000 | 6.625%, 11/1/2015 | 116,000 | ||
Transocean, Inc., Convertible | ||||
| 240,000 | 1.500%, 12/15/2037 | 194,400 | ||
Whiting Petroleum Corporation | ||||
| 205,000 | 7.000%, 2/1/2014 | 144,525 | ||
| Total Energy | 2,904,570 | |||
| Financials (4.0%) | ||||
AXA SA | ||||
| 200,000 | 6.463%, 12/14/2018e | 87,366 | ||
Bank of America Corporation | ||||
| 80,000 | 8.000%, 1/30/2018 | 57,543 | ||
BBVA Bancomer SA | ||||
| 200,000 | 6.008%, 5/17/2022e | 133,063 | ||
Deluxe Corporation | ||||
| 100,000 | 5.125%, 10/1/2014 | 45,000 | ||
Fairfax Financial Holdings, Ltd. | ||||
| 100,000 | 7.750%, 6/15/2017 | 76,000 | ||
General Motors Acceptance Corporation, LLC | ||||
| 205,000 | 6.875%, 9/15/2011e | 167,948 | ||
| 129,000 | 6.875%, 8/28/2012e | 99,018 | ||
J.P. Morgan Chase Capital XX | ||||
| 440,000 | 6.550%, 9/29/2036 | 371,927 | ||
The accompanying Notes to Financial Statements are an integral part of this schedule.
213
Table of Contents
Diversified Income Plus Portfolio
Schedule of Investments as of December 31, 2008
Principal Amount | Long-Term Fixed Income (65.6%) | Value | ||
| Financials (4.0%) - continued | ||||
Lehman Brothers Holdings, Inc. | ||||
| 400,000 | 7.000%, 9/27/2027j | 38,000 | ||
Lincoln National Corporation | ||||
| 630,000 | 7.000%, 5/17/2066 | 264,600 | ||
MetLife, Inc. | ||||
| 50,000 | 7.875%, 12/15/2037e | 31,368 | ||
Mitsubishi UFG Capital Finance, Ltd. | ||||
| 200,000 | 6.346%, 7/25/2016 | 139,345 | ||
Nuveen Investments, Inc. | ||||
| 100,000 | 10.500%, 11/15/2015e | 22,125 | ||
ProLogis Trust | ||||
| 210,000 | 5.625%, 11/15/2016 | 100,725 | ||
Prudential Financial, Inc. | ||||
| 85,000 | 8.875%, 6/15/2038 | 54,759 | ||
Rabobank Capital Funding Trust | ||||
| 420,000 | 5.254%, 10/21/2016e | 230,275 | ||
Rouse Company, LP | ||||
| 210,000 | 3.625%, 3/15/2009 | 87,150 | ||
| 105,000 | 6.750%, 5/1/2013e | 37,800 | ||
Royal Bank of Scotland Group plc | ||||
| 420,000 | 6.990%, 10/5/2017e | 196,365 | ||
Swiss RE Capital I, LP | ||||
| 420,000 | 6.854%, 5/25/2016e | 133,583 | ||
Wachovia Capital Trust III | ||||
| 420,000 | 5.800%, 3/15/2011 | 247,800 | ||
Wells Fargo Capital XIII | ||||
| 440,000 | 7.700%, 3/26/2013 | 363,137 | ||
| Total Financials | 2,984,897 | |||
| Technology (2.3%) | ||||
Amkor Technology, Inc. | ||||
| 100,000 | 7.750%, 5/15/2013 | 57,000 | ||
Avago Technologies Finance Pte | ||||
| 26,000 | 7.703%, 3/2/2009f | 20,703 | ||
| 130,000 | 10.125%, 12/1/2013 | 98,962 | ||
EMC Corporation, Convertible | ||||
| 250,000 | 1.750%, 12/1/2013 | 233,750 | ||
Flextronics International, Ltd. | ||||
| 170,000 | 6.250%, 11/15/2014 | 126,650 | ||
Freescale Semiconductor, Inc. | ||||
| 310,000 | 8.875%, 12/15/2014 | 136,400 | ||
Intel Corporation, Convertible | ||||
| 400,000 | 2.950%, 12/15/2035 | 346,500 | ||
Iron Mountain, Inc. | ||||
| 205,000 | 7.750%, 1/15/2015 | 183,987 | ||
NXP BV/NXP Funding, LLC | ||||
| 80,000 | 7.503%, 1/15/2009f | 26,600 | ||
Sanmina-SCI Corporation | ||||
| 160,000 | 6.750%, 3/1/2013h | 68,800 | ||
Seagate Technology HDD Holdings | ||||
| 230,000 | 6.800%, 10/1/2016 | 119,600 | ||
Sungard Data Systems, Inc. | ||||
| 330,000 | 4.875%, 1/15/2014 | 227,700 | ||
Unisys Corporation | ||||
| 210,000 | 8.000%, 10/15/2012 | 58,800 | ||
| Total Technology | 1,705,452 | |||
| Transportation (1.0%) | ||||
Avis Budget Car Rental, LLC | ||||
| 105,000 | 7.750%, 5/15/2016h | 30,450 | ||
Continental Airlines, Inc. | ||||
| 191,770 | 7.875%, 7/2/2018 | 107,391 | ||
Delta Air Lines, Inc. | ||||
| 140,000 | 7.920%, 11/18/2010 | 93,100 | ||
Hertz Corporation | ||||
| 270,000 | 8.875%, 1/1/2014 | 166,050 | ||
Kansas City Southern de Mexico SA de CV | ||||
| 150,000 | 7.625%, 12/1/2013 | 123,000 | ||
Piper Jaffray Equipment Trust Securities | ||||
| 312,671 | 6.750%, 4/1/2011i | 223,560 | ||
| Total Transportation | 743,551 | |||
| Utilities (5.0%) | ||||
AES Corporation | ||||
| 430,000 | 7.750%, 10/15/2015 | 361,200 | ||
AmeriGas Partners, LP | ||||
| 100,000 | 7.250%, 5/20/2015 | 81,500 | ||
Dynegy Holdings, Inc. | ||||
| 110,000 | 6.875%, 4/1/2011 | 96,250 | ||
| 120,000 | 8.375%, 5/1/2016 | 85,200 | ||
| 100,000 | 7.750%, 6/1/2019 | 69,000 | ||
Edison Mission Energy | ||||
| 130,000 | 7.750%, 6/15/2016 | 115,700 | ||
| 200,000 | 7.000%, 5/15/2017 | 174,000 | ||
El Paso Corporation | ||||
| 100,000 | 12.000%, 12/12/2013 | 98,000 | ||
| 250,000 | 6.875%, 6/15/2014 | 201,829 | ||
Energy Future Holdings Corporation | ||||
| 210,000 | 10.875%, 11/1/2017e | 149,100 | ||
Enterprise Products Operating, LP | ||||
| 700,000 | 7.034%, 1/15/2068 | 329,000 | ||
Exelon Corporation | ||||
| 410,000 | 4.900%, 6/15/2015 | 336,130 | ||
Illinois Power Company | ||||
| 160,000 | 6.125%, 11/15/2017 | 143,539 | ||
Intergen NV | ||||
| 200,000 | 9.000%, 6/30/2017e | 164,000 | ||
Kinder Morgan Finance Company ulc | ||||
| 120,000 | 5.700%, 1/5/2016 | 89,400 | ||
Mirant North America, LLC | ||||
| 170,000 | 7.375%, 12/31/2013 | 163,200 | ||
NRG Energy, Inc. | ||||
| 320,000 | 7.375%, 2/1/2016 | 297,600 | ||
Pacific Energy Partners, LP/Pacific Energy Finance Corporation | ||||
| 110,000 | 7.125%, 6/15/2014 | 96,078 | ||
Regency Energy Partners, LP | ||||
| 100,000 | 8.375%, 12/15/2013 | 68,500 | ||
Reliant Energy, Inc. | ||||
| 105,000 | 6.750%, 12/15/2014 | 94,500 | ||
| 200,000 | 7.875%, 6/15/2017 | 162,000 | ||
Sabine Pass LNG, LP | ||||
| 205,000 | 7.500%, 11/30/2016 | 147,600 | ||
SemGroup, LP | ||||
| 150,000 | 8.750%, 11/15/2015e,j | 5,250 | ||
Southern Star Central Corporation | ||||
| 110,000 | 6.750%, 3/1/2016 | 91,300 | ||
The accompanying Notes to Financial Statements are an integral part of this schedule.
214
Table of Contents
Diversified Income Plus Portfolio
Schedule of Investments as of December 31, 2008
Principal Amount | Long-Term Fixed Income (65.6%) | Value | ||
| Utilities (5.0%) - continued | ||||
Southern Union Company | ||||
| 200,000 | 7.200%, 11/1/2066 | 69,000 | ||
Williams Partners, LP | ||||
| 120,000 | 7.250%, 2/1/2017 | 94,800 | ||
| Total Utilities | 3,783,676 | |||
Total Long-Term Fixed Income (cost $64,734,710) | 49,228,548 | |||
| Shares | Common Stock (24.1%) | Value | ||
| Consumer Discretionary (1.5%) | ||||
| 1,900 | Black & Decker Corporation | 79,439 | ||
| 8,600 | CBS Corporation | 70,434 | ||
| 8,600 | Gannett Company, Inc.h | 68,800 | ||
| 2,400 | Genuine Parts Company | 90,864 | ||
| 5,500 | Home Depot, Inc. | 126,610 | ||
| 3,600 | Johnson Controls, Inc. | 65,376 | ||
| 5,900 | KB Homeh | 80,358 | ||
| 3,500 | Mattel, Inc. | 56,000 | ||
| 2,500 | McDonald’s Corporation | 155,475 | ||
| 6,900 | Men’s Wearhouse, Inc. | 93,426 | ||
| 2,100 | NIKE, Inc. | 107,100 | ||
| 1,500 | VF Corporation | 82,155 | ||
| 2,800 | Walt Disney Company | 63,532 | ||
| Total Consumer Discretionary | 1,139,569 | |||
| Consumer Staples (2.5%) | ||||
| 6,300 | Altria Group, Inc. | 94,878 | ||
| 3,600 | Coca-Cola Company | 162,972 | ||
| 1,300 | Colgate-Palmolive Company | 89,102 | ||
| 3,000 | ConAgra Foods, Inc. | 49,500 | ||
| 1,800 | Costco Wholesale Corporation | 94,500 | ||
| 3,300 | CVS/Caremark Corporation | 94,842 | ||
| 1,200 | Diageo plc ADR | 68,088 | ||
| 2,700 | General Mills, Inc. | 164,025 | ||
| 2,400 | Kimberly-Clark Corporation | 126,576 | ||
| 5,000 | Kraft Foods, Inc. | 134,250 | ||
| 1,700 | Lorillard, Inc. | 95,795 | ||
| 2,800 | McCormick & Company, Inc. | 89,208 | ||
| 1,600 | Molson Coors Brewing Company | 78,272 | ||
| 4,100 | Philip Morris International, Inc. | 178,391 | ||
| 3,237 | Procter & Gamble Company | 200,111 | ||
| 3,300 | Wal-Mart Stores, Inc. | 184,998 | ||
| Total Consumer Staples | 1,905,508 | |||
| Energy (3.3%) | ||||
| 1,100 | Apache Corporation | 81,983 | ||
| 2,400 | BP plc ADR | 112,176 | ||
| 5,400 | Chevron Corporation | 399,438 | ||
| 4,900 | ConocoPhillips | 253,820 | ||
| 1,200 | Devon Energy Corporation | 78,852 | ||
| 5,400 | Exxon Mobil Corporation | 431,082 | ||
| 3,900 | Halliburton Company | 70,902 | ||
| 22,530 | Kayne Anderson MLP Investment Company | 367,239 | ||
| 5,500 | Marathon Oil Corporation | 150,480 | ||
| 2,000 | Occidental Petroleum Corporation | 119,980 | ||
| 12,000 | Precision Drilling Corporationh | 100,680 | ||
| 2,300 | Royal Dutch Shell plc ADR | 121,762 | ||
| 2,300 | Total SA ADR | 127,190 | ||
| 3,300 | Valero Energy Corporation | 71,412 | ||
| Total Energy | 2,486,996 | |||
| Financials (6.8%) | ||||
| 1,400 | Acadia Realty Trust | 19,978 | ||
| 800 | ACE, Ltd. | 42,336 | ||
| 1,900 | AFLAC, Inc. | 87,096 | ||
| 700 | Alexandria Real Estate Equities, Inc. | 42,238 | ||
| 1,500 | AMB Property Corporation | 35,130 | ||
| 1,000 | American Campus Communities, Inc. | 20,480 | ||
| 786 | Apartment Investment & Management Company | 9,078 | ||
| 1,200 | AvalonBay Communities, Inc. | 72,696 | ||
| 11,600 | Bank of America Corporation | 163,328 | ||
| 5,200 | Bank of New York Mellon Corporation | 147,316 | ||
| 3,700 | BB&T Corporationh | 101,602 | ||
| 1,100 | BioMed Realty Trust, Inc. | 12,892 | ||
| 1,700 | Boston Properties, Inc. | 93,500 | ||
| 1,200 | Brandywine Realty Trust | 9,252 | ||
| 700 | BRE Properties, Inc. | 19,586 | ||
| 700 | Brookfield Asset Management, Inc. | 10,689 | ||
| 2,900 | Brookfield Properties Corporation | 22,417 | ||
| 900 | Camden Property Trust | 28,206 | ||
| 1,500 | Chubb Corporation | 76,500 | ||
| 9,800 | Citigroup, Inc. | 65,758 | ||
| 1,500 | Colonial Properties Trust | 12,495 | ||
| 900 | Corporate Office Properties Trusth | 27,630 | ||
| 600 | Cullen/Frost Bankers, Inc. | 30,408 | ||
| 3,400 | DCT Industrial Trust, Inc. | 17,204 | ||
| 2,000 | DiamondRock Hospitality Company | 10,140 | ||
| 1,400 | Digital Realty Trust, Inc.h | 45,990 | ||
| 1,400 | Douglas Emmett, Inc. | 18,284 | ||
| 1,000 | Duke Realty Corporation | 10,960 | ||
| 600 | Entertainment Properties Trust | 17,880 | ||
| 3,000 | Equity Residential REIT | 89,460 | ||
| 600 | Essex Property Trust, Inc. | 46,050 | ||
| 1,500 | Everest Re Group, Ltd. | 114,210 | ||
| 1,400 | Extra Space Storage, Inc. | 14,448 | ||
| 1,200 | Federal Realty Investment Trust | 74,496 | ||
| 32,726 | Fiduciary/Claymore MLP Opportunity Fund | 406,457 | ||
| 1,200 | Forest City Enterprises | 8,040 | ||
| 4,400 | Glacier Bancorp, Inc.h | 83,688 | ||
| 600 | Goldman Sachs Group, Inc. | 50,634 | ||
| 2,000 | Health Care Property Investors, Inc. | 55,540 | ||
| 900 | Health Care REIT, Inc. | 37,980 | ||
| 600 | Healthcare Realty Trust, Inc. | 14,088 | ||
| 600 | Highwoods Properties, Inc. | 16,416 | ||
| 500 | Home Properties, Inc. | 20,300 | ||
| 6,400 | Host Hotels & Resorts, Inc.h | 48,448 | ||
| 4,700 | Hudson City Bancorp, Inc. | 75,012 | ||
| 4,600 | iShares S&P U.S. Preferred Stock Index Fundh | 134,366 | ||
| 8,300 | J.P. Morgan Chase & Company | 261,699 | ||
| 6,200 | KeyCorp | 52,824 | ||
| 600 | Kilroy Realty Corporation | 20,076 | ||
| 2,822 | Kimco Realty Corporation | 51,586 | ||
| 900 | LaSalle Hotel Properties | 9,945 | ||
The accompanying Notes to Financial Statements are an integral part of this schedule.
215
Table of Contents
Diversified Income Plus Portfolio
Schedule of Investments as of December 31, 2008
Shares | Common Stock (24.1%) | Value | ||
| Financials (6.8%) - continued | ||||
| 1,200 | Liberty Property Trust | 27,396 | ||
| 5,800 | Lincoln National Corporation | 109,272 | ||
| 1,200 | Macerich Companyh | 21,792 | ||
| 1,000 | Mack-Cali Realty Corporation | 24,500 | ||
| 2,100 | MetLife, Inc. | 73,206 | ||
| 400 | Mid-America Apartment Communities, Inc.h | 14,864 | ||
| 1,400 | National Retail Properties, Inc.h | 24,066 | ||
| 1,400 | Nationwide Health Properties, Inc.h | 40,208 | ||
| 5,600 | Old Republic International Corporation | 66,752 | ||
| 1,000 | Omega Healthcare Investors, Inc. | 15,970 | ||
| 1,800 | One Liberty Properties, Inc. | 15,840 | ||
| 1,500 | People’s United Financial, Inc. | 26,745 | ||
| 400 | Plum Creek Timber Company, Inc. | 13,896 | ||
| 700 | PNC Financial Services Group, Inc. | 34,300 | ||
| 900 | Post Properties, Inc. | 14,850 | ||
| 4,400 | PowerShares Preferred Portfolio | 54,692 | ||
| 4,700 | ProLogis Trust | 65,283 | ||
| 1,556 | Public Storage, Inc. | 123,702 | ||
| 1,300 | �� | Regency Centers Corporation | 60,710 | |
| 4,600 | Regions Financial Corporation | 36,616 | ||
| 1,500 | Senior Housing Property Trust | 26,880 | ||
| 3,200 | Simon Property Group, Inc. | 170,016 | ||
| 1,035 | SL Green Realty Corporationh | 26,807 | ||
| 4,900 | SPDR DJ Wilshire International Real Estate ETF | 132,692 | ||
| 2,600 | T. Rowe Price Group, Inc. | 92,144 | ||
| 700 | Tanger Factory Outlet Centers, Inc.h | 26,334 | ||
| 1,100 | Taubman Centers, Inc. | 28,006 | ||
| 9,528 | Tortoise North American Energy Corporation | 101,664 | ||
| 1,500 | Travelers Companies, Inc. | 67,800 | ||
| 7,500 | U.S. Bancorp | 187,575 | ||
| 1,000 | UDR, Inc. | 13,790 | ||
| 2,100 | Ventas, Inc. | 70,497 | ||
| 1,800 | Vornado Realty Trust | 108,630 | ||
| 500 | Weingarten Realty Investorsh | 10,345 | ||
| 7,600 | Wells Fargo & Company | 224,048 | ||
Total Financials | 5,108,720 | |||
| Health Care (2.6%) | ||||
| 4,400 | Abbott Laboratories | 234,828 | ||
| 2,200 | AstraZeneca plc | 90,266 | ||
| 1,700 | Baxter International, Inc. | 91,103 | ||
| 7,300 | Bristol-Myers Squibb Company | 169,725 | ||
| 4,700 | CIGNA Corporation | 79,195 | ||
| 2,900 | Eli Lilly and Company | 116,783 | ||
| 4,100 | Johnson & Johnson | 245,303 | ||
| 2,000 | McKesson Corporation | 77,460 | ||
| 2,600 | Medtronic, Inc. | 81,692 | ||
| 4,200 | Merck & Company, Inc. | 127,680 | ||
| 14,900 | Pfizer, Inc. | 263,879 | ||
| 2,800 | Sanofi-Aventis ADR | 90,048 | ||
| 1,100 | Teva Pharmaceutical Industries, Ltd. ADR | 46,827 | ||
| 3,100 | UnitedHealth Group, Inc. | 82,460 | ||
| 3,700 | Wyeth | 138,787 | ||
Total Health Care | 1,936,036 | |||
| Industrials (2.1%) | ||||
| 2,000 | 3M Company | 115,080 | ||
| 2,800 | Boeing Company | 119,476 | ||
| 2,900 | Caterpillar, Inc. | 129,543 | ||
| 2,000 | Danaher Corporation | 113,220 | ||
| 3,600 | Emerson Electric Company | 131,796 | ||
| 1,700 | General Dynamics Corporation | 97,903 | ||
| 14,100 | General Electric Company | 228,420 | ||
| 1,900 | Hubbell, Inc. | 62,092 | ||
| 1,400 | Illinois Tool Works, Inc. | 49,070 | ||
| 5,400 | Masco Corporation | 60,102 | ||
| 4,200 | Republic Services, Inc. | 104,118 | ||
| 5,700 | Trinity Industries, Inc. | 89,832 | ||
| 3,800 | Tyco International, Ltd. | 82,080 | ||
| 2,300 | United Technologies Corporation | 123,280 | ||
| 2,700 | Waste Management, Inc. | 89,478 | ||
Total Industrials | 1,595,490 | |||
| Information Technology (1.8%) | ||||
| 4,000 | Accenture, Ltd. | 131,160 | ||
| 5,100 | Automatic Data Processing, Inc. | 200,634 | ||
| 3,400 | Broadcom Corporationk | 57,698 | ||
| 4,200 | Hewlett-Packard Company | 152,418 | ||
| 9,300 | Intel Corporation | 136,338 | ||
| 2,300 | International Business Machines Corporation | 193,568 | ||
| 2,900 | Microchip Technology, Inc.h | 56,637 | ||
| 5,400 | Microsoft Corporation | 104,976 | ||
| 11,900 | Motorola, Inc. | 52,717 | ||
| 5,500 | Nokia Oyj ADR | 85,800 | ||
| 4,400 | Paychex, Inc. | 115,632 | ||
| 4,900 | SanDisk Corporationk | 47,040 | ||
Total Information Technology | 1,334,618 | |||
| Materials (0.8%) | ||||
| 1,000 | Air Products and Chemicals, Inc. | 50,270 | ||
| 2,900 | Bemis Company, Inc. | 68,672 | ||
| 3,200 | Dow Chemical Company | 48,288 | ||
| 4,500 | E.I. du Pont de Nemours and Company | 113,850 | ||
| 1,100 | Vulcan Materials Companyh | 76,538 | ||
| 12,600 | Wausau Paper Corporation | 144,144 | ||
| 200 | Weyerhaeuser Company | 6,122 | ||
| 5,700 | Worthington Industries, Inc.h | 62,814 | ||
Total Materials | 570,698 | |||
| Telecommunications Services (1.4%) | ||||
| 1,800 | America Movil SA de CV ADR | 55,782 | ||
| 14,000 | AT&T, Inc. | 399,000 | ||
| 1,500 | CenturyTel, Inc.h | 40,995 | ||
| 24,800 | Qwest Communications International, Inc.h | 90,272 | ||
| 2,800 | Shenandoah Telecommunications Company | 78,540 | ||
| 6,700 | Verizon Communications, Inc. | 227,130 | ||
| 3,500 | Vodafone Group plc ADR | 71,540 | ||
| 10,300 | Windstream Corporation | 94,760 | ||
Total Telecommunications Services | 1,058,019 | |||
| Utilities (1.3%) | ||||
| 3,000 | Atmos Energy Corporation | 71,100 | ||
| 6,900 | Black Hills Corporation | 186,024 | ||
| 1,000 | Entergy Corporation | 83,130 | ||
The accompanying Notes to Financial Statements are an integral part of this schedule.
216
Table of Contents
Diversified Income Plus Portfolio
Schedule of Investments as of December 31, 2008
Shares | Common Stock (24.1%) | Value | ||||
| Utilities (1.3%) - continued | ||||||
| 1,500 | FirstEnergy Corporation | 72,870 | ||||
| 1,900 | FPL Group, Inc. | 95,627 | ||||
| 17,400 | Korea Electric Power Corporation ADR | 202,014 | ||||
| 9,800 | PNM Resources, Inc. | 98,784 | ||||
| 2,600 | Progress Energy, Inc. | 103,610 | ||||
| 1,100 | Southern Company | 40,700 | ||||
Total Utilities | 953,859 | |||||
Total Common Stock (cost $24,188,511) | 18,089,513 | |||||
Shares | Preferred Stock (1.9%) | Value | ||||
| Basic Materials (0.4%) | ||||||
| 6,000 | Freeport-McMoran Copper & Gold, Inc., Convertible, 6.750% | 284,700 | ||||
Total Basic Materials | 284,700 | |||||
| Consumer Staples (0.5%) | ||||||
| 10,000 | Archer-Daniels-Midland Company, Convertible, 6.250% | 379,000 | ||||
Total Consumer Staples | 379,000 | |||||
| Financials (0.9%) | ||||||
| 8,442 | Allegro Investment Corporation SA, Reverse Convertible, 20.000%e,k,l | 283,557 | ||||
| 2,600 | Merrill Lynch & Company, Inc., 8.625% | 51,428 | ||||
| 22,000 | MetLife, Inc., Convertible, 6.375% | 226,600 | ||||
| 70 | Preferred Blocker, Inc., 9.000%e | 22,032 | ||||
| 2,600 | U.S. Bancorp, 7.875% | 69,420 | ||||
Total Financials | 653,037 | |||||
| U.S. Government (<0.1%) | ||||||
| 2,600 | Federal National Mortgage Association, 8.250% | 2,158 | ||||
Total U.S. Government | 2,158 | |||||
| Utilities (0.1%) | ||||||
| 2,600 | Xcel Energy, Inc., 7.600% | 64,818 | ||||
Total Utilities | 64,818 | |||||
Total Preferred Stock (cost $1,428,943) | 1,383,713 | |||||
Shares | Collateral Held for Securities Loaned (2.2%) | Value | ||||
| 1,642,478 | Thrivent Financial Securities Lending Trust | 1,642,478 | ||||
Total Collateral Held for Securities Loaned (cost $1,642,478) | 1,642,478 | |||||
| Shares or Principal Amount | Short-Term Investments (3.1%)m | Value | ||||
Federal National Mortgage Association Discount Notes | ||||||
| 400,000 | 0.317%, 5/14/2009n | 399,470 | ||||
| Shares or Principal Amount | Short-Term Investments (3.1%)m | Value | ||||
| 1,906,331 | Thrivent Money Market Portfolio | 1,906,331 | ||||
Total Short-Term Investments (at amortized cost) | 2,305,801 | |||||
Total Investments (cost $97,624,893) 101.1% | $ | 75,802,361 | ||||
Other Assets and Liabilities, Net (1.1%) | (797,240 | ) | ||||
Total Net Assets 100.0% | $ | 75,005,121 | ||||
| a | The stated interest rate represents the weighted average of all contracts within the bank loan facility as discussed in item 2(U) in the Notes to Financial Statements. |
| b | All or a portion of the loan is unfunded as discussed in item 2(U) of the Notes to Financial Statements. |
| c | Denotes investments purchased on a when-issued or delayed delivery basis. |
| d | All or a portion of the security is insured or guaranteed. |
| e | Denotes securities sold under Rule 144A of the Securities Act of 1933, which exempts them from registration. These securities have been deemed liquid and may be resold to other dealers in the program or to other qualified institutional buyers. As of December 31, 2008, the value of these investments was $6,108,895 or 8.1% of total net assets. |
| f | Denotes variable rate obligations for which the current yield and next scheduled reset date are shown. |
| g | Subsequent to December 31, 2008, the company has entered into bankruptcy and the security has decreased in value. |
| h | All or a portion of the security is on loan as discussed in item 2(M) of the Notes to Financial Statements. |
| i | Denotes restricted securities. Restricted securities are investment securities which have been deemed illiquid and cannot be offered for public sale without first being registered under the Securities Act of 1933. The following table indicates the acquisition date and cost of restricted securities Diversified Income Plus Portfolio owned as of December 31, 2008. |
Security | Acquisition Date | Cost | |||
Commercial Mortgage Pass- Through Certificates | 5/2/2007 | $ | 2,000,000 | ||
Piper Jaffray Equipment Trust Securities | 9/13/2006 | 310,804 | |||
Tunica Biloxi Gaming Authority | 11/8/2005 | 260,000 | |||
Turning Stone Resort Casino Enterprise | 9/8/2006 | 130,651 | |||
Wachovia Bank Commercial Mortgage Trust | 4/25/2007 | 2,000,000 | |||
| j | In bankruptcy. |
| k | Non-income producing security. |
| l | These securities are Equity-Linked Structured Securities as discussed in item 2(Q) of the Notes to Financial Statements. |
| m | The interest rate shown reflects the yield, coupon rate or, for securities purchased at a discount, the discount rate at the date of purchase. |
| n | At December 31, 2008, $399,470 of investments were held on deposit with the counterparty and pledged as the initial margin deposit for open financial futures contracts. |
The accompanying Notes to Financial Statements are an integral part of this schedule.
217
Table of Contents
Diversified Income Plus Portfolio
Schedule of Investments as of December 31, 2008
Definitions: | ||
ADR - | American Depositary Receipt, which are certificates for an underlying foreign security’s shares held by an issuing U.S. depository bank. | |
REIT - | Real Estate Investment Trust, is a company that buys, develops, manages and/or sells real estate assets. | |
ETF - | Exchange Traded Fund. | |
Gross unrealized appreciation and depreciation of investments, based on cost for federal income tax purposes, were as follows:
Gross unrealized appreciation | $ | 1,041,994 | ||
Gross unrealized depreciation | (23,702,909 | ) | ||
Net unrealized appreciation (depreciation) | $ | (22,660,915 | ) | |
Cost for federal income tax purposes | $ | 98,463,276 |
The following table is a summary of the inputs used, as of December 31, 2008, in valuing the Diversified Income Plus Portfolio’s assets carried at fair value as discussed in item 2(A) of the Notes to Financial Statements.
Level | Investments in Securities | Other Financial Instruments* | ||||
Level 1 | $ | 22,716,446 | $ | 82,487 | ||
Level 2 | 51,044,020 | — | ||||
Level 3 | 2,041,895 | — | ||||
Totals (Level 1,2,3) | $ | 75,802,361 | $ | 82,487 | ||
The following table is a reconciliation of assets in which significant unobservable inputs (Level 3) were used in determining fair value for the Diversified Income Plus Portfolio as discussed in item 2(A) of the Notes to Financial Statements.
| Investments in Securities | Other Financial Instruments* | ||||||
Value December 31, 2007 | $ | 3,917,638 | $ | — | |||
Accrued Discounts/Premiums | 2,381 | — | |||||
Realized Gain/(Loss) | (93,460 | ) | — | ||||
Change in Unrealized Gain/(Loss) | (2,026,538 | ) | — | ||||
Net Purchases/Sales | (344,987 | ) | — | ||||
Transfers In and/or Out of Level 3 | 586,861 | — | |||||
Value December 31, 2008 | $ | 2,041,895 | $ | — | |||
| * | Other Financial Instruments include Futures, Forwards, Written Options and Swap agreements. |
Futures | Number of Contracts Long/(Short) | Expiration Date | Notional Principal Amount | Value | Unrealized Gain/(Loss) | ||||||||||||
5-Yr. U.S. Treasury Bond Futures | 52 | March 2009 | $ | 6,024,846 | $ | 6,190,844 | $ | 165,998 | |||||||||
10-Yr. U.S. Treasury Bond Futures | (15 | ) | March 2009 | (1,758,236 | ) | (1,886,251 | ) | (128,015 | ) | ||||||||
S&P 500 Index Futures | 6 | March 2009 | 1,311,705 | 1,350,150 | 38,445 | ||||||||||||
S&P 500 Index Mini-Futures | 4 | March 2009 | 173,961 | 180,020 | 6,059 | ||||||||||||
Total Futures | $ | 82,487 | |||||||||||||||
The accompanying Notes to Financial Statements are an integral part of this schedule.
218
Table of Contents
Diversified Income Plus Portfolio
Schedule of Investments as of December 31, 2008
Investment in Affiliates
Affiliated issuers, as defined under the Investment Company Act of 1940, include those in which the Portfolio’s holdings of an issuer represent 5% or more of the outstanding voting securities of an issuer, or any affiliated mutual fund.
A summary of transactions for the fiscal year to date, in Diversified Income Plus Portfolio, is as follows:
Portfolio | Value December 31, 2007 | Gross Purchases and Additions | Gross Sales and Reductions | Balance of Shares Held at December 31, 2008 | Value December 31, 2008 | Income Earned January 1, 2008 - December 31, 2008 | |||||||||||
Money Market | $ | 1,238,981 | $ | 47,846,448 | $ | 47,179,098 | 1,906,331 | $ | 1,906,331 | $ | 127,621 | ||||||
Thrivent Financial Securities Lending Trust | 10,240,727 | 28,525,438 | 37,123,687 | 1,642,478 | 1,642,478 | 41,374 | |||||||||||
Total Value and Income Earned | 11,479,708 | 3,548,809 | 168,995 | ||||||||||||||
The accompanying Notes to Financial Statements are an integral part of this schedule.
219
Table of Contents
Partner Socially Responsible Bond Portfolio
Schedule of Investments as of December 31, 2008
Principal | Long-Term Fixed Income (80.2%) | Value | |||
| Asset-Backed Securities (12.1%) | |||||
American Express Credit Corporation | |||||
| $70,000 | 1.936%, 1/6/2009a | $ | 68,437 | ||
Americredit Automobile Receivables Trust | |||||
| 30,247 | 4.870%, 12/6/2010 | 29,604 | |||
| 70,000 | 5.200%, 3/6/2011 | 68,505 | |||
| 57,497 | 3.430%, 7/6/2011b | 54,175 | |||
| 27,704 | 5.420%, 8/8/2011 | 25,633 | |||
| 26,202 | 5.210%, 10/6/2011 | 25,493 | |||
Bear Stearns Asset-Backed Securities, Inc. | |||||
| 75,339 | 5.000%, 1/25/2034 | 59,322 | |||
Capital Auto Receivables Asset Trust | |||||
| 80,000 | 4.730%, 9/15/2010 | 78,356 | |||
Carmax Auto Owner Trust | |||||
| 44,075 | 1.895%, 1/15/2009a | 42,858 | |||
DaimlerChrysler Auto Trust | |||||
| 63,355 | 4.200%, 7/8/2010 | 62,759 | |||
Ford Credit Auto Owner Trust | |||||
| 75,000 | 5.160%, 11/15/2010 | 74,177 | |||
Harley Davidson Motorcycle Trust | |||||
| 43,200 | 2.095%, 1/15/2009a | 42,456 | |||
Household Automotive Trust | |||||
| 44,647 | 5.610%, 8/17/2011 | 43,065 | |||
| 13,062 | 5.280%, 9/17/2011 | 12,619 | |||
| 100,000 | 4.550%, 7/17/2012 | 94,168 | |||
Residential Asset Securitization Trust | |||||
| 44,699 | 6.250%, 11/25/2036 | 25,401 | |||
Triad Auto Receivables Owner Trust | |||||
| 20,204 | 4.770%, 1/12/2011 | 19,972 | |||
| Total Asset-Backed Securities | 827,000 | ||||
| Capital Goods (1.7%) | |||||
Roper Industries, Inc. | |||||
| 70,000 | 6.625%, 8/15/2013 | 70,199 | |||
Weyerhaeuser Company | |||||
| 50,000 | 2.466%, 3/24/2009a | 48,012 | |||
| Total Capital Goods | 118,211 | ||||
| Collateralized Mortgage Obligations (1.8%) | |||||
Chase Funding Trust | |||||
| 63,714 | 4.045%, 11/25/2029 | 61,481 | |||
Impac CMB Trust | |||||
| 27,973 | 0.741%, 1/26/2009a | 11,940 | |||
MASTR Alternative Loans Trust | |||||
| 35,330 | 6.250%, 7/25/2036 | 20,883 | |||
Structured Asset Securities Corporation | |||||
| 30,977 | 5.000%, 6/25/2035 | 25,517 | |||
| Total Collateralized Mortgage Obligations | 119,821 | ||||
| Commercial Mortgage-Backed Securities (1.0%) | |||||
Credit Suisse First Boston Mortgage Securities Corporation | |||||
| 62,086 | 4.992%, 12/25/2033 | 25,048 | |||
WFS Financial Owner Trust | |||||
| 41,972 | 4.390%, 11/19/2012 | 41,856 | |||
| Total Commercial Mortgage-Backed Securities | 66,904 | ||||
| Communications Services (1.0%) | |||||
Thomson Reuters Corporation | |||||
| 70,000 | 5.950%, 7/15/2013 | 65,172 | |||
| Total Communications Services | 65,172 | ||||
| Consumer Cyclical (1.7%) | |||||
CVS Caremark Corporation | |||||
| 70,000 | 2.503%, 3/2/2009a | 64,408 | |||
Home Depot, Inc. | |||||
| 60,000 | 2.046%, 3/16/2009a | 56,684 | |||
| Total Consumer Cyclical | 121,092 | ||||
| Energy (3.1%) | |||||
Chesapeake Energy Corporation | |||||
| 95,000 | 7.250%, 12/15/2018 | 74,100 | |||
Kinder Morgan Energy Partners, LP | |||||
| 70,000 | 5.950%, 2/15/2018 | 59,742 | |||
Pioneer Natural Resources Company | |||||
| 110,000 | 5.875%, 7/15/2016 | 76,317 | |||
| Total Energy | 210,159 | ||||
| Financials (25.1%) | |||||
Australia & New Zealand Banking Group, Ltd. | |||||
| 100,000 | 6.200%, 7/19/2013c | 96,756 | |||
BAC Capital Trust XIV | |||||
| 90,000 | 3.003%, 3/1/2009a | 38,992 | |||
Bank of America Corporation | |||||
| 75,000 | 2.835%, 2/12/2009a | 73,436 | |||
| 80,000 | 8.000%, 1/30/2018 | 57,543 | |||
Capital One Auto Finance Trust | |||||
| 22,838 | 5.330%, 11/15/2010 | 22,759 | |||
Chase Manhattan Corporation | |||||
| 70,000 | 7.000%, 11/15/2009 | 70,739 | |||
Credit Agricole SA | |||||
| 100,000 | 6.637%, 5/31/2017c | 49,971 | |||
Deutsche Bank NY | |||||
| 70,000 | 2.448%, 3/18/2009a | 68,630 | |||
Giants Stadium, LLC | |||||
| 300,000 | 15.000%, 1/5/2009a,c | 300,000 | |||
| 450,000 | 15.500%, 1/28/2009a,c | 450,000 | |||
Glitnir Banki HF | |||||
| 50,000 | 4.859%, 1/21/2009a,d,e | 2,375 | |||
Goldman Sachs Group, Inc. | |||||
| 80,000 | 4.164%, 1/23/2009a | 77,903 | |||
Hartford Life Global Funding Trusts | |||||
| 70,000 | 2.899%, 2/17/2009a | 61,687 | |||
The accompanying Notes to Financial Statements are an integral part of this schedule.
220
Table of Contents
Partner Socially Responsible Bond Portfolio
Schedule of Investments as of December 31, 2008
Principal Amount | Long-Term Fixed Income (80.2%) | Value | |||
| Financials (25.1%) - continued | |||||
HRPT Properties Trust | |||||
| $50,000 | 2.521%, 3/16/2009a | $ | 36,718 | ||
Huntington National Bank | |||||
| 20,000 | 4.650%, 6/30/2009 | 19,696 | |||
Independence Community Bank Corporation | |||||
| 70,000 | 3.750%, 4/1/2014 | 57,528 | |||
ProLogis | |||||
| 50,000 | 6.625%, 5/15/2018 | 23,916 | |||
Royal Bank of Scotland Group plc | |||||
| 140,000 | 7.640%, 9/29/2017 | 55,760 | |||
SLM Corporation | |||||
| 25,000 | 3.675%, 1/26/2009a | 23,565 | |||
Sovereign Bancorp, Inc. | |||||
| 30,000 | 2.461%, 3/1/2009a | 29,498 | |||
Sovereign Bank | |||||
| 15,000 | 4.903%, 2/2/2009a | 10,693 | |||
Wachovia Capital Trust III | |||||
| 150,000 | 5.800%, 3/15/2011 | 88,500 | |||
| Total Financials | 1,716,665 | ||||
| Technology (0.9%) | |||||
Hewlett-Packard Company | |||||
| 60,000 | 2.006%, 3/16/2009a | 59,622 | |||
| Total Technology | 59,622 | ||||
| Transportation (0.7%) | |||||
Skyway Concession Company, LLC | |||||
| 50,000 | 1.748%, 3/30/2009a,c | 44,487 | |||
| Total Transportation | 44,487 | ||||
| U.S. Government (26.9%) | |||||
Federal Home Loan Mortgage Corporation | |||||
| 750,000 | 6.625%, 9/15/2009 | 781,049 | |||
U.S. Department of Housing & Urban Development | |||||
| 1,000,000 | 3.440%, 8/1/2011 | 1,050,794 | |||
| Total U.S. Government | 1,831,843 | ||||
| U.S. Municipals (4.2%) | |||||
Georgetown University | |||||
| 100,000 | 7.220%, 4/1/2019 | 99,081 | |||
Oakland, California Redevelopment Agency (Series T) | |||||
| 60,000 | 5.252%, 9/1/2016 | 57,292 | |||
Toll Road Investors Partnership II, LP | |||||
| 500,000 | Zero Coupon, 2/15/2043c | 128,330 | |||
| Total U.S. Municipals | 284,703 | ||||
| Total Long-Term Fixed Income (cost $5,670,028) | 5,465,679 | ||||
| Shares or Principal Amount | Short-Term Investments (19.3%)f | Value | |||
Bear Stearns Companies, LLC | |||||
| 70,000 | 2.456%, 3/9/2009a | $ | 68,869 | ||
Federal Home Loan Bank Discount Notes | |||||
| 500,000 | 0.070%, 1/20/2009 | 499,982 | |||
Federal National Mortgage Association Discount Notes | |||||
| 100,000 | 0.400%, 5/14/2009g | 99,853 | |||
| 605,703 | Thrivent Money Market Portfolio | 605,703 | |||
Wachovia Bank | |||||
| 40,000 | 1.538%, 3/23/2009 | 39,732 | |||
Total Short-Term Investments (cost $1,313,204) | 1,314,139 | ||||
Total Investments (cost $6,983,232) 99.5% | $ | 6,779,818 | |||
| Other Assets and Liabilities, Net 0.5% | 36,513 | ||||
| Total Net Assets 100.0% | $ | 6,816,331 | |||
| a | Denotes variable rate obligations for which the current yield and next scheduled reset date are shown. |
| b | All or a portion of the security is insured or guaranteed. |
| c | Denotes securities sold under Rule 144A of the Securities Act of 1933, which exempts them from registration. These securities have been deemed liquid and may be resold to other dealers in the program or to other qualified institutional buyers. As of December 31, 2008, the value of these investments was $1,069,544 or 15.7% of total net assets. |
| d | Denotes restricted securities. Restricted securities are investment securities which have been deemed illiquid and cannot be offered for public sale without first being registered under the Securities Act of 1933. The following table indicates the acquisition date and cost of restricted securities Partner Socially Responsible Bond Portfolio owned as of December 31, 2008. |
Security | Acquisition Date | Cost | |||
Glitnir Banki HF | 5/1/2008 | $ | 43,733 | ||
| e | In bankruptcy. |
| f | The interest rate shown reflects the yield, coupon rate or, for securities purchased at a discount, the discount rate at the date of purchase. |
| g | At December 31, 2008, $99,853 of investments were held on deposit with the counterparty and pledged as the initial margin deposit for open financial futures contracts. |
Gross unrealized appreciation and depreciation of investments, based on cost for federal income tax purposes, were as follows:
Gross unrealized appreciation | $ | 139,622 | ||
Gross unrealized depreciation | (343,036 | ) | ||
Net unrealized appreciation (depreciation) | $ | (203,414 | ) | |
Cost for federal income tax purposes | $ | 6,983,232 |
The accompanying Notes to Financial Statements are an integral part of this schedule.
221
Table of Contents
Partner Socially Responsible Bond Portfolio
Schedule of Investments as of December 31, 2008
The following table is a summary of the inputs used, as of December 31, 2008, in valuing the Partner Socially Responsible Bond Portfolio’s assets carried at fair value as discussed in item 2(A) of the Notes to Financial Statements.
Level | Investments in Securities | Other Financial Instruments* | ||||
Level 1 | $ | 605,703 | ($31,755 | ) | ||
Level 2 | 6,174,115 | — | ||||
Level 3 | — | — | ||||
Totals (Level 1,2,3) | $ | 6,779,818 | ($31,755 | ) | ||
| * | Other Financial Instruments include Futures, Forwards, Written Options and Swap agreements. |
Futures | Number of Contracts Long/(Short) | Expiration Date | Notional Principal Amount | Value | Unrealized Gain/(Loss) | ||||||||||||
2-Yr. U.S. Treasury Bond Futures | (13 | ) | March 2009 | ($ | 2,804,810 | ) | ($ | 2,834,811 | ) | ($ | 30,001 | ) | |||||
10-Yr. U.S. Treasury Bond Futures | 3 | March 2009 | 379,004 | 377,250 | (1,754 | ) | |||||||||||
Total Futures | ($ | 31,755 | ) | ||||||||||||||
Investment in Affiliates
Affiliated issuers, as defined under the Investment Company Act of 1940, include those in which the Portfolio’s holdings of an issuer represent 5% or more of the outstanding voting securities of an issuer, or any affiliated mutual fund.
A summary of transactions for the fiscal year to date, in Partner Socially Responsible Bond Portfolio, is as follows:
Portfolio | Value April 30, 2008† | Gross Purchases and Additions | Gross Sales and Reductions | Balance of Shares Held at December 31, 2008 | Value December 31, 2008 | Income Earned April 30, 2008 - December 31, 2008 | |||||||||||
Money Market | $ | — | $ | 1,791,211 | $ | 1,185,508 | 605,703 | $ | 605,703 | $ | 2,876 | ||||||
Total Value and Income Earned | — | 605,703 | 2,876 | ||||||||||||||
| † | Partner Socially Responsible Bond Portfolio was incepted on 4/30/2008. |
The accompanying Notes to Financial Statements are an integral part of this schedule.
222
Table of Contents
Schedule of Investments as of December 31, 2008
| Principal Amount | Bank Loans (0.6%)a | Value | ||||
| Communications Services (0.3%) | ||||||
Alltel Communications, Inc., Term Loan | ||||||
| $ | 3,092,172 | 4.371%, 5/15/2015 | $ | 3,041,152 | ||
| Total Communications Services | 3,041,152 | |||||
| Consumer Cyclical (0.1%) | ||||||
General Motors Corporation, Term Loan | ||||||
| 2,180,000 | 2.375%, 11/29/2013b,c | 982,809 | ||||
| Total Consumer Cyclical | 982,809 | |||||
| Consumer Non-Cyclical (0.2%) | ||||||
HCA, Inc., Term Loan | ||||||
| 3,072,163 | 3.709%, 11/18/2013 | 2,397,147 | ||||
| Total Consumer Non-Cyclical | 2,397,147 | |||||
Total Bank Loans (cost $6,208,292) | 6,421,108 | |||||
| Principal Amount | Long-Term Fixed Income (100.9%) | Value | ||||
| Asset-Backed Securities (4.4%) | ||||||
Bear Stearns Mortgage Funding Trust | ||||||
| 3,269,266 | 0.611%, 1/26/2009d | 593,182 | ||||
Capitalsource Commercial Loan Trust | ||||||
| 4,612,246 | 0.638%, 1/20/2009d,e | 3,612,698 | ||||
Credit Based Asset Servicing and Securitization, LLC | ||||||
| 1,861,449 | 0.581%, 1/26/2009d | 1,785,753 | ||||
Discover Card Master Trust | ||||||
| 11,499,999 | 5.650%, 3/16/2020 | 8,708,433 | ||||
First Franklin Mortgage Loan Asset-Backed Certificates | ||||||
| 3,625,076 | 0.561%, 1/26/2009d | 3,343,016 | ||||
Ford Credit Floor Plan Master Owner Trust | ||||||
| 8,500,000 | 1.375%, 1/15/2009d | 8,206,079 | ||||
GE Commercial Loan Trust | ||||||
| 16,074 | 4.563%, 1/20/2009d,f | 15,913 | ||||
GMAC Mortgage Corporation Loan Trust | ||||||
| 10,000,600 | 0.541%, 1/26/2009d,g | 3,472,339 | ||||
| 194,704 | 0.571%, 1/26/2009d,g | 178,313 | ||||
| 8,502,674 | 0.651%, 1/26/2009d,g | 4,485,534 | ||||
IndyMac Seconds Asset-Backed Trust | ||||||
| 1,625,315 | 0.641%, 1/26/2009d,g | 699,007 | ||||
Merna Re, Ltd. | ||||||
| 12,250,000 | 3.209%, 3/31/2009d,f | 11,060,525 | ||||
Residential Funding Mortgage Securities II | ||||||
| 1,740,324 | 0.601%, 1/26/2009d,g | 1,669,586 | ||||
| Total Asset-Backed Securities | 47,830,378 | |||||
| Basic Materials (1.7%) | ||||||
ArcelorMittal | ||||||
| 7,250,000 | 6.125%, 6/1/2018 | 4,964,495 | ||||
E.I. Du Pont de Nemours & Company | ||||||
| 3,100,000 | 5.875%, 1/15/2014 | 3,191,670 | ||||
| 2,600,000 | 6.000%, 7/15/2018 | 2,730,741 | ||||
Freeport-McMoRan Copper & Gold, Inc. | ||||||
| 1,500,000 | 7.084%, 4/1/2009d | 990,000 | ||||
Georgia-Pacific Corporation | ||||||
| 4,200,000 | 9.500%, 12/1/2011 | 3,969,000 | ||||
Precision Castparts Corporation | ||||||
| 3,500,000 | 5.600%, 12/15/2013 | 3,155,793 | ||||
| Total Basic Materials | 19,001,699 | |||||
| Capital Goods (3.4%) | ||||||
Caterpillar Financial Services Corporation | ||||||
| 1,800,000 | 5.450%, 4/15/2018 | 1,685,313 | ||||
Caterpillar, Inc. | ||||||
| 3,400,000 | 7.900%, 12/15/2018 | 3,913,903 | ||||
CRH America, Inc. | ||||||
| 2,400,000 | 6.000%, 9/30/2016 | 1,494,706 | ||||
| 5,000,000 | 8.125%, 7/15/2018 | 3,609,995 | ||||
Honeywell International, Inc. | ||||||
| 6,700,000 | 5.300%, 3/1/2018 | 6,835,855 | ||||
John Deere Capital Corporation | ||||||
| 5,200,000 | 5.350%, 4/3/2018 | 4,871,958 | ||||
| 3,900,000 | 5.750%, 9/10/2018 | 3,795,843 | ||||
Lockheed Martin Corporation | ||||||
| 1,805,000 | 6.150%, 9/1/2036 | 1,957,032 | ||||
Owens Corning, Inc. | ||||||
| 1,800,000 | 7.000%, 12/1/2036 | 1,180,334 | ||||
Systems 2001 Asset Trust, LLC | ||||||
| 3,268,907 | 6.664%, 9/15/2013e | 3,127,676 | ||||
United Technologies Corporation | ||||||
| 5,500,000 | 4.875%, 5/1/2015 | 5,361,295 | ||||
| Total Capital Goods | 37,833,910 | |||||
| Collateralized Mortgage Obligations (3.9%) | ||||||
Banc of America Mortgage Securities, Inc. | ||||||
| 8,557,670 | 4.802%, 9/25/2035 | 6,371,270 | ||||
Citigroup Mortgage Loan Trust, Inc. | ||||||
| 574,652 | 5.536%, 3/25/2036 | 569,854 | ||||
Countrywide Alternative Loan Trust | ||||||
| 7,422,166 | 6.000%, 1/25/2037 | 5,075,018 | ||||
Deutsche Alt-A Securities, Inc. | ||||||
| 4,208,707 | 3.026%, 1/1/2009d | 1,799,874 | ||||
HomeBanc Mortgage Trust | ||||||
| 3,823,361 | 5.979%, 4/25/2037 | 1,977,542 | ||||
J.P. Morgan Mortgage Trust | ||||||
| 7,753,044 | 5.005%, 7/25/2035 | 4,979,284 | ||||
Merrill Lynch Mortgage Investors, Inc. | ||||||
| 6,342,508 | 4.870%, 6/25/2035 | 4,402,779 | ||||
Thornburg Mortgage Securities Trust | ||||||
| 4,965,502 | 0.561%, 1/26/2009d | 4,875,274 | ||||
The accompanying Notes to Financial Statements are an integral part of this schedule.
223
Table of Contents
Income Portfolio
Schedule of Investments as of December 31, 2008
| Principal Amount | Long-Term Fixed Income (100.9%) | Value | ||||
| Collateralized Mortgage Obligations (3.9%) - continued | ||||||
Wachovia Mortgage Loan Trust, LLC | ||||||
| $ | 5,260,976 | 5.564%, 5/20/2036 | $ | 3,799,619 | ||
Washington Mutual Alternative Loan Trust | ||||||
| 7,875,485 | 3.006%, 1/1/2009d | 2,888,279 | ||||
Washington Mutual Mortgage Pass-Through Certificates | ||||||
| 1,192,403 | 0.761%, 1/25/2009d | 651,262 | ||||
| 2,518,876 | 4.833%, 9/25/2035 | 1,731,364 | ||||
Zuni Mortgage Loan Trust | ||||||
| 3,318,472 | 0.601%, 1/26/2009d | 3,145,716 | ||||
| Total Collateralized Mortgage Obligations | 42,267,135 | |||||
| Commercial Mortgage-Backed Securities (8.6%) | ||||||
Banc of America Commercial Mortgage, Inc. | ||||||
| 3,000,000 | 5.118%, 7/11/2043 | 2,783,448 | ||||
Banc of America Large Loan Trust | ||||||
| 3,675,914 | 1.305%, 1/15/2009d,f | 2,915,349 | ||||
| 5,000,000 | 1.405%, 1/15/2009d,f | 3,762,970 | ||||
Bear Stearns Commercial Mortgage Securities, Inc. | ||||||
| 3,000,000 | 1.345%, 1/15/2009d,e | 2,275,641 | ||||
Citigroup Commercial Mortgage Trust | ||||||
| 26,318 | 1.265%, 1/15/2009d,f | 22,801 | ||||
| 12,500,000 | 1.335%, 1/15/2009d,f | 6,648,763 | ||||
Commercial Mortgage Pass-Through Certificates | ||||||
| 300,218 | 1.295%, 1/15/2009d,f | 268,455 | ||||
| 2,000,000 | 1.325%, 1/15/2009d,e | 1,156,168 | ||||
| 10,000,000 | 1.375%, 1/15/2009d,e | 5,974,880 | ||||
Credit Suisse Mortgage Capital Certificates | ||||||
| 7,500,000 | 1.365%, 1/15/2009d,f | 4,845,570 | ||||
Crown Castle International Corporation | ||||||
| 10,000,000 | 5.245%, 11/15/2036f | 8,315,400 | ||||
Greenwich Capital Commercial Funding Corporation | ||||||
| 10,750,000 | 5.867%, 8/10/2017 | 5,461,441 | ||||
J.P. Morgan Chase Commercial Mortgage Securities Corporation | ||||||
| 5,500,000 | 4.302%, 1/15/2038 | 5,062,002 | ||||
| 9,803,721 | 5.284%, 5/15/2047 | 8,106,433 | ||||
| 11,500,000 | 6.007%, 6/15/2049 | 8,121,599 | ||||
Merrill Lynch Mortgage Trust | ||||||
| 6,000,000 | 4.747%, 5/12/2043 | 4,847,652 | ||||
| 8,625,000 | 5.442%, 1/12/2044 | 5,097,151 | ||||
Wachovia Bank Commercial Mortgage Trust | ||||||
| 15,000,000 | 1.315%, 1/15/2009d,e | 9,401,759 | ||||
| 7,700,000 | 4.390%, 2/15/2036 | 6,966,852 | ||||
| 2,000,000 | 5.765%, 7/15/2045 | 1,597,424 | ||||
Washington Mutual Asset Securities Corporation | ||||||
| 1,438,674 | 3.830%, 1/25/2035f | 1,364,120 | ||||
| Total Commercial Mortgage- Backed Securities | 94,995,878 | |||||
| Communications Services (10.9%) | ||||||
Alltel Corporation | ||||||
| 1,250,000 | 7.000%, 3/15/2016 | 1,231,250 | ||||
AT&T, Inc. | ||||||
| 3,100,000 | 6.700%, 11/15/2013 | 3,283,898 | ||||
| 4,275,000 | 5.500%, 2/1/2018 | 4,320,422 | ||||
| 2,100,000 | 6.500%, 9/1/2037 | 2,261,679 | ||||
| 2,000,000 | 6.400%, 5/15/2038 | 2,142,362 | ||||
British Telecom plc | ||||||
| 3,075,000 | 9.125%, 12/15/2030 | 3,268,547 | ||||
Citizens Communications Company | ||||||
| 6,310,000 | 6.250%, 1/15/2013 | 5,363,499 | ||||
Comcast Corporation | ||||||
| 5,400,000 | 6.500%, 1/15/2015 | 5,307,827 | ||||
| 4,300,000 | 5.900%, 3/15/2016 | 4,105,705 | ||||
| 6,000,000 | 5.700%, 5/15/2018 | 5,626,847 | ||||
| 2,700,000 | 6.400%, 5/15/2038 | 2,693,690 | ||||
Cox Communications, Inc. | ||||||
| 6,000,000 | 4.625%, 6/1/2013 | 5,200,014 | ||||
| 1,230,000 | 5.450%, 12/15/2014 | 1,075,709 | ||||
| 3,400,000 | 9.375%, 1/15/2019f | 3,557,423 | ||||
Deutsche Telekom International Finance BV | ||||||
| 6,500,000 | 6.750%, 8/20/2018 | 6,591,064 | ||||
Intelsat Subsidiary Holding Company, Ltd. | ||||||
| 5,350,000 | 8.875%, 1/15/2015f | 4,868,500 | ||||
New Cingular Wireless Services, Inc. | ||||||
| 1,350,000 | 8.750%, 3/1/2031 | 1,687,616 | ||||
News America, Inc. | ||||||
| 2,140,000 | 6.400%, 12/15/2035 | 1,977,912 | ||||
| 2,275,000 | 6.650%, 11/15/2037 | 2,251,706 | ||||
Rogers Cable, Inc. | ||||||
| 1,055,000 | 6.750%, 3/15/2015 | 1,027,374 | ||||
| 2,410,000 | 8.750%, 5/1/2032 | 2,523,885 | ||||
Rogers Communications, Inc. | ||||||
| 3,750,000 | 6.800%, 8/15/2018 | 3,789,116 | ||||
Rogers Wireless Communications, Inc. | ||||||
| 1,700,000 | 8.000%, 12/15/2012 | 1,627,750 | ||||
| 3,000,000 | 6.375%, 3/1/2014 | 2,851,791 | ||||
| 3,200,000 | 7.500%, 3/15/2015 | 3,168,410 | ||||
Telecom Italia Capital SA | ||||||
| 5,450,000 | 5.250%, 11/15/2013 | 4,155,625 | ||||
| 2,750,000 | 5.250%, 10/1/2015 | 2,093,438 | ||||
Telefonica Emisones SAU | ||||||
| 4,400,000 | 6.221%, 7/3/2017 | 4,334,867 | ||||
Thomson Reuters Corporation | ||||||
| 4,500,000 | 6.500%, 7/15/2018 | 4,092,044 | ||||
Time Warner Cable, Inc. | ||||||
| 3,500,000 | 5.850%, 5/1/2017 | 3,197,436 | ||||
| 3,300,000 | 6.750%, 7/1/2018 | 3,177,257 | ||||
| 2,800,000 | 8.750%, 2/14/2019 | 3,044,538 | ||||
The accompanying Notes to Financial Statements are an integral part of this schedule.
224
Table of Contents
Income Portfolio
Schedule of Investments as of December 31, 2008
| Principal Amount | Long-Term Fixed Income (100.9%) | Value | ||||
| Communications Services (10.9%) - continued | ||||||
Time Warner Entertainment Company, LP | ||||||
| $ | 1,850,000 | 8.375%, 3/15/2023 | $ | 1,863,067 | ||
Verizon Communications, Inc. | ||||||
| 2,750,000 | 5.500%, 2/15/2018 | 2,645,077 | ||||
| 2,000,000 | 8.750%, 11/1/2018 | 2,346,444 | ||||
| 5,150,000 | 8.950%, 3/1/2039 | 6,652,203 | ||||
| Total Communications Services | 119,405,992 | |||||
| Consumer Cyclical (3.2%) | ||||||
D.R. Horton, Inc. | ||||||
| 6,500,000 | 5.375%, 6/15/2012 | 4,793,750 | ||||
Ford Motor Credit Company | ||||||
| 7,250,000 | 7.375%, 10/28/2009 | 6,367,101 | ||||
JC Penney & Company, Inc. | ||||||
| 1,200,000 | 7.950%, 4/1/2017 | 915,124 | ||||
Macy’s Retail Holdings, Inc. | ||||||
| 4,400,000 | 7.875%, 7/15/2015 | 3,169,162 | ||||
McDonald’s Corporation | ||||||
| 4,200,000 | 5.800%, 10/15/2017 | 4,491,346 | ||||
| 2,600,000 | 6.300%, 3/1/2038 | 2,867,813 | ||||
MGM MIRAGE | ||||||
| 5,240,000 | 13.000%, 11/15/2013f,h | 4,991,100 | ||||
Nissan Motor Acceptance Corporation | ||||||
| 4,100,000 | 5.625%, 3/14/2011f | 4,031,186 | ||||
Wal-Mart Stores, Inc. | ||||||
| 3,025,000 | 5.875%, 4/5/2027 | 3,189,218 | ||||
| Total Consumer Cyclical | 34,815,800 | |||||
| Consumer Non-Cyclical (5.8%) | ||||||
Altria Group, Inc. | ||||||
| 3,000,000 | 9.700%, 11/10/2018 | 3,242,490 | ||||
| 2,500,000 | 9.950%, 11/10/2038 | 2,722,028 | ||||
AmerisourceBergen Corporation | ||||||
| 3,000,000 | 5.875%, 9/15/2015 | 2,621,952 | ||||
AstraZeneca plc | ||||||
| 4,300,000 | 5.400%, 9/15/2012 | 4,541,169 | ||||
Baxter International, Inc. | ||||||
| 3,325,000 | 5.900%, 9/1/2016 | 3,596,230 | ||||
Bottling Group, LLC | ||||||
| 5,000,000 | 6.950%, 3/15/2014 | 5,429,024 | ||||
Bunge Limited Finance Corporation | ||||||
| 6,000,000 | 5.350%, 4/15/2014 | 4,304,490 | ||||
Cargill, Inc. | ||||||
| 6,500,000 | 5.600%, 9/15/2012f | 6,120,588 | ||||
Community Health Systems, Inc. | ||||||
| 3,600,000 | 8.875%, 7/15/2015 | 3,312,000 | ||||
Coventry Health Care, Inc. | ||||||
| 900,000 | 5.950%, 3/15/2017 | 469,209 | ||||
General Mills, Inc. | ||||||
| 3,500,000 | 5.650%, 9/10/2012 | 3,572,573 | ||||
| 4,600,000 | 5.200%, 3/17/2015 | 4,496,114 | ||||
Kellogg Company | ||||||
| 5,600,000 | 4.250%, 3/6/2013 | 5,423,000 | ||||
Kroger Company | ||||||
| 2,500,000 | 6.400%, 8/15/2017 | 2,521,158 | ||||
| 1,625,000 | 6.150%, 1/15/2020 | 1,603,264 | ||||
PepsiCo, Inc. | ||||||
| 1,050,000 | 7.900%, 11/1/2018 | 1,286,929 | ||||
Safeway, Inc. | ||||||
| 1,600,000 | 6.350%, 8/15/2017 | 1,581,906 | ||||
Schering-Plough Corporation | ||||||
| 3,000,000 | 6.000%, 9/15/2017 | 2,969,727 | ||||
United Health Group | ||||||
| 2,500,000 | 6.500%, 6/15/2037 | 2,098,383 | ||||
Wyeth | ||||||
| 1,425,000 | 5.950%, 4/1/2037 | 1,582,159 | ||||
| Total Consumer Non-Cyclical | 63,494,393 | |||||
| Energy (6.5%) | ||||||
Apache Corporation | ||||||
| 4,145,000 | 5.250%, 4/15/2013 | 4,200,021 | ||||
Energy Transfer Partners, LP | ||||||
| 5,900,000 | 6.700%, 7/1/2018 | 4,973,062 | ||||
Enterprise Products Operating, LP | ||||||
| 4,800,000 | 5.600%, 10/15/2014 | 4,072,498 | ||||
| 4,000,000 | 6.300%, 9/15/2017 | 3,385,472 | ||||
EOG Resources, Inc. | ||||||
| 4,500,000 | 5.875%, 9/15/2017 | 4,568,351 | ||||
Magellan Midstream Partners, LP | ||||||
| 2,700,000 | 6.450%, 6/1/2014 | 2,548,473 | ||||
Marathon Oil Corporation | ||||||
| 2,900,000 | 6.000%, 10/1/2017 | 2,472,755 | ||||
Nexen, Inc. | ||||||
| 1,100,000 | 5.650%, 5/15/2017 | 920,785 | ||||
| 3,075,000 | 6.400%, 5/15/2037 | 2,406,132 | ||||
Oneok Partners, LP | ||||||
| 3,250,000 | 6.850%, 10/15/2037 | 2,579,333 | ||||
Plains All American Pipeline, LP | ||||||
| 3,150,000 | 6.500%, 5/1/2018 | 2,512,119 | ||||
Premcor Refining Group, Inc. | ||||||
| 2,500,000 | 6.125%, 5/1/2011 | 2,534,093 | ||||
| 2,800,000 | 6.750%, 5/1/2014 | 2,632,543 | ||||
Quicksilver Resources, Inc. | ||||||
| 3,800,000 | 8.250%, 8/1/2015 | 2,413,000 | ||||
Ras Laffan Liquefied Natural Gas Company, Ltd. II | ||||||
| 3,450,000 | 5.298%, 9/30/2020f | 2,458,022 | ||||
Ras Laffan Liquefied Natural Gas Company, Ltd. III | ||||||
| 1,600,000 | 5.832%, 9/30/2016f | 1,191,120 | ||||
Southern Natural Gas Company | ||||||
| 3,000,000 | 5.900%, 4/1/2017f | 2,377,374 | ||||
Transcontinental Gas Pipe Corporation | ||||||
| 3,000,000 | 8.875%, 7/15/2012 | 2,927,679 | ||||
| 900,000 | 6.400%, 4/15/2016 | 821,588 | ||||
Transocean, Inc. | ||||||
| 5,400,000 | 6.000%, 3/15/2018 | 4,918,324 | ||||
Western Oil Sands, Inc. | ||||||
| 8,400,000 | 8.375%, 5/1/2012 | 8,018,992 | ||||
XTO Energy, Inc. | ||||||
| 3,100,000 | 5.300%, 6/30/2015 | 2,823,905 | ||||
| 2,500,000 | 6.750%, 8/1/2037 | 2,341,410 | ||||
| 1,150,000 | 6.375%, 6/15/2038 | 1,011,869 | ||||
| Total Energy | 71,108,920 | |||||
The accompanying Notes to Financial Statements are an integral part of this schedule.
225
Table of Contents
Income Portfolio
Schedule of Investments as of December 31, 2008
| Principal Amount | Long-Term Fixed Income (100.9%) | Value | ||||
| Financials (25.4%) | ||||||
Ace INA Holdings, Inc. | ||||||
| $ | 1,425,000 | 5.800%, 3/15/2018 | $ | 1,282,432 | ||
American Express Bank FSB/Salt Lake City, UT | ||||||
| 2,250,000 | 6.000%, 9/13/2017 | 2,107,199 | ||||
American Express Centurion Bank | ||||||
| 2,800,000 | 5.550%, 10/17/2012 | 2,659,846 | ||||
American Express Company | ||||||
| 6,200,000 | 3.150%, 12/9/2011h | 6,249,358 | ||||
American Express Credit Corporation | ||||||
| 3,250,000 | 7.300%, 8/20/2013 | 3,326,674 | ||||
American International Group, Inc. | ||||||
| 5,000,000 | 8.250%, 8/15/2018f | 3,659,595 | ||||
Australia & New Zealand Banking Group, Ltd. | ||||||
| 2,600,000 | 6.200%, 7/19/2013f | 2,515,656 | ||||
AXA SA | ||||||
| 3,900,000 | 6.463%, 12/14/2018f | 1,703,641 | ||||
Bank of America Corporation | ||||||
| 3,000,000 | 6.000%, 9/1/2017 | 3,046,866 | ||||
| 7,825,000 | 8.125%, 5/15/2018 | 5,853,100 | ||||
Bear Stearns Companies, Inc. | ||||||
| 2,800,000 | 6.950%, 8/10/2012 | 2,908,004 | ||||
| 3,800,000 | 6.400%, 10/2/2017 | 3,948,876 | ||||
BNP Paribas SA | ||||||
| 3,350,000 | 5.186%, 6/29/2015f | 1,900,411 | ||||
Capital One Capital III | ||||||
| 2,650,000 | 7.686%, 8/15/2036 | 1,210,202 | ||||
Capital One Capital IV | ||||||
| 2,400,000 | 6.745%, 2/17/2037 | 1,095,470 | ||||
Capital One Financial Corporation | ||||||
| 1,500,000 | 6.150%, 9/1/2016 | 1,055,546 | ||||
Capmark Financial Group, Inc. | ||||||
| 6,000,000 | 6.300%, 5/10/2017 | 1,650,402 | ||||
Chubb Corporation | ||||||
| 3,250,000 | 5.750%, 5/15/2018 | 3,120,543 | ||||
CIGNA Corporation | ||||||
| 4,000,000 | 6.350%, 3/15/2018 | 3,569,804 | ||||
CIT Group, Inc. | ||||||
| 1,850,000 | 4.750%, 12/15/2010 | 1,628,490 | ||||
| 900,000 | 5.400%, 2/13/2012h | 726,126 | ||||
| 5,005,000 | 7.625%, 11/30/2012 | 4,225,066 | ||||
| 930,000 | 12.000%, 12/18/2018f | 716,100 | ||||
Citigroup Capital XXI | ||||||
| 1,900,000 | 8.300%, 12/21/2037 | 1,465,350 | ||||
Citigroup, Inc. | ||||||
| 3,100,000 | 5.000%, 9/15/2014 | 2,726,704 | ||||
| 3,800,000 | 6.000%, 8/15/2017 | 3,782,558 | ||||
| 6,250,000 | 8.400%, 4/30/2018 | 4,126,813 | ||||
CME Group, Inc. | ||||||
| 6,300,000 | 5.400%, 8/1/2013 | 6,257,910 | ||||
Corestates Capital Trust I | ||||||
| 3,000,000 | 8.000%, 12/15/2026f | 2,463,960 | ||||
Countrywide Home Loans, Inc. | ||||||
| 4,125,000 | 4.125%, 9/15/2009 | 4,076,659 | ||||
Coventry Health Care, Inc. | ||||||
| 1,800,000 | 5.875%, 1/15/2012 | 1,321,796 | ||||
| 1,500,000 | 6.125%, 1/15/2015 | 891,203 | ||||
Credit Agricole SA | ||||||
| 3,600,000 | 6.637%, 5/31/2017f | 1,798,934 | ||||
Credit Suisse/New York, NY | ||||||
| 4,500,000 | 6.000%, 2/15/2018 | 4,132,463 | ||||
Endurance Specialty Holdings, Ltd. | ||||||
| 4,200,000 | 6.150%, 10/15/2015 | 3,641,971 | ||||
ERP Operating, LP | ||||||
| 2,500,000 | 5.125%, 3/15/2016 | 1,768,775 | ||||
Fifth Third Bancorp | ||||||
| 2,800,000 | 5.450%, 1/15/2017 | 2,295,390 | ||||
Fifth Third Bank | ||||||
| 3,000,000 | 4.200%, 2/23/2010 | 2,886,891 | ||||
General Electric Capital Corporation | ||||||
| 8,000,000 | 3.000%, 12/9/2011 | 8,270,800 | ||||
| 2,800,000 | 5.625%, 9/15/2017 | 2,816,643 | ||||
| 1,300,000 | 6.150%, 8/7/2037 | 1,303,401 | ||||
| 650,000 | 5.875%, 1/14/2038 | 636,259 | ||||
| 4,500,000 | 6.375%, 11/15/2067 | 2,828,561 | ||||
General Motors Acceptance Corporation, LLC | ||||||
| 791,000 | 6.000%, 12/15/2011f | 639,872 | ||||
Goldman Sachs Group, Inc. | ||||||
| 5,500,000 | 5.125%, 1/15/2015 | 5,046,052 | ||||
| 2,600,000 | 6.150%, 4/1/2018 | 2,498,499 | ||||
| 1,300,000 | 6.750%, 10/1/2037 | 1,055,428 | ||||
HSBC Capital Funding, LP/Jersey Channel Islands | ||||||
| 4,000,000 | 9.547%, 6/30/2010f | 3,169,192 | ||||
HSBC Holdings plc | ||||||
| 1,220,000 | 6.500%, 5/2/2036 | 1,238,678 | ||||
| 2,200,000 | 6.800%, 6/1/2038 | 2,324,828 | ||||
International Lease Finance Corporation | ||||||
| 3,250,000 | 5.750%, 6/15/2011 | 2,370,173 | ||||
| 3,100,000 | 5.300%, 5/1/2012 | 2,177,434 | ||||
J.P. Morgan Chase & Company | ||||||
| 2,800,000 | 5.750%, 1/2/2013 | 2,840,729 | ||||
| 8,000,000 | 7.900%, 4/30/2018 | 6,654,640 | ||||
Keybank National Association | ||||||
| 3,250,000 | 5.500%, 9/17/2012 | 3,029,770 | ||||
| 1,270,000 | 5.450%, 3/3/2016 | 1,000,282 | ||||
KeyCorp | ||||||
| 1,200,000 | 6.500%, 5/14/2013 | 1,106,264 | ||||
Lehman Brothers Holdings, Inc. | ||||||
| 5,500,000 | 5.625%, 1/24/2013i | 522,500 | ||||
Liberty Property, LP | ||||||
| 2,840,000 | 5.500%, 12/15/2016 | 1,690,152 | ||||
Lincoln National Corporation | ||||||
| 2,805,000 | 7.000%, 5/17/2066 | 1,178,100 | ||||
Merrill Lynch & Company, Inc. | ||||||
| 5,000,000 | 5.450%, 2/5/2013 | 4,806,230 | ||||
| 5,000,000 | 6.875%, 4/25/2018 | 5,230,130 | ||||
| 1,350,000 | 6.110%, 1/29/2037 | 1,213,549 | ||||
| 3,000,000 | 7.750%, 5/14/2038 | 3,305,043 | ||||
MetLife Capital Trust X | ||||||
| 3,800,000 | 9.250%, 4/8/2038f | 2,650,770 | ||||
MetLife, Inc. | ||||||
| 4,400,000 | 6.817%, 8/15/2018 | 4,190,569 | ||||
The accompanying Notes to Financial Statements are an integral part of this schedule.
226
Table of Contents
Income Portfolio
Schedule of Investments as of December 31, 2008
| Principal Amount | Long-Term Fixed Income (100.9%) | Value | ||||
| Financials (25.4%) - continued | ||||||
Mitsubishi UFG Capital Finance, Ltd. | ||||||
| $ | 6,730,000 | 6.346%, 7/25/2016 | $ | 4,688,946 | ||
Morgan Stanley | ||||||
| 9,650,000 | 6.625%, 4/1/2018 | 8,465,848 | ||||
National City Bank | ||||||
| 3,100,000 | 5.800%, 6/7/2017 | 2,633,949 | ||||
Nationwide Health Properties, Inc. | ||||||
| 7,150,000 | 6.250%, 2/1/2013 | 6,154,892 | ||||
Preferred Term Securities XXIII, Ltd. | ||||||
| 5,688,933 | 2.196%, 3/23/2009d,e | 2,380,818 | ||||
ProLogis | ||||||
| 2,670,000 | 5.500%, 4/1/2012 | 1,608,670 | ||||
| 2,600,000 | 5.625%, 11/15/2015 | 1,293,929 | ||||
| 2,000,000 | 6.625%, 5/15/2018h | 956,646 | ||||
Prudential Financial, Inc. | ||||||
| 2,900,000 | 6.000%, 12/1/2017 | 2,326,374 | ||||
| 1,095,000 | 5.900%, 3/17/2036 | 694,187 | ||||
| 1,120,000 | 5.700%, 12/14/2036 | 698,053 | ||||
Prudential Financial, Inc., Convertible | ||||||
| 5,700,000 | 0.366%, 3/15/2009d | 5,395,050 | ||||
QBE Insurance Group, Ltd. | ||||||
| 1,680,000 | 9.750%, 3/14/2014f,j | 1,367,990 | ||||
RBS Capital Trust I | ||||||
| 3,750,000 | 5.512%, 9/30/2014 | 1,499,093 | ||||
Regency Centers, LP | ||||||
| 2,500,000 | 5.875%, 6/15/2017 | 1,583,253 | ||||
Regions Financial Corporation | ||||||
| 2,300,000 | 6.375%, 5/15/2012 | 2,021,902 | ||||
Reinsurance Group of America, Inc. | ||||||
| 4,785,000 | 5.625%, 3/15/2017 | 3,586,281 | ||||
Resona Bank, Ltd. | ||||||
| 6,000,000 | 5.850%, 4/15/2016f | 3,401,262 | ||||
Rio Tinto Finance, Ltd. | ||||||
| 4,550,000 | 6.500%, 7/15/2018 | 3,335,928 | ||||
Simon Property Group, LP | ||||||
| 2,280,000 | 5.750%, 12/1/2015 | 1,489,282 | ||||
SLM Corporation | ||||||
| 4,700,000 | 5.400%, 10/25/2011 | 3,555,240 | ||||
| 2,600,000 | 8.450%, 6/15/2018 | 2,055,615 | ||||
SMFG Preferred Capital GBP 1, Ltd. | ||||||
| 3,660,000 | 6.078%, 1/25/2017f | 2,469,146 | ||||
Swiss RE Capital I, LP | ||||||
| 4,200,000 | 6.854%, 5/25/2016f | 1,335,831 | ||||
Travelers Companies, Inc. | ||||||
| 995,000 | 6.250%, 6/15/2037 | 956,664 | ||||
Travelers Property Casualty Corporation | ||||||
| 3,000,000 | 5.000%, 3/15/2013 | 2,838,144 | ||||
Wachovia Bank NA | ||||||
| 3,825,000 | 4.875%, 2/1/2015 | 3,662,059 | ||||
Wachovia Capital Trust III | ||||||
| 3,585,000 | 5.800%, 3/15/2011 | 2,115,150 | ||||
WEA Finance, LLC | ||||||
| 3,100,000 | 7.125%, 4/15/2018f,h | 2,199,112 | ||||
WellPoint, Inc. | ||||||
| 3,500,000 | 5.000%, 12/15/2014 | 3,040,149 | ||||
Wells Fargo & Company | ||||||
| 5,300,000 | 5.625%, 12/11/2017h | 5,529,368 | ||||
Wells Fargo Capital XIII | ||||||
| 5,500,000 | 7.700%, 3/26/2013 | 4,539,211 | ||||
Wells Fargo Capital XV | ||||||
| 4,400,000 | 9.750%, 9/26/2013h | 4,444,000 | ||||
Willis North America, Inc. | ||||||
| 4,600,000 | 6.200%, 3/28/2017 | 3,186,811 | ||||
| Total Financials | 277,100,185 | |||||
| Foreign (0.1%) | ||||||
United Mexican States | ||||||
| 1,100,000 | 6.050%, 1/11/2040 | 1,067,000 | ||||
| Total Foreign | 1,067,000 | |||||
| Mortgage-Backed Securities (8.0%) | ||||||
Federal National Mortgage Association Conventional 30- Yr. Pass Through | ||||||
| 65,750,000 | 5.500%, 1/1/2039c | 67,393,750 | ||||
| 10,000,000 | 6.000%, 1/1/2039c | 10,293,750 | ||||
| 10,000,000 | 6.500%, 1/1/2039c | 10,384,380 | ||||
| Total Mortgage-Backed Securities | 88,071,880 | |||||
| Technology (1.5%) | ||||||
Hewlett-Packard Company | ||||||
| 3,900,000 | 4.500%, 3/1/2013 | 3,958,828 | ||||
| 3,000,000 | 5.500%, 3/1/2018 | 3,027,678 | ||||
International Business Machines Corporation | ||||||
| 4,800,000 | 7.625%, 10/15/2018 | 5,756,136 | ||||
| 3,200,000 | 8.000%, 10/15/2038 | 4,259,974 | ||||
| Total Technology | 17,002,616 | |||||
| Transportation (3.4%) | ||||||
Burlington Northern Santa Fe Corporation | ||||||
| 2,800,000 | 7.000%, 12/15/2025 | 2,855,658 | ||||
Continental Airlines, Inc. | ||||||
| 575,311 | 7.875%, 7/2/2018 | 322,174 | ||||
| 3,250,000 | 5.983%, 4/19/2022 | 2,177,500 | ||||
Delta Air Lines, Inc. | ||||||
| 6,500,000 | 7.111%, 9/18/2011 | 5,200,000 | ||||
FedEx Corporation | ||||||
| 3,518,470 | 6.845%, 1/15/2019 | 3,181,890 | ||||
| 3,265,284 | 6.720%, 1/15/2022 | 3,115,784 | ||||
Kansas City Southern de Mexico SA de CV | ||||||
| 5,850,000 | 7.375%, 6/1/2014 | 4,786,470 | ||||
Northwest Airlines, Inc. | ||||||
| 6,950,000 | 6.841%, 4/1/2011 | 5,699,001 | ||||
Piper Jaffray Equipment Trust Securities | ||||||
| 4,221,055 | 6.750%, 4/1/2011e | 3,018,054 | ||||
Union Pacific Corporation | ||||||
| 4,700,000 | 5.450%, 1/31/2013 | 4,558,807 | ||||
| 2,600,000 | 5.700%, 8/15/2018 | 2,503,111 | ||||
| Total Transportation | 37,418,449 | |||||
The accompanying Notes to Financial Statements are an integral part of this schedule.
227
Table of Contents
Income Portfolio
Schedule of Investments as of December 31, 2008
| Principal Amount | Long-Term Fixed Income (100.9%) | Value | ||||
| U.S. Government (6.9%) | ||||||
Federal Home Loan Banks | ||||||
| $ | 7,800,000 | 4.625%, 10/10/2012 | $ | 8,438,360 | ||
Federal Home Loan Mortgage Corporation | ||||||
| 7,158,517 | 0.511%, 1/26/2009d | 6,794,998 | ||||
| 5,000,000 | 4.625%, 10/25/2012h | 5,408,010 | ||||
| 12,500,000 | 4.125%, 9/27/2013h | 13,469,088 | ||||
| 5,000,000 | 5.000%, 12/14/2018 | 5,182,575 | ||||
Federal National Mortgage Association | ||||||
| 13,000,000 | 5.250%, 8/1/2012k | 13,702,259 | ||||
U.S. Treasury Bonds | ||||||
| 4,000,000 | 6.250%, 8/15/2023 | 5,455,624 | ||||
U.S. Treasury Notes | ||||||
| 7,200,000 | 2.750%, 2/28/2013 | 7,692,754 | ||||
| 8,665,000 | 4.000%, 8/15/2018 | 10,006,047 | ||||
| Total U.S. Government | 76,149,715 | |||||
| Utilities (7.2%) | ||||||
AES Corporation | ||||||
| 6,300,000 | 8.000%, 6/1/2020f | 4,882,499 | ||||
CenterPoint Energy Resources Corporation | ||||||
| 6,850,000 | 6.125%, 11/1/2017 | 5,759,548 | ||||
Cleveland Electric Illuminating Company | ||||||
| 1,775,000 | 5.700%, 4/1/2017 | 1,439,087 | ||||
Columbus Southern Power Company | ||||||
| 2,400,000 | 6.050%, 5/1/2018 | 2,325,120 | ||||
Commonwealth Edison Company | ||||||
| 2,930,000 | 5.400%, 12/15/2011 | 2,852,657 | ||||
| 3,500,000 | 7.500%, 7/1/2013 | 3,539,991 | ||||
| 1,500,000 | 6.150%, 9/15/2017 | 1,394,772 | ||||
Consolidated Natural Gas Company | ||||||
| 1,550,000 | 5.000%, 12/1/2014 | 1,423,157 | ||||
Dominion Resources, Inc. | ||||||
| 2,400,000 | 8.875%, 1/15/2019 | 2,588,134 | ||||
DTE Energy Company | ||||||
| 2,500,000 | 6.375%, 4/15/2033 | 1,970,785 | ||||
Exelon Corporation | ||||||
| 1,500,000 | 6.750%, 5/1/2011 | 1,463,951 | ||||
| 3,500,000 | 4.900%, 6/15/2015 | 2,869,405 | ||||
Florida Power Corporation | ||||||
| 2,000,000 | 6.400%, 6/15/2038 | 2,233,480 | ||||
Illinois Power Company | ||||||
| 3,600,000 | 6.125%, 11/15/2017 | 3,229,625 | ||||
ITC Holdings Corporation | ||||||
| 3,000,000 | 5.875%, 9/30/2016f | 2,860,827 | ||||
| 4,000,000 | 6.050%, 1/31/2018f | 3,838,299 | ||||
MidAmerican Energy Holdings Company | ||||||
| 2,400,000 | 6.125%, 4/1/2036 | 2,231,621 | ||||
| 3,350,000 | 6.500%, 9/15/2037 | 3,270,086 | ||||
Nevada Power Company | ||||||
| 2,800,000 | 6.750%, 7/1/2037 | 2,498,457 | ||||
Nisource Finance Corporation | ||||||
| 2,800,000 | 6.400%, 3/15/2018 | 1,747,416 | ||||
NRG Energy, Inc. | ||||||
| 2,000,000 | 7.250%, 2/1/2014 | 1,870,000 | ||||
| 1,500,000 | 7.375%, 2/1/2016 | 1,395,000 | ||||
Ohio Edison Company | ||||||
| 1,550,000 | 6.875%, 7/15/2036 | 1,406,749 | ||||
Power Contract Financing, LLC | ||||||
| 1,028,982 | 6.256%, 2/1/2010e | 1,008,341 | ||||
Power Receivables Finance, LLC | ||||||
| 2,344,562 | 6.290%, 1/1/2012e | 2,296,686 | ||||
Progress Energy, Inc. | ||||||
| 1,075,000 | 7.000%, 10/30/2031 | 995,947 | ||||
PSEG Power, LLC | ||||||
| 4,800,000 | 5.000%, 4/1/2014 | 4,306,799 | ||||
Southern Star Central Corporation | ||||||
| 3,600,000 | 6.750%, 3/1/2016 | 2,988,000 | ||||
Southwestern Public Service Company | ||||||
| 2,770,000 | 6.000%, 10/1/2036 | 2,085,530 | ||||
TXU Corporation | ||||||
| 1,345,000 | 5.550%, 11/15/2014 | 628,422 | ||||
Union Electric Company | ||||||
| 2,900,000 | 6.400%, 6/15/2017 | 2,643,794 | ||||
Virginia Electric and Power Company | ||||||
| 1,300,000 | 5.950%, 9/15/2017 | 1,308,628 | ||||
| 1,300,000 | 6.350%, 11/30/2037 | 1,319,460 | ||||
| Total Utilities | 78,672,273 | |||||
Total Long-Term Fixed Income (cost $1,279,744,950) | 1,106,236,223 | |||||
| Shares | Preferred Stock (0.1%) | Value | ||||
| Financials (0.1%) | ||||||
| 167 | Preferred Blocker, Inc., 9.000%f | 52,563 | ||||
| 1,300,000 | Wachovia Corporation, 7.980% | 1,108,120 | ||||
| Total Financials | 1,160,683 | |||||
| U.S. Government (<0.1%) | ||||||
| 359,990 | Federal National Mortgage | |||||
Association, 8.250% | 298,792 | |||||
| Total U.S. Government | 298,792 | |||||
Total Preferred Stock (cost $8,320,736) | 1,459,475 | |||||
| Shares | Collateral Held for Securities Loaned (3.4%) | Value | ||||
| 37,623,842 | Thrivent Financial Securities Lending Trust | 37,623,842 | ||||
Total Collateral Held for Securities Loaned (cost $37,623,842) | 37,623,842 | |||||
| Shares or Principal Amount | Short-Term Investments (4.7%)l | Value | ||||
Federal Home Loan Bank Discount Notes | ||||||
| 7,500,000 | 0.010%, 1/6/2009 | 7,499,990 | ||||
| 1,600,000 | 0.250%, 5/14/2009m | 1,598,522 | ||||
The accompanying Notes to Financial Statements are an integral part of this schedule.
228
Table of Contents
Income Portfolio
Schedule of Investments as of December 31, 2008
| Shares or Principal Amount | Short-Term Investments (4.7%)l | Value | ||||
Federal Home Loan Mortgage Corporation Discount Notes | ||||||
| 3,200,000 | 0.130%, 1/27/2009 | $ | 3,199,700 | |||
Federal National Mortgage Association Discount Notes | ||||||
| 7,200,000 | 0.130%, 1/28/2009 | 7,199,298 | ||||
| 16,750,000 | 0.416%, 5/14/2009k,m | 16,724,549 | ||||
| 15,221,153 | Thrivent Money Market Portfolio | 15,221,153 | ||||
| Total Short-Term Investments (at amortized cost) | 51,443,212 | |||||
Total Investments (cost $1,383,341,032) 109.7% | $ | 1,203,183,860 | ||||
| Other Assets and Liabilities, Net (9.7%) | (106,080,832 | ) | ||||
| Total Net Assets 100.0% | $ | 1,097,103,028 | ||||
| a | The stated interest rate represents the weighted average of all contracts within the bank loan facility as discussed in item 2(U) in the Notes to Financial Statements. |
| b | All or a portion of the loan is unfunded as discussed in item 2(U) of the Notes to Financial Statements. |
| c | Denotes investments purchased on a when-issued or delayed delivery basis. |
| d | Denotes variable rate obligations for which the current yield and next scheduled reset date are shown. |
| e | Denotes restricted securities. Restricted securities are investment securities which have been deemed illiquid and cannot be offered for public sale without first being registered under the Securities Act of 1933. The following table indicates the acquisition date and cost of restricted securities Income Portfolio owned as of December 31, 2008. |
Security | Acquisition Date | Cost | |||
Bear Stearns Commercial Mortgage Securities, Inc. | 3/30/2007 | $ | 3,000,000 | ||
Capitalsource Commercial Loan Trust | 4/5/2007 | 4,612,246 | |||
Commercial Mortgage Pass- Through Certificates | 5/2/2007 | 10,000,000 | |||
Commercial Mortgage Pass- Through Certificates | 10/18/2006 | 2,000,000 | |||
Piper Jaffray Equipment Trust Securities | 9/13/2006 | 4,195,847 | |||
Power Contract Financing, LLC | 6/11/2003 | 1,028,820 | |||
Power Receivables Finance, LLC | 9/30/2003 | 2,343,873 | |||
Preferred Term Securities XXIII, Ltd. | 9/14/2006 | 5,688,933 | |||
Systems 2001 Asset Trust, LLC | 6/4/2001 | 3,268,907 | |||
Wachovia Bank Commercial Mortgage Trust | 4/25/2007 | 15,000,717 | |||
| f | Denotes securities sold under Rule 144A of the Securities Act of 1933, which exempts them from registration. These securities have been deemed liquid and may be resold to other dealers in the program or to other qualified institutional buyers. As of December 31, 2008, the value of these investments was $112,440,839 or 10.2% of total net assets. |
| g | All or a portion of the security is insured or guaranteed. |
| h | All or a portion of the security is on loan as discussed in item 2(M) of the Notes to Financial Statements. |
| i | In bankruptcy. |
| j | Security is fair valued as discussed in item 2(A) of the Notes to Financial Statements. |
| k | At December 31, 2008, $4,837,323 of investments were held on deposit with the counterparty and pledged as the initial margin deposit for open financial futures contracts. |
| l | The interest rate shown reflects the yield, coupon rate or, for securities purchased at a discount, the discount rate at the date of purchase. |
| m | At December 31, 2008, $10,634,772 of investments were pledged as collateral with the custodian under the agreement between the counterparty, the custodian and the fund for open swap contracts. |
Gross unrealized appreciation and depreciation of investments, based on cost for federal income tax purposes, were as follows:
Gross unrealized appreciation | $ | 20,641,077 | ||
Gross unrealized depreciation | (202,422,400 | ) | ||
Net unrealized appreciation (depreciation) | $ | (181,781,323 | ) | |
Cost for federal income tax purposes | $ | 1,384,965,183 |
The following table is a summary of the inputs used, as of December 31, 2008, in valuing the Income Portfolio’s assets carried at fair value as discussed in item 2(A) of the Notes to Financial Statements.
Level | Investments in Securities | Other Financial Instruments* | |||||
Level 1 | $ | 53,143,787 | ($ | 5,149,103 | ) | ||
Level 2 | 1,102,919,037 | (5,265,553 | ) | ||||
Level 3 | 47,121,036 | — | |||||
Totals (Level 1,2,3) | $ | 1,203,183,860 | ($10,414,656 | ) | |||
The following table is a reconciliation of assets in which significant unobservable inputs (Level 3) were used in determining fair value for the Income Portfolio as discussed in item 2(A) of the Notes to Financial Statements.
| Investments in Securities | Other Financial Instruments* | |||||||
Value December 31, 2007 | $ | 54,053,739 | $ | 18,992 | ||||
Accrued Discounts/Premiums | (129,866 | ) | — | |||||
Realized Gain/(Loss) | (329,496 | ) | — | |||||
Change in Unrealized Gain/(Loss) | (18,535,030 | ) | (18,992 | ) | ||||
Net Purchases/Sales | (11,700,022 | ) | — | |||||
Transfers In and/or Out of Level 3 | 23,761,711 | — | ||||||
Value December 31, 2008 | $ | 47,121,036 | $ | — | ||||
| * | Other Financial Instruments include Futures, Forwards, Written Options and Swap agreements. |
The accompanying Notes to Financial Statements are an integral part of this schedule.
229
Table of Contents
Income Portfolio
Schedule of Investments as of December 31, 2008
Futures | Number of Contracts Long/(Short) | Expiration Date | Notional Principal Amount | Value | Unrealized Gain/(Loss) | ||||||||||||
2-Yr. U.S. Treasury Bond Futures | 315 | March 2009 | $ | 68,144,319 | $ | 68,689,688 | $ | 545,369 | |||||||||
5-Yr. U.S. Treasury Bond Futures | (295 | ) | March 2009 | (33,941,397 | ) | (35,121,133 | ) | (1,179,736 | ) | ||||||||
10-Yr. U.S. Treasury Bond Futures | (975 | ) | March 2009 | (114,460,993 | ) | (122,606,250 | ) | (8,145,257 | ) | ||||||||
20-Yr. U.S. Treasury Bond Futures | 265 | March 2009 | 32,951,902 | 36,582,423 | 3,630,521 | ||||||||||||
Total Futures | ($5,149,103 | ) | |||||||||||||||
Credit Default Swaps and Counterparty | Buy/Sell Protection1 | Termination Date | Notional Principal Amount2 | Upfront Payments Received (Made) | Value3 | Unrealized Gain/(Loss) | ||||||||||
CDS International Paper, 5 Year, at 6.00%; J.P. Morgan Chase and Co. | Buy | 12/20/2013 | $ | 4,000,000 | $ | — | ($110,060 | ) | ($110,060 | ) | ||||||
CDS Macy’s, 5 Year, at 5.55%; Bank of America | Buy | 12/20/2013 | 6,300,000 | — | 272,062 | 272,062 | ||||||||||
CDX HY, Series 10, 5 Year, at 5.00%; Bank of America | Sell | 6/20/2013 | 22,170,000 | 1,818,248 | (3,510,179 | ) | (1,546,697 | ) | ||||||||
CDX HY, Series 11, 5 Year, at 5.00%; Bank of America | Sell | 12/20/2013 | 15,500,000 | 2,695,278 | (3,119,514 | ) | (501,647 | ) | ||||||||
CDX IG, Series 10, 5 Year, at 1.55%; Bank of America | Sell | 6/20/2013 | 9,467,200 | 103,175 | (217,224 | ) | (118,869 | ) | ||||||||
CDX IG, Series 10, 5 Year, at 1.55%; J.P. Morgan Chase and Co. | Sell | 6/20/2013 | 9,467,200 | 95,361 | (217,224 | ) | (126,090 | ) | ||||||||
LCDX North America, Series 9, 5 Year, at 2.25%; J.P. Morgan Chase and Co. | Sell | 12/20/2012 | 15,680,000 | 399,000 | (3,461,948 | ) | (3,134,252 | ) | ||||||||
Total Credit Default Swaps | ($10,364,087 | ) | ($5,265,553 | ) | ||||||||||||
| 1 | As the buyer of protection, Income Portfolio pays periodic fees in return for payment by the seller which is contingent upon an adverse credit event occurring in the underlying issuer or reference entity. As the seller of protection, Income Portfolio collects periodic fees from the buyer and profits if the credit of the underlying issuer or reference entity remains stable or improves while the swap is outstanding, but the seller in a credit default swap contract would be required to pay the amount of credit loss, determined as specified in the agreement, to the buyer in the event of an adverse credit event in the reference entity. |
| 2 | The maximum potential amount of future payments Income Portfolio could be required to make as the seller or receive as the buyer of protection. |
| 3 | The market value for credit indices (CDX or LCDX) serve as an indicator of the current status of the payment/performance risk and represent the liability or profit for the credit default swap contract had the contract been closed as of the reporting date. In the case when protection has been sold, the market value of the swap will increase when the swap spread declines representing an improvement in the reference entity’s credit worthiness. The market value of the swap will decrease when the swap spread increases representing a deterioration in the reference entity’s credit worthiness. |
Investment in Affiliates
Affiliated issuers, as defined under the Investment Company Act of 1940, include those in which the Portfolio’s holdings of an issuer represent 5% or more of the outstanding voting securities of an issuer, or any affiliated mutual fund.
A summary of transactions for the fiscal year to date, in Income Portfolio, is as follows:
Portfolio | Value December 31, 2007 | Gross Purchases and Additions | Gross Sales and Reductions | Balance of Shares Held at December 31, 2008 | Value December 31, 2008 | Income Earned January 1, 2008 - December 31, 2008 | |||||||||||
Money Market | $ | 23,481,154 | $ | 148,318,914 | $ | 156,578,915 | 15,221,153 | $ | 15,221,153 | $ | 842,526 | ||||||
Thrivent Financial Securities Lending Trust | 132,421,350 | 235,703,682 | 330,501,190 | 37,623,842 | 37,623,842 | 714,363 | |||||||||||
Total Value and Income Earned | 155,902,504 | 52,844,995 | 1,556,889 | ||||||||||||||
The accompanying Notes to Financial Statements are an integral part of this schedule.
230
Table of Contents
Schedule of Investments as of December 31, 2008
| Principal Amount | Long-Term Fixed Income (110.2%) | Value | ||||
| Asset-Backed Securities (7.8%) | ||||||
Americredit Automobile Receivables Trust | ||||||
| $ | 1,450,705 | 1.956%, 1/6/2009a,b | $ | 1,281,563 | ||
Bear Stearns Mortgage Funding Trust | ||||||
| 700,557 | 0.611%, 1/26/2009b | 127,110 | ||||
Countrywide Asset-Backed Certificates | ||||||
| 1,510,729 | 5.549%, 4/25/2036a | 1,254,152 | ||||
Countrywide Home Loans Asset- Backed Securities | ||||||
| 750,000 | 6.085%, 6/25/2021a | 321,832 | ||||
Credit Based Asset Servicing and Securitization, LLC | ||||||
| 930,724 | 0.581%, 1/26/2009b | 892,876 | ||||
| 879,894 | 5.501%, 12/25/2036 | 729,946 | ||||
Discover Card Master Trust | ||||||
| 1,200,000 | 5.650%, 3/16/2020 | 908,706 | ||||
First Franklin Mortgage Loan Asset-Backed Certificates | ||||||
| 1,053,005 | 0.581%, 1/26/2009b | 994,992 | ||||
First Horizon ABS Trust | ||||||
| 1,784,772 | 0.601%, 1/26/2009a,b | 1,057,638 | ||||
| 1,493,580 | 0.631%, 1/26/2009a,b | 703,041 | ||||
Ford Credit Floor Plan Master Owner Trust | ||||||
| 1,500,000 | 1.375%, 1/15/2009b | 1,448,132 | ||||
GMAC Mortgage Corporation Loan Trust | ||||||
| 2,608,853 | 0.541%, 1/26/2009a,b | 905,827 | ||||
| 2,125,668 | 0.651%, 1/26/2009a,b | 1,121,384 | ||||
Green Tree Financial Corporation | ||||||
| 35,783 | 6.330%, 11/1/2029 | 28,966 | ||||
IndyMac Seconds Asset-Backed Trust | ||||||
| 1,083,543 | 0.641%, 1/26/2009a,b | 466,005 | ||||
Residential Funding Mortgage Securities II | ||||||
| 386,739 | 0.601%, 1/26/2009a,b | 371,019 | ||||
SLM Student Loan Trust | ||||||
| 234,712 | 3.545%, 1/26/2009b | 233,676 | ||||
Wachovia Asset Securitization, Inc. | ||||||
| 1,705,379 | 0.611%, 1/26/2009a,b,c | 646,023 | ||||
| Total Asset-Backed Securities | 13,492,888 | |||||
| Basic Materials (0.5%) | ||||||
Alcan, Inc. | ||||||
| 500,000 | 5.200%, 1/15/2014 | 371,381 | ||||
| 275,000 | 6.125%, 12/15/2033 | 168,032 | ||||
Dow Chemical Company | ||||||
| 27,000 | 7.375%, 11/1/2029 | 25,428 | ||||
Potash Corporation of Saskatchewan, Inc. | ||||||
| 300,000 | 7.750%, 5/31/2011 | 312,450 | ||||
| Total Basic Materials | 877,291 | |||||
| Capital Goods (1.0%) | ||||||
General Electric Company | ||||||
| 600,000 | 5.000%, 2/1/2013 | 606,775 | ||||
Honeywell International, Inc. | ||||||
| 500,000 | 5.300%, 3/1/2018 | 510,139 | ||||
John Deere Capital Corporation | ||||||
| 350,000 | 7.000%, 3/15/2012 | 362,996 | ||||
Lockheed Martin Corporation | ||||||
| 27,000 | 6.150%, 9/1/2036 | 29,274 | ||||
United Technologies Corporation | ||||||
| 275,000 | 6.050%, 6/1/2036 | 289,265 | ||||
| Total Capital Goods | 1,798,449 | |||||
| Collateralized Mortgage Obligations (4.1%) | ||||||
Chase Mortgage Finance Corporation | ||||||
| 1,980,452 | 4.567%, 2/25/2037 | 1,609,856 | ||||
J.P. Morgan Mortgage Trust | ||||||
| 1,938,261 | 5.005%, 7/25/2035 | 1,244,821 | ||||
Merrill Lynch Mortgage Investors, Inc. | ||||||
| 1,585,627 | 4.870%, 6/25/2035 | 1,100,695 | ||||
Thornburg Mortgage Securities Trust | ||||||
| 1,241,376 | 0.561%, 1/26/2009b | 1,218,819 | ||||
| 1,514,991 | 0.581%, 1/26/2009b | 1,256,024 | ||||
Zuni Mortgage Loan Trust | ||||||
| 737,438 | 0.601%, 1/26/2009b | 699,048 | ||||
| Total Collateralized Mortgage Obligations | 7,129,263 | |||||
| Commercial Mortgage-Backed Securities (8.1%) | ||||||
Banc of America Commercial Mortgage, Inc. | ||||||
| 700,000 | 5.118%, 7/11/2043 | 649,471 | ||||
Bear Stearns Commercial Mortgage Securities, Inc. | ||||||
| 2,500,000 | 1.345%, 1/15/2009b,c | 1,896,367 | ||||
| 1,000,000 | 5.835%, 9/11/2042 | 453,085 | ||||
Citigroup Commercial Mortgage Trust | ||||||
| 13,159 | 1.265%, 1/15/2009b,d | 11,401 | ||||
Commercial Mortgage Pass- Through Certificates | ||||||
| 75,055 | 1.295%, 1/15/2009b,d | 67,114 | ||||
| 2,500,000 | 1.325%, 1/15/2009b,c | 1,445,210 | ||||
Credit Suisse First Boston Mortgage Securities Corporation | ||||||
| 120,529 | 3.861%, 3/15/2036 | 118,096 | ||||
| 500,000 | 4.829%, 11/15/2037 | 412,188 | ||||
Credit Suisse Mortgage Capital Certificates | ||||||
| 2,500,000 | 1.365%, 1/15/2009b,d | 1,615,190 | ||||
Crown Castle International Corporation | ||||||
| 1,000,000 | 5.245%, 11/15/2036d | 831,540 | ||||
General Electric Commercial Mortgage Corporation | ||||||
| 800,000 | 4.641%, 9/10/2013 | 717,346 | ||||
GMAC Commercial Mortgage Securities, Inc. | ||||||
| 500,000 | 4.547%, 12/10/2041 | 451,652 | ||||
The accompanying Notes to Financial Statements are an integral part of this schedule.
231
Table of Contents
Bond Index Portfolio
Schedule of Investments as of December 31, 2008
| Principal Amount | Long-Term Fixed Income (110.2%) | Value | ||||
| Commercial Mortgage-Backed Securities (8.1%) - continued | ||||||
Greenwich Capital Commercial Funding Corporation | ||||||
| $ | 1,000,000 | 5.867%, 8/10/2017 | $ | 508,041 | ||
| 1,000,000 | 5.317%, 6/10/2036 | 831,943 | ||||
GS Mortgage Securities Corporation II | ||||||
| 2,000,000 | 2.006%, 1/6/2009b,d | 1,322,970 | ||||
J.P. Morgan Chase Commercial Mortgage Securities Corporation | ||||||
| 500,000 | 4.654%, 1/12/2037 | 433,598 | ||||
| 1,500,000 | 5.336%, 5/15/2047 | 1,125,266 | ||||
LB-UBS Commercial Mortgage Trust | ||||||
| 23,833 | 3.086%, 5/15/2027 | 23,781 | ||||
| 700,000 | 4.786%, 10/15/2029 | 559,723 | ||||
| 731,199 | 4.553%, 7/15/2030 | 676,943 | ||||
| Total Commercial Mortgage- Backed Securities | 14,150,925 | |||||
| Communications Services (2.2%) | ||||||
AT&T, Inc. | ||||||
| 300,000 | 6.400%, 5/15/2038 | 321,354 | ||||
BellSouth Corporation | ||||||
| 27,000 | 6.875%, 10/15/2031 | 28,070 | ||||
British Telecom plc | ||||||
| 302,000 | 9.125%, 12/15/2030 | 321,008 | ||||
Cingular Wireless, Inc. | ||||||
| 400,000 | 6.500%, 12/15/2011 | 401,598 | ||||
Cox Communications, Inc. | ||||||
| 500,000 | 7.750%, 11/1/2010 | 490,758 | ||||
| 135,000 | 6.450%, 12/1/2036d | 117,387 | ||||
France Telecom SA | ||||||
| 200,000 | 7.750%, 3/1/2011 | 210,461 | ||||
News America, Inc. | ||||||
| 275,000 | 6.400%, 12/15/2035 | 254,171 | ||||
SBC Communications, Inc. | ||||||
| 275,000 | 5.875%, 2/1/2012 | 280,215 | ||||
Telecom Italia Capital SA | ||||||
| 800,000 | 5.250%, 10/1/2015 | 609,000 | ||||
Tele-Communications, Inc. (TCI Group) | ||||||
| 425,000 | 7.875%, 8/1/2013 | 436,992 | ||||
Time Warner Cable, Inc. | ||||||
| 300,000 | 7.300%, 7/1/2038 | 311,660 | ||||
Verizon Global Funding Corporation | ||||||
| 27,000 | 7.750%, 12/1/2030 | 29,940 | ||||
| Total Communications Services | 3,812,614 | |||||
| Consumer Cyclical (0.9%) | ||||||
AOL Time Warner, Inc. | ||||||
| 27,000 | 7.625%, 4/15/2031 | 26,536 | ||||
DaimlerChrysler North American Holdings Corporation | ||||||
| 27,000 | 8.500%, 1/18/2031 | 19,743 | ||||
McDonald’s Corporation | ||||||
| 325,000 | 6.300%, 3/1/2038 | 358,477 | ||||
Target Corporation | ||||||
| 27,000 | 7.000%, 7/15/2031 | 24,802 | ||||
Wal-Mart Stores, Inc. | ||||||
| 527,000 | 7.550%, 2/15/2030 | 635,931 | ||||
Walt Disney Company | ||||||
| 500,000 | 5.625%, 9/15/2016 | 518,794 | ||||
| Total Consumer Cyclical | 1,584,283 | |||||
| Consumer Non-Cyclical (1.9%) | ||||||
Boston Scientific Corporation | ||||||
| 275,000 | 7.000%, 11/15/2035 | 203,500 | ||||
Bunge Limited Finance Corporation | ||||||
| 600,000 | 5.350%, 4/15/2014 | 430,449 | ||||
Coca-Cola HBC Finance BV | ||||||
| 475,000 | 5.125%, 9/17/2013 | 463,841 | ||||
Genentech, Inc. | ||||||
| 400,000 | 4.400%, 7/15/2010 | 404,516 | ||||
GlaxoSmithKline Capital, Inc. | ||||||
| 300,000 | 6.375%, 5/15/2038 | 338,951 | ||||
Kellogg Company | ||||||
| 600,000 | 4.250%, 3/6/2013 | 581,036 | ||||
| 27,000 | 7.450%, 4/1/2031 | 32,989 | ||||
Kraft Foods, Inc. | ||||||
| 27,000 | 6.500%, 11/1/2031 | 25,914 | ||||
Philip Morris International, Inc. | ||||||
| 300,000 | 6.375%, 5/16/2038 | 312,019 | ||||
Wyeth | ||||||
| 550,000 | 6.000%, 2/15/2036 | 590,098 | ||||
| Total Consumer Non-Cyclical | 3,383,313 | |||||
| Energy (1.4%) | ||||||
Anadarko Finance Company | ||||||
| 500,000 | 6.750%, 5/1/2011 | 500,179 | ||||
| 27,000 | 7.500%, 5/1/2031 | 23,875 | ||||
Burlington Resources, Inc. | ||||||
| 500,000 | 6.500%, 12/1/2011 | 510,622 | ||||
Conoco, Inc. | ||||||
| 27,000 | 6.950%, 4/15/2029 | 29,055 | ||||
Devon Financing Corporation, ULC | ||||||
| 27,000 | 7.875%, 9/30/2031 | 29,730 | ||||
Energy Transfer Partners, LP | ||||||
| 450,000 | 6.700%, 7/1/2018 | 379,301 | ||||
Petro-Canada | ||||||
| 300,000 | 6.800%, 5/15/2038 | 226,390 | ||||
Valero Energy Corporation | ||||||
| 500,000 | 4.750%, 6/15/2013 | 459,416 | ||||
XTO Energy, Inc. | ||||||
| 275,000 | 6.375%, 6/15/2038 | 241,969 | ||||
| Total Energy | 2,400,537 | |||||
| Financials (7.7%) | ||||||
Abbey National plc | ||||||
| 27,000 | 7.950%, 10/26/2029 | 23,518 | ||||
AIG SunAmerica Global Financing VI | ||||||
| 500,000 | 6.300%, 5/10/2011d | 429,935 | ||||
AXA SA | ||||||
| 27,000 | 8.600%, 12/15/2030 | 17,679 | ||||
BAC Capital Trust XI | ||||||
| 275,000 | 6.625%, 5/23/2036 | 254,117 | ||||
Bank One Corporation | ||||||
| 900,000 | 5.900%, 11/15/2011 | 902,891 | ||||
The accompanying Notes to Financial Statements are an integral part of this schedule.
232
Table of Contents
Bond Index Portfolio
Schedule of Investments as of December 31, 2008
| Principal Amount | Long-Term Fixed Income (110.2%) | Value | ||||
| Financials (7.7%) - continued | ||||||
BB&T Corporation | ||||||
| $ | 600,000 | 6.500%, 8/1/2011 | $ | 607,314 | ||
BNP Paribas SA | ||||||
| 1,100,000 | 5.186%, 6/29/2015d | 624,016 | ||||
Chubb Corporation | ||||||
| 600,000 | 6.500%, 5/15/2038 | 572,793 | ||||
CIGNA Corporation | ||||||
| 450,000 | 6.350%, 3/15/2018 | 401,603 | ||||
CIT Group, Inc. | ||||||
| 725,000 | 4.750%, 12/15/2010 | 638,192 | ||||
Citigroup, Inc. | ||||||
| 590,000 | 5.000%, 9/15/2014 | 518,953 | ||||
| 250,000 | 4.700%, 5/29/2015 | 215,754 | ||||
General Electric Capital Corporation | ||||||
| 500,000 | 3.000%, 12/9/2011 | 516,925 | ||||
| 475,000 | 5.875%, 1/14/2038 | 464,958 | ||||
Goldman Sachs Group, Inc. | ||||||
| 950,000 | 6.600%, 1/15/2012 | 937,332 | ||||
Household Finance Corporation | ||||||
| 650,000 | 6.375%, 11/27/2012 | 635,947 | ||||
HSBC Finance Corporation | ||||||
| 350,000 | 5.000%, 6/30/2015 | 310,673 | ||||
HSBC Holdings plc | ||||||
| 300,000 | 6.800%, 6/1/2038 | 317,022 | ||||
International Lease Finance Corporation | ||||||
| 850,000 | 5.875%, 5/1/2013 | 567,463 | ||||
Marsh & McLennan Companies, Inc. | ||||||
| 185,000 | 5.750%, 9/15/2015 | 164,784 | ||||
Merrill Lynch & Company, Inc. | ||||||
| 475,000 | 5.000%, 2/3/2014 | 460,522 | ||||
MetLife, Inc. | ||||||
| 200,000 | 5.000%, 6/15/2015 | 187,338 | ||||
Morgan Stanley Dean Witter & Company | ||||||
| 850,000 | 6.750%, 4/15/2011 | 836,337 | ||||
Preferred Term Securities XXIII, Ltd. | ||||||
| 1,219,057 | 2.196%, 3/23/2009b,c | 510,175 | ||||
ProLogis Trust | ||||||
| 500,000 | 5.500%, 3/1/2013 | 289,975 | ||||
Prudential Financial, Inc. | ||||||
| 275,000 | 5.700%, 12/14/2036 | 171,397 | ||||
Rio Tinto Finance. Ltd. | ||||||
| 500,000 | 7.125%, 7/15/2028 | 352,983 | ||||
Student Loan Marketing Corporation | ||||||
| 500,000 | 4.000%, 1/15/2010 | 452,597 | ||||
Union Planters Corporation | ||||||
| 550,000 | 4.375%, 12/1/2010 | 516,508 | ||||
Wachovia Bank NA | ||||||
| 500,000 | 4.875%, 2/1/2015 | 478,700 | ||||
Washington Mutual Bank FA | ||||||
| 500,000 | 5.500%, 1/15/2013 | 50 | ||||
| Total Financials | 13,378,451 | |||||
| Foreign (1.9%) | ||||||
African Development Bank | ||||||
| 250,000 | 6.875%, 10/15/2015 | 303,002 | ||||
Codelco, Inc. | ||||||
| 300,000 | 6.375%, 11/30/2012d | 305,222 | ||||
Kreditanstalt fuer Wiederaufbau | ||||||
| 600,000 | 3.750%, 6/27/2011 | 624,282 | ||||
Pemex Project Funding Master Trust | ||||||
| 95,000 | 9.125%, 10/13/2010 | 99,988 | ||||
Republic of Italy | ||||||
| 600,000 | 6.000%, 2/22/2011 | 642,600 | ||||
| 200,000 | 4.375%, 6/15/2013 | 206,331 | ||||
United Mexican States | ||||||
| 1,100,000 | 5.625%, 1/15/2017 | 1,100,000 | ||||
| Total Foreign | 3,281,425 | |||||
| Mortgage-Backed Securities (35.5%) | ||||||
Federal Home Loan Mortgage Corporation Gold 15-Yr. Pass Through | ||||||
| 2,325 | 7.500%, 12/1/2009 | 2,360 | ||||
| 4,914 | 6.500%, 10/1/2012 | 5,106 | ||||
| 3,933 | 6.500%, 1/1/2013 | 4,087 | ||||
| 6,514 | 6.000%, 9/1/2013 | 6,755 | ||||
| 12,244 | 5.500%, 3/1/2014 | 12,724 | ||||
| 24,364 | 6.000%, 4/1/2014 | 25,264 | ||||
| 8,747 | 7.000%, 10/1/2014 | 9,162 | ||||
| 14,143 | 6.500%, 3/1/2016 | 14,694 | ||||
| 23,683 | 6.000%, 6/1/2016 | 24,558 | ||||
| 33,071 | 6.000%, 9/1/2016 | 34,293 | ||||
| 282,849 | 7.000%, 6/1/2017 | 296,244 | ||||
| 485,676 | 5.500%, 12/1/2017 | 502,670 | ||||
Federal Home Loan Mortgage Corporation Gold 30-Yr. Pass Through | ||||||
| 4,921 | 6.500%, 4/1/2024 | 5,165 | ||||
| 7,447 | 7.000%, 5/1/2024 | 7,790 | ||||
| 1,343 | 7.500%, 8/1/2025 | 1,420 | ||||
| 15,679 | 8.500%, 11/1/2025 | 16,915 | ||||
| 2,503 | 8.000%, 1/1/2026 | 2,656 | ||||
| 3,633 | 7.000%, 4/1/2027 | 3,823 | ||||
| 4,243 | 7.500%, 7/1/2027 | 4,484 | ||||
| 6,915 | 7.000%, 8/1/2027 | 7,277 | ||||
| 4,363 | 7.500%, 10/1/2027 | 4,608 | ||||
| 5,396 | 7.000%, 5/1/2028 | 5,679 | ||||
| 24,045 | 6.000%, 8/1/2028 | 24,944 | ||||
| 11,435 | 6.500%, 2/1/2029 | 11,975 | ||||
| 26,298 | 6.000%, 3/1/2029 | 27,249 | ||||
| 10,814 | 7.000%, 7/1/2029 | 11,382 | ||||
| 16,341 | 7.500%, 10/1/2029 | 17,233 | ||||
| 8,518 | 7.500%, 11/1/2029 | 8,983 | ||||
| 16,047 | 6.500%, 5/1/2031 | 16,764 | ||||
| 66,422 | 6.000%, 6/1/2031 | 68,739 | ||||
| 13,547 | 7.000%, 6/1/2031 | 14,237 | ||||
| 12,997 | 7.000%, 6/1/2031 | 13,659 | ||||
| 63,932 | 6.000%, 7/1/2031 | 66,162 | ||||
| 14,799 | 7.000%, 9/1/2031 | 15,552 | ||||
| 53,557 | 6.500%, 10/1/2031 | 55,950 | ||||
| 284,022 | 6.000%, 1/1/2032 | 293,930 | ||||
| 50,060 | 6.000%, 1/1/2032 | 51,806 | ||||
| 24,080 | 7.000%, 5/1/2032 | 25,306 | ||||
| 312,255 | 6.500%, 7/1/2032 | 325,819 | ||||
| 232,699 | 6.500%, 10/1/2032 | 242,807 | ||||
| 444,980 | 6.000%, 11/1/2032 | 460,086 | ||||
The accompanying Notes to Financial Statements are an integral part of this schedule.
233
Table of Contents
Bond Index Portfolio
Schedule of Investments as of December 31, 2008
| Principal Amount | Long-Term Fixed Income (110.2%) | Value | ||||
| Mortgage-Backed Securities (35.5%) - continued | ||||||
| $ | 7,000,000 | 5.000%, 1/1/2038e | $ | 7,153,125 | ||
| 10,700,000 | 6.000%, 1/1/2038e | 11,021,000 | ||||
Federal National Mortgage Association Conventional 15- Yr. Pass Through | ||||||
| 1,652 | 6.000%, 4/1/2011 | 1,718 | ||||
| 554 | 7.500%, 7/1/2011 | 576 | ||||
| 2,551 | 8.000%, 7/1/2012 | 2,687 | ||||
| 4,451 | 6.500%, 12/1/2012 | 4,627 | ||||
| 10,980 | 6.500%, 6/1/2013 | 11,416 | ||||
| 19,268 | 6.000%, 12/1/2013 | 20,086 | ||||
| 8,100,000 | 5.000%, 1/1/2023e | 8,312,625 | ||||
Federal National Mortgage Association Conventional 30- Yr. Pass Through | ||||||
| 6,273 | 10.500%, 8/1/2020 | 7,197 | ||||
| 5,636 | 8.000%, 12/1/2024 | 5,974 | ||||
| 9,809 | 7.000%, 10/1/2025 | 10,388 | ||||
| 28,768 | 6.500%, 11/1/2025 | 30,153 | ||||
| 1,117 | 8.500%, 12/1/2025 | 1,205 | ||||
| 6,066 | 7.500%, 1/1/2026 | 6,440 | ||||
| 7,801 | 6.500%, 5/1/2026 | 8,170 | ||||
| 4,672 | 8.000%, 9/1/2026 | 4,952 | ||||
| 5,255 | 7.500%, 2/1/2027 | 5,577 | ||||
| 3,776 | 7.000%, 3/1/2027 | 3,999 | ||||
| 10,434 | 6.500%, 8/1/2027 | 10,926 | ||||
| 1,330 | 7.500%, 11/1/2027 | 1,410 | ||||
| 7,079 | 9.000%, 11/1/2027 | 7,745 | ||||
| 4,266 | 7.000%, 1/1/2028 | 4,518 | ||||
| 64,978 | 7.500%, 2/1/2028 | 68,924 | ||||
| 10,228 | 6.000%, 5/1/2028 | 10,601 | ||||
| 3,035 | 6.500%, 9/1/2028 | 3,177 | ||||
| 14,484 | 7.000%, 10/1/2028 | 15,322 | ||||
| 41,696 | 7.500%, 11/1/2028 | 44,252 | ||||
| 82,329 | 6.000%, 12/1/2028 | 85,330 | ||||
| 4,974 | 7.000%, 12/1/2028 | 5,262 | ||||
| 12,475 | 6.500%, 2/1/2029 | 13,056 | ||||
| 44,714 | 6.000%, 3/1/2029 | 46,344 | ||||
| 21,258 | 7.000%, 3/1/2029 | 22,491 | ||||
| 53,231 | 6.500%, 4/1/2029 | 55,710 | ||||
| 4,324 | 6.500%, 8/1/2029 | 4,525 | ||||
| 13,039 | 7.500%, 8/1/2029 | 13,810 | ||||
| 19,169 | 7.000%, 10/1/2029 | 20,280 | ||||
| 11,451 | 7.500%, 12/1/2029 | 12,128 | ||||
| 7,518 | 8.000%, 4/1/2030 | 7,985 | ||||
| 4,842 | 7.500%, 12/1/2030 | 5,126 | ||||
| 81,697 | 6.000%, 5/1/2031 | 84,496 | ||||
| 172,793 | 6.500%, 4/1/2032 | 180,298 | ||||
| 159,508 | 6.500%, 5/1/2032 | 166,436 | ||||
| 90,215 | 7.000%, 5/1/2032 | 95,465 | ||||
| 553,996 | 6.500%, 7/1/2032 | 578,061 | ||||
| 269,676 | 6.500%, 8/1/2032 | 281,390 | ||||
| 29,400,000 | 5.500%, 1/1/2039e | 30,135,000 | ||||
Government National Mortgage Association 15-Yr. Pass Through | ||||||
| 1,469 | 6.500%, 6/15/2009 | 1,513 | ||||
| 21,033 | 7.000%, 9/15/2013 | 22,166 | ||||
Government National Mortgage Association 30-Yr. Pass Through | ||||||
| 5,633 | 7.500%, 3/15/2023 | 5,971 | ||||
| 4,389 | 7.000%, 1/15/2024 | 4,651 | ||||
| 2,841 | 9.000%, 9/15/2024 | 3,039 | ||||
| 6,546 | 8.000%, 6/15/2025 | 6,964 | ||||
| 1,963 | 8.000%, 9/15/2026 | 2,089 | ||||
| 9,185 | 7.500%, 3/15/2027 | 9,733 | ||||
| 8,368 | 7.500%, 10/15/2027 | 8,867 | ||||
| 7,972 | 7.000%, 11/15/2027 | 8,447 | ||||
| 7,488 | 7.000%, 1/15/2028 | 7,928 | ||||
| 12,514 | 6.500%, 7/15/2028 | 13,153 | ||||
| 12,355 | 7.000%, 8/15/2028 | 13,081 | ||||
| 50,823 | 7.500%, 11/15/2028 | 53,856 | ||||
| 12,162 | 6.500%, 12/15/2028 | 12,784 | ||||
| 49,813 | 6.500%, 3/15/2029 | 52,357 | ||||
| 10,908 | 6.500%, 4/15/2029 | 11,465 | ||||
| 10,153 | 8.000%, 10/15/2030 | 10,820 | ||||
| 14,387 | 7.500%, 1/15/2031 | 15,283 | ||||
| 6,483 | 7.000%, 4/15/2031 | 6,856 | ||||
| 28,418 | 6.500%, 6/15/2031 | 29,870 | ||||
| 24,169 | 7.000%, 9/15/2031 | 25,558 | ||||
| 292,597 | 6.500%, 1/15/2032 | 307,544 | ||||
| 39,556 | 6.500%, 4/15/2032 | 41,576 | ||||
| Total Mortgage-Backed Securities | 62,017,871 | |||||
| Municipals (0.7%) | ||||||
Hydro-Quebec | ||||||
| 27,000 | 8.400%, 1/15/2022 | 40,068 | ||||
Province of Nova Scotia | ||||||
| 250,000 | 7.250%, 7/27/2013 | 296,152 | ||||
Province of Quebec | ||||||
| 400,000 | 4.875%, 5/5/2014 | 415,716 | ||||
| 400,000 | 7.500%, 7/15/2023 | 537,883 | ||||
| Total Municipals | 1,289,819 | |||||
| Technology (0.3%) | ||||||
International Business Machines Corporation | ||||||
| 500,000 | 4.250%, 9/15/2009 | 507,109 | ||||
| Total Technology | 507,109 | |||||
| Transportation (0.3%) | ||||||
Union Pacific Corporation | ||||||
| 500,000 | 7.000%, 2/1/2016 | 519,486 | ||||
| Total Transportation | 519,486 | |||||
| U.S. Government (34.3%) | ||||||
Federal Farm Credit Bank | ||||||
| 1,000,000 | 5.375%, 7/18/2011 | 1,096,641 | ||||
Federal Home Loan Banks | ||||||
| 3,000,000 | 3.625%, 7/1/2011 | 3,170,088 | ||||
| 1,000,000 | 4.625%, 10/10/2012 | 1,081,841 | ||||
| 1,000,000 | 3.625%, 5/29/2013f | 1,048,206 | ||||
| 850,000 | 4.500%, 9/16/2013 | 926,297 | ||||
Federal Home Loan Mortgage Corporation | ||||||
| 1,050,000 | 6.000%, 6/15/2011 | 1,163,704 | ||||
| 1,000,000 | 5.125%, 7/15/2012 | 1,104,580 | ||||
The accompanying Notes to Financial Statements are an integral part of this schedule.
234
Table of Contents
Bond Index Portfolio
Schedule of Investments as of December 31, 2008
| Principal Amount | Long-Term Fixed Income (110.2%) | Value | |||||
| U.S. Government (34.3%) - continued | |||||||
| $ | 500,000 | 3.750%, 6/28/2013 | $ | 532,451 | |||
| 3,200,000 | 5.125%, 11/17/2017f | 3,707,696 | |||||
| 1,000,000 | 5.000%, 12/14/2018 | 1,036,515 | |||||
| 700,000 | 6.750%, 3/15/2031 | 1,026,507 | |||||
Federal National Mortgage Association | |||||||
| 2,000,000 | 6.125%, 3/15/2012 | 2,271,538 | |||||
| 1,000,000 | 5.000%, 4/15/2015f | 1,133,173 | |||||
| 500,000 | 5.960%, 9/11/2028 | 660,238 | |||||
| 100,000 | 6.250%, 5/15/2029 | 136,539 | |||||
Resolution Funding Corporation | |||||||
| 200,000 | 8.125%, 10/15/2019 | 288,596 | |||||
Tennessee Valley Authority | |||||||
| 250,000 | 6.000%, 3/15/2013 | 283,358 | |||||
U.S. Treasury Bonds | |||||||
| 4,200,000 | 7.250%, 5/15/2016f | 5,623,733 | |||||
| 4,500,000 | 5.250%, 11/15/2028 | 5,941,404 | |||||
U.S. Treasury Notes | |||||||
| 3,000,000 | 6.000%, 8/15/2009 | 3,104,064 | |||||
| 2,000,000 | 3.625%, 1/15/2010 | 2,069,922 | |||||
| 2,750,000 | 4.375%, 12/15/2010 | 2,953,456 | |||||
| 2,945,000 | 5.000%, 2/15/2011 | 3,219,483 | |||||
| 4,500,000 | 4.500%, 11/30/2011f | 4,956,678 | |||||
| 500,000 | 4.375%, 8/15/2012f | 560,390 | |||||
| 1,000,000 | 2.875%, 1/31/2013f | 1,073,516 | |||||
| 1,000,000 | 2.000%, 11/30/2013 | 1,025,938 | |||||
| 2,500,000 | 4.250%, 8/15/2014 | 2,873,437 | |||||
| 3,175,000 | 4.500%, 2/15/2016f | 3,737,572 | |||||
| 400,000 | 4.625%, 2/15/2017 | 473,062 | |||||
| 600,000 | 4.500%, 5/15/2017 | 704,063 | |||||
| 375,000 | 4.250%, 11/15/2017 | 436,846 | |||||
| 450,000 | 3.750%, 11/15/2018 | 509,413 | |||||
| Total U.S. Government | 59,930,945 | ||||||
| Utilities (1.6%) | |||||||
CenterPoint Energy Houston Electric, LLC | |||||||
| 400,000 | 5.600%, 7/1/2023 | 330,857 | |||||
Commonwealth Edison Company | |||||||
| 275,000 | 5.900%, 3/15/2036 | 228,697 | |||||
FirstEnergy Corporation | |||||||
| 27,000 | 7.375%, 11/15/2031 | 25,542 | |||||
National Rural Utilities Cooperative Finance | |||||||
| 27,000 | 8.000%, 3/1/2032 | 26,613 | |||||
Oncor Electric Delivery Company | |||||||
| 475,000 | 6.375%, 1/15/2015 | 454,986 | |||||
Oneok Partners, LP | |||||||
| 275,000 | 6.650%, 10/1/2036 | 213,077 | |||||
Progress Energy, Inc. | |||||||
| 400,000 | 7.000%, 10/30/2031 | 370,585 | |||||
Public Service Company of Colorado | |||||||
| 600,000 | 7.875%, 10/1/2012 | 630,997 | |||||
Southern California Edison Company | |||||||
| 225,000 | 5.000%, 1/15/2014 | 229,024 | |||||
Xcel Energy, Inc. | |||||||
| 275,000 | 6.500%, 7/1/2036 | 252,483 | |||||
| Total Utilities | 2,762,861 | ||||||
Total Long-Term Fixed Income (cost $204,155,809) | 192,317,530 | ||||||
| Shares | Collateral Held for Securities Loaned (9.7%) | Value | |||||
| 17,005,159 | Thrivent Financial Securities Lending Trust | 17,005,159 | |||||
Total Collateral Held for Securities Loaned (cost $17,005,159) | 17,005,159 | ||||||
| Shares or Principal Amount | Short-Term Investments (21.3%)g | Value | |||||
Federal Home Loan Bank Discount Notes | |||||||
| 5,000,000 | 0.010%, 1/6/2009 | 4,999,993 | |||||
| 4,910,000 | 0.040%, 1/12/2009 | 4,909,940 | |||||
| 4,350,000 | 0.070%, 1/13/2009 | 4,349,899 | |||||
Federal National Mortgage Association Discount Notes | |||||||
| 10,265,000 | 0.050%, 1/27/2009 | 10,264,629 | |||||
| 12,754,279 | Thrivent Money Market Portfolio | 12,754,279 | |||||
| Total Short-Term Investments (at amortized cost) | 37,278,740 | ||||||
Total Investments (cost $258,439,708) 141.2% | $ | 246,601,429 | |||||
| Other Assets and Liabilities, Net (41.2%) | (71,952,409 | ) | |||||
| Total Net Assets 100.0% | $ | 174,649,020 | |||||
| a | All or a portion of the security is insured or guaranteed. |
| b | Denotes variable rate obligations for which the current yield and next scheduled reset date are shown. |
| c | Denotes restricted securities. Restricted securities are investment securities which have been deemed illiquid and cannot be offered for public sale without first being registered under the Securities Act of 1933. The following table indicates the acquisition date and cost of restricted securities Bond Index Portfolio owned as of December 31, 2008. |
Security | Acquisition Date | Cost | |||
Bear Stearns Commercial Mortgage Securities, Inc. | 3/30/2007 | $ | 2,500,000 | ||
Commercial Mortgage Pass- Through Certificates | 10/18/2006 | 2,500,000 | |||
Preferred Term Securities XXIII, Ltd. | 9/14/2006 | 1,219,057 | |||
Wachovia Asset Securitization, Inc. | 3/16/2007 | 1,705,379 | |||
The accompanying Notes to Financial Statements are an integral part of this schedule.
235
Table of Contents
Bond Index Portfolio
Schedule of Investments as of December 31, 2008
| d | Denotes securities sold under Rule 144A of the Securities Act of 1933, which exempts them from registration. These securities have been deemed liquid and may be resold to other dealers in the program or to other qualified institutional buyers. As of December 31, 2008, the value of these investments was $5,324,775 or 3.0% of total net assets. |
| e | Denotes investments purchased on a when-issued or delayed delivery basis. |
| f | All or a portion of the security is on loan as discussed in item 2(M) of the Notes to Financial Statements. |
| g | The interest rate shown reflects the yield, coupon rate or, for securities purchased at a discount, the discount rate at the date of purchase. |
Gross unrealized appreciation and depreciation of investments, based on cost for federal income tax purposes, were as follows:
Gross unrealized appreciation | $ | 8,046,718 | ||
Gross unrealized depreciation | (19,962,409 | ) | ||
Net unrealized appreciation (depreciation) | $ | (11,915,691 | ) | |
Cost for federal income tax purposes | $ | 258,517,120 |
The following table is a summary of the inputs used, as of December 31, 2008, in valuing the Bond Index Portfolio’s assets carried at fair value as discussed in item 2(A) of the Notes to Financial Statements.
Level | Investments in Securities | Other Financial Instruments* | ||||
Level 1 | $ | 29,759,438 | $ | — | ||
Level 2 | 215,500,276 | — | ||||
Level 3 | 1,341,715 | — | ||||
Totals (Level 1,2,3) | $ | 246,601,429 | $ | — | ||
The following table is a reconciliation of assets in which significant unobservable inputs (Level 3) were used in determining fair value for the Bond Index Portfolio as discussed in item 2(A) of the Notes to Financial Statements.
| Investments in Securities | Other Financial Instruments* | ||||||
Value December 31, 2007 | $ | 1,996,120 | $ | — | |||
Accrued Discounts/Premiums | — | — | |||||
Realized Gain/(Loss) | (10,352 | ) | — | ||||
Change in Unrealized Gain/(Loss) | (823,030 | ) | — | ||||
Net Purchases/Sales | (1,000,622 | ) | — | ||||
Transfers In and/or Out of Level 3 | 1,179,599 | — | |||||
Value December 31, 2008 | $ | 1,341,715 | $ | — | |||
| * | Other Financial Instruments include Futures, Forwards, Written Options and Swap agreements. |
The accompanying Notes to Financial Statements are an integral part of this schedule.
236
Table of Contents
Bond Index Portfolio
Schedule of Investments as of December 31, 2008
Investment in Affiliates
Affiliated issuers, as defined under the Investment Company Act of 1940, include those in which the Portfolio’s holdings of an issuer represent 5% or more of the outstanding voting securities of an issuer, or any affiliated mutual fund.
A summary of transactions for the fiscal year to date, in Bond Index Portfolio, is as follows:
Portfolio | Value December 31, 2007 | Gross Purchases and Additions | Gross Sales and Reductions | Balance of Shares Held at December 31, 2008 | Value December 31, 2008 | Income Earned January 1, 2008 - December 31, 2008 | |||||||||||
Money Market | $ | 21,567,103 | $ | 80,489,461 | $ | 89,302,285 | 12,754,279 | $ | 12,754,279 | $ | 635,831 | ||||||
Thrivent Financial Securities Lending Trust | 55,206,278 | 90,564,971 | 128,766,090 | 17,005,159 | 17,005,159 | 453,599 | |||||||||||
Total Value and Income Earned | 76,773,381 | 29,759,438 | 1,089,430 | ||||||||||||||
The accompanying Notes to Financial Statements are an integral part of this schedule.
237
Table of Contents
Limited Maturity Bond Portfolio
Schedule of Investments as of December 31, 2008
| Principal Amount | Bank Loans (0.4%)a | Value | ||||
| Communications Services (0.4%) | ||||||
Alltel Communications, Inc., Term Loan | ||||||
| $ | 3,291,667 | 4.371%, 5/15/2015 | $ | 3,237,354 | ||
| Total Communications Services | 3,237,354 | |||||
Total Bank Loans (cost $3,162,549) | 3,237,354 | |||||
| Principal Amount | Long-Term Fixed Income (99.1%) | Value | ||||
| Asset-Backed Securities (24.4%) | ||||||
Americredit Automobile Receivables Trust | ||||||
| 2,176,058 | 1.956%, 1/6/2009b,c | 1,922,344 | ||||
| 3,538,244 | 3.430%, 7/6/2011b | 3,333,846 | ||||
| 5,000,000 | 5.490%, 7/6/2012b | 4,704,655 | ||||
Bank of America Credit Card Trust | ||||||
| 9,500,000 | 4.070%, 7/16/2012 | 9,161,867 | ||||
BMW Vehicle Lease Trust | ||||||
| 9,000,000 | 4.590%, 8/15/2013 | 8,704,377 | ||||
Cabela’s Master Credit Card Trust | ||||||
| 7,500,000 | 4.310%, 12/16/2013d | 7,008,908 | ||||
Capital Auto Receivables Asset Trust | ||||||
| 6,873,881 | 5.380%, 7/15/2010 | 6,628,656 | ||||
| 7,061,167 | 4.980%, 5/15/2011 | 6,938,614 | ||||
Carmax Auto Owner Trust | ||||||
| 8,250,000 | 1.595%, 1/15/2009c | 7,772,383 | ||||
Citibank Credit Card Issuance Trust | ||||||
| 7,000,000 | 4.850%, 2/10/2011 | 6,996,584 | ||||
CNH Equipment Trust | ||||||
| 5,000,000 | 1.795%, 1/15/2009c | 4,775,915 | ||||
| 5,856,764 | 4.400%, 5/16/2011 | 5,736,548 | ||||
Countrywide Asset-Backed Certificates | ||||||
| 3,021,459 | 5.549%, 4/25/2036b | 2,508,303 | ||||
| 5,000,000 | 5.683%, 10/25/2046 | 4,156,590 | ||||
Countrywide Home Loans Asset-Backed Securities | ||||||
| 4,500,000 | 6.085%, 6/25/2021b | 1,930,991 | ||||
CPL Transition Funding, LLC | ||||||
| 2,807,556 | 5.560%, 1/15/2012 | 2,839,787 | ||||
Credit Acceptance Auto Dealer Loan Trust | ||||||
| 1,865,302 | 5.320%, 10/15/2012b,d | 1,843,902 | ||||
Credit Based Asset Servicing and Securitization, LLC | ||||||
| 4,223,492 | 5.501%, 12/25/2036 | 3,503,741 | ||||
DaimlerChrysler Auto Trust | ||||||
| 1,686,435 | 5.330%, 8/8/2010 | 1,674,518 | ||||
| 9,500,000 | 5.000%, 2/8/2012 | 9,027,536 | ||||
Discover Card Master Trust | ||||||
| 9,500,000 | 5.100%, 10/15/2013 | 8,928,252 | ||||
Drive Auto Receivables Trust | ||||||
| 781,301 | 5.300%, 7/15/2011b,d | 777,008 | ||||
First Franklin Mortgage Loan Asset-Backed Certificates | ||||||
| 215,069 | 5.500%, 3/25/2036e,f | 22 | ||||
First Horizon ABS Trust | ||||||
| 1,074,935 | 0.601%, 1/26/2009b,c | 586,778 | ||||
Ford Credit Auto Owner Trust | ||||||
| 3,500,000 | 5.150%, 11/15/2011 | 3,361,498 | ||||
GE Commercial Loan Trust | ||||||
| 26,790 | 4.563%, 1/20/2009c,d | 26,522 | ||||
GMAC Mortgage Corporation Loan Trust | ||||||
| 6,087,322 | 0.541%, 1/26/2009b,c | 2,113,597 | ||||
| 535,436 | 0.571%, 1/26/2009b,c | 490,360 | ||||
| 2,550,802 | 0.651%, 1/26/2009b,c | 1,345,660 | ||||
| 5,500,000 | 5.750%, 10/25/2036b | 3,767,852 | ||||
Harley Davidson Motorcycle Trust | ||||||
| 8,500,000 | 1.545%, 1/15/2009c | 8,133,072 | ||||
| 1,626,462 | 5.240%, 1/15/2012 | 1,616,942 | ||||
| 1,067,497 | 3.200%, 5/15/2012 | 1,060,033 | ||||
Honda Auto Receivables Owner Trust | ||||||
| 4,000,000 | 4.470%, 1/18/2012 | 3,824,336 | ||||
Household Home Equity Loan Trust | ||||||
| 6,500,000 | 5.320%, 3/20/2036 | 5,796,349 | ||||
| 3,500,000 | 5.660%, 3/20/2036 | 3,117,149 | ||||
Merna Re, Ltd. | ||||||
| 7,500,000 | 3.209%, 3/31/2009c,d | 6,771,750 | ||||
Merrill Auto Trust Securitization | ||||||
| 9,000,000 | 5.500%, 3/15/2012 | 8,740,071 | ||||
Mortgage Equity Conversion Asset Trust | ||||||
| 6,870,219 | 1.830%, 1/25/2009c,e | 6,510,220 | ||||
| 6,905,420 | 1.850%, 1/25/2009c,e | 6,535,980 | ||||
Nissan Auto Receivables Owner Trust | ||||||
| 135,973 | 4.740%, 9/15/2009 | 135,919 | ||||
| 6,000,000 | 5.030%, 5/16/2011 | 5,903,154 | ||||
| 6,500,000 | 4.280%, 7/15/2013 | 5,863,540 | ||||
Nomura Asset Acceptance Corporation | ||||||
| 245,161 | 0.611%, 1/26/2009c,d | 200,096 | ||||
PG&E Energy Recovery Funding, LLC | ||||||
| 329,850 | 3.870%, 6/25/2011 | 330,185 | ||||
Popular ABS Mortgage Pass- Through Trust | ||||||
| 421,596 | 4.000%, 12/25/2034 | 407,244 | ||||
Renaissance Home Equity Loan Trust | ||||||
| 4,665,000 | 5.608%, 5/25/2036 | 4,389,266 | ||||
Residential Asset Mortgage Products, Inc. | ||||||
| 1,594,422 | 4.547%, 12/25/2034 | 1,102,632 | ||||
Residential Asset Securities Corporation | ||||||
| 1,618,392 | 5.010%, 4/25/2033 | 1,270,316 | ||||
Residential Funding Mortgage Securities | ||||||
| 1,234,130 | 4.470%, 7/25/2018b | 1,126,182 | ||||
Santander Drive Auto Receivables Trust | ||||||
| 4,415,508 | 5.050%, 9/15/2011b | 4,302,727 | ||||
The accompanying Notes to Financial Statements are an integral part of this schedule.
238
Table of Contents
Limited Maturity Bond Portfolio
Schedule of Investments as of December 31, 2008
| Principal Amount | Long-Term Fixed Income (99.1%) | Value | ||||
| Asset-Backed Securities (24.4%) - continued | ||||||
SLM Student Loan Trust | ||||||
| $ | 352,068 | 3.545%, 1/26/2009c | $ | 350,514 | ||
USAA Auto Owner Trust | ||||||
| 7,000,000 | 4.500%, 10/15/2013 | 6,255,228 | ||||
Wachovia Asset Securitization, Inc. | ||||||
| 2,131,724 | 0.611%, 1/26/2009b,c,e | 807,529 | ||||
Wachovia Auto Loan Owner Trust | ||||||
| 3,040,975 | 5.230%, 8/22/2011d | 3,008,363 | ||||
Wachovia Auto Owner Trust | ||||||
| 9,500,000 | 4.810%, 9/20/2012 | 9,000,234 | ||||
Washington Mutual Master Note Trust | ||||||
| 9,000,000 | 1.225%, 1/15/2009c,d | 7,658,118 | ||||
| Total Asset-Backed Securities | 226,784,763 | |||||
| Basic Materials (1.1%) | ||||||
ArcelorMittal | ||||||
| 2,000,000 | 5.375%, 6/1/2013 | 1,508,292 | ||||
E.I. Du Pont de Nemours & Company | ||||||
| 3,350,000 | 5.875%, 1/15/2014 | 3,449,063 | ||||
Lubrizol Corporation | ||||||
| 2,400,000 | 4.625%, 10/1/2009 | 2,357,374 | ||||
Nucor Corporation | ||||||
| 2,700,000 | 5.000%, 6/1/2013 | 2,673,634 | ||||
| Total Basic Materials | 9,988,363 | |||||
| Capital Goods (3.1%) | ||||||
Caterpillar Financial Services Corporation | ||||||
| 1,000,000 | 4.850%, 12/7/2012 | 948,789 | ||||
| 3,350,000 | 6.200%, 9/30/2013g | 3,453,572 | ||||
General Dynamics Corporation | ||||||
| 2,350,000 | 5.250%, 2/1/2014 | 2,408,329 | ||||
John Deere Capital Corporation | ||||||
| 2,500,000 | 4.400%, 7/15/2009 | 2,502,060 | ||||
| 1,700,000 | 5.350%, 1/17/2012 | 1,674,706 | ||||
| 10,000,000 | 2.875%, 6/19/2012g | 10,284,910 | ||||
Litton Industries, Inc. | ||||||
| 3,350,000 | 8.000%, 10/15/2009 | 3,382,110 | ||||
Lockheed Martin Corporation | ||||||
| 2,750,000 | 4.121%, 3/14/2013 | 2,680,763 | ||||
Textron Financial Corporation | ||||||
| 2,100,000 | 5.125%, 2/3/2011 | 1,580,533 | ||||
| Total Capital Goods | 28,915,772 | |||||
| Collateralized Mortgage Obligations (6.8%) | ||||||
American Home Mortgage Assets Trust | ||||||
| 4,508,789 | 3.213%, 1/1/2009c | 1,534,304 | ||||
Banc of America Mortgage Securities, Inc. | ||||||
| 2,495,987 | 4.802%, 9/25/2035 | 1,858,288 | ||||
Bear Stearns Adjustable Rate Mortgage Trust | ||||||
| 2,963,194 | 4.625%, 8/25/2010c | 2,267,928 | ||||
Chase Mortgage Finance Corporation | ||||||
| 3,960,905 | 4.567%, 2/25/2037 | 3,219,713 | ||||
Chaseflex Trust | ||||||
| 4,534,468 | 6.500%, 2/25/2035 | 3,370,493 | ||||
Citigroup Mortgage Loan Trust, Inc. | ||||||
| 574,652 | 5.536%, 3/25/2036 | 569,854 | ||||
Commercial Mortgage Acceptance Corporation | ||||||
| 1,554,334 | 7.030%, 6/15/2031 | 1,548,595 | ||||
Countrywide Alternative Loan Trust | ||||||
| 3,521,095 | 5.500%, 2/25/2036 | 2,276,229 | ||||
| 3,534,365 | 6.000%, 1/25/2037 | 2,416,675 | ||||
Countrywide Home Loans, Inc. | ||||||
| 3,589,345 | 5.334%, 3/20/2036 | 1,824,206 | ||||
| 3,482,750 | 5.805%, 9/20/2036 | 1,600,128 | ||||
Deutsche Alt-A Securities, Inc. | ||||||
| 5,892,189 | 3.026%, 1/1/2009c | 2,519,823 | ||||
HomeBanc Mortgage Trust | ||||||
| 2,659,729 | 5.979%, 4/25/2037 | 1,375,681 | ||||
Impac CMB Trust | ||||||
| 1,555,714 | 0.731%, 1/26/2009c | 610,174 | ||||
| 1,096,679 | 0.791%, 1/26/2009c | 428,879 | ||||
J.P. Morgan Alternative Loan Trust | ||||||
| 5,521,893 | 5.801%, 3/25/2036 | 2,766,739 | ||||
J.P. Morgan Mortgage Trust | ||||||
| 4,651,826 | 5.005%, 7/25/2035 | 2,987,570 | ||||
Merrill Lynch Mortgage Investors, Inc. | ||||||
| 3,488,379 | 4.870%, 6/25/2035 | 2,421,528 | ||||
Residential Accredit Loans, Inc. | ||||||
| 2,460,543 | 5.595%, 9/25/2035 | 1,345,479 | ||||
Thornburg Mortgage Securities Trust | ||||||
| 2,120,987 | 0.581%, 1/26/2009c | 1,758,434 | ||||
Wachovia Mortgage Loan Trust, LLC | ||||||
| 3,188,471 | 5.564%, 5/20/2036 | 2,302,799 | ||||
Washington Mutual Alternative Loan Trust | ||||||
| 6,737,915 | 3.006%, 1/1/2009c | 2,471,083 | ||||
| 4,602,763 | 3.196%, 1/1/2009c | 1,754,763 | ||||
Washington Mutual Mortgage Pass-Through Certificates | ||||||
| 4,820,882 | 3.136%, 1/1/2009c | 1,519,185 | ||||
| 1,703,433 | 0.761%, 1/25/2009c | 930,374 | ||||
| 1,763,213 | 4.833%, 9/25/2035 | 1,211,955 | ||||
Washington Mutual, Inc. | ||||||
| 4,981,170 | 2.996%, 1/1/2009c | 1,842,015 | ||||
| 4,592,346 | 3.076%, 1/1/2009c | 1,725,552 | ||||
Wells Fargo Mortgage Backed Securities Trust | ||||||
| 8,500,000 | 3.732%, 9/25/2034 | 8,335,559 | ||||
| 895,423 | 4.950%, 3/25/2036 | 585,527 | ||||
| 1,505,797 | 5.093%, 3/25/2036 | 1,079,116 | ||||
| Total Collateralized Mortgage Obligations | 62,458,648 | |||||
The accompanying Notes to Financial Statements are an integral part of this schedule.
239
Table of Contents
Limited Maturity Bond Portfolio
Schedule of Investments as of December 31, 2008
| Principal Amount | Long-Term Fixed Income (99.1%) | Value | ||||
| Commercial Mortgage-Backed Securities (10.5%) | ||||||
Banc of America Commercial Mortgage, Inc. | ||||||
| $ | 5,135,000 | 5.001%, 9/10/2010 | $ | 4,643,365 | ||
| 661,212 | 4.037%, 11/10/2039 | 657,546 | ||||
Banc of America Large Loan Trust | ||||||
| 5,881,462 | 1.305%, 1/15/2009c,d | 4,664,558 | ||||
| 7,000,000 | 1.405%, 1/15/2009c,d | 5,268,158 | ||||
Bear Stearns Commercial Mortgage Securities, Inc. | ||||||
| 4,000,000 | 1.345%, 1/15/2009c,e | 3,034,188 | ||||
| 7,751,232 | 3.869%, 2/11/2041 | 7,725,792 | ||||
| 7,522,540 | 5.422%, 9/11/2042 | 6,882,221 | ||||
Citigroup Commercial Mortgage Trust | ||||||
| 10,527 | 1.265%, 1/15/2009c,d | 9,121 | ||||
Commercial Mortgage Pass-Through Certificates | ||||||
| 90,066 | 1.295%, 1/15/2009c,d | 80,536 | ||||
| 8,000,000 | 1.375%, 1/15/2009c,e | 4,779,904 | ||||
Credit Suisse First Boston Mortgage Securities Corporation | ||||||
| 6,000,000 | 4.609%, 2/15/2038 | 5,601,684 | ||||
| 7,699,653 | 3.382%, 5/15/2038 | 7,358,112 | ||||
Crown Castle International Corporation | ||||||
| 6,500,000 | 5.245%, 11/15/2036d | 5,405,010 | ||||
General Electric Commercial Mortgage Corporation | ||||||
| 2,066,273 | 4.591%, 7/10/2045 | 2,003,483 | ||||
J.P. Morgan Chase Commercial Mortgage Securities Corporation | ||||||
| 1,004,432 | 2.790%, 1/12/2039 | 995,432 | ||||
| 9,100,000 | 5.198%, 12/15/2044 | 8,150,251 | ||||
LB-UBS Commercial Mortgage Trust | ||||||
| 10,313 | 3.323%, 3/15/2027 | 10,282 | ||||
| 1,152,186 | 4.207%, 11/15/2027 | 1,120,506 | ||||
| 4,031,372 | 4.567%, 6/15/2029 | 3,997,303 | ||||
| 9,060,000 | 4.187%, 8/15/2029 | 8,887,715 | ||||
| 1,418,504 | 4.741%, 9/15/2040 | 1,393,105 | ||||
TIAA Real Estate CDO, Ltd. | ||||||
| 8,000,000 | 5.806%, 8/15/2039 | 6,513,752 | ||||
Wachovia Bank Commercial Mortgage Trust | ||||||
| 5,360,311 | 3.894%, 11/15/2035 | 5,344,005 | ||||
Washington Mutual Asset Securities Corporation | ||||||
| 3,003,231 | 3.830%, 1/25/2035d | 2,847,601 | ||||
| Total Commercial Mortgage-Backed Securities | 97,373,630 | |||||
| Communications Services (4.2%) | ||||||
Alltel Corporation | ||||||
| 2,675,000 | 7.000%, 7/1/2012 | 2,661,625 | ||||
| 3,400,000 | 6.500%, 11/1/2013 | 3,332,000 | ||||
Ameritech Capital Funding Corporation | ||||||
| 2,800,000 | 6.250%, 5/18/2009 | 2,832,306 | ||||
AT&T, Inc. | ||||||
| 1,250,000 | 4.950%, 1/15/2013 | 1,256,908 | ||||
| 2,700,000 | 6.700%, 11/15/2013 | 2,860,169 | ||||
British Telecom plc | ||||||
| 2,000,000 | 8.625%, 12/15/2010 | 2,057,398 | ||||
Comcast Cable Communications, Inc. | ||||||
| 2,100,000 | 6.875%, 6/15/2009 | 2,109,841 | ||||
Cox Communications, Inc. | ||||||
| 1,760,000 | 7.875%, 8/15/2009 | 1,730,061 | ||||
| 1,400,000 | 4.625%, 1/15/2010 | 1,354,662 | ||||
GTE Corporation | ||||||
| 2,450,000 | 7.510%, 4/1/2009 | 2,459,021 | ||||
Rogers Cable, Inc. | ||||||
| 2,620,000 | 7.875%, 5/1/2012 | 2,614,878 | ||||
SBC Communications, Inc. | ||||||
| 2,500,000 | 4.125%, 9/15/2009 | 2,510,242 | ||||
Telecom Italia Capital SA | ||||||
| 1,400,000 | 6.200%, 7/18/2011 | 1,242,500 | ||||
Thomson Reuters Corporation | ||||||
| 2,000,000 | 5.950%, 7/15/2013 | 1,862,056 | ||||
Time Warner Cable, Inc. | ||||||
| 2,400,000 | 5.400%, 7/2/2012 | 2,240,993 | ||||
| 2,000,000 | 6.200%, 7/1/2013 | 1,891,790 | ||||
| 2,000,000 | 8.250%, 2/14/2014 | 2,028,932 | ||||
Verizon Communications, Inc. | ||||||
| 1,350,000 | 4.350%, 2/15/2013 | 1,305,700 | ||||
| Total Communications Services | 38,351,082 | |||||
| Consumer Cyclical (3.3%) | ||||||
CVS Caremark Corporation | ||||||
| 2,700,000 | 2.503%, 3/2/2009c | 2,484,300 | ||||
CVS Corporation | ||||||
| 2,800,000 | 4.000%, 9/15/2009 | 2,766,047 | ||||
D.R. Horton, Inc. | ||||||
| 2,100,000 | 8.000%, 2/1/2009 | 2,104,088 | ||||
Ford Motor Credit Company | ||||||
| 4,000,000 | 7.375%, 10/28/2009 | 3,512,884 | ||||
May Department Stores Company | ||||||
| 2,100,000 | 4.800%, 7/15/2009 | 1,990,458 | ||||
McDonald’s Corporation | ||||||
| 2,725,000 | 4.300%, 3/1/2013 | 2,782,372 | ||||
MGM MIRAGE | ||||||
| 3,940,000 | 13.000%, 11/15/2013d,g | 3,752,850 | ||||
Nissan Motor Acceptance Corporation | ||||||
| 2,800,000 | 4.625%, 3/8/2010d | 2,772,753 | ||||
SLM Private Credit Student Loan Trust | ||||||
| 2,144,465 | 2.006%, 3/16/2009c | 1,923,304 | ||||
Wal-Mart Stores, Inc. | ||||||
| 1,300,000 | 4.250%, 4/15/2013g | 1,338,063 | ||||
Walt Disney Company | ||||||
| 5,400,000 | 4.705%, 1/16/2009c | 5,301,877 | ||||
| Total Consumer Cyclical | 30,728,996 | |||||
| Consumer Non-Cyclical (3.7%) | ||||||
Abbott Laboratories | ||||||
| 1,400,000 | 5.150%, 11/30/2012 | 1,494,156 | ||||
The accompanying Notes to Financial Statements are an integral part of this schedule.
240
Table of Contents
Limited Maturity Bond Portfolio
Schedule of Investments as of December 31, 2008
| Principal Amount | Long-Term Fixed Income (99.1%) | Value | |||
| Consumer Non-Cyclical (3.7%) - continued | |||||
Altria Group, Inc. | |||||
| $2,700,000 | 8.500%, 11/10/2013 | $ | 2,796,509 | ||
AstraZeneca plc | |||||
| 1,375,000 | 5.400%, 9/15/2012 | 1,452,118 | |||
Bottling Group, LLC | |||||
| 3,350,000 | 6.950%, 3/15/2014 | 3,637,447 | |||
Cargill, Inc. | |||||
| 2,000,000 | 5.200%, 1/22/2013d | 1,832,190 | |||
Diageo Capital plc | |||||
| 3,000,000 | 7.375%, 1/15/2014 | 3,195,753 | |||
Fortune Brands, Inc. | |||||
| 2,000,000 | 5.125%, 1/15/2011 | 1,921,012 | |||
H. J. Heinz Company | |||||
| 3,300,000 | 15.590%, 12/1/2011d | 3,689,796 | |||
Kellogg Company | |||||
| 2,750,000 | 5.125%, 12/3/2012 | 2,749,070 | |||
Kroger Company | |||||
| 2,475,000 | 7.250%, 6/1/2009 | 2,501,022 | |||
Philip Morris International, Inc. | |||||
| 3,700,000 | 6.875%, 3/17/2014 | 3,888,286 | |||
President and Fellows of Harvard College | |||||
| 5,000,000 | 5.000%, 1/15/2014d | 5,184,500 | |||
| Total Consumer Non-Cyclical | 34,341,859 | ||||
| Energy (1.8%) | |||||
Energy Transfer Partners, LP | |||||
| 2,000,000 | 6.000%, 7/1/2013 | 1,779,072 | |||
Enterprise Products Operating, LP | |||||
| 1,000,000 | 4.625%, 10/15/2009 | 968,541 | |||
| 2,700,000 | 9.750%, 1/31/2014 | 2,749,377 | |||
Occidental Petroleum Corporation | |||||
| 2,000,000 | 7.000%, 11/1/2013 | 2,182,890 | |||
Premcor Refining Group, Inc. | |||||
| 2,100,000 | 6.125%, 5/1/2011 | 2,128,638 | |||
Ras Laffan Liquefied Natural Gas Company, Ltd. III | |||||
| 1,250,000 | 5.832%, 9/30/2016d | 930,562 | |||
Sempra Energy | |||||
| 3,400,000 | 7.950%, 3/1/2010 | 3,436,037 | |||
Transocean, Inc. | |||||
| 1,350,000 | 5.250%, 3/15/2013 | 1,253,875 | |||
Western Oil Sands, Inc. | |||||
| 1,350,000 | 8.375%, 5/1/2012 | 1,288,767 | |||
| Total Energy | 16,717,759 | ||||
| Financials (25.3%) | |||||
Allstate Life Global Funding Trust | |||||
| 2,000,000 | 5.375%, 4/30/2013 | 1,968,796 | |||
American Express Centurion Bank | |||||
| 2,000,000 | 5.200%, 11/26/2010 | 1,941,480 | |||
American Express Company | |||||
| 10,000,000 | 3.150%, 12/9/2011g | 10,079,610 | |||
| 3,350,000 | 5.875%, 5/2/2013 | 3,215,913 | |||
Australia & New Zealand Banking Group, Ltd. | |||||
| 3,350,000 | 6.200%, 7/19/2013d | 3,241,326 | |||
Bank of America Corporation | |||||
| 10,000,000 | 3.125%, 6/15/2012 | 10,391,820 | |||
Bank of New York Mellon Corporation | |||||
| 3,400,000 | 4.950%, 11/1/2012 | 3,451,908 | |||
Bear Stearns Companies, Inc. | |||||
| 2,000,000 | 4.550%, 6/23/2010 | 1,997,030 | |||
Berkshire Hathaway Finance Corporation | |||||
| 1,350,000 | 5.000%, 8/15/2013 | 1,373,275 | |||
Capmark Financial Group, Inc. | |||||
| 1,650,000 | 5.875%, 5/10/2012 | 562,635 | |||
CIT Group, Inc. | |||||
| 2,400,000 | 5.200%, 11/3/2010 | 2,079,845 | |||
| 1,000,000 | 7.625%, 11/30/2012 | 844,169 | |||
Citigroup, Inc. | |||||
| 3,400,000 | 5.125%, 2/14/2011 | 3,318,373 | |||
| 10,000,000 | 2.875%, 12/9/2011 | 10,311,720 | |||
| 2,000,000 | 5.500%, 4/11/2013 | 1,947,368 | |||
| 3,350,000 | 8.400%, 4/30/2018 | 2,211,971 | |||
CME Group, Inc. | |||||
| 2,700,000 | 5.400%, 8/1/2013 | 2,681,961 | |||
Corestates Capital Trust I | |||||
| 700,000 | 8.000%, 12/15/2026d | 574,924 | |||
Credit Suisse New York, NY | |||||
| 2,000,000 | 5.000%, 5/15/2013 | 1,924,862 | |||
Developers Diversified Realty Corporation | |||||
| 1,400,000 | 4.625%, 8/1/2010 | 986,252 | |||
Fifth Third Bancorp | |||||
| 1,325,000 | 6.250%, 5/1/2013 | 1,228,943 | |||
General Electric Capital Corporation | |||||
| 2,100,000 | 5.200%, 2/1/2011 | 2,126,897 | |||
| 10,000,000 | 3.000%, 12/9/2011 | 10,338,500 | |||
| 2,000,000 | 4.800%, 5/1/2013 | 1,967,784 | |||
Goldman Sachs Group, Inc. | |||||
| 6,500,000 | 1.578%, 3/23/2009c | 6,190,106 | |||
| 2,100,000 | 6.875%, 1/15/2011 | 2,115,340 | |||
| 10,000,000 | 3.250%, 6/15/2012g | 10,433,212 | |||
Goldman Sachs Group, Inc., Convertible | |||||
| 5,000,000 | 1.000%, 1/31/2015h | 4,136,500 | |||
| 2,500,000 | 1.000%, 5/7/2015h | 2,029,750 | |||
HSBC USA, Inc. | |||||
| 10,000,000 | 3.125%, 12/16/2011 | 10,385,060 | |||
International Lease Finance Corporation | |||||
| 2,050,000 | 5.750%, 6/15/2011 | 1,495,032 | |||
| 3,350,000 | 5.000%, 9/15/2012 | 2,308,512 | |||
iSTAR Financial, Inc. | |||||
| 1,500,000 | 4.875%, 1/15/2009 | 1,500,021 | |||
J.P. Morgan Chase & Company | |||||
| 3,350,000 | 6.750%, 2/1/2011 | 3,434,329 | |||
| 1,600,000 | 5.600%, 6/1/2011 | 1,607,552 | |||
| 10,000,000 | 3.125%, 12/1/2011 | 10,388,990 | |||
Keybank National Association | |||||
| 10,000,000 | 3.200%, 6/15/2012g | 10,389,640 | |||
Lehman Brothers Holdings E- Capital Trust I | |||||
| 3,500,000 | Zero Coupon, 8/19/2010i | 350 | |||
Lehman Brothers Holdings, Inc. | |||||
| 1,700,000 | 5.250%, 2/6/2012i | 161,500 | |||
The accompanying Notes to Financial Statements are an integral part of this schedule.
241
Table of Contents
Limited Maturity Bond Portfolio
Schedule of Investments as of December 31, 2008
| Principal Amount | Long-Term Fixed Income (99.1%) | Value | ||||
| Financials (25.3%) - continued | ||||||
Lincoln National Corporation | ||||||
| $ | 1,200,000 | 5.650%, 8/27/2012 | $ | 988,920 | ||
Merrill Lynch & Company, Inc. | ||||||
| 6,500,000 | 3.079%, 2/5/2009c | 6,167,772 | ||||
| 2,000,000 | 6.150%, 4/25/2013 | 1,981,778 | ||||
Metropolitan Life Global Funding | ||||||
| 2,680,000 | 5.125%, 4/10/2013d | 2,497,114 | ||||
Monumental Global Funding, Ltd. | ||||||
| 1,330,000 | 5.500%, 4/22/2013d | 1,254,733 | ||||
Morgan Stanley | ||||||
| 3,250,000 | 5.033%, 1/15/2009c | 3,027,827 | ||||
| 1,350,000 | 5.050%, 1/21/2011 | 1,296,667 | ||||
| 1,350,000 | 5.250%, 11/2/2012g | 1,227,790 | ||||
Nations Bank Capital Trust IV | ||||||
| 6,300,000 | 8.250%, 4/15/2027 | 5,211,656 | ||||
Northern Trust Company | ||||||
| 2,000,000 | 5.500%, 8/15/2013 | 2,053,538 | ||||
Protective Life Secured Trust | ||||||
| 2,000,000 | 4.000%, 10/7/2009 | 1,933,920 | ||||
Prudential Financial, Inc., Convertible | ||||||
| 4,575,000 | 0.366%, 3/15/2009c | 4,330,237 | ||||
Regions Bank | ||||||
| 10,000,000 | 3.250%, 12/9/2011g | 10,403,610 | ||||
Rio Tinto Finance. Ltd. | ||||||
| 2,000,000 | 5.875%, 7/15/2013 | 1,593,026 | ||||
Simon Property Group, LP | ||||||
| 3,300,000 | 4.600%, 6/15/2010 | 2,941,320 | ||||
SLM Corporation | ||||||
| 2,400,000 | 4.000%, 1/15/2009 | 2,399,524 | ||||
Sovereign Bank | ||||||
| 6,600,000 | 2.750%, 1/17/2012 | 6,770,683 | ||||
State Street Capital Trust II | ||||||
| 2,000,000 | 8.250%, 3/15/2011 | 1,545,180 | ||||
Suntrust Bank | ||||||
| 10,000,000 | 3.000%, 11/16/2011 | 10,341,040 | ||||
Swedbank AB | ||||||
| 6,600,000 | 3.000%, 12/22/2011d,g | 6,650,490 | ||||
UnitedHealth Group, Inc. | ||||||
| 2,000,000 | 5.500%, 11/15/2012 | 1,822,560 | ||||
Wachovia Capital Trust III | ||||||
| 700,000 | 5.800%, 3/15/2011 | 413,000 | ||||
Wachovia Corporation | ||||||
| 1,605,000 | 6.150%, 3/15/2009 | 1,602,565 | ||||
| 2,000,000 | 5.500%, 5/1/2013 | 1,977,682 | ||||
Wells Fargo & Company | ||||||
| 2,000,000 | 2.096%, 3/16/2009c | 1,979,240 | ||||
| 675,000 | 4.375%, 1/31/2013 | 660,971 | ||||
Wells Fargo Capital XIII | ||||||
| 2,000,000 | 7.700%, 3/26/2013 | 1,650,622 | ||||
Wells Fargo Capital XV | ||||||
| 2,000,000 | 9.750%, 9/26/2013 | 2,020,000 | ||||
| Total Financials | 234,086,721 | |||||
| Foreign (0.5%) | ||||||
Corporacion Andina de Fomento | ||||||
| 5,000,000 | 5.750%, 1/12/2017 | 4,181,460 | ||||
| Total Foreign | 4,181,460 | |||||
| Mortgage-Backed Securities (1.2%) | ||||||
Federal National Mortgage Association Conventional 30- Yr. Pass Through | ||||||
| 3,000,000 | 6.000%, 1/1/2039j | 3,088,125 | ||||
| 8,000,000 | 6.500%, 1/1/2039j | 8,307,504 | ||||
| Total Mortgage-Backed Securities | 11,395,629 | |||||
| Technology (1.0%) | ||||||
Hewlett-Packard Company | ||||||
| 2,700,000 | 4.500%, 3/1/2013 | 2,740,727 | ||||
International Business Machines Corporation | ||||||
| 4,000,000 | 6.500%, 10/15/2013g | 4,384,932 | ||||
Sun Microsystems, Inc. | ||||||
| 700,000 | 7.650%, 8/15/2009g | 682,500 | ||||
Xerox Corporation | ||||||
| 2,100,000 | 5.500%, 5/15/2012 | 1,759,905 | ||||
| Total Technology | 9,568,064 | |||||
| Transportation (1.0%) | ||||||
Delta Air Lines, Inc. | ||||||
| 1,375,000 | 7.111%, 9/18/2011 | 1,100,000 | ||||
FedEx Corporation | ||||||
| 1,300,000 | 3.500%, 4/1/2009 | 1,295,533 | ||||
Norfolk Southern Corporation | ||||||
| 3,125,000 | 6.200%, 4/15/2009 | 3,128,991 | ||||
Northwest Airlines, Inc. | ||||||
| 2,400,000 | 6.841%, 4/1/2011 | 1,968,000 | ||||
Union Pacific Corporation | ||||||
| 1,150,000 | 6.125%, 1/15/2012 | 1,119,809 | ||||
| 800,000 | 5.450%, 1/31/2013 | 775,967 | ||||
| Total Transportation | 9,388,300 | |||||
| U.S. Government (8.6%) | ||||||
Federal Home Loan Banks | ||||||
| 7,500,000 | 4.625%, 10/10/2012g | 8,113,807 | ||||
Federal Home Loan Mortgage Corporation | ||||||
| 4,242,084 | 0.511%, 1/26/2009c | 4,026,666 | ||||
Federal National Mortgage Association | ||||||
| 10,000,000 | 4.625%, 5/1/2013 | 10,360,100 | ||||
U.S. Treasury Notes | ||||||
| 18,000,000 | 2.125%, 1/31/2010 | 18,329,760 | ||||
| 1,525,000 | 2.750%, 2/28/2013 | 1,629,368 | ||||
U.S. Treasury Notes, TIPS | ||||||
| 38,789,888 | 2.000%, 7/15/2014g | 36,683,713 | ||||
| Total U.S. Government | 79,143,414 | |||||
| U.S. Municipals (0.9%) | ||||||
Denver, Colorado City & County Airport Revenue Bonds | ||||||
| 5,500,000 | 5.250%, 5/15/2010 | 5,569,355 | ||||
Houston, Texas Utility System Revenue Bonds | ||||||
| 1,350,000 | 5.000%, 5/15/2011 | 1,409,724 | ||||
The accompanying Notes to Financial Statements are an integral part of this schedule.
242
Table of Contents
Limited Maturity Bond Portfolio
Schedule of Investments as of December 31, 2008
| Principal Amount | Long-Term Fixed Income (99.1%) | Value | |||||
| U.S. Municipals (0.9%) - continued | |||||||
South Carolina State Public Service Authority Revenue Bonds | |||||||
| $ | 1,350,000 | 5.750%, 1/1/2014k | $ | 1,427,787 | |||
| Total U.S. Municipals | 8,406,866 | ||||||
| Utilities (1.7%) | |||||||
Carolina Power & Light, Inc. | |||||||
| 2,700,000 | 5.950%, 3/1/2009 | 2,703,618 | |||||
Cleveland Electric Illuminating Company | |||||||
| 625,000 | 7.430%, 11/1/2009 | 630,155 | |||||
Duke Energy Carolinas, LLC | |||||||
| 2,700,000 | 5.750%, 11/15/2013 | 2,792,429 | |||||
National Rural Utilities Cooperative Finance Corporation | |||||||
| 2,650,000 | 5.500%, 7/1/2013 | 2,568,531 | |||||
Oncor Electric Delivery Company | |||||||
| 2,700,000 | 5.950%, 9/1/2013d | 2,518,098 | |||||
Pacific Gas & Electric Company | |||||||
| 1,000,000 | 3.600%, 3/1/2009l | 997,225 | |||||
Power Receivables Finance, LLC | |||||||
| 370,194 | 6.290%, 1/1/2012e | 362,635 | |||||
Virginia Electric & Power Company | |||||||
| 2,000,000 | 4.500%, 12/15/2010 | 1,973,892 | |||||
| 1,360,000 | 5.100%, 11/30/2012 | 1,329,566 | |||||
| Total Utilities | 15,876,149 | ||||||
Total Long-Term Fixed Income (cost $1,008,060,947) | 917,707,475 | ||||||
| Shares | Preferred Stock (0.3%) | Value | |||||
| Financials (0.3%) | |||||||
| 50,250 | Allegro Investment Corporation SA, Reverse Convertible, 20.000%d,h,m | 1,687,837 | |||||
| 94,063 | Credit Suisse NY, Convertible, | 1,103,359 | |||||
| Total Financials | 2,791,196 | ||||||
| U.S. Government (<0.1%) | |||||||
| 148,505 | Federal National Mortgage Association, 8.250% | 123,259 | |||||
| Total U.S. Government | 123,259 | ||||||
Total Preferred Stock (cost $7,948,206) | 2,914,455 | ||||||
| Contracts | Options Purchased (0.1%) | Value | |||||
Put on 10-Yr. U.S. Treasury Bond Futures | |||||||
| 440 | $121.50, expires 2/20/2009 | $ | 426,250 | ||||
Total Options Purchased (cost $296,945) | 426,250 | ||||||
| Shares | Collateral Held for Securities Loaned (11.3%) | Value | |||||
| 105,038,013 | Thrivent Financial Securities Lending Trust | 105,038,013 | |||||
| Total Collateral Held for Securities Loaned (cost $105,038,013) | 105,038,013 | ||||||
| Shares or Principal Amount | Short-Term Investments (1.0%)n | Value | |||||
Federal National Mortgage Association Discount Notes | |||||||
| 7,900,000 | 0.411%, 5/14/2009l,o | 7,888,099 | |||||
| 1,334,891 | Thrivent Money Market Portfolio | 1,334,891 | |||||
| Total Short-Term Investments (at amortized cost) | 9,222,990 | ||||||
Total Investments (cost $1,133,729,650) 112.2% | $ | 1,038,546,537 | |||||
| Other Assets and Liabilities, Net (12.2%) | (112,607,017 | ) | |||||
| Total Net Assets 100.0% | $ | 925,939,520 | |||||
| a | The stated interest rate represents the weighted average of all contracts within the bank loan facility as discussed in item 2(U) in the Notes to Financial Statements. |
| b | All or a portion of the security is insured or guaranteed. |
| c | Denotes variable rate obligations for which the current yield and next scheduled reset date are shown. |
| d | Denotes securities sold under Rule 144A of the Securities Act of 1933, which exempts them from registration. These securities have been deemed liquid and may be resold to other dealers in the program or to other qualified institutional buyers. As of December 31, 2008, the value of these investments was $82,156,824 or 8.9% of total net assets. |
| e | Denotes restricted securities. Restricted securities are investment securities which have been deemed illiquid and cannot be offered for public sale without first being registered under the Securities Act of 1933. The following table indicates the acquisition date and cost of restricted securities Limited Maturity Bond Portfolio owned as of December 31, 2008. |
Security | Acquisition Date | Cost | |||
Bear Stearns Commercial Mortgage Securities, Inc. | 3/30/2007 | $ | 4,000,000 | ||
Commercial Mortgage Pass- Through Certificates | 5/2/2007 | 8,000,000 | |||
First Franklin Mortgage Loan Asset-Backed Certificates | 4/19/2006 | 214,738 | |||
Mortgage Equity Conversion Asset Trust | 2/14/2007 | 6,870,219 | |||
Mortgage Equity Conversion Asset Trust | 1/18/2007 | 6,905,420 | |||
Power Receivables Finance, LLC | 9/30/2003 | 370,085 | |||
Wachovia Asset Securitization, Inc. | 3/16/2007 | 2,131,724 | |||
| f | Defaulted security. |
| g | All or a portion of the security is on loan as discussed in item 2(M) of the Notes to Financial Statements. |
The accompanying Notes to Financial Statements are an integral part of this schedule.
243
Table of Contents
Limited Maturity Bond Portfolio
Schedule of Investments as of December 31, 2008
| h | These securities are Equity-Linked Structured Securities as discussed in item 2(Q) of the Notes to Financial Statements. |
| i | In bankruptcy. |
| j | Denotes investments purchased on a when-issued or delayed delivery basis. |
| k | Denotes securities that have been pre-refunded or escrowed to maturity. Under such an arrangement, money is deposited into an irrevocable escrow account and is used to purchase U.S. Treasury securities or government agency securities with maturing principals and interest earnings sufficient to pay all debt service requirements of the pre-refunded bonds. |
| l | At December 31, 2008, $3,193,911 of investments were held on deposit with the counterparty and pledged as the initial margin deposit for open financial futures contracts. |
| m | Non-income producing security. |
| n | The interest rate shown reflects the yield, coupon rate or, for securities purchased at a discount, the discount rate at the date of purchase. |
| o | At December 31, 2008, $4,593,071 of investments were pledged as collateral with the custodian under the agreement between the counterparty, the custodian and the fund for open swap contracts. |
Definitions: | ||||
TIPS | - | Treasury Inflation Protected Security. | ||
LIBOR | - | London Interbank Offered Rate. | ||
Gross unrealized appreciation and depreciation of investments, based on cost for federal income tax purposes, were as follows:
Gross unrealized appreciation | $ | 11,154,843 | ||
Gross unrealized depreciation | (106,607,025 | ) | ||
Net unrealized appreciation (depreciation) | $ | (95,452,182 | ) | |
Cost for federal income tax purposes | $ | 1,133,998,719 |
The following table is a summary of the inputs used, as of December 31, 2008, in valuing the Limited Maturity Bond Portfolio’s assets carried at fair value as discussed in item 2(A) of the Notes to Financial Statements.
Level | Investments in Securities | Other Financial Instruments* | ||||
Level 1 | $ | 106,922,413 | ($6,663,348 | ) | ||
Level 2 | 890,322,530 | (2,057,838 | ) | |||
Level 3 | 41,301,594 | — | ||||
Totals (Level 1,2,3) | $ | 1,038,546,537 | ($8,721,186 | ) | ||
The following table is a reconciliation of assets in which significant unobservable inputs (Level 3) were used in determining fair value for the Limited Maturity Bond Portfolio as discussed in item 2(A) of the Notes to Financial Statements.
| Investments in Securities | Other Financial Instruments* | ||||||
Value December 31, 2007 | $ | 64,830,388 | $ | — | |||
Accrued Discounts/Premiums | (27,119 | ) | — | ||||
Realized Gain/(Loss) | — | — | |||||
Change in Unrealized Gain/(Loss) | (26,867,551 | ) | — | ||||
Net Purchases/Sales | 5,568,594 | — | |||||
Transfers In and/or Out of Level 3 | (2,202,718 | ) | — | ||||
Value December 31, 2008 | $ | 41,301,594 | $ | — | |||
| * | Other Financial Instruments include Futures, Forwards, Written Options and Swap agreements. |
The accompanying Notes to Financial Statements are an integral part of this schedule.
244
Table of Contents
Limited Maturity Bond Portfolio
Schedule of Investments as of December 31, 2008
Futures | Number of Contracts Long/(Short) | Expiration Date | Notional Principal Amount | Value | Unrealized Gain/(Loss) | |||||||||
2-Yr. U.S. Treasury Bond Futures | (120 | ) | March 2009 | ($25,947,760 | ) | ($26,167,500 | ) | ($219,740 | ) | |||||
5-Yr. U.S. Treasury Bond Futures | (825 | ) | March 2009 | (95,751,602 | ) | (98,220,120 | ) | (2,468,518 | ) | |||||
10-Yr. U.S. Treasury Bond Futures | (280 | ) | March 2009 | (32,820,396 | ) | (35,210,000 | ) | (2,389,604 | ) | |||||
20-Yr. U.S. Treasury Bond Futures | (210 | ) | March 2009 | (27,404,359 | ) | (28,989,845 | ) | (1,585,486 | ) | |||||
Total Futures | ($6,663,348 | ) |
Credit Default Swaps and Counterparty | Buy/Sell Protection1 | Termination Date | Notional Principal Amount2 | Upfront Payments Received (Made) | Value3 | Unrealized Gain/(Loss) | ||||||||||
CDS International Paper, 5 Year, at 6.00%; J.P. Morgan Chase and Co. | Buy | 12/20/2013 | $ | 2,000,000 | $ | — | ($55,030 | ) | ($55,030 | ) | ||||||
CDX HY, Series 10, 5 Year, at 5.00%; Bank of America | Sell | 6/20/2013 | 2,250,000 | 198,438 | (356,243 | ) | (167,873 | ) | ||||||||
CDX HY, Series 10, 5 Year, at 5.00%; J.P. Morgan Chase and Co. | Sell | 6/20/2013 | 4,500,000 | 240,625 | (712,486 | ) | (432,231 | ) | ||||||||
CDX HY, Series 11, 5 Year, at 5.00%; Bank of America | Sell | 12/20/2013 | 9,000,000 | 1,590,000 | (1,811,330 | ) | (253,176 | ) | ||||||||
CDX IG, Series 10, 5 Year, at 1.55%; Bank of America | Sell | 6/20/2013 | 4,880,000 | 53,183 | (111,971 | ) | (61,273 | ) | ||||||||
CDX IG, Series 10, 5 Year, at 1.55%; J.P. Morgan Chase and Co. | Sell | 6/20/2013 | 4,880,000 | 49,155 | (111,971 | ) | (64,991 | ) | ||||||||
LCDX North America, Series 9, 5 Year, at 2.25%; J.P. Morgan Chase and Co. | Sell | 12/20/2012 | 9,996,000 | 283,050 | (2,206,992 | ) | (1,979,680 | ) | ||||||||
Total Credit Default Swaps | ($5,366,023 | ) | ($3,014,254 | ) | ||||||||||||
Interest Rate Swaps and Counterparty | Fund Receives | Fund Pays | Termination Date | Notional Principal Amount | Upfront Payments Received (Made) | Value | Unrealized Gain/(Loss) | |||||||||||
Bank of America, N.A., 2 Year | 5.306 | % | 3 Month LIBOR | 6/29/2009 | $ | 30,000,000 | N/A | $ | 594,821 | $ | 594,821 | |||||||
Bank of America, N.A., 2 Year | 5.275 | % | 3 Month LIBOR | 5/29/2009 | 24,000,000 | N/A | 361,595 | 361,595 | ||||||||||
Total Interest Rate Swaps | $ | 956,416 | $ | 956,416 | ||||||||||||||
| 1 | As the buyer of protection, Limited Maturity Bond Portfolio pays periodic fees in return for payment by the seller which is contingent upon an adverse credit event occurring in the underlying issuer or reference entity. As the seller of protection, Limited Maturity Bond Portfolio collects periodic fees from the buyer and profits if the credit of the underlying issuer or reference entity remains stable or improves while the swap is outstanding, but the seller in a credit default swap contract would be required to pay the amount of credit loss, determined as specified in the agreement, to the buyer in the event of an adverse credit event in the reference entity. |
| 2 | The maximum potential amount of future payments Limited Maturity Bond Portfolio could be required to make as the seller or receive as the buyer of protection. |
| 3 | The market value for credit indices (CDX or LCDX) serve as an indicator of the current status of the payment/performance risk and represent the liability or profit for the credit default swap contract had the contract been closed as of the reporting date. In the case when protection has been sold, the market value of the swap will increase when the swap spread declines representing an improvement in the reference entity’s credit worthiness. The market value of the swap will decrease when the swap spread increases representing a deterioration in the reference entity’s credit worthiness. |
The accompanying Notes to Financial Statements are an integral part of this schedule.
245
Table of Contents
Limited Maturity Bond Portfolio
Schedule of Investments as of December 31, 2008
Investment in Affiliates
Affiliated issuers, as defined under the Investment Company Act of 1940, include those in which the Portfolio’s holdings of an issuer represent 5% or more of the outstanding voting securities of an issuer, or any affiliated mutual fund.
A summary of transactions for the fiscal year to date, in Limited Maturity Bond Portfolio, is as follows:
Portfolio | Value December 31, 2007 | Gross Purchases and Additions | Gross Sales and Reductions | Balance of Shares Held at December 31, 2008 | Value December 31, 2008 | Income Earned January 1, 2008 - December 31, 2008 | |||||||||||
Money Market | $ | 13,111,425 | $ | 199,341,876 | $ | 211,118,410 | 1,334,891 | $ | 1,334,891 | $ | 833,162 | ||||||
Thrivent Financial Securities Lending Trust | 129,554,563 | 415,909,018 | 440,425,568 | 105,038,013 | 105,038,013 | 980,360 | |||||||||||
Total Value and Income Earned | 142,665,988 | 106,372,904 | 1,813,522 | ||||||||||||||
The accompanying Notes to Financial Statements are an integral part of this schedule.
246
Table of Contents
Schedule of Investments as of December 31, 2008
| Principal Amount | Long-Term Fixed Income (120.4%) | Value | ||||
| Asset-Backed Securities (18.7%) | ||||||
Americredit Automobile Receivables Trust | ||||||
| $ | 1,450,705 | 1.956%, 1/6/2009a,b | $ | 1,281,563 | ||
Credit Based Asset Servicing and Securitization, LLC | ||||||
| 744,579 | 0.581%, 1/26/2009b | 714,301 | ||||
| 281,566 | 5.501%, 12/25/2036 | 233,583 | ||||
First Horizon ABS Trust | ||||||
| 713,909 | 0.601%, 1/26/2009a,b | 423,055 | ||||
| 1,194,864 | 0.631%, 1/26/2009a,b | 562,433 | ||||
Ford Credit Floor Plan Master Owner Trust | ||||||
| 1,500,000 | 1.375%, 1/15/2009b | 1,448,131 | ||||
GMAC Mortgage Corporation Loan Trust | ||||||
| 1,700,535 | 0.651%, 1/26/2009a,b | 897,107 | ||||
Residential Funding Mortgage Securities | ||||||
| 308,533 | 4.470%, 7/25/2018a | 281,545 | ||||
Residential Funding Mortgage Securities II | ||||||
| 193,369 | 0.601%, 1/26/2009a,b | 185,510 | ||||
SLM Student Loan Trust | ||||||
| 234,712 | 3.545%, 1/26/2009b | 233,676 | ||||
Wachovia Asset Securitization, Inc. | ||||||
| 852,689 | 0.611%, 1/26/2009a,b,c | 323,012 | ||||
| Total Asset-Backed Securities | 6,583,916 | |||||
| Collateralized Mortgage Obligations (22.4%) | ||||||
Banc of America Mortgage Securities, Inc. | ||||||
| 713,139 | 4.802%, 9/25/2035 | 530,939 | ||||
Chaseflex Trust | ||||||
| 256,986 | 5.590%, 9/25/2036 | 246,999 | ||||
Countrywide Alternative Loan Trust | ||||||
| 352,109 | 5.500%, 2/25/2036 | 227,623 | ||||
| 282,749 | 6.000%, 1/25/2037 | 193,334 | ||||
Countrywide Home Loans | ||||||
| 528,946 | 0.561%, 1/26/2009b | 497,465 | ||||
Credit Suisse First Boston Mortgage Securities Corporation | ||||||
| 65,992 | 1.211%, 1/26/2009b | 37,000 | ||||
GSAA Home Equity Trust | ||||||
| 304,913 | 4.316%, 11/25/2034 | 277,777 | ||||
Impac CMB Trust | ||||||
| 518,571 | 0.731%, 1/26/2009b | 203,391 | ||||
| 91,494 | 0.791%, 1/26/2009b | 35,781 | ||||
J.P. Morgan Alternative Loan Trust | ||||||
| 265,693 | 0.541%, 1/25/2009b | 234,082 | ||||
| 448,630 | 5.810%, 5/25/2036 | 358,596 | ||||
J.P. Morgan Mortgage Trust | ||||||
| 242,439 | 6.500%, 1/25/2035 | 166,904 | ||||
MASTR Alternative Loans Trust | ||||||
| 313,620 | 6.500%, 5/25/2034 | 262,951 | ||||
Merrill Lynch Mortgage Investors, Inc. | ||||||
| 998,945 | 4.870%, 6/25/2035 | 693,438 | ||||
MLCC Mortgage Investors, Inc. | ||||||
| 249,541 | 0.801%, 1/25/2009b | 208,845 | ||||
Residential Accredit Loans, Inc. | ||||||
| 306,232 | 5.500%, 12/25/2034 | 216,655 | ||||
| 276,811 | 5.595%, 9/25/2035 | 151,366 | ||||
Thornburg Mortgage Securities Trust | ||||||
| 1,303,444 | 0.561%, 1/26/2009b | 1,279,759 | ||||
Washington Mutual Mortgage Pass-Through Certificates | ||||||
| 325,819 | 5.871%, 8/25/2046 | 279,086 | ||||
Washington Mutual, Inc. | ||||||
| 424,031 | 6.063%, 10/25/2036 | 354,764 | ||||
Wells Fargo Mortgage Backed Securities Trust | ||||||
| 644,705 | 4.950%, 3/25/2036 | 421,580 | ||||
| 458,300 | 5.240%, 4/25/2036 | 331,923 | ||||
| 410,710 | 5.500%, 4/25/2036 | 256,694 | ||||
| 585,896 | 6.000%, 7/25/2037 | 380,466 | ||||
| Total Collateralized Mortgage Obligations | 7,847,418 | |||||
| Commercial Mortgage-Backed Securities (12.7%) | ||||||
Commercial Mortgage Pass- Through Certificates | ||||||
| 60,044 | 1.295%, 1/15/2009b,d | 53,691 | ||||
GMAC Commercial Mortgage Securities, Inc. | ||||||
| 230,000 | 4.547%, 12/10/2041 | 207,760 | ||||
Greenwich Capital Commercial Funding Corporation | ||||||
| 500,000 | 5.867%, 8/10/2017 | 254,021 | ||||
J.P. Morgan Chase Commercial Mortgage Securities Corporation | ||||||
| 400,000 | 4.302%, 1/15/2038 | 368,146 | ||||
| 1,000,000 | 6.007%, 6/15/2049 | 706,226 | ||||
LB-UBS Commercial Mortgage Trust | ||||||
| 974,931 | 4.553%, 7/15/2030 | 902,590 | ||||
Merrill Lynch Countrywide Commercial Mortgage Trust | ||||||
| 400,000 | 5.172%, 12/12/2049 | 300,843 | ||||
TIAA Real Estate CDO, Ltd. | ||||||
| 500,000 | 5.806%, 8/15/2039 | 407,109 | ||||
Wachovia Bank Commercial Mortgage Trust | ||||||
| 2,000,000 | 1.315%, 1/15/2009b,c | 1,253,568 | ||||
| Total Commercial Mortgage- Backed Securities | 4,453,954 | |||||
| Mortgage-Backed Securities (63.2%) | ||||||
Federal Home Loan Mortgage Corporation Gold 30-Yr. Pass Through | ||||||
| 4,000,000 | 6.000%, 1/1/2038e | 4,120,000 | ||||
Federal National Mortgage Association | ||||||
| 1,624,499 | 6.000%, 8/1/2024 | 1,677,922 | ||||
The accompanying Notes to Financial Statements are an integral part of this schedule.
247
Table of Contents
Mortgage Securities Portfolio
Schedule of Investments as of December 31, 2008
| Principal Amount | Long-Term Fixed Income (120.4%) | Value | |||||
| Mortgage-Backed Securities (63.2%) - continued | |||||||
Federal National Mortgage Association Conventional 30- Yr. Pass Through | |||||||
| $ | 13,000,000 | 5.500%, 1/1/2039e | $ | 13,325,000 | |||
| 3,000,000 | 6.500%, 1/1/2039e | 3,115,314 | |||||
| Total Mortgage-Backed Securities | 22,238,236 | ||||||
| U.S. Government (3.4%) | |||||||
U.S. Treasury Notes | |||||||
| 100,000 | 4.875%, 4/30/2011f | 109,633 | |||||
U.S. Treasury Notes, TIPS | |||||||
| 1,149,330 | 2.000%, 7/15/2014 | 1,086,925 | |||||
| Total U.S. Government | 1,196,558 | ||||||
Total Long-Term Fixed Income (cost $47,196,619) | 42,320,082 | ||||||
| Contracts | Options Purchased (<0.1%) | Value | |||||
Put on 10-Yr. U.S. Treasury Bond Futures | |||||||
| 10 | $121.50, expires 2/20/2009 | $ | 9,687 | ||||
Total Options Purchased (cost $6,749) | 9,687 | ||||||
| Shares or Principal Amount | Short-Term Investments (31.9%)g | Value | |||||
Federal Home Loan Bank Discount Notes | |||||||
| 3,000,000 | 0.070%, 1/13/2009 | 2,999,930 | |||||
| 1,500,000 | 0.181%, 1/28/2009 | 1,499,796 | |||||
Federal Home Loan Mortgage Corporation Discount Notes | |||||||
| 2,560,000 | 0.010%, 1/13/2009 | 2,559,992 | |||||
Federal National Mortgage Association Discount Notes | |||||||
| 2,735,000 | 0.050%, 1/27/2009 | 2,734,901 | |||||
| 1,429,000 | 0.180%, 2/2/2009 | 1,428,771 | |||||
| 896 | Thrivent Money Market Portfolio | 896 | |||||
| Total Short-Term Investments (at amortized cost) | 11,224,286 | ||||||
| Total Investments (cost $58,427,654) 152.3% | $ | 53,554,055 | |||||
| Other Assets and Liabilities, Net (52.3%) | (18,387,298 | ) | |||||
| Total Net Assets 100.0% | $ | 35,166,757 | |||||
| a | All or a portion of the security is insured or guaranteed. |
| b | Denotes variable rate obligations for which the current yield and next scheduled reset date are shown. |
| c | Denotes restricted securities. Restricted securities are investment securities which have been deemed illiquid and cannot be offered for public sale without first being registered under the Securities Act of 1933. The following table indicates the acquisition date and cost of restricted securities Mortgage Securities Portfolio owned as of December 31, 2008. |
Security | Acquisition Date | Cost | |||
Wachovia Asset Securitization, Inc. | 3/16/2007 | $ | 852,690 | ||
Wachovia Bank Commercial Mortgage Trust | 2/28/2007 | $ | 2,000,214 | ||
| d | Denotes securities sold under Rule 144A of the Securities Act of 1933, which exempts them from registration. These securities have been deemed liquid and may be resold to other dealers in the program or to other qualified institutional buyers. As of December 31, 2008, the value of these investments was $53,691 or 0.2% of total net assets. |
| e | Denotes investments purchased on a when-issued or delayed delivery basis. |
| f | At December 31, 2008, $109,633 of investments were held on deposit with the counterparty and pledged as the initial margin deposit for open financial futures contracts. |
| g | The interest rate shown reflects the yield, coupon rate or, for securities purchased at a discount, the discount rate at the date of purchase. |
Definitions: | ||||
TIPS | - | Treasury Inflation Protected Security. | ||
Gross unrealized appreciation and depreciation of investments, based on cost for federal income tax purposes, were as follows:
Gross unrealized appreciation | $ | 499,903 | ||
Gross unrealized depreciation | (5,373,502 | ) | ||
Net unrealized appreciation (depreciation) | $ | (4,873,599 | ) | |
Cost for federal income tax purposes | $ | 58,427,654 |
The following table is a summary of the inputs used, as of December 31, 2008, in valuing the Mortgage Securities Portfolio’s assets carried at fair value as discussed in item 2(A) of the Notes to Financial Statements.
Level | Investments in Securities | Other Financial Instruments* | ||||
Level 1 | $ | 10,583 | $ | 34,516 | ||
Level 2 | 53,543,472 | — | ||||
Level 3 | — | — | ||||
Totals (Level 1,2,3) | $ | 53,554,055 | $ | 34,516 | ||
| * | Other Financial Instruments include Futures, Forwards, Written Options and Swap agreements. |
The accompanying Notes to Financial Statements are an integral part of this schedule.
248
Table of Contents
Mortgage Securities Portfolio
Schedule of Investments as of December 31, 2008
Futures | Number of Contracts Long/(Short) | Expiration Date | Notional Principal Amount | Value | Unrealized Gain/(Loss) | ||||||||
10-Yr. U.S. Treasury Bond Futures | 5 | March 2009 | $ | 594,234 | $ | 628,750 | $ | 34,516 | |||||
Total Futures | $ | 34,516 | |||||||||||
Investment in Affiliates
Affiliated issuers, as defined under the Investment Company Act of 1940, include those in which the Portfolio’s holdings of an issuer represent 5% or more of the outstanding voting securities of an issuer, or any affiliated mutual fund.
A summary of transactions for the fiscal year to date, in Mortgage Securities Portfolio, is as follows:
Portfolio | Value December 31, 2007 | Gross Purchases and Additions | Gross Sales and Reductions | Balance of Shares Held at December 31, 2008 | Value December 31, 2008 | Income Earned January 1, 2008 - December 31, 2008 | |||||||||||
Money Market | $ | 870 | $ | 26 | $ | — | 896 | $ | 896 | $ | 26 | ||||||
Total Value and Income Earned | 870 | 896 | 26 | ||||||||||||||
The accompanying Notes to Financial Statements are an integral part of this schedule.
249
Table of Contents
Schedule of Investments as of December 31, 2008
| Principal Amount | Certificates of Deposit (1.2%)a | Value | ||||
Bank of New York Mellon | ||||||
| $ | 1,830,000 | 5.410%, 5/15/2009 | $ | 1,838,568 | ||
US Bank NA | ||||||
| 6,500,000 | 2.950%, 3/11/2009 | 6,500,000 | ||||
Total Certificates of Deposit | 8,338,568 | |||||
| Principal Amount | Commercial Paper (73.7%)a | Value | ||||
| Asset-Backed Commercial Paper (4.7%) | ||||||
GOVCO, Inc. | ||||||
| 6,400,000 | 2.600%, 1/28/2009b | 6,387,520 | ||||
| 8,010,000 | 2.250%, 4/30/2009b | 7,950,425 | ||||
| 8,025,000 | 1.300%, 6/23/2009b | 7,974,866 | ||||
| 9,540,000 | 1.300%, 6/29/2009b | 9,478,335 | ||||
Total Asset-Backed Commercial Paper | 31,791,146 | |||||
| Banking-Domestic (5.3%) | ||||||
Bank of America Corporation | ||||||
| 5,780,000 | 1.600%, 1/20/2009 | 5,775,119 | ||||
| 4,560,000 | 1.648%, 2/12/2009 | 4,551,232 | ||||
| 8,110,000 | 2.955%, 3/17/2009 | 8,060,073 | ||||
HSBC USA, Inc, | ||||||
| 4,450,000 | 0.550%, 1/5/2009 | 4,449,728 | ||||
Rabobank USA Finance Corporation | ||||||
| 8,025,000 | 0.490%, 4/3/2009 | 8,014,951 | ||||
River Fuel Company No. 2, Inc. | ||||||
| 1,600,000 | 2.100%, 1/15/2009b | 1,598,693 | ||||
River Fuel Trust No. 1 | ||||||
| 3,580,000 | 2.160%, 4/30/2009b | 3,554,439 | ||||
Total Banking-Domestic | 36,004,235 | |||||
| Basic Industry (2.9%) | ||||||
BASF AG | ||||||
| 6,400,000 | 2.000%, 1/9/2009 | 6,397,156 | ||||
| 1,460,000 | 2.450%, 1/28/2009 | 1,457,317 | ||||
| 3,760,000 | 2.000%, 3/5/2009 | 3,746,840 | ||||
Praxair, Inc. | ||||||
| 7,918,000 | 0.600%, 3/30/2009 | 7,906,387 | ||||
Total Basic Industry | 19,507,700 | |||||
| Brokerage (2.8%) | ||||||
Citigroup, Inc. | ||||||
| 9,440,000 | 1.000%, 3/27/2009b | 9,417,711 | ||||
| 9,540,000 | 1.000%, 3/30/2009b | 9,516,680 | ||||
Total Brokerage | 18,934,391 | |||||
| Consumer Cyclical (0.9%) | ||||||
Toyota Credit Puerto Rico | ||||||
| 6,490,000 | 2.700%, 3/23/2009 | 6,450,574 | ||||
Total Consumer Cyclical | 6,450,574 | |||||
| Education (0.4%) | ||||||
Northwestern University | ||||||
| 2,565,000 | 2.450%, 2/2/2009 | 2,559,414 | ||||
Total Education | 2,559,414 | |||||
| Finance (31.1%) | ||||||
Barton Capital Corporation | ||||||
| 4,790,000 | 2.150%, 1/23/2009b | 4,783,706 | ||||
| 9,500,000 | 0.750%, 4/8/2009b | 9,480,802 | ||||
| 7,800,000 | 0.450%, 4/13/2009b | 7,790,055 | ||||
| 7,950,000 | 0.450%, 4/17/2009b | 7,939,466 | ||||
Bryant Illinois Park Fund | ||||||
| 8,025,000 | 1.500%, 1/30/2009b | 8,015,303 | ||||
| 2,250,000 | 1.600%, 2/17/2009b | 2,245,300 | ||||
Chariot Funding, LLC | ||||||
| 2,934,000 | 0.050%, 1/2/2009b | 2,933,996 | ||||
Chase Bank USA | ||||||
| 8,015,000 | 0.400%, 3/30/2009 | 8,015,000 | ||||
Ciesco, LLC | ||||||
| 9,630,000 | 0.250%, 2/10/2009b | 9,627,325 | ||||
| 9,530,000 | 0.750%, 3/23/2009b | 9,513,918 | ||||
Enterprise Funding Corporation | ||||||
| 7,940,000 | 1.400%, 2/23/2009b | 7,923,635 | ||||
| 9,525,000 | 0.500%, 4/13/2009b | 9,511,506 | ||||
Falcon Asset Securitization Corporation | ||||||
| 8,000,000 | 0.200%, 1/26/2009b | 7,998,889 | ||||
General Electric Capital Corporation | ||||||
| 6,500,000 | 2.820%, 3/11/2009 | 6,464,868 | ||||
HSBC Finance Corporation | ||||||
| 8,115,000 | 2.950%, 3/11/2009 | 8,069,117 | ||||
ING US Funding, LLC | ||||||
| 8,120,000 | 2.975%, 3/12/2009 | 8,073,028 | ||||
Kitty Hawk Funding Corporation | ||||||
| 6,450,000 | 0.750%, 3/23/2009b | 6,439,116 | ||||
Old Line Funding Corporation | ||||||
| 4,800,000 | 2.600%, 2/20/2009b | 4,782,667 | ||||
| 4,867,000 | 1.650%, 3/20/2009b | 4,849,600 | ||||
| 6,360,000 | 1.000%, 3/25/2009b | 6,345,337 | ||||
| 9,490,000 | 0.450%, 4/20/2009b | 9,477,070 | ||||
Ranger Funding Company, LLC | ||||||
| 8,030,000 | 1.550%, 2/24/2009b | 8,011,330 | ||||
| 6,350,000 | 0.500%, 4/6/2009b | 6,341,622 | ||||
| 9,525,000 | 0.500%, 4/13/2009b | 9,511,506 | ||||
Thunder Bay Funding, Inc. | ||||||
| 5,850,000 | 1.600%, 2/20/2009b | 5,837,000 | ||||
| 4,700,000 | 1.500%, 3/13/2009b | 4,686,096 | ||||
| 4,740,000 | 1.000%, 3/20/2009b | 4,729,730 | ||||
Yorktown Capital, LLC | ||||||
| 1,000,000 | 1.600%, 1/21/2009b | 999,111 | ||||
| 8,000,000 | 1.600%, 2/24/2009b | 7,980,800 | ||||
| 4,770,000 | 0.400%, 3/6/2009b | 4,766,608 | ||||
| 9,525,000 | 0.500%, 4/13/2009b | 9,511,506 | ||||
Total Finance | 212,655,013 | |||||
| Insurance (1.9%) | ||||||
Swiss Reinsurance Company | ||||||
| 6,888,000 | 1.547%, 2/12/2009 | 6,875,569 | ||||
| 6,490,000 | 3.020%, 3/16/2009 | 6,449,712 | ||||
Total Insurance | 13,325,281 | |||||
| U.S. Government (20.5%) | ||||||
Federal Home Loan Bank Discount Notes | ||||||
| 4,770,000 | 2.550%, 2/17/2009 | 4,754,119 | ||||
| 3,170,000 | 2.750%, 3/2/2009 | 3,155,471 | ||||
| 4,815,000 | 1.100%, 3/26/2009 | 4,802,642 | ||||
| 5,420,000 | 2.565%, 4/14/2009 | 5,380,230 | ||||
| 2,550,000 | 2.000%, 4/16/2009 | 2,535,125 | ||||
The accompanying Notes to Financial Statements are an integral part of this schedule.
250
Table of Contents
Money Market Portfolio
Schedule of Investments as of December 31, 2008
| Principal Amount | Commercial Paper (73.7%)a | Value | |||||
| U.S. Government (20.5%) - continued | |||||||
Federal Home Loan Banks | |||||||
| $ | 19,020,000 | 3.750%, 8/18/2009 | $ | 19,381,795 | |||
Federal Home Loan Mortgage Corporation | |||||||
| 4,750,000 | 4.875%, 2/17/2009 | 4,763,130 | |||||
Federal Home Loan Mortgage Corporation Discount Notes | |||||||
| 14,420,000 | 2.604%, 2/24/2009 | 14,363,666 | |||||
| 994,000 | 3.000%, 3/2/2009 | 989,030 | |||||
| 9,570,000 | 1.950%, 3/18/2009 | 9,530,604 | |||||
| 8,070,000 | 3.050%, 3/30/2009 | 8,009,834 | |||||
| 3,200,000 | 2.250%, 3/31/2009 | 3,182,200 | |||||
| 8,030,000 | 1.800%, 5/18/2009 | 7,974,994 | |||||
| 3,190,000 | 2.150%, 5/26/2009 | 3,162,375 | |||||
| 4,110,000 | 1.150%, 12/4/2009 | 4,065,755 | |||||
Federal National Mortgage Association Discount Notes | |||||||
| 7,750,000 | 2.250%, 2/17/2009 | 7,727,235 | |||||
| 2,950,000 | 2.700%, 2/27/2009 | 2,937,389 | |||||
| 6,400,000 | 2.700%, 3/16/2009 | 6,364,480 | |||||
| 8,000,000 | 2.500%, 3/18/2009 | 7,957,778 | |||||
| 4,890,000 | 3.000%, 3/19/2009 | 4,858,622 | |||||
| 3,200,000 | 2.000%, 4/22/2009 | 3,180,267 | |||||
| 3,011,000 | 2.870%, 5/1/2009 | 2,982,195 | |||||
| 8,010,000 | 1.730%, 5/20/2009 | 7,956,495 | |||||
Total U.S. Government | 140,015,431 | ||||||
| U.S. Municipal (3.2%) | |||||||
Alaska Housing Financing Corporation | |||||||
| 9,550,000 | 3.000%, 1/27/2009 | 9,529,308 | |||||
| 7,640,000 | 3.000%, 3/12/2009 | 7,595,433 | |||||
| 5,100,000 | 2.950%, 4/13/2009 | 5,057,373 | |||||
Total U.S. Municipal | 22,182,114 | ||||||
Total Commercial Paper | 503,425,299 | ||||||
| Principal Amount | Variable Rate Notes (25.4%)a | Value | |||||
| Banking-Domestic (10.7%) | |||||||
Bank of America Corporation | |||||||
| 5,000,000 | 2.906%, 2/6/2009c | 5,000,000 | |||||
Bank of America NA | |||||||
| 4,860,000 | 4.350%, 1/5/2009c | 4,860,000 | |||||
Barclays Bank plc NY | |||||||
| 4,880,000 | 2.740%, 2/11/2009c | 4,880,000 | |||||
Bear Stearns & Company, Inc. | |||||||
| 4,800,000 | 1.558%, 3/30/2009b,c | 4,793,622 | |||||
Branch Banking and Trust Company | |||||||
| 6,485,000 | 2.610%, 3/4/2009c | 6,485,000 | |||||
Deutsche Bank AG/NY | |||||||
| 6,470,000 | 1.735%, 3/23/2009c | 6,470,000 | |||||
HSBC Bank USA NA | |||||||
| 3,175,000 | 2.329%, 3/10/2009c | 3,162,249 | |||||
Rabobank Nederland NV/NY | |||||||
| 6,310,000 | 2.129%, 2/13/2009c,d | 6,310,000 | |||||
Royal Bank of Canada NY | |||||||
| 6,490,000 | 3.215%, 1/2/2009c | 6,490,000 | |||||
Svenska Handelsbanken NY | |||||||
| 9,770,000 | 2.519%, 2/26/2009c | 9,770,000 | |||||
Wachovia Bank | |||||||
| 4,870,000 | 4.418%, 1/5/2009b,c | 4,870,000 | |||||
Wells Fargo & Company | |||||||
| 4,136,000 | 1.971%, 1/5/2009c | 4,140,991 | |||||
| 5,775,000 | 1.345%, 1/15/2009c,d | 5,775,000 | |||||
Total Banking-Domestic | 73,006,862 | ||||||
| Banking-Foreign (3.5%) | |||||||
ING Bank NV | |||||||
| 6,480,000 | 1.716%, 3/26/2009c,d | 6,480,000 | |||||
Royal Bank of Canada | |||||||
| 4,850,000 | 2.449%, 2/17/2009c,d | 4,850,000 | |||||
Societe Generale | |||||||
| 4,880,000 | 2.620%, 3/4/2009c,d | 4,880,000 | |||||
Svenska Handelsbanken AB | |||||||
| 8,100,000 | 3.885%, 1/26/2009c,d | 8,100,000 | |||||
Total Banking-Foreign | 24,310,000 | ||||||
| Consumer Cyclical (2.8%) | |||||||
American Honda Finance Corporation | |||||||
| 8,770,000 | 4.419%, 1/8/2009c,d | 8,770,000 | |||||
| 3,240,000 | 4.949%, 1/14/2009c,d | 3,240,000 | |||||
| 4,850,000 | 2.989%, 2/5/2009c,d | 4,850,000 | |||||
| 2,240,000 | 2.246%, 3/9/2009c,d | 2,240,217 | |||||
Total Consumer Cyclical | 19,100,217 | ||||||
| Finance (3.4%) | |||||||
Bear Stearns & Company, Inc. | |||||||
| 7,950,000 | 0.250%, 1/2/2009b,c | 7,919,429 | |||||
| 8,635,000 | 3.765%, 1/30/2009b,c | 8,645,334 | |||||
Procter & Gamble International Funding SCA | |||||||
| 6,470,000 | 2.309%, 2/19/2009c | 6,470,000 | |||||
Total Finance | 23,034,763 | ||||||
| Insurance (1.2%) | |||||||
Allstate Life Global Funding Trust | |||||||
| 8,100,000 | 1.775%, 3/20/2009c | 8,100,000 | |||||
Total Insurance | 8,100,000 | ||||||
| U.S. Government (3.8%) | |||||||
Federal Home Loan Banks | |||||||
| 3,250,000 | 0.640%, 1/2/2009c | 3,250,000 | |||||
| 3,100,000 | 4.038%, 1/5/2009c | 3,099,987 | |||||
| 7,380,000 | 3.003%, 2/1/2009c | 7,381,151 | |||||
| 8,030,000 | 2.361%, 2/18/2009c | 8,030,000 | |||||
| 4,330,000 | 2.038%, 2/20/2009c | 4,315,752 | |||||
Total U.S. Government | 26,076,890 | ||||||
Total Variable Rate Notes | 173,628,732 | ||||||
| Total Investments (at amortized cost) 100.3% | $ | 685,392,599 | |||||
Other Assets and Liabilities, Net (0.3)% | (1,946,072 | ) | |||||
Total Net Assets 100.0% | $ | 683,446,527 | |||||
| a | The interest rate shown reflects the yield, coupon rate or, for securities purchased at a discount, the discount rate at the date of purchase. |
| b | Denotes investments that benefit from credit enhancement or liquidity support provided by a third party bank or institution. |
The accompanying Notes to Financial Statements are an integral part of this schedule.
251
Table of Contents
Money Market Portfolio
Schedule of Investments as of December 31, 2008
| c | Denotes variable rate obligations for which the current yield and next scheduled reset date are shown. |
| d | Denotes securities sold under Rule 144A of the Securities Act of 1933, which exempts them from registration. These securities have been deemed liquid and may be resold to other dealers in the program or to other qualified institutional buyers. As of December 31, 2008, the value of these investments was $55,495,217 or 8.1% of total net assets. |
Cost for federal income tax purposes | $ | 685,392,599 |
The following table is a summary of the inputs used, as of December 31, 2008, in valuing the Money Market Portfolio’s assets carried at fair value as discussed in item 2(A) of the Notes to Financial Statements.
Level | Investments in Securities | Other Financial Instruments* | ||||
Level 1 | $ | — | $ | — | ||
Level 2 | 685,392,599 | — | ||||
Level 3 | — | — | ||||
Totals (Level 1,2,3) | $ | 685,392,599 | $ | — | ||
| * | Other Financial Instruments include Futures, Forwards, Written Options and Swap agreements. |
The accompanying Notes to Financial Statements are an integral part of this schedule.
252
Table of Contents
[THIS PAGE INTENTIONALLY LEFT BLANK]
253
Table of Contents
Statement of Assets and Liabilities
As of December 31, 2008 | Aggressive Allocation Portfolio | Moderately Aggressive Allocation Portfolio | Moderate Allocation Portfolio | Moderately Conservative Allocation Portfolio | ||||||||||||
Assets | ||||||||||||||||
Investments at cost | $ | 529,949,128 | $ | 1,962,996,771 | $ | 2,459,237,924 | $ | 907,119,344 | ||||||||
Investments in securities at market value | 2,596,036 | 23,342,566 | 44,851,134 | 22,072,632 | ||||||||||||
Investments in affiliates at market value | 351,385,548 | 1,329,772,843 | 1,755,683,154 | 691,837,216 | ||||||||||||
Investments at Market Value | 353,981,584 | 1,353,115,409 | 1,800,534,288 | 713,909,848 | ||||||||||||
Cash | — | — | 7,999,998 | — | ||||||||||||
Dividends and interest receivable | 197 | 71,050 | 163,186 | 89,998 | ||||||||||||
Prepaid expenses | 1,500 | 3,372 | 4,076 | 2,008 | ||||||||||||
Receivable for investments sold | — | 4,288 | — | — | ||||||||||||
Receivable for fund shares sold | 153,484 | 100,067 | 539,102 | 350,681 | ||||||||||||
Unrealized gain on forward contracts | — | — | — | — | ||||||||||||
Receivable from affiliate | — | — | — | — | ||||||||||||
Receivable for variation margin | 391,435 | 1,579,550 | 3,126,445 | 873,700 | ||||||||||||
Total Assets | 354,528,200 | 1,354,873,736 | 1,812,367,095 | 715,226,235 | ||||||||||||
Liabilities | ||||||||||||||||
Accrued expenses | 10,501 | 13,192 | 16,082 | 11,881 | ||||||||||||
Other liabilities | — | 4 | — | — | ||||||||||||
Payable for investments purchased | 142,548 | — | 198,511 | 154,644 | ||||||||||||
Payable upon return of collateral for securities loaned | — | — | — | — | ||||||||||||
Payable for fund shares redeemed | 10,936 | 104,355 | 340,592 | 196,037 | ||||||||||||
Unrealized loss on forward contracts | — | — | — | — | ||||||||||||
Payable to affiliate | 54,295 | 191,069 | 253,497 | 107,793 | ||||||||||||
Total Liabilities | 218,280 | 308,620 | 808,682 | 470,355 | ||||||||||||
Net Assets | ||||||||||||||||
Capital stock (beneficial interest) | 483,926,213 | 1,811,293,233 | 2,303,359,535 | 857,602,528 | ||||||||||||
Accumulated undistributed net investment income/(loss) | 18,195,152 | 78,086,145 | 103,629,794 | 36,822,581 | ||||||||||||
Accumulated undistributed net realized gain/(loss) | 27,487,124 | 71,282,044 | 57,022,845 | 12,008,785 | ||||||||||||
Net unrealized appreciation/(depreciation) on: | ||||||||||||||||
Investments | — | (1,958,256 | ) | (4,505,573 | ) | (2,465,531 | ) | |||||||||
Affiliated investments | (175,967,544 | ) | (607,923,106 | ) | (654,198,063 | ) | (190,743,965 | ) | ||||||||
Futures contracts | 668,975 | 3,785,056 | 6,249,875 | 1,531,482 | ||||||||||||
Foreign currency forward contracts | — | — | — | — | ||||||||||||
Foreign currency transactions | — | — | — | — | ||||||||||||
Total Net Assets | $ | 354,309,920 | $ | 1,354,565,116 | $ | 1,811,558,413 | $ | 714,755,880 | ||||||||
Shares of beneficial interest outstanding | 41,649,189 | 156,797,721 | 203,042,701 | 77,138,928 | ||||||||||||
Net asset value per share | $ | 8.51 | $ | 8.64 | $ | 8.92 | $ | 9.27 | ||||||||
The accompanying Notes to Financial Statements are an integral part of this schedule.
254
Table of Contents
Thrivent Series Fund, Inc.
Statement of Assets and Liabilities - continued
| Technology Portfolio | Partner Healthcare Portfolio | Partner Natural Resources Portfolio | Partner Emerging Markets Portfolio | Real Estate Securities Portfolio | Partner Utilities Portfolio | Partner Small Cap Growth Portfolio | ||||||||||||||||||||
| $ | 30,330,782 | $ | 7,671,282 | $ | 10,633,403 | $ | 9,317,321 | $ | 325,045,247 | $ | 5,878,999 | $ | 152,087,891 | |||||||||||||
| 22,953,911 | 6,782,864 | 5,667,353 | 5,253,985 | 189,858,284 | 4,192,947 | 105,708,893 | ||||||||||||||||||||
| 3,614,665 | 348,090 | 680,495 | 71,414 | 34,808,228 | 562,032 | 25,703,120 | ||||||||||||||||||||
| 26,568,576 | 7,130,954 | 6,347,848 | 5,325,399 | 224,666,512 | 4,754,979 | 131,412,013 | ||||||||||||||||||||
| — | — | 1,127,591 | 8,124 | (a) | — | — | — | |||||||||||||||||||
| 13,469 | 12,757 | 5,768 | 9,598 | 1,820,920 | 6,320 | 62,486 | ||||||||||||||||||||
| 865 | 913 | 913 | 921 | 1,322 | 913 | 1,034 | ||||||||||||||||||||
| 50,904 | — | — | — | 22,414 | 7,557 | 759,367 | ||||||||||||||||||||
| 8,527 | 2,234 | 27,121 | 475 | 29,915 | 644 | 17,297 | ||||||||||||||||||||
| — | — | — | — | — | 184 | — | ||||||||||||||||||||
| — | — | — | 967 | — | 3,002 | — | ||||||||||||||||||||
| — | — | — | — | — | — | 163,020 | ||||||||||||||||||||
| 26,642,341 | 7,146,858 | 7,509,241 | 5,345,484 | 226,541,083 | 4,773,599 | 132,415,217 | ||||||||||||||||||||
| 13,585 | 8,533 | 9,150 | 15,625 | 25,359 | 7,333 | 20,155 | ||||||||||||||||||||
| — | — | — | — | — | — | — | ||||||||||||||||||||
| — | — | 903,196 | — | 480,021 | 389,538 | 649,982 | ||||||||||||||||||||
| 2,295,165 | — | — | — | 28,447,323 | — | 19,195,880 | ||||||||||||||||||||
| 115 | 702 | 372 | 594 | 35,763 | 24,438 | 760 | ||||||||||||||||||||
| — | — | 2,272 | — | — | 239 | — | ||||||||||||||||||||
| 16,210 | 2,225 | 219 | — | 132,910 | — | 87,518 | ||||||||||||||||||||
| 2,325,075 | 11,460 | 915,209 | 16,219 | 29,121,376 | 421,548 | 19,954,295 | ||||||||||||||||||||
| 43,519,109 | 7,805,504 | 10,956,922 | 9,654,508 | 306,887,473 | 5,905,622 | 185,018,572 | ||||||||||||||||||||
| (5,298 | ) | 671 | (874 | ) | (485 | ) | (14,704 | ) | (1,143 | ) | 104,760 | |||||||||||||||
| (15,434,339 | ) | (130,471 | ) | (76,182 | ) | (332,693 | ) | (9,073,529 | ) | (428,114 | ) | (52,528,100 | ) | |||||||||||||
| (3,762,206 | ) | (540,328 | ) | (4,285,555 | ) | (3,991,922 | ) | (100,378,735 | ) | (1,124,020 | ) | (20,675,878 | ) | |||||||||||||
| — | — | — | — | — | — | — | ||||||||||||||||||||
| — | — | — | — | — | — | 541,568 | ||||||||||||||||||||
| — | — | (2,272 | ) | — | — | (55 | ) | — | ||||||||||||||||||
| — | 22 | 1,993 | (143 | ) | (798 | ) | (239 | ) | — | |||||||||||||||||
| $ | 24,317,266 | $ | 7,135,398 | $ | 6,594,032 | $ | 5,329,265 | $ | 197,419,707 | $ | 4,352,051 | $ | 112,460,922 | |||||||||||||
| 6,691,316 | 797,715 | 1,151,922 | 953,452 | 21,127,203 | 627,981 | 15,103,227 | ||||||||||||||||||||
| $ | 3.63 | $ | 8.94 | $ | 5.72 | $ | 5.59 | $ | 9.34 | $ | 6.93 | $ | 7.45 | |||||||||||||
(a) | Includes foreign currency holdings of $8,124 (cost $8,227). |
The accompanying Notes to Financial Statements are an integral part of this schedule.
255
Table of Contents
Thrivent Series Fund, Inc.
Statement of Assets and Liabilities - continued
As of December 31, 2008 | Partner Small Cap Value Portfolio | Small Cap Stock Portfolio | Small Cap Index Portfolio | Mid Cap Growth Portfolio II | ||||||||||||
Assets | ||||||||||||||||
Investments at cost | $ | 252,505,076 | $ | 319,848,507 | $ | 270,837,832 | $ | 102,410,500 | ||||||||
Investments in securities at market value | 164,676,787 | 280,797,614 | 191,924,082 | 77,275,476 | ||||||||||||
Investments in affiliates at market value | 29,869,770 | 34,066,034 | 45,437,682 | 9,067,238 | ||||||||||||
Investments at Market Value | 194,546,557 | 314,863,648 | 237,361,764 | 86,342,714 | ||||||||||||
Cash | — | — | — | — | ||||||||||||
Dividends and interest receivable | 337,766 | 419,402 | 358,568 | 25,490 | ||||||||||||
Prepaid expenses | 1,064 | 1,371 | 1,267 | 836 | ||||||||||||
Receivable for investments sold | 115,438 | 10,525,114 | 981,901 | — | ||||||||||||
Receivable for fund shares sold | 16,828 | 16,159 | 26,368 | 2,142 | ||||||||||||
Unrealized gain on forward contracts | — | — | — | — | ||||||||||||
Receivable from affiliate | — | — | — | — | ||||||||||||
Receivable for variation margin | — | 65,865 | 63,001 | 16,205 | ||||||||||||
Total Assets | 195,017,653 | 325,891,559 | 238,792,869 | 86,387,387 | ||||||||||||
Liabilities | ||||||||||||||||
Accrued expenses | 20,409 | 42,316 | 45,781 | 11,044 | ||||||||||||
Payable for investments purchased | — | 9,414,141 | 1,959,716 | 198,932 | ||||||||||||
Payable upon return of collateral for securities loaned | 26,942,036 | 28,172,401 | 44,468,815 | 5,387,577 | ||||||||||||
Payable for fund shares redeemed | 7,025 | 28,537 | 63,166 | 506 | ||||||||||||
Unrealized loss on forward contracts | — | — | — | — | ||||||||||||
Payable to affiliate | 117,383 | 174,439 | 61,770 | 18,449 | ||||||||||||
Total Liabilities | 27,086,853 | 37,831,834 | 46,599,248 | 5,616,508 | ||||||||||||
Net Assets | ||||||||||||||||
Capital stock (beneficial interest) | 226,448,535 | 418,344,085 | 198,045,153 | 99,161,256 | ||||||||||||
Accumulated undistributed net investment income/(loss) | 392,994 | 571,211 | 3,619,275 | (3,939 | ) | |||||||||||
Accumulated undistributed net realized gain/(loss) | (952,210 | ) | (125,870,712 | ) | 23,902,025 | (2,318,652 | ) | |||||||||
Net unrealized appreciation/(depreciation) on: | ||||||||||||||||
Investments | (57,958,519 | ) | (4,984,859 | ) | (33,476,068 | ) | (16,067,786 | ) | ||||||||
Futures contracts | — | — | 103,236 | — | ||||||||||||
Foreign currency forward contracts | — | — | — | — | ||||||||||||
Foreign currency transactions | — | — | — | — | ||||||||||||
Total Net Assets | $ | 167,930,800 | $ | 288,059,725 | $ | 192,193,621 | $ | 80,770,879 | ||||||||
Shares of beneficial interest outstanding | 13,915,747 | 33,948,948 | 18,235,957 | 14,299,757 | ||||||||||||
Net asset value per share | $ | 12.07 | $ | 8.49 | $ | 10.54 | $ | 5.65 | ||||||||
The accompanying Notes to Financial Statements are an integral part of this schedule.
256
Table of Contents
Thrivent Series Fund, Inc.
Statement of Assets and Liabilities - continued
| Mid Cap Growth Portfolio | Partner Mid Cap Value Portfolio | Mid Cap Stock Portfolio | Mid Cap Index Portfolio | Partner Worldwide Allocation Portfolio | Partner International Stock Portfolio | Partner Socially Responsible Stock Portfolio | ||||||||||||||||||||
| $ | 449,660,341 | $ | 161,381,432 | $ | 503,451,903 | $ | 102,985,827 | $ | 128,736,669 | $ | 1,025,813,771 | $ | 4,669,812 | |||||||||||||
| 264,562,623 | 121,355,600 | 370,780,964 | 73,226,825 | 97,019,519 | 755,742,844 | 3,129,333 | ||||||||||||||||||||
| 45,721,945 | 6,539,246 | 26,357,032 | 10,854,213 | 8,811,716 | 35,282,138 | 69,852 | ||||||||||||||||||||
| 310,284,568 | 127,894,846 | 397,137,996 | 84,081,038 | 105,831,235 | 791,024,982 | 3,199,185 | ||||||||||||||||||||
| — | — | 8,969,650 | — | 25,450 | (a) | 8,752 | (b) | — | ||||||||||||||||||
| 186,312 | 303,512 | 424,087 | 127,050 | 300,418 | 1,375,623 | 4,949 | ||||||||||||||||||||
| 1,642 | 932 | 1,342 | 985 | 1,058 | 2,787 | 913 | ||||||||||||||||||||
| — | 156,646 | — | 929,709 | 55,570 | — | — | ||||||||||||||||||||
| 16,192 | 9,186 | 3,100 | 2,120 | 4,897 | 17,939 | — | ||||||||||||||||||||
| — | — | — | — | 10,694 | — | — | ||||||||||||||||||||
| — | — | — | — | — | — | 2,390 | ||||||||||||||||||||
| — | — | — | 35,147 | 26,712 | — | — | ||||||||||||||||||||
| 310,488,714 | 128,365,122 | 406,536,175 | 85,176,049 | 106,256,034 | 792,430,083 | 3,207,437 | ||||||||||||||||||||
| 39,531 | 20,741 | 33,543 | 22,033 | 43,438 | 126,883 | 6,691 | ||||||||||||||||||||
| 549,855 | 320,302 | — | 406,020 | 243,825 | — | — | ||||||||||||||||||||
| 34,543,185 | 4,605,487 | 26,343,474 | 9,562,918 | — | 13,420,165 | — | ||||||||||||||||||||
| 144,855 | 501 | 56,095 | 20,670 | 2,452 | 228,736 | 26 | ||||||||||||||||||||
| — | — | — | — | 1,481 | — | — | ||||||||||||||||||||
| 109,492 | 81,267 | 220,033 | 24,112 | 63,307 | 528,845 | — | ||||||||||||||||||||
| 35,386,918 | 5,028,298 | 26,653,145 | 10,035,753 | 354,503 | 14,304,629 | 6,717 | ||||||||||||||||||||
| 485,617,875 | 184,657,645 | 605,759,236 | 89,472,361 | 142,617,792 | 1,196,947,111 | 4,952,454 | ||||||||||||||||||||
| (6,748 | ) | 271,966 | 247,551 | 1,511,561 | (33,448 | ) | 591,039 | (594 | ) | |||||||||||||||||
| (71,133,558 | ) | (28,106,201 | ) | (119,809,850 | ) | 3,008,584 | (13,931,441 | ) | (184,616,576 | ) | (280,513 | ) | ||||||||||||||
| (139,375,773 | ) | (33,486,586 | ) | (106,313,907 | ) | (18,904,789 | ) | (22,905,434 | ) | (234,788,789 | ) | (1,470,627 | ) | |||||||||||||
| — | — | — | 52,579 | 147,633 | — | — | ||||||||||||||||||||
| — | — | — | — | 9,213 | — | — | ||||||||||||||||||||
| — | — | — | — | (2,784 | ) | (7,331 | ) | — | ||||||||||||||||||
| $ | 275,101,796 | $ | 123,336,824 | $ | 379,883,030 | $ | 75,140,296 | $ | 105,901,531 | $ | 778,125,454 | $ | 3,200,720 | |||||||||||||
| 28,798,351 | 14,956,081 | 53,648,641 | 9,039,390 | 17,564,821 | 95,160,414 | 493,677 | ||||||||||||||||||||
| $ | 9.55 | $ | 8.25 | $ | 7.08 | $ | 8.31 | $ | 6.03 | $ | 8.18 | $ | 6.48 | |||||||||||||
(a) | Includes foreign currency holdings of $25,450 (cost $25,085). |
(b) | Includes foreign currency holdings of $8,752 (cost $8,553). |
The accompanying Notes to Financial Statements are an integral part of this schedule.
257
Table of Contents
Thrivent Series Fund, Inc.
Statement of Assets and Liabilities - continued
As of December 31, 2008 | Partner All Cap Growth Portfolio | Partner All Cap Value Portfolio | Partner All Cap Portfolio | Large Cap Growth Portfolio II | ||||||||||||
Assets | ||||||||||||||||
Investments at cost | $ | 3,862,314 | $ | 3,476,663 | $ | 68,414,698 | $ | 312,789,334 | ||||||||
Investments in securities at market value | 2,363,285 | 2,277,386 | 55,911,433 | 297,709,393 | ||||||||||||
Investments in affiliates at market value | 77,149 | 201,541 | 2,695,498 | 10,128,865 | ||||||||||||
Investments at Market Value | 2,440,434 | 2,478,927 | 58,606,931 | 307,838,258 | ||||||||||||
Cash | — | — | — | — | ||||||||||||
Dividends and interest receivable | 1,069 | 5,227 | 118,285 | 274,917 | ||||||||||||
Prepaid expenses | 914 | 914 | 947 | 838 | ||||||||||||
Receivable for investments sold | 16 | 95,069 | 1,184,543 | 3,516,723 | ||||||||||||
Receivable for written options | — | — | — | — | ||||||||||||
Receivable for fund shares sold | 98 | 5,948 | 1,374 | 269 | ||||||||||||
Receivable from affiliate | 3,509 | 4,610 | — | — | ||||||||||||
Receivable for variation margin | — | — | — | — | ||||||||||||
Total Assets | 2,446,040 | 2,590,695 | 59,912,080 | 311,631,005 | ||||||||||||
Liabilities | ||||||||||||||||
Accrued expenses | 7,399 | 11,566 | 17,173 | 15,602 | ||||||||||||
Payable for investments purchased | 28,497 | 111,823 | 1,053,613 | 2,366,319 | ||||||||||||
Payable upon return of collateral for securities loaned | — | — | 2,623,789 | 211,680 | ||||||||||||
Payable for fund shares redeemed | 367 | 5,998 | 25,895 | 1,502 | ||||||||||||
Payable to affiliate | — | — | 38,374 | 50,677 | ||||||||||||
Mortgage dollar roll deferred revenue | — | — | — | — | ||||||||||||
Total Liabilities | 36,263 | 129,387 | 3,758,844 | 2,645,780 | ||||||||||||
Net Assets | ||||||||||||||||
Capital stock (beneficial interest) | 4,646,329 | 4,626,419 | 87,950,048 | 316,777,299 | ||||||||||||
Accumulated undistributed net investment income/(loss) | (682 | ) | 137 | 740,269 | (56 | ) | ||||||||||
Accumulated undistributed net realized gain/(loss) | (813,990 | ) | (1,167,512 | ) | (22,729,314 | ) | (2,840,942 | ) | ||||||||
Net unrealized appreciation/(depreciation) on: | ||||||||||||||||
Investments | (1,421,880 | ) | (997,736 | ) | (9,807,767 | ) | (4,951,076 | ) | ||||||||
Written option contracts | — | — | — | — | ||||||||||||
Futures contracts | — | — | — | — | ||||||||||||
Foreign currency transactions | — | — | — | — | ||||||||||||
Total Net Assets | $ | 2,409,777 | $ | 2,461,308 | $ | 56,153,236 | $ | 308,985,225 | ||||||||
Shares of beneficial interest outstanding | 451,009 | 449,608 | 9,207,872 | 52,789,240 | ||||||||||||
Net asset value per share | $ | 5.34 | $ | 5.47 | $ | 6.10 | $ | 5.85 | ||||||||
The accompanying Notes to Financial Statements are an integral part of this schedule.
258
Table of Contents
Thrivent Series Fund, Inc.
Statement of Assets and Liabilities - continued
| Large Cap Growth Portfolio | Partner Growth Stock Portfolio | Large Cap Value Portfolio | Large Cap Stock Portfolio | Large Cap Index Portfolio | Equity Income Plus Portfolio | Balanced Portfolio | ||||||||||||||||||||
| $ | 1,070,010,875 | $ | 62,076,216 | $ | 850,210,340 | $ | 616,466,099 | $ | 403,396,229 | $ | 49,535,215 | $ | 358,969,017 | |||||||||||||
| 829,223,168 | 50,804,634 | 647,651,330 | 474,464,064 | 318,112,576 | 34,199,848 | 295,145,463 | ||||||||||||||||||||
| 32,282,241 | 2,002,776 | 28,592,567 | 32,091,863 | 9,665,613 | 6,999,027 | 28,560,581 | ||||||||||||||||||||
| 861,505,409 | 52,807,410 | 676,243,897 | 506,555,927 | 327,778,189 | 41,198,875 | 323,706,044 | ||||||||||||||||||||
| 5,530,657 | — | — | — | — | — | 372 | ||||||||||||||||||||
| 1,368,901 | 75,542 | 1,411,815 | 903,438 | 735,870 | 114,639 | 1,144,587 | ||||||||||||||||||||
| 4,115 | 943 | 2,215 | 2,235 | 1,609 | 913 | 1,448 | ||||||||||||||||||||
| 14,966,188 | 116,814 | — | 1,562,437 | — | — | — | ||||||||||||||||||||
| — | — | — | — | — | 1,488 | — | ||||||||||||||||||||
| 23,689 | 1,867 | 9,066 | 12,521 | 22,084 | 240 | 6,179 | ||||||||||||||||||||
| — | — | — | — | — | — | ��� | ||||||||||||||||||||
| — | — | — | 169,575 | 35,700 | 67,869 | 107,100 | ||||||||||||||||||||
| 883,398,959 | 53,002,576 | 677,666,993 | 509,206,133 | 328,573,452 | 41,384,024 | 324,965,730 | ||||||||||||||||||||
| 137,695 | 18,550 | 44,497 | 53,982 | 61,777 | 10,118 | 56,465 | ||||||||||||||||||||
| 14,878,886 | 51,152 | 1,010,986 | 2,302,979 | 472,728 | — | 28,088,660 | ||||||||||||||||||||
| 23,002,052 | 779,005 | 11,994,350 | 9,071,777 | 7,915,380 | — | 16,513,429 | ||||||||||||||||||||
| 461,948 | 26,913 | 159,936 | 89,345 | 308,790 | 78 | 183,612 | ||||||||||||||||||||
| 379,503 | 32,994 | 362,509 | 288,359 | 103,464 | 22,364 | 87,803 | ||||||||||||||||||||
| — | — | — | — | — | — | 14,891 | ||||||||||||||||||||
| 38,860,084 | 908,614 | 13,572,278 | 11,806,442 | 8,862,139 | 32,560 | 44,944,860 | ||||||||||||||||||||
| 2,286,598,620 | 68,189,705 | 927,791,176 | 749,950,903 | 387,044,913 | 59,360,902 | 308,204,371 | ||||||||||||||||||||
| 147,296 | 163,452 | 350,222 | 197,339 | 9,560,870 | (682 | ) | 11,677,975 | |||||||||||||||||||
| (1,233,701,575 | ) | (6,989,810 | ) | (90,080,240 | ) | (142,906,694 | ) | (1,293,745 | ) | (9,808,323 | ) | (4,642,423 | ) | |||||||||||||
| (208,505,466 | ) | (9,268,806 | ) | (173,966,443 | ) | (109,910,172 | ) | (75,618,040 | ) | (8,336,340 | ) | (35,262,973 | ) | |||||||||||||
| — | — | — | — | — | 1,488 | — | ||||||||||||||||||||
| — | — | — | 68,315 | 17,315 | 134,419 | 43,920 | ||||||||||||||||||||
| — | (579 | ) | — | — | — | — | — | |||||||||||||||||||
| $ | 844,538,875 | $ | 52,093,962 | $ | 664,094,715 | $ | 497,399,691 | $ | 319,711,313 | $ | 41,351,464 | $ | 280,020,870 | |||||||||||||
| 77,041,433 | 7,485,763 | 81,984,913 | 81,445,977 | 23,298,749 | 6,000,758 | 23,822,093 | ||||||||||||||||||||
| $ | 10.96 | $ | 6.96 | $ | 8.10 | $ | 6.11 | $ | 13.72 | $ | 6.89 | $ | 11.75 | |||||||||||||
The accompanying Notes to Financial Statements are an integral part of this schedule.
259
Table of Contents
Thrivent Series Fund, Inc.
Statement of Assets and Liabilities - continued
As of December 31, 2008 | High Yield Portfolio | Diversified Income Plus Portfolio | Partner Socially Responsible Bond Portfolio | Income Portfolio | ||||||||||||
Assets | ||||||||||||||||
Investments at cost | $ | 833,740,460 | $ | 97,624,893 | $ | 6,983,232 | $ | 1,383,341,032 | ||||||||
Investments in securities at market value | 569,355,854 | 72,253,552 | 6,174,115 | 1,150,338,865 | ||||||||||||
Investments in affiliates at market value | 55,659,513 | 3,548,809 | 605,703 | 52,844,995 | ||||||||||||
Investments at Market Value | 625,015,367 | 75,802,361 | 6,779,818 | 1,203,183,860 | ||||||||||||
Cash | 9,515,037 | — | — | 13,219,692 | ||||||||||||
Dividends and interest receivable | 14,313,881 | 899,404 | 71,965 | 15,099,612 | ||||||||||||
Prepaid expenses | 1,935 | 975 | 917 | 2,890 | ||||||||||||
Receivable for investments sold | 7,942,581 | 384,993 | — | 2,485,289 | ||||||||||||
Receivable for fund shares sold | 77,588 | 961 | — | 988 | ||||||||||||
Swap agreements, at value | — | — | — | 272,062 | ||||||||||||
Receivable from affiliate | — | — | 1,272 | — | ||||||||||||
Receivable for variation margin | — | 43,395 | 406 | 1,664,927 | ||||||||||||
Total Assets | 656,866,389 | 77,132,089 | 6,854,378 | 1,235,929,320 | ||||||||||||
Liabilities | ||||||||||||||||
Distributions payable | — | — | 358 | — | ||||||||||||
Accrued expenses | 46,392 | 17,106 | 7,993 | 71,923 | ||||||||||||
Payable for investments purchased | 7,950,530 | 301,973 | — | 88,799,816 | ||||||||||||
Payable upon return of collateral for securities loaned | 49,481,715 | 1,642,478 | — | 37,623,842 | ||||||||||||
Payable for fund shares redeemed | 223,063 | 110,457 | 28,052 | 333,072 | ||||||||||||
Swap agreements, at value | 1,729,124 | — | — | 10,636,149 | ||||||||||||
Payable for variation margin | — | 27,625 | 1,644 | 904,222 | ||||||||||||
Payable to affiliate | 215,773 | 27,329 | — | 407,905 | ||||||||||||
Mortgage dollar roll deferred revenue | — | — | — | 49,363 | ||||||||||||
Total Liabilities | 59,646,597 | 2,126,968 | 38,047 | 138,826,292 | ||||||||||||
Net Assets | ||||||||||||||||
Capital stock (beneficial interest) | 1,739,873,478 | 113,121,723 | 6,808,723 | 1,338,910,817 | ||||||||||||
Accumulated undistributed net investment income/(loss) | 716,482 | �� | 5,941,252 | (359 | ) | 657,301 | ||||||||||
Accumulated undistributed net realized gain/(loss) | (933,463,657 | ) | (22,317,809 | ) | 243,136 | (51,893,262 | ) | |||||||||
Net unrealized appreciation/(depreciation) on: | ||||||||||||||||
Investments | (208,725,093 | ) | (21,822,532 | ) | (203,414 | ) | (180,157,172 | ) | ||||||||
Futures contracts | — | 82,487 | (31,755 | ) | (5,149,103 | ) | ||||||||||
Swap agreements | (1,181,418 | ) | — | — | (5,265,553 | ) | ||||||||||
Total Net Assets | $ | 597,219,792 | $ | 75,005,121 | $ | 6,816,331 | $ | 1,097,103,028 | ||||||||
Shares of beneficial interest outstanding | 171,748,685 | 14,969,822 | 680,577 | 133,826,878 | ||||||||||||
Net asset value per share | $ | 3.48 | $ | 5.01 | $ | 10.02 | $ | 8.20 | ||||||||
The accompanying Notes to Financial Statements are an integral part of this schedule.
260
Table of Contents
Thrivent Series Fund, Inc.
Statement of Assets and Liabilities - continued
| Bond Index Portfolio | Limited Maturity Bond Portfolio | Mortgage Securities Portfolio | Money Market Portfolio | |||||||||||
| $ | 258,439,708 | $ | 1,133,729,650 | $ | 58,427,654 | $ | 685,392,599 | |||||||
| 216,841,991 | 932,173,633 | 53,553,159 | 685,392,599 | |||||||||||
| 29,759,438 | 106,372,904 | 896 | — | |||||||||||
| 246,601,429 | 1,038,546,537 | 53,554,055 | 685,392,599 | a | ||||||||||
| 745 | 759 | 2,016,929 | 554 | |||||||||||
| 1,342,016 | 7,027,629 | 76,554 | 1,128,216 | |||||||||||
| 1,122 | 2,296 | 867 | 103,847 | |||||||||||
| — | 3,090,365 | 1,605,547 | — | |||||||||||
| 1,329 | 18,873 | 250 | 7,852,414 | |||||||||||
| — | 956,416 | — | — | |||||||||||
| — | — | — | — | |||||||||||
| — | 1,583,909 | — | — | |||||||||||
| 247,946,641 | 1,051,226,784 | 57,254,202 | 694,477,630 | |||||||||||
| — | 4,885 | — | 7 | |||||||||||
| 25,586 | 47,588 | 12,437 | 40,250 | |||||||||||
| 55,991,274 | 14,372,188 | 22,003,516 | — | |||||||||||
| 17,005,159 | 105,038,013 | — | — | |||||||||||
| 172,944 | 94,722 | 34,250 | 10,785,403 | |||||||||||
| — | 5,366,023 | — | — | |||||||||||
| — | — | 7,734 | — | |||||||||||
| 55,427 | 354,524 | 16,946 | 205,443 | |||||||||||
| 47,231 | 9,321 | 12,562 | — | |||||||||||
| 73,297,621 | 125,287,264 | 22,087,445 | 11,031,103 | |||||||||||
| 190,528,522 | 1,050,146,749 | 40,930,467 | 683,446,527 | |||||||||||
| 7,557 | 218,540 | (1 | ) | 34,344 | ||||||||||
| (4,048,780 | ) | (20,521,470 | ) | (924,626 | ) | (34,344 | ) | |||||||
| (11,838,279 | ) | (95,183,113 | ) | (4,873,599 | ) | — | ||||||||
| — | (6,663,348 | ) | 34,516 | — | ||||||||||
| — | (2,057,838 | ) | — | — | ||||||||||
| $ | 174,649,020 | $ | 925,939,520 | $ | 35,166,757 | $ | 683,446,527 | |||||||
| 17,971,340 | 105,310,361 | 3,985,569 | 683,446,527 | |||||||||||
| $ | 9.72 | $ | 8.79 | $ | 8.82 | $ | 1.00 | |||||||
a | Securities held by this fund are valued on the basis of amortized cost, which approximates market value. |
The accompanying Notes to Financial Statements are an integral part of this schedule.
261
Table of Contents
Statement of Operations
For the year ended December 31, 2008 | Aggressive Allocation Portfolio | Moderately Aggressive Allocation Portfolio | Moderate Allocation Portfolio | Moderately Conservative Allocation Portfolio | ||||||||||||
Investment Income | ||||||||||||||||
Dividends | $ | — | $ | — | $ | — | $ | — | ||||||||
Interest | 6,422 | 333,489 | 762,851 | 410,747 | ||||||||||||
Income from securities loaned | — | — | — | — | ||||||||||||
Income from affiliated investments | 11,814,900 | 58,003,103 | 85,794,428 | 33,519,866 | ||||||||||||
Foreign dividend tax withholding | — | — | — | — | ||||||||||||
Total Investment Income | 11,821,322 | 58,336,592 | 86,557,279 | 33,930,613 | ||||||||||||
Expenses | ||||||||||||||||
Adviser fees | 670,907 | 2,190,139 | 2,778,658 | 1,119,071 | ||||||||||||
Sub-Adviser fees | — | — | — | — | ||||||||||||
Accounting and pricing fees | 27,996 | 53,103 | 61,095 | 32,103 | ||||||||||||
Administrative service fees | 134,274 | 495,633 | 636,878 | 238,577 | ||||||||||||
Audit and legal fees | 19,984 | 39,650 | 45,533 | 23,957 | ||||||||||||
Custody fees | 6,498 | 7,916 | 10,638 | 7,683 | ||||||||||||
Insurance expenses | 6,077 | 13,145 | 15,657 | 7,804 | ||||||||||||
Printing and postage expenses | 850 | 3,249 | 4,258 | 1,616 | ||||||||||||
Directors’ fees | 1,676 | 1,676 | 1,675 | 1,675 | ||||||||||||
Other expenses | 6,388 | 7,366 | 7,614 | 6,613 | ||||||||||||
Total Expenses Before Reimbursement | 874,650 | 2,811,877 | 3,562,006 | 1,439,099 | ||||||||||||
Less: | ||||||||||||||||
Reimbursement from adviser | — | — | — | — | ||||||||||||
Custody earnings credit | (201 | ) | (101 | ) | (181 | ) | (214 | ) | ||||||||
Total Net Expenses | 874,449 | 2,811,776 | 3,561,825 | 1,438,885 | ||||||||||||
Net Investment Income/(Loss) | 10,946,873 | 55,524,816 | 82,995,454 | 32,491,728 | ||||||||||||
Realized and Unrealized Gains/(Losses) | ||||||||||||||||
Net realized gains/(losses) on: | ||||||||||||||||
Investments | — | (10 | ) | (232 | ) | (120 | ) | |||||||||
Affiliated investments | (26,376,358 | ) | (88,841,351 | ) | (90,342,881 | ) | (19,128,113 | ) | ||||||||
Distributions of realized capital gains from affiliated investments | 33,937,272 | 99,294,239 | 89,939,873 | 21,565,839 | ||||||||||||
Futures contracts | (817,731 | ) | (6,952,494 | ) | (13,940,546 | ) | (6,366,794 | ) | ||||||||
Foreign currency transactions | — | — | — | — | ||||||||||||
Change in net unrealized appreciation/(depreciation) on: | ||||||||||||||||
Investments | — | (1,958,256 | ) | (4,505,573 | ) | (2,465,531 | ) | |||||||||
Affiliated investments | (218,530,580 | ) | (712,107,044 | ) | (745,998,988 | ) | (210,379,312 | ) | ||||||||
Futures contracts | 668,975 | 3,785,056 | 6,249,875 | 1,531,482 | ||||||||||||
Foreign currency forward contracts | — | — | — | — | ||||||||||||
Foreign currency transactions | — | — | — | — | ||||||||||||
Net Realized and Unrealized Gains/(Losses) | (211,118,422 | ) | (706,779,860 | ) | (758,598,472 | ) | (215,242,549 | ) | ||||||||
Net Increase/(Decrease) in Net Assets Resulting From Operations | $ | (200,171,549 | ) | $ | (651,255,044 | ) | $ | (675,603,018 | ) | $ | (182,750,821 | ) | ||||
The accompanying Notes to Financial Statements are an integral part of this schedule.
262
Table of Contents
Thrivent Series Fund, Inc.
Statement of Operations - continued
Technology | Partner Healthcare Portfolio(a) | Partner Natural Resources Portfolio(a) | Partner Emerging Markets Portfolio(a) | Real Estate Securities Portfolio | Partner Utilities Portfolio(a) | Partner Small Cap Growth Portfolio | ||||||||||||||||||||
| $ | 161,535 | $ | 45,801 | $ | 51,162 | $ | 142,613 | $ | 9,896,673 | $ | 98,573 | $ | 752,752 | |||||||||||||
| 40 | 1,048 | 7,028 | 3,232 | 192,075 | 1,407 | 35,090 | ||||||||||||||||||||
| 143,563 | — | — | — | 731,956 | — | 688,096 | ||||||||||||||||||||
| 60,733 | 2,998 | 8,955 | 1,821 | 258,695 | 4,125 | 172,005 | ||||||||||||||||||||
| (553 | ) | (563 | ) | (2,526 | ) | (10,436 | ) | (23,696 | ) | (3,202 | ) | (19,079 | ) | |||||||||||||
| 365,318 | 49,284 | 64,619 | 137,230 | 11,055,703 | 100,903 | 1,628,864 | ||||||||||||||||||||
| 312,020 | 11,340 | 13,593 | 18,643 | 2,464,754 | 8,741 | 726,977 | ||||||||||||||||||||
| — | 24,571 | 20,390 | 42,765 | — | 13,111 | 812,815 | ||||||||||||||||||||
| 19,080 | 16,146 | 17,956 | 24,505 | 34,342 | 17,635 | 26,601 | ||||||||||||||||||||
| 12,481 | 1,134 | 1,359 | 1,535 | 92,428 | 874 | 46,194 | ||||||||||||||||||||
| 13,236 | 12,783 | 12,657 | 18,839 | 17,584 | 12,657 | 15,162 | ||||||||||||||||||||
| 10,135 | 5,841 | 9,047 | 22,664 | 19,231 | 4,592 | 39,564 | ||||||||||||||||||||
| 3,626 | 2,157 | 2,157 | 2,177 | 5,502 | 2,157 | 4,242 | ||||||||||||||||||||
| 69 | 9 | 12 | 13 | 575 | 7 | 302 | ||||||||||||||||||||
| 893 | 2,136 | 2,135 | 2,135 | 6,284 | 2,137 | 5,778 | ||||||||||||||||||||
| 6,588 | 4,485 | 5,838 | 4,174 | 10,946 | 5,626 | 7,214 | ||||||||||||||||||||
| 378,128 | 80,602 | 85,144 | 137,450 | 2,651,646 | 67,537 | 1,684,849 | ||||||||||||||||||||
| (7,946 | ) | (28,033 | ) | (31,050 | ) | (60,600 | ) | (38,601 | ) | (41,188 | ) | (179,090 | ) | |||||||||||||
| (8 | ) | (25 | ) | (174 | ) | (91 | ) | (108 | ) | (127 | ) | (30 | ) | |||||||||||||
| 370,174 | 52,544 | 53,920 | 76,759 | 2,612,937 | 26,222 | 1,505,729 | ||||||||||||||||||||
| (4,856 | ) | (3,260 | ) | 10,699 | 60,471 | 8,442,766 | 74,681 | 123,135 | ||||||||||||||||||
| (15,256,131 | ) | (130,471 | ) | (76,182 | ) | (332,693 | ) | (6,625,554 | ) | (428,114 | ) | (49,301,148 | ) | |||||||||||||
| — | — | — | — | — | — | — | ||||||||||||||||||||
| — | — | — | — | — | — | — | ||||||||||||||||||||
| 142,875 | — | — | — | (474,598 | ) | — | (2,243,423 | ) | ||||||||||||||||||
| (12,180 | ) | 9,681 | (3,423 | ) | (11,656 | ) | (16,079 | ) | (7,137 | ) | — | |||||||||||||||
| (10,146,791 | ) | (540,328 | ) | (4,285,555 | ) | (3,991,922 | ) | (121,962,416 | ) | (1,124,020 | ) | (32,316,854 | ) | |||||||||||||
| — | — | — | — | — | — | — | ||||||||||||||||||||
| — | — | — | — | — | — | 541,568 | ||||||||||||||||||||
| — | — | (2,272 | ) | — | 1,780 | (55 | ) | — | ||||||||||||||||||
| — | 22 | 1,993 | (143 | ) | (2,019 | ) | (239 | ) | — | |||||||||||||||||
| (25,272,227 | ) | (661,096 | ) | (4,365,439 | ) | (4,336,414 | ) | (129,078,886 | ) | (1,559,565 | ) | (83,319,857 | ) | |||||||||||||
| $ | (25,277,083 | ) | $ | (664,356 | ) | $ | (4,354,740 | ) | $ | (4,275,943 | ) | $ | (120,636,120 | ) | $ | (1,484,884 | ) | $ | (83,196,722 | ) | ||||||
(a) | For the period from April 30, 2008 (inception) through December 31, 2008. |
The accompanying Notes to Financial Statements are an integral part of this schedule.
263
Table of Contents
Thrivent Series Fund, Inc.
Statement of Operations - continued
For the year ended December 31, 2008 | Partner Small Cap Value Portfolio | Small Cap Stock Portfolio | Small Cap Index Portfolio | Mid Cap Growth Portfolio II | ||||||||||||
Investment Income | ||||||||||||||||
Dividends | $ | 2,869,560 | $ | 3,346,084 | $ | 3,477,481 | $ | 186,495 | ||||||||
Interest | 11,387 | 96,765 | 30,969 | 3,607 | ||||||||||||
Income from securities loaned | 584,582 | 1,095,235 | 1,241,878 | 77,691 | ||||||||||||
Income from affiliated investments | 200,603 | 611,359 | 91,700 | 43,392 | ||||||||||||
Foreign dividend tax withholding | — | (1,528 | ) | (1,322 | ) | — | ||||||||||
Total Investment Income | 3,666,132 | 5,147,915 | 4,840,706 | 311,185 | ||||||||||||
Expenses | ||||||||||||||||
Adviser fees | 377,712 | 2,504,916 | 971,320 | 326,081 | ||||||||||||
Sub-Adviser fees | 1,133,137 | — | — | — | ||||||||||||
Accounting and pricing fees | 27,811 | 39,991 | 48,505 | 18,234 | ||||||||||||
Administrative service fees | 56,657 | 110,996 | 85,339 | 10,869 | ||||||||||||
Audit and legal fees | 15,218 | 18,517 | 17,886 | 12,864 | ||||||||||||
Custody fees | 21,194 | 74,198 | 63,785 | 9,484 | ||||||||||||
Insurance expenses | 4,430 | 5,759 | 5,438 | 3,506 | ||||||||||||
Printing and postage expenses | 336 | 660 | 404 | 63 | ||||||||||||
Directors’ fees | 4,957 | 6,252 | (1,143 | ) | 1,475 | |||||||||||
Other expenses | 7,017 | 8,535 | 9,295 | 6,648 | ||||||||||||
Total Expenses Before Reimbursement | 1,648,469 | 2,769,824 | 1,200,829 | 389,224 | ||||||||||||
Less: | ||||||||||||||||
Reimbursement from adviser | (27,933 | ) | (77,641 | ) | (9,930 | ) | (187,555 | ) | ||||||||
Custody earnings credit | (1,607 | ) | (857 | ) | (934 | ) | (1 | ) | ||||||||
Total Net Expenses | 1,618,929 | 2,691,326 | 1,189,965 | 201,668 | ||||||||||||
Net Investment Income/(Loss) | 2,047,203 | 2,456,589 | 3,650,741 | 109,517 | ||||||||||||
Realized and Unrealized Gains/(Losses) | ||||||||||||||||
Net realized gains/(losses) on: | ||||||||||||||||
Investments | 6,100,805 | (124,815,263 | ) | 28,239,452 | (2,172,161 | ) | ||||||||||
Futures contracts | — | 468,068 | (1,964,086 | ) | (103,144 | ) | ||||||||||
Foreign currency transactions | — | — | — | — | ||||||||||||
Change in net unrealized appreciation/(depreciation) on: | ||||||||||||||||
Investments | (72,429,819 | ) | (47,846,509 | ) | (125,317,648 | ) | (21,214,625 | ) | ||||||||
Futures contracts | — | — | 49,846 | — | ||||||||||||
Foreign currency forward contracts | — | — | — | — | ||||||||||||
Foreign currency transactions | — | — | — | — | ||||||||||||
Net Realized and Unrealized Gains/(Losses) | (66,329,014 | ) | (172,193,704 | ) | (98,992,436 | ) | (23,489,930 | ) | ||||||||
Net Increase/(Decrease) in Net Assets Resulting From Operations | $ | (64,281,811 | ) | $ | (169,737,115 | ) | $ | (95,341,695 | ) | $ | (23,380,413 | ) | ||||
The accompanying Notes to Financial Statements are an integral part of this schedule.
264
Table of Contents
Thrivent Series Fund, Inc.
Statement of Operations - continued
| Mid Cap Growth Portfolio | Partner Mid Cap Value Portfolio | Mid Cap Stock Portfolio | Mid Cap Index Portfolio | Partner Worldwide Allocation Portfolio(a) | Partner International Stock Portfolio | Partner Socially Responsible Stock Portfolio(a) | ||||||||||||||||||||
| $ | 3,295,442 | $ | 2,360,277 | $ | 5,064,362 | $ | 1,698,332 | $ | 1,369,952 | $ | 40,384,409 | $ | 34,057 | |||||||||||||
| 20,408 | 10,788 | 79,255 | 7,602 | 501,377 | 389,894 | 1,129 | ||||||||||||||||||||
| 1,029,240 | 79,108 | 597,425 | 300,440 | — | 1,612,504 | — | ||||||||||||||||||||
| 684,004 | 167,926 | 517,839 | 40,055 | 70,067 | 548,457 | 1,591 | ||||||||||||||||||||
| — | (79 | ) | (217 | ) | — | (123,262 | ) | (3,826,591 | ) | (350 | ) | |||||||||||||||
| 5,029,094 | 2,618,020 | 6,258,664 | 2,046,429 | 1,818,134 | 39,108,673 | 36,427 | ||||||||||||||||||||
| 2,067,746 | 292,807 | 2,757,835 | 401,742 | 225,900 | 5,518,384 | 8,555 | ||||||||||||||||||||
| — | 583,696 | — | — | 288,088 | 3,976,378 | 14,258 | ||||||||||||||||||||
| 56,663 | 21,425 | 33,385 | 29,409 | 49,553 | 121,027 | 15,796 | ||||||||||||||||||||
| 155,081 | 35,060 | 122,669 | 34,435 | 17,133 | 351,007 | 856 | ||||||||||||||||||||
| 22,672 | 12,566 | 18,331 | 14,616 | 20,243 | 34,700 | 12,657 | ||||||||||||||||||||
| 21,844 | 39,502 | 39,810 | 38,391 | 105,616 | 315,817 | 2,111 | ||||||||||||||||||||
| 6,915 | 3,859 | 5,623 | 4,164 | 2,546 | 11,606 | 2,157 | ||||||||||||||||||||
| 878 | 229 | 760 | 175 | 137 | 1,970 | 7 | ||||||||||||||||||||
| 5,836 | 2,490 | 8,504 | (1,081 | ) | 2,137 | 17,963 | 2,137 | |||||||||||||||||||
| 9,572 | 6,569 | 8,056 | 7,679 | 4,290 | 11,971 | 4,304 | ||||||||||||||||||||
| 2,347,207 | 998,203 | 2,994,973 | 529,530 | 715,643 | 10,360,823 | 62,838 | ||||||||||||||||||||
| (88,872 | ) | (24,570 | ) | (68,187 | ) | (5,014 | ) | (143,744 | ) | (922,548 | ) | (34,882 | ) | |||||||||||||
| (17 | ) | (96 | ) | (114 | ) | (512 | ) | (800 | ) | (495 | ) | (10 | ) | |||||||||||||
| 2,258,318 | 973,537 | 2,926,672 | 524,004 | 571,099 | 9,437,780 | 27,946 | ||||||||||||||||||||
| 2,770,776 | 1,644,483 | 3,331,992 | 1,522,425 | 1,247,035 | 29,670,893 | 8,481 | ||||||||||||||||||||
| (38,138,585 | ) | (26,491,608 | ) | (110,131,447 | ) | 5,616,919 | (13,524,029 | ) | (164,851,925 | ) | (280,513 | ) | ||||||||||||||
| 1,188,579 | — | — | (1,182,415 | ) | (401,531 | ) | — | — | ||||||||||||||||||
| — | — | — | — | (216,364 | ) | (1,158,206 | ) | — | ||||||||||||||||||
| (216,054,842 | ) | (37,787,729 | ) | (127,005,637 | ) | (52,956,783 | ) | (22,905,434 | ) | (442,842,983 | ) | (1,470,627 | ) | |||||||||||||
| — | — | — | 80,528 | 147,633 | — | — | ||||||||||||||||||||
| — | — | — | — | 9,213 | 46,752 | — | ||||||||||||||||||||
| — | — | — | — | (2,784 | ) | (64,031 | ) | — | ||||||||||||||||||
| (253,004,848 | ) | (64,279,337 | ) | (237,137,084 | ) | (48,441,751 | ) | (36,893,296 | ) | (608,870,393 | ) | (1,751,140 | ) | |||||||||||||
| $ | (250,234,072 | ) | $ | (62,634,854 | ) | $ | (233,805,092 | ) | $ | (46,919,326 | ) | $ | (35,646,261 | ) | $ | (579,199,500 | ) | $ | (1,742,659 | ) | ||||||
(a) | For the period from April 30, 2008 (inception) through December 31, 2008. |
The accompanying Notes to Financial Statements are an integral part of this schedule.
265
Table of Contents
Thrivent Series Fund, Inc.
Statement of Operations - continued
For the year ended December 31, 2008 | Partner All Cap Growth Portfolio(a) | Partner All Cap Value Portfolio(a) | Partner All Cap Portfolio | Large Cap Growth Portfolio II | ||||||||||||
Investment Income | ||||||||||||||||
Dividends | $ | 19,639 | $ | 60,820 | $ | 1,421,730 | $ | 541,018 | ||||||||
Interest | 1,186 | 973 | 114 | — | ||||||||||||
Income from mortgage dollar rolls | — | — | — | — | ||||||||||||
Income from securities loaned | — | — | 53,183 | 2,298 | ||||||||||||
Income from affiliated investments | 1,541 | 900 | 33,283 | 21,900 | ||||||||||||
Foreign dividend tax withholding | (542 | ) | (307 | ) | — | (24,719 | ) | |||||||||
Total Investment Income | 21,824 | 62,386 | 1,508,310 | 540,497 | ||||||||||||
Expenses | ||||||||||||||||
Adviser fees | 7,653 | 7,748 | 311,153 | 284,529 | ||||||||||||
Sub-Adviser fees | 16,581 | 11,621 | 530,411 | — | ||||||||||||
Accounting and pricing fees | 16,091 | 15,831 | 21,287 | 18,202 | ||||||||||||
Administrative service fees | 765 | 775 | 26,576 | 10,670 | ||||||||||||
Audit and legal fees | 12,657 | 12,931 | 14,169 | 12,887 | ||||||||||||
Custody fees | 4,967 | 14,693 | 29,355 | 28,807 | ||||||||||||
Insurance expenses | 2,156 | 2,156 | 3,950 | 3,519 | ||||||||||||
Printing and postage expenses | 7 | 7 | 156 | 40 | ||||||||||||
Directors’ fees | 2,135 | 2,135 | 1,409 | 1,456 | ||||||||||||
Other expenses | 4,610 | 4,752 | 6,737 | 6,762 | ||||||||||||
Total Expenses Before Reimbursement | 67,622 | 72,649 | 945,203 | 366,872 | ||||||||||||
Less: | ||||||||||||||||
Reimbursement from adviser | (42,107 | ) | (47,331 | ) | (181,591 | ) | (145,626 | ) | ||||||||
Custody earnings credit | (6 | ) | (9 | ) | (1 | ) | (4 | ) | ||||||||
Total Net Expenses | 25,509 | 25,309 | 763,611 | 221,242 | ||||||||||||
Net Investment Income/(Loss) | (3,685 | ) | 37,077 | 744,699 | 319,255 | |||||||||||
Realized and Unrealized Gains/(Losses) | ||||||||||||||||
Net realized gains/(losses) on: | ||||||||||||||||
Investments | (813,990 | ) | (1,158,374 | ) | (22,629,783 | ) | (2,763,096 | ) | ||||||||
Written option contracts | — | — | — | 5,331 | ||||||||||||
Futures contracts | — | — | — | — | ||||||||||||
Foreign currency transactions | — | (78 | ) | — | — | |||||||||||
Change in net unrealized appreciation/(depreciation) on: | ||||||||||||||||
Investments | (1,421,880 | ) | (997,736 | ) | (25,229,107 | ) | (11,416,754 | ) | ||||||||
Written option contracts | — | — | — | (160 | ) | |||||||||||
Futures contracts | — | — | — | — | ||||||||||||
Foreign currency transactions | — | — | — | — | ||||||||||||
Net Realized and Unrealized Gains/(Losses) | (2,235,870 | ) | (2,156,188 | ) | (47,858,890 | ) | (14,174,679 | ) | ||||||||
Net Increase/(Decrease) in Net Assets Resulting | $ | (2,239,555 | ) | $ | (2,119,111 | ) | $ | (47,114,191 | ) | $ | (13,855,424 | ) | ||||
(a) | For the period from April 30, 2008 (inception) through December 31, 2008. |
The accompanying Notes to Financial Statements are an integral part of this schedule.
266
Table of Contents
Thrivent Series Fund, Inc.
Statement of Operations - continued
| Large Cap Growth Portfolio | Partner Growth Stock Portfolio | Large Cap Value Portfolio | Large Cap Stock Portfolio | Large Cap Index Portfolio | Equity Income Plus Portfolio(a) | Balanced Portfolio | ||||||||||||||||||||
| $ | 20,260,148 | $ | 952,077 | $ | 23,554,057 | $ | 15,861,893 | $ | 10,966,358 | $ | 960,755 | $ | 5,761,647 | |||||||||||||
| 341,964 | 65 | 156,366 | 190,503 | 36,429 | 88,047 | 5,564,454 | ||||||||||||||||||||
| — | — | — | — | — | — | 888,958 | ||||||||||||||||||||
| 1,318,497 | 40,601 | 754,848 | 515,419 | 316,804 | — | 383,942 | ||||||||||||||||||||
| 521,781 | 40,274 | 391,845 | 521,263 | 164,096 | 70,993 | 570,950 | ||||||||||||||||||||
| (267,246 | ) | (34,249 | ) | (214,480 | ) | (154,109 | ) | — | (6,931 | ) | — | |||||||||||||||
| 22,175,144 | 998,768 | 24,642,636 | 16,934,969 | 11,483,687 | 1,112,864 | 13,169,951 | ||||||||||||||||||||
| 7,519,677 | 345,509 | 5,271,301 | 5,030,806 | 1,553,315 | 203,210 | 1,292,500 | ||||||||||||||||||||
| — | 345,509 | — | — | — | — | — | ||||||||||||||||||||
| 146,606 | 24,076 | 52,442 | 56,928 | 61,460 | 12,421 | 71,891 | ||||||||||||||||||||
| 563,976 | 25,913 | 263,565 | 244,781 | 144,266 | 9,379 | 116,750 | ||||||||||||||||||||
| 51,634 | 14,181 | 27,794 | 28,645 | 22,131 | 12,931 | 19,899 | ||||||||||||||||||||
| 81,783 | 31,390 | 27,994 | 54,652 | 60,056 | 15,859 | 64,807 | ||||||||||||||||||||
| 17,015 | 3,963 | 8,927 | 9,056 | 6,889 | 2,158 | 6,154 | ||||||||||||||||||||
| 3,227 | 136 | 1,595 | 1,443 | 715 | 80 | 601 | ||||||||||||||||||||
| 9,956 | 714 | 17,492 | 14,265 | (4,860 | ) | 2,135 | (5,884 | ) | ||||||||||||||||||
| 16,534 | 6,693 | 10,171 | 10,470 | 10,219 | 4,764 | 9,589 | ||||||||||||||||||||
| 8,410,408 | 798,084 | 5,681,281 | 5,451,046 | 1,854,191 | 262,937 | 1,576,307 | ||||||||||||||||||||
| (66,316 | ) | (92,173 | ) | (50,631 | ) | (70,630 | ) | (16,708 | ) | (11,430 | ) | (66,887 | ) | |||||||||||||
| (444 | ) | (16 | ) | (99 | ) | (182 | ) | (314 | ) | (593 | ) | (413 | ) | |||||||||||||
| 8,343,648 | 705,895 | 5,630,551 | 5,380,234 | 1,837,169 | 250,914 | 1,509,007 | ||||||||||||||||||||
| 13,831,496 | 292,873 | 19,012,085 | 11,554,735 | 9,646,518 | 861,950 | 11,660,944 | ||||||||||||||||||||
| (301,816,808 | ) | (6,535,953 | ) | (79,374,035 | ) | (129,944,857 | ) | 9,184,261 | (7,406,892 | ) | 9,297,046 | |||||||||||||||
| 684,223 | — | — | 221,540 | — | 325,189 | — | ||||||||||||||||||||
| 2,982,700 | — | — | 386,459 | (3,637,026 | ) | (2,726,699 | ) | (3,305,318 | ) | |||||||||||||||||
| — | (108,121 | ) | — | — | — | — | — | |||||||||||||||||||
| (635,119,774 | ) | (36,888,032 | ) | (293,816,484 | ) | (226,249,110 | ) | (224,016,728 | ) | (8,336,340 | ) | (129,735,343 | ) | |||||||||||||
| (9,700 | ) | — | — | — | — | 1,488 | — | |||||||||||||||||||
| — | — | — | 170,635 | 55,665 | 134,419 | 74,600 | ||||||||||||||||||||
| — | (628 | ) | — | — | — | — | — | |||||||||||||||||||
| (933,279,359 | ) | (43,532,734 | ) | (373,190,519 | ) | (355,415,333 | ) | (218,413,828 | ) | (18,008,835 | ) | (123,669,015 | ) | |||||||||||||
| $ | (919,447,863 | ) | $ | (43,239,861 | ) | $ | (354,178,434 | ) | $ | (343,860,598 | ) | $ | (208,767,310 | ) | $ | (17,146,885 | ) | $ | (112,008,071 | ) | ||||||
The accompanying Notes to Financial Statements are an integral part of this schedule.
267
Table of Contents
Thrivent Series Fund, Inc.
Statement of Operations - continued
For the year ended December 31, 2008 | High Yield Portfolio | Diversified Income Plus Portfolio | Partner Socially Responsible Bond Portfolio(a) | Income Portfolio | ||||||||||||
Investment Income | ||||||||||||||||
Dividends | $ | 838,759 | $ | 1,247,475 | $ | — | $ | 368,939 | ||||||||
Interest | 64,834,917 | 5,050,516 | 208,317 | 73,731,194 | ||||||||||||
Income from mortgage dollar rolls | — | 38,663 | — | 2,709,388 | ||||||||||||
Income from securities loaned | 496,727 | 41,374 | — | 714,363 | ||||||||||||
Income from affiliated investments | 954,482 | 127,621 | 2,876 | 842,526 | ||||||||||||
Foreign dividend tax withholding | — | (5,190 | ) | — | — | |||||||||||
Total Investment Income | 67,124,885 | 6,500,459 | 211,193 | 78,366,410 | ||||||||||||
Expenses | ||||||||||||||||
Adviser fees | 2,962,552 | 425,419 | 13,830 | 5,179,221 | ||||||||||||
Sub-Adviser fees | — | — | 18,440 | — | ||||||||||||
Accounting and pricing fees | 82,089 | 45,309 | 17,199 | 97,254 | ||||||||||||
Administrative service fees | 222,191 | 31,906 | 1,383 | 388,442 | ||||||||||||
Audit and legal fees | 24,287 | 14,436 | 12,687 | 35,882 | ||||||||||||
Custody fees | 27,815 | 26,476 | 5,470 | 59,670 | ||||||||||||
Insurance expenses | 8,127 | 4,085 | 2,164 | 11,468 | ||||||||||||
Printing and postage expenses | 1,406 | 163 | 11 | 2,255 | ||||||||||||
Directors’ fees | 9,786 | 47 | 2,136 | 21,842 | ||||||||||||
Other expenses | 8,242 | 7,518 | 3,370 | 9,855 | ||||||||||||
Total Expenses Before Reimbursement | 3,346,495 | 555,359 | 76,690 | 5,805,889 | ||||||||||||
Less: | ||||||||||||||||
Reimbursement from adviser | (126,240 | ) | (18,239 | ) | (45,335 | ) | (116,712 | ) | ||||||||
Custody earnings credit | (2,738 | ) | (324 | ) | (8 | ) | (848 | ) | ||||||||
Total Net Expenses | 3,217,517 | 536,796 | 31,347 | 5,688,329 | ||||||||||||
Net Investment Income/(Loss) | 63,907,368 | 5,963,663 | 179,846 | 72,678,081 | ||||||||||||
Realized and Unrealized Gains/(Losses) | ||||||||||||||||
Net realized gains/(losses) on: | ||||||||||||||||
Investments | (47,043,161 | ) | (14,393,050 | ) | (28,466 | ) | (41,058,432 | ) | ||||||||
Net increase from payments by affiliates | — | — | — | — | ||||||||||||
Written option contracts | — | 7,188 | — | 107,813 | ||||||||||||
Futures contracts | 185,183 | (6,733 | ) | 262,727 | (2,797,518 | ) | ||||||||||
Swap agreements | (3,408,936 | ) | (148,919 | ) | — | 1,790,831 | ||||||||||
Change in net unrealized appreciation/(depreciation) on: | ||||||||||||||||
Investments | (180,479,456 | ) | (16,986,147 | ) | (203,414 | ) | (163,941,472 | ) | ||||||||
Written option contracts | — | — | — | (18,992 | ) | |||||||||||
Futures contracts | — | 56,087 | (31,755 | ) | (5,887,084 | ) | ||||||||||
Swap agreements | (662,476 | ) | 45,482 | — | (5,181,498 | ) | ||||||||||
Net Realized and Unrealized Gains/(Losses) | (231,408,846 | ) | (31,426,092 | ) | (908 | ) | (216,986,352 | ) | ||||||||
Net Increase/(Decrease) in Net Assets Resulting | $ | (167,501,478 | ) | $ | (25,462,429 | ) | $ | 178,938 | $ | (144,308,271 | ) | |||||
(a) | For the period from April 30, 2008 (inception) through December 31, 2008. |
The accompanying Notes to Financial Statements are an integral part of this schedule.
268
Table of Contents
Thrivent Series Fund, Inc.
Statement of Operations - continued
| Bond Index Portfolio | Limited Maturity Bond Portfolio | Mortgage Securities Portfolio | Money Market Portfolio | |||||||||||
| $ | — | $ | 542,014 | $ | — | $ | 738,685 | |||||||
| 7,923,747 | 44,984,720 | 1,593,838 | 24,175,773 | |||||||||||
| 1,430,752 | 1,092,052 | 687,686 | — | |||||||||||
| 453,599 | 980,360 | — | — | |||||||||||
| 635,831 | 833,162 | 26 | — | |||||||||||
| — | — | — | — | |||||||||||
| 10,443,929 | 48,432,308 | 2,281,550 | 24,914,458 | |||||||||||
| 700,783 | 3,972,302 | 213,475 | 3,032,512 | |||||||||||
| — | — | — | — | |||||||||||
| 47,088 | 65,447 | 24,541 | 51,145 | |||||||||||
| 60,067 | 297,923 | 12,809 | 227,438 | |||||||||||
| 15,680 | 29,048 | 13,131 | 23,251 | |||||||||||
| 16,701 | 38,647 | 14,090 | 27,023 | |||||||||||
| 4,684 | 9,017 | 3,639 | 93,582 | |||||||||||
| 334 | 1,930 | 65 | 1,367 | |||||||||||
| 1,148 | 21,297 | 1,307 | 15,057 | |||||||||||
| 5,635 | 8,055 | 5,034 | 7,687 | |||||||||||
| 852,120 | 4,443,666 | 288,091 | 3,479,062 | |||||||||||
| (74,138 | ) | (109,741 | ) | (4 | ) | (758,128 | ) | |||||||
| (423 | ) | (1,390 | ) | (551 | ) | (460 | ) | |||||||
| 777,559 | 4,332,535 | 287,536 | 2,720,474 | |||||||||||
| 9,666,370 | 44,099,773 | 1,994,014 | 22,193,984 | |||||||||||
| 1,649,536 | 1,218,028 | 786,501 | (3,280,902 | ) | ||||||||||
| — | — | — | 3,250,000 | |||||||||||
| — | (2,569,449 | ) | (6,217 | ) | — | |||||||||
| — | (12,123,478 | ) | 138,873 | — | ||||||||||
| — | 1,541,796 | — | — | |||||||||||
| (13,481,529 | ) | (89,389,147 | ) | (4,970,614 | ) | — | ||||||||
| — | — | (19,750 | ) | — | ||||||||||
| — | (6,200,872 | ) | 15,202 | — | ||||||||||
| — | (3,073,327 | ) | — | — | ||||||||||
| (11,831,993 | ) | (110,596,449 | ) | (4,056,005 | ) | (30,902 | ) | |||||||
| $ | (2,165,623 | ) | $ | (66,496,676 | ) | $ | (2,061,991 | ) | $ | 22,163,082 | ||||
The accompanying Notes to Financial Statements are an integral part of this schedule.
269
Table of Contents
Statement of Changes in Net Assets
| Aggressive Allocation Portfolio | Moderately Aggressive Allocation Portfolio | |||||||||||||||
For the periods ended | 12/31/2008 | 12/31/2007 | 12/31/2008 | 12/31/2007 | ||||||||||||
Operations | ||||||||||||||||
Net investment income/(loss) | $ | 10,946,873 | $ | 5,046,855 | $ | 55,524,816 | $ | 27,359,595 | ||||||||
Net realized gains/(losses) | 6,743,183 | 13,529,118 | 3,500,384 | 40,075,979 | ||||||||||||
Change in net unrealized appreciation/(depreciation) | (217,861,605 | ) | 16,297,862 | (710,280,244 | ) | 28,688,911 | ||||||||||
Net Change in Net Assets Resulting From Operations | (200,171,549 | ) | 34,873,835 | (651,255,044 | ) | 96,124,485 | ||||||||||
Distributions to Shareholders | ||||||||||||||||
From net investment income | (6,895,956 | ) | (2,527,875 | ) | (33,855,722 | ) | (11,999,419 | ) | ||||||||
From net realized gains | (11,712,072 | ) | (1,708,150 | ) | (33,582,044 | ) | (5,496,139 | ) | ||||||||
Total Distributions to Shareholders | (18,608,028 | ) | (4,236,025 | ) | (67,437,766 | ) | (17,495,558 | ) | ||||||||
Capital Stock Transactions | ||||||||||||||||
Sold | 96,905,699 | 155,305,591 | 305,758,512 | 651,007,278 | ||||||||||||
Distributions reinvested | 18,608,028 | 4,236,025 | 67,437,766 | 17,495,558 | ||||||||||||
Redeemed | (38,848,508 | ) | (27,375,563 | ) | (80,759,724 | ) | (30,130,863 | ) | ||||||||
Capital Stock Transactions | 76,665,219 | 132,166,053 | 292,436,554 | 638,371,973 | ||||||||||||
Net Increase/(Decrease) in Net Assets | (142,114,358 | ) | 162,803,863 | (426,256,256 | ) | 717,000,900 | ||||||||||
Net Assets, Beginning of Period | 496,424,278 | 333,620,415 | 1,780,821,372 | 1,063,820,472 | ||||||||||||
Net Assets, End of Period | $ | 354,309,920 | $ | 496,424,278 | $ | 1,354,565,116 | $ | 1,780,821,372 | ||||||||
Accumulated undistributed net investment income/(loss) | $ | 18,195,152 | $ | 6,892,200 | $ | 78,086,145 | $ | 33,851,966 | ||||||||
Capital Stock Share Transactions | ||||||||||||||||
Sold | 8,287,460 | 11,263,297 | 26,380,154 | 49,054,322 | ||||||||||||
Distributions reinvested | 1,517,412 | 298,960 | 5,684,906 | 1,291,185 | ||||||||||||
Redeemed | (3,386,481 | ) | (1,965,843 | ) | (7,372,833 | ) | (2,253,776 | ) | ||||||||
Total Capital Stock Share Transactions | 6,418,391 | 9,596,414 | 24,692,227 | 48,091,731 | ||||||||||||
The accompanying Notes to Financial Statements are an integral part of this schedule.
270
Table of Contents
Thrivent Series Fund, Inc.
Statement of Changes in Net Assets - continued
| Moderate Allocation Portfolio | Moderately Conservative Allocation Portfolio | Technology Portfolio | Partner Healthcare Portfolio | Partner Natural Resources Portfolio | ||||||||||||||||||||||||||
| 12/31/2008 | 12/31/2007 | 12/31/2008 | 12/31/2007 | 12/31/2008 | 12/31/2007 | 12/31/2008(a) | 12/31/2008(a) | |||||||||||||||||||||||
| $ | 82,995,454 | $ | 46,928,201 | $ | 32,491,728 | $ | 19,986,617 | $ | (4,856 | ) | $ | (74,408 | ) | $ | (3,260 | ) | $ | 10,699 | ||||||||||||
| (14,343,786 | ) | 37,972,142 | (3,929,188 | ) | 8,437,287 | (15,125,436 | ) | 6,988,361 | (120,790 | ) | (79,605 | ) | ||||||||||||||||||
| (744,254,686 | ) | 17,542,705 | (211,313,361 | ) | 1,063,171 | (10,146,791 | ) | (1,643,496 | ) | (540,306 | ) | (4,285,834 | ) | |||||||||||||||||
| (675,603,018 | ) | 102,443,048 | (182,750,821 | ) | 29,487,075 | (25,277,083 | ) | 5,270,457 | (664,356 | ) | (4,354,740 | ) | ||||||||||||||||||
| (52,371,012 | ) | (20,474,750 | ) | (21,495,292 | ) | (9,226,416 | ) | — | — | (5,750 | ) | (8,150 | ) | |||||||||||||||||
| (32,531,242 | ) | (9,193,702 | ) | (6,930,728 | ) | (3,496,569 | ) | (6,532,649 | ) | (1,732,497 | ) | — | — | |||||||||||||||||
| (84,902,254 | ) | (29,668,452 | ) | (28,426,020 | ) | (12,722,985 | ) | (6,532,649 | ) | (1,732,497 | ) | (5,750 | ) | (8,150 | ) | |||||||||||||||
| 441,267,971 | 817,843,870 | 217,799,157 | 316,043,720 | 14,361,328 | 13,700,767 | 13,723,313 | 18,271,675 | |||||||||||||||||||||||
| 84,902,254 | 29,668,452 | 28,426,020 | 12,722,985 | 6,532,649 | 1,732,497 | 5,750 | 8,150 | |||||||||||||||||||||||
| (122,966,627 | ) | (25,462,340 | ) | (77,240,026 | ) | (23,517,461 | ) | (21,405,970 | ) | (15,686,349 | ) | (5,923,559 | ) | (7,322,903 | ) | |||||||||||||||
| 403,203,598 | 822,049,982 | 168,985,151 | 305,249,244 | (511,993 | ) | (253,085 | ) | 7,805,504 | 10,956,922 | |||||||||||||||||||||
| (357,301,674 | ) | 894,824,578 | (42,191,690 | ) | 322,013,334 | (32,321,725 | ) | 3,284,875 | 7,135,398 | 6,594,032 | ||||||||||||||||||||
| 2,168,860,087 | 1,274,035,509 | 756,947,570 | 434,934,236 | 56,638,991 | 53,354,116 | — | — | |||||||||||||||||||||||
| $ | 1,811,558,413 | $ | 2,168,860,087 | $ | 714,755,880 | $ | 756,947,570 | $ | 24,317,266 | $ | 56,638,991 | $ | 7,135,398 | $ | 6,594,032 | |||||||||||||||
| $ | 103,629,794 | $ | 52,367,256 | $ | 36,822,581 | $ | 21,491,535 | $ | (5,298 | ) | $ | (5,692 | ) | $ | 671 | $ | (874 | ) | ||||||||||||
| 38,318,715 | 64,569,209 | 19,393,557 | 26,385,207 | 2,324,976 | 1,644,515 | 1,368,023 | 1,877,037 | |||||||||||||||||||||||
| 7,376,967 | 2,318,790 | 2,556,274 | 1,061,717 | 1,107,867 | 212,077 | 643 | 1,424 | |||||||||||||||||||||||
| (11,781,195 | ) | (1,999,561 | ) | (7,494,597 | ) | (1,960,724 | ) | (3,612,354 | ) | (1,941,831 | ) | (570,951 | ) | (726,539 | ) | |||||||||||||||
| 33,914,487 | 64,888,438 | 14,455,234 | 25,486,200 | (179,511 | ) | (85,239 | ) | 797,715 | 1,151,922 | |||||||||||||||||||||
(a) | For the period from April 30, 2008 (inception) through December 31, 2008. |
The accompanying Notes to Financial Statements are an integral part of this schedule.
271
Table of Contents
Thrivent Series Fund, Inc.
Statement of Changes in Net Assets - continued
| Partner Emerging Markets Portfolio | Real Estate Securities Portfolio | Partner Utilities Portfolio | ||||||||||||||
For the periods ended | 12/31/2008(a) | 12/31/2008 | 12/31/2007 | 12/31/2008(a) | ||||||||||||
Operations | ||||||||||||||||
Net investment income/(loss) | $ | 60,471 | $ | 8,442,766 | $ | 5,641,182 | $ | 74,681 | ||||||||
Net realized gains/(losses) | (344,349 | ) | (7,116,231 | ) | 27,142,782 | (435,251 | ) | |||||||||
Change in net unrealized appreciation/(depreciation) | (3,992,065 | ) | (121,962,655 | ) | (90,531,446 | ) | (1,124,314 | ) | ||||||||
Net Change in Net Assets Resulting From Operations | (4,275,943 | ) | (120,636,120 | ) | (57,747,482 | ) | (1,484,884 | ) | ||||||||
Distributions to Shareholders | ||||||||||||||||
From net investment income | (49,300 | ) | (14,566,225 | ) | (4,518,187 | ) | (70,001 | ) | ||||||||
From net realized gains | — | (28,080,349 | ) | (20,759,334 | ) | — | ||||||||||
From return of capital | — | (5,059,614 | ) | — | — | |||||||||||
Total Distributions to Shareholders | (49,300 | ) | (47,706,188 | ) | (25,277,521 | ) | (70,001 | ) | ||||||||
Capital Stock Transactions | ||||||||||||||||
Sold | 14,221,039 | 69,004,871 | 129,952,520 | 11,290,054 | ||||||||||||
Distributions reinvested | 49,300 | 47,706,188 | 25,277,521 | 70,001 | ||||||||||||
Redeemed | (4,615,831 | ) | (77,375,670 | ) | (113,666,828 | ) | (5,453,119 | ) | ||||||||
Capital Stock Transactions | 9,654,508 | 39,335,389 | 41,563,213 | 5,906,936 | ||||||||||||
Net Increase/(Decrease) in Net Assets | 5,329,265 | (129,006,919 | ) | (41,461,790 | ) | 4,352,051 | ||||||||||
Net Assets, Beginning of Period | — | 326,426,626 | 367,888,416 | — | ||||||||||||
Net Assets, End of Period | $ | 5,329,265 | $ | 197,419,707 | $ | 326,426,626 | $ | 4,352,051 | ||||||||
Accumulated undistributed net investment income/(loss) | $ | (485 | ) | $ | (14,704 | ) | $ | 6,180,400 | $ | (1,143 | ) | |||||
Capital Stock Share Transactions | ||||||||||||||||
Sold | 1,492,935 | 4,166,491 | 6,544,568 | 1,202,982 | ||||||||||||
Distributions reinvested | 8,820 | 3,559,449 | 1,146,586 | 10,101 | ||||||||||||
Redeemed | (548,303 | ) | (4,997,767 | ) | (5,334,208 | ) | (585,102 | ) | ||||||||
Total Capital Stock Share Transactions | 953,452 | 2,728,173 | 2,356,946 | 627,981 | ||||||||||||
(a) | For the period from April 30, 2008 (inception) through December 31, 2008. |
The accompanying Notes to Financial Statements are an integral part of this schedule.
272
Table of Contents
Thrivent Series Fund, Inc.
Statement of Changes in Net Assets - continued
| Partner Small Cap Growth Portfolio | Partner Small Cap Value Portfolio | Small Cap Stock Portfolio | Small Cap Index Portfolio | |||||||||||||||||||||||||||
| 12/31/2008 | 12/31/2007 | 12/31/2008 | 12/31/2007 | 12/31/2008 | 12/31/2007 | 12/31/2008 | 12/31/2007 | |||||||||||||||||||||||
| $ | 123,135 | $ | (442,642 | ) | $ | 2,047,203 | $ | 1,227,541 | $ | 2,456,589 | $ | 2,757,210 | $ | 3,650,741 | $ | 4,150,180 | ||||||||||||||
| (51,544,571 | ) | 10,702,887 | 6,100,805 | 9,538,439 | (124,347,195 | ) | 45,912,085 | 26,275,366 | 58,821,760 | |||||||||||||||||||||
| (31,775,286 | ) | (786,204 | ) | (72,429,819 | ) | (12,594,945 | ) | (47,846,509 | ) | (21,979,231 | ) | (125,267,802 | ) | (61,418,882 | ) | |||||||||||||||
| (83,196,722 | ) | 9,474,041 | (64,281,811 | ) | (1,828,965 | ) | (169,737,115 | ) | 26,690,064 | (95,341,695 | ) | 1,553,058 | ||||||||||||||||||
| (14,000 | ) | — | (2,545,338 | ) | (615,484 | ) | (4,048,322 | ) | (1,255,527 | ) | (3,385,779 | ) | (2,602,454 | ) | ||||||||||||||||
| (10,509,420 | ) | (6,970,287 | ) | (16,838,215 | ) | (8,696,064 | ) | (46,096,464 | ) | (24,156,432 | ) | (58,824,685 | ) | (43,516,538 | ) | |||||||||||||||
| — | — | — | — | — | — | — | — | |||||||||||||||||||||||
| (10,523,420 | ) | (6,970,287 | ) | (19,383,553 | ) | (9,311,548 | ) | (50,144,786 | ) | (25,411,959 | ) | (62,210,464 | ) | (46,118,992 | ) | |||||||||||||||
| 45,652,970 | 66,000,948 | 84,134,259 | 75,075,073 | 103,667,043 | 105,231,025 | 6,966,769 | 11,020,921 | |||||||||||||||||||||||
| 10,523,420 | 6,970,287 | 19,383,553 | 9,311,548 | 50,144,786 | 25,411,959 | 62,210,464 | 46,118,992 | |||||||||||||||||||||||
| (17,565,263 | ) | (15,350,073 | ) | (37,539,486 | ) | (51,250,153 | ) | (45,725,077 | ) | (138,735,421 | ) | (77,326,919 | ) | (94,428,601 | ) | |||||||||||||||
| 38,611,127 | 57,621,162 | 65,978,326 | 33,136,468 | 108,086,752 | (8,092,437 | ) | (8,149,686 | ) | (37,288,688 | ) | ||||||||||||||||||||
| (55,109,015 | ) | 60,124,916 | (17,687,038 | ) | 21,995,955 | (111,795,149 | ) | (6,814,332 | ) | (165,701,845 | ) | (81,854,622 | ) | |||||||||||||||||
| 167,569,937 | 107,445,021 | 185,617,838 | 163,621,883 | 399,854,874 | 406,669,206 | 357,895,466 | 439,750,088 | |||||||||||||||||||||||
| $ | 112,460,922 | $ | 167,569,937 | $ | 167,930,800 | $ | 185,617,838 | $ | 288,059,725 | $ | 399,854,874 | $ | 192,193,621 | $ | 357,895,466 | |||||||||||||||
| $ | 104,760 | $ | (4,375 | ) | $ | 392,994 | $ | 1,237,819 | $ | 571,211 | $ | 2,650,294 | $ | 3,619,275 | $ | 4,127,633 | ||||||||||||||
| 3,890,323 | 4,713,003 | 4,761,828 | 3,842,026 | 7,926,538 | 6,673,393 | 436,587 | 518,783 | |||||||||||||||||||||||
| 910,882 | 491,415 | 1,332,053 | 453,569 | 4,096,169 | 1,588,635 | 4,267,480 | 2,167,755 | |||||||||||||||||||||||
| (1,717,371 | ) | (1,096,289 | ) | (2,242,123 | ) | (2,593,763 | ) | (3,899,039 | ) | (8,792,993 | ) | (5,095,584 | ) | (4,465,216 | ) | |||||||||||||||
| 3,083,834 | 4,108,129 | 3,851,758 | 1,701,832 | 8,123,668 | (530,965 | ) | (391,517 | ) | (1,778,678 | ) | ||||||||||||||||||||
The accompanying Notes to Financial Statements are an integral part of this schedule.
273
Table of Contents
Thrivent Series Fund, Inc.
Statement of Changes in Net Assets - continued
| Mid Cap Growth Portfolio II | Mid Cap Growth Portfolio | |||||||||||||||
For the periods ended | 12/31/2008 | 12/31/2007 | 12/31/2008 | 12/31/2007 | ||||||||||||
Operations | ||||||||||||||||
Net investment income/(loss) | $ | 109,517 | $ | 59,305 | $ | 2,770,776 | $ | 2,336,205 | ||||||||
Net realized gains/(losses) | (2,275,305 | ) | 5,142,708 | (36,950,006 | ) | 116,447,960 | ||||||||||
Change in net unrealized appreciation/(depreciation) | (21,214,625 | ) | 596,425 | (216,054,842 | ) | 2,203,691 | ||||||||||
Net Change in Net Assets Resulting From Operations | (23,380,413 | ) | 5,798,438 | (250,234,072 | ) | 120,987,856 | ||||||||||
Distributions to Shareholders | ||||||||||||||||
From net investment income | (179,857 | ) | (151,556 | ) | (5,290,257 | ) | (2,797,022 | ) | ||||||||
From net realized gains | (5,096,454 | ) | (5,117,206 | ) | (105,080,869 | ) | (26,785,497 | ) | ||||||||
Total Distributions to Shareholders | (5,276,311 | ) | (5,268,762 | ) | (110,371,126 | ) | (29,582,519 | ) | ||||||||
Capital Stock Transactions | ||||||||||||||||
Sold | 79,643,955 | 3,433,049 | 33,072,691 | 62,197,640 | ||||||||||||
Distributions reinvested | 5,276,311 | 5,268,762 | 110,371,126 | 29,582,519 | ||||||||||||
Redeemed | (7,938,547 | ) | (8,489,801 | ) | (177,573,481 | ) | (168,229,734 | ) | ||||||||
Capital Stock Transactions | 76,981,719 | 212,010 | (34,129,664 | ) | (76,449,575 | ) | ||||||||||
Net Increase/(Decrease) in Net Assets | 48,324,995 | 741,686 | (394,734,862 | ) | 14,955,762 | |||||||||||
Net Assets, Beginning of Period | 32,445,884 | 31,704,198 | 669,836,658 | 654,880,896 | ||||||||||||
Net Assets, End of Period | $ | 80,770,879 | $ | 32,445,884 | $ | 275,101,796 | $ | 669,836,658 | ||||||||
Accumulated undistributed net investment income/(loss) | $ | (3,939 | ) | $ | 55,507 | $ | (6,748 | ) | $ | 2,286,448 | ||||||
Capital Stock Share Transactions | ||||||||||||||||
Sold | 11,784,491 | 303,001 | 1,930,847 | 3,249,754 | ||||||||||||
Distributions reinvested | 600,104 | 480,201 | 7,534,490 | 1,527,928 | ||||||||||||
Redeemed | (925,192 | ) | (730,985 | ) | (13,854,985 | ) | (8,817,483 | ) | ||||||||
Total Capital Stock Share Transactions | 11,459,403 | 52,217 | (4,389,648 | ) | (4,039,801 | ) | ||||||||||
The accompanying Notes to Financial Statements are an integral part of this schedule.
274
Table of Contents
Thrivent Series Fund, Inc.
Statement of Changes in Net Assets - continued
| Partner Mid Cap Value Portfolio | Mid Cap Stock Portfolio | Mid Cap Index Portfolio | Partner Worldwide Allocation Portfolio | |||||||||||||||||||||||
| 12/31/2008 | 12/31/2007 | 12/31/2008 | 12/31/2007 | 12/31/2008 | 12/31/2007 | 12/31/2008 (a) | ||||||||||||||||||||
| $ | 1,644,483 | $ | 964,512 | $ | 3,331,992 | $ | 2,776,850 | $ | 1,522,425 | $ | 1,856,650 | $ | 1,247,035 | |||||||||||||
| (26,491,608 | ) | 2,366,071 | (110,131,447 | ) | 26,512,336 | 4,434,504 | 16,283,257 | (14,141,924 | ) | |||||||||||||||||
| (37,787,729 | ) | (1,986,968 | ) | (127,005,637 | ) | (7,031,481 | ) | (52,876,255 | ) | (5,768,495 | ) | (22,751,372 | ) | |||||||||||||
| (62,634,854 | ) | 1,343,615 | (233,805,092 | ) | 22,257,705 | (46,919,326 | ) | 12,371,412 | (35,646,261 | ) | ||||||||||||||||
| (2,140,821 | ) | — | (5,709,119 | ) | (3,442,513 | ) | (1,606,594 | ) | (1,542,576 | ) | (1,070,000 | ) | ||||||||||||||
| (3,977,150 | ) | (371,536 | ) | (35,581,789 | ) | (28,823,966 | ) | (15,982,601 | ) | (9,057,618 | ) | — | ||||||||||||||
| (6,117,971 | ) | (371,536 | ) | (41,290,908 | ) | (32,266,479 | ) | (17,589,195 | ) | (10,600,194 | ) | (1,070,000 | ) | |||||||||||||
| 105,815,967 | 60,675,050 | 271,252,543 | 127,211,109 | 4,158,752 | 9,092,400 | 213,602,323 | ||||||||||||||||||||
| 6,117,971 | 371,536 | 41,290,908 | 32,266,479 | 17,589,195 | 10,600,194 | 1,070,000 | ||||||||||||||||||||
| (14,864,298 | ) | (21,943,990 | ) | (45,510,935 | ) | (125,364,393 | ) | (28,281,629 | ) | (35,035,996 | ) | (72,054,531 | ) | |||||||||||||
| 97,069,640 | 39,102,596 | 267,032,516 | 34,113,195 | (6,533,682 | ) | (15,343,402 | ) | 142,617,792 | ||||||||||||||||||
| 28,316,815 | 40,074,675 | (8,063,484 | ) | 24,104,421 | (71,042,203 | ) | (13,572,184 | ) | 105,901,531 | |||||||||||||||||
| 95,020,009 | 54,945,334 | 387,946,514 | 363,842,093 | 146,182,499 | 159,754,683 | — | ||||||||||||||||||||
| $ | 123,336,824 | $ | 95,020,009 | $ | 379,883,030 | $ | 387,946,514 | $ | 75,140,296 | $ | 146,182,499 | $ | 105,901,531 | |||||||||||||
| $ | 271,966 | $ | 960,793 | $ | 247,551 | $ | 2,764,937 | $ | 1,511,561 | $ | 1,849,565 | $ | (33,448 | ) | ||||||||||||
| 8,857,013 | 4,487,166 | 24,745,093 | 9,259,801 | 350,475 | 576,653 | 25,128,268 | ||||||||||||||||||||
| 558,889 | 25,317 | 4,028,721 | 2,289,881 | 1,408,522 | 657,018 | 177,470 | ||||||||||||||||||||
| (1,545,235 | ) | (1,634,745 | ) | (4,616,668 | ) | (9,182,728 | ) | (2,336,499 | ) | (2,232,287 | ) | (7,740,917 | ) | |||||||||||||
| 7,870,667 | 2,877,738 | 24,157,146 | 2,366,954 | (577,502 | ) | (998,616 | ) | 17,564,821 | ||||||||||||||||||
(a) | For the period from April 30, 2008 (inception) through December 31, 2008. |
The accompanying Notes to Financial Statements are an integral part of this schedule.
275
Table of Contents
Thrivent Series Fund, Inc.
Statement of Changes in Net Assets - continued
| Partner International Stock Portfolio | Partner Socially Responsible Stock Portfolio | Partner All Cap Growth Portfolio | ||||||||||||||
For the periods ended | 12/31/2008 | 12/31/2007 | 12/31/2008(a) | 12/31/2008(a) | ||||||||||||
Operations | ||||||||||||||||
Net investment income/(loss) | $ | 29,670,893 | $ | 30,820,433 | $ | 8,481 | $ | (3,685 | ) | |||||||
Net realized gains/(losses) | (166,010,131 | ) | 187,962,718 | (280,513 | ) | (813,990 | ) | |||||||||
Change in net unrealized appreciation/(depreciation) | (442,860,262 | ) | (74,547,597 | ) | (1,470,627 | ) | (1,421,880 | ) | ||||||||
Net Change in Net Assets Resulting From Operations | (579,199,500 | ) | 144,135,554 | (1,742,659 | ) | (2,239,555 | ) | |||||||||
Distributions to Shareholders | ||||||||||||||||
From net investment income | (58,984,879 | ) | (20,042,187 | ) | (9,075 | ) | — | |||||||||
From net realized gains | (180,439,928 | ) | (47,186,402 | ) | — | — | ||||||||||
Total Distributions to Shareholders | (239,424,807 | ) | (67,228,589 | ) | (9,075 | ) | — | |||||||||
Capital Stock Transactions | ||||||||||||||||
Sold | 118,759,221 | 248,378,419 | 6,091,780 | 7,332,525 | ||||||||||||
Distributions reinvested | 239,424,807 | 67,228,589 | 9,075 | — | ||||||||||||
Redeemed | (205,204,537 | ) | (290,543,926 | ) | (1,148,401 | ) | (2,683,193 | ) | ||||||||
Capital Stock Transactions | 152,979,491 | 25,063,082 | 4,952,454 | 4,649,332 | ||||||||||||
Net Increase/(Decrease) in Net Assets | (665,644,816 | ) | 101,970,047 | 3,200,720 | 2,409,777 | |||||||||||
Net Assets, Beginning of Period | 1,443,770,270 | 1,341,800,223 | — | — | ||||||||||||
Net Assets, End of Period | $ | 778,125,454 | $ | 1,443,770,270 | $ | 3,200,720 | $ | 2,409,777 | ||||||||
Accumulated undistributed net investment income/(loss) | $ | 591,039 | $ | 26,642,912 | $ | (594 | ) | $ | (682 | ) | ||||||
Capital Stock Share Transactions | ||||||||||||||||
Sold | 7,911,742 | 14,492,955 | 628,024 | 782,391 | ||||||||||||
Distributions reinvested | 19,901,572 | 3,889,418 | 1,400 | – | ||||||||||||
Redeemed | (16,309,607 | ) | (16,935,224 | ) | (135,747 | ) | (331,382 | ) | ||||||||
Total Capital Stock Share Transactions | 11,503,707 | 1,447,149 | 493,677 | 451,009 | ||||||||||||
(a) | For the period from April 30, 2008 (inception) through December 31, 2008. |
The accompanying Notes to Financial Statements are an integral part of this schedule.
276
Table of Contents
Thrivent Series Fund, Inc.
Statement of Changes in Net Assets - continued
| Partner All Cap Value Portfolio | Partner All Cap Portfolio | Large Cap Growth Portfolio II | Large Cap Growth Portfolio | |||||||||||||||||||||||
| 12/31/2008(a) | 12/31/2008 | 12/31/2007 | 12/31/2008 | 12/31/2007 | 12/31/2008 | 12/31/2007 | ||||||||||||||||||||
| $ | 37,077 | $ | 744,699 | $ | 652,048 | $ | 319,255 | $ | 136,361 | $ | 13,831,496 | $ | 15,558,513 | |||||||||||||
| (1,158,452 | ) | (22,629,783 | ) | 15,629,818 | (2,757,765 | ) | 3,956,805 | (298,149,885 | ) | 257,720,543 | ||||||||||||||||
| (997,736 | ) | (25,229,107 | ) | 3,206,997 | (11,416,914 | ) | 1,219,739 | (635,129,474 | ) | 106,478,512 | ||||||||||||||||
| (2,119,111 | ) | (47,114,191 | ) | 19,488,863 | (13,855,424 | ) | 5,312,905 | (919,447,863 | ) | 379,757,568 | ||||||||||||||||
| (46,000 | ) | (654,002 | ) | (469,104 | ) | (458,318 | ) | (217,804 | ) | (15,449,558 | ) | (26,284,570 | ) | |||||||||||||
| — | (15,641,826 | ) | (10,483,224 | ) | (3,907,923 | ) | (2,106,701 | ) | — | — | ||||||||||||||||
| (46,000 | ) | (16,295,828 | ) | (10,952,328 | ) | (4,366,241 | ) | (2,324,505 | ) | (15,449,558 | ) | (26,284,570 | ) | |||||||||||||
| 8,189,090 | 11,206,437 | 17,191,190 | 296,963,301 | 2,636,876 | 82,982,927 | 327,249,242 | ||||||||||||||||||||
| 46,000 | 16,295,828 | 10,952,328 | 4,366,241 | 2,324,505 | 15,449,558 | 26,284,570 | ||||||||||||||||||||
| (3,608,671 | ) | (25,510,363 | ) | (15,652,567 | ) | (8,106,552 | ) | (9,896,977 | ) | (872,447,212 | ) | (485,209,703 | ) | |||||||||||||
| 4,626,419 | 1,991,902 | 12,490,951 | 293,222,990 | (4,935,596 | ) | (774,014,727 | ) | (131,675,891 | ) | |||||||||||||||||
| 2,461,308 | (61,418,117 | ) | 21,027,486 | 275,001,325 | (1,947,196 | ) | (1,708,912,148 | ) | 221,797,107 | |||||||||||||||||
| — | 117,571,353 | 96,543,867 | 33,983,900 | 35,931,096 | 2,553,451,023 | 2,331,653,916 | ||||||||||||||||||||
| $ | 2,461,308 | $ | 56,153,236 | $ | 117,571,353 | $ | 308,985,225 | $ | 33,983,900 | $ | 844,538,875 | $ | 2,553,451,023 | |||||||||||||
| $ | 137 | $ | 740,269 | $ | 649,572 | $ | (56 | ) | $ | 133,875 | $ | 147,296 | $ | 1,445,555 | ||||||||||||
| 887,796 | 1,175,844 | 1,375,057 | 50,351,554 | 229,272 | 4,950,812 | 18,173,866 | ||||||||||||||||||||
| 8,403 | 1,829,882 | 901,886 | 514,033 | 205,416 | 1,348,205 | 1,397,103 | ||||||||||||||||||||
| (446,591 | ) | (2,839,612 | ) | (1,257,975 | ) | (917,601 | ) | (860,420 | ) | (62,070,891 | ) | (26,878,171 | ) | |||||||||||||
| 449,608 | 166,114 | 1,018,968 | 49,947,986 | (425,732 | ) | (55,771,874 | ) | (7,307,202 | ) | |||||||||||||||||
The accompanying Notes to Financial Statements are an integral part of this schedule.
277
Table of Contents
Thrivent Series Fund, Inc.
Statement of Changes in Net Assets - continued
| Partner Growth Stock Portfolio | Large Cap Value Portfolio | |||||||||||||||
For the periods ended | 12/31/2008 | 12/31/2007 | 12/31/2008 | 12/31/2007 | ||||||||||||
Operations | ||||||||||||||||
Net investment income/(loss) | $ | 292,873 | $ | 711,384 | $ | 19,012,085 | $ | 15,140,425 | ||||||||
Net realized gains/(losses) | (6,644,074 | ) | 9,614,806 | (79,374,035 | ) | 25,706,355 | ||||||||||
Change in net unrealized appreciation/(depreciation) | (36,888,660 | ) | 210,085 | (293,816,484 | ) | (4,276,476 | ) | |||||||||
Net Change in Net Assets Resulting From Operations | (43,239,861 | ) | 10,536,275 | (354,178,434 | ) | 36,570,304 | ||||||||||
Distributions to Shareholders | ||||||||||||||||
From net investment income | (684,434 | ) | (621,984 | ) | (33,783,735 | ) | (10,416,269 | ) | ||||||||
From net realized gains | (9,541,540 | ) | (5,894,305 | ) | (34,992,145 | ) | (36,284,324 | ) | ||||||||
From return of capital | — | — | — | — | ||||||||||||
Total Distributions to Shareholders | (10,225,974 | ) | (6,516,289 | ) | (68,775,880 | ) | (46,700,593 | ) | ||||||||
Capital Stock Transactions | ||||||||||||||||
Sold | 3,498,176 | 12,472,567 | 125,697,204 | 281,729,618 | ||||||||||||
Distributions reinvested | 10,225,974 | 6,516,289 | 68,775,880 | 46,700,593 | ||||||||||||
Capital Contributions from adviser | — | — | — | — | ||||||||||||
Redeemed | (26,218,829 | ) | (21,624,457 | ) | (112,324,933 | ) | (85,093,171 | ) | ||||||||
Capital Stock Transactions | (12,494,679 | ) | (2,635,601 | ) | 82,148,151 | 243,337,040 | ||||||||||
Net Increase/(Decrease) in Net Assets | (65,960,514 | ) | 1,384,385 | (340,806,163 | ) | 233,206,751 | ||||||||||
Net Assets, Beginning of Period | 118,054,476 | 116,670,091 | 1,004,900,878 | 771,694,127 | ||||||||||||
Net Assets, End of Period | $ | 52,093,962 | $ | 118,054,476 | $ | 664,094,715 | $ | 1,004,900,878 | ||||||||
Accumulated undistributed net investment income/(loss) | $ | 163,452 | $ | 663,134 | $ | 350,222 | $ | 15,127,143 | ||||||||
Capital Stock Share Transactions | ||||||||||||||||
Sold | 314,980 | 919,198 | 10,311,148 | 20,633,683 | ||||||||||||
Distributions reinvested | 958,565 | 479,590 | 6,720,986 | 3,332,852 | ||||||||||||
Redeemed | (2,499,468 | ) | (1,603,480 | ) | (9,997,370 | ) | (6,189,367 | ) | ||||||||
Total Capital Stock Share Transactions | (1,225,923 | ) | (204,692 | ) | 7,034,764 | 17,777,168 | ||||||||||
The accompanying Notes to Financial Statements are an integral part of this schedule.
278
Table of Contents
Thrivent Series Fund, Inc.
Statement of Changes in Net Assets - continued
| Large Cap Stock Portfolio | Large Cap Index Portfolio | Equity Income Plus Portfolio | Balanced Portfolio | |||||||||||||||||||||||
| 12/31/2008 | 12/31/2007 | 12/31/2008 | 12/31/2007 | 12/31/2008 (a) | 12/31/2008 | 12/31/2007 | ||||||||||||||||||||
| $ | 11,554,735 | $ | 12,547,778 | $ | 9,646,518 | $ | 11,402,197 | $ | 861,950 | $ | 11,660,944 | $ | 14,707,344 | |||||||||||||
| (129,336,858 | ) | 57,773,385 | 5,547,235 | 53,072,174 | (9,808,402 | ) | 5,991,728 | 21,852,036 | ||||||||||||||||||
| (226,078,475 | ) | (4,240,826 | ) | (223,961,063 | ) | (27,507,607 | ) | (8,200,433 | ) | (129,660,743 | ) | (7,599,552 | ) | |||||||||||||
| (343,860,598 | ) | 66,080,337 | (208,767,310 | ) | 36,966,764 | (17,146,885 | ) | (112,008,071 | ) | 28,959,828 | ||||||||||||||||
| (23,831,561 | ) | (10,350,750 | ) | (11,179,657 | ) | (11,629,702 | ) | (862,553 | ) | (14,582,912 | ) | (16,298,675 | ) | |||||||||||||
| (67,919,651 | ) | (15,366,693 | ) | (54,442,738 | ) | (28,177,160 | ) | — | (14,276,173 | ) | — | |||||||||||||||
| — | — | — | — | (22,448 | ) | — | — | |||||||||||||||||||
| (91,751,212 | ) | (25,717,443 | ) | (65,622,395 | ) | (39,806,862 | ) | (885,001 | ) | (28,859,085 | ) | (16,298,675 | ) | |||||||||||||
| 52,961,051 | 272,621,495 | 8,728,957 | 15,626,706 | 63,762,264 | 6,880,428 | 12,683,917 | ||||||||||||||||||||
| 91,751,212 | 25,717,443 | 65,622,395 | 39,806,862 | 885,001 | 28,859,085 | 16,298,676 | ||||||||||||||||||||
| — | 787,819 | — | — | — | — | — | ||||||||||||||||||||
| (271,830,135 | ) | (108,624,345 | ) | (113,707,492 | ) | (146,437,231 | ) | (5,263,915 | ) | (103,300,713 | ) | (119,323,765 | ) | |||||||||||||
| (127,117,872 | ) | 190,502,412 | (39,356,140 | ) | (91,003,663 | ) | 59,383,350 | (67,561,200 | ) | (90,341,172 | ) | |||||||||||||||
| (562,729,682 | ) | 230,865,306 | (313,745,845 | ) | (93,843,761 | ) | 41,351,464 | (208,428,356 | ) | (77,680,019 | ) | |||||||||||||||
| 1,060,129,373 | 829,264,067 | 633,457,158 | 727,300,919 | — | 488,449,226 | 566,129,245 | ||||||||||||||||||||
| $ | 497,399,691 | $ | 1,060,129,373 | $ | 319,711,313 | $ | 633,457,158 | $ | 41,351,464 | $ | 280,020,870 | $ | 488,449,226 | |||||||||||||
| $ | 197,339 | $ | 12,493,400 | $ | 9,560,870 | $ | 11,347,356 | $ | (682 | ) | $ | 11,677,975 | $ | 14,650,464 | ||||||||||||
| 5,383,871 | 24,986,081 | 467,473 | 607,207 | 6,404,407 | 457,968 | 740,173 | ||||||||||||||||||||
| 10,941,285 | 2,318,056 | 3,423,235 | 1,531,434 | 128,430 | 1,992,233 | 944,517 | ||||||||||||||||||||
| (30,939,551 | ) | (9,898,451 | ) | (5,753,579 | ) | (5,698,881 | ) | (532,079 | ) | (7,093,103 | ) | (6,972,610 | ) | |||||||||||||
| (14,614,395 | ) | 17,405,686 | (1,862,871 | ) | (3,560,240 | ) | 6,000,758 | (4,642,902 | ) | (5,287,920 | ) | |||||||||||||||
(a) | For the period from April 30, 2008 (inception) through December 31, 2008. |
The accompanying Notes to Financial Statements are an integral part of this schedule.
279
Table of Contents
Thrivent Series Fund, Inc.
Statement of Changes in Net Assets - continued
| High Yield Portfolio | Diversified Income Plus Portfolio | |||||||||||||||
For the periods ended | 12/31/2008 | 12/31/2007 | 12/31/2008 | 12/31/2007 | ||||||||||||
Operations | ||||||||||||||||
Net investment income/(loss) | $ | 63,907,368 | $ | 60,844,090 | $ | 5,963,663 | $ | 7,123,365 | ||||||||
Net realized gains/(losses) | (50,266,914 | ) | 8,187,330 | (14,541,514 | ) | 1,022,093 | ||||||||||
Change in net unrealized appreciation/(depreciation) | (181,141,932 | ) | (45,549,775 | ) | (16,884,578 | ) | (10,059,952 | ) | ||||||||
Net Change in Net Assets Resulting From Operations | (167,501,478 | ) | 23,481,645 | (25,462,429 | ) | (1,914,494 | ) | |||||||||
Distributions to Shareholders | ||||||||||||||||
From net investment income | (66,652,176 | ) | (61,327,393 | ) | (6,984,985 | ) | (2,651,827 | ) | ||||||||
Total Distributions to Shareholders | (66,652,176 | ) | (61,327,393 | ) | (6,984,985 | ) | (2,651,827 | ) | ||||||||
Capital Stock Transactions | ||||||||||||||||
Sold | 109,379,698 | 230,542,045 | 3,367,953 | 48,025,036 | ||||||||||||
Distributions reinvested | 66,652,176 | 61,271,776 | 6,984,985 | 2,651,827 | ||||||||||||
Redeemed | (119,240,873 | ) | (326,406,650 | ) | (34,178,684 | ) | (22,904,551 | ) | ||||||||
Capital Stock Transactions | 56,791,001 | (34,592,829 | ) | (23,825,746 | ) | 27,772,312 | ||||||||||
Net Increase/(Decrease) in Net Assets | (177,362,653 | ) | (72,438,577 | ) | (56,273,160 | ) | 23,205,991 | |||||||||
Net Assets, Beginning of Period | 774,582,445 | 847,021,022 | 131,278,281 | 108,072,290 | ||||||||||||
Net Assets, End of Period | $ | 597,219,792 | $ | 774,582,445 | $ | 75,005,121 | $ | 131,278,281 | ||||||||
Accumulated undistributed net investment income/(loss) | $ | 716,482 | $ | 2,411,996 | $ | 5,941,252 | $ | 6,919,937 | ||||||||
Capital Stock Share Transactions | ||||||||||||||||
Sold | 23,707,042 | 46,461,806 | 535,255 | 6,612,794 | ||||||||||||
Distributions reinvested | 15,699,435 | 12,170,460 | 1,120,322 | 362,450 | ||||||||||||
Redeemed | (27,769,002 | ) | (64,416,970 | ) | (5,483,298 | ) | (3,217,824 | ) | ||||||||
Total Capital Stock Share Transactions | 11,637,475 | (5,784,704 | ) | (3,827,721 | ) | 3,757,420 | ||||||||||
The accompanying Notes to Financial Statements are an integral part of this schedule.
280
Table of Contents
Thrivent Series Fund, Inc.
Statement of Changes in Net Assets - continued
Partner Socially | Income Portfolio | Bond Index Portfolio | Limited Maturity Bond Portfolio | |||||||||||||||||||||||
| 12/31/2008(a) | 12/31/2008 | 12/31/2007 | 12/31/2008 | 12/31/2007 | 12/31/2008 | 12/31/2007 | ||||||||||||||||||||
| $ | 179,846 | $ | 72,678,081 | $ | 68,321,345 | $ | 9,666,370 | $ | 10,921,419 | $ | 44,099,773 | $ | 38,509,496 | |||||||||||||
| 234,261 | (41,957,306 | ) | 2,500,252 | 1,649,536 | 89,080 | (11,933,103 | ) | (4,454,771 | ) | |||||||||||||||||
| (235,169 | ) | (175,029,046 | ) | (22,217,094 | ) | (13,481,529 | ) | 1,232,483 | (98,663,346 | ) | (3,181,145 | ) | ||||||||||||||
| 178,938 | (144,308,271 | ) | 48,604,503 | (2,165,623 | ) | 12,242,982 | (66,496,676 | ) | 30,873,580 | |||||||||||||||||
| (171,330 | ) | (73,945,918 | ) | (66,556,877 | ) | (9,755,017 | ) | (10,947,777 | ) | (45,270,503 | ) | (37,803,391 | ) | |||||||||||||
| (171,330 | ) | (73,945,918 | ) | (66,556,877 | ) | (9,755,017 | ) | (10,947,777 | ) | (45,270,503 | ) | (37,803,391 | ) | |||||||||||||
| 9,301,898 | 118,286,630 | 458,441,743 | 16,193,275 | 13,540,803 | 121,741,322 | 378,763,273 | ||||||||||||||||||||
| 170,972 | 73,945,918 | 66,556,877 | 9,755,017 | 10,947,777 | 45,265,617 | 37,803,392 | ||||||||||||||||||||
| (2,664,147 | ) | (295,159,930 | ) | (170,524,092 | ) | (54,595,260 | ) | (48,380,446 | ) | (103,109,449 | ) | (101,455,408 | ) | |||||||||||||
| 6,808,723 | (102,927,382 | ) | 354,474,528 | (28,646,968 | ) | (23,891,866 | ) | 63,897,490 | 315,111,257 | |||||||||||||||||
| 6,816,331 | (321,181,571 | ) | 336,522,154 | (40,567,608 | ) | (22,596,661 | ) | (47,869,689 | ) | 308,181,446 | ||||||||||||||||
| — | 1,418,284,599 | 1,081,762,445 | 215,216,628 | 237,813,289 | 973,809,209 | 665,627,763 | ||||||||||||||||||||
| $ | 6,816,331 | $ | 1,097,103,028 | $ | 1,418,284,599 | $ | 174,649,020 | $ | 215,216,628 | $ | 925,939,520 | $ | 973,809,209 | |||||||||||||
| $ | (359 | ) | $ | 657,301 | $ | 688,369 | $ | 7,557 | $ | 8,303 | $ | 218,540 | $ | 256,650 | ||||||||||||
| 930,798 | 12,419,141 | 46,904,581 | 1,598,241 | 1,328,880 | 12,556,040 | 38,335,963 | ||||||||||||||||||||
| 17,193 | 8,157,489 | 6,791,583 | 978,080 | 1,074,621 | 4,806,381 | 3,824,293 | ||||||||||||||||||||
| (267,414 | ) | (32,348,747 | ) | (17,395,475 | ) | (5,524,475 | ) | (4,748,169 | ) | (11,037,603 | ) | (10,272,253 | ) | |||||||||||||
| 680,577 | (11,772,117 | ) | 36,300,689 | (2,948,154 | ) | (2,344,668 | ) | 6,324,818 | 31,888,003 | |||||||||||||||||
(a) | For the period from April 30, 2008 (inception) through December 31, 2008. |
The accompanying Notes to Financial Statements are an integral part of this schedule.
281
Table of Contents
Thrivent Series Fund, Inc.
Statement of Changes in Net Assets - continued
| Mortgage Securities Portfolio | Money Market Portfolio | |||||||||||||||
For the periods ended | 12/31/2008 | 12/31/2007 | 12/31/2008 | 12/31/2007 | ||||||||||||
Operations | ||||||||||||||||
Net investment income/(loss) | $ | 1,994,014 | $ | 2,712,798 | $ | 22,193,984 | $ | 34,384,945 | ||||||||
Net realized gains/(losses) | 919,157 | (50,225 | ) | (30,902 | ) | (3,442 | ) | |||||||||
Change in net unrealized appreciation/(depreciation) | (4,975,162 | ) | (40,624 | ) | — | — | ||||||||||
Net Change in Net Assets Resulting From Operations | (2,061,991 | ) | 2,621,949 | 22,163,082 | 34,381,503 | |||||||||||
Distributions to Shareholders | ||||||||||||||||
From net investment income | (1,935,505 | ) | (2,676,830 | ) | (22,163,082 | ) | (34,544,766 | ) | ||||||||
Total Distributions to Shareholders | (1,935,505 | ) | (2,676,830 | ) | (22,163,082 | ) | (34,544,766 | ) | ||||||||
Capital Stock Transactions | ||||||||||||||||
Sold | 1,597,422 | 3,242,280 | 3,604,017,558 | 2,557,010,814 | ||||||||||||
Distributions reinvested | 1,935,505 | 2,676,830 | 22,163,082 | 34,539,698 | ||||||||||||
Redeemed | (14,157,852 | ) | (13,914,943 | ) | (3,684,287,640 | ) | (2,440,416,695 | ) | ||||||||
Capital Stock Transactions | (10,624,925 | ) | (7,995,833 | ) | (58,107,000 | ) | 151,133,817 | |||||||||
Net Increase/(Decrease) in Net Assets | (14,622,421 | ) | (8,050,714 | ) | (58,107,000 | ) | 150,970,554 | |||||||||
Net Assets, Beginning of Period | 49,789,178 | 57,839,892 | 741,553,527 | 590,582,973 | ||||||||||||
Net Assets, End of Period | $ | 35,166,757 | $ | 49,789,178 | $ | 683,446,527 | $ | 741,553,527 | ||||||||
Accumulated undistributed net investment income/(loss) | $ | (1 | ) | — | $ | 34,344 | $ | 3,442 | ||||||||
Capital Stock Share Transactions | ||||||||||||||||
Sold | 170,644 | 335,708 | 3,604,017,559 | 2,557,010,814 | ||||||||||||
Distributions reinvested | 206,750 | 277,329 | 22,163,081 | 34,539,698 | ||||||||||||
Redeemed | (1,517,992 | ) | (1,441,305 | ) | (3,684,287,640 | ) | (2,440,416,695 | ) | ||||||||
Total Capital Stock Share Transactions | (1,140,598 | ) | (828,268 | ) | (58,107,000 | ) | 151,133,817 | |||||||||
The accompanying Notes to Financial Statements are an integral part of this schedule.
282
Table of Contents
Notes to Financial Statements
As of December 31, 2008
(1) ORGANIZATION
Thrivent Series Fund, Inc. (the “Fund”), a company organized under the laws of Minnesota, is registered under the Investment Company Act of 1940. The Fund is divided into forty-one separate series (each, a “Portfolio”), each with its own investment objective and policies. The Fund consists of four asset allocation portfolios, twenty-eight equity portfolios, two hybrid portfolios, six fixed-income portfolios, and one money market portfolio. The assets of each Portfolio are segregated, and each has a separate class of capital stock.
Shares in the Fund are currently sold, without sales charges, only to retirement plans sponsored by Thrivent Financial for Lutherans (“Thrivent Financial” or the “Adviser”) or separate accounts of Thrivent Financial or Thrivent Life Insurance Company (“Thrivent Life”), which are used to fund benefits of variable life insurance and variable annuity contracts issued by Thrivent Financial and Thrivent Life.
Under the Fund’s organizational documents, its officers and directors are indemnified against certain liabilities arising out of the performance of their duties to the Fund. In addition, in the normal course of business, the Fund enters into contracts with service providers and others that provide general damage clauses. The Fund’s maximum exposure under these contracts is unknown, as this would involve future claims that may be made against the Fund. However, based on experience, the Fund expects the risk of loss to be remote.
(2) SIGNIFICANT ACCOUNTING POLICIES
(A) Valuation of Investments — Securities traded on U.S. or foreign securities exchanges or included in a national market system are valued at the official closing price at the close of each business day unless otherwise stated below. Over-the-counter securities and listed securities for which no price is readily available are valued at the current bid price considered best to represent the value at that time. Swap agreements are valued at the fair value of the contract as furnished by an independent pricing service. Security prices are based on quotes that are obtained from an independent pricing service approved by the Board of Directors. The pricing service, in determining values of fixed-income securities, takes into consideration such factors as current quotations by broker/dealers, coupon, maturity, quality, type of issue, trading characteristics, and other yield and risk factors it deems relevant in determining valuations. Securities which cannot be valued by the approved pricing service are valued using valuations obtained from dealers that make markets in the securities. Exchange listed options and futures contracts are valued at the last quoted sales price. Investments in open-ended mutual funds are valued at their net asset value at the close of each business day.
For all Portfolios, other than Money Market Portfolio, short-term securities with maturities of 60 days or less are valued at amortized cost. Securities held by Money Market Portfolio are valued on the basis of amortized cost (which approximates market value), whereby a portfolio security is valued at its cost initially and thereafter valued to reflect a constant amortization to maturity of any discount or premium. The market values of the securities held in Money Market Portfolio are determined once per week using prices supplied by the Fund’s independent pricing service. Money Market Portfolio and the Fund’s investment adviser follow procedures necessary to maintain a constant net asset value of $1.00 per share.
All securities for which market values are not readily available or deemed unreliable are appraised at fair value as determined in good faith under the direction of the Board of Directors. As of December 31, 2008, the following Portfolios held fair valued securities:
Portfolio | Number of Securities | Percent of Fund’s Net Assets | |||
Partner Worldwide | |||||
Allocation | 1 | 0.29 | % | ||
Partner International Stock | 1 | 0.48 | % | ||
Income | 1 | 0.12 | % | ||
High Yield | 4 | < 0.01 | % |
In September 2006, the FASB issued FASB Statement No. 157 – Fair Value Measurements (FAS 157). The objective of the statement is to improve the consistency and comparability of fair value measurements used in financial reporting. FAS 157 defines fair value, establishes a framework for measuring fair value in generally accepted accounting principles, and expands disclosures about fair value requirements. Various inputs are summarized in the three broad levels: Level 1 includes quoted prices in active markets for identical securities; Level 2 includes other significant observable inputs such as quoted prices for similar securities, interest rates, prepayment speeds and credit risk; and Level 3 includes significant unobservable inputs such as the Portfolio’s own assumptions and broker evaluations in determining the fair value of investments.
Fair Valuation of International Securities — Because many foreign markets close before the U.S. markets, events may occur between the close of the foreign market and the close of the U.S. markets that could have a material impact on the valuation of foreign securities. The Portfolios, under the supervision of the Board of Directors, evaluate the impacts of these events and may adjust the valuation of foreign securities to reflect the fair value as of the close of the U.S. markets. The Board of Directors has authorized the Fund’s investment adviser to make fair valuation determinations pursuant to policies approved by the Board of Directors.
283
Table of Contents
THRIVENT SERIES FUND, INC.
Notes to Financial Statements
As of December 31, 2008
(2) SIGNIFICANT ACCOUNTING POLICIES - continued
(B) Foreign Currency Translation — The accounting records of each Portfolio are maintained in U.S. dollars. Securities and other assets and liabilities that are denominated in foreign currencies are translated into U.S. dollars at the daily closing rates of exchange.
Foreign currency amounts related to the purchase or sale of securities and income and expenses are translated at the exchange rate on the transaction date. Net realized and unrealized currency gains and losses are recorded from sales of foreign currency, exchange gains or losses between the trade date and settlement dates on securities transactions, and other translation gains or losses on dividends, interest income and foreign withholding taxes. The Portfolios do not separately report the effect of changes in foreign exchange rates from changes in market prices on securities held. Such changes are included in net realized and unrealized gain or loss from investments in the Statement of Operations.
For federal income tax purposes, the portfolios treat the effect of changes in foreign exchange rates arising from actual foreign currency transactions and the changes in foreign exchange rates between the trade date and settlement date as ordinary income.
(C) Foreign Currency Contracts — In connection with purchases and sales of securities denominated in foreign currencies all Portfolios, except Money Market Portfolio, may enter into forward currency contracts. Additionally, the Portfolios may enter into such contracts to hedge certain other foreign currency denominated investments. These contracts are recorded at market value and the related realized and unrealized foreign exchange gains and losses are included in the Statement of Operations. In the event that counterparties fail to settle these forward contracts, the Portfolios could be exposed to foreign currency fluctuations. Foreign currency contracts are valued daily and unrealized appreciation or depreciation is recorded daily as the difference between the contract exchange rate and the closing forward rate applied to the face amount of the contract. A realized gain or loss is recorded at the time a forward contract is closed. During the year or period ended December 31, 2008, Technology Portfolio, Partner Healthcare Portfolio, Partner Natural Resources Portfolio, Partner Emerging Markets Portfolio, Partner Real Estate Securities Portfolio, Partner Utilities Portfolio, Partner Worldwide Allocation Portfolio, Partner International Stock Portfolio, Partner All Cap Value Portfolio and Partner Growth Stock Portfolio engaged in this type of investment.
(D) Foreign Denominated Investments — Foreign denominated assets and currency contracts may involve more risks than domestic transactions including currency risk, political and economic risk, regulatory risk, and market risk. Certain Portfolios may also invest in securities of companies located in emerging markets. Future economic or political developments could adversely affect the liquidity or value, or both, of such securities.
(E) Income Taxes — No provision has been made for income taxes because each Portfolio’s policy is to qualify as a regulated investment company under the Internal Revenue Code and distribute substantially all taxable income on a timely basis. It is also the intention of the Portfolios to distribute an amount sufficient to avoid imposition of any federal excise tax. The Portfolios, accordingly, anticipate paying no federal taxes and no federal tax provision was recorded. Each Portfolio is treated as a separate taxable entity for federal income tax purposes.
Certain Portfolios are subject to foreign income taxes imposed by certain countries in which they invest. Withholding taxes have been provided for in accordance with the applicable country’s tax rules and rates. These amounts are shown as foreign dividend tax withholding on the Statement of Operations.
In June 2006, the Financial Accounting Standards Board (FASB) issued FASB Interpretation No. 48 – Accounting for Uncertainty in Income Taxes (FIN 48), an interpretation of FASB Statement 109 that requires additional disclosures with respect to the tax effects of certain income tax positions, whether those positions were taken on previously filed tax returns or are expected to be taken on future returns. These positions must meet a “more likely than not” standard that, based on the technical merits of the position, would have a greater than 50 percent likelihood of being sustained upon examination. In evaluating whether a tax position has met the more-likely-than-not recognition threshold, management of the Fund must presume that the position will be examined by the appropriate taxing authority that has full knowledge of all relevant information.
FIN 48 requires management of the Fund to analyze all open tax years, as defined by the statute of limitations, for all major jurisdictions. Open tax years are those that are open for examination by taxing authorities. Major jurisdictions for the Portfolios include Federal, Minnesota and Wisconsin, as well as certain foreign countries. As of December 31, 2008, open Federal, Minnesota and Wisconsin tax years include the tax years ended December 31, 2005, through 2008. Additionally, as of December 31, 2008, the December 31, 2004, tax year is open for Minnesota and Wisconsin. The Portfolios have no examinations in progress and none are expected at this time.
284
Table of Contents
THRIVENT SERIES FUND, INC.
Notes to Financial Statements
As of December 31, 2008
(2) SIGNIFICANT ACCOUNTING POLICIES - continued
As of December 31, 2008, management of the Fund has reviewed all open tax years and major jurisdictions and concluded that the adoption of FIN 48 resulted in no effect to the Portfolio’s tax liability, financial position or results of operations. There is no tax liability resulting from unrecognized tax benefits related to uncertain income tax positions taken or expected to be taken in future tax returns. The Portfolios are also not aware of any tax positions for which it is reasonably possible that the total amounts of unrecognized tax benefits will significantly change in the next 12 months.
(F) Expenses and Income — Estimated expenses are accrued daily. The Portfolios are charged for those expenses that are directly attributable to them. Expenses that are not directly attributable to a Portfolio are allocated among all appropriate Portfolios in proportion to their respective net assets, number of shareholder accounts or other reasonable basis.
Interest income is accrued daily and is determined on the basis of interest or discount earned on all debt securities, including accretion of market discount and original issue discount and amortization of premium. Pay down gains and losses on mortgage- and asset-backed securities are recorded as components of interest income. Dividend income is recorded on the ex-dividend date.
(G) Custody Earnings Credit — The Portfolios have a deposit arrangement with the custodian whereby interest earned on uninvested cash balances is used to pay a portion of custodian fees. This deposit arrangement is an alternative to overnight investments. Earnings credits are shown as a reduction of total expenses on the Statement of Operations.
(H) Distributions to Shareholders — Dividends from net investment income and distributions from realized capital gains, if available, are declared and paid to each shareholder. Dividends and capital gain distributions are recorded on the ex-dividend date. With the exception of Money Market Portfolio, net realized gains from securities transactions, if any, are paid at least annually for all Portfolios after the close of the Portfolios’ fiscal year. Any Portfolio subject to excise taxes would require an additional distribution prior to the close of the fiscal year.
Dividends are declared and reinvested daily for High Yield Portfolio, Partner Socially Responsible Bond Portfolio, Income Portfolio, Bond Index Portfolio, Limited Maturity Bond Portfolio and Mortgage Securities Portfolio; declared daily and reinvested monthly for Money Market Portfolio; and declared and reinvested at least annually for all other Portfolios.
(I) Options — All Portfolios, with the exception of Money Market Portfolio, may buy put and call options and write put and covered call options. The Portfolios intend to use such derivative instruments as hedges to facilitate buying or selling securities or to provide protection against adverse movements in security prices or interest rates. The Portfolios may also enter into options contracts to protect against adverse foreign exchange rate fluctuations. Option contracts are valued daily and unrealized appreciation or depreciation is recorded. A Portfolio will realize a gain or loss upon expiration or closing of the option transaction. When an option is exercised, the proceeds upon sale for a written call option or the cost of a security for purchased put and call options is adjusted by the amount of premium received or paid.
Buying put options tends to decrease a Portfolio’s exposure to the underlying security while buying call options tends to increase a Portfolio’s exposure to the underlying security. The risk associated with purchasing put and call options is limited to the premium paid. Writing put options tends to increase a Portfolio’s exposure to the underlying security while writing call options tends to decrease a Portfolio’s exposure to the underlying security. The writer of an option has no control over whether the underlying security may be bought or sold, and therefore bears the market risk of an unfavorable change in the price of the underlying security. Risks of loss may exceed amounts recognized on the Statement of Assets and Liabilities. During the year or period ended December 31, 2008, Large Cap Growth Portfolio II, Large Cap Growth Portfolio, Large Cap Stock Portfolio, Equity Income Plus Portfolio, Diversified Income Plus Portfolio, Income Portfolio, Limited Maturity Bond Portfolio and Mortgage Securities Portfolio engaged in these types of investments.
(J) Financial Futures Contracts — Certain Portfolios may use futures contracts to manage the exposure to interest rate and market fluctuations. Gains or losses on futures contracts can offset changes in the yield of securities. When a futures contract is opened, cash or other investments equal to the required “initial margin deposit” are held on deposit with and pledged to the broker. Additional securities held by the Portfolios may be earmarked to cover open futures contracts. The futures contract’s daily change in value (“variation margin”) is either paid to or received from the broker, and is recorded as an unrealized gain or loss. When the contract is closed, the realized gain or loss is recorded equal to the difference between the value of the contract when opened and the value of the contract when closed. Futures contracts involve, to varying degrees, risk of loss in excess of the variation margin disclosed in the
285
Table of Contents
THRIVENT SERIES FUND, INC.
Notes to Financial Statements
As of December 31, 2008
(2) SIGNIFICANT ACCOUNTING POLICIES - continued
Statement of Assets and Liabilities. During the year or period ended December 31, 2008, Aggressive Allocation Portfolio, Moderately Aggressive Allocation Portfolio, Moderate Allocation Portfolio, Moderately Conservative Allocation Portfolio, Technology Portfolio, Real Estate Securities Portfolio, Partner Small Cap Growth Portfolio, Small Cap Stock Portfolio, Small Cap Index Portfolio, Mid Cap Growth Portfolio II, Mid Cap Growth Portfolio, Mid Cap Index Portfolio, Partner Worldwide Allocation Portfolio, Large Cap Growth Portfolio, Large Cap Stock Portfolio, Large Cap Index Portfolio, Equity Income Plus Portfolio, Balanced Portfolio, High Yield Portfolio, Diversified Income Plus Portfolio, Partner Socially Responsible Bond Portfolio, Income Portfolio, Limited Maturity Bond Portfolio and Mortgage Securities Portfolio engaged in this type of investment.
(K) Swap Agreements — Certain Portfolios enter into swap transactions, which involve swapping one or more investment characteristics of a security or a basket of securities with another party. Such transactions include market risk, risk of default by the other party to the transaction, risk of imperfect correlation and manager risk and may involve commissions or other costs. Swap transactions generally do not involve delivery of securities, other underlying assets or principal. Accordingly, the risk of loss with respect to swap transactions is generally limited to the net amount of payments that the Portfolio is contractually obligated to make, or in the case of the counterparty defaulting, the net amount of payments that the Portfolio is contractually entitled to receive. Risks of loss may exceed amounts recognized on the Statement of Assets and Liabilities. If there is a default by the counterparty, the Portfolio may have contractual remedies pursuant to the agreements related to the transaction. The contracts are valued daily and unrealized appreciation or depreciation is recorded. Swap agreements are valued at fair value of the contract as provided by an independent pricing service. The pricing service takes into account such factors as swap curves, default probabilities, recent trades, recovery rates and other factors it deems relevant in determining valuations. Periodic payments and receipts and payments received or made as a result of a credit event or termination of the contract are recognized as realized gains or losses on the Statement of Operations. Collateral, in the form of cash or securities, may be required to be held with the Fund’s custodian, or third party, in connection with these agreements.
Credit Default Swaps — A credit default swap is an agreement between two parties to exchange the credit risk of a particular issuer, basket of securities or reference entity. In a credit default swap transaction, a buyer pays periodic fees in return for payment by the seller which is contingent upon an adverse credit event occurring in the underlying issuer or reference entity. The seller collects periodic fees from the buyer and profits if the credit of the underlying issuer or reference entity remains stable or improves while the swap is outstanding, but the seller in a credit default swap contract would be required to pay the amount of credit loss, determined as specified in the agreement, to the buyer in the event of an adverse credit event in the reference entity. A buyer of a credit default swap is said to buy protection whereas a seller of a credit default swap is said to sell protection. The Portfolios may be either the protection seller or the protection buyer.
Certain Portfolios enter into credit default derivative contracts directly through credit default swaps (CDS) or through credit default swap indices (CDX Indices). CDX indices are static portfolios of equally weighted credit default swaps referencing corporate bonds and/or loans designed to provide diversified credit exposure to these asset classes. Portfolios sell default protection and assume long-risk positions in individual credits or the indices. Index positions are entered into to gain exposure to the corporate bond and/or loan markets in a cost efficient and diversified structure. In the event that a position would default, by going into bankruptcy and failing to pay interest or principal on borrowed money, within any given CDX index held, the maximum potential amount of future payments required would be equal to the pro-rata share of that position within the index based on the notional amount of the index. In the event of a default under a CDS contract the maximum potential amount of future payments would be the notional amount. For CDS the default events could be bankruptcy and failing to pay interest or principal on borrowed money or a restructuring. A restructuring is a change in the underlying obligations which would include reduction in interest or principal, maturity extension and subordination to other obligations. Refer to the credit default swap tables located within the fund’s Schedule of Investments for additional information as of December 31, 2008. During the year ended December 31, 2008, High Yield Portfolio, Diversified Income Plus Portfolio, Income Portfolio and Limited Maturity Bond Portfolio engaged in these types of investments.
Total Rate of Return Swaps — A total rate of return swap is an agreement in which one party makes payments based on a set rate, either fixed or variable, while the other party makes payments based on the return of an underlying asset plus any capital gains and losses over the payment period. The underlying asset is typically an index, loan or a basket of assets. Total rate of return swaps provide the Portfolios with the additional flexibility of gaining exposure to a market or securities index by using the most cost-effective vehicle available. During the year ended December 31, 2008, none of the Portfolios engaged in this type of investment.
286
Table of Contents
THRIVENT SERIES FUND, INC.
Notes to Financial Statements
As of December 31, 2008
(2) SIGNIFICANT ACCOUNTING POLICIES - continued
Interest Rate Swaps — An interest rate swap is an agreement between two parties to exchange cash flows based on the difference between two interest rates. Typically, one party pays a fixed-rate for a specific period while the other pays a variable-rate based on an underlying index for the same period. Interest rate swaps allow the Portfolios to manage exposure to interest rate fluctuations. During the year ended December 31, 2008, Limited Maturity Bond Portfolio engaged in this type of investment.
(L) Mortgage Dollar Roll Transactions — Certain Portfolios enter into dollar roll transactions on securities issued or to be issued by the Government National Mortgage Association, Federal National Mortgage Association and Federal Home Loan Mortgage Corporation, in which the Portfolios sell mortgage securities and simultaneously agree to repurchase similar (same type and coupon) securities at a later date at an agreed upon price. During the period between the sale and repurchase, the Portfolios forgo principal and interest paid on the mortgage securities sold. The Portfolios are compensated from negotiated fees paid by brokers offered as an inducement to the Portfolios to roll over their purchase commitments. These fees are recognized over the roll period and are included in Income from mortgage dollar rolls in the Statement of Operations. During the year ended December 31, 2008, Balanced Portfolio, Diversified Income Plus Portfolio, Income Portfolio, Bond Index Portfolio, Limited Maturity Bond Portfolio and Mortgage Securities Portfolio engaged in this type of transaction.
(M) Securities Lending — The Fund has entered into a Securities Lending Agreement (the “Agreement”) with Dresdner Bank AG (“Dresdner”). The Agreement authorizes Dresdner to lend securities to authorized borrowers on behalf of the Portfolios. Pursuant to the Agreement, all loaned securities are initially collateralized by cash equal to at least 102% of the value of the loaned securities. All cash collateral received is invested in Thrivent Financial Securities Lending Trust. The Portfolios receive dividends and interest that would have been earned on the securities loaned while simultaneously seeking to earn income on the investment of cash collateral. Amounts earned on investments in Thrivent Financial Securities Lending Trust, net of rebates, fees paid to Dresdner for services provided and any other securities lending expenses, are included in Income from securities loaned on the Statement of Operations. By investing any cash collateral it receives in these transactions, a Portfolio could realize additional gains or losses. If the borrower fails to return the securities or the invested collateral has declined in value, the Portfolio could lose money. As of December 31, 2008, all Portfolios except Aggressive Allocation Portfolio, Moderately Aggressive Allocation Portfolio, Moderate Allocation Portfolio, Moderately Conservative Allocation Portfolio, Partner Healthcare Portfolio, Partner Natural Resources Portfolio, Partner Emerging Markets Portfolio, Partner Utilities Portfolio, Partner Worldwide Allocation Portfolio, Partner Socially Responsible Stock Portfolio, Partner All Cap Growth Portfolio, Partner All Cap Value Portfolio, Equity Income Plus Portfolio, Partner Socially Responsible Bond Portfolio, Mortgage Securities Portfolio and Money Market Portfolio had securities on loan. The value of securities on loan is as follows:
Fund | Securities on Loan | ||
Technology | $ | 2,200,908 | |
Real Estate Securities | 28,467,442 | ||
Partner Small Cap Growth | 18,944,453 | ||
Partner Small Cap Value | 26,045,350 | ||
Small Cap Stock | 27,587,537 | ||
Small Cap Index | 42,738,246 | ||
Mid Cap Growth II | 5,334,559 | ||
Mid Cap Growth | 34,200,853 | ||
Partner Mid Cap Value | 4,612,488 | ||
Mid Cap Stock | 25,899,793 | ||
Mid Cap Index | 9,452,042 | ||
Partner International Stock | 13,085,780 | ||
Partner All Cap | 2,535,819 | ||
Large Cap Growth II | 208,373 | ||
Large Cap Growth | 22,253,096 | ||
Partner Growth Stock | 763,591 | ||
Large Cap Value | 11,734,660 | ||
Large Cap Stock | 8,856,603 | ||
Large Cap Index | 7,608,994 | ||
Balanced | 15,935,025 | ||
High Yield | 47,213,147 | ||
Diversified Income Plus | 1,581,045 | ||
Income | 36,286,679 | ||
Bond Index | 16,486,851 | ||
Limited Maturity Bond | 97,460,592 | ||
(N) When Issued and Delayed Delivery Transactions — Certain Portfolios may purchase or sell securities on a when-issued or delayed delivery basis. These transactions involve a commitment by a Portfolio to purchase or sell securities for a predetermined price or yield, with payment and delivery taking place beyond the customary settlement period. When delayed delivery purchases are outstanding, a Portfolio will designate liquid assets in an amount sufficient to meet the purchase price. When purchasing a security on a delayed delivery basis, a Portfolio assumes the rights and risks of ownership of the security, including the risk of price and yield fluctuations, and takes such fluctuations into account when determining its net asset value. A Portfolio may dispose of a delayed delivery transaction after it is entered into, and may sell when-issued securities before they are delivered, which may result in a capital gain or loss. When a Portfolio has sold a security on a delayed delivery basis, a Portfolio does not participate in future gains and losses with respect to the security.
287
Table of Contents
THRIVENT SERIES FUND, INC.
Notes to Financial Statements
As of December 31, 2008
(2) SIGNIFICANT ACCOUNTING POLICIES - continued
(O) Treasury Inflation Protected Securities — Certain Portfolios may invest in treasury inflation protected securities (TIPS). These securities are fixed income securities whose principal value is periodically adjusted to the rate of inflation. The interest rate is generally fixed at issuance. Interest is paid based on the principal value, which is adjusted for inflation. Generally, any increase or decrease in the principal amount will be included as taxable interest in the Statement of Operations and received upon maturity or sale of the security. During the year ended December 31, 2008, Diversified Income Plus Portfolio, Income Portfolio, Limited Maturity Bond Portfolio and Mortgage Securities Portfolio engaged in this type of investment.
(P) Repurchase Agreements — Each Portfolio may engage in repurchase agreement transactions in pursuit of its investment objective. A repurchase agreement consists of a purchase and a simultaneous agreement to resell an investment for later delivery at an agreed upon price and rate of interest. The Portfolio must take possession of collateral either directly or through a third-party custodian. If the original seller of a security subject to a repurchase agreement fails to repurchase the security at the agreed upon time, the Portfolio could incur a loss due to a drop in the market value of the security during the time it takes the Portfolio to either sell the security or take action to enforce the original seller’s agreement to repurchase the security. Also, if a defaulting original seller filed for bankruptcy or became insolvent, disposition of such security might be delayed by pending court action. The Portfolio may only enter into repurchase agreements with banks and other recognized financial institutions such as broker/dealers that are found by the Portfolios’ investment adviser (or a subadviser) to be creditworthy. During the year ended December 31, 2008, Mid Cap Stock Portfolio, Partner International Stock Portfolio, Large Cap Growth Portfolio, Large Cap Value Portfolio, High Yield Portfolio, Income Portfolio and Limited Maturity Bond Portfolio engaged in this type of investment.
(Q) Equity-Linked Structured Securities — Certain Portfolios may invest in equity-linked structured notes, which are debt securities that combine the characteristics of common stock and the sale of an option. The return component is based upon the performance of a single equity security, a basket of equity securities, or an equity index and the sale of an option which is recognized as income. There is no guaranteed return of principal with these securities. The appreciation potential of these securities may be limited by a maximum payment or call right and can be influenced by many unpredictable factors. During the year ended December 31, 2008, High Yield Portfolio, Diversified Income Plus Portfolio and Limited Maturity Bond Portfolio engaged in this type of investment.
(R) Credit Risk — The Portfolios may be susceptible to credit risk to the extent the issuer or counterparty defaults on its payment obligation. The Portfolios’ policy is to monitor the creditworthiness of the issuers. Interest receivables on defaulted securities are monitored for the ability to collect payments in default and adjusted accordingly.
(S) Accounting Estimates — The preparation of financial statements in conformity with accounting principles generally accepted in the United States of America require management to make estimates and assumptions that affect the reported amounts of assets and liabilities and disclosure of contingent assets and liabilities at the date of the financial statements and the reported amounts of income and expenses during the reporting period. Actual results could differ from those estimates.
(T) Temporary Guarantee Program — The Fund, on behalf of Thrivent Money Market Portfolio, was a participant in the U.S. Department of the Treasury’s Temporary Guarantee Program for Money Market Funds (the “Program”) during the Program’s initial phase from September 19, 2008 through December 18, 2008. The U.S. Treasury has extended the program until April 30, 2009, and the Fund, on behalf of the Portfolio, is a participant in the extended Program.
The Program continues to guarantee the share price of a fund held by shareholders as of September 19, 2008, at $1.00 per share. Persons who were not shareholders as of September 19, 2008 are not covered by the Program.
The guarantee under the Program would be triggered if a fund’s per share net asset value falls below $0.995 (a “Guarantee Event”) and the fund commences the process of liquidation. Under the terms of the Program, the U.S. Treasury guarantees payment to each eligible shareholder the difference between the amount received in liquidation and the amount that eligible shareholder would have received had the net asset value of the fund been $1.00 per share. If the number of shares held by the eligible shareholder in a participating fund fluctuates over the duration of the Program, the Program would cover the lesser of (i) the number of shares held by the eligible shareholder in the fund as of September 19, 2008, or (ii) the number of shares held by the eligible shareholder as of the date of the Guarantee Event.
To participate in the initial phase of the Program, Thrivent Money Market Portfolio was required to pay an initial participation fee in the amount of 0.01% of the total net assets of the Portfolio as of September 19, 2008. To participate in the extension of the Program, the Portfolio was required to pay a participation fee of 0.015% of the total net assets of the Portfolio as of September 19, 2008.
288
Table of Contents
THRIVENT SERIES FUND, INC.
Notes to Financial Statements
As of December 31, 2008
(2) SIGNIFICANT ACCOUNTING POLICIES - continued
(U) Loan Commitments — Certain Portfolios may enter into loan commitments, which generally have interest rates which are reset daily, monthly, quarterly or semi-annually by reference to a base lending rate, plus a premium. These base rates are primarily the London-Interbank Offered Rate (“LIBOR”), and secondarily the prime rate offered by one or more major United States banks (the “Prime Rate”) and the certificate of deposit (“CD”) rate or other base lending rates used by commercial lenders. Loan commitments often require prepayments from excess cash flows or allow the borrower to repay at its election. The rate at which the borrower repays cannot be predicted with accuracy. Therefore, the remaining maturity may be considerably less than the stated maturity shown in the Schedule of Investments.
All or a portion of these loan commitments may be unfunded. The Portfolio is obligated to fund these commitments at the borrower’s discretion. Therefore, the Portfolio must have funds sufficient to cover its contractual obligation. These unfunded loan commitments, which are marked to market daily, are presented in the Schedule of Investments.
(V) Recent Accounting Pronouncements — In March 2008, the FASB issued Statement of Financial Accounting Standards No. 161 – Disclosures about Derivative Instruments and Hedging Activities: An Amendment of FASB Statement No. 133 (“FAS 161”). FAS 161 is intended to improve financial reporting for derivative instruments by requiring enhanced disclosure that enables investors to understand how and why an entity uses derivatives, how derivatives are accounted for and how derivative instruments affect an entity’s results of operations and financial position. The provisions are effective for fiscal years and interim periods beginning after November 15, 2008. Management of the Fund is currently evaluating the impact that FAS 161 will have on the Fund’s financial statements.
(W) Other — For financial statement purposes, investment security transactions are accounted for on the trade date. Realized gains and losses from investment transactions are determined on a specific cost identification basis, which is the same basis used for federal income tax purposes.
289
Table of Contents
THRIVENT SERIES FUND, INC.
Notes to Financial Statements
As of December 31, 2008
(3) FEES AND COMPENSATION PAID TO AFFILIATES
(A) Investment Advisory Fees — Each Portfolio pays Thrivent Financial, the Fund’s investment adviser, a fee for its advisory services. The fees are accrued daily and paid monthly. The annual rates of fees as a percent of average daily net assets were as follows:
Portfolio (M - Millions) | $0 to $50M | $50 to $200M | $200 to $250M | $250 to $500M | $500 to $750M | $750 to $1,000M | $1,000 to $1,500M | $1,500 to $2,000M | $2,000 to $2,500M | $2,500 to $5,000M | Over $5,000M | ||||||||||||||||||||||
Aggressive Allocation Portfolio | 0.150 | % | 0.150 | % | 0.150 | % | 0.150 | % | 0.125 | % | 0.125 | % | 0.125 | % | 0.125 | % | 0.125 | % | 0.125 | % | 0.125 | % | |||||||||||
Moderately Aggressive Allocation Portfolio | 0.150 | % | 0.150 | % | 0.150 | % | 0.150 | % | 0.125 | % | 0.125 | % | 0.125 | % | 0.125 | % | 0.125 | % | 0.125 | % | 0.125 | % | |||||||||||
Moderate Allocation Portfolio | 0.150 | % | 0.150 | % | 0.150 | % | 0.150 | % | 0.125 | % | 0.125 | % | 0.125 | % | 0.125 | % | 0.125 | % | 0.125 | % | 0.125 | % | |||||||||||
Moderately Conservative Allocation Portfolio | 0.150 | % | 0.150 | % | 0.150 | % | 0.150 | % | 0.125 | % | 0.125 | % | 0.125 | % | 0.125 | % | 0.125 | % | 0.125 | % | 0.125 | % | |||||||||||
Technology Portfolio | 0.750 | % | 0.750 | % | 0.750 | % | 0.750 | % | 0.750 | % | 0.750 | % | 0.750 | % | 0.750 | % | 0.750 | % | 0.750 | % | 0.750 | % | |||||||||||
Partner Healthcare Portfolio | 0.950 | % | 0.900 | % | 0.900 | % | 0.900 | % | 0.900 | % | 0.900 | % | 0.900 | % | 0.900 | % | 0.900 | % | 0.900 | % | 0.900 | % | |||||||||||
Partner Natural Resources Portfolio | 0.750 | % | 0.725 | % | 0.725 | % | 0.725 | % | 0.725 | % | 0.725 | % | 0.725 | % | 0.725 | % | 0.725 | % | 0.725 | % | 0.725 | % | |||||||||||
Partner Emerging Markets Portfolio | 1.200 | % | 1.070 | % | 1.070 | % | 1.070 | % | 1.070 | % | 1.070 | % | 1.070 | % | 1.070 | % | 1.070 | % | 1.070 | % | 1.070 | % | |||||||||||
Real Estate Securities Portfolio | 0.800 | % | 0.800 | % | 0.800 | % | 0.800 | % | 0.750 | % | 0.750 | % | 0.750 | % | 0.750 | % | 0.750 | % | 0.750 | % | 0.750 | % | |||||||||||
Partner Utilities Portfolio | 0.750 | % | 0.725 | % | 0.725 | % | 0.725 | % | 0.725 | % | 0.725 | % | 0.725 | % | 0.725 | % | 0.725 | % | 0.725 | % | 0.725 | % | |||||||||||
Partner Small Cap Growth Portfolio | 1.000 | % | 1.000 | % | 1.000 | % | 1.000 | % | 0.900 | % | 0.900 | % | 0.900 | % | 0.900 | % | 0.900 | % | 0.900 | % | 0.900 | % | |||||||||||
Partner Small Cap Value Portfolio | 0.800 | % | 0.800 | % | 0.800 | % | 0.800 | % | 0.800 | % | 0.800 | % | 0.800 | % | 0.800 | % | 0.800 | % | 0.800 | % | 0.800 | % | |||||||||||
Small Cap Stock Portfolio | 0.700 | % | 0.700 | % | 0.650 | % | 0.650 | % | 0.650 | % | 0.650 | % | 0.600 | % | 0.600 | % | 0.600 | % | 0.550 | % | 0.525 | % | |||||||||||
Small Cap Index Portfolio | 0.350 | % | 0.350 | % | 0.350 | % | 0.300 | % | 0.250 | % | 0.250 | % | 0.200 | % | 0.150 | % | 0.100 | % | 0.100 | % | 0.100 | % | |||||||||||
Mid Cap Growth Portfolio II | 0.900 | % | 0.900 | % | 0.900 | % | 0.900 | % | 0.800 | % | 0.800 | % | 0.800 | % | 0.800 | % | 0.800 | % | 0.800 | % | 0.800 | % | |||||||||||
Mid Cap Growth Portfolio | 0.400 | % | 0.400 | % | 0.400 | % | 0.400 | % | 0.400 | % | 0.400 | % | 0.400 | % | 0.400 | % | 0.400 | % | 0.400 | % | 0.400 | % | |||||||||||
Partner Mid Cap Value Portfolio | 0.750 | % | 0.750 | % | 0.750 | % | 0.700 | % | 0.700 | % | 0.700 | % | 0.700 | % | 0.700 | % | 0.700 | % | 0.700 | % | 0.700 | % | |||||||||||
Mid Cap Stock Portfolio | 0.700 | % | 0.700 | % | 0.650 | % | 0.650 | % | 0.650 | % | 0.650 | % | 0.600 | % | 0.600 | % | 0.600 | % | 0.550 | % | 0.525 | % | |||||||||||
Mid Cap Index Portfolio | 0.350 | % | 0.350 | % | 0.350 | % | 0.300 | % | 0.250 | % | 0.250 | % | 0.200 | % | 0.150 | % | 0.100 | % | 0.100 | % | 0.100 | % | |||||||||||
Partner Worldwide Allocation Portfolio | 0.900 | % | 0.900 | % | 0.900 | % | 0.850 | % | 0.850 | % | 0.850 | % | 0.850 | % | 0.850 | % | 0.850 | % | 0.850 | % | 0.850 | % | |||||||||||
Partner International Stock Portfolio | 0.850 | % | 0.850 | % | 0.850 | % | 0.850 | % | 0.800 | % | 0.800 | % | 0.750 | % | 0.700 | % | 0.700 | % | 0.700 | % | 0.700 | % | |||||||||||
Partner Socially Responsible Stock Portfolio | 0.800 | % | 0.775 | % | 0.775 | % | 0.775 | % | 0.775 | % | 0.775 | % | 0.775 | % | 0.775 | % | 0.775 | % | 0.775 | % | 0.775 | % | |||||||||||
Partner All Cap Growth Portfolio | 0.950 | % | 0.950 | % | 0.950 | % | 0.900 | % | 0.900 | % | 0.900 | % | 0.900 | % | 0.900 | % | 0.900 | % | 0.900 | % | 0.900 | % | |||||||||||
Partner All Cap Value Portfolio | 0.750 | % | 0.700 | % | 0.700 | % | 0.700 | % | 0.700 | % | 0.700 | % | 0.700 | % | 0.700 | % | 0.700 | % | 0.700 | % | 0.700 | % | |||||||||||
Partner All Cap Portfolio | 0.950 | % | 0.950 | % | 0.950 | % | 0.950 | % | 0.900 | % | 0.900 | % | 0.900 | % | 0.900 | % | 0.900 | % | 0.900 | % | 0.900 | % | |||||||||||
Large Cap Growth Portfolio II | 0.800 | % | 0.800 | % | 0.800 | % | 0.800 | % | 0.700 | % | 0.700 | % | 0.700 | % | 0.700 | % | 0.700 | % | 0.700 | % | 0.700 | % | |||||||||||
Large Cap Growth Portfolio | 0.400 | % | 0.400 | % | 0.400 | % | 0.400 | % | 0.400 | % | 0.400 | % | 0.400 | % | 0.400 | % | 0.400 | % | 0.400 | % | 0.400 | % | |||||||||||
Partner Growth Stock Portfolio | 0.800 | % | 0.800 | % | 0.800 | % | 0.800 | % | 0.700 | % | 0.700 | % | 0.700 | % | 0.700 | % | 0.700 | % | 0.700 | % | 0.700 | % | |||||||||||
Large Cap Value Portfolio | 0.600 | % | 0.600 | % | 0.600 | % | 0.600 | % | 0.600 | % | 0.600 | % | 0.600 | % | 0.600 | % | 0.600 | % | 0.600 | % | 0.600 | % | |||||||||||
Large Cap Stock Portfolio | 0.650 | % | 0.650 | % | 0.650 | % | 0.650 | % | 0.575 | % | 0.550 | % | 0.475 | % | 0.475 | % | 0.475 | % | 0.450 | % | 0.425 | % | |||||||||||
Large Cap Index Portfolio | 0.350 | % | 0.350 | % | 0.350 | % | 0.300 | % | 0.250 | % | 0.250 | % | 0.200 | % | 0.150 | % | 0.100 | % | 0.100 | % | 0.100 | % | |||||||||||
Equity Income Plus Portfolio | 0.650 | % | 0.650 | % | 0.650 | % | 0.600 | % | 0.600 | % | 0.600 | % | 0.600 | % | 0.600 | % | 0.600 | % | 0.600 | % | 0.600 | % | |||||||||||
Balanced Portfolio | 0.350 | % | 0.350 | % | 0.350 | % | 0.300 | % | 0.300 | % | 0.300 | % | 0.300 | % | 0.300 | % | 0.300 | % | 0.300 | % | 0.300 | % | |||||||||||
High Yield Portfolio | 0.400 | % | 0.400 | % | 0.400 | % | 0.400 | % | 0.400 | % | 0.400 | % | 0.400 | % | 0.400 | % | 0.400 | % | 0.400 | % | 0.400 | % | |||||||||||
Diversified Income Plus Portfolio | 0.400 | % | 0.400 | % | 0.400 | % | 0.400 | % | 0.400 | % | 0.400 | % | 0.400 | % | 0.400 | % | 0.400 | % | 0.400 | % | 0.400 | % |
290
Table of Contents
THRIVENT SERIES FUND, INC.
Notes to Financial Statements
As of December 31, 2008
(3) FEES AND COMPENSATION PAID TO AFFILIATES - continued
Portfolio (M - Millions) | $0 to $50M | $50 to $200M | $200 to $250M | $250 to $500M | $500 to $750M | $750 to $1,000M | $1,000 to $1,500M | $1,500 to $2,000M | $2,000 to $2,500M | $2,500 to $5,000M | Over $5,000M | ||||||||||||||||||||||
Partner Socially Responsible Bond Portfolio | 0.700 | % | 0.675 | % | 0.675 | % | 0.675 | % | 0.675 | % | 0.675 | % | 0.675 | % | 0.675 | % | 0.675 | % | 0.675 | % | 0.675 | % | |||||||||||
Income Portfolio | 0.400 | % | 0.400 | % | 0.400 | % | 0.400 | % | 0.400 | % | 0.400 | % | 0.400 | % | 0.400 | % | 0.400 | % | 0.400 | % | 0.400 | % | |||||||||||
Bond Index Portfolio | 0.350 | % | 0.350 | % | 0.350 | % | 0.300 | % | 0.250 | % | 0.250 | % | 0.200 | % | 0.150 | % | 0.100 | % | 0.100 | % | 0.100 | % | |||||||||||
Limited Maturity Bond Portfolio | 0.400 | % | 0.400 | % | 0.400 | % | 0.400 | % | 0.400 | % | 0.400 | % | 0.400 | % | 0.400 | % | 0.400 | % | 0.400 | % | 0.400 | % | |||||||||||
Mortgage Securities Portfolio | 0.500 | % | 0.500 | % | 0.500 | % | 0.500 | % | 0.500 | % | 0.500 | % | 0.500 | % | 0.500 | % | 0.500 | % | 0.500 | % | 0.500 | % | |||||||||||
Money Market Portfolio | 0.400 | % | 0.400 | % | 0.400 | % | 0.400 | % | 0.400 | % | 0.400 | % | 0.400 | % | 0.400 | % | 0.400 | % | 0.400 | % | 0.400 | % |
The following subadvisory fees are charged as part of the total investment advisory fees stated in the table above. The subadvisory fees are borne directly by the Adviser and do not increase the overall fees paid by the Portfolio.
Partner Healthcare Portfolio
The Adviser has entered into a subadvisory agreement with Sectoral Asset Management, Inc. for the performance of subadvisory services. The fee payable is equal to 0.65% of the first $50 million of average daily net assets, 0.60% of the next $50 million, 0.40% of the next $150 million and 0.35% of average daily net assets over $250 million.
Partner Natural Resources Portfolio
The Adviser has entered into a subadvisory agreement with BlackRock Investment Management, LLC (“BlackRock”) for the performance of subadvisory services. The fee payable is equal to 0.45% of the first $50 million of average daily net assets, 0.425% of the next $50 million, 0.40% of the next $150 million and 0.375% of average daily net assets over $250 million. Thrivent Partner Utilities Portfolio is included in determining breakpoints for the assets managed by BlackRock.
Partner Emerging Markets Portfolio
The Adviser has entered into a subadvisory agreement with Aberdeen Asset Management Investment Services Limited (“Aberdeen”) for the performance of subadvisory services. The fee payable is equal to 0.85% of the first $50 million of average daily net assets, 0.72% of the next $50 million and 0.68% of average daily net assets over $100 million. Thrivent Partner Worldwide Allocation Portfolio and Thrivent Partner Worldwide Allocation Fund are included in determining breakpoints for the assets managed by Aberdeen.
Partner Utilities Portfolio
The Adviser has entered into a subadvisory agreement with BlackRock for the performance of subadvisory services. The fee payable is equal to 0.45% of the first $50 million of average daily net assets, 0.425% of the next $50 million, 0.40% of the next $150 million and 0.375% of average daily net assets over $250 million. Thrivent Partner Natural Resources Portfolio is included in determining breakpoints for the assets managed by BlackRock.
Partner Small Cap Growth Portfolio
The Adviser paid Transamerica Investment Management, LLC (“Transamerica”) an annual subadvisory fee for the performance of subadvisory services until the termination of the subadvisory agreement on April 30, 2008. The fee payable was equal to 0.50% of average daily net assets.
The Adviser has entered into a subadvisory agreement with Turner Investment Partners, Inc. (“Turner”) for the performance of subadvisory services. The fee payable is equal to 0.65% of the first $100 million of average daily net assets and 0.60% of average daily net assets over $100 million. Thrivent Partner Small Cap Growth Fund is included in determining breakpoints for the assets managed by Turner.
Partner Small Cap Value Portfolio
The Adviser has entered into a subadvisory agreement with T. Rowe Price Associates, Inc. for the performance of subadvisory services. The fee payable is equal to 0.60% of average daily net assets.
Partner Mid Cap Value Portfolio
The Adviser has entered into a subadvisory agreement with Goldman Sachs Asset Management, LP (“GSAM”) for the performance of subadvisory services. The fee payable is equal to 0.50% of average daily net assets for the first $250 million and 0.45% for assets over $250 million. Thrivent Partner Mid Cap Value Fund is included in determining breakpoints for the assets managed by GSAM.
Partner Worldwide Allocation Portfolio
The Adviser has entered into subadvisory agreements with Mercator Asset Management, LP (“Mercator”), Principal Global Investors, LLC (“Principal”), Aberdeen, Victory Capital Management, Inc. (“Victory”) and GSAM for the performance of subadvisory services.
The fee payable for Mercator is equal to 0.75% of the first $25 million of average daily net assets managed by Mercator, 0.60% of the next $25 million, 0.55% of the next $25 million, 0.50% of the next $225 million, 0.40% of the next $200 million and 0.20% of average daily net assets over $500 million. Thrivent Partner Worldwide Allocation Fund, Thrivent Partner International Stock Portfolio and Thrivent Partner International Stock Fund are included in determining breakpoints for the assets managed by Mercator.
291
Table of Contents
THRIVENT SERIES FUND, INC.
Notes to Financial Statements
As of December 31, 2008
(3) FEES AND COMPENSATION PAID TO AFFILIATES - continued
The fee payable for Principal is equal to 0.35% of the first $500 million of average daily net assets managed by Principal, 0.30% of the next $500 million and 0.25% of average daily net assets over $1 billion. Thrivent Partner Worldwide Allocation Fund, Thrivent Partner International Stock Portfolio and Thrivent Partner International Stock Fund are included in determining breakpoints for the assets managed by Principal.
The fee payable for Aberdeen is equal to 0.85% of the first $50 million of average daily net assets managed by Aberdeen, 0.72% of the next $50 million and 0.68% of average daily net assets over $100 million. Thrivent Partner Emerging Markets Portfolio and Partner Worldwide Allocation Fund are included in determining breakpoints for the assets managed by Aberdeen.
The fee payable for Victory is equal to 0.95% of the first $25 million of average daily net assets managed by Victory, 0.85% of the next $75 million and 0.80% of average daily net assets over $100 million. Thrivent Partner Worldwide Allocation Fund is included in determining breakpoints for the assets managed by Victory.
The fee payable for GSAM is equal to 0.55% of the first $50 million of average daily net assets managed by GSAM, 0.50% of the next $200 million and 0.45% of average daily net assets over $250 million. Thrivent Partner Worldwide Allocation Fund is included in determining breakpoints for the assets managed by GSAM.
Partner International Stock Portfolio
The Adviser has entered into subadvisory agreements with Principal and Mercator for the performance of subadvisory services.
The fee payable for Mercator is equal to 0.75% of the first $25 million of average daily net assets managed by Mercator, 0.60% of the next $25 million, 0.55% of the next $25 million, 0.50% of the next $225 million, 0.40% of the next $200 million and 0.20% of average daily net assets over $500 million. Thrivent Partner International Stock Fund, Thrivent Partner Worldwide Allocation Portfolio and Thrivent Partner Worldwide Allocation Fund are included in determining breakpoints for the assets managed by Mercator.
The fee payable for Principal is equal to 0.35% of the first $500 million of average daily net assets managed by Principal, 0.30% of the next $500 million and 0.25% of average daily net assets over $1 billion. Thrivent Partner International Stock Fund, Thrivent Partner Worldwide Allocation Portfolio and Thrivent Partner Worldwide Allocation Fund are included in determining breakpoints for the assets managed by Principal.
Partner Socially Responsible Stock Portfolio
The Adviser has entered into a subadvisory agreement with Calvert Asset Management Company, Inc. (“Calvert”) for the performance of subadvisory services. The fee payable is equal to 0.50% of average daily net assets for the first $50 million, 0.475% for the next $50 million, 0.45% for the next $50 million, 0.425% of the next $100 million and 0.40% for assets over $250 million.
Partner All Cap Growth Portfolio
The Adviser has entered into a subadvisory agreement with Calamos Advisors LLC for the performance of subadvisory services. The fee payable is equal to 0.65% of average daily net assets.
Partner All Cap Value Portfolio
The Adviser has entered into a subadvisory agreement with OppenheimerFunds, Inc. for the performance of subadvisory services. The fee payable is equal to 0.45% of the first $50 million of average daily net assets, 0.40% of the next $200 million and 0.35% of average daily net assets over $250 million.
Partner All Cap Portfolio
The Adviser has entered into a subadvisory agreement with Pyramis Global Advisors, LLC (“Pyramis Advisors”) for the performance of subadvisory services. Pyramis Advisors is a wholly owned subsidiary of Fidelity Management & Research Corporation. The fee payable is equal to 0.60% of average daily net assets for the first $100 million, 0.55% for the next $400 million, 0.50% for the next $250 million and 0.45% for assets over $750 million.
Partner Growth Stock Portfolio
The Adviser has entered into a subadvisory agreement with T. Rowe Price Associates, Inc. for the performance of subadvisory services. The fee payable is equal to 0.40% of average daily net assets for the first $500 million and 0.35% for assets over $500 million.
Partner Socially Responsible Bond Portfolio
The Adviser has entered into a subadvisory agreement with Calvert for the performance of subadvisory services. The fee payable is equal to 0.40% of average daily net assets for the first $50 million, 0.375% for the next $50 million, 0.35% for the next $50 million, 0.325% of the next $100 million and 0.30% for assets over $250 million.
292
Table of Contents
THRIVENT SERIES FUND, INC.
Notes to Financial Statements
As of December 31, 2008
(3) FEES AND COMPENSATION PAID TO AFFILIATES - continued
As of December 31, 2008, the following voluntary expense reimbursements, as a percentage of net assets, were in effect:
Portfolio | Expense Reimbursement | Expiration Date | |||
Partner Small Cap Growth | 0.10 | % | N/A | ||
Mid Cap Growth II | 0.50 | % | N/A | ||
Partner International Stock | 0.06 | % | N/A | ||
Partner All Cap | 0.20 | % | N/A | ||
Large Cap Growth II | 0.40 | % | N/A | ||
Partner Growth Stock | 0.10 | % | N/A | ||
Money Market | 0.10 | % | N/A |
As of December 31, 2008, contractual expense reimbursements to limit expenses to the following percentages were in effect:
Portfolio | Expense Limit | Expiration Date | |||
Partner Healthcare | 1.39 | % | 4/30/2009 | ||
Partner Natural Resources | 1.19 | % | 4/30/2009 | ||
Partner Emerging Markets | 1.50 | % | 4/30/2009 | ||
Partner Utilities | 0.90 | % | 4/30/2009 | ||
Partner Worldwide Allocation | 1.00 | % | 4/30/2009 | ||
Partner Socially Responsible Stock | 0.98 | % | 4/30/2009 | ||
Partner All Cap Growth | 1.00 | % | 4/30/2009 | ||
Partner All Cap Value | 0.98 | % | 4/30/2009 | ||
Equity Income Plus | 0.85 | % | 4/30/2009 | ||
Partner Socially Responsible Bond | 0.68 | % | 4/30/2009 |
Each equity, hybrid and fixed income Portfolio may invest in Money Market Portfolio, subject to certain limitations. During the year or period ended December 31, 2008, all the Portfolios invested in Money Market Portfolio. These related-party transactions are subject to the same terms as non-related party transactions except that, to avoid duplicate investment advisory fees, Thrivent Financial reimburses an amount equal to the smaller of the amount of the advisory fee for that Portfolio or the amount of the advisory fee which is charged to the Portfolio for its investment in Money Market Portfolio.
(B) Other Expenses — The Fund has entered into an agreement with the Adviser to provide accounting personnel and services. For the year ended December 31, 2008, the Adviser received aggregate fees for accounting personnel and services of $1,517,680 from the Fund.
The Fund has entered into an agreement with the Adviser to provide certain administrative personnel and services. For the year ended December 31, 2008, the Adviser received aggregate fees for administrative personnel and services of $5,291,045 from the Fund.
Each Director is eligible to participate in a deferred compensation plan with respect to fees received from the Fund. Participants in the plan may designate their deferred Director’s fees as if invested in any one of the portfolios of Thrivent Mutual Funds. The value of each Director’s deferred compensation account will increase or decrease as if it were invested in shares of the selected portfolios of Thrivent Mutual Funds. The deferred fees remain in the appropriate fund until distribution in accordance with the plan. The eferred fee liability is an unsecured liability.
Those Directors not participating in the above plan received $237,550 in fees from the Fund for the year ended December 31, 2008. No remuneration has been paid by the Fund to any of the officers or affiliated Directors of the Fund. In addition, the Fund reimbursed unaffiliated Directors for reasonable expenses incurred in relation to attendance at the meetings and industry conferences.
Certain officers and non-independent directors of the Fund are officers and directors of Thrivent Financial and Thrivent Life; however, they receive no compensation from the Fund.
(C) Indirect Expenses — Some Portfolios invest in other mutual funds. Fees and expenses of those underlying funds are not included in the Portfolio’s expense ratio. The Portfolio indirectly bears its proportionate share of the annualized weighted average expense ratio for the underlying funds in which it invests.
(4) OTHER TRANSACTIONS WITH AFFILIATES
On September 15, 2008, the Adviser purchased $1,750,000 of Thrivent Money Market Fund’s securities. The Fund realized a loss of $3,250,000 for the difference between the amortized cost of the securities and the market value as of that date, but at the same time also recognized a loss recovery in the same amount. In the accompanying Statement of Operations, the loss is reflected in “Net realized gains/(losses) on Investments,” and the loss recovery is reflected in “Net increase from payments by affiliate.” There was no impact to the total return as a result of these payments.
(5) TAX INFORMATION
Distributions are based on amounts calculated in accordance with the applicable federal income tax regulations, which may differ from accounting principles generally accepted in the United States of America. To the extent that these differences are permanent in nature, such amounts are reclassified within the capital accounts based on their federal tax-basis treatment; temporary differences do not require reclassifications.
293
Table of Contents
THRIVENT SERIES FUND, INC.
Notes to Financial Statements
As of December 31, 2008
(5) TAX INFORMATION - continued
On the Statement of Assets and Liabilities, as a result of permanent book-to-tax differences, reclassification adjustments were made as follows [Increase (Decrease)]:
Portfolio | Accumulated Net Investment Income/(Loss) | Accumulated Net Realized Gain/(Loss) | Capital Stock | |||||||||
Aggressive Allocation | $ | 7,252,035 | $ | 20,774,188 | $ | (28,026,223 | ) | |||||
Moderately Aggressive Allocation | 22,565,085 | 67,790,069 | (90,355,154 | ) | ||||||||
Moderate Allocation | 20,638,096 | 71,376,487 | (92,014,583 | ) | ||||||||
Moderately Conservative Allocation | 4,334,610 | 15,940,576 | (20,275,186 | ) | ||||||||
Technology | 5,250 | 13,398 | (18,648 | ) | ||||||||
Partner Healthcare | 9,681 | (9,681 | ) | — | ||||||||
Partner Natural Resources | (3,423 | ) | 3,423 | — | ||||||||
Partner Emerging Markets | (11,656 | ) | 11,656 | — | ||||||||
Real Estate Securities | (71,645 | ) | 71,645 | — | ||||||||
Partner Utilities | (5,823 | ) | 7,137 | (1,314 | ) | |||||||
Partner Small Cap Value | (346,690 | ) | 346,690 | — | ||||||||
Small Cap Stock | (487,350 | ) | 487,350 | — | ||||||||
Small Cap Index | (773,320 | ) | 773,320 | — | ||||||||
Mid Cap Growth II | 10,894 | (10,116 | ) | (778 | ) | |||||||
Mid Cap Growth | 226,285 | (210,149 | ) | (16,136 | ) | |||||||
Partner Mid Cap Value | (192,489 | ) | 192,489 | — | ||||||||
Mid Cap Stock | (140,259 | ) | 140,259 | — | ||||||||
Mid Cap Index | (253,835 | ) | 254,735 | (900 | ) | |||||||
Partner Worldwide Allocation | (210,483 | ) | 210,483 | — | ||||||||
Partner International Stock | 3,262,113 | (3,262,113 | ) | — | ||||||||
Partner All Cap Growth | 3,003 | — | (3,003 | ) | ||||||||
Partner All Cap Value | 9,060 | (9,060 | ) | — | ||||||||
Large Cap Growth II | 5,132 | (4,652 | ) | (480 | ) | |||||||
Large Cap Growth | 319,803 | (287,313 | ) | (32,490 | ) | |||||||
Partner Growth Stock | (108,121 | ) | 108,121 | — | ||||||||
Large Cap Value | (5,271 | ) | 5,271 | — | ||||||||
Large Cap Stock | (19,235 | ) | 807,054 | (787,819 | ) | |||||||
Large Cap Index | (253,347 | ) | 253,347 | — | ||||||||
Equity Income Plus | (79 | ) | 79 | — | ||||||||
Balanced | (50,521 | ) | 50,521 | — | ||||||||
High Yield | 1,049,294 | 7,831,279 | (8,880,573 | ) | ||||||||
Diversified Income Plus | 42,637 | 1,486,310 | (1,528,947 | ) | ||||||||
Partner Socially Responsible Bond | (8,875 | ) | 8,875 | — | ||||||||
Income | 1,236,769 | (1,236,769 | ) | — | ||||||||
Bond Index | 87,901 | (87,901 | ) | — | ||||||||
Limited Maturity Bond | 1,132,620 | (1,132,620 | ) | — | ||||||||
Mortgage Securities | (58,510 | ) | 58,510 | — | ||||||||
At December 31, 2008, the components of distributable earnings on a tax basis were as follows:
Portfolio | Undistributed Ordinary Income | Undistributed Long-Term Capital Gain | ||||
Aggressive Allocation | $ | 18,475,748 | $ | 27,879,365 | ||
Moderately Aggressive Allocation | 78,090,007 | 75,451,755 | ||||
Moderate Allocation | 103,633,656 | 66,988,445 | ||||
Moderately Conservative Allocation | 36,826,443 | 15,747,741 | ||||
Partner Healthcare | 1,353 | — | ||||
Partner Emerging Markets | 666 | — | ||||
Partner Small Cap Growth | 111,079 | — | ||||
Partner Small Cap Value | 402,209 | 144,591 | ||||
Small Cap Stock | 589,106 | — | ||||
Small Cap Index | 3,644,037 | 31,401,932 | ||||
Mid Cap Growth II | 229 | — | ||||
Mid Cap Growth | 21,500 | — | ||||
Partner Mid Cap Value | 275,828 | — | ||||
Mid Cap Stock | 263,581 | — | ||||
Mid Cap Index | 1,519,774 | 4,748,476 | ||||
Partner Worldwide Allocation | 54,934 | — | ||||
Partner International Stock | 1,275,782 | — | ||||
Partner Socially Responsible Stock | 89 | — | ||||
Partner All Cap Value | 819 | — | ||||
Partner All Cap | 744,537 | — | ||||
Large Cap Growth II | 4,141 | — | ||||
Large Cap Growth | 256,755 | — | ||||
Partner Growth Stock | 168,813 | — | ||||
Large Cap Value | 380,128 | — | ||||
Large Cap Stock | 230,716 | — | ||||
Large Cap Index | 9,602,608 | 17,224,089 | ||||
Balanced | 11,715,502 | 4,137,168 | ||||
High Yield | 749,442 | — | ||||
Diversified Income Plus | 5,981,148 | — | ||||
Partner Socially Responsible Bond | 73,480 | 138,583 | ||||
Income | 702,576 | — | ||||
Bond Index | 23,316 | — | ||||
Limited Maturity Bond | 581,044 | — | ||||
Mortgage Securities | 4,415 | — | ||||
Money Market | 59,294 | — | ||||
At December 31, 2008, the following Portfolios had accumulated net realized capital loss carryovers expiring as follows:
Portfolio | Capital Loss Carryover | Expiration Year | |||
Technology | $ | 11,378,393 | 2016 | ||
| $ | 11,378,393 | ||||
Partner Healthcare | 63,868 | 2016 | |||
| $ | 63,868 | ||||
294
Table of Contents
THRIVENT SERIES FUND, INC.
Notes to Financial Statements
As of December 31, 2008
(5) TAX INFORMATION - continued
Portfolio | Capital Loss Carryover | Expiration Year | |||
Partner Natural Resources | 19,375 | 2016 | |||
| $ | 19,375 | ||||
Partner Emerging Markets | 63,274 | 2016 | |||
| $ | 63,274 | ||||
Real Estate Securities | 8,026,304 | 2016 | |||
| $ | 8,026,304 | ||||
Partner Utilities | 375,164 | 2016 | |||
| $ | 375,164 | ||||
Partner Small Cap Growth | 34,011,452 | 2016 | |||
| $ | 34,011,452 | ||||
Small Cap Stock | 60,120,995 | 2016 | |||
| $ | 60,120,995 | ||||
Mid Cap Growth II | 966,671 | 2016 | |||
| $ | 966,671 | ||||
Mid Cap Growth | 22,824,794 | 2009 | |||
| 10,809,135 | 2010 | ||||
| 249,951 | 2016 | ||||
| $ | 33,883,880 | ||||
Partner Mid Cap Value | 16,998,457 | 2016 | |||
| $ | 16,998,457 | ||||
Mid Cap Stock | 90,742,741 | 2016 | |||
| $ | 90,742,741 | ||||
Partner Worldwide Allocation | 8,058,363 | 2016 | |||
| $ | 8,058,363 | ||||
Partner International Stock | 9,506,834 | 2009 | |||
| 2,858,197 | 2010 | ||||
| 103,512,698 | 2016 | ||||
| $ | 115,877,729 | ||||
Partner Socially Responsible Stock | 99,213 | 2016 | |||
| $ | 99,213 | ||||
Partner All Cap Growth | 536,343 | 2016 | |||
| $ | 536,343 | ||||
Partner All Cap Value | 499,435 | 2016 | |||
| $ | 499,435 | ||||
Partner All Cap | 12,922,307 | 2016 | |||
| $ | 12,922,307 | ||||
Large Cap Growth II | 1,622,617 | 2016 | |||
| $ | 1,622,617 | ||||
Large Cap Growth | 790,945 | 2009 | |||
| 724,404,403 | 2010 | ||||
| 198,356,425 | 2011 | ||||
| 163,972,971 | 2016 | ||||
| $ | 1,087,524,744 | ||||
Partner Growth Stock | 1,995,784 | 2016 | |||
| $ | 1,995,784 | ||||
Large Cap Value | 71,155,534 | 2016 | |||
| $ | 71,155,534 | ||||
Large Cap Stock | 94,278,931 | 2016 | |||
| $ | 94,278,931 | ||||
Equity Income Plus | 5,806,753 | 2016 | |||
| $ | 5,806,753 | ||||
High Yield | 288,927,133 | 2009 | |||
| 184,350,285 | 2010 | ||||
| 364,926,135 | 2011 | ||||
| 30,516,064 | 2012 | ||||
| 10,993,224 | 2013 | ||||
| 560,014 | 2014 | ||||
| 42,742,264 | 2016 | ||||
| $ | 923,015,119 | ||||
Diversified Income Plus | 3,470,883 | 2009 | |||
| 2,850,377 | 2010 | ||||
| 9,888,171 | 2016 | ||||
| $ | 16,209,431 | ||||
Income | 2,082,528 | 2014 | |||
| 39,514,415 | 2016 | ||||
| $ | 41,596,943 | ||||
Bond Index | 3,724,141 | 2014 | |||
| 103,719 | 2015 | ||||
| $ | 3,827,860 | ||||
Limited Maturity Bond | 2,108,299 | 2013 | |||
| 1,181,750 | 2014 | ||||
| 1,010,934 | 2015 | ||||
| 10,244,655 | 2016 | ||||
| $ | 14,545,638 | ||||
Mortgage Securities | 890,110 | 2014 | |||
| $ | 890,110 | ||||
Money Market | 3,442 | 2015 | |||
| 30,902 | 2016 | ||||
| $ | 34,344 | ||||
To the extent that these Portfolios realize future net capital gains, taxable distributions will be reduced by any unused capital loss carryovers as permitted by the Internal Revenue Code.
The following capital loss carryovers were utilized during 2008: Bond Index Portfolio, $1,675,164; and Mortgage Securities Portfolio, $988,556. In addition, the following capital loss carryovers expired during the fiscal year 2008: High Yield Portfolio, $8,880,573; Diversified Income Plus Portfolio, $1,527,875.
295
Table of Contents
THRIVENT SERIES FUND, INC.
Notes to Financial Statements
As of December 31, 2008
(5) TAX INFORMATION - continued
The following Portfolios deferred, on a tax basis, the following post-October 2008 losses:
Portfolio | Post-October Loss | ||
Moderately Aggressive Allocation | $ | 388,794 | |
Moderate Allocation | 3,715,725 | ||
Moderately Conservative Allocation | 2,207,474 | ||
Technology | 836,209 | ||
Partner Healthcare | 64,815 | ||
Partner Natural Resources | 55,263 | ||
Partner Emerging Markets | 269,178 | ||
Real Estate Securities | 541,410 | ||
Partner Utilities | 23,328 | ||
Partner Small Cap Growth | 15,922,461 | ||
Partner Small Cap Value | 242,455 | ||
Small Cap Stock | 50,530,766 | ||
Small Cap Index | 4,353,158 | ||
Mid Cap Growth II | 802,728 | ||
Mid Cap Growth | 28,030,634 | ||
Partner Mid Cap Value | 7,923,056 | ||
Mid Cap Stock | 16,823,232 | ||
Partner Worldwide Allocation | 4,881,859 | ||
Partner International Stock | 62,967,899 | ||
Partner Socially Responsible Stock | 181,300 | ||
Partner All Cap Growth | 277,647 | ||
Partner All Cap Value | 642,895 | ||
Partner All Cap | 8,497,607 | ||
Large Cap Growth II | 496,162 | ||
Large Cap Growth | 135,660,350 | ||
Partner Growth Stock | 4,750,102 | ||
Large Cap Value | 17,805,726 | ||
Large Cap Stock | 33,358,821 | ||
Large Cap Index | 1,011,842 | ||
Equity Income Plus | 3,360,762 | ||
Balanced | 392,062 | ||
High Yield | 10,092,262 | ||
Diversified Income Plus | 5,207,972 | ||
Income | 1,938,672 | ||
Bond Index | 143,510 | ||
Limited Maturity Bond | 4,143,645 | ||
These amounts are deferred for tax purposes and deemed to occur in the next fiscal year.
The tax character of distributions paid during the years ended December 31, 2008 and 2007 was as follows:
| Ordinary Income | Long Term Capital Gain | Return of Capital | ||||||||||||||||
Portfolio | 12/31/2008 | 12/31/2007 | 12/31/2008 | 12/31/2007 | 12/31/2008 | 12/31/2007 | ||||||||||||
Aggressive Allocation | $ | 7,526,815 | $ | 2,926,982 | $ | 11,081,213 | $ | 1,309,043 | $ | — | $ | — | ||||||
Moderately Aggressive Allocation | 36,926,896 | 13,819,491 | 30,510,870 | 3,676,067 | — | — | ||||||||||||
Moderate Allocation | 56,128,055 | 23,641,224 | 28,774,199 | 6,027,228 | — | — | ||||||||||||
Moderately Conservative Allocation | 22,275,657 | 10,511,324 | 6,150,363 | 2,211,661 | — | — | ||||||||||||
Technology | 3,405,645 | — | 3,127,004 | 1,732,497 | — | — | ||||||||||||
Partner Healthcare | 5,750 | — | — | — | — | — | ||||||||||||
Partner Natural Resources | 8,150 | — | — | — | — | — | ||||||||||||
Partner Emerging Markets | 49,300 | — | — | — | — | — | ||||||||||||
Real Estate Securities | 21,072,190 | 9,482,349 | 21,574,384 | 15,795,172 | 5,059,614 | — | ||||||||||||
Partner Utilities | 70,001 | — | — | — | — | — | ||||||||||||
Partner Small Cap Growth | 673,449 | — | 9,849,971 | 6,970,287 | — | — | ||||||||||||
Partner Small Cap Value | 4,087,268 | 2,750,761 | 15,296,285 | 6,560,787 | — | — | ||||||||||||
Small Cap Stock | 4,048,321 | 1,730,614 | 46,096,465 | 23,681,345 | — | — | ||||||||||||
296
Table of Contents
THRIVENT SERIES FUND, INC.
Notes to Financial Statements
As of December 31, 2008
(5) TAX INFORMATION - continued
| Ordinary Income | Long Term Capital Gain | Return of Capital | ||||||||||
Portfolio | 12/31/2008 | 12/31/2007 | 12/31/2008 | 12/31/2007 | 12/31/2008 | 12/31/2007 | ||||||
Small Cap Index | 4,228,977 | 3,047,945 | 57,981,487 | 43,071,047 | — | — | ||||||
Mid Cap Growth II | 2,256,570 | 950,204 | 3,019,741 | 4,318,558 | — | — | ||||||
Mid Cap Growth | 40,872,402 | 9,950,328 | 69,498,724 | 19,632,191 | — | — | ||||||
Partner Mid Cap Value | 3,568,008 | 270,773 | 2,549,963 | 100,763 | — | — | ||||||
Mid Cap Stock | 15,969,270 | 19,151,592 | 25,321,638 | 13,114,887 | — | — | ||||||
Mid Cap Index | 1,733,105 | 1,575,726 | 15,856,090 | 9,024,468 | — | — | ||||||
Partner Worldwide Allocation | 1,070,000 | — | — | — | — | — | ||||||
Partner International Stock | 101,439,313 | 20,042,187 | 137,985,494 | 47,186,402 | — | — | ||||||
Partner Socially Responsible Stock | 9,075 | — | — | — | — | — | ||||||
Partner All Cap Value | 46,000 | — | — | — | — | — | ||||||
Partner All Cap | 8,044,382 | 1,219,402 | 8,251,446 | 9,732,926 | — | — | ||||||
Large Cap Growth II | 2,086,463 | 1,030,065 | 2,279,778 | 1,294,440 | — | — | ||||||
Large Cap Growth | 15,449,558 | 26,284,570 | — | — | — | — | ||||||
Partner Growth Stock | 1,631,127 | 1,291,652 | 8,594,847 | 5,224,637 | — | — | ||||||
Large Cap Value | 38,585,764 | 19,527,987 | 30,190,116 | 27,172,606 | — | — | ||||||
Large Cap Stock | 47,673,626 | 11,787,487 | 44,077,586 | 13,929,956 | — | — | ||||||
Large Cap Index | 11,533,169 | 11,629,702 | 54,089,226 | 28,177,160 | — | — | ||||||
Equity Income Plus | 862,553 | — | — | — | 22,448 | — | ||||||
Balanced | 15,909,241 | 16,298,675 | 12,949,844 | — | — | — | ||||||
High Yield | 66,652,176 | 61,327,393 | — | — | — | — | ||||||
Diversified Income Plus | 6,984,985 | 2,651,827 | — | — | — | — | ||||||
Partner Socially Responsible Bond | 171,330 | — | — | — | — | — | ||||||
Income | 73,945,918 | 66,556,877 | — | — | — | — | ||||||
Bond Index | 9,755,017 | 10,947,777 | — | — | — | — | ||||||
Limited Maturity Bond | 45,270,503 | 37,803,391 | — | — | — | — | ||||||
Mortgage Securities | 1,935,505 | 2,676,830 | — | — | — | — | ||||||
Money Market | 22,163,082 | 34,544,766 | — | — | — | — | ||||||
(6) SECURITY TRANSACTIONS
(A) Purchases and Sales of Investment Securities — For the year ended December 31, 2008, the cost of purchases and the proceeds from sales of investment securities other than U.S. Government and short-term securities were as follows:
| In thousands | ||||||
Portfolio | Purchases | Sales | ||||
Aggressive Allocation | $ | 227,863 | $ | 135,694 | ||
Moderately Aggressive Allocation | 773,536 | 440,776 | ||||
Moderate Allocation | 949,234 | 449,296 | ||||
Moderately Conservative Allocation | 364,090 | 157,983 | ||||
Technology | 107,583 | 113,035 | ||||
Partner Healthcare | 9,499 | 2,045 | ||||
Partner Natural Resources | 10,064 | 35 | ||||
Partner Emerging Markets | 11,198 | 1,619 | ||||
Real Estate Securities | 148,369 | 134,999 | ||||
Partner Utilities | 6,524 | 777 | ||||
Partner Small Cap Growth | 319,201 | 294,385 | ||||
Partner Small Cap Value | 108,336 | 56,177 | ||||
Small Cap Stock | 1,077,487 | 1,007,087 | ||||
Small Cap Index | 87,903 | 152,733 | ||||
Mid Cap Growth II | 108,613 | 38,996 | ||||
Mid Cap Growth | 404,416 | 517,200 | ||||
Partner Mid Cap Value | 200,335 | 107,600 | ||||
Mid Cap Stock | 1,169,058 | 923,471 | ||||
Mid Cap Index | 27,689 | 51,295 | ||||
Partner Worldwide Allocation | 168,030 | 34,881 | ||||
Partner International Stock | 793,056 | 840,783 | ||||
Partner Socially Responsible Stock | 6,057 | 1,176 | ||||
Partner All Cap Growth | 6,613 | 2,014 | ||||
Partner All Cap Value | 9,950 | 5,516 | ||||
Partner All Cap | 229,113 | 241,131 | ||||
Large Cap Growth II | 347,399 | 68,758 | ||||
Large Cap Growth | 3,270,179 | 4,006,101 | ||||
Partner Growth Stock | 37,777 | 58,835 | ||||
Large Cap Value | 517,137 | 459,410 | ||||
Large Cap Stock | 795,723 | 993,265 | ||||
Large Cap Index | 40,328 | 133,220 | ||||
Equity Income Plus | 76,014 | 26,630 | ||||
Balanced | 41,038 | 110,150 | ||||
High Yield | 428,665 | 343,275 | ||||
Diversified Income Plus | 89,944 | 113,070 | ||||
Partner Socially Responsible Bond | 7,258 | 2,413 | ||||
Income | 513,037 | 521,187 | ||||
Bond Index | 7,764 | 38,800 | ||||
Limited Maturity Bond | 496,078 | 333,470 | ||||
Mortgage Securities | 6,414 | 8,251 | ||||
297
Table of Contents
THRIVENT SERIES FUND, INC.
Notes to Financial Statements
As of December 31, 2008
(6) SECURITY TRANSACTIONS - continued
Purchases and Sales of U.S. Government Securities were:
| In thousands | ||||||
Portfolio | Purchases | Sales | ||||
Balanced | $ | 498,382 | $ | 537,842 | ||
Diversified Income Plus | 28,198 | 31,526 | ||||
Partner Socially Responsible Bond | 786 | — | ||||
Income | 1,603,975 | 1,744,078 | ||||
Bond Index | 786,164 | 809,451 | ||||
Limited Maturity Bond | 731,772 | 859,379 | ||||
Mortgage Securities | 387,743 | 405,368 | ||||
(B) Investments in Restricted Securities — Certain Portfolios may own restricted securities that have been deemed illiquid and were purchased in private placement transactions without registration under the Securities Act of 1933. Unless such securities subsequently become registered, they generally may be resold only in privately negotiated transactions with a limited number of purchasers. As of December 31, 2008, the following Portfolios held restricted securities:
Portfolio | Number of Securities | Percent of Portfolio’s Net Assets | |||
Partner Worldwide Allocation | 5 | 0.31 | % | ||
Balanced | 4 | 1.45 | % | ||
High Yield | 8 | 2.75 | % | ||
Diversified Income Plus | 5 | 3.97 | % | ||
Partner Socially Responsible Bond | 1 | 0.03 | % | ||
Income | 10 | 3.12 | % | ||
Bond Index | 4 | 2.57 | % | ||
Limited Maturity Bond | 7 | 2.38 | % | ||
Mortgage Securities | 2 | 4.48 | % |
The Portfolios have no right to require registration of unregistered securities.
(C) Investments in High-Yielding Securities — High Yield Portfolio invests primarily in high-yielding fixed income securities. Each of the other Portfolios, except Money Market Portfolio, may also invest in high-yielding securities. These securities will typically be in the lower rating categories or will be non-rated and generally will involve more risk than securities in the higher rating categories. Lower rated or unrated securities are more likely to react to developments affecting market risk and credit risk than are more highly rated securities, which react primarily to movements in the general level of interest rates.
(D) Investments in Options and Futures Contracts — The movement in the price of the security underlying an option or futures contract may not correlate perfectly with the movement in the prices of the portfolio securities being hedged. A lack of correlation could render the Portfolio’s hedging strategy unsuccessful and could result in a loss to the Portfolio. In the event that a liquid secondary market would not exist, the Portfolio could be prevented from entering into a closing transaction which could result in additional losses to the Portfolio.
(E) Written Option Contracts — The number of contracts and premium amounts associated with covered call option contracts written during the year ended December 31, 2008, were as follows:
| Number of Contracts | Premium Amount | ||||||
Large Cap Growth II | |||||||
Balance at December 31, 2007 | 4 | $ | 680 | ||||
Opened | 609 | 114,521 | |||||
Closed | (272 | ) | (60,562 | ) | |||
Expired | (118 | ) | (16,551 | ) | |||
Exercised | (223 | ) | (38,088 | ) | |||
Balance at December 31, 2008 | — | $ | — | ||||
Large Cap Growth | |||||||
Balance at December 31, 2007 | 243 | $ | 41,290 | ||||
Opened | 33,735 | 6,668,130 | |||||
Closed | (21,355 | ) | (4,423,622 | ) | |||
Expired | (6,965 | ) | (1,163,466 | ) | |||
Exercised | (5,658 | ) | (1,122,332 | ) | |||
Balance at December 31, 2008 | — | $ | — | ||||
Large Cap Stock | |||||||
Balance at December 31, 2007 | — | $ | — | ||||
Opened | 4,802 | 1,084,188 | |||||
Closed | (2,619 | ) | (613,256 | ) | |||
Expired | (1,024 | ) | (206,987 | ) | |||
Exercised | (1,159 | ) | (263,945 | ) | |||
Balance at December 31, 2008 | — | $ | — | ||||
Equity Income Plus | |||||||
Balance at April 30, 2008 | — | $ | — | ||||
Opened | 1,225 | 969,632 | |||||
Closed | (1,175 | ) | (942,894 | ) | |||
Expired | — | — | |||||
Exercised | — | — | |||||
Balance at December 31, 2008 | 50 | $ | 26,738 | ||||
Diversified Income Plus | |||||||
Balance at December 31, 2007 | — | $ | — | ||||
Opened | 6 | 35,079 | |||||
Closed | — | — | |||||
Expired | (2 | ) | (7,188 | ) | |||
Exercised | (4 | ) | (27,891 | ) | |||
Balance at December 31, 2008 | — | $ | — | ||||
Income | |||||||
Balance at December 31, 2007 | 7 | $ | 25,898 | ||||
Opened | 65 | 386,720 | |||||
Closed | — | — | |||||
Expired | (30 | ) | (107,813 | ) | |||
Exercised | (42 | ) | (304,805 | ) | |||
Balance at December 31, 2008 | — | $ | — | ||||
298
Table of Contents
THRIVENT SERIES FUND, INC.
Notes to Financial Statements
As of December 31, 2008
(6) SECURITY TRANSACTIONS - continued
| Number of Contracts | Premium Amount | ||||||
Limited Maturity Bond | |||||||
Balance at December 31, 2007 | — | $ | — | ||||
Opened | 3,080 | 4,810,823 | |||||
Closed | (3,080 | ) | (4,810,823 | ) | |||
Expired | — | — | |||||
Exercised | — | — | |||||
Balance at December 31, 2008 | — | $ | — | ||||
Mortgage Securities | |||||||
Balance at December 31, 2007 | 4 | $ | 21,250 | ||||
Opened | 87 | 202,088 | |||||
Closed | (70 | ) | (109,353 | ) | |||
Expired | (10 | ) | (52,188 | ) | |||
Exercised | (11 | ) | (61,797 | ) | |||
Balance at December 31, 2008 | — | $ | — | ||||
(7) SECURITY TRANSACTIONS WITH AFFILIATED FUNDS
The Portfolios are permitted to purchase or sell securities from or to certain other Portfolios under specified conditions outlined in procedures adopted by the Board of Directors. The procedures have been designed to ensure that any purchase or sale of securities by the Portfolio from or to another portfolio or fund that is or could be considered an affiliate by virtue of having a common investment adviser (or affiliated investment advisers), common Directors and/ or common officers complies with Rule 17a-7 of the Investment Company Act of 1940. Further, as defined under the procedures, each transaction is effected at the current market price. Pursuant to these procedures, during the year ended December 31, 2008, the Portfolios engaged in purchases and sales of securities of 64,996,469 and $303,075,902, respectively.
(8) SHARES OF BENEFICIAL INTEREST
The shares of each Portfolio have equal rights and privileges with all shares of that Portfolio. Shares in the Portfolio are currently sold only to separate accounts of Thrivent Financial, Thrivent Life and retirement plans sponsored by Thrivent Financial.
Authorized capital stock consists of ten billion shares as follows:
Portfolio | Shares Authorized | Par Value | |||
Aggressive Allocation | 300,000,000 | $ | 0.01 | ||
Moderately Aggressive Allocation | 350,000,000 | 0.01 | |||
Moderate Allocation | 350,000,000 | 0.01 | |||
Moderately Conservative Allocation | 300,000,000 | 0.01 | |||
Technology | 100,000,000 | 0.01 | |||
Partner Healthcare | 200,000,000 | 0.01 | |||
Partner Natural Resources | 200,000,000 | 0.01 | |||
Partner Emerging Markets | 200,000,000 | 0.01 | |||
Real Estate Securities | 200,000,000 | 0.01 | |||
Partner Utilities | 200,000,000 | 0.01 | |||
Partner Small Cap Growth | 200,000,000 | 0.01 | |||
Partner Small Cap Value | 200,000,000 | 0.01 | |||
Small Cap Stock | 200,000,000 | 0.01 | |||
Small Cap Index | 200,000,000 | 0.01 | |||
Mid Cap Growth II | 200,000,000 | 0.01 | |||
Mid Cap Growth | 200,000,000 | 0.01 | |||
Partner Mid Cap Value | 200,000,000 | 0.01 | |||
Mid Cap Stock | 200,000,000 | 0.01 | |||
Mid Cap Index | 200,000,000 | 0.01 | |||
Partner Worldwide Allocation | 200,000,000 | 0.01 | |||
Partner International Stock | 250,000,000 | 0.01 | |||
Partner Socially Responsible Stock | 200,000,000 | 0.01 | |||
Partner All Cap Growth | 200,000,000 | 0.01 | |||
Partner All Cap Value | 200,000,000 | 0.01 | |||
Partner All Cap | 200,000,000 | 0.01 | |||
Large Cap Growth II | 200,000,000 | 0.01 | |||
Large Cap Growth | 300,000,000 | 0.01 | |||
Partner Growth Stock | 200,000,000 | 0.01 | |||
Large Cap Value | 200,000,000 | 0.01 | |||
Large Cap Stock | 250,000,000 | 0.01 | |||
Large Cap Index | 200,000,000 | 0.01 | |||
Equity Income Plus | 200,000,000 | 0.01 | |||
Balanced | 200,000,000 | 0.01 | |||
High Yield | 300,000,000 | 0.01 | |||
Diversified Income Plus | 200,000,000 | 0.01 | |||
Partner Socially Responsible Bond | 200,000,000 | 0.01 | |||
Income | 300,000,000 | 0.01 | |||
Bond Index | 200,000,000 | 0.01 | |||
Limited Maturity Bond | 200,000,000 | 0.01 | |||
Mortgage Securities | 200,000,000 | 0.01 | |||
Money Market | 1,200,000,000 | 0.01 | |||
299
Table of Contents
Financial Highlights
| FOR A SHARE OUTSTANDING THROUGHOUT EACH PERIOD* | |||||||||||||||||||||||
| Income from Investment Operations | Less Distributions from | ||||||||||||||||||||||
| Net Asset Value, Beginning of Period | Net Investment Income/(Loss) | Net Realized and Unrealized Gain/(Loss) on Investments(a) | Total from Investment Operations | Net Investment Income | Net Realized Gain on Investments | ||||||||||||||||||
AGGRESSIVE ALLOCATION PORTFOLIO | |||||||||||||||||||||||
Year Ended 12/31/2008 | $ | 14.09 | $ | 0.25 | $ | (5.34 | ) | $ | (5.09 | ) | $ | (0.18 | ) | $ | (0.31 | ) | |||||||
Year Ended 12/31/2007 | 13.01 | 0.13 | 1.09 | 1.22 | (0.08 | ) | (0.06 | ) | |||||||||||||||
Year Ended 12/31/2006 | 11.44 | 0.07 | 1.50 | 1.57 | — | — | |||||||||||||||||
Year Ended 12/31/2005 (c) | 10.00 | — | 1.44 | 1.44 | — | — | |||||||||||||||||
MODERATELY AGGRESSIVE ALLOCATION PORTFOLIO | |||||||||||||||||||||||
Year Ended 12/31/2008 | 13.48 | 0.33 | (4.71 | ) | (4.38 | ) | (0.23 | ) | (0.23 | ) | |||||||||||||
Year Ended 12/31/2007 | 12.66 | 0.18 | 0.80 | 0.98 | (0.11 | ) | (0.05 | ) | |||||||||||||||
Year Ended 12/31/2006 | 11.19 | 0.12 | 1.35 | 1.47 | — | — | |||||||||||||||||
Year Ended 12/31/2005 (c) | 10.00 | 0.02 | 1.19 | 1.21 | (0.02 | ) | — | ||||||||||||||||
MODERATE ALLOCATION PORTFOLIO | |||||||||||||||||||||||
Year Ended 12/31/2008 | 12.82 | 0.37 | (3.83 | ) | (3.46 | ) | (0.27 | ) | (0.17 | ) | |||||||||||||
Year Ended 12/31/2007 | 12.22 | 0.24 | 0.58 | 0.82 | (0.15 | ) | (0.07 | ) | |||||||||||||||
Year Ended 12/31/2006 | 10.96 | 0.18 | 1.08 | 1.26 | — | — | |||||||||||||||||
Year Ended 12/31/2005 (c) | 10.00 | 0.04 | 0.96 | 1.00 | (0.04 | ) | — | ||||||||||||||||
MODERATELY CONSERVATIVE ALLOCATION PORTFOLIO | |||||||||||||||||||||||
Year Ended 12/31/2008 | 12.08 | 0.37 | (2.80 | ) | (2.43 | ) | (0.29 | ) | (0.09 | ) | |||||||||||||
Year Ended 12/31/2007 | 11.69 | 0.27 | 0.39 | 0.66 | (0.20 | ) | (0.07 | ) | |||||||||||||||
Year Ended 12/31/2006 | 10.68 | 0.23 | 0.78 | 1.01 | — | — | |||||||||||||||||
Year Ended 12/31/2005 (c) | 10.00 | 0.06 | 0.68 | 0.74 | (0.06 | ) | — | ||||||||||||||||
TECHNOLOGY PORTFOLIO |
| ||||||||||||||||||||||
Year Ended 12/31/2008 | 8.24 | — | (3.59 | ) | (3.59 | ) | — | (1.02 | ) | ||||||||||||||
Year Ended 12/31/2007 | 7.67 | (0.01 | ) | 0.85 | 0.84 | — | (0.27 | ) | |||||||||||||||
Year Ended 12/31/2006 | 7.53 | (0.02 | ) | 0.26 | 0.24 | — | (0.10 | ) | |||||||||||||||
Year Ended 12/31/2005 | 7.28 | (0.02 | ) | 0.29 | 0.27 | (0.02 | ) | — | |||||||||||||||
Year Ended 12/31/2004 | 6.94 | 0.02 | 0.32 | 0.34 | — | — | |||||||||||||||||
PARTNER HEALTHCARE PORTFOLIO | |||||||||||||||||||||||
Year Ended 12/31/2008 (d) | 10.00 | — | (1.05 | ) | (1.05 | ) | (0.01 | ) | — | ||||||||||||||
PARTNER NATURAL RESOURCES PORTFOLIO | |||||||||||||||||||||||
Year Ended 12/31/2008 (d) | 10.00 | 0.01 | (4.28 | ) | (4.27 | ) | (0.01 | ) | — | ||||||||||||||
PARTNER EMERGING MARKETS PORTFOLIO | |||||||||||||||||||||||
Year Ended 12/31/2008 (d) | 10.00 | 0.06 | (4.42 | ) | (4.36 | ) | (0.05 | ) | — | ||||||||||||||
(a) | The amount shown may not correlate with the change in aggregate gains and losses of portfolio securities due to the timing of sales and redemptions of fund shares. |
(c) | Since inception, 4/29/2005. |
(d) | Since inception, 4/30/2008. |
| * | All per share amounts have been rounded to the nearest cent. |
The accompanying Notes to Financial Statements are an integral part of this schedule.
300
Table of Contents
Thrivent Series Fund, Inc.
Financial Highlights - continued
| RATIOS / SUPPLEMENTAL DATA | ||||||||||||||||||||||||||
| Ratio to Average Net Assets** | Ratios to Average Net Assets Before Expenses Waived, Credited or Paid Indirectly** | |||||||||||||||||||||||||
| Total Distributions | Net Asset Value, End of Period | Total Return(b) | Net Assets, End of Period (in millions) | Expenses | Net Investment Income/(Loss) | Expenses | Net Investment Income/(Loss) | Portfolio Turnover Rate | ||||||||||||||||||
| $ | (0.49 | ) | $ | 8.51 | (37.23 | )% | $ | 354.3 | 0.20 | % | 2.45 | % | 0.20 | % | 2.45 | % | 30 | % | ||||||||
| (0.14 | ) | 14.09 | 9.33 | % | 496.4 | 0.15 | % | 1.17 | % | 0.20 | % | 1.12 | % | 16 | % | |||||||||||
| — | 13.01 | 13.77 | % | 333.6 | 0.04 | % | 0.88 | % | 0.20 | % | 0.72 | % | 8 | % | ||||||||||||
| — | 11.44 | 14.45 | % | 71.8 | 0.10 | % | 0.11 | % | 0.37 | % | (0.16 | )% | 7 | % | ||||||||||||
| (0.46 | ) | 8.64 | (33.40 | )% | 1,354.6 | 0.17 | % | 3.36 | % | 0.17 | % | 3.36 | % | 27 | % | |||||||||||
| (0.16 | ) | 13.48 | 7.74 | % | 1,780.8 | 0.13 | % | 1.86 | % | 0.17 | % | 1.82 | % | 18 | % | |||||||||||
| — | 12.66 | 13.15 | % | 1,063.8 | 0.05 | % | 1.58 | % | 0.18 | % | 1.44 | % | 14 | % | ||||||||||||
| (0.02 | ) | 11.19 | 12.12 | % | 238.1 | 0.10 | % | 0.69 | % | 0.24 | % | 0.55 | % | 4 | % | |||||||||||
| (0.44 | ) | 8.92 | (27.74 | )% | 1,811.6 | 0.17 | % | 3.91 | % | 0.17 | % | 3.91 | % | 22 | % | |||||||||||
| (0.22 | ) | 12.82 | 6.75 | % | 2,168.9 | 0.14 | % | 2.68 | % | 0.17 | % | 2.65 | % | 18 | % | |||||||||||
| — | 12.22 | 11.52 | % | 1,274.0 | 0.08 | % | 2.29 | % | 0.18 | % | 2.19 | % | 19 | % | ||||||||||||
| (0.04 | ) | 10.96 | 9.98 | % | 331.2 | 0.12 | % | 1.29 | % | 0.22 | % | 1.19 | % | 4 | % | |||||||||||
| (0.38 | ) | 9.27 | (20.61 | )% | 714.8 | 0.18 | % | 4.09 | % | 0.18 | % | 4.09 | % | 21 | % | |||||||||||
| (0.27 | ) | 12.08 | 5.59 | % | 756.9 | 0.17 | % | 3.36 | % | 0.19 | % | 3.34 | % | 13 | % | |||||||||||
| — | 11.69 | 9.53 | % | 434.9 | 0.15 | % | 2.94 | % | 0.20 | % | 2.89 | % | 19 | % | ||||||||||||
| (0.06 | ) | 10.68 | 7.40 | % | 146.7 | 0.17 | % | 2.12 | % | 0.27 | % | 2.02 | % | 5 | % | |||||||||||
| (1.02 | ) | 3.63 | (48.32 | )% | 24.3 | 0.89 | % | (0.01 | )% | 0.91 | % | (0.03 | )% | 269 | % | |||||||||||
| (0.27 | ) | 8.24 | 11.08 | % | 56.6 | 0.86 | % | (0.14 | )% | 0.87 | % | (0.15 | )% | 147 | % | |||||||||||
| (0.10 | ) | 7.67 | 3.26 | % | 53.4 | 0.88 | % | (0.23 | )% | 0.89 | % | (0.24 | )% | 133 | % | |||||||||||
| (0.02 | ) | 7.53 | 3.72 | % | 59.8 | 0.86 | % | (0.33 | )% | 0.88 | % | (0.34 | )% | 47 | % | |||||||||||
| — | 7.28 | 4.85 | % | 56.6 | 0.73 | % | 0.35 | % | 0.90 | % | 0.18 | % | 59 | % | ||||||||||||
| (0.01 | ) | 8.94 | (10.48 | )% | 7.1 | 1.39 | % | (0.09 | )% | 2.12 | % | (0.83 | )% | 40 | % | |||||||||||
| (0.01 | ) | 5.72 | (42.68 | )% | 6.6 | 1.19 | % | 0.23 | % | 1.87 | % | (0.45 | )% | 1 | % | |||||||||||
| (0.05 | ) | 5.59 | (43.58 | )% | 5.3 | 1.50 | % | 1.18 | % | 2.68 | % | 0.00 | % | 25 | % | |||||||||||
(b) | Total investment return assumes dividend reinvestment and does not reflect any deduction for sales charges. Not annualized for periods less than one year. Total return shown does not reflect charges and expenses imposed on contract holders by the variable accounts. Those charges and expenses reduce the return received by contract holders as compared to the return presented. |
| ** | Computed on an annualized basis for periods less than one year. |
The accompanying Notes to Financial Statements are an integral part of this schedule.
301
Table of Contents
Thrivent Series Fund, Inc.
Financial Highlights - continued
| FOR A SHARE OUTSTANDING THROUGHOUT EACH PERIOD* | |||||||||||||||||||||||||||
| Income from Investment Operations | Less Distributions from | ||||||||||||||||||||||||||
| Net Asset Value, Beginning of Period | Net Investment Income/(Loss) | Net Realized and Unrealized Gain/(Loss) on Investments(a) | Total from Investment Operations | Net Investment Income | Net Realized Gain on Investments | Return of Capital | |||||||||||||||||||||
REAL ESTATE SECURITIES PORTFOLIO | |||||||||||||||||||||||||||
Year Ended 12/31/2008 | $ | 17.74 | $ | 0.41 | $ | (6.35 | ) | $ | (5.94 | ) | $ | (0.74 | ) | $ | (1.46 | ) | $ | (0.26 | ) | ||||||||
Year Ended 12/31/2007 | 22.93 | 0.32 | (3.84 | ) | (3.52 | ) | (0.30 | ) | (1.37 | ) | — | ||||||||||||||||
Year Ended 12/31/2006 | 18.16 | 0.29 | 5.65 | 5.94 | (0.29 | ) | (0.88 | ) | — | ||||||||||||||||||
Year Ended 12/31/2005 | 17.04 | 0.26 | 1.80 | 2.06 | (0.24 | ) | (0.70 | ) | — | ||||||||||||||||||
Year Ended 12/31/2004 | 12.66 | 0.37 | 4.07 | 4.44 | — | (0.06 | ) | — | |||||||||||||||||||
PARTNER UTILITIES PORTFOLIO | |||||||||||||||||||||||||||
Year Ended 12/31/2008 (c) | 10.00 | 0.12 | (3.08 | ) | (2.96 | ) | (0.11 | ) | — | — | |||||||||||||||||
PARTNER SMALL CAP GROWTH PORTFOLIO | |||||||||||||||||||||||||||
Year Ended 12/31/2008 | 13.94 | 0.01 | (5.77 | ) | (5.76 | ) |
| — |
| (0.73 | ) | — | |||||||||||||||
Year Ended 12/31/2007 | 13.58 | (0.04 | ) | 1.21 | 1.17 | — | (0.81 | ) | — | ||||||||||||||||||
Year Ended 12/31/2006 | 12.11 | (0.05 | ) | 1.57 | 1.52 | — | (0.05 | ) | — | ||||||||||||||||||
Year Ended 12/31/2005 | 12.33 | (0.06 | ) | 0.50 | 0.44 | — | (0.66 | ) | — | ||||||||||||||||||
Year Ended 12/31/2004 | 11.07 | (0.07 | ) | 1.33 | 1.26 | — | — | — | |||||||||||||||||||
PARTNER SMALL CAP VALUE PORTFOLIO | |||||||||||||||||||||||||||
Year Ended 12/31/2008 | 18.44 | 0.13 | (4.85 | ) | (4.72 | ) | (0.20 | ) | (1.45 | ) | — | ||||||||||||||||
Year Ended 12/31/2007 | 19.57 | 0.11 | (0.21 | ) | (0.10 | ) | (0.07 | ) | (0.96 | ) | — | ||||||||||||||||
Year Ended 12/31/2006 | 16.82 | 0.08 | 3.45 | 3.53 | (0.04 | ) | (0.74 | ) | — | ||||||||||||||||||
Year Ended 12/31/2005 | 16.56 | 0.07 | 0.71 | 0.78 | (0.04 | ) | (0.48 | ) | — | ||||||||||||||||||
Year Ended 12/31/2004 | 13.73 | 0.07 | 2.95 | 3.02 | — | (0.19 | ) | — | |||||||||||||||||||
SMALL CAP STOCK PORTFOLIO | |||||||||||||||||||||||||||
Year Ended 12/31/2008 | 15.48 | 0.06 | (5.34 | ) | (5.28 | ) | (0.13 | ) | (1.58 | ) | — | ||||||||||||||||
Year Ended 12/31/2007 | 15.43 | 0.10 | 0.88 | 0.98 | (0.05 | ) | (0.88 | ) | — | ||||||||||||||||||
Year Ended 12/31/2006 | 14.62 | 0.05 | 1.78 | 1.83 | (0.02 | ) | (1.00 | ) | — | ||||||||||||||||||
Year Ended 12/31/2005 | 14.74 | 0.02 | 1.16 | 1.18 | (0.01 | ) | (1.29 | ) | — | ||||||||||||||||||
Year Ended 12/31/2004 | 12.34 | 0.01 | 2.56 | 2.57 | — | (0.17 | ) | — | |||||||||||||||||||
SMALL CAP INDEX PORTFOLIO | |||||||||||||||||||||||||||
Year Ended 12/31/2008 | 19.21 | 0.22 | (5.15 | ) | (4.93 | ) | (0.20 | ) | (3.54 | ) | — | ||||||||||||||||
Year Ended 12/31/2007 | 21.55 | 0.24 | (0.11 | ) | 0.13 | (0.14 | ) | (2.33 | ) | — | |||||||||||||||||
Year Ended 12/31/2006 | 19.41 | 0.17 | 2.64 | 2.81 | (0.14 | ) | (0.53 | ) | — | ||||||||||||||||||
Year Ended 12/31/2005 | 19.26 | 0.15 | 1.18 | 1.33 | (0.13 | ) | (1.05 | ) | — | ||||||||||||||||||
Year Ended 12/31/2004 | 15.83 | 0.13 | 3.36 | 3.49 | (0.06 | ) | — | — | |||||||||||||||||||
(a) | The amount shown may not correlate with the change in aggregate gains and losses of portfolio securities due to the timing of sales and redemptions of fund shares. |
(c) | Since inception, 4/30/2008. |
| * | All per share amounts have been rounded to the nearest cent. |
The accompanying Notes to Financial Statements are an integral part of this schedule.
302
Table of Contents
Thrivent Series Fund, Inc.
Financial Highlights - continued
| RATIOS / SUPPLEMENTAL DATA | ||||||||||||||||||||||||||
| Ratios to Average Net Assets Before Expenses Waived, Credited or Paid Indirectly** | ||||||||||||||||||||||||||
| Ratio to Average Net Assets** | ||||||||||||||||||||||||||
| Total Distributions | Net Asset Value, End of Period | Total Return(b) | Net Assets, End of Period (in millions) | Expenses | Net Investment Income/(Loss) | Expenses | Net Investment Income/(Loss) | Portfolio Turnover Rate | ||||||||||||||||||
| $ | (2.46 | ) | $ | 9.34 | (37.24 | )% | $ | 197.4 | 0.85 | % | 2.74 | % | 0.86 | % | 2.73 | % | 45 | % | ||||||||
| (1.67 | ) | 17.74 | (16.80 | )% | 326.4 | 0.86 | % | 1.60 | % | 0.86 | % | 1.60 | % | 71 | % | |||||||||||
| (1.17 | ) | 22.93 | 34.18 | % | 367.9 | 0.84 | % | 1.41 | % | 0.86 | % | 1.40 | % | 69 | % | |||||||||||
| (0.94 | ) | 18.16 | 13.25 | % | 274.6 | 0.86 | % | 1.88 | % | 0.87 | % | 1.87 | % | 83 | % | |||||||||||
| (0.06 | ) | 17.04 | 35.19 | % | 175.0 | 0.79 | % | 2.60 | % | 0.90 | % | 2.49 | % | 119 | % | |||||||||||
| (0.11 | ) | 6.93 | (29.57 | )% | 4.4 | 0.90 | % | 2.55 | % | 2.31 | % | 1.14 | % | 22 | % | |||||||||||
| (0.73 | ) | 7.45 | (43.23 | )% | 112.5 | 0.98 | % | 0.08 | % | 1.09 | % | (0.04 | )% | 199 | % | |||||||||||
| (0.81 | ) | 13.94 | 8.52 | % | 167.6 | 0.99 | % | (0.32 | )% | 1.10 | % | (0.42 | )% | 98 | % | |||||||||||
| (0.05 | ) | 13.58 | 12.59 | % | 107.4 | 0.99 | % | (0.42 | )% | 1.12 | % | (0.55 | )% | 113 | % | |||||||||||
| (0.66 | ) | 12.11 | 3.96 | % | 64.7 | 0.99 | % | (0.60 | )% | 1.17 | % | (0.78 | )% | 104 | % | |||||||||||
| — | 12.33 | 11.32 | % | 53.9 | 1.00 | % | (0.69 | )% | 1.19 | % | (0.88 | )% | 255 | % | ||||||||||||
| (1.65 | ) | 12.07 | (27.05 | )% | 167.9 | 0.86 | % | 1.08 | % | 0.87 | % | 1.07 | % | 31 | % | |||||||||||
| (1.03 | ) | 18.44 | (1.03 | )% | 185.6 | 0.86 | % | 0.68 | % | 0.87 | % | 0.66 | % | 29 | % | |||||||||||
| (0.78 | ) | 19.57 | 21.50 | % | 163.6 | 0.86 | % | 0.52 | % | 0.88 | % | 0.51 | % | 25 | % | |||||||||||
| (0.52 | ) | 16.82 | 4.89 | % | 106.2 | 0.88 | % | 0.51 | % | 0.89 | % | 0.49 | % | 37 | % | |||||||||||
| (0.19 | ) | 16.56 | 22.26 | % | 77.5 | 0.80 | % | 0.51 | % | 0.99 | % | 0.32 | % | 106 | % | |||||||||||
| (1.71 | ) | 8.49 | (37.52 | )% | 288.1 | 0.73 | % | 0.66 | % | 0.75 | % | 0.64 | % | 286 | % | |||||||||||
| (0.93 | ) | 15.48 | 6.14 | % | 399.9 | 0.72 | % | 0.66 | % | 0.74 | % | 0.65 | % | 126 | % | |||||||||||
| (1.02 | ) | 15.43 | 12.79 | % | 406.7 | 0.73 | % | 0.33 | % | 0.74 | % | 0.32 | % | 94 | % | |||||||||||
| (1.30 | ) | 14.62 | 8.81 | % | 290.2 | 0.74 | % | 0.20 | % | 0.76 | % | 0.19 | % | 113 | % | |||||||||||
| (0.17 | ) | 14.74 | 20.94 | % | 216.8 | 0.76 | % | 0.06 | % | 0.78 | % | 0.04 | % | 93 | % | |||||||||||
| (3.74 | ) | 10.54 | (31.07 | )% | 192.2 | 0.42 | % | 1.28 | % | 0.42 | % | 1.28 | % | 31 | % | |||||||||||
| (2.47 | ) | 19.21 | (0.50 | )% | 357.9 | 0.39 | % | 1.00 | % | 0.39 | % | 0.99 | % | 16 | % | |||||||||||
| (0.67 | ) | 21.55 | 14.72 | % | 439.8 | 0.39 | % | 0.71 | % | 0.39 | % | 0.71 | % | 14 | % | |||||||||||
| (1.18 | ) | 19.41 | 7.32 | % | 473.7 | 0.39 | % | 0.75 | % | 0.39 | % | 0.75 | % | 14 | % | |||||||||||
| (0.06 | ) | 19.26 | 22.10 | % | 485.9 | 0.34 | % | 0.80 | % | 0.39 | % | 0.75 | % | 21 | % | |||||||||||
(b) | Total investment return assumes dividend reinvestment and does not reflect any deduction for sales charges. Not annualized for periods less than one year. Total return shown does not reflect charges and expenses imposed on contract holders by the variable accounts. Those charges and expenses reduce the return received by contract holders as compared to the return presented. |
| ** | Computed on an annualized basis for periods less than one year. |
The accompanying Notes to Financial Statements are an integral part of this schedule.
303
Table of Contents
Thrivent Series Fund, Inc.
Financial Highlights - continued
| FOR A SHARE OUTSTANDING THROUGHOUT EACH PERIOD* | ||||||||||||||||||||||
| Income from Investment Operations | Less Distributions from | |||||||||||||||||||||
| Net Asset Value, Beginning of Period | Net Investment Income/(Loss) | Net Realized and Unrealized Gain/(Loss) on Investments(a) | Total from Investment Operations | Net Investment Income | Net Realized Gain on Investments | |||||||||||||||||
MID CAP GROWTH PORTFOLIO II | ||||||||||||||||||||||
Year Ended 12/31/2008 | $ | 11.42 | $ | 0.01 | $ | (4.37 | ) | $ | (4.36 | ) | $ | (0.03 | ) | $ | (1.38 | ) | ||||||
Year Ended 12/31/2007 | 11.37 | 0.03 | 2.13 | 2.16 | (0.06 | ) | (2.05 | ) | ||||||||||||||
Year Ended 12/31/2006 | 10.60 | 0.06 | 0.85 | 0.91 | (0.02 | ) | (0.12 | ) | ||||||||||||||
Year Ended 12/31/2005 | 9.53 | 0.02 | 1.05 | 1.07 | — | — | ||||||||||||||||
Year Ended 12/31/2004 | 8.19 | — | 1.34 | 1.34 | — | — | ||||||||||||||||
MID CAP GROWTH PORTFOLIO | ||||||||||||||||||||||
Year Ended 12/31/2008 | 20.18 | 0.10 | (7.19 | ) | (7.09 | ) | (0.18 | ) | (3.36 | ) | ||||||||||||
Year Ended 12/31/2007 | 17.59 | 0.08 | 3.38 | 3.46 | (0.08 | ) | (0.79 | ) | ||||||||||||||
Year Ended 12/31/2006 | 16.21 | 0.08 | 1.32 | 1.40 | (0.02 | ) | — | |||||||||||||||
Year Ended 12/31/2005 | 14.57 | 0.02 | 1.62 | 1.64 | — | — | ||||||||||||||||
Year Ended 12/31/2004 | 13.08 | — | 1.49 | 1.49 | — | — | ||||||||||||||||
PARTNER MID CAP VALUE PORTFOLIO | ||||||||||||||||||||||
Year Ended 12/31/2008 | 13.41 | 0.08 | (4.61 | ) | (4.53 | ) | (0.18 | ) | (0.45 | ) | ||||||||||||
Year Ended 12/31/2007 | 13.06 | 0.14 | 0.28 | 0.42 | — | (0.07 | ) | |||||||||||||||
Year Ended 12/31/2006 | 11.48 | 0.10 | 1.70 | 1.80 | (0.10 | ) | (0.12 | ) | ||||||||||||||
Year Ended 12/31/2005 (c) | 10.00 | 0.04 | 1.51 | 1.55 | (0.04 | ) | (0.03 | ) | ||||||||||||||
MID CAP STOCK PORTFOLIO | ||||||||||||||||||||||
Year Ended 12/31/2008 | 13.15 | 0.04 | (5.08 | ) | (5.04 | ) | (0.12 | ) | (0.91 | ) | ||||||||||||
Year Ended 12/31/2007 | 13.41 | 0.08 | 0.76 | 0.84 | (0.12 | ) | (0.98 | ) | ||||||||||||||
Year Ended 12/31/2006 | 12.82 | 0.13 | 1.51 | 1.64 | (0.05 | ) | (1.00 | ) | ||||||||||||||
Year Ended 12/31/2005 | 11.66 | 0.05 | 1.76 | 1.81 | (0.02 | ) | (0.63 | ) | ||||||||||||||
Year Ended 12/31/2004 | 10.04 | 0.02 | 1.70 | 1.72 | — | (0.10 | ) | |||||||||||||||
MID CAP INDEX PORTFOLIO | ||||||||||||||||||||||
Year Ended 12/31/2008 | 15.20 | 0.19 | (5.02 | ) | (4.83 | ) | (0.19 | ) | (1.87 | ) | ||||||||||||
Year Ended 12/31/2007 | 15.05 | 0.20 | 1.00 | 1.20 | (0.15 | ) | (0.90 | ) | ||||||||||||||
Year Ended 12/31/2006 | 14.43 | 0.18 | 1.20 | 1.38 | (0.14 | ) | (0.62 | ) | ||||||||||||||
Year Ended 12/31/2005 | 13.34 | 0.14 | 1.44 | 1.58 | (0.07 | ) | (0.42 | ) | ||||||||||||||
Year Ended 12/31/2004 | 11.53 | 0.08 | 1.74 | 1.82 | — | (0.01 | ) | |||||||||||||||
PARTNER WORLDWIDE ALLOCATION PORTFOLIO | ||||||||||||||||||||||
Year Ended 12/31/2008 (d) | 10.00 | 0.07 | (3.98 | ) | (3.91 | ) | (0.06 | ) | — | |||||||||||||
(a) | The amount shown may not correlate with the change in aggregate gains and losses of portfolio securities due to the timing of sales and redemptions of fund shares. |
(c) | Since inception, 4/29/2005. |
(d) | Since inception, 4/30/2008. |
| * | All per share amounts have been rounded to the nearest cent. |
The accompanying Notes to Financial Statements are an integral part of this schedule.
304
Table of Contents
Thrivent Series Fund, Inc.
Financial Highlights - continued
| RATIOS / SUPPLEMENTAL DATA | ||||||||||||||||||||||||||
| Ratios to Average Net Assets Before Expenses Waived, Credited or Paid Indirectly** | ||||||||||||||||||||||||||
| Ratio to Average Net Assets** | ||||||||||||||||||||||||||
| Total Distributions | Net Asset Value, End of Period | Total Return(b) | Net Assets, End of Period (in millions) | Expenses | Net Investment Income/(Loss) | Expenses | Net Investment Income/(Loss) | Portfolio Turnover Rate | ||||||||||||||||||
| $ | (1.41 | ) | $ | 5.65 | (42.71 | )% | $ | 80.8 | 0.56 | % | 0.30 | % | 1.07 | % | (0.22 | )% | 104 | % | ||||||||
| (2.11 | ) | 11.42 | 19.80 | % | 32.4 | 0.59 | % | 0.18 | % | 1.11 | % | (0.33 | )% | 81 | % | |||||||||||
| (0.14 | ) | 11.37 | 8.60 | % | 31.7 | 0.39 | % | 0.44 | % | 1.11 | % | (0.28 | )% | 147 | % | |||||||||||
| — | 10.60 | 11.22 | % | 38.2 | 0.39 | % | 0.17 | % | 1.10 | % | (0.54 | )% | 136 | % | ||||||||||||
| — | 9.53 | 16.41 | % | 38.4 | 0.47 | % | (0.04 | )% | 1.16 | % | (0.73 | )% | 227 | % | ||||||||||||
| (3.54 | ) | 9.55 | (41.13 | )% | 275.1 | 0.44 | % | 0.54 | % | 0.45 | % | 0.52 | % | 82 | % | |||||||||||
| (0.87 | ) | 20.18 | 19.92 | % | 669.8 | 0.44 | % | 0.35 | % | 0.45 | % | 0.34 | % | 80 | % | |||||||||||
| (0.02 | ) | 17.59 | 8.63 | % | 654.9 | 0.45 | % | 0.40 | % | 0.45 | % | 0.40 | % | 149 | % | |||||||||||
| — | 16.21 | 11.27 | % | 747.5 | 0.45 | % | 0.11 | % | 0.45 | % | 0.11 | % | 135 | % | ||||||||||||
| — | 14.57 | 11.36 | % | 784.9 | 0.45 | % | 0.00 | % | 0.46 | % | (0.01 | )% | 150 | % | ||||||||||||
| (0.63 | ) | 8.25 | (35.05 | )% | 123.3 | 0.83 | % | 1.41 | % | 0.85 | % | 1.39 | % | 97 | % | |||||||||||
| (0.07 | ) | 13.41 | 3.16 | % | 95.0 | 0.89 | % | 1.24 | % | 0.90 | % | 1.23 | % | 85 | % | |||||||||||
| (0.22 | ) | 13.06 | 15.72 | % | 54.9 | 0.96 | % | 1.07 | % | 0.98 | % | 1.05 | % | 57 | % | |||||||||||
| (0.07 | ) | 11.48 | 15.44 | % | 21.2 | 1.25 | % | 0.88 | % | 1.49 | % | 0.63 | % | 30 | % | |||||||||||
| (1.03 | ) | 7.08 | (40.75 | )% | 379.9 | 0.72 | % | 0.81 | % | 0.73 | % | 0.80 | % | 234 | % | |||||||||||
| (1.10 | ) | 13.15 | 5.70 | % | 387.9 | 0.72 | % | 0.70 | % | 0.74 | % | 0.69 | % | 215 | % | |||||||||||
| (1.05 | ) | 13.41 | 13.41 | % | 363.8 | 0.73 | % | 1.26 | % | 0.75 | % | 1.24 | % | 184 | % | |||||||||||
| (0.65 | ) | 12.82 | 16.37 | % | 224.2 | 0.76 | % | 0.62 | % | 0.78 | % | 0.60 | % | 124 | % | |||||||||||
| (0.10 | ) | 11.66 | 17.24 | % | �� | 111.7 | 0.68 | % | 0.26 | % | 0.82 | % | 0.12 | % | 126 | % | ||||||||||
| (2.06 | ) | 8.31 | (36.29 | )% | 75.1 | 0.46 | % | 1.33 | % | 0.46 | % | 1.32 | % | 24 | % | |||||||||||
| (1.05 | ) | 15.20 | 7.63 | % | 146.2 | 0.43 | % | 1.16 | % | 0.43 | % | 1.15 | % | 20 | % | |||||||||||
| (0.76 | ) | 15.05 | 9.81 | % | 159.8 | 0.43 | % | 1.10 | % | 0.43 | % | 1.10 | % | 11 | % | |||||||||||
| (0.49 | ) | 14.43 | 12.34 | % | 171.5 | 0.43 | % | 1.08 | % | 0.44 | % | 1.07 | % | 19 | % | |||||||||||
| (0.01 | ) | 13.34 | 15.75 | % | 135.4 | 0.45 | % | 0.77 | % | 0.46 | % | 0.76 | % | 23 | % | |||||||||||
| (0.06 | ) | 6.03 | (39.09 | )% | 105.9 | 1.00 | % | 2.17 | % | 1.25 | % | 1.92 | % | 49 | % | |||||||||||
(b) | Total investment return assumes dividend reinvestment and does not reflect any deduction for sales charges. Not annualized for periods less than one year. Total return shown does not reflect charges and expenses imposed on contract holders by the variable accounts. Those charges and expenses reduce the return received by contract holders as compared to the return presented. |
| ** | Computed on an annualized basis for periods less than one year. |
The accompanying Notes to Financial Statements are an integral part of this schedule.
305
Table of Contents
Thrivent Series Fund, Inc.
Financial Highlights - continued
| FOR A SHARE OUTSTANDING THROUGHOUT EACH PERIOD* | |||||||||||||||||||||||
| Income from Investment Operations | Less Distributions from | ||||||||||||||||||||||
| Net Asset Value, Beginning of Period | Net Investment Income/(Loss) | Net Realized and Unrealized Gain/(Loss) on Investments(a) | Total from Investment Operations | Net Investment Income | Net Realized Gain on Investments | ||||||||||||||||||
PARTNER INTERNATIONAL STOCK PORTFOLIO | |||||||||||||||||||||||
Year Ended 12/31/2008 | $ | 17.26 | $ | 0.33 | $ | (6.56 | ) | $ | (6.23 | ) | $ | (0.68 | ) | $ | (2.17 | ) | |||||||
Year Ended 12/31/2007 | 16.32 | 0.36 | 1.37 | 1.73 | (0.24 | ) | (0.55 | ) | |||||||||||||||
Year Ended 12/31/2006 | 13.63 | 0.23 | 2.67 | 2.90 | (0.21 | ) | — | ||||||||||||||||
Year Ended 12/31/2005 | 12.12 | 0.17 | 1.48 | 1.65 | (0.14 | ) | — | ||||||||||||||||
Year Ended 12/31/2004 | 10.62 | 0.13 | 1.52 | 1.65 | (0.15 | ) | — | ||||||||||||||||
PARTNER SOCIALLY RESPONSIBLE STOCK PORTFOLIO | |||||||||||||||||||||||
Year Ended 12/31/2008 (c) | 10.00 | 0.02 | (3.52 | ) | (3.50 | ) | (0.02 | ) | — | ||||||||||||||
PARTNER ALL CAP GROWTH PORTFOLIO | |||||||||||||||||||||||
Year Ended 12/31/2008 (c) | 10.00 | (0.01 | ) | (4.65 | ) | (4.66 | ) | — | — | ||||||||||||||
PARTNER ALL CAP VALUE PORTFOLIO | |||||||||||||||||||||||
Year Ended 12/31/2008 (c) | 10.00 | 0.08 | (4.51 | ) | (4.43 | ) | (0.10 | ) | — | ||||||||||||||
PARTNER ALL CAP PORTFOLIO | |||||||||||||||||||||||
Year Ended 12/31/2008 | 13.00 | 0.09 | (5.05 | ) | (4.96 | ) | (0.08 | ) | (1.86 | ) | |||||||||||||
Year Ended 12/31/2007 | 12.03 | 0.07 | 2.28 | 2.35 | (0.06 | ) | (1.32 | ) | |||||||||||||||
Year Ended 12/31/2006 | 10.47 | 0.06 | 1.55 | 1.61 | (0.05 | ) | — | ||||||||||||||||
Year Ended 12/31/2005 | 8.89 | 0.05 | 1.58 | 1.63 | (0.05 | ) | — | ||||||||||||||||
Year Ended 12/31/2004 | 7.83 | 0.04 | 1.03 | 1.07 | (0.01 | ) | — | ||||||||||||||||
LARGE CAP GROWTH PORTFOLIO II | |||||||||||||||||||||||
Year Ended 12/31/2008 | 11.96 | 0.02 | (4.49 | ) | (4.47 | ) | (0.06 | ) | (1.58 | ) | |||||||||||||
Year Ended 12/31/2007 | 11.00 | 0.06 | 1.71 | 1.77 | (0.08 | ) | (0.73 | ) | |||||||||||||||
Year Ended 12/31/2006 | 10.37 | 0.07 | 0.63 | 0.70 | (0.06 | ) | (0.01 | ) | |||||||||||||||
Year Ended 12/31/2005 | 9.77 | 0.06 | 0.62 | 0.68 | (0.08 | ) | — | ||||||||||||||||
Year Ended 12/31/2004 | 9.08 | 0.08 | 0.61 | 0.69 | — | — | |||||||||||||||||
LARGE CAP GROWTH PORTFOLIO | |||||||||||||||||||||||
Year Ended 12/31/2008 | 19.23 | 0.18 | (8.26 | ) | (8.08 | ) | (0.19 | ) | — | ||||||||||||||
Year Ended 12/31/2007 | 16.64 | 0.12 | 2.67 | 2.79 | (0.20 | ) | — | ||||||||||||||||
Year Ended 12/31/2006 | 15.67 | 0.09 | 0.96 | 1.05 | (0.08 | ) | — | ||||||||||||||||
Year Ended 12/31/2005 | 14.76 | 0.08 | 0.95 | 1.03 | (0.12 | ) | — | ||||||||||||||||
Year Ended 12/31/2004 | 13.78 | 0.11 | 0.94 | 1.05 | (0.07 | ) | — | ||||||||||||||||
(a) | The amount shown may not correlate with the change in aggregate gains and losses of portfolio securities due to the timing of sales and redemptions of fund shares. |
(c) | Since inception, 4/30/2008. |
| * | All per share amounts have been rounded to the nearest cent. |
The accompanying Notes to Financial Statements are an integral part of this schedule.
306
Table of Contents
Thrivent Series Fund, Inc.
Financial Highlights - continued
| RATIOS / SUPPLEMENTAL DATA | ||||||||||||||||||||||||||
| Ratio to Average Net Assets** | Ratios to Average Net Assets Before Expenses Waived, Credited or Paid Indirectly** | |||||||||||||||||||||||||
| Total Distributions | Net Asset Value, End of Period | Total Return(b) | Net Assets, End of Period (in millions) | Expenses | Net Investment Income/(Loss) | Expenses | Net Investment Income/(Loss) | Portfolio Turnover Rate | ||||||||||||||||||
| $ | (2.85 | ) | $ | 8.18 | (41.10 | )% | $ | 778.1 | 0.81 | % | 2.54 | % | 0.89 | % | 2.46 | % | 70 | % | ||||||||
| (0.79 | ) | 17.26 | 10.57 | % | 1,443.8 | 0.81 | % | 2.11 | % | 0.88 | % | 2.04 | % | 113 | % | |||||||||||
| (0.21 | ) | 16.32 | 21.50 | % | 1,341.8 | 0.89 | % | 1.51 | % | 0.89 | % | 1.51 | % | 50 | % | |||||||||||
| (0.14 | ) | 13.63 | 13.71 | % | 1,055.9 | 0.94 | % | 1.58 | % | 0.94 | % | 1.58 | % | 46 | % | |||||||||||
| (0.15 | ) | 12.12 | 15.65 | % | 721.0 | 0.94 | % | 1.18 | % | 0.94 | % | 1.18 | % | 63 | % | |||||||||||
| (0.02 | ) | 6.48 | (34.98 | )% | 3.2 | 0.98 | % | 0.30 | % | 2.19 | % | (0.92 | )% | 32 | % | |||||||||||
| — | 5.34 | (46.57 | )% | 2.4 | 1.00 | % | (0.14 | )% | 2.64 | % | (1.79 | )% | 62 | % | ||||||||||||
| (0.10 | ) | 5.47 | (44.21 | )% | 2.5 | 0.98 | % | 1.43 | % | 2.80 | % | (0.40 | )% | 168 | % | |||||||||||
| (1.94 | ) | 6.10 | (42.91 | )% | 56.2 | 0.86 | % | 0.84 | % | 1.07 | % | 0.64 | % | 260 | % | |||||||||||
| (1.38 | ) | 13.00 | 20.37 | % | 117.6 | 0.84 | % | 0.61 | % | 1.05 | % | 0.41 | % | 169 | % | |||||||||||
| (0.05 | ) | 12.03 | 15.47 | % | 96.5 | 0.85 | % | 0.51 | % | 1.05 | % | 0.31 | % | 162 | % | |||||||||||
| (0.05 | ) | 10.47 | 18.33 | % | 82.2 | 0.95 | % | 0.62 | % | 1.08 | % | 0.49 | % | 150 | % | |||||||||||
| (0.01 | ) | 8.89 | 13.64 | % | 59.7 | 0.95 | % | 0.55 | % | 1.13 | % | 0.37 | % | 172 | % | |||||||||||
| (1.64 | ) | 5.85 | (41.92 | )% | 309.0 | 0.62 | % | 0.90 | % | 1.03 | % | 0.49 | % | 149 | % | |||||||||||
| (0.81 | ) | 11.96 | 16.47 | % | 34.0 | 0.65 | % | 0.39 | % | 1.06 | % | (0.01 | )% | 156 | % | |||||||||||
| (0.07 | ) | 11.00 | 6.78 | % | 35.9 | 0.40 | % | 0.57 | % | 1.03 | % | (0.07 | )% | 132 | % | |||||||||||
| (0.08 | ) | 10.37 | 7.08 | % | 42.6 | 0.40 | % | 0.55 | % | 1.00 | % | (0.05 | )% | 113 | % | |||||||||||
| — | 9.77 | 7.56 | % | 43.9 | 0.38 | % | 0.87 | % | 1.08 | % | 0.17 | % | 177 | % | ||||||||||||
| (0.19 | ) | 10.96 | (42.00 | )% | 844.5 | 0.44 | % | 0.74 | % | 0.45 | % | 0.73 | % | 177 | % | |||||||||||
| (0.20 | ) | 19.23 | 16.75 | % | 2,553.5 | 0.44 | % | 0.63 | % | 0.45 | % | 0.63 | % | 163 | % | |||||||||||
| (0.08 | ) | 16.64 | 6.72 | % | 2,331.7 | 0.45 | % | 0.54 | % | 0.45 | % | 0.53 | % | 141 | % | |||||||||||
| (0.12 | ) | 15.67 | 7.01 | % | 2,375.0 | 0.45 | % | 0.50 | % | 0.45 | % | 0.50 | % | 111 | % | |||||||||||
| (0.07 | ) | 14.76 | 7.68 | % | 2,448.2 | 0.45 | % | 0.79 | % | 0.45 | % | 0.79 | % | 104 | % | |||||||||||
(b) | Total investment return assumes dividend reinvestment and does not reflect any deduction for sales charges. Not annualized for periods less than one year. Total return shown does not reflect charges and expenses imposed on contract holders by the variable accounts. Those charges and expenses reduce the return received by contract holders as compared to the return presented. |
| ** | Computed on an annualized basis for periods less than one year. |
The accompanying Notes to Financial Statements are an integral part of this schedule.
307
Table of Contents
Thrivent Series Fund, Inc.
Financial Highlights - continued
| FOR A SHARE OUTSTANDING THROUGHOUT EACH PERIOD* | ||||||||||||||||||||||
| Income from Investment Operations | Less Distributions from | |||||||||||||||||||||
| Net Asset Value, Beginning of Period | Net Investment Income/(Loss) | Net Realized and Unrealized Gain/(Loss) on Investments(a) | Total from Investment Operations | Net Investment Income | Net Realized Gain on Investments | |||||||||||||||||
PARTNER GROWTH STOCK PORTFOLIO | ||||||||||||||||||||||
Year Ended 12/31/2008 | $ | 13.55 | $ | 0.05 | $ | (5.29 | ) | $ | (5.24 | ) | $ | (0.09 | ) | $ | (1.26 | ) | ||||||
Year Ended 12/31/2007 | 13.08 | 0.08 | 1.14 | 1.22 | (0.07 | ) | (0.68 | ) | ||||||||||||||
Year Ended 12/31/2006 | 11.86 | 0.07 | 1.45 | 1.52 | (0.02 | ) | (0.28 | ) | ||||||||||||||
Year Ended 12/31/2005 | 11.21 | 0.02 | 0.68 | 0.70 | (0.05 | ) | — | |||||||||||||||
Year Ended 12/31/2004 | 10.19 | 0.07 | 0.95 | 1.02 | — | — | ||||||||||||||||
LARGE CAP VALUE PORTFOLIO | ||||||||||||||||||||||
Year Ended 12/31/2008 | 13.41 | 0.23 | (4.66 | ) | (4.43 | ) | (0.43 | ) | (0.45 | ) | ||||||||||||
Year Ended 12/31/2007 | 13.50 | 0.19 | 0.48 | 0.67 | (0.17 | ) | (0.59 | ) | ||||||||||||||
Year Ended 12/31/2006 | 11.78 | 0.18 | 1.97 | 2.15 | (0.14 | ) | (0.29 | ) | ||||||||||||||
Year Ended 12/31/2005 | 11.14 | 0.14 | 0.63 | 0.77 | (0.13 | ) | — | |||||||||||||||
Year Ended 12/31/2004 | 9.76 | 0.13 | 1.25 | 1.38 | — | — | ||||||||||||||||
LARGE CAP STOCK PORTFOLIO | ||||||||||||||||||||||
Year Ended 12/31/2008 | 11.04 | 0.15 | (4.05 | ) | (3.90 | ) | (0.28 | ) | (0.75 | ) | ||||||||||||
Year Ended 12/31/2007 | 10.54 | 0.12 | 0.68 | 0.80 | (0.12 | ) | (0.18 | ) | ||||||||||||||
Year Ended 12/31/2006 | 9.62 | 0.13 | 0.99 | 1.12 | (0.07 | ) | (0.13 | ) | ||||||||||||||
Year Ended 12/31/2005 | 9.28 | 0.07 | 0.42 | 0.49 | (0.08 | ) | (0.07 | ) | ||||||||||||||
Year Ended 12/31/2004 | 8.56 | 0.10 | 0.62 | 0.72 | — | — | ||||||||||||||||
LARGE CAP INDEX PORTFOLIO | ||||||||||||||||||||||
Year Ended 12/31/2008 | 25.18 | 0.47 | (8.99 | ) | (8.52 | ) | (0.50 | ) | (2.44 | ) | ||||||||||||
Year Ended 12/31/2007 | 25.32 | 0.49 | 0.87 | 1.36 | (0.44 | ) | (1.06 | ) | ||||||||||||||
Year Ended 12/31/2006 | 22.31 | 0.43 | 2.94 | 3.37 | (0.36 | ) | — | |||||||||||||||
Year Ended 12/31/2005 | 21.63 | 0.35 | 0.67 | 1.02 | (0.34 | ) | — | |||||||||||||||
Year Ended 12/31/2004 | 19.79 | 0.34 | 1.73 | 2.07 | (0.23 | ) | — | |||||||||||||||
EQUITY INCOME PLUS PORTFOLIO | ||||||||||||||||||||||
Year Ended 12/31/2008 (c) | 10.00 | 0.15 | (3.11 | ) | (2.96 | ) | (0.15 | ) | — | |||||||||||||
BALANCED PORTFOLIO | ||||||||||||||||||||||
Year Ended 12/31/2008 | 17.16 | 0.56 | (4.82 | ) | (4.26 | ) | (0.58 | ) | (0.57 | ) | ||||||||||||
Year Ended 12/31/2007 | 16.77 | 0.57 | 0.35 | 0.92 | (0.53 | ) | — | |||||||||||||||
Year Ended 12/31/2006 | 15.48 | 0.50 | 1.22 | 1.72 | (0.43 | ) | — | |||||||||||||||
Year Ended 12/31/2005 | 15.28 | 0.42 | 0.16 | 0.58 | (0.38 | ) | — | |||||||||||||||
Year Ended 12/31/2004 | 14.45 | 0.37 | 0.78 | 1.15 | (0.32 | ) | — | |||||||||||||||
(a) | The amount shown may not correlate with the change in aggregate gains and losses of portfolio securities due to the timing of sales and redemptions of fund shares. |
(c) | Since inception, 4/30/2008. |
| * | All per share amounts have been rounded to the nearest cent. |
The accompanying Notes to Financial Statements are an integral part of this schedule.
308
Table of Contents
Thrivent Series Fund, Inc.
Financial Highlights - continued
| RATIOS / SUPPLEMENTAL DATA | ||||||||||||||||||||||||||
| Ratio to Average Net Assets** | Ratios to Average Net Assets Before Expenses Waived, Credited or Paid Indirectly** | |||||||||||||||||||||||||
| Total Distributions | Net Asset Value, End of Period | Total Return(b) | Net Assets, End of Period (in millions) | Expenses | Net Investment Income/(Loss) | Expenses | Net Investment Income/(Loss) | Portfolio Turnover Rate | ||||||||||||||||||
| $ | (1.35 | ) | $ | 6.96 | (42.13 | )% | $ | 52.1 | 0.82 | % | 0.34 | % | 0.92 | % | 0.23 | % | 44 | % | ||||||||
| (0.75 | ) | 13.55 | 9.28 | % | 118.1 | 0.80 | % | 0.59 | % | 0.91 | % | 0.48 | % | 55 | % | |||||||||||
| (0.30 | ) | 13.08 | 13.17 | % | 116.7 | 0.79 | % | 0.55 | % | 0.90 | % | 0.44 | % | 39 | % | |||||||||||
| (0.05 | ) | 11.86 | 6.32 | % | 120.4 | 0.90 | % | 0.23 | % | 0.90 | % | 0.22 | % | 42 | % | |||||||||||
| — | 11.21 | 9.95 | % | 107.4 | 0.80 | % | 0.64 | % | 0.92 | % | 0.52 | % | 33 | % | ||||||||||||
| (0.88 | ) | 8.10 | (34.33 | )% | 664.1 | 0.64 | % | 2.16 | % | 0.65 | % | 2.16 | % | 53 | % | |||||||||||
| (0.76 | ) | 13.41 | 4.70 | % | 1,004.9 | 0.64 | % | 1.68 | % | 0.65 | % | 1.67 | % | 37 | % | |||||||||||
| (0.43 | ) | 13.50 | 18.72 | % | 771.7 | 0.64 | % | 1.65 | % | 0.65 | % | 1.64 | % | 43 | % | |||||||||||
| (0.13 | ) | 11.78 | 7.02 | % | 514.5 | 0.65 | % | 1.53 | % | 0.65 | % | 1.52 | % | 53 | % | |||||||||||
| — | 11.14 | 14.13 | % | 351.2 | 0.66 | % | 1.52 | % | 0.66 | % | 1.52 | % | 51 | % | ||||||||||||
| (1.03 | ) | 6.11 | (37.68 | )% | 497.4 | 0.66 | % | 1.42 | % | 0.67 | % | 1.41 | % | 100 | % | |||||||||||
| (0.30 | ) | 11.04 | 7.57 | % | 1,060.1 | 0.65 | % | 1.31 | % | 0.66 | % | 1.30 | % | 114 | % | |||||||||||
| (0.20 | ) | 10.54 | 11.95 | % | 829.3 | 0.67 | % | 1.45 | % | 0.68 | % | 1.44 | % | 77 | % | |||||||||||
| (0.15 | ) | 9.62 | 5.31 | % | 602.4 | 0.71 | % | 0.95 | % | 0.72 | % | 0.94 | % | 60 | % | |||||||||||
| — | 9.28 | 8.49 | % | 442.9 | 0.72 | % | 1.16 | % | 0.73 | % | 1.15 | % | 68 | % | ||||||||||||
| (2.94 | ) | 13.72 | (37.12 | )% | 319.7 | 0.38 | % | 2.01 | % | 0.39 | % | 2.00 | % | 8 | % | |||||||||||
| (1.50 | ) | 25.18 | 5.17 | % | 633.5 | 0.36 | % | 1.64 | % | 0.36 | % | 1.64 | % | 5 | % | |||||||||||
| (0.36 | ) | 25.32 | 15.36 | % | 727.3 | 0.36 | % | 1.59 | % | 0.36 | % | 1.59 | % | 7 | % | |||||||||||
| (0.34 | ) | 22.31 | 4.75 | % | 795.3 | 0.35 | % | 1.54 | % | 0.35 | % | 1.54 | % | 7 | % | |||||||||||
| (0.23 | ) | 21.63 | 10.56 | % | 831.9 | 0.32 | % | 1.70 | % | 0.37 | % | 1.65 | % | 6 | % | |||||||||||
| (0.15 | ) | 6.89 | (29.58 | )% | 41.4 | 0.80 | % | 2.74 | % | 0.84 | % | 2.71 | % | 74 | % | |||||||||||
| (1.15 | ) | 11.75 | (26.06 | )% | 280.0 | 0.39 | % | 3.00 | % | 0.41 | % | 2.98 | % | 133 | % | |||||||||||
| (0.53 | ) | 17.16 | 5.46 | % | 488.4 | 0.38 | % | 2.78 | % | 0.39 | % | 2.77 | % | 121 | % | |||||||||||
| (0.43 | ) | 16.77 | 11.41 | % | 566.1 | 0.38 | % | 2.72 | % | 0.39 | % | 2.72 | % | 127 | % | |||||||||||
| (0.38 | ) | 15.48 | 3.92 | % | 663.5 | 0.37 | % | 2.52 | % | 0.38 | % | 2.52 | % | 130 | % | |||||||||||
| (0.32 | ) | 15.28 | 8.09 | % | 748.7 | 0.33 | % | 2.54 | % | 0.37 | % | 2.50 | % | 119 | % | |||||||||||
(b) | Total investment return assumes dividend reinvestment and does not reflect any deduction for sales charges. Not annualized for periods less than one year. Total return shown does not reflect charges and expenses imposed on contract holders by the variable accounts. Those charges and expenses reduce the return received by contract holders as compared to the return presented. |
| ** | Computed on an annualized basis for periods less than one year. |
The accompanying Notes to Financial Statements are an integral part of this schedule.
309
Table of Contents
Thrivent Series Fund, Inc.
Financial Highlights - continued
| FOR A SHARE OUTSTANDING THROUGHOUT EACH PERIOD* | ||||||||||||||||||||||
| Income from Investment Operations | Less Distributions from | |||||||||||||||||||||
| Net Asset Value, Beginning of Period | Net Investment Income/(Loss) | Net Realized and Unrealized Gain/(Loss) on Investments(a) | Total from Investment Operations | Net Investment Income | Net Realized Gain on Investments | |||||||||||||||||
HIGH YIELD PORTFOLIO | ||||||||||||||||||||||
Year Ended 12/31/2008 | $ | 4.84 | $ | 0.37 | $ | (1.34 | ) | $ | (0.97 | ) | $ | (0.39 | ) | $ | — | |||||||
Year Ended 12/31/2007 | 5.11 | 0.40 | (0.26 | ) | 0.14 | (0.41 | ) | — | ||||||||||||||
Year Ended 12/31/2006 | 5.01 | 0.40 | 0.10 | 0.50 | (0.40 | ) | — | |||||||||||||||
Year Ended 12/31/2005 | 5.22 | 0.41 | (0.21 | ) | 0.20 | (0.41 | ) | — | ||||||||||||||
Year Ended 12/31/2004 | 5.14 | 0.42 | 0.08 | 0.50 | (0.42 | ) | — | |||||||||||||||
DIVERSIFIED INCOME PLUS PORTFOLIO | ||||||||||||||||||||||
Year Ended 12/31/2008 | 6.98 | 0.46 | (2.00 | ) | (1.54 | ) | (0.43 | ) | — | |||||||||||||
Year Ended 12/31/2007 | 7.19 | 0.34 | (0.41 | ) | (0.07 | ) | (0.14 | ) | — | |||||||||||||
Year Ended 12/31/2006 | 6.54 | 0.42 | 0.48 | 0.90 | (0.25 | ) | — | |||||||||||||||
Year Ended 12/31/2005 | 6.80 | 0.49 | (0.26 | ) | 0.23 | (0.49 | ) | — | ||||||||||||||
Year Ended 12/31/2004 | 6.74 | 0.46 | 0.06 | 0.52 | (0.46 | ) | — | |||||||||||||||
PARTNER SOCIALLY RESPONSIBLE BOND PORTFOLIO | ||||||||||||||||||||||
Year Ended 12/31/2008 (c) | 10.00 | 0.26 | 0.01 | 0.27 | (0.25 | ) | — | |||||||||||||||
INCOME PORTFOLIO | ||||||||||||||||||||||
Year Ended 12/31/2008 | 9.74 | 0.51 | (1.53 | ) | (1.02 | ) | (0.52 | ) | — | |||||||||||||
Year Ended 12/31/2007 | 9.90 | 0.53 | (0.17 | ) | 0.36 | (0.52 | ) | — | ||||||||||||||
Year Ended 12/31/2006 | 9.95 | 0.51 | 0.01 | 0.52 | (0.51 | ) | (0.06 | ) | ||||||||||||||
Year Ended 12/31/2005 | 10.23 | 0.47 | (0.24 | ) | 0.23 | (0.47 | ) | (0.04 | ) | |||||||||||||
Year Ended 12/31/2004 | 10.20 | 0.44 | 0.03 | 0.47 | (0.44 | ) | — | |||||||||||||||
BOND INDEX PORTFOLIO | ||||||||||||||||||||||
Year Ended 12/31/2008 | 10.29 | 0.48 | (0.56 | ) | (0.08 | ) | (0.49 | ) | — | |||||||||||||
Year Ended 12/31/2007 | �� | 10.22 | 0.50 | 0.07 | 0.57 | (0.50 | ) | — | ||||||||||||||
Year Ended 12/31/2006 | 10.30 | 0.48 | (0.08 | ) | 0.40 | (0.48 | ) | — | ||||||||||||||
Year Ended 12/31/2005 | 10.52 | 0.44 | (0.22 | ) | 0.22 | (0.44 | ) | — | ||||||||||||||
Year Ended 12/31/2004 | 10.58 | 0.43 | (0.02 | ) | 0.41 | (0.43 | ) | (0.04 | ) | |||||||||||||
LIMITED MATURITY BOND PORTFOLIO | ||||||||||||||||||||||
Year Ended 12/31/2008 | 9.84 | 0.42 | (1.04 | ) | (0.62 | ) | (0.43 | ) | — | |||||||||||||
Year Ended 12/31/2007 | 9.92 | 0.47 | (0.08 | ) | 0.39 | (0.47 | ) | — | ||||||||||||||
Year Ended 12/31/2006 | 9.92 | 0.44 | — | 0.44 | (0.44 | ) | — | |||||||||||||||
Year Ended 12/31/2005 | 10.09 | 0.37 | (0.17 | ) | 0.20 | (0.37 | ) | — | ||||||||||||||
Year Ended 12/31/2004 | 10.21 | 0.29 | (0.10 | ) | 0.19 | (0.29 | ) | (0.02 | ) | |||||||||||||
(a) | The amount shown may not correlate with the change in aggregate gains and losses of portfolio securities due to the timing of sales and redemptions of fund shares. |
(c) | Since inception, 4/30/2008. |
| * | All per share amounts have been rounded to the nearest cent. |
The accompanying Notes to Financial Statements are an integral part of this schedule.
310
Table of Contents
Thrivent Series Fund, Inc.
Financial Highlights - continued
| RATIOS /SUPPLEMENTAL DATA | ||||||||||||||||||||||||
| Ratios to Average Net | ||||||||||||||||||||||||
| Assets Before Expenses | ||||||||||||||||||||||||
| Ratio to Average Net | Waived, Credited or Paid | |||||||||||||||||||||||
| Assets** | Indirectly** | |||||||||||||||||||||||
Total | Net Asset Value, End of Period | Total Return(b) | Net Assets, End of Period (in millions) | Expenses | Net Investment Income/(Loss) | Expenses | Net Investment Income/(Loss) | Portfolio Turnover Rate | ||||||||||||||||
| $(0.39) | $ | 3.48 | (21.19 | )% | $ | 597.2 | 0.43 | % | 8.63 | % | 0.45 | % | 8.61 | % | 50 | % | ||||||||
| (0.41) | 4.84 | 2.71 | % | 774.6 | 0.45 | % | 8.00 | % | 0.45 | % | 8.00 | % | 69 | % | ||||||||||
| (0.40) | 5.11 | 10.31 | % | 847.0 | 0.45 | % | 8.00 | % | 0.45 | % | 7.99 | % | 66 | % | ||||||||||
| (0.41) | 5.01 | 4.04 | % | 802.6 | 0.45 | % | 8.05 | % | 0.45 | % | 8.04 | % | 53 | % | ||||||||||
| (0.42) | 5.22 | 10.14 | % | 884.5 | 0.45 | % | 8.21 | % | 0.45 | % | 8.21 | % | 71 | % | ||||||||||
| (0.43) | 5.01 | (23.30 | )% | 75.0 | 0.51 | % | 5.61 | % | 0.52 | % | 5.59 | % | 115 | % | ||||||||||
| (0.14) | 6.98 | (0.99 | )% | 131.3 | 0.48 | % | 5.30 | % | 0.50 | % | 5.28 | % | 168 | % | ||||||||||
| (0.25) | 7.19 | 14.19 | % | 108.1 | 0.51 | % | 6.62 | % | 0.52 | % | 6.60 | % | 170 | % | ||||||||||
| (0.49) | 6.54 | 3.62 | % | 94.0 | 0.49 | % | 7.46 | % | 0.51 | % | 7.44 | % | 66 | % | ||||||||||
| (0.46) | 6.80 | 8.02 | % | 105.1 | 0.49 | % | 6.89 | % | 0.51 | % | 6.87 | % | 91 | % | ||||||||||
| (0.25) | 10.02 | 2.68 | % | 6.8 | 0.68 | % | 3.89 | % | 1.66 | % | 2.91 | % | 60 | % | ||||||||||
| (0.52) | 8.20 | (10.85 | )% | 1,097.1 | 0.44 | % | 5.61 | % | 0.45 | % | 5.60 | % | 160 | % | ||||||||||
| (0.52) | 9.74 | 3.77 | % | 1,418.3 | 0.44 | % | 5.43 | % | 0.45 | % | 5.43 | % | 228 | % | ||||||||||
| (0.57) | 9.90 | 5.42 | % | 1,081.8 | 0.45 | % | 5.22 | % | 0.45 | % | 5.22 | % | 303 | % | ||||||||||
| (0.51) | 9.95 | 2.31 | % | 924.3 | 0.45 | % | 4.70 | % | 0.45 | % | 4.69 | % | 259 | % | ||||||||||
| (0.44) | 10.23 | 4.74 | % | 985.1 | 0.45 | % | 4.36 | % | 0.45 | % | 4.36 | % | 207 | % | ||||||||||
| (0.49) | 9.72 | (0.82 | )% | 174.6 | 0.39 | % | 4.83 | % | 0.43 | % | 4.79 | % | 346 | % | ||||||||||
| (0.50) | 10.29 | 5.66 | % | 215.2 | 0.40 | % | 4.86 | % | 0.43 | % | 4.84 | % | 331 | % | ||||||||||
| (0.48) | 10.22 | 4.04 | % | 237.8 | 0.41 | % | 4.70 | % | 0.42 | % | 4.69 | % | 352 | % | ||||||||||
| (0.44) | 10.30 | 2.18 | % | 272.4 | 0.40 | % | 4.19 | % | 0.41 | % | 4.18 | % | 360 | % | ||||||||||
| (0.47) | 10.52 | 3.91 | % | 275.6 | 0.40 | % | 3.99 | % | 0.41 | % | 3.98 | % | 349 | % | ||||||||||
| (0.43) | 8.79 | (6.46 | )% | 925.9 | 0.44 | % | 4.44 | % | 0.45 | % | 4.43 | % | 121 | % | ||||||||||
| (0.47) | 9.84 | 3.98 | % | 973.8 | 0.44 | % | 4.82 | % | 0.45 | % | 4.81 | % | 128 | % | ||||||||||
| (0.44) | 9.92 | 4.57 | % | 665.6 | 0.44 | % | 4.49 | % | 0.45 | % | 4.48 | % | 137 | % | ||||||||||
| (0.37) | 9.92 | 1.96 | % | 454.1 | 0.45 | % | 3.70 | % | 0.46 | % | 3.69 | % | 267 | % | ||||||||||
| (0.31) | 10.09 | 1.89 | % | 316.2 | 0.46 | % | 2.84 | % | 0.46 | % | 2.84 | % | 219 | % | ||||||||||
(b) | Total investment return assumes dividend reinvestment and does not reflect any deduction for sales charges. Not annualized for periods less than one year. Total return shown does not reflect charges and expenses imposed on contract holders by the variable accounts. Those charges and expenses reduce the return received by contract holders as compared to the return presented. |
| ** | Computed on an annualized basis for periods less than one year. |
The accompanying Notes to Financial Statements are an integral part of this schedule.
311
Table of Contents
Thrivent Series Fund, Inc.
Financial Highlights - continued
FOR A SHARE OUSTANDING THROUGHOUT EACH PERIOD* | ||||||||||||||||||||||
| Income from Investment Operations | Less Distributions from | |||||||||||||||||||||
| Net Asset Value, Beginning of Period | Net Investment Income/(Loss) | Net Realized and Unrealized Gain/(Loss) on Investments(a) | Total from Investment Operations | Net Investment Income | Net Realized Gain on Investments | |||||||||||||||||
MORTGAGE SECURITIES PORTFOLIO | ||||||||||||||||||||||
Year Ended 12/31/2008 | $ | 9.71 | $ | 0.44 | $ | (0.91 | ) | $ | (0.47 | ) | $ | (0.42 | ) | $ | — | |||||||
Year Ended 12/31/2007 | 9.71 | 0.49 | (0.01 | ) | 0.48 | (0.48 | ) | — | ||||||||||||||
Year Ended 12/31/2006 | 9.75 | 0.48 | (0.04 | ) | 0.44 | (0.48 | ) | — | ||||||||||||||
Year Ended 12/31/2005 | 9.99 | 0.43 | (0.24 | ) | 0.19 | (0.43 | ) | — | ||||||||||||||
Year Ended 12/31/2004 | 9.99 | 0.40 | — | 0.40 | (0.39 | ) | (0.01 | ) | ||||||||||||||
MONEY MARKET PORTFOLIO | ||||||||||||||||||||||
Year Ended 12/31/2008 | 1.00 | 0.03 | — | 0.03 | (0.03 | ) | — | |||||||||||||||
Year Ended 12/31/2007 | 1.00 | 0.05 | — | 0.05 | (0.05 | ) | — | |||||||||||||||
Year Ended 12/31/2006 | 1.00 | 0.05 | — | 0.05 | (0.05 | ) | — | |||||||||||||||
Year Ended 12/31/2005 | 1.00 | 0.03 | — | 0.03 | (0.03 | ) | — | |||||||||||||||
Year Ended 12/31/2004 | 1.00 | 0.01 | — | 0.01 | (0.01 | ) | — | |||||||||||||||
(a) | The amount shown may not correlate with the change in aggregate gains and losses of portfolio securities due to the timing of sales and redemptions of fund shares. |
| * | All per share amounts have been rounded to the nearest cent. |
The accompanying Notes to Financial Statements are an integral part of this schedule.
312
Table of Contents
Thrivent Series Fund, Inc.
Financial Highlights - continued
| RATIOS / SUPPLEMENTAL DATA | ||||||||||||||||||||||||||
| Ratios to Average Net | ||||||||||||||||||||||||||
| Assets Before Expenses | ||||||||||||||||||||||||||
| Ratio to Average Net | Waived, Credited or Paid | |||||||||||||||||||||||||
| Assets** | Indirectly** | |||||||||||||||||||||||||
Total | Net Asset Value, End of Period | Total Return(b) | Net Assets, End of Period (in millions) | Expenses | Net Investment Income/(Loss) | Expenses | Net Investment Income/(Loss) | Portfolio Turnover Rate | ||||||||||||||||||
| $ | (0.42 | ) | $ | 8.82 | (4.96 | )% | $ | 35.2 | 0.67 | % | 4.67 | % | 0.67 | % | 4.67 | % | 721 | % | ||||||||
| (0.48 | ) | 9.71 | 5.09 | % | 49.8 | 0.65 | % | 5.05 | % | 0.65 | % | 5.05 | % | 731 | % | |||||||||||
| (0.48 | ) | 9.71 | 4.71 | % | 57.8 | 0.62 | % | 5.01 | % | 0.62 | % | 5.01 | % | 740 | % | |||||||||||
| (0.43 | ) | 9.75 | 2.00 | % | 66.9 | 0.61 | % | 4.40 | % | 0.62 | % | 4.39 | % | 703 | % | |||||||||||
| (0.40 | ) | 9.99 | 4.02 | % | 57.4 | 0.49 | % | 4.02 | % | 0.63 | % | 3.88 | % | 684 | % | |||||||||||
| (0.03 | ) | 1.00 | 2.95 | % | 683.4 | 0.36 | % | 2.93 | % | 0.46 | % | 2.83 | % | N/A | ||||||||||||
| (0.05 | ) | 1.00 | 5.14 | % | 741.6 | 0.35 | % | 5.03 | % | 0.45 | % | 4.93 | % | N/A | ||||||||||||
| (0.05 | ) | 1.00 | 4.85 | % | 590.6 | 0.35 | % | 4.80 | % | 0.45 | % | 4.70 | % | N/A | ||||||||||||
| (0.03 | ) | 1.00 | 2.86 | % | 373.7 | 0.46 | % | 2.85 | % | 0.46 | % | 2.85 | % | N/A | ||||||||||||
| (0.01 | ) | 1.00 | 0.97 | % | 323.2 | 0.46 | % | 1.00 | % | 0.47 | % | 0.99 | % | N/A | ||||||||||||
(b) | Total investment return assumes dividend reinvestment and does not reflect any deduction for sales charges. Not annualized for periods less than one year. Total return shown does not reflect charges and expenses imposed on contract holders by the variable accounts. Those charges and expenses reduce the return received by contract holders as compared to the return presented. |
| ** | Computed on an annualized basis for periods less than one year. |
The accompanying Notes to Financial Statements are an integral part of this schedule.
313
Table of Contents
(unaudited)
Proxy Voting
The policies and procedures that the Fund uses to determine how to vote proxies relating to portfolio securities are attached to the Fund’s Statement of Additional Information. You may request a free copy of the Statement of Additional Information or the report of how the Fund voted proxies relating to portfolio securities during the most recent 12-month period ended June 30 by calling 1-800-847-4836. You also may review the Statement of Additional Information or the report of how the Fund voted proxies relating to portfolio securities during the most recent 12-month period ended June 30 at the Thrivent Financial web site (www.thrivent.com) or the SEC web site (www.sec.gov).
Quarterly Schedule of Portfolio Holdings
The Fund files its Schedule of Portfolio Holdings on Form N-Q with the SEC for the first and third quarters of each fiscal year. You may request a free copy of the Fund’s Forms N-Q by calling 1-800-847-4836. The Fund’s Forms N-Q also are available on the Thrivent Financial web site (www.thrivent.com) or the SEC web site (www.sec.gov). You also may review and copy the Forms N-Q for the Fund at the SEC’s Public Reference Room in Washington, DC. You may get information about the operation of the Public Reference Room by calling 1-800-SEC-0330.
Board Approval of Investment Advisory Agreements and Subadvisory Agreements
Both the Investment Company Act of 1940 and the terms of the Investment Advisory and Subadvisory Agreements of the Thrivent Series Fund, Inc. (the “Fund”) require that these agreements be approved annually by a majority of the Board of Directors, including a majority of the Independent Directors.
At its meeting on November 11, 2008, the Board of Directors of the Portfolios of the Fund voted unanimously to renew the existing Investment Advisory Agreement between the Fund and Thrivent Financial for Lutherans (the “Adviser”) for all of the Portfolios of the Fund. The Board also unanimously approved the Subadvisory Agreements for each of the Portfolios for which there is an investment subadviser (each a “Subadviser”). The Adviser and Subadvisers are referred to, collectively, as the “Advisory Organizations.” In connection with its reapproval of the agreements with the Advisory Organizations, the Board considered the following factors:
| 1. | The nature, extent and quality of the services provided by the Advisory Organizations; |
| 2. | The performance of the Portfolios; |
| 3. | The costs of services provided and profits realized by the Adviser; |
| 4. | The extent to which economies of scale may be realized as the Portfolios grow; and |
| 5. | Whether the breakpoint levels reflect these economies of scale for the benefit of shareholders. |
In connection with the renewal process, the Contracts Committee of the Board (consisting of each of the Independent Directors of the Fund) met on July 24, August 26 and November 11, 2008, to consider information relevant to the renewal process. The Independent Directors also retained the services of Management Practice, Inc. (“MPI”) as an independent consultant to assist them in the compilation, organization and evaluation of relevant information. This information included statistical comparisons of the advisory fees, total operating expenses, and performance of each of the Portfolios in comparison to a peer group of comparable investment companies; detailed information prepared by Portfolio management with respect to the cost of services provided to the Portfolios and fees charged, including effective advisory fees that take into account breakpoints and fee waivers by the Adviser; profit realized by the Adviser and its affiliates that provide services to the Portfolios; and information regarding the types of services furnished to the Portfolios, the personnel providing the services, staff additions, systems improvements and plans for further hiring. The Board also received reports from the Adviser’s investment management staff with respect to the performance of the Portfolios. In addition to its review of the information presented to the Board during the contract renewal process and throughout the year, the Board also considered knowledge gained from discussions with Portfolio Management.
The Independent Directors were represented by independent counsel throughout the review process and during private sessions of the Independent Directors to consider reapproval of the agreements. The Directors also received a memorandum from independent counsel summarizing their responsibilities under the Investment Company Act of 1940 in reviewing and approving the Advisory Agreement and the Subadvisory Agreements. The Contract Committee’s and Board’s consideration of the factors listed above and the information provided to it are discussed below.
314
Table of Contents
Additional Information
(unaudited)
Nature, Extent and Quality of Services
At each of the Board’s regular quarterly meetings during 2008, management presented information describing the services furnished to the Portfolios by the Adviser and, as appropriate, the Subadvisers. During these meetings, management reported on the investment management, portfolio trading, and compliance functions provided to the Portfolios under the Advisory and Subadvisory Agreements. During the renewal process, the Board considered the specific services provided under the Advisory Agreement as compared to the services provided by other mutual fund investment advisers under similar investment advisory agreements. The Board also considered information relating to the investment experience and educational backgrounds of the Adviser’s portfolio managers and those of the Subadvisers.
The Board received reports at each of its quarterly meetings from the Adviser’s Chief Investment Officer and from the Directors of Equity and Fixed Income Investments. In addition, the Board had, over the past year, met with a majority of the portfolio managers of both the Adviser and each of the Subadvisers, which gave the Board an opportunity to evaluate the managers’ abilities, experience, and the quality of services they provide to the Portfolios. Information was also presented to the Board describing the portfolio compliance functions performed by the Adviser and the Adviser’s oversight of Subadvisers to the Fund. The Independent Directors also received quarterly reports from the Fund’s Chief Compliance Officer.
The Board also considered other benefits to the Adviser and its affiliates derived from its relationship with the Fund. The Board reviewed with the Adviser each of these arrangements and the reasonableness of the costs relative to the services performed.
The Adviser also reviewed with the Board the Adviser’s ongoing program to enhance portfolio management capabilities, including recruitment of research analysts and other personnel, and investment technology systems and applications to improve investment research trading, portfolio compliance, and investment reporting functions. The Board viewed these actions as a significant factor in approving the current Advisory Agreement as they demonstrated the Adviser’s commitment to provide the Portfolios with quality service and competitive investment performance.
Performance of the Portfolios
The Board received regular monthly performance reports, which included both the absolute and relative investment performance of each Portfolio. In addition, in connection with each of its regular quarterly meetings, the Board received more extensive information on the performance of each Portfolio, including absolute performance, relative performance rankings within each Portfolio’s Lipper peer group and performance as compared to benchmark index returns. The Board considered investment performance for each Portfolio over the one-, three- and five-year periods. When evaluating investment performance, the Board placed emphasis on longer-term performance and on the trend of performance, focusing particularly upon the three-year performance record.
For the three-year period ended September 30, 2008, 68% of the internally managed Portfolios and 67% of the subadvised Portfolios performed at or above the median of their respective Lipper peer groups. The Board concluded that the performance of the individual Portfolios was either satisfactory compared to their peer groups of funds or that the Adviser had taken appropriate actions to improve performance.
Cost of Services and Profitability to the Advisory Organization
The Board considered both the contractual and effective advisory fees for each of the Portfolios. They noted that 68% of the Portfolios, representing 83% of total Fund assets, had contractual advisory fees at or below the medians of their peer groups. The Board also considered advisory fees after the voluntary and contractual fee waivers and expense reimbursements provided by the Adviser for several of the Portfolios, noting that 68% of the Portfolios, representing 61% of total Fund assets, had effective advisory fees at or below the medians of their peer groups. In addition, the Board reviewed information prepared by MPI comparing each Portfolio’s overall expense ratio with the expense ratio of its peer group of funds. The Board also considered the profitability of the Adviser both overall and on a Portfolio-by-Portfolio basis.
The Board considered the allocations of the Adviser’s costs to the Portfolios. The internal audit department of the Adviser conducted a review of such allocations and reported to the Board regarding the reasonableness and consistency of these allocations. The Board was satisfied with the results of this review.
315
Table of Contents
Additional Information
(unaudited)
From its review of the MPI data and expense and profit information provided by the Adviser, the Board concluded that the profits earned by the Adviser from the Advisory Agreements were reasonable, particularly in light of the expense reimbursements and waivers in effect. On the basis of this information and review, the Board concluded that the advisory fees charged to the Portfolios for investment management services were reasonable.
With respect to fees paid to Subadvisers under the Subadvisory Agreements, the Directors considered that those contracts had been negotiated at arm’s length between the Adviser and each Subadviser and that the markup for additional services provided by the Adviser was reasonable. The Board also was informed of any separate arrangements for unrelated services between a Subadviser and the Adviser or its affiliates.
Economies of Scale and Breakpoints
The Directors considered whether economies of scale might be realized as a Portfolio’s assets increase. Because of differences between Portfolios as to management style and cost, it is difficult to generalize as to whether or to what extent economies in the advisory function may be realized as a Portfolio’s assets increase. Typically, expected economies of scale, where they exist, are shared through the use of fee breakpoints and/or fee waivers by the Adviser.
The Directors considered information provided by the Adviser related to the breakpoints in the Advisory Agreement and fee waivers provided by the Adviser. The Adviser explained that its general goal with respect to fee waivers, expense reimbursements and breakpoints was that the overall expense ratio for each Portfolio should be at or below the median expense ratio of its peer group. The Adviser noted that 97% of the Portfolios, representing 99.8% of total Fund assets, had net operating expenses at or below the median of their peer groups. The Board also noted that while some Portfolios were increasing in assets and other were decreasing in assets, the Portfolios overall were not experiencing significant asset growth.
Based on the factors discussed above, the Contracts Committee unanimously recommended approval of the Advisory Agreement and the Subadvisory Agreements, and the Board, including all of the Independent Directors voting separately, approved each of the agreements.
316
Table of Contents
Board of Directors and Officers
The following table provides information about the Directors and Officers of the Funds. Each Director oversees each of 41 series of the Fund and also serves as:
| • | Trustee of Thrivent Mutual Funds, a registered investment company consisting of 29 series, which offer Class A and Institutional Class shares. |
| • | Trustee of Thrivent Financial Securities Lending Trust, a registered investment company consisting of one portfolio that serves as a cash collateral fund for a securities lending program sponsored by Thrivent Financial. |
The 41 series of the Fund, 29 portfolios of Thrivent Mutual Funds and Thrivent Financial Securities Lending Trust are referred to herein as the “Fund Complex.” The Statement of Additional Information includes additional information about the Directors and is available, without charge, by calling 1-800-847-4836.
Interested Director (1)
Name, Address | Position | Number of Portfolios in Fund Complex Overseen by Director | Principal Occupation | Other Directorships | ||||
Pamela J. Moret 625 Fourth Avenue South Minneapolis, MN Age 52 | President from 2004 until November 2008; Director from 2004 until December 2008 | 71 | Executive Vice President, Strategic Development, Thrivent Financial since 2008; Executive Vice President, Marketing and Products, Thrivent Financial from 2002 until 2008 | Director, American Public Media and affiliates; Director, Luther Seminary |
Independent Directors (3)
Name, Address | Position | Number of Portfolios in Fund Complex Overseen by Director | Principal Occupation | Other Directorships | ||||
F. Gregory Campbell 625 Fourth Avenue South Minneapolis, MN Age 69 | Director since 2004 | 71 | President, Carthage College | Director, Optique Funds, Inc., an investment company consisting of four portfolios; Director, Kenosha Hospital and Medical Center Board; Director, Prairie School Board; Director, United Health Systems Board |
317
Table of Contents
Board of Directors and Officers
Name, Address | Position | Number of Portfolios in Fund Complex Overseen by Director | Principal Occupation | Other Directorships | ||||
Herbert F. Eggerding, Jr. 625 Fourth Avenue South Minneapolis, MN Age 71 | Director since 1990 | 71 | Management consultant to several privately owned companies | None | ||||
Noel K. Estenson 625 Fourth Avenue South Minneapolis, MN Age 70 | Director since 1997 | 71 | Retired | None | ||||
Richard L. Gady 625 Fourth Avenue South Minneapolis, MN Age 65 | Director since 2004 | 71 | Retired; previously Vice President, Public Affairs and Chief Economist, ConAgra, Inc. (agribusiness) | None | ||||
Richard A. Hauser 625 Fourth Avenue South Minneapolis, MN Age 65 | Director since 2004 | 71 | Vice President and Assistant General Counsel, Boeing Company since June 2007; President, National Legal Center for the Public Interest since 2004; General Counsel U.S. Department of Housing and Urban Development from 2001 to 2004; Partner, Baker & Hostetler, from 1986 to 2001 | None | ||||
Connie M. Levi 625 Fourth Avenue South Minneapolis, MN Age 69 | Chairperson beginning in 2009; Director since 1993 | 71 | Retired | None | ||||
Douglas D. Sims 625 Fourth Avenue South Minneapolis, MN Age 62 | Director since 2006 | 71 | Retired; previously Chief Executive Officer of CoBank from 1994 to June 30, 2006 | Director, Keystone Neighborhood Company; Director, Center for Corporate Excellence | ||||
Edward W. Smeds 625 Fourth Avenue South Minneapolis, MN Age 72 | Chairman from 2004 until December 2008; Director from 2004 until December 2008 | 71 | Retired | Chairman of Carthage College Board | ||||
318
Table of Contents
Board of Directors and Officers
Name, Address | Position | Number of Portfolios in Fund Complex Overseen by Director | Principal Occupation | Other Directorships | ||||
Constance L. Souders 625 Fourth Avenue South Minneapolis, MN Age 58 | Director since 2007 | 71 | Retired; previously Director from 1983 to September 30, 2007, Executive Vice President from 2001 to 2007, AML Compliance Officer from 2003 to 2007, Chief Financial Officer from 2000 to 2005, Chief Administrative Officer from 2000 to 2005 and Treasurer from 1992 to 2005 of Harbor Capital Advisors, Inc.; Director from 1992 to 2007, President from 2000 to 2007 and AML Compliance Officer from 2003 to 2007 of Harbor Services Group, Inc.; Director from 1992 to 2007, Executive Vice President from 2001 to 2007, Chief Compliance Officer from 2004 to 2007, AML Compliance Officer from 2003 to 2007, Supervisory Registered Principal from 2000 to 2007, Interim President from 2002 to 2003, Treasurer from 2000 to 2005 and Secretary from 2000 to 2005 of Harbor Funds Distributors, Inc.; Vice President from 2000 to 2007, Chief Financial Officer from 2000 to 2005 and Treasurer from 1992 to 2005 of Harbor Funds | None |
319
Table of Contents
Board of Directors and Officers
Executive Officers
Name, Address | Position with Fund | Principal Occupation During the Past 5 Years | ||
Russell W. Swansen 625 Fourth Avenue South Age 51 | President since November 2008; previously, Vice President since 2004 | Senior Vice President and Chief Investment Officer, Thrivent Financial since 2004; Managing Director, Colonnade Advisors LLC from 2001 to 2003 | ||
David S. Royal 625 Fourth Avenue South Minneapolis, MN Age 37 | Secretary and Chief Legal Officer since 2006 | Vice President — Asset Management, Thrivent Financial since 2006; Partner, Kirkland & Ellis LLP from April 2004 to June 2006; Associate, Skadden, Arps, Slate, Meagher & Flom LLP from 1997 to 2004 | ||
Katie S. Kloster 625 Fourth Avenue South Minneapolis, MN Age 43 | Vice President Investment Company and Investment Adviser Chief Compliance Officer since 2004 | Vice President and IC and IA Chief Compliance Officer, Thrivent Financial since 2004; previously Vice President and Controller of Thrivent Financial | ||
Gerard V. Vaillancourt 625 Fourth Avenue South Minneapolis, MN Age 41 | Treasurer and Principal Financial Officer since 2005 | Vice President, Mutual Fund Accounting since 2006; Head of Mutual Fund Accounting, Thrivent Financial from 2005 to 2006; Director, Fund Accounting Administration, Thrivent Financial from 2002 to 2005 | ||
Janice M. Guimond 625 Fourth Avenue South Minneapolis, MN Age 44 | Vice President since 2005 | Vice President, Investment Operations, Thrivent Financial since 2003; Manager of Portfolio Reporting, Thrivent Financial from 2003 to 2004; Independent Consultant from 2001 to 2003 | ||
Karl D. Anderson 625 Fourth Avenue South Minneapolis, MN Age 47 | Vice President since 2006 | Vice President, Products, Thrivent Financial | ||
Brian W. Picard 4321 North Ballard Road Appleton, WI Age 38 | Vice President Anti- Money Laundering Officer since 2006 | Director of FSO Compliance Corp. BCM since 2006; Manager of Field and Securities Compliance from 2002 to 2006, Thrivent Financial | ||
Kenneth L. Kirchner 4321 North Ballard Road Appleton, WI Age 42 | Assistant Vice President since 2004 | Director, Mutual Funds Operations, Thrivent Financial since 2004; Manager, Shareholder Services, Thrivent Financial from 2003 to 2004 | ||
Mark D. Anema 625 Fourth Avenue South Minneapolis, MN Age 47 | Assistant Vice President since 2007 | Vice President, Accumulation and Retirement Income Solutions, Thrivent Financial since 2007; Vice President, Strategic Planning, Thrivent Financial from 2004 to 2007; Insurance Practice Engagement Manager, McKinsey and Company from 1999 to 2004 | ||
James M. Odland 625 Fourth Avenue South Minneapolis, MN Age 53 | Assistant Secretary since 2006 | Vice President, Office of the General Counsel, Thrivent Financial since 2005; Senior Securities Counsel, Allianz Life Insurance Company from January 2005 to August 2005; Vice President and Chief Legal Officer, Woodbury Financial Services, Inc. from September 2003 to January 2005; Vice President and Group Counsel, Corporate Practice Group, American Express Financial Advisors, Inc. from 2001 to 2003 | ||
320
Table of Contents
Board of Directors and Officers
Name, Address | Position with Fund | Principal Occupation During the Past 5 Years | ||
John L. Sullivan 625 Fourth Avenue South Age 38 | Assistant Secretary since 2007 | Senior Counsel, Thrivent Financial since 2007; previously Senior Counsel, Division of Investment Management of the Securities and Exchange Commission | ||
Todd J. Kelly 4321 North Ballard Road Appleton, WI Age 39 | Assistant Treasurer since 1999 | Director, Fund Accounting Operations, Thrivent Financial | ||
Sarah L. Bergstrom 625 Fourth Avenue South Age 31 | Assistant Treasurer since 2007 | Director, Fund Accounting Administration, Thrivent Financial since 2007; Manager, Fund Accounting Administration, Thrivent Financial from 2005 to 2007; Manager, Mutual Fund Tax Reporting, Thrivent Financial from 2004 to 2005; Supervisor, Mutual Fund Tax Reporting, Thrivent Financial from 2002 to 2004 | ||
| (1) | “Interested person” of the Fund as defined in the Investment Company Act of 1940 by virtue of positions with Thrivent Financial. Ms. Moret is considered an interested person because of her principal occupation with Thrivent Financial. |
| (2) | Each Director serves an indefinite term until her or his successor is duly elected and qualified. Officers serve at the discretion of the Board until their successors are duly appointed and qualified. |
| (3) | The Directors other than Ms. Moret are not “interested persons” of the Trust and are referred to as “Independent Directors.” |
321
Table of Contents
Supplement to Prospectus dated April 30, 2008
With respect to Thrivent Partner Healthcare Portfolio, Thrivent Partner All Cap Value Portfolio,
Thrivent Diversified Income Plus Portfolio and Thrivent Income Portfolio
The “Portfolio Management” section of the prospectus is amended.
Thrivent Partner Healthcare Portfolio
The second paragraph under Thrivent Partner Healthcare Portfolio is deleted and replaced with the following:
Stephan Patten, CFA of S.A.M. serves as portfolio manager of the Portfolio. He joined S.A.M. in 2001 as an Assistant Portfolio Manager and became a Portfolio Manager in 2004. In 1996, Mr. Patten completed a B.Sc. in biochemistry at McGill University and, in 2001, received his Masters of Business Administration from the same university.
Thrivent Partner All Cap Value Portfolio
The second paragraph under Thrivent Partner All Cap Value Portfolio is deleted and replaced with the following:
John Damian and Mitch Williams, CFA serve as portfolio co-managers of the Portfolio. Mr. Damian has been a Senior Vice President of OFI since 2004 and was previously a Vice President of OFI since 2001. Mr. Williams has been a Vice President of OFI since 2006 and was previously a Senior Research Analyst of OFI since 2002.
Thrivent Diversified Income Plus Portfolio
The first paragraph under Thrivent Diversified Income Portfolio is deleted and replaced with the following:
Mark L. Simenstad, CFA, David R. Spangler, CFA, Kevin R. Brimmer, FSA and Paul J. Ocenasek, CFA serve as portfolio co-managers of the Thrivent Diversified Income Plus Portfolio.
In addition, the fifth paragraph under Thrivent Diversified Income Portfolio is deleted and replaced with the following:
Paul J. Ocenasek, CFA has been with Thrivent Financial since 1987 and has been a portfolio manager since 1997 of other Thrivent mutual funds, including the High Yield Portfolio and the Income Portfolio.
Thrivent Income Portfolio
The description under Thrivent Income Portfolio is deleted and replaced with the following:
Stephen D. Lowe, CFA has served as the portfolio manager of Thrivent Income Portfolio since 2009. He has also been a senior portfolio manager of the high yield portion of Thrivent Financial’s general account since 2005. Prior to this position, he was, since 2004, a high yield research manager and, since 2002, an associate portfolio manager of the high yield portion of the general account. He has been with Thrivent Financial since 1997.
Please include this Supplement with your Prospectus
322
Table of Contents
Thrivent Variable Life Account I
Supplement to Prospectus dated April 30, 2008 for
Thrivent Financial Variable Universal Life Insurance II
Regarding Initial Premium
The Initial Premium language that appears on page 27 of your prospectus is amended as follows:
The following language is deleted:
We will issue your Contract if you meet all underwriting and other requirements. We issue Contracts only with a Date of Issue between the 1st and the 28th of any month. New Contracts that would otherwise receive a Date of Issue of the 29th through the 31st of any month will instead be given a Date of Issue of the first Valuation Date in the following month.
The above paragraph will be replaced in its entirety with the following:
We will issue your Contract if you meet all underwriting and other requirements. We issue Contracts only with a Date of Issue between the 1st and the 28th of any month. New Contracts that would otherwise receive a Date of Issue of the 29th through the 31st of any month will instead be given a Date of Issue of the 28th day of the month.
The date of this Supplement is December 15, 2008.
Please include this Supplement with your Prospectus
Thrivent Financial for Lutherans
Service Center
4321 North Ballard Road
Appleton, WI 54919-0001
Toll-Free Telephone Number
(800)-847-4836
323
Table of Contents
[THIS PAGE INTENTIONALLY LEFT BLANK]
324
Table of Contents
We’re Listening to You!
In response to concerns regarding multiple mailings, we send one copy of a shareholder report and one copy of a prospectus for Thrivent Series Fund, Inc. to each household. This consolidation helps reduce printing and postage costs, thereby saving money. If you wish to receive an additional copy of this report, call us toll-free at 800-847-4836. Or you can enroll in eDelivery today at Thrivent.com and receive your annual and semiannual reports and prospectus electronically.
Thrivent Financial for Lutherans®
625 Fourth Ave. S., Minneapolis, MN 55415-1665
www.thrivent.com • e-mail: mail@thrivent.com • 800-THRIVENT (800-847-4836)
23572AR R2-09
Table of Contents
| Item 2. | Code of Ethics |
As of the end of the period covered by this report, registrant has adopted a code of ethics (as defined in Item 2 of Form N-CSR) applicable to registrant’s Principal Executive Officer, Principal Financial Officer, and Principal Accounting Officer. No waivers were granted to such code of ethics during the period covered by this report. A copy of this code of ethics is filed as an exhibit to this Form N-CSR.
| Item 3. | Audit Committee Financial Expert |
Registrant’s Board of Directors has determined that Herbert F. Eggerding, Jr., an independent director, is the Audit Committee Financial Expert.
| Item 4. | Principal Accountant Fees and Services |
| (a) | Audit Fees |
The aggregate fees billed by registrant’s independent public accountants, PricewaterhouseCoopers LLP (“PwC”), for each of the last two complete fiscal years and the fiscal period covered by this report for professional services rendered in connection with the audit of registrant’s annual financial statements or services that are normally provided by the accountant in connection with statutory and regulatory filings or engagements were $481,087 for the year ended December 31, 2007 and $556,733 for the year ended December 31, 2008.
| (b) | Audit-Related Fees |
The aggregate fees PwC billed to registrant for each of the last two fiscal years for assurance and other services which are reasonably related to the performance of registrant’s audit and are not reported under Item 4(a) were $0 for the fiscal year ended December 31, 2007 and $0 for the fiscal year ended December 31, 2008. The aggregate fees PwC billed to registrant’s investment adviser and any entity controlling, controlled by, or under common control with registrant’s investment adviser for assurance and other services directly related to the operations and financial reporting of registrant were $0 for the year ended December 31, 2007 and $0 for the year ended December 31, 2008.
| (c) | Tax Fees |
The aggregate tax fees PwC billed to registrant for each of the last two fiscal years for tax compliance, tax advice, and tax planning services were $91,375 for the year ended December 31, 2007 and $106,601 for the year ended December 31, 2008. The aggregate tax fees PwC billed to registrant’s investment adviser and any entity controlling, controlled by, or under common control with registrant’s investment adviser for services directly related to the operations and financial reporting of registrant were $0 for the year ended December 31, 2007 and $0 for the year ended December 31, 2008.
| (d) | All Other Fees |
The aggregate fees PwC billed to registrant for each of the last two fiscal years for products and services provided other than the services reported in paragraphs (a) through (c) of this item were $18,174 for the year ended December 31, 2007 and $0 for the year ended December 31, 2008. The aggregate fees PwC billed to registrant’s investment adviser and any entity controlling, controlled by, or under common control with registrant’s investment adviser for products and services provided other than the services reported in paragraphs (a) through (c) of this item were $0 for the year ended December 31, 2007 and $0 for the year ended December 31, 2008.
Table of Contents
| (e) | Registrant’s audit committee charter, adopted in August 2004, provides that the audit committee (comprised of the independent Directors of registrant) is responsible for pre-approval of all auditing services performed for the registrant. The audit committee also is responsible for pre-approval (subject to the de minimis exceptions for non-audit services described in Section 10A(i)(1)(B) of the Securities Exchange Act of 1934) of all non-auditing services performed for the registrant or for any service affiliate of registrant. In addition, registrant’s audit committee charter permits a designated member of the audit committee to pre-approve, between meetings, one or more audit or non-audit service projects, subject to an expense limit and notification to the audit committee at the next committee meeting. Registrant’s audit committee pre-approved all fees described above that PwC billed to registrant. |
| (f) | Less than 50% of the hours billed by PwC for auditing services to registrant for the fiscal year ended December 31, 2008, were for work performed by persons other than full-time, permanent employees of PwC. |
| (g) | The aggregate non-audit fees billed by PwC to registrant and to registrant’s investment adviser and any entity controlling, controlled by, or under common control with registrant’s investment adviser for the fiscal years ending December 31, 2007 and December 31, 2008 were $1,582 and $1,500, respectively. |
| (h) | Registrant’s audit committee has considered the non-audit services provided to the registrant and registrant’s investment adviser and any entity controlling, controlled by, or under common control with registrant’s investment adviser as described above and determined that these services do not compromise PwC’s independence. |
| Item 5. | Audit Committee of Listed Registrants |
Not applicable.
| Item 6. | Schedule of Investments |
| (a) | Registrant’s Schedule of Investments is included in the report to shareholders filed under Item 1. |
| (b) | Not applicable to this filing. |
| Item 7. | Disclosure of Proxy Voting Policies and Procedures for Closed-End Management Investment Companies |
Not applicable.
| Item 8. | Purchases of Equity Securities by Closed-End Management Investment Company and Affiliated Purchasers. |
Not applicable.
| Item 9. | Submission of Matters to a Vote of Security Holders |
There have been no material changes to the procedures by which shareholders may recommend nominees to registrant’s board of trustees.
| Item 10. | Controls and Procedures |
(a)(i) Registrant’s President and Treasurer have concluded that registrant’s disclosure controls and procedures (as defined in Rule 30a-3(c) under the Investment Company Act) are effective, based on their evaluation of these controls and procedures as of a date within 90 days of the filing date of this report.
Table of Contents
(a)(ii) Registrant’s President and Treasurer are aware of no change in registrant’s internal control over financial reporting (as defined in Rule 30a-3(d) under the Investment Company Act) that occurred during registrant’s most recent fiscal quarter that has materially affected, or is reasonably likely to materially affect, registrant’s internal control over financial reporting.
| Item 11. | Exhibits |
| (a) | The code of ethics pursuant to Item 2 is attached hereto. |
| (b) | Certifications pursuant to Rules 30a-2(a) and 30a-2(b) under the Investment Company Act of 1940 are attached hereto. |
Table of Contents
SIGNATURES
Pursuant to the requirements of the Securities Exchange Act of 1934 and the Investment Company Act of 1940, the registrant has duly caused this report to be signed on its behalf by the undersigned, thereunto duly authorized.
| Date: February 26, 2009 | THRIVENT SERIES FUND, INC. | |||||||
| By: | /s/ Russell W. Swansen | |||||||
| Russell W. Swansen | ||||||||
| President | ||||||||
Pursuant to the requirements of the Securities Exchange Act of 1934 and the Investment Company Act of 1940, this report has been signed below by the following persons on behalf of the registrant and in the capacities and on the dates indicated.
| Date: February 26, 2009 | By: | /s/ Russell W. Swansen | ||||||
| Russell W. Swansen | ||||||||
| President | ||||||||
| Date: February 26, 2009 | By: | /s/ Gerard V. Vaillancourt | ||||||
| Gerard V. Vaillancourt | ||||||||
| Treasurer | ||||||||