| UNITED STATES |
|
| SECURITIES AND EXCHANGE COMMISSION |
|
| Washington, D.C. 20549 |
|
FORM N-CSR
CERTIFIED SHAREHOLDER REPORT OF REGISTERED
MANAGEMENT INVESTMENT COMPANIES
Investment Company Act file number | 811-04604 | ||||||||
| |||||||||
CREDIT SUISSE CAPITAL FUNDS | |||||||||
(Exact name of registrant as specified in charter) | |||||||||
| |||||||||
466 Lexington Avenue, New York, New York |
| 10017-3140 | |||||||
(Address of principal executive offices) |
| (Zip code) | |||||||
| |||||||||
J. Kevin Gao, Esq. | |||||||||
(Name and address of agent for service) | |||||||||
| |||||||||
Registrant’s telephone number, including area code: | (212) 875-3500 |
| |||||||
| |||||||||
Date of fiscal year end: | October 31 |
| |||||||
| |||||||||
Date of reporting period: | November 1, 2005 to April 30, 2006 |
| |||||||
Item 1. Reports to Stockholders.

CREDIT SUISSE FUNDS
Semiannual Report
April 30, 2006
(unaudited)
n CREDIT SUISSE
LARGE CAP VALUE FUND
n CREDIT SUISSE
SMALL CAP VALUE FUND
The Funds' investment objectives, risks, charges and expenses (which should be considered carefully before investing), and more complete information about the the Funds, are provided in the Prospectus, which should be read carefully before investing. You may obtain additional copies by calling 800-927-2874 or by writing to Credit Suisse Funds, P.O. Box 55030, Boston, MA 02205-5030.
Credit Suisse Asset Management Securities, Inc., Distributor, is located at 466 Lexington Ave., New York, NY 10017-3140. Credit Suisse Funds are advised by Credit Suisse Asset Management, LLC.
Investors in the Credit Suisse Funds should be aware that they may be eligible to purchase Common Class and/or Advisor Class shares (where offered) directly or through certain intermediaries. Such shares are not subject to a sales charge but may be subject to an ongoing service and distribution fee of up to 0.50% of average daily net assets. Investors in the Credit Suisse Funds should also be aware that they may be eligible for a reduction or waiver of the sales charge with respect to Class A, B or C shares. For more information, please review the relevant prospectuses or consult your financial representative.
The views of the Funds' management are as of the date of the letter and Fund holdings described in this document are as of April 30, 2006; these views and Fund holdings may have changed subsequent to these dates. Nothing in this document is a recommendation to purchase or sell securities.
Fund shares are not deposits or other obligations of Credit Suisse Asset Management, LLC ("Credit Suisse") or any affiliate, are not FDIC-insured and are not guaranteed by Credit Suisse or any affiliate. Fund investments are subject to investment risks, including loss of your investment.
Credit Suisse Large Cap Value Fund
Semiannual Investment Adviser's Report
April 30, 2006 (unaudited)
May 31, 2006
Dear Shareholder:
Performance Summary
11/01/05 – 04/30/06
| Fund & Benchmark | Performance | ||||||
| Common1 | 10.35 | % | |||||
| Advisor1 | 10.07 | % | |||||
| Class A1,2 | 10.22 | % | |||||
| Class B1,2 | 9.80 | % | |||||
| Class C1,2 | 9.81 | % | |||||
| Russell 1000® Value Index3 | 12.87 | % | |||||
Performance for the Fund's Class A, Class B and Class C Shares is without the maximum sales charge of 5.75%, 4.00% and 1.00%, respectively.2
Market Overview: GDP rebounds, market moves upward
The period was an overall positive one for US equities, supported by economic expansion and optimism over corporate earnings. While fourth quarter 2005 GDP growth was modest compared with earlier quarters, as the economy absorbed a severe hurricane season, growth rebounded: First quarter 2006 GDP rose at its highest quarterly rate in more than two years. Notwithstanding the period immediately following this report, investors' appetite for risk taking remained, in general, healthy during the semiannual period ended
April 30, 2006. This occurred during a period of high energy costs, steadily rising interest rates and ongoing political tensions in the Middle East.
Most sectors of the market advanced, led by economically sensitive areas such as energy, materials and producer durables companies. In the large-capitalization area, value stocks outperformed growth stocks. Small-capitalization stocks outpaced larger cap stocks in general, extending a long period of small cap outperformance.
Strategic Review: Focus on company fundamentals
The Fund participated in the market's rally but trailed its benchmark. This was due in part to certain technology holdings that struggled, such as Microsoft and International Business Machines (0.9% and 2.3% of the Fund's net assets, respectively, as of April 30, 2006), which lagged as investors favored more-speculative technology stocks. The Fund's health care and financial services stocks, while positive in absolute terms, underperformed. On the positive side, the Fund's performance was aided by good stock selection in the energy-services
1
Credit Suisse Large Cap Value Fund
Semiannual Investment Adviser's Report (continued)
April 30, 2006 (unaudited)
sector, as well as its overweighting in that sector. The Fund's producer durables and consumer discretionary holdings also had good performance.
In terms of noteworthy recent portfolio activity, our purchases included Abbott Laboratories (1.3% of the Fund's net assets as of April 30, 2006), a health care products company, using weakness in the stock price as a buying opportunity. We believe that the company has the potential to improve its growth rate and relative valuation. In the financial services area, we purchased Aflac (1.3% of the Fund's net assets as of April 30, 2006). We viewed the stock as undervalued compared with its historical range, and we think the company's insurance sales in Japan could rebound going forward. Our sales included a number of stocks that had appreciated to reach our price target, such as McDonalds and JC Penney.
Going forward, we will continue to adhere to our strategy of investing in dividend-paying stocks of companies with large market capitalizations. Using proprietary bottom-up equity research and detailed quantitative analyses, we look for stocks that are deeply discounted relative to our view of their upside potential, in terms of valuation and/or income, with an emphasis on companies that stand to benefit from the positive impact of a likely significant event.
The Credit Suisse Large Cap Value Team
Stephen J. Kaszynski
Robert E. Rescoe
Adam Scheiner
The value of investments generally will fluctuate in response to market movements and the fund's performance will largely depend on the performance of value stocks, which may be more volatile than the overall market.
In addition to historical information, this report contains forward-looking statements, which may concern, among other things, domestic and foreign market, industry and economic trends and developments and government regulation and their potential impact on the Fund's investment portfolio. These statements are subject to risks and uncertainties and actual trends, developments and regulations in the future and their impact on the Fund could be materially different from that projected, anticipated or implied. The Fund has no obligation to update or revise forward-looking statements.
2
Credit Suisse Large Cap Value Fund
Semiannual Investment Adviser's Report (continued)
April 30, 2006 (unaudited)
Average Annual Returns as of March 31, 20061
| 1 Year | 5 Years | 10 Years | Since Inception | Inception Date | |||||||||||||||||||
| Common Class | 10.42 | % | 5.53 | % | — | 5.92 | % | 8/01/00 | |||||||||||||||
| Advisor Class | 9.87 | % | — | — | 12.76 | % | 6/06/03 | ||||||||||||||||
| Class A Without Sales Charge | 10.16 | % | 5.47 | % | 10.29 | % | 11.62 | % | 7/09/92 | ||||||||||||||
| Class A With Maximum Sales Charge | 3.84 | % | 4.22 | % | 9.64 | % | 11.14 | % | 7/09/92 | ||||||||||||||
| Class B Without CDSC | 9.33 | % | 4.68 | % | 9.49 | % | 9.35 | % | 2/28/96 | ||||||||||||||
| Class B With CDSC | 5.46 | % | 4.68 | % | 9.49 | % | 9.35 | % | 2/28/96 | ||||||||||||||
| Class C Without CDSC | 9.33 | % | 4.68 | % | — | 5.74 | % | 2/28/00 | |||||||||||||||
| Class C With CDSC | 8.36 | % | 4.68 | % | — | 5.74 | % | 2/28/00 | |||||||||||||||
Average Annual Returns as of April 30, 20061
| 1 Year | 5 Years | 10 Years | Since Inception | Inception Date | |||||||||||||||||||
| Common Class | 16.92 | % | 5.29 | % | — | 6.38 | % | 8/01/00 | |||||||||||||||
| Advisor Class | 16.34 | % | — | — | 13.53 | % | 6/06/03 | ||||||||||||||||
| Class A Without Sales Charge | 16.67 | % | 5.23 | % | 10.51 | % | 11.79 | % | 7/09/92 | ||||||||||||||
| Class A With Maximum Sales Charge | 9.95 | % | 3.99 | % | 9.86 | % | 11.31 | % | 7/09/92 | ||||||||||||||
| Class B Without CDSC | 15.76 | % | 4.44 | % | 9.72 | % | 9.58 | % | 2/28/96 | ||||||||||||||
| Class B With CDSC | 11.76 | % | 4.44 | % | 9.72 | % | 9.58 | % | 2/28/96 | ||||||||||||||
| Class C Without CDSC | 15.79 | % | 4.44 | % | — | 6.16 | % | 2/28/00 | |||||||||||||||
| Class C With CDSC | 14.79 | % | 4.44 | % | — | 6.16 | % | 2/28/00 | |||||||||||||||
Returns represent past performance and include change in share price and reinvestment of dividends and capital gains. Past performance cannot guarantee future results. The current performance of the Fund may be lower or higher than the figures shown. Returns and share price will fluctuate, and redemption value may be more or less than original cost. The performance results do not reflect the deduction of taxes that a shareholder would pay on fund distributions or the redemption of fund shares. Performance information current to the most recent month-end is available at www.credit-suisse.com/us.
1 Fee waivers and/or expense reimbursements may reduce expenses for the Fund, without which performance would be lower. Waivers and/or reimbursements may be discontinued at any time.
2 Total return for Class A Shares for the reporting period, based on offering price (with maximum sales charge of 5.75%), was 3.90%. Total return for Class B Shares for the reporting period, based on redemption value (including maximum contingent deferred sales charge of 4%), was 5.92%. Total return for Class C Shares for the reporting period, based on redemption value (including maximum contingent deferred sales charge of 1%), was 8.83%.
3 The Russell 1000® Value Index measures the performance of those companies in the Russell 1000® Index with lower price-to-book ratios and lower forecasted growth values. It is an unmanaged index of common stocks that includes reinvestment of dividends and is compiled by Frank Russell Company. Investors cannot invest directly in an index.
3
Credit Suisse Large Cap Value Fund
Semiannual Investment Adviser's Report (continued)
April 30, 2006 (unaudited)
Information About Your Fund's Expenses
As an investor of the Fund, you incur two types of costs: ongoing expenses and transaction costs. Ongoing expenses include management fees, distribution and service (12b-1) fees and other Fund expenses. Examples of transaction costs include sales charges (loads), redemption fees and account maintenance fees, which are not shown in this section and which would result in higher total expenses. The following table is intended to help you understand your ongoing expenses of investing in the Fund and to help you compare these expenses with the ongoing expenses of investing in other mutual funds. The table is based on an investment of $1,000 made at the beginning of the six month period ended April 30, 2006.
The table illustrates your Fund's expenses in two ways:
• Actual Fund Return. This helps you estimate the actual dollar amount of ongoing expenses paid on a $1,000 investment in the Fund using the Fund's actual return during the period. To estimate the expenses you paid over the period, simply divide your account value by $1,000 (for example, an $8,600 account value divided by $1,000 = 8.6), then multiply the result by the number in the "Expenses Paid per $1,000" line under the share class you hold.
• Hypothetical 5% Fund Return. This helps you to compare your Fund's ongoing expenses with those of other mutual funds using the Fund's actual expense ratio and a hypothetical rate of return of 5% per year before expenses. Examples using a 5% hypothetical fund return may be found in the shareholder reports of other mutual funds. The hypothetical account values and expenses may not be used to estimate the actual ending account balance or expenses you paid for the period.
Please note that the expenses shown in these tables are meant to highlight your ongoing expenses only and do not reflect any transaction costs, such as sales charges (loads) or redemption fees. If these transaction costs had been included, your costs would have been higher. The "Expenses Paid per $1,000" line of the tables is useful in comparing ongoing expenses only and will not help you determine the relative total expenses of owning different funds.
4
Credit Suisse Large Cap Value Fund
Semiannual Investment Adviser's Report (continued)
April 30, 2006 (unaudited)
Expenses and Value of a $1,000 Investment
for the six month period ended April 30, 2006
| Actual Fund Return | Common Class | Advisor Class | Class A | Class B | Class C | ||||||||||||||||||
| Beginning Account Value 11/1/05 | $ | 1,000.00 | $ | 1,000.00 | $ | 1,000.00 | $ | 1,000.00 | $ | 1,000.00 | |||||||||||||
| Ending Account Value 4/30/06 | $ | 1,103.50 | $ | 1,100.70 | $ | 1,102.20 | $ | 1,098.00 | $ | 1,098.10 | |||||||||||||
| Expenses Paid per $1,000* | $ | 4.80 | $ | 7.40 | $ | 6.10 | $ | 9.99 | $ | 9.99 | |||||||||||||
| Hypothetical 5% Fund Return | |||||||||||||||||||||||
| Beginning Account Value 11/1/05 | $ | 1,000.00 | $ | 1,000.00 | $ | 1,000.00 | $ | 1,000.00 | $ | 1,000.00 | |||||||||||||
| Ending Account Value 4/30/06 | $ | 1,020.23 | $ | 1,017.75 | $ | 1,018.99 | $ | 1,015.27 | $ | 1,015.27 | |||||||||||||
| Expenses Paid per $1,000* | $ | 4.61 | $ | 7.10 | $ | 5.86 | $ | 9.59 | $ | 9.59 | |||||||||||||
| Common Class | Advisor Class | Class A | Class B | Class C | |||||||||||||||||||
| Annualized Expense Ratios* | 0.92 | % | 1.42 | % | 1.17 | % | 1.92 | % | 1.92 | % | |||||||||||||
* Expenses are equal to the Fund's annualized expense ratio for each share class, multiplied by the average account value over the period, multiplied by the number of days in the most recent fiscal half year period, then divided by 365.
The "Expenses Paid per $1,000" and the "Annualized Expense Ratios" in the tables are based on actual expenses paid by the Fund during the period, net of fee waivers and/or expense reimbursements. If those fee waivers and/or expense reimbursements had not been in effect, the Fund's actual expenses would have been higher.
For more information, please refer to the Fund's prospectus.
5
Credit Suisse Large Cap Value Fund
Semiannual Investment Adviser's Report (continued)
April 30, 2006 (unaudited)
SECTOR BREAKDOWN*
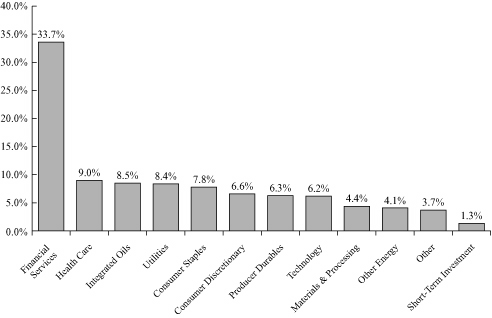
* Expressed as a percentage of total investments (excluding security lending collateral) and may vary over time.
6
Credit Suisse Small Cap Value Fund
Semiannual Investment Adviser's Report
April 30, 2006 (unaudited)
May 31, 2006
Dear Shareholder:
Performance Summary
11/01/05 – 04/30/06
| Fund & Benchmark | Performance | ||||||
| Common1 | 10.95 | % | |||||
| Class A1,2 | 10.95 | % | |||||
| Class B1,2 | 10.58 | % | |||||
| Class C1,2 | 10.51 | % | |||||
| Russell 2000® Index3 | 18.89 | % | |||||
| Russell 2000® Value Index3 | 17.51 | % | |||||
Performance for the Fund's Class A, Class B and Class C Shares is without the maximum sales charge of 5.75%, 4.00% and 1.00%, respectively.2
Market Overview: GDP rebounds, market moves upward
The period was an overall positive one for US equities, supported by economic expansion and optimism over corporate earnings. While fourth quarter 2005 GDP growth was modest compared with earlier quarters, as the economy absorbed a severe hurricane season, growth rebounded: First quarter 2006 GDP rose at its highest quarterly rate in more than two years. Notwithstanding the period immediately following this report, investors' appetite for risk taking remained, in general, healthy during the semiannual period ended April 30, 2006. This occurred during a period of high energy costs, steadily rising interest rates and ongoing political tensions in the Middle East.
Small-capitalization stocks outpaced large-cap stocks in the period, as small cap funds received record cash inflows during the period (to illustrate, small cap fund inflows for the first quarter of 2006 exceeded flows for all of 2005).
Portfolio Review: Adhering to value disciplines
Not surprisingly, the most liquid securities in the Russell 2000 Value Index were the greatest beneficiaries of cash inflows. Our investing philosophy leads us to invest in stocks that meet our strict valuation and qualitative criteria, not merely those that may satisfy the market's immediate appetite for a favored asset class. Nonetheless, the Fund delivered strong absolute returns and participated in the rally in small-cap stocks but underperformed its benchmarks.
From a sector allocation perspective, the Fund's transportation-related holdings struggled initially, particularly in the auto parts area, but began to rebound near the end of the period as investors seemed to re-acknowledge the viability of many of these businesses. The Fund's energy, utilities and consumer
7
Credit Suisse Small Cap Value Fund
Semiannual Investment Adviser's Report (continued)
April 30, 2006 (unaudited)
staples stocks outperformed, while its materials, producer durables and technology holdings had solid but lagging returns.
With regard to noteworthy portfolio activity, our recent purchases included WCI Communities (0.9% of the Fund's net assets as of April 30, 2006), a leading builder of homes for affluent retirees. The stock was attractively priced in our view, particularly based on book value. We believe that demand for high quality retirement residences could continue regardless of interest rate fluctuations, and we welcomed the opportunity to invest in this company at a significant discount to our valuation estimate. We also established a position in NETGEAR (1.9% of the Fund's net assets as of April 30, 2006), a provider of networking products used in homes and small businesses. We believe the stock's valuation is inexpensive, given the company's large cash position and its potential to benefit from robust demand for wireless networking products.
Our sales included Manitowac, a construction equipment manufacturer. After management raised earnings guidance to reflect strong demand for its products, the stock rose more than 75% in the first quarter of 2006, and it exceeded our valuation estimate.
We continue to position the Fund for a high level of growth of capital, aiming for potentially good absolute performance when small cap stocks are in favor, and attempting to be more defensive when they are not. Using proprietary bottom-up equity research, we continue to invest in stocks that are deeply discounted relative to our view of their intrinsic value, with an emphasis on companies that we think have sustainable competitive advantages.
The Credit Suisse Small Cap Value Team
Stephen J. Kaszynski
Robert E. Rescoe
T. Ryan Harkins
Because of the nature of the Fund's investments in special-situation, start-up and other small companies, an investment in the Fund may be more volatile and less liquid than investments in larger companies.
In addition to historical information, this report contains forward-looking statements, which may concern, among other things, domestic and foreign market, industry and economic trends and developments and government regulation and their potential impact on the Fund's investment portfolio. These statements are subject to risks and uncertainties and actual trends, developments and regulations in the future and their impact on the Fund could be materially different from that projected, anticipated or implied. The Fund has no obligation to update or revise forward-looking statements.
8
Credit Suisse Small Cap Value Fund
Semiannual Investment Adviser's Report (continued)
April 30, 2006 (unaudited)
Average Annual Returns as of March 31, 20061
| 1 Year | 5 Years | 10 Years | Since Inception | Inception Date | |||||||||||||||||||
| Common Class | 15.53 | % | 13.33 | % | — | 14.11 | % | 8/01/00 | |||||||||||||||
| Class A Without Sales Charge | 15.55 | % | 13.34 | % | 12.09 | % | 14.19 | % | 7/09/92 | ||||||||||||||
| Class A With Maximum Sales Charge | 8.91 | % | 12.01 | % | 11.43 | % | 13.70 | % | 7/09/92 | ||||||||||||||
| Class B Without CDSC | 14.73 | % | 12.50 | % | 11.26 | % | 11.37 | % | 2/28/96 | ||||||||||||||
| Class B With CDSC | 10.73 | % | 12.50 | % | 11.26 | % | 11.37 | % | 2/28/96 | ||||||||||||||
| Class C Without CDSC | 14.74 | % | 12.50 | % | — | 14.85 | % | 2/28/00 | |||||||||||||||
| Class C With CDSC | 13.74 | % | 12.50 | % | — | 14.85 | % | 2/28/00 | |||||||||||||||
Average Annual Returns as of April 30, 20061
| 1 Year | 5 Years | 10 Years | Since Inception | Inception Date | |||||||||||||||||||
| Common Class | 21.11 | % | 11.91 | % | — | 13.76 | % | 8/01/00 | |||||||||||||||
| Class A Without Sales Charge | 21.12 | % | 11.91 | % | 11.88 | % | 14.04 | % | 7/09/92 | ||||||||||||||
| Class A With Maximum Sales Charge | 14.14 | % | 10.59 | % | 11.21 | % | 13.55 | % | 7/09/92 | ||||||||||||||
| Class B Without CDSC | 20.32 | % | 11.08 | % | 11.06 | % | 11.20 | % | 2/28/96 | ||||||||||||||
| Class B With CDSC | 16.32 | % | 11.08 | % | 11.06 | % | 11.20 | % | 2/28/96 | ||||||||||||||
| Class C Without CDSC | 20.23 | % | 11.08 | % | — | 14.50 | % | 2/28/00 | |||||||||||||||
| Class C With CDSC | 19.23 | % | 11.08 | % | — | 14.50 | % | 2/28/00 | |||||||||||||||
Returns represent past performance and include change in share price and reinvestment of dividends and capital gains. Past performance cannot guarantee future results. The current performance of the Fund may be lower or higher than the figures shown. Returns and share price will fluctuate, and redemption value may be more or less than original cost. The performance results do not reflect the deduction of taxes that a shareholder would pay on fund distributions or the redemption of fund shares. Performance information current to the most recent month-end is available at www.credit-suisse.com/us.
1 Fee waivers and/or expense reimbursements may reduce expenses for the Fund, without which performance would be lower. Waivers and/or reimbursements may be discontinued at any time.
2 Total return for Class A Shares for the reporting period, based on offering price (with maximum sales charge of 5.75%), was 4.57%. Total return for Class B Shares for the reporting period, based on redemption value (including maximum contingent deferred sales charge of 4%), was 6.63%. Total return for Class C Shares for the reporting period, based on redemption value (including maximum contingent deferred sales charge of 1%), was 9.53%.
3 The Russell 2000® Index measures the performance of the 2,000 smallest companies in the Russell 3000® Index, which represent approximately 8% of the total market capitalization of the Russell 3000® Index. It is an unmanaged index of common stocks which includes reinvestment of dividends and is compiled by Frank Russell Company. The Russell 2000@ Value Index measures the performance of those Russell 2000® companies with lower price-to- book ratios and lower forecasted growth values. Investors cannot invest directly in an index.
9
Credit Suisse Small Cap Value Fund
Semiannual Investment Adviser's Report (continued)
April 30, 2006 (unaudited)
Information About Your Fund's Expenses
As an investor of the Fund, you incur two types of costs: ongoing expenses and transaction costs. Ongoing expenses include management fees, distribution and service (12b-1) fees and other Fund expenses. Examples of transaction costs include sales charges (loads), redemption fees and account maintenance fees, which are not shown in this section and which would result in higher total expenses. The following table is intended to help you understand your ongoing expenses of investing in the Fund and to help you compare these expenses with the ongoing expenses of investing in other mutual funds. The table is based on an investment of $1,000 made at the beginning of the six month period ended April 30, 2006.
The table illustrates your Fund's expenses in two ways:
• Actual Fund Return. This helps you estimate the actual dollar amount of ongoing expenses paid on a $1,000 investment in the Fund using the Fund's actual return during the period. To estimate the expenses you paid over the period, simply divide your account value by $1,000 (for example, an $8,600 account value divided by $1,000 = 8.6), then multiply the result by the number in the "Expenses Paid per $1,000" line under the share class you hold.
• Hypothetical 5% Fund Return. This helps you to compare your Fund's ongoing expenses with those of other mutual funds using the Fund's actual expense ratio and a hypothetical rate of return of 5% per year before expenses. Examples using a 5% hypothetical fund return may be found in the shareholder reports of other mutual funds. The hypothetical account values and expenses may not be used to estimate the actual ending account balance or expenses you paid for the period.
Please note that the expenses shown in these tables are meant to highlight your ongoing expenses only and do not reflect any transaction costs, such as sales charges (loads) or redemption fees. If these transaction costs had been included, your costs would have been higher. The "Expenses Paid per $1,000" line of the tables is useful in comparing ongoing expenses only and will not help you determine the relative total expenses of owning different funds.
10
Credit Suisse Small Cap Value Fund
Semiannual Investment Adviser's Report (continued)
April 30, 2006 (unaudited)
Expenses and Value of a $1,000 Investment
for the six month period ended April 30, 2006
| Actual Fund Return | Common Class | Class A | Class B | Class C | |||||||||||||||
| Beginning Account Value 11/1/05 | $ | 1,000.00 | $ | 1,000.00 | $ | 1,000.00 | $ | 1,000.00 | |||||||||||
| Ending Account Value 4/30/06 | $ | 1,109.50 | $ | 1,109.50 | $ | 1,105.80 | $ | 1,105.10 | |||||||||||
| Expenses Paid per $1,000* | $ | 7.06 | $ | 7.06 | $ | 10.96 | $ | 10.96 | |||||||||||
| Hypothetical 5% Fund Return | |||||||||||||||||||
| Beginning Account Value 11/1/05 | $ | 1,000.00 | $ | 1,000.00 | $ | 1,000.00 | $ | 1,000.00 | |||||||||||
| Ending Account Value 4/30/06 | $ | 1,018.10 | $ | 1,018.10 | $ | 1,014.38 | $ | 1,014.38 | |||||||||||
| Expenses Paid per $1,000* | $ | 6.76 | $ | 6.76 | $ | 10.49 | $ | 10.49 | |||||||||||
| Common Class | Class A | Class B | Class C | ||||||||||||||||
| Annualized Expense Ratios* | 1.35 | % | 1.35 | % | 2.10 | % | 2.10 | % | |||||||||||
* Expenses are equal to the Fund's annualized expense ratio for each share class, multiplied by the average account value over the period, multiplied by the number of days in the most recent fiscal half year period, then divided by 365.
The "Expenses Paid per $1,000" and the "Annualized Expense Ratios" in the tables are based on actual expenses paid by the Fund during the period, net of fee waivers and/or expense reimbursements. If those fee waivers and/or expense reimbursements had not been in effect, the Fund's actual expenses would have been higher.
For more information, please refer to the Fund's prospectus.
11
Credit Suisse Small Cap Value Fund
Semiannual Investment Adviser's Report (continued)
April 30, 2006 (unaudited)
SECTOR BREAKDOWN*
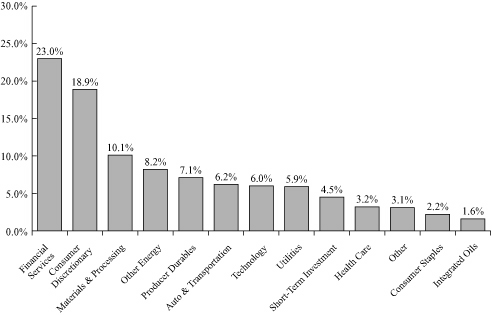
* Expressed as a percentage of total investments (excluding security lending collateral) and may vary over time.
12
Credit Suisse Large Cap Value Fund
Schedule of Investments
April 30, 2006 (unaudited)
| Number of Shares | Value | ||||||||||
| COMMON STOCKS (99.4%) | |||||||||||
| Aerospace & Defense (5.9%) | |||||||||||
| L-3 Communications Holdings, Inc. | 73,300 | $ | 5,988,610 | ||||||||
| Precision Castparts Corp. | 67,700 | 4,263,746 | |||||||||
| United Technologies Corp. | 160,200 | 10,062,162 | |||||||||
| 20,314,518 | |||||||||||
| Banks (12.9%) | |||||||||||
| Bank of America Corp. | 293,649 | 14,658,958 | |||||||||
| Bank of New York Company, Inc. | 43,900 | 1,543,085 | |||||||||
| Hudson City Bancorp, Inc. | 321,079 | 4,305,675 | |||||||||
| Mercantile Bankshares Corp.§ | 120,500 | 4,528,390 | |||||||||
| North Fork Bancorporation, Inc. | 91,100 | 2,744,843 | |||||||||
| U.S. Bancorp | 180,000 | 5,659,200 | |||||||||
| Wells Fargo & Co. | 155,100 | 10,653,819 | |||||||||
| 44,093,970 | |||||||||||
| Beverages (1.0%) | |||||||||||
| Coca-Cola Co. | 84,800 | 3,558,208 | |||||||||
| Buildings (1.7%) | |||||||||||
| American Standard Companies, Inc.§ | 133,800 | 5,824,314 | |||||||||
| Chemicals (0.8%) | |||||||||||
| Du Pont (E. I.) de Nemours & Co. | 59,700 | 2,632,770 | |||||||||
| Communications Equipment (0.9%) | |||||||||||
| Motorola, Inc. | 139,800 | 2,984,730 | |||||||||
| Computers & Peripherals (2.7%) | |||||||||||
| Dell, Inc.* | 57,000 | 1,493,400 | |||||||||
| International Business Machines Corp. | 95,000 | 7,822,300 | |||||||||
| 9,315,700 | |||||||||||
| Diversified Financials (12.5%) | |||||||||||
| American Express Co. | 56,300 | 3,029,503 | |||||||||
| Capital One Financial Corp. | 59,800 | 5,181,072 | |||||||||
| Citigroup, Inc. | 211,900 | 10,584,405 | |||||||||
| Freddie Mac | 53,000 | 3,236,180 | |||||||||
| JPMorgan Chase & Co. | 100,500 | 4,560,690 | |||||||||
| Lehman Brothers Holdings, Inc. | 38,600 | 5,834,390 | |||||||||
| Morgan Stanley | 100,900 | 6,487,870 | |||||||||
| SLM Corp. | 76,900 | 4,066,472 | |||||||||
| 42,980,582 | |||||||||||
| Diversified Telecommunications Services (4.7%) | |||||||||||
| ALLTEL Corp. | 75,100 | 4,834,187 | |||||||||
| AT&T, Inc. | 269,000 | 7,050,490 | |||||||||
| Sprint Nextel Corp. | 176,400 | 4,374,720 | |||||||||
| 16,259,397 | |||||||||||
See Accompanying Notes to Financial Statements.
13
Credit Suisse Large Cap Value Fund
Schedule of Investments (continued)
April 30, 2006 (unaudited)
| Number of Shares | Value | ||||||||||
| COMMON STOCKS | |||||||||||
| Electric Utilities (3.8%) | |||||||||||
| Dominion Resources, Inc. | 29,200 | $ | 2,186,204 | ||||||||
| Exelon Corp. | 92,700 | 5,005,800 | |||||||||
| Mirant Corp.* | 138,600 | 3,404,016 | �� | ||||||||
| TXU Corp. | 46,800 | 2,322,684 | |||||||||
| 12,918,704 | |||||||||||
| Electrical Equipment (1.2%) | |||||||||||
| Emerson Electric Co. | 49,900 | 4,239,005 | |||||||||
| Energy Equipment & Services (1.9%) | |||||||||||
| Halliburton Co. | 55,600 | 4,345,140 | |||||||||
| Weatherford International, Ltd.* | 41,600 | 2,201,888 | |||||||||
| 6,547,028 | |||||||||||
| Food & Drug Retailing (1.3%) | |||||||||||
| CVS Corp. | 149,800 | 4,452,056 | |||||||||
| Food Products (1.8%) | |||||||||||
| Kellogg Co. | 131,400 | 6,085,134 | |||||||||
| Healthcare Providers & Services (1.0%) | |||||||||||
| Aetna, Inc. | 89,300 | 3,438,050 | |||||||||
| Household Products (1.3%) | |||||||||||
| Procter & Gamble Co. | 76,900 | 4,476,349 | |||||||||
| Industrial Conglomerates (3.8%) | |||||||||||
| 3M Co. | 44,300 | 3,784,549 | |||||||||
| General Electric Co. | 263,100 | 9,100,629 | |||||||||
| 12,885,178 | |||||||||||
| Insurance (7.9%) | |||||||||||
| Aflac, Inc. | 91,800 | 4,364,172 | |||||||||
| Allstate Corp. | 76,800 | 4,338,432 | |||||||||
| Hartford Financial Services Group, Inc. | 120,800 | 11,105,144 | |||||||||
| St. Paul Travelers Companies, Inc. | 168,800 | 7,432,264 | |||||||||
| 27,240,012 | |||||||||||
| Machinery (1.5%) | |||||||||||
| Deere & Co. | 59,600 | 5,231,688 | |||||||||
| Media (1.0%) | |||||||||||
| Time Warner, Inc. | 191,800 | 3,337,320 | |||||||||
| Multiline Retail (1.5%) | |||||||||||
| Federated Department Stores, Inc. | 22,600 | 1,759,410 | |||||||||
| Kohl's Corp.* | 63,300 | 3,534,672 | |||||||||
| 5,294,082 | |||||||||||
| Oil & Gas (10.7%) | |||||||||||
| Chevron Corp. | 192,100 | 11,721,942 | |||||||||
| ConocoPhillips | 67,800 | 4,535,820 | |||||||||
| Exxon Mobil Corp. | 205,300 | 12,950,324 | |||||||||
| Newfield Exploration Co.* | 88,800 | 3,960,480 | |||||||||
| Noble Energy, Inc. | 81,900 | 3,683,862 | |||||||||
| 36,852,428 | |||||||||||
See Accompanying Notes to Financial Statements.
14
Credit Suisse Large Cap Value Fund
Schedule of Investments (continued)
April 30, 2006 (unaudited)
| Number of Shares | Value | ||||||||||
| COMMON STOCKS | |||||||||||
| Paper & Forest Products (0.8%) | |||||||||||
| International Paper Co. | 72,800 | $ | 2,646,280 | ||||||||
| Personal Products (1.0%) | |||||||||||
| Alberto-Culver Co. | 74,300 | 3,341,271 | |||||||||
| Pharmaceuticals (8.0%) | |||||||||||
| Abbott Laboratories | 102,300 | 4,372,302 | |||||||||
| Johnson & Johnson | 125,500 | 7,355,555 | |||||||||
| Pfizer, Inc. | 399,700 | 10,124,401 | |||||||||
| Wyeth | 115,900 | 5,640,853 | |||||||||
| 27,493,111 | |||||||||||
| Real Estate (0.7%) | |||||||||||
| Liberty Property Trust | 52,000 | 2,324,400 | |||||||||
| Semiconductor Equipment & Products (0.7%) | |||||||||||
| Applied Materials, Inc. | 130,700 | 2,346,065 | |||||||||
| Software (0.9%) | |||||||||||
| Microsoft Corp. | 132,800 | 3,207,120 | |||||||||
| Specialty Retail (3.1%) | |||||||||||
| Abercrombie & Fitch Co. Class A | 30,100 | 1,827,973 | |||||||||
| Home Depot, Inc. | 149,200 | 5,957,556 | |||||||||
| Office Depot, Inc.* | 72,000 | 2,921,760 | |||||||||
| 10,707,289 | |||||||||||
| Tobacco (2.4%) | |||||||||||
| Altria Group, Inc. | 113,400 | 8,296,344 | |||||||||
| TOTAL COMMON STOCKS (Cost $275,336,471) | 341,323,103 | ||||||||||
| SHORT-TERM INVESTMENTS (2.1%) | |||||||||||
| State Street Navigator Prime Portfolio§§ | 2,932,300 | 2,932,300 | |||||||||
| Par | (000) | ||||||||||
| State Street Bank and Trust Co. Euro Time Deposit, 3.850%, 5/01/06 | $ | 4,350 | 4,350,000 | ||||||||
| TOTAL SHORT-TERM INVESTMENTS (Cost $7,282,300) | 7,282,300 | ||||||||||
| TOTAL INVESTMENTS AT VALUE (101.5%) (Cost $282,618,771) | 348,605,403 | ||||||||||
| LIABILITIES IN EXCESS OF OTHER ASSETS (-1.5%) | (5,314,037 | ) | |||||||||
| NET ASSETS (100.0%) | $ | 343,291,366 | |||||||||
* Non-income producing security.
§ Security or portion thereof is out on loan.
§§ Represents security purchased with cash collateral received for securities on loan.
See Accompanying Notes to Financial Statements.
15
Credit Suisse Small Cap Value Fund
Schedule of Investments
April 30, 2006 (unaudited)
| Number of Shares | Value | ||||||||||
| COMMON STOCKS (94.6%) | |||||||||||
| Aerospace & Defense (0.6%) | |||||||||||
| DRS Technologies, Inc.§ | 42,600 | $ | 2,365,578 | ||||||||
| Agriculture (1.9%) | |||||||||||
| Delta and Pine Land Co.§ | 243,000 | 7,187,940 | |||||||||
| Auto Components (4.8%) | |||||||||||
| Accuride Corp.*§ | 560,500 | 5,745,125 | |||||||||
| American Axle & Manufacturing Holdings, Inc.§ | 212,500 | 3,742,125 | |||||||||
| Proliance International, Inc.*§ | 308,398 | 1,541,990 | |||||||||
| Visteon Corp.*§ | 1,217,300 | 7,157,724 | |||||||||
| 18,186,964 | |||||||||||
| Banks (10.9%) | |||||||||||
| Alabama National Bancorp.§ | 83,900 | 5,779,032 | |||||||||
| First Midwest Bancorp, Inc.§ | 104,300 | 3,757,929 | |||||||||
| First Niagara Financial Group, Inc.§ | 19,900 | 278,600 | |||||||||
| Independent Bank Corp./MA§ | 130,100 | 4,139,782 | |||||||||
| NewAlliance Bancshares, Inc.§ | 300,100 | 4,333,444 | |||||||||
| Prosperity Bancshares, Inc.§ | 193,000 | 6,291,800 | |||||||||
| Provident Financial Services, Inc. | 313,600 | 5,723,200 | |||||||||
| South Financial Group, Inc. | 206,000 | 5,588,780 | |||||||||
| Sun Bancorp, Inc.*§ | 47,046 | 859,530 | |||||||||
| Webster Financial Corp.§ | 94,700 | 4,446,165 | |||||||||
| 41,198,262 | |||||||||||
| Chemicals (1.3%) | |||||||||||
| Chemtura Corp.§ | 402,400 | 4,909,280 | |||||||||
| Commercial Services & Supplies (5.0%) | |||||||||||
| Banta Corp.§ | 141,400 | 7,152,012 | |||||||||
| Viad Corp. | 162,400 | 5,338,088 | |||||||||
| Watson Wyatt Worldwide, Inc. Class A§ | 191,200 | 6,303,864 | |||||||||
| 18,793,964 | |||||||||||
| Construction & Engineering (1.0%) | |||||||||||
| EMCOR Group, Inc.*§ | 72,900 | 3,648,645 | |||||||||
| Containers & Packaging (2.5%) | |||||||||||
| Crown Holdings, Inc.* | 354,500 | 5,682,635 | |||||||||
| Greif, Inc.§ | 56,800 | 3,679,504 | |||||||||
| 9,362,139 | |||||||||||
| Distributor (0.5%) | |||||||||||
| Core-Mark Holding Company, Inc.*§ | 49,000 | 2,062,900 | |||||||||
| Diversified Financials (4.8%) | |||||||||||
| Apollo Investment Corp.§ | 232,900 | 4,355,230 | |||||||||
| Assured Guaranty, Ltd. | 230,100 | 5,717,985 | |||||||||
| National Financial Partners Corp. | 114,300 | 5,943,600 | |||||||||
| Patriot Capital Funding, Inc.§ | 159,800 | 2,034,254 | |||||||||
| 18,051,069 | |||||||||||
See Accompanying Notes to Financial Statements.
16
Credit Suisse Small Cap Value Fund
Schedule of Investments (continued)
April 30, 2006 (unaudited)
| Number of Shares | Value | ||||||||||
| COMMON STOCKS | |||||||||||
| Diversified Telecommunications Services (2.2%) | |||||||||||
| Eschelon Telecom, Inc.*§ | 221,800 | $ | 3,579,852 | ||||||||
| General Communication, Inc.*§ | 383,700 | 4,604,400 | |||||||||
| 8,184,252 | |||||||||||
| Electric Utilities (1.8%) | |||||||||||
| Empire District Electric Co.§ | 135,400 | 3,080,350 | |||||||||
| OGE Energy Corp.§ | 126,200 | 3,806,192 | |||||||||
| 6,886,542 | |||||||||||
| Electrical Equipment (1.7%) | |||||||||||
| Brady Corp.§ | 174,900 | 6,291,153 | |||||||||
| Electronic Equipment & Instruments (4.3%) | |||||||||||
| Electro Scientific Industries, Inc.*§ | 166,700 | 3,339,001 | |||||||||
| Roper Industries, Inc.§ | 84,100 | 3,991,386 | |||||||||
| Varian, Inc.* | 141,400 | 6,118,378 | |||||||||
| Woodhead Industries, Inc.§ | 176,600 | 2,878,580 | |||||||||
| 16,327,345 | |||||||||||
| Energy Equipment & Services (1.1%) | |||||||||||
| Union Drilling, Inc.* | 264,700 | 4,171,672 | |||||||||
| Food & Drug Retailing (1.7%) | |||||||||||
| Ruddick Corp.§ | 272,000 | 6,313,120 | |||||||||
| Gas Utilities (1.8%) | |||||||||||
| South Jersey Industries, Inc.§ | 136,600 | 3,630,828 | |||||||||
| WGL Holdings, Inc.§ | 111,100 | 3,268,562 | |||||||||
| 6,899,390 | |||||||||||
| Healthcare Equipment & Supplies (1.2%) | |||||||||||
| Invacare Corp. | 146,800 | 4,499,420 | |||||||||
| Healthcare Providers & Services (3.2%) | |||||||||||
| Centene Corp.*§ | 52,900 | 1,359,001 | |||||||||
| LifePoint Hospitals, Inc.*§ | 197,100 | 6,248,070 | |||||||||
| Service Corp. International | 533,600 | 4,295,480 | |||||||||
| 11,902,551 | |||||||||||
| Hotels, Restaurants & Leisure (2.8%) | |||||||||||
| Landry's Restaurants, Inc.§ | 201,500 | 7,147,205 | |||||||||
| Marcus Corp.§ | 187,875 | 3,387,386 | |||||||||
| 10,534,591 | |||||||||||
| Household Durables (2.7%) | |||||||||||
| Libbey, Inc.§ | 204,500 | 2,809,830 | |||||||||
| Tempur-Pedic International, Inc.*§ | 240,500 | 3,797,495 | |||||||||
| WCI Communities, Inc.*§ | 137,400 | 3,521,562 | |||||||||
| 10,128,887 | |||||||||||
See Accompanying Notes to Financial Statements.
17
Credit Suisse Small Cap Value Fund
Schedule of Investments (continued)
April 30, 2006 (unaudited)
| Number of Shares | Value | ||||||||||
| COMMON STOCKS | |||||||||||
| Industrial Conglomerates (3.1%) | |||||||||||
| Carlisle Companies, Inc. | 87,000 | $ | 7,351,500 | ||||||||
| Teleflex, Inc. | 66,400 | 4,331,936 | |||||||||
| 11,683,436 | |||||||||||
| Insurance (3.6%) | |||||||||||
| Argonaut Group, Inc.*§ | 153,700 | 5,364,130 | |||||||||
| Hanover Insurance Group, Inc. | 121,400 | 6,422,060 | |||||||||
| ProAssurance Corp.* | 37,800 | 1,904,364 | |||||||||
| 13,690,554 | |||||||||||
| Internet Software & Services (1.9%) | |||||||||||
| NETGEAR, Inc.*§ | 324,900 | 7,294,005 | |||||||||
| IT Consulting & Services (1.8%) | |||||||||||
| CACI International, Inc. Class A*§ | 106,800 | 6,679,272 | |||||||||
| Leisure Equipment & Products (0.5%) | |||||||||||
| Smith & Wesson Holding Corp*§ | 279,100 | 1,783,449 | |||||||||
| Machinery (3.7%) | |||||||||||
| Albany International Corp., Class A§ | 159,300 | 6,228,630 | |||||||||
| Briggs & Stratton Corp.§ | 90,100 | 3,039,974 | |||||||||
| ESCO Technologies, Inc.*§ | 89,500 | 4,537,650 | |||||||||
| 13,806,254 | |||||||||||
| Media (4.4%) | |||||||||||
| Harte-Hanks, Inc.§ | 180,900 | 4,938,570 | |||||||||
| Salem Communications Corp. Class A*§ | 392,000 | 5,989,760 | |||||||||
| Source Interlink Companies, Inc.*§ | 517,000 | 5,599,110 | |||||||||
| 16,527,440 | |||||||||||
| Metals/ Mining (1.1%) | |||||||||||
| James River Coal Co.*§ | 119,300 | 4,193,395 | |||||||||
| Multiline Retail (0.9%) | |||||||||||
| Bon-Ton Stores, Inc.§ | 116,700 | 3,322,449 | |||||||||
| Oil & Gas (7.5%) | |||||||||||
| Comstock Resources, Inc.* | 169,500 | 5,268,060 | |||||||||
| Denbury Resources, Inc.* | 143,400 | 4,674,840 | |||||||||
| EXCO Resources, Inc.*§ | 310,200 | 3,979,866 | |||||||||
| Forest Oil Corp.* | 94,200 | 3,444,894 | |||||||||
| KCS Energy, Inc.*§ | 197,900 | 5,808,365 | |||||||||
| Mariner Energy, Inc.* | 76,236 | 1,482,790 | |||||||||
| Range Resources Corp.§ | 131,050 | 3,476,757 | |||||||||
| 28,135,572 | |||||||||||
See Accompanying Notes to Financial Statements.
18
Credit Suisse Small Cap Value Fund
Schedule of Investments (continued)
April 30, 2006 (unaudited)
| Number of Shares | Value | ||||||||||
| COMMON STOCKS | |||||||||||
| Real Estate (3.4%) | |||||||||||
| Affordable Residential Communities§ | 205,200 | $ | 1,883,736 | ||||||||
| Annaly Mortgage Management, Inc.§ | 390,600 | 5,261,382 | |||||||||
| DiamondRock Hospitality Co | 121,900 | 1,744,389 | |||||||||
| Eagle Hospitality Properties Trust, Inc.§ | 398,500 | 3,582,515 | |||||||||
| RAIT Investment Trust§ | 16,100 | 416,668 | |||||||||
| 12,888,690 | |||||||||||
| Road & Rail (1.3%) | |||||||||||
| Laidlaw International, Inc. | 197,900 | 4,898,025 | |||||||||
| Semiconductor Equipment & Products (0.9%) | |||||||||||
| Credence Systems Corp.*§ | 215,100 | 1,525,059 | |||||||||
| Photronics, Inc.*§ | 101,000 | 1,814,970 | |||||||||
| 3,340,029 | |||||||||||
| Textiles & Apparel (2.7%) | |||||||||||
| Tommy Hilfiger Corp.* | 354,700 | 5,905,755 | |||||||||
| Warnaco Group, Inc.*§ | 200,200 | 4,460,456 | |||||||||
| 10,366,211 | |||||||||||
| TOTAL COMMON STOCKS (Cost $274,097,408) | 356,514,445 | ||||||||||
| SHORT-TERM INVESTMENTS (26.9%) | |||||||||||
| State Street Navigator Prime Portfolio§§ | 84,545,963 | 84,545,963 | |||||||||
| Par | (000) | ||||||||||
| State Street Bank and Trust Co. Euro Time Deposit, 3.850%, 5/01/06 | $ | 16,800 | 16,800,000 | ||||||||
| TOTAL SHORT-TERM INVESTMENTS (Cost $101,345,963) | 101,345,963 | ||||||||||
| TOTAL INVESTMENTS AT VALUE (121.5%) (Cost $375,443,371) | 457,860,408 | ||||||||||
| LIABILITIES IN EXCESS OF OTHER ASSETS (-21.5%) | (81,130,020 | ) | |||||||||
| NET ASSETS (100.0%) | $ | 376,730,388 | |||||||||
* Non-income producing security.
§ Security or portion thereof is out on loan.
§§ Represents security purchased with cash collateral received for securities on loan.
See Accompanying Notes to Financial Statements.
19
Credit Suisse Funds
Statements of Assets and Liabilities
April 30, 2006 (unaudited)
| Large Cap Value Fund | Small Cap Value Fund | ||||||||||
| Assets | |||||||||||
| Investments at value, including collateral for securities on loan of $2,932,300 and $84,545,963, respectively (Cost $282,618,771, and $375,443,371, respectively) (Note 2) | $ | 348,605,4031 | $ | 457,860,4082 | |||||||
| Cash | 966 | 798 | |||||||||
| Receivable for investments sold | 6,142,780 | 4,153,881 | |||||||||
| Dividend and interest receivable | 292,567 | 110,915 | |||||||||
| Receivable for fund shares sold | 126,852 | 604,108 | |||||||||
| Prepaid expenses and other assets | 65,136 | 74,006 | |||||||||
| Total Assets | 355,233,704 | 462,804,116 | |||||||||
| Liabilities | |||||||||||
| Advisory fee payable (Note 3) | 155,026 | 224,080 | |||||||||
| Administrative services fee payable (Note 3) | 63,410 | 69,953 | |||||||||
| Shareholder servicing/Distribution fee payable (Note 3) | 83,796 | 98,600 | |||||||||
| Payable for investments purchased | 7,951,902 | 769,049 | |||||||||
| Payable upon return of securities loaned (Note 2) | 2,932,300 | 84,545,963 | |||||||||
| Payable for fund shares redeemed | 549,558 | 176,934 | |||||||||
| Trustees' fee payable | 1,879 | 1,879 | |||||||||
| Other accrued expenses payable | 204,467 | 187,270 | |||||||||
| Total Liabilities | 11,942,338 | 86,073,728 | |||||||||
| Net Assets | |||||||||||
| Capital stock, $0.001 par value (Note 6) | 16,779 | 15,893 | |||||||||
| Paid-in capital (Note 6) | 241,099,250 | 249,664,322 | |||||||||
| Undistributed net investment income (loss) | (49,906 | ) | 1,153,038 | ||||||||
| Accumulated net realized gain on investments and foreign currency transactions | 36,238,611 | 43,480,098 | |||||||||
| Net unrealized appreciation from investments | 65,986,632 | 82,417,037 | |||||||||
| Net Assets | $ | 343,291,366 | $ | 376,730,388 | |||||||
| Common Shares | |||||||||||
| Net assets | $ | 569,995 | $ | 68,265,833 | |||||||
| Shares outstanding | 27,955 | 2,863,316 | |||||||||
| Net asset value, offering price, and redemption price per share | $ | 20.39 | $ | 23.84 | |||||||
| Advisor Shares | |||||||||||
| Net assets | $ | 8,298,595 | N/A | ||||||||
| Shares outstanding | 404,276 | N/A | |||||||||
| Net asset value, offering price, and redemption price per share | $ | 20.53 | N/A | ||||||||
See Accompanying Notes to Financial Statements.
20
Credit Suisse Funds
Statements of Assets and Liabilities (continued)
April 30, 2006 (unaudited)
| Large Cap Value Fund | Small Cap Value Fund | ||||||||||
| A Shares | |||||||||||
| Net assets | $ | 313,570,891 | $ | 274,005,278 | |||||||
| Shares outstanding | 15,312,421 | 11,438,739 | |||||||||
| Net asset value and redemption price per share | $ | 20.48 | $ | 23.95 | |||||||
| Maximum offering price per share (net asset value/(1-5.75%)) | $ | 21.73 | $ | 25.41 | |||||||
| B Shares | |||||||||||
| Net assets | $ | 17,428,809 | $ | 16,387,910 | |||||||
| Shares outstanding | 863,773 | 754,774 | |||||||||
| Net asset value and offering price per share | $ | 20.18 | $ | 21.71 | |||||||
| C Shares | |||||||||||
| Net assets | $ | 3,423,076 | $ | 18,071,367 | |||||||
| Shares outstanding | 170,594 | 836,116 | |||||||||
| Net asset value and offering price per share | $ | 20.07 | $ | 21.61 | |||||||
1 Including $2,867,720 of securities on loan.
2 Including $82,421,957 of securities on loan.
See Accompanying Notes to Financial Statements.
21
Credit Suisse Funds
Statements of Operations
For the Six Months Ended April 30, 2006 (unaudited)
| Large Cap Value Fund | Small Cap Value Fund | ||||||||||
| Investment Income (Note 2) | |||||||||||
| Dividends | $ | 3,587,765 | $ | 3,394,022 | |||||||
| Interest | 65,405 | 268,364 | |||||||||
| Securities lending | 4,162 | 37,475 | |||||||||
| Foreign taxes withheld | (2,389 | ) | — | ||||||||
| Total investment income | 3,654,943 | 3,699,861 | |||||||||
| Expenses | |||||||||||
| Investment advisory fees (Note 3) | 942,096 | 1,304,561 | |||||||||
| Administrative services fees (Note 3) | 283,431 | 298,892 | |||||||||
| Shareholder servicing/Distribution fees (Note 3) | |||||||||||
| Common Class | — | 89,372 | |||||||||
| Advisor Class | 21,268 | — | |||||||||
| Class A | 385,391 | 315,434 | |||||||||
| Class B | 93,415 | 84,793 | |||||||||
| Class C | 17,808 | 85,748 | |||||||||
| Transfer agent fees (Note 3) | 198,927 | 229,216 | |||||||||
| Registration fees | 36,881 | 44,534 | |||||||||
| Printing fees (Note 3) | 25,701 | 26,822 | |||||||||
| Audit and tax fees | 20,125 | 19,213 | |||||||||
| Custodian fees | 16,252 | 16,418 | |||||||||
| Legal fees | 8,821 | 8,740 | |||||||||
| Trustees' fees | 5,402 | 5,402 | |||||||||
| Commitment fees (Note 4) | 4,458 | 4,331 | |||||||||
| Insurance expense | 3,750 | 3,761 | |||||||||
| Miscellaneous expense | 8,674 | 7,439 | |||||||||
| Total expenses | 2,072,400 | 2,544,676 | |||||||||
| Net investment income | 1,582,543 | 1,155,185 | |||||||||
| Net Realized and Unrealized Gain (Loss) from Investments and Foreign Currency Related Items | |||||||||||
| Net realized gain from investments | 36,330,416 | 43,588,663 | |||||||||
| Net realized loss on foreign currency transactions | (2,589 | ) | — | ||||||||
| Net change in unrealized appreciation (depreciation) from investments | (4,951,319 | ) | (7,960,579 | ) | |||||||
| Net realized and unrealized gain from investments | 31,376,508 | 35,628,084 | |||||||||
| Net increase in net assets resulting from operations | $ | 32,959,051 | $ | 36,783,269 | |||||||
See Accompanying Notes to Financial Statements.
22
Credit Suisse Funds
Statements of Changes in Net Assets
| Large Cap Value Fund | Small Cap Value Fund | ||||||||||||||||||
| For the Six Months Ended April 30, 2006 (unaudited) | For the Year Ended October 31, 2005 | For the Six Months Ended April 30, 2006 (unaudited) | For the Year Ended October 31, 2005 | ||||||||||||||||
| From Operations | |||||||||||||||||||
| Net investment income (loss) | $ | 1,582,543 | $ | 2,967,789 | $ | 1,155,185 | $ | (793,296 | ) | ||||||||||
| Net realized gain from investments and foreign currency transactions | 36,327,827 | 40,854,220 | 43,588,663 | 36,063,294 | |||||||||||||||
| Net change in unrealized appreciation (depreciation) from investments and foreign currency translations | (4,951,319 | ) | (780,833 | ) | (7,960,579 | ) | 6,808,700 | ||||||||||||
| Net increase in net assets resulting from operations | 32,959,051 | 43,041,176 | 36,783,269 | 42,078,698 | |||||||||||||||
| From Dividends and Distributions | |||||||||||||||||||
| Dividends from net investment income | |||||||||||||||||||
| Common Class shares | (3,680 | ) | (8,380 | ) | — | — | |||||||||||||
| Advisor shares | (32,574 | ) | (72,120 | ) | — | — | |||||||||||||
| Class A shares | (1,566,768 | ) | (3,033,174 | ) | — | — | |||||||||||||
| Class B shares | (24,785 | ) | (53,593 | ) | — | — | |||||||||||||
| Class C shares | (4,642 | ) | (8,921 | ) | — | — | |||||||||||||
| Distributions from net realized gains | |||||||||||||||||||
| Common Class shares | (70,029 | ) | (42,520 | ) | (7,509,989 | ) | (4,991,665 | ) | |||||||||||
| Advisor shares | (969,206 | ) | (730,089 | ) | — | — | |||||||||||||
| Class A shares | (35,411,384 | ) | (19,844,244 | ) | (23,829,326 | ) | (18,702,976 | ) | |||||||||||
| Class B shares | (2,267,901 | ) | (1,556,864 | ) | (1,880,065 | ) | (2,007,856 | ) | |||||||||||
| Class C shares | (426,845 | ) | (248,446 | ) | (1,851,334 | ) | (1,230,506 | ) | |||||||||||
| Net decrease in net assets resulting from dividends and distributions | (40,777,814 | ) | (25,598,351 | ) | (35,070,714 | ) | (26,933,003 | ) | |||||||||||
| From Capital Share Transactions (Note 6) | |||||||||||||||||||
| Proceeds from sale of shares | 21,136,772 | 32,045,431 | 71,760,030 | 105,952,515 | |||||||||||||||
| Reinvestment of dividends and distributions | 37,760,101 | 23,706,286 | 32,583,478 | 24,873,671 | |||||||||||||||
| Net asset value of shares redeemed | (41,217,825 | ) | (84,331,477 | ) | (64,716,008 | ) | (91,459,760 | ) | |||||||||||
| Net increase (decrease) in net assets from capital share transactions | 17,679,048 | (28,579,760 | ) | 39,627,500 | 39,366,426 | ||||||||||||||
| Net increase (decrease) in net assets | 9,860,285 | (11,136,935 | ) | 41,340,055 | 54,512,121 | ||||||||||||||
| Net Assets | |||||||||||||||||||
| Beginning of period | 333,431,081 | 344,568,016 | 335,390,333 | 280,878,212 | |||||||||||||||
| End of period | $ | 343,291,366 | $ | 333,431,081 | $ | 376,730,388 | $ | 335,390,333 | |||||||||||
| Undistributed net investment income (loss) | $ | (49,906 | ) | $ | — | $ | 1,153,038 | $ | — | ||||||||||
See Accompanying Notes to Financial Statements.
23
Credit Suisse Large Cap Value Fund
Financial Highlights
(For a Common Class Share of the Fund Outstanding Throughout Each Period)
| For the Six Months Ended April 30, 2006 | For the Year Ended October 31, | ||||||||||||||||||||||||||
| (unaudited) | 2005 | 2004 | 2003 | 2002 | 2001 | ||||||||||||||||||||||
| Per share data | |||||||||||||||||||||||||||
| Net asset value, beginning of period | $ | 20.97 | $ | 19.98 | $ | 18.61 | $ | 16.82 | $ | 19.95 | $ | 24.63 | |||||||||||||||
| INVESTMENT OPERATIONS | |||||||||||||||||||||||||||
| Net investment income1 | 0.12 | 0.24 | 0.23 | 0.14 | 0.17 | 0.19 | |||||||||||||||||||||
| Net gain (loss) on investments and foreign currency related items (both realized and unrealized) | 1.90 | 2.32 | 1.87 | 2.10 | (1.45 | ) | (2.52 | ) | |||||||||||||||||||
| Total from investment operations | 2.02 | 2.56 | 2.10 | 2.24 | (1.28 | ) | (2.33 | ) | |||||||||||||||||||
| LESS DIVIDENDS AND DISTRIBUTIONS | |||||||||||||||||||||||||||
| Dividends from net investment income | (0.12 | ) | (0.25 | ) | (0.23 | ) | (0.14 | ) | (0.19 | ) | (0.22 | ) | |||||||||||||||
| Distributions from net realized gains | (2.48 | ) | (1.32 | ) | (0.50 | ) | (0.31 | ) | (1.66 | ) | (2.13 | ) | |||||||||||||||
| Total dividends and distributions | (2.60 | ) | (1.57 | ) | (0.73 | ) | (0.45 | ) | (1.85 | ) | (2.35 | ) | |||||||||||||||
| Net asset value, end of period | $ | 20.39 | $ | 20.97 | $ | 19.98 | $ | 18.61 | $ | 16.82 | $ | 19.95 | |||||||||||||||
| Total return2 | 10.35 | % | 13.34 | % | 11.51 | % | 13.63 | % | (7.63 | )% | (10.51 | )% | |||||||||||||||
| RATIOS AND SUPPLEMENTAL DATA | |||||||||||||||||||||||||||
| Net assets, end of period (000s omitted) | $ | 570 | $ | 591 | $ | 664 | $ | 737 | $ | 3,061 | $ | 3,421 | |||||||||||||||
| Ratio of expenses to average net assets | 0.92 | %3 | 0.91 | % | 0.95 | % | 1.24 | % | 1.03 | % | 1.03 | % | |||||||||||||||
| Ratio of net investment income to average net assets | 1.25 | %3 | 1.15 | % | 1.16 | % | 0.82 | % | 0.92 | % | 0.86 | % | |||||||||||||||
| Decrease reflected in above operating expense ratios due to waivers/reimbursements | — | — | — | — | 0.29 | % | 0.18 | % | |||||||||||||||||||
| Portfolio turnover rate | 40 | % | 58 | % | 48 | % | 53 | % | 28 | % | 38 | % | |||||||||||||||
1 Per share information is calculated using the average shares outstanding method.
2 Total returns are historical and assume changes in share price and reinvestment of all dividends and distributions. Had certain expenses not been reduced during the periods shown, total returns would have been lower. Total returns for periods less than one year are not annualized.
3 Annualized.
See Accompanying Notes to Financial Statements.
24
Credit Suisse Large Cap Value Fund
Financial Highlights
(For an Advisor Class Share of the Fund Outstanding Throughout Each Period)
| For the Six Months Ended April 30, 2006 | For the Year Ended October 31, | ||||||||||||||||||
| (unaudited) | 2005 | 2004 | 20031 | ||||||||||||||||
| Per share data | |||||||||||||||||||
| Net asset value, beginning of period | $ | 21.10 | $ | 20.09 | $ | 18.71 | $ | 17.84 | |||||||||||
| INVESTMENT OPERATIONS | |||||||||||||||||||
| Net investment income2 | 0.07 | 0.14 | 0.13 | 0.04 | |||||||||||||||
| Net gain on investments and foreign currency related items (both realized and unrealized) | 1.92 | 2.34 | 1.88 | 0.83 | |||||||||||||||
| Total from investment operations | 1.99 | 2.48 | 2.01 | 0.87 | |||||||||||||||
| LESS DIVIDENDS AND DISTRIBUTIONS | |||||||||||||||||||
| Dividends from net investment income | (0.08 | ) | (0.15 | ) | (0.13 | ) | (0.00 | )3 | |||||||||||
| Distributions from net realized gains | (2.48 | ) | (1.32 | ) | (0.50 | ) | — | ||||||||||||
| Total dividends and distributions | (2.56 | ) | (1.47 | ) | (0.63 | ) | — | ||||||||||||
| Net asset value, end of period | $ | 20.53 | $ | 21.10 | $ | 20.09 | $ | 18.71 | |||||||||||
| Total return4 | 10.07 | % | 12.81 | % | 10.96 | % | 4.90 | % | |||||||||||
| RATIOS AND SUPPLEMENTAL DATA | |||||||||||||||||||
| Net assets, end of period (000s omitted) | $ | 8,299 | $ | 8,368 | $ | 12,228 | $ | 22,336 | |||||||||||
| Ratio of expenses to average net assets | 1.42 | %5 | 1.41 | % | 1.45 | % | 1.49 | %5 | |||||||||||
| Ratio of net investment income to average net assets | 0.75 | %5 | 0.65 | % | 0.66 | % | 0.51 | %5 | |||||||||||
| Portfolio turnover rate | 40 | % | 58 | % | 48 | % | 53 | % | |||||||||||
1 For the period June 6, 2003 (inception date) through October 31, 2003.
2 Per share information is calculated using the average shares outstanding method.
3 This amount represents less than $(0.01) per share.
4 Total returns are historical and assume changes in share price and reinvestment of all dividends and distributions. Total returns for periods less than one year are not annualized.
5 Annualized.
See Accompanying Notes to Financial Statements.
25
Credit Suisse Large Cap Value Fund
Financial Highlights
(For a Class A Share of the Fund Outstanding Throughout Each Period)
| For the Six Months Ended April 30, 2006 | For the Year Ended October 31, | ||||||||||||||||||||||||||
| (unaudited) | 2005 | 2004 | 2003 | 2002 | 2001 | ||||||||||||||||||||||
| Per share data | |||||||||||||||||||||||||||
| Net asset value, beginning of period | $ | 21.05 | $ | 20.05 | $ | 18.68 | $ | 16.83 | $ | 19.96 | $ | 24.62 | |||||||||||||||
| INVESTMENT OPERATIONS | |||||||||||||||||||||||||||
| Net investment income1 | 0.10 | 0.19 | 0.18 | 0.14 | 0.17 | 0.21 | |||||||||||||||||||||
| Net gain (loss) on investments and foreign currency related items (both realized and unrealized) | 1.91 | 2.33 | 1.87 | 2.15 | (1.45 | ) | (2.55 | ) | |||||||||||||||||||
| Total from investment operations | 2.01 | 2.52 | 2.05 | 2.29 | (1.28 | ) | (2.34 | ) | |||||||||||||||||||
| LESS DIVIDENDS AND DISTRIBUTIONS | |||||||||||||||||||||||||||
| Dividends from net investment income | (0.10 | ) | (0.20 | ) | (0.18 | ) | (0.13 | ) | (0.19 | ) | (0.19 | ) | |||||||||||||||
| Distributions from net realized gains | (2.48 | ) | (1.32 | ) | (0.50 | ) | (0.31 | ) | (1.66 | ) | (2.13 | ) | |||||||||||||||
| Total dividends and distributions | (2.58 | ) | (1.52 | ) | (0.68 | ) | (0.44 | ) | (1.85 | ) | (2.32 | ) | |||||||||||||||
| Net asset value, end of period | $ | 20.48 | $ | 21.05 | $ | 20.05 | $ | 18.68 | $ | 16.83 | $ | 19.96 | |||||||||||||||
| Total return2 | 10.22 | % | 13.06 | % | 11.19 | % | 13.97 | % | (7.63 | )% | (10.48 | )% | |||||||||||||||
| RATIOS AND SUPPLEMENTAL DATA | |||||||||||||||||||||||||||
| Net assets, end of period (000s omitted) | $ | 313,571 | $ | 300,777 | $ | 302,823 | $ | 306,410 | $ | 114,733 | $ | 133,665 | |||||||||||||||
| Ratio of expenses to average net assets | 1.17 | %3 | 1.16 | % | 1.20 | % | 1.24 | % | 1.03 | % | 1.04 | % | |||||||||||||||
| Ratio of net investment income to average net assets | 1.00 | %3 | 0.91 | % | 0.91 | % | 0.78 | % | 0.90 | % | 0.94 | % | |||||||||||||||
| Decrease reflected in above operating expense ratios due to waivers/reimbursements | — | — | — | — | 0.28 | % | 0.10 | % | |||||||||||||||||||
| Portfolio turnover rate | 40 | % | 58 | % | 48 | % | 53 | % | 28 | % | 38 | % | |||||||||||||||
1 Per share information is calculated using the average shares outstanding method.
2 Total returns are historical and assume changes in share price, reinvestment of all dividends and distributions, and no sales charge. Had certain expenses not been reduced during the periods shown, total returns would have been lower. Total returns for periods less than one year are not annualized.
3 Annualized.
See Accompanying Notes to Financial Statements.
26
Credit Suisse Large Cap Value Fund
Financial Highlights
(For a Class B Share of the Fund Outstanding Throughout Each Period)
| For the Six Months Ended April 30, 2006 | For the Year Ended October 31, | ||||||||||||||||||||||||||
| (unaudited) | 2005 | 2004 | 2003 | 2002 | 2001 | ||||||||||||||||||||||
| Per share data | |||||||||||||||||||||||||||
| Net asset value, beginning of period | $ | 20.78 | $ | 19.81 | $ | 18.46 | $ | 16.66 | $ | 19.78 | $ | 24.44 | |||||||||||||||
| INVESTMENT OPERATIONS | |||||||||||||||||||||||||||
| Net investment income1 | 0.03 | 0.04 | 0.03 | 0.01 | 0.03 | 0.04 | |||||||||||||||||||||
| Net gain (loss) on investments and foreign currency related items (both realized and unrealized) | 1.88 | 2.30 | 1.85 | 2.13 | (1.43 | ) | (2.52 | ) | |||||||||||||||||||
| Total from investment operations | 1.91 | 2.34 | 1.88 | 2.14 | (1.40 | ) | (2.48 | ) | |||||||||||||||||||
| LESS DIVIDENDS AND DISTRIBUTIONS | |||||||||||||||||||||||||||
| Dividends from net investment income | (0.03 | ) | (0.05 | ) | (0.03 | ) | (0.03 | ) | (0.06 | ) | (0.05 | ) | |||||||||||||||
| Distributions from net realized gains | (2.48 | ) | (1.32 | ) | (0.50 | ) | (0.31 | ) | (1.66 | ) | (2.13 | ) | |||||||||||||||
| Total dividends and distributions | (2.51 | ) | (1.37 | ) | (0.53 | ) | (0.34 | ) | (1.72 | ) | (2.18 | ) | |||||||||||||||
| Net asset value, end of period | $ | 20.18 | $ | 20.78 | $ | 19.81 | $ | 18.46 | $ | 16.66 | $ | 19.78 | |||||||||||||||
| Total return2 | 9.80 | % | 12.23 | % | 10.40 | % | 13.07 | % | (8.29 | )% | (11.00 | )% | |||||||||||||||
| RATIOS AND SUPPLEMENTAL DATA | |||||||||||||||||||||||||||
| Net assets, end of period (000s omitted) | $ | 17,429 | $ | 20,057 | $ | 25,118 | $ | 29,696 | $ | 28,312 | $ | 33,087 | |||||||||||||||
| Ratio of expenses to average net assets | 1.92 | %3 | 1.91 | % | 1.95 | % | 1.99 | % | 1.78 | % | 1.79 | % | |||||||||||||||
| Ratio of net investment income to average net assets | 0.25 | %3 | 0.15 | % | 0.16 | % | 0.06 | % | 0.15 | % | 0.19 | % | |||||||||||||||
| Decrease reflected in above operating expense ratios due to waivers/reimbursements | — | — | — | — | 0.27 | % | 0.10 | % | |||||||||||||||||||
| Portfolio turnover rate | 40 | % | 58 | % | 48 | % | 53 | % | 28 | % | 38 | % | |||||||||||||||
1 Per share information is calculated using the average shares outstanding method.
2 Total returns are historical and assume changes in share price, reinvestment of all dividends and distributions and no sales charge. Had certain expenses not been reduced during the periods shown, total returns would have been lower. Total returns for periods less than one year are not annualized.
3 Annualized.
See Accompanying Notes to Financial Statements.
27
Credit Suisse Large Cap Value Fund
Financial Highlights
(For a Class C Share of the Fund Outstanding Throughout Each Period)
| For the Six Months Ended April 30, 2006 | For the Year Ended October 31, | ||||||||||||||||||||||||||
| (unaudited) | 2005 | 2004 | 2003 | 2002 | 2001 | ||||||||||||||||||||||
| Per share data | |||||||||||||||||||||||||||
| Net asset value, beginning of period | $ | 20.68 | $ | 19.72 | $ | 18.38 | $ | 16.58 | $ | 19.71 | $ | 24.39 | |||||||||||||||
| INVESTMENT OPERATIONS | |||||||||||||||||||||||||||
| Net investment income1 | 0.02 | 0.03 | 0.03 | 0.01 | 0.03 | 0.03 | |||||||||||||||||||||
| Net gain (loss) on investments and foreign currency related items (both realized and unrealized) | 1.88 | 2.30 | 1.84 | 2.13 | (1.43 | ) | (2.51 | ) | |||||||||||||||||||
| Total from investment operations | 1.90 | 2.33 | 1.87 | 2.14 | (1.40 | ) | (2.48 | ) | |||||||||||||||||||
| LESS DIVIDENDS AND DISTRIBUTIONS | |||||||||||||||||||||||||||
| Dividends from net investment income | (0.03 | ) | (0.05 | ) | (0.03 | ) | (0.03 | ) | (0.07 | ) | (0.07 | ) | |||||||||||||||
| Distributions from net realized gains | (2.48 | ) | (1.32 | ) | (0.50 | ) | (0.31 | ) | (1.66 | ) | (2.13 | ) | |||||||||||||||
| Total dividends and distributions | (2.51 | ) | (1.37 | ) | (0.53 | ) | (0.34 | ) | (1.73 | ) | (2.20 | ) | |||||||||||||||
| Net asset value, end of period | $ | 20.07 | $ | 20.68 | $ | 19.72 | $ | 18.38 | $ | 16.58 | $ | 19.71 | |||||||||||||||
| Total return2 | 9.81 | % | 12.23 | % | 10.39 | % | 13.14 | % | (8.35 | )% | (11.07 | )% | |||||||||||||||
| RATIOS AND SUPPLEMENTAL DATA | |||||||||||||||||||||||||||
| Net assets, end of period (000s omitted) | $ | 3,423 | $ | 3,638 | $ | 3,736 | $ | 3,479 | $ | 2,104 | $ | 1,916 | |||||||||||||||
| Ratio of expenses to average net assets | 1.92 | %3 | 1.91 | % | 1.95 | % | 1.99 | % | 1.78 | % | 1.79 | % | |||||||||||||||
| Ratio of net investment income to average net assets | 0.25 | %3 | 0.15 | % | 0.16 | % | 0.06 | % | 0.16 | % | 0.13 | % | |||||||||||||||
| Decrease reflected in above operating expense ratios due to waivers/reimbursements | — | — | — | — | 0.28 | % | 0.10 | % | |||||||||||||||||||
| Portfolio turnover rate | 40 | % | 58 | % | 48 | % | 53 | % | 28 | % | 38 | % | |||||||||||||||
1 Per share information is calculated using the average shares outstanding method.
2 Total returns are historical and assume changes in share price, reinvestment of all dividends and distributions and no sales charge. Had certain expenses not been reduced during the periods shown, total returns would have been lower. Total returns for periods less than one year are not annualized.
3 Annualized.
See Accompanying Notes to Financial Statements.
28
Credit Suisse Small Cap Value Fund
Financial Highlights
(For a Common Class Share of the Fund Outstanding Throughout Each Period)
| For the Six Months Ended April 30, 2006 | For the Year Ended October 31, | ||||||||||||||||||||||||||
| (unaudited) | 2005 | 2004 | 2003 | 2002 | 2001 | ||||||||||||||||||||||
| Per share data | |||||||||||||||||||||||||||
| Net asset value, beginning of period | $ | 23.84 | $ | 22.66 | $ | 20.02 | $ | 18.56 | $ | 21.07 | $ | 22.62 | |||||||||||||||
| INVESTMENT OPERATIONS | |||||||||||||||||||||||||||
| Net investment income (loss)1 | 0.08 | (0.03 | ) | (0.05 | ) | (0.02 | ) | 0.02 | 0.04 | ||||||||||||||||||
| Net gain on investments (both realized and unrealized) | 2.39 | 3.39 | 3.75 | 3.08 | 0.31 | 1.72 | |||||||||||||||||||||
| Total from investment operations | 2.47 | 3.36 | 3.70 | 3.06 | 0.33 | 1.76 | |||||||||||||||||||||
| LESS DIVIDENDS AND DISTRIBUTIONS | |||||||||||||||||||||||||||
| Dividends from net investment income | — | — | — | (0.01 | ) | (0.05 | ) | (0.09 | ) | ||||||||||||||||||
| Distributions from net realized gains | (2.47 | ) | (2.18 | ) | (1.06 | ) | (1.59 | ) | (2.79 | ) | (3.22 | ) | |||||||||||||||
| Total dividends and distributions | (2.47 | ) | (2.18 | ) | (1.06 | ) | (1.60 | ) | (2.84 | ) | (3.31 | ) | |||||||||||||||
| Net asset value, end of period | $ | 23.84 | $ | 23.84 | $ | 22.66 | $ | 20.02 | $ | 18.56 | $ | 21.07 | |||||||||||||||
| Total return2 | 10.95 | % | 15.56 | % | 19.14 | % | 17.75 | % | 0.61 | % | 9.79 | % | |||||||||||||||
| RATIOS AND SUPPLEMENTAL DATA | |||||||||||||||||||||||||||
| Net assets, end of period (000s omitted) | $ | 68,266 | $ | 74,013 | $ | 50,068 | $ | 47,969 | $ | 45,075 | $ | 30,667 | |||||||||||||||
| Ratio of expenses to average net assets | 1.35 | %3 | 1.38 | % | 1.42 | % | 1.48 | % | 1.32 | % | 1.33 | % | |||||||||||||||
| Ratio of net investment income (loss) to average net assets | 0.75 | %3 | (0.16 | )% | (0.22 | )% | (0.10 | )% | 0.12 | % | 0.18 | % | |||||||||||||||
| Decrease reflected in above operating expense ratios due to waivers/reimbursements | — | — | — | 0.04 | % | 0.14 | % | 0.02 | % | ||||||||||||||||||
| Portfolio turnover rate | 40 | % | 43 | % | 41 | % | 30 | % | 18 | % | 54 | % | |||||||||||||||
1 Per share information is calculated using the average shares outstanding method.
2 Total returns are historical and assume changes in share price and reinvestment of all dividends and distributions. Had certain expenses not been reduced during the periods shown, total returns would have been lower. Total returns for periods less than one year are not annualized.
3 Annualized.
See Accompanying Notes to Financial Statements.
29
Credit Suisse Small Cap Value Fund
Financial Highlights
(For a Class A Share of the Fund Outstanding Throughout Each Period)
| For the Six Months Ended April 30, 2006 | For the Year Ended October 31, | ||||||||||||||||||||||||||
| (unaudited) | 2005 | 2004 | 2003 | 2002 | 2001 | ||||||||||||||||||||||
| Per share data | |||||||||||||||||||||||||||
| Net asset value, beginning of period | $ | 23.94 | $ | 22.75 | $ | 20.10 | $ | 18.62 | $ | 21.09 | $ | 22.54 | |||||||||||||||
| INVESTMENT OPERATIONS | |||||||||||||||||||||||||||
| Net investment income (loss)1 | 0.09 | (0.04 | ) | (0.05 | ) | (0.02 | ) | 0.02 | 0.05 | ||||||||||||||||||
| Net gain on investments (both realized and unrealized) | 2.39 | 3.42 | 3.76 | 3.10 | 0.33 | 1.76 | |||||||||||||||||||||
| Total from investment operations | 2.48 | 3.38 | 3.71 | 3.08 | 0.35 | 1.81 | |||||||||||||||||||||
| LESS DIVIDENDS AND DISTRIBUTIONS | |||||||||||||||||||||||||||
| Dividends from net investment income | — | — | — | (0.01 | ) | (0.03 | ) | (0.04 | ) | ||||||||||||||||||
| Distributions from net realized gains | (2.47 | ) | (2.19 | ) | (1.06 | ) | (1.59 | ) | (2.79 | ) | (3.22 | ) | |||||||||||||||
| Total dividends and distributions | (2.47 | ) | (2.19 | ) | (1.06 | ) | (1.60 | ) | (2.82 | ) | (3.26 | ) | |||||||||||||||
| Net asset value, end of period | $ | 23.95 | $ | 23.94 | $ | 22.75 | $ | 20.10 | $ | 18.62 | $ | 21.09 | |||||||||||||||
| Total return2 | 10.95 | % | 15.54 | % | 19.11 | % | 17.80 | % | 0.71 | % | 9.70 | % | |||||||||||||||
| RATIOS AND SUPPLEMENTAL DATA | |||||||||||||||||||||||||||
| Net assets, end of period (000s omitted) | $ | 274,005 | $ | 227,166 | $ | 198,773 | $ | 188,318 | $ | 151,340 | $ | 199,213 | |||||||||||||||
| Ratio of expenses to average net assets | 1.35 | %3 | 1.38 | % | 1.42 | % | 1.48 | % | 1.32 | % | 1.33 | % | |||||||||||||||
| Ratio of net investment income (loss) to average net assets | 0.75 | %3 | (0.16 | )% | 0.22 | % | (0.11 | )% | 0.11 | % | 0.25 | % | |||||||||||||||
| Decrease reflected in above operating expense ratios due to waivers/reimbursements | — | — | — | 0.04 | % | 0.12 | % | 0.02 | % | ||||||||||||||||||
| Portfolio turnover rate | 40 | % | 43 | % | 41 | % | 30 | % | 18 | % | 54 | % | |||||||||||||||
1 Per share information is calculated using the average shares outstanding method.
2 Total returns are historical and assume changes in share price, reinvestment of all dividends and distributions and no sales charge. Had certain expenses not been reduced during the periods shown, total returns would have been lower. Total returns for periods less than one year are not annualized.
3 Annualized.
See Accompanying Notes to Financial Statements.
30
Credit Suisse Small Cap Value Fund
Financial Highlights
(For a Class B Share of the Fund Outstanding Throughout Each Period)
| For the Six Months Ended April 30, 2006 | For the Year Ended October 31, | ||||||||||||||||||||||||||
| (unaudited) | 2005 | 2004 | 2003 | 2002 | 2001 | ||||||||||||||||||||||
| Per share data | |||||||||||||||||||||||||||
| Net asset value, beginning of period | $ | 21.99 | $ | 21.20 | $ | 18.93 | $ | 17.74 | $ | 20.33 | $ | 21.95 | |||||||||||||||
| INVESTMENT OPERATIONS | |||||||||||||||||||||||||||
| Net investment loss1 | (0.01 | ) | (0.20 | ) | (0.20 | ) | (0.15 | ) | (0.12 | ) | (0.10 | ) | |||||||||||||||
| Net gain on investments (both realized and unrealized) | 2.20 | 3.17 | 3.53 | 2.93 | 0.32 | 1.70 | |||||||||||||||||||||
| Total from investment operations | 2.19 | 2.97 | 3.33 | 2.78 | 0.20 | 1.60 | |||||||||||||||||||||
| LESS DISTRIBUTIONS | |||||||||||||||||||||||||||
| Distributions from net realized gains | (2.47 | ) | (2.18 | ) | (1.06 | ) | (1.59 | ) | (2.79 | ) | (3.22 | ) | |||||||||||||||
| Net asset value, end of period | $ | 21.71 | $ | 21.99 | $ | 21.20 | $ | 18.93 | $ | 17.74 | $ | 20.33 | |||||||||||||||
| Total return2 | 10.58 | % | 14.72 | % | 18.25 | % | 16.88 | % | (0.08 | )% | 8.88 | % | |||||||||||||||
| RATIOS AND SUPPLEMENTAL DATA | |||||||||||||||||||||||||||
| Net assets, end of period (000s omitted) | $ | 16,388 | $ | 18,133 | $ | 20,425 | $ | 22,669 | $ | 19,999 | $ | 17,818 | |||||||||||||||
| Ratio of expenses to average net assets | 2.10 | %3 | 2.13 | % | 2.17 | % | 2.23 | % | 2.07 | % | 2.08 | % | |||||||||||||||
| Ratio of net investment loss to average net assets | (0.00 | )%3,4 | (0.91 | )% | (0.97 | )% | (0.86 | )% | (0.63 | )% | (0.50 | )% | |||||||||||||||
| Decrease reflected in above operating expense ratios due to waivers/reimbursements | — | — | — | 0.04 | % | 0.13 | % | 0.02 | % | ||||||||||||||||||
| Portfolio turnover rate | 40 | % | 43 | % | 41 | % | 30 | % | 18 | % | 54 | % | |||||||||||||||
1 Per share information is calculated using the average shares outstanding method.
2 Total returns are historical and assume changes in share price, reinvestment of all distributions and no sales charge. Had certain expenses not been reduced during the periods shown, total returns would have been lower. Total returns for periods less than one year are not annualized.
3 Annualized.
4 This amount represents less than (0.01)%.
See Accompanying Notes to Financial Statements.
31
Credit Suisse Small Cap Value Fund
Financial Highlights
(For a Class C Share of the Fund Outstanding Throughout Each Period)
| For the Six Months Ended April 30, 2006 | For the Year Ended October 31, | ||||||||||||||||||||||||||
| (unaudited) | 2005 | 2004 | 2003 | 2002 | 2001 | ||||||||||||||||||||||
| Per share data | |||||||||||||||||||||||||||
| Net asset value, beginning of period | $ | 21.91 | $ | 21.13 | $ | 18.87 | $ | 17.69 | $ | 20.28 | $ | 21.94 | |||||||||||||||
| INVESTMENT OPERATIONS | |||||||||||||||||||||||||||
| Net investment loss1 | (0.01 | ) | (0.20 | ) | (0.19 | ) | (0.15 | ) | (0.12 | ) | (0.11 | ) | |||||||||||||||
| Net gain on investments (both realized and unrealized) | 2.18 | 3.16 | 3.51 | 2.92 | 0.32 | 1.67 | |||||||||||||||||||||
| Total from investment operations | 2.17 | 2.96 | 3.32 | 2.77 | 0.20 | 1.56 | |||||||||||||||||||||
| LESS DISTRIBUTIONS | |||||||||||||||||||||||||||
| Distributions from net realized gains | (2.47 | ) | (2.18 | ) | (1.06 | ) | (1.59 | ) | (2.79 | ) | (3.22 | ) | |||||||||||||||
| Net asset value, end of period | $ | 21.61 | $ | 21.91 | $ | 21.13 | $ | 18.87 | $ | 17.69 | $ | 20.28 | |||||||||||||||
| Total return2 | 10.51 | % | 14.72 | % | 18.25 | % | 16.87 | % | (0.07 | )% | 8.93 | % | |||||||||||||||
| RATIOS AND SUPPLEMENTAL DATA | |||||||||||||||||||||||||||
| Net assets, end of period (000s omitted) | $ | 18,071 | $ | 16,079 | $ | 11,613 | $ | 8,138 | $ | 4,271 | $ | 1,481 | |||||||||||||||
| Ratio of expenses to average net assets | 2.10 | %3 | 2.13 | % | 2.17 | % | 2.23 | % | 2.07 | % | 2.08 | % | |||||||||||||||
| Ratio of net investment loss to average net assets | (0.00 | )%3,4 | (0.91 | )% | (0.97 | )% | (0.86 | )% | (0.63 | )% | (0.52 | )% | |||||||||||||||
| Decrease reflected in above operating expense ratios due to waivers/reimbursements | — | — | — | 0.04 | % | 0.14 | % | 0.02 | % | ||||||||||||||||||
| Portfolio turnover rate | 40 | % | 43 | % | 41 | % | 30 | % | 18 | % | 54 | % | |||||||||||||||
1 Per share information is calculated using the average shares outstanding method.
2 Total returns are historical and assume changes in share price, reinvestment of all distributions and no sales charge. Had certain expenses not been reduced during the periods shown, total returns would have been lower. Total returns for periods less than one year are not annualized.
3 Annualized.
4 This amount represents less than (0.01)%.
See Accompanying Notes to Financial Statements.
32
Credit Suisse Funds
Notes to Financial Statements
April 30, 2006 (unaudited)
Note 1. Organization
The Credit Suisse Capital Funds (the "Trust") covered in this report are comprised of Credit Suisse Large Cap Value Fund ("Large Cap Value") and Credit Suisse Small Cap Value Fund ("Small Cap Value"), (each a "Fund" and collectively, the "Funds"). The Trust is registered under the Investment Company Act of 1940, as amended (the "1940 Act"), as an open-end management investment company. The Trust was organized under the laws of the Commonwealth of Massachusetts as a business trust on November 26, 1985. Each Fund is classified as diversified.
Investment objectives for each Fund are as follows: Large Cap Value seeks long-term capital appreciation and continuity of income; Small Cap Value seeks a high level of growth of capital.
Large Cap Value offers five classes of shares: Common Class shares, Advisor Class shares, Class A shares, Class B shares and Class C shares. Small Cap Value offers four classes of shares: Common Class shares, Class A shares, Class B shares and Class C shares. Effective December 12, 2001, Large Cap Value closed the Common Class to new investments, except for reinvestment of dividends. Large Cap Value's Common Class shareholders as of the close of business on December 12, 2001 may continue to hold Common Class shares but may not add to their accounts. Although no further shares can be purchased, Large Cap Value's shareholders can redeem their Common Class shares through any available method. The Small Cap Value's Common Class shares are closed to new investors, other than (1) investors in employee retirement, stock, bonus, pension or profit-sharing plans, (2) investment advisory clients of Credit Suisse Asset Management, LLC ("Credit Suisse"), (3) certain registered investment advisers ("RIAs"), (4) certain broker-dealers and RlAs with clients participating in comprehensive fee programs (5) employees of Credit Suisse or its affiliates and current and former Directors or Trustees of funds advised by Credit Suisse or its affiliates and (6) Credit Suisse or its affiliates. Any Common Class shareholder as of the close of business on December 12, 2001 can continue to buy Common Class shares of the fund and open new accounts under the same Social Security number. Each class of shares in each Fund represents an equal pro rata interest in each Fund, except that they bear different expenses, which reflect the difference in the range of services provided to them. Class A shares of each Fund are sold subject to a front-end sales charge of up to 5.75%. Class B shares are sold subject to a contingent deferred sales charge which declines from 4% to zero depending on the period of time the shares are held. Class C shares of each Fund are sold subject to a conti ngent deferred sales charge of 1.00% if redeemed within the first year of purchase.
33
Credit Suisse Funds
Notes to Financial Statements (continued)
April 30, 2006 (unaudited)
Note 2. Significant Accounting Policies
A) SECURITY VALUATION — The net asset value of each Fund is determined daily as of the close of regular trading on the New York Stock Exchange, Inc. (the "Exchange") on each day the Exchange is open for business. Each Fund's equity investments are valued at market value, which is generally determined using the closing price on the exchange or market on which the security is primarily traded at the time of valuation (the "Valuation Time"). If no sales are reported, equity investments are generally valued at the most recent bid quotation as of the Valuation Time or at the lowest asked quotation in the case of a short sale of securities. Debt securities with a remaining maturity greater than 60 days are valued in accordance with the price supplied by a pricing service, which may use a matrix, formula or other objective method that takes into consideration market indices, yield curves and other specific adjustments. Debt obligations that wi ll mature in 60 days or less are valued on the basis of amortized cost, which approximates market value, unless it is determined that this method would not represent fair value. Investments in mutual funds are valued at the mutual fund's closing net asset value per share on the day of valuation. Securities and other assets for which market quotations are not readily available, or whose values have been materially affected by events occurring before the Funds' Valuation Time but after the close of the securities' primary markets, are valued at fair value as determined in good faith by or under the direction of, the Board of Trustees under procedures established by the Board of Trustees. The Funds may utilize a service provided by an independent third party which has been approved by the Board of Trustees to fair value certain securities. When fair-value pricing is employed, the prices of securities used by a fund to calculate its net asset value may differ from quoted or published prices for the same securiti es.
B) SECURITY TRANSACTIONS AND INVESTMENT INCOME — Security transactions are accounted for on a trade date basis. Interest income is recorded on the accrual basis. Dividends are recorded on the ex-dividend date. Certain expenses are class-specific and vary by class. Income, expenses (excluding class-specific expenses) and realized/unrealized gains/losses are allocated proportionately to each class of shares based upon the relative net asset value of outstanding shares of that class. The cost of investments sold is determined by use of the specific identification method for both financial reporting and income tax purposes.
C) DIVIDENDS AND DISTRIBUTIONS TO SHAREHOLDERS — Dividends from net investment income, if any, are declared and paid quarterly by Large Cap Value and at least annually by Small Cap Value. Distributions of net realized capital gains, if any, are declared and paid at least annually by the Funds.
34
Credit Suisse Funds
Notes to Financial Statements (continued)
April 30, 2006 (unaudited)
Note 2. Significant Accounting Policies
However, to the extent that a net realized capital gain can be reduced by a capital loss carryforward, such gain will not be distributed. Income and capital gain distributions are determined in accordance with federal income tax regulations, which may differ from accounting principles generally accepted in the United States of America (GAAP).
D) FEDERAL INCOME TAXES — No provision is made for federal taxes as it is each Fund's intention to have each Fund continue to qualify for and elect the tax treatment applicable to regulated investment companies under the Internal Revenue Code of 1986, as amended, and make the requisite distributions to its shareholders which will be sufficient to relieve it from federal income and excise taxes.
E) USE OF ESTIMATES — The preparation of financial statements in conformity with GAAP requires management to make estimates and assumptions that affect the reported amounts of assets and liabilities and disclosure of contingent assets and liabilities at the date ofthe financial statements and the reported amounts of revenues and expenses during the reporting period. Actual results could differ from these estimates.
F) SHORT-TERM INVESTMENTS — The Funds, together with other funds/portfolios advised by Credit Suisse, an indirect, wholly-owned subsidiary of Credit Suisse Group, pool available cash into either a short-term variable rate time deposit issued by State Street Bank and Trust Company ("SSB"), the Funds' custodian, or a money market fund advised by Credit Suisse. The short-term time deposit issued by SSB is a variable rate account classified as a short-term investment.
G) SECURITIES LENDING — Loans of securities are required at all times to be secured by collateral at least equal to 102% of the market value of domestic securities on loan (including any accrued interest thereon) and 105% of the market value of foreign securities on loan (including any accrued interest thereon). Cash collateral received by the Funds in connection with securities lending activity may be pooled together with cash collateral for other funds/portfolios advised by Credit Suisse and may be invested in a variety of investments, including certain Credit Suisse-advised funds, funds advised by SSB, the Funds' securities lending agent, or money market instruments. However, in the event of default or bankruptcy by the other party to the agreement, realization and/or retention of the collateral may be subject to legal proceedings.
SSB has been engaged by the Funds to act as the Funds' securities lending agent. The Funds' securities lending arrangement provides that the Funds and SSB will share the net income earned from securities lending activities. During the
35
Credit Suisse Funds
Notes to Financial Statements (continued)
April 30, 2006 (unaudited)
Note 2. Significant Accounting Policies
six months ended April 30, 2006, total earnings from the Fund's investment in cash collateral received in connection with Large Cap Value and Small Cap Value's security lending arrangements were $141,282, and $1,519,866, respectively, of which $135,414, and $1,466,302, respectively, were rebated to borrowers (brokers). The Funds retained $4,162, and $37,475 in income, respectively, from the cash collateral investment and SSB, as lending agent, was paid $1,706, and $16,089 respectively. The Funds may also be entitled to certain minimum amounts of income from their securities lending activities. Securities lending is accrued as earned.
H) OTHER — Large Cap Value may invest up to 10% and Small Cap Value may invest up to 15% of its net assets in restricted and other illiquid securities. Non-publicly traded securities may be less liquid than publicly traded securities. Although these securities may be resold in privately negotiated transactions, the prices realized from such sales could differ from the price originally paid by the Funds or the current carrying values, and the difference could be material.
Note 3. Transactions with Affiliates and Related Parties
Credit Suisse serves as investment adviser for the Funds. For its investment advisory services, Credit Suisse is entitled to receive the following fees, computed daily and payable monthly, on each Fund's average daily net assets as follows:
| Fund | Annual Rate | ||||||
| Large Cap Value | 0.75% of average daily net assets up to and including $75 million | ||||||
| 0.50% of average daily net assets in excess of $75 million | |||||||
| Small Cap Value | 0.875% of first $100 million of average daily net assets | ||||||
| 0.75% of next $100 million of average daily net assets | |||||||
| 0.625% of average daily net assets over $200 million | |||||||
For the six months ended April 30, 2006, investment advisory fees earned for each Fund were as follows:
| Fund | Gross Advisory Fee | ||||||
| Large Cap Value | $ | 942,096 | |||||
| Small Cap Value | 1,304,561 | ||||||
Credit Suisse Asset Management Securities, Inc. ("CSAMSI"), an affiliate of Credit Suisse, and SSB serve as co-administrators to the Funds.
For its co-administrative services, CSAMSI currently receives a fee calculated at an annual rate of 0.10% of each Fund's average daily net assets. For the
36
Credit Suisse Funds
Notes to Financial Statements (continued)
April 30, 2006 (unaudited)
Note 3. Transactions with Affiliates and Related Parties
six months ended April 30, 2006, co-administrative services fees earned by CSAMSI were as follows:
| Fund | Co-Administration Fee | ||||||
| Large Cap Value | $ | 169,823 | |||||
| Small Cap Value | 178,976 | ||||||
For its co-administrative services, SSB receives a fee, exclusive of out-of-pocket expenses, calculated in total for all the Credit Suisse funds/portfolios co-administered by SSB and allocated based upon relative average net assets of each fund/portfolio, subject to an annual minimum fee.
For the six months ended April 30, 2006, co-administrative services fees earned by SSB (including out-of-pocket fees) were as follows:
| Fund | Co-Administration Fee | ||||||
| Large Cap Value | $ | 113,608 | |||||
| Small Cap Value | 119,916 | ||||||
In addition to serving as each Fund's co-administrator, CSAMSI currently serves as distributor of each Fund's shares. Pursuant to distribution plans adopted by each Fund pursuant to Rule 12b-1 under the 1940 Act, CSAMSI receives fees for its distribution services. This fee is calculated at an annual rate of 0.25% of the average daily net assets of the Common Class of Small Cap Value and Class A shares of each Fund. Advisor Class shares of Large Cap Value may pay this fee at an annual rate not to exceed 0.75% of such classes average daily assets; such fee is currently calculated at the annual rate of 0.50% of the average daily net assets of such class. For the Class B and Class C shares, the fee is calculated at annual rate of 1.00% of average daily net assets of such classes.
Certain brokers, dealers and financial representatives provide transfer agent related services to the Funds, and receive compensation from Credit Suisse. Credit Suisse is then reimbursed by the Funds. For the six months ended April 30, 2006, the Small Cap Value Fund reimbursed Credit Suisse the following amounts, which are included in the Fund transfer agent expense as follows:
| Fund | Amount | ||||||
| Small Cap Value | $ | 66,707 | |||||
For the six months ended April 30, 2006, CSAMSI and its affiliates advised the Funds that they retained the following amounts from commissions earned on the sale of the Funds' Class A shares:
| Fund | Amount | ||||||
| Large Cap Value | $ | 6,763 | |||||
| Small Cap Value | 9,913 | ||||||
37
Credit Suisse Funds
Notes to Financial Statements (continued)
April 30, 2006 (unaudited)
Note 3. Transactions with Affiliates and Related Parties
Merrill Corporation ("Merrill"), an affiliate of Credit Suisse, has been engaged by the Funds to provide certain financial printing and fulfillment services. For the six months ended April 30, 2006, Merrill was paid for its services by the Funds as follows:
| Fund | Amount | ||||||
| Large Cap Value | $ | 252 | |||||
| Small Cap Value | 252 | ||||||
Note 4. Line of Credit
The Funds, together with other funds/portfolios advised by Credit Suisse (collectively, the "Participating Funds"), participate in a $75 million committed, unsecured line of credit facility ("Credit Facility") for temporary or emergency purposes with Deutsche Bank, A.G. as administrative agent and syndication agent and SSB as operations agent. Under the terms of the Credit Facility, the Participating Funds pay an aggregate commitment fee at a rate of 0.10% per annum on the average unused amount of the Credit Facility, which is allocated among the Participating Funds in such manner as is determined by the governing Boards of the Participating Funds. In addition, the Participating Funds pay interest on borrowings at the Federal Funds rate plus 0.50%. At April 30, 2006, and during the six months ended April 30, 2006, the Funds had no borrowings under the Credit Facility.
Note 5. Purchases and Sales of Securities
For the six months ended April 30, 2006, purchases and sales of investment securities (excluding short-term investments) were as follows:
| Purchases | Sales | ||||||||||
| Large Cap Value | $ | 133,439,148 | $ | 152,229,276 | |||||||
| Small Cap Value | 141,819,112 | 139,233,239 | |||||||||
At April 30, 2006, the identified cost for federal income tax purposes, as well as the gross unrealized appreciation from investments for those securities having an excess of value over cost, gross unrealized depreciation from investments for those securities having an excess of cost over value and the net unrealized appreciation from investments were as follows:
| Fund | Identified Cost | Gross Unrealized Appreciation | Gross Unrealized (Depreciation) | Net Unrealized Appreciation | |||||||||||||||
| Large Cap Value | $ | 282,618,771 | $ | 68,516,849 | $ | (2,530,217 | ) | $ | 65,986,632 | ||||||||||
| Small Cap Value | 375,443,371 | 87,120,877 | (4,703,840 | ) | 82,417,037 | ||||||||||||||
38
Credit Suisse Funds
Notes to Financial Statements (continued)
April 30, 2006 (unaudited)
Note 6. Capital Share Transactions
Large Cap Value is authorized to issue an unlimited number of full and fractional shares of beneficial interest, $0.001 par value per share, of which an unlimited number of shares are classified as Common Class shares, Advisor Class shares, Class A shares, Class B shares and Class C shares. Small Cap Value is authorized to issue an unlimited number of full and fractional shares of beneficial interest, $.001 par value per share, of which an unlimited number of shares are classified as Common Class shares, Class A shares, Class B shares and Class C shares. Transactions in capital shares of the Funds were as follows:
| Large Cap Value | |||||||||||||||||||
| Common Class | |||||||||||||||||||
| For the Six Months Ended April 30, 2006 (unaudited) | For the Year Ended October 31, 2005 | ||||||||||||||||||
| Shares | Value | Shares | Value | ||||||||||||||||
| Shares sold | — | $ | — | — | $ | — | |||||||||||||
| Shares issued in reinvestment of dividends and distributions | 3,722 | 72,433 | 2,481 | 49,506 | |||||||||||||||
| Shares redeemed | (3,957 | ) | (77,619 | ) | (7,513 | ) | (154,832 | ) | |||||||||||
| Net decrease | (235 | ) | $ | (5,186 | ) | (5,032 | ) | $ | (105,326 | ) | |||||||||
| Large Cap Value | |||||||||||||||||||
| Advisor Class | |||||||||||||||||||
| For the Six Months Ended April 30, 2006 (unaudited) | For the Year Ended October 31, 2005 | ||||||||||||||||||
| Shares | Value | Shares | Value | ||||||||||||||||
| Shares sold | 24,526 | $ | 494,314 | 61,977 | $ | 1,287,597 | |||||||||||||
| Shares issued in reinvestment of dividends and distributions | 51,168 | 1,001,766 | 40,096 | 802,200 | |||||||||||||||
| Shares redeemed | (68,076 | ) | (1,378,915 | ) | (314,077 | ) | (6,471,666 | ) | |||||||||||
| Net increase (decrease) | 7,618 | $ | 117,165 | (212,004 | ) | $ | (4,381,869 | ) | |||||||||||
| Large Cap Value | |||||||||||||||||||
| Class A | |||||||||||||||||||
| For the Six Months Ended April 30, 2006 (unaudited) | For the Year Ended October 31, 2005 | ||||||||||||||||||
| Shares | Value | Shares | Value | ||||||||||||||||
| Shares sold | 972,212 | $ | 19,558,204 | 1,390,878 | $ | 28,943,323 | |||||||||||||
| Shares issued in reinvestment of dividends and distributions | 1,767,072 | 34,526,477 | 1,067,455 | 21,352,065 | |||||||||||||||
| Shares redeemed | (1,714,685 | ) | (34,285,277 | ) | (3,275,850 | ) | (67,806,252 | ) | |||||||||||
| Net increase (decrease) | 1,024,599 | $ | 19,799,404 | (817,517 | ) | $ | (17,510,864 | ) | |||||||||||
39
Credit Suisse Funds
Notes to Financial Statements (continued)
April 30, 2006 (unaudited)
Note 6. Capital Share Transactions
| Large Cap Value | |||||||||||||||||||
| Class B | |||||||||||||||||||
| For the Six Months Ended April 30, 2006 (unaudited) | For the Year Ended October 31, 2005 | ||||||||||||||||||
| Shares | Value | Shares | Value | ||||||||||||||||
| Shares sold | 42,535 | $ | 832,152 | 69,764 | $ | 1,411,742 | |||||||||||||
| Shares issued in reinvestment of dividends and distributions | 93,012 | 1,788,974 | 65,273 | 1,282,519 | |||||||||||||||
| Shares redeemed | (237,082 | ) | (4,731,920 | ) | (437,878 | ) | (8,987,992 | ) | |||||||||||
| Net decrease | (101,535 | ) | $ | (2,110,794 | ) | (302,841 | ) | $ | (6,293,731 | ) | |||||||||
| Large Cap Value | |||||||||||||||||||
| Class C | |||||||||||||||||||
| For the Six Months Ended April 30, 2006 (unaudited) | For the Year Ended October 31, 2005 | ||||||||||||||||||
| Shares | Value | Shares | Value | ||||||||||||||||
| Shares sold | 13,132 | $ | 252,093 | 20,215 | $ | 402,769 | |||||||||||||
| Shares issued in reinvestment of dividends and distributions | 19,371 | 370,451 | 11,253 | 219,996 | |||||||||||||||
| Shares redeemed | (37,861 | ) | (744,085 | ) | (45,000 | ) | (910,735 | ) | |||||||||||
| Net decrease | (5,358 | ) | $ | (121,541 | ) | (13,532 | ) | $ | (287,970 | ) | |||||||||
| Small Cap Value | |||||||||||||||||||
| Common Class | |||||||||||||||||||
| For the Six Months Ended April 30, 2006 (unaudited) | For the Year Ended October 31, 2005 | ||||||||||||||||||
| Shares | Value | Shares | Value | ||||||||||||||||
| Shares sold | 155,586 | $ | 3,634,085 | 1,507,009 | $ | 36,109,474 | |||||||||||||
| Shares issued in reinvestment of dividends and distributions | 330,655 | 7,459,586 | 223,428 | 4,957,871 | |||||||||||||||
| Shares redeemed | (727,374 | ) | (16,897,438 | ) | (835,342 | ) | (19,682,856 | ) | |||||||||||
| Net increase (decrease) | (241,133 | ) | $ | (5,803,767 | ) | 895,095 | $ | 21,384,489 | |||||||||||
| Small Cap Value | |||||||||||||||||||
| Class A | |||||||||||||||||||
| For the Six Months Ended April 30, 2006 (unaudited) | For the Year Ended October 31, 2005 | ||||||||||||||||||
| Shares | Value | Shares | Value | ||||||||||||||||
| Shares sold | 2,792,385 | $ | 65,020,515 | 2,629,854 | $ | 62,247,948 | |||||||||||||
| Shares issued in reinvestment of dividends and distributions | 987,897 | 22,395,554 | 785,344 | 17,505,316 | |||||||||||||||
| Shares redeemed | (1,829,384 | ) | (42,511,778 | ) | (2,664,545 | ) | (62,603,687 | ) | |||||||||||
| Net increase | 1,950,898 | $ | 44,904,291 | 750,653 | $ | 17,149,577 | |||||||||||||
40
Credit Suisse Funds
Notes to Financial Statements (continued)
April 30, 2006 (unaudited)
Note 6. Capital Share Transactions
| Small Cap Value | |||||||||||||||||||
| Class B | |||||||||||||||||||
| For the Six Months Ended April 30, 2006 (unaudited) | For the Year Ended October 31, 2005 | ||||||||||||||||||
| Shares | Value | Shares | Value | ||||||||||||||||
| Shares sold | 22,073 | $ | 468,601 | 95,400 | $ | 2,064,361 | |||||||||||||
| Shares issued in reinvestment of distributions | 78,280 | 1,611,772 | 82,688 | 1,703,368 | |||||||||||||||
| Shares redeemed | (170,346 | ) | (3,683,406 | ) | (316,688 | ) | (6,919,461 | ) | |||||||||||
| Net decrease | (69,993 | ) | $ | (1,603,033 | ) | (138,600 | ) | $ | (3,151,732 | ) | |||||||||
| Small Cap Value | |||||||||||||||||||
| Class C | |||||||||||||||||||
| For the Six Months Ended April 30, 2006 (unaudited) | For the Year Ended October 31, 2005 | ||||||||||||||||||
| Shares | Value | Shares | Value | ||||||||||||||||
| Shares sold | 124,653 | $ | 2,636,829 | 255,397 | $ | 5,530,732 | |||||||||||||
| Shares issued in reinvestment of distributions | 54,440 | 1,116,566 | 34,443 | 707,116 | |||||||||||||||
| Shares redeemed | (76,927 | ) | (1,623,386 | ) | (105,409 | ) | (2,253,756 | ) | |||||||||||
| Net increase | 102,166 | $ | 2,130,009 | 184,431 | $ | 3,984,092 | |||||||||||||
On April 30, 2006 the number of shareholders that held 5% or more of the outstanding shares of each class of the Funds were as follows:
| Fund | Number of Shareholders | Approximate Percentage of Outstanding Shares | |||||||||
| Large Cap Value | |||||||||||
| Common Class | 3 | 47 | % | ||||||||
| Advisor Class | 1 | 94 | % | ||||||||
| Class A | 2 | 18 | % | ||||||||
| Class B | 1 | 8 | % | ||||||||
| Class C | 3 | 29 | % | ||||||||
| Small Cap Value | |||||||||||
| Common Class | 2 | 68 | % | ||||||||
| Class A | 2 | 11 | % | ||||||||
| Class B | 1 | 7 | % | ||||||||
| Class C | 1 | 10 | % | ||||||||
Some of the shareholders are omnibus accounts, which hold shares on behalf of individual shareholders.
Note 7. Contingencies
In the normal course of business, the Funds may provide general indemnifications pursuant to certain contracts and organizational documents. The Funds' maximum exposure under these arrangements is dependent on future claims that may be made against the Funds and, therefore, cannot be estimated; however, based on experience, the risk of loss from such claims is considered remote.
41
Credit Suisse Large Cap Value Fund
Board Approval of Advisory Agreements (unaudited)
In approving the Advisory Agreement, the Board of Trustees, including the Independent Trustees, considered the following factors with respect to the Large Cap Value Fund (the "Fund"):
Investment Advisory Fee Rates
The Board reviewed and considered the actual and contractual advisory fee rate of 0.55% paid by the Fund ("Contractual Advisory Fee") to Credit Suisse Asset Management, LLC ("Credit Suisse") in light of the extent and quality of the advisory services provided by Credit Suisse.
Additionally, the Board received and considered information comparing the Fund's Contractual Advisory Fee and the Fund's overall expenses with those of funds in both the relevant expense group ("Expense Group") and universe of funds (the "Expense Universe") provided by Lipper Inc., an independent provider of investment company data.
Nature, Extent and Quality of the Services under the Advisory Agreement
The Board received and considered information regarding the nature, extent and quality of services provided to the Fund by Credit Suisse under the Advisory Agreement. The Board also noted information received at regular meetings throughout the year related to the services rendered by Credit Suisse. The Board reviewed background information about Credit Suisse, including its Form ADV. The Board considered the background and experience of Credit Suisse's senior management and the expertise of, and the amount of attention given to the Fund by, senior personnel of Credit Suisse. In addition, the Board reviewed the qualifications, backgrounds and responsibilities of the portfolio management team primarily responsible for the day-to-day portfolio management of the Fund and the extent of the resources devoted to research and analysis of actual and potential investments. The Board also received and considered information about the nature, extent and quality of services and fee rates offered to other Credit Suisse clients for comparable services.
Fund Performance
The Board received and considered the one-, two-, three-, four-, five- and ten-year performance of the Fund, along with comparisons, for all presented periods, both to the relevant performance group ("Performance Group") and universe of funds ("Performance Universe") for the Fund. The Board was
42
Credit Suisse Large Cap Value Fund
Board Approval of Advisory Agreements (unaudited) (continued)
provided with a description of the methodology used to arrive at the data for the funds included in the Performance Group and the Performance Universe.
The Board reviewed information comparing the performance of various Credit Suisse Funds to performance benchmarks that the Board had previously established and progress that had been made in certain instances toward achieving those benchmarks. The Board also reviewed comparisons between the Fund and its identified benchmark over various time periods.
Credit Suisse Profitability
The Board received and considered a profitability analysis of Credit Suisse based on the fees payable under the Advisory Agreement for the Fund, including other relationships between the Fund on the one hand and Credit Suisse affiliates on the other. The Board received profitability information for the other funds in the Credit Suisse family of funds.
Economies of Scale
The Board considered whether economies of scale in the provision of services to the Fund were being passed along to the shareholders. Accordingly, the Board considered whether the breakpoints currently applicable to the Fund's advisory fee were reasonable or whether further adjustments to the fee structure would be appropriate.
Other Benefits to Credit Suisse
The Board considered other benefits received by Credit Suisse and its affiliates as a result of their relationship with the Fund. Such benefits include, among others, research arrangements with brokers who execute transactions on behalf of the Fund, administrative and brokerage relationships with affiliates of Credit Suisse and benefits potentially derived from an increase in Credit Suisse's businesses as a result of its relationship with the Fund (such as the ability to market to shareholders other financial products offered by Credit Suisse and its affiliates).
The Board considered the standards applied in seeking best execution, whether and to what extent soft dollar credits are sought and how any such credits are utilized, any benefits that may be achieved by using an affiliated broker and the existence of quality controls applicable to brokerage allocation
43
Credit Suisse Large Cap Value Fund
Board Approval of Advisory Agreements (unaudited) (continued)
procedures. The Board also reviewed Credit Suisse's method for allocating portfolio investment opportunities among its advisory clients.
Conclusions
In selecting Credit Suisse, and approving the Advisory Agreement and the investment advisory fee under such agreement, the Board concluded that:
• The Contractual Advisory Fee level was considered reasonable given that it was in the third quintile of the Fund's Expense Group.
• The Fund's ten-year performance was the best in its Performance Group and its performance in all other periods was above or at the median of its Performance Group and Performance Universe. The Board considered the improvements in the Fund's performance to be a positive reflection of the enhanced research and portfolio management changes.
• The Board was satisfied with the nature and extent of the investment advisory services provided to the Fund by Credit Suisse and that, based on dialogue with management and counsel, the services provided by Credit Suisse under the Advisory Agreement is typical of, and consistent with, those provided to similar mutual funds by other investment advisers.
• In light of the costs of providing investment management and other services to the Fund and Credit Suisse's ongoing commitment to the Fund, the profits and other ancillary benefits that Credit Suisse and its affiliates received were considered reasonable.
• Credit Suisse's profitability based on fees payable under the Advisory Agreement was reasonable in light of the nature, extent and quality of the services provided to the Fund thereunder.
• The Fund's current fee structure was considered reasonable.
No single factor reviewed by the Board was identified by the Board as the principal factor in determining whether to approve the Advisory Agreement. The Independent Trustees were advised by separate independent legal counsel throughout the process.
44
Credit Suisse Small Cap Value Fund
Board Approval of Advisory Agreements (unaudited)
In approving the Advisory Agreement, the Board of Trustees, including the Independent Trustees, considered the following factors with respect to the Small Cap Value Fund (the "Fund"):
Investment Advisory Fee Rates
The Board reviewed and considered the actual and contractual advisory fee rate of 0.74% paid by the Fund ("Contractual Advisory Fee"), to Credit Suisse in light of the extent and quality of the advisory services provided by Credit Suisse.
Additionally, the Board received and considered information comparing the Fund's Contractual Advisory Fee and the Fund's overall expenses with those of funds in both the relevant expense group ("Expense Group") and universe of funds (the "Expense Universe") provided by Lipper Inc., an independent provider of investment company data.
Nature, Extent and Quality of the Services under the Advisory Agreement
The Board received and considered information regarding the nature, extent and quality of services provided to the Fund by Credit Suisse under the Advisory Agreement. The Board also noted information received at regular meetings throughout the year related to the services rendered by Credit Suisse. The Board reviewed background information about Credit Suisse, including its Form ADV. The Board considered the background and experience of Credit Suisse's senior management and the expertise of, and the amount of attention given to the Fund by, senior personnel of Credit Suisse. In addition, the Board reviewed the qualifications, backgrounds and responsibilities of the portfolio management team primarily responsible for the day-to-day portfolio management of the Fund and the extent of the resources devoted to research and analysis of actual and potential investments. The Board also received and considered information about the nature, extent and quality of services and fee rates offered to other Credit Suisse clients for comparable services.
Fund Performance
The Board received and considered the one-, two-, three-, four-, five- and ten-year performance of the Fund, along with comparisons, for all presented periods, both to the relevant performance group ("Performance Group") and universe of funds ("Performance Universe") for the Fund. The Board was provided with a description of the methodology used to arrive at the data for the funds included in the Performance Group and the Performance Universe.
45
Credit Suisse Small Cap Value Fund
Board Approval of Advisory Agreements (unaudited) (continued)
The Board reviewed information comparing the performance of various Credit Suisse Funds to performance benchmarks that the Board had previously established and progress that had been made in certain instances toward achieving those benchmarks. The Board also reviewed comparisons between the Fund and its identified benchmark over various time periods.
Credit Suisse Profitability
The Board received and considered a profitability analysis of Credit Suisse based on the fees payable under the Advisory Agreement for the Fund, including other relationships between the Fund on the one hand and Credit Suisse affiliates on the other. The Board received profitability information for the other funds in the Credit Suisse family of funds.
Economies of Scale
The Board considered whether economies of scale in the provision of services to the Fund were being passed along to the shareholders. Accordingly, the Board considered whether the breakpoints currently applicable to the Fund's advisory fee were reasonable or whether further adjustments to the fee structure would be appropriate.
Other Benefits to Credit Suisse
The Board considered other benefits received by Credit Suisse and its affiliates as a result of their relationship with the Fund. Such benefits include, among others, research arrangements with brokers who execute transactions on behalf of the Fund, administrative and brokerage relationships with affiliates of Credit Suisse and benefits potentially derived from an increase in Credit Suisse's businesses as a result of its relationship with the Fund (such as the ability to market to shareholders other financial products offered by Credit Suisse and its affiliates).
The Board considered the standards applied in seeking best execution, whether and to what extent soft dollar credits are sought and how any such credits are utilized, any benefits that may be achieved by using an affiliated broker and the existence of quality controls applicable to brokerage allocation procedures. The Board also reviewed Credit Suisse's method for allocating portfolio investment opportunities among its advisory clients.
46
Credit Suisse Small Cap Value Fund
Board Approval of Advisory Agreements (unaudited) (continued)
Conclusions
In selecting Credit Suisse, and approving the Advisory Agreement and the investment advisory fee under such agreement, the Board concluded that:
• The Contractual Advisory Fee level was considered reasonable given that it was below the median of the Fund's Expense Group.
• The Fund's performance for all periods was in a reasonable range around the median or above the median for its Performance Group and Performance Universe, except its three-year performance was below the median in both the Performance Group and Performance Universe. The Board considered the improvements in the Fund's recent performance to be a positive reflection of the enhanced research and portfolio management changes instituted by Credit Suisse.
• The Board was satisfied with the nature and extent of the investment advisory services provided to the Fund by Credit Suisse and that, based on dialogue with management and counsel, the services provided by Credit Suisse under the Advisory Agreement is typical of, and consistent with, those provided to similar mutual funds by other investment advisers. The Board understood that Credit Suisse had or was in the process of addressing any performance issues.
• In light of the costs of providing investment management and other services to the Fund and Credit Suisse's ongoing commitment to the Fund, the profits and other ancillary benefits that Credit Suisse and its affiliates received were considered reasonable.
• Credit Suisse's profitability based on fees payable under the Advisory Agreement was reasonable in light of the nature, extent and quality of the services provided to the Fund thereunder.
• The Fund's current fee structure was considered reasonable.
No single factor reviewed by the Board was identified by the Board as the principal factor in determining whether to approve the Advisory Agreement. The Independent Trustees were advised by separate independent legal counsel throughout the process.
47
Credit Suisse Funds
Privacy Policy Notice (unaudited)
Important Privacy Choices for Consumers
We are committed to maintaining the privacy of every current and prospective customer. We recognize that you entrust important personal information to us, and we wish to assure you that we take seriously our responsibilities in protecting and safeguarding this information.
In connection with making available investment products and services to current and potential customers, we may obtain nonpublic personal information about you. This information may include your name, address, e-mail address, social security number, account number, assets, income, financial situation, transaction history and other personal information.
We may collect nonpublic information about you from the following sources:
• Information we receive on applications, forms, questionnaires, web sites, agreements or in the course of establishing or maintaining a customer relationship; and
• Information about your transactions with us, our affiliates, or others.
We do not disclose any nonpublic personal information about our customers or former customers to anyone, except with your consent or as otherwise permitted by law.
In cases where we believe that additional products and services may be of interest to you, we may share the information described above with our affiliates.
We may also disclose this information to firms that perform services on our behalf. These agents and service providers are required to treat the information confidentially and use it only for the purpose for which it is provided.
We restrict access to nonpublic personal information about you to those employees, agents or other parties who need to know that information to provide products or services to you or in connection with your investments with or through us. We maintain physical, electronic and procedural safeguards that comply with federal standards to guard your nonpublic personal information.
Note: This Notice is provided to clients and prospective clients of Credit Suisse Asset Management, LLC ("Credit Suisse"), and Credit Suisse Asset Management Securities, Inc., and shareholders and prospective shareholders in Credit-Suisse-sponsored and-advised investment companies, including Credit Suisse Funds, and other consumers and customers, as applicable. This Notice is not intended to be incorporated in any offering materials but is merely a statement of our current Privacy Policy, and may be amended from time to time upon notice to you. This Notice is dated as of May 17, 2006.
48
Credit Suisse Funds
Proxy Policy and Portfolio Holdings Information
Information regarding how each Fund voted proxies related to its portfolio securities during the 12-month period ended June 30 of each year as well as the policies and procedures that each Fund uses to determine how to vote proxies relating to its portfolio securities are available:
• By calling 1-800-927-2874
• On the Funds' website, www.credit-suisse.com/us
• On the website of the Securities and Exchange Commission, http://www.sec.gov.
Each Fund files a complete schedule of its portfolio holdings for the first and third quarters of its fiscal year with the SEC on Form N-Q. The Funds' Forms N-Q are available on the SEC's website at http://www.sec.gov and may be reviewed and copied at the SEC's Public Reference Room in Washington, DC. Information on the operation of the SEC's Public Reference Room may be obtained by calling 1-202-551-8090.
49

P.O. BOX 55030, BOSTON, MA 02205-5030
800-927-2874 n www.credit-suisse.com/us
CREDIT SUISSE ASSET MANAGEMENT SECURITIES, INC., DISTRIBUTOR. USEQVAL-SAR-0406
Item 2. Code of Ethics.
This item is inapplicable to a semi-annual report on Form N-CSR.
Item 3. Audit Committee Financial Expert.
This item is inapplicable to a semi-annual report on Form N-CSR.
Item 4. Principal Accountant Fees and Services.
This item is inapplicable to a semi-annual report on Form N-CSR.
Item 5. Audit Committee of Listed Registrants.
This item is not applicable to the registrant.
Item 6. Schedule of Investments.
Included as part of the report to shareholders filed under Item 1 of this Form.
Item 7. Disclosure of Proxy Voting Policies and Procedures for Closed-End Management Investment Companies.
This item is not applicable to the registrant.
Item 8. Portfolio Managers of Closed-End Management Investment Companies.
This item is not applicable to the registrant.
Item 9. Purchases of Equity Securities by Closed-End Management Investment Company and Affiliated Purchasers.
This item is not applicable to the registrant.
Item 10. Submission of Matters to a Vote of Security Holders.
The Nominating Committee recommends Board member candidates. Shareholders of the registrant may also submit nominees that will be considered by the Committee. Recommendations should be mailed to the registrant’s Secretary, c/o Credit Suisse Asset Management, LLC, 466 Lexington Avenue, New York, NY 10017. Any submission should include at a minimum the following information: the name, age, business address, residence address and principal occupation or employment of such individual; the class, series and number of shares of the registrant that are beneficially owned by such individual; the date such shares were acquired and the investment intent of such acquisition; whether such shareholder believes such individual is, or is not, an “interested person” of the registrant (as defined in the Investment Company Act of 1940) and information regarding such individual that is sufficient, in the Committee’s discretion, to make such determination; and all other information relating to such individual that is required to be disclosed in solicitation of proxies for election of directors in an election contest (even if an election contest is not involved) or is otherwise required pursuant to the rules for proxy materials under the Securities Exchange Act of 1934.
Item 11. Controls and Procedures.
(a) As of a date within 90 days from the filing date of this report, the principal executive officer and principal financial officer concluded that the registrant’s disclosure controls and procedures (as defined in Rule 30a-3(c) under the Investment Company Act of 1940 (the “Act”)) were effective
based on their evaluation of the disclosure controls and procedures required by Rule 30a-3(b) under the Act and Rules 13a-15(b) or 15d-15(b) under the Securities Exchange Act of 1934.
(b) There were no changes in registrant’s internal control over financial reporting (as defined in Rule 30a-3(d) under the Act) that occurred during the registrant’s last fiscal half-year that have materially affected, or are reasonably likely to materially affect, the registrant’s internal control over financial reporting.
Item 12. Exhibits.
(a)(1) Not applicable.
(a)(2) The certifications of the registrant as required by Rule 30a-2(a) under the Act are exhibits to this report.
(a)(3) Not applicable.
(b) The certifications of the registrant as required by Rule 30a-2(b) under the Act are an exhibit to this report.
SIGNATURES
Pursuant to the requirements of the Securities Exchange Act of 1934 and the Investment Company Act of 1940, the registrant has duly caused this report to be signed on its behalf by the undersigned, thereunto duly authorized.
| CREDIT SUISSE CAPITAL FUNDS | ||
|
| ||
| /s/Steven B. Plump |
| |
| Name: | Steven B. Plump | |
| Title: | Chief Executive Officer | |
| Date: | July 5, 2006 | |
Pursuant to the requirements of the Securities Exchange Act of 1934 and the Investment Company Act of 1940, this report has been signed below by the following persons on behalf of the registrant and in the capacities and on the dates indicated.
| /s/Steven B. Plump |
| |
| Name: | Steven B. Plump | |
| Title: | Chief Executive Officer | |
| Date: | July 5, 2006 | |
| /s/Michael A. Pignataro |
| |
| Name: | Michael A. Pignataro | |
| Title: | Chief Financial Officer | |
| Date: | July 5, 2006 | |