UNITED STATES
SECURITIES AND EXCHANGE COMMISSION
Washington, D.C. 20549
FORM N-CSR
CERTIFIED SHAREHOLDER REPORT OF REGISTERED
MANAGEMENT INVESTMENT COMPANIES
Investment Company Act file number | 811-04604 | ||||||||
| |||||||||
CREDIT SUISSE CAPITAL FUNDS | |||||||||
(Exact name of registrant as specified in charter) | |||||||||
| |||||||||
Eleven Madison Avenue, New York, New York |
| 10010 | |||||||
(Address of principal executive offices) |
| (Zip code) | |||||||
| |||||||||
J. Kevin Gao, Esq. | |||||||||
(Name and address of agent for service) | |||||||||
| |||||||||
Registrant’s telephone number, including area code: | (212) 325-2000 |
| |||||||
| |||||||||
Date of fiscal year end: | October 31 |
| |||||||
| |||||||||
Date of reporting period: | November 1, 2007 to April 30, 2008 |
| |||||||
Item 1. Reports to Stockholders.

CREDIT SUISSE FUNDS
Semiannual Report
April 30, 2008
(unaudited)
n CREDIT SUISSE
ABSOLUTE RETURN FUND
The Fund's investment objectives, risks, charges and expenses (which should be considered carefully before investing), and more complete information about the Fund, are provided in the Prospectus, which should be read carefully before investing. You may obtain additional copies by calling 800-927-2874 or by writing to Credit Suisse Funds, P.O. Box 55030, Boston, MA 02205-5030.
Credit Suisse Asset Management Securities, Inc., Distributor, is located at Eleven Madison Avenue, New York, NY 10010. Credit Suisse Funds are advised by Credit Suisse Asset Management, LLC.
Investors in the Credit Suisse Funds should be aware that they may be eligible to purchase Common Class and/or Advisor Class shares (where offered) directly or through certain intermediaries. Such shares are not subject to a sales charge but may be subject to an ongoing service and distribution fee of up to 0.50% of average daily net assets. Investors in the Credit Suisse Funds should also be aware that they may be eligible for a reduction or waiver of the sales charge with respect to Class A, B or C shares (where offered). For more information, please review the relevant prospectuses or consult your financial representative.
The views of the Fund's management are as of the date of the letter and the Fund holdings described in this document are as of April 30, 2008; these views and Fund holdings may have changed subsequent to these dates. Nothing in this document is a recommendation to purchase or sell securities.
Fund shares are not deposits or other obligations of Credit Suisse Asset Management, LLC ("Credit Suisse") or any affiliate, are not FDIC-insured and are not guaranteed by Credit Suisse or any affiliate. Fund investments are subject to investment risks, including loss of your investment.
Credit Suisse Absolute Return Fund
Semiannual Investment Adviser's Report
April 30, 2008 (unaudited)
June 16, 2008
Dear Shareholder:
Performance Summary
11/01/07 – 04/30/08
| Fund & Benchmark | Performance | ||||||
| Common1 | (2.28 | )% | |||||
| Class A1,2 | (2.43 | )% | |||||
| Class C1,2 | (2.74 | )% | |||||
| LIBOR + 350 bps3 | 4.19 | % | |||||
| Merrill Lynch US Treasury Notes & Bonds 0-1 Year Index4 | 2.40 | % | |||||
Performance for the Fund's Class A and Class C shares is without the maximum sales charge of 4.00% and 1.00%, respectively.2
Market Review: The credit crunch has widespread repercussions
The six-month period ended April 30, 2008 was a volatile one for global equity markets. Heightened fears of a U.S. recession with possible stagflation and concerns of systemic risk in the financial system drove the increase in volatility.
The negative news began to flow in January with fears of credit downgrades for the monoline bond insurers, weak economic U.S. data, and the revelation of Societe Generale's rogue trader. The unwinding of Societe Generale's long positions and subsequent €4.9 billion loss was thought to be largely behind the sharp fall in global equity markets on January 21. Additionally, the U.S. Federal Reserve's 0.75% emergency rate cut helped sentiment, but many developed and emerging markets still suffered double digit falls in January.
Global equities staged a partial recovery through February, with a decoupling of the United States from the rest of the world. For example, in Europe, business surveys were surprisingly stronger than forecast, while in the United States, weakening consumer confidence was compounded by a softening labor market. Emerging markets and Asia ex Japan outperformed, with China's market staging a recovery. Additionally, positive political developments in Taiwan and Thailand helped these countries to outperform their regional peers.
In March, equity market volatility reached its highest point in more than five years as the increased risk of default led to a vicious spiral of illiquidity and distressed selling that triggered the crisis at Bear Stearns and undermined the global financial system. Uncertainty drove some commodity prices to new highs — oil hit $111 and gold went above $1,000. Additionally, as investors shunned stocks even remotely linked to the consumer cycle, the blue chips were
1
Credit Suisse Absolute Return Fund
Semiannual Investment Adviser's Report (continued)
April 30, 2008 (unaudited)
among the biggest casualties, ironic because of their greater liquidity. The Fed's rapid response calmed some of the fears and caused global equity markets to stage a modest rally, led by the financials, going into quarter end.
The Bear Stearns rescue in mid-March increasingly appears to be a key watershed as it signaled the willingness of central banks to underwrite the debt and counterparty obligations of key financial institutions and find more effective means to channel liquidity to banks and brokers.
The banking sector has also made a more concerted effort to separate their good and bad assets, and buyers are now making acceptable bids for some of the bad assets. In addition, we have started to see the first moves to rebuild balance sheets through raising new capital via equity, which does relieve some of the strains in the credit markets. There is still more to do but the actions so far have reduced the risk of an even deeper financial crisis, as evidenced by credit derivatives and equities rising from their lows.
Despite the Federal Reserve's latest initiatives, banking and credit problems remain. However, there is still a risk of an overshoot for commodities and currencies driven by investors looking for a hedge against inflation and an alternative to equities. In fact, some have now risen beyond fundamentally justifiable values. Government bonds are overbought with negative real rates in the U.S., while in equity, long-term valuations are more attractive.
Risk aversion led to a further unwinding of the 'carry trade' with Sterling and the U.S. Dollar at a record low versus the Euro and the Japanese Yen (up 11.5% year to date).
The global economy is showing divergent trends, for example, the sharp slowdown in the United States and the countries most closely linked to it (e.g., Canada and Mexico) as compared to emerging countries, where domestic demand remains robust with the strength of infrastructure spending and export growth also solid.
In Europe, growth has softened, but there is growing dispersion across the Euro region — Germany and France remain firm, while Spain and Italy are weakening. The European Central Bank, however, is unlikely to cut rates anytime soon. Additionally, there are risks for Eastern Europe given their strong links within the Euro area. And, in the UK, the slowdown in the housing market has accelerated as both the availability and cost of credit have risen.
In Japan, domestic demand weakened as household spending stagnated. Housing starts have recovered, albeit from a low base, and exports are still providing some stimulus despite the stronger currency.
2
Credit Suisse Absolute Return Fund
Semiannual Investment Adviser's Report (continued)
April 30, 2008 (unaudited)
In some emerging markets, the combination of higher inflation and sharply rising grain prices poses a serious dichotomy for policymakers. With inflation in China reaching an 11 year high (8.7%), fears of further austerity measures have grown, though the resource based markets, Brazil and Russia, have continued to outperform.
Strategic Review: We remain positive on stocks
Main contributors to performance included U.S. stocks and Hong Kong equities (held from March on) and the use of tactical allocation with commodities. Conversely, primary detractors from performance included all stocks held from October until the beginning of February.
Currently, we are still positive for stocks, as the markets are currently discounting negative profit growth and we believe this is too pessimistic. Our expectation going forward is for weak, but not negative, profit growth. Should this materialize, it would have a positive impact on stocks due to the current attractive valuation. With equities, valuations have become even more attractive and the sentiment factor is now increasing its positive stance given more signs of capitulation. Within equities, emerging markets and Canada remain our preferred regions. Additionally, given the problems in Japan (collapsing sentiment indicators combined with a slowdown), this equity market remains our least attractive market
From a valuation perspective, Canadian stocks look attractive compared to Canadian bonds. We have a positive view on commodities and the Canadian stock market is highly exposed to that asset class.
There has still been surprisingly strong growth in emerging market equities despite the U.S. slowdown. This is the "decoupling" discussion in the markets, which refers to the capability of countries to insulate themselves from a slowdown in the United States. Additionally, we like Hong Kong due to its surprising growth and very positive earnings revisions.
With our expectation for slow growth, we chose to invest in less cyclical markets like the U.S. as opposed to European stocks. As soon as the economy starts to pick up (3rd and 4th quarters in our expectations), we might shift into the more cyclical European markets.
In fixed income markets, sentiment is growing more extreme and we do not see any value in long-term bonds, particularly government issues. We therefore remain in the short duration space.
3
Credit Suisse Absolute Return Fund
Semiannual Investment Adviser's Report (continued)
April 30, 2008 (unaudited)
Market Outlook: Expecting growth to pick up by year-end
The financial markets remain fraught with great uncertainty. In our opinion, the greatest unrest concerns the consequences of the immense leverage in the bond markets and fears of an uncontrolled sell-off. A persistent stream of bad news in recent weeks has pushed the markets to test new lows and we believe volatility is likely to remain high. Nonetheless, this scenario also opens opportunities for medium-term investors, since the equity markets are discounting a much gloomier scenario than our evaluation of the global economy would warrant.
After the stellar growth rates of the last few years (at levels not seen since the 1960s), the world economy has clearly been slowing down over the past year or so. At the same time, however, there has been a real shift in momentum. While the G4 countries — the U.S., Europe, the UK and Japan — are experiencing a severe slowdown, emerging markets, particularly China and India, continue to move ahead and are compensating in some part.
The U.S. economy is still slowing down with indicators negative in the aggregate. However, the aggregate is only mildly negative. The main problem in the U.S. remains the housing market and the impact it will have on the consumer. GDP growth for the first half of this year came in close to zero, with the consumer and housing sectors being the main drags. Falls in equity markets and home prices, combined with rising energy and utility prices, have generated a sharp fall in consumer confidence. Home prices are already lower and expected to fall further, while jobs data have also been weak, suggesting that labor income, the key support factor for private consumption growth, is deteriorating sharply. In our opinion, this implies that a significant slowdown is underway in the U.S. domestic economy on top of the housing contraction (which has been ongoing for almost two years). Employment growth has not been as strong as in previous cycles and thu s the downside, in terms of job cuts as the economy slows, seems to be more limited. Additionally, the overall balance sheet health of the non-financial corporate sector, together with an inventory build-up that seems to have been (apart from housing) lower than in the past, also speaks in favor of a more limited downside. We still believe the fiscal stimulus package will be able to boost growth in the months to come but this does depend on consumer sentiment and willingness to actually spend the money.
There are clearly downside risks to our expectation that growth will pick up again later this year. The Fed has cut interest rates drastically, but the easing has been partly offset. Interest rates for mortgages and other areas of credit for private households have increased since the cuts. This could imply that the Fed will have to do more and it might continue to act swiftly.
4
Credit Suisse Absolute Return Fund
Semiannual Investment Adviser's Report (continued)
April 30, 2008 (unaudited)
In Europe, the picture is a bit more encouraging. Although the Eurozone economies are also slowing down, the region is still expected to have positive growth of between 0.5-1% this year. An important positive is that activity in the main economies of France and Germany is surprising on the upside. In fact, German export growth accelerated again in January to above 9% year over year, and there appears to be room for improvement of consumer spending following the strong employment growth and potentially stronger wage gains this year. It is the Spanish and Italian economies that are in the worst shape. Consider that, even though the European consumer and producer sentiment data have been deteriorating and overall growth has slowed down, exports have remained surprisingly resilient given the strength of the Euro.
As for the UK, we expect a situation similar to that of the U.S. (i.e., a housing market led slowdown). In fact, house prices in the UK are already showing negative growth month-on-month and will soon be negative year-on-year.
Of the major economies, Japan remains a big concern in our opinion. The Tankan survey, which measures business sentiment, continues to trend lower, while the country's economy is also suffering from a demand-led slowdown, with consumer confidence at very weak levels.
As for emerging markets, we continue to argue in favor of the decoupling scenario, which seems to have been confirmed by recent history. For the emerging markets world, the credit shock related to credit market problems has been much less pronounced or even nonexistent. In fact, new trade patterns with strong increases of trade between emerging markets seem to have led to a declining importance of the U.S.
Recently, commodity prices have been strong almost across the board. Oil has firmly established itself above the $100 per barrel level and the gold price continues to enter uncharted territory, trading for the first time at above $1,000 per ounce. The price of gold has been pushed higher based on structural factors as well as by the weak U.S. dollar. And as long as U.S. economic data remain poor, we believe the price of gold will remain high. This is because the dollar will weaken more due to further expectations of interest rate cuts, and because of an interest rate differential that is not in favor of the dollar. Investors are thus buying gold as a safe-haven alternative to the U.S. dollar. Overall, the medium- to longer-term arguments, such as a growing affluent population fuelling demand and supply side constraints, remain intact and we are likely to see further upside. In the short term (the next three months), we believe commodity mark ets remain vulnerable to profit taking and an unwinding of the speculative positions that have been built-up over recent weeks and months.
5
Credit Suisse Absolute Return Fund
Semiannual Investment Adviser's Report (continued)
April 30, 2008 (unaudited)
One of the key characteristics of the bond markets has been the steepening in all of the major markets with the exception of Japan, where the short end of the term structure is firmly anchored at very low levels. Nevertheless, even in Japan, the worst performing part of the curve in yield terms has been the long end. This is understandable considering the increased inflation risk that needs to be priced in. At the same time, most of the major yield curves have been flat between 10 years and 30 years, if not inverted. We believe this is nothing more than a return to a so-called "normal" shape. The main question that remains is how much further this trend could go. With the Fed still firmly in easing mode and the market anticipating rate cuts by the other main central banks, we believe that the curve steepening could go further. In fact, because of the overall low level of interest rates, the phenomenon could even surpass previous top levels.
Christine Gaelzer
Portfolio Manager
There is no guarantee that the Fund's absolute return will be achieved, and there may be negative returns at any given time. In addition, investments in the Fund are subject to a number of risks, including, but not limited to, asset class risk, issuer risk, credit risk, derivatives risk and foreign securities risk.
In addition to historical information, this report contains forward-looking statements that may concern, among other things, domestic and foreign market, industry and economic trends and developments and government regulation and their potential impact on the Fund's investments. These statements are subject to risks and uncertainties and actual trends, developments and regulations in the future, and their impact on the Fund could be materially different from those projected, anticipated or implied. The Fund has no obligation to update or revise forward-looking statements.
6
Credit Suisse Absolute Return Fund
Semiannual Investment Adviser's Report (continued)
April 30, 2008 (unaudited)
Average Annual Returns as of March 31, 20081
| One Year | Since Inception | Inception Date | |||||||||||||
| Common Class | 3.15 | % | 4.18 | % | 12/29/06 | ||||||||||
| Class A Without Sales Charge | 2.91 | % | 3.93 | % | 12/29/06 | ||||||||||
| Class A With Maximum Sales Charge | (1.20 | )% | (0.25 | )% | 12/29/06 | ||||||||||
| Class C Without CDSC | 2.12 | % | 2.94 | % | 12/29/06 | ||||||||||
| Class C With CDSC | 1.15 | % | 2.94 | % | 12/29/06 | ||||||||||
Average Annual Returns as of April 30, 20081
| One Year | Since Inception | Inception Date | |||||||||||||
| Common Class | 4.83 | % | 6.61 | % | 12/29/06 | ||||||||||
| Class A Without Sales Charge | 4.58 | % | 6.25 | % | 12/29/06 | ||||||||||
| Class A With Maximum Sales Charge | 0.43 | % | 1.97 | % | 12/29/06 | ||||||||||
| Class C Without CDSC | 3.79 | % | 5.24 | % | 12/29/06 | ||||||||||
| Class C With CDSC | 2.79 | % | 5.24 | % | 12/29/06 | ||||||||||
Returns represent past performance and include change in share price and reinvestment of dividends and capital gains. Past performance cannot guarantee future results. The current performance of the Fund may be lower or higher than the figures shown. Returns and share price will fluctuate, and redemption value may be more or less than original cost. The performance results do not reflect the deduction of taxes that a shareholder would pay on fund distributions or the redemption of fund shares. Performance information current to the most recent month-end is available at www.credit-suisse.com/us.
1 Fee waivers and/or expense reimbursements may reduce expenses for the Fund, without which performance would be lower. Waivers and/or reimbursements may be discontinued at any time.
2 Total return for the Fund's Class A shares for the reporting period, based on offering price (including maximum sales charge of 4.00%), was –6.30%. Total return for the Fund's Class C shares for the reporting period, based on redemption value (including a maximum contingent deferred sales charge of 1.00%) was –3.67%.
3 Over a three to five-year economic cycle, the Fund aims to achieve an aggregate positive absolute return of 3-month LIBOR + 350 basis points, gross of fees. The Fund is not designed to achieve consistent annual returns, and the return in any year may be lower than the three- to five-year aggregate return the Fund seeks.
4 The Merrill Lynch US Treasury Notes & Bonds 0-1 Year Index tracks the performance of all outstanding US Treasury Notes and Bonds having less than one year remaining term to maturity and a minimum amount outstanding of $1 billion. The Index is rebalanced daily to take account of issues that are maturing and new additions. Bonds are "purchased" into the Index basket on the day they fall below one year to maturity and are removed on the day they mature. Additional sub-indices are available that segment the Index into quarterly maturity ranges. Investors cannot invest directly in an index.
7
Credit Suisse Absolute Return Fund
Semiannual Investment Adviser's Report (continued)
April 30, 2008 (unaudited)
Information About Your Fund's Expenses
As an investor of the Fund, you incur two types of costs: ongoing expenses and transaction costs. Ongoing expenses include management fees, distribution and service (12b-1) fees and other Fund expenses. Examples of transaction costs include sales charges (loads), redemption fees and account maintenance fees, which are not shown in this section and which would result in higher total expenses. The following table is intended to help you understand your ongoing expenses of investing in the Fund and to help you compare these expenses with the ongoing expenses of investing in other mutual funds. The table is based on an investment of $1,000 made at the beginning of the six month period ended April 30, 2008.
The table illustrates your Fund's expenses in two ways:
• Actual Fund Return. This helps you estimate the actual dollar amount of ongoing expenses paid on a $1,000 investment in the Fund using the Fund's actual return during the period. To estimate the expenses you paid over the period, simply divide your account value by $1,000 (for example, an $8,600 account value divided by $1,000 = 8.6), then multiply the result by the number in the "Expenses Paid per $1,000" line under the share class you hold.
• Hypothetical 5% Fund Return. This helps you to compare your Fund's ongoing expenses with those of other mutual funds using the Fund's actual expense ratio and a hypothetical rate of return of 5% per year before expenses. Examples using a 5% hypothetical fund return may be found in the shareholder reports of other mutual funds. The hypothetical account values and expenses may not be used to estimate the actual ending account balance or expenses you paid for the period.
Please note that the expenses shown in these tables are meant to highlight your ongoing expenses only and do not reflect any transaction costs, such as sales charges (loads) or redemption fees. If these transaction costs had been included, your costs would have been higher. The "Expenses Paid per $1,000" line of the tables is useful in comparing ongoing expenses only and will not help you determine the relative total expenses of owning different funds.
8
Credit Suisse Absolute Return Fund
Semiannual Investment Adviser's Report (continued)
April 30, 2008 (unaudited)
Expenses and Value of a $1,000 Investment
for the six month period ended April 30, 2008
| Actual Fund Return | Common Class | Class A | Class C | ||||||||||||
| Beginning Account Value 11/1/07 | $ | 1,000.00 | $ | 1,000.00 | $ | 1,000.00 | |||||||||
| Ending Account Value 4/30/08 | $ | 977.20 | $ | 975.70 | $ | 972.60 | |||||||||
| Expenses Paid per $1,000* | $ | 4.92 | $ | 6.14 | $ | 9.81 | |||||||||
| Hypothetical 5% Fund Return | |||||||||||||||
| Beginning Account Value 11/1/07 | $ | 1,000.00 | $ | 1,000.00 | $ | 1,000.00 | |||||||||
| Ending Account Value 4/30/08 | $ | 1,019.89 | $ | 1,018.65 | $ | 1,014.92 | |||||||||
| Expenses Paid per $1,000* | $ | 5.02 | $ | 6.27 | $ | 10.02 | |||||||||
| Common Class | Class A | Class C | |||||||||||||
| Annualized Expense Ratios* | 1.00 | % | 1.25 | % | 2.00 | % | |||||||||
* Expenses are equal to the Fund's annualized expense ratio for each share class, multiplied by the average account value over the period, multiplied by the number of days in the most recent fiscal half year period, then divided by 366.
The "Expenses Paid per $1,000" and the "Annualized Expense Ratios" in the tables are based on actual expenses paid by the Fund during the period, net of fee waivers and/or expense reimbursements. If those fee waivers and/or expense reimbursements had not been in effect, the Fund's actual expenses would have been higher.
For more information, please refer to the Fund's prospectus.
9
Credit Suisse Absolute Return Fund
Semiannual Investment Adviser's Report (continued)
April 30, 2008 (unaudited)
| Sector Breakdown* | |||||||
| Commingled Funds | 55.9 | % | |||||
| United States Agency Obligations | 44.1 | % | |||||
| Total | 100.0 | % | |||||
* Expressed as a percentage of total investments (excluding security lending collateral) and may vary over time.
10
Credit Suisse Absolute Return Fund
Schedule of Investments
April 30, 2008 (unaudited)
| Number of Shares | Value | ||||||||||
| COMMON STOCKS (56.2%) | |||||||||||
| Commingled Funds (56.2%) | |||||||||||
| iPATH Dow Jones-AIG Commodity Index Total Return ETN* | 7,050 | $ | 452,116 | ||||||||
| iShares Lehman 7-10 Year Treasury Bond Fund§ | 12,710 | 1,133,351 | |||||||||
| iShares MSCI Australia Index Fund§ | 10,910 | 303,080 | |||||||||
| iShares MSCI Canada Index Fund | 12,080 | 392,117 | |||||||||
| iShares MSCI Emerging Markets Index§ | 8,391 | 1,230,624 | |||||||||
| iShares MSCI Hong Kong Index Fund | 12,800 | 248,960 | |||||||||
| iShares S&P 500 Index Fund | 4,900 | 679,091 | |||||||||
| TOTAL COMMON STOCKS (Cost $4,196,344) | 4,439,339 | ||||||||||
| Par (000) | Ratings† (S&P/Moody's) | Maturity | Rate% | ||||||||||||||||||||
| UNITED STATES AGENCY OBLIGATIONS (44.2%) | |||||||||||||||||||||||
| $ | 500 | Fannie Mae Discount Notes(a) | (AAA, Aaa) | 05/07/08 | 2.030 | 499,777 | |||||||||||||||||
| 520 | Federal Home Loan Discount Notes(a) | (AAA, Aaa) | 05/21/08 | 1.918 | 519,357 | ||||||||||||||||||
| 500 | Freddie Mac Discount Notes(a) | (AAA, Aaa) | 05/12/08 | 1.875 | 499,594 | ||||||||||||||||||
| 450 | Freddie Mac Discount Notes(a) | (AAA, Aaa) | 05/19/08 | 2.081 | 449,393 | ||||||||||||||||||
| 600 | Freddie Mac Discount Notes | (AAA, Aaa) | 01/18/11 | 4.750 | 626,518 | ||||||||||||||||||
| 500 | United States Treasury Notes | (AAA, Aaa) | 05/15/08 | 2.625 | 500,352 | ||||||||||||||||||
| 400 | United States Treasury Notes | (AAA, Aaa) | 06/30/08 | 5.125 | 402,656 | ||||||||||||||||||
| TOTAL UNITED STATES AGENCY OBLIGATIONS (Cost $3,479,723) | 3,497,647 | ||||||||||||||||||||||
| Number of Shares | |||||||||||
| SHORT-TERM INVESTMENT (28.8%) | |||||||||||
| State Street Navigator Prime Portfolio§§ (Cost $2,278,991) | 2,278,991 | 2,278,991 | |||||||||
| TOTAL INVESTMENTS AT VALUE (129.2%) (Cost $9,955,058) | 10,215,977 | ||||||||||
| LIABILITIES IN EXCESS OF OTHER ASSETS (-29.2%) | (2,308,870 | ) | |||||||||
| NET ASSETS (100.0%) | $ | 7,907,107 | |||||||||
INVESTMENT ABBREVIATION
ETN = Exchange Traded Note
† Credit ratings given by the Standard & Poor's Division of The McGraw-Hill Companies, Inc. ("S&P") and Moody's Investors Service, Inc. ("Moody's") are unaudited.
(a) Zero-coupon bond. Rate represents annualized yield at date of purchase.
* Non-income producing security.
§ Security or portion thereof is out on loan.
§§ Represents security purchased with cash collateral received for securities on loan.
See Accompanying Notes to Financial Statements.
11
Credit Suisse Absolute Return Fund
Statement of Assets and Liabilities
April 30, 2008 (unaudited)
| Assets | |||||||
| Investments at value, including collateral for securities on loan of $2,278,991 (Cost $9,955,058) (Note 2) | $ | 10,215,9771 | |||||
| Cash | 71,318 | ||||||
| Interest receivable | 21,083 | ||||||
| Receivable for fund shares sold | 20,893 | ||||||
| Receivable from investment adviser (Note 3) | 5,654 | ||||||
| Prepaid expenses and other assets | 34,004 | ||||||
| Total Assets | 10,368,929 | ||||||
| Liabilities | |||||||
| Distribution fee payable (Note 3) | 848 | ||||||
| Payable upon return of securities loaned (Note 2) | 2,278,991 | ||||||
| Offering Costs payable (Note 3) | 159,381 | ||||||
| Trustees' fee payable | 13,043 | ||||||
| Other accrued expenses payable | 9,559 | ||||||
| Total Liabilities | 2,461,822 | ||||||
| Net Assets | |||||||
| Capital stock, $.001 par value (Note 6) | 784 | ||||||
| Paid-in capital (Note 6) | 7,660,569 | ||||||
| Undistributed net investment income | 43,352 | ||||||
| Accumulated net realized loss on investments | (58,517 | ) | |||||
| Net unrealized appreciation from investments | 260,919 | ||||||
| Net Assets | $ | 7,907,107 | |||||
| Common Shares | |||||||
| Net assets | $ | 5,092,000 | |||||
| Shares outstanding | 505,208 | ||||||
| Net asset value, offering price, and redemption price per share | $ | 10.08 | |||||
| A Shares | |||||||
| Net assets | $ | 2,336,608 | |||||
| Shares outstanding | 231,561 | ||||||
| Net asset value and redemption price per share | $ | 10.09 | |||||
| Maximum offering price per share (net asset value/ (1-4.00%)) | $ | 10.51 | |||||
| C Shares | |||||||
| Net assets | $ | 478,499 | |||||
| Shares outstanding | 47,535 | ||||||
| Net asset value and offering price per share | $ | 10.07 | |||||
1 Including $2,230,932 of securities on loan.
See Accompanying Notes to Financial Statements.
12
Credit Suisse Absolute Return Fund
Statement of Operations
For the Six Months Ended April 30, 2008 (unaudited)
| Investment Income (Note 2) | |||||||
| Interest | $ | 63,300 | |||||
| Dividends | 62,777 | ||||||
| Securities lending | 12,735 | ||||||
| Total investment income | 138,812 | ||||||
| Expenses | |||||||
| Investment advisory fees (Note 3) | 27,822 | ||||||
| Administrative services fees (Note 3) | 4,414 | ||||||
| Distribution fees (Note 3) | |||||||
| Class A | 2,440 | ||||||
| Class C | 1,916 | ||||||
| Offering costs (Note 3) | 27,510 | ||||||
| Trustees' fees | 13,373 | ||||||
| Audit and tax fees | 12,572 | ||||||
| Legal fees | 8,927 | ||||||
| Printing fees (Note 3) | 5,073 | ||||||
| Registration fees | 3,029 | ||||||
| Insurance expense | 103 | ||||||
| Interest expense (Note 4) | 55 | ||||||
| Commitment fees (Note 4) | 31 | ||||||
| Total expenses | 107,265 | ||||||
| Less: fees waived and expenses reimbursed (Note 3) | (65,812 | ) | |||||
| Net expenses | 41,453 | ||||||
| Net investment income | 97,359 | ||||||
| Net Realized and Unrealized (Loss) from Investments | |||||||
| Net realized loss from investments | (33,615 | ) | |||||
| Net change in unrealized appreciation (depreciation) from investments | (219,685 | ) | |||||
| Net realized and unrealized loss from investments | �� | (253,300 | ) | ||||
| Net decrease in net assets resulting from operations | $ | (155,941 | ) | ||||
See Accompanying Notes to Financial Statements.
13
Credit Suisse Absolute Return Fund
Statements of Changes in Net Assets
| For the Six Months Ended April 30, 2008 (unaudited) | For the Period Ended October 31, 20071 | ||||||||||
| From Operations | |||||||||||
| Net investment income | $ | 97,359 | $ | 163,712 | |||||||
| Net realized gain (loss) from investments | (33,615 | ) | 32,289 | ||||||||
| Net change in unrealized appreciation (depreciation) from investments | (219,685 | ) | 480,604 | ||||||||
| Net increase (decrease) in net assets resulting from operations | (155,941 | ) | 676,605 | ||||||||
| From Dividends and Distributions | |||||||||||
| Dividends from net investment income | |||||||||||
| Common Class shares | (251,406 | ) | — | ||||||||
| Class A shares | (81,581 | ) | — | ||||||||
| Class C shares | (16,603 | ) | — | ||||||||
| Distributions from net realized gains | |||||||||||
| Common Class shares | (40,951 | ) | — | ||||||||
| Class A shares | (14,197 | ) | — | ||||||||
| Class C shares | (2,043 | ) | — | ||||||||
| Net decrease in net assets resulting from dividends and distributions | (406,781 | ) | — | ||||||||
| From Capital Share Transactions (Note 6) | |||||||||||
| Proceeds from sale of shares | 1,601,480 | 1,347,944 | |||||||||
| Reinvestment of dividends and distributions | 110,617 | — | |||||||||
| Net asset value of shares redeemed | (216,068 | ) | (5,050,749 | ) | |||||||
| Net increase (decrease) in net assets from capital share transactions | 1,496,029 | (3,702,805 | ) | ||||||||
| Net increase (decrease) in net assets | 933,307 | (3,026,200 | ) | ||||||||
| Net Assets | |||||||||||
| Beginning of period | 6,973,800 | 10,000,0002 | |||||||||
| End of period | $ | 7,907,107 | $ | 6,973,800 | |||||||
| Undistributed net investment income | $ | 43,352 | $ | 295,583 | |||||||
1 For the period December 29, 2006 (commencement of operations) through October 31, 2007.
2 The Fund was seeded on December 29, 2006.
See Accompanying Notes to Financial Statements.
14
Credit Suisse Absolute Return Fund
Financial Highlights
(For a Common Class Share of the Fund Outstanding Throughout Each Period)
| For the Six Months Ended April 30, 2008 (unaudited) | For the Period Ended October 31, 20071 | ||||||||||
| Per share data | |||||||||||
| Net asset value, beginning of period | $ | 10.91 | $ | 10.00 | |||||||
| INVESTMENT OPERATIONS | |||||||||||
| Net investment income2 | 0.14 | 0.19 | |||||||||
| Net gain (loss) on investments (both realized and unrealized) | (0.39 | ) | 0.72 | ||||||||
| Total from investment operations | (0.25 | ) | 0.91 | ||||||||
| LESS DIVIDENDS AND DISTRIBUTIONS | |||||||||||
| Dividends from net investment income | (0.50 | ) | — | ||||||||
| Distributions from net realized gains | (0.08 | ) | — | ||||||||
| Total dividends and distributions | (0.58 | ) | — | ||||||||
| Net asset value, end of period | $ | 10.08 | $ | 10.91 | |||||||
| Total return3 | (2.28 | )% | 9.10 | % | |||||||
| RATIOS AND SUPPLEMENTAL DATA | |||||||||||
| Net assets, end of period (000s omitted) | $ | 5,092 | $ | 5,511 | |||||||
| Ratio of expenses to average net assets4 | 1.00 | % | 1.00 | % | |||||||
| Ratio of net investment income to average net assets4 | 2.76 | % | 2.21 | % | |||||||
| Decrease reflected in above operating expense ratios due to waivers/reimbursements4 | 1.84 | % | 3.29 | % | |||||||
| Portfolio turnover rate | 39 | % | 206 | % | |||||||
1 For the period December 29, 2006 (commencement of operations) through October 31, 2007.
2 Per share information is calculated using the average shares outstanding method.
3 Total returns are historical and assume changes in share price and reinvestment of all dividends and distributions. Had certain expenses not been reduced during the periods shown, total returns would have been lower. Total returns for periods less than one year are not annualized.
4 Annualized.
See Accompanying Notes to Financial Statements.
15
Credit Suisse Absolute Return Fund
Financial Highlights
(For a Class A Share of the Fund Outstanding Throughout Each Period)
| For the Six Months Ended April 30, 2008 (unaudited) | For the Period Ended October 31, 20071 | ||||||||||
| Per share data | |||||||||||
| Net asset value, beginning of period | $ | 10.89 | $ | 10.00 | |||||||
| INVESTMENT OPERATIONS | |||||||||||
| Net investment income2 | 0.12 | 0.17 | |||||||||
| Net gain (loss) on investments (both realized and unrealized) | (0.39 | ) | 0.72 | ||||||||
| Total from investment operations | (0.27 | ) | 0.89 | ||||||||
| LESS DIVIDENDS AND DISTRIBUTIONS | |||||||||||
| Dividends from net investment income | (0.45 | ) | — | ||||||||
| Distributions from net realized gains | (0.08 | ) | — | ||||||||
| Total dividends and distributions | (0.53 | ) | — | ||||||||
| Net asset value, end of period | $ | 10.09 | $ | 10.89 | |||||||
| Total return3 | (2.43 | )% | 8.90 | % | |||||||
| RATIOS AND SUPPLEMENTAL DATA | |||||||||||
| Net assets, end of period (000s omitted) | $ | 2,337 | $ | 1,345 | |||||||
| Ratio of expenses to average net assets4 | 1.25 | % | 1.25 | % | |||||||
| Ratio of net investment income to average net assets4 | 2.41 | % | 1.90 | % | |||||||
| Decrease reflected in above operating expense ratios due to waivers/reimbursements4 | 1.66 | % | 3.33 | % | |||||||
| Portfolio turnover rate | 39 | % | 206 | % | |||||||
1 For the period December 29, 2006 (commencement of operations) through October 31, 2007.
2 Per share information is calculated using the average shares outstanding method.
3 Total returns are historical and assume changes in share price, reinvestment of all dividends and distributions and no sales charge. Had certain expenses not been reduced during the periods shown, total returns would have been lower. Total returns for periods less than one year are not annualized.
4 Annualized.
See Accompanying Notes to Financial Statements.
16
Credit Suisse Absolute Return Fund
Financial Highlights
(For a Class C Share of the Fund Outstanding Throughout Each Period)
| For the Six Months Ended April 30, 2008 (unaudited) | For the Period Ended October 31, 20071 | ||||||||||
| Per share data | |||||||||||
| Net asset value, beginning of period | $ | 10.82 | $ | 10.00 | |||||||
| INVESTMENT OPERATIONS | |||||||||||
| Net investment income2 | 0.09 | 0.10 | |||||||||
| Net gain (loss) on investments (both realized and unrealized) | (0.39 | ) | 0.72 | ||||||||
| Total from investment operations | (0.30 | ) | 0.82 | ||||||||
| LESS DIVIDENDS AND DISTRIBUTIONS | |||||||||||
| Dividends from net investment income | (0.37 | ) | — | ||||||||
| Distributions from net realized gains | (0.08 | ) | — | ||||||||
| Total dividends and distributions | (0.45 | ) | — | ||||||||
| Net asset value, end of period | $ | 10.07 | $ | 10.82 | |||||||
| Total return3 | (2.74 | )% | 8.20 | % | |||||||
| RATIOS AND SUPPLEMENTAL DATA | |||||||||||
| Net assets, end of period (000s omitted) | $ | 478 | $ | 118 | |||||||
| Ratio of expenses to average net assets4 | 2.00 | % | 2.00 | % | |||||||
| Ratio of net investment income to average net assets4 | 1.88 | % | 1.15 | % | |||||||
| Decrease reflected in above operating expense ratios due to waivers/reimbursements4 | 1.52 | % | 3.37 | % | |||||||
| Portfolio turnover rate | 39 | % | 206 | % | |||||||
1 For the period December 29, 2006 (commencement of operations) through October 31, 2007.
2 Per share information is calculated using the average shares outstanding method.
3 Total returns are historical and assume changes in share price, reinvestment of all dividends and distributions and no sales charge. Had certain expenses not been reduced during the periods shown, total returns would have been lower. Total returns for periods less than one year are not annualized.
4 Annualized.
See Accompanying Notes to Financial Statements.
17
Credit Suisse Absolute Return Fund
Notes to Financial Statements
April 30, 2008 (unaudited)
Note 1. Organization
The Credit Suisse Capital Funds (the "Trust") covered in this report is the Absolute Return Fund (the "Fund"). The Trust is registered under the Investment Company Act of 1940, as amended (the "1940 Act") as an open-end management investment company. The Trust was organized under the laws of the Commonwealth of Massachusetts as a business trust on November 26, 1985. The Fund is a diversified, open-end management investment company that seeks to achieve a positive absolute return over a three to five year economic cycle.
The Fund is authorized to offer three classes of shares: Common Class shares, Class A shares, and Class C shares. Each class of shares in the Fund represents an equal pro rata interest in the Fund, except that they bear different expenses which reflect the differences in the range of services provided to them. Class A shares are sold subject to a front-end sales charge of up to 4.00%. Class C shares are sold subject to a contingent deferred sales charge of 1.00% if redeemed within the first year of purchase.
Note 2. Significant Accounting Policies
A) SECURITY VALUATION — The net asset value of the Fund is determined daily as of the close of regular trading on The New York Stock Exchange, Inc. (the "Exchange") on each day the Exchange is open for business. Equity investments are valued at market value, which is generally, determined using the closing price on the exchange or market on which the security is primarily traded at the time of valuation (the "Valuation Time"). If no sales are reported, equity investments are generally valued at the most recent bid quotation as of the Valuation Time or at the lowest asked quotation in the case of a short sale of securities. Debt securities with a remaining maturity greater than 60 days are valued in accordance with the price supplied by a pricing service, which may use a matrix, formula or other objective method that takes into consideration market indices, yield curves and other specific adjustments. Debt obligations that will mature in 60 days or less are valued on the basis of amortized cost, which approximates market value, unless it is determined that using this method would not represent fair value. Investments in mutual funds are valued at the mutual fund's closing net asset value per share on the day of valuation. Securities and other assets for which market quotations are not readily available, or whose values have been materially affected by events occurring before the Fund's Valuation Time but after the close of the securities' primary markets, are valued at fair value as determined in good faith by, or under the direction of, the Board of Trustees under procedures established by the Board of Trustees. The Fund may utilize a service provided by an
18
Credit Suisse Absolute Return Fund
Notes to Financial Statements (continued)
April 30, 2008 (unaudited)
Note 2. Significant Accounting Policies
independent third party which has been approved by the Board of Trustees to fair value certain securities. When fair-value pricing is employed, the prices of securities used by a fund to calculate its net asset value may differ from quoted or published prices for the same securities.
B) SECURITY TRANSACTIONS AND INVESTMENT INCOME — Security transactions are accounted for on a trade date basis. Interest income is recorded on the accrual basis. Dividends are recorded on the ex-dividend date. Certain expenses are class specific expenses and vary by class. Income, expenses (excluding class-specific expenses) and realized/unrealized gains/losses are allocated proportionately to each class of shares based upon the relative net asset value of outstanding shares of that class. The cost of investments sold is determined by use of the specific identification method for both financial reporting and income tax purposes.
C) DIVIDENDS AND DISTRIBUTIONS TO SHAREHOLDERS — Dividends from net investment income and distributions of net realized capital gains, if any, are declared and paid at least annually. However, to the extent that a net realized capital gain can be reduced by a capital loss carryforward, such gain will not be distributed. Income and capital gain distributions are determined in accordance with federal income tax regulations, which may differ from accounting principles generally accepted in the United States of America ("GAAP").
D) FEDERAL INCOME TAXES — No provision is made for federal taxes as it is the Fund's intention to continue to qualify for and elect the tax treatment applicable to regulated investment companies under the Internal Revenue Code of 1986, as amended, and to make the requisite distributions to its shareholders, which will be sufficient to relieve it from federal income and excise taxes.
E) USE OF ESTIMATES — The preparation of financial statements in conformity with GAAP requires management to make estimates and assumptions that affect the reported amounts of assets and liabilities and disclosure of contingent assets and liabilities at the date of the financial statements and the reported amounts of income and expenses during the reporting period. Actual results could differ from these estimates.
F) SHORT-TERM INVESTMENTS — The Fund, together with other funds/portfolios advised by Credit Suisse Asset Management, LLC ("Credit Suisse"), an indirect, wholly-owned subsidiary of Credit Suisse Group, pools available cash into either a short-term variable rate time deposit issued by State Street Bank and Trust Company ("SSB"), the Fund's custodian, or a
19
Credit Suisse Absolute Return Fund
Notes to Financial Statements (continued)
April 30, 2008 (unaudited)
Note 2. Significant Accounting Policies
money market fund advised by Credit Suisse. The short-term time deposit issued by SSB is a variable rate account classified as a short-term investment.
G) SECURITIES LENDING — Loans of securities are required at all times to be secured by collateral at least equal to 102% of the market value of domestic securities on loan (including any accrued interest thereon) and 105% of the market value of foreign securities on loan (including any accrued interest thereon). Cash collateral received by the Fund in connection with securities lending activity may be pooled together with cash collateral for other funds/portfolios advised by Credit Suisse and may be invested in a variety of investments, including certain Credit Suisse-advised funds, funds advised by SSB, the Fund's securities lending agent, or money market instruments. However, in the event of default or bankruptcy by the other party to the agreement, realization and/or retention of the collateral may be subject to legal proceedings.
SSB has been engaged by the Fund to act as the Fund's securities lending agent. The Fund's securities lending arrangement provides that the Fund and SSB will share the net income earned from securities lending activities. During the six months ended April 30, 2008, total earnings from the Fund's investment in cash collateral received in connection with securities lending arrangements was $36,621, of which $20,731 was rebated to borrowers (brokers). The Fund retained $12,735 in income from the cash collateral investment, and SSB, as lending agent, was paid $3,155. The Fund may also be entitled to certain minimum amounts of income from its securities lending activities. Securities lending income is accrued as earned.
Note 3. Transactions with Affiliates and Related Parties
Credit Suisse serves as investment adviser for the Fund. For its investment advisory services, Credit Suisse is entitled to receive a fee from the Fund at an annual rate of 0.75% of the Fund's average daily net assets. For the six months ended April 30, 2008, investment advisory fees earned, voluntarily waived and expenses reimbursed were as follows:
| Gross Advisory Fee | Waiver | Net Advisory Fee | Expense Reimbursement | ||||||||||||
| $ | 27,822 | $ | (27,822 | ) | $ | — | $ | (37,990 | ) | ||||||
Fee waivers and reimbursements are voluntary and may be discontinued by Credit Suisse at any time.
20
Credit Suisse Absolute Return Fund
Notes to Financial Statements (continued)
April 30, 2008 (unaudited)
Note 3. Transactions with Affiliates and Related Parties
Credit Suisse Asset Management Securities, Inc. ("CSAMSI"), an affiliate of Credit Suisse, and SSB serve as co-administrators to the Fund. For its co-administrative services, CSAMSI currently receives a fee calculated at an annual rate of 0.09% of the Fund's average daily net assets. For the six months ended April 30, 2008, co-administrative services fees earned by CSAMSI were $3,338.
For its co-administrative services, SSB receives a fee, exclusive of out-of-pocket expenses, calculated in total for all the Credit Suisse funds/portfolios co-administered by SSB and allocated based upon relative average net assets of each fund/portfolio, subject to an annual minimum fee. For the six months ended April 30, 2008, co-administrative services fees earned by SSB (including out-of-pocket expenses) were $1,076.
In addition to serving as the Fund's co-administrator, CSAMSI currently serves as distributor of the Fund's shares. Pursuant to distribution plans adopted by the Fund pursuant to Rule 12b-1 under the 1940 Act, CSAMSI receives fees for its distribution services. For Class A shares the fees are calculated at an annual rate of 0.25% of the average daily net assets. For Class C shares of the Fund, the fees are calculated at an annual rate of 1.00% of the average daily net assets. Common Class shares do not bear distribution fees.
For the six months ended April 30, 2008, Credit Suisse and its affiliates advised the Fund that they retained $323 from commissions earned on the sale of the Fund's Class A shares.
Merrill Corporation ("Merrill"), an affiliate of Credit Suisse, has been engaged by the Fund to provide certain financial printing and fulfillment services. For the six months ended April 30, 2008, Merrill was paid $5,073 for its services to the Fund.
The Fund will reimburse Credit Suisse for offering costs in the amount of $159,381 that have been paid by Credit Suisse. Offering costs, including initial registration costs, were deferred and will be charged to expenses during the Fund's first year of operation. For the six months ended April 30, 2008, $27,510 has been expensed to the Fund.
Note 4. Line of Credit
The Fund, together with other funds/portfolios advised by Credit Suisse (collectively, the "Participating Funds"), participates in a $50 million committed, unsecured line of credit facility ("Credit Facility") for temporary or emergency purposes with Deutsche Bank, A.G. as administrative agent and
21
Credit Suisse Absolute Return Fund
Notes to Financial Statements (continued)
April 30, 2008 (unaudited)
Note 4. Line of Credit
syndication agent and SSB as operations agent. Under the terms of the Credit Facility, the Participating Funds pay an aggregate commitment fee at a rate of 0.10% per annum on the average unused amount of the Credit Facility, which is allocated among the Participating Funds in such manner as is determined by the governing Boards of the Participating Funds. In addition, the Participating Funds pay interest on borrowing at the Federal Funds rate plus 0.50%. Effective June 2008, Deutsche Bank, A.G. will no longer serve as administrative agent and syndication agent to the credit facility. At April 30, 2008, the Fund had no borrowing under the Credit Facility. During the six months ended April 30, 2008, the Fund had borrowings under the Credit Facility as follows:
| Average Daily Loan Balance | Weighted Average Interest Rate% | Maximum Daily Loan Outstanding | |||||||||
| $ | 197,000 | 3.343 | % | $ | 201,000 | ||||||
Note 5. Purchases and Sales of Securities
For the six months ended April 30, 2008, purchases and sales of investment securities (excluding short-term investments) were $3,877,940 and $2,149,993, respectively.
At April 30, 2008, the identified cost for federal income tax purposes, as well as the gross unrealized appreciation from investments for those securities having an excess of value over cost, gross unrealized depreciation from investments for those securities having an excess of cost over value and the net unrealized appreciation from investments were $9,955,058, $324,916, $(63,997) and $260,919, respectively.
Note 6. Capital Share Transactions
The Fund is authorized to issue an unlimited number of full and fractional shares of capital stock, $.001 par value per share, of which an unlimited number are classified as Common class shares, Class A shares, and Class C shares. Transactions in capital shares for each class of the fund were as follows:
| Common Class | |||||||||||||||||||
| For the Six Months Ended April 30, 2008 (unaudited) | For the Period Ended October 31, 20071,2 | ||||||||||||||||||
| Shares | Value | Shares | Value | ||||||||||||||||
| Shares sold | 30 | $ | 300 | 991,922 | $ | 9,919,740 | |||||||||||||
| Shares issued in reinvestment of dividends and distributions | 111 | 1,127 | — | — | |||||||||||||||
| Shares redeemed | — | — | (486,855 | ) | (5,000,000 | ) | |||||||||||||
| Net increase | 141 | $ | 1,427 | 505,067 | $ | 4,919,740 | |||||||||||||
22
Credit Suisse Absolute Return Fund
Notes to Financial Statements (continued)
April 30, 2008 (unaudited)
Note 6. Capital Share Transactions
| Class A | |||||||||||||||||||
| For the Six Months Ended April 30, 2008 (unaudited) | For the Period Ended October 31, 20071,3 | ||||||||||||||||||
| Shares | Value | Shares | Value | ||||||||||||||||
| Shares sold | 120,764 | $ | 1,236,673 | 128,409 | $ | 1,318,204 | |||||||||||||
| Shares issued in reinvestment of dividends and distributions | 9,197 | 93,111 | — | — | |||||||||||||||
| Shares redeemed | (21,912 | ) | (216,068 | ) | (4,897 | ) | (50,749 | ) | |||||||||||
| Net increase | 108,049 | $ | 1,113,716 | 123,512 | $ | 1,267,455 | |||||||||||||
| Class C | |||||||||||||||||||
| For the Six Months Ended April 30, 2008 (unaudited) | For the Period Ended October 31, 20071,3 | ||||||||||||||||||
| Shares | Value | Shares | Value | ||||||||||||||||
| Shares sold | 34,996 | $ | 364,507 | 10,917 | $ | 110,000 | |||||||||||||
| Shares issued in reinvestment of dividends and distributions | 1,622 | 16,379 | — | — | |||||||||||||||
| Net increase | 36,618 | $ | 380,886 | 10,917 | $ | 110,000 | |||||||||||||
1 For the period December 29, 2006 (commencement of operations) through October 31, 2007.
2 The Class was seeded on December 29, 2006 with initial capital of $9,900,000 and 990,000 shares.
3 The Classes were seeded on December 29, 2006 with initial capital of $50,000 and 5,000 shares.
On April 30, 2008 the number of shareholders that held 5% or more of the outstanding shares of each class of the Fund was as follows:
| Number of Shareholders | Approximate Percentage of Outstanding Shares | ||||||||||
| Common Class | 1 | 99 | % | ||||||||
| Class A | 2 | 88 | % | ||||||||
| Class C | 1 | 90 | % | ||||||||
Some of the shareholders are omnibus accounts, which hold shares on behalf of individual shareholders.
Note 7. Contingencies
In the normal course of business, the Fund may provide general indemnifications pursuant to certain contracts and organizational documents. The Fund's maximum exposure under these arrangements is dependent on future claims that may be made against the Fund and, therefore, cannot be estimated; however, based on experience, the risk of loss from such claims is considered remote.
23
Credit Suisse Absolute Return Fund
Notes to Financial Statements (continued)
April 30, 2008 (unaudited)
Note 8. Recent Accounting Pronouncements
During June 2006, the Financial Accounting Standards Board ("FASB") issued FASB Interpretation 48 ("FIN 48" or the "Interpretation"), Accounting for Uncertainty in Income Taxes — an interpretation of FASB statement 109. FIN 48 supplements FASB Statement 109, Accounting for Income Taxes, by defining the confidence level that a tax position must meet in order to be recognized in the financial statements. FIN 48 prescribes a comprehensive model for how a fund should recognize, measure, present, and disclose in its financial statements uncertain tax positions that the fund has taken or expects to take on a tax return. FIN 48 requires that the t ax effects of a position be recognized only if it is "more likely than not" to be sustained based solely on its technical merits. Management must be able to conclude that the tax law, regulations, case law, and other objective information regarding the technical merits sufficiently support the position's sustainability with a likelihood of more than 50 percent. During the period ended April 30, 2008, Management has adopted FIN 48. There was no material impact to the financial statements or disclosures thereto as a result of the adoption of this pronouncement.
On September 20, 2006, the FASB released Statement of Financial Accounting Standards No. 157 "Fair Value Measurements" ("FAS 157"). FAS 157 establishes an authoritative definition of fair value, sets out a framework for measuring fair value, and requires additional disclosures about fair-value measurements. The application of FAS 157 is required for fiscal years, beginning after November 15, 2007 and interim periods within those fiscal years. As of April 30, 2008, management does not believe the adoption of FAS 157 will impact the amounts reported in the financial statements, however, additional disclosures will be required in subsequent reports.
In March 2008, FASB issued Statement of Financial Accounting Standards No. 161, Disclosures about Derivative Instruments and Hedging Activities ("FAS 161"), an amendment of FASB Statement No. 133. FAS 161 requires enhanced disclosures about (a) how and why an entity uses derivative instruments, (b) how derivative instruments and hedging activities are accounted for, and (c) how derivative instruments and related hedging activities affect a fund's financial position, financial performance, and cash flows. Management of the Funds does not believe the adoption of FAS 161 will materially impact the financial statement amounts, but will require additional disclosures. This will include qualitative and quantitative disclosures on derivative positions existing at period end and the effect of using de rivatives during the reporting period. FAS 161 is effective for financial statements issued for fiscal years and interim periods beginning after November 15, 2008.
24
Credit Suisse Absolute Return Fund
Privacy Policy Notice (unaudited)
Important Privacy Choices for Consumers
We are committed to maintaining the privacy of every current and prospective customer. We recognize that you entrust important personal information to us, and we wish to assure you that we take seriously our responsibilities in protecting and safeguarding this information.
In connection with making available investment products and services to current and potential customers, we may obtain nonpublic personal information about you. This information may include your name, address, e-mail address, social security number, account number, assets, income, financial situation, transaction history and other personal information.
We may collect nonpublic information about you from the following sources:
• Information we receive on applications, forms, questionnaires, web sites, agreements or in the course of establishing or maintaining a customer relationship; and
• Information about your transactions with us, our affiliates, or others.
We do not disclose any nonpublic personal information about our customers or former customers to anyone, except with your consent or as otherwise permitted by law.
In cases where we believe that additional products and services may be of interest to you, we may share the information described above with our affiliates.
We may also disclose this information to firms that perform services on our behalf. These agents and service providers are required to treat the information confidentially and use it only for the purpose for which it is provided.
We restrict access to nonpublic personal information about you to those employees, agents or other parties who need to know that information to provide products or services to you or in connection with your investments with or through us. We maintain physical, electronic and procedural safeguards that comply with federal standards to guard your nonpublic personal information.
Note: This Notice is provided to clients and prospective clients of Credit Suisse Asset Management, LLC ("Credit Suisse"), and Credit Suisse Asset Management Securities, Inc., and shareholders and prospective shareholders in Credit Suisse sponsored and advised investment companies, including Credit Suisse Funds, and other consumers and customers, as applicable. This Notice is not intended to be incorporated in any offering materials but is merely a statement of our current Privacy Policy, and may be amended from time to time upon notice to you. This Notice is dated as of May 13, 2008.
25
Credit Suisse Absolute Return Fund
Proxy Voting and Portfolio Holdings Information (unaudited)
Information regarding how the Fund voted proxies related to its portfolio securities during the 12 month period ended June 30 of each year, as well as the policies and procedures that the Fund uses to determine how to vote proxies relating to its portfolio securities are available:
• By calling 1-800-927-2874
• On the Fund's website, www.credit-suisse.com/us
• On the website of the Securities and Exchange Commission, www.sec.gov.
The Fund files a complete schedule of its portfolio holdings for the first and third quarters of its fiscal year with the SEC on Form N-Q. The Fund's Forms N-Q are available on the SEC's website at www.sec.gov and may be reviewed and copied at the SEC's Public Reference Room in Washington, DC. Information on the operation of the SEC's Public Reference Room may be obtained by calling 1-202-551-8090.
26
This page intentionally left blank
This page intentionally left blank

P.O. BOX 55030, BOSTON, MA 02205-5030
800-927-2874 n www.credit-suisse.com/us
CREDIT SUISSE ASSET MANAGEMENT SECURITIES, INC., DISTRIBUTOR. AR-SAR-0408

CREDIT SUISSE FUNDS
Semiannual Report
April 30, 2008
(unaudited)
n CREDIT SUISSE
LARGE CAP VALUE FUND
n CREDIT SUISSE
SMALL CAP CORE FUND
The Funds' investment objectives, risks, charges and expenses (which should be considered carefully before investing), and more complete information about the Funds, are provided in the Prospectus, which should be read carefully before investing. You may obtain additional copies by calling 800-927-2874 or by writing to Credit Suisse Funds, P.O. Box 55030, Boston, MA 02205-5030.
Credit Suisse Asset Management Securities, Inc., Distributor, is located at Eleven Madison Avenue, New York, NY 10010. Credit Suisse Funds are advised by Credit Suisse Asset Management, LLC.
Investors in the Credit Suisse Funds should be aware that they may be eligible to purchase Common Class and/or Advisor Class shares (where offered) directly or through certain intermediaries. Such shares are not subject to a sales charge but may be subject to an ongoing service and distribution fee of up to 0.50% of average daily net assets. Investors in the Credit Suisse Funds should also be aware that they may be eligible for a reduction or waiver of the sales charge with respect to Class A, B or C shares (where offered). For more information, please review the relevant prospectuses or consult your financial representative.
The views of the Funds' management are as of the date of the letter and the Fund holdings described in this document are as of April 30, 2008; these views and Fund holdings may have changed subsequent to these dates. Nothing in this document is a recommendation to purchase or sell securities.
Fund shares are not deposits or other obligations of Credit Suisse Asset Management, LLC ("Credit Suisse") or any affiliate, are not FDIC-insured and are not guaranteed by Credit Suisse or any affiliate. Fund investments are subject to investment risks, including loss of your investment.
Credit Suisse Large Cap Value Fund
Semiannual Investment Adviser's Report
April 30, 2008 (unaudited)
June 11, 2008
Dear Shareholder:
Performance Summary
11/01/07 – 04/30/08
| Fund and Benchmark | Performance | ||||||
| Common Class1 | (11.33 | %) | |||||
| Advisor Class1 | (11.45 | %) | |||||
| Class A1,2 | (11.49 | %) | |||||
| Class B1,2 | (11.81 | %) | |||||
| Class C1,2 | (11.84 | %) | |||||
| Russell 1000® Value Index3 | (9.84 | %) | |||||
Performance for the Fund's Class A, Class B and Class C Shares is without the maximum sales charge of 5.75%, 4.00% and 1.00%, respectively.2
Market Review: Housing and the dollar continue to weaken
The six-month period ended April 30, 2008 was a volatile one for U.S. equities, with the benchmark Russell 1000 Value Index falling –9.84% and the bellwether S&P 500 Index losing –9.64% in total return. In fact, nine out of the ten economic sectors in the large-cap S&P 500 Index fell during the period.
The weak dollar and elevated commodity prices buoyed the energy sector, which was up 5.6%. And, as the credit crunch intensified in the first quarter of 2008, the greatest laggards in the large-cap space were the financial (-21.3%) and information technology (-15.6%) sectors.
During the period, the U.S. Federal Reserve cut the Federal Funds rate five times, for a total of 250 basis points. The last cut of 25 basis points, on April 30, 2008, brought the rate down to the 2% level. At that time, the Fed said "substantial" easing should promote growth, but to date, economic activity "remains weak."
The U.S. housing sector has continued to weaken in 2008. In fact, since January 2007, the S&P/Case Shiller U.S. Home Price Index (a measure of home prices in 20 U.S. metropolitan areas) has fallen every month. Additionally, the number of homes entering foreclosure jumped more than 100% in the first three months of the year as compared to the same quarter in 2007. According to RealtyTrac, one in every 194 homes received a foreclosure filing. In fact, foreclosure activity rose in 46 of the 50 states and in 90 of the 100 largest metropolitan areas.
1
Credit Suisse Large Cap Value Fund
Semiannual Investment Adviser's Report (continued)
April 30, 2008 (unaudited)
Gross Domestic Product rose only a scant 0.6% in both Q4'07 and Q1'08, compared to being up 4.9% in Q3'07, as housing and the credit crunch put the breaks on economic growth. Inflation appears to be well contained.
The labor market has weakened considerably in 2008. Non-farm payrolls fell by 260,000 in the first four months of 2008, as compared to an increase of 374,000 in the same period of 2007. Additionally, the household unemployment rate measured 5.0% in April, up from 4.7% in November of 2007.
Additionally, while the U.S. dollar falls, crude oil continues to rise. During the six-month period ended April 30, 2008, crude rose from $88 to $113 per barrel.
Strategic Review and Outlook: Expect the market to remain volatile over the short term
Stock selection in four sectors produced positive performance, while six sectors underperformed during the six-month period. The largest contributors to performance relative to the benchmark came primarily from stock selection within the telecomm services sector followed by the consumer discretionary and information technology sectors. Conversely, stock selection in the consumer staples, healthcare and industrials groups was the largest detractor to performnce.
As of April 30, 2008, the Fund's largest overweights against the Russell 1000 Value Index were in the energy (+1.79%) and healthcare (+1.61%) sectors, while the largest underweights were in the consumer discretionary (-1.09%) and materials (-0.99%) sectors.
The Federal Reserve believes that the substantial easing thus far, in combination with ongoing measures to foster market liquidity, should help to promote moderate growth over time while mitigating the risks to economic activity. In addition, though the outlook is uncertain, inflation is expected to moderate in coming quarters, but will need to be carefully monitored.
The Federal Open Market Committee's next interest rate meeting is scheduled for June 25, 2008. Based on interest-rate futures as of May 6, 2008, traders are expecting the Fed to leave its target rate at the current level of 2.00%.
The near-term outlook for the U.S. housing market remains bleak. In fact, Federal Reserve Chairman Ben Bernanke urged the government and mortgage lenders to intensify their efforts to avoid home foreclosures in a speech given in New York on May 5, 2008. Additionally, the outlook for merger and acquisition activity is unlikely to improve in upcoming quarters as the Federal Reserve said the proportion of U.S. banks making it tougher for companies to borrow approached a record high in the past three months as the credit crunch deepened.
2
Credit Suisse Large Cap Value Fund
Semiannual Investment Adviser's Report (continued)
April 30, 2008 (unaudited)
Further, expectations for U.S. stock market volatility remain high on a historical basis, though they have been significantly reduced since hitting a multi-year high in mid-March.
Now that the Fed appears to be done easing, we expect our Valuation and Capital Use factors — and the companies we choose based on them — to rebound as contributing factors to performance. From a sector perspective, we are favorable toward energy, industrials, and financials, while we are currently underweight healthcare, consumer staples, and consumer services.
Jordan Low
Portfolio Manager
The value of investments generally will fluctuate in response to market movements and the Fund's performance will largely depend on the performance of value stocks, which may be more volatile than the overall market.
In addition to historical information, this report contains forward-looking statements that may concern, among other things, domestic and foreign market, industry and economic trends and developments and government regulation and their potential impact on the Fund's investments. These statements are subject to risks and uncertainties and actual trends, developments and regulations in the future, and their impact on the Fund could be materially different from those projected, anticipated or implied. The Fund has no obligation to update or revise forward-looking statements.
The Fund adopted new investment strategies effective December 1, 2006 so that its holdings are selected using quantitative stock selection models rather than a more traditional fundamental analysis approach. Investors should be aware that performance information for periods prior to December 1, 2006 does not reflect the current investment strategies.
3
Credit Suisse Large Cap Value Fund
Semiannual Investment Adviser's Report (continued)
April 30, 2008 (unaudited)
Average Annual Returns as of March 31, 20081
| 1 Year | 5 Years | 10 Years | Since Inception | Inception Date | |||||||||||||||||||
| Common Class | (9.87 | )% | 11.30 | % | — | 5.02 | % | 08/01/00 | |||||||||||||||
| Advisor Class | (10.15 | )% | — | — | 8.21 | % | 06/06/03 | ||||||||||||||||
| Class A Without Sales Charge | (10.08 | )% | 11.13 | % | 5.08 | % | — | ||||||||||||||||
| Class A With Maximum Sales Charge | (15.25 | )% | 9.82 | % | 4.45 | % | — | ||||||||||||||||
| Class B Without CDSC | (10.74 | )% | 10.29 | % | 4.31 | % | — | 02/28/96 | |||||||||||||||
| Class B With CDSC | (13.66 | )% | 10.29 | % | 4.31 | % | — | 02/28/96 | |||||||||||||||
| Class C Without CDSC | (10.82 | )% | 10.28 | % | — | 4.67 | % | 02/28/00 | |||||||||||||||
| Class C With CDSC | (11.54 | )% | 10.28 | % | — | 4.67 | % | 02/28/00 | |||||||||||||||
Average Annual Returns as of April 30, 20081
| 1 Year | 5 Years | 10 Years | Since Inception | Inception Date | |||||||||||||||||||
| Common Class | (9.93 | )% | 10.75 | % | — | 5.51 | % | 08/01/00 | |||||||||||||||
| Advisor Class | (10.28 | )% | — | — | 8.92 | % | 06/06/03 | ||||||||||||||||
| Class A Without Sales Charge | (10.21 | )% | 10.57 | % | 5.52 | % | — | ||||||||||||||||
| Class A With Maximum Sales Charge | (15.39 | )% | 9.27 | % | 4.90 | % | — | ||||||||||||||||
| Class B Without CDSC | (10.89 | )% | 9.73 | % | 4.75 | % | — | 02/28/96 | |||||||||||||||
| Class B With CDSC | (13.80 | )% | 9.73 | % | 4.75 | % | — | 02/28/96 | |||||||||||||||
| Class C Without CDSC | (10.91 | )% | 9.74 | % | — | 5.12 | % | 02/28/00 | |||||||||||||||
| Class C With CDSC | (11.64 | )% | 9.74 | % | — | 5.12 | % | 02/28/00 | |||||||||||||||
Returns represent past performance and include change in share price and reinvestment of dividends and capital gains. Past performance cannot guarantee future results. The current performance of the Fund may be lower or higher than the figures shown. Returns and share price will fluctuate, and redemption value may be more or less than original cost. The performance results do not reflect the deduction of taxes that a shareholder would pay on fund distributions or the redemption of fund shares. Performance information current to the most recent month-end is available at www.credit-suisse.com/us
1 Fee waivers and/or expense reimbursements may reduce expenses for the Fund, without which performance would be lower. Waivers and/or reimbursements may be discontinued at any time.
2 Total return for the Fund's Class A Shares for the reporting period, based on offering price (including maximum sales charge of 5.75%), was -16.60%. Total return for the Fund's Class B Shares for the reporting period, based on redemption value (including maximum contingent deferred sales charge of 4.00%), was -14.70%. Total return for the Fund's Class C Shares for the reporting period, based on redemption value (including maximum contingent deferred sales charge of 1.00%), was -12.56%.
3 The Russell 1000® Value Index measures the performance of those companies in the Russell 1000® Index with lower price-to-book ratios and lower forecasted growth values. It is an unmanaged index of common stocks that includes reinvestment of dividends and is compiled by Frank Russell Company. Investors cannot invest directly in an index.
4
Credit Suisse Large Cap Value Fund
Semiannual Investment Adviser's Report (continued)
April 30, 2008 (unaudited)
Information About Your Fund's Expenses
As an investor of the Fund, you incur two types of costs: ongoing expenses and transaction costs. Ongoing expenses include management fees, distribution and service (12b-1) fees and other Fund expenses. Examples of transaction costs include sales charges (loads), redemption fees and account maintenance fees, which are not shown in this section and which would result in higher total expenses. The following table is intended to help you understand your ongoing expenses of investing in the Fund and to help you compare these expenses with the ongoing expenses of investing in other mutual funds. The table is based on an investment of $1,000 made at the beginning of the six month period ended April 30, 2008.
The table illustrates your Fund's expenses in two ways:
• Actual Fund Return. This helps you estimate the actual dollar amount of ongoing expenses paid on a $1,000 investment in the Fund using the Fund's actual return during the period. To estimate the expenses you paid over the period, simply divide your account value by $1,000 (for example, an $8,600 account value divided by $1,000 = 8.6), then multiply the result by the number in the "Expenses Paid per $1,000" line under the share class you hold.
• Hypothetical 5% Fund Return. This helps you to compare your Fund's ongoing expenses with those of other mutual funds using the Fund's actual expense ratio and a hypothetical rate of return of 5% per year before expenses. Examples using a 5% hypothetical fund return may be found in the shareholder reports of other mutual funds. The hypothetical account values and expenses may not be used to estimate the actual ending account balance or expenses you paid for the period.
Please note that the expenses shown in these tables are meant to highlight your ongoing expenses only and do not reflect any transaction costs, such as sales charges (loads) or redemption fees. If these transaction costs had been included, your costs would have been higher. The "Expenses Paid per $1,000" line of the tables is useful in comparing ongoing expenses only and will not help you determine the relative total expenses of owning different funds.
5
Credit Suisse Large Cap Value Fund
Semiannual Investment Adviser's Report (continued)
April 30, 2008 (unaudited)
Expenses and Value of a $1,000 Investment
for the six month period ended April 30, 2008
| Actual Fund Return | Common Class | Advisor Class | Class A | Class B | Class C | ||||||||||||||||||
| Beginning Account Value 11/1/07 | $ | 1,000.00 | $ | 1,000.00 | $ | 1,000.00 | $ | 1,000.00 | $ | 1,000.00 | |||||||||||||
| Ending Account Value 4/30/08 | $ | 886.70 | $ | 885.50 | $ | 885.10 | $ | 881.90 | $ | 881.60 | |||||||||||||
| Expenses Paid per $1,000* | $ | 4.60 | $ | 6.94 | $ | 5.77 | $ | 9.26 | $ | 9.26 | |||||||||||||
| Hypothetical 5% Fund Return | |||||||||||||||||||||||
| Beginning Account Value 11/1/07 | $ | 1,000.00 | $ | 1,000.00 | $ | 1,000.00 | $ | 1,000.00 | $ | 1,000.00 | |||||||||||||
| Ending Account Value 4/30/08 | $ | 1,019.99 | $ | 1,017.50 | $ | 1,018.75 | $ | 1,015.02 | $ | 1,015.02 | |||||||||||||
| Expenses Paid per $1,000* | $ | 4.92 | $ | 7.42 | $ | 6.17 | $ | 9.92 | $ | 9.92 | |||||||||||||
| Common Class | Advisor Class | Class A | Class B | Class C | |||||||||||||||||||
| Annualized Expense Ratios* | 0.98 | % | 1.48 | % | 1.23 | % | 1.98 | % | 1.98 | % | |||||||||||||
* Expenses are equal to the Fund's annualized expense ratio for each share class, multiplied by the average account value over the period, multiplied by the number of days in the most recent fiscal half year period, then divided by 366.
The "Expenses Paid per $1,000" and the "Annualized Expense Ratios" in the tables are based on actual expenses paid by the Fund during the period, net of fee waivers and/or expense reimbursements. If those fee waivers and/or expense reimbursements had not been in effect, the Fund's actual expenses would have been higher.
For more information, please refer to the Fund's prospectus.
6
Credit Suisse Large Cap Value Fund
Semiannual Investment Adviser's Report (continued)
April 30, 2008 (unaudited)
SECTOR BREAKDOWN*
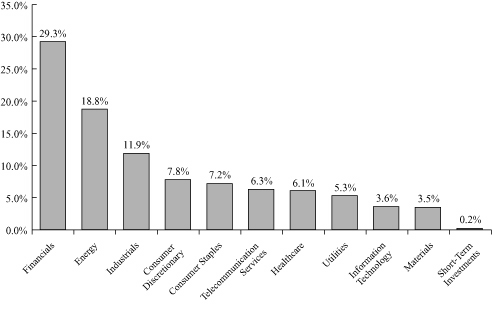
* Expressed as a percentage of total investments (excluding security lending collateral) and may vary over time.
7
Credit Suisse Small Cap Core Fund
Semiannual Investment Adviser's Report
April 30, 2008 (unaudited)
June 11, 2008
Dear Shareholder:
Performance Summary
11/01/07 – 04/30/08
| Fund and Benchmark | Performance | ||||||
| Common Class1 | (13.69 | %) | |||||
| Class A1,2 | (13.69 | %) | |||||
| Class B1,2 | (14.00 | %) | |||||
| Class C1,2 | (14.05 | %) | |||||
| Standard & Poor's SmallCap 600® Index3 | (11.59 | %) | |||||
Performance for the Fund's Class A, Class B and Class C Shares is without the maximum sales charge of 5.75%, 4.00% and 1.00%, respectively.2
Market Review: Housing and the dollar continue to weaken
The six-month period ended April 30, 2008 was a volatile one for U.S. equities, with the benchmark S&P 600 SmallCap Index returning –11.59%.
During the period, the U.S. Federal Reserve cut the Federal Funds rate five times, for a total of 250 basis points. The last cut of 25 basis points, on April 30, 2008, brought the rate down to the 2% level. At that time, the Fed said "substantial" easing should promote growth, but to date, economic activity "remains weak."
The U.S. housing sector has continued to weaken in 2008. In fact, since January 2007, the S&P/Case Shiller U.S. Home Price Index (a measure of home prices in 20 U.S. metropolitan areas) has fallen every month. Additionally, the number of homes entering foreclosure jumped more than 100% in the first three months of the year as compared to the same quarter in 2007. According to RealtyTrac, one in every 194 homes received a foreclosure filing. In fact, foreclosure activity rose in 46 of the 50 states and in 90 of the 100 largest metropolitan areas.
Gross Domestic Product rose only a scant 0.6% in both Q4'07 and Q1'08, compared to being up 4.9% in Q3'07, as housing and the credit crunch put the breaks on economic growth. Inflation appears to be well contained.
The labor market has weakened considerably in 2008. Non-farm payrolls fell by 260,000 in the first four months of 2008, as compared to an increase of 374,000 in the same period of 2007. Additionally, the household unemployment rate measured 5.0% in April, up from 4.7% in November of 2007.
8
Credit Suisse Small Cap Core Fund
Semiannual Investment Adviser's Report (continued)
April 30, 2008 (unaudited)
Additionally, while the U.S. dollar falls, crude oil continues to rise. During the six-month period ended April 30, 2008, crude rose from $88 to $113 per barrel.
Strategic Review and Outlook: Expect the market to remain volatile over the short term
Stock selection in three sectors produced positive performance, while seven sectors underperformed during the six-month period. The largest contributors to performance relative to the benchmark came primarily from the materials and telecomm services sectors. Conversely, stock selection in industrials, financials and healthcare was the largest detractor to performance.
As of April 30, 2008, the Fund's largest overweights against the SmallCap 600 Index were in the energy (+2.87%) and materials (+2.53%) sectors, while the largest underweights were in the information technology (-2.93%) and financials (-2.44%) sectors.
The Federal Reserve believes that the substantial easing thus far, in combination with ongoing measures to foster market liquidity, should help to promote moderate growth over time while mitigating the risks to economic activity. In addition, though the outlook is uncertain, inflation is expected to moderate in coming quarters, but will need to be carefully monitored.
The Federal Open Market Committee's next interest rate meeting is scheduled for June 25, 2008. Based on interest-rate futures as of May 6, 2008, traders are expecting the Fed to leave its target rate at the current level of 2.00%.
The near-term outlook for the U.S. housing market remains bleak. In fact, Federal Reserve Chairman Ben Bernanke urged the government and mortgage lenders to intensify their efforts to avoid home foreclosures in a speech given in New York on May 5, 2008. Additionally, the outlook for merger and acquisition activity is unlikely to improve in upcoming quarters as the Federal Reserve said the proportion of U.S. banks making it tougher for companies to borrow approached a record high in the past three months as the credit crunch deepened. Further, expectations for U.S. stock market volatility remain high on a historical basis, though they have been significantly reduced since hitting a multi-year high in mid-March.
Now that the Fed appears to be done easing, we expect our Valuation and Capital Use factors — and the companies we choose based on them — to rebound as contributing factors to performance. Rising oil and gas prices lead us to be favorable toward energy and basic materials, while the continuing credit
9
Credit Suisse Small Cap Core Fund
Semiannual Investment Adviser's Report (continued)
April 30, 2008 (unaudited)
and housing issues, plus the tightening of consumer belts lead us to be currently underweight in financials, tech and consumer cyclicals.
Jordan Low
Portfolio Manager
Because of the nature of the Fund's investments in special-situation, start-up and other small companies, an investment in the Fund may be more volatile and less liquid than investments in larger companies.
In addition to historical information, this report contains forward-looking statements that may concern, among other things, domestic and foreign market, industry and economic trends and developments and government regulation and their potential impact on the Fund's investments. These statements are subject to risks and uncertainties and actual trends, developments and regulations in the future, and their impact on the Fund could be materially different from those projected, anticipated or implied. The Fund has no obligation to update or revise forward-looking statements.
The Fund adopted new investment strategies effective December 1, 2006 so that its holdings are selected using quantitative stock selection models rather than a more traditional fundamental analysis approach. Investors should be aware that performance information for periods prior to December 1, 2006 does not reflect the current investment strategies.
10
Credit Suisse Small Cap Core Fund
Semiannual Investment Adviser's Report (continued)
April 30, 2008 (unaudited)
Average Annual Returns as of March 31, 20081
| 1 Year | 5 Years | 10 Years | Since Inception | Inception Date | |||||||||||||||||||
| Common Class | (13.21 | )% | 11.54 | % | — | 8.94 | % | 08/01/00 | |||||||||||||||
| Class A Without Sales Charge | (13.22 | )% | 11.54 | % | 6.46 | % | — | ||||||||||||||||
| Class A With Maximum Sales Charge | (18.20 | )% | 10.22 | % | 5.83 | % | — | ||||||||||||||||
| Class B Without CDSC | (13.87 | )% | 10.72 | % | 5.66 | % | — | 02/28/96 | |||||||||||||||
| Class B With CDSC | (15.87 | )% | 10.72 | % | 5.66 | % | — | 02/28/96 | |||||||||||||||
| Class C Without CDSC | (13.90 | )% | 10.71 | % | — | 9.53 | % | 02/28/00 | |||||||||||||||
| Class C With CDSC | (14.39 | )% | 10.71 | % | — | 9.53 | % | 02/28/00 | |||||||||||||||
Average Annual Returns as of April 30, 20081
| 1 Year | 5 Years | 10 Years | Since Inception | Inception Date | |||||||||||||||||||
| Common Class | (10.78 | )% | 11.15 | % | — | 9.54 | % | 08/01/00 | |||||||||||||||
| Class A Without Sales Charge | (10.80 | )% | 11.16 | % | 7.03 | % | — | ||||||||||||||||
| Class A With Maximum Sales Charge | (15.92 | )% | 9.84 | % | 6.40 | % | — | ||||||||||||||||
| Class B Without CDSC | (11.46 | )% | 10.33 | % | 6.23 | % | — | 02/28/96 | |||||||||||||||
| Class B With CDSC | (13.52 | )% | 10.33 | % | 6.23 | % | — | 02/28/96 | |||||||||||||||
| Class C Without CDSC | (11.55 | )% | 10.31 | % | — | 10.07 | % | 02/28/00 | |||||||||||||||
| Class C With CDSC | (12.06 | )% | 10.31 | % | — | 10.07 | % | 02/28/00 | |||||||||||||||
Returns represent past performance and include change in share price and reinvestment of dividends and capital gains. Past performance cannot guarantee future results. The current performance of the Fund may be lower or higher than the figures shown. Returns and share price will fluctuate, and redemption value may be more or less than original cost. The performance results do not reflect the deduction of taxes that a shareholder would pay on fund distributions or the redemption of fund shares. Performance information current to the most recent month-end is available at www.credit-suisse.com/us
1 Fee waivers and/or expense reimbursements may reduce expenses for the Fund, without which performance would be lower. Waivers and/or reimbursement may be discontinued at any time.
2 Total return for the Fund's Class A Shares for the reporting period, based on offering price (including maximum sales charge of 5.75%), was -18.66%. Total return for the Fund's Class B Shares for the reporting period, based on redemption value (including maximum contingent deferred sales charge of 4.00%), was -15.99%. Total return for the Fund's Class C Shares for the reporting period, based on redemption value (including maximum contingent deferred sales charge of 1.00%), was -14.54%.
3 The Standard & Poor's SmallCap 600® Index is an unmanaged market weighted index of 600 U.S. stocks selected on the basis of capitalization, liquidity and industry group representation. It is a registered trademark of The McGraw-Hill Co., Inc. Investors cannot invest directly in an index.
11
Credit Suisse Small Cap Core Fund
Semiannual Investment Adviser's Report (continued)
April 30, 2008 (unaudited)
Information About Your Fund's Expenses
As an investor of the Fund, you incur two types of costs: ongoing expenses and transaction costs. Ongoing expenses include management fees, distribution and service (12b-1) fees and other Fund expenses. Examples of transaction costs include sales charges (loads), redemption fees and account maintenance fees, which are not shown in this section and which would result in higher total expenses. The following table is intended to help you understand your ongoing expenses of investing in the Fund and to help you compare these expenses with the ongoing expenses of investing in other mutual funds. The table is based on an investment of $1,000 made at the beginning of the six month period ended April 30, 2008.
The table illustrates your Fund's expenses in two ways:
• Actual Fund Return. This helps you estimate the actual dollar amount of ongoing expenses paid on a $1,000 investment in the Fund using the Fund's actual return during the period. To estimate the expenses you paid over the period, simply divide your account value by $1,000 (for example, an $8,600 account value divided by $1,000 = 8.6), then multiply the result by the number in the "Expenses Paid per $1,000" line under the share class you hold.
• Hypothetical 5% Fund Return. This helps you to compare your Fund's ongoing expenses with those of other mutual funds using the Fund's actual expense ratio and a hypothetical rate of return of 5% per year before expenses. Examples using a 5% hypothetical fund return may be found in the shareholder reports of other mutual funds. The hypothetical account values and expenses may not be used to estimate the actual ending account balance or expenses you paid for the period.
Please note that the expenses shown in these tables are meant to highlight your ongoing expenses only and do not reflect any transaction costs, such as sales charges (loads) or redemption fees. If these transaction costs had been included, your costs would have been higher. The "Expenses Paid per $1,000" line of the tables is useful in comparing ongoing expenses only and will not help you determine the relative total expenses of owning different funds.
12
Credit Suisse Small Cap Core Fund
Semiannual Investment Adviser's Report (continued)
April 30, 2008 (unaudited)
Expenses and Value of a $1,000 Investment
for the six month period ended April 30, 2008
| Actual Fund Return | Common Class | Class A | Class B | Class C | |||||||||||||||
| Beginning Account Value 11/1/07 | $ | 1,000.00 | $ | 1,000.00 | $ | 1,000.00 | $ | 1,000.00 | |||||||||||
| Ending Account Value 4/30/08 | $ | 863.10 | $ | 863.10 | $ | 860.00 | $ | 859.50 | |||||||||||
| Expenses Paid per $1,000* | $ | 7.09 | $ | 7.13 | $ | 10.59 | $ | 10.59 | |||||||||||
| Hypothetical 5% Fund Return | |||||||||||||||||||
| Beginning Account Value 11/1/07 | $ | 1,000.00 | $ | 1,000.00 | $ | 1,000.00 | $ | 1,000.00 | |||||||||||
| Ending Account Value 4/30/08 | $ | 1,017.26 | $ | 1,017.21 | $ | 1,013.48 | $ | 1,013.48 | |||||||||||
| Expenses Paid per $1,000* | $ | 7.67 | $ | 7.72 | $ | 11.46 | $ | 11.46 | |||||||||||
| Common Class | Class A | Class B | Class C | ||||||||||||||||
| Annualized Expense Ratios* | 1.53 | % | 1.54 | % | 2.29 | % | 2.29 | % | |||||||||||
* Expenses are equal to the Fund's annualized expense ratio for each share class, multiplied by the average account value over the period, multiplied by the number of days in the most recent fiscal half year period, then divided by 366.
The "Expense Paid per $1,000" and the "Annualized Expense Ratios" in the tables are based on actual expenses paid by the Fund during the period, net of fee waivers and/or expense reimbursements. If those fee waivers and/or expense reimbursements had not been in effect, the Fund's actual expenses would have been higher.
For more information, please refer to the Fund's prospectus.
13
Credit Suisse Small Cap Core Fund
Semiannual Investment Adviser's Report (continued)
April 30, 2008 (unaudited)
SECTOR BREAKDOWN*
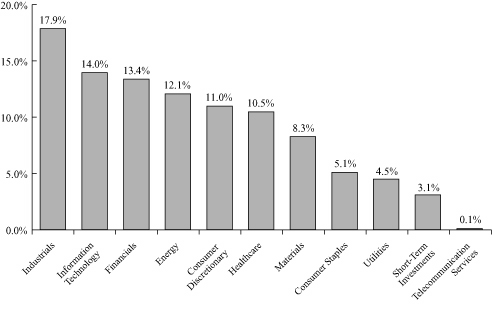
* Expressed as a percentage of total investments (excluding security lending collateral) and may vary over time.
14
Credit Suisse Large Cap Value Fund
Schedule of Investments
April 30, 2008 (unaudited)
| Number of Shares | Value | ||||||||||
| COMMON STOCKS (99.7%) | |||||||||||
| Aerospace & Defense (0.9%) | |||||||||||
| Boeing Co. | 17,300 | $ | 1,468,078 | ||||||||
| Northrop Grumman Corp. | 3,200 | 235,424 | |||||||||
| Raytheon Co. | 6,200 | 396,614 | |||||||||
| 2,100,116 | |||||||||||
| Air Freight & Couriers (0.1%) | |||||||||||
| FedEx Corp. | 1,800 | 172,566 | |||||||||
| Ryder System, Inc. | 2,023 | 138,515 | |||||||||
| 311,081 | |||||||||||
| Airlines (0.3%) | |||||||||||
| Southwest Airlines Co.§ | 44,000 | 582,560 | |||||||||
| Auto Components (0.7%) | |||||||||||
| Autoliv, Inc.§ | 11,300 | 692,012 | |||||||||
| BorgWarner, Inc.§ | 13,500 | 663,525 | |||||||||
| Johnson Controls, Inc. | 5,000 | 176,300 | |||||||||
| 1,531,837 | |||||||||||
| Automobiles (0.7%) | |||||||||||
| General Motors Corp.§ | 71,700 | 1,663,440 | |||||||||
| Hertz Global Holdings, Inc.*§ | 4,197 | 53,973 | |||||||||
| 1,717,413 | |||||||||||
| Banks (9.5%) | |||||||||||
| Astoria Financial Corp. | 3,172 | 75,176 | |||||||||
| Bank of America Corp. | 164,790 | 6,186,217 | |||||||||
| Bank of New York Mellon Corp. | 53,000 | 2,307,090 | |||||||||
| BB&T Corp.§ | 5,200 | 178,308 | |||||||||
| Fulton Financial Corp.§ | 6,384 | 79,609 | |||||||||
| Hudson City Bancorp, Inc. | 11,628 | 222,444 | |||||||||
| Huntington Bancshares, Inc. | 14,403 | 135,244 | |||||||||
| National City Corp.§ | 21,694 | 136,672 | |||||||||
| Northern Trust Corp. | 20,400 | 1,511,844 | |||||||||
| Popular, Inc.§ | 24,300 | 303,021 | |||||||||
| SunTrust Banks, Inc. | 21,061 | 1,174,151 | |||||||||
| The Colonial BancGroup, Inc.§ | 17,400 | 141,636 | |||||||||
| U.S. Bancorp | 64,053 | 2,170,756 | |||||||||
| Wachovia Corp.§ | 77,398 | 2,256,152 | |||||||||
| Washington Federal, Inc.§ | 3,189 | 75,930 | |||||||||
| Wells Fargo & Co. | 170,200 | 5,063,450 | |||||||||
| Whitney Holding Corp.§ | 2,522 | 59,040 | |||||||||
| Wilmington Trust Corp.§ | 2,533 | 83,285 | |||||||||
| Zions Bancorporation§ | 4,141 | 191,935 | |||||||||
| 22,351,960 | |||||||||||
| Beverages (1.5%) | |||||||||||
| Coca-Cola Co. | 9,500 | 559,265 | |||||||||
| Hansen Natural Corp.*§ | 7,000 | 247,730 | |||||||||
| Molson Coors Brewing Co. Class B | 5,700 | 312,588 | |||||||||
See Accompanying Notes to Financial Statements.
15
Credit Suisse Large Cap Value Fund
Schedule of Investments (continued)
April 30, 2008 (unaudited)
| Number of Shares | Value | ||||||||||
| COMMON STOCKS | |||||||||||
| Beverages | |||||||||||
| Pepsi Bottling Group, Inc. | 40,700 | $ | 1,371,997 | ||||||||
| PepsiAmericas, Inc. | 43,100 | 1,107,670 | |||||||||
| 3,599,250 | |||||||||||
| Biotechnology (0.3%) | |||||||||||
| Amgen, Inc.* | 5,700 | 238,659 | |||||||||
| Biogen Idec, Inc.* | 4,000 | 242,760 | |||||||||
| Invitrogen Corp.*§ | 3,200 | 299,424 | |||||||||
| 780,843 | |||||||||||
| Building Products (0.4%) | |||||||||||
| Lennox International, Inc. | 14,800 | 490,472 | |||||||||
| Masco Corp. | 12,860 | 234,181 | |||||||||
| USG Corp.*§ | 2,874 | 101,481 | |||||||||
| 826,134 | |||||||||||
| Chemicals (1.1%) | |||||||||||
| Air Products and Chemicals, Inc. | 4,079 | 401,496 | |||||||||
| Dow Chemical Co. | 16,100 | 646,415 | |||||||||
| E.I. du Pont de Nemours & Co. | 3,800 | 185,858 | |||||||||
| Eastman Chemical Co.§ | 2,856 | 209,916 | |||||||||
| Lubrizol Corp. | 18,800 | 1,096,416 | |||||||||
| The Mosaic Co.* | 1,200 | 147,012 | |||||||||
| 2,687,113 | |||||||||||
| Commercial Services & Supplies (0.8%) | |||||||||||
| DST Systems, Inc.*§ | 16,800 | 1,005,312 | |||||||||
| Steelcase, Inc. Class A§ | 82,000 | 908,560 | |||||||||
| 1,913,872 | |||||||||||
| Communications Equipment (0.1%) | |||||||||||
| Motorola, Inc. | 18,300 | 182,268 | |||||||||
| Computers & Peripherals (1.4%) | |||||||||||
| International Business Machines Corp. | 1,000 | 120,700 | |||||||||
| Lexmark International, Inc. Class A* | 18,600 | 583,854 | |||||||||
| Seagate Technology | 65,900 | 1,243,533 | |||||||||
| Western Digital Corp.* | 43,900 | 1,272,661 | |||||||||
| 3,220,748 | |||||||||||
| Construction & Engineering (0.0%) | |||||||||||
| Shaw Group, Inc.* | 258 | 12,750 | |||||||||
| Containers & Packaging (0.0%) | |||||||||||
| Owens-Illinois, Inc.* | 343 | 18,916 | |||||||||
| Diversified Financials (10.3%) | |||||||||||
| Ameriprise Financial, Inc. | 18,400 | 873,816 | |||||||||
| Capital One Financial Corp.§ | 14,769 | 782,757 | |||||||||
| Citigroup, Inc. | 235,100 | 5,940,977 | |||||||||
| Discover Financial Services | 29,500 | 537,195 | |||||||||
See Accompanying Notes to Financial Statements.
16
Credit Suisse Large Cap Value Fund
Schedule of Investments (continued)
April 30, 2008 (unaudited)
| Number of Shares | Value | ||||||||||
| COMMON STOCKS | |||||||||||
| Diversified Financials | |||||||||||
| Fannie Mae | 5,900 | $ | 166,970 | ||||||||
| Federated Investors, Inc. Class B§ | 10,600 | 354,888 | |||||||||
| Freddie Mac | 6,200 | 154,442 | |||||||||
| GLG Partners, Inc.§ | 86,700 | 715,275 | |||||||||
| Goldman Sachs Group, Inc. | 10,700 | 2,047,659 | |||||||||
| Janus Capital Group, Inc.§ | 51,800 | 1,453,508 | |||||||||
| JPMorgan Chase & Co. | 110,200 | 5,251,030 | |||||||||
| Lehman Brothers Holdings, Inc.§ | 22,800 | 1,008,672 | |||||||||
| Marshall & Ilsley Corp.§ | 9,588 | 239,508 | |||||||||
| Merrill Lynch & Co., Inc. | 6,500 | 323,895 | |||||||||
| Morgan Stanley | 36,648 | 1,781,093 | |||||||||
| Nasdaq OMX Group, Inc.*§ | 31,000 | 1,129,950 | |||||||||
| Nymex Holdings, Inc. | 2,400 | 222,240 | |||||||||
| State Street Corp. | 18,000 | 1,298,520 | |||||||||
| 24,282,395 | |||||||||||
| Diversified Telecommunication Services (6.3%) | |||||||||||
| AT&T, Inc. | 229,605 | 8,888,010 | |||||||||
| FairPoint Communications, Inc.§ | 2,644 | 24,351 | |||||||||
| Sprint Nextel Corp. | 25,800 | 206,142 | |||||||||
| Time Warner Cable, Inc. Class A* | 6,700 | 187,600 | |||||||||
| Verizon Communications, Inc. | 140,200 | 5,394,896 | |||||||||
| Windstream Corp. | 21,200 | 248,888 | |||||||||
| 14,949,887 | |||||||||||
| Electric Utilities (4.8%) | |||||||||||
| Alliant Energy Corp. | 39,500 | 1,487,965 | |||||||||
| American Electric Power Co, Inc. | 14,425 | 643,788 | |||||||||
| Constellation Energy Group | 15,100 | 1,278,215 | |||||||||
| Dominion Resources, Inc.§ | 20,200 | 876,478 | |||||||||
| DTE Energy Co.§ | 9,100 | 366,821 | |||||||||
| Edison International | 35,600 | 1,857,252 | |||||||||
| Entergy Corp. | 7,800 | 895,908 | |||||||||
| FPL Group, Inc. | 15,400 | 1,020,866 | |||||||||
| Mirant Corp.*§ | 2,378 | 97,760 | |||||||||
| NSTAR§ | 3,816 | 122,913 | |||||||||
| Pepco Holdings, Inc. | 30,500 | 759,755 | |||||||||
| Pinnacle West Capital Corp.§ | 3,576 | 121,369 | |||||||||
| PPL Corp. | 3,490 | 167,590 | |||||||||
| Public Service Enterprise Group, Inc. | 35,600 | 1,563,196 | |||||||||
| TECO Energy, Inc. | 7,501 | 120,091 | |||||||||
| 11,379,967 | |||||||||||
| Electrical Equipment (0.5%) | |||||||||||
| Energizer Holdings, Inc.*§ | 13,800 | 1,091,028 | |||||||||
| Electronic Equipment & Instruments (0.2%) | |||||||||||
| Avnet, Inc.* | 15,400 | 403,326 | |||||||||
| Intersil Corp. Class A | 2,092 | 55,898 | |||||||||
| 459,224 | |||||||||||
See Accompanying Notes to Financial Statements.
17
Credit Suisse Large Cap Value Fund
Schedule of Investments (continued)
April 30, 2008 (unaudited)
| Number of Shares | Value | ||||||||||
| COMMON STOCKS | |||||||||||
| Energy Equipment & Services (0.0%) | |||||||||||
| ENSCO International, Inc.§ | 376 | $ | 23,962 | ||||||||
| Food & Drug Retailing (0.7%) | |||||||||||
| Kroger Co. | 44,400 | 1,209,900 | |||||||||
| Safeway, Inc. | 16,800 | 530,880 | |||||||||
| 1,740,780 | |||||||||||
| Food Products (1.8%) | |||||||||||
| Campbell Soup Co. | 7,800 | 271,440 | |||||||||
| Corn Products International, Inc.§ | 34,200 | 1,586,196 | |||||||||
| Kellogg Co. | 20,700 | 1,059,219 | |||||||||
| Kraft Foods, Inc. Class A | 39,400 | 1,246,222 | |||||||||
| Wm. Wrigley Jr. Co. | 1,022 | 77,836 | |||||||||
| 4,240,913 | |||||||||||
| Gas Utilities (0.4%) | |||||||||||
| UGI Corp. | 39,300 | 1,021,800 | |||||||||
| Healthcare Equipment & Supplies (0.9%) | |||||||||||
| Boston Scientific Corp.* | 13,000 | 173,290 | |||||||||
| IMS Health, Inc. | 30,500 | 754,875 | |||||||||
| Kinetic Concepts, Inc.* | 27,400 | 1,086,684 | |||||||||
| 2,014,849 | |||||||||||
| Healthcare Providers & Services (1.1%) | |||||||||||
| Aetna, Inc. | 28,300 | 1,233,880 | |||||||||
| CIGNA Corp. | 8,800 | 375,848 | |||||||||
| Humana, Inc.* | 3,100 | 148,149 | |||||||||
| Quest Diagnostics, Inc. | 6,000 | 301,080 | |||||||||
| WellPoint, Inc.* | 10,728 | 533,718 | |||||||||
| 2,592,675 | |||||||||||
| Hotels, Restaurants & Leisure (0.4%) | |||||||||||
| Carnival Corp. | 4,100 | 164,697 | |||||||||
| McDonald's Corp. | 13,400 | 798,372 | |||||||||
| 963,069 | |||||||||||
| Household Durables (0.8%) | |||||||||||
| American Greetings Corp. Class A§ | 14,200 | 254,180 | |||||||||
| NVR, Inc.*§ | 1,100 | 674,850 | |||||||||
| Whirlpool Corp.§ | 11,900 | 866,082 | |||||||||
| 1,795,112 | |||||||||||
| Household Products (1.9%) | |||||||||||
| Clorox Co. | 5,100 | 270,300 | |||||||||
| Procter & Gamble Co. | 62,800 | 4,210,740 | |||||||||
| 4,481,040 | |||||||||||
See Accompanying Notes to Financial Statements.
18
Credit Suisse Large Cap Value Fund
Schedule of Investments (continued)
April 30, 2008 (unaudited)
| Number of Shares | Value | ||||||||||
| COMMON STOCKS | |||||||||||
| Industrial Conglomerates (5.9%) | |||||||||||
| 3M Co. | 3,300 | $ | 253,770 | ||||||||
| Carlisle Companies, Inc.§ | 20,900 | 603,592 | |||||||||
| General Electric Co. | 304,800 | 9,966,960 | |||||||||
| Honeywell International, Inc. | 5,200 | 308,880 | |||||||||
| KBR, Inc. | 6,061 | 174,799 | |||||||||
| Reynolds American, Inc. | 8,200 | 441,570 | |||||||||
| Tyco International, Ltd. | 46,300 | 2,166,377 | |||||||||
| 13,915,948 | |||||||||||
| Insurance (9.5%) | |||||||||||
| ACE, Ltd. | 11,031 | 665,059 | |||||||||
| Aflac, Inc. | 22,600 | 1,506,742 | |||||||||
| Allied World Assurance Holdings, Ltd. | 5,300 | 218,519 | |||||||||
| Allstate Corp. | 3,500 | 176,260 | |||||||||
| American Financial Group, Inc. | 48,150 | 1,320,273 | |||||||||
| American International Group, Inc. | 45,600 | 2,106,720 | |||||||||
| Arch Capital Group, Ltd.* | 12,700 | 897,255 | |||||||||
| Assurant, Inc. | 20,000 | 1,300,000 | |||||||||
| Chubb Corp. | 3,400 | 180,098 | |||||||||
| CNA Financial Corp.§ | 45,400 | 1,217,174 | |||||||||
| Endurance Specialty Holdings, Ltd.§ | 36,200 | 1,344,106 | |||||||||
| Erie Indemnity Co. Class A§ | 1,306 | 69,767 | |||||||||
| Hanover Insurance Group, Inc. | 1,767 | 79,303 | |||||||||
| Hartford Financial Services Group, Inc. | 2,200 | 156,794 | |||||||||
| Leucadia National Corp.§ | 5,823 | 298,254 | |||||||||
| Loews Corp. | 48,600 | 2,046,546 | |||||||||
| Markel Corp.* | 364 | 158,122 | |||||||||
| MetLife, Inc. | 17,000 | 1,034,450 | |||||||||
| Prudential Financial, Inc. | 24,800 | 1,877,608 | |||||||||
| Reinsurance Group of America, Inc. | 12,900 | 670,542 | |||||||||
| RenaissanceRe Holdings, Ltd. | 12,600 | 648,144 | |||||||||
| SAFECO Corp. | 3,235 | 215,904 | |||||||||
| StanCorp Financial Group, Inc. | 13,000 | 666,120 | |||||||||
| The PMI Group, Inc.§ | 3,107 | 17,492 | |||||||||
| Torchmark Corp. | 23,900 | 1,547,286 | |||||||||
| Transatlantic Holdings, Inc. | 624 | 40,466 | |||||||||
| Travelers Companies, Inc. | 9,000 | 453,600 | |||||||||
| Unitrin, Inc.§ | 1,638 | 62,146 | |||||||||
| Unum Group | 13,400 | 311,014 | |||||||||
| W.R. Berkley Corp. | 29,900 | 768,131 | |||||||||
| XL Capital, Ltd. Class A§ | 5,868 | 204,734 | |||||||||
| 22,258,629 | |||||||||||
| Internet Software & Services (0.1%) | |||||||||||
| IAC/InterActiveCorp* | 15,100 | 314,231 | |||||||||
| IT Consulting & Services (0.2%) | |||||||||||
| Accenture, Ltd. Class A | 13,800 | 518,190 | |||||||||
See Accompanying Notes to Financial Statements.
19
Credit Suisse Large Cap Value Fund
Schedule of Investments (continued)
April 30, 2008 (unaudited)
| Number of Shares | Value | ||||||||||
| COMMON STOCKS | |||||||||||
| Leisure Equipment & Products (0.7%) | |||||||||||
| Callaway Golf Co.§ | 28,400 | $ | 390,216 | ||||||||
| Mattel, Inc.§ | 64,800 | 1,215,000 | |||||||||
| 1,605,216 | |||||||||||
| Machinery (2.9%) | |||||||||||
| AGCO Corp.* | 1,103 | 66,323 | |||||||||
| Cummins, Inc. | 27,600 | 1,729,140 | |||||||||
| Deere & Co. | 8,100 | 680,967 | |||||||||
| Dover Corp. | 21,200 | 1,048,764 | |||||||||
| Eaton Corp. | 15,200 | 1,335,168 | |||||||||
| Manitowoc Company, Inc.§ | 8,300 | 313,906 | |||||||||
| Parker Hannifin Corp. | 16,700 | 1,333,495 | |||||||||
| The Timken Co. | 7,900 | 285,585 | |||||||||
| 6,793,348 | |||||||||||
| Media (2.5%) | |||||||||||
| Cablevision Systems Corp.*§ | 44,500 | 1,023,500 | |||||||||
| Clear Channel Communications, Inc. | 14,299 | 431,115 | |||||||||
| Comcast Corp. Class A | 8,700 | 178,785 | |||||||||
| News Corp. Class A | 13,000 | 232,700 | |||||||||
| Regal Entertainment Group Class A§ | 70,800 | 1,342,368 | |||||||||
| Time Warner, Inc. | 54,300 | 806,355 | |||||||||
| Walt Disney Co.§ | 55,400 | 1,796,622 | |||||||||
| 5,811,445 | |||||||||||
| Metals & Mining (1.9%) | |||||||||||
| Alcoa, Inc. | 30,174 | 1,049,452 | |||||||||
| Alpha Natural Resources, Inc.* | 7,100 | 345,415 | |||||||||
| Freeport-McMoRan Copper & Gold, Inc. | 11,200 | 1,274,000 | |||||||||
| Nucor Corp. | 14,000 | 1,057,000 | |||||||||
| Southern Copper Corp.§ | 7,200 | 826,272 | |||||||||
| 4,552,139 | |||||||||||
| Multiline Retail (0.2%) | |||||||||||
| Big Lots, Inc.*§ | 13,100 | 354,093 | |||||||||
| Wal-Mart Stores, Inc. | 2,300 | 133,354 | |||||||||
| 487,447 | |||||||||||
| Oil & Gas (18.8%) | |||||||||||
| Anadarko Petroleum Corp. | 5,500 | 366,080 | |||||||||
| Apache Corp. | 9,600 | 1,292,928 | |||||||||
| Chesapeake Energy Corp.§ | 3,700 | 191,290 | |||||||||
| Chevron Corp. | 101,400 | 9,749,610 | |||||||||
| ConocoPhillips | 74,400 | 6,409,560 | |||||||||
| Devon Energy Corp. | 14,500 | 1,644,300 | |||||||||
| Exxon Mobil Corp. | 176,500 | 16,426,855 | |||||||||
| Frontier Oil Corp. | 41,000 | 1,018,850 | |||||||||
| Marathon Oil Corp. | 40,300 | 1,836,471 | |||||||||
See Accompanying Notes to Financial Statements.
20
Credit Suisse Large Cap Value Fund
Schedule of Investments (continued)
April 30, 2008 (unaudited)
| Number of Shares | Value | ||||||||||
| COMMON STOCKS | |||||||||||
| Oil & Gas | |||||||||||
| Murphy Oil Corp. | 15,000 | $ | 1,355,100 | ||||||||
| Occidental Petroleum Corp. | 46,100 | 3,835,981 | |||||||||
| Valero Energy Corp. | 2,300 | 112,355 | |||||||||
| 44,239,380 | |||||||||||
| Paper & Forest Products (0.4%) | |||||||||||
| International Paper Co. | 35,900 | 939,503 | |||||||||
| Pharmaceuticals (3.9%) | |||||||||||
| Bristol-Myers Squibb Co. | 15,000 | 329,550 | |||||||||
| Johnson & Johnson | 38,800 | 2,603,092 | |||||||||
| Merck & Company, Inc. | 13,447 | 511,524 | |||||||||
| Pfizer, Inc. | 251,900 | 5,065,709 | |||||||||
| Sepracor, Inc.* | 28,400 | 612,020 | |||||||||
| Watson Pharmaceuticals, Inc.*§ | 4,300 | 133,472 | |||||||||
| 9,255,367 | |||||||||||
| Road & Rail (0.2%) | |||||||||||
| CSX Corp. | 3,000 | 188,850 | |||||||||
| Norfolk Southern Corp. | 3,100 | 184,698 | |||||||||
| 373,548 | |||||||||||
| Semiconductor Equipment & Products (1.2%) | |||||||||||
| Analog Devices, Inc. | 15,800 | 508,918 | |||||||||
| Cree, Inc.*§ | 2,299 | 59,774 | |||||||||
| MEMC Electronic Materials, Inc.* | 12,100 | 761,937 | |||||||||
| Microchip Technology, Inc. | 12,700 | 466,725 | |||||||||
| Teradyne, Inc.* | 3,117 | 41,425 | |||||||||
| Texas Instruments, Inc. | 34,800 | 1,014,768 | |||||||||
| 2,853,547 | |||||||||||
| Software (0.4%) | |||||||||||
| Autodesk, Inc.* | 21,800 | 828,400 | |||||||||
| Specialty Retail (1.8%) | |||||||||||
| Abercrombie & Fitch Co. Class A | 8,600 | 639,066 | |||||||||
| AnnTaylor Stores Corp.* | 9,200 | 232,760 | |||||||||
| Bare Escentuals, Inc.*§ | 4,800 | 109,488 | |||||||||
| J. Crew Group, Inc.* | 3,700 | 175,750 | |||||||||
| Lowe's Companies, Inc. | 7,300 | 183,887 | |||||||||
| RadioShack Corp.§ | 77,000 | 1,070,300 | |||||||||
| The Gap, Inc. | 72,300 | 1,346,226 | |||||||||
| The Home Depot, Inc. | 6,000 | 172,800 | |||||||||
| The TJX Companies, Inc. | 12,000 | 386,640 | |||||||||
| 4,316,917 | |||||||||||
| Textiles & Apparel (0.0%) | |||||||||||
| Jones Apparel Group, Inc. | 3,111 | 49,247 | |||||||||
See Accompanying Notes to Financial Statements.
21
Credit Suisse Large Cap Value Fund
Schedule of Investments (continued)
April 30, 2008 (unaudited)
| Number of Shares | Value | ||||||||||
| COMMON STOCKS | |||||||||||
| Tobacco (1.2%) | |||||||||||
| Altria Group, Inc. | 21,900 | $ | 438,000 | ||||||||
| Loews Corp. Carolina Group | 18,600 | 1,221,462 | |||||||||
| Philip Morris International, Inc.* | 21,900 | 1,117,557 | |||||||||
| UST, Inc.§ | 2,400 | 124,968 | |||||||||
| 2,901,987 | |||||||||||
| TOTAL COMMON STOCKS (Cost $216,189,611) | 234,888,051 | ||||||||||
| SHORT-TERM INVESTMENTS (12.1%) | |||||||||||
| State Street Navigator Prime Portfolio§§ | 28,038,065 | 28,038,065 | |||||||||
| Par (000) | |||||||||||
| State Street Bank and Trust Co. Euro Time Deposit, 1.100%, 5/01/08 | $ | 413 | 413,000 | ||||||||
| TOTAL SHORT-TERM INVESTMENTS (Cost $28,451,065) | 28,451,065 | ||||||||||
| TOTAL INVESTMENTS AT VALUE (111.8%) (Cost $244,640,676) | 263,339,116 | ||||||||||
| LIABILITIES IN EXCESS OF OTHER ASSETS (-11.8%) | (27,801,364 | ) | |||||||||
| NET ASSETS (100.0%) | $ | 235,537,752 | |||||||||
* Non-income producing security.
§ Security or portion thereof is out on loan.
§§ Represents security purchased with cash collateral received for securities on loan.
See Accompanying Notes to Financial Statements.
22
Credit Suisse Small Cap Core Fund
Schedule of Investments
April 30, 2008 (unaudited)
| Number of Shares | Value | ||||||||||
| COMMON STOCKS (97.1%) | |||||||||||
| Aerospace & Defense (1.7%) | |||||||||||
| Alliant Techsystems, Inc.* | 6,100 | $ | 670,878 | ||||||||
| Cubic Corp. | 28,200 | 764,502 | |||||||||
| Curtiss-Wright Corp. | 25,900 | 1,229,991 | |||||||||
| Orbital Sciences Corp.* | 2,000 | 53,820 | |||||||||
| Teledyne Technologies, Inc.* | 2,000 | 117,460 | |||||||||
| 2,836,651 | |||||||||||
| Air Freight & Couriers (0.2%) | |||||||||||
| Hub Group, Inc. Class A* | 12,500 | 408,625 | |||||||||
| Airlines (0.3%) | |||||||||||
| Allegiant Travel Co* | 400 | 10,900 | |||||||||
| SkyWest, Inc. | 22,200 | 422,466 | |||||||||
| 433,366 | |||||||||||
| Auto Components (1.5%) | |||||||||||
| Aftermarket Technology Corp.* | 6,800 | 155,788 | |||||||||
| ArvinMeritor, Inc.§ | 1,000 | 14,940 | |||||||||
| Autoliv, Inc. | 2,700 | 165,348 | |||||||||
| Cooper Tire & Rubber Co. | 34,600 | 454,644 | |||||||||
| Lear Corp.* | 5,100 | 145,707 | |||||||||
| LKQ Corp.* | 73,600 | 1,601,536 | |||||||||
| 2,537,963 | |||||||||||
| Banks (4.7%) | |||||||||||
| Boston Private Financial Holdings, Inc.§ | 11,800 | 109,740 | |||||||||
| Brookline Bancorp, Inc.§ | 2,000 | 21,600 | |||||||||
| Cascade Bancorp§ | 24,000 | 218,880 | |||||||||
| Cathay General Bancorp§ | 7,600 | 129,580 | |||||||||
| Central Pacific Financial Corp.§ | 25,500 | 468,180 | |||||||||
| Citizens Republic Bancorp, Inc.§ | 25,300 | 208,725 | |||||||||
| Corus Bankshares, Inc.§ | 2,900 | 21,257 | |||||||||
| Downey Financial Corp.§ | 600 | 8,484 | |||||||||
| East West Bancorp, Inc.§ | 42,700 | 608,048 | |||||||||
| First Bancorp. | 22,000 | 226,380 | |||||||||
| First Citizens BancShares, Inc. | 1,400 | 197,078 | |||||||||
| First Financial Bancorp. | 24,000 | 314,880 | |||||||||
| Flagstar Bancorp, Inc.§ | 1,700 | 10,404 | |||||||||
| Frontier Financial Corp.§ | 25,400 | 406,400 | |||||||||
| Hancock Holding Co.§ | 2,000 | 82,540 | |||||||||
| Hanmi Financial Corp.§ | 38,400 | 268,416 | |||||||||
| Pacific Capital Bancorp§ | 9,700 | 197,686 | |||||||||
| Prosperity Bancshares, Inc.§ | 18,200 | 563,654 | |||||||||
| Provident Bankshares Corp.§ | 38,100 | 488,061 | |||||||||
| Santander Bancorp§ | 19,200 | 217,152 | |||||||||
| South Financial Group, Inc.§ | 24,126 | 145,721 | |||||||||
| Sterling Financial Corp.§ | 37,900 | 462,759 | |||||||||
| Susquehanna Bancshares, Inc.§ | 2,000 | 39,780 | |||||||||
| SVB Financial Group*§ | 14,000 | 681,240 | |||||||||
See Accompanying Notes to Financial Statements.
23
Credit Suisse Small Cap Core Fund
Schedule of Investments (continued)
April 30, 2008 (unaudited)
| Number of Shares | Value | ||||||||||
| COMMON STOCKS | |||||||||||
| Banks | |||||||||||
| Synovus Financial Corp.§ | 24,900 | $ | 294,816 | ||||||||
| The Colonial BancGroup, Inc.§ | 1,200 | 9,768 | |||||||||
| UMB Financial Corp. | 2,000 | 99,280 | |||||||||
| United Community Banks, Inc.§ | 34,300 | 470,939 | |||||||||
| Webster Financial Corp. | 10,000 | 260,500 | |||||||||
| Whitney Holding Corp. | 26,900 | 629,729 | |||||||||
| Wintrust Financial Corp.§ | 2,000 | 63,440 | |||||||||
| 7,925,117 | |||||||||||
| Beverages (0.3%) | |||||||||||
| Boston Beer Company, Inc. Class A*§ | 9,400 | 416,420 | |||||||||
| Biotechnology (3.1%) | |||||||||||
| BioMarin Pharmaceutical, Inc.* | 23,300 | 849,518 | |||||||||
| Cubist Pharmaceuticals, Inc.*§ | 16,100 | 311,696 | |||||||||
| Exelixis, Inc.*§ | 1,700 | 12,937 | |||||||||
| IDEXX Laboratories, Inc.* | 20,600 | 1,095,920 | |||||||||
| LifeCell Corp.*§ | 12,000 | 609,360 | |||||||||
| Martek Biosciences Corp.* | 17,300 | 609,998 | |||||||||
| OSI Pharmaceuticals, Inc.* | 4,900 | 169,785 | |||||||||
| Pharmanet Development Group, Inc.*§ | 24,100 | 575,026 | |||||||||
| Regeneron Pharmaceuticals, Inc.* | 26,500 | 519,930 | |||||||||
| Savient Pharmaceuticals, Inc.* | 14,600 | 318,864 | |||||||||
| ViroPharma, Inc.*§ | 3,532 | 32,353 | |||||||||
| XenoPort, Inc.* | 3,100 | 132,618 | |||||||||
| 5,238,005 | |||||||||||
| Building Products (0.1%) | |||||||||||
| Drew Industries, Inc.*§ | 7,400 | 180,486 | |||||||||
| NCI Building Systems, Inc.* | 500 | 12,070 | |||||||||
| 192,556 | |||||||||||
| Chemicals (3.4%) | |||||||||||
| Ashland, Inc. | 3,700 | 196,174 | |||||||||
| Calgon Carbon Corp.*§ | 19,000 | 270,750 | |||||||||
| CF Industries Holdings, Inc. | 10,000 | 1,337,000 | |||||||||
| Chemtura Corp. | 1,800 | 12,456 | |||||||||
| FMC Corp. | 10,900 | 684,302 | |||||||||
| H.B. Fuller Co. | 2,000 | 46,160 | |||||||||
| Innospec, Inc. | 22,700 | 462,853 | |||||||||
| Lubrizol Corp. | 13,600 | 793,152 | |||||||||
| NewMarket Corp. | 4,400 | 285,692 | |||||||||
| Olin Corp. | 16,300 | 328,771 | |||||||||
| OM Group, Inc.*§ | 23,000 | 1,259,480 | |||||||||
| W.R. Grace & Co.* | 500 | 12,680 | |||||||||
| 5,689,470 | |||||||||||
See Accompanying Notes to Financial Statements.
24
Credit Suisse Small Cap Core Fund
Schedule of Investments (continued)
April 30, 2008 (unaudited)
| Number of Shares | Value | ||||||||||
| COMMON STOCKS | |||||||||||
| Commercial Services & Supplies (4.4%) | |||||||||||
| Arbitron, Inc.§ | 2,000 | $ | 95,680 | ||||||||
| Atlas Air Worldwide Holdings, Inc.* | 14,100 | 855,588 | |||||||||
| Basin Water, Inc.*§ | 2,200 | 8,624 | |||||||||
| Brink's Co. | 11,700 | 851,175 | |||||||||
| Career Education Corp.*§ | 900 | 18,135 | |||||||||
| CDI Corp. | 4,000 | 108,800 | |||||||||
| Clean Harbors, Inc.* | 6,900 | 455,193 | |||||||||
| Con-way, Inc. | 3,600 | 166,500 | |||||||||
| Consolidated Graphics, Inc.* | 6,300 | 366,471 | |||||||||
| Corinthian Colleges, Inc.*§ | 1,700 | 19,295 | |||||||||
| Covanta Holding Corp.* | 7,400 | 197,062 | |||||||||
| CSG Systems International, Inc.* | 12,400 | 150,040 | |||||||||
| Darling International, Inc.* | 47,300 | 722,271 | |||||||||
| DeVry, Inc. | 3,100 | 176,700 | |||||||||
| FactSet Research Systems, Inc.§ | 2,000 | 120,060 | |||||||||
| G&K Services, Inc. Class A | 8,400 | 264,852 | |||||||||
| Global Cash Access Holdings, Inc.*§ | 2,100 | 12,978 | |||||||||
| Heidrick & Struggles International, Inc.§ | 5,900 | 176,587 | |||||||||
| Hewitt Associates, Inc. Class A* | 3,300 | 135,300 | |||||||||
| Intermec, Inc.* | 600 | 12,672 | |||||||||
| Koppers Holdings, Inc. | 9,700 | 469,868 | |||||||||
| Korn/Ferry International* | 700 | 13,062 | |||||||||
| Net 1 UEPS Technologies, Inc.* | 500 | 11,720 | |||||||||
| Pre-Paid Legal Services, Inc.*§ | 10,400 | 454,896 | |||||||||
| Stericycle, Inc.* | 3,400 | 181,492 | |||||||||
| Strayer Education, Inc. | 900 | 167,121 | |||||||||
| Team, Inc.* | 5,600 | 166,488 | |||||||||
| Tetra Technologies, Inc.*§ | 9,700 | 204,961 | |||||||||
| Watson Wyatt Worldwide, Inc. Class A | 14,000 | 820,680 | |||||||||
| 7,404,271 | |||||||||||
| Communications Equipment (0.4%) | |||||||||||
| Arris Group, Inc.* | 60,684 | 491,541 | |||||||||
| Plantronics, Inc. | 7,000 | 174,370 | |||||||||
| 665,911 | |||||||||||
| Computers & Peripherals (0.6%) | |||||||||||
| Hutchinson Technology, Inc.*§ | 26,900 | 380,366 | |||||||||
| NCR Corp.* | 20,200 | 497,526 | |||||||||
| Smart Modular Technologies, Inc.* | 15,600 | 94,068 | |||||||||
| 971,960 | |||||||||||
| Construction & Engineering (1.5%) | |||||||||||
| Dycom Industries, Inc.* | 1,000 | 14,380 | |||||||||
| EMCOR Group, Inc.* | 2,000 | 50,120 | |||||||||
| Perini Corp.* | 9,700 | 350,946 | |||||||||
| Shaw Group, Inc.* | 41,800 | 2,065,756 | |||||||||
| 2,481,202 | |||||||||||
See Accompanying Notes to Financial Statements.
25
Credit Suisse Small Cap Core Fund
Schedule of Investments (continued)
April 30, 2008 (unaudited)
| Number of Shares | Value | ||||||||||
| COMMON STOCKS | |||||||||||
| Containers & Packaging (0.5%) | |||||||||||
| Myers Industries, Inc. | 12,000 | $ | 150,960 | ||||||||
| Rock-Tenn Co. Class A | 18,400 | 624,312 | |||||||||
| 775,272 | |||||||||||
| Distributor (0.0%) | |||||||||||
| Pool Corp. | 2,000 | 43,660 | |||||||||
| Diversified Financials (1.2%) | |||||||||||
| Bankrate, Inc.*§ | 5,300 | 276,872 | |||||||||
| CBIZ, Inc.*§ | 23,600 | 209,332 | |||||||||
| FCStone Group, Inc.*§ | 4,600 | 190,532 | |||||||||
| Federated Investors, Inc. Class B | 8,500 | 284,580 | |||||||||
| GAMCO Investors, Inc. Class A§ | 5,100 | 234,651 | |||||||||
| Greenhill & Company, Inc.§ | 3,200 | 208,160 | |||||||||
| IndyMac Bancorp, Inc.§ | 2,500 | 8,125 | |||||||||
| MF Global, Ltd.* | 7,100 | 93,507 | |||||||||
| Nelnet, Inc. Class A§ | 1,000 | 12,790 | |||||||||
| optionsXpress Holdings, Inc.§ | 16,500 | 354,255 | |||||||||
| The First Marblehead Corp.§ | 1,600 | 5,920 | |||||||||
| World Acceptance Corp.*§ | 4,900 | 192,962 | |||||||||
| 2,071,686 | |||||||||||
| Diversified Telecommunication Services (0.1%) | |||||||||||
| Cbeyond, Inc.*§ | 600 | 11,844 | |||||||||
| CenturyTel, Inc. | 5,100 | 165,495 | |||||||||
| General Communication, Inc. Class A*§ | 1,900 | 11,799 | |||||||||
| PAETEC Holding Corp.*§ | 1,900 | 14,649 | |||||||||
| 203,787 | |||||||||||
| Electric Utilities (1.1%) | |||||||||||
| Black Hills Corp.§ | 3,600 | 140,436 | |||||||||
| El Paso Electric Co.* | 30,800 | 695,156 | |||||||||
| Hawaiian Electric Industries, Inc.§ | 16,300 | 401,795 | |||||||||
| ITC Holdings Corp.§ | 6,500 | 362,570 | |||||||||
| Ormat Technologies, Inc. | 4,200 | 207,060 | |||||||||
| 1,807,017 | |||||||||||
| Electronic Equipment & Instruments (6.2%) | |||||||||||
| Acuity Brands, Inc.§ | 15,600 | 746,304 | |||||||||
| American Superconductor Corp.*§ | 500 | 12,640 | |||||||||
| Analogic Corp. | 4,800 | 276,432 | |||||||||
| Anixter International, Inc.*§ | 13,500 | 769,095 | |||||||||
| AZZ, Inc.*§ | 3,600 | 96,048 | |||||||||
| Belden, Inc. | 16,400 | 553,336 | |||||||||
| Benchmark Electronics, Inc.* | 33,200 | 590,296 | |||||||||
| Checkpoint Systems, Inc.* | 2,000 | 51,860 | |||||||||
| Daktronics, Inc.§ | 2,000 | 29,580 | |||||||||
| EnerSys*§ | 17,600 | 411,840 | |||||||||
| FLIR Systems, Inc.*§ | 49,600 | 1,702,768 | |||||||||
| Ingram Micro, Inc.* | 10,400 | 176,904 | |||||||||
See Accompanying Notes to Financial Statements.
26
Credit Suisse Small Cap Core Fund
Schedule of Investments (continued)
April 30, 2008 (unaudited)
| Number of Shares | Value | ||||||||||
| COMMON STOCKS | |||||||||||
| Electronic Equipment & Instruments | |||||||||||
| Littelfuse, Inc.* | 9,600 | $ | 352,896 | ||||||||
| Methode Electronics, Inc. | 40,100 | 434,684 | |||||||||
| Mettler-Toledo International, Inc.* | 4,800 | 457,248 | |||||||||
| Molex, Inc. | 14,500 | 411,510 | |||||||||
| MTS Systems Corp. | 11,100 | 381,618 | |||||||||
| Plexus Corp.* | 14,800 | 356,532 | |||||||||
| Regal-Beloit Corp. | 15,400 | 571,186 | |||||||||
| Riverbed Technology, Inc.* | 900 | 12,303 | |||||||||
| Rofin-Sinar Technologies, Inc.* | 3,700 | 140,896 | |||||||||
| Technitrol, Inc. | 14,700 | 308,700 | |||||||||
| Trimble Navigation, Ltd.*§ | 15,500 | 508,245 | |||||||||
| Varian, Inc.* | 8,600 | 437,998 | |||||||||
| Woodward Governor Co. | 19,300 | 678,009 | |||||||||
| 10,468,928 | |||||||||||
| Energy Equipment & Services (6.1%) | |||||||||||
| Atwood Oceanics, Inc.* | 13,300 | 1,339,177 | |||||||||
| Core Laboratories NV* | 7,500 | 939,600 | |||||||||
| Dril-Quip, Inc.* | 9,500 | 543,020 | |||||||||
| GulfMark Offshore, Inc.*§ | 5,200 | 310,960 | |||||||||
| Helmerich & Payne, Inc. | 6,700 | 360,125 | |||||||||
| ION Geophysical Corp.*§ | 2,000 | 31,860 | |||||||||
| Lufkin Industries, Inc. | 7,200 | 543,240 | |||||||||
| NATCO Group, Inc. Class A* | 10,400 | 526,240 | |||||||||
| Oceaneering International, Inc.* | 18,300 | 1,222,074 | |||||||||
| Oil States International, Inc.* | 28,400 | 1,421,704 | |||||||||
| Tidewater, Inc. | 8,300 | 541,326 | |||||||||
| Trico Marine Services, Inc.*§ | 9,100 | 342,979 | |||||||||
| Unit Corp.* | 17,400 | 1,105,074 | |||||||||
| W-H Energy Services, Inc.* | 13,300 | 1,027,957 | |||||||||
| 10,255,336 | |||||||||||
| Food & Drug Retailing (2.6%) | |||||||||||
| Casey's General Stores, Inc.§ | 18,000 | 398,340 | |||||||||
| Flowers Foods, Inc. | 48,500 | 1,255,665 | |||||||||
| Longs Drug Stores Corp. | 23,600 | 945,416 | |||||||||
| Nash Finch Co.§ | 8,700 | 318,246 | |||||||||
| Performance Food Group Co.* | 11,000 | 368,060 | |||||||||
| Terra Industries, Inc.* | 27,600 | 1,044,936 | |||||||||
| The Great Atlantic & Pacific Tea Company, Inc.*§ | 2,000 | 55,040 | |||||||||
| 4,385,703 | |||||||||||
| Food Products (1.5%) | |||||||||||
| Cal-Maine Foods, Inc.§ | 8,800 | 260,040 | |||||||||
| Chiquita Brands International, Inc.*§ | 6,500 | 147,875 | |||||||||
| Corn Products International, Inc. | 13,300 | 616,854 | |||||||||
| Del Monte Foods Co. | 14,100 | 127,182 | |||||||||
| Fresh Del Monte Produce, Inc.* | 18,500 | 586,265 | |||||||||
See Accompanying Notes to Financial Statements.
27
Credit Suisse Small Cap Core Fund
Schedule of Investments (continued)
April 30, 2008 (unaudited)
| Number of Shares | Value | ||||||||||
| COMMON STOCKS | |||||||||||
| Food Products | |||||||||||
| Herbalife, Ltd.§ | 8,600 | $ | 376,508 | ||||||||
| Hormel Foods Corp. | 7,600 | 299,516 | |||||||||
| Ralcorp Holdings, Inc.* | 2,000 | 122,080 | |||||||||
| 2,536,320 | |||||||||||
| Forestry & Paper (0.1%) | |||||||||||
| Louisiana-Pacific Corp.§ | 1,300 | 14,963 | |||||||||
| Neenah Paper, Inc. | 2,000 | 45,960 | |||||||||
| Wausau Paper Corp.§ | 2,500 | 19,350 | |||||||||
| 80,273 | |||||||||||
| Gas Utilities (3.3%) | |||||||||||
| Atmos Energy Corp. | 29,200 | 808,256 | |||||||||
| Energen Corp. | 13,800 | 941,712 | |||||||||
| MDU Resources Group, Inc. | 5,100 | 147,237 | |||||||||
| National Fuel Gas Co. | 16,700 | 854,706 | |||||||||
| Northwest Natural Gas Co.§ | 10,800 | 484,596 | |||||||||
| ONEOK, Inc. | 6,300 | 303,156 | |||||||||
| Southern Union Co. | 42,700 | 1,093,974 | |||||||||
| UGI Corp. | 35,600 | 925,600 | |||||||||
| 5,559,237 | |||||||||||
| Healthcare Equipment & Supplies (1.6%) | |||||||||||
| Accuray, Inc.*§ | 1,600 | 12,528 | |||||||||
| Bruker Corp.* | 800 | 9,696 | |||||||||
| Haemonetics Corp.* | 16,900 | 967,187 | |||||||||
| Integra LifeSciences Holdings*§ | 2,000 | 84,740 | |||||||||
| Kinetic Concepts, Inc.* | 12,500 | 495,750 | |||||||||
| Mentor Corp. | 2,000 | 58,540 | |||||||||
| Meridian Bioscience, Inc.§ | 15,899 | 428,160 | |||||||||
| STERIS Corp. | 11,800 | 326,978 | |||||||||
| SurModics, Inc.*§ | 5,400 | 240,138 | |||||||||
| 2,623,717 | |||||||||||
| Healthcare Providers & Services (5.4%) | |||||||||||
| Air Methods Corp.*§ | 14,900 | 597,490 | |||||||||
| Amedisys, Inc.*§ | 13,499 | 699,248 | |||||||||
| Amerigroup Corp.* | 26,300 | 683,537 | |||||||||
| AmSurg Corp.* | 12,700 | 324,358 | |||||||||
| Apria Healthcare Group, Inc.* | 7,200 | 126,864 | |||||||||
| Centene Corp.* | 2,000 | 36,740 | |||||||||
| eResearch Technology, Inc.* | 11,700 | 142,506 | |||||||||
| Kindred Healthcare, Inc.* | 6,200 | 147,126 | |||||||||
| MAXIMUS, Inc. | 5,900 | 223,728 | |||||||||
| MedCath Corp.*§ | 3,300 | 61,248 | |||||||||
| Molina Healthcare, Inc.*§ | 16,300 | 404,729 | |||||||||
| Owens & Minor, Inc. | 14,000 | 634,480 | |||||||||
| PARAXEL International Corp.* | 35,800 | 909,320 | |||||||||
| Pediatrix Medical Group, Inc.* | 17,700 | 1,203,954 | |||||||||
See Accompanying Notes to Financial Statements.
28
Credit Suisse Small Cap Core Fund
Schedule of Investments (continued)
April 30, 2008 (unaudited)
| Number of Shares | Value | ||||||||||
| COMMON STOCKS | |||||||||||
| Healthcare Providers & Services | |||||||||||
| Pharmaceutical Product Development, Inc. | 15,300 | $ | 633,726 | ||||||||
| Res-Care, Inc.* | 17,700 | 288,333 | |||||||||
| Sunrise Senior Living, Inc.* | 15,400 | 330,330 | |||||||||
| WellCare Health Plans, Inc.* | 35,400 | 1,549,812 | |||||||||
| 8,997,529 | |||||||||||
| Hotels, Restaurants & Leisure (2.8%) | |||||||||||
| Bob Evans Farms, Inc. | 7,000 | 196,490 | |||||||||
| CBRL Group, Inc.§ | 10,500 | 387,870 | |||||||||
| CEC Entertainment, Inc.* | 11,900 | 442,680 | |||||||||
| Chipotle Mexican Grill, Inc. Class B*§ | 3,500 | 297,395 | |||||||||
| Choice Hotels International, Inc. | 4,300 | 148,307 | |||||||||
| CKE Restaurants, Inc.§ | 3,000 | 31,470 | |||||||||
| Isle of Capri Casinos, Inc.* | 1,600 | 10,784 | |||||||||
| Jack in the Box, Inc.* | 36,800 | 984,400 | |||||||||
| Landry's Restaurants, Inc.§ | 16,200 | 258,714 | |||||||||
| Live Nation, Inc.*§ | 1,000 | 13,790 | |||||||||
| Lodgian, Inc.* | 1,100 | 10,681 | |||||||||
| Morgans Hotel Group Co.*§ | 800 | 11,192 | |||||||||
| P.F. Chang's China Bistro, Inc.*§ | 10,100 | 313,403 | |||||||||
| Panera Bread Co. Class A* | 2,000 | 104,520 | |||||||||
| Papa John's International, Inc.*§ | 12,300 | 332,100 | |||||||||
| Ruby Tuesday, Inc.§ | 1,600 | 13,616 | |||||||||
| Shuffle Master, Inc.*§ | 2,300 | 11,293 | |||||||||
| Sonic Corp.*§ | 2,000 | 43,980 | |||||||||
| Texas Roadhouse, Inc. Class A*§ | 2,000 | 23,600 | |||||||||
| Triarc Companies, Inc. Class B§ | 1,700 | 12,070 | |||||||||
| WMS Industries, Inc.*§ | 30,200 | 1,092,938 | |||||||||
| 4,741,293 | |||||||||||
| Household Durables (0.6%) | |||||||||||
| KB Home§ | 9,300 | 209,250 | |||||||||
| Kimball International, Inc. Class B | 1,100 | 11,297 | |||||||||
| La-Z-Boy, Inc.§ | 1,500 | 9,555 | |||||||||
| Meritage Homes Corp*§ | 600 | 11,382 | |||||||||
| NVR, Inc.* | 500 | 306,750 | |||||||||
| Tupperware Brands Corp. | 8,100 | 319,140 | |||||||||
| Universal Electronics, Inc.*§ | 2,000 | 51,400 | |||||||||
| 918,774 | |||||||||||
| Industrial Conglomerates (0.9%) | |||||||||||
| Walter Industries, Inc. | 21,200 | 1,470,432 | |||||||||
| Insurance (2.9%) | |||||||||||
| Allied World Assurance Holdings, Ltd. | 3,700 | 152,551 | |||||||||
| American Equity Investment Life Holding Co.§ | 13,600 | 131,240 | |||||||||
| American Financial Group, Inc. | 6,400 | 175,488 | |||||||||
| Arch Capital Group, Ltd.* | 2,000 | 141,300 | |||||||||
| Argo Group International Holdings, Ltd.* | 5,700 | 204,174 | |||||||||
| Aspen Insurance Holdings, Ltd. | 10,600 | 275,494 | |||||||||
See Accompanying Notes to Financial Statements.
29
Credit Suisse Small Cap Core Fund
Schedule of Investments (continued)
April 30, 2008 (unaudited)
| Number of Shares | Value | ||||||||||
| COMMON STOCKS | |||||||||||
| Insurance | |||||||||||
| Conseco, Inc.* | 13,100 | $ | 152,615 | ||||||||
| Endurance Specialty Holdings, Ltd. | 3,400 | 126,242 | |||||||||
| HealthExtras, Inc.* | 2,000 | 56,440 | |||||||||
| Infinity Property & Casualty Corp. | 6,500 | 251,940 | |||||||||
| Max Capital Group, Ltd. | 4,900 | 114,709 | |||||||||
| MGIC Investment Corp.§ | 10,200 | 132,906 | |||||||||
| Navigators Group, Inc.* | 4,500 | 220,500 | |||||||||
| Philadelphia Consolidated Holding Corp.* | 23,000 | 848,240 | |||||||||
| Platinum Underwriters Holdings, Ltd. | 3,900 | 139,893 | |||||||||
| ProAssurance Corp.*§ | 7,600 | 402,268 | |||||||||
| Radian Group, Inc.§ | 21,100 | 113,940 | |||||||||
| Selective Insurance Group, Inc. | 21,900 | 466,908 | |||||||||
| State Auto Financial Corp. | 7,700 | 212,135 | |||||||||
| United Fire & Casualty Co. | 8,900 | 293,255 | |||||||||
| Zenith National Insurance Corp. | 7,100 | 263,694 | |||||||||
| 4,875,932 | |||||||||||
| Internet & Catalog Retail (0.2%) | |||||||||||
| Blue Nile, Inc.*§ | 5,100 | 253,317 | |||||||||
| Coldwater Creek, Inc.*§ | 2,400 | 12,816 | |||||||||
| GSI Commerce, Inc.* | 900 | 12,528 | |||||||||
| 278,661 | |||||||||||
| Internet Software & Services (1.1%) | |||||||||||
| Acme Packet, Inc.*§ | 1,500 | 13,725 | |||||||||
| Allscripts Heathcare Solutions, Inc.*§ | 1,200 | 13,392 | |||||||||
| InfoSpace, Inc. | 40,400 | 487,224 | |||||||||
| j2 Global Communications, Inc.*§ | 17,600 | 376,640 | |||||||||
| Sohu.com, Inc.*§ | 12,800 | 884,864 | |||||||||
| United Online, Inc. | 2,000 | 21,360 | |||||||||
| 1,797,205 | |||||||||||
| IT Consulting & Services (0.4%) | |||||||||||
| Acxiom Corp. | 13,000 | 153,790 | |||||||||
| CACI International, Inc. Class A*§ | 9,700 | 486,164 | |||||||||
| 639,954 | |||||||||||
| Leisure Equipment & Products (0.7%) | |||||||||||
| GeoEye, Inc.* | 3,800 | 87,514 | |||||||||
| JAKKS Pacific, Inc.*§ | 14,500 | 340,605 | |||||||||
| Polaris Industries, Inc.§ | 11,900 | 553,945 | |||||||||
| RC2 Corp.* | 13,000 | 240,500 | |||||||||
| Smith & Wesson Holding Corp.*§ | 2,400 | 18,000 | |||||||||
| 1,240,564 | |||||||||||
| Machinery (5.9%) | |||||||||||
| AGCO Corp.* | 18,600 | 1,118,418 | |||||||||
| American Railcar Industries, Inc.§ | 600 | 12,372 | |||||||||
| Applied Industrial Technologies, Inc. | 14,500 | 350,320 | |||||||||
| Badger Meter, Inc.§ | 5,200 | 270,764 | |||||||||
See Accompanying Notes to Financial Statements.
30
Credit Suisse Small Cap Core Fund
Schedule of Investments (continued)
April 30, 2008 (unaudited)
| Number of Shares | Value | ||||||||||
| COMMON STOCKS | |||||||||||
| Machinery | |||||||||||
| Columbus McKinnon Corp.* | 6,800 | $ | 192,508 | ||||||||
| Dionex Corp.* | 14,700 | 1,149,834 | |||||||||
| EnPro Industries, Inc.*§ | 7,000 | 254,100 | |||||||||
| Esterline Technologies Corp.* | 11,400 | 634,524 | |||||||||
| Flowserve Corp. | 2,200 | 272,998 | |||||||||
| FreightCar America, Inc. | 3,300 | 126,720 | |||||||||
| Gardner Denver, Inc.* | 25,900 | 1,203,055 | |||||||||
| H&E Equipment Services, Inc.*§ | 10,800 | 141,588 | |||||||||
| Kaydon Corp.§ | 13,800 | 722,706 | |||||||||
| Kennametal, Inc. | 5,500 | 191,235 | |||||||||
| Manitowoc Company, Inc. | 22,000 | 832,040 | |||||||||
| MFRI, Inc.* | 800 | 12,608 | |||||||||
| Mueller Industries, Inc. | 17,500 | 566,475 | |||||||||
| Reliance Steel & Aluminum Co. | 3,700 | 224,886 | |||||||||
| Robbins & Myers, Inc. | 15,300 | 609,858 | |||||||||
| RSC Holdings, Inc.*§ | 11,900 | 109,956 | |||||||||
| Taylor Devices, Inc.* | 2,600 | 13,130 | |||||||||
| Titan International, Inc.§ | 3,800 | 135,394 | |||||||||
| Valmont Industries, Inc.§ | 7,600 | 748,296 | |||||||||
| 9,893,785 | |||||||||||
| Marine (0.4%) | |||||||||||
| Genco Shipping & Trading, Ltd.§ | 8,000 | 541,200 | |||||||||
| Kirby Corp.* | 2,000 | 109,680 | |||||||||
| 650,880 | |||||||||||
| Media (0.7%) | |||||||||||
| Getty Images, Inc.* | 400 | 13,060 | |||||||||
| Harte-Hanks, Inc.§ | 9,300 | 127,038 | |||||||||
| Interactive Data Corp. | 6,100 | 164,578 | |||||||||
| LodgeNet Interactive Corp.*§ | 2,000 | 12,240 | |||||||||
| Meredith Corp.§ | 3,600 | 116,676 | |||||||||
| Netflix, Inc.*§ | 9,700 | 310,206 | |||||||||
| R.H. Donnelley Corp.*§ | 2,400 | 11,496 | |||||||||
| Regal Entertainment Group Class A§ | 16,200 | 307,152 | |||||||||
| Scholastic Corp.*§ | 6,100 | 171,715 | |||||||||
| Warner Music Group Corp. | 2,300 | 19,987 | |||||||||
| 1,254,148 | |||||||||||
| Metals & Mining (4.4%) | |||||||||||
| AK Steel Holding Corp. | 14,800 | 929,144 | |||||||||
| Century Aluminum Co.* | 13,600 | 942,344 | |||||||||
| Cleveland-Cliffs, Inc. | 11,000 | 1,764,400 | |||||||||
| Compass Minerals International, Inc. | 13,300 | 837,900 | |||||||||
| GrafTech International, Ltd.* | 23,700 | 465,705 | |||||||||
| Hecla Mining Co.* | 65,300 | 669,978 | |||||||||
| Massey Energy Co. | 34,600 | 1,810,618 | |||||||||
| Stillwater Mining Co.*§ | 800 | 11,344 | |||||||||
| 7,431,433 | |||||||||||
See Accompanying Notes to Financial Statements.
31
Credit Suisse Small Cap Core Fund
Schedule of Investments (continued)
April 30, 2008 (unaudited)
| Number of Shares | Value | ||||||||||
| COMMON STOCKS | |||||||||||
| Multiline Retail (0.5%) | |||||||||||
| Big Lots, Inc.*§ | 17,700 | $ | 478,431 | ||||||||
| BJ's Wholesale Club, Inc.* | 5,200 | 198,224 | |||||||||
| Dillard's, Inc. Class A§ | 600 | 12,240 | |||||||||
| Dollar Tree, Inc.* | 5,800 | 183,280 | |||||||||
| Retail Ventures, Inc.*§ | 2,600 | 13,338 | |||||||||
| 885,513 | |||||||||||
| Oil & Gas (6.0%) | |||||||||||
| Bois d'Arc Energy, Inc.*§ | 21,200 | 506,680 | |||||||||
| BPZ Resources, Inc.*§ | 6,800 | 132,464 | |||||||||
| Cabot Oil & Gas Corp. | 32,500 | 1,851,525 | |||||||||
| Comstock Resources, Inc.* | 6,200 | 282,038 | |||||||||
| Concho Resources, Inc.* | 5,400 | 148,878 | |||||||||
| Continental Resources, Inc.*§ | 21,000 | 902,370 | |||||||||
| Frontier Oil Corp. | 7,100 | 176,435 | |||||||||
| Gulfport Energy Corp.*§ | 9,300 | 107,787 | |||||||||
| Helix Energy Solutions Group, Inc.* | 36,200 | 1,250,710 | |||||||||
| Holly Corp. | 5,500 | 228,140 | |||||||||
| Mariner Energy, Inc.* | 10,500 | 289,380 | |||||||||
| Petroleum Development Corp.* | 7,200 | 541,656 | |||||||||
| St. Mary Land & Exploration Co. | 2,000 | 87,440 | |||||||||
| Stone Energy Corp.* | 25,900 | 1,578,346 | |||||||||
| Swift Energy Co.* | 16,500 | 860,310 | |||||||||
| W&T Offshore, Inc. | 27,700 | 1,132,930 | |||||||||
| 10,077,089 | |||||||||||
| Personal Products (0.3%) | |||||||||||
| Chattem, Inc.*§ | 7,000 | 489,160 | |||||||||
| Pharmaceuticals (0.5%) | |||||||||||
| InterMune, Inc.*§ | 700 | 11,095 | |||||||||
| MannKind Corp.*§ | 2,100 | 5,460 | |||||||||
| Nektar Therapeutics* | 1,800 | 8,676 | |||||||||
| Obagi Medical Products, Inc.* | 1,500 | 12,015 | |||||||||
| Sciele Pharma, Inc.* | 24,300 | 468,261 | |||||||||
| Sepracor, Inc.* | 6,000 | 129,300 | |||||||||
| Synutra International, Inc.*§ | 400 | 13,280 | |||||||||
| Watson Pharmaceuticals, Inc.* | 6,500 | 201,760 | |||||||||
| 849,847 | |||||||||||
| Real Estate (4.5%) | |||||||||||
| Anthracite Capital, Inc.§ | 12,200 | 95,160 | |||||||||
| Anworth Mortgage Asset Corp. | 6,800 | 45,424 | |||||||||
| Ashford Hospitality Trust | 43,900 | 254,181 | |||||||||
| Brandywine Realty Trust | 17,400 | 303,630 | |||||||||
| BRE Properties, Inc. | 3,600 | 172,620 | |||||||||
| Colonial Properties Trust | 23,200 | 562,136 | |||||||||
| EastGroup Properties, Inc.§ | 9,900 | 472,329 | |||||||||
| Entertainment Properties Trust | 15,700 | 837,752 | |||||||||
See Accompanying Notes to Financial Statements.
32
Credit Suisse Small Cap Core Fund
Schedule of Investments (continued)
April 30, 2008 (unaudited)
| Number of Shares | Value | ||||||||||
| COMMON STOCKS | |||||||||||
| Real Estate | |||||||||||
| Essex Property Trust, Inc. | 8,300 | $ | 987,700 | ||||||||
| FelCor Lodging Trust, Inc. | 22,900 | 288,311 | |||||||||
| HRPT Properties Trust | 42,800 | 296,604 | |||||||||
| Jones Lang LaSalle, Inc. | 4,400 | 341,484 | |||||||||
| Lexington Realty Trust | 27,800 | 400,320 | |||||||||
| Mid-America Apartment Communities, Inc. | 14,200 | 745,500 | |||||||||
| National Health Investors, Inc. | 15,700 | 480,263 | |||||||||
| Parkway Properties, Inc. | 12,400 | 491,784 | |||||||||
| Pennsylvania Real Estate Investment Trust§ | 11,700 | 294,606 | |||||||||
| Ramco-Gershenson Properties Trust | 13,500 | 303,345 | |||||||||
| Realty Income Corp.§ | 9,000 | 236,790 | |||||||||
| 7,609,939 | |||||||||||
| Road & Rail (0.8%) | |||||||||||
| AMERCO*§ | 200 | 11,486 | |||||||||
| Arkansas Best Corp.§ | 14,800 | 584,304 | |||||||||
| Dollar Thrifty Automotive Group, Inc.*§ | 900 | 11,871 | |||||||||
| Forward Air Corp.§ | 2,000 | 68,180 | |||||||||
| Genesee & Wyoming, Inc. Class A* | 9,300 | 331,824 | |||||||||
| Heartland Express, Inc.§ | 2,000 | 30,940 | |||||||||
| J.B. Hunt Transport Services, Inc.§ | 4,600 | 156,262 | |||||||||
| Knight Transportation, Inc.§ | 2,000 | 33,980 | |||||||||
| Pacer International, Inc.§ | 700 | 12,992 | |||||||||
| Werner Enterprises, Inc.§ | 8,900 | 173,105 | |||||||||
| 1,414,944 | |||||||||||
| Semiconductor Equipment & Products (2.9%) | |||||||||||
| Advanced Energy Industries, Inc.* | 30,400 | 425,600 | |||||||||
| Amkor Technology, Inc.*§ | 40,200 | 383,910 | |||||||||
| ATMI, Inc.* | 2,000 | 58,880 | |||||||||
| Brooks Automation, Inc.* | 3,100 | 32,116 | |||||||||
| Cabot Microelectronics Corp.*§ | 12,800 | 435,840 | |||||||||
| Cymer, Inc.*§ | 18,300 | 475,617 | |||||||||
| Diodes, Inc.*§ | 2,000 | 54,080 | |||||||||
| Entegris, Inc.* | 26,300 | 198,302 | |||||||||
| FormFactor, Inc.*§ | 600 | 11,562 | |||||||||
| MKS Instruments, Inc.* | 33,600 | 767,760 | |||||||||
| OmniVision Technologies, Inc.*§ | 28,200 | 452,328 | |||||||||
| ON Semiconductor Corp.*§ | 2,000 | 14,940 | |||||||||
| PMC-Sierra, Inc.*§ | 2,100 | 16,317 | |||||||||
| QLogic Corp.* | 11,200 | 178,752 | |||||||||
| Semtech Corp.* | 12,100 | 196,504 | |||||||||
| Skyworks Solutions, Inc.*§ | 31,100 | 270,259 | |||||||||
| Standard Microsystems Corp.*§ | 6,900 | 204,585 | |||||||||
| Teradyne, Inc.* | 21,100 | 280,419 | |||||||||
| Tessera Technologies, Inc.* | 600 | 12,144 | |||||||||
| Varian Semiconductor Equipment Associates, Inc.* | 49 | 1,795 | |||||||||
| Zoran Corp.* | 34,700 | 456,652 | |||||||||
| 4,928,362 | |||||||||||
See Accompanying Notes to Financial Statements.
33
Credit Suisse Small Cap Core Fund
Schedule of Investments (continued)
April 30, 2008 (unaudited)
| Number of Shares | Value | ||||||||||
| COMMON STOCKS | |||||||||||
| Software (4.2%) | |||||||||||
| ACI Worldwide, Inc.*§ | 600 | $ | 13,260 | ||||||||
| ANSYS, Inc.* | 10,300 | 414,369 | |||||||||
| Aspen Technology, Inc.* | 38,700 | 531,738 | |||||||||
| Cognex Corp. | 2,500 | 63,000 | |||||||||
| Epicor Software Corp.*§ | 19,400 | 155,200 | |||||||||
| Informatica Corp.* | 31,200 | 497,952 | |||||||||
| JDA Software Group, Inc.* | 46,300 | 875,070 | |||||||||
| MICROS Systems, Inc.* | 27,700 | 987,505 | |||||||||
| MicroStrategy, Inc. Class A* | 4,200 | 372,666 | |||||||||
| Parametric Technology Corp.* | 11,500 | 200,445 | |||||||||
| Phoenix Technologies, Ltd.* | 17,100 | 201,609 | |||||||||
| Progress Software Corp.* | 2,000 | 60,460 | |||||||||
| SPSS, Inc.* | 22,500 | 950,400 | |||||||||
| Sybase, Inc.* | 17,300 | 508,966 | |||||||||
| Take-Two Interactive Software, Inc.* | 30,400 | 797,696 | |||||||||
| Taleo Corp. Class A* | 16,900 | 329,550 | |||||||||
| TIBCO Software, Inc.* | 1,800 | 13,806 | |||||||||
| VASCO Data Security International, Inc.*§ | 900 | 9,081 | |||||||||
| VeriFone Holdings, Inc.*§ | 900 | 10,071 | |||||||||
| 6,992,844 | |||||||||||
| Specialty Retail (2.6%) | |||||||||||
| Aaron Rents, Inc.§ | 2,000 | 49,800 | |||||||||
| Aeropostale, Inc.*§ | 10,600 | 336,974 | |||||||||
| Barnes & Noble, Inc.§ | 6,500 | 209,820 | |||||||||
| bebe Stores, Inc.§ | 1,100 | 10,989 | |||||||||
| Buckle, Inc.§ | 6,500 | 315,770 | |||||||||
| Cato Corp. Class A | 9,300 | 160,425 | |||||||||
| Charming Shoppes, Inc.*§ | 2,500 | 12,900 | |||||||||
| Chico's FAS, Inc.* | 1,800 | 12,726 | |||||||||
| Christopher & Banks Corp.§ | 1,200 | 14,220 | |||||||||
| Dress Barn, Inc.*§ | 13,200 | 177,672 | |||||||||
| Hanesbrands, Inc.* | 4,700 | 164,594 | |||||||||
| Jos. A. Bank Clothiers, Inc.*§ | 20,400 | 497,964 | |||||||||
| Men's Wearhouse, Inc. | 38,000 | 1,011,940 | |||||||||
| OfficeMax, Inc. | 600 | 10,962 | |||||||||
| Rent-A-Center, Inc.* | 17,000 | 366,010 | |||||||||
| The Gymboree Corp.* | 2,000 | 86,440 | |||||||||
| The Talbots, Inc.§ | 900 | 7,227 | |||||||||
| Tractor Supply Co.*§ | 11,700 | 416,052 | |||||||||
| United Rentals, Inc.* | 21,100 | 397,524 | |||||||||
| Zumiez, Inc.*§ | 2,700 | 56,565 | |||||||||
| 4,316,574 | |||||||||||
| Textiles & Apparel (1.4%) | |||||||||||
| Brown Shoe Co., Inc.§ | 15,300 | 255,204 | |||||||||
| Crocs, Inc.*§ | 34,900 | 356,329 | |||||||||
| Deckers Outdoor Corp.* | 6,700 | 925,069 | |||||||||
| K-Swiss, Inc. Class A§ | 800 | 11,720 | |||||||||
See Accompanying Notes to Financial Statements.
34
Credit Suisse Small Cap Core Fund
Schedule of Investments (continued)
April 30, 2008 (unaudited)
| Number of Shares | Value | ||||||||||
| COMMON STOCKS | |||||||||||
| Textiles & Apparel | |||||||||||
| Movado Group, Inc. | 11,600 | $ | 253,344 | ||||||||
| Oxford Industries, Inc. | 2,500 | 69,475 | |||||||||
| Quiksilver, Inc.* | 3,000 | 29,190 | |||||||||
| Sealy Corp.§ | 16,200 | 98,820 | |||||||||
| Skechers U.S.A., Inc. Class A* | 600 | 14,190 | |||||||||
| Volcom, Inc.*§ | 600 | 11,394 | |||||||||
| Warnaco Group, Inc.* | 5,700 | 262,998 | |||||||||
| Wolverine World Wide, Inc. | 2,000 | 57,480 | |||||||||
| 2,345,213 | |||||||||||
| Tobacco (0.4%) | |||||||||||
| Universal Corp.§ | 10,400 | 667,576 | |||||||||
| Water Utilities (0.1%) | |||||||||||
| American States Water Co.§ | 4,900 | 171,598 | |||||||||
| Wireless Telecommunication Services (0.0%) | |||||||||||
| Centennial Communications Corp.*§ | 2,100 | 12,726 | |||||||||
| GoAmerica, Inc.*§ | 2,200 | 13,794 | |||||||||
| 26,520 | |||||||||||
| TOTAL COMMON STOCKS (Cost $158,162,900) | 162,978,222 | ||||||||||
| SHORT-TERM INVESTMENTS (24.8%) | |||||||||||
| State Street Navigator Prime Portfolio§§ | 36,339,549 | 36,339,549 | |||||||||
| Par (000) | |||||||||||
| State Street Bank and Trust Co. Euro Time Deposit, 1.100%, 5/01/08 | $ | 5,161 | 5,161,000 | ||||||||
| TOTAL SHORT-TERM INVESTMENTS (Cost $41,500,549) | 41,500,549 | ||||||||||
| TOTAL INVESTMENTS AT VALUE (121.9%) (Cost $199,663,449) | 204,478,771 | ||||||||||
| LIABILITIES IN EXCESS OF OTHER ASSETS (-21.9%) | (36,685,642 | ) | |||||||||
| NET ASSETS (100.0%) | $ | 167,793,129 | |||||||||
* Non-income producing security.
§ Security or portion thereof is out on loan.
§§ Represents security purchased with cash collateral received for securities on loan.
See Accompanying Notes to Financial Statements.
35
Credit Suisse Funds
Statements of Assets and Liabilities
April 30, 2008 (unaudited)
| Large Cap Value Fund | Small Cap Core Fund | ||||||||||
| Assets | |||||||||||
| Investments at value, including collateral for securities on loan of $28,038,065 and $36,339,549 (Cost 244,640,676 and $199,663,449, respectively) (Note 2) | $ | 263,339,1161 | $ | 204,478,7712 | |||||||
| Cash | 922 | 502 | |||||||||
| Receivable for investments sold | 8,037,689 | — | |||||||||
| Dividends receivable | 293,382 | 78,688 | |||||||||
| Receivable for fund shares sold | 238,752 | 131,598 | |||||||||
| Prepaid expenses and other assets | 42,109 | 52,720 | |||||||||
| Total Assets | 271,951,970 | 204,742,279 | |||||||||
| Liabilities | |||||||||||
| Advisory fee payable (Note 3) | 96,116 | 96,420 | |||||||||
| Administrative services fee payable (Note 3) | 15,044 | 1,972 | |||||||||
| Shareholders servicing/Distribution fee payable (Note 3) | 52,945 | 44,363 | |||||||||
| Payable upon return of securities loaned (Note 2) | 28,038,065 | 36,339,549 | |||||||||
| Payable for investments purchased | 7,809,570 | — | |||||||||
| Payable for fund shares redeemed | 137,019 | 229,333 | |||||||||
| Trustees' fee payable | 11,831 | 11,831 | |||||||||
| Other accrued expenses payable | 253,628 | 225,682 | |||||||||
| Total Liabilities | 36,414,218 | 36,949,150 | |||||||||
| Net Assets | |||||||||||
| Capital stock, $.001 par value (Note 6) | 16,858 | 14,024 | |||||||||
| Paid-in capital (Note 6) | 230,421,047 | 176,639,907 | |||||||||
| Undistributed net investment income (loss) | 203,976 | (238,633 | ) | ||||||||
| Accumulated net realized loss on investments | (13,802,569 | ) | (13,437,491 | ) | |||||||
| Net unrealized appreciation from investments | 18,698,440 | 4,815,322 | |||||||||
| Net Assets | $ | 235,537,752 | $ | 167,793,129 | |||||||
| Common Shares | |||||||||||
| Net assets | $ | 438,043 | $ | 28,592,825 | |||||||
| Shares outstanding | 31,543 | 2,357,791 | |||||||||
| Net asset value, offering price, and redemption price per share | $ | 13.89 | $ | 12.13 | |||||||
| Advisor Shares | |||||||||||
| Net assets | $ | 3,617,209 | N/A | ||||||||
| Shares outstanding | 257,379 | N/A | |||||||||
| Net asset value, offering price, and redemption price per share | $ | 14.05 | N/A | ||||||||
See Accompanying Notes to Financial Statements.
36
Credit Suisse Funds
Statements of Assets and Liabilities (continued)
April 30, 2008 (unaudited)
| Large Cap Value Fund | Small Cap Core Fund | ||||||||||
| A Shares | |||||||||||
| Net assets | $ | 224,244,742 | $ | 123,044,587 | |||||||
| Shares outstanding | 16,038,534 | 10,028,976 | |||||||||
| Net asset value and redemption price per share | $ | 13.98 | $ | 12.27 | |||||||
| Maximum offering price per share (net asset value/(1-5.75%)) | $ | 14.83 | $ | 13.02 | |||||||
| B Shares | |||||||||||
| Net assets | $ | 5,617,060 | $ | 6,218,144 | |||||||
| Shares outstanding | 410,833 | 626,493 | |||||||||
| Net asset value and offering price per share | $ | 13.67 | $ | 9.93 | |||||||
| C Shares | |||||||||||
| Net assets | $ | 1,620,698 | $ | 9,937,573 | |||||||
| Shares outstanding | 119,574 | 1,010,871 | |||||||||
| Net asset value and offering price per share | $ | 13.55 | $ | 9.83 | |||||||
1 Including $27,365,071 of securities on loan.
2 Including $35,430,617 of securities on loan.
See Accompanying Notes to Financial Statements.
37
Credit Suisse Funds
Statements of Operations
For the Six Months Ended April 30, 2008 (unaudited)
| Large Cap Value Fund | Small Cap Core Fund | ||||||||||
| Investment Income (Note 2) | |||||||||||
| Dividends | $ | 3,240,456 | $ | 1,046,515 | |||||||
| Interest | 22,172 | 11,680 | |||||||||
| Securities lending | 80,708 | 226,635 | |||||||||
| Foreign taxes withheld | — | (1,165 | ) | ||||||||
| Total investment income | 3,343,336 | 1,283,665 | |||||||||
| Expenses | |||||||||||
| Investment advisory fees (Note 3) | 629,003 | 661,535 | |||||||||
| Administrative services fees (Note 3) | 149,703 | 112,461 | |||||||||
| Shareholder servicing/Distribution fees (Note 3) | |||||||||||
| Common Class | — | 45,359 | |||||||||
| Advisor Class | 10,225 | — | |||||||||
| Class A | 298,185 | 167,681 | |||||||||
| Class B | 33,688 | 34,717 | |||||||||
| Class C | 8,821 | 58,167 | |||||||||
| Transfer agent fees (Note 3) | 267,766 | 182,808 | |||||||||
| Printing fees (Note 3) | 78,761 | 103,730 | |||||||||
| Registration fees | 30,654 | 46,540 | |||||||||
| Audit and tax fees | 23,158 | 23,369 | |||||||||
| Trustees' fees | 12,161 | 12,161 | |||||||||
| Legal fees | 10,177 | 11,712 | |||||||||
| Custodian fees | 7,748 | 24,088 | |||||||||
| Insurance expense | 3,317 | 2,831 | |||||||||
| Commitment fees (Note 4) | 2,583 | 1,181 | |||||||||
| Interest expense (Note 4) | — | 15,997 | |||||||||
| Miscellaneous expense | 13,214 | 17,961 | |||||||||
| Total expenses | 1,579,164 | 1,522,298 | |||||||||
| Net investment income (loss) | 1,764,172 | (238,633 | ) | ||||||||
| Net Realized and Unrealized Gain (Loss) from Investments | |||||||||||
| Net realized loss from investments | (13,256,007 | ) | (11,488,804 | ) | |||||||
| Net change in unrealized appreciation (depreciation) from investments | (21,714,517 | ) | (21,110,248 | ) | |||||||
| Net realized and unrealized loss from investments | (34,970,524 | ) | (32,599,052 | ) | |||||||
| Net decrease in net assets resulting from operations | $ | (33,206,352 | ) | $ | (32,837,685 | ) | |||||
See Accompanying Notes to Financial Statements.
38
Credit Suisse Funds
Statements of Changes in Net Assets
| Large Cap Value Fund | Small Cap Core Fund | ||||||||||||||||||
| For the Six Months Ended April 30, 2008 (unaudited) | For the Year Ended October 31, 2007 | For the Six Months Ended April 30, 2008 (unaudited) | For the Year Ended October 31, 2007 | ||||||||||||||||
| From Operations | |||||||||||||||||||
| Net investment income (loss) | $ | 1,764,172 | $ | 3,402,070 | $ | (238,633 | ) | $ | (1,282,761 | ) | |||||||||
| Net realized gain (loss) from investments and futures contracts | (13,256,007 | ) | 47,875,606 | (11,488,804 | ) | 82,850,616 | |||||||||||||
| Net change in unrealized appreciation (depreciation) from investments | (21,714,517 | ) | (20,353,000 | ) | (21,110,248 | ) | (54,277,099 | ) | |||||||||||
| Net increase (decrease) in net assets resulting from operations | (33,206,352 | ) | 30,924,676 | (32,837,685 | ) | 27,290,756 | |||||||||||||
| From Dividends and Distributions | |||||||||||||||||||
| Dividends from net investment income | |||||||||||||||||||
| Common Class shares | (4,304 | ) | (8,128 | ) | — | (443,533 | ) | ||||||||||||
| Advisor Class shares | (27,810 | ) | (47,395 | ) | — | — | |||||||||||||
| Class A shares | (1,923,717 | ) | (3,148,980 | ) | — | (1,047,496 | ) | ||||||||||||
| Class B shares | (27,095 | ) | (35,780 | ) | — | (7,318 | ) | ||||||||||||
| Class C shares | (7,122 | ) | (7,596 | ) | — | (9,246 | ) | ||||||||||||
| Distributions from net realized gains | |||||||||||||||||||
| Common Class shares | (93,955 | ) | (121,952 | ) | (18,726,370 | ) | (10,787,263 | ) | |||||||||||
| Advisor Class shares | (809,768 | ) | (1,189,286 | ) | — | — | |||||||||||||
| Class A shares | (45,714,836 | ) | (59,880,116 | ) | (55,796,532 | ) | (36,102,988 | ) | |||||||||||
| Class B shares | (1,401,314 | ) | (2,873,710 | ) | (3,314,156 | ) | (2,083,903 | ) | |||||||||||
| Class C shares | (349,709 | ) | (536,230 | ) | (5,876,025 | ) | (2,781,596 | ) | |||||||||||
| Net decrease in net assets resulting from dividends and distributions | (50,359,630 | ) | (67,849,173 | ) | (83,713,083 | ) | (53,263,343 | ) | |||||||||||
| From Capital Share Transactions (Note 6) | |||||||||||||||||||
| Proceeds from sale of shares | 5,709,376 | 21,394,602 | 8,851,908 | 28,165,427 | |||||||||||||||
| Reinvestment of dividends and distributions | 46,328,381 | 62,317,135 | 78,197,396 | 48,478,465 | |||||||||||||||
| Net asset value of shares redeemed | (30,431,405 | ) | (79,174,493 | ) | (53,660,507 | ) | (161,740,661 | ) | |||||||||||
| Net increase (decrease) in net assets from capital share transactions | 21,606,352 | 4,537,244 | 33,388,797 | (85,096,769 | ) | ||||||||||||||
| Net decrease in net assets | (61,959,630 | ) | (32,387,253 | ) | (83,161,971 | ) | (111,069,356 | ) | |||||||||||
| Net Assets | |||||||||||||||||||
| Beginning of period | 297,497,382 | 329,884,635 | 250,955,100 | 362,024,456 | |||||||||||||||
| End of period | $ | 235,537,752 | $ | 297,497,382 | $ | 167,793,129 | $ | 250,955,100 | |||||||||||
| Undistributed net investment income (loss) | $ | 203,976 | $ | 429,852 | $ | (238,633 | ) | $ | — | ||||||||||
See Accompanying Notes to Financial Statements.
39
Credit Suisse Large Cap Value Fund
Financial Highlights
(For a Common Class Share of the Fund Outstanding Throughout Each Period)
| For the Six Months Ended April 30, 2008 | For the Year Ended October 31, | ||||||||||||||||||||||||||
| (unaudited) | 2007 | 2006 | 2005 | 2004 | 2003 | ||||||||||||||||||||||
| Per share data | |||||||||||||||||||||||||||
| Net asset value, beginning of period | $ | 19.17 | $ | 21.93 | $ | 20.97 | $ | 19.98 | $ | 18.61 | $ | 16.82 | |||||||||||||||
| INVESTMENT OPERATIONS | |||||||||||||||||||||||||||
| Net investment income1 | 0.12 | 0.26 | 0.28 | 0.24 | 0.23 | 0.14 | |||||||||||||||||||||
| Net gain (loss) on investments and foreign currency related items (both realized and unrealized) | (2.06 | ) | 1.68 | 3.42 | 2.32 | 1.87 | 2.10 | ||||||||||||||||||||
| Total from investment operations | (1.94 | ) | 1.94 | 3.70 | 2.56 | 2.10 | 2.24 | ||||||||||||||||||||
| LESS DIVIDENDS AND DISTRIBUTIONS | |||||||||||||||||||||||||||
| Dividends from net investment income | (1.67 | ) | (0.25 | ) | (0.26 | ) | (0.25 | ) | (0.23 | ) | (0.14 | ) | |||||||||||||||
| Distributions from net realized gains | (1.67 | ) | (4.45 | ) | (2.48 | ) | (1.32 | ) | (0.50 | ) | (0.31 | ) | |||||||||||||||
| Total dividends and distributions | (3.34 | ) | (4.70 | ) | (2.74 | ) | (1.57 | ) | (0.73 | ) | (0.45 | ) | |||||||||||||||
| Net asset value, end of period | $ | 13.89 | $ | 19.17 | $ | 21.93 | $ | 20.97 | $ | 19.98 | $ | 18.61 | |||||||||||||||
| Total return2 | (11.33 | )% | 10.59 | % | 19.44 | % | 13.34 | % | 11.51 | % | 13.63 | % | |||||||||||||||
| RATIOS AND SUPPLEMENTAL DATA | |||||||||||||||||||||||||||
| Net assets, end of period (000s omitted) | $ | 438 | $ | 570 | $ | 600 | $ | 591 | $ | 664 | $ | 737 | |||||||||||||||
| Ratio of expenses to average net assets | 0.98 | %3 | 0.82 | % | 0.89 | % | 0.91 | % | 0.95 | % | 1.24 | % | |||||||||||||||
| Ratio of net investment income to average net assets | 1.68 | %3 | 1.37 | % | 1.37 | % | 1.15 | % | 1.16 | % | 0.82 | % | |||||||||||||||
| Portfolio turnover rate | 56 | % | 163 | % | 78 | % | 58 | % | 48 | % | 53 | % | |||||||||||||||
1 Per share information is calculated using the average shares outstanding method.
2 Total returns are historical and assume changes in share price and reinvestment of all dividends and distributions. Had certain expenses not been reduced during the periods shown, total returns would have been lower. Total returns for periods less than one year are not annualized.
3 Annualized.
See Accompanying Notes to Financial Statements.
40
Credit Suisse Large Cap Value Fund
Financial Highlights
(For an Advisor Class Share of the Fund Outstanding Throughout Each Period)
| For the Six Months Ended April 30, 2008 | For the Year Ended October 31, | ||||||||||||||||||||||||||
| (unaudited) | 2007 | 2006 | 2005 | 2004 | 20031 | ||||||||||||||||||||||
| Per share data | |||||||||||||||||||||||||||
| Net asset value, beginning of period | $ | 19.33 | $ | 22.08 | $ | 21.10 | $ | 20.09 | $ | 18.71 | $ | 17.84 | |||||||||||||||
| INVESTMENT OPERATIONS | |||||||||||||||||||||||||||
| Net investment income2 | 0.09 | 0.17 | 0.18 | 0.14 | 0.13 | 0.04 | |||||||||||||||||||||
| Net gain (loss) on investments and foreign currency related items (both realized and unrealized) | (2.08 | ) | 1.69 | 3.44 | 2.34 | 1.88 | 0.83 | ||||||||||||||||||||
| Total from investment operations | (1.99 | ) | 1.86 | 3.62 | 2.48 | 2.01 | 0.87 | ||||||||||||||||||||
| LESS DIVIDENDS AND DISTRIBUTIONS | |||||||||||||||||||||||||||
| Dividends from net investment income | (1.62 | ) | (0.16 | ) | (0.16 | ) | (0.15 | ) | (0.13 | ) | (0.00 | )3 | |||||||||||||||
| Distributions from net realized gains | (1.67 | ) | (4.45 | ) | (2.48 | ) | (1.32 | ) | (0.50 | ) | — | ||||||||||||||||
| Total dividends and distributions | (3.29 | ) | (4.61 | ) | (2.64 | ) | (1.47 | ) | (0.63 | ) | — | ||||||||||||||||
| Net asset value, end of period | $ | 14.05 | $ | 19.33 | $ | 22.08 | $ | 21.10 | $ | 20.09 | $ | 18.71 | |||||||||||||||
| Total return4 | (11.45 | )% | 10.01 | % | 18.84 | % | 12.81 | % | 10.96 | % | 4.90 | % | |||||||||||||||
| RATIOS AND SUPPLEMENTAL DATA | |||||||||||||||||||||||||||
| Net assets, end of period (000s omitted) | $ | 3,617 | $ | 5,234 | $ | 5,806 | $ | 8,368 | $ | 12,228 | $ | 22,336 | |||||||||||||||
| Ratio of expenses to average net assets | 1.48 | %5 | 1.32 | % | 1.39 | % | 1.41 | % | 1.45 | % | 1.49 | %5 | |||||||||||||||
| Ratio of net investment income to average net assets | 1.20 | %5 | 0.87 | % | 0.87 | % | 0.65 | % | 0.66 | % | 0.51 | %5 | |||||||||||||||
| Portfolio turnover rate | 56 | % | 163 | % | 78 | % | 58 | % | 48 | % | 53 | % | |||||||||||||||
1 For the period June 6, 2003 (inception date) through October 31, 2003.
2 Per share information is calculated using the average shares outstanding method.
3 This amount represents less than $(0.01) per share.
4 Total returns are historical and assume changes in share price and reinvestment of all dividends and distributions. Had certain expenses not been reduced during the periods shown, total returns would have been lower. Total returns for periods less than one year are not annualized.
5 Annualized.
See Accompanying Notes to Financial Statements.
41
Credit Suisse Large Cap Value Fund
Financial Highlights
(For a Class A Share of the Fund Outstanding Throughout Each Period)
| For the Six Months Ended April 30, 2008 | For the Year Ended October 31, | ||||||||||||||||||||||||||
| (unaudited) | 2007 | 2006 | 2005 | 2004 | 2003 | ||||||||||||||||||||||
| Per share data | |||||||||||||||||||||||||||
| Net asset value, beginning of period | $ | 19.28 | $ | 22.03 | $ | 21.05 | $ | 20.05 | $ | 18.68 | $ | 16.83 | |||||||||||||||
| INVESTMENT OPERATIONS | |||||||||||||||||||||||||||
| Net investment income1 | 0.11 | 0.22 | 0.22 | 0.19 | 0.18 | 0.14 | |||||||||||||||||||||
| Net gain (loss) on investments and foreign currency related items (both realized and unrealized) | (2.10 | ) | 1.69 | 3.45 | 2.33 | 1.87 | 2.15 | ||||||||||||||||||||
| Total from investment operations | (1.99 | ) | 1.91 | 3.67 | 2.52 | 2.05 | 2.29 | ||||||||||||||||||||
| LESS DIVIDENDS AND DISTRIBUTIONS | |||||||||||||||||||||||||||
| Dividends from net investment income | (1.64 | ) | (0.21 | ) | (0.21 | ) | (0.20 | ) | (0.18 | ) | (0.13 | ) | |||||||||||||||
| Distributions from net realized gains | (1.67 | ) | (4.45 | ) | (2.48 | ) | (1.32 | ) | (0.50 | ) | (0.31 | ) | |||||||||||||||
| Total dividends and distributions | (3.31 | ) | (4.66 | ) | (2.69 | ) | (1.52 | ) | (0.68 | ) | (0.44 | ) | |||||||||||||||
| Net asset value, end of period | $ | 13.98 | $ | 19.28 | $ | 22.03 | $ | 21.05 | $ | 20.05 | $ | 18.68 | |||||||||||||||
| Total return2 | (11.49 | )% | 10.32 | % | 19.18 | % | 13.06 | % | 11.19 | % | 13.97 | % | |||||||||||||||
| RATIOS AND SUPPLEMENTAL DATA | |||||||||||||||||||||||||||
| Net assets, end of period (000s omitted) | $ | 224,245 | $ | 280,329 | $ | 305,866 | $ | 300,777 | $ | 302,823 | $ | 306,410 | |||||||||||||||
| Ratio of expenses to average net assets | 1.23 | %3 | 1.07 | % | 1.14 | % | 1.16 | % | 1.20 | % | 1.24 | % | |||||||||||||||
| Ratio of net investment income to average net assets | 1.43 | %3 | 1.12 | % | 1.12 | % | 0.91 | % | 0.91 | % | 0.78 | % | |||||||||||||||
| Portfolio turnover rate | 56 | % | 163 | % | 78 | % | 58 | % | 48 | % | 53 | % | |||||||||||||||
1 Per share information is calculated using the average shares outstanding method.
2 Total returns are historical and assume changes in share price, reinvestment of all dividends and distributions and no sales charge. Had certain expenses not been reduced during the periods shown, total returns would have been lower. Total returns for periods less than one year are not annualized.
3 Annualized.
See Accompanying Notes to Financial Statements.
42
Credit Suisse Large Cap Value Fund
Financial Highlights
(For a Class B Share of the Fund Outstanding Throughout Each Period)
| For the Six Months Ended April 30, 2008 | For the Year Ended October 31, | ||||||||||||||||||||||||||
| (unaudited) | 2007 | 2006 | 2005 | 2004 | 2003 | ||||||||||||||||||||||
| Per share data | |||||||||||||||||||||||||||
| Net asset value, beginning of period | $ | 18.92 | $ | 21.70 | $ | 20.78 | $ | 19.81 | $ | 18.46 | $ | 16.66 | |||||||||||||||
| INVESTMENT OPERATIONS | |||||||||||||||||||||||||||
| Net investment income1 | 0.05 | 0.07 | 0.07 | 0.04 | 0.03 | 0.01 | |||||||||||||||||||||
| Net gain (loss) on investments and foreign currency related items (both realized and unrealized) | (2.05 | ) | 1.66 | 3.39 | 2.30 | 1.85 | 2.13 | ||||||||||||||||||||
| Total from investment operations | (2.00 | ) | 1.73 | 3.46 | 2.34 | 1.88 | 2.14 | ||||||||||||||||||||
| LESS DIVIDENDS AND DISTRIBUTIONS | |||||||||||||||||||||||||||
| Dividends from net investment income | (1.58 | ) | (0.06 | ) | (0.06 | ) | (0.05 | ) | (0.03 | ) | (0.03 | ) | |||||||||||||||
| Distributions from net realized gains | (1.67 | ) | (4.45 | ) | (2.48 | ) | (1.32 | ) | (0.50 | ) | (0.31 | ) | |||||||||||||||
| Total dividends and distributions | (3.25 | ) | (4.51 | ) | (2.54 | ) | (1.37 | ) | (0.53 | ) | (0.34 | ) | |||||||||||||||
| Net asset value, end of period | $ | 13.67 | $ | 18.92 | $ | 21.70 | $ | 20.78 | $ | 19.81 | $ | 18.46 | |||||||||||||||
| Total return2 | (11.81 | )% | 9.49 | % | 18.25 | % | 12.23 | % | 10.40 | % | 13.07 | % | |||||||||||||||
| RATIOS AND SUPPLEMENTAL DATA | |||||||||||||||||||||||||||
| Net assets, end of period (000s omitted) | $ | 5,617 | $ | 9,224 | $ | 14,994 | $ | 20,057 | $ | 25,118 | $ | 29,696 | |||||||||||||||
| Ratio of expenses to average net assets | 1.98 | %3 | 1.82 | % | 1.89 | % | 1.91 | % | 1.95 | % | 1.99 | % | |||||||||||||||
| Ratio of net investment income to average net assets | 0.71 | %3 | 0.39 | % | 0.37 | % | 0.15 | % | 0.16 | % | 0.06 | % | |||||||||||||||
| Portfolio turnover rate | 56 | % | 163 | % | 78 | % | 58 | % | 48 | % | 53 | % | |||||||||||||||
1 Per share information is calculated using the average shares outstanding method.
2 Total returns are historical and assume changes in share price, reinvestment of all dividends and distributions and no sales charge. Had certain expenses not been reduced during the periods shown, total returns would have been lower. Total returns for periods less than one year are not annualized.
3 Annualized.
See Accompanying Notes to Financial Statements.
43
Credit Suisse Large Cap Value Fund
Financial Highlights
(For a Class C Share of the Fund Outstanding Throughout Each Period)
| For the Six Months Ended April 30, 2008 | For the Year Ended October 31, | ||||||||||||||||||||||||||
| (unaudited) | 2007 | 2006 | 2005 | 2004 | 2003 | ||||||||||||||||||||||
| Per share data | |||||||||||||||||||||||||||
| Net asset value, beginning of period | $ | 18.79 | $ | 21.58 | $ | 20.68 | $ | 19.72 | $ | 18.38 | $ | 16.58 | |||||||||||||||
| INVESTMENT OPERATIONS | |||||||||||||||||||||||||||
| Net investment income1 | 0.05 | 0.07 | 0.07 | 0.03 | 0.03 | 0.01 | |||||||||||||||||||||
| Net gain (loss) on investments and foreign currency related items (both realized and unrealized) | (2.04 | ) | 1.65 | 3.37 | 2.30 | 1.84 | 2.13 | ||||||||||||||||||||
| Total from investment operations | (1.99 | ) | 1.72 | 3.44 | 2.33 | 1.87 | 2.14 | ||||||||||||||||||||
| LESS DIVIDENDS AND DISTRIBUTIONS | |||||||||||||||||||||||||||
| Dividends from net investment income | (1.58 | ) | (0.06 | ) | (0.06 | ) | (0.05 | ) | (0.03 | ) | (0.03 | ) | |||||||||||||||
| Distributions from net realized gains | (1.67 | ) | (4.45 | ) | (2.48 | ) | (1.32 | ) | (0.50 | ) | (0.31 | ) | |||||||||||||||
| Total dividends and distributions | (3.25 | ) | (4.51 | ) | (2.54 | ) | (1.37 | ) | (0.53 | ) | (0.34 | ) | |||||||||||||||
| Net asset value, end of period | $ | 13.55 | $ | 18.79 | $ | 21.58 | $ | 20.68 | $ | 19.72 | $ | 18.38 | |||||||||||||||
| Total return2 | (11.84 | )% | 9.50 | % | 18.25 | % | 12.23 | % | 10.39 | % | 13.14 | % | |||||||||||||||
| RATIOS AND SUPPLEMENTAL DATA | |||||||||||||||||||||||||||
| Net assets, end of period (000s omitted) | $ | 1,621 | $ | 2,140 | $ | 2,618 | $ | 3,638 | $ | 3,736 | $ | 3,479 | |||||||||||||||
| Ratio of expenses to average net assets | 1.98 | %3 | 1.82 | % | 1.89 | % | 1.91 | % | 1.95 | % | 1.99 | % | |||||||||||||||
| Ratio of net investment income to average net assets | 0.69 | %3 | 0.39 | % | 0.37 | % | 0.15 | % | 0.16 | % | 0.06 | % | |||||||||||||||
| Portfolio turnover rate | 56 | % | 163 | % | 78 | % | 58 | % | 48 | % | 53 | % | |||||||||||||||
1 Per share information is calculated using the average shares outstanding method.
2 Total returns are historical and assume changes in share price, reinvestment of all dividends and distributions and no sales charge. Had certain expenses not been reduced during the periods shown, total returns would have been lower. Total returns for periods less than one year are not annualized.
3 Annualized.
See Accompanying Notes to Financial Statements.
44
Credit Suisse Small Cap Core Fund
Financial Highlights
(For a Common Class Share of the Fund Outstanding Throughout Each Period)
| For the Six Months Ended April 30, 2008 | For the Year Ended October 31, | ||||||||||||||||||||||||||
| (unaudited) | 2007 | 2006 | 2005 | 2004 | 2003 | ||||||||||||||||||||||
| Per share data | |||||||||||||||||||||||||||
| Net asset value, beginning of period | $ | 22.41 | $ | 24.33 | $ | 23.84 | $ | 22.66 | $ | 20.02 | $ | 18.56 | |||||||||||||||
| INVESTMENT OPERATIONS | |||||||||||||||||||||||||||
| Net investment income (loss)1 | (0.01 | ) | (0.08 | ) | 0.11 | (0.03 | ) | (0.05 | ) | (0.02 | ) | ||||||||||||||||
| Net gain (loss) on investments and futures contracts (both realized and unrealized) | (2.61 | ) | 2.16 | 2.85 | 3.39 | 3.75 | 3.08 | ||||||||||||||||||||
| Total from investment operations | (2.62 | ) | 2.08 | 2.96 | 3.36 | 3.70 | 3.06 | ||||||||||||||||||||
| LESS DIVIDENDS AND DISTRIBUTIONS | |||||||||||||||||||||||||||
| Dividends from net investment income | — | (0.14 | ) | — | — | — | (0.01 | ) | |||||||||||||||||||
| Distributions from net realized gains | (7.66 | ) | (3.86 | ) | (2.47 | ) | (2.18 | ) | (1.06 | ) | (1.59 | ) | |||||||||||||||
| Total dividends and distributions | (7.66 | ) | (4.00 | ) | (2.47 | ) | (2.18 | ) | (1.06 | ) | (1.60 | ) | |||||||||||||||
| Net asset value, end of period | $ | 12.13 | $ | 22.41 | $ | 24.33 | $ | 23.84 | $ | 22.66 | $ | 20.02 | |||||||||||||||
| Total return2 | (13.69 | )% | 9.58 | % | 13.23 | % | 15.56 | % | 19.14 | % | 17.75 | % | |||||||||||||||
| RATIOS AND SUPPLEMENTAL DATA | |||||||||||||||||||||||||||
| Net assets, end of period (000s omitted) | $ | 28,593 | $ | 57,452 | $ | 70,525 | $ | 74,013 | $ | 50,068 | $ | 47,969 | |||||||||||||||
| Ratio of expenses to average net assets | 1.53 | %3 | 1.34 | % | 1.37 | % | 1.38 | % | 1.42 | % | 1.48 | % | |||||||||||||||
| Ratio of net investment income (loss) to average net assets | (0.15 | )%3 | (0.39 | )% | 0.47 | % | (0.16 | )% | (0.22 | )% | (0.10 | )% | |||||||||||||||
| Decrease reflected in above operating expense ratios due to waivers/reimbursements | — | — | — | — | — | 0.04 | % | ||||||||||||||||||||
| Portfolio turnover rate | 82 | % | 262 | % | 67 | % | 43 | % | 41 | % | 30 | % | |||||||||||||||
1 Per share information is calculated using the average shares outstanding method.
2 Total returns are historical and assume changes in share price and reinvestment of all dividends and distributions. Had certain expenses not been reduced during the periods shown, total returns would have been lower. Total returns for periods less than one year are not annualized.
3 Annualized.
See Accompanying Notes to Financial Statements.
45
Credit Suisse Small Cap Core Fund
Financial Highlights
(For a Class A Share of the Fund Outstanding Throughout Each Period)
| For the Six Months Ended April 30, 2008 | For the Year Ended October 31, | ||||||||||||||||||||||||||
| (unaudited) | 2007 | 2006 | 2005 | 2004 | 2003 | ||||||||||||||||||||||
| Per share data | |||||||||||||||||||||||||||
| Net asset value, beginning of period | $ | 22.57 | $ | 24.44 | $ | 23.94 | $ | 22.75 | $ | 20.10 | $ | 18.62 | |||||||||||||||
| INVESTMENT OPERATIONS | |||||||||||||||||||||||||||
| Net investment income (loss)1 | (0.01 | ) | (0.08 | ) | 0.12 | (0.04 | ) | (0.05 | ) | (0.02 | ) | ||||||||||||||||
| Net gain (loss) on investments and futures contracts (both realized and unrealized) | (2.63 | ) | 2.18 | 2.85 | 3.42 | 3.76 | 3.10 | ||||||||||||||||||||
| Total from investment operations | (2.64 | ) | 2.10 | 2.97 | 3.38 | 3.71 | 3.08 | ||||||||||||||||||||
| LESS DIVIDENDS AND DISTRIBUTIONS | |||||||||||||||||||||||||||
| Dividends from net investment income | — | (0.11 | ) | — | — | — | (0.01 | ) | |||||||||||||||||||
| Distributions from net realized gains | (7.66 | ) | (3.86 | ) | (2.47 | ) | (2.19 | ) | (1.06 | ) | (1.59 | ) | |||||||||||||||
| Total dividends and distributions | (7.66 | ) | (3.97 | ) | (2.47 | ) | (2.19 | ) | (1.06 | ) | (1.60 | ) | |||||||||||||||
| Net asset value, end of period | $ | 12.27 | $ | 22.57 | $ | 24.44 | $ | 23.94 | $ | 22.75 | $ | 20.10 | |||||||||||||||
| Total return2 | (13.69 | )% | 9.61 | % | 13.22 | % | 15.54 | % | 19.11 | % | 17.80 | % | |||||||||||||||
| RATIOS AND SUPPLEMENTAL DATA | |||||||||||||||||||||||||||
| Net assets, end of period (000s omitted) | $ | 123,045 | $ | 169,076 | $ | 263,006 | $ | 227,166 | $ | 198,773 | $ | 188,318 | |||||||||||||||
| Ratio of expenses to average net assets | 1.54 | %3 | 1.35 | % | 1.37 | % | 1.38 | % | 1.42 | % | 1.48 | % | |||||||||||||||
| Ratio of net investment income (loss) to average net assets | (0.19 | )%3 | (0.38 | )% | 0.47 | % | (0.16 | )% | (0.22 | )% | (0.11 | )% | |||||||||||||||
| Decrease reflected in above operating expense ratios due to waivers/reimbursements | — | — | — | — | — | 0.04 | % | ||||||||||||||||||||
| Portfolio turnover rate | 82 | % | 262 | % | 67 | % | 43 | % | 41 | % | 30 | % | |||||||||||||||
1 Per share information is calculated using the average shares outstanding method.
2 Total returns are historical and assume changes in share price, reinvestment of all dividends and distributions and no sales charge. Had certain expenses not been reduced during the periods shown, total returns would have been lower. Total returns for periods less than one year are not annualized.
3 Annualized.
See Accompanying Notes to Financial Statements.
46
Credit Suisse Small Cap Core Fund
Financial Highlights
(For a Class B Share of the Fund Outstanding Throughout Each Period)
| For the Six Months Ended April 30, 2008 | For the Year Ended October 31, | ||||||||||||||||||||||||||
| (unaudited) | 2007 | 2006 | 2005 | 2004 | 2003 | ||||||||||||||||||||||
| Per share data | |||||||||||||||||||||||||||
| Net asset value, beginning of period | $ | 19.91 | $ | 22.07 | $ | 21.99 | $ | 21.20 | $ | 18.93 | $ | 17.74 | |||||||||||||||
| INVESTMENT OPERATIONS | |||||||||||||||||||||||||||
| Net investment loss1 | (0.05 | ) | (0.22 | ) | (0.06 | ) | (0.20 | ) | (0.20 | ) | (0.15 | ) | |||||||||||||||
| Net gain (loss) on investments and futures contracts (both realized and unrealized) | (2.27 | ) | 1.93 | 2.61 | 3.17 | 3.53 | 2.93 | ||||||||||||||||||||
| Total from investment operations | (2.32 | ) | 1.71 | 2.55 | 2.97 | 3.33 | 2.78 | ||||||||||||||||||||
| LESS DIVIDENDS AND DISTRIBUTIONS | |||||||||||||||||||||||||||
| Dividends from net investment income | — | (0.01 | ) | — | — | — | — | ||||||||||||||||||||
| Distributions from net realized gains | (7.66 | ) | (3.86 | ) | (2.47 | ) | (2.18 | ) | (1.06 | ) | (1.59 | ) | |||||||||||||||
| Total dividends and distributions | (7.66 | ) | (3.87 | ) | (2.47 | ) | (2.18 | ) | (1.06 | ) | (1.59 | ) | |||||||||||||||
| Net asset value, end of period | $ | 9.93 | $ | 19.91 | $ | 22.07 | $ | 21.99 | $ | 21.20 | $ | 18.93 | |||||||||||||||
| Total return2 | (14.00 | )% | 8.74 | % | 12.41 | % | 14.72 | % | 18.25 | % | 16.88 | % | |||||||||||||||
| RATIOS AND SUPPLEMENTAL DATA | |||||||||||||||||||||||||||
| Net assets, end of period (000s omitted) | $ | 6,218 | $ | 9,122 | $ | 12,465 | $ | 18,133 | $ | 20,425 | $ | 22,669 | |||||||||||||||
| Ratio of expenses to average net assets | 2.29 | %3 | 2.10 | % | 2.12 | % | 2.13 | % | 2.17 | % | 2.23 | % | |||||||||||||||
| Ratio of net investment loss to average net assets | (0.94 | )%3 | (1.13 | )% | (0.28 | )% | (0.91 | )% | (0.97 | )% | (0.86 | )% | |||||||||||||||
| Decrease reflected in above operating expense ratios due to waivers/reimbursements | — | — | — | — | — | 0.04 | % | ||||||||||||||||||||
| Portfolio turnover rate | 82 | % | 262 | % | 67 | % | 43 | % | 41 | % | 30 | % | |||||||||||||||
1 Per share information is calculated using the average shares outstanding method.
2 Total returns are historical and assume changes in share price, reinvestment of all dividends and distributions and no sales charge. Had certain expenses not been reduced during the periods shown, total returns would have been lower. Total returns for periods less than one year are not annualized.
3 Annualized.
See Accompanying Notes to Financial Statements.
47
Credit Suisse Small Cap Core Fund
Financial Highlights
(For a Class C Share of the Fund Outstanding Throughout Each Period)
| For the Six Months Ended April 30, 2008 | For the Year Ended October 31, | ||||||||||||||||||||||||||
| (unaudited) | 2007 | 2006 | 2005 | 2004 | 2003 | ||||||||||||||||||||||
| Per share data | |||||||||||||||||||||||||||
| Net asset value, beginning of period | $ | 19.80 | $ | 21.97 | $ | 21.91 | $ | 21.13 | $ | 18.87 | $ | 17.69 | |||||||||||||||
| INVESTMENT OPERATIONS | |||||||||||||||||||||||||||
| Net investment loss1 | (0.05 | ) | (0.22 | ) | (0.06 | ) | (0.20 | ) | (0.19 | ) | (0.15 | ) | |||||||||||||||
| Net gain (loss) on investments and futures contracts (both realized and unrealized) | (2.26 | ) | 1.92 | 2.59 | 3.16 | 3.51 | 2.92 | ||||||||||||||||||||
| Total from investment operations | (2.31 | ) | 1.70 | 2.53 | 2.96 | 3.32 | 2.77 | ||||||||||||||||||||
| LESS DIVIDENDS AND DSITRIBUTIONS | |||||||||||||||||||||||||||
| Dividends from net investment income | — | (0.01 | ) | — | — | — | — | ||||||||||||||||||||
| Distributions from net realized gains | (7.66 | ) | (3.86 | ) | (2.47 | ) | (2.18 | ) | (1.06 | ) | (1.59 | ) | |||||||||||||||
| Total dividends and distributions | (7.66 | ) | (3.87 | ) | (2.47 | ) | (2.18 | ) | (1.06 | ) | (1.59 | ) | |||||||||||||||
| Net asset value, end of period | $ | 9.83 | $ | 19.80 | $ | 21.97 | $ | 21.91 | $ | 21.13 | $ | 18.87 | |||||||||||||||
| Total return2 | (14.05 | )% | 8.74 | % | 12.36 | % | 14.72 | % | 18.25 | % | 16.87 | % | |||||||||||||||
| RATIOS AND SUPPLEMENTAL DATA | |||||||||||||||||||||||||||
| Net assets, end of period (000s omitted) | $ | 9,938 | $ | 15,305 | $ | 16,028 | $ | 16,079 | $ | 11,613 | $ | 8,138 | |||||||||||||||
| Ratio of expenses to average net assets | 2.29 | %3 | 2.10 | % | 2.12 | % | 2.13 | % | 2.17 | % | 2.23 | % | |||||||||||||||
| Ratio of net investment loss to average net assets | (0.94 | )%3 | (1.14 | )% | (0.28 | )% | (0.91 | )% | (0.97 | )% | (0.86 | )% | |||||||||||||||
| Decrease reflected in above operating expense ratios due to waivers/reimbursements | — | — | — | — | — | 0.04 | % | ||||||||||||||||||||
| Portfolio turnover rate | 82 | % | 262 | % | 67 | % | 43 | % | 41 | % | 30 | % | |||||||||||||||
1 Per share information is calculated using the average shares outstanding method.
2 Total returns are historical and assume changes in share price, reinvestment of all dividends and distributions and no sales charge. Had certain expenses not been reduced during the periods shown, total returns would have been lower. Total returns for periods less than one year are not annualized.
3 Annualized.
See Accompanying Notes to Financial Statements.
48
Credit Suisse Funds
Notes to Financial Statements
April 30, 2008 (unaudited)
Note 1. Organization
The Credit Suisse Capital Funds (the "Trust") is registered under the Investment Company Act of 1940, as amended (the "1940 Act") as an open-end management investment company and currently offers three managed investment funds, two of which, the Credit Suisse Large Cap Value Fund ("Large Cap Value") and Credit Suisse Small Cap Core Fund ("Small Cap Core"), (each a "Fund" and collectively, the "Funds") are contained in this report. The Trust was organized under the laws of the Commonwealth of Massachusetts as a business trust on November 26, 1985. Each Fund is classified as diversified. Investment objectives for each Fund are as follows: Large Cap Value seeks long-term capital appreciation and continuity of income; Small Cap Core seeks a high level of growth of capital.
Large Cap Value offers five classes of shares: Common Class shares, Advisor Class shares, Class A shares, Class B shares and Class C shares. Small Cap Core offers four classes of shares: Common Class shares, Class A shares, Class B shares and Class C shares. Effective December 12, 2001, Large Cap Value closed the Common Class to new investments, except for reinvestment of dividends. Large Cap Value's Common Class shareholders as of the close of business on December 12, 2001 may continue to hold Common Class shares but may not add to their accounts. Although no further shares can be purchased, Large Cap Value's shareholders can redeem their Common Class shares through any available method. The Small Cap Core's Common Class shares are closed to new investors, with certain exceptions as set forth in the prospectus. Each class of shares in each Fund represents an equal pro rata interest in each Fund, except that they bear different expenses, whi ch reflect the difference in the range of services provided to them. Class A shares of each Fund are sold subject to a front-end sales charge of up to 5.75%. Class B shares of each Fund are sold subject to a contingent deferred sales charge which declines from 4% to zero depending on the period of time the shares are held. Class C shares of each Fund are sold subject to a contingent deferred sales charge of 1.00% if redeemed within the first year of purchase.
Note 2. Significant Accounting Policies
A) SECURITY VALUATION — The net asset value of each Fund is determined daily as of the close of regular trading on the New York Stock Exchange, Inc. (the "Exchange") on each day the Exchange is open for business. Equity investments are valued at market value, which is generally determined using the closing price on the exchange or market on which the security is primarily traded at the time of valuation (the "Valuation Time"). If no sales are reported, equity investments are generally valued at the most recent bid
49
Credit Suisse Funds
Notes to Financial Statements (continued)
April 30, 2008 (unaudited)
Note 2. Significant Accounting Policies
quotation as of the Valuation Time or at the lowest asked quotation in the case of a short sale of securities. Debt securities with a remaining maturity greater than 60 days are valued in accordance with the price supplied by a pricing service, which may use a matrix, formula or other objective method that takes into consideration market indices, yield curves and other specific adjustments. Debt obligations that will mature in 60 days or less are valued on the basis of amortized cost, which approximates market value, unless it is determined that using this method would not represent fair value. Investments in mutual funds are valued at the mutual fund's closing net asset value per share on the day of valuation. Securities and other assets for which market quotations are not readily available, or whose values have been materially affected by events occurring before the Funds' Valuation Time but after the close of the securities' primary marke ts, are valued at fair value as determined in good faith by or under the direction of, the Board of Trustees under procedures established by the Board of Trustees. The Funds may utilize a service provided by an independent third party which has been approved by the Board of Trustees to fair value certain securities. When fair-value pricing is employed, the prices of securities used by a fund to calculate its net asset value may differ from quoted or published prices for the same securities.
B) FOREIGN CURRENCY TRANSACTIONS — The books and records of the Funds are maintained in U.S. dollars. Transactions denominated in foreign currencies are recorded at the current prevailing exchange rates. All assets and liabilities denominated in foreign currencies are translated into U.S. dollar amounts at the current exchange rate at the end of the period. Translation gains or losses resulting from changes in the exchange rate during the reporting period and realized gains and losses on the settlement of foreign currency transactions are reported in the results of operations for the current period. The Funds do not isolate that portion of realized gains and losses on investments in equity securities which is due to changes in the foreign exchange rate from that which is due to changes in market prices of equity securities. The Funds isolate that portion of realized gains and losses on investments in debt securities which is due to changes in the foreign exchange rate from that which is due to changes in market prices of debt securities.
C) SECURITY TRANSACTIONS AND INVESTMENT INCOME — Security transactions are accounted for on a trade date basis. Interest income is recorded on the accrual basis. Dividends are recorded on the ex-dividend date. Certain expenses are class-specific and vary by class. Income, expenses (excluding class-specific expenses) and realized/unrealized gains/losses are allocated proportionately to each class of shares based upon the relative net asset value
50
Credit Suisse Funds
Notes to Financial Statements (continued)
April 30, 2008 (unaudited)
Note 2. Significant Accounting Policies
of outstanding shares of that class. The cost of investments sold is determined by use of the specific identification method for both financial reporting and income tax purposes.
D) DIVIDENDS AND DISTRIBUTIONS TO SHAREHOLDERS — Dividends from net investment income, if any, are declared and paid quarterly by Large Cap Value and at least annually by Small Cap Core. Distributions of net realized capital gains, if any, are declared and paid at least annually by the Funds. However, to the extent that a net realized capital gain can be reduced by a capital loss carryforward, such gain will not be distributed. Income and capital gain distributions are determined in accordance with federal income tax regulations, which may differ from accounting principles generally accepted in the United States of America ("GAAP").
E) FEDERAL INCOME TAXES — No provision is made for federal taxes as it is each Fund's intention to continue to qualify for and elect the tax treatment applicable to regulated investment companies under the Internal Revenue Code of 1986, as amended, and to make the requisite distributions to its shareholders which will be sufficient to relieve it from federal income and excise taxes.
F) USE OF ESTIMATES — The preparation of financial statements in conformity with GAAP requires management to make estimates and assumptions that affect the reported amounts of assets and liabilities and disclosure of contingent assets and liabilities at the date of the financial statements and the reported amounts of income and expenses during the reporting period. Actual results could differ from these estimates.
G) SHORT-TERM INVESTMENTS — The Funds, together with other funds/portfolios advised by Credit Suisse Asset Management, LLC ("Credit Suisse"), an indirect, wholly-owned subsidiary of Credit Suisse Group, pool available cash into either a short-term variable rate time deposit issued by State Street Bank and Trust Company ("SSB"), the Funds' custodian, or a money market fund advised by Credit Suisse. The short-term time deposit issued by SSB is a variable rate account classified as a short-term investment.
H) SECURITIES LENDING — Loans of securities are required at all times to be secured by collateral at least equal to 102% of the market value of domestic securities on loan (including any accrued interest thereon) and 105% of the market value of foreign securities on loan (including any accrued interest thereon). Cash collateral received by the Funds in connection with securities lending activity may be pooled together with cash collateral for other funds/portfolios advised by Credit Suisse and may be invested in a variety of
51
Credit Suisse Funds
Notes to Financial Statements (continued)
April 30, 2008 (unaudited)
Note 2. Significant Accounting Policies
investments, including certain Credit Suisse-advised funds, funds advised by SSB, the Funds' securities lending agent, or money market instruments. However, in the event of default or bankruptcy by the other party to the agreement, realization and/or retention of the collateral may be subject to legal proceedings.
SSB has been engaged by the Funds to act as the Funds' securities lending agent. The Funds' securities lending arrangement provides that the Funds and SSB will share the net income earned from securities lending activities. During the six months ended April 30, 2008, total earnings from the Funds' investment in cash collateral received in connection with Large Cap Value and Small Cap Core's security lending arrangements were $550,103, and $939,475, respectively, of which $449,161, and $656,347, respectively, were rebated to borrowers (brokers). The Funds retained $80,708, and $226,635, in income, respectively, from the cash collateral investment and SSB, as lending agent, was paid $20,234, and $56,493, respectively. The Funds may also be entitled to certain minimum amounts of income from their securities lending activities. Securities lending income is accrued as earned.
Note 3. Transactions with Affiliates and Related Parties
Credit Suisse serves as investment adviser to each Fund. For its investment advisory services, Credit Suisse is entitled to receive a fee from Large Cap Value at an annual rate of 0.50% and for Small Cap Core, the lower of 0.70% or the following tiered fee:
| Fund | Annual Rate | ||||||
| Small Cap Core | 0.875% of first $100 million of average daily net assets | ||||||
| 0.75% of next $100 million of average daily net assets | |||||||
| 0.625% of average daily net assets over $200 million | |||||||
For the six months ended April 30, 2008, investment advisory fees earned for each Fund were as follows:
| Fund | Investment Advisory Fee | ||||||
| Large Cap Value | $ | 629,003 | |||||
| Small Cap Core | 661,535 | ||||||
Credit Suisse Asset Management Securities, Inc. ("CSAMSI"), an affiliate of Credit Suisse, and SSB serve as co-administrators to the Funds. For its co-administrative services, CSAMSI currently receives a fee calculated at an annual rate of 0.09% of each Fund's average daily net assets. For the
52
Credit Suisse Funds
Notes to Financial Statements (continued)
April 30, 2008 (unaudited)
Note 3. Transactions with Affiliates and Related Parties
six months ended April 30, 2008, co-administrative services fees earned by CSAMSI were as follows:
| Fund | Co-Administration Fee | ||||||
| Large Cap Value | $ | 113,221 | |||||
| Small Cap Core | 85,055 | ||||||
For its co-administrative services, SSB receives a fee, exclusive of out-of-pocket expenses, calculated in total for all the Credit Suisse funds/portfolios co-administered by SSB and allocated based upon relative average net assets of each fund/portfolio, subject to an annual minimum fee. For the six months ended April 30, 2008, co-administrative services fees earned by SSB (including out-of-pocket fees) were as follows:
| Fund | Co-Administration Fee | ||||||
| Large Cap Value | $ | 36,482 | |||||
| Small Cap Core | 27,406 | ||||||
In addition to serving as each Fund's co-administrator, CSAMSI currently serves as distributor of each Fund's shares. Pursuant to distribution plans adopted by each Fund pursuant to Rule 12b-1 under the 1940 Act, CSAMSI receives fees for its distribution services. This fee is calculated at an annual rate of 0.25% of the average daily net assets of the Common Class of Small Cap Core and Class A shares of each Fund. Advisor Class shares of Large Cap Value may pay this fee at an annual rate not to exceed 0.75% of such class' average daily net assets; such fee is currently calculated at the annual rate of 0.50% of the average daily net assets of such class. For the Class B and Class C shares, the fee is calculated at annual rate of 1.00% of the average daily net assets of such classes.
Certain brokers, dealers and financial representatives provide transfer agent related services to the Funds, and receive compensation from Credit Suisse. Credit Suisse is then reimbursed by the Funds. For the six months ended April 30, 2008, the Small Cap Core Fund reimbursed Credit Suisse $30,848, which is included in the Fund's transfer agent expense.
For the six months ended April 30, 2008, CSAMSI and its affiliates advised the Funds that they retained the following amounts from commissions earned on the sale of the Funds' Class A shares:
| Fund | Amount | ||||||
| Large Cap Value | $ | 1,062 | |||||
| Small Cap Core | 1,174 | ||||||
53
Credit Suisse Funds
Notes to Financial Statements (continued)
April 30, 2008 (unaudited)
Note 3. Transactions with Affiliates and Related Parties
Merrill Corporation ("Merrill"), an affiliate of Credit Suisse, has been engaged by the Funds to provide certain financial printing and fulfillment services. For the six months ended April 30, 2008, Merrill was paid for its services by the Funds as follows:
| Fund | Amount | ||||||
| Large Cap Value | $ | 11,627 | |||||
| Small Cap Core | 11,909 | ||||||
Note 4. Line of Credit
The Funds, together with other funds/portfolios advised by Credit Suisse (collectively, the "Participating Funds"), participate in a $50 million committed, unsecured line of credit facility ("Credit Facility") for temporary or emergency purposes with Deutsche Bank, A.G. as administrative agent and syndication agent and SSB as operations agent. Under the terms of the Credit Facility, the Participating Funds pay an aggregate commitment fee at a rate of 0.10% per annum on the average unused amount of the Credit Facility, which is allocated among the Participating Funds in such manner as is determined by the governing Boards of the Participating Funds. In addition, the Participating Funds pay interest on borrowings at the Federal Funds rate plus 0.50%. Effective June 2008, Deutsche Bank, A.G. will no longer serve as administrative agent and syndication agent to the credit facility. At April 30, 2008, the Funds had no borrowings under the Credit Facility. During the six months ended April 30, 2008, Small Cap Core had borrowings under the Credit Facility as follows:
| Average Daily Loan Balance | Weighted Average Interest Rate% | Maximum Daily Loan Outstanding | |||||||||
| $ | 7,035,000 | 4.775 | % | $ | 14,176,000 | ||||||
Note 5. Purchases and Sales of Securities
For the six months ended April 30, 2008, purchases and sales of investment securities (excluding short-term investments) were as follows:
| Purchases | Sales | ||||||||||
| Large Cap Value | $ | 142,490,302 | $ | 169,438,589 | |||||||
| Small Cap Core | 158,942,868 | 213,046,795 | |||||||||
54
Credit Suisse Funds
Notes to Financial Statements (continued)
April 30, 2008 (unaudited)
Note 5. Purchases and Sales of Securities
At April 30, 2008, the identified cost for federal income tax purposes, as well as the gross unrealized appreciation from investments for those securities having an excess of value over cost, gross unrealized depreciation from investments for those securities having an excess of cost over value and the net unrealized appreciation from investments were as follows:
| Fund | Identified Cost | Gross Unrealized Appreciation | Gross Unrealized Depreciation | Net Unrealized Appreciation | |||||||||||||||
| Large Cap Value | $ | 244,640,676 | $ | 35,343,528 | $ | (16,645,088 | ) | $ | 18,698,440 | ||||||||||
| Small Cap Core | 199,663,449 | 20,111,567 | (15,296,245 | ) | 4,815,322 | ||||||||||||||
Note 6. Capital Share Transactions
Large Cap Value is authorized to issue an unlimited number of full and fractional shares of beneficial interest, $.001 par value per share, of which an unlimited number of shares are classified as Common Class shares, Advisor Class shares, Class A shares, Class B shares and Class C shares. Small Cap Core is authorized to issue an unlimited number of full and fractional shares of beneficial interest, $.001 par value per share, of which an unlimited number of shares are classified as Common Class shares, Class A shares, Class B shares and Class C shares. Transactions in capital shares of the Funds were as follows:
| Large Cap Value | |||||||||||||||||||
| Common Class | |||||||||||||||||||
| For the Six Months Ended April 30, 2008 (unaudited) | For the Year Ended October 31, 2007 | ||||||||||||||||||
| Shares | Value | Shares | Value | ||||||||||||||||
| Shares sold | — | $ | — | — | $ | — | |||||||||||||
| Shares issued in reinvestment of dividends and distributions | 6,129 | 92,263 | 7,115 | 128,023 | |||||||||||||||
| Shares redeemed | (4,338 | ) | (66,016 | ) | (4,740 | ) | (88,143 | ) | |||||||||||
| Net increase | 1,791 | $ | 26,247 | 2,375 | $ | 39,880 | |||||||||||||
| Advisor Class | |||||||||||||||||||
| For the Six Months Ended April 30, 2008 (unaudited) | For the Year Ended October 31, 2007 | ||||||||||||||||||
| Shares | Value | Shares | Value | ||||||||||||||||
| Shares sold | 17,109 | $ | 243,535 | 50,447 | $ | 970,179 | |||||||||||||
| Shares issued in reinvestment of dividends and distributions | 55,075 | 837,578 | 68,259 | 1,236,684 | |||||||||||||||
| Shares redeemed | (85,516 | ) | (1,284,202 | ) | (110,959 | ) | (2,099,396 | ) | |||||||||||
| Net increase (decrease) | (13,332 | ) | $ | (203,089 | ) | 7,747 | $ | 107,467 | |||||||||||
55
Credit Suisse Funds
Notes to Financial Statements (continued)
April 30, 2008 (unaudited)
Note 6. Capital Share Transactions
| Class A | |||||||||||||||||||
| For the Six Months Ended April 30, 2008 (unaudited) | For the Year Ended October 31, 2007 | ||||||||||||||||||
| Shares | Value | Shares | Value | ||||||||||||||||
| Shares sold | 338,547 | $ | 5,081,626 | 1,006,054 | $ | 19,218,085 | |||||||||||||
| Shares issued in reinvestment of dividends and distributions | 2,903,787 | 43,992,842 | 3,227,878 | 58,342,735 | |||||||||||||||
| Shares redeemed | (1,744,875 | ) | (26,182,077 | ) | (3,578,078 | ) | (69,028,836 | ) | |||||||||||
| Net increase | 1,497,459 | $ | 22,892,391 | 655,854 | $ | 8,531,984 | |||||||||||||
| Class B | |||||||||||||||||||
| For the Six Months Ended April 30, 2008 (unaudited) | For the Year Ended October 31, 2007 | ||||||||||||||||||
| Shares | Value | Shares | Value | ||||||||||||||||
| Shares sold | 21,443 | $ | 319,288 | 40,106 | $ | 734,562 | |||||||||||||
| Shares issued in reinvestment of dividends and distributions | 76,063 | 1,127,288 | 121,867 | 2,156,976 | |||||||||||||||
| Shares redeemed | (174,141 | ) | (2,638,014 | ) | (365,331 | ) | (6,899,682 | ) | |||||||||||
| Net decrease | (76,635 | ) | $ | (1,191,438 | ) | (203,358 | ) | $ | (4,008,144 | ) | |||||||||
| Class C | |||||||||||||||||||
| For the Six Months Ended April 30, 2008 (unaudited) | For the Year Ended October 31, 2007 | ||||||||||||||||||
| Shares | Value | Shares | Value | ||||||||||||||||
| Shares sold | 4,505 | $ | 64,927 | 24,990 | $ | 471,776 | |||||||||||||
| Shares issued in reinvestment of dividends and distributions | 18,954 | 278,410 | 25,751 | 452,717 | |||||||||||||||
| Shares redeemed | (17,767 | ) | (261,096 | ) | (58,179 | ) | (1,058,436 | ) | |||||||||||
| Net increase (decrease) | 5,692 | $ | 82,241 | (7,438 | ) | $ | (133,943 | ) | |||||||||||
| Small Cap Core | |||||||||||||||||||
| Common Class | |||||||||||||||||||
| For the Six Months Ended April 30, 2008 (unaudited) | For the Year Ended October 31, 2007 | ||||||||||||||||||
| Shares | Value | Shares | Value | ||||||||||||||||
| Shares sold | 92,551 | $ | 1,212,302 | 190,146 | $ | 4,167,929 | |||||||||||||
| Shares issued in reinvestment of dividends and distributions | 1,445,424 | 18,631,516 | 527,601 | 11,174,389 | |||||||||||||||
| Shares redeemed | (1,743,912 | ) | (23,218,630 | ) | (1,052,896 | ) | (23,121,659 | ) | |||||||||||
| Net decrease | (205,937 | ) | $ | (3,374,812 | ) | (335,149 | ) | $ | (7,779,341 | ) | |||||||||
56
Credit Suisse Funds
Notes to Financial Statements (continued)
April 30, 2008 (unaudited)
Note 6. Capital Share Transactions
| Class A | |||||||||||||||||||
| For the Six Months Ended April 30, 2008 (unaudited) | For the Year Ended October 31, 2007 | ||||||||||||||||||
| Shares | Value | Shares | Value | ||||||||||||||||
| Shares sold | 478,121 | $ | 6,353,936 | 945,098 | $ | 20,834,263 | |||||||||||||
| Shares issued in reinvestment of dividends and distributions | 3,984,894 | 51,963,012 | 1,599,148 | 34,047,203 | |||||||||||||||
| Shares redeemed | (1,923,779 | ) | (25,828,646 | ) | (5,814,264 | ) | (130,843,603 | ) | |||||||||||
| Net increase (decrease) | 2,539,236 | $ | 32,488,302 | (3,270,018 | ) | $ | (75,962,137 | ) | |||||||||||
| Class B | |||||||||||||||||||
| For the Six Months Ended April 30, 2008 (unaudited) | For the Year Ended October 31, 2007 | ||||||||||||||||||
| Shares | Value | Shares | Value | ||||||||||||||||
| Shares sold | 27,041 | $ | 288,534 | 17,794 | $ | 342,299 | |||||||||||||
| Shares issued in reinvestment of dividends and distributions | 273,541 | 2,894,059 | 94,639 | 1,783,036 | |||||||||||||||
| Shares redeemed | (132,304 | ) | (1,532,806 | ) | (218,952 | ) | (4,281,909 | ) | |||||||||||
| Net increase (decrease) | 168,278 | $ | 1,649,787 | (106,519 | ) | $ | (2,156,574 | ) | |||||||||||
| Class C | |||||||||||||||||||
| For the Six Months Ended April 30, 2008 (unaudited) | For the Year Ended October 31, 2007 | ||||||||||||||||||
| Shares | Value | Shares | Value | ||||||||||||||||
| Shares sold | 90,919 | $ | 997,136 | 145,468 | $ | 2,820,936 | |||||||||||||
| Shares issued in reinvestment of dividends and distributions | 449,314 | 4,708,809 | 78,687 | 1,473,837 | |||||||||||||||
| Shares redeemed | (302,455 | ) | (3,080,425 | ) | (180,516 | ) | (3,493,490 | ) | |||||||||||
| Net increase | 237,778 | $ | 2,625,520 | 43,639 | $ | 801,283 | |||||||||||||
Small Cap Core imposes a 2% redemption fee on all classes of shares currently being offered that are purchased on or after March 1, 2007 and redeemed or exchanged within 30 days from the date of purchase. Reinvested dividends and distributions are not subject to the fee. The fee is charged based on the value of shares at redemption, is paid directly to the Fund and becomes part of the Fund's daily net asset value calculation. When shares are redeemed that are subject to the fee, reinvested dividends are redeemed first, followed by the shares held longest.
57
Credit Suisse Funds
Notes to Financial Statements (continued)
April 30, 2008 (unaudited)
Note 6. Capital Share Transactions
On April 30, 2008, the number of shareholders that held 5% or more of the outstanding shares of each class of the Funds were as follows:
| Fund | Number of Shareholders | Approximate Percentage of Outstanding Shares | |||||||||
| Large Cap Value | |||||||||||
| Common Class | 4 | 72 | % | ||||||||
| Advisor Class | 2 | 98 | % | ||||||||
| Class A | 2 | 20 | % | ||||||||
| Class B | 1 | 10 | % | ||||||||
| Class C | 4 | 46 | % | ||||||||
| Small Cap Core | |||||||||||
| Common Class | 4 | 65 | % | ||||||||
| Class A | 1 | 5 | % | ||||||||
| Class B | 1 | 6 | % | ||||||||
| Class C | 1 | 8 | % | ||||||||
Some of the shareholders are omnibus accounts, which hold shares on behalf of individual shareholders.
Note 7. Contingencies
In the normal course of business, the Funds may provide general indemnifications pursuant to certain contracts and organizational documents. The Funds' maximum exposure under these arrangements is dependent on future claims that may be made against the Funds and, therefore, cannot be estimated; however, based on experience, the risk of loss from such claims is considered remote.
Note 8. Recent Accounting Pronouncements
During June 2006, the Financial Accounting Standards Board ("FASB") issued FASB Interpretation 48 ("FIN 48" or the "Interpretation"), Accounting for Uncertainty in Income Taxes — an interpretation of FASB statement 109. FIN 48 supplements FASB Statement 109, Accounting for Income Taxes, by defining the confidence level that a tax position must meet in order to be recognized in the financial statements. FIN 48 prescribes a comprehensive model for how a fund should recognize, measure, present, and disclose in its financial statements uncertain tax positions that the fund has taken or expects to take on a tax return. FIN 48 requires that the t ax effects of a position be recognized only if it is "more likely than not" to be sustained based solely on its technical merits. Management must be able to conclude that the tax law, regulations, case law, and other objective information regarding the technical merits sufficiently
58
Credit Suisse Funds
Notes to Financial Statements (continued)
April 30, 2008 (unaudited)
Note 8. Recent Accounting Pronouncements
support the position's sustainability with a likelihood of more than 50 percent. During the period ended April 30, 2008, Management has adopted FIN 48. There was no material impact to the financial statements or disclosures thereto as a result of the adoption of this pronouncement.
On September 20, 2006, the FASB released Statement of Financial Accounting Standards No. 157 "Fair Value Measurements" ("FAS 157"). FAS 157 establishes an authoritative definition of fair value, sets out a framework for measuring fair value, and requires additional disclosures about fair-value measurements. The application of FAS 157 is required for fiscal years, beginning after November 15, 2007 and interim periods within those fiscal years. As of April 30, 2008, management does not believe the adoption of FAS 157 will impact the amounts reported in the financial statements, however, additional disclosures will be required in subsequent reports.
In March 2008, FASB issued Statement of Financial Accounting Standards No. 161, Disclosures about Derivative Instruments and Hedging Activities ("FAS 161"), an amendment of FASB Statement No. 133. FAS 161 requires enhanced disclosures about (a) how and why an entity uses derivative instruments, (b) how derivative instruments and hedging activities are accounted for, and (c) how derivative instruments and related hedging activities affect a fund's financial position, financial performance, and cash flows. Management of the Funds does not believe the adoption of FAS 161 will materially impact the financial statement amounts, but will require additional disclosures. This will include qualitative and quantitative disclosures on derivative positions existing at period end and the effect of using de rivatives during the reporting period. FAS 161 is effective for financial statements issued for fiscal years and interim periods beginning after November 15, 2008.
59
Credit Suisse Large Cap Value Fund
Board Approval of Advisory Agreement (unaudited)
In approving the renewal of the current Advisory Agreement, the Board of Trustees, including the Independent Trustees, at a meeting held on November 13 and 14, 2007, considered the following factors with respect to the Credit Suisse Large Cap Value Fund (the "Fund"):
Investment Advisory Fee Rates
The Board reviewed and considered the contractual advisory fee rate of 0.50% ("Contractual Advisory Fee") in light of the extent and quality of the advisory services provided by Credit Suisse Asset Management, LLC ("Credit Suisse").
Additionally, the Board received and considered information comparing the Fund's Contractual Advisory Fee and the Fund's overall expenses with those of funds in both the relevant expense group ("Expense Group") and universe of funds ("Expense Universe") provided by Lipper Inc., an independent provider of investment company data.
Nature, Extent and Quality of the Services under the Advisory Agreement
The Board received and considered information regarding the nature, extent and quality of services provided to the Fund by Credit Suisse under the Advisory Agreement. The Board also noted information received at regular meetings throughout the year related to the services rendered by Credit Suisse. The Board reviewed background information about Credit Suisse, including its Form ADV. The Board considered the background and experience of Credit Suisse's senior management and the expertise of, and the amount of attention given to the Fund by, senior personnel of Credit Suisse. In addition, the Board reviewed the qualifications, backgrounds and responsibilities of the portfolio management team primarily responsible for the day-to-day portfolio management of the Fund and the extent of the resources devoted to research and analysis of actual and potential investments. The Board also received and considered information about the nature, extent and quality of services and fee rates offered to other Credit Suisse clients for comparable services.
Fund Performance
The Board received and considered the performance results of the Fund over time, along with comparisons both to the relevant performance group ("Performance Group") and universe of funds ("Performance Universe") for the Fund. The Board was provided with a description of the methodology used to arrive at the funds included in the Performance Group and the Performance Universe.
60
Credit Suisse Large Cap Value Fund
Board Approval of Advisory Agreement (unaudited) (continued)
Credit Suisse Profitability
The Board received and considered a profitability analysis of Credit Suisse based on the fees payable under the Advisory Agreement for the Fund, including other relationships between the Fund on the one hand and Credit Suisse affiliates on the other. The Board received profitability information for the other funds in the Credit Suisse family of funds.
Economies of Scale
The Board considered whether economies of scale in the provision of services to the Fund were being passed along to the shareholders. Accordingly, the Board considered whether alternative fee structures (such as breakpoint fee structures) would be more appropriate or reasonable taking into consideration economies of scale or other efficiencies that might accrue from increases in the Fund's asset levels.
Other Benefits to Credit Suisse
The Board considered other benefits received by Credit Suisse and its affiliates as a result of their relationship with the Fund. Such benefits include, among others, research arrangements with brokers who execute transactions on behalf of the Fund, administrative and brokerage relationships with affiliates of Credit Suisse and benefits potentially derived from an increase in Credit Suisse's businesses as a result of its relationship with the Fund (such as the ability to market to shareholders other financial products offered by Credit Suisse and its affiliates).
The Board considered the standards applied in seeking best execution, whether and to what extent soft dollar credits are sought and how any such credits are utilized, any benefits that may be achieved by using an affiliated broker and the existence of quality controls applicable to brokerage allocation procedures. The Board also reviewed Credit Suisse's method for allocating portfolio investment opportunities among its advisory clients.
Conclusions
In selecting Credit Suisse, and approving the Advisory Agreement and the investment advisory fee under such agreement, the Board concluded that:
• The Contractual Advisory Fee was one of the lowest in the Fund's Expense Group and was considered reasonable.
61
Credit Suisse Large Cap Value Fund
Board Approval of Advisory Agreement (unaudited) (continued)
• The Fund's performance was below most of its peers in the Performance Group and Performance Universe for the one- and two-year periods and above most of its peers in the Performance Group and Performance Universe for most of the longer-term periods. The Board noted that changes in the investment strategies and portfolio management had gone into effect on December 1, 2006 and that the Board would continue to monitor steps undertaken by Credit Suisse to improve performance.
• Aside from performance (as described above), the Board was satisfied with the nature and extent of the investment advisory services provided to the Fund by Credit Suisse and that, based on dialogue with management and counsel, the services provided by Credit Suisse under the Advisory Agreement are typical of, and consistent with, those provided to similar mutual funds by other investment advisers.
• In light of the costs of providing investment management and other services to the Fund and Credit Suisse's ongoing commitment to the Fund, the profits and other ancillary benefits that Credit Suisse and its affiliates received were considered reasonable.
• Credit Suisse's profitability based on fees payable under the Advisory Agreement was reasonable in light of the nature, extent and quality of the services provided to the Fund thereunder.
• In light of the amount of the Contractual Advisory fee, the Fund's current fee structure (without breakpoints) was considered reasonable.
No single factor reviewed by the Board was identified by the Board as the principal factor in determining whether to approve the Advisory Agreement. The Independent Trustees were advised by separate independent legal counsel throughout the process.
62
Credit Suisse Small Cap Core Fund
Board Approval of Advisory Agreement (unaudited)
In approving the renewal of the current Advisory Agreement, the Board of Trustees, including the Independent Trustees, at a meeting held on November 13 and 14, 2007, considered the following factors with respect to the Credit Suisse Small Cap Core Fund (the "Fund"):
Investment Advisory Fee Rates
The Board reviewed and considered the contractual advisory fee that is assessed at the lower of (a) 0.70% of the Fund's average daily net assets or (b) 0.875% of its average daily net assets up to $100 million, 0.75% of its average daily net assets in excess of $100 million but less than $200 million and 0.625% of its average daily net assets over $200 million ("Contractual Advisory Fee") in light of the extent and quality of the advisory services provided by Credit Suisse Asset Management, LLC ("Credit Suisse").
Additionally, the Board received and considered information comparing the Fund's Contractual Advisory Fee and the Fund's overall expenses with those of funds in both the relevant expense group ("Expense Group") and universe of funds ("Expense Universe") provided by Lipper Inc., an independent provider of investment company data.
Nature, Extent and Quality of the Services under the Advisory Agreement
The Board received and considered information regarding the nature, extent and quality of services provided to the Fund by Credit Suisse under the Advisory Agreement. The Board also noted information received at regular meetings throughout the year related to the services rendered by Credit Suisse. The Board reviewed background information about Credit Suisse, including its Form ADV. The Board considered the background and experience of Credit Suisse's senior management and the expertise of, and the amount of attention given to the Fund by, senior personnel of Credit Suisse. In addition, the Board reviewed the qualifications, backgrounds and responsibilities of the portfolio management team primarily responsible for the day-to-day portfolio management of the Fund and the extent of the resources devoted to research and analysis of actual and potential investments. The Board also received and considered information about the nature, extent and quality of services and fee rates offered to other Credit Suisse clients for comparable services.
63
Credit Suisse Small Cap Core Fund
Board Approval of Advisory Agreement (unaudited) (continued)
Fund Performance
The Board received and considered the performance results of the Fund over time, along with comparisons both to the relevant performance group ("Performance Group") and universe of funds ("Performance Universe") for the Fund. The Board was provided with a description of the methodology used to arrive at the funds included in the Performance Group and the Performance Universe.
Credit Suisse Profitability
The Board received and considered a profitability analysis of Credit Suisse based on the fees payable under the Advisory Agreement for the Fund, including other relationships between the Fund on the one hand and Credit Suisse affiliates on the other. The Board received profitability information for the other funds in the Credit Suisse family of funds.
Economies of Scale
The Board considered whether economies of scale in the provision of services to the Fund were being passed along to the shareholders. Accordingly, the Board considered whether the breakpoints in the Fund's advisory fee structure were appropriate or reasonable taking into consideration economies of scale or other efficiencies that might accrue from increases in the Fund's asset levels.
Other Benefits to Credit Suisse
The Board considered other benefits received by Credit Suisse and its affiliates as a result of their relationship with the Fund. Such benefits include, among others, research arrangements with brokers who execute transactions on behalf of the Fund, administrative and brokerage relationships with affiliates of Credit Suisse and benefits potentially derived from an increase in Credit Suisse's businesses as a result of its relationship with the Fund (such as the ability to market to shareholders other financial products offered by Credit Suisse and its affiliates).
The Board considered the standards applied in seeking best execution, whether and to what extent soft dollar credits are sought and how any such credits are utilized, any benefits that may be achieved by using an affiliated broker and the existence of quality controls applicable to brokerage allocation procedures. The Board also reviewed Credit Suisse's method for allocating portfolio investment opportunities among its advisory clients.
64
Credit Suisse Small Cap Core Fund
Board Approval of Advisory Agreement (unaudited) (continued)
Conclusions
In selecting Credit Suisse, and approving the Advisory Agreement and the investment advisory fee under such agreement, the Board concluded that:
• The Contractual Advisory Fee was among the lowest in the Fund's expense group and the Board considered the fee to be reasonable.
• The Fund's performance was below most of its peers in the Performance Group and Performance Universe for most of the periods reviewed. The Board noted that changes in the investment strategies and portfolio management of the Fund had gone into effect on December 1, 2006 and that it would continue to monitor steps undertaken by Credit Suisse to improve performance.
• Aside from performance (as described above), the Board was satisfied with the nature and extent of the investment advisory services provided to the Fund by Credit Suisse and that, based on dialogue with management and counsel, the services provided by Credit Suisse under the Advisory Agreement are typical of, and consistent with, those provided to similar mutual funds by other investment advisers.
• In light of the costs of providing investment management and other services to the Fund and Credit Suisse's ongoing commitment to the Fund, the profits and other ancillary benefits that Credit Suisse and its affiliates received were considered reasonable.
• Credit Suisse's profitability based on fees payable under the Advisory Agreement was reasonable in light of the nature, extent and quality of the services provided to the Fund thereunder.
• In light of the amount of the Contractual Advisory Fee, the Fund's current fee structure was considered reasonable.
No single factor reviewed by the Board was identified by the Board as the principal factor in determining whether to approve the Advisory Agreement. The Independent Trustees were advised by separate independent legal counsel throughout the process.
65
Credit Suisse Funds
Privacy Policy Notice (unaudited)
Important Privacy Choices for Consumers
We are committed to maintaining the privacy of every current and prospective customer. We recognize that you entrust important personal information to us, and we wish to assure you that we take seriously our responsibilities in protecting and safeguarding this information.
In connection with making available investment products and services to current and potential customers, we may obtain nonpublic personal information about you. This information may include your name, address, e-mail address, social security number, account number, assets, income, financial situation, transaction history and other personal information.
We may collect nonpublic information about you from the following sources:
• Information we receive on applications, forms, questionnaires, web sites, agreements or in the course of establishing or maintaining a customer relationship; and
• Information about your transactions with us, our affiliates, or others.
We do not disclose any nonpublic personal information about our customers or former customers to anyone, except with your consent or as otherwise permitted by law.
In cases where we believe that additional products and services may be of interest to you, we may share the information described above with our affiliates.
We may also disclose this information to firms that perform services on our behalf. These agents and service providers are required to treat the information confidentially and use it only for the purpose for which it is provided.
We restrict access to nonpublic personal information about you to those employees, agents or other parties who need to know that information to provide products or services to you or in connection with your investments with or through us. We maintain physical, electronic and procedural safeguards that comply with federal standards to guard your nonpublic personal information.
Note: This Notice is provided to clients and prospective clients of Credit Suisse Asset Management, LLC ("Credit Suisse"), and Credit Suisse Asset Management Securities, Inc., and shareholders and prospective shareholders in Credit Suisse sponsored and advised investment companies, including Credit Suisse Funds, and other consumers and customers, as applicable. This Notice is not intended to be incorporated in any offering materials but is merely a statement of our current Privacy Policy, and may be amended from time to time upon notice to you. This Notice is dated as of May 13, 2008.
66
Credit Suisse Funds
Proxy Voting and Portfolio Holdings Information (unaudited)
Information regarding how each Fund voted proxies related to its portfolio securities during the 12 month period ended June 30 of each year, as well as the policies and procedures that each Fund uses to determine how to vote proxies relating to its portfolio securities are available:
• By calling 1-800-927-2874
• On the Funds' website, www.credit-suisse.com/us
• On the website of the Securities and Exchange Commission, www.sec.gov.
Each fund files a complete schedule of its portfolio holdings for the first and third quarters of its fiscal year with the SEC on Form N-Q. Each Fund's Forms N-Q are available on the SEC's website at www.sec.gov and may be reviewed and copied at the SEC's Public Reference Room in Washington, DC. Information on the operation of the SEC's Public Reference Room may be obtained by calling 1-202-551-8090.
67
This page intentionally left blank

P.O. BOX 55030, BOSTON, MA 02205-5030
800-927-2874 n www.credit-suisse.com/us
CREDIT SUISSE ASSET MANAGEMENT SECURITIES, INC., DISTRIBUTOR. USEQVAL-SAR-0408
Item 2. Code of Ethics.
This item is inapplicable to a semi-annual report on Form N-CSR.
Item 3. Audit Committee Financial Expert.
This item is inapplicable to a semi-annual report on Form N-CSR.
Item 4. Principal Accountant Fees and Services.
This item is inapplicable to a semi-annual report on Form N-CSR.
Item 5. Audit Committee of Listed Registrants.
This item is not applicable to the registrant.
Item 6. Schedule of Investments.
Included as part of the report to shareholders filed under Item 1 of this Form.
Item 7. Disclosure of Proxy Voting Policies and Procedures for Closed-End Management Investment Companies.
This item is not applicable to the registrant.
Item 8. Portfolio Managers of Closed-End Management Investment Companies.
This item is not applicable to the registrant.
Item 9. Purchases of Equity Securities by Closed-End Management Investment Company and Affiliated Purchasers.
This item is not applicable to the registrant.
Item 10. Submission of Matters to a Vote of Security Holders.
The Nominating Committee recommends Board member candidates. Shareholders of the registrant may also submit nominees that will be considered by the Committee. Recommendations should be mailed to the registrant’s Secretary, c/o Credit Suisse Asset Management, LLC, Eleven Madison Avenue, New York, NY 10010. Any submission should include at a minimum the following information: the name, age, business address, residence address and principal occupation or employment of such individual; the class, series and number of shares of the registrant that are beneficially owned by such individual; the date such shares were acquired and the investment intent of such acquisition; whether such shareholder believes such individual is, or is not, an “interested person” of the registrant (as defined in the Investment Company Act of 1940) and information regarding such individual that is sufficient, in the Committee’s discretion, to make such determination; and all other information relating to such individual that is required to be disclosed in solicitation of proxies for election of directors in an election contest (even if an election contest is not involved) or is otherwise required pursuant to the rules for proxy materials under the Securities Exchange Act of 1934.
Item 11. Controls and Procedures.
(a) As of a date within 90 days from the filing date of this report, the principal executive officer and principal financial officer concluded that the registrant’s disclosure controls and procedures (as defined in Rule 30a-3(c) under the Investment Company Act of 1940 (the “Act”)) were effective
based on their evaluation of the disclosure controls and procedures required by Rule 30a-3(b) under the Act and Rules 13a-15(b) or 15d-15(b) under the Securities Exchange Act of 1934.
(b) There were no changes in registrant’s internal control over financial reporting (as defined in Rule 30a-3(d) under the Act) that occurred during the registrant’s last fiscal half-year that have materially affected, or are reasonably likely to materially affect, the registrant’s internal control over financial reporting.
Item 12. Exhibits.
(a)(1) | Not applicable. |
|
|
(a)(2) | The certifications of the registrant as required by Rule 30a-2(a) under the Act are exhibits to this report. |
|
|
(a)(3) | Not applicable. |
|
|
(b) | The certifications of the registrant as required by Rule 30a-2(b) under the Act are an exhibit to this report. |
SIGNATURES
Pursuant to the requirements of the Securities Exchange Act of 1934 and the Investment Company Act of 1940, the registrant has duly caused this report to be signed on its behalf by the undersigned, thereunto duly authorized.
CREDIT SUISSE CAPITAL FUNDS
/s/George R. Hornig |
| |
Name: | George R. Hornig | |
Title: | Chief Executive Officer | |
Date: | July 8, 2008 | |
Pursuant to the requirements of the Securities Exchange Act of 1934 and the Investment Company Act of 1940, this report has been signed below by the following persons on behalf of the registrant and in the capacities and on the dates indicated.
/s/George R. Hornig |
| |
Name: | George R. Hornig | |
Title: | Chief Executive Officer | |
Date: | July 8, 2008 | |
/s/Michael A. Pignataro |
| |
Name: | Michael A. Pignataro | |
Title: | Chief Financial Officer | |
Date: | July 8, 2008 | |