UNITED STATES
SECURITIES AND EXCHANGE COMMISSION
Washington, D.C. 20549
FORM N-CSR
CERTIFIED SHAREHOLDER REPORT OF REGISTERED
MANAGEMENT INVESTMENT COMPANIES
Investment Company Act file number | 811-04604 | ||||||||
| |||||||||
CREDIT SUISSE CAPITAL FUNDS | |||||||||
(Exact name of registrant as specified in charter) | |||||||||
| |||||||||
Eleven Madison Avenue, New York, New York |
| 10010 | |||||||
(Address of principal executive offices) |
| (Zip code) | |||||||
| |||||||||
J. Kevin Gao, Esq. Credit Suisse Capital Funds Eleven Madison Avenue New York, New York 10010 | |||||||||
(Name and address of agent for service) | |||||||||
| |||||||||
Registrant’s telephone number, including area code: | (212) 325-2000 |
| |||||||
| |||||||||
Date of fiscal year end: | October 31 |
| |||||||
| |||||||||
Date of reporting period: | November 1, 2006 to April 30, 2007 |
| |||||||
Item 1. Reports to Stockholders.

CREDIT SUISSE FUNDS
Semiannual Report
April 30, 2007
(unaudited)
n CREDIT SUISSE
LARGE CAP VALUE FUND
n CREDIT SUISSE
SMALL CAP CORE FUND
The Funds' investment objectives, risks, charges and expenses (which should be considered carefully before investing), and more complete information about the Funds, are provided in the Prospectus, which should be read carefully before investing. You may obtain additional copies by calling 800-927-2874 or by writing to Credit Suisse Funds, P.O. Box 55030, Boston, MA 02205-5030.
Credit Suisse Asset Management Securities, Inc., Distributor, is located at Eleven Madison Ave., New York, NY 10010. Credit Suisse Funds are advised by Credit Suisse Asset Management, LLC.
Investors in the Credit Suisse Funds should be aware that they may be eligible to purchase Common Class and/or Advisor Class shares (where offered) directly or through certain intermediaries. Such shares are not subject to a sales charge but may be subject to an ongoing service and distribution fee of up to 0.50% of average daily net assets. Investors in the Credit Suisse Funds should also be aware that they may be eligible for a reduction or waiver of the sales charge with respect to Class A, B or C shares (where offered). For more information, please review the relevant prospectuses or consult your financial representative.
The views of the Funds' management are as of the date of the letter and Fund holdings described in this document are as of April 30, 2007; these views and Fund holdings may have changed subsequent to these dates. Nothing in this document is a recommendation to purchase or sell securities.
Fund shares are not deposits or other obligations of Credit Suisse Asset Management, LLC ("Credit Suisse") or any affiliate, are not FDIC-insured and are not guaranteed by Credit Suisse or any affiliate. Fund investments are subject to investment risks, including loss of your investment.
Credit Suisse Large Cap Value Fund
Semiannual Investment Adviser's Report
April 30, 2007 (unaudited)
May 15, 2007
Dear Shareholder:
Performance Summary
11/01/06 – 04/30/07
| Fund & Benchmark | Performance | ||||||
| Common1 | 8.86 | % | |||||
| Advisor1 | 8.57 | % | |||||
| Class A1,2 | 8.74 | % | |||||
| Class B1,2 | 8.36 | % | |||||
| Class C1,2 | 8.36 | % | |||||
| Russell 1000® Value Index3 | 9.79 | % | |||||
Performance for the Fund's Class A, Class B and Class C Shares is without the maximum sales charge of 5.75%, 4.00% and 1.00%, respectively.2
Market Review: Consumer confidence out of synch with the market
The semiannual period ended April 30, 2007, was a strong one for U.S. equities. Encouraged by a record flow of mergers and acquisitions and healthy corporate earnings, the U.S. equity market gained during the final two months of 2006. Over the same period, investor expectations of near-term market volatility — as measured by the Chicago Board Options Exchange Volatility Index ("VIX Index"), which incepted in 1993 — hovered at near-record lows of 10.89%. Additionally, most S&P 500 companies' first-quarter 2007 earnings reports have exceeded investor expectations.
The market, despite a sudden sell-off in February that drove the S&P 500 down by 1.96% for the month, continued its strong performance during the quarter. The S&P 500 finished April up by more than 5% year-to-date.
Overall, the first quarter of 2007 marked the slowest U.S. economic growth in four years. This was mainly due to the ongoing drop in residential investments (down by 17%) and the increased trade deficit. Together, these factors contributed to a 0.52% drop in the overall GDP growth rate for the quarter. Additionally, consumer spending, which accounts for about 70% of the U.S. economy, grew at an average rate of 3.8%, down from 4.2% during the previous quarter. Further, U.S. inflation — excluding volatile food and energy costs — jumped to 2.2% on an annual basis, up from a 1.8% fourth-quarter gain. At the same time, the U.S. Federal Funds rate remained unchanged at 5.25% over the period. These issues combined to cause U.S. consumer confidence to drop to its lowest level since October 2006, despite the fact that business investments, including spending on commercial construction as well as equipment and software, managed to rise at an annual rate of 2%.
1
Credit Suisse Large Cap Value Fund
Semiannual Investment Adviser's Report (continued)
April 30, 2007 (unaudited)
From a global perspective, the European economy has sustained its strong momentum of growth during the first quarter of 2007.
Strategic review and outlook: Expect moderate growth
The largest contributors to performance were the other energy, utilities, and consumer discretionary sectors. Stock selection in technology was the largest detractor to performance. Additionally, financial services and materials and processing further contributed to underperformance.
For the next quarter, we expect the growth of the U.S. economy to continue at a moderate rate. However, contradicting readings from major U.S. economic indicators point to a slim chance of a Federal Funds rate increase or decrease over this time. Additionally, merger and acquisition activity is expected to remain at high levels over the quarter.
Throughout 2007, we expect a further weakening in the housing market in general (and sub-prime loan performance in particular). Additionally, while the U.S. dollar is expected to weaken relative to the Euro in the coming year, European equities are expected to outperform their U.S. counterparts. We also anticipate that stock market volatility, as measured by the VIX Index, will reach higher levels than those recorded during the first quarter of 2007.
Credit Suisse Quantitative Strategies Team
Joseph Cherian
William Weng
Todd Jablonski
The value of investments generally will fluctuate in response to market movements and the Fund's performance will largely depend on the performance of value stocks, which may be more volatile than the overall market.
In addition to historical information, this report contains forward-looking statements that may concern, among other things, domestic and foreign market, industry and economic trends and developments and government regulation and their potential impact on the Fund's investments. These statements are subject to risks and uncertainties and actual trends, developments and regulations in the future, and their impact on the Fund could be materially different from those projected, anticipated or implied. The Fund has no obligation to update or revise forward-looking statements.
The Fund adopted new investment strategies effective December 1, 2006 so that its holdings are selected using quantitative stock selection models rather than a more traditional fundamental analysis approach. Investors should be aware that performance information for periods prior to December 1, 2006 does not reflect the current investment strategies.
2
Credit Suisse Large Cap Value Fund
Semiannual Investment Adviser's Report (continued)
April 30, 2007 (unaudited)
Average Annual Returns as of March 31, 20071
| 1 Year | 5 Years | 10 Years | Since Inception | Inception Date | |||||||||||||||||||
| Common Class | 16.62 | % | 8.32 | % | — | 7.46 | % | 08/01/00 | |||||||||||||||
| Advisor Class | 16.03 | % | — | — | 13.61 | % | 06/06/03 | ||||||||||||||||
| Class A Without Sales Charge | 16.37 | % | 8.21 | % | 10.20 | % | — | 09/19/49 | |||||||||||||||
| Class A With Maximum Sales Charge | 9.69 | % | 6.93 | % | 9.55 | % | — | 09/19/49 | |||||||||||||||
| Class B Without CDSC | 15.48 | % | 7.40 | % | 9.39 | % | — | 02/28/96 | |||||||||||||||
| Class B With CDSC | 11.80 | % | 7.40 | % | 9.39 | % | — | 02/28/96 | |||||||||||||||
| Class C Without CDSC | 15.52 | % | 7.40 | % | — | 7.07 | % | 02/28/00 | |||||||||||||||
| Class C With CDSC | 14.60 | % | 7.40 | % | — | 7.07 | % | 02/28/00 | |||||||||||||||
Average Annual Returns as of April 30, 20071
| 1 Year | 5 Years | 10 Years | Since Inception | Inception Date | |||||||||||||||||||
| Common Class | 17.84 | % | 9.87 | % | — | 8.01 | % | 08/01/00 | |||||||||||||||
| Advisor Class | 17.23 | % | — | — | 14.47 | % | 06/06/03 | ||||||||||||||||
| Class A Without Sales Charge | 17.57 | % | 9.74 | % | 10.24 | % | — | 09/19/49 | |||||||||||||||
| Class A With Maximum Sales Charge | 10.81 | % | 8.45 | % | 9.58 | % | — | 09/19/49 | |||||||||||||||
| Class B Without CDSC | 16.70 | % | 8.93 | % | 9.44 | % | — | 02/28/96 | |||||||||||||||
| Class B With CDSC | 12.98 | % | 8.93 | % | 9.44 | % | — | 02/28/96 | |||||||||||||||
| Class C Without CDSC | 16.69 | % | 8.93 | % | — | 7.57 | % | 02/28/00 | |||||||||||||||
| Class C With CDSC | 15.76 | % | 8.93 | % | — | 7.57 | % | 02/28/00 | |||||||||||||||
Returns represent past performance and include change in share price and reinvestment of dividends and capital gains. Past performance cannot guarantee future results. The current performance of the Fund may be lower or higher than the figures shown. Returns and share price will fluctuate, and redemption value may be more or less than original cost. The performance results do not reflect the deduction of taxes that a shareholder would pay on fund distributions or the redemption of fund shares. Performance information current to the most recent month-end is available at www.credit-suisse.com/us
1 Fee waivers and/or expense reimbursements may reduce expenses for the Fund, without which performance would be lower. Waivers and/or reimbursements may be discontinued at any time.
2 Total return for the Fund's Class A Shares for the reporting period, based on offering price (including maximum sales charge of 5.75%), was 2.50%. Total return for the Fund's Class B Shares for the reporting period, based on redemption value (including maximum contingent deferred sales charge of 4%), was 4.90%. Total return for the Fund's Class C Shares for the reporting period, based on redemption value (including maximum contingent deferred sales charge of 1%), was 7.50%.
3 The Russell 1000® Value Index measures the performance of those companies in the Russell 1000® Index with lower price-to-book ratios and lower forecasted growth values. It is an unmanaged index of common stocks that includes reinvestment of dividends and is compiled by Frank Russell Company. Investors cannot invest directly in an index.
3
Credit Suisse Large Cap Value Fund
Semiannual Investment Adviser's Report (continued)
April 30, 2007 (unaudited)
Information About Your Fund's Expenses
As an investor of the Fund, you incur two types of costs: ongoing expenses and transaction costs. Ongoing expenses include management fees, distribution and service (12b-1) fees and other Fund expenses. Examples of transaction costs include sales charges (loads), redemption fees and account maintenance fees, which are not shown in this section and which would result in higher total expenses. The following table is intended to help you understand your ongoing expenses of investing in the Fund and to help you compare these expenses with the ongoing expenses of investing in other mutual funds. The table is based on an investment of $1,000 made at the beginning of the six month period ended April 30, 2007.
The table illustrates your Fund's expenses in two ways:
• Actual Fund Return. This helps you estimate the actual dollar amount of ongoing expenses paid on a $1,000 investment in the Fund using the Fund's actual return during the period. To estimate the expenses you paid over the period, simply divide your account value by $1,000 (for example, an $8,600 account value divided by $1,000 = 8.6), then multiply the result by the number in the "Expenses Paid per $1,000" line under the share class you hold.
• Hypothetical 5% Fund Return. This helps you to compare your Fund's ongoing expenses with those of other mutual funds using the Fund's actual expense ratio and a hypothetical rate of return of 5% per year before expenses. Examples using a 5% hypothetical fund return may be found in the shareholder reports of other mutual funds. The hypothetical account values and expenses may not be used to estimate the actual ending account balance or expenses you paid for the period.
Please note that the expenses shown in these tables are meant to highlight your ongoing expenses only and do not reflect any transaction costs, such as sales charges (loads) or redemption fees. If these transaction costs had been included, your costs would have been higher. The "Expenses Paid per $1,000" line of the tables is useful in comparing ongoing expenses only and will not help you determine the relative total expenses of owning different funds.
4
Credit Suisse Large Cap Value Fund
Semiannual Investment Adviser's Report (continued)
April 30, 2007 (unaudited)
Expenses and Value of a $1,000 Investment
for the six month period ended April 30, 2007
| Actual Fund Return | Common Class | Advisor Class | Class A | Class B | Class C | ||||||||||||||||||
| Beginning Account Value 11/1/06 | $ | 1,000.00 | $ | 1,000.00 | $ | 1,000.00 | $ | 1,000.00 | $ | 1,000.00 | |||||||||||||
| Ending Account Value 4/30/07 | $ | 1,088.60 | $ | 1,085.70 | $ | 1,087.40 | $ | 1,083.60 | $ | 1,083.60 | |||||||||||||
| Expenses Paid per $1,000* | $ | 4.19 | $ | 6.77 | $ | 5.49 | $ | 9.35 | $ | 9.35 | |||||||||||||
| Hypothetical 5% Fund Return | |||||||||||||||||||||||
| Beginning Account Value 11/1/06 | $ | 1,000.00 | $ | 1,000.00 | $ | 1,000.00 | $ | 1,000.00 | $ | 1,000.00 | |||||||||||||
| Ending Account Value 4/30/07 | $ | 1,020.78 | $ | 1,018.30 | $ | 1,019.54 | $ | 1,015.82 | $ | 1,015.82 | |||||||||||||
| Expenses Paid per $1,000* | $ | 4.06 | $ | 6.56 | $ | 5.31 | $ | 9.05 | $ | 9.05 | |||||||||||||
| Common Class | Advisor Class | Class A | Class B | Class C | |||||||||||||||||||
| Annualized Expense Ratios* | 0.81 | % | 1.31 | % | 1.06 | % | 1.81 | % | 1.81 | % | |||||||||||||
* Expenses are equal to the Fund's annualized expense ratio for each share class, multiplied by the average account value over the period, multiplied by the number of days in the most recent fiscal half year period, then divided by 365.
The "Expenses Paid per $1,000" and the "Annualized Expense Ratios" in the tables are based on actual expenses paid by the Fund during the period, net of fee waivers and/or expense reimbursements. If those fee waivers and/or expense reimbursements had not been in effect, the Fund's actual expenses would have been higher.
For more information, please refer to the Fund's prospectus.
5
Credit Suisse Large Cap Value Fund
Semiannual Investment Adviser's Report (continued)
April 30, 2007 (unaudited)
SECTOR BREAKDOWN*
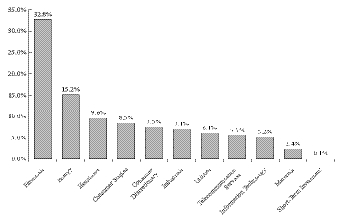
* Expressed as a percentage of total investments (excluding security lending collateral) and may vary over time.
6
Credit Suisse Small Cap Core Fund
Semiannual Investment Adviser's Report
April 30, 2007 (unaudited)
May 15, 2007
Dear Shareholder:
Performance Summary
11/01/06 – 04/30/07
| Fund & Benchmark | Performance | ||||||
| Common1 | 6.01 | % | |||||
| Class A1,2 | 6.07 | % | |||||
| Class B1,2 | 5.63 | % | |||||
| Class C1, 2 | 5.67 | % | |||||
| Standard & Poor's SmallCap 600® Index3 | 8.41 | % | |||||
| Russell 2000® Index3 | 6.87 | % | |||||
| Russell 2000® Value Index3 | 6.36 | % | |||||
Performance for the Fund's Class A, Class B and Class C shares is without the maximum sales charge of 5.75%, 4.00% and 1.00%, respectively.2
Market Review: Consumer confidence out of synch with the market
The semiannual period ended April 30, 2007, was a strong one for U.S. equities. Encouraged by a record flow of mergers and acquisitions and healthy corporate earnings, the U.S. equity market gained during the final two months of 2006. Over the same period, investor expectations of near-term market volatility — as measured by the Chicago Board Options Exchange Volatility Index ("VIX Index"), which incepted in 1993 — hovered at near-record lows of 10.89%. Additionally, most S&P 600 companies' first-quarter 2007 earnings reports have exceeded investor expectations.
The small-cap equity market, despite a pause in February that drove the S&P 600 down by 0.54% for the month, continued its strong performance during the quarter. The S&P 600 finished April up by more than 5.5% year-to-date.
Overall, the first quarter of 2007 marked the slowest U.S. economic growth in four years. This was mainly due to the ongoing drop in residential investments (down by 17%) and the increased trade deficit. Together, these factors also contributed to a 0.52% drop in the overall GDP growth rate for the quarter. Additionally, consumer spending, which accounts for about 70% of the U.S. economy, grew at an average rate of 3.8%, down from 4.2% during the previous quarter. Further, U.S. inflation — excluding volatile food and energy costs — jumped to 2.2% on an annual basis, up from a 1.8% fourth-quarter gain. At the same time, the U.S. Federal Funds rate remained unchanged at 5.25% over the period. These issues combined to cause U.S. consumer confidence to drop to its lowest level since October 2006, despite the fact that business investments, including spending on commercial construction as well as equipment and software, managed to rise at an annual rate of 2%.
7
Credit Suisse Small Cap Core Fund
Semiannual Investment Adviser's Report (continued)
April 30, 2007 (unaudited)
From a global perspective, the European economy has sustained its strong momentum of growth during the first quarter of 2007.
Strategic review and outlook: Expect moderate growth
The largest contributor to performance came primarily from stock selection within the energy, consumer discretionary and materials sectors. Stock selection from industrials was the outsized detractor to performance. Additionally, asset selection in the financials and health care sectors also contributed heavily to the underperformance.
For the next quarter, we expect the growth of the U.S. economy to continue at a moderate rate. However, contradicting readings from major U.S. economic indicators point to a slim chance of a Federal Funds rate increase or decrease over this time. Additionally, merger and acquisition activity is expected to remain at high levels over the quarter.
Throughout 2007, we expect a further weakening in the housing market in general (and sub-prime loan performance in particular). Additionally, while the U.S. dollar is expected to weaken relative to the Euro in the coming year, European equities are expected to outperform their U.S. counterparts. We also anticipate that stock market volatility, as measured by the VIX Index, will reach higher levels than those recorded during the first quarter of 2007.
Credit Suisse Quantitative Strategies Team
Joseph Cherian
William Weng
Todd Jablonski
Because of the nature of the Fund's investments in special-situation, start-up and other small companies, an investment in the Fund may be more volatile and less liquid than investments in larger companies.
In addition to historical information, this report contains forward-looking statements that may concern, among other things, domestic and foreign market, industry and economic trends and developments and government regulation and their potential impact on the Fund's investments. These statements are subject to risks and uncertainties and actual trends, developments and regulations in the future, and their impact on the Fund could be materially different from those projected, anticipated or implied. The Fund has no obligation to update or revise forward-looking statements.
The Fund adopted new investment strategies effective December 1, 2006 so that its holdings are selected using quantitative stock selection models rather than a more traditional fundamental analysis approach. Investors should be aware that performance information for periods prior to December 1, 2006 does not reflect the current investment strategies.
8
Credit Suisse Small Cap Core Fund
Semiannual Investment Adviser's Report (continued)
April 30, 2007 (unaudited)
Average Annual Returns as of March 31, 20071
| 1 Year | 5 Years | 10 Years | Since Inception | Inception Date | |||||||||||||||||||
| Common Class | 5.19 | % | 9.47 | % | — | 12.73 | % | 08/01/00 | |||||||||||||||
| Class A Without Sales Charge | 5.16 | % | 9.49 | % | 11.68 | % | — | 02/08/67 | |||||||||||||||
| Class A With Maximum Sales Charge | (0.88 | )% | 8.20 | % | 11.03 | % | — | 02/08/67 | |||||||||||||||
| Class B Without CDSC | 4.39 | % | 8.67 | % | 10.84 | % | — | 02/28/96 | |||||||||||||||
| Class B With CDSC | 0.93 | % | 8.67 | % | 10.84 | % | — | 02/28/96 | |||||||||||||||
| Class C Without CDSC | 4.37 | % | 8.66 | % | — | 13.31 | % | 02/28/00 | |||||||||||||||
| Class C With CDSC | 3.51 | % | 8.66 | % | — | 13.31 | % | 02/28/00 | |||||||||||||||
Average Annual Returns as of April 30, 20071
| 1 Year | 5 Years | 10 Years | Since Inception | Inception Date | |||||||||||||||||||
| Common Class | 8.19 | % | 9.45 | % | — | 12.92 | % | 08/01/00 | |||||||||||||||
| Class A Without Sales Charge | 8.24 | % | 9.48 | % | 11.90 | % | — | 02/08/67 | |||||||||||||||
| Class A With Maximum Sales Charge | 2.02 | % | 8.19 | % | 11.24 | % | — | 02/08/67 | |||||||||||||||
| Class B Without CDSC | 7.38 | % | 8.66 | % | 11.06 | % | — | 02/28/96 | |||||||||||||||
| Class B With CDSC | 3.82 | % | 8.66 | % | 11.06 | % | — | 02/28/96 | |||||||||||||||
| Class C Without CDSC | 7.43 | % | 8.65 | % | — | 13.48 | % | 02/28/00 | |||||||||||||||
| Class C With CDSC | 6.54 | % | 8.65 | % | — | 13.48 | % | 02/28/00 | |||||||||||||||
Returns represent past performance and include change in share price and reinvestment of dividends and capital gains. Past performance cannot guarantee future results. The current performance of the Fund may be lower or higher than the figures shown. Returns and share price will fluctuate, and redemption value may be more or less than original cost. The performance results do not reflect the deduction of taxes that a shareholder would pay on fund distributions or the redemption of fund shares. Performance information current to the most recent month-end is available at www.credit-suisse.com/us
1 Fee waivers and/or expense reimbursements may reduce expenses for the Fund, without which performance would be lower. Waivers and/or reimbursements may be discontinued at any time.
2 Total return for the Fund's Class A Shares for the reporting period, based on offering price (including maximum sales charge of 5.75%), was down 0.03%. Total return for the Fund's Class B Shares for the reporting period, based on redemption value (including maximum contingent deferred sales charge of 4%), was 2.13%. Total return for the Fund's Class C Shares for the reporting period, based on redemption value (including maximum contingent deferred sales charge of 1%), was 4.79%.
3 The Standard & Poor's SmallCap 600® Index is an unmanaged market weighted index of 600 U.S. stocks selected on the basis of capitalization, liquidity and industry group representation. It is a registered trademark of The McGraw-Hill Co., Inc. The Standard & Poor's SmallCap 600® Index became the Fund's benchmark index on December 1, 2006 in connection with the change in the Fund's investment strategy. The Russell 2000® Index measures the perfo rmance of the 2,000 smallest companies in the Russell 3000® Index, which represents approximately 8% of the total market capitalization of the Russell 3000® Index. The Russell 2000® Value Index measures the perfomance of those companies in the Russell 2000® Index with lower price-to-book ratios and lower forecasted growth values. The Russell 2000® Index and the Russell 2000® Value Index are unmanaged indices of common stocks that include reinvestment of dividends and are compiled by Frank Russell Company. Investors cannot invest directly in an index.
9
Credit Suisse Small Cap Core Fund
Semiannual Investment Adviser's Report (continued)
April 30, 2007 (unaudited)
Information About Your Fund's Expenses
As an investor of the Fund, you incur two types of costs: ongoing expenses and transaction costs. Ongoing expenses include management fees, distribution and service (12b-1) fees and other Fund expenses. Examples of transaction costs include sales charges (loads), redemption fees and account maintenance fees, which are not shown in this section and which would result in higher total expenses. The following table is intended to help you understand your ongoing expenses of investing in the Fund and to help you compare these expenses with the ongoing expenses of investing in other mutual funds. The table is based on an investment of $1,000 made at the beginning of the six month period ended April 30, 2007.
The table illustrates your Fund's expenses in two ways:
• Actual Fund Return. This helps you estimate the actual dollar amount of ongoing expenses paid on a $1,000 investment in the Fund using the Fund's actual return during the period. To estimate the expenses you paid over the period, simply divide your account value by $1,000 (for example, an $8,600 account value divided by $1,000 = 8.6), then multiply the result by the number in the "Expenses Paid per $1,000" line under the share class you hold.
• Hypothetical 5% Fund Return. This helps you to compare your Fund's ongoing expenses with those of other mutual funds using the Fund's actual expense ratio and a hypothetical rate of return of 5% per year before expenses. Examples using a 5% hypothetical fund return may be found in the shareholder reports of other mutual funds. The hypothetical account values and expenses may not be used to estimate the actual ending account balance or expenses you paid for the period.
Please note that the expenses shown in these tables are meant to highlight your ongoing expenses only and do not reflect any transaction costs, such as sales charges (loads) or redemption fees. If these transaction costs had been included, your costs would have been higher. The "Expenses Paid per $1,000" line of the tables is useful in comparing ongoing expenses only and will not help you determine the relative total expenses of owning different funds.
10
Credit Suisse Small Cap Core Fund
Semiannual Investment Adviser's Report (continued)
April 30, 2007 (unaudited)
Expenses and Value of a $1,000 Investment
for the six month period ended April 30, 2007
| Actual Fund Return | Common Class | Class A | Class B | Class C | |||||||||||||||
| Beginning Account Value 11/1/06 | $ | 1,000.00 | $ | 1,000.00 | $ | 1,000.00 | $ | 1,000.00 | |||||||||||
| Ending Account Value 4/30/07 | $ | 1,060.10 | $ | 1,060.70 | $ | 1,056.30 | $ | 1,056.70 | |||||||||||
| Expenses Paid per $1,000* | $ | 6.90 | $ | 6.90 | $ | 10.71 | $ | 10.71 | |||||||||||
| Hypothetical 5% Fund Return | |||||||||||||||||||
| Beginning Account Value 11/1/06 | $ | 1,000.00 | $ | 1,000.00 | $ | 1,000.00 | $ | 1,000.00 | |||||||||||
| Ending Account Value 4/30/07 | $ | 1,024.79 | $ | 1,013.50 | $ | 1,021.00 | $ | 1,021.00 | |||||||||||
| Expenses Paid per $1,000* | $ | 7.24 | $ | 7.24 | $ | 10.86 | $ | 10.86 | |||||||||||
| Common Class | Class A | Class B | Class C | ||||||||||||||||
| Annualized Expense Ratios* | 1.35 | % | 1.35 | % | 2.10 | % | 2.10 | % | |||||||||||
* Expenses are equal to the Fund's annualized expense ratio for each share class, multiplied by the average account value over the period, multiplied by the number of days in the most recent fiscal half year period, then divided by 365.
The "Expenses Paid per $1,000" and the "Annualized Expense Ratios" in the tables are based on actual expenses paid by the Fund during the period, net of fee waivers and/or expense reimbursements. If those fee waivers and/or expense reimbursements had not been in effect, the Fund's actual expenses would have been higher.
For more information, please refer to the Fund's prospectus.
11
Credit Suisse Small Cap Core Fund
Semiannual Investment Adviser's Report (continued)
April 30, 2007 (unaudited)
SECTOR BREAKDOWN*
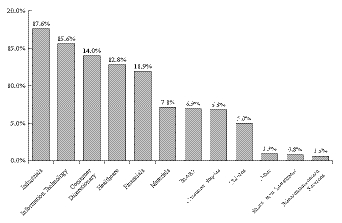
* Expressed as a percentage of total investments (excluding security lending collateral) and may vary over time.
12
Credit Suisse Large Cap Value Fund
Schedule of Investments
April 30, 2007 (unaudited)
| Number of Shares | Value | ||||||||||
| COMMON STOCKS (99.9%) | |||||||||||
| Aerospace & Defense (1.2%) | |||||||||||
| L-3 Communications Holdings, Inc. | 17,800 | $ | 1,600,754 | ||||||||
| Raytheon Co. | 42,000 | 2,248,680 | |||||||||
| 3,849,434 | |||||||||||
| Air Freight & Couriers (0.7%) | |||||||||||
| Ryder System, Inc. | 41,900 | 2,205,616 | |||||||||
| Airlines (0.3%) | |||||||||||
| Alaska Air Group, Inc.*§ | 18,900 | 559,440 | |||||||||
| Southwest Airlines Co. | 20,700 | 297,045 | |||||||||
| 856,485 | |||||||||||
| Auto Components (1.3%) | |||||||||||
| Autoliv, Inc.§ | 33,200 | 1,930,580 | |||||||||
| BorgWarner, Inc. | 17,100 | 1,332,261 | |||||||||
| TRW Automotive Holdings Corp.* | 23,600 | 874,616 | |||||||||
| 4,137,457 | |||||||||||
| Banks (9.3%) | |||||||||||
| Bank of America Corp. | 196,449 | 9,999,254 | |||||||||
| Fifth Third Bancorp§ | 16,500 | 669,735 | |||||||||
| Marshall & Ilsley Corp. | 9,600 | 460,992 | |||||||||
| Mellon Financial Corp. | 31,300 | 1,343,709 | |||||||||
| Northern Trust Corp. | 34,100 | 2,146,595 | |||||||||
| PNC Financial Services Group, Inc. | 39,800 | 2,949,180 | |||||||||
| Synovus Financial Corp. | 70,500 | 2,224,980 | |||||||||
| U.S. Bancorp | 14,000 | 480,900 | |||||||||
| Wachovia Corp. | 36,000 | 1,999,440 | |||||||||
| Washington Mutual, Inc.§ | 7,900 | 331,642 | |||||||||
| Wells Fargo & Co. | 181,400 | 6,510,446 | |||||||||
| 29,116,873 | |||||||||||
| Beverages (1.1%) | |||||||||||
| Molson Coors Brewing Co. Class B | 24,000 | 2,262,720 | |||||||||
| Pepsi Bottling Group, Inc. | 34,100 | 1,118,821 | |||||||||
| 3,381,541 | |||||||||||
| Biotechnology (0.5%) | |||||||||||
| Biogen Idec, Inc.* | 31,200 | 1,472,952 | |||||||||
| Chemicals (1.2%) | |||||||||||
| Ashland, Inc. | 19,600 | 1,175,020 | |||||||||
| Dow Chemical Co. | 16,900 | 753,909 | |||||||||
| Lubrizol Corp.§ | 16,400 | 983,016 | |||||||||
| Rohm and Haas Co. | 17,400 | 890,358 | |||||||||
| 3,802,303 | |||||||||||
| Commercial Services & Supplies (0.5%) | |||||||||||
| Korn/Ferry International* | 20,500 | 483,185 | |||||||||
| Manpower, Inc. | 4,100 | 329,025 | |||||||||
| Steelcase, Inc. Class A§ | 43,500 | 849,120 | |||||||||
| 1,661,330 | |||||||||||
See Accompanying Notes to Financial Statements.
13
Credit Suisse Large Cap Value Fund
Schedule of Investments (continued)
April 30, 2007 (unaudited)
| Number of Shares | Value | ||||||||||
| COMMON STOCKS | |||||||||||
| Computers & Peripherals (2.4%) | |||||||||||
| Hewlett-Packard Co. | 97,100 | $ | 4,091,794 | ||||||||
| International Business Machines Corp. | 26,400 | 2,698,344 | |||||||||
| Western Digital Corp.* | 36,000 | 636,480 | |||||||||
| 7,426,618 | |||||||||||
| Diversified Financials (13.7%) | |||||||||||
| Ameriprise Financial, Inc. | 5,300 | 315,191 | |||||||||
| Citigroup, Inc. | 227,200 | 12,182,464 | |||||||||
| Countrywide Financial Corp. | 75,500 | 2,799,540 | |||||||||
| Fannie Mae | 10,800 | 636,336 | |||||||||
| Freddie Mac | 15,700 | 1,017,046 | |||||||||
| Goldman Sachs Group, Inc. | 13,300 | 2,907,513 | |||||||||
| JPMorgan Chase & Co. | 188,600 | 9,826,060 | |||||||||
| Lehman Brothers Holdings, Inc. | 32,600 | 2,454,128 | |||||||||
| Merrill Lynch & Company, Inc. | 53,800 | 4,854,374 | |||||||||
| Morgan Stanley | 63,300 | 5,317,833 | |||||||||
| Principal Financial Group, Inc. | 11,700 | 742,833 | |||||||||
| 43,053,318 | |||||||||||
| Diversified Telecommunication Services (5.4%) | |||||||||||
| ALLTEL Corp. | 10,300 | 645,707 | |||||||||
| AT&T, Inc. | 286,405 | 11,089,602 | |||||||||
| CenturyTel, Inc. | 40,000 | 1,842,000 | |||||||||
| Sprint Nextel Corp. | 26,700 | 534,801 | |||||||||
| Verizon Communications, Inc. | 72,100 | 2,752,778 | |||||||||
| 16,864,888 | |||||||||||
| Electric Utilities (5.2%) | |||||||||||
| Alliant Energy Corp.§ | 49,100 | 2,150,580 | |||||||||
| Ameren Corp. | 21,900 | 1,151,283 | |||||||||
| Constellation Energy Group | 12,600 | 1,122,912 | |||||||||
| DTE Energy Co.§ | 41,400 | 2,094,426 | |||||||||
| Edison International | 43,000 | 2,251,050 | |||||||||
| FirstEnergy Corp.§ | 38,900 | 2,662,316 | |||||||||
| FPL Group, Inc. | 27,100 | 1,744,427 | |||||||||
| Pepco Holdings, Inc. | 23,200 | 684,864 | |||||||||
| PG & E Corp. | 48,900 | 2,474,340 | |||||||||
| 16,336,198 | |||||||||||
| Electronic Equipment & Instruments (0.8%) | |||||||||||
| Tektronix, Inc. | 27,600 | 811,164 | |||||||||
| Vishay Intertechnology, Inc.* | 103,200 | 1,718,280 | |||||||||
| 2,529,444 | |||||||||||
| Energy Equipment & Services (0.8%) | |||||||||||
| ENSCO International, Inc. | 26,000 | 1,465,880 | |||||||||
| Unit Corp.* | 16,300 | 931,545 | |||||||||
| 2,397,425 | |||||||||||
| Food & Drug Retailing (1.4%) | |||||||||||
| Kroger Co. | 60,000 | 1,770,600 | |||||||||
| Safeway, Inc. | 74,900 | 2,718,870 | |||||||||
| 4,489,470 | |||||||||||
See Accompanying Notes to Financial Statements.
14
Credit Suisse Large Cap Value Fund
Schedule of Investments (continued)
April 30, 2007 (unaudited)
| Number of Shares | Value | ||||||||||
| COMMON STOCKS | |||||||||||
| Food Products (1.6%) | |||||||||||
| Corn Products International, Inc. | 61,100 | $ | 2,433,002 | ||||||||
| General Mills, Inc. | 30,500 | 1,826,950 | |||||||||
| J.M. Smucker Co. | 7,400 | 413,068 | |||||||||
| Kraft Foods, Inc. Class A | 9,607 | 321,546 | |||||||||
| 4,994,566 | |||||||||||
| Gas Utilities (0.9%) | |||||||||||
| Energen Corp. | 27,600 | 1,546,980 | |||||||||
| MDU Resources Group, Inc.§ | 23,500 | 712,050 | |||||||||
| UGI Corp. | 18,600 | 527,496 | |||||||||
| 2,786,526 | |||||||||||
| Healthcare Providers & Services (2.8%) | |||||||||||
| Aetna, Inc. | 56,500 | 2,648,720 | |||||||||
| AmerisourceBergen Corp. | 11,600 | 579,884 | |||||||||
| Coventry Health Care, Inc.* | 5,500 | 318,065 | |||||||||
| Humana, Inc.* | 13,900 | 879,036 | |||||||||
| McKesson Corp. | 24,900 | 1,464,867 | |||||||||
| WellPoint, Inc.* | 37,100 | 2,929,787 | |||||||||
| 8,820,359 | |||||||||||
| Hotels, Restaurants & Leisure (0.4%) | |||||||||||
| Brinker International, Inc.§ | 17,500 | 544,250 | |||||||||
| McDonald's Corp. | 13,900 | 671,092 | |||||||||
| 1,215,342 | |||||||||||
| Household Durables (1.3%) | |||||||||||
| American Greetings Corp. Class A§ | 30,500 | 776,225 | |||||||||
| Leggett & Platt, Inc.§ | 26,300 | 618,576 | |||||||||
| Whirlpool Corp.§ | 25,800 | 2,735,574 | |||||||||
| 4,130,375 | |||||||||||
| Household Products (2.7%) | |||||||||||
| Clorox Co. | 37,800 | 2,535,624 | |||||||||
| Colgate-Palmolive Co. | 9,300 | 629,982 | |||||||||
| Procter & Gamble Co. | 85,600 | 5,504,936 | |||||||||
| 8,670,542 | |||||||||||
| Industrial Conglomerates (2.0%) | |||||||||||
| General Electric Co. | 174,100 | 6,417,326 | |||||||||
| Insurance (9.1%) | |||||||||||
| American Financial Group, Inc.§ | 36,750 | 1,296,173 | |||||||||
| American International Group, Inc. | 54,800 | 3,831,068 | |||||||||
| Aon Corp. | 23,000 | 891,250 | |||||||||
| Arthur J. Gallagher & Co.§ | 42,100 | 1,177,116 | |||||||||
| Assurant, Inc.§ | 39,500 | 2,272,435 | |||||||||
| Axis Capital Holdings, Ltd. | 51,600 | 1,914,360 | |||||||||
| Genworth Financial, Inc. Class A | 68,700 | 2,506,863 | |||||||||
| Hartford Financial Services Group, Inc. | 34,100 | 3,450,920 | |||||||||
| HCC Insurance Holdings, Inc. | 64,300 | 1,971,438 | |||||||||
| PartnerRe, Ltd.§ | 18,500 | 1,332,370 | |||||||||
See Accompanying Notes to Financial Statements.
15
Credit Suisse Large Cap Value Fund
Schedule of Investments (continued)
April 30, 2007 (unaudited)
| Number of Shares | Value | ||||||||||
| COMMON STOCKS | |||||||||||
| Insurance | |||||||||||
| Prudential Financial, Inc. | 37,500 | $ | 3,562,500 | ||||||||
| Reinsurance Group of America, Inc.§ | 21,800 | 1,358,358 | |||||||||
| SAFECO Corp.§ | 19,700 | 1,314,778 | |||||||||
| StanCorp Financial Group, Inc. | 7,100 | 337,960 | |||||||||
| W.R. Berkley Corp. | 43,500 | 1,413,315 | |||||||||
| 28,630,904 | |||||||||||
| IT Consulting & Services (1.0%) | |||||||||||
| Accenture, Ltd. Class A | 29,600 | 1,157,360 | |||||||||
| Electronic Data Systems Corp. | 63,800 | 1,865,512 | |||||||||
| 3,022,872 | |||||||||||
| Leisure Equipment & Products (0.1%) | |||||||||||
| Hasbro, Inc.§ | 11,400 | 360,354 | |||||||||
| Machinery (1.6%) | |||||||||||
| Cummins, Inc. | 12,500 | 1,152,000 | |||||||||
| Dover Corp. | 27,500 | 1,323,300 | |||||||||
| Parker Hannifin Corp. | 26,800 | 2,469,352 | |||||||||
| 4,944,652 | |||||||||||
| Media (3.0%) | |||||||||||
| CBS Corp. Class B§ | 10,100 | 320,877 | |||||||||
| CTC Media, Inc.*§ | 11,500 | 299,920 | |||||||||
| DirecTV Group, Inc.* | 54,700 | 1,304,048 | |||||||||
| EchoStar Communications Corp. Class A* | 41,400 | 1,926,342 | |||||||||
| Time Warner, Inc. | 163,700 | 3,377,131 | |||||||||
| Walt Disney Co. | 60,900 | 2,130,282 | |||||||||
| 9,358,600 | |||||||||||
| Metals & Mining (1.1%) | |||||||||||
| Freeport-McMoRan Copper & Gold, Inc. Class B§ | 37,313 | 2,505,941 | |||||||||
| Nucor Corp. | 17,300 | 1,097,858 | |||||||||
| 3,603,799 | |||||||||||
| Multiline Retail (0.6%) | |||||||||||
| Federated Department Stores, Inc. | 28,900 | 1,269,288 | |||||||||
| Kohl's Corp.* | 8,800 | 651,552 | |||||||||
| 1,920,840 | |||||||||||
| Oil & Gas (14.4%) | |||||||||||
| Chevron Corp. | 119,700 | 9,311,463 | |||||||||
| Cimarex Energy Co.§ | 8,800 | 346,720 | |||||||||
| ConocoPhillips | 72,600 | 5,034,810 | |||||||||
| Devon Energy Corp. | 5,700 | 415,359 | |||||||||
| Exxon Mobil Corp. | 257,800 | 20,464,164 | |||||||||
| Marathon Oil Corp. | 33,100 | 3,361,305 | |||||||||
| Newfield Exploration Co.* | 30,000 | 1,312,500 | |||||||||
| Todco*§ | 24,300 | 1,104,678 | |||||||||
| Valero Energy Corp. | 57,700 | 4,052,271 | |||||||||
| 45,403,270 | |||||||||||
See Accompanying Notes to Financial Statements.
16
Credit Suisse Large Cap Value Fund
Schedule of Investments (continued)
April 30, 2007 (unaudited)
| Number of Shares | Value | ||||||||||
| COMMON STOCKS | |||||||||||
| Personal Products (0.3%) | |||||||||||
| Estee Lauder Companies, Inc. Class A§ | 18,000 | $ | 925,560 | ||||||||
| Pharmaceuticals (6.3%) | |||||||||||
| Forest Laboratories, Inc.* | 28,600 | 1,521,806 | |||||||||
| Johnson & Johnson | 32,900 | 2,112,838 | |||||||||
| Merck & Company, Inc. | 83,900 | 4,315,816 | |||||||||
| Pfizer, Inc. | 390,400 | 10,329,984 | |||||||||
| Watson Pharmaceuticals, Inc.*§ | 58,000 | 1,583,400 | |||||||||
| 19,863,844 | |||||||||||
| Real Estate (0.8%) | |||||||||||
| Boston Properties, Inc. | 17,900 | 2,104,324 | |||||||||
| Simon Property Group, Inc. | 3,000 | 345,840 | |||||||||
| 2,450,164 | |||||||||||
| Road & Rail (0.8%) | |||||||||||
| Union Pacific Corp. | 6,900 | 788,325 | |||||||||
| YRC Worldwide, Inc.*§ | 40,500 | 1,611,495 | |||||||||
| 2,399,820 | |||||||||||
| Semiconductor Equipment & Products (1.0%) | |||||||||||
| Applied Materials, Inc. | 17,900 | 344,038 | |||||||||
| Novellus Systems, Inc.* | 28,000 | 906,360 | |||||||||
| Teradyne, Inc.* | 116,900 | 2,039,905 | |||||||||
| 3,290,303 | |||||||||||
| Specialty Retail (0.7%) | |||||||||||
| Circuit City Stores, Inc.§ | 31,200 | 544,440 | |||||||||
| Sherwin-Williams Co. | 14,600 | 931,042 | |||||||||
| TJX Companies, Inc. | 22,100 | 616,369 | |||||||||
| 2,091,851 | |||||||||||
| Textiles & Apparel (0.1%) | |||||||||||
| Phillips-Van Heusen Corp. | 5,500 | 307,450 | |||||||||
| Tobacco (1.4%) | |||||||||||
| Altria Group, Inc. | 29,200 | 2,012,464 | |||||||||
| Loews Corp. - Carolina Group | 30,900 | 2,364,777 | |||||||||
| 4,377,241 | |||||||||||
| Wireless Telecommunication Services (0.1%) | |||||||||||
| United States Cellular Corp.* | 6,000 | 435,000 | |||||||||
| TOTAL COMMON STOCKS (Cost $265,122,343) | 314,002,912 | ||||||||||
See Accompanying Notes to Financial Statements.
17
Credit Suisse Large Cap Value Fund
Schedule of Investments (continued)
April 30, 2007 (unaudited)
| Number of Shares | Value | ||||||||||
| SHORT-TERM INVESTMENTS (6.5%) | |||||||||||
| State Street Navigator Prime Portfolio§§ | 20,285,365 | $ | 20,285,365 | ||||||||
| Par (000) | |||||||||||
| State Street Bank and Trust Co. Euro Time Deposit, 4.100%, 5/01/07 | $ | 263 | 263,000 | ||||||||
| TOTAL SHORT-TERM INVESTMENTS (Cost $20,548,365) | 20,548,365 | ||||||||||
| TOTAL INVESTMENTS AT VALUE (106.4%) (Cost $285,670,708) | 334,551,277 | ||||||||||
| LIABILITIES IN EXCESS OF OTHER ASSETS (-6.4%) | (20,235,073 | ) | |||||||||
| NET ASSETS (100.0%) | $ | 314,316,204 | |||||||||
* Non-income producing security.
§ Security or portion thereof is out on loan.
§§ Represents security purchased with cash collateral received for securities on loan.
See Accompanying Notes to Financial Statements.
18
Credit Suisse Small Cap Core Fund
Schedule of Investments
April 30, 2007 (unaudited)
| Number of Shares | Value | ||||||||||
| COMMON STOCKS (99.4%) | |||||||||||
| Aerospace & Defense (1.4%) | |||||||||||
| Armor Holdings, Inc.* | 37,800 | $ | 2,702,700 | ||||||||
| Cubic Corp. | 6,800 | 136,884 | |||||||||
| Orbital Sciences Corp.* | 16,000 | 333,920 | |||||||||
| United Industrial Corp.§ | 13,000 | 635,960 | |||||||||
| 3,809,464 | |||||||||||
| Air Freight & Couriers (0.1%) | |||||||||||
| Hub Group, Inc. Class A* | 11,800 | 424,800 | |||||||||
| Airlines (0.9%) | |||||||||||
| ExpressJet Holdings, Inc.*§ | 83,000 | 495,510 | |||||||||
| SkyWest, Inc.§ | 75,500 | 2,054,355 | |||||||||
| 2,549,865 | |||||||||||
| Auto Components (1.1%) | |||||||||||
| Accuride Corp.*§ | 90,900 | 1,328,049 | |||||||||
| ArvinMeritor, Inc.§ | 32,000 | 660,800 | |||||||||
| Keystone Automotive Industries, Inc.* | 8,800 | 292,688 | |||||||||
| Modine Manufacturing Co. | 10,800 | 249,804 | |||||||||
| Standard Motor Products, Inc. | 7,900 | 144,807 | |||||||||
| Wabtec Corp. | 8,400 | 312,060 | |||||||||
| 2,988,208 | |||||||||||
| Banks (3.7%) | |||||||||||
| Cathay General Bancorp | 8,400 | 275,436 | |||||||||
| Central Pacific Financial Corp.§ | 14,600 | 501,656 | |||||||||
| Chittenden Corp.§ | 17,600 | 511,456 | |||||||||
| City Bank/Lynnwood WA | 4,400 | 137,324 | |||||||||
| Corus Bankshares, Inc.§ | 23,100 | 388,311 | |||||||||
| Downey Financial Corp. | 2,100 | 140,595 | |||||||||
| East West Bancorp, Inc.§ | 34,500 | 1,375,170 | |||||||||
| FirstFed Financial Corp.*§ | 10,500 | 645,540 | |||||||||
| Nara Bancorp, Inc.§ | 16,200 | 267,462 | |||||||||
| Prosperity Bancshares, Inc.§ | 49,800 | 1,727,562 | |||||||||
| Sterling Bancshares, Inc.§ | 67,350 | 769,810 | |||||||||
| Sterling Financial Corp. | 36,300 | 1,070,124 | |||||||||
| Taylor Capital Group, Inc. | 3,300 | 98,142 | |||||||||
| Umpqua Holdings Corp. | 44,600 | 1,112,324 | |||||||||
| Whitney Holding Corp. | 40,900 | 1,258,493 | |||||||||
| Wilshire Bancorp, Inc. | 16,800 | 231,168 | |||||||||
| 10,510,573 | |||||||||||
| Beverages (0.3%) | |||||||||||
| Boston Beer Company, Inc. Class A* | 21,400 | 689,294 | |||||||||
| Coca-Cola Bottling Co. Consolidated | 800 | 44,176 | |||||||||
| 733,470 | |||||||||||
| Biotechnology (1.4%) | |||||||||||
| Cubist Pharmaceuticals, Inc.* | 12,800 | 274,560 | |||||||||
| Digene Corp.* | 9,400 | 430,990 | |||||||||
See Accompanying Notes to Financial Statements.
19
Credit Suisse Small Cap Core Fund
Schedule of Investments (continued)
April 30, 2007 (unaudited)
| Number of Shares | Value | ||||||||||
| COMMON STOCKS | |||||||||||
| Biotechnology | |||||||||||
| Kendle International, Inc.*§ | 29,900 | $ | 1,018,992 | ||||||||
| LifeCell Corp.* | 7,800 | 229,320 | |||||||||
| OSI Pharmaceuticals, Inc.* | 3,900 | 135,330 | |||||||||
| Regeneron Pharmaceuticals, Inc.* | 10,800 | 293,760 | |||||||||
| United Therapeutics Corp.* | 5,100 | 285,141 | |||||||||
| ViroPharma, Inc.*§ | 76,200 | 1,149,096 | |||||||||
| 3,817,189 | |||||||||||
| Building Products (1.0%) | |||||||||||
| Lamson & Sessions Co.* | 5,200 | 131,456 | |||||||||
| Lennox International, Inc. | 61,000 | 2,062,410 | |||||||||
| NCI Building Systems, Inc.*§ | 9,700 | 484,709 | |||||||||
| 2,678,575 | |||||||||||
| Chemicals (1.4%) | |||||||||||
| Arch Chemicals, Inc.§ | 13,700 | 414,014 | |||||||||
| CF Industries Holdings, Inc. | 5,100 | 202,419 | |||||||||
| Georgia Gulf Corp.§ | 56,700 | 905,499 | |||||||||
| H.B. Fuller Co. | 67,500 | 1,725,975 | |||||||||
| Hercules, Inc.*§ | 10,100 | 190,284 | |||||||||
| PolyOne Corp.*§ | 66,900 | 438,864 | |||||||||
| Spartech Corp. | 4,900 | 137,494 | |||||||||
| 4,014,549 | |||||||||||
| Commercial Services & Supplies (4.8%) | |||||||||||
| ABM Industries, Inc.§ | 32,000 | 900,480 | |||||||||
| Administaff, Inc.§ | 21,500 | 713,585 | |||||||||
| Atlas Air Worldwide Holdings, Inc.* | 4,800 | 276,096 | |||||||||
| Bristow Group, Inc.*§ | 19,000 | 714,400 | |||||||||
| Consolidated Graphics, Inc.*§ | 15,500 | 1,166,375 | |||||||||
| CPI Corp. | 8,500 | 488,835 | |||||||||
| CRA International, Inc.*§ | 2,700 | 139,239 | |||||||||
| eFunds Corp.* | 23,100 | 644,490 | |||||||||
| FactSet Research Systems, Inc.§ | 17,100 | 1,051,821 | |||||||||
| Gevity HR, Inc.§ | 11,800 | 220,070 | |||||||||
| Headwaters, Inc.*§ | 36,400 | 788,788 | |||||||||
| Heidrick & Struggles International, Inc.* | 25,000 | 1,179,500 | |||||||||
| Kelly Services, Inc. Class A | 4,700 | 134,890 | |||||||||
| Korn/Ferry International* | 6,000 | 141,420 | |||||||||
| Labor Ready, Inc.* | 73,100 | 1,586,270 | |||||||||
| Layne Christensen Co* | 3,800 | 143,906 | |||||||||
| PHH Corp.* | 25,500 | 777,750 | |||||||||
| Pre-Paid Legal Services, Inc.* | 2,400 | 136,920 | |||||||||
| Viad Corp.§ | 13,900 | 567,676 | |||||||||
| Watson Wyatt Worldwide, Inc. Class A§ | 36,600 | 1,724,958 | |||||||||
| 13,497,469 | |||||||||||
| Commingled Fund (0.9%) | |||||||||||
| iShares S&P SmallCap 600 Index Fund | 34,800 | 2,418,252 | |||||||||
See Accompanying Notes to Financial Statements.
20
Credit Suisse Small Cap Core Fund
Schedule of Investments (continued)
April 30, 2007 (unaudited)
| Number of Shares | Value | ||||||||||
| COMMON STOCKS | |||||||||||
| Communications Equipment (1.0%) | |||||||||||
| Arris Group, Inc.* | 57,000 | $ | 844,740 | ||||||||
| Brocade Communications Systems, Inc.* | 28,000 | 273,560 | |||||||||
| Comtech Telecommunications Corp.*§ | 29,900 | 1,131,715 | |||||||||
| CPI International, Inc.* | 7,200 | 139,536 | |||||||||
| Symmetricom, Inc.*§ | 39,900 | 325,983 | |||||||||
| 2,715,534 | |||||||||||
| Computers & Peripherals (0.7%) | |||||||||||
| Hutchinson Technology, Inc.*§ | 28,800 | 547,200 | |||||||||
| Komag, Inc.*§ | 49,100 | 1,350,741 | |||||||||
| 1,897,941 | |||||||||||
| Construction & Engineering (1.2%) | |||||||||||
| EMCOR Group, Inc.*§ | 33,000 | 2,068,770 | |||||||||
| Perini Corp.* | 3,400 | 144,840 | |||||||||
| URS Corp.* | 24,400 | 1,066,280 | |||||||||
| 3,279,890 | |||||||||||
| Construction Materials (0.3%) | |||||||||||
| Texas Industries, Inc.§ | 9,600 | 731,232 | |||||||||
| Containers & Packaging (0.4%) | |||||||||||
| AptarGroup, Inc. | 7,500 | 549,375 | |||||||||
| Rock-Tenn Co. Class A | 17,100 | 654,246 | |||||||||
| 1,203,621 | |||||||||||
| Diversified Financials (1.7%) | |||||||||||
| ACA Capital Holdings, Inc.* | 9,300 | 133,455 | |||||||||
| Cash America International, Inc. | 9,600 | 414,336 | |||||||||
| Euronet Worldwide, Inc.* | 5,500 | 153,175 | |||||||||
| EZCORP, Inc. Class A* | 9,100 | 137,865 | |||||||||
| Investment Technology Group, Inc.*§ | 14,000 | 529,760 | |||||||||
| Jackson Hewitt Tax Service, Inc. | 15,000 | 413,700 | |||||||||
| Knight Capital Group, Inc. Class A* | 15,400 | 249,480 | |||||||||
| MCG Capital Corp. | 29,100 | 512,742 | |||||||||
| National Financial Partners Corp. | 9,000 | 414,630 | |||||||||
| optionsXpress Holdings, Inc. | 5,900 | 145,612 | |||||||||
| SWS Group, Inc.§ | 63,399 | 1,647,740 | |||||||||
| 4,752,495 | |||||||||||
| Diversified Telecommunication Services (0.3%) | |||||||||||
| CT Communications, Inc.§ | 35,400 | 864,114 | |||||||||
| Electric Utilities (2.3%) | |||||||||||
| Cleco Corp.§ | 53,900 | 1,512,434 | |||||||||
| El Paso Electric Co.* | 39,200 | 1,034,880 | |||||||||
| PNM Resources, Inc. | 25,300 | 823,515 | |||||||||
| Portland General Electric Co. | 23,900 | 692,622 | |||||||||
| UIL Holdings Corp. | 28,200 | 963,030 | |||||||||
| Unisource Energy Corp. | 39,000 | 1,497,990 | |||||||||
| 6,524,471 | |||||||||||
See Accompanying Notes to Financial Statements.
21
Credit Suisse Small Cap Core Fund
Schedule of Investments (continued)
April 30, 2007 (unaudited)
| Number of Shares | Value | ||||||||||
| COMMON STOCKS | |||||||||||
| Electrical Equipment (1.1%) | |||||||||||
| A.O. Smith Corp. | 8,200 | $ | 312,420 | ||||||||
| Acuity Brands, Inc.§ | 20,000 | 1,182,400 | |||||||||
| Belden CDT, Inc. | 7,400 | 413,512 | |||||||||
| General Cable Corp.* | 2,500 | 143,600 | |||||||||
| Genlyte Group, Inc.* | 7,900 | 616,279 | |||||||||
| Regal-Beloit Corp.§ | 9,800 | 451,976 | |||||||||
| 3,120,187 | |||||||||||
| Electronic Equipment & Instruments (3.2%) | |||||||||||
| Anixter International, Inc.* | 10,600 | 758,960 | |||||||||
| Benchmark Electronics, Inc.* | 31,000 | 656,580 | |||||||||
| Coherent, Inc.*§ | 26,700 | 838,113 | |||||||||
| FLIR Systems, Inc.*§ | 22,400 | 906,976 | |||||||||
| Littelfuse, Inc.*§ | 20,000 | 802,200 | |||||||||
| LoJack Corp.* | 7,600 | 139,840 | |||||||||
| Methode Electronics, Inc.§ | 49,100 | 740,428 | |||||||||
| Park Electrochemical Corp.§ | 19,100 | 526,205 | |||||||||
| Plexus Corp.*§ | 33,900 | 710,544 | |||||||||
| Trimble Navigation, Ltd.*§ | 42,000 | 1,204,560 | |||||||||
| TTM Technologies, Inc.*§ | 29,700 | 272,646 | |||||||||
| Varian, Inc.*§ | 22,400 | 1,298,304 | |||||||||
| 8,855,356 | |||||||||||
| Energy Equipment & Services (4.0%) | |||||||||||
| Atwood Oceanics, Inc.* | 27,800 | 1,748,620 | |||||||||
| Basic Energy Services, Inc.* | 12,300 | 317,955 | |||||||||
| Complete Production Services, Inc.* | 19,200 | 462,144 | |||||||||
| Hercules Offshore, Inc.*§ | 20,400 | 641,172 | |||||||||
| Lufkin Industries, Inc. | 29,000 | 1,804,380 | |||||||||
| SEACOR Holdings, Inc.*§ | 26,100 | 2,486,808 | |||||||||
| Unit Corp.*§ | 47,600 | 2,720,340 | |||||||||
| W-H Energy Services, Inc.* | 18,300 | 990,213 | |||||||||
| 11,171,632 | |||||||||||
| Food & Drug Retailing (2.7%) | |||||||||||
| Arden Group, Inc. Class A | 1,300 | 175,227 | |||||||||
| Casey's General Stores, Inc.§ | 23,000 | 578,450 | |||||||||
| Central European Distribution Corp.*§ | 32,800 | 975,800 | |||||||||
| Longs Drug Stores Corp.§ | 42,500 | 2,326,450 | |||||||||
| Nash Finch Co.§ | 33,600 | 1,309,392 | |||||||||
| Performance Food Group Co.*§ | 42,000 | 1,312,500 | |||||||||
| Terra Industries, Inc.* | 11,600 | 204,624 | |||||||||
| Village Super Market, Inc. Class A | 4,594 | 202,412 | |||||||||
| Weis Markets, Inc. | 9,700 | 417,488 | |||||||||
| 7,502,343 | |||||||||||
| Food Products (2.6%) | |||||||||||
| Corn Products International, Inc. | 72,700 | 2,894,914 | |||||||||
| Delta & Pine Land Co.§ | 17,100 | 705,204 | |||||||||
See Accompanying Notes to Financial Statements.
22
Credit Suisse Small Cap Core Fund
Schedule of Investments (continued)
April 30, 2007 (unaudited)
| Number of Shares | Value | ||||||||||
| COMMON STOCKS | |||||||||||
| Food Products | |||||||||||
| Hain Celestial Group, Inc.*§ | 10,100 | $ | 303,303 | ||||||||
| Imperial Sugar Co.§ | 12,300 | 366,048 | |||||||||
| J & J Snack Foods Corp. | 14,700 | 572,859 | |||||||||
| Ralcorp Holdings, Inc.*§ | 13,800 | 908,178 | |||||||||
| Seaboard Corp. | 400 | 997,200 | |||||||||
| USANA Health Sciences, Inc.*§ | 11,700 | 466,128 | |||||||||
| 7,213,834 | |||||||||||
| Gas Utilities (2.7%) | |||||||||||
| Atmos Energy Corp. | 67,900 | 2,153,788 | |||||||||
| Energen Corp. | 52,800 | 2,959,440 | |||||||||
| Southwest Gas Corp.§ | 35,100 | 1,329,939 | |||||||||
| UGI Corp. | 39,200 | 1,111,712 | |||||||||
| 7,554,879 | |||||||||||
| Healthcare Equipment & Supplies (5.0%) | |||||||||||
| ArthroCare Corp.*§ | 26,200 | 1,081,012 | |||||||||
| Bruker BioSciences Corp.* | 12,500 | 143,875 | |||||||||
| Haemonetics Corp.* | 21,500 | 1,028,560 | |||||||||
| Hologic, Inc.*§ | 16,100 | 926,555 | |||||||||
| ICU Medical, Inc.*§ | 14,600 | 609,550 | |||||||||
| Immucor, Inc.*§ | 32,400 | 1,057,212 | |||||||||
| LCA-Vision, Inc.§ | 15,100 | 633,747 | |||||||||
| Mentor Corp.§ | 44,400 | 1,727,604 | |||||||||
| Meridian Bioscience, Inc.§ | 68,800 | 2,045,424 | |||||||||
| Noven Pharmaceuticals, Inc.* | 26,900 | 629,729 | |||||||||
| Palomar Medical Technologies, Inc.*§ | 13,000 | 532,220 | |||||||||
| Respironics, Inc.*§ | 28,300 | 1,153,508 | |||||||||
| SurModics, Inc.*§ | 44,400 | 1,803,972 | |||||||||
| Viasys Healthcare, Inc.*§ | 20,900 | 669,218 | |||||||||
| Zoll Medical Corp.* | 5,000 | 120,850 | |||||||||
| 14,163,036 | |||||||||||
| Healthcare Providers & Services (4.8%) | |||||||||||
| Amedisys, Inc.*§ | 27,099 | 849,554 | |||||||||
| Amerigroup Corp.* | 65,000 | 1,828,450 | |||||||||
| AMN Healthcare Services, Inc.* | 5,800 | 141,230 | |||||||||
| AmSurg Corp.*§ | 33,500 | 768,825 | |||||||||
| Apria Healthcare Group, Inc.* | 8,400 | 266,616 | |||||||||
| Centene Corp.* | 44,500 | 926,045 | |||||||||
| Gentiva Health Services, Inc.*§ | 47,900 | 896,688 | |||||||||
| Healthspring, Inc.* | 45,500 | 1,070,160 | |||||||||
| Healthways, Inc.*§ | 26,600 | 1,128,372 | |||||||||
| MedCath Corp.* | 15,300 | 454,716 | |||||||||
| Molina Healthcare, Inc.* | 9,600 | 290,112 | |||||||||
| National Healthcare Corp. | 7,900 | 405,349 | |||||||||
| Omnicell, Inc.* | 14,400 | 330,336 | |||||||||
| PAREXEL International Corp.*§ | 34,300 | 1,347,304 | |||||||||
| Pediatrix Medical Group, Inc.* | 13,100 | 747,355 | |||||||||
See Accompanying Notes to Financial Statements.
23
Credit Suisse Small Cap Core Fund
Schedule of Investments (continued)
April 30, 2007 (unaudited)
| Number of Shares | Value | ||||||||||
| COMMON STOCKS | |||||||||||
| Healthcare Providers & Services | |||||||||||
| PSS World Medical, Inc.* | 15,000 | $ | 301,500 | ||||||||
| Sierra Health Services, Inc.* | 19,700 | 815,974 | |||||||||
| Sunrise Senior Living, Inc.*§ | 16,500 | 631,785 | |||||||||
| Vital Images, Inc.* | 8,400 | 259,224 | |||||||||
| 13,459,595 | |||||||||||
| Hotels, Restaurants & Leisure (2.7%) | |||||||||||
| CBRL Group, Inc.* | 3,200 | 142,656 | |||||||||
| CKE Restaurants, Inc.§ | 97,300 | 1,976,163 | |||||||||
| Jack in the Box, Inc.* | 17,200 | 1,145,864 | |||||||||
| Monarch Casino & Resort, Inc.* | 10,800 | 288,036 | |||||||||
| O'Charley's, Inc.* | 17,100 | 360,981 | |||||||||
| P.F. Chang's China Bistro, Inc.*§ | 41,600 | 1,591,200 | |||||||||
| RARE Hospitality International, Inc.*§ | 51,800 | 1,508,416 | |||||||||
| Town Sports International Holdings, Inc.* | 6,100 | 139,019 | |||||||||
| WMS Industries, Inc.*§ | 11,700 | 466,362 | |||||||||
| 7,618,697 | |||||||||||
| Household Durables (1.3%) | |||||||||||
| Ethan Allen Interiors, Inc.§ | 24,000 | 847,200 | |||||||||
| Kimball International, Inc. Class B | 21,800 | 392,400 | |||||||||
| National Presto Industries, Inc.§ | 11,800 | 697,262 | |||||||||
| NVR, Inc.* | 1,200 | 988,800 | |||||||||
| Toro Co.§ | 12,000 | 603,000 | |||||||||
| 3,528,662 | |||||||||||
| Household Products (0.2%) | |||||||||||
| WD-40 Co.§ | 12,700 | 439,166 | |||||||||
| Industrial Conglomerates (0.4%) | |||||||||||
| Chemed Corp. | 13,700 | 689,110 | |||||||||
| Lydall, Inc.* | 7,700 | 111,958 | |||||||||
| Pioneer Companies, Inc.*§ | 15,600 | 453,960 | |||||||||
| 1,255,028 | |||||||||||
| Insurance (5.0%) | |||||||||||
| Argonaut Group, Inc.* | 36,100 | 1,213,321 | |||||||||
| Delphi Financial Group, Inc. Class A§ | 39,700 | 1,695,190 | |||||||||
| Hilb Rogal and Hobbs Co.§ | 23,200 | 1,008,040 | |||||||||
| Max Capital Group Ltd. | 21,300 | 570,840 | |||||||||
| Odyssey Re Holdings Corp.§ | 33,000 | 1,382,700 | |||||||||
| Philadelphia Consolidated Holding Corp.*§ | 52,800 | 2,291,520 | |||||||||
| Phoenix Companies, Inc. | 20,500 | 305,450 | |||||||||
| ProAssurance Corp.*§ | 31,000 | 1,669,040 | |||||||||
| Safety Insurance Group, Inc.§ | 28,600 | 1,145,716 | |||||||||
| Selective Insurance Group, Inc.§ | 33,200 | 865,856 | |||||||||
| Tower Group, Inc.§ | 28,900 | 886,941 | |||||||||
| Triad Guaranty, Inc.*§ | 13,100 | 579,151 | |||||||||
| Universal American Financial Corp.* | 29,700 | 551,232 | |||||||||
| 14,164,997 | |||||||||||
See Accompanying Notes to Financial Statements.
24
Credit Suisse Small Cap Core Fund
Schedule of Investments (continued)
April 30, 2007 (unaudited)
| Number of Shares | Value | ||||||||||
| COMMON STOCKS | |||||||||||
| Internet & Catalog Retail (0.3%) | |||||||||||
| Insight Enterprises, Inc.* | 36,600 | $ | 725,412 | ||||||||
| Internet Software & Services (2.1%) | |||||||||||
| Allscripts Heathcare Solutions, Inc.*§ | 39,300 | 1,039,485 | |||||||||
| Digital River, Inc.* | 7,700 | 450,681 | |||||||||
| InfoSpace, Inc.*§ | 23,700 | 608,142 | |||||||||
| j2 Global Communications, Inc.*§ | 33,900 | 974,964 | |||||||||
| United Online, Inc.§ | 140,400 | 2,025,972 | |||||||||
| Websense, Inc.*§ | 37,900 | 936,509 | |||||||||
| 6,035,753 | |||||||||||
| IT Consulting & Services (0.3%) | |||||||||||
| Sykes Enterprises, Inc.* | 42,300 | 780,858 | |||||||||
| Leisure Equipment & Products (1.0%) | |||||||||||
| Build-A-Bear- Workshop, Inc.*§ | 21,100 | 581,305 | |||||||||
| JAKKS Pacific, Inc.*§ | 37,200 | 893,916 | |||||||||
| RC2 Corp.* | 31,600 | 1,259,576 | |||||||||
| 2,734,797 | |||||||||||
| Machinery (5.2%) | |||||||||||
| Applied Industrial Technologies, Inc.§ | 28,000 | 752,360 | |||||||||
| Barnes Group, Inc. | 12,200 | 296,460 | |||||||||
| Cascade Corp. | 2,200 | 136,334 | |||||||||
| Ceradyne, Inc.*§ | 42,300 | 2,489,355 | |||||||||
| Dionex Corp.*§ | 9,700 | 669,300 | |||||||||
| EnPro Industries, Inc.*§ | 36,900 | 1,389,654 | |||||||||
| Freightcar America, Inc.§ | 11,800 | 587,168 | |||||||||
| Gardner Denver, Inc.* | 76,500 | 2,891,700 | |||||||||
| Hurco Companies, Inc.* | 3,300 | 145,563 | |||||||||
| IDEX Corp. | 8,400 | 440,748 | |||||||||
| Kaydon Corp. | 3,100 | 147,343 | |||||||||
| Manitowoc Company, Inc. | 51,600 | 3,520,668 | |||||||||
| Mueller Industries, Inc. | 31,000 | 1,016,800 | |||||||||
| 14,483,453 | |||||||||||
| Marine (0.4%) | |||||||||||
| American Commercial Lines, Inc.*§ | 16,600 | 489,202 | |||||||||
| Cal Dive International, Inc.* | 19,300 | 281,008 | |||||||||
| Horizon Lines, Inc. Class A | 4,200 | 142,842 | |||||||||
| Hornbeck Offshore Services, Inc.* | 9,200 | 290,996 | |||||||||
| 1,204,048 | |||||||||||
| Media (0.7%) | |||||||||||
| InVentiv Health, Inc.*§ | 16,300 | 618,585 | |||||||||
| Sonic Solutions*§ | 55,900 | 728,377 | |||||||||
| World Wrestling Entertainment, Inc. Class A§ | 35,600 | 605,556 | |||||||||
| 1,952,518 | |||||||||||
| Metals & Mining (4.7%) | |||||||||||
| Alpha Natural Resources, Inc.*§ | 43,200 | 750,384 | |||||||||
| Carpenter Technology Corp.§ | 26,100 | 3,167,757 | |||||||||
See Accompanying Notes to Financial Statements.
25
Credit Suisse Small Cap Core Fund
Schedule of Investments (continued)
April 30, 2007 (unaudited)
| Number of Shares | Value | ||||||||||
| COMMON STOCKS | |||||||||||
| Metals & Mining | |||||||||||
| Chaparral Steel Co. | 41,800 | $ | 2,946,900 | ||||||||
| Cleveland-Cliffs, Inc.§ | 46,900 | 3,249,701 | |||||||||
| Coeur d'Alene Mines Corp.*§ | 68,200 | 278,938 | |||||||||
| Metal Management, Inc. | 11,900 | 572,033 | |||||||||
| Quanex Corp.§ | 54,200 | 2,332,226 | |||||||||
| 13,297,939 | |||||||||||
| Multiline Retail (0.1%) | |||||||||||
| Big Lots, Inc.* | 8,800 | 283,360 | |||||||||
| Oil & Gas (2.9%) | |||||||||||
| Cabot Oil & Gas Corp. | 23,000 | 837,660 | |||||||||
| Delek US Holdings, Inc. | 45,500 | 867,685 | |||||||||
| General Maritime Corp. | 4,300 | 137,901 | |||||||||
| Helix Energy Solutions Group, Inc.*§ | 56,700 | 2,169,342 | |||||||||
| Houston Exploration Co.* | 3,800 | 210,406 | |||||||||
| Mariner Energy, Inc.* | 8,700 | 196,185 | |||||||||
| OMI Corp. | 21,400 | 622,098 | |||||||||
| Rosetta Resources, Inc.* | 9,100 | 195,741 | |||||||||
| St. Mary Land & Exploration Co. | 8,000 | 292,960 | |||||||||
| Swift Energy Co.*§ | 30,400 | 1,235,760 | |||||||||
| Western Refining, Inc.§ | 35,000 | 1,386,700 | |||||||||
| 8,152,438 | |||||||||||
| Paper & Forest Products (0.2%) | |||||||||||
| Buckeye Technologies, Inc.* | 35,800 | 453,586 | |||||||||
| Potlatch Corp. | 3,200 | 138,848 | |||||||||
| 592,434 | |||||||||||
| Personal Products (0.8%) | |||||||||||
| NBTY, Inc.*§ | 40,900 | 2,020,869 | |||||||||
| Playtex Products, Inc.*§ | 21,100 | 321,142 | |||||||||
| 2,342,011 | |||||||||||
| Pharmaceuticals (1.6%) | |||||||||||
| Alpharma, Inc. Class A§ | 44,400 | 1,078,920 | |||||||||
| Bradley Pharmaceuticals, Inc.*§ | 7,600 | 149,188 | |||||||||
| K-V Pharmaceutical Co. Class A*§ | 22,800 | 593,028 | |||||||||
| Medicis Pharmaceutical Corp. Class A§ | 8,300 | 252,320 | |||||||||
| MGI Pharma, Inc.* | 37,500 | 825,750 | |||||||||
| Salix Pharmaceuticals, Ltd.* | 10,400 | 135,408 | |||||||||
| Sciele Pharma, Inc.*§ | 64,500 | 1,594,440 | |||||||||
| 4,629,054 | |||||||||||
| Real Estate (1.4%) | |||||||||||
| Alexandria Real Estate Equities, Inc. | 2,700 | 285,795 | |||||||||
| Avatar Holdings, Inc.*§ | 6,100 | 457,927 | |||||||||
| Colonial Properties Trust | 2,300 | 114,103 | |||||||||
| Cousins Properties, Inc. | 4,100 | 137,637 | |||||||||
| Entertainment Properties Trust§ | 13,600 | 821,712 | |||||||||
See Accompanying Notes to Financial Statements.
26
Credit Suisse Small Cap Core Fund
Schedule of Investments (continued)
April 30, 2007 (unaudited)
| Number of Shares | Value | ||||||||||
| COMMON STOCKS | |||||||||||
| Real Estate | |||||||||||
| Essex Property Trust, Inc. | 1,100 | $ | 141,746 | ||||||||
| Lexington Realty Trust | 13,200 | 275,748 | |||||||||
| Mid-America Apartment Communities, Inc. | 10,100 | 544,895 | |||||||||
| National Retail Properties, Inc.§ | 23,900 | 572,405 | |||||||||
| PS Business Parks, Inc. | 1,600 | 110,240 | |||||||||
| Realty Income Corp. | 9,800 | 273,420 | |||||||||
| Senior Housing Properties Trust | 5,800 | 132,414 | |||||||||
| 3,868,042 | |||||||||||
| Road & Rail (1.2%) | |||||||||||
| Arkansas Best Corp.§ | 43,400 | 1,709,960 | |||||||||
| Kansas City Southern* | 7,400 | 274,910 | |||||||||
| Knight Transportation, Inc.§ | 17,500 | 340,725 | |||||||||
| Landstar System, Inc. | 2,800 | 135,268 | |||||||||
| Old Dominion Freight Line, Inc.* | 26,300 | 777,428 | |||||||||
| 3,238,291 | |||||||||||
| Semiconductor Equipment & Products (5.3%) | |||||||||||
| Advanced Energy Industries, Inc.* | 68,500 | 1,678,250 | |||||||||
| Amkor Technology, Inc.* | 19,700 | 275,603 | |||||||||
| Brooks Automation, Inc.* | 35,500 | 620,185 | |||||||||
| Cymer, Inc.*§ | 60,600 | 2,454,906 | |||||||||
| Diodes, Inc.*§ | 21,100 | 779,012 | |||||||||
| MKS Instruments, Inc.* | 72,000 | 1,940,400 | |||||||||
| MPS Group, Inc.* | 49,200 | 673,548 | |||||||||
| ON Semiconductor Corp.*§ | 27,300 | 292,383 | |||||||||
| Photronics, Inc.*§ | 112,000 | 1,685,600 | |||||||||
| Supertex, Inc.*§ | 20,200 | 661,550 | |||||||||
| Varian Semiconductor Equipment Associates, Inc.*§ | 59,100 | 3,921,876 | |||||||||
| 14,983,313 | |||||||||||
| Software (3.0%) | |||||||||||
| Cerner Corp.*§ | 21,900 | 1,165,956 | |||||||||
| Dendrite International, Inc.* | 30,300 | 481,770 | |||||||||
| Eclipsys Corp.* | 12,000 | 224,880 | |||||||||
| Inter-Tel, Inc.§ | 47,000 | 1,185,340 | |||||||||
| Manhattan Associates, Inc.* | 12,400 | 358,608 | |||||||||
| MicroStrategy, Inc. Class A* | 2,500 | 284,400 | |||||||||
| Progress Software Corp.*§ | 37,200 | 1,120,836 | |||||||||
| Quality Systems, Inc.§ | 8,900 | 360,183 | |||||||||
| SPSS, Inc.*§ | 19,700 | 722,202 | |||||||||
| Sybase, Inc.* | 22,800 | 551,532 | |||||||||
| THQ, Inc.* | 8,200 | 273,634 | |||||||||
| TradeStation Group, Inc.*§ | 148,900 | 1,813,602 | |||||||||
| 8,542,943 | |||||||||||
| Specialty Retail (4.8%) | |||||||||||
| Aaron Rents, Inc.§ | 42,100 | 1,194,377 | |||||||||
| Aeropostale, Inc.* | 6,700 | 275,705 | |||||||||
See Accompanying Notes to Financial Statements.
27
Credit Suisse Small Cap Core Fund
Schedule of Investments (continued)
April 30, 2007 (unaudited)
| Number of Shares | Value | ||||||||||
| COMMON STOCKS | |||||||||||
| Specialty Retail | |||||||||||
| Asbury Automotive Group, Inc. | 30,100 | $ | 865,977 | ||||||||
| Building Materials Holding Corp.§ | 34,300 | 498,036 | |||||||||
| Cato Corp. Class A§ | 15,300 | 330,633 | |||||||||
| Charlotte Russe Holding, Inc.* | 4,800 | 131,184 | |||||||||
| Children's Place Retail Stores, Inc.*§ | 25,800 | 1,364,046 | |||||||||
| Christopher & Banks Corp.§ | 42,300 | 732,213 | |||||||||
| Dick's Sporting Goods, Inc.* | 5,000 | 280,450 | |||||||||
| Dress Barn, Inc.*§ | 56,000 | 1,114,960 | |||||||||
| Genesco, Inc.*§ | 18,400 | 932,512 | |||||||||
| Gymboree Corp.* | 35,200 | 1,343,936 | |||||||||
| Men's Wearhouse, Inc. | 31,800 | 1,375,986 | |||||||||
| Rent-A-Center, Inc.* | 9,900 | 275,616 | |||||||||
| Select Comfort Corp.*§ | 65,400 | 1,212,516 | |||||||||
| Stage Stores, Inc.§ | 21,749 | 479,565 | |||||||||
| Tractor Supply Co.* | 7,500 | 388,050 | |||||||||
| Tween Brands, Inc.*§ | 17,100 | 669,636 | |||||||||
| 13,465,398 | |||||||||||
| Textiles & Apparel (2.1%) | |||||||||||
| Brown Shoe Co., Inc.* | 6,800 | 183,464 | |||||||||
| Columbia Sportswear Co. | 4,300 | 269,180 | |||||||||
| Crocs, Inc.* | 10,800 | 603,504 | |||||||||
| Deckers Outdoor Corp.*§ | 4,800 | 363,504 | |||||||||
| K-Swiss, Inc. Class A§ | 28,000 | 808,640 | |||||||||
| Kellwood Co. | 28,700 | 808,766 | |||||||||
| Oxford Industries, Inc. | 7,800 | 362,076 | |||||||||
| Phillips-Van Heusen Corp. | 39,100 | 2,185,690 | |||||||||
| Wolverine World Wide, Inc. | 10,100 | 288,658 | |||||||||
| 5,873,482 | |||||||||||
| Tobacco (0.4%) | |||||||||||
| Alliance One International, Inc.* | 44,600 | 437,526 | |||||||||
| Universal Corp. | 7,500 | 470,100 | |||||||||
| Vector Group, Ltd.§ | 8,000 | 146,000 | |||||||||
| 1,053,626 | |||||||||||
| Wireless Telecommunication Services (0.3%) | |||||||||||
| Syniverse Holdings, Inc.* | 18,200 | 187,642 | |||||||||
| USA Mobility, Inc. | 29,500 | 630,120 | |||||||||
| 817,762 | |||||||||||
| TOTAL COMMON STOCKS (Cost $262,639,055) | 278,516,056 | ||||||||||
| SHORT-TERM INVESTMENTS (23.2%) | |||||||||||
| State Street Navigator Prime Portfolio§§ | 62,782,797 | 62,782,797 | |||||||||
| Par (000) | |||||||||||
| State Street Bank and Trust Co. Euro Time Deposit, 4.100%, 5/01/07 | $ | 2,338 | 2,338,000 | ||||||||
See Accompanying Notes to Financial Statements.
28
Credit Suisse Small Cap Core Fund
Schedule of Investments (continued)
April 30, 2007 (unaudited)
| Value | |||||||
| TOTAL SHORT-TERM INVESTMENTS (Cost $65,120,797) | $ | 65,120,797 | |||||
| TOTAL INVESTMENTS AT VALUE (122.6%) (Cost $327,759,852) | 343,636,853 | ||||||
| LIABILITIES IN EXCESS OF OTHER ASSETS (-22.6%) | (63,320,614 | ) | |||||
| NET ASSETS (100.0%) | $ | 280,316,239 | |||||
* Non-income producing security.
§ Security or portion thereof is out on loan.
§§ Represents security purchased with cash collateral received for securities on loan.
See Accompanying Notes to Financial Statements.
29
Credit Suisse Funds
Statements of Assets and Liabilities
April 30, 2007 (unaudited)
| Large Cap Value Fund | Small Cap Core Fund | ||||||||||
| Assets | |||||||||||
| Investments at value, including collateral for securities on loan of $20,285,365 and $62,782,797, respectively (Cost $285,670,708, and $327,759,852, respectively) (Note 2) | $ | 334,551,2771 | $ | 343,636,8532 | |||||||
| Cash | 624 | 779 | |||||||||
| Dividend and interest receivable | 275,501 | 78,509 | |||||||||
| Receivable for fund shares sold | 213,949 | 156,595 | |||||||||
| Prepaid expenses and other assets | 29,279 | 55,562 | |||||||||
| Total Assets | 335,070,630 | 343,928,298 | |||||||||
| Liabilities | |||||||||||
| Advisory fee payable (Note 3) | 128,417 | 163,234 | |||||||||
| Administrative services fee payable (Note 3) | 43,259 | 40,296 | |||||||||
| Shareholder servicing/Distribution fee payable (Note 2) | 73,946 | 74,472 | |||||||||
| Payable upon return of securities loaned (Note 2) | 20,285,365 | 62,782,797 | |||||||||
| Payable for fund shares redeemed | 109,059 | 368,244 | |||||||||
| Trustees' fee payable | 3,792 | 3,792 | |||||||||
| Other accrued expenses payable | 110,588 | 179,224 | |||||||||
| Total Liabilities | 20,754,426 | 63,612,059 | |||||||||
| Net Assets | |||||||||||
| Capital stock, $0.001 par value (Note 6) | 16,465 | 13,017 | |||||||||
| Paid-in capital (Note 6) | 228,269,326 | 181,349,982 | |||||||||
| Undistributed net investment income (loss) | 434,540 | (537,063 | ) | ||||||||
| Accumulated net realized gain on investments, foreign currency transactions and futures contracts | 36,715,304 | 83,613,302 | |||||||||
| Net unrealized appreciation from investments | 48,880,569 | 15,877,001 | |||||||||
| Net Assets | $ | 314,316,204 | $ | 280,316,239 | |||||||
| Common Shares | |||||||||||
| Net assets | $ | 626,239 | $ | 64,567,231 | |||||||
| Shares outstanding | 32,955 | 2,977,810 | |||||||||
| Net asset value, offering price, and redemption price per share | $ | 19.00 | $ | 21.68 | |||||||
| Advisor Shares | |||||||||||
| Net assets | $ | 5,907,847 | N/A | ||||||||
| Shares outstanding | 308,300 | N/A | |||||||||
| Net asset value, offering price, and redemption price per share | $ | 19.16 | N/A | ||||||||
See Accompanying Notes to Financial Statements.
30
Credit Suisse Funds
Statements of Assets and Liabilities (continued)
April 30, 2007 (unaudited)
| Large Cap Value Fund | Small Cap Core Fund | ||||||||||
| A Shares | |||||||||||
| Net assets | $ | 293,267,701 | $ | 189,659,049 | |||||||
| Shares outstanding | 15,348,996 | 8,685,846 | |||||||||
| Net asset value and redemption price per share | $ | 19.11 | $ | 21.84 | |||||||
| Maximum offering price per share (net asset value/(1-5.75%)) | $ | 20.28 | $ | 23.17 | |||||||
| B Shares | |||||||||||
| Net assets | $ | 12,085,501 | $ | 10,896,510 | |||||||
| Shares outstanding | 644,302 | 563,304 | |||||||||
| Net asset value and offering price per share | $ | 18.76 | $ | 19.34 | |||||||
| C Shares | |||||||||||
| Net assets | $ | 2,428,916 | $ | 15,193,449 | |||||||
| Shares outstanding | 130,409 | 789,816 | |||||||||
| Net asset value and offering price per share | $ | 18.63 | $ | 19.24 | |||||||
1 Including $19,829,155 of securities on loan.
2 Including $61,305,833 of securities on loan.
See Accompanying Notes to Financial Statements.
31
Credit Suisse Funds
Statements of Operations
For the Six Months Ended April 30, 2007 (unaudited)
| Large Cap Value Fund | Small Cap Core Fund | ||||||||||
| Investment Income (Note 2) | |||||||||||
| Dividends | $ | 3,413,130 | $ | 1,185,964 | |||||||
| Interest | 48,925 | 173,659 | |||||||||
| Securities lending | 8,925 | 72,683 | |||||||||
| Foreign taxes withheld | — | (358 | ) | ||||||||
| Total investment income | 3,470,980 | 1,431,948 | |||||||||
| Expenses | |||||||||||
| Investment advisory fees (Note 3) | 806,234 | 1,078,042 | |||||||||
| Administrative services fees (Note 3) | 201,323 | 197,445 | |||||||||
| Shareholder servicing/Distribution fee (Note 3) | |||||||||||
| Common Class | — | 83,667 | |||||||||
| Advisor Class | 14,743 | — | |||||||||
| Class A | 367,597 | 265,045 | |||||||||
| Class B | 66,154 | 57,376 | |||||||||
| Class C | 12,587 | 75,568 | |||||||||
| Transfer agent fees (Note 3) | 138,597 | 267,145 | |||||||||
| Registration fees | 26,885 | 30,570 | |||||||||
| Printing fees (Note 3) | 20,159 | 26,098 | |||||||||
| Audit and tax fees | 19,838 | 20,022 | |||||||||
| Custodian fees | 17,761 | 17,155 | |||||||||
| Legal fees | 13,256 | 13,942 | |||||||||
| Insurance expense | 14,996 | 15,233 | |||||||||
| Trustees' fees | 7,006 | 7,006 | |||||||||
| Commitment fees (Note 4) | 4,330 | 6,196 | |||||||||
| Miscellaneous expense | 6,168 | 5,105 | |||||||||
| Total expenses | 1,737,634 | 2,165,615 | |||||||||
| Net investment income | 1,733,346 | (733,667 | ) | ||||||||
| Net Realized and Unrealized Gain (Loss) from Investments and Futures Contracts | |||||||||||
| Net realized gain from investments | 36,789,523 | 83,685,737 | |||||||||
| Net realized loss from futures contracts | — | (72,371 | ) | ||||||||
| Net change in unrealized appreciation (depreciation) from investments | (11,885,388 | ) | (64,325,668 | ) | |||||||
| Net realized and unrealized gain from investments and futures contracts | 24,904,135 | 19,287,698 | |||||||||
| Net increase in net assets resulting from operations | $ | 26,637,481 | $ | 18,554,031 | |||||||
See Accompanying Notes to Financial Statements.
32
Credit Suisse Funds
Statements of Changes in Net Assets
| Large Cap Value Fund | Small Cap Core Fund | ||||||||||||||||||
| For the Six Months Ended April 30, 2007 (unaudited) | For the Year Ended October 31, 2006 | For the Six Months Ended April 30, 2007 (unaudited) | For the Year Ended October 31, 2006 | ||||||||||||||||
| From Operations | |||||||||||||||||||
| Net investment income (loss) | $ | 1,733,346 | $ | 3,519,157 | $ | (733,667 | ) | $ | 1,511,286 | ||||||||||
| Net realized gain on investments, foreign currency transactions and futures contracts | 36,789,523 | 64,610,542 | 83,613,366 | 52,059,311 | |||||||||||||||
| Net change in unrealized appreciation (depreciation) from investments | (11,885,388 | ) | (10,171,994 | ) | (64,325,668 | ) | (10,174,947 | ) | |||||||||||
| Net increase in net assets resulting from operations | 26,637,481 | 57,957,705 | 18,554,031 | 43,395,650 | |||||||||||||||
| From Dividends and Distributions | |||||||||||||||||||
| Dividends from net investment income | |||||||||||||||||||
| Common Class shares | (4,072 | ) | (7,242 | ) | (443,533 | ) | — | ||||||||||||
| Advisor shares | (23,410 | ) | (55,871 | ) | — | — | |||||||||||||
| Class A shares | (1,549,208 | ) | (3,096,473 | ) | (1,047,496 | ) | — | ||||||||||||
| Class B shares | (16,234 | ) | (47,610 | ) | (7,318 | ) | — | ||||||||||||
| Class C shares | (3,176 | ) | (8,918 | ) | (9,246 | ) | — | ||||||||||||
| Distributions from net realized gains | |||||||||||||||||||
| Common Class shares | (121,952 | ) | (70,029 | ) | (10,787,263 | ) | (7,509,989 | ) | |||||||||||
| Advisor shares | (1,189,286 | ) | (969,206 | ) | — | — | |||||||||||||
| Class A shares | (59,880,116 | ) | (35,411,384 | ) | (36,102,988 | ) | (23,829,327 | ) | |||||||||||
| Class B shares | (2,873,710 | ) | (2,267,901 | ) | (2,083,904 | ) | (1,880,065 | ) | |||||||||||
| Class C shares | (536,230 | ) | (426,845 | ) | (2,781,596 | ) | (1,851,334 | ) | |||||||||||
| Net decrease in net assets resulting from dividends and distributions | (66,197,394 | ) | (42,361,479 | ) | (53,263,344 | ) | (35,070,715 | ) | |||||||||||
| From Capital Share Transactions (Note 6) | |||||||||||||||||||
| Proceeds from sale of shares | 12,696,845 | 34,985,488 | 16,667,198 | 112,745,835 | |||||||||||||||
| Reinvestment of dividends and distributions | 60,822,451 | 39,200,260 | 48,478,471 | 32,583,478 | |||||||||||||||
| Net asset value of shares redeemed | (49,527,814 | ) | (93,328,420 | ) | (112,144,573 | ) | (127,020,125 | ) | |||||||||||
| Net increase (decrease) in net assets from capital share transactions | 23,991,482 | (19,142,672 | ) | (46,998,904 | ) | 18,309,188 | |||||||||||||
| Net increase (decrease) in net assets | (15,568,431 | ) | (3,546,446 | ) | (81,708,217 | ) | 26,634,123 | ||||||||||||
| Net Assets | |||||||||||||||||||
| Beginning of period | 329,884,635 | 333,431,081 | 362,024,456 | 335,390,333 | |||||||||||||||
| End of period | $ | 314,316,204 | $ | 329,884,635 | $ | 280,316,239 | $ | 362,024,456 | |||||||||||
| Undistributed net investment income (loss) | $ | 434,540 | $ | 297,294 | $ | (537,063 | ) | $ | 1,704,197 | ||||||||||
See Accompanying Notes to Financial Statements.
33
Credit Suisse Large Cap Value Fund
Financial Highlights
(For a Common Class Share of the Fund Outstanding Throughout Each Period)
| For the Six Months Ended April 30, 2007 | For the Year Ended October 31, | ||||||||||||||||||||||||||
| (unaudited) | 2006 | 2005 | 2004 | 2003 | 2002 | ||||||||||||||||||||||
| Per share data | |||||||||||||||||||||||||||
| Net asset value, beginning of period | $ | 21.93 | $ | 20.97 | $ | 19.98 | $ | 18.61 | $ | 16.82 | $ | 19.95 | |||||||||||||||
| INVESTMENT OPERATIONS | |||||||||||||||||||||||||||
| Net investment income1 | 0.13 | 0.28 | 0.24 | 0.23 | 0.14 | 0.17 | |||||||||||||||||||||
| Net gain (loss) on investments and foreign currency related items (both realized and unrealized) | 1.51 | 3.42 | 2.32 | 1.87 | 2.10 | (1.45 | ) | ||||||||||||||||||||
| Total from investment operations | 1.64 | 3.70 | 2.56 | 2.10 | 2.24 | (1.28 | ) | ||||||||||||||||||||
| LESS DIVIDENDS AND DISTRIBUTIONS | |||||||||||||||||||||||||||
| Dividends from net investment income | (0.12 | ) | (0.26 | ) | (0.25 | ) | (0.23 | ) | (0.14 | ) | (0.19 | ) | |||||||||||||||
| Distributions from net realized gains | (4.45 | ) | (2.48 | ) | (1.32 | ) | (0.50 | ) | (0.31 | ) | (1.66 | ) | |||||||||||||||
| Total dividends and distributions | (4.57 | ) | (2.74 | ) | (1.57 | ) | (0.73 | ) | (0.45 | ) | (1.85 | ) | |||||||||||||||
| Net asset value, end of period | $ | 19.00 | $ | 21.93 | $ | 20.97 | $ | 19.98 | $ | 18.61 | $ | 16.82 | |||||||||||||||
| Total return2 | 8.86 | % | 19.44 | % | 13.34 | % | 11.51 | % | 13.63 | % | (7.63 | )% | |||||||||||||||
| RATIOS AND SUPPLEMENTAL DATA | |||||||||||||||||||||||||||
| Net assets, end of period (000s omitted) | $ | 626 | $ | 600 | $ | 591 | $ | 664 | $ | 737 | $ | 3,061 | |||||||||||||||
| Ratio of expenses to average net assets | 0.81 | %3 | 0.89 | % | 0.91 | % | 0.95 | % | 1.24 | % | 1.03 | % | |||||||||||||||
| Ratio of net investment income to average net assets | 1.37 | %3 | 1.37 | % | 1.15 | % | 1.16 | % | 0.82 | % | 0.92 | % | |||||||||||||||
| Decrease reflected in above operating expense ratios due to waivers/reimbursements | — | — | — | — | — | 0.29 | % | ||||||||||||||||||||
| Portfolio turnover rate | 106 | % | 78 | % | 58 | % | 48 | % | 53 | % | 28 | % | |||||||||||||||
1 Per share information is calculated using the average shares outstanding method.
2 Total returns are historical and assume changes in share price and reinvestment of all dividends and distributions. Had certain expenses not been reduced during the period shown, total returns would have been lower. Total returns for periods less than one year are not annualized.
3 Annualized.
See Accompanying Notes to Financial Statements.
34
Credit Suisse Large Cap Value Fund
Financial Highlights
(For an Advisor Class Share of the Fund Outstanding Throughout Each Period)
| For the Six Months Ended April 30, 2007 | For the Year Ended October 31, | ||||||||||||||||||||||
| (unaudited) | 2006 | 2005 | 2004 | 20031 | |||||||||||||||||||
| Per share data | |||||||||||||||||||||||
| Net asset value, beginning of period | $ | 22.08 | $ | 21.10 | $ | 20.09 | $ | 18.71 | $ | 17.84 | |||||||||||||
| INVESTMENT OPERATIONS | |||||||||||||||||||||||
| Net investment income2 | 0.08 | 0.18 | 0.14 | 0.13 | 0.04 | ||||||||||||||||||
| Net gain on investments and foreign currency related items (both realized and unrealized) | 1.52 | 3.44 | 2.34 | 1.88 | 0.83 | ||||||||||||||||||
| Total from investment operations | 1.60 | 3.62 | 2.48 | 2.01 | 0.87 | ||||||||||||||||||
| LESS DIVIDENDS AND DISTRIBUTIONS | |||||||||||||||||||||||
| Dividends from net investment income | (0.07 | ) | (0.16 | ) | (0.15 | ) | (0.13 | ) | (0.00 | )3 | |||||||||||||
| Distributions from net realized gains | (4.45 | ) | (2.48 | ) | (1.32 | ) | (0.50 | ) | — | ||||||||||||||
| Total dividends and distributions | (4.52 | ) | (2.64 | ) | (1.47 | ) | (0.63 | ) | — | ||||||||||||||
| Net asset value, end of period | $ | 19.16 | $ | 22.08 | $ | 21.10 | $ | 20.09 | $ | 18.71 | |||||||||||||
| Total return4 | 8.57 | % | 18.84 | % | 12.81 | % | 10.96 | % | 4.90 | % | |||||||||||||
| RATIOS AND SUPPLEMENTAL DATA | |||||||||||||||||||||||
| Net assets, end of period (000s omitted) | $ | 5,908 | $ | 5,806 | $ | 8,368 | $ | 12,228 | $ | 22,336 | |||||||||||||
| Ratio of expenses to average net assets | 1.31 | %5 | 1.39 | % | 1.41 | % | 1.45 | % | 1.49 | %5 | |||||||||||||
| Ratio of net investment income to average net assets | 0.87 | %5 | 0.87 | % | 0.65 | % | 0.66 | % | 0.51 | %5 | |||||||||||||
| Portfolio turnover rate | 106 | % | 78 | % | 58 | % | 48 | % | 53 | % | |||||||||||||
1 For the period June 6, 2003 (inception date) through October 31, 2003.
2 Per share information is calculated using the average shares outstanding method.
3 This amount represents less than $(0.01) per share.
4 Total returns are historical and assume changes in share price and reinvestment of all dividends and distributions. Total returns for periods less than one year are not annualized.
5 Annualized.
See Accompanying Notes to Financial Statements.
35
Credit Suisse Large Cap Value Fund
Financial Highlights
(For a Class A Share of the Fund Outstanding Throughout Each Period)
| For the Six Months Ended April 30, 2007 | For the Year Ended October 31, | ||||||||||||||||||||||||||
| (unaudited) | 2006 | 2005 | 2004 | 2003 | 2002 | ||||||||||||||||||||||
| Per share data | |||||||||||||||||||||||||||
| Net asset value, beginning of period | $ | 22.03 | $ | 21.05 | $ | 20.05 | $ | 18.68 | $ | 16.83 | $ | 19.96 | |||||||||||||||
| INVESTMENT OPERATIONS | |||||||||||||||||||||||||||
| Net investment income1 | 0.11 | 0.22 | 0.19 | 0.18 | 0.14 | 0.17 | |||||||||||||||||||||
| Net gain (loss) on investments and foreign currency related items (both realized and unrealized) | 1.52 | 3.45 | 2.33 | 1.87 | 2.15 | (1.45 | ) | ||||||||||||||||||||
| Total from investment operations | 1.63 | 3.67 | 2.52 | 2.05 | 2.29 | (1.28 | ) | ||||||||||||||||||||
| LESS DIVIDENDS AND DISTRIBUTIONS | |||||||||||||||||||||||||||
| Dividends from net investment income | (0.10 | ) | (0.21 | ) | (0.20 | ) | (0.18 | ) | (0.13 | ) | (0.19 | ) | |||||||||||||||
| Distributions from net realized gains | (4.45 | ) | (2.48 | ) | (1.32 | ) | (0.50 | ) | (0.31 | ) | (1.66 | ) | |||||||||||||||
| Total dividends and distributions | (4.55 | ) | (2.69 | ) | (1.52 | ) | (0.68 | ) | (0.44 | ) | (1.85 | ) | |||||||||||||||
| Net asset value, end of period | $ | 19.11 | $ | 22.03 | $ | 21.05 | $ | 20.05 | $ | 18.68 | $ | 16.83 | |||||||||||||||
| Total return2 | 8.74 | % | 19.18 | % | 13.06 | % | 11.19 | % | 13.97 | % | (7.63 | )% | |||||||||||||||
| RATIOS AND SUPPLEMENTAL DATA | |||||||||||||||||||||||||||
| Net assets, end of period (000s omitted) | $ | 293,268 | $ | 305,866 | $ | 300,777 | $ | 302,823 | $ | 306,410 | $ | 114,733 | |||||||||||||||
| Ratio of expenses to average net assets | 1.06 | %3 | 1.14 | % | 1.16 | % | 1.20 | % | 1.24 | % | 1.03 | % | |||||||||||||||
| Ratio of net investment income to average net assets | 1.15 | %3 | 1.12 | % | 0.91 | % | 0.91 | % | 0.78 | % | 0.90 | % | |||||||||||||||
| Decrease reflected in above operating expense ratios due to waivers/reimbursements | — | — | — | — | — | 0.28 | % | ||||||||||||||||||||
| Portfolio turnover rate | 106 | % | 78 | % | 58 | % | 48 | % | 53 | % | 28 | % | |||||||||||||||
1 Per share information is calculated using the average shares outstanding method.
2 Total returns are historical and assume changes in share price, reinvestment of all dividends and distributions and no sales charge. Had certain expenses not been reduced during the period shown, total returns would have been lower. Total returns for periods less than one year are not annualized.
3 Annualized.
See Accompanying Notes to Financial Statements.
36
Credit Suisse Large Cap Value Fund
Financial Highlights
(For a Class B Share of the Fund Outstanding Throughout Each Period)
| For the Six Months Ended April 30, 2007 | For the Year Ended October 31, | ||||||||||||||||||||||||||
| (unaudited) | 2006 | 2005 | 2004 | 2003 | 2002 | ||||||||||||||||||||||
| Per share data | |||||||||||||||||||||||||||
| Net asset value, beginning of period | $ | 21.70 | $ | 20.78 | $ | 19.81 | $ | 18.46 | $ | 16.66 | $ | 19.78 | |||||||||||||||
| INVESTMENT OPERATIONS | |||||||||||||||||||||||||||
| Net investment income1 | 0.04 | 0.07 | 0.04 | 0.03 | 0.01 | 0.03 | |||||||||||||||||||||
| Net gain (loss) on investments and foreign currency related items (both realized and unrealized) | 1.49 | 3.39 | 2.30 | 1.85 | 2.13 | (1.43 | ) | ||||||||||||||||||||
| Total from investment operations | 1.53 | 3.46 | 2.34 | 1.88 | 2.14 | (1.40 | ) | ||||||||||||||||||||
| LESS DIVIDENDS AND DISTRIBUTIONS | |||||||||||||||||||||||||||
| Dividends from net investment income | (0.02 | ) | (0.06 | ) | (0.05 | ) | (0.03 | ) | (0.03 | ) | (0.06 | ) | |||||||||||||||
| Distributions from net realized gains | (4.45 | ) | (2.48 | ) | (1.32 | ) | (0.50 | ) | (0.31 | ) | (1.66 | ) | |||||||||||||||
| Total dividends and distributions | (4.47 | ) | (2.54 | ) | (1.37 | ) | (0.53 | ) | (0.34 | ) | (1.72 | ) | |||||||||||||||
| Net asset value, end of period | $ | 18.76 | $ | 21.70 | $ | 20.78 | $ | 19.81 | $ | 18.46 | $ | 16.66 | |||||||||||||||
| Total return2 | 8.36 | % | 18.25 | % | 12.23 | % | 10.40 | % | 13.07 | % | (8.29 | )% | |||||||||||||||
| RATIOS AND SUPPLEMENTAL DATA | |||||||||||||||||||||||||||
| Net assets, end of period (000s omitted) | $ | 12,085 | $ | 14,994 | $ | 20,057 | $ | 25,118 | $ | 29,696 | $ | 28,312 | |||||||||||||||
| Ratio of expenses to average net assets | 1.81 | %3 | 1.89 | % | 1.91 | % | 1.95 | % | 1.99 | % | 1.78 | % | |||||||||||||||
| Ratio of net investment income to average net assets | 0.40 | %3 | 0.37 | % | 0.15 | % | 0.16 | % | 0.06 | % | 0.15 | % | |||||||||||||||
| Decrease reflected in above operating expense ratios due to waivers/reimbursements | — | — | — | — | — | 0.27 | % | ||||||||||||||||||||
| Portfolio turnover rate | 106 | % | 78 | % | 58 | % | 48 | % | 53 | % | 28 | % | |||||||||||||||
1 Per share information is calculated using the average shares outstanding method.
2 Total returns are historical and assume changes in share price, reinvestment of all dividends and distributions and no sales charge. Had certain expenses not been reduced during the period shown, total returns would have been lower. Total returns for periods less than one year are not annualized.
3 Annualized.
See Accompanying Notes to Financial Statements.
37
Credit Suisse Large Cap Value Fund
Financial Highlights
(For a Class C Share of the Fund Outstanding Throughout Each Period)
| For the Six Months Ended April 30, 2007 | For the Year Ended October 31, | ||||||||||||||||||||||||||
| (unaudited) | 2006 | 2005 | 2004 | 2003 | 2002 | ||||||||||||||||||||||
| Per share data | |||||||||||||||||||||||||||
| Net asset value, beginning of period | $ | 21.58 | $ | 20.68 | $ | 19.72 | $ | 18.38 | $ | 16.58 | $ | 19.71 | |||||||||||||||
| INVESTMENT OPERATIONS | |||||||||||||||||||||||||||
| Net investment income1 | 0.04 | 0.07 | 0.03 | �� | 0.03 | 0.01 | 0.03 | ||||||||||||||||||||
| Net gain (loss) on investments and foreign currency related items (both realized and unrealized) | 1.48 | 3.37 | 2.30 | 1.84 | 2.13 | (1.43 | ) | ||||||||||||||||||||
| Total from investment operations | 1.52 | 3.44 | 2.33 | 1.87 | 2.14 | (1.40 | ) | ||||||||||||||||||||
| LESS DIVIDENDS AND DISTRIBUTIONS | |||||||||||||||||||||||||||
| Dividends from net investment income | (0.02 | ) | (0.06 | ) | (0.05 | ) | (0.03 | ) | (0.03 | ) | (0.07 | ) | |||||||||||||||
| Distributions from net realized gains | (4.45 | ) | (2.48 | ) | (1.32 | ) | (0.50 | ) | (0.31 | ) | (1.66 | ) | |||||||||||||||
| Total dividends and distributions | (4.47 | ) | (2.54 | ) | (1.37 | ) | (0.53 | ) | (0.34 | ) | (1.73 | ) | |||||||||||||||
| Net asset value, end of period | $ | 18.63 | $ | 21.58 | $ | 20.68 | $ | 19.72 | $ | 18.38 | $ | 16.58 | |||||||||||||||
| Total return2 | 8.36 | % | 18.25 | % | 12.23 | % | 10.39 | % | 13.14 | % | (8.35 | )% | |||||||||||||||
| RATIOS AND SUPPLEMENTAL DATA | |||||||||||||||||||||||||||
| Net assets, end of period (000s omitted) | $ | 2,429 | $ | 2,618 | $ | 3,638 | $ | 3,736 | $ | 3,479 | $ | 2,104 | |||||||||||||||
| Ratio of expenses to average net assets | 1.81 | %3 | 1.89 | % | 1.91 | % | 1.95 | % | 1.99 | % | 1.78 | % | |||||||||||||||
| Ratio of net investment income to average net assets | 0.40 | %3 | 0.37 | % | 0.15 | % | 0.16 | % | 0.06 | % | 0.16 | % | |||||||||||||||
| Decrease reflected in above operating expense ratios due to waivers/reimbursements | — | — | — | — | — | 0.28 | % | ||||||||||||||||||||
| Portfolio turnover rate | 106 | % | 78 | % | 58 | % | 48 | % | 53 | % | 28 | % | |||||||||||||||
1 Per share information is calculated using the average shares outstanding method.
2 Total returns are historical and assume changes in share price, reinvestment of all dividends and distributions and no sales charge. Had certain expenses not been reduced during the period shown, total returns would have been lower. Total returns for periods less than one year are not annualized.
3 Annualized.
See Accompanying Notes to Financial Statements.
38
Credit Suisse Small Cap Core Fund
Financial Highlights
(For a Common Class Share of the Fund Outstanding Throughout Each Period)
| For the Six Months Ended April 30, 2007 | For the Year Ended October 31, | ||||||||||||||||||||||||||
| (unaudited) | 2006 | 2005 | 2004 | 2003 | 2002 | ||||||||||||||||||||||
| Per share data | |||||||||||||||||||||||||||
| Net asset value, beginning of period | $ | 24.33 | $ | 23.84 | $ | 22.66 | $ | 20.02 | $ | 18.56 | $ | 21.07 | |||||||||||||||
| INVESTMENT OPERATIONS | |||||||||||||||||||||||||||
| Net investment income (loss)1 | (0.05 | ) | 0.11 | (0.03 | ) | (0.05 | ) | (0.02 | ) | 0.02 | |||||||||||||||||
| Net gain on investments and futures contracts (both realized and unrealized) | 1.40 | 2.85 | 3.39 | 3.75 | 3.08 | 0.31 | |||||||||||||||||||||
| Total from investment operations | 1.35 | 2.96 | 3.36 | 3.70 | 3.06 | 0.33 | |||||||||||||||||||||
| LESS DIVIDENDS AND DISTRIBUTIONS | |||||||||||||||||||||||||||
| Dividends from net investment income | (0.14 | ) | — | — | — | (0.01 | ) | (0.05 | ) | ||||||||||||||||||
| Distributions from net realized gains | (3.86 | ) | (2.47 | ) | (2.18 | ) | (1.06 | ) | (1.59 | ) | (2.79 | ) | |||||||||||||||
| Total dividends and distributions | (4.00 | ) | (2.47 | ) | (2.18 | ) | (1.06 | ) | (1.60 | ) | (2.84 | ) | |||||||||||||||
| Net asset value, end of period | $ | 21.68 | $ | 24.33 | $ | 23.84 | $ | 22.66 | $ | 20.02 | $ | 18.56 | |||||||||||||||
| Total return2 | 6.01 | % | 13.23 | % | 15.56 | % | 19.14 | % | 17.75 | % | 0.61 | % | |||||||||||||||
| RATIOS AND SUPPLEMENTAL DATA | |||||||||||||||||||||||||||
| Net assets, end of period (000s omitted) | $ | 64,567 | $ | 70,525 | $ | 74,013 | $ | 50,068 | $ | 47,969 | $ | 45,075 | |||||||||||||||
| Ratio of expenses to average net assets | 1.35 | %3 | 1.37 | % | 1.38 | % | 1.42 | % | 1.48 | % | 1.32 | % | |||||||||||||||
| Ratio of net investment income (loss) to average net assets | (0.43 | )%3 | 0.47 | % | (0.16 | )% | (0.22 | )% | (0.10 | )% | 0.12 | % | |||||||||||||||
| Decrease reflected in above operating expense ratios due to waivers/reimbursements | — | — | — | — | 0.04 | % | 0.14 | % | |||||||||||||||||||
| Portfolio turnover rate | 151 | % | 67 | % | 43 | % | 41 | % | 30 | % | 18 | % | |||||||||||||||
1 Per share information is calculated using the average shares outstanding method.
2 Total returns are historical and assume changes in share price and reinvestment of all dividends and distributions. Had certain expenses not been reduced during the periods shown, total returns would have been lower. Total returns for periods less than one year are not annualized.
3 Annualized.
See Accompanying Notes to Financial Statements.
39
Credit Suisse Small Cap Core Fund
Financial Highlights
(For a Class A Share of the Fund Outstanding Throughout Each Period)
| For the Six Months Ended April 30, 2007 | For the Year Ended October 31, | ||||||||||||||||||||||||||
| (unaudited) | 2006 | 2005 | 2004 | 2003 | 2002 | ||||||||||||||||||||||
| Per share data | |||||||||||||||||||||||||||
| Net asset value, beginning of period | $ | 24.44 | $ | 23.94 | $ | 22.75 | $ | 20.10 | $ | 18.62 | $ | 21.09 | |||||||||||||||
| INVESTMENT OPERATIONS | |||||||||||||||||||||||||||
| Net investment income (loss)1 | (0.04 | ) | 0.12 | (0.04 | ) | (0.05 | ) | (0.02 | ) | 0.02 | |||||||||||||||||
| Net gain on investments and futures contracts (both realized and unrealized) | 1.41 | 2.85 | 3.42 | 3.76 | 3.10 | 0.33 | |||||||||||||||||||||
| Total from investment operations | 1.37 | 2.97 | 3.38 | 3.71 | 3.08 | 0.35 | |||||||||||||||||||||
| LESS DIVIDENDS AND DISTRIBUTIONS | |||||||||||||||||||||||||||
| Dividends from net investment income | (0.11 | ) | — | — | — | (0.01 | ) | (0.03 | ) | ||||||||||||||||||
| Distributions from net realized gains | (3.86 | ) | (2.47 | ) | (2.19 | ) | (1.06 | ) | (1.59 | ) | (2.79 | ) | |||||||||||||||
| Total dividends and distributions | (3.97 | ) | (2.47 | ) | (2.19 | ) | (1.06 | ) | (1.60 | ) | (2.82 | ) | |||||||||||||||
| Net asset value, end of period | $ | 21.84 | $ | 24.44 | $ | 23.94 | $ | 22.75 | $ | 20.10 | $ | 18.62 | |||||||||||||||
| Total return2 | 6.07 | % | 13.22 | % | 15.54 | % | 19.11 | % | 17.80 | % | 0.71 | % | |||||||||||||||
| RATIOS AND SUPPLEMENTAL DATA | |||||||||||||||||||||||||||
| Net assets, end of period (000s omitted) | $ | 189,659 | $ | 263,006 | $ | 227,166 | $ | 198,773 | $ | 188,318 | $ | 151,340 | |||||||||||||||
| Ratio of expenses to average net assets | 1.35 | %3 | 1.37 | % | 1.38 | % | 1.42 | % | 1.48 | % | 1.32 | % | |||||||||||||||
| Ratio of net investment income (loss) to average net assets | (0.40 | )%3 | 0.47 | % | (0.16 | )% | (0.22 | )% | (0.11 | )% | 0.11 | % | |||||||||||||||
| Decrease reflected in above operating expense ratios due to waivers/reimbursements | — | — | — | — | 0.04 | % | 0.12 | % | |||||||||||||||||||
| Portfolio turnover rate | 151 | % | 67 | % | 43 | % | 41 | % | 30 | % | 18 | % | |||||||||||||||
1 Per share information is calculated using the average shares outstanding method.
2 Total returns are historical and assume changes in share price, reinvestment of all dividends and distributions and no sales charge. Had certain expenses not been reduced during the periods shown, total returns would have been lower. Total returns for periods less than one year are not annualized.
3 Annualized.
See Accompanying Notes to Financial Statements.
40
Credit Suisse Small Cap Core Fund
Financial Highlights
(For a Class B Share of the Fund Outstanding Throughout Each Period)
| For the Six Months Ended April 30, 2007 | For the Year Ended October 31, | ||||||||||||||||||||||||||
| (unaudited) | 2006 | 2005 | 2004 | 2003 | 2002 | ||||||||||||||||||||||
| Per share data | |||||||||||||||||||||||||||
| Net asset value, beginning of period | $ | 22.07 | $ | 21.99 | $ | 21.20 | $ | 18.93 | $ | 17.74 | $ | 20.33 | |||||||||||||||
| INVESTMENT OPERATIONS | |||||||||||||||||||||||||||
| Net investment loss1 | (0.11 | ) | (0.06 | ) | (0.20 | ) | (0.20 | ) | (0.15 | ) | (0.12 | ) | |||||||||||||||
| Net gain on investments and futures contracts (both realized and unrealized) | 1.25 | 2.61 | 3.17 | 3.53 | 2.93 | 0.32 | |||||||||||||||||||||
| Total from investment operations | 1.14 | 2.55 | 2.97 | 3.33 | 2.78 | 0.20 | |||||||||||||||||||||
| LESS DIVIDENDS AND DISTRIBUTIONS | |||||||||||||||||||||||||||
| Dividends from net investment income | (0.01 | ) | — | — | — | — | — | ||||||||||||||||||||
| Distributions from net realized gains | (3.86 | ) | (2.47 | ) | (2.18 | ) | (1.06 | ) | (1.59 | ) | (2.79 | ) | |||||||||||||||
| Total dividends and distributions | (3.87 | ) | (2.47 | ) | (2.18 | ) | (1.59 | ) | (1.59 | ) | (2.79 | ) | |||||||||||||||
| Net asset value, end of period | $ | 19.34 | $ | 22.07 | $ | 21.99 | $ | 21.20 | $ | 18.93 | $ | 17.74 | |||||||||||||||
| Total return2 | 5.63 | % | 12.41 | % | 14.72 | % | 18.25 | % | 16.88 | % | (0.08 | )% | |||||||||||||||
| RATIOS AND SUPPLEMENTAL DATA | |||||||||||||||||||||||||||
| Net assets, end of period (000s omitted) | $ | 10,897 | $ | 12,465 | $ | 18,133 | $ | 20,425 | $ | 22,669 | $ | 19,999 | |||||||||||||||
| Ratio of expenses to average net assets | 2.10 | %3 | 2.12 | % | 2.13 | % | 2.17 | % | 2.23 | % | 2.07 | % | |||||||||||||||
| Ratio of net investment loss to average net assets | (1.17 | )%3 | (0.28 | )% | (0.91 | )% | (0.97 | )% | (0.86 | )% | (0.63 | )% | |||||||||||||||
| Decrease reflected in above operating expense ratios due to waivers/reimbursements | — | — | — | — | 0.04 | % | 0.13 | % | |||||||||||||||||||
| Portfolio turnover rate | 151 | % | 67 | % | 43 | % | 41 | % | 30 | % | 18 | % | |||||||||||||||
1 Per share information is calculated using the average shares outstanding method.
2 Total returns are historical and assume changes in share price, reinvestment of all dividends and distributions and no sales charge. Had certain expenses not been reduced during the periods shown, total returns would have been lower. Total returns for periods less than one year are not annualized.
3 Annualized.
See Accompanying Notes to Financial Statements.
41
Credit Suisse Small Cap Core Fund
Financial Highlights
(For a Class C Share of the Fund Outstanding Throughout Each Period)
| For the Six Months Ended April 30, 2007 | For the Year Ended October 31, | ||||||||||||||||||||||||||
| (unaudited) | 2006 | 2005 | 2004 | 2003 | 2002 | ||||||||||||||||||||||
| Per share data | |||||||||||||||||||||||||||
| Net asset value, beginning of period | $ | 21.97 | $ | 21.91 | $ | 21.13 | $ | 18.87 | $ | 17.69 | $ | 20.28 | |||||||||||||||
| INVESTMENT OPERATIONS | |||||||||||||||||||||||||||
| Net investment loss1 | (0.11 | ) | (0.06 | ) | (0.20 | ) | (0.19 | ) | (0.15 | ) | (0.12 | ) | |||||||||||||||
| Net gain on investments and futures contracts (both realized and unrealized) | 1.25 | 2.59 | 3.16 | 3.51 | 2.92 | 0.32 | |||||||||||||||||||||
| Total from investment operations | 1.14 | 2.53 | 2.96 | 3.32 | 2.77 | 0.20 | |||||||||||||||||||||
| LESS DIVIDENDS AND DISTRIBUTIONS | |||||||||||||||||||||||||||
| Dividends from net investment income | (0.01 | ) | — | — | — | — | — | ||||||||||||||||||||
| Distributions from net realized gains | (3.86 | ) | (2.47 | ) | (2.18 | ) | (1.06 | ) | (1.59 | ) | (2.79 | ) | |||||||||||||||
| Total dividends and distributions | (3.87 | ) | (2.47 | ) | (2.18 | ) | (1.59 | ) | (1.59 | ) | (2.79 | ) | |||||||||||||||
| Net asset value, end of period | $ | 19.24 | $ | 21.97 | $ | 21.91 | $ | 21.13 | $ | 18.87 | $ | 17.69 | |||||||||||||||
| Total return2 | 5.67 | % | 12.36 | % | 14.72 | % | 18.25 | % | 16.87 | % | (0.07 | )% | |||||||||||||||
| RATIOS AND SUPPLEMENTAL DATA | |||||||||||||||||||||||||||
| Net assets, end of period (000s omitted) | $ | 15,193 | $ | 16,028 | $ | 16,079 | $ | 11,613 | $ | 8,138 | $ | 4,271 | |||||||||||||||
| Ratio of expenses to average net assets | 2.10 | %3 | 2.12 | % | 2.13 | % | 2.17 | % | 2.23 | % | 2.07 | % | |||||||||||||||
| Ratio of net investment loss to average net assets | (1.17 | )%3 | (0.28 | )% | (0.91 | )% | (0.97 | )% | (0.86 | )% | (0.63 | )% | |||||||||||||||
| Decrease reflected in above operating expense ratios due to waivers/reimbursements | — | — | — | — | 0.04 | % | 0.14 | % | |||||||||||||||||||
| Portfolio turnover rate | 151 | % | 67 | % | 43 | % | 41 | % | 30 | % | 18 | % | |||||||||||||||
1 Per share information is calculated using the average shares outstanding method.
2 Total returns are historical and assume changes in share price, reinvestment of all dividends and distributions and no sales charge. Had certain expenses not been reduced during the periods shown, total returns would have been lower. Total returns for periods less than one year are not annualized.
3 Annualized.
See Accompanying Notes to Financial Statements.
42
Credit Suisse Funds
Notes to Financial Statements
April 30, 2007 (unaudited)
Note 1. Organization
The Credit Suisse Capital Funds (the "Trust") covered in this report are comprised of Credit Suisse Large Cap Value Fund ("Large Cap Value") and Credit Suisse Small Cap Core Fund ("Small Cap Core"), (each a "Fund" and collectively, the "Funds"). The Trust is registered under the Investment Company Act of 1940, as amended (the "1940 Act"), as an open-end management investment company. The Trust was organized under the laws of the Commonwealth of Massachusetts as a business trust on November 26, 1985.
Each Fund is classified as diversified. Small Cap Core changed its name from Credit Suisse Small Cap Value Fund, Inc., effective December 1, 2006. Investment objectives for each Fund are as follows: Large Cap Value seeks long-term capital appreciation and continuity of income; Small Cap Core seeks a high level of growth of capital.
Large Cap Value offers five classes of shares: Common Class shares, Advisor Class shares, Class A shares, Class B shares and Class C shares. Small Cap Core offers four classes of shares: Common Class shares, Class A shares, Class B shares and Class C shares. Effective December 12, 2001, Large Cap Value closed the Common Class to new investments, except for reinvestment of dividends. Large Cap Value's Common Class shareholders as of the close of business on December 12, 2001 may continue to hold Common Class shares but may not add to their accounts. Although no further shares can be purchased, Large Cap Value's shareholders can redeem their Common Class shares through any available method. The Small Cap Core's Common Class shares are closed to new investors, with certain exceptions as set forth in the prospectus. Each class of shares in each Fund represents an equal pro rata interest in each Fund, except that they bear different expenses, whi ch reflect the difference in the range of services provided to them. Class A shares of each Fund are sold subject to a front-end sales charge of up to 5.75%. Class B shares of each Fund are sold subject to a contingent deferred sales charge which declines from 4.00% to zero depending on the period of time the shares are held. Class C shares of each Fund are sold subject to a contingent deferred sales charge of 1.00% if redeemed within the first year of purchase.
Note 2. Significant Accounting Policies
A) SECURITY VALUATION — The net asset value of each Fund is determined daily as of the close of regular trading on the New York Stock Exchange, Inc. (the "Exchange") on each day the Exchange is open for business. Equity investments are valued at market value, which is generally determined using the closing price on the exchange or market on which the security is
43
Credit Suisse Funds
Notes to Financial Statements (continued)
April 30, 2007 (unaudited)
Note 2. Significant Accounting Policies
primarily traded at the time of valuation (the "Valuation Time"). If no sales are reported, equity investments are generally valued at the most recent bid quotation as of the Valuation Time or at the lowest asked quotation in the case of a short sale of securities. Debt securities with a remaining maturity greater than 60 days are valued in accordance with the price supplied by a pricing service, which may use a matrix, formula or other objective method that takes into consideration market indices, yield curves and other specific adjustments. Debt obligations that will mature in 60 days or less are valued on the basis of amortized cost, which approximates market value, unless it is determined that this method would not represent fair value. Investments in mutual funds are valued at the mutual fund's closing net asset value per share on the day of valuation. Securities and other assets for which market quotations are not readily available, or whose values have been materially affected by events occurring before the Funds' Valuation Time but after the close of the securities' primary markets, are valued at fair value as determined in good faith by or under the direction of, the Board of Trustees under procedures established by the Board of Trustees. The Funds may utilize a service provided by an independent third party which has been approved by the Board of Trustees to fair value certain securities. When fair-value pricing is employed, the prices of securities used by a fund to calculate its net asset value may differ from quoted or published prices for the same securities.
B) FOREIGN CURRENCY TRANSACTIONS — The books and records of the Funds are maintained in U.S. dollars. Transactions denominated in foreign currencies are recorded at the current prevailing exchange rates. All assets and liabilities denominated in foreign currencies are translated into U.S. dollar amounts at the current exchange rate at the end of the period. Translation gains or losses resulting from changes in the exchange rate during the reporting period and realized gains and losses on the settlement of foreign currency transactions are reported in the results of operations for the current period. The Funds do not isolate that portion of realized gains and losses on investments in equity securities which is due to changes in the foreign exchange rate from that which is due to changes in market prices of equity securities. The Funds isolate that portion of realized gains and losses on investments in debt securities which is due to changes in the foreign exchange rate from that which is due to changes in market prices of debt securities.
C) SECURITY TRANSACTIONS AND INVESTMENT INCOME — Security transactions are accounted for on a trade date basis. Interest income is recorded on the accrual basis. Dividends are recorded on the ex-dividend date. Certain expenses are class-specific and vary by class. Income, expenses (excluding
44
Credit Suisse Funds
Notes to Financial Statements (continued)
April 30, 2007 (unaudited)
Note 2. Significant Accounting Policies
class-specific expenses) and realized/unrealized gains/losses are allocated proportionately to each class of shares based upon the relative net asset value of outstanding shares of that class. The cost of investments sold is determined by use of the specific identification method for both financial reporting and income tax purposes.
D) DIVIDENDS AND DISTRIBUTIONS TO SHAREHOLDERS — Dividends from net investment income, if any, are declared and paid quarterly by Large Cap Value and at least annually by Small Cap Core. Distributions of net realized capital gains, if any, are declared and paid at least annually by the Funds. However, to the extent that a net realized capital gain can be reduced by a capital loss carryforward, such gain will not be distributed. Income and capital gain distributions are determined in accordance with federal income tax regulations, which may differ from accounting principles generally accepted in the United States of America (GAAP).
E) FEDERAL INCOME TAXES — No provision is made for federal taxes as it is each Fund's intention to continue to qualify for and elect the tax treatment applicable to regulated investment companies under the Internal Revenue Code of 1986, as amended, and make the requisite distributions to its shareholders which will be sufficient to relieve it from federal income and excise taxes.
F) USE OF ESTIMATES — The preparation of financial statements in conformity with GAAP requires management to make estimates and assumptions that affect the reported amounts of assets and liabilities and disclosure of contingent assets and liabilities at the date of the financial statements and the reported amounts of income and expenses during the reporting period. Actual results could differ from these estimates.
G) SHORT-TERM INVESTMENTS — The Funds, together with other funds/portfolios advised by Credit Suisse Asset Management, LLC ("Credit Suisse"), an indirect, wholly-owned subsidiary of Credit Suisse Group, pool available cash into either a short-term variable rate time deposit issued by State Street Bank and Trust Company ("SSB"), the Funds' custodian, or a money market fund advised by Credit Suisse. The short-term time deposit issued by SSB is a variable rate account classified as a short-term investment.
H) SECURITIES LENDING — Loans of securities are required at all times to be secured by collateral at least equal to 102% of the market value of domestic securities on loan (including any accrued interest thereon) and 105% of the market value of foreign securities on loan (including any accrued interest thereon). Cash collateral received by the Funds in connection with securities
45
Credit Suisse Funds
Notes to Financial Statements (continued)
April 30, 2007 (unaudited)
Note 2. Significant Accounting Policies
lending activity may be pooled together with cash collateral for other funds/portfolios advised by Credit Suisse and may be invested in a variety of investments, including certain Credit Suisse-advised funds, funds advised by SSB, the Funds' securities lending agent, or money market instruments. However, in the event of default or bankruptcy by the other party to the agreement, realization and/or retention of the collateral may be subject to legal proceedings.
SSB has been engaged by the Funds to act as the Funds' securities lending agent. The Funds' securities lending arrangement provides that the Funds and SSB will share the net income earned from securities lending activities. During the six months ended April 30, 2007, total earnings from the Fund's investment in cash collateral received in connection with Large Cap Value and Small Cap Core's security lending arrangements were $448,589, and $1,714,771, respectively, of which $437,193, and $1,621,610, respectively, were rebated to borrowers (brokers). The Funds retained $8,925, and $72,683 in income, respectively, from the cash collateral investment and SSB, as lending agent, was paid $2,471, and $20,478 respectively. The Funds may also be entitled to certain minimum amounts of income from their securities lending activities. Securities lending income is accrued as earned.
I) OTHER — Large Cap Value may invest up to 10% and Small Cap Core may invest up to 15% of its net assets in restricted and other illiquid securities. Non-publicly traded securities may be less liquid than publicly traded securities. Although these securities may be resold in privately negotiated transactions, the prices realized from such sales could differ from the price originally paid by the Funds or the current carrying values, and the difference could be material.
Note 3. Transactions with Affiliates and Related Parties
Credit Suisse serves as investment adviser for the Funds. For its investment advisory services, effective December 1, 2006, Credit Suisse agreed to change the investment advisory fee of Large Cap Value from 0.75% to 0.50%, and Small Cap Core to the lower of 0.70% or the following tiered fee:
| Fund | Annual Rate | ||||||
| Small Cap Core | 0.875% of first $100 million of average daily net assets | ||||||
| 0.75% of next $100 million of average daily net assets | |||||||
| 0.625% of average daily net assets over $200 million | |||||||
46
Credit Suisse Funds
Notes to Financial Statements (continued)
April 30, 2007 (unaudited)
Note 3. Transactions with Affiliates and Related Parties
For the six months ended April 30, 2007, investment advisory fees earned for each Fund were as follows:
| Fund | Gross Advisory Fee | ||||||
| Large Cap Value | $ | 806,234 | |||||
| Small Cap Core | 1,078,042 | ||||||
Credit Suisse Asset Management Securities, Inc. ("CSAMSI"), an affiliate of Credit Suisse, and SSB serve as co-administrators to the Funds. For its co-administrative services, CSAMSI currently receives a fee calculated at an annual rate of 0.09% of each Fund's average daily net assets. For the six months ended April 30, 2007, co-administrative services fees earned by CSAMSI were as follows:
| Fund | Co-Administration Fee | ||||||
| Large Cap Value | $ | 145,047 | |||||
| Small Cap Core | 140,466 | ||||||
Effective December 1, 2006, the co-administration fee was reduced from an annual rate of 0.10% to 0.09%.
For its co-administrative services, SSB receives a fee, exclusive of out-of-pocket expenses, calculated in total for all the Credit Suisse funds/portfolios co-administered by SSB and allocated based upon relative average net assets of each fund/portfolio, subject to an annual minimum fee. For the six months ended April 30, 2007, co-administrative services fees earned by SSB (including out-of-pocket fees) were as follows:
| Fund | Co-Administration Fee | ||||||
| Large Cap Value | $ | 56,276 | |||||
| Small Cap Core | 56,979 | ||||||
In addition to serving as each Fund's co-administrator, CSAMSI currently serves as distributor of each Fund's shares. Pursuant to distribution plans adopted by each Fund pursuant to Rule 12b-1 under the 1940 Act, CSAMSI receives fees for its distribution services. This fee is calculated at an annual rate of 0.25% of the average daily net assets of the Common Class of Small Cap Core and Class A shares of each Fund. Advisor Class shares of Large Cap Value may pay this fee at an annual rate not to exceed 0.75% of such class' average daily net assets; such fee is currently calculated at the annual rate of 0.50% of the average daily net assets of such class. For the Class B and Class C shares, the fee is calculated at annual rate of 1.00% of average daily net assets of such classes.
47
Credit Suisse Funds
Notes to Financial Statements (continued)
April 30, 2007 (unaudited)
Note 3. Transactions with Affiliates and Related Parties
Certain brokers, dealers and financial representatives provide transfer agent related services to the Funds, and receive compensation from Credit Suisse. Credit Suisse is then reimbursed by the Funds. For the six months ended April 30, 2007, the Small Cap Core Fund reimbursed Credit Suisse the following amount, which is included in the Fund's transfer agent expense as follows:
| Fund | Amount | ||||||
| Small Cap Core | $ | 51,355 | |||||
For the six months ended April 30, 2007, CSAMSI and its affiliates advised the Funds that they retained the following amounts from commissions earned on the sale of the Funds' Class A shares:
| Fund | Amount | ||||||
| Large Cap Value | $ | 4,116 | |||||
| Small Cap Core | 4,725 | ||||||
Merrill Corporation ("Merrill"), an affiliate of Credit Suisse, has been engaged by the Funds to provide certain financial printing and fulfillment services. For the six months ended April 30, 2007, Merrill was paid for its services by the Funds as follows:
| Fund | Amount | ||||||
| Large Cap Value | $ | 15,493 | |||||
| Small Cap Core | 15,567 | ||||||
Note 4. Line of Credit
The Funds, together with other funds/portfolios advised by Credit Suisse (collectively, the "Participating Funds"), participate in a $75 million committed, unsecured line of credit facility ("Credit Facility") for temporary or emergency purposes with Deutsche Bank, A.G. as administrative agent and syndication agent and SSB as operations agent. Under the terms of the Credit Facility, the Participating Funds pay an aggregate commitment fee at a rate of 0.10% per annum on the average unused amount of the Credit Facility, which is allocated among the Participating Funds in such manner as is determined by the governing Boards of the Participating Funds. In addition, the Participating Funds pay interest on borrowings at the Federal Funds rate plus 0.50%. At April 30, 2007, and during the six months ended April 30, 2007, the Funds had no borrowings under the Credit Facility.
48
Credit Suisse Funds
Notes to Financial Statements (continued)
April 30, 2007 (unaudited)
Note 5. Purchases and Sales of Securities
For the six months ended April 30, 2007, purchases and sales of investment securities (excluding short-term investments) were as follows:
| Fund | Purchases | Sales | |||||||||
| Large Cap Value | $ | 336,464,780 | $ | 371,777,023 | |||||||
| Small Cap Core | 458,730,957 | 539,538,088 | |||||||||
At April 30, 2007, the identified cost for federal income tax purposes, as well as the gross unrealized appreciation from investments for those securities having an excess of value over cost, gross unrealized depreciation from investments for those securities having an excess of cost over value and the net unrealized appreciation from investments were as follows:
| Fund | Identified Cost | Gross Unrealized Appreciation | Gross Unrealized (Depreciation) | Net Unrealized Appreciation | |||||||||||||||
| Large Cap Value | $ | 285,670,708 | $ | 50,334,009 | $ | (1,453,440 | ) | $ | 48,880,569 | ||||||||||
| Small Cap Core | 327,759,852 | 25,225,446 | (9,348,445 | ) | 15,877,001 | ||||||||||||||
Note 6. Capital Share Transactions
Large Cap Value is authorized to issue an unlimited number of full and fractional shares of beneficial interest, $0.001 par value per share, of which an unlimited number of shares are classified as Common Class shares, Advisor Class shares, Class A shares, Class B shares and Class C shares. Small Cap Core is authorized to issue an unlimited number of full and fractional shares of beneficial interest, $.001 par value per share, of which an unlimited number of shares are classified as Common Class shares, Class A shares, Class B shares and Class C shares. Transactions in capital shares of the Funds were as follows:
| Large Cap Value | |||||||||||||||||||
| Common Class | |||||||||||||||||||
| For the Six Months Ended April 30, 2007 (unaudited) | For the Year Ended October 31, 2006 | ||||||||||||||||||
| Shares | Value | Shares | Value | ||||||||||||||||
| Shares sold | — | $ | — | — | $ | — | |||||||||||||
| Shares issued in reinvestment of dividends and distributions | 6,902 | 123,968 | 3,892 | 75,906 | |||||||||||||||
| Shares redeemed | (1,324 | ) | (24,607 | ) | (4,705 | ) | (92,528 | ) | |||||||||||
| Net increase (decrease) | 5,578 | $ | 99,361 | (813 | ) | $ | (16,622 | ) | |||||||||||
49
Credit Suisse Funds
Notes to Financial Statements (continued)
April 30, 2007 (unaudited)
Note 6. Capital Share Transactions
| Advisor Class | |||||||||||||||||||
| For the Six Months Ended April 30, 2007 (unaudited) | For the Year Ended October 31, 2006 | ||||||||||||||||||
| Shares | Value | Shares | Value | ||||||||||||||||
| Shares sold | 39,189 | $ | 753,550 | 67,105 | $ | 1,378,725 | |||||||||||||
| Shares issued in reinvestment of dividends and distributions | 67,013 | 1,212,789 | 52,301 | 1,025,063 | |||||||||||||||
| Shares redeemed | (60,866 | ) | (1,143,602 | ) | (253,100 | ) | (5,156,089 | ) | |||||||||||
| Net increase (decrease) | 45,336 | $ | 822,737 | (133,694 | ) | $ | (2,752,301 | ) | |||||||||||
| Class A | |||||||||||||||||||
| For the Six Months Ended April 30, 2007 (unaudited) | For the Year Ended October 31, 2006 | ||||||||||||||||||
| Shares | Value | Shares | Value | ||||||||||||||||
| Shares sold | 590,255 | $ | 11,198,904 | 1,577,376 | $ | 32,034,528 | |||||||||||||
| Shares issued in reinvestment of dividends and distributions | 3,152,374 | 56,894,435 | 1,835,069 | 35,919,520 | |||||||||||||||
| Shares redeemed | (2,278,854 | ) | (44,115,507 | ) | (3,815,046 | ) | (77,593,150 | ) | |||||||||||
| Net increase (decrease) | 1,463,775 | $ | 23,977,832 | (402,601 | ) | $ | (9,639,102 | ) | |||||||||||
| Class B | |||||||||||||||||||
| For the Six Months Ended April 30, 2007 (unaudited) | For the Year Ended October 31, 2006 | ||||||||||||||||||
| Shares | Value | Shares | Value | ||||||||||||||||
| Shares sold | 32,997 | $ | 602,672 | 62,933 | $ | 1,242,638 | |||||||||||||
| Shares issued in reinvestment of dividends and distributions | 121,076 | 2,142,074 | 93,835 | 1,805,726 | |||||||||||||||
| Shares redeemed | (200,597 | ) | (3,802,986 | ) | (431,250 | ) | (8,672,931 | ) | |||||||||||
| Net decrease | (46,524 | ) | $ | (1,058,240 | ) | (274,482 | ) | $ | (5,624,567 | ) | |||||||||
| Class C | |||||||||||||||||||
| For the Six Months Ended April 30, 2007 (unaudited) | For the Year Ended October 31, 2006 | ||||||||||||||||||
| Shares | Value | Shares | Value | ||||||||||||||||
| Shares sold | 7,644 | $ | 141,719 | 17,099 | $ | 329,597 | |||||||||||||
| Shares issued in reinvestment of dividends and distributions | 25,563 | 449,185 | 19,549 | 374,045 | |||||||||||||||
| Shares redeemed | (24,118 | ) | (441,112 | ) | (91,280 | ) | (1,813,722 | ) | |||||||||||
| Net increase (decrease) | 9,089 | $ | 149,792 | (54,632 | ) | $ | (1,110,080 | ) | |||||||||||
50
Credit Suisse Funds
Notes to Financial Statements (continued)
April 30, 2007 (unaudited)
Note 6. Capital Share Transactions
| Small Cap Core | |||||||||||||||||||
| Common Class | |||||||||||||||||||
| For the Six Months Ended April 30, 2007 (unaudited) | For the Year Ended October 31, 2006 | ||||||||||||||||||
| Shares | Value | Shares | Value | ||||||||||||||||
| Shares sold | 86,690 | $ | 1,870,021 | 576,180 | $ | 13,468,606 | |||||||||||||
| Shares issued in reinvestment of dividends and distributions | 527,601 | 11,174,389 | 330,655 | 7,459,586 | |||||||||||||||
| Shares redeemed | (535,358 | ) | (11,740,725 | ) | (1,112,407 | ) | (25,871,552 | ) | |||||||||||
| Net increase (decrease) | 78,933 | $ | 1,303,685 | (205,572 | ) | $ | (4,943,360 | ) | |||||||||||
| Class A | |||||||||||||||||||
| For the Six Months Ended April 30, 2007 (unaudited) | For the Year Ended October 31, 2006 | ||||||||||||||||||
| Shares | Value | Shares | Value | ||||||||||||||||
| Shares sold | 595,513 | $ | 13,084,569 | 4,062,317 | $ | 94,724,548 | |||||||||||||
| Shares issued in reinvestment of dividends and distributions | 1,599,148 | 34,047,204 | 987,897 | 22,395,554 | |||||||||||||||
| Shares redeemed | (4,268,573 | ) | (96,431,472 | ) | (3,778,297 | ) | (88,120,027 | ) | |||||||||||
| Net increase (decrease) | (2,073,912 | ) | $ | (49,299,699 | ) | 1,271,917 | $ | 29,000,075 | |||||||||||
| Class B | |||||||||||||||||||
| For the Six Months Ended April 30, 2007 (unaudited) | For the Year Ended October 31, 2006 | ||||||||||||||||||
| Shares | Value | Shares | Value | ||||||||||||||||
| Shares sold | 12,480 | $ | 238,349 | 32,214 | $ | 682,832 | |||||||||||||
| Shares issued in reinvestment of dividends and distributions | 94,639 | 1,783,036 | 78,280 | 1,611,772 | |||||||||||||||
| Shares redeemed | (108,549 | ) | (2,132,467 | ) | (370,527 | ) | (7,935,071 | ) | |||||||||||
| Net decrease | (1,430 | ) | $ | (111,082 | ) | (260,033 | ) | $ | (5,640,467 | ) | |||||||||
| Class C | |||||||||||||||||||
| For the Six Months Ended April 30, 2007 (unaudited) | For the Year Ended October 31, 2006 | ||||||||||||||||||
| Shares | Value | Shares | Value | ||||||||||||||||
| Shares sold | 76,318 | $ | 1,474,259 | 183,143 | $ | 3,869,849 | |||||||||||||
| Shares issued in reinvestment of dividends and distributions | 78,687 | 1,473,842 | 54,440 | 1,116,566 | |||||||||||||||
| Shares redeemed | (94,643 | ) | (1,839,909 | ) | (242,079 | ) | (5,093,475 | ) | |||||||||||
| Net increase (decrease) | 60,362 | $ | 1,108,192 | (4,496 | ) | $ | (107,060 | ) | |||||||||||
Effective March 1, 2007, Small Cap Core imposes a 2% redemption fee on all classes of shares currently being offered that are purchased on or after March 1, 2007 and redeemed or exchanged within 30 days from the date of purchase. Reinvested dividends and distributions are not subject to the fee. The fee is charged based on the value of shares at redemption, is paid directly to the
51
Credit Suisse Funds
Notes to Financial Statements (continued)
April 30, 2007 (unaudited)
Note 6. Capital Share Transactions
Fund and becomes part of the Fund's daily net asset value calculation. When shares are redeemed that are subject to the fee, reinvested dividends are redeemed first, followed by the shares held longest.
On April 30, 2007, the number of shareholders that held 5% or more of the outstanding shares of each class of the Funds were as follows:
| Fund | Number of Shareholders | Approximate Percentage of Outstanding Shares | |||||||||
| Large Cap Value | |||||||||||
| Common Class | 5 | 63 | % | ||||||||
| Advisor Class | 2 | 99 | % | ||||||||
| Class A | 2 | 21 | % | ||||||||
| Class B | 1 | 10 | % | ||||||||
| Class C | 5 | 44 | % | ||||||||
| Small Cap Core | |||||||||||
| Common Class | 2 | 71 | % | ||||||||
| Class A | 2 | 14 | % | ||||||||
| Class B | 1 | 9 | % | ||||||||
| Class C | 1 | 9 | % | ||||||||
Some of the shareholders are omnibus accounts, which hold shares on behalf of individual shareholders.
Note 7. Contingencies
In the normal course of business, the Funds may provide general indemnifications pursuant to certain contracts and organizational documents. The Funds' maximum exposure under these arrangements is dependent on future claims that may be made against the Funds and, therefore, cannot be estimated; however, based on experience, the risk of loss from such claims is considered remote.
Note 8. Recent Accounting Pronouncements
During June 2006, the Financial Accounting Standards Board ("FASB") issued FASB Interpretation 48 ("FIN 48" or the "Interpretation"), Accounting for Uncertainty in Income Taxes — an interpretation of FASB statement 109. FIN 48 supplements FASB Statement 109, Accounting for Income Taxes, by defining the confidence level that a tax position must meet in order to be recognized in the financial statements. FIN 48 prescribes a comprehensive model for how a fund should recognize, measure, present, and disclose in its financial statements uncertain tax positions that the fund has taken or expects to take on a tax
52
Credit Suisse Funds
Notes to Financial Statements (continued)
April 30, 2007 (unaudited)
Note 8. Recent Accounting Pronouncements
return. FIN 48 requires that the tax effects of a position be recognized only if it is "more likely than not" to be sustained based solely on its technical merits. Management must be able to conclude that the tax law, regulations, case law, and other objective information regarding the technical merits sufficiently support the position's sustainability with a likelihood of more than 50 percent. FIN 48 is effective for fiscal periods beginning after December 15, 2006. At adoption, the financial statements must be adjusted to reflect only those tax positions that are more likely than not to be sustained as of the adoption date.
On September 20, 2006, the FASB released Statement of Financial Accounting Standards No. 157 "Fair Value Measurements" ("FAS 157"). FAS 157 establishes an authoritative definition of fair value, sets out a framework for measuring fair value, and requires additional disclosures about fair-value measurements. The application of FAS 157 is required for fiscal years, beginning after November 15, 2007 and interim periods within those fiscal years.
At this time, management is evaluating the implications of FIN 48 and FAS 157 and their impact on the financial statements has not yet been determined.
53
Credit Suisse Large Cap Value Fund
Board Approval of Advisory Agreement (unaudited)
In approving the renewal of the current Advisory Agreement, the Board of Trustees, including the Independent Trustees, at a meeting held on November 14-15, 2006, considered the following factors with respect to the Credit Suisse Large Cap Value Fund (the "Fund"):
Investment Advisory Fee Rates
The Board reviewed and considered the contractual advisory fee rate of 0.50% effective December 1, 2006 ("Contractual Advisory Fee") in connection with the Fund's change in investment strategy also effective on that date, in light of the extent and quality of the advisory services provided by Credit Suisse Asset Management, LLC ("Credit Suisse").
Additionally, the Board received and considered information comparing the Fund's Contractual Advisory Fee and the Fund's overall expenses with those of funds in both the relevant expense group ("Expense Group") and universe of funds (the "Expense Universe") provided by Lipper Inc., an independent provider of investment company data.
Nature, Extent and Quality of the Services under the Advisory Agreement
The Board received and considered information regarding the nature, extent and quality of services provided to the Fund by Credit Suisse under the Advisory Agreement. The Board also noted information received at regular meetings throughout the year related to the services rendered by Credit Suisse. The Board reviewed background information about Credit Suisse, including its Form ADV. The Board considered the background and experience of Credit Suisse's senior management and the expertise of, and the amount of attention given to the Fund by, senior personnel of Credit Suisse. In addition, the Board reviewed the qualifications, backgrounds and responsibilities of the portfolio management team primarily responsible for the day-to-day portfolio management of the Fund and the extent of the resources devoted to research and analysis of actual and potential investments. The Board also received and considered information about the nature, extent and quality of services and fee rates offered to other Credit Suisse clients for comparable services.
Fund Performance
The Board received and considered the performance results of the Fund over time, along with comparisons both to the relevant performance group ("Performance Group") and universe of funds ("Performance Universe") for
54
Credit Suisse Large Cap Value Fund
Board Approval of Advisory Agreement (unaudited) (continued)
the Fund. The Board was provided with a description of the methodology used to arrive at the funds included in the Performance Group and the Performance Universe.
Credit Suisse Profitability
The Board received and considered a profitability analysis of Credit Suisse based on the fees payable under the Advisory Agreement for the Fund, including other relationships between the Fund on the one hand and Credit Suisse affiliates on the other. The Board received profitability information for the other funds in the Credit Suisse family of funds.
Economies of Scale
The Board considered whether economies of scale in the provision of services to the Fund were being passed along to the shareholders. Accordingly, the Board considered whether alternative fee structures (such as breakpoint fee structures) would be more appropriate or reasonable taking into consideration economies of scale or other efficiencies that might accrue from increases in the Fund's asset levels.
Other Benefits to Credit Suisse
The Board considered other benefits received by Credit Suisse and its affiliates as a result of their relationship with the Fund. Such benefits include, among others, research arrangements with brokers who execute transactions on behalf of the Fund, administrative and brokerage relationships with affiliates of Credit Suisse and benefits potentially derived from an increase in Credit Suisse's businesses as a result of its relationship with the Fund (such as the ability to market to shareholders other financial products offered by Credit Suisse and its affiliates).
The Board considered the standards applied in seeking best execution, whether and to what extent soft dollar credits are sought and how any such credits are utilized, any benefits that may be achieved by using an affiliated broker and the existence of quality controls applicable to brokerage allocation procedures. The Board also reviewed Credit Suisse's method for allocating portfolio investment opportunities among its advisory clients.
55
Credit Suisse Large Cap Value Fund
Board Approval of Advisory Agreement (unaudited) (continued)
Conclusions
In selecting Credit Suisse, and approving the Advisory Agreement and the investment advisory fee under such agreement, the Board concluded that:
• The Contractual Advisory Fee was the lowest in the Fund's Expense Group and was considered reasonable.
• The Fund's performance was above most of its peers in the Performance Group and Performance Universe for most periods. In view of the organizational realignment of Credit Suisse's asset management business and the potential impact of those changes on the Fund, the Board had approved changes in the investment strategies and portfolio management of the Fund to a quantitative strategies approach to be implemented by the Credit Suisse Quantitative Strategies Group. The quantitative strategies and Contractual Advisory Fee went into effect on December 1, 2006.
• The Board was satisfied with the nature and extent of the investment advisory services provided to the Fund by Credit Suisse and that, based on dialogue with management and counsel, the services provided by Credit Suisse under the Advisory Agreement are typical of, and consistent with, those provided to similar mutual funds by other investment advisers.
• In light of the costs of providing investment management and other services to the Fund and Credit Suisse's ongoing commitment to the Fund, the profits and other ancillary benefits that Credit Suisse and its affiliates received were considered reasonable.
• Credit Suisse's profitability based on fees payable under the Advisory Agreement was reasonable in light of the nature, extent and quality of the services provided to the Fund thereunder.
• In light of the amount of the Contractual Advisory fee, the Fund's current fee structure (without breakpoints) was considered reasonable.
No single factor reviewed by the Board was identified by the Board as the principal factor in determining whether to approve the Advisory Agreement. The Independent Trustees were advised by separate independent legal counsel throughout the process.
56
Credit Suisse Small Cap Core Fund
Board Approval of Advisory Agreement (unaudited)
In approving the renewal of the current Advisory Agreement, the Board of Trustees, including the Independent Trustees, at a meeting held on November 14-15, 2006, considered the following factors with respect to the Credit Suisse Small Cap Core Fund (formerly the Credit Suisse Small Cap Value Fund) (the "Fund"):
Investment Advisory Fee Rates
The Board reviewed and considered the contractual advisory fee that, effective December 1, 2006, will be assessed at the lower of (a) 0.70% of the Fund's average daily net assets or (b) 0.875% of its average daily net assets up to $100 million, 0.75% of its average daily net assets in excess of $100 million but less than $200 million and 0.625% of its average daily net assets over $200 million ("Contractual Advisory Fee") in connection with the Fund's change in investment strategy to become effective on that date, in light of the extent and quality of the advisory services provided by Credit Suisse Asset Management, LLC ("Credit Suisse").
Additionally, the Board received and considered information comparing the Fund's Contractual Advisory Fee and the Fund's overall expenses with those of funds in both the relevant expense group ("Expense Group") and universe of funds ("Expense Universe") provided by Lipper Inc., an independent provider of investment company data.
Nature, Extent and Quality of the Services under the Advisory Agreement
The Board received and considered information regarding the nature, extent and quality of services provided to the Fund by Credit Suisse under the Advisory Agreement. The Board also noted information received at regular meetings throughout the year related to the services rendered by Credit Suisse. The Board reviewed background information about Credit Suisse, including its Form ADV. The Board considered the background and experience of Credit Suisse's senior management and the expertise of, and the amount of attention given to the Fund by, senior personnel of Credit Suisse. In addition, the Board reviewed the qualifications, backgrounds and responsibilities of the portfolio management team primarily responsible for the day-to-day portfolio management of the Fund and the extent of the resources devoted to research and analysis of actual and potential investments. The Board also received and considered information about the nature, extent and quality of services and fee rates offered to other Credit Suisse clients for comparable services.
57
Credit Suisse Small Cap Core Fund
Board Approval of Advisory Agreement (unaudited) (continued)
Fund Performance
The Board received and considered the performance results of the Fund over time, along with comparisons both to the relevant performance group ("Performance Group") and universe of funds ("Performance Universe") for the Fund. The Board was provided with a description of the methodology used to arrive at the funds included in the Performance Group and the Performance Universe.
Credit Suisse Profitability
The Board received and considered a profitability analysis of Credit Suisse based on the fees payable under the Advisory Agreement for the Fund, including any fee waivers or fee caps, as well as other relationships between the Fund on the one hand and Credit Suisse affiliates on the other. The Board received profitability information for the other funds in the Credit Suisse family of funds.
Economies of Scale
The Board considered whether economies of scale in the provision of services to the Fund were being passed along to the shareholders. Accordingly, the Board considered whether the breakpoints in the Fund's new advisory fee structure were appropriate or reasonable taking into consideration economies of scale or other efficiencies that might accrue from increases in the Fund's asset levels.
Other Benefits to Credit Suisse
The Board considered other benefits received by Credit Suisse and its affiliates as a result of their relationship with the Fund. Such benefits include, among others, research arrangements with brokers who execute transactions on behalf of the Fund, administrative and brokerage relationships with affiliates of Credit Suisse and benefits potentially derived from an increase in Credit Suisse's businesses as a result of its relationship with the Fund (such as the ability to market to shareholders other financial products offered by Credit Suisse and its affiliates).
The Board considered the standards applied in seeking best execution, whether and to what extent soft dollar credits are sought and how any such credits are utilized, any benefits that may be achieved by using an affiliated broker and the existence of quality controls applicable to brokerage allocation procedures. The Board also reviewed Credit Suisse's method for allocating portfolio investment opportunities among its advisory clients.
58
Credit Suisse Small Cap Core Fund
Board Approval of Advisory Agreement (unaudited) (continued)
Conclusions
In selecting Credit Suisse, and approving the Advisory Agreement and the investment advisory fee under such agreement, the Board concluded that:
• The flat rate of 0.70% under the Contractual Advisory Fee level was among the lowest in the Fund's expense group and the Board considered the fee to be reasonable.
• The Fund's recent performance was below most of its peers in the Performance Group and Performance Universe in the recent periods and above the median of its Performance Group and Performance Universe for longer-term periods. As a result of performance concerns, and in view of the organizational realignment of Credit Suisse's asset management business and the potential impact of those changes on the Fund, the Board had approved changes in the investment strategies and portfolio management of the Fund to a quantitative strategies approach to be implemented by the Credit Suisse Quantitative Strategies Group. The quantitative strategies and Contractual Advisory Fee went into effect on December 1, 2006. The Board would continue to monitor steps taken by Credit Suisse to improve performance.
• Aside from performance (as described above), the Board was satisfied with the nature and extent of the investment advisory services provided to the Fund by Credit Suisse and that, based on dialogue with management and counsel, the services provided by Credit Suisse under the Advisory Agreement are typical of, and consistent with, those provided to similar mutual funds by other investment advisers.
• In light of the costs of providing investment management and other services to the Fund and Credit Suisse's ongoing commitment to the Fund and willingness to cap fees and expenses, the profits and other ancillary benefits that Credit Suisse and its affiliates received were considered reasonable.
• Credit Suisse's profitability based on fees payable under the Advisory Agreement was reasonable in light of the nature, extent and quality of the services provided to the Fund thereunder.
• In light of the amount of the Contractual Advisory Fee, the Fund's current fee structure was considered reasonable.
No single factor reviewed by the Board was identified by the Board as the principal factor in determining whether to approve the Advisory Agreement. The Independent Trustees were advised by separate independent legal counsel throughout the process.
59
Credit Suisse Funds
Privacy Policy Notice (unaudited)
Important Privacy Choices for Consumers
We are committed to maintaining the privacy of every current and prospective customer. We recognize that you entrust important personal information to us, and we wish to assure you that we take seriously our responsibilities in protecting and safeguarding this information.
In connection with making available investment products and services to current and potential customers, we may obtain nonpublic personal information about you. This information may include your name, address, e-mail address, social security number, account number, assets, income, financial situation, transaction history and other personal information.
We may collect nonpublic information about you from the following sources:
• Information we receive on applications, forms, questionnaires, web sites, agreements or in the course of establishing or maintaining a customer relationship; and
• Information about your transactions with us, our affiliates, or others.
We do not disclose any nonpublic personal information about our customers or former customers to anyone, except with your consent or as otherwise permitted by law.
In cases where we believe that additional products and services may be of interest to you, we may share the information described above with our affiliates.
We may also disclose this information to firms that perform services on our behalf. These agents and service providers are required to treat the information confidentially and use it only for the purpose for which it is provided.
We restrict access to nonpublic personal information about you to those employees, agents or other parties who need to know that information to provide products or services to you or in connection with your investments with or through us. We maintain physical, electronic and procedural safeguards that comply with federal standards to guard your nonpublic personal information.
Note: This Notice is provided to clients and prospective clients of Credit Suisse Asset Management, LLC ("Credit Suisse"), and Credit Suisse Asset Management Securities, Inc., and shareholders and prospective shareholders in Credit Suisse-sponsored and-advised investment companies, including Credit Suisse Funds, and other consumers and customers, as applicable. This Notice is not intended to be incorporated in any offering materials but is merely a statement of our current Privacy Policy, and may be amended from time to time upon notice to you. This Notice is dated as of June 5, 2007.
60
Credit Suisse Funds
Proxy Voting and Portfolio Holdings Information (unaudited)
Information regarding how each Fund voted proxies related to its portfolio securities during the 12 month period ended June 30 of each year, as well as the policies and procedures that each Fund uses to determine how to vote proxies relating to its portfolio securities are available:
• By calling 1-800-927-2874
• On the Fund's website, www.credit-suisse.com/us
• On the website of the Securities and Exchange Commission, www.sec.gov.
Each Fund files a complete schedule of its portfolio holdings for the first and third quarters of its fiscal year with the SEC on Form N-Q. The Funds' Forms N-Q are available on the SEC's website at www.sec.gov and may be reviewed and copied at the SEC's Public Reference Room in Washington, DC. Information on the operation of the SEC's Public Reference Room may be obtained by calling 1-202-551-8090.
61

P.O. BOX 55030, BOSTON, MA 02205-5030
800-927-2874 n www.credit-suisse.com/us
CREDIT SUISSE ASSET MANAGEMENT SECURITIES, INC., DISTRIBUTOR. USEQVAL-SAR-0407

CREDIT SUISSE FUNDS
Semiannual Report
April 30, 2007
(unaudited)
n CREDIT SUISSE
ABSOLUTE RETURN FUND
The Fund's investment objectives, risks, charges and expenses (which should be considered carefully before investing), and more complete information about the Fund, are provided in the Prospectus, which should be read carefully before investing. You may obtain additional copies by calling 800-927-2874 or by writing to Credit Suisse Funds, P.O. Box 55030, Boston, MA 02205-5030.
Credit Suisse Asset Management Securities, Inc., Distributor, is located at Eleven Madison Ave., New York, NY 10010. Credit Suisse Funds are advised by Credit Suisse Asset Management, LLC.
Investors in the Credit Suisse Funds should be aware that they may be eligible to purchase Common Class and/or Advisor Class shares (where offered) directly or through certain intermediaries. Such shares are not subject to a sales charge but may be subject to an ongoing service and distribution fee of up to 0.50% of average daily net assets. Investors in the Credit Suisse Funds should also be aware that they may be eligible for a reduction or waiver of the sales charge with respect to Class A, B or C shares (where offered). For more information, please review the relevant prospectuses or consult your financial representative.
The views of the Fund's management are as of the date of the letter and Fund holdings described in this document are as of April 30, 2007; these views and Fund holdings may have changed subsequent to these dates. Nothing in this document is a recommendation to purchase or sell securities.
Fund shares are not deposits or other obligations of Credit Suisse Asset Management, LLC ("Credit Suisse") or any affiliate, are not FDIC-insured and are not guaranteed by Credit Suisse or any affiliate. Fund investments are subject to investment risks, including loss of your investment.
Credit Suisse Absolute Return Fund
Semiannual Investment Adviser's Report
April 30, 2007 (unaudited)
June 6, 2007
Dear Shareholder:
Performance Summary
12/29/06 – 04/30/07
| Fund | Performance | ||||||
| Common1 | 1.70 | % | |||||
| Class A1, 2 | 1.60 | % | |||||
| Class C1 , 2 | 1.40 | % | |||||
| LIBOR + 350 bps3 | 2.95 | % | |||||
Performance for the Fund's Class A and Class C shares is without the maximum sales charge of 4.00% and 1.00%, respectively.2
Market Review: Germany leads European Growth
The Credit Suisse Absolute Return Fund commenced operations on December 29, 2006. The Fund seeks to deliver positive aggregate return streams over a three- to five-year time horizon, regardless of individual market movements. To that end, the Fund employs a dynamic asset allocation-driven strategy that can invest in a wide range of equity and debt securities, exchange-traded funds, commodity-linked derivatives and money market instruments. The Fund generally invests between 30% to 75% of assets in equity markets and 25% to 70% of assets in fixed income or cash securities.
The period from December 29, 2006 (inception) to April 30, 2007, was a strong one for global equities with markets producing healthy returns over the period.
European and especially German growth were surprisingly positive. This comeback now places Germany back in the lead as the growth engine within the European Union. This change is due to significant improvement of the labor market and business climate in Germany — primarily driven by the expansionary policy from the relatively new German administration.
Continental Europe is benefiting from the recovering German economy, which boosted returns there. Additionally, growth and merger and acquisition activity in the UK has continued to boost share prices. Conversely, there are worries that some of the peripheral economies, such as Spain and Ireland — which have benefited from low eurozone interest rates and buoyant property markets — may be boiling over.
While most major currencies have strengthened against the dollar, boosting returns, the yen has weakened. Emerging markets have generally performed
1
Credit Suisse Absolute Return Fund
Semiannual Investment Adviser's Report (continued)
April 30, 2007 (unaudited)
well and China has benefited from growing investor appetite for investments in the region.
In the United States, the equity market, despite a sudden sell-off in February continued its strong performance, finishing April up by more than 5% year-to-date.
Strategic Review and Outlook: Looking for a reacceleration of global growth
Leading contributors to performance were Swiss equities (7.8% of the Fund as of April 30, 2007), commodities (2.4% of the Fund as of April 30, 2007) and a short duration in U.S. fixed income (49.1% of the Fund as of April 30, 2007). Conversely, emerging markets (3.7% of the Fund as of April 30, 2007) and Japanese equities (16.5% of the Fund as of April 30, 2007) were the leading detractors to performance. Additionally, as of April 30, 2007, cash and cash equivalents represented 3.6% of the Fund and U.S. Treasury notes represented 17.5%.
We expect to maintain our relative preference for equities over bonds. Additionally, our favoring of cyclical markets translates into equity positions in the portfolio with Japan as the largest followed by Switzerland and Emerging Markets. On the fixed income investments, we remain with an overall short duration in the range of 1.8 to 2.3 years. We will continue our investments in the high quality sector and are strategically adding some positions in asset-backed securities for yield enhancement. Our view on commodities remains slightly positive to neutral and we will therefore maintain our tactical position in that asset class.
The overall macroeconomic picture seems intact and we are convinced that we will experience a reacceleration in global growth in the second half of 2007. The U.S. economy and monetary policy are on track, so we expect the Fed will stay sidelined. Additionally, we believe the German comeback, together with the exploding European money supply (M3) and a continuation of worrisome statements from the European Central Bank (ECB) regarding inflation, increases the likelihood of the ECB raising rates. Further, although Japanese economy fundamentals are in positive territory, it has proven very hard to maintain domestic inflationary pressure on the economy. This restricts the action range for Bank of Japan and we believe monetary policy makers will be very watchful not to repeat the mistakes from the past.
In our opinion, the combination of very constructive growth patterns and attractive valuations in equity markets will provide a solid foundation for equity investments going forward. This will be especially true for those exposed to
2
Credit Suisse Absolute Return Fund
Semiannual Investment Adviser's Report (continued)
April 30, 2007 (unaudited)
more cyclical markets. Our point of view remains that cyclical markets will outperform their defensive peers over the next 1 to 3 months.
Finally, during the reporting period, we have maintained our negative view on fixed income markets. As technical research sees significant downside and our quantitative models have turned even more negative for bonds, we will maintain our positioning for now.
The Credit Suisse Multi-Asset Class Solutions Team
Guy Stern
Christine Gaelzer
There is no guarantee that the Fund's absolute return will be achieved, and there may be negative returns at any given time. In addition, investments in the Fund are subject to a number of risks, including, but not limited to, asset class risk, issuer risk, credit risk, derivatives risk and foreign securities risk.
In addition to historical information, this report contains forward-looking statements that may concern, among other things, domestic and foreign market, industry and economic trends and developments and government regulation and their potential impact on the Fund's investments. These statements are subject to risks and uncertainties and actual trends, developments and regulations in the future, and their impact on the Fund could be materially different from those projected, anticipated or implied. The Fund has no obligation to update or revise forward-looking statements.
3
Credit Suisse Absolute Return Fund
Semiannual Investment Adviser's Report (continued)
April 30, 2007 (unaudited)
Cumulative Returns as of March 31, 20071
| Since Inception | Inception Date | ||||||||||
| Common Class | 1.00 | % | 12/29/06 | ||||||||
| Class A Without Sales Charge | 1.00 | % | 12/29/06 | ||||||||
| Class A With Maximum Sales Charge | (3.07 | )% | 12/29/06 | ||||||||
| Class C Without CDSC | 0.80 | % | 12/29/06 | ||||||||
| Class C With CDSC | (0.20 | )% | 12/29/06 | ||||||||
Cumulative Returns as of April 30, 20071
| Since Inception | Inception Date | ||||||||||
| Common Class | 1.70 | % | 12/29/06 | ||||||||
| Class A Without Sales Charge | 1.60 | % | 12/29/06 | ||||||||
| Class A With Maximum Sales Charge | (2.50 | )% | 12/29/06 | ||||||||
| Class C Without CDSC | 1.40 | % | 12/29/06 | ||||||||
| Class C With CDSC | 0.40 | % | 12/29/06 | ||||||||
Returns represent past performance and include change in share price and reinvestment of dividends and capital gains. Past performance cannot guarantee future results. The current performance of the Fund may be lower or higher than the figures shown. Returns and share price will fluctuate, and redemption value may be more or less than original cost. The performance results do not reflect the deduction of taxes that a shareholder would pay on fund distributions or the redemption of fund shares. Performance information current to the most recent month-end is available at www.credit-suisse.com/us.
1 Fee waivers and/or expense reimbursements may reduce expenses for the Fund, without which performance would be lower. Waivers and/or reimbursements may be discontinued at any time.
2 Total return for the Fund's Class A shares for the reporting period, based on offering price (including maximum sales charge of 4.00%), was down 2.50%. Total return for the Fund's Class C shares for the reporting period, based on redemption value (including maximum contingent deferred sales charge of 1.00%) was 0.40%.
3 Over a three to five-year economic cycle, the Fund aims to achieve an aggregate positive absolute return of 3-month LIBOR + 350 basis points, gross of fees. The Fund is not designed to achieve consistent annual returns, and the return in any year may be lower than the three to five-year aggregate return the Fund seeks.
4
Credit Suisse Absolute Return Fund
Semiannual Investment Adviser's Report (continued)
April 30, 2007 (unaudited)
Information About Your Fund's Expenses
As an investor of the Fund, you incur two types of costs: ongoing expenses and transaction costs. Ongoing expenses include management fees, distribution and service (12b-1) fees and other Fund expenses. Examples of transaction costs include sales charges (loads), redemption fees and account maintenance fees, which are not shown in this section and which would result in higher total expenses. The following table is intended to help you understand your ongoing expenses of investing in the Fund and to help you compare these expenses with the ongoing expenses of investing in other mutual funds. The table is based on an investment of $1,000 made at the beginning of the period ended April 30, 2007.
The table illustrates your Fund's expenses in two ways:
• Actual Fund Return. This helps you estimate the actual dollar amount of ongoing expenses paid on a $1,000 investment in the Fund using the Fund's actual return during the period. To estimate the expenses you paid over the period, simply divide your account value by $1,000 (for example, an $8,600 account value divided by $1,000 = 8.6), then multiply the result by the number in the "Expenses Paid per $1,000" line under the share class you hold.
• Hypothetical 5% Fund Return. This helps you to compare your Fund's ongoing expenses with those of other mutual funds using the Fund's actual expense ratio and a hypothetical rate of return of 5% per year before expenses. Examples using a 5% hypothetical fund return may be found in the shareholder reports of other mutual funds. The hypothetical account values and expenses may not be used to estimate the actual ending account balance or expenses you paid for the period.
Please note that the expenses shown in these tables are meant to highlight your ongoing expenses only and do not reflect any transaction costs, such as sales charges (loads) or redemption fees. If these transaction costs had been included, your costs would have been higher. The "Expenses Paid per $1,000" line of the tables is useful in comparing ongoing expenses only and will not help you determine the relative total expenses of owning different funds.
5
Credit Suisse Absolute Return Fund
Semiannual Investment Adviser's Report (continued)
April 30, 2007 (unaudited)
Expenses and Value of a $1,000 Investment
for the period ended April 30, 2007
| Actual Fund Return | Common Class | Class A | Class C | ||||||||||||
| Beginning Account Value 12/29/06 | $ | 1,000.00 | $ | 1,000.00 | $ | 1,000.00 | |||||||||
| Ending Account Value 4/30/07 | $ | 1,017.00 | $ | 1,016.00 | $ | 1,014.00 | |||||||||
| Expenses Paid per $1,000* | $ | 3.40 | $ | 4.25 | $ | 6.79 | |||||||||
| Hypothetical 5% Fund Return | |||||||||||||||
| Beginning Account Value 12/29/06 | $ | 1,000.00 | $ | 1,000.00 | $ | 1,000.00 | |||||||||
| Ending Account Value 4/30/07 | $ | 1,013.48 | $ | 1,012.64 | $ | 1,010.11 | |||||||||
| Expenses Paid per $1,000* | $ | 3.39 | $ | 4.24 | $ | 6.77 | |||||||||
| Common Class | Class A | Class C | |||||||||||||
| Annualized Expense Ratios* | 1.00 | % | 1.25 | % | 2.00 | % | |||||||||
* Expenses are equal to the Fund's annualized expense ratio for each share class, multiplied by the average account value over the period, multiplied by the number of days in the most recent fiscal half year period, then divided by 365.
The "Expenses Paid per $1,000" and the "Annualized Expense Ratios" in the tables are based on actual expenses paid by the Fund during the period, net of fee waivers and/or expense reimbursements. If those fee waivers and/or expense reimbursements had not been in effect, the Fund's actual expenses would have been higher.
For more information, please refer to the Fund's prospectus.
6
Credit Suisse Absolute Return Fund
Semiannual Investment Adviser's Report (continued)
April 30, 2007 (unaudited)
| Sector Breakdown* | |||||||
| Commingled Funds | 47.6 | % | |||||
| United States Agency Obligations | 39.1 | % | |||||
| Commercial Paper | 9.7 | % | |||||
| Short-Term Investment | 3.6 | % | |||||
| Total | 100.0 | % | |||||
* Expressed as a percentage of total investments and may vary over time.
7
Credit Suisse Absolute Return Fund
Schedule of Investments
April 30, 2007 (unaudited)
| Number of Shares | Value | ||||||||||
| COMMON STOCKS (47.9%) | |||||||||||
| Commingled Funds (47.9%) | |||||||||||
| iPATH Dow Jones-AIG Commodity Index Total Return ETN | 4,820 | $ | 247,748 | �� | |||||||
| iShares Lehman 7-10 Year Treasury Bond Fund | 21,400 | 1,781,978 | |||||||||
| iShares MSCI Emerging Markets Index | 3,091 | 373,517 | |||||||||
| iShares MSCI Japan Index Fund | 117,240 | 1,674,187 | |||||||||
| iShares MSCI Switzerland Index Fund | 29,100 | 790,938 | |||||||||
| TOTAL COMMON STOCKS (Cost $4,758,486) | 4,868,368 | ||||||||||
| Par (000) | Ratings† (S&P/Moody's) | Maturity | Rate% | ||||||||||||||||||||
| COMMERCIAL PAPER (9.8%) | |||||||||||||||||||||||
| ASSET BACKED | (9.8 | %) | |||||||||||||||||||||
| $ | 500 | General Electric Capital Corp., Series MTN, Notes | (AAA, Aaa) | 06/06/07 | 5.260 | 497,395 | |||||||||||||||||
| 500 | Park Sienna LLC | (A-1+, P-1) | 05/18/07 | 5.313 | 498,751 | ||||||||||||||||||
| TOTAL COMMERCIAL PAPER (Cost $996,146) | 996,146 | ||||||
| UNITED STATES AGENCY OBLIGATIONS (39.3%) | |||||||
| 500 | Fannie Mae Discount Notes | (AAA, Aaa) | 05/02/07 | 5.200 | 499,928 | ||||||||||||||||||
| 500 | Fannie Mae Discount Notes | (AAA, Aaa) | 05/30/07 | 5.210 | 497,926 | ||||||||||||||||||
| 500 | Fannie Mae Discount Notes | (AAA, Aaa) | 02/16/12 | 5.000 | 503,922 | ||||||||||||||||||
| 500 | Federal Home Loan Discount Notes | (AAA, Aaa) | 05/25/07 | 5.210 | 498,283 | ||||||||||||||||||
| 500 | Freddie Mac Discount Notes | (AAA, Aaa) | 05/25/07 | 5.220 | 498,282 | ||||||||||||||||||
| 500 | Freddie Mac Discount Notes | (AAA, Aaa) | 06/11/07 | 5.220 | 497,070 | ||||||||||||||||||
| 500 | Freddie Mac Discount Notes | (AAA, Aaa) | 03/05/12 | 4.750 | 498,610 | ||||||||||||||||||
| 500 | Freddie Mac Discount Notes | (AAA, Aaa) | 02/16/17 | 5.000 | 500,843 | ||||||||||||||||||
| TOTAL UNITED STATES AGENCY OBLIGATIONS (Cost $3,987,153) | 3,994,864 | ||||||||||||||||||||||
| SHORT-TERM INVESTMENT (3.6%) | |||||||||||||||||||||||
| 367 | State Street Bank and Trust Co. Euro Time Deposit (Cost $367,000) | 05/01/07 | 4.100 | 367,000 | |||||||||||||||||||
| TOTAL INVESTMENTS AT VALUE (100.6%) (Cost $10,108,785) | 10,226,378 | ||||||||||||||||||||||
| LIABILITIES IN EXCESS OF OTHER ASSETS (-0.6%) | (57,711 | ) | |||||||||||||||||||||
| NET ASSETS (100.0%) | $ | 10,168,667 | |||||||||||||||||||||
INVESTMENT ABBREVIATIONS
ETN = Exchange Traded Note
MTN = Medium Term Note
† Credit ratings given by the Standard & Poor's Division of The McGraw-Hill Companies, Inc. ("S&P") and Moody's Investors Service, Inc. ("Moody's") are unaudited.
See Accompanying Notes to Financial Statements.
8
Credit Suisse Absolute Return Fund
Statement of Assets and Liabilities
April 30, 2007 (unaudited)
| Assets | |||||||
| Investments at value (Cost $10,108,785) (Note 2) | $ | 10,226,378 | |||||
| Cash | 872 | ||||||
| Interest receivable | 14,420 | ||||||
| Receivable from investment adviser (Note 3) | 20,927 | ||||||
| Organizational costs (Note 3) | 107,855 | ||||||
| Prepaid expenses | 3,046 | ||||||
| Total Assets | 10,373,498 | ||||||
| Liabilities | |||||||
| Administrative services fee payable (Note 3) | 1,391 | ||||||
| Distribution fee payable (Note 3) | 52 | ||||||
| Trustees' fee payable | 2,655 | ||||||
| Organizational fee payable (Note 3) | 159,381 | ||||||
| Other accrued expenses payable | 41,352 | ||||||
| Total Liabilities | 204,831 | ||||||
| Net Assets | |||||||
| Capital stock, $0.001 par value (Note 6) | 1,000 | ||||||
| Paid-in capital (Note 6) | 9,999,000 | ||||||
| Undistributed net investment income | 61,308 | ||||||
| Accumulated net realized loss on investments | (10,234 | ) | |||||
| Net unrealized appreciation from investments | 117,593 | ||||||
| Net Assets | $ | 10,168,667 | |||||
| Common Shares | |||||||
| Net assets | $ | 10,067,184 | |||||
| Shares outstanding | 990,000 | ||||||
| Net asset value, offering price, and redemption price per share | $ | 10.17 | |||||
| A Shares | |||||||
| Net assets | $ | 50,803 | |||||
| Shares outstanding | 5,000 | ||||||
| Net asset value and redemption price per share | $ | 10.16 | |||||
| Maximum offering price per share ((net asset value /(1-4.00%)) | $ | 10.58 | |||||
| C Shares | |||||||
| Net assets | $ | 50,680 | |||||
| Shares outstanding | 5,000 | ||||||
| Net asset value and offering price per share | $ | 10.14 | |||||
See Accompanying Notes to Financial Statements.
9
Credit Suisse Absolute Return Fund
Statement of Operations
For the Period December 29, 20061 through April 30, 2007 (unaudited)
| Investment Income (Note 2) | |||||||
| Interest | $ | 74,671 | |||||
| Dividends | 19,426 | ||||||
| Total investment income | 94,097 | ||||||
| Expenses | |||||||
| Investment advisory fees (Note 3) | 24,439 | ||||||
| Administrative services fees (Note 3) | 4,127 | ||||||
| Distribution fees (Note 3) | |||||||
| Class A | 41 | ||||||
| Class C | 163 | ||||||
| Offering costs (Note 3) | 51,526 | ||||||
| Custodian fees | 14,177 | ||||||
| Transfer agent fees | 11,335 | ||||||
| Printing fees (Note 3) | 11,311 | ||||||
| Audit fees | 9,777 | ||||||
| Legal fees | 9,426 | ||||||
| Trustees' fees | 4,520 | ||||||
| Registration fees | 792 | ||||||
| Commitment fee (Note 4) | 377 | ||||||
| Miscellaneous expense | 1,885 | ||||||
| Total expenses | 143,896 | ||||||
| Less: fees waived and expenses reimbursed (Note 3) | (111,107 | ) | |||||
| Net expenses | 32,789 | ||||||
| Net investment income | 61,308 | ||||||
| Net Realized and Unrealized Gain (Loss) from Investments | |||||||
| Net realized loss from investments | (10,234 | ) | |||||
| Net change in unrealized appreciation (depreciation) from investments | 117,593 | ||||||
| Net realized and unrealized gain from investments | 107,359 | ||||||
| Net increase in net assets resulting from operations | $ | 168,667 | |||||
1 Commencement of operations
See Accompanying Notes to Financial Statements.
10
Credit Suisse Absolute Return Fund
Statement of Changes in Net Assets
| For the Period Ended April 30, 20071 (unaudited) | |||||||
| From Operations | |||||||
| Net investment income | $ | 61,308 | |||||
| Net realized loss from investments | (10,234 | ) | |||||
| Net change in unrealized appreciation (depreciation) from investments | 117,593 | ||||||
| Net increase in net assets resulting from operations | 168,667 | ||||||
| Net Assets | |||||||
| Beginning of period | 10,000,0002 | ||||||
| End of period | $ | 10,168,667 | |||||
| Undistributed net investment income | $ | 61,308 | |||||
1 For the period December 29, 2006 (commencement of operations) through April 30, 2007.
2 The Fund was seeded on December 29, 2006.
See Accompanying Notes to Financial Statements.
11
Credit Suisse Absolute Return Fund
Financial Highlights
(For Common Class, Class A and Class C Shares of the Fund
Outstanding Throughout The Period)
| For the Period Ended April 30, 20071 (unaudited) | |||||||||||||||
| Common | Class A | Class C | |||||||||||||
| Per share data | |||||||||||||||
| Net asset value, beginning of period | $ | 10.00 | $ | 10.00 | $ | 10.00 | |||||||||
| INVESTMENT OPERATIONS | |||||||||||||||
| Net investment income2 | 0.06 | 0.05 | 0.03 | ||||||||||||
| Net gain on investments (both realized and unrealized) | 0.11 | 0.11 | 0.11 | ||||||||||||
| Total from investment operations | 0.17 | 0.16 | 0.14 | ||||||||||||
| Net asset value, end of period | $ | 10.17 | $ | 10.16 | $ | 10.14 | |||||||||
| Total return3 | 1.70 | % | 1.60 | % | 1.40 | % | |||||||||
| RATIOS AND SUPPLEMENTAL DATA | |||||||||||||||
| Net assets, end of period (000s omitted) | $ | 10,067 | $ | 51 | $ | 51 | |||||||||
| Ratio of expenses to average net assets | 1.00 | %4 | 1.25 | %4 | 2.00 | %4 | |||||||||
| Ratio of net investment income to average net assets | 1.89 | %4 | 1.64 | %4 | 0.89 | %4 | |||||||||
| Decrease reflected in above operating expense ratios due to waivers/reimbursements | 3.41 | %4 | 3.41 | %4 | 3.41 | %4 | |||||||||
| Portfolio turnover rate | 59 | % | 59 | % | 59 | % | |||||||||
1 For the period December 29, 2006 (commencement of operations) through April 30, 2007.
2 Per share information is calculated using the average shares outstanding method.
3 Total returns are historical and assume changes in share price, reinvestment of all dividends and distributions and no sales charge. Had certain expenses not been reduced during the period shown, total returns would have been lower. Total returns for periods less than one year are not annualized.
4 Annualized.
See Accompanying Notes to Financial Statements.
12
Credit Suisse Absolute Return Fund
Notes to Financial Statements
April 30, 2007 (unaudited)
Note 1. Organization
The Credit Suisse Capital Funds (the "Trust") is an open-end management investment company registered under the Investment Company Act of 1940, as amended (the "1940 Act") and currently offers three managed investment funds of which one, the Absolute Return Fund (the "Fund"), is included in this report. The Trust was organized under the laws of the Commonwealth of Massachusetts as a business trust on November 26, 1985. The Fund is a diversified, open-end management investment company that seeks to achieve a positive absolute return over a three to five year economic cycle.
The Fund is authorized to offer three classes of shares: Common Class shares, Class A shares and Class C shares. Each class of shares in the Fund represents an equal pro rata interest in the Fund, except that they bear different expenses which reflect the differences in the range of services provided to them. Class A shares are sold subject to a front-end sales charge of up to 4.00%. Class C shares are sold subject to a contingent deferred sales charge of 1.00% if redeemed within the first year of purchase.
Note 2. Significant Accounting Policies
A) SECURITY VALUATION — The net asset value of the Fund is determined daily as of the close of regular trading on The New York Stock Exchange, Inc. (the "Exchange") on each day the Exchange is open for business. Equity investments are valued at market value, which is generally, determined using the closing price on the exchange or market on which the security is primarily traded at the time of valuation (the "Valuation Time"). If no sales are reported, equity investments are generally valued at the most recent bid quotation as of the Valuation Time or at the lowest asked quotation in the case of a short sale of securities. Debt securities with a remaining maturity greater than 60 days are valued in accordance with the price supplied by a pricing service, which may use a matrix, formula or other objective method that takes into consideration market indices, yield curves and other specific adjustments. Debt obligations that will mature in 60 days or less are valued on the basis of amortized cost, which approximates market value, unless it is determined that using this method would not represent fair value. Investments in mutual funds are valued at the mutual fund's closing net asset value per share on the day of valuation. Securities and other assets for which market quotations are not readily available, or whose values have been materially affected by events occurring before the Fund's Valuation Time but after the close of the securities' primary markets, are valued at fair value as determined in good faith by, or under the direction of, the Board of Trustees under procedures established by the Board of Trustees. The Fund may utilize a service provided by an
13
Credit Suisse Absolute Return Fund
Notes to Financial Statements (continued)
April 30, 2007 (unaudited)
Note 2. Significant Accounting Policies
independent third party which has been approved by the Board of Trustees to fair value certain securities. When fair-value pricing is employed, the prices of securities used by a fund to calculate its net asset value may differ from quoted or published prices for the same securities.
B) SECURITY TRANSACTIONS AND INVESTMENT INCOME — Security transactions are accounted for on a trade date basis. Interest income is recorded on the accrual basis. Dividends are recorded on the ex-dividend date. Certain expenses are class specific expenses and vary by class. Income, expenses (excluding class-specific expenses) and realized/unrealized gains/losses are allocated proportionately to each class of shares based upon the relative net asset value of outstanding shares of that class. The cost of investments sold is determined by use of the specific identification method for both financial reporting and income tax purposes.
C) DIVIDENDS AND DISTRIBUTIONS TO SHAREHOLDERS — Dividends from net investment income and distributions of net realized capital gains, if any, are declared and paid at least annually. However, to the extent that a net realized capital gain can be reduced by a capital loss carryforward, such gain will not be distributed. Income and capital gain distributions are determined in accordance with federal income tax regulations, which may differ from accounting principles generally accepted in the United States of America ("GAAP").
D) FEDERAL INCOME TAXES — No provision is made for federal taxes as it is the Fund's intention to continue to qualify for and elect the tax treatment applicable to regulated investment companies under the Internal Revenue Code of 1986, as amended, and to make the requisite distributions to its shareholders, which will be sufficient to relieve it from federal income and excise taxes.
E) USE OF ESTIMATES — The preparation of financial statements in conformity with GAAP requires management to make estimates and assumptions that affect the reported amounts of assets and liabilities and disclosure of contingent assets and liabilities at the date of the financial statements and the reported amounts of income and expenses during the reporting period. Actual results could differ from these estimates.
F) SHORT-TERM INVESTMENTS — The Fund, together with other funds/portfolios advised by Credit Suisse Asset Management, LLC ("Credit Suisse"), an indirect, wholly-owned subsidiary of Credit Suisse Group, pools available cash into either a short-term variable rate time deposit issued by State Street Bank and Trust Company ("SSB"), the Fund's custodian, or a money
14
Credit Suisse Absolute Return Fund
Notes to Financial Statements (continued)
April 30, 2007 (unaudited)
Note 2. Significant Accounting Policies
market fund advised by Credit Suisse. The short-term time deposit issued by SSB is a variable rate account classified as a short-term investment.
G) SECURITIES LENDING — Loans of securities are required at all times to be secured by collateral at least equal to 102% of the market value of domestic securities on loan (including any accrued interest thereon) and 105% of the market value of foreign securities on loan (including any accrued interest thereon). Cash collateral received by the Fund in connection with securities lending activity may be pooled together with cash collateral for other funds/portfolios advised by Credit Suisse and may be invested in a variety of investments, including certain Credit Suisse-advised funds, funds advised by SSB, the Fund's security lending agent, or money market instruments. However, in the event of default or bankruptcy by the other party to the agreement, realization and/or retention of the collateral may be subject to legal proceedings. The Fund had no securities out on loan at April 30, 2007.
SSB has been engaged by the Fund to act as the Fund's securities lending agent. The Fund's securities lending arrangement provides that the Fund and SSB will share the net income earned from securities lending activities. The Fund may also be entitled to certain minimum amounts of income from its securities lending activities. Securities lending income is accrued as earned.
H) OTHER — The Fund may invest up to 15% of its net assets in non-publicly traded securities. Non-publicly traded securities may be less liquid than publicly traded securities. Although these securities may be resold in privately negotiated transactions, the prices realized from such sales could differ from the price originally paid by the Fund or the current carrying values, and the difference could be material.
Note 3. Transactions with Affiliates and Related Parties
Credit Suisse serves as investment adviser for the Fund. For its investment advisory services, Credit Suisse is entitled to receive a fee from the Fund at an annual rate of 0.75% of the Fund's average daily net assets. For the period ended April 30, 2007, investment advisory fees earned, voluntarily waived and expenses reimbursed were as follows:
| Gross Advisory Fee | Waiver | Net Advisory Fee | Expense Reimbursement | ||||||||||||
| $ | 24,439 | $ | (24,439 | ) | $ | — | $ | (86,668 | ) | ||||||
Fee waivers and reimbursements are voluntary and may be discontinued by Credit Suisse at any time.
15
Credit Suisse Absolute Return Fund
Notes to Financial Statements (continued)
April 30, 2007 (unaudited)
Note 3. Transactions with Affiliates and Related Parties
Credit Suisse Asset Management Securities, Inc. ("CSAMSI"), an affiliate of Credit Suisse, and SSB serve as co-administrators to the Fund. For its co-administrative services, CSAMSI currently receives a fee calculated at an annual rate of 0.09% of the Fund's average daily net assets. For the period ended April 30, 2007, co-administrative services fees earned by CSAMSI were $2,933.
For its co-administrative services, SSB receives a fee, exclusive of out-of-pocket expenses, calculated in total for all the Credit Suisse funds/portfolios co-administered by SSB and allocated based upon relative average net assets of each fund/portfolio, subject to an annual minimum fee. For the period ended April 30, 2007, co-administrative services fees earned by SSB (including out-of-pocket expenses) were $1,194.
In addition to serving as the Fund's co-administrator, CSAMSI currently serves as distributor of the Fund's shares. Pursuant to distribution plans adopted by the Fund pursuant to Rule 12b-1 under the 1940 Act, CSAMSI receives fees for its distribution services. For Class A shares the fees are calculated at an annual rate of 0.25% of the average daily net assets. For Class C shares of the Fund, the fees are calculated at an annual rate of 1.00% of the average daily net assets. Common Class shares do not bear distribution fees.
Merrill Corporation ("Merrill"), an affiliate of Credit Suisse, has been engaged by the Fund to provide certain financial printing and fulfillment services. For the period ended April 30, 2007, Merrill was paid $436 for its services to the Fund.
The Fund will reimburse Credit Suisse for offering costs in the amount of $159,381 that have been paid by Credit Suisse. Offering costs, including initial registration costs, were deferred and will be charged to expenses during the Fund's first year of operation. For the period ended April 30, 2007, $51,526 has been expensed to the Fund.
Note 4. Line of Credit
Effective June 14, 2007, the Fund, together with other funds/portfolios advised by Credit Suisse (collectively, the "Participating Funds"), participates in a $50 million committed, unsecured line of credit facility ("Credit Facility") for temporary or emergency purposes with Deutsche Bank, A.G. as administrative agent and syndication agent and SSB as operations agent. Under the terms of the Credit Facility, the Participating Funds pay an aggregate commitment fee at a rate of 0.10% per annum on the average unused amount
16
Credit Suisse Absolute Return Fund
Notes to Financial Statements (continued)
April 30, 2007 (unaudited)
Note 4. Line of Credit
of the Credit Facility, which is allocated among the Participating Funds in such manner as is determined by the governing Boards of the Participating Funds. In addition, the Participating Funds pay interest on borrowing at the Federal Funds rate plus 0.50%.
Note 5. Purchases and Sales of Securities
For the period ended April 30, 2007, purchases and sales of investment securities (excluding short-term investments) were $8,400,858 and $2,136,509, respectively.
At April 30, 2007, the identified cost for federal income tax purposes, as well as the gross unrealized appreciation from investments for those securities having an excess of value over cost, gross unrealized depreciation from investments for those securities having an excess of cost over value and the net unrealized appreciation from investments were as follows; $10,108,785, $126,432, $(8,839) and $117,593, respectively.
Note 6. Capital Share Transactions
The Fund is authorized to issue an unlimited number of full and fractional shares of capital stock, $.001 par value per share, of which an unlimited number are classified as Common Class shares, Class A shares, and Class C shares. Transactions in capital shares for each class of the fund were as follows:
| Common Class | |||||||||||
| For the Period Ended April 30, 2007 (unaudited) 1,2 | |||||||||||
| Shares | Value | ||||||||||
| Shares | 990,000 | $ | 9,900,000 | ||||||||
| Net increase | 990,000 | $ | 9,900,000 | ||||||||
| Class A | |||||||||||
| For the Period Ended April 30, 2007 (unaudited) 1,3 | |||||||||||
| Shares | Value | ||||||||||
| Shares | 5,000 | $ | 50,000 | ||||||||
| Net increase | 5,000 | $ | 50,000 | ||||||||
17
Credit Suisse Absolute Return Fund
Notes to Financial Statements (continued)
April 30, 2007 (unaudited)
Note 6. Capital Share Transactions
| Class C | |||||||||||
| For the Period Ended April 30, 2007 (unaudited) 1,3 | |||||||||||
| Shares | Value | ||||||||||
| Shares | 5,000 | $ | 50,000 | ||||||||
| Net increase | 5,000 | $ | 50,000 | ||||||||
1 For the period December 29, 2006 (commencement of operations) through April 30, 2007.
2 The Class was seeded on December 29, 2006 with initial capital of $9,900,000 and 990,000 shares.
3 The Classes were seeded on December 29, 2006 with initial capital of $50,000 and 5,000 shares.
On April 30, 2007 the number of shareholders that held 5% or more of the outstanding shares of each class of the Fund was as follows:
| Fund | Number of Shareholders | Approximate Percentage of Outstanding Shares | |||||||||
| Common Class | 1 | 100 | % | ||||||||
| Class A | 1 | 100 | % | ||||||||
| Class C | 1 | 100 | % | ||||||||
Some of the shareholders are omnibus accounts, which hold shares on behalf of individual shareholders.
Note 7. Contingencies
In the normal course of business, the Fund may provide general indemnifications pursuant to certain contracts and organizational documents. The Fund's maximum exposure under these arrangements is dependent on future claims that may be made against the Fund and, therefore, cannot be estimated; however, based on experience, the risk of loss from such claims is considered remote.
Note 8. Recent Accounting Pronouncements
During June 2006, the Financial Accounting Standards Board ("FASB") issued FASB Interpretation 48 ("FIN 48" of the "Interpretation"), Accounting for Uncertainty in Income Taxes – an interpretation of FASB statement 109. FIN 48 supplements FASB Statement 109, Accounting for Income Taxes, by defining the confidence level that a tax position must meet in order to be recognized in the financial statements. FIN 48 prescribes a comprehensive model for how a fund should recognize, measure, present, and disclose in its financial statements uncertain tax positions that the fund has taken or expects to take on a tax return. FIN 48 requires that the tax effects of a position be recognized only if it
18
Credit Suisse Absolute Return Fund
Notes to Financial Statements (continued)
April 30, 2007 (unaudited)
Note 8. Recent Accounting Pronouncements
is "more likely than not" to be sustained based solely on it technical merits. Management must be able to conclude that the tax law, regulations, case law, and other objective information regarding the technical merits sufficiently support the position's sustainability with a likelihood of more than 50 percent. FIN 48 is effective for fiscal periods beginning after December 15, 2006. At adoption, the financial statements must be adjusted to reflect only those tax positions that are more likely then not to be sustained as of the adoption date.
On September 20, 2006, the FASB released Statement of Financial Accounting Standards No. 157 "Fair Value Measurement" ("FAS 157"). FAS 157 establishes an authoritative definition of fair value, sets out a framework for measuring fair value, and requires additional disclosures about fair-value measurements. The application of FAS 157 is required for fiscal years, beginning after November 15, 2007 and interim periods within those fiscal years.
At this time, management is evaluating the implications of FIN 48 and FAS 157 and their impact on the financial statements has not yet been determined.
19
Credit Suisse Absolute Return Fund
Board Approval of Advisory Agreement (unaudited)
In considering the Investment Advisory Agreement, the Board of Trustees, including the Independent Trustees, at a meeting on February 16, 2006, considered the following factors with respect to the Absolute Return Fund:
Investment Advisory Fee Rate
The Board reviewed and considered the proposed contractual advisory fee rate of 0.75% per annum of the Fund's average daily net assets ("Proposed Advisory Fee") paid by the Fund to Credit Suisse in light of the extent and quality of the advisory services that are expected to be provided by Credit Suisse to the Absolute Return Fund.
Additionally, the Board received and considered information comparing the Fund's Proposed Advisory Fee with the investment advisory fees charged by other funds with a similar objective and strategy. The Proposed Advisory Fee was within the median range of advisory fees (middle third) compared to other similar funds.
Nature, Extent and Quality of the Services under the Investment Advisory
Agreement
The Board received and considered information regarding the nature, extent and quality of services that will be provided to the Fund by Credit Suisse under the proposed Investment Advisory Agreement. The Board reviewed background information about Credit Suisse. The Board considered the background and experience of Credit Suisse's senior management and the expertise of, and the amount of attention that will be given to the Fund by, senior personnel of Credit Suisse. In addition, the Board reviewed the qualifications, backgrounds and responsibilities of the portfolio management team that will be primarily responsible for the day-to-day portfolio management of the Fund and the extent of the resources to be devoted to research and analysis of actual and potential investments.
Credit Suisse Profitability
The Board received and reviewed a profitability analysis for Credit Suisse based on the fees payable under the Investment Advisory Agreement for the Fund, based on differing amounts of average net assets.
20
Credit Suisse Absolute Return Fund
Board Approval of Advisory Agreement (unaudited) (continued)
Economies of Scale
The Board considered whether economies of scale in the provision of services to the Fund will be passed along to the shareholders. Accordingly, the Board considered whether a breakpoint should be applicable to the Fund's advisory fee.
Other Benefits to Credit Suisse
The Board considered other benefits that are expected to be received by Credit Suisse and its affiliates as a result of their relationship with the Fund. Such benefits include, among others, research arrangements with brokers who execute transactions on behalf of the Fund, administrative and brokerage relationships with affiliates of Credit Suisse and benefits potentially derived from an increase in Credit Suisse's businesses as a result of its relationship with the Fund (such as the ability to market to shareholders other financial products offered by Credit Suisse and its affiliates).
The Board was also aware of Credit Suisse's method for allocating portfolio investment opportunities among its advisory clients.
Conclusions
In selecting Credit Suisse, and approving the Advisory Agreement and the investment advisory fee under such Agreement, the Board concluded that:
• The Proposed Advisory Fee rate was considered reasonable as compared to other funds with a similar objective and strategy.
• The Board was satisfied with the nature and extent of the investment advisory services that will be provided to the Fund by Credit Suisse and that, based on dialogue with management and counsel, the services to be provided by Credit Suisse under the Investment Advisory Agreement are typical of, and consistent with, those provided to similar mutual funds by other investment advisers.
• In light of the potential costs of providing investment management and other services to the Fund and Credit Suisse's ongoing commitment to the Fund, the profits and other ancillary benefits that Credit Suisse and its affiliates may receive is considered reasonable.
• Credit Suisse's estimated profitability based on fees payable under the Investment Advisory Agreement is reasonable in light of the nature, extent and quality of the services expected to be provided to the Fund thereunder.
21
Credit Suisse Absolute Return Fund
Board Approval of Advisory Agreement (unaudited) (continued)
• The Fund's fee structure is considered reasonable.
No single factor reviewed by the Board was identified by the Board as the principal factor in determining whether to approve the Advisory Agreement. The Independent Trustees were advised by separate independent legal counsel throughout the process.
22
Credit Suisse Absolute Return Fund
Privacy Policy Notice (unaudited)
Important Privacy Choices for Consumers
We are committed to maintaining the privacy of every current and prospective customer. We recognize that you entrust important personal information to us, and we wish to assure you that we take seriously our responsibilities in protecting and safeguarding this information.
In connection with making available investment products and services to current and potential customers, we may obtain nonpublic personal information about you. This information may include your name, address, e-mail address, social security number, account number, assets, income, financial situation, transaction history and other personal information.
We may collect nonpublic information about you from the following sources:
• Information we receive on applications, forms, questionnaires, web sites, agreements or in the course of establishing or maintaining a customer relationship; and
• Information about your transactions with us, our affiliates, or others.
We do not disclose any nonpublic personal information about our customers or former customers to anyone, except with your consent or as otherwise permitted by law.
In cases where we believe that additional products and services may be of interest to you, we may share the information described above with our affiliates.
We may also disclose this information to firms that perform services on our behalf. These agents and service providers are required to treat the information confidentially and use it only for the purpose for which it is provided.
We restrict access to nonpublic personal information about you to those employees, agents or other parties who need to know that information to provide products or services to you or in connection with your investments with or through us. We maintain physical, electronic and procedural safeguards that comply with federal standards to guard your nonpublic personal information.
Note: This Notice is provided to clients and prospective clients of Credit Suisse Asset Management, LLC ("Credit Suisse"), and Credit Suisse Asset Management Securities, Inc., and shareholders and prospective shareholders in Credit Suisse-sponsored and advised investment companies, including Credit Suisse Funds, and other consumers and customers, as applicable. This Notice is not intended to be incorporated in any offering materials but is merely a statement of our current Privacy Policy, and may be amended from time to time upon notice to you. This Notice is dated as of June 5, 2007.
23
Credit Suisse Absolute Return Fund
Proxy Voting and Portfolio Holdings Information (unaudited)
Information regarding how the Fund voted proxies related to its portfolio securities during the 12 month period ended June 30 of each year, as well as the policies and procedures that the Fund uses to determine how to vote proxies relating to its portfolio securities are available:
• By calling 1-800-927-2874
• On the Fund's website, www.credit-suisse.com/us
• On the website of the Securities and Exchange Commission, www.sec.gov.
The Fund files a complete schedule of its portfolio holdings for the first and third quarters of its fiscal year with the SEC on Form N-Q. The Fund's Forms N-Q are available on the SEC's website at www.sec.gov and may be reviewed and copied at the SEC's Public Reference Room in Washington, DC. Information on the operation of the SEC's Public Reference Room may be obtained by calling 1-202-551-8090.
24

P.O. BOX 55030, BOSTON, MA 02205-5030
800-927-2874 n www.credit-suisse.com/us
CREDIT SUISSE ASSET MANAGEMENT SECURITIES, INC., DISTRIBUTOR. AR-SAR-0407
Item 2. Code of Ethics.
This item is inapplicable to a semi-annual report on Form N-CSR.
Item 3. Audit Committee Financial Expert.
This item is inapplicable to a semi-annual report on Form N-CSR.
Item 4. Principal Accountant Fees and Services.
This item is inapplicable to a semi-annual report on Form N-CSR.
Item 5. Audit Committee of Listed Registrants.
This item is not applicable to the registrant.
Item 6. Schedule of Investments.
Included as part of the report to shareholders filed under Item 1 of this Form.
Item 7. Disclosure of Proxy Voting Policies and Procedures for Closed-End Management Investment Companies.
This item is not applicable to the registrant.
Item 8. Portfolio Managers of Closed-End Management Investment Companies.
This item is not applicable to the registrant.
Item 9. Purchases of Equity Securities by Closed-End Management Investment Company and Affiliated Purchasers.
This item is not applicable to the registrant.
Item 10. Submission of Matters to a Vote of Security Holders.
The Nominating Committee recommends Board member candidates. Shareholders of the registrant may also submit nominees that will be considered by the Committee. Recommendations should be mailed to the registrant’s Secretary, c/o Credit Suisse Asset Management, LLC, Eleven Madison Avenue, New York, NY 10010. Any submission should include at a minimum the following information: the name, age, business address, residence address and principal occupation or employment of such individual; the class, series and number of shares of the registrant that are beneficially owned by such individual; the date such shares were acquired and the investment intent of such acquisition; whether such shareholder believes such individual is, or is not, an “interested person” of the registrant (as defined in the Investment Company Act of 1940) and information regarding such individual that is sufficient, in the Committee’s discretion, to make such determination; and all other information relating to such individual that is required to be disclosed in solicitation of proxies for election of directors in an election contest (even if an election contest is not involved) or is otherwise required pursuant to the rules for proxy materials under the Securities Exchange Act of 1934.
Item 11. Controls and Procedures.
(a) As of a date within 90 days from the filing date of this report, the principal executive officer and principal financial officer concluded that the registrant’s disclosure controls and procedures (as defined in Rule 30a-3(c) under the Investment Company Act of 1940 (the “Act”)) were effective
based on their evaluation of the disclosure controls and procedures required by Rule 30a-3(b) under the Act and Rules 13a-15(b) or 15d-15(b) under the Securities Exchange Act of 1934.
(b) There were no changes in registrant’s internal control over financial reporting (as defined in Rule 30a-3(d) under the Act) that occurred during the registrant’s last fiscal half-year that have materially affected, or are reasonably likely to materially affect, the registrant’s internal control over financial reporting.
Item 12. Exhibits.
(a)(1) Not applicable.
(a)(2) The certifications of the registrant as required by Rule 30a-2(a) under the Act are exhibits to this report.
(a)(3) Not applicable.
(b) The certifications of the registrant as required by Rule 30a-2(b) under the Act are an exhibit to this report.
SIGNATURES
Pursuant to the requirements of the Securities Exchange Act of 1934 and the Investment Company Act of 1940, the registrant has duly caused this report to be signed on its behalf by the undersigned, thereunto duly authorized.
CREDIT SUISSE CAPITAL FUNDS | ||
|
| |
| /s/ Keith M. Schappert |
|
| Name: Keith M. Schappert | |
| Title: Chief Executive Officer | |
| Date: July 5, 2007 | |
Pursuant to the requirements of the Securities Exchange Act of 1934 and the Investment Company Act of 1940, this report has been signed below by the following persons on behalf of the registrant and in the capacities and on the dates indicated.
/s/ Keith M. Schappert |
| |
| Name: Keith M. Schappert | |
| Title: Chief Executive Officer | |
| Date: July 5, 2007 | |
/s/ Michael A. Pignataro |
| |
| Name: Michael A. Pignataro | |
| Title: Chief Financial Officer | |
| Date: July 5, 2007 | |