UNITED STATES
SECURITIES AND EXCHANGE COMMISSION
Washington, D.C. 20549
FORM N-CSR
CERTIFIED SHAREHOLDER REPORT OF REGISTERED
MANAGEMENT INVESTMENT COMPANIES
Investment Company Act file number | 811-04604 | |||||||
| ||||||||
CREDIT SUISSE CAPITAL FUNDS | ||||||||
(Exact name of registrant as specified in charter) | ||||||||
| ||||||||
Eleven Madison Avenue, New York, New York |
| 10010 | ||||||
(Address of principal executive offices) |
| (Zip code) | ||||||
| ||||||||
J. Kevin Gao, Esq. Credit Suisse Capital Funds Eleven Madison Avenue New York, New York 10010 | ||||||||
(Name and address of agent for service) | ||||||||
| ||||||||
Registrant’s telephone number, including area code: | (212) 325-2000 |
| ||||||
| ||||||||
Date of fiscal year end: | October 31 |
| ||||||
| ||||||||
Date of reporting period: | November 1, 2009 to April 30, 2010 |
| ||||||
Item 1. Reports to Stockholders.

CREDIT SUISSE FUNDS
Semiannual Report
April 30, 2010
(unaudited)
n CREDIT SUISSE
LARGE CAP VALUE FUND
n CREDIT SUISSE
SMALL CAP CORE FUND
The Funds' investment objectives, risks, charges and expenses (which should be considered carefully before investing), and more complete information about the Funds, are provided in the Prospectus, which should be read carefully before investing. You may obtain additional copies by calling 877-870-2874 or by writing to Credit Suisse Funds, P.O. Box 55030, Boston, MA 02205-5030.
Credit Suisse Asset Management Securities, Inc., Distributor, is located at Eleven Madison Avenue, New York, NY 10010. Credit Suisse Funds are advised by Credit Suisse Asset Management, LLC.
Investors in the Credit Suisse Funds should be aware that they may be eligible to purchase Common Class and/or Advisor Class shares (where offered) directly or through certain intermediaries. Such shares are not subject to a sales charge but may be subject to an ongoing service and distribution fee of up to 0.50% of average daily net assets. Investors in the Credit Suisse Funds should also be aware that they may be eligible for a reduction or waiver of the sales charge with respect to Class A, B or C shares (where offered). For more information, please review the relevant prospectuses or consult your financial representative.
The views of the Funds' management are as of the date of the letter and the Fund holdings described in this document are as of April 30, 2010; these views and Fund holdings may have changed subsequent to these dates. Nothing in this document is a recommendation to purchase or sell securities.
Fund shares are not deposits or other obligations of Credit Suisse Asset Management, LLC ("Credit Suisse") or any affiliate, are not FDIC-insured and are not guaranteed by Credit Suisse or any affiliate. Fund investments are subject to investment risks, including loss of your investment.
Credit Suisse Large Cap Value Fund
Semiannual Investment Adviser's Report
April 30, 2010 (unaudited)
May 12, 2010
Dear Shareholder:
Performance Summary
11/01/09 – 04/30/10
| Fund and Benchmark | Performance | ||||||
| Common Class1 | 14.26 | % | |||||
| Advisor Class1 | 13.97 | % | |||||
| Class A1,2 | 14.10 | % | |||||
| Class B1,2 | 13.70 | % | |||||
| Class C1,2 | 13.63 | % | |||||
| Russell 1000 Value Index3 | 17.77 | % | |||||
Performance shown for the Fund's Class A, Class B and Class C Shares does not reflect sales charges, which are a maximum of 5.75%, 4.00% and 1.00%, respectively.2
Market Review: A positive period
For the six-month period ended April 30, 2010, the markets generally posted positive results. The S&P 500 Total Return Index gained 15.66% and the Dow Jones Industrial Average increased 14.87%. U.S. large cap value stocks also performed well, with the Russell 1000 Value Index gained 17.77%. The historically low interest rates set by the U.S. Federal Reserve in 2008 remained unchanged during the period. Consumer confidence improved during the six-month period (up to 57.7 from 47.7 in October 2009 as measured by the Consumer Confidence Index). The labor market strengthened with non-farm payrolls growing by 162,000 jobs in March and household unemployment decreasing to 9.7%.
Strategic Review and Outlook: A return to fundamentals
For the six-month period ended April 30, 2010, the Fund underperformed its benchmark. The Fund's biggest overweight positions were in the consumer discretionary and information technology sectors, both of which detracted from performance as a result of poor stock selection. Industrials and energy were the greatest underweights, with both sectors detracting from the Fund's performance due to sector weighting. The consumer staples sector was the biggest contributor to performance, while the consumer discretionary sector was the biggest drag.
The past six months provided a difficult environment for individual stock picks due to market volatility, although the change from a bear to a bull market provided a good environment for taking directional bets. We believe, however, that volatility gradually will become less important as investors begin to focus
1
Credit Suisse Large Cap Value Fund
Semiannual Investment Adviser's Report (continued)
April 30, 2010 (unaudited)
more on underlying fundamentals of companies. We also believe that a focus on balance sheet and earnings quality will be positively rewarded in 2010.
Credit Suisse Quantitative Equities Group
Mika Toikka
Timothy Schwider
The value of investments generally will fluctuate in response to market movements and the Fund's performance will largely depend on the performance of value stocks, which may be more volatile than the overall market.
In addition to historical information, this report contains forward-looking statements, which may concern, among other things, domestic and foreign market, industry and economic trends and developments and government regulation and their potential impact on the Fund's investments. These statements are subject to risks and uncertainties and actual trends, developments and regulations in the future, and their impact on the Fund could be materially different from those projected, anticipated or implied. The Fund has no obligation to update or revise forward-looking statements.
The Fund adopted new investment strategies effective December 1, 2006 so that its holdings are selected using quantitative stock selection models rather than a more traditional fundamental analysis approach. Investors should be aware that performance information for periods prior to December 1, 2006 does not reflect the current investment strategies.
Average Annual Returns as of March 31, 20101
| 1 Year | 5 Years | 10 Years | Since Inception | Inception Date | |||||||||||||||||||
| Common Class | 54.01 | % | 2.25 | % | — | 3.56 | % | 08/01/00 | |||||||||||||||
| Advisor Class | 53.18 | % | 1.77 | % | — | 5.00 | % | 06/06/03 | |||||||||||||||
| Class A Without Sales Charge | 53.59 | % | 2.01 | % | 3.05 | % | — | ||||||||||||||||
| Class A With Maximum Sales Charge | 44.80 | % | 0.81 | % | 2.45 | % | — | ||||||||||||||||
| Class B Without CDSC | 52.42 | % | 1.22 | % | 2.27 | % | — | 02/28/96 | |||||||||||||||
| Class B With CDSC | 48.42 | % | 1.22 | % | 2.27 | % | — | 02/28/96 | |||||||||||||||
| Class C Without CDSC | 52.50 | % | 1.23 | % | 2.27 | % | — | 02/28/00 | |||||||||||||||
| Class C With CDSC | 51.50 | % | 1.23 | % | 2.27 | % | — | 02/28/00 | |||||||||||||||
2
Credit Suisse Large Cap Value Fund
Semiannual Investment Adviser's Report (continued)
April 30, 2010 (unaudited)
Average Annual Returns as of April 30, 20101
| 1 Year | 5 Years | 10 Years | Since Inception | Inception Date | |||||||||||||||||||
| Common Class | 38.90 | % | 2.99 | % | — | 3.62 | % | 08/01/00 | |||||||||||||||
| Advisor Class | 38.21 | % | 2.50 | % | — | 5.06 | % | 06/06/03 | |||||||||||||||
| Class A Without Sales Charge | 38.51 | % | 2.74 | % | 3.05 | % | — | ||||||||||||||||
| Class A With Maximum Sales Charge | 30.57 | % | 1.52 | % | 2.44 | % | — | ||||||||||||||||
| Class B Without CDSC | 37.58 | % | 1.96 | % | 2.28 | % | — | 02/28/96 | |||||||||||||||
| Class B With CDSC | 33.58 | % | 1.96 | % | 2.28 | % | — | 02/28/96 | |||||||||||||||
| Class C Without CDSC | 37.43 | % | 1.96 | % | 2.27 | % | — | 02/28/00 | |||||||||||||||
| Class C With CDSC | 36.43 | % | 1.96 | % | 2.27 | % | — | 02/28/00 | |||||||||||||||
Returns represent past performance and include change in share price and reinvestment of dividends and capital gains. Past performance cannot guarantee future results. The current performance of the Fund may be lower or higher than the figures shown. Returns and share price will fluctuate, and redemption value may be more or less than original cost. The performance results do not reflect the deduction of taxes that a shareholder would pay on fund distributions or the redemption of fund shares. Performance information current to the most recent month-end is available at www.credit-suisse.com/us.
The annualized gross expense ratios are 1.09% for Common Class shares, 1.59% for Advisor Class shares, 1.34% for Class A shares, 2.09% for Class B shares and 2.09% for Class C shares. The annualized net expense ratios after fee waivers and/or expense reimbursements are 1.05% for Common Class shares, 1.55% for Advisor Class shares, 1.30% for Class A shares, 2.05% for Class B shares and 2.05% for Class C shares.
1 Fee waivers and/or expense reimbursements may reduce expenses for the Fund, without which performance would be lower. Waivers and/or reimbursements may be discontinued at any time.
2 Total return for the Fund's Class A shares for the reporting period, based on offering price (including maximum sales charge of 5.75%), was 7.53%. Total return for the Fund's Class B shares for the reporting period, based on redemption value (including maximum contingent deferred sales charge of 4.00%), was 9.70%. Total return for the Fund's Class C shares for the reporting period, based on redemption value (including maximum contingent deferred sales charge of 1.00%), was 12.63%.
3 The Russell 1000® Value Index measures the performance of those companies in the Russell 1000® Index with lower price-to-book ratios and lower forecasted growth values. It is an unmanaged index of common stocks that includes reinvestment of dividends and is compiled by Frank Russell Company. Investors cannot invest directly in an index.
3
Credit Suisse Large Cap Value Fund
Semiannual Investment Adviser's Report (continued)
April 30, 2010 (unaudited)
Information About Your Fund's Expenses
As an investor of the Fund, you incur two types of costs: ongoing expenses and transaction costs. Ongoing expenses include management fees, distribution and service (12b-1) fees and other Fund expenses. Examples of transaction costs include sales charges (loads), redemption fees and account maintenance fees, which are not shown in this section and which would result in higher total expenses. The following table is intended to help you understand your ongoing expenses of investing in the Fund and to help you compare these expenses with the ongoing expenses of investing in other mutual funds. The table is based on an investment of $1,000 made at the beginning of the six month period ended April 30, 2010.
The table illustrates your Fund's expenses in two ways:
• Actual Fund Return. This helps you estimate the actual dollar amount of ongoing expenses paid on a $1,000 investment in the Fund using the Fund's actual return during the period. To estimate the expenses you paid over the period, simply divide your account value by $1,000 (for example, an $8,600 account value divided by $1,000 = 8.6), then multiply the result by the number in the "Expenses Paid per $1,000" line under the share class you hold.
• Hypothetical 5% Fund Return. This helps you to compare your Fund's ongoing expenses with those of other mutual funds using the Fund's actual expense ratio and a hypothetical rate of return of 5% per year before expenses. Examples using a 5% hypothetical fund return may be found in the shareholder reports of other mutual funds. The hypothetical account values and expenses may not be used to estimate the actual ending account balance or expenses you paid for the period.
Please note that the expenses shown in these tables are meant to highlight your ongoing expenses only and do not reflect any transaction costs, such as sales charges (loads) or redemption fees. If these transaction costs had been included, your costs would have been higher. The "Expenses Paid per $1,000" line of the tables is useful in comparing ongoing expenses only and will not help you determine the relative total expenses of owning different funds.
4
Credit Suisse Large Cap Value Fund
Semiannual Investment Adviser's Report (continued)
April 30, 2010 (unaudited)
Expenses and Value for a $1,000 Investment
for the six month period ended April 30, 2010
| Actual Fund Return | Common Class | Advisor Class | Class A | Class B | Class C | ||||||||||||||||||
| Beginning Account Value 11/1/09 | $ | 1,000.00 | $ | 1,000.00 | $ | 1,000.00 | $ | 1,000.00 | $ | 1,000.00 | |||||||||||||
| Ending Account Value 4/30/10 | $ | 1,142.60 | $ | 1,139.70 | $ | 1,141.00 | $ | 1,137.00 | $ | 1,136.30 | |||||||||||||
| Expenses Paid per $1,000* | $ | 5.58 | $ | 8.22 | $ | 6.90 | $ | 10.86 | $ | 10.86 | |||||||||||||
| Hypothetical 5% Fund Return | |||||||||||||||||||||||
| Beginning Account Value 11/1/09 | $ | 1,000.00 | $ | 1,000.00 | $ | 1,000.00 | $ | 1,000.00 | $ | 1,000.00 | |||||||||||||
| Ending Account Value 4/30/10 | $ | 1,019.59 | $ | 1,017.11 | $ | 1,018.35 | $ | 1,014.63 | $ | 1,014.63 | |||||||||||||
| Expenses Paid per $1,000* | $ | 5.26 | $ | 7.75 | $ | 6.51 | $ | 10.24 | $ | 10.24 | |||||||||||||
| Common Class | Advisor Class | Class A | Class B | Class C | |||||||||||||||||||
| Annualized Expense Ratios* | 1.05 | % | 1.55 | % | 1.30 | % | 2.05 | % | 2.05 | % | |||||||||||||
* Expenses are equal to the Fund's annualized expense ratio for each share class, multiplied by the average account value over the period, multiplied by the number of days in the most recent fiscal half year period, then divided by 365.
The "Expenses Paid per $1,000" and the "Annualized Expense Ratios" in the tables are based on actual expenses paid by the Fund during the period, net of fee waivers and/or expense reimbursements. If those fee waivers and/or expense reimbursements had not been in effect, the Fund's actual expenses would have been higher.
For more information, please refer to the Fund's prospectus.
5
Credit Suisse Large Cap Value Fund
Semiannual Investment Adviser's Report (continued)
April 30, 2010 (unaudited)
SECTOR BREAKDOWN*
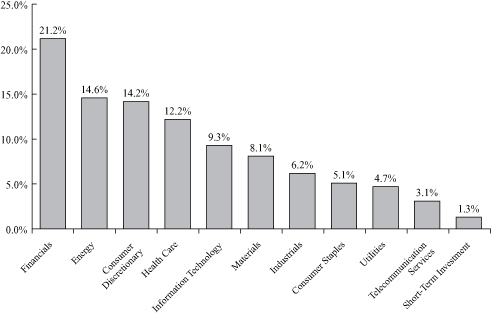
* Expressed as a percentage of total investments (excluding securities lending collateral if applicable) and may vary over time.
6
Credit Suisse Small Cap Core Fund
Semiannual Investment Adviser's Report
April 30, 2010 (unaudited)
May 12, 2010
Dear Shareholder:
Performance Summary
11/01/09 – 04/30/10
| Fund and Benchmark | Performance | ||||||
| Common Class1 | 25.91 | % | |||||
| Class A1,2 | 25.92 | % | |||||
| Class B1,2 | 25.47 | % | |||||
| Class C1,2 | 25.44 | % | |||||
| Standard & Poor's SmallCap 600 Index3 | 28.14 | % | |||||
Performance shown for the Fund's Class A, Class B and Class C Shares does not reflect sales charges, which are a maximum of 5.75%, 4.00% and 1.00%, respectively.2
Market Review: A positive period
For the six-month period ended April 30, 2010, the markets generally posted positive results. The S&P 500 Total Return Index gained 15.66%, and the Dow Jones Industrial Average increased 14.87%. U.S. small cap stocks demonstrated even stronger performance, with the S&P SmallCap 600 Index gaining 28.14%. The historically low interest rates set by the U.S. Federal Reserve in 2008 remained unchanged during the period. Consumer confidence improved during the six-month period (up to 57.7 from 47.7 in October 2009 as measured by the Consumer Confidence Index). The labor market strengthened with non-farm payrolls growing by 162,000 jobs in March and household unemployment decreasing to 9.7%.
Strategic Review and Outlook: A return to fundamentals
For the six-month period ended April 30, 2010, the Fund underperformed its benchmark. Financials and industrials were the largest detractors from the Fund's performance due to poor sector allocation. On the other hand, the Fund's overweight positions in the consumer discretionary and information technology sectors were positive contributors to the Fund's performance.
The past six months provided a difficult environment for individual stock picks due to market volatility, although the change from a bear to a bull market provided a good environment for taking directional bets. We believe, however, that volatility gradually will become less important as investors begin to focus more on underlying fundamentals of companies. We also believe that a focus on balance sheet and earnings quality will be positively rewarded in 2010.
7
Credit Suisse Small Cap Core Fund
Semiannual Investment Adviser's Report (continued)
April 30, 2010 (unaudited)
Credit Suisse Quantitative Equities Group
Mika Toikka
Timothy Schwider
Because of the nature of the Fund's investments in special-situation, start-up and other small companies, an investment in the Fund may be more volatile and less liquid than investments in larger companies.
In addition to historical information, this report contains forward-looking statements, which may concern, among other things, domestic and foreign market, industry and economic trends and developments and government regulation and their potential impact on the Fund's investments. These statements are subject to risks and uncertainties and actual trends, developments and regulations in the future, and their impact on the Fund could be materially different from those projected, anticipated or implied. The Fund has no obligation to update or revise forward-looking statements.
The Fund adopted new investment strategies effective December 1, 2006 so that its holdings are selected using quantitative stock selection models rather than a more traditional fundamental analysis approach. Investors should be aware that performance information for periods prior to December 1, 2006 does not reflect the current investment strategies.
Average Annual Returns as of March 31, 20101
1 Year | 5 Years | 10 Years | Since Inception | Inception Date | |||||||||||||||||||
| Common Class | 53.66 | % | (0.06 | )% | — | 6.41 | % | 08/01/00 | |||||||||||||||
| Class A Without Sales Charge | 53.55 | % | (0.05 | )% | 6.42 | % | — | ||||||||||||||||
| Class A With Maximum Sales Charge | 44.69 | % | (1.23 | )% | 5.80 | % | — | ||||||||||||||||
| Class B Without CDSC | 52.42 | % | (0.80 | )% | 5.63 | % | — | 02/28/96 | |||||||||||||||
| Class B With CDSC | 48.42 | % | (0.80 | )% | 5.63 | % | — | 02/28/96 | |||||||||||||||
| Class C Without CDSC | 52.62 | % | (0.80 | )% | 5.63 | % | — | 02/28/00 | |||||||||||||||
| Class C With CDSC | 51.62 | % | (0.80 | )% | 5.63 | % | — | 02/28/00 | |||||||||||||||
8
Credit Suisse Small Cap Core Fund
Semiannual Investment Adviser's Report (continued)
April 30, 2010 (unaudited)
Average Annual Returns as of April 30, 20101
1 Year | 5 Years | 10 Years | Since Inception | Inception Date | |||||||||||||||||||
| Common Class | 40.22 | % | 2.04 | % | — | 6.90 | % | 08/01/00 | |||||||||||||||
| Class A Without Sales Charge | 40.22 | % | 2.06 | % | 7.18 | % | — | ||||||||||||||||
| Class A With Maximum Sales Charge | 32.08 | % | 0.85 | % | 6.55 | % | — | ||||||||||||||||
| Class B Without CDSC | 39.25 | % | 1.30 | % | 6.38 | % | — | 02/28/96 | |||||||||||||||
| Class B With CDSC | 35.25 | % | 1.30 | % | 6.38 | % | — | 02/28/96 | |||||||||||||||
| Class C Without CDSC | 39.15 | % | 1.28 | % | 6.37 | % | — | 02/28/00 | |||||||||||||||
| Class C With CDSC | 38.15 | % | 1.28 | % | 6.37 | % | — | 02/28/00 | |||||||||||||||
Returns represent past performance and include change in share price and reinvestment of dividends and capital gains. Past performance cannot guarantee future results. The current performance of the Fund may be lower or higher than the figures shown. Returns and share price will fluctuate, and redemption value may be more or less than original cost. The performance results do not reflect the deduction of taxes that a shareholder would pay on fund distributions or the redemption of fund shares. Performance information current to the most recent month-end is available at www.credit-suisse.com/us.
The annualized gross expense ratios are 1.77% for Common Class shares, 1.76% for Class A shares, 2.52% for Class B shares and 2.51% for Class C shares. The annualized net expense ratios after fee waivers and/or expense reimbursements are 1.55% for Common Class shares, 1.55% for Class A shares, 2.30% for Class B shares and 2.30% for Class C shares.
1 Fee waivers and/or expense reimbursements may reduce expenses for the Fund, without which performance would be lower. Waivers and/or reimbursements may be discontinued at any time.
2 Total return for the Fund's Class A shares for the reporting period, based on offering price (including maximum sales charge of 5.75%), was 18.71%. Total return for the Fund's Class B shares for the reporting period, based on redemption value (including maximum contingent deferred sales charge of 4.00%), was 21.47%. Total return for the Fund's Class C shares for the reporting period, based on redemption value (including maximum contingent deferred sales charge of 1.00%), was 24.44%.
3 The Standard & Poor's SmallCap 600® Index is an unmanaged market weighted index of 600 U.S. stocks selected on the basis of capitalization, liquidity and industry group representation. It is a registered trademark of The McGraw-Hill Co., Inc. Investors cannot invest directly in an index.
9
Credit Suisse Small Cap Core Fund
Semiannual Investment Adviser's Report (continued)
April 30, 2010 (unaudited)
Information About Your Fund's Expenses
As an investor of the Fund, you incur two types of costs: ongoing expenses and transaction costs. Ongoing expenses include management fees, distribution and service (12b-1) fees and other Fund expenses. Examples of transaction costs include sales charges (loads), redemption fees and account maintenance fees, which are not shown in this section and which would result in higher total expenses. The following table is intended to help you understand your ongoing expenses of investing in the Fund and to help you compare these expenses with the ongoing expenses of investing in other mutual funds. The table is based on an investment of $1,000 made at the beginning of the six month period ended April 30, 2010.
The table illustrates your Fund's expenses in two ways:
• Actual Fund Return. This helps you estimate the actual dollar amount of ongoing expenses paid on a $1,000 investment in the Fund using the Fund's actual return during the period. To estimate the expenses you paid over the period, simply divide your account value by $1,000 (for example, an $8,600 account value divided by $1,000 = 8.6), then multiply the result by the number in the "Expenses Paid per $1,000" line under the share class you hold.
• Hypothetical 5% Fund Return. This helps you to compare your Fund's ongoing expenses with those of other mutual funds using the Fund's actual expense ratio and a hypothetical rate of return of 5% per year before expenses. Examples using a 5% hypothetical fund return may be found in the shareholder reports of other mutual funds. The hypothetical account values and expenses may not be used to estimate the actual ending account balance or expenses you paid for the period.
Please note that the expenses shown in these tables are meant to highlight your ongoing expenses only and do not reflect any transaction costs, such as sales charges (loads) or redemption fees. If these transaction costs had been included, your costs would have been higher. The "Expenses Paid per $1,000" line of the tables is useful in comparing ongoing expenses only and will not help you determine the relative total expenses of owning different funds.
10
Credit Suisse Small Cap Core Fund
Semiannual Investment Adviser's Report (continued)
April 30, 2010 (unaudited)
Expenses and Value for a $1,000 Investment
for the six month period ended April 30, 2010
| Actual Fund Return | Common Class | Class A | Class B | Class C | |||||||||||||||
| Beginning Account Value 11/1/09 | $ | 1,000.00 | $ | 1,000.00 | $ | 1,000.00 | $ | 1,000.00 | |||||||||||
| Ending Account Value 4/30/10 | $ | 1,259.10 | $ | 1,259.20 | $ | 1,254.70 | $ | 1,254.40 | |||||||||||
| Expenses Paid per $1,000* | $ | 8.68 | $ | 8.68 | $ | 12.86 | $ | 12.86 | |||||||||||
| Hypothetical 5% Fund Return | |||||||||||||||||||
| Beginning Account Value 11/1/09 | $ | 1,000.00 | $ | 1,000.00 | $ | 1,000.00 | $ | 1,000.00 | |||||||||||
| Ending Account Value 4/30/10 | $ | 1,017.11 | $ | 1,017.11 | $ | 1,013.39 | $ | 1,013.39 | |||||||||||
| Expenses Paid per $1,000* | $ | 7.75 | $ | 7.75 | $ | 11.48 | $ | 11.48 | |||||||||||
| Common Class | Class A | Class B | Class C | ||||||||||||||||
| Annualized Expense Ratios* | 1.55 | % | 1.55 | % | 2.30 | % | 2.30 | % | |||||||||||
* Expenses are equal to the Fund's annualized expense ratio for each share class, multiplied by the average account value over the period, multiplied by the number of days in the most recent fiscal half year period, then divided by 365.
The "Expenses Paid per $1,000" and the "Annualized Expense Ratios" in the tables are based on actual expenses paid by the Fund during the period, net of fee waivers and/or expense reimbursements. If those fee waivers and/or expense reimbursements had not been in effect, the Fund's actual expenses would have been higher.
For more information, please refer to the Fund's prospectus.
11
Credit Suisse Small Cap Core Fund
Semiannual Investment Adviser's Report (continued)
April 30, 2010 (unaudited)
SECTOR BREAKDOWN*
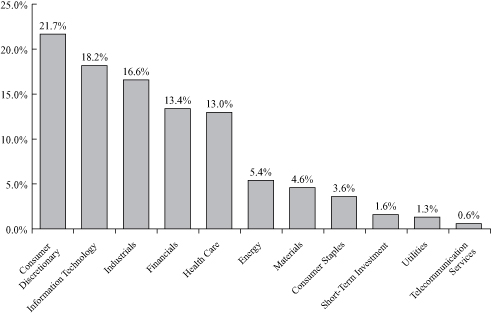
* Expressed as a percentage of total investments (excluding securities lending collateral if applicable) and may vary over time.
12
Credit Suisse Large Cap Value Fund
Schedule of Investments
April 30, 2010 (unaudited)
| Number of Shares | Value | ||||||||||
| COMMON STOCKS (98.9%) | |||||||||||
| Aerospace & Defense (0.6%) | |||||||||||
| Alliant Techsystems, Inc.*§ | 221 | $ | 17,881 | ||||||||
| BE Aerospace, Inc.* | 100 | 2,971 | |||||||||
| Cubic Corp. | 51 | 1,903 | |||||||||
| General Dynamics Corp. | 2,300 | 175,628 | |||||||||
| Honeywell International, Inc. | 300 | 14,241 | |||||||||
| ITT Corp. | 1,400 | 77,798 | |||||||||
| L-3 Communications Holdings, Inc. | 1,000 | 93,570 | |||||||||
| Lockheed Martin Corp. | 300 | 25,467 | |||||||||
| Northrop Grumman Corp. | 2,200 | 149,226 | |||||||||
| Raytheon Co. | 900 | 52,470 | |||||||||
| Spirit Aerosystems Holdings, Inc. Class A*§ | 500 | 11,090 | |||||||||
| The Boeing Co. | 5,400 | 391,122 | |||||||||
| United Technologies Corp. | 600 | 44,970 | |||||||||
| 1,058,337 | |||||||||||
| Air Freight & Logistics (0.2%) | |||||||||||
| FedEx Corp. | 2,300 | 207,023 | |||||||||
| United Parcel Service, Inc. Class B | 2,900 | 200,506 | |||||||||
| 407,529 | |||||||||||
| Airlines (0.6%) | |||||||||||
| Alaska Air Group, Inc.* | 23,200 | 960,712 | |||||||||
| Southwest Airlines Co. | 4,100 | 54,038 | |||||||||
| 1,014,750 | |||||||||||
| Auto Components (1.5%) | |||||||||||
| Autoliv, Inc.*§ | 35,305 | 1,932,949 | |||||||||
| Johnson Controls, Inc. | 7,500 | 251,925 | |||||||||
| TRW Automotive Holdings Corp.*§ | 11,300 | 363,973 | |||||||||
| 2,548,847 | |||||||||||
| Automobiles (0.2%) | |||||||||||
| Ford Motor Co.*§ | 24,900 | 324,198 | |||||||||
| Harley-Davidson, Inc.§ | 1,800 | 60,894 | |||||||||
| 385,092 | |||||||||||
| Beverages (1.1%) | |||||||||||
| Central European Distribution Corp.*§ | 500 | 17,325 | |||||||||
| Coca-Cola Enterprises, Inc. | 44,700 | 1,239,531 | |||||||||
| Constellation Brands, Inc. Class A*§ | 1,400 | 25,578 | |||||||||
| Dr. Pepper Snapple Group, Inc. | 2,000 | 65,460 | |||||||||
| Molson Coors Brewing Co. Class B | 800 | 35,488 | |||||||||
| PepsiCo, Inc. | 5,433 | 354,340 | |||||||||
| The Coca-Cola Co. | 3,800 | 203,110 | |||||||||
| 1,940,832 | |||||||||||
| Biotechnology (2.5%) | |||||||||||
| Amgen, Inc.* | 16,700 | 957,912 | |||||||||
| Biogen Idec, Inc.* | 5,200 | 276,900 | |||||||||
See Accompanying Notes to Financial Statements.
13
Credit Suisse Large Cap Value Fund
Schedule of Investments (continued)
April 30, 2010 (unaudited)
| Number of Shares | Value | ||||||||||
| COMMON STOCKS | |||||||||||
| Biotechnology | |||||||||||
| Cephalon, Inc.*§ | 40,086 | $ | 2,573,521 | ||||||||
| Gilead Sciences, Inc.* | 10,300 | 408,601 | |||||||||
| Myriad Genetics, Inc.*§ | 500 | 12,005 | |||||||||
| OSI Pharmaceuticals, Inc.*§ | 300 | 17,601 | |||||||||
| 4,246,540 | |||||||||||
| Building Products (0.2%) | |||||||||||
| Armstrong World Industries, Inc.*§ | 600 | 26,130 | |||||||||
| Lennox International, Inc. | 4,800 | 217,248 | |||||||||
| Masco Corp.§ | 1,500 | 24,345 | |||||||||
| Owens Corning*§ | 800 | 27,824 | |||||||||
| USG Corp.* | 200 | 4,720 | |||||||||
| 300,267 | |||||||||||
| Capital Markets (2.2%) | |||||||||||
| Affiliated Managers Group, Inc.*§ | 300 | 25,254 | |||||||||
| American Capital, Ltd.* | 1 | 6 | |||||||||
| Ameriprise Financial, Inc. | 2,000 | 92,720 | |||||||||
| BlackRock, Inc. | 800 | 147,200 | |||||||||
| Eaton Vance Corp. | 6,900 | 243,156 | |||||||||
| Federated Investors, Inc. Class B§ | 22,100 | 533,052 | |||||||||
| Franklin Resources, Inc. | 900 | 104,076 | |||||||||
| Greenhill & Co., Inc.§ | 100 | 8,789 | |||||||||
| Invesco, Ltd. | 3,000 | 68,970 | |||||||||
| Investment Technology Group, Inc.* | 100 | 1,737 | |||||||||
| Legg Mason, Inc.§ | 1,200 | 38,028 | |||||||||
| Morgan Stanley | 7,700 | 232,694 | |||||||||
| Raymond James Financial, Inc. | 700 | 21,448 | |||||||||
| State Street Corp. | 1,800 | 78,300 | |||||||||
| The Bank of New York Mellon Corp. | 7,000 | 217,910 | |||||||||
| The Goldman Sachs Group, Inc. | 13,500 | 1,960,200 | |||||||||
| 3,773,540 | |||||||||||
| Chemicals (2.8%) | |||||||||||
| Air Products & Chemicals, Inc. | 1,000 | 76,780 | |||||||||
| Airgas, Inc. | 800 | 50,760 | |||||||||
| Albemarle Corp. | 700 | 31,962 | |||||||||
| Ashland, Inc. | 41,900 | 2,495,564 | |||||||||
| Cabot Corp. | 700 | 22,778 | |||||||||
| Celanese Corp. Series A | 500 | 15,995 | |||||||||
| Cytec Industries, Inc. | 300 | 14,418 | |||||||||
| E.I. Du Pont de Nemours & Co. | 4,700 | 187,248 | |||||||||
| Eastman Chemical Co. | 620 | 41,491 | |||||||||
| Ecolab, Inc. | 200 | 9,768 | |||||||||
| Huntsman Corp. | 10,900 | 124,369 | |||||||||
| International Flavors & Fragrances, Inc. | 293 | 14,676 | |||||||||
| Lubrizol Corp. | 13,000 | 1,174,420 | |||||||||
| NewMarket Corp. | 1,200 | 132,000 | |||||||||
| PPG Industries, Inc. | 1,300 | 91,481 | |||||||||
See Accompanying Notes to Financial Statements.
14
Credit Suisse Large Cap Value Fund
Schedule of Investments (continued)
April 30, 2010 (unaudited)
| Number of Shares | Value | ||||||||||
| COMMON STOCKS | |||||||||||
| Chemicals | |||||||||||
| RPM International, Inc. | 700 | $ | 15,456 | ||||||||
| The Dow Chemical Co. | 8,300 | 255,889 | |||||||||
| The Scotts Miracle-Gro Co. Class A | 214 | 10,368 | |||||||||
| Valspar Corp. | 700 | 21,924 | |||||||||
| 4,787,347 | |||||||||||
| Commercial Banks (5.9%) | |||||||||||
| Associated Banc-Corp.§ | 1,200 | 17,436 | |||||||||
| Bancorpsouth, Inc.§ | 2,491 | 55,151 | |||||||||
| Bank of Hawaii Corp.§ | 300 | 15,864 | |||||||||
| BB&T Corp. | 5,200 | 172,848 | |||||||||
| BOK Financial Corp.§ | 300 | 16,329 | |||||||||
| CapitalSource, Inc. | 2,800 | 16,716 | |||||||||
| City National Corp.§ | 200 | 12,456 | |||||||||
| Comerica, Inc. | 1,300 | 54,600 | |||||||||
| Commerce Bancshares, Inc. | 100 | 4,142 | |||||||||
| Cullen/Frost Bankers, Inc.§ | 691 | 41,018 | |||||||||
| Fifth Third Bancorp | 5,900 | 87,969 | |||||||||
| First Citizens BancShares, Inc. Class A | 170 | 35,020 | |||||||||
| First Horizon National Corp.* | 2,058 | 29,120 | |||||||||
| Fulton Financial Corp.§ | 3,984 | 41,832 | |||||||||
| Huntington Bancshares, Inc.§ | 8,900 | 60,253 | |||||||||
| Keycorp | 7,000 | 63,140 | |||||||||
| M&T Bank Corp.§ | 800 | 69,880 | |||||||||
| Marshall & Ilsley Corp. | 4,000 | 36,400 | |||||||||
| PNC Financial Services Group, Inc. | 4,600 | 309,166 | |||||||||
| Regions Financial Corp.§ | 8,900 | 78,676 | |||||||||
| SunTrust Banks, Inc.§ | 3,800 | 112,480 | |||||||||
| Synovus Financial Corp.§ | 11,100 | 33,411 | |||||||||
| TCF Financial Corp.§ | 800 | 14,904 | |||||||||
| U.S. Bancorp | 16,800 | 449,736 | |||||||||
| Valley National Bancorp | 1,000 | 16,240 | |||||||||
| Wells Fargo & Co. | 244,300 | 8,088,773 | |||||||||
| Whitney Holding Corp.§ | 700 | 9,590 | |||||||||
| Wilmington Trust Corp.§ | 400 | 6,932 | |||||||||
| Zions Bancorporation§ | 1,100 | 31,603 | |||||||||
| 9,981,685 | |||||||||||
| Commercial Services & Supplies (0.1%) | |||||||||||
| Avery Dennison Corp. | 700 | 27,321 | |||||||||
| Cintas Corp. | 1,000 | 27,250 | |||||||||
| Corrections Corp. of America* | 700 | 14,504 | |||||||||
| Covanta Holding Corp.*§ | 800 | 13,984 | |||||||||
| Pitney Bowes, Inc.§ | 1,500 | 38,100 | |||||||||
| R. R. Donnelley & Sons Co. | 1,500 | 32,235 | |||||||||
| Republic Services, Inc. | 1,900 | 58,957 | |||||||||
| Waste Management, Inc.§ | 400 | 13,872 | |||||||||
| 226,223 | |||||||||||
See Accompanying Notes to Financial Statements.
15
Credit Suisse Large Cap Value Fund
Schedule of Investments (continued)
April 30, 2010 (unaudited)
| Number of Shares | Value | ||||||||||
| COMMON STOCKS | |||||||||||
| Communications Equipment (0.7%) | |||||||||||
| Brocade Communications Systems, Inc.* | 2,100 | $ | 13,629 | ||||||||
| Ciena Corp.*§ | 400 | 7,396 | |||||||||
| CommScope, Inc.*§ | 600 | 19,548 | |||||||||
| EchoStar Corp. Class A* | 9,200 | 176,732 | |||||||||
| JDS Uniphase Corp.*§ | 300 | 3,897 | |||||||||
| Motorola, Inc.* | 16,500 | 116,655 | |||||||||
| Plantronics, Inc.§ | 300 | 9,960 | |||||||||
| QUALCOMM, Inc. | 19,400 | 751,556 | |||||||||
| Tellabs, Inc. | 3,000 | 27,240 | |||||||||
| 1,126,613 | |||||||||||
| Computers & Peripherals (2.9%) | |||||||||||
| Apple, Inc.* | 300 | 78,336 | |||||||||
| EMC Corp.* | 13,300 | 252,833 | |||||||||
| Hewlett-Packard Co. | 4,100 | 213,077 | |||||||||
| Lexmark International, Inc. Class A* | 500 | 18,525 | |||||||||
| NetApp, Inc.* | 300 | 10,401 | |||||||||
| SanDisk Corp.* | 900 | 35,901 | |||||||||
| Seagate Technology* | 1,500 | 27,555 | |||||||||
| Teradata Corp.* | 29,700 | 863,379 | |||||||||
| Western Digital Corp.* | 82,877 | 3,405,416 | |||||||||
| 4,905,423 | |||||||||||
| Construction & Engineering (0.1%) | |||||||||||
| Dycom Industries, Inc.* | 20 | 212 | |||||||||
| Fluor Corp. | 269 | 14,214 | |||||||||
| KBR, Inc. | 1,361 | 30,051 | |||||||||
| MasTec, Inc.*§ | 1,400 | 17,514 | |||||||||
| Quanta Services, Inc.* | 1,600 | 32,208 | |||||||||
| URS Corp.* | 600 | 30,810 | |||||||||
| 125,009 | |||||||||||
| Construction Materials (0.0%) | |||||||||||
| Martin Marietta Materials, Inc.§ | 100 | 9,588 | |||||||||
| Vulcan Materials Co. | 1,000 | 57,280 | |||||||||
| 66,868 | |||||||||||
| Consumer Finance (0.9%) | |||||||||||
| American Express Co. | 24,200 | 1,116,104 | |||||||||
| AmeriCredit Corp.* | 700 | 16,758 | |||||||||
| Capital One Financial Corp. | 5,700 | 247,437 | |||||||||
| Discover Financial Services | 4,200 | 64,932 | |||||||||
| SLM Corp.* | 2,700 | 33,048 | |||||||||
| 1,478,279 | |||||||||||
| Containers & Packaging (0.1%) | |||||||||||
| Aptargroup, Inc. | 400 | 17,216 | |||||||||
| Ball Corp. | 200 | 10,642 | |||||||||
| Bemis Co., Inc. | 900 | 27,369 | |||||||||
See Accompanying Notes to Financial Statements.
16
Credit Suisse Large Cap Value Fund
Schedule of Investments (continued)
April 30, 2010 (unaudited)
| Number of Shares | Value | ||||||||||
| COMMON STOCKS | |||||||||||
| Containers & Packaging | |||||||||||
| Greif, Inc. Class A§ | 200 | $ | 11,836 | ||||||||
| Packaging Corp. of America | 700 | 17,311 | |||||||||
| Pactiv Corp.* | 400 | 10,164 | |||||||||
| Sealed Air Corp. | 1,500 | 32,250 | |||||||||
| Sonoco Products Co. | 700 | 23,191 | |||||||||
| Temple-Inland, Inc. | 1,000 | 23,320 | |||||||||
| 173,299 | |||||||||||
| Distributors (0.0%) | |||||||||||
| Genuine Parts Co. | 1,200 | 51,360 | |||||||||
| Diversified Consumer Services (1.6%) | |||||||||||
| Corinthian Colleges, Inc.*§ | 71,500 | 1,116,830 | |||||||||
| DeVry, Inc. | 700 | 43,673 | |||||||||
| H&R Block, Inc. | 73,400 | 1,343,954 | |||||||||
| ITT Educational Services, Inc.*§ | 2,200 | 222,486 | |||||||||
| Service Corp. International | 1,400 | 12,572 | |||||||||
| 2,739,515 | |||||||||||
| Diversified Financial Services (5.7%) | |||||||||||
| Bank of America Corp. | 161,044 | 2,871,415 | |||||||||
| Citigroup, Inc.* | 523,500 | 2,287,695 | |||||||||
| CME Group, Inc. | 800 | 262,728 | |||||||||
| Interactive Brokers Group, Inc. Class A*§ | 1,000 | 17,140 | |||||||||
| JPMorgan Chase & Co. | 82,900 | 3,529,882 | |||||||||
| Leucadia National Corp.*§ | 800 | 20,248 | |||||||||
| NYSE Euronext | 19,000 | 619,970 | |||||||||
| The NASDAQ OMX Group, Inc.* | 500 | 10,500 | |||||||||
| 9,619,578 | |||||||||||
| Diversified Telecommunication Services (1.7%) | |||||||||||
| AT&T, Inc. | 73,205 | 1,907,722 | |||||||||
| CenturyTel, Inc.§ | 2,400 | 81,864 | |||||||||
| Frontier Communications Corp.§ | 1,300 | 10,348 | |||||||||
| Qwest Communications International, Inc. | 45,400 | 237,442 | |||||||||
| Verizon Communications, Inc. | 20,600 | 595,134 | |||||||||
| Windstream Corp.§ | 1,700 | 18,785 | |||||||||
| 2,851,295 | |||||||||||
| Electric Utilities (0.9%) | |||||||||||
| Allegheny Energy, Inc.§ | 900 | 19,602 | |||||||||
| American Electric Power Co., Inc. | 3,600 | 123,480 | |||||||||
| DPL, Inc. | 700 | 19,726 | |||||||||
| Duke Energy Corp. | 9,600 | 161,088 | |||||||||
| Edison International | 2,600 | 89,362 | |||||||||
| Entergy Corp. | 1,700 | 138,193 | |||||||||
| Exelon Corp. | 4,800 | 209,232 | |||||||||
| FirstEnergy Corp.§ | 4,300 | 162,841 | |||||||||
| FPL Group, Inc. | 2,800 | 145,740 | |||||||||
| Great Plains Energy, Inc. | 900 | 17,397 | |||||||||
See Accompanying Notes to Financial Statements.
17
Credit Suisse Large Cap Value Fund
Schedule of Investments (continued)
April 30, 2010 (unaudited)
| Number of Shares | Value | ||||||||||
| COMMON STOCKS | |||||||||||
| Electric Utilities | |||||||||||
| Hawaiian Electric Industries, Inc.§ | 900 | $ | 21,015 | ||||||||
| Northeast Utilities | 1,200 | 33,348 | |||||||||
| NV Energy, Inc. | 1,000 | 12,490 | |||||||||
| Pepco Holdings, Inc. | 1,600 | 26,784 | |||||||||
| Pinnacle West Capital Corp. | 900 | 33,606 | |||||||||
| Progress Energy, Inc. | 2,200 | 87,824 | |||||||||
| Southern Co. | 5,700 | 196,992 | |||||||||
| Westar Energy, Inc. | 700 | 16,583 | |||||||||
| 1,515,303 | |||||||||||
| Electrical Equipment (1.2%) | |||||||||||
| Emerson Electric Co. | 200 | 10,446 | |||||||||
| First Solar, Inc.*§ | 100 | 14,355 | |||||||||
| General Cable Corp.*§ | 68,485 | 1,956,616 | |||||||||
| Hubbell, Inc. Class B | 200 | 9,294 | |||||||||
| Rockwell Automation, Inc. | 1,100 | 66,792 | |||||||||
| Thomas & Betts Corp.* | 400 | 16,776 | |||||||||
| 2,074,279 | |||||||||||
| Electronic Equipment, Instruments & Components (0.9%) | |||||||||||
| Arrow Electronics, Inc.* | 500 | 15,250 | |||||||||
| Avnet, Inc.* | 700 | 22,379 | |||||||||
| Corning, Inc. | 2,000 | 38,500 | |||||||||
| Ingram Micro, Inc. Class A* | 1,400 | 25,424 | |||||||||
| Jabil Circuit, Inc. | 67,800 | 1,038,696 | |||||||||
| Molex, Inc.§ | 1,100 | 24,651 | |||||||||
| Tech Data Corp.* | 600 | 25,740 | |||||||||
| Vishay Intertechnology, Inc.* | 34,200 | 356,022 | |||||||||
| 1,546,662 | |||||||||||
| Energy Equipment & Services (2.4%) | |||||||||||
| Baker Hughes, Inc.§ | 3,101 | 154,291 | |||||||||
| Diamond Offshore Drilling, Inc.§ | 2,900 | 229,390 | |||||||||
| Dresser-Rand Group, Inc.* | 9,301 | 328,139 | |||||||||
| FMC Technologies, Inc.* | 10,300 | 697,207 | |||||||||
| Halliburton Co. | 6,700 | 205,355 | |||||||||
| Helix Energy Solutions Group, Inc.* | 62,600 | 912,708 | |||||||||
| Helmerich & Payne, Inc. | 500 | 20,310 | |||||||||
| Nabors Industries, Ltd.*§ | 2,200 | 47,454 | |||||||||
| National-Oilwell Varco, Inc. | 14,700 | 647,241 | |||||||||
| Oceaneering International, Inc.* | 200 | 13,100 | |||||||||
| Oil States International, Inc.* | 300 | 14,493 | |||||||||
| Patterson-UTI Energy, Inc.§ | 1,000 | 15,290 | |||||||||
| Pride International, Inc.* | 700 | 21,231 | |||||||||
| Rowan Cos., Inc.*§ | 900 | 26,820 | |||||||||
| Schlumberger, Ltd. | 9,200 | 657,064 | |||||||||
| SEACOR Holdings, Inc.*§ | 100 | 8,417 | |||||||||
| Seahawk Drilling, Inc.*§ | 6 | 100 | |||||||||
| Smith International, Inc. | 700 | 33,432 | |||||||||
See Accompanying Notes to Financial Statements.
18
Credit Suisse Large Cap Value Fund
Schedule of Investments (continued)
April 30, 2010 (unaudited)
| Number of Shares | Value | ||||||||||
| COMMON STOCKS | |||||||||||
| Energy Equipment & Services | |||||||||||
| Superior Energy Services, Inc.* | 600 | $ | 16,236 | ||||||||
| Tidewater, Inc.§ | 700 | 37,527 | |||||||||
| Unit Corp.*§ | 300 | 14,331 | |||||||||
| 4,100,136 | |||||||||||
| Food & Staples Retailing (0.2%) | |||||||||||
| BJ's Wholesale Club, Inc.*§ | 300 | 11,484 | |||||||||
| CVS Caremark Corp. | 7,500 | 276,975 | |||||||||
| Safeway, Inc. | 3,021 | 71,296 | |||||||||
| SUPERVALU, Inc.§ | 1,700 | 25,330 | |||||||||
| The Kroger Co. | 900 | 20,007 | |||||||||
| 405,092 | |||||||||||
| Food Products (1.3%) | |||||||||||
| Archer-Daniels-Midland Co. | 2,260 | 63,145 | |||||||||
| Bunge, Ltd. | 3,900 | 206,505 | |||||||||
| Campbell Soup Co. | 400 | 14,344 | |||||||||
| ConAgra Foods, Inc. | 3,500 | 85,645 | |||||||||
| Corn Products International, Inc. | 500 | 18,000 | |||||||||
| Del Monte Foods Co. | 1,400 | 20,916 | |||||||||
| General Mills, Inc. | 1,600 | 113,888 | |||||||||
| H.J. Heinz Co. | 701 | 32,856 | |||||||||
| Hormel Foods Corp.§ | 700 | 28,532 | |||||||||
| Kellogg Co. | 300 | 16,482 | |||||||||
| Kraft Foods, Inc. Class A | 10,800 | 319,680 | |||||||||
| Lancaster Colony Corp.§ | 600 | 32,982 | |||||||||
| Mead Johnson Nutrition Co. | 15,900 | 820,599 | |||||||||
| Ralcorp Holdings, Inc.* | 400 | 26,620 | |||||||||
| Sara Lee Corp.§ | 4,500 | 63,990 | |||||||||
| Smithfield Foods, Inc.*§ | 1,200 | 22,488 | |||||||||
| The Hershey Co. | 5,430 | 255,264 | |||||||||
| The J.M. Smucker Co. | 1,000 | 61,070 | |||||||||
| Tyson Foods, Inc. Class A | 2,900 | 56,811 | |||||||||
| 2,259,817 | |||||||||||
| Gas Utilities (0.1%) | |||||||||||
| AGL Resources, Inc. | 500 | 19,755 | |||||||||
| Atmos Energy Corp. | 600 | 17,748 | |||||||||
| Energen Corp. | 500 | 24,435 | |||||||||
| National Fuel Gas Co. | 700 | 36,414 | |||||||||
| ONEOK, Inc. | 900 | 44,226 | |||||||||
| Questar Corp. | 1,300 | 62,335 | |||||||||
| UGI Corp. | 1,100 | 30,239 | |||||||||
| 235,152 | |||||||||||
| Health Care Equipment & Supplies (0.3%) | |||||||||||
| Boston Scientific Corp.* | 7,135 | 49,089 | |||||||||
| CareFusion Corp.* | 5,400 | 148,932 | |||||||||
| Hill-Rom Holdings, Inc. | 100 | 3,171 | |||||||||
See Accompanying Notes to Financial Statements.
19
Credit Suisse Large Cap Value Fund
Schedule of Investments (continued)
April 30, 2010 (unaudited)
| Number of Shares | Value | ||||||||||
| COMMON STOCKS | |||||||||||
| Health Care Equipment & Supplies | |||||||||||
| Hologic, Inc.* | 1,700 | $ | 30,379 | ||||||||
| Inverness Medical Innovations, Inc.*§ | 300 | 11,934 | |||||||||
| Kinetic Concepts, Inc.*§ | 500 | 21,650 | |||||||||
| STERIS Corp.§ | 400 | 13,312 | |||||||||
| Stryker Corp. | 300 | 17,232 | |||||||||
| The Cooper Cos., Inc.§ | 300 | 11,667 | |||||||||
| Thoratec Corp.*§ | 300 | 13,377 | |||||||||
| Zimmer Holdings, Inc.* | 1,700 | 103,547 | |||||||||
| 424,290 | |||||||||||
| Health Care Providers & Services (4.1%) | |||||||||||
| Aetna, Inc. | 3,000 | 88,650 | |||||||||
| AmerisourceBergen Corp. | 100 | 3,085 | |||||||||
| Brookdale Senior Living, Inc.* | 100 | 2,150 | |||||||||
| Cardinal Health, Inc. | 2,700 | 93,663 | |||||||||
| CIGNA Corp. | 2,000 | 64,120 | |||||||||
| Community Health Systems, Inc.*§ | 700 | 28,602 | |||||||||
| Coventry Health Care, Inc.* | 1,000 | 23,740 | |||||||||
| Health Net, Inc.* | 1,000 | 22,020 | |||||||||
| Henry Schein, Inc.*§ | 300 | 18,141 | |||||||||
| Humana, Inc.* | 39,900 | 1,824,228 | |||||||||
| LifePoint Hospitals, Inc.*§ | 300 | 11,454 | |||||||||
| Lincare Holdings, Inc.*§ | 300 | 14,007 | |||||||||
| McKesson Corp. | 1,000 | 64,810 | |||||||||
| Medco Health Solutions, Inc.* | 800 | 47,136 | |||||||||
| Mednax, Inc.* | 200 | 10,988 | |||||||||
| Omnicare, Inc. | 600 | 16,674 | |||||||||
| Tenet Healthcare Corp.* | 2,800 | 17,500 | |||||||||
| UnitedHealth Group, Inc. | 8,800 | 266,728 | |||||||||
| Universal Health Services, Inc. Class B | 500 | 18,560 | |||||||||
| WellPoint, Inc.* | 78,928 | 4,246,326 | |||||||||
| 6,882,582 | |||||||||||
| Hotels, Restaurants & Leisure (0.4%) | |||||||||||
| Boyd Gaming Corp.* | 100 | 1,270 | |||||||||
| Carnival Corp. | 1,900 | 79,230 | |||||||||
| Darden Restaurants, Inc. | 208 | 9,308 | |||||||||
| Hyatt Hotels Corp. Class A*§ | 500 | 20,585 | |||||||||
| Las Vegas Sands Corp.* | 300 | 7,458 | |||||||||
| Marriott International, Inc. Class A§ | 800 | 29,408 | |||||||||
| MGM Mirage*§ | 700 | 11,123 | |||||||||
| Panera Bread Co. Class A*§ | 102 | 7,950 | |||||||||
| Penn National Gaming, Inc.* | 300 | 9,288 | |||||||||
| Royal Caribbean Cruises, Ltd.*§ | 2,800 | 100,352 | |||||||||
| Starbucks Corp. | 1,500 | 38,970 | |||||||||
| Starwood Hotels & Resorts Worldwide, Inc. | 1,300 | 70,863 | |||||||||
| The Cheesecake Factory, Inc.*§ | 400 | 10,868 | |||||||||
| Wendy's/Arby's Group, Inc. Class A | 6,700 | 35,577 | |||||||||
| Wyndham Worldwide Corp. | 5,000 | 134,050 | |||||||||
See Accompanying Notes to Financial Statements.
20
Credit Suisse Large Cap Value Fund
Schedule of Investments (continued)
April 30, 2010 (unaudited)
| Number of Shares | Value | ||||||||||
| COMMON STOCKS | |||||||||||
| Hotels, Restaurants & Leisure | |||||||||||
| Wynn Resorts, Ltd. | 500 | $ | 44,120 | ||||||||
| Yum! Brands, Inc. | 300 | 12,726 | |||||||||
| 623,146 | |||||||||||
| Household Durables (0.3%) | |||||||||||
| D.R. Horton, Inc.§ | 2,000 | 29,380 | |||||||||
| Fortune Brands, Inc. | 1,100 | 57,662 | |||||||||
| Garmin, Ltd.§ | 700 | 26,166 | |||||||||
| Harman International Industries, Inc.* | 300 | 11,844 | |||||||||
| Jarden Corp. | 600 | 19,272 | |||||||||
| KB Home§ | 300 | 5,559 | |||||||||
| Leggett & Platt, Inc.§ | 921 | 22,592 | |||||||||
| Lennar Corp. Class A§ | 1,200 | 23,880 | |||||||||
| Mohawk Industries, Inc.*§ | 400 | 25,496 | |||||||||
| Newell Rubbermaid, Inc.§ | 2,000 | 34,140 | |||||||||
| NVR, Inc.*§ | 100 | 71,805 | |||||||||
| Pulte Group, Inc.*§ | 2,500 | 32,725 | |||||||||
| Stanley Black & Decker, Inc. | 1,110 | 68,987 | |||||||||
| Toll Brothers, Inc.*§ | 1,200 | 27,084 | |||||||||
| Whirlpool Corp. | 600 | 65,322 | |||||||||
| 521,914 | |||||||||||
| Household Products (0.3%) | |||||||||||
| Colgate-Palmolive Co. | 200 | 16,820 | |||||||||
| Kimberly-Clark Corp. | 700 | 42,882 | |||||||||
| The Procter & Gamble Co. | 7,600 | 472,416 | |||||||||
| 532,118 | |||||||||||
| Independent Power Producers & Energy Traders (3.0%) | |||||||||||
| Calpine Corp.* | 900 | 12,267 | |||||||||
| Constellation Energy Group, Inc. | 139,800 | 4,941,930 | |||||||||
| Mirant Corp.* | 1,578 | 18,399 | |||||||||
| RRI Energy, Inc.*§ | 10,500 | 42,735 | |||||||||
| The AES Corp.* | 1,200 | 13,848 | |||||||||
| 5,029,179 | |||||||||||
| Industrial Conglomerates (1.9%) | |||||||||||
| 3M Co. | 300 | 26,601 | |||||||||
| Carlisle Cos., Inc. | 300 | 11,319 | |||||||||
| General Electric Co. | 169,600 | 3,198,656 | |||||||||
| Textron, Inc.§ | 2,100 | 47,964 | |||||||||
| 3,284,540 | |||||||||||
| Insurance (4.0%) | |||||||||||
| Allied World Assurance Co. Holdings, Ltd. | 1,500 | 65,355 | |||||||||
| American Financial Group, Inc. | 600 | 17,658 | |||||||||
| American International Group, Inc.*§ | 8,300 | 322,870 | |||||||||
| American National Insurance Co. | 100 | 11,016 | |||||||||
| AON Corp. | 2,200 | 93,412 | |||||||||
See Accompanying Notes to Financial Statements.
21
Credit Suisse Large Cap Value Fund
Schedule of Investments (continued)
April 30, 2010 (unaudited)
| Number of Shares | Value | ||||||||||
| COMMON STOCKS | |||||||||||
| Insurance | |||||||||||
| Arch Capital Group, Ltd.* | 1,400 | $ | 105,812 | ||||||||
| Aspen Insurance Holdings, Ltd. | 2,600 | 70,148 | |||||||||
| Assurant, Inc. | 800 | 29,144 | |||||||||
| Axis Capital Holdings, Ltd. | 2,900 | 90,393 | |||||||||
| Chubb Corp. | 2,800 | 148,036 | |||||||||
| Cincinnati Financial Corp.§ | 1,400 | 39,760 | |||||||||
| CNA Financial Corp.*§ | 400 | 11,248 | |||||||||
| Endurance Specialty Holdings, Ltd. | 100 | 3,685 | |||||||||
| Erie Indemnity Co. Class A§ | 906 | 41,957 | |||||||||
| Everest Re Group, Ltd. | 1,900 | 145,635 | |||||||||
| Fidelity National Financial, Inc. Class A | 1,500 | 22,770 | |||||||||
| First American Corp. | 900 | 31,113 | |||||||||
| Genworth Financial, Inc. Class A* | 146,500 | 2,420,180 | |||||||||
| Hanover Insurance Group, Inc. | 500 | 22,525 | |||||||||
| Hartford Financial Services Group, Inc. | 6,300 | 179,991 | |||||||||
| HCC Insurance Holdings, Inc. | 1,100 | 29,909 | |||||||||
| Lincoln National Corp. | 1,900 | 58,121 | |||||||||
| Loews Corp. | 2,604 | 96,973 | |||||||||
| Marsh & McLennan Cos., Inc. | 3,500 | 84,770 | |||||||||
| MBIA, Inc.*§ | 57,100 | 547,018 | |||||||||
| MetLife, Inc. | 4,300 | 195,994 | |||||||||
| Old Republic International Corp. | 1,800 | 27,018 | |||||||||
| OneBeacon Insurance Group, Ltd. Class A§ | 600 | 9,732 | |||||||||
| PartnerRe, Ltd. | 2,400 | 186,192 | |||||||||
| Principal Financial Group, Inc. | 13,900 | 406,158 | |||||||||
| Protective Life Corp. | 700 | 16,849 | |||||||||
| Prudential Financial, Inc. | 1,800 | 114,408 | |||||||||
| Reinsurance Group of America, Inc.§ | 400 | 20,652 | |||||||||
| RenaissanceRe Holdings, Ltd. | 1,800 | 100,710 | |||||||||
| StanCorp Financial Group, Inc.§ | 500 | 22,480 | |||||||||
| The Allstate Corp. | 4,100 | 133,947 | |||||||||
| The Progressive Corp. | 4,800 | 96,432 | |||||||||
| The Travelers Cos., Inc. | 5,500 | 279,070 | |||||||||
| Torchmark Corp.§ | 600 | 32,124 | |||||||||
| Transatlantic Holdings, Inc. | 324 | 16,113 | |||||||||
| Unitrin, Inc.§ | 638 | 18,661 | |||||||||
| Unum Group | 2,600 | 63,622 | |||||||||
| Validus Holdings, Ltd. | 2,500 | 63,925 | |||||||||
| W.R. Berkley Corp.§ | 700 | 18,900 | |||||||||
| Wesco Financial Corp. | 100 | 37,905 | |||||||||
| White Mountains Insurance Group, Ltd. | 200 | 68,720 | |||||||||
| XL Capital, Ltd. Class A | 7,600 | 135,280 | |||||||||
| 6,754,391 | |||||||||||
| Internet & Catalog Retail (1.0%) | |||||||||||
| Amazon.com, Inc.* | 100 | 13,706 | |||||||||
| Expedia, Inc. | 61,000 | 1,440,210 | |||||||||
| Liberty Media Corp. - Interactive Class A* | 5,000 | 76,850 | |||||||||
See Accompanying Notes to Financial Statements.
22
Credit Suisse Large Cap Value Fund
Schedule of Investments (continued)
April 30, 2010 (unaudited)
| Number of Shares | Value | ||||||||||
| COMMON STOCKS | |||||||||||
| Internet & Catalog Retail | |||||||||||
| priceline.com, Inc.* | 400 | $ | 104,820 | ||||||||
| 1,635,586 | |||||||||||
| Internet Software & Services (0.9%) | |||||||||||
| AOL, Inc.* | 14,263 | 333,184 | |||||||||
| eBay, Inc.* | 30,700 | 730,967 | |||||||||
| Google, Inc. Class A* | 300 | 157,632 | |||||||||
| Monster Worldwide, Inc.*§ | 200 | 3,486 | |||||||||
| Sohu.com, Inc.*§ | 6,300 | 303,345 | |||||||||
| Yahoo!, Inc.* | 300 | 4,959 | |||||||||
| 1,533,573 | |||||||||||
| IT Services (0.9%) | |||||||||||
| Amdocs, Ltd.* | 4,800 | 153,312 | |||||||||
| Broadridge Financial Solutions, Inc. | 512 | 12,191 | |||||||||
| Computer Sciences Corp.* | 1,200 | 62,868 | |||||||||
| Convergys Corp.*§ | 300 | 3,792 | |||||||||
| Global Payments, Inc. | 269 | 11,516 | |||||||||
| International Business Machines Corp. | 300 | 38,700 | |||||||||
| Mastercard, Inc. Class A | 2,100 | 520,884 | |||||||||
| SAIC, Inc.* | 700 | 12,187 | |||||||||
| The Western Union Co. | 34,000 | 620,500 | |||||||||
| 1,435,950 | |||||||||||
| Leisure Equipment & Products (0.1%) | |||||||||||
| Hasbro, Inc. | 800 | 30,688 | |||||||||
| Mattel, Inc. | 3,900 | 89,895 | |||||||||
| 120,583 | |||||||||||
| Life Sciences Tools & Services (0.1%) | |||||||||||
| PerkinElmer, Inc. | 600 | 15,030 | |||||||||
| Thermo Fisher Scientific, Inc.* | 3,000 | 165,840 | |||||||||
| Waters Corp.* | 254 | 18,285 | |||||||||
| 199,155 | |||||||||||
| Machinery (0.8%) | |||||||||||
| AGCO Corp.*§ | 700 | 24,514 | |||||||||
| Bucyrus International, Inc. | 700 | 44,107 | |||||||||
| Caterpillar, Inc. | 2,300 | 156,607 | |||||||||
| Cummins, Inc. | 1,100 | 79,453 | |||||||||
| Danaher Corp. | 700 | 58,996 | |||||||||
| Deere & Co. | 2,600 | 155,532 | |||||||||
| Dover Corp. | 400 | 20,888 | |||||||||
| Eaton Corp. | 1,300 | 100,308 | |||||||||
| Gardner Denver, Inc. | 376 | 18,909 | |||||||||
| Illinois Tool Works, Inc. | 3,500 | 178,850 | |||||||||
| Kennametal, Inc.§ | 500 | 16,430 | |||||||||
| Lincoln Electric Holdings, Inc. | 300 | 17,982 | |||||||||
| Oshkosh Corp.* | 2,500 | 96,550 | |||||||||
See Accompanying Notes to Financial Statements.
23
Credit Suisse Large Cap Value Fund
Schedule of Investments (continued)
April 30, 2010 (unaudited)
| Number of Shares | Value | ||||||||||
| COMMON STOCKS | |||||||||||
| Machinery | |||||||||||
| Parker Hannifin Corp. | 1,300 | $ | 89,934 | ||||||||
| Pentair, Inc.§ | 500 | 18,080 | |||||||||
| Snap-on, Inc. | 300 | 14,454 | |||||||||
| SPX Corp. | 300 | 20,964 | |||||||||
| Terex Corp.*§ | 800 | 21,216 | |||||||||
| The Manitowoc Co., Inc.§ | 5,300 | 74,253 | |||||||||
| The Timken Co. | 1,000 | 35,180 | |||||||||
| Toro Co.§ | 300 | 17,082 | |||||||||
| Trinity Industries, Inc.§ | 700 | 17,423 | |||||||||
| WABCO Holdings, Inc.* | 275 | 9,127 | |||||||||
| 1,286,839 | |||||||||||
| Marine (0.0%) | |||||||||||
| Alexander & Baldwin, Inc.§ | 400 | 14,232 | |||||||||
| Kirby Corp.*§ | 300 | 12,624 | |||||||||
| 26,856 | |||||||||||
| Media (4.8%) | |||||||||||
| Cablevision Systems Corp. Group A | 1,500 | 41,160 | |||||||||
| CBS Corp. Class B | 4,800 | 77,808 | |||||||||
| Central European Media Enterprises, Ltd. Class A* | 1,100 | 37,400 | |||||||||
| Clear Channel Outdoor Holdings, Inc. Class A*§ | 1,300 | 15,054 | |||||||||
| Comcast Corp. Class A | 23,900 | 471,786 | |||||||||
| CTC Media, Inc. | 3,100 | 52,359 | |||||||||
| DIRECTV Class A* | 12,900 | 467,367 | |||||||||
| DISH Network Corp. Class A | 63,200 | 1,399,880 | |||||||||
| DreamWorks Animation SKG, Inc. Class A* | 700 | 27,783 | |||||||||
| Gannett Co., Inc. | 145,000 | 2,467,900 | |||||||||
| Interpublic Group of Cos., Inc.* | 4,100 | 36,531 | |||||||||
| John Wiley & Sons, Inc. Class A | 344 | 14,541 | |||||||||
| Lamar Advertising Co. Class A* | 400 | 14,888 | |||||||||
| Liberty Global, Inc. Class A*§ | 2,100 | 57,561 | |||||||||
| Liberty Media Corp. - Capital Series A*§ | 16,800 | 743,736 | |||||||||
| Liberty Media Corp. - Starz Series A* | 1,280 | 70,899 | |||||||||
| Madison Square Garden, Inc.* | 475 | 9,856 | |||||||||
| News Corp. Class A | 17,900 | 276,018 | |||||||||
| Scripps Networks Interactive, Inc. Class A | 300 | 13,602 | |||||||||
| The McGraw-Hill Cos., Inc. | 5,900 | 198,948 | |||||||||
| The New York Times Co. Class A*§ | 700 | 6,944 | |||||||||
| The Walt Disney Co. | 13,949 | 513,881 | |||||||||
| The Washington Post Co. Class B | 100 | 50,716 | |||||||||
| Time Warner Cable, Inc. | 2,800 | 157,500 | |||||||||
| Time Warner, Inc. | 16,200 | 535,896 | |||||||||
| Viacom, Inc. Class B* | 3,900 | 137,787 | |||||||||
| Virgin Media, Inc.§ | 8,800 | 154,792 | |||||||||
| Warner Music Group Corp.* | 100 | 685 | |||||||||
| 8,053,278 | |||||||||||
See Accompanying Notes to Financial Statements.
24
Credit Suisse Large Cap Value Fund
Schedule of Investments (continued)
April 30, 2010 (unaudited)
| Number of Shares | Value | ||||||||||
| COMMON STOCKS | |||||||||||
| Metals & Mining (3.4%) | |||||||||||
| AK Steel Holding Corp.§ | 900 | $ | 15,075 | ||||||||
| Alcoa, Inc.§ | 3,900 | 52,416 | |||||||||
| Allegheny Technologies, Inc.§ | 800 | 42,776 | |||||||||
| Carpenter Technology Corp. | 400 | 15,708 | |||||||||
| Cliffs Natural Resources, Inc. | 900 | 56,277 | |||||||||
| Commercial Metals Co. | 800 | 11,904 | |||||||||
| Freeport-McMoRan Copper & Gold, Inc. | 69,200 | 5,226,676 | |||||||||
| Nucor Corp. | 2,400 | 108,768 | |||||||||
| Reliance Steel & Aluminum Co. | 700 | 34,167 | |||||||||
| Royal Gold, Inc. | 300 | 15,354 | |||||||||
| Southern Copper Corp. | 300 | 9,174 | |||||||||
| Steel Dynamics, Inc. | 1,700 | 26,707 | |||||||||
| Titanium Metals Corp.* | 200 | 3,084 | |||||||||
| United States Steel Corp. | 1,100 | 60,126 | |||||||||
| 5,678,212 | |||||||||||
| Multi-Utilities (0.7%) | |||||||||||
| Alliant Energy Corp.§ | 800 | 27,360 | |||||||||
| Ameren Corp. | 1,900 | 49,324 | |||||||||
| CenterPoint Energy, Inc. | 100 | 1,436 | |||||||||
| CMS Energy Corp.§ | 2,200 | 35,772 | |||||||||
| Consolidated Edison, Inc. | 2,200 | 99,440 | |||||||||
| Dominion Resources, Inc. | 4,400 | 183,920 | |||||||||
| DTE Energy Co. | 1,400 | 67,438 | |||||||||
| Integrys Energy Group, Inc.§ | 400 | 19,844 | |||||||||
| MDU Resources Group, Inc. | 1,300 | 27,560 | |||||||||
| NiSource, Inc. | 2,400 | 39,120 | |||||||||
| NSTAR§ | 1,038 | 37,991 | |||||||||
| OGE Energy Corp. | 600 | 24,828 | |||||||||
| PG&E Corp. | 2,900 | 127,020 | |||||||||
| Public Service Enterprise Group, Inc. | 4,084 | 131,219 | |||||||||
| SCANA Corp. | 800 | 31,576 | |||||||||
| Sempra Energy | 1,924 | 94,622 | |||||||||
| TECO Energy, Inc. | 1,600 | 27,088 | |||||||||
| Vectren Corp.§ | 500 | 12,505 | |||||||||
| Wisconsin Energy Corp. | 800 | 42,008 | |||||||||
| Xcel Energy, Inc. | 3,500 | 76,125 | |||||||||
| 1,156,196 | |||||||||||
| Multiline Retail (2.1%) | |||||||||||
| 99 Cents Only Stores*§ | 300 | 4,656 | |||||||||
| Big Lots, Inc.*§ | 800 | 30,560 | |||||||||
| Dollar Tree, Inc.* | 800 | 48,576 | |||||||||
| Family Dollar Stores, Inc.§ | 400 | 15,824 | |||||||||
| J.C. Penney Co., Inc. | 1,700 | 49,589 | |||||||||
| Kohl's Corp.* | 3,500 | 192,465 | |||||||||
| Macy's, Inc. | 112,400 | 2,607,680 | |||||||||
| Nordstrom, Inc. | 13,100 | 541,423 | |||||||||
| Sears Holdings Corp.*§ | 500 | 60,475 | |||||||||
See Accompanying Notes to Financial Statements.
25
Credit Suisse Large Cap Value Fund
Schedule of Investments (continued)
April 30, 2010 (unaudited)
| Number of Shares | Value | ||||||||||
| COMMON STOCKS | |||||||||||
| Multiline Retail | |||||||||||
| Target Corp. | 438 | $ | 24,909 | ||||||||
| 3,576,157 | |||||||||||
| Office Electronics (0.1%) | |||||||||||
| Xerox Corp. | 8,361 | 91,135 | |||||||||
| Oil, Gas & Consumable Fuels (12.2%) | |||||||||||
| Anadarko Petroleum Corp. | 3,800 | 236,208 | |||||||||
| Apache Corp. | 2,600 | 264,576 | |||||||||
| Arch Coal, Inc. | 1,200 | 32,400 | |||||||||
| Cabot Oil & Gas Corp. | 800 | 28,904 | |||||||||
| Chesapeake Energy Corp. | 4,600 | 109,480 | |||||||||
| Chevron Corp. | 27,300 | 2,223,312 | |||||||||
| Cimarex Energy Co. | 700 | 47,656 | |||||||||
| CNX Gas Corp.*§ | 2,700 | 103,329 | |||||||||
| Cobalt International Energy, Inc.* | 1,300 | 14,963 | |||||||||
| Comstock Resources, Inc.*§ | 400 | 12,824 | |||||||||
| Concho Resources, Inc.*§ | 600 | 34,092 | |||||||||
| ConocoPhillips | 11,100 | 657,009 | |||||||||
| Consol Energy, Inc. | 3,600 | 160,848 | |||||||||
| Continental Resources, Inc.*§ | 27,400 | 1,346,984 | |||||||||
| Denbury Resources, Inc.*§ | 2,745 | 52,567 | |||||||||
| Devon Energy Corp. | 3,300 | 222,189 | |||||||||
| El Paso Corp. | 3,800 | 45,980 | |||||||||
| Enterprise Products Partners LP | 14,400 | 510,624 | |||||||||
| EOG Resources, Inc. | 2,100 | 235,452 | |||||||||
| EXCO Resources, Inc. | 18,800 | 348,740 | |||||||||
| Exxon Mobil Corp. | 77,500 | 5,258,375 | |||||||||
| Forest Oil Corp.* | 500 | 14,650 | |||||||||
| Frontline, Ltd.§ | 1,600 | 58,400 | |||||||||
| Hess Corp. | 2,200 | 139,810 | |||||||||
| Marathon Oil Corp. | 5,400 | 173,610 | |||||||||
| Murphy Oil Corp. | 1,400 | 84,210 | |||||||||
| Newfield Exploration Co.* | 1,300 | 75,647 | |||||||||
| Noble Energy, Inc. | 1,300 | 99,320 | |||||||||
| Occidental Petroleum Corp. | 76,700 | 6,800,222 | |||||||||
| Overseas Shipholding Group, Inc.§ | 300 | 15,018 | |||||||||
| Pioneer Natural Resources Co.§ | 800 | 51,304 | |||||||||
| Plains Exploration & Production Co.* | 500 | 14,655 | |||||||||
| Range Resources Corp.§ | 1,200 | 57,312 | |||||||||
| SandRidge Energy, Inc.*§ | 1,100 | 8,261 | |||||||||
| Southern Union Co. | 800 | 20,904 | |||||||||
| Spectra Energy Corp. | 4,700 | 109,698 | |||||||||
| St. Mary Land & Exploration Co.§ | 300 | 12,072 | |||||||||
| Sunoco, Inc. | 900 | 29,502 | |||||||||
| Teekay Corp. | 800 | 20,040 | |||||||||
| Tesoro Corp.§ | 30,300 | 398,445 | |||||||||
| The Williams Cos., Inc. | 4,600 | 108,606 | |||||||||
| Valero Energy Corp. | 4,200 | 87,318 | |||||||||
See Accompanying Notes to Financial Statements.
26
Credit Suisse Large Cap Value Fund
Schedule of Investments (continued)
April 30, 2010 (unaudited)
| Number of Shares | Value | ||||||||||
| COMMON STOCKS | |||||||||||
| Oil, Gas & Consumable Fuels | |||||||||||
| Whiting Petroleum Corp.* | 400 | $ | 36,132 | ||||||||
| XTO Energy, Inc. | 4,600 | 218,592 | |||||||||
| 20,580,240 | |||||||||||
| Paper & Forest Products (1.8%) | |||||||||||
| Domtar Corp.* | 100 | 7,084 | |||||||||
| International Paper Co. | 107,500 | 2,874,550 | |||||||||
| MeadWestvaco Corp. | 1,400 | 38,038 | |||||||||
| Schweitzer-Mauduit International, Inc.§ | 95 | 5,407 | |||||||||
| Weyerhaeuser Co. | 1,700 | 84,184 | |||||||||
| 3,009,263 | |||||||||||
| Personal Products (2.0%) | |||||||||||
| NBTY, Inc.* | 10,000 | 406,800 | |||||||||
| The Estee Lauder Cos., Inc. Class A | 45,500 | 2,999,360 | |||||||||
| 3,406,160 | |||||||||||
| Pharmaceuticals (5.2%) | |||||||||||
| Bristol-Myers Squibb Co. | 15,600 | 394,524 | |||||||||
| Eli Lilly & Co. | 4,100 | 143,377 | |||||||||
| Endo Pharmaceuticals Holdings, Inc.* | 100,600 | 2,203,140 | |||||||||
| Forest Laboratories, Inc.* | 43,000 | 1,172,180 | |||||||||
| Johnson & Johnson | 4,700 | 302,210 | |||||||||
| King Pharmaceuticals, Inc.* | 71,200 | 697,760 | |||||||||
| Medicis Pharmaceutical Corp. Class A§ | 47,068 | 1,194,586 | |||||||||
| Merck & Co., Inc. | 25,661 | 899,161 | |||||||||
| Mylan, Inc.*§ | 15,300 | 337,059 | |||||||||
| Pfizer, Inc. | 77,897 | 1,302,438 | |||||||||
| Teva Pharmaceutical Industries, Ltd. ADR | 3,022 | 177,482 | |||||||||
| Watson Pharmaceuticals, Inc.* | 800 | 34,256 | |||||||||
| 8,858,173 | |||||||||||
| Professional Services (0.0%) | |||||||||||
| Manpower, Inc. | 600 | 33,660 | |||||||||
| Verisk Analytics, Inc. Class A* | 800 | 22,416 | |||||||||
| 56,076 | |||||||||||
| Real Estate Investment Trusts (2.5%) | |||||||||||
| Alexandria Real Estate Equities, Inc.§ | 300 | 21,243 | |||||||||
| AMB Property Corp. | 1,100 | 30,646 | |||||||||
| Annaly Capital Management, Inc. | 147,200 | 2,495,040 | |||||||||
| Apartment Investment & Management Co. Class A§ | 904 | 20,259 | |||||||||
| AvalonBay Communities, Inc.§ | 531 | 55,245 | |||||||||
| Boston Properties, Inc. | 1,100 | 86,746 | |||||||||
| Brandywine Realty Trust | 900 | 11,466 | |||||||||
| BRE Properties, Inc. | 300 | 12,528 | |||||||||
| Camden Property Trust§ | 400 | 19,372 | |||||||||
| Chimera Investment Corp. | 20,000 | 81,400 | |||||||||
| Corporate Office Properties Trust§ | 300 | 12,135 | |||||||||
| Cousins Properties, Inc. | 1 | 8 | |||||||||
See Accompanying Notes to Financial Statements.
27
Credit Suisse Large Cap Value Fund
Schedule of Investments (continued)
April 30, 2010 (unaudited)
| Number of Shares | Value | ||||||||||
| COMMON STOCKS | |||||||||||
| Real Estate Investment Trusts | |||||||||||
| Douglas Emmett, Inc. | 900 | $ | 15,066 | ||||||||
| Duke Realty Corp.§ | 1,700 | 23,001 | |||||||||
| EastGroup Properties, Inc.§ | 200 | 8,176 | |||||||||
| Equity Residential | 2,200 | 99,594 | |||||||||
| Essex Property Trust, Inc.§ | 300 | 31,746 | |||||||||
| Federal Realty Investment Trust§ | 300 | 23,217 | |||||||||
| HCP, Inc. | 1,600 | 51,392 | |||||||||
| Health Care REIT, Inc. | 600 | 26,958 | |||||||||
| Hospitality Properties Trust§ | 1,200 | 31,788 | |||||||||
| Host Hotels & Resorts, Inc.§ | 4,714 | 76,650 | |||||||||
| HRPT Properties Trust | 1,600 | 12,544 | |||||||||
| Kimco Realty Corp. | 3,000 | 46,770 | |||||||||
| Liberty Property Trust | 800 | 27,048 | |||||||||
| Mack-Cali Realty Corp. | 500 | 17,180 | |||||||||
| Nationwide Health Properties, Inc. | 400 | 14,008 | |||||||||
| Plum Creek Timber Co., Inc.§ | 800 | 31,840 | |||||||||
| ProLogis§ | 3,500 | 46,095 | |||||||||
| Public Storage | 279 | 27,038 | |||||||||
| Rayonier, Inc.§ | 3,438 | 168,393 | |||||||||
| Realty Income Corp.§ | 700 | 22,953 | |||||||||
| Regency Centers Corp.§ | 600 | 24,630 | |||||||||
| Senior Housing Properties Trust | 1,200 | 26,976 | |||||||||
| Simon Property Group, Inc. | 1,433 | 127,566 | |||||||||
| SL Green Realty Corp. | 600 | 37,302 | |||||||||
| Taubman Centers, Inc. | 300 | 13,011 | |||||||||
| The Macerich Co.§ | 654 | 29,240 | |||||||||
| UDR, Inc.§ | 1,130 | 22,950 | |||||||||
| Ventas, Inc. | 1,300 | 61,399 | |||||||||
| Vornado Realty Trust | 1,619 | 134,976 | |||||||||
| Walter Investment Management Corp.§ | 36 | 653 | |||||||||
| Weingarten Realty Investors§ | 700 | 16,184 | |||||||||
| 4,142,432 | |||||||||||
| Real Estate Management & Development (0.0%) | |||||||||||
| Altisource Portfolio Solutions SA*§ | 33 | 797 | |||||||||
| Forest City Enterprises, Inc. Class A*§ | 500 | 7,725 | |||||||||
| Jones Lang LaSalle, Inc. | 300 | 23,664 | |||||||||
| 32,186 | |||||||||||
| Road & Rail (0.3%) | |||||||||||
| CSX Corp. | 3,000 | 168,150 | |||||||||
| Hertz Global Holdings, Inc.*§ | 1,500 | 21,690 | |||||||||
| Kansas City Southern* | 300 | 12,165 | |||||||||
| Landstar System, Inc. | 286 | 12,647 | |||||||||
| Norfolk Southern Corp. | 2,500 | 148,325 | |||||||||
| Ryder System, Inc. | 323 | 15,026 | |||||||||
| Union Pacific Corp. | 1,900 | 143,754 | |||||||||
| 521,757 | |||||||||||
See Accompanying Notes to Financial Statements.
28
Credit Suisse Large Cap Value Fund
Schedule of Investments (continued)
April 30, 2010 (unaudited)
| Number of Shares | Value | ||||||||||
| COMMON STOCKS | |||||||||||
| Semiconductors & Semiconductor Equipment (2.6%) | |||||||||||
| Advanced Micro Devices, Inc.* | 2,200 | $ | 19,932 | ||||||||
| Altera Corp. | 13,700 | 347,432 | |||||||||
| Applied Materials, Inc. | 10,100 | 139,178 | |||||||||
| Atmel Corp.* | 9,600 | 52,224 | |||||||||
| Broadcom Corp. Class A | 11,100 | 382,839 | |||||||||
| Fairchild Semiconductor International, Inc.* | 700 | 7,854 | |||||||||
| Integrated Device Technology, Inc.* | 1,400 | 9,254 | |||||||||
| Intel Corp. | 88,600 | 2,022,738 | |||||||||
| International Rectifier Corp.*§ | 100 | 2,302 | |||||||||
| Intersil Corp. Class A | 300 | 4,464 | |||||||||
| KLA-Tencor Corp. | 1,400 | 47,684 | |||||||||
| Linear Technology Corp.§ | 400 | 12,024 | |||||||||
| LSI Corp.* | 5,100 | 30,702 | |||||||||
| Marvell Technology Group, Ltd.* | 1,600 | 33,040 | |||||||||
| Maxim Integrated Products, Inc. | 800 | 15,536 | |||||||||
| Micron Technology, Inc.*§ | 5,900 | 55,165 | |||||||||
| National Semiconductor Corp. | 8,100 | 119,718 | |||||||||
| Novellus Systems, Inc.*§ | 9,100 | 238,420 | |||||||||
| PMC-Sierra, Inc.* | 1,500 | 13,275 | |||||||||
| Texas Instruments, Inc. | 600 | 15,606 | |||||||||
| Xilinx, Inc. | 30,600 | 788,868 | |||||||||
| 4,358,255 | |||||||||||
| Software (0.4%) | |||||||||||
| Activision Blizzard, Inc. | 53,100 | 588,348 | |||||||||
| Autodesk, Inc.* | 700 | 23,807 | |||||||||
| CA, Inc. | 800 | 18,248 | |||||||||
| Compuware Corp.* | 2,400 | 20,640 | |||||||||
| Microsoft Corp. | 700 | 21,378 | |||||||||
| Novell, Inc.* | 3,500 | 19,635 | |||||||||
| Red Hat, Inc.* | 400 | 11,948 | |||||||||
| Symantec Corp.* | 800 | 13,416 | |||||||||
| Synopsys, Inc.* | 100 | 2,271 | |||||||||
| 719,691 | |||||||||||
| Specialty Retail (1.8%) | |||||||||||
| Aaron's, Inc.§ | 350 | 7,900 | |||||||||
| Abercrombie & Fitch Co. Class A | 300 | 13,119 | |||||||||
| Advance Auto Parts, Inc. | 13,138 | 592,524 | |||||||||
| Aeropostale, Inc.*§ | 24,775 | 719,451 | |||||||||
| AutoNation, Inc.*§ | 700 | 14,140 | |||||||||
| Barnes & Noble, Inc.§ | 500 | 11,020 | |||||||||
| Best Buy Co., Inc. | 800 | 36,480 | |||||||||
| CarMax, Inc.*§ | 500 | 12,285 | |||||||||
| Collective Brands, Inc.* | 800 | 18,760 | |||||||||
| Foot Locker, Inc. | 300 | 4,605 | |||||||||
| GameStop Corp. Class A*§ | 500 | 12,155 | |||||||||
| Home Depot, Inc. | 11,900 | 419,475 | |||||||||
| Lowe's Cos., Inc. | 7,500 | 203,400 | |||||||||
See Accompanying Notes to Financial Statements.
29
Credit Suisse Large Cap Value Fund
Schedule of Investments (continued)
April 30, 2010 (unaudited)
| Number of Shares | Value | ||||||||||
| COMMON STOCKS | |||||||||||
| Specialty Retail | |||||||||||
| Ltd Brands, Inc.§ | 600 | $ | 16,080 | ||||||||
| Office Depot, Inc.* | 1,800 | 12,348 | |||||||||
| Penske Auto Group, Inc.*§ | 3,500 | 52,430 | |||||||||
| RadioShack Corp. | 4,600 | 99,130 | |||||||||
| Ross Stores, Inc.§ | 3,400 | 190,400 | |||||||||
| The Gap, Inc. | 4,100 | 101,393 | |||||||||
| The Gymboree Corp.*§ | 300 | 14,739 | |||||||||
| TJX Cos., Inc. | 300 | 13,902 | |||||||||
| Williams-Sonoma, Inc.§ | 14,000 | 403,200 | |||||||||
| 2,968,936 | |||||||||||
| Textiles, Apparel & Luxury Goods (0.5%) | |||||||||||
| NIKE, Inc. Class B | 427 | 32,414 | |||||||||
| Phillips-Van Heusen Corp. | 300 | 18,903 | |||||||||
| Polo Ralph Lauren Corp. | 200 | 17,980 | |||||||||
| Skechers U.S.A., Inc. Class A* | 17,300 | 663,455 | |||||||||
| The Warnaco Group, Inc.* | 1,900 | 90,896 | |||||||||
| VF Corp. | 400 | 34,568 | |||||||||
| 858,216 | |||||||||||
| Thrifts & Mortgage Finance (0.1%) | |||||||||||
| First Niagara Financial Group, Inc. | 1,200 | 16,680 | |||||||||
| Hudson City Bancorp, Inc. | 1,500 | 19,950 | |||||||||
| New York Community Bancorp, Inc.§ | 2,900 | 47,763 | |||||||||
| People's United Financial, Inc. | 2,600 | 40,378 | |||||||||
| TFS Financial Corp.§ | 200 | 2,828 | |||||||||
| Washington Federal, Inc. | 600 | 12,342 | |||||||||
| 139,941 | |||||||||||
| Tobacco (0.1%) | |||||||||||
| Lorillard, Inc. | 200 | 15,674 | |||||||||
| Philip Morris International, Inc. | 200 | 9,816 | |||||||||
| Reynolds American, Inc. | 1,300 | 69,446 | |||||||||
| 94,936 | |||||||||||
| Trading Companies & Distributors (0.1%) | |||||||||||
| MSC Industrial Direct Co., Inc. Class A | 1,576 | 85,876 | |||||||||
| WESCO International, Inc.*§ | 400 | 16,248 | |||||||||
| 102,124 | |||||||||||
| Water Utilities (0.0%) | |||||||||||
| American Water Works Co., Inc. | 200 | 4,356 | |||||||||
| Aqua America, Inc.§ | 900 | 16,497 | |||||||||
| 20,853 | |||||||||||
| Wireless Telecommunication Services (1.5%) | |||||||||||
| Crown Castle International Corp.* | 1,500 | 56,775 | |||||||||
| NII Holdings, Inc.* | 45,300 | 1,921,626 | |||||||||
| Sprint Nextel Corp.*§ | 83,000 | 352,750 | |||||||||
See Accompanying Notes to Financial Statements.
30
Credit Suisse Large Cap Value Fund
Schedule of Investments (continued)
April 30, 2010 (unaudited)
| Number of Shares | Value | ||||||||||
| COMMON STOCKS | |||||||||||
| Wireless Telecommunication Services | |||||||||||
| Syniverse Holdings, Inc.*§ | 500 | $ | 10,040 | ||||||||
| Telephone & Data Systems, Inc. | 2,300 | 79,718 | |||||||||
| United States Cellular Corp.* | 1,600 | 67,328 | |||||||||
| 2,488,237 | |||||||||||
| TOTAL COMMON STOCKS (Cost $152,603,056) | 167,147,825 | ||||||||||
| SHORT-TERM INVESTMENTS (11.3%) | |||||||||||
| State Street Navigator Prime Portfolio§§ | 16,791,510 | 16,791,510 | |||||||||
| Par (000) | |||||||||||
| State Street Bank and Trust Co. Euro Time Deposit, 0.010%, 05/03/10 | $ | 2,264 | 2,264,000 | ||||||||
| TOTAL SHORT-TERM INVESTMENTS (Cost $19,055,510) | 19,055,510 | ||||||||||
| TOTAL INVESTMENTS AT VALUE (110.2%) (Cost $171,658,566) | 186,203,335 | ||||||||||
| LIABILITIES IN EXCESS OF OTHER ASSETS (-10.2%) | (17,184,151 | ) | |||||||||
| NET ASSETS (100.0%) | $ | 169,019,184 | |||||||||
INVESTMENT ABBREVIATION
ADR = American Depositary Receipt
* Non-income producing security.
§ Security or portion thereof is out on loan.
§§ Represents security purchased with cash collateral received for securities on loan.
See Accompanying Notes to Financial Statements.
31
Credit Suisse Small Cap Core Fund
Schedule of Investments
April 30, 2010 (unaudited)
| Number of Shares | Value | ||||||||||
| COMMON STOCKS (98.8%) | |||||||||||
| Aerospace & Defense (1.2%) | |||||||||||
| AAR Corp.*§ | 2,300 | $ | 56,074 | ||||||||
| Aerovironment, Inc.*§ | 900 | 23,562 | |||||||||
| American Science and Engineering, Inc. | 2,000 | 150,300 | |||||||||
| Applied Signal Technology, Inc.§ | 3,300 | 61,677 | |||||||||
| Ceradyne, Inc.* | 1,600 | 35,520 | |||||||||
| Cubic Corp.§ | 5,096 | 190,132 | |||||||||
| Curtiss-Wright Corp.§ | 2,500 | 89,175 | |||||||||
| Esterline Technologies Corp.*§ | 1,600 | 89,248 | |||||||||
| GenCorp, Inc.*§ | 12,300 | 76,506 | |||||||||
| ITT Corp. | 100 | 5,557 | |||||||||
| Moog, Inc. Class A* | 2,600 | 96,642 | |||||||||
| Orbital Sciences Corp.*§ | 3,300 | 60,654 | |||||||||
| Stanley, Inc.* | 900 | 28,467 | |||||||||
| Teledyne Technologies, Inc.* | 2,000 | 87,200 | |||||||||
| Triumph Group, Inc. | 1,000 | 77,560 | |||||||||
| 1,128,274 | |||||||||||
| Air Freight & Logistics (0.2%) | |||||||||||
| Atlas Air Worldwide Holdings, Inc.* | 100 | 5,527 | |||||||||
| Forward Air Corp.§ | 2,600 | 72,852 | |||||||||
| HUB Group, Inc. Class A* | 2,100 | 67,221 | |||||||||
| 145,600 | |||||||||||
| Airlines (2.2%) | |||||||||||
| Alaska Air Group, Inc.* | 44,752 | 1,853,180 | |||||||||
| Allegiant Travel Co.* | 1,000 | 51,430 | |||||||||
| Continental Airlines, Inc. Class B* | 4,900 | 109,515 | |||||||||
| Skywest, Inc. | 5,100 | 76,398 | |||||||||
| 2,090,523 | |||||||||||
| Auto Components (0.5%) | |||||||||||
| Autoliv, Inc.*§ | 1,600 | 87,600 | |||||||||
| Cooper Tire & Rubber Co.§ | 7,200 | 152,784 | |||||||||
| Drew Industries, Inc.*§ | 1,700 | 43,605 | |||||||||
| Spartan Motors, Inc.§ | 7,000 | 43,190 | |||||||||
| Standard Motor Products, Inc.§ | 4,200 | 44,772 | |||||||||
| Superior Industries International, Inc. | 7,100 | 119,706 | |||||||||
| 491,657 | |||||||||||
| Automobiles (0.3%) | |||||||||||
| Winnebago Industries, Inc.*§ | 18,200 | 302,666 | |||||||||
| Beverages (0.0%) | |||||||||||
| The Boston Beer Co., Inc. Class A*§ | 800 | 45,608 | |||||||||
| Biotechnology (1.0%) | |||||||||||
| Alexion Pharmaceuticals, Inc.* | 1,000 | 54,880 | |||||||||
| Arqule, Inc.*§ | 6,400 | 40,768 | |||||||||
| Cepheid, Inc.*§ | 1,900 | 37,981 | |||||||||
| Cubist Pharmaceuticals, Inc.* | 3,436 | 77,035 | |||||||||
See Accompanying Notes to Financial Statements.
32
Credit Suisse Small Cap Core Fund
Schedule of Investments (continued)
April 30, 2010 (unaudited)
| Number of Shares | Value | ||||||||||
| COMMON STOCKS | |||||||||||
| Biotechnology | |||||||||||
| Emergent Biosolutions, Inc.*§ | 19,100 | $ | 310,948 | ||||||||
| Martek Biosciences Corp.*§ | 2,100 | 46,263 | |||||||||
| Regeneron Pharmaceuticals, Inc.*§ | 10,533 | 268,908 | |||||||||
| Savient Pharmaceuticals, Inc.*§ | 5,100 | 73,950 | |||||||||
| 910,733 | |||||||||||
| Building Products (2.7%) | |||||||||||
| AAON, Inc.§ | 2,700 | 65,178 | |||||||||
| Ameron International Corp.§ | 100 | 6,939 | |||||||||
| Apogee Enterprises, Inc.§ | 6,200 | 85,188 | |||||||||
| Armstrong World Industries, Inc.*§ | 18,800 | 818,740 | |||||||||
| Gibraltar Industries, Inc.* | 6,900 | 103,638 | |||||||||
| Griffon Corp.*§ | 19,134 | 269,789 | |||||||||
| Lennox International, Inc. | 11,000 | 497,860 | |||||||||
| NCI Building Systems, Inc.*§ | 3,800 | 52,364 | |||||||||
| Quanex Building Products Corp.§ | 8,500 | 161,500 | |||||||||
| Simpson Manufacturing Co., Inc.§ | 10,700 | 363,693 | |||||||||
| Universal Forest Products, Inc.§ | 4,400 | 185,020 | |||||||||
| 2,609,909 | |||||||||||
| Capital Markets (0.8%) | |||||||||||
| Greenhill & Co., Inc.§ | 100 | 8,789 | |||||||||
| Investment Technology Group, Inc.*§ | 6,290 | 109,257 | |||||||||
| LaBranche & Co., Inc.*§ | 9,800 | 48,412 | |||||||||
| optionsXpress Holdings, Inc.*§ | 2,500 | 44,375 | |||||||||
| Piper Jaffray Cos.*§ | 7,000 | 275,520 | |||||||||
| Stifel Financial Corp.*§ | 1,700 | 97,461 | |||||||||
| SWS Group, Inc. | 5,900 | 65,313 | |||||||||
| TradeStation Group, Inc.*§ | 8,100 | 67,716 | |||||||||
| 716,843 | |||||||||||
| Chemicals (3.0%) | |||||||||||
| A. Schulman, Inc.§ | 5,876 | 152,835 | |||||||||
| American Vanguard Corp.§ | 5,000 | 40,500 | |||||||||
| Arch Chemicals, Inc.§ | 1,400 | 47,614 | |||||||||
| Ashland, Inc. | 24,300 | 1,447,308 | |||||||||
| Balchem Corp.§ | 6,450 | 167,313 | |||||||||
| Calgon Carbon Corp.*§ | 3,534 | 54,777 | |||||||||
| H.B. Fuller Co. | 2,800 | 65,660 | |||||||||
| Lubrizol Corp. | 100 | 9,034 | |||||||||
| NewMarket Corp. | 4,200 | 462,000 | |||||||||
| OM Group, Inc.*§ | 1,800 | 67,950 | |||||||||
| PolyOne Corp.*§ | 9,000 | 101,790 | |||||||||
| Quaker Chemical Corp.§ | 2,314 | 72,821 | |||||||||
| Stepan Co.§ | 1,700 | 128,775 | |||||||||
| Zep, Inc.§ | 4,800 | 88,512 | |||||||||
| 2,906,889 | |||||||||||
See Accompanying Notes to Financial Statements.
33
Credit Suisse Small Cap Core Fund
Schedule of Investments (continued)
April 30, 2010 (unaudited)
| Number of Shares | Value | ||||||||||
| COMMON STOCKS | |||||||||||
| Commercial Banks (4.5%) | |||||||||||
| Bank of the Ozarks, Inc.§ | 4,500 | $ | 173,115 | ||||||||
| Boston Private Financial Holdings, Inc.§ | 14,400 | 114,192 | |||||||||
| City Holding Co.§ | 900 | 31,536 | |||||||||
| Columbia Banking System, Inc.§ | 6,500 | 146,120 | |||||||||
| Community Bank System, Inc.§ | 2,200 | 54,274 | |||||||||
| East West Bancorp, Inc.§ | 5,930 | 116,169 | |||||||||
| First Bancorp§ | 14,400 | 30,528 | |||||||||
| First Commonwealth Financial Corp.§ | 17,640 | 115,542 | |||||||||
| First Financial Bancorp§ | 10,100 | 193,011 | |||||||||
| First Financial Bankshares, Inc.§ | 8,947 | 478,485 | |||||||||
| First Midwest Bancorp, Inc.§ | 10,150 | 154,280 | |||||||||
| FNB Corp.§ | 6,300 | 58,716 | |||||||||
| Fulton Financial Corp.§ | 5,800 | 60,900 | |||||||||
| Glacier Bancorp, Inc.§ | 4,030 | 74,515 | |||||||||
| Hancock Holding Co.§ | 1,600 | 65,408 | |||||||||
| Home Bancshares, Inc.§ | 1,100 | 30,932 | |||||||||
| Independent Bank Corp./MA§ | 4,700 | 121,918 | |||||||||
| M&T Bank Corp.§ | 17 | 1,485 | |||||||||
| Nara Bancorp, Inc.*§ | 7,200 | 64,800 | |||||||||
| National Penn Bancshares, Inc.§ | 23,200 | 169,824 | |||||||||
| NBT Bancorp, Inc.§ | 2,400 | 58,728 | |||||||||
| Old National Bancorp§ | 7,000 | 93,870 | |||||||||
| Pinnacle Financial Partners, Inc.*§ | 2,900 | 44,312 | |||||||||
| PrivateBancorp, Inc.§ | 9,100 | 130,312 | |||||||||
| Prosperity Bancshares, Inc.§ | 400 | 15,688 | |||||||||
| S&T Bancorp, Inc.§ | 10,600 | 254,930 | |||||||||
| Signature Bank*§ | 2,200 | 88,836 | |||||||||
| Simmons First National Corp. Class A§ | 3,500 | 98,280 | |||||||||
| Sterling Bancorp§ | 5,700 | 61,047 | |||||||||
| Sterling Bancshares, Inc.§ | 22,125 | 130,095 | |||||||||
| Susquehanna Bancshares, Inc.§ | 16,300 | 177,670 | |||||||||
| Tompkins Financial Corp.§ | 1,980 | 80,428 | |||||||||
| Trustmark Corp.§ | 300 | 7,344 | |||||||||
| UMB Financial Corp.§ | 1,700 | 71,604 | |||||||||
| Umpqua Holdings Corp.§ | 10,975 | 163,966 | |||||||||
| United Bankshares, Inc.§ | 3,800 | 110,352 | |||||||||
| United Community Banks, Inc.*§ | 19,102 | 111,556 | |||||||||
| Webster Financial Corp.§ | 8,800 | 182,336 | |||||||||
| Western Alliance Bancorp*§ | 83 | 722 | |||||||||
| Whitney Holding Corp.§ | 5,300 | 72,610 | |||||||||
| Wilshire Bancorp, Inc.§ | 4,400 | 47,784 | |||||||||
| Wintrust Financial Corp.§ | 2,100 | 78,330 | |||||||||
| 4,336,550 | |||||||||||
| Commercial Services & Supplies (2.4%) | |||||||||||
| ABM Industries, Inc.§ | 2,520 | 54,155 | |||||||||
| ATC Technology Corp.*§ | 8,400 | 171,696 | |||||||||
| Bowne & Co., Inc.§ | 22,500 | 251,550 | |||||||||
| Consolidated Graphics, Inc.*§ | 10,459 | 438,337 | |||||||||
See Accompanying Notes to Financial Statements.
34
Credit Suisse Small Cap Core Fund
Schedule of Investments (continued)
April 30, 2010 (unaudited)
| Number of Shares | Value | ||||||||||
| COMMON STOCKS | |||||||||||
| Commercial Services & Supplies | |||||||||||
| G&K Services, Inc. Class A§ | 4,186 | $ | 115,073 | ||||||||
| Healthcare Services Group, Inc.§ | 7,300 | 156,877 | |||||||||
| Interface, Inc. Class A§ | 18,500 | 241,980 | |||||||||
| Mine Safety Appliances Co.§ | 3,000 | 88,170 | |||||||||
| Mobile Mini, Inc.*§ | 8,000 | 132,960 | |||||||||
| SYKES Enterprises, Inc.*§ | 16,200 | 368,226 | |||||||||
| Tetra Tech., Inc.* | 3,700 | 90,095 | |||||||||
| The Geo Group, Inc.*§ | 3,200 | 67,776 | |||||||||
| The Standard Register Co.§ | 3,000 | 15,450 | |||||||||
| United Stationers, Inc.* | 1,500 | 91,830 | |||||||||
| Viad Corp.§ | 1,500 | 35,100 | |||||||||
| 2,319,275 | |||||||||||
| Communications Equipment (1.1%) | |||||||||||
| Acme Packet, Inc.* | 4,900 | 128,086 | |||||||||
| Arris Group, Inc.* | 8,084 | 99,353 | |||||||||
| Bel Fuse, Inc. Class B§ | 2,548 | 59,674 | |||||||||
| Black Box Corp. | 2,200 | 68,618 | |||||||||
| Blue Coat Systems, Inc.*§ | 2,400 | 78,072 | |||||||||
| CommScope, Inc.* | 1,300 | 42,354 | |||||||||
| Comtech Telecommunications Corp.*§ | 1,700 | 53,108 | |||||||||
| Digi International, Inc.*§ | 4,900 | 52,479 | |||||||||
| EMS Technologies, Inc.*§ | 3,700 | 58,793 | |||||||||
| Emulex Corp.* | 700 | 8,225 | |||||||||
| Harmonic, Inc.* | 5,800 | 39,672 | |||||||||
| Netgear, Inc.*§ | 2,300 | 62,238 | |||||||||
| Network Equipment Technologies, Inc.*§ | 6,500 | 33,345 | |||||||||
| PC-Tel, Inc.*§ | 1,900 | 12,369 | |||||||||
| Plantronics, Inc.§ | 200 | 6,640 | |||||||||
| Symmetricom, Inc.*§ | 10,600 | 70,278 | |||||||||
| Tekelec*§ | 3,600 | 65,268 | |||||||||
| Viasat, Inc.*§ | 2,300 | 81,535 | |||||||||
| 1,020,107 | |||||||||||
| Computers & Peripherals (1.5%) | |||||||||||
| 3PAR, Inc.*§ | 400 | 3,732 | |||||||||
| Adaptec, Inc.*§ | 26,900 | 83,121 | |||||||||
| Avid Technology, Inc.*§ | 9,000 | 131,400 | |||||||||
| Compellent Technologies, Inc.*§ | 5,100 | 64,107 | |||||||||
| Hutchinson Technology, Inc.*§ | 5,400 | 32,886 | |||||||||
| Intermec, Inc.*§ | 5,200 | 59,644 | |||||||||
| Intevac, Inc.*§ | 4,700 | 65,424 | |||||||||
| Lexmark International, Inc. Class A*§ | 14,000 | 518,700 | |||||||||
| Novatel Wireless, Inc.*§ | 7,600 | 52,060 | |||||||||
| SanDisk Corp.* | 2,500 | 99,725 | |||||||||
| Stratasys, Inc.* | 4,400 | 104,896 | |||||||||
| Synaptics, Inc.*§ | 2,760 | 84,511 | |||||||||
| Teradata Corp.* | 3,500 | 101,745 | |||||||||
| 1,401,951 | |||||||||||
See Accompanying Notes to Financial Statements.
35
Credit Suisse Small Cap Core Fund
Schedule of Investments (continued)
April 30, 2010 (unaudited)
| Number of Shares | Value | ||||||||||
| COMMON STOCKS | |||||||||||
| Construction & Engineering (0.4%) | |||||||||||
| Comfort Systems USA, Inc.§ | 8,100 | $ | 114,048 | ||||||||
| Dycom Industries, Inc.* | 8,700 | 92,394 | |||||||||
| EMCOR Group, Inc.*§ | 3,600 | 102,816 | |||||||||
| Insituform Technologies, Inc. Class A* | 4,000 | 95,880 | |||||||||
| Orion Marine Group, Inc.*§ | 100 | 1,896 | |||||||||
| 407,034 | |||||||||||
| Construction Materials (0.2%) | |||||||||||
| Eagle Materials, Inc.§ | 2,400 | 76,488 | |||||||||
| Headwaters, Inc.* | 12,200 | 73,200 | |||||||||
| Texas Industries, Inc.§ | 1,582 | 59,863 | |||||||||
| 209,551 | |||||||||||
| Consumer Finance (0.3%) | |||||||||||
| Cash America International, Inc.§ | 1,700 | 63,002 | |||||||||
| EZCORP, Inc. Class A* | 2,900 | 60,059 | |||||||||
| First Cash Financial Services, Inc.* | 2,600 | 57,356 | |||||||||
| World Acceptance Corp.*§ | 3,600 | 127,008 | |||||||||
| 307,425 | |||||||||||
| Containers & Packaging (0.3%) | |||||||||||
| Myers Industries, Inc.§ | 6,100 | 66,246 | |||||||||
| Rock-Tenn Co. Class A§ | 2,100 | 108,360 | |||||||||
| Temple-Inland, Inc. | 4,100 | 95,612 | |||||||||
| 270,218 | |||||||||||
| Distributors (0.0%) | |||||||||||
| Audiovox Corp. Class A*§ | 2,200 | 20,482 | |||||||||
| Diversified Consumer Services (2.3%) | |||||||||||
| American Public Education, Inc.*§ | 1,100 | 46,585 | |||||||||
| Capella Education Co.*§ | 800 | 72,496 | |||||||||
| Career Education Corp.*§ | 2,700 | 79,029 | |||||||||
| Coinstar, Inc.*§ | 1,800 | 79,848 | |||||||||
| Corinthian Colleges, Inc.*§ | 104,900 | 1,638,538 | |||||||||
| DeVry, Inc.§ | 100 | 6,239 | |||||||||
| H&R Block, Inc. | 300 | 5,493 | |||||||||
| Hillenbrand, Inc. | 3,516 | 86,423 | |||||||||
| ITT Educational Services, Inc.*§ | 500 | 50,565 | |||||||||
| Lincoln Educational Services Corp.* | 100 | 2,496 | |||||||||
| Pre-Paid Legal Services, Inc.*§ | 1,500 | 66,705 | |||||||||
| Regis Corp.§ | 100 | 1,912 | |||||||||
| Universal Technical Institute, Inc.* | 4,500 | 107,820 | |||||||||
| 2,244,149 | |||||||||||
| Diversified Financial Services (0.6%) | |||||||||||
| Interactive Brokers Group, Inc. Class A*§ | 16,500 | 282,810 | |||||||||
| MSCI, Inc. Class A* | 200 | 6,930 | |||||||||
| PHH Corp.* | 10,200 | 231,438 | |||||||||
See Accompanying Notes to Financial Statements.
36
Credit Suisse Small Cap Core Fund
Schedule of Investments (continued)
April 30, 2010 (unaudited)
| Number of Shares | Value | ||||||||||
| COMMON STOCKS | |||||||||||
| Diversified Financial Services | |||||||||||
| Portfolio Recovery Associates, Inc.*§ | 1,000 | $ | 66,470 | ||||||||
| 587,648 | |||||||||||
| Diversified Telecommunication Services (0.6%) | |||||||||||
| Cbeyond, Inc.*§ | 5,800 | 89,204 | |||||||||
| Consolidated Communications Holdings, Inc.§ | 1,900 | 35,245 | |||||||||
| General Communication, Inc. Class A*§ | 6,100 | 37,515 | |||||||||
| Iowa Telecommunications Services, Inc.§ | 2,100 | 35,364 | |||||||||
| Neutral Tandem, Inc.*§ | 19,600 | 332,220 | |||||||||
| Premiere Global Services, Inc.*§ | 2,300 | 21,551 | |||||||||
| 551,099 | |||||||||||
| Electric Utilities (0.3%) | |||||||||||
| Allete, Inc.§ | 1,600 | 58,352 | |||||||||
| Central Vermont Public Service Corp.§ | 2,500 | 54,525 | |||||||||
| El Paso Electric Co.*§ | 2,400 | 51,000 | |||||||||
| UIL Holdings Corp. | 1,700 | 49,351 | |||||||||
| Unisource Energy Corp.§ | 2,100 | 69,972 | |||||||||
| 283,200 | |||||||||||
| Electrical Equipment (2.3%) | |||||||||||
| A.O. Smith Corp. | 1,300 | 67,119 | |||||||||
| Acuity Brands, Inc.§ | 2,300 | 103,983 | |||||||||
| AZZ, Inc.§ | 700 | 28,434 | |||||||||
| Baldor Electric Co.§ | 2,200 | 84,502 | |||||||||
| Belden, Inc. | 10,400 | 285,584 | |||||||||
| Brady Corp. Class A§ | 2,900 | 99,644 | |||||||||
| Encore Wire Corp.§ | 1,100 | 24,431 | |||||||||
| EnerSys* | 500 | 12,940 | |||||||||
| General Cable Corp.* | 48,500 | 1,385,645 | |||||||||
| II-VI, Inc.*§ | 1,900 | 68,134 | |||||||||
| Powell Industries, Inc.*§ | 400 | 13,432 | |||||||||
| Regal-Beloit Corp.§ | 100 | 6,327 | |||||||||
| Vicor Corp.*§ | 4,400 | 66,528 | |||||||||
| 2,246,703 | |||||||||||
| Electronic Equipment, Instruments & Components (3.5%) | |||||||||||
| Agilysys, Inc.§ | 4,700 | 50,995 | |||||||||
| Anixter International, Inc.*§ | 1,600 | 83,840 | |||||||||
| Benchmark Electronics, Inc.* | 3,416 | 73,922 | |||||||||
| Brightpoint, Inc.*§ | 29,400 | 237,846 | |||||||||
| Checkpoint Systems, Inc.*§ | 5,100 | 115,209 | |||||||||
| Cognex Corp. | 6,400 | 133,824 | |||||||||
| CTS Corp. | 7,300 | 76,650 | |||||||||
| Daktronics, Inc.§ | 7,900 | 66,202 | |||||||||
| DTS, Inc.*§ | 3,800 | 126,312 | |||||||||
| Electro Scientific Industries, Inc.*§ | 5,900 | 81,243 | |||||||||
| FARO Technologies, Inc.*§ | 3,700 | 93,277 | |||||||||
| Gerber Scientific, Inc.*§ | 5,500 | 39,600 | |||||||||
See Accompanying Notes to Financial Statements.
37
Credit Suisse Small Cap Core Fund
Schedule of Investments (continued)
April 30, 2010 (unaudited)
| Number of Shares | Value | ||||||||||
| COMMON STOCKS | |||||||||||
| Electronic Equipment, Instruments & Components | |||||||||||
| Insight Enterprises, Inc.*§ | 9,900 | $ | 148,797 | ||||||||
| Jabil Circuit, Inc.§ | 18,600 | 284,952 | |||||||||
| Littelfuse, Inc.*§ | 4,400 | 185,812 | |||||||||
| Mercury Computer Systems, Inc.*§ | 5,100 | 65,586 | |||||||||
| Methode Electronics, Inc.§ | 7,900 | 87,690 | |||||||||
| MTS Systems Corp.§ | 3,700 | 110,519 | |||||||||
| Newport Corp.*§ | 8,100 | 95,823 | |||||||||
| Park Electrochemical Corp.§ | 4,400 | 132,924 | |||||||||
| Plexus Corp.* | 2,500 | 92,625 | |||||||||
| Radisys Corp.*§ | 5,400 | 52,866 | |||||||||
| Rogers Corp.*§ | 3,600 | 120,492 | |||||||||
| Sanmina-SCI Corp.* | 11,600 | 206,828 | |||||||||
| Scansource, Inc.*§ | 1,600 | 44,576 | |||||||||
| SYNNEX Corp.*§ | 1,200 | 32,904 | |||||||||
| Tech Data Corp.* | 145 | 6,221 | |||||||||
| Technitrol, Inc. | 9,300 | 50,220 | |||||||||
| TTM Technologies, Inc.*§ | 9,600 | 104,256 | |||||||||
| Vishay Intertechnology, Inc.* | 35,100 | 365,391 | |||||||||
| 3,367,402 | |||||||||||
| Energy Equipment & Services (3.8%) | |||||||||||
| Bristow Group, Inc.*§ | 2,100 | 81,291 | |||||||||
| CARBO Ceramics, Inc.§ | 1,105 | 80,941 | |||||||||
| Complete Production Services, Inc.*§ | 53,100 | 801,279 | |||||||||
| Dresser-Rand Group, Inc.*§ | 215 | 7,585 | |||||||||
| Dril-Quip, Inc.*§ | 1,700 | 98,481 | |||||||||
| FMC Technologies, Inc.* | 1,700 | 115,073 | |||||||||
| Global Industries, Ltd.*§ | 44,958 | 301,219 | |||||||||
| Gulf Island Fabrication, Inc. | 2,800 | 67,116 | |||||||||
| Helix Energy Solutions Group, Inc.* | 64,300 | 937,494 | |||||||||
| Hornbeck Offshore Services, Inc.*§ | 1,300 | 31,811 | |||||||||
| ION Geophysical Corp.* | 25,800 | 155,058 | |||||||||
| Lufkin Industries, Inc.§ | 900 | 76,617 | |||||||||
| Matrix Service Co.* | 5,900 | 62,717 | |||||||||
| Oil States International, Inc.* | 2,700 | 130,437 | |||||||||
| Pioneer Drilling Co.* | 11,866 | 87,096 | |||||||||
| Rowan Cos., Inc.*§ | 12,800 | 381,440 | |||||||||
| SEACOR Holdings, Inc.*§ | 1,240 | 104,371 | |||||||||
| Superior Well Services, Inc.*§ | 4,100 | 59,450 | |||||||||
| Tetra Technologies, Inc.*§ | 5,000 | 61,450 | |||||||||
| 3,640,926 | |||||||||||
| Food & Staples Retailing (0.6%) | |||||||||||
| Casey's General Stores, Inc.§ | 2,800 | 108,164 | |||||||||
| Great Atlantic & Pacific Tea Co.*§ | 17,400 | 140,070 | |||||||||
| Nash Finch Co.§ | 900 | 31,518 | |||||||||
| Spartan Stores, Inc.§ | 1,400 | 21,126 | |||||||||
| The Andersons, Inc. | 4,181 | 151,101 | |||||||||
| United Natural Foods, Inc.*§ | 2,500 | 76,725 | |||||||||
See Accompanying Notes to Financial Statements.
38
Credit Suisse Small Cap Core Fund
Schedule of Investments (continued)
April 30, 2010 (unaudited)
| Number of Shares | Value | ||||||||||
| COMMON STOCKS | |||||||||||
| Food & Staples Retailing | |||||||||||
| Weis Markets, Inc.§ | 100 | $ | 3,728 | ||||||||
| 532,432 | |||||||||||
| Food Products (2.6%) | |||||||||||
| Cal-Maine Foods, Inc. | 700 | 23,366 | |||||||||
| Calavo Growers, Inc.§ | 2,600 | 45,084 | |||||||||
| Chiquita Brands International, Inc.*§ | 49,100 | 738,464 | |||||||||
| Darling International, Inc.* | 11,300 | 107,237 | |||||||||
| Diamond Foods, Inc.§ | 1,700 | 72,607 | |||||||||
| J & J Snack Foods Corp.§ | 5,900 | 274,881 | |||||||||
| Lancaster Colony Corp.§ | 14,002 | 769,690 | |||||||||
| Lance, Inc. | 5,900 | 136,762 | |||||||||
| Mead Johnson Nutrition Co. | 2,488 | 128,406 | |||||||||
| Sanderson Farms, Inc.§ | 1,200 | 68,004 | |||||||||
| The Hain Celestial Group, Inc.*§ | 2,400 | 47,472 | |||||||||
| TreeHouse Foods, Inc.*§ | 2,000 | 84,580 | |||||||||
| 2,496,553 | |||||||||||
| Gas Utilities (0.5%) | |||||||||||
| New Jersey Resources Corp.§ | 2,200 | 83,006 | |||||||||
| Nicor, Inc.§ | 100 | 4,351 | |||||||||
| Northwest Natural Gas Co.§ | 1,400 | 66,346 | |||||||||
| Piedmont Natural Gas Co., Inc.§ | 3,800 | 104,500 | |||||||||
| South Jersey Industries, Inc.§ | 1,600 | 72,176 | |||||||||
| Southwest Gas Corp. | 2,500 | 77,750 | |||||||||
| The Laclede Group, Inc. | 1,200 | 40,896 | |||||||||
| WGL Holdings, Inc.§ | 100 | 3,574 | |||||||||
| 452,599 | |||||||||||
| Health Care Equipment & Supplies (2.9%) | |||||||||||
| Abaxis, Inc.*§ | 4,900 | 126,959 | |||||||||
| Align Technology, Inc.*§ | 31,600 | 536,568 | |||||||||
| American Medical Systems Holdings, Inc.*§ | 8,000 | 143,360 | |||||||||
| Analogic Corp. | 800 | 38,256 | |||||||||
| Cantel Medical Corp.§ | 3,000 | 59,880 | |||||||||
| Conmed Corp.*§ | 1,800 | 40,032 | |||||||||
| CryoLife, Inc.*§ | 6,900 | 42,159 | |||||||||
| Cyberonics, Inc.*§ | 5,205 | 101,654 | |||||||||
| ev3, Inc.* | 6,800 | 130,084 | |||||||||
| Greatbatch, Inc.*§ | 11,240 | 251,102 | |||||||||
| Haemonetics Corp.*§ | 1,400 | 81,004 | |||||||||
| ICU Medical, Inc.* | 1,000 | 35,610 | |||||||||
| Immucor, Inc.*§ | 400 | 8,564 | |||||||||
| Integra LifeSciences Holdings* | 1,200 | 54,516 | |||||||||
| Invacare Corp.§ | 2,500 | 66,075 | |||||||||
| Kensey Nash Corp.*§ | 2,600 | 58,890 | |||||||||
| Meridian Bioscience, Inc.§ | 5,200 | 103,948 | |||||||||
| Merit Medical Systems, Inc.*§ | 6,300 | 101,871 | |||||||||
| Natus Medical, Inc.*§ | 6,300 | 107,352 | |||||||||
See Accompanying Notes to Financial Statements.
39
Credit Suisse Small Cap Core Fund
Schedule of Investments (continued)
April 30, 2010 (unaudited)
| Number of Shares | Value | ||||||||||
| COMMON STOCKS | |||||||||||
| Health Care Equipment & Supplies | |||||||||||
| Neogen Corp.*§ | 5,250 | $ | 138,022 | ||||||||
| Palomar Medical Technologies, Inc.*§ | 4,400 | 55,264 | |||||||||
| SurModics, Inc.*§ | 3,900 | 72,540 | |||||||||
| Symmetry Medical, Inc.*§ | 7,800 | 90,168 | |||||||||
| The Cooper Cos., Inc.§ | 2,400 | 93,336 | |||||||||
| West Pharmaceutical Services, Inc.§ | 1,800 | 75,330 | |||||||||
| Zoll Medical Corp.* | 4,700 | 143,585 | |||||||||
| 2,756,129 | |||||||||||
| Health Care Providers & Services (4.6%) | |||||||||||
| Air Methods Corp.*§ | 2,300 | 76,084 | |||||||||
| Almost Family, Inc.*§ | 1,785 | 75,613 | |||||||||
| Amedisys, Inc.*§ | 1,700 | 97,886 | |||||||||
| AMERIGROUP Corp.*§ | 2,900 | 105,096 | |||||||||
| AMN Healthcare Services, Inc.*§ | 7,000 | 63,980 | |||||||||
| Amsurg Corp.*§ | 1,800 | 37,296 | |||||||||
| Bio-Reference Laboratories, Inc.*§ | 5,000 | 117,000 | |||||||||
| Catalyst Health Solutions, Inc.* | 2,104 | 89,020 | |||||||||
| Centene Corp.*§ | 2,855 | 65,379 | |||||||||
| Chemed Corp.§ | 1,300 | 71,513 | |||||||||
| Corvel Corp.*§ | 1,500 | 49,950 | |||||||||
| Cross Country Healthcare, Inc.*§ | 7,310 | 73,246 | |||||||||
| Genoptix, Inc.*§ | 4,600 | 177,974 | |||||||||
| Gentiva Health Services, Inc.*§ | 4,420 | 126,766 | |||||||||
| Hanger Orthopedic Group, Inc.*§ | 7,000 | 130,480 | |||||||||
| Healthspring, Inc.* | 2,715 | 47,784 | |||||||||
| Healthways, Inc.* | 7,100 | 115,659 | |||||||||
| HMS Holdings Corp.*§ | 1,500 | 80,250 | |||||||||
| Humana, Inc.* | 5,200 | 237,744 | |||||||||
| inVentiv Health, Inc.* | 7,400 | 170,422 | |||||||||
| IPC The Hospitalist Co.* | 3,100 | 96,224 | |||||||||
| Laboratory Corp. of America Holdings*§ | 100 | 7,857 | |||||||||
| Landauer, Inc.§ | 1,800 | 122,670 | |||||||||
| LCA-Vision, Inc.*§ | 3,900 | 32,877 | |||||||||
| LHC Group, Inc.*§ | 16,600 | 566,060 | |||||||||
| Magellan Health Services, Inc.* | 1,894 | 79,946 | |||||||||
| Medcath Corp.*§ | 4,300 | 42,742 | |||||||||
| Mednax, Inc.*§ | 2,600 | 142,844 | |||||||||
| Molina Healthcare, Inc.*§ | 900 | 26,253 | |||||||||
| MWI Veterinary Supply, Inc.* | 2,700 | 113,265 | |||||||||
| Odyssey HealthCare, Inc.* | 7,400 | 154,142 | |||||||||
| PharMerica Corp.*§ | 31,000 | 598,300 | |||||||||
| PSS World Medical, Inc.*§ | 3,400 | 79,662 | |||||||||
| RehabCare Group, Inc.* | 1,586 | 45,233 | |||||||||
| Res-Care, Inc.*§ | 5,950 | 69,258 | |||||||||
| WellCare Health Plans, Inc.* | 8,300 | 237,629 | |||||||||
| 4,424,104 | |||||||||||
See Accompanying Notes to Financial Statements.
40
Credit Suisse Small Cap Core Fund
Schedule of Investments (continued)
April 30, 2010 (unaudited)
| Number of Shares | Value | ||||||||||
| COMMON STOCKS | |||||||||||
| Health Care Technology (0.4%) | |||||||||||
| Computer Programs & Systems, Inc.§ | 2,100 | $ | 94,626 | ||||||||
| Eclipsys Corp.*§ | 3,800 | 78,584 | |||||||||
| Omnicell, Inc.*§ | 7,000 | 93,450 | |||||||||
| Phase Forward, Inc.* | 3,700 | 62,197 | |||||||||
| Quality Systems, Inc.§ | 1,147 | 73,419 | |||||||||
| 402,276 | |||||||||||
| Hotels, Restaurants & Leisure (3.2%) | |||||||||||
| Ameristar Casinos, Inc.§ | 3,900 | 73,437 | |||||||||
| BJ's Restaurants, Inc.*§ | 4,500 | 108,585 | |||||||||
| Bob Evans Farms, Inc. | 15,600 | 482,508 | |||||||||
| Brinker International, Inc. | 800 | 14,816 | |||||||||
| Buffalo Wild Wings, Inc.*§ | 812 | 33,568 | |||||||||
| California Pizza Kitchen, Inc.* | 5,500 | 112,750 | |||||||||
| CEC Entertainment, Inc.*§ | 1,300 | 50,765 | |||||||||
| CKE Restaurants, Inc. | 4,400 | 54,296 | |||||||||
| Cracker Barrel Old Country Store, Inc.§ | 1,400 | 69,118 | |||||||||
| DineEquity, Inc.*§ | 20,000 | 822,600 | |||||||||
| Interval Leisure Group, Inc.*§ | 9,200 | 136,068 | |||||||||
| Jack in the Box, Inc.*§ | 2,900 | 68,208 | |||||||||
| Landry's Restaurants, Inc.*§ | 2,000 | 46,180 | |||||||||
| Marcus Corp.§ | 4,600 | 59,110 | |||||||||
| Multimedia Games, Inc.*§ | 6,100 | 27,877 | |||||||||
| O'Charley's, Inc.*§ | 4,600 | 43,930 | |||||||||
| P.F. Chang's China Bistro, Inc.* | 1,300 | 56,732 | |||||||||
| Papa John's International, Inc.* | 1,200 | 32,880 | |||||||||
| Peet's Coffee & Tea, Inc.*§ | 3,000 | 118,860 | |||||||||
| Pinnacle Entertainment, Inc.* | 13,700 | 185,361 | |||||||||
| Red Robin Gourmet Burgers, Inc.*§ | 3,400 | 82,994 | |||||||||
| Ruby Tuesday, Inc.*§ | 14,100 | 157,779 | |||||||||
| Ruth's Hospitality Group, Inc.* | 6,000 | 32,580 | |||||||||
| Shuffle Master, Inc.*§ | 12,000 | 115,200 | |||||||||
| Sonic Corp.*§ | 3,500 | 40,985 | |||||||||
| Texas Roadhouse, Inc. Class A*§ | 3,000 | 44,340 | |||||||||
| The Cheesecake Factory, Inc.*§ | 300 | 8,151 | |||||||||
| 3,079,678 | |||||||||||
| Household Durables (2.0%) | |||||||||||
| American Greetings Corp. Class A§ | 700 | 17,192 | |||||||||
| Blyth, Inc.§ | 2,900 | 167,156 | |||||||||
| Ethan Allen Interiors, Inc. | 9,500 | 191,900 | |||||||||
| Helen of Troy, Ltd.*§ | 6,700 | 180,967 | |||||||||
| Kid Brands, Inc.*§ | 3,600 | 35,892 | |||||||||
| La-Z-Boy, Inc.*§ | 51,100 | 666,344 | |||||||||
| Leggett & Platt, Inc.§ | 636 | 15,601 | |||||||||
| M/I Homes, Inc.*§ | 4,000 | 62,400 | |||||||||
| Meritage Homes Corp.*§ | 3,400 | 80,852 | |||||||||
| National Presto Industries, Inc.§ | 1,200 | 134,364 | |||||||||
| Skyline Corp.§ | 1,600 | 37,296 | |||||||||
See Accompanying Notes to Financial Statements.
41
Credit Suisse Small Cap Core Fund
Schedule of Investments (continued)
April 30, 2010 (unaudited)
| Number of Shares | Value | ||||||||||
| COMMON STOCKS | |||||||||||
| Household Durables | |||||||||||
| Standard Pacific Corp.*§ | 20,700 | $ | 132,687 | ||||||||
| Tempur-Pedic International, Inc.* | 300 | 10,110 | |||||||||
| Universal Electronics, Inc.* | 1,800 | 38,196 | |||||||||
| Whirlpool Corp. | 1,600 | 174,192 | |||||||||
| 1,945,149 | |||||||||||
| Household Products (0.2%) | |||||||||||
| Central Garden & Pet Co. Class A*§ | 14,000 | 144,620 | |||||||||
| WD-40 Co.§ | 2,000 | 70,460 | |||||||||
| 215,080 | |||||||||||
| Independent Power Producers & Energy Traders (0.2%) | |||||||||||
| Constellation Energy Group, Inc. | 4,200 | 148,470 | |||||||||
| Industrial Conglomerates (0.2%) | |||||||||||
| Standex International Corp. | 2,748 | 65,595 | |||||||||
| Tredegar Corp. | 8,100 | 138,186 | |||||||||
| 203,781 | |||||||||||
| Insurance (1.5%) | |||||||||||
| American Physicians Capital, Inc.§ | 1,800 | 60,192 | |||||||||
| AMERISAFE, Inc.* | 3,900 | 66,690 | |||||||||
| Delphi Financial Group, Inc. Class A§ | 2,800 | 77,000 | |||||||||
| eHealth, Inc.*§ | 2,300 | 31,533 | |||||||||
| Employers Holdings, Inc. | 6,200 | 102,176 | |||||||||
| Infinity Property & Casualty Corp. | 2,500 | 115,325 | |||||||||
| National Financial Partners Corp.*§ | 9,200 | 141,588 | |||||||||
| Navigators Group, Inc.* | 900 | 36,117 | |||||||||
| Presidential Life Corp.§ | 2,348 | 27,659 | |||||||||
| ProAssurance Corp.*§ | 1,800 | 109,710 | |||||||||
| RLI Corp.§ | 900 | 52,200 | |||||||||
| Safety Insurance Group, Inc. | 1,912 | 71,299 | |||||||||
| Selective Insurance Group, Inc. | 18,690 | 312,310 | |||||||||
| Stewart Information Services Corp. | 4,200 | 47,796 | |||||||||
| Tower Group, Inc.§ | 2,500 | 57,650 | |||||||||
| United Fire & Casualty Co.§ | 2,575 | 58,890 | |||||||||
| Zenith National Insurance Corp.§ | 2,300 | 86,986 | |||||||||
| 1,455,121 | |||||||||||
| Internet & Catalog Retail (0.9%) | |||||||||||
| Blue Nile, Inc.*§ | 900 | 48,591 | |||||||||
| Expedia, Inc.§ | 15,900 | 375,399 | |||||||||
| HSN, Inc.*§ | 8,700 | 262,131 | |||||||||
| NutriSystem, Inc.§ | 1,700 | 32,861 | |||||||||
| PetMed Express, Inc.§ | 5,100 | 112,914 | |||||||||
| 831,896 | |||||||||||
See Accompanying Notes to Financial Statements.
42
Credit Suisse Small Cap Core Fund
Schedule of Investments (continued)
April 30, 2010 (unaudited)
| Number of Shares | Value | ||||||||||
| COMMON STOCKS | |||||||||||
| Internet Software & Services (0.8%) | |||||||||||
| comScore, Inc.* | 5,200 | $ | 94,380 | ||||||||
| DealerTrack Holdings, Inc.*§ | 5,900 | 89,975 | |||||||||
| Infospace, Inc.*§ | 7,700 | 80,619 | |||||||||
| j2 Global Communications, Inc.*§ | 2,500 | 60,200 | |||||||||
| Open Text Corp.*§ | 28 | 1,180 | |||||||||
| Perficient, Inc.*§ | 6,400 | 79,808 | |||||||||
| Sohu.com, Inc.*§ | 2,000 | 96,300 | |||||||||
| Stamps.com, Inc.*§ | 2,900 | 30,740 | |||||||||
| The Knot, Inc.*§ | 6,300 | 51,093 | |||||||||
| United Online, Inc.§ | 11,500 | 91,655 | |||||||||
| ValueClick, Inc.*§ | 10,900 | 112,052 | |||||||||
| 788,002 | |||||||||||
| IT Services (2.9%) | |||||||||||
| CACI International, Inc. Class A*§ | 1,600 | 75,888 | |||||||||
| Ciber, Inc.*§ | 16,800 | 66,696 | |||||||||
| CSG Systems International, Inc.*§ | 15,061 | 342,186 | |||||||||
| Cybersource Corp.* | 4,500 | 115,560 | |||||||||
| Fidelity National Information Services, Inc. | 11,200 | 294,448 | |||||||||
| Forrester Research, Inc.* | 2,200 | 70,642 | |||||||||
| Gartner, Inc.*§ | 19,419 | 467,610 | |||||||||
| Global Cash Access Holdings, Inc.* | 12,430 | 107,892 | |||||||||
| Heartland Payment Systems, Inc.§ | 2,100 | 38,598 | |||||||||
| Integral Systems, Inc.*§ | 3,900 | 34,008 | |||||||||
| MAXIMUS, Inc. | 1,000 | 61,910 | |||||||||
| NCI, Inc. Class A*§ | 1,500 | 42,615 | |||||||||
| NeuStar, Inc. Class A*§ | 400 | 9,788 | |||||||||
| StarTek, Inc.*§ | 1,300 | 8,814 | |||||||||
| TeleTech Holdings, Inc.*§ | 2,000 | 33,100 | |||||||||
| VeriFone Holdings, Inc.*§ | 50,100 | 953,403 | |||||||||
| Wright Express Corp.*§ | 2,185 | 74,224 | |||||||||
| 2,797,382 | |||||||||||
| Leisure Equipment & Products (1.5%) | |||||||||||
| Arctic Cat, Inc.*§ | 2,700 | 39,825 | |||||||||
| Brunswick Corp.§ | 20,800 | 434,720 | |||||||||
| Callaway Golf Co.§ | 33,700 | 316,443 | |||||||||
| Jakks Pacific, Inc.*§ | 22,700 | 347,083 | |||||||||
| Polaris Industries, Inc.§ | 2,000 | 118,340 | |||||||||
| Pool Corp. | 2,700 | 66,231 | |||||||||
| RC2 Corp.* | 4,600 | 84,502 | |||||||||
| Sturm, Ruger & Co., Inc.§ | 4,100 | 68,429 | |||||||||
| 1,475,573 | |||||||||||
| Life Sciences Tools & Services (0.6%) | |||||||||||
| Cambrex Corp.*§ | 7,200 | 31,608 | |||||||||
| Dionex Corp.*§ | 3,900 | 318,123 | |||||||||
| Enzo Biochem, Inc.*§ | 8,100 | 48,357 | |||||||||
| eResearchTechnology, Inc.*§ | 9,300 | 68,541 | |||||||||
See Accompanying Notes to Financial Statements.
43
Credit Suisse Small Cap Core Fund
Schedule of Investments (continued)
April 30, 2010 (unaudited)
| Number of Shares | Value | ||||||||||
| COMMON STOCKS | |||||||||||
| Life Sciences Tools & Services | |||||||||||
| Kendle International, Inc.*§ | 3,500 | $ | 57,925 | ||||||||
| Paraxel International Corp.* | 3,700 | 87,246 | |||||||||
| 611,800 | |||||||||||
| Machinery (3.1%) | |||||||||||
| Actuant Corp. Class A§ | 3,900 | 89,427 | |||||||||
| Albany International Corp. Class A§ | 3,400 | 86,598 | |||||||||
| Astec Industries, Inc.*§ | 1,200 | 39,744 | |||||||||
| Badger Meter, Inc.§ | 6,000 | 248,160 | |||||||||
| Barnes Group, Inc.§ | 2,500 | 52,000 | |||||||||
| Briggs & Stratton Corp.§ | 4,000 | 94,960 | |||||||||
| Cascade Corp.§ | 2,700 | 94,122 | |||||||||
| CIRCOR International, Inc.§ | 2,300 | 79,258 | |||||||||
| CLARCOR, Inc. | 2,800 | 105,896 | |||||||||
| Colfax Corp.*§ | 1,200 | 15,660 | |||||||||
| Donaldson Co., Inc.§ | 3,200 | 148,160 | |||||||||
| EnPro Industries, Inc.*§ | 4,700 | 148,426 | |||||||||
| ESCO Technologies, Inc.§ | 5,100 | 157,335 | |||||||||
| Gardner Denver, Inc. | 3,000 | 150,870 | |||||||||
| Graco, Inc.§ | 11,100 | 384,948 | |||||||||
| John Bean Technologies Corp.§ | 6,300 | 115,731 | |||||||||
| Kaydon Corp.§ | 1,900 | 79,097 | |||||||||
| Lindsay Corp.§ | 3,269 | 124,320 | |||||||||
| Lydall, Inc.* | 1,900 | 15,314 | |||||||||
| Mueller Industries, Inc.§ | 2,100 | 62,265 | |||||||||
| Oshkosh Corp.* | 9,500 | 366,890 | |||||||||
| Robbins & Myers, Inc.§ | 1,982 | 51,354 | |||||||||
| Tennant Co.§ | 730 | 25,178 | |||||||||
| The Middleby Corp.*§ | 200 | 12,224 | |||||||||
| Toro Co.§ | 1,900 | 108,186 | |||||||||
| WABCO Holdings, Inc.* | 155 | 5,144 | |||||||||
| Watts Water Technologies, Inc. Class A§ | 3,300 | 117,084 | |||||||||
| 2,978,351 | |||||||||||
| Media (1.1%) | |||||||||||
| Arbitron, Inc.§ | 1,500 | 46,215 | |||||||||
| Dolan Media Co.* | 1,400 | 16,646 | |||||||||
| E.W. Scripps Co. Class A*§ | 7,500 | 82,050 | |||||||||
| Harte-Hanks, Inc.§ | 1,165 | 16,776 | |||||||||
| John Wiley & Sons, Inc. Class A§ | 319 | 13,484 | |||||||||
| Liberty Media Corp. - Capital Series A* | 8,100 | 358,587 | |||||||||
| Live Nation, Inc.*§ | 29,426 | 461,694 | |||||||||
| Scholastic Corp.§ | 1,500 | 40,515 | |||||||||
| Valassis Communications, Inc.* | 300 | 9,807 | |||||||||
| World Wrestling Entertainment, Inc. Class A§ | 1,200 | 21,900 | |||||||||
| 1,067,674 | |||||||||||
See Accompanying Notes to Financial Statements.
44
Credit Suisse Small Cap Core Fund
Schedule of Investments (continued)
April 30, 2010 (unaudited)
| Number of Shares | Value | ||||||||||
| COMMON STOCKS | |||||||||||
| Metals & Mining (0.5%) | |||||||||||
| A.M. Castle & Co.*§ | 3,900 | $ | 53,508 | ||||||||
| AMCOL International Corp.§ | 1,400 | 40,236 | |||||||||
| Brush Engineered Materials, Inc.* | 4,600 | 136,758 | |||||||||
| Century Aluminum Co.*§ | 3,700 | 49,876 | |||||||||
| Hecla Mining Co.*§ | 5,400 | 32,238 | |||||||||
| Olympic Steel, Inc.§ | 2,000 | 63,560 | |||||||||
| Reliance Steel & Aluminum Co. | 100 | 4,881 | |||||||||
| RTI International Metals, Inc.*§ | 1,700 | 45,985 | |||||||||
| Worthington Industries, Inc.§ | 2,055 | 32,818 | |||||||||
| 459,860 | |||||||||||
| Multi-Utilities (0.3%) | |||||||||||
| Avista Corp.§ | 3,200 | 69,216 | |||||||||
| CH Energy Group, Inc.§ | 3,414 | 141,408 | |||||||||
| NorthWestern Corp.§ | 1,800 | 54,396 | |||||||||
| NSTAR§ | 150 | 5,490 | |||||||||
| 270,510 | |||||||||||
| Multiline Retail (1.1%) | |||||||||||
| 99 Cents Only Stores* | 3,412 | 52,954 | |||||||||
| Big Lots, Inc.* | 100 | 3,820 | |||||||||
| Fred's, Inc. Class A§ | 26,000 | 361,140 | |||||||||
| Macy's, Inc. | 25,800 | 598,560 | |||||||||
| Nordstrom, Inc.§ | 100 | 4,133 | |||||||||
| Tuesday Morning Corp.*§ | 7,300 | 41,245 | |||||||||
| 1,061,852 | |||||||||||
| Oil, Gas & Consumable Fuels (1.6%) | |||||||||||
| ATP Oil & Gas Corp.*§ | 17,500 | 319,550 | |||||||||
| Brigham Exploration Co.* | 33,900 | 661,389 | |||||||||
| Consol Energy, Inc. | 200 | 8,936 | |||||||||
| Holly Corp.§ | 2,300 | 62,100 | |||||||||
| Penn Virginia Corp.§ | 2,700 | 68,877 | |||||||||
| Petroleum Development Corp.* | 1,300 | 30,433 | |||||||||
| Petroquest Energy, Inc.*§ | 11,600 | 68,556 | |||||||||
| St. Mary Land & Exploration Co.§ | 3,500 | 140,840 | |||||||||
| Stone Energy Corp.*§ | 2,500 | 40,750 | |||||||||
| Swift Energy Co.*§ | 2,200 | 79,596 | |||||||||
| World Fuel Services Corp.§ | 3,200 | 90,976 | |||||||||
| 1,572,003 | |||||||||||
| Paper & Forest Products (0.6%) | |||||||||||
| Buckeye Technologies, Inc.* | 14,487 | 204,557 | |||||||||
| Clearwater Paper Corp.*§ | 1,300 | 82,784 | |||||||||
| Deltic Timber Corp.§ | 2,000 | 105,240 | |||||||||
| Neenah Paper, Inc.§ | 2,000 | 35,000 | |||||||||
| Schweitzer-Mauduit International, Inc.§ | 1,020 | 58,058 | |||||||||
| Wausau Paper Corp.*§ | 9,100 | 80,535 | |||||||||
| 566,174 | |||||||||||
See Accompanying Notes to Financial Statements.
45
Credit Suisse Small Cap Core Fund
Schedule of Investments (continued)
April 30, 2010 (unaudited)
| Number of Shares | Value | ||||||||||
| COMMON STOCKS | |||||||||||
| Personal Products (0.0%) | |||||||||||
| The Estee Lauder Cos., Inc. Class A | 600 | $ | 39,552 | ||||||||
| Pharmaceuticals (3.6%) | |||||||||||
| Endo Pharmaceuticals Holdings, Inc.* | 3,900 | 85,410 | |||||||||
| Medicis Pharmaceutical Corp. Class A | 112,614 | 2,858,143 | |||||||||
| Mylan, Inc.*§ | 200 | 4,406 | |||||||||
| Par Pharmaceutical Cos., Inc.* | 1,900 | 51,566 | |||||||||
| Salix Pharmaceuticals, Ltd.*§ | 3,000 | 120,600 | |||||||||
| Viropharma, Inc.*§ | 23,591 | 300,078 | |||||||||
| 3,420,203 | |||||||||||
| Professional Services (0.9%) | |||||||||||
| Administaff, Inc.§ | 3,200 | 70,848 | |||||||||
| CDI Corp.§ | 3,200 | 55,776 | |||||||||
| Exponent, Inc.*§ | 3,000 | 89,430 | |||||||||
| Heidrick & Struggles International, Inc. | 3,800 | 100,358 | |||||||||
| Kelly Services, Inc. Class A*§ | 5,900 | 94,872 | |||||||||
| Navigant Consulting, Inc.* | 2,000 | 25,760 | |||||||||
| On Assignment, Inc.*§ | 8,600 | 60,458 | |||||||||
| School Specialty, Inc.*§ | 3,500 | 82,110 | |||||||||
| SFN Group, Inc.* | 10,000 | 85,500 | |||||||||
| TrueBlue, Inc.*§ | 9,900 | 156,321 | |||||||||
| Volt Information Sciences, Inc.*§ | 3,000 | 37,620 | |||||||||
| 859,053 | |||||||||||
| Real Estate Investment Trusts (5.2%) | |||||||||||
| Acadia Realty Trust§ | 2,912 | 55,561 | |||||||||
| American Campus Communities, Inc.§ | 10,300 | 290,151 | |||||||||
| BioMed Realty Trust, Inc.§ | 14,400 | 266,544 | |||||||||
| CBL & Associates Properties, Inc. | 3,400 | 49,640 | |||||||||
| Cedar Shopping Centers, Inc. | 11,200 | 89,152 | |||||||||
| Colonial Properties Trust§ | 6,600 | 104,082 | |||||||||
| Cousins Properties, Inc.§ | 3,959 | 31,910 | |||||||||
| Developers Diversified Realty Corp. | 29,700 | 365,013 | |||||||||
| DiamondRock Hospitality Co.*§ | 20,191 | 221,899 | |||||||||
| DuPont Fabros Technology, Inc. | 1,100 | 24,387 | |||||||||
| EastGroup Properties, Inc.§ | 1,500 | 61,320 | |||||||||
| Entertainment Properties Trust | 3,400 | 148,648 | |||||||||
| Equity Lifestyle Properties, Inc. | 3,000 | 166,530 | |||||||||
| Extra Space Storage, Inc.§ | 14,000 | 210,280 | |||||||||
| Franklin Street Properties Corp.§ | 15,700 | 231,418 | |||||||||
| Hatteras Financial Corp.§ | 300 | 8,001 | |||||||||
| Healthcare Realty Trust, Inc.§ | 5,500 | 132,770 | |||||||||
| Home Properties, Inc.§ | 2,600 | 129,194 | |||||||||
| Inland Real Estate Corp.§ | 19,500 | 183,690 | |||||||||
| Kilroy Realty Corp.§ | 2,700 | 94,662 | |||||||||
| Kite Realty Group Trust | 14,900 | 80,758 | |||||||||
| LaSalle Hotel Properties§ | 3,800 | 100,130 | |||||||||
| Lexington Realty Trust§ | 24,469 | 173,241 | |||||||||
See Accompanying Notes to Financial Statements.
46
Credit Suisse Small Cap Core Fund
Schedule of Investments (continued)
April 30, 2010 (unaudited)
| Number of Shares | Value | ||||||||||
| COMMON STOCKS | |||||||||||
| Real Estate Investment Trusts | |||||||||||
| LTC Properties, Inc. | 5,300 | $ | 147,870 | ||||||||
| Medical Properties Trust, Inc.§ | 18,600 | 186,930 | |||||||||
| Mid-America Apartment Communities, Inc.§ | 1,700 | 93,959 | |||||||||
| National Retail Properties, Inc.§ | 4,500 | 105,885 | |||||||||
| Nationwide Health Properties, Inc.§ | 200 | 7,004 | |||||||||
| Parkway Properties, Inc.§ | 4,900 | 96,530 | |||||||||
| Pennsylvania Real Estate Investment Trust§ | 8,900 | 140,531 | |||||||||
| Post Properties, Inc.§ | 3,000 | 77,280 | |||||||||
| Potlatch Corp.§ | 13,720 | 513,951 | |||||||||
| PS Business Parks, Inc.§ | 1,400 | 84,000 | |||||||||
| Rayonier, Inc.§ | 278 | 13,616 | |||||||||
| Sovran Self Storage, Inc.§ | 2,100 | 77,469 | |||||||||
| Sunstone Hotel Investors, Inc.* | 900 | 11,457 | |||||||||
| Tanger Factory Outlet Centers, Inc.§ | 2,400 | 99,840 | |||||||||
| Urstadt Biddle Properties, Class A§ | 4,700 | 79,242 | |||||||||
| 4,954,545 | |||||||||||
| Real Estate Management & Development (0.2%) | |||||||||||
| Forestar Group, Inc.*§ | 8,100 | 182,574 | |||||||||
| Road & Rail (0.3%) | |||||||||||
| Arkansas Best Corp.§ | 1,500 | 45,690 | |||||||||
| Heartland Express, Inc.§ | 3,100 | 51,274 | |||||||||
| Knight Transportation, Inc.§ | 3,357 | 71,470 | |||||||||
| Landstar System, Inc.§ | 181 | 8,004 | |||||||||
| Marten Transport, Ltd.* | 1,500 | 32,775 | |||||||||
| Old Dominion Freight Line, Inc.*§ | 1,700 | 60,996 | |||||||||
| 270,209 | |||||||||||
| Semiconductors & Semiconductor Equipment (5.9%) | |||||||||||
| Actel Corp.*§ | 5,800 | 90,016 | |||||||||
| Advanced Energy Industries, Inc.* | 7,700 | 113,344 | |||||||||
| Altera Corp.§ | 29,900 | 758,264 | |||||||||
| ATMI, Inc.*§ | 4,700 | 85,211 | |||||||||
| Brooks Automation, Inc.*§ | 14,700 | 142,884 | |||||||||
| Cabot Microelectronics Corp.*§ | 1,400 | 53,704 | |||||||||
| Cohu, Inc.§ | 5,400 | 87,210 | |||||||||
| Cymer, Inc.* | 1,900 | 64,885 | |||||||||
| Cypress Semiconductor Corp.*§ | 8,800 | 113,432 | |||||||||
| Diodes, Inc.* | 3,700 | 79,439 | |||||||||
| DSP Group, Inc.*§ | 4,900 | 40,033 | |||||||||
| Exar Corp.*§ | 9,300 | 68,727 | |||||||||
| FEI Co.*§ | 6,000 | 135,000 | |||||||||
| Hittite Microwave Corp.*§ | 1,300 | 66,664 | |||||||||
| Kopin Corp.*§ | 14,900 | 62,729 | |||||||||
| Kulicke & Soffa Industries, Inc.*§ | 15,700 | 128,740 | |||||||||
| Micrel, Inc.§ | 4,900 | 57,183 | |||||||||
| Microsemi Corp.*§ | 4,703 | 77,882 | |||||||||
| MKS Instruments, Inc.*§ | 4,000 | 90,720 | |||||||||
See Accompanying Notes to Financial Statements.
47
Credit Suisse Small Cap Core Fund
Schedule of Investments (continued)
April 30, 2010 (unaudited)
| Number of Shares | Value | ||||||||||
| COMMON STOCKS | |||||||||||
| Semiconductors & Semiconductor Equipment | |||||||||||
| NVIDIA Corp.*§ | 300 | $ | 4,716 | ||||||||
| Pericom Semiconductor Corp.* | 6,000 | 70,080 | |||||||||
| Rudolph Technologies, Inc.*§ | 6,600 | 62,898 | |||||||||
| Semtech Corp.*§ | 260 | 4,719 | |||||||||
| Sigma Designs, Inc.*§ | 6,100 | 72,346 | |||||||||
| Skyworks Solutions, Inc.*§ | 9,800 | 165,032 | |||||||||
| Standard Microsystems Corp.* | 4,900 | 125,832 | |||||||||
| Supertex, Inc.*§ | 3,019 | 81,543 | |||||||||
| Tessera Technologies, Inc.*§ | 4,100 | 83,148 | |||||||||
| TriQuint Semiconductor, Inc.* | 27,100 | 204,334 | |||||||||
| Ultratech, Inc.*§ | 5,500 | 80,795 | |||||||||
| Varian Semiconductor Equipment Associates, Inc.* | 4,100 | 135,054 | |||||||||
| Veeco Instruments, Inc.*§ | 50,200 | 2,208,298 | |||||||||
| 5,614,862 | |||||||||||
| Software (2.7%) | |||||||||||
| Advent Software, Inc.* | 4,400 | 198,792 | |||||||||
| ANSYS, Inc.* | 2,916 | 131,220 | |||||||||
| Ariba, Inc.*§ | 100 | 1,427 | |||||||||
| AsiaInfo Holdings, Inc.*§ | 4,600 | 130,686 | |||||||||
| Blackbaud, Inc.§ | 3,600 | 82,980 | |||||||||
| CommVault Systems, Inc.* | 6,600 | 138,270 | |||||||||
| Concur Technologies, Inc.*§ | 2,369 | 99,285 | |||||||||
| Ebix, Inc.*§ | 6,600 | 107,382 | |||||||||
| Epicor Software Corp.*§ | 9,600 | 88,128 | |||||||||
| EPIQ Systems, Inc.*§ | 2,900 | 34,945 | |||||||||
| Fair Isaac Corp.§ | 300 | 6,318 | |||||||||
| Interactive Intelligence, Inc.*§ | 2,800 | 55,356 | |||||||||
| JDA Software Group, Inc.* | 2,832 | 81,845 | |||||||||
| Manhattan Associates, Inc.*§ | 5,200 | 149,032 | |||||||||
| Netscout Systems, Inc.* | 4,800 | 69,696 | |||||||||
| Pegasystems, Inc.§ | 200 | 6,334 | |||||||||
| Progress Software Corp.*§ | 2,300 | 74,175 | |||||||||
| Radiant Systems, Inc.*§ | 6,100 | 85,827 | |||||||||
| Red Hat, Inc.* | 100 | 2,987 | |||||||||
| Smith Micro Software, Inc.*§ | 7,100 | 67,379 | |||||||||
| Sonic Solutions* | 6,700 | 84,085 | |||||||||
| Take-Two Interactive Software, Inc.*§ | 30,400 | 330,448 | |||||||||
| Taleo Corp. Class A*§ | 2,400 | 62,352 | |||||||||
| THQ, Inc.*§ | 15,200 | 115,520 | |||||||||
| TiVo, Inc.*§ | 800 | 14,016 | |||||||||
| Tyler Technologies, Inc.*§ | 15,700 | 267,528 | |||||||||
| Ultimate Software Group, Inc.*§ | 500 | 16,725 | |||||||||
| Websense, Inc.*§ | 2,300 | 52,371 | |||||||||
| 2,555,109 | |||||||||||
See Accompanying Notes to Financial Statements.
48
Credit Suisse Small Cap Core Fund
Schedule of Investments (continued)
April 30, 2010 (unaudited)
| Number of Shares | Value | ||||||||||
| COMMON STOCKS | |||||||||||
| Specialty Retail (6.7%) | |||||||||||
| Advance Auto Parts, Inc. | 200 | $ | 9,020 | ||||||||
| Aeropostale, Inc.*§ | 46,349 | 1,345,975 | |||||||||
| Big 5 Sporting Goods Corp.§ | 4,600 | 77,970 | |||||||||
| Brown Shoe Co., Inc.§ | 9,400 | 176,720 | |||||||||
| Cabela's, Inc.*§ | 2,200 | 39,952 | |||||||||
| Christopher & Banks Corp. | 7,700 | 75,383 | |||||||||
| Collective Brands, Inc.*§ | 4,300 | 100,835 | |||||||||
| GameStop Corp. Class A*§ | 300 | 7,293 | |||||||||
| Genesco, Inc.*§ | 4,800 | 159,792 | |||||||||
| Group 1 Automotive, Inc.*§ | 19,600 | 608,580 | |||||||||
| Haverty Furniture Cos., Inc.§ | 4,100 | 66,830 | |||||||||
| Hibbett Sports, Inc.*§ | 1,700 | 46,750 | |||||||||
| HOT Topic, Inc.§ | 40,252 | 307,525 | |||||||||
| J. Crew Group, Inc.*§ | 100 | 4,647 | |||||||||
| Jo-Ann Stores, Inc.*§ | 1,500 | 66,180 | |||||||||
| JOS. A. Bank Clothiers, Inc.*§ | 977 | 59,460 | |||||||||
| Lumber Liquidators Holdings, Inc.*§ | 3,400 | 103,564 | |||||||||
| MarineMax, Inc.*§ | 5,100 | 56,865 | |||||||||
| Midas, Inc.*§ | 2,700 | 31,077 | |||||||||
| Monro Muffler, Inc.§ | 2,000 | 71,720 | |||||||||
| OfficeMax, Inc.*§ | 75,200 | 1,428,800 | |||||||||
| PEP Boys-Manny, Moe & Jack§ | 10,600 | 132,818 | |||||||||
| Rent-A-Center, Inc.*§ | 5,500 | 142,010 | |||||||||
| Ross Stores, Inc.§ | 1,000 | 56,000 | |||||||||
| Sonic Automotive, Inc. Class A*§ | 8,400 | 89,712 | |||||||||
| Stage Stores, Inc. | 8,112 | 123,708 | |||||||||
| Stein Mart, Inc.*§ | 6,300 | 59,724 | |||||||||
| The Buckle, Inc.§ | 1,350 | 48,843 | |||||||||
| The Cato Corp. Class A§ | 4,700 | 111,625 | |||||||||
| The Children's Place Retail Stores, Inc.*§ | 1,500 | 68,730 | |||||||||
| The Dress Barn, Inc.*§ | 5,220 | 144,490 | |||||||||
| The Finish Line, Inc. Class A | 10,900 | 175,599 | |||||||||
| The Gymboree Corp.*§ | 1,600 | 78,608 | |||||||||
| The Men's Wearhouse, Inc.§ | 2,900 | 68,527 | |||||||||
| Tractor Supply Co.§ | 2,000 | 134,340 | |||||||||
| Zale Corp.*§ | 4,800 | 15,648 | |||||||||
| Zumiez, Inc.*§ | 4,500 | 83,520 | |||||||||
| 6,378,840 | |||||||||||
| Textiles, Apparel & Luxury Goods (2.0%) | |||||||||||
| Carter's, Inc.* | 3,300 | 106,326 | |||||||||
| CROCS, Inc.*§ | 19,400 | 187,404 | |||||||||
| Deckers Outdoor Corp.* | 800 | 112,464 | |||||||||
| Iconix Brand Group, Inc.*§ | 4,000 | 69,040 | |||||||||
| Jones Apparel Group, Inc.§ | 22,700 | 493,952 | |||||||||
| K-Swiss, Inc. Class A*§ | 2,900 | 36,076 | |||||||||
| Liz Claiborne, Inc.* | 5,500 | 48,070 | |||||||||
| Lululemon Athletica, Inc.*§ | 300 | 11,286 | |||||||||
| Maidenform Brands, Inc.* | 4,494 | 102,553 | |||||||||
See Accompanying Notes to Financial Statements.
49
Credit Suisse Small Cap Core Fund
Schedule of Investments (continued)
April 30, 2010 (unaudited)
| Number of Shares | Value | ||||||||||
| COMMON STOCKS | |||||||||||
| Textiles, Apparel & Luxury Goods | |||||||||||
| Movado Group, Inc.*§ | 4,200 | $ | 52,122 | ||||||||
| Oxford Industries, Inc.§ | 3,200 | 69,088 | |||||||||
| Perry Ellis International, Inc.*§ | 2,400 | 57,912 | |||||||||
| Phillips-Van Heusen Corp. | 100 | 6,301 | |||||||||
| Polo Ralph Lauren Corp.§ | 100 | 8,990 | |||||||||
| Quiksilver, Inc.* | 28,100 | 149,773 | |||||||||
| Skechers U.S.A., Inc. Class A* | 2,100 | 80,535 | |||||||||
| Steven Madden, Ltd.* | 100 | 5,796 | |||||||||
| The Timberland Co. Class A* | 2,200 | 47,300 | |||||||||
| True Religion Apparel, Inc.* | 1,700 | 53,125 | |||||||||
| Unifirst Corp. | 1,400 | 68,418 | |||||||||
| Volcom, Inc.*§ | 3,900 | 92,976 | |||||||||
| Wolverine World Wide, Inc. | 2,600 | 79,586 | |||||||||
| 1,939,093 | |||||||||||
| Thrifts & Mortgage Finance (0.3%) | |||||||||||
| Bank Mutual Corp.§ | 8,900 | 63,368 | |||||||||
| Brookline Bancorp, Inc.§ | 5,900 | 64,841 | |||||||||
| Dime Community Bancshares§ | 1,700 | 21,675 | |||||||||
| NewAlliance Bancshares, Inc.§ | 111 | 1,447 | |||||||||
| Trustco Bank Corp. NY§ | 23,545 | 156,574 | |||||||||
| 307,905 | |||||||||||
| Tobacco (0.1%) | |||||||||||
| Alliance One International, Inc.*§ | 20,600 | 104,854 | |||||||||
| Universal Corp.§ | 100 | 5,178 | |||||||||
| 110,032 | |||||||||||
| Trading Companies & Distributors (0.8%) | |||||||||||
| Applied Industrial Technologies, Inc.§ | 3,100 | 95,418 | |||||||||
| Beacon Roofing Supply, Inc.*§ | 18,800 | 417,360 | |||||||||
| Kaman Corp.§ | 3,424 | 93,852 | |||||||||
| Lawson Products, Inc.§ | 900 | 14,625 | |||||||||
| MSC Industrial Direct Co., Inc. Class A§ | 455 | 24,793 | |||||||||
| Watsco, Inc.§ | 1,800 | 106,596 | |||||||||
| 752,644 | |||||||||||
| Water Utilities (0.1%) | |||||||||||
| American States Water Co.§ | 1,100 | 41,052 | |||||||||
| California Water Service Group§ | 200 | 7,746 | |||||||||
| 48,798 | |||||||||||
| Wireless Telecommunication Services (0.1%) | |||||||||||
| NTELOS Holdings Corp. | 1,600 | 31,408 | |||||||||
| Syniverse Holdings, Inc.*§ | 100 | 2,008 | |||||||||
| USA Mobility, Inc.*§ | 1,400 | 19,516 | |||||||||
| 52,932 | |||||||||||
| TOTAL COMMON STOCKS (Cost $78,692,707) | 94,641,222 | ||||||||||
See Accompanying Notes to Financial Statements.
50
Credit Suisse Small Cap Core Fund
Schedule of Investments (continued)
April 30, 2010 (unaudited)
| Number of Shares | Value | ||||||||||
| SHORT-TERM INVESTMENTS (47.3%) | |||||||||||
| State Street Navigator Prime Portfolio§§ | 43,821,151 | $ | 43,821,151 | ||||||||
| Par (000) | |||||||||||
| State Street Bank and Trust Co. Euro Time Deposit, 0.010%, 05/03/10 | $ | 1,558 | 1,558,000 | ||||||||
| TOTAL SHORT-TERM INVESTMENTS (Cost $45,379,151) | 45,379,151 | ||||||||||
| TOTAL INVESTMENTS AT VALUE (146.1%) (Cost $124,071,858) | 140,020,373 | ||||||||||
| LIABILITIES IN EXCESS OF OTHER ASSETS (-46.1%) | (44,196,090 | ) | |||||||||
| NET ASSETS (100.0%) | $ | 95,824,283 | |||||||||
* Non-income producing security.
§ Security or portion thereof is out on loan.
§§ Represents security purchased with cash collateral received for securities on loan.
See Accompanying Notes to Financial Statements.
51
Credit Suisse Funds
Statements of Assets and Liabilities
April 30, 2010 (unaudited)
| Large Cap Value Fund | Small Cap Core Fund | ||||||||||
| Assets | |||||||||||
| Investments at value, including collateral for securities on loan of $16,791,510 and $43,821,151, respectively (Cost $171,658,566 and $124,071,858, respectively) (Note 2) | $ | 186,203,3351 | $ | 140,020,3732 | |||||||
| Cash | 5,589 | 430 | |||||||||
| Receivable for investments sold | 5,702,761 | 2,841,014 | |||||||||
| Dividend and interest receivable | 101,354 | 71,495 | |||||||||
| Receivable for fund shares sold | 18,214 | 20,967 | |||||||||
| Prepaid expenses and other assets | 40,723 | 48,939 | |||||||||
| Total Assets | 192,071,976 | 143,003,218 | |||||||||
| Liabilities | |||||||||||
| Advisory fee payable (Note 3) | 80,235 | 55,980 | |||||||||
| Administrative services fee payable (Note 3) | 30,872 | 22,084 | |||||||||
| Shareholder servicing/Distribution fee payable (Note 3) | 40,880 | 26,487 | |||||||||
| Payable upon return of securities loaned (Note 2) | 16,791,510 | 43,821,151 | |||||||||
| Payable for investments purchased | 5,918,156 | 3,111,028 | |||||||||
| Payable for fund shares redeemed | 39,649 | 12,299 | |||||||||
| Trustees' fee payable | 5,571 | 5,629 | |||||||||
| Other accrued expenses payable | 145,919 | 124,277 | |||||||||
| Total Liabilities | 23,052,792 | 47,178,935 | |||||||||
| Net Assets | |||||||||||
| Capital stock, $.001 par value (Note 6) | 13,381 | 8,514 | |||||||||
| Paid-in capital (Note 6) | 192,632,631 | 121,772,948 | |||||||||
| Undistributed (accumulated) net investment income (loss) | 176,321 | (179,277 | ) | ||||||||
| Accumulated net realized loss on investments and foreign currency transactions | (38,347,918 | ) | (41,726,417 | ) | |||||||
| Net unrealized appreciation from investments | 14,544,769 | 15,948,515 | |||||||||
| Net Assets | $ | 169,019,184 | $ | 95,824,283 | |||||||
| Common Shares | |||||||||||
| Net assets | $ | 368,809 | $ | 14,969,660 | |||||||
| Shares outstanding | 29,347 | 1,305,413 | |||||||||
| Net asset value, offering price and redemption price per share | $ | 12.57 | $ | 11.47 | |||||||
| Advisor Shares | |||||||||||
| Net assets | $ | 2,384,093 | N/A | ||||||||
| Shares outstanding | 187,888 | N/A | |||||||||
| Net asset value, offering price and redemption price per share | $ | 12.69 | N/A | ||||||||
See Accompanying Notes to Financial Statements.
52
Credit Suisse Funds
Statements of Assets and Liabilities (continued)
April 30, 2010 (unaudited)
| Large Cap Value Fund | Small Cap Core Fund | ||||||||||
| A Shares | |||||||||||
| Net assets | $ | 162,876,403 | $ | 70,083,102 | |||||||
| Shares outstanding | 12,886,991 | 6,037,101 | |||||||||
| Net asset value and redemption price per share | $ | 12.64 | $ | 11.61 | |||||||
| Maximum offering price per share (net asset value/(1-5.75%)) | $ | 13.41 | $ | 12.32 | |||||||
| B Shares | |||||||||||
| Net assets | $ | 2,321,429 | $ | 2,996,136 | |||||||
| Shares outstanding | 188,786 | 323,643 | |||||||||
| Net asset value and offering price per share | $ | 12.30 | $ | 9.26 | |||||||
| C Shares | |||||||||||
| Net assets | $ | 1,068,450 | $ | 7,775,385 | |||||||
| Shares outstanding | 87,624 | 847,959 | |||||||||
| Net asset value and offering price per share | $ | 12.19 | $ | 9.17 | |||||||
1 Including $16,146,016 of securities on loan.
2 Including $41,151,698 of securities on loan.
See Accompanying Notes to Financial Statements.
53
Credit Suisse Funds
Statements of Operations
For the Six Months Ended April 30, 2010 (unaudited)
| Large Cap Value Fund | Small Cap Core Fund | ||||||||||
| Investment Income (Note 2) | |||||||||||
| Dividends | $ | 1,594,913 | $ | 491,398 | |||||||
| Interest | 215 | 137 | |||||||||
| Securities lending | 18,857 | 59,468 | |||||||||
| Foreign taxes withheld | (156 | ) | — | ||||||||
| Total investment income | 1,613,829 | 551,003 | |||||||||
| Expenses | |||||||||||
| Investment advisory fees (Note 3) | 409,840 | 314,647 | |||||||||
| Administrative services fees (Note 3) | 137,451 | 88,475 | |||||||||
| Shareholder servicing/Distribution fees (Note 3) | |||||||||||
| Common Class | — | 18,568 | |||||||||
| Advisor Class | 5,741 | — | |||||||||
| Class A | 197,367 | 81,266 | |||||||||
| Class B | 11,775 | 15,038 | |||||||||
| Class C | 5,184 | 35,124 | |||||||||
| Custodian fees | 136,380 | 95,009 | |||||||||
| Transfer agent fees | 102,399 | 81,500 | |||||||||
| Printing fees (Note 3) | 26,746 | 23,209 | |||||||||
| Registration fees | 22,960 | 26,899 | |||||||||
| Audit and tax fees | 19,436 | 16,973 | |||||||||
| Trustees' fees | 12,500 | 12,557 | |||||||||
| Legal fees | 13,606 | 11,037 | |||||||||
| Insurance expense | 8,838 | 5,083 | |||||||||
| Commitment fees (Note 4) | 1,997 | 1,100 | |||||||||
| Miscellaneous expense | 4,959 | 4,328 | |||||||||
| Total expenses | 1,117,179 | 830,813 | |||||||||
| Less: fees waived (Note 3) | (36,447 | ) | (96,472 | ) | |||||||
| Net expenses | 1,080,732 | 734,341 | |||||||||
| Net investment income (loss) | 533,097 | (183,338 | ) | ||||||||
| Net Realized and Unrealized Gain from Investments | |||||||||||
| Net realized gain from investments | 10,786,280 | 6,879,289 | |||||||||
| Net change in unrealized appreciation (depreciation) from investments | 10,311,841 | 14,058,478 | |||||||||
| Net realized and unrealized gain from investments | 21,098,121 | 20,937,767 | |||||||||
| Net increase in net assets resulting from operations | $ | 21,631,218 | $ | 20,754,429 | |||||||
See Accompanying Notes to Financial Statements.
54
Credit Suisse Funds
Statements of Changes in Net Assets
| Large Cap Value Fund | Small Cap Core Fund | ||||||||||||||||||
| For the Six Months Ended April 30, 2010 (unaudited) | For the Year Ended October 31, 2009 | For the Six Months Ended April 30, 2010 (unaudited) | For the Year Ended October 31, 2009 | ||||||||||||||||
| From Operations | |||||||||||||||||||
| Net investment income (loss) | $ | 533,097 | $ | 1,907,870 | $ | (183,338 | ) | $ | (187,067 | ) | |||||||||
| Net realized gain (loss) from investments and foreign currency transactions | 10,786,280 | (23,957,446 | ) | 6,879,289 | (30,534,342 | ) | |||||||||||||
| Net change in unrealized appreciation (depreciation) from investments | 10,311,841 | 39,359,889 | 14,058,478 | 27,015,590 | |||||||||||||||
| Net increase (decrease) in net assets resulting from operations | 21,631,218 | 17,310,313 | 20,754,429 | (3,705,819 | ) | ||||||||||||||
| From Dividends and Distributions | |||||||||||||||||||
| Dividends from net investment income | |||||||||||||||||||
| Common Class shares | (1,925 | ) | (4,407 | ) | — | — | |||||||||||||
| Advisor Class shares | (9,503 | ) | (22,379 | ) | — | — | |||||||||||||
| Class A shares | (750,191 | ) | (1,807,556 | ) | — | — | |||||||||||||
| Class B shares | (7,258 | ) | (20,225 | ) | — | — | |||||||||||||
| Class C shares | (3,217 | ) | (7,343 | ) | — | — | |||||||||||||
| Distributions from return of capital | |||||||||||||||||||
| Common Class shares | — | — | — | (9,406 | ) | ||||||||||||||
| Advisor Class shares | — | — | — | — | |||||||||||||||
| Class A shares | — | — | — | (44,485 | ) | ||||||||||||||
| Class B shares | — | — | — | (507 | ) | ||||||||||||||
| Class C shares | — | — | — | (838 | ) | ||||||||||||||
| Net decrease in net assets resulting from dividends and distributions | (772,094 | ) | (1,861,910 | ) | — | (55,236 | ) | ||||||||||||
| From Capital Share Transactions (Note 6) | |||||||||||||||||||
| Proceeds from sale of shares | 2,186,621 | 5,029,255 | 1,873,299 | 5,453,785 | |||||||||||||||
| Reinvestment of dividends and distributions | 694,209 | 1,680,734 | — | 51,416 | |||||||||||||||
| Net asset value of shares redeemed | (11,160,454 | ) | (22,255,405 | ) | (10,823,325 | )1 | (24,000,877 | )2 | |||||||||||
| Net decrease in net assets from capital share transactions | (8,279,624 | ) | (15,545,416 | ) | (8,950,026 | ) | (18,495,676 | ) | |||||||||||
| Net increase (decrease) in net assets | 12,579,500 | (97,013 | ) | 11,804,403 | (22,256,731 | ) | |||||||||||||
| Net Assets | |||||||||||||||||||
| Beginning of period | 156,439,684 | 156,536,697 | 84,019,880 | 106,276,611 | |||||||||||||||
| End of period | $ | 169,019,184 | $ | 156,439,684 | $ | 95,824,283 | $ | 84,019,880 | |||||||||||
| Undistributed (accumulated) net investment income (loss) | $ | 176,321 | $ | 415,318 | $ | (179,277 | ) | $ | 4,061 | ||||||||||
1 Net of $1,214 of redemption fees retained by the Fund.
2 Net of $11 of redemption fees retained by the Fund.
See Accompanying Notes to Financial Statements.
55
Credit Suisse Large Cap Value Fund
Financial Highlights
(For a Common Class Share of the Fund Outstanding Throughout Each Period)
| For the Six Months Ended April 30, 2010 | For the Year Ended October 31, | ||||||||||||||||||||||||||
| (unaudited) | 2009 | 2008 | 2007 | 2006 | 2005 | ||||||||||||||||||||||
| Per share data | |||||||||||||||||||||||||||
| Net asset value, beginning of period | $ | 11.06 | $ | 9.88 | $ | 19.17 | $ | 21.93 | $ | 20.97 | $ | 19.98 | |||||||||||||||
| INVESTMENT OPERATIONS | |||||||||||||||||||||||||||
| Net investment income1 | 0.05 | 0.15 | 0.26 | 0.26 | 0.28 | 0.24 | |||||||||||||||||||||
| Net gain (loss) on investments and foreign currency related items (both realized and unrealized) | 1.52 | 1.18 | (6.09 | ) | 1.68 | 3.42 | 2.32 | ||||||||||||||||||||
| Total from investment operations | 1.57 | 1.33 | (5.83 | ) | 1.94 | 3.70 | 2.56 | ||||||||||||||||||||
| LESS DIVIDENDS AND DISTRIBUTIONS | |||||||||||||||||||||||||||
| Dividends from net investment income | (0.06 | ) | (0.15 | ) | (0.26 | ) | (0.25 | ) | (0.26 | ) | (0.25 | ) | |||||||||||||||
| Distributions from net realized gains | — | — | (3.20 | ) | (4.45 | ) | (2.48 | ) | (1.32 | ) | |||||||||||||||||
| Total dividends and distributions | (0.06 | ) | (0.15 | ) | (3.46 | ) | (4.70 | ) | (2.74 | ) | (1.57 | ) | |||||||||||||||
| Net asset value, end of period | $ | 12.57 | $ | 11.06 | $ | 9.88 | $ | 19.17 | $ | 21.93 | $ | 20.97 | |||||||||||||||
| Total return2 | 14.26 | % | 13.74 | % | (36.29 | )% | 10.59 | % | 19.44 | % | 13.34 | % | |||||||||||||||
| RATIOS AND SUPPLEMENTAL DATA | |||||||||||||||||||||||||||
| Net assets, end of period (000s omitted) | $ | 369 | $ | 329 | $ | 300 | $ | 570 | $ | 600 | $ | 591 | |||||||||||||||
| Ratio of expenses to average net assets | 1.05 | %3 | 1.05 | % | 0.90 | % | 0.82 | % | 0.89 | % | 0.91 | % | |||||||||||||||
| Ratio of net investment income to average net assets | 0.92 | %3 | 1.61 | % | 1.89 | % | 1.37 | % | 1.37 | % | 1.15 | % | |||||||||||||||
| Decrease reflected in above operating expense ratios due to waivers/reimbursements | 0.04 | %3 | 0.14 | % | — | — | — | — | |||||||||||||||||||
| Portfolio turnover rate | 191 | % | 489 | % | 179 | % | 163 | % | 78 | % | 58 | % | |||||||||||||||
1 Per share information is calculated using the average shares outstanding method.
2 Total returns are historical and assume changes in share price and reinvestment of all dividends and distributions. Had certain expenses not been reduced during the periods shown, total returns would have been lower. Total returns for periods less than one year are not annualized.
3 Annualized.
See Accompanying Notes to Financial Statements.
56
Credit Suisse Large Cap Value Fund
Financial Highlights
(For an Advisor Class Share of the Fund Outstanding Throughout Each Period)
| For the Six Months Ended April 30, 2010 | For the Year Ended October 31, | ||||||||||||||||||||||||||
| (unaudited) | 2009 | 2008 | 2007 | 2006 | 2005 | ||||||||||||||||||||||
| Per share data | |||||||||||||||||||||||||||
| Net asset value, beginning of period | $ | 11.18 | $ | 10.01 | $ | 19.33 | $ | 22.08 | $ | 21.10 | $ | 20.09 | |||||||||||||||
| INVESTMENT OPERATIONS | |||||||||||||||||||||||||||
| Net investment income1 | 0.03 | 0.11 | 0.19 | 0.17 | 0.18 | 0.14 | |||||||||||||||||||||
| Net gain (loss) on investments and foreign currency related items (both realized and unrealized) | 1.53 | 1.17 | (6.12 | ) | 1.69 | 3.44 | 2.34 | ||||||||||||||||||||
| Total from investment operations | 1.56 | 1.28 | (5.93 | ) | 1.86 | 3.62 | 2.48 | ||||||||||||||||||||
| LESS DIVIDENDS AND DISTRIBUTIONS | |||||||||||||||||||||||||||
| Dividends from net investment income | (0.05 | ) | (0.11 | ) | (0.19 | ) | (0.16 | ) | (0.16 | ) | (0.15 | ) | |||||||||||||||
| Distributions from net realized gains | — | — | (3.20 | ) | (4.45 | ) | (2.48 | ) | (1.32 | ) | |||||||||||||||||
| Total dividends and distributions | (0.05 | ) | (0.11 | ) | (3.39 | ) | (4.61 | ) | (2.64 | ) | (1.47 | ) | |||||||||||||||
| Net asset value, end of period | $ | 12.69 | $ | 11.18 | $ | 10.01 | $ | 19.33 | $ | 22.08 | $ | 21.10 | |||||||||||||||
| Total return2 | 13.97 | % | 13.05 | % | (36.45 | )% | 10.01 | % | 18.84 | % | 12.81 | % | |||||||||||||||
| RATIOS AND SUPPLEMENTAL DATA | |||||||||||||||||||||||||||
| Net assets, end of period (000s omitted) | $ | 2,384 | $ | 2,148 | $ | 2,097 | $ | 5,234 | $ | 5,806 | $ | 8,368 | |||||||||||||||
| Ratio of expenses to average net assets | 1.55 | %3 | 1.55 | % | 1.41 | % | 1.32 | % | 1.39 | % | 1.41 | % | |||||||||||||||
| Ratio of net investment income to average net assets | 0.42 | %3 | 1.11 | % | 1.38 | % | 0.87 | % | 0.87 | % | 0.65 | % | |||||||||||||||
| Decrease reflected in above operating expense ratios due to waivers/reimbursements | 0.04 | %3 | 0.14 | % | — | — | — | — | |||||||||||||||||||
| Portfolio turnover rate | 191 | % | 489 | % | 179 | % | 163 | % | 78 | % | 58 | % | |||||||||||||||
1 Per share information is calculated using the average shares outstanding method.
2 Total returns are historical and assume changes in share price and reinvestment of all dividends and distributions. Had certain expenses not been reduced during the periods shown, total returns would have been lower. Total returns for periods less than one year are not annualized.
3 Annualized.
See Accompanying Notes to Financial Statements.
57
Credit Suisse Large Cap Value Fund
Financial Highlights
(For a Class A Share of the Fund Outstanding Throughout Each Period)
| For the Six Months Ended April 30, 2010 | For the Year Ended October 31, | ||||||||||||||||||||||||||
| (unaudited) | 2009 | 2008 | 2007 | 2006 | 2005 | ||||||||||||||||||||||
| Per share data | |||||||||||||||||||||||||||
| Net asset value, beginning of period | $ | 11.13 | $ | 9.95 | $ | 19.28 | $ | 22.03 | $ | 21.05 | $ | 20.05 | |||||||||||||||
| INVESTMENT OPERATIONS | |||||||||||||||||||||||||||
| Net investment income1 | 0.04 | 0.13 | 0.23 | 0.22 | 0.22 | 0.19 | |||||||||||||||||||||
| Net gain (loss) on investments and foreign currency related items (both realized and unrealized) | 1.53 | 1.18 | (6.14 | ) | 1.69 | 3.45 | 2.33 | ||||||||||||||||||||
| Total from investment operations | 1.57 | 1.31 | (5.91 | ) | 1.91 | 3.67 | 2.52 | ||||||||||||||||||||
| LESS DIVIDENDS AND DISTRIBUTIONS | |||||||||||||||||||||||||||
| Dividends from net investment income | (0.06 | ) | (0.13 | ) | (0.22 | ) | (0.21 | ) | (0.21 | ) | (0.20 | ) | |||||||||||||||
| Distributions from net realized gains | — | — | (3.20 | ) | (4.45 | ) | (2.48 | ) | (1.32 | ) | |||||||||||||||||
| Total dividends and distributions | (0.06 | ) | (0.13 | ) | (3.42 | ) | (4.66 | ) | (2.69 | ) | (1.52 | ) | |||||||||||||||
| Net asset value, end of period | $ | 12.64 | $ | 11.13 | $ | 9.95 | $ | 19.28 | $ | 22.03 | $ | 21.05 | |||||||||||||||
| Total return2 | 14.10 | % | 13.43 | % | (36.46 | )% | 10.32 | % | 19.18 | % | 13.06 | % | |||||||||||||||
| RATIOS AND SUPPLEMENTAL DATA | |||||||||||||||||||||||||||
| Net assets, end of period (000s omitted) | $ | 162,876 | $ | 150,638 | $ | 150,304 | $ | 280,329 | $ | 305,866 | $ | 300,777 | |||||||||||||||
| Ratio of expenses to average net assets | 1.30 | %3 | 1.30 | % | 1.16 | % | 1.07 | % | 1.14 | % | 1.16 | % | |||||||||||||||
| Ratio of net investment income to average net assets | 0.67 | %3 | 1.38 | % | 1.63 | % | 1.12 | % | 1.12 | % | 0.91 | % | |||||||||||||||
| Decrease reflected in above operating expense ratios due to waivers/reimbursements | 0.04 | %3 | 0.14 | % | — | — | — | — | |||||||||||||||||||
| Portfolio turnover rate | 191 | % | 489 | % | 179 | % | 163 | % | 78 | % | 58 | % | |||||||||||||||
1 Per share information is calculated using the average shares outstanding method.
2 Total returns are historical and assume changes in share price, reinvestment of all dividends and distributions and no sales charge. Had certain expenses not been reduced during the periods shown, total returns would have been lower. Total returns for periods less than one year are not annualized.
3 Annualized.
See Accompanying Notes to Financial Statements.
58
Credit Suisse Large Cap Value Fund
Financial Highlights
(For a Class B Share of the Fund Outstanding Throughout Each Period)
| For the Six Months Ended April 30, 2010 | For the Year Ended October 31, | ||||||||||||||||||||||||||
| (unaudited) | 2009 | 2008 | 2007 | 2006 | 2005 | ||||||||||||||||||||||
| Per share data | |||||||||||||||||||||||||||
| Net asset value, beginning of period | $ | 10.85 | $ | 9.73 | $ | 18.92 | $ | 21.70 | $ | 20.78 | $ | 19.81 | |||||||||||||||
| INVESTMENT OPERATIONS | |||||||||||||||||||||||||||
| Net investment income (loss)1 | (0.00 | )2 | 0.06 | 0.12 | 0.07 | 0.07 | 0.04 | ||||||||||||||||||||
| Net gain (loss) on investments and foreign currency related items (both realized and unrealized) | 1.48 | 1.14 | (6.00 | ) | 1.66 | 3.39 | 2.30 | ||||||||||||||||||||
| Total from investment operations | 1.48 | 1.20 | (5.88 | ) | 1.73 | 3.46 | 2.34 | ||||||||||||||||||||
| LESS DIVIDENDS AND DISTRIBUTIONS | |||||||||||||||||||||||||||
| Dividends from net investment income | (0.03 | ) | (0.08 | ) | (0.11 | ) | (0.06 | ) | (0.06 | ) | (0.05 | ) | |||||||||||||||
| Distributions from net realized gains | — | — | (3.20 | ) | (4.45 | ) | (2.48 | ) | (1.32 | ) | |||||||||||||||||
| Total dividends and distributions | (0.03 | ) | (0.08 | ) | (3.31 | ) | (4.51 | ) | (2.54 | ) | (1.37 | ) | |||||||||||||||
| Net asset value, end of period | $ | 12.30 | $ | 10.85 | $ | 9.73 | $ | 18.92 | $ | 21.70 | $ | 20.78 | |||||||||||||||
| Total return3 | 13.70 | % | 12.54 | % | (36.93 | )% | 9.49 | % | 18.25 | % | 12.23 | % | |||||||||||||||
| RATIOS AND SUPPLEMENTAL DATA | |||||||||||||||||||||||||||
| Net assets, end of period (000s omitted) | $ | 2,321 | $ | 2,372 | $ | 2,864 | $ | 9,224 | $ | 14,994 | $ | 20,057 | |||||||||||||||
| Ratio of expenses to average net assets | 2.05 | %4 | 2.05 | % | 1.91 | % | 1.82 | % | 1.89 | % | 1.91 | % | |||||||||||||||
| Ratio of net investment income (loss) to average net assets | (0.07 | )%4 | 0.66 | % | 0.89 | % | 0.39 | % | 0.37 | % | 0.15 | % | |||||||||||||||
| Decrease reflected in above operating expense ratios due to waivers/reimbursements | 0.04 | %4 | 0.14 | % | — | — | — | — | |||||||||||||||||||
| Portfolio turnover rate | 191 | % | 489 | % | 179 | % | 163 | % | 78 | % | 58 | % | |||||||||||||||
1 Per share information is calculated using the average shares outstanding method.
2 This amount represents less than $(0.01) per share.
3 Total returns are historical and assume changes in share price, reinvestment of all dividends and distributions and no sales charge. Had certain expenses not been reduced during the periods shown, total returns would have been lower. Total returns for periods less than one year are not annualized.
4 Annualized.
See Accompanying Notes to Financial Statements.
59
Credit Suisse Large Cap Value Fund
Financial Highlights
(For a Class C Share of the Fund Outstanding Throughout Each Period)
| For the Six Months Ended April 30, 2010 | For the Year Ended October 31, | ||||||||||||||||||||||||||
| (unaudited) | 2009 | 2008 | 2007 | 2006 | 2005 | ||||||||||||||||||||||
| Per share data | |||||||||||||||||||||||||||
| Net asset value, beginning of period | $ | 10.76 | $ | 9.65 | $ | 18.79 | $ | 21.58 | $ | 20.68 | $ | 19.72 | |||||||||||||||
| INVESTMENT OPERATIONS | |||||||||||||||||||||||||||
| Net investment income (loss)1 | (0.00 | )2 | 0.06 | 0.12 | 0.07 | 0.07 | 0.03 | ||||||||||||||||||||
| Net gain (loss) on investments and foreign currency related items (both realized and unrealized) | 1.46 | 1.13 | (5.95 | ) | 1.65 | 3.37 | 2.30 | ||||||||||||||||||||
| Total from investment operations | 1.46 | 1.19 | (5.83 | ) | 1.72 | 3.44 | 2.33 | ||||||||||||||||||||
| LESS DIVIDENDS AND DISTRIBUTIONS | |||||||||||||||||||||||||||
| Dividends from net investment income | (0.03 | ) | (0.08 | ) | (0.11 | ) | (0.06 | ) | (0.06 | ) | (0.05 | ) | |||||||||||||||
| Distributions from net realized gains | — | — | (3.20 | ) | (4.45 | ) | (2.48 | ) | (1.32 | ) | |||||||||||||||||
| Total dividends and distributions | (0.03 | ) | (0.08 | ) | (3.31 | ) | (4.51 | ) | (2.54 | ) | (1.37 | ) | |||||||||||||||
| Net asset value, end of period | $ | 12.19 | $ | 10.76 | $ | 9.65 | $ | 18.79 | $ | 21.58 | $ | 20.68 | |||||||||||||||
| Total return3 | 13.63 | % | 12.55 | % | (36.91 | )% | 9.50 | % | 18.25 | % | 12.23 | % | |||||||||||||||
| RATIOS AND SUPPLEMENTAL DATA | |||||||||||||||||||||||||||
| Net assets, end of period (000s omitted) | $ | 1,069 | $ | 954 | $ | 972 | $ | 2,140 | $ | 2,618 | $ | 3,638 | |||||||||||||||
| Ratio of expenses to average net assets | 2.05 | %4 | 2.05 | % | 1.91 | % | 1.82 | % | 1.89 | % | 1.91 | % | |||||||||||||||
| Ratio of net investment income (loss) to average net assets | (0.09 | )%4 | 0.63 | % | 0.89 | % | 0.39 | % | 0.37 | % | 0.15 | % | |||||||||||||||
| Decrease reflected in above operating expense ratios due to waivers/reimbursements | 0.04 | %4 | 0.14 | % | — | — | — | — | |||||||||||||||||||
| Portfolio turnover rate | 191 | % | 489 | % | 179 | % | 163 | % | 78 | % | 58 | % | |||||||||||||||
1 Per share information is calculated using the average shares outstanding method.
2 This amount represents less than $(0.01) per share.
3 Total returns are historical and assume changes in share price, reinvestment of all dividends and distributions and no sales charge. Had certain expenses not been reduced during the periods shown, total returns would have been lower. Total returns for periods less than one year are not annualized.
4 Annualized.
See Accompanying Notes to Financial Statements.
60
Credit Suisse Small Cap Core Fund
Financial Highlights
(For a Common Class Share of the Fund Outstanding Throughout Each Period)
| For the Six Months Ended April 30, 2010 | For the Year Ended October 31, | ||||||||||||||||||||||||||
| (unaudited) | 2009 | 2008 | 2007 | 2006 | 2005 | ||||||||||||||||||||||
| Per share data | |||||||||||||||||||||||||||
| Net asset value, beginning of period | $ | 9.11 | $ | 9.21 | $ | 22.41 | $ | 24.33 | $ | 23.84 | $ | 22.66 | |||||||||||||||
| INVESTMENT OPERATIONS | |||||||||||||||||||||||||||
| Net investment income (loss)1 | (0.02 | ) | (0.01 | ) | 0.01 | (0.08 | ) | 0.11 | (0.03 | ) | |||||||||||||||||
| Net gain (loss) on investments and futures contracts (both realized and unrealized) | 2.38 | (0.08 | ) | (5.55 | ) | 2.16 | 2.85 | 3.39 | |||||||||||||||||||
| Total from investment operations | 2.36 | (0.09 | ) | (5.54 | ) | 2.08 | 2.96 | 3.36 | |||||||||||||||||||
| REDEMPTION FEES | 0.002 | 0.002 | 0.002 | — | — | — | |||||||||||||||||||||
| LESS DIVIDENDS AND DISTRIBUTIONS | |||||||||||||||||||||||||||
| Dividends from net investment income | — | — | — | (0.14 | ) | — | — | ||||||||||||||||||||
| Distributions from net realized gains | — | — | (7.66 | ) | (3.86 | ) | (2.47 | ) | (2.18 | ) | |||||||||||||||||
| Distributions from return of capital | — | (0.01 | ) | — | — | — | — | ||||||||||||||||||||
| Total dividends and distributions | — | (0.01 | ) | (7.66 | ) | (4.00 | ) | (2.47 | ) | (2.18 | ) | ||||||||||||||||
| Net asset value, end of period | $ | 11.47 | $ | 9.11 | $ | 9.21 | $ | 22.41 | $ | 24.33 | $ | 23.84 | |||||||||||||||
| Total return3 | 25.91 | % | (1.02 | )% | (34.47 | )% | 9.58 | % | 13.23 | % | 15.56 | % | |||||||||||||||
| RATIOS AND SUPPLEMENTAL DATA | |||||||||||||||||||||||||||
| Net assets, end of period (000s omitted) | $ | 14,970 | $ | 14,325 | $ | 16,565 | $ | 57,452 | $ | 70,525 | $ | 74,013 | |||||||||||||||
| Ratio of expenses to average net assets | 1.55 | %4 | 1.55 | % | 1.47 | % | 1.34 | % | 1.37 | % | 1.38 | % | |||||||||||||||
| Ratio of net investment income (loss) to average net assets | (0.32 | )%4 | (0.15 | )% | 0.09 | % | (0.39 | )% | 0.47 | % | (0.16 | )% | |||||||||||||||
| Decrease reflected in above operating expense ratios due to waivers/reimbursements | 0.22 | %4 | 0.30 | % | — | — | — | — | |||||||||||||||||||
| Portfolio turnover rate | 91 | % | 423 | % | 195 | % | 262 | % | 67 | % | 43 | % | |||||||||||||||
1 Per share information is calculated using the average shares outstanding method.
2 This amount represents less than $0.01 per share.
3 Total returns are historical and assume changes in share price and reinvestment of all dividends and distributions. Had certain expenses not been reduced during the periods shown, total returns would have been lower. Total returns for periods less than one year are not annualized.
4 Annualized.
See Accompanying Notes to Financial Statements.
61
Credit Suisse Small Cap Core Fund
Financial Highlights
(For a Class A Share of the Fund Outstanding Throughout Each Period)
| For the Six Months Ended April 30, 2010 | For the Year Ended October 31, | ||||||||||||||||||||||||||
| (unaudited) | 2009 | 2008 | 2007 | 2006 | 2005 | ||||||||||||||||||||||
| Per share data | |||||||||||||||||||||||||||
| Net asset value, beginning of period | $ | 9.22 | $ | 9.32 | $ | 22.57 | $ | 24.44 | $ | 23.94 | $ | 22.75 | |||||||||||||||
| INVESTMENT OPERATIONS | |||||||||||||||||||||||||||
| Net investment income (loss)1 | (0.02 | ) | (0.01 | ) | 0.01 | (0.08 | ) | 0.12 | (0.04 | ) | |||||||||||||||||
| Net gain (loss) on investments and futures contracts (both realized and unrealized) | 2.41 | (0.08 | ) | (5.60 | ) | 2.18 | 2.85 | 3.42 | |||||||||||||||||||
| Total from investment operations | 2.39 | (0.09 | ) | (5.59 | ) | 2.10 | 2.97 | 3.38 | |||||||||||||||||||
| REDEMPTION FEES | 0.002 | 0.002 | 0.002 | — | — | — | |||||||||||||||||||||
| LESS DIVIDENDS AND DISTRIBUTIONS | |||||||||||||||||||||||||||
| Dividends from net investment income | — | — | — | (0.11 | ) | — | ��� | ||||||||||||||||||||
| Distributions from net realized gains | — | — | (7.66 | ) | (3.86 | ) | (2.47 | ) | (2.19 | ) | |||||||||||||||||
| Distributions from return of capital | — | (0.01 | ) | — | — | — | — | ||||||||||||||||||||
| Total dividends and distributions | — | (0.01 | ) | (7.66 | ) | (3.97 | ) | (2.47 | ) | (2.19 | ) | ||||||||||||||||
| Net asset value, end of period | $ | 11.61 | $ | 9.22 | $ | 9.32 | $ | 22.57 | $ | 24.44 | $ | 23.94 | |||||||||||||||
| Total return3 | 25.92 | % | (1.01 | )% | (34.44 | )% | 9.61 | % | 13.22 | % | 15.54 | % | |||||||||||||||
| RATIOS AND SUPPLEMENTAL DATA | |||||||||||||||||||||||||||
| Net assets, end of period (000s omitted) | $ | 70,083 | $ | 60,426 | $ | 79,414 | $ | 169,076 | $ | 263,006 | $ | 227,166 | |||||||||||||||
| Ratio of expenses to average net assets | 1.55 | %4 | 1.55 | % | 1.47 | % | 1.35 | % | 1.37 | % | 1.38 | % | |||||||||||||||
| Ratio of net investment income (loss) to average net assets | (0.32 | )%4 | (0.14 | )% | 0.10 | % | (0.38 | )% | 0.47 | % | (0.16 | )% | |||||||||||||||
| Decrease reflected in above operating expense ratios due to waivers/reimbursements | 0.21 | %4 | 0.30 | % | — | — | — | — | |||||||||||||||||||
| Portfolio turnover rate | 91 | % | 423 | % | 195 | % | 262 | % | 67 | % | 43 | % | |||||||||||||||
1 Per share information is calculated using the average shares outstanding method.
2 This amount represents less than $0.01 per share.
3 Total returns are historical and assume changes in share price, reinvestment of all dividends and distributions and no sales charge. Had certain expenses not been reduced during the periods shown, total returns would have been lower. Total returns for periods less than one year are not annualized.
4 Annualized.
See Accompanying Notes to Financial Statements.
62
Credit Suisse Small Cap Core Fund
Financial Highlights
(For a Class B Share of the Fund Outstanding Throughout Each Period)
| For the Six Months Ended April 30, 2010 | For the Year Ended October 31, | ||||||||||||||||||||||||||
| (unaudited) | 2009 | 2008 | 2007 | 2006 | 2005 | ||||||||||||||||||||||
| Per share data | |||||||||||||||||||||||||||
| Net asset value, beginning of period | $ | 7.38 | $ | 7.51 | $ | 19.91 | $ | 22.07 | $ | 21.99 | $ | 21.20 | |||||||||||||||
| INVESTMENT OPERATIONS | |||||||||||||||||||||||||||
| Net investment loss1 | (0.04 | ) | (0.06 | ) | (0.07 | ) | (0.22 | ) | (0.06 | ) | (0.20 | ) | |||||||||||||||
| Net gain (loss) on investments and futures contracts (both realized and unrealized) | 1.92 | (0.07 | ) | (4.67 | ) | 1.93 | 2.61 | 3.17 | |||||||||||||||||||
| Total from investment operations | 1.88 | (0.13 | ) | (4.74 | ) | 1.71 | 2.55 | 2.97 | |||||||||||||||||||
| REDEMPTION FEES | 0.002 | — | — | — | — | — | |||||||||||||||||||||
| LESS DIVIDENDS AND DISTRIBUTIONS | |||||||||||||||||||||||||||
| Dividends from net investment income | — | — | — | (0.01 | ) | — | — | ||||||||||||||||||||
| Distributions from net realized gains | — | — | (7.66 | ) | (3.86 | ) | (2.47 | ) | (2.18 | ) | |||||||||||||||||
| Distributions from return of capital | — | (0.00 | )3 | — | — | — | — | ||||||||||||||||||||
| Total dividends and distributions | — | (0.00 | )3 | (7.66 | ) | (3.87 | ) | (2.47 | ) | (2.18 | ) | ||||||||||||||||
| Net asset value, end of period | $ | 9.26 | $ | 7.38 | $ | 7.51 | $ | 19.91 | $ | 22.07 | $ | 21.99 | |||||||||||||||
| Total return4 | 25.47 | % | (1.72 | )% | (34.96 | )% | 8.74 | % | 12.41 | % | 14.72 | % | |||||||||||||||
| RATIOS AND SUPPLEMENTAL DATA | |||||||||||||||||||||||||||
| Net assets, end of period (000s omitted) | $ | 2,996 | $ | 3,038 | $ | 3,981 | $ | 9,122 | $ | 12,465 | $ | 18,133 | |||||||||||||||
| Ratio of expenses to average net assets | 2.30 | %5 | 2.30 | % | 2.23 | % | 2.10 | % | 2.12 | % | 2.13 | % | |||||||||||||||
| Ratio of net investment loss to average net assets | (1.08 | )%5 | (0.89 | )% | (0.65 | )% | (1.13 | )% | (0.28 | )% | (0.91 | )% | |||||||||||||||
| Decrease reflected in above operating expense ratios due to waivers/reimbursements | 0.22 | %5 | 0.30 | % | — | — | — | — | |||||||||||||||||||
| Portfolio turnover rate | 91 | % | 423 | % | 195 | % | 262 | % | 67 | % | 43 | % | |||||||||||||||
1 Per share information is calculated using the average shares outstanding method.
2 This amount represents less than $0.01 per share.
3 This amount represents less than $(0.01) per share.
4 Total returns are historical and assume changes in share price, reinvestment of all dividends and distributions and no sales charge. Had certain expenses not been reduced during the periods shown, total returns would have been lower. Total returns for periods less than one year are not annualized.
5 Annualized.
See Accompanying Notes to Financial Statements.
63
Credit Suisse Small Cap Core Fund
Financial Highlights
(For a Class C Share of the Fund Outstanding Throughout Each Period)
| For the Six Months Ended April 30, 2010 | For the Year Ended October 31, | ||||||||||||||||||||||||||
| (unaudited) | 2009 | 2008 | 2007 | 2006 | 2005 | ||||||||||||||||||||||
| Per share data | |||||||||||||||||||||||||||
| Net asset value, beginning of period | $ | 7.31 | $ | 7.44 | $ | 19.80 | $ | 21.97 | $ | 21.91 | $ | 21.13 | |||||||||||||||
| INVESTMENT OPERATIONS | |||||||||||||||||||||||||||
| Net investment loss1 | (0.04 | ) | (0.06 | ) | (0.07 | ) | (0.22 | ) | (0.06 | ) | (0.20 | ) | |||||||||||||||
| Net gain (loss) on investments and futures contracts (both realized and unrealized) | 1.90 | (0.07 | ) | (4.63 | ) | 1.92 | 2.59 | 3.16 | |||||||||||||||||||
| Total from investment operations | 1.86 | (0.13 | ) | (4.70 | ) | 1.70 | 2.53 | 2.96 | |||||||||||||||||||
| REDEMPTION FEES | 0.002 | 0.002 | 0.002 | — | — | — | |||||||||||||||||||||
| LESS DIVIDENDS AND DISTRIBUTIONS | |||||||||||||||||||||||||||
| Dividends from net investment income | — | — | — | (0.01 | ) | — | — | ||||||||||||||||||||
| Distributions from net realized gains | — | — | (7.66 | ) | (3.86 | ) | (2.47 | ) | (2.18 | ) | |||||||||||||||||
| Distributions from return of capital | — | (0.00 | )3 | — | — | — | — | ||||||||||||||||||||
| Total dividends and distributions | — | (0.00 | )3 | (7.66 | ) | (3.87 | ) | (2.47 | ) | (2.18 | ) | ||||||||||||||||
| Net asset value, end of period | $ | 9.17 | $ | 7.31 | $ | 7.44 | $ | 19.80 | $ | 21.97 | $ | 21.91 | |||||||||||||||
| Total return4 | 25.44 | % | (1.73 | )% | (34.95 | )% | 8.74 | % | 12.36 | % | 14.72 | % | |||||||||||||||
| RATIOS AND SUPPLEMENTAL DATA | |||||||||||||||||||||||||||
| Net assets, end of period (000s omitted) | $ | 7,775 | $ | 6,232 | $ | 6,318 | $ | 15,305 | $ | 16,028 | $ | 16,079 | |||||||||||||||
| Ratio of expenses to average net assets | 2.30 | %5 | 2.30 | % | 2.23 | % | 2.10 | % | 2.12 | % | 2.13 | % | |||||||||||||||
| Ratio of net investment loss to average net assets | (1.07 | )%5 | (0.91 | )% | (0.66 | )% | (1.14 | )% | (0.28 | )% | (0.91 | )% | |||||||||||||||
| Decrease reflected in above operating expense ratios due to waivers/reimbursements | 0.21 | %5 | 0.30 | % | — | — | — | — | |||||||||||||||||||
| Portfolio turnover rate | 91 | % | 423 | % | 195 | % | 262 | % | 67 | % | 43 | % | |||||||||||||||
1 Per share information is calculated using the average shares outstanding method.
2 This amount represents less than $0.01 per share.
3 This amount represents less than $(0.01) per share.
4 Total returns are historical and assume changes in share price, reinvestment of all dividends and distributions and no sales charge. Had certain expenses not been reduced during the periods shown, total returns would have been lower. Total returns for periods less than one year are not annualized.
5 Annualized.
See Accompanying Notes to Financial Statements.
64
Credit Suisse Funds
Notes to Financial Statements
April 30, 2010 (unaudited)
Note 1. Organization
Credit Suisse Capital Funds (the "Trust") is registered under the Investment Company Act of 1940, as amended (the "1940 Act") as an open-end management investment company and currently offers two managed investment funds, the Credit Suisse Large Cap Value Fund ("Large Cap Value") and Credit Suisse Small Cap Core Fund ("Small Cap Core"), (each a "Fund" and collectively, the "Funds"). The Trust was organized under the laws of the Commonwealth of Massachusetts as a business trust on November 26, 1985. Each Fund is classified as diversified. Investment objectives for each Fund are as follows: Large Cap Value seeks long-term capital appreciation and continuity of income and Small Cap Core seeks a high level of growth of capital.
Large Cap Value offers five classes of shares: Common Class shares, Advisor Class shares, Class A shares, Class B shares and Class C shares. Small Cap Core offers four classes of shares: Common Class shares, Class A shares, Class B shares and Class C shares. Effective December 12, 2001, Large Cap Value closed the Common Class to new investments, except for reinvestment of dividends. Effective December 12, 2001, Small Cap Core's Common Class shares are closed to new investors, with certain exceptions as set forth in the prospectus. Each class of shares represents an equal pro rata interest in each Fund, except that they bear different expenses, which reflect the differences in the range of services provided to them. Class A shares of each Fund are sold subject to a front-end sales charge of 5.75%. Class B shares of each Fund are sold subject to a contingent deferred sales charge which declines from 4.00% to zero depending on the period of tim e the shares are held. Class C shares of each Fund are sold subject to a contingent deferred sales charge of 1.00% if the shares are redeemed within the first year of purchase.
Note 2. Significant Accounting Policies
A) SECURITY VALUATION — The net asset value of each Fund is determined daily as of the close of regular trading on the New York Stock Exchange, Inc. (the "Exchange") on each day the Exchange is open for business. Equity investments are valued at market value, which is generally determined using the closing price on the exchange or market on which the security is primarily traded at the time of valuation (the "Valuation Time"). If no sales are reported, equity investments are generally valued at the most recent bid quotation as of the Valuation Time or at the lowest asked quotation in the case of a short sale of securities. Debt securities with a remaining maturity greater than 60 days are valued in accordance with the price supplied by a pricing service, which may use a matrix, formula or other objective method that takes
65
Credit Suisse Funds
Notes to Financial Statements (continued)
April 30, 2010 (unaudited)
Note 2. Significant Accounting Policies
into consideration market indices, yield curves and other specific adjustments. Debt obligations that will mature in 60 days or less are valued on the basis of amortized cost, which approximates market value, unless it is determined that using this method would not represent fair value. Investments in mutual funds are valued at the mutual fund's closing net asset value per share on the day of valuation. Securities and other assets for which market quotations are not readily available, or whose values have been materially affected by events occurring before the Funds' Valuation Time but after the close of the securities' primary markets, are valued at fair value as determined in good faith by, or under the direction of, the Board of Trustees under procedures established by the Board of Trustees. The Funds may utilize a service provided by an independent third party which has been approved by the Board of Trustees to fair value certain securit ies. When fair-value pricing is employed, the prices of securities used by a fund to calculate its net asset value may differ from quoted or published prices for the same securities.
In accordance with the authoritative guidance on fair value measurements and disclosures under accounting principles generally accepted in the United States of America ("GAAP"), the Funds disclose the fair value of their investments in a hierarchy that prioritizes the inputs to valuation techniques used to measure the fair value. In accordance with GAAP, fair value is defined as the price that a Fund would receive upon selling an investment in a timely transaction to an independent buyer in the principal or most advantageous market of the investment. GAAP established a three-tier hierarchy to maximize the use of observable market data and minimize the use of unobservable inputs and to establish classification of fair value measurements for disclosure purposes. Inputs refer broadly to the assumptions that market participants would use in pricing the asset or liability, including assumptions about risk, for example, the risk inherent in a part icular valuation technique used to measure fair value including such a pricing model and/or the risk inherent in the inputs to the valuation technique. Inputs may be observable or unobservable. Observable inputs are inputs that reflect the assumptions market participants would use in pricing the asset or liability developed based on market data obtained from sources independent of the reporting entity. Unobservable inputs are inputs that reflect the reporting entity's own assumptions about the assumptions market participants would use in pricing the asset or liability developed based on the best information available in the circumstances. The
66
Credit Suisse Funds
Notes to Financial Statements (continued)
April 30, 2010 (unaudited)
Note 2. Significant Accounting Policies
three-tier hierarchy of inputs is summarized in the three broad Levels listed below.
• Level 1 – quoted prices in active markets for identical investments
• Level 2 – other significant observable inputs (including quoted prices for similar investments, interest rates, prepayment speeds, credit risk, etc.)
• Level 3 – significant unobservable inputs (including a Fund's own assumptions in determining the fair value of investments)
The inputs or methodology used for valuing securities are not necessarily an indication of the risk associated with investing in those securities.
The following is a summary of the inputs used as of April 30, 2010 in valuing each Fund's investments carried at value:
Large Cap Value Fund
| Level 1 | Level 2 | Level 3 | Total | ||||||||||||||||
| Investments in Securities | |||||||||||||||||||
| Common Stocks | $ | 167,147,825 | $ | — | $ | — | $ | 167,147,825 | |||||||||||
| Short-Term Investments | 16,791,510 | 2,264,000 | — | 19,055,510 | |||||||||||||||
| Other Financial Instruments* | — | — | — | — | |||||||||||||||
| $ | 183,939,335 | $ | 2,264,000 | $ | — | $ | 186,203,335 | ||||||||||||
*Other financial instruments include futures, forwards and swap contracts.
Small Cap Core
| Level 1 | Level 2 | Level 3 | Total | ||||||||||||||||
| Investments in Securities | |||||||||||||||||||
| Common Stocks | $ | 94,641,222 | $ | — | $ | — | $ | 94,641,222 | |||||||||||
| Short-Term Investments | 43,821,151 | 1,558,000 | — | 45,379,151 | |||||||||||||||
| Other Financial Instruments* | — | — | — | — | |||||||||||||||
| $ | 138,462,373 | $ | 1,558,000 | $ | — | $ | 140,020,373 | ||||||||||||
*Other financial instruments include futures, forwards and swap contracts.
Each Fund adopted FASB Accounting Standards Update 2010-06 "Fair Value Measurements and Disclosures (ASC 820)" which requires each Fund to disclose details of significant transfers in and out of Level 1 and Level 2 measurements and the reasons for the transfers. For the six months ended April 30, 2010, there were no significant transfers in and out of Level 1 and Level 2.
B) DERIVATIVE INSTRUMENTS AND HEDGING ACTIVITIES — Effective October 31, 2009, each Fund adopted amendments to authoritative guidance on
67
Credit Suisse Funds
Notes to Financial Statements (continued)
April 30, 2010 (unaudited)
Note 2. Significant Accounting Policies
disclosures about derivative instruments and hedging activities which require that each Fund disclose (a) how and why an entity uses derivative instruments, (b) how derivative instruments and hedging activities are accounted for, and (c) how derivative instruments and related hedging activities affect a fund's financial position, financial performance, and cash flows. The Funds have not entered into any derivative or hedging activities during the period covered by this report.
C) FOREIGN CURRENCY TRANSACTIONS — The books and records of the Funds are maintained in U.S. dollars. Transactions denominated in foreign currencies are recorded at the current prevailing exchange rates. All assets and liabilities denominated in foreign currencies are translated into U.S. dollar amounts at the current exchange rate at the end of the period. Translation gains or losses resulting from changes in the exchange rate during the reporting period and realized gains and losses on the settlement of foreign currency transactions are reported in the results of operations for the current period. The Funds do not isolate that portion of realized gains and losses on investments in equity securities which is due to changes in the foreign exchange rate from that which is due to changes in market prices of equity securities. The Funds isolate that portion of realized gains and losses on investments in debt securities which is due to changes in the foreign exchange rate from that which is due to changes in market prices of debt securities.
D) SECURITY TRANSACTIONS AND INVESTMENT INCOME — Security transactions are accounted for on a trade date basis. Interest income is recorded on the accrual basis. Dividends are recorded on the ex-dividend date. Certain expenses are class-specific expenses and vary by class. Income, expenses (excluding class-specific expenses) and realized/unrealized gains/losses are allocated proportionately to each class of shares based upon the relative net asset value of the outstanding shares of that class. The cost of investments sold is determined by use of the specific identification method for both financial reporting and income tax purposes.
E) DIVIDENDS AND DISTRIBUTIONS TO SHAREHOLDERS — Dividends from net investment income, if any, are declared and paid quarterly by Large Cap Value and at least annually by Small Cap Core. Distributions of net realized capital gains, if any, are declared and paid at least annually by the Funds. However, to the extent that a net realized capital gain can be reduced by a capital loss carryforward, such gain will not be distributed. Income and capital gain distributions are determined in accordance with federal income tax regulations, which may differ from GAAP.
68
Credit Suisse Funds
Notes to Financial Statements (continued)
April 30, 2010 (unaudited)
Note 2. Significant Accounting Policies
F) FEDERAL INCOME TAXES — No provision is made for federal taxes as it is each Fund's intention to continue to qualify for and elect the tax treatment applicable to regulated investment companies under the Internal Revenue Code of 1986, as amended, and to make the requisite distributions to its shareholders, which will be sufficient to relieve it from federal income and excise taxes.
Each Fund adopted the authoritative guidance for uncertainty in income taxes and recognizes a tax benefit or liability from an uncertain position only if it is more likely than not that the position is sustainable based solely on its technical merits and consideration of the relevant taxing authority's widely understood administrative practices and procedures. Each Fund has reviewed its current tax positions and has determined that no provision for income tax is required in each Fund's financial statements. Each Fund's federal tax returns for the prior three fiscal years remain subject to examination by the Internal Revenue Service.
G) USE OF ESTIMATES — The preparation of financial statements in conformity with GAAP requires management to make estimates and assumptions that affect the reported amounts of assets and liabilities and disclosure of contingent assets and liabilities at the date of the financial statements and the reported amounts of income and expenses during the reporting period. Actual results could differ from these estimates.
H) SHORT-TERM INVESTMENTS — The Funds, together with other funds/portfolios advised by Credit Suisse Asset Management, LLC ("Credit Suisse"), an indirect, wholly-owned subsidiary of Credit Suisse Group AG, pool available cash into a short-term variable rate time deposit issued by State Street Bank and Trust Company ("SSB"), the Funds' custodian. The short-term time deposit issued by SSB is a variable rate account classified as a short-term investment.
I) SECURITIES LENDING — Loans of securities are required at all times to be secured by collateral at least equal to 102% of the market value of domestic securities on loan (including any accrued interest thereon) and 105% of the market value of foreign securities on loan (including any accrued interest thereon). Cash collateral received by the Funds in connection with securities lending activity may be pooled together with cash collateral for other funds/portfolios advised by Credit Suisse and may be invested in a variety of investments, including funds advised by SSB, the Funds' securities lending agent, or money market instruments. However, in the event of default or
69
Credit Suisse Funds
Notes to Financial Statements (continued)
April 30, 2010 (unaudited)
Note 2. Significant Accounting Policies
bankruptcy by the other party to the agreement, realization and/or retention of the collateral may be subject to legal proceedings.
SSB has been engaged by the Funds to act as the Funds' securities lending agent. The Funds' securities lending arrangement provides that the Funds and SSB will share the net income earned from securities lending activities. During the six months ended April 30, 2010, total earnings from the Funds' investment in cash collateral received in connection with Large Cap Value and Small Cap Core's securities lending arrangements were $27,304 and $87,611, respectively, of which $3,704 and $13,288, respectively, were rebated to borrowers (brokers). The Funds retained $18,857 and $59,468 in income, respectively, from the cash collateral investment, and SSB, as lending agent, was paid $4,743 and $14,855, respectively. Securities lending income is accrued as earned.
Note 3. Transactions with Affiliates and Related Parties
Credit Suisse serves as investment adviser for each Fund. For its investment advisory services, Credit Suisse is entitled to receive a fee from Large Cap Value at an annual rate of 0.50% and for Small Cap Core, the lower of 0.70% or the following tiered fee:
| Fund | Annual Rate | ||||||
| Small Cap Core | 0.875% of first $100 million of average daily net assets | ||||||
| 0.75% of next $100 million of average daily net assets | |||||||
| 0.625% of average daily net assets over $200 million | |||||||
For the six months ended April 30, 2010, investment advisory fees earned and voluntarily waived were as follows:
| Fund | Gross Investment Advisory Fee | Waiver | Net Investment Advisory Fee | ||||||||||||
| Large Cap Value | $ | 409,840 | $ | (36,447 | ) | $ | 373,393 | ||||||||
| Small Cap Core | 314,647 | (96,472 | ) | 218,175 | |||||||||||
Fee waivers and expense reimbursements are voluntary and may be discontinued by Credit Suisse at any time.
Credit Suisse Asset Management Securities, Inc. ("CSAMSI"), an affiliate of Credit Suisse, and SSB serve as co-administrators to the Funds. For its co-administrative services, CSAMSI currently receives a fee calculated at an annual rate of 0.09% of each Fund's average daily net assets. For the six months
70
Credit Suisse Funds
Notes to Financial Statements (continued)
April 30, 2010 (unaudited)
Note 3. Transactions with Affiliates and Related Parties
ended April 30, 2010, co-administrative services fees earned by CSAMSI were as follows:
| Fund | Co-Administration Fee | ||||||
| Large Cap Value | $ | 73,771 | |||||
| Small Cap Core | 40,455 | ||||||
For its co-administrative services, SSB receives a fee, exclusive of out-of-pocket expenses, calculated in total for all the Credit Suisse funds/portfolios co-administered by SSB and allocated based upon the relative average net assets of each fund/portfolio, subject to an annual minimum fee. For the six months ended April 30, 2010, co-administrative services fees earned by SSB (including out-of-pocket expenses) were as follows:
| Fund | Co-Administration Fee | ||||||
| Large Cap Value | $ | 63,680 | |||||
| Small Cap Core | 48,020 | ||||||
In addition to serving as each Fund's co-administrator, CSAMSI currently serves as distributor of each Fund's shares. Pursuant to distribution plans adopted by each Fund pursuant to Rule 12b-1 under the 1940 Act, CSAMSI receives fees for its distribution services. This fee is calculated at an annual rate of 0.25% of the average daily net assets of the Common Class of Small Cap Core and Class A shares of each Fund. Advisor Class shares of Large Cap Value may pay this fee at an annual rate not to exceed 0.75% of such class' average daily net assets; such fee is currently calculated at the annual rate of 0.50% of the average daily net assets of such class. For the Class B and Class C shares of each Fund, the fee is calculated at an annual rate of 1.00% of average daily net assets.
Certain brokers, dealers and financial representatives provide transfer agent related services to the Funds and receive compensation from Credit Suisse. Credit Suisse is then reimbursed by the Funds. For the six months ended April 30, 2010, Small Cap Core reimbursed Credit Suisse $10,958, which is included in the Fund's transfer agent expense.
For the six months ended April 30, 2010, CSAMSI and its affiliates advised the Funds that they retained the following amounts from commissions earned on the sale of the Funds' Class A shares:
| Fund | Amount | ||||||
| Large Cap Value | $ | 2,722 | |||||
| Small Cap Core | 1,782 | ||||||
71
Credit Suisse Funds
Notes to Financial Statements (continued)
April 30, 2010 (unaudited)
Note 3. Transactions with Affiliates and Related Parties
Merrill Corporation ("Merrill"), an affiliate of Credit Suisse, has been engaged by each Fund to provide certain financial printing services. For the six months ended April 30, 2010, Merrill was paid for its services by the Funds as follows:
| Fund | Amount | ||||||
| Large Cap Value | $ | 28,853 | |||||
| Small Cap Core | 29,862 | ||||||
Note 4. Line of Credit
The Funds, together with other funds/portfolios advised by Credit Suisse (collectively, the "Participating Funds"), participate in a committed, unsecured line of credit facility ("Credit Facility") for temporary or emergency purposes with SSB. Under the terms of the Credit Facility, the Participating Funds pay an aggregate commitment fee on the average unused amount of the Credit Facility, which is allocated among the Participating Funds in such manner as is determined by the governing Boards of the Participating Funds. In addition, the Participating Funds pay interest on borrowings at either the Overnight Federal Funds rate or the Overnight LIBOR rate plus a spread. At April 30, 2010, and during the six months ended April 30, 2010, the Funds had no borrowings under the Credit Facility.
Note 5. Purchases and Sales of Securities
For the six months ended April 30, 2010, purchases and sales of investment securities (excluding short-term investments) were as follows:
| Fund | Purchases | Sales | |||||||||
| Large Cap Value | $ | 303,703,028 | $ | 311,157,506 | |||||||
| Small Cap Core | 78,634,931 | 87,933,238 | |||||||||
At April 30, 2010, the identified cost for federal income tax purposes, as well as the gross unrealized appreciation from investments for those securities having an excess of value over cost, gross unrealized depreciation from investments for those securities having an excess of cost over value and the net unrealized appreciation from investments were as follows:
| Fund | Identified Cost | Gross Unrealized Appreciation | Gross Unrealized Depreciation | Net Unrealized Appreciation | |||||||||||||||
| Large Cap Value | $ | 171,658,566 | $ | 17,240,179 | $ | (2,695,410 | ) | $ | 14,544,769 | ||||||||||
| Small Cap Core | 124,071,858 | 17,654,905 | (1,706,390 | ) | 15,948,515 | ||||||||||||||
72
Credit Suisse Funds
Notes to Financial Statements (continued)
April 30, 2010 (unaudited)
Note 6. Capital Share Transactions
Large Cap Value is authorized to issue an unlimited number of full and fractional shares of beneficial interest, $.001 par value per share, of which an unlimited number of shares are classified as Common Class shares, Advisor Class shares, Class A shares, Class B shares and Class C shares. Small Cap Core is authorized to issue an unlimited number of full and fractional shares of beneficial interest, $.001 par value per share, of which an unlimited number of shares are classified as Common Class shares, Class A shares, Class B shares and Class C shares. Transactions in capital shares of the Funds were as follows:
| Large Cap Value | |||||||||||||||||||
| Common Class | |||||||||||||||||||
| For the Six Months Ended April 30, 2010 (unaudited) | For the Year Ended October 31, 2009 | ||||||||||||||||||
| Shares | Value | Shares | Value | ||||||||||||||||
| Shares issued in reinvestment of dividends | 158 | $ | 1,925 | 481 | $ | 4,387 | |||||||||||||
| Shares redeemed | (556 | ) | (7,209 | ) | (1,044 | ) | (10,922 | ) | |||||||||||
| Net decrease | (398 | ) | $ | (5,284 | ) | (563 | ) | $ | (6,535 | ) | |||||||||
| Advisor Class | |||||||||||||||||||
| For the Six Months Ended April 30, 2010 (unaudited) | For the Year Ended October 31, 2009 | ||||||||||||||||||
| Shares | Value | Shares | Value | ||||||||||||||||
| Shares sold | 12,144 | $ | 148,414 | 36,539 | $ | 343,128 | |||||||||||||
| Shares issued in reinvestment of dividends | 779 | 9,503 | 2,466 | 22,379 | |||||||||||||||
| Shares redeemed | (17,179 | ) | (205,625 | ) | (56,458 | ) | (554,306 | ) | |||||||||||
| Net decrease | (4,256 | ) | $ | (47,708 | ) | (17,453 | ) | $ | (188,799 | ) | |||||||||
| Class A | |||||||||||||||||||
| For the Six Months Ended April 30, 2010 (unaudited) | For the Year Ended October 31, 2009 | ||||||||||||||||||
| Shares | Value | Shares | Value | ||||||||||||||||
| Shares sold | 157,842 | $ | 1,902,000 | 487,330 | $ | 4,568,968 | |||||||||||||
| Shares issued in reinvestment of dividends | 55,303 | 674,693 | 179,251 | 1,632,423 | |||||||||||||||
| Shares redeemed | (865,252 | ) | (10,446,130 | ) | (2,229,384 | ) | (20,785,132 | ) | |||||||||||
| Net decrease | (652,107 | ) | $ | (7,869,437 | ) | (1,562,803 | ) | $ | (14,583,741 | ) | |||||||||
73
Credit Suisse Funds
Notes to Financial Statements (continued)
April 30, 2010 (unaudited)
Note 6. Capital Share Transactions
| Class B | |||||||||||||||||||
| For the Six Months Ended April 30, 2010 (unaudited) | For the Year Ended October 31, 2009 | ||||||||||||||||||
| Shares | Value | Shares | Value | ||||||||||||||||
| Shares sold | 6,472 | $ | 76,702 | 11,044 | $ | 97,706 | |||||||||||||
| Shares issued in reinvestment of dividends | 482 | 5,634 | 1,842 | 15,953 | |||||||||||||||
| Shares redeemed | (36,861 | ) | (428,005 | ) | (88,424 | ) | (797,485 | ) | |||||||||||
| Net decrease | (29,907 | ) | $ | (345,669 | ) | (75,538 | ) | $ | (683,826 | ) | |||||||||
| Class C | |||||||||||||||||||
| For the Six Months Ended April 30, 2010 (unaudited) | For the Year Ended October 31, 2009 | ||||||||||||||||||
| Shares | Value | Shares | Value | ||||||||||||||||
| Shares sold | 5,166 | $ | 59,505 | 1,972 | $ | 19,453 | |||||||||||||
| Shares issued in reinvestment of dividends | 212 | 2,454 | 650 | 5,592 | |||||||||||||||
| Shares redeemed | (6,418 | ) | (73,485 | ) | (14,664 | ) | (107,560 | ) | |||||||||||
| Net decrease | (1,040 | ) | $ | (11,526 | ) | (12,042 | ) | $ | (82,515 | ) | |||||||||
| Small Cap Core | |||||||||||||||||||
| Common Class | |||||||||||||||||||
| For the Six Months Ended April 30, 2010 (unaudited) | For the Year Ended October 31, 2009 | ||||||||||||||||||
| Shares | Value | Shares | Value | ||||||||||||||||
| Shares sold | 34,167 | $ | 351,086 | 119,702 | $ | 979,480 | |||||||||||||
| Shares issued in reinvestment of dividends and distributions | — | — | 1,193 | 9,282 | |||||||||||||||
| Shares redeemed | (301,125 | ) | (3,112,868 | ) | (346,795 | ) | (2,867,227 | ) | |||||||||||
| Net decrease | (266,958 | ) | $ | (2,761,782 | ) | (225,900 | ) | $ | (1,878,465 | ) | |||||||||
| Class A | |||||||||||||||||||
| For the Six Months Ended April 30, 2010 (unaudited) | For the Year Ended October 31, 2009 | ||||||||||||||||||
| Shares | Value | Shares | Value | ||||||||||||||||
| Shares sold | 99,245 | $ | 1,043,014 | 425,464 | $ | 3,430,260 | |||||||||||||
| Shares issued in reinvestment of dividends and distributions | — | — | 5,208 | 40,982 | |||||||||||||||
| Shares redeemed | (614,118 | ) | (6,448,042 | ) | (2,401,105 | ) | (19,377,580 | ) | |||||||||||
| Net decrease | (514,873 | ) | $ | (5,405,028 | ) | (1,970,433 | ) | $ | (15,906,338 | ) | |||||||||
74
Credit Suisse Funds
Notes to Financial Statements (continued)
April 30, 2010 (unaudited)
Note 6. Capital Share Transactions
| Class B | |||||||||||||||||||
| For the Six Months Ended April 30, 2010 (unaudited) | For the Year Ended October 31, 2009 | ||||||||||||||||||
| Shares | Value | Shares | Value | ||||||||||||||||
| Shares sold | 3,807 | $ | 31,351 | 21,723 | $ | 142,940 | |||||||||||||
| Shares issued in reinvestment of dividends and distributions | — | — | 71 | 453 | |||||||||||||||
| Shares redeemed | (91,636 | ) | (759,511 | ) | (140,305 | ) | (915,961 | ) | |||||||||||
| Net decrease | (87,829 | ) | $ | (728,160 | ) | (118,511 | ) | $ | (772,568 | ) | |||||||||
| Class C | |||||||||||||||||||
| For the Six Months Ended April 30, 2010 (unaudited) | For the Year Ended October 31, 2009 | ||||||||||||||||||
| Shares | Value | Shares | Value | ||||||||||||||||
| Shares sold | 55,716 | $ | 447,848 | 132,977 | $ | 901,105 | |||||||||||||
| Shares issued in reinvestment of dividends and distributions | — | — | 111 | 699 | |||||||||||||||
| Shares redeemed | (60,025 | ) | (502,904 | ) | (130,072 | ) | (840,109 | ) | |||||||||||
| Net increase (decrease) | (4,309 | ) | $ | (55,056 | ) | 3,016 | $ | 61,695 | |||||||||||
Small Cap Core imposes a 2% redemption fee on all classes of shares currently being offered that are purchased on or after March 1, 2007 and redeemed or exchanged within 30 days from the date of purchase. Reinvested dividends and distributions are not subject to the fee. The fee is charged based on the value of shares at redemption, is paid directly to the Fund and becomes part of the Fund's daily net asset value calculation. When shares are redeemed that are subject to the fee, reinvested dividends are redeemed first, followed by the shares held longest.
On April 30, 2010, the number of shareholders that held 5% or more of the outstanding shares of each class of the Funds was as follows:
| Number of Shareholders | Approximate Percentage of Outstanding Shares | ||||||||||
| Large Cap Value | |||||||||||
| Common Class | 4 | 82 | % | ||||||||
| Advisor Class | 2 | 99 | % | ||||||||
| Class A | 2 | 19 | % | ||||||||
| Class B | 2 | 16 | % | ||||||||
| Class C | 3 | 44 | % | ||||||||
| Small Cap Core | |||||||||||
| Common Class | 3 | 56 | % | ||||||||
| Class A | 1 | 6 | % | ||||||||
| Class C | 1 | 5 | % | ||||||||
Some of the shareholders are omnibus accounts, which hold shares on behalf of individual shareholders.
75
Credit Suisse Funds
Notes to Financial Statements (continued)
April 30, 2010 (unaudited)
Note 7. Contingencies
In the normal course of business, the Funds may provide general indemnifications pursuant to certain contracts and organizational documents. The Funds' maximum exposure under these arrangements is dependent on future claims that may be made against the Funds and, therefore, cannot be estimated; however, based on experience, the risk of loss from such claims is considered remote.
Note 8. Subsequent Events
Effective October 31, 2009, each Fund adopted the FASB amendments to general standards on accounting for and disclosures of subsequent events. Management has evaluated the possibility of subsequent events existing in the Funds' financial statements through June 23, 2010.
On May 3, 2010, the Board of Trustees of Credit Suisse Large Cap Value Fund, a series of the Credit Suisse Capital Funds (the "Acquired Fund"), approved the proposed reorganization of the Acquired Fund (a "Reorganization") whereby all of the assets and liabilities of the Acquired Fund would be transferred to Credit Suisse Large Cap Blend Fund, Inc. (the "Acquiring Fund") in exchange for shares of beneficial interest of the Acquiring Fund. The Acquired Fund would then be liquidated and shares of beneficial interest of the Acquiring Fund would be distributed to the shareholders of the Acquired Fund. The Reorganization is subject to the completion of certain conditions, including the approval of the Acquired Fund's shareholders.
On May 3, 2010, the Board of Trustees of Credit Suisse Small Cap Core Fund, a series of the Credit Suisse Capital Funds (the "Fund"), approved the proposed recommendation to change the investment strategy of the Fund. In late July 2010, the Fund's investment strategy will change to a "large cap blend" strategy whereby the Fund generally will invest at least 80% of its assets, plus any borrowings for investment purposes, in equity securities of U.S. companies with large market capitalizations ("large companies"). As a result of the change of investment strategy, the Fund's name will change to Credit Suisse Large Cap Blend II Fund. For more detailed information, please refer to the Supplement to the Prospectuses and Statement of Additional Information for the Fund dated May 3, 2010.
76
Credit Suisse Large Cap Value Fund
Board Approval of Advisory Agreement (unaudited)
In approving the renewal of the current Advisory Agreement, the Board of Trustees, including the Independent Trustees, at a meeting held on November 16 and 17, 2009, considered the following factors with respect to the Credit Suisse Large Cap Value Fund (the "Fund"):
Investment Advisory Fee Rates
The Board reviewed and considered the contractual advisory fee rate of 0.50% for the Fund ("Contractual Advisory Fee") in light of the extent and quality of the advisory services provided by Credit Suisse Asset Management, LLC ("Credit Suisse"). The Board also reviewed and considered the fee waivers currently in place for the Fund and considered the actual fee rate of 0.35% paid by the Fund after taking waivers into account ("Net Advisory Fee"). The Board acknowledged that voluntary fee waivers could be discontinued at any time.
Additionally, the Board received and considered information comparing the Fund's Contractual Advisory Fee, Net Advisory Fee and the Fund's overall expenses with those of funds in both the relevant expense group ("Expense Group") and universe of funds ("Expense Universe") provided by Lipper Inc., an independent provider of investment company data.
Nature, Extent and Quality of the Services under the Advisory Agreement
The Board received and considered information regarding the nature, extent and quality of services provided to the Fund by Credit Suisse under the Advisory Agreement. The Board also noted information received at regular meetings throughout the year related to the services rendered by Credit Suisse. The Board reviewed background information about Credit Suisse, including its Form ADV. The Board considered the background and experience of Credit Suisse's senior management and the expertise of, and the amount of attention given to the Fund by, senior personnel of Credit Suisse. In addition, the Board reviewed the qualifications, backgrounds and responsibilities of the portfolio management team primarily responsible for the day-to-day portfolio management of the Fund and the extent of the resources devoted to research and analysis of actual and potential investments. The Board also received and considered information about the nature, extent and quality of services and fee rates offered to other Credit Suisse clients for comparable services.
77
Credit Suisse Large Cap Value Fund
Board Approval of Advisory Agreement (unaudited) (continued)
Fund Performance
The Board received and considered performance results of the Fund over time, along with comparisons both to the relevant performance group ("Performance Group") and universe of funds ("Performance Universe") for the Fund. The Board was provided with a description of the methodology used to arrive at the funds included in the Performance Group and the Performance Universe.
Credit Suisse Profitability
The Board received and considered a profitability analysis of Credit Suisse based on the fees payable under the Advisory Agreement for the Fund, including any fee waivers, as well as other relationships between the Fund on the one hand and Credit Suisse affiliates on the other. The Board received profitability information for the other funds in the Credit Suisse family of funds.
Economies of Scale
The Board considered whether economies of scale in the provision of services to the Fund were being passed along to the shareholders. Accordingly, the Board considered whether alternative fee structures (such as breakpoint fee structures) would be more appropriate or reasonable taking into consideration economies of scale or other efficiencies that might accrue from increases in the Fund's asset levels.
Other Benefits to Credit Suisse
The Board considered other benefits received by Credit Suisse and its affiliates as a result of their relationship with the Fund. Such benefits include, among others, benefits potentially derived from an increase in Credit Suisse's businesses as a result of its relationship with the Fund (such as the ability to market to shareholders other financial products offered by Credit Suisse and its affiliates).
The Board considered the standards applied in seeking best execution, any benefits that may be achieved by using an affiliated broker and the existence of quality controls applicable to brokerage allocation procedures. The Board also reviewed Credit Suisse's method for allocating portfolio investment opportunities among its advisory clients.
78
Credit Suisse Large Cap Value Fund
Board Approval of Advisory Agreement (unaudited) (continued)
Conclusions
In selecting Credit Suisse, and approving the Advisory Agreement and the investment advisory fee under such agreement, the Board concluded that:
• The combined Contractual Advisory Fee and co-administration fees were among the lowest in the Expense Group, and the Net Advisory Fee was the lowest in the Expense Group. The Board considered the fee to be reasonable.
• The Fund's performance was above the median of its Performance Group and Performance Universe for all time periods.
• The Board was satisfied with the nature and extent of the investment advisory services provided to the Fund by Credit Suisse and that, based on dialogue with management and counsel, the services provided by Credit Suisse under the Advisory Agreement are typical of, and consistent with, those provided to similar mutual funds by other investment advisers.
• In light of the costs of providing investment management and other services to the Fund and Credit Suisse's ongoing commitment to the Fund and willingness to waive fees, the profits and other ancillary benefits that Credit Suisse and its affiliates received were considered reasonable.
• Credit Suisse's profitability based on fees payable under the Advisory Agreement was reasonable in light of the nature, extent and quality of the services provided to the Fund thereunder.
• In light of the combined Contractual Advisory Fee and co-administration fee, as well as the fee waivers and the Net Advisory Fee, the Fund's current fee structure (without breakpoints) was considered reasonable.
No single factor reviewed by the Board was identified by the Board as the principal factor in determining whether to approve the Advisory Agreement. The Independent Trustees were advised by separate independent legal counsel throughout the process.
79
Credit Suisse Small Cap Core Fund
Board Approval of Advisory Agreement (unaudited)
In approving the renewal of the current Advisory Agreement, the Board of Trustees, including the Independent Trustees, at a meeting held on November 16 and 17, 2009, considered the following factors with respect to the Credit Suisse Small Cap Core Fund (the "Fund"):
Investment Advisory Fee Rates
The Board reviewed and considered the contractual advisory fee that is assessed at the lower of (a) 0.70% of the Fund's average daily net assets or (b) 0.875% of its average daily net assets up to $100 million, 0.75% of its average daily net assets in excess of $100 million but less than $200 million and 0.625% of its average daily net assets over $200 million ("Contractual Advisory Fee") in light of the extent and quality of the advisory services provided by Credit Suisse Asset Management, LLC ("Credit Suisse"). The Board also reviewed and considered the fee waivers currently in place for the Fund and considered the actual fee rate of 0.36% paid by the Fund after taking waivers and breakpoints into account ("Net Advisory Fee"). The Board acknowledged that voluntary fee waivers could be discontinued at any time.
Additionally, the Board received and considered information comparing the Fund's Contractual Advisory Fee, Net Advisory Fee and the Fund's overall expenses with those of funds in both the relevant expense group ("Expense Group") and universe of funds ("Expense Universe") provided by Lipper Inc., an independent provider of investment company data.
Nature, Extent and Quality of the Services under the Advisory Agreement
The Board received and considered information regarding the nature, extent and quality of services provided to the Fund by Credit Suisse under the Advisory Agreement. The Board also noted information received at regular meetings throughout the year related to the services rendered by Credit Suisse. The Board reviewed background information about Credit Suisse, including its Form ADV. The Board considered the background and experience of Credit Suisse's senior management and the expertise of, and the amount of attention given to the Fund by, senior personnel of Credit Suisse. In addition, the Board reviewed the qualifications, backgrounds and responsibilities of the portfolio management team primarily responsible for the day-to-day portfolio management of the Fund and the extent of the resources devoted to research and analysis of actual and potential investments. The Board also received and considered information about the nature, extent and quality of services and fee rates offered to other Credit Suisse clients for comparable services.
80
Credit Suisse Small Cap Core Fund
Board Approval of Advisory Agreement (unaudited) (continued)
Fund Performance
The Board received and considered performance results of the Fund over time, along with comparisons both to the relevant performance group ("Performance Group") and universe of funds ("Performance Universe") for the Fund. The Board was provided with a description of the methodology used to arrive at the funds included in the Performance Group and the Performance Universe.
Credit Suisse Profitability
The Board received and considered a profitability analysis of Credit Suisse based on the fees payable under the Advisory Agreement for the Fund, including any fee waivers, as well as other relationships between the Fund on the one hand and Credit Suisse affiliates on the other. The Board received profitability information for the other funds in the Credit Suisse family of funds.
Economies of Scale
The Board considered whether economies of scale in the provision of services to the Fund were being passed along to the shareholders. Accordingly, the Board considered whether the breakpoints in the Fund's advisory fee structure were appropriate or reasonable taking into consideration economies of scale or other efficiencies that might accrue from increases in the Fund's asset levels.
Other Benefits to Credit Suisse
The Board considered other benefits received by Credit Suisse and its affiliates as a result of their relationship with the Fund. Such benefits include, among others, benefits potentially derived from an increase in Credit Suisse's businesses as a result of its relationship with the Fund (such as the ability to market to shareholders other financial products offered by Credit Suisse and its affiliates).
The Board considered the standards applied in seeking best execution, any benefits that may be achieved by using an affiliated broker and the existence of quality controls applicable to brokerage allocation procedures. The Board also reviewed Credit Suisse's method for allocating portfolio investment opportunities among its advisory clients.
81
Credit Suisse Small Cap Core Fund
Board Approval of Advisory Agreement (unaudited) (continued)
Conclusions
In selecting Credit Suisse, and approving the Advisory Agreement and the investment advisory fee under such agreement, the Board concluded that:
• Although the combined Contractual Advisory Fee and co-administration fees were slightly above the median of the Fund's Expense Group, the fee was considered reasonable, recognizing that the Net Advisory Fee was the lowest in the Expense Group.
• The Fund's performance was below the median for all periods in its Performance Group and Performance Universe except for the ten year period in the Performance Group. The Board determined that it would continue to monitor steps taken by Credit Suisse to improve performance.
• Aside from performance (as discussed above), the Board was satisfied with the nature and extent of the investment advisory services provided to the Fund by Credit Suisse and that, based on dialogue with management and counsel, the services provided by Credit Suisse under the Advisory Agreement are typical of, and consistent with, those provided to similar mutual funds by other investment advisers.
• In light of the costs of providing investment management and other services to the Fund and Credit Suisse's ongoing commitment to the Fund and willingness to waive fees, the profits and other ancillary benefits that Credit Suisse and its affiliates received were considered reasonable.
• Credit Suisse's profitability based on fees payable under the Advisory Agreement was reasonable in light of the nature, extent and quality of the services provided to the Fund thereunder.
• The Fund's current fee structure was considered reasonable in light of fee waivers, the Net Advisory Fee and the existence of breakpoints, which enable shareholders to share in economies of scale as the Fund grows.
No single factor reviewed by the Board was identified by the Board as the principal factor in determining whether to approve the Advisory Agreement. The Independent Trustees were advised by separate independent legal counsel throughout the process.
82
Credit Suisse Funds
Notice of Privacy and Information Practices (unaudited)
At Credit Suisse, we know that you are concerned with how we protect and handle nonpublic personal information that identifies you. This notice is designed to help you understand what nonpublic personal information we collect from you and from other sources, and how we use that information in connection with your investments and investment choices that may be available to you. Except where otherwise noted, this notice is applicable only to consumers who are current or former investors, meaning individual persons whose investments are primarily for household, family or personal use ("individual investors"). Specified sections of this notice, however, also apply to other types of investors (called "institutional investors"). Where the notice applies to institutional investors, the notice expressly states so. This notice is being provided by Credit Suisse Funds and Credit Suisse Closed-End Funds. This notice applies solely to U.S. registered in vestment companies advised by Credit Suisse Asset Management, LLC.
Categories of information we may collect:
We may collect information about you, including nonpublic personal information, such as
• Information we receive from you on applications, forms, agreements, questionnaires, Credit Suisse websites and other websites that are part of our investment program, or in the course of establishing or maintaining a customer relationship, such as your name, address, e-mail address, Social Security number, assets, income, financial situation; and
• Information we obtain from your transactions and experiences with us, our affiliates, or others, such as your account balances or other investment information, assets purchased and sold, and other parties to a transaction, where applicable.
Categories of information we disclose and parties to whom we disclose it:
• We do not disclose nonpublic personal information about our individual investors, except as permitted or required by law or regulation. Whether you are an individual investor or institutional investor, we may share the information described above with our affiliates that perform services on our behalf, and with our asset management and private banking affiliates; as well as with unaffiliated third parties that perform services on our behalf, such as our accountants, auditors, attorneys, broker-dealers, fund administrators, and other service providers.
83
Credit Suisse Funds
Notice of Privacy and Information Practices (unaudited) (continued)
• We want our investors to be informed about additional products or services. Whether you are an individual investor or an institutional investor, we may disclose information, including nonpublic personal information, regarding our transactions and experiences with you to our affiliates.
• In addition, whether you are an individual investor or an institutional investor, we reserve the right to disclose information, including nonpublic personal information, about you to any person or entity, including without limitation any governmental agency, regulatory authority or self-regulatory organization having jurisdiction over us or our affiliates, if (i) we determine in our discretion that such disclosure is necessary or advisable pursuant to or in connection with any United States federal, state or local, or non-U.S., court order (or other legal process), law, rule, regulation, or executive order or policy, including without limitation any anti-money laundering law or the USA PATRIOT Act of 2001; and (ii) such disclosure is not otherwise prohibited by law, rule, regulation, or executive order or policy.
Confidentiality and security
• To protect nonpublic personal information about individual investors, we restrict access to those employees and agents who need to know that information to provide products or services to us and to our investors. We maintain physical, electronic, and procedural safeguards to protect nonpublic personal information.
Other Disclosures
This notice is not intended to be incorporated in any offering materials, but is a statement of our current Notice of Privacy and Information Practices and may be amended from time to time. This notice is current as of May 3, 2010.
84
Credit Suisse Funds
Proxy Voting and Portfolio Holdings Information (unaudited)
Information regarding how each Fund voted proxies related to its portfolio securities during the 12 month period ended June 30 of each year, as well as the policies and procedures that each Fund uses to determine how to vote proxies relating to its portfolio securities are available:
• By calling 1-877-870-2874
• On the Funds' website, www.credit-suisse.com/us
• On the website of the Securities and Exchange Commission, www.sec.gov.
Each Fund files a complete schedule of its portfolio holdings for the first and third quarters of its fiscal year with the SEC on Form N-Q. The Funds' Forms N-Q are available on the SEC's website at www.sec.gov and may be reviewed and copied at the SEC's Public Reference Room in Washington, DC. Information on the operation of the SEC's Public Reference Room may be obtained by calling 1-202-551-8090.
85

P.O. BOX 55030, BOSTON, MA 02205-5030
877-870-2874 n www.credit-suisse.com/us
CREDIT SUISSE ASSET MANAGEMENT SECURITIES, INC., DISTRIBUTOR. USEQVAL-SAR-0410
Item 2. Code of Ethics.
This item is inapplicable to a semi-annual report on Form N-CSR.
Item 3. Audit Committee Financial Expert.
This item is inapplicable to a semi-annual report on Form N-CSR.
Item 4. Principal Accountant Fees and Services.
This item is inapplicable to a semi-annual report on Form N-CSR.
Item 5. Audit Committee of Listed Registrants.
This item is not applicable to the registrant.
Item 6. Schedule of Investments.
Included as part of the report to shareholders filed under Item 1 of this Form.
Item 7. Disclosure of Proxy Voting Policies and Procedures for Closed-End Management Investment Companies.
This item is not applicable to the registrant.
Item 8. Portfolio Managers of Closed-End Management Investment Companies.
This item is not applicable to the registrant.
Item 9. Purchases of Equity Securities by Closed-End Management Investment Company and Affiliated Purchasers.
This item is not applicable to the registrant.
Item 10. Submission of Matters to a Vote of Security Holders.
The Nominating Committee recommends Board member candidates. Shareholders of the registrant may also submit nominees that will be considered by the Committee. Recommendations should be mailed to the registrant’s Secretary, c/o Credit Suisse Asset Management, LLC, Eleven Madison Avenue, New York, NY 10010. Any submission should include at a minimum the following information: the name, age, business address, residence address and principal occupation or employment of such individual; the class, series and number of shares of the registrant that are beneficially owned by such individual; the date such shares were acquired and the investment intent of such acquisition; whether such shareholder believes such individual is, or is not, an “interested person” of the registrant (as defined in the Investment Company Act of 1940) and information regarding such individual that is sufficient, in the Committee’s discretion, to make such determination; and all other information relating to such individual that is required to be disclosed in solicitation of proxies for election of directors in an election contest (even if an election contest is not involved) or is otherwise required pursuant to the rules for proxy materials under the Securities Exchange Act of 1934.
Item 11. Controls and Procedures.
(a) As of a date within 90 days from the filing date of this report, the principal executive officer and principal financial officer concluded that the registrant’s disclosure controls and procedures (as defined in Rule 30a-3(c) under the Investment Company Act of 1940 (the “Act”)) were effective
based on their evaluation of the disclosure controls and procedures required by Rule 30a-3(b) under the Act and Rules 13a-15(b) or 15d-15(b) under the Securities Exchange Act of 1934.
(b) There were no changes in registrant’s internal control over financial reporting (as defined in Rule 30a-3(d) under the Act) that occurred during the registrant’s last fiscal half-year that have materially affected, or are reasonably likely to materially affect, the registrant’s internal control over financial reporting.
Item 12. Exhibits.
(a)(1) Not applicable.
(a)(2) The certifications of the registrant as required by Rule 30a-2(a) under the Act are exhibits to this report.
(a)(3) Not applicable.
(b) The certifications of the registrant as required by Rule 30a-2(b) under the Act are an exhibit to this report.
SIGNATURES
Pursuant to the requirements of the Securities Exchange Act of 1934 and the Investment Company Act of 1940, the registrant has duly caused this report to be signed on its behalf by the undersigned, thereunto duly authorized.
CREDIT SUISSE CAPITAL FUNDS | ||
| ||
/s/John G. Popp |
| |
Name: | John G. Popp | |
Title: | Chief Executive Officer | |
Date: | July 6, 2010 | |
Pursuant to the requirements of the Securities Exchange Act of 1934 and the Investment Company Act of 1940, this report has been signed below by the following persons on behalf of the registrant and in the capacities and on the dates indicated.
/s/John G. Popp |
| |
Name: | John G. Popp | |
Title: | Chief Executive Officer | |
Date: | July 6, 2010 | |
|
| |
|
| |
/s/Michael A. Pignataro |
| |
Name: | Michael A. Pignataro | |
Title: | Chief Financial Officer | |
Date: | July 6, 2010 | |