UNITED STATES
SECURITIES AND EXCHANGE COMMISSION
Washington, D.C. 20549
FORM N-CSR
CERTIFIED SHAREHOLDER REPORT OF REGISTERED
MANAGEMENT INVESTMENT COMPANIES
Investment Company Act file number | 811-04604 | |||||||
| ||||||||
CREDIT SUISSE CAPITAL FUNDS | ||||||||
(Exact name of registrant as specified in charter) | ||||||||
| ||||||||
Eleven Madison Avenue, New York, New York |
| 10010 | ||||||
(Address of principal executive offices) |
| (Zip code) | ||||||
| ||||||||
J. Kevin Gao, Esq. Credit Suisse Capital Funds Eleven Madison Avenue New York, New York 10010 | ||||||||
(Name and address of agent for service) | ||||||||
| ||||||||
Registrant’s telephone number, including area code: | (212) 325-2000 |
| ||||||
| ||||||||
Date of fiscal year end: | October 31 |
| ||||||
| ||||||||
Date of reporting period: | November 1, 2008 to April 30, 2009 |
| ||||||
Item 1. Reports to Stockholders.

CREDIT SUISSE FUNDS
Semiannual Report
April 30, 2009
(unaudited)
n CREDIT SUISSE
LARGE CAP VALUE FUND
n CREDIT SUISSE
SMALL CAP CORE FUND
The Funds' investment objectives, risks, charges and expenses (which should be considered carefully before investing), and more complete information about the Funds, are provided in the Prospectus, which should be read carefully before investing. You may obtain additional copies by calling 877-870-2874 or by writing to Credit Suisse Funds, P.O. Box 55030, Boston, MA 02205-5030.
Credit Suisse Asset Management Securities, Inc., Distributor, is located at Eleven Madison Avenue, New York, NY 10010. Credit Suisse Funds are advised by Credit Suisse Asset Management, LLC.
Investors in the Credit Suisse Funds should be aware that they may be eligible to purchase Common Class and/or Advisor Class shares (where offered) directly or through certain intermediaries. Such shares are not subject to a sales charge but may be subject to an ongoing service and distribution fee of up to 0.50% of average daily net assets. Investors in the Credit Suisse Funds should also be aware that they may be eligible for a reduction or waiver of the sales charge with respect to Class A, B or C shares (where offered). For more information, please review the relevant prospectuses or consult your financial representative.
The views of the Funds' management are as of the date of the letter and the Fund holdings described in this document are as of April 30, 2009; these views and Fund holdings may have changed subsequent to these dates. Nothing in this document is a recommendation to purchase or sell securities.
Fund shares are not deposits or other obligations of Credit Suisse Asset Management, LLC ("Credit Suisse") or any affiliate, are not FDIC-insured and are not guaranteed by Credit Suisse or any affiliate. Fund investments are subject to investment risks, including loss of your investment.
Credit Suisse Large Cap Value Fund
Semiannual Investment Adviser's Report
April 30, 2009 (unaudited)
June 2, 2009
Dear Shareholder:
Performance Summary
11/01/08 – 04/30/09
| Fund and Benchmark | Performance | ||||||
| Common Class1 | (6.44 | )% | |||||
| Advisor Class1 | (6.78 | )% | |||||
| Class A1,2 | (6.56 | )% | |||||
| Class B1,2 | (6.99 | )% | |||||
| Class C1,2 | (6.94 | )% | |||||
| Russell 1000® Value Index3 | (13.27 | )% | |||||
Performance shown for the Fund's Class A, Class B and Class C Shares does not reflect sales charges, which are a maximum of 5.75%, 4.00% and 1.00%, respectively.2
Market Review: Signs of a beginning recovery
The six-month period ended April 30, 2009, was a hopeful one for equities. April saw an overall rally in the performance of markets across the globe. For instance, the S&P 500 Total Return Index increased by 9.57%, bringing the six month performance to -8.53%.
The Dow Jones Industrial Average increased by 7.56% in April, ending the six-month period at -10.78%. Looking at large caps, the Russell 1000 Value Index gained 10.71% to return -13.27% for the period.
As of month end, the target Federal Funds rate was being maintained at 0.00% - 0.25%, while the discount rate stood at 0.50%. Additionally, the Consumer Confidence Index was at 39.2 as of April 28, up from 26.9 in March. Further, the labor market continued to weaken, with non-farm payrolls falling by 539,000 jobs in April across nearly all major private-sector industries, while the household unemployment rate rose to 8.9%. Nine out of ten sectors within the S&P 500 posted positive returns, with financials as the biggest winner, gaining 22.17%. In contrast, the health care sector was down 0.89%.
On May 5, 2009, Federal Reserve Chairman Ben S. Bernanke provided a guardedly optimistic assessment of the state of the economy and advised a joint congressional economic committee that the economy appears to be on track for a recovery. On the other hand, this recovery is expected to be slow and unemployment is expected to continue to rise in the near term.
1
Credit Suisse Large Cap Value Fund
Semiannual Investment Adviser's Report (continued)
April 30, 2009 (unaudited)
Strategic Review and Outlook: We are maintaining a long-term approach
For the semiannual period ending April 30, 2009, the Fund's Common class shares outperformed the Russell 1000 Value Index by 6.83% (net of fees). The largest positive contributors to performance included information technology (due to sector weighting), telecomm services (due to stock selection), and industrials and consumer discretionary. And, although financials has been the strongest sector for the six-month period due to stock selection, sector allocation in financials actually detracted from Fund performance. The main detractors from performance included telecomm services, health care, and utilities — all due to sector weightings.
Although we expect the market to remain difficult in the near term, we are comfortable with our proactive, long-term investment strategy going forward.
Jordan Low
Portfolio Manager
The value of investments generally will fluctuate in response to market movements and the Fund's performance will largely depend on the performance of value stocks, which may be more volatile than the overall market.
In addition to historical information, this report contains forward-looking statements, which may concern, among other things, domestic and foreign market, industry and economic trends and developments and government regulation and their potential impact on the Fund's investments. These statements are subject to risks and uncertainties and actual trends, developments and regulations in the future, and their impact on the Fund could be materially different from those projected, anticipated or implied. The Fund has no obligation to update or revise forward-looking statements.
The Fund adopted new investment strategies effective December 1, 2006 so that its holdings are selected using quantitative stock selection models rather than a more traditional fundamental analysis approach. Investors should be aware that performance information for periods prior to December 1, 2006 does not reflect the current investment strategies.
2
Credit Suisse Large Cap Value Fund
Semiannual Investment Adviser's Report (continued)
April 30, 2009 (unaudited)
Average Annual Returns as of March 31, 20091
| 1 Year | 5 Years | 10 Years | Since Inception | Inception Date | |||||||||||||||||||
| Common Class | (37.47 | )% | (3.88 | )% | — | (1.08 | )% | 08/01/00 | |||||||||||||||
| Advisor Class | (37.76 | )% | (4.32 | )% | — | (1.60 | )% | 06/06/03 | |||||||||||||||
| Class A Without Sales Charge | (37.62 | )% | (4.11 | )% | (0.59 | )% | — | ||||||||||||||||
| Class A With Maximum Sales Charge | (41.20 | )% | (5.25 | )% | (1.18 | )% | — | ||||||||||||||||
| Class B Without CDSC | (38.13 | )% | (4.85 | )% | (1.33 | )% | — | 02/28/96 | |||||||||||||||
| Class B With CDSC | (40.58 | )% | (4.85 | )% | (1.33 | )% | — | 02/28/96 | |||||||||||||||
| Class C Without CDSC | (38.10 | )% | (4.85 | )% | — | (1.21 | )% | 02/28/00 | |||||||||||||||
| Class C With CDSC | (38.71 | )% | (4.85 | )% | — | (1.21 | )% | 02/28/00 | |||||||||||||||
Average Annual Returns as of April 30, 20091
| 1 Year | 5 Years | 10 Years | Since Inception | Inception Date | |||||||||||||||||||
| Common Class | (32.78 | )% | (1.42 | )% | — | 0.21 | % | 08/01/00 | |||||||||||||||
| Advisor Class | (33.10 | )% | (1.89 | )% | — | 0.28 | % | 06/06/03 | |||||||||||||||
| Class A Without Sales Charge | (32.92 | )% | (1.66 | )% | (0.03 | )% | — | ||||||||||||||||
| Class A With Maximum Sales Charge | (36.76 | )% | (2.82 | )% | (0.63 | )% | — | ||||||||||||||||
| Class B Without CDSC | (33.48 | )% | (2.42 | )% | (0.78 | )% | — | 02/28/96 | |||||||||||||||
| Class B With CDSC | (36.11 | )% | (2.42 | )% | (0.78 | )% | — | 02/28/96 | |||||||||||||||
| Class C Without CDSC | (33.41 | )% | (2.41 | )% | — | 0.01 | % | 02/28/00 | |||||||||||||||
| Class C With CDSC | (34.06 | )% | (2.41 | )% | — | 0.01 | % | 02/28/00 | |||||||||||||||
Returns represent past performance and include change in share price and reinvestment of dividends and capital gains. Past performance cannot guarantee future results. The current performance of the Fund may be lower or higher than the figures shown. Returns and share price will fluctuate, and redemption value may be more or less than original cost. The performance results do not reflect the deduction of taxes that a shareholder would pay on fund distributions or the redemption of fund shares. Performance information current to the most recent month-end is available at www.credit-suisse.com/us.
The annualized gross expense ratios are 1.26% for Common Class shares, 1.77% for Advisor Class shares, 1.52% for Class A shares, 2.27% for Class B shares and 2.27% for Class C shares. The annualized net expense ratios after fee waivers and/or expense reimbursements are 1.05% for Common Class shares, 1.55% for Advisor Class shares, 1.30% for Class A shares, 2.05% for Class B shares and 2.05% for Class C shares.
1 Fee waivers and/or expense reimbursements may reduce expenses for the Fund, without which performance would be lower. Waivers and/or reimbursements may be discontinued at any time.
3
Credit Suisse Large Cap Value Fund
Semiannual Investment Adviser's Report (continued)
April 30, 2009 (unaudited)
2 Total return for the Fund's Class A shares for the reporting period, based on offering price (including maximum sales charge of 5.75%), was (11.96)%. Total return for the Fund's Class B shares for the reporting period, based on redemption value (including maximum contingent deferred sales charge of 4.00%), was (10.68)%. Total return for the Fund's Class C shares for the reporting period, based on redemption value (including maximum contingent deferred sales charge of 1.00%), was (7.86)%.
3 The Russell 1000® Value Index measures the performance of those companies in the Russell 1000® Index with lower price-to-book ratios and lower forecasted growth values. It is an unmanaged index of common stocks that includes reinvestment of dividends and is compiled by Frank Russell Company. Investors cannot invest directly in an index.
4
Credit Suisse Large Cap Value Fund
Semiannual Investment Adviser's Report (continued)
April 30, 2009 (unaudited)
Information About Your Fund's Expenses
As an investor of the Fund, you incur two types of costs: ongoing expenses and transaction costs. Ongoing expenses include management fees, distribution and service (12b-1) fees and other Fund expenses. Examples of transaction costs include sales charges (loads), redemption fees and account maintenance fees, which are not shown in this section and which would result in higher total expenses. The following table is intended to help you understand your ongoing expenses of investing in the Fund and to help you compare these expenses with the ongoing expenses of investing in other mutual funds. The table is based on an investment of $1,000 made at the beginning of the six month period ended April 30, 2009.
The table illustrates your Fund's expenses in two ways:
• Actual Fund Return. This helps you estimate the actual dollar amount of ongoing expenses paid on a $1,000 investment in the Fund using the Fund's actual return during the period. To estimate the expenses you paid over the period, simply divide your account value by $1,000 (for example, an $8,600 account value divided by $1,000 = 8.6), then multiply the result by the number in the "Expenses Paid per $1,000" line under the share class you hold.
• Hypothetical 5% Fund Return. This helps you to compare your Fund's ongoing expenses with those of other mutual funds using the Fund's actual expense ratio and a hypothetical rate of return of 5% per year before expenses. Examples using a 5% hypothetical fund return may be found in the shareholder reports of other mutual funds. The hypothetical account values and expenses may not be used to estimate the actual ending account balance or expenses you paid for the period.
Please note that the expenses shown in these tables are meant to highlight your ongoing expenses only and do not reflect any transaction costs, such as sales charges (loads) or redemption fees. If these transaction costs had been included, your costs would have been higher. The "Expenses Paid per $1,000" line of the tables is useful in comparing ongoing expenses only and will not help you determine the relative total expenses of owning different funds.
5
Credit Suisse Large Cap Value Fund
Semiannual Investment Adviser's Report (continued)
April 30, 2009 (unaudited)
Expenses and Value for a $1,000 Investment
for the six month period ended April 30, 2009
| Actual Fund Return | Common Class | Advisor Class | Class A | Class B | Class C | ||||||||||||||||||
| Beginning Account Value 11/1/08 | $ | 1,000.00 | $ | 1,000.00 | $ | 1,000.00 | $ | 1,000.00 | $ | 1,000.00 | |||||||||||||
| Ending Account Value 4/30/09 | $ | 935.60 | $ | 932.20 | $ | 934.40 | $ | 930.10 | $ | 930.60 | |||||||||||||
| Expenses Paid per $1,000* | $ | 5.04 | $ | 7.43 | $ | 6.24 | $ | 9.81 | $ | 9.81 | |||||||||||||
| Hypothetical 5% Fund Return | |||||||||||||||||||||||
| Beginning Account Value 11/1/08 | $ | 1,000.00 | $ | 1,000.00 | $ | 1,000.00 | $ | 1,000.00 | $ | 1,000.00 | |||||||||||||
| Ending Account Value 4/30/09 | $ | 1,019.59 | $ | 1,017.11 | $ | 1,018.35 | $ | 1,014.63 | $ | 1,014.63 | |||||||||||||
| Expenses Paid per $1,000* | $ | 5.26 | $ | 7.75 | $ | 6.51 | $ | 10.24 | $ | 10.24 | |||||||||||||
| Common Class | Advisor Class | Class A | Class B | Class C | |||||||||||||||||||
| Annualized Expense Ratios* | 1.05 | % | 1.55 | % | 1.30 | % | 2.05 | % | 2.05 | % | |||||||||||||
* Expenses are equal to the Fund's annualized expense ratio for each share class, multiplied by the average account value over the period, multiplied by the number of days in the most recent fiscal half year period, then divided by 365.
The "Expenses Paid per $1,000" and the "Annualized Expense Ratios" in the tables are based on actual expenses paid by the Fund during the period, net of fee waivers and/or expense reimbursements. If those fee waivers and/or expense reimbursements had not been in effect, the Fund's actual expenses would have been higher.
For more information, please refer to the Fund's prospectus.
6
Credit Suisse Large Cap Value Fund
Semiannual Investment Adviser's Report (continued)
April 30, 2009 (unaudited)
SECTOR BREAKDOWN*
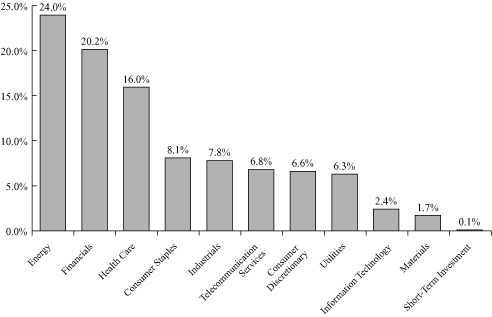
* Expressed as a percentage of total investments (excluding securities lending collateral if applicable) and may vary over time.
7
Credit Suisse Small Cap Core Fund
Semiannual Investment Adviser's Report
April 30, 2009 (unaudited)
June 2, 2009
Dear Shareholder:
Performance Summary
11/01/08 – 04/30/09
| Fund and Benchmark | Performance | ||||||
| Common Class1 | (11.12 | )% | |||||
| Class A1,2 | (11.10 | )% | |||||
| Class B1,2 | (11.44 | )% | |||||
| Class C1,2 | (11.41 | )% | |||||
| Standard & Poor's SmallCap 600 Index3 | (8.47 | )% | |||||
Performance shown for the Fund's Class A, Class B and Class C Shares does not reflect sales charges, which are a maximum of 5.75%, 4.00% and 1.00%, respectively.2
Market Review: Signs of a beginning recovery
The six-month period ended April 30, 2009, was a hopeful one for equities. April saw an overall rally in the performance of markets across the globe. For instance, the S&P 500 Total Return Index increased by 9.57%, bringing the six month performance to -8.53%.
The Dow Jones Industrial Average increased by 7.56% in April, ending the six-month period at -10.78%. Looking at small caps, the S&P 600 Index gained 17.45%, bringing the six month return to -8.47%.
As of month end, the target Federal Funds rate was being maintained at 0.00% - 0.25%, while the discount rate stood at 0.50%. Additionally, the Consumer Confidence Index was at 39.2 as of April 28, up from 26.9 in March. Further, the labor market continued to weaken, with non-farm payrolls falling by 539,000 jobs in April across nearly all major private-sector industries, while the household unemployment rate rose to 8.9%. Nine out of ten sectors within the S&P 500 posted positive returns, with financials as the biggest winner, gaining 22.17%. In contrast, the health care sector was down 0.89%.
On May 5, 2009, Federal Reserve Chairman Ben S. Bernanke provided a guardedly optimistic assessment of the state of the economy and advised a joint congressional economic committee that the economy appears to be on track for a recovery. On the other hand, this recovery is expected to be slow and unemployment is expected to continue to rise in the near term.
8
Credit Suisse Small Cap Core Fund
Semiannual Investment Adviser's Report (continued)
April 30, 2009 (unaudited)
Strategic Review and Outlook: We are maintaining a long-term approach
For the semiannual period ending April 30, 2009, the Fund underperformed the S&P 600 Index. November's performance in particular was hurt by the hedge fund unwind. By nature, small cap stocks are less liquid and more risky than other asset classes. Add to this the continued liquidation of numerous funds and hedge funds in the beginning of the fourth quarter, and the result is increased volatility in the small cap space. As hedge funds tend to have more investments in small caps relative to index weights, when they are forced to unwind, the sell off of small caps causes a depression in prices. Overall, the main positive contributors to performance included industrials and financials (both due to stock selection and sector weightings), and utilities (due to stock selection). Conversely, energy, consumer discretionary, and health care all detracted from performance due to stock selection and sector weightings.
Although we expect the market to remain difficult in the near term, we are comfortable with our proactive, long-term investment strategy going forward.
Jordan Low
Portfolio Manager
Because of the nature of the Fund's investments in special-situation, start-up and other small companies, an investment in the Fund may be more volatile and less liquid than investments in larger companies.
In addition to historical information, this report contains forward-looking statements, which may concern, among other things, domestic and foreign market, industry and economic trends and developments and government regulation and their potential impact on the Fund's investments. These statements are subject to risks and uncertainties and actual trends, developments and regulations in the future, and their impact on the Fund could be materially different from those projected, anticipated or implied. The Fund has no obligation to update or revise forward-looking statements.
The Fund adopted new investment strategies effective December 1, 2006 so that its holdings are selected using quantitative stock selection models rather than a more traditional fundamental analysis approach. Investors should be aware that performance information for periods prior to December 1, 2006 does not reflect the current investment strategies.
9
Credit Suisse Small Cap Core Fund
Semiannual Investment Adviser's Report (continued)
April 30, 2009 (unaudited)
Average Annual Returns as of March 31, 20091
| 1 Year | 5 Years | 10 Years | Since Inception | Inception Date | |||||||||||||||||||
| Common Class | (38.49 | )% | (5.21 | )% | — | 1.99 | % | 08/01/00 | |||||||||||||||
| Class A Without Sales Charge | (38.40 | )% | (5.18 | )% | 4.14 | % | — | ||||||||||||||||
| Class A With Maximum Sales Charge | (41.93 | )% | (6.29 | )% | 3.52 | % | — | ||||||||||||||||
| Class B Without CDSC | (38.89 | )% | (5.90 | )% | 3.36 | % | — | 02/28/96 | |||||||||||||||
| Class B With CDSC | (41.33 | )% | (5.90 | )% | 3.36 | % | — | 02/28/96 | |||||||||||||||
| Class C Without CDSC | (38.94 | )% | (5.92 | )% | — | 2.71 | % | 02/28/00 | |||||||||||||||
| Class C With CDSC | (39.55 | )% | (5.92 | )% | ��� | 2.71 | % | 02/28/00 | |||||||||||||||
Average Annual Returns as of April 30, 20091
| 1 Year | 5 Years | 10 Years | Since Inception | Inception Date | |||||||||||||||||||
| Common Class | (32.52 | )% | (2.27 | )% | — | 3.64 | % | 08/01/00 | |||||||||||||||
| Class A Without Sales Charge | (32.47 | )% | (2.25 | )% | 4.71 | % | — | ||||||||||||||||
| Class A With Maximum Sales Charge | (36.36 | )% | (3.41 | )% | 4.09 | % | — | ||||||||||||||||
| Class B Without CDSC | (33.02 | )% | (2.99 | )% | 3.93 | % | — | 02/28/96 | |||||||||||||||
| Class B With CDSC | (35.70 | )% | (2.99 | )% | 3.93 | % | — | 02/28/96 | |||||||||||||||
| Class C Without CDSC | (32.95 | )% | (2.99 | )% | — | 4.28 | % | 02/28/00 | |||||||||||||||
| Class C With CDSC | (33.62 | )% | (2.99 | )% | — | 4.28 | % | 02/28/00 | |||||||||||||||
Returns represent past performance and include change in share price and reinvestment of dividends and capital gains. Past performance cannot guarantee future results. The current performance of the Fund may be lower or higher than the figures shown. Returns and share price will fluctuate, and redemption value may be more or less than original cost. The performance results do not reflect the deduction of taxes that a shareholder would pay on fund distributions or the redemption of fund shares. Performance information current to the most recent month-end is available at www.credit-suisse.com/us.
The annualized gross expense ratios are 1.98% for Common Class shares, 1.97% for Class A shares, 2.73% for Class B shares and 2.73% for Class C shares. The annualized net expense ratios after fee waivers and/or expense reimbursements are 1.55% for Common Class shares, 1.55% for Class A shares, 2.30% for Class B shares and 2.30% for Class C shares.
1 Fee waivers and/or expense reimbursements may reduce expenses for the Fund, without which performance would be lower. Waivers and/or reimbursements may be discontinued at any time.
10
Credit Suisse Small Cap Core Fund
Semiannual Investment Adviser's Report (continued)
April 30, 2009 (unaudited)
2 Total return for the Fund's Class A shares for the reporting period, based on offering price (including maximum sales charge of 5.75%), was (16.22)%. Total return for the Fund's Class B shares for the reporting period, based on redemption value (including maximum contingent deferred sales charge of 4.00%), was (14.98)%. Total return for the Fund's Class C shares for the reporting period, based on redemption value (including maximum contingent deferred sales charge of 1.00%), was (12.30)%.
3 The Standard & Poor's SmallCap 600® Index is an unmanaged market weighted index of 600 U.S. stocks selected on the basis of capitalization, liquidity and industry group representation. It is a registered trademark of The McGraw-Hill Co., Inc. Investors cannot invest directly in an index.
11
Credit Suisse Small Cap Core Fund
Semiannual Investment Adviser's Report (continued)
April 30, 2009 (unaudited)
Information About Your Fund's Expenses
As an investor of the Fund, you incur two types of costs: ongoing expenses and transaction costs. Ongoing expenses include management fees, distribution and service (12b-1) fees and other Fund expenses. Examples of transaction costs include sales charges (loads), redemption fees and account maintenance fees, which are not shown in this section and which would result in higher total expenses. The following table is intended to help you understand your ongoing expenses of investing in the Fund and to help you compare these expenses with the ongoing expenses of investing in other mutual funds. The table is based on an investment of $1,000 made at the beginning of the six month period ended April 30, 2009.
The table illustrates your Fund's expenses in two ways:
• Actual Fund Return. This helps you estimate the actual dollar amount of ongoing expenses paid on a $1,000 investment in the Fund using the Fund's actual return during the period. To estimate the expenses you paid over the period, simply divide your account value by $1,000 (for example, an $8,600 account value divided by $1,000 = 8.6), then multiply the result by the number in the "Expenses Paid per $1,000" line under the share class you hold.
• Hypothetical 5% Fund Return. This helps you to compare your Fund's ongoing expenses with those of other mutual funds using the Fund's actual expense ratio and a hypothetical rate of return of 5% per year before expenses. Examples using a 5% hypothetical fund return may be found in the shareholder reports of other mutual funds. The hypothetical account values and expenses may not be used to estimate the actual ending account balance or expenses you paid for the period.
Please note that the expenses shown in these tables are meant to highlight your ongoing expenses only and do not reflect any transaction costs, such as sales charges (loads) or redemption fees. If these transaction costs had been included, your costs would have been higher. The "Expenses Paid per $1,000" line of the tables is useful in comparing ongoing expenses only and will not help you determine the relative total expenses of owning different funds.
12
Credit Suisse Small Cap Core Fund
Semiannual Investment Adviser's Report (continued)
April 30, 2009 (unaudited)
Expenses and Value for a $1,000 Investment
for the six month period ended April 30, 2009
| Actual Fund Return | Common Class | Class A | Class B | Class C | |||||||||||||||
| Beginning Account Value 11/1/08 | $ | 1,000.00 | $ | 1,000.00 | $ | 1,000.00 | $ | 1,000.00 | |||||||||||
| Ending Account Value 4/30/09 | $ | 888.80 | $ | 889.00 | $ | 885.60 | $ | 885.90 | |||||||||||
| Expenses Paid per $1,000* | $ | 7.26 | $ | 7.26 | $ | 10.75 | $ | 10.75 | |||||||||||
| Hypothetical 5% Fund Return | |||||||||||||||||||
| Beginning Account Value 11/1/08 | $ | 1,000.00 | $ | 1,000.00 | $ | 1,000.00 | $ | 1,000.00 | |||||||||||
| Ending Account Value 4/30/09 | $ | 1,017.11 | $ | 1,017.11 | $ | 1,013.39 | $ | 1,013.39 | |||||||||||
| Expenses Paid per $1,000* | $ | 7.75 | $ | 7.75 | $ | 11.48 | $ | 11.48 | |||||||||||
| Common Class | Class A | Class B | Class C | ||||||||||||||||
| Annualized Expense Ratios* | 1.55 | % | 1.55 | % | 2.30 | % | 2.30 | % | |||||||||||
* Expenses are equal to the Fund's annualized expense ratio for each share class, multiplied by the average account value over the period, multiplied by the number of days in the most recent fiscal half year period, then divided by 365.
The "Expenses Paid per $1,000" and the "Annualized Expense Ratios" in the tables are based on actual expenses paid by the Fund during the period, net of fee waivers and/or expense reimbursements. If those fee waivers and/or expense reimbursements had not been in effect, the Fund's actual expenses would have been higher.
For more information, please refer to the Fund's prospectus.
13
Credit Suisse Small Cap Core Fund
Semiannual Investment Adviser's Report (continued)
April 30, 2009 (unaudited)
SECTOR BREAKDOWN*
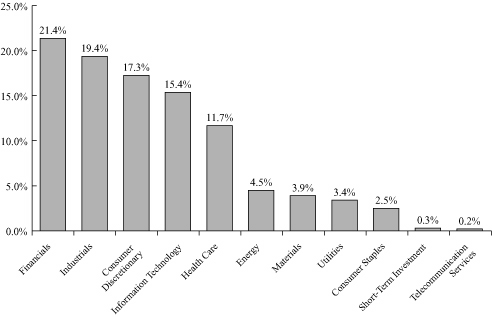
* Expressed as a percentage of total investments (excluding securities lending collateral if applicable) and may vary over time.
14
Credit Suisse Large Cap Value Fund
Schedule of Investments
April 30, 2009 (unaudited)
| Number of Shares | Value | ||||||||||
| COMMON STOCKS (99.0%) | |||||||||||
| Aerospace & Defense (2.0%) | |||||||||||
| Alliant Techsystems, Inc.* | 600 | $ | 47,790 | ||||||||
| Cubic Corp. | 51 | 1,464 | |||||||||
| General Dynamics Corp. | 13,000 | 671,710 | |||||||||
| ITT Corp. | 1,400 | 57,414 | |||||||||
| L-3 Communications Holdings, Inc. | 900 | 68,535 | |||||||||
| Lockheed Martin Corp. | 2,400 | 188,472 | |||||||||
| Northrop Grumman Corp. | 9,500 | 459,325 | |||||||||
| Raytheon Co. | 9,500 | 429,685 | |||||||||
| Spirit AeroSystems Holdings, Inc. Class A* | 3,500 | 44,625 | |||||||||
| The Boeing Co. | 100 | 4,005 | |||||||||
| United Technologies Corp. | 14,200 | 693,528 | |||||||||
| 2,666,553 | |||||||||||
| Air Freight & Logistics (0.4%) | |||||||||||
| FedEx Corp. | 10,600 | 593,176 | |||||||||
| UTI Worldwide, Inc.* | 300 | 4,038 | |||||||||
| 597,214 | |||||||||||
| Airlines (0.1%) | |||||||||||
| AMR Corp.* | 1,500 | 7,140 | |||||||||
| Continental Airlines, Inc. Class B* | 4,200 | 44,184 | |||||||||
| Copa Holdings SA Class A | 100 | 3,065 | |||||||||
| Delta Air Lines, Inc.* | 15,300 | 94,401 | |||||||||
| Southwest Airlines Co. | 400 | 2,792 | |||||||||
| 151,582 | |||||||||||
| Auto Components (0.1%) | |||||||||||
| Autoliv, Inc. | 1,500 | 37,005 | |||||||||
| Federal-Mogul Corp.* | 700 | 7,770 | |||||||||
| Johnson Controls, Inc. | 200 | 3,802 | |||||||||
| The Goodyear Tire & Rubber Co.* | 900 | 9,891 | |||||||||
| TRW Automotive Holdings Corp.* | 1,700 | 14,654 | |||||||||
| 73,122 | |||||||||||
| Automobiles (0.1%) | |||||||||||
| Ford Motor Co.* | 25,500 | 152,490 | |||||||||
| Harley-Davidson, Inc. | 100 | 2,216 | |||||||||
| Thor Industries, Inc. | 600 | 13,794 | |||||||||
| 168,500 | |||||||||||
| Beverages (0.3%) | |||||||||||
| Constellation Brands, Inc. Class A* | 6,300 | 73,017 | |||||||||
| Dr. Pepper Snapple Group, Inc.* | 6,500 | 134,615 | |||||||||
| Molson Coors Brewing Co. Class B | 100 | 3,825 | |||||||||
| PepsiCo, Inc. | 3,200 | 159,232 | |||||||||
| The Coca-Cola Co. | 100 | 4,305 | |||||||||
| The Pepsi Bottling Group, Inc. | 100 | 3,127 | |||||||||
| 378,121 | |||||||||||
See Accompanying Notes to Financial Statements.
15
Credit Suisse Large Cap Value Fund
Schedule of Investments (continued)
April 30, 2009 (unaudited)
| Number of Shares | Value | ||||||||||
| COMMON STOCKS | |||||||||||
| Biotechnology (1.3%) | |||||||||||
| Amgen, Inc.* | 34,700 | $ | 1,681,909 | ||||||||
| Biogen Idec, Inc.* | 500 | 24,170 | |||||||||
| 1,706,079 | |||||||||||
| Building Products (0.0%) | |||||||||||
| Armstrong World Industries, Inc.* | 600 | 10,908 | |||||||||
| Masco Corp. | 1,300 | 11,518 | |||||||||
| Owens Corning, Inc.* | 600 | 10,740 | |||||||||
| USG Corp.* | 200 | 2,972 | |||||||||
| 36,138 | |||||||||||
| Capital Markets (3.7%) | |||||||||||
| American Capital, Ltd. | 7,200 | 22,248 | |||||||||
| Ameriprise Financial, Inc. | 7,500 | 197,625 | |||||||||
| Bank of New York Mellon Corp. | 38,800 | 988,624 | |||||||||
| E*TRADE Financial Corp.* | 3,900 | 5,577 | |||||||||
| Franklin Resources, Inc. | 4,600 | 278,208 | |||||||||
| Invesco, Ltd. | 11,500 | 169,280 | |||||||||
| Investment Technology Group, Inc.* | 12,600 | 287,028 | |||||||||
| Jefferies Group, Inc. | 3,700 | 72,409 | |||||||||
| MF Global, Ltd.* | 600 | 3,660 | |||||||||
| Morgan Stanley | 33,100 | 782,484 | |||||||||
| Northern Trust Corp. | 800 | 43,488 | |||||||||
| Raymond James Financial, Inc. | 3,200 | 50,208 | |||||||||
| State Street Corp. | 10,700 | 365,191 | |||||||||
| The Goldman Sachs Group, Inc. | 13,400 | 1,721,900 | |||||||||
| 4,987,930 | |||||||||||
| Chemicals (0.8%) | |||||||||||
| Cabot Corp. | 1,200 | 17,520 | |||||||||
| Celanese Corp. Series A | 600 | 12,504 | |||||||||
| Cytec Industries, Inc. | 1,600 | 31,776 | |||||||||
| E.I. du Pont de Nemours & Co. | 100 | 2,790 | |||||||||
| Eastman Chemical Co. | 2,556 | 101,422 | |||||||||
| FMC Corp. | 1,500 | 73,095 | |||||||||
| Huntsman Corp. | 1,600 | 8,576 | |||||||||
| Intrepid Potash, Inc.* | 400 | 9,876 | |||||||||
| Nalco Holding Co. | 200 | 3,264 | |||||||||
| PPG Industries, Inc. | 2,000 | 88,100 | |||||||||
| Praxair, Inc. | 100 | 7,461 | |||||||||
| RPM International, Inc. | 4,300 | 59,426 | |||||||||
| The Dow Chemical Co. | 31,500 | 504,000 | |||||||||
| The Lubrizol Corp. | 2,300 | 99,406 | |||||||||
| The Mosaic Co. | 600 | 24,270 | |||||||||
| The Valspar Corp. | 1,000 | 24,000 | |||||||||
| 1,067,486 | |||||||||||
See Accompanying Notes to Financial Statements.
16
Credit Suisse Large Cap Value Fund
Schedule of Investments (continued)
April 30, 2009 (unaudited)
| Number of Shares | Value | ||||||||||
| COMMON STOCKS | |||||||||||
| Commercial Banks (4.1%) | |||||||||||
| BancorpSouth, Inc. | 400 | $ | 9,300 | ||||||||
| Bank of Hawaii Corp. | 1,600 | 56,224 | |||||||||
| BB&T Corp. | 18,600 | 434,124 | |||||||||
| BOK Financial Corp. | 700 | 26,362 | |||||||||
| CapitalSource, Inc. | 7,300 | 22,557 | |||||||||
| City National Corp. | 1,300 | 47,580 | |||||||||
| Comerica, Inc. | 900 | 18,882 | |||||||||
| Cullen/Frost Bankers, Inc. | 1,900 | 89,471 | |||||||||
| Fifth Third Bancorp | 4,500 | 18,450 | |||||||||
| First Citizens BancShares, Inc. Class A | 170 | 20,344 | |||||||||
| Fulton Financial Corp. | 5,884 | 38,893 | |||||||||
| KeyCorp | 100 | 615 | |||||||||
| M&T Bank Corp. | 800 | 41,960 | |||||||||
| PNC Financial Services Group, Inc. | 14,400 | 571,680 | |||||||||
| Popular, Inc. | 1,300 | 3,718 | |||||||||
| Regions Financial Corp. | 14,200 | 63,758 | |||||||||
| SunTrust Banks, Inc. | 1,561 | 22,541 | |||||||||
| TCF Financial Corp. | 1,300 | 18,083 | |||||||||
| U.S. Bancorp | 59,100 | 1,076,802 | |||||||||
| Valley National Bancorp | 2,500 | 36,175 | |||||||||
| Wells Fargo & Co. | 143,100 | 2,863,431 | |||||||||
| Whitney Holding Corp. | 2,222 | 26,575 | |||||||||
| Wilmington Trust Corp. | 2,233 | 32,401 | |||||||||
| Zions Bancorporation | 2,841 | 31,052 | |||||||||
| 5,570,978 | |||||||||||
| Commercial Services & Supplies (0.5%) | |||||||||||
| Avery Dennison Corp. | 3,600 | 103,464 | |||||||||
| Cintas Corp. | 4,400 | 112,904 | |||||||||
| Corrections Corp. of America* | 400 | 5,652 | |||||||||
| Pitney Bowes, Inc. | 600 | 14,724 | |||||||||
| R. R. Donnelley & Sons Co. | 7,200 | 83,880 | |||||||||
| Republic Services, Inc. | 3,900 | 81,900 | |||||||||
| Steelcase, Inc. Class A | 2,100 | 9,513 | |||||||||
| Waste Management, Inc. | 12,000 | 320,040 | |||||||||
| 732,077 | |||||||||||
| Communications Equipment (0.0%) | |||||||||||
| ADC Telecommunications, Inc.* | 1,000 | 7,360 | |||||||||
| EchoStar Corp. Class A* | 400 | 6,328 | |||||||||
| JDS Uniphase Corp.* | 1,000 | 4,610 | |||||||||
| Motorola, Inc. | 2,500 | 13,825 | |||||||||
| Tellabs, Inc.* | 4,000 | 20,960 | |||||||||
| 53,083 | |||||||||||
| Computers & Peripherals (0.3%) | |||||||||||
| Diebold, Inc. | 300 | 7,929 | |||||||||
| EMC Corp.* | 21,200 | 265,636 | |||||||||
| Lexmark International, Inc. Class A* | 1,600 | 31,392 | |||||||||
See Accompanying Notes to Financial Statements.
17
Credit Suisse Large Cap Value Fund
Schedule of Investments (continued)
April 30, 2009 (unaudited)
| Number of Shares | Value | ||||||||||
| COMMON STOCKS | |||||||||||
| Computers & Peripherals | |||||||||||
| NCR Corp.* | 500 | $ | 5,075 | ||||||||
| QLogic Corp.* | 4,200 | 59,556 | |||||||||
| Seagate Technology | 1,100 | 8,976 | |||||||||
| Sun Microsystems, Inc.* | 300 | 2,748 | |||||||||
| Teradata Corp.* | 3,100 | 51,832 | |||||||||
| 433,144 | |||||||||||
| Construction & Engineering (0.0%) | |||||||||||
| Aecom Technology Corp.* | 300 | 7,719 | |||||||||
| KBR, Inc. | 1,061 | 16,573 | |||||||||
| Quanta Services, Inc.* | 300 | 6,819 | |||||||||
| 31,111 | |||||||||||
| Construction Materials (0.0%) | |||||||||||
| Eagle Materials, Inc. | 100 | 2,780 | |||||||||
| Vulcan Materials Co. | 500 | 23,775 | |||||||||
| 26,555 | |||||||||||
| Consumer Finance (0.1%) | |||||||||||
| American Express Co. | 5,500 | 138,710 | |||||||||
| AmeriCredit Corp.* | 1,400 | 14,238 | |||||||||
| Discover Financial Services | 3,800 | 30,894 | |||||||||
| SLM Corp.* | 1,800 | 8,694 | |||||||||
| 192,536 | |||||||||||
| Containers & Packaging (0.3%) | |||||||||||
| AptarGroup, Inc. | 1,800 | 55,854 | |||||||||
| Bemis Co., Inc. | 3,300 | 79,332 | |||||||||
| Packaging Corp. of America | 300 | 4,761 | |||||||||
| Pactiv Corp.* | 4,400 | 96,184 | |||||||||
| Sealed Air Corp. | 5,400 | 102,924 | |||||||||
| Sonoco Products Co. | 3,300 | 80,553 | |||||||||
| Temple-Inland, Inc. | 1,100 | 13,134 | |||||||||
| 432,742 | |||||||||||
| Distributors (0.0%) | |||||||||||
| Genuine Parts Co. | 300 | 10,188 | |||||||||
| Diversified Consumer Services (0.3%) | |||||||||||
| Career Education Corp.* | 3,000 | 66,120 | |||||||||
| H&R Block, Inc. | 23,800 | 360,332 | |||||||||
| Service Corporation International | 2,800 | 12,684 | |||||||||
| Weight Watchers International, Inc. | 100 | 2,488 | |||||||||
| 441,624 | |||||||||||
| Diversified Financial Services (5.0%) | |||||||||||
| Bank of America Corp. | 215,444 | 1,923,915 | |||||||||
| CIT Group, Inc. | 3,800 | 8,436 | |||||||||
| Citigroup, Inc. | 184,600 | 563,030 | |||||||||
| JPMorgan Chase & Co. | 126,000 | 4,158,000 | |||||||||
See Accompanying Notes to Financial Statements.
18
Credit Suisse Large Cap Value Fund
Schedule of Investments (continued)
April 30, 2009 (unaudited)
| Number of Shares | Value | ||||||||||
| COMMON STOCKS | |||||||||||
| Diversified Financial Services | |||||||||||
| Leucadia National Corp.* | 1,923 | $ | 40,825 | ||||||||
| NYSE Euronext | 3,500 | 81,095 | |||||||||
| The NASDAQ OMX Group, Inc.* | 2,000 | 38,460 | |||||||||
| 6,813,761 | |||||||||||
| Diversified Telecommunication Services (6.2%) | |||||||||||
| AT&T, Inc. | 202,105 | 5,177,930 | |||||||||
| CenturyTel, Inc. | 3,400 | 92,310 | |||||||||
| Embarq Corp. | 2,500 | 91,400 | |||||||||
| Verizon Communications, Inc. | 96,600 | 2,930,844 | |||||||||
| Windstream Corp. | 7,600 | 63,080 | |||||||||
| 8,355,564 | |||||||||||
| Electric Utilities (2.9%) | |||||||||||
| American Electric Power Co., Inc. | 13,700 | 361,406 | |||||||||
| DPL, Inc. | 3,500 | 78,505 | |||||||||
| Duke Energy Corp. | 42,900 | 592,449 | |||||||||
| Edison International | 11,100 | 316,461 | |||||||||
| Entergy Corp. | 1,900 | 123,063 | |||||||||
| FirstEnergy Corp. | 10,400 | 425,360 | |||||||||
| FPL Group, Inc. | 13,900 | 747,681 | |||||||||
| Great Plains Energy, Inc. | 100 | 1,447 | |||||||||
| Pepco Holdings, Inc. | 7,400 | 88,430 | |||||||||
| Pinnacle West Capital Corp. | 3,400 | 93,092 | |||||||||
| Progress Energy, Inc. | 9,400 | 320,728 | |||||||||
| Southern Co. | 26,100 | 753,768 | |||||||||
| 3,902,390 | |||||||||||
| Electrical Equipment (0.1%) | |||||||||||
| Cooper Industries, Ltd. Class A | 1,400 | 45,906 | |||||||||
| Thomas & Betts Corp.* | 1,800 | 56,016 | |||||||||
| 101,922 | |||||||||||
| Electronic Equipment, Instruments & Components (0.2%) | |||||||||||
| Arrow Electronics, Inc.* | 400 | 9,096 | |||||||||
| Avnet, Inc.* | 400 | 8,756 | |||||||||
| AVX Corp. | 1,500 | 15,015 | |||||||||
| Ingram Micro, Inc. Class A* | 5,700 | 82,764 | |||||||||
| Jabil Circuit, Inc. | 1,200 | 9,720 | |||||||||
| Molex, Inc. | 1,200 | 20,004 | |||||||||
| Tech Data Corp.* | 1,400 | 40,306 | |||||||||
| Tyco Electronics, Ltd. | 3,000 | 52,320 | |||||||||
| 237,981 | |||||||||||
| Energy Equipment & Services (0.3%) | |||||||||||
| BJ Services Co. | 6,100 | 84,729 | |||||||||
| Global Industries, Ltd.* | 500 | 3,235 | |||||||||
| Halliburton Co. | 100 | 2,022 | |||||||||
| Helix Energy Solutions Group, Inc.* | 900 | 8,181 | |||||||||
See Accompanying Notes to Financial Statements.
19
Credit Suisse Large Cap Value Fund
Schedule of Investments (continued)
April 30, 2009 (unaudited)
| Number of Shares | Value | ||||||||||
| COMMON STOCKS | |||||||||||
| Energy Equipment & Services | |||||||||||
| Helmerich & Payne, Inc. | 700 | $ | 21,574 | ||||||||
| Hercules Offshore, Inc.* | 500 | 1,600 | |||||||||
| Key Energy Services, Inc.* | 3,500 | 15,365 | |||||||||
| Nabors Industries, Ltd.* | 1,200 | 18,252 | |||||||||
| Oil States International, Inc.* | 500 | 9,450 | |||||||||
| Patterson-UTI Energy, Inc. | 1,200 | 15,252 | |||||||||
| Pride International, Inc.* | 1,600 | 36,320 | |||||||||
| Rowan Cos., Inc. | 2,400 | 37,464 | |||||||||
| Schlumberger, Ltd. | 100 | 4,899 | |||||||||
| SEACOR Holdings, Inc.* | 600 | 39,432 | |||||||||
| Tidewater, Inc. | 1,600 | 69,200 | |||||||||
| Unit Corp.* | 300 | 8,187 | |||||||||
| 375,162 | |||||||||||
| Food & Staples Retailing (1.6%) | |||||||||||
| BJ's Wholesale Club, Inc.* | 2,000 | 66,680 | |||||||||
| Costco Wholesale Corp. | 100 | 4,860 | |||||||||
| CVS Caremark Corp. | 22,300 | 708,694 | |||||||||
| Safeway, Inc. | 14,900 | 294,275 | |||||||||
| SUPERVALU, Inc. | 400 | 6,540 | |||||||||
| The Kroger Co. | 12,500 | 270,250 | |||||||||
| Wal-Mart Stores, Inc. | 14,700 | 740,880 | |||||||||
| Walgreen Co. | 100 | 3,143 | |||||||||
| 2,095,322 | |||||||||||
| Food Products (5.3%) | |||||||||||
| Archer-Daniels-Midland Co. | 194,800 | 4,795,976 | |||||||||
| Bunge, Ltd. | 4,100 | 196,841 | |||||||||
| Campbell Soup Co. | 100 | 2,572 | |||||||||
| ConAgra Foods, Inc. | 200 | 3,540 | |||||||||
| Corn Products International, Inc. | 1,400 | 33,460 | |||||||||
| Dean Foods Co.* | 1,000 | 20,700 | |||||||||
| Del Monte Foods Co. | 6,614 | 49,936 | |||||||||
| General Mills, Inc. | 10,400 | 527,176 | |||||||||
| H.J. Heinz Co. | 4,700 | 161,774 | |||||||||
| Hormel Foods Corp. | 2,400 | 75,096 | |||||||||
| Kellogg Co. | 100 | 4,211 | |||||||||
| Kraft Foods, Inc. Class A | 50,000 | 1,170,000 | |||||||||
| McCormick & Co., Inc. | 500 | 14,725 | |||||||||
| Sara Lee Corp. | 100 | 832 | |||||||||
| The Hershey Co. | 100 | 3,614 | |||||||||
| The J.M. Smucker Co. | 1,000 | 39,400 | |||||||||
| Tyson Foods, Inc. Class A | 100 | 1,054 | |||||||||
| 7,100,907 | |||||||||||
| Gas Utilities (0.3%) | |||||||||||
| AGL Resources, Inc. | 2,456 | 76,554 | |||||||||
| Atmos Energy Corp. | 3,000 | 74,130 | |||||||||
| Energen Corp. | 603 | 21,780 | |||||||||
See Accompanying Notes to Financial Statements.
20
Credit Suisse Large Cap Value Fund
Schedule of Investments (continued)
April 30, 2009 (unaudited)
| Number of Shares | Value | ||||||||||
| COMMON STOCKS | |||||||||||
| Gas Utilities | |||||||||||
| National Fuel Gas Co. | 1,000 | $ | 32,710 | ||||||||
| Questar Corp. | 3,600 | 106,992 | |||||||||
| UGI Corp. | 3,600 | 82,584 | |||||||||
| 394,750 | |||||||||||
| Health Care Equipment & Supplies (0.9%) | |||||||||||
| Beckman Coulter, Inc. | 400 | 21,024 | |||||||||
| Becton, Dickinson & Co. | 100 | 6,048 | |||||||||
| Boston Scientific Corp.* | 47,600 | 400,316 | |||||||||
| Covidien, Ltd. | 17,000 | 560,660 | |||||||||
| Hologic, Inc.* | 900 | 13,374 | |||||||||
| Hospira, Inc.* | 4,600 | 151,202 | |||||||||
| Inverness Medical Innovations, Inc.* | 1,300 | 41,977 | |||||||||
| Zimmer Holdings, Inc.* | 600 | 26,394 | |||||||||
| 1,220,995 | |||||||||||
| Health Care Providers & Services (1.8%) | |||||||||||
| Aetna, Inc. | 5,300 | 116,653 | |||||||||
| AmerisourceBergen Corp. | 4,500 | 151,380 | |||||||||
| Brookdale Senior Living, Inc. | 200 | 2,062 | |||||||||
| Cardinal Health, Inc. | 3,000 | 101,370 | |||||||||
| CIGNA Corp. | 8,200 | 161,622 | |||||||||
| Community Health Systems, Inc.* | 2,500 | 57,100 | |||||||||
| Coventry Health Care, Inc.* | 4,100 | 65,231 | |||||||||
| Health Management Associates, Inc. Class A* | 2,800 | 13,076 | |||||||||
| Health Net, Inc.* | 100 | 1,444 | |||||||||
| Henry Schein, Inc.* | 200 | 8,208 | |||||||||
| Humana, Inc.* | 2,400 | 69,072 | |||||||||
| LifePoint Hospitals, Inc.* | 1,100 | 28,435 | |||||||||
| McKesson Corp. | 2,700 | 99,900 | |||||||||
| MEDNAX, Inc.* | 100 | 3,590 | |||||||||
| Omnicare, Inc. | 3,300 | 84,843 | |||||||||
| Quest Diagnostics, Inc. | 2,700 | 138,591 | |||||||||
| UnitedHealth Group, Inc. | 26,300 | 618,576 | |||||||||
| Universal Health Services, Inc. Class B | 1,100 | 55,440 | |||||||||
| WellPoint, Inc.* | 15,328 | 655,425 | |||||||||
| 2,432,018 | |||||||||||
| Health Care Technology (0.0%) | |||||||||||
| IMS Health, Inc. | 4,800 | 60,288 | |||||||||
| Hotels, Restaurants & Leisure (0.5%) | |||||||||||
| Boyd Gaming Corp. | 400 | 3,676 | |||||||||
| Carnival Corp. | 11,800 | 317,184 | |||||||||
| International Speedway Corp. Class A | 1,000 | 23,680 | |||||||||
| Interval Leisure Group, Inc.* | 1,000 | 8,010 | |||||||||
| McDonald's Corp. | 3,500 | 186,515 | |||||||||
| Royal Caribbean Cruises, Ltd. | 4,600 | 67,758 | |||||||||
| Wyndham Worldwide Corp. | 1,100 | 12,848 | |||||||||
| Yum! Brands, Inc. | 100 | 3,335 | |||||||||
| 623,006 | |||||||||||
See Accompanying Notes to Financial Statements.
21
Credit Suisse Large Cap Value Fund
Schedule of Investments (continued)
April 30, 2009 (unaudited)
| Number of Shares | Value | ||||||||||
| COMMON STOCKS | |||||||||||
| Household Durables (0.3%) | |||||||||||
| D.R. Horton, Inc. | 100 | $ | 1,305 | ||||||||
| Fortune Brands, Inc. | 500 | 19,655 | |||||||||
| Harman International Industries, Inc. | 500 | 9,095 | |||||||||
| Jarden Corp.* | 2,300 | 46,230 | |||||||||
| KB HOME | 200 | 3,614 | |||||||||
| Leggett & Platt, Inc. | 5,300 | 76,108 | |||||||||
| Lennar Corp. Class A | 1,400 | 13,636 | |||||||||
| M.D.C. Holdings, Inc. | 400 | 13,672 | |||||||||
| Mohawk Industries, Inc.* | 100 | 4,731 | |||||||||
| Newell Rubbermaid, Inc. | 9,300 | 97,185 | |||||||||
| NVR, Inc.* | 100 | 50,537 | |||||||||
| The Black & Decker Corp. | 200 | 8,060 | |||||||||
| Whirlpool Corp. | 2,500 | 112,900 | |||||||||
| 456,728 | |||||||||||
| Household Products (0.3%) | |||||||||||
| Clorox Co. | 100 | 5,605 | |||||||||
| Kimberly-Clark Corp. | 8,300 | 407,862 | |||||||||
| The Procter & Gamble Co. | 100 | 4,944 | |||||||||
| 418,411 | |||||||||||
| Independent Power Producers & Energy Traders (1.2%) | |||||||||||
| Constellation Energy Group, Inc. | 200 | 4,816 | |||||||||
| Mirant Corp.* | 123,678 | 1,574,421 | |||||||||
| Reliant Energy, Inc.* | 3,200 | 15,872 | |||||||||
| 1,595,109 | |||||||||||
| Industrial Conglomerates (3.4%) | |||||||||||
| Carlisle Cos., Inc. | 1,800 | 40,950 | |||||||||
| General Electric Co. | 357,700 | 4,524,905 | |||||||||
| Koninklijke (Royal) Philips Electronics NV NY Shares | 3,500 | 62,930 | |||||||||
| 4,628,785 | |||||||||||
| Insurance (5.4%) | |||||||||||
| Aflac, Inc. | 16,100 | 465,129 | |||||||||
| Allied World Assurance Co. Holdings, Ltd. | 1,600 | 59,424 | |||||||||
| American Financial Group, Inc. | 2,650 | 46,587 | |||||||||
| Aon Corp. | 10,400 | 438,880 | |||||||||
| Arch Capital Group, Ltd.* | 1,500 | 86,670 | |||||||||
| Arthur J. Gallagher & Co. | 3,100 | 69,688 | |||||||||
| Assurant, Inc. | 4,000 | 97,760 | |||||||||
| Axis Capital Holdings, Ltd. | 3,500 | 86,240 | |||||||||
| Brown & Brown, Inc. | 3,000 | 58,380 | |||||||||
| CNA Financial Corp. | 900 | 10,773 | |||||||||
| Endurance Specialty Holdings, Ltd. | 1,700 | 44,472 | |||||||||
| Erie Indemnity Co. Class A | 906 | 32,000 | |||||||||
| Everest Re Group, Ltd. | 2,100 | 156,744 | |||||||||
| Fidelity National Financial, Inc. Class A | 7,200 | 130,536 | |||||||||
| First American Corp. | 3,100 | 87,048 | |||||||||
See Accompanying Notes to Financial Statements.
22
Credit Suisse Large Cap Value Fund
Schedule of Investments (continued)
April 30, 2009 (unaudited)
| Number of Shares | Value | ||||||||||
| COMMON STOCKS | |||||||||||
| Insurance | |||||||||||
| Genworth Financial, Inc. Class A | 4,400 | $ | 10,384 | ||||||||
| Hanover Insurance Group, Inc. | 1,667 | 49,977 | |||||||||
| HCC Insurance Holdings, Inc. | 3,700 | 88,504 | |||||||||
| Lincoln National Corp. | 8,800 | 98,912 | |||||||||
| Loews Corp. | 10,700 | 266,323 | |||||||||
| Manulife Financial Corp. | 2,900 | 49,590 | |||||||||
| Markel Corp.* | 264 | 75,768 | |||||||||
| Marsh & McLennan Cos., Inc. | 17,400 | 366,966 | |||||||||
| MBIA, Inc.* | 1,700 | 8,041 | |||||||||
| Mercury General Corp. | 600 | 20,268 | |||||||||
| MetLife, Inc. | 17,200 | 511,700 | |||||||||
| Old Republic International Corp. | 7,800 | 73,086 | |||||||||
| OneBeacon Insurance Group, Ltd. Class A | 800 | 9,296 | |||||||||
| PartnerRe, Ltd. | 1,800 | 122,742 | |||||||||
| Protective Life Corp. | 2,300 | 19,711 | |||||||||
| Prudential Financial, Inc. | 12,200 | 352,336 | |||||||||
| RenaissanceRe Holdings, Ltd. | 2,000 | 97,320 | |||||||||
| StanCorp Financial Group, Inc. | 1,600 | 43,888 | |||||||||
| The Allstate Corp. | 18,700 | 436,271 | |||||||||
| The Chubb Corp. | 12,400 | 482,980 | |||||||||
| The Hartford Financial Services Group, Inc. | 10,700 | 122,729 | |||||||||
| The Progressive Corp.* | 23,000 | 351,440 | |||||||||
| The Travelers Cos., Inc. | 33,000 | 1,357,620 | |||||||||
| Torchmark Corp. | 2,800 | 82,124 | |||||||||
| Transatlantic Holdings, Inc. | 624 | 23,668 | |||||||||
| Unitrin, Inc. | 1,338 | 22,746 | |||||||||
| Unum Group | 11,500 | 187,910 | |||||||||
| W.R. Berkley Corp. | 4,600 | 109,986 | |||||||||
| White Mountains Insurance Group, Ltd. | 200 | 38,264 | |||||||||
| XL Capital, Ltd. Class A | 1,468 | 13,961 | |||||||||
| 7,364,842 | |||||||||||
| Internet & Catalog Retail (0.1%) | |||||||||||
| Expedia, Inc.* | 7,000 | 95,270 | |||||||||
| HSN, Inc.* | 1,100 | 7,601 | |||||||||
| Liberty Media Corp. — Interactive Class A* | 6,200 | 32,860 | |||||||||
| Ticketmaster Entertainment, Inc.* | 1,000 | 5,260 | |||||||||
| 140,991 | |||||||||||
| IT Services (1.1%) | |||||||||||
| Broadridge Financial Solutions, Inc. | 58,812 | 1,138,012 | |||||||||
| Computer Sciences Corp.* | 5,100 | 188,496 | |||||||||
| Convergys Corp.* | 100 | 1,011 | |||||||||
| DST Systems, Inc.* | 200 | 7,234 | |||||||||
| Genpact, Ltd.* | 100 | 896 | |||||||||
| Lender Processing Services, Inc. | 1,100 | 31,526 | |||||||||
| SAIC, Inc.* | 5,700 | 103,170 | |||||||||
| 1,470,345 | |||||||||||
See Accompanying Notes to Financial Statements.
23
Credit Suisse Large Cap Value Fund
Schedule of Investments (continued)
April 30, 2009 (unaudited)
| Number of Shares | Value | ||||||||||
| COMMON STOCKS | |||||||||||
| Leisure Equipment & Products (0.2%) | |||||||||||
| Eastman Kodak Co. | 9,100 | $ | 27,755 | ||||||||
| Hasbro, Inc. | 2,400 | 63,984 | |||||||||
| Mattel, Inc. | 12,300 | 184,008 | |||||||||
| 275,747 | |||||||||||
| Life Sciences Tools & Services (0.3%) | |||||||||||
| Charles River Laboratories International, Inc.* | 300 | 8,295 | |||||||||
| Life Technologies Corp.* | 1,031 | 38,456 | |||||||||
| PerkinElmer, Inc. | 2,200 | 32,054 | |||||||||
| Thermo Fisher Scientific, Inc.* | 9,300 | 326,244 | |||||||||
| 405,049 | |||||||||||
| Machinery (0.7%) | |||||||||||
| AGCO Corp.* | 803 | 19,513 | |||||||||
| Caterpillar, Inc. | 200 | 7,116 | |||||||||
| Crane Co. | 1,700 | 39,253 | |||||||||
| Danaher Corp. | 2,600 | 151,944 | |||||||||
| Deere & Co. | 100 | 4,126 | |||||||||
| Dover Corp. | 800 | 24,624 | |||||||||
| Eaton Corp. | 3,000 | 131,400 | |||||||||
| Flowserve Corp. | 1,000 | 67,900 | |||||||||
| Gardner Denver, Inc.* | 1,776 | 47,277 | |||||||||
| IDEX Corp. | 100 | 2,525 | |||||||||
| Illinois Tool Works, Inc. | 100 | 3,280 | |||||||||
| Ingersoll-Rand Co., Ltd. Class A | 1,300 | 28,301 | |||||||||
| Lincoln Electric Holdings, Inc. | 400 | 17,812 | |||||||||
| Oshkosh Corp. | 700 | 6,720 | |||||||||
| Pentair, Inc. | 100 | 2,664 | |||||||||
| Terex Corp.* | 600 | 8,280 | |||||||||
| The Manitowoc Co., Inc. | 5,300 | 31,535 | |||||||||
| The Timken Co. | 20,700 | 332,856 | |||||||||
| Trinity Industries, Inc. | 2,700 | 39,447 | |||||||||
| 966,573 | |||||||||||
| Marine (0.0%) | |||||||||||
| Alexander & Baldwin, Inc. | 1,400 | 37,296 | |||||||||
| Media (2.2%) | |||||||||||
| Cablevision Systems Corp. Group A | 100 | 1,716 | |||||||||
| CBS Corp. Class B | 20,000 | 140,800 | |||||||||
| Clear Channel Outdoor Holdings, Inc. Class A* | 100 | 384 | |||||||||
| Comcast Corp. Class A | 74,400 | 1,150,224 | |||||||||
| Gannett Co., Inc. | 7,700 | 30,107 | |||||||||
| Hearst-Argyle Television, Inc. | 700 | 3,150 | |||||||||
| Liberty Global, Inc. Class A* | 4,900 | 80,801 | |||||||||
| Liberty Media Corp. - Capital Series A* | 1,000 | 11,700 | |||||||||
| Omnicom Group, Inc. | 300 | 9,441 | |||||||||
| Regal Entertainment Group Class A | 900 | 11,754 | |||||||||
| Scripps Networks Interactive Class A | 2,900 | 79,576 | |||||||||
See Accompanying Notes to Financial Statements.
24
Credit Suisse Large Cap Value Fund
Schedule of Investments (continued)
April 30, 2009 (unaudited)
| Number of Shares | Value | ||||||||||
| COMMON STOCKS | |||||||||||
| Media | |||||||||||
| The E.W. Scripps Co. Class A | 400 | $ | 788 | ||||||||
| The Interpublic Group of Cos., Inc.* | 2,300 | 14,398 | |||||||||
| The McGraw-Hill Cos., Inc. | 5,400 | 162,810 | |||||||||
| The New York Times Co. Class A | 1,600 | 8,608 | |||||||||
| The Walt Disney Co. | 57,200 | 1,252,680 | |||||||||
| Virgin Media, Inc. | 2,900 | 22,388 | |||||||||
| Warner Music Group Corp.* | 1,400 | 7,532 | |||||||||
| 2,988,857 | |||||||||||
| Metals & Mining (0.4%) | |||||||||||
| Carpenter Technology Corp. | 1,400 | 28,938 | |||||||||
| Century Aluminum Co.* | 200 | 808 | |||||||||
| Commercial Metals Co. | 100 | 1,488 | |||||||||
| Freeport-McMoRan Copper & Gold, Inc. | 100 | 4,265 | |||||||||
| Nucor Corp. | 8,500 | 345,865 | |||||||||
| Reliance Steel & Aluminum Co. | 2,100 | 73,983 | |||||||||
| Schnitzer Steel Industries, Inc. Class A | 200 | 9,912 | |||||||||
| Steel Dynamics, Inc. | 2,500 | 31,125 | |||||||||
| Titanium Metals Corp. | 100 | 679 | |||||||||
| United States Steel Corp. | 200 | 5,310 | |||||||||
| 502,373 | |||||||||||
| Multi-Utilities (1.9%) | |||||||||||
| Alliant Energy Corp. | 3,700 | 82,732 | |||||||||
| CenterPoint Energy, Inc. | 4,300 | 45,752 | |||||||||
| Dominion Resources, Inc. | 19,600 | 591,136 | |||||||||
| DTE Energy Co. | 5,500 | 162,635 | |||||||||
| Integrys Energy Group, Inc. | 2,600 | 68,666 | |||||||||
| MDU Resources Group, Inc. | 6,200 | 108,934 | |||||||||
| NiSource, Inc. | 2,600 | 28,574 | |||||||||
| NSTAR | 3,616 | 113,578 | |||||||||
| OGE Energy Corp. | 3,100 | 79,701 | |||||||||
| PG&E Corp. | 12,200 | 452,864 | |||||||||
| SCANA Corp. | 100 | 3,022 | |||||||||
| Sempra Energy | 8,500 | 391,170 | |||||||||
| TECO Energy, Inc. | 7,101 | 75,200 | |||||||||
| Vectren Corp. | 2,700 | 59,859 | |||||||||
| Xcel Energy, Inc. | 15,400 | 283,976 | |||||||||
| 2,547,799 | |||||||||||
| Multiline Retail (0.4%) | |||||||||||
| Family Dollar Stores, Inc. | 4,300 | 142,717 | |||||||||
| J.C. Penney Co., Inc. | 1,000 | 30,690 | |||||||||
| Macy's, Inc. | 14,300 | 195,624 | |||||||||
| Sears Holdings Corp.* | 1,800 | 112,446 | |||||||||
| 481,477 | |||||||||||
See Accompanying Notes to Financial Statements.
25
Credit Suisse Large Cap Value Fund
Schedule of Investments (continued)
April 30, 2009 (unaudited)
| Number of Shares | Value | ||||||||||
| COMMON STOCKS | |||||||||||
| Office Electronics (0.0%) | |||||||||||
| Xerox Corp. | 8,900 | $ | 54,379 | ||||||||
| Zebra Technologies Corp. Class A* | 100 | 2,125 | |||||||||
| 56,504 | |||||||||||
| Oil, Gas & Consumable Fuels (23.5%) | |||||||||||
| Anadarko Petroleum Corp. | 15,900 | 684,654 | |||||||||
| Apache Corp. | 11,400 | 830,604 | |||||||||
| Cabot Oil & Gas Corp. | 100 | 3,019 | |||||||||
| Chesapeake Energy Corp. | 12,300 | 242,433 | |||||||||
| Chevron Corp. | 158,700 | 10,490,070 | |||||||||
| Cimarex Energy Co. | 1,800 | 48,420 | |||||||||
| ConocoPhillips | 52,400 | 2,148,400 | |||||||||
| Devon Energy Corp. | 400 | 20,740 | |||||||||
| El Paso Corp. | 200 | 1,380 | |||||||||
| EnCana Corp. | 100 | 4,573 | |||||||||
| EOG Resources, Inc. | 2,100 | 133,308 | |||||||||
| Exxon Mobil Corp. | 181,200 | 12,080,604 | |||||||||
| Forest Oil Corp.* | 800 | 12,800 | |||||||||
| Marathon Oil Corp. | 26,400 | 784,080 | |||||||||
| Mariner Energy, Inc.* | 700 | 7,966 | |||||||||
| Murphy Oil Corp. | 63,800 | 3,043,898 | |||||||||
| Newfield Exploration Co.* | 600 | 18,708 | |||||||||
| Noble Energy | 5,400 | 306,450 | |||||||||
| Occidental Petroleum Corp. | 600 | 33,774 | |||||||||
| Overseas Shipholding Group, Inc. | 700 | 20,097 | |||||||||
| Petro-Canada | 1,800 | 56,754 | |||||||||
| Pioneer Natural Resources Co. | 100 | 2,312 | |||||||||
| Plains Exploration & Production Co.* | 100 | 1,887 | |||||||||
| Royal Dutch Shell PLC ADR | 200 | 9,136 | |||||||||
| Southern Union Co. | 3,700 | 58,867 | |||||||||
| Spectra Energy Corp. | 21,500 | 311,750 | |||||||||
| St. Mary Land & Exploration Co. | 1,200 | 21,444 | |||||||||
| Sunoco, Inc. | 1,600 | 42,416 | |||||||||
| Teekay Corp. | 1,400 | 20,216 | |||||||||
| Tesoro Corp. | 3,300 | 50,325 | |||||||||
| TransCanada Corp. | 100 | 2,497 | |||||||||
| Valero Energy Corp. | 18,000 | 357,120 | |||||||||
| Walter Industries, Inc. | 100 | 2,280 | |||||||||
| XTO Energy, Inc. | 300 | 10,398 | |||||||||
| 31,863,380 | |||||||||||
| Paper & Forest Products (0.2%) | |||||||||||
| International Paper Co. | 8,000 | 101,280 | |||||||||
| MeadWestvaco Corp. | 5,900 | 92,394 | |||||||||
| Schweitzer-Mauduit International, Inc. | 95 | 2,182 | |||||||||
| Weyerhaeuser Co. | 100 | 3,526 | |||||||||
| 199,382 | |||||||||||
See Accompanying Notes to Financial Statements.
26
Credit Suisse Large Cap Value Fund
Schedule of Investments (continued)
April 30, 2009 (unaudited)
| Number of Shares | Value | ||||||||||
| COMMON STOCKS | |||||||||||
| Personal Products (0.0%) | |||||||||||
| NBTY, Inc.* | 700 | $ | 18,137 | ||||||||
| Pharmaceuticals (11.5%) | |||||||||||
| Bristol-Myers Squibb Co. | 5,900 | 113,280 | |||||||||
| Eli Lilly & Co. | 30,700 | 1,010,644 | |||||||||
| Endo Pharmaceuticals Holdings, Inc.* | 100 | 1,654 | |||||||||
| Forest Laboratories, Inc.* | 9,400 | 203,886 | |||||||||
| Johnson & Johnson | 70,400 | 3,686,144 | |||||||||
| King Pharmaceuticals, Inc.* | 5,100 | 40,188 | |||||||||
| Merck & Co., Inc. | 52,000 | 1,260,480 | |||||||||
| Pfizer, Inc. | 409,600 | 5,472,256 | |||||||||
| Sepracor, Inc.* | 68,000 | 966,280 | |||||||||
| Teva Pharmaceutical Industries, Ltd. ADR | 3,022 | 132,635 | |||||||||
| Valeant Pharmaceuticals International* | 43,984 | 737,172 | |||||||||
| Watson Pharmaceuticals, Inc.* | 1,800 | 55,692 | |||||||||
| Wyeth | 45,300 | 1,920,720 | |||||||||
| 15,601,031 | |||||||||||
| Professional Services (0.1%) | |||||||||||
| Manpower, Inc. | 2,400 | 103,416 | |||||||||
| Real Estate Investment Trusts (1.3%) | |||||||||||
| Alexandria Real Estate Equities, Inc. | 1,000 | 36,480 | |||||||||
| AMB Property Corp. | 1,000 | 19,090 | |||||||||
| Annaly Capital Management, Inc. | 18,200 | 256,074 | |||||||||
| Apartment Investment & Management Co. Class A | 604 | 4,409 | |||||||||
| AvalonBay Communities, Inc. | 831 | 47,209 | |||||||||
| Boston Properties, Inc. | 1,200 | 59,304 | |||||||||
| Brandywine Realty Trust | 800 | 4,952 | |||||||||
| BRE Properties, Inc. | 500 | 12,285 | |||||||||
| Camden Property Trust | 200 | 5,426 | |||||||||
| CBL & Associates Properties, Inc. | 684 | 5,431 | |||||||||
| Developers Diversified Realty Corp. | 1,337 | 5,522 | |||||||||
| Digital Realty Trust, Inc. | 300 | 10,803 | |||||||||
| Douglas Emmett, Inc. | 1,300 | 12,441 | |||||||||
| Duke Realty Corp. | 1,400 | 13,678 | |||||||||
| Equity Residential | 2,700 | 61,803 | |||||||||
| Essex Property Trust, Inc. | 200 | 12,698 | |||||||||
| Federal Realty Investment Trust | 500 | 27,600 | |||||||||
| HCP, Inc. | 7,500 | 164,625 | |||||||||
| Health Care REIT, Inc. | 3,200 | 109,024 | |||||||||
| Hospitality Properties Trust | 3,200 | 39,168 | |||||||||
| Host Hotels & Resorts, Inc. | 5,000 | 38,450 | |||||||||
| HRPT Properties Trust | 2,200 | 9,482 | |||||||||
| iStar Financial, Inc. | 1,100 | 3,707 | |||||||||
| Kilroy Realty Corp. | 400 | 8,616 | |||||||||
| Kimco Realty Corp. | 3,000 | 36,060 | |||||||||
| Liberty Property Trust | 1,200 | 29,208 | |||||||||
| Mack-Cali Realty Corp. | 100 | 2,686 | |||||||||
| Nationwide Health Properties, Inc. | 3,100 | 76,539 | |||||||||
See Accompanying Notes to Financial Statements.
27
Credit Suisse Large Cap Value Fund
Schedule of Investments (continued)
April 30, 2009 (unaudited)
| Number of Shares | Value | ||||||||||
| COMMON STOCKS | |||||||||||
| Real Estate Investment Trusts | |||||||||||
| Plum Creek Timber Co., Inc. | 1,200 | $ | 41,424 | ||||||||
| ProLogis | 2,200 | 20,042 | |||||||||
| Public Storage | 4,300 | 287,498 | |||||||||
| Rayonier, Inc. | 2,300 | 88,826 | |||||||||
| Regency Centers Corp. | 700 | 26,215 | |||||||||
| SL Green Realty Corp. | 1,900 | 33,554 | |||||||||
| UDR, Inc. | 1,530 | 15,407 | |||||||||
| Ventas, Inc. | 3,600 | 103,104 | |||||||||
| Vornado Realty Trust | 1,426 | 69,717 | |||||||||
| Weingarten Realty Investors | 800 | 12,432 | |||||||||
| 1,810,989 | |||||||||||
| Real Estate Management & Development (0.0%) | |||||||||||
| CB Richard Ellis Group, Inc. Class A* | 1,300 | 9,750 | |||||||||
| Jones Lang LaSalle, Inc. | 1,100 | 35,497 | |||||||||
| 45,247 | |||||||||||
| Road & Rail (0.3%) | |||||||||||
| Avis Budget Group, Inc.* | 200 | 418 | |||||||||
| Hertz Global Holdings, Inc.* | 2,700 | 18,360 | |||||||||
| Norfolk Southern Corp. | 9,100 | 324,688 | |||||||||
| Ryder System, Inc. | 1,323 | 36,634 | |||||||||
| 380,100 | |||||||||||
| Semiconductors & Semiconductor Equipment (0.5%) | |||||||||||
| Advanced Micro Devices, Inc.* | 5,800 | 20,938 | |||||||||
| Atmel Corp.* | 1,700 | 6,528 | |||||||||
| Cree, Inc.* | 1,699 | 46,536 | |||||||||
| Fairchild Semiconductor International, Inc.* | 1,300 | 8,008 | |||||||||
| Integrated Device Technology, Inc.* | 3,200 | 17,376 | |||||||||
| Intel Corp. | 29,400 | 463,932 | |||||||||
| International Rectifier Corp.* | 1,900 | 32,072 | |||||||||
| Intersil Corp. Class A | 192 | 2,227 | |||||||||
| Lam Research Corp.* | 200 | 5,576 | |||||||||
| LSI Corp.* | 1,600 | 6,144 | |||||||||
| Micron Technology, Inc.* | 5,700 | 27,816 | |||||||||
| Novellus Systems, Inc.* | 2,300 | 41,538 | |||||||||
| Teradyne, Inc.* | 17 | 101 | |||||||||
| 678,792 | |||||||||||
| Software (0.2%) | |||||||||||
| Amdocs, Ltd.* | 3,800 | 79,534 | |||||||||
| Cadence Design Systems, Inc.* | 2,900 | 16,182 | |||||||||
| Compuware Corp.* | 3,400 | 25,432 | |||||||||
| McAfee, Inc.* | 100 | 3,754 | |||||||||
| Novell, Inc.* | 6,500 | 24,440 | |||||||||
| Symantec Corp.* | 800 | 13,800 | |||||||||
| Synopsys, Inc.* | 4,800 | 104,544 | |||||||||
| 267,686 | |||||||||||
See Accompanying Notes to Financial Statements.
28
Credit Suisse Large Cap Value Fund
Schedule of Investments (continued)
April 30, 2009 (unaudited)
| Number of Shares | Value | ||||||||||
| COMMON STOCKS | |||||||||||
| Specialty Retail (2.2%) | |||||||||||
| American Eagle Outfitters, Inc. | 1,100 | $ | 16,302 | ||||||||
| AnnTaylor Stores Corp.* | 1,200 | 8,868 | |||||||||
| AutoNation, Inc.* | 300 | 5,313 | |||||||||
| Barnes & Noble, Inc. | 1,200 | �� | 31,344 | ||||||||
| Bed Bath & Beyond, Inc.* | 200 | 6,084 | |||||||||
| Foot Locker, Inc. | 5,200 | 61,828 | |||||||||
| Limited Brands, Inc. | 3,100 | 35,402 | |||||||||
| Lowe's Cos., Inc. | 47,200 | 1,014,800 | |||||||||
| Office Depot, Inc.* | 3,400 | 8,806 | |||||||||
| OfficeMax, Inc. | 800 | 5,960 | |||||||||
| RadioShack Corp. | 4,400 | 61,952 | |||||||||
| Staples, Inc. | 100 | 2,062 | |||||||||
| The Gap, Inc. | 8,400 | 130,536 | |||||||||
| The Home Depot, Inc. | 57,500 | 1,513,400 | |||||||||
| Williams-Sonoma, Inc. | 888 | 12,432 | |||||||||
| 2,915,089 | |||||||||||
| Textiles, Apparel & Luxury Goods (0.2%) | |||||||||||
| Jones Apparel Group, Inc. | 2,911 | 26,898 | |||||||||
| Liz Claiborne, Inc. | 3,200 | 15,168 | |||||||||
| Phillips-Van Heusen Corp. | 200 | 5,806 | |||||||||
| VF Corp. | 2,900 | 171,883 | |||||||||
| 219,755 | |||||||||||
| Thrifts & Mortgage Finance (0.3%) | |||||||||||
| Astoria Financial Corp. | 2,772 | 22,897 | |||||||||
| Hudson City Bancorp, Inc. | 11,428 | 143,536 | |||||||||
| MGIC Investment Corp. | 4,200 | 10,752 | |||||||||
| New York Community Bancorp, Inc. | 11,600 | 131,196 | |||||||||
| Washington Federal, Inc. | 2,889 | 37,499 | |||||||||
| 345,880 | |||||||||||
| Tobacco (0.7%) | |||||||||||
| Altria Group, Inc. | 17,400 | 284,142 | |||||||||
| Lorillard, Inc. | 6,300 | 397,719 | |||||||||
| Reynolds American, Inc. | 5,800 | 220,284 | |||||||||
| 902,145 | |||||||||||
| Trading Companies & Distributors (0.0%) | |||||||||||
| GATX Corp. | 900 | 27,099 | |||||||||
| United Rentals, Inc.* | 2,000 | 12,120 | |||||||||
| 39,219 | |||||||||||
| Water Utilities (0.0%) | |||||||||||
| American Water Works Co., Inc. | 2,100 | 37,800 | |||||||||
| Aqua America, Inc. | 400 | 7,340 | |||||||||
| 45,140 | |||||||||||
See Accompanying Notes to Financial Statements.
29
Credit Suisse Large Cap Value Fund
Schedule of Investments (continued)
April 30, 2009 (unaudited)
| Number of Shares | Value | ||||||||||
| COMMON STOCKS | |||||||||||
| Wireless Telecommunication Services (0.6%) | |||||||||||
| Sprint Nextel Corp.* | 94,400 | $ | 411,584 | ||||||||
| Syniverse Holdings, Inc.* | 26,900 | 338,940 | |||||||||
| United States Cellular Corp.* | 300 | 10,200 | |||||||||
| 760,724 | |||||||||||
| TOTAL COMMON STOCKS (Cost $134,403,055) | 134,003,827 | ||||||||||
| Par (000) | |||||||||||
| SHORT-TERM INVESTMENT (0.1%) | |||||||||||
| State Street Bank and Trust Co. Euro Time Deposit, 0.010%, 05/01/09 (Cost $122,000) | $ | 122 | 122,000 | ||||||||
| TOTAL INVESTMENTS AT VALUE (99.1%) (Cost $134,525,055) | 134,125,827 | ||||||||||
| OTHER ASSETS IN EXCESS OF LIABILITIES (0.9%) | 1,228,531 | ||||||||||
| NET ASSETS (100.0%) | $ | 135,354,358 | |||||||||
INVESTMENT ABBREVIATION
ADR = American Depositary Receipt
* Non-income producing security.
See Accompanying Notes to Financial Statements.
30
Credit Suisse Small Cap Core Fund
Schedule of Investments
April 30, 2009 (unaudited)
| Number of Shares | Value | ||||||||||
| COMMON STOCKS (99.9%) | |||||||||||
| Aerospace & Defense (1.7%) | |||||||||||
| Aerovironment, Inc.* | 2,000 | $ | 47,320 | ||||||||
| American Science and Engineering, Inc. | 1,100 | 66,286 | |||||||||
| Applied Signal Technology, Inc. | 4,800 | 94,848 | |||||||||
| Argon ST, Inc.* | 100 | 2,039 | |||||||||
| Cubic Corp. | 1,896 | 54,434 | |||||||||
| Curtiss-Wright Corp. | 14,200 | 453,974 | |||||||||
| Esterline Technologies Corp.* | 7,007 | 184,635 | |||||||||
| GenCorp, Inc.* | 4,300 | 10,320 | |||||||||
| Orbital Sciences Corp.* | 25,000 | 386,500 | |||||||||
| Stanley, Inc.* | 2,200 | 56,716 | |||||||||
| Teledyne Technologies, Inc.* | 100 | 3,193 | |||||||||
| 1,360,265 | |||||||||||
| Air Freight & Logistics (0.0%) | |||||||||||
| Hub Group, Inc. Class A* | 100 | 2,300 | |||||||||
| Airlines (3.2%) | |||||||||||
| AirTran Holdings, Inc.* | 140,600 | 977,170 | |||||||||
| Alaska Air Group, Inc.* | 16,400 | 275,192 | |||||||||
| Copa Holdings SA Class A | 31,800 | 974,670 | |||||||||
| Republic Airways Holdings, Inc.* | 400 | 2,864 | |||||||||
| SkyWest, Inc. | 28,200 | 339,528 | |||||||||
| 2,569,424 | |||||||||||
| Auto Components (0.2%) | |||||||||||
| Cooper Tire & Rubber Co. | 400 | 3,308 | |||||||||
| Drew Industries, Inc.* | 100 | 1,428 | |||||||||
| Standard Motor Products, Inc. | 1,400 | 5,600 | |||||||||
| Superior Industries International, Inc. | 500 | 7,540 | |||||||||
| WABCO Holdings, Inc. | 10,000 | 159,900 | |||||||||
| 177,776 | |||||||||||
| Automobiles (0.0%) | |||||||||||
| Fleetwood Enterprises, Inc.* | 23,800 | 690 | |||||||||
| Monaco Coach Corp. | 9,400 | 423 | |||||||||
| Winnebago Industries, Inc. | 200 | 1,762 | |||||||||
| 2,875 | |||||||||||
| Beverages (0.1%) | |||||||||||
| The Boston Beer Co., Inc. Class A* | 1,600 | 42,560 | |||||||||
| Biotechnology (1.6%) | |||||||||||
| ArQule, Inc.* | 3,600 | 16,020 | |||||||||
| Cepheid, Inc.* | 1,300 | 12,610 | |||||||||
| Cubist Pharmaceuticals, Inc.* | 13,736 | 228,018 | |||||||||
| Emergent Biosolutions, Inc.* | 63,300 | 677,943 | |||||||||
| Halozyme Therapeutics, Inc.* | 100 | 632 | |||||||||
| Martek Biosciences Corp. | 10,600 | 193,132 | |||||||||
| Maxygen, Inc.* | 300 | 1,755 | |||||||||
| Metabolix, Inc.* | 100 | 790 | |||||||||
See Accompanying Notes to Financial Statements.
31
Credit Suisse Small Cap Core Fund
Schedule of Investments (continued)
April 30, 2009 (unaudited)
| Number of Shares | Value | ||||||||||
| COMMON STOCKS | |||||||||||
| Biotechnology | |||||||||||
| Regeneron Pharmaceuticals, Inc.* | 8,133 | $ | 107,843 | ||||||||
| Rigel Pharmaceuticals, Inc.* | 100 | 664 | |||||||||
| Savient Pharmaceuticals, Inc.* | 6,900 | 36,432 | |||||||||
| 1,275,839 | |||||||||||
| Building Products (0.8%) | |||||||||||
| AAON, Inc. | 100 | 1,948 | |||||||||
| Apogee Enterprises, Inc. | 2,700 | 36,180 | |||||||||
| Griffon Corp.* | 29,100 | 252,297 | |||||||||
| Quanex Building Products Corp. | 4,600 | 47,150 | |||||||||
| Simpson Manufacturing Co., Inc. | 8,000 | 178,080 | |||||||||
| Universal Forest Products, Inc. | 4,200 | 140,952 | |||||||||
| 656,607 | |||||||||||
| Capital Markets (2.9%) | |||||||||||
| Evercore Partners, Inc. Class A | 100 | 1,888 | |||||||||
| Greenhill & Co., Inc. | 5,700 | 441,921 | |||||||||
| Hercules Technology Growth Capital, Inc. | 200 | 1,202 | |||||||||
| Investment Technology Group, Inc.* | 72,400 | 1,649,272 | |||||||||
| LaBranche & Co., Inc.* | 6,900 | 28,842 | |||||||||
| optionsXpress Holdings, Inc. | 11,500 | 189,290 | |||||||||
| Penson Worldwide, Inc.* | 100 | 1,014 | |||||||||
| Piper Jaffray Cos., Inc.* | 200 | 6,934 | |||||||||
| Prospect Capital Corp. | 100 | 907 | |||||||||
| TradeStation Group, Inc.* | 4,200 | 34,062 | |||||||||
| 2,355,332 | |||||||||||
| Chemicals (1.4%) | |||||||||||
| A. Schulman, Inc. | 3,276 | 51,401 | |||||||||
| American Vanguard Corp. | 6,700 | 85,693 | |||||||||
| Arch Chemicals, Inc. | 3,000 | 72,540 | |||||||||
| Balchem Corp. | 4,700 | 116,983 | |||||||||
| Calgon Carbon Corp.* | 43,134 | 732,415 | |||||||||
| Georgia Gulf Corp. | 5,700 | 6,270 | |||||||||
| H.B. Fuller Co. | 100 | 1,766 | |||||||||
| Koppers Holdings, Inc. | 100 | 1,896 | |||||||||
| Penford Corp. | 1,300 | 5,811 | |||||||||
| PolyOne Corp.* | 11,000 | 30,140 | |||||||||
| Quaker Chemical Corp. | 1,414 | 16,544 | |||||||||
| Stepan Co. | 800 | 31,656 | |||||||||
| Zep, Inc. | 1,100 | 14,883 | |||||||||
| 1,167,998 | |||||||||||
| Commercial Banks (8.8%) | |||||||||||
| Bank of the Ozarks, Inc. | 1,100 | 27,313 | |||||||||
| Boston Private Financial Holdings, Inc. | 7,800 | 35,958 | |||||||||
| Cascade Bancorp | 2,900 | 4,814 | |||||||||
| Central Pacific Financial Corp. | 4,300 | 25,198 | |||||||||
| Chemical Financial Corp. | 200 | 4,270 | |||||||||
See Accompanying Notes to Financial Statements.
32
Credit Suisse Small Cap Core Fund
Schedule of Investments (continued)
April 30, 2009 (unaudited)
| Number of Shares | Value | ||||||||||
| COMMON STOCKS | |||||||||||
| Commercial Banks | |||||||||||
| City Holding Co. | 100 | $ | 2,949 | ||||||||
| Columbia Banking System, Inc. | 5,400 | 53,460 | |||||||||
| Community Bank System, Inc. | 21,300 | 350,385 | |||||||||
| East West Bancorp, Inc. | 61,500 | 420,045 | |||||||||
| F.N.B. Corp. | 6,600 | 49,632 | |||||||||
| First BanCorp. | 51,100 | 281,561 | |||||||||
| First Commonwealth Financial Corp. | 31,600 | 273,972 | |||||||||
| First Financial Bancorp. | 9,900 | 106,821 | |||||||||
| First Financial Bankshares, Inc. | 7,100 | 349,888 | |||||||||
| First Midwest Bancorp, Inc. | 19,000 | 168,340 | |||||||||
| Frontier Financial Corp. | 2,900 | 4,118 | |||||||||
| Glacier Bancorp, Inc. | 19,200 | 294,144 | |||||||||
| Hancock Holding Co. | 5,700 | 215,859 | |||||||||
| Hanmi Financial Corp. | 4,700 | 7,285 | |||||||||
| Home Bancshares, Inc. | 200 | 4,410 | |||||||||
| Independent Bank Corp./MA | 2,600 | 51,896 | |||||||||
| Irwin Financial Corp.* | 1,800 | 2,268 | |||||||||
| Lakeland Bancorp, Inc. | 100 | 851 | |||||||||
| MainSource Financial Group, Inc. | 100 | 866 | |||||||||
| MB Financial, Inc. | 300 | 4,089 | |||||||||
| Nara Bancorp, Inc. | 2,900 | 10,759 | |||||||||
| National Penn Bancshares, Inc. | 40,200 | 325,218 | |||||||||
| NBT Bancorp, Inc. | 100 | 2,368 | |||||||||
| Old National Bancorp | 55,500 | 756,465 | |||||||||
| Pacific Capital Bancorp | 400 | 2,776 | |||||||||
| PacWest Bancorp | 300 | 4,371 | |||||||||
| Pinnacle Financial Partners, Inc.* | 3,300 | 58,872 | |||||||||
| PrivateBancorp, Inc. | 17,700 | 358,425 | |||||||||
| Prosperity Bancshares, Inc. | 14,100 | 391,557 | |||||||||
| Provident Bankshares Corp. | 100 | 879 | |||||||||
| Renasant Corp. | 100 | 1,410 | |||||||||
| S&T Bancorp, Inc. | 17,500 | 312,725 | |||||||||
| Santander BanCorp | 100 | 670 | |||||||||
| Signature Bank* | 9,200 | 250,148 | |||||||||
| Sterling Bancorp | 4,700 | 53,768 | |||||||||
| Sterling Bancshares, Inc. | 11,600 | 77,140 | |||||||||
| Sterling Financial Corp. | 1,700 | 5,423 | |||||||||
| Susquehanna Bancshares, Inc. | 100 | 806 | |||||||||
| Texas Capital Bancshares, Inc.* | 500 | 7,000 | |||||||||
| The South Financial Group, Inc. | 4,826 | 8,011 | |||||||||
| Tompkins Financial Corp. | 1,600 | 67,440 | |||||||||
| TriCo Bancshares | 200 | 3,200 | |||||||||
| UCBH Holdings, Inc. | 13,200 | 16,896 | |||||||||
| UMB Financial Corp. | 9,500 | 434,815 | |||||||||
| Umpqua Holdings Corp. | 35,800 | 343,322 | |||||||||
| United Bankshares, Inc. | 16,500 | 428,010 | |||||||||
| United Community Banks, Inc. | 5,112 | 32,973 | |||||||||
| Univest Corp. of Pennsylvania | 100 | 2,087 | |||||||||
See Accompanying Notes to Financial Statements.
33
Credit Suisse Small Cap Core Fund
Schedule of Investments (continued)
April 30, 2009 (unaudited)
| Number of Shares | Value | ||||||||||
| COMMON STOCKS | |||||||||||
| Commercial Banks | |||||||||||
| WesBanco, Inc. | 100 | $ | 1,989 | ||||||||
| Western Alliance Bancorp* | 83 | 540 | |||||||||
| Whitney Holding Corp. | 30,600 | 365,976 | |||||||||
| Wilshire Bancorp, Inc. | 2,400 | 9,696 | |||||||||
| Wintrust Financial Corp. | 2,300 | 39,100 | |||||||||
| 7,115,227 | |||||||||||
| Commercial Services & Supplies (2.7%) | |||||||||||
| ABM Industries, Inc. | 27,025 | 473,478 | |||||||||
| ATC Technology Corp.* | 8,400 | 133,476 | |||||||||
| Comfort Systems USA, Inc. | 200 | 2,158 | |||||||||
| Deluxe Corp. | 9,800 | 142,100 | |||||||||
| EnergySolutions | 39,800 | 386,060 | |||||||||
| G&K Services, Inc. Class A | 2,286 | 57,081 | |||||||||
| GeoEye, Inc.* | 300 | 7,467 | |||||||||
| Healthcare Services Group, Inc. | 3,000 | 53,640 | |||||||||
| Herman Miller, Inc. | 500 | 7,435 | |||||||||
| Interface, Inc. Class A | 6,900 | 39,951 | |||||||||
| M&F Worldwide Corp.* | 400 | 6,380 | |||||||||
| Mobile Mini, Inc.* | 700 | 9,590 | |||||||||
| Sykes Enterprises, Inc.* | 10,900 | 214,294 | |||||||||
| Team, Inc.* | 300 | 4,311 | |||||||||
| Tetra Technologies, Inc.* | 22,200 | 545,232 | |||||||||
| The Geo Group, Inc.* | 100 | 1,663 | |||||||||
| The Standard Register Co. | 1,700 | 8,874 | |||||||||
| United Stationers, Inc.* | 1,000 | 32,730 | |||||||||
| Viad Corp. | 2,400 | 45,792 | |||||||||
| 2,171,712 | |||||||||||
| Communications Equipment (3.9%) | |||||||||||
| Airvana, Inc.* | 100 | 569 | |||||||||
| Arris Group, Inc.* | 106,684 | 1,138,318 | |||||||||
| Bel Fuse, Inc. Class B | 1,448 | 23,429 | |||||||||
| Black Box Corp. | 1,400 | 38,318 | |||||||||
| Blue Coat Systems, Inc.* | 4,700 | 62,322 | |||||||||
| Cogo Group, Inc.* | 300 | 2,454 | |||||||||
| Comtech Telecommunications Corp.* | 1,800 | 60,246 | |||||||||
| Digi International, Inc.* | 7,100 | 51,617 | |||||||||
| Ditech Networks, Inc.* | 8,700 | 8,527 | |||||||||
| EMS Technologies, Inc.* | 2,400 | 45,720 | |||||||||
| Harmonic, Inc.* | 12,400 | 90,892 | |||||||||
| Ixia* | 200 | 1,152 | |||||||||
| NETGEAR, Inc.* | 4,100 | 65,641 | |||||||||
| Network Equipment Technologies, Inc.* | 3,700 | 14,541 | |||||||||
| Oplink Communications, Inc.* | 100 | 1,104 | |||||||||
| PC-Tel, Inc. | 2,100 | 10,227 | |||||||||
| Riverbed Technology, Inc.* | 79,300 | 1,452,776 | |||||||||
| Symmetricom, Inc.* | 5,600 | 27,888 | |||||||||
| Tekelec* | 3,300 | 51,150 | |||||||||
See Accompanying Notes to Financial Statements.
34
Credit Suisse Small Cap Core Fund
Schedule of Investments (continued)
April 30, 2009 (unaudited)
| Number of Shares | Value | ||||||||||
| COMMON STOCKS | |||||||||||
| Communications Equipment | |||||||||||
| Tollgrade Communications, Inc.* | 1,750 | $ | 10,412 | ||||||||
| ViaSat, Inc.* | 100 | 2,299 | |||||||||
| 3,159,602 | |||||||||||
| Computers & Peripherals (0.7%) | |||||||||||
| 3PAR, Inc.* | 400 | 3,064 | |||||||||
| Adaptec, Inc.* | 14,600 | 41,756 | |||||||||
| Avid Technology, Inc.* | 100 | 1,107 | |||||||||
| Electronics for Imaging, Inc.* | 400 | 3,928 | |||||||||
| Hutchinson Technology, Inc.* | 1,800 | 3,456 | |||||||||
| Intermec, Inc.* | 100 | 1,208 | |||||||||
| Novatel Wireless, Inc.* | 600 | 4,110 | |||||||||
| STEC, Inc.* | 100 | 960 | |||||||||
| Stratasys, Inc.* | 5,700 | 53,352 | |||||||||
| Synaptics, Inc.* | 13,060 | 424,189 | |||||||||
| 537,130 | |||||||||||
| Construction & Engineering (0.6%) | |||||||||||
| Dycom Industries, Inc.* | 100 | 842 | |||||||||
| EMCOR Group, Inc.* | 600 | 12,474 | |||||||||
| Insituform Technologies, Inc. Class A* | 6,000 | 91,980 | |||||||||
| Layne Christensen Co.* | 2,700 | 58,482 | |||||||||
| MasTec, Inc.* | 20,300 | 253,953 | |||||||||
| Orion Marine Group, Inc.* | 100 | 1,498 | |||||||||
| Perini Corp.* | 100 | 1,730 | |||||||||
| Pike Electric Corp.* | 800 | 8,304 | |||||||||
| Sterling Construction Co., Inc.* | 1,400 | 26,278 | |||||||||
| 455,541 | |||||||||||
| Construction Materials (0.5%) | |||||||||||
| Eagle Materials, Inc. | 100 | 2,780 | |||||||||
| Headwaters, Inc.* | 3,000 | 7,560 | |||||||||
| Texas Industries, Inc. | 12,582 | 402,372 | |||||||||
| 412,712 | |||||||||||
| Consumer Finance (0.1%) | |||||||||||
| Cash America International, Inc. | 100 | 2,236 | |||||||||
| First Cash Financial Services, Inc.* | 2,800 | 46,032 | |||||||||
| 48,268 | |||||||||||
| Containers & Packaging (0.2%) | |||||||||||
| Chesapeake Corp.* | 6,600 | 66 | |||||||||
| Myers Industries, Inc. | 3,545 | 35,556 | |||||||||
| Rock-Tenn Co. Class A | 200 | 7,552 | |||||||||
| Temple-Inland, Inc. | 7,900 | 94,326 | |||||||||
| 137,500 | |||||||||||
| Distributors (0.0%) | |||||||||||
| Audiovox Corp. Class A* | 1,100 | 6,116 | |||||||||
See Accompanying Notes to Financial Statements.
35
Credit Suisse Small Cap Core Fund
Schedule of Investments (continued)
April 30, 2009 (unaudited)
| Number of Shares | Value | ||||||||||
| COMMON STOCKS | |||||||||||
| Diversified Consumer Services (1.7%) | |||||||||||
| American Public Education, Inc.* | 100 | $ | 3,600 | ||||||||
| Capella Education Co.* | 400 | 20,552 | |||||||||
| Hillenbrand, Inc. | 16,916 | 307,533 | |||||||||
| Lincoln Educational Services Corp.* | 2,300 | 38,157 | |||||||||
| Regis Corp . | 46,600 | 891,924 | |||||||||
| Steiner Leisure, Ltd.* | 100 | 3,164 | |||||||||
| Universal Technical Institute, Inc.* | 8,100 | 115,344 | |||||||||
| 1,380,274 | |||||||||||
| Diversified Financial Services (0.3%) | |||||||||||
| Asset Acceptance Capital Corp.* | 100 | 829 | |||||||||
| Compass Diversified Holdings | 500 | 4,470 | |||||||||
| Financial Federal Corp. | 200 | 4,922 | |||||||||
| MarketAxess Holdings, Inc.* | 100 | 959 | |||||||||
| PHH Corp.* | 8,900 | 149,342 | |||||||||
| Portfolio Recovery Associates, Inc.* | 2,000 | 69,940 | |||||||||
| 230,462 | |||||||||||
| Diversified Telecommunication Services (0.2%) | |||||||||||
| Alaska Communications Systems Group, Inc. | 900 | 5,427 | |||||||||
| Cbeyond, Inc.* | 2,600 | 52,988 | |||||||||
| Consolidated Communications Holdings, Inc. | 200 | 2,250 | |||||||||
| FairPoint Communications, Inc. | 8,500 | 8,840 | |||||||||
| General Communication, Inc. Class A* | 5,800 | 44,428 | |||||||||
| Global Crossing, Ltd.* | 100 | 726 | |||||||||
| Neutral Tandem, Inc.* | 300 | 8,580 | |||||||||
| Premiere Global Services, Inc.* | 700 | 7,378 | |||||||||
| Shenandoah Telecommunications Co. | 100 | 1,963 | |||||||||
| 132,580 | |||||||||||
| Electric Utilities (0.5%) | |||||||||||
| ALLETE, Inc. | 100 | 2,604 | |||||||||
| Central Vermont Public Service Corp. | 1,100 | 18,876 | |||||||||
| El Paso Electric Co.* | 25,200 | 347,760 | |||||||||
| UIL Holdings Corp. | 100 | 2,309 | |||||||||
| Unisource Energy Corp. | 100 | 2,632 | |||||||||
| 374,181 | |||||||||||
| Electrical Equipment (1.8%) | |||||||||||
| A.O. Smith Corp. | 5,500 | 170,995 | |||||||||
| Acuity Brands, Inc. | 100 | 2,874 | |||||||||
| AZZ, Inc.* | 300 | 9,279 | |||||||||
| Baldor Electric Co. | 4,600 | 106,720 | |||||||||
| Belden, Inc. | 22,300 | 359,476 | |||||||||
| Brady Corp. Class A | 20,600 | 434,042 | |||||||||
| C&D Technologies, Inc.* | 2,400 | 5,256 | |||||||||
| Encore Wire Corp. | 100 | 2,184 | |||||||||
| EnerSys* | 18,300 | 312,015 | |||||||||
| Magnetek, Inc.* | 4,200 | 7,350 | |||||||||
See Accompanying Notes to Financial Statements.
36
Credit Suisse Small Cap Core Fund
Schedule of Investments (continued)
April 30, 2009 (unaudited)
| Number of Shares | Value | ||||||||||
| COMMON STOCKS | |||||||||||
| Electrical Equipment | |||||||||||
| Regal-Beloit Corp. | 100 | $ | 4,063 | ||||||||
| Vicor Corp. | 2,500 | 13,425 | |||||||||
| 1,427,679 | |||||||||||
| Electronic Equipment, Instruments & Components (1.3%) | |||||||||||
| Agilysys, Inc. | 3,000 | 18,090 | |||||||||
| Anixter International, Inc.* | 100 | 3,978 | |||||||||
| Benchmark Electronics, Inc.* | 29,216 | 354,390 | |||||||||
| Brightpoint, Inc.* | 6,300 | 32,823 | |||||||||
| Checkpoint Systems, Inc.* | 800 | 9,720 | |||||||||
| Cognex Corp. | 4,800 | 67,536 | |||||||||
| Coherent, Inc.* | 100 | 1,900 | |||||||||
| CTS Corp. | 4,400 | 26,708 | |||||||||
| Daktronics, Inc. | 100 | 904 | |||||||||
| DTS, Inc.* | 100 | 2,665 | |||||||||
| Echelon Corp.* | 100 | 796 | |||||||||
| Electro Scientific Industries, Inc.* | 7,400 | 63,640 | |||||||||
| FARO Technologies, Inc.* | 4,000 | 60,640 | |||||||||
| Gerber Scientific, Inc.* | 1,700 | 6,715 | |||||||||
| Insight Enterprises, Inc.* | 5,800 | 33,176 | |||||||||
| IPG Photonics Corp.* | 300 | 3,351 | |||||||||
| Keithley Instruments, Inc. | 1,300 | 4,498 | |||||||||
| Littelfuse, Inc.* | 500 | 8,195 | |||||||||
| Mercury Computer Systems, Inc.* | 2,400 | 19,488 | |||||||||
| Methode Electronics, Inc. | 4,800 | 28,896 | |||||||||
| MTS Systems Corp. | 2,100 | 44,373 | |||||||||
| Multi-Fineline Electronix, Inc.* | 100 | 2,007 | |||||||||
| Newport Corp.* | 4,400 | 21,956 | |||||||||
| OSI Systems, Inc.* | 100 | 1,875 | |||||||||
| Park Electrochemical Corp. | 2,600 | 53,560 | |||||||||
| Plexus Corp.* | 700 | 15,505 | |||||||||
| Rofin-Sinar Technologies, Inc.* | 300 | 6,393 | |||||||||
| Rogers Corp.* | 1,900 | 48,355 | |||||||||
| ScanSource, Inc.* | 600 | 14,826 | |||||||||
| SYNNEX Corp.* | 200 | 4,306 | |||||||||
| Tech Data Corp.* | 1,200 | 34,548 | |||||||||
| Technitrol, Inc. | 3,200 | 13,024 | |||||||||
| TTM Technologies, Inc.* | 5,700 | 42,294 | |||||||||
| 1,051,131 | |||||||||||
| Energy Equipment & Services (4.0%) | |||||||||||
| Atwood Oceanics, Inc.* | 100 | 2,232 | |||||||||
| CARBO Ceramics, Inc. | 69,600 | 2,137,416 | |||||||||
| Dril-Quip, Inc.* | 100 | 3,438 | |||||||||
| Gulf Island Fabrication, Inc. | 1,700 | 21,998 | |||||||||
| ION Geophysical Corp.* | 11,000 | 27,500 | |||||||||
| Lufkin Industries, Inc. | 10,000 | 349,000 | |||||||||
| Matrix Service Co.* | 2,900 | 27,782 | |||||||||
| Oil States International, Inc.* | 36,100 | 682,290 | |||||||||
See Accompanying Notes to Financial Statements.
37
Credit Suisse Small Cap Core Fund
Schedule of Investments (continued)
April 30, 2009 (unaudited)
| Number of Shares | Value | ||||||||||
| COMMON STOCKS | |||||||||||
| Energy Equipment & Services | |||||||||||
| Pioneer Drilling Co.* | 5,800 | $ | 29,000 | ||||||||
| 3,280,656 | |||||||||||
| Food & Staples Retailing (0.9%) | |||||||||||
| Casey's General Stores, Inc. | 17,200 | 457,692 | |||||||||
| Nash Finch Co. | 2,100 | 61,509 | |||||||||
| PriceSmart, Inc. | 100 | 1,785 | |||||||||
| Spartan Stores, Inc. | 8,000 | 130,160 | |||||||||
| The Andersons, Inc. | 400 | 6,428 | |||||||||
| The Pantry, Inc.* | 3,100 | 73,222 | |||||||||
| United Natural Foods, Inc.* | 100 | 2,278 | |||||||||
| Winn-Dixie Stores, Inc.* | 200 | 2,292 | |||||||||
| 735,366 | |||||||||||
| Food Products (1.2%) | |||||||||||
| B&G Foods, Inc. Class A | 400 | 2,448 | |||||||||
| Cal-Maine Foods, Inc. | 1,500 | 39,705 | |||||||||
| Chiquita Brands International, Inc.* | 100 | 757 | |||||||||
| Darling International, Inc.* | 10,400 | 59,488 | |||||||||
| Green Mountain Coffee Roasters, Inc.* | 7,400 | 535,094 | |||||||||
| J & J Snack Foods Corp. | 5,300 | 205,428 | |||||||||
| Lance, Inc. | 4,700 | 108,852 | |||||||||
| TreeHouse Foods, Inc.* | 100 | 2,659 | |||||||||
| Zhongpin, Inc.* | 100 | 875 | |||||||||
| 955,306 | |||||||||||
| Gas Utilities (2.8%) | |||||||||||
| Atmos Energy Corp. | 23,100 | 570,801 | |||||||||
| New Jersey Resources Corp. | 13,800 | 454,296 | |||||||||
| Piedmont Natural Gas Co., Inc. | 19,600 | 478,632 | |||||||||
| South Jersey Industries, Inc. | 100 | 3,471 | |||||||||
| Southwest Gas Corp. | 18,427 | 372,410 | |||||||||
| The Laclede Group, Inc. | 10,300 | 357,204 | |||||||||
| 2,236,814 | |||||||||||
| Health Care Equipment & Supplies (2.6%) | |||||||||||
| Abaxis, Inc.* | 5,400 | 81,648 | |||||||||
| ABIOMED, Inc.* | 500 | 3,335 | |||||||||
| Accuray, Inc.* | 500 | 3,025 | |||||||||
| Align Technology, Inc.* | 700 | 8,687 | |||||||||
| American Medical Systems Holdings, Inc.* | 8,800 | 108,856 | |||||||||
| AngioDynamics, Inc.* | 100 | 1,267 | |||||||||
| Cantel Medical Corp.* | 1,500 | 21,195 | |||||||||
| Conceptus, Inc.* | 500 | 6,770 | |||||||||
| CONMED Corp.* | 3,500 | 46,620 | |||||||||
| CryoLife, Inc.* | 3,800 | 20,634 | |||||||||
| Cyberonics, Inc.* | 34,300 | 454,132 | |||||||||
| Greatbatch, Inc.* | 29,300 | 616,472 | |||||||||
| Haemonetics Corp.* | 8,500 | 438,855 | |||||||||
See Accompanying Notes to Financial Statements.
38
Credit Suisse Small Cap Core Fund
Schedule of Investments (continued)
April 30, 2009 (unaudited)
| Number of Shares | Value | ||||||||||
| COMMON STOCKS | |||||||||||
| Health Care Equipment & Supplies | |||||||||||
| ICU Medical, Inc.* | 200 | $ | 7,520 | ||||||||
| Integra LifeSciences Holdings* | 1,300 | 33,566 | |||||||||
| Invacare Corp. | 3,900 | 60,021 | |||||||||
| IRIS International, Inc.* | 100 | 1,117 | |||||||||
| Kensey Nash Corp.* | 500 | 10,470 | |||||||||
| Merit Medical Systems, Inc.* | 3,000 | 46,530 | |||||||||
| Natus Medical, Inc.* | 400 | 3,512 | |||||||||
| Neogen Corp.* | 200 | 4,534 | |||||||||
| Palomar Medical Technologies, Inc.* | 4,600 | 39,606 | |||||||||
| Somanetics Corp.* | 200 | 3,242 | |||||||||
| SurModics, Inc.* | 1,800 | 39,060 | |||||||||
| Symmetry Medical, Inc.* | 4,400 | 31,944 | |||||||||
| Synovis Life Technologies, Inc.* | 100 | 1,518 | |||||||||
| Theragenics Corp.* | 6,700 | 8,308 | |||||||||
| Vnus Medical Technologies* | 200 | 4,430 | |||||||||
| West Pharmaceutical Services, Inc. | 100 | 3,265 | |||||||||
| Wright Medical Group, Inc.* | 100 | 1,375 | |||||||||
| Zoll Medical Corp.* | 800 | 12,864 | |||||||||
| 2,124,378 | |||||||||||
| Health Care Providers & Services (6.1%) | |||||||||||
| Air Methods Corp.* | 300 | 7,965 | |||||||||
| Almost Family, Inc.* | 785 | 19,389 | |||||||||
| Amedisys, Inc.* | 12,600 | 422,604 | |||||||||
| AMERIGROUP Corp.* | 15,500 | 462,985 | |||||||||
| AMN Healthcare Services, Inc.* | 4,200 | 28,938 | |||||||||
| AmSurg Corp.* | 7,900 | 162,266 | |||||||||
| Bio-Reference Laboratories, Inc.* | 100 | 2,567 | |||||||||
| Catalyst Health Solutions, Inc.* | 18,004 | 405,990 | |||||||||
| Centene Corp.* | 40,500 | 743,985 | |||||||||
| CorVel Corp.* | 900 | 20,250 | |||||||||
| Cross Country Healthcare, Inc.* | 8,100 | 71,361 | |||||||||
| Emeritus Corp.* | 100 | 904 | |||||||||
| Genoptix, Inc.* | 500 | 14,540 | |||||||||
| Gentiva Health Services, Inc.* | 12,400 | 197,532 | |||||||||
| Hanger Orthopedic Group, Inc.* | 8,100 | 112,671 | |||||||||
| Healthspring, Inc.* | 26,400 | 243,672 | |||||||||
| Healthways, Inc.* | 3,900 | 40,677 | |||||||||
| HMS Holdings Corp.* | 500 | 14,990 | |||||||||
| inVentiv Health, Inc.* | 4,000 | 44,360 | |||||||||
| IPC The Hospitalist Co.* | 100 | 1,833 | |||||||||
| Kindred Healthcare, Inc.* | 57,206 | 744,822 | |||||||||
| Landauer, Inc. | 1,100 | 58,278 | |||||||||
| LCA-Vision, Inc. | 2,145 | 12,334 | |||||||||
| LHC Group, Inc.* | 300 | 6,846 | |||||||||
| Magellan Health Services, Inc.* | 13,394 | 395,927 | |||||||||
| MedCath Corp.* | 2,400 | 24,288 | |||||||||
| MEDNAX, Inc.* | 13,400 | 481,060 | |||||||||
See Accompanying Notes to Financial Statements.
39
Credit Suisse Small Cap Core Fund
Schedule of Investments (continued)
April 30, 2009 (unaudited)
| Number of Shares | Value | ||||||||||
| COMMON STOCKS | |||||||||||
| Health Care Providers & Services | |||||||||||
| Molina Healthcare, Inc.* | 100 | $ | 2,165 | ||||||||
| MWI Veterinary Supply, Inc.* | 1,400 | 43,512 | |||||||||
| Odyssey HealthCare, Inc.* | 3,800 | 39,368 | |||||||||
| PSS World Medical, Inc.* | 100 | 1,452 | |||||||||
| RehabCare Group, Inc.* | 2,286 | 38,176 | |||||||||
| Res-Care, Inc.* | 3,250 | 52,065 | |||||||||
| Sunrise Senior Living, Inc.* | 10,700 | 27,285 | |||||||||
| 4,947,057 | |||||||||||
| Health Care Technology (0.1%) | |||||||||||
| Computer Programs & Systems, Inc. | 300 | 10,497 | |||||||||
| Omnicell, Inc.* | 7,300 | 64,240 | |||||||||
| Phase Forward, Inc.* | 2,900 | 41,354 | |||||||||
| 116,091 | |||||||||||
| Hotels, Restaurants & Leisure (3.5%) | |||||||||||
| Ambassadors Group, Inc. | 100 | 1,220 | |||||||||
| Buffalo Wild Wings, Inc.* | 23,912 | 933,525 | |||||||||
| California Pizza Kitchen, Inc.* | 2,000 | 31,420 | |||||||||
| CEC Entertainment, Inc.* | 7,500 | 228,450 | |||||||||
| CKE Restaurants, Inc. | 6,700 | 64,119 | |||||||||
| Cracker Barrel Old Country Store, Inc. | 1,000 | 32,610 | |||||||||
| DineEquity, Inc. | 1,700 | 54,468 | |||||||||
| Domino's Pizza, Inc.* | 200 | 1,888 | |||||||||
| Gaylord Entertainment Co.* | 400 | 5,576 | |||||||||
| Interval Leisure Group, Inc.* | 4,900 | 39,249 | |||||||||
| Jack in the Box, Inc.* | 17,800 | 437,702 | |||||||||
| Multimedia Games, Inc.* | 3,000 | 6,360 | |||||||||
| O'Charley's, Inc. | 2,200 | 15,334 | |||||||||
| P.F. Chang's China Bistro, Inc.* | 2,900 | 87,522 | |||||||||
| Peet's Coffee & Tea, Inc.* | 4,500 | 122,760 | |||||||||
| Ruth's Hospitality Group, Inc.* | 2,300 | 8,326 | |||||||||
| Shuffle Master, Inc.* | 6,900 | 26,289 | |||||||||
| Sonic Corp.* | 14,900 | 162,708 | |||||||||
| Texas Roadhouse, Inc. Class A* | 500 | 5,690 | |||||||||
| The Marcus Corp. | 2,500 | 31,750 | |||||||||
| The Steak n Shake Co.* | 24,300 | 280,908 | |||||||||
| WMS Industries, Inc.* | 5,600 | 179,816 | |||||||||
| Wyndham Worldwide Corp. | 5,100 | 59,568 | |||||||||
| 2,817,258 | |||||||||||
| Household Durables (1.1%) | |||||||||||
| Centex Corp. | 9,900 | 108,306 | |||||||||
| Champion Enterprises, Inc.* | 4,600 | 2,668 | |||||||||
| CSS Industries, Inc. | 100 | 1,986 | |||||||||
| Jarden Corp.* | 30,700 | 617,070 | |||||||||
| La-Z-Boy, Inc. | 6,500 | 17,290 | |||||||||
| Libbey, Inc. | 4,500 | 5,490 | |||||||||
| Meritage Homes Corp.* | 100 | 2,081 | |||||||||
See Accompanying Notes to Financial Statements.
40
Credit Suisse Small Cap Core Fund
Schedule of Investments (continued)
April 30, 2009 (unaudited)
| Number of Shares | Value | ||||||||||
| COMMON STOCKS | |||||||||||
| Household Durables | |||||||||||
| National Presto Industries, Inc. | 1,200 | $ | 85,512 | ||||||||
| Russ Berrie & Co., Inc.* | 5,200 | 9,932 | |||||||||
| Skyline Corp. | 500 | 10,365 | |||||||||
| Standard Pacific Corp.* | 20,300 | 37,961 | |||||||||
| Universal Electronics, Inc.* | 1,700 | 31,858 | |||||||||
| 930,519 | |||||||||||
| Household Products (0.3%) | |||||||||||
| Central Garden & Pet Co.* | 13,500 | 129,870 | |||||||||
| Central Garden & Pet Co. Class A* | 7,200 | 65,304 | |||||||||
| Spectrum Brands, Inc.* | 12,800 | 1,536 | |||||||||
| WD-40 Co. | 2,100 | 56,826 | |||||||||
| 253,536 | |||||||||||
| Industrial Conglomerates (0.4%) | |||||||||||
| Standex International Corp. | 1,648 | 22,858 | |||||||||
| Tredegar Corp. | 15,300 | 268,974 | |||||||||
| 291,832 | |||||||||||
| Insurance (2.9%) | |||||||||||
| American Equity Investment Life Holding Co. | 800 | 4,504 | |||||||||
| American Physicians Capital, Inc. | 900 | 37,494 | |||||||||
| Amerisafe, Inc.* | 2,300 | 35,328 | |||||||||
| Baldwin & Lyons, Inc. Class B | 500 | 10,025 | |||||||||
| Crawford & Co. Class B* | 100 | 595 | |||||||||
| Delphi Financial Group, Inc. Class A | 5,200 | 89,804 | |||||||||
| eHealth, Inc.* | 2,900 | 55,651 | |||||||||
| Flagstone Reinsurance Holdings, Ltd. | 4,500 | 41,670 | |||||||||
| Greenlight Capital Re, Ltd. Class A* | 7,000 | 108,360 | |||||||||
| Hilltop Holdings, Inc.* | 800 | 9,064 | |||||||||
| Horace Mann Educators Corp. | 36,900 | 323,982 | |||||||||
| Infinity Property & Casualty Corp. | 2,700 | 95,148 | |||||||||
| LandAmerica Financial Group, Inc. | 2,800 | 129 | |||||||||
| National Financial Partners Corp. | 1,600 | 11,296 | |||||||||
| Navigators Group, Inc.* | 7,400 | 335,812 | |||||||||
| OneBeacon Insurance Group, Ltd. Class A | 500 | 5,810 | |||||||||
| Presidential Life Corp. | 2,648 | 28,307 | |||||||||
| ProAssurance Corp.* | 10,500 | 461,370 | |||||||||
| Safety Insurance Group, Inc. | 2,102 | 69,471 | |||||||||
| Selective Insurance Group, Inc. | 29,100 | 429,516 | |||||||||
| Tower Group, Inc. | 4,300 | 116,917 | |||||||||
| United Fire & Casualty Co. | 2,775 | 51,809 | |||||||||
| Zenith National Insurance Corp. | 100 | 2,279 | |||||||||
| 2,324,341 | |||||||||||
| Internet & Catalog Retail (0.4%) | |||||||||||
| Blue Nile, Inc.* | 1,900 | 80,864 | |||||||||
| HSN, Inc.* | 4,900 | 33,859 | |||||||||
| NutriSystem, Inc. | 3,600 | 49,464 | |||||||||
See Accompanying Notes to Financial Statements.
41
Credit Suisse Small Cap Core Fund
Schedule of Investments (continued)
April 30, 2009 (unaudited)
| Number of Shares | Value | ||||||||||
| COMMON STOCKS | |||||||||||
| Internet & Catalog Retail | |||||||||||
| PetMed Express, Inc.* | 3,700 | $ | 60,162 | ||||||||
| Stamps.com, Inc.* | 4,700 | 43,992 | |||||||||
| Ticketmaster Entertainment, Inc.* | 4,900 | 25,774 | |||||||||
| 294,115 | |||||||||||
| Internet Software & Services (1.1%) | |||||||||||
| AsiaInfo Holdings, Inc.* | 7,500 | 125,625 | |||||||||
| Bankrate, Inc.* | 1,700 | 42,500 | |||||||||
| comScore, Inc.* | 100 | 1,276 | |||||||||
| DealerTrack Holdings, Inc.* | 500 | 7,590 | |||||||||
| DivX, Inc.* | 200 | 1,026 | |||||||||
| InfoSpace, Inc.* | 9,200 | 60,996 | |||||||||
| Internet Brands, Inc. Class A* | 100 | 613 | |||||||||
| j2 Global Communications, Inc.* | 16,600 | 398,234 | |||||||||
| Liquidity Services, Inc.* | 200 | 1,506 | |||||||||
| LoopNet, Inc.* | 200 | 1,718 | |||||||||
| Perficient, Inc.* | 4,000 | 27,880 | |||||||||
| SAVVIS, Inc.* | 500 | 5,690 | |||||||||
| Switch & Data Facilities Co.* | 100 | 1,157 | |||||||||
| The Knot, Inc.* | 100 | 907 | |||||||||
| United Online, Inc. | 10,300 | 54,590 | |||||||||
| Vignette Corp.* | 200 | 1,652 | |||||||||
| Vocus, Inc.* | 300 | 5,100 | |||||||||
| Websense, Inc.* | 10,000 | 178,300 | |||||||||
| 916,360 | |||||||||||
| IT Services (1.4%) | |||||||||||
| CACI International, Inc. Class A* | 900 | 35,595 | |||||||||
| CIBER, Inc.* | 7,900 | 25,517 | |||||||||
| CSG Systems International, Inc.* | 15,900 | 230,550 | |||||||||
| CyberSource Corp.* | 34,700 | 506,967 | |||||||||
| Gartner, Inc.* | 10,500 | 141,855 | |||||||||
| Heartland Payment Systems, Inc. | 3,000 | 24,120 | |||||||||
| Integral Systems, Inc.* | 400 | 2,652 | |||||||||
| MAXIMUS, Inc. | 2,100 | 84,693 | |||||||||
| NCI, Inc. Class A* | 1,100 | 26,796 | |||||||||
| RightNow Technologies, Inc.* | 200 | 1,510 | |||||||||
| Sapient Corp.* | 500 | 2,565 | |||||||||
| StarTek, Inc.* | 1,400 | 5,768 | |||||||||
| VeriFone Holdings, Inc.* | 100 | 751 | |||||||||
| Wright Express Corp.* | 1,800 | 41,184 | |||||||||
| 1,130,523 | |||||||||||
| Leisure Equipment & Products (0.7%) | |||||||||||
| Arctic Cat, Inc. | 500 | 2,000 | |||||||||
| Brunswick Corp. | 11,200 | 66,976 | |||||||||
| Callaway Golf Co. | 200 | 1,510 | |||||||||
| Nautilus, Inc.* | 2,400 | 2,400 | |||||||||
| Polaris Industries, Inc. | 12,800 | 428,160 | |||||||||
See Accompanying Notes to Financial Statements.
42
Credit Suisse Small Cap Core Fund
Schedule of Investments (continued)
April 30, 2009 (unaudited)
| Number of Shares | Value | ||||||||||
| COMMON STOCKS | |||||||||||
| Leisure Equipment & Products | |||||||||||
| Pool Corp. | 100 | $ | 1,786 | ||||||||
| RC2 Corp.* | 2,400 | 27,144 | |||||||||
| Sturm, Ruger & Co., Inc.* | 4,800 | 59,088 | |||||||||
| 589,064 | |||||||||||
| Life Sciences Tools & Services (0.4%) | |||||||||||
| Cambrex Corp.* | 2,600 | 6,058 | |||||||||
| Dionex Corp.* | 3,600 | 226,800 | |||||||||
| Enzo Biochem, Inc.* | 4,300 | 17,630 | |||||||||
| eResearchTechnology, Inc.* | 5,200 | 26,364 | |||||||||
| Kendle International, Inc.* | 900 | 8,010 | |||||||||
| Nektar Therapeutics* | 300 | 1,680 | |||||||||
| PARAXEL International Corp.* | 3,500 | 34,685 | |||||||||
| 321,227 | |||||||||||
| Machinery (4.8%) | |||||||||||
| Actuant Corp. Class A | 100 | 1,226 | |||||||||
| American Railcar Industries, Inc. | 100 | 912 | |||||||||
| Badger Meter, Inc. | 200 | 7,792 | |||||||||
| Barnes Group, Inc. | 800 | 11,328 | |||||||||
| Basin Water, Inc.* | 2,200 | 660 | |||||||||
| CIRCOR International, Inc. | 2,000 | 51,460 | |||||||||
| CLARCOR, Inc. | 15,900 | 494,172 | |||||||||
| Columbus McKinnon Corp.* | 100 | 1,296 | |||||||||
| Crane Co. | 23,100 | 533,379 | |||||||||
| ESCO Technologies, Inc.* | 100 | 4,158 | |||||||||
| Force Protection, Inc.* | 500 | 3,810 | |||||||||
| Gardner Denver, Inc.* | 22,328 | 594,371 | |||||||||
| Graham Corp. | 17,037 | 212,963 | |||||||||
| John Bean Technologies Corp. | 3,400 | 37,468 | |||||||||
| Kaydon Corp. | 100 | 3,196 | |||||||||
| Lindsay Corp. | 1,569 | 61,050 | |||||||||
| Lydall, Inc.* | 2,100 | 9,009 | |||||||||
| Mueller Industries, Inc. | 16,288 | 357,847 | |||||||||
| Oshkosh Corp. | 32,600 | 312,960 | |||||||||
| RBC Bearings, Inc.* | 300 | 5,550 | |||||||||
| Robbins & Myers, Inc. | 21,057 | 399,030 | |||||||||
| Tennant Co. | 5,400 | 80,298 | |||||||||
| The Gorman-Rupp Co. | 8,900 | 189,570 | |||||||||
| The Toro Co. | 100 | 3,038 | |||||||||
| Valmont Industries, Inc. | 7,000 | 446,460 | |||||||||
| Wabash National Corp. | 3,300 | 4,125 | |||||||||
| Watts Water Technologies, Inc. Class A | 4,100 | 91,266 | |||||||||
| 3,918,394 | |||||||||||
| Marine (0.6%) | |||||||||||
| Kirby Corp.* | 15,700 | 484,502 | |||||||||
See Accompanying Notes to Financial Statements.
43
Credit Suisse Small Cap Core Fund
Schedule of Investments (continued)
April 30, 2009 (unaudited)
| Number of Shares | Value | ||||||||||
| COMMON STOCKS | |||||||||||
| Media (0.2%) | |||||||||||
| 4Kids Entertainment, Inc.* | 1,300 | $ | 1,664 | ||||||||
| Harte-Hanks, Inc. | 900 | 7,434 | |||||||||
| Live Nation, Inc.* | 10,400 | 40,664 | |||||||||
| National CineMedia, Inc. | 8,400 | 122,052 | |||||||||
| Outdoor Channel Holdings, Inc.* | 100 | 748 | |||||||||
| R.H. Donnelley Corp.* | 2,400 | 336 | |||||||||
| Radio One, Inc. Class D* | 26,700 | 12,015 | |||||||||
| 184,913 | |||||||||||
| Metals & Mining (1.6%) | |||||||||||
| A.M. Castle & Co. | 2,000 | 19,380 | |||||||||
| Brush Engineered Materials, Inc.* | 2,400 | 40,608 | |||||||||
| Century Aluminum Co.* | 7,100 | 28,684 | |||||||||
| RTI International Metals, Inc.* | 2,800 | 36,428 | |||||||||
| Worthington Industries, Inc. | 77,000 | 1,147,300 | |||||||||
| 1,272,400 | |||||||||||
| Multi-Utilities (0.1%) | |||||||||||
| Avista Corp. | 100 | 1,505 | |||||||||
| CH Energy Group, Inc. | 1,814 | 80,614 | |||||||||
| 82,119 | |||||||||||
| Multiline Retail (0.4%) | |||||||||||
| Fred's, Inc. Class A | 24,500 | 334,670 | |||||||||
| Tuesday Morning Corp.* | 3,600 | 12,276 | |||||||||
| 346,946 | |||||||||||
| Oil, Gas & Consumable Fuels (0.5%) | |||||||||||
| Atlas America, Inc. | 100 | 1,556 | |||||||||
| Carrizo Oil & Gas, Inc.* | 600 | 7,398 | |||||||||
| Delek US Holdings, Inc. | 200 | 2,054 | |||||||||
| Encore Energy Partners LP | 100 | 1,670 | |||||||||
| GMX Resources, Inc.* | 100 | 1,094 | |||||||||
| Holly Corp. | 100 | 2,096 | |||||||||
| Knightsbridge Tankers, Ltd. | 9,900 | 130,977 | |||||||||
| Overseas Shipholding Group, Inc. | 7,300 | 209,583 | |||||||||
| Penn Virginia Corp. | 100 | 1,407 | |||||||||
| Permian Basin Royalty Trust | 1,357 | 11,969 | |||||||||
| PetroQuest Energy, Inc.* | 5,500 | 16,555 | |||||||||
| Rosetta Resources, Inc.* | 200 | 1,410 | |||||||||
| Sabine Royalty Trust | 100 | 3,706 | |||||||||
| Swift Energy Co.* | 500 | 5,410 | |||||||||
| World Fuel Services Corp. | 100 | 3,813 | |||||||||
| 400,698 | |||||||||||
| Paper & Forest Products (0.2%) | |||||||||||
| Buckeye Technologies, Inc.* | 4,000 | 20,600 | |||||||||
| Deltic Timber Corp. | 1,500 | 63,210 | |||||||||
| Schweitzer-Mauduit International, Inc. | 1,920 | 44,102 | |||||||||
See Accompanying Notes to Financial Statements.
44
Credit Suisse Small Cap Core Fund
Schedule of Investments (continued)
April 30, 2009 (unaudited)
| Number of Shares | Value | ||||||||||
| COMMON STOCKS | |||||||||||
| Paper & Forest Products | |||||||||||
| Wausau Paper Corp. | 6,400 | $ | 55,872 | ||||||||
| 183,784 | |||||||||||
| Personal Products (0.0%) | |||||||||||
| Elizabeth Arden, Inc.* | 100 | 866 | |||||||||
| Mannatech, Inc. | 1,921 | 8,395 | |||||||||
| 9,261 | |||||||||||
| Pharmaceuticals (0.9%) | |||||||||||
| Cypress Bioscience, Inc.* | 400 | 2,880 | |||||||||
| Medicis Pharmaceutical Corp. Class A | 36,200 | 581,734 | |||||||||
| Noven Pharmaceuticals, Inc.* | 5,781 | 59,660 | |||||||||
| Salix Pharmaceuticals, Ltd.* | 2,400 | 26,400 | |||||||||
| The Medicines Co.* | 100 | 998 | |||||||||
| ViroPharma, Inc.* | 9,800 | 55,174 | |||||||||
| 726,846 | |||||||||||
| Professional Services (0.5%) | |||||||||||
| CBIZ, Inc.* | 600 | 4,716 | |||||||||
| CDI Corp. | 1,500 | 17,925 | |||||||||
| Exponent, Inc.* | 100 | 2,790 | |||||||||
| Heidrick & Struggles International, Inc. | 900 | 15,210 | |||||||||
| ICF International, Inc.* | 200 | 5,502 | |||||||||
| Kelly Services, Inc. Class A | 1,200 | 13,632 | |||||||||
| Kforce, Inc.* | 100 | 1,091 | |||||||||
| MPS Group, Inc.* | 1,000 | 8,040 | |||||||||
| On Assignment, Inc.* | 1,800 | 6,336 | |||||||||
| Spherion Corp.* | 6,400 | 22,976 | |||||||||
| The Corporate Executive Board Co. | 17,400 | 300,672 | |||||||||
| 398,890 | |||||||||||
| Real Estate Investment Trusts (5.3%) | |||||||||||
| Acadia Realty Trust | 4,712 | 68,324 | |||||||||
| BioMed Realty Trust, Inc. | 10,800 | 123,228 | |||||||||
| Colonial Properties Trust | 6,400 | 46,336 | |||||||||
| DiamondRock Hospitality Co. | 12,400 | 80,476 | |||||||||
| EastGroup Properties, Inc. | 11,800 | 396,598 | |||||||||
| Entertainment Properties Trust | 16,600 | 383,626 | |||||||||
| Extra Space Storage, Inc. | 11,200 | 79,632 | |||||||||
| Franklin Street Properties Corp. | 30,800 | 411,180 | |||||||||
| Home Properties, Inc. | 4,000 | 145,760 | |||||||||
| Inland Real Estate Corp. | 40,100 | 352,078 | |||||||||
| Kilroy Realty Corp. | 4,300 | 92,622 | |||||||||
| Kite Realty Group Trust | 4,400 | 15,400 | |||||||||
| LaSalle Hotel Properties | 6,200 | 74,152 | |||||||||
| Lexington Realty Trust | 10,698 | 41,187 | |||||||||
| LTC Properties, Inc. | 2,900 | 52,229 | |||||||||
| Medical Properties Trust, Inc. | 9,900 | 52,866 | |||||||||
| Mid-America Apartment Communities, Inc. | 3,400 | 125,766 | |||||||||
See Accompanying Notes to Financial Statements.
45
Credit Suisse Small Cap Core Fund
Schedule of Investments (continued)
April 30, 2009 (unaudited)
| Number of Shares | Value | ||||||||||
| COMMON STOCKS | |||||||||||
| Real Estate Investment Trusts | |||||||||||
| National Retail Properties, Inc. | 25,200 | $ | 447,048 | ||||||||
| Parkway Properties, Inc. | 2,600 | 36,062 | |||||||||
| Pennsylvania Real Estate Investment Trust | 4,800 | 37,200 | |||||||||
| Post Properties, Inc. | 5,500 | 70,180 | |||||||||
| PS Business Parks, Inc. | 8,300 | 363,125 | |||||||||
| Senior Housing Properties Trust | 33,300 | 545,787 | |||||||||
| Sovran Self Storage, Inc. | 2,800 | 63,112 | |||||||||
| Tanger Factory Outlet Centers, Inc. | 3,900 | 129,948 | |||||||||
| Urstadt Biddle Properties, Class A | 2,700 | 41,472 | |||||||||
| 4,275,394 | |||||||||||
| Real Estate Management & Development (0.0%) | |||||||||||
| Consolidated-Tomoka Land Co. | 200 | 6,958 | |||||||||
| Forest City Enterprises, Inc. Class A | 200 | 1,686 | |||||||||
| Tejon Ranch Co.* | 100 | 2,320 | |||||||||
| 10,964 | |||||||||||
| Road & Rail (1.0%) | |||||||||||
| Heartland Express, Inc. | 23,700 | 354,315 | |||||||||
| Knight Transportation, Inc. | 24,157 | 427,096 | |||||||||
| Marten Transport Ltd.* | 200 | 4,148 | |||||||||
| Old Dominion Freight Line, Inc.* | 100 | 2,815 | |||||||||
| Saia, Inc.* | 100 | 1,306 | |||||||||
| 789,680 | |||||||||||
| Semiconductors & Semiconductor Equipment (3.8%) | |||||||||||
| Actel Corp.* | 6,700 | 82,879 | |||||||||
| Advanced Energy Industries, Inc.* | 9,000 | 75,870 | |||||||||
| Applied Micro Circuits Corp.* | 300 | 1,635 | |||||||||
| Axcelis Technologies, Inc.* | 32,000 | 15,040 | |||||||||
| Brooks Automation, Inc.* | 7,800 | 48,516 | |||||||||
| Cohu, Inc. | 6,400 | 62,464 | |||||||||
| Cymer, Inc.* | 700 | 19,887 | |||||||||
| Cypress Semiconductor Corp.* | 17,000 | 134,810 | |||||||||
| Diodes, Inc.* | 600 | 8,928 | |||||||||
| DSP Group, Inc.* | 3,100 | 19,499 | |||||||||
| Exar Corp.* | 11,100 | 68,265 | |||||||||
| Fairchild Semiconductor International, Inc.* | 24,300 | 149,688 | |||||||||
| FEI Co.* | 800 | 13,744 | |||||||||
| Hittite Microwave Corp.* | 2,500 | 92,900 | |||||||||
| Kopin Corp.* | 8,400 | 23,100 | |||||||||
| Kulicke & Soffa Industries, Inc.* | 7,800 | 31,200 | |||||||||
| Micrel, Inc. | 5,500 | 41,250 | |||||||||
| Microsemi Corp.* | 37,903 | 508,658 | |||||||||
| MKS Instruments, Inc.* | 8,100 | 126,765 | |||||||||
| Monolithic Power Systems, Inc.* | 600 | 11,100 | |||||||||
| OmniVision Technologies, Inc.* | 600 | 5,706 | |||||||||
| Pericom Semiconductor Corp.* | 4,700 | 41,877 | |||||||||
| Photronics, Inc.* | 8,600 | 14,362 | |||||||||
See Accompanying Notes to Financial Statements.
46
Credit Suisse Small Cap Core Fund
Schedule of Investments (continued)
April 30, 2009 (unaudited)
| Number of Shares | Value | ||||||||||
| COMMON STOCKS | |||||||||||
| Semiconductors & Semiconductor Equipment | |||||||||||
| Power Integrations, Inc. | 800 | $ | 17,040 | ||||||||
| Rudolph Technologies, Inc.* | 3,900 | 20,397 | |||||||||
| Semtech Corp.* | 26,786 | 386,254 | |||||||||
| Skyworks Solutions, Inc.* | 20,300 | 179,452 | |||||||||
| Standard Microsystems Corp.* | 2,700 | 42,822 | |||||||||
| Supertex, Inc.* | 1,619 | 41,641 | |||||||||
| TriQuint Semiconductor, Inc.* | 17,200 | 65,876 | |||||||||
| Ultratech, Inc.* | 11,300 | 152,776 | |||||||||
| Varian Semiconductor Equipment Associates, Inc.* | 20,000 | 511,800 | |||||||||
| Veeco Instruments, Inc.* | 4,600 | 33,304 | |||||||||
| Zoran Corp.* | 500 | 4,470 | |||||||||
| 3,053,975 | |||||||||||
| Software (3.3%) | |||||||||||
| ANSYS, Inc.* | 2,916 | 80,540 | |||||||||
| Blackbaud, Inc. | 5,300 | 80,666 | |||||||||
| Bottomline Technologies, Inc.* | 100 | 785 | |||||||||
| Catapult Communications Corp.* | 522 | 3,858 | |||||||||
| Commvault Systems, Inc.* | 500 | 6,225 | |||||||||
| Concur Technologies, Inc.* | 14,369 | 388,969 | |||||||||
| DemandTec, Inc.* | 100 | 722 | |||||||||
| Ebix, Inc.* | 1,100 | 30,580 | |||||||||
| Epicor Software Corp.* | 7,300 | 40,296 | |||||||||
| Informatica Corp.* | 100 | 1,590 | |||||||||
| JDA Software Group, Inc.* | 3,232 | 45,604 | |||||||||
| Mentor Graphics Corp.* | 200 | 1,344 | |||||||||
| MICROS Systems, Inc.* | 23,400 | 490,932 | |||||||||
| MSC.Software Corp.* | 100 | 614 | |||||||||
| Phoenix Technologies, Ltd.* | 3,453 | 9,841 | |||||||||
| Progress Software Corp.* | 16,400 | 347,516 | |||||||||
| Quality Systems, Inc. | 7,947 | 426,118 | |||||||||
| Radiant Systems, Inc.* | 3,100 | 22,847 | |||||||||
| Smith Micro Software, Inc.* | 3,600 | 30,960 | |||||||||
| Sonic Solutions* | 3,100 | 6,820 | |||||||||
| SPSS, Inc.* | 5,400 | 166,860 | |||||||||
| SuccessFactors, Inc.* | 100 | 871 | |||||||||
| Take-Two Interactive Software, Inc. | 30,400 | 276,032 | |||||||||
| Taleo Corp. Class A* | 500 | 6,005 | |||||||||
| TeleCommunication Systems, Inc. Class A* | 1,924 | 18,874 | |||||||||
| The Ultimate Software Group, Inc.* | 500 | 9,365 | |||||||||
| THQ, Inc.* | 8,300 | 28,386 | |||||||||
| Tyler Technologies, Inc.* | 2,400 | 39,600 | |||||||||
| VASCO Data Security International, Inc.* | 100 | 692 | |||||||||
| Wind River Systems, Inc.* | 11,500 | 84,295 | |||||||||
| 2,647,807 | |||||||||||
| Specialty Retail (4.7%) | |||||||||||
| Aaron Rents, Inc. | 6,600 | 221,496 | |||||||||
| America's Car-Mart, Inc.* | 100 | 1,622 | |||||||||
See Accompanying Notes to Financial Statements.
47
Credit Suisse Small Cap Core Fund
Schedule of Investments (continued)
April 30, 2009 (unaudited)
| Number of Shares | Value | ||||||||||
| COMMON STOCKS | |||||||||||
| Specialty Retail | |||||||||||
| Charlotte Russe Holding, Inc.* | 2,600 | $ | 32,630 | ||||||||
| Christopher & Banks Corp. | 4,400 | 24,464 | |||||||||
| Haverty Furniture Cos., Inc. | 8,700 | 94,395 | |||||||||
| hhgregg, Inc.* | 100 | 1,660 | |||||||||
| Hot Topic, Inc.* | 67,952 | 831,732 | |||||||||
| Jo-Ann Stores, Inc.* | 2,600 | 47,632 | |||||||||
| Jos. A. Bank Clothiers, Inc.* | 2,277 | 92,082 | |||||||||
| MarineMax, Inc.* | 1,400 | 6,370 | |||||||||
| Midas, Inc.* | 3,300 | 33,000 | |||||||||
| Monro Muffler Brake, Inc. | 3,900 | 97,383 | |||||||||
| OfficeMax, Inc. | 9,200 | 68,540 | |||||||||
| RadioShack Corp. | 40,900 | 575,872 | |||||||||
| Select Comfort Corp.* | 14,100 | 14,241 | |||||||||
| Sonic Automotive, Inc. Class A | 1,800 | 9,288 | |||||||||
| Stage Stores, Inc. | 100 | 1,225 | |||||||||
| Stein Mart, Inc.* | 3,000 | 13,110 | |||||||||
| Systemax, Inc.* | 100 | 1,686 | |||||||||
| The Buckle, Inc. | 10,750 | 401,728 | |||||||||
| The Cato Corp. Class A | 3,700 | 71,114 | |||||||||
| The Children's Place Retail Stores, Inc.* | 12,161 | 345,859 | |||||||||
| The Dress Barn, Inc.* | 14,400 | 218,016 | |||||||||
| The Finish Line, Inc. Class A | 7,329 | 62,297 | |||||||||
| The Gymboree Corp.* | 100 | 3,440 | |||||||||
| The Men's Wearhouse, Inc. | 2,969 | 55,342 | |||||||||
| The Pep Boys-Manny, Moe & Jack | 5,300 | 39,220 | |||||||||
| Tractor Supply Co.* | 10,687 | 431,541 | |||||||||
| Tween Brands, Inc.* | 1,800 | 5,256 | |||||||||
| Zale Corp.*` | 4,100 | 15,252 | |||||||||
| Zumiez, Inc.* | 1,500 | 18,090 | |||||||||
| 3,835,583 | |||||||||||
| Textiles, Apparel & Luxury Goods (4.2%) | |||||||||||
| Carter's, Inc.* | 23,800 | 508,844 | |||||||||
| Crocs, Inc.* | 9,900 | 22,275 | |||||||||
| Fossil, Inc.* | 79,355 | 1,599,797 | |||||||||
| Iconix Brand Group, Inc.* | 500 | 7,130 | |||||||||
| Jones Apparel Group, Inc. | 100 | 924 | |||||||||
| K-Swiss, Inc. Class A | 200 | 2,008 | |||||||||
| Liz Claiborne, Inc. | 11,800 | 55,932 | |||||||||
| Maidenform Brands, Inc.* | 2,294 | 29,248 | |||||||||
| Perry Ellis International, Inc.* | 1,000 | 7,330 | |||||||||
| Quiksilver, Inc.* | 38,600 | 63,690 | |||||||||
| The Warnaco Group, Inc.* | 21,700 | 625,828 | |||||||||
| UniFirst Corp. | 1,700 | 63,393 | |||||||||
| Volcom, Inc.* | 600 | 8,094 | |||||||||
| Wolverine World Wide, Inc. | 20,800 | 433,264 | |||||||||
| 3,427,757 | |||||||||||
See Accompanying Notes to Financial Statements.
48
Credit Suisse Small Cap Core Fund
Schedule of Investments (continued)
April 30, 2009 (unaudited)
| Number of Shares | Value | ||||||||||
| COMMON STOCKS | |||||||||||
| Thrifts & Mortgage Finance (1.2%) | |||||||||||
| Abington Bancorp, Inc. | 100 | $ | 879 | ||||||||
| Anchor BanCorp Wisconsin, Inc. | 1,500 | 2,445 | |||||||||
| Bank Mutual Corp. | 5,400 | 55,458 | |||||||||
| Brookline Bancorp, Inc. | 7,100 | 70,432 | |||||||||
| Corus Bankshares, Inc.* | 7,400 | 1,554 | |||||||||
| Dime Community Bancshares | 5,100 | 42,534 | |||||||||
| Downey Financial Corp. | 5,400 | 149 | |||||||||
| Flagstar Bancorp, Inc.* | 8,800 | 12,760 | |||||||||
| Flushing Financial Corp. | 400 | 3,684 | |||||||||
| Guaranty Financial Group, Inc.* | 11,000 | 6,490 | |||||||||
| IndyMac Bancorp, Inc.* | 2,500 | 162 | |||||||||
| Ocwen Financial Corp.* | 58,200 | 647,184 | |||||||||
| TrustCo Bank Corp. NY | 26,300 | 157,800 | |||||||||
| United Financial Bancorp, Inc. | 200 | 2,654 | |||||||||
| 1,004,185 | |||||||||||
| Tobacco (0.1%) | |||||||||||
| Alliance One International, Inc.* | 10,900 | 40,875 | |||||||||
| Trading Companies & Distributors (1.4%) | |||||||||||
| Applied Industrial Technologies, Inc. | 100 | 2,250 | |||||||||
| Beacon Roofing Supply, Inc.* | 13,500 | 214,650 | |||||||||
| Building Materials Holding Corp.* | 9,400 | 2,350 | |||||||||
| H&E Equipment Services, Inc.* | 200 | 1,506 | |||||||||
| Kaman Corp. | 3,209 | 54,264 | |||||||||
| Lawson Products, Inc. | 500 | 5,740 | |||||||||
| RSC Holdings, Inc.* | 500 | 3,575 | |||||||||
| Rush Enterprises, Inc. Class A* | 100 | 1,316 | |||||||||
| Watsco, Inc. | 15,100 | 648,545 | |||||||||
| WESCO International, Inc.* | 8,800 | 228,800 | |||||||||
| 1,162,996 | |||||||||||
| Water Utilities (0.0%) | |||||||||||
| Consolidated Water Co., Ltd. | 100 | 1,341 | |||||||||
| SJW Corp. | 700 | 17,640 | |||||||||
| 18,981 | |||||||||||
| Wireless Telecommunication Services (0.0%) | |||||||||||
| USA Mobility, Inc. | 1,500 | 16,680 | |||||||||
| TOTAL COMMON STOCKS (Cost $81,425,212) | 80,809,164 | ||||||||||
| Par (000) | |||||||||||
| SHORT-TERM INVESTMENT (0.3%) | |||||||||||
| State Street Bank and Trust Co. Euro Time Deposit, 0.010%, 05/01/09 (Cost $259,000) | $ | 259 | 259,000 | ||||||||
| TOTAL INVESTMENTS AT VALUE (100.2%) (Cost $81,684,212) | 81,068,164 | ||||||||||
| LIABILITIES IN EXCESS OF OTHER ASSETS (-0.2%) | (158,946 | ) | |||||||||
| NET ASSETS (100.0%) | $ | 80,909,218 | |||||||||
* Non-income producing security.
See Accompanying Notes to Financial Statements.
49
Credit Suisse Funds
Statements of Assets and Liabilities
April 30, 2009 (unaudited)
| Large Cap Value Fund | Small Cap Core Fund | ||||||||||
| Assets | |||||||||||
| Investments at value, (Cost $134,525,055 and $81,684,212, respectively) (Note 2) | $ | 134,125,827 | $ | 81,068,164 | |||||||
| Cash | 787 | 31 | |||||||||
| Receivable for investments sold | 33,624,871 | 6,438,034 | |||||||||
| Dividend receivable | 76,087 | 68,703 | |||||||||
| Receivable for fund shares sold | 14,240 | 20,234 | |||||||||
| Prepaid expenses and other assets | 25,435 | 23,288 | |||||||||
| Total Assets | 167,867,247 | 87,618,454 | |||||||||
| Liabilities | |||||||||||
| Advisory fee payable (Note 3) | 30,402 | 17,713 | |||||||||
| Administrative services fee payable (Note 3) | 25,413 | 32,168 | |||||||||
| Shareholder servicing/Distribution fee payable (Note 3) | 28,990 | 20,684 | |||||||||
| Payable for investments purchased | 32,201,899 | 6,442,178 | |||||||||
| Payable for fund shares redeemed | 69,156 | 20,268 | |||||||||
| Trustees' fee payable | 5,677 | 5,677 | |||||||||
| Other accrued expenses payable | 151,352 | 170,548 | |||||||||
| Total Liabilities | 32,512,889 | 6,709,236 | |||||||||
| Net Assets | |||||||||||
| Capital stock, $.001 par value (Note 6) | 14,712 | 10,055 | |||||||||
| Paid-in capital (Note 6) | 207,727,846 | 137,348,193 | |||||||||
| Undistributed net investment income | 258,267 | 2,902 | |||||||||
| Accumulated net realized loss on investments and foreign currency transactions | (72,247,241 | ) | (55,835,884 | ) | |||||||
| Net unrealized depreciation from investments and foreign currency translations | (399,226 | ) | (616,048 | ) | |||||||
| Net Assets | $ | 135,354,358 | $ | 80,909,218 | |||||||
| Common Shares | |||||||||||
| Net assets | $ | 280,053 | $ | 13,802,871 | |||||||
| Shares outstanding | 30,616 | 1,687,117 | |||||||||
| Net asset value, offering price and redemption price per share | $ | 9.15 | $ | 8.18 | |||||||
| Advisor Shares | |||||||||||
| Net assets | $ | 1,930,360 | $ | N | A | ||||||
| Shares outstanding | 208,715 | NA | |||||||||
| Net asset value, offering price and redemption price per share | $ | 9.25 | NA | ||||||||
| A Shares | |||||||||||
| Net assets | $ | 130,179,675 | $ | 58,611,039 | |||||||
| Shares outstanding | 14,141,642 | 7,082,121 | |||||||||
| Net asset value and redemption price per share | $ | 9.21 | $ | 8.28 | |||||||
| Maximum offering price per share (net asset value/(1-5.75%)) | $ | 9.77 | $ | 8.79 | |||||||
See Accompanying Notes to Financial Statements.
50
Credit Suisse Funds
Statements of Assets and Liabilities (continued)
April 30, 2009 (unaudited)
| Large Cap Value Fund | Small Cap Core Fund | ||||||||||
| B Shares | |||||||||||
| Net assets | $ | 2,179,160 | $ | 3,054,081 | |||||||
| Shares outstanding | 242,542 | 459,291 | |||||||||
| Net asset value and offering price per share | $ | 8.98 | $ | 6.65 | |||||||
| C Shares | |||||||||||
| Net assets | $ | 785,110 | $ | 5,441,227 | |||||||
| Shares outstanding | 88,155 | 826,173 | |||||||||
| Net asset value and offering price per share | $ | 8.91 | $ | 6.59 | |||||||
See Accompanying Notes to Financial Statements.
51
Credit Suisse Funds
Statements of Operations
For the Six Months Ended April 30, 2009 (unaudited)
| Large Cap Value Fund | Small Cap Core Fund | ||||||||||
| Investment Income (Note 2) | |||||||||||
| Dividends | $ | 1,932,300 | $ | 694,638 | |||||||
| Interest | 11 | 10 | |||||||||
| Securities lending | 400 | 505 | |||||||||
| Foreign taxes withheld | (22,746 | ) | (771 | ) | |||||||
| Total investment income | 1,909,965 | 694,382 | |||||||||
| Expenses | |||||||||||
| Investment advisory fees (Note 3) | 323,867 | 279,198 | |||||||||
| Administrative services fees (Note 3) | 111,838 | 83,679 | |||||||||
| Shareholder servicing/Distribution fees (Note 3) | |||||||||||
| Common Class | — | 16,240 | |||||||||
| Advisor Class | 4,450 | — | |||||||||
| Class A | 155,622 | 73,441 | |||||||||
| Class B | 11,069 | 15,090 | |||||||||
| Class C | 3,982 | 25,040 | |||||||||
| Transfer agent fees | 186,434 | 159,709 | |||||||||
| Custodian fees | 86,534 | 72,379 | |||||||||
| Registration fees | 32,504 | 27,645 | |||||||||
| Printing fees (Note 3) | 30,474 | 23,456 | |||||||||
| Audit and tax fees | 19,072 | 16,168 | |||||||||
| Legal fees | 12,594 | 9,489 | |||||||||
| Trustees' fees | 8,219 | 8,219 | |||||||||
| Insurance expense | 3,870 | 2,774 | |||||||||
| Commitment fees (Note 4) | 1,519 | 1,082 | |||||||||
| Interest expense (Note 4) | — | 773 | |||||||||
| Miscellaneous expense | 3,306 | 2,888 | |||||||||
| Total expenses | 995,354 | 817,270 | |||||||||
| Less: fees waived (Note 3) | (140,110 | ) | (168,949 | ) | |||||||
| Net expenses | 855,244 | 648,321 | |||||||||
| Net investment income | 1,054,721 | 46,061 | |||||||||
| Net Realized and Unrealized Gain (Loss) from Investments and Foreign Currency Related Items | |||||||||||
| Net realized loss from investments | (47,024,557 | ) | (37,641,745 | ) | |||||||
| Net realized gain from foreign currency transactions | 93 | — | |||||||||
| Net change in unrealized appreciation (depreciation) from investments | 34,727,733 | 24,509,505 | |||||||||
| Net change in unrealized appreciation (depreciation) from foreign currency translations | 2 | — | |||||||||
| Net realized and unrealized loss from investments and foreign currency related items | (12,296,729 | ) | (13,132,240 | ) | |||||||
| Net decrease in net assets resulting from operations | $ | (11,242,008 | ) | $ | (13,086,179 | ) | |||||
See Accompanying Notes to Financial Statements.
52
Credit Suisse Funds
Statements of Changes in Net Assets
| Large Cap Value Fund | Small Cap Core Fund | ||||||||||||||||||
| For the Six Months Ended April 30, 2009 (unaudited) | For the Year Ended October 31, 2008 | For the Six Months Ended April 30, 2009 (unaudited) | For the Year Ended October 31, 2008 | ||||||||||||||||
| From Operations | |||||||||||||||||||
| Net investment income | $ | 1,054,721 | $ | 3,676,133 | $ | 46,061 | $ | 47,202 | |||||||||||
| Net realized loss from investments and foreign currency transactions | (47,024,464 | ) | (24,676,544 | ) | (37,641,745 | ) | (16,280,781 | ) | |||||||||||
| Net change in unrealized appreciation (depreciation) from investments and foreign currency translations | 34,727,735 | (75,539,918 | ) | 24,509,505 | (51,051,123 | ) | |||||||||||||
| Net decrease in net assets resulting from operations | (11,242,008 | ) | (96,540,329 | ) | (13,086,179 | ) | (67,284,702 | ) | |||||||||||
| From Dividends and Distributions | |||||||||||||||||||
| Dividends from net investment income | |||||||||||||||||||
| Common Class shares | (2,638 | ) | (8,192 | ) | (9,406 | ) | — | ||||||||||||
| Advisor Class shares | (15,572 | ) | (48,163 | ) | — | — | |||||||||||||
| Class A shares | (1,170,460 | ) | (3,573,660 | ) | (44,485 | ) | — | ||||||||||||
| Class B shares | (17,031 | ) | (46,838 | ) | (507 | ) | — | ||||||||||||
| Class C shares | (6,130 | ) | (13,426 | ) | (838 | ) | — | ||||||||||||
| Distributions from net realized gains | |||||||||||||||||||
| Common Class shares | — | (93,955 | ) | — | (18,726,350 | ) | |||||||||||||
| Advisor Class shares | — | (809,768 | ) | — | — | ||||||||||||||
| Class A shares | — | (45,714,836 | ) | — | (55,796,349 | ) | |||||||||||||
| Class B shares | — | (1,401,314 | ) | — | (3,314,155 | ) | |||||||||||||
| Class C shares | — | (349,709 | ) | — | (5,876,025 | ) | |||||||||||||
| Net decrease in net assets resulting from dividends and distributions | (1,211,831 | ) | (52,059,861 | ) | (55,236 | ) | (83,712,879 | ) | |||||||||||
| From Capital Share Transactions (Note 6) | |||||||||||||||||||
| Proceeds from sale of shares | 2,897,108 | 8,518,621 | 3,389,635 | 14,272,135 | |||||||||||||||
| Reinvestment of dividends and distributions | 1,093,183 | 47,881,522 | 51,416 | 78,197,395 | |||||||||||||||
| Net asset value of shares redeemed | (12,718,791 | ) | (48,760,638 | ) | (15,667,029 | )1 | (86,150,438 | )2 | |||||||||||
| Net increase (decrease) in net assets from capital share transactions | (8,728,500 | ) | 7,639,505 | (12,225,978 | ) | 6,319,092 | |||||||||||||
| Net decrease in net assets | (21,182,339 | ) | (140,960,685 | ) | (25,367,393 | ) | (144,678,489 | ) | |||||||||||
| Net Assets | |||||||||||||||||||
| Beginning of period | 156,536,697 | 297,497,382 | 106,276,611 | 250,955,100 | |||||||||||||||
| End of period | $ | 135,354,358 | $ | 156,536,697 | $ | 80,909,218 | $ | 106,276,611 | |||||||||||
| Undistributed net investment income | $ | 258,267 | $ | 415,377 | $ | 2,902 | $ | 12,077 | |||||||||||
1 Net of $9 of redemption fees retained by the Fund.
2 Net of $9,830 of redemption fees retained by the Fund.
See Accompanying Notes to Financial Statements.
53
Credit Suisse Large Cap Value Fund
Financial Highlights
(For a Common Class Share of the Fund Outstanding Throughout Each Period)
| For the Six Months Ended April 30, 2009 | For the Year Ended October 31, | ||||||||||||||||||||||||||
| (unaudited) | 2008 | 2007 | 2006 | 2005 | 2004 | ||||||||||||||||||||||
| Per share data | |||||||||||||||||||||||||||
| Net asset value, beginning of period | $ | 9.88 | $ | 19.17 | $ | 21.93 | $ | 20.97 | $ | 19.98 | $ | 18.61 | |||||||||||||||
| INVESTMENT OPERATIONS | |||||||||||||||||||||||||||
| Net investment income1 | 0.08 | 0.26 | 0.26 | 0.28 | 0.24 | 0.23 | |||||||||||||||||||||
| Net gain (loss) on investments and foreign currency related items (both realized and unrealized) | (0.72 | ) | (6.09 | ) | 1.68 | 3.42 | 2.32 | 1.87 | |||||||||||||||||||
| Total from investment operations | (0.64 | ) | (5.83 | ) | 1.94 | 3.70 | 2.56 | 2.10 | |||||||||||||||||||
| LESS DIVIDENDS AND DISTRIBUTIONS | |||||||||||||||||||||||||||
| Dividends from net investment income | (0.09 | ) | (0.26 | ) | (0.25 | ) | (0.26 | ) | (0.25 | ) | (0.23 | ) | |||||||||||||||
| Distributions from net realized gains | — | (3.20 | ) | (4.45 | ) | (2.48 | ) | (1.32 | ) | (0.50 | ) | ||||||||||||||||
| Total dividends and distributions | (0.09 | ) | (3.46 | ) | (4.70 | ) | (2.74 | ) | (1.57 | ) | (0.73 | ) | |||||||||||||||
| Net asset value, end of period | $ | 9.15 | $ | 9.88 | $ | 19.17 | $ | 21.93 | $ | 20.97 | $ | 19.98 | |||||||||||||||
| Total return2 | (6.44 | )% | (36.29 | )% | 10.59 | % | 19.44 | % | 13.34 | % | 11.51 | % | |||||||||||||||
| RATIOS AND SUPPLEMENTAL DATA | |||||||||||||||||||||||||||
| Net assets, end of period (000s omitted) | $ | 280 | $ | 300 | $ | 570 | $ | 600 | $ | 591 | $ | 664 | |||||||||||||||
| Ratio of expenses to average net assets | 1.05 | %3 | 0.90 | % | 0.82 | % | 0.89 | % | 0.91 | % | 0.95 | % | |||||||||||||||
| Ratio of net investment income to average net assets | 1.88 | %3 | 1.89 | % | 1.37 | % | 1.37 | % | 1.15 | % | 1.16 | % | |||||||||||||||
| Decrease reflected in above operating expense ratios due to waivers/reimbursements | 0.21 | %3 | — | — | — | — | — | ||||||||||||||||||||
| Portfolio turnover rate | 229 | % | 179 | % | 163 | % | 78 | % | 58 | % | 48 | % | |||||||||||||||
1 Per share information is calculated using the average shares outstanding method.
2 Total returns are historical and assume changes in share price and reinvestment of all dividends and distributions. Had certain expenses not been reduced during the periods shown, total returns would have been lower. Total returns for periods less than one year are not annualized.
3 Annualized.
See Accompanying Notes to Financial Statements.
54
Credit Suisse Large Cap Value Fund
Financial Highlights
(For an Advisor Class Share of the Fund Outstanding Throughout Each Period)
| For the Six Months Ended April 30, 2009 | For the Year Ended October 31, | ||||||||||||||||||||||||||
| (unaudited) | 2008 | 2007 | 2006 | 2005 | 2004 | ||||||||||||||||||||||
| Per share data | |||||||||||||||||||||||||||
| Net asset value, beginning of period | $ | 10.01 | $ | 19.33 | $ | 22.08 | $ | 21.10 | $ | 20.09 | $ | 18.71 | |||||||||||||||
| INVESTMENT OPERATIONS | |||||||||||||||||||||||||||
| Net investment income1 | 0.06 | 0.19 | 0.17 | 0.18 | 0.14 | 0.13 | |||||||||||||||||||||
| Net gain (loss) on investments and foreign currency related items (both realized and unrealized) | (0.74 | ) | (6.12 | ) | 1.69 | 3.44 | 2.34 | 1.88 | |||||||||||||||||||
| Total from investment operations | (0.68 | ) | (5.93 | ) | 1.86 | 3.62 | 2.48 | 2.01 | |||||||||||||||||||
| LESS DIVIDENDS AND DISTRIBUTIONS | |||||||||||||||||||||||||||
| Dividends from net investment income | (0.08 | ) | (0.19 | ) | (0.16 | ) | (0.16 | ) | (0.15 | ) | (0.13 | ) | |||||||||||||||
| Distributions from net realized gains | — | (3.20 | ) | (4.45 | ) | (2.48 | ) | (1.32 | ) | (0.50 | ) | ||||||||||||||||
| Total dividends and distributions | (0.08 | ) | (3.39 | ) | (4.61 | ) | (2.64 | ) | (1.47 | ) | (0.63 | ) | |||||||||||||||
| Net asset value, end of period | $ | 9.25 | $ | 10.01 | $ | 19.33 | $ | 22.08 | $ | 21.10 | $ | 20.09 | |||||||||||||||
| Total return2 | (6.78 | )% | (36.45 | )% | 10.01 | % | 18.84 | % | 12.81 | % | 10.96 | % | |||||||||||||||
| RATIOS AND SUPPLEMENTAL DATA | |||||||||||||||||||||||||||
| Net assets, end of period (000s omitted) | $ | 1,930 | $ | 2,097 | $ | 5,234 | $ | 5,806 | $ | 8,368 | $ | 12,228 | |||||||||||||||
| Ratio of expenses to average net assets | 1.55 | %3 | 1.41 | % | 1.32 | % | 1.39 | % | 1.41 | % | 1.45 | % | |||||||||||||||
| Ratio of net investment income to average net assets | 1.38 | %3 | 1.38 | % | 0.87 | % | 0.87 | % | 0.65 | % | 0.66 | % | |||||||||||||||
| Decrease reflected in above operating expense ratios due to waivers/reimbursements | 0.22 | %3 | — | — | — | — | — | ||||||||||||||||||||
| Portfolio turnover rate | 229 | % | 179 | % | 163 | % | 78 | % | 58 | % | 48 | % | |||||||||||||||
1 Per share information is calculated using the average shares outstanding method.
2 Total returns are historical and assume changes in share price and reinvestment of all dividends and distributions. Had certain expenses not been reduced during the periods shown, total returns would have been lower. Total returns for periods less than one year are not annualized.
3 Annualized.
See Accompanying Notes to Financial Statements.
55
Credit Suisse Large Cap Value Fund
Financial Highlights
(For a Class A Share of the Fund Outstanding Throughout Each Period)
| For the Six Months Ended April 30, 2009 | For the Year Ended October 31, | ||||||||||||||||||||||||||
| (unaudited) | 2008 | 2007 | 2006 | 2005 | 2004 | ||||||||||||||||||||||
| Per share data | |||||||||||||||||||||||||||
| Net asset value, beginning of period | $ | 9.95 | $ | 19.28 | $ | 22.03 | $ | 21.05 | $ | 20.05 | $ | 18.68 | |||||||||||||||
| INVESTMENT OPERATIONS | |||||||||||||||||||||||||||
| Net investment income1 | 0.07 | 0.23 | 0.22 | 0.22 | 0.19 | 0.18 | |||||||||||||||||||||
| Net gain (loss) on investments and foreign currency related items (both realized and unrealized) | (0.73 | ) | (6.14 | ) | 1.69 | 3.45 | 2.33 | 1.87 | |||||||||||||||||||
| Total from investment operations | (0.66 | ) | (5.91 | ) | 1.91 | 3.67 | 2.52 | 2.05 | |||||||||||||||||||
| LESS DIVIDENDS AND DISTRIBUTIONS | |||||||||||||||||||||||||||
| Dividends from net investment income | (0.08 | ) | (0.22 | ) | (0.21 | ) | (0.21 | ) | (0.20 | ) | (0.18 | ) | |||||||||||||||
| Distributions from net realized gains | — | (3.20 | ) | (4.45 | ) | (2.48 | ) | (1.32 | ) | (0.50 | ) | ||||||||||||||||
| Total dividends and distributions | (0.08 | ) | (3.42 | ) | (4.66 | ) | (2.69 | ) | (1.52 | ) | (0.68 | ) | |||||||||||||||
| Net asset value, end of period | $ | 9.21 | $ | 9.95 | $ | 19.28 | $ | 22.03 | $ | 21.05 | $ | 20.05 | |||||||||||||||
| Total return2 | (6.56 | )% | (36.46 | )% | 10.32 | % | 19.18 | % | 13.06 | % | 11.19 | % | |||||||||||||||
| RATIOS AND SUPPLEMENTAL DATA | |||||||||||||||||||||||||||
| Net assets, end of period (000s omitted) | $ | 130,180 | $ | 150,304 | $ | 280,329 | $ | 305,866 | $ | 300,777 | $ | 302,823 | |||||||||||||||
| Ratio of expenses to average net assets | 1.30 | %3 | 1.16 | % | 1.07 | % | 1.14 | % | 1.16 | % | 1.20 | % | |||||||||||||||
| Ratio of net investment income to average net assets | 1.65 | %3 | 1.63 | % | 1.12 | % | 1.12 | % | 0.91 | % | 0.91 | % | |||||||||||||||
| Decrease reflected in above operating expense ratios due to waivers/reimbursements | 0.22 | %3 | — | — | — | — | — | ||||||||||||||||||||
| Portfolio turnover rate | 229 | % | 179 | % | 163 | % | 78 | % | 58 | % | 48 | % | |||||||||||||||
1 Per share information is calculated using the average shares outstanding method.
2 Total returns are historical and assume changes in share price, reinvestment of all dividends and distributions and no sales charge. Had certain expenses not been reduced during the periods shown, total returns would have been lower. Total returns for periods less than one year are not annualized.
3 Annualized.
See Accompanying Notes to Financial Statements.
56
Credit Suisse Large Cap Value Fund
Financial Highlights
(For a Class B Share of the Fund Outstanding Throughout Each Period)
| For the Six Months Ended April 30, 2009 | For the Year Ended October 31, | ||||||||||||||||||||||||||
| (unaudited) | 2008 | 2007 | 2006 | 2005 | 2004 | ||||||||||||||||||||||
| Per share data | |||||||||||||||||||||||||||
| Net asset value, beginning of period | $ | 9.73 | $ | 18.92 | $ | 21.70 | $ | 20.78 | $ | 19.81 | $ | 18.46 | |||||||||||||||
| INVESTMENT OPERATIONS | |||||||||||||||||||||||||||
| Net investment income1 | 0.04 | 0.12 | 0.07 | 0.07 | 0.04 | 0.03 | |||||||||||||||||||||
| Net gain (loss) on investments and foreign currency related items (both realized and unrealized) | (0.72 | ) | (6.00 | ) | 1.66 | 3.39 | 2.30 | 1.85 | |||||||||||||||||||
| Total from investment operations | (0.68 | ) | (5.88 | ) | 1.73 | 3.46 | 2.34 | 1.88 | |||||||||||||||||||
| LESS DIVIDENDS AND DISTRIBUTIONS | |||||||||||||||||||||||||||
| Dividends from net investment income | (0.07 | ) | (0.11 | ) | (0.06 | ) | (0.06 | ) | (0.05 | ) | (0.03 | ) | |||||||||||||||
| Distributions from net realized gains | — | (3.20 | ) | (4.45 | ) | (2.48 | ) | (1.32 | ) | (0.50 | ) | ||||||||||||||||
| Total dividends and distributions | (0.07 | ) | (3.31 | ) | (4.51 | ) | (2.54 | ) | (1.37 | ) | (0.53 | ) | |||||||||||||||
| Net asset value, end of period | $ | 8.98 | $ | 9.73 | $ | 18.92 | $ | 21.70 | $ | 20.78 | $ | 19.81 | |||||||||||||||
| Total return2 | (6.99 | )% | (36.93 | )% | 9.49 | % | 18.25 | % | 12.23 | % | 10.40 | % | |||||||||||||||
| RATIOS AND SUPPLEMENTAL DATA | |||||||||||||||||||||||||||
| Net assets, end of period (000s omitted) | $ | 2,179 | $ | 2,864 | $ | 9,224 | $ | 14,994 | $ | 20,057 | $ | 25,118 | |||||||||||||||
| Ratio of expenses to average net assets | 2.05 | %3 | 1.91 | % | 1.82 | % | 1.89 | % | 1.91 | % | 1.95 | % | |||||||||||||||
| Ratio of net investment income to average net assets | 0.94 | %3 | 0.89 | % | 0.39 | % | 0.37 | % | 0.15 | % | 0.16 | % | |||||||||||||||
| Decrease reflected in above operating expense ratios due to waivers/reimbursements | 0.22 | %3 | — | — | — | — | — | ||||||||||||||||||||
| Portfolio turnover rate | 229 | % | 179 | % | 163 | % | 78 | % | 58 | % | 48 | % | |||||||||||||||
1 Per share information is calculated using the average shares outstanding method.
2 Total returns are historical and assume changes in share price, reinvestment of all dividends and distributions and no sales charge. Had certain expenses not been reduced during the periods shown, total returns would have been lower. Total returns for periods less than one year are not annualized.
3 Annualized.
See Accompanying Notes to Financial Statements.
57
Credit Suisse Large Cap Value Fund
Financial Highlights
(For a Class C Share of the Fund Outstanding Throughout Each Period)
| For the Six Months Ended April 30, 2009 | For the Year Ended October 31, | ||||||||||||||||||||||||||
| (unaudited) | 2008 | 2007 | 2006 | 2005 | 2004 | ||||||||||||||||||||||
| Per share data | |||||||||||||||||||||||||||
| Net asset value, beginning of period | $ | 9.65 | $ | 18.79 | $ | 21.58 | $ | 20.68 | $ | 19.72 | $ | 18.38 | |||||||||||||||
| INVESTMENT OPERATIONS | |||||||||||||||||||||||||||
| Net investment income1 | 0.04 | 0.12 | 0.07 | 0.07 | 0.03 | 0.03 | |||||||||||||||||||||
| Net gain (loss) on investments and foreign currency related items (both realized and unrealized) | (0.71 | ) | (5.95 | ) | 1.65 | 3.37 | 2.30 | 1.84 | |||||||||||||||||||
| Total from investment operations | (0.67 | ) | (5.83 | ) | 1.72 | 3.44 | 2.33 | 1.87 | |||||||||||||||||||
| LESS DIVIDENDS AND DISTRIBUTIONS | |||||||||||||||||||||||||||
| Dividends from net investment income | (0.07 | ) | (0.11 | ) | (0.06 | ) | (0.06 | ) | (0.05 | ) | (0.03 | ) | |||||||||||||||
| Distributions from net realized gains | — | (3.20 | ) | (4.45 | ) | (2.48 | ) | (1.32 | ) | (0.50 | ) | ||||||||||||||||
| Total dividends and distributions | (0.07 | ) | (3.31 | ) | (4.51 | ) | (2.54 | ) | (1.37 | ) | (0.53 | ) | |||||||||||||||
| Net asset value, end of period | $ | 8.91 | $ | 9.65 | $ | 18.79 | $ | 21.58 | $ | 20.68 | $ | 19.72 | |||||||||||||||
| Total return2 | (6.94 | )% | (36.91 | )% | 9.50 | % | 18.25 | % | 12.23 | % | 10.39 | % | |||||||||||||||
| RATIOS AND SUPPLEMENTAL DATA | |||||||||||||||||||||||||||
| Net assets, end of period (000s omitted) | $ | 785 | $ | 972 | $ | 2,140 | $ | 2,618 | $ | 3,638 | $ | 3,736 | |||||||||||||||
| Ratio of expenses to average net assets | 2.05 | %3 | 1.91 | % | 1.82 | % | 1.89 | % | 1.91 | % | 1.95 | % | |||||||||||||||
| Ratio of net investment income to average net assets | 0.91 | %3 | 0.89 | % | 0.39 | % | 0.37 | % | 0.15 | % | 0.16 | % | |||||||||||||||
| Decrease reflected in above operating expense ratios due to waivers/reimbursements | 0.22 | %3 | — | — | — | — | — | ||||||||||||||||||||
| Portfolio turnover rate | 229 | % | 179 | % | 163 | % | 78 | % | 58 | % | 48 | % | |||||||||||||||
1 Per share information is calculated using the average shares outstanding method.
2 Total returns are historical and assume changes in share price, reinvestment of all dividends and distributions and no sales charge. Had certain expenses not been reduced during the periods shown, total returns would have been lower. Total returns for periods less than one year are not annualized.
3 Annualized.
See Accompanying Notes to Financial Statements.
58
Credit Suisse Small Cap Core Fund
Financial Highlights
(For a Common Class Share of the Fund Outstanding Throughout Each Period)
| For the Six Months Ended April 30, 2009 | For the Year Ended October 31, | ||||||||||||||||||||||||||
| (unaudited) | 2008 | 2007 | 2006 | 2005 | 2004 | ||||||||||||||||||||||
| Per share data | |||||||||||||||||||||||||||
| Net asset value, beginning of period | $ | 9.21 | $ | 22.41 | $ | 24.33 | $ | 23.84 | $ | 22.66 | $ | 20.02 | |||||||||||||||
| INVESTMENT OPERATIONS | |||||||||||||||||||||||||||
| Net investment income (loss)1 | 0.01 | 0.01 | (0.08 | ) | 0.11 | (0.03 | ) | (0.05 | ) | ||||||||||||||||||
| Net gain (loss) on investments and futures contracts (both realized and unrealized) | (1.03 | ) | (5.55 | ) | 2.16 | 2.85 | 3.39 | 3.75 | |||||||||||||||||||
| Total from investment operations | (1.02 | ) | (5.54 | ) | 2.08 | 2.96 | 3.36 | 3.70 | |||||||||||||||||||
| REDEMPTION FEES | 0.002 | 0.002 | — | — | — | — | |||||||||||||||||||||
| LESS DIVIDENDS AND DISTRIBUTIONS | |||||||||||||||||||||||||||
| Dividends from net investment income | (0.01 | ) | — | (0.14 | ) | — | — | — | |||||||||||||||||||
| Distributions from net realized gains | — | (7.66 | ) | (3.86 | ) | (2.47 | ) | (2.18 | ) | (1.06 | ) | ||||||||||||||||
| Total dividends and distributions | (0.01 | ) | (7.66 | ) | (4.00 | ) | (2.47 | ) | (2.18 | ) | (1.06 | ) | |||||||||||||||
| Net asset value, end of period | $ | 8.18 | $ | 9.21 | $ | 22.41 | $ | 24.33 | $ | 23.84 | $ | 22.66 | |||||||||||||||
| Total return3 | (11.12 | )% | (34.47 | )% | 9.58 | % | 13.23 | % | 15.56 | % | 19.14 | % | |||||||||||||||
| RATIOS AND SUPPLEMENTAL DATA | |||||||||||||||||||||||||||
| Net assets, end of period (000s omitted) | $ | 13,803 | $ | 16,565 | $ | 57,452 | $ | 70,525 | $ | 74,013 | $ | 50,068 | |||||||||||||||
| Ratio of expenses to average net assets | 1.55 | %4 | 1.47 | % | 1.34 | % | 1.37 | % | 1.38 | % | 1.42 | % | |||||||||||||||
| Ratio of net investment income (loss) to average net assets | 0.19 | %4 | 0.09 | % | (0.39 | )% | 0.47 | % | (0.16 | )% | (0.22 | )% | |||||||||||||||
| Decrease reflected in above operating expense ratios due to waivers/reimbursements | 0.43 | %4 | — | — | — | — | — | ||||||||||||||||||||
| Portfolio turnover rate | 196 | % | 195 | % | 262 | % | 67 | % | 43 | % | 41 | % | |||||||||||||||
1 Per share information is calculated using the average shares outstanding method.
2 This amount represents less than $0.01 per share.
3 Total returns are historical and assume changes in share price and reinvestment of all dividends and distributions. Had certain expenses not been reduced during the periods shown, total returns would have been lower. Total returns for periods less than one year are not annualized.
4 Annualized.
See Accompanying Notes to Financial Statements.
59
Credit Suisse Small Cap Core Fund
Financial Highlights
(For a Class A Share of the Fund Outstanding Throughout Each Period)
| For the Six Months Ended April 30, 2009 | For the Year Ended October 31, | ||||||||||||||||||||||||||
| (unaudited) | 2008 | 2007 | 2006 | 2005 | 2004 | ||||||||||||||||||||||
| Per share data | |||||||||||||||||||||||||||
| Net asset value, beginning of period | $ | 9.32 | $ | 22.57 | $ | 24.44 | $ | 23.94 | $ | 22.75 | $ | 20.10 | |||||||||||||||
| INVESTMENT OPERATIONS | |||||||||||||||||||||||||||
| Net investment income (loss)1 | 0.01 | 0.01 | (0.08 | ) | 0.12 | (0.04 | ) | (0.05 | ) | ||||||||||||||||||
| Net gain (loss) on investments and futures contracts (both realized and unrealized) | (1.04 | ) | (5.60 | ) | 2.18 | 2.85 | 3.42 | 3.76 | |||||||||||||||||||
| Total from investment operations | (1.03 | ) | (5.59 | ) | 2.10 | 2.97 | 3.38 | 3.71 | |||||||||||||||||||
| REDEMPTION FEES | 0.002 | 0.002 | — | — | — | — | |||||||||||||||||||||
| LESS DIVIDENDS AND DISTRIBUTIONS | |||||||||||||||||||||||||||
| Dividends from net investment income | (0.01 | ) | — | (0.11 | ) | — | — | — | |||||||||||||||||||
| Distributions from net realized gains | — | (7.66 | ) | (3.86 | ) | (2.47 | ) | (2.19 | ) | (1.06 | ) | ||||||||||||||||
| Total dividends and distributions | (0.01 | ) | (7.66 | ) | (3.97 | ) | (2.47 | ) | (2.19 | ) | (1.06 | ) | |||||||||||||||
| Net asset value, end of period | $ | 8.28 | $ | 9.32 | $ | 22.57 | $ | 24.44 | $ | 23.94 | $ | 22.75 | |||||||||||||||
| Total return3 | (11.10 | )% | (34.44 | )% | 9.61 | % | 13.22 | % | 15.54 | % | 19.11 | % | |||||||||||||||
| RATIOS AND SUPPLEMENTAL DATA | |||||||||||||||||||||||||||
| Net assets, end of period (000s omitted) | $ | 58,611 | $ | 79,414 | $ | 169,076 | $ | 263,006 | $ | 227,166 | $ | 198,773 | |||||||||||||||
| Ratio of expenses to average net assets | 1.55 | %4 | 1.47 | % | 1.35 | % | 1.37 | % | 1.38 | % | 1.42 | % | |||||||||||||||
| Ratio of net investment income (loss) to average net assets | 0.19 | %4 | 0.10 | % | (0.38 | )% | 0.47 | % | (0.16 | )% | (0.22 | )% | |||||||||||||||
| Decrease reflected in above operating expense ratios due to waivers/reimbursements | 0.42 | %4 | — | — | — | — | — | ||||||||||||||||||||
| Portfolio turnover rate | 196 | % | 195 | % | 262 | % | 67 | % | 43 | % | 41 | % | |||||||||||||||
1 Per share information is calculated using the average shares outstanding method.
2 This amount represents less than $0.01 per share.
3 Total returns are historical and assume changes in share price, reinvestment of all dividends and distributions and no sales charge. Had certain expenses not been reduced during the periods shown, total returns would have been lower. Total returns for periods less than one year are not annualized.
4 Annualized.
See Accompanying Notes to Financial Statements.
60
Credit Suisse Small Cap Core Fund
Financial Highlights
(For a Class B Share of the Fund Outstanding Throughout Each Period)
| For the Six Months Ended April 30, 2009 | For the Year Ended October 31, | ||||||||||||||||||||||||||
| (unaudited) | 2008 | 2007 | 2006 | 2005 | 2004 | ||||||||||||||||||||||
| Per share data | |||||||||||||||||||||||||||
| Net asset value, beginning of period | $ | 7.51 | $ | 19.91 | $ | 22.07 | $ | 21.99 | $ | 21.20 | $ | 18.93 | |||||||||||||||
| INVESTMENT OPERATIONS | |||||||||||||||||||||||||||
| Net investment loss1 | (0.02 | ) | (0.07 | ) | (0.22 | ) | (0.06 | ) | (0.20 | ) | (0.20 | ) | |||||||||||||||
| Net gain (loss) on investments and futures contracts (both realized and unrealized) | (0.84 | ) | (4.67 | ) | 1.93 | 2.61 | 3.17 | 3.53 | |||||||||||||||||||
| Total from investment operations | (0.86 | ) | (4.74 | ) | 1.71 | 2.55 | 2.97 | 3.33 | |||||||||||||||||||
| LESS DIVIDENDS AND DISTRIBUTIONS | |||||||||||||||||||||||||||
| Dividends from net investment income | (0.00 | )2 | — | (0.01 | ) | — | — | — | |||||||||||||||||||
| Distributions from net realized gains | — | (7.66 | ) | (3.86 | ) | (2.47 | ) | (2.18 | ) | (1.06 | ) | ||||||||||||||||
| Total dividends and distributions | (0.00 | )2 | (7.66 | ) | (3.87 | ) | (2.47 | ) | (2.18 | ) | (1.06 | ) | |||||||||||||||
| Net asset value, end of period | $ | 6.65 | $ | 7.51 | $ | 19.91 | $ | 22.07 | $ | 21.99 | $ | 21.20 | |||||||||||||||
| Total return3 | (11.44 | )% | (34.96 | )% | 8.74 | % | 12.41 | % | 14.72 | % | 18.25 | % | |||||||||||||||
| RATIOS AND SUPPLEMENTAL DATA | |||||||||||||||||||||||||||
| Net assets, end of period (000s omitted) | $ | 3,054 | $ | 3,981 | $ | 9,122 | $ | 12,465 | $ | 18,133 | $ | 20,425 | |||||||||||||||
| Ratio of expenses to average net assets | 2.30 | %4 | 2.23 | % | 2.10 | % | 2.12 | % | 2.13 | % | 2.17 | % | |||||||||||||||
| Ratio of net investment loss to average net assets | (0.56 | )%4 | (0.65 | )% | (1.13 | )% | (0.28 | )% | (0.91 | )% | (0.97 | )% | |||||||||||||||
| Decrease reflected in above operating expense ratios due to waivers/reimbursements | 0.43 | %4 | — | — | — | — | — | ||||||||||||||||||||
| Portfolio turnover rate | 196 | % | 195 | % | 262 | % | 67 | % | 43 | % | 41 | % | |||||||||||||||
1 Per share information is calculated using the average shares outstanding method.
2 This amount represents less than $(0.01) per share.
3 Total returns are historical and assume changes in share price, reinvestment of all dividends and distributions and no sales charge. Had certain expenses not been reduced during the periods shown, total returns would have been lower. Total returns for periods less than one year are not annualized.
4 Annualized.
See Accompanying Notes to Financial Statements.
61
Credit Suisse Small Cap Core Fund
Financial Highlights
(For a Class C Share of the Fund Outstanding Throughout Each Period)
| For the Six Months Ended April 30, 2009 | For the Year Ended October 31, | ||||||||||||||||||||||||||
| (unaudited) | 2008 | 2007 | 2006 | 2005 | 2004 | ||||||||||||||||||||||
| Per share data | |||||||||||||||||||||||||||
| Net asset value, beginning of period | $ | 7.44 | $ | 19.80 | $ | 21.97 | $ | 21.91 | $ | 21.13 | $ | 18.87 | |||||||||||||||
| INVESTMENT OPERATIONS | |||||||||||||||||||||||||||
| Net investment loss1 | (0.02 | ) | (0.07 | ) | (0.22 | ) | (0.06 | ) | (0.20 | ) | (0.19 | ) | |||||||||||||||
| Net gain (loss) on investments and futures contracts (both realized and unrealized) | (0.83 | ) | (4.63 | ) | 1.92 | 2.59 | 3.16 | 3.51 | |||||||||||||||||||
| Total from investment operations | (0.85 | ) | (4.70 | ) | 1.70 | 2.53 | 2.96 | 3.32 | |||||||||||||||||||
| REDEMPTION FEES | 0.002 | 0.002 | — | — | — | — | |||||||||||||||||||||
| LESS DIVIDENDS AND DISTRIBUTIONS | |||||||||||||||||||||||||||
| Dividends from net investment income | (0.00 | )3 | — | (0.01 | ) | — | — | — | |||||||||||||||||||
| Distributions from net realized gains | — | (7.66 | ) | (3.86 | ) | (2.47 | ) | (2.18 | ) | (1.06 | ) | ||||||||||||||||
| Total dividends and distributions | (0.00 | )3 | (7.66 | ) | (3.87 | ) | (2.47 | ) | (2.18 | ) | (1.06 | ) | |||||||||||||||
| Net asset value, end of period | $ | 6.59 | $ | 7.44 | $ | 19.80 | $ | 21.97 | $ | 21.91 | $ | 21.13 | |||||||||||||||
| Total return4 | (11.41 | )% | (34.95 | )% | 8.74 | % | 12.36 | % | 14.72 | % | 18.25 | % | |||||||||||||||
| RATIOS AND SUPPLEMENTAL DATA | |||||||||||||||||||||||||||
| Net assets, end of period (000s omitted) | $ | 5,441 | $ | 6,318 | $ | 15,305 | $ | 16,028 | $ | 16,079 | $ | 11,613 | |||||||||||||||
| Ratio of expenses to average net assets | 2.30 | %5 | 2.23 | % | 2.10 | % | 2.12 | % | 2.13 | % | 2.17 | % | |||||||||||||||
| Ratio of net investment loss to average net assets | (0.55 | )%5 | (0.66 | )% | (1.14 | )% | (0.28 | )% | (0.91 | )% | (0.97 | )% | |||||||||||||||
| Decrease reflected in above operating expense ratios due to waivers/reimbursements | 0.43 | %5 | — | — | — | — | — | ||||||||||||||||||||
| Portfolio turnover rate | 196 | % | 195 | % | 262 | % | 67 | % | 43 | % | 41 | % | |||||||||||||||
1 Per share information is calculated using the average shares outstanding method.
2 This amount represents less than $0.01 per share.
3 This amount represents less than $(0.01) per share.
4 Total returns are historical and assume changes in share price, reinvestment of all dividends and distributions and no sales charge. Had certain expenses not been reduced during the periods shown, total returns would have been lower. Total returns for periods less than one year are not annualized.
5 Annualized.
See Accompanying Notes to Financial Statements.
62
Credit Suisse Funds
Notes to Financial Statements
April 30, 2009 (unaudited)
Note 1. Organization
Credit Suisse Capital Funds (the "Trust") is registered under the Investment Company Act of 1940, as amended (the "1940 Act") as an open-end management investment company and currently offers two managed investment funds, the Credit Suisse Large Cap Value Fund ("Large Cap Value") and Credit Suisse Small Cap Core Fund ("Small Cap Core"), (each a "Fund" and collectively, the "Funds") which are contained in this report. The Trust was organized under the laws of the Commonwealth of Massachusetts as a business trust on November 26, 1985. Each Fund is classified as diversified. Investment objectives for each Fund are as follows: Large Cap Value seeks long-term capital appreciation and continuity of income and Small Cap Core seeks a high level of growth of capital.
Large Cap Value offers five classes of shares: Common Class shares, Advisor Class shares, Class A shares, Class B shares and Class C shares. Small Cap Core offers four classes of shares: Common Class shares, Class A shares, Class B shares and Class C shares. Effective December 12, 2001, Large Cap Value closed the Common Class to new investments, except for reinvestment of dividends. Large Cap Value's Common Class shareholders as of the close of business on December 12, 2001 may continue to hold Common Class shares but may not add to their accounts. Although no further shares can be purchased, Large Cap Value's shareholders can redeem their Common Class shares through any available method. The Small Cap Core's Common Class shares are closed to new investors, with certain exceptions as set forth in the prospectus. Each class of shares in each Fund represents an equal pro rata interest in each Fund, except that they bear different expenses, whi ch reflect the differences in the range of services provided to them. Class A shares of each Fund are sold subject to a front-end sales charge of 5.75%. Class B shares of each Fund are sold subject to a contingent deferred sales charge which declines from 4.00% to zero depending on the period of time the shares are held. Class C shares of each Fund are sold subject to a contingent deferred sales charge of 1.00% if the shares are redeemed within the first year of purchase.
Note 2. Significant Accounting Policies
A) SECURITY VALUATION — The net asset value of each Fund is determined daily as of the close of regular trading on the New York Stock Exchange, Inc. (the "Exchange") on each day the Exchange is open for business. Equity investments are valued at market value, which is generally determined using the closing price on the exchange or market on which the security is primarily traded at the time of valuation (the "Valuation Time"). If no sales are reported, equity investments are generally valued at the most recent bid
63
Credit Suisse Funds
Notes to Financial Statements (continued)
April 30, 2009 (unaudited)
Note 2. Significant Accounting Policies
quotation as of the Valuation Time or at the lowest asked quotation in the case of a short sale of securities. Debt securities with a remaining maturity greater than 60 days are valued in accordance with the price supplied by a pricing service, which may use a matrix, formula or other objective method that takes into consideration market indices, yield curves and other specific adjustments. Debt obligations that will mature in 60 days or less are valued on the basis of amortized cost, which approximates market value, unless it is determined that using this method would not represent fair value. Investments in mutual funds are valued at the mutual fund's closing net asset value per share on the day of valuation. Securities and other assets for which market quotations are not readily available, or whose values have been materially affected by events occurring before the Funds' Valuation Time but after the close of the securities' primary marke ts, are valued at fair value as determined in good faith by, or under the direction of, the Board of Trustees under procedures established by the Board of Trustees. The Funds may utilize a service provided by an independent third party which has been approved by the Board of Trustees to fair value certain securities. When fair-value pricing is employed, the prices of securities used by a fund to calculate its net asset value may differ from quoted or published prices for the same securities.
Each Fund adopted Financial Accounting Standards Board Statement of Financial Accounting Standards No. 157, Fair Value Measurements ("FAS 157"), effective November 1, 2008. In accordance with FAS 157, fair value is defined as the price that a Fund would receive upon selling an investment in a timely transaction to an independent buyer in the principal or most advantageous market of the investment. FAS 157 established a three-tier hierarchy to maximize the use of observable market data and minimize the use of unobservable inputs and to establish classification of fair value measurements for disclosure purposes. Inputs refer broadly to the assumptions that market participants would use in pricing the asset or liability, including assumptions about risk, for example, the risk inherent in a particular valuation technique used to measure fair value including such a pricing model and/or the risk inherent in the inputs to the valuation technique. I nputs may be observable or unobservable. Observable inputs are inputs that reflect the assumptions market participants would use in pricing the asset or liability developed based on market data obtained from sources independent of the reporting entity. Unobservable inputs are inputs that reflect the reporting entity's own assumptions about the assumptions market participants would use in pricing the asset or liability developed based on the best information available in the
64
Credit Suisse Funds
Notes to Financial Statements (continued)
April 30, 2009 (unaudited)
Note 2. Significant Accounting Policies
circumstances. The three-tier hierarchy of inputs is summarized in the three broad Levels listed below.
• Level 1 – quoted prices in active markets for identical investments
• Level 2 – other significant observable inputs (including quoted prices for similar investments, interest rates, prepayment speeds, credit risk, etc.)
• Level 3 – significant unobservable inputs (including a Fund's own assumptions in determining the fair value of investments)
The inputs or methodology used for valuing securities are not necessarily an indication of the risk associated with investing in those securities.
The following is a summary of the inputs used as of April 30, 2009 in valuing each Fund's investments carried at value:
| Large Cap Value | |||||||||||
| Valuation Inputs | Investments in Securities | Other Financial Instruments* | |||||||||
| Level 1 – Quoted Prices | $ | 134,003,827 | $ | — | |||||||
| Level 2 – Other Significant Observable Inputs | 122,000 | — | |||||||||
| Level 3 – Significant Unobservable Inputs | — | — | |||||||||
| Total | $ | 134,125,827 | $ | — | |||||||
| Small Cap Core | |||||||||||
| Valuation Inputs | Investments in Securities | Other Financial Instruments* | |||||||||
| Level 1 – Quoted Prices | $ | 80,809,164 | $ | — | |||||||
| Level 2 – Other Significant Observable Inputs | 259,000 | — | |||||||||
| Level 3 – Significant Unobservable Inputs | — | — | |||||||||
| Total | $ | 81,068,164 | $ | — | |||||||
*Other financial instruments include futures, forwards and swap contracts.
B) FOREIGN CURRENCY TRANSACTIONS — The books and records of the Funds are maintained in U.S. dollars. Transactions denominated in foreign currencies are recorded at the current prevailing exchange rates. All assets and liabilities denominated in foreign currencies are translated into U.S. dollar amounts at the current exchange rate at the end of the period. Translation gains or losses resulting from changes in the exchange rate during the reporting period and realized gains and losses on the settlement of foreign currency transactions are reported in the results of operations for the current period. The Funds do not isolate that portion of realized gains and losses on investments in equity securities which is due to changes in the foreign exchange rate from that which is due to changes in market prices of equity securities. The Funds isolate that portion of realized gains and losses on investments in debt
65
Credit Suisse Funds
Notes to Financial Statements (continued)
April 30, 2009 (unaudited)
Note 2. Significant Accounting Policies
securities which is due to changes in the foreign exchange rate from that which is due to changes in market prices of debt securities.
C) SECURITY TRANSACTIONS AND INVESTMENT INCOME — Security transactions are accounted for on a trade date basis. Interest income is recorded on the accrual basis. Dividends are recorded on the ex-dividend date. Certain expenses are class-specific expenses and vary by class. Income, expenses (excluding class-specific expenses) and realized/unrealized gains/losses are allocated proportionately to each class of shares based upon the relative net asset value of the outstanding shares of that class. The cost of investments sold is determined by use of the specific identification method for both financial reporting and income tax purposes.
D) DIVIDENDS AND DISTRIBUTIONS TO SHAREHOLDERS — Dividends from net investment income, if any, are declared and paid quarterly by Large Cap Value and at least annually by Small Cap Core. Distributions of net realized capital gains, if any, are declared and paid at least annually by the Funds. However, to the extent that a net realized capital gain can be reduced by a capital loss carryforward, such gain will not be distributed. Income and capital gain distributions are determined in accordance with federal income tax regulations, which may differ from accounting principles generally accepted in the United States of America ("GAAP").
E) FEDERAL INCOME TAXES — No provision is made for federal taxes as it is each Fund's intention to continue to qualify for and elect the tax treatment applicable to regulated investment companies under the Internal Revenue Code of 1986, as amended, and to make the requisite distributions to its shareholders, which will be sufficient to relieve it from federal income and excise taxes.
During June 2006, the Financial Accounting Standards Board ("FASB") issued FASB Interpretation 48 ("FIN 48" or the "Interpretation"), Accounting for Uncertainty in Income Taxes — an interpretation of FASB statement 109. The Funds have reviewed their current tax positions and have determined that no provision for income tax is required in the Funds' financial statements. The Funds' federal tax returns for the prior three fiscal years remain subject to examination by the Internal Revenue Service.
F) USE OF ESTIMATES — The preparation of financial statements in conformity with GAAP requires management to make estimates and assumptions that affect the reported amounts of assets and liabilities and disclosure of contingent assets and liabilities at the date of the financial
66
Credit Suisse Funds
Notes to Financial Statements (continued)
April 30, 2009 (unaudited)
Note 2. Significant Accounting Policies
statements and the reported amounts of income and expenses during the reporting period. Actual results could differ from these estimates.
G) SHORT-TERM INVESTMENTS — The Funds, together with other funds/portfolios advised by Credit Suisse Asset Management, LLC ("Credit Suisse"), an indirect, wholly-owned subsidiary of Credit Suisse Group AG, pool available cash into either a short-term variable rate time deposit issued by State Street Bank and Trust Company ("SSB"), the Funds' custodian, or a money market fund advised by Credit Suisse. The short-term time deposit issued by SSB is a variable rate account classified as a short-term investment.
H) SECURITIES LENDING — Loans of securities are required at all times to be secured by collateral at least equal to 102% of the market value of domestic securities on loan (including any accrued interest thereon) and 105% of the market value of foreign securities on loan (including any accrued interest thereon). Cash collateral received by the Funds in connection with securities lending activity may be pooled together with cash collateral for other funds/portfolios advised by Credit Suisse and may be invested in a variety of investments, including certain Credit Suisse-advised funds, funds advised by SSB, the Funds' securities lending agent, or money market instruments. However, in the event of default or bankruptcy by the other party to the agreement, realization and/or retention of the collateral may be subject to legal proceedings.
SSB has been engaged by the Funds to act as the Funds' securities lending agent. The Funds' securities lending arrangement provides that the Funds and SSB will share the net income earned from securities lending activities. During the six months ended April 30, 2009, total earnings from the Funds' investment in cash collateral received in connection with Large Cap Value and Small Cap Core's securities lending arrangements were $527 and $644, respectively, of which $27 and $13, respectively, were rebated to borrowers (brokers). The Funds retained $400 and $505 in income, respectively, from the cash collateral investment, and SSB, as lending agent, was paid $100 and $126, respectively. The Funds may also be entitled to certain minimum amounts of income from its securities lending activities. Securities lending income is accrued as earned.
Note 3. Transactions with Affiliates and Related Parties
Credit Suisse serves as investment adviser for each Fund. For its investment advisory services, Credit Suisse is entitled to receive a fee from Large Cap
67
Credit Suisse Funds
Notes to Financial Statements (continued)
April 30, 2009 (unaudited)
Note 3. Transactions with Affiliates and Related Parties
Value at an annual rate of 0.50% and for Small Cap Core, the lower of 0.70% or the following tiered fee:
| Fund | Annual Rate | ||||||
| Small Cap Core | 0.875% of first $100 million of average daily net assets | ||||||
| 0.75% of next $100 million of average daily net assets | |||||||
| 0.625% of average daily net assets over $200 million | |||||||
For the six months ended April 30, 2009, investment advisory fees earned and voluntarily waived were as follows:
| Fund | Gross Advisory Fee | Waiver | Net Advisory Fee | ||||||||||||
| Large Cap Value | $ | 323,867 | $ | (140,110 | ) | $ | 183,757 | ||||||||
| Small Cap Core | 279,198 | (168,949 | ) | 110,249 | |||||||||||
Fee waivers and reimbursements are voluntary and may be discontinued by Credit Suisse at any time.
Credit Suisse Asset Management Securities, Inc. ("CSAMSI"), an affiliate of Credit Suisse, and SSB serve as co-administrators to the Funds. For its co-administrative services, CSAMSI currently receives a fee calculated at an annual rate of 0.09% of each Fund's average daily net assets. For the six months ended April 30, 2009, co-administrative services fees earned by CSAMSI were as follows:
| Fund | Co-Administration Fee | ||||||
| Large Cap Value | $ | 58,296 | |||||
| Small Cap Core | 35,897 | ||||||
For its co-administrative services, SSB receives a fee, exclusive of out-of-pocket expenses, calculated in total for all the Credit Suisse funds/portfolios co-administered by SSB and allocated based upon the relative average net assets of each fund/portfolio, subject to an annual minimum fee. For the six months ended April 30, 2009, co-administrative services fees earned by SSB (including out-of-pocket expenses) were as follows:
| Fund | Administrative Services Fee | ||||||
| Large Cap Value | $ | 53,542 | |||||
| Small Cap Core | 47,782 | ||||||
In addition to serving as each Fund's co-administrator, CSAMSI currently serves as distributor of each Fund's shares. Pursuant to distribution plans adopted by each Fund pursuant to Rule 12b-1 under the 1940 Act, CSAMSI receives fees for its distribution services. This fee is calculated at an annual rate
68
Credit Suisse Funds
Notes to Financial Statements (continued)
April 30, 2009 (unaudited)
Note 3. Transactions with Affiliates and Related Parties
of 0.25% of the average daily net assets of the Common Class of Small Cap Core and Class A shares of each Fund. Advisor Class shares of Large Cap Value may pay this fee at an annual rate not to exceed 0.75% of such class' average daily net assets; such fee is currently calculated at the annual rate of 0.50% of the average daily net assets of such class. For the Class B and Class C shares, the fee is calculated at an annual rate of 1.00% of average daily net assets of such classes.
Certain brokers, dealers and financial representatives provide transfer agent related services to the Funds and receive compensation from Credit Suisse. Credit Suisse is then reimbursed by the Funds. For the six months ended April 30, 2009, Small Cap Core reimbursed Credit Suisse $12,665, which is included in the Fund's transfer agent expense.
For the six months ended April 30, 2009, CSAMSI and its affiliates advised the Funds that they retained the following amounts from commissions earned on the sale of the Funds' Class A shares:
| Fund | Amount | ||||||
| Large Cap Value | $ | 14,711 | |||||
| Small Cap Core | 261 | ||||||
Merrill Corporation ("Merrill"), an affiliate of Credit Suisse, has been engaged by each Fund to provide certain financial printing and fulfillment services. For the six months ended April 30, 2009, Merrill was paid for its services by the Funds as follows:
| Fund | Amount | ||||||
| Large Cap Value | $ | 15,532 | |||||
| Small Cap Core | 15,199 | ||||||
Note 4. Line of Credit
The Fund, together with other funds/portfolios advised by Credit Suisse (collectively, the "Participating Funds"), participates in a $50 million committed, unsecured line of credit facility ("Credit Facility") for temporary or emergency purposes with SSB. Under the terms of the Credit Facility, the Participating Funds pay an aggregate commitment fee on the average unused amount of the Credit Facility, which is allocated among the Participating Funds in such manner as is determined by the governing Boards of the Participating Funds. In addition, the Participating Funds pay interest on borrowings at either the Overnight Federal Funds rate or the Overnight LIBOR rate plus a spread. At April 30, 2009, the Funds had no loans outstanding under the Credit Facility.
69
Credit Suisse Funds
Notes to Financial Statements (continued)
April 30, 2009 (unaudited)
Note 4. Line of Credit
During the six months ended April 30, 2009, Small Cap Core had borrowings under the Credit Facility as follows:
| Average Daily Loan Balance | Weighted Average Interest Rate % | Maximum Daily Loan Outstanding | |||||||||
| 3,630,800 | 0.767 | % | 4,974,000 | ||||||||
Note 5. Purchases and Sales of Securities
For the six months ended April 30, 2009, purchases and sales of investment securities (excluding short-term investments) were as follows:
| Fund | Purchases | Sales | |||||||||
| Large Cap Value | $ | 321,015,698 | $ | 329,772,987 | |||||||
| Small Cap Core | 164,519,413 | 175,972,226 | |||||||||
At April 30, 2009, the identified cost for federal income tax purposes, as well as the gross unrealized appreciation from investments for those securities having an excess of value over cost, gross unrealized depreciation from investments for those securities having an excess of cost over value and the net unrealized depreciation from investments were as follows:
| Fund | Identified Cost | Gross Unrealized Appreciation | Gross Unrealized Depreciation | Net Unrealized Depreciation | |||||||||||||||
| Large Cap Value | $ | 134,525,055 | $ | 4,403,793 | $ | (4,803,021 | ) | $ | (399,228 | ) | |||||||||
| Small Cap Core | 81,684,212 | 8,073,436 | (8,689,484 | ) | (616,048 | ) | |||||||||||||
Note 6. Capital Share Transactions
Large Cap Value is authorized to issue an unlimited number of full and fractional shares of beneficial interest, $.001 par value per share, of which an unlimited number of shares are classified as Common Class shares, Advisor Class shares, Class A shares, Class B shares and Class C shares. Small Cap Core is authorized to issue an unlimited number of full and fractional shares of beneficial interest, $.001 par value per share, of which an unlimited number of shares are classified as Common Class shares, Class A shares, Class B shares and Class C shares. Transactions in capital shares of the Funds were as follows:
| Large Cap Value | |||||||||||||||||||
| Common Class | |||||||||||||||||||
| For the Six Months Ended April 30, 2009 (unaudited) | For the Year Ended October 31, 2008 | ||||||||||||||||||
| Shares | Value | Shares | Value | ||||||||||||||||
| Shares issued in reinvestment of dividends and distributions | 309 | $ | 2,638 | 6,448 | $ | 96,151 | |||||||||||||
| Shares redeemed | (1 | ) | (13 | ) | (5,892 | ) | (82,348 | ) | |||||||||||
| Net increase | 308 | $ | 2,625 | 556 | $ | 13,803 | |||||||||||||
70
Credit Suisse Funds
Notes to Financial Statements (continued)
April 30, 2009 (unaudited)
Note 6. Capital Share Transactions
| Advisor Class | |||||||||||||||||||
| For the Six Months Ended April 30, 2009 (unaudited) | For the Year Ended October 31, 2008 | ||||||||||||||||||
| Shares | Value | Shares | Value | ||||||||||||||||
| Shares sold | 23,578 | $ | 204,478 | 26,713 | $ | 362,974 | |||||||||||||
| Shares issued in reinvestment of dividends and distributions | 1,789 | 15,571 | 56,720 | 857,931 | |||||||||||||||
| Shares redeemed | (26,249 | ) | (216,187 | ) | (144,547 | ) | (2,051,759 | ) | |||||||||||
| Net increase (decrease) | (882 | ) | $ | 3,862 | (61,114 | ) | $ | (830,854 | ) | ||||||||||
| Class A | |||||||||||||||||||
| For the Six Months Ended April 30, 2009 (unaudited) | For the Year Ended October 31, 2008 | ||||||||||||||||||
| Shares | Value | Shares | Value | ||||||||||||||||
| Shares sold | 302,876 | $ | 2,619,997 | 553,808 | $ | 7,721,476 | |||||||||||||
| Shares issued in reinvestment of dividends and distributions | 122,562 | 1,056,859 | 3,026,522 | 45,501,396 | |||||||||||||||
| Shares redeemed | (1,385,697 | ) | (11,883,864 | ) | (3,019,504 | ) | (42,030,850 | ) | |||||||||||
| Net increase (decrease) | (960,259 | ) | $ | (8,207,008 | ) | 560,826 | $ | 11,192,022 | |||||||||||
| Class B | |||||||||||||||||||
| For the Six Months Ended April 30, 2009 (unaudited) | For the Year Ended October 31, 2008 | ||||||||||||||||||
| Shares | Value | Shares | Value | ||||||||||||||||
| Shares sold | 8,201 | $ | 68,968 | 25,130 | $ | 363,183 | |||||||||||||
| Shares issued in reinvestment of dividends and distributions | 1,577 | 13,446 | 77,347 | 1,142,704 | |||||||||||||||
| Shares redeemed | (61,467 | ) | (522,685 | ) | (295,714 | ) | (4,099,155 | ) | |||||||||||
| Net decrease | (51,689 | ) | $ | (440,271 | ) | (193,237 | ) | $ | (2,593,268 | ) | |||||||||
| Class C | |||||||||||||||||||
| For the Six Months Ended April 30, 2009 (unaudited) | For the Year Ended October 31, 2008 | ||||||||||||||||||
| Shares | Value | Shares | Value | ||||||||||||||||
| Shares sold | 446 | $ | 3,665 | 5,010 | $ | 70,988 | |||||||||||||
| Shares issued in reinvestment of dividends and distributions | 552 | 4,669 | 19,369 | 283,340 | |||||||||||||||
| Shares redeemed | (13,549 | ) | (96,042 | ) | (37,555 | ) | (496,526 | ) | |||||||||||
| Net decrease | (12,551 | ) | $ | (87,708 | ) | (13,176 | ) | $ | (142,198 | ) | |||||||||
71
Credit Suisse Funds
Notes to Financial Statements (continued)
April 30, 2009 (unaudited)
Note 6. Capital Share Transactions
| Small Cap Core | |||||||||||||||||||
| Common Class | |||||||||||||||||||
| For the Six Months Ended April 30, 2009 (unaudited) | For the Year Ended October 31, 2008 | ||||||||||||||||||
| Shares | Value | Shares | Value | ||||||||||||||||
| Shares sold | 72,005 | $ | 557,710 | 186,693 | $ | 2,333,411 | |||||||||||||
| Shares issued in reinvestment of dividends and distributions | 1,193 | 9,282 | 1,445,424 | 18,631,515 | |||||||||||||||
| Shares redeemed | (184,352 | ) | (1,369,514 | ) | (2,397,574 | ) | (30,848,910 | ) | |||||||||||
| Net decrease | (111,154 | ) | $ | (802,522 | ) | (765,457 | ) | $ | (9,883,984 | ) | |||||||||
| Class A | |||||||||||||||||||
| For the Six Months Ended April 30, 2009 (unaudited) | For the Year Ended October 31, 2008 | ||||||||||||||||||
| Shares | Value | Shares | Value | ||||||||||||||||
| Shares sold | 311,641 | $ | 2,394,709 | 790,044 | $ | 9,992,664 | |||||||||||||
| Shares issued in reinvestment of dividends and distributions | 5,208 | 40,982 | 3,984,893 | 51,963,012 | |||||||||||||||
| Shares redeemed | (1,757,135 | ) | (13,320,993 | ) | (3,742,270 | ) | (47,602,280 | ) | |||||||||||
| Net increase (decrease) | (1,440,286 | ) | $ | (10,885,302 | ) | 1,032,667 | $ | 14,353,396 | |||||||||||
| Class B | |||||||||||||||||||
| For the Six Months Ended April 30, 2009 (unaudited) | For the Year Ended October 31, 2008 | ||||||||||||||||||
| Shares | Value | Shares | Value | ||||||||||||||||
| Shares sold | 17,096 | $ | 109,904 | 31,010 | $ | 326,117 | |||||||||||||
| Shares issued in reinvestment of dividends and distributions | 71 | 453 | 273,541 | 2,894,059 | |||||||||||||||
| Shares redeemed | (87,859 | ) | (527,538 | ) | (232,783 | ) | (2,491,904 | ) | |||||||||||
| Net increase (decrease) | (70,692 | ) | $ | (417,181 | ) | 71,768 | $ | 728,272 | |||||||||||
| Class C | |||||||||||||||||||
| For the Six Months Ended April 30, 2009 (unaudited) | For the Year Ended October 31, 2008 | ||||||||||||||||||
| Shares | Value | Shares | Value | ||||||||||||||||
| Shares sold | 53,122 | $ | 327,312 | 156,343 | $ | 1,619,943 | |||||||||||||
| Shares issued in reinvestment of dividends and distributions | 111 | 699 | 449,314 | 4,708,809 | |||||||||||||||
| Shares redeemed | (76,312 | ) | (448,984 | ) | (529,498 | ) | (5,207,344 | ) | |||||||||||
| Net increase (decrease) | (23,079 | ) | $ | (120,973 | ) | 76,159 | $ | 1,121,408 | |||||||||||
Small Cap Core imposes a 2% redemption fee on all classes of shares currently being offered that are purchased on or after March 1, 2007 and redeemed or exchanged within 30 days from the date of purchase. Reinvested dividends and
72
Credit Suisse Funds
Notes to Financial Statements (continued)
April 30, 2009 (unaudited)
Note 6. Capital Share Transactions
distributions are not subject to the fee. The fee is charged based on the value of shares at redemption, is paid directly to the Fund and becomes part of the Fund's daily net asset value calculation. When shares are redeemed that are subject to the fee, reinvested dividends are redeemed first, followed by the shares held longest.
On April 30, 2009, the number of shareholders that held 5% or more of the outstanding shares of each class of the Funds was as follows:
| Number of Shareholders | Approximate Percentage of Outstanding Shares | ||||||||||
| Large Cap Value | |||||||||||
| Common Class | 4 | 76 | % | ||||||||
| Advisor Class | 2 | 97 | % | ||||||||
| Class A | 2 | 19 | % | ||||||||
| Class B | 2 | 14 | % | ||||||||
| Class C | 3 | 45 | % | ||||||||
| Small Cap Core | |||||||||||
| Common Class | 4 | 58 | % | ||||||||
| Class A | 1 | 6 | % | ||||||||
| Class B | 1 | 5 | % | ||||||||
| Class C | 1 | 7 | % | ||||||||
Some of the shareholders are omnibus accounts, which hold shares on behalf of individual shareholders.
Note 7. Contingencies
In the normal course of business, the Funds may provide general indemnifications pursuant to certain contracts and organizational documents. The Funds' maximum exposure under these arrangements is dependent on future claims that may be made against the Funds and, therefore, cannot be estimated; however, based on experience, the risk of loss from such claims is considered remote.
Note 8. Recent Accounting Pronouncements
In March 2008, FASB issued Statement of Financial Accounting Standards No. 161, Disclosures about Derivative Instruments and Hedging Activities ("FAS 161"), an amendment of FASB Statement No. 133. FAS 161 requires enhanced disclosures about (a) how and why an entity uses derivative instruments, (b) how derivative instruments and hedging activities are accounted for, and (c) how derivative instruments and related hedging
73
Credit Suisse Funds
Notes to Financial Statements (continued)
April 30, 2009 (unaudited)
Note 8. Recent Accounting Pronouncements
activities affect a fund's financial position, financial performance, and cash flows. Management of the Fund does not believe the adoption of FAS 161 will materially impact the financial statement amounts, but will require additional disclosures. This will include qualitative and quantitative disclosures on derivative positions existing at period end and the effect of using derivatives during the reporting period. FAS 161 is effective for financial statements issued for fiscal years and interim periods beginning after November 15, 2008.
74
Credit Suisse Large Cap Value Fund
Board Approval of Advisory Agreement (unaudited)
In approving the renewal of the current Advisory Agreement, the Board of Trustees, including the Independent Trustees, at a meeting held on November 18 and 19, 2008, considered the following factors with respect to the Credit Suisse Large Cap Value Fund (the "Fund"):
Investment Advisory Fee Rates
The Board reviewed and considered the contractual advisory fee rate of 0.50% ("Contractual Advisory Fee") in light of the extent and quality of the advisory services provided by Credit Suisse Asset Management, LLC ("Credit Suisse").
Additionally, the Board received and considered information comparing the Fund's Contractual Advisory Fee and the Fund's overall expenses with those of funds in both the relevant expense group ("Expense Group") and universe of funds ("Expense Universe") provided by Lipper Inc., an independent provider of investment company data.
Nature, Extent and Quality of the Services under the Advisory Agreement
The Board received and considered information regarding the nature, extent and quality of services provided to the Fund by Credit Suisse under the Advisory Agreement. The Board also noted information received at regular meetings throughout the year related to the services rendered by Credit Suisse. The Board reviewed background information about Credit Suisse, including its Form ADV. The Board considered the background and experience of Credit Suisse's senior management and the expertise of, and the amount of attention given to the Fund by, senior personnel of Credit Suisse. In addition, the Board reviewed the qualifications, backgrounds and responsibilities of the portfolio management team primarily responsible for the day-to-day portfolio management of the Fund and the extent of the resources devoted to research and analysis of actual and potential investments. The Board also received and considered information about the nature, extent and quality of services and fee rates offered to other Credit Suisse clients for comparable services.
Fund Performance
The Board received and considered the performance results of the Fund over time, along with comparisons both to the relevant performance group ("Performance Group") and universe of funds ("Performance Universe") for the Fund. The Board was provided with a description of the methodology used
75
Credit Suisse Large Cap Value Fund
Board Approval of Advisory Agreement (unaudited) (continued)
to arrive at the funds included in the Performance Group and the Performance Universe.
Credit Suisse Profitability
The Board received and considered a profitability analysis of Credit Suisse based on the fees payable under the Advisory Agreement for the Fund, including other relationships between the Fund on the one hand and Credit Suisse affiliates on the other. The Board received profitability information for the other funds in the Credit Suisse family of funds.
Economies of Scale
The Board considered whether economies of scale in the provision of services to the Fund were being passed along to the shareholders. Accordingly, the Board considered whether alternative fee structures (such as breakpoint fee structures) would be more appropriate or reasonable taking into consideration economies of scale or other efficiencies that might accrue from increases in the Fund's asset levels.
Other Benefits to Credit Suisse
The Board considered other benefits received by Credit Suisse and its affiliates as a result of their relationship with the Fund. Such benefits include, among others, research arrangements with brokers who execute transactions on behalf of the Fund, administrative and brokerage relationships with affiliates of Credit Suisse and benefits potentially derived from an increase in Credit Suisse's businesses as a result of its relationship with the Fund (such as the ability to market to shareholders other financial products offered by Credit Suisse and its affiliates).
The Board considered the standards applied in seeking best execution, whether and to what extent soft dollar credits are sought and how any such credits are utilized, any benefits that may be achieved by using an affiliated broker and the existence of quality controls applicable to brokerage allocation procedures. The Board also reviewed Credit Suisse's method for allocating portfolio investment opportunities among its advisory clients.
76
Credit Suisse Large Cap Value Fund
Board Approval of Advisory Agreement (unaudited) (continued)
Conclusions
In selecting Credit Suisse, and approving the Advisory Agreement and the investment advisory fee under such agreement, the Board concluded that:
• The Contractual Advisory Fee was below the median of the Fund's Expense Group and was considered reasonable.
• The Fund's performance was below its peers in the Performance Group for all time periods except the ten year. The Fund's performance was above the median of its Performance Universe for the four, five and ten year periods, but was below the median of its Performance Universe for the one, two and three year periods. The Board noted that changes in the investment strategies and portfolio management had gone into effect on December 1, 2006 and that the Board would continue to monitor steps undertaken by Credit Suisse to improve performance.
• Aside from performance (as described above), the Board was satisfied with the nature and extent of the investment advisory services provided to the Fund by Credit Suisse and that, based on dialogue with management and counsel, the services provided by Credit Suisse under the Advisory Agreement are typical of, and consistent with, those provided to similar mutual funds by other investment advisers.
• In light of the costs of providing investment management and other services to the Fund and Credit Suisse's ongoing commitment to the Fund, the profits and other ancillary benefits that Credit Suisse and its affiliates received were considered reasonable.
• Credit Suisse's profitability based on fees payable under the Advisory Agreement was reasonable in light of the nature, extent and quality of the services provided to the Fund thereunder.
• In light of the relatively small size of the Fund and the amount of the Contractual Advisory Fee, the Fund's current fee structure (without breakpoints) was considered reasonable.
No single factor reviewed by the Board was identified by the Board as the principal factor in determining whether to approve the Advisory Agreement. The Independent Trustees were advised by separate independent legal counsel throughout the process.
77
Credit Suisse Small Cap Core Fund
Board Approval of Advisory Agreement (unaudited)
In approving the renewal of the current Advisory Agreement, the Board of Trustees, including the Independent Trustees, at a meeting held on November 18 and 19, 2008, considered the following factors with respect to the Credit Suisse Small Cap Core Fund (the "Fund"):
Investment Advisory Fee Rates
The Board reviewed and considered the contractual advisory fee that is assessed at the lower of (a) 0.70% of the Fund's average daily net assets or (b) 0.875% of its average daily net assets up to $100 million, 0.75% of its average daily net assets in excess of $100 million but less than $200 million and 0.625% of its average daily net assets over $200 million ("Contractual Advisory Fee") in light of the extent and quality of the advisory services provided by Credit Suisse Asset Management, LLC ("Credit Suisse").
Additionally, the Board received and considered information comparing the Fund's Contractual Advisory Fee and the Fund's overall expenses with those of funds in both the relevant expense group ("Expense Group") and universe of funds ("Expense Universe") provided by Lipper Inc., an independent provider of investment company data.
Nature, Extent and Quality of the Services under the Advisory Agreement
The Board received and considered information regarding the nature, extent and quality of services provided to the Fund by Credit Suisse under the Advisory Agreement. The Board also noted information received at regular meetings throughout the year related to the services rendered by Credit Suisse. The Board reviewed background information about Credit Suisse, including its Form ADV. The Board considered the background and experience of Credit Suisse's senior management and the expertise of, and the amount of attention given to the Fund by, senior personnel of Credit Suisse. In addition, the Board reviewed the qualifications, backgrounds and responsibilities of the portfolio management team primarily responsible for the day-to-day portfolio management of the Fund and the extent of the resources devoted to research and analysis of actual and potential investments. The Board also received and considered information about the nature, extent and quality of services and fee rates offered to other Credit Suisse clients for comparable services.
78
Credit Suisse Small Cap Core Fund
Board Approval of Advisory Agreement (unaudited) (continued)
Fund Performance
The Board received and considered the performance results of the Fund over time, along with comparisons both to the relevant performance group ("Performance Group") and universe of funds ("Performance Universe") for the Fund. The Board was provided with a description of the methodology used to arrive at the funds included in the Performance Group and the Performance Universe.
Credit Suisse Profitability
The Board received and considered a profitability analysis of Credit Suisse based on the fees payable under the Advisory Agreement for the Fund, including other relationships between the Fund on the one hand and Credit Suisse affiliates on the other. The Board received profitability information for the other funds in the Credit Suisse family of funds.
Economies of Scale
The Board considered whether economies of scale in the provision of services to the Fund were being passed along to the shareholders. Accordingly, the Board considered whether the breakpoints in the Fund's advisory fee structure were appropriate or reasonable taking into consideration economies of scale or other efficiencies that might accrue from increases in the Fund's asset levels.
Other Benefits to Credit Suisse
The Board considered other benefits received by Credit Suisse and its affiliates as a result of their relationship with the Fund. Such benefits include, among others, research arrangements with brokers who execute transactions on behalf of the Fund, administrative and brokerage relationships with affiliates of Credit Suisse and benefits potentially derived from an increase in Credit Suisse's businesses as a result of its relationship with the Fund (such as the ability to market to shareholders other financial products offered by Credit Suisse and its affiliates).
The Board considered the standards applied in seeking best execution, whether and to what extent soft dollar credits are sought and how any such credits are utilized, any benefits that may be achieved by using an affiliated broker and the existence of quality controls applicable to brokerage allocation procedures. The Board also reviewed Credit Suisse's method for allocating portfolio investment opportunities among its advisory clients.
79
Credit Suisse Small Cap Core Fund
Board Approval of Advisory Agreement (unaudited) (continued)
Conclusions
In selecting Credit Suisse, and approving the Advisory Agreement and the investment advisory fee under such agreement, the Board concluded that:
• Although the combined Contractual Advisory Fee and co-administration fees were slightly above the median fee of the Fund's Expense Group, the net advisory fee was slightly below the median and the Board considered the fee to be reasonable.
• The Fund's performance was at or above the median for all periods in the Performance Group except the two year period. The Fund was also above the median for the one and ten year periods in the Performance Universe but was below the median for the remaining periods reviewed. The Board noted the recent improvement in performance and the changes in the Fund's investment strategies and portfolio management that had gone into effect on December 1, 2006.
• The Board was satisfied with the nature and extent of the investment advisory services provided to the Fund by Credit Suisse and that, based on dialogue with management and counsel, the services provided by Credit Suisse under the Advisory Agreement are typical of, and consistent with, those provided to similar mutual funds by other investment advisers.
• In light of the costs of providing investment management and other services to the Fund and Credit Suisse's ongoing commitment to the Fund, the profits and other ancillary benefits that Credit Suisse and its affiliates received were considered reasonable.
• Credit Suisse's profitability based on fees payable under the Advisory Agreement was reasonable in light of the nature, extent and quality of the services provided to the Fund thereunder.
• The Fund's current fee structure was considered reasonable as the existence of breakpoints serves to enable shareholders to share in economies of scale as the Fund grows.
No single factor reviewed by the Board was identified by the Board as the principal factor in determining whether to approve the Advisory Agreement. The Independent Trustees were advised by separate independent legal counsel throughout the process.
80
Credit Suisse Funds
Notice of Privacy and Information Practices (unaudited)
At Credit Suisse, we know that you are concerned with how we protect and handle nonpublic personal information that identifies you. This notice is designed to help you understand what nonpublic personal information we collect from you and from other sources, and how we use that information in connection with your investments and investment choices that may be available to you. Except where otherwise noted, this notice is applicable only to consumers who are current or former investors, meaning individual persons whose investments are primarily for household, family or personal use ("individual investors"). Specified sections of this notice, however, also apply to other types of investors (called "institutional investors"). Where the notice applies to institutional investors, the notice expressly states so. This notice is being provided by Credit Suisse Funds, Credit Suisse Institutional Funds, and Credit Suisse Closed-End Funds. This notice applies solely to U.S. registered investment companies advised by Credit Suisse Asset Management, LLC.
Categories of information we may collect:
We may collect information about you, including nonpublic personal information, such as
• Information we receive from you on applications, forms, agreements, questionnaires, Credit Suisse websites and other websites that are part of our investment program, or in the course of establishing or maintaining a customer relationship, such as your name, address, e-mail address, Social Security number, assets, income, financial situation; and
• Information we obtain from your transactions and experiences with us, our affiliates, or others, such as your account balances or other investment information assets purchased and sold, and other parties to a transaction, where applicable.
Categories of information we disclose and parties to whom we disclose it:
• We do not disclose nonpublic personal information about our individual investors, except as permitted or required by law or regulation. Whether you are an individual investor or institutional investor, we may share the information described above with our affiliates that perform services on our behalf, and with our asset management and private banking affiliates; as well as with unaffiliated third parties that perform services on our behalf, such as our accountants, auditors, attorneys, broker-dealers, fund administrators, and other service providers.
81
Credit Suisse Funds
Notice of Privacy and Information Practices (unaudited) (continued)
• We want our investors to be informed about additional products or services. Whether you are an individual investor or an institutional investor, we may disclose information, including nonpublic personal information, regarding our transactions and experiences with you to our affiliates.
• In addition, whether you are an individual investor or an institutional investor, we reserve the right to disclose information, including nonpublic personal information, about you to any person or entity, including without limitation any governmental agency, regulatory authority or self-regulatory organization having jurisdiction over us or our affiliates, if (i) we determine in our discretion that such disclosure is necessary or advisable pursuant to or in connection with any United States federal, state or local, or non-U.S., court order (or other legal process), law, rule, regulation, or executive order or policy, including without limitation any anti-money laundering law or the USA PATRIOT Act of 2001; and (ii) such disclosure is not otherwise prohibited by law, rule, regulation, or executive order or policy.
Confidentiality and security
• To protect nonpublic personal information about individual investors, we restrict access to those employees and agents who need to know that information to provide products or services to us and to our investors. We maintain physical, electronic, and procedural safeguards to protect nonpublic personal information.
Other Disclosures
This notice is not intended to be incorporated in any offering materials, but is a statement of our current Notice of Privacy and Information Practices and may be amended from time to time. This notice is current as of May 12, 2009.
82
Credit Suisse Funds
Proxy Voting and Portfolio Holdings Information (unaudited)
Information regarding how each Fund voted proxies related to its portfolio securities during the 12 month period ended June 30 of each year, as well as the policies and procedures that each Fund uses to determine how to vote proxies relating to its portfolio securities are available:
• By calling 1-877-870-2874
• On the Funds' website, www.credit-suisse.com/us
• On the website of the Securities and Exchange Commission, www.sec.gov.
Each Fund files a complete schedule of its portfolio holdings for the first and third quarters of its fiscal year with the SEC on Form N-Q. The Funds' Forms N-Q are available on the SEC's website at www.sec.gov and may be reviewed and copied at the SEC's Public Reference Room in Washington, DC. Information on the operation of the SEC's Public Reference Room may be obtained by calling 1-202-551-8090.
83
This page intentionally left blank

P.O. BOX 55030, BOSTON, MA 02205-5030
877-870-2874 n www.credit-suisse.com/us
CREDIT SUISSE ASSET MANAGEMENT SECURITIES, INC., DISTRIBUTOR. USEQVAL-SAR-0409
Item 2. Code of Ethics.
This item is inapplicable to a semi-annual report on Form N-CSR.
Item 3. Audit Committee Financial Expert.
This item is inapplicable to a semi-annual report on Form N-CSR.
Item 4. Principal Accountant Fees and Services.
This item is inapplicable to a semi-annual report on Form N-CSR.
Item 5. Audit Committee of Listed Registrants.
This item is not applicable to the registrant.
Item 6. Schedule of Investments.
Included as part of the report to shareholders filed under Item 1 of this Form.
Item 7. Disclosure of Proxy Voting Policies and Procedures for Closed-End Management Investment Companies.
This item is not applicable to the registrant.
Item 8. Portfolio Managers of Closed-End Management Investment Companies.
This item is not applicable to the registrant.
Item 9. Purchases of Equity Securities by Closed-End Management Investment Company and Affiliated Purchasers.
This item is not applicable to the registrant.
Item 10. Submission of Matters to a Vote of Security Holders.
The Nominating Committee recommends Board member candidates. Shareholders of the registrant may also submit nominees that will be considered by the Committee. Recommendations should be mailed to the registrant’s Secretary, c/o Credit Suisse Asset Management, LLC, Eleven Madison Avenue, New York, NY 10010. Any submission should include at a minimum the following information: the name, age, business address, residence address and principal occupation or employment of such individual; the class, series and number of shares of the registrant that are beneficially owned by such individual; the date such shares were acquired and the investment intent of such acquisition; whether such shareholder believes such individual is, or is not, an “interested person” of the registrant (as defined in the Investment Company Act of 1940) and information regarding such individual that is sufficient, in the Committee’s discretion, to make such determination; and all other information relating to such individual that is required to be disclosed in solicitation of proxies for election of directors in an election contest (even if an election contest is not involved) or is otherwise required pursuant to the rules for proxy materials under the Securities Exchange Act of 1934.
Item 11. Controls and Procedures.
(a) As of a date within 90 days from the filing date of this report, the principal executive officer and principal financial officer concluded that the registrant’s disclosure controls and procedures (as defined in Rule 30a-3(c) under the Investment Company Act of 1940 (the “Act”)) were effective
based on their evaluation of the disclosure controls and procedures required by Rule 30a-3(b) under the Act and Rules 13a-15(b) or 15d-15(b) under the Securities Exchange Act of 1934.
(b) There were no changes in registrant’s internal control over financial reporting (as defined in Rule 30a-3(d) under the Act) that occurred during the registrant’s last fiscal half-year that have materially affected, or are reasonably likely to materially affect, the registrant’s internal control over financial reporting.
Item 12. Exhibits.
(a)(1) Not applicable.
(a)(2) The certifications of the registrant as required by Rule 30a-2(a) under the Act are exhibits to this report.
(a)(3) Not applicable.
(b) The certifications of the registrant as required by Rule 30a-2(b) under the Act are an exhibit to this report.
SIGNATURES
Pursuant to the requirements of the Securities Exchange Act of 1934 and the Investment Company Act of 1940, the registrant has duly caused this report to be signed on its behalf by the undersigned, thereunto duly authorized.
CREDIT SUISSE CAPITAL FUNDS | |
|
|
/s/ George R. Hornig |
|
Name: George R. Hornig |
|
Title: Chief Executive Officer |
|
Date: July 6, 2009 |
|
Pursuant to the requirements of the Securities Exchange Act of 1934 and the Investment Company Act of 1940, this report has been signed below by the following persons on behalf of the registrant and in the capacities and on the dates indicated.
/s/ George R. Hornig |
|
Name: George R. Hornig |
|
Title: Chief Executive Officer |
|
Date: July 6, 2009 |
|
|
|
|
|
/s/ Michael A. Pignataro |
|
Name: Michael A. Pignataro |
|
Title: Chief Financial Officer |
|
Date: July 6, 2009 |
|