UNITED STATES
SECURITIES AND EXCHANGE COMMISSION
Washington, D.C. 20549
FORM N-CSR
CERTIFIED SHAREHOLDER REPORT
OF
REGISTERED MANAGEMENT COMPANY
| Investment Company Act file number: | 811-21478 |
| Name of Registrant: | Vanguard Convertible Securities Fund |
| Address of Registrant: | P.O. Box 2600
Valley Forge, PA 19482 |
| Name and address of agent for service: | Heidi Stam, Esquire
P.O. Box 876
Valley Forge, PA 19482 |
Registrant’s telephone number, including area code: (610) 669-1000
| Date of fiscal year end: | November 30 |
| Date of reporting period: | December 1, 2005 - May 31, 2005 |
| Item 1: | Reports to Shareholders |
Vanguard® Convertible Securities Fund |
|
|
|
|
|
> Semiannual Report |
|
|
|
|
|
May 31, 2006 |

> | Vanguard Convertible Securities Fund logged an excellent half-year return of 8.4%, well ahead of its benchmark index and the average return among peer funds. |
> | The fund’s gains were shaped by the advisor’s successful selection among convertible securities in a range of industries. The fund also benefited from stock and bond markets that favored small companies with low credit ratings. |
> | The broad bond market was flat for the half-year; stock gains were greatest among small-capitalization and foreign stocks. |
Contents | |
| |
Your Fund’s Total Returns | 1 |
Chairman’s Letter | 2 |
Advisor’s Report | 6 |
Fund Profile | 9 |
Performance Summary | 10 |
Financial Statements | 11 |
About Your Fund’s Expenses | 20 |
Trustees Approve Advisory Agreement | 22 |
Glossary | 23 |
Please note: The opinions expressed in this report are just that—informed opinions. They should not be considered promises or advice. Also, please keep in mind that the information and opinions cover the period through the date on the cover of this report. Of course, the risks of investing in your fund are spelled out in the prospectus.
Your Fund’s Total Returns
Six Months Ended May 31, 2006 | |
| Total |
| Return |
Vanguard Convertible Securities Fund | 8.4% |
Merrill Lynch All US Convertibles Index | 5.4 |
Average Convertible Securities Fund1 | 4.5 |
Dow Jones Wilshire 5000 Index | 3.4 |
Your Fund’s Performance at a Glance | | |
November 30, 2005–May 31, 2006 | | |
| | | | |
| | | Distributions Per Share |
| Starting | Ending | Income | Capital |
| Share Price | Share Price | Dividends | Gains |
Vanguard Convertible Securities Fund | $13.57 | $14.08 | $0.18 | $0.43 |
1 Derived from data provided by Lipper Inc.
1

Chairman’s Letter
Dear Shareholder,
During the fiscal half-year ended May 31, 2006, an investment trend of embracing risk continued, with emerging-market stocks and economically sensitive smaller companies the chief beneficiaries. Vanguard Convertible Securities Fund flourished in this environment, returning 8.4%.
The fund focuses on convertible bonds issued by companies that have good growth prospects but weaker credit ratings than the market as a whole. During the recent period of strong economic growth, investors showed faith in the growth prospects of these lower-rated companies and favored their securities.
The fund’s convertible bonds were of a slightly lower credit quality than those of its index, giving it a relative performance advantage during the period. The fund also widely outdistanced the average return among peer funds, partly due to the advisor’s superior security selection and partly to a focus solely on convertible securities. Peer funds tend to include “straight” stocks and bonds that do not offer a conversion feature.
Bonds treaded water as rates continued to rise
Bond market returns were flat during the past six months, as rising interest rates put pressure on prices. The Federal Reserve Board raised its target for the federal funds rate from 4.00% to 5.00%
2
in four separate actions as part of its efforts to rein in inflationary pressures. Yields moved higher across the maturity spectrum, a change from the pattern in prior months when yields rose at the shorter end but fell at the longer end.
In general, short-term and municipal securities outperformed long-term taxable bonds. High-yield bonds, which are less sensitive to changes in interest rates, turned in impressive relative results.
Stocks gained ground, then stumbled late in the period
The U.S. stock market advanced through much of the fiscal half-year, with some indexes approaching a five-year high in early May. Despite ongoing concerns about high energy costs and the possibility of inflation, investors generally remained positive about the economy. In mid-May, however, worries over whether the Fed would continue to raise interest rates gave some investors pause, leading to a decline in the major indexes.
In the U.S. market, small-capitalization stocks once again outperformed their large-cap counterparts, a persistent trend over the past few years. Returns of international stocks, aided by a weak dollar, continued to surpass those of U.S. stocks. Although emerging markets experienced noteworthy losses in May, they were strong performers for the half-year.
Market Barometer | | | |
| Total Returns |
| Periods Ended May 31, 2006 |
| Six Months | One Year | Five Years1 |
Stocks | | | |
Russell 1000 Index (Large-caps) | 2.8% | 9.4% | 2.6% |
Russell 2000 Index (Small-caps) | 7.0 | 18.2 | 9.1 |
Dow Jones Wilshire 5000 Index (Entire market) | 3.4 | 10.8 | 3.7 |
MSCI All Country World Index ex USA (International) | 15.4 | 30.9 | 11.0 |
| | | |
| | | |
Bonds | | | |
Lehman Aggregate Bond Index (Broad taxable market) | 0.0% | –0.5% | 5.0% |
Lehman Municipal Bond Index | 1.5 | 1.9 | 5.3 |
Citigroup 3-Month Treasury Bill Index | 2.1 | 3.8 | 2.1 |
| | | |
| | | |
CPI | | | |
Consumer Price Index | 2.5% | 4.2% | 2.6% |
1 Annualized.
3
Advisor’s skill and market environment combined to boost fund’s return
Vanguard Convertible Securities Fund enjoyed a six-month return that significantly outdistanced broad stock and bond markets. The outsized result is attributable to several factors. The fund’s advisor, Oaktree Capital Management, did an excellent job of selecting convertible bonds and convertible preferred stocks that performed well during the period. Top performers represented a wide range of industries, including wireless telecommunications, airlines, casinos, and biotechnology. The fund’s low costs helped provide investors a leg up on funds that bear a heavier cost burden. For a more detailed discussion of the portfolio and the advisor’s strategy, please see the Advisor’s Report that begins on page 6.
The fund’s return also reflected the results of the fixed income markets, specifically the performance of lower-credit-quality bonds. During the half-year, the debt market embraced increased risk, resulting in higher prices (and lower yields) on lower-quality bonds. In a strong economic environment, investors believe lower-rated bonds are less likely to default; thus they bid up the prices of these potentially higher-returning securities. This trend boosted prices for the nearly 90% of the portfolio invested in convertible bonds. These bonds don’t pay as much interest as traditional bonds, but they offer the possibility of a higher total return if the company’s stock performs well.
Annualized Expense Ratios1 | | |
Your fund compared with its peer group | | |
| | Average |
| | Convertible |
| Fund | Securities Fund |
Convertible Securities Fund | 0.89% | 1.51% |
1 | Fund expense ratio reflects the six months ended May 31, 2006. Peer-group expense ratio is derived from data provided by Lipper Inc. and captures information through year-end 2005. |
4
Maintain realistic expectations as market cycles wane
Your fund has benefited from two extended rallies—the run-up in prices of lower-quality bonds and the outperformance of equities for small- and mid-sized companies, providing a boost to the potential payoff for investing in convertible bonds. Both trends won’t continue forever; markets cycle through preferences for one segment over another. The portfolio’s lower-quality bonds are very sensitive to the performance of the overall economy. If the economy softens and the threat of defaults increases, investors could lose their appetite for the portfolio’s lower-rated names, reversing the trend of the past six months.
It is important to remember the Convertible Securities Fund’s goal: to provide returns comparable to those of stocks over the long term, but with less risk. The fund’s fixed income component provides more protection than an all-equity portfolio, while the bonds’ link to stock performance provides the potential for higher returns than an all-bond portfolio—an unusual combination that can help diversify a portfolio made up of traditional stock or bond investments.
We hope you keep the fund’s long-term outlook in mind and that you use the fund in a portfolio that provides exposure to multiple asset classes and investment styles.
Thank you for entrusting your assets to Vanguard.
Sincerely,

John J. Brennan
Chairman and Chief Executive Officer
June 12, 2006
5
Advisor’s Report
The 2006 fiscal year for Vanguard Convertible Securities Fund started strongly as a combination of rising underlying equity prices and tighter credit spreads for non-investment-grade securities pushed convertible prices substantially higher.
Mid-cap stocks were particularly strong, with the Russell 2000 Index advancing to all-time highs and easily outpacing the larger-cap equity indexes. However, concerns about inflation and rising interest rates weighed on investors late in the period and curtailed the gains of both equities and convertibles.
In this generally positive environment, we are pleased to report that the fund far outperformed its primary benchmark, the Merrill Lynch All US Convertibles Index. Our outperformance was attributable to specific security selection, with a wide variety of names contributing to our advantage.
The investment environment
Although the convertible market achieved a reasonable return over the past several months, the period was basically uneventful in most respects. Redemptions from convertible hedge funds were not the negative factor they were in early 2005, and overall demand was quite strong most of the time.
The energy sector was by far the most volatile part of the convertible market. It began the period with stellar gains but then fell substantially early in calendar 2006 as oil and gas prices retreated from their elevated levels. However, toward the end of the fiscal half-year, energy prices climbed again and so did prices for most energy-related investments.
The metals and materials groups also were fertile areas for above-average gains and were among the top contributors to the index’s return. Airlines, certain health care names, and several telecommunications issues delivered above-average returns as well. Detracting from performance were convertibles from the media, utilities, and consumer staples sectors. Auto issues remained under particular pressure, reflecting the industry’s well-known challenges. The overall creditworthiness of the convertible market was unchanged during the period.
Helped by the two-tranche, $5 billion Amgen deal, new issuance during the period was reasonable, although somewhat lighter than expected, given the surge in late 2005. Nearly all of the issues were convertible bonds (almost 90%), and most were reasonably priced. Other major deals came from SanDisk, Gilead Sciences, Medtronic, Teva Pharmaceutical, and Nabors Industries.
We remain optimistic about prospects for a more vibrant calendar going forward. Convertible issuance should get a boost from rising interest rates (which make convertibles a relatively cheap way to finance) as well as from increased equity
6
volatility. Issuance in 2006 is expected to total $50 billion to $60 billion, well above 2005’s $37.5 billion.
Our successes
As mentioned above, the fund enjoyed good performance from a wide variety of names in several sectors. Top contributors included convertibles from AMR, American Tower, Commscope, RF Micro Devices, PDL BioPharma, and Scientific Games.
We used the opportunity to steadily scale out of holdings that had risen enough in price to become pure equity substitutes and no longer offered the downside protection we require. We substantially reduced our positions in AMR, Cephalon, and Commscope and eliminated our stakes in American Tower, Amylin Pharmaceuticals, The Pantry, and PDL BioPharma. Many of the convertibles we sold were backed by small- to mid-capitalization equities and, by definition, from lower-credit-quality issuers.
We are finding value now across the entire credit spectrum in the convertibles market, but somewhat more than usual in the investment-grade segment. While we used some of the proceeds from our sales to purchase new issues (including Amgen’s), we allocated a large portion to secondary purchases of mid- to large-capitalization names that we deemed both statistically and fundamentally attractive. These include convertibles from American Express, Electronic Data Systems, Fisher Scientific, Hilton Hotels,
L-3 Communications, Wyeth, and Vornado Realty. All had attractive yields, low-to-moderate conversion premiums, and above-average credit quality, and therefore offered a favorable imbalance of upside potential to downside risk.
Our shortfalls
Detractors from our six-month performance were holdings in CV Therapeutics, Genzyme, Intel, and Sepracor. We have sold Intel and substantially reduced our positions in CV Therapeutics and Sepracor.
Disappointing results also came from Hutchinson Technology and MeriStar Hospitality.
Compared with the benchmark index, we were underweighted in metals and materials issues, which performed very strongly for most of the period. Many of the securities in these groups had undesirable structures or were priced well beyond our normal purchase level. None of our holdings experienced a significant negative credit development.
The fund’s positioning
We continue to pursue a balanced strategy and continue to take profits in order to keep the portfolio correctly positioned. We are very comfortable with the overall credit quality of the portfolio and are fully invested in convertible securities, with a mix of about 90% convertible bonds and 10% convertible preferreds. As usual, the fund has no direct exposure to common stocks. We believe that the convertible securities market is reasonably cheap and
7
that convertibles remain an attractive long-term investment. We remain confident that our portfolio can do reasonably well in a wide variety of market environments.
Larry Keele, Portfolio Manager
Oaktree Capital Management, LLC
June 16, 2006
Major Portfolio Changes | |
| |
Additions | Comments |
Hilton Hotels | Attractive convertible and common-stock price. |
Fisher Scientific International | Very attractive convertible characteristics with a strong |
| fundamental equity story. |
Electronic Data Systems | Improving fundamentals; convertible has very |
| favorable balance of upside/downside characteristics. |
Gilead Sciences | Five-year-maturity bond with relatively low conversion |
| premium and non-call status for life. |
| |
Deletions | Comments |
American Tower | Reached our price target. |
PDL BioPharma | Substantial appreciation led to sale. |
The Pantry | Reached our price target. |
8
Fund Profile
As of May 31, 2006
Portfolio Characteristics | |
| |
Number of Securities | 99 |
Yield | 3.4% |
Conversion Premium | 28.9% |
Average Weighted Maturity | 4.2 years |
Average Coupon | 2.6% |
Average Quality1 | Ba3/BB |
Average Duration | 4.8 years |
Foreign Holdings | 7.8% |
Turnover Rate | 162%2 |
Expense Ratio | 0.89%2 |
Short-Term Reserves | 4% |
Sector Diversification (% of portfolio) |
| |
Consumer Discretionary | 12% |
Consumer Staples | 1 |
Energy | 8 |
Financials | 7 |
Health Care | 30 |
Industrials | 7 |
Information Technology | 26 |
Materials | 2 |
Telecommunication Services | 1 |
Utilities | 2 |
Short-Term Reserves | 4% |
Distribution by Maturity | |
(% of fixed income portfolio) | |
| |
Under 1 Year | 2% |
1–5 Years | 83 |
5–10 Years | 14 |
10–20 Years | 0 |
20–30 Years | 1 |
Distribution by Credit Quality1 | |
(% of fixed income portfolio) | |
| |
Aaa/AAA | 0% |
Aa/AA | 0 |
A/A | 4 |
Baa/BBB | 13 |
Ba/BB | 14 |
B/B | 31 |
Below B/B | 6 |
Not Rated | 32 |
Volatility Measures | | |
| | Broad |
| Fund | Index3 |
R-Squared | 0.69 | 1.00 |
Beta | 0.77 | 1.00 |
Ten Largest Holdings4 (% of total net assets) |
| | |
Fisher Scientific | health care | |
International Inc. | equipment | 3.7% |
Teva Pharmaceutical | pharmaceuticals | 2.8 |
Chesapeake Energy Corp. | oil and gas | |
| exploration and | |
| production | 2.7 |
Manor Care, Inc. | health care facilities | 2.6 |
Electronic Data Systems | data processing | |
| and outsourced | |
| services | 2.6 |
Genzyme Corp. | biotechnology | 2.5 |
Hilton Hotels Corp. | hotels, resorts, | |
| and cruise lines | 2.4 |
General Motors Corp. | automobile | |
| manufacturers | 2.2 |
Andrew Corp. | communications | |
| equipment | 2.1 |
L-3 Communications Corp. | aerospace and | |
| defense | 2.1 |
Top Ten | | 25.7% |
1 | Ratings: Moody’s Investors Service, Standard & Poor’s. |
3 | Dow Jones Wilshire 5000 Index. |
4 | “Ten Largest Holdings” excludes any temporary cash investments and equity index products. See page 23 for a glossary of investment terms. |
9
Performance Summary
All of the returns in this report represent past performance, which is not a guarantee of future results that may be achieved by the fund. (Current performance may be lower or higher than the performance data cited. For performance data current to the most recent month-end, visit our website at www.vanguard.com.) Note, too, that both investment returns and principal value can fluctuate widely, so an investor’s shares, when sold, could be worth more or less than their original cost. The returns shown do not reflect taxes that a shareholder would pay on fund distributions or on the sale of fund shares.
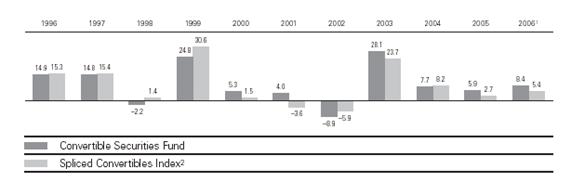
Fiscal-Year Total Returns (%): November 30, 1995–May 31, 2006
Average Annual Total Returns: Periods Ended March 31, 2006
This table presents average annual total returns through the latest calendar quarter—rather than through the end of the fiscal period. Securities and Exchange Commission rules require that we provide this information.
| | | | Ten Years |
| Inception Date | One Year | Five Years | Capital | Income | Total |
Convertible Securities Fund3 | 6/17/1986 | 20.32% | 8.60% | 5.63% | 4.09% | 9.72% |
1 | Six months ended May 31, 2006. |
2 | CS First Boston Convertibles Index through November 30, 2004; Merrill Lynch All US Convertibles Index thereafter. |
3 | Total return figures do not reflect the 1% fee assessed on redemptions of shares purchased on or after September 15, 2005, and held for less than one year. |
Note: See Financial Highlights table on page 17 for dividend and capital gains information.
10
Financial Statements (unaudited)
Statement of Net Assets
As of May 31, 2006
The fund provides a complete list of its holdings four times in each fiscal year, at the quarter-ends. For the second and fourth fiscal quarters, the lists appear in the fund’s semiannual and annual reports to shareholders. For the first and third fiscal quarters, the fund files the lists with the Securities and Exchange Commission on Form N-Q. Shareholders can look up the fund’s Forms N-Q on the SEC’s website at www.sec.gov. Forms N-Q may also be reviewed and copied at the SEC’s Public Reference Room (see the back cover of this report for further information).
| | Face | Market |
| | Amount | Value• |
| | ($000) | ($000) |
| Convertible Bonds (87.1%) | | |
| Consumer Discretionary (9.9%) | | |
| Arvinmeritor Inc. | | |
1 | 4.625%, 3/1/26 | 1,985 | 2,089 |
| Caesars Entertainment, Inc. | | |
| 4.150%, 4/15/24 | 5,220 | 6,867 |
| Carnival Corp. | | |
| 1.132%, 4/29/33 | 4,380 | 2,831 |
| Dick’s Sporting Goods, Inc. | | |
^ | 1.606%, 2/18/24 | 9,390 | 7,042 |
| Hilton Hotels Corp. | | |
| 3.375%, 4/15/23 | 11,935 | 15,381 |
| Liberty Media Corp. | | |
| 0.750%, 3/30/08 | 795 | 841 |
| Scientific Games Corp. | | |
1 | 0.750%, 12/1/24 | 5,555 | 7,617 |
| Shuffle Master, Inc. | | |
1 | 1.250%, 4/15/09 | 785 | 1,071 |
| The Interpublic Group of | | |
| Companies, Inc. | | |
| 4.500%, 3/15/23 | 9,960 | 10,209 |
| The Walt Disney Co. | | |
| 2.125%, 4/15/08 | 5,835 | 6,528 |
| United Auto Group, Inc. | | |
1 | 3.500%, 4/1/26 | 1,860 | 1,990 |
| | | 62,466 |
| Consumer Staples (1.1%) | | |
| Vector Group Ltd. | | |
| 6.250%, 7/15/08 | 2,740 | 2,740 |
| Wild Oats Markets, Inc. | | |
| 3.250%, 5/15/34 | 3,890 | 4,172 |
| | | 6,912 |
| Energy (4.0%) | | |
| Cooper Cameron Corp. | | |
| 1.500%, 5/15/09 | 2,115 | 3,077 |
| Hanover Compressor Co. | | |
| 4.750%, 1/15/14 | 805 | 1,089 |
| McMoRan Exploration Co. | | |
1 | 5.250%, 10/6/11 | 4,920 | 5,763 |
| 5.250%, 10/6/11 | 405 | 474 |
| Nabors Industries Ltd. | | |
1 | 0.940%, 5/15/11 | 12,090 | 12,053 |
| SEACOR Holdings Inc. | | |
| 2.875%, 12/15/24 | 2,125 | 2,640 |
| | | 25,096 |
| Financials (4.5%) | | |
| American Express Credit Corp. | | |
| 1.850%, 12/1/33 | 5,690 | 5,854 |
| American Financial Realty Trust | | |
| 4.375%, 7/15/24 | 3,420 | 3,031 |
| BankUnited Capital Trust | | |
| 3.125%, 3/1/34 | 4,260 | 4,244 |
| Conseco Inc. | | |
1 | 3.500%, 9/30/35 | 8,840 | 9,625 |
| Vornado Realty L.P. | | |
| 3.875%, 4/15/25 | 5,440 | 5,902 |
| | | 28,656 |
| Health Care (30.4%) | | |
| Allergan, Inc. | | |
1 | 1.500%, 4/1/26 | 4,915 | 4,651 |
| Amgen Inc. | | |
1 | 0.125%, 2/1/11 | 9,140 | 8,763 |
| Biomartin Pharmaceutical Inc. | | |
| 2.500%, 3/29/13 | 1,975 | 2,056 |
| Cephalon Inc. | | |
| 0.000%, 6/15/33 | 4,905 | 5,481 |
11
| | Face | Market |
| | Amount | Value• |
| | ($000) | ($000) |
| Cubist Pharmaceuticals, Inc. | | |
| 2.250%, 6/15/13 | 2,245 | 2,245 |
| CV Therapeutics | | |
| 3.250%, 8/16/13 | 715 | 654 |
| Cytyc Corp. | | |
| 2.250%, 3/15/24 | 1,890 | 1,961 |
| Emdeon (WebMD) Corp. | | |
^ | 3.125%, 9/1/25 | 8,545 | 8,470 |
| First Horizon | | |
| Pharmaceutical Corp. | | |
| 1.750%, 3/8/24 | 10,090 | 10,733 |
| Fisher Scientific | | |
| International Inc. | | |
^ | 3.250%, 3/1/11 | 20,775 | 23,424 |
| Genzyme Corp. | | |
| 1.250%, 12/1/08 | 14,960 | 15,484 |
| Gilead Sciences Inc. | | |
1 ^ | 0.500%, 5/1/11 | 11,265 | 10,772 |
| Invitrogen Corp. | | |
| 2.000%, 8/1/23 | 6,675 | 7,092 |
| JDS Uniphase Corp. | | |
1 | 1.000%, 5/15/26 | 3,270 | 3,282 |
| Manor Care, Inc. | | |
| 2.125%, 8/1/35 | 515 | 574 |
1 ^ | 2.125%, 8/1/35 | 13,995 | 15,587 |
| Medarex Inc. | | |
1 | 2.250%, 5/15/11 | 5,555 | 5,562 |
| 2.250%, 5/15/11 | 1,465 | 1,467 |
| Medicis Pharmaceutical Corp. | | |
| 1.500%, 6/4/33 | 4,945 | 4,772 |
| Medtronic Inc. | | |
1 | 1.500%, 4/15/11 | 10,460 | 10,499 |
| MGI Pharma Inc. | | |
| 1.682%, 3/2/11 | 9,760 | 6,280 |
| Omnicare, Inc. | | |
| 3.250%, 12/15/35 | 9,425 | 8,494 |
| SFBC International, Inc. | | |
| 2.250%, 8/15/24 | 2,750 | 2,324 |
| Teva Pharmaceutical Financial | | |
| 1.750%, 2/1/26 | 18,340 | 17,492 |
| Wyeth | | |
| 4.238%, 7/15/06 | 12,650 | 13,172 |
| | | 191,291 |
| Industrials (7.5%) | | |
| Alliant Techsystems Inc. | | |
| 2.750%, 2/15/24 | 3,000 | 3,262 |
| AMR Corp. | | |
| 4.500%, 2/15/24 | 2,090 | 2,717 |
| C&D Technologies Inc. | | |
1 | 5.250%, 11/1/25 | 3,485 | 3,581 |
| Continental Airlines, Inc. | | |
^ | 4.500%, 2/1/07 | 3,475 | 3,405 |
| DRS Technologies Inc. | | |
1 | 2.000%, 2/1/26 | 8,685 | 9,000 |
| FTI Consulting | | |
1 ^ | 3.750%, 7/15/12 | 3,215 | 3,549 |
| 3.750%, 7/15/12 | 450 | 497 |
| L-3 Communications Corp. | | |
| 3.000%, 8/1/35 | 13,610 | 13,202 |
| Waste Connections Inc. | | |
| 3.750%, 4/1/26 | 595 | 590 |
1 | 3.750%, 4/1/26 | 7,280 | 7,216 |
| | | 47,019 |
| Information Technology (26.5%) | | |
| Amdocs Ltd. | | |
| 0.500%, 3/15/24 | 10,530 | 10,688 |
| Andrew Corp. | | |
| 3.250%, 8/15/13 | 13,075 | 13,255 |
| Avnet Inc. | | |
| 2.000%, 3/15/34 | 7,820 | 7,331 |
| Cadence Design | | |
| 0.000%, 8/15/23 | 4,175 | 4,973 |
| Coherent, Inc. | | |
1 | 2.750%, 3/1/11 | 8,200 | 8,743 |
| Commscope Inc. | | |
| 1.000%, 3/15/24 | 610 | 854 |
| Conexant Systems Inc. | | |
1 | 4.000%, 3/1/26 | 9,020 | 8,670 |
| Digital River, Inc. | | |
| 1.250%, 1/1/24 | 5,860 | 6,864 |
| Electronic Data Systems | | |
| 3.875%, 7/15/23 | 16,115 | 16,115 |
| Euronet Worldwide, Inc. | | |
^ | 1.625%, 12/15/24 | 1,860 | 2,188 |
| 3.500%, 10/15/25 | 5,650 | 6,321 |
| FEI Co. | | |
1 | 2.875%, 6/1/13 | 3,150 | 3,284 |
| Flextronics International Ltd. | | |
| 1.000%, 8/1/10 | 8,490 | 8,065 |
| Hutchinson Technology Inc. | | |
| 2.250%, 3/15/10 | 5,945 | 5,633 |
| 3.250%, 1/15/26 | 1,075 | 973 |
| Kulicke & Soffa Industries, Inc. | | |
| 0.500%, 11/30/08 | 8,545 | 7,114 |
| LSI Logic | | |
| 4.000%, 5/15/10 | 12,470 | 12,969 |
12
| | Face | Market |
| | Amount | Value• |
| | ($000) | ($000) |
| Lucent Technologies, Inc. | | |
| 2.750%, 6/15/23 | 4,135 | 4,099 |
| Novell Inc. | | |
| 0.500%, 7/15/24 | 7,815 | 7,131 |
| Openwave Systems Inc. | | |
| 2.750%, 9/9/08 | 3,215 | 3,400 |
| Powerwave Technologies Inc. | | |
| 1.250%, 7/15/08 | 2,895 | 3,134 |
| 1.875%, 11/15/24 | 3,015 | 3,256 |
| Quantum Corp. | | |
| 4.375%, 8/1/10 | 1,375 | 1,286 |
| Red Hat, Inc. | | |
| 0.500%, 1/15/24 | 1,100 | 1,284 |
| RF Micro Devices Inc. | | |
| 1.500%, 7/1/10 | 11,840 | 13,024 |
| Vishay Intertechnology | | |
| 3.625%, 8/1/23 | 5,415 | 5,665 |
| | | 166,319 |
| Materials (0.7%) | | |
| Apex Silver Mines Ltd. | | |
| 4.000%, 9/15/24 | 4,535 | 3,481 |
| Coeur D’Alene | | |
| 1.250%, 1/15/24 | 1,025 | 933 |
| | | 4,414 |
| Telecommunication Services (1.2%) | | |
| Qwest Communications | | |
| International, Inc. | | |
| 3.500%, 11/15/25 | 5,470 | 7,419 |
| | | |
| | | |
| Utilities (1.3%) | | |
| CMS Energy Corp. | | |
| 2.875%, 12/1/24 | 7,535 | 8,025 |
| Total Convertible Bonds | | |
| (Cost $541,421) | | 547,617 |
| | | |
| | | |
| | Shares | |
| Convertible Preferred Stocks (10.4%) | | |
| Consumer Discretionary (2.2%) | | |
| General Motors Corp. | | |
| 6.250% Cvt. Pfd. | 679,500 | 13,590 |
| | | |
| | | |
| Energy (3.6%) | | |
| Chesapeake Energy Corp. | | |
| 4.500% Cvt. Pfd. | 20,700 | 1,925 |
1 | 5.000% Cvt. Pfd. | 147,400 | 15,311 |
| Goodrich Petroleum Corp. | | |
1 | 5.375% Cvt. Pfd. | 111,900 | 5,525 |
| | | 22,761 |
| Financials (2.0%) | | |
| Aspen Insurance | | |
| Holdings, Ltd. | | |
| 5.625% Cvt. Pfd. | 132,400 | 6,355 |
| Conseco Inc. | | |
| 5.500% Cvt. Pfd. | 46,500 | 1,331 |
| Travelers Property | | |
| Casualty Corp. | | |
| 4.500% Cvt. Pfd. | 197,925 | 4,920 |
| | | 12,606 |
| Materials (1.4%) | | |
| Celanese Corp. Series A | | |
| 4.250% Cvt. Pfd. | 238,800 | 7,045 |
| Freeport-McMoRan | | |
| Copper & Gold, Inc. | | |
| 5.500% Cvt. Pfd. | 1,410 | 1,768 |
| | | 8,813 |
| Utilities (1.2%) | | |
| NRG Energy, Inc. | | |
| 4.000% Cvt. Pfd. | 710 | 963 |
| 5.750% Cvt. Pfd. | 25,200 | 6,347 |
| | | 7,310 |
| Total Convertible Preferred Stocks | | |
| (Cost $63,618) | | 65,080 |
| Temporary Cash Investments (11.4%) | | |
2 | Vanguard Market Liquidity | | |
| Fund, 5.010% | 22,352,278 | 22,352 |
2 | Vanguard Market Liquidity | | |
| Fund, 5.010%—Note F | 49,337,452 | 49,337 |
| Total Temporary Cash Investments | | |
| (Cost $71,689) | | 71,689 |
| Total Investments (108.9%) | | |
| (Cost $676,728) | | 684,386 |
| Other Assets and Liabilities (–8.9%) | | |
| Other Assets—Note C | | 11,598 |
| Security Lending Collateral | | |
| Payable to Brokers—Note F | | (49,337) |
| Other Liabilities | | (18,408) |
| | | (56,147) |
| Net Assets (100%) | | |
| Applicable to 44,635,016 outstanding | | |
| $.001 par value shares of beneficial | | |
| interest (unlimited authorization) | | 628,239 |
| Net Asset Value Per Share | | $14.08 |
13
At May 31, 2006, net assets consisted of:3 | | |
| Amount | Per |
| ($000) | Share |
Paid-in Capital | 567,397 | $12.72 |
Undistributed Net | | |
Investment Income | 2,788 | .06 |
Accumulated Net | | |
Realized Gains | 50,396 | 1.13 |
Unrealized Appreciation | 7,658 | .17 |
Net Assets | 628,239 | $14.08 |
• | See Note A in Notes to Financial Statements. |
^ | Part of security position is on loan to broker/dealers. See Note F in Notes to Financial Statements. |
1 | Security exempt from registration under Rule 144A of the Securities Act of 1933. Such securities may be sold in transactions exempt from registration, normally to qualified institutional buyers. At May 31, 2006, the aggregate value of these securities was $164,203,000, representing 26.1% of net assets. |
2 | Affiliated money market fund available only to Vanguard funds and certain trusts and accounts managed by Vanguard. Rate shown is the 7-day yield. |
3 | See Note D in Notes to Financial Statements for the tax-basis components of net assets. |
14
Statement of Operations
| Six Months Ended |
| May 31, 2006 |
| ($000) |
Investment Income | |
Income | |
Dividends | 1,495 |
Interest1 | 9,376 |
Security Lending | 106 |
Total Income | 10,977 |
Expenses | |
Investment Advisory Fees—Note B | |
Basic Fee | 1,103 |
Performance Adjustment | 683 |
The Vanguard Group—Note C | |
Management and Administrative | 769 |
Marketing and Distribution | 84 |
Custodian Fees | 10 |
Shareholders’ Reports | 9 |
Total Expenses | 2,658 |
Net Investment Income | 8,319 |
Realized Net Gain (Loss) on Investment Securities Sold | 50,435 |
Change in Unrealized Appreciation (Depreciation) of Investment Securities | (13,528) |
Net Increase (Decrease) in Net Assets Resulting from Operations | 45,226 |
1 | Interest income from an affiliated company of the fund was $494,000. |
15
Statement of Changes in Net Assets
| Six Months Ended | Year Ended |
| May 31, | Nov. 30, |
| 2006 | 2005 |
| ($000) | ($000) |
Increase (Decrease) in Net Assets | | |
Operations | | |
Net Investment Income | 8,319 | 14,691 |
Realized Net Gain (Loss) | 50,435 | 21,903 |
Change in Unrealized Appreciation (Depreciation) | (13,528) | (12,213) |
Net Increase (Decrease) in Net Assets Resulting from Operations | 45,226 | 24,381 |
Distributions | | |
Net Investment Income | (7,418) | (17,976) |
Realized Capital Gain1 | (17,355) | (34,225) |
Total Distributions | (24,773) | (52,201) |
Capital Share Transactions—Note G | | |
Issued | 83,925 | 47,507 |
Issued in Lieu of Cash Distributions | 21,587 | 45,081 |
Redeemed2 | (49,948) | (471,096) |
Net Increase (Decrease) from Capital Share Transactions | 55,564 | (378,508) |
Total Increase (Decrease) | 76,017 | (406,328) |
Net Assets | | |
Beginning of Period | 552,222 | 958,550 |
End of Period3 | 628,239 | 552,222 |
1 | Includes fiscal 2006 and 2005 short-term gain distributions totaling $2,825,000 and $9,035,000, |
respectively. Short-term gain distributions are treated as ordinary income dividends for tax
purposes.
2 | Net of redemption fees of $21,000 and $0. |
3 | Net Assets—End of Period includes undistributed net investment income of $2,788,000 and $1,846,000. |
16
Financial Highlights
| | | | | | |
| Six Months | | | | | |
| Ended | Year Ended November 30, |
For a Share Outstanding | May 31, | | | | | |
Throughout Each Period | 2006 | 2005 | 2004 | 2003 | 2002 | 2001 |
Net Asset Value, Beginning of Period | $13.57 | $13.62 | $13.05 | $10.57 | $12.12 | $12.68 |
Investment Operations | | | | | | |
Net Investment Income | .19 | .29 | .39 | .41 | .47 | .53 |
Net Realized and Unrealized Gain (Loss) | | | | | | |
on Investments | .93 | .48 | .60 | 2.48 | (1.53) | (.04) |
Total from Investment Operations | 1.12 | .77 | .99 | 2.89 | (1.06) | .49 |
Distributions | | | | | | |
Dividends from Net Investment Income | (.18) | (.32) | (.42) | (.41) | (.49) | (.54) |
Distributions from Realized Capital Gains | (.43) | (.50) | — | — | — | (.51) |
Total Distributions | (.61) | (.82) | (.42) | (.41) | (.49) | (1.05) |
Net Asset Value, End of Period | $14.08 | $13.57 | $13.62 | $13.05 | $10.57 | $12.12 |
| | | | | | |
| | | | | | |
Total Return1 | 8.44% | 5.92% | 7.71% | 28.07% | –8.88% | 3.98% |
| | | | | | |
| | | | | | |
Ratios/Supplemental Data | | | | | | |
Net Assets, End of Period (Millions) | $628 | $552 | $959 | $817 | $291 | $300 |
Ratio of Total Expenses to | | | | | | |
Average Net Assets2 | 0.89%3 | 0.86% | 0.68% | 0.84% | 0.95% | 0.71% |
Ratio of Net Investment Income to | | | | | | |
Average Net Assets | 2.79%3 | 2.18% | 2.94% | 3.82% | 4.27% | 4.21% |
Portfolio Turnover Rate | 162%3 | 86% | 123% | 127% | 118% | 156% |
1 | Total returns do not reflect the 1% fee assessed on redemptions of shares purchased on or after |
September 15, 2005, and held for less than one year.
2 | Includes performance-based investment advisory fee increases (decreases) of 0.23%, 0.20%, 0.06%, 0.13%, 0.21%, and 0.01%. |
See accompanying Notes, which are an integral part of the Financial Statements.
17
Notes to Financial Statements
Vanguard Convertible Securities Fund is registered under the Investment Company Act of 1940 as an open-end investment company, or mutual fund.
A. The following significant accounting policies conform to generally accepted accounting principles for U.S. mutual funds. The fund consistently follows such policies in preparing its financial statements.
1. Security Valuation: Securities are valued as of the close of trading on the New York Stock Exchange (generally 4:00 p.m. Eastern time) on the valuation date. Equity securities are valued at the latest quoted sales prices or official closing prices taken from the primary market in which each security trades; such securities not traded on the valuation date are valued at the mean of the latest quoted bid and asked prices. Bonds, and temporary cash investments acquired over 60 days to maturity, are valued using the latest bid prices or using valuations based on a matrix system (which considers such factors as security prices, yields, maturities, and ratings), both as furnished by independent pricing services. Investments in Vanguard Market Liquidity Fund are valued at that fund’s net asset value. Securities for which market quotations are not readily available, or whose values have been materially affected by events occurring before the fund’s pricing time but after the close of the securities’ primary markets, are valued by methods deemed by the board of trustees to represent fair value.
2. Federal Income Taxes: The fund intends to continue to qualify as a regulated investment company and distribute all of its taxable income. Accordingly, no provision for federal income taxes is required in the financial statements.
3. Distributions: Distributions to shareholders are recorded on the ex-dividend date.
4. Security Lending: The fund may lend its securities to qualified institutional borrowers to earn additional income. Security loans are required to be secured at all times by collateral at least equal to the market value of securities loaned. The fund invests cash collateral received in Vanguard Market Liquidity Fund, and records a liability for the return of the collateral, during the period the securities are on loan. Security lending income represents the income earned on investing cash collateral, less expenses associated with the loan.
5. Other: Dividend income is recorded on the ex-dividend date. Interest income includes income distributions received from Vanguard Market Liquidity Fund and is accrued daily. Premiums and discounts on debt securities purchased are amortized and accreted, respectively, to interest income over the lives of the respective securities. Security transactions are accounted for on the date securities are bought or sold. Costs used to determine realized gains (losses) on the sale of investment securities are those of the specific securities sold. Fees assessed on redemptions of capital shares are credited to paid-in capital.
B. Oaktree Capital Management, LLC, provides investment advisory services to the fund for a fee calculated at an annual percentage rate of average net assets. The basic fee is subject to quarterly adjustments based on the fund’s performance for the preceding three years relative to the Credit Suisse First Boston Convertible Securities Index for periods prior to December 1, 2004, and the Merrill Lynch All US Convertibles Index beginning December 1, 2004. The benchmark change will be fully phased in by November 30, 2007. For the six months ended May 31, 2006, the investment advisory fee represented an effective annual basic rate of 0.37% of the fund’s average net assets before an increase of $683,000 (0.23%) based on performance.
18
C. The Vanguard Group furnishes at cost corporate management, administrative, marketing, and distribution services. The costs of such services are allocated to the fund under methods approved by the board of trustees. The fund has committed to provide up to 0.40% of its net assets in capital contributions to Vanguard. At May 31, 2006, the fund had contributed capital of $68,000 to Vanguard (included in Other Assets), representing 0.01% of the fund’s net assets and 0.07% of Vanguard’s capitalization. The fund’s trustees and officers are also directors and officers of Vanguard.
D. Distributions are determined on a tax basis and may differ from net investment income and realized capital gains for financial reporting purposes. Differences may be permanent or temporary. Permanent differences are reclassified among capital accounts in the financial statements to reflect their tax character. Temporary differences arise when certain items of income, expense, gain, or loss are recognized in different periods for financial statement and tax purposes; these differences will reverse at some time in the future. Differences in classification may also result from the treatment of short-term gains as ordinary income for tax purposes. The fund’s tax-basis capital gains and losses are determined only at the end of each fiscal year.
Certain of the fund’s convertible preferred stock investments are treated as debt securities for tax purposes. During the six months ended May 31, 2006, the fund realized gains of $41,000 from the sale of these securities, which are included in distributable net investment income for tax purposes; accordingly, such gains have been reclassified from accumulated net realized gains to undistributed net investment income.
At May 31, 2006, net unrealized appreciation of investment securities for tax purposes was $7,658,000, consisting of unrealized gains of $23,501,000 on securities that had risen in value since their purchase and $15,843,000 in unrealized losses on securities that had fallen in value since their purchase.
E. During the six months ended May 31, 2006, the fund purchased $494,813,000 of investment securities and sold $455,406,000 of investment securities, other than temporary cash investments.
F. The market value of securities on loan to broker/dealers at May 31, 2006, was $48,325,000, for which the fund received cash collateral of $49,337,000.
G. Capital shares issued and redeemed were:
| Six Months Ended | Year Ended |
| May 31, 2006 | November 30, 2005 |
| Shares | Shares |
| (000) | (000) |
Issued | 5,914 | 3,643 |
Issued in Lieu of Cash Distributions | 1,590 | 3,418 |
Redeemed | (3,556) | (36,767) |
Net Increase (Decrease) in Shares Outstanding | 3,948 | (29,706) |
19
About Your Fund’s Expenses
As a shareholder of the fund, you incur ongoing costs, which include costs for portfolio management, administrative services, and shareholder reports (like this one), among others. Operating expenses, which are deducted from a fund’s gross income, directly reduce the investment return of the fund.
A fund’s expenses are expressed as a percentage of its average net assets. This figure is known as the expense ratio. The following examples are intended to help you understand the ongoing costs (in dollars) of investing in your fund and to compare these costs with those of other mutual funds. The examples are based on an investment of $1,000 made at the beginning of the period shown and held for the entire period.
The table below illustrates your fund’s costs in two ways:
• Based on actual fund return. This section helps you to estimate the actual expenses that you paid over the period. The “Ending Account Value” shown is derived from the fund’s actual return, and the third column shows the dollar amount that would have been paid by an investor who started with $1,000 in the fund. You may use the information here, together with the amount you invested, to estimate the expenses that you paid over the period.
To do so, simply divide your account value by $1,000 (for example, an $8,600 account value divided by $1,000 = 8.6), then multiply the result by the number given for your fund under the heading “Expenses Paid During Period.”
• Based on hypothetical 5% yearly return. This section is intended to help you compare your fund’s costs with those of other mutual funds. It assumes that the fund had a yearly return of 5% before expenses, but that the expense ratio is unchanged. In this case—because the return used is not the fund’s actual return—the results do not apply to your investment. The example is useful in making comparisons because the Securities and Exchange Commission requires all mutual funds to calculate expenses based on a 5% return. You can assess your fund’s costs by comparing this hypothetical example with the hypothetical examples that appear in shareholder reports of other funds.
Six Months Ended May 31, 2006 | | | |
| Beginning | Ending | Expenses |
| Account Value | Account Value | Paid During |
Convertible Securities Fund | 11/30/2005 | 5/31/2006 | Period1 |
Based on Actual Fund Return | $1,000.00 | $1,084.41 | $4.63 |
Based on Hypothetical 5% Yearly Return | 1,000.00 | 1,020.49 | 4.48 |
Note that the expenses shown in the table are meant to highlight and help you compare ongoing costs only and do not reflect any transactional costs or account maintenance fees. They do not include your fund’s low-balance fee or the 1% fee assessed on redemptions of shares held less than one year. These fees are fully described in the prospectus. If these fees were applied to your account, your costs would be higher. Your fund does not carry a “sales load.”
1 | These calculations are based on expenses incurred in the most recent six-month period. The fund’s annualized six-month expense ratio for that period is 0.89%. The dollar amounts shown as “Expenses Paid” are equal to the annualized expense ratio multiplied by the average account value over the period, multiplied by the number of days in the most recent six-month period, then divided by the number of days in the most recent 12-month period. |
20
The calculations assume no shares were bought or sold during the period. Your actual costs may have been higher or lower, depending on the amount of your investment and the timing of any purchases or redemptions.
You can find more information about the fund’s expenses, including annual expense ratios, in the Financial Statements section of this report. For additional information on operating expenses and other shareholder costs, please refer to the appropriate fund prospectus.
21
Trustees Approve Advisory Agreement
The board of trustees of Vanguard Convertible Securities Fund has renewed the fund’s investment advisory agreement with Oaktree Capital Management, LLC. The board determined that the retention of Oaktree was in the best interests of the fund and its shareholders.
The board decided to approve the agreement based upon its evaluation of Oaktree’s investment staff, portfolio management process, and performance. The trustees considered the factors discussed below, among others. However, no single factor determined whether the board approved the agreement. Rather, it was the totality of the circumstances that drove the board’s decision.
Nature, extent, and quality of services
The board considered the quality of the fund’s investment management over both short- and long-term periods and took into account the organizational depth and stability of the firm. Founded in 1995, Oaktree Capital Management specializes in managing convertible securities. The advisor uses a bottom-up investment approach to select convertibles considered to have the best balance of upside potential and downside protection. Discipline is key to the fund’s management; Oaktree invests predominantly in convertibles possessing an attractive combination of conversion and income features—true hybrid securities—and sells the issues when their characteristics become too similar to those of conventional bonds or common stocks. Oaktree is a deep and stable firm, and has advised the fund since 1996.
The board concluded that the advisor’s experience, stability, and performance, among other factors, warranted continuation of the advisory agreement.
Investment performance
The board considered the short- and long-term performance of the fund, including any periods of outperformance or underperformance of relevant benchmarks and peer groups. The board concluded that the advisor has carried out the fund’s investment strategy in disciplined fashion, and that the performance provided by Oaktree has been favorable compared with that of the fund’s benchmark and peer group. Information about the fund’s performance, including some of the data considered by the board, can be found in the Performance Summary section of this report.
Cost
The board concluded that the fund’s expense ratio was far below the average expense ratio charged by funds in its peer group. The fund’s advisory fee was also well below the peer-group average. Information about the fund’s expense ratio appears in the About Your Fund’s Expenses section of this report as well as in the Financial Statements section, which also includes information about the advisory fee rate.
The board did not consider profitability of Oaktree in determining whether to approve the advisory fee, because Oaktree is independent of Vanguard and the advisory fee is the result of arm’slength negotiations.
The benefit of economies of scale
The board concluded that the fund’s shareholders benefit from economies of scale because of breakpoints in the fund’s advisory fee schedule. The breakpoints reduce the effective rate of the fee as the fund’s assets increase.
The board will consider whether to renew the advisory agreement again after a one-year period.
22
Glossary
Average Coupon. The average interest rate paid on the fixed income securities held by a fund. It is expressed as a percentage of face value.
Average Duration. An estimate of how much the value of the bonds held by a fund will fluctuate in response to a change in interest rates. To see how the value could change, multiply the average duration by the change in rates. If interest rates rise by 1 percentage point, the value of the bonds in a fund with an average duration of five years would decline by about 5%. If rates decrease by a percentage point, the value would rise by 5%.
Average Quality. An indicator of credit risk, this figure is the average of the ratings assigned to a fund’s holdings by credit-rating agencies. The agencies make their judgment after appraising an issuer’s ability to meet its obligations. Quality is graded on a scale, with Aaa or AAA indicating the most creditworthy bond issuers.
Average Weighted Maturity. The average length of time until fixed income securities held by a fund reach maturity and are repaid. The figure reflects the proportion of fund assets represented by each security.
Beta. A measure of the magnitude of a fund’s past share-price fluctuations in relation to the ups and downs of a given market index. The index is assigned a beta of 1.00. Compared with a given index, a fund with a beta of 1.20 typically would have seen its share price rise or fall by 12% when the index rose or fell by 10%. A fund’s beta should be reviewed in conjunction with its R-squared (see definition below). The lower the R-squared, the less correlation there is between the fund and the index, and the less reliable beta is as an indicator of volatility.
Conversion Premium. The average percentage by which the weighted average market price of the convertible securities held by a fund exceeds the weighted average market price of their underlying common stocks. For example, if a stock is trading at $25 per share and a bond convertible into the stock is trading at a price equivalent to $30 per share of stock, the conversion premium is 20% ($5 ÷ $25 = 20%).
Expense Ratio. The percentage of a fund’s average net assets used to pay its annual administrative and advisory expenses. These expenses directly reduce returns to investors.
Foreign Holdings. The percentage of a fund’s net assets represented by securities of companies based outside the United States.
R-Squared. A measure of how much of a fund’s past returns can be explained by the returns from the market in general, as measured by a given index. If a fund’s total returns were precisely synchronized with an index’s returns, its R-squared would be 1.00. If the fund’s returns bore no relationship to the index’s returns, its R-squared would be 0.
Short-Term Reserves. The percentage of a fund invested in highly liquid, short-term securities that can be readily converted to cash.
Turnover Rate. An indication of the fund’s trading activity. Funds with high turnover rates incur higher transaction costs and may be more likely to distribute capital gains (which may be taxable to investors). The turnover rate excludes in-kind transactions, which have minimal impact on costs.
Yield. A snapshot of a fund’s income from interest and dividends. The yield, expressed as a percentage of the fund’s net asset value, is based on income earned over the past 30 days and is annualized, or projected forward for the coming year.
23
The People Who Govern Your Fund
The trustees of your mutual fund are there to see that the fund is operated and managed in your best interests since, as a shareholder, you are a part owner of the fund. Your fund trustees also serve on the board of directors of The Vanguard Group, Inc., which is owned by the Vanguard funds and provides services to them on an at-cost basis.
A majority of Vanguard’s board members are independent, meaning that they have no affiliation with Vanguard or the funds they oversee, apart from the sizable personal investments they have made as private individuals.
Our independent board members bring distinguished backgrounds in business, academia, and public service to their task of working with Vanguard officers to establish the policies and oversee the activities of the funds. Among board members’ responsibilities are selecting investment advisors for the funds; monitoring fund operations, performance, and costs; reviewing contracts; nominating and selecting new trustees/directors; and electing Vanguard officers.
Each trustee serves a fund until its termination; or until the trustee’s retirement, resignation, or death; or otherwise as specified in the fund’s organizational documents. Any trustee may be removed at a shareholders’ meeting by a vote representing two-thirds of the net asset value of all shares of the fund together with shares of other Vanguard funds organized within the same trust. The table on these two pages shows information for each trustee and executive officer of the fund. The mailing address of the trustees and officers is P.O. Box 876, Valley Forge, PA 19482.
Chairman of the Board, Chief Executive Officer, and Trustee |
| |
John J. Brennan1 | |
Born 1954 | Principal Occupation(s) During the Past Five Years: Chairman of the Board, Chief |
Trustee since May 1987; | Executive Officer, and Director/Trustee of The Vanguard Group, Inc., and of each |
Chairman of the Board and | of the investment companies served by The Vanguard Group. |
Chief Executive Officer | |
136 Vanguard Funds Overseen | |
| |
Independent Trustees | |
| |
Charles D. Ellis | |
Born 1937 | Principal Occupation(s) During the Past Five Years: Applecore Partners (pro bono ventures |
Trustee since January 2001 | in education); Senior Advisor to Greenwich Associates (international business strategy |
136 Vanguard Funds Overseen | consulting); Successor Trustee of Yale University; Overseer of the Stern School of |
| Business at New York University; Trustee of the Whitehead Institute for Biomedical |
| Research. |
| |
Rajiv L. Gupta | |
Born 1945 | Principal Occupation(s) During the Past Five Years: Chairman and Chief Executive Officer |
Trustee since December 20012 | of Rohm and Haas Co. (chemicals); Board Member of the American Chemistry Council; |
136 Vanguard Funds Overseen | Director of Tyco International, Ltd. (diversified manufacturing and services) (since 2005); |
| Trustee of Drexel University and of the Chemical Heritage Foundation. |
| |
JoAnn Heffernan Heisen | |
Born 1950 | Principal Occupation(s) During the Past Five Years: Corporate Vice President and Chief |
Trustee since July 1998 | Global Diversity Officer (since January 2006), Vice President and Chief Information |
136 Vanguard Funds Overseen | Officer (1997–2005), and Member of the Executive Committee of Johnson & Johnson |
| (pharmaceuticals/consumer products); Director of the University Medical Center |
| at Princeton and Women’s Research and Education Institute. |
André F. Perold | |
Born 1952 | Principal Occupation(s) During the Past Five Years: George Gund Professor of Finance |
Trustee since December 2004 | and Banking, Harvard Business School (since 2000); Senior Associate Dean, Director |
136 Vanguard Funds Overseen | of Faculty Recruiting, and Chair of Finance Faculty, Harvard Business School; Director |
| and Chairman of UNX, Inc. (equities trading firm) (since 2003); Director of registered |
| investment companies advised by Merrill Lynch Investment Managers and affiliates |
| (1985–2004), Genbel Securities Limited (South African financial services firm) |
| (1999–2003), Gensec Bank (1999–2003), Sanlam, Ltd. (South African insurance |
| company) (2001–2003), and Stockback, Inc. (credit card firm) (2000–2002). |
| |
Alfred M. Rankin, Jr. | |
Born 1941 | Principal Occupation(s) During the Past Five Years: Chairman, President, Chief |
Trustee since January 1993 | Executive Officer, and Director of NACCO Industries, Inc. (forklift trucks/housewares/ |
136 Vanguard Funds Overseen | lignite); Director of Goodrich Corporation (industrial products/aircraft systems and |
| services); Director of Standard Products Company (supplier for the automotive |
| industry) until 1998. |
| |
J. Lawrence Wilson | |
Born 1936 | Principal Occupation(s) During the Past Five Years: Retired Chairman and Chief |
Trustee since April 1985 | Executive Officer of Rohm and Haas Co. (chemicals); Director of Cummins Inc. |
136 Vanguard Funds Overseen | (diesel engines), MeadWestvaco Corp. (packaging products), and AmerisourceBergen |
| Corp. (pharmaceutical distribution); Trustee of Vanderbilt University and of Culver |
| Educational Foundation. |
| |
Executive Officers1 | |
| |
Heidi Stam | |
Born 1956 | Principal Occupation(s) During the Past Five Years: Principal of The Vanguard Group, Inc., |
Secretary since July 2005 | since November 1997; General Counsel of The Vanguard Group since July 2005; |
136 Vanguard Funds Overseen | Secretary of The Vanguard Group and of each of the investment companies served |
| by The Vanguard Group since July 2005. |
| |
Thomas J. Higgins | |
Born 1957 | Principal Occupation(s) During the Past Five Years: Principal of The Vanguard Group, Inc.; |
Treasurer since July 1998 | Treasurer of each of the investment companies served by The Vanguard Group. |
136 Vanguard Funds Overseen | |
| |
Vanguard Senior Management Team | |
| |
R. Gregory Barton | |
Mortimer J. Buckley | |
James H. Gately | |
Kathleen C. Gubanich | |
F. William McNabb, III | |
Michael S. Miller | |
Ralph K. Packard | |
George U. Sauter | |
| |
Founder | |
| |
John C. Bogle | |
Chairman and Chief Executive Officer, 1974–1996 |
1 | Officers of the funds are “interested persons” as defined in the Investment Company Act of 1940. |
2 | December 2002 for Vanguard Equity Income Fund, Vanguard Growth Equity Fund, the Vanguard Municipal Bond Funds, and the Vanguard State Tax-Exempt Funds. |
More information about the trustees is in the Statement of Additional Information, available from The Vanguard Group.

P.O. Box 2600
Valley Forge, PA 19482-2600
Connect with Vanguard™ > www.vanguard.com
Fund Information > 800-662-7447 | Vanguard, Connect with Vanguard, and the ship logo are |
| trademarks of The Vanguard Group, Inc. |
Direct Investor Account Services > 800-662-2739 | |
| All other marks are the exclusive property |
| of their respective owners. |
Institutional Investor Services > 800-523-1036 | |
| |
Text Telephone > 800-952-3335 | All comparative mutual fund data are |
| from Lipper Inc. or Morningstar, Inc., |
| unless otherwise noted. |
| |
This material may be used in conjunction | You can obtain a free copy of Vanguard’s |
with the offering of shares of any | proxy voting guidelines by visiting |
Vanguard | our website, www.vanguard.com, |
fund only if preceded or accompanied by | and searching for “proxy voting |
the fund’s current prospectus. | guidelines,” or by calling |
| Vanguard at 800-662-2739. They are |
| also available from |
| the SEC’s website, www.sec.gov. In |
| addition, you may |
| obtain a free report on how your fund |
| voted the proxies for securities it owned |
| during the 12 months ended June 30. |
| To get the report, visit either |
| www.vanguard.com or www.sec.gov. |
| |
| You can review and copy information |
| about your fund |
| at the SEC’s Public Reference Room in |
| Washington, D.C. |
| To find out more about this public |
| service, call the SEC at 202-551-8090. |
| Information about your fund is also |
| available on the SEC’s website, and you can receive copies of this information, |
| for a fee, by sending a request in either |
| of two ways: via e-mail addressed to |
| publicinfo@sec.gov or via regular mail |
| addressed to the |
| Public Reference Section, Securities and |
| Exchange Commission, Washington, DC |
| 20549-0102. |
| |
| © 2006 The Vanguard Group, Inc. |
| All rights reserved. |
| Vanguard Marketing |
| Corporation, Distributor. |
| Q822 072006 |
Item 2: Not Applicable
Item 3: Not Applicable
Item 4: Not Applicable
Item 5: Not applicable.
Item 6: Not applicable.
Item 7: Not applicable.
Item 8: Not applicable.
Item 9: Not applicable.
Item 10: Not applicable.
Item 11: Controls and Procedures
(a) Disclosure Controls and Procedures. The Principal Executive and Financial Officers concluded that the Registrant's Disclosure Controls and Procedures are effective based on their evaluation of the Disclosure Controls and Procedures as of a date within 90 days of the filing date of this report.
(b) Internal Control Over Financial Reporting. There were no significant changes in Registrant‘s Internal Control Over Financial Reporting or in other factors that could significantly affect this control subsequent to the date of the evaluation, including any corrective actions with regard to significant deficiencies and material weaknesses.
Item 12: Exhibits.
Certifications.
Pursuant to the requirements of the Securities Exchange Act of 1934 and the Investment Company Act of 1940, the registrant has duly caused this report to be signed on its behalf by the undersigned, thereunto duly authorized.
| VANGUARD CONVERTIBLE SECURITIES FUND
|
| BY: | (signature)
|
| (HEIDI STAM)
JOHN J. BRENNAN*
CHIEF EXECUTIVE OFFICER |
Pursuant to the requirements of the Securities Exchange Act of 1934 and the Investment Company Act of 1940, this report has been signed below by the following persons on behalf of the registrant and in the capacities and on the dates indicated.
| VANGUARD CONVERTIBLE SECURITIES FUND
|
| BY: | (signature)
|
| (HEIDI STAM)
JOHN J. BRENNAN*
CHIEF EXECUTIVE OFFICER |
| VANGUARD CONVERTIBLE SECURITIES FUND
|
| BY: | (signature)
|
| (HEIDI STAM)
THOMAS J. HIGGINS*
TREASURER |
*By Power of Attorney. See File Number 2-31333, filed on January 23, 2006. Incorporated by Reference.