> | For the fiscal half-year, Vanguard Convertible Securities Fund returned –0.8%, declining slightly more than its benchmark index but less than its peer-group average. |
> | Bond market gains and an incipient recovery in the stock market provided some support for the fund’s hybrid holdings in a volatile investment environment. |
> | The fund benefited from the advisor’s sector positioning and securities selection, enjoying especially strong performance among energy holdings and avoiding much of the trouble in the beleaguered financials sector. |
Contents | |
| |
Your Fund’s Total Returns | 1 |
Chairman’s Letter | 2 |
Advisor’s Report | 7 |
Fund Profile | 10 |
Performance Summary | 11 |
Financial Statements | 12 |
About Your Fund’s Expenses | 22 |
Trustees Approve Advisory Agreement | 24 |
Glossary | 25 |
Please note: The opinions expressed in this report are just that—informed opinions. They should not be considered promises or advice. Also, please keep in mind that the information and opinions cover the period through the date on the cover of this report. Of course, the risks of investing in your fund are spelled out in the prospectus.
Your Fund’s Total Returns
Six Months Ended May 31, 2008 | | |
| Ticker | Total |
| Symbol | Returns |
Vanguard Convertible Securities Fund | VCVSX | –0.8% |
Merrill Lynch All US Convertibles Index | | –0.6 |
Average Convertible Securities Fund1 | | –1.5 |
Your Fund’s Performance at a Glance | | | | |
November 30, 2007–May 31, 2008 | | | | |
| | | Distributions Per Share |
| Starting | Ending | Income | Capital |
| Share Price | Share Price | Dividends | Gains |
Vanguard Convertible Securities Fund | $14.95 | $13.70 | $0.300 | $0.820 |
1 | Derived from data provided by Lipper Inc. |
1

Chairman’s Letter
Dear Shareholder,
During the six months ended May 31, convertible securities—which combine some of the characteristics of common stocks and bonds—faced stiff headwinds. Risk-averse investors shunned common stocks and lower-rated bonds in favor of the relative safety of U.S. Treasury and other high-quality bonds.
Falling stock prices diminished the attractiveness of the equity conversion feature of convertible securities, driving down their prices. At the same time, the benefit of bond-like returns was tempered by the below-investment-grade ratings of most convertible bonds.
Against this backdrop, Vanguard Convertible Securities Fund returned –0.8%, declining slightly more than its benchmark index but less than the peer-group average.
The conservative strategies of the advisor—Oaktree Capital Management, L.P.—helped the fund to hold up better than many competitors. Your advisor focuses on convertible bonds that appear to offer significant protection against declines in the value of the underlying common stock. In addition, the advisor keeps the fund fully invested in convertible securities, unlike many peer funds whose holdings include common stocks and traditional bonds.
2
Economic uncertainty set the tone for stocks
Financial markets struggled to find their footing during the half-year. Oil prices climbed to record highs, the housing market worsened, and consumers grew increasingly wary of spending as economic uncertainty took hold.
The broad U.S. stock market returned –3.6% for the period, a disappointing result, but one that was buoyed by a recovery in April and May. For the most part, growth stocks outperformed value stocks, and international stocks generally kept pace with U.S. stocks.
Investors’ ‘flight to quality’ unsettled the bond market
The broad bond market outpaced stocks for the six months, but the bond results were far from uniform. As noted above, investors heavily favored Treasury issues, and this “flight to quality” pressured the prices of many other types of bonds—including municipal bonds, which experienced unusual volatility.
In an effort to revive the slowing economy and increase liquidity in the credit markets, the Federal Reserve Board lowered its target for the federal funds rate in five separate actions, to 2.0%. At the end of the period, the Fed continued to face the delicate task of balancing its efforts to stimulate the economy with rising concerns about inflationary pressures.
Market Barometer | | | |
| Total Returns |
| Periods Ended May 31, 2008 |
| Six Months | One Year | Five Years1 |
Stocks | | | |
Russell 1000 Index (Large-caps) | –3.8% | –6.2% | 10.4% |
Russell 2000 Index (Small-caps) | –1.9 | –10.5 | 12.5 |
Dow Jones Wilshire 5000 Index (Entire market) | –3.6 | –6.1 | 11.0 |
MSCI All Country World Index ex USA (International) | –3.2 | 3.0 | 22.1 |
| | | |
Bonds | | | |
Lehman U.S. Aggregate Bond Index (Broad taxable market) | 1.5% | 6.9% | 3.8% |
Lehman Municipal Bond Index | 1.4 | 3.9 | 3.7 |
Citigroup 3-Month Treasury Bill Index | 1.3 | 3.6 | 3.0 |
| | | |
CPI | | | |
Consumer Price Index | 3.1% | 4.2% | 3.4% |
1 Annualized.
3
Downside protection, sector choices supported the fund’s returns
Your fund’s six-month results reflected the “hybrid” stock-and-bond-like nature of its portfolio, as well as the advisor’s sector positioning.
The performance of a convertible security generally reflects changes in the price of its underlying common stock, although convertibles tend not to rise—or fall—as much as their equity counterparts. When stock prices are on the upswing, the conversion feature becomes more attractive and boosts returns. And when stocks struggle and bonds shine, the bond-like stream of interest and principal payments on convertible bonds (and dividend payments on convertible preferred stocks) can provide a cushion for returns.
This was evident in the fiscal half-year: Vanguard Convertible Securities Fund returned –0.8%, declining less than the –3.6% return of the broad U.S. stock market but trailing the 1.5% return of the broad U.S. bond market.
The continued surge in fuel prices to once-unimaginable levels was a double-edged sword for the fund’s portfolio. Energy was among the best-performing sectors in the convertibles market, while industrials swooned. Your fund benefited from the advisor’s significantly above-benchmark weighting in the energy sector. Two top-ten holdings were among the fund’s
Annualized Expense Ratios1 | | |
Your Fund Compared With Its Peer Group | | |
| | Average |
| | Convertible |
| Fund | Securities Fund |
Convertible Securities Fund | 0.70% | 1.43% |
1 Fund expense ratio reflects the six months ended May 31, 2008. Peer-group expense ratio is derived from data provided by Lipper Inc. and captures information through year-end 2007.
4
leading contributors: Transocean, an international offshore drilling contractor, and Chesapeake Energy, a U.S.-based natural gas producer. Among industrials, however, soaring oil prices took a big bite out of airlines’ already thin profit margins, trimming the return of UAL (United Air Lines).
In the financials sector, your fund benefited from having less exposure than its benchmark index. Also, the fund avoided securities of homebuilders and subprime lenders, a distinct advantage as these segments have borne much of the brunt of the subprime-mortgage meltdown and ongoing liquidity crunch.
The cloud of credit-market turmoil did have a silver lining for potential buyers of new convertible issues. Many capital-hungry companies with sharply falling stock prices—notably banks and other financial institutions—were driven to issue convertible securities with higher yields and other features to attract investors. Based on careful credit analysis, the advisor took advantage of some of these offerings, including a Bank of America issue that is now a top-ten holding and performed well in the period.
For more information on the fund’s positioning and performance during the half-year, please see the Advisor’s Report, which begins on page 7.
Chart a balanced course, and then stick with it
Whether short-term performance is gratifying or disappointing, we at Vanguard always encourage investors to maintain a long-term focus. We believe the key to investment success is to determine a diversified mix of stock, bond, and money market funds that is consistent with your long-term goals, time horizon, and risk tolerance. Once you have made this important asset allocation decision, you should stick with it—and try to ignore the many temptations and distractions in the marketplace.
The Convertible Securities Fund—with holdings aimed at capturing some of the growth potential of stocks while offering the downside protection of bonds—can play an important complementary role within a diversified portfolio. The advisor’s disciplined and conservative focus has helped deliver outstanding long-term results in this complex and specialized asset class. And the fund’s low expenses
5
have helped investors to keep more of the returns. While this benefit is especially evident in lean times, it’s an advantage that compounds over the years.
As I close this report to you, it’s my pleasure to introduce the fund’s new president, F. William McNabb III. Bill is a man of great character and integrity who is intimately familiar with all aspects of Vanguard—from how we serve our clients to how we invest for them.
Bill and I have worked together very closely for more than two decades. I’m thrilled that the fund’s board elected him president, effective March 1, and designated him to succeed me as chief executive officer, a role he will assume within a year, after an orderly transition.
Bill and the rest of our team will serve you and our other clients extremely well in the years ahead.
Thank you for entrusting your assets to Vanguard.
Sincerely,

John J. Brennan
Chairman and Chief Executive Officer
June 11, 2008
6
Advisor’s Report
The Convertible Securities Fund performed reasonably well in a very challenging investment environment. Although financial markets were in turmoil during the fiscal half-year, convertible securities provided a strong level of downside price protection. Demand for convertibles and the supply of new issues were quite robust.
Given the environment, we were satisfied with the portfolio’s return, which was in line with that of our primary benchmark, the Merrill Lynch All US Convertibles Index.
The investment environment
The first half of fiscal-year 2008 saw a continuation of the very negative, highly volatile, and challenging investment environment that characterized the end of the prior period. The result was losses for most equity and equity-related benchmarks. This sharp decline in equity prices was the most dominant influence on convertible performance for the six months.
Numerous factors contributed to the troubles, but in summary: Equities were hurt by economic weakness that was compounded by large liquidity disruptions throughout the fixed income marketplace and the painful unwinding of leverage across many fronts of the U.S. and international economies. Offsetting these negative factors was a significant and unprecedented government effort to lower interest rates, increase credit market liquidity, buttress consumer spending through economic stimulus, and overhaul the financial regulatory system. These actions provided moments of relief and several periods of price improvement, but the overall psychology and market trend remained very unsettled.
Although they were certainly affected by the turmoil, convertible securities provided meaningful downside protection. Their valuations were buoyed by the continued high volatility, which was quite substantial during some days and from day to day, as well as by their relatively short duration and generally stable credit quality. Overall, the convertible securities market functioned normally, with sizable new issuance and good trading activity.
Within the convertibles market, energy and materials (including metals) were the best-performing sectors, while information technology and consumer discretionary were the weakest. As you would expect, any exposure to financials (lending, housing, brokerage, etc.) was particularly painful. Transportation issues—airlines and autos—were exceptionally weak as the price of oil soared through $125 per barrel. Health care, one of the largest convertible sectors, showed mixed performance; some lower-rated issues came under severe selling pressure, while the larger, stronger companies performed well above average.
For the period, 73 new issues were priced, totaling $61.7 billion. They included several exceptionally large deals—notably from American International Group, Bank of America, Chesapeake Energy, Citigroup, Lehman Brothers Holdings, and Transocean. Financial services companies were easily
7
the most dominant issuers, as many needed to re-equitize their balance sheets. Although nearly all of these deals were rated investment-grade and featured extended periods of call protection, most were issued in the less-desirable convertible preferred or mandatory convertible structures. Overall, pricing in the new-issue market was generally attractive for investors.
Our successes
Energy and health care were sectors where we found statistically and fundamentally attractive convertibles. Our best individual performers were Alpha Natural Resources, BioMarin Pharmaceutical, Chesapeake Energy, Gilead Sciences, and McMoRan Exploration.
We were also able to capitalize on the active new-issue calendar, as many securities performed well immediately after issuance. Convertibles from Bank of America, Pioneer Natural Resources, Suntech Power Holdings, and Transocean all performed well. We found value in more investment-grade issues than usual; several names that were new to the convertible universe arrived with above-average credit ratings.
Our shortfalls
A wide variety of holdings hurt our overall performance during the period. Significant detractors included convertibles from Ciena, General Motors, UAL, and VeriFone Holdings. Other disappointing holdings were Cadence Design Systems, Hologic, Iconix Brand Group, and Washington Mutual.
As discussed above, any exposure to financials was painful. Although we were well underweighted in this sector relative to the index (about 10% of the fund’s assets versus 25% of the index, at the end of the period), our small holdings in several financial issues hampered our performance. However, it was gratifying that one of our larger financial positions, the new Bank of America 7.25% convertible preferred, performed relatively well.
8
The fund’s positioning
In the near term, we are trimming or eliminating holdings that have become pure bond substitutes. These are issues that have developed bond-like yields and very high conversion premiums but offer little, if any, upside equity potential. While realizing that potential has seemed an unlikely scenario on most days lately, we are sticking to our discipline of reducing or selling issues whose underlying equity has little prospect for growth and redeploying the proceeds into securities with a more attractive upside/downside balance. As mentioned earlier, convertibles have provided relatively strong downside protection in these difficult times, but that process creates securities with undesirably elevated conversion premiums.
Larry W. Keele, CFA
Principal and Founder
Oaktree Capital Management, L.P.
June 11, 2008
Major Portfolio Changes: | |
Six Months Ended May 31, 2008 | |
| |
Additions | Comments |
Alpha Natural Resources | Attractive new issue from an undervalued coal company. |
(2.38% convertible note due 4/15/2015) | |
Bank of America | Statistically attractive new issue with extended call protection. |
(7.25% convertible preferred) | |
Health Management Associates | New issue, with six-year put, from a company with an attractive |
(3.75% convertible note due 5/1/2028) | fundamental story. |
Inverness Medical Innovations | Very cheap convertible preferred from a well-managed |
(3.00% convertible preferred) | health care company. |
Suntech Power Holdings | Attractive long-term equity prospects, with a very favorable |
(3.00% convertible note due 3/15/2013) | risk/return convertible structure. |
| |
Reductions | Comments |
McMoRan Exploration | Sold after becoming a pure equity substitute. Proceeds invested |
(6.75% convertible preferred) | in a similar company with a balanced convertible structure. |
NII Holdings | Sold after developing a very high conversion premium and |
(3.13% convertible note due 6/15/2012) | becoming a pure bond substitute. |
TriZetto Group | Sold after the company agreed to a cash takeover. |
(1.13% convertible note due 4/15/2012) | |
(2.75% convertible note due 10/1/2025) | |
VeriFone Holdings | Sold after announcing fundamental disappointments and |
(1.63% convertible note due 6/15/2012) | developing a high conversion premium. |
9
Fund Profile
As of May 31, 2008
Portfolio Characteristics | |
| |
Number of Securities | 117 |
Yield1 | 2.7% |
Conversion Premium | 33.6% |
Average Weighted Maturity | 5.1 years |
Average Coupon | 2.5% |
Average Quality2 | Ba2/BB |
Average Duration | 5.5 years |
Foreign Holdings | 7.3% |
Turnover Rate | 96%3 |
Expense Ratio | 0.70%3 |
Short-Term Reserves | 3.3% |
Distribution by Maturity | |
(% of fixed income portfolio) | |
| |
Under 1 Year | 3.5% |
1–5 Years | 63.3 |
5–10 Years | 25.6 |
10–20 Years | 6.1 |
20–30 Years | 1.0 |
Over 30 Years | 0.5 |
Distribution by Credit Quality2 | |
(% of fixed income portfolio) | |
| |
Aaa/AAA | 0.0% |
Aa/AA | 0.5 |
A/A | 9.9 |
Baa/BBB | 11.7 |
Ba/BB | 15.0 |
B/B | 18.6 |
Below B/B | 7.3 |
Not Rated | 37.0 |
Volatility Measures4 | |
| Fund Versus |
| Comparative Index5 |
R-Squared | 0.84 |
Beta | 0.90 |
Ten Largest Holdings6 (% of total net assets) |
| | |
Transocean Inc. | oil and gas drilling | 3.6% |
Gilead Sciences Inc. | biotechnology | 3.2 |
Chesapeake Energy Corp. | oil and gas | |
| exploration and | |
| production | 2.6 |
Inverness Medical | | |
Innovations Inc. | health care supplies | 2.4 |
ON Semiconductor | semiconductors | 2.3 |
Bank of America Corp. | diversified financial | |
| services | 2.2 |
Equinix Inc. | Internet software | |
| and services | 2.1 |
Ciena Corp. | communications | |
| equipment | 2.0 |
Teva Pharmaceutical | | |
Financial | pharmaceuticals | 2.0 |
Suntech Power Holdings | electrical components | |
| and equipment | 1.8 |
Top Ten | | 24.2% |
Sector Diversification (% of market exposure) |
| |
Consumer Discretionary | 6.8% |
Consumer Staples | 3.5 |
Energy | 20.9 |
Financials | 10.7 |
Health Care | 25.1 |
Industrials | 13.7 |
Information Technology | 15.0 |
Materials | 1.1 |
Telecommunication Services | 3.2 |
Utilities | 0.0 |
1 30-day SEC yield. See the Glossary on pages 25–26.
2 Ratings: Moody’s Investors Service, Standard & Poor’s.
3 Annualized.
4 For an explanation of R-squared, beta, and other terms used here, see the Glossary on pages 25–26.
5 Merrill Lynch All US Convertibles Index.
6 The holdings listed exclude any temporary cash investments and equity index products.
10
Performance Summary
All of the returns in this report represent past performance, which is not a guarantee of future results that may be achieved by the fund. (Current performance may be lower or higher than the performance data cited. For performance data current to the most recent month-end, visit our website at www.vanguard.com/performance.) Note, too, that both investment returns and principal value can fluctuate widely, so an investor’s shares, when sold, could be worth more or less than their original cost. The returns shown do not reflect taxes that a shareholder would pay on fund distributions or on the sale of fund shares.
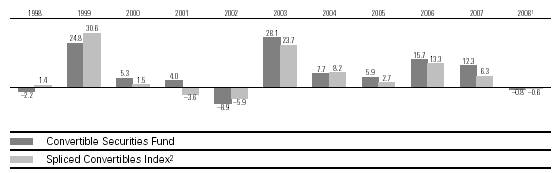
Fiscal-Year Total Returns (%): November 30, 1997–May 31, 2008
Average Annual Total Returns: Periods Ended March 31, 2008
This table presents average annual total returns through the latest calendar quarter—rather than through the end of the fiscal period. Securities and Exchange Commission rules require that we provide this information.
| | | | | | Ten Years |
| Inception Date | One Year | Five Years | Capital | Income | Total |
Convertible Securities Fund3 | 6/17/1986 | 2.43% | 11.77% | 3.04% | 3.89% | 6.93% |
1 Six months ended May 31, 2008.
2 CS First Boston Convertibles Index through November 30, 2004; Merrill Lynch All US Convertibles Index thereafter.
3 Total returns do not reflect the 1% fee assessed on redemptions of shares purchased on or after September 15, 2005, and held for less than one year, or the account service fee that may be applicable to certain accounts with balances below $10,000.
Note: See Financial Highlights table on page 18 for dividend and capital gains information.
11
Financial Statements (unaudited)
Statement of Net Assets
As of May 31, 2008
The fund provides a complete list of its holdings four times in each fiscal year, at the quarter-ends. For the second and fourth fiscal quarters, the lists appear in the fund’s semiannual and annual reports to shareholders. For the first and third fiscal quarters, the fund files the lists with the Securities and Exchange Commission on Form N-Q. Shareholders can look up the fund’s Forms N-Q on the SEC’s website at www.sec.gov. Forms N-Q may also be reviewed and copied at the SEC’s Public Reference Room (see the back cover of this report for further information).
| | | | Face | Market |
| | | Maturity | Amount | Value• |
| | Coupon | Date | ($000) | ($000) |
Convertible Bonds (83.9%) | | | | |
Consumer Discretionary (6.6%) | | | | |
1 | American Real Estate | 4.000% | 8/15/13 | 4,995 | 4,629 |
| Ford Motor Co. | 4.250% | 12/15/36 | 17,880 | 17,008 |
| General Motors Corp. | 6.250% | 7/15/33 | 747* | 12,367 |
1 | Iconix Brand Group | 1.875% | 6/30/12 | 8,640 | 7,117 |
| Interpublic Group | 4.250% | 3/15/23 | 13,920 | 15,016 |
| Sonic Automotive, Inc. | 4.250% | 11/30/15 | 4,380 | 4,457 |
1 | Stewart Enterprises | 3.125% | 7/15/14 | 4,245 | 3,831 |
| | | | | 64,425 |
Consumer Staples (3.4%) | | | | |
| Archer-Daniels-Midland Co. | 0.875% | 2/15/14 | 4,420 | 4,961 |
1 | Archer-Daniels-Midland Co. | 0.875% | 2/15/14 | 9,615 | 10,793 |
| Chattem Inc. | 1.625% | 5/1/14 | 6,960 | 7,221 |
| Molson Coors Brewing Co. | 2.500% | 7/30/13 | 7,835 | 10,019 |
| | | | | 32,994 |
Energy (18.6%) | | | | |
| Alpha Natural Resources | 2.375% | 4/15/15 | 1,200 | 1,995 |
| Bill Barrett Corp. | 5.000% | 3/15/28 | 9,005 | 10,243 |
| Carrizo Oil & Gas | 4.375% | 6/1/28 | 13,310 | 13,510 |
| Chesapeake Energy Corp. | 2.250% | 12/15/38 | 20,560 | 20,226 |
| Hercules Offshore LLC | 3.375% | 6/1/38 | 6,215 | 6,122 |
| Hornbeck Offshore Services | 1.625% | 11/15/26 | 12,120 | 15,196 |
| Nabors Industries Ltd. | 0.940% | 5/15/11 | 12,415 | 13,812 |
1 | Patriot Coal Corp. | 3.250% | 5/31/13 | 5,570 | 6,113 |
| Peabody Energy Corp. | 4.750% | 12/15/41 | 2,730 | 3,965 |
| Pennsylvania Virginia Co. | 4.500% | 11/15/12 | 7,860 | 10,365 |
| Pioneer Natural Resources | 2.875% | 1/15/38 | 3,755 | 5,393 |
| St. Mary Land & Exploration | 3.500% | 4/1/27 | 12,100 | 14,127 |
| Superior Energy Services, Inc. | 1.500% | 12/15/26 | 7,170 | 9,411 |
1 | Superior Energy Services, Inc. | 1.500% | 12/15/26 | 3,440 | 4,515 |
| Transocean Inc. | 1.500% | 12/15/37 | 3,290 | 3,722 |
| Transocean Inc. | 1.500% | 12/15/37 | 15,300 | 17,193 |
| Transocean Inc. | 1.625% | 12/15/37 | 12,740 | 14,285 |
| Trico Marine | 3.000% | 1/15/27 | 7,225 | 7,333 |
1 | Trico Marine | 6.500% | 5/15/28 | 3,395 | 4,108 |
| | | | | 181,634 |
12
| | | | Face | Market |
| | | Maturity | Amount | Value• |
| | Coupon | Date | ($000) | ($000) |
Financials (2.9%) | | | | |
| CapitalSource Inc. | 7.250% | 7/15/37 | 6,005 | 5,037 |
| Lehman Brothers Holdings | 1.000% | 5/14/12 | 7,180 | 6,456 |
1 | Prologis Inc. | 2.250% | 4/1/37 | 8,695 | 8,565 |
1 | Rayonier TRS Holdings Inc. | 3.750% | 10/15/12 | 7,745 | 8,248 |
| | | | | 28,306 |
Health Care (22.1%) | | | | |
1 | Allergan, Inc. | 1.500% | 4/1/26 | 10,095 | 11,104 |
| Allergan, Inc. | 1.500% | 4/1/26 | 5,955 | 6,550 |
| Alpharma Inc. | 2.125% | 3/15/27 | 8,815 | 8,914 |
| American Medical Systems Holdings, Inc. | 3.250% | 7/1/36 | 3,790 | 3,738 |
| Cubist Pharmaceuticals Inc. | 2.250% | 6/15/13 | 13,735 | 12,653 |
| Five Star Quality Care Inc. | 3.750% | 10/15/26 | 4,645 | 3,542 |
| Genzyme Corp. | 1.250% | 12/1/08 | 15,335 | 16,485 |
| Gilead Sciences Inc. | 0.500% | 5/1/11 | 1,745 | 2,598 |
1 | Gilead Sciences Inc. | 0.500% | 5/1/11 | 19,495 | 29,023 |
1 | Health Management Assoc. | 3.750% | 5/1/28 | 8,960 | 9,681 |
| Hologic Inc. | 2.000% | 12/15/37 | 17,235 | 15,339 |
1 | Integra Lifesciences | 2.375% | 6/1/12 | 7,790 | 6,982 |
1 | Inverness Medical Innovations Inc. | 3.000% | 5/15/16 | 8,400 | 8,757 |
| Invitrogen Corp. | 1.500% | 2/15/24 | 11,520 | 12,053 |
| Invitrogen Corp. | 3.250% | 6/15/25 | 3,675 | 4,185 |
| Kendle International Inc. | 3.375% | 7/15/12 | 3,540 | 3,713 |
| Lifepoint Hospital, Inc. | 3.500% | 5/15/14 | 5,270 | 4,783 |
| Medtronic Inc. | 1.500% | 4/15/11 | 7,400 | 7,752 |
1 | Medtronic Inc. | 1.500% | 4/15/11 | 960 | 1,006 |
1 | Nuvasive Inc. | 2.250% | 3/15/13 | 8,430 | 9,579 |
| SFBC International, Inc. | 2.250% | 8/15/24 | 8,255 | 7,182 |
| Sonosite Inc. | 3.750% | 7/15/14 | 3,425 | 3,631 |
| Teva Pharmaceutical Financial | 1.750% | 2/1/26 | 17,625 | 19,498 |
| Thoratec Corp. | 1.379% | 5/16/34 | 4,220 | 2,569 |
1 | Wilson Greatbatch | 2.250% | 6/15/13 | 6,010 | 4,785 |
| | | | | 216,102 |
Industrials (13.0%) | | | | |
1 | AAR Corp. | 1.625% | 3/1/14 | 5,110 | 4,158 |
| AAR Corp. | 1.750% | 2/1/26 | 800 | 729 |
| Albany International Corp. | 2.250% | 3/15/26 | 2,355 | 2,329 |
1 | Alliant Techsystems Inc. | 2.750% | 9/15/11 | 6,830 | 8,623 |
| AMR Corp. | 4.500% | 2/15/24 | 8,650 | 6,844 |
1 | Barnes Group Inc. | 3.375% | 3/15/27 | 6,080 | 7,843 |
| Barnes Group Inc. | 3.375% | 3/15/27 | 2,490 | 3,212 |
| Covanta Holding | 1.000% | 2/1/27 | 10,645 | 11,816 |
1 | DRS Technologies Inc. | 2.000% | 2/1/26 | 3,015 | 4,078 |
1 | General Cable Corp. | 1.000% | 10/15/12 | 15,185 | 16,438 |
| JA Solar Holdings Co. Ltd. | 4.500% | 5/15/13 | 9,310 | 9,170 |
| L-3 Communications Corp. | 3.000% | 8/1/35 | 12,937 | 15,880 |
| SunPower Corp. | 0.750% | 8/1/27 | 5,840 | 7,037 |
| Suntech Power Holdings | 0.250% | 2/15/12 | 3,171 | 3,516 |
1 | Suntech Power Holdings | 3.000% | 3/15/13 | 11,380 | 14,410 |
| UAL Corp. | 5.000% | 2/1/21 | 3,870 | 1,979 |
1 | Waste Connections, Inc. | 3.750% | 4/1/26 | 5,790 | 6,535 |
| Waste Connections, Inc. | 3.750% | 4/1/26 | 2,280 | 2,574 |
| | | | | 127,171 |
13
| | | | Face | Market |
| | | Maturity | Amount | Value• |
| | Coupon | Date | ($000) | ($000) |
Information Technology (14.4%) | | | | |
| Arris Group, Inc. | 2.000% | 11/15/26 | 3,555 | 3,167 |
| CACI International Inc. | 2.125% | 5/1/14 | 5,175 | 5,680 |
1 | CACI International Inc. | 2.125% | 5/1/14 | 1,600 | 1,756 |
| Ciena Corp. | 0.250% | 5/1/13 | 20,720 | 19,839 |
| Digital River, Inc. | 1.250% | 1/1/24 | 736 | 775 |
| Equinix Inc. | 2.500% | 4/15/12 | 17,100 | 17,998 |
| Equinix Inc. | 3.000% | 10/15/14 | 2,555 | 2,894 |
| Fair Isaac Corp. | 1.500% | 8/15/23 | 4,980 | 4,918 |
| FEI Co. | 2.875% | 6/1/13 | 6,020 | 6,253 |
1 | FEI Co. | 2.875% | 6/1/13 | 45 | 47 |
| Flextronics International Ltd. | 1.000% | 8/1/10 | 14,925 | 14,477 |
| Lawson Software Inc. | 2.500% | 4/15/12 | 3,705 | 3,640 |
1 | Lawson Software Inc. | 2.500% | 4/15/12 | 9,355 | 9,191 |
| Magma Design Automation Inc. | 2.000% | 5/15/10 | 235 | 203 |
1 | Magma Design Automation Inc. | 2.000% | 5/15/10 | 4,324 | 3,735 |
| ON Semiconductor | 2.625% | 12/15/26 | 19,165 | 22,207 |
| Sybase Inc. | 1.750% | 2/22/25 | 5,735 | 7,685 |
| Symantec Corp. | 0.750% | 6/15/11 | 9,825 | 12,171 |
1 | Synnex Corp. | 4.000% | 5/15/18 | 2,440 | 2,547 |
1 | Xilinx Inc. | 3.125% | 3/15/37 | 2,260 | 2,254 |
| | | | | 141,437 |
Materials (1.1%) | | | | |
| Coeur D’Alene Mines Corp. | 1.250% | 1/15/24 | 9,710 | 8,181 |
| Coeur D’Alene Mines Corp. | 3.250% | 3/15/28 | 2,895 | 2,497 |
| | | | | 10,678 |
Telecommunication Services (1.8%) | | | | |
| Globalstar | 5.750% | 4/1/28 | 5,045 | 3,872 |
| NII Holdings | 3.125% | 6/15/12 | 300 | 259 |
1 | SBA Communications | 1.875% | 5/1/13 | 13,315 | 14,026 |
| | | | | 18,157 |
Total Convertible Bonds (Cost $784,609) | | | | 820,904 |
| | | | | |
| | | | Shares | |
Convertible Preferred Stocks (12.4%) | | | | |
Energy (1.5%) | | | | |
| Chesapeake Energy Corp. | 5.000% | | 31,000 | 4,789 |
1 | Chesapeake Energy Corp. | 5.000% | | 2,200 | 340 |
| Goodrich Petroleum Corp. | 5.375% | | 137,200 | 9,964 |
| | | | | 15,093 |
Financials (7.4%) | | | | |
† | American International Group, Inc. | 8.500% | | 50,500 | 3,736 |
| Aspen Insurance Holdings, Ltd. | 5.625% | | 165,460 | 8,014 |
| Bank of America Corp. | 7.250% | | 21,550 | 21,792 |
| CIT Group Inc. | 8.750% | | 218,200 | 11,698 |
| Citigroup Inc. | 6.500% | | 272,600 | 13,153 |
† | Federal National Mortgage Assn. | 8.750% | | 97,700 | 4,873 |
† | Legg Mason Inc. | 7.000% | | 39,500 | 1,935 |
† | Lehman Brothers Holdings | 7.250% | | 5,880 | 6,380 |
| Washington Mutual Inc. | 7.750% | | 1,480 | 1,125 |
| | | | | 72,706 |
14
| | | | Market |
| | | | Value• |
| Coupon | | Shares | ($000) |
Health Care (2.0%) | | | | |
† Inverness Medical Innovations Inc. | 3.000% | | 56,532 | 14,642 |
Schering-Plough Corp. | 6.000% | | 24,100 | 4,722 |
| | | | 19,364 |
Industrials (0.2%) | | | | |
Continental Airlines Financial Trust | 6.000% | | 115,000 | 2,099 |
| | | | |
Telecommunication Services (1.3%) | | | | |
Crown Castle International Corp. | 6.250% | | 203,600 | 12,381 |
Total Convertible Preferred Stocks (Cost $142,291) | | | 121,643 |
Temporary Cash Investment (3.3%) | | | | |
2 Vanguard Market Liquidity Fund | | | | |
(Cost $32,388) | 2.319% | | 32,387,999 | 32,388 |
Total Investments (99.6%) (Cost $959,288) | | | | 974,935 |
Other Assets and Liabilities (0.4%) | | | | |
Other Assets—Note C | | | | 16,423 |
Liabilities | | | | (12,772) |
| | | | 3,651 |
Net Assets (100%) | | | | |
Applicable to 71,449,862 outstanding $.001 par value shares of | | |
beneficial interest (unlimited authorization) | | | | 978,586 |
Net Asset Value Per Share | | | | $13.70 |
At May 31, 2008, net assets consisted of:3 | | |
| Amount | Per |
| ($000) | Share |
Paid-in Capital | 952,516 | $13.33 |
Undistributed Net Investment Income | 2,642 | .04 |
Accumulated Net Realized Gains | 7,781 | .11 |
Unrealized Appreciation | 15,647 | .22 |
Net Assets | 978,586 | $13.70 |
• | See Note A in Notes to Financial Statements. |
* | Represents shares in thousands. |
† New issue that has not paid a dividend as of May 31, 2008.
1 Security exempt from registration under Rule 144A of the Securities Act of 1933. Such securities may be sold in transactions exempt from registration, normally to qualified institutional buyers. At May 31, 2008, the aggregate value of these securities was $234,817,000, representing 24.0% of net assets.
2 Affiliated money market fund available only to Vanguard funds and certain trusts and accounts managed by Vanguard. Rate shown is the 7-day yield.
3 See Note D in Notes to Financial Statements for the tax-basis components of net assets.
15
Statement of Operations
| Six Months Ended |
| May 31, 2008 |
| ($000) |
Investment Income | |
Income | |
Dividends | 3,341 |
Interest1 | 12,673 |
Total Income | 16,014 |
Expenses | |
Investment Advisory Fees—Note B | |
Basic Fee | 1,571 |
Performance Adjustment | 637 |
The Vanguard Group—Note C | |
Management and Administrative | 805 |
Marketing and Distribution | 95 |
Custodian Fees | 4 |
Shareholders’ Reports | 7 |
Trustees’ Fees and Expenses | 1 |
Total Expenses | 3,120 |
Net Investment Income | 12,894 |
Realized Net Gain (Loss) on Investment Securities Sold | 6,590 |
Change in Unrealized Appreciation (Depreciation) of Investment Securities | (25,764) |
Net Increase (Decrease) in Net Assets Resulting from Operations | (6,280) |
1 Interest income from an affiliated company of the fund was $861,000.
16
Statement of Changes in Net Assets
| Six Months Ended | Year Ended |
| May 31, | November 30, |
| 2008 | 2007 |
| ($000) | ($000) |
Increase (Decrease) in Net Assets | | |
Operations | | |
Net Investment Income | 12,894 | 22,207 |
Realized Net Gain (Loss) | 6,590 | 64,494 |
Change in Unrealized Appreciation (Depreciation) | (25,764) | 3,425 |
Net Increase (Decrease) in Net Assets Resulting from Operations | (6,280) | 90,126 |
Distributions | | |
Net Investment Income | (18,325) | (27,011) |
Realized Capital Gain1 | (48,731) | (49,952) |
Total Distributions | (67,056) | (76,963) |
Capital Share Transactions—Note F | | |
Issued | 209,621 | 207,475 |
Issued in Lieu of Cash Distributions | 60,334 | 68,629 |
Redeemed2 | (89,677) | (144,621) |
Net Increase (Decrease) from Capital Share Transactions | 180,278 | 131,483 |
Total Increase (Decrease) | 106,942 | 144,646 |
Net Assets | | |
Beginning of Period | 871,644 | 726,998 |
End of Period3 | 978,586 | 871,644 |
1 Includes fiscal 2008 and 2007 short-term gain distributions totaling $28,823,000 and $24,339,000, respectively. Short-term gain distributions are treated as ordinary income dividends for tax purposes.
2 Net of redemption fees of $103,000 and $185,000.
3 Net Assets—End of Period includes undistributed net investment income of $2,642,000 and $9,231,000.
17
Financial Highlights
| Six Months | | | | | |
| Ended | | | | | |
For a Share Outstanding | May 31, | Year Ended November 30, |
Throughout Each Period | 2008 | 2007 | 2006 | 2005 | 2004 | 2003 |
Net Asset Value, Beginning of Period | $14.95 | $14.81 | $13.57 | $13.62 | $13.05 | $10.57 |
Investment Operations | | | | | | |
Net Investment Income | .201 | .42 | .43 | .29 | .39 | .41 |
Net Realized and Unrealized Gain (Loss) | | | | | | |
on Investments | (.33) | 1.25 | 1.62 | .48 | .60 | 2.48 |
Total from Investment Operations | (.13) | 1.67 | 2.05 | .77 | .99 | 2.89 |
Distributions | | | | | | |
Dividends from Net Investment Income | (.30) | (.51) | (.38) | (.32) | (.42) | (.41) |
Distributions from Realized Capital Gains | (.82) | (1.02) | (.43) | (.50) | — | — |
Total Distributions | (1.12) | (1.53) | (.81) | (.82) | (.42) | (.41) |
Net Asset Value, End of Period | $13.70 | $14.95 | $14.81 | $13.57 | $13.62 | $13.05 |
| | | | | | |
Total Return2 | –0.83% | 12.34% | 15.70% | 5.92% | 7.71% | 28.07% |
| | | | | | |
Ratios/Supplemental Data | | | | | | |
Net Assets, End of Period (Millions) | $979 | $872 | $727 | $552 | $959 | $817 |
Ratio of Total Expenses to | | | | | | |
Average Net Assets3 | 0.70%* | 0.77% | 0.87% | 0.86% | 0.68% | 0.84% |
Ratio of Net Investment Income to | | | | | | |
Average Net Assets | 2.89%* | 2.83% | 3.14% | 2.18% | 2.94% | 3.82% |
Portfolio Turnover Rate | 96%* | 116% | 138% | 86% | 123% | 127% |
1 Calculated based on average shares outstanding.
2 Total returns do not reflect the 1% fee assessed on redemptions of shares purchased on or after September 15, 2005, and held for less than one year, or the account service fee that may be applicable to certain accounts with balances below $10,000.
3 Includes performance-based investment advisory fee increases (decreases) of 0.14%, 0.16%, 0.22%, 0.20%, 0.06%, and 0.13%.
See accompanying Notes, which are an integral part of the Financial Statements.
18
Notes to Financial Statements
Vanguard Convertible Securities Fund is registered under the Investment Company Act of 1940 as an open-end investment company, or mutual fund.
A. The following significant accounting policies conform to generally accepted accounting principles for U.S. mutual funds. The fund consistently follows such policies in preparing its financial statements.
1. Security Valuation: Securities are valued as of the close of trading on the New York Stock Exchange (generally 4 p.m., Eastern time) on the valuation date. Equity securities are valued at the latest quoted sales prices or official closing prices taken from the primary market in which each security trades; such securities not traded on the valuation date are valued at the mean of the latest quoted bid and asked prices. Bonds, and temporary cash investments acquired over 60 days to maturity, are valued using the latest bid prices or using valuations based on a matrix system (which considers such factors as security prices, yields, maturities, and ratings), both as furnished by independent pricing services. Investments in Vanguard Market Liquidity Fund are valued at that fund’s net asset value. Other temporary cash investments are valued at amortized cost, which approximates market value. Securities for which market quotations are not readily available, or whose values have been materially affected by events occurring before the fund’s pricing time but after the close of the securities’ primary markets, are valued by methods deemed by the board of trustees to represent fair value.
2. Federal Income Taxes: The fund intends to continue to qualify as a regulated investment company and distribute all of its taxable income. Management has analyzed the fund’s tax positions taken on federal income tax returns for all open tax years (tax years ended November 30, 2004–2007) and for the period ended May 31, 2008, and has concluded that no provision for federal income tax is required in the fund’s financial statements.
3. | Distributions: Distributions to shareholders are recorded on the ex-dividend date. |
4. Other: Dividend income is recorded on the ex-dividend date. Interest income includes income distributions received from Vanguard Market Liquidity Fund and is accrued daily. Premiums and discounts on debt securities purchased are amortized and accreted, respectively, to interest income over the lives of the respective securities. Security transactions are accounted for on the date securities are bought or sold. Costs used to determine realized gains (losses) on the sale of investment securities are those of the specific securities sold. Fees assessed on redemptions of capital shares are credited to paid-in capital.
B. Oaktree Capital Management, L.P., provides investment advisory services to the fund for a fee calculated at an annual percentage rate of average net assets. The basic fee is subject to quarterly adjustments based on the fund’s performance for the preceding three years relative to the Merrill Lynch All US Convertibles Index. For the six months ended May 31, 2008, the investment advisory fee represented an effective annual basic rate of 0.35% of the fund’s average net assets before an increase of $637,000 (0.14%) based on performance.
C. The Vanguard Group furnishes at cost corporate management, administrative, marketing, and distribution services. The costs of such services are allocated to the fund under methods approved by the board of trustees. The fund has committed to provide up to 0.40% of its net assets in capital contributions to Vanguard. At May 31, 2008, the fund had contributed capital of $77,000 to Vanguard (included in Other Assets), representing 0.01% of the fund’s net assets and 0.08% of Vanguard’s capitalization. The fund’s trustees and officers are also directors and officers of Vanguard.
19
D. Distributions are determined on a tax basis and may differ from net investment income and realized capital gains for financial reporting purposes. Differences may be permanent or temporary. Permanent differences are reclassified among capital accounts in the financial statements to reflect their tax character. Temporary differences arise when certain items of income, expense, gain, or loss are recognized in different periods for financial statement and tax purposes; these differences will reverse at some time in the future. Differences in classification may also result from the treatment of short-term gains as ordinary income for tax purposes. The fund’s tax-basis capital gains and losses are determined only at the end of each fiscal year.
Certain of the fund’s convertible preferred stock investments are treated as debt securities for tax purposes. During the six months ended May 31, 2008, the fund realized gains of $24,000 from the sale of these securities, which are included in distributable net investment income for tax purposes; accordingly, such gains have been reclassified from accumulated net realized gains to undistributed net investment income.
Certain of the fund’s convertible bond investments are in securities considered to be “contingent payment debt instruments,” for which any realized gains increase (and all or part of any realized losses decrease) income for tax purposes. During the six months ended May 31, 2008, the fund realized net losses of $1,182,000 from the sale of these securities, which decreased distributable net income for tax purposes; accordingly, such losses have been reclassified from accumulated net realized gains to undistributed net investment income.
At May 31, 2008, the cost of investment securities for tax purposes was $959,662,000. Net unrealized appreciation of investment securities for tax purposes was $15,273,000, consisting of unrealized gains of $58,474,000 on securities that had risen in value since their purchase and $43,201,000 in unrealized losses on securities that had fallen in value since their purchase.
E. During the six months ended May 31, 2008, the fund purchased $544,063,000 of investment securities and sold $411,042,000 of investment securities, other than temporary cash investments.
F. Capital shares issued and redeemed were:
| Six Months Ended | Year Ended |
| May 31, 2008 | November 30, 2007 |
| Shares | Shares |
| (000) | (000) |
Issued | 15,392 | 14,411 |
Issued in Lieu of Cash Distributions | 4,405 | 4,965 |
Redeemed | (6,666) | (10,137) |
Net Increase (Decrease) in Shares Outstanding | 13,131 | 9,239 |
G. In September 2006, the Financial Accounting Standards Board issued Statement of Financial Accounting Standards No. 157 (“FAS 157”), “Fair Value Measurements.” FAS 157 establishes a framework for measuring fair value and expands disclosures about fair value measurements in financial statements, effective for the fund’s current fiscal period.
20
The various inputs that may be used to determine the value of the fund’s investments are summarized in three broad levels. The inputs or methodologies used for valuing securities are not necessarily an indication of the risk associated with investing in those securities.
Level 1—Quoted prices in active markets for identical securities.
Level 2—Other significant observable inputs (including quoted prices for similar securities, interest rates, prepayment speeds, credit risk, etc.).
Level 3—Significant unobservable inputs (including the fund’s own assumptions used to determine the fair value of investments).
The following table summarizes the fund’s investments as of May 31, 2008, based on the inputs used to value them.
| Investments |
| in Securities |
Valuation Inputs | ($000) |
Level 1—Quoted prices | 166,398 |
Level 2—Other significant observable inputs | 808,537 |
Level 3—Significant unobservable inputs | — |
Total | 974,935 |
21
About Your Fund’s Expenses
As a shareholder of the fund, you incur ongoing costs, which include costs for portfolio management, administrative services, and shareholder reports (like this one), among others. Operating expenses, which are deducted from a fund’s gross income, directly reduce the investment return of the fund.
A fund’s expenses are expressed as a percentage of its average net assets. This figure is known as the expense ratio. The following examples are intended to help you understand the ongoing costs (in dollars) of investing in your fund and to compare these costs with those of other mutual funds. The examples are based on an investment of $1,000 made at the beginning of the period shown and held for the entire period.
The table below illustrates your fund’s costs in two ways:
• Based on actual fund return. This section helps you to estimate the actual expenses that you paid over the period. The “Ending Account Value” shown is derived from the fund’s actual return, and the third column shows the dollar amount that would have been paid by an investor who started with $1,000 in the fund. You may use the information here, together with the amount you invested, to estimate the expenses that you paid over the period.
To do so, simply divide your account value by $1,000 (for example, an $8,600 account value divided by $1,000 = 8.6), then multiply the result by the number given for your fund under the heading “Expenses Paid During Period.”
• Based on hypothetical 5% yearly return. This section is intended to help you compare your fund’s costs with those of other mutual funds. It assumes that the fund had a yearly return of 5% before expenses, but that the expense ratio is unchanged. In this case—because the return used is not the fund’s actual return—the results do not apply to your investment. The example is useful in making comparisons because the Securities and Exchange Commission requires all mutual funds to calculate expenses based on a 5% return. You can assess your fund’s costs by comparing this hypothetical example with the hypothetical examples that appear in shareholder reports of other funds.
Six Months Ended May 31, 2008 | | | |
| Beginning | Ending | Expenses |
| Account Value | Account Value | Paid During |
Convertible Securities Fund | 11/30/2007 | 5/31/2008 | Period1 |
Based on Actual Fund Return | $1,000.00 | $991.67 | $3.49 |
Based on Hypothetical 5% Yearly Return | 1,000.00 | 1,021.50 | 3.54 |
1 The calculations are based on expenses incurred in the most recent six-month period. The fund’s annualized six-month expense ratio for that period is 0.70%. The dollar amounts shown as “Expenses Paid” are equal to the annualized expense ratio multiplied by the average account value over the period, multiplied by the number of days in the most recent six-month period, then divided by the number of days in the most recent 12-month period.
22
Note that the expenses shown in the table on page 22 are meant to highlight and help you compare ongoing costs only and do not reflect transaction costs incurred by the fund for buying and selling securities. Further, the expenses do not include the 1% fee on redemptions of shares held for less than one year, nor do they include the account service fee described in the prospectus. If such fees were applied to your account, your costs would be higher. Your fund does not carry a “sales load.”
The calculations assume no shares were bought or sold during the period. Your actual costs may have been higher or lower, depending on the amount of your investment and the timing of any purchases or redemptions.
You can find more information about the fund’s expenses, including annual expense ratios, in the Financial Statements section of this report. For additional information on operating expenses and other shareholder costs, please refer to your fund’s current prospectus.
23
Trustees Approve Advisory Agreement
The board of trustees of Vanguard Convertible Securities Fund has renewed the fund’s investment advisory agreement with Oaktree Capital Management, L.P. The board determined that the retention of Oaktree was in the best interests of the fund and its shareholders.
The board based its decision upon an evaluation of the advisor’s investment staff, portfolio management process, and performance. The trustees considered the factors discussed below, among others. However, no single factor determined whether the board approved the agreement. Rather, it was the totality of the circumstances that drove the board’s decision.
Nature, extent, and quality of services
The board considered the quality of the fund’s investment management over both the short and long term, and took into account the organizational depth and stability of the advisor. The board noted that Oaktree, founded in 1995, specializes in managing convertible securities. The advisor uses a bottom-up investment approach to select convertible securities considered to have the best balance of upside potential and downside protection. Discipline is key to the fund’s management; Oaktree invests predominantly in convertibles possessing an attractive combination of conversion and income features—true hybrid securities—and sells the issues when their characteristics become too similar to those of conventional bonds or common stocks. Oaktree has advised the fund since 1996, and the board noted the depth and experience of its convertibles team.
The board concluded that the advisor’s experience, stability, and performance, among other factors, warranted continuation of the advisory agreement.
Investment performance
The board considered the short- and long-term performance of the fund, including any periods of outperformance or underperformance of a relevant benchmark and peer group. The board concluded that the advisor has carried out the fund’s investment strategy in disciplined fashion, and that performance results have been favorable compared with that of the fund’s benchmark and peer group. Information about the fund’s most recent performance can be found in the Performance Summary section of this report.
Cost
The board concluded that the fund’s expense ratio was far below the average expense ratio charged by funds in its peer group. The board noted that the fund’s advisory fee rate was also below the peer-group average. Information about the fund’s expense ratio appears in the About Your Fund’s Expenses section of this report as well as in the Financial Statements section, which also includes information about the advisory fee rate.
The board did not consider profitability of Oaktree in determining whether to approve the advisory fee, because Oaktree is independent of Vanguard and the advisory fee is the result of arm’s-length negotiations.
The benefit of economies of scale
The board concluded that the fund’s shareholders benefit from economies of scale because of breakpoints in the fund’s advisory fee schedule. The breakpoints reduce the effective rate of the fee as the fund’s assets increase.
The board will consider whether to renew the advisory agreement again after a one-year period.
24
Glossary
Average Coupon. The average interest rate paid on the fixed income securities held by a fund. It is expressed as a percentage of face value.
Average Duration. An estimate of how much the value of the bonds held by a fund will fluctuate in response to a change in interest rates. To see how the value could change, multiply the average duration by the change in rates. If interest rates rise by 1 percentage point, the value of the bonds in a fund with an average duration of five years would decline by about 5%. If rates decrease by a percentage point, the value would rise by 5%.
Average Quality. An indicator of credit risk, this figure is the average of the ratings assigned to a fund’s holdings by credit-rating agencies. The agencies make their judgment after appraising an issuer’s ability to meet its obligations. Quality is graded on a scale, with Aaa or AAA indicating the most creditworthy bond issuers.
Average Weighted Maturity. The average length of time until fixed income securities held by a fund reach maturity and are repaid. The figure reflects the proportion of fund assets represented by each security.
Beta. A measure of the magnitude of a fund’s past share-price fluctuations in relation to the ups and downs of a given market index. The index is assigned a beta of 1.00. Compared with a given index, a fund with a beta of 1.20 typically would have seen its share price rise or fall by 12% when the index rose or fell by 10%. For this report, beta is based on returns over the past 36 months for both the fund and the index. Note that a fund’s beta should be reviewed in conjunction with its R-squared (see definition below). The lower the R-squared, the less correlation there is between the fund and the index, and the less reliable beta is as an indicator of volatility.
Conversion Premium. The average percentage by which the weighted average market price of the convertible securities held by a fund exceeds the weighted average market price of their underlying common stocks. For example, if a stock is trading at $25 per share and a bond convertible into the stock is trading at a price equivalent to $30 per share of stock, the conversion premium is 20% ($5 ÷ $25 = 20%).
Expense Ratio. The percentage of a fund’s average net assets used to pay its annual administrative and advisory expenses. These expenses directly reduce returns to investors.
Foreign Holdings. The percentage of a fund’s net assets represented by securities of companies based outside the United States.
Inception Date. The date on which the assets of a fund (or one of its share classes) are first invested in accordance with the fund’s investment objective. For funds with a subscription period, the inception date is the day after that period ends. Investment performance is measured from the inception date.
Market Exposure. A measure that reflects a fund’s security investments excluding any holdings in short-term reserves.
R-Squared. A measure of how much of a fund’s past returns can be explained by the returns from the market in general, as measured by a given index. If a fund’s total returns were precisely synchronized with an index’s returns, its R-squared would be 1.00. If the fund’s returns bore no relationship to the index’s returns, its R-squared would be 0. For this report, R-squared is based on returns over the past 36 months for both the fund and the index.
25
Short-Term Reserves. The percentage of a fund invested in highly liquid, short-term securities that can be readily converted to cash.
Turnover Rate. An indication of the fund’s trading activity. Funds with high turnover rates incur higher transaction costs and may be more likely to distribute capital gains (which may be taxable to investors). The turnover rate excludes in-kind transactions, which have minimal impact on costs.
Yield. A fund’s 30-day SEC yield is derived using a formula specified by the U.S. Securities and Exchange Commission. Under the formula, data related to the fund’s security holdings in the previous 30 days are used to calculate the fund’s hypothetical net income for that period, which is then annualized and divided by the fund’s estimated average net assets over the calculation period. For the purposes of this calculation, a security’s income is based on its current market yield to maturity (in the case of bonds) or its projected dividend yield (for stocks). Because the SEC yield represents hypothetical annualized income, it will differ—at times significantly—from the fund’s actual experience. As a result, the fund’s income distributions may be higher or lower than implied by the SEC yield.
26
This page intentionally left blank.
The People Who Govern Your Fund
The trustees of your mutual fund are there to see that the fund is operated and managed in your best interests since, as a shareholder, you are a part owner of the fund. Your fund’s trustees also serve on the board of directors of The Vanguard Group, Inc., which is owned by the Vanguard funds and provides services to them on an at-cost basis.
A majority of Vanguard’s board members are independent, meaning that they have no affiliation with Vanguard or the funds they oversee, apart from the sizable personal investments they have made as private individuals.
Our independent board members bring distinguished backgrounds in business, academia, and public service to their task of working with Vanguard officers to establish the policies and oversee the activities of the funds. Among board members’ responsibilities are selecting investment advisors for the funds; monitoring fund operations, performance, and costs; reviewing contracts; nominating and selecting new trustees/directors; and electing Vanguard officers.
Each trustee serves a fund until its termination; or until the trustee’s retirement, resignation, or death; or otherwise as specified in the fund’s organizational documents. Any trustee may be removed at a shareholders’ meeting by a vote representing two-thirds of the net asset value of all shares of the fund together with shares of other Vanguard funds organized within the same trust. The table on these two pages shows information for each trustee and executive officer of the fund. The mailing address of the trustees and officers is P.O. Box 876, Valley Forge, PA 19482.
Chairman of the Board, Chief Executive Officer, and Trustee |
| |
John J. Brennan1 | |
Born 1954 | Principal Occupation(s) During the Past Five Years: Chairman of the Board, Chief Executive |
Trustee since May 1987; | Officer, and Director/Trustee of The Vanguard Group, Inc., and of each of the investment |
Chairman of the Board and | companies served by The Vanguard Group; Director of Vanguard Marketing Corporation. |
Chief Executive Officer | |
155 Vanguard Funds Overseen | |
| |
Independent Trustees | |
| |
Charles D. Ellis | |
Born 1937 | Principal Occupation(s) During the Past Five Years: Applecore Partners (pro bono ventures |
Trustee since January 2001 | in education); Senior Advisor to Greenwich Associates (international business strategy |
155 Vanguard Funds Overseen | consulting); Successor Trustee of Yale University; Overseer of the Stern School of Business |
| at New York University; Trustee of the Whitehead Institute for Biomedical Research. |
| |
Emerson U. Fullwood | |
Born 1948 | Principal Occupation(s) During the Past Five Years: Executive Chief Staff and Marketing |
Trustee since January 2008 | Officer for North America since 2004 and Corporate Vice President of Xerox Corporation |
155 Vanguard Funds Overseen | (photocopiers and printers); Director of SPX Corporation (multi-industry manufacturing), |
| of the United Way of Rochester, and of the Boy Scouts of America. |
| |
Rajiv L. Gupta | |
Born 1945 | Principal Occupation(s) During the Past Five Years: Chairman, President, and |
Trustee since December 20012 | Chief Executive Officer of Rohm and Haas Co. (chemicals); Board Member of |
155 Vanguard Funds Overseen | the American Chemistry Council; Director of Tyco International, Ltd. (diversified |
| manufacturing and services) since 2005. |
| |
Amy Gutmann | |
Born 1949 | Principal Occupation(s) During the Past Five Years: President of the University of |
Trustee since June 2006 | Pennsylvania since 2004; Professor in the School of Arts and Sciences, Annenberg School |
155 Vanguard Funds Overseen | for Communication, and Graduate School of Education of the University of Pennsylvania |
| since 2004; Provost (2001–2004) and Laurance S. Rockefeller Professor of Politics and |
| the University Center for Human Values (1990–2004), Princeton University; Director of |
| Carnegie Corporation of New York since 2005 and of Schuylkill River Development |
| Corporation and Greater Philadelphia Chamber of Commerce since 2004; Trustee of |
| the National Constitution Center since 2007. |
JoAnn Heffernan Heisen | |
Born 1950 | Principal Occupation(s) During the Past Five Years: Corporate Vice President and |
Trustee since July 1998 | Chief Global Diversity Officer since 2006, Vice President and Chief Information |
155 Vanguard Funds Overseen | Officer (1997–2005), and Member of the Executive Committee of Johnson & |
| Johnson (pharmaceuticals/consumer products); Director of the University Medical |
| Center at Princeton and Women’s Research and Education Institute. |
| |
André F. Perold | |
Born 1952 | Principal Occupation(s) During the Past Five Years: George Gund Professor of Finance |
Trustee since December 2004 | and Banking, Harvard Business School; Senior Associate Dean and Director of Faculty |
155 Vanguard Funds Overseen | Recruiting, Harvard Business School; Director and Chairman of UNX, Inc. (equities |
| trading firm); Chair of the Investment Committee of HighVista Strategies LLC (private |
| investment firm) since 2005. |
| |
Alfred M. Rankin, Jr. | |
Born 1941 | Principal Occupation(s) During the Past Five Years: Chairman, President, Chief Executive |
Trustee since January 1993 | Officer, and Director of NACCO Industries, Inc. (forklift trucks/housewares/lignite); Director |
155 Vanguard Funds Overseen | of Goodrich Corporation (industrial products/aircraft systems and services). |
| |
| |
J. Lawrence Wilson | |
Born 1936 | Principal Occupation(s) During the Past Five Years: Retired Chairman and Chief Executive |
Trustee since April 1985 | Officer of Rohm and Haas Co. (chemicals); Director of Cummins Inc. (diesel engines) and |
155 Vanguard Funds Overseen | AmerisourceBergen Corp. (pharmaceutical distribution); Trustee of Vanderbilt University |
| and of Culver Educational Foundation. |
| |
| |
Executive Officers1 | |
| |
Thomas J. Higgins | |
Born 1957 | Principal Occupation(s) During the Past Five Years: Principal of The Vanguard Group, Inc.; |
Treasurer since July 1998 | Treasurer of each of the investment companies served by The Vanguard Group. |
155 Vanguard Funds Overseen | |
| |
| |
F. William McNabb III | |
Born 1957 | Principal Occupation(s) During the Past Five Years: President of The Vanguard Group, Inc., |
President since March 2008 | and of each of the investment companies served by The Vanguard Group since 2008; |
155 Vanguard Funds Overseen | Director of Vanguard Marketing Corporation; Managing Director of The Vanguard Group |
| (1995–2008). |
| |
Heidi Stam | |
Born 1956 | Principal Occupation(s) During the Past Five Years: Managing Director of The Vanguard |
Secretary since July 2005 | Group, Inc., since 2006; General Counsel of The Vanguard Group since 2005; Secretary of |
155 Vanguard Funds Overseen | The Vanguard Group, and of each of the investment companies served by The Vanguard |
| Group, since 2005; Director and Senior Vice President of Vanguard Marketing Corporation |
| since 2005; Principal of The Vanguard Group (1997–2006). |
Vanguard Senior Management Team | | |
| | | |
R. Gregory Barton | Kathleen C. Gubanich | Michael S. Miller | Glenn W. Reed |
Mortimer J. Buckley | Paul A. Heller | Ralph K. Packard | George U. Sauter |
Founder |
|
John C. Bogle |
Chairman and Chief Executive Officer, 1974–1996 |
1 Officers of the funds are “interested persons” as defined in the Investment Company Act of 1940.
2 December 2002 for Vanguard Equity Income Fund, Vanguard Growth Equity Fund, the Vanguard Municipal Bond Funds, and the Vanguard State Tax-Exempt Funds.
More information about the trustees is in the Statement of Additional Information, available from The Vanguard Group.
| 
|
| P.O. Box 2600 |
| Valley Forge, PA 19482-2600 |
Connect with Vanguard® > www.vanguard.com
Fund Information > 800-662-7447 | Vanguard, Connect with Vanguard, and the ship logo are |
| trademarks of The Vanguard Group, Inc. |
Direct Investor Account Services > 800-662-2739 | |
| All other marks are the exclusive property of their |
Institutional Investor Services > 800-523-1036 | respective owners. |
| |
Text Telephone for People | All comparative mutual fund data are from Lipper Inc. |
With Hearing Impairment > 800-952-3335 | or Morningstar, Inc., unless otherwise noted. |
| |
| |
| You can obtain a free copy of Vanguard’s proxy voting |
This material may be used in conjunction | guidelines by visiting our website, www.vanguard.com, |
with the offering of shares of any Vanguard | and searching for “proxy voting guidelines,” or by |
fund only if preceded or accompanied by | calling Vanguard at 800-662-2739. The guidelines are |
the fund’s current prospectus. | also available from the SEC’s website, www.sec.gov. |
| In addition, you may obtain a free report on how your |
| fund voted the proxies for securities it owned during |
| the 12 months ended June 30. To get the report, visit |
| either www.vanguard.com or www.sec.gov. |
| |
| |
| You can review and copy information about your fund |
| at the SEC’s Public Reference Room in Washington, D.C. |
| To find out more about this public service, call the SEC |
| at 202-551-8090. Information about your fund is also |
| available on the SEC’s website, and you can receive |
| copies of this information, for a fee, by sending a |
| request in either of two ways: via e-mail addressed to |
| publicinfo@sec.gov or via regular mail addressed to the |
| Public Reference Section, Securities and Exchange |
| Commission, Washington, DC 20549-0102. |
| |
| |
| |
| |
| |
| © 2008 The Vanguard Group, Inc. |
| All rights reserved. |
| Vanguard Marketing Corporation, Distributor. |
| |
| Q822 072008 |
(a) Disclosure Controls and Procedures. The Principal Executive and Financial Officers concluded that the Registrant's Disclosure Controls and Procedures are effective based on their evaluation of the Disclosure Controls and Procedures as of a date within 90 days of the filing date of this report.
(b) Internal Control Over Financial Reporting. There were no significant changes in Registrant’s Internal Control Over Financial Reporting or in other factors that could significantly affect this control subsequent to the date of the evaluation, including any corrective actions with regard to significant deficiencies and material weaknesses.
Pursuant to the requirements of the Securities Exchange Act of 1934 and the Investment Company Act of 1940, the registrant has duly caused this report to be signed on its behalf by the undersigned, thereunto duly authorized.
Pursuant to the requirements of the Securities Exchange Act of 1934 and the Investment Company Act of 1940, this report has been signed below by the following persons on behalf of the registrant and in the capacities and on the dates indicated.
*By Power of Attorney. Filed on January 18, 2008, see File Number 2-29601. Incorporated by Reference.