
> For the six months ended May 31, Vanguard Convertible Securities Fund returned about 24%, a bit behind the return of its benchmark index, but ahead of the average return of its peer group.
> Convertible securities fell sharply in the fourth quarter of 2008. However, when the equity market began to bounce back in March, demand for hybrid securities took off.
> Holdings in the materials and financial sectors benefited the fund, while positions in the consumer discretionary and energy sectors weakened returns.
Contents | |
| |
Your Fund’s Total Returns | 1 |
President’s Letter | 2 |
Advisor’s Report | 7 |
Fund Profile | 11 |
Performance Summary | 12 |
Financial Statements | 13 |
About Your Fund’s Expenses | 24 |
Trustees Approve Advisory Agreement | 26 |
Glossary | 27 |
Please note: The opinions expressed in this report are just that—informed opinions. They should not be considered promises or advice. Also, please keep in mind that the information and opinions cover the period through the date on the front of this report. Of course, the risks of investing in your fund are spelled out in the prospectus.
Your Fund’s Total Returns
Six Months Ended May 31, 2009 | | |
| Ticker | Total |
| Symbol | Returns |
Vanguard Convertible Securities Fund | VCVSX | 24.02% |
Merrill Lynch All Convertibles-All Qualities Index | | 25.03 |
Average Convertible Securities Fund1 | | 21.81 |
Your Fund’s Performance at a Glance | | | | |
November 30, 2008–May 31, 2009 | | | | |
| | | Distributions Per Share |
| Starting | Ending | Income | Capital |
| Share Price | Share Price | Dividends | Gains |
Vanguard Convertible Securities Fund | $8.86 | $10.75 | $0.205 | $0.000 |
1 Derived from data provided by Lipper Inc.
1

President’s Letter
Dear Shareholder,
Convertible securities have stock and bond characteristics, which can provide some protection in down markets, but these features do not make them bullet-proof—as last year demonstrated. The performance of a convertible security generally reflects changes in the price of its underlying common stock, although convertibles don’t typically rise—or fall—as dramatically as their equity counterparts. When stock prices are on the rise, the conversion feature becomes more attractive and boosts returns. And when stocks struggle, the bond characteristics of convertible issues can provide a cushion for returns.
Not in the fall of 2008, however. Amid the turmoil in the stock and credit markets, convertible securities declined, by some measures, more sharply than stocks. During the past six months, though, more typical patterns prevailed. In March, stocks began to rally and convertible issues experienced an upswing. By May 31, convertibles had bounced back sharply, producing double-digit returns for the six-month period.
For the fiscal half-year, the fund registered a return of about 24%. The fund lagged its benchmark index, which returned about 25% for the period, but outperformed its peers.
Please note that shortly after the close of the fiscal period, the fund was closed to new accounts. Current shareholders may invest up to $25,000 annually.
2
Stocks ended the period with impressive gains
Global stock markets improved significantly during the six months ended May 31. The broad U.S. stock market returned nearly 7%—the first six-month gain since October 2007. May saw the third consecutive monthly gain for U.S. stocks, with investors heartened by an apparent moderation in the bad economic news. Consumer confidence ticked higher, and earlier estimates of first-quarter GDP were revised upward.
International stocks returned about 22% for the fiscal half-year—the highest six-month return since April 2006. Higher commodity prices and a slight rebound in manufacturing orders helped reverse the steep declines that plagued international markets earlier in the period. Aggressive stimulus measures by some governments, including China’s, helped the world’s emerging markets claw their way toward recovery.
Despite encouraging signs, many investors remained fearful that long-term inflation would be kindled by the U.S. Treasury’s massive borrowing, a weaker dollar, and higher crude-oil prices. The U.S. economy also continues to struggle with high levels of unemployment.
Government actions spurred investor confidence in bonds
The fixed income market gyrated during the fiscal half-year. After Lehman Brothers’ collapse in September, investors sought the safety of U.S. Treasury bonds,
Market Barometer | | | |
| | | Total Returns |
| Periods Ended May 31, 2009 |
| Six Months | One Year | Five Years1 |
Stocks | | | |
Russell 1000 Index (Large-caps) | 5.73% | –32.95% | –1.55% |
Russell 2000 Index (Small-caps) | 7.03 | –31.79 | –1.18 |
Dow Jones U.S. Total Stock Market Index | 6.58 | –32.39 | –1.13 |
MSCI All Country World Index ex USA (International) | 22.20 | –35.55 | 5.65 |
| | | |
| | | |
Bonds | | | |
Barclays Capital U.S. Aggregate Bond Index | | | |
(Broad taxable market) | 5.11% | 5.36% | 5.01% |
Barclays Capital Municipal Bond Index | 9.00 | 3.57 | 4.41 |
Citigroup 3-Month Treasury Bill Index | 0.12 | 0.89 | 3.03 |
| | | |
| | | |
CPI | | | |
Consumer Price Index | 0.67% | –1.28% | 2.49% |
1 Annualized.
3
considered the safest of all securities. The difference between the yields of Treasuries and those of corporate bonds surged to levels not seen since the 1930s.
The credit market crisis also rattled the municipal bond market. At the beginning of the period, municipal bond yields were higher than those of Treasuries, a reversal of the traditional relationship between taxable and tax-exempt yields. Since December, munis have stabilized in part because of federal government initiatives to make them more attractive. For the six months, the broad municipal bond market returned about 9%.
In an effort to thaw the credit markets and stimulate the economy, the Federal Reserve Board reduced its target for short-term interest rates to an all-time low of 0% to 0.25% in December. In recent months, the Fed has unveiled plans to purchase Treasury and mortgage-backed securities to drive up their prices and push down yields, and thus keep borrowing costs, such as mortgage rates, low.
By the end of the period, bond investors were more optimistic and willing to take on riskier, higher-yielding corporate bonds. Barclays Capital U.S. Aggregate Bond Index returned about 5% for the fiscal half-year, while high-yield bonds, as measured by the Barclays Capital U.S. Corporate High Yield Bond Index, returned nearly 37% for the same period.
Expense Ratios1 | | |
Your Fund Compared With Its Peer Group | | |
| | Average |
| | Convertible |
| Fund | Securities Fund |
Convertible Securities Fund | 0.72% | 1.41% |
1 The fund expense ratio shown is from the prospectus dated March 20, 2009, and represents estimated costs for the current fiscal year based on the fund’s current net assets. For the six months ended May 31, 2009, the annualized expense ratio was 0.76%. The peer group expense ratio is derived from data provided by Lipper Inc. and captures information through year-end 2008.
4
Renewed demand for convertibles led fund to significant gains
During the past six months, the Convertible Securities Fund’s advisor, Oaktree Capital Management, L.P., maintained a somewhat defensive posture, emphasizing securities with good downside protection. This positioning helped limit losses during the first half of the six-month period, but restrained returns as the market rallied in the second half.
Still, the fund rebounded significantly from the beginning of the period. It’s important to note that the fund’s return of about 24% would be a substantial result for a full year, let alone six months. This swift reversal of fortune stems largely from two related factors: investors’ increased appetite for risk and the revival of the equity markets. In addition, massive selling by hedge funds, which battered convertible securities during 2008, had largely run its course by early 2009.
Because convertible issues have equity-like characteristics—they can be exchanged for the issuing company’s common stock at a predetermined price—their fortunes are tied, to some degree, to the performance of the stock market. And because the companies that issue convertible securities are typically smaller and generally do not have high credit ratings, their performance relies on investors’ willingness to bear credit risk. (Large, investment-grade companies have cheaper financing options at their disposal).
On balance, these characteristics worked in the fund’s favor during the half-year, as convertibles outpaced higher-quality issues. About half of the fund’s holdings were securities rated BBB or lower, consistent with the convertible market’s lower credit quality bias, which helped the fund’s performance. However, the fund had a greater percentage of its assets than the benchmark in nonrated securities, which underperformed for the period, partly because big institutional investors often avoid them. This hurt fund returns.
From an industry standpoint, materials and financial securities were the largest contributors to the fund’s returns for the half-year. Holdings in the consumer discretionary and energy sectors detracted from performance.
For more information on the fund’s positioning and performance during the half-year, please see the Advisor’s Report that follows this letter.
Long-term focus is key, regardless of market conditions
The significant volatility in convertible securities over the six-month period serves as a good reminder that the market can change course quickly—and with intensity. Because excessive attention to short-term volatility can impede good investment decisions, Vanguard encourages shareholders to maintain a long-term focus. We believe that successful investing
5
begins with a diversified portfolio that includes a balanced mix of stock, bond, and money market funds that complement your long-term goals. Once you have selected the investments for your portfolio, try to avoid making changes based on short-term market fluctuations.
The Convertible Securities Fund can play an important role in a diversified portfolio, providing opportunity for growth during bull markets and potentially offering some protection during bear markets. The fund’s advisor focuses on securities that, in its judgment, are likely to capture much of the appreciation of the underlying stocks but to suffer a lower percentage of any declines. This strategy has led to impressive long-term results. And, because the fund’s expenses are low, its shareholders may keep more of its returns.
Thank you for entrusting your assets to Vanguard.
Sincerely,

F. William McNabb III
President and Chief Executive Officer June 12, 2009
6
Advisor’s Report
We are pleased to report that Vanguard Convertible Securities Fund returned about 24% for the six months ended May 31, 2009. The fiscal half-year was marked by great volatility and challenges for any long-term investing strategy, but the fund performed reasonably well. Convertible securities in general bounced back sharply from their late 2008 lows as demand returned to a market offering a wide variety of attractively priced securities. Our overall success was a result of our superior security selection in a market we felt was ripe with low-risk/high-return opportunities.
The investment environment
The period began amid highly negative economic conditions, producing sharply lower equity prices. Even after an impressive rally in late March, most equity market indexes ended the first calendar quarter of 2009 with double-digit losses. Despite these declines, convertible securities performed exceptionally well on both absolute and relative bases.
Convertibles were buoyed by buyers taking advantage of cheap securities, substantially reduced selling by convertible arbitrage funds, and very little new convertible issuance. On balance, there was much more demand for convertible securities than supply during the period.
In addition to traditional buyers of convertible securities like us, both equity and yield investors moved into the market and substantially increased their buying of convertible paper in the past several months. Investors were drawn by relatively attractive yields and reasonable conversion premiums on many short-term securities (with maturities of one to four years).
Even more unusual, but now highly apparent, is the fact that many companies took advantage of the market weakness by repurchasing their convertible securities at deep discounts to their par value. We do not recall a prior period when so many companies were buying back their convertibles. This trend boosted short-term demand, although we consider it a longer-term drawback for the convertible securities market, as it takes securities out of the investable universe.
The latter portion of the fiscal half-year represented a much more positive investing environment. Equity markets began a sustained rally in March, and this upturn continued very steadily through the end of May. Convertible issues participated in the rally, as more buyers entered the market. By May 31, the fund, and convertible securities in general, had produced double-digit returns for the six-month period.
An important influence on the valuations of convertible securities was the substantial reduction in selling by arbitrageurs. If arbitrageurs were to resume their selling of convertible securities, we would expect that those sales would be offset by the currently strong demand for convertible issues and that they would not noticeably weaken valuations. However, we would welcome any future forced selling as an opportunity to invest.
7
After several dry months, new convertible issuance finally resumed in late March with several interesting and attractively priced offerings entering the market. These include issues from Alcoa, Amkor Technology, CommScope, Ingersoll Rand, Johnson Controls, and Newell Rubbermaid. All of these offerings were well received by investors, and all of the newly introduced convertible securities traded sharply higher after issuance. The bonds were priced with short-term maturities, attractive yields, low conversion premiums, and call protection for life. For the six-month period, approximately $13 billion in securities was introduced by 38 issuers; during the fourth calendar quarter of 2008, there were no new issues.
One attractive feature of recent offerings is that most of the convertible securities were issued as senior securities. This makes them pari passu with high yield debt (that is, they have the same rights to payment as high-yield bonds in any bankruptcy of the issuer), a positive change from the past, when most convertibles were more subordinated. While it is impossible to predict the amount of upcoming issuance, we are optimistic that many companies will choose to issue convertible securities to satisfy their financing needs over the balance of 2009. The market is clearly open to issuance, and we believe pricing is attractive for long-only, long-term convertible investors like us.
Our successes
Given that the six-month period through May 31 was initially marked by a very negative investing environment that gave way to a very positive one, some of our earlier relative successes lagged in the latter, more bullish phase of the period. For example, many of our health care holdings performed well early in the period, on both absolute and relative bases, but they were basically unchanged (or lower) when the market rose later in the period.
In the past few months, financial and materials/metals holdings were the fund’s best performers. These holdings included issuers such as Bank of America, Chesapeake Energy, Fifth Third Bancorp, Freeport-McMoRan Copper & Gold, and U.S. Steel. For the fiscal half-year, our best performers were convertible securities from CommScope, Equinix, Inverness Medical Innovations, and ON Semiconductor.
We derived a fair amount of our returns from the new issuance that resumed in mid-March. Newly issued convertible securities from Alcoa, Newell Rubbermaid, Teradyne, and Allied Technologies performed very well in a short period of time.
8
Our shortfalls
As with any diversified portfolio, there are always securities that detract from performance. During the fiscal half-year, our biggest detractors were in a variety of industries, although none significantly weakened our overall performance. Convertible securities from Continental Airlines, Cubist Pharmaceuticals, KeyCorp, and UAL were some of our larger disappointments. From an industry perspective, our underweighting in financials hurt our relative performance in the latter portion of the period, when financials staged a significant rebound.
We were also hindered by our standard sell discipline, which caused us to take profits in several deep cyclical holdings after they performed very strongly. Many of these convertible issues became pure equity substitutes (with little of the downside protection we insist on), and despite their short-term strong performance, their prices continued to advance significantly.
The fund’s positioning
In the near term, we are trimming or eliminating high-conversion-premium convertible securities, although many of them have relatively attractive yields, stable credits, and short durations. These securities have developed bond-like yields but, because of their very high conversion premiums, offer little if any upside potential related to the underlying equity security. We are redeploying the proceeds from our sales of these securities into securities with a more attractive balance between upside potential and downside protection, both in new offerings and secondary purchases.
In terms of credit quality, most of our recent purchases have been in the non-investment-grade portion of the market. In fact, we currently consider many highly rated convertible securities to be relatively expensive. Over time, as we trim our bond-like securities, our average conversion premium will fall closer to the fund’s historical levels.
As usual, we are fully invested and continue to steadily find opportunities in many parts of the market. The overall market is clearly not as cheap as it was in the late fall of last year, but we believe the “technical” picture of the market is quite healthy and offers excellent opportunities for superior relative returns.
Larry W. Keele,
CFA Principal and Founder
Oaktree Capital Management, L.P.
June 10, 2009
9
Major Portfolio Changes: | |
Six Months Ended May 31, 2009 | |
| |
Additions | Comments |
Allegheny Technologies | Attractive new issue by high-quality metals investment. |
(4.25% convertible note due 6/1/14) | |
Continental Airlines | Attractive substitution for our AMR bonds, which were sold from |
(5.00% convertible note due 6/15/23) | the portfolio. The CAL bonds are puttable at 100 on 06/15/2010. |
Qwest Communications | Very cheap convertible bond with very limited downside risk. |
(3.50% convertible note due 11/15/25) | |
Teradyne | Statistically cheap new issue with attractive equity valuation. |
(4.50% convertible note due 3/15/14) | |
| |
| |
Reductions | Comments |
Amkor Technologies | Reducing after substantial appreciation over the past few months. |
(6.00% convertible note due 4/15/14) | Bonds were purchased at 100 from the new deal priced in March |
| of this year. |
AMR | |
(4.25% convertible note due 2/15/24) | Put bonds back to the company at 100 in early 2009. |
CommScope | Sold after rapid and substantial appreciation in early 2009. |
(3.50% convertible note due 3/15/24) | |
Freeport-McMoRan Copper & Gold | Sold after the security more than doubled from our initial |
(5.50% convertible preferred) | purchases. The convertibles became substantially less attractive. |
Medtronic | Sold after bonds appreciated and became statistically unattractive. |
(1.50% convertible note due 4/15/11) | |
10
Convertible Securities Fund
Fund Profile | |
As of May 31, 2009 | |
| |
Portfolio Characteristics | |
| |
Number of Securities | 149 |
Yield1 | 4.7% |
Conversion Premium | 51.8% |
Average Weighted Maturity | 3.6 years |
Average Coupon | 2.9% |
Average Quality2 | Ba3/BB- |
Average Duration | 3.3 years |
Foreign Holdings | 5.9% |
Turnover Rate3 | 67% |
Expense Ratio4 | 0.72% |
Short-Term Reserves | 1.8% |
Distribution by Maturity | |
(% of fixed income portfolio) | |
| |
Under 1 Year | 0.6% |
1–5 Years | 87.5 |
5–10 Years | 11.3 |
10–20 Years | 0.6 |
Distribution by Credit Quality2 | |
(% of fixed income portfolio) | |
| |
Aaa/AAA | 0.0% |
Aa/AA | 0.0 |
A/A | 6.1 |
Baa/BBB | 11.8 |
Ba/BB | 18.7 |
B/B | 21.0 |
Below B/B | 3.5 |
Not Rated | 38.9 |
Volatility Measures5 | |
| Fund Versus |
| Comparative Index6 |
R-Squared | 0.97 |
Beta | 0.91 |
Ten Largest Holdings7 (% of total net assets) |
| | |
SBA | wireless | |
Communications Corp. | telecommunication | |
| services | 3.2% |
Qwest Communications | integrated | |
International, Inc. | telecommunication | |
| services | 2.6 |
Invitrogen Corp. | biotechnology | 2.3 |
Equinix Inc. | Internet software | |
| and services | 1.9 |
Bank of America Corp. | diversified financial | |
| services | 1.8 |
Textron Inc. | industrial | |
| conglomerates | 1.7 |
ON Semiconductor | semiconductors | 1.6 |
Teva Pharmaceutical | pharmaceuticals | |
Financial | | 1.5 |
Symantec Corp. | systems software | 1.5 |
Continental Airlines, Inc. | airlines | 1.5 |
Top Ten | | 19.6% |
Sector Diversification (% of market exposure) |
| |
Consumer Discretionary | 7.5% |
Consumer Staples | 2.2 |
Energy | 15.9 |
Financials | 3.7 |
Health Care | 23.2 |
Industrials | 14.5 |
Information Technology | 20.8 |
Materials | 3.1 |
Telecommunication Services | 8.2 |
Utilities | 0.9 |
1 30-day SEC yield. See the Glossary.
2 Ratings: Moody’s Investors Service, Standard & Poor’s.
3 Annualized.
4 The expense ratio shown is from the prospectus dated March 20, 2009, and represents estimated costs for the current fiscal year based on the fund’s current net assets. For the six months ended May 31, 2009, the annualized expense ratio was 0.76%.
5 For an explanation of R-squared, beta, and other terms used here, see the Glossary.
6 Merrill Lynch All Convertibles-All Qualities Index.
7 The holdings listed exclude any temporary cash investments and equity Index products.
11
Convertible Securities Fund
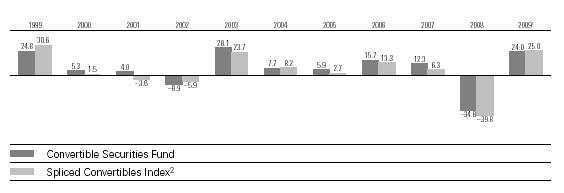
Performance Summary
All of the returns in this report represent past performance, which is not a guarantee of future results that may be achieved by the fund. (Current performance may be lower or higher than the performance data cited. For performance data current to the most recent month-end, visit our website at www.vanguard.com/performance.) Note, too, that both investment returns and principal value can fluctuate widely, so an investor’s shares, when sold, could be worth more or less than their original cost. The returns shown do not reflect taxes that a shareholder would pay on fund distributions or on the sale of fund shares.
Fiscal-Year Total Returns (%): November 30, 1998–May 31, 2009
Average Annual Total Returns: Periods Ended March 31, 2009
This table presents average annual total returns through the latest calendar quarter—rather than through the end of the fiscal period. Securities and Exchange Commission rules require that we provide this information.
| | | | | | Ten Years |
| Inception Date | One Year | Five Years | Capital | Income | Total |
Convertible Securities Fund3 | 6/17/1986 | –23.96% | –0.23% | 1.41% | 3.72% | 5.13% |
1 Six months ended May 31, 2009.
2 CS First Boston Convertibles Index through November 30, 2004; Merrill Lynch All Convertibles-All Qualities Index thereafter.
3 Total returns do not reflect the 1% fee assessed on redemptions of shares purchased on or after September 15, 2005, and held for less than one year or the account service fee that may be applicable to certain accounts with balances below $10,000.
Note: See Financial Highlights table for dividend and capital gains information.
12
Convertible Securities Fund
Financial Statements (unaudited)
Statement of Net Assets
As of May 31, 2009
The fund provides a complete list of its holdings four times in each fiscal year, at the quarter-ends. For the second and fourth fiscal quarters, the lists appear in the fund’s semiannual and annual reports to shareholders. For the first and third fiscal quarters, the fund files the lists with the Securities and Exchange Commission on Form N-Q. Shareholders can look up the fund’s Forms N-Q on the SEC’s website at www.sec.gov. Forms N-Q may also be reviewed and copied at the SEC’s Public Reference Room (see the back cover of this report for further information).
| | | | Face | Market |
| | | Maturity | Amount | Value• |
| | Coupon | Date | ($000) | ($000) |
Convertible Bonds (89.3%) | | | | |
Consumer Discretionary (6.7%) | | | | |
| Borg-Warner Inc. | 3.500% | 4/15/12 | 8,490 | 10,475 |
| D.R. Horton Inc. | 2.000% | 5/15/14 | 5,855 | 5,584 |
| Iconix Brand Group | 1.875% | 6/30/12 | 9,715 | 8,549 |
1 | Iconix Brand Group | 1.875% | 6/30/12 | 8,455 | 7,440 |
1 | International Game Technology | 3.250% | 5/1/14 | 12,540 | 14,013 |
| Interpublic Group | 4.250% | 3/15/23 | 24,425 | 21,525 |
| Newell Rubbermaid, Inc. | 5.500% | 3/15/14 | 10,445 | 15,720 |
1 | SAKS Inc. | 7.500% | 12/1/13 | 1,730 | 1,687 |
1 | Stewart Enterprises | 3.125% | 7/15/14 | 4,245 | 3,099 |
| Wyndham Worldwide | 3.500% | 5/1/12 | 9,390 | 10,317 |
| | | | | 98,409 |
Consumer Staples (1.9%) | | | | |
| Chattem Inc. | 1.625% | 5/1/14 | 11,235 | 10,280 |
| Molson Coors Brewing Co. | 2.500% | 7/30/13 | 9,875 | 10,850 |
| Nash Finch Co. | 1.631% | 3/15/35 | 9,675 | 3,701 |
| Tyson Foods Inc. | 3.250% | 10/15/13 | 3,390 | 3,534 |
| | | | | 28,365 |
Energy (14.2%) | | | | |
| Alpha Natural Resources | 2.375% | 4/15/15 | 10,075 | 8,035 |
| Bill Barrett Corp. | 5.000% | 3/15/28 | 12,795 | 11,547 |
| Bristow Group | 3.000% | 6/15/38 | 12,005 | 8,584 |
| Carrizo Oil & Gas | 4.375% | 6/1/28 | 11,520 | 8,078 |
| Chesapeake Energy Corp. | 2.750% | 11/15/35 | 24,001 | 21,571 |
| Chesapeake Energy Corp. | 2.250% | 12/15/38 | 23,715 | 13,755 |
| Core Laboratories LP | 0.250% | 10/31/11 | 16,105 | 17,977 |
| GMX Resources | 5.000% | 2/1/13 | 6,510 | 5,566 |
| Goodrich Petroleum Corp. | 3.250% | 12/1/26 | 15,825 | 13,333 |
| Hornbeck Offshore Services | 1.625% | 11/15/26 | 22,845 | 19,018 |
1 | Patriot Coal Corp. | 3.250% | 5/31/13 | 3,515 | 1,938 |
| Pennsylvania Virginia Co. | 4.500% | 11/15/12 | 13,390 | 10,779 |
| Quicksilver Resources | 1.875% | 11/1/24 | 10,600 | 10,534 |
| SEACOR Holdings Inc. | 2.875% | 12/15/24 | 9,320 | 10,124 |
| St. Mary Land & Exploration | 3.500% | 4/1/27 | 16,675 | 13,903 |
| Superior Energy Services, Inc. | 1.500% | 12/15/26 | 13,750 | 11,773 |
1 | Superior Energy Services, Inc. | 1.500% | 12/15/26 | 3,440 | 2,945 |
| Transocean Inc. | 1.500% | 12/15/37 | 14,435 | 13,064 |
13
Convertible Securities Fund
| | | | Face | Market |
| | | Maturity | Amount | Value• |
| | Coupon | Date | ($000) | ($000) |
| Transocean Inc. | 1.500% | 12/15/37 | 3,290 | 2,887 |
| Trico Marine | 8.125% | 2/1/13 | 2,768 | 1,384 |
| Trico Marine | 3.000% | 1/15/27 | 7,415 | 1,974 |
| | | | | 208,769 |
Financials (3.3%) | | | | |
1 | Cash America International, Inc. | 5.250% | 5/15/29 | 7,165 | 7,756 |
1 | Digital Realty Trust LP | 5.500% | 4/15/29 | 4,800 | 4,688 |
1 | MF Global Ltd. | 9.000% | 6/20/38 | 6,230 | 5,327 |
| National Rural Utilities Cooperative Finance Corp. | 5.125% | 6/15/28 | 10,425 | 8,926 |
| Old Republic International Corp. | 8.000% | 5/15/12 | 10,015 | 10,291 |
1 | Rayonier TRS Holdings Inc. | 3.750% | 10/15/12 | 4,940 | 4,909 |
| Rayonier TRS Holdings Inc. | 3.750% | 10/15/12 | 130 | 129 |
| SVB Financial | 3.875% | 4/15/11 | 8,485 | 7,149 |
| | | | | 49,175 |
Health Care (20.7%) | | | | |
| Allergan, Inc. | 1.500% | 4/1/26 | 11,630 | 11,804 |
1 | Allergan, Inc. | 1.500% | 4/1/26 | 8,495 | 8,622 |
| American Medical Systems Holdings, Inc. | 3.250% | 7/1/36 | 11,155 | 10,667 |
| Amerigroup Corp. | 2.000% | 5/15/12 | 23,685 | 21,553 |
| Amgen Inc. | 0.125% | 2/1/11 | 14,065 | 13,151 |
| Amgen Inc. | 0.375% | 2/1/13 | 13,695 | 12,257 |
| Amylin Pharmaceuticals, Inc. | 2.500% | 4/15/11 | 6,430 | 5,498 |
| Cephalon Inc. | 2.500% | 5/1/14 | 20,710 | 21,098 |
| Chemed Corp. | 1.875% | 5/15/14 | 4,780 | 3,513 |
| China Medical Technologies, Inc. | 3.500% | 11/15/11 | 5,270 | 4,559 |
| China Medical Technologies, Inc. | 4.000% | 8/15/13 | 9,235 | 5,368 |
| Cubist Pharmaceuticals Inc. | 2.250% | 6/15/13 | 20,265 | 16,921 |
1 | Cyberomnics Inc. | 3.000% | 9/27/12 | 5,265 | 3,982 |
1 | Gilead Sciences Inc. | 0.500% | 5/1/11 | 15,735 | 18,843 |
| Gilead Sciences Inc. | 0.500% | 5/1/11 | 1,745 | 2,090 |
| Hologic Inc. | 2.000% | 12/15/37 | 11,065 | 7,690 |
1 | Integra Lifesciences | 2.375% | 6/1/12 | 7,790 | 5,852 |
1 | Inverness Medical Innovations Inc. | 3.000% | 5/15/16 | 8,400 | 7,949 |
| Inverness Medical Innovations Inc. | 3.000% | 5/15/16 | 3,505 | 3,317 |
| Invitrogen Corp. | 1.500% | 2/15/24 | 24,255 | 23,194 |
| Invitrogen Corp. | 3.250% | 6/15/25 | 10,975 | 11,002 |
| Kendle International Inc. | 3.375% | 7/15/12 | 6,540 | 4,733 |
| Medtronic Inc. | 1.500% | 4/15/11 | 7,412 | 7,060 |
| Mylan Labratories Inc. | 1.250% | 3/15/12 | 17,005 | 14,922 |
1 | Nuvasive Inc. | 2.250% | 3/15/13 | 18,140 | 17,936 |
| Protein Design Labs | 2.000% | 2/15/12 | 2,820 | 2,432 |
1 | PSS World Medical Inc. | 3.125% | 8/1/14 | 6,055 | 5,684 |
| Teva Pharmaceutical Financial | 1.750% | 2/1/26 | 20,778 | 22,830 |
| Valeant Pharmaceuticals International | 4.000% | 11/15/13 | 5,565 | 5,301 |
1 | Wilson Greatbatch | 2.250% | 6/15/13 | 6,010 | 4,778 |
| Wilson Greatbatch | 2.250% | 6/15/13 | 1,540 | 1,224 |
| | | | | 305,830 |
Industrials (13.0%) | | | | |
1 | AAR Corp. | 1.625% | 3/1/14 | 5,110 | 3,577 |
1 | Alliant Techsystems Inc. | 2.750% | 9/15/11 | 6,675 | 7,050 |
| Alliant Techsystems Inc. | 2.750% | 9/15/11 | 1,990 | 2,102 |
| Barnes Group Inc. | 3.750% | 8/1/25 | 7,635 | 7,425 |
14
Convertible Securities Fund
| | | | Face | Market |
| | | Maturity | Amount | Value• |
| | Coupon | Date | ($000) | ($000) |
| Barnes Group Inc. | 3.375% | 3/15/27 | 7,065 | 5,864 |
1 | Barnes Group Inc. | 3.375% | 3/15/27 | 6,080 | 5,046 |
| Continental Airlines, Inc. | 5.000% | 6/15/23 | 24,090 | 22,042 |
1 | Covanta Holding | 3.250% | 6/1/14 | 8,815 | 8,749 |
| Covanta Holding | 1.000% | 2/1/27 | 16,755 | 14,053 |
1 | General Cable Corp. | 1.000% | 10/15/12 | 12,580 | 9,923 |
| General Cable Corp. | 1.000% | 10/15/12 | 395 | 312 |
| General Cable Corp. | 0.875% | 11/15/13 | 1,760 | 1,639 |
| Hertz Global Holdings Inc. | 5.250% | 6/1/14 | 5,195 | 5,266 |
| L-3 Communications Corp. | 3.000% | 8/1/35 | 20,891 | 20,525 |
| SunPower Corp. | 4.750% | 4/15/14 | 6,420 | 7,857 |
| SunPower Corp. | 1.250% | 2/15/27 | 4,685 | 3,777 |
| Suntech Power Holdings | 0.250% | 2/15/12 | 6,951 | 6,577 |
1 | Suntech Power Holdings | 3.000% | 3/15/13 | 11,380 | 7,938 |
| Suntech Power Holdings | 3.000% | 3/15/13 | 7,690 | 5,364 |
| Textron Inc. | 4.500% | 5/1/13 | 23,180 | 25,440 |
| Triumph Group | 2.625% | 10/1/26 | 6,025 | 5,799 |
| UAL Corp. | 4.500% | 6/30/21 | 10,030 | 3,962 |
| Waste Connections, Inc. | 3.750% | 4/1/26 | 6,240 | 6,373 |
1 | Waste Connections, Inc. | 3.750% | 4/1/26 | 4,185 | 4,274 |
| | | | | 190,934 |
Information Technology (18.6%) | | | | |
1 | Alliance Data System Co. | 1.750% | 8/1/13 | 7,705 | 5,596 |
1 | Amkor Tech Inc. | 6.000% | 4/15/14 | 4,260 | 6,843 |
| Arris Group, Inc. | 2.000% | 11/15/26 | 4,635 | 4,326 |
| CACI International Inc. | 2.125% | 5/1/14 | 9,215 | 8,270 |
1 | CACI International Inc. | 2.125% | 5/1/14 | 1,575 | 1,414 |
| Ciena Corp. | 0.250% | 5/1/13 | 12,265 | 7,880 |
| Ciena Corp. | 0.875% | 6/15/17 | 12,970 | 6,436 |
| Commscope Inc. | 3.250% | 7/1/15 | 11,630 | 12,720 |
| CSG Systems International Inc. | 2.500% | 6/15/24 | 9,685 | 8,559 |
| Earthlink Inc. | 3.250% | 11/15/26 | 10,425 | 10,725 |
| EMC Corp. | 1.750% | 12/1/11 | 13,995 | 13,978 |
| EMC Corp. | 1.750% | 12/1/13 | 12,495 | 12,167 |
| Equinix Inc. | 2.500% | 4/15/12 | 27,270 | 24,868 |
| Equinix Inc. | 3.000% | 10/15/14 | 3,180 | 2,663 |
| FEI Co. | 2.875% | 6/1/13 | 3,830 | 3,715 |
| Informatica Corp. | 3.000% | 3/15/26 | 11,545 | 11,891 |
| Itron Inc. | 2.500% | 8/1/26 | 7,510 | 8,496 |
1 | Lawson Software Inc. | 2.500% | 4/15/12 | 8,845 | 7,463 |
| Lawson Software Inc. | 2.500% | 4/15/12 | 5,820 | 4,911 |
1 | Magma Design Automation Inc. | 2.000% | 5/15/10 | 1,264 | 787 |
| Magma Design Automation Inc. | 2.000% | 5/15/10 | 235 | 146 |
| Micron Technology Inc. | 4.250% | 10/15/13 | 2,680 | 3,139 |
| Micron Technology Inc. | 1.875% | 6/1/14 | 21,825 | 12,658 |
1 | NetApp Inc. | 1.750% | 6/1/13 | 15,650 | 13,733 |
| ON Semiconductor | 2.625% | 12/15/26 | 26,862 | 24,176 |
| Symantec Corp. | 0.750% | 6/15/11 | 22,420 | 22,560 |
1 | Synnex Corp. | 4.000% | 5/15/18 | 7,405 | 7,618 |
| Teradyne Inc. | 4.500% | 3/15/14 | 13,260 | 19,542 |
| WebMD Corp. | 1.750% | 6/15/23 | 7,395 | 7,108 |
| | | | | 274,388 |
15
Convertible Securities Fund
| | | | Face | Market |
| | | Maturity | Amount | Value• |
| | Coupon | Date | ($000) | ($000) |
Materials (2.8%) | | | | |
| Allegheny Technologies Inc. | 4.250% | 6/1/14 | 9,375 | 10,172 |
1 | Kinross Gold | 1.750% | 3/15/28 | 14,025 | 13,657 |
| Newport Mining Corp . | 3.000% | 2/15/12 | 8,150 | 10,085 |
| United States Steel Corp. | 4.000% | 5/15/14 | 5,705 | 7,046 |
| | | | | 40,960 |
Telecommunication Services (7.3%) | | | | |
| NII Holdings, Inc. | 2.750% | 8/15/25 | 12,960 | 11,972 |
| Qwest Communications International, Inc. | 3.500% | 11/15/25 | 38,168 | 38,407 |
1 | SBA Communications Corp. | 1.875% | 5/1/13 | 40,034 | 33,228 |
1 | SBA Communications Corp. | 4.000% | 10/1/14 | 13,380 | 13,597 |
| Time Warner Telecom Inc. | 2.375% | 4/1/26 | 11,930 | 10,528 |
| | | | | 107,732 |
Utilities (0.8%) | | | | |
| CMS Energy Corp. | 2.875% | 12/1/24 | 7,565 | 7,716 |
| Unisource Energy Corp. | 4.500% | 3/1/35 | 5,120 | 4,147 |
| | | | | 11,863 |
Total Convertible Bonds (Cost $1,365,670) | | | | 1,316,425 |
| | | | | |
| | | | | |
| | | | Shares | |
Convertible Preferred Stocks (8.5%) | | | | |
Consumer Discretionary (0.7%) | | | | |
| Interpublic Group | 5.250% | | 20,940 | 11,177 |
| | | | | |
Financials (5.5%) | | | | |
| Aspen Insurance Holdings, Ltd. | 5.625% | | 165,460 | 7,146 |
| Bank of America Corp. | 7.250% | | 35,330 | 26,895 |
| Citigroup Inc. | 6.500% | | 290,300 | 11,303 |
| Fifth Third Bank | 8.500% | | 200,510 | 17,703 |
| KeyCorp | 7.750% | | 275,951 | 18,213 |
| | | | | 81,260 |
Health Care (0.9%) | | | | |
| Inverness Medical Innovations Inc. | 3.000% | | 60,503 | 12,869 |
| | | | | |
Industrials (0.2%) | | | | |
| Continental Airlines Financial Trust | 6.000% | | 163,300 | 2,398 |
| | | | | |
Telecommunication Services (0.5%) | | | | |
| Crown Castle International Corp. | 6.250% | | 161,900 | 7,862 |
| | | | | |
Utilities (0.7%) | | | | |
| CMS Energy Corp. | 4.500% | | 37,500 | 2,259 |
2 | FPL Group Inc. | 8.375% | | 154,300 | 7,812 |
| | | | | 10,071 |
Total Convertible Preferred Stocks (Cost $135,601) | | | 125,637 |
Temporary Cash Investments (1.8%) | | | | |
Money Market Fund (1.8%) | | | | |
3 | Vanguard Market Liquidity Fund | | | | |
| (Cost $26,036) | 0.391% | | 26,035,531 | 26,036 |
Total Investments (99.6%) (Cost $1,527,307) | | | | 1,468,098 |
16
Convertible Securities Fund
| Market |
| Value• |
| ($000) |
Other Assets and Liabilities (0.4%) | |
Other Assets | 23,532 |
Liabilities | (17,057) |
| 6,475 |
Net Assets (100%) | |
Applicable to 137,219,603 outstanding $.001 par value shares of | |
beneficial interest (unlimited authorization) | 1,474,573 |
Net Asset Value Per Share | $10.75 |
| |
| |
| |
At May 31, 2009, net assets consisted of: | |
| Amount |
| ($000) |
Paid-in Capital | 1,602,175 |
Undistributed Net Investment Income | 11,220 |
Accumulated Net Realized Losses | (79,613) |
Unrealized Appreciation (Depreciation) | (59,209) |
Net Assets | 1,474,573 |
• See Note A in Notes to Financial Statements.
1 Security exempt from registration under Rule 144A of the Securities Act of 1933. Such securities may be sold in transactions exempt from registration, normally to qualified institutional buyers. At May 31, 2009, the aggregate value of these securities was $277,941,000, representing 18.8% of net assets.
2 New issue that has not paid a dividend as of May 31, 2009.
3 Affiliated money market fund available only to Vanguard funds and certain trusts and accounts managed by Vanguard. Rate shown is the 7-day yield.
See accompanying Notes, which are an integral part of the Financial Statements.
17
Convertible Securities Fund
Statement of Operations
| Six Months Ended |
| May 31, 2009 |
| ($000) |
Investment Income | |
Income | |
Dividends | 4,547 |
Interest1 | 24,849 |
Total Income | 29,396 |
Expenses | |
Investment Advisory Fees—Note B | |
Basic Fee | 1,794 |
Performance Adjustment | 736 |
The Vanguard Group—Note C | |
Management and Administrative | 1,297 |
Marketing and Distribution | 137 |
Custodian Fees | 7 |
Shareholders’ Reports | 13 |
Trustees’ Fees and Expenses | 1 |
Total Expenses | 3,985 |
Net Investment Income | 25,411 |
Realized Net Gain (Loss) on Investment Securities Sold | (8,750) |
Change in Unrealized Appreciation (Depreciation) of Investment Securities | 216,832 |
Net Increase (Decrease) in Net Assets Resulting from Operations | 233,493 |
1 Interest income from an affiliated company of the fund was $194,000.
See accompanying Notes, which are an integral part of the Financial Statements.
18
Convertible Securities Fund
Statement of Changes in Net Assets
| Six Months Ended | | Year Ended |
| May 31, | | November 30, |
| 2009 | | 2008 |
| ($000) | | ($000) |
Increase (Decrease) in Net Assets | | | |
Operations | | | |
Net Investment Income | 25,411 | | 28,972 |
Realized Net Gain (Loss) | (8,750) | | (69,374) |
Change in Unrealized Appreciation (Depreciation) | 216,832 | | (317,452) |
Net Increase (Decrease) in Net Assets Resulting from Operations | 233,493 | | (357,854) |
Distributions | | | |
Net Investment Income | (20,549) | | (33,367) |
Realized Capital Gain1 | — | | (48,731) |
Total Distributions | (20,549) | | (82,098) |
Capital Share Transactions | | | |
Issued | 635,397 | | 431,344 |
Issued in Lieu of Cash Distributions | 17,513 | | 73,425 |
Redeemed2 | (107,048) | | (220,694) |
Net Increase (Decrease) from Capital Share Transactions | 545,862 | | 284,075 |
Total Increase (Decrease) | 758,806 | | (155,877) |
Net Assets | | | |
Beginning of Period | 715,767 | | 871,644 |
End of Period3 | 1,474,573 | | 715,767 |
1 Includes fiscal 2008 short-term gain distributions totaling $28,823,000. Short-term gain distributions are treated as ordinary income dividends for tax purposes.
2 Net of redemption fees for fiscal 2009 and 2008 of $425,000 and $388,000, respectively.
3 Net Assets—End of Period includes undistributed net investment income of $11,220,000 and $5,438,000. See accompanying Notes, which are an integral part of the Financial Statements.
19
Convertible Securities Fund
Financial Highlights
| | | | | | |
| Six Months | | | | | |
| Ended | | | |
For a Share Outstanding | May 31, | Year Ended November 30, |
Throughout Each Period | 2009 | 2008 | 2007 | 2006 | 2005 | 2004 |
Net Asset Value, Beginning of Period | $8.86 | $14.95 | $14.81 | $13.57 | $13.62 | $13.05 |
Investment Operations | | | | | | |
Net Investment Income | .2331 | .401 | .420 | .430 | .290 | .390 |
Net Realized and Unrealized Gain | | | | | | |
(Loss)on Investments | 1.862 | (5.170) | 1.250 | 1.620 | .480 | .600 |
Total from Investment Operations | 2.095 | (4.769) | 1.670 | 2.050 | .770 | .990 |
Distributions | | | | | | |
Dividends from Net Investment Income | (.205) | (.501) | (.510) | (.380) | (.320) | (.420) |
Distributions from Realized Capital Gains | — | (.820) | (1.020) | (.430) | (.500) | — |
Total Distributions | (.205) | (1.321) | (1.530) | (.810) | (.820) | (.420) |
Net Asset Value, End of Period | $10.75 | $8.86 | $14.95 | $14.81 | $13.57 | $13.62 |
| | | | | | |
| | | | | | |
Total Return2 | 24.02% | –34.81% | 12.34% | 15.70% | 5.92% | 7.71% |
| | | | | | |
| | | | | | |
Ratios/Supplemental Data | | | | | | |
Net Assets, End of Period (Millions) | $1,475 | $716 | $872 | $727 | $552 | $959 |
Ratio of Total Expenses to | | | | | | |
Average Net Assets3 | 0.76%4 | 0.71% | 0.77% | 0.87% | 0.86% | 0.68% |
Ratio of Net Investment Income to | | | | | | |
Average Net Assets | 4.84%4 | 3.28% | 2.83% | 3.14% | 2.18% | 2.94% |
Portfolio Turnover Rate | 67%4 | 77% | 116% | 138% | 86% | 123% |
1 Calculated based on average shares outstanding.
2 Total returns do not reflect the 1% fee assessed on redemptions of shares purchased on or after September 15, 2005, and held for less than one year, or the account service fee that may be applicable to certain accounts with balances below $10,000.
3 Includes performance-based investment advisory fee increases (decreases) of 0.14%, 0.15%, 0.16%, 0.22%, 0.20%, and 0.06%.
4 Annualized.
See accompanying Notes, which are an integral part of the Financial Statements.
20
Convertible Securities Fund
Notes to Financial Statements
Vanguard Convertible Securities Fund is registered under the Investment Company Act of 1940 as an open-end investment company, or mutual fund.
A. The following significant accounting policies conform to generally accepted accounting principles for U.S. mutual funds. The fund consistently follows such policies in preparing its financial statements.
1. Security Valuation: Securities are valued as of the close of trading on the New York Stock Exchange (generally 4 p.m., Eastern time) on the valuation date. Equity securities are valued at the latest quoted sales prices or official closing prices taken from the primary market in which each security trades; such securities not traded on the valuation date are valued at the mean of the latest quoted bid and asked prices. Bonds, and temporary cash investments acquired over 60 days to maturity, are valued using the latest bid prices or using valuations based on a matrix system (which considers such factors as security prices, yields, maturities, and ratings), both as furnished by independent pricing services. Investments in Vanguard Market Liquidity Fund are valued at that fund’s net asset value. Other temporary cash investments are valued at amortized cost, which approximates market value. Securities for which market quotations are not readily available, or whose values have been materially affected by events occurring before the fund’s pricing time but after the close of the securities’ primary markets, are valued by methods deemed by the board of trustees to represent fair value.
2. Federal Income Taxes: The fund intends to continue to qualify as a regulated investment company and distribute all of its taxable income. Management has analyzed the fund’s tax positions taken on federal income tax returns for all open tax years (tax years ended November 30, 2005–2008) and for the period ended May 31, 2009, and has concluded that no provision for federal income tax is required in the fund’s financial statements.
3. Distributions: Distributions to shareholders are recorded on the ex-dividend date.
4. Other: Dividend income is recorded on the ex-dividend date. Interest income includes income distributions received from Vanguard Market Liquidity Fund and is accrued daily. Premiums and discounts on debt securities purchased are amortized and accreted, respectively, to interest income over the lives of the respective securities. Security transactions are accounted for on the date securities are bought or sold. Costs used to determine realized gains (losses) on the sale of investment securities are those of the specific securities sold. Fees assessed on redemptions of capital shares are credited to paid-in capital.
B. Oaktree Capital Management, L.P., provides investment advisory services to the fund for a fee calculated at an annual percentage rate of average net assets. The basic fee is subject to quarterly adjustments based on the fund’s performance for the preceding three years relative to the Merrill Lynch All Convertibles-All Qualities Index. For the six months ended May 31, 2009, the investment advisory fee represented an effective annual basic rate of 0.34% of the fund’s average net assets before an increase of $736,000 (0.14%) based on performance.
C. The Vanguard Group furnishes at cost corporate management, administrative, marketing, and distribution services. The costs of such services are allocated to the fund under methods approved by the board of trustees. The fund has committed to provide up to 0.40% of its net assets in capital contributions to Vanguard. At May 31, 2009, the fund had contributed capital of $327,000 to Vanguard (included in Other Assets), representing 0.02% of the fund’s net assets and 0.13% of Vanguard’s capitalization. The fund’s trustees and officers are also directors and officers of Vanguard.
21
Convertible Securities Fund
D. Distributions are determined on a tax basis and may differ from net investment income and realized capital gains for financial reporting purposes. Differences may be permanent or temporary. Permanent differences are reclassified among capital accounts in the financial statements to reflect their tax character. Temporary differences arise when certain items of income, expense, gain, or loss are recognized in different periods for financial statement and tax purposes; these differences will reverse at some time in the future. Differences in classification may also result from the treatment of short-term gains as ordinary income for tax purposes.
Certain of the fund’s convertible bond investments are in securities considered to be “contingent payment debt instruments,” for which any realized gains increase (and all or part of any realized losses decrease) income for tax purposes. During the six months ended May 31, 2009, the fund realized net gains of $920,000 from the sale of these securities, which increased distributable net income for tax purposes; accordingly, such gains have been reclassified from accumulated net realized losses to undistributed net investment income.
The fund’s tax-basis capital gains and losses are determined only at the end of each fiscal year. For tax purposes, at November 30, 2008, the fund had available realized losses of $69,976,000 to offset future net capital gains through November 30, 2016. The fund will use these capital losses to offset net taxable capital gains, if any, realized during the year ending November 30, 2009; should the fund realize net capital losses for the year, the losses will be added to the loss carryforward balance above.
At May 31, 2009, the cost of investment securities for tax purposes was $1,527,344,000. Net unrealized depreciation of investment securities for tax purposes was $59,246,000, consisting of unrealized gains of $64,009,000 on securities that had risen in value since their purchase and $123,255,000 in unrealized losses on securities that had fallen in value since their purchase.
E. During the six months ended May 31, 2009, the fund purchased $911,046,000 of investment securities and sold $342,771,000 of investment securities, other than temporary cash investments.
F. Capital shares issued and redeemed were:
| Six Months Ended | | Year Ended |
| May 31, 2009 | | November 30, 2008 |
| Shares | | Shares |
| (000) | | (000) |
Issued | 66,048 | | 35,899 |
Issued in Lieu of Cash Distributions | 1,875 | | 5,474 |
Redeemed | (11,484) | | (18,911) |
Net Increase (Decrease) in Shares Outstanding | 56,439 | | 22,462 |
22
Convertible Securities Fund
G. In September 2006, the Financial Accounting Standards Board issued Statement of Financial Accounting Standards No. 157 (“FAS 157”), “Fair Value Measurements.” FAS 157 establishes a framework for measuring fair value and expands disclosures about fair value measurements in financial statements.
The various inputs that may be used to determine the value of the fund’s investments are summarized in three broad levels. The inputs or methodologies used for valuing securities are not necessarily an indication of the risk associated with investing in those securities.
Level 1—Quoted prices in active markets for identical securities.
Level 2—Other significant observable inputs (including quoted prices for similar securities, interest rates, prepayment speeds, credit risk, etc.).
Level 3—Significant unobservable inputs (including the fund’s own assumptions used to determine the fair value of investments).
The following table summarizes the fund’s investments as of May 31, 2009, based on the inputs used to value them:
| Investments |
| in Securities |
Valuation Inputs | ($000) |
Level 1—Quoted prices | 151,673 |
Level 2—Other significant observable inputs | 1,316,425 |
Level 3—Significant unobservable inputs | — |
Total | 1,468,098 |
23
About Your Fund’s Expenses
As a shareholder of the fund, you incur ongoing costs, which include costs for portfolio management, administrative services, and shareholder reports (like this one), among others. Operating expenses, which are deducted from a fund’s gross income, directly reduce the investment return of the fund.
A fund’s expenses are expressed as a percentage of its average net assets. This figure is known as the expense ratio. The following examples are intended to help you understand the ongoing costs (in dollars) of investing in your fund and to compare these costs with those of other mutual funds. The examples are based on an investment of $1,000 made at the beginning of the period shown and held for the entire period.
The accompanying table illustrates your fund’s costs in two ways:
• Based on actual fund return. This section helps you to estimate the actual expenses that you paid over the period. The “Ending Account Value” shown is derived from the fund’s actual return, and the third column shows the dollar amount that would have been paid by an investor who started with $1,000 in the fund. You may use the information here, together with the amount you invested, to estimate the expenses that you paid over the period.
To do so, simply divide your account value by $1,000 (for example, an $8,600 account value divided by $1,000 = 8.6), then multiply the result by the number given for your fund under the heading “Expenses Paid During Period.”
• Based on hypothetical 5% yearly return. This section is intended to help you compare your fund’s costs with those of other mutual funds. It assumes that the fund had a yearly return of 5% before expenses, but that the expense ratio is unchanged. In this case—because the return used is not the fund’s actual return—the results do not apply to your investment. The example is useful in making comparisons because the Securities and Exchange Commission requires all mutual funds to calculate expenses based on a 5% return. You can assess your fund’s costs by comparing this hypothetical example with the hypothetical examples that appear in shareholder reports of other funds.
Six Months Ended May 31, 2009 | | | |
| Beginning | Ending | Expenses |
| Account Value | Account Value | Paid During |
Convertible Securities Fund | 11/30/2008 | 5/31/2009 | Period1 |
Based on Actual Fund Return | $1,000.00 | $1,240.17 | $4.24 |
Based on Hypothetical 5% Yearly Return | 1,000.00 | 1,021.14 | 3.83 |
1 The calculations are based on expenses incurred in the most recent six-month period. The fund’s annualized six-month expense ratio for that period is 0.76%. The dollar amounts shown as “Expenses Paid” are equal to the annualized expense ratio multiplied by the average account value over the period, multiplied by the number of days in the most recent six-month period, then divided by the number of days in the most recent 12-month period.
24
Note that the expenses shown in the table are meant to highlight and help you compare ongoing costs only and do not reflect transaction costs incurred by the fund for buying and selling securities. Further, the expenses do not include the 1% fee on redemptions of shares held for less than one year, nor do they include the account service fee described in the prospectus. If such fees were applied to your account, your costs would be higher. Your fund does not carry a “sales load.”
The calculations assume no shares were bought or sold during the period. Your actual costs may have been higher or lower, depending on the amount of your investment and the timing of any purchases or redemptions.
You can find more information about the fund’s expenses, including annual expense ratios, in the Financial Statements section of this report. For additional information on operating expenses and other shareholder costs, please refer to your fund’s current prospectus.
25
Trustees Approve Advisory Agreement
The board of trustees of Vanguard Convertible Securities Fund has renewed the fund’s investment advisory agreement with Oaktree Capital Management, L.P. The board determined that the retention of Oaktree was in the best interests of the fund and its shareholders.
The board based its decision upon an evaluation of the advisor’s investment staff, portfolio management process, and performance. The trustees considered the factors discussed below, among others. However, no single factor determined whether the board approved the agreement. Rather, it was the totality of the circumstances that drove the board’s decision.
Nature, extent, and quality of services
The board considered the quality of the fund’s investment management over both the short and long term, and took into account the organizational depth and stability of the advisor. The board noted that Oaktree, founded in 1995, specializes in managing convertible securities. The advisor uses a bottom-up investment approach to select convertible securities with the best balance of upside potential and downside protection. Discipline is key to the fund’s management; Oaktree invests predominantly in convertibles possessing an attractive combination of conversion and income features—true hybrid securities—and sells the issues when their characteristics become too similar to those of conventional bonds or common stocks. Oaktree has advised the fund since 1996.
The board concluded that the advisor’s experience, stability, and performance, among other factors, warranted continuation of the advisory agreement.
Investment performance
The board considered the short- and long-term performance of the fund, including any periods of outperformance or underperformance of a relevant benchmark and peer group. The board concluded that the advisor has carried out the fund’s investment strategy in disciplined fashion, and that performance results have allowed the fund to remain competitive versus its benchmark and its peer group. Information about the fund’s most recent performance can be found in the Performance Summary section of this report.
Cost
The board concluded that the fund’s expense ratio was well below the average expense ratio charged by funds in its peer group. The board noted that the fund’s advisory fee rate was also below the peer-group average. Information about the fund’s expense ratio appears in the About Your Fund’s Expenses section of this report as well as in the Financial Statements section, which also includes information about the advisory fee rate.
The board did not consider profitability of Oaktree in determining whether to approve the advisory fee, because Oaktree is independent of Vanguard and the advisory fee is the result of arm’s-length negotiations.
The benefit of economies of scale
The board concluded that the fund’s shareholders benefit from economies of scale because of breakpoints in the fund’s advisory fee schedule. The breakpoints reduce the effective rate of the fee as the fund’s assets increase.
The board will consider whether to renew the advisory agreement again after a one-year period.
26
Glossary
Average Coupon. The average interest rate paid on the fixed income securities held by a fund. It is expressed as a percentage of face value.
Average Duration. An estimate of how much the value of the bonds held by a fund will fluctuate in response to a change in interest rates. To see how the value could change, multiply the average duration by the change in rates. If interest rates rise by 1 percentage point, the value of the bonds in a fund with an average duration of five years would decline by about 5%. If rates decrease by a percentage point, the value would rise by 5%.
Average Quality. An indicator of credit risk, this figure is the average of the ratings assigned to a fund’s holdings by credit-rating agencies. The agencies make their judgment after appraising an issuer’s ability to meet its obligations. Quality is graded on a scale, with Aaa or AAA indicating the most creditworthy bond issuers.
Average Weighted Maturity. The average length of time until fixed income securities held by a fund reach maturity and are repaid. The figure reflects the proportion of fund assets represented by each security.
Beta. A measure of the magnitude of a fund’s past share-price fluctuations in relation to the ups and downs of a given market index. The index is assigned a beta of 1.00. Compared with a given index, a fund with a beta of 1.20 typically would have seen its share price rise or fall by 12% when the index rose or fell by 10%. For this report, beta is based on returns over the past 36 months for both the fund and the index. Note that a fund’s beta should be reviewed in conjunction with its R-squared (see definition). The lower the R-squared, the less correlation there is between the fund and the index, and the less reliable beta is as an indicator of volatility.
Conversion Premium. The average percentage by which the weighted average market price of the convertible securities held by a fund exceeds the weighted average market price of their underlying common stocks. For example, if a stock is trading at $25 per share and a bond convertible into the stock is trading at a price equivalent to $30 per share of stock, the conversion premium is 20% ($5 ÷ $25 = 20%).
Expense Ratio. The percentage of a fund’s average net assets used to pay its annual administrative and advisory expenses. These expenses directly reduce returns to investors.
Foreign Holdings. The percentage of a fund’s net assets represented by securities of companies based outside the United States.
Inception Date. The date on which the assets of a fund (or one of its share classes) are first invested in accordance with the fund’s investment objective. For funds with a subscription period, the inception date is the day after that period ends. Investment performance is measured from the inception date.
Market Exposure. A measure that reflects a fund’s security investments excluding any holdings in short-term reserves.
R-Squared. A measure of how much of a fund’s past returns can be explained by the returns from the market in general, as measured by a given index. If a fund’s total returns were precisely synchronized with an index’s returns, its R-squared would be 1.00. If the fund’s returns bore no relationship to the index’s returns, its R-squared would be 0. For this report, R-squared is based on returns over the past 36 months for both the fund and the index.
27
Short-Term Reserves. The percentage of a fund invested in highly liquid, short-term securities that can be readily converted to cash.
Turnover Rate. An indication of the fund’s trading activity. Funds with high turnover rates incur higher transaction costs and may be more likely to distribute capital gains (which may be taxable to investors). The turnover rate excludes in-kind transactions, which have minimal impact on costs.
Yield. A fund’s 30-day SEC yield is derived using a formula specified by the U.S. Securities and Exchange Commission. Under the formula, data related to the fund’s security holdings in the previous 30 days are used to calculate the fund’s hypothetical net income for that period, which is then annualized and divided by the fund’s estimated average net assets over the calculation period. For the purposes of this calculation, a security’s income is based on its current market yield to maturity (in the case of bonds) or its projected dividend yield (for stocks). Because the SEC yield represents hypothetical annualized income, it will differ—at times significantly—from the fund’s actual experience. As a result, the fund’s income distributions may be higher or lower than implied by the SEC yield.
28
This page intentionally left blank.
This page intentionally left blank.
This page intentionally left blank.
The People Who Govern Your Fund
The trustees of your mutual fund are there to see that the fund is operated and managed in your best interests since, as a shareholder, you are a part owner of the fund. Your fund’s trustees also serve on the board of directors of The Vanguard Group, Inc., which is owned by the Vanguard funds and provides services to them on an at-cost basis.
A majority of Vanguard’s board members are independent, meaning that they have no affiliation with Vanguard or the funds they oversee, apart from the sizable personal investments they have made as private individuals. The independent board members have distinguished backgrounds in business, academia, and public service. Each of the trustees and executive officers oversees 157 Vanguard funds.
The following table provides information for each trustee and executive officer of the fund. More information about the trustees is in the Statement of Additional Information, which can be obtained, without charge, by contacting Vanguard at 800-662-7447, or online at www.vanguard.com.
Chairman of the Board and Interested Trustee
John J. Brennan1
Born 1954. Trustee Since May 1987. Chairman of the Board. Principal Occupation(s) During the Past Five Years: Chairman of the Board and Director/Trustee of The Vanguard Group, Inc., and of each of the investment companies served by The Vanguard Group; Chief Executive Officer and President of The Vanguard Group and of each of the investment companies served by The Vanguard Group (1996–2008).
Independent Trustees
Charles D. Ellis
Born 1937. Trustee Since January 2001. Principal Occupation(s) During the Past Five Years: Applecore Partners (pro bono ventures in education); Senior Advisor to Greenwich Associates (international business strategy consulting); Successor Trustee of Yale University; Overseer of the Stern School of Business at New York University; Trustee of the Whitehead Institute for Biomedical Research.
Emerson U. Fullwood
Born 1948. Trustee Since January 2008. Principal Occupation(s) During the Past Five Years: Retired Executive Chief Staff and Marketing Officer for North America and Corporate Vice President of Xerox Corporation (photocopiers and printers); Director of SPX Corporation (multi-industry manufacturing), the United Way of Rochester, the Boy Scouts of America, Amerigroup Corporation (direct health and medical insurance carriers), and Monroe Community College Foundation.
Rajiv L. Gupta
Born 1945. Trustee Since December 2001.2 Principal Occupation(s) During the Past Five Years: Retired Chairman and Chief Executive Officer of Rohm and Haas Co. (chemicals); President of Rohm and Haas Co. (2006–2008); Board Member of American Chemistry Council; Director of Tyco International, Ltd. (diversified manufacturing and services) and Hewlett-Packard Co. (electronic computer manufacturing); Trustee of The Conference Board.
Amy Gutmann
Born 1949. Trustee Since June 2006. Principal
Occupation(s) During the Past Five Years: President of the University of Pennsylvania; Christopher H. Browne Distinguished Professor of Political Science in the School of Arts and Sciences with Secondary Appointments at the Annenberg School for Communication and the Graduate School of Education of the University of Pennsylvania; Director of Carnegie Corporation of New York, Schuylkill River Development Corporation, and Greater Philadelphia Chamber of Commerce; Trustee of the National Constitution Center.
JoAnn Heffernan Heisen
Born 1950. Trustee Since July 1998. Principal Occupation(s) During the Past Five Years: Retired Corporate Vice President, Chief Global Diversity Officer, and Member of the Executive Committee of Johnson & Johnson (pharmaceuticals/consumer products); Vice President and Chief Information Officer (1997–2005) of Johnson & Johnson; Director of the University Medical Center at Princeton and Women’s Research and Education Institute.
André F. Perold
Born 1952. Trustee Since December 2004. Principal Occupation(s) During the Past Five Years: George Gund Professor of Finance and Banking, Senior Associate Dean, and Director of Faculty Recruiting, Harvard Business School; Director and Chairman of UNX, Inc. (equities trading firm); Chair of the Investment Committee of HighVista Strategies LLC (private investment firm).
Alfred M. Rankin, Jr.
Born 1941. Trustee Since January 1993. Principal Occupation(s) During the Past Five Years: Chairman, President, Chief Executive Officer, and Director of NACCO Industries, Inc. (forklift trucks/housewares/ lignite); Director of Goodrich Corporation (industrial products/aircraft systems and services).
J. Lawrence Wilson
Born 1936. Trustee Since April 1985. Principal Occupation(s) During the Past Five Years: Retired Chairman and Chief Executive Officer of Rohm and Haas Co. (chemicals); Director of Cummins Inc. (diesel engines) and AmerisourceBergen Corp. (pharmaceutical distribution); Trustee of Vanderbilt University and of Culver Educational Foundation.
Executive Officers
Thomas J. Higgins1
Born 1957. Chief Financial Officer Since September 2008. Principal Occupation(s) During the Past Five Years: Principal of The Vanguard Group, Inc.; Chief Financial Officer of each of the investment companies served by The Vanguard Group since 2008; Treasurer of each of the investment companies served by The Vanguard Group (1998–2008).
Kathryn J. Hyatt1
Born 1955. Treasurer Since November 2008. Principal Occupation(s) During the Past Five Years: Principal of The Vanguard Group, Inc.; Treasurer of each of the investment companies served by The Vanguard Group since 2008; Assistant Treasurer of each of the investment companies served by The Vanguard Group (1988–2008).
F. William McNabb III1
Born 1957. Chief Executive Officer Since August 2008. President Since March 2008. Principal Occupation(s) During the Past Five Years: Director of The Vanguard Group, Inc., since 2008; Chief Executive Officer and President of The Vanguard Group and of each of the investment companies served by The Vanguard Group since 2008; Director of Vanguard Marketing Corporation; Managing Director of The Vanguard Group (1995–2008).
Heidi Stam1
Born 1956. Secretary Since July 2005. Principal Occupation(s) During the Past Five Years: Managing Director of The Vanguard Group, Inc., since 2006; General Counsel of The Vanguard Group since 2005; Secretary of The Vanguard Group and of each of the investment companies served by The Vanguard Group since 2005; Director and Senior Vice President of Vanguard Marketing Corporation since 2005; Principal of The Vanguard Group (1997–2006).
Vanguard Senior Management Team |
| |
| |
R. Gregory Barton | Michael S. Miller |
Mortimer J. Buckley | James M. Norris |
Kathleen C. Gubanich | Glenn W. Reed |
Paul A. Heller | George U. Sauter |
Founder
John C. Bogle
Chairman and Chief Executive Officer, 1974–1996
1 These individuals are “interested persons” as defined in the Investment Company Act of 1940.
2 December 2002 for Vanguard Equity Income Fund, Vanguard Growth Equity Fund, the Vanguard Municipal Bond Funds, and the Vanguard State Tax-Exempt Funds.

P.O. Box 2600
Valley Forge, PA 19482-2600
Connect with Vanguard® > www.vanguard.com
Fund Information > 800-662-7447 | All comparative mutual fund data are from Lipper Inc. |
| or Morningstar, Inc., unless otherwise noted. |
Direct Investor Account Services > 800-662-2739 | |
| You can obtain a free copy of Vanguard’s proxy voting |
Institutional Investor Services > 800-523-1036 | guidelines by visiting our website, www.vanguard.com, |
| and searching for “proxy voting guidelines,” or by |
Text Telephone for People | calling Vanguard at 800-662-2739. The guidelines are |
With Hearing Impairment > 800-952-3335 | also available from the SEC’s website, www.sec.gov. |
| In addition, you may obtain a free report on how your |
| fund voted the proxies for securities it owned during |
| the 12 months ended June 30. To get the report, visit |
This material may be used in conjunction | either www.vanguard.com or www.sec.gov. |
with the offering of shares of any Vanguard | |
fund only if preceded or accompanied by | |
the fund’s current prospectus. | |
| |
| You can review and copy information about your fund |
| at the SEC’s Public Reference Room in Washington, D.C. |
| To find out more about this public service, call the SEC |
CFA® is a trademark owned by CFA Institute. | at 202-551-8090. Information about your fund is also |
| available on the SEC’s website, and you can receive |
| copies of this information, for a fee, by sending a |
| request in either of two ways: via e-mail addressed to |
| publicinfo@sec.gov or via regular mail addressed to the |
| Public Reference Section, Securities and Exchange |
| Commission, Washington, DC 20549-0102. |
| |
| |
| |
| |
| © 2009 The Vanguard Group, Inc. |
| All rights reserved. |
| Vanguard Marketing Corporation, Distributor. |
| |
| Q822 072009 |