UNITED STATES
SECURITIES AND EXCHANGE COMMISSION
Washington, D.C. 20549
FORM N-CSR
CERTIFIED SHAREHOLDER REPORT
OF
REGISTERED MANAGEMENT INVESTMENT COMPANIES
Investment Company Act file number: 811-4627
Name of Registrant: Vanguard Convertible Securities Fund
Address of Registrant:
P.O. Box 2600
Valley Forge, PA 19482
Name and address of agent for service:
Heidi Stam, Esquire
P.O. Box 876
Valley Forge, PA 19482
Registrant’s telephone number, including area code: (610) 669-1000
Date of fiscal year end: November 30
Date of reporting period: December 1, 2011 – May 31, 2012
Item 1: Reports to Shareholders

|
| Semiannual Report | May 31, 2012 |
| Vanguard Convertible Securities Fund |
> For the fiscal half-year ended May 31, 2012, Vanguard Convertible Securities Fund returned 4.42%, ahead of its benchmark index and its peer group.
> The fund’s results were in between those of the broad U.S. stock and bond markets, consistent with convertible securities’ hybrid investment characteristics.
> The advisor’s heavier exposure to U.S. convertible securities boosted the fund’s results relative to its benchmark.
| |
| Contents | |
| Your Fund’s Total Returns. | 1 |
| Chairman’s Letter. | 2 |
| Advisor’s Report. | 7 |
| Fund Profile. | 10 |
| Performance Summary. | 12 |
| Financial Statements. | 13 |
| About Your Fund’s Expenses. | 26 |
| Trustees Approve Advisory Agreement. | 28 |
| Glossary. | 29 |
Please note: The opinions expressed in this report are just that—informed opinions. They should not be considered promises or advice. Also, please keep in mind that the information and opinions cover the period through the date on the front of this report. Of course, the risks of investing in your fund are spelled out in the prospectus.
See the Glossary for definitions of investment terms used in this report.
About the cover: Vanguard was named for the HMS Vanguard, flagship of British Admiral Horatio Nelson. A ship—whose performance and safety depend on the work of all hands—has served as a fitting metaphor for the Vanguard crew as we strive to help clients reach their financial goals.
Your Fund’s Total Returns
| |
| Six Months Ended May 31, 2012 | |
| | Total |
| | Returns |
| Vanguard Convertible Securities Fund | 4.42% |
| Convertibles Composite Index | 3.78 |
| Convertible Securities Funds Average | 2.38 |
Convertibles Composite Index: CS First Boston Convertible Securities Index through November 30, 2004; Bank of America Merrill Lynch All US Convertibles Index (formerly Bank of America Merrill Lynch All Convertibles-All Qualities Index) through December 31, 2010; and 70% Bank of America Merrill Lynch All US Convertibles Index and 30% Bank of America Merrill Lynch Global 300 Convertibles ex-US Index (hedged) thereafter.
Convertible Securities Funds Average: Derived from data provided by Lipper Inc.
| | | | |
| Your Fund’s Performance at a Glance | | | | |
| November 30, 2011, Through May 31, 2012 | | | | |
| | | | Distributions Per Share |
| | Starting | Ending | Income | Capital |
| | Share Price | Share Price | Dividends | Gains |
| Vanguard Convertible Securities Fund | $12.12 | $12.20 | $0.269 | $0.177 |
1

Chairman’s Letter
Dear Shareholder,
Convertible securities, which combine some of the characteristics of common stocks and bonds, are expected to produce returns that fall between these two asset classes. After several years of atypical results, Vanguard Convertible Securities Fund returned to form during the recent reporting period: Its return trailed the broad U.S. stock market but was ahead of the broad U.S. bond market.
The fund returned 4.42% for the six months ended May 31, 2012, compared with 6.06% for the Dow Jones U.S. Total Stock Market Index and 3.46% for the Barclays U.S. Aggregate Bond Index. The fund’s return edged the 3.78% result of its benchmark and surpassed the 2.38% average return of its peers.
Please note that Vanguard recently announced that it had eliminated the redemption fee for your fund, effective May 23. The fund’s trustees determined that the fee, one of several measures in place to protect the interests of long-term investors and discourage frequent trading, was no longer needed.
U.S. stocks significantly outpaced their international counterparts
The six months ended May 31 were marked by volatility in a pattern that has become all too familiar. At the start of the period, global stock markets rose as the U.S. economy seemed to be strengthening and Europe experienced a temporary lull in its debt crisis.
2
Stocks later reversed course, however, amid news of dwindling economic growth at home and trouble abroad as Europe’s debt drama once again intensified, causing renewed concern among investors. Despite erasing some earlier gains, U.S. stocks returned more than 6% for the six months.
International stocks didn’t fare as well, returning about –4% for the half-year. European companies were the worst performers. Concerns focused on Greece and Spain, but healthier markets throughout Europe felt the effects of resurgent investor worries about indebtedness. Emerging markets and the developed markets of the Pacific region were also hurt by signs of slowing growth.
Investors’ flight to safety helped boost bond returns
The broad U.S. taxable bond market posted a solid return of about 3.5% for the half-year. The yields of U.S. Treasury bonds, which flirted with higher levels early in the period, reached record lows by the end of the six months as investors fled to the perceived safety of government debt. This “flight to quality” boosted bond prices modestly. (Bond yields and prices move in opposite directions.) Municipal bonds continued to be a bright spot in the fixed income world, producing an impressive return of almost 6%.
As it has since December 2008, the Federal Reserve Board held its target for the shortest-term interest rates
| | | |
| Market Barometer | | | |
| |
| | | | Total Returns |
| | | Periods Ended May 31, 2012 |
| | Six | One | Five Years |
| | Months | Year | (Annualized) |
| Stocks | | | |
| Russell 1000 Index (Large-caps) | 6.23% | -1.23% | -0.75% |
| Russell 2000 Index (Small-caps) | 4.06 | -8.88 | -0.73 |
| Dow Jones U.S. Total Stock Market Index | 6.06 | -1.88 | -0.45 |
| MSCI All Country World Index ex USA (International) | -4.04 | -20.49 | -5.55 |
| |
| Bonds | | | |
| Barclays U.S. Aggregate Bond Index (Broad taxable | | | |
| market) | 3.46% | 7.12% | 6.72% |
| Barclays Municipal Bond Index (Broad tax-exempt | | | |
| market) | 5.75 | 10.40 | 5.87 |
| Citigroup Three-Month U.S. Treasury Bill Index | 0.02 | 0.04 | 0.95 |
| |
| CPI | | | |
| Consumer Price Index | 1.58% | 1.70% | 2.02% |
3
between 0% and 0.25%. That policy has kept a tight lid on the returns available from money market funds and savings accounts.
For convertible securities, a return to the familiar
Vanguard Convertible Securities Fund, which had been riding down an unpredictable road at times during the past few years, moved back onto the main highway over the recent six months. As I noted before, when convertibles are performing as expected, their returns generally fall between those of stocks and bonds. That hasn’t often been the case in recent years.
In fiscal years 2009 and 2010, the fund uncharacteristically outperformed the broad stock and bond markets. The prices of convertibles rose as investors sought alternatives to volatile stocks and low-yielding bonds. In fiscal year 2011, however, returns for convertibles fell below the results of both stocks and bonds. Investors favored the highest-quality securities, including U.S. Treasuries, and avoided riskier convertibles.
Because they can be converted into common stocks, these investments have the potential for growth. At the same time, their fixed income aspect can provide some income and soften stock market turbulence. For the recent fiscal half-year, we saw both the stock and bond characteristics at work.
For the first four months of the period, the fund’s convertible securities rose in tandem with their underlying stocks as equity markets climbed. Although some
| | |
| Expense Ratios | | |
| Your Fund Compared With Its Peer Group | | |
| | | Peer Group |
| | Fund | Average |
| Convertible Securities Fund | 0.59% | 1.35% |
The fund expense ratio shown is from the prospectus dated March 27, 2012, and represents estimated costs for the current fiscal year. For the six months ended May 31, 2012, the fund’s annualized expense ratio was 0.38%. The peer-group expense ratio is derived from data provided by Lipper Inc. and captures information through year-end 2011.
Peer group: Convertible Securities Funds.
4
of the gains dissipated during the spring as global stock markets declined, the early returns more than offset the later negative ones.
The fund benefited from having less exposure to international securities than the benchmark had. International holdings, which made up about 16% of the fund’s assets on average, didn’t keep pace with their U.S. counterparts as Europe’s sovereign-debt crisis escalated again over the period’s final months.
Oaktree Capital Management, L.P., the fund’s advisor, made several wise decisions that enhanced performance. Credit research is an area of expertise for Oaktree. Its investments in unrated bonds and those rated below investment grade (BB+ or lower) by Standard & Poor’s during the period outperformed the investment-grade bonds that composed a larger percentage of the index. The advisor’s selections in the consumer discretionary, information technology, and health care sectors were also productive.
For more information on the fund’s positioning and performance during the half-year, please see the Advisor’s Report that follows this letter.
In quest for income, don’t forget balance and diversification
One reason investors choose the Convertible Securities Fund is the opportunity it offers to provide income. This has become an ever more pressing concern for investors during the period of historically low interest rates the United States has experienced since the 2008–2009 financial crisis.
At times like these, some investors may feel tempted to tilt their holdings toward higher-yielding securities as a way to make up the income gap. The drawback to such an approach, however, is that a portfolio focused exclusively on income can lack balance and diversification. At Vanguard, we believe the benefits of these two principles help compensate for the reality that different types of investments fall in and out of favor over time.
This issue can loom especially large for retired investors. They may find that a total-return spending approach, in which they make modest withdrawals from principal when necessary, can be preferable to a strategy in which they tap only income. You can read more about this in a Vanguard research paper––Income in Retirement: Common Investment Strategies, available at vanguard.com/research.
5
Again, we believe it’s best to create a portfolio that includes a mix of stock, bond, and money market funds tailored to your unique goals, time horizon, and risk tolerance. The Convertible Securities Fund, with its experienced portfolio managers and relatively low costs, can play a helpful role in such a plan.
Thank you for entrusting your assets to Vanguard.
Sincerely,

F. William McNabb III
Chairman and Chief Executive Officer
June 14, 2012
6
Advisor’s Report
We are pleased to report that Vanguard Convertible Securities Fund produced attractive absolute and relative returns for the six months ended May 31, 2012. Convertible securities participated in the strength of underlying equities during the period’s market rallies while also providing downside protection during stock retreats, and the fund returned 4.42%. The fund’s blended benchmark—70% Bank of America Merrill Lynch All US Convertibles Index,
30% Bank of America Merrill Lynch Global 300 Convertibles ex-US Index (hedged)—returned 3.78%.
The Convertible Securities Fund’s investment strategy is to create a highly diversified global portfolio. The fund emphasizes investments in convertible bonds with relatively near-term maturities or put dates. It also focuses on “balanced” convertibles—securities with reasonable
| |
| Major portfolio changes | |
| Six Months Ended May 31, 2012 | |
| |
| Additions | Comments |
| Omnicare Inc. | Attractive convertible with improving equity potential. |
| (3.75% convertible note due 4/1/42) | |
| Salix Pharmaceuticals Ltd. | Very attractive convertible with excellent upside/ |
| (1.5% convertible note due 3/15/19) | downside profile. |
| Stone Energy Corp. | Attractive long-term investment in the oil and gas industry. |
| (1.75% convertible note due 3/1/17) | |
| priceline.com | New-issue convertible with high credit quality, above-average |
| (1% convertible note due 3/15/18) | growth equity potential. |
| Olam International Ltd. | Increased investment in this balanced convertible with exposure |
| (6% convertible note due 10/15/16) | to attractively priced stock. |
| African Minerals Ltd. | Balanced convertible with exposure to an attractive stock. |
| (8.5% convertible note due 2/10/17) | Chinese state-owned enterprise recently invested $1.5 billion |
| | for a 25% stake in its mines. |
| |
| Reductions | Comments |
| Alliance Data Systems Corp. | Sold all after substantial appreciation, with convertible becoming |
| (1.75% convertible note due 8/1/13) | a pure equity substitute. |
| SBA Communications Corp. | Substantially reduced after rapid appreciation, and bonds mature |
| (1.875% convertible note due 5/1/13) | in one year. |
| SunPower Corp. | Sold after convertible developed a very high conversion premium. |
| (4.5% convertible note due 3/15/15) | |
| Electronic Arts Inc. | Sold after company fundamentals weakened and the convertible |
| (0.75% convertible note due 7/15/16) | note became less attractive. |
| Nidec Corp. | Reduced weighting because the convertible had minimal |
| (0% convertible note due 9/18/15) | sensitivity to a rise in the underlying stock. |
| Seadrill Ltd. | Reduced exposure because the convertible had appreciated and |
| (3.375% convertible note due 10/27/17) | provides less protection if the underlying shares decline. |
7
yields and stable credit quality along with good call protection and low to moderate conversion premiums. We believe these securities have a favorable balance of upside potential and downside risk. In addition, the fund underweights riskier, yet potentially higher-return, convertible preferred shares. We do, however, consider them part of our investable universe and make some use of them. It is important to note that the fund does not invest in common stocks or nonconvertible debt. We do not attempt to time the market and therefore are fully invested, holding only a small amount of cash for potential investments. With careful security selection, we believe that a portfolio of attractive convertible securities can produce equity-type returns with lower volatility and lower structural risk over long periods of time.
The investment environment
Vibrant equity and credit markets in late 2011 and the first months of 2012 provided a favorable environment for convertibles. Stock markets advanced strongly, and credit spreads tightened in global bond markets. Convertibles were able to capture nearly all of the return of their underlying stocks, most of which performed well through the first quarter of 2012. Equity markets were weaker in April, and this weakness accelerated in May, when the Standard & Poor’s 500 Index fell about 6% for the month. Convertibles provided a strong measure of downside protection during this decline, limiting their losses, and demand for them remained high throughout the six months.
New issuance of convertible securities was lackluster in the United States but stronger in other markets. The most notable issue came from priceline.com, which was purchased for the fund and performed well in the secondary market. Global primary market proceeds declined late in the period as equities became more volatile and the market entered its slower summer months.
In late 2011 and early 2012, equity markets produced strong returns amid dramatically lower volatility. This was in sharp contrast to the second half of 2011, when very large daily moves were the norm. Volatility returned in April and May 2012, although not at 2011 levels.
We were reasonably active during the early months of 2012 and acquired several new names for the portfolio, either from the new issue calendar or new secondary market trades. Because of the purchase opportunities we saw, we were sellers of both our bond-like convertibles with relatively high conversion premiums and, as usual, our highly appreciated, equity-substitute convertibles.
Our successes
Homebuilders and convertibles with exposure to construction and housing performed especially well during the period. The big winner here was Lennar, one of the fund’s largest holdings. Additional standouts appeared in pharmaceutical and health care, as well as in technology. Top individual drivers of performance
8
over the six months were convertibles from SBA Communications, Gilead Sciences, Energy XXI Bermuda, and ON Semiconductor. Because of their issues’ above-average appreciation, we have recently reduced our exposure to Lennar and SBA Communications. We are pleased to report that there were no credit issues or defaults in the portfolio.
Our shortfalls
No companies underperformed materially during the period, although some natural resources and energy firms detracted on a relative basis. Many natural resource companies are lagging because of weaker-than-expected growth in China, which will probably lead to lower demand and lower prices for various commodities. Positions in the coal and oil and gas sectors hurt fund performance, as those industries suffered a general decline during the six months. Specific detractors included SanDisk, James River Coal, and Chesapeake Energy. We are maintaining our exposure to SanDisk but have eliminated all our coal investments and reduced our exposure to Chesapeake Energy.
The fund’s positioning
The portfolio remains fully invested, approximately 89% in convertible bonds and 11% in convertible preferreds. About 16% of the fund is invested in non-U.S. securities, as we continue to ramp up to the target allocation of 30%. The portfolio is well-positioned, with an attractive current yield of 3.4% and an average credit quality of Ba3/BB–.
Our near-term outlook is relatively positive, despite the recent weakness and increased volatility in equity markets. The convertible market remains strong as investors continue to allocate funds to holdings that offer a reasonable current yield, equity upside potential, and a buffer against a significant equity correction. While we could tread water over the near term, we know that most of our companies are doing better than they were several quarters ago, and we believe the U.S. economy continues to improve. However, macroeconomic risk remains high, with renewed uncertainty in the Eurozone, rising tension in the Middle East, and a slowing Chinese economy.
We have been encouraged by attractive pricing on new convertible bonds during the past few months, and we anticipate some more select opportunities going forward. As the market remains volatile, we also expect new opportunities to open up in the secondary market, and we are seeing more attractive investments as a result of the recent equity market decline.
Larry W. Keele, CFA Principal and Founder
Jean-Paul Nedelec, Managing Director
Abe Ofer, Managing Director
Oaktree Capital Management, L.P.
June 19, 2012
9
Convertible Securities Fund
Fund Profile
As of May 31, 2012
| |
| Portfolio Characteristics | |
| Ticker Symbol | VCVSX |
| Number of Securities | 205 |
| 30-Day SEC yield | 3.38% |
| Conversion Premium | 50.8% |
| Average Weighted Maturity | 5.1 years |
| Average Coupon | 2.9% |
| Average Duration | 4.4 years |
| Foreign Holdings | 17.2% |
| Turnover Rate (Annualized) | 85% |
| Expense Ratio1 | 0.59% |
| Short-Term Reserves | 1.6% |
| |
| Distribution by Maturity (% of fixed income |
| portfolio) | |
| Under 1 Year | 3.4% |
| 1 - 5 Years | 62.6 |
| 5 - 10 Years | 28.7 |
| 10 - 20 Years | 0.8 |
| 20 - 30 Years | 4.5 |
| |
| Distribution by Credit Quality (% of fixed | |
| income portfolio) | |
| AAA | 0.1% |
| AA | 0.3 |
| A | 4.6 |
| BBB | 6.7 |
| BB | 19.3 |
| B | 13.4 |
| Not Rated | 55.6 |
For information about these ratings, see the Glossary entry for Credit Quality.
| | |
| Total Fund Volatility Measures | |
| | | DJ |
| | Conv. | U.S. Total |
| | Comp. | Market |
| | Index | Index |
| R-Squared | 0.97 | 0.91 |
| Beta | 1.10 | 0.73 |
These measures show the degree and timing of the fund’s fluctuations compared with the indexes over 36 months.
| | |
| Ten Largest Holdings (% of total net assets) |
| Gilead Sciences Inc. | Biotechnology | 2.6% |
| Micron Technology Inc. | Semiconductors | 2.3 |
| MGM Resorts | | |
| International | Casinos & Gaming | 2.1 |
| priceline.com Inc. | Internet Retail | 2.1 |
| Omnicare Inc. | Health Care | |
| | Services | 1.9 |
| Salix Pharmaceuticals | | |
| Ltd. | Pharmaceuticals | 1.9 |
| Hologic Inc. | Health Care | |
| | Equipment | 1.8 |
| United States Steel | | |
| Corp. | Steel | 1.8 |
| Nuance | Application | |
| Communications Inc. | Software | 1.7 |
| Cemex SAB de CV | Cement | 1.7 |
| Top Ten | | 19.9% |
The holdings listed exclude any temporary cash investments and equity index products.
1 The expense ratio shown is from the prospectus dated March 27, 2012, and represents estimated costs for the current fiscal year. For the six months ended May 31, 2012, the annualized expense ratio was 0.38%.
10
Convertible Securities Fund
| |
| Sector Diversification (% of market | |
| exposure) | |
| Consumer | |
| Discretionary | 12.8% |
| Consumer Staples | 1.7 |
| Energy | 9.3 |
| Financials | 15.8 |
| Health Care | 20.4 |
| Industrials | 10.6 |
| Information | |
| Technology | 20.8 |
| Materials | 7.0 |
| Telecommunication | |
| Services | 1.0 |
| Utilities | 0.6 |
11
Convertible Securities Fund
Performance Summary
All of the returns in this report represent past performance, which is not a guarantee of future results that may be achieved by the fund. (Current performance may be lower or higher than the performance data cited. For performance data current to the most recent month-end, visit our website at vanguard.com/performance.) Note, too, that both investment returns and principal value can fluctuate widely, so an investor’s shares, when sold, could be worth more or less than their original cost. The returns shown do not reflect taxes that a shareholder would pay on fund distributions or on the sale of fund shares.
Fiscal-Year Total Returns (%): November 30, 2001, Through May 31, 2012
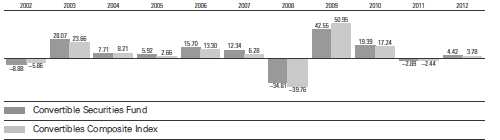
Convertibles Composite Index: CS First Boston Convertible Securities Index through November 30, 2004; Bank of America Merrill Lynch All US Convertibles Index (formerly Bank of America Merrill Lynch All Convertibles-All Qualities Index) through December 31, 2010; and 70% Bank of America Merrill Lynch All US Convertibles Index and 30% Bank of America Merrill Lynch Global 300 Convertibles ex-US Index (hedged) thereafter.
Note: For 2012, performance data reflect the six months ended May 31, 2012.
Average Annual Total Returns: Periods Ended March 31, 2012
This table presents returns through the latest calendar quarter—rather than through the end of the fiscal period.
Securities and Exchange Commission rules require that we provide this information.
| | | | | | |
| | | | | | | Ten Years |
| | Inception Date | One Year | Five Years | Income | Capital | Total |
| Convertible Securities | | | | | | |
| Fund | 6/17/1986 | -2.98% | 5.32% | 3.77% | 4.05% | 7.82% |
See Financial Highlights for dividend and capital gains information.
12
Convertible Securities Fund
Financial Statements (unaudited)
Statement of Net Assets
As of May 31, 2012
The fund reports a complete list of its holdings in regulatory filings four times in each fiscal year, at the quarter-ends. For the second and fourth fiscal quarters, the lists appear in the fund’s semiannual and annual reports to shareholders. For the first and third fiscal quarters, the fund files the lists with the Securities and Exchange Commission on Form N-Q. Shareholders can look up the fund’s Forms N-Q on the SEC’s website at sec.gov. Forms N-Q may also be reviewed and copied at the SEC’s Public Reference Room (see the back cover of this report for further information).
| | | | | |
| | | | | Face | Market |
| | | Maturity | | Amount | Value |
| | Coupon | Date Currency | (000) | ($000) |
| Convertible Bonds (85.9%) | | | | | |
| Consumer Discretionary (10.1%) | | | | | |
| Aegis Group Capital Jersey Ltd. Cvt. | 2.500% | 4/20/15 | GBP | 3,100 | 5,557 |
| 1 Gaylord Entertainment Co. Cvt. | 3.750% | 10/1/14 | USD | 3,240 | 4,779 |
| 1 Goldman Sachs Group Inc. Cvt. | | | | | |
| (Convertible into Ford Motor Co.) | 0.250% | 2/28/17 | USD | 21,785 | 18,005 |
| Group 1 Automotive Inc. Cvt. | 2.250% | 6/15/36 | USD | 2,375 | 2,541 |
| Hengdeli Holdings Ltd. Cvt. | 2.500% | 10/20/15 | HKD | 22,000 | 2,700 |
| Intime Department Store Group Co. Ltd. Cvt. | 1.750% | 10/27/13 | HKD | 19,000 | 2,444 |
| 1 Lennar Corp. Cvt. | 2.000% | 12/1/20 | USD | 7,625 | 8,912 |
| 1 Lennar Corp. Cvt. | 2.750% | 12/15/20 | USD | 2,905 | 4,063 |
| Liberty Interactive LLC Cvt. | 3.125% | 3/30/23 | USD | 11,880 | 13,484 |
| MGM Resorts International Cvt. | 4.250% | 4/15/15 | USD | 34,840 | 34,448 |
| Newford Capital Ltd. Cvt. | 0.000% | 5/12/16 | USD | 5,700 | 5,237 |
| Nokian Renkaat OYJ Cvt. | 0.000% | 6/27/14 | EUR | 3,100 | 4,408 |
| Power Regal Group Ltd. Cvt. | 2.250% | 6/2/14 | HKD | 19,180 | 2,820 |
| 1 priceline.com Inc. Cvt. | 1.000% | 3/15/18 | USD | 33,360 | 34,319 |
| Ryland Group Inc. Cvt. | 1.625% | 5/15/18 | USD | 9,670 | 9,791 |
| Sekisui House Ltd. Cvt. | 0.000% | 7/5/16 | JPY | 150,000 | 1,907 |
| Steinhoff Finance Holding GmbH Cvt. | 4.500% | 3/31/18 | EUR | 200 | 227 |
| Steinhoff Finance Holding GmbH Cvt. | 5.000% | 5/22/16 | EUR | 3,500 | 4,386 |
| TUI Travel PLC Cvt. | 4.900% | 4/27/17 | GBP | 1,900 | 2,577 |
| TUI Travel PLC Cvt. | 6.000% | 10/5/14 | GBP | 200 | 290 |
| | | | | | 162,895 |
| Consumer Staples (1.6%) | | | | | |
| Aeon Co. Ltd. Cvt. | 0.300% | 11/22/13 | JPY | 107,000 | 1,489 |
| Glory River Holdings Ltd. Cvt. | 1.000% | 7/29/15 | HKD | 24,100 | 3,060 |
| Marine Harvest ASA Cvt. | 4.500% | 2/23/15 | EUR | 700 | 784 |
| Olam International Ltd. Cvt. | 6.000% | 10/15/16 | USD | 4,500 | 4,460 |
| Pescanova SA Cvt. | 5.125% | 4/20/17 | EUR | 1,850 | 1,987 |
| Pescanova SA Cvt. | 6.750% | 3/5/15 | EUR | 2,050 | 2,528 |
| San Miguel Corp. Cvt. | 2.000% | 5/5/14 | USD | 5,400 | 5,516 |
| Unicharm Corp. Cvt. | 0.000% | 9/24/15 | JPY | 310,000 | 4,560 |
| Wilmar International Ltd. Cvt. | 0.000% | 12/18/12 | USD | 2,000 | 2,312 |
| | | | | | 26,696 |
| Energy (5.6%) | | | | | |
| BPZ Resources Inc. Cvt. | 6.500% | 3/1/15 | USD | 9,035 | 7,702 |
| Cie Generale de Geophysique - Veritas Cvt. | 1.750% | 1/1/16 | EUR | 2,060 | 2,586 |
13
Convertible Securities Fund
| | | | | |
| | | | | Face | Market |
| | | Maturity | | Amount | Value |
| | Coupon | Date Currency | (000) | ($000) |
| 1 Endeavour International Corp. Cvt. | 5.500% | 7/15/16 | USD | 7,960 | 7,084 |
| Helix Energy Solutions Group Inc. Cvt. | 3.250% | 3/15/32 | USD | 17,385 | 18,233 |
| Lukoil International Finance BV Cvt. | 2.625% | 6/16/15 | USD | 5,300 | 5,414 |
| Newpark Resources Inc. Cvt. | 4.000% | 10/1/17 | USD | 254 | 239 |
| Paladin Energy Ltd. Cvt. | 3.625% | 11/4/15 | USD | 5,117 | 3,991 |
| Pembina Pipeline Corp. Cvt. | 5.750% | 12/31/18 | CAD | 570 | 585 |
| Pembina Pipeline Corp. Cvt. | 5.750% | 11/30/20 | CAD | 185 | 191 |
| 1 Petroleum Development Corp. Cvt. | 3.250% | 5/15/16 | USD | 6,820 | 6,309 |
| Petrominerales Ltd. Cvt. | 2.625% | 8/25/16 | USD | 3,000 | 2,850 |
| Progress Energy Resources Corp. Cvt. | 5.250% | 10/31/14 | CAD | 3,467 | 3,357 |
| Seadrill Ltd. Cvt. | 3.375% | 10/27/17 | USD | 2,300 | 2,661 |
| 1 Stone Energy Corp. Cvt. | 1.750% | 3/1/17 | USD | 21,775 | 19,761 |
| Subsea 7 SA Cvt. | 2.250% | 10/11/13 | USD | 3,500 | 3,749 |
| Technip SA Cvt. | 0.500% | 1/1/16 | EUR | 831 | 1,144 |
| TMK Bonds SA Cvt. | 5.250% | 2/11/15 | USD | 4,100 | 4,016 |
| | | | | | 89,872 |
| Financials (12.5%) | | | | | |
| 1 American Equity Investment Life | | | | | |
| Holding Co. Cvt. | 3.500% | 9/15/15 | USD | 15,465 | 16,548 |
| 1 American Equity Investment Life | | | | | |
| Holding Co. Cvt. | 5.250% | 12/6/29 | USD | 3,277 | 4,104 |
| 1 Amtrust Financial Services Inc. Cvt. | 5.500% | 12/15/21 | USD | 9,645 | 11,019 |
| Annaly Capital Management Inc. Cvt. | 4.000% | 2/15/15 | USD | 5,105 | 6,113 |
| Annaly Capital Management Inc. Cvt. | 5.000% | 5/15/15 | USD | 10,800 | 10,503 |
| BES Finance Ltd. Cvt. | 1.625% | 4/15/13 | USD | 5,600 | 4,984 |
| 1 BioMed Realty LP Cvt. | 3.750% | 1/15/30 | USD | 5,915 | 6,758 |
| CapitaLand Ltd. Cvt. | 2.875% | 9/3/16 | SGD | 4,750 | 3,532 |
| China Overseas Grand Oceans Finance | | | | | |
| Cayman Ltd. Cvt. | 2.000% | 3/21/17 | HKD | 17,000 | 2,229 |
| DFC Global Corp. Cvt. | 3.000% | 4/1/28 | USD | 9,441 | 10,243 |
| 1 DFC Global Corp. Cvt. | 3.250% | 4/15/17 | USD | 13,525 | 13,897 |
| 1 Fidelity National Financial Inc. Cvt. | 4.250% | 8/15/18 | USD | 9,600 | 10,584 |
| Fonciere Des Regions Cvt. | 3.340% | 1/1/17 | EUR | 3,453 | 3,844 |
| 1 Forest City Enterprises Inc. Cvt. | 4.250% | 8/15/18 | USD | 22,427 | 21,446 |
| Graubuendner Kantonalbank Cvt. | 2.000% | 5/8/14 | CHF | 4,390 | 4,655 |
| 1 Host Hotels & Resorts LP Cvt. | 2.500% | 10/15/29 | USD | 15,360 | 19,584 |
| Industrivarden AB Cvt. | 1.875% | 2/27/17 | EUR | 1,350 | 1,630 |
| Industrivarden AB Cvt. | 2.500% | 2/27/15 | EUR | 1,950 | 2,637 |
| KFW Cvt. | 1.500% | 7/30/14 | EUR | 1,200 | 1,669 |
| Knight Capital Group Inc. Cvt. | 3.500% | 3/15/15 | USD | 7,525 | 7,158 |
| 1 NorthStar Realty Finance LP Cvt. | 7.500% | 3/15/31 | USD | 12,110 | 12,276 |
| Old Republic International Corp. Cvt. | 3.750% | 3/15/18 | USD | 8,515 | 8,291 |
| ORIX Corp. Cvt. | 1.000% | 3/31/14 | JPY | 275,000 | 3,904 |
| QBE Funding Trust Cvt. | 0.000% | 5/12/30 | USD | 2,955 | 1,862 |
| Sherson Ltd. Cvt. | 0.000% | 6/4/14 | HKD | 36,750 | 5,457 |
| Shui On Land Ltd. Cvt. | 4.500% | 9/29/15 | CNY | 4,000 | 606 |
| 1 SL Green Operating Partnership LP Cvt. | 3.000% | 10/15/17 | USD | 2,480 | 2,734 |
| Wereldhave NV Cvt. | 2.875% | 11/18/15 | EUR | 2,850 | 3,438 |
| | | | | | 201,705 |
| Health Care (18.0%) | | | | | |
| 1 Accuray Inc. Cvt. | 3.750% | 8/1/16 | USD | 2,150 | 2,053 |
| Brookdale Senior Living Inc. Cvt. | 2.750% | 6/15/18 | USD | 19,895 | 17,955 |
| Chemed Corp. Cvt. | 1.875% | 5/15/14 | USD | 8,955 | 8,709 |
| Gilead Sciences Inc. Cvt. | 1.625% | 5/1/16 | USD | 32,720 | 41,841 |
14
Convertible Securities Fund
| | | | | |
| | | | | Face | Market |
| | | Maturity | | Amount | Value |
| | Coupon | Date Currency | (000) | ($000) |
| Hologic Inc. Cvt. | 2.000% | 12/15/37 | USD | 15,205 | 15,471 |
| Hologic Inc. Cvt. | 2.000% | 3/1/42 | USD | 14,180 | 12,833 |
| 1 Illumina Inc. Cvt. | 0.250% | 3/15/16 | USD | 2,305 | 2,083 |
| Insulet Corp. Cvt. | 3.750% | 6/15/16 | USD | 4,839 | 5,063 |
| 1 Integra LifeSciences Holdings Corp. Cvt. | 1.625% | 12/15/16 | USD | 13,193 | 12,451 |
| LifePoint Hospitals Inc. Cvt. | 3.500% | 5/15/14 | USD | 13,784 | 14,060 |
| Medicis Pharmaceutical Corp. Cvt. | 1.375% | 6/1/17 | USD | 14,255 | 14,380 |
| Medivation Inc. Cvt. | 2.625% | 4/1/17 | USD | 3,775 | 4,322 |
| Molina Healthcare Inc. Cvt. | 3.750% | 10/1/14 | USD | 7,375 | 8,297 |
| Omnicare Inc. Cvt. | 3.750% | 4/1/42 | USD | 33,729 | 31,157 |
| Onyx Pharmaceuticals Inc. Cvt. | 4.000% | 8/15/16 | USD | 8,787 | 12,203 |
| Orpea Cvt. | 3.875% | 1/1/16 | EUR | 1,559 | 1,914 |
| 1 PSS World Medical Inc. Cvt. | 3.125% | 8/1/14 | USD | 9,875 | 11,381 |
| Qiagen Euro Finance SA Cvt. | 3.250% | 5/16/26 | USD | 3,500 | 3,907 |
| 1 Salix Pharmaceuticals Ltd. Cvt. | 1.500% | 3/15/19 | USD | 24,770 | 25,668 |
| Salix Pharmaceuticals Ltd. Cvt. | 2.750% | 5/15/15 | USD | 3,437 | 4,511 |
| Sawai Pharmaceutical Co. Ltd. Cvt. | 0.000% | 9/17/15 | JPY | 145,000 | 1,950 |
| Teleflex Inc. Cvt. | 3.875% | 8/1/17 | USD | 8,990 | 10,372 |
| 1 United Therapeutics Corp. Cvt. | 1.000% | 9/15/16 | USD | 16,605 | 18,535 |
| Volcano Corp. Cvt. | 2.875% | 9/1/15 | USD | 7,655 | 9,177 |
| | | | | | 290,293 |
| Industrials (9.7%) | | | | | |
| Abengoa SA Cvt. | 4.500% | 2/3/17 | EUR | 2,150 | 2,193 |
| 1 Air Lease Corp. Cvt. | 3.875% | 12/1/18 | USD | 20,335 | 20,818 |
| Asahi Glass Co. Ltd. Cvt. | 0.000% | 11/14/14 | JPY | 185,000 | 2,330 |
| Avis Budget Group Inc. Cvt. | 3.500% | 10/1/14 | USD | 13,300 | 15,943 |
| 1 Barnes Group Inc. Cvt. | 3.375% | 3/15/27 | USD | 1,885 | 1,989 |
| Barnes Group Inc. Cvt. | 3.375% | 3/15/27 | USD | 7,740 | 8,166 |
| 1 CBIZ Inc. Cvt. | 4.875% | 10/1/15 | USD | 2,435 | 2,447 |
| Chart Industries Inc. Cvt. | 2.000% | 8/1/18 | USD | 9,560 | 11,114 |
| Covanta Holding Corp. Cvt. | 3.250% | 6/1/14 | USD | 20,635 | 23,034 |
| 1 Greenbrier Cos. Inc. Cvt. | 3.500% | 4/1/18 | USD | 17,000 | 14,153 |
| 1 Kaman Corp. Cvt. | 3.250% | 11/15/17 | USD | 5,380 | 5,931 |
| Kloeckner & Co. Financial Services SA Cvt. | 2.500% | 12/22/17 | EUR | 3,300 | 3,470 |
| Larsen & Toubro Ltd. Cvt. | 3.500% | 10/22/14 | USD | 2,600 | 2,523 |
| 1 Lufthansa Malta Blues LP Cvt. | 0.750% | 4/5/17 | EUR | 1,388 | 1,741 |
| Misarte Cvt. | 3.250% | 1/1/16 | EUR | 2,842 | 3,757 |
| Navistar International Corp. Cvt. | 3.000% | 10/15/14 | USD | 1,970 | 1,916 |
| Nexans SA Cvt. | 4.000% | 1/1/16 | EUR | 2,485 | 3,150 |
| Nidec Corp. Cvt. | 0.000% | 9/18/15 | JPY | 100,000 | 1,273 |
| PB Issuer No 2 Ltd. Cvt. | 1.750% | 4/12/16 | USD | 2,810 | 2,543 |
| Russel Metals Inc. Cvt. | 7.750% | 9/30/16 | CAD | 3,325 | 3,779 |
| SGL Carbon SE Cvt. | 0.750% | 5/16/13 | EUR | 1,750 | 2,195 |
| SM Investments Corp. Cvt. | 1.625% | 2/15/17 | USD | 2,600 | 2,567 |
| Societa Iniziative Autostradali e Servizi SPA Cvt. | 2.625% | 6/30/17 | EUR | 1,878 | 2,044 |
| Tem SAS Cvt. | 4.250% | 1/1/15 | EUR | 1,758 | 2,219 |
| 1 Titan Machinery Inc. Cvt. | 3.750% | 5/1/19 | USD | 7,545 | 7,620 |
| Wabash National Corp. Cvt. | 3.375% | 5/1/18 | USD | 7,255 | 7,036 |
| | | | | | 155,951 |
| Information Technology (20.2%) | | | | | |
| 1 3D Systems Corp. Cvt. | 5.500% | 12/15/16 | USD | 5,495 | 8,201 |
| Atos Cvt. | 2.500% | 1/1/16 | EUR | 2,466 | 3,561 |
| AU Optronics Corp. Cvt. | 0.000% | 10/13/15 | USD | 3,200 | 2,496 |
| 1 BroadSoft Inc. Cvt. | 1.500% | 7/1/18 | USD | 7,695 | 7,253 |
15
Convertible Securities Fund
| | | | | | |
| | | | | | Face | Market |
| | | | Maturity | | Amount | Value |
| | | Coupon | Date Currency | (000) | ($000) |
| | Cap Gemini SA Cvt. | 3.500% | 1/1/14 | EUR | 1,402 | 1,878 |
| 1 | Ciena Corp. Cvt. | 3.750% | 10/15/18 | USD | 15,715 | 15,931 |
| | Comtech Telecommunications Corp. Cvt. | 3.000% | 5/1/29 | USD | 8,815 | 9,476 |
| 1 | Concur Technologies Inc. Cvt. | 2.500% | 4/15/15 | USD | 9,335 | 12,381 |
| 1 | CSG Systems International Inc. Cvt. | 3.000% | 3/1/17 | USD | 5,410 | 5,417 |
| 1 | DealerTrack Holdings Inc. Cvt. | 1.500% | 3/15/17 | USD | 7,120 | 7,218 |
| | Econocom Group Cvt. | 4.000% | 6/1/16 | EUR | 1,946 | 2,421 |
| | Hanwha SolarOne Co. Ltd. Cvt. | 3.500% | 1/15/18 | USD | 1,953 | 1,172 |
| | Hon Hai Precision Industry Co. Ltd. Cvt. | 0.000% | 10/12/13 | USD | 100 | 98 |
| | Ingenico Cvt. | 2.750% | 1/1/17 | EUR | 1,256 | 1,843 |
| | Intel Corp. Cvt. | 2.950% | 12/15/35 | USD | 5,745 | 6,363 |
| | Intel Corp. Cvt. | 3.250% | 8/1/39 | USD | 9,364 | 12,290 |
| | Ixia Cvt. | 3.000% | 12/15/15 | USD | 8,320 | 8,216 |
| | Lam Research Corp. Cvt. | 0.500% | 5/15/16 | USD | 8,965 | 8,685 |
| | Lam Research Corp. Cvt. | 1.250% | 5/15/18 | USD | 12,205 | 12,098 |
| | Linear Technology Corp. Cvt. | 3.000% | 5/1/27 | USD | 6,850 | 7,004 |
| | Mentor Graphics Corp. Cvt. | 4.000% | 4/1/31 | USD | 13,740 | 14,358 |
| 1 | Micron Technology Inc. Cvt. | 1.500% | 8/1/31 | USD | 16,860 | 14,500 |
| | Micron Technology Inc. Cvt. | 1.875% | 6/1/27 | USD | 9,869 | 8,438 |
| 1 | Micron Technology Inc. Cvt. | 1.875% | 8/1/31 | USD | 3,660 | 3,143 |
| 1 | Micron Technology Inc. Cvt. | 3.125% | 5/1/32 | USD | 13,290 | 11,811 |
| | Neopost SA Cvt. | 3.750% | 2/1/15 | EUR | 2,845 | 3,587 |
| | NetApp Inc. Cvt. | 1.750% | 6/1/13 | USD | 7,935 | 8,768 |
| 1 | Nuance Communications Inc. Cvt. | 2.750% | 11/1/31 | USD | 26,300 | 27,385 |
| | ON Semiconductor Corp. Cvt. | 2.625% | 12/15/26 | USD | 22,217 | 23,189 |
| 1 | Photronics Inc. Cvt. | 3.250% | 4/1/16 | USD | 1,035 | 1,009 |
| | Rovi Corp. Cvt. | 2.625% | 2/15/40 | USD | 5,731 | 5,609 |
| | SanDisk Corp. Cvt. | 1.500% | 8/15/17 | USD | 26,970 | 26,835 |
| 1 | Take-Two Interactive Software Inc. Cvt. | 1.750% | 12/1/16 | USD | 10,785 | 10,084 |
| 1 | TIBCO Software Inc. Cvt. | 2.250% | 5/1/32 | USD | 18,775 | 17,766 |
| | TTM Technologies Inc. Cvt. | 3.250% | 5/15/15 | USD | 4,196 | 4,233 |
| | VeriSign Inc. Cvt. | 3.250% | 8/15/37 | USD | 491 | 620 |
| 1 | Vishay Intertechnology Inc. Cvt. | 2.250% | 11/15/40 | USD | 2,875 | 2,641 |
| 1 | Vishay Intertechnology Inc. Cvt. | 2.250% | 5/15/41 | USD | 10,745 | 8,381 |
| | | | | | | 326,359 |
| Materials (6.8%) | | | | | |
| | African Minerals Ltd. Cvt. | 8.500% | 2/10/17 | USD | 2,000 | 1,950 |
| | AngloGold Ashanti Holdings Finance plc Cvt. | 3.500% | 5/22/14 | USD | 2,300 | 2,461 |
| | Aquarius Platinum Ltd. Cvt. | 4.000% | 12/18/15 | USD | 2,400 | 1,688 |
| | ArcelorMittal Cvt. | 5.000% | 5/15/14 | USD | 1,295 | 1,329 |
| | Cemex SAB de CV Cvt. | 3.250% | 3/15/16 | USD | 10,729 | 7,644 |
| | Cemex SAB de CV Cvt. | 4.875% | 3/15/15 | USD | 26,799 | 19,429 |
| | Glencore Finance Europe SA Cvt. | 5.000% | 12/31/14 | USD | 1,400 | 1,618 |
| | Goldcorp Inc. Cvt. | 2.000% | 8/1/14 | USD | 1,085 | 1,217 |
| | Kaiser Aluminum Corp. Cvt. | 4.500% | 4/1/15 | USD | 8,605 | 10,409 |
| | Petropavlovsk 2010 Ltd. Cvt. | 4.000% | 2/18/15 | USD | 3,100 | 2,570 |
| | RTI International Metals Inc. Cvt. | 3.000% | 12/1/15 | USD | 11,885 | 11,543 |
| | Salzgitter Finance BV Cvt. | 1.125% | 10/6/16 | EUR | 200 | 232 |
| | Salzgitter Finance BV Cvt. | 2.000% | 11/8/17 | EUR | 2,650 | 3,346 |
| 1,2 | ShengdaTech Inc. Cvt. | 6.500% | 12/15/15 | USD | 305 | 21 |
| | Steel Dynamics Inc. Cvt. | 5.125% | 6/15/14 | USD | 8,841 | 9,195 |
| | Tata Steel Ltd. Cvt. | 4.500% | 11/21/14 | USD | 3,531 | 3,351 |
| | United States Steel Corp. Cvt. | 4.000% | 5/15/14 | USD | 28,085 | 28,296 |
| | Welspun Corp. Ltd. Cvt. | 4.500% | 10/17/14 | USD | 2,700 | 2,282 |
16
Convertible Securities Fund
| | | | | |
| | | | | Face | Market |
| | | Maturity | | Amount | Value |
| | Coupon | Date Currency | (000) | ($000) |
| Western Areas NL Cvt. | 6.375% | 7/2/14 | AUD | 1,185 | 1,121 |
| Western Areas NL Cvt. | 6.400% | 7/2/15 | AUD | 500 | 483 |
| | | | | | 110,185 |
| Telecommunication Services (0.9%) | | | | | |
| Billion Express Investments Ltd. Cvt. | 0.750% | 10/18/15 | USD | 4,800 | 4,807 |
| Inmarsat PLC Cvt. | 1.750% | 11/16/17 | USD | 1,300 | 1,547 |
| Portugal Telecom International Finance BV Cvt. | 4.125% | 8/28/14 | EUR | 1,450 | 1,636 |
| SBA Communications Corp. Cvt. | 1.875% | 5/1/13 | USD | 3,177 | 4,031 |
| SK Telecom Co. Ltd. Cvt. | 1.750% | 4/7/14 | USD | 2,961 | 2,998 |
| | | | | | 15,019 |
| Utilities (0.5%) | | | | | |
| Tata Power Co. Ltd. Cvt. | 1.750% | 11/21/14 | USD | 2,700 | 2,560 |
| YTL Corp. Finance Labuan Ltd. Cvt. | 1.875% | 3/18/15 | USD | 5,800 | 6,191 |
| | | | | | 8,751 |
| Total Convertible Bonds (Cost $1,417,125) | | | | | 1,387,726 |
| |
| | | | | Shares | |
| Convertible Preferred Stocks (10.9%) | | | | | |
| Consumer Discretionary (2.3%) | | | | | |
| General Motors Co. Pfd. | 4.750% | | | 599,100 | 22,054 |
| Interpublic Group of Cos. Inc. Pfd. | 5.250% | | | 15,740 | 15,701 |
| | | | | | 37,755 |
| Energy (3.4%) | | | | | |
| Apache Corp. Pfd. | 6.000% | | | 211,300 | 10,129 |
| 1 Chesapeake Energy Corp. Pfd. | 5.750% | | | 9,090 | 7,522 |
| Energy XXI Bermuda Ltd. Pfd. | 5.625% | | | 49,610 | 16,757 |
| Goodrich Petroleum Corp. Pfd. | 5.375% | | | 358,000 | 12,754 |
| SandRidge Energy Inc. Pfd. | 8.500% | | | 78,620 | 8,196 |
| | | | | | 55,358 |
| Financials (2.8%) | | | | | |
| Entertainment Properties Trust Pfd. | 5.750% | | | 190,300 | 3,613 |
| Fifth Third Bancorp Pfd. | 8.500% | | | 90,350 | 12,299 |
| Health Care REIT Inc. Pfd. | 6.500% | | | 190,133 | 10,196 |
| MetLife Inc. Pfd. | 5.000% | | | 187,900 | 11,022 |
| Wintrust Financial Corp. Pfd. | 5.000% | | | 7,530 | 7,493 |
| | | | | | 44,623 |
| Health Care (1.8%) | | | | | |
| HealthSouth Corp. Pfd. | 6.500% | | | 16,430 | 16,060 |
| Omnicare Capital Trust II Pfd. | 4.000% | | | 275,500 | 12,294 |
| | | | | | 28,354 |
| Industrials (0.6%) | | | | | |
| Continental Airlines Finance Trust II Pfd. | 6.000% | | | 112,030 | 4,033 |
| Stanley Black & Decker Inc. Pfd. | 4.750% | | | 46,480 | 5,378 |
| | | | | | 9,411 |
| Total Convertible Preferred Stocks (Cost $173,384) | | | | | 175,501 |
17
Convertible Securities Fund
| | | |
| | | | Market |
| | | | Value |
| | Coupon | Shares | ($000) |
| Temporary Cash Investment (1.6%) | | | |
| Money Market Fund (1.6%) | | | |
| 3 Vanguard Market Liquidity Fund | | | |
| (Cost $26,111) | 0.148% | 26,111,000 | 26,111 |
| Total Investments (98.4%) (Cost $1,616,620) | | | 1,589,338 |
| Other Assets and Liabilities (1.6%) | | | |
| Other Assets | | | 42,012 |
| Liabilities | | | (16,786) |
| | | | 25,226 |
| Net Assets (100%) | | | |
| Applicable to 132,337,489 outstanding $.001 par value shares of | | |
| beneficial interest (unlimited authorization) | | | 1,614,564 |
| Net Asset Value Per Share | | | $12.20 |
| |
| At May 31, 2012, net assets consisted of: | |
| | Amount |
| | ($000) |
| Paid-in Capital | 1,602,615 |
| Undistributed Net Investment Income | 17,248 |
| Accumulated Net Realized Gains | 16,665 |
| Unrealized Appreciation (Depreciation) | |
| Investment Securities | (27,282) |
| Forward Currency Contracts | 5,516 |
| Foreign Currencies | (198) |
| Net Assets | 1,614,564 |
See Note A in Notes to Financial Statements.
1 Security exempt from registration under Rule 144A of the Securities Act of 1933. Such securities may be sold in transactions exempt from registration, normally to qualified institutional buyers. At May 31, 2012, the aggregate value of these securities was $509,716,000, representing 31.6% of net assets.
2 Non-income-producing security--interest payments in default.
3 Affiliated money market fund available only to Vanguard funds and certain trusts and accounts managed by Vanguard. Rate shown is the 7-day yield.
REIT—Real Estate Investment Trust.
AUD—Australian dollars.
CAD—Canadian dollars.
CHF—Swiss francs.
CNY—Chinese Yuan.
EUR—Euro.
GBP—British pounds.
HKD—Hong Kong dollars.
JPY—Japanese Yen.
SGD—Singapore dollars.
USD—United States dollars.
See accompanying Notes, which are an integral part of the Financial Statements.
18
Convertible Securities Fund
| |
| Statement of Operations | |
| |
| | Six Months Ended |
| | May 31, 2012 |
| | ($000) |
| Investment Income | |
| Income | |
| Dividends | 5,337 |
| Interest1,2 | 27,082 |
| Total Income | 32,419 |
| Expenses | |
| Investment Advisory Fees—Note B | |
| Basic Fee | 2,899 |
| Performance Adjustment | (1,494) |
| The Vanguard Group—Note C | |
| Management and Administrative | 1,675 |
| Marketing and Distribution | 168 |
| Custodian Fees | 27 |
| Shareholders’ Reports | 7 |
| Trustees’ Fees and Expenses | 2 |
| Total Expenses | 3,284 |
| Net Investment Income | 29,135 |
| Realized Net Gain (Loss) | |
| Investment Securities Sold | 22,855 |
| Foreign Currencies and Forward Currency Contracts | 3,961 |
| Realized Net Gain (Loss) | 26,816 |
| Change in Unrealized Appreciation (Depreciation) | |
| Investment Securities | 15,273 |
| Foreign Currencies and Forward Currency Contracts | 3,485 |
| Change in Unrealized Appreciation (Depreciation) | 18,758 |
| Net Increase (Decrease) in Net Assets Resulting from Operations | 74,709 |
1 Interest income is net of foreign withholding taxes of $11,000.
2 Interest income from an affiliated company of the fund was $23,000.
See accompanying Notes, which are an integral part of the Financial Statements.
19
Convertible Securities Fund
| | |
| Statement of Changes in Net Assets | | |
| |
| | Six Months Ended | Year Ended |
| | May 31, | November 30, |
| | 2012 | 2011 |
| | ($000) | ($000) |
| Increase (Decrease) in Net Assets | | |
| Operations | | |
| Net Investment Income | 29,135 | 65,989 |
| Realized Net Gain (Loss) | 26,816 | 50,338 |
| Change in Unrealized Appreciation (Depreciation) | 18,758 | (189,816) |
| Net Increase (Decrease) in Net Assets Resulting from Operations | 74,709 | (73,489) |
| Distributions | | |
| Net Investment Income | (36,581) | (68,040) |
| Realized Capital Gain1 | (24,089) | (121,860) |
| Total Distributions | (60,670) | (189,900) |
| Capital Share Transactions | | |
| Issued | 97,050 | 538,457 |
| Issued in Lieu of Cash Distributions | 53,010 | 166,796 |
| Redeemed2 | (229,960) | (494,030) |
| Net Increase (Decrease) from Capital Share Transactions | (79,900) | 211,223 |
| Total Increase (Decrease) | (65,861) | (52,166) |
| Net Assets | | |
| Beginning of Period | 1,680,425 | 1,732,591 |
| End of Period3 | 1,614,564 | 1,680,425 |
1 Includes fiscal 2012 and 2011 short-term gain distributions totaling $3,130,000 and $71,840,000, respectively. Short-term gain distributions are treated as ordinary income dividends for tax purposes.
2 Net of redemption fees for fiscal 2012 and 2011 of $174,000 and $945,000, respectively.
3 Net Assets—End of Period includes undistributed net investment income of $17,248,000 and $16,842,000.
See accompanying Notes, which are an integral part of the Financial Statements.
20
Convertible Securities Fund
| | | | | | |
| Financial Highlights | | | �� | | | |
| |
| |
| Six Months | | | | | |
| | Ended | | | | | |
| For a Share Outstanding | May 31, | | | Year Ended November 30, |
| Throughout Each Period | 2012 | 2011 | 2010 | 2009 | 2008 | 2007 |
| Net Asset Value, Beginning of Period | $12.12 | $13.85 | $12.12 | $8.86 | $14.95 | $14.81 |
| Investment Operations | | | | | | |
| Net Investment Income | .217 | .451 | .555 | .475 | .401 | .420 |
| Net Realized and Unrealized Gain (Loss) | | | | | | |
| on Investments | .309 | (.752) | 1.742 | 3.211 | (5.170) | 1.250 |
| Total from Investment Operations | .526 | (.301) | 2.297 | 3.686 | (4.769) | 1.670 |
| Distributions | | | | | | |
| Dividends from Net Investment Income | (.269) | (.474) | (.567) | (.426) | (.501) | (.510) |
| Distributions from Realized Capital Gains | (.177) | (.955) | — | — | (.820) | (1.020) |
| Total Distributions | (.446) | (1.429) | (.567) | (.426) | (1.321) | (1.530) |
| Net Asset Value, End of Period | $12.20 | $12.12 | $13.85 | $12.12 | $8.86 | $14.95 |
| |
| Total Return1 | 4.42% | -2.89% | 19.39% | 42.55% | -34.81% | 12.34% |
| |
| Ratios/Supplemental Data | | | | | | |
| Net Assets, End of Period (Millions) | $1,615 | $1,680 | $1,733 | $1,715 | $716 | $872 |
| Ratio of Total Expenses to | | | | | | |
| Average Net Assets2 | 0.38% | 0.59% | 0.68% | 0.72% | 0.71% | 0.77% |
| Ratio of Net Investment Income to | | | | | | |
| Average Net Assets | 3.41% | 3.36% | 4.08% | 4.65% | 3.28% | 2.83% |
| Portfolio Turnover Rate | 85% | 90% | 103% | 103% | 77% | 116% |
The expense ratio, net income ratio, and turnover rate for the current period have been annualized.
1 Total returns do not include transaction or account service fees that may have applied in the periods shown. Fund prospectuses provide information about any applicable transaction and account service fees.
2 Includes performance-based investment advisory fee increases (decreases) of (0.17%), 0.03%, 0.12%, 0.12%, 0.15%, and 0.16%.
See accompanying Notes, which are an integral part of the Financial Statements.
21
Convertible Securities Fund
Notes to Financial Statements
Vanguard Convertible Securities Fund is registered under the Investment Company Act of 1940 as an open-end investment company, or mutual fund. The fund invests in securities of foreign issuers, which may subject it to investment risks not normally associated with investing in securities of United States corporations.
A. The following significant accounting policies conform to generally accepted accounting principles for U.S. mutual funds. The fund consistently follows such policies in preparing its financial statements.
1. Security Valuation: Securities are valued as of the close of trading on the New York Stock Exchange (generally 4 p.m., Eastern time) on the valuation date. Equity securities are valued at the latest quoted sales prices or official closing prices taken from the primary market in which each security trades; such securities not traded on the valuation date are valued at the mean of the latest quoted bid and asked prices. Bonds, and temporary cash investments acquired over 60 days to maturity, are valued using the latest bid prices or using valuations based on a matrix system (which considers such factors as security prices, yields, maturities, and ratings), both as furnished by independent pricing services. Investments in Vanguard Market Liquidity Fund are valued at that fund’s net asset value. Other temporary cash investments are valued at amortized cost, which approximates market value. Securities for which market quotations are not readily available, or whose values have been materially affected by events occurring before the fund’s pricing time but after the close of the securities’ primary markets, are valued by methods deemed by the board of trustees to represent fair value.
2. Foreign Currency: Securities and other assets and liabilities denominated in foreign currencies are translated into U.S. dollars using exchange rates obtained from an independent third party as of the fund’s pricing time on the valuation date. Realized gains (losses) and unrealized appreciation (depreciation) on investment securities include the effects of changes in exchange rates since the securities were purchased, combined with the effects of changes in security prices. Fluctuations in the value of other assets and liabilities resulting from changes in exchange rates are recorded as unrealized foreign currency gains (losses) until the assets or liabilities are settled in cash, at which time they are recorded as realized foreign currency gains (losses).
3. Forward Currency Contracts: The fund enters into forward currency contracts to protect the value of securities and related receivables and payables against changes in future foreign exchange rates. The fund’s risks in using these contracts include movement in the values of the foreign currencies relative to the U.S. dollar and the ability of the counterparties to fulfill their obligations under the contracts. Counterparty risk is mitigated by entering into forward currency contracts only with highly rated counterparties, by a master netting arrangement between the fund and the counterparty, and by the posting of collateral by the counterparty. The forward currency contracts contain provisions whereby a counterparty may terminate open contracts if the fund’s net assets decline below a certain level, triggering a payment by the fund if the fund is in a net liability position at the time of the termination. The payment amount would be reduced by any collateral the fund has posted. Any securities posted as collateral for open contracts are noted in the Statement of Net Assets.
Forward currency contracts are valued at their quoted daily prices obtained from an independent third party, adjusted for currency risk based on the expiration date of each contract. The aggregate principal amounts of the contracts are not recorded in the Statement of Net Assets. Fluctuations in the value of the contracts are recorded in the Statement of Net Assets as an asset (liability) and in the Statement of Operations as unrealized appreciation (depreciation) until the contracts are closed, when they are recorded as realized forward currency contract gains (losses).
22
Convertible Securities Fund
4. Federal Income Taxes: The fund intends to continue to qualify as a regulated investment company and distribute all of its taxable income. Management has analyzed the fund’s tax positions taken for all open federal income tax years (November 30, 2008–2011), and for the period ended May 31, 2012, and has concluded that no provision for federal income tax is required in the fund’s financial statements.
5. Distributions: Distributions to shareholders are recorded on the ex-dividend date.
6. Other: Dividend income is recorded on the ex-dividend date. Interest income includes income distributions received from Vanguard Market Liquidity Fund and is accrued daily. Premiums and discounts on debt securities purchased are amortized and accreted, respectively, to interest income over the lives of the respective securities. Security transactions are accounted for on the date securities are bought or sold. Costs used to determine realized gains (losses) on the sale of investment securities are those of the specific securities sold. Fees assessed on redemptions of capital shares are credited to paid-in-capital.
B. Oaktree Capital Management, L.P., provides investment advisory services to the fund for a fee calculated at an annual percentage rate of average net assets. The basic fee is subject to quarterly adjustments based on the fund’s performance for the preceding three years relative to the Bank of America Merrill Lynch All US Convertibles Index (previously Merrill Lynch All Convertibles-All Qualities Index) for periods prior to March 1, 2011, and a composite index weighted 70% Bank of America Merrill Lynch All US Convertibles Index and 30% Bank of America Merrill Lynch Global 300 Convertibles ex-US Index (hedged) thereafter. The benchmark change will be fully phased in by February 2014.
For the six months ended May 31, 2012, the investment advisory fee represented an effective annual basic rate of 0.34% of the fund’s average net assets before a decrease of $1,494,000 (0.17%) based on performance.
C. The Vanguard Group furnishes at cost corporate management, administrative, marketing, and distribution services. The costs of such services are allocated to the fund under methods approved by the board of trustees. The fund has committed to provide up to 0.40% of its net assets in capital contributions to Vanguard. At May 31, 2012, the fund had contributed capital of $250,000 to Vanguard (included in Other Assets), representing 0.02% of the fund’s net assets and 0.10% of Vanguard’s capitalization. The fund’s trustees and officers are also directors and officers of Vanguard.
D. Various inputs may be used to determine the value of the fund’s investments. These inputs are summarized in three broad levels for financial statement purposes. The inputs or methodologies used to value securities are not necessarily an indication of the risk associated with investing in those securities.
Level 1—Quoted prices in active markets for identical securities.
Level 2—Other significant observable inputs (including quoted prices for similar securities, interest rates, prepayment speeds, credit risk, etc.).
Level 3—Significant unobservable inputs (including the fund’s own assumptions used to determine the fair value of investments).
23
Convertible Securities Fund
The following table summarizes the market value of the fund’s investments as of May 31, 2012, based on the inputs used to value them:
| | | |
| | Level 1 | Level 2 | Level 3 |
| Investments | ($000) | ($000) | ($000) |
| Convertible Bonds | — | 1,387,726 | — |
| Convertible Preferred Stocks | 175,501 | — | — |
| Temporary Cash Investments | 26,111 | — | — |
| Forward Currency Contracts—Assets | — | 6,027 | — |
| Forward Currency Contracts—Liabilities | — | (511) | — |
| Total | 201,612 | 1,393,242 | — |
E. At May 31, 2012, the fund had open forward currency contracts to receive and deliver currencies as follows. Unrealized appreciation (depreciation) on open forward currency contracts is treated as realized gain (loss) for tax purposes.
| | | | | | |
| | | | | | | Unrealized |
| | Contract | | | | | Appreciation |
| | Settlement | | | Contract Amount (000) | (Depreciation) |
| Counterparty | Date | | Receive | | Deliver | ($000) |
| UBS AG | 7/19/12 | USD | 77,488 | EUR | 62,650 | 4,793 |
| UBS AG | 7/19/12 | USD | 19,079 | HKD | 148,050 | 5 |
| UBS AG | 7/19/12 | USD | 18,031 | JPY | 1,413,105 | (511) |
| UBS AG | 7/19/12 | USD | 8,963 | GBP | 5,825 | 314 |
| UBS AG | 7/19/12 | USD | 8,120 | CAD | 8,420 | 381 |
| UBS AG | 7/19/12 | USD | 4,759 | CHF | 4,620 | 296 |
| UBS AG | 7/19/12 | USD | 3,628 | SGD | 4,675 | 120 |
| UBS AG | 7/19/12 | USD | 1,748 | AUD | 1,810 | 118 |
| | | | | | | 5,516 |
AUD—Australian dollar.
CAD—Canadian dollar.
CHF—Swiss Franc.
EUR—Euro.
GBP—British pound.
HKD—Hong Kong dollar.
JPY—Japanese yen.
SGD—Singapore dollar.
USD—U.S. dollar.
24
Convertible Securities Fund
F. Distributions are determined on a tax basis and may differ from net investment income and realized capital gains for financial reporting purposes. Differences may be permanent or temporary. Permanent differences are reclassified among capital accounts in the financial statements to reflect their tax character. Temporary differences arise when certain items of income, expense, gain, or loss are recognized in different periods for financial statement and tax purposes; these differences will reverse at some time in the future. Differences in classification may also result from the treatment of short-term gains as ordinary income for tax purposes. The fund’s tax-basis capital gains and losses are determined only at the end of each fiscal year.
During the six months ended May 31, 2012, the fund realized net foreign currency losses of $69,000 (including the foreign currency component on sales of foreign currency denominated bonds), which decreased distributable net income for tax purposes; accordingly, such losses have been reclassified from accumulated net realized gains to undistributed net investment income.
Certain of the fund’s convertible preferred stock investments are treated as debt securities for tax purposes. During the six months ended May 31, 2012, the fund realized gains of $91,000 from the sale of these securities, which are included in distributable net investment income for tax purposes; accordingly, such gains have been reclassified from accumulated net realized gains to undistributed net investment income.
Certain of the fund’s convertible bond investments are in securities considered to be “contingent payment debt instruments,” for which any realized gains increase (and all or part of any realized losses decrease) income for tax purposes. During the six months ended May 31, 2012, the fund realized net gains of $8,153,000 from the sale of these securities, which increased distributable net income for tax purposes; accordingly, such gains have been reclassified from accumulated net realized gains to undistributed net investment income.
At May 31, 2012, the cost of investment securities for tax purposes was $1,616,284,000. Net unrealized depreciation of investment securities for tax purposes was $26,946,000, consisting of unrealized gains of $72,712,000 on securities that had risen in value since their purchase and $99,658,000 in unrealized losses on securities that had fallen in value since their purchase.
G. During the six months ended May 31, 2012, the fund purchased $698,257,000 of investment securities and sold $790,347,000 of investment securities, other than temporary cash investments.
H. Capital shares issued and redeemed were:
| | |
| | Six Months Ended | Year Ended |
| | May 31, 2012 | November 30, 2011 |
| | Shares | Shares |
| | (000) | (000) |
| Issued | 7,735 | 39,245 |
| Issued in Lieu of Cash Distributions | 4,418 | 12,534 |
| Redeemed | (18,462) | (38,263) |
| Net Increase (Decrease) in Shares Outstanding | (6,309) | 13,516 |
I. In preparing the financial statements as of May 31, 2012, management considered the impact of subsequent events for potential recognition or disclosure in these financial statements.
25
About Your Fund’s Expenses
As a shareholder of the fund, you incur ongoing costs, which include costs for portfolio management, administrative services, and shareholder reports (like this one), among others. Operating expenses, which are deducted from a fund’s gross income, directly reduce the investment return of the fund.
A fund’s expenses are expressed as a percentage of its average net assets. This figure is known as the expense ratio. The following examples are intended to help you understand the ongoing costs (in dollars) of investing in your fund and to compare these costs with those of other mutual funds. The examples are based on an investment of $1,000 made at the beginning of the period shown and held for the entire period.
The accompanying table illustrates your fund’s costs in two ways:
• Based on actual fund return. This section helps you to estimate the actual expenses that you paid over the period. The ”Ending Account Value“ shown is derived from the fund‘s actual return, and the third column shows the dollar amount that would have been paid by an investor who started with $1,000 in the fund. You may use the information here, together with the amount you invested, to estimate the expenses that you paid over the period.
To do so, simply divide your account value by $1,000 (for example, an $8,600 account value divided by $1,000 = 8.6), then multiply the result by the number given for your fund under the heading ”Expenses Paid During Period.“
• Based on hypothetical 5% yearly return. This section is intended to help you compare your fund‘s costs with those of other mutual funds. It assumes that the fund had a yearly return of 5% before expenses, but that the expense ratio is unchanged. In this case—because the return used is not the fund’s actual return—the results do not apply to your investment. The example is useful in making comparisons because the Securities and Exchange Commission requires all mutual funds to calculate expenses based on a 5% return. You can assess your fund’s costs by comparing this hypothetical example with the hypothetical examples that appear in shareholder reports of other funds.
Note that the expenses shown in the table are meant to highlight and help you compare ongoing costs only and do not reflect transaction costs incurred by the fund for buying and selling securities. Further, the expenses do not include any purchase, redemption, or account service fees described in the fund prospectus. If such fees were applied to your account, your costs would be higher. Your fund does not carry a “sales load.”
The calculations assume no shares were bought or sold during the period. Your actual costs may have been higher or lower, depending on the amount of your investment and the timing of any purchases or redemptions.
You can find more information about the fund’s expenses, including annual expense ratios, in the Financial Statements section of this report. For additional information on operating expenses and other shareholder costs, please refer to your fund’s current prospectus.
26
| | | |
| Six Months Ended May 31, 2012 | | | |
| | Beginning | Ending | Expenses |
| | Account Value | Account Value | Paid During |
| Convertible Securities Fund | 11/30/2011 | 5/31/2012 | Period |
| Based on Actual Fund Return | $1,000.00 | $1,044.20 | $1.94 |
| Based on Hypothetical 5% Yearly Return | 1,000.00 | 1,023.10 | 1.92 |
The calculations are based on expenses incurred in the most recent six-month period. The fund’s annualized six-month expense ratio for that period is 0.38%. The dollar amounts shown as “Expenses Paid” are equal to the annualized expense ratio multiplied by the average account value over the period, multiplied by the number of days in the most recent six-month period, then divided by the number of days in the most recent 12-month period.
27
Trustees Approve Advisory Agreement
The board of trustees of Vanguard Convertible Securities Fund has approved the fund’s investment advisory agreement with Oaktree Capital Management, L.P. The board determined that the retention of the advisor was in the best interests of the fund and its shareholders.
The board based its decision upon an evaluation of the advisor’s investment staff, portfolio management process, and performance. The trustees considered the factors discussed below, among others. However, no single factor determined whether the board approved the agreement. Rather, it was the totality of the circumstances that drove the board’s decision.
Nature, extent, and quality of services
The board considered the quality of the fund’s investment management over both the short and long term, and took into account the organizational depth and stability of the advisor. The board noted that Oaktree, founded in 1995, specializes in managing convertible securities. The advisor uses a bottom-up investment approach to select convertible securities that it believes have the best balance of upside potential and downside protection. Discipline is key to the fund’s management; Oaktree invests predominantly in convertibles possessing an attractive combination of conversion and income features—true hybrid securities—and sells the issues when their characteristics become too similar to those of conventional bonds or common stocks. Oaktree has advised the fund since 1996.
The board concluded that the advisor’s experience, stability, depth, and performance, among other factors, warranted continuation of the advisory agreement.
Investment performance
The board considered the short- and long-term performance of the fund, including any periods of outperformance or underperformance of a relevant benchmark and peer group. The board concluded that the advisor has carried out the fund’s investment strategy in disciplined fashion, and that performance results have allowed the fund to remain competitive versus its benchmark and its peer group. Information about the fund’s most recent performance can be found in the Performance Summary section of this report.
Cost
The board concluded that the fund’s expense ratio was well below the average expense ratio charged by funds in its peer group and that the fund’s advisory fee rate was also well below its peer-group average. Information about the fund’s expenses appears in the About Your Fund’s Expenses section of this report as well as in the Financial Statements section, which also includes information about the advisory fee rate.
The board did not consider profitability of Oaktree in determining whether to approve the advisory fee, because Oaktree is independent of Vanguard and the advisory fee is the result of arm’s-length negotiations.
The benefit of economies of scale
The board concluded that the fund’s shareholders benefit from economies of scale because of breakpoints in the fund’s advisory fee schedule. The breakpoints reduce the effective rate of the fee as the fund’s assets increase.
The board will consider whether to renew the advisory agreement again after a one-year period.
28
Glossary
30-Day SEC Yield. A fund’s 30-day SEC yield is derived using a formula specified by the U.S. Securities and Exchange Commission. Under the formula, data related to the fund’s security holdings in the previous 30 days are used to calculate the fund’s hypothetical net income for that period, which is then annualized and divided by the fund’s estimated average net assets over the calculation period. For the purposes of this calculation, a security’s income is based on its current market yield to maturity (for bonds), its actual income (for asset-backed securities), or its projected dividend yield (for stocks). Because the SEC yield represents hypothetical annualized income, it will differ—at times significantly—from the fund’s actual experience. As a result, the fund’s income distributions may be higher or lower than implied by the SEC yield.
Average Coupon. The average interest rate paid on the fixed income securities held by a fund. It is expressed as a percentage of face value.
Average Duration. An estimate of how much the value of the bonds held by a fund will fluctuate in response to a change in interest rates. To see how the value could change, multiply the average duration by the change in rates. If interest rates rise by 1 percentage point, the value of the bonds in a fund with an average duration of five years would decline by about 5%. If rates decrease by a percentage point, the value would rise by 5%.
Average Weighted Maturity. The average length of time until fixed income securities held by a fund reach maturity and are repaid. The figure reflects the proportion of fund assets represented by each security.
Beta. A measure of the magnitude of a fund’s past share-price fluctuations in relation to the ups and downs of a given market index. The index is assigned a beta of 1.00. Compared with a given index, a fund with a beta of 1.20 typically would have seen its share price rise or fall by 12% when the index rose or fell by 10%. For this report, beta is based on returns over the past 36 months for both the fund and the index. Note that a fund’s beta should be reviewed in conjunction with its R-squared (see definition). The lower the R-squared, the less correlation there is between the fund and the index, and the less reliable beta is as an indicator of volatility.
Conversion Premium. The average percentage by which the weighted average market price of the convertible securities held by a fund exceeds the weighted average market price of their underlying common stocks. For example, if a stock is trading at $25 per share and a bond that is convertible into the stock is trading at a price equivalent to $30 per share of stock, the conversion premium is 20% ($5 ÷ $25 = 20%).
Credit Quality. For this report, credit-quality ratings are measured on a scale that generally ranges from AAA (highest) to D (lowest). “Not Rated” is used to classify securities for which a rating is not available. Credit-quality ratings are obtained from S&P.
Expense Ratio. A fund’s total annual operating expenses expressed as a percentage of the fund’s average net assets. The expense ratio includes management and administrative expenses, but does not include the transaction costs of buying and selling portfolio securities.
Foreign Holdings. The percentage of a fund represented by securities or depositary receipts of companies based outside the United States.
29
Inception Date. The date on which the assets of a fund (or one of its share classes) are first invested in accordance with the fund’s investment objective. For funds with a subscription period, the inception date is the day after that period ends. Investment performance is measured from the inception date.
Market Exposure. A measure that reflects a fund’s security investments excluding any holdings in short-term reserves.
R-Squared. A measure of how much of a fund’s past returns can be explained by the returns from the market in general, as measured by a given index. If a fund’s total returns were precisely synchronized with an index’s returns, its R-squared would be 1.00. If the fund’s returns bore no relationship to the index’s returns, its R-squared would be 0. For this report, R-squared is based on returns over the past 36 months for both the fund and the index.
Short-Term Reserves. The percentage of a fund invested in highly liquid, short-term securities that can be readily converted to cash.
Turnover Rate. An indication of the fund’s trading activity. Funds with high turnover rates incur higher transaction costs and may be more likely to distribute capital gains (which may be taxable to investors). The turnover rate excludes in-kind transactions, which have minimal impact on costs.
30
This page intentionally left blank.
The People Who Govern Your Fund
The trustees of your mutual fund are there to see that the fund is operated and managed in your best interests since, as a shareholder, you are a part owner of the fund. Your fund’s trustees also serve on the board of directors of The Vanguard Group, Inc., which is owned by the Vanguard funds and provides services to them on an at-cost basis.
A majority of Vanguard’s board members are independent, meaning that they have no affiliation with Vanguard or the funds they oversee, apart from the sizable personal investments they have made as private individuals. The independent board members have distinguished backgrounds in business, academia, and public service. Each of the trustees and executive officers oversees 179 Vanguard funds.
The following table provides information for each trustee and executive officer of the fund. More information about the trustees is in the Statement of Additional Information, which can be obtained, without charge, by contacting Vanguard at 800-662-7447, or online at vanguard.com.
| |
| InterestedTrustee1 | and Delphi Automotive LLP (automotive components); |
| | Senior Advisor at New Mountain Capital; Trustee of |
| F. William McNabb III | The Conference Board. |
| Born 1957. Trustee Since July 2009. Chairman of the | |
| Board. Principal Occupation(s) During the Past Five | Amy Gutmann |
| Years: Chairman of the Board of The Vanguard Group, | Born 1949. Trustee Since June 2006. Principal |
| Inc., and of each of the investment companies served | Occupation(s) During the Past Five Years: President |
| by The Vanguard Group, since January 2010; Director | of the University of Pennsylvania; Christopher H. |
| of The Vanguard Group since 2008; Chief Executive | Browne Distinguished Professor of Political Science |
| Officer and President of The Vanguard Group and of | in the School of Arts and Sciences with secondary |
| each of the investment companies served by The | appointments at the Annenberg School for |
| Vanguard Group since 2008; Director of Vanguard | Communication and the Graduate School of Education |
| Marketing Corporation; Managing Director of The | of the University of Pennsylvania; Member of the |
| Vanguard Group (1995–2008). | National Commission on the Humanities and Social |
| | Sciences; Trustee of Carnegie Corporation of New |
| Independent Trustees | York and of the National Constitution Center; Chair |
| of the U. S. Presidential Commission for the Study |
| Emerson U. Fullwood | of Bioethical Issues. |
| Born 1948. Trustee Since January 2008. Principal | |
| Occupation(s) During the Past Five Years: Executive | JoAnn Heffernan Heisen |
| Chief Staff and Marketing Officer for North America | Born 1950. Trustee Since July 1998. Principal |
| and Corporate Vice President (retired 2008) of Xerox | Occupation(s) During the Past Five Years: Corporate |
| Corporation (document management products and | Vice President and Chief Global Diversity Officer |
| services); Executive in Residence and 2010 | (retired 2008) and Member of the Executive |
| Distinguished Minett Professor at the Rochester | Committee (1997–2008) of Johnson & Johnson |
| Institute of Technology; Director of SPX Corporation | (pharmaceuticals/medical devices/consumer |
| (multi-industry manufacturing), the United Way of | products); Director of Skytop Lodge Corporation |
| Rochester, Amerigroup Corporation (managed health | (hotels), the University Medical Center at Princeton, |
| care), the University of Rochester Medical Center, | the Robert Wood Johnson Foundation, and the Center |
| Monroe Community College Foundation, and North | for Talent Innovation; Member of the Advisory Board |
| Carolina A&T University. | of the Maxwell School of Citizenship and Public Affairs |
| | at Syracuse University. |
| |
| Rajiv L. Gupta | |
| Born 1945. Trustee Since December 2001.2 | F. Joseph Loughrey |
| Principal Occupation(s) During the Past Five Years: | Born 1949. Trustee Since October 2009. Principal |
| Chairman and Chief Executive Officer (retired 2009) | Occupation(s) During the Past Five Years: President |
| and President (2006–2008) of Rohm Haas Co. | and Chief Operating Officer (retired 2009) of Cummins |
| (chemicals); Director of Tyco International, Ltd. | Inc. (industrial machinery); Director of SKF AB |
| (diversified manufacturing and services), Hewlett- | (industrial machinery), Hillenbrand, Inc. (specialized |
| Packard Co. (electronic computer manufacturing), | consumer services), the Lumina Foundation for |
| | |
| Education, and Oxfam America; Chairman of the | Executive Officers | |
| Advisory Council for the College of Arts and Letters | | |
| and Member of the Advisory Board to the Kellogg | Glenn Booraem | |
| Institute for International Studies at the University | Born 1967. Controller Since July 2010. Principal |
| of Notre Dame. | Occupation(s) During the Past Five Years: Principal |
| | of The Vanguard Group, Inc.; Controller of each of |
| Mark Loughridge | the investment companies served by The Vanguard |
| Born 1953. Trustee Since March 2012. Principal | Group; Assistant Controller of each of the investment |
| Occupation(s) During the Past Five Years: Senior Vice | companies served by The Vanguard Group (2001–2010). |
| President and Chief Financial Officer at IBM (information | | |
| technology services); Fiduciary Member of IBM’s | Thomas J. Higgins | |
| Retirement Plan Committee. | Born 1957. Chief Financial Officer Since September |
| | 2008. Principal Occupation(s) During the Past Five |
| Scott C. Malpass | Years: Principal of The Vanguard Group, Inc.; Chief |
| Born 1962. Trustee Since March 2012. Principal | Financial Officer of each of the investment companies |
| Occupation(s) During the Past Five Years: Chief | served by The Vanguard Group; Treasurer of each of |
| Investment Officer and Vice President at the University | the investment companies served by The Vanguard |
| of Notre Dame; Assistant Professor of Finance at the | Group (1998–2008). | |
| Mendoza College of Business at Notre Dame; Member | | |
| of the Notre Dame 403(b) Investment Committee; | Kathryn J. Hyatt | |
| Director of TIFF Advisory Services, Inc. (investment | Born 1955. Treasurer Since November 2008. Principal |
| advisor); Member of the Investment Advisory | Occupation(s) During the Past Five Years: Principal of |
| Committees of the Financial Industry Regulatory | The Vanguard Group, Inc.; Treasurer of each of the |
| Authority (FINRA) and of Major League Baseball. | investment companies served by The Vanguard |
| | Group; Assistant Treasurer of each of the investment |
| André F. Perold | companies served by The Vanguard Group (1988–2008). |
| Born 1952. Trustee Since December 2004. Principal | | |
| Occupation(s) During the Past Five Years: George | Heidi Stam | |
| Gund Professor of Finance and Banking at the Harvard | Born 1956. Secretary Since July 2005. Principal |
| Business School (retired 2011); Chief Investment | Occupation(s) During the Past Five Years: Managing |
| Officer and Managing Partner of HighVista Strategies | Director of The Vanguard Group, Inc.; General Counsel |
| LLC (private investment firm); Director of Rand | of The Vanguard Group; Secretary of The Vanguard |
| Merchant Bank; Overseer of the Museum of Fine | Group and of each of the investment companies |
| Arts Boston. | served by The Vanguard Group; Director and Senior |
| | Vice President of Vanguard Marketing Corporation. |
| Alfred M. Rankin, Jr. | | |
| Born 1941. Trustee Since January 1993. Principal | Vanguard Senior ManagementTeam |
| Occupation(s) During the Past Five Years: Chairman, | | |
| President, and Chief Executive Officer of NACCO | Mortimer J. Buckley | Michael S. Miller |
| Industries, Inc. (forklift trucks/housewares/lignite); | Kathleen C. Gubanich | James M. Norris |
| Director of Goodrich Corporation (industrial products/ | Paul A. Heller | Glenn W. Reed |
| aircraft systems and services) and the National | Martha G. King | George U. Sauter |
| Association of Manufacturers; Chairman of the Board | Chris D. McIsaac | |
| of the Federal Reserve Bank of Cleveland and of | | |
| University Hospitals of Cleveland; Advisory Chairman | | |
| of the Board of The Cleveland Museum of Art. | Chairman Emeritus and Senior Advisor | |
| | | |
| Peter F. Volanakis | John J. Brennan | |
| Born 1955. Trustee Since July 2009. Principal | Chairman, 1996–2009 | |
| Occupation(s) During the Past Five Years: President | Chief Executive Officer and President, 1996–2008 |
| and Chief Operating Officer (retired 2010) of Corning | | |
| Incorporated (communications equipment); Director | Founder | |
| of SPX Corporation (multi-industry manufacturing); | | |
| Overseer of the Amos Tuck School of Business | John C. Bogle | |
| Administration at Dartmouth College; Advisor to the | Chairman and Chief Executive Officer, 1974–1996 | |
| Norris Cotton Cancer Center. | | |
1 Mr. McNabb is considered an “interested person,” as defined in the Investment Company Act of 1940, because he is an officer of the Vanguard funds.
2 December 2002 for Vanguard Equity Income Fund, Vanguard Growth Equity Fund, the Vanguard Municipal Bond Funds, and the Vanguard State Tax-Exempt Funds.
|  |
| P.O. Box 2600 |
| Valley Forge, PA 19482-2600 |
Connect with Vanguard® > vanguard.com
| |
| Fund Information > 800-662-7447 | CFA® is a trademark owned by CFA Institute. |
| Direct Investor Account Services > 800-662-2739 | |
| Institutional Investor Services > 800-523-1036 | |
| Text Telephone for People | |
| With Hearing Impairment > 800-749-7273 | |
| |
| This material may be used in conjunction | |
| with the offering of shares of any Vanguard | |
| fund only if preceded or accompanied by | |
| the fund’s current prospectus. | |
| |
| All comparative mutual fund data are from Lipper Inc. or | |
| Morningstar, Inc., unless otherwise noted. | |
| |
| You can obtain a free copy of Vanguard’s proxy voting | |
| guidelines by visiting vanguard.com/proxyreporting or by | |
| calling Vanguard at 800-662-2739. The guidelines are | |
| also available from the SEC’s website, sec.gov. In | |
| addition, you may obtain a free report on how your fund | |
| voted the proxies for securities it owned during the 12 | |
| months ended June 30. To get the report, visit either | |
| vanguard.com/proxyreporting or sec.gov. | |
| |
| You can review and copy information about your fund at | |
| the SEC’s Public Reference Room in Washington, D.C. To | |
| find out more about this public service, call the SEC at | |
| 202-551-8090. Information about your fund is also | |
| available on the SEC’s website, and you can receive | |
| copies of this information, for a fee, by sending a | |
| request in either of two ways: via e-mail addressed to | |
| publicinfo@sec.gov or via regular mail addressed to the | |
| Public Reference Section, Securities and Exchange | |
| Commission, Washington, DC 20549-1520. | |
| | © 2012 The Vanguard Group, Inc. |
| | All rights reserved. |
| | Vanguard Marketing Corporation, Distributor. |
| |
| | Q822 072012 |
Item 2:
Not Applicable.
Item 3:
Not Applicable.
Item 4: Principal Accountant Fees and Services.
Not Applicable.
Item 5: Audit Committee of Listed Registrants.
Not Applicable.
Item 6: Investments.
Not Applicable.
Item 7: Disclosure of Proxy Voting Policies and Procedures for Closed-End Management Investment Companies.
Not Applicable.
Item 8: Portfolio Managers of Closed-End Management Investment Companies.
Not Applicable.
Item 9: Purchase of Equity Securities by Closed-End Management Investment Company and Affiliated Purchasers.
Not Applicable.
Item 10: Submission of Matters to a Vote of Security Holders.
Not Applicable.
Item 11: Controls and Procedures.
(a) Disclosure Controls and Procedures. The Principal Executive and Financial Officers concluded that the Registrant's Disclosure Controls and Procedures are effective based on their evaluation of the Disclosure Controls and Procedures as of a date within 90 days of the filing date of this report.
(b) Internal Control Over Financial Reporting. There were no significant changes in Registrant’s Internal Control Over Financial Reporting or in other factors that could significantly affect this control subsequent to the date of the evaluation, including any corrective actions with regard to significant deficiencies and material weaknesses.
Item 12: Exhibits.
(a) Certifications.
Pursuant to the requirements of the Securities Exchange Act of 1934 and the Investment Company Act of 1940, the registrant has duly caused this report to be signed on its behalf by the undersigned, thereunto duly authorized.
| |
| | VANGUARD CONVERTIBLE SECURITIES FUND |
| |
| By: | /s/ F. WILLIAM MCNABB III* |
| | F. WILLIAM MCNABB III |
| | CHIEF EXECUTIVE OFFICER |
| |
| Date: July 25, 2012 |
Pursuant to the requirements of the Securities Exchange Act of 1934 and the Investment Company Act of 1940, this report has been signed below by the following persons on behalf of the registrant and in the capacities and on the dates indicated.
| |
| | VANGUARD CONVERTIBLE SECURITIES FUND |
| |
| By: | /s/ F. WILLIAM MCNABB III* |
| | F. WILLIAM MCNABB III |
| | CHIEF EXECUTIVE OFFICER |
| |
| Date: July 25, 2012 |
| |
| | VANGUARD CONVERTIBLE SECURITIES FUND |
| |
| By: | /s/ THOMAS J. HIGGINS* |
| | THOMAS J. HIGGINS |
| | CHIEF FINANCIAL OFFICER |
| |
| Date: July 25, 2012 |
* By: /s/ Heidi Stam
Heidi Stam, pursuant to a Power of Attorney filed on March 27, 2012 see file Number 2-11444, Incorporated by Reference.