UNITED STATES
SECURITIES AND EXCHANGE COMMISSION
Washington, D.C. 20549
FORM N-CSRS
CERTIFIED SHAREHOLDER REPORT
OF
REGISTERED MANAGEMENT INVESTMENT COMPANIES
Investment Company Act file number: 811-04627
Name of Registrant: Vanguard Convertible Securities Fund
Address of Registrant:
P.O. Box 2600
Valley Forge, PA 19482
Name and address of agent for service:
Heidi Stam, Esquire
P.O. Box 876
Valley Forge, PA 19482
Registrant’s telephone number, including area code: (610) 669-1000
Date of fiscal year end: November 30
Date of reporting period: December 1, 2014 – May 31, 2015
Item 1: Reports to Shareholders
Semiannual Report | May 31, 2015
Vanguard Convertible Securities Fund
The mission continues
On May 1, 1975, Vanguard began operations, a fledgling company based on the simple but revolutionary idea that a mutual fund company should be managed solely in the interest of its investors.
Four decades later, that revolutionary spirit continues to animate the enterprise. Vanguard remains on a mission to give investors the best chance of investment success.
As we mark our 40th anniversary, we thank you for entrusting your assets to Vanguard and giving us the opportunity to help you reach your financial goals in the decades to come.
| |
| Contents | |
| Your Fund’s Total Returns. | 1 |
| Chairman’s Letter. | 2 |
| Advisor’s Report. | 7 |
| Fund Profile. | 10 |
| Performance Summary. | 12 |
| Financial Statements. | 13 |
| About Your Fund’s Expenses. | 28 |
| Trustees Approve Advisory Arrangement. | 30 |
| Glossary. | 31 |
Please note: The opinions expressed in this report are just that—informed opinions. They should not be considered promises or advice.
Also, please keep in mind that the information and opinions cover the period through the date on the front of this report. Of course, the risks of investing in your fund are spelled out in the prospectus.
See the Glossary for definitions of investment terms used in this report.
About the cover: Since our founding, Vanguard has drawn inspiration from the enterprise and valor demonstrated by British naval hero Horatio Nelson and his command at the Battle of the Nile in 1798. The photograph displays a replica of a merchant ship from the same era as Nelson’s flagship, the HMS Vanguard.
Your Fund’s Total Returns
| |
| Six Months Ended May 31, 2015 | |
| | Total |
| | Returns |
| Vanguard Convertible Securities Fund | 6.69% |
| Convertibles Composite Index | 6.63 |
| Convertible Securities Funds Average | 4.28 |
For a benchmark description, see the Glossary.
Convertible Securities Funds Average: Derived from data provided by Lipper, a Thomson Reuters Company.
| | | | |
| Your Fund’s Performance at a Glance | | | | |
| November 30, 2014, Through May 31, 2015 | | | | |
| | | | Distributions Per Share |
| | Starting | Ending | Income | Capital |
| | Share Price | Share Price | Dividends | Gains |
| Vanguard Convertible Securities Fund | $13.85 | $13.52 | $0.167 | $1.010 |
1

Chairman’s Letter
Dear Shareholder,
Vanguard Convertible Securities Fund returned 6.69% for the six months ended May 31, 2015.
The fund’s return was in line with that of its benchmark index but surpassed the average return of its peer group by more than 2 percentage points. Exposure to strongly performing international convertibles helped the fund outperform its peers.
Convertible securities are bonds and preferred stocks that can be converted into common shares at a predetermined price. In rising stock markets, the value of convertible securities increases along with the price of their underlying stock. Of course, in declining stock markets, that value suffers, but the bond portion of the fund helps hedge against steep drops in price.
The Convertible Securities Fund has been successfully guided through the market’s ups and downs for many years by its advisor, Oaktree Capital Management. I would like to express my appreciation to Oaktree’s Larry Keele, who plans to retire at the end of June after nearly two decades at the helm of your fund. Larry and his colleagues have delivered strong long-term results for our clients. And it was Larry’s foresight that led to the expansion of the fund’s mandate to include non-U.S. convertible securities.
2
Larry has been instrumental in building the fund’s management team, which we are confident will continue to serve our clients with distinction. The U.S. portion of the fund will be managed by Stu Spangler, who has worked closely with Larry for 18 years and became a co-manager of the fund earlier this year. Two other senior Oaktree portfolio managers—Jean-Paul Nedelec and Abe Ofer—will remain responsible for overseeing the non-U.S. portion of the portfolio.
U.S. stocks stayed positive although clouds hovered
The broad U.S. stock market returned nearly 4% for the six months ended May 31. Corporate profits generally exceeded expectations, the Federal Reserve remained cautious about its timing for raising short-term interest rates, and other nations’ central banks continued their monetary stimulus programs. These factors helped offset pressures on the market that included perceived high stock valuations and renewed debt troubles for Greece.
International stocks returned almost 4% for U.S. investors, although results would have been more robust if not for the dollar’s strength against many foreign currencies. Returns for the developed markets of the Pacific region, led by Japan, exceeded those of Europe and emerging markets. (You can read about Vanguard’s assessment of Japan’s economy in Japan: The Long Road Back to Inflation,
| | | |
| Market Barometer | | | |
| |
| | | | Total Returns |
| | | Periods Ended May 31, 2015 |
| | Six | One | Five Years |
| | Months | Year | (Annualized) |
| Stocks | | | |
| Russell 1000 Index (Large-caps) | 3.41% | 11.91% | 16.68% |
| Russell 2000 Index (Small-caps) | 6.94 | 11.32 | 15.04 |
| Russell 3000 Index (Broad U.S. market) | 3.67 | 11.86 | 16.54 |
| FTSE All-World ex US Index (International) | 3.78 | 0.08 | 8.51 |
| |
| Bonds | | | |
| Barclays U.S. Aggregate Bond Index (Broad taxable market) | 1.09% | 3.03% | 3.90% |
| Barclays Municipal Bond Index (Broad tax-exempt market) | 0.71 | 3.18 | 4.53 |
| Citigroup Three-Month U.S. Treasury Bill Index | 0.00 | 0.02 | 0.05 |
| |
| CPI | | | |
| Consumer Price Index | 0.70% | -0.04% | 1.74% |
3
available at vanguard.com/research. This is part of the Global Macro Matters series produced by our economists.)
Taxable bonds gained ground, despite setbacks along the way
The broad U.S. taxable bond market returned 1.09%, although results turned slightly negative in the latter half of the period. Overall, the stimulus policies of central banks across the globe helped boost bond returns. The yield of the 10-year Treasury note ended May at 2.14%, down from 2.25% six months earlier. (Bond prices and yields move in opposite directions.)
International bond markets (as measured by the Barclays Global Aggregate Index ex USD) returned –6.65%, restrained by the U.S. dollar’s strength. Without this currency effect, international bond returns were positive.
The Fed’s continued target of 0%–0.25% for short-term interest rates severely limited returns for money market funds and savings accounts.
Equity markets’ advance boosted the fund’s result
The Convertible Securities Fund outpaced the broad U.S. stock and bond markets for the six months. Various factors contributed to the strong showing: the outperformance of U.S. small- and mid-capitalization stocks, the strengthening of equity markets abroad, and a robust demand for convertibles.
| | |
| Expense Ratios | | |
| Your Fund Compared With Its Peer Group | | |
| | | Peer Group |
| | Fund | Average |
| Convertible Securities Fund | 0.41% | 1.24% |
The fund expense ratio shown is from the prospectus dated March 25, 2015, and represents estimated costs for the current fiscal year. For the six months ended May 31, 2015, the fund’s annualized expense ratio was 0.38%. This decrease from the estimated expense ratio reflects a performance-based investment advisory fee adjustment. When the performance is positive, the fund’s expenses increase; when it is negative, expenses decrease. The peer-group expense ratio is derived from data provided by Lipper, a Thomson Reuters Company, and captures information through year-end 2014.
Peer group: Convertible Securities Funds.
4
The fund’s result mirrored that of the Russell 2000 Index (+6.94%), which consists of small-caps and is closely correlated with the U.S. convertible bond market.
The performance of convertible securities often, but not always, reflects that of small- and mid-cap stocks because most companies that issue convertibles are small or midsize. These firms usually have low-rated or unrated credit and often have difficulty securing traditional sources of financing because of their credit risk. And issuing convertibles is an attractive funding method for them because they typically require lower interest payments than they would with bonds.
Demand for convertibles has risen in recent months because investors are searching for additional income and alternatives to conventional bonds. Investors have been willing to take on the added credit risk because convertibles offer more upside potential than traditional bonds held to maturity. With the Fed expected to raise interest rates in the near term, investors also have been attracted to convertibles’ relatively short duration (a measure of sensitivity to rate changes) and ties to the stock market. These features make convertibles less vulnerable to rate hikes.
Still, it’s not certain how global convertible securities will perform when U.S. rates eventually rise. It’s also important to remember that even though convertibles are less prone to swings than the stock market, they are more volatile than traditional bonds. Put simply, they aren’t bond substitutes. That’s why it is important to consider this fund a complement to an already well-diversified portfolio.
As I mentioned earlier, the Convertible Securities Fund’s result was buoyed by robust demand. New issuance of global convertibles totaled nearly $43 billion for the six months, slightly less than the $44 billion issued for the same period last year.
Despite some weakness earlier in the most recent period, global stock markets proved resilient. Aggressive steps by several central banks helped boost confidence in international stocks and bonds, including convertibles.
Although the fund consists primarily of U.S. securities, it has increased its exposure to international markets, which now offer more reasonably priced issues with good credit ratings. As of the end of the period, non-U.S. assets were about 30% of the fund.
5
For more information on the fund’s positioning and performance during the period, please see the Advisor’s Report that follows this letter.
Promoting good corporate governance is one way we protect your interests
Our core purpose is “to take a stand for all investors, to treat them fairly, and to give them the best chance for investment success.” This means more than offering smart investments, trustworthy guidance, and low fees. It also means working with the companies held by Vanguard funds to make sure that your interests remain paramount.
Because promoting good corporate governance supports our core purpose, we want to inform our investors—regardless of which Vanguard fund they may own—about our efforts in this area. As one of the world’s largest investment managers, we are making our voice heard in corporate boardrooms to promote the highest standards of stewardship. Our advocacy encompasses a range of corporate governance issues, including executive compensation and succession planning, board composition and effectiveness, oversight of strategy and risk, and communication with shareholders.
We also exert our influence in an important way when Vanguard funds cast their proxy votes at companies’ shareholder meetings.
Most of these votes take place at this time of year, making it an appropriate time to remind you that we work hard to represent your best interests. Good governance, we believe, is essential for any company seeking to maximize its long-term returns to shareholders. You can learn more about our efforts at vanguard.com/corporategovernance.
Thank you for your confidence in Vanguard.
Sincerely,
F. William McNabb III
Chairman and Chief Executive Officer
June 11, 2015
6
Advisor’s Report
Vanguard Convertible Securities Fund performed well for the six months ended May 31, 2015. Convertible securities participated in the strength of underlying equities during market rallies and provided downside protection during periods of volatility.
The Convertible Securities Fund returned 6.69%, in line with the 6.63% return of its blended benchmark (70% Bank of America Merrill Lynch All US Convertibles Index and 30% Bank of America Merrill Lynch Global 300 Convertibles ex-US Index [hedged]).
The investment strategy of the Convertible Securities Fund is to create a highly diversified global portfolio of convertible securities. The fund emphasizes investments in convertible bonds with relatively near-term maturities or put dates. We focus on “balanced” convertibles with
| |
| Major Portfolio Changes | |
| Six Months Ended May 31, 2015 | |
| |
| Additions | Comments |
| Brocade Communications Systems | Attractive new issue on a compelling growth story. |
| (1.375% convertible note due 01/01/20) | |
| Cemex | Balanced convertible with exposure to strengthening credit and |
| (3.72% convertible note due 03/15/20) | strong equity catalysts. |
| DH | Balanced new issue offering an attractive yield on a company with |
| (5.00% convertible note due 09/30/20) | a good growth profile. |
| |
| Horizon Pharma | Balanced new issue with above-average growth potential. |
| (2.50% convertible note due 03/15/22) | |
| SunEdison | Balanced new issues that provide exposure to a compelling |
| (2.625% convertible note due 06/01/23) | growth story. |
| (3.375% convertible note due 06/01/25) | |
| Whiting Petroleum | Very attractive new issue in conjunction with a sharply discounted |
| (1.25% convertible note due 04/01/20) | equity offering. |
| |
| Reductions | Comments |
| AOL | Sold the position as the company is being acquired by Verizon. |
| (0.75% convertible note due 09/01/19) | |
| BioMarin Pharmaceutical | Reducing after substantial appreciation and after bonds developed |
| (0.75% convertible note due 10/15/18) | significant downside risk. |
| (1.50% convertible note due 10/15/20) | |
| Grand City Properties | Sold after substantial appreciation and after bonds developed |
| (1.50% convertible note due 02/24/19) | significant downside risk. |
| Omnicare | Sold both issues after substantial appreciation with the company |
| (3.25% convertible note due 12/15/35) | being acquired by CVS Health. |
| (3.50% convertible note due 02/15/44) | |
| SanDisk | Sold after deterioration in company fundamentals. |
| (0.50% convertible note due 10/15/20) | |
7
reasonable yields, stable credit quality, good call protection, and low to moderate conversion premiums. We believe these securities have a favorable balance of upside potential and downside risk. The fund underweights riskier yet potentially higher-return convertible preferred shares, but we consider them part of our investable universe and make some use of them.
The fund does not invest in common stocks or nonconvertible debt. We do not attempt market timing and therefore are fully invested, holding only a small amount of cash for potential investments. We believe that a portfolio of attractive, carefully selected convertible securities can produce equity-type returns with lower volatility and lower structural risk over long periods.
The investment environment
Overall, the convertible bond market generated positive returns for the half year, buoyed by strong technical and fundamental market conditions. Demand for the asset class was strong, and convertibles were pushed higher by advances in both equity and credit markets. The highlights of the period were the continued strength of the equity market and the robust pace of new convertible issues. Convertible bonds performed as expected, capturing much of the performance of equities while providing meaningful downside protection in periods of market weakness.
Strength in the equity markets boosted convertible bond performance. Equity markets showed momentum and hit record highs in recent months; the S&P 500 Index was up 2.97%, the Russell 2000 Index up 6.94%, and the MSCI EAFE 100% Hedged to USD Index up 12.00% for the period. U.S. convertibles were powered by the strength in their underlying stocks, with many technology and health care companies performing well. European and Japanese stock markets benefited from the aggressive quantitative easing programs of their central banks, the resulting weakness of the euro and yen relative to the U.S. dollar, and better growth prospects in Europe. We saw strong, steady demand for convertibles as a wide variety of investors pursued them for equity-type returns or as a hedge against an impending rise in interest rates.
During the period, we were encouraged by the increase in new issue volume. New issuance totaled about $43 billion, with U.S. issuance of $25 billion, ahead of the non-U.S. issuance of about $18 billion. U.S. issuance was driven by higher equity prices and a stronger economic outlook among potential issuers. We are seeing companies use new issue proceeds for increased capital spending, mergers and acquisitions, and stock buybacks. The first few months of 2015 saw the best start of a year for issuance since 2008. Demand ranged from good to extremely strong for every convertible deal, and nearly every deal performed well after issuance. Outside the United States, demand for convertibles has been robust and, in most cases, it has been easier to buy than to sell. Strong demand and insufficient supply has led to a richening of the market, particularly in investment-grade issues.
8
Our successes
The portfolio returns were broad-based, though performance was aided by exposure to a number of individual positions with particularly strong underlying stock moves. The top individual contributors were convertibles from BioMarin Pharmaceutical, Omnicare, NXP Semiconductors, Hologic, and SunEdison. Among industries, our security selection in the semiconductor and integrated oil businesses generated strong returns relative to the index.
Our shortfalls
Our portfolio had several winners but securities in the oil and gas sector were meaningful detractors. Significant individual security detractors were Halcón Resources, Goodrich Petroleum, Chesapeake Energy, Iconix Brand Group, Spectranetics, and Micron Technology. By industry, our holdings in software and pharmaceuticals hurt our performance relative to the index.
The fund’s positioning
We remain fully invested in a highly diversified, well-balanced portfolio of convertible securities. The fund’s investments are about 70% U.S.-based and about 30% outside the United States as we approach the target 30% allocation to non-U.S. convertibles. The portfolio has an attractive current yield of 1.9% and an average credit quality of Ba3/BB–. The vast majority of issuers in the portfolio are performing well fundamentally and, importantly, are positioned well from a credit perspective.
Our near-term outlook for convertible securities investing is positive, but that remains highly dependent on underlying equity performance. On the back of stronger economic data, it is increasingly likely that the Federal Reserve will initiate interest rate hikes during the second half of 2015. Historically, convertible returns have correlated most highly with equities and done relatively well when rates are rising. Over the past several periods of rising rates, equities have gone up and convertible securities have produced positive returns (with straight fixed income posting negative returns).
We believe that some fixed income investors could shift part of their portfolios into convertibles to try to gain exposure to equity-linked returns while still holding fixed income-related securities. Balanced convertibles with reasonable equity sensitivity and pure equity convertibles should perform relatively well in an environment of increasing interest rates and higher equity prices. Busted convertibles—those trading well below conversion value—or yield-oriented convertibles are likely to do more poorly. Overall, we expect demand for convertibles to remain relatively strong and expect bigger issues to be the top securities in trading volume. Liquidity remains challenging for smaller convertible deals issued by smaller-capitalization companies.
Larry W. Keele, CFA, Principal and Co-Founder
Stu Spangler, CFA, Managing Director
Abe Ofer, Managing Director
Jean-Paul Nedelec, Managing Director
Oaktree Capital Management, L.P.
June 17, 2015
9
Convertible Securities Fund
Fund Profile
As of May 31, 2015
| |
| Portfolio Characteristics | |
| Ticker Symbol | VCVSX |
| Number of Securities | 207 |
| 30-Day SEC Yield | 1.95% |
| Conversion Premium | 30.0% |
| Average Weighted Maturity | 4.8 years |
| Average Coupon | 2.1% |
| Average Duration | 6.2 years |
| Foreign Holdings | 31.1% |
| Turnover Rate (Annualized) | 98% |
| Expense Ratio1 | 0.41% |
| Short-Term Reserves | 3.2% |
| |
| Distribution by Maturity | |
| (% of fixed income portfolio) | |
| Under 1 Year | 2.5% |
| 1 - 5 Years | 62.7 |
| 5 - 10 Years | 33.4 |
| 10 - 20 Years | 0.5 |
| 20 - 30 Years | 0.9 |
| |
| Distribution by Credit Quality (% of fixed | |
| income portfolio) | |
| AAA | 0.0% |
| AA | 0.1 |
| A | 0.8 |
| BBB | 6.8 |
| BB | 14.7 |
| B | 9.6 |
| Below B | 3.0 |
| Not Rated | 65.0 |
Credit-quality ratings are obtained from S&P. "Not Rated" is used to classify securities for which a rating is not available. Not rated securities include a fund's investment in Vanguard Market Liquidity Fund or Vanguard Municipal Cash Management Fund, each of which invests in high-quality money market instruments and may serve as a cash management vehicle for the Vanguard funds, trusts, and accounts. For more information about these ratings, see the Glossary entry for Credit Quality.
| | |
| Total Fund Volatility Measures | |
| | | DJ |
| | Convertibles | U.S. Total |
| | Composite | Market |
| | Index | FA Index |
| R-Squared | 0.86 | 0.67 |
| Beta | 1.01 | 0.56 |
These measures show the degree and timing of the fund’s fluctuations compared with the indexes over 36 months.
| | |
| Ten Largest Holdings (% of total net assets) |
| NXP Semiconductors NV Semiconductors & | |
| | Semiconductor | |
| | Equipment | 2.0% |
| Jazz Investments I Ltd. | Pharmaceuticals | 2.0 |
| Hologic Inc. | Health Care | |
| | Equipment & | |
| | Supplies | 1.9 |
| Red Hat Inc. | Software | 1.8 |
| Priceline Group Inc. | Internet & Catalog | |
| | Retail | 1.7 |
| SunEdison Inc. | Semiconductors & | |
| | Semiconductor | |
| | Equipment | 1.7 |
| Scorpio Tankers Inc. | Oil, Gas & | |
| | Consumable Fuels | 1.5 |
| Whiting Petroleum Corp. Oil, Gas & | |
| | Consumable Fuels | 1.5 |
| Verint Systems Inc. | Software | 1.5 |
| Cemex SAB de CV | Construction | |
| | Materials | 1.5 |
| Top Ten | | 17.1% |
The holdings listed exclude any temporary cash investments and equity index products.
1 The expense ratio shown is from the prospectus dated March 25, 2015, and represents estimated costs for the current fiscal year. For the six months ended May 31, 2015, the annualized expense ratio was 0.38%.
10
Convertible Securities Fund
| |
| Sector Diversification (% of market exposure) |
| |
| Consumer Discretionary | 7.9% |
| Consumer Staples | 2.2 |
| Energy | 8.3 |
| Financials | 11.9 |
| Health Care | 22.3 |
| Industrials | 10.0 |
| Information Technology | 28.5 |
| Materials | 6.1 |
| Telecommunication Services | 1.5 |
| Utilities | 1.3 |
11
Convertible Securities Fund
Performance Summary
All of the returns in this report represent past performance, which is not a guarantee of future results that may be achieved by the fund. (Current performance may be lower or higher than the performance data cited. For performance data current to the most recent month-end, visit our website at vanguard.com/performance.) Note, too, that both investment returns and principal value can fluctuate widely, so an investor’s shares, when sold, could be worth more or less than their original cost. The returns shown do not reflect taxes that a shareholder would pay on fund distributions or on the sale of fund shares.
Fiscal-Year Total Returns (%): November 30, 2004, Through May 31, 2015
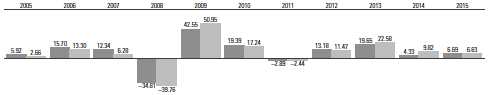
| |
| Convertible Securities Fund |
| Convertibles Composite Index |
For a benchmark description, see the Glossary.
Note: For 2015, performance data reflect the six months ended May 31, 2015.
Average Annual Total Returns: Periods Ended March 31, 2015
This table presents returns through the latest calendar quarter—rather than through the end of the fiscal period.
Securities and Exchange Commission rules require that we provide this information.
| | | | | | |
| | | | | | | Ten Years |
| | Inception Date | One Year | Five Years | Income | Capital | Total |
| Convertible Securities | | | | | | |
| Fund | 6/17/1986 | 3.52% | 9.11% | 3.64% | 4.76% | 8.40% |
See Financial Highlights for dividend and capital gains information.
12
Convertible Securities Fund
Financial Statements (unaudited)
Statement of Net Assets
As of May 31, 2015
The fund reports a complete list of its holdings in regulatory filings four times in each fiscal year, at the quarter-ends. For the second and fourth fiscal quarters, the lists appear in the fund’s semiannual and annual reports to shareholders. For the first and third fiscal quarters, the fund files the lists with the Securities and Exchange Commission on Form N-Q. Shareholders can look up the fund’s Forms N-Q on the SEC’s website at sec.gov. Forms N-Q may also be reviewed and copied at the SEC’s Public Reference Room (see the back cover of this report for further information).
| | | | | |
| | | | | | Market |
| | | | | | Value |
| | | | | Shares | ($000) |
| Common Stocks (0.0%) | | | | | |
| Energy (0.0%) | | | | | |
| Halcon Resources Corp. | | | | 200,494 | 211 |
| Total Common Stocks (Cost $269) | | | | | 211 |
| |
| | | | | Face | |
| | | Maturity | | Amount | |
| | Coupon | Date | Currency | (000) | |
| Convertible Bonds (91.3%) | | | | | |
| Consumer Discretionary (7.7%) | | | | | |
| Asics Corp. Cvt. | 0.000% | 3/1/19 | JPY | 140,000 | 1,485 |
| Cineplex Inc. Cvt. | 4.500% | 12/31/18 | CAD | 5,713 | 4,938 |
| Enterprise Funding Ltd. Cvt. | 3.500% | 9/10/20 | GBP | 1,600 | 2,302 |
| FF Group Finance Luxembourg Cvt. | 1.750% | 7/3/19 | EUR | 8,000 | 7,368 |
| Iconix Brand Group Inc. Cvt. | 1.500% | 3/15/18 | USD | 18,977 | 19,618 |
| Jarden Corp. Cvt. | 1.125% | 3/15/34 | USD | 20,449 | 24,219 |
| K’s Holdings Corp. Cvt. | 0.000% | 12/20/19 | JPY | 590,000 | 6,299 |
| Liberty Media Corp. Cvt. | 1.375% | 10/15/23 | USD | 24,325 | 24,112 |
| Lotte Shopping Co. Ltd. Cvt. | 0.000% | 1/24/18 | KRW | 4,200,000 | 4,044 |
| NH Hoteles SA Cvt. | 4.000% | 11/8/18 | EUR | 5,700 | 7,703 |
| priceline.com Inc. Cvt. | 0.350% | 6/15/20 | USD | 28,805 | 32,532 |
| ResortTrust Inc. Cvt. | 0.000% | 12/1/21 | JPY | 560,000 | 5,194 |
| SAF-Holland SA Cvt. | 1.000% | 9/12/20 | EUR | 900 | 1,248 |
| Sumitomo Forestry Co. Ltd. Cvt. | 0.000% | 8/24/18 | JPY | 430,000 | 3,774 |
| Takashimaya Co. Ltd. Cvt. | 0.000% | 12/11/20 | JPY | 670,000 | 6,208 |
| | | | | | 151,044 |
| Consumer Staples (2.2%) | | | | | |
| Hengan International Group Co. Ltd. Cvt. | 0.000% | 6/27/18 | HKD | 32,000 | 4,395 |
| Herbalife Ltd. Cvt. | 2.000% | 8/15/19 | USD | 12,595 | 11,115 |
| J Sainsbury PLC Cvt. | 1.250% | 11/21/19 | GBP | 3,200 | 5,195 |
| Marine Harvest ASA Cvt. | 0.875% | 5/6/19 | EUR | 4,300 | 5,552 |
| Olam International Ltd. Cvt. | 6.000% | 10/15/16 | USD | 6,100 | 6,375 |
| Rallye SA Cvt. | 1.000% | 10/2/20 | EUR | 3,380 | 4,092 |
| Sonae Investments BV Cvt. | 1.625% | 6/11/19 | EUR | 5,300 | 5,879 |
| | | | | | 42,603 |
13
| | | | | |
| Convertible Securities Fund | | | | | |
| |
| |
| |
| | | | | Face | Market |
| | | Maturity | | Amount | Value |
| | Coupon | Date | Currency | (000) | ($000) |
| Energy (6.1%) | | | | | |
| Aabar Investments PJSC Cvt. | 1.000% | 3/27/22 | EUR | 7,000 | 8,159 |
| 1 BPZ Resources Inc. Cvt. | 8.500% | 10/1/17 | USD | 7,060 | 1,695 |
| BW Group Ltd. Cvt. | 1.750% | 9/10/19 | USD | 5,000 | 4,565 |
| Cheniere Energy Inc. Cvt. | 4.250% | 3/15/45 | USD | 10,765 | 8,639 |
| Cobalt International Energy Inc. Cvt. | 3.125% | 5/15/24 | USD | 21,520 | 16,732 |
| RAG-Stiftung Cvt. | 0.000% | 2/18/21 | EUR | 100 | 128 |
| 2 Scorpio Tankers Inc. Cvt. | 2.375% | 7/1/19 | USD | 27,680 | 29,081 |
| SEACOR Holdings Inc. Cvt. | 2.500% | 12/15/27 | USD | 19,165 | 19,668 |
| Subsea 7 SA Cvt. | 1.000% | 10/5/17 | USD | 400 | 371 |
| 2 Whiting Petroleum Corp. Cvt. | 1.250% | 4/1/20 | USD | 26,540 | 29,061 |
| | | | | | 118,099 |
| Financials (10.3%) | | | | | |
| Alstria Office REIT-AG Cvt. | 2.750% | 6/14/18 | EUR | 2,600 | 3,681 |
| AmTrust Financial Services Inc. Cvt. | 2.750% | 12/15/44 | USD | 13,070 | 12,155 |
| Aroundtown Property Holdings PLC Cvt. | 3.000% | 5/5/20 | EUR | 4,700 | 5,291 |
| AYC Finance Ltd. Cvt. | 0.500% | 5/2/19 | USD | 2,886 | 3,333 |
| Azimut Holding SPA Cvt. | 2.125% | 11/25/20 | EUR | 8,300 | 11,489 |
| Beni Stabili SPA Cvt. | 3.375% | 1/17/18 | EUR | 1,600 | 2,137 |
| BES Finance Ltd. Cvt. | 3.500% | 12/6/15 | USD | 5,000 | 4,950 |
| BNP Paribas SA Cvt. | 0.250% | 9/27/16 | EUR | 7,200 | 8,859 |
| British Land Jersey Ltd. Cvt. | 1.500% | 9/10/17 | GBP | 1,300 | 2,504 |
| Caja de Ahorros y Pensiones | | | | | |
| de Barcelona Cvt. | 1.000% | 11/25/17 | EUR | 10,400 | 12,840 |
| CapitaCommercial Trust Cvt. | 2.500% | 9/12/17 | SGD | 4,000 | 3,296 |
| CapitaLand Ltd. Cvt. | 2.800% | 6/8/25 | SGD | 9,250 | 6,795 |
| Carillion Finance Jersey Ltd. Cvt. | 2.500% | 12/19/19 | GBP | 4,000 | 6,518 |
| Colony Financial Inc. Cvt. | 5.000% | 4/15/23 | USD | 9,164 | 10,327 |
| Deutsche Euroshop AG Cvt. | 1.750% | 11/20/17 | EUR | 2,100 | 3,226 |
| Deutsche Wohnen AG Cvt. | 0.500% | 11/22/20 | EUR | 2,600 | 3,777 |
| 2 DH Corp. Cvt. | 5.000% | 9/30/20 | CAD | 9,560 | 8,322 |
| 2 Element Financial Corp. Cvt. | 4.250% | 6/30/20 | CAD | 7,385 | 6,324 |
| 2 Element Financial Corp. Cvt. | 5.125% | 6/30/19 | CAD | 14,279 | 14,123 |
| Encore Capital Group Inc. Cvt. | 3.000% | 7/1/20 | USD | 6,463 | 6,689 |
| Fonciere Des Regions Cvt. | 3.340% | 1/1/17 | EUR | 1,482 | 1,903 |
| Industrivarden AB Cvt. | 0.000% | 5/15/19 | SEK | 13,000 | 1,742 |
| INTU Jersey Ltd. Cvt. | 2.500% | 10/4/18 | GBP | 1,900 | 3,249 |
| National Bank of Abu Dhabi PJSC Cvt. | 1.000% | 3/12/18 | USD | 1,000 | 1,048 |
| Nexity SA Cvt. | 0.630% | 1/1/20 | EUR | 3,623 | 4,382 |
| Portfolio Recovery Associates Inc. Cvt. | 3.000% | 8/1/20 | USD | 20,868 | 22,746 |
| 2 RWT Holdings Inc. Cvt. | 5.625% | 11/15/19 | USD | 7,690 | 7,440 |
| St. Modwen Properties Securities | | | | | |
| Jersey Ltd. Cvt. | 2.875% | 3/6/19 | GBP | 4,700 | 7,556 |
| T&D Holdings Inc. Cvt. | 0.000% | 6/5/20 | JPY | 490,000 | 4,214 |
| Unibail-Rodamco SE Cvt. | 0.000% | 1/1/22 | EUR | 1,467 | 1,629 |
| Unite Jersey Issuer Ltd. Cvt. | 2.500% | 10/10/18 | GBP | 4,500 | 8,743 |
| | | | | | 201,288 |
| Health Care (19.8%) | | | | | |
| Alere Inc. Cvt. | 3.000% | 5/15/16 | USD | 5,003 | 6,129 |
| Allscripts Healthcare Solutions Inc. Cvt. | 1.250% | 7/1/20 | USD | 2,985 | 3,140 |
| BioMarin Pharmaceutical Inc. Cvt. | 0.750% | 10/15/18 | USD | 9,700 | 14,247 |
| BioMarin Pharmaceutical Inc. Cvt. | 1.500% | 10/15/20 | USD | 2,025 | 3,043 |
| Brookdale Senior Living Inc. Cvt. | 2.750% | 6/15/18 | USD | 16,890 | 23,561 |
14
| | | | | |
| Convertible Securities Fund | | | | | |
| |
| |
| |
| | | | | Face | Market |
| | | Maturity | | Amount | Value |
| | Coupon | Date | Currency | (000) | ($000) |
| Cepheid Inc. Cvt. | 1.250% | 2/1/21 | USD | 13,075 | 14,301 |
| Elekta AB Cvt. | 2.750% | 4/25/17 | SEK | 20,511 | 2,357 |
| Emergent Biosolutions Inc. Cvt. | 2.875% | 1/15/21 | USD | 6,371 | 7,820 |
| Fresenius Medical Care AG & Co. KGaA Cvt. | 1.125% | 1/31/20 | EUR | 800 | 1,082 |
| HealthSouth Corp. Cvt. | 2.000% | 12/1/43 | USD | 18,460 | 22,383 |
| 2 HeartWare International Inc. Cvt. | 1.750% | 12/15/21 | USD | 11,093 | 10,705 |
| Hologic Inc. Cvt. | 2.000% | 3/1/42 | USD | 28,611 | 36,622 |
| 2 Horizon Pharma Investment Ltd. Cvt. | 2.500% | 3/15/22 | USD | 13,507 | 18,369 |
| 2 Illumina Inc. Cvt. | 0.500% | 6/15/21 | USD | 21,230 | 25,688 |
| Insulet Corp. Cvt. | 2.000% | 6/15/19 | USD | 10,879 | 10,349 |
| 2 Jazz Investments I Ltd. Cvt. | 1.875% | 8/15/21 | USD | 32,052 | 38,202 |
| 2 Ligand Pharmaceuticals Inc. Cvt. | 0.750% | 8/15/19 | USD | 8,845 | 11,603 |
| 2 Medicines Co. Cvt. | 2.500% | 1/15/22 | USD | 11,215 | 12,357 |
| Medidata Solutions Inc. Cvt. | 1.000% | 8/1/18 | USD | 14,805 | 18,164 |
| Molina Healthcare Inc. Cvt. | 1.625% | 8/15/44 | USD | 4,285 | 5,820 |
| 2 Molina Healthcare Inc. Cvt. | 1.625% | 8/15/44 | USD | 13,255 | 18,002 |
| Nikkiso Co. Ltd. Cvt. | 0.000% | 8/2/18 | JPY | 245,000 | 2,002 |
| NuVasive Inc. Cvt. | 2.750% | 7/1/17 | USD | 18,285 | 24,285 |
| Orpea Cvt. | 1.750% | 1/1/20 | EUR | 1,738 | 2,806 |
| Qiagen NV Cvt | 0.375% | 3/19/19 | USD | 3,400 | 3,671 |
| Qiagen NV Cvt | 0.875% | 3/19/21 | USD | 3,600 | 3,958 |
| Shionogi & Co. Ltd. Cvt. | 0.000% | 12/17/19 | JPY | 570,000 | 5,609 |
| Spectranetics Corp. Cvt. | 2.625% | 6/1/34 | USD | 14,940 | 16,070 |
| Terumo Corp. Cvt. | 0.000% | 12/6/21 | JPY | 760,000 | 6,399 |
| 2 Wright Medical Group Inc. Cvt. | 2.000% | 2/15/20 | USD | 15,830 | 17,225 |
| | | | | | 385,969 |
| Industrials (9.4%) | | | | | |
| 51job Inc. Cvt. | 3.250% | 4/15/19 | USD | 6,240 | 6,209 |
| Aecon Group Inc. Cvt. | 5.500% | 12/31/18 | CAD | 4,503 | 3,838 |
| Chart Industries Inc. Cvt. | 2.000% | 8/1/18 | USD | 2,698 | 2,646 |
| China Merchants Holdings Pacific Ltd. Cvt. | 1.250% | 11/6/17 | HKD | 16,000 | 2,466 |
| Daifuku Co. Ltd. Cvt. | 0.000% | 10/2/17 | JPY | 115,000 | 1,256 |
| DP World Ltd. Cvt. | 1.750% | 6/19/24 | USD | 5,600 | 6,104 |
| Echo Global Logistics Inc. Cvt. | 2.500% | 5/1/20 | USD | 9,320 | 10,060 |
| GVM Debentures Lux 1 SA Cvt. | 5.750% | 2/14/18 | EUR | 6,200 | 6,350 |
| 2 Huron Consulting Group Inc. Cvt. | 1.250% | 10/1/19 | USD | 13,715 | 14,666 |
| Johnson Electric Holdings Ltd. Cvt. | 1.000% | 4/2/21 | USD | 11,000 | 11,990 |
| Kawasaki Kisen Kaisha Ltd. Cvt. | 0.000% | 9/26/18 | JPY | 530,000 | 4,905 |
| KEYW Holding Corp. Cvt. | 2.500% | 7/15/19 | USD | 9,445 | 7,408 |
| Larsen & Toubro Ltd. Cvt. | 0.675% | 10/22/19 | USD | 6,325 | 6,878 |
| LIXIL Group Corp. Cvt. | 0.000% | 3/4/22 | JPY | 810,000 | 6,200 |
| Macquarie Infrastructure Co. LLC Cvt. | 2.875% | 7/15/19 | USD | 4,130 | 4,928 |
| MISUMI Group Inc. Cvt. | 0.000% | 10/22/18 | USD | 4,600 | 5,599 |
| Nagoya Railroad Co. Ltd. Cvt. | 0.000% | 12/11/24 | JPY | 750,000 | 6,487 |
| OCI Cvt. | 3.875% | 9/25/18 | EUR | 5,200 | 6,678 |
| Park24 Co. Ltd. Cvt. | 0.000% | 4/26/18 | JPY | 270,000 | 2,271 |
| Prysmian SPA Cvt. | 1.250% | 3/8/18 | EUR | 3,300 | 4,117 |
| Sacyr SA Cvt. | 4.000% | 5/8/19 | EUR | 4,400 | 4,682 |
| Schindler Holding AG Cvt. | 0.375% | 6/5/17 | CHF | 3,300 | 3,660 |
| Siemens Financieringsmaatschappij NV Cvt. | 1.050% | 8/16/17 | USD | 2,000 | 2,173 |
| Siemens Financieringsmaatschappij NV Cvt. | 1.650% | 8/16/19 | USD | 8,500 | 9,633 |
| Societa Iniziative Autostradali | | | | | |
| e Servizi SPA Cvt. | 2.625% | 6/30/17 | EUR | 1,195 | 1,452 |
15
| | | | | |
| Convertible Securities Fund | | | | | |
| |
| |
| |
| | | | | Face | Market |
| | | Maturity | | Amount | Value |
| | Coupon | Date Currency | (000) | ($000) |
| 2 SolarCity Corp. Cvt. | 1.625% | 11/1/19 | USD | 22,375 | 21,941 |
| Tong Jie Ltd. Cvt. | 0.000% | 2/18/18 | HKD | 30,000 | 4,193 |
| UTi Worldwide Inc. Cvt. | 4.500% | 3/1/19 | USD | 15,095 | 15,340 |
| | | | | | 184,130 |
| Information Technology (27.7%) | | | | | |
| Alcatel-Lucent Cvt. | 0.000% | 1/30/19 | EUR | 235 | 302 |
| Alcatel-Lucent Cvt. | 0.130% | 1/30/20 | EUR | 3,067 | 4,044 |
| ASM Pacific Technology Ltd. Cvt. | 2.000% | 3/28/19 | HKD | 18,000 | 2,542 |
| 2 Brocade Communications Systems Inc. Cvt. | 1.375% | 1/1/20 | USD | 20,675 | 21,928 |
| 2 CalAmp Corp. Cvt. | 1.625% | 5/15/20 | USD | 7,395 | 7,390 |
| Canadian Solar Inc. Cvt. | 4.250% | 2/15/19 | USD | 6,015 | 6,286 |
| Cardtronics Inc. Cvt. | 1.000% | 12/1/20 | USD | 13,885 | 13,711 |
| 2 Ciena Corp. Cvt. | 3.750% | 10/15/18 | USD | 11,410 | 15,910 |
| Citrix Systems Inc. Cvt. | 0.500% | 4/15/19 | USD | 23,765 | 25,072 |
| Econocom Group Cvt. | 1.500% | 1/15/19 | EUR | 4,975 | 5,907 |
| 2 Electronics For Imaging Inc. Cvt. | 0.750% | 9/1/19 | USD | 16,375 | 17,112 |
| Epistar Corp. Cvt. | 0.000% | 8/7/18 | USD | 7,100 | 7,364 |
| 2 Euronet Worldwide Inc. Cvt. | 1.500% | 10/1/44 | USD | 16,805 | 18,706 |
| Finisar Corp. Cvt. | 0.500% | 12/15/33 | USD | 7,215 | 7,422 |
| 2 FireEye Inc. Cvt. | 1.000% | 6/1/35 | USD | 8,425 | 8,815 |
| 2 FireEye Inc. Cvt. | 1.625% | 6/1/35 | USD | 4,200 | 4,397 |
| Indra Sistemas SA Cvt. | 1.750% | 10/17/18 | EUR | 1,400 | 1,470 |
| InvenSense Inc. Cvt. | 1.750% | 11/1/18 | USD | 8,120 | 7,648 |
| j2 Global Inc. Cvt. | 3.250% | 6/15/29 | USD | 17,661 | 20,487 |
| 2 LinkedIn Corp. Cvt. | 0.500% | 11/1/19 | USD | 4,295 | 4,271 |
| 2 Microchip Technology Inc. Cvt. | 1.625% | 2/15/25 | USD | 20,570 | 21,406 |
| Nihon Unisys Ltd. Cvt. | 0.000% | 6/20/16 | JPY | 350,000 | 3,152 |
| NVIDIA Corp. Cvt. | 1.000% | 12/1/18 | USD | 22,610 | 27,485 |
| 2 NXP Semiconductor NV Cvt. | 1.000% | 12/1/19 | USD | 31,242 | 39,463 |
| ON Semiconductor Corp. Cvt. | 2.625% | 12/15/26 | USD | 8,417 | 11,379 |
| Photronics Inc. Cvt. | 3.250% | 4/1/19 | USD | 3,304 | 3,851 |
| 2 Red Hat Inc. Cvt. | 0.250% | 10/1/19 | USD | 28,000 | 35,193 |
| 2 Rovi Corp. Cvt. | 0.500% | 3/1/20 | USD | 15,130 | 14,061 |
| Salesforce.com Inc. Cvt. | 0.250% | 4/1/18 | USD | 21,400 | 26,763 |
| Semiconductor Manufacturing | | | | | |
| International Corp. Cvt. | 0.000% | 11/7/18 | USD | 4,500 | 5,513 |
| Siliconware Precision Industries Co. Ltd. Cvt. | 0.000% | 10/31/19 | USD | 4,000 | 4,486 |
| STMicroelectronics NV Cvt. | 0.000% | 7/3/19 | USD | 400 | 413 |
| STMicroelectronics NV Cvt. | 1.000% | 7/3/21 | USD | 4,800 | 5,167 |
| 2 SunEdison Inc. Cvt. | 0.250% | 1/15/20 | USD | 13,295 | 16,228 |
| 2 SunEdison Inc. Cvt. | 2.625% | 6/1/23 | USD | 7,260 | 7,491 |
| 2 SunEdison Inc. Cvt. | 3.375% | 6/1/25 | USD | 8,230 | 8,657 |
| 2 SunPower Corp. Cvt. | 0.875% | 6/1/21 | USD | 10,765 | 10,805 |
| Synchronoss Technologies Inc. Cvt. | 0.750% | 8/15/19 | USD | 12,410 | 13,930 |
| 2 Trina Solar Ltd. Cvt. | 3.500% | 6/15/19 | USD | 2,975 | 3,154 |
| TTM Technologies Inc. Cvt. | 1.750% | 12/15/20 | USD | 11,808 | 13,675 |
| Verint Systems Inc. Cvt. | 1.500% | 6/1/21 | USD | 24,100 | 28,664 |
| Vishay Intertechnology Inc. Cvt. | 2.250% | 5/15/41 | USD | 8,735 | 7,163 |
| Web.com Group Inc. Cvt. | 1.000% | 8/15/18 | USD | 13,765 | 13,533 |
| WebMD Health Corp. Cvt. | 1.500% | 12/1/20 | USD | 10,320 | 11,410 |
| WebMD Health Corp. Cvt. | 2.500% | 1/31/18 | USD | 2,690 | 2,762 |
| Yandex NV Cvt. | 1.125% | 12/15/18 | USD | 2,721 | 2,369 |
| | | | | | 538,957 |
16
| | | | | | |
| Convertible Securities Fund | | | | | |
| |
| |
| |
| | | | | | Face | Market |
| | | | Maturity | | Amount | Value |
| | | Coupon | Date | Currency | (000) | ($000) |
| Materials (5.9%) | | | | | |
| | APERAM Cvt. | 0.625% | 7/8/21 | USD | 7,400 | 8,889 |
| | Buzzi Unicem SPA Cvt. | 1.375% | 7/17/19 | EUR | 3,700 | 4,758 |
| 2 | Cemex SAB de CV Cvt. | 3.720% | 3/15/20 | USD | 17,550 | 18,943 |
| | Cemex SAB de CV Cvt. | 3.720% | 3/15/20 | USD | 8,800 | 9,489 |
| 2 | Chemtrade Logistics Income Fund Cvt. | 5.250% | 6/30/21 | CAD | 5,331 | 4,415 |
| | Chemtrade Logistics Income Fund Cvt. | 5.750% | 12/31/18 | CAD | 332 | 291 |
| | Gabriel Finance LP Cvt. | 2.000% | 11/26/16 | EUR | 4,100 | 4,858 |
| | NV Bekaert SA Cvt. | 0.750% | 6/18/18 | EUR | 5,200 | 5,737 |
| | Outokumpu OYJ Cvt. | 3.250% | 2/26/20 | EUR | 6,900 | 7,683 |
| | RTI International Metals Inc. Cvt. | 1.625% | 10/15/19 | USD | 19,030 | 21,801 |
| | Salzgitter Finance BV Cvt. | 2.000% | 11/8/17 | EUR | 3,800 | 5,229 |
| 2,3 | ShengdaTech Inc. Cvt. | 6.500% | 12/15/15 | USD | 305 | 1 |
| | Teijin Ltd. Cvt. | 0.000% | 12/12/18 | JPY | 140,000 | 1,382 |
| | Teijin Ltd. Cvt. | 0.000% | 12/10/21 | JPY | 610,000 | 6,217 |
| | Toray Industries Inc. Cvt. | 0.000% | 8/31/21 | JPY | 560,000 | 5,916 |
| | United States Steel Corp. Cvt. | 2.750% | 4/1/19 | USD | 7,695 | 9,349 |
| | | | | | | 114,958 |
| Telecommunication Services (0.9%) | | | | | |
| | Billion Express Investments Ltd. Cvt. | 0.750% | 10/18/15 | USD | 7,900 | 8,137 |
| | Inmarsat PLC Cvt. | 1.750% | 11/16/17 | USD | 2,000 | 2,976 |
| | Telecom Italia SPA Cvt. | 1.125% | 3/26/22 | EUR | 5,100 | 5,767 |
| | | | | | | 16,880 |
| Utilities (1.3%) | | | | | |
| | Chugoku Electric Power Co. Inc. Cvt. | 0.000% | 3/25/20 | JPY | 580,000 | 5,306 |
| | ENN Energy Holdings Ltd. Cvt. | 0.000% | 2/26/18 | USD | 5,500 | 6,579 |
| | Northland Power Inc. Cvt. | 4.750% | 6/30/20 | CAD | 6,225 | 5,151 |
| | Northland Power Inc. Cvt. | 5.000% | 6/30/19 | CAD | 2,661 | 2,231 |
| | Suez Environnement Co. Cvt. | 0.000% | 2/27/20 | EUR | 2,336 | 3,080 |
| | Superior Plus Corp. Cvt. | 6.000% | 6/30/19 | CAD | 2,558 | 2,175 |
| | | | | | | 24,522 |
| Total Convertible Bonds (Cost $1,690,112) | | | | | 1,778,450 |
17
| | | | |
| Convertible Securities Fund | | | |
| |
| |
| |
| | | | | Market |
| | | | | Value |
| | | Coupon | Shares | ($000) |
| Convertible Preferred Stocks (6.3%) | | | |
| Energy (2.0%) | | | |
| 2 | Chesapeake Energy Corp. Pfd. | 5.750% | 15,490 | 12,663 |
| | Goodrich Petroleum Corp. Pfd. | 5.375% | 130,670 | 1,242 |
| | Halcon Resources Corp. Pfd. | 5.750% | 16,120 | 3,482 |
| | McDermott International Inc. Pfd. | 6.250% | 393,800 | 7,793 |
| 2 | Penn Virginia Corp. Pfd. | 6.000% | 144,678 | 7,490 |
| | Rex Energy Corp. Pfd. | 6.000% | 81,900 | 3,652 |
| | Sanchez Energy Corp. Pfd. | 4.875% | 84,603 | 2,538 |
| | | | | 38,860 |
| Financials (1.3%) | | | |
| | American Tower Corp. Pfd. | 5.500% | 147,100 | 14,876 |
| | Crown Castle International Corp. Pfd. | 4.500% | 104,700 | 10,768 |
| | | | | 25,644 |
| Health Care (2.0%) | | | |
| | Actavis plc Pfd. | 5.500% | 18,500 | 19,529 |
| | Alere Inc. Pfd. | 3.000% | 40,706 | 14,318 |
| | Amsurg Corp. Pfd. | 5.250% | 35,550 | 4,733 |
| | | | | 38,580 |
| Industrials (0.3%) | | | |
| | Genesee & Wyoming Inc. Pfd. | 5.000% | 56,340 | 5,981 |
| |
| Materials (0.1%) | | | |
| | ArcelorMittal Pfd. | 6.000% | 78,500 | 1,361 |
| |
| Telecommunication Services (0.6%) | | | |
| | Iridium Communications Inc. Pfd. | 7.000% | 101,800 | 12,057 |
| Total Convertible Preferred Stocks (Cost $145,988) | | | 122,483 |
| Temporary Cash Investment (3.2%) | | | |
| Money Market Fund (3.2%) | | | |
| 4 | Vanguard Market Liquidity Fund | | | |
| | (Cost $62,305) | 0.136% | 62,305,399 | 62,305 |
| Total Investments (100.8%) (Cost $1,898,674) | | | 1,963,449 |
| Other Assets and Liabilities (-0.8%) | | | |
| Other Assets5 | | | 46,507 |
| Liabilities | | | (62,007) |
| | | | | (15,500) |
| Net Assets (100%) | | | |
| Applicable to 144,027,469 outstanding $.001 par value shares of | | | |
| beneficial interest (unlimited authorization) | | | 1,947,949 |
| Net Asset Value Per Share | | | $13.52 |
18
| |
| Convertible Securities Fund | |
| |
| |
| |
| At May 31, 2015, net assets consisted of: | |
| | Amount |
| | ($000) |
| Paid-in Capital | 1,801,528 |
| Undistributed Net Investment Income | 8,534 |
| Accumulated Net Realized Gains | 74,099 |
| Unrealized Appreciation (Depreciation) | |
| Investment Securities | 64,775 |
| Forward Currency Contracts | (1,060) |
| Foreign Currencies | 73 |
| Net Assets | 1,947,949 |
• See Note A in Notes to Financial Statements.
1 Non-income-producing security—issuer in bankruptcy.
2 Security exempt from registration under Rule 144A of the Securities Act of 1933. Such securities may be sold in transactions exempt from registration, normally to qualified institutional buyers. At May 31, 2015, the aggregate value of these securities was $581,608,000, representing 29.9% of net assets.
3 Non-income-producing security—interest payments in default.
4 Affiliated money market fund available only to Vanguard funds and certain trusts and accounts managed by Vanguard. Rate shown is the 7-day yield.
5 Cash of $465,000 has been segregated as collateral for open forward currency contracts.
REIT—Real Estate Investment Trust.
CAD—Canadian dollar.
CHF—Swiss franc.
EUR—Euro.
GBP—British pound.
HKD—Hong Kong dollar.
JPY—Japanese yen.
KRW—South Korean won.
SEK—Swedish krona.
SGD—Singapore dollar.
USD—U.S. dollar.
See accompanying Notes, which are an integral part of the Financial Statements.
19
| |
| Convertible Securities Fund | |
| |
| |
| Statement of Operations | |
| |
| | Six Months Ended |
| | May 31, 2015 |
| | ($000) |
| Investment Income | |
| Income | |
| Dividends | 4,148 |
| Interest1,2 | 18,371 |
| Total Income | 22,519 |
| Expenses | |
| Investment Advisory Fees—Note B | |
| Basic Fee | 3,253 |
| Performance Adjustment | (1,615) |
| The Vanguard Group—Note C | |
| Management and Administrative | 1,800 |
| Marketing and Distribution | 166 |
| Custodian Fees | 41 |
| Shareholders’ Reports | 12 |
| Trustees’ Fees and Expenses | 2 |
| Total Expenses | 3,659 |
| Net Investment Income | 18,860 |
| Realized Net Gain (Loss) | |
| Investment Securities Sold | 48,775 |
| Foreign Currencies and Forward Currency Contracts | 39,264 |
| Realized Net Gain (Loss) | 88,039 |
| Change in Unrealized Appreciation (Depreciation) | |
| Investment Securities | 29,910 |
| Foreign Currencies and Forward Currency Contracts | (12,329) |
| Change in Unrealized Appreciation (Depreciation) | 17,581 |
| Net Increase (Decrease) in Net Assets Resulting from Operations | 124,480 |
1 Interest income from an affiliated company of the fund was $25,000.
2 Interest income is net of foreign withholding taxes of $10,000.
See accompanying Notes, which are an integral part of the Financial Statements.
20
| | |
| Convertible Securities Fund | | |
| |
| |
| Statement of Changes in Net Assets | | |
| |
| | Six Months Ended | Year Ended |
| | May 31, | November 30, |
| | 2015 | 2014 |
| | ($000) | ($000) |
| Increase (Decrease) in Net Assets | | |
| Operations | | |
| Net Investment Income | 18,860 | 42,934 |
| Realized Net Gain (Loss) | 88,039 | 162,934 |
| Change in Unrealized Appreciation (Depreciation) | 17,581 | (118,068) |
| Net Increase (Decrease) in Net Assets Resulting from Operations | 124,480 | 87,800 |
| Distributions | | |
| Net Investment Income | (23,891) | (62,172) |
| Realized Capital Gain1 | (143,706) | (135,778) |
| Total Distributions | (167,597) | (197,950) |
| Capital Share Transactions | | |
| Issued | 79,789 | 266,327 |
| Issued in Lieu of Cash Distributions | 152,353 | 178,681 |
| Redeemed | (242,322) | (394,062) |
| Net Increase (Decrease) from Capital Share Transactions | (10,180) | 50,946 |
| Total Increase (Decrease) | (53,297) | (59,204) |
| Net Assets | | |
| Beginning of Period | 2,001,246 | 2,060,450 |
| End of Period2 | 1,947,949 | 2,001,246 |
1 Includes fiscal 2015 and 2014 short-term gain distributions totaling $40,124,000 and $40,382,000, respectively. Short-term gain distributions are treated as ordinary income dividends for tax purposes.
2 Net Assets—End of Period includes undistributed (overdistributed) net investment income of $8,534,000 and $10,863,000.
See accompanying Notes, which are an integral part of the Financial Statements.
21
| | | | | | |
| Convertible Securities Fund | | | | | | |
| |
| |
| Financial Highlights | | | | | | |
| |
| |
| Six Months | | | | | |
| | Ended | | | | | |
| For a Share Outstanding | May 31, | | | Year Ended November 30, |
| Throughout Each Period | 2015 | 2014 | 2013 | 2012 | 2011 | 2010 |
| Net Asset Value, Beginning of Period | $13.85 | $14.64 | $12.95 | $12.12 | $13.85 | $12.12 |
| Investment Operations | | | | | | |
| Net Investment Income | .132 | . 287 | . 333 | . 407 | . 451 | . 555 |
| Net Realized and Unrealized Gain (Loss) | | | | | | |
| on Investments | .715 | .313 | 2.101 | 1.134 | (.752) | 1.742 |
| Total from Investment Operations | .847 | .600 | 2.434 | 1.541 | (.301) | 2.297 |
| Distributions | | | | | | |
| Dividends from Net Investment Income | (.167) | (. 425) | (. 355) | (. 534) | (. 474) | (. 567) |
| Distributions from Realized Capital Gains | (1.010) | (. 965) | (. 389) | (.177) | (. 955) | — |
| Total Distributions | (1.177) | (1.390) | (.744) | (.711) | (1.429) | (.567) |
| Net Asset Value, End of Period | $13.52 | $13.85 | $14.64 | $12.95 | $12.12 | $13.85 |
| |
| Total Return1 | 6.69% | 4.33% | 19.65% | 13.18% | -2.89% | 19.39% |
| |
| Ratios/Supplemental Data | | | | | | |
| Net Assets, End of Period (Millions) | $1,948 | $2,001 | $2,060 | $1,643 | $1,680 | $1,733 |
| Ratio of Total Expenses to | | | | | | |
| Average Net Assets2 | 0.38% | 0.41% | 0.63% | 0.52% | 0.59% | 0.68% |
| Ratio of Net Investment Income to | | | | | | |
| Average Net Assets | 1.96% | 2.02% | 2.41% | 3.23% | 3.36% | 4.08% |
| Portfolio Turnover Rate | 98% | 85% | 101% | 82% | 90% | 103% |
The expense ratio, net income ratio, and turnover rate for the current period have been annualized.
1 Total returns do not include transaction or account service fees that may have applied in the periods shown. Fund prospectuses provide information about any applicable transaction and account service fees.
2 Includes performance-based investment advisory fee increases (decreases) of (0.17%), (0.15%), 0.07%, (0.04%), 0.03%, and 0.12%.
See accompanying Notes, which are an integral part of the Financial Statements.
22
Convertible Securities Fund
Notes to Financial Statements
Vanguard Convertible Securities Fund is registered under the Investment Company Act of 1940 as an open-end investment company, or mutual fund. The fund invests in securities of foreign issuers, which may subject it to investment risks not normally associated with investing in securities of United States corporations.
A. The following significant accounting policies conform to generally accepted accounting principles for U.S. investment companies. The fund consistently follows such policies in preparing its financial statements.
1. Security Valuation: Securities are valued as of the close of trading on the New York Stock Exchange (generally 4 p.m., Eastern time) on the valuation date. Equity securities are valued at the latest quoted sales prices or official closing prices taken from the primary market in which each security trades; such securities not traded on the valuation date are valued at the mean of the latest quoted bid and asked prices. Bonds, and temporary cash investments acquired over 60 days to maturity, are valued using the latest bid prices or using valuations based on a matrix system (which considers such factors as security prices, yields, maturities, and ratings), both as furnished by independent pricing services. Investments in Vanguard Market Liquidity Fund are valued at that fund’s net asset value. Other temporary cash investments are valued at amortized cost, which approximates market value. Securities for which market quotations are not readily available, or whose values have been affected by events occurring before the fund’s pricing time but after the close of the securities’ primary markets, are valued at their fair values calculated according to procedures adopted by the board of trustees. These procedures include obtaining quotations from an independent pricing service, monitoring news to identify significant market- or security-specific events, and evaluating changes in the values of foreign market proxies (for example, ADRs, futures contracts, or exchange-traded funds), between the time the foreign markets close and the fund’s pricing time. When fair-value pricing is employed, the prices of securities used by a fund to calculate its net asset value may differ from quoted or published prices for the same securities.
2. Foreign Currency: Securities and other assets and liabilities denominated in foreign currencies are translated into U.S. dollars using exchange rates obtained from an independent third party as of the fund’s pricing time on the valuation date. Realized gains (losses) and unrealized appreciation (depreciation) on investment securities include the effects of changes in exchange rates since the securities were purchased, combined with the effects of changes in security prices. Fluctuations in the value of other assets and liabilities resulting from changes in exchange rates are recorded as unrealized foreign currency gains (losses) until the assets or liabilities are settled in cash, at which time they are recorded as realized foreign currency gains (losses).
3. Forward Currency Contracts: The fund enters into forward currency contracts to protect the value of securities and related receivables and payables against changes in future foreign exchange rates. The fund’s risks in using these contracts include movement in the values of the foreign currencies relative to the U.S. dollar and the ability of the counterparties to fulfill their obligations under the contracts. The fund mitigates its counterparty risk by entering into forward currency contracts only with a diverse group of prequalified counterparties, monitoring their financial strength, entering into master netting arrangements with its counterparties, and requiring its counterparties to transfer collateral as security for their performance. The master netting arrangements provide that, in the event of a counterparty’s default (including bankruptcy), the fund may terminate the forward currency contracts, determine the net amount owed by either party in accordance with its master
23
Convertible Securities Fund
netting arrangements, and sell or retain any collateral held up to the net amount owed to the fund under the master netting arrangements. The forward currency contracts contain provisions whereby a counterparty may terminate open contracts if the fund’s net assets decline below a certain level, triggering a payment by the fund if the fund is in a net liability position at the time of the termination. The payment amount would be reduced by any collateral the fund has pledged. Any assets pledged as collateral for open contracts are noted in the Statement of Net Assets. The value of collateral received or pledged is compared daily to the value of the forward currency contracts exposure with each counterparty, and any difference, if in excess of a specified minimum transfer amount, is adjusted and settled within two business days.
Forward currency contracts are valued at their quoted daily prices obtained from an independent third party, adjusted for currency risk based on the expiration date of each contract. The notional amounts of the contracts are not recorded in the Statement of Net Assets. Fluctuations in the value of the contracts are recorded in the Statement of Net Assets as an asset (liability) and in the Statement of Operations as unrealized appreciation (depreciation) until the contracts are closed, when they are recorded as realized forward currency contract gains (losses).
During the six months ended May 31, 2015, the fund’s average investment in forward currency contracts represented 18% of net assets, based on the average of notional amounts at each quarter-end during the period.
4. Federal Income Taxes: The fund intends to continue to qualify as a regulated investment company and distribute all of its taxable income. Management has analyzed the fund’s tax positions taken for all open federal income tax years (November 30, 2011–2014), and for the period ended May 31, 2015, and has concluded that no provision for federal income tax is required in the fund’s financial statements.
5. Distributions: Distributions to shareholders are recorded on the ex-dividend date.
6. Credit Facility: The fund and certain other funds managed by The Vanguard Group participate in a $3 billion committed credit facility provided by a syndicate of lenders pursuant to a credit agreement that may be renewed annually; each fund is individually liable for its borrowings, if any, under the credit facility. Borrowings may be utilized for temporary and emergency purposes, and are subject to the fund’s regulatory and contractual borrowing restrictions. The participating funds are charged administrative fees and an annual commitment fee of 0.06% of the undrawn amount of the facility; these fees are allocated to the funds based on a method approved by the fund’s board of trustees and included in Management and Administrative expenses on the fund’s Statement of Operations. Any borrowings under this facility bear interest at a rate equal to the higher of the federal funds rate or LIBOR reference rate plus an agreed-upon spread.
The fund had no borrowings outstanding at May 31, 2015, or at any time during the period then ended.
7. Other: Dividend income is recorded on the ex-dividend date. Interest income includes income distributions received from Vanguard Market Liquidity Fund and is accrued daily. Premiums and discounts on debt securities purchased are amortized and accreted, respectively, to interest income over the lives of the respective securities. Security transactions are accounted for on the date securities are bought or sold. Costs used to determine realized gains (losses) on the sale of investment securities are those of the specific securities sold.
24
Convertible Securities Fund
B. Oaktree Capital Management, L.P., provides investment advisory services to the fund for a fee calculated at an annual percentage rate of average net assets. The basic fee is subject to quarterly adjustments based on the fund’s performance for the preceding three years relative to a composite index weighted 70% Bank of America Merrill Lynch All US Convertibles Index and 30% Bank of America Merrill Lynch Global 300 Convertibles ex-US Index (hedged). For the six months ended May 31, 2015, the investment advisory fee represented an effective annual basic rate of 0.34% of the fund’s average net assets before a decrease of $1,615,000 (0.17%) based on performance.
C. The Vanguard Group furnishes at cost corporate management, administrative, marketing, and distribution services. The costs of such services are allocated to the fund based on methods approved by the board of trustees. The fund has committed to invest up to 0.40% of its net assets in Vanguard. At May 31, 2015, the fund had contributed capital of $172,000 to Vanguard (included in Other Assets), representing 0.01% of the fund’s net assets and 0.07% of Vanguard’s capitalization. The fund’s trustees and officers are also directors and employees, respectively, of Vanguard.
D. Various inputs may be used to determine the value of the fund’s investments. These inputs are summarized in three broad levels for financial statement purposes. The inputs or methodologies used to value securities are not necessarily an indication of the risk associated with investing in those securities.
Level 1—Quoted prices in active markets for identical securities.
Level 2—Other significant observable inputs (including quoted prices for similar securities, interest rates, prepayment speeds, credit risk, etc.).
Level 3—Significant unobservable inputs (including the fund’s own assumptions used to determine the fair value of investments).
The following table summarizes the market value of the fund’s investments as of May 31, 2015, based on the inputs used to value them:
| | | |
| | Level 1 | Level 2 | Level 3 |
| Investments | ($000) | ($000) | ($000) |
| Common Stocks | 211 | — | — |
| Convertible Bonds | — | 1,772,125 | 6,325 |
| Convertible Preferred Stocks | — | 122,483 | — |
| Temporary Cash Investments | 62,305 | — | — |
| Forward Currency Contracts—Assets | — | 3,645 | — |
| Forward Currency Contracts—Liabilities | — | (4,705) | — |
| Total | 62,516 | 1,893,548 | 6,325 |
25
Convertible Securities Fund
E. At May 31, 2015, the fund had open forward currency contracts to receive and deliver currencies as follows. Unrealized appreciation (depreciation) on open forward currency contracts, except for Hong Kong and Singapore dollar currency contracts, is treated as realized gain (loss) for tax purposes.
| | | | | | |
| | | | | | | Unrealized |
| | Contract | | | | | Appreciation |
| | Settlement | | | | Contract Amount (000) | (Depreciation) |
| Counterparty | Date | | Receive | | Deliver | ($000) |
| UBS AG | 7/23/15 | USD | 173,861 | EUR | 161,618 | (3,777) |
| UBS AG | 7/23/15 | USD | 80,899 | JPY | 9,669,850 | 2,934 |
| UBS AG | 7/23/15 | USD | 44,991 | CAD | 55,357 | 516 |
| UBS AG | 7/23/15 | USD | 34,732 | GBP | 23,255 | (798) |
| UBS AG | 7/23/15 | USD | 13,617 | HKD | 105,545 | 6 |
| UBS AG | 7/23/15 | USD | 5,914 | CAD | 7,385 | (19) |
| UBS AG | 7/23/15 | USD | 4,372 | SEK | 37,766 | (62) |
| UBS AG | 7/23/15 | USD | 3,961 | KRW | 4,300,410 | 87 |
| UBS AG | 7/23/15 | USD | 3,537 | CHF | 3,360 | (46) |
| UBS AG | 7/23/15 | USD | 2,448 | SGD | 3,237 | 49 |
| UBS AG | 7/23/15 | USD | 1,702 | EUR | 1,500 | 53 |
| UBS AG | 7/23/15 | USD | 992 | SGD | 1,343 | (3) |
| | | | | | | (1,060) |
| Refer to the Statement of Net Assets for currency abbreviations. |
F. Distributions are determined on a tax basis and may differ from net investment income and realized capital gains for financial reporting purposes. Differences may be permanent or temporary. Permanent differences are reclassified among capital accounts in the financial statements to reflect their tax character. Temporary differences arise when certain items of income, expense, gain, or loss are recognized in different periods for financial statement and tax purposes. These differences will reverse at some time in the future. Differences in classification may also result from the treatment of short-term gains as ordinary income for tax purposes. The fund’s tax-basis capital gains and losses are determined only at the end of each fiscal year.
During the six months ended May 31, 2015, the fund realized net foreign currency losses of $5,804,000 (including the foreign currency component on sales of foreign currency denominated bonds), which decreased distributable net income for tax purposes; accordingly, such losses have been reclassified from accumulated net realized gains to undistributed net investment income.
Certain of the fund’s convertible preferred stock investments are treated as debt securities for tax purposes. During the six months ended May 31, 2015, the fund realized gains of $19,000 from the sale of these securities, which are included in distributable net investment income for tax purposes; accordingly, such gains have been reclassified from accumulated net realized gains to undistributed net investment income.
26
Convertible Securities Fund
Certain of the fund’s convertible bond investments are in securities considered to be “contingent payment debt instruments,” for which any realized gains increase (and all or part of any realized losses decrease) income for tax purposes. During the six months ended May 31, 2015, the fund realized net gains of $8,487,000 from the sale of these securities, which increased distributable net income for tax purposes; accordingly, such gains have been reclassified from accumulated net realized gains to undistributed net investment income.
At May 31, 2015, the cost of investment securities for tax purposes was $1,898,737,000. Net unrealized appreciation of investment securities for tax purposes was $64,712,000, consisting of unrealized gains of $148,272,000 on securities that had risen in value since their purchase and $83,560,000 in unrealized losses on securities that had fallen in value since their purchase.
G. During the six months ended May 31, 2015, the fund purchased $912,500,000 of investment securities and sold $1,040,815,000 of investment securities, other than temporary cash investments.
H. Capital shares issued and redeemed were:
| | |
| | Six Months Ended | Year Ended |
| | May 31, 2015 | November 30, 2014 |
| | Shares | Shares |
| | (000) | (000) |
| Issued | 6,045 | 18,911 |
| Issued in Lieu of Cash Distributions | 11,989 | 13,040 |
| Redeemed | (18,494) | (28,206) |
| Net Increase (Decrease) in Shares Outstanding | (460) | 3,745 |
I. Management has determined that no material events or transactions occurred subsequent to May 31, 2015, that would require recognition or disclosure in these financial statements.
27
About Your Fund’s Expenses
As a shareholder of the fund, you incur ongoing costs, which include costs for portfolio management, administrative services, and shareholder reports (like this one), among others. Operating expenses, which are deducted from a fund’s gross income, directly reduce the investment return of the fund.
A fund’s expenses are expressed as a percentage of its average net assets. This figure is known as the expense ratio. The following examples are intended to help you understand the ongoing costs (in dollars) of investing in your fund and to compare these costs with those of other mutual funds. The examples are based on an investment of $1,000 made at the beginning of the period shown and held for the entire period.
The accompanying table illustrates your fund’s costs in two ways:
• Based on actual fund return. This section helps you to estimate the actual expenses that you paid over the period. The ”Ending Account Value“ shown is derived from the fund‘s actual return, and the third column shows the dollar amount that would have been paid by an investor who started with $1,000 in the fund. You may use the information here, together with the amount you invested, to estimate the expenses that you paid over the period.
To do so, simply divide your account value by $1,000 (for example, an $8,600 account value divided by $1,000 = 8.6), then multiply the result by the number given for your fund under the heading ”Expenses Paid During Period.“
• Based on hypothetical 5% yearly return. This section is intended to help you compare your fund‘s costs with those of other mutual funds. It assumes that the fund had a yearly return of 5% before expenses, but that the expense ratio is unchanged. In this case—because the return used is not the fund’s actual return—the results do not apply to your investment. The example is useful in making comparisons because the Securities and Exchange Commission requires all mutual funds to calculate expenses based on a 5% return. You can assess your fund’s costs by comparing this hypothetical example with the hypothetical examples that appear in shareholder reports of other funds.
Note that the expenses shown in the table are meant to highlight and help you compare ongoing costs only and do not reflect transaction costs incurred by the fund for buying and selling securities. Further, the expenses do not include any purchase, redemption, or account service fees described in the fund prospectus. If such fees were applied to your account, your costs would be higher. Your fund does not carry a “sales load.”
The calculations assume no shares were bought or sold during the period. Your actual costs may have been higher or lower, depending on the amount of your investment and the timing of any purchases or redemptions.
You can find more information about the fund’s expenses, including annual expense ratios, in the Financial Statements section of this report. For additional information on operating expenses and other shareholder costs, please refer to your fund’s current prospectus.
28
| | | |
| Six Months Ended May 31, 2015 | | | |
| | Beginning | Ending | Expenses |
| | Account Value | Account Value | Paid During |
| Convertible Securities Fund | 11/30/2014 | 5/31/2015 | Period |
| Based on Actual Fund Return | $1,000.00 | $1,066.88 | $1.96 |
| Based on Hypothetical 5% Yearly Return | 1,000.00 | 1,023.04 | 1.92 |
The calculations are based on expenses incurred in the most recent six-month period. The fund’s annualized six-month expense ratio for that period is 0.38%. The dollar amounts shown as “Expenses Paid” are equal to the annualized expense ratio multiplied by the average account value over the period, multiplied by the number of days in the most recent six-month period, then divided by the number of days in the most recent 12-month period.
29
Trustees Approve Advisory Arrangement
The board of trustees of Vanguard Convertible Securities Fund has renewed the fund’s investment advisory arrangement with Oaktree Capital Management, L.P. (Oaktree). The board determined that renewing the fund’s advisory arrangement was in the best interests of the fund and its shareholders.
The board based its decision upon an evaluation of the advisor’s investment staff, portfolio management process, and performance. The trustees considered the factors discussed below, among others. However, no single factor determined whether the board approved the arrangement. Rather, it was the totality of the circumstances that drove the board’s decision.
Nature, extent, and quality of services
The board reviewed the quality of the fund’s investment management services over both the short and long term, and took into account the organizational depth and stability of the advisor. The board considered that Oaktree, founded in 1995, specializes in managing convertible securities, distressed debt, and high-yield bonds. The advisor uses a bottom-up investment approach to select convertible securities that it believes have the best balance of upside potential and downside protection. Discipline is key to the fund’s management; Oaktree invests predominantly in convertibles possessing an attractive combination of conversion and income features—true hybrid securities—and sells the issues when their characteristics become too similar to those of conventional bonds or common stocks. Oaktree has advised the fund since 1996.
The board concluded that the advisor’s experience, stability, depth, and performance, among other factors, warranted continuation of the advisory arrangement.
Investment performance
The board considered the short- and long-term performance of the fund, including any periods of outperformance or underperformance relative to a benchmark index and peer group. The board concluded that the performance was such that the advisory arrangement should continue. Information about the fund’s most recent performance can be found in the Performance Summary section of this report.
Cost
The board concluded that the fund’s expense ratio was well below the average expense ratio charged by funds in its peer group and that the fund’s advisory fee rate was also well below its peer-group average. Information about the fund’s expenses appears in the About Your Fund’s Expenses section of this report as well as in the Financial Statements section, which also includes information about the advisory fee rate.
The board did not consider profitability of Oaktree in determining whether to approve the advisory fee, because Oaktree is independent of Vanguard and the advisory fee is the result of arm’s-length negotiations.
The benefit of economies of scale
The board concluded that the fund’s shareholders benefit from economies of scale because of breakpoints in the fund’s advisory fee schedule. The breakpoints reduce the effective rate of the fee as the fund’s assets increase.
The board will consider whether to renew the advisory arrangement again after a one-year period.
30
Glossary
30-Day SEC Yield. A fund’s 30-day SEC yield is derived using a formula specified by the U.S. Securities and Exchange Commission. Under the formula, data related to the fund’s security holdings in the previous 30 days are used to calculate the fund’s hypothetical net income for that period, which is then annualized and divided by the fund’s estimated average net assets over the calculation period. For the purposes of this calculation, a security’s income is based on its current market yield to maturity (for bonds), its actual income (for asset-backed securities), or its projected dividend yield (for stocks). Because the SEC yield represents hypothetical annualized income, it will differ—at times significantly—from the fund’s actual experience. As a result, the fund’s income distributions may be higher or lower than implied by the SEC yield.
Average Coupon. The average interest rate paid on the fixed income securities held by a fund. It is expressed as a percentage of face value.
Average Duration. An estimate of how much the value of the bonds held by a fund will fluctuate in response to a change in interest rates. To see how the value could change, multiply the average duration by the change in rates. If interest rates rise by 1 percentage point, the value of the bonds in a fund with an average duration of five years would decline by about 5%. If rates decrease by a percentage point, the value would rise by 5%.
Average Weighted Maturity. The average length of time until fixed income securities held by a fund reach maturity and are repaid. The figure reflects the proportion of fund assets represented by each security.
Beta. A measure of the magnitude of a fund’s past share-price fluctuations in relation to the ups and downs of a given market index. The index is assigned a beta of 1.00. Compared with a given index, a fund with a beta of 1.20 typically would have seen its share price rise or fall by 12% when the index rose or fell by 10%. For this report, beta is based on returns over the past 36 months for both the fund and the index. Note that a fund’s beta should be reviewed in conjunction with its R-squared (see definition). The lower the R-squared, the less correlation there is between the fund and the index, and the less reliable beta is as an indicator of volatility.
Conversion Premium. The average percentage by which the weighted average market price of the convertible securities held by a fund exceeds the weighted average market price of their underlying common stocks. For example, if a stock is trading at $25 per share and a bond that is convertible into the stock is trading at a price equivalent to $30 per share of stock, the conversion premium is 20% ($5 ÷ $25 = 20%).
Credit Quality. Credit-quality ratings are measured on a scale that generally ranges from AAA (highest) to D (lowest). Credit-quality ratings are obtained from S&P. “Not Rated” is used to classify securities for which a rating is not available. Not rated securities include a fund’s investment in Vanguard Market Liquidity Fund or Vanguard Municipal Cash Management Fund, each of which invests in high-quality money market instruments and may serve as a cash management vehicle for the Vanguard funds, trusts, and accounts.
Expense Ratio. A fund’s total annual operating expenses expressed as a percentage of the fund’s average net assets. The expense ratio includes management and administrative expenses, but does not include the transaction costs of buying and selling portfolio securities.
31
Foreign Holdings. The percentage of a fund represented by securities or depositary receipts of companies based outside the United States.
Inception Date. The date on which the assets of a fund (or one of its share classes) are first invested in accordance with the fund’s investment objective. For funds with a subscription period, the inception date is the day after that period ends. Investment performance is measured from the inception date.
Market Exposure. A measure that reflects a fund’s security investments excluding any holdings in short-term reserves.
R-Squared. A measure of how much of a fund’s past returns can be explained by the returns from the market in general, as measured by a given index. If a fund’s total returns were precisely synchronized with an index’s returns, its R-squared would be 1.00. If the fund’s returns bore no relationship to the index’s returns, its R-squared would be 0. For this report, R-squared is based on returns over the past 36 months for both the fund and the index.
Short-Term Reserves. The percentage of a fund invested in highly liquid, short-term securities that can be readily converted to cash.
Turnover Rate. An indication of the fund’s trading activity. Funds with high turnover rates incur higher transaction costs and may be more likely to distribute capital gains (which may be taxable to investors). The turnover rate excludes in-kind transactions, which have minimal impact on costs.
Benchmark Information
Convertibles Composite Index: CS First Boston Convertible Securities Index through November 30, 2004; Bank of America Merrill Lynch All US Convertibles Index (formerly Bank of America Merrill Lynch All Convertibles-All Qualities Index) through December 31, 2010; and 70% Bank of America Merrill Lynch All US Convertibles Index and 30% Bank of America Merrill Lynch Global 300 Convertibles ex-US Index (hedged) thereafter.
32
This page intentionally left blank.
This page intentionally left blank.
This page intentionally left blank.
The People Who Govern Your Fund
The trustees of your mutual fund are there to see that the fund is operated and managed in your best interests since, as a shareholder, you are a part owner of the fund. Your fund’s trustees also serve on the board of directors of The Vanguard Group, Inc., which is owned by the Vanguard funds and provides services to them on an at-cost basis.
A majority of Vanguard’s board members are independent, meaning that they have no affiliation with Vanguard or the funds they oversee, apart from the sizable personal investments they have made as private individuals. The independent board members have distinguished backgrounds in business, academia, and public service. Each of the trustees and executive officers oversees 179 Vanguard funds.
The following table provides information for each trustee and executive officer of the fund. More information about the trustees is in the Statement of Additional Information, which can be obtained, without charge, by contacting Vanguard at 800-662-7447, or online at vanguard.com.
| |
| InterestedTrustee1 | Rajiv L. Gupta |
| | Born 1945. Trustee Since December 2001.2 Principal |
| F. William McNabb III | Occupation(s) During the Past Five Years and Other |
| Born 1957. Trustee Since July 2009. Chairman of | Experience: Chairman and Chief Executive Officer |
| the Board. Principal Occupation(s) During the Past | (retired 2009) and President (2006–2008) of |
| Five Years and Other Experience: Chairman of the | Rohm and Haas Co. (chemicals); Director of Tyco |
| Board of The Vanguard Group, Inc., and of each of | International PLC (diversified manufacturing and |
| the investment companies served by The Vanguard | services), Hewlett-Packard Co. (electronic computer |
| Group, since January 2010; Director of The Vanguard | manufacturing), and Delphi Automotive PLC |
| Group since 2008; Chief Executive Officer and | (automotive components); Senior Advisor at New |
| President of The Vanguard Group, and of each of | Mountain Capital. |
| the investment companies served by The Vanguard | |
| Group, since 2008; Director of Vanguard Marketing | Amy Gutmann |
| Corporation; Managing Director of The Vanguard | Born 1949. Trustee Since June 2006. Principal |
| Group (1995–2008). | Occupation(s) During the Past Five Years and |
| | Other Experience: President of the University of |
| | Pennsylvania; Christopher H. Browne Distinguished |
| IndependentTrustees | Professor of Political Science, School of Arts and |
| | Sciences, and Professor of Communication, Annenberg |
| Emerson U. Fullwood | School for Communication, with secondary faculty |
| Born 1948. Trustee Since January 2008. Principal | appointments in the Department of Philosophy, School |
| Occupation(s) During the Past Five Years and | of Arts and Sciences, and at the Graduate School of |
| Other Experience: Executive Chief Staff and | Education, University of Pennsylvania; Trustee of the |
| Marketing Officer for North America and Corporate | National Constitution Center; Chair of the Presidential |
| Vice President (retired 2008) of Xerox Corporation | Commission for the Study of Bioethical Issues. |
| (document management products and services); | |
| Minett Professor at the Rochester Institute of | JoAnn Heffernan Heisen |
| Technology; Director of SPX Corporation (multi-industry | Born 1950. Trustee Since July 1998. Principal |
| manufacturing), the United Way of Rochester, | Occupation(s) During the Past Five Years and Other |
| Amerigroup Corporation (managed health care), the | Experience: Corporate Vice President and Chief |
| University of Rochester Medical Center, Monroe | Global Diversity Officer (retired 2008) and Member |
| Community College Foundation, and North Carolina | of the Executive Committee (1997–2008) of Johnson |
| A&T University. | & Johnson (pharmaceuticals/medical devices/ |
| consumer products); Director of Skytop Lodge |
| | Corporation (hotels), the University Medical Center |
| | at Princeton, the Robert Wood Johnson Foundation, |
| | and the Center for Talent Innovation; Member of |
| | the Advisory Board of the Institute for Women’s |
| | Leadership at Rutgers University. |
| | |
| | |
| F. Joseph Loughrey | Executive Officers | |
| Born 1949. Trustee Since October 2009. Principal | | |
| Occupation(s) During the Past Five Years and Other | Glenn Booraem | |
| Experience: President and Chief Operating Officer | Born 1967. Treasurer Since May 2015. Principal |
| (retired 2009) of Cummins Inc. (industrial machinery); | Occupation(s) During the Past Five Years and |
| Chairman of the Board of Hillenbrand, Inc. (specialized | Other Experience: Principal of The Vanguard Group, |
| consumer services), and of Oxfam America; Director | Inc.; Treasurer of each of the investment companies |
| of SKF AB (industrial machinery), Hyster-Yale Materials | served by The Vanguard Group; Controller of each of |
| Handling, Inc. (forklift trucks), the Lumina Foundation | the investment companies served by The Vanguard |
| for Education, and the V Foundation for Cancer | Group (2010–2015); Assistant Controller of each of |
| Research; Member of the Advisory Council for the | the investment companies served by The Vanguard |
| College of Arts and Letters and of the Advisory Board | Group (2001–2010). | |
| to the Kellogg Institute for International Studies, both | | |
| at the University of Notre Dame. | Thomas J. Higgins | |
| Born 1957. Chief Financial Officer Since September |
| Mark Loughridge | 2008. Principal Occupation(s) During the Past Five |
| Born 1953. Trustee Since March 2012. Principal | Years and Other Experience: Principal of The Vanguard |
| Occupation(s) During the Past Five Years and Other | Group, Inc.; Chief Financial Officer of each of the |
| Experience: Senior Vice President and Chief Financial | investment companies served by The Vanguard Group; |
| Officer (retired 2013) at IBM (information technology | Treasurer of each of the investment companies served |
| services); Fiduciary Member of IBM’s Retirement Plan | by The Vanguard Group (1998–2008). |
| Committee (2004–2013); Director of the Dow Chemical | |
| Company; Member of the Council on Chicago Booth. | Peter Mahoney | |
| Born 1974. Controller Since May 2015. Principal |
| Scott C. Malpass | Occupation(s) During the Past Five Years and |
| Born 1962. Trustee Since March 2012. Principal | Other Experience: Head of Global Fund Accounting |
| Occupation(s) During the Past Five Years and Other | at The Vanguard Group, Inc.; Controller of each of the |
| Experience: Chief Investment Officer and Vice | investment companies served by The Vanguard Group; |
| President at the University of Notre Dame; Assistant | Head of International Fund Services at The Vanguard |
| Professor of Finance at the Mendoza College of | Group (2008–2014). | |
| Business at Notre Dame; Member of the Notre Dame | | |
| 403(b) Investment Committee; Board Member of | Heidi Stam | |
| TIFF Advisory Services, Inc., and Catholic Investment | Born 1956. Secretary Since July 2005. Principal |
| Services, Inc. (investment advisors); Member of | Occupation(s) During the Past Five Years and Other |
| the Investment Advisory Committee of Major | Experience: Managing Director of The Vanguard |
| League Baseball. | Group, Inc.; General Counsel of The Vanguard Group; |
| Secretary of The Vanguard Group and of each of the |
| André F. Perold | investment companies served by The Vanguard Group; |
| Born 1952. Trustee Since December 2004. Principal | Director and Senior Vice President of Vanguard |
| Occupation(s) During the Past Five Years and Other | Marketing Corporation. | |
| Experience: George Gund Professor of Finance and | | |
| Banking, Emeritus at the Harvard Business School | Vanguard Senior ManagementTeam |
| (retired 2011); Chief Investment Officer and Managing | |
| Partner of HighVista Strategies LLC (private investment | Mortimer J. Buckley | Michael S. Miller |
| firm); Director of Rand Merchant Bank; Overseer of | Kathleen C. Gubanich | James M. Norris |
| the Museum of Fine Arts Boston. | Paul A. Heller | Thomas M. Rampulla |
| Martha G. King | Glenn W. Reed |
| Peter F. Volanakis | John T. Marcante | Karin A. Risi |
| Born 1955. Trustee Since July 2009. Principal | Chris D. McIsaac | |
| Occupation(s) During the Past Five Years and Other | | |
| Experience: President and Chief Operating Officer | Chairman Emeritus and Senior Advisor |
| (retired 2010) of Corning Incorporated (communications | John J. Brennan | |
| equipment); Trustee of Colby-Sawyer College; | Chairman, 1996–2009 | |
| Member of the Advisory Board of the Norris Cotton | Chief Executive Officer and President, 1996–2008 |
| Cancer Center and of the Advisory Board of the | | |
| Parthenon Group (strategy consulting). | Founder | |
| | John C. Bogle | |
| | Chairman and Chief Executive Officer, 1974–1996 |
1 Mr. McNabb is considered an “interested person,” as defined in the Investment Company Act of 1940, because he is an officer of the Vanguard funds.
2 December 2002 for Vanguard Equity Income Fund, the Vanguard Municipal Bond Funds, and the Vanguard State Tax-Exempt Funds.
|  |
| P.O. Box 2600 | |
| Valley Forge, PA 19482-2600 | |
Connect with Vanguard® > vanguard.com
| |
| Fund Information > 800-662-7447 | CFA® is a registered trademark owned by CFA Institute. |
| Direct Investor Account Services > 800-662-2739 | |
| Institutional Investor Services > 800-523-1036 | |
| Text Telephone for People | |
| Who Are Deaf or Hard of Hearing> 800-749-7273 | |
| |
| This material may be used in conjunction | |
| with the offering of shares of any Vanguard | |
| fund only if preceded or accompanied by | |
| the fund’s current prospectus. | |
| |
| All comparative mutual fund data are from Lipper, a | |
| Thomson Reuters Company, or Morningstar, Inc., unless | |
| otherwise noted. | |
| |
| You can obtain a free copy of Vanguard’s proxy voting | |
| guidelines by visiting vanguard.com/proxyreporting or by | |
| calling Vanguard at 800-662-2739. The guidelines are | |
| also available from the SEC’s website, sec.gov. In | |
| addition, you may obtain a free report on how your fund | |
| voted the proxies for securities it owned during the 12 | |
| months ended June 30. To get the report, visit either | |
| vanguard.com/proxyreporting or sec.gov. | |
| |
| You can review and copy information about your fund at | |
| the SEC’s Public Reference Room in Washington, D.C. To | |
| find out more about this public service, call the SEC at | |
| 202-551-8090. Information about your fund is also | |
| available on the SEC’s website, and you can receive | |
| copies of this information, for a fee, by sending a | |
| request in either of two ways: via email addressed to | |
| publicinfo@sec.gov or via regular mail addressed to the | |
| Public Reference Section, Securities and Exchange | |
| Commission, Washington, DC 20549-1520. | |
| |
| | © 2015 The Vanguard Group, Inc. |
| | All rights reserved. |
| | Vanguard Marketing Corporation, Distributor. |
| |
| | Q822 072015 |
Item 2: Code of Ethics.
Not Applicable.
Item 3: Audit Committee Financial Expert.
Not Applicable.
Item 4: Principal Accountant Fees and Services.
(a) Audit Fees.
Not Applicable.
Item 5: Audit Committee of Listed Registrants.
Not Applicable.
Item 6: Investments.
Not Applicable.
Item 7: Disclosure of Proxy Voting Policies and Procedures for Closed-End Management Investment Companies.
Not Applicable.
Item 8: Portfolio Managers of Closed-End Management Investment Companies.
Not Applicable.
Item 9: Purchase of Equity Securities by Closed-End Management Investment Company and Affiliated Purchasers.
Not Applicable.
Item 10: Submission of Matters to a Vote of Security Holders.
Not Applicable.
Item 11: Controls and Procedures.
(a) Disclosure Controls and Procedures. The Principal Executive and Financial Officers concluded that the Registrant’s Disclosure Controls and Procedures are effective based on their evaluation of the Disclosure Controls and Procedures as of a date within 90 days of the filing date of this report.
(b) Internal Control Over Financial Reporting. There were no significant changes in Registrant’s Internal Control Over Financial Reporting or in other factors that could significantly affect this control subsequent to the date of the evaluation, including any corrective actions with regard to significant deficiencies and material weaknesses.
Item 12: Exhibits.
Pursuant to the requirements of the Securities Exchange Act of 1934 and the Investment Company Act of 1940, the registrant has duly caused this report to be signed on its behalf by the undersigned, thereunto duly authorized.
| |
| | VANGUARD CONVERTIBLE SECURITIES FUND |
| |
| By: | /s/ F. WILLIAM MCNABB III* |
| | F. WILLIAM MCNABB III |
| | CHIEF EXECUTIVE OFFICER |
| |
| Date: July 16, 2015 |
Pursuant to the requirements of the Securities Exchange Act of 1934 and the Investment Company Act of 1940, this report has been signed below by the following persons on behalf of the registrant and in the capacities and on the dates indicated.
| |
| | VANGUARD CONVERTIBLE SECURITIES FUND |
| |
| By: | /s/ F. WILLIAM MCNABB III* |
| | F. WILLIAM MCNABB III |
| | CHIEF EXECUTIVE OFFICER |
| |
| Date: July 16, 2015 |
| |
| | VANGUARD CONVERTIBLE SECURITIES FUND |
| |
| By: | /s/ THOMAS J. HIGGINS* |
| | THOMAS J. HIGGINS |
| | CHIEF FINANCIAL OFFICER |
| |
| Date: July 16, 2015 |
* By: /s/ Heidi Stam
Heidi Stam, pursuant to a Power of Attorney filed on April 22, 2014 see file Number 2-17620, Incorporated by Reference.