UNITED STATES
SECURITIES AND EXCHANGE COMMISSION
Washington, D.C. 20549
FORM N-CSR
CERTIFIED SHAREHOLDER REPORT
OF
REGISTERED MANAGEMENT INVESTMENT COMPANIES
| | |
| Investment Company Act file number: 811-04627 |
Name of Registrant: | Vanguard Convertible Securities Fund |
Address of Registrant: | P.O. Box 2600 |
| | Valley Forge, PA 19482 |
Name and address of agent for service: | Anne E. Robinson, Esquire |
| | P.O. Box 876 |
| | Valley Forge, PA 19482 |
Registrant’s telephone number, including area code: (610) 669-1000 |
Date of fiscal year end: November 30 | |
Date of reporting period: November 30, 2016 – May 31, 2017 |
Item 1: Reports to Shareholders | |
Semiannual Report | May 31, 2017
Vanguard Convertible Securities Fund
A new format, unwavering commitment
As you begin reading this report, you’ll notice that we’ve made some improvements to the opening sections—based on feedback from you, our clients.
Page 1 starts with a new ”Your Fund’s Performance at a Glance,” a concise, handy summary of how your fund performed during the period.
In the renamed ”Chairman’s Perspective,” Bill McNabb will focus on enduring principles and investment insights.
We’ve modified some tables, and eliminated some redundancy, but we haven’t removed any information.
At Vanguard, we’re always looking for better ways to communicate and to help you make sound investment decisions. Thank you for entrusting your assets to us.
| |
| Contents | |
| Your Fund’s Performance at a Glance. | 1 |
| Chairman’s Perspective. | 2 |
| Advisor’s Report. | 6 |
| Fund Profile. | 9 |
| Performance Summary. | 11 |
| Financial Statements. | 12 |
| About Your Fund’s Expenses. | 26 |
| Trustees Approve Advisory Arrangement. | 28 |
| Glossary. | 30 |
Please note: The opinions expressed in this report are just that—informed opinions. They should not be considered promises or advice. Also, please keep in mind that the information and opinions cover the period through the date on the front of this report. Of course, the risks of investing in your fund are spelled out in the prospectus.
See the Glossary for definitions of investment terms used in this report.
About the cover: No matter what language you speak, Vanguard has one consistent message and set of principles. Our primary focus is on you, our clients. We conduct our business with integrity as a faithful steward of your assets. This message is shown translated into seven languages, reflecting our expanding global presence.
Your Fund’s Performance at a Glance
• Vanguard Convertible Securities Fund gives investors exposure to corporate bonds and preferred stocks that can be exchanged for common stocks at a predetermined price.
• For the six months ended May 31, 2017, the Convertible Securities Fund returned 4.54%. The fund trailed both its benchmark and the average return of its peers.
• Relative performance was hurt by a lack of exposure to highly equity-sensitive technology positions (which offer no downside protection) and poor returns from oil-and gas-related energy holdings.
• Although the fund invests primarily in U.S. convertibles, more than a third of its assets are in international securities. Broadening the fund’s mandate over the years to include international securities has enhanced its diversification.
• The advisor focuses on balanced convertibles, which have a mix of equity and bond characteristics, that have the potential to capture a higher percentage of equity market increases and a lower percentage of declines. Issuer and sector allocations are a result of our bottom-up research process.
| | |
| Total Returns: Six Months Ended May 31, 2017 | | |
| | | Total |
| | | Returns |
| Vanguard Convertible Securities Fund | | 4.54% |
| Convertibles Composite Index | | 8.22 |
| Convertible Securities Funds Average | | 7.55 |
| For a benchmark description, see the Glossary. | | |
| Convertible Securities Funds Average: Derived from data provided by Lipper, a Thomson Reuters Company. | |
| |
| |
| Expense Ratios | | |
| Your Fund Compared With Its Peer Group | | |
| | | Peer Group |
| | Fund | Average |
| Convertible Securities Fund | 0.34% | 1.38% |
The fund expense ratio shown is from the prospectus dated March 24, 2017, and represents estimated costs for the current fiscal year. For the six months ended May 31, 2017, the fund’s annualized expense ratio was 0.35%. The peer-group expense ratio is derived from data provided by Lipper, a Thomson Reuters Company, and captures information through year-end 2016.
Peer group: Convertible Securities Funds.
1
Chairman’s Perspective

Bill McNabb
Chairman and Chief Executive Officer
Dear Shareholder,
At the end of May, we completed the latest round of expense ratio changes for our U.S.-based funds. The estimated savings for our investors during the six-month period was more than $300 million across our fund lineup—another record for us.1
That’s a remarkable amount, but it’s also business as usual here at Vanguard. After all, we’ve been cutting costs for investors for more than 40 years. Indeed, we’ve become so synonymous with driving down costs that when other investment companies lower their fees, the financial press often refers to it as the “Vanguard effect.”
To be sure, high costs persist in some areas of the industry. But the good news is, our 40-year campaign to lower costs seems to be approaching its mathematical limits, with some fund expenses now near zero not just at Vanguard but at other investment companies as well.
What makes investors successful?
While we’ll continue our drive for cost efficiency, we’ll also keep vigorously promoting our three other linchpin investment principles:
• Goals. Create clear, appropriate investment goals.
• Balance. Develop a suitable asset allocation using broadly diversified funds.
1 This figure represents cumulative net savings from expense ratio changes for all Vanguard fund share classes announced from December 2016
through May 2017. The estimated savings is the difference between prior and current expense ratios multiplied by average assets under
management (AUM). Average AUM is based on averaging one month’s daily average assets over the 12 months of each fund’s fiscal year.
2
• Discipline. Maintain perspective and long-term discipline.
Today, these tenets are more relevant than ever. They’re essential elements of our Personal Advisor Services recommendations, the model portfolios we develop for financial advisors, and our target-date funds.
We’re convinced that as investors increasingly adopt low-cost portfolios, focusing on goals, balance, and discipline could make the difference between achieving financial objectives and falling short.
Of course, there’s nothing new about our philosophy. And it seems simple enough. But unfortunately, we all have built-in behavioral biases that can make it hard to stick to the plan. We might, for example, allow natural inertia to keep us from rebalancing our portfolios to control risk, or we may become too wedded to an opinion or approach.
Lessons from the last crisis
Although it can be difficult at times to follow proven investing principles, it’s not impossible, even under the most challenging circumstances.
During the financial crisis of 2008–2009, various media outlets asked me whether our investors were pulling out of the
| | | |
| Market Barometer | | | |
| | | | Total Returns |
| | | Periods Ended May 31, 2017 |
| | Six | One | Five Years |
| | Months | Year | (Annualized) |
| Stocks | | | |
| Russell 1000 Index (Large-caps) | 10.55% | 17.48% | 15.37% |
| Russell 2000 Index (Small-caps) | 4.33 | 20.36 | 14.04 |
| Russell 3000 Index (Broad U.S. market) | 10.06 | 17.69 | 15.26 |
| FTSE All-World ex US Index (International) | 16.80 | 18.45 | 8.86 |
| |
| Bonds | | | |
| Bloomberg Barclays U.S. Aggregate Bond Index | | | |
| (Broad taxable market) | 2.52% | 1.58% | 2.24% |
| Bloomberg Barclays Municipal Bond Index | | | |
| (Broad tax-exempt market) | 5.16 | 1.46 | 3.31 |
| Citigroup Three-Month U.S. Treasury Bill Index | 0.26 | 0.41 | 0.12 |
| |
| CPI | | | |
| Consumer Price Index | 1.40% | 1.87% | 1.27% |
3
market and running for the hills. In actuality, we didn’t see that at Vanguard. Our clients were certainly nervous, and they contacted us more often. But for the most part, they didn’t engage in the excessive, panicked trading that can be so destructive to building wealth. Those who relied on financial advisors who follow our philosophy were wisely counseled to stay the course.
The accompanying chart shows the importance of patience and discipline. Investors who maintained a 60% stock/ 40% bond mix through the bear market were amply rewarded afterward, while those who fled stocks when they hit bottom were left far behind.
It’s not different this time
Today, nearly a decade after the global financial crisis, the world seems very different. Market indexes recently hit a series of all-time highs. With the wind at their backs and the increasing availability of low-cost funds, investors may be tempted to ask, “What could go wrong?” The answer is, “A lot.” Performance chasing and market-timing won’t be any more effective with low-cost funds than they are with high-cost funds.
| Reacting to volatility can hurt returns |
|
| Investors who kept a balanced portfolio through the 2008–2009 crash were rewarded |
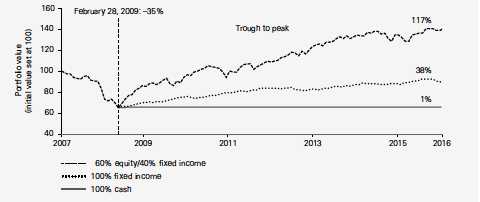
| Notes: On October 31, 2007, close to the equity market’s peak, the value of a hypothetical 60/40 portfolio is set at 100. Subsequent returns |
|
| are calculated relative to this starting value of 100. It is assumed that all dividends and income are reinvested in the components of the |
| indexes. The initial allocation for the portfolios was 42% U.S. stocks, 18% international stocks, and 40% U.S. bonds. The rebalanced portfolio |
| is returned to this allocation every month-end. Returns for the U.S. stock allocation are based on the MSCI US Broad Market Index. Returns for |
| the international stock allocation are based on the MSCI All Country World Index ex USA. Returns for the bond allocation are based on the |
| Bloomberg Barclays U.S. Aggregate Bond Index. Returns for the cash allocation are based on the Citigroup 3-Month U.S. Treasury Bill Index. |
| Sources: Vanguard, using data provided by Thomson Reuters Datastream. |
4
Whether markets are sunny or stormy, investors need to stick to their investment plans, maintain balanced and diversified portfolios, and think long-term.
We strive to help investors follow the principles that lead to enduring success. I’d like to think that will be the real “Vanguard effect.”
As always, thank you for investing with Vanguard.
Sincerely,

F. William McNabb III
Chairman and Chief Executive Officer
June 14, 2017
5
Advisor’s Report
The investment strategy of Vanguard Convertible Securities Fund is to create a highly diversified global portfolio of convertible securities. The fund emphasizes investments in convertible bonds with relatively near-term maturities or put dates. We focus on “balanced” convertibles, where the securities have a reasonable yield and stable credit quality, good call protection, and low to moderate conversion premiums. We believe these securities have a favorable balance of upside potential and downside risk. The fund underweights convertible preferred shares, which are riskier but may offer higher returns. We do, however, consider them part of our investable universe and make some use of them.
| |
| Major Portfolio Changes | |
| Six Months Ended May 31, 2017 | |
| |
| Additions | Comments |
| Microchip Technology | Balanced convertible with strong equity catalysts. |
| (1.625% convertible note due 02/15/2027) | |
| (2.25% convertible note due 02/15/2037) | |
| Tesla | Balanced convertible with strong equity catalysts. |
| (1.25% convertible note due 03/01/2021) | |
| (2.375% convertible note due 03/15/2022) | |
| Ensco Jersey Finance | Balanced convertible with attractive equity valuation. |
| (3.00% convertible note due 01/31/2024) | |
| Nabors Industries | Balanced convertible with attractive equity valuation. |
| (0.75% convertible note due 01/15/2024) | |
| Allergan | Attractive equity valuation with strong growth prospects. |
| (5.5% mandatory convertible preferred) | |
| Square Inc. | Balanced convertible with strong equity catalysts. |
| (0.375% convertible note due 03/01/2022) | |
| |
| Reductions | Comments |
| Microchip Technology | Took profits and rotated into new issues. |
| (1.625% convertible note due 02/15/2025) | |
| (1.625% convertible note due 02/15/2027) | |
| (2.25% convertible note due 02/15/2037) | |
| Herbalife | Sold as bonds lacked a balanced profile. |
| (2.00% convertible note due 08/15/2019) | |
| Finisar | Sold as bonds lacked a balanced profile. |
| (0.50% convertible note due 12/15/2033) | |
| (0.50% convertible note due 12/15/2036) | |
| Micron Technology | Took profits with strong equity rally. |
| (3.00% convertible note due 11/15/2043) | |
| Ensco Jersey Finance | Sold out of position as bonds lacked a balanced profile. |
| (3.00% convertible note due 01/31/2024) | |
| Akamai Technologies | Sold as bonds lacked a balanced profile. |
| (0.00% convertible note due 02/15/2019) | |
6
Importantly, the fund does not invest in common stocks or nonconvertible debt. We do not attempt market-timing and therefore are fully invested, holding only a small amount of cash for potential investments. We believe that a portfolio of attractive, carefully selected convertible securities can produce equity-type returns with lower volatility and lower structural risk over long periods.
For the six months ended May 31, 2017, the fund returned 4.54%, underperforming the 8.22% return of its blended benchmark (70% Bank of America Merrill Lynch All US Convertibles Index and 30% Bank of America Merrill Lynch Global 300 Convertibles ex-US Index [hedged]). Our lack of exposure to highly equity-sensitive technology positions, which do not provide downside protection, and poor returns from oil- and gas-related energy holdings dampened our relative performance.
On a separate note, you may have noticed that in recent periods the fund’s dividend yield has declined. This follows our increased allocation to non-U.S. securities, as has been discussed in previous fund reports. The greater international exposure gives the fund better diversification and a larger opportunity set. The fund is investing in foreign currency contracts to neutralize the effect of currency fluctuations in different markets around the world. Fluctuations in those currency values can result in a loss, which may be deducted from income under tax rules. From time to time, such a situation will affect the level of the fund’s dividend.
The investment environment
Following the U.S. presidential election in November, equity markets rallied and U.S. Treasury interest rates increased. Market participants, expecting an expansionary fiscal policy from the Trump administration, discounted faster economic growth and higher inflation. During the postelection period, the yield of the 10-year Treasury note rose 57 basis points to 2.45% at year-end, while interest rates increased only 30 basis points, to 0.20%, for comparable European government bonds and 10 basis points, to 0.04%, for comparable Japanese government bonds. (A basis point is one one-hundredth of a percentage point.) Both European and U.S. high-yield credit spreads tightened nearly 40 basis points, reflecting investors’ increased comfort regarding creditworthiness.
The global equity rally continued in the first five months of 2017 as reduced geopolitical concerns and signs of strength in global growth led the FTSE All-World Total Return Index (Local) to return nearly 9% through May 31. In U.S. markets, large-capitalization stocks (up 8.66%, as measured by the S&P 500 Index) far outpaced small- and mid-caps (up 1.48%, as measured by the Russell 2000 Index), and Treasury rate trends reversed. The 10-year Treasury yield peaked in mid-March at 2.62%, then began to pull back, ending May at 2.21%.
The fund remains highly sensitive to its underlying equity performance as a result of convertible bonds’ historically
7
low coupons in the current rate environment. The portfolio remains structurally conservative, with 91.3% of it consisting of short- to intermediate-term bonds, defined as bonds with maturities or puts within seven years. Convertible preferreds constitute 8.6% of the portfolio, a significant underweighting versus the benchmark. We are comfortable with our current portfolio construction, with its balance between equity participation and the downside protection provided by the fixed income component.
As of the end of May, about $34.1 billion of new convertible bond issuance had come to market, 1.5 times greater than the volume during the comparable period last year. A majority of the supply (about $21.3 billion) came from the United States, with about $8.6 billion from Europe, $3 billion from Japan, and $1.3 billion from elsewhere in Asia.
Successes
The portfolio’s relative returns benefited from our security selection in the telecommunication services sector. Top absolute contributors to performance were convertibles from Micron Technology, Tesla, and Square.
Our shortfalls
Security selection in health care and energy detracted the most from relative performance. Lower oil prices hurt the value of our energy holdings. Our chief absolute detractors were Ensco, Sanchez Energy, and Finisar.
The fund’s positioning
We remain fully invested in a highly diversified, well-balanced portfolio of convertible securities. At the end of the period, 64% of the fund’s investments were in U.S.-based companies and the rest outside the country. The fund had an attractive current yield of 2.0% and an average credit quality of Ba2/BB. The vast majority of issuers in the fund are performing well and, importantly, enjoy good to strong credit fundamentals.
Nonrated convertible bonds have dominated the new-issuance market. This trend is positive because we continue to favor intermediate-term convertible bonds, which have a higher degree of downside protection than the convertible preferred structure. Also, our bottom-up, credit-intensive investment style allows us to find value in the nonrated convertibles segment of the market.
We remain focused on balanced convertibles with credit profiles that are stable to improving. Our issuer and sector allocations, and their relative weightings compared with the benchmark, result from our bottom-up research process centering on credit fundamentals.
|
| Stu Spangler, CFA, Managing Director |
| Abe Ofer, Managing Director |
| Jean-Pierre Latrille, Managing Director |
| Petar Raketic, Managing Director |
| Oaktree Capital Management, L.P. |
| June 19, 2017 |
8
Convertible Securities Fund
| |
| Fund Profile | |
| As of May 31, 2017 | |
| |
| Portfolio Characteristics | |
| Ticker Symbol | VCVSX |
| Number of Securities | 170 |
| 30-Day SEC Yield | 1.82% |
| Conversion Premium | 34.8% |
| Average Weighted Maturity | 4.8 years |
| Average Coupon | 2.2% |
| Average Duration | 4.2 years |
| Foreign Holdings | 38.1% |
| Turnover Rate (Annualized) | 121% |
| Expense Ratio1 | 0.34% |
| Short-Term Reserves | 2.4% |
| |
| Distribution by Maturity | |
| (% of fixed income portfolio) | |
| Under 1 Year | 0.8% |
| 1 - 5 Years | 66.0 |
| 5 - 10 Years | 29.6 |
| 10 - 20 Years | 2.1 |
| 20 - 30 Years | 1.5 |
| |
| Distribution by Credit Quality (% of fixed | |
| income portfolio) | |
| AAA | 0.0% |
| AA | 0.0 |
| A | 4.1 |
| BBB | 3.0 |
| BB | 8.8 |
| B | 11.8 |
| Below B | 0.4 |
| Not Rated | 71.9 |
Credit-quality ratings are obtained from S&P. "Not Rated" is used to
classify securities for which a rating is not available. Not rated
securities include a fund's investment in Vanguard Market Liquidity
Fund or Vanguard Municipal Cash Management Fund, each of
which invests in high-quality money market instruments and may
serve as a cash management vehicle for the Vanguard funds, trusts,
and accounts. For more information about these ratings, see the
Glossary entry for Credit Quality.
| | |
| Total Fund Volatility Measures | |
| | | DJ |
| | Convertibles | U.S. Total |
| | Composite | Market |
| | Index | FA Index |
| R-Squared | 0.90 | 0.72 |
| Beta | 0.93 | 0.55 |
These measures show the degree and timing of the fund’s
fluctuations compared with the indexes over 36 months.
| | |
| Ten Largest Holdings (% of total net assets) |
| Ctrip.com International | Internet & Direct | |
| Ltd. | Marketing Retail | 2.0% |
| Tesla Inc. | Automobiles | 1.8 |
| Cemex SAB de CV | Construction | |
| | Materials | 1.8 |
| Microchip Technology | Semiconductors & | |
| Inc. | Semiconductor | |
| | Equipment | 1.7 |
| Liberty Interactive LLC | Media | 1.6 |
| Wells Fargo & Co. | Banks | 1.6 |
| Liberty Media Corp. | Media | 1.6 |
| Priceline Group Inc. | Internet & Direct | |
| | Marketing Retail | 1.6 |
| Micron Technology Inc. | Semiconductors & | |
| | Semiconductor | |
| | Equipment | 1.5 |
| Square Inc. | IT Services | 1.4 |
| Top Ten | | 16.6% |
The holdings listed exclude any temporary cash investments and equity index products.
1 The expense ratio shown is from the prospectus dated March 24, 2017, and represents estimated costs for the current fiscal year. For the six
months ended May 31, 2017, the annualized expense ratio was 0.35%.
9
Convertible Securities Fund
Sector Diversification (% of market exposure)
| |
| Consumer Discretionary | 17.2% |
| Consumer Staples | 2.6 |
| Energy | 4.7 |
| Financials | 13.3 |
| Health Care | 14.5 |
| Industrials | 11.3 |
| Information Technology | 26.2 |
| Materials | 6.8 |
| Telecommunication Services | 1.2 |
| Utilities | 2.2 |
10
Convertible Securities Fund
Performance Summary
All of the returns in this report represent past performance, which is not a guarantee of future results that may be achieved by the fund. (Current performance may be lower or higher than the performance data cited. For performance data current to the most recent month-end, visit our website at vanguard.com/performance.) Note, too, that both investment returns and principal value can fluctuate widely, so an investor’s shares, when sold, could be worth more or less than their original cost. The returns shown do not reflect taxes that a shareholder would pay on fund distributions or on the sale of fund shares.
Fiscal-Year Total Returns (%): November 30, 2006, Through May 31, 2017
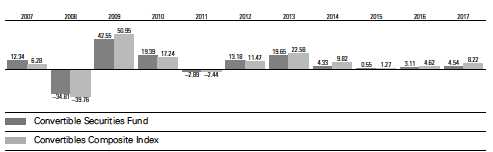
For a benchmark description, see the Glossary.
Note: For 2017, performance data reflect the six months ended May 31, 2017.
Average Annual Total Returns: Periods Ended March 31, 2017
This table presents returns through the latest calendar quarter—rather than through the end of the fiscal period.
Securities and Exchange Commission rules require that we provide this information.
| | | | | | |
| | | | | | | Ten Years |
| | Inception Date | One Year | Five Years | Income | Capital | Total |
| Convertible Securities | | | | | | |
| Fund | 6/17/1986 | 11.61% | 6.58% | 3.28% | 2.67% | 5.95% |
See Financial Highlights for dividend and capital gains information.
11
Convertible Securities Fund
Financial Statements (unaudited)
Statement of Net Assets
As of May 31, 2017
The fund reports a complete list of its holdings in regulatory filings four times in each fiscal year, at the quarter-ends. For the second and fourth fiscal quarters, the lists appear in the fund’s semiannual and annual reports to shareholders. For the first and third fiscal quarters, the fund files the lists with the Securities and Exchange Commission on Form N-Q. Shareholders can look up the fund’s Forms N-Q on the SEC’s website at sec.gov. Forms N-Q may also be reviewed and copied at the SEC’s Public Reference Room (see the back cover of this report for further information).
| | | | | |
| | | | | Face | Market |
| | | Maturity | | Amount | Value• |
| | Coupon | Date | Currency | (000) | ($000) |
| Convertible Bonds (88.9%) | | | | | |
| Consumer Discretionary (16.7%) | | | | | |
| Cie Generale des Etablissements Michelin Cvt. | 0.000% | 1/10/22 | USD | 3,800 | 3,920 |
| Ctrip.com International Ltd. Cvt. | 1.000% | 7/1/20 | USD | 11,070 | 12,765 |
| 1 Ctrip.com International Ltd. Cvt. | 1.250% | 9/15/22 | USD | 13,440 | 14,532 |
| 1 DISH Network Corp. Cvt. | 2.375% | 3/15/24 | USD | 7,200 | 7,528 |
| 1 DISH Network Corp. Cvt. | 3.375% | 8/15/26 | USD | 6,987 | 8,494 |
| 1 Liberty Interactive LLC Cvt. | 1.750% | 9/30/46 | USD | 18,845 | 21,919 |
| 1 Liberty Media Corp-Liberty Formula One Cvt. | 1.000% | 1/30/23 | USD | 15,534 | 17,029 |
| Liberty Media Corp. Cvt. | 1.375% | 10/15/23 | USD | 4,606 | 5,389 |
| 1 Liberty Media Corp. Cvt. | 2.250% | 9/30/46 | USD | 15,025 | 16,208 |
| Live Nation Entertainment Inc. Cvt. | 2.500% | 5/15/19 | USD | 11,971 | 13,617 |
| LVMH Moet Hennessy Louis Vuitton SE Cvt. | 0.000% | 2/16/21 | USD | 7,972 | 9,343 |
| NHK Spring Co. Ltd. Cvt. | 0.000% | 9/20/19 | USD | 4,450 | 4,862 |
| Priceline Group Inc. Cvt. | 0.900% | 9/15/21 | USD | 18,713 | 21,461 |
| SEB SA Regs Cvt. | 0.000% | 11/17/21 | EUR | 884 | 1,093 |
| Sony Corp. Cvt. | 0.000% | 9/30/22 | JPY | 1,089,000 | 11,094 |
| Steinhoff Finance Holdings GmbH Cvt. | 1.250% | 8/11/22 | EUR | 8,000 | 8,973 |
| Sumitomo Forestry Co. Ltd. Cvt. | 0.000% | 8/24/18 | JPY | 430,000 | 4,116 |
| Suzuki Motor Corp. Cvt. | 0.000% | 3/31/23 | JPY | 610,000 | 7,437 |
| Tesla Inc. Cvt. | 2.375% | 3/15/22 | USD | 1,430 | 1,696 |
| Tesla Motors Inc. Cvt. | 1.250% | 3/1/21 | USD | 21,673 | 23,827 |
| Valeo SA Cvt. | 0.000% | 6/16/21 | USD | 6,800 | 7,701 |
| Vipshop Holdings Ltd. Cvt. | 1.500% | 3/15/19 | USD | 3,155 | 3,145 |
| 1 World Wrestling Entertainment Inc. Cvt. | 3.375% | 12/15/23 | USD | 5,363 | 5,675 |
| | | | | | 231,824 |
| Consumer Staples (1.7%) | | | | | |
| Co Economica Delta SA Cvt. | 1.000% | 12/1/23 | EUR | 5,400 | 6,347 |
| Marine Harvest ASA Cvt. | 0.125% | 11/5/20 | EUR | 4,900 | 6,552 |
| Vector Group Ltd. Cvt. | 1.750% | 4/15/20 | USD | 9,045 | 10,379 |
| | | | | | 23,278 |
| Energy (4.3%) | | | | | |
| 1 Aegean Marine Petroleum Network Inc. Cvt. | 4.250% | 12/15/21 | USD | 3,145 | 2,259 |
| BP Capital Markets PLC Cvt. | 1.000% | 4/28/23 | GBP | 1,600 | 2,429 |
| Cheniere Energy Inc. Cvt. | 4.250% | 3/15/45 | USD | 14,020 | 9,726 |
| Fugro NV Cvt. | 4.000% | 10/26/21 | EUR | 2,300 | 2,679 |
| 1 Golar LNG Ltd. Cvt. | 2.750% | 2/15/22 | USD | 9,655 | 8,967 |
12
| | | | | |
| Convertible Securities Fund | | | | | |
| |
| |
| |
| | | | | Face | Market |
| | | Maturity | | Amount | Value• |
| | Coupon | Date | Currency | (000) | ($000) |
| 1 Green Plains Inc. Cvt. | 4.125% | 9/1/22 | USD | 4,335 | 4,481 |
| 1 Scorpio Tankers Inc. Cvt. | 2.375% | 7/1/19 | USD | 4,270 | 3,774 |
| SEACOR Holdings Inc. Cvt. | 3.000% | 11/15/28 | USD | 8,952 | 7,822 |
| TOTAL SA Cvt. | 0.500% | 12/2/22 | USD | 9,200 | 9,487 |
| Weatherford International Ltd. Cvt. | 5.875% | 7/1/21 | USD | 7,726 | 8,528 |
| | | | | | 60,152 |
| Financials (10.8%) | | | | | |
| ADLER Real Estate AG Cvt. | 2.500% | 7/19/21 | EUR | 137 | 2,390 |
| AmTrust Financial Services Inc. Cvt. | 2.750% | 12/15/44 | USD | 4,780 | 3,403 |
| Apollo Commercial Real Estate Finance Inc. Cvt. | 5.500% | 3/15/19 | USD | 7,260 | 7,873 |
| Aroundtown Property Holdings PLC Cvt. | 1.500% | 1/18/21 | EUR | 7,600 | 9,401 |
| Blackstone Mortgage Trust Inc. Cvt. | 4.375% | 5/5/22 | USD | 3,270 | 3,264 |
| Brait SE Cvt. | 2.750% | 9/18/20 | GBP | 2,900 | 3,561 |
| BUWOG AG Cvt. | 0.000% | 9/9/21 | EUR | 5,300 | 6,269 |
| CapitaLand Ltd. Cvt. | 2.800% | 6/8/25 | SGD | 10,250 | 7,413 |
| Colony Financial Inc. Cvt. | 5.000% | 4/15/23 | USD | 10,130 | 10,605 |
| 1 Element Financial Corp. Cvt. | 4.250% | 6/30/20 | CAD | 5,510 | 3,946 |
| 1 Element Financial Corp. Cvt. | 5.125% | 6/30/19 | CAD | 16,114 | 11,936 |
| Encore Capital Group Inc. Cvt. | 3.000% | 7/1/20 | USD | 7,371 | 7,449 |
| EZCORP Inc. Cvt. | 2.125% | 6/15/19 | USD | 3,716 | 3,528 |
| Glanbia Co-operative Society Ltd. Cvt. | 1.375% | 6/9/21 | EUR | 5,800 | 7,060 |
| 1 Hercules Capital Inc. Cvt. | 4.375% | 2/1/22 | USD | 5,660 | 5,745 |
| IMMOFINANZ AG Cvt. | 2.000% | 1/24/24 | EUR | 2,800 | 3,491 |
| 1 LendingTree Inc. Cvt. | 0.625% | 6/1/22 | USD | 6,310 | 6,413 |
| 1 MGIC Investment Corp. Cvt. | 9.000% | 4/1/63 | USD | 6,613 | 8,576 |
| Nexity SA Cvt. | 0.125% | 1/1/23 | EUR | 6,960 | 8,464 |
| Portfolio Recovery Associates Inc. Cvt. | 3.000% | 8/1/20 | USD | 3,572 | 3,355 |
| 1 PRA Group Inc. Cvt. | 3.500% | 6/1/23 | USD | 7,180 | 7,184 |
| Remgro Jersey GBP Ltd. Cvt. | 2.625% | 3/22/21 | GBP | 3,000 | 3,974 |
| Starwood Property Trust Inc. Cvt. | 4.550% | 3/1/18 | USD | 2,255 | 2,395 |
| Wells Fargo & Co. Cvt. | 0.250% | 11/6/23 | USD | 9,920 | 11,531 |
| | | | | | 149,226 |
| Health Care (11.1%) | | | | | |
| BioMarin Pharmaceutical Inc. Cvt. | 0.750% | 10/15/18 | USD | 11,295 | 12,453 |
| Fresenius SE & Co. KGaA Cvt. | 0.000% | 1/31/24 | EUR | 4,600 | 5,232 |
| GN Store Nord A/S Cvt. | 0.000% | 5/31/22 | EUR | 2,900 | 3,339 |
| HealthSouth Corp. Cvt. | 2.000% | 12/1/43 | USD | 3,134 | 3,957 |
| Innoviva Inc. Cvt. | 2.125% | 1/15/23 | USD | 9,885 | 8,921 |
| 1 Insulet Corp. Cvt. | 1.250% | 9/15/21 | USD | 12,872 | 12,727 |
| Ionis Pharmaceuticals Inc. Cvt. | 1.000% | 11/15/21 | USD | 6,025 | 6,100 |
| Ironwood Pharmaceuticals Inc. Cvt. | 2.250% | 6/15/22 | USD | 6,686 | 8,583 |
| Jazz Investments I Ltd. Cvt. | 1.875% | 8/15/21 | USD | 11,826 | 12,550 |
| 1 Neurocrine Biosciences Inc. Cvt. | 2.250% | 5/15/24 | USD | 6,310 | 6,121 |
| Nevro Corp. Cvt. | 1.750% | 6/1/21 | USD | 4,365 | 4,490 |
| NuVasive Inc. Cvt. | 2.250% | 3/15/21 | USD | 9,006 | 12,271 |
| 1 Pacira Pharmaceuticals Inc. Cvt. | 2.375% | 4/1/22 | USD | 8,412 | 8,585 |
| Qiagen NV Cvt | 0.375% | 3/19/19 | USD | 3,400 | 4,172 |
| Qiagen NV Cvt | 0.875% | 3/19/21 | USD | 4,600 | 5,923 |
| Quidel Corp. Cvt. | 3.250% | 12/15/20 | USD | 1,950 | 2,066 |
| Recipharm AB Cvt. | 2.750% | 10/6/21 | SEK | 28,000 | 3,252 |
| Spectranetics Corp. Cvt. | 2.625% | 6/1/34 | USD | 9,871 | 10,846 |
| Terumo Corp. Cvt. | 0.000% | 12/4/19 | JPY | 480,000 | 5,304 |
| Wright Medical Group Inc. Cvt. | 2.000% | 2/15/20 | USD | 14,745 | 16,100 |
| | | | | | 152,992 |
13
Convertible Securities Fund
| | | | | |
| | | | | Face | Market |
| | | Maturity | | Amount | Value• |
| | Coupon | Date | Currency | (000) | ($000) |
| Industrials (9.7%) | | | | | |
| 51job Inc. Cvt. | 3.250% | 4/15/19 | USD | 6,729 | 7,738 |
| 1 Aerojet Rocketdyne Holdings Inc. Cvt. | 2.250% | 12/15/23 | USD | 8,725 | 9,434 |
| Airbus Group SE Cvt. | 0.000% | 6/14/21 | EUR | 6,000 | 7,906 |
| Brenntag Finance BV Cvt. | 1.875% | 12/2/22 | USD | 9,500 | 9,892 |
| CRRC Corp. Ltd. Cvt. | 0.000% | 2/5/21 | USD | 8,000 | 8,268 |
| DP World Ltd. Cvt. | 1.750% | 6/19/24 | USD | 4,000 | 4,167 |
| Dycom Industries Inc. Cvt. | 0.750% | 9/15/21 | USD | 4,639 | 5,199 |
| General Cable Corp. Cvt. | 4.500% | 11/15/29 | USD | 6,295 | 4,749 |
| 1 Greenbrier Cos. Inc. Cvt. | 2.875% | 2/1/24 | USD | 9,793 | 10,295 |
| GVM Debentures Lux 1 SA Cvt. | 5.750% | 2/14/18 | EUR | 7,200 | 7,886 |
| Larsen & Toubro Ltd. Cvt. | 0.675% | 10/22/19 | USD | 3,677 | 3,752 |
| LIXIL Group Corp. Cvt. | 0.000% | 3/4/22 | JPY | 550,000 | 5,115 |
| Minebea Mitsumi Inc. Cvt. | 0.000% | 8/3/22 | JPY | 620,000 | 6,543 |
| Mirait Holdings Corp. Cvt. | 0.000% | 12/30/21 | JPY | 565,000 | 5,382 |
| Nagoya Railroad Co. Ltd. Cvt. | 0.000% | 12/11/24 | JPY | 690,000 | 6,729 |
| Shimizu Corp. Cvt. | 0.000% | 10/16/20 | JPY | 670,000 | 6,633 |
| Siemens Financieringsmaatschappij NV Cvt. | 1.650% | 8/16/19 | USD | 500 | 644 |
| Siemens Financieringsmaatschappij NV Cvt. | 1.650% | 8/16/19 | USD | 8,000 | 9,942 |
| 1 Tutor Perini Corp. Cvt. | 2.875% | 6/15/21 | USD | 5,885 | 6,617 |
| Vinci SA Cvt. | 0.375% | 2/16/22 | USD | 4,200 | 4,599 |
| Zhejiang Expressway Co. Ltd. Cvt. | 0.000% | 4/21/22 | EUR | 2,600 | 2,928 |
| | | | | | 134,418 |
| Information Technology (25.3%) | | | | | |
| Abigrove Ltd. Cvt. | 0.000% | 2/16/22 | USD | 3,200 | 3,100 |
| 1 Blackhawk Network Holdings Inc. Cvt. | 1.500% | 1/15/22 | USD | 17,340 | 19,323 |
| Citrix Systems Inc. Cvt. | 0.500% | 4/15/19 | USD | 10,589 | 13,051 |
| CSG Systems International Inc. Cvt. | 4.250% | 3/15/36 | USD | 1,796 | 1,905 |
| 1 Cypress Semiconductor Corp. Cvt. | 4.500% | 1/15/22 | USD | 11,653 | 14,326 |
| Electronics For Imaging Inc. Cvt. | 0.750% | 9/1/19 | USD | 15,028 | 16,174 |
| Envestnet Inc. Cvt. | 1.750% | 12/15/19 | USD | 2,370 | 2,266 |
| Finisar Corp. Cvt. | 0.500% | 12/15/33 | USD | 2,605 | 2,813 |
| Indra Sistemas SA Cvt. | 1.250% | 10/7/23 | EUR | 6,500 | 7,840 |
| 1 Inphi Corp. Cvt. | 0.750% | 9/1/21 | USD | 4,718 | 4,727 |
| Integrated Device Technology Inc. Cvt. | 0.875% | 11/15/22 | USD | 11,997 | 12,589 |
| InterDigital Inc. Cvt. | 1.500% | 3/1/20 | USD | 4,583 | 5,711 |
| j2 Global Inc. Cvt. | 3.250% | 6/15/29 | USD | 6,841 | 9,325 |
| Knowles Corp. Cvt. | 3.250% | 11/1/21 | USD | 6,055 | 7,145 |
| 1 Microchip Technology Inc. Cvt. | 1.625% | 2/15/27 | USD | 21,655 | 23,888 |
| Micron Technology Inc. Cvt. | 3.000% | 11/15/43 | USD | 18,313 | 20,980 |
| Nanya Technology Corp. Cvt. | 0.000% | 1/24/22 | USD | 6,600 | 7,309 |
| 1 Nice Systems Inc. Cvt. | 1.250% | 1/15/24 | USD | 14,160 | 15,806 |
| 1 Nuance Communications Inc. Cvt. | 1.250% | 4/1/25 | USD | 5,900 | 6,151 |
| Nuance Communications Inc. Cvt. | 1.500% | 11/1/35 | USD | 8,378 | 8,881 |
| ON Semiconductor Corp. Cvt. | 1.000% | 12/1/20 | USD | 18,390 | 19,919 |
| 1 OSI Systems Inc. Cvt. | 1.250% | 9/1/22 | USD | 11,507 | 11,500 |
| Proofpoint Inc. Cvt. | 0.750% | 6/15/20 | USD | 1,822 | 2,233 |
| 1 ServiceNow Inc. Cvt. | 0.000% | 6/1/22 | USD | 3,225 | 3,245 |
| 1 Silicon Laboratories Inc. Cvt. | 1.375% | 3/1/22 | USD | 15,555 | 16,722 |
| 1 Square Inc. Cvt. | 0.375% | 3/1/22 | USD | 16,695 | 20,034 |
| 1 Teradyne Inc. Cvt. | 1.250% | 12/15/23 | USD | 10,704 | 13,561 |
| Ubisoft Entertainment SA Cvt. | 0.000% | 9/27/21 | EUR | 6,389 | 9,079 |
14
| | | | | |
| Convertible Securities Fund | | | | | |
| |
| |
| |
| | | | | Face | Market |
| | | Maturity | | Amount | Value• |
| | Coupon | Date | Currency | (000) | ($000) |
| Veeco Instruments Inc. Cvt. | 2.700% | 1/15/23 | USD | 9,468 | 10,101 |
| Verint Systems Inc. Cvt. | 1.500% | 6/1/21 | USD | 13,243 | 12,846 |
| Viavi Solutions Inc. Cvt. | 0.625% | 8/15/33 | USD | 9,345 | 10,554 |
| 1 Viavi Solutions Inc. Cvt. | 1.000% | 3/1/24 | USD | 3,195 | 3,445 |
| 1 WebMD Health Corp. Cvt. | 2.625% | 6/15/23 | USD | 4,055 | 3,916 |
| 1 Zillow Group Inc. Cvt. | 2.000% | 12/1/21 | USD | 8,650 | 9,580 |
| | | | | | 350,045 |
| Materials (6.6%) | | | | | |
| BASF SE Cvt. | 0.925% | 3/9/23 | USD | 6,500 | 6,639 |
| Bekaert SA Cvt. | 0.000% | 6/9/21 | EUR | 4,500 | 5,669 |
| Cemex SAB de CV Cvt. | 3.720% | 3/15/20 | USD | 5,845 | 6,451 |
| Cemex SAB de CV Cvt. | 3.720% | 3/15/20 | USD | 17,257 | 18,940 |
| 1 Chemtrade Logistics Income Fund Cvt. | 5.250% | 6/30/21 | CAD | 5,035 | 3,830 |
| Kansai Paint Co. Ltd. Cvt. | 0.000% | 6/17/22 | JPY | 790,000 | 7,511 |
| Mitsubishi Chemical Holdings Corp. Cvt. | 0.000% | 3/29/24 | JPY | 840,000 | 7,774 |
| 1 Pretium Resources Inc. Cvt. | 2.250% | 3/15/22 | USD | 5,340 | 4,839 |
| RTI International Metals Inc. Cvt. | 1.625% | 10/15/19 | USD | 12,815 | 15,090 |
| Silver Standard Resources Inc. Cvt. | 2.875% | 2/1/33 | USD | 7,480 | 7,186 |
| Teijin Ltd. Cvt. | 0.000% | 12/10/21 | JPY | 270,000 | 2,852 |
| Toray Industries Inc. Cvt. | 0.000% | 8/30/19 | JPY | 480,000 | 4,892 |
| | | | | | 91,673 |
| Telecommunication Services (1.1%) | | | | | |
| Inmarsat PLC Cvt. | 3.875% | 9/9/23 | USD | 6,200 | 7,186 |
| Telenor East Holding II AS Cvt. | 0.250% | 9/20/19 | USD | 7,600 | 8,410 |
| | | | | | 15,596 |
| Utilities (1.6%) | | | | | |
| China Yangtze Power International | | | | | |
| BVI 1 Ltd. Cvt. | 0.000% | 11/9/21 | USD | 6,453 | 6,671 |
| Kyushu Electric Power Co. Inc. Cvt. | 0.000% | 3/31/22 | JPY | 590,000 | 5,874 |
| Northland Power Inc. Cvt. | 4.750% | 6/30/20 | CAD | 4,617 | 3,879 |
| Northland Power Inc. Cvt. | 5.000% | 6/30/19 | CAD | 2,661 | 2,220 |
| 1 NRG Yield Inc. Cvt. | 3.250% | 6/1/20 | USD | 4,080 | 4,021 |
| | | | | | 22,665 |
| Total Convertible Bonds (Cost $1,161,301) | | | | | 1,231,869 |
| |
| | | | | Shares | |
| Convertible Preferred Stocks (8.6%) | | | | | |
| Consumer Staples (0.9%) | | | | | |
| Bunge Ltd. Pfd. | 4.875% | | | 115,253 | 12,527 |
| |
| Energy (0.2%) | | | | | |
| Sanchez Energy Corp. Pfd. | 6.500% | | | 110,232 | 3,095 |
| |
| Financials (2.3%) | | | | | |
| American Tower Corp. Pfd. | 5.500% | | | 73,020 | 8,717 |
| AMG Capital Trust II Pfd. | 5.150% | | | 92,400 | 5,307 |
| 1 Mandatory Exchangeable Trust Pfd. | 5.750% | | | 46,901 | 6,711 |
| Wells Fargo & Co. Pfd. | 7.500% | | | 8,110 | 10,259 |
| | | | | | 30,994 |
15
| | | |
| Convertible Securities Fund | | | |
| |
| |
| |
| | | | Market |
| | | | Value• |
| | Coupon | Shares | ($000) |
| Health Care (3.1%) | | | |
| Allergan plc Pfd. | 5.500% | 22,571 | 18,001 |
| Anthem Inc. Pfd. | 5.250% | 213,600 | 11,013 |
| Becton Dickinson and Co. Pfd. | 6.125% | 267,200 | 14,204 |
| | | | 43,218 |
| Industrials (1.3%) | | | |
| Rexnord Corp. Pfd. | 5.750% | 177,046 | 9,399 |
| Stanley Black & Decker Inc. Pfd. | 5.375% | 51,100 | 5,321 |
| Stericycle Inc. Pfd. | 5.250% | 51,700 | 3,542 |
| | | | 18,262 |
| Information Technology (0.3%) | | | |
| Belden Inc. Pfd. | 6.750% | 45,346 | 4,505 |
| |
| Utilities (0.5%) | | | |
| Dynegy Inc. Pfd. | 7.000% | 33,500 | 2,074 |
| NextEra Energy Inc. Pfd. | 6.123% | 96,800 | 5,159 |
| | | | 7,233 |
| Total Convertible Preferred Stocks (Cost $118,677) | | | 119,834 |
| Temporary Cash Investment (1.2%) | | | |
| Money Market Fund (1.2%) | | | |
| 2 Vanguard Market Liquidity Fund (Cost $16,058) | 1.040% | 160,552 | 16,059 |
| Total Investments (98.7%) (Cost $1,296,036) | | | 1,367,762 |
| |
| | | | Amount |
| | | | ($000) |
| Other Assets and Liabilities (1.3%) | | | |
| Other Assets | | | |
| Investment in Vanguard | | | 97 |
| Receivables for Investment Securities Sold | | | 21,039 |
| Receivables for Accrued Income | | | 6,944 |
| Receivables for Capital Shares Issued | | | 347 |
| Other Assets 3 | | | 6,974 |
| Total Other Assets | | | 35,401 |
| Liabilities | | | |
| Payables to Investment Advisor | | | (496) |
| Payables for Investment Securities Purchased | | | (5,026) |
| Payables for Capital Shares Redeemed | | | (3,416) |
| Payables to Vanguard | | | (3,242) |
| Other Liabilities | | | (5,660) |
| Total Liabilities | | | (17,840) |
| Net Assets (100%) | | | |
| Applicable to 105,124,145 outstanding $.001 par value shares of | | | |
| beneficial interest (unlimited authorization) | | | 1,385,323 |
| Net Asset Value Per Share | | | $13.18 |
16
| |
| Convertible Securities Fund | |
| |
| |
| |
| At May 31, 2017, net assets consisted of: | |
| | Amount |
| | ($000) |
| Paid-in Capital | 1,326,288 |
| Undistributed Net Investment Income | 3,957 |
| Accumulated Net Realized Losses | (13,449) |
| Unrealized Appreciation (Depreciation) | |
| Investment Securities | 71,726 |
| Forward Currency Contracts | (3,184) |
| Foreign Currencies | (15) |
| Net Assets | 1,385,323 |
• See Note A in Notes to Financial Statements.
1 Security exempt from registration under Rule 144A of the Securities Act of 1933. Such securities may be sold in transactions exempt
from registration, normally to qualified institutional buyers. At May 31, 2017, the aggregate value of these securities was $394,070,000,
representing 28.4% of net assets.
2 Affiliated money market fund available only to Vanguard funds and certain trusts and accounts managed by Vanguard. Rate shown
is the 7-day yield.
3 Cash of $2,250,000 has been segregated as collateral for open forward currency contracts.
CAD—Canadian dollar.
EUR—Euro.
GBP—British pound.
JPY—Japanese yen.
SEK—Sweden Krona.
SGD—Singapore dollar.
USD—U.S. dollar.
See accompanying Notes, which are an integral part of the Financial Statements.
17
| |
| Convertible Securities Fund | |
| |
| |
| Statement of Operations | |
| |
| | Six Months Ended |
| | May 31, 2017 |
| | ($000) |
| Investment Income | |
| Income | |
| Dividends | 2,409 |
| Interest1,2 | 18,084 |
| Total Income | 20,493 |
| Expenses | |
| Investment Advisory Fees—Note B | |
| Basic Fee | 2,492 |
| Performance Adjustment | (1,487) |
| The Vanguard Group—Note C | |
| Management and Administrative | 1,360 |
| Marketing and Distribution | 103 |
| Custodian Fees | 28 |
| Shareholders’ Reports | 33 |
| Trustees’ Fees and Expenses | 1 |
| Total Expenses | 2,530 |
| Net Investment Income | 17,963 |
| Realized Net Gain (Loss) | |
| Investment Securities Sold1 | 16,440 |
| Foreign Currencies and Forward Currency Contracts | 7,967 |
| Realized Net Gain (Loss) | 24,407 |
| Change in Unrealized Appreciation (Depreciation) | |
| Investment Securities | 38,747 |
| Foreign Currencies and Forward Currency Contracts | (15,846) |
| Change in Unrealized Appreciation (Depreciation) | 22,901 |
| Net Increase (Decrease) in Net Assets Resulting from Operations | 65,271 |
1 Interest income and realized net gain (loss) from affiliated companies of the fund were $125,000 and $4,000, respectively.
2 Interest income is net of foreign withholding taxes of $22,000.
See accompanying Notes, which are an integral part of the Financial Statements.
18
| | |
| Convertible Securities Fund | | |
| |
| |
| Statement of Changes in Net Assets | | |
| |
| | Six Months Ended | Year Ended |
| | May 31, | November 30, |
| | 2017 | 2016 |
| | ($000) | ($000) |
| Increase (Decrease) in Net Assets | | |
| Operations | | |
| Net Investment Income | 17,963 | 31,311 |
| Realized Net Gain (Loss) | 24,407 | (42,651) |
| Change in Unrealized Appreciation (Depreciation) | 22,901 | 48,310 |
| Net Increase (Decrease) in Net Assets Resulting from Operations | 65,271 | 36,970 |
| Distributions | | |
| Net Investment Income | (7,272) | (30,592) |
| Realized Capital Gain1 | — | (18,604) |
| Total Distributions | (7,272) | (49,196) |
| Capital Share Transactions | | |
| Issued | 41,329 | 109,702 |
| Issued in Lieu of Cash Distributions | 6,566 | 44,703 |
| Redeemed | (217,287) | (386,378) |
| Net Increase (Decrease) from Capital Share Transactions | (169,392) | (231,973) |
| Total Increase (Decrease) | (111,393) | (244,199) |
| Net Assets | | |
| Beginning of Period | 1,496,716 | 1,740,915 |
| End of Period2 | 1,385,323 | 1,496,716 |
1 Includes fiscal 2017 and 2016 short-term gain distributions totaling $0 and $0, respectively. Short-term gain distributions are
treated as ordinary income dividends for tax purposes.
2 Net Assets—End of Period includes undistributed (overdistributed) net investment income of $3,957,000 and $1,994,000.
See accompanying Notes, which are an integral part of the Financial Statements.
19
| | | | | | |
| Convertible Securities Fund | | | | | | |
| |
| |
| Financial Highlights | | | | | | |
| |
| |
| Six Months | | | | | |
| | Ended | | | | | |
| For a Share Outstanding | May 31, | | | Year Ended November 30, |
| Throughout Each Period | 2017 | 2016 | 2015 | 2014 | 2013 | 2012 |
| Net Asset Value, Beginning of Period | $12.67 | $12.67 | $13.85 | $14.64 | $12.95 | $12.12 |
| Investment Operations | | | | | | |
| Net Investment Income | .167 | .259 | .251 | .287 | .333 | .407 |
| Net Realized and Unrealized Gain (Loss) | | | | | | |
| on Investments | .406 | .117 | (.180) | .313 | 2.101 | 1.134 |
| Total from Investment Operations | .573 | .376 | .071 | .600 | 2.434 | 1.541 |
| Distributions | | | | | | |
| Dividends from Net Investment Income | (. 063) | (. 237) | (. 241) | (. 425) | (. 355) | (. 534) |
| Distributions from Realized Capital Gains | — | (.139) | (1.010) | (.965) | (.389) | (.177) |
| Total Distributions | (.063) | (.376) | (1.251) | (1.390) | (.744) | (.711) |
| Net Asset Value, End of Period | $13.18 | $12.67 | $12.67 | $13.85 | $14.64 | $12.95 |
| |
| Total Return1 | 4.54% | 3.11% | 0.55% | 4.33% | 19.65% | 13.18% |
| |
| Ratios/Supplemental Data | | | | | | |
| Net Assets, End of Period (Millions) | $1,385 | $1,497 | $1,741 | $2,001 | $2,060 | $1,643 |
| Ratio of Total Expenses to | | | | | | |
| Average Net Assets2 | 0.35% | 0.34% | 0.38% | 0.41% | 0.63% | 0.52% |
| Ratio of Net Investment Income to | | | | | | |
| Average Net Assets | 2.47% | 2.04% | 1.86% | 2.02% | 2.41% | 3.23% |
| Portfolio Turnover Rate | 121% | 103% | 95% | 85% | 101% | 82% |
The expense ratio, net investment income ratio, and turnover rate for the current period have been annualized.
1 Total returns do not include transaction or account service fees that may have applied in the periods shown. Fund prospectuses provide
information about any applicable transaction and account service fees.
2 Includes performance-based investment advisory fee increases (decreases) of (0.20%), (0.21%), (0.17%), (0.15%), 0.07%, and (0.04%).
See accompanying Notes, which are an integral part of the Financial Statements.
20
Convertible Securities Fund
Notes to Financial Statements
Vanguard Convertible Securities Fund is registered under the Investment Company Act of 1940 as an open-end investment company, or mutual fund. The fund invests in securities of foreign issuers, which may subject it to investment risks not normally associated with investing in securities of U.S. corporations.
A. The following significant accounting policies conform to generally accepted accounting principles for U.S. investment companies. The fund consistently follows such policies in preparing its financial statements.
1. Security Valuation: Securities are valued as of the close of trading on the New York Stock Exchange (generally 4 p.m., Eastern time) on the valuation date. Equity securities are valued at the latest quoted sales prices or official closing prices taken from the primary market in which each security trades; such securities not traded on the valuation date are valued at the mean of the latest quoted bid and asked prices. Bonds and temporary cash investments are valued using the latest bid prices or using valuations based on a matrix system (which considers such factors as security prices, yields, maturities, and ratings), both as furnished by independent pricing services. Investments in Vanguard Market Liquidity Fund are valued at that fund’s net asset value. Securities for which market quotations are not readily available, or whose values have been affected by events occurring before the fund’s pricing time but after the close of the securities’ primary markets, are valued at their fair values calculated according to procedures adopted by the board of trustees. These procedures include obtaining quotations from an independent pricing service, monitoring news to identify significant market- or security-specific events, and evaluating changes in the values of foreign market proxies (for example, ADRs, futures contracts, or exchange-traded funds), between the time the foreign markets close and the fund’s pricing time. When fair-value pricing is employed, the prices of securities used by a fund to calculate its net asset value may differ from quoted or published prices for the same securities.
2. Foreign Currency: Securities and other assets and liabilities denominated in foreign currencies are translated into U.S. dollars using exchange rates obtained from an independent third party as of the fund’s pricing time on the valuation date. Realized gains (losses) and unrealized appreciation (depreciation) on investment securities include the effects of changes in exchange rates since the securities were purchased, combined with the effects of changes in security prices. Fluctuations in the value of other assets and liabilities resulting from changes in exchange rates are recorded as unrealized foreign currency gains (losses) until the assets or liabilities are settled in cash, at which time they are recorded as realized foreign currency gains (losses).
3. Forward Currency Contracts: The fund enters into forward currency contracts to protect the value of securities and related receivables and payables against changes in future foreign exchange rates. The fund’s risks in using these contracts include movement in the values of the foreign currencies relative to the U.S. dollar and the ability of the counterparties to fulfill their obligations under the contracts. The fund mitigates its counterparty risk by entering into forward currency contracts only with a diverse group of prequalified counterparties, monitoring their financial strength, entering into master netting arrangements with its counterparties, and requiring its counterparties to transfer collateral as security for their performance. In the absence of a default, the collateral pledged or received by the fund cannot be repledged, resold, or rehypothecated. The master netting arrangements provide that, in the event of a counterparty’s default (including bankruptcy), the fund may terminate the forward currency contracts, determine the net amount owed by either party in accordance with its master netting arrangements, and sell or retain any collateral held up to the net
21
Convertible Securities Fund
amount owed to the fund under the master netting arrangements. The forward currency contracts contain provisions whereby a counterparty may terminate open contracts if the fund’s net assets decline below a certain level, triggering a payment by the fund if the fund is in a net liability position at the time of the termination. The payment amount would be reduced by any collateral the fund has pledged. Any assets pledged as collateral for open contracts are noted in the Statement of Net Assets. The value of collateral received or pledged is compared daily to the value of the forward currency contracts exposure with each counterparty, and any difference, if in excess of a specified minimum transfer amount, is adjusted and settled within two business days.
Forward currency contracts are valued at their quoted daily prices obtained from an independent third party, adjusted for currency risk based on the expiration date of each contract. The notional amounts of the contracts are not recorded in the Statement of Net Assets. Fluctuations in the value of the contracts are recorded in the Statement of Net Assets as an asset (liability) and in theStatement of Operations as unrealized appreciation (depreciation) until the contracts are closed, when they are recorded as realized forward currency contract gains (losses).
During the six months ended May 31, 2017, the fund’s average investment in forward currency contracts represented 21% of net assets, based on the average of notional amounts at each quarter-end during the period.
4. Federal Income Taxes: The fund intends to continue to qualify as a regulated investment company and distribute all of its taxable income. Management has analyzed the fund’s tax positions taken for all open federal income tax years (November 30, 2013–2016), and for the period ended May 31, 2017, and has concluded that no provision for federal income tax is required in the fund’s financial statements.
5. Distributions: Distributions to shareholders are recorded on the ex-dividend date.
6. Credit Facility: The fund and certain other funds managed by The Vanguard Group (“Vanguard”) participate in a $3.1 billion committed credit facility provided by a syndicate of lenders pursuant to a credit agreement that may be renewed annually; each fund is individually liable for its borrowings, if any, under the credit facility. Borrowings may be utilized for temporary and emergency purposes, and are subject to the fund’s regulatory and contractual borrowing restrictions. The participating funds are charged administrative fees and an annual commitment fee of 0.10% of the undrawn amount of the facility; these fees are allocated to the funds based on a method approved by the fund’s board of trustees and included in Management and Administrative expenses on the fund’s Statement of Operations. Any borrowings under this facility bear interest at a rate based upon the higher of the one-month London Interbank Offered Rate, federal funds effective rate, or overnight bank funding rate plus an agreed-upon spread.
The fund had no borrowings outstanding at May 31, 2017, or at any time during the period then ended.
7. Other: Dividend income is recorded on the ex-dividend date. Interest income includes income distributions received from Vanguard Market Liquidity Fund and is accrued daily. Premiums and discounts on debt securities purchased are amortized and accreted, respectively, to interest income over the lives of the respective securities. Security transactions are accounted for on the date securities are bought or sold. Costs used to determine realized gains (losses) on the sale of investment securities are those of the specific securities sold.
22
Convertible Securities Fund
B. Oaktree Capital Management, L.P., provides investment advisory services to the fund for a fee calculated at an annual percentage rate of average net assets. The basic fee is subject to quarterly adjustments based on the fund’s performance for the preceding three years relative to a composite index weighted 70% Bank of America Merrill Lynch All US Convertibles Index and 30% Bank of America Merrill Lynch Global 300 Convertibles ex-US Index (hedged). For the six months ended May 31, 2017, the investment advisory fee represented an effective annual basic rate of 0.34% of the fund’s average net assets before a decrease of $1,487,000 (0.20%) based on performance.
C. In accordance with the terms of a Funds’ Service Agreement (the “FSA”) between Vanguard and the fund, Vanguard furnishes to the fund corporate management, administrative, marketing, distribution, and cash management services at Vanguard’s cost of operations (as defined by the FSA). These costs of operations are allocated to the fund based on methods and guidelines approved by the board of trustees. Vanguard does not require reimbursement in the current period for certain costs of operations (such as deferred compensation/benefits and risk/insurance costs); the fund’s liability for these costs of operations is included in Payables to Vanguard on the Statement of Net Assets.
Upon the request of Vanguard, the fund may invest up to 0.40% of its net assets as capital in Vanguard. At May 31, 2017, the fund had contributed to Vanguard capital in the amount of $97,000, representing 0.01% of the fund’s net assets and 0.04% of Vanguard’s capitalization. The fund’s trustees and officers are also directors and employees, respectively, of Vanguard.
D. Various inputs may be used to determine the value of the fund’s investments. These inputs are summarized in three broad levels for financial statement purposes. The inputs or methodologies used to value securities are not necessarily an indication of the risk associated with investing in those securities.
Level 1—Quoted prices in active markets for identical securities.
Level 2—Other significant observable inputs (including quoted prices for similar securities, interest
rates, prepayment speeds, credit risk, etc.).
Level 3—Significant unobservable inputs (including the fund’s own assumptions used to determine
the fair value of investments).
The following table summarizes the market value of the fund’s investments as of May 31, 2017, based on the inputs used to value them:
| | | |
| | Level 1 | Level 2 | Level 3 |
| Investments | ($000) | ($000) | ($000) |
| Convertible Bonds | — | 1,231,869 | — |
| Convertible Preferred Stocks | 49,958 | 69,876 | — |
| Temporary Cash Investments | 16,059 | — | — |
| Forward Currency Contracts—Assets | — | 2,476 | — |
| Forward Currency Contracts—Liabilities | — | (5,660) | — |
| Total | 66,017 | 1,298,561 | — |
23
Convertible Securities Fund
E. At May 31, 2017, the fund had open forward currency contracts to receive and deliver currencies as follows. Unrealized appreciation (depreciation) on open forward currency contracts, except for Singapore dollar currency contracts, is treated as realized gain (loss) for tax purposes.
| | | | | | |
| | | | | | | Unrealized |
| | Contract | | Appreciation |
| | Settlement | Contract Amount (000) | (Depreciation) |
| Counterparty | Date | | Receive | | Deliver | ($000) |
| UBS AG | 7/20/17 | EUR | 6,862 | USD | 7,553 | 176 |
| UBS AG | 7/20/17 | JPY | 756,100 | USD | 6,787 | 56 |
| UBS AG | 7/20/17 | CAD | 3,736 | USD | 2,730 | 38 |
| UBS AG | 7/20/17 | SGD | 2,536 | USD | 1,837 | (3) |
| UBS AG | 7/20/17 | JPY | 183,400 | USD | 1,687 | (27) |
| UBS AG | 7/20/17 | SEK | 6,483 | USD | 733 | 16 |
| UBS AG | 7/20/17 | CAD | 475 | USD | 352 | (1) |
| UBS AG | 7/20/17 | USD | 86,043 | JPY | 9,295,580 | 1,918 |
| UBS AG | 7/20/17 | USD | 8,374 | JPY | 931,200 | (54) |
| UBS AG | 7/20/17 | USD | 114,476 | EUR | 106,326 | (5,288) |
| UBS AG | 7/20/17 | USD | 30,929 | CAD | 41,375 | 272 |
| UBS AG | 7/20/17 | USD | 3,881 | SEK | 34,680 | (121) |
| UBS AG | 7/20/17 | USD | 9,067 | SGD | 12,660 | (88) |
| UBS AG | 7/20/17 | USD | 9,640 | GBP | 7,530 | (78) |
| UBS AG | 7/20/17 | USD | 398 | EUR | 353 | — |
| UBS AG | 7/20/17 | USD | 43 | CAD | 59 | — |
| | | | | | | (3,184) |
| Refer to the Statement of Net Assets for currency abbreviations. | | | | | |
F. Distributions are determined on a tax basis and may differ from net investment income and realized capital gains for financial reporting purposes. Differences may be permanent or temporary. Permanent differences are reclassified among capital accounts in the financial statements to reflect their tax character. Temporary differences arise when certain items of income, expense, gain, or loss are recognized in different periods for financial statement and tax purposes. These differences will reverse at some time in the future. Differences in classification may also result from the treatment of short-term gains as ordinary income for tax purposes. The fund’s tax-basis capital gains and losses are determined only at the end of each fiscal year.
During the six months ended May 31, 2017, the fund realized net foreign currency losses of $8,709,000 (including the foreign currency component on sales of foreign currency denominated bonds), which decreased distributable net income for tax purposes; accordingly, such losses have been reclassified from accumulated net realized losses to undistributed net investment income.
Certain of the fund’s convertible preferred stock investments are treated as debt securities for tax purposes. During the six months ended May 31, 2017, the fund realized gains of $3,000 from the sale of these securities, which are included in distributable net investment income for tax purposes; accordingly, such gains have been reclassified from accumulated net realized losses to undistributed net investment income.
24
Convertible Securities Fund
Certain of the fund’s convertible bond investments are in securities considered to be “contingent payment debt instruments,” for which any realized gains increase (and all or part of any realized losses decrease) income for tax purposes. During the six months ended May 31, 2017, the fund realized net losses of $22,000 from the sale of these securities, which decreased distributable net income for tax purposes; accordingly, such losses have been reclassified from accumulated net realized losses to undistributed net investment income.
At May 31, 2017, the cost of investment securities for tax purposes was $1,296,198,000. Net unrealized appreciation of investment securities for tax purposes was $71,564,000, consisting of unrealized gains of $88,985,000 on securities that had risen in value since their purchase and $17,421,000 in unrealized losses on securities that had fallen in value since their purchase.
G. During the six months ended May 31, 2017, the fund purchased $858,525,000 of investment securities and sold $1,036,986,000 of investment securities, other than temporary cash investments.
H. Capital shares issued and redeemed were:
| | |
| | Six Months Ended | Year Ended |
| | May 31, 2017 | November 30, 2016 |
| | Shares | Shares |
| | (000) | (000) |
| Issued | 3,182 | 8,932 |
| Issued in Lieu of Cash Distributions | 514 | 3,668 |
| Redeemed | (16,701) | (31,874) |
| Net Increase (Decrease) in Shares Outstanding | (13,005) | (19,274) |
I. Management has determined that no material events or transactions occurred subsequent to May 31, 2017, that would require recognition or disclosure in these financial statements.
25
About Your Fund’s Expenses
As a shareholder of the fund, you incur ongoing costs, which include costs for portfolio management, administrative services, and shareholder reports (like this one), among others. Operating expenses, which are deducted from a fund’s gross income, directly reduce the investment return of the fund.
A fund’s expenses are expressed as a percentage of its average net assets. This figure is known as the expense ratio. The following examples are intended to help you understand the ongoing costs (in dollars) of investing in your fund and to compare these costs with those of other mutual funds. The examples are based on an investment of $1,000 made at the beginning of the period shown and held for the entire period.
The accompanying table illustrates your fund’s costs in two ways:
• Based on actual fund return. This section helps you to estimate the actual expenses that you paid over the period. The ”Ending Account Value“ shown is derived from the fund‘s actual return, and the third column shows the dollar amount that would have been paid by an investor who started with $1,000 in the fund. You may use the information here, together with the amount you invested, to estimate the expenses that you paid over the period.
To do so, simply divide your account value by $1,000 (for example, an $8,600 account value divided by $1,000 = 8.6), then multiply the result by the number given for your fund under the heading ”Expenses Paid During Period.“
• Based on hypothetical 5% yearly return. This section is intended to help you compare your fund‘s costs with those of other mutual funds. It assumes that the fund had a yearly return of 5% before expenses, but that the expense ratio is unchanged. In this case—because the return used is not the fund’s actual return—the results do not apply to your investment. The example is useful in making comparisons because the Securities and Exchange Commission requires all mutual funds to calculate expenses based on a 5% return. You can assess your fund’s costs by comparing this hypothetical example with the hypothetical examples that appear in shareholder reports of other funds.
Note that the expenses shown in the table are meant to highlight and help you compare ongoing costs only and do not reflect transaction costs incurred by the fund for buying and selling securities. Further, the expenses do not include any purchase, redemption, or account service fees described in the fund prospectus. If such fees were applied to your account, your costs would be higher. Your fund does not carry a “sales load.”
The calculations assume no shares were bought or sold during the period. Your actual costs may have been higher or lower, depending on the amount of your investment and the timing of any purchases or redemptions.
You can find more information about the fund’s expenses, including annual expense ratios, in the Financial Statements section of this report. For additional information on operating expenses and other shareholder costs, please refer to your fund’s current prospectus.
26
| | | |
| Six Months Ended May 31, 2017 | | | |
| | Beginning | Ending | Expenses |
| | Account Value | Account Value | Paid During |
| Convertible Securities Fund | 11/30/2016 | 5/31/2017 | Period |
| Based on Actual Fund Return | $1,000.00 | $1,045.38 | $1.78 |
| Based on Hypothetical 5% Yearly Return | 1,000.00 | 1,023.19 | 1.77 |
The calculations are based on expenses incurred in the most recent six-month period. The fund’s annualized six-month expense ratio for that
period is 0.35%. The dollar amounts shown as “Expenses Paid” are equal to the annualized expense ratio multiplied by the average account
value over the period, multiplied by the number of days in the most recent six-month period, then divided by the number of days in the most
recent 12-month period (182/365).
27
Trustees Approve Advisory Arrangement
The board of trustees of Vanguard Convertible Securities Fund has renewed the fund’s investment advisory arrangement with Oaktree Capital Management, L.P. (Oaktree). The board determined that renewing the fund’s advisory arrangement was in the best interests of the fund and its shareholders.
The board based its decision upon an evaluation of the advisor’s investment staff, portfolio management process, and performance. This evaluation included information provided to the board by Vanguard’s Portfolio Review Department, which is responsible for fund and advisor oversight and product management. The Portfolio Review Department met regularly with the advisor and made monthly presentations to the board during the fiscal year that directed the board’s focus to relevant information and topics.
The board, or an investment committee made up of board members, also received information throughout the year during advisor presentations. For each advisor presentation, the board was provided with letters and reports that included information about, among other things, the advisory firm and the advisor’s assessment of the investment environment, portfolio performance, and portfolio characteristics.
In addition, the board received monthly reports, which included a Market and Economic Report, a Fund Dashboard Monthly Summary, and a Fund Performance Report.
Prior to their meeting, the trustees were provided with a memo and materials that summarized the information they received over the course of the year. They also considered the factors discussed below, among others. However, no single factor determined whether the board approved the arrangement. Rather, it was the totality of the circumstances that drove the board’s decision.
Nature, extent, and quality of services
The board reviewed the quality of the fund’s investment management services over both the short and long term and took into account the organizational depth and stability of the advisor. The board considered that Oaktree, founded in 1995, specializes in managing convertible securities, distressed debt, and high-yield bonds. The advisor uses a bottom-up investment approach to select convertible securities that it believes have the best balance of upside potential and downside protection. Discipline is key to the fund’s management; Oaktree invests predominantly in convertibles possessing an attractive combination of conversion and income features—true hybrid securities—and sells the issues when their characteristics become too similar to those of conventional bonds or common stocks. Oaktree has advised the fund since 1996.
The board concluded that the advisor’s experience, stability, depth, and performance, among other factors, warranted continuation of the advisory arrangement.
Investment performance
The board considered the short- and long-term performance of the fund, including any periods of outperformance or underperformance compared with a benchmark index and peer group. The board concluded that the performance was such that the advisory arrangement should continue. Information about the fund’s most recent performance can be found in the Performance Summary section of this report.
28
Cost
The board concluded that the fund’s expense ratio was well below the average expense ratio charged by funds in its peer group and that the fund’s advisory fee rate was also well below its peer-group average. Information about the fund’s expense ratio appears in the About Your Fund’s Expenses section of this report as well as in the Financial Statements section, which also includes information about the advisory fee rate.
The board did not consider the profitability of Oaktree in determining whether to approve the advisory fee, because Oaktree is independent of Vanguard and the advisory fee is the result of arm’s-length negotiations.
The benefit of economies of scale
The board concluded that the fund’s shareholders benefit from economies of scale because of breakpoints in the fund’s advisory fee schedule. The breakpoints reduce the effective rate of the fee as the fund’s assets increase.
The board will consider whether to renew the advisory arrangement again after a one-year period.
29
Glossary
30-Day SEC Yield. A fund’s 30-day SEC yield is derived using a formula specified by the U.S. Securities and Exchange Commission. Under the formula, data related to the fund’s security holdings in the previous 30 days are used to calculate the fund’s hypothetical net income for that period, which is then annualized and divided by the fund’s estimated average net assets over the calculation period. For the purposes of this calculation, a security’s income is based on its current market yield to maturity (for bonds), its actual income (for asset-backed securities), or its projected dividend yield (for stocks). Because the SEC yield represents hypothetical annualized income, it will differ—at times significantly—from the fund’s actual experience. As a result, the fund’s income distributions may be higher or lower than implied by the SEC yield.
Average Coupon. The average interest rate paid on the fixed income securities held by a fund. It is expressed as a percentage of face value.
Average Duration. An estimate of how much the value of the bonds held by a fund will fluctuate in response to a change in interest rates. To see how the value could change, multiply the average duration by the change in rates. If interest rates rise by 1 percentage point, the value of the bonds in a fund with an average duration of five years would decline by about 5%. If rates decrease by a percentage point, the value would rise by 5%.
Average Weighted Maturity. The average length of time until fixed income securities held by a fund reach maturity and are repaid. The figure reflects the proportion of fund assets represented by each security.
Beta. A measure of the magnitude of a fund’s past share-price fluctuations in relation to the ups and downs of a given market index. The index is assigned a beta of 1.00. Compared with a given index, a fund with a beta of 1.20 typically would have seen its share price rise or fall by 12% when the index rose or fell by 10%. For this report, beta is based on returns over the past 36 months for both the fund and the index. Note that a fund’s beta should be reviewed in conjunction with its R-squared (see definition). The lower the R-squared, the less correlation there is between the fund and the index, and the less reliable beta is as an indicator of volatility.
Conversion Premium. The average percentage by which the weighted average market price of the convertible securities held by a fund exceeds the weighted average market price of their underlying common stocks. For example, if a stock is trading at $25 per share and a bond that is convertible into the stock is trading at a price equivalent to $30 per share of stock, the conversion premium is 20% ($5 ÷ $25 = 20%).
Credit Quality. Credit-quality ratings are measured on a scale that generally ranges from AAA (highest) to D (lowest). Credit-quality ratings are obtained from S&P. “Not Rated” is used to classify securities for which a rating is not available. Not rated securities include a fund’s investment in Vanguard Market Liquidity Fund or Vanguard Municipal Cash Management Fund, each of which invests in high-quality money market instruments and may serve as a cash management vehicle for the Vanguard funds, trusts, and accounts.
Expense Ratio. A fund’s total annual operating expenses expressed as a percentage of the fund’s average net assets. The expense ratio includes management and administrative expenses, but does not include the transaction costs of buying and selling portfolio securities.
30
Foreign Holdings. The percentage of a fund represented by securities or depositary receipts of companies based outside the United States.
Inception Date. The date on which the assets of a fund (or one of its share classes) are first invested in accordance with the fund’s investment objective. For funds with a subscription period, the inception date is the day after that period ends. Investment performance is measured from the inception date.
Market Exposure. A measure that reflects a fund’s security investments excluding any holdings in short-term reserves.
R-Squared. A measure of how much of a fund’s past returns can be explained by the returns from the market in general, as measured by a given index. If a fund’s total returns were precisely synchronized with an index’s returns, its R-squared would be 1.00. If the fund’s returns bore no relationship to the index’s returns, its R-squared would be 0. For this report, R-squared is based on returns over the past 36 months for both the fund and the index.
Short-Term Reserves. The percentage of a fund invested in highly liquid, short-term securities that can be readily converted to cash.
Turnover Rate. An indication of the fund’s trading activity. Funds with high turnover rates incur higher transaction costs and may be more likely to distribute capital gains (which may be taxable to investors). The turnover rate excludes in-kind transactions, which have minimal impact on costs.
Benchmark Information
Convertibles Composite Index: CS First Boston Convertible Securities Index through November 30, 2004; Bank of America Merrill Lynch All US Convertibles Index (formerly Bank of America Merrill Lynch All Convertibles-All Qualities Index) through December 31, 2010; and 70% Bank of America Merrill Lynch All US Convertibles Index and 30% Bank of America Merrill Lynch Global 300 Convertibles ex-US Index (hedged) thereafter.
31
The Global Industry Classification Standard (“GICS”) was developed by and is the exclusive property and a service mark of
MSCI Inc. (“MSCI”) and Standard and Poor’s, a division of McGraw-Hill Companies, Inc. (“S&P”), and is licensed for use by
Vanguard. Neither MSCI, S&P nor any third party involved in making or compiling the GICS or any GICS classification makes
any express or implied warranties or representations with respect to such standard or classification (or the results to be
obtained by the use thereof), and all such parties hereby expressly disclaim all warranties of originality, accuracy, completeness,
merchantability or fitness for a particular purpose with respect to any such standard or classification. Without limiting any of
the foregoing, in no event shall MSCI, S&P, any of its affiliates or any third party involved in making or compiling the GICS
or any GICS classification have any liability for any direct, indirect, special, punitive, consequential or any other damages
(including lost profits) even if notified of the possibility of such damages.
32
This page intentionally left blank.
This page intentionally left blank.
This page intentionally left blank.
The People Who Govern Your Fund
The trustees of your mutual fund are there to see that the fund is operated and managed in your best interests since, as a shareholder, you are a part owner of the fund. Your fund’s trustees also serve on the board of directors of The Vanguard Group, Inc., which is owned by the Vanguard funds and provides services to them on an at-cost basis.
A majority of Vanguard’s board members are independent, meaning that they have no affiliation with Vanguard or the funds they oversee, apart from the sizable personal investments they have made as private individuals. The independent board members have distinguished backgrounds in business, academia, and public service. Each of the trustees and executive officers oversees 197 Vanguard funds.
The following table provides information for each trustee and executive officer of the fund. The mailing address of the trustees and officers is P.O. Box 876, Valley Forge, PA 19482. More information about the trustees is in the Statement of Additional Information, which can be obtained, without charge, by contacting Vanguard at 800-662-7447, or online at vanguard.com.
Interested Trustee1
F. William McNabb III
Born 1957. Trustee Since July 2009. Chairman of the Board. Principal Occupation(s) During the Past Five Years and Other Experience: Chairman of the Board of The Vanguard Group, Inc., and of each of the investment companies served by The Vanguard Group, since January 2010; Director of The Vanguard Group since 2008; Chief Executive Officer and President of The Vanguard Group, and of each of the investment companies served by The Vanguard Group, since 2008; Director of Vanguard Marketing Corporation; Managing Director of The Vanguard Group (1995–2008).
Independent Trustees
Emerson U. Fullwood
Born 1948. Trustee Since January 2008. Principal Occupation(s) During the Past Five Years and Other Experience: Executive Chief Staff and Marketing Officer for North America and Corporate Vice President (retired 2008) of Xerox Corporation (document management products and services); Executive in Residence and 2009–2010 Distinguished Minett Professor at the Rochester Institute of Technology; Lead Director of SPX FLOW, Inc. (multi-industry manufacturing); Director of the United Way of Rochester, the University of Rochester Medical Center, Monroe Community College Foundation, North Carolina A&T University, and Roberts Wesleyan College; Trustee of the University of Rochester.
Rajiv L. Gupta
Born 1945. Trustee Since December 2001.2 Principal Occupation(s) During the Past Five Years and Other Experience: Chairman and Chief Executive Officer (retired 2009) and President (2006–2008) of Rohm and Haas Co. (chemicals); Director of Arconic Inc. (diversified manufacturer), HP Inc. (printer and personal computer manufacturing), and Delphi Automotive plc (automotive components); Senior Advisor at New Mountain Capital.
Amy Gutmann
Born 1949. Trustee Since June 2006. Principal Occupation(s) During the Past Five Years and Other Experience: President of the University of Pennsylvania; Christopher H. Browne Distinguished Professor of Political Science, School of Arts and Sciences, and Professor of Communication, Annenberg School for Communication, with secondary faculty appointments in the Department of Philosophy, School of Arts and Sciences, and at the Graduate School of Education, University of Pennsylvania; Trustee of the National Constitution Center.
JoAnn Heffernan Heisen
Born 1950. Trustee Since July 1998. Principal Occupation(s) During the Past Five Years and Other Experience: Corporate Vice President and Member of the Executive Committee (1997–2008), Chief Global Diversity Officer (retired 2008), Vice President and Chief Information Officer (1997–2006), Controller (1995–1997), Treasurer (1991–1995), and Assistant Treasurer (1989–1991) of Johnson & Johnson (pharmaceuticals/medical devices/consumer products); Director of Skytop Lodge Corporation (hotels) and the Robert Wood Johnson Foundation; Member of the Advisory Board of the Institute for Women’s Leadership at Rutgers University.
F. Joseph Loughrey
Born 1949. Trustee Since October 2009. Principal Occupation(s) During the Past Five Years and Other Experience: President and Chief Operating Officer (retired 2009) of Cummins Inc. (industrial machinery); Chairman of the Board of Hillenbrand, Inc. (specialized consumer services), Oxfam America, and the Lumina Foundation for Education; Director of SKF AB (industrial machinery), Hyster-Yale Materials Handling, Inc. (forklift trucks), and the V Foundation for Cancer
Research; Member of the Advisory Council for the College of Arts and Letters and Chair of the Advisory Board to the Kellogg Institute for International Studies, both at the University of Notre Dame.
Mark Loughridge
Born 1953. Trustee Since March 2012. Principal Occupation(s) During the Past Five Years and Other Experience: Senior Vice President and Chief Financial Officer (retired 2013) at IBM (information technology services); Fiduciary Member of IBM’s Retirement Plan Committee (2004–2013); Director of the Dow Chemical Company; Member of the Council on Chicago Booth.
Scott C. Malpass
Born 1962. Trustee Since March 2012. Principal Occupation(s) During the Past Five Years and Other Experience: Chief Investment Officer and Vice President at the University of Notre Dame; Assistant Professor of Finance at the Mendoza College of Business at Notre Dame; Member of the Notre Dame 403(b) Investment Committee, the Board of Advisors for Spruceview Capital Partners, and the Investment Advisory Committee of Major League Baseball; Board Member of TIFF Advisory Services, Inc., and Catholic Investment Services, Inc. (investment advisors); Member of the Board of Superintendence of the Institute for the Works of Religion.
André F. Perold
Born 1952. Trustee Since December 2004. Principal Occupation(s) During the Past Five Years and Other Experience: George Gund Professor of Finance and Banking, Emeritus at the Harvard Business School (retired 2011); Chief Investment Officer and Co-Managing Partner of HighVista Strategies LLC (private investment firm); Overseer of the Museum of Fine Arts Boston.
Peter F. Volanakis
Born 1955. Trustee Since July 2009. Principal Occupation(s) During the Past Five Years and Other Experience: President and Chief Operating Officer (retired 2010) of Corning Incorporated (communications equipment); Chairman of the Board of Trustees of Colby-Sawyer College; Member of the Board of Hypertherm, Inc. (industrial cutting systems, software, and consumables).
Executive Officers
Glenn Booraem
Born 1967. Investment Stewardship Officer Since February 2017. Principal Occupation(s) During the Past Five Years and Other Experience: Principal of The Vanguard Group, Inc.; Treasurer (2015–2017), Controller (2010–2015), and Assistant Controller (2001–2010) of each of the investment companies served by The Vanguard Group.
Thomas J. Higgins
Born 1957. Chief Financial Officer Since September 2008. Principal Occupation(s) During the Past Five Years and Other Experience: Principal of The Vanguard Group, Inc.; Chief Financial Officer of each of the investment companies served by The Vanguard Group; Treasurer of each of the investment companies served by The Vanguard Group (1998–2008).
Peter Mahoney
Born 1974. Controller Since May 2015. Principal Occupation(s) During the Past Five Years and Other Experience: Principal of The Vanguard Group, Inc.; Controller of each of the investment companies served by The Vanguard Group; Head of International Fund Services at The Vanguard Group (2008–2014).
Anne E. Robinson
Born 1970. Secretary Since September 2016. Principal Occupation(s) During the Past Five Years and Other Experience: Managing Director of The Vanguard Group, Inc.; General Counsel of The Vanguard Group; Secretary of The Vanguard Group and of each of the investment companies served by The Vanguard Group; Director and Senior Vice President of Vanguard Marketing Corporation; Managing Director and General Counsel of Global Cards and Consumer Services at Citigroup (2014–2016); Counsel at American Express (2003–2014).
Michael Rollings
Born 1963. Treasurer Since February 2017. Principal Occupation(s) During the Past Five Years and Other Experience: Managing Director of The Vanguard Group, Inc.; Treasurer of each of the investment companies served by The Vanguard Group; Executive Vice President and Chief Financial Officer of MassMutual Financial Group (2006–2016).
Vanguard Senior Management Team
| |
| Mortimer J. Buckley | James M. Norris |
| John James | Thomas M. Rampulla |
| Martha G. King | Glenn W. Reed |
| John T. Marcante | Karin A. Risi |
| Chris D. McIsaac | |
| |
| Chairman Emeritus and Senior Advisor |
| John J. Brennan | |
| Chairman, 1996–2009 | |
| Chief Executive Officer and President, 1996–2008 |
| |
| Founder | |
| John C. Bogle | |
| Chairman and Chief Executive Officer, 1974–1996 |
1 Mr. McNabb is considered an “interested person,” as defined in the Investment Company Act of 1940, because he is an officer of the Vanguard funds.
2 December 2002 for Vanguard Equity Income Fund, the Vanguard Municipal Bond Funds, and the Vanguard State Tax-Exempt Funds.
| |  |
| | | P.O. Box 2600 |
| | | Valley Forge, PA 19482-2600 |
| |
| |
| |
| Connect with Vanguard® > vanguard.com |
| |
| |
| |
| Fund Information > 800-662-7447 | | CFA® is a registered trademark owned by CFA Institute. |
| Direct Investor Account Services > 800-662-2739 | |
| Institutional Investor Services > 800-523-1036 | |
| Text Telephone for People | | |
| Who Are Deaf or Hard of Hearing> 800-749-7273 | |
| |
| This material may be used in conjunction | |
| with the offering of shares of any Vanguard | |
| fund only if preceded or accompanied by | |
| the fund’s current prospectus. | |
| |
| All comparative mutual fund data are from Lipper, a | |
| Thomson Reuters Company, or Morningstar, Inc., unless | |
| otherwise noted. | | |
| |
| You can obtain a free copy of Vanguard’s proxy voting | |
| guidelines by visiting vanguard.com/proxyreporting or by | |
| calling Vanguard at 800-662-2739. The guidelines are | |
| also available from the SEC’s website, sec.gov. In | |
| addition, you may obtain a free report on how your fund | |
| voted the proxies for securities it owned during the 12 | |
| months ended June 30. To get the report, visit either | |
| vanguard.com/proxyreporting or sec.gov. | |
| |
| You can review and copy information about your fund at | |
| the SEC’s Public Reference Room in Washington, D.C. To | |
| find out more about this public service, call the SEC at | |
| 202-551-8090. Information about your fund is also | |
| available on the SEC’s website, and you can receive | |
| copies of this information, for a fee, by sending a | |
| request in either of two ways: via email addressed to | |
| publicinfo@sec.gov or via regular mail addressed to the | |
| Public Reference Section, Securities and Exchange | |
| Commission, Washington, DC 20549-1520. | |
| |
| | | © 2017 The Vanguard Group, Inc. |
| | | All rights reserved. |
| | | Vanguard Marketing Corporation, Distributor. |
| |
| | | Q822 072017 |
Item 2: Code of Ethics. The Registrant has adopted a code of ethics that applies to the Registrant’s
principal executive officer, principal financial officer, principal accounting officer or controller or
persons performing similar functions. The Code of Ethics was amended during the reporting
period covered by this report to make certain technical, non-material changes.
Item 3: Audit Committee Financial Expert.
Not Applicable.
Item 4: Principal Accountant Fees and Services.
(a) Audit Fees.
Not Applicable.
Item 5: Audit Committee of Listed Registrants.
Not Applicable.
Item 6: Investments.
Not Applicable.
Item 7: Disclosure of Proxy Voting Policies and Procedures for Closed-End Management
Investment Companies.
Not Applicable.
Item 8: Portfolio Managers of Closed-End Management Investment Companies.
Not Applicable.
Item 9: Purchase of Equity Securities by Closed-End Management Investment Company and
Affiliated Purchasers.
Not Applicable.
Item 10: Submission of Matters to a Vote of Security Holders.
Not Applicable.
Item 11: Controls and Procedures.
(a) Disclosure Controls and Procedures. The Principal Executive and Financial
Officers concluded that the Registrant’s Disclosure Controls and Procedures are effective
based on their evaluation of the Disclosure Controls and Procedures as of a date within 90 days of the filing date of this report.
(b) Internal Control Over Financial Reporting. There were no significant changes in Registrant’s Internal Control Over Financial Reporting or in other factors that could significantly affect this control subsequent to the date of the evaluation, including any corrective actions with regard to significant deficiencies and material weaknesses.
Item 12: Exhibits.
(a) Certifications.
Pursuant to the requirements of the Securities Exchange Act of 1934 and the Investment Company Act of 1940, the registrant has duly caused this report to be signed on its behalf by the undersigned, thereunto duly authorized.
| |
| | VANGUARD CONVERTIBLE SECURITIES FUND |
|
| |
| BY: | /s/ F. WILLIAM MCNABB III* |
| | F. WILLIAM MCNABB III |
| | CHIEF EXECUTIVE OFFICER |
| |
| Date: July 18, 2017 |
Pursuant to the requirements of the Securities Exchange Act of 1934 and the Investment Company Act of 1940, this report has been signed below by the following persons on behalf of the registrant and in the capacities and on the dates indicated.
| |
| | VANGUARD CONVERTIBLE SECURITIES FUND |
|
| BY: | /s/ F. WILLIAM MCNABB III* |
| | F. WILLIAM MCNABB III |
| CHIEF EXECUTIVE OFFICER |
Date: July 18, 2017 |
| VANGUARD CONVERTIBLE SECURITIES FUND |
BY: | /s/ THOMAS J. HIGGINS* |
| | THOMAS J. HIGGINS |
| | CHIEF FINANCIAL OFFICER |
Date: July 18, 2017 |
* By: /s/ Anne E. Robinson
Anne E. Robinson, pursuant to a Power of Attorney filed on October 4, 2016 see file Number
33-32548, Incorporated by Reference.
0448435, v0.58