UNITED STATES
SECURITIES AND EXCHANGE COMMISSION
Washington, D.C. 20549
FORM N-CSR
CERTIFIED SHAREHOLDER REPORT
OF
REGISTERED MANAGEMENT INVESTMENT COMPANIES
| | |
| Investment Company Act file number: | 811-04627 |
Name of Registrant: | Vanguard Convertible Securities Fund |
Address of Registrant: | P.O. Box 2600 |
| | Valley Forge, PA 19482 |
Name and address of agent for service: | Heidi Stam, Esquire |
| | P.O. Box 876 |
| | Valley Forge, PA 19482 |
Registrant’s telephone number, including area code: (610) 669-1000 |
Date of fiscal year end: November 30 |
Date of reporting period: December 1, 2015 – May 31, 2016 |
Item 1: Reports to Shareholders |

Semiannual Report | May 31, 2016
Vanguard Convertible Securities Fund
Vanguard’s Principles for Investing Success
We want to give you the best chance of investment success. These principles, grounded in Vanguard’s research and experience, can put you on the right path.
Goals. Create clear, appropriate investment goals.
Balance. Develop a suitable asset allocation using broadly diversified funds. Cost. Minimize cost.
Discipline. Maintain perspective and long-term discipline.
A single theme unites these principles: Focus on the things you can control.
We believe there is no wiser course for any investor.
| |
| Contents | |
| Your Fund’s Total Returns. | 1 |
| Chairman’s Letter. | 2 |
| Advisor’s Report. | 7 |
| Fund Profile. | 10 |
| Performance Summary. | 12 |
| Financial Statements. | 13 |
| About Your Fund’s Expenses. | 27 |
| Trustees Approve Advisory Arrangement. | 29 |
| Glossary. | 30 |
Please note: The opinions expressed in this report are just that—informed opinions. They should not be considered promises or advice.
Also, please keep in mind that the information and opinions cover the period through the date on the front of this report. Of course, the
risks of investing in your fund are spelled out in the prospectus.
See the Glossary for definitions of investment terms used in this report.
About the cover: Pictured is a sailing block on the Brilliant, a 1932 schooner docked in Mystic, Connecticut. A type of pulley, the
sailing block helps coordinate the setting of the sails. At Vanguard, the intricate coordination of technology and people allows
us to help millions of clients around the world reach their financial goals.
Your Fund’s Total Returns
| |
| Six Months Ended May 31, 2016 | |
| | Total |
| | Returns |
| Vanguard Convertible Securities Fund | -1.31% |
| Convertibles Composite Index | -0.73 |
| Convertible Securities Funds Average | -1.21 |
| For a benchmark description, see the Glossary. |
| Convertible Securities Funds Average: Derived from data provided by Lipper, a Thomson Reuters Company. |
| | | | |
| Your Fund’s Performance at a Glance | | | |
| November 30, 2015, Through May 31, 2016 | | | |
| | | | Distributions Per Share |
| | Starting | Ending | Income | Capital |
| | Share Price | Share Price | Dividends | Gains |
| Vanguard Convertible Securities Fund | $12.67 | $12.21 | $0.152 | $0.139 |
1

Chairman’s Letter
Dear Shareholder,
Vanguard Convertible Securities Fund returned –1.31% for the six months ended May 31, 2016. The fund trailed its benchmark, the Convertibles Composite Index, and finished slightly behind the average return of its peer group.
Convertible securities are corporate bonds and preferred stocks that can be exchanged for common stocks at a fixed price. Because stocks and bonds often move in opposite directions, convertibles can benefit from either gains in the underlying common stock or from the relative price stability and income provided by bonds and preferred stock dividends. Of course, convertibles have risks, including a tendency to have lower credit quality than investment-grade bonds.
The sharp decline in global stock markets earlier in the period contributed most to the fund’s negative return. The fund’s limited exposure to higher-risk convertibles weighed on its performance relative to its benchmark.
On a separate note, later this year, the Convertible Securities Fund will mark the 20th anniversary of its relationship with its advisor, Oaktree Capital Management. I’d like to express my appreciation to Oaktree’s highly experienced team of portfolio managers and analysts for managing the fund during some of the most challenging market conditions of our time. Their deep knowledge of the complex convertibles
2
market and their disciplined approach has helped them serve our shareholders with distinction.
The Convertible Securities Fund celebrated another milestone—its 30th anniversary—just after the close of this fiscal period. Much has changed in the financial markets in the past three decades, but the value the fund offers as a complement to a well-diversified portfolio still holds true.
In a tale of two halves, stocks fell and then rose
U.S. stocks advanced about 1% for the six months. Equities retreated over the period’s first half before rebounding, as a sharp recovery in oil prices seemed to alleviate fears of a global economic slowdown.
The period began with the Federal Reserve’s long-anticipated but small increase in short-term interest rates. Through the succeeding months, mixed signals from Fed officials—as well as from economic data—created uncertainty about when the next increase might occur.
International stocks fared worse than their U.S. counterparts, returning about –1%. Emerging-market stocks rose a bit, while stocks from the developed markets of Europe and the Pacific region declined. European stocks lagged amid investor
| | | |
| Market Barometer | | | |
| |
| | Total Returns |
| | Periods Ended May 31, 2016 |
| | Six | One | Five Years |
| | Months | Year | (Annualized) |
| Stocks | | | |
| Russell 1000 Index (Large-caps) | 1.64% | 0.78% | 11.44% |
| Russell 2000 Index (Small-caps) | -2.86 | -5.97 | 7.86 |
| Russell 3000 Index (Broad U.S. market) | 1.29 | 0.22 | 11.15 |
| FTSE All-World ex US Index (International) | -1.14 | -10.87 | 0.52 |
| |
| Bonds | | | |
| Barclays U.S. Aggregate Bond Index (Broad taxable market) | 3.12% | 2.99% | 3.33% |
| Barclays Municipal Bond Index (Broad tax-exempt market) | 3.42 | 5.87 | 5.07 |
| Citigroup Three-Month U.S. Treasury Bill Index | 0.10 | 0.12 | 0.05 |
| |
| CPI | | | |
| Consumer Price Index | 1.22% | 1.02% | 1.23% |
3
anxiety in the lead-up to the United Kingdom’s June vote on whether to remain in the European Union.
Bonds enjoyed a strong ride after some early weakness
The broad U.S. taxable bond market returned 3.12%. After dipping in December, bonds climbed. The yield of the 10-year U.S. Treasury note closed at 1.85% at the end of May, down from 2.22% six months earlier. (Bond prices and yields move in opposite directions.)
Money market funds and savings accounts produced limited returns as the Fed’s target rate of 0.25%–0.5% remained historically low, despite the quarter-percentage-point rise in December.
International bond markets (as measured by the Barclays Global Aggregate Index ex USD) returned 9.17%. In a reversal from the trend of recent years, foreign currencies strengthened against the dollar, boosting international bonds. Even without this currency benefit, international bond returns were solidly positive.
Global stock market weakness weighed on the fund’s result
Vanguard Convertible Securities Fund offers investors exposure to a niche asset class that includes attractive features of both stocks and bonds.
Because of its hybrid characteristics, the fund typically produces a return somewhere in between those of the broad U.S. stock and bond markets. But turbulence
| | |
| Expense Ratios | | |
| Your Fund Compared With Its Peer Group | | |
| | | Peer Group |
| | Fund | Average |
| Convertible Securities Fund | 0.38% | 1.30% |
The fund expense ratio shown is from the prospectus dated March 29, 2016, and represents estimated costs for the current fiscal year. For
the six months ended May 31, 2016, the fund’s annualized expense ratio was 0.35%. This decrease from the estimated expense ratio reflects
a performance-based investment advisory fee adjustment. When the performance is positive, the fund’s expenses increase; when it is
negative, expenses decrease. The peer-group expense ratio is derived from data provided by Lipper, a Thomson Reuters Company, and
captures information through year-end 2015.
Peer group: Convertible Securities Funds.
4
earlier in the period, particularly in stocks and bonds perceived to be especially risky, hurt the fund’s result, which lagged both the U.S. stock and bond markets.
The fund registered a sharply negative return for the first half of the period as the value of its underlying stocks tumbled. Risk-averse investors gravitated toward assets considered more secure, such as large-capitalization stocks and investment-grade bonds. This hurt U.S. convertibles, which are mostly issued by small or midsized companies that have low-rated or unrated credit and thus find it difficult to secure traditional sources of financing.
As stock markets recovered in the second half of the period, convertibles rebounded—but not enough to overcome earlier setbacks. Improvements in the global economy and the European Central Bank’s decision to expand its stimulus program contributed to investors’ confidence in the markets.
Global issuance of convertible securities also picked up, but remained weaker than it had been for the same period a year earlier. New issuance totaled about $31 billion for the six months, with most of the supply coming from Europe. The United States represented about $10 billion in new issuance. European investors searching for yield in a low- or even negative-yield environment found high-quality, short-dated convertibles appealing. Unlike their U.S. counterparts, international convertibles tend to be higher quality and issued by larger companies.
The Convertible Securities Fund offers global exposure (on a U.S. dollar-hedged basis) to the convertibles market. Although the fund invests primarily in U.S. convertibles, about a third of its assets are in international securities. As we’ve noted previously, increasing exposure to international convertibles has enhanced diversification and expanded investment opportunities for the advisor.
For more information on the fund’s positioning and performance during the period, please see the Advisor’s Report that follows this letter.
Consider rebalancing to manage your risk
Let’s say you’ve taken the time to carefully create an appropriate asset allocation for your investment portfolio. Your efforts have produced a diversified mix of stock, bond, and money market funds tailored to your goals, time horizon, and risk tolerance.
But what should you do when your portfolio drifts from its original asset allocation as the financial markets rise or fall? Consider rebalancing to bring it back to the proper mix.
Just one year of outsized returns can throw your allocation out of whack. Take 2013 as an example. That year, the broad stock market (as measured by the Russell 3000 Index) returned 33.55% and the broad taxable bond market (as measured by the Barclays U.S. Aggregate Bond Index) returned –2.02%. A hypothetical portfolio that tracked the broad domestic market indexes and started the year with
5
60% stocks and 40% bonds would have ended with a more aggressive mix of 67% stocks and 33% bonds.
Rebalancing to bring your portfolio back to its original targets would require you to shift assets away from areas that have been performing well toward those that have been falling behind. That isn’t easy or intuitive. It’s a way to minimize risk rather than maximize returns and to stick with your investment plan through different types of markets. (You can read more about our approach in Best Practices for Portfolio Rebalancing at vanguard.com/ research.)
It’s not necessary to check your portfolio every day or every month, much less rebalance it that frequently. It may be more appropriate to monitor it annually or semiannually and rebalance when your allocation swings 5 percentage points or more from its target.
It’s important, of course, to be aware of the tax implications. You’ll want to consult with your tax advisor, but generally speaking, it may be a good idea to make any asset changes within a tax-advantaged retirement account or to direct new cash flows into the underweighted asset class.
However you go about it, keeping your asset allocation from drifting too far off target can help you stay on track with the investment plan you’ve crafted to meet your financial goals.
As always, thank you for investing with Vanguard.
Sincerely,

F. William McNabb III
Chairman and Chief Executive Officer
June 13, 2016
6
Advisor’s Report
The investment strategy of the Vanguard Convertible Securities Fund is to create a highly diversified global portfolio of convertible securities. The fund emphasizes investments in convertible bonds with relatively near-term maturities or put dates. We focus on “balanced” convertibles, where the securities have a reasonable yield and stable credit quality, good call protection, and low-to-moderate conversion premiums. We believe these securities
have a favorable balance of upside potential and downside risk. The fund underweights convertible preferred shares, which are riskier but may offer higher returns; we do, however, consider them part of our investable universe and make some use of them.
Importantly, the fund does not invest in common stocks or non-convertible debt. We do not attempt market timing and
| |
| Major Portfolio Changes | |
| Six Months Ended May 31, 2016 | |
| |
| Additions | Comments |
| Nexity | Balanced new issue on attractive company. |
| (0.125% convertible note due 01/01/23) | |
| Rovi | Balanced convertible with strong equity catalysts. |
| (0.50% convertible note due 03/01/20) | |
| SanDisk | Balanced convertible with limited downside and attractive |
| (0.50% convertible note due 10/15/20) | upside participation. |
| Starwood Property Trust | Balanced convertibles with limited downside and attractive |
| (4.55% convertible note due 03/01/18) | upside participation. |
| (4.00% convertible note due 01/15/19) | |
| Steinhoff Finance Holdings | Acted on temporary weakness to add this balanced convertible. |
| (1.25% convertible note due 08/11/22) | |
| Yahoo | Balanced convertible with limited downside and attractive |
| (0.00% convertible note due 12/01/18) | upside participation. |
| |
| Reductions | Comments |
| Jarden | Sold on substantial appreciation after acquisition by |
| (1.125% convertible note due 03/15/34) | Newell Rubbermaid was announced. |
| LinkedIn | Sold as bond lacked a balanced profile. |
| (0.50% convertible note due 11/01/19) | |
| Marine Harvest | Took profits on the 2019 convertible bond and switched |
| (0.875% convertible note due 05/06/19) | into the more balanced 2020 convertible bond. |
| SanDisk | Sold after acquisition by Western Digital received |
| (0.50% convertible note due 10/15/20) | shareholder approval. |
| Technip | Reduced position after substantial appreciation and bonds |
| (0.875% convertible note due 01/25/21) | developed significant downside risk. |
| Yahoo | Sold appreciated position after potential divestiture discussions. |
| (0.00% convertible note due 12/01/18) | |
7
therefore are fully invested, holding only a small amount of cash for potential investments. We believe that a portfolio of attractive, carefully selected convertible securities can produce equity-type returns with lower volatility and lower structural risk over long periods.
Despite the market snapback that began in mid-February, the fund posted a negative return for the half year. Equities declined and credit spreads widened during the first three months of the period before reversing course. Convertible securities participated in the strength of underlying equities during market rallies, while also providing downside protection during periods of volatility.
For the six months ended May 31, 2016, the fund returned –1.31%, lagging the –0.73% return of its blended benchmark.
The investment environment
The equity and credit rally resulted from a combination of factors, including the European Central Bank’s early February decision to increase the size and scope of its quantitative easing program, the Federal Reserve’s dovish comments about how many interest rate increases it expected to make in 2016, rising energy and commodity prices, and capital flows into the high-yield bond market. Given the weak performance of global equities and the high correlation between convertible and equity market returns, it’s not surprising that convertibles generated a modest negative return for the six months.
The fund remains highly sensitive to underlying equity performance as a result of convertible bonds’ historically low coupons in the current interest rate environment. The portfolio remains structurally conservative, with short- to intermediate-term bonds, defined as bonds with maturities or puts within seven years, accounting for 94% of investments. Convertible preferred shares represent 7.9% of the portfolio, which is significantly underweight versus the benchmark index. We are comfortable with our current portfolio construction, with its balance between the equity participation and the downside protection provided by the fixed income component.
The new issuance market maintained the lackluster pace we saw in the second half of 2015. New issuance totaled $30.9 billion for the period, with most of the supply coming from Europe ($14.2 billion). The United States provided $10.4 billion in new issuance, while Asia and Japan together provided just over $6.0 billion. While we are disappointed that new issuance lagged the same period a year earlier, we are optimistic that levels will pick up in the latter half of 2016, given the new issuance we saw in March and May.
Successes
The portfolio returns for the period were broad based. The top individual contributors to the fund’s performance on an absolute basis were convertibles from WebMD, Alere, WPX Energy, and Cemex. On an industry basis, our security selection in the pharmaceuticals sector generated strong returns for the fund relative to the benchmark.
8
Our shortfalls
Though we trailed the benchmark for the six months, we were pleased to generally keep pace with it during a period when our portfolio had several winners and an absence of meaningful detractors. For the most part, our performance detractors were the result of declining underlying equities, rather than any credit deterioration.
Our chief detractors were LinkedIn and Scorpio Tankers. LinkedIn, a leading professional networking website, reported slower-than-expected growth. Although the equity price fell precipitously, the convertible bond responded as we had expected, experiencing a limited share of the equity’s decline. The stock price of Scorpio, an operator of vessels used to transport refinery products, fell because of a weak energy price environment. However, daily rates for its ships continue to be strong and the convertible remains “balanced.”
The fund’s positioning
We remain fully invested in a highly diversified, well-balanced portfolio of convertible securities. At the end of the period, the fund’s investments were 67% in the United States and 33% outside the
United States. The fund had an attractive current yield of 2.1% and average credit quality of Ba3/BB–. The vast majority of the issuers held in the fund are fundamentally strong performers and, well-positioned from a credit perspective.
Our current outlook is constructive. Convertible valuations and demand from market participants have remained stable. We believe that the fund should provide a favorable asymmetrical exposure to equities, as it will participate in more of the stock market’s advance, if that occurs, than its loss in the event equities decline. We will continue our focus on credit quality and intermediate-term bonds, which should dampen volatility in equities.
Stu Spangler, CFA, Managing Director
Jean-Paul Nedelec, Managing Director
Abe Ofer, Managing Director
Jean-Pierre Latrille, Senior Vice President
Petar Raketic, Senior Vice President
Oaktree Capital Management, L.P.
June 17, 2016
9
Convertible Securities Fund
Fund Profile
As of May 31, 2016
| |
| Portfolio Characteristics | |
| Ticker Symbol | VCVSX |
| Number of Securities | 168 |
| 30-Day SEC Yield | 2.07% |
| Conversion Premium | 39.0% |
| Average Weighted Maturity | 4.2 years |
| Average Coupon | 2.2% |
| Average Duration | 5.4 years |
| Foreign Holdings | 32.7% |
| Turnover Rate (Annualized) | 97% |
| Expense Ratio1 | 0.38% |
| Short-Term Reserves | 1.8% |
| |
| Distribution by Maturity | |
| (% of fixed income portfolio) | |
| Under 1 Year | 1.0% |
| 1 - 5 Years | 68.6 |
| 5 - 10 Years | 29.8 |
| 10 - 20 Years | 0.3 |
| 20 - 30 Years | 0.3 |
| |
| Distribution by Credit Quality (% of fixed | |
| income portfolio) | |
| AAA | 0.0% |
| AA | 0.0 |
| A | 1.8 |
| BBB | 5.1 |
| BB | 10.5 |
| B | 9.1 |
| Below B | 0.7 |
| Not Rated | 72.8 |
Credit-quality ratings are obtained from S&P. "Not Rated" is used to classify securities for which a rating is not available. Not rated
securities include a fund's investment in Vanguard Market Liquidity Fund or Vanguard Municipal Cash Management Fund, each of
which invests in high-quality money market instruments and may serve as a cash management vehicle for the Vanguard funds,
trusts, and accounts. For more information about these ratings, see the Glossary entry for Credit Quality.
| | |
| Total Fund Volatility Measures | |
| | | DJ |
| | Convertibles | U.S. Total |
| | Composite | Market |
| | Index | FA Index |
| R-Squared | 0.91 | 0.73 |
| Beta | 0.91 | 0.54 |
These measures show the degree and timing of the fund’s fluctuations compared with the indexes over 36 months.
| | |
| Ten Largest Holdings (% of total net assets) |
| Citrix Systems Inc. | Software | 2.7% |
| Priceline Group Inc. | Internet & Catalog | |
| | Retail | 1.9 |
| Dycom Industries Inc. | Construction & | |
| | Engineering | 1.8 |
| Herbalife Ltd. | Personal Products | 1.8 |
| Cemex SAB de CV | Construction | |
| | Materials | 1.7 |
| Nuance | | |
| Communications Inc. | Software | 1.7 |
| Ctrip.com International | Internet & Catalog | |
| Ltd. | Retail | 1.7 |
| Jazz Investments I Ltd. | Pharmaceuticals | 1.6 |
| Microchip Technology | Semiconductors & | |
| Inc. | Semiconductor | |
| | Equipment | 1.6 |
| NXP Semiconductors NV Semiconductors & | |
| | Semiconductor | |
| | Equipment | 1.6 |
| Top Ten | | 18.1% |
The holdings listed exclude any temporary cash investments and equity index products.
1 The expense ratio shown is from the prospectus dated March 29, 2016, and represents estimated costs for the current fiscal year. For the
six months ended May 31, 2016, the annualized expense ratio was 0.35%.
10
Convertible Securities Fund
Sector Diversification (% of market exposure)
| |
| Consumer Discretionary | 10.0% |
| Consumer Staples | 4.5 |
| Energy | 6.6 |
| Financials | 14.0 |
| Health Care | 17.4 |
| Industrials | 10.7 |
| Information Technology | 28.2 |
| Materials | 6.4 |
| Telecommunication Services | 0.9 |
| Utilities | 1.3 |
11
Convertible Securities Fund
Performance Summary
All of the returns in this report represent past performance, which is not a guarantee of future results that may be achieved by the fund. (Current performance may be lower or higher than the performance data cited. For performance data current to the most recent month-end, visit our website at vanguard.com/performance.) Note, too, that both investment returns and principal value can fluctuate widely, so an investor’s shares, when sold, could be worth more or less than their original cost. The returns shown do not reflect taxes that a shareholder would pay on fund distributions or on the sale of fund shares.
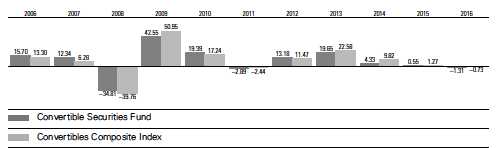
Fiscal-Year Total Returns (%): November 30, 2005, Through May 31, 2016
For a benchmark description, see the Glossary.
Note: For 2016, performance data reflect the six months ended May 31, 2016.
Average Annual Total Returns: Periods Ended March 31, 2016
This table presents returns through the latest calendar quarter—rather than through the end of the fiscal period.
Securities and Exchange Commission rules require that we provide this information.
| | | | | | |
| | | | | Ten Years |
| | Inception Date | One Year | Five Years | Income | Capital | Total |
| Convertible Securities | | | | | | |
| Fund | 6/17/1986 | -8.05% | 3.64% | 3.48% | 2.04% | 5.52% |
See Financial Highlights for dividend and capital gains information.
12
Convertible Securities Fund
Financial Statements (unaudited)
Statement of Net Assets
As of May 31, 2016
The fund reports a complete list of its holdings in regulatory filings four times in each fiscal year, at the quarter-ends. For the second and fourth fiscal quarters, the lists appear in the fund’s semiannual and annual reports to shareholders. For the first and third fiscal quarters, the fund files the lists with the Securities and Exchange Commission on Form N-Q. Shareholders can look up the fund’s Forms N-Q on the SEC’s website at sec.gov. Forms N-Q may also be reviewed and copied at the SEC’s Public Reference Room (see the back cover of this report for further information).
| | | | | |
| | | | | Face | Market |
| | | Maturity | | Amount | Value• |
| | Coupon | Date | Currency | (000) | ($000) |
| Convertible Bonds (89.4%) | | | | | |
| Consumer Discretionary (9.8%) | | | | | |
| Cineplex Inc. Cvt. | 4.500% | 12/31/18 | CAD | 5,713 | 4,618 |
| 1 Ctrip.com International Ltd. Cvt. | 1.000% | 7/1/20 | USD | 20,630 | 22,706 |
| 1 Ctrip.com International Ltd. Cvt. | 1.990% | 7/1/25 | USD | 2,915 | 3,323 |
| FF Group Finance Luxembourg Cvt. | 1.750% | 7/3/19 | EUR | 500 | 462 |
| Iida Group Holdings Co. Ltd. Cvt. | 0.000% | 6/18/20 | JPY | 500,000 | 5,046 |
| K’s Holdings Corp. Cvt. | 0.000% | 12/20/19 | JPY | 400,000 | 4,086 |
| Liberty Media Corp. Cvt. | 1.375% | 10/15/23 | USD | 22,314 | 22,161 |
| Live Nation Entertainment Inc. Cvt. | 2.500% | 5/15/19 | USD | 1,410 | 1,429 |
| LVMH Moet Hennessy Louis Vuitton SE Cvt. | 0.000% | 2/16/21 | USD | 4,384 | 4,509 |
| NH Hoteles SA Cvt. | 4.000% | 11/8/18 | EUR | 6,100 | 7,839 |
| NHK Spring Co. Ltd. Cvt. | 0.000% | 9/20/19 | USD | 4,050 | 4,086 |
| Priceline Group Inc. Cvt. | 0.350% | 6/15/20 | USD | 19,520 | 23,070 |
| Priceline Group Inc. Cvt. | 0.900% | 9/15/21 | USD | 6,165 | 6,300 |
| ResortTrust Inc. Cvt. | 0.000% | 12/1/21 | JPY | 560,000 | 5,297 |
| Shutterfly Inc. Cvt. | 0.250% | 5/15/18 | USD | 7,410 | 7,484 |
| Sony Corp. Cvt. | 0.000% | 9/30/22 | JPY | 466,000 | 4,435 |
| Steinhoff Finance Holdings GmbH Cvt. | 1.250% | 8/11/22 | EUR | 7,500 | 8,495 |
| Sumitomo Forestry Co. Ltd. Cvt. | 0.000% | 8/24/18 | JPY | 430,000 | 4,050 |
| Suzuki Motor Corp. Cvt. | 0.000% | 3/31/23 | JPY | 500,000 | 4,752 |
| Takashimaya Co. Ltd. Cvt. | 0.000% | 12/11/20 | JPY | 500,000 | 4,560 |
| | | | | | 148,708 |
| Consumer Staples (3.6%) | | | | | |
| Herbalife Ltd. Cvt. | 2.000% | 8/15/19 | USD | 27,852 | 27,155 |
| Marine Harvest ASA Cvt. | 0.125% | 11/5/20 | EUR | 8,000 | 10,047 |
| Sonae Investments BV Cvt. | 1.625% | 6/11/19 | EUR | 3,900 | 4,120 |
| Vector Group Ltd. Cvt. | 1.750% | 4/15/20 | USD | 12,065 | 13,038 |
| | | | | | 54,360 |
| Energy (3.7%) | | | | | |
| BW Group Ltd. Cvt. | 1.750% | 9/10/19 | USD | 6,400 | 5,424 |
| Cheniere Energy Inc. Cvt. | 4.250% | 3/15/45 | USD | 7,380 | 4,174 |
| 1 Scorpio Tankers Inc. Cvt. | 2.375% | 7/1/19 | USD | 10,445 | 8,735 |
| SEACOR Holdings Inc. Cvt. | 2.500% | 12/15/27 | USD | 6,220 | 6,072 |
| SEACOR Holdings Inc. Cvt. | 3.000% | 11/15/28 | USD | 7,140 | 5,864 |
| Technip SA Cvt. | 0.875% | 1/25/21 | EUR | 2,600 | 3,451 |
| TOTAL SA Cvt. | 0.500% | 12/2/22 | USD | 8,000 | 8,004 |
| 1 Whiting Petroleum Corp. Cvt. | 1.250% | 4/1/20 | USD | 18,700 | 14,212 |
| | | | | | 55,936 |
13
Convertible Securities Fund
| | | | | |
| | | | | Face | Market |
| | | Maturity | | Amount | Value• |
| | Coupon | Date | Currency | (000) | ($000) |
| Financials (12.0%) | | | | | |
| AmTrust Financial Services Inc. Cvt. | 2.750% | 12/15/44 | USD | 12,700 | 9,906 |
| Apollo Commercial Real Estate | | | | | |
| Finance Inc. Cvt. | 5.500% | 3/15/19 | USD | 2,907 | 2,967 |
| Aroundtown Property Holdings plc Cvt. | 1.500% | 1/18/21 | EUR | 3,100 | 3,709 |
| Aroundtown Property Holdings plc Cvt. | 3.000% | 5/5/20 | EUR | 7,800 | 11,885 |
| AYC Finance Ltd. Cvt. | 0.500% | 5/2/19 | USD | 2,886 | 3,030 |
| Azimut Holding SPA Cvt. | 2.125% | 11/25/20 | EUR | 10,300 | 12,784 |
| Beni Stabili SpA SIIQ Cvt. | 0.875% | 1/31/21 | EUR | 7,300 | 8,106 |
| Blackstone Mortgage Trust Inc. Cvt. | 5.250% | 12/1/18 | USD | 5,805 | 6,200 |
| British Land White 2015 Ltd. | 0.000% | 6/9/20 | GBP | 3,400 | 4,737 |
| CapitaLand Ltd. Cvt. | 2.800% | 6/8/25 | SGD | 14,750 | 10,250 |
| China Overseas Finance Investment | | | | | |
| Cayman V Ltd. Cvt. | 0.000% | 1/5/23 | USD | 3,800 | 3,802 |
| Colony Financial Inc. Cvt. | 5.000% | 4/15/23 | USD | 7,359 | 7,032 |
| Colony Starwood Homes Cvt. | 3.000% | 7/1/19 | USD | 1,320 | 1,369 |
| 1 Element Financial Corp. Cvt. | 4.250% | 6/30/20 | CAD | 8,650 | 6,778 |
| 1 Element Financial Corp. Cvt. | 5.125% | 6/30/19 | CAD | 15,464 | 13,208 |
| 1 Empire State Realty OP LP Cvt. | 2.625% | 8/15/19 | USD | 6,055 | 6,638 |
| Encore Capital Group Inc. Cvt. | 3.000% | 7/1/20 | USD | 8,660 | 7,237 |
| 1 Extra Space Storage LP Cvt. | 3.125% | 10/1/35 | USD | 9,273 | 10,664 |
| Grand City Properties SA Cvt. | 0.250% | 3/2/22 | EUR | 3,200 | 3,724 |
| Nexity SA Cvt. | 0.125% | 1/1/23 | EUR | 6,960 | 7,901 |
| Portfolio Recovery Associates Inc. Cvt. | 3.000% | 8/1/20 | USD | 8,398 | 6,661 |
| Remgro Jersey GBP Ltd. Cvt. | 2.625% | 3/22/21 | GBP | 2,300 | 3,346 |
| Spirit Realty Capital Inc. Cvt. | 2.875% | 5/15/19 | USD | 5,865 | 6,111 |
| Spirit Realty Capital Inc. Cvt. | 3.750% | 5/15/21 | USD | 5,260 | 5,674 |
| St. Modwen Properties Securities | | | | | |
| Jersey Ltd. Cvt. | 2.875% | 3/6/19 | GBP | 4,800 | 6,851 |
| Starwood Property Trust Inc. Cvt. | 4.550% | 3/1/18 | USD | 5,116 | 5,321 |
| Unite Jersey Issuer Ltd. Cvt. | 2.500% | 10/10/18 | GBP | 3,300 | 6,542 |
| | | | | | 182,433 |
| Health Care (14.5%) | | | | | |
| Allscripts Healthcare Solutions Inc. Cvt. | 1.250% | 7/1/20 | USD | 9,795 | 10,125 |
| BioMarin Pharmaceutical Inc. Cvt. | 0.750% | 10/15/18 | USD | 13,615 | 16,321 |
| Brookdale Senior Living Inc. Cvt. | 2.750% | 6/15/18 | USD | 12,630 | 12,472 |
| Depomed Inc. Cvt. | 2.500% | 9/1/21 | USD | 8,844 | 10,983 |
| HealthSouth Corp. Cvt. | 2.000% | 12/1/43 | USD | 13,216 | 15,669 |
| Healthways Inc. Cvt. | 1.500% | 7/1/18 | USD | 6,620 | 6,314 |
| Hologic Inc. Cvt. | 0.000% | 12/15/43 | USD | 8,785 | 10,784 |
| Horizon Pharma Investment Ltd. Cvt. | 2.500% | 3/15/22 | USD | 10,849 | 9,913 |
| Insulet Corp. Cvt. | 2.000% | 6/15/19 | USD | 10,814 | 10,239 |
| 1 Ironwood Pharmaceuticals Inc. Cvt. | 2.250% | 6/15/22 | USD | 13,209 | 13,201 |
| Jazz Investments I Ltd. Cvt. | 1.875% | 8/15/21 | USD | 22,289 | 24,922 |
| Medicines Co. Cvt. | 2.500% | 1/15/22 | USD | 7,008 | 8,909 |
| Medidata Solutions Inc. Cvt. | 1.000% | 8/1/18 | USD | 11,620 | 12,528 |
| 1 NuVasive Inc. Cvt. | 2.250% | 3/15/21 | USD | 17,815 | 20,142 |
| Qiagen NV Cvt. | 0.375% | 3/19/19 | USD | 3,400 | 3,521 |
| Qiagen NV Cvt. | 0.875% | 3/19/21 | USD | 4,800 | 5,035 |
| Spectranetics Corp. Cvt. | 2.625% | 6/1/34 | USD | 8,139 | 7,122 |
| Terumo Corp. Cvt. | 0.000% | 12/6/21 | JPY | 500,000 | 5,983 |
| 1 Wright Medical Group NV Cvt. | 2.250% | 11/15/21 | USD | 15,055 | 16,626 |
| | | | | | 220,809 |
14
Convertible Securities Fund
| | | | | |
| | | | | Face | Market |
| | | Maturity | | Amount | Value• |
| | Coupon | Date | Currency | (000) | ($000) |
| Industrials (10.4%) | | | | | |
| 51job Inc. Cvt. | 3.250% | 4/15/19 | USD | 6,240 | 6,416 |
| Aecon Group Inc. Cvt. | 5.500% | 12/31/18 | CAD | 1,852 | 1,511 |
| Atlas Air Worldwide Holdings Inc. Cvt. | 2.250% | 6/1/22 | USD | 3,901 | 3,823 |
| Brenntag Finance BV Cvt. | 1.875% | 12/2/22 | USD | 9,250 | 9,773 |
| Carillion Finance Jersey Ltd. Cvt. | 2.500% | 12/19/19 | GBP | 5,200 | 7,248 |
| CRRC Corp. Ltd. Cvt. | 0.000% | 2/5/21 | USD | 5,250 | 5,519 |
| DP World Ltd. Cvt. | 1.750% | 6/19/24 | USD | 7,400 | 7,317 |
| 1 Dycom Industries Inc. Cvt. | 0.750% | 9/15/21 | USD | 24,705 | 27,716 |
| Echo Global Logistics Inc. Cvt. | 2.500% | 5/1/20 | USD | 8,140 | 7,713 |
| GVM Debentures Lux 1 SA Cvt. | 5.750% | 2/14/18 | EUR | 6,200 | 5,734 |
| Huron Consulting Group Inc. Cvt. | 1.250% | 10/1/19 | USD | 13,435 | 13,158 |
| International Consolidated Airlines | | | | | |
| Group SA Cvt. | 0.625% | 11/17/22 | EUR | 4,900 | 5,182 |
| Johnson Electric Holdings Ltd. Cvt. | 1.000% | 4/2/21 | USD | 4,500 | 4,601 |
| Keihan Electric Railway Co. Ltd. Cvt. | 0.000% | 3/30/21 | JPY | 390,000 | 3,619 |
| KEYW Holding Corp. Cvt. | 2.500% | 7/15/19 | USD | 8,750 | 7,749 |
| Larsen & Toubro Ltd. Cvt. | 0.675% | 10/22/19 | USD | 6,325 | 6,048 |
| LIXIL Group Corp. Cvt. | 0.000% | 3/4/22 | JPY | 470,000 | 4,087 |
| MISUMI Group Inc. Cvt. | 0.000% | 10/22/18 | USD | 1,400 | 1,832 |
| Nagoya Railroad Co. Ltd. Cvt. | 0.000% | 12/11/24 | JPY | 750,000 | 7,742 |
| Prysmian SPA Cvt. | 1.250% | 3/8/18 | EUR | 3,300 | 4,167 |
| Sacyr SA Cvt. | 4.000% | 5/8/19 | EUR | 4,400 | 3,630 |
| Safran SA Cvt. | 0.000% | 12/31/20 | EUR | 3,430 | 4,021 |
| Shimizu Corp. Cvt. | 0.000% | 10/16/20 | JPY | 360,000 | 3,503 |
| Siemens Financieringsmaatschappij NV Cvt. | 1.650% | 8/16/19 | USD | 5,250 | 5,779 |
| | | | | | 157,888 |
| Information Technology (27.6%) | | | | | |
| Abigrove Ltd. Cvt. | 0.500% | 4/29/21 | USD | 4,000 | 3,946 |
| Advanced Semiconductor Engineering Inc. Cvt. | 0.000% | 3/27/18 | USD | 6,600 | 6,229 |
| 1 BroadSoft Inc. Cvt. | 1.000% | 9/1/22 | USD | 10,255 | 13,094 |
| CalAmp Corp. Cvt. | 1.625% | 5/15/20 | USD | 1,995 | 1,995 |
| Canadian Solar Inc. Cvt. | 4.250% | 2/15/19 | USD | 5,420 | 4,749 |
| Cardtronics Inc. Cvt. | 1.000% | 12/1/20 | USD | 17,497 | 17,803 |
| 1 Ciena Corp. Cvt. | 3.750% | 10/15/18 | USD | 7,540 | 8,624 |
| Citrix Systems Inc. Cvt. | 0.500% | 4/15/19 | USD | 35,200 | 40,634 |
| 1 CSG Systems International Inc. Cvt. | 4.250% | 3/15/36 | USD | 8,885 | 9,390 |
| 1 DH Corp. Cvt. | 5.000% | 9/30/20 | CAD | 13,003 | 10,167 |
| Econocom Group Cvt. | 1.500% | 1/15/19 | EUR | 6,518 | 8,396 |
| Electronics For Imaging Inc. Cvt. | 0.750% | 9/1/19 | USD | 15,280 | 16,273 |
| Euronet Worldwide Inc. Cvt. | 1.500% | 10/1/44 | USD | 11,034 | 13,682 |
| 1 Inphi Corp. Cvt. | 1.125% | 12/1/20 | USD | 10,867 | 11,546 |
| 1 Integrated Device Technology Inc. Cvt. | 0.875% | 11/15/22 | USD | 15,490 | 15,809 |
| Intel Corp. Cvt. | 2.950% | 12/15/35 | USD | 3,100 | 3,953 |
| InterDigital Inc. Cvt. | 1.500% | 3/1/20 | USD | 12,144 | 12,903 |
| j2 Global Inc. Cvt. | 3.250% | 6/15/29 | USD | 19,066 | 22,069 |
| 1 Knowles Corp. Cvt. | 3.250% | 11/1/21 | USD | 8,905 | 9,289 |
| Microchip Technology Inc. Cvt. | 1.625% | 2/15/25 | USD | 22,305 | 24,800 |
| 1 Nuance Communications Inc. Cvt. | 1.000% | 12/15/35 | USD | 13,035 | 11,658 |
| Nuance Communications Inc. Cvt. | 1.500% | 11/1/35 | USD | 14,438 | 14,375 |
| NXP Semiconductors NV Cvt. | 1.000% | 12/1/19 | USD | 20,031 | 23,649 |
| 1 ON Semiconductor Corp. Cvt. | 1.000% | 12/1/20 | USD | 3,340 | 3,048 |
| 1 Proofpoint Inc. Cvt. | 0.750% | 6/15/20 | USD | 7,375 | 7,559 |
| Red Hat Inc. Cvt. | 0.250% | 10/1/19 | USD | 13,550 | 17,124 |
| Rovi Corp. Cvt. | 0.500% | 3/1/20 | USD | 20,109 | 19,455 |
15
|
| Convertible Securities Fund |
| | | | | |
| | | | | Face | Market |
| | | Maturity | | Amount | Value• |
| | Coupon | Date | Currency | (000) | ($000) |
| Semiconductor Manufacturing | | | | | |
| International Corp. Cvt. | 0.000% | 11/7/18 | USD | 4,000 | 4,200 |
| SunPower Corp. Cvt. | 0.875% | 6/1/21 | USD | 945 | 703 |
| 1 SunPower Corp. Cvt. | 4.000% | 1/15/23 | USD | 10,545 | 9,570 |
| Synchronoss Technologies Inc. Cvt. | 0.750% | 8/15/19 | USD | 9,755 | 9,755 |
| TTM Technologies Inc. Cvt. | 1.750% | 12/15/20 | USD | 12,323 | 12,207 |
| Web.com Group Inc. Cvt. | 1.000% | 8/15/18 | USD | 3,650 | 3,363 |
| WebMD Health Corp. Cvt. | 2.500% | 1/31/18 | USD | 3,030 | 3,555 |
| 1 WebMD Health Corp. Cvt. | 2.625% | 6/15/23 | USD | 9,730 | 10,113 |
| Workday Inc. Cvt. | 0.750% | 7/15/18 | USD | 3,635 | 4,105 |
| Workday Inc. Cvt. | 1.500% | 7/15/20 | USD | 7,930 | 9,348 |
| | | | | | 419,138 |
| Materials (5.9%) | | | | | |
| APERAM Cvt. | 0.625% | 7/8/21 | USD | 7,400 | 8,566 |
| Bekaert SA Cvt. | 0.000% | 6/9/21 | EUR | 3,200 | 3,587 |
| Buzzi Unicem SPA Cvt. | 1.375% | 7/17/19 | EUR | 3,700 | 5,284 |
| Cemex SAB de CV Cvt. | 3.720% | 3/15/20 | USD | 18,662 | 17,461 |
| Cemex SAB de CV Cvt. | 3.720% | 3/15/20 | USD | 9,565 | 8,949 |
| 1 Chemtrade Logistics Income Fund Cvt. | 5.250% | 6/30/21 | CAD | 5,331 | 4,096 |
| OCI Cvt. | 3.875% | 9/25/18 | EUR | 2,400 | 2,458 |
| RTI International Metals Inc. Cvt. | 1.625% | 10/15/19 | USD | 13,740 | 14,693 |
| Stillwater Mining Co. Cvt. | 1.750% | 10/15/32 | USD | 15,777 | 16,743 |
| Teijin Ltd. Cvt. | 0.000% | 12/12/18 | JPY | 140,000 | 1,418 |
| Teijin Ltd. Cvt. | 0.000% | 12/10/21 | JPY | 610,000 | 6,487 |
| | | | | | 89,742 |
| Telecommunication Services (0.6%) | | | | | |
| America Movil SAB de Cvt. | 0.000% | 5/28/20 | EUR | 7,600 | 8,511 |
| |
| Utilities (1.3%) | | | | | |
| Northland Power Inc. Cvt. | 4.750% | 6/30/20 | CAD | 6,225 | 5,186 |
| Northland Power Inc. Cvt. | 5.000% | 6/30/19 | CAD | 2,661 | 2,232 |
| 1 Pattern Energy Group Inc. Cvt. | 4.000% | 7/15/20 | USD | 10,995 | 10,693 |
| Superior Plus Corp. Cvt. | 6.000% | 6/30/19 | CAD | 2,558 | 1,982 |
| | | | | | 20,093 |
| Total Convertible Bonds (Cost $1,337,079) | | | | | 1,357,618 |
| |
| | | | | Shares | |
| Convertible Preferred Stocks (8.0%) | | | | | |
| Consumer Staples (0.8%) | | | | | |
| Bunge Ltd. Pfd. | 4.875% | | | 129,625 | 12,452 |
| |
| Energy (2.7%) | | | | | |
| Anadarko Petroleum Corp. Pfd. | 7.500% | | | 34,400 | 1,317 |
| Hess Corp. Pfd. | 8.000% | | | 140,100 | 10,678 |
| Kinder Morgan Inc. Pfd. | 9.750% | | | 91,500 | 4,172 |
| McDermott International Inc. Pfd. | 6.250% | | | 283,700 | 4,928 |
| Southwestern Energy Co. Pfd. | 6.250% | | | 361,400 | 11,666 |
| WPX Energy Inc. Pfd. | 6.250% | | | 162,900 | 8,227 |
| | | | | | 40,988 |
| Financials (1.7%) | | | | | |
| American Tower Corp. Pfd. | 5.500% | | | 205,000 | 21,653 |
| Crown Castle International Corp. Pfd. | 4.500% | | | 35,400 | 3,863 |
| | | | | | 25,516 |
16
Convertible Securities Fund
| | | |
| | | | Market |
| | | | Value• |
| | Coupon | Shares | ($000) |
| Health Care (2.4%) | | | |
| Allergan plc Pfd. | 5.500% | 27,162 | 23,003 |
| Anthem Inc. Pfd. | 5.250% | 145,800 | 6,482 |
| Teva Pharmaceutical Industries Ltd. Pfd. | 7.000% | 8,365 | 7,109 |
| | | | 36,594 |
| Telecommunication Services (0.4%) | | | |
| Frontier Communications Corp. Pfd. | 11.125% | 51,600 | 5,070 |
| Total Convertible Preferred Stocks (Cost $119,631) | | | 120,620 |
| Temporary Cash Investment (1.8%) | | | |
| Money Market Fund (1.8%) | | | |
| 2 Vanguard Market Liquidity Fund (Cost $27,830) | 0.523% | 27,829,571 | 27,830 |
| Total Investments (99.2%) (Cost $1,484,540) | | | 1,506,068 |
| |
| | | | Amount |
| | | | ($000) |
| Other Assets and Liabilities (0.8%) | | | |
| Other Assets | | | |
| Investment in Vanguard | | | 127 |
| Receivables for Investment Securities Sold | | | 25,070 |
| Receivables for Accrued Income | | | 7,855 |
| Receivables for Capital Shares Issued | | | 393 |
| Other Assets | | | 6,233 |
| Total Other Assets | | | 39,678 |
| Liabilities | | | |
| Payables for Investment Securities Purchased | | | (17,951) |
| Payables to Investment Advisor | | | (486) |
| Payables for Capital Shares Redeemed | | | (1,193) |
| Payables to Vanguard | | | (3,489) |
| Other Liabilities | | | (4,255) |
| Total Liabilities | | | (27,374) |
| Net Assets (100%) | | | |
| Applicable to 124,376,350 outstanding $.001 par value shares of | | | |
| beneficial interest (unlimited authorization) | | | 1,518,372 |
| Net Asset Value Per Share | | | $12.21 |
17
Convertible Securities Fund
| |
| At May 31, 2016, net assets consisted of: | |
| | Amount |
| | ($000) |
| Paid-in Capital | 1,573,398 |
| Overdistributed Net Investment Income | (1,616) |
| Accumulated Net Realized Losses | (80,617) |
| Unrealized Appreciation (Depreciation) | |
| Investment Securities | 21,528 |
| Forward Currency Contracts | 5,667 |
| Foreign Currencies | 12 |
| Net Assets | 1,518,372 |
• See Note A in Notes to Financial Statements.
1 Security exempt from registration under Rule 144A of the Securities Act of 1933. Such securities may be sold in transactions exempt
from registration, normally to qualified institutional buyers. At May 31, 2016, the aggregate value of these securities was $298,605,000,
representing 19.7% of net assets.
2 Affiliated money market fund available only to Vanguard funds and certain trusts and accounts managed by Vanguard. Rate shown is
the 7-day yield.
CAD—Canadian dollar.
EUR—Euro.
GBP—British pound.
JPY—Japanese yen.
SGD—Singapore dollar.
USD—U.S. dollar.
See accompanying Notes, which are an integral part of the Financial Statements.
18
Convertible Securities Fund
Statement of Operations
| |
| | Six Months Ended |
| | May 31, 2016 |
| | ($000) |
| Investment Income | |
| Income | |
| Dividends | 3,093 |
| Interest1,2 | 15,182 |
| Total Income | 18,275 |
| Expenses | |
| Investment Advisory Fees—Note B | |
| Basic Fee | 2,635 |
| Performance Adjustment | (1,626) |
| The Vanguard Group—Note C | |
| Management and Administrative | 1,488 |
| Marketing and Distribution | 139 |
| Custodian Fees | 36 |
| Shareholders’ Reports | 7 |
| Trustees’ Fees and Expenses | 1 |
| Total Expenses | 2,680 |
| Net Investment Income | 15,595 |
| Realized Net Gain (Loss) | |
| Investment Securities Sold | (70,981) |
| Foreign Currencies and Forward Currency Contracts | (3,942) |
| Realized Net Gain (Loss) | (74,923) |
| Change in Unrealized Appreciation (Depreciation) | |
| Investment Securities | 40,905 |
| Foreign Currencies and Forward Currency Contracts | (11,014) |
| Change in Unrealized Appreciation (Depreciation) | 29,891 |
| Net Increase (Decrease) in Net Assets Resulting from Operations | (29,437) |
| 1 Interest income from an affiliated company of the fund was $65,000. |
| 2 Interest income is net of foreign withholding taxes of $18,000. |
See accompanying Notes, which are an integral part of the Financial Statements.
19
Convertible Securities Fund
Statement of Changes in Net Assets
| | |
| | Six Months Ended | Year Ended |
| | May 31, | November 30, |
| | 2016 | 2015 |
| | ($000) | ($000) |
| Increase (Decrease) in Net Assets | | |
| Operations | | |
| Net Investment Income | 15,595 | 34,926 |
| Realized Net Gain (Loss) | (74,923) | 26,394 |
| Change in Unrealized Appreciation (Depreciation) | 29,891 | (48,891) |
| Net Increase (Decrease) in Net Assets Resulting from Operations | (29,437) | 12,429 |
| Distributions | | |
| Net Investment Income | (20,247) | (34,408) |
| Realized Capital Gain1 | (18,604) | (143,706) |
| Total Distributions | (38,851) | (178,114) |
| Capital Share Transactions | | |
| Issued | 37,742 | 141,337 |
| Issued in Lieu of Cash Distributions | 35,367 | 161,732 |
| Redeemed | (227,364) | (397,715) |
| Net Increase (Decrease) from Capital Share Transactions | (154,255) | (94,646) |
| Total Increase (Decrease) | (222,543) | (260,331) |
| Net Assets | | |
| Beginning of Period | 1,740,915 | 2,001,246 |
| End of Period2 | 1,518,372 | 1,740,915 |
1 Includes fiscal 2016 and 2015 short-term gain distributions totaling $0 and $40,124,000, respectively. Short-term gain distributions are
treated as ordinary income dividends for tax purposes.
2 Net Assets—End of Period includes undistributed (overdistributed) net investment income of ($1,616,000) and $13,980,000.
See accompanying Notes, which are an integral part of the Financial Statements.
20
Convertible Securities Fund
Financial Highlights
| | | | | | |
| Six Months | | | | | |
| | Ended | | | | | |
| For a Share Outstanding | May 31, | Year Ended November 30, |
| Throughout Each Period | 2016 | 2015 | 2014 | 2013 | 2012 | 2011 |
| Net Asset Value, Beginning of Period | $12.67 | $13.85 | $14.64 | $12.95 | $12.12 | $13.85 |
| Investment Operations | | | | | | |
| Net Investment Income | .125 | .251 | .287 | .333 | .407 | .451 |
| Net Realized and Unrealized Gain (Loss) | | | | | | |
| on Investments | (.294) | (.180) | .313 | 2.101 | 1.134 | (.752) |
| Total from Investment Operations | (.169) | .071 | .600 | 2.434 | 1.541 | (.301) |
| Distributions | | | | | | |
| Dividends from Net Investment Income | (.152) | (. 241) | (. 425) | (. 355) | (. 534) | (. 474) |
| Distributions from Realized Capital Gains | (.139) | (1.010) | (. 965) | (. 389) | (.177) | (. 955) |
| Total Distributions | (.291) | (1.251) | (1.390) | (.744) | (.711) | (1.429) |
| Net Asset Value, End of Period | $12.21 | $12.67 | $13.85 | $14.64 | $12.95 | $12.12 |
| |
| Total Return1 | -1.31% | 0.55% | 4.33% | 19.65% | 13.18% | -2.89% |
| |
| Ratios/Supplemental Data | | | | | | |
| Net Assets, End of Period (Millions) | $1,518 | $1,741 | $2,001 | $2,060 | $1,643 | $1,680 |
| Ratio of Total Expenses to | | | | | | |
| Average Net Assets2 | 0.35% | 0.38% | 0.41% | 0.63% | 0.52% | 0.59% |
| Ratio of Net Investment Income to | | | | | | |
| Average Net Assets | 2.02% | 1.86% | 2.02% | 2.41% | 3.23% | 3.36% |
| Portfolio Turnover Rate | 97% | 95% | 85% | 101% | 82% | 90% |
The expense ratio, net investment income ratio, and turnover rate for the current period have been annualized.
1 Total returns do not include transaction or account service fees that may have applied in the periods shown. Fund prospectuses provide
information about any applicable transaction and account service fees.
2 Includes performance-based investment advisory fee increases (decreases) of (0.21%), (0.17%), (0.15%), 0.07%, (0.04%), and 0.03%.
See accompanying Notes, which are an integral part of the Financial Statements.
21
Convertible Securities Fund
Notes to Financial Statements
Vanguard Convertible Securities Fund is registered under the Investment Company Act of 1940 as an open-end investment company, or mutual fund. The fund invests in securities of foreign issuers, which may subject it to investment risks not normally associated with investing in securities of U.S. corporations.
A. The following significant accounting policies conform to generally accepted accounting principles for U.S. investment companies. The fund consistently follows such policies in preparing its financial statements.
1. Security Valuation: Securities are valued as of the close of trading on the New York Stock Exchange (generally 4 p.m., Eastern time) on the valuation date. Equity securities are valued at the latest quoted sales prices or official closing prices taken from the primary market in which each security trades; such securities not traded on the valuation date are valued at the mean of the latest quoted bid and asked prices. Bonds and temporary cash investments acquired over 60 days to maturity are valued using the latest bid prices or using valuations based on a matrix system (which considers such factors as security prices, yields, maturities, and ratings), both as furnished by independent pricing services. Investments in Vanguard Market Liquidity Fund are valued at that fund’s net asset value. Other temporary cash investments are valued at amortized cost, which approximates market value. Securities for which market quotations are not readily available, or whose values have been affected by events occurring before the fund’s pricing time but after the close of the securities’ primary markets, are valued at their fair values calculated according to procedures adopted by the board of trustees. These procedures include obtaining quotations from an independent pricing service, monitoring news to identify significant market- or security-specific events, and evaluating changes in the values of foreign market proxies (for example, ADRs, futures contracts, or exchange-traded funds), between the time the foreign markets close and the fund’s pricing time. When fair-value pricing is employed, the prices of securities used by a fund to calculate its net asset value may differ from quoted or published prices for the same securities.
2. Foreign Currency: Securities and other assets and liabilities denominated in foreign currencies are translated into U.S. dollars using exchange rates obtained from an independent third party as of the fund’s pricing time on the valuation date. Realized gains (losses) and unrealized appreciation (depreciation) on investment securities include the effects of changes in exchange rates since the securities were purchased, combined with the effects of changes in security prices. Fluctuations in the value of other assets and liabilities resulting from changes in exchange rates are recorded as unrealized foreign currency gains (losses) until the assets or liabilities are settled in cash, at which time they are recorded as realized foreign currency gains (losses).
3. Forward Currency Contracts: The fund enters into forward currency contracts to protect the value of securities and related receivables and payables against changes in future foreign exchange rates. The fund’s risks in using these contracts include movement in the values of the foreign currencies relative to the U.S. dollar and the ability of the counterparties to fulfill their obligations under the contracts. The fund mitigates its counterparty risk by entering into forward currency contracts only with a diverse group of prequalified counterparties, monitoring their financial strength, entering into master netting arrangements with its counterparties, and requiring its counterparties to transfer collateral as security for their performance. The master netting arrangements provide that, in the event of a counterparty’s default (including bankruptcy), the fund may terminate the forward currency contracts, determine the net amount owed by either party in accordance with its master netting
22
Convertible Securities Fund
arrangements, and sell or retain any collateral held up to the net amount owed to the fund under the master netting arrangements. The forward currency contracts contain provisions whereby a counterparty may terminate open contracts if the fund’s net assets decline below a certain level, triggering a payment by the fund if the fund is in a net liability position at the time of the termination. The payment amount would be reduced by any collateral the fund has pledged. Any assets pledged as collateral for open contracts are noted in the Statement of Net Assets. The value of collateral received or pledged is compared daily to the value of the forward currency contracts exposure with each counterparty, and any difference, if in excess of a specified minimum transfer amount, is adjusted and settled within two business days.
Forward currency contracts are valued at their quoted daily prices obtained from an independent third party, adjusted for currency risk based on the expiration date of each contract. The notional amounts of the contracts are not recorded in the Statement of Net Assets. Fluctuations in the value of the contracts are recorded in the Statement of Net Assets as an asset (liability) and in the Statement of Operations as unrealized appreciation (depreciation) until the contracts are closed, when they are recorded as realized forward currency contract gains (losses).
During the six months ended May 31, 2016, the fund’s average investment in forward currency contracts represented 23% of net assets, based on the average of notional amounts at each quarter-end during the period.
4. Federal Income Taxes: The fund intends to continue to qualify as a regulated investment company and distribute all of its taxable income. Management has analyzed the fund’s tax positions taken for all open federal income tax years (November 30, 2012–2015), and for the period ended May 31, 2016, and has concluded that no provision for federal income tax is required in the fund’s financial statements.
5. Distributions: Distributions to shareholders are recorded on the ex-dividend date.
6. Credit Facility: The fund and certain other funds managed by The Vanguard Group (“Vanguard”) participate in a $3.1 billion committed credit facility provided by a syndicate of lenders pursuant to a credit agreement that may be renewed annually; each fund is individually liable for its borrowings, if any, under the credit facility. Borrowings may be utilized for temporary and emergency purposes, and are subject to the fund’s regulatory and contractual borrowing restrictions. The participating funds are charged administrative fees and an annual commitment fee of 0.10% of the undrawn amount of the facility; these fees are allocated to the funds based on a method approved by the fund’s board of trustees and included in Management and Administrative expenses on the fund’s Statement of Operations. Any borrowings under this facility bear interest at a rate based upon the higher of the one-month London Interbank Offered Rate, federal funds effective rate, or overnight bank funding rate plus an agreed-upon spread.
The fund had no borrowings outstanding at May 31, 2016, or at any time during the period then ended.
7. Other: Dividend income is recorded on the ex-dividend date. Interest income includes income distributions received from Vanguard Market Liquidity Fund and is accrued daily. Premiums and discounts on debt securities purchased are amortized and accreted, respectively, to interest income over the lives of the respective securities. Security transactions are accounted for on the date securities are bought or sold. Costs used to determine realized gains (losses) on the sale of investment securities are those of the specific securities sold.
23
Convertible Securities Fund
B. Oaktree Capital Management, L.P., provides investment advisory services to the fund for a fee calculated at an annual percentage rate of average net assets. The basic fee is subject to quarterly adjustments based on the fund’s performance for the preceding three years relative to a composite index weighted 70% Bank of America Merrill Lynch All US Convertibles Index and 30% Bank of America Merrill Lynch Global 300 Convertibles ex-US Index (hedged). For the six months ended May 31, 2016, the investment advisory fee represented an effective annual basic rate of 0.34% of the fund’s average net assets before a decrease of $1,626,000 (-0.21%) based on performance.
C. In accordance with the terms of a Funds’ Service Agreement (the “FSA”) between Vanguard and the fund, Vanguard furnishes to the fund corporate management, administrative, marketing, and distribution services at Vanguard’s cost of operations (as defined by the FSA). These costs of operations are allocated to the fund based on methods and guidelines approved by the board of trustees. Vanguard does not require reimbursement in the current period for certain costs of operations (such as deferred compensation/benefits and risk/insurance costs); the fund’s liability for these costs of operations is included in Payables to Vanguard on the Statement of Net Assets.
Upon the request of Vanguard, the fund may invest up to 0.40% of its net assets as capital in Vanguard. At May 31, 2016, the fund had contributed to Vanguard capital in the amount of $127,000, representing 0.01% of the fund’s net assets and 0.05% of Vanguard’s capitalization. The fund’s trustees and officers are also directors and employees, respectively, of Vanguard.
D. Various inputs may be used to determine the value of the fund’s investments. These inputs are summarized in three broad levels for financial statement purposes. The inputs or methodologies used to value securities are not necessarily an indication of the risk associated with investing in those securities.
Level 1—Quoted prices in active markets for identical securities.
Level 2—Other significant observable inputs (including quoted prices for similar securities, interest rates, prepayment speeds, credit risk, etc.).
Level 3—Significant unobservable inputs (including the fund’s own assumptions used to determine the fair value of investments).
The following table summarizes the market value of the fund’s investments as of May 31, 2016, based on the inputs used to value them:
| | | |
| | Level 1 | Level 2 | Level 3 |
| Investments | ($000) | ($000) | ($000) |
| Convertible Bonds | — | 1,357,618 | — |
| Convertible Preferred Stocks | — | 120,620 | — |
| Temporary Cash Investments | 27,830 | — | — |
| Forward Currency Contracts—Assets | — | 6,190 | — |
| Forward Currency Contracts—Liabilities | — | (523) | — |
| Total | 27,830 | 1,483,905 | — |
24
Convertible Securities Fund
E. At May 31, 2016, the fund had open forward currency contracts to receive and deliver currencies as follows. Unrealized appreciation (depreciation) on open forward currency contracts, except for Singapore dollar currency contracts, is treated as realized gain (loss) for tax purposes.
| | | | | | |
| | | | | | | Unrealized |
| | Contract | | | | | Appreciation |
| | Settlement | Contract Amount (000) | (Depreciation) |
| Counterparty | Date | | Receive | | Deliver | ($000) |
| UBS AG | 7/22/16 | EUR | 10,911 | USD | 12,363 | (201) |
| UBS AG | 7/22/16 | JPY | 889,100 | USD | 8,120 | (77) |
| UBS AG | 7/22/16 | SGD | 2,423 | USD | 1,802 | (44) |
| UBS AG | 7/22/16 | USD | 140,174 | EUR | 123,017 | 3,048 |
| UBS AG | 7/22/16 | USD | 73,451 | JPY | 7,994,755 | 1,124 |
| UBS AG | 7/22/16 | USD | 51,013 | CAD | 64,690 | 1,682 |
| UBS AG | 7/22/16 | USD | 27,836 | GBP | 19,350 | (200) |
| UBS AG | 7/22/16 | USD | 12,344 | SGD | 16,550 | 336 |
| UBS AG | 7/22/16 | USD | 1,187 | EUR | 1,066 | (1) |
| | | | | | | 5,667 |
| Refer to the Statement of Net Assets for currency abbreviations. |
At May 31, 2016, counterparties had deposited in segregated accounts securities with a value of $3,716,000 in connection with open forward currency contracts. After May 31, 2016, the counterparty posted additional collateral of $1,502,000 in connection with open forward currency contracts as of May 31, 2016.
F. Distributions are determined on a tax basis and may differ from net investment income and realized capital gains for financial reporting purposes. Differences may be permanent or temporary. Permanent differences are reclassified among capital accounts in the financial statements to reflect their tax character. Temporary differences arise when certain items of income, expense, gain, or loss are recognized in different periods for financial statement and tax purposes. These differences will reverse at some time in the future. Differences in classification may also result from the treatment of short-term gains as ordinary income for tax purposes. The fund’s tax-basis capital gains and losses are determined only at the end of each fiscal year.
During the six months ended May 31, 2016, the fund realized net foreign currency losses of $7,436,000 (including the foreign currency component on sales of foreign currency denominated bonds), which decreased distributable net income for tax purposes; accordingly, such losses have been reclassified from accumulated net realized losses to overdistributed net investment income.
Certain of the fund’s convertible bond investments are in securities considered to be “contingent payment debt instruments,” for which any realized gains increase (and all or part of any realized losses decrease) income for tax purposes. During the six months ended May 31, 2016, the fund realized net losses of $3,508,000 from the sale of these securities, which decreased distributable net income for tax purposes; accordingly, such losses have been reclassified from accumulated net realized losses to overdistributed net investment income.
25
Convertible Securities Fund
At May 31, 2016, the cost of investment securities for tax purposes was $1,484,540,000. Net unrealized appreciation of investment securities for tax purposes was $21,528,000, consisting of unrealized gains of $72,659,000 on securities that had risen in value since their purchase and $51,131,000 in unrealized losses on securities that had fallen in value since their purchase.
G. During the six months ended May 31, 2016, the fund purchased $735,242,000 of investment securities and sold $911,075,000 of investment securities, other than temporary cash investments.
H. Capital shares issued and redeemed were:
| | |
| | Six Months Ended | Year Ended |
| | May 31, 2016 | November 30, 2015 |
| | Shares | Shares |
| | (000) | (000) |
| Issued | 3,188 | 10,764 |
| Issued in Lieu of Cash Distributions | 2,916 | 12,705 |
| Redeemed | (19,130) | (30,554) |
| Net Increase (Decrease) in Shares Outstanding | (13,026) | (7,085) |
I. Management has determined that no material events or transactions occurred subsequent to May 31, 2016, that would require recognition or disclosure in these financial statements.
26
About Your Fund’s Expenses
As a shareholder of the fund, you incur ongoing costs, which include costs for portfolio management, administrative services, and shareholder reports (like this one), among others. Operating expenses, which are deducted from a fund’s gross income, directly reduce the investment return of the fund.
A fund’s expenses are expressed as a percentage of its average net assets. This figure is known as the expense ratio. The following examples are intended to help you understand the ongoing costs (in dollars) of investing in your fund and to compare these costs with those of other mutual funds. The examples are based on an investment of $1,000 made at the beginning of the period shown and held for the entire period.
The accompanying table illustrates your fund’s costs in two ways:
• Based on actual fund return. This section helps you to estimate the actual expenses that you paid over the period. The ”Ending Account Value“ shown is derived from the fund‘s actual return, and the third column shows the dollar amount that would have been paid by an investor who started with $1,000 in the fund. You may use the information here, together with the amount you invested, to estimate the expenses that you paid over the period.
To do so, simply divide your account value by $1,000 (for example, an $8,600 account value divided by $1,000 = 8.6), then multiply the result by the number given for your fund under the heading ”Expenses Paid During Period.“
• Based on hypothetical 5% yearly return. This section is intended to help you compare your fund‘s costs with those of other mutual funds. It assumes that the fund had a yearly return of 5% before expenses, but that the expense ratio is unchanged. In this case—because the return used is not the fund’s actual return—the results do not apply to your investment. The example is useful in making comparisons because the Securities and Exchange Commission requires all mutual funds to calculate expenses based on a 5% return. You can assess your fund’s costs by comparing this hypothetical example with the hypothetical examples that appear in shareholder reports of other funds.
Note that the expenses shown in the table are meant to highlight and help you compare ongoing costs only and do not reflect transaction costs incurred by the fund for buying and selling securities. Further, the expenses do not include any purchase, redemption, or account service fees described in the fund prospectus. If such fees were applied to your account, your costs would be higher. Your fund does not carry a “sales load.”
The calculations assume no shares were bought or sold during the period. Your actual costs may have been higher or lower, depending on the amount of your investment and the timing of any purchases or redemptions.
You can find more information about the fund’s expenses, including annual expense ratios, in the Financial Statements section of this report. For additional information on operating expenses and other shareholder costs, please refer to your fund’s current prospectus.
27
| | | |
| Six Months Ended May 31, 2016 | | | |
| | Beginning | Ending | Expenses |
| | Account Value | Account Value | Paid During |
| Convertible Securities Fund | 11/30/2015 | 5/31/2016 | Period |
| Based on Actual Fund Return | $1,000.00 | $986.86 | $1.74 |
| Based on Hypothetical 5% Yearly Return | 1,000.00 | 1,023.25 | 1.77 |
The calculations are based on expenses incurred in the most recent six-month period. The fund’s annualized six-month expense ratio for that
period is 0.35%. The dollar amounts shown as “Expenses Paid” are equal to the annualized expense ratio multiplied by the average account
value over the period, multiplied by the number of days in the most recent six-month period, then divided by the number of days in the most
recent 12-month period (183/366).
28
Trustees Approve Advisory Arrangement
The board of trustees of Vanguard Convertible Securities Fund has renewed the fund’s investment advisory arrangement with Oaktree Capital Management, L.P. (Oaktree). The board determined that renewing the fund’s advisory arrangement was in the best interests of the fund and its shareholders.
The board based its decision upon an evaluation of the advisor’s investment staff, portfolio management process, and performance. The trustees considered the factors discussed below, among others. However, no single factor determined whether the board approved the arrangement. Rather, it was the totality of the circumstances that drove the board’s decision.
Nature, extent, and quality of services
The board reviewed the quality of the fund’s investment management services over both the short and long term, and took into account the organizational depth and stability of the advisor. The board considered that Oaktree, founded in 1995, specializes in managing convertible securities, distressed debt, and high-yield bonds. The advisor uses a bottom-up investment approach to select convertible securities that it believes have the best balance of upside potential and downside protection. Discipline is key to the fund’s management; Oaktree invests predominantly in convertibles possessing an attractive combination of conversion and income features—true hybrid securities—and sells the issues when their characteristics become too similar to those of conventional bonds or common stocks. Oaktree has advised the fund since 1996.
The board concluded that the advisor’s experience, stability, depth, and performance, among other factors, warranted continuation of the advisory arrangement.
Investment performance
The board considered the short- and long-term performance of the fund, including any periods of outperformance or underperformance relative to a benchmark index and peer group. The board concluded that the performance was such that the advisory arrangement should continue. Information about the fund’s most recent performance can be found in the Performance Summary section of this report.
Cost
The board concluded that the fund’s expense ratio was well below the average expense ratio charged by funds in its peer group and that the fund’s advisory fee rate was also well below its peer-group average. Information about the fund’s expenses appears in the About Your Fund’s Expenses section of this report as well as in the Financial Statements section, which also includes information about the advisory fee rate.
The board did not consider profitability of Oaktree in determining whether to approve the advisory fee, because Oaktree is independent of Vanguard and the advisory fee is the result of arm’s-length negotiations.
The benefit of economies of scale
The board concluded that the fund’s shareholders benefit from economies of scale because of breakpoints in the fund’s advisory fee schedule. The breakpoints reduce the effective rate of the fee as the fund’s assets increase.
The board will consider whether to renew the advisory arrangement again after a one-year period.
29
Glossary
30-Day SEC Yield. A fund’s 30-day SEC yield is derived using a formula specified by the U.S. Securities and Exchange Commission. Under the formula, data related to the fund’s security holdings in the previous 30 days are used to calculate the fund’s hypothetical net income for that period, which is then annualized and divided by the fund’s estimated average net assets over the calculation period. For the purposes of this calculation, a security’s income is based on its current market yield to maturity (for bonds), its actual income (for asset-backed securities), or its projected dividend yield (for stocks). Because the SEC yield represents hypothetical annualized income, it will differ—at times significantly—from the fund’s actual experience. As a result, the fund’s income distributions may be higher or lower than implied by the SEC yield.
Average Coupon. The average interest rate paid on the fixed income securities held by a fund. It is expressed as a percentage of face value.
Average Duration. An estimate of how much the value of the bonds held by a fund will fluctuate in response to a change in interest rates. To see how the value could change, multiply the average duration by the change in rates. If interest rates rise by 1 percentage point, the value of the bonds in a fund with an average duration of five years would decline by about 5%. If rates decrease by a percentage point, the value would rise by 5%.
Average Weighted Maturity. The average length of time until fixed income securities held by a fund reach maturity and are repaid. The figure reflects the proportion of fund assets represented by each security.
Beta. A measure of the magnitude of a fund’s past share-price fluctuations in relation to the ups and downs of a given market index. The index is assigned a beta of 1.00. Compared with a given index, a fund with a beta of 1.20 typically would have seen its share price rise or fall by 12% when the index rose or fell by 10%. For this report, beta is based on returns over the past 36 months for both the fund and the index. Note that a fund’s beta should be reviewed in conjunction with its R-squared (see definition). The lower the R-squared, the less correlation there is between the fund and the index, and the less reliable beta is as an indicator of volatility.
Conversion Premium. The average percentage by which the weighted average market price of the convertible securities held by a fund exceeds the weighted average market price of their underlying common stocks. For example, if a stock is trading at $25 per share and a bond that is convertible into the stock is trading at a price equivalent to $30 per share of stock, the conversion premium is 20% ($5 ÷ $25 = 20%).
Credit Quality. Credit-quality ratings are measured on a scale that generally ranges from AAA (highest) to D (lowest). Credit-quality ratings are obtained from S&P. “Not Rated” is used to classify securities for which a rating is not available. Not rated securities include a fund’s investment in Vanguard Market Liquidity Fund or Vanguard Municipal Cash Management Fund, each of which invests in high-quality money market instruments and may serve as a cash management vehicle for the Vanguard funds, trusts, and accounts.
Expense Ratio. A fund’s total annual operating expenses expressed as a percentage of the fund’s average net assets. The expense ratio includes management and administrative expenses, but does not include the transaction costs of buying and selling portfolio securities.
30
Foreign Holdings. The percentage of a fund represented by securities or depositary receipts of companies based outside the United States.
Inception Date. The date on which the assets of a fund (or one of its share classes) are first invested in accordance with the fund’s investment objective. For funds with a subscription period, the inception date is the day after that period ends. Investment performance is measured from the inception date.
Market Exposure. A measure that reflects a fund’s security investments excluding any holdings in short-term reserves.
R-Squared. A measure of how much of a fund’s past returns can be explained by the returns from the market in general, as measured by a given index. If a fund’s total returns were precisely synchronized with an index’s returns, its R-squared would be 1.00. If the fund’s returns bore no relationship to the index’s returns, its R-squared would be 0. For this report, R-squared is based on returns over the past 36 months for both the fund and the index.
Short-Term Reserves. The percentage of a fund invested in highly liquid, short-term securities that can be readily converted to cash.
Turnover Rate. An indication of the fund’s trading activity. Funds with high turnover rates incur higher transaction costs and may be more likely to distribute capital gains (which may be taxable to investors). The turnover rate excludes in-kind transactions, which have minimal impact on costs.
Benchmark Information
Convertibles Composite Index: CS First Boston Convertible Securities Index through November 30, 2004; Bank of America Merrill Lynch All US Convertibles Index (formerly Bank of America Merrill Lynch All Convertibles-All Qualities Index) through December 31, 2010; and 70% Bank of America Merrill Lynch All US Convertibles Index and 30% Bank of America Merrill Lynch Global 300 Convertibles ex-US Index (hedged) thereafter.
31
The People Who Govern Your Fund
The trustees of your mutual fund are there to see that the fund is operated and managed in your best interests since, as a shareholder, you are a part owner of the fund. Your fund’s trustees also serve on the board of directors of The Vanguard Group, Inc., which is owned by the Vanguard funds and provides services to them on an at-cost basis.
A majority of Vanguard’s board members are independent, meaning that they have no affiliation with Vanguard or the funds they oversee, apart from the sizable personal investments they have made as private individuals. The independent board members have distinguished backgrounds in business, academia, and public service. Each of the trustees and executive officers oversees 198 Vanguard funds.
The following table provides information for each trustee and executive officer of the fund. More information about the trustees is in the Statement of Additional Information, which can be obtained, without charge, by contacting Vanguard at 800-662-7447, or online at vanguard.com.
| |
| InterestedTrustee1 | Rajiv L. Gupta |
| | Born 1945. Trustee Since December 2001.2 Principal |
| F. William McNabb III | Occupation(s) During the Past Five Years and Other |
| Born 1957. Trustee Since July 2009. Chairman of | Experience: Chairman and Chief Executive Officer |
| the Board. Principal Occupation(s) During the Past | (retired 2009) and President (2006–2008) of |
| Five Years and Other Experience: Chairman of the | Rohm and Haas Co. (chemicals); Director of Tyco |
| Board of The Vanguard Group, Inc., and of each of | International plc (diversified manufacturing and |
| the investment companies served by The Vanguard | services), HP Inc. (printer and personal computer |
| Group, since January 2010; Director of The Vanguard | manufacturing), and Delphi Automotive plc |
| Group since 2008; Chief Executive Officer and | (automotive components); Senior Advisor at |
| President of The Vanguard Group, and of each of | New Mountain Capital. |
| the investment companies served by The Vanguard | |
| Group, since 2008; Director of Vanguard Marketing | Amy Gutmann |
| Corporation; Managing Director of The Vanguard | Born 1949. Trustee Since June 2006. Principal |
| Group (1995–2008). | Occupation(s) During the Past Five Years and |
| | Other Experience: President of the University of |
| IndependentTrustees | Pennsylvania; Christopher H. Browne Distinguished |
| | Professor of Political Science, School of Arts and |
| Emerson U. Fullwood | Sciences, and Professor of Communication, Annenberg |
| Born 1948. Trustee Since January 2008. Principal | School for Communication, with secondary faculty |
| Occupation(s) During the Past Five Years and Other | appointments in the Department of Philosophy, School |
| Experience: Executive Chief Staff and Marketing | of Arts and Sciences, and at the Graduate School of |
| Officer for North America and Corporate Vice President | Education, University of Pennsylvania; Trustee of the |
| (retired 2008) of Xerox Corporation (document manage- | National Constitution Center; Chair of the Presidential |
| ment products and services); Executive in Residence | Commission for the Study of Bioethical Issues. |
| and 2009–2010 Distinguished Minett Professor at | |
| the Rochester Institute of Technology; Lead Director | JoAnn Heffernan Heisen |
| of SPX FLOW, Inc. (multi-industry manufacturing); | Born 1950. Trustee Since July 1998. Principal |
| Director of the United Way of Rochester, the University | Occupation(s) During the Past Five Years and |
| of Rochester Medical Center, Monroe Community | Other Experience: Corporate Vice President and |
| College Foundation, North Carolina A&T University, | Chief Global Diversity Officer (retired 2008) and |
| and Roberts Wesleyan College. | Member of the Executive Committee (1997–2008) |
| | of Johnson & Johnson (pharmaceuticals/medical |
| | devices/consumer products); Director of Skytop |
| | Lodge Corporation (hotels) and the Robert Wood |
| | Johnson Foundation; Member of the Advisory |
| | Board of the Institute for Women’s Leadership |
| | at Rutgers University. |
| | |
| F. Joseph Loughrey | Executive Officers | |
| Born 1949. Trustee Since October 2009. Principal | | |
| Occupation(s) During the Past Five Years and Other | Glenn Booraem | |
| Experience: President and Chief Operating Officer | Born 1967. Treasurer Since May 2015. Principal |
| (retired 2009) of Cummins Inc. (industrial machinery); | Occupation(s) During the Past Five Years and |
| Chairman of the Board of Hillenbrand, Inc. (specialized | Other Experience: Principal of The Vanguard Group, |
| consumer services), and of Oxfam America; Director | Inc.; Treasurer of each of the investment companies |
| of SKF AB (industrial machinery), Hyster-Yale Materials | served by The Vanguard Group; Controller of each of |
| Handling, Inc. (forklift trucks), the Lumina Foundation | the investment companies served by The Vanguard |
| for Education, and the V Foundation for Cancer | Group (2010–2015); Assistant Controller of each of |
| Research; Member of the Advisory Council for the | the investment companies served by The Vanguard |
| College of Arts and Letters and of the Advisory Board | Group (2001–2010). | |
| to the Kellogg Institute for International Studies, both | | |
| at the University of Notre Dame. | Thomas J. Higgins | |
| Born 1957. Chief Financial Officer Since September |
| Mark Loughridge | 2008. Principal Occupation(s) During the Past Five |
| Born 1953. Trustee Since March 2012. Principal | Years and Other Experience: Principal of The Vanguard |
| Occupation(s) During the Past Five Years and Other | Group, Inc.; Chief Financial Officer of each of the |
| Experience: Senior Vice President and Chief Financial | investment companies served by The Vanguard Group; |
| Officer (retired 2013) at IBM (information technology | Treasurer of each of the investment companies served |
| services); Fiduciary Member of IBM’s Retirement Plan | by The Vanguard Group (1998–2008). |
| Committee (2004–2013); Director of the Dow Chemical | | |
| Company; Member of the Council on Chicago Booth. | Peter Mahoney | |
| Born 1974. Controller Since May 2015. Principal |
| Scott C. Malpass | Occupation(s) During the Past Five Years and |
| Born 1962. Trustee Since March 2012. Principal | Other Experience: Head of Global Fund Accounting |
| Occupation(s) During the Past Five Years and Other | at The Vanguard Group, Inc.; Controller of each of the |
| Experience: Chief Investment Officer and Vice | investment companies served by The Vanguard Group; |
| President at the University of Notre Dame; Assistant | Head of International Fund Services at The Vanguard |
| Professor of Finance at the Mendoza College of | Group (2008–2014). | |
| Business at Notre Dame; Member of the Notre Dame | | |
| 403(b) Investment Committee, the Board of Advisors | Heidi Stam | |
| for Spruceview Capital Partners, and the Investment | Born 1956. Secretary Since July 2005. Principal |
| Advisory Committee of Major League Baseball; Board | Occupation(s) During the Past Five Years and Other |
| Member of TIFF Advisory Services, Inc., and Catholic | Experience: Managing Director of The Vanguard |
| Investment Services, Inc. (investment advisors). | Group, Inc.; General Counsel of The Vanguard Group; |
| Secretary of The Vanguard Group and of each of the |
| André F. Perold | investment companies served by The Vanguard Group; |
| Born 1952. Trustee Since December 2004. Principal | Director and Senior Vice President of Vanguard |
| Occupation(s) During the Past Five Years and Other | Marketing Corporation. | |
| Experience: George Gund Professor of Finance and | | |
| Banking, Emeritus at the Harvard Business School | Vanguard Senior ManagementTeam |
| (retired 2011); Chief Investment Officer and Managing | Mortimer J. Buckley | James M. Norris |
| Partner of HighVista Strategies LLC (private investment | Kathleen C. Gubanich | Thomas M. Rampulla |
| firm); Director of Rand Merchant Bank; Overseer of | Martha G. King | Glenn W. Reed |
| the Museum of Fine Arts Boston. | John T. Marcante | Karin A. Risi |
| Chris D. McIsaac | |
| Peter F. Volanakis | | |
| Born 1955. Trustee Since July 2009. Principal | | |
| Occupation(s) During the Past Five Years and Other | Chairman Emeritus and Senior Advisor |
| Experience: President and Chief Operating Officer | | |
| (retired 2010) of Corning Incorporated (communications | John J. Brennan | |
| equipment); Trustee of Colby-Sawyer College and | Chairman, 1996–2009 | |
| Chairman of its Finance and Enrollment Committee; | Chief Executive Officer and President, 1996–2008 |
| Member of the Advisory Board of the Norris Cotton | | |
| Cancer Center. | Founder | |
| | John C. Bogle | |
| | Chairman and Chief Executive Officer, 1974–1996 |
1 Mr. McNabb is considered an “interested person,” as defined in the Investment Company Act of 1940, because he is an officer of the Vanguard funds.
2 December 2002 for Vanguard Equity Income Fund, the Vanguard Municipal Bond Funds, and the Vanguard State Tax-Exempt Funds.
| |  |
| | | P.O. Box 2600 |
| | | Valley Forge, PA 19482-2600 |
| |
| |
| |
| Connect with Vanguard® > vanguard.com |
| |
| |
| |
| Fund Information > 800-662-7447 | | CFA® is a registered trademark owned by CFA Institute. |
| Direct Investor Account Services > 800-662-2739 | |
| Institutional Investor Services > 800-523-1036 | |
| Text Telephone for People | | |
| Who Are Deaf or Hard of Hearing> 800-749-7273 | |
| |
| This material may be used in conjunction | |
| with the offering of shares of any Vanguard | |
| fund only if preceded or accompanied by | |
| the fund’s current prospectus. | |
| |
| All comparative mutual fund data are from Lipper, a | |
| Thomson Reuters Company, or Morningstar, Inc., unless | |
| otherwise noted. | | |
| |
| You can obtain a free copy of Vanguard’s proxy voting | |
| guidelines by visiting vanguard.com/proxyreporting or by | |
| calling Vanguard at 800-662-2739. The guidelines are | |
| also available from the SEC’s website, sec.gov. In | |
| addition, you may obtain a free report on how your fund | |
| voted the proxies for securities it owned during the 12 | |
| months ended June 30. To get the report, visit either | |
| vanguard.com/proxyreporting or sec.gov. | |
| |
| You can review and copy information about your fund at | |
| the SEC’s Public Reference Room in Washington, D.C. To | |
| find out more about this public service, call the SEC at | |
| 202-551-8090. Information about your fund is also | |
| available on the SEC’s website, and you can receive | |
| copies of this information, for a fee, by sending a | |
| request in either of two ways: via email addressed to | |
| publicinfo@sec.gov or via regular mail addressed to the | |
| Public Reference Section, Securities and Exchange | |
| Commission, Washington, DC 20549-1520. | |
| |
| | | © 2016 The Vanguard Group, Inc. |
| | | All rights reserved. |
| | | Vanguard Marketing Corporation, Distributor. |
| |
| | | Q822 072016 |
Item 2: Code of Ethics.
Not Applicable.
Item 3: Audit Committee Financial Expert.
Not Applicable.
Item 4: Principal Accountant Fees and Services.
(a) Audit Fees.
Not Applicable.
Item 5: Audit Committee of Listed Registrants.
Not Applicable.
Item 6: Investments.
Not Applicable.
Item 7: Disclosure of Proxy Voting Policies and Procedures for Closed-End Management
Investment Companies.
Not Applicable.
Item 8: Portfolio Managers of Closed-End Management Investment Companies.
Not Applicable.
Item 9: Purchase of Equity Securities by Closed-End Management Investment Company and
Affiliated Purchasers.
Not Applicable.
Item 10: Submission of Matters to a Vote of Security Holders.
Not Applicable.
Item 11: Controls and Procedures.
(a) Disclosure Controls and Procedures. The Principal Executive and Financial Officers concluded that the Registrant’s Disclosure Controls and Procedures are effective based on their evaluation of the Disclosure Controls and Procedures as of a date within 90 days of the filing date of this report.
(b) Internal Control Over Financial Reporting. There were no significant changes in Registrant’s Internal Control Over Financial Reporting or in other factors that could significantly affect this control subsequent to the date of the evaluation, including any corrective actions with regard to significant deficiencies and material weaknesses.
Item 12: Exhibits.
(a) Certifications.
Pursuant to the requirements of the Securities Exchange Act of 1934 and the Investment Company Act of 1940, the registrant has duly caused this report to be signed on its behalf by the undersigned, thereunto duly authorized.
| |
| | VANGUARD CONVERTIBLE SECURITIES FUND |
| |
| |
| BY: | /s/ F. WILLIAM MCNABB III* |
| | F. WILLIAM MCNABB III |
| | CHIEF EXECUTIVE OFFICER |
| |
| Date: July 15, 2016 |
Pursuant to the requirements of the Securities Exchange Act of 1934 and the Investment Company Act of 1940, this report has been signed below by the following persons on behalf of the registrant and in the capacities and on the dates indicated.
| |
| | VANGUARD CONVERTIBLE SECURITIES FUND |
| |
| BY: | /s/ F. WILLIAM MCNABB III* |
| | F. WILLIAM MCNABB III |
| | CHIEF EXECUTIVE OFFICER |
Date: July 15, 2016 |
| VANGUARD CONVERTIBLE SECURITIES FUND |
| |
| BY: | /s/ THOMAS J. HIGGINS* |
| | THOMAS J. HIGGINS |
| | CHIEF FINANCIAL OFFICER |
Date: July 15, 2016 |
* By: /s/ Heidi Stam
Heidi Stam, pursuant to a Power of Attorney filed on April 22, 2014 see file Number 2-17620, Incorporated by Reference.