UNITED STATES
SECURITIES AND EXCHANGE COMMISSION
Washington, D.C. 20549
FORM N-CSR
CERTIFIED SHAREHOLDER REPORT
OF
REGISTERED MANAGEMENT INVESTMENT COMPANIES
| | |
| Investment Company Act file number: | 811-04627 |
Name of Registrant: | Vanguard Convertible Securities Fund |
Address of Registrant: | P.O. Box 2600 |
| | Valley Forge, PA 19482 |
Name and address of agent for service: | Anne E. Robinson, Esquire |
| | P.O. Box 876 |
| | Valley Forge, PA 19482 |
Registrant’s telephone number, including area code: (610) 669-1000 |
Date of fiscal year end: November 30 |
Date of reporting period: December 1, 2017—May 31, 2018 |
Item 1: Reports to Shareholders |

Semiannual Report | May 31, 2018
Vanguard Convertible Securities Fund
Vanguard’s Principles for Investing Success
We want to give you the best chance of investment success. These principles, grounded in Vanguard’s research and experience, can put you on the right path.
Goals. Create clear, appropriate investment goals.
Balance. Develop a suitable asset allocation using broadly diversified funds.
Cost. Minimize cost.
Discipline. Maintain perspective and long-term discipline.
A single theme unites these principles: Focus on the things you can control.
We believe there is no wiser course for any investor.
| |
| Contents | |
| Your Fund’s Performance at a Glance. | 1 |
| CEO’s Perspective. | 2 |
| Advisor’s Report. | 4 |
| Fund Profile. | 7 |
| Performance Summary. | 9 |
| Financial Statements. | 10 |
| About Your Fund’s Expenses. | 25 |
| Trustees Approve Advisory Arrangement. | 27 |
| Glossary. | 29 |
Please note: The opinions expressed in this report are just that—informed opinions. They should not be considered promises
or advice. Also, please keep in mind that the information and opinions cover the period through the date on the front of this
report. Of course, the risks of investing in your fund are spelled out in the prospectus.
See the Glossary for definitions of investment terms used in this report.
About the cover: Nautical images have been part of Vanguard’s rich heritage since its start in 1975. For an
incoming ship, a lighthouse offers a beacon and safe path to shore. You can similarly depend on Vanguard to put
you first––and light the way––as you strive to meet your financial goals. Our client focus and low costs,
stemming from our unique ownership structure, assure that your interests are paramount.
Your Fund’s Performance at a Glance
• Vanguard Convertible Securities Fund offers investors exposure to corporate bonds and preferred stocks that can be exchanged for common stocks at a predetermined price.
• For the six months ended May 31, 2018, the fund returned 2.41%, trailing its benchmark by about 2 percentage points and its peer-group average return more than that.
• The fund’s limited exposure to higher-risk preferred stocks compared with its benchmark weighed on relative performance.
• Although the fund invests primarily in U.S. convertibles, a portion of its assets are in international securities.
• The advisor remains focused on balanced convertibles with stable to improving credit profiles and underlying equity valuation with potential for appreciation. Issuer and sector allocations (and their weightings versus the benchmark) are a result of a research process focused on credit fundamentals and security valuation.
| |
| Total Returns: Six Months Ended May 31, 2018 | |
| | Total |
| | Returns |
| Vanguard Convertible Securities Fund | 2.41% |
| Convertibles Composite Index | 4.40 |
| Convertible Securities Funds Average | 5.00 |
| For a benchmark description, see the Glossary. |
| Convertible Securities Funds Average: Derived from data provided by Lipper, a Thomson Reuters Company. |
| | |
| Expense Ratios | | |
| Your Fund Compared With Its Peer Group | | |
| | | Peer Group |
| | Fund | Average |
| Convertible Securities Fund | 0.35% | 1.28% |
The fund expense ratio shown is from the prospectus dated March 27, 2018, and represents estimated costs for the current fiscal year. For
the six months ended May 31, 2018, the fund’s annualized expense ratio was 0.34%. The peer-group expense ratio is derived from data
provided by Lipper, a Thomson Reuters Company, and captures information through year-end 2017.
Peer group: Convertible Securities Funds.
1
CEO’s Perspective

Tim Buckley
President and Chief Executive Officer
Dear Shareholder,
I feel extremely fortunate to have the chance to lead a company filled with people who come to work every day passionate about Vanguard’s core purpose: to take a stand for all investors, to treat them fairly, and to give them the best chance for investment success.
When I joined Vanguard in 1991, I found a mission-driven team focused on improving lives—helping people retire more comfortably, put their children through college, and achieve financial security. I also found a company with purpose in an industry ripe for improvement.
It was clear, even early in my career, that the cards were stacked against most investors. Hidden fees, performance-chasing, and poor advice were relentlessly eroding investors’ dreams.
We knew Vanguard could be different and, as a result, could make a real difference. We have lowered the costs of investing for our shareholders significantly. And we’re proud of the performance of our funds.
Vanguard is built for Vanguard investors—we focus solely on you, our fund shareholders. Everything we do is designed to give our clients the best chance for investment success. In my role as CEO, I’ll keep this priority
2
front and center. We’re proud of what we’ve achieved, but we’re even more excited about what’s to come.
Steady, time-tested guidance
Our guidance for investors, as always, is to stay the course, tune out the hyperbolic headlines, and focus on your goals and what you can control, such as costs and how much you save. This time-tested advice has served our clients well over the decades.
Regardless of how the markets perform in the short term, I’m incredibly optimistic about the future for our investors. We have a dedicated team serving you, and we will never stop striving to make
Vanguard the best place for you to invest through our high-quality funds and services, advice and guidance to help you meet your financial goals, and an experience that makes you feel good about entrusting us with your hard-earned savings.
Thank you for your continued loyalty.
Sincerely,

Mortimer J. Buckley
President and Chief Executive Officer
June 12, 2018
| | | |
| Market Barometer | | | |
| | | | Total Returns |
| | | Periods Ended May 31, 2018 |
| | Six | One | Five Years |
| | Months | Year | (Annualized) |
| Stocks | | | |
| Russell 1000 Index (Large-caps) | 3.33% | 14.60% | 12.91% |
| Russell 2000 Index (Small-caps) | 6.47 | 20.76 | 12.18 |
| Russell 3000 Index (Broad U.S. market) | 3.57 | 15.06 | 12.85 |
| FTSE All-World ex US Index (International) | 0.36 | 9.62 | 5.84 |
| |
| Bonds | | | |
| Bloomberg Barclays U.S. Aggregate Bond Index | | | |
| (Broad taxable market) | -1.04% | -0.37% | 1.98% |
| Bloomberg Barclays Municipal Bond Index | | | |
| (Broad tax-exempt market) | 0.71 | 1.11 | 2.92 |
| Citigroup Three-Month U.S. Treasury Bill Index | 0.73 | 1.24 | 0.35 |
| |
| CPI | | | |
| Consumer Price Index | 1.99% | 2.80% | 1.55% |
3
Advisor’s Report
The investment strategy of Vanguard Convertible Securities Fund is to create a highly diversified global portfolio of convertible securities. The fund emphasizes investments in convertible bonds with relatively near-term maturities or put dates. We focus on “balanced” convertibles, where the securities have a reasonable yield and stable credit quality, good call protection, and low to moderate conversion premiums. We believe these securities have a favorable balance of upside potential and downside risk. The fund underweights convertible preferred shares, which are riskier but may offer higher returns. We do, however, consider them part of our investable universe and make some use of them.
Importantly, the fund does not invest in common stocks or nonconvertible debt. We do not attempt market-timing and therefore are fully invested, holding only a small amount of cash for potential
| |
| Major Portfolio Changes | |
| Six Months Ended May 31, 2018 | |
| |
| Additions | Comments |
| Herbalife Nutrition | Balanced convertible with strong equity catalysts. |
| 2.000% convertible note due 08/15/2019 | |
| 2.625% convertible note due 03/15/2024 | |
| JP Morgan Chase Financial Co. LLC | Balanced new issue. |
| (Voya Financial) | |
| 0.25% convertible note due 05/01/2023 | |
| Tesla | Balanced convertible with strong equity catalysts. |
| 1.25% convertible note due 03/01/2021 | |
| Akamai Technologies | Balanced convertible with defensive bond floor. |
| 0.000% convertible note due 02/15/2019 | |
| 0.125% convertible note due 05/01/2025 | |
| Exact Sciences | Balanced new issue with favorable equity upside. |
| 1.00% convertible note due 01/15/2025 | |
| |
| Reductions | Comments |
| Herbalife Nutrition | Took profits and rotated into new issues. |
| 2.000% convertible note due 08/15/2019 | |
| 2.625% convertible note due 03/15/2024 | |
| Cypress Semiconductor | Took profits and rotated into more balanced names. |
| 4.50% convertible note due 01/15/2022 | |
| Tesla | Rotated into more balanced names. |
| 1.25% convertible note due 03/01/2021 | |
| II-VI | Rotated into names with more attractive equity valuation. |
| 0.25% convertible note due 09/01/2022 | |
| Microchip | Rotated into more balanced names. |
| 1.625% convertible note due 02/15/2027 | |
4
investments. We believe that a portfolio of attractive, carefully selected convertible securities can produce equity-type returns with lower volatility and lower structural risk over long periods.
The fund returned 2.41% for the six months ended May 31, 2018. It underperformed the 4.40% return of its blended benchmark (70% ICE BofAML All US Convertibles Index and 30% ICE BofAML Global 300 Convertibles ex-US Index [hedged]). Our lack of exposure to highly equity-sensitive positions, especially in the information technology sector, hurt relative performance.
The investment environment
The period saw considerable volatility. After a strong start in December and January, global equities fell in February and March before recovering in April and May. The FTSE All World Total Return Index (Local) was up more than 2% for the half year. In U.S. markets, small-capitalization stocks (up more than 6%, as measured by the Russell 2000 Index) dramatically outperformed broader large-cap stocks (up more than 3%, as measured by the Standard & Poor’s 500 Index).
Markets responded to a variety of investor concerns, including elevated valuations for technology stocks, algorithm-driven stock selling, fear over a political shift in Italy, rising U.S. interest rates, and escalating trade tensions between the United States and China. Continued anxiety as to whether central banks will be able to normalize monetary policy without hurting financial markets or the real economy also took a toll. After reaching historic lows in 2017, equity market volatility spiked in late January, then ended the period near its seven-year average. The 10-year U.S. Treasury yield began December at 2.42%; after reaching a mid-May peak of 3.11%, it finished the six months at 2.86%. In Europe, the interest rate rise was more subdued.
The fund remains highly sensitive to underlying equity performance as a result of convertible bonds’ historically low coupons in the current rate environment. The portfolio remains structurally conservative, with 85% of it consisting of short- to intermediate-term bonds, defined as bonds with maturities or puts within seven years. Convertible preferreds constitute 5.6% of the portfolio, a significant underweighting compared with the benchmark. We are comfortable with our current portfolio construction, with its balance between equity participation and the downside protection provided by the fixed income component.
Our outlook for the fund remains positive. History has shown that during periods of rising interest rates, flattening yield curves and an expanding economy, convertible securities have provided favorable returns, especially versus other fixed income investments. The negative impact of higher interest rates on convertibles’ fixed income values has been more than offset by the positive impact from the embedded equity options. At this point in the economic cycle, and in view of the
5
increasing volatility in the stock and fixed income markets, we believe the fund is a conservative way to participate in a meaningful part of the equity market’s appreciation while minimizing losses should the market decline. The continued strong demand for new issuance should encourage more companies to raise capital in our market; this, in turn, will help keep our market reasonably valued and the fund’s profile well-balanced.
Our successes
Our underweighting of the declining utilities sector helped the fund’s relative performance. The top absolute contributors to performance were convertibles from Herbalife, World Wrestling Entertainment, and ServiceNow.
Our shortfalls
Security selection in information technology and health care detracted the most from relative performance. Our chief absolute detractors from absolute results were Tesla, Belden, and Dermira.
The fund’s positioning
We remain fully invested in a highly diversified, well-balanced portfolio of convertible securities. At the end of the period, the fund’s investments were 68.8% in the United States and 31.2% outside the United States. The fund had an attractive current yield of 1.4% and an average credit quality of Ba2/BB.
We continue to believe that convertibles should provide investors with equity-type returns over a full market cycle while absorbing about two-thirds of the stock market’s volatility. Since the enhancement of our portfolio management team in early 2017, we have been working to improve our results by focusing on outperforming during down markets while capturing most of the return during periods when the market is up. Our track record over the second half of 2017 and into early 2018 showed considerable improvement on that front. With the return of market volatility in the first quarter, the fund continued to outperform during down weeks.
During the weeks when the equity markets had positive returns, however, we lagged more than expected, and the result was underperformance for the period. Our analysis indicates that the shortfall in first-quarter performance was attributable not to our process, but to our implementation of the process during the first bout of equity market volatility the fund had seen since the management transition. Lessons learned from the first quarter of 2018 should lead to improved relative performance going forward.
Stu Spangler, CFA, Managing Director
Andrew Watts, CFA, Managing Director
Abe Ofer, Managing Director
Jean-Pierre Latrille, Managing Director
Petar Raketic, CFA, Managing Director
Oaktree Capital Management, L.P.
June 19, 2018
6
Convertible Securities Fund
Fund Profile
As of May 31, 2018
| |
| Portfolio Characteristics | |
| Ticker Symbol | VCVSX |
| Number of Securities | 201 |
| 30-Day SEC Yield | 1.25% |
| Conversion Premium | 26.3% |
| Average Weighted Maturity | 4.0 years |
| Average Coupon | 1.6% |
| Average Duration | 3.8 years |
| Foreign Holdings | 31.2% |
| Turnover Rate (Annualized) | 199% |
| Expense Ratio1 | 0.35% |
| Short-Term Reserves | 5.3% |
| |
| Distribution by Maturity | |
| (% of fixed income portfolio) | |
| Under 1 Year | 9.7% |
| 1 - 5 Years | 69.0 |
| 5 - 10 Years | 19.9 |
| 10 - 20 Years | 0.5 |
| 20 - 30 Years | 0.9 |
| |
| Distribution by Credit Quality (% of fixed | |
| income portfolio) | |
| AAA | 0.0% |
| AA | 0.0 |
| A | 4.0 |
| BBB | 5.4 |
| BB | 5.0 |
| B | 4.5 |
| Below B | 1.4 |
| Not Rated | 79.7 |
Credit-quality ratings are obtained from S&P. "Not Rated" is used to
classify securities for which a rating is not available. Not rated
securities include a fund's investment in Vanguard Market Liquidity
Fund or Vanguard Municipal Cash Management Fund, each of
which invests in high-quality money market instruments and may
serve as a cash management vehicle for the Vanguard funds, trusts,
and accounts. For more information about these ratings, see the
Glossary entry for Credit Quality.
| | |
| Total Fund Volatility Measures | |
| | | DJ |
| | Convertibles | U.S. Total |
| | Composite | Market |
| | Index | FA Index |
| R-Squared | 0.92 | 0.74 |
| Beta | 0.90 | 0.50 |
| These measures show the degree and timing of the fund’s |
| fluctuations compared with the indexes over 36 months. |
| | |
| Ten Largest Holdings (% of total net assets) |
| JPMorgan Chase Bank | Diversified Financial | |
| | Services | 1.4% |
| Extra Space Storage LP | Real Estate | |
| | Investment Trusts | 1.4 |
| NextEra Energy Inc. | Electric Utilities | 1.3 |
| Workday Inc. | Software | 1.3 |
| Illumina Inc. | Life Sciences Tools | |
| | & Services | 1.3 |
| Silicon Laboratories Inc. | Semiconductors & | |
| | Semiconductor | |
| | Equipment | 1.2 |
| Jazz Investments I Ltd. | Pharmaceuticals | 1.2 |
| Zendesk Inc. | Software | 1.2 |
| Becton Dickinson and | Health Care | |
| Co. | Equipment & | |
| | Supplies | 1.1 |
| Yahoo! Inc. | Internet Software & | |
| | Services | 1.1 |
| Top Ten | | 12.5% |
| The holdings listed exclude any temporary cash investments and equity index products. |
1 The expense ratio shown is from the prospectus dated March 27, 2018, and represents estimated costs for the current fiscal year. For
the six months ended May 31, 2018, the annualized expense ratio was 0.34%.
7
Convertible Securities Fund
| |
| Sector Diversification (% of market exposure) |
| |
| Consumer Discretionary | 10.8% |
| Consumer Staples | 1.1 |
| Energy | 10.6 |
| Financials | 9.2 |
| Health Care | 15.8 |
| Industrials | 10.2 |
| Information Technology | 31.3 |
| Materials | 3.3 |
| Real Estate | 3.6 |
| Utilities | 4.1 |
Sector categories are based on the Global Industry Classification
Standard (“GICS”), except for the “Other” category (if applicable),
which includes securities that have not been provided a GICS
classification as of the effective reporting period.
8
Convertible Securities Fund
Performance Summary
All of the returns in this report represent past performance, which is not a guarantee of future results that may be achieved by the fund. (Current performance may be lower or higher than the performance data cited. For performance data current to the most recent month-end, visit our website at vanguard.com/performance.) Note, too, that both investment returns and principal value can fluctuate widely, so an investor’s shares, when sold, could be worth more or less than their original cost. The returns shown do not reflect taxes that a shareholder would pay on fund distributions or on the sale of fund shares.
Fiscal-Year Total Returns (%): November 30, 2007, Through May 31, 2018
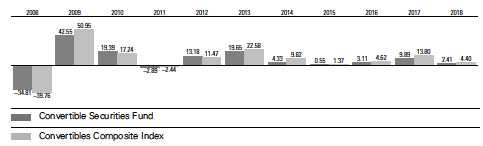
For a benchmark description, see the Glossary.
Note: For 2018, performance data reflect the six months ended May 31, 2018.
Average Annual Total Returns: Periods Ended March 31, 2018
This table presents returns through the latest calendar quarter—rather than through the end of the fiscal period.
Securities and Exchange Commission rules require that we provide this information.
| | | | | | |
| | | | | Ten Years |
| | Inception Date | One Year | Five Years | Income | Capital | Total |
| Convertible Securities | | | | | | |
| Fund | 6/17/1986 | 6.27% | 5.60% | 3.13% | 3.21% | 6.34% |
See Financial Highlights for dividend and capital gains information.
9
Convertible Securities Fund
Financial Statements (unaudited)
Statement of Net Assets
As of May 31, 2018
The fund reports a complete list of its holdings in regulatory filings four times in each fiscal year, at the quarter-ends. For the second and fourth fiscal quarters, the lists appear in the fund’s semiannual and annual reports to shareholders. For the first and third fiscal quarters, the fund files the lists with the Securities and Exchange Commission on Form N-Q. Shareholders can look up the fund’s Forms N-Q on the SEC’s website at sec.gov. Forms N-Q may also be reviewed and copied at the SEC’s Public Reference Room (see the back cover of this report for further information).
| | | | | |
| | | | | Face | Market |
| | | Maturity | | Amount | Value • |
| | Coupon | Date | Currency | (000) | ($000) |
| Convertible Bonds (89.6%) | | | | | |
| Consumer Discretionary (10.3%) | | | | | |
| 1 Chegg Inc. Cvt. | 0.250% | 5/15/23 | USD | 6,850 | 8,241 |
| 1 China Lodging Group Ltd. Cvt. | 0.375% | 11/1/22 | USD | 6,196 | 7,284 |
| Cie Generale des Etablissements | | | | | |
| Michelin Cvt. | 0.000% | 1/10/22 | USD | 2,400 | 2,357 |
| Ctrip.com International Ltd. Cvt. | 1.000% | 7/1/20 | USD | 7,462 | 7,763 |
| CyberAgent Inc. Cvt. | 0.000% | 2/17/23 | JPY | 170,000 | 1,762 |
| CyberAgent Inc. Cvt. | 0.000% | 2/19/25 | JPY | 380,000 | 4,035 |
| EDION Corp. Cvt. | 0.000% | 6/19/25 | JPY | 230,000 | 2,238 |
| Harvest International Co. Cvt. | 0.000% | 11/21/22 | HKD | 53,000 | 7,239 |
| 1 Liberty Media Corp. Cvt. | 2.125% | 3/31/48 | USD | 11,840 | 12,077 |
| 1 Live Nation Entertainment Inc. Cvt. | 2.500% | 3/15/23 | USD | 3,495 | 3,502 |
| Lotte Shopping Co. Ltd. Cvt. | 0.000% | 4/4/23 | KRW | 6,200,000 | 5,895 |
| LVMH Moet Hennessy Louis Vuitton SE Cvt. | 0.000% | 2/16/21 | USD | 13 | 4,836 |
| NHK Spring Co. Ltd. Cvt. | 0.000% | 9/20/19 | USD | 3,450 | 3,545 |
| Priceline Group Inc. Cvt. | 0.900% | 9/15/21 | USD | 9,928 | 12,157 |
| 1 Restoration Hardware Holdings Inc. Cvt. | 0.000% | 7/15/20 | USD | 5,740 | 5,982 |
| SEB SA Regs Cvt. | 0.000% | 11/17/21 | EUR | 20 | 4,669 |
| Sony Corp. Cvt. | 0.000% | 9/30/22 | JPY | 796,000 | 8,909 |
| Valeo SA Cvt. | 0.000% | 6/16/21 | USD | 4,800 | 4,824 |
| 1 Wayfair Inc. Cvt. | 0.375% | 9/1/22 | USD | 3,940 | 4,357 |
| Zhongsheng Group Holdings Ltd. Cvt. | 0.000% | 5/23/23 | HKD | 27,000 | 3,468 |
| | | | | | 115,140 |
| Consumer Staples (0.9%) | | | | | |
| 1 Herbalife Ltd. Cvt. | 2.625% | 3/15/24 | USD | 9,580 | 9,876 |
| |
| Energy (8.8%) | | | | | |
| Borr Drilling Ltd. Cvt. | 3.875% | 5/23/23 | USD | 3,000 | 3,112 |
| BP Capital Markets plc Cvt. | 1.000% | 4/28/23 | GBP | 1,300 | 2,275 |
| Bristow Group Inc. Cvt. | 4.500% | 6/1/23 | USD | 1,664 | 1,706 |
| BW Group Ltd. Cvt. | 1.750% | 9/10/19 | USD | 3,600 | 3,420 |
| Cheniere Energy Inc. Cvt. | 4.250% | 3/15/45 | USD | 8,178 | 6,500 |
| Chesapeake Energy Corp. Cvt. | 5.500% | 9/15/26 | USD | 5,380 | 5,192 |
| Ensco Jersey Finance Ltd. Cvt. | 3.000% | 1/31/24 | USD | 10,625 | 9,546 |
| Golar LNG Ltd. Cvt. | 2.750% | 2/15/22 | USD | 10,302 | 10,435 |
| Green Plains Inc. Cvt. | 4.125% | 9/1/22 | USD | 3,360 | 3,534 |
| Kunlun Energy Co. Ltd. Cvt. | 1.625% | 7/25/19 | CNY | 24,000 | 4,063 |
| Oasis Petroleum Inc. Cvt. | 2.625% | 9/15/23 | USD | 4,270 | 5,515 |
10
Convertible Securities Fund
| | | | | | |
| | | | | | Face | Market |
| | | | Maturity | | Amount | Value • |
| | | Coupon | Date | Currency | (000) | ($000) |
| 1 | Oil States International Inc. Cvt. | 1.500% | 2/15/23 | USD | 4,950 | 5,430 |
| | PDC Energy Inc. Cvt. | 1.125% | 9/15/21 | USD | 7,167 | 7,436 |
| | RAG-Stiftung Cvt. | 0.000% | 3/16/23 | EUR | 4,200 | 5,185 |
| | TOTAL SA Cvt. | 0.500% | 12/2/22 | USD | 5,200 | 5,583 |
| | Transocean Inc. Cvt. | 0.500% | 1/30/23 | USD | 7,360 | 10,021 |
| | Weatherford International Ltd. Cvt. | 5.875% | 7/1/21 | USD | 9,125 | 8,914 |
| | | | | | | 97,867 |
| Financials (7.9%) | | | | | |
| | Apollo Commercial Real Estate Finance | | | | | |
| | Inc. Cvt. | 4.750% | 8/23/22 | USD | 2,705 | 2,711 |
| | Archer Obligations SA Cvt. | 0.000% | 3/31/23 | EUR | 5,600 | 8,268 |
| | Blackstone Mortgage Trust Inc. Cvt. | 4.375% | 5/5/22 | USD | 5,970 | 5,827 |
| | BofA Finance LLC Cvt. | 0.250% | 5/1/23 | USD | 3,745 | 3,640 |
| | Encore Capital Group Inc. Cvt. | 3.000% | 7/1/20 | USD | 3,714 | 3,887 |
| 1 | Extra Space Storage LP Cvt. | 3.125% | 10/1/35 | USD | 13,429 | 15,255 |
| 1 | EZCORP Inc. Cvt. | 2.375% | 5/1/25 | USD | 2,736 | 2,727 |
| | Haitong International Securities Group | | | | | |
| | Ltd. Cvt. | 0.000% | 10/25/21 | HKD | 16,000 | 2,050 |
| 1 | Hope Bancorp Inc. Cvt. | 2.000% | 5/15/38 | USD | 2,730 | 2,715 |
| | JPMorgan Chase Bank NA Cvt. | 0.000% | 1/11/21 | USD | 800 | 764 |
| 1,2 | JPMorgan Chase Bank NA Cvt. | 0.000% | 1/28/21 | HKD | 50,000 | 6,428 |
| | JPMorgan Chase Financial Co. LLC Cvt. | 0.250% | 5/1/23 | USD | 8,520 | 8,455 |
| | Magyar Nemzeti Vagyonkezelo Zrt Cvt. | 3.375% | 4/2/19 | EUR | 4,300 | 5,203 |
| | Orpar SA Cvt. | 0.000% | 6/20/24 | EUR | 3,200 | 3,958 |
| 1 | PRA Group Inc. Cvt. | 3.500% | 6/1/23 | USD | 7,755 | 8,316 |
| 3 | Shizuoka Bank Ltd. Cvt. | 1.860% | 1/25/23 | USD | 3,200 | 3,264 |
| | Starwood Property Trust Inc. Cvt. | 4.000% | 1/15/19 | USD | 4,780 | 5,213 |
| | | | | | | 88,681 |
| Health Care (13.9%) | | | | | |
| | Alder Biopharmaceuticals Inc. Cvt. | 2.500% | 2/1/25 | USD | 1,800 | 1,983 |
| | Allscripts Healthcare Solutions Inc. Cvt. | 1.250% | 7/1/20 | USD | 1,385 | 1,406 |
| | AMAG Pharmaceuticals Inc. Cvt. | 3.250% | 6/1/22 | USD | 5,120 | 5,938 |
| | ANI Pharmaceuticals Inc. Cvt. | 3.000% | 12/1/19 | USD | 3,350 | 3,758 |
| 1 | Array BioPharma Inc. Cvt. | 2.625% | 12/1/24 | USD | 970 | 1,286 |
| | Bayer AG Cvt. | 0.050% | 6/15/20 | EUR | 1,800 | 2,423 |
| | BioMarin Pharmaceutical Inc. Cvt. | 0.599% | 8/1/24 | USD | 7,675 | 7,606 |
| | BioMarin Pharmaceutical Inc. Cvt. | 0.750% | 10/15/18 | USD | 1,800 | 1,877 |
| 1 | DexCom Inc. Cvt. | 0.750% | 5/15/22 | USD | 9,080 | 10,052 |
| | Exact Sciences Corp. Cvt. | 1.000% | 1/15/25 | USD | 9,750 | 10,326 |
| | Flexion Therapeutics Inc. Cvt. | 3.375% | 5/1/24 | USD | 3,045 | 3,856 |
| | GN Store Nord A/S Cvt. | 0.000% | 5/31/22 | EUR | 3,300 | 4,258 |
| | Illumina Inc. Cvt. | 0.000% | 6/15/19 | USD | 9,505 | 11,039 |
| | Illumina Inc. Cvt. | 0.500% | 6/15/21 | USD | 2,405 | 3,150 |
| | Innoviva Inc. Cvt. | 2.125% | 1/15/23 | USD | 5,682 | 5,695 |
| 1 | Insulet Corp. Cvt. | 1.375% | 11/15/24 | USD | 6,060 | 7,133 |
| | Ironwood Pharmaceuticals Inc. Cvt. | 2.250% | 6/15/22 | USD | 1,725 | 2,266 |
| 1 | Jazz Investments I Ltd. Cvt. | 1.500% | 8/15/24 | USD | 7,750 | 7,921 |
| | Jazz Investments I Ltd. Cvt. | 1.875% | 8/15/21 | USD | 4,593 | 4,937 |
| | Korian SA Cvt. | 2.500% | Perpetual | EUR | 57 | 2,755 |
| 1 | Ligand Pharmaceuticals Inc. Cvt. | 0.750% | 5/15/23 | USD | 8,910 | 8,939 |
| | Medipal Holdings Corp. Cvt. | 0.000% | 10/7/22 | JPY | 230,000 | 2,508 |
| | Neurocrine Biosciences Inc. Cvt. | 2.250% | 5/15/24 | USD | 4,035 | 5,803 |
| | Nevro Corp. Cvt. | 1.750% | 6/1/21 | USD | 1,025 | 1,106 |
| | NMC Health Jersey Ltd. Cvt. | 1.875% | 4/30/25 | USD | 3,800 | 3,605 |
| | QIAGEN NV Cvt. | 0.500% | 9/13/23 | USD | 5,800 | 6,295 |
| 11 |
Convertible Securities Fund
| | | | | |
| | | | | Face | Market |
| | | Maturity | | Amount | Value • |
| | Coupon | Date | Currency | (000) | ($000) |
| Quidel Corp. Cvt. | 3.250% | 12/15/20 | USD | 1,056 | 2,136 |
| 1 Sarepta Therapeutics Inc. Cvt. | 1.500% | 11/15/24 | USD | 3,065 | 4,546 |
| 1 Supernus Pharmaceuticals Inc. Cvt. | 0.625% | 4/1/23 | USD | 8,750 | 10,267 |
| 1 Teladoc Inc. Cvt. | 3.000% | 12/15/22 | USD | 5,365 | 7,293 |
| Wright Medical Group Inc. Cvt. | 2.000% | 2/15/20 | USD | 1,545 | 1,649 |
| Wright Medical Group NV Cvt. | 2.250% | 11/15/21 | USD | 1,030 | 1,343 |
| | | | | | 155,155 |
| Industrials (9.4%) | | | | | |
| 1 Air Transport Services Group Inc. Cvt. | 1.125% | 10/15/24 | USD | 855 | 815 |
| Airbus Group SE Cvt. | 0.000% | 6/14/21 | EUR | 3,000 | 4,458 |
| Airbus SE Cvt. | 0.000% | 7/1/22 | EUR | 5,000 | 6,921 |
| ANA Holdings Inc. Cvt. | 0.000% | 9/19/24 | JPY | 720,000 | 6,916 |
| Atlas Air Worldwide Holdings Inc. Cvt. | 2.250% | 6/1/22 | USD | 1,240 | 1,490 |
| Brenntag Finance BV Cvt. | 1.875% | 12/2/22 | USD | 3,250 | 3,188 |
| 1 Chart Industries Inc. Cvt. | 1.000% | 11/15/24 | USD | 4,285 | 5,365 |
| China Railway Construction Corp. Ltd. Cvt. | 0.000% | 1/29/21 | USD | 6,000 | 6,307 |
| DP World Ltd. Cvt. | 1.750% | 6/19/24 | USD | 4,400 | 4,593 |
| Dycom Industries Inc. Cvt. | 0.750% | 9/15/21 | USD | 2,022 | 2,345 |
| Elis SA Cvt. | 0.000% | 10/6/23 | EUR | 2,707 | 3,093 |
| Greenbrier Cos. Inc. Cvt. | 2.875% | 2/1/24 | USD | 1,503 | 1,697 |
| Johnson Electric Holdings Ltd. Cvt. | 1.000% | 4/2/21 | USD | 2,750 | 2,949 |
| Kaman Corp. Cvt. | 3.250% | 5/1/24 | USD | 5,705 | 7,068 |
| Larsen & Toubro Ltd. Cvt. | 0.675% | 10/22/19 | USD | 3,677 | 3,874 |
| Minebea Mitsumi Inc. Cvt. | 0.000% | 8/3/22 | JPY | 290,000 | 3,196 |
| Mirait Holdings Corp. Cvt. | 0.000% | 12/30/21 | JPY | 95,000 | 1,116 |
| Nagoya Railroad Co. Ltd. Cvt. | 0.000% | 12/11/24 | JPY | 540,000 | 5,386 |
| Navistar International Corp. Cvt. | 4.500% | 10/15/18 | USD | 6,170 | 6,217 |
| Navistar International Corp. Cvt. | 4.750% | 4/15/19 | USD | 1,970 | 2,032 |
| RTI International Metals Inc. Cvt. | 1.625% | 10/15/19 | USD | 1,080 | 1,091 |
| Safran SA Cvt. | 0.000% | 12/31/20 | EUR | 41 | 5,138 |
| Seven Group Holdings Ltd. Cvt. | 2.200% | 3/5/25 | AUD | 5,000 | 3,805 |
| Shanghai Port Group BVI Holding Co. | | | | | |
| Ltd. Cvt. | 0.000% | 8/9/22 | USD | 5,469 | 5,882 |
| Shimizu Corp. Cvt. | 0.000% | 10/16/20 | JPY | 470,000 | 4,558 |
| Vinci SA Cvt. | 0.375% | 2/16/22 | USD | 4,800 | 5,164 |
| | | | | | 104,664 |
| Information Technology (29.8%) | | | | | |
| Akamai Technologies Inc. Cvt. | 0.000% | 2/15/19 | USD | 5,058 | 5,102 |
| 1 Akamai Technologies Inc. Cvt. | 0.125% | 5/1/25 | USD | 4,645 | 4,709 |
| 1 Atlassian Inc. Cvt. | 0.625% | 5/1/23 | USD | 10,475 | 10,963 |
| Carbonite Inc. Cvt. | 2.500% | 4/1/22 | USD | 2,045 | 3,300 |
| Citrix Systems Inc. Cvt. | 0.500% | 4/15/19 | USD | 8,058 | 11,790 |
| Cornerstone OnDemand Inc. Cvt. | 1.500% | 7/1/18 | USD | 7,265 | 7,257 |
| 1 Coupa Software Inc. Cvt. | 0.375% | 1/15/23 | USD | 3,745 | 4,965 |
| CSG Systems International Inc. Cvt. | 4.250% | 3/15/36 | USD | 693 | 730 |
| Cypress Semiconductor Corp. Cvt. | 4.500% | 1/15/22 | USD | 2,371 | 3,272 |
| Envestnet Inc. Cvt. | 1.750% | 12/15/19 | USD | 5,797 | 6,101 |
| 1 Etsy Inc. Cvt. | 0.000% | 3/1/23 | USD | 9,445 | 10,471 |
| 1 Five9 Inc. Cvt. | 0.125% | 5/1/23 | USD | 1,715 | 1,805 |
| 1 GDS Holdings Ltd. Cvt. | 2.000% | 6/1/25 | USD | 3,600 | 3,600 |
| Guidewire Software Inc. Cvt. | 1.250% | 3/15/25 | USD | 11,305 | 11,774 |
| HubSpot Inc. Cvt. | 0.250% | 6/1/22 | USD | 3,936 | 5,498 |
| 1 IAC FinanceCo Inc. Cvt. | 0.875% | 10/1/22 | USD | 6,426 | 7,673 |
| 1 II-VI Inc. Cvt. | 0.250% | 9/1/22 | USD | 3,395 | 3,864 |
| |
| 12 |
Convertible Securities Fund
| | | | | |
| | | | | Face | Market |
| | | Maturity | | Amount | Value • |
| | Coupon | Date | Currency | (000) | ($000) |
| Indra Sistemas SA Cvt. | 1.250% | 10/7/23 | EUR | 3,200 | 3,917 |
| Integrated Device Technology Inc. Cvt. | 0.875% | 11/15/22 | USD | 4,481 | 5,257 |
| InterDigital Inc. Cvt. | 1.500% | 3/1/20 | USD | 4,320 | 5,177 |
| j2 Global Inc. Cvt. | 3.250% | 6/15/29 | USD | 8,565 | 11,421 |
| Kakao Corp. Cvt. | 0.000% | 5/11/21 | KRW | 3,600,000 | 3,457 |
| Microchip Technology Inc. Cvt. | 1.625% | 2/15/27 | USD | 6,550 | 8,327 |
| Micron Technology Inc. Cvt. | 3.000% | 11/15/43 | USD | 2,565 | 5,049 |
| 1 New Relic Inc. Cvt. | 0.500% | 5/1/23 | USD | 7,485 | 8,236 |
| Nice Systems Inc. Cvt. | 1.250% | 1/15/24 | USD | 3,197 | 4,314 |
| 1 Nutanix Inc. Cvt. | 0.000% | 1/15/23 | USD | 4,670 | 5,969 |
| 1 Okta Inc. Cvt. | 0.250% | 2/15/23 | USD | 4,730 | 6,234 |
| ON Semiconductor Corp. Cvt. | 1.000% | 12/1/20 | USD | 6,785 | 9,949 |
| Palo Alto Networks Inc. Cvt. | 0.000% | 7/1/19 | USD | 2,675 | 5,045 |
| Proofpoint Inc. Cvt. | 0.750% | 6/15/20 | USD | 2,088 | 3,113 |
| 1 Pure Storage Inc. Cvt. | 0.125% | 4/15/23 | USD | 6,505 | 6,833 |
| 1 Q2 Holdings Inc. Cvt. | 0.750% | 2/15/23 | USD | 5,189 | 5,945 |
| 1 Quotient Technology Inc. Cvt. | 1.750% | 12/1/22 | USD | 3,164 | 3,280 |
| 1 Rambus Inc. Cvt. | 1.375% | 2/1/23 | USD | 4,875 | 4,791 |
| RealPage Inc. Cvt. | 1.500% | 11/15/22 | USD | 3,185 | 4,757 |
| 1 RingCentral Inc. Cvt. | 0.000% | 3/15/23 | USD | 6,485 | 7,201 |
| SCREEN Holdings Co. Ltd. Cvt. | 0.000% | 6/11/25 | JPY | 170,000 | 1,653 |
| 1 ServiceNow Inc. Cvt. | 0.000% | 6/1/22 | USD | 6,695 | 9,410 |
| Silicon Laboratories Inc. Cvt. | 1.375% | 3/1/22 | USD | 10,034 | 12,862 |
| 1 Square Inc. Cvt. | 0.500% | 5/15/23 | USD | 7,740 | 8,119 |
| STMicroelectronics NV Cvt. | 0.250% | 7/3/24 | USD | 4,200 | 5,229 |
| 1 Synaptics Inc. Cvt. | 0.500% | 6/15/22 | USD | 3,275 | 3,015 |
| 1 Twilio Inc. Cvt. | 0.250% | 6/1/23 | USD | 6,870 | 7,020 |
| Twitter Inc. Cvt. | 1.000% | 9/15/21 | USD | 1,785 | 1,681 |
| Ubisoft Entertainment SA Cvt. | 0.000% | 9/27/21 | EUR | 7 | 823 |
| Viavi Solutions Inc. Cvt. | 0.625% | 8/15/33 | USD | 6,480 | 6,474 |
| 1 Weibo Corp. Cvt. | 1.250% | 11/15/22 | USD | 3,461 | 3,712 |
| 1 Workday Inc. Cvt. | 0.250% | 10/1/22 | USD | 12,930 | 14,282 |
| Yahoo! Inc. Cvt. | 0.000% | 12/1/18 | USD | 8,553 | 12,356 |
| Yandex NV Cvt. | 1.125% | 12/15/18 | USD | 2,460 | 2,404 |
| 1 Zendesk Inc. Cvt. | 0.250% | 3/15/23 | USD | 11,760 | 12,837 |
| Zillow Group Inc. Cvt. | 2.000% | 12/1/21 | USD | 7,450 | 9,438 |
| | | | | | 332,461 |
| Materials (3.2%) | | | | | |
| Angang Steel Co. Ltd. Cvt. | 0.000% | 5/25/23 | HKD | 26,000 | 3,315 |
| Cleveland-Cliffs Inc. Cvt. | 1.500% | 1/15/25 | USD | 1,680 | 2,047 |
| Glencore Funding LLC Cvt. | 0.000% | 3/27/25 | USD | 3,200 | 3,040 |
| Kansai Paint Co. Ltd. Cvt. | 0.000% | 6/17/22 | JPY | 610,000 | 5,769 |
| LG Chem Ltd. Cvt. | 0.000% | 4/16/21 | USD | 2,200 | 2,167 |
| Mitsubishi Chemical Holdings Corp. Cvt. | 0.000% | 3/29/24 | JPY | 780,000 | 7,654 |
| Royal Gold Inc. Cvt. | 2.875% | 6/15/19 | USD | 3,620 | 3,845 |
| Sika AG Cvt. | 0.150% | 6/5/25 | CHF | 2,660 | 2,743 |
| Teijin Ltd. Cvt. | 0.000% | 12/10/21 | JPY | 90,000 | 970 |
| Toray Industries Inc. Cvt. | 0.000% | 8/30/19 | JPY | 400,000 | 3,953 |
| | | | | | 35,503 |
| Real Estate (3.2%) | | | | | |
| ADLER Real Estate AG Cvt. | 0.000% | 7/19/21 | EUR | 178 | 3,337 |
| Aroundtown SA Cvt. | 1.500% | 1/18/21 | EUR | 1,700 | 2,591 |
| CA Immobilien Anlagen AG Cvt. | 0.750% | 4/4/25 | EUR | 2,400 | 3,227 |
| CapitaLand Ltd. Cvt. | 1.950% | 10/17/23 | SGD | 5,000 | 3,777 |
| |
| 13 |
Convertible Securities Fund
| | | | | |
| | | | | Face | Market |
| | | Maturity | | Amount | Value • |
| | Coupon | Date | Currency | (000) | ($000) |
| Consus Real Estate AG Cvt. | 4.000% | 11/29/22 | EUR | 6,000 | 6,313 |
| IH Merger Sub LLC Cvt. | 3.500% | 1/15/22 | USD | 9,263 | 10,107 |
| Nexity SA Cvt. | 0.125% | 1/1/23 | EUR | 5,383 | 6,362 |
| | | | | | 35,714 |
| Utilities (2.2%) | | | | | |
| Cahaya Capital Ltd. Cvt. | 0.000% | 9/18/21 | USD | 2,038 | 2,008 |
| China Yangtze Power International BVI 1 | | | | | |
| Ltd. Cvt. | 0.000% | 11/9/21 | USD | 4,231 | 4,823 |
| Kyushu Electric Power Co. Inc. Cvt. | 0.000% | 3/31/22 | JPY | 510,000 | 4,899 |
| 1 NextEra Energy Partners LP Cvt. | 1.500% | 9/15/20 | USD | 3,165 | 3,167 |
| Northland Power Inc. Cvt. | 4.750% | 6/30/20 | CAD | 3,633 | 3,189 |
| Northland Power Inc. Cvt. | 5.000% | 6/30/19 | CAD | 1,333 | 1,141 |
| 1 NRG Energy Inc. Cvt. | 2.750% | 6/1/48 | USD | 5,145 | 5,252 |
| | | | | | 24,479 |
| Total Convertible Bonds (Cost $936,368) | | | | | 999,540 |
| |
| | | | | Shares | |
| Convertible Preferred Stocks (5.6%) | | | | | |
| Consumer Staples (0.1%) | | | | | |
| Bunge Ltd. Pfd. | 4.875% | Perpetual | | 14,300 | 1,529 |
| |
| Energy (1.3%) | | | | | |
| Hess Corp. Pfd. | 8.000% | 2/1/19 | | 62,550 | 4,270 |
| Nabors Industries Ltd. Pfd. | 6.000% | 5/1/21 | | 70,000 | 3,533 |
| WPX Energy Inc. Pfd. | 6.250% | 7/31/18 | | 92,650 | 7,060 |
| | | | | | 14,863 |
| Financials (0.8%) | | | | | |
| Wells Fargo & Co. Pfd. | 7.500% | Perpetual | | 7,392 | 9,274 |
| |
| Health Care (1.1%) | | | | | |
| Becton Dickinson and Co. Pfd. | 6.125% | 5/1/20 | | 219,320 | 12,713 |
| |
| Industrials (0.3%) | | | | | |
| Rexnord Corp. Pfd. | 5.750% | 11/15/19 | | 52,246 | 3,258 |
| |
| Real Estate (0.2%) | | | | | |
| Crown Castle International Corp. Pfd. | 6.875% | 8/1/20 | | 1,974 | 2,059 |
| |
| Utilities (1.8%) | | | | | |
| NextEra Energy Inc. Pfd. | 6.123% | 9/1/19 | | 139,170 | 7,900 |
| NextEra Energy Inc. Pfd. | 6.371% | 9/1/18 | | 48,400 | 3,537 |
| Vistra Energy Corp. Pfd. | 7.000% | 7/1/19 | | 83,450 | 8,203 |
| | | | | | 19,640 |
| Total Convertible Preferred Stocks (Cost $56,807) | | | | 63,336 |
| Temporary Cash Investment (5.4%) | | | | | |
| Money Market Fund (5.4%) | | | | | |
| 4 Vanguard Market Liquidity Fund | | | | | |
| (Cost $60,027) | 1.961% | | | 600,297 | 60,036 |
| Total Investments (100.6%) (Cost $1,053,202) | | | | | 1,122,912 |
| |
| |
| |
| 14 |
Convertible Securities Fund
| |
| | Market |
| | Value• |
| | ($000) |
| Other Assets and Liabilities (-0.6%) | |
| Other Assets | 34,266 |
| Liabilities | (41,464) |
| | (7,198) |
| Net Assets (100%) | |
| Applicable to 81,450,959 outstanding $.001 par value shares of | |
| beneficial interest (unlimited authorization) | 1,115,714 |
| Net Asset Value Per Share | $13.70 |
| |
| | Amount |
| | ($000) |
| Statement of Assets and Liabilities | |
| Assets | |
| Investments in Securities, at Value | |
| Unaffiliated Issuers | 1,062,876 |
| Affiliated Issuers | 60,036 |
| Total Investments in Securities | 1,122,912 |
| Investment in Vanguard | 59 |
| Receivables for Investment Securities Sold | 21,604 |
| Receivables for Accrued Income | 3,780 |
| Receivables for Capital Shares Issued | 281 |
| Unrealized Appreciation—Forward Currency Contracts | 7,546 |
| Other Assets | 996 |
| Total Asset | 1,157,178 |
| Liabilities | |
| Payables to Investment Advisor | 351 |
| Payables for Investment Securities Purchased | 37,639 |
| Payables for Capital Shares Redeemed | 486 |
| Payables to Vanguard | 2,807 |
| Unrealized Depreciation—Forward Currency Contracts | 168 |
| Other Liabilities | 13 |
| Total Liabilities | 41,464 |
| Net Assets | 1,115,714 |
15
Convertible Securities Fund
| |
| At May 31, 2018, net assets consisted of: | |
| | Amount |
| | ($000) |
| Paid-in Capital | 1,005,057 |
| Undistributed Net Investment Income | 3,610 |
| Accumulated Net Realized Gains | 30,027 |
| Unrealized Appreciation (Depreciation) | |
| Investment Securities | 69,710 |
| Forward Currency Contracts | 7,378 |
| Foreign Currencies | (68) |
| Net Assets | 1,115,714 |
• See Note A in Notes to Financial Statements.
1 Security exempt from registration under Rule 144A of the Securities Act of 1933. Such securities may be sold in transactions
exempt from registration, normally to qualified institutional buyers. At May 31, 2018, the aggregate value of these securities was
$319,160,000, representing 28.6% of net assets.
2 Security value determined using significant unobservable inputs.
3 Adjustable-rate security based upon 3-month USD LIBOR plus spread.
4 Affiliated money market fund available only to Vanguard funds and certain trusts and accounts managed by Vanguard. Rate shown
is the 7-day yield.
16
Convertible Securities Fund
| | | | | | |
| Derivative Financial Instruments Outstanding as of Period End | | | |
| |
| Forward Currency Contracts | | | | | | |
| | | | | | | Unrealized |
| | Contract | | | | | Appreciation |
| | Settlement | Contract Amount (000) | (Depreciation) |
| Counterparty | Date | | Receive | | Deliver | ($000) |
| UBS AG | 7/19/18 | EUR | 7,523 | USD | 8,966 | (138) |
| UBS AG | 7/19/18 | JPY | 565,900 | USD | 5,163 | 58 |
| UBS AG | 7/19/18 | JPY | 202,200 | USD | 1,874 | (8) |
| UBS AG | 7/19/18 | GBP | 939 | USD | 1,262 | (11) |
| UBS AG | 7/19/18 | USD | 96,625 | EUR | 77,631 | 5,510 |
| UBS AG | 7/19/18 | USD | 72,004 | JPY | 7,666,225 | 1,283 |
| UBS AG | 7/19/18 | USD | 22,677 | HKD | 177,683 | (5) |
| UBS AG | 7/19/18 | USD | 8,211 | KRW | 8,764,030 | 65 |
| UBS AG | 7/19/18 | USD | 4,333 | CAD | 5,440 | 133 |
| UBS AG | 7/19/18 | USD | 3,976 | SGD | 5,200 | 88 |
| UBS AG | 7/19/18 | USD | 3,947 | CNH | 24,933 | 68 |
| UBS AG | 7/19/18 | USD | 3,819 | AUD | 4,931 | 88 |
| UBS AG | 7/19/18 | USD | 3,452 | GBP | 2,400 | 253 |
| UBS AG | 7/19/18 | USD | 1,165 | KRW | 1,254,000 | — |
| UBS AG | 7/19/18 | USD | 946 | JPY | 103,100 | (5) |
| UBS AG | 7/19/18 | USD | 624 | EUR | 533 | (1) |
| | | | | | | 7,378 |
AUD—Australian dollar.
CAD—Canadian dollar.
CHF—Swissfranc.
CNH—Chinese yuan (offshore).
CNY—Chinese yuan.
EUR—euro.
GBP—Britishpound.
HKD—Hong Kong dollar.
JPY—Japaneseyen.
KRW—SouthKoreanwon.
SGD—Singapore dollar.
USD—U.S.dollar.
Unrealized appreciation (depreciation) on open forward currency contracts, except for Hong Kong dollar and Singapore dollar currency contracts, is treated as realized gain (loss) for tax purposes. Unrealized appreciation (depreciation) for Hong Kong dollar and Singapore dollar currency contracts are generally treated the same for financial reporting and tax purposes.
At May 31, 2018, a counterparty had deposited in a segregated account securities with a value of $6,987,000 and cash of $790,000 in connection with open forward currency contracts.
See accompanying Notes, which are an integral part of the Financial Statements.
17
Convertible Securities Fund
Statement of Operations
| |
| | Six Months Ended |
| | May 31, 2018 |
| | ($000) |
| Investment Income | |
| Income | |
| Dividends | 2,625 |
| Interest1,2 | 7,436 |
| Total Income | 10,061 |
| Expenses | |
| Investment Advisory Fees—Note B | |
| Basic Fee | 2,060 |
| Performance Adjustment | (1,286) |
| The Vanguard Group—Note C | |
| Management and Administrative | 1,130 |
| Marketing and Distribution | 75 |
| Custodian Fees | 22 |
| Shareholders’ Reports and Proxy | 19 |
| Trustees’ Fees and Expenses | 1 |
| Total Expenses | 2,021 |
| Net Investment Income | 8,040 |
| Realized Net Gain (Loss) | |
| Investment Securities Sold1 | 42,924 |
| Forward Currency Contracts | (8,419) |
| Foreign Currencies | (101) |
| Realized Net Gain (Loss) | 34,404 |
| Change in Unrealized Appreciation (Depreciation) | |
| Investment Securities1 | (22,305) |
| Forward Currency Contracts | 8,199 |
| Foreign Currencies | (60) |
| Change in Unrealized Appreciation (Depreciation) | (14,166) |
| Net Increase (Decrease) in Net Assets Resulting from Operations | 28,278 |
1 Interest income, realized net gain (loss), and change in unrealized appreciation (depreciation) from an affiliated company of the fund
were $555,000, ($15,000), and $10,000, respectively. Purchases and sales are for temporary cash investment purposes.
2 Interest income is net of foreign withholding taxes of $2,000.
See accompanying Notes, which are an integral part of the Financial Statements.
18
Convertible Securities Fund
Statement of Changes in Net Assets
| | |
| | Six Months Ended | Year Ended |
| | May 31, | November 30, |
| | 2018 | 2017 |
| | ($000) | ($000) |
| Increase (Decrease) in Net Assets | | |
| Operations | | |
| Net Investment Income | 8,040 | 29,634 |
| Realized Net Gain (Loss) | 34,404 | 58,640 |
| Change in Unrealized Appreciation (Depreciation) | (14,166) | 45,560 |
| Net Increase (Decrease) in Net Assets Resulting from Operations | 28,278 | 133,834 |
| Distributions | | |
| Net Investment Income | (14,990) | (19,753) |
| Realized Capital Gain1 | (16,965) | — |
| Total Distributions | (31,955) | (19,753) |
| Capital Share Transactions | | |
| Issued | 32,890 | 75,249 |
| Issued in Lieu of Cash Distributions | 28,955 | 17,875 |
| Redeemed | (234,621) | (411,754) |
| Net Increase (Decrease) from Capital Share Transactions | (172,776) | (318,630) |
| Total Increase (Decrease) | (176,453) | (204,549) |
| Net Assets | | |
| Beginning of Period | 1,292,167 | 1,496,716 |
| End of Period2 | 1,115,714 | 1,292,167 |
1 Includes fiscal 2018 and 2017 short-term gain distributions totaling $0 and $0, respectively. Short-term gain distributions are
treated as ordinary income dividends for tax purposes.
2 Net Assets—End of Period includes undistributed (overdistributed) net investment income of $3,610,000 and $5,418,000.
See accompanying Notes, which are an integral part of the Financial Statements.
19
Convertible Securities Fund
Financial Highlights
| | | | | | |
| Six Months | | | | | |
| | Ended | | | | | |
| For a Share Outstanding | May 31, | Year Ended November 30, |
| Throughout Each Period | 2018 | 2017 | 2016 | 2015 | 2014 | 2013 |
| Net Asset Value, Beginning of Period | $13.73 | $12.67 | $12.67 | $13.85 | $14.64 | $12.95 |
| Investment Operations | | | | | | |
| Net Investment Income | . 0921 | .2771 | .259 | .251 | .287 | .333 |
| Net Realized and Unrealized Gain (Loss) | | | | | | |
| on Investments | .231 | . 967 | .117 | (.180) | .313 | 2.101 |
| Total from Investment Operations | .323 | 1.244 | .376 | .071 | .600 | 2.434 |
| Distributions | | | | | | |
| Dividends from Net Investment Income | (.169) | (.184) | (. 237) | (. 241) | (. 425) | (. 355) |
| Distributions from Realized Capital Gains | (.184) | — | (.139) | (1.010) | (.965) | (.389) |
| Total Distributions | (.353) | (.184) | (.376) | (1.251) | (1.390) | (.744) |
| Net Asset Value, End of Period | $13.70 | $13.73 | $12.67 | $12.67 | $13.85 | $14.64 |
| |
| Total Return2 | 2.41% | 9.89% | 3.11% | 0.55% | 4.33% | 19.65% |
| |
| Ratios/Supplemental Data | | | | | | |
| Net Assets, End of Period (Millions) | $1,116 | $1,292 | $1,497 | $1,741 | $2,001 | $2,060 |
| Ratio of Total Expenses to | | | | | | |
| Average Net Assets3 | 0.34% | 0.35% | 0.34% | 0.38% | 0.41% | 0.63% |
| Ratio of Net Investment Income to | | | | | | |
| Average Net Assets | 1.35% | 2.10% | 2.04% | 1.86% | 2.02% | 2.41% |
| Portfolio Turnover Rate | 199% | 130% | 103% | 95% | 85% | 101% |
The expense ratio, net investment income ratio, and turnover rate for the current period have been annualized.
1 Calculated based on average shares outstanding.
2 Total returns do not include account service fees that may have applied in the periods shown. Fund prospectuses provide information
about any applicable account service fees.
3 Includes performance-based investment advisory fee increases (decreases) of (0.22%), (0.20%), (0.21%), (0.17%), (0.15%), and 0.07%.
See accompanying Notes, which are an integral part of the Financial Statements.
20
Convertible Securities Fund
Notes to Financial Statements
Vanguard Convertible Securities Fund is registered under the Investment Company Act of 1940 as an open-end investment company, or mutual fund. The fund invests in securities of foreign issuers, which may subject it to investment risks not normally associated with investing in securities of U.S. corporations.
A. The following significant accounting policies conform to generally accepted accounting principles for U.S. investment companies. The fund consistently follows such policies in preparing its financial statements.
1. Security Valuation: Securities are valued as of the close of trading on the New York Stock Exchange (generally 4 p.m., Eastern time) on the valuation date. Equity securities are valued at the latest quoted sales prices or official closing prices taken from the primary market in which each security trades; such securities not traded on the valuation date are valued at the mean of the latest quoted bid and asked prices. Bonds and temporary cash investments are valued using the latest bid prices or using valuations based on a matrix system (which considers such factors as security prices, yields, maturities, and ratings), both as furnished by independent pricing services. Investments in Vanguard Market Liquidity Fund are valued at that fund’s net asset value. Securities for which market quotations are not readily available, or whose values have been affected by events occurring before the fund’s pricing time but after the close of the securities’ primary markets, are valued at their fair values calculated according to procedures adopted by the board of trustees. These procedures include obtaining quotations from an independent pricing service, monitoring news to identify significant market- or security-specific events, and evaluating changes in the values of foreign market proxies (for example, ADRs, futures contracts, or exchange-traded funds), between the time the foreign markets close and the fund’s pricing time. When fair-value pricing is employed, the prices of securities used by a fund to calculate its net asset value may differ from quoted or published prices for the same securities.
2. Foreign Currency: Securities and other assets and liabilities denominated in foreign currencies are translated into U.S. dollars using exchange rates obtained from an independent third party as of the fund’s pricing time on the valuation date. Realized gains (losses) and unrealized appreciation (depreciation) on investment securities include the effects of changes in exchange rates since the securities were purchased, combined with the effects of changes in security prices. Fluctuations in the value of other assets and liabilities resulting from changes in exchange rates are recorded as unrealized foreign currency gains (losses) until the assets or liabilities are settled in cash, at which time they are recorded as realized foreign currency gains (losses).
3. Forward Currency Contracts: The fund enters into forward currency contracts to protect the value of securities and related receivables and payables against changes in future foreign exchange rates. The fund’s risks in using these contracts include movement in the values of the foreign currencies relative to the U.S. dollar and the ability of the counterparties to fulfill their obligations under the contracts. The fund mitigates its counterparty risk by entering into forward currency contracts only with a diverse group of prequalified counterparties, monitoring their financial strength, entering into master netting arrangements with its counterparties, and requiring its counterparties to transfer collateral as security for their performance. In the absence of a default, the collateral pledged or received by the fund cannot be repledged, resold, or rehypothecated.
The master netting arrangements provide that, in the event of a counterparty’s default (including bankruptcy), the fund may terminate the forward currency contracts, determine the net amount owed by either party in accordance with its master netting arrangements, and sell or retain any collateral held up to the net amount owed to the fund under the master netting arrangements.
21
Convertible Securities Fund
The forward currency contracts contain provisions whereby a counterparty may terminate open contracts if the fund’s net assets decline below a certain level, triggering a payment by the fund if the fund is in a net liability position at the time of the termination. The payment amount would be reduced by any collateral the fund has pledged. Any assets pledged as collateral for open contracts are noted in the Statement of Net Assets. The value of collateral received or pledged is compared daily to the value of the forward currency contracts exposure with each counterparty, and any difference, if in excess of a specified minimum transfer amount, is adjusted and settled within two business days.
Forward currency contracts are valued at their quoted daily prices obtained from an independent third party, adjusted for currency risk based on the expiration date of each contract. The notional amounts of the contracts are not recorded in the Statement of Net Assets. Fluctuations in the value of the contracts are recorded in the Statement of Assets and Liabilities as an asset (liability) and in the Statement of Operations as unrealized appreciation (depreciation) until the contracts are closed, when they are recorded as realized forward currency contract gains (losses).
During the six months ended May 31, 2018, the fund’s average investment in forward currency contracts represented 24% of net assets, based on the average of notional amounts at each quarter-end during the period.
4. Federal Income Taxes: The fund intends to continue to qualify as a regulated investment company and distribute all of its taxable income. Management has analyzed the fund’s tax positions taken for all open federal income tax years (November 30, 2014–2017), and for the period ended May 31, 2018, and has concluded that no provision for federal income tax is required in the fund’s financial statements.
5. Distributions: Distributions to shareholders are recorded on the ex-dividend date.
6. Credit Facility: The fund and certain other funds managed by The Vanguard Group (“Vanguard”) participate in a $3.1 billion committed credit facility provided by a syndicate of lenders pursuant to a credit agreement that may be renewed annually; each fund is individually liable for its borrowings, if any, under the credit facility. Borrowings may be utilized for temporary and emergency purposes, and are subject to the fund’s regulatory and contractual borrowing restrictions. The participating funds are charged administrative fees and an annual commitment fee of 0.10% of the undrawn amount of the facility; these fees are allocated to the funds based on a method approved by the fund’s board of trustees and included in Management and Administrative expenses on the fund’s Statement of Operations. Any borrowings under this facility bear interest at a rate based upon the higher of the one-month London Interbank Offered Rate, federal funds effective rate, or overnight bank funding rate plus an agreed-upon spread.
The fund had no borrowings outstanding at May 31, 2018, or at any time during the period then ended.
7. Other: Dividend income is recorded on the ex-dividend date. Interest income includes income distributions received from Vanguard Market Liquidity Fund and is accrued daily. Premiums and discounts on debt securities purchased are amortized and accreted, respectively, to interest income over the lives of the respective securities. Security transactions are accounted for on the date securities are bought or sold. Costs used to determine realized gains (losses) on the sale of investment securities are those of the specific securities sold.
22
Convertible Securities Fund
B. Oaktree Capital Management, L.P., provides investment advisory services to the fund for a fee calculated at an annual percentage rate of average net assets. The basic fee is subject to quarterly adjustments based on the fund’s performance for the preceding three years relative to a composite index weighted 70% ICE BofAML All US Convertibles Index and 30% ICE BofAML Global 300 Convertibles ex-US Index (hedged). For the six months ended May 31, 2018, the investment advisory fee represented an effective annual basic rate of 0.35% of the fund’s average net assets before a decrease of $1,286,000 (0.22%) based on performance.
C. In accordance with the terms of a Funds’ Service Agreement (the “FSA”) between Vanguard and the fund, Vanguard furnishes to the fund corporate management, administrative, marketing, and distribution services at Vanguard’s cost of operations (as defined by the FSA). These costs of operations are allocated to the fund based on methods and guidelines approved by the board of trustees. Vanguard does not require reimbursement in the current period for certain costs of operations (such as deferred compensation/benefits and risk/insurance costs); the fund’s liability for these costs of operations is included in Payables to Vanguard on the Statement of Assets and Liabilities. All other costs of operations payable to Vanguard are generally settled twice a month.
Upon the request of Vanguard, the fund may invest up to 0.40% of its net assets as capital in Vanguard. At May 31, 2018, the fund had contributed to Vanguard capital in the amount of $59,000, representing 0.01% of the fund’s net assets and 0.02% of Vanguard’s capitalization. The fund’s trustees and officers are also directors and employees, respectively, of Vanguard.
D. Various inputs may be used to determine the value of the fund’s investments. These inputs are summarized in three broad levels for financial statement purposes. The inputs or methodologies used to value securities are not necessarily an indication of the risk associated with investing in those securities.
Level 1—Quoted prices in active markets for identical securities.
Level 2—Other significant observable inputs (including quoted prices for similar securities, interest rates, prepayment speeds, credit risk, etc.).
Level 3—Significant unobservable inputs (including the fund’s own assumptions used to determine
the fair value of investments). Any investments valued with significant unobservable inputs are
noted on the Statement of Net Assets.
The following table summarizes the market value of the fund’s investments as of May 31, 2018, based on the inputs used to value them:
| | | |
| | Level 1 | Level 2 | Level 3 |
| Investments | ($000) | ($000) | ($000) |
| Convertible Bonds | — | 993,112 | 6,428 |
| Convertible Preferred Stocks | 11,736 | 51,600 | — |
| Temporary Cash Investments | 60,036 | — | — |
| Forward Currency Contracts—Assets | — | 7,546 | — |
| Forward Currency Contracts—Liabilities | — | (168) | — |
| Total | 71,772 | 1,052,090 | 6,428 |
23
Convertible Securities Fund
E. Distributions are determined on a tax basis and may differ from net investment income and realized capital gains for financial reporting purposes. Differences may be permanent or temporary. Permanent differences are reclassified among capital accounts in the financial statements to reflect their tax character. Temporary differences arise when certain items of income, expense, gain, or loss are recognized in different periods for financial statement and tax purposes. These differences will reverse at some time in the future. Differences in classification may also result from the treatment of short-term gains as ordinary income for tax purposes. The fund’s tax-basis capital gains and losses are determined only at the end of each fiscal year.
During the six months ended May 31, 2018, the fund realized net foreign currency gains of $5,179,000 (including the foreign currency component on sales of foreign currency denominated bonds), which increased distributable net income for tax purposes; accordingly, such gains have been reclassified from accumulated net realized gains to undistributed net investment income.
Certain of the fund’s convertible bond investments are in securities considered to be “contingent payment debt instruments,” for which any realized gains increase (and all or part of any realized losses decrease) income for tax purposes. During the six months ended May 31, 2018, the fund realized net losses of $37,000 from the sale of these securities, which decreased distributable net income for tax purposes; accordingly, such losses have been reclassified from accumulated net realized gains to undistributed net investment income.
At May 31, 2018, the cost of investment securities for tax purposes was $1,053,202,000. Net unrealized appreciation of investment securities for tax purposes was $69,710,000, consisting of unrealized gains of $77,294,000 on securities that had risen in value since their purchase and $7,584,000 in unrealized losses on securities that had fallen in value since their purchase.
F. During the six months ended May 31, 2018, the fund purchased $1,091,930,000 of investment securities and sold $1,281,975,000 of investment securities, other than temporary cash investments.
G. Capital shares issued and redeemed were:
| | |
| | Six Months Ended | Year Ended |
| | May 31, 2018 | November 30, 2017 |
| | Shares | Shares |
| | (000) | (000) |
| Issued | 2,422 | 5,714 |
| Issued in Lieu of Cash Distributions | 2,151 | 1,364 |
| Redeemed | (17,243) | (31,086) |
| Net Increase (Decrease) in Shares Outstanding | (12,670) | (24,008) |
H. Management has determined that no events or transactions occurred subsequent to May 31, 2018, that would require recognition or disclosure in these financial statements.
24
About Your Fund’s Expenses
As a shareholder of the fund, you incur ongoing costs, which include costs for portfolio management, administrative services, and shareholder reports (like this one), among others. Operating expenses, which are deducted from a fund’s gross income, directly reduce the investment return of the fund.
A fund’s expenses are expressed as a percentage of its average net assets. This figure is known as the expense ratio. The following examples are intended to help you understand the ongoing costs (in dollars) of investing in your fund and to compare these costs with those of other mutual funds. The examples are based on an investment of $1,000 made at the beginning of the period shown and held for the entire period.
The accompanying table illustrates your fund’s costs in two ways:
• Based on actual fund return. This section helps you to estimate the actual expenses that you paid over the period. The ”Ending Account Value“ shown is derived from the fund‘s actual return, and the third column shows the dollar amount that would have been paid by an investor who started with $1,000 in the fund. You may use the information here, together with the amount you invested, to estimate the expenses that you paid over the period.
To do so, simply divide your account value by $1,000 (for example, an $8,600 account value divided by $1,000 = 8.6), then multiply the result by the number given for your fund under the heading ”Expenses Paid During Period.“
• Based on hypothetical 5% yearly return. This section is intended to help you compare your fund‘s costs with those of other mutual funds. It assumes that the fund had a yearly return of 5% before expenses, but that the expense ratio is unchanged. In this case—because the return used is not the fund’s actual return—the results do not apply to your investment. The example is useful in making comparisons because the Securities and Exchange Commission requires all mutual funds to calculate expenses based on a 5% return. You can assess your fund’s costs by comparing this hypothetical example with the hypothetical examples that appear in shareholder reports of other funds.
Note that the expenses shown in the table are meant to highlight and help you compare ongoing costs only and do not reflect transaction costs incurred by the fund for buying and selling securities. Further, the expenses do not include any purchase, redemption, or account service fees described in the fund prospectus. If such fees were applied to your account, your costs would be higher. Your fund does not carry a “sales load.”
The calculations assume no shares were bought or sold during the period. Your actual costs may have been higher or lower, depending on the amount of your investment and the timing of any purchases or redemptions.
You can find more information about the fund’s expenses, including annual expense ratios, in the Financial Statements section of this report. For additional information on operating expenses and other shareholder costs, please refer to your fund’s current prospectus.
25
| | | |
| Six Months Ended May 31, 2018 | | | |
| | Beginning | Ending | Expenses |
| | Account Value | Account Value | Paid During |
| Convertible Securities Fund | 11/30/2017 | 5/31/2018 | Period |
| Based on Actual Fund Return | $1,000.00 | $1,024.10 | $1.72 |
| Based on Hypothetical 5% Yearly Return | 1,000.00 | 1,023.24 | 1.72 |
The calculations are based on expenses incurred in the most recent six-month period. The fund’s annualized six-month expense ratio for
that period is 0.34%. The dollar amounts shown as “Expenses Paid” are equal to the annualized expense ratio multiplied by the average
account value over the period, multiplied by the number of days in the most recent six-month period, then divided by the number of days in
the most recent 12-month period (182/365).
26
Trustees Approve Advisory Arrangement
The board of trustees of Vanguard Convertible Securities Fund has renewed the fund’s investment advisory arrangement with Oaktree Capital Management, L.P. (Oaktree). The board determined that renewing the fund’s advisory arrangement was in the best interests of the fund and its shareholders.
The board based its decision upon an evaluation of the advisor’s investment staff, portfolio management process, and performance. This evaluation included information provided to the board by Vanguard’s Portfolio Review Department, which is responsible for fund and advisor oversight and product management. The Portfolio Review Department met regularly with the advisor and made monthly presentations to the board during the fiscal year that directed the board’s focus to relevant information and topics.
The board, or an investment committee made up of board members, also received information throughout the year during advisor presentations. For each advisor presentation, the board was provided with letters and reports that included information about, among other things, the advisory firm and the advisor’s assessment of the investment environment, portfolio performance, and portfolio characteristics.
In addition, the board received monthly reports, which included a Market and Economic Report, a Fund Dashboard Monthly Summary, and a Fund Performance Report.
Prior to their meeting, the trustees were provided with a memo and materials that summarized the information they received over the course of the year. They also considered the factors discussed below, among others. However, no single factor determined whether the board approved the arrangement. Rather, it was the totality of the circumstances that drove the board’s decision.
Nature, extent, and quality of services
The board reviewed the quality of the fund’s investment management services over both the short and long term, and took into account the organizational depth and stability of the advisor. The board considered that Oaktree, founded in 1995, specializes in managing a variety of investment types, including alternative and niche assets within convertible securities, distressed debt, high-yield bonds, real estate, control investments, and listed equities. The advisor uses a bottom-up investment approach to select convertible securities that it believes have the best balance of upside potential and downside protection. Discipline is key to the fund’s management; Oaktree invests predominantly in convertibles possessing an attractive combination of conversion and income features—true hybrid securities—and sells the issues when their characteristics become too similar to those of conventional bonds or common stocks. Oaktree has advised the fund since 1996.
The board concluded that the advisor’s experience, stability, depth, and performance, among other factors, warranted continuation of the advisory arrangement.
Investment performance
The board considered the short- and long-term performance of the fund, including any periods of outperformance or underperformance compared with a benchmark index and peer group. The board concluded that the performance was such that the advisory arrangement should continue. Information about the fund’s most recent performance can be found in the Performance Summary section of this report.
Cost
The board concluded that the fund’s expense ratio was well below the average expense ratio charged by funds in its peer group and that the fund’s advisory fee rate was also well below its peer-group average. Information about the fund’s expense ratio appears in the About Your Fund’s Expenses section of this report as well as in the Financial Statements section, which also includes information about the advisory fee rate.
The board did not consider the profitability of Oaktree in determining whether to approve the advisory fee, because Oaktree is independent of Vanguard and the advisory fee is the result of arm’s-length negotiations.
The benefit of economies of scale
The board concluded that the fund’s shareholders benefit from economies of scale because of breakpoints in the fund’s advisory fee schedule. The breakpoints reduce the effective rate of the fee as the fund’s assets increase.
The board will consider whether to renew the advisory arrangement again after a one-year period.
28
Glossary
30-Day SEC Yield. A fund’s 30-day SEC yield is derived using a formula specified by the U.S. Securities and Exchange Commission. Under the formula, data related to the fund’s security holdings in the previous 30 days are used to calculate the fund’s hypothetical net income for that period, which is then annualized and divided by the fund’s estimated average net assets over the calculation period. For the purposes of this calculation, a security’s income is based on its current market yield to maturity (for bonds), its actual income (for asset-backed securities), or its projected dividend yield (for stocks). Because the SEC yield represents hypothetical annualized income, it will differ—at times significantly—from the fund’s actual experience. As a result, the fund’s income distributions may be higher or lower than implied by the SEC yield.
Average Coupon. The average interest rate paid on the fixed income securities held by a fund. It is expressed as a percentage of face value.
Average Duration. An estimate of how much the value of the bonds held by a fund will fluctuate in response to a change in interest rates. To see how the value could change, multiply the average duration by the change in rates. If interest rates rise by 1 percentage point, the value of the bonds in a fund with an average duration of five years would decline by about 5%. If rates decrease by a percentage point, the value would rise by 5%.
Average Weighted Maturity. The average length of time until fixed income securities held by a fund reach maturity and are repaid. The figure reflects the proportion of fund assets represented by each security.
Beta. A measure of the magnitude of a fund’s past share-price fluctuations in relation to the ups and downs of a given market index. The index is assigned a beta of 1.00. Compared with a given index, a fund with a beta of 1.20 typically would have seen its share price rise or fall by 12% when the index rose or fell by 10%. For this report, beta is based on returns over the past 36 months for both the fund and the index. Note that a fund’s beta should be reviewed in conjunction with its R-squared (see definition). The lower the R-squared, the less correlation there is between the fund and the index, and the less reliable beta is as an indicator of volatility.
Conversion Premium. The average percentage by which the weighted average market price of the convertible securities held by a fund exceeds the weighted average market price of their underlying common stocks. For example, if a stock is trading at $25 per share and a bond that is convertible into the stock is trading at a price equivalent to $30 per share of stock, the conversion premium is 20% ($5 ÷ $25 = 20%).
Credit Quality. Credit-quality ratings are measured on a scale that generally ranges from AAA (highest) to D (lowest). Credit-quality ratings are obtained from S&P. “Not Rated” is used to classify securities for which a rating is not available. Not rated securities include a fund’s investment in Vanguard Market Liquidity Fund or Vanguard Municipal Cash Management Fund, each of which invests in high-quality money market instruments and may serve as a cash management vehicle for the Vanguard funds, trusts, and accounts.
Expense Ratio. A fund’s total annual operating expenses expressed as a percentage of the fund’s average net assets. The expense ratio includes management and administrative expenses, but does not include the transaction costs of buying and selling portfolio securities.
29
Foreign Holdings. The percentage of a fund represented by securities or depositary receipts of companies based outside the United States.
Inception Date. The date on which the assets of a fund (or one of its share classes) are first invested in accordance with the fund’s investment objective. For funds with a subscription period, the inception date is the day after that period ends. Investment performance is measured from the inception date.
Market Exposure. A measure that reflects a fund’s security investments excluding any holdings in short-term reserves.
R-Squared. A measure of how much of a fund’s past returns can be explained by the returns from the market in general, as measured by a given index. If a fund’s total returns were precisely synchronized with an index’s returns, its R-squared would be 1.00. If the fund’s returns bore no relationship to the index’s returns, its R-squared would be 0. For this report, R-squared is based on returns over the past 36 months for both the fund and the index.
Short-Term Reserves. The percentage of a fund invested in highly liquid, short-term securities that can be readily converted to cash.
Turnover Rate. An indication of the fund’s trading activity. Funds with high turnover rates incur higher transaction costs and may be more likely to distribute capital gains (which may be taxable to investors). The turnover rate excludes in-kind transactions, which have minimal impact on costs.
Benchmark Information
Convertibles Composite Index: CS First Boston Convertible Securities Index through November
30, 2004; Bank of America Merrill Lynch All US Convertibles Index (formerly Bank of America
Merrill Lynch All Convertibles-All Qualities Index) through December 31, 2010; and 70% ICE
BofAML All US Convertibles Index and 30% ICE BofAML Global 300 Convertibles ex-US Index
(hedged) thereafter.
30
The Global Industry Classification Standard (“GICS”) was developed by and is the exclusive property and a service mark
of MSCI Inc. (“MSCI”) and Standard and Poor’s, a division of McGraw-Hill Companies, Inc. (“S&P”), and is licensed for use
by Vanguard. Neither MSCI, S&P nor any third party involved in making or compiling the GICS or any GICS classification
makes any express or implied warranties or representations with respect to such standard or classification (or the results
to be obtained by the use thereof), and all such parties hereby expressly disclaim all warranties of originality, accuracy,
completeness, merchantability or fitness for a particular purpose with respect to any such standard or classification.
Without limiting any of the foregoing, in no event shall MSCI, S&P, any of its affiliates or any third party involved in
making or compiling the GICS or any GICS classification have any liability for any direct, indirect, special, punitive,
consequential or any other damages (including lost profits) even if notified of the possibility of such damages.
31
This page intentionally left blank.
This page intentionally left blank.
This page intentionally left blank.
The People Who Govern Your Fund
The trustees of your mutual fund are there to see that the fund is operated and managed in your best interests since, as a shareholder, you are a part owner of the fund. Your fund’s trustees also serve on the board of directors of The Vanguard Group, Inc., which is owned by the Vanguard funds and provides services to them on an at-cost basis.
A majority of Vanguard’s board members are independent, meaning that they have no affiliation with Vanguard or the funds they oversee, apart from the sizable personal investments they have made as private individuals. The independent board members have distinguished backgrounds in business, academia, and public service. Each of the trustees and executive officers oversees 208 Vanguard funds.
Information for each trustee and executive officer of the fund appears below. The mailing address of the trustees and officers is P.O. Box 876, Valley Forge, PA 19482. More information about the trustees is in the Statement of Additional Information, which can be obtained, without charge, by contacting Vanguard at 800-662-7447, or online at vanguard.com.
Interested Trustees1
F. William McNabb III
Born in 1957. Trustee since July 2009. Principal occupation(s) during the past five years and other experience: chairman of the board (January 2010–present) of Vanguard and of each of the investment companies served by Vanguard, trustee (2009–present) of each of the investment companies served by Vanguard, and director (2008–present) of Vanguard. Chief executive officer and president (2008–2017) of Vanguard and each of the investment companies served by Vanguard, managing director (1995–2008) of Vanguard, and director (1997–2018) of Vanguard Marketing Corporation. Director (2018–present) of UnitedHealth Group.
Mortimer J. Buckley
Born in 1969. Trustee since January 2018. Principal occupation(s) during the past five years and other experience: chief executive officer (January 2018–present) of Vanguard; chief executive officer, president, and trustee (January 2018–present) of each of the investment companies served by Vanguard; president and director (2017–present) of Vanguard; and president (February 2018–present) of Vanguard Marketing Corporation. Chief investment officer (2013–2017), managing director (2002–2017), head of the Retail Investor Group (2006–2012), and chief information officer (2001–2006) of Vanguard. Chairman of the board (2011–2017) of the Children’s Hospital of Philadelphia.
Independent Trustees
Emerson U. Fullwood
Born in 1948. Trustee since January 2008. Principal occupation(s) during the past five years and other experience: executive chief staff and marketing officer for North America and corporate vice president (retired 2008) of Xerox Corporation (document management products and services). Former president of the Worldwide Channels Group, Latin America, and Worldwide Customer Service and executive chief staff officer of Developing Markets of Xerox. Executive in residence and 2009–2010 Distinguished Minett Professor at the Rochester Institute of Technology. Lead director of SPX FLOW, Inc. (multi-industry manufacturing). Director of the University of Rochester Medical Center, the Monroe Community College Foundation, the United Way of Rochester, North Carolina A&T University, and Roberts Wesleyan College. Trustee of the University of Rochester.
Amy Gutmann
Born in 1949. Trustee since June 2006. Principal occupation(s) during the past five years and other experience: president (2004–present) of the University of Pennsylvania. Christopher H. Browne Distinguished Professor of Political Science, School of Arts and Sciences, and professor of communication, Annenberg School for Communication, with secondary faculty appointments in the Department of Philosophy, School of Arts and Sciences, and at the Graduate School of Education, University of Pennsylvania. Trustee of the National Constitution Center.
1 Mr. McNabb and Mr. Buckley are considered “interested persons,” as defined in the Investment Company Act of 1940, because they are officers of the Vanguard funds.
JoAnn Heffernan Heisen
Born in 1950. Trustee since July 1998. Principal occupation(s) during the past five years and other experience: corporate vice president of Johnson & Johnson (pharmaceuticals/medical devices/consumer products) and member of its executive committee (1997–2008). Chief global diversity officer (retired 2008), vice president and chief information officer (1997–2006), controller (1995–1997), treasurer (1991–1995), and assistant treasurer (1989–1991) of Johnson & Johnson. Director of Skytop Lodge Corporation (hotels) and the Robert Wood Johnson Foundation. Member of the advisory board of the Institute for Women’s Leadership at Rutgers University.
F. Joseph Loughrey
Born in 1949. Trustee since October 2009. Principal occupation(s) during the past five years and other experience: president and chief operating officer (retired 2009) and vice chairman of the board (2008–2009) of Cummins Inc. (industrial machinery). Chairman of the board of Hillenbrand, Inc. (specialized consumer services), Oxfam America, and the Lumina Foundation for Education. Director of the V Foundation for Cancer Research. Member of the advisory council for the College of Arts and Letters and chair of the advisory board to the Kellogg Institute for International Studies, both at the University of Notre Dame.
Mark Loughridge
Born in 1953. Trustee since March 2012. Principal occupation(s) during the past five years and other experience: senior vice president and chief financial officer (retired 2013) of IBM (information technology services). Fiduciary member of IBM’s Retirement Plan Committee (2004–2013), senior vice president and general manager (2002–2004) of IBM Global Financing, vice president and controller (1998–2002) of IBM, and a variety of other prior management roles at IBM. Member of the Council on Chicago Booth.
Scott C. Malpass
Born in 1962. Trustee since March 2012. Principal occupation(s) during the past five years and other experience: chief investment officer (1989–present) and vice president (1996–present) of the University of Notre Dame. Assistant professor of finance at the Mendoza College of Business, University of Notre Dame, and member of the Notre Dame 403(b) Investment Committee. Chairman of the board of TIFF Advisory Services, Inc. Member of the board of Catholic Investment Services, Inc. (investment advisors), the board of advisors for Spruceview Capital Partners, and the board of superintendence of the Institute for the Works of Religion.
Deanna Mulligan
Born in 1963. Trustee since January 2018. Principal occupation(s) during the past five years and other experience: president (2010–present) and chief executive officer (2011–present) of The Guardian Life Insurance Company of America. Chief operating officer (2010–2011) and executive vice president (2008–2010) of Individual Life and Disability of The Guardian Life Insurance Company of America. Member of the board of The Guardian Life Insurance Company of America, the American Council of Life Insurers, the Partnership for New York City (business leadership), and the Committee Encouraging Corporate Philanthropy. Trustee of the Economic Club of New York and the Bruce Museum (arts and science). Member of the Advisory Council for the Stanford Graduate School of Business.
André F. Perold
Born in 1952. Trustee since December 2004. Principal occupation(s) during the past five years and other experience: George Gund Professor of Finance and Banking, Emeritus at the Harvard Business School (retired 2011). Chief investment officer and co-managing partner of HighVista Strategies LLC (private investment firm). Overseer of the Museum of Fine Arts Boston.
Sarah Bloom Raskin
Born in 1961. Trustee since January 2018. Principal occupation(s) during the past five years and other experience: deputy secretary (2014–2017) of the United States Department of the Treasury. Governor (2010–2014) of the Federal Reserve Board. Commissioner (2007–2010) of financial regulation for the State of Maryland. Member of the board of directors (2012–2014) of Neighborhood Reinvestment Corporation. Director of i(x) Investments, LLC.
Peter F. Volanakis
Born in 1955. Trustee since July 2009. Principal occupation(s) during the past five years and other experience: president and chief operating officer (retired 2010) of Corning Incorporated (communications equipment) and director of Corning Incorporated (2000–2010) and Dow Corning (2001–2010). Director (2012) of SPX Corporation (multi-industry manufacturing). Overseer of the Amos Tuck School of Business Administration, Dartmouth College (2001–2013). Chairman of the board of trustees of Colby-Sawyer College. Member of the Board of Hypertherm Inc. (industrial cutting systems, software, and consumables).
Executive Officers
Glenn Booraem
Born in 1967. Principal occupation(s) during the past five years and other experience: principal of Vanguard. Investment stewardship officer (2017–present), treasurer (2015–2017), controller (2010–2015), and assistant controller (2001–2010) of each of the investment companies served by Vanguard.
Christine M. Buchanan
Born in 1970. Principal occupation(s) during the past five years and other experience: principal of Vanguard and global head of Fund Administration at Vanguard. Treasurer (2017–present) of each of the investment companies served by Vanguard. Partner (2005–2017) at KPMG LLP (audit, tax, and advisory services).
Brian Dvorak
Born in 1973. Principal occupation(s) during the past five years and other experience: principal of Vanguard. Chief compliance officer (2017–present) of Vanguard and each of the investment companies served by Vanguard. Assistant vice president (2017–present) of Vanguard Marketing Corporation. Vice president and director of Enterprise Risk Management (2011–2013) at Oppenheimer Funds, Inc.
Thomas J. Higgins
Born in 1957. Principal occupation(s) during the past five years and other experience: principal of Vanguard. Chief financial officer (2008–present) and treasurer (1998–2008) of each of the investment companies served by Vanguard.
Peter Mahoney
Born in 1974. Principal occupation(s) during the past five years and other experience: principal of Vanguard. Controller (2015–present) of each of the investment companies served by Vanguard. Head of International Fund Services (2008–2014) at Vanguard.
Anne E. Robinson
Born in 1970. Principal occupation(s) during the past five years and other experience: general counsel (2016–present) of Vanguard. Secretary (2016–present) of Vanguard and of each of the investment companies served by Vanguard. Managing director (2016–present) of Vanguard. Director and senior vice president (2016–2018) of Vanguard Marketing Corporation. Managing director and general counsel of Global Cards and Consumer Services (2014–2016) at Citigroup. Counsel (2003–2014) at American Express.
Michael Rollings
Born in 1963. Principal occupation(s) during the past five years and other experience: finance director (2017–present) and treasurer (2017) of each of the investment companies served by Vanguard. Managing director (2016–present) of Vanguard. Chief financial officer (2016–present) of Vanguard. Director (2016–present) of Vanguard Marketing Corporation. Executive vice president and chief financial officer (2006–2016) of MassMutual Financial Group.
| |
| Vanguard Senior Management Team |
| |
| Mortimer J. Buckley | James M. Norris |
| Gregory Davis | Thomas M. Rampulla |
| John James | Karin A. Risi |
| Martha G. King | Anne E. Robinson |
| John T. Marcante | Michael Rollings |
| Chris D. McIsaac | |
| |
| |
| Chairman Emeritus and Senior Advisor |
| |
| John J. Brennan | |
| Chairman, 1996–2009 | |
| Chief Executive Officer and President, 1996–2008 |
| |
| |
| Founder | |
| |
| John C. Bogle | |
| Chairman and Chief Executive Officer, 1974–1996 |
|  |
| | P.O. Box 2600 |
| | Valley Forge, PA 19482-2600 |
| |
| |
| |
| Connect with Vanguard® > vanguard.com |
| |
| |
| |
| Fund Information > 800-662-7447 | Source for Bloomberg Barclays indexes: Bloomberg |
| Direct Investor Account Services > 800-662-2739 | Index Services Limited. Copyright 2018, Bloomberg. All |
| | rights reserved. |
| Institutional Investor Services > 800-523-1036 | |
| | CFA® is a registered trademark owned by CFA Institute. |
| Text Telephone for People | |
| Who Are Deaf or Hard of Hearing > 800-749-7273 | |
| |
| This material may be used in conjunction | |
| with the offering of shares of any Vanguard | |
| fund only if preceded or accompanied by | |
| the fund’s current prospectus. | |
| |
| All comparative mutual fund data are from Lipper, a | |
| Thomson Reuters Company, or Morningstar, Inc., unless | |
| otherwise noted. | |
| |
| You can obtain a free copy of Vanguard’s proxy voting | |
| guidelines by visiting vanguard.com/proxyreporting or by | |
| calling Vanguard at 800-662-2739. The guidelines are | |
| also available from the SEC’s website, sec.gov. In | |
| addition, you may obtain a free report on how your fund | |
| voted the proxies for securities it owned during the 12 | |
| months ended June 30. To get the report, visit either | |
| vanguard.com/proxyreporting or sec.gov. | |
| |
| You can review and copy information about your fund at | |
| the SEC’s Public Reference Room in Washington, D.C. To | |
| find out more about this public service, call the SEC at | |
| 202-551-8090. Information about your fund is also | |
| available on the SEC’s website, and you can receive | |
| copies of this information, for a fee, by sending a | |
| request in either of two ways: via email addressed to | |
| publicinfo@sec.gov or via regular mail addressed to the | |
| Public Reference Section, Securities and Exchange | |
| Commission, Washington, DC 20549-1520. | |
| | © 2018 The Vanguard Group, Inc. |
| | All rights reserved. |
| | Vanguard Marketing Corporation, Distributor. |
| |
| | Q822 072018 |
Item 2: Code of Ethics.
Not Applicable.
Item 3: Audit Committee Financial Expert.
Not Applicable.
Item 4: Principal Accountant Fees and Services.
(a) Audit Fees.
Not Applicable.
Item 5: Audit Committee of Listed Registrants.
Not Applicable.
Item 6: Investments.
Not Applicable.
Item 7: Disclosure of Proxy Voting Policies and Procedures for Closed-End Management Investment
Companies.
Not Applicable.
Item 8: Portfolio Managers of Closed-End Management Investment Companies.
Not Applicable.
Item 9: Purchase of Equity Securities by Closed-End Management Investment Company and
Affiliated Purchasers.
Not Applicable.
Item 10: Submission of Matters to a Vote of Security Holders.
Not Applicable.
Item 11: Controls and Procedures.
(a) Disclosure Controls and Procedures. The Principal Executive and Financial Officers concluded that the Registrant’s Disclosure Controls and Procedures are effective based on their evaluation of the Disclosure Controls and Procedures as of a date within 90 days of the filing date of this report.
(b) Internal Control Over Financial Reporting. There were no significant changes in Registrant’s Internal Control Over Financial Reporting or in other factors that could significantly affect this control subsequent to the date of the evaluation, including any corrective actions with regard to significant deficiencies and material weaknesses.
Item 12: Disclosure of Securities Lending Activities for Closed-End Management
Investment Companies.
Not Applicable.
Item 13: Exhibits.
(a) Certifications.
Pursuant to the requirements of the Securities Exchange Act of 1934 and the Investment Company Act of 1940, the registrant has duly caused this report to be signed on its behalf by the undersigned, thereunto duly authorized.
| |
| | VANGUARD CONVERTIBLE SECURITIES FUND |
| |
| |
| BY: | /s/ MORTIMER J. BUCKLEY* |
| | MORTIMER J. BUCKLEY |
| | CHIEF EXECUTIVE OFFICER |
| |
| Date: July 20, 2018 |
Pursuant to the requirements of the Securities Exchange Act of 1934 and the Investment Company Act of 1940, this report has been signed below by the following persons on behalf of the registrant and in the capacities and on the dates indicated.
| |
| | VANGUARD CONVERTIBLE SECURITIES FUND |
| |
| BY: | /s/ MORTIMER J. BUCKLEY* |
| | MORTIMER J. BUCKLEY |
| | CHIEF EXECUTIVE OFFICER |
| Date: July 20, 2018 |
| VANGUARD CONVERTIBLE SECURITIES FUND |
| |
| BY: | /s/ THOMAS J. HIGGINS* |
| | THOMAS J. HIGGINS |
| | CHIEF FINANCIAL OFFICER |
| Date: July 20, 2018 |
* By: /s/ Anne E. Robinson
Anne E. Robinson, pursuant to a Power of Attorney filed on January 18, 2018; see file Number 33-32216, Incorporated by Reference.