| |
Vanguard® Convertible Securities Fund
|
| |
> Semiannual Report
| |
| |
May 31, 2007
| |
| |
| |
| |
| 
|
| |
| |
| |
| |
| |
| |
| |
| |
| |
| |
| |
> Vanguard Convertible Securities Fund’s fiscal half-year return of 8.1% outpaced the returns of both its benchmark index and the average return of its peer funds.
> The fund benefited from favorable markets for mid-capitalization and small-cap stocks and below-investment-grade bonds.
> As you might expect given the fund’s hybrid stock/bond mixture, returns were in between those of stocks in general (10.5%) and bonds in general (0.7%).
Contents | |
| |
Your Fund’s Total Returns | 1 |
Chairman’s Letter | 2 |
Advisor’s Report | 6 |
Fund Profile | 9 |
Performance Summary | 10 |
Financial Statements | 11 |
About Your Fund’s Expenses | 21 |
Trustees Approve Advisory Agreement | 23 |
Glossary | 24 |
Please note: The opinions expressed in this report are just that—informed opinions. They should not be considered promises or advice. Also, please keep in mind that the information and opinions cover the period through the date on the cover of this report. Of course, the risks of investing in your fund are spelled out in the prospectus.
Your Fund’s Total Returns
Six Months Ended May 31, 2007 | | |
| Ticker | Total |
| Symbol | Returns |
Vanguard Convertible Securities Fund | VCVSX | 8.1% |
Merrill Lynch All US Convertibles Index | | 7.7 |
Average Convertible Securities Fund1 | | 7.8 |
Dow Jones Wilshire 5000 Index | | 10.5 |
Your Fund’s Performance at a Glance |
November 30, 2006–May 31, 2007 |
| | | Distributions Per Share |
| Starting | Ending | Income | Capital |
| Share Price | Share Price | Dividends | Gains |
Vanguard Convertible Securities Fund | $14.81 | $14.62 | $0.270 | $1.020 |
1 Derived from data provided by Lipper Inc.
1

Chairman’s Letter
Dear Shareholder,
Vanguard Convertible Securities Fund benefited from a surging stock market and a rally in lower-rated debt during the fiscal six months ended May 31. These trends were favorable for the fund because of the hybrid nature of convertible securities, which share characteristics of both stocks and bonds.
Good securities selection by the fund’s advisor, Oaktree Capital Management, helped the fund beat the returns of both its index and peer group. The best-performing sector was the fund’s industrials sector, which was buoyed by strong demand for chemicals, materials, metals, and capital goods.
The fund also had favorable exposure to consumer discretionary securities, especially the automobiles subsector, through its holdings in Ford Motor convertible bonds and General Motors convertible preferred stock (about 10% of fund assets were in convertible preferreds). Both companies have been engaged in major restructuring efforts aimed at shoring up their finances.
Stocks were shaken early on but roared back in second half
Despite a short-lived tumble in late February and a cooldown of the domestic economy, the broad U.S. stock market moved solidly upward over the six months. In the first half of the period, the broad market had a modest positive return, but the second half saw a solid advance.
2
U.S. stocks were buoyed by an unprecedented flurry of merger-and-acquisition activity, particularly within the private-equity sector. Mid-capitalization stocks were the market leaders, outpacing the gains of large- and small-cap issues. As had been the case for well over a year, international stocks outperformed U.S. equities. Emerging markets again produced better gains than the developed markets of Europe and the Pacific.
Mixed economic news led to weak bond returns
Over the six months, the yields of longer-term bonds rose faster than those of short-term bonds. This caused the “inverted” yield curve—which had persisted for many months as long-term U.S. Treasury yields remained lower than shorter-term yields—to begin a return to its historical upward-sloping maturity/yield relationship. The Federal Reserve Board’s intimations of concern about the inflation outlook helped to push long-term rates higher. However, the Fed held its target federal funds rate at 5.25% throughout the period.
Money market instruments remained a bright spot in the fixed income universe, with the Citigroup 3-Month Treasury Bill Index—a proxy for money market yields—returning 2.5% for the half-year. The yield of the 3-month Treasury bill fell to 4.7% from its initial 5.0%. The broad taxable bond market returned 0.7% for the period, while municipal bonds posted a return of 0.3%.
Market Barometer | | | |
| | | Total Returns |
| Periods Ended May 31, 2007 |
| Six Months | One Year | Five Years1 |
Stocks | | | |
Russell 1000 Index (Large-caps) | 10.7% | 22.9% | 10.1% |
Russell 2000 Index (Small-caps) | 8.4 | 18.9 | 13.1 |
Dow Jones Wilshire 5000 Index (Entire market) | 10.5 | 22.5 | 10.7 |
MSCI All Country World Index ex USA (International) | 15.1 | 28.9 | 18.7 |
| | | |
Bonds | | | |
Lehman U.S. Aggregate Bond Index (Broad taxable market) | 0.7% | 6.7% | 4.7% |
Lehman Municipal Bond Index | 0.3 | 4.8 | 4.9 |
Citigroup 3-Month Treasury Bill Index | 2.5 | 5.1 | 2.6 |
| | | |
CPI | | | |
Consumer Price Index | 3.2% | 2.7% | 3.0% |
1 Annualized.
3
Market trends, advisor skill aid convertible funds’ returns
Convertible securities, “hybrid” instruments that can provide some of the upside potential of equities and some of the downside protection of fixed income investments, are mostly issued by small and mid-sized companies with weaker credit ratings. These market segments were a good place for the Convertible Securities Fund to be during the six months ended May 31. The prices of mid-cap stocks surged an impressive 12.4%, and small-cap stocks climbed 8.4%. The market for lower credit-quality bonds was strong (high-yield, or “junk,” bonds returned 6%), reflecting investors’ greater appetite for risk arising from an environment of favorable economic and corporate profit growth.
Investing in smaller, and lower-rated, companies puts a premium on securities selection and credit analysis, and Oaktree Capital Management’s skills in these areas were an important factor in enhancing the fund’s return during the fiscal half-year. The Advisor’s Report, which begins on page 6, provides a more detailed look at the fund’s strategies with convertible bonds, its primary investment vehicle, as well as with convertible preferred stocks over the period.
The industrials group was the fund’s top performer, and the fund’s auto company holdings (within consumer discretionary) also did well. The health care sector—and its large pharmaceuticals component—was a slight drag on overall returns. Financials lagged, but the fund wasn’t
Annualized Expense Ratios1 | | |
Your fund compared with its peer group | | |
| | Average |
| | Convertible |
| Fund | Securities Fund |
Convertible Securities Fund | 0.79% | 1.45% |
1 Fund expense ratio reflects the six months ended May 31, 2007. Peer-group expense ratio is derived from data provided by Lipper Inc. and captures information through year-end 2006.
4
overly exposed to this area. Airlines were the worst-performing group, in part owing to the earnings squeeze created by higher energy prices.
For proper perspective, take a broad view
Favorable short-term market trends have a way of changing course, sometimes abruptly. So it’s best to view fund performance beyond the limited half-year perspective of a semiannual report. Over the past ten years—a period of highly varied economic and financial-market activity—the Convertible Securities Fund earned an average annual total return of 9.3% a year. By comparison, the fund’s benchmark returned 8.4%, and the average convertible securities fund earned 7.9%.
Aiding the fund’s performance have been its low costs—a favorable tailwind that can be counted on in every economic environment. The Convertible Securities Fund’s average annualized expense ratio of 0.79% ($7.90 per $1,000 invested) is significantly lower than the convertible-fund industry average of 1.45% ($14.50 per $1,000). This cost advantage helps maximize your share of the fund’s return, with the benefits compounding over time.
The Convertible Securities Fund can play a diversifying role in your portfolio because it offers you the opportunity to participate in stock market growth as well as the potential for some bond-based downside protection (compared to an all-equity portfolio). The amount you choose to invest in a specific fund, however, should be based on a portfolio plan that focuses foremost on your goals, time horizon, financial circumstances, and comfort level with risk and then on an appropriate mix of stocks and fixed income assets to reflect those factors.
Thank you for entrusting your assets to Vanguard.
Sincerely,

John J. Brennan
Chairman and Chief Executive Officer
June 12, 2007
5
Advisor’s Report
The Convertible Securities Fund got off to a reasonably strong start in the fiscal half-year. Fund investors benefited from positive financial markets, which boosted the prices of most of the equities underlying convertibles, and from a relatively stable interest rate environment. We were pleased with our absolute return and, especially, with the consistency of our performance—the fund had a positive return in each of the six months and ended slightly ahead of its primary benchmark, the Merrill Lynch All US Convertibles Index.
During the period, the demand for convertibles stayed quite strong while the supply of new convertibles accelerated to above-average levels, producing a reasonably balanced market.
The investment environment
The primary driver of convertible performance over the past several months was the strength in stocks, particularly those of small- and mid-capitalization companies, several of which issued higher profit forecasts. Higher stock market volatility also helped lift convertible valuations, because greater volatility translates into higher values for the options embedded in convertibles. U.S. stocks were initially jolted in February by a sell-off in the Chinese market, and the volatility continued with news of rapidly increasing credit problems in the subprime mortgage market.
Despite a few weeks of retreating equity prices, convertibles performed relatively well as a result of increasing demand for them. This, in turn, opened the floodgates—115 issues came to market, totaling about $60 billion. Thirty-three new issues were priced in March alone, making it the third-highest issuance month. Significant new names among issuers included Ford Motor, NII Holdings, General Motors, Vornado Realty, and Advanced Micro Devices. Most deals were attractively priced and performed well in secondary trading. Meanwhile, brisk redemptions removed $51 billion worth of older convertibles from the market.
It is important to note that the new Ford convertible bond deal plus the company’s preexisting large convertible preferred issue make Ford the top name in the Merrill Lynch index, with a total weighting of 2.9%. In second place is General Motors, whose three convertible issues have a total weighting of 2.4%. Given that combination, it is clear that the financial fundamentals and security-price movements of the automobile industry will be a major swing factor in the index’s return going forward. (We are currently underweighted in auto industry convertibles relative to the index.)
6
Our successes
We were able to capitalize on several opportunities, including convertibles issued by Celanese, EMC, General Cable, Gilead Sciences, Itron, and Manor Care. We added to our holdings in Gilead, which continued to perform well and is one of our top weightings. Other contributors during the half-year were Ciena, Cytyc, and MedImmune.
We took advantage of the continued equity strength by taking profits in several holdings that had little downside protection. We sold or substantially reduced our holdings in Celanese, MedImmune, Manor Care, NRG Energy, and Time Warner Telecom. Proceeds went into newly issued convertibles priced at par, or into new secondary-trading purchases, the vast majority of which were trading 90%–115% of par.
In contrast to this time last year, we are finding more opportunities in below-investment-grade convertibles. These include securities rated between CCC+ and BB, as well as nonrated issues (which represent about 35% of the market). We assign internal Oaktree credit ratings to these non-rated issues, with most of them conservatively rated in the B to BB range. New nonrated names include Goodrich Petroleum, Barnes Group, Chemed, and Lawson Software. In most cases, the convertibles constitute the company’s only debt.
None of our holdings experienced a negative credit development, and we believe all of them have stable-to-improving credit metrics.
Our shortfalls
Poor results came from Amgen, LSI Logic, Sirius Satellite Radio, and Symantec. We reduced our positions in LSI Logic and Amgen and exited from Symantec. Other disappointing positions included Powerwave Technologies, RF Micro Devices, and Eastman Kodak. Increases in orders at several telecommunications firms have been slower than expected, weakening many common stocks in this industry. We were underweighted in the materials sector, a strong performer over the past several quarters.
The fund’s positioning
In the near term, we plan to continue trimming holdings that become pure equity substitutes and to redeploy the proceeds into a mix of new-issue convertibles and attractive existing names. The broadly defined health care sector remains our largest portfolio weighting, followed by
7
the telecom equipment industry. We have no exposure to subprime lending and only limited exposure to the financial services and real estate areas.
Overall, we are finding a variety of interesting names in the active new-issue calendar, as well as several special situations in the secondary market. These will keep us in our normally fully invested position. Our average portfolio quality remains unchanged at BB–, and our current mix is 92% convertible bonds and 8% convertible preferreds. We are confident that our portfolio is positioned to do relatively well in a wide variety of market environments.
Larry W. Keele, CFA
Principal and Founder
Oaktree Capital Management, L.P.
June 12, 2007
Major Portfolio Changes: | |
Six Months Ended May 31, 2007 | |
| |
Additions | Comments |
Goodrich Petroleum | Cheap convertible preferred from a promising oil and gas |
(5.375% convertible preferred) | exploration company. |
LifePoint Hospitals | Attractive fundamental story with statistically attractive |
(3.50% convertible note due 5/15/2014) | convertible structure. |
Lawson Software | New convertible from an issuer with an attractive long-term |
(2.50% convertible note due 4/15/2012) | growth story. |
NII Holdings | Newly issued convertible with attractive risk/return profile. |
(3.13% convertible note due 6/15/2012) | |
| |
| |
Reductions | Comments |
Celanese | Sold after reaching price target. |
(4.25% convertible preferred) | |
MedImmune | Sold after company was acquired by AstraZeneca. |
(1.38% convertible note due 7/15/2011) | |
Manor Care | Sold after substantial appreciation, with the convertible |
(2.13% convertible note due 8/1/2035) | becoming a pure equity substitute. |
Powerwave Technologies | Sold after it developed a high conversion premium with |
(1.88% convertible note due 11/15/2024) | company fundamentals not improving. |
8
Fund Profile
As of May 31, 2007
Portfolio Characteristics | |
| |
Number of Securities | 118 |
Yield | 2.9% |
Conversion Premium | 24.0% |
Average Weighted Maturity | 5.3 years |
Average Coupon | 2.6% |
Average Quality1 | Ba3/BB– |
Average Duration | 5.2 years |
Foreign Holdings | 6.4% |
Turnover Rate | 117%2 |
Expense Ratio | 0.79%2 |
Short-Term Reserves | 2% |
Distribution by Maturity | |
(% of fixed income portfolio) | |
| |
Under 1 Year | 1% |
1–5 Years | 73 |
5–10 Years | 22 |
10–20 Years | 2 |
20–30 Years | 1 |
Over 30 Years | 1 |
Distribution by Credit Quality1 | |
(% of fixed income portfolio) | |
| |
Aaa/AAA | 0% |
Aa/AA | 0 |
A/A | 7 |
Baa/BBB | 11 |
Ba/BB | 16 |
B/B | 26 |
Below B/B | 6 |
Not Rated | 34 |
Volatility Measures3 | |
| Fund Versus |
| Spliced Index4 |
R-Squared | 0.86 |
Beta | 1.02 |
Ten Largest Holdings5 (% of total net assets) |
| | |
EMC Corp. | computer storage | |
| and peripherals | 3.0% |
Gilead Sciences Inc. | biotechnology | 3.0 |
Cameron | oil and | |
International Corp. | gas equipment | |
| and services | 2.6 |
Chesapeake Energy Corp. | oil and | |
| gas exploration | |
| and production | 2.5 |
Wyeth | pharmaceuticals | 2.5 |
Ciena Corp. | communications | |
| equipment | 2.5 |
Andrew Corp. | communications | |
| equipment | 2.2 |
General Motors Corp. | automobile | |
| manufacturers | 2.1 |
Allergan, Inc. | pharmaceuticals | 2.0 |
Cadence Design | application software | 2.0 |
Top Ten | | 24.4% |
Sector Diversification (% of portfolio) | |
| |
Consumer Discretionary | 6% |
Consumer Staples | 2 |
Energy | 11 |
Financials | 4 |
Health Care | 29 |
Industrials | 13 |
Information Technology | 29 |
Materials | 1 |
Telecommunication Services | 3 |
Utilities | 0 |
Short-Term Reserves | 2% |
1 Ratings: Moody’s Investors Service, Standard & Poor’s.
2 Annualized.
3 For an explanation of R-squared, beta, and other terms used here, see the Glossary on page 24.
4 CS First Boston Convertibles Index through November 30, 2004; Merrill Lynch All US Convertibles Index thereafter.
5 “Ten Largest Holdings” excludes any temporary cash investments and equity index products.
9
Performance Summary
All of the returns in this report represent past performance, which is not a guarantee of future results that may be achieved by the fund. (Current performance may be lower or higher than the performance data cited. For performance data current to the most recent month-end, visit our website at www.vanguard.com/performance.) Note, too, that both investment returns and principal value can fluctuate widely, so an investor’s shares, when sold, could be worth more or less than their original cost. The returns shown do not reflect taxes that a shareholder would pay on fund distributions or on the sale of fund shares.
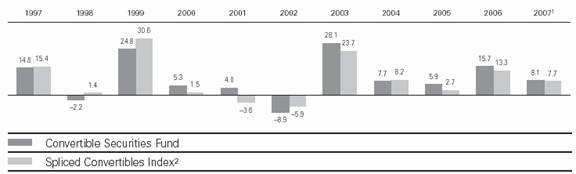
Fiscal-Year Total Returns (%): November 30, 1996–May 31, 2007
Average Annual Total Returns: Periods Ended March 31, 2007
This table presents average annual total returns through the latest calendar quarter—rather than through the end of the fiscal period. Securities and Exchange Commission rules require that we provide this information.
| | | | | | Ten Years |
| Inception Date | One Year | Five Years | Capital | Income | Total |
Convertible Securities Fund3 | 6/17/1986 | 7.21% | 10.38% | 5.24% | 4.03% | 9.27% |
1 Six months ended May 31, 2007.
2 CS First Boston Convertibles Index through November 30, 2004; Merrill Lynch All US Convertibles Index thereafter.
3 Total return figures do not reflect the 1% fee assessed on redemptions of shares purchased on or after September 15, 2005, and held for less than one year.
Note: See Financial Highlights table on page 17 for dividend and capital gains information.
10
Financial Statements (unaudited)
Statement of Net Assets
As of May 31, 2007
The fund provides a complete list of its holdings four times in each fiscal year, at the quarter-ends. For the second and fourth fiscal quarters, the lists appear in the fund’s semiannual and annual reports to shareholders. For the first and third fiscal quarters, the fund files the lists with the Securities and Exchange Commission on Form N-Q. Shareholders can look up the fund’s Forms N-Q on the SEC’s website at www.sec.gov. Forms N-Q may also be reviewed and copied at the SEC’s Public Reference Room (see the back cover of this report for further information).
| | Face | Market |
| | Amount | Value• |
| | ($000) | ($000) |
Convertible Bonds (89.2%) | | |
Consumer Discretionary (3.8%) | | |
| American Real Estate | | |
1 | 4.100%, 8/15/13 | 6,720 | 6,586 |
| Ford Motor Co. | | |
| 4.250%, 12/15/36 | 7,285 | 8,296 |
| Scientific Games Corp. | | |
1 | 0.750%, 12/1/24 | 2,250 | 3,026 |
| Sinclair Broadcast Group | | |
| 3.000%, 5/15/27 | 6,280 | 6,209 |
| Sirius Satellite Radio Inc. | | |
| 3.250%, 10/15/11 | 2,290 | 2,064 |
| The Interpublic Group | | |
| of Companies, Inc. | | |
| 4.500%, 3/15/23 | 3,905 | 4,447 |
| | | 30,628 |
Consumer Staples (0.7%) | | |
| Archer-Daniels-Midland Co. | | |
1 | 0.875%, 2/15/14 | 3,630 | 3,544 |
| Nash Finch Co. | | |
| 1.631%, 3/15/35 | 4,230 | 2,258 |
| | | 5,802 |
Energy (6.4%) | | |
| Cameron International Corp. | | |
| 2.500%, 6/15/26 | 16,965 | 20,676 |
| Delta Petroleum Corp. | | |
| 3.750%, 5/1/37 | 1,110 | 1,092 |
| Goodrich Petroleum Corp. | | |
1 | 3.250%, 12/1/26 | 1,275 | 1,173 |
| McMoRan Exploration Co. | | |
1 | 5.250%, 10/6/11 | 3,510 | 3,971 |
| 5.250%, 10/6/11 | 405 | 458 |
| Oil States International, Inc. | | |
| 2.375%, 7/1/25 | 1,775 | 2,478 |
| Peabody Energy Corp. | | |
| 4.750%, 12/15/66 | 7,585 | 8,609 |
| Superior Energy Services, Inc. | | |
1 | 1.500%, 12/15/26 | 9,890 | 10,644 |
| 1.500%, 12/15/26 | 1,800 | 1,937 |
| | | | |
| | | 51,038 |
Financials (3.2%) | | |
| CapitalSource Inc. | | |
| 3.500%, 7/15/34 | 2,950 | 3,466 |
| Fairfax Financial Holdings Ltd. | | |
| 5.000%, 7/15/23 | 860 | 913 |
| Lehman Brothers Holdings | | |
| 1.000%, 5/14/12 | 8,660 | 8,534 |
| Privatebancorp. Inc. | | |
1 | 3.625%, 3/15/27 | 1,515 | 1,515 |
| Prologis Inc. | | |
1 | 2.250%, 4/1/37 | 9,090 | 8,885 |
| Rait Financial | | |
1 | 6.875%, 4/15/27 | 2,690 | 2,697 |
| | | 26,010 |
Health Care (29.2%) | | |
| Allergan, Inc. | | |
| 1.500%, 4/1/26 | 4,690 | 5,212 |
1 | 1.500%, 4/1/26 | 10,095 | 11,218 |
| American Medical | | |
| Systems Holdings, Inc. | | |
| 3.250%, 7/1/36 | 7,875 | 9,125 |
| Amgen Inc. | | |
1 | 0.125%, 2/1/11 | 1,315 | 1,207 |
| 0.125%, 2/1/11 | 7,825 | 7,179 |
| Biomartin Pharmaceutical Inc. | | |
| 1.875%, 4/23/17 | 9,805 | 10,406 |
| Chemed Corp | | |
1 | 1.875%, 5/15/14 | 3,900 | 4,036 |
| China Medical | | |
| Technologies, Inc. | | |
1 | 3.500%, 11/15/11 | 3,230 | 3,242 |
| Conceptus Inc. | | |
| 2.250%, 2/15/27 | 3,880 | 3,705 |
11
| | Face | Market |
| | Amount | Value• |
| | ($000) | ($000) |
| Cytyc Corp. | | |
| 2.250%, 3/15/24 | 6,900 | 9,919 |
| Fisher Scientific | | |
| International Inc. | | |
| 3.250%, 3/1/11 | 6,435 | 9,604 |
| Genzyme Corp. | | |
| 1.250%, 12/1/08 | 14,625 | 15,466 |
| Gilead Sciences Inc. | | |
1 | 0.500%, 5/1/11 | 19,495 | 23,126 |
| 0.500%, 5/1/11 | 685 | 813 |
| Inverness Medical | | |
| Innovations Inc. | | |
1 | 3.000%, 5/15/16 | 8,400 | 9,492 |
| Invitrogen Corp. | | |
| 2.000%, 8/1/23 | 4,985 | 5,795 |
| Kyphon Inc. | | |
1 | 1.000%, 2/1/12 | 2,665 | 2,675 |
| LifePoint Hospitals, Inc. | | |
| 3.500%, 5/15/14 | 9,925 | 10,347 |
| Manor Care, Inc. | | |
| 2.000%, 6/1/36 | 240 | 335 |
| Medarex Inc. | | |
1 | 2.250%, 5/15/11 | 3,645 | 4,921 |
| 2.250%, 5/15/11 | 1,465 | 1,978 |
| Medicis Pharmaceutical Corp. | | |
| 1.500%, 6/4/33 | 9,570 | 9,761 |
| Medtronic Inc. | | |
1 | 1.500%, 4/15/11 | 960 | 1,014 |
| Mylan Laboratories Inc. | | |
| 1.250%, 3/15/12 | 8,890 | 9,034 |
| Protein Design Labs | | |
| 2.000%, 2/15/12 | 3,705 | 4,747 |
| Regeneron Pharmaceutical, Inc. | |
| 5.500%, 10/17/08 | 4,520 | 4,639 |
| SFBC International, Inc. | | |
| 2.250%, 8/15/24 | 6,695 | 6,871 |
| Teva Pharmaceutical | | |
| Finance LLC | | |
| 0.500%, 2/1/24 | 6,855 | 7,575 |
| Thoratec Corp. | | |
| 1.379%, 5/16/34 | 5,290 | 3,696 |
| TriZetto Group | | |
| 2.750%, 10/1/25 | 5,805 | 6,741 |
1 | 1.125%, 4/15/12 | 1,795 | 1,813 |
| Wilson Greatbatch | | |
1 | 2.250%, 6/15/13 | 8,285 | 8,562 |
| Wyeth | | |
| 4.876%, 1/15/24 | 17,675 | 20,005 |
12
| | Face | Market |
| | Amount | Value• |
| | ($000) | ($000) |
| Alliant Techsystems Inc. | | |
| 2.750%, 2/15/24 | 3,000 | 3,982 |
1 | 2.750%, 9/15/11 | 6,830 | 8,068 |
| Barnes Group Inc. | | | |
1 | 3.375%, 3/15/27 | 6,080 | 7,395 | |
| Covanta Holding | | | |
| 1.000%, 2/1/27 | 8,980 | 9,204 | |
| DRS Technologies Inc. | | | |
1 | 2.000%, 2/1/26 | 9,460 | 9,696 | |
| EDO Corp. | | | |
| 4.000%, 11/15/25 | 1,520 | 1,763 | |
| General Cable Corp. | | | |
| 0.875%, 11/15/13 | 4,470 | 6,588 | |
| L-3 Communications Corp. | | | |
| 3.000%, 8/1/35 | 13,842 | 15,399 | |
| Sunpower Corp. | | | |
| 1.250%, 2/15/27 | 3,550 | 4,012 | |
| Suntech Power Holdings | | | |
1 | 0.250%, 2/15/12 | 335 | 329 | |
| Trinity Industries | | | |
| 3.875%, 6/1/36 | 2,110 | 2,434 | |
| Triumph Group | | | |
1 | 2.625%, 10/1/26 | 6,620 | 8,805 | |
| UAL Corp. | | | |
| 5.000%, 2/1/21 | 9,605 | 10,641 | |
| Waste Connections Inc. | | | |
| 3.750%, 4/1/26 | 2,280 | 2,508 | |
1 | 3.750%, 4/1/26 | 7,280 | 8,008 | |
| WESCO International, Inc. | | | |
1 | 1.750%, 11/15/26 | 4,540 | 4,455 | |
| | | 106,722 | |
Information Technology (29.3%) | | | |
| Andrew Corp. | | | |
| 3.250%, 8/15/13 | 16,310 | 18,036 | |
| Anixter International Inc. | | | |
1 | 1.000%, 2/15/13 | 8,455 | 10,778 | |
| Arris Group, Inc. | | | |
| 2.000%, 11/15/26 | 9,260 | 11,486 | |
| Cadence Design | | | |
1 | 1.375%, 12/15/11 | 13,605 | 16,248 | |
| Ciena Corp. | | | |
| 0.250%, 5/1/13 | 19,625 | 19,772 | |
| Coherent, Inc. | | | |
1 | 2.750%, 3/1/11 | 6,245 | 6,510 | |
| 2.750%, 3/1/11 | 65 | 68 | |
| Electronic Data Systems | | | |
| 3.875%, 7/15/23 | 9,750 | 10,018 | |
| EMC Corp. | | | |
13
| | Face | Market |
| | Amount | Value• |
| | ($000) | ($000) |
1 | 1.750%, 12/1/11 | 17,000 | 20,357 |
| 1.750%, 12/1/11 | 3,220 | 13,856 |
| Epicor Software | | |
| 2.375%, 5/15/27 | 7,115 | 7,337 |
| Equinix Inc. | | |
| 2.500%, 4/15/12 | 4,035 | 4,075 |
| Euronet Worldwide, Inc. | | |
| 1.625%, 12/15/24 | 9,270 | 9,467 |
| FEI Co. | | |
1 | 2.875%, 6/1/13 | 45 | 65 |
| 2.875%, 6/1/13 | 1,970 | 2,859 |
| Flextronics International Ltd. | | |
| 1.000%, 8/1/10 | 10,610 | 10,146 |
| Itron Inc. | | |
| 2.500%, 8/1/26 | 9,695 | 11,876 |
| Kemet Corp. | | |
1 | 2.250%, 11/15/26 | 1,420 | 1,450 |
| Lawson Software Inc. | | |
1 | 2.500%, 4/15/12 | 7,065 | 7,242 |
| Linear Technology Corp. | | |
1 | 3.125%, 5/1/27 | 8,275 | 8,327 |
| LSI Logic | | |
| 4.000%, 5/15/10 | 13,940 | 14,010 |
| Lucent Technologies, Inc. | | |
| 2.875%, 6/15/23 | 3,210 | 3,358 |
| Macrovision Corp. | | |
1 | 2.625%, 8/15/11 | 7,750 | 9,203 |
| Magma Design Automation Inc. | |
1 | 2.000%, 5/15/10 | 4,324 | 4,875 |
| Maxtor Corp. | | |
| 6.800%, 4/30/10 | 2,455 | 2,593 |
| McDATA Corp. | | |
| 2.250%, 2/15/10 | 1,805 | 1,753 |
| Nortel Networks Corp. | | |
1 | 1.750%, 4/15/12 | 1,280 | 1,294 |
| SPSS Inc. | | |
1 | 2.500%, 3/15/12 | 1,000 | 1,164 |
| Sybase Inc. | | |
| 1.750%, 2/22/25 | 6,175 | 6,769 |
| Symmetricom Inc. | | |
| 3.250%, 6/15/25 | 3,375 | 3,295 |
| Xilinx Inc. | | |
1 | 3.125%, 3/15/37 | 6,485 | 6,761 |
| | | 235,048 |
Materials (0.4%) | | |
| Graftech International | | |
| 1.625%, 1/15/24 | 2,870 | 3,035 |
14
| | Face | Market |
| | Amount | Value• |
| | ($000) | ($000) |
Telecommunication Services (2.9%) | |
| FiberTower Corp. | | |
1 | 9.000%, 11/15/12 | 2,115 | 2,252 |
| Level 3 Communications, Inc. | | |
| 2.875%, 7/15/10 | 8,490 | 9,169 |
| NII Holdings, Inc. | | |
1 | 3.125%, 6/15/12 | 11,490 | 11,490 |
| | | 22,911 |
Total Convertible Bonds | | |
(Cost $667,883) | | 715,453 |
Convertible Preferred Stocks (9.5%) | |
Consumer Discretionary (2.1%) | |
| General Motors Corp. | | |
† | 1.500% Cvt. Pfd. | 116,900 | 2,923 |
| 6.250% Cvt. Pfd. | 599,600 | 13,866 |
| | | 16,789 |
Consumer Staples (0.8%) | | |
| Bunge Ltd. | | |
| 4.875% Cvt. Pfd. | 57,300 | 6,303 |
| | | |
Energy (4.2%) | | |
| Bristow Group | | |
| 5.500% Cvt. Pfd. | 90,500 | 5,713 |
| Chesapeake Energy Corp. | | |
| 5.000% Cvt. Pfd. | 31,000 | 3,484 |
1 | 5.000% Cvt. Pfd. | 147,400 | 16,564 |
| Edge Petroleum Corp. | | |
| 5.750% Cvt. Pfd. | 21,900 | 1,205 |
| Goodrich Petroleum Corp. | | |
| 5.375% Cvt. Pfd. | 101,800 | 6,897 |
| | | 33,863 |
Financials (1.1%) | | |
| Aspen Insurance | | |
| Holdings, Ltd. | | |
| 5.625% Cvt. Pfd. | 155,360 | 8,758 |
| | | |
Health Care (0.2%) | | |
| Quadramed Corp. | | |
| 5.500% Cvt. Pfd. | 65,600 | 1,837 |
| | | |
Materials (1.1%) | | |
| Freeport-McMoRan, Inc. | | |
† | 6.750% Cvt. Pfd. | 69,700 | 8,556 |
| | | | |
15
| | Face | Market |
| | Amount | Value• |
| | ($000) | ($000) |
Total Convertible Preferred Stocks | |
(Cost $70,335) | | 76,106 |
Temporary Cash Investment (1.6%) | |
2 | Vanguard Market | | |
| Liquidity Fund, 5.279% | | |
| (Cost $13,246) | 13,246,166 | 13,246 |
Total Investments (100.3%) | | |
(Cost $751,464) | | 804,805 |
| | | | |
| | Market |
| | Value• |
| | ($000) |
Other Assets and Liabilities (–0.3%) | |
Other Assets—Note C | | 18,656 |
Liabilities | | (21,421) |
| | (2,765) |
Net Assets (100%) | | |
Applicable to 54,849,483 outstanding | |
$.001 par value shares of beneficial | |
interest (unlimited authorization) | 802,040 |
Net Asset Value Per Share | | $14.62 |
| | |
| | |
| | |
At May 31, 2007, net assets consisted of:3 | |
| Amount | Per |
| ($000) | Share |
Paid-in Capital | 715,696 | $13.05 |
Undistributed Net | | |
Investment Income | 4,019 | .07 |
Accumulated Net Realized Gains | 28,984 | .53 |
Unrealized Appreciation | 53,341 | .97 |
Net Assets | 802,040 | $14.62 |
• See Note A in Notes to Financial Statements.
† New issue that has not paid a dividend as of May 31, 2007.
1 Security exempt from registration under Rule 144A of the Securities Act of 1933. Such securities may be sold in transactions exempt from registration, normally to qualified institutional buyers. At May 31, 2007, the aggregate value of these securities was $284,683,000, representing 35.5% of net assets.
2 Affiliated money market fund available only to Vanguard funds and certain trusts and accounts managed by Vanguard. Rate shown is the 7-day yield.
3 See Note E in Notes to Financial Statements for the tax-basis components of net assets.
16
Statement of Operations
| Six Months Ended |
| May 31, 2007 |
| ($000) |
Investment Income | |
Income | |
Dividends | 1,357 |
Interest1 | 12,480 |
Security Lending | 20 |
Total Income | 13,857 |
Expenses | |
Investment Advisory Fees—Note B | |
Basic Fee | 1,334 |
Performance Adjustment | 659 |
The Vanguard Group—Note C | |
Management and Administrative | 859 |
Marketing and Distribution | 70 |
Custodian Fees | 8 |
Shareholders’ Reports | 10 |
Trustees’ Fees and Expenses | 1 |
Total Expenses | 2,941 |
Expenses Paid Indirectly—Note D | (5) |
Net Expenses | 2,936 |
Net Investment Income | 10,921 |
Realized Net Gain (Loss) on Investment Securities Sold | 32,389 |
Change in Unrealized Appreciation (Depreciation) of Investment Securities | 15,355 |
Net Increase (Decrease) in Net Assets Resulting from Operations | 58,665 |
1 Interest income from an affiliated company of the fund was $291,000.
17
Statement of Changes in Net Assets
| Six Months Ended | | Year Ended |
| May 31, | | November 30, |
| 2007 | | 2006 |
| ($000) | | ($000) |
Increase (Decrease) in Net Assets | | | |
Operations | | | |
Net Investment Income | 10,921 | | 19,822 |
Realized Net Gain (Loss) | 32,389 | | 53,501 |
Change in Unrealized Appreciation (Depreciation) | 15,355 | | 16,800 |
Net Increase (Decrease) in Net Assets Resulting from Operations | 58,665 | | 90,123 |
Distributions | | | |
Net Investment Income | (13,589) | | (16,633) |
Realized Capital Gain1 | (49,952) | | (17,355) |
Total Distributions | (63,541) | | (33,988) |
Capital Share Transactions—Note G | | | |
Issued | 101,531 | | 181,669 |
Issued in Lieu of Cash Distributions | 56,947 | | 29,617 |
Redeemed2 | (78,560) | | (92,645) |
Net Increase (Decrease) from Capital Share Transactions | 79,918 | | 118,641 |
Total Increase (Decrease) | 75,042 | | 174,776 |
Net Assets | | | |
Beginning of Period | 726,998 | | 552,222 |
End of Period3 | 802,040 | | 726,998 |
1 Includes fiscal 2007 and 2006 short-term gain distributions totaling $24,339,000 and $2,825,000, respectively. Short-term gain distributions are treated as ordinary income dividends for tax purposes.
2 Net of redemption fees of $99,000 and $83,000.
3 Net Assets—End of Period includes undistributed net investment income of $4,019,000 and $3,393,000.
18
Financial Highlights
| Six Months | | | | | |
| Ended | | | |
For a Share Outstanding | May 31, | Year Ended November 30, |
Throughout Each Period | 2007 | 2006 | 2005 | 2004 | 2003 | 2002 |
Net Asset Value, Beginning of Period | $14.81 | $13.57 | $13.62 | $13.05 | $10.57 | $12.12 |
Investment Operations | | | | | | |
Net Investment Income | .21 | .43 | .29 | .39 | .41 | .47 |
Net Realized and Unrealized | | | | | | |
Gain (Loss)on Investments | .89 | 1.62 | .48 | .60 | 2.48 | (1.53) |
Total from Investment Operations | 1.10 | 2.05 | .77 | .99 | 2.89 | (1.06) |
Distributions | | | | | | |
Dividends from Net Investment Income | (.27) | (.38) | (.32) | (.42) | (.41) | (.49) |
Distributions from Realized Capital Gains | (1.02) | (.43) | (.50) | — | — | — |
Total Distributions | (1.29) | (.81) | (.82) | (.42) | (.41) | (.49) |
Net Asset Value, End of Period | $14.62 | $14.81 | $13.57 | $13.62 | $13.05 | $10.57 |
| | | | | | |
Total Return1 | 8.08% | 15.70% | 5.92% | 7.71% | 28.07% | –8.88% |
| | | | | | |
Ratios/Supplemental Data | | | | | | |
Net Assets, End of Period (Millions) | $802 | $727 | $552 | $959 | $817 | $291 |
Ratio of Total Expenses to | | | | | | |
Average Net Assets2 | 0.79%* | 0.87% | 0.86% | 0.68% | 0.84% | 0.95% |
Ratio of Net Investment Income | | | | | | |
to Average Net Assets | 2.93%* | 3.14% | 2.18% | 2.94% | 3.82% | 4.27% |
Portfolio Turnover Rate | 117%* | 138% | 86% | 123% | 127% | 118% |
1 Total returns do not reflect the 1% fee assessed on redemptions of shares purchased on or after September 15, 2005, and held for less than one year.
2 Includes performance-based investment advisory fee increases (decreases) of 0.18%, 0.22%, 0.20%, 0.06%, 0.13%, and 0.21%.
* Annualized.
See accompanying Notes, which are an integral part of the Financial Statements.
19
Notes to Financial Statements
Vanguard Convertible Securities Fund is registered under the Investment Company Act of 1940 as an open-end investment company, or mutual fund.
A. The following significant accounting policies conform to generally accepted accounting principles for U.S. mutual funds. The fund consistently follows such policies in preparing its financial statements.
1. Security Valuation: Securities are valued as of the close of trading on the New York Stock Exchange (generally 4 p.m., Eastern time) on the valuation date. Equity securities are valued at the latest quoted sales prices or official closing prices taken from the primary market in which each security trades; such securities not traded on the valuation date are valued at the mean of the latest quoted bid and asked prices. Bonds, and temporary cash investments acquired over 60 days to maturity, are valued using the latest bid prices or using valuations based on a matrix system (which considers such factors as security prices, yields, maturities, and ratings), both as furnished by independent pricing services. Investments in Vanguard Market Liquidity Fund are valued at that fund’s net asset value. Other temporary cash investments are valued at amortized cost, which approximates market value. Securities for which market quotations are not readily available, or whose values have been materially affected by events occurring before the fund’s pricing time but after the close of the securities’ primary markets, are valued by methods deemed by the board of trustees to represent fair value.
2. Federal Income Taxes: The fund intends to continue to qualify as a regulated investment company and distribute all of its taxable income. Accordingly, no provision for federal income taxes is required in the financial statements.
3. Distributions: Distributions to shareholders are recorded on the ex-dividend date.
4. Security Lending: The fund may lend its securities to qualified institutional borrowers to earn additional income. Security loans are required to be secured at all times by collateral at least equal to the market value of securities loaned. The fund invests cash collateral received in Vanguard Market Liquidity Fund, and records a liability for the return of the collateral, during the period the securities are on loan. Security lending income represents the income earned on investing cash collateral, less expenses associated with the loan.
5. Other: Dividend income is recorded on the ex-dividend date. Interest income includes income distributions received from Vanguard Market Liquidity Fund and is accrued daily. Premiums and discounts on debt securities purchased are amortized and accreted, respectively, to interest income over the lives of the respective securities. Security transactions are accounted for on the date securities are bought or sold. Costs used to determine realized gains (losses) on the sale of investment securities are those of the specific securities sold. Fees assessed on redemptions of capital shares are credited to paid-in capital.
B. Oaktree Capital Management, L.P., provides investment advisory services to the fund for a fee calculated at an annual percentage rate of average net assets. The basic fee is subject to quarterly adjustments based on the fund’s performance for the preceding three years relative to the Credit Suisse First Boston Convertible Securities Index for periods prior to December 1, 2004, and the Merrill Lynch All US Convertibles Index beginning December 1, 2004. The benchmark change will be fully phased in by November 30, 2007. For the six months ended May 31, 2007, the investment advisory fee represented an effective annual basic rate of 0.36% of the fund’s average net assets before an increase of $659,000 (0.18%) based on performance.
20
C. The Vanguard Group furnishes at cost corporate management, administrative, marketing, and distribution services. The costs of such services are allocated to the fund under methods approved by the board of trustees. The fund has committed to provide up to 0.40% of its net assets in capital contributions to Vanguard. At May 31, 2007, the fund had contributed capital of $69,000 to Vanguard (included in Other Assets), representing 0.01% of the fund’s net assets and 0.07% of Vanguard’s capitalization. The fund’s trustees and officers are also directors and officers of Vanguard.
D. The fund’s custodian bank has agreed to reduce its fees when the fund maintains cash on deposit in the non-interest-bearing custody account. For the six months ended May 31, 2007, custodian fee offset arrangements reduced the fund’s expenses by $5,000.
E. Distributions are determined on a tax basis and may differ from net investment income and realized capital gains for financial reporting purposes. Differences may be permanent or temporary. Permanent differences are reclassified among capital accounts in the financial statements to reflect their tax character. Temporary differences arise when certain items of income, expense, gain, or loss are recognized in different periods for financial statement and tax purposes; these differences will reverse at some time in the future. Differences in classification may also result from the treatment of short-term gains as ordinary income for tax purposes. The fund’s tax-basis capital gains and losses are determined only at the end of each fiscal year.
Certain of the fund’s convertible preferred stock investments are treated as debt securities for tax purposes. During the six months ended May 31, 2007, the fund realized gains of $39,000 from the sale of these securities, which are included in distributable net investment income for tax purposes; accordingly, such gains have been reclassified from accumulated net realized gains to undistributed net investment income.
Certain of the fund’s convertible bond investments are in securities considered to be “contingent payment debt instruments,” for which any realized gains increase (and all or part of any realized losses decrease) income for tax purposes. During the six months ended May 31, 2007, the fund realized net gains of $3,255,000 from the sale of these securities, which increased distributable net income for tax purposes; accordingly, such gains have been reclassified from accumulated net realized gains to undistributed net investment income.
At May 31, 2007, the cost of investment securities for tax purposes was $751,768,000. Net unrealized appreciation of investment securities for tax purposes was $53,037,000, consisting of unrealized gains of $60,498,000 on securities that had risen in value since their purchase and $7,461,000 in unrealized losses on securities that had fallen in value since their purchase.
F. During the six months ended May 31, 2007, the fund purchased $446,764,000 of investment securities and sold $428,697,000 of investment securities, other than temporary cash investments.
21
G. Capital shares issued and redeemed were:
| Six Months Ended | | Year Ended |
| May 31, 2007 | | November 30, 2006 |
| Shares | | Shares |
| (000) | | (000) |
Issued | 7,198 | | 12,806 |
Issued in Lieu of Cash Distributions | 4,163 | | 2,164 |
Redeemed | (5,591) | | (6,577) |
Net Increase (Decrease) in Shares Outstanding | 5,770 | | 8,393 |
H. In June 2006, the Financial Accounting Standards Board issued Interpretation No. 48 (“FIN 48”), “Accounting for Uncertainty in Income Taxes.” FIN 48 establishes the minimum threshold for recognizing, and a system for measuring, the benefits of tax-return positions in financial statements. FIN 48 will be effective for the fund’s fiscal year beginning December 1, 2007. Management is in the process of analyzing the fund’s tax positions for purposes of implementing FIN 48; based on the analysis completed to date, management does not believe the adoption of FIN 48 will result in any material impact to the fund’s financial statements.
22
About Your Fund’s Expenses
As a shareholder of the fund, you incur ongoing costs, which include costs for portfolio management, administrative services, and shareholder reports (like this one), among others. Operating expenses, which are deducted from a fund’s gross income, directly reduce the investment return of the fund.
A fund’s expenses are expressed as a percentage of its average net assets. This figure is known as the expense ratio. The following examples are intended to help you understand the ongoing costs (in dollars) of investing in your fund and to compare these costs with those of other mutual funds. The examples are based on an investment of $1,000 made at the beginning of the period shown and held for the entire period.
The table below illustrates your fund’s costs in two ways:
• Based on actual fund return. This section helps you to estimate the actual expenses that you paid over the period. The “Ending Account Value” shown is derived from the fund’s actual return, and the third column shows the dollar amount that would have been paid by an investor who started with $1,000 in the fund. You may use the information here, together with the amount you invested, to estimate the expenses that you paid over the period.
To do so, simply divide your account value by $1,000 (for example, an $8,600 account value divided by $1,000 = 8.6), then multiply the result by the number given for your fund under the heading “Expenses Paid During Period.”
• Based on hypothetical 5% yearly return. This section is intended to help you compare your fund’s costs with those of other mutual funds. It assumes that the fund had a yearly return of 5% before expenses, but that the expense ratio is unchanged. In this case—because the return used is not the fund’s actual return—the results do not apply to your investment. The example is useful in making comparisons because the Securities and Exchange Commission requires all mutual funds to calculate expenses based on a 5% return. You can assess your fund’s costs by comparing this hypothetical example with the hypothetical examples that appear in shareholder reports of other funds.
Six Months Ended May 31, 2007 | | | |
| Beginning | Ending | Expenses |
| Account Value | Account Value | Paid During |
Convertible Securities Fund | 11/30/2006 | 5/31/2007 | Period1 |
Based on Actual Fund Return | $1,000.00 | $1,080.77 | $4.10 |
Based on Hypothetical 5% Yearly Return | 1,000.00 | 1,020.99 | 3.98 |
Note that the expenses shown in the table are meant to highlight and help you compare ongoing costs only and do not reflect transaction costs incurred by the fund for buying and selling securities. Further, the expenses do not include the 1% fee on redemptions of shares held for less than one year, nor do they include any account service fee described in the prospectus. If such fees were applied to your account, your costs would be higher. Your fund does not carry a “sales load.”
1 The calculations are based on expenses incurred in the most recent six-month period. The fund’s annualized six-month expense ratio for that period was 0.79%. The dollar amounts shown as “Expenses Paid” are equal to the annualized expense ratio multiplied by the average account value over the period, multiplied by the number of days in the most recent six-month period, then divided by the number of days in the most recent 12-month period.
23
The calculations assume no shares were bought or sold during the period. Your actual costs may have been higher or lower, depending on the amount of your investment and the timing of any purchases or redemptions.
You can find more information about the fund’s expenses, including annual expense ratios, in the Financial Statements section of this report. For additional information on operating expenses and other shareholder costs, please refer to your fund’s current prospectus.
24
Trustees Approve Advisory Agreement
The board of trustees of Vanguard Convertible Securities Fund has renewed the fund’s investment advisory agreement with Oaktree Capital Management, L.P. The board determined that the retention of Oaktree was in the best interests of the fund and its shareholders.
The board approved a change in the process for the quarterly calculation of the fund’s asset-based advisory fee. The calculation now will be based on the average daily net assets of the fund, rather than the average month-end net assets.
The board based its decisions upon an evaluation of Oaktree’s investment staff, portfolio management process, and performance. The trustees considered the factors discussed below, among others. However, no single factor determined whether the board approved the agreement. Rather, it was the totality of the circumstances that drove the board’s decision.
Nature, extent, and quality of services
The board considered the quality of the fund’s investment management over both short- and long-term periods and took into account the organizational depth and stability of the firm. The board noted that Oaktree, founded in 1995, specializes in managing convertible securities. The advisor uses a bottom-up investment approach to select convertibles considered to have the best balance of upside potential and downside protection. Discipline is key to the fund’s management; Oaktree invests predominantly in convertibles possessing an attractive combination of conversion and income features—true hybrid securities—and sells the issues when their characteristics become too similar to those of conventional bonds or common stocks. Oaktree is a deep and stable firm, and has advised the fund since 1996.
The board concluded that the advisor’s experience, stability, and performance, among other factors, warranted continuation of the advisory agreement.
Investment performance
The board considered the short- and long-term performance of the fund, including any periods of outperformance or underperformance of a relevant benchmark and peer group. The board concluded that the advisor has carried out the fund’s investment strategy in disciplined fashion, and that the performance provided by Oaktree has been favorable compared with that of the fund’s benchmark and peer group. Information about the fund’s most recent performance can be found in the Performance Summary section of this report.
Cost
The board concluded that the fund’s expense ratio was far below the average expense ratio charged by funds in its peer group. The fund’s advisory fee rate was also below the peer-group average. Information about the fund’s expense ratio appears in the About Your Fund’s Expenses section of this report as well as in the Financial Statements section, which also includes information about the advisory fee rate.
The board did not consider profitability of Oaktree in determining whether to approve the advisory fee, because Oaktree is independent of Vanguard and the advisory fee is the result of arm’s-length negotiations.
The benefit of economies of scale
The board concluded that the fund’s shareholders benefit from economies of scale because of breakpoints in the fund’s advisory fee schedule. The breakpoints reduce the effective rate of the fee as the fund’s assets increase.
The board will consider whether to renew the advisory agreement again after a one-year period.
25
Glossary
Average Coupon. The average interest rate paid on the fixed income securities held by a fund. It is expressed as a percentage of face value.
Average Duration. An estimate of how much the value of the bonds held by a fund will fluctuate in response to a change in interest rates. To see how the value could change, multiply the average duration by the change in rates. If interest rates rise by 1 percentage point, the value of the bonds in a fund with an average duration of five years would decline by about 5%. If rates decrease by a percentage point, the value would rise by 5%.
Average Quality. An indicator of credit risk, this figure is the average of the ratings assigned to a fund’s holdings by credit-rating agencies. The agencies make their judgment after appraising an issuer’s ability to meet its obligations. Quality is graded on a scale, with Aaa or AAA indicating the most creditworthy bond issuers.
Average Weighted Maturity. The average length of time until fixed income securities held by a fund reach maturity and are repaid. The figure reflects the proportion of fund assets represented by each security.
Beta. A measure of the magnitude of a fund’s past share-price fluctuations in relation to the ups and downs of a given market index. The index is assigned a beta of 1.00. Compared with a given index, a fund with a beta of 1.20 typically would have seen its share price rise or fall by 12% when the index rose or fell by 10%. A fund’s beta should be reviewed in conjunction with its R-squared (see definition below). The lower the R-squared, the less correlation there is between the fund and the index, and the less reliable beta is as an indicator of volatility.
Conversion Premium. The average percentage by which the weighted average market price of the convertible securities held by a fund exceeds the weighted average market price of their underlying common stocks. For example, if a stock is trading at $25 per share and a bond convertible into the stock is trading at a price equivalent to $30 per share of stock, the conversion premium is 20% ($5 ÷ $25 = 20%).
Expense Ratio. The percentage of a fund’s average net assets used to pay its annual administrative and advisory expenses. These expenses directly reduce returns to investors.
Foreign Holdings. The percentage of a fund’s net assets represented by securities of companies based outside the United States.
Inception Date. The date on which the assets of a fund (or one of its share classes) are first invested in accordance with the fund’s investment objective. For funds with a subscription period, the inception date is the day after that period ends. Investment performance is measured from the inception date.
R-Squared. A measure of how much of a fund’s past returns can be explained by the returns from the market in general, as measured by a given index. If a fund’s total returns were precisely synchronized with an index’s returns, its R-squared would be 1.00. If the fund’s returns bore no relationship to the index’s returns, its R-squared would be 0.
Short-Term Reserves. The percentage of a fund invested in highly liquid, short-term securities that can be readily converted to cash.
Turnover Rate. An indication of the fund’s trading activity. Funds with high turnover rates incur higher transaction costs and may be more likely to distribute capital gains (which may be taxable to
investors). The turnover rate excludes in-kind transactions, which have minimal impact on costs.
Yield. A snapshot of a fund’s income from interest and dividends. The yield, expressed as a percentage of the fund’s net asset value, is based on income earned over the past 30 days and is annualized, or projected forward for the coming year.
26
This page intentionally left blank.
This page intentionally left blank.
The People Who Govern Your Fund
The trustees of your mutual fund are there to see that the fund is operated and managed in your best interests since, as a shareholder, you are a part owner of the fund. Your fund’s trustees also serve on the board of directors of The Vanguard Group, Inc., which is owned by the Vanguard funds and provides services to them on an at-cost basis.
A majority of Vanguard’s board members are independent, meaning that they have no affiliation with Vanguard or the funds they oversee, apart from the sizable personal investments they have made as private individuals.
Our independent board members bring distinguished backgrounds in business, academia, and public service to their task of working with Vanguard officers to establish the policies and oversee the activities of the funds. Among board members’ responsibilities are selecting investment advisors for the funds; monitoring fund operations, performance, and costs; reviewing contracts; nominating and selecting new trustees/directors; and electing Vanguard officers.
Each trustee serves a fund until its termination; or until the trustee’s retirement, resignation, or death; or otherwise as specified in the fund’s organizational documents. Any trustee may be removed at a shareholders’ meeting by a vote representing two-thirds of the net asset value of all shares of the fund together with shares of other Vanguard funds organized within the same trust. The table on these two pages shows information for each trustee and executive officer of the fund. The mailing address of the trustees and officers is P.O. Box 876, Valley Forge, PA 19482.
Chairman of the Board, Chief Executive Officer, and Trustee |
| |
John J. Brennan1 | |
Born 1954 | Principal Occupation(s) During the Past Five Years: Chairman of the Board, Chief Executive |
Trustee since May 1987; | Officer, and Director/Trustee of The Vanguard Group, Inc., and of each of the investment |
Chairman of the Board and | companies served by The Vanguard Group. |
Chief Executive Officer | |
147 Vanguard Funds Overseen | |
| |
Independent Trustees | |
| |
Charles D. Ellis | |
Born 1937 | Principal Occupation(s) During the Past Five Years: Applecore Partners (pro bono ventures |
Trustee since January 2001 | in education); Senior Advisor to Greenwich Associates (international business strategy |
147 Vanguard Funds Overseen | consulting); Successor Trustee of Yale University; Overseer of the Stern School of Business |
| at New York University; Trustee of the Whitehead Institute for Biomedical Research. |
| |
Rajiv L. Gupta | |
Born 1945 | Principal Occupation(s) During the Past Five Years: Chairman and Chief Executive Officer |
Trustee since December 20012 | of Rohm and Haas Co. (chemicals); Board Member of the American Chemistry Council; |
147 Vanguard Funds Overseen | Director of Tyco International, Ltd. (diversified manufacturing and services) since 2005; |
| Trustee of Drexel University and of the Chemical Heritage Foundation. |
| |
Amy Gutmann | |
Born 1949 | Principal Occupation(s) During the Past Five Years: President of the University of |
Trustee since June 2006 | Pennsylvania since 2004; Professor in the School of Arts and Sciences, Annenberg School |
147 Vanguard Funds Overseen | for Communication, and Graduate School of Education of the University of Pennsylvania |
| since 2004; Provost (2001–2004) and Laurance S. Rockefeller Professor of Politics and |
| the University Center for Human Values (1990–2004), Princeton University; Director of |
| Carnegie Corporation of New York since 2005 and of Schuylkill River Development |
| Corporation and Greater Philadelphia Chamber of Commerce since 2004. |
JoAnn Heffernan Heisen | |
Born 1950 | Principal Occupation(s) During the Past Five Years: Corporate Vice President and |
Trustee since July 1998 | Chief Global Diversity Officer since 2006, Vice President and Chief Information |
147 Vanguard Funds Overseen | Officer (1997–2005), and Member of the Executive Committee of Johnson & |
| Johnson (pharmaceuticals/consumer products); Director of the University Medical |
| Center at Princeton and Women’s Research and Education Institute. |
| |
André F. Perold | |
Born 1952 | Principal Occupation(s) During the Past Five Years: George Gund Professor of Finance |
Trustee since December 2004 | and Banking, Harvard Business School; Senior Associate Dean, Director of Faculty |
147 Vanguard Funds Overseen | Recruiting, and Chair of Finance Faculty, Harvard Business School; Director and Chairman |
| of UNX, Inc. (equities trading firm) since 2003; Chair of the Investment Committee of |
| HighVista Strategies LLC (private investment firm) since 2005. |
| |
Alfred M. Rankin, Jr. | |
Born 1941 | Principal Occupation(s) During the Past Five Years: Chairman, President, Chief Executive |
Trustee since January 1993 | Officer, and Director of NACCO Industries, Inc. (forklift trucks/housewares/lignite); Director |
147 Vanguard Funds Overseen | of Goodrich Corporation (industrial products/aircraft systems and services). |
| |
| |
J. Lawrence Wilson | |
Born 1936 | Principal Occupation(s) During the Past Five Years: Retired Chairman and Chief Executive |
Trustee since April 1985 | Officer of Rohm and Haas Co. (chemicals); Director of Cummins Inc. (diesel engines) and |
147 Vanguard Funds Overseen | AmerisourceBergen Corp. (pharmaceutical distribution); Trustee of Vanderbilt University |
| and of Culver Educational Foundation. |
| |
Executive Officers1 | |
| |
Heidi Stam | |
Born 1956 | Principal Occupation(s) During the Past Five Years: Managing Director of The Vanguard |
Secretary since July 2005 | Group, Inc., since 2006; General Counsel of The Vanguard Group since 2005; Secretary of |
147 Vanguard Funds Overseen | The Vanguard Group, and of each of the investment companies served by The Vanguard |
| Group, since 2005; Principal of The Vanguard Group (1997–2006). |
| |
Thomas J. Higgins | |
Born 1957 | Principal Occupation(s) During the Past Five Years: Principal of The Vanguard Group, Inc.; |
Treasurer since July 1998 | Treasurer of each of the investment companies served by The Vanguard Group. |
147 Vanguard Funds Overseen | |
| |
Vanguard Senior Management Team |
| |
R. Gregory Barton | Kathleen C. Gubanich | Michael S. Miller |
Mortimer J. Buckley | Paul A. Heller | Ralph K. Packard |
James H. Gately | F. William McNabb, III | George U. Sauter |
| |
Founder | |
| |
John C. Bogle | |
Chairman and Chief Executive Officer, 1974–1996 |
1 Officers of the funds are “interested persons” as defined in the Investment Company Act of 1940.
2 December 2002 for Vanguard Equity Income Fund, Vanguard Growth Equity Fund, the Vanguard Municipal Bond Funds, and the Vanguard State Tax-Exempt Funds.
More information about the trustees is in the Statement of Additional Information, available from The Vanguard Group.
P.O. Box 2600
Valley Forge, PA 19482-2600
Connect with Vanguard® > www.vanguard.com
Fund Information > 800-662-7447 | Vanguard, Connect with Vanguard, and the ship logo are |
| trademarks of The Vanguard Group, Inc. |
| |
Direct Investor Account Services > 800-662-2739 |
| All other marks are the exclusive property of their |
| respective owners. |
| |
Institutional Investor Services > 800-523-1036 |
| |
Text Telephone for People | |
With Hearing Impairment > 800-952-3335 | All comparative mutual fund data are from Lipper Inc. |
| or Morningstar, Inc., unless otherwise noted. |
| |
| |
| You can obtain a free copy of Vanguard’s proxy voting |
| guidelines by visiting our website, www.vanguard.com, |
This material may be used in conjunction | and searching for “proxy voting guidelines,” or by calling |
with the offering of shares of any Vanguard | Vanguard at 800-662-2739. They are also available from |
fund only if preceded or accompanied by | the SEC’s website, www.sec.gov. In addition, you may |
the fund’s current prospectus. | obtain a free report on how your fund voted the proxies for |
| securities it owned during the 12 months ended June 30. |
| To get the report, visit either www.vanguard.com |
| or www.sec.gov. |
| |
| You can review and copy information about your fund |
| at the SEC’s Public Reference Room in Washington, D.C. |
| To find out more about this public service, call the SEC |
| at 202-551-8090. Information about your fund is also |
| available on the SEC’s website, and you can receive |
| copies of this information, for a fee, by sending a |
| request in either of two ways: via e-mail addressed to |
| publicinfo@sec.gov or via regular mail addressed to the |
| Public Reference Section, Securities and Exchange |
| Commission, Washington, DC 20549-0102. |
| |
| |
| |
| |
| © 2007 The Vanguard Group, Inc. |
| All rights reserved. |
| Vanguard Marketing Corporation, Distributor. |
| |
| Q822 072007 |
Item 2: Not Applicable.
Item 3: Not Applicable.
Item 4: Not Applicable.
Item 5: Not Applicable.
Item 6: Not Applicable.
Item 7: Not applicable.
Item 8: Not Applicable.
Item 9: Not Applicable.
Item 10: Not Applicable.
Item 11: Controls and Procedures.
(a) Disclosure Controls and Procedures. The Principal Executive and Financial Officers concluded that the Registrant's Disclosure Controls and Procedures are effective based on their evaluation of the Disclosure Controls and Procedures as of a date within 90 days of the filing date of this report.
(b) Internal Control Over Financial Reporting. There were no significant changes in Registrant’s Internal Control Over Financial Reporting or in other factors that could significantly affect this control subsequent to the date of the evaluation, including any corrective actions with regard to significant deficiencies and material weaknesses.
Item 12: Exhibits.
Pursuant to the requirements of the Securities Exchange Act of 1934 and the Investment Company Act of 1940, the registrant has duly caused this report to be signed on its behalf by the undersigned, thereunto duly authorized.
VANGUARD CONVERTIBLE SECURITIES FUND |
BY: | |
(signature) |
(HEIDI STAM) |
JOHN J. BRENNAN* |
CHIEF EXECUTIVE OFFICER |
Date: July 20, 2007
Pursuant to the requirements of the Securities Exchange Act of 1934 and the Investment Company Act of 1940, this report has been signed below by the following persons on behalf of the registrant and in the capacities and on the dates indicated.
VANGUARD CONVERTIBLE SECURITIES FUND |
BY: | |
(signature) |
(HEIDI STAM) |
JOHN J. BRENNAN* |
CHIEF EXECUTIVE OFFICER |
Date: July 20, 2007
VANGUARD CONVERTIBLE SECURITIES FUND |
BY: | |
(signature) |
(HEIDI STAM) |
THOMAS J. HIGGINS* |
TREASURER |
Date: July 20, 2007
*By Power of Attorney. See File Number 002-65955-99, filed on July 27, 2006. Incorporated by Reference.