Table of Contents
UNITED STATES
SECURITIES AND EXCHANGE COMMISSION
Washington, D.C. 20549
Form N-CSR
CERTIFIED SHAREHOLDER REPORT OF
REGISTERED MANAGEMENT INVESTMENT COMPANIES
Investment Company Act file number: 811-4676
Harbor Funds
(Exact name of Registrant as specified in charter)
111 South Wacker Drive, 34th Floor
Chicago, Illinois 60606-4302
Chicago, Illinois 60606-4302
(Address of principal executive offices) (Zip code)
| Charles F. McCain, Esq. HARBOR FUNDS 111 South Wacker Drive, 34th Floor Chicago, Illinois 60606-4302 | Christopher P. Harvey, Esq. DECHERT LLP One International Place – 40th Floor 100 Oliver Street Boston, MA 02110-2605 |
(Name and address of agent for service)
Registrant’s telephone number, including area code: (312) 443-4400
Date of fiscal year end: October 31
Date of reporting period: October 31, 2017
ITEM 1 – REPORTS TO STOCKHOLDERS
The following are copies of reports transmitted to shareholders pursuant to Rule 30e-1 under the Investment Company Act of 1940, as amended (the “1940 Act”) (17 CFR 270.30e-1):
Table of Contents


Annual Report
October 31, 2017
Domestic Equity Funds
| Institutional Class | Administrative Class | Investor Class | Retirement Class | |
| GROWTH FUNDS | ||||
| Harbor Capital Appreciation Fund | HACAX | HRCAX | HCAIX | HNACX |
| Harbor Mid Cap Growth Fund | HAMGX | HRMGX | HIMGX | HNMGX |
| Harbor Small Cap Growth Fund | HASGX | HRSGX | HISGX | HNSGX |
| Harbor Small Cap Growth Opportunities Fund | HASOX | HRSOX | HISOX | HNSOX |
| VALUE FUNDS | ||||
| Harbor Large Cap Value Fund | HAVLX | HRLVX | HILVX | HNLVX |
| Harbor Mid Cap Value Fund | HAMVX | HRMVX | HIMVX | HNMVX |
| Harbor Small Cap Value Fund | HASCX | HSVRX | HISVX | HNVRX |
| Harbor Small Cap Value Opportunities Fund | HSOVX | HSAVX | HSIVX | HSRVX |
Table of Contents
| 96 | |
| 97 | |
| Additional Information | |
| 101 | |
| 101 | |
| 101 | |
| 102 | |
| 102 | |
| 104 | |
| 105 | |
| 108 | |
| 109 |
This document must be preceded or accompanied by a Prospectus.
Harbor Domestic Equity Funds
Annual Report Overview (Unaudited)
Annual Report Overview (Unaudited)
The Funds' fiscal year ended October 31, 2017. Performance data shown represents past performance and is no guarantee of future results. Past performance is net of management fees and expenses and reflects reinvested dividends and distributions, but does not reflect the deduction of taxes that a shareholder would pay on Fund distributions or upon the redemption of Fund shares. Past performance reflects the beneficial effect of any expense waivers or reimbursements, without which returns would have been lower. Investment returns and principal value will fluctuate and when redeemed may be worth more or less than their original cost. Returns for periods less than one year are not annualized. Current performance may be higher or lower than what is shown here and is available through the most recent month end at harborfunds.com or by calling 800-422-1050.
For information on the different share classes, please refer to the current prospectus. The returns of the unmanaged indices shown in this report assume the reinvestment of dividends but do not reflect fees and expenses and are not available for direct investment.
| Total Return Year Ended October 31, 2017 | |||||||
| GROWTH FUNDS | Institutional Class | Administrative Class | Investor Class | Retirement Class | |||
Harbor Capital Appreciation Fund | 32.52% | 32.20% | 32.04% | 32.62% | |||
Harbor Mid Cap Growth Fund | 31.00 | 30.71 | 30.61 | 31.12 | |||
Harbor Small Cap Growth Fund | 26.72 | 26.02 | 26.29 | 26.78 | |||
Harbor Small Cap Growth Opportunities Fund | 23.07 | 22.70 | 22.63 | 23.14 | |||
| VALUE FUNDS | |||||||
Harbor Large Cap Value Fund | 26.00 | 25.77 | 25.52 | 26.08 | |||
Harbor Mid Cap Value Fund | 19.16 | 18.84 | 18.71 | 19.22 | |||
Harbor Small Cap Value Fund | 33.00 | 32.67 | 32.49 | 33.06 | |||
Harbor Small Cap Value Opportunities Fund | 0.70 a | 0.60 a | 0.60 a | 0.70 a | |||
| COMMONLY USED MARKET INDICES | Total Return Year Ended October 31, 2017 |
S&P 500 (large cap, domestic equity) | 23.63% |
Russell 1000® Growth (large cap, domestic equity) | 29.71 |
Russell 1000® Value (large cap, domestic equity) | 17.78 |
Russell Midcap® Growth (mid cap, domestic equity) | 26.25 |
Russell Midcap® Value (mid cap, domestic equity) | 17.12 |
Russell 2000® Growth (small cap, domestic equity) | 31.00 |
Russell 2000® Value (small cap, domestic equity) | 24.81 |
| a | For the period August 1, 2017 (inception) through October 31, 2017. |
1
Harbor Domestic Equity Funds
Annual Report Overview—Continued
Annual Report Overview—Continued
| EXPENSE RATIOS1 | Morningstar Average2 | ||||||||||
| DOMESTIC EQUITY FUNDS | 2013 | 2014 | 2015 | 2016 | 2017 | ||||||
| Harbor Capital Appreciation Fund | |||||||||||
Institutional Class | 0.65% | 0.65% | 0.64% | 0.64% | 0.65% | 0.87% | |||||
Administrative Class | 0.90 | 0.90 | 0.89 | 0.89 | 0.90 | 1.16 | |||||
Investor Class | 1.02 | 1.02 | 1.01 | 1.01 | 1.02 | 1.25 | |||||
Retirement Class | N/A | N/A | N/A | 0.59 a | 0.59 | 0.80 | |||||
| Harbor Mid Cap Growth Fund | |||||||||||
Institutional Class | 0.84% | 0.83% | 0.84% | 0.85% | 0.87% | 1.00% | |||||
Administrative Class | 1.09 | 1.08 | 1.09 | 1.10 | 1.12 | 1.29 | |||||
Investor Class | 1.21 | 1.20 | 1.21 | 1.22 | 1.24 | 1.33 | |||||
Retirement Class | N/A | N/A | N/A | 0.80 a | 0.81 | 0.93 | |||||
| Harbor Small Cap Growth Fund | |||||||||||
Institutional Class | 0.83% | 0.83% | 0.83% | 0.85% | 0.85% | 1.06% | |||||
Administrative Class | 1.08 | 1.08 | 1.08 | 1.10 | 1.10 | 1.32 | |||||
Investor Class | 1.20 | 1.20 | 1.20 | 1.22 | 1.22 | 1.39 | |||||
Retirement Class | N/A | N/A | N/A | 0.80 a | 0.79 | 1.02 | |||||
| Harbor Small Cap Growth Opportunities Fund | |||||||||||
Institutional Class | N/A | 0.90% b | 0.90% | 0.89% | 0.88% | 1.06% | |||||
Administrative Class | N/A | 1.15 b | 1.15 | 1.13 | 1.13 | 1.32 | |||||
Investor Class | N/A | 1.27 b | 1.27 | 1.26 | 1.25 | 1.39 | |||||
Retirement Class | N/A | N/A | N/A | 0.84 a | 0.81 | 1.02 | |||||
| Harbor Large Cap Value Fund | |||||||||||
Institutional Class | 0.68% | 0.68% | 0.68% | 0.68% | 0.68% | 0.83% | |||||
Administrative Class | 0.93 | 0.93 | 0.93 | 0.93 | 0.93 | 1.14 | |||||
Investor Class | 1.05 | 1.05 | 1.05 | 1.05 | 1.05 | 1.19 | |||||
Retirement Class | N/A | N/A | N/A | 0.63 a | 0.60 | 0.78 | |||||
| Harbor Mid Cap Value Fund | |||||||||||
Institutional Class | 0.93% | 0.89% | 0.86% | 0.84% | 0.84% | 0.92% | |||||
Administrative Class | 1.18 | 1.14 | 1.11 | 1.09 | 1.09 | 1.27 | |||||
Investor Class | 1.30 | 1.26 | 1.23 | 1.21 | 1.21 | 1.28 | |||||
Retirement Class | N/A | N/A | N/A | 0.79 a | 0.77 | 0.86 | |||||
| Harbor Small Cap Value Fund | |||||||||||
Institutional Class | 0.84% | 0.84% | 0.85% | 0.86% | 0.87% | 1.07% | |||||
Administrative Class | 1.09 | 1.09 | 1.10 | 1.11 | 1.12 | 1.47 | |||||
Investor Class | 1.21 | 1.21 | 1.22 | 1.23 | 1.24 | 1.51 | |||||
Retirement Class | N/A | N/A | N/A | 0.81 a | 0.81 | 1.01 | |||||
| Harbor Small Cap Value Opportunities Fund | |||||||||||
Institutional Class | N/A | N/A | N/A | N/A | 0.88% c | 1.07% | |||||
Administrative Class | N/A | N/A | N/A | N/A | 1.13 c | 1.47 | |||||
Investor Class | N/A | N/A | N/A | N/A | 1.25 c | 1.51 | |||||
Retirement Class | N/A | N/A | N/A | N/A | 0.80 c | 1.01 | |||||
| 1 | Harbor Funds’ expense ratios are for the fiscal years ended October 31 (unless otherwise noted) and are shown net of all expense offsets, waivers and reimbursements (see Financial Highlights). |
| 2 | The Morningstar Average includes all actively managed no-load funds in the October 31, 2017 Morningstar Universe with the same investment style as the comparable Harbor Funds portfolio and with the following additional characteristics for each Harbor Funds share class: Institutional Class contains funds with 12b-1 fees less than or equal to 0.25%; Administrative Class contains funds with 12b-1 fees and which are restricted primarily for use by retirement plans; Investor Class contains funds with 12b-1 fees and a minimum investment less than $50,000; and Retirement Class contains funds with no 12b-1 fees. |
| a | Annualized figures for the period March 1, 2016 (commencement of operations) through October 31, 2016 |
| b | Annualized figures for the period February 1, 2014 (inception) through October 31, 2014 |
| c | Annualized figures for the period August 1, 2017 (inception) through October 31, 2017 |
2
Letter from the Chairman
 Charles F. McCain Chairman |
Dear Fellow Shareholder:
I am honored to be writing my first shareholder letter to you as Chairman of the Board of Trustees of Harbor Funds. David Van Hooser, our long-standing Chairman, retired from the Board of Trustees on September 22, 2017 after 17 years of distinguished service. Over that 17 year tenure, I have admired how Dave has maintained a singular focus on serving the best interests of Harbor Funds and its shareholders. He has served as an example to me and the other men and women who work diligently to support Harbor Funds. I remain committed to carrying on the responsibility that Dave so fully embraced to place the interests of Harbor Funds and its shareholders first.
We have also had other changes on the Board of Trustees over the past year. Rodger Smith, our long-standing Lead Independent Trustee, retired from the Board on December 31, 2016 after a 29 year tenure. He was replaced as Lead Independent Trustee by Randy Hack, who has served on the Board since 2010. Shareholders also elected two new independent Trustees to the Board on September 22, 2017 in Katie Quirk and Joe Dowling. With their election, eight of the nine members of the Board are independent of Harbor Capital Advisors, the investment adviser to Harbor Funds.
Market Review
U.S. equities generally had strong returns for the fiscal year ended October 31, 2017. The period began with a U.S. election that fueled a market rally based upon optimism that promises of tax cuts, infrastructure spending and a business-friendly approach to regulation could lead to improved economic growth and higher corporate earnings.
As the fiscal year continued, U.S. stocks advanced despite rising interest rates, falling oil prices and political uncertainty, as corporate earnings exceeded expectations. Better-than-expected economic growth and job gains drove U.S. equity indexes to record levels toward the end of the period, while oil prices stabilized and the Federal Reserve stayed on track to continue raising short-term interest rates while laying the groundwork for gradually reducing its U.S. Treasury bond balance sheet holdings.
The Russell 3000® Index, a measure of the broad U.S. stock market, had a return of 23.98% for the fiscal year. Growth stocks outperformed value stocks by a significant margin, and small cap stocks outperformed both large cap and mid cap stocks.
Comments by the portfolio managers of each Harbor domestic equity fund can be found in the pages preceding each Fund’s portfolio of investments. As always, we recommend that shareholders maintain a long-term perspective in evaluating all of their investments, including those in Harbor Funds.
| Returns For Periods Ended October 31, 2017 | ||||||||
| Annualized | ||||||||
| Domestic Equities | 1 Year | 5 Years | 10 Years | 30 Years | ||||
Russell 3000® (entire U.S. stock market) | 23.98% | 15.12% | 7.61% | 10.60% | ||||
S&P 500 (large cap stocks) | 23.63 | 15.18 | 7.51 | 10.50 | ||||
Russell Midcap® (mid cap stocks) | 21.09 | 14.87 | 8.09 | 12.11 | ||||
Russell 2000® (small cap stocks) | 27.85 | 14.49 | 7.63 | 10.45 | ||||
Russell 3000® Growth (growth stocks) | 29.80 | 16.71 | 9.05 | 10.16 | ||||
Russell 3000® Value (value stocks) | 18.30 | 13.48 | 6.07 | 10.68 | ||||
| International & Global | ||||||||
MSCI EAFE (ND) (foreign stocks) | 23.44% | 8.53% | 1.10% | 5.62% | ||||
MSCI EAFE Small Cap (ND) (foreign small cap stocks) | 27.51 | 13.03 | 4.18 | N/A | ||||
MSCI World (ND) (global stocks) | 22.77 | 11.56 | 4.10 | 7.44 | ||||
MSCI All Country World Ex. U.S. (ND) (foreign stocks) | 23.64 | 7.29 | 0.92 | N/A | ||||
MSCI Emerging Markets (ND) (emerging market stocks) | 26.45 | 4.83 | 0.60 | N/A | ||||
| Strategic Markets | ||||||||
Bloomberg Commodity Index Total ReturnSM (commodities) | 2.35% | -9.37% | -6.93% | N/A | ||||
| Fixed Income | ||||||||
ICE BofAML U.S. Non-Distressed High Yield (domestic high-yield bonds) | 8.62% | 6.33% | 6.69% | N/A | ||||
Bloomberg Barclays U.S. Aggregate Bond (domestic bonds) | 0.90 | 2.04 | 4.19 | 6.43% | ||||
Bloomberg Barclays U.S. TIPS (domestic inflation-linked bonds) | -0.11 | -0.11 | 3.81 | N/A | ||||
ICE BofAML U.S. 3-Month Treasury Bill (proxy for money market returns) | 0.72 | 0.24 | 0.45 | 3.35 | ||||
Stay focused on the long-term
Major U.S. indexes hit record levels toward the end of the fiscal year, supported by continued earnings gains and favorable economic data. Against this backdrop, the third calendar quarter of 2017 marked the eighth consecutive quarter of gains for U.S. equities.
With equities having rallied for an extended period, it is reasonable to question whether the market’s advance might be due for a slowdown or even a reversal in the near future. For even the most experienced investment professionals, it is difficult to reliably predict the movements of stock prices or bond prices with certainty, particularly in the shorter-term.
3
We always encourage shareholders to take a long-term perspective with all of their investments. While past performance is never a guarantee of future results, over the long term, the returns of equities and debt securities have historically helped many investors achieve their financial objectives. We encourage all investors to maintain a diversified portfolio of equities, debt and cash in an allocation consistent with their long-term financial goals and comfort with risk.
Harbor Funds offers a variety of equity, strategic markets and fixed income funds to help you achieve your financial goals.
Thank you for investing with Harbor Funds.
December 21, 2017
 |
| Charles F. McCain |
| Chairman |
4
Harbor Capital Appreciation Fund
Managers' Commentary (Unaudited)
Managers' Commentary (Unaudited)
Subadviser
Jennison Associates LLC
466 Lexington Avenue
New York, NY 10017
New York, NY 10017
Portfolio Managers
Spiros Segalas
Since 1990
Since 1990
Kathleen A. McCarragher
Since 2013
Since 2013
Jennison has subadvised the Fund since 1990.
Investment Objective
The Fund seeks long-term growth of capital.

Spiros Segalas

Kathleen A. McCarragher
Management’s Discussion of
Fund Performance
Fund Performance
MARKET REVIEW
Equity returns were strong in the 12-month period ended October 31, 2017, as global GDP advanced at a healthy pace, long-term interest rates remained close to historical lows, and central banks tightened monetary policy prudently and gradually in light of subdued inflation. In the U.S., solid economic fundamentals included stable and moderate economic expansion, robust employment, accelerating corporate profit growth, and accumulating cash on company balance sheets.
PERFORMANCE
The Harbor Capital Appreciation Fund advanced 32.52% (Institutional Class), 32.20% (Administrative Class), 32.04% (Investor Class), and 32.62% (Retirement Class) for the fiscal year, outperforming the Russell 1000® Growth Index, which rose 29.71%, and the broader equity market, as represented by the S&P 500 Index, which climbed 23.63%.
Most of the benchmark’s sectors, especially Information Technology, posted significant positive returns. Early strength in Industrials and Financials reflected the prospect of a less onerous regulatory environment and increased spending on infrastructure. With legislative accomplishments elusive and factionalism impeding cooperation, market expectations for these sectors moderated. Energy was the lone sector to decline, as commodities prices were generally weak.
Information Technology positions were impressive contributors to Fund outperformance. Internet and mobile technologies have been transforming businesses and consumer behavior for some time, yet their impact continued to grow. Nowhere is this more dramatic than China. Alibaba reported financial results that beat expectations on most key metrics. Within China, it operates the largest global online wholesale platform for small businesses, the largest online retail website, and the largest online third-party platform for brands and retailers. These businesses are in the early stages of what is broadly expected to be long-term growth.
Tencent, China’s largest and most visited Internet service portal, continued to perform well fundamentally driven by its dominant position and monetization opportunities in China’s online gaming and instant messaging markets and its growing advertising and payment service efforts.
The technology of social media has clearly changed how we interact with friends and family, and how and when we consume and share information. Facebook’s revenue and earnings beat consensus expectations, with user growth solid and engagement strong. The company’s opportunities to monetize its businesses remain substantial.
Both Nvidia and Adobe Systems continued to benefit from technological advances beyond the Internet and mobile. Nvidia has transformed itself from a personal computer-centric graphics provider to the driver of high-growth markets such as gaming, automotive, high-performance computing, and cloud and enterprise, where developers have coalesced and standardized around its architecture and platform. Adobe Systems, while historically best known for Photoshop and the PDF and Flash platforms, has successfully transformed into a subscription-based provider of digital media, document, creative, marketing, and analytics services.
Apple’s fundamental strength reflects the proliferation of the iOS platform across the global mobile phone, tablet, and personal computer landscape as well as the financial power related to the attractive margin profile of the company’s hardware products.
Technological and behavioral changes are transforming industries well beyond Information Technology. Within the Consumer Discretionary sector, notable holdings include Amazon in retail, Netflix in media and entertainment, and Tesla in autos and replaceable power. Amazon’s scale dominance allows an advantageous cost structure and the ability to aggressively invest
5
Harbor Capital Appreciation Fund
Managers' Commentary—Continued
Managers' Commentary—Continued
| TOP TEN HOLDINGS (% of net assets) | |
| Apple Inc. | 6.3% |
| Amazon.com Inc. | 4.5% |
| Facebook Inc. | 4.4% |
| Alibaba Group Holding Ltd. ADR | 4.2% |
| Microsoft Corp. | 4.1% |
| MasterCard Inc. | 3.3% |
| Visa Inc. | 3.3% |
| Netflix Inc. | 3.1% |
| Tencent Holdings Ltd. | 3.1% |
| Adobe Systems Inc. | 2.7% |
in its businesses. The long-term positioning of Netflix has been strengthened by exclusive deals and original content, international expansion, and scale advantage, which enabled the company to fund content costs with a global subscriber base. Tesla continued to be positioned to drive rapid growth in the adoption of electric autos, and with its Model 3, target the mainstream automotive market.
However, technological change affected other Consumer Discretionary holdings negatively, with the incursion of online competition weighing on the stocks of both O’Reilly Automotive and Ulta Beauty.
The Fund’s Health Care positions lagged the benchmark sector. Notable detractors included Alexion Pharmaceuticals, which makes drugs for rare genetic diseases; it declined on material and unanticipated management changes and on an investigation into sales practices. Allergan’s decline reflected potential patent expirations and constraints on its ability to raise drug prices.
In Information Technology, cellular phone chipmaker Qualcomm fell on new and ongoing antitrust litigation. Internet security hardware and software maker Palo Alto Networks declined on weaker than projected product revenue and a lowered outlook.
The Fund’s positions in O’Reilly Automotive, Ulta, Allergan, Qualcomm, and Palo Alto were eliminated during the year.
OUTLOOK & STRATEGY
Robust equity market returns have been fueled by strong corporate earnings gains. There have been exceptions, though, as illustrated by the ongoing shift in the retail sector, where investors have reacted to growing online disruption of traditional brick-and-mortar franchises. Large technology companies with data-centric and highly scalable business models are beginning to attract greater regulatory scrutiny. Fines and less flexibility in acquiring adjacent businesses seem likely to us and could affect longer-term valuation parameters despite continued above-average sales and earnings growth. Other risks include geopolitical uncertainty, threats to free trade, and any shift in monetary policy away from central bank gradualism. That said, we believe the fundamental outlook for companies in the Fund remains strong as of the end of the reporting period. Recent valuation gains reflect strong earnings and cash flow growth, as well as a modest upward move in valuations accorded these future cash flows. Longer-term valuation measures appear to be appropriate in our view.
This report contains the current opinions of Jennison Associates LLC as of the date of this report and should not be considered as investment advice or a recommendation of any particular security, strategy or investment product. Such opinions are subject to change without notice and securities described herein may no longer be included in, or may at any time be removed from, the Fund’s portfolio. This report is distributed for informational purposes only. Information contained herein has been obtained from sources believed reliable, but not guaranteed.
Equity securities, such as common stocks, are affected by company specific events and by movements in the overall stock markets in which those securities principally trade, among other factors. An adverse company specific event, or downturn in those stock markets, can depress the value of a particular company’s equity securities. For information on the different share classes and the risks associated with an investment in the Fund, please refer to the current prospectus.
6
Harbor Capital Appreciation Fund
Fund Summary—October 31, 2017 (Unaudited)
Fund Summary—October 31, 2017 (Unaudited)
| INSTITUTIONAL CLASS | |
| Fund # | 2012 |
| Cusip | 411511504 |
| Ticker | HACAX |
| Inception Date | 12/29/1987 |
| Net Expense Ratio | 0.65% a |
| Total Net Assets (000s) | $23,896,840 |
| ADMINISTRATIVE CLASS | |
| Fund # | 2212 |
| Cusip | 411511827 |
| Ticker | HRCAX |
| Inception Date | 11/01/2002 |
| Net Expense Ratio | 0.90% a |
| Total Net Assets (000s) | $493,860 |
| INVESTOR CLASS | |
| Fund # | 2412 |
| Cusip | 411511819 |
| Ticker | HCAIX |
| Inception Date | 11/01/2002 |
| Net Expense Ratio | 1.02% a |
| Total Net Assets (000s) | $1,531,809 |
| RETIREMENT CLASS | |
| Fund # | 2512 |
| Cusip | 411512528 |
| Ticker | HNACX |
| Inception Date | 03/01/2016 |
| Net Expense Ratio | 0.59% a |
| Total Net Assets (000s) | $2,892,484 |
Portfolio Statistics
| Portfolio | Benchmark | ||
| Weighted Average Market Cap (MM) | $261,451 | $225,048 | |
| Price/Earning Ratio (P/E) | 40.9x | 31.8x | |
| Price/Book Ratio (P/B) | 8.6x | 7.9x | |
| Beta vs. Russell 1000® Growth Index | 1.11 | N/A | |
| Portfolio Turnover (Year Ended 10/31/2017) | 52% | N/A |
Sector Allocation (% of investments)
(Excludes cash and short-term investments)

| a | Reflects a contractual management fee waiver effective through February 28, 2018 |
7
Harbor Capital Appreciation Fund
Fund Performance Summary (Unaudited)
Fund Performance Summary (Unaudited)
The graph compares a $50,000 investment in the Institutional Class shares of the Fund with the performance of the Russell 1000® Growth Index and the S&P 500 Index. The Fund’s performance assumes the reinvestment of all dividend and capital gain distributions.
CHANGE IN A $50,000 INVESTMENT
For the period 11/01/2007 through 10/31/2017

| TOTAL RETURNS For the periods ended 10/31/2017 | 1 Year | Annualized | Inception Date | Final Value of a $50,000 Investment | ||||||||||
| 5 Years | 10 Years | |||||||||||||
| Harbor Capital Appreciation Fund | ||||||||||||||
Institutional Class | 32.52% | 17.88% | 9.42% | 12/29/1987 | $123,034 | |||||||||
Administrative Class | 32.20 | 17.59 | 9.15 | 11/01/2002 | 119,992 | |||||||||
Investor Class | 32.04 | 17.44 | 9.02 | 11/01/2002 | 118,575 | |||||||||
Retirement Class1 | 32.62 | 17.90 | 9.43 | 03/01/2016 | 123,147 | |||||||||
| Comparative Indices | ||||||||||||||
Russell 1000® Growth | 29.71% | 16.83% | 9.13% | — | $119,819 | |||||||||
S&P 500 | 23.63 | 15.18 | 7.51 | — | 103,191 | |||||||||
As stated in the Fund’s current prospectus, the expense ratios were 0.65% (Net) and 0.70% (Gross) (Institutional Class); 0.90% (Net) and 0.95% (Gross) (Administrative Class); 1.02% (Net) and 1.07% (Gross) (Investor Class); and 0.57% (Net) and 0.62% (Gross) (Retirement Class). The net expense ratios reflect a contractual management fee waiver effective through 02/28/2018. The expense ratios in the prospectus may differ from the actual expense ratios for the period disclosed within this report. The expense ratios shown in the prospectus are based on the prior fiscal year, adjusted to reflect changes, if any, in contractual arrangements that occurred prior to the date of the prospectus (or supplement thereto, if applicable).
Performance data shown represents past performance and is no guarantee of future results. Past performance is net of management fees and expenses and reflects reinvested dividends and distributions, but does not reflect the deduction of taxes that a shareholder would pay on Fund distributions or upon the redemption of Fund shares. Past performance reflects the beneficial effect of any expense waivers or reimbursements, without which returns would have been lower. Investment returns and principal value will fluctuate and when redeemed may be worth more or less than their original cost. Returns for periods less than one year are not annualized. Current performance may be higher or lower and is available through the most recent month end at harborfunds.com or by calling 800-422-1050.
| 1 | Retirement Class shares commenced operations on March 1, 2016. The performance attributed to the Retirement Class shares prior to that date is that of the Institutional Class shares. Performance prior to March 1, 2016 has not been adjusted to reflect the lower expenses of Retirement Class shares. During this period, Retirement Class shares would have had returns similar to, but somewhat higher than, Institutional Class shares due to the fact that Retirement Class shares represent interests in the same portfolio as Institutional Class shares but are subject to lower expenses. |
8
Harbor Capital Appreciation Fund
Portfolio of Investments—October 31, 2017
Portfolio of Investments—October 31, 2017
Value, Cost, and Principal Amounts in Thousands
Equity Holdings (% of net assets)
(Excludes net cash and short-term investments of 0.0%)

| COMMON STOCKS—100.0% | |||
| Shares | Value | ||
| AEROSPACE & DEFENSE—2.3% | |||
| 2,592,309 | Boeing Co. | $ 668,764 | |
| AIR FREIGHT & LOGISTICS—1.4% | |||
| 1,854,834 | FedEx Corp. | 418,840 | |
| AUTOMOBILES—1.4% | |||
| 1,210,270 | Tesla Inc.* | 401,241 | |
| BANKS—1.8% | |||
| 5,231,476 | JPMorgan Chase & Co. | 526,339 | |
| BEVERAGES—1.1% | |||
| 5,525,650 | Monster Beverage Corp.* | 320,101 | |
| BIOTECHNOLOGY—6.1% | |||
| 4,322,319 | AbbVie Inc. | 390,089 | |
| 1,963,519 | Alexion Pharmaceuticals Inc.* | 234,955 | |
| 3,712,767 | BioMarin Pharmaceutical Inc.* | 304,781 | |
| 3,207,054 | Celgene Corp.* | 323,816 | |
| COMMON STOCKS—Continued | |||
| Shares | Value | ||
| BIOTECHNOLOGY—Continued | |||
| 560,227 | Regeneron Pharmaceuticals Inc.* | $ 225,559 | |
| 1,987,290 | Vertex Pharmaceuticals Inc.* | 290,601 | |
| 1,769,801 | |||
| CAPITAL MARKETS—1.5% | |||
| 1,835,256 | Goldman Sachs Group Inc. | 445,013 | |
| CHEMICALS—1.5% | |||
| 3,031,505 | Albemarle Corp. | 427,109 | |
| ELECTRONIC EQUIPMENT, INSTRUMENTS & COMPONENTS—0.6% | |||
| 5,514,769 | Corning Inc. | 172,667 | |
| EQUITY REAL ESTATE INVESTMENT TRUSTS (REITs)—1.3% | |||
| 3,573,644 | Crown Castle International Corp. | 382,666 | |
| FOOD & STAPLES RETAILING—0.8% | |||
| 1,366,274 | Costco Wholesale Corp. | 220,079 | |
| HEALTH CARE PROVIDERS & SERVICES—1.6% | |||
| 2,149,092 | UnitedHealth Group Inc. | 451,782 | |
| HOTELS, RESTAURANTS & LEISURE—4.0% | |||
| 4,881,198 | Marriott International Inc. | 583,206 | |
| 3,408,006 | McDonald's Corp. | 568,830 | |
| 1,152,036 | |||
| INTERNET & DIRECT MARKETING RETAIL—9.8% | |||
| 1,172,299 | Amazon.com Inc.* | 1,295,719 | |
| 4,527,896 | Netflix Inc.* | 889,414 | |
| 331,623 | Priceline Group Inc.* | 634,050 | |
| 2,819,183 | |||
| INTERNET SOFTWARE & SERVICES—16.5% | |||
| 6,534,317 | Alibaba Group Holding Ltd. ADR (CHN)*,1 | 1,208,130 | |
| 666,946 | Alphabet Inc. Class A* | 688,982 | |
| 680,098 | Alphabet Inc. Class C* | 691,415 | |
| 6,991,786 | Facebook Inc.* | 1,258,941 | |
| 19,765,390 | Tencent Holdings Ltd. (CHN) | 888,357 | |
| 4,735,825 | |||
| IT SERVICES—9.1% | |||
| 1,912,977 | FleetCor Technologies Inc.* | 316,158 | |
| 6,476,577 | MasterCard Inc. | 963,520 | |
| 5,552,725 | PayPal Holdings Inc.* | 402,906 | |
| 8,775,055 | Visa Inc. | 965,080 | |
| 2,647,664 | |||
| LIFE SCIENCES TOOLS & SERVICES—1.0% | |||
| 1,410,258 | Illumina Inc.* | 289,371 | |
| MACHINERY—2.6% | |||
| 2,458,950 | Catepillar Inc. | 333,926 | |
| 2,191,288 | Parker-Hannifin Corp. | 400,151 | |
| 734,077 | |||
| MEDIA—1.5% | |||
| 1,265,926 | Charter Communications Inc.* | 423,035 | |
| OIL, GAS & CONSUMABLE FUELS—1.1% | |||
| 2,328,303 | Concho Resources Inc.* | 312,482 | |
| PERSONAL PRODUCTS—1.2% | |||
| 3,042,378 | Estée Lauder Companies Inc. | 340,168 | |
9
Harbor Capital Appreciation Fund
Portfolio of Investments—Continued
Portfolio of Investments—Continued
Value, Cost, and Principal Amounts in Thousands
| COMMON STOCKS—Continued | |||
| Shares | Value | ||
| PHARMACEUTICALS—1.8% | |||
| 8,520,616 | Bristol-Myers Squibb Co. | $ 525,381 | |
| SEMICONDUCTORS & SEMICONDUCTOR EQUIPMENT—5.5% | |||
| 2,070,262 | Broadcom Ltd. | 546,363 | |
| 3,131,835 | NVIDIA Corp. | 647,695 | |
| 4,085,803 | Texas Instruments Inc. | 395,056 | |
| 1,589,114 | |||
| SOFTWARE—14.2% | |||
| 6,782,320 | Activision Blizzard Inc. | 444,174 | |
| 4,378,307 | Adobe Systems Inc.* | 766,904 | |
| 14,149,007 | Microsoft Corp. | 1,176,915 | |
| 3,268,608 | Red Hat Inc.* | 394,946 | |
| 7,212,213 | Salesforce.com Inc.* | 738,098 | |
| 3,256,393 | Splunk Inc.* | 219,155 | |
| 2,972,595 | Workday Inc.* | 329,928 | |
| 4,070,120 | |||
| SPECIALTY RETAIL—1.7% | |||
| 2,217,425 | Home Depot Inc. | 367,605 | |
| 3,074,603 | Industria de Diseno Textil SA (SP)2 | 114,922 | |
| 482,527 | |||
| TECHNOLOGY HARDWARE, STORAGE & PERIPHERALS—6.3% | |||
| 10,823,610 | Apple Inc. | 1,829,623 | |
| TEXTILES, APPAREL & LUXURY GOODS—2.3% | |||
| 1,777,375 | adidas AG (GER) | 395,613 | |
| 554,108 | Kering SA (FR) | 254,117 | |
| 649,730 | |||
| TOTAL COMMON STOCKS | |||
(Cost $16,395,679) | 28,804,738 | ||
| SHORT-TERM INVESTMENTS—0.3% | |||
| Principal Amount | Value | ||
| REPURCHASE AGREEMENTS—0.0% | |||
| $ | 8,240 | Repurchase Agreement with Fixed Income Clearing Corp. dated October 31, 2017 due November 01, 2017 at 0.001% collateralized by U.S. Treasury Notes (value $8,407) | $ 8,240 |
| Shares | |||
| INVESTMENT COMPANY-SECURITIES LENDING INVESTMENT FUND—0.3% | |||
| 90,739,211 | State Street Navigator Securities Lending Government Money Market Portfolio (1-day yield of 1.000%)3 | 90,739 | |
| TOTAL SHORT-TERM INVESTMENTS | |||
(Cost $98,979) | 98,979 | ||
| TOTAL INVESTMENTS—100.3% | |||
(Cost $16,494,658) | 28,903,717 | ||
CASH AND OTHER ASSETS, LESS LIABILITIES—(0.3)% | (88,724) | ||
TOTAL NET ASSETS—100.0% | $28,814,993 | ||
FAIR VALUE MEASUREMENTS
The following table summarizes the Fund’s investments as of October 31, 2017 based on the inputs used to value them.
| Asset Category | Quoted Prices Level 1 (000s) | Other Significant Observable Inputs Level 2 (000s) | Significant Unobservable Inputs Level 3 (000s) | Total (000s) | ||||
| Common Stocks | ||||||||
Aerospace & Defense | $ 668,764 | $ — | $— | $ 668,764 | ||||
Air Freight & Logistics | 418,840 | — | — | 418,840 | ||||
Automobiles | 401,241 | — | — | 401,241 | ||||
Banks | 526,339 | — | — | 526,339 | ||||
Beverages | 320,101 | — | — | 320,101 | ||||
Biotechnology | 1,769,801 | — | — | 1,769,801 | ||||
Capital Markets | 445,013 | — | — | 445,013 | ||||
Chemicals | 427,109 | — | — | 427,109 | ||||
Electronic Equipment, Instruments & Components | 172,667 | — | — | 172,667 | ||||
Equity Real Estate Investment Trusts (REITs) | 382,666 | — | — | 382,666 | ||||
Food & Staples Retailing | 220,079 | — | — | 220,079 | ||||
Health Care Providers & Services | 451,782 | — | — | 451,782 | ||||
Hotels, Restaurants & Leisure | 1,152,036 | — | — | 1,152,036 | ||||
Internet & Direct Marketing Retail | 2,819,183 | — | — | 2,819,183 | ||||
Internet Software & Services | 3,847,468 | 888,357 | — | 4,735,825 | ||||
IT Services | 2,647,664 | — | — | 2,647,664 | ||||
Life Sciences Tools & Services | 289,371 | — | — | 289,371 |
10
Harbor Capital Appreciation Fund
Portfolio of Investments—Continued
Portfolio of Investments—Continued
FAIR VALUE MEASUREMENTS—Continued
| Asset Category | Quoted Prices Level 1 (000s) | Other Significant Observable Inputs Level 2 (000s) | Significant Unobservable Inputs Level 3 (000s) | Total (000s) | ||||
Machinery | $ 734,077 | $ — | $— | $ 734,077 | ||||
Media | 423,035 | — | — | 423,035 | ||||
Oil, Gas & Consumable Fuels | 312,482 | — | — | 312,482 | ||||
Personal Products | 340,168 | — | — | 340,168 | ||||
Pharmaceuticals | 525,381 | — | — | 525,381 | ||||
Semiconductors & Semiconductor Equipment | 1,589,114 | — | — | 1,589,114 | ||||
Software | 4,070,120 | — | — | 4,070,120 | ||||
Specialty Retail | 367,605 | 114,922 | — | 482,527 | ||||
Technology Hardware, Storage & Peripherals | 1,829,623 | — | — | 1,829,623 | ||||
Textiles, Apparel & Luxury Goods | — | 649,730 | — | 649,730 | ||||
| Short-Term Investments | ||||||||
Repurchase Agreements | — | 8,240 | — | 8,240 | ||||
Investment Company-Securities Lending Investment Fund | 90,739 | — | — | 90,739 | ||||
Total Investments in Securities | $27,242,468 | $1,661,249 | $— | $28,903,717 |
There were no Level 3 holdings at October 31, 2017 or 2016, and no transfers between levels during the year.
For more information on valuation inputs and their aggregation into the levels used in the table above, please refer to the Fair Value Measurements and Disclosures in Note 2 of the accompanying Notes to Financial Statements.
| * | Non-income producing security |
| 1 | ADR after the name of a foreign holding stands for American Depositary Receipts representing ownership of foreign securities. ADRs are issued by U.S. banking institutions. |
| 2 | All or a portion of this security was out on loan as of October 31, 2017. |
| 3 | Represents the investment of collateral received from securities lending activities. |
| CHN | China |
| FR | France |
| GER | Germany |
| SP | Spain |
The accompanying notes are an integral part of the Financial Statements.
11
Harbor Mid Cap Growth Fund
Managers' Commentary (Unaudited)
Managers' Commentary (Unaudited)
Subadviser
Wellington Management Company LLP
280 Congress Street
Boston, MA 02210
Boston, MA 02210
Portfolio Managers
Stephen Mortimer
Since 2010
Since 2010
Michael T. Carmen, CFA, CPA
Since 2005
Mario E. Abularach, CFA, CMT
Since 2006
Since 2006
Wellington Management has subadvised the Fund since 2005.
Investment Objective
The Fund seeks long-term growth of capital.

Stephen Mortimer

Michael T. Carmen

Mario E. Abularach
Management’s Discussion of
Fund Performance
Fund Performance
MARKET REVIEW
U.S. equities rose during the 12-month period ended October 31, 2017, building on a strong finish to 2016. Despite a common perception that markets preferred Hillary Clinton, stocks soared following Donald Trump’s victory on hopes of increased fiscal stimulus, reduced regulatory restrictions, and lower corporate taxes. Market strength continued into the new calendar year, despite rising concern about stretched valuations and overly optimistic policy expectations. However, risk-on sentiment ground to a halt in March after the Republicans' failure to repeal and replace the Affordable Care Act cast a cloud over the Trump administration’s pro-growth agenda. As the year continued, plunging oil prices, heightened political risk, and two rate hikes from the U.S. Federal Reserve (Fed) were not enough to derail the eight-year-old market rally. Controversy surrounding President Donald Trump continued to mount, however strong employment data and corporate earnings propelled U.S. equities to a series of new highs. The persistently low rate of inflation growth was a concern for the Fed even though the economic landscape has remained largely positive. Core consumer price inflation (CPI) rose 0.2% in August after five consecutive months of downside surprises, providing some relief for the Fed and increasing expectations for interest-rate increases at the end of the year and in 2018. U.S. equities finished the period with strong momentum, as corporate earnings season got off to a positive start. Returns varied by market-cap for the period, as small-cap stocks, measured by the Russell 2000® Index, outperformed mid- and large-cap stocks, measured by the S&P Midcap® 400 Index and S&P 500 Index, respectively.
Performance
For the one-year period ended October 31, 2017, the Harbor Mid Cap Growth Fund outperformed the Russell Midcap® Growth Index. The Fund returned 31.00% (Institutional Class), 30.71% (Administrative Class), 30.61% (Investor Class), and 31.12% (Retirement Class) for the period, while the index finished up 26.25%.
Relative outperformance was driven by positive security selection, most notably within the Information Technology, Consumer Discretionary, and Health Care sectors. Sector allocation, a residual of the bottom-up stock selection process, also proved favorable, with the most significant contributions from relative overweight exposure to Information Technology and a relative underweight exposure to Consumer Discretionary. In contrast, overweight exposure to the poor performing Energy sector and weak security selection within Financials partially offset positive relative returns.
Information Technology holding Arista, a U.S.-based data center switching company, was the largest relative contributor during the period. Arista had strong performance throughout the trailing 12 months and announced that it beat revenues and also raised guidance during its earnings announcement in early August. The company continued to benefit from the shifting of workloads to the cloud and market share gains from Cisco, a multinational technology conglomerate, which have driven Arista’s accelerating revenue growth. We trimmed our position throughout the period to control the position size. Consumer Discretionary holding Panera Bread was another top contributor. Early in the period, Panera reported solid fourth quarter results along with strong earnings. The company demonstrated an expanded sales gap compared to peers and revised 2017 guidance upward. During the second quarter, the company agreed
12
Harbor Mid Cap Growth Fund
Managers' Commentary—Continued
Managers' Commentary—Continued
| TOP TEN HOLDINGS (% of net assets) | |
| ServiceNow Inc. | 4.1% |
| Workday Inc. | 3.7% |
| Guidewire Software Inc. | 3.2% |
| Arista Networks Inc. | 3.1% |
| Microchip Technology Inc. | 3.1% |
| Align Technology Inc. | 3.0% |
| Autodesk Inc. | 2.7% |
| Hilton Worldwide Holdings Inc. | 2.7% |
| TD Ameritrade Holding Corp. | 2.7% |
| CoStar Group Inc. | 2.6% |
to be acquired by JAB Holdings, a European investment firm with a growing presence in café brands. We eliminated the stock after it rallied on this news. Other notable contributors on a relative basis were Health Care company Align Technology and Information Technology holdings Micron Technology and Mobileye.
Consumer Discretionary company Ulta Beauty, a U.S. beauty and cosmetics retailer, was the largest detractor from relative performance over the period. Ulta’s stock price declined after reaching its year to date peak early in June on concerns of retail trends. Investors worried that Amazon’s encroachment in the beauty and cosmetics industry would negatively affect Ulta, and the stock sold off as a result. We eliminated our position late in the period as we felt growth prospects for the company had diminished. Health Care holding DexCom, a medical device manufacturer specializing in glucose monitoring, was the second largest detractor from relative results over the period. DexCom’s stock plummeted at the end of September after key competitor Abbott’s Libre device, used for advanced glucose monitoring for adults with diabetes, was approved by the FDA. While we believe that overall market dynamics may see accelerated penetration of glucose monitoring as a result, we trimmed our position over the period. Other notable detractors from relative performance included Information Technology companies Advanced Micro Devices and Ultimate Software Group, as well as Consumer Discretionary holding Dave & Busters.
The Fund is largely constructed without regard to benchmark weightings by sector; however, we typically do not expect to exceed the benchmark weight by more than two times in any given sector. Bottom-up investment decisions resulted in increased exposure to the Information Technology sector, becoming the Fund’s largest overweight sector by the end of the period. Despite trimming our exposure over the period, the Fund’s second largest overweight was Health Care. The Fund ended the period most underweight the Industrials, Real Estate, and Financials sectors relative to the Fund’s benchmark.
OUTLOOK & STRATEGY
Our investment philosophy is based on four key underlying premises. We believe that changes in earnings expectations drive security prices and opportunities arise where our expectations differ significantly from consensus. In addition, we believe that human nature has an anchoring bias that can often miss transformational change, and early identification of this change can lead to excess returns. We view being flexible as a key tenant of our philosophy and recognize growth exists in unexpected places across sectors of the market. Finally, we believe that our valuation discipline helps control portfolio risk by seeking to balance downside risk with potential upside reward.
We employ this philosophy, together with a bottom-up fundamental analysis and opportunistic investment approach, in managing the Fund. We consider a broad universe of available stocks within the mid cap market, typically focusing on companies with accelerating operating momentum and earnings growth combined with an upside potential at least two times the downside case. To narrow the universe of available companies, we rely on intensive bottom-up fundamental proprietary research.
This report contains the current opinions of Wellington Management Company LLP as of the date of this report and should not be considered as investment advice or a recommendation of any particular security, strategy or investment product. Such opinions are subject to change without notice and securities described herein may no longer be included in, or may at any time be removed from, the Fund’s portfolio. This report is distributed for informational purposes only. Information contained herein has been obtained from sources believed reliable, but not guaranteed.
Stocks of mid cap companies pose special risks, including possible illiquidity and greater price volatility than stocks of larger, more established companies. Equity securities, such as common stocks, are affected by company specific events and by movements in the overall stock markets in which those securities principally trade, among other factors. An adverse company specific event, or downturn in those stock markets, can depress the value of a particular company’s equity securities. For information on the different share classes and the risks associated with an investment in the Fund, please refer to the current prospectus.
13
Harbor Mid Cap Growth Fund
Fund Summary—October 31, 2017 (Unaudited)
Fund Summary—October 31, 2017 (Unaudited)
| INSTITUTIONAL CLASS | |
| Fund # | 2019 |
| Cusip | 411511876 |
| Ticker | HAMGX |
| Inception Date | 11/01/2000 |
| Net Expense Ratio | 0.87% |
| Total Net Assets (000s) | $145,914 |
| ADMINISTRATIVE CLASS | |
| Fund # | 2219 |
| Cusip | 411511793 |
| Ticker | HRMGX |
| Inception Date | 11/01/2002 |
| Net Expense Ratio | 1.12% |
| Total Net Assets (000s) | $110,114 |
| INVESTOR CLASS | |
| Fund # | 2419 |
| Cusip | 411511785 |
| Ticker | HIMGX |
| Inception Date | 11/01/2002 |
| Net Expense Ratio | 1.24% |
| Total Net Assets (000s) | $20,121 |
| RETIREMENT CLASS | |
| Fund # | 2519 |
| Cusip | 411512510 |
| Ticker | HNMGX |
| Inception Date | 03/01/2016 |
| Net Expense Ratio | 0.81% |
| Total Net Assets (000s) | $127,446 |
Portfolio Statistics
| Portfolio | Benchmark | ||
| Weighted Average Market Cap (MM) | $17,664 | $15,466 | |
| Price/Earning Ratio (P/E) | 54.9x | 33.1x | |
| Price/Book Ratio (P/B) | 10.5x | 6.8x | |
| Beta vs. Russell Midcap® Growth Index | 1.11 | N/A | |
| Portfolio Turnover (Year Ended 10/31/2017) | 87% | N/A |
Sector Allocation (% of investments)
(Excludes cash and short-term investments)

14
Harbor Mid Cap Growth Fund
Fund Performance Summary (Unaudited)
Fund Performance Summary (Unaudited)
The graph compares a $50,000 investment in the Institutional Class shares of the Fund with the performance of the Russell Midcap® Growth Index. The Fund’s performance assumes the reinvestment of all dividend and capital gain distributions.
CHANGE IN A $50,000 INVESTMENT
For the period 11/01/2007 through 10/31/2017

| TOTAL RETURNS For the periods ended 10/31/2017 | 1 Year | Annualized | Inception Date | Final Value of a $50,000 Investment | ||||||||||
| 5 Years | 10 Years | |||||||||||||
| Harbor Mid Cap Growth Fund | ||||||||||||||
Institutional Class | 31.00% | 14.51% | 6.51% | 11/01/2000 | $ 93,910 | |||||||||
Administrative Class | 30.71 | 14.20 | 6.24 | 11/01/2002 | 91,602 | |||||||||
Investor Class | 30.61 | 14.09 | 6.12 | 11/01/2002 | 90,600 | |||||||||
Retirement Class1 | 31.12 | 14.54 | 6.52 | 03/01/2016 | 93,994 | |||||||||
| Comparative Index | ||||||||||||||
Russell Midcap® Growth | 26.25% | 15.34% | 8.23% | — | $110,231 | |||||||||
As stated in the Fund’s current prospectus, the expense ratios were 0.87% (Institutional Class); 1.12% (Administrative Class); 1.24% (Investor Class); and 0.79% (Retirement Class). The expense ratios in the prospectus may differ from the actual expense ratios for the period disclosed within this report. The expense ratios shown in the prospectus are based on the prior fiscal year, adjusted to reflect changes, if any, in contractual arrangements that occurred prior to the date of the prospectus (or supplement thereto, if applicable).
Performance data shown represents past performance and is no guarantee of future results. Past performance is net of management fees and expenses and reflects reinvested dividends and distributions, but does not reflect the deduction of taxes that a shareholder would pay on Fund distributions or upon the redemption of Fund shares. Past performance reflects the beneficial effect of any expense waivers or reimbursements, without which returns would have been lower. Investment returns and principal value will fluctuate and when redeemed may be worth more or less than their original cost. Returns for periods less than one year are not annualized. Current performance may be higher or lower and is available through the most recent month end at harborfunds.com or by calling 800-422-1050.
| 1 | Retirement Class shares commenced operations on March 1, 2016. The performance attributed to the Retirement Class shares prior to that date is that of the Institutional Class shares. Performance prior to March 1, 2016 has not been adjusted to reflect the lower expenses of Retirement Class shares. During this period, Retirement Class shares would have had returns similar to, but somewhat higher than, Institutional Class shares due to the fact that Retirement Class shares represent interests in the same portfolio as Institutional Class shares but are subject to lower expenses. |
15
Harbor Mid Cap Growth Fund
Portfolio of Investments—October 31, 2017
Portfolio of Investments—October 31, 2017
Value, Cost, and Principal Amounts in Thousands
Equity Holdings (% of net assets)
(Excludes net cash and short-term investments of 5.9%)

| COMMON STOCKS—94.1% | |||
| Shares | Value | ||
| AIRLINES—1.0% | |||
| 214,336 | JetBlue Airways Corp.* | $ 4,104 | |
| AUTOMOBILES—0.9% | |||
| 10,645 | Tesla Inc.* | 3,529 | |
| BEVERAGES—1.1% | |||
| 75,449 | Monster Beverage Corp.* | 4,371 | |
| BIOTECHNOLOGY—4.2% | |||
| 143,920 | Exact Sciences Corp.* | 7,914 | |
| 19,499 | Incyte Corp.* | 2,209 | |
| 94,100 | Ionis Pharmaceuticals Inc.* | 5,374 | |
| 11,093 | Tesaro Inc.* | 1,284 | |
| 16,781 | |||
| CAPITAL MARKETS—2.7% | |||
| 217,136 | TD Ameritrade Holding Corp. | 10,855 | |
| CHEMICALS—0.9% | |||
| 354,141 | Platform Specialty Products Corp.* | 3,789 | |
| COMMON STOCKS—Continued | |||
| Shares | Value | ||
| COMMERCIAL SERVICES & SUPPLIES—2.2% | |||
| 65,727 | Brink's Co. | $ 5,002 | |
| 75,581 | Clean Harbors Inc.* | 4,044 | |
| 9,046 | |||
| COMMUNICATIONS EQUIPMENT—4.3% | |||
| 62,626 | Arista Networks Inc.* | 12,518 | |
| 33,799 | Harris Corp. | 4,709 | |
| 17,227 | |||
| CONTAINERS & PACKAGING—2.6% | |||
| 106,068 | International Paper Co. | 6,074 | |
| 38,419 | Packaging Corp. of America | 4,467 | |
| 10,541 | |||
| DIVERSIFIED FINANCIAL SERVICES—0.9% | |||
| 326,045 | Double Eagle Acquisition Corp. (CYM)* | 3,482 | |
| ELECTRICAL EQUIPMENT—1.3% | |||
| 27,042 | Rockwell Automation Inc. | 5,431 | |
| ELECTRONIC EQUIPMENT, INSTRUMENTS & COMPONENTS—2.8% | |||
| 92,109 | Trimble Inc.* | 3,765 | |
| 21,400 | Universal Display Corp. | 3,135 | |
| 39,535 | Zebra Technologies Corp.* | 4,586 | |
| 11,486 | |||
| ENERGY EQUIPMENT & SERVICES—0.5% | |||
| 68,101 | Baker Hughes A GE Co. | 2,140 | |
| FOOD PRODUCTS—1.7% | |||
| 240,946 | Blue Buffalo Pet Products Inc.* | 6,971 | |
| HEALTH CARE EQUIPMENT & SUPPLIES—9.6% | |||
| 50,204 | Align Technology Inc.* | 11,998 | |
| 86,703 | DexCom Inc.* | 3,899 | |
| 60,666 | Edwards Lifesciences Corp.* | 6,202 | |
| 174,270 | Hologic Inc.* | 6,596 | |
| 171,510 | Insulet Corp.* | 10,086 | |
| 38,781 | |||
| HEALTH CARE TECHNOLOGY—1.0% | |||
| 67,109 | Veeva Systems Inc.* | 4,090 | |
| HOTELS, RESTAURANTS & LEISURE—9.6% | |||
| 79,957 | Dave & Buster's Entertainment Inc.* | 3,854 | |
| 38,267 | Domino's Pizza Inc. | 7,003 | |
| 151,834 | Hilton Worldwide Holdings Inc. | 10,974 | |
| 27,259 | Marriott Vacations Worldwide Corp. | 3,588 | |
| 330,168 | Melco Resorts & Entertainment Ltd. ADR (HK)1 | 8,347 | |
| 32,655 | Wynn Resorts Ltd. | 4,816 | |
| 38,582 | |||
| INTERNET & DIRECT MARKETING RETAIL—3.1% | |||
| 18,970 | Netflix Inc.* | 3,726 | |
| 127,077 | Wayfair Inc.* | 8,883 | |
| 12,609 | |||
| INTERNET SOFTWARE & SERVICES—5.7% | |||
| 35,670 | CoStar Group Inc.* | 10,550 | |
| 137,477 | Godaddy Inc.* | 6,420 | |
| 144,649 | Zillow Group Inc. Class C* | 5,971 | |
| 22,941 | |||
16
Harbor Mid Cap Growth Fund
Portfolio of Investments—Continued
Portfolio of Investments—Continued
Value, Cost, and Principal Amounts in Thousands
| COMMON STOCKS—Continued | |||
| Shares | Value | ||
| IT SERVICES—1.3% | |||
| 50,761 | Global Payments Inc. | $ 5,277 | |
| MACHINERY—3.5% | |||
| 57,147 | IDEX Corp. | 7,327 | |
| 60,258 | Middleby Corp.* | 6,984 | |
| 14,311 | |||
| OIL, GAS & CONSUMABLE FUELS—0.9% | |||
| 119,184 | Newfield Exploration Co.* | 3,670 | |
| PHARMACEUTICALS—1.4% | |||
| 49,400 | Eisai Co. Ltd. (JP) | 2,749 | |
| 127,100 | Ono Pharmaceutical Co. Ltd. (JP) | 2,913 | |
| 5,662 | |||
| PROFESSIONAL SERVICES—1.7% | |||
| 129,775 | TransUnion* | 6,812 | |
| ROAD & RAIL—1.1% | |||
| 108,807 | Knight-Swift Transportation Holdings Inc.* | 4,510 | |
| SEMICONDUCTORS & SEMICONDUCTOR EQUIPMENT—11.2% | |||
| 745,287 | Advanced Micro Devices Inc.* | 8,187 | |
| 55,952 | Cavium Inc.* | 3,860 | |
| 133,943 | Microchip Technology Inc. | 12,698 | |
| 135,904 | Micron Technology Inc.* | 6,022 | |
| 47,901 | NVIDIA Corp. | 9,906 | |
| 90,308 | Teradyne Inc. | 3,873 | |
| 44,546 | |||
| SOFTWARE—15.9% | |||
| 87,177 | Autodesk Inc.* | 10,894 | |
| 159,756 | Guidewire Software Inc.* | 12,777 | |
| COMMON STOCKS—Continued | |||
| Shares | Value | ||
| SOFTWARE—Continued | |||
| 76,320 | PTC Inc.* | $ 5,071 | |
| 132,000 | ServiceNow Inc.* | 16,681 | |
| 136,338 | Workday Inc.* | 15,132 | |
| 838,221 | Zynga Inc.* | 3,269 | |
| 63,824 | |||
| TRADING COMPANIES & DISTRIBUTORS—1.0% | |||
| 79,114 | AerCap Holdings NV (NET)* | 4,165 | |
| TOTAL COMMON STOCKS | |||
(Cost $292,275) | 379,533 | ||
| SHORT-TERM INVESTMENTS—5.8% | |||
| (Cost $23,512) | |||
| Principal Amount | |||
| REPURCHASE AGREEMENTS | |||
| $ | 23,512 | Repurchase Agreement with Bank of America dated October 31, 2017 due November 01, 2017 at 1.040% collateralized by U.S. Treasury Notes (value $23,991) | 23,512 |
| TOTAL INVESTMENTS—99.9% | |||
(Cost $315,787) | 403,045 | ||
CASH AND OTHER ASSETS, LESS LIABILITIES—0.1% | 550 | ||
TOTAL NET ASSETS—100.0% | $403,595 | ||
FAIR VALUE MEASUREMENTS
The following table summarizes the Fund’s investments as of October 31, 2017 based on the inputs used to value them.
| Asset Category | Quoted Prices Level 1 (000s) | Other Significant Observable Inputs Level 2 (000s) | Significant Unobservable Inputs Level 3 (000s) | Total (000s) | ||||
| Common Stocks | ||||||||
Airlines | $ 4,104 | $— | $— | $ 4,104 | ||||
Automobiles | 3,529 | — | — | 3,529 | ||||
Beverages | 4,371 | — | — | 4,371 | ||||
Biotechnology | 16,781 | — | — | 16,781 | ||||
Capital Markets | 10,855 | — | — | 10,855 | ||||
Chemicals | 3,789 | — | — | 3,789 | ||||
Commercial Services & Supplies | 9,046 | — | — | 9,046 | ||||
Communications Equipment | 17,227 | — | — | 17,227 | ||||
Containers & Packaging | 10,541 | — | — | 10,541 | ||||
Diversified Financial Services | 3,482 | — | — | 3,482 | ||||
Electrical Equipment | 5,431 | — | — | 5,431 | ||||
Electronic Equipment, Instruments & Components | 11,486 | — | — | 11,486 | ||||
Energy Equipment & Services | 2,140 | — | — | 2,140 | ||||
Food Products | 6,971 | — | — | 6,971 | ||||
Health Care Equipment & Supplies | 38,781 | — | — | 38,781 | ||||
Health Care Technology | 4,090 | — | — | 4,090 | ||||
Hotels, Restaurants & Leisure | 38,582 | — | — | 38,582 | ||||
Internet & Direct Marketing Retail | 12,609 | — | — | 12,609 | ||||
Internet Software & Services | 22,941 | — | — | 22,941 |
17
Harbor Mid Cap Growth Fund
Portfolio of Investments—Continued
Portfolio of Investments—Continued
FAIR VALUE MEASUREMENTS—Continued
| Asset Category | Quoted Prices Level 1 (000s) | Other Significant Observable Inputs Level 2 (000s) | Significant Unobservable Inputs Level 3 (000s) | Total (000s) | ||||
IT Services | $ 5,277 | $ — | $— | $ 5,277 | ||||
Machinery | 14,311 | — | — | 14,311 | ||||
Oil, Gas & Consumable Fuels | 3,670 | — | — | 3,670 | ||||
Pharmaceuticals | — | 5,662 | — | 5,662 | ||||
Professional Services | 6,812 | — | — | 6,812 | ||||
Road & Rail | 4,510 | — | — | 4,510 | ||||
Semiconductors & Semiconductor Equipment | 44,546 | — | — | 44,546 | ||||
Software | 63,824 | — | — | 63,824 | ||||
Trading Companies & Distributors | 4,165 | — | — | 4,165 | ||||
| Short-Term Investments | ||||||||
Repurchase Agreements | — | 23,512 | — | 23,512 | ||||
Total Investments in Securities | $373,871 | $29,174 | $— | $403,045 |
The following is a rollforward of the Fund’s Level 3 investments during the year ended October 31, 2017.
| Valuation Description | Balance Beginning at 11/01/2016 (000s) | Purchases (000s) | Sales (000s) | Discount/ (Premium) (000s) | Total Realized Gain/(Loss) (000s) | Change in Unrealized Appreciation/ (Depreciation)w (000s) | Transfers In Level 3 (000s) | Transfers Out of Level 3 (000s) | Ending Balance as of 10/31/2017 (000s) | |||||||||
| Common Stocks | ||||||||||||||||||
Life Sciences Tools & Services | $180 | $— | $(182) | $— | $— | $2 | $— | $— | $— |
There were no transfers between levels during the year.
For more information on valuation inputs and their aggregation into the levels used in the table above, please refer to the Fair Value Measurements and Disclosures in Note 2 of the accompanying Notes to Financial Statements.
| * | Non-income producing security | ||
| 1 | ADR after the name of a foreign holding stands for American Depositary Receipts representing ownership of foreign securities. ADRs are issued by U.S. banking institutions. | ||
| w | Amounts in this category are included in the “Realized and Change in Unrealized Gain/(Loss) on Investment Transactions” section of the Statement of Operations. | ||
| Valuation Description | Unrealized Gain/(Loss) as of 10/31/2017 (000s) | ||
Common Stocks | $2 | ||
| CYM | Cayman Islands | ||
| HK | Hong Kong | ||
| JP | Japan | ||
| NET | Netherlands | ||
The accompanying notes are an integral part of the Financial Statements.
18
Harbor Small Cap Growth Fund
Managers' Commentary (Unaudited)
Managers' Commentary (Unaudited)
Subadviser
Westfield Capital Management Company, L.P.
One Financial Center
23rd Floor
23rd Floor
Boston, MA 02111
Portfolio Managers
William Muggia
Lead Portfolio Manager
Since 2000
Since 2000
Ethan Meyers, CFA
Since 2000
Since 2000
John Montgomery
Since 2011
Since 2011
Bruce Jacobs, CFA
Since 2011
Since 2011
Hamlen Thompson
Since 2011
Since 2011
Westfield has subadvised the Fund since 2000.
Investment Objective
The Fund seeks long-term growth of capital.

William Muggia

Ethan Meyers

John Montgomery

Bruce Jacobs

Hamlen Thompson
Management’s Discussion of
Fund Performance
Fund Performance
Market Review
Domestic equities posted broad gains in the twelve months ended October 31, 2017, rising across all market capitalizations. The rally, which was catalyzed by the U.S. presidential election last November, carried over into 2017. Positive economic data at home and signs of improvements in the Eurozone and emerging economies powered the advance, overshadowing investor concerns about geopolitical tension and a lack of momentum on domestic policy initiatives. Most economic indicators continued pointing to strength in the U.S. economy in 2017 – by the end of summer unemployment levels dropped to a 16-year low, consumer confidence remained strong, and the ISM Manufacturing PMI reading climbed above 60, a level last seen in 2004. The U.S. Federal Reserve’s (Fed) commitment to unwinding some of the monetary stimulus, along with the White House’s tax reform proposals also supported the advance in risk assets.
Performance
The Harbor Small Cap Growth Fund rose 26.72% (Institutional Class), 26.02% (Administrative Class), 26.29% (Investor Class), and 26.78% (Retirement Class) in the twelve-month period ended October 31, 2017, underperforming the Russell 2000® Growth Index (the “Index”), which advanced 31.00%. Investments in Industrials and Information Technology were the Fund’s biggest source of relative weakness, overshadowing relative outperformance within Consumer Discretionary, Energy, and Financials.
The Industrials sector detracted 365 basis points (bps) from relative returns. This economically-sensitive segment followed an extremely volatile trading pattern during the period, surging after the U.S. presidential election, underperforming through the first half of 2017, and regaining momentum early in the Fall. We remained constructive on the group, searching for investment opportunities within both cyclical and steady growth categories. While the Fund’s overweight of the sector helped, stock specific weakness across a number of sub-industries held back performance results. The airline industry was a meaningful area of relative losses. Industry-wide pricing softened in July and August, putting pressure on all airline operators. Low cost airline operator Spirit Airlines, Inc., the Fund’s sole investment in the segment, was caught in the downdraft and had to lower its earnings guidance for the second quarter of 2017. Rising jet fuel prices and lingering operational issues related to pilot negotiations were additional headwinds that Spirit was facing. While our longer-term investment thesis on the airline industry remains intact, our analysis of Spirit’s fundamental characteristics and industry standing prompted us to sell our investment in the stock. Also underperforming, but maintained in the Fund were shares of Matson, Inc., a provider of multimodal transportation services between the continental U.S. and ports in Hawaii and China. The stock retreated in August, following the news of new transportation operators looking to enter the highly concentrated Hawaiian markets. Our review revealed no immediate competitive threat to Matson’s earnings prospects. The new entrants have not yet secured terminal access or financing and we estimate 2020 as the earliest possible date for their operations launch.
The Fund’s positions in the Information Technology sector also underperformed, detracting 106 bps from relative results. Generally speaking, Information Technology companies outperformed the market during the period, driven by strength in the high growth industries, such as internet software & services and electronic equipment, instruments & components. Although the Fund’s Information Technology holdings delivered incremental gains across
19
Harbor Small Cap Growth Fund
Managers' Commentary—Continued
Managers' Commentary—Continued
| TOP TEN HOLDINGS (% of net assets) | |
| ICON plc | 2.7% |
| John Bean Technologies Corp. | 2.7% |
| Installed Building Products Inc. | 2.6% |
| Berry Global Group Inc. | 2.5% |
| Eldorado Resorts Inc. | 2.0% |
| Ryder System Inc. | 2.0% |
| Integra LifeSciences Holdings Corp. | 1.8% |
| Nektar Therapeutics | 1.8% |
| Rush Enterprises Inc. | 1.8% |
| BMC Stock Holdings Inc. | 1.7% |
half of the sub-industries where we are invested, isolated weakness within application software and lack of exposure to the electronic components sub-industry led to the relative performance shortfall. Shares of The Ultimate Software Group, Inc., a provider of web-based payroll and workforce management software, declined following the company’s quarterly report in August. The earnings were better than expected, but revenues missed consensus estimates, held back by timing related delays. Management called out continued positive bookings momentum, with sales exceeding internal targets, but cited increased complexity associated with significantly larger new clients as a reason for extending backlog conversion. We trimmed our investment following the report, but remained invested in the stock at October 31, 2017. We think The Ultimate Software is a high-quality company with a seasoned management team, which can address implementation delays and backlog conversion rates.
The Consumer Discretionary sector contributed 263 bps to relative performance. We have been selective with our positioning in Consumer Discretionary, overweighting areas of secular strength, such as leisure, gaming and lodging, and avoiding traditional brick and mortar retail categories. We also continued to like, and have had success with, investments within homebuilding. The U.S. housing industry has seen a steady recovery, driven by an improving job market. Single family housing starts continued to be below their long-term average, suggesting further room for growth. Insulation installer Installed Building Products, Inc. was the sector’s top driver of relative strength and we believe the company should continue to benefit from the rebound in single-family housing starts and housing completions in the U.S. Eldorado Resorts Inc., an operator of hotels, resorts, and casinos, also augmented relative returns. Recent quarterly results suggest that the company is on its way to achieving synergy targets stemming from its acquisition of Isle of Capri Casinos, Inc. earlier this year. We think the combined entity, which represents one of the largest regional gaming assets in the market, should realize further synergies from the deal while also benefitting from the strong consumer and economic backdrop.
Outlook & Strategy
The U.S. stock market continues to grind higher as earnings are starting to accelerate across many different economic sectors. We continue to see exciting innovation across Health Care and Technology. With global growth picking up speed and some signs of wage inflation in the U.S., interest rates finally look to us to be poised to edge higher. U.S. manufacturing and transportation are accelerating and we have recently added exposure to more economically and rate sensitive areas like Financials, Energy and Industrials. Given overall low interest rates and inflation versus history, coupled with a stronger earnings outlook, specific stock valuations look attractive and new idea generation remains robust. With the Fed slowly increasing interest rates we believe stocks are finally following earnings growth instead of macroeconomic factors that drove outperformance of expensive low volatility stocks over much of the last seven years. Equity correlations have dropped to 10-year lows, which bodes well for active stock picking going forward.
This report contains the current opinions of Westfield Capital Management Company, L.P. as of the date of this report and should not be considered as investment advice or a recommendation of any particular security, strategy or investment product. Such opinions are subject to change without notice and securities described herein may no longer be included in, or may at any time be removed from, the Fund’s portfolio. This report is distributed for informational purposes only. Information contained herein has been obtained from sources believed reliable, but not guaranteed.
Stocks of small cap companies pose special risks, including possible illiquidity and greater price volatility than stocks of larger, more established companies. Equity securities, such as common stocks, are affected by company specific events and by movements in the overall stock markets in which those securities principally trade, among other factors. An adverse company specific event, or downturn in those stock markets, can depress the value of a particular company’s equity securities. For information on the different share classes and the risks associated with an investment in the Fund, please refer to the current prospectus.
20
Harbor Small Cap Growth Fund
Fund Summary—October 31, 2017 (Unaudited)
Fund Summary—October 31, 2017 (Unaudited)
| INSTITUTIONAL CLASS | |
| Fund # | 2010 |
| Cusip | 411511868 |
| Ticker | HASGX |
| Inception Date | 11/01/2000 |
| Net Expense Ratio | 0.85% |
| Total Net Assets (000s) | $509,889 |
| ADMINISTRATIVE CLASS | |
| Fund # | 2210 |
| Cusip | 411511769 |
| Ticker | HRSGX |
| Inception Date | 11/01/2002 |
| Net Expense Ratio | 1.10% |
| Total Net Assets (000s) | $719 |
| INVESTOR CLASS | |
| Fund # | 2410 |
| Cusip | 411511777 |
| Ticker | HISGX |
| Inception Date | 11/01/2002 |
| Net Expense Ratio | 1.22% |
| Total Net Assets (000s) | $7,913 |
| RETIREMENT CLASS | |
| Fund # | 2510 |
| Cusip | 411512494 |
| Ticker | HNSGX |
| Inception Date | 03/01/2016 |
| Net Expense Ratio | 0.79% |
| Total Net Assets (000s) | $189,516 |
Portfolio Statistics
| Portfolio | Benchmark | ||
| Weighted Average Market Cap (MM) | $3,833 | $2,483 | |
| Price/Earning Ratio (P/E) | 39.5x | 32.7x | |
| Price/Book Ratio (P/B) | 4.6x | 5.0x | |
| Beta vs. Russell 2000® Growth Index | 0.95 | N/A | |
| Portfolio Turnover (Year Ended 10/31/2017) | 83% | N/A |
Sector Allocation (% of investments)
(Excludes cash and short-term investments)

21
Harbor Small Cap Growth Fund
Fund Performance Summary (Unaudited)
Fund Performance Summary (Unaudited)
The graph compares a $50,000 investment in the Institutional Class shares of the Fund with the performance of the Russell 2000® Growth Index. The Fund’s performance assumes the reinvestment of all dividend and capital gain distributions.
CHANGE IN A $50,000 INVESTMENT
For the period 11/01/2007 through 10/31/2017

| TOTAL RETURNS For the periods ended 10/31/2017 | 1 Year | Annualized | Inception Date | Final Value of a $50,000 Investment | ||||||||||
| 5 Years | 10 Years | |||||||||||||
| Harbor Small Cap Growth Fund | ||||||||||||||
Institutional Class | 26.72% | 15.42% | 8.13% | 11/01/2000 | $109,291 | |||||||||
Administrative Class | 26.02 | 15.08 | 7.84 | 11/01/2002 | 106,390 | |||||||||
Investor Class | 26.29 | 15.01 | 7.74 | 11/01/2002 | 105,350 | |||||||||
Retirement Class1 | 26.78 | 15.46 | 8.15 | 03/01/2016 | 109,436 | |||||||||
| Comparative Index | ||||||||||||||
Russell 2000® Growth | 31.00% | 15.36% | 8.16% | — | $109,558 | |||||||||
As stated in the Fund’s current prospectus, the expense ratios were 0.86% (Institutional Class); 1.11% (Administrative Class); 1.23% (Investor Class); and 0.78% (Retirement Class). The expense ratios in the prospectus may differ from the actual expense ratios for the period disclosed within this report. The expense ratios shown in the prospectus are based on the prior fiscal year, adjusted to reflect changes, if any, in contractual arrangements that occurred prior to the date of the prospectus (or supplement thereto, if applicable).
Performance data shown represents past performance and is no guarantee of future results. Past performance is net of management fees and expenses and reflects reinvested dividends and distributions, but does not reflect the deduction of taxes that a shareholder would pay on Fund distributions or upon the redemption of Fund shares. Past performance reflects the beneficial effect of any expense waivers or reimbursements, without which returns would have been lower. Investment returns and principal value will fluctuate and when redeemed may be worth more or less than their original cost. Returns for periods less than one year are not annualized. Current performance may be higher or lower and is available through the most recent month end at harborfunds.com or by calling 800-422-1050.
| 1 | Retirement Class shares commenced operations on March 1, 2016. The performance attributed to the Retirement Class shares prior to that date is that of the Institutional Class shares. Performance prior to March 1, 2016 has not been adjusted to reflect the lower expenses of Retirement Class shares. During this period, Retirement Class shares would have had returns similar to, but somewhat higher than, Institutional Class shares due to the fact that Retirement Class shares represent interests in the same portfolio as Institutional Class shares but are subject to lower expenses. |
22
Harbor Small Cap Growth Fund
Portfolio of Investments—October 31, 2017
Portfolio of Investments—October 31, 2017
Value, Cost, and Principal Amounts in Thousands
Equity Holdings (% of net assets)
(Excludes net cash and short-term investments of 2.9%)

| COMMON STOCKS—97.1% | |||
| Shares | Value | ||
| AEROSPACE & DEFENSE—2.2% | |||
| 199,292 | KLX Inc.* | $ 10,933 | |
| 100,030 | Mercury Systems Inc.* | 5,049 | |
| 15,982 | |||
| BANKS—3.7% | |||
| 268,340 | Bank of NT Butterfield & Son Ltd. (BM) | 10,023 | |
| 105,483 | FCB Financial Holdings Inc.* | 4,926 | |
| 142,239 | Pacific Premier Bancorp Inc.* | 5,746 | |
| 84,608 | Pinnacle Financial Partners Inc. | 5,601 | |
| 26,296 | |||
| BIOTECHNOLOGY—5.7% | |||
| 267,510 | Acceleron Pharma Inc.* | 10,433 | |
| COMMON STOCKS—Continued | |||
| Shares | Value | ||
| BIOTECHNOLOGY—Continued | |||
| 79,250 | Avexis Inc.* | $ 8,283 | |
| 101,100 | Clovis Oncology Inc.* | 7,620 | |
| 58,725 | Neurocrine Biosciences Inc.* | 3,647 | |
| 166,070 | Prothena Corp. plc (IE)* | 9,640 | |
| 39,623 | |||
| CHEMICALS—2.3% | |||
| 193,310 | H.B. Fuller Co. | 10,994 | |
| 69,767 | Trinseo SA (LUX) | 4,953 | |
| 15,947 | |||
| COMMUNICATIONS EQUIPMENT—1.3% | |||
| 425,090 | Ciena Corp.* | 9,042 | |
| CONSTRUCTION MATERIALS—1.6% | |||
| 359,830 | Summit Materials Inc.* | 11,299 | |
| CONSUMER FINANCE—1.0% | |||
| 654,390 | SLM Corp.* | 6,930 | |
| CONTAINERS & PACKAGING—2.5% | |||
| 293,690 | Berry Global Group Inc.* | 17,460 | |
| DIVERSIFIED CONSUMER SERVICES—2.2% | |||
| 128,340 | Bright Horizons Family Solutions Inc.* | 11,076 | |
| 291,295 | Chegg Inc.* | 4,518 | |
| 15,594 | |||
| DIVERSIFIED TELECOMMUNICATION SERVICES—0.5% | |||
| 314,503 | Orbcomm Inc.* | 3,557 | |
| ELECTRONIC EQUIPMENT, INSTRUMENTS & COMPONENTS—1.1% | |||
| 172,484 | Orbotech Ltd. (IL)* | 7,714 | |
| EQUITY REAL ESTATE INVESTMENT TRUSTS (REITs)—2.9% | |||
| 99,110 | Camden Property Trust | 9,043 | |
| 125,113 | Community Healthcare Trust Inc. | 3,432 | |
| 133,440 | QTS Realty Trust Inc. | 7,719 | |
| 20,194 | |||
| HEALTH CARE EQUIPMENT & SUPPLIES—6.5% | |||
| 65,848 | Cantel Medical Corp. | 6,458 | |
| 278,250 | Integra LifeSciences Holdings Corp.* | 13,017 | |
| 97,072 | Masimo Corp.* | 8,519 | |
| 84,200 | Nevro Corp.* | 7,374 | |
| 438,460 | Wright Medical Group NV (NET)* | 11,492 | |
| 46,860 | |||
| HEALTH CARE TECHNOLOGY—1.4% | |||
| 196,744 | Omnicell Inc.* | 9,798 | |
| HOTELS, RESTAURANTS & LEISURE—4.8% | |||
| 560,747 | Eldorado Resorts Inc.* | 14,411 | |
| 360,700 | Sonic Corp. | 9,162 | |
| 45,515 | Vail Resorts Inc. | 10,424 | |
| 33,997 | |||
| HOUSEHOLD DURABLES—2.6% | |||
| 261,052 | Installed Building Products Inc.* | 18,195 | |
| INTERNET SOFTWARE & SERVICES—1.6% | |||
| 39,419 | CoStar Group Inc.* | 11,658 | |
| IT SERVICES—4.2% | |||
| 80,595 | Euronet Worldwide Inc.* | 7,789 | |
23
Harbor Small Cap Growth Fund
Portfolio of Investments—Continued
Portfolio of Investments—Continued
Value, Cost, and Principal Amounts in Thousands
| COMMON STOCKS—Continued | |||
| Shares | Value | ||
| IT SERVICES—Continued | |||
| 210,470 | Interxion Holding NV (NET)* | $ 11,237 | |
| 285,825 | WNS Holdings Ltd. ADR (JE)*,1 | 10,838 | |
| 29,864 | |||
| LIFE SCIENCES TOOLS & SERVICES—2.7% | |||
| 159,664 | ICON plc (IE)* | 18,978 | |
| MACHINERY—4.6% | |||
| 100,320 | Flowserve Corp. | 4,421 | |
| 175,110 | John Bean Technologies Corp. | 18,719 | |
| 559,990 | Milacron Holdings Corp.* | 10,052 | |
| 33,192 | |||
| MARINE—0.6% | |||
| 144,030 | Matson Inc. | 3,922 | |
| MEDIA—4.5% | |||
| 411,751 | Lions Gate Entertainment Corp. Class B (CAN)* | 11,389 | |
| 52,295 | Madison Square Garden Co.* | 11,645 | |
| 143,554 | Nexstar Media Group Inc. | 9,159 | |
| 32,193 | |||
| OIL, GAS & CONSUMABLE FUELS—2.0% | |||
| 105,310 | Resolute Energy Corp.* | 3,163 | |
| 309,080 | RSP Permian Inc.* | 10,635 | |
| 13,798 | |||
| PAPER & FOREST PRODUCTS—1.0% | |||
| 307,670 | KapStone Paper and Packaging Corp. | 6,910 | |
| PHARMACEUTICALS—5.1% | |||
| 263,231 | Aclaris Therapeutics Inc.* | 6,636 | |
| 1,712,565 | Cardiome Pharma Corp. (CAN)* | 3,014 | |
| 255,520 | Medicines Co.* | 7,343 | |
| 539,883 | Nektar Therapeutics* | 13,006 | |
| 226,234 | Pacira Pharmaceuticals Inc.* | 7,251 | |
| 37,250 | |||
| PROFESSIONAL SERVICES—1.1% | |||
| 123,495 | WageWorks Inc.* | 7,873 | |
| ROAD & RAIL—2.0% | |||
| 175,690 | Ryder System Inc. | 14,245 | |
| SEMICONDUCTORS & SEMICONDUCTOR EQUIPMENT—6.3% | |||
| 162,810 | Cavium Inc.* | 11,232 | |
| 266,970 | Integrated Device Technology Inc.* | 8,295 | |
| 157,040 | Microsemi Corp.* | 8,381 | |
| 50,991 | MKS Instruments Inc. | 5,540 | |
| 88,574 | Monolithic Power Systems Inc. | 10,777 | |
| 44,225 | |||
| COMMON STOCKS—Continued | |||
| Shares | Value | ||
| SOFTWARE—10.2% | |||
| 219,102 | Bottomline Technologies de Inc.* | $ 7,134 | |
| 100,373 | BroadSoft Inc.* | 5,505 | |
| 164,911 | Commvault Systems Inc.* | 8,584 | |
| 205,117 | Fortinet Inc.* | 8,084 | |
| 90,610 | Nice Ltd. ADR (IL)1 | 7,549 | |
| 131,109 | Proofpoint Inc.* | 12,116 | |
| 120,560 | Tableau Software Inc.* | 9,776 | |
| 25,115 | Ultimate Software Group Inc.* | 5,088 | |
| 284,659 | Zendesk Inc.* | 8,824 | |
| 72,660 | |||
| SPECIALTY RETAIL—1.2% | |||
| 47,090 | Lithia Motors Inc. | 5,330 | |
| 86,630 | National Vision Holdings Inc.* | 2,495 | |
| 7,825 | |||
| THRIFTS & MORTGAGE FINANCE—1.5% | |||
| 756,531 | MGIC Investment Corp.* | 10,818 | |
| TRADING COMPANIES & DISTRIBUTORS—6.2% | |||
| 569,891 | BMC Stock Holdings Inc.* | 12,224 | |
| 251,146 | Rush Enterprises Inc.* | 12,753 | |
| 384,300 | Univar Inc.* | 11,433 | |
| 46,905 | Watsco Inc. | 7,813 | |
| 44,223 | |||
| TOTAL COMMON STOCKS | |||
(Cost $539,007) | 688,122 | ||
| SHORT-TERM INVESTMENTS—3.9% | |||
| (Cost $27,333) | |||
| Principal Amount | |||
| REPURCHASE AGREEMENTS | |||
| $ | 27,333 | Repurchase Agreement with Fixed Income Clearing Corp. dated October 31, 2017 due November 01, 2017 at 0.001% collateralized by U.S. Treasury Notes (value $27,883) | 27,333 |
| TOTAL INVESTMENTS—101.0% | |||
(Cost $566,340) | 715,455 | ||
CASH AND OTHER ASSETS, LESS LIABILITIES—(1.0)% | (7,418) | ||
TOTAL NET ASSETS—100.0% | $708,037 | ||
24
Harbor Small Cap Growth Fund
Portfolio of Investments—Continued
Portfolio of Investments—Continued
FAIR VALUE MEASUREMENTS
Repurchase Agreements valued at $27,333 are classified as Level 2. All other holdings at October 31, 2017 (as disclosed in the preceding Portfolio of Investments) are classified as Level 1. There were no Level 3 holdings at October 31, 2017 or 2016 and no transfers between levels during the year.
For more information on valuation inputs and their aggregation into the levels identified above, please refer to the Fair Value Measurements and Disclosures in Note 2 of the accompanying Notes to Financial Statements.
AFFILIATED TRANSACTIONS
Certain of the Fund’s investments are in companies that are considered to be affiliated companies of the Fund because the Fund owned more than 5% of the outstanding voting securities of the company during the year ended October 31, 2017. Transactions during the period in securities of these companies were as follows:
| Security Name | Beginning Balance as of 11/01/2016 (000s) | Purchases (000s) | Sales (000s) | Net Realized Gain/(Loss) (000s) | Change in Unrealized Appreciation/ (Depreciation) (000s) | Net Dividend Income (000s) | Ending Balance as of 10/31/2017 (000s) | |||||||
Cardiome Pharma Corp. (CAN)* | $4,880 | $– | $(192) | $(341) | $(1,333) | $– | $3,014 |
| * | Non-income producing security |
| 1 | ADR after the name of a foreign holding stands for American Depositary Receipts representing ownership of foreign securities. ADRs are issued by U.S. banking institutions. |
| BM | Bermuda |
| CAN | Canada |
| IE | Ireland |
| IL | Israel |
| JE | Jersey |
| LUX | Luxembourg |
| NET | Netherlands |
The accompanying notes are an integral part of the Financial Statements.
25
Harbor Small Cap Growth Opportunities Fund
Managers' Commentary (Unaudited)
Managers' Commentary (Unaudited)
Subadviser
Elk Creek Partners, LLC
44 Cook Street
Suite 705
Suite 705
Denver, CO 80206
Portfolio Managers
Cam Philpott, CFA
Since 2014
Since 2014
Lance Marx, CFA
Since 2014
Since 2014
David Hand, CFA
Since 2014
Since 2014
Hiren Patel, Ph.D.
Since 2014
Since 2014
Sean McGinnis, CFA
Since 2014
Since 2014
Elk Creek has subadvised the Fund since 2014.
Investment Objective
The Fund seeks long-term growth of capital.

Cam Philpott

Lance Marx

David Hand

Hiren Patel

Sean McGinnis
Management’s Discussion of
Fund Performance
Fund Performance
Market REVIEW
Domestic equity markets have posted strong, positive absolute returns for the fiscal year ended October 31, 2017, with all of the major indices ending up green. While the strength of positive market sentiment has fluctuated, we surmise that the performance of equities reflects a generally optimistic outlook based on a Republican led initiative to cut taxes and regulations and stimulate growth.
It has appeared to us that throughout the year, investor sentiment has swung through several distinct moods based on strong corporate earnings reports, increasing equity valuations and hope for policy initiatives that continue to prove evasive without news of tangible progress out of Washington. Industrial stock returns have been representative of these moods with strong returns early in the year based on earnings results, followed by a lackluster period in late summer as policy initiatives stalled, and increased volatility due to concerns about the prospect of future growth in light of current multiples.
Our investment strategy employs a bottom-up process that focuses on finding companies that we believe can grow revenues and earnings faster than peers and above investor expectations. While we are subject to the market’s short-term movements based on macroeconomic concerns, we believe that stocks ultimately reflect the fundamentals of their businesses over time. We believe that our proven ability to identify businesses with strong fundamentals should lead to long-term outperformance through a full market cycle.
Performance
Small cap stocks have outperformed large cap stocks over the twelve months ended October 31, 2017, as represented by the Russell 2000® Index return of 27.85%. Within small cap stocks, growth has outperformed value with the Russell 2000® Growth Index posting a return of 31.00% vs. the Russell 2000® Value Index return of 24.81%, in the same period. For the period, the Harbor Small Cap Growth Opportunities Fund returned 23.07% (Institutional Class), 22.70% (Administrative Class), 22.63% (Investor Class), and 23.14% (Retirement Class) underperforming its benchmark, the Russell 2000® Growth Index.
Performance of the Fund has been driven primarily by stock selection, which is consistent with our team’s investment process and reflected in our longer-term track record. The sector in which stock selection most helped the Fund was Consumer Discretionary. Stock selection in the Information Technology and Health Care sectors detracted from performance over the last fiscal year. Sector allocation is not a primary focus of our investment strategy.
Exact Sciences Corp., a molecular diagnostics company focused on cancer detection, was a primary contributor for the Fund through the fiscal year as the company’s sales of Cologuard exceeded expectations. The company continued to make inroads into the colon cancer test market as more insurance companies cover this test, and doctors used the test for more patients. While patient compliance with colonoscopy recommendations is improving, roughly one of three patients do not comply with recommendations for the procedure, and we believe that Cologuard’s more patient-friendly profile will continue to make inroads with all patients, especially the many who are not getting tested currently.
26
Harbor Small Cap Growth Opportunities Fund
Managers' Commentary—Continued
Managers' Commentary—Continued
| TOP TEN HOLDINGS (% of net assets) | |
| Maxlinear Inc. | 2.9% |
| Interxion Holding NV | 2.8% |
| WNS Holdings Ltd. ADR | 2.1% |
| Sarepta Therapeutics Inc. | 2.0% |
| ICU Medical Inc. | 1.9% |
| Chegg Inc. | 1.8% |
| WageWorks Inc. | 1.8% |
| Evolent Health Inc. | 1.7% |
| Exact Sciences Corp. | 1.7% |
| Synchronoss Technologies Inc. | 1.7% |
Chegg, Inc., a leading digital education company, was another top contributor for the Fund as operating results have been ahead of forecasts. Beyond its core business of digital textbooks, the company is offering additional student services in areas like tutoring, studying, and test prep. Recently, Chegg aligned with Stanley Kaplan to offer standardized test courses, and we highlight this as an example of how Chegg is developing multiple areas of growth.
Synchronoss Technologies, Inc., a mobile solutions software company, was the leading detractor after an activist investor disclosed that it was no longer interested in discussing a potential acquisition of the entire company, though the investor did express that it was prepared to consider other forms of a potential transaction. Although the company issued a press release indicating its commitment to enhancing shareholder value and continuing to explore strategic options, the stock sold off significantly. In early October, the company issued several press releases regarding their strategic process, including resuming negotiations with the activist investor. We maintained our position in these shares at October 31, 2017.
Endologix Inc., a medical device company, was a weak stock for the Fund during this period when the company ran into regulatory issues for its new aortic stent. We viewed this product as a key addition to the company’s existing offerings, and the regulatory delay lowered our estimates of anticipated growth rates, which was a central component of our investment thesis. We sold this position entirely.
Outlook & StRategy
Even though the equity markets have had strong absolute returns, in some respects, investor sentiment seems more fragile than performance would suggest. For example, investors have seen the carnage in retail stocks and many have attributed that largely to Amazon’s success. Accordingly, they have developed hypersensitivity to potential disruption risks across most industries rather than just retail, being quick to sell on news that they perceive to be a threat to growth rates. Further, we have seen investors swiftly and severely selling individual stocks that report negative news. Selling off on negative news is not surprising; rather, the magnitude of the downward moves is what is surprising to us. Relative to previous periods that we have observed, the market seems to quickly presume a negative scenario with higher certainty than has been typically warranted. This behavior often leads to more volatility, and often, share prices take longer to recover, even when the market’s fears are shown to be unfounded. We saw this several times during this past period.
We strongly believe, and our historical results show, that over time stocks will track to their underlying businesses. It is our task to get the businesses right, and we are unwavering in our efforts in that regard. Nonetheless, in our view we are in a market that seems to be reacting negatively to headlines, with less attention to underlying fundamentals. We believe these pessimistic narratives can dictate a stock’s direction in the short-term, but it is our assessment that underlying businesses, rather than short-term passions, are the ultimate arbiter of stocks’ values. Ultimately, the compounding of successful execution over time accrues to long-term shareholders. We are steadfast in our commitment to our longstanding investment process where stock selection is based on identifying individual companies that we believe have sustainable growth opportunities and attractive valuations.
This report contains the current opinions of Elk Creek Partners, LLC as of the date of this report and should not be considered as investment advice or a recommendation of any particular security, strategy or investment product. Such opinions are subject to change without notice and securities described herein may no longer be included in, or may at any time be removed from, the Fund’s portfolio. This report is distributed for informational purposes only. Information contained herein has been obtained from sources believed reliable, but not guaranteed.
Stocks of small cap companies pose special risks, including possible illiquidity and greater price volatility than stocks of larger, more established companies. Equity securities, such as common stocks, are affected by company specific events and by movements in the overall stock markets in which those securities principally trade, among other factors. An adverse company specific event, or downturn in those stock markets, can depress the value of a particular company’s equity securities. For information on the different share classes and the risks associated with an investment in the Fund, please refer to the current prospectus.
27
Harbor Small Cap Growth Opportunities Fund
Fund Summary—October 31, 2017 (Unaudited)
Fund Summary—October 31, 2017 (Unaudited)
| INSTITUTIONAL CLASS | |
| Fund # | 2037 |
| Cusip | 411512668 |
| Ticker | HASOX |
| Inception Date | 02/01/2014 |
| Net Expense Ratio | 0.88% |
| Total Net Assets (000s) | $254,925 |
| ADMINISTRATIVE CLASS | |
| Fund # | 2237 |
| Cusip | 411512650 |
| Ticker | HRSOX |
| Inception Date | 02/01/2014 |
| Net Expense Ratio | 1.13% |
| Total Net Assets (000s) | $1,308 |
| INVESTOR CLASS | |
| Fund # | 2437 |
| Cusip | 411512643 |
| Ticker | HISOX |
| Inception Date | 02/01/2014 |
| Net Expense Ratio | 1.25% |
| Total Net Assets (000s) | $1,167 |
| RETIREMENT CLASS | |
| Fund # | 2537 |
| Cusip | 411512486 |
| Ticker | HNSOX |
| Inception Date | 03/01/2016 |
| Net Expense Ratio | 0.81% |
| Total Net Assets (000s) | $47,569 |
Portfolio Statistics
| Portfolio | Benchmark | ||
| Weighted Average Market Cap (MM) | $1,871 | $2,483 | |
| Price/Earning Ratio (P/E) | 40.4x | 32.7x | |
| Price/Book Ratio (P/B) | 3.5x | 5.0x | |
| Beta vs. Russell 2000® Growth Index | 1.07 | N/A | |
| Portfolio Turnover (Year Ended 10/31/2017) | 67% | N/A |
Sector Allocation (% of investments)
(Excludes cash and short-term investments)

28
Harbor Small Cap Growth Opportunities Fund
Fund Performance Summary (Unaudited)
Fund Performance Summary (Unaudited)
The graph compares a $50,000 investment in the Institutional Class shares of the Fund with the performance of the Russell 2000® Growth Index. The Fund’s performance assumes the reinvestment of all dividend and capital gain distributions.
CHANGE IN A $50,000 INVESTMENT
For the period 02/01/2014 through 10/31/2017
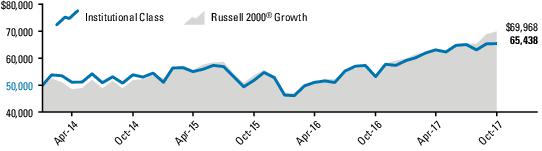
| TOTAL RETURNS For the periods ended 10/31/2017 | 1 Year | 5 Years | Annualized | Inception Date | Final Value of a $50,000 Investment | |||||||||
| Life of Fund | ||||||||||||||
| Harbor Small Cap Growth Opportunities Fund | ||||||||||||||
Institutional Class | 23.07% | N/A | 7.44% | 02/01/2014 | $65,438 | |||||||||
Administrative Class | 22.70 | N/A | 7.33 | 02/01/2014 | 65,190 | |||||||||
Investor Class | 22.63 | N/A | 7.04 | 02/01/2014 | 64,521 | |||||||||
Retirement Class1 | 23.14 | N/A | 7.49 | 03/01/2016 | 65,542 | |||||||||
| Comparative Index | ||||||||||||||
Russell 2000® Growth2 | 31.00% | N/A | 9.38% | — | $69,968 | |||||||||
As stated in the Fund’s current prospectus, the expense ratios were 0.90% (Institutional Class); 1.15% (Administrative Class); 1.27% (Investor Class); and 0.82% (Retirement Class). The expense ratios in the prospectus may differ from the actual expense ratios for the period disclosed within this report. The expense ratios shown in the prospectus are based on the prior fiscal year, adjusted to reflect changes, if any, in contractual arrangements that occurred prior to the date of the prospectus (or supplement thereto, if applicable).
Performance data shown represents past performance and is no guarantee of future results. Past performance is net of management fees and expenses and reflects reinvested dividends and distributions, but does not reflect the deduction of taxes that a shareholder would pay on Fund distributions or upon the redemption of Fund shares. Past performance reflects the beneficial effect of any expense waivers or reimbursements, without which returns would have been lower. Investment returns and principal value will fluctuate and when redeemed may be worth more or less than their original cost. Returns for periods less than one year are not annualized. Current performance may be higher or lower and is available through the most recent month end at harborfunds.com or by calling 800-422-1050.
| 1 | Retirement Class shares commenced operations on March 1, 2016. The performance attributed to the Retirement Class shares prior to that date is that of the Institutional Class shares. Performance prior to March 1, 2016 has not been adjusted to reflect the lower expenses of Retirement Class shares. During this period, Retirement Class shares would have had returns similar to, but somewhat higher than, Institutional Class shares due to the fact that Retirement Class shares represent interests in the same portfolio as Institutional Class shares but are subject to lower expenses. |
| 2 | The “Life of Fund” return and “Final Value of a $50,000 Investment” as shown reflect the period 02/01/2014 through 10/31/2017. |
29
Harbor Small Cap Growth Opportunities Fund
Portfolio of Investments—October 31, 2017
Portfolio of Investments—October 31, 2017
Value, Cost, and Principal Amounts in Thousands
Equity Holdings (% of net assets)
(Excludes net cash and short-term investments of 3.6%)

| COMMON STOCKS—96.4% | |||
| Shares | Value | ||
| AEROSPACE & DEFENSE—1.2% | |||
| 223,610 | KeyW Holding Corp.* | $ 1,689 | |
| 33,336 | Maxar Technologies Ltd. (CAN) | 2,110 | |
| 3,799 | |||
| AIR FREIGHT & LOGISTICS—2.0% | |||
| 41,003 | Atlas Air Worldwide Holdings Inc.* | 2,516 | |
| 148,490 | Echo Global Logistics Inc.* | 3,571 | |
| 6,087 | |||
| BANKS—2.2% | |||
| 49,075 | Chemical Financial Corp. | 2,586 | |
| 57,257 | FB Financial Corp.* | 2,340 | |
| 84,295 | Tristate Capital Holdings Inc.* | 1,909 | |
| 6,835 | |||
| BEVERAGES—0.8% | |||
| 210,256 | Primo Water Corp.* | 2,315 | |
| BIOTECHNOLOGY—5.6% | |||
| 43,914 | BioSpecifics Technologies Corp.* | 2,010 | |
| 92,059 | Exact Sciences Corp.* | 5,062 | |
| 24,498 | Ligand Pharmaceuticals Inc.* | 3,561 | |
| 125,767 | Sarepta Therapeutics Inc.* | 6,202 | |
| 16,835 | |||
| BUILDING PRODUCTS—1.3% | |||
| 69,676 | Caesarstone Ltd. (IL)* | 1,972 | |
| 132,082 | NCI Building Systems Inc.* | 2,107 | |
| 4,079 | |||
| CAPITAL MARKETS—0.6% | |||
| 48,531 | Financial Engines Inc. | 1,752 | |
| COMMERCIAL SERVICES & SUPPLIES—2.3% | |||
| 213,662 | Hudson Technologies Inc.* | 1,265 | |
| 311,252 | InnerWorkings Inc.* | 3,386 | |
| 49,818 | TETRA Tech Inc. | 2,454 | |
| 7,105 | |||
| COMMUNICATIONS EQUIPMENT—0.9% | |||
| 336,350 | Infinera Corp.* | 2,815 | |
| CONSTRUCTION & ENGINEERING—1.2% | |||
| 40,327 | Dycom Industries Inc.* | 3,542 | |
| CONSUMER FINANCE—0.9% | |||
| 50,708 | Green Dot Corp.* | 2,871 | |
| DIVERSIFIED CONSUMER SERVICES—1.8% | |||
| 347,001 | Chegg Inc.* | 5,382 | |
| DIVERSIFIED TELECOMMUNICATION SERVICES—1.1% | |||
| 272,522 | Iridium Communications Inc.* | 3,270 | |
| ELECTRICAL EQUIPMENT—0.4% | |||
| 125,571 | Power Solutions International Inc.* | 1,224 | |
| ELECTRONIC EQUIPMENT, INSTRUMENTS & COMPONENTS—1.8% | |||
| 62,822 | Methode Electronics Inc. | 2,946 | |
| 47,624 | MTS Systems Corp. | 2,479 | |
| 5,425 | |||
| FOOD PRODUCTS—0.5% | |||
| 107,036 | Freshpet Inc.* | 1,664 | |
| HEALTH CARE EQUIPMENT & SUPPLIES—7.2% | |||
| 1,146,051 | Cerus Corp.* | 3,289 | |
30
Harbor Small Cap Growth Opportunities Fund
Portfolio of Investments—Continued
Portfolio of Investments—Continued
Value, Cost, and Principal Amounts in Thousands
| COMMON STOCKS—Continued | |||
| Shares | Value | ||
| HEALTH CARE EQUIPMENT & SUPPLIES—Continued | |||
| 135,766 | Cryolife Inc.* | $ 2,641 | |
| 30,004 | ICU Medical Inc.* | 5,734 | |
| 236,353 | Invacare Corp. | 3,663 | |
| 28,610 | Nuvasive Inc.* | 1,623 | |
| 191,518 | Wright Medical Group NV (NET)* | 5,020 | |
| 21,970 | |||
| HEALTH CARE PROVIDERS & SERVICES—1.5% | |||
| 120,382 | Surgery Partners Inc.* | 1,113 | |
| 100,719 | Teladoc Inc.* | 3,329 | |
| 4,442 | |||
| HEALTH CARE TECHNOLOGY—3.1% | |||
| 320,409 | Evolent Health Inc.* | 5,207 | |
| 147,313 | Vocera Communications Inc.* | 4,157 | |
| 9,364 | |||
| HOTELS, RESTAURANTS & LEISURE—4.8% | |||
| 19,266 | Churchill Downs Inc. | 4,018 | |
| 174,491 | Habit Restaurants Inc.* | 2,146 | |
| 160,626 | Planet Fitness Inc. | 4,279 | |
| 225,684 | Playa Hotels & Resorts NV (NET)* | 2,332 | |
| 52,297 | Wingstop Inc. | 1,771 | |
| 14,546 | |||
| HOUSEHOLD DURABLES—1.0% | |||
| 109,807 | Century Communities Inc.* | 3,135 | |
| INSURANCE—2.1% | |||
| 55,269 | Kinsale Capital Group Inc. | 2,397 | |
| 202,169 | National General Holdings Corp. | 4,080 | |
| 6,477 | |||
| INTERNET & DIRECT MARKETING RETAIL—0.8% | |||
| 46,787 | NutriSystem Inc. | 2,337 | |
| INTERNET SOFTWARE & SERVICES—4.7% | |||
| 29,391 | 2U Inc.* | 1,870 | |
| 92,353 | Carbonite Inc.* | 2,097 | |
| 56,329 | Cloudera Inc.* | 852 | |
| 314,091 | Gogo Inc.* | 3,122 | |
| 48,100 | Hortonworks Inc.* | 794 | |
| 239,308 | Quotient Technology Inc.* | 3,745 | |
| 55,992 | Twilio Inc.* | 1,789 | |
| 14,269 | |||
| IT SERVICES—6.5% | |||
| 146,373 | Blackhawk Network Holdings Inc.* | 4,969 | |
| 162,310 | Interxion Holding NV (NET)* | 8,666 | |
| 168,883 | WNS Holdings Ltd. ADR (IND)*,1 | 6,404 | |
| 20,039 | |||
| LIFE SCIENCES TOOLS & SERVICES—1.1% | |||
| 152,782 | Luminex Corp. | 3,262 | |
| MACHINERY—5.3% | |||
| 77,540 | Actuant Corp. | 1,977 | |
| 29,941 | Barnes Group Inc. | 1,949 | |
| 52,542 | CIRCOR International Inc. | 2,309 | |
| 101,431 | Kornit Digital Ltd. (IL)* | 1,577 | |
| 131,667 | NN Inc. | 3,891 | |
| COMMON STOCKS—Continued | |||
| Shares | Value | ||
| MACHINERY—Continued | |||
| 71,064 | REV Group Inc. | $ 1,834 | |
| 113,653 | Rexnord Corp.* | 2,900 | |
| 16,437 | |||
| MEDIA—1.3% | |||
| 78,531 | AMC Entertainment Holdings Inc. | 1,091 | |
| 107,569 | World Wrestling Entertainment Inc. | 2,854 | |
| 3,945 | |||
| OIL, GAS & CONSUMABLE FUELS—2.2% | |||
| 182,893 | Callon Petroleum Co.* | 2,028 | |
| 111,087 | SM Energy Co. | 2,370 | |
| 227,178 | SRC Energy Inc.* | 2,167 | |
| 6,565 | |||
| PERSONAL PRODUCTS—0.6% | |||
| 89,697 | Elf Beauty Inc.* | 1,901 | |
| PHARMACEUTICALS—3.0% | |||
| 128,109 | Medicines Co.* | 3,682 | |
| 117,699 | Pacira Pharmaceuticals Inc.* | 3,772 | |
| 321,002 | Teligent Inc.* | 1,823 | |
| 9,277 | |||
| PROFESSIONAL SERVICES—4.2% | |||
| 102,049 | Korn/Ferry International | 4,269 | |
| 50,976 | On Assignment Inc.* | 3,121 | |
| 84,085 | WageWorks Inc.* | 5,360 | |
| 12,750 | |||
| REAL ESTATE MANAGEMENT & DEVELOPMENT—0.4% | |||
| 43,683 | Marcus & Millichap Inc.* | 1,242 | |
| ROAD & RAIL—1.7% | |||
| 123,207 | Daseke Inc.* | 1,704 | |
| 52,161 | Saia Inc.* | 3,380 | |
| 5,084 | |||
| SEMICONDUCTORS & SEMICONDUCTOR EQUIPMENT—4.1% | |||
| 92,094 | Inphi Corp.* | 3,774 | |
| 365,442 | Maxlinear Inc.* | 8,942 | |
| 12,716 | |||
| SOFTWARE—6.8% | |||
| 71,652 | BroadSoft Inc.* | 3,930 | |
| 152,035 | Callidus Software Inc.* | 3,854 | |
| 50,507 | Imperva Inc.* | 2,157 | |
| 22,798 | Proofpoint Inc.* | 2,107 | |
| 450,146 | Synchronoss Technologies Inc.* | 5,100 | |
| 248,984 | Vasco Data Security International Inc.* | 3,386 | |
| 20,534 | |||
| SPECIALTY RETAIL—2.4% | |||
| 72,396 | Camping World Holdings Inc. | 3,042 | |
| 76,191 | J. Jill Inc.* | 389 | |
| 45,472 | National Vision Holdings Inc.* | 1,310 | |
| 123,299 | Party City Holdco Inc.* | 1,375 | |
| 171,814 | Tile Shop Holdings Inc. | 1,469 | |
| 7,585 | |||
| TECHNOLOGY HARDWARE, STORAGE & PERIPHERALS—1.2% | |||
| 115,821 | Electronics for Imaging Inc.* | 3,574 | |
31
Harbor Small Cap Growth Opportunities Fund
Portfolio of Investments—Continued
Portfolio of Investments—Continued
Value, Cost, and Principal Amounts in Thousands
| COMMON STOCKS—Continued | |||
| Shares | Value | ||
| TEXTILES, APPAREL & LUXURY GOODS—0.9% | |||
| 127,984 | Canada Goose Holdings Inc. (CAN)* | $ 2,749 | |
| THRIFTS & MORTGAGE FINANCE—1.7% | |||
| 12,042 | LendingTree Inc.* | 3,228 | |
| 21,961 | Meta Financial Group Inc. | 1,916 | |
| 5,144 | |||
| TRADING COMPANIES & DISTRIBUTORS—2.0% | |||
| 68,981 | Beacon Roofing Supply Inc.* | 3,822 | |
| 176,389 | Foundation Building Materials Inc.* | 2,373 | |
| 6,195 | |||
| WATER UTILITIES—0.6% | |||
| 141,111 | Aquaventure Holdings Ltd. (VG)* | 1,717 | |
| WIRELESS TELECOMMUNICATION SERVICES—0.6% | |||
| 49,832 | Shenandoah Telecommunications Co. | 1,894 | |
| TOTAL COMMON STOCKS | |||
(Cost $264,353) | 294,150 | ||
| SHORT-TERM INVESTMENTS—3.1% | |||
| (Cost $9,354) | |||
| Principal Amount | Value | ||
| REPURCHASE AGREEMENTS | |||
| $ | 9,354 | Repurchase Agreement with Fixed Income Clearing Corp. dated October 31, 2017 due November 01, 2017 at 0.001% collateralized by U.S. Treasury Notes (value $9,545) | $ 9,354 |
| TOTAL INVESTMENTS—99.5% | |||
(Cost $273,707) | 303,504 | ||
CASH AND OTHER ASSETS, LESS LIABILITIES—0.5% | 1,465 | ||
TOTAL NET ASSETS—100.0% | $304,969 | ||
FAIR VALUE MEASUREMENTS
Repurchase Agreements valued at $9,354 are classified as Level 2. All other holdings at October 31, 2017 (as disclosed in the preceding Portfolio of Investments) are classified as Level 1. There were no Level 3 holdings at October 31, 2017 or 2016 and no transfers between levels during the year.
For more information on valuation inputs and their aggregation into the levels identified above, please refer to the Fair Value Measurements and Disclosures in Note 2 of the accompanying Notes to Financial Statements.
| * | Non-income producing security |
| 1 | ADR after the name of a foreign holding stands for American Depositary Receipts representing ownership of foreign securities. ADRs are issued by U.S. banking institutions. |
| CAN | Canada |
| IL | Israel |
| IND | India |
| NET | Netherlands |
| VG | Virgin Islands |
The accompanying notes are an integral part of the Financial Statements.
32
Harbor Large Cap Value Fund
Manager’s Commentary (Unaudited)
Manager’s Commentary (Unaudited)
Subadviser
Aristotle Capital Management, LLC
11100 Santa
Monica Boulevard
Suite 1700
Suite 1700
Los Angeles, CA 90025
Portfolio Manager
Howard Gleicher, CFA
Since 2012
Since 2012
Aristotle has subadvised the Fund since 2012.
Investment Objective
The Fund seeks long-term total return.

Howard Gleicher
Management’s Discussion of
Fund Performance
Fund Performance
Markets Review
In the face of continued U.S. Federal Reserve (Fed) tightening, falling oil prices, a major global cyber-attack, a dysfunctional political environment and three major hurricanes that caused devastation across several states, U.S. territories and Caribbean islands., U.S. equity markets continued to march happily upward. Recent earnings reported by many U.S. businesses exceeded expectations and continued to be the focal point of investors. Overall, macroeconomic data reported during the period was generally positive, including U.S. GDP growth of 3.1%—the strongest in two years. On June 14, 2017 the Federal Open Market Committee (FOMC) announced the much anticipated, and for some investors, rather worrying decision to begin reducing the size of its balance sheet. The Policy Normalization Principles and Plans outlines a process that is intended to be gradual and, the Fed hopes, easily digestible by financial markets.
Performance
In this environment, the Harbor Large Cap Value Fund performed well, generating a return of 26.00% (Institutional Class), 25.77% (Administrative Class), 25.52% (Investor Class), and 26.08% (Retirement Class) over the year ended October 31, 2017. This return exceeded the 17.78% return of the Russell 1000® Value Index and the 23.63% return of the S&P 500 Index. The vast majority of the outperformance was attributable to security selection, but sector allocation was also additive to performance.
The primary contributors to outperformance were security selection in Information Technology, Industrials and Consumer Discretionary, as well as an underweight to Telecom, Energy and Real Estate.
Meanwhile, the primary detractors from relative return were stock selection in the Consumer Staples sector and an underweight in Financials relative to the Fund’s benchmark. Overall, the positive factors outweighed the negative in the year, yielding significant outperformance relative to the Russell 1000® Value Index.
Diversified financial services company, Ameriprise Financial, Inc. was a primary contributor to performance. The company reported better-than-expected quarterly results, amidst declining expenses, strong net inflows into investment advisory accounts and improved advisor productivity. Spun off from American Express in 2005, Ameriprise continued to transform itself from what was originally an insurance company into what is now a major player in the asset management industry, in our view.
National grocer Kroger was a primary detractor from performance. We believe Kroger is facing two main headwinds. First, their string of same store sales growth has come to an end. Even though same store sales growth has leveled, the company continues to garner market share. Second, Amazon announced its intention to acquire Whole Foods. While certainly a factor to monitor going forward, Whole Foods competes with Kroger in a fraction of their markets and in a fraction of total products.
Outlook & Strategy
Our work at Aristotle Capital is focused on individual companies. Where broader issues are relevant, we take a long-term view, attempting to minimize the distractions of what may be on others’ minds. While the headlines focus on short-term news, in our view, the fundamentals of a business are the most important determinants of its long-term stock price performance. Consequently, we believe the best way for an investment manager to consistently add value is to maintain a long-term perspective and focus on understanding a company’s key attributes and value drivers, or catalysts. We will persist in our quest to add value through in-depth
33
Harbor Large Cap Value Fund
Manager’s Commentary—Continued
Manager’s Commentary—Continued
| TOP TEN HOLDINGS (% of net assets) | |
| Adobe Systems Inc. | 4.1% |
| Baxter International Inc. | 3.5% |
| Bank of America Corp. | 3.3% |
| Microsoft Corp. | 3.3% |
| Home Depot Inc. | 3.2% |
| Microchip Technology Inc. | 3.2% |
| AbbVie Inc. | 3.1% |
| Danaher Corp. | 2.9% |
| Oshkosh Corp. | 2.9% |
| Ameriprise Financial Inc. | 2.8% |
company research, focusing on what we perceive to be high-quality businesses with an attractive valuation and catalysts we believe will materialize in a three- to five-year time horizon.
This report contains the current opinions of Aristotle Capital Management, LLC as of the date of this report and should not be considered as investment advice or a recommendation of any particular security, strategy or investment product. Such opinions are subject to change without notice and securities described herein may no longer be included in, or may at any time be removed from, the Fund’s portfolio. This report is distributed for informational purposes only. Information contained herein has been obtained from sources believed reliable, but not guaranteed.
Equity securities, such as common stocks, are affected by company specific events and by movements in the overall stock markets in which those securities principally trade, among other factors. An adverse company specific event, or downturn in those stock markets, can depress the value of a particular company’s equity securities. For information on the different share classes and the risks associated with an investment in the Fund, please refer to the current prospectus.
34
Harbor Large Cap Value Fund
Fund Summary—October 31, 2017 (Unaudited)
Fund Summary—October 31, 2017 (Unaudited)
| INSTITUTIONAL CLASS | |
| Fund # | 2013 |
| Cusip | 411511603 |
| Ticker | HAVLX |
| Inception Date | 12/29/1987 |
| Net Expense Ratio | 0.68% a |
| Total Net Assets (000s) | $498,360 |
| ADMINISTRATIVE CLASS | |
| Fund # | 2213 |
| Cusip | 411511751 |
| Ticker | HRLVX |
| Inception Date | 11/01/2002 |
| Net Expense Ratio | 0.93% a |
| Total Net Assets (000s) | $53,006 |
| INVESTOR CLASS | |
| Fund # | 2413 |
| Cusip | 411511744 |
| Ticker | HILVX |
| Inception Date | 11/01/2002 |
| Net Expense Ratio | 1.05% a |
| Total Net Assets (000s) | $71,374 |
| RETIREMENT CLASS | |
| Fund # | 2513 |
| Cusip | 411512478 |
| Ticker | HNLVX |
| Inception Date | 03/01/2016 |
| Net Expense Ratio | 0.60% a |
| Total Net Assets (000s) | $143,966 |
Portfolio Statistics
| Portfolio | Benchmark | ||
| Weighted Average Market Cap (MM) | $96,823 | $120,800 | |
| Price/Earning Ratio (P/E) | 26.5x | 22.8x | |
| Price/Book Ratio (P/B) | 3.4x | 2.2x | |
| Beta vs. Russell 1000® Value Index | 1.01 | N/A | |
| Portfolio Turnover (Year Ended 10/31/2017) | 16% | N/A |
Sector Allocation (% of investments)
(Excludes cash and short-term investments)

| a | Reflects an expense limitation agreement (excluding interest expense, if any) effective through February 28, 2018 |
35
Harbor Large Cap Value Fund
Fund Performance Summary (Unaudited)
Fund Performance Summary (Unaudited)
The graph compares a $50,000 investment in the Institutional Class shares of the Fund with the performance of the Russell 1000® Value Index. The Fund’s performance assumes the reinvestment of all dividend and capital gain distributions.
CHANGE IN A $50,000 INVESTMENT
For the period 11/01/2007 through 10/31/2017

| TOTAL RETURNS For the periods ended 10/31/2017 | 1 Year | Annualized | Inception Date | Final Value of a $50,000 Investment | ||||||||||
| 5 Years | 10 Years | |||||||||||||
| Harbor Large Cap Value Fund | ||||||||||||||
Institutional Class | 26.00% | 16.36% | 7.31% | 12/29/1987 | $101,242 | |||||||||
Administrative Class | 25.77 | 16.06 | 7.03 | 11/01/2002 | 98,673 | |||||||||
Investor Class | 25.52 | 15.91 | 6.90 | 11/01/2002 | 97,481 | |||||||||
Retirement Class1 | 26.08 | 16.38 | 7.32 | 03/01/2016 | 101,334 | |||||||||
| Comparative Index | ||||||||||||||
Russell 1000® Value | 17.78% | 13.48% | 5.99% | — | $ 89,464 | |||||||||
As stated in the Fund’s current prospectus, the expense ratios were 0.68% (Net) and 0.73% (Gross) (Institutional Class); 0.93% (Net) and 0.98% (Gross) (Administrative Class); 1.05% (Net) and 1.10% (Gross) (Investor Class); and 0.60% (Net) and 0.65% (Gross) (Retirement Class). The net expense ratios reflect an expense limitation agreement (excluding interest expense, if any) effective through 02/28/2018. The expense ratios in the prospectus may differ from the actual expense ratios for the period disclosed within this report. The expense ratios shown in the prospectus are based on the prior fiscal year, adjusted to reflect changes, if any, in contractual arrangements that occurred prior to the date of the prospectus (or supplement thereto, if applicable).
Performance data shown represents past performance and is no guarantee of future results. Past performance is net of management fees and expenses and reflects reinvested dividends and distributions, but does not reflect the deduction of taxes that a shareholder would pay on Fund distributions or upon the redemption of Fund shares. Past performance reflects the beneficial effect of any expense waivers or reimbursements, without which returns would have been lower. Investment returns and principal value will fluctuate and when redeemed may be worth more or less than their original cost. Returns for periods less than one year are not annualized. Current performance may be higher or lower and is available through the most recent month end at harborfunds.com or by calling 800-422-1050.
| 1 | Retirement Class shares commenced operations on March 1, 2016. The performance attributed to the Retirement Class shares prior to that date is that of the Institutional Class shares. Performance prior to March 1, 2016 has not been adjusted to reflect the lower expenses of Retirement Class shares. During this period, Retirement Class shares would have had returns similar to, but somewhat higher than, Institutional Class shares due to the fact that Retirement Class shares represent interests in the same portfolio as Institutional Class shares but are subject to lower expenses. |
36
Harbor Large Cap Value Fund
Portfolio of Investments—October 31, 2017
Portfolio of Investments—October 31, 2017
Value, Cost, and Principal Amounts in Thousands
Equity Holdings (% of net assets)
(Excludes net cash and short-term investments of 3.0%)

| COMMON STOCKS—97.0% | |||
| Shares | Value | ||
| AEROSPACE & DEFENSE—2.8% | |||
| 105,000 | General Dynamics Corp. | $ 21,313 | |
| BANKS—13.8% | |||
| 2,350,000 | Banco Bilbao Vizcaya SA ADR (SP)1 | 20,539 | |
| 912,000 | Bank of America Corp. | 24,980 | |
| 115,000 | BOK Financial Corp. | 9,944 | |
| 110,000 | Cullen/Frost Bankers Inc. | 10,835 | |
| 124,578 | East West Bancorp Inc. | 7,455 | |
| 43,898 | First Republic Bank | 4,275 | |
| 147,000 | JPMorgan Chase & Co. | 14,790 | |
| 1,860,000 | Mitsubishi UFJ Financial Group Inc. ADR (JP)1 | 12,629 | |
| 105,447 | |||
| BEVERAGES—1.9% | |||
| 324,000 | Coca-Cola Co. | 14,897 | |
| BIOTECHNOLOGY—5.2% | |||
| 260,000 | AbbVie Inc. | 23,465 | |
| 94,000 | Amgen Inc. | 16,471 | |
| 39,936 | |||
| CAPITAL MARKETS—2.8% | |||
| 139,000 | Ameriprise Financial Inc. | 21,759 | |
| COMMON STOCKS—Continued | |||
| Shares | Value | ||
| CHEMICALS—5.2% | |||
| 266,000 | Dowdupont Inc. | $ 19,235 | |
| 181,000 | PPG Industries Inc. | 21,039 | |
| 40,274 | |||
| CONSTRUCTION MATERIALS—2.7% | |||
| 96,000 | Martin Marietta Materials Inc. | 20,818 | |
| CONSUMER FINANCE—2.4% | |||
| 199,000 | Capital One Financial Corp. | 18,344 | |
| ENERGY EQUIPMENT & SERVICES—1.5% | |||
| 270,000 | Halliburton Co. | 11,540 | |
| FOOD & STAPLES RETAILING—3.9% | |||
| 616,000 | Kroger Co. | 12,751 | |
| 260,000 | Walgreens Boots Alliance Inc. | 17,230 | |
| 29,981 | |||
| FOOD PRODUCTS—3.7% | |||
| 320,000 | Archer Daniels Midland Co. | 13,078 | |
| 367,000 | Mondelez International Inc. | 15,205 | |
| 28,283 | |||
| GAS UTILITIES—2.2% | |||
| 287,000 | National Fuel Gas Co. | 16,660 | |
| HEALTH CARE EQUIPMENT & SUPPLIES—9.1% | |||
| 414,000 | Baxter International Inc. | 26,691 | |
| 240,000 | Danaher Corp. | 22,145 | |
| 258,000 | Medtronic plc (IE) | 20,774 | |
| 69,610 | |||
| HEALTH CARE PROVIDERS & SERVICES—1.6% | |||
| 393,000 | Acadia Healthcare Co. Inc.* | 12,324 | |
| HOUSEHOLD DURABLES—2.6% | |||
| 356,000 | Lennar Corp. | 19,818 | |
| INDEPENDENT POWER & RENEWABLE ELECTRICITY PRODUCERS—1.3% | |||
| 946,000 | AES Corp. | 10,056 | |
| INSURANCE—2.3% | |||
| 119,000 | Chubb Ltd. (SWS) | 17,948 | |
| IT SERVICES—2.5% | |||
| 261,000 | PayPal Holdings Inc.* | 18,938 | |
| MACHINERY—2.9% | |||
| 246,000 | Oshkosh Corp. | 22,524 | |
| OIL, GAS & CONSUMABLE FUELS—5.7% | |||
| 215,000 | EQT Corp. | 13,446 | |
| 200,000 | Phillips 66 | 18,216 | |
| 84,000 | Pioneer Natural Resources Co. | 12,572 | |
| 44,234 | |||
| PERSONAL PRODUCTS—2.4% | |||
| 320,000 | Unilever NV (UK) | 18,547 | |
| PHARMACEUTICALS—2.2% | |||
| 200,000 | Novartis AG ADR (SWS)1 | 16,516 | |
| SEMICONDUCTORS & SEMICONDUCTOR EQUIPMENT—3.2% | |||
| 257,000 | Microchip Technology Inc. | 24,364 | |
37
Harbor Large Cap Value Fund
Portfolio of Investments—Continued
Portfolio of Investments—Continued
Value, Cost, and Principal Amounts in Thousands
| COMMON STOCKS—Continued | |||
| Shares | Value | ||
| SOFTWARE—9.9% | |||
| 178,000 | Adobe Systems Inc.* | $ 31,178 | |
| 135,000 | ANSYS Inc.* | 18,456 | |
| 310,000 | Microsoft Corp. | 25,786 | |
| 75,420 | |||
| SPECIALTY RETAIL—3.2% | |||
| 147,000 | Home Depot Inc. | 24,370 | |
| TOTAL COMMON STOCKS | |||
(Cost $593,286) | 743,921 | ||
| SHORT-TERM INVESTMENTS—3.9% | |||
| (Cost $29,522) | |||
| Principal Amount | Value | ||
| REPURCHASE AGREEMENTS | |||
| $ | 29,522 | Repurchase Agreement with Fixed Income Clearing Corp. dated October 31, 2017 due November 01, 2017 at 0.001% collateralized by U.S. Treasury Notes (value $30,112) | $ 29,522 |
| TOTAL INVESTMENTS—100.9% | |||
(Cost $622,808) | 773,443 | ||
CASH AND OTHER ASSETS, LESS LIABILITIES—(0.9)% | (6,737) | ||
TOTAL NET ASSETS—100.0% | $766,706 | ||
FAIR VALUE MEASUREMENTS
Repurchase Agreements valued at $29,522 are classified as Level 2. All other holdings at October 31, 2017 (as disclosed in the preceding Portfolio of Investments) are classified as Level 1. There were no Level 3 holdings at October 31, 2017 or 2016 and no transfers between levels during the year.
For more information on valuation inputs and their aggregation into the levels identified above, please refer to the Fair Value Measurements and Disclosures in Note 2 of the accompanying Notes to Financial Statements.
| * | Non-income producing security |
| 1 | ADR after the name of a foreign holding stands for American Depositary Receipts representing ownership of foreign securities. ADRs are issued by U.S. banking institutions. |
| IE | Ireland |
| JP | Japan |
| SP | Spain |
| SWS | Switzerland |
| UK | United Kingdom |
The accompanying notes are an integral part of the Financial Statements.
38
Harbor Mid Cap Value Fund
Managers' Commentary (Unaudited)
Managers' Commentary (Unaudited)
Subadviser
LSV Asset Management
155 North Wacker Dr.
Suite 4600
Suite 4600
Chicago, IL 60606
Portfolio Managers
Josef Lakonishok, Ph.D.
Since 2004
Since 2004
Menno Vermeulen, CFA
Since 2004
Since 2004
Puneet Mansharamani, CFA
Since 2006
Greg Sleight
Since 2015
Since 2015
Guy Lakonishok, CFA
Since 2015
Since 2015
LSV has subadvised the Fund since 2004.
Investment Objective
The Fund seeks long-term total return.

Josef Lakonishok

Menno Vermeulen

Puneet Mansharamani

Greg Sleight

Guy Lakonishok
Management’s Discussion of
Fund Performance
Fund Performance
Market Review
The U.S equity market as measured by the Russell 3000® Index finished up 23.98% for the twelve months ended October 31, 2017. Small cap stocks led the way with particularly strong returns immediately following the 2016 Presidential election. Large cap stocks as measured by the Russell 1000® Index returned 23.67%, while small cap stocks as measured by the Russell 2000® Index gained 27.85%. The Russell Midcap® Index finished up 21.09% for the twelve months ended October 31, 2017. Growth stocks significantly outperformed across all market capitalization segments based on the Russell Indices—The Russell Midcap® Growth Index gained 26.25% while the Russell Midcap® Value Index was up 17.12%.
Equity markets surged following the elections in November 2016, particularly small cap stocks, as the Russell 2000® Index returned over 11% in November alone. Markets have been broadly supported by strong economic data and improved corporate earnings. In 2017, U.S. GDP growth advanced 3.1% in the second quarter and 3.0% (preliminary) in the third quarter, both exceeding market expectations after advancing just 1.4% in the first quarter. In monetary policy news, the U.S. Federal Reserve (Fed) raised interest rates in December, March and June.
From a sector perspective, Technology and Financial stocks led the way among mid cap stocks over the period, each advancing over 30%. Financial stocks rallied in late 2016 and have largely benefitted from both the Fed interest rate hikes and positive economic data. Cyclical sectors, including Materials and Industrials, outperformed while more defensive segments of the market, namely Consumer Staples and Real Estate, lagged over the period. Energy stocks were also down 1.2% during the period.
Performance
The Harbor Mid Cap Value Fund returned 19.16% (Institutional Class), 18.84% (Administrative Class), 18.71% (Investor Class), and 19.22% (Retirement Class) compared to 17.12% for the Russell Midcap® Value Index for the fiscal year ended October 31, 2017. While value stocks as measured by the Russell Indices lagged over the period, the Fund outperformed its benchmark. Our comprehensive definition of value contributed to the strong results relative to the Russell Midcap® Value Index. We define value stocks as those that are cheap on multiple measures of valuation including cash flow, earnings, book value and dividend yield. While stocks that were cheap on book value lagged over the period, stocks that were cheap on cash flow and earnings, which we favor, performed well among mid cap stocks.
The Fund’s Energy exposure contributed to the strong relative performance in the period. The Fund was underweight Energy stocks which, were down 1.3%. The Fund was overweight refiners, which advanced over 30% and underweight oil & gas exploration and production stocks, which declined 10%. Holdings that performed particularly well included Valero Energy, PBF Energy and Tesoro Corp.
The Fund’s holdings in the Industrials sector also contributed to the relative outperformance, as names in the construction machinery, and aerospace and defense industries performed particularly well—top individual contributors included Wabash National Corp., Meritor, and Spirit Aerosystems. Industrials was also one of the top returning sectors over the period and the Fund’s overweight to the sector had a positive impact on relative returns. The Fund’s
39
Harbor Mid Cap Value Fund
Managers' Commentary—Continued
Managers' Commentary—Continued
| TOP TEN HOLDINGS (% of net assets) | |
| Ameriprise Financial Inc. | 1.8% |
| Public Service Enterprise Group Inc. | 1.7% |
| Lam Research Corp. | 1.6% |
| Valero Energy Corp. | 1.5% |
| Entergy Corp. | 1.4% |
| FirstEnergy Corp. | 1.4% |
| Lincoln National Corp. | 1.4% |
| Regions Financial Corp. | 1.4% |
| SunTrust Banks Inc. | 1.4% |
| Spirit AeroSystems Holdings Inc. | 1.3% |
overweight to Financials and Information Technology, the two best performing sectors, also contributed positively over the period. Additional stocks that added value included LAM Research and Applied Materials in the Technology sector, Ameriprise Financial, and chemical company Huntsman Corp.
Stock selection in the Consumer Discretionary sector was weak over the period as the Fund’s exposure to retail and restaurant stocks detracted. Holdings that struggled included Brinker International, Dick’s Sporting Goods, Foot Locker and Finish Line Inc. Other stocks that detracted included Chicago Bridge & Iron in the Industrial sector, grocery store Kroger and, Scana in the Utilities sector.
Outlook & Strategy
Our portfolio decision making process is quantitative and driven by (1) a proprietary model which ranks securities on fundamental measures of value and indicators of near-term appreciation potential and, (2) a portfolio construction process that controls for risk while maximizing the expected return of the portfolio. The objective of the model is to pick undervalued stocks with high near-term appreciation potential. The process is purely bottom-up with no emphasis placed on macro-economic analysis.
Sector weightings are a residual of our bottom-up stock selection process subject to minimum and maximum exposures to sectors and industries. The Fund’s most significant sector exposures on an absolute basis are to Financials, Industrials, Information Technology, and Consumer Discretionary stocks. Relative to its benchmark, the Fund is overweight Technology, Industrials, and Financial stocks. The Fund is underweight the Utilities, Real Estate, and Energy sectors.
The most significant change in sector weights was an increase in the Fund’s weight to Industrials. We initiated positions in American Airlines and added to current airline holdings United Continental Holdings and JetBlue Airways. We also initiated positions in highly ranked companies Manpower Group, Orbital ATK, Owens Corning and Snap-On Inc. in the Industrials sector. We reduced the Fund’s exposure to the Utilities sector as many Utilities are trading at what we consider to be relatively high valuations. We sold Ameren Corp, Centerpoint Energy and PPL Corp and reduced the Fund’s weight to AES Corp., American Electric Power, and Public Service Energy Group.
Even though equity markets continue to hit new highs, we believe the Fund trades at attractive valuations and we are still able to find attractively priced stocks across many sectors and industries to build the portfolio. The companies the Fund holds are generating strong cash flows and good earnings that we believe are attractively valued which is reflected in the Fund’s portfolio characteristics.
This report contains the current opinions of LSV Asset Management as of the date of this report and should not be considered as investment advice or a recommendation of any particular security, strategy or investment product. Such opinions are subject to change without notice and securities described herein may no longer be included in, or may at any time be removed from, the Fund’s portfolio. This report is distributed for informational purposes only. Information contained herein has been obtained from sources believed reliable, but not guaranteed.
Stocks of mid cap companies pose special risks, including possible illiquidity and greater price volatility than stocks of larger, more established companies. Equity securities, such as common stocks, are affected by company specific events and by movements in the overall stock markets in which those securities principally trade, among other factors. An adverse company specific event, or downturn in those stock markets, can depress the value of a particular company’s equity securities. For information on the different share classes and the risks associated with an investment in the Fund, please refer to the current prospectus.
40
Harbor Mid Cap Value Fund
Fund Summary—October 31, 2017 (Unaudited)
Fund Summary—October 31, 2017 (Unaudited)
| INSTITUTIONAL CLASS | |
| Fund # | 2023 |
| Cusip | 411511835 |
| Ticker | HAMVX |
| Inception Date | 03/01/2002 |
| Net Expense Ratio | 0.84% a |
| Total Net Assets (000s) | $739,122 |
| ADMINISTRATIVE CLASS | |
| Fund # | 2223 |
| Cusip | 411511728 |
| Ticker | HRMVX |
| Inception Date | 11/01/2002 |
| Net Expense Ratio | 1.09% a |
| Total Net Assets (000s) | $48,809 |
| INVESTOR CLASS | |
| Fund # | 2423 |
| Cusip | 411511736 |
| Ticker | HIMVX |
| Inception Date | 11/01/2002 |
| Net Expense Ratio | 1.21% a |
| Total Net Assets (000s) | $110,094 |
| RETIREMENT CLASS | |
| Fund # | 2523 |
| Cusip | 411512460 |
| Ticker | HNMVX |
| Inception Date | 03/01/2016 |
| Net Expense Ratio | 0.77% a |
| Total Net Assets (000s) | $89,942 |
Portfolio Statistics
| Portfolio | Benchmark | ||
| Weighted Average Market Cap (MM) | $12,134 | $13,729 | |
| Price/Earning Ratio (P/E) | 17.3x | 24.3x | |
| Price/Book Ratio (P/B) | 2.1x | 2.1x | |
| Beta vs. Russell Midcap® Value Index | 1.09 | N/A | |
| Portfolio Turnover (Year Ended 10/31/2017) | 22% | N/A |
Sector Allocation (% of investments)
(Excludes cash and short-term investments)

| a | Reflects a contractual management fee waiver effective through February 28, 2018 |
41
Harbor Mid Cap Value Fund
Fund Performance Summary (Unaudited)
Fund Performance Summary (Unaudited)
The graph compares a $50,000 investment in the Institutional Class shares of the Fund with the performance of the Russell Midcap® Value Index. The Fund’s performance assumes the reinvestment of all dividend and capital gain distributions.
CHANGE IN A $50,000 INVESTMENT
For the period 11/01/2007 through 10/31/2017

| TOTAL RETURNS For the periods ended 10/31/2017 | 1 Year | Annualized | Inception Date | Final Value of a $50,000 Investment | ||||||||||
| 5 Years | 10 Years | |||||||||||||
| Harbor Mid Cap Value Fund | ||||||||||||||
Institutional Class | 19.16% | 15.57% | 8.36% | 03/01/2002 | $111,596 | |||||||||
Administrative Class | 18.84 | 15.29 | 8.09 | 11/01/2002 | 108,860 | |||||||||
Investor Class | 18.71 | 15.15 | 7.96 | 11/01/2002 | 107,519 | |||||||||
Retirement Class1 | 19.22 | 15.58 | 8.36 | 03/01/2016 | 111,648 | |||||||||
| Comparative Index | ||||||||||||||
Russell Midcap® Value | 17.12% | 14.49% | 7.90% | — | $106,911 | |||||||||
As stated in the Fund’s current prospectus, the expense ratios were 0.86% (Net) and 0.87% (Gross) (Institutional Class); 1.11% (Net) and 1.12% (Gross) (Administrative Class); 1.23% (Net) and 1.24% (Gross) (Investor Class); and 0.78% (Net) and 0.79% (Gross) (Retirement Class). The net expense ratios reflect a contractual management fee waiver effective through 02/28/2018. The expense ratios in the prospectus may differ from the actual expense ratios for the period disclosed within this report. The expense ratios shown in the prospectus are based on the prior fiscal year, adjusted to reflect changes, if any, in contractual arrangements that occurred prior to the date of the prospectus (or supplement thereto, if applicable).
Performance data shown represents past performance and is no guarantee of future results. Past performance is net of management fees and expenses and reflects reinvested dividends and distributions, but does not reflect the deduction of taxes that a shareholder would pay on Fund distributions or upon the redemption of Fund shares. Past performance reflects the beneficial effect of any expense waivers or reimbursements, without which returns would have been lower. Investment returns and principal value will fluctuate and when redeemed may be worth more or less than their original cost. Returns for periods less than one year are not annualized. Current performance may be higher or lower and is available through the most recent month end at harborfunds.com or by calling 800-422-1050.
| 1 | Retirement Class shares commenced operations on March 1, 2016. The performance attributed to the Retirement Class shares prior to that date is that of the Institutional Class shares. Performance prior to March 1, 2016 has not been adjusted to reflect the lower expenses of Retirement Class shares. During this period, Retirement Class shares would have had returns similar to, but somewhat higher than, Institutional Class shares due to the fact that Retirement Class shares represent interests in the same portfolio as Institutional Class shares but are subject to lower expenses. |
42
Harbor Mid Cap Value Fund
Portfolio of Investments—October 31, 2017
Portfolio of Investments—October 31, 2017
Value, Cost, and Principal Amounts in Thousands
Equity Holdings (% of net assets)
(Excludes net cash and short-term investments of 1.0%)


| COMMON STOCKS—99.0% | |||
| Shares | Value | ||
| AEROSPACE & DEFENSE—4.3% | |||
| 35,500 | Huntington Ingalls Industries Inc. | $ 8,266 | |
| 53,100 | Moog Inc.* | 4,660 | |
| 52,800 | Orbital ATK Inc. | 7,019 | |
| 161,102 | Spirit AeroSystems Holdings Inc. | 12,904 | |
| 124,900 | Textron Inc. | 6,587 | |
| 85,800 | Triumph Group Inc. | 2,664 | |
| 42,100 | |||
| AIR FREIGHT & LOGISTICS—0.5% | |||
| 74,217 | Atlas Air Worldwide Holdings Inc.* | 4,553 | |
| AIRLINES—2.6% | |||
| 79,057 | Alaska Air Group Inc. | 5,220 | |
| 153,800 | American Airlines Group Inc. | 7,201 | |
| 315,600 | JetBlue Airways Corp.* | 6,044 | |
| 139,300 | United Continental Holdings Inc.* | 8,146 | |
| 26,611 | |||
| AUTO COMPONENTS—2.2% | |||
| 118,200 | American Axle & Manufacturing Holdings Inc.* | 2,103 | |
| 29,600 | Cooper-Standard Holdings Inc.* | 3,300 | |
| 277,200 | Goodyear Tire & Rubber Co. | 8,479 | |
| 46,300 | Lear Corp. | 8,130 | |
| 22,012 | |||
| AUTOMOBILES—0.4% | |||
| 91,600 | Harley-Davidson Inc. | 4,336 | |
| BANKS—6.6% | |||
| 120,000 | Banco Latinoamericano de Comercio Exterior SA (PA) | 3,364 | |
| 134,800 | CIT Group Inc. | 6,284 | |
| 138,500 | Citizens Financial Group Inc. | 5,264 | |
| 327,900 | Fifth Third Bancorp | 9,476 | |
| 495,200 | KeyCorp | 9,038 | |
| 905,300 | Regions Financial Corp. | 14,014 | |
| 225,100 | SunTrust Banks Inc. | 13,553 | |
| 113,400 | Zions Bancorporation | 5,269 | |
| 66,262 | |||
| BUILDING PRODUCTS—0.6% | |||
| 76,600 | Owens Corning Inc. | 6,334 | |
| CAPITAL MARKETS—3.0% | |||
| 111,000 | Ameriprise Financial Inc. | 17,376 | |
| 144,135 | Lazard Ltd. (BM) | 6,852 | |
| 121,300 | Legg Mason Inc. | 4,631 | |
| 28,859 | |||
| CHEMICALS—4.4% | |||
| 90,300 | A. Schulman Inc. | 3,549 | |
| 86,000 | Cabot Corp. | 5,243 | |
| 72,800 | Celanese Corp. | 7,594 | |
| 141,100 | Eastman Chemical Co. | 12,813 | |
43
Harbor Mid Cap Value Fund
Portfolio of Investments—Continued
Portfolio of Investments—Continued
Value, Cost, and Principal Amounts in Thousands
| COMMON STOCKS—Continued | |||
| Shares | Value | ||
| CHEMICALS—Continued | |||
| 289,700 | Huntsman Corp. | $ 9,276 | |
| 70,400 | Trinseo SA (LUX) | 4,998 | |
| 43,473 | |||
| COMMERCIAL SERVICES & SUPPLIES—0.4% | |||
| 20,712 | LSC Communications Inc. | 335 | |
| 228,100 | Pitney Bowes Inc. | 3,134 | |
| 55,233 | RR Donnelley & Sons Co. | 508 | |
| 3,977 | |||
| COMMUNICATIONS EQUIPMENT—1.1% | |||
| 232,600 | Juniper Networks Inc. | 5,776 | |
| 49,300 | NETGEAR Inc.* | 2,300 | |
| 64,600 | Plantronics Inc. | 2,930 | |
| 11,006 | |||
| CONSTRUCTION & ENGINEERING—0.2% | |||
| 86,400 | Tutor Perini Corp.* | 2,436 | |
| CONSUMER FINANCE—1.6% | |||
| 144,400 | Discover Financial Services | 9,607 | |
| 225,200 | Navient Corp. | 2,806 | |
| 56,500 | Nelnet Inc. | 3,307 | |
| 15,720 | |||
| CONTAINERS & PACKAGING—1.6% | |||
| 201,198 | Owens-Illinois Inc.* | 4,807 | |
| 64,200 | Packaging Corp. of America | 7,464 | |
| 51,800 | WestRock Co. | 3,177 | |
| 15,448 | |||
| DIVERSIFIED FINANCIAL SERVICES—0.5% | |||
| 120,200 | Voya Financial Inc. | 4,827 | |
| ELECTRIC UTILITIES—3.8% | |||
| 44,200 | American Electric Power Co. Inc. | 3,289 | |
| 82,400 | Edison International | 6,588 | |
| 162,200 | Entergy Corp. | 13,991 | |
| 409,500 | FirstEnergy Corp. | 13,493 | |
| 37,361 | |||
| ELECTRONIC EQUIPMENT, INSTRUMENTS & COMPONENTS—2.9% | |||
| 76,400 | Avnet Inc. | 3,041 | |
| 235,500 | Corning Inc. | 7,373 | |
| 480,500 | Flex Ltd. (SGP)* | 8,553 | |
| 41,800 | Tech Data Corp.* | 3,878 | |
| 196,236 | TTM Technologies Inc.* | 3,096 | |
| 154,200 | Vishay Intertechnology Inc. | 3,431 | |
| 29,372 | |||
| ENERGY EQUIPMENT & SERVICES—1.1% | |||
| 190,000 | Diamond Offshore Drilling Inc.* | 3,179 | |
| 629,600 | McDermott International Inc. (PA)* | 4,168 | |
| 74,800 | Oceaneering International Inc.* | 1,512 | |
| 131,800 | Rowan Cos. plc (UK)* | 1,889 | |
| 10,748 | |||
| EQUITY REAL ESTATE INVESTMENT TRUSTS (REITs)—10.1% | |||
| 181,700 | Brandywine Realty Trust | 3,178 | |
| 286,300 | CBL & Associates Properties Inc. | 2,245 | |
| 472,900 | DDR Corp. | 3,627 | |
| 507,836 | Franklin Street Properties Corp. | 5,078 | |
| 211,000 | Government Properties Income Trust | 3,834 | |
| COMMON STOCKS—Continued | |||
| Shares | Value | ||
| EQUITY REAL ESTATE INVESTMENT TRUSTS (REITs)—Continued | |||
| 188,700 | Hersha Hospitality Trust | $ 3,338 | |
| 229,600 | Hospitality Properties Trust | 6,562 | |
| 512,200 | Host Hotels & Resorts Inc. | 10,019 | |
| 733,500 | Lexington Realty Trust | 7,423 | |
| 243,500 | Mack-Cali Realty Corp. | 5,545 | |
| 263,000 | Medical Properties Trust Inc. | 3,479 | |
| 209,300 | OMEGA Healthcare Investors Inc. | 6,040 | |
| 320,900 | Piedmont Office Realty Trust Inc. | 6,206 | |
| 234,300 | Sabra Health Care REIT Inc. | 4,667 | |
| 209,812 | Select Income REIT | 5,069 | |
| 411,114 | Senior Housing Properties Trust | 7,565 | |
| 334,600 | Summit Hotel Properties Inc. | 5,290 | |
| 565,400 | Vereit Inc. | 4,461 | |
| 244,700 | Xenia Hotels & Resorts Inc. | 5,325 | |
| 98,951 | |||
| FOOD & STAPLES RETAILING—0.7% | |||
| 62,200 | Ingles Markets Inc. | 1,449 | |
| 240,200 | Kroger Co. | 4,972 | |
| 73,814 | Supervalu Inc.* | 1,203 | |
| 7,624 | |||
| FOOD PRODUCTS—1.6% | |||
| 67,500 | Archer Daniels Midland Co. | 2,759 | |
| 43,785 | Bunge Ltd. (BM) | 3,011 | |
| 32,700 | JM Smucker Co. | 3,468 | |
| 86,900 | Tyson Foods Inc. | 6,336 | |
| 15,574 | |||
| HEALTH CARE PROVIDERS & SERVICES—3.4% | |||
| 126,800 | Cardinal Health Inc. | 7,849 | |
| 35,000 | CIGNA Corp. | 6,903 | |
| 116,600 | HCA Holdings Inc.* | 8,821 | |
| 61,286 | LifePoint Health Inc.* | 2,951 | |
| 57,348 | Magellan Health Inc.* | 4,892 | |
| 73,000 | Owens & Minor Inc. | 1,793 | |
| 33,209 | |||
| HOTELS, RESTAURANTS & LEISURE—1.4% | |||
| 171,600 | Brinker International Inc. | 5,272 | |
| 87,500 | Wyndham Worldwide Corp. | 9,349 | |
| 14,621 | |||
| HOUSEHOLD DURABLES—2.4% | |||
| 99,700 | CalAtlantic Group Inc. | 4,919 | |
| 101,478 | Ethan Allen Interiors Inc. | 3,019 | |
| 65,200 | Meritage Homes Corp.* | 3,175 | |
| 183,453 | Pulte Group Inc. | 5,546 | |
| 40,100 | Whirlpool Corp. | 6,574 | |
| 23,233 | |||
| INDEPENDENT POWER & RENEWABLE ELECTRICITY PRODUCERS—0.3% | |||
| 283,200 | AES Corp. | 3,010 | |
| INSURANCE—8.5% | |||
| 65,100 | Aflac Inc. | 5,461 | |
| 38,100 | Allstate Corp. | 3,576 | |
| 47,574 | American Financial Group Inc. | 5,019 | |
| 83,000 | AmTrust Financial Services Inc. | 1,042 | |
| 40,100 | Assurant Inc. | 4,036 | |
| 88,400 | Assured Guaranty Ltd. (BM) | 3,280 | |
| 51,900 | Axis Capital Holdings Ltd. (BM) | 2,823 | |
| 44,900 | Everest Re Group Ltd. (BM) | 10,661 | |
44
Harbor Mid Cap Value Fund
Portfolio of Investments—Continued
Portfolio of Investments—Continued
Value, Cost, and Principal Amounts in Thousands
| COMMON STOCKS—Continued | |||
| Shares | Value | ||
| INSURANCE—Continued | |||
| 150,800 | Hartford Financial Services Group Inc. | $ 8,301 | |
| 179,800 | Lincoln National Corp. | 13,625 | |
| 186,500 | Maiden Holdings Ltd. (BM) | 1,539 | |
| 60,800 | Principal Financial Group Inc. | 4,004 | |
| 134,600 | Universal Insurance Holdings Inc. | 3,210 | |
| 139,000 | Unum Group | 7,234 | |
| 77,600 | Validus Holdings Ltd. (BM) | 4,041 | |
| 156,600 | XL Group Ltd. (BM) | 6,338 | |
| 84,190 | |||
| INTERNET SOFTWARE & SERVICES—0.0% | |||
| 190,700 | DHI Group Inc.* | 420 | |
| IT SERVICES—0.8% | |||
| 110,756 | Convergys Corp. | 2,850 | |
| 228,100 | Western Union Co. | 4,530 | |
| 7,380 | |||
| LEISURE PRODUCTS—0.3% | |||
| 184,500 | American Outdoor Brands Corp.* | 2,644 | |
| MACHINERY—4.9% | |||
| 42,500 | AGCO Corp. | 2,914 | |
| 170,200 | Briggs & Stratton Corp. | 4,289 | |
| 61,457 | Cummins Inc. | 10,871 | |
| 161,900 | Meritor Inc.* | 4,211 | |
| 86,200 | Oshkosh Corp. | 7,892 | |
| 29,300 | Snap-on Inc. | 4,623 | |
| 64,700 | Timken Co. | 3,051 | |
| 111,200 | Trinity Industries Inc. | 3,616 | |
| 327,400 | Wabash National Corp. | 7,367 | |
| 48,834 | |||
| MEDIA—0.9% | |||
| 76,200 | AMC Networks Inc.* | 3,877 | |
| 164,900 | Gannett Co. Inc. | 1,435 | |
| 98,500 | TEGNA Inc. | 1,205 | |
| 108,800 | Viacom Inc. | 2,614 | |
| 9,131 | |||
| METALS & MINING—0.6% | |||
| 78,500 | Reliance Steel & Aluminum Co. | 6,032 | |
| MORTGAGE REAL ESTATE INVESTMENT TRUSTS (REITs)—1.9% | |||
| 624,000 | Annaly Capital Management Inc. | 7,151 | |
| 171,000 | Invesco Mortgage Capital Inc. | 2,945 | |
| 298,300 | MFA Financial Inc. | 2,458 | |
| 191,300 | PennyMac Mortgage Investment Trust | 3,072 | |
| 316,100 | Two Harbors Investment Corp. | 3,098 | |
| 18,724 | |||
| MULTILINE RETAIL—0.9% | |||
| 33,600 | Dillard's Inc. | 1,707 | |
| 124,800 | Kohl's Corp. | 5,212 | |
| 102,800 | Macy's Inc. | 1,928 | |
| 8,847 | |||
| MULTI-UTILITIES—2.3% | |||
| 340,300 | Public Service Enterprise Group Inc. | 16,743 | |
| 136,840 | SCANA Corp. | 5,903 | |
| 22,646 | |||
| COMMON STOCKS—Continued | |||
| Shares | Value | ||
| OIL, GAS & CONSUMABLE FUELS—3.6% | |||
| 47,100 | Andeavor Corp. | $ 5,004 | |
| 89,800 | Marathon Petroleum Corp. | 5,365 | |
| 192,400 | Murphy Oil Corp. | 5,147 | |
| 163,700 | PBF Energy Inc. | 4,742 | |
| 66,300 | Ship Finance International Ltd. (BM) | 988 | |
| 183,400 | Valero Energy Corp. | 14,468 | |
| 35,714 | |||
| PAPER & FOREST PRODUCTS—0.5% | |||
| 98,600 | Domtar Corp. | 4,666 | |
| PHARMACEUTICALS—1.1% | |||
| 41,200 | Jazz Pharmaceuticals plc (IE)* | 5,831 | |
| 110,150 | Lannett Co. Inc.* | 2,192 | |
| 84,495 | Mylan NV (NET)* | 3,017 | |
| 11,040 | |||
| PROFESSIONAL SERVICES—0.6% | |||
| 47,700 | ManpowerGroup Inc. | 5,880 | |
| ROAD & RAIL—0.7% | |||
| 74,200 | ArcBest Corp. | 2,419 | |
| 62,800 | Ryder System Inc. | 5,092 | |
| 7,511 | |||
| SEMICONDUCTORS & SEMICONDUCTOR EQUIPMENT—5.2% | |||
| 475,000 | Amkor Technology Inc.* | 5,496 | |
| 178,800 | Applied Materials Inc. | 10,090 | |
| 84,900 | Cirrus Logic Inc.* | 4,754 | |
| 74,800 | Lam Research Corp. | 15,601 | |
| 409,900 | On Semiconductor Corp.* | 8,739 | |
| 141,100 | Teradyne Inc. | 6,052 | |
| 50,732 | |||
| SOFTWARE—0.3% | |||
| 87,700 | CA Inc. | 2,840 | |
| SPECIALTY RETAIL—3.3% | |||
| 92,800 | Bed Bath & Beyond Inc. | 1,847 | |
| 68,800 | Dick's Sporting Goods Inc. | 1,683 | |
| 123,900 | Finish Line Inc. | 1,149 | |
| 53,600 | Foot Locker Inc. | 1,612 | |
| 89,100 | GameStop Corp. | 1,665 | |
| 138,900 | Gap Inc. | 3,610 | |
| 73,700 | Group 1 Automotive Inc. | 5,791 | |
| 61,063 | Murphy USA Inc.* | 4,541 | |
| 677,800 | Office Depot Inc. | 2,101 | |
| 76,700 | Penske Automotive Group Inc. | 3,576 | |
| 26,700 | The Children's Place Retail Stores Inc. | 2,905 | |
| 30,480 | |||
| TECHNOLOGY HARDWARE, STORAGE & PERIPHERALS—3.3% | |||
| 242,314 | HP Inc. | 5,222 | |
| 197,600 | NCR Corp.* | 6,341 | |
| 112,600 | NetApp Inc. | 5,002 | |
| 143,800 | Seagate Technology plc (IE) | 5,316 | |
| 65,200 | Western Digital Corp. | 5,820 | |
| 189,900 | Xerox Corp. | 5,756 | |
| 33,457 | |||
| TEXTILES, APPAREL & LUXURY GOODS—0.4% | |||
| 38,500 | Carter's Inc. | 3,724 | |
45
Harbor Mid Cap Value Fund
Portfolio of Investments—Continued
Portfolio of Investments—Continued
Value, Cost, and Principal Amounts in Thousands
| COMMON STOCKS—Continued | |||
| Shares | Value | ||
| THRIFTS & MORTGAGE FINANCE—0.8% | |||
| 249,400 | MGIC Investment Corp.* | $ 3,566 | |
| 185,900 | Radian Group Inc. | 3,897 | |
| 7,463 | |||
| TOBACCO—0.1% | |||
| 15,991 | Universal Corp. | 917 | |
| TRADING COMPANIES & DISTRIBUTORS—0.3% | |||
| 113,600 | Aircastle Ltd. (BM) | 2,642 | |
| TOTAL COMMON STOCKS | |||
(Cost $844,404) | 977,571 | ||
| SHORT-TERM INVESTMENTS—0.9% | |||
| (Cost $9,351) | |||
| Principal Amount | Value | ||
| REPURCHASE AGREEMENTS | |||
| $ | 9,351 | Repurchase Agreement with Fixed Income Clearing Corp. dated October 31, 2017 due November 01, 2017 at 0.001% collateralized by U.S. Treasury Notes (value $9,540) | $ 9,351 |
| TOTAL INVESTMENTS—99.9% | |||
(Cost $853,755) | 986,922 | ||
CASH AND OTHER ASSETS, LESS LIABILITIES—0.1% | 1,045 | ||
TOTAL NET ASSETS—100.0% | $987,967 | ||
FAIR VALUE MEASUREMENTS
Repurchase Agreements valued at $9,351 are classified as Level 2. All other holdings at October 31, 2017 (as disclosed in the preceding Portfolio of Investments) are classified as Level 1. There were no Level 3 holdings at October 31, 2017 or 2016 and no transfers between levels during the year.
For more information on valuation inputs and their aggregation into the levels identified above, please refer to the Fair Value Measurements and Disclosures in Note 2 of the accompanying Notes to Financial Statements.
| * | Non-income producing security |
| BM | Bermuda |
| IE | Ireland |
| LUX | Luxembourg |
| NET | Netherlands |
| PA | Panama |
| SGP | Singapore |
| UK | United Kingdom |
The accompanying notes are an integral part of the Financial Statements.
46
Harbor Small Cap Value Fund
Manager’s Commentary (Unaudited)
Manager’s Commentary (Unaudited)
Subadviser
EARNEST Partners LLC
1180 Peachtree St. NE
Suite 2300
Suite 2300
Atlanta, GA 30309
Portfolio Manager
Paul Viera
Since 2001
Since 2001
EARNEST Partners has subadvised the Fund since 2001.
Investment Objective
The Fund seeks long-term total return.

Paul Viera
Management’s Discussion of
Fund Performance
Fund Performance
Market Review
The U.S. equity markets were strongly positive during the 12-month period ended October 31, 2017. The U.S. small cap market, represented by the Russell 2000® Index, ended the period up 27.85% while the U.S. large cap Russell 1000® Index gained 23.67%. The international equity markets were also higher as developed countries, represented by the MSCI EAFE Index, finished the period up 23.44%, while the MSCI Emerging Markets Index advanced by 26.45% during the same period.
Investors paid close attention to the U.S. Federal Reserve (Fed) most recently in anticipation of rate changes and reduction of the Fed’s balance sheet. While the Fed unanimously voted to maintain the current target range for the federal funds rate at 1.00% to 1.25%, it did suggest that a further hike is possible by the end of the calendar year. Additionally, it noted that it would begin to reduce its $4.5 trillion balance sheet beginning in October, another step in its efforts to increase interest rates from historically low levels. The Fed noted that while higher prices in the aftermath of the hurricanes will likely boost inflation in the short-term, inflation on a 12-month basis is expected to remain below its target of 2%. The 2017 GDP growth pierced 3.0% in the back half of the period and the unemployment rate remained around 4%. During the trailing 12-month period ended October 31, 2017, the U.S. 10-year treasury rate climbed from 1.9 to 2.4%. Most interestingly, 2017 marks the first year in history the Dow Jones Industrial Average reached four 1,000-point milestones in a year. The domestic equity markets continue to grind higher on the back of positive earnings and stronger than expected economic growth.
Performance
The Harbor Small Cap Value Fund posted a return of 33.00% (Institutional Class), 32.67% (Administrative Class), 32.49% (Investor Class), and 33.06% (Retirement Class) for the period ended October 31, 2017. The Fund outperformed its benchmark, the Russell 2000® Value Index, which returned 24.81% during the period. Stock selection was positive during the period and was particularly strong in Information Technology. The Fund also maintained a relative overweight to the sector which contributed to performance during the period.
Contributing to performance, Coherent designs, manufactures, and markets lasers, precision optics, and related accessories used in a diverse range of commercial and scientific research applications. Coherent is thought of as the industry’s high-quality, high-priced supplier of laser systems. Coherent outperformed in the period on the back of strong revenues and earnings as demand for its excimer lasers used in the manufacture of flat panel displays continued to ramp up. Coherent is the only viable supplier of such laser annealing systems and we believe should continue to enjoy healthy growth and margin prospects as high-quality displays continue to penetrate the market. The stock was up 152% during the period.
Detracting from performance, MEDNAX, Inc. is a national medical group comprising the nation’s leading providers of neonatal, anesthesia, maternal-fetal and pediatric medical and surgical subspecialty services. MEDNAX physician practices care for roughly 25% of all neonatal intensive care units (NICUs) in the United States. The company continued to be very active in the mergers & acquisitions space, consolidating the companies under a single company umbrella leveraging administrative services and best practices. MEDNAX traded down 28% during the period due to weaker than expected results. Within the company’s anesthesiology segment the payor-mix shifted towards more Medicaid and uninsured which reimburses at a lower rate differential than third party or Medicare. Looking forward, we believe MEDNAX’s core business of neonatology is in a relatively stable reimbursement environment, providing strong cash flow for expansion into anesthesia. Recent expansion into anesthesia will diversify the company’s payer mix away from Medicaid (which pays for many NICU stays) into Medicare (which covers most surgeries in the U.S.).
47
Harbor Small Cap Value Fund
Manager’s Commentary—Continued
Manager’s Commentary—Continued
| TOP TEN HOLDINGS (% of net assets) | |
| Coherent Inc. | 4.3% |
| Entegris Inc. | 3.9% |
| Advanced Energy Industries Inc. | 3.3% |
| Monolithic Power Systems Inc. | 3.3% |
| Global Payments Inc. | 3.1% |
| Hexcel Corp. | 3.1% |
| Littelfuse Inc. | 2.7% |
| Cabot Microelectronics Corp. | 2.5% |
| Catalent Inc. | 2.5% |
| Raymond James Financial Inc. | 2.2% |
Outlook & Strategy
As of October 31, 2017, the Fund had an overweight in the Industrials, Health Care, and Information Technology sectors and an underweight in Financials, Real Estate, Consumer Discretionary, and Utilities. The Fund had a market weight to Energy, Materials, Telecommunications, and Consumer Staples. The Fund’s relative overweight and underweight positions are an outgrowth of where we believe we are finding good individual investment opportunities.
In managing the Harbor Small Cap Value Fund, we seek companies with share prices that we believe do not fully reflect their earnings growth outlook. Going forward, we will continue to employ our three-step investment methodology: screen the broad universe to identify stocks that we believe are best positioned to outperform, measure and manage downside risk to the benchmark, and perform in-depth, thorough, fundamental research to find what we believe are the best stocks to include in the Fund.
This report contains the current opinions of EARNEST Partners LLC as of the date of this report and should not be considered as investment advice or a recommendation of any particular security, strategy or investment product. Such opinions are subject to change without notice and securities described herein may no longer be included in, or may at any time be removed from, the Fund’s portfolio. This report is distributed for informational purposes only. Information contained herein has been obtained from sources believed reliable, but not guaranteed.
Stocks of small cap companies pose special risks, including possible illiquidity and greater price volatility than stocks of larger, more established companies. Equity securities, such as common stocks, are affected by company specific events and by movements in the overall stock markets in which those securities principally trade, among other factors. An adverse company specific event, or downturn in those stock markets, can depress the value of a particular company’s equity securities. For information on the different share classes and the risks associated with an investment in the Fund, please refer to the current prospectus.
48
Harbor Small Cap Value Fund
Fund Summary—October 31, 2017 (Unaudited)
Fund Summary—October 31, 2017 (Unaudited)
| INSTITUTIONAL CLASS | |
| Fund # | 2022 |
| Cusip | 411511843 |
| Ticker | HASCX |
| Inception Date | 12/14/2001 |
| Net Expense Ratio | 0.87% |
| Total Net Assets (000s) | $1,081,412 |
| ADMINISTRATIVE CLASS | |
| Fund # | 2222 |
| Cusip | 411511710 |
| Ticker | HSVRX |
| Inception Date | 11/01/2002 |
| Net Expense Ratio | 1.12% |
| Total Net Assets (000s) | $4,462 |
| INVESTOR CLASS | |
| Fund # | 2422 |
| Cusip | 411511694 |
| Ticker | HISVX |
| Inception Date | 11/01/2002 |
| Net Expense Ratio | 1.24% |
| Total Net Assets (000s) | $37,548 |
| RETIREMENT CLASS | |
| Fund # | 2522 |
| Cusip | 411512452 |
| Ticker | HNVRX |
| Inception Date | 03/01/2016 |
| Net Expense Ratio | 0.81% |
| Total Net Assets (000s) | $57,196 |
Portfolio Statistics
| Portfolio | Benchmark | ||
| Weighted Average Market Cap (MM) | $4,983 | $2,035 | |
| Price/Earning Ratio (P/E) | 27.6x | 24.3x | |
| Price/Book Ratio (P/B) | 3.2x | 1.7x | |
| Beta vs. Russell 2000® Value Index | 0.84 | N/A | |
| Portfolio Turnover (Year Ended 10/31/2017) | 8% | N/A |
Sector Allocation (% of investments)
(Excludes cash and short-term investments)

49
Harbor Small Cap Value Fund
Fund Performance Summary (Unaudited)
Fund Performance Summary (Unaudited)
The graph compares a $50,000 investment in the Institutional Class shares of the Fund with the performance of the Russell 2000® Value Index. The Fund’s performance assumes the reinvestment of all dividend and capital gain distributions.
CHANGE IN A $50,000 INVESTMENT
For the period 11/01/2007 through 10/31/2017

| TOTAL RETURNS For the periods ended 10/31/2017 | 1 Year | Annualized | Inception Date | Final Value of a $50,000 Investment | ||||||||||
| 5 Years | 10 Years | |||||||||||||
| Harbor Small Cap Value Fund | ||||||||||||||
Institutional Class | 33.00% | 17.12% | 8.52% | 12/14/2001 | $113,269 | |||||||||
Administrative Class | 32.67 | 16.81 | 8.25 | 11/01/2002 | 110,473 | |||||||||
Investor Class | 32.49 | 16.68 | 8.12 | 11/01/2002 | 109,148 | |||||||||
Retirement Class1 | 33.06 | 17.14 | 8.53 | 03/01/2016 | 113,399 | |||||||||
| Comparative Index | ||||||||||||||
Russell 2000® Value | 24.81% | 13.58% | 7.04% | — | $ 98,723 | |||||||||
As stated in the Fund’s current prospectus, the expense ratios were 0.87% (Institutional Class); 1.12% (Administrative Class); 1.24% (Investor Class); and 0.79% (Retirement Class). The expense ratios in the prospectus may differ from the actual expense ratios for the period disclosed within this report. The expense ratios shown in the prospectus are based on the prior fiscal year, adjusted to reflect changes, if any, in contractual arrangements that occurred prior to the date of the prospectus (or supplement thereto, if applicable).
Performance data shown represents past performance and is no guarantee of future results. Past performance is net of management fees and expenses and reflects reinvested dividends and distributions, but does not reflect the deduction of taxes that a shareholder would pay on Fund distributions or upon the redemption of Fund shares. Past performance reflects the beneficial effect of any expense waivers or reimbursements, without which returns would have been lower. Investment returns and principal value will fluctuate and when redeemed may be worth more or less than their original cost. Returns for periods less than one year are not annualized. Current performance may be higher or lower and is available through the most recent month end at harborfunds.com or by calling 800-422-1050.
| 1 | Retirement Class shares commenced operations on March 1, 2016. The performance attributed to the Retirement Class shares prior to that date is that of the Institutional Class shares. Performance prior to March 1, 2016 has not been adjusted to reflect the lower expenses of Retirement Class shares. During this period, Retirement Class shares would have had returns similar to, but somewhat higher than, Institutional Class shares due to the fact that Retirement Class shares represent interests in the same portfolio as Institutional Class shares but are subject to lower expenses. |
50
Harbor Small Cap Value Fund
Portfolio of Investments—October 31, 2017
Portfolio of Investments—October 31, 2017
Value, Cost, and Principal Amounts in Thousands
Equity Holdings (% of net assets)
(Excludes net cash and short-term investments of 2.8%)

| COMMON STOCKS—97.2% | |||
| Shares | Value | ||
| AEROSPACE & DEFENSE—6.9% | |||
| 611,994 | Hexcel Corp. | $ 37,142 | |
| 201,189 | Moog Inc.* | 17,656 | |
| 153,380 | Teledyne Technologies Inc.* | 26,069 | |
| 80,867 | |||
| BANKS—4.2% | |||
| 432,051 | Sterling Bancorp | 10,823 | |
| 483,887 | Trustmark Corp. | 15,939 | |
| 289,323 | United Bankshares Inc. | 10,401 | |
| 300,831 | WesBanco Inc. | 12,154 | |
| 49,317 | |||
| CAPITAL MARKETS—4.6% | |||
| 276,936 | Eaton Vance Corp. | 13,977 | |
| 310,076 | Raymond James Financial Inc. | 26,288 | |
| 276,753 | Stifel Financial Corp. | 14,676 | |
| 54,941 | |||
| CHEMICALS—3.6% | |||
| 303,513 | Cabot Corp. | 18,502 | |
| 239,624 | Scotts Miracle-Gro Co. | 23,872 | |
| 42,374 | |||
| CONSUMER FINANCE—1.8% | |||
| 328,775 | Firstcash Inc. | 20,992 | |
| COMMON STOCKS—Continued | |||
| Shares | Value | ||
| ELECTRICAL EQUIPMENT—2.1% | |||
| 356,040 | EnerSys | $ 24,699 | |
| ELECTRONIC EQUIPMENT, INSTRUMENTS & COMPONENTS—11.9% | |||
| 193,080 | Coherent Inc.* | 50,724 | |
| 445,582 | FLIR Systems Inc. | 20,862 | |
| 152,397 | Littelfuse Inc. | 31,851 | |
| 248,281 | OSI Systems Inc.* | 21,943 | |
| 449,125 | Sanmina Corp.* | 14,698 | |
| 140,078 | |||
| ENERGY EQUIPMENT & SERVICES—2.5% | |||
| 167,806 | Core Laboratories NV | 16,764 | |
| 544,369 | Oil States International Inc.* | 12,548 | |
| 29,312 | |||
| EQUITY REAL ESTATE INVESTMENT TRUSTS (REITs)—3.8% | |||
| 128,298 | EastGroup Properties Inc. | 11,622 | |
| 917,203 | Medical Properties Trust Inc. | 12,135 | |
| 131,295 | SBA Communications Corp.* | 20,637 | |
| 44,394 | |||
| FOOD & STAPLES RETAILING—0.8% | |||
| 238,414 | United Natural Foods Inc.* | 9,243 | |
| FOOD PRODUCTS—1.5% | |||
| 944,120 | Darling Ingredients Inc.* | 17,230 | |
| GAS UTILITIES—3.6% | |||
| 503,453 | South Jersey Industries Inc. | 17,102 | |
| 291,798 | WGL Holdings Inc. | 25,007 | |
| 42,109 | |||
| HEALTH CARE EQUIPMENT & SUPPLIES—1.6% | |||
| 196,396 | Cantel Medical Corp. | 19,263 | |
| HEALTH CARE PROVIDERS & SERVICES—3.5% | |||
| 193,551 | Centene Corp.* | 18,130 | |
| 301,079 | MEDNAX Inc.* | 13,184 | |
| 159,289 | Molina Healthcare Inc.* | 10,805 | |
| 42,119 | |||
| HOTELS, RESTAURANTS & LEISURE—2.3% | |||
| 872,489 | Bloomin' Brands Inc. | 15,513 | |
| 470,856 | Penn National Gaming Inc.* | 12,284 | |
| 27,797 | |||
| HOUSEHOLD DURABLES—1.7% | |||
| 401,865 | Meritage Homes Corp.* | 19,571 | |
| INSURANCE—6.6% | |||
| 560,037 | American Equity Investment Life Holding Co. | 16,527 | |
| 330,312 | Horace Mann Educators Corp. | 14,468 | |
| 171,436 | Reinsurance Group of America Inc. | 25,609 | |
| 192,142 | State Auto Financial Corp. | 4,926 | |
| 366,919 | United Fire Group Inc. | 16,911 | |
| 78,441 | |||
| IT SERVICES—4.6% | |||
| 354,479 | Global Payments Inc. | 36,848 | |
| 373,487 | ManTech International Corp. | 17,334 | |
| 54,182 | |||
| MACHINERY—11.2% | |||
| 265,920 | Albany International Corp. | 16,048 | |
51
Harbor Small Cap Value Fund
Portfolio of Investments—Continued
Portfolio of Investments—Continued
Value, Cost, and Principal Amounts in Thousands
| COMMON STOCKS—Continued | |||
| Shares | Value | ||
| MACHINERY—Continued | |||
| 401,464 | Altra Industrial Motion Corp. | $ 19,230 | |
| 538,579 | Franklin Electric Co. Inc. | 24,505 | |
| 1,942,816 | Mueller Water Products Inc. | 23,197 | |
| 166,177 | Snap-on Inc. | 26,220 | |
| 474,078 | Timken Co. | 22,353 | |
| 131,553 | |||
| OIL, GAS & CONSUMABLE FUELS—1.5% | |||
| 373,555 | Gulfport Energy Corp.* | 5,117 | |
| 245,253 | PDC Energy Inc.* | 12,491 | |
| 17,608 | |||
| PHARMACEUTICALS—2.4% | |||
| 677,256 | Catalent Inc.* | 28,844 | |
| SEMICONDUCTORS & SEMICONDUCTOR EQUIPMENT—13.0% | |||
| 459,739 | Advanced Energy Industries Inc.* | 38,949 | |
| 309,029 | Cabot Microelectronics Corp. | 29,874 | |
| 1,416,631 | Entegris Inc. | 46,394 | |
| 319,164 | Monolithic Power Systems Inc. | 38,833 | |
| 154,050 | |||
| TRADING COMPANIES & DISTRIBUTORS—1.5% | |||
| 300,301 | GATX Corp. | 17,841 | |
| TOTAL COMMON STOCKS | |||
(Cost $629,944) | 1,146,825 | ||
| SHORT-TERM INVESTMENTS—2.8% | |||
| (Cost $33,578) | |||
| Principal Amount | Value | ||
| REPURCHASE AGREEMENTS | |||
| $ | 33,578 | Repurchase Agreement with Fixed Income Clearing Corp. dated October 31, 2017 due November 01, 2017 at 0.001% collateralized by U.S. Treasury Notes (value $34,254) | $ 33,578 |
| TOTAL INVESTMENTS—100.0% | |||
(Cost $663,522) | 1,180,403 | ||
CASH AND OTHER ASSETS, LESS LIABILITIES—0.0% | 215 | ||
TOTAL NET ASSETS—100.0% | $1,180,618 | ||
FAIR VALUE MEASUREMENTS
Repurchase Agreements valued at $33,578 are classified as Level 2. All other holdings at October 31, 2017 (as disclosed in the preceding Portfolio of Investments) are classified as Level 1. There were no Level 3 holdings at October 31, 2017 or 2016 and no transfers between levels during the year.
For more information on valuation inputs and their aggregation into the levels identified above, please refer to the Fair Value Measurements and Disclosures in Note 2 of the accompanying Notes to Financial Statements.
| * | Non-income producing security |
The accompanying notes are an integral part of the Financial Statements.
52
Harbor Small Cap Value Opportunities Fund
Manager’s Commentary (Unaudited)
Manager’s Commentary (Unaudited)
Subadviser
Sapience Investments, LLC
520 Newport Center Dr.
Suite 650
Suite 650
Newport Beach, CA
92660
92660
Portfolio Manager
Samir Sikka
Since 2017
Since 2017
Sapience Investments, LLC has subadvised the Fund since 2017.
Investment Objective
The Fund seeks long-term total return.

Samir Sikka
Management’s Discussion of
Fund Performance
Fund Performance
Market Review
The U.S. equity markets moved higher during the period August 1, 2017, the Fund’s inception, through October 31, 2017 and volatility, as measured by the CBOE Volatility Index, dropped below levels last experienced in December 2006. Strong consumer confidence, respectable corporate earnings growth, and solid economic data appear to be driving the momentum and calm in U.S. equity markets. Among U.S. small caps, growth stocks outpaced their value counterparts during the period. Small-cap stocks outperformed large- and mid-cap equities over this same period.
The strength in economic data as well as rising inflation has also provided more comfort to the U.S. Federal Reserve (Fed). In September, Chair Janet Yellen announced the Fed would initiate its balance sheet normalization program. The Fed also reaffirmed its intention to raise interest rates one more time in 2017 and three times in 2018. In October, the Fed was set to allow approximately six billion dollars of government bond interest to mature with the expectation that this amount would increase over time.
Performance
For the period August 1, 2017 through October 31, 2017, the Harbor Small Cap Value Opportunities Fund underperformed its benchmark, the Russell 2000® Value Index. The Fund returned 0.70% (Institutional Class), 0.60% (Administrative Class), 0.60% (Investor Class), 0.70% (Retirement Class) while the Russell 2000® Value Index rose 4.59%. In a momentum-driven market, we expect the Fund to underperform, as was the case for this period.
From a relative perspective, stock selection caused the performance shortfall between the Fund and the Russell 2000® Value Index. More specifically, compared with benchmark, security selection hindered performance in the Health Care, Consumer Discretionary, and Consumer Staples sectors. In the Health Care sector, Envision Healthcare Corp. was the largest detractor. Declining hospital volumes coupled with lowered guidance and concerns regarding Envision’s exposure to Florida post-hurricane Irma hindered the company’s stock price during the period. These concerns overshadowed Envision’s announcement regarding its definitive agreement to sell its American Medical Response (AMR) subsidiary. Although we believe this sale is a positive for Envision, we also believe the market is not allocating full credit to the company for the value of this asset sale. Further exacerbating the situation is the temporary imbalance in Envision’s financials. Envision’s management team has proactively excluded the ambulance subsidiary from its EBITDA, while simultaneously not reporting the cash that it expects to receive for this transaction (approximately $2.4 billion in cash). Within Consumer Discretionary, Party City Holdco Inc. detracted the most value from relative return. Party City’s stock price declined after rumors concerning a potential takeout did not materialize. Party City’s shares rebounded slightly after reporting results that were arguably better than expectation given the current retail backdrop. We believe Party City is somewhat misunderstood in the marketplace as it is viewed as a challenged retailer. However, Party City operates as a leader in a niche industry—party goods—with dominant share in both retail and wholesale segments in the U.S. and with a smaller footprint internationally that we believe should grow over time. TreeHouse Foods, Inc. was the worst performer in the Consumer Staples sector. The company’s shares declined during the period after the company posted weak earnings results and lowered its guidance for the year. Despite this revision in guidance, we believe TreeHouse’s experienced management team will deliver on the anticipated Ralcorp acquisition synergies and may implement additional cost cuts. Additionally, as a supplier to Amazon, TreeHouse is poised to benefit if Amazon’s grocery business continues to expand. This was the primary factor behind the company adjusting its margins lower but increasing the revenue growth rate in its long-term model.
53
Harbor Small Cap Value Opportunities Fund
Manager’s Commentary—Continued
Manager’s Commentary—Continued
| TOP TEN HOLDINGS (% of net assets) | |
| Signet Jewelers Ltd. | 4.5% |
| Michaels Cos Inc. | 3.9% |
| Sterling Bancorp | 3.1% |
| Envision Healthcare Corp. | 2.6% |
| Evertec Inc. | 2.6% |
| Forum Energy Technologies Inc. | 2.6% |
| Aspen Insurance Holdings Ltd. | 2.5% |
| RSP Permian Inc. | 2.4% |
| TreeHouse Foods Inc. | 2.4% |
| WPX Energy Inc. | 2.3% |
On the positive side, an overweight and security selection in the Industrials sector enhanced relative performance. Additionally, stock selection in Energy augmented return relative to the benchmark. In Industrials, Continental Building Products, Inc. added the most value to relative performance. Continental’s shares advanced after hurricane season shifted into full force with hurricane Irma pummeling the southeast. The company generates a portion of its sales in this region and it is anticipated that Continental will benefit from the post-hurricane repair and restoration construction activity. Within the Energy sector, Oasis Petroleum Inc. was the top performer. During the period, shares of Oasis rebounded from lows experienced in the second quarter of 2017 after declining in commiseration with the overall Energy sector. In September, the company publicly offered its master limited partnership, Oasis Midstream Partners LP. This partnership represents approximately one third of Oasis’ midstream assets, and this offering has created tangible valuation in the public market for Oasis’ remaining midstream assets, which also benefited the company’s stock price during the period.
Outlook & Strategy
After several years of positive returns, investors appear to have become either fearless or complacent. The synchronized global economic recovery is taking shape against a backdrop of subdued market volatility. Markets have not only priced in an economic improvement but have also assumed that the recovery will be durable. While the current economic picture appears promising, we must not overlook the risks associated with high levels of debt in the global financial system and over dependence on accommodative central banks. As the Fed embarked on its unwinding of Quantitative Easing in October, we entered unfamiliar territory. Although well telegraphed by the Fed, the market’s reaction to these events is still unknown. We believe the current state of inertia in the financial markets requires an event to trigger a shift in investor mindset. A market pullback should result in increased volatility and a widening opportunity set. As fundamental value investors, facing a market that is starved of attractive investment opportunities, we would welcome such a development.
This report contains the current opinions of Sapience Investments, LLC as of the date of this report and should not be considered as investment advice or a recommendation of any particular security, strategy or investment product. Such opinions are subject to change without notice and securities described herein may no longer be included in, or may at any time be removed from, the Fund’s portfolio. This report is distributed for informational purposes only. Information contained herein has been obtained from sources believed reliable, but not guaranteed.
Stocks of small cap companies pose special risks, including possible illiquidity and greater price volatility than stocks of larger, more established companies. Equity securities, such as common stocks, are affected by company specific events and by movements in the overall stock markets in which those securities principally trade, among other factors. An adverse company specific event, or downturn in those stock markets, can depress the value of a particular company’s equity securities. For information on the different share classes and the risks associated with an investment in the Fund, please refer to the current prospectus.
54
Harbor Small Cap Value Opportunities Fund
Fund Summary—October 31, 2017 (Unaudited)
Fund Summary—October 31, 2017 (Unaudited)
| INSTITUTIONAL CLASS | |
| Fund # | 2041 |
| Cusip | 411512320 |
| Ticker | HSOVX |
| Inception Date | 08/01/2017 |
| Net Expense Ratio | 0.88% a,b |
| Total Net Assets (000s) | $24,655 |
| ADMINISTRATIVE CLASS | |
| Fund # | 2241 |
| Cusip | 411512312 |
| Ticker | HSAVX |
| Inception Date | 08/01/2017 |
| Net Expense Ratio | 1.13% a,b |
| Total Net Assets (000s) | $252 |
| INVESTOR CLASS | |
| Fund # | 2441 |
| Cusip | 411512296 |
| Ticker | HSIVX |
| Inception Date | 08/01/2017 |
| Net Expense Ratio | 1.25% a,b |
| Total Net Assets (000s) | $254 |
| RETIREMENT CLASS | |
| Fund # | 2541 |
| Cusip | 411512288 |
| Ticker | HSRVX |
| Inception Date | 08/01/2017 |
| Net Expense Ratio | 0.80% a,b |
| Total Net Assets (000s) | $30 |
Portfolio Statistics
| Portfolio | Benchmark | ||
| Weighted Average Market Cap (MM) | $3,152 | $2,035 | |
| Price/Earning Ratio (P/E) | 21.6x | 24.3x | |
| Price/Book Ratio (P/B) | 1.8x | 1.7x | |
| Beta vs. Russell 2000® Value Index | 0.95 | N/A | |
| Portfolio Turnover (Period Ended 10/31/2017) | 9% c | N/A |
Sector Allocation (% of investments)
(Excludes cash and short-term investments)

| a | Annualized |
| b | Reflects an expense limitation agreement (excluding interest expense, if any) effective through February 28, 2019 |
| c | Unannualized |
55
Harbor Small Cap Value Opportunities Fund
Fund Performance Summary (Unaudited)
Fund Performance Summary (Unaudited)
The graph compares a $50,000 investment in the Institutional Class shares of the Fund with the performance of the Russell 2000® Value Index. The Fund’s performance assumes the reinvestment of all dividend and capital gain distributions.
CHANGE IN A $50,000 INVESTMENT
For the period 08/01/2017 through 10/31/2017

| TOTAL RETURNS For the periods ended 10/31/2017 | 1 Year | 5 Years | Unannualized | Inception Date | Final Value of a $50,000 Investment | |||||||||
| Life of Fund | ||||||||||||||
| Harbor Small Cap Value Opportunities Fund | ||||||||||||||
Institutional Class | N/A | N/A | 0.70% | 08/01/2017 | $50,350 | |||||||||
Administrative Class | N/A | N/A | 0.60 | 08/01/2017 | 50,300 | |||||||||
Investor Class | N/A | N/A | 0.60 | 08/01/2017 | 50,300 | |||||||||
Retirement Class | N/A | N/A | 0.70 | 08/01/2017 | 50,350 | |||||||||
| Comparative Index | ||||||||||||||
Russell 2000® Value | N/A | N/A | 4.59% | — | $52,293 | |||||||||
As stated in the Fund’s current prospectus, the expense ratios were 0.88% (Net) and 1.59% (Gross) (Institutional Class); 1.13% (Net) and 1.84% (Gross) (Administrative Class); 1.25% (Net) and 1.96% (Gross) (Investor Class); and 0.80% (Net) and 1.51% (Gross) (Retirement Class). The net expense ratios reflect an expense limitation agreement effective through 02/28/2019. The expense ratios in the prospectus may differ from the actual expense ratios for the period disclosed within this report. The expense ratios shown in the prospectus are based on estimates for the current fiscal year.
Performance data shown represents past performance and is no guarantee of future results. Past performance is net of management fees and expenses and reflects reinvested dividends and distributions, but does not reflect the deduction of taxes that a shareholder would pay on Fund distributions or upon the redemption of Fund shares. Past performance reflects the beneficial effect of any expense waivers or reimbursements, without which returns would have been lower. Investment returns and principal value will fluctuate and when redeemed may be worth more or less than their original cost. Returns for periods less than one year are not annualized. Current performance may be higher or lower and is available through the most recent month end at harborfunds.com or by calling 800-422-1050.
56
Harbor Small Cap Value Opportunities Fund
Portfolio of Investments—October 31, 2017
Portfolio of Investments—October 31, 2017
Value, Cost, and Principal Amounts in Thousands
Equity Holdings (% of net assets)
(Excludes net cash and short-term investments of 2.1%)

| COMMON STOCKS—97.9% | |||
| Shares | Value | ||
| BANKS—15.7% | |||
| 12,850 | Bank of NT Butterfield & Son Ltd. (BM) | $ 480 | |
| 9,850 | Bankunited Inc. | 343 | |
| 7,700 | Cathay General Bancorp | 322 | |
| 18,800 | First Hawaiian Inc. | 550 | |
| 4,650 | Hancock Holding Co. | 227 | |
| 30,750 | Sterling Bancorp | 770 | |
| 5,250 | Texas Capital Bancshares Inc.* | 452 | |
| 4,600 | UMB Financial Corp. | 338 | |
| 5,650 | Wintrust Financial Corp. | 459 | |
| 3,941 | |||
| BUILDING PRODUCTS—1.3% | |||
| 11,950 | Continental Building Products Inc.* | 319 | |
| CAPITAL MARKETS—1.5% | |||
| 11,030 | Artisan Partners Asset Management Inc. | 380 | |
| COMMERCIAL SERVICES & SUPPLIES—4.0% | |||
| 9,650 | Kar Auction Services Inc. | 457 | |
| COMMON STOCKS—Continued | |||
| Shares | Value | ||
| COMMERCIAL SERVICES & SUPPLIES—Continued | |||
| 12,200 | Ritchie Bros Auctioneers Inc. (CAN) | $ 342 | |
| 14,200 | Steelcase Inc. | 206 | |
| 1,005 | |||
| CONSUMER FINANCE—1.5% | |||
| 11,930 | Onemain Holdings Inc.* | 379 | |
| CONTAINERS & PACKAGING—1.2% | |||
| 10,500 | Silgan Holdings Inc. | 307 | |
| ELECTRONIC EQUIPMENT, INSTRUMENTS & COMPONENTS—1.1% | |||
| 14,750 | VeriFone Holdings Inc.* | 282 | |
| ENERGY EQUIPMENT & SERVICES—4.0% | |||
| 46,510 | Forum Energy Technologies Inc.* | 670 | |
| 92,700 | Weatherford International plc (IE)* | 321 | |
| 991 | |||
| EQUITY REAL ESTATE INVESTMENT TRUSTS (REITs)—6.0% | |||
| 11,800 | Corecivic Inc. | 291 | |
| 9,900 | Education Realty Trust Inc. | 346 | |
| 23,150 | Outfront Media Inc. | 543 | |
| 20,450 | Physicians Realty Trust | 355 | |
| 1,535 | |||
| FOOD PRODUCTS—5.7% | |||
| 9,600 | Hain Celestial Group Inc.* | 346 | |
| 5,700 | Post Holdings Inc.* | 472 | |
| 9,050 | TreeHouse Foods Inc.* | 601 | |
| 1,419 | |||
| HEALTH CARE EQUIPMENT & SUPPLIES—1.0% | |||
| 5,200 | Integer Holdings Corp.* | 253 | |
| HEALTH CARE PROVIDERS & SERVICES—5.3% | |||
| 6,450 | Amedisys Inc.* | 310 | |
| 15,250 | Envision Healthcare Corp.* | 650 | |
| 8,450 | MEDNAX Inc.* | 370 | |
| 1,330 | |||
| INSURANCE—5.6% | |||
| 7,990 | Argo Group International Holdings Ltd. (BM) | 503 | |
| 14,500 | Aspen Insurance Holdings Ltd. (BM) | 622 | |
| 4,950 | First American Financial Corp. | 269 | |
| 1,394 | |||
| INTERNET SOFTWARE & SERVICES—1.9% | |||
| 20,300 | Cars.com Inc.* | 484 | |
| IT SERVICES—2.6% | |||
| 43,300 | Evertec Inc. (PRI) | 650 | |
| LIFE SCIENCES TOOLS & SERVICES—1.0% | |||
| 1,120 | BIO-RAD Laboratories Inc.* | 246 | |
| MACHINERY—4.3% | |||
| 9,750 | Actuant Corp. | 249 | |
| 3,697 | Altra Industrial Motion Corp. | 177 | |
| 4,230 | EnPro Industries Inc. | 354 | |
| 6,280 | Terex Corp. | 296 | |
| 1,076 | |||
| MARINE—1.2% | |||
| 4,300 | Kirby Corp.* | 305 | |
57
Harbor Small Cap Value Opportunities Fund
Portfolio of Investments—Continued
Portfolio of Investments—Continued
Value, Cost, and Principal Amounts in Thousands
| COMMON STOCKS—Continued | |||
| Shares | Value | ||
| MEDIA—0.1% | |||
| 979 | Liberty Global plc LiLAC Class A (UK)* | $ 21 | |
| MORTGAGE REAL ESTATE INVESTMENT TRUSTS (REITs)—1.5% | |||
| 24,300 | Redwood Trust Inc. | 382 | |
| MULTI-UTILITIES—1.4% | |||
| 6,160 | Northwestern Corp. | 365 | |
| OIL, GAS & CONSUMABLE FUELS—6.5% | |||
| 47,250 | Oasis Petroleum Inc.* | 446 | |
| 17,520 | RSP Permian Inc.* | 603 | |
| 51,950 | WPX Energy Inc.* | 586 | |
| 1,635 | |||
| PROFESSIONAL SERVICES—2.5% | |||
| 7,250 | Korn/Ferry International | 304 | |
| 21,350 | Resources Connection Inc. | 336 | |
| 640 | |||
| ROAD & RAIL—2.6% | |||
| 5,570 | Genesee & Wyoming Inc.* | 400 | |
| 6,300 | Knight-Swift Transportation Holdings Inc.* | 261 | |
| 661 | |||
| SPECIALTY RETAIL—14.1% | |||
| 204,200 | Ascena Retail Group Inc.* | 396 | |
| 50,900 | Michaels Cos Inc.* | 988 | |
| 47,700 | Party City Holdco Inc.* | 532 | |
| 29,400 | Sally Beauty Holdings Inc.* | 509 | |
| 17,400 | Signet Jewelers Ltd. | 1,141 | |
| 3,566 | |||
| COMMON STOCKS—Continued | |||
| Shares | Value | ||
| TECHNOLOGY HARDWARE, STORAGE & PERIPHERALS—1.6% | |||
| 21,200 | Diebold Nixdorf Inc. | $ 409 | |
| THRIFTS & MORTGAGE FINANCE—1.5% | |||
| 11,130 | Washington Federal Inc. | 387 | |
| TRADING COMPANIES & DISTRIBUTORS—1.2% | |||
| 7,190 | Air Lease Corp. | 312 | |
| TOTAL COMMON STOCKS | |||
(Cost $24,624) | 24,674 | ||
| SHORT-TERM INVESTMENTS—2.0% | |||
| (Cost $498) | |||
| Principal Amount | |||
| REPURCHASE AGREEMENTS | |||
| $ | 498 | Repurchase Agreement with Fixed Income Clearing Corp. dated October 31, 2017 due November 01, 2017 at 0.001% collateralized by U.S. Treasury Notes (value $510) | 498 |
| TOTAL INVESTMENTS—99.9% | |||
(Cost $25,122) | 25,172 | ||
CASH AND OTHER ASSETS, LESS LIABILITIES—0.1% | 19 | ||
TOTAL NET ASSETS—100.0% | $25,191 | ||
FAIR VALUE MEASUREMENTS
Repurchase Agreements valued at $498 are classified as Level 2. All other holdings at October 31, 2017 (as disclosed in the preceding Portfolio of Investments) are classified as Level 1. There were no Level 3 holdings at August 1, 2017 (inception) or October 31, 2017 and no transfers between levels during the period.
For more information on valuation inputs and their aggregation into the levels identified above, please refer to the Fair Value Measurements and Disclosures in Note 2 of the accompanying Notes to Financial Statements.
| * | Non-income producing security |
| BM | Bermuda |
| CAN | Canada |
| IE | Ireland |
| PRI | Puerto Rico |
| UK | United Kingdom |
The accompanying notes are an integral part of the Financial Statements.
58
Harbor Domestic Equity Funds
StatementS of Assets and Liabilities—October 31, 2017
StatementS of Assets and Liabilities—October 31, 2017
(All amounts in thousands, except per share amounts)
| Harbor Capital Appreciation Fund | Harbor Mid Cap Growth Fund | Harbor Small Cap Growth Fund | Harbor Small Cap Growth Opportunities Fund | Harbor Large Cap Value Fund | Harbor Mid Cap Value Fund | Harbor Small Cap Value Fund | Harbor Small Cap Value Opportunities Fund | |
| ASSETS | ||||||||
Investments, at identified cost* | $16,494,658 | $315,787 | $566,340 | $273,707 | $622,808 | $853,755 | $ 663,522 | $25,122 |
Investments, at value(Including securities loaned of $86,225, $0, $0, $0, $0, $0, $0 and $0) | $28,895,477 | $379,533 | $688,122 | $294,150 | $743,921 | $977,571 | $1,146,825 | $24,674 |
Repurchase agreements | 8,240 | 23,512 | 27,333 | 9,354 | 29,522 | 9,351 | 33,578 | 498 |
Cash | — | — | — | — | 1 | 1 | — | 1 |
| Receivables for: | ||||||||
Investments sold | 25,843 | 1,106 | 2,329 | 2,033 | — | 263 | — | — |
Capital shares sold | 31,169 | 212 | 262 | 390 | 1,896 | 1,171 | 1,934 | — |
Dividends | 11,799 | 58 | 29 | 18 | 386 | 1,030 | 500 | 9 |
Interest | — | 1 | — | — | — | — | — | — |
Securities lending income | 3 | — | — | — | — | — | — | — |
Withholding tax | 1,812 | — | — | — | 55 | — | — | — |
Prepaid registration fees | 45 | 33 | 31 | 9 | 36 | 23 | 40 | 2 |
Other assets | 1,553 | 49 | 48 | 7 | 68 | 29 | 70 | 86 |
Total Assets | 28,975,941 | 404,504 | 718,154 | 305,961 | 775,885 | 989,439 | 1,182,947 | 25,270 |
| LIABILITIES | ||||||||
| Payables for: | ||||||||
Investments purchased | 32,012 | 374 | 9,130 | 652 | 8,376 | — | — | 21 |
Foreign currency spot contracts | 7 | — | — | — | — | — | — | — |
Capital shares reacquired | 17,518 | 133 | 389 | 94 | 294 | 563 | 1,136 | — |
Collateral for securities loaned | 90,739 | — | — | — | — | — | — | — |
| Accrued expenses: | ||||||||
Management fees | 13,273 | 254 | 449 | 195 | 363 | 613 | 735 | 16 |
12b-1 fees | 430 | 28 | 2 | — | 26 | 34 | 9 | — |
Transfer agent fees | 1,917 | 22 | 38 | 18 | 48 | 74 | 79 | 2 |
Trustees' fees and expenses | 184 | 4 | 4 | 1 | 2 | 4 | 5 | — |
Other | 4,868 | 94 | 105 | 32 | 70 | 184 | 365 | 40 |
Total Liabilities | 160,948 | 909 | 10,117 | 992 | 9,179 | 1,472 | 2,329 | 79 |
NET ASSETS | $28,814,993 | $403,595 | $708,037 | $304,969 | $766,706 | $987,967 | $1,180,618 | $25,191 |
| Net Assets Consist of: | ||||||||
Paid-in capital | $13,477,919 | $284,686 | $497,327 | $261,996 | $595,013 | $819,321 | $ 640,191 | $25,028 |
Accumulated undistributed net investment income/(loss) | 35,329 | (318) | (35) | (6) | 863 | 7,117 | (8) | 37 |
Accumulated net realized gain/(loss) | 2,892,647 | 31,969 | 61,630 | 13,182 | 20,195 | 28,362 | 23,554 | 76 |
Unrealized appreciation/(depreciation) of investments and translation of assets and liabilities in foreign currencies | 12,409,098 | 87,258 | 149,115 | 29,797 | 150,635 | 133,167 | 516,881 | 50 |
| $28,814,993 | $403,595 | $708,037 | $304,969 | $766,706 | $987,967 | $1,180,618 | $25,191 | |
The accompanying notes are an integral part of the Financial Statements.
59
| Harbor Capital Appreciation Fund | Harbor Mid Cap Growth Fund | Harbor Small Cap Growth Fund | Harbor Small Cap Growth Opportunities Fund | Harbor Large Cap Value Fund | Harbor Mid Cap Value Fund | Harbor Small Cap Value Fund | Harbor Small Cap Value Opportunities Fund | |||||||||
| NET ASSET VALUE PER SHARE BY CLASS | ||||||||||||||||
| Institutional Class | ||||||||||||||||
Net assets | $23,896,840 | $145,914 | $509,889 | $254,925 | $498,360 | $739,122 | $1,081,412 | $24,655 | ||||||||
Shares of beneficial interest1 | 317,259 | 12,985 | 33,858 | 20,242 | 33,509 | 31,685 | 29,926 | 2,449 | ||||||||
Net asset value per share2 | $ 75.32 | $ 11.24 | $ 15.06 | $ 12.59 | $ 14.87 | $ 23.33 | $ 36.14 | $ 10.07 | ||||||||
| Administrative Class | ||||||||||||||||
Net assets | $ 493,860 | $110,114 | $ 719 | $ 1,308 | $ 53,006 | $ 48,809 | $ 4,462 | $ 252 | ||||||||
Shares of beneficial interest1 | 6,667 | 10,185 | 50 | 104 | 3,573 | 2,079 | 124 | 25 | ||||||||
Net asset value per share2 | $ 74.08 | $ 10.81 | $ 14.17 | $ 12.54 | $ 14.84 | $ 23.47 | $ 35.97 | $ 10.06 | ||||||||
| Investor Class | ||||||||||||||||
Net assets | $ 1,531,809 | $ 20,121 | $ 7,913 | $ 1,167 | $ 71,374 | $110,094 | $ 37,548 | $ 254 | ||||||||
Shares of beneficial interest1 | 21,018 | 1,909 | 581 | 94 | 4,762 | 4,739 | 1,064 | 25 | ||||||||
Net asset value per share2 | $ 72.88 | $ 10.54 | $ 13.62 | $ 12.41 | $ 14.99 | $ 23.23 | $ 35.29 | $ 10.06 | ||||||||
| Retirement Class | ||||||||||||||||
Net assets | $ 2,892,484 | $127,446 | $189,516 | $ 47,569 | $143,966 | $ 89,942 | $ 57,196 | $ 30 | ||||||||
Shares of beneficial interest1 | 38,393 | 11,328 | 12,566 | 3,773 | 9,681 | 3,854 | 1,582 | 3 | ||||||||
Net asset value per share2 | $ 75.34 | $ 11.25 | $ 15.08 | $ 12.61 | $ 14.87 | $ 23.33 | $ 36.16 | $ 10.07 | ||||||||
| * | Including repurchase agreements and short-term investments |
| 1 | Par value $0.01 (unlimited authorizations) |
| 2 | Per share amounts can be recalculated to the amounts disclosed herein when total net assets and shares of beneficial interest are not rounded to thousands. |
60
Harbor Domestic Equity Funds
StatementS of Operations—Year Ended October 31, 2017
StatementS of Operations—Year Ended October 31, 2017
(All amounts in thousands)
| Harbor Capital Appreciation Fund | Harbor Mid Cap Growth Fund | Harbor Small Cap Growth Fund | Harbor Small Cap Growth Opportunities Fund | Harbor Large Cap Value Fund | Harbor Mid Cap Value Fund | Harbor Small Cap Value Fund | Harbor Small Cap Value Opportunities Funda | |
| Investment Income | ||||||||
Dividends | $ 222,839 | $ 2,657 | $ 3,641 | $ 631 | $ 9,621 | $ 24,248 | $ 10,539 | $ 93 |
Interest | 185 | 85 | 19 | 8 | 18 | 8 | 33 | — |
Net securities lending income | 23 | — | — | — | — | — | — | — |
Foreign taxes withheld | (1,700) | (12) | (2) | — | (167) | (4) | (38) | — |
Total Investment Income | 221,347 | 2,730 | 3,658 | 639 | 9,472 | 24,252 | 10,534 | 93 |
| Operating Expenses | ||||||||
Management fees | 157,071 | 2,745 | 5,011 | 1,857 | 3,246 | 7,008 | 7,138 | 47 |
| 12b-1 fees: | ||||||||
Administrative Class | 1,165 | 298 | 1 | 3 | 71 | 119 | 6 | — |
Investor Class | 3,790 | 50 | 20 | 3 | 193 | 359 | 76 | — |
Shareholder communications | 2,193 | 23 | 28 | 7 | 26 | 124 | 229 | 11 |
Custodian fees | 1,126 | 46 | 36 | 27 | 25 | 35 | 32 | 7 |
| Transfer agent fees: | ||||||||
Institutional Class | 19,199 | 127 | 449 | 185 | 349 | 603 | 782 | 6 |
Administrative Class | 403 | 101 | — | 1 | 25 | 41 | 2 | — |
Investor Class | 3,134 | 42 | 17 | 3 | 160 | 296 | 63 | — |
Retirement Class | 292 | 8 | 20 | 5 | 4 | 7 | 2 | — |
Professional fees | 748 | 12 | 19 | 7 | 13 | 29 | 26 | 63 |
Trustees' fees and expenses | 760 | 12 | 19 | 6 | 13 | 26 | 25 | — |
Registration fees | 198 | 66 | 64 | 58 | 91 | 83 | 95 | 72 |
Miscellaneous | 251 | 13 | 16 | 12 | 14 | 19 | 19 | 8 |
Total expenses | 190,330 | 3,543 | 5,700 | 2,174 | 4,230 | 8,749 | 8,495 | 214 |
Management fees waived | (12,325) | — | — | — | — | (217) | — | — |
Transfer agent fees waived | (2,250) | (26) | (50) | (21) | (47) | (82) | (86) | — |
Other expenses reimbursed | — | — | — | — | (176) | — | — | (158) |
Net expenses | 175,755 | 3,517 | 5,650 | 2,153 | 4,007 | 8,450 | 8,409 | 56 |
Net Investment Income/(Loss) | 45,592 | (787) | (1,992) | (1,514) | 5,465 | 15,802 | 2,125 | 37 |
| Realized and Change in Net Unrealized Gain/(Loss) on Investment Transactions | ||||||||
| Net realized gain/(loss) on: | ||||||||
Investments | 3,441,569 | 49,750 | 88,078 | 24,181 | 26,388 | 27,835 | 29,319 | 76 |
Foreign currency transactions | (382) | (12) | — | — | — | — | — | — |
Redemption in-kind | 58,783 | — | — | — | — | — | — | — |
| Change in net unrealized appreciation/(depreciation) on: | ||||||||
Investments | 3,868,155 | 50,803 | 68,228 | 22,607 | 86,165 | 112,584 | 234,567 | 50 |
Translations of assets and liabilities in foreign currencies | 93 | 4 | — | — | — | — | — | — |
Net gain/(loss) on investment transactions | 7,368,218 | 100,545 | 156,306 | 46,788 | 112,553 | 140,419 | 263,886 | 126 |
Net Increase/(Decrease) in Net Assets Resulting from Operations | $7,413,810 | $ 99,758 | $154,314 | $45,274 | $118,018 | $156,221 | $266,011 | $ 163 |
| a | For the period August 1, 2017 (inception) through October 31, 2017. |
The accompanying notes are an integral part of the Financial Statements.
61
[THIS PAGE INTENTIONALLY LEFT BLANK]
62
Harbor Domestic Equity Funds
Statements of Changes In Net Assets
Statements of Changes In Net Assets
(All amounts in thousands)
| Harbor Capital Appreciation Fund | Harbor Mid Cap Growth Fund | Harbor Small Cap Growth Fund | ||||||
| November 1, 2016 through October 31, 2017 | November 1, 2015 through October 31, 2016 | November 1, 2016 through October 31, 2017 | November 1, 2015 through October 31, 2016 | November 1, 2016 through October 31, 2017 | November 1, 2015 through October 31, 2016 | |||
| INCREASE/(DECREASE) IN NET ASSETS | ||||||||
| Operations: | ||||||||
Net investment income/(loss) | $ 45,592 | $ 29,114 | $ (787) | $ (2,419) | $ (1,992) | $ (1,245) | ||
Net realized gain/(loss) on investments | 3,499,970 | 1,533,430 | 49,738 | 1,228 | 88,078 | (2,281) | ||
Change in net unrealized appreciation/(depreciation) of investments | 3,868,248 | (1,946,895) | 50,807 | (3,958) | 68,228 | 928 | ||
Net increase/(decrease) in assets resulting from operations | 7,413,810 | (384,351) | 99,758 | (5,149) | 154,314 | (2,598) | ||
| Distributions to Shareholders | ||||||||
| Net investment income: | ||||||||
Institutional Class | (21,322) | (18,442) | — | (1,218) | — | — | ||
Administrative Class | — | — | — | (1,470) | — | — | ||
Investor Class | — | — | — | (49) | — | — | ||
Retirement Class | (1,881) | — | — | — | — | — | ||
| Net realized gain on investments: | ||||||||
Institutional Class | (1,220,935) | (1,555,558) | — | (20,507) | (2,458) | (67,517) | ||
Administrative Class | (30,286) | (40,125) | — | (40,876) | (3) | (95) | ||
Investor Class | (88,361) | (142,031) | — | (2,859) | (45) | (1,414) | ||
Retirement Class | (65,872) | — | — | — | (418) | — | ||
Total distributions to shareholders | (1,428,657) | (1,756,156) | — | (66,979) | (2,924) | (69,026) | ||
Net Increase/(Decrease) Derived from Capital Share Transactions | (1,897,442) | (637,379) | (195,061) | (14,050) | (30,962) | 58,935 | ||
Net increase/(decrease) in net assets | 4,087,711 | (2,777,886) | (95,303) | (86,178) | 120,428 | (12,689) | ||
| Net Assets | ||||||||
Beginning of period | 24,727,282 | 27,505,168 | 498,898 | 585,076 | 587,609 | 600,298 | ||
End of period* | $28,814,993 | $24,727,282 | $ 403,595 | $498,898 | $708,037 | $587,609 | ||
* Includes accumulated undistributed net investment income/(loss) of: | $ 35,329 | $ 19,425 | $ (318) | $ (4,017) | $ (35) | $ (1,048) | ||
| a | Inception |
The accompanying notes are an integral part of the Financial Statements.
63
| Harbor Small Cap Growth Opportunities Fund | Harbor Large Cap Value Fund | Harbor Mid Cap Value Fund | Harbor Small Cap Value Fund | Harbor Small Cap Value Opportunities Fund | ||||||||
| November 1, 2016 through October 31, 2017 | November 1, 2015 through October 31, 2016 | November 1, 2016 through October 31, 2017 | November 1, 2015 through October 31, 2016 | November 1, 2016 through October 31, 2017 | November 1, 2015 through October 31, 2016 | November 1, 2016 through October 31, 2017 | November 1, 2015 through October 31, 2016 | August 1, 2017a through October 31, 2017 | ||||
| $ (1,514) | $ (1,015) | $ 5,465 | $ 3,969 | $ 15,802 | $ 16,390 | $ 2,125 | $ 3,936 | $ 37 | ||||
| 24,181 | (4,313) | 26,388 | 15,132 | 27,835 | 12,864 | 29,319 | (5,052) | 76 | ||||
| 22,607 | 14,268 | 86,165 | 4,837 | 112,584 | 153 | 234,567 | 69,284 | 50 | ||||
| 45,274 | 8,940 | 118,018 | 23,938 | 156,221 | 29,407 | 266,011 | 68,168 | 163 | ||||
| — | — | (3,694) | (2,884) | (10,454) | (6,586) | (2,998) | (2,908) | — | ||||
| — | — | (277) | (143) | (625) | (315) | (3) | — | — | ||||
| — | — | (460) | (257) | (2,058) | (1,677) | (10) | — | — | ||||
| — | — | (259) | (19) | (270) | — | (12) | — | — | ||||
| — | (6,945) | (10,933) | (9,776) | (9,256) | (8,684) | — | (27,732) | — | ||||
| — | (103) | (318) | (1,072) | (636) | (503) | — | (37) | — | ||||
| — | (21) | (2,114) | (1,298) | (2,358) | (2,946) | — | (590) | — | ||||
| — | — | (134) | — | (232) | — | — | — | — | ||||
| — | (7,069) | (18,189) | (15,449) | (25,889) | (20,711) | (3,023) | (31,267) | — | ||||
| 68,733 | (19,521) | 285,851 | 87,069 | 48,486 | 121,804 | 157,261 | (121,896) | 25,028 | ||||
| 114,007 | (17,650) | 385,680 | 95,558 | 178,818 | 130,500 | 420,249 | (84,995) | 25,191 | ||||
| 190,962 | 208,612 | 381,026 | 285,468 | 809,149 | 678,649 | 760,369 | 845,364 | — | ||||
| $304,969 | $190,962 | $766,706 | $381,026 | $987,967 | $809,149 | $1,180,618 | $ 760,369 | $25,191 | ||||
| $ (6) | $ (913) | $ 863 | $ 1,062 | $ 7,117 | $ 9,598 | $ (8) | $ 2,050 | $ 37 | ||||
64
Harbor Domestic Equity Funds
Statements of Changes in Net Assets—Capital Stock Activity
Statements of Changes in Net Assets—Capital Stock Activity
(All amounts in thousands)
| Harbor Capital Appreciation Fund | Harbor Mid Cap Growth Fund | Harbor Small Cap Growth Fund | ||||||
| November 1, 2016 through October 31, 2017 | November 1, 2015 through October 31, 2016 | November 1, 2016 through October 31, 2017 | November 1, 2015 through October 31, 2016 | November 1, 2016 through October 31, 2017 | November 1, 2015 through October 31, 2016 | |||
| AMOUNT ($) | ||||||||
| Institutional Class | ||||||||
Net proceeds from sale of shares | $ 3,276,589 | $ 4,324,920 | $ 34,285 | $ 205,012 | $ 63,756 | $ 128,476 | ||
Reinvested distributions | 1,106,036 | 1,408,137 | — | 18,634 | 2,405 | 65,160 | ||
Cost of shares reacquired | (7,001,496) | (6,847,149) | (233,261) | (99,889) | (199,752) | (183,722) | ||
Cost of shares reacquired through redemption in-kind | (107,830) | — | — | — | — | — | ||
Net increase/(decrease) in net assets | $(2,726,701) | $(1,114,092) | $(198,976) | $ 123,757 | $(133,591) | $ 9,914 | ||
| Administrative Class | ||||||||
Net proceeds from sale of shares | $ 98,518 | $ 162,947 | $ 55,699 | $ 41,024 | $ 986 | $ 199 | ||
Reinvested distributions | 29,735 | 39,492 | — | 42,343 | 3 | 95 | ||
Cost of shares reacquired | (285,429) | (217,037) | (153,126) | (219,131) | (1,097) | (387) | ||
Net increase/(decrease) in net assets | $ (157,176) | $ (14,598) | $ (97,427) | $(135,764) | $ (108) | $ (93) | ||
| Investor Class | ||||||||
Net proceeds from sale of shares | $ 250,072 | $ 399,155 | $ 8,536 | $ 6,204 | $ 804 | $ 1,050 | ||
Reinvested distributions | 86,039 | 138,997 | — | 2,892 | 44 | 1,411 | ||
Cost of shares reacquired | (676,775) | (1,022,417) | (10,864) | (13,658) | (3,211) | (4,062) | ||
Net increase/(decrease) in net assets | $ (340,664) | $ (484,265) | $ (2,328) | $ (4,562) | $ (2,363) | $ (1,601) | ||
| Retirement Class | ||||||||
Net proceeds from sale of shares | $ 2,162,111 | $ 1,062,582 | $ 119,909 | $ 2,588 | $ 139,351 | $ 53,839 | ||
Reinvested distributions | 66,899 | — | — | — | 418 | — | ||
Cost of shares reacquired | (901,911) | (87,006) | (16,239) | (69) | (34,669) | (3,124) | ||
Net increase/(decrease) in net assets | $ 1,327,099 | $ 975,576 | $ 103,670 | $ 2,519 | $ 105,100 | $ 50,715 | ||
| a | Inception |
The accompanying notes are an integral part of the Financial Statements.
65
| Harbor Small Cap Growth Opportunities Fund | Harbor Large Cap Value Fund | Harbor Mid Cap Value Fund | Harbor Small Cap Value Fund | Harbor Small Cap Value Opportunities Fund | ||||||||
| November 1, 2016 through October 31, 2017 | November 1, 2015 through October 31, 2016 | November 1, 2016 through October 31, 2017 | November 1, 2015 through October 31, 2016 | November 1, 2016 through October 31, 2017 | November 1, 2015 through October 31, 2016 | November 1, 2016 through October 31, 2017 | November 1, 2015 through October 31, 2016 | August 1, 2017a through October 31, 2017 | ||||
| $ 91,607 | $ 61,682 | $ 292,174 | $135,414 | $ 239,318 | $ 250,615 | $ 345,325 | $ 213,448 | $24,494 | ||||
| — | 6,942 | 14,027 | 12,187 | 19,313 | 14,725 | 2,418 | 25,802 | — | ||||
| (46,086) | (107,425) | (191,931) | (76,749) | (216,527) | (156,502) | (253,759) | (363,914) | — | ||||
| — | — | — | — | — | — | — | — | — | ||||
| $ 45,521 | $ (38,801) | $ 114,270 | $ 70,852 | $ 42,104 | $ 108,838 | $ 93,984 | $(124,664) | $24,494 | ||||
| $ 1,411 | $ 853 | $ 43,445 | $ 3,581 | $ 16,625 | $ 20,937 | $ 2,733 | $ 235 | $ 250 | ||||
| — | 103 | 594 | 1,215 | 1,259 | 817 | 3 | 37 | — | ||||
| (408) | (3,582) | (5,086) | (18,742) | (16,615) | (10,516) | (280) | (121) | — | ||||
| $ 1,003 | $ (2,626) | $ 38,953 | $ (13,946) | $ 1,269 | $ 11,238 | $ 2,456 | $ 151 | $ 250 | ||||
| $ 387 | $ 424 | $ 56,096 | $ 51,121 | $ 48,514 | $ 64,185 | $ 42,084 | $ 5,036 | $ 253 | ||||
| — | 21 | 2,403 | 1,367 | 4,335 | 4,553 | 10 | 585 | — | ||||
| (312) | (171) | (59,100) | (25,830) | (116,100) | (81,262) | (29,939) | (5,330) | — | ||||
| $ 75 | $ 274 | $ (601) | $ 26,658 | $ (63,251) | $ (12,524) | $ 12,155 | $ 291 | $ 253 | ||||
| $ 27,035 | $ 21,950 | $ 135,337 | $ 3,590 | $ 78,013 | $ 15,590 | $ 51,537 | $ 2,355 | $ 31 | ||||
| — | — | 393 | 19 | 501 | — | 12 | — | — | ||||
| (4,901) | (318) | (2,501) | (104) | (10,150) | (1,338) | (2,883) | (29) | — | ||||
| $ 22,134 | $ 21,632 | $ 133,229 | $ 3,505 | $ 68,364 | $ 14,252 | $ 48,666 | $ 2,326 | $ 31 | ||||
66
Harbor Domestic Equity Funds
Statements of Changes in Net Assets—Capital Stock Activity—Continued
Statements of Changes in Net Assets—Capital Stock Activity—Continued
(All amounts in thousands)
| Harbor Capital Appreciation Fund | Harbor Mid Cap Growth Fund | Harbor Small Cap Growth Fund | ||||||
| November 1, 2016 through October 31, 2017 | November 1, 2015 through October 31, 2016 | November 1, 2016 through October 31, 2017 | November 1, 2015 through October 31, 2016 | November 1, 2016 through October 31, 2017 | November 1, 2015 through October 31, 2016 | |||
| SHARES | ||||||||
| Institutional Class | ||||||||
Shares sold | 50,273 | 73,643 | 3,495 | 25,045 | 4,659 | 11,230 | ||
Shares issued due to reinvestment of distributions | 19,319 | 23,073 | — | 2,167 | 186 | 5,430 | ||
Shares reacquired | (108,725) | (116,665) | (25,934) | (11,696) | (14,867) | (15,829) | ||
Shares reacquired through redemption in-kind | (1,623) | — | — | — | — | — | ||
Net increase/(decrease) in shares outstanding | (40,756) | (19,949) | (22,439) | 15,516 | (10,022) | 831 | ||
Beginning of period | 358,015 | 377,964 | 35,424 | 19,908 | 43,880 | 43,049 | ||
End of period | 317,259 | 358,015 | 12,985 | 35,424 | 33,858 | 43,880 | ||
| Administrative Class | ||||||||
Shares sold | 1,555 | 2,791 | 5,811 | 5,026 | 73 | 19 | ||
Shares issued due to reinvestment of distributions | 527 | 655 | — | 5,096 | — | 8 | ||
Shares reacquired | (4,754) | (3,733) | (16,802) | (27,691) | (83) | (34) | ||
Net increase/(decrease) in shares outstanding | (2,672) | (287) | (10,991) | (17,569) | (10) | (7) | ||
Beginning of period | 9,339 | 9,626 | 21,176 | 38,745 | 60 | 67 | ||
End of period | 6,667 | 9,339 | 10,185 | 21,176 | 50 | 60 | ||
| Investor Class | ||||||||
Shares sold | 3,962 | 6,993 | 905 | 770 | 64 | 100 | ||
Shares issued due to reinvestment of distributions | 1,548 | 2,336 | — | 356 | 4 | 129 | ||
Shares reacquired | (10,756) | (17,816) | (1,123) | (1,667) | (262) | (381) | ||
Net increase/(decrease) in shares outstanding | (5,246) | (8,487) | (218) | (541) | (194) | (152) | ||
Beginning of period | 26,264 | 34,751 | 2,127 | 2,668 | 775 | 927 | ||
End of period | 21,018 | 26,264 | 1,909 | 2,127 | 581 | 775 | ||
| Retirement Class | ||||||||
Shares sold | 33,211 | 18,414 | 12,594 | 325 | 10,446 | 4,829 | ||
Shares issued due to reinvestment of distributions | 1,169 | — | — | — | 32 | — | ||
Shares reacquired | (12,930) | (1,471) | (1,583) | (8) | (2,485) | (256) | ||
Net increase/(decrease) in shares outstanding | 21,450 | 16,943 | 11,011 | 317 | 7,993 | 4,573 | ||
Beginning of period | 16,943 | — | 317 | — | 4,573 | — | ||
End of period | 38,393 | 16,943 | 11,328 | 317 | 12,566 | 4,573 | ||
| a | Inception |
The accompanying notes are an integral part of the Financial Statements.
67
| Harbor Small Cap Growth Opportunities Fund | Harbor Large Cap Value Fund | Harbor Mid Cap Value Fund | Harbor Small Cap Value Fund | Harbor Small Cap Value Opportunities Fund | ||||||||
| November 1, 2016 through October 31, 2017 | November 1, 2015 through October 31, 2016 | November 1, 2016 through October 31, 2017 | November 1, 2015 through October 31, 2016 | November 1, 2016 through October 31, 2017 | November 1, 2015 through October 31, 2016 | November 1, 2016 through October 31, 2017 | November 1, 2015 through October 31, 2016 | August 1, 2017a through October 31, 2017 | ||||
| 7,471 | 6,437 | 21,074 | 11,516 | 10,728 | 13,268 | 10,669 | 8,291 | 2,449 | ||||
| — | 684 | 1,088 | 1,079 | 875 | 784 | 79 | 1,041 | — | ||||
| (3,816) | (10,416) | (13,823) | (6,429) | (9,705) | (8,146) | (7,907) | (13,820) | — | ||||
| — | — | — | — | — | — | — | — | — | ||||
| 3,655 | (3,295) | 8,339 | 6,166 | 1,898 | 5,906 | 2,841 | (4,488) | 2,449 | ||||
| 16,587 | 19,882 | 25,170 | 19,004 | 29,787 | 23,881 | 27,085 | 31,573 | — | ||||
| 20,242 | 16,587 | 33,509 | 25,170 | 31,685 | 29,787 | 29,926 | 27,085 | 2,449 | ||||
| 125 | 89 | 3,133 | 303 | 739 | 1,095 | 83 | 9 | 25 | ||||
| — | 10 | 45 | 108 | 56 | 43 | — | 2 | — | ||||
| (35) | (378) | (366) | (1,683) | (735) | (537) | (9) | (5) | — | ||||
| 90 | (279) | 2,812 | (1,272) | 60 | 601 | 74 | 6 | 25 | ||||
| 14 | 293 | 761 | 2,033 | 2,019 | 1,418 | 50 | 44 | — | ||||
| 104 | 14 | 3,573 | 761 | 2,079 | 2,019 | 124 | 50 | 25 | ||||
| 34 | 43 | 4,142 | 4,261 | 2,188 | 3,364 | 1,323 | 198 | 25 | ||||
| — | 2 | 185 | 120 | 196 | 243 | — | 24 | — | ||||
| (26) | (17) | (4,213) | (2,161) | (5,230) | (4,225) | (926) | (211) | — | ||||
| 8 | 28 | 114 | 2,220 | (2,846) | (618) | 397 | 11 | 25 | ||||
| 86 | 58 | 4,648 | 2,428 | 7,585 | 8,203 | 667 | 656 | — | ||||
| 94 | 86 | 4,762 | 4,648 | 4,739 | 7,585 | 1,064 | 667 | 25 | ||||
| 2,211 | 2,006 | 9,515 | 317 | 3,539 | 811 | 1,572 | 94 | 3 | ||||
| — | — | 30 | 2 | 23 | — | — | — | — | ||||
| (414) | (30) | (174) | (9) | (451) | (68) | (83) | (1) | — | ||||
| 1,797 | 1,976 | 9,371 | 310 | 3,111 | 743 | 1,489 | 93 | 3 | ||||
| 1,976 | — | 310 | — | 743 | — | 93 | — | — | ||||
| 3,773 | 1,976 | 9,681 | 310 | 3,854 | 743 | 1,582 | 93 | 3 | ||||
68
Harbor Domestic Equity Funds Financial Highlights
Selected Data for a Share Outstanding for the Periods Presented
Selected Data for a Share Outstanding for the Periods Presented
| HARBOR CAPITAL APPRECIATION FUND | |||||
| Institutional Class | |||||
| Year Ended October 31, | 2017 | 2016 | 2015 | 2014 | 2013 |
Net asset value beginning of period | $ 60.36 | $ 65.27 | $ 61.97 | $ 54.71 | $ 41.44 |
| Income from Investment Operations | |||||
Net investment income/(loss)a | 0.13 e | 0.09 e | 0.07 e | 0.06 | 0.16 |
Net realized and unrealized gains/(losses) on investments | 18.38 | (0.84) | 7.05 | 8.98 | 13.28 |
Total from investment operations | 18.51 | (0.75) | 7.12 | 9.04 | 13.44 |
| Less Distributions | |||||
Dividends from net investment income | (0.06) | (0.05) | (0.05) | (0.05) | (0.17) |
Distributions from net realized capital gains1 | (3.49) | (4.11) | (3.77) | (1.73) | — |
Total distributions | (3.55) | (4.16) | (3.82) | (1.78) | (0.17) |
Net asset value end of period | 75.32 | 60.36 | 65.27 | 61.97 | 54.71 |
Net assets end of period (000s) | $23,896,840 | $21,608,221 | $24,669,740 | $22,531,379 | $19,366,148 |
| Ratios and Supplemental Data (%) | |||||
Total returnb | 32.52% | (1.23)% | 12.16% | 16.95% | 32.55% |
Ratio of total expenses to average net assets2 | 0.71 | 0.69 | 0.68 | 0.67 | 0.68 |
Ratio of net expenses to average net assetsa | 0.65 | 0.64 | 0.64 | 0.65 | 0.65 |
Ratio of net investment income to average net assetsa | 0.20 | 0.15 | 0.12 | 0.11 | 0.35 |
Portfolio turnover | 52 | 34 | 37 | 34 | 48 |
| Investor Class | |||||
| Year Ended October 31, | 2017 | 2016 | 2015 | 2014 | 2013 |
Net asset value beginning of period | $ 58.66 | $ 63.73 | $ 60.76 | $ 53.82 | $ 40.79 |
| Income from Investment Operations | |||||
Net investment income/(loss)a | (0.11) e | (0.13) e | (0.16) e | (0.17) | (0.01) |
Net realized and unrealized gains/(losses) on investments | 17.82 | (0.83) | 6.90 | 8.84 | 13.07 |
Total from investment operations | 17.71 | (0.96) | 6.74 | 8.67 | 13.06 |
| Less Distributions | |||||
Dividends from net investment income | — | — | — | — | (0.03) |
Distributions from net realized capital gains1 | (3.49) | (4.11) | (3.77) | (1.73) | — |
Total distributions | (3.49) | (4.11) | (3.77) | (1.73) | (0.03) |
Net asset value end of period | 72.88 | 58.66 | 63.73 | 60.76 | 53.82 |
Net assets end of period (000s) | $ 1,531,809 | $ 1,540,557 | $ 2,214,518 | $ 1,910,930 | $ 1,780,774 |
| Ratios and Supplemental Data (%) | |||||
Total returnb | 32.04% | (1.60)% | 11.75% | 16.53% | 32.04% |
Ratio of total expenses to average net assets2 | 1.08 | 1.06 | 1.05 | 1.04 | 1.05 |
Ratio of net expenses to average net assetsa | 1.02 | 1.01 | 1.01 | 1.02 | 1.02 |
Ratio of net investment income to average net assetsa | (0.17) | (0.22) | (0.25) | (0.26) | (0.03) |
Portfolio turnover | 52 | 34 | 37 | 34 | 48 |
See page 83 for notes to the Financial Highlights.
The accompanying notes are an integral part of the Financial Statements.
69
| Administrative Class | ||||
| 2017 | 2016 | 2015 | 2014 | 2013 |
| $ 59.50 | $ 64.51 | $ 61.39 | $ 54.29 | $ 41.12 |
| (0.04) e | (0.06) e | (0.08) e | (0.11) | 0.02 |
| 18.11 | (0.84) | 6.97 | 8.94 | 13.21 |
| 18.07 | (0.90) | 6.89 | 8.83 | 13.23 |
| — | — | — | — | (0.06) |
| (3.49) | (4.11) | (3.77) | (1.73) | — |
| (3.49) | (4.11) | (3.77) | (1.73) | (0.06) |
| 74.08 | 59.50 | 64.51 | 61.39 | 54.29 |
| $493,860 | $555,665 | $620,910 | $582,430 | $613,413 |
| 32.20% | (1.48)% | 11.88% | 16.69% | 32.21% |
| 0.96 | 0.94 | 0.93 | 0.92 | 0.93 |
| 0.90 | 0.89 | 0.89 | 0.90 | 0.90 |
| (0.06) | (0.11) | (0.13) | (0.14) | 0.11 |
| 52 | 34 | 37 | 34 | 48 |
| Retirement Class | |
| 2017 | 2016 f |
| $ 60.37 | $ 55.79 |
| 0.16 e | 0.05 e |
| 18.40 | 4.53 |
| 18.56 | 4.58 |
| (0.10) | — |
| (3.49) | — |
| (3.59) | — |
| 75.34 | 60.37 |
| $2,892,484 | $1,022,839 |
| 32.62% | 8.21% c |
| 0.63 | 0.65 d |
| 0.59 | 0.59 d |
| 0.23 | 0.13 d |
| 52 | 34 |
70
Harbor Domestic Equity Funds Financial Highlights—Continued
Selected Data for a Share Outstanding for the Periods Presented
Selected Data for a Share Outstanding for the Periods Presented
| HARBOR MID CAP GROWTH FUND | |||||
| Institutional Class | |||||
| Year Ended October 31, | 2017 | 2016 | 2015 | 2014 | 2013 |
Net asset value beginning of period | $ 8.58 | $ 9.76 | $ 11.43 | $ 11.76 | $ 9.22 |
| Income from Investment Operations | |||||
Net investment income/(loss)a | (0.01) e | (0.03) e | (0.04) e | (0.04) | (0.03) |
Net realized and unrealized gains/(losses) on investments | 2.67 | (0.03) | 0.20 | 1.55 | 2.76 |
Total from investment operations | 2.66 | (0.06) | 0.16 | 1.51 | 2.73 |
| Less Distributions | |||||
Dividends from net investment income | — | (0.06) | — | — | — |
Distributions from net realized capital gains1 | — | (1.06) | (1.83) | (1.84) | (0.19) |
Total distributions | — | (1.12) | (1.83) | (1.84) | (0.19) |
Net asset value end of period | 11.24 | 8.58 | 9.76 | 11.43 | 11.76 |
Net assets end of period (000s) | $145,914 | $303,802 | $194,308 | $306,371 | $323,666 |
| Ratios and Supplemental Data (%) | |||||
Total returnb | 31.00% | (0.60)% | 1.55% | 14.45% | 30.13% |
Ratio of total expenses to average net assets2 | 0.88 | 0.86 | 0.84 | 0.84 | 0.84 |
Ratio of net expenses to average net assetsa | 0.87 | 0.85 | 0.84 | 0.83 | 0.84 |
Ratio of net investment income to average net assetsa | (0.14) | (0.31) | (0.35) | (0.34) | (0.27) |
Portfolio turnover | 87 | 84 | 82 | 95 | 111 |
| Investor Class | |||||
| Year Ended October 31, | 2017 | 2016 | 2015 | 2014 | 2013 |
Net asset value beginning of period | $ 8.07 | $ 9.24 | $ 10.95 | $ 11.37 | $ 8.96 |
| Income from Investment Operations | |||||
Net investment income/(loss)a | (0.04) e | (0.05) e | (0.07) e | (0.05) | (0.12) |
Net realized and unrealized gains/(losses) on investments | 2.51 | (0.04) | 0.19 | 1.47 | 2.72 |
Total from investment operations | 2.47 | (0.09) | 0.12 | 1.42 | 2.60 |
| Less Distributions | |||||
Dividends from net investment income | — | (0.02) | — | — | — |
Distributions from net realized capital gains1 | — | (1.06) | (1.83) | (1.84) | (0.19) |
Total distributions | — | (1.08) | (1.83) | (1.84) | (0.19) |
Net asset value end of period | 10.54 | 8.07 | 9.24 | 10.95 | 11.37 |
Net assets end of period (000s) | $ 20,121 | $ 17,167 | $ 24,647 | $ 37,887 | $ 35,501 |
| Ratios and Supplemental Data (%) | |||||
Total returnb | 30.61% | (1.05)% | 1.21% | 14.09% | 29.54% |
Ratio of total expenses to average net assets2 | 1.25 | 1.22 | 1.21 | 1.21 | 1.21 |
Ratio of net expenses to average net assetsa | 1.24 | 1.22 | 1.21 | 1.20 | 1.21 |
Ratio of net investment income to average net assetsa | (0.48) | (0.68) | (0.71) | (0.71) | (0.63) |
Portfolio turnover | 87 | 84 | 82 | 95 | 111 |
See page 83 for notes to the Financial Highlights.
The accompanying notes are an integral part of the Financial Statements.
71
| Administrative Class | ||||
| 2017 | 2016 | 2015 | 2014 | 2013 |
| $ 8.27 | $ 9.45 | $ 11.15 | $ 11.54 | $ 9.08 |
| (0.04) e | (0.05) e | (0.06) e | (0.07) | (0.05) |
| 2.58 | (0.03) | 0.19 | 1.52 | 2.70 |
| 2.54 | (0.08) | 0.13 | 1.45 | 2.65 |
| — | (0.04) | — | — | — |
| — | (1.06) | (1.83) | (1.84) | (0.19) |
| — | (1.10) | (1.83) | (1.84) | (0.19) |
| 10.81 | 8.27 | 9.45 | 11.15 | 11.54 |
| $110,114 | $175,211 | $366,121 | $384,511 | $408,494 |
| 30.71% | (0.91)% | 1.29% | 14.16% | 29.70% |
| 1.13 | 1.10 | 1.09 | 1.09 | 1.09 |
| 1.12 | 1.10 | 1.09 | 1.08 | 1.09 |
| (0.45) | (0.57) | (0.58) | (0.59) | (0.52) |
| 87 | 84 | 82 | 95 | 111 |
| Retirement Class | |
| 2017 | 2016 f |
| $ 8.58 | $ 7.76 |
| 0.01 e | (0.03) e |
| 2.66 | 0.85 |
| 2.67 | 0.82 |
| — | — |
| — | — |
| — | — |
| 11.25 | 8.58 |
| $127,446 | $2,718 |
| 31.12% | 10.57% c |
| 0.81 | 0.81 d |
| 0.81 | 0.80 d |
| 0.07 | (0.45) d |
| 87 | 84 |
72
Harbor Domestic Equity Funds Financial Highlights—Continued
Selected Data for a Share Outstanding for the Periods Presented
Selected Data for a Share Outstanding for the Periods Presented
| HARBOR SMALL CAP GROWTH FUND | |||||
| Institutional Class | |||||
| Year Ended October 31, | 2017 | 2016 | 2015 | 2014 | 2013 |
Net asset value beginning of period | $ 11.94 | $ 13.65 | $ 15.45 | $ 15.72 | $ 11.81 |
| Income from Investment Operations | |||||
Net investment income/(loss)a | (0.04) e | (0.02) e | (0.03) e | (0.05) | 0.03 |
Net realized and unrealized gains/(losses) on investments | 3.22 | (0.11) | 0.55 | 1.91 | 4.48 |
Total from investment operations | 3.18 | (0.13) | 0.52 | 1.86 | 4.51 |
| Less Distributions | |||||
Dividends from net investment income | — | — | — | — | (0.04) |
Distributions from net realized capital gains1 | (0.06) | (1.58) | (2.32) | (2.13) | (0.56) |
Total distributions | (0.06) | (1.58) | (2.32) | (2.13) | (0.60) |
Net asset value end of period | 15.06 | 11.94 | 13.65 | 15.45 | 15.72 |
Net assets end of period (000s) | $509,889 | $523,888 | $587,761 | $603,476 | $601,255 |
| Ratios and Supplemental Data (%) | |||||
Total returnb | 26.72% | (0.99)% | 3.35% | 12.94% | 39.90% |
Ratio of total expenses to average net assets2 | 0.86 | 0.85 | 0.84 | 0.83 | 0.83 |
Ratio of net expenses to average net assetsa | 0.85 | 0.85 | 0.83 | 0.83 | 0.83 |
Ratio of net investment income to average net assetsa | (0.30) | (0.21) | (0.22) | (0.29) | 0.22 |
Portfolio turnover | 83 | 89 | 78 | 76 | 73 |
| Investor Class | |||||
| Year Ended October 31, | 2017 | 2016 | 2015 | 2014 | 2013 |
Net asset value beginning of period | $ 10.84 | $ 12.59 | $ 14.47 | $ 14.90 | $ 11.22 |
| Income from Investment Operations | |||||
Net investment income/(loss)a | (0.08) e | (0.06) e | (0.08) e | (0.51) | (0.06) |
Net realized and unrealized gains/(losses) on investments | 2.92 | (0.11) | 0.52 | 2.21 | 4.30 |
Total from investment operations | 2.84 | (0.17) | 0.44 | 1.70 | 4.24 |
| Less Distributions | |||||
Dividends from net investment income | — | — | — | — | — |
Distributions from net realized capital gains1 | (0.06) | (1.58) | (2.32) | (2.13) | (0.56) |
Total distributions | (0.06) | (1.58) | (2.32) | (2.13) | (0.56) |
Net asset value end of period | 13.62 | 10.84 | 12.59 | 14.47 | 14.90 |
Net assets end of period (000s) | $ 7,913 | $ 8,401 | $ 11,660 | $ 14,266 | $ 24,249 |
| Ratios and Supplemental Data (%) | |||||
Total returnb | 26.29% | (1.44)% | 2.98% | 12.53% | 39.50% |
Ratio of total expenses to average net assets2 | 1.23 | 1.22 | 1.21 | 1.20 | 1.20 |
Ratio of net expenses to average net assetsa | 1.22 | 1.22 | 1.20 | 1.20 | 1.20 |
Ratio of net investment income to average net assetsa | (0.67) | (0.58) | (0.59) | (0.66) | (0.16) |
Portfolio turnover | 83 | 89 | 78 | 76 | 73 |
See page 83 for notes to the Financial Highlights.
The accompanying notes are an integral part of the Financial Statements.
73
| Administrative Class | ||||
| 2017 | 2016 | 2015 | 2014 | 2013 |
| $11.30 | $13.04 | $14.89 | $15.26 | $11.46 |
| (0.07) e | (0.05) e | (0.07) e | 0.54 i | (7.68) i |
| 3.00 | (0.11) | 0.54 | 1.22 | 12.04 |
| 2.93 | (0.16) | 0.47 | 1.76 | 4.36 |
| — | — | — | — | — |
| (0.06) | (1.58) | (2.32) | (2.13) | (0.56) |
| (0.06) | (1.58) | (2.32) | (2.13) | (0.56) |
| 14.17 | 11.30 | 13.04 | 14.89 | 15.26 |
| $ 719 | $ 686 | $ 877 | $ 650 | $ 636 |
| 26.02% | (1.29)% | 3.12% | 12.65% | 39.72% |
| 1.11 | 1.10 | 1.09 | 1.08 | 1.08 |
| 1.10 | 1.10 | 1.08 | 1.08 | 1.08 |
| (0.56) | (0.46) | (0.47) | (0.54) | 0.19 |
| 83 | 89 | 78 | 76 | 73 |
| Retirement Class | |
| 2017 | 2016 f |
| $ 11.95 | $ 10.72 |
| (0.04) e | (0.02) e |
| 3.23 | 1.25 |
| 3.19 | 1.23 |
| — | — |
| (0.06) | — |
| (0.06) | — |
| 15.08 | 11.95 |
| $189,516 | $54,634 |
| 26.78% | 11.47% c |
| 0.79 | 0.81 d |
| 0.79 | 0.80 d |
| (0.26) | (0.27) d |
| 83 | 89 |
74
Harbor Domestic Equity Funds Financial Highlights—Continued
Selected Data for a Share Outstanding for the Periods Presented
Selected Data for a Share Outstanding for the Periods Presented
| HARBOR SMALL CAP GROWTH OPPORTUNITIES FUND | ||||
| Institutional Class | ||||
| Year Ended October 31, | 2017 | 2016 | 2015 | 2014 g |
Net asset value beginning of period | $ 10.23 | $ 10.31 | $ 10.77 | $ 10.00 |
| Income from Investment Operations | ||||
Net investment income/(loss)a | (0.07) e | (0.05) e | (0.06) e | (0.02) |
Net realized and unrealized gains/(losses) on investments | 2.43 | 0.32 | (0.35) | 0.79 |
Total from investment operations | 2.36 | 0.27 | (0.41) | 0.77 |
| Less Distributions | ||||
Dividends from net investment income | — | — | — | — |
Distributions from net realized capital gains1 | — | (0.35) | (0.05) | — |
Total distributions | — | (0.35) | (0.05) | — |
Net asset value end of period | 12.59 | 10.23 | 10.31 | 10.77 |
Net assets end of period (000s) | $254,925 | $169,718 | $205,007 | $57,779 |
| Ratios and Supplemental Data (%) | ||||
Total returnb | 23.07% | 2.62% | (3.78)% | 7.70% c |
Ratio of total expenses to average net assets2 | 0.88 | 0.89 | 0.90 | 1.60 d |
Ratio of net expenses to average net assetsa | 0.88 | 0.89 | 0.90 | 0.90 d |
Ratio of net investment income to average net assetsa | (0.61) | (0.48) | (0.55) | (0.67) d |
Portfolio turnover | 67 | 85 | 103 | 55 c |
| Investor Class | ||||
| Year Ended October 31, | 2017 | 2016 | 2015 | 2014 g |
Net asset value beginning of period | $ 10.12 | $ 10.24 | $ 10.74 | $ 10.00 |
| Income from Investment Operations | ||||
Net investment income/(loss)a | (0.11) e | (0.09) e | (0.09) e | (0.05) |
Net realized and unrealized gains/(losses) on investments | 2.40 | 0.32 | (0.36) | 0.79 |
Total from investment operations | 2.29 | 0.23 | (0.45) | 0.74 |
| Less Distributions | ||||
Dividends from net investment income | — | — | — | — |
Distributions from net realized capital gains1 | — | (0.35) | (0.05) | — |
Total distributions | — | (0.35) | (0.05) | — |
Net asset value end of period | 12.41 | 10.12 | 10.24 | 10.74 |
Net assets end of period (000s) | $ 1,167 | $ 871 | $ 599 | $ 1,809 |
| Ratios and Supplemental Data (%) | ||||
Total returnb | 22.63% | 2.24% | (4.17)% | 7.40% c |
Ratio of total expenses to average net assets2 | 1.25 | 1.26 | 1.27 | 1.97 d |
Ratio of net expenses to average net assetsa | 1.25 | 1.26 | 1.27 | 1.27 d |
Ratio of net investment income to average net assetsa | (0.99) | (0.87) | (0.86) | (1.03) d |
Portfolio turnover | 67 | 85 | 103 | 55 c |
See page 83 for notes to the Financial Highlights.
The accompanying notes are an integral part of the Financial Statements.
75
| Administrative Class | |||
| 2017 | 2016 | 2015 | 2014 g |
| $10.22 | $10.27 | $10.75 | $10.00 |
| (0.12) e | (0.07) e | (0.09) e | (0.09) |
| 2.44 | 0.37 | (0.34) | 0.84 |
| 2.32 | 0.30 | (0.43) | 0.75 |
| — | — | — | — |
| — | (0.35) | (0.05) | — |
| — | (0.35) | (0.05) | — |
| 12.54 | 10.22 | 10.27 | 10.75 |
| $1,308 | $ 143 | $3,006 | $ 269 |
| 22.70% | 2.94% | (3.98)% | 7.50% c |
| 1.13 | 1.14 | 1.15 | 1.85 d |
| 1.13 | 1.13 | 1.15 | 1.15 d |
| (0.96) | (0.69) | (0.80) | (0.90) d |
| 67 | 85 | 103 | 55 c |
| Retirement Class | |
| 2017 | 2016 f |
| $ 10.24 | $ 9.04 |
| (0.07) e | (0.04) e |
| 2.44 | 1.24 |
| 2.37 | 1.20 |
| — | — |
| — | — |
| — | — |
| 12.61 | 10.24 |
| $47,569 | $20,230 |
| 23.14% | 13.27% c |
| 0.81 | 0.85 d |
| 0.81 | 0.84 d |
| (0.57) | (0.60) d |
| 67 | 85 |
76
Harbor Domestic Equity Funds Financial Highlights—Continued
Selected Data for a Share Outstanding for the Periods Presented
Selected Data for a Share Outstanding for the Periods Presented
| HARBOR LARGE CAP VALUE FUND | |||||
| Institutional Class | |||||
| Year Ended October 31, | 2017 | 2016 | 2015 | 2014 | 2013 |
Net asset value beginning of period | $ 12.32 | $ 12.16 | $ 12.24 | $ 10.85 | $ 8.52 |
| Income from Investment Operations | |||||
Net investment income/(loss)a | 0.15 e | 0.16 e | 0.15 e | 0.15 | 0.14 |
Net realized and unrealized gains/(losses) on investments | 2.97 | 0.64 | 0.70 | 1.37 | 2.31 |
Total from investment operations | 3.12 | 0.80 | 0.85 | 1.52 | 2.45 |
| Less Distributions | |||||
Dividends from net investment income | (0.14) | (0.13) | (0.14) | (0.13) | (0.12) |
Distributions from net realized capital gains1 | (0.43) | (0.51) | (0.79) | — | — |
Total distributions | (0.57) | (0.64) | (0.93) | (0.13) | (0.12) |
Net asset value end of period | 14.87 | 12.32 | 12.16 | 12.24 | 10.85 |
Net assets end of period (000s) | $498,360 | $310,127 | $231,033 | $202,596 | $179,382 |
| Ratios and Supplemental Data (%) | |||||
Total returnb | 26.00% | 7.14% | 7.29% | 14.13% | 29.06% |
Ratio of total expenses to average net assets2 | 0.72 | 0.72 | 0.70 | 0.70 | 0.71 |
Ratio of net expenses to average net assetsa | 0.68 | 0.68 | 0.68 | 0.68 | 0.68 |
Ratio of net investment income to average net assetsa | 1.10 | 1.32 | 1.25 | 1.26 | 1.43 |
Portfolio turnover | 16 | 34 | 24 | 32 | 26 |
| Investor Class | |||||
| Year Ended October 31, | 2017 | 2016 | 2015 | 2014 | 2013 |
Net asset value beginning of period | $ 12.42 | $ 12.25 | $ 12.33 | $ 10.94 | $ 8.59 |
| Income from Investment Operations | |||||
Net investment income/(loss)a | 0.10 e | 0.11 e | 0.11 e | 0.13 | 0.09 |
Net realized and unrealized gains/(losses) on investments | 2.99 | 0.66 | 0.70 | 1.35 | 2.34 |
Total from investment operations | 3.09 | 0.77 | 0.81 | 1.48 | 2.43 |
| Less Distributions | |||||
Dividends from net investment income | (0.09) | (0.09) | (0.10) | (0.09) | (0.08) |
Distributions from net realized capital gains1 | (0.43) | (0.51) | (0.79) | — | — |
Total distributions | (0.52) | (0.60) | (0.89) | (0.09) | (0.08) |
Net asset value end of period | 14.99 | 12.42 | 12.25 | 12.33 | 10.94 |
Net assets end of period (000s) | $ 71,374 | $ 57,716 | $ 29,745 | $ 20,189 | $ 11,934 |
| Ratios and Supplemental Data (%) | |||||
Total returnb | 25.52% | 6.80% | 6.87% | 13.62% | 28.52% |
Ratio of total expenses to average net assets2 | 1.09 | 1.09 | 1.07 | 1.07 | 1.08 |
Ratio of net expenses to average net assetsa | 1.05 | 1.05 | 1.05 | 1.05 | 1.05 |
Ratio of net investment income to average net assetsa | 0.75 | 0.94 | 0.89 | 0.88 | 1.04 |
Portfolio turnover | 16 | 34 | 24 | 32 | 26 |
See page 83 for notes to the Financial Highlights.
The accompanying notes are an integral part of the Financial Statements.
77
| Administrative Class | ||||
| 2017 | 2016 | 2015 | 2014 | 2013 |
| $ 12.30 | $12.15 | $ 12.23 | $ 10.85 | $ 8.51 |
| 0.10 e | 0.13 e | 0.12 e | 0.15 | 0.16 |
| 2.99 | 0.63 | 0.70 | 1.34 | 2.27 |
| 3.09 | 0.76 | 0.82 | 1.49 | 2.43 |
| (0.12) | (0.10) | (0.11) | (0.11) | (0.09) |
| (0.43) | (0.51) | (0.79) | — | — |
| (0.55) | (0.61) | (0.90) | (0.11) | (0.09) |
| 14.84 | 12.30 | 12.15 | 12.23 | 10.85 |
| $53,006 | $9,361 | $24,690 | $20,927 | $13,453 |
| 25.77% | 6.77% | 7.02% | 13.78% | 28.76% |
| 0.97 | 0.96 | 0.95 | 0.95 | 0.96 |
| 0.93 | 0.93 | 0.93 | 0.93 | 0.93 |
| 0.70 | 1.09 | 1.00 | 1.02 | 1.16 |
| 16 | 34 | 24 | 32 | 26 |
| Retirement Class | |
| 2017 | 2016 f |
| $ 12.32 | $10.94 |
| 0.12 e | 0.12 e |
| 3.00 | 1.33 |
| 3.12 | 1.45 |
| (0.14) | (0.07) |
| (0.43) | — |
| (0.57) | (0.07) |
| 14.87 | 12.32 |
| $143,966 | $3,822 |
| 26.08% | 13.24% c |
| 0.64 | 0.67 d |
| 0.60 | 0.63 d |
| 0.83 | 1.46 d |
| 16 | 34 |
78
Harbor Domestic Equity Funds Financial Highlights—Continued
Selected Data for a Share Outstanding for the Periods Presented
Selected Data for a Share Outstanding for the Periods Presented
| HARBOR MID CAP VALUE FUND | |||||
| Institutional Class | |||||
| Year Ended October 31, | 2017 | 2016 | 2015 | 2014 | 2013 |
Net asset value beginning of period | $ 20.17 | $ 20.27 | $ 20.32 | $ 17.50 | $ 12.64 |
| Income from Investment Operations | |||||
Net investment income/(loss)a | 0.39 e | 0.44 e | 0.34 e | 0.18 | 0.28 |
Net realized and unrealized gains/(losses) on investments | 3.43 | 0.08 | (0.07) | 2.84 | 4.86 |
Total from investment operations | 3.82 | 0.52 | 0.27 | 3.02 | 5.14 |
| Less Distributions | |||||
Dividends from net investment income | (0.35) | (0.27) | (0.19) | (0.20) | (0.28) |
Distributions from net realized capital gains1 | (0.31) | (0.35) | (0.13) | — | — |
Total distributions | (0.66) | (0.62) | (0.32) | (0.20) | (0.28) |
Net asset value end of period | 23.33 | 20.17 | 20.27 | 20.32 | 17.50 |
Net assets end of period (000s) | $739,122 | $600,800 | $484,078 | $195,247 | $82,231 |
| Ratios and Supplemental Data (%) | |||||
Total returnb | 19.16% | 2.81% | 1.32% | 17.39% | 41.48% |
Ratio of total expenses to average net assets2 | 0.87 | 0.86 | 0.86 | 0.89 | 0.93 |
Ratio of net expenses to average net assetsa | 0.84 | 0.84 | 0.86 | 0.89 | 0.93 |
Ratio of net investment income to average net assetsa | 1.76 | 2.28 | 1.66 | 1.40 | 1.87 |
Portfolio turnover | 22 | 18 | 12 | 13 | 18 |
| Investor Class | |||||
| Year Ended October 31, | 2017 | 2016 | 2015 | 2014 | 2013 |
Net asset value beginning of period | $ 20.09 | $ 20.19 | $ 20.27 | $ 17.49 | $ 12.63 |
| Income from Investment Operations | |||||
Net investment income/(loss)a | 0.31 e | 0.37 e | 0.27 e | 0.17 | 0.13 |
Net realized and unrealized gains/(losses) on investments | 3.41 | 0.08 | (0.08) | 2.78 | 4.96 |
Total from investment operations | 3.72 | 0.45 | 0.19 | 2.95 | 5.09 |
| Less Distributions | |||||
Dividends from net investment income | (0.27) | (0.20) | (0.14) | (0.17) | (0.23) |
Distributions from net realized capital gains1 | (0.31) | (0.35) | (0.13) | — | — |
Total distributions | (0.58) | (0.55) | (0.27) | (0.17) | (0.23) |
Net asset value end of period | 23.23 | 20.09 | 20.19 | 20.27 | 17.49 |
Net assets end of period (000s) | $110,094 | $152,358 | $165,642 | $ 91,724 | $19,260 |
| Ratios and Supplemental Data (%) | |||||
Total returnb | 18.71% | 2.45% | 0.93% | 16.97% | 40.99% |
Ratio of total expenses to average net assets2 | 1.24 | 1.23 | 1.23 | 1.26 | 1.31 |
Ratio of net expenses to average net assetsa | 1.21 | 1.21 | 1.23 | 1.26 | 1.30 |
Ratio of net investment income to average net assetsa | 1.40 | 1.92 | 1.29 | 1.01 | 1.21 |
Portfolio turnover | 22 | 18 | 12 | 13 | 18 |
See page 83 for notes to the Financial Highlights.
The accompanying notes are an integral part of the Financial Statements.
79
| Administrative Class | ||||
| 2017 | 2016 | 2015 | 2014 | 2013 |
| $ 20.30 | $ 20.40 | $ 20.47 | $ 17.64 | $12.74 |
| 0.34 e | 0.40 e | 0.29 e | 0.25 | 0.23 |
| 3.45 | 0.07 | (0.07) | 2.75 | 4.92 |
| 3.79 | 0.47 | 0.22 | 3.00 | 5.15 |
| (0.31) | (0.22) | (0.16) | (0.17) | (0.25) |
| (0.31) | (0.35) | (0.13) | — | — |
| (0.62) | (0.57) | (0.29) | (0.17) | (0.25) |
| 23.47 | 20.30 | 20.40 | 20.47 | 17.64 |
| $48,809 | $40,992 | $28,929 | $14,775 | $3,479 |
| 18.84% | 2.54% | 1.05% | 17.15% | 41.17% |
| 1.12 | 1.11 | 1.11 | 1.14 | 1.19 |
| 1.09 | 1.09 | 1.11 | 1.14 | 1.18 |
| 1.51 | 2.03 | 1.41 | 1.13 | 1.58 |
| 22 | 18 | 12 | 13 | 18 |
| Retirement Class | |
| 2017 | 2016 f |
| $ 20.17 | $ 18.36 |
| 0.40 e | 0.28 e |
| 3.43 | 1.53 |
| 3.83 | 1.81 |
| (0.36) | — |
| (0.31) | — |
| (0.67) | — |
| 23.33 | 20.17 |
| $89,942 | $14,999 |
| 19.22% | 9.86% c |
| 0.80 | 0.82 d |
| 0.77 | 0.79 d |
| 1.79 | 2.11 d |
| 22 | 18 |
80
Harbor Domestic Equity Funds Financial Highlights—Continued
Selected Data for a Share Outstanding for the Periods Presented
Selected Data for a Share Outstanding for the Periods Presented
| HARBOR SMALL CAP VALUE FUND | |||||
| Institutional Class | |||||
| Year Ended October 31, | 2017 | 2016 | 2015 | 2014 | 2013 |
Net asset value beginning of period | $ 27.27 | $ 26.21 | $ 27.17 | $ 28.89 | $ 21.41 |
| Income from Investment Operations | |||||
Net investment income/(loss)a | 0.08 e | 0.12 e | 0.10 e | 0.06 | 0.13 |
Net realized and unrealized gains/(losses) on investments | 8.90 | 1.92 | (0.09) | 2.68 | 7.84 |
Total from investment operations | 8.98 | 2.04 | 0.01 | 2.74 | 7.97 |
| Less Distributions | |||||
Dividends from net investment income | (0.11) | (0.09) | (0.06) | (0.05) | (0.22) |
Distributions from net realized capital gains1 | — | (0.89) | (0.91) | (4.41) | (0.27) |
Total distributions | (0.11) | (0.98) | (0.97) | (4.46) | (0.49) |
Net asset value end of period | 36.14 | 27.27 | 26.21 | 27.17 | 28.89 |
Net assets end of period (000s) | $1,081,412 | $738,705 | $827,423 | $709,251 | $519,607 |
| Ratios and Supplemental Data (%) | |||||
Total returnb | 33.00% | 8.18% | 0.01% | 11.03% | 37.91% |
Ratio of total expenses to average net assets2 | 0.88 | 0.86 | 0.85 | 0.84 | 0.84 |
Ratio of net expenses to average net assetsa | 0.87 | 0.86 | 0.85 | 0.84 | 0.84 |
Ratio of net investment income to average net assetsa | 0.24 | 0.48 | 0.38 | 0.33 | 0.45 |
Portfolio turnover | 8 | 10 | 17 | 13 | 22 |
| Investor Class | |||||
| Year Ended October 31, | 2017 | 2016 | 2015 | 2014 | 2013 |
Net asset value beginning of period | $ 26.65 | $ 25.63 | $ 26.63 | $ 28.45 | $ 21.08 |
| Income from Investment Operations | |||||
Net investment income/(loss)a | (0.05) e | 0.03 e | 0.01 e | 0.09 | (0.09) |
Net realized and unrealized gains/(losses) on investments | 8.71 | 1.88 | (0.10) | 2.50 | 7.86 |
Total from investment operations | 8.66 | 1.91 | (0.09) | 2.59 | 7.77 |
| Less Distributions | |||||
Dividends from net investment income | (0.02) | — | — | — | (0.13) |
Distributions from net realized capital gains1 | — | (0.89) | (0.91) | (4.41) | (0.27) |
Total distributions | (0.02) | (0.89) | (0.91) | (4.41) | (0.40) |
Net asset value end of period | 35.29 | 26.65 | 25.63 | 26.63 | 28.45 |
Net assets end of period (000s) | $ 37,548 | $ 17,775 | $ 16,797 | $ 17,265 | $ 17,330 |
| Ratios and Supplemental Data (%) | |||||
Total returnb | 32.49% | 7.79% | (0.37)% | 10.61% | 37.41% |
Ratio of total expenses to average net assets2 | 1.25 | 1.23 | 1.22 | 1.21 | 1.21 |
Ratio of net expenses to average net assetsa | 1.24 | 1.23 | 1.22 | 1.21 | 1.21 |
Ratio of net investment income to average net assetsa | (0.16) | 0.10 | 0.02 | (0.04) | 0.07 |
Portfolio turnover | 8 | 10 | 17 | 13 | 22 |
See page 83 for notes to the Financial Highlights.
The accompanying notes are an integral part of the Financial Statements.
81
| Administrative Class | ||||
| 2017 | 2016 | 2015 | 2014 | 2013 |
| $27.16 | $26.07 | $27.05 | $28.80 | $ 21.34 |
| (0.02) e | 0.05 e | 0.06 e | (0.12) | 0.01 |
| 8.88 | 1.93 | (0.13) | 2.78 | 7.87 |
| 8.86 | 1.98 | (0.07) | 2.66 | 7.88 |
| (0.05) | — | — | — | (0.15) |
| — | (0.89) | (0.91) | (4.41) | (0.27) |
| (0.05) | (0.89) | (0.91) | (4.41) | (0.42) |
| 35.97 | 27.16 | 26.07 | 27.05 | 28.80 |
| $4,462 | $1,360 | $1,144 | $5,690 | $12,171 |
| 32.67% | 7.93% | (0.28)% | 10.74% | 37.54% |
| 1.13 | 1.11 | 1.10 | 1.09 | 1.09 |
| 1.12 | 1.11 | 1.10 | 1.09 | 1.09 |
| (0.05) | 0.21 | 0.21 | 0.10 | 0.20 |
| 8 | 10 | 17 | 13 | 22 |
| Retirement Class | |
| 2017 | 2016 f |
| $ 27.29 | $23.91 |
| 0.06 e | 0.05 e |
| 8.94 | 3.33 |
| 9.00 | 3.38 |
| (0.13) | — |
| — | — |
| (0.13) | — |
| 36.16 | 27.29 |
| $57,196 | $2,529 |
| 33.06% | 14.14% c |
| 0.81 | 0.82 d |
| 0.81 | 0.81 d |
| 0.17 | 0.27 d |
| 8 | 10 |
82
Harbor Domestic Equity Funds Financial Highlights—Continued
Selected Data for a Share Outstanding for the Periods Presented
Selected Data for a Share Outstanding for the Periods Presented
| HARBOR SMALL CAP VALUE OPPORTUNITIES FUND | |||||||
| Institutional Class | Administrative Class | Investor Class | Retirement Class | ||||
| Period Ended October 31, 2017h | Period Ended October 31, 2017h | Period Ended October 31, 2017h | Period Ended October 31, 2017h | ||||
Net asset value beginning of period | $ 10.00 | $10.00 | $10.00 | $10.00 | |||
| Income from Investment Operations | |||||||
Net investment income/(loss)a | 0.02 e | 0.01 e | 0.01 e | 0.01 e | |||
Net realized and unrealized gains/(losses) on investments | 0.05 | 0.05 | 0.05 | 0.06 | |||
Total from investment operations | 0.07 | 0.06 | 0.06 | 0.07 | |||
| Less Distributions | |||||||
Dividends from net investment income | — | — | — | — | |||
Distributions from net realized capital gains1 | — | — | — | — | |||
Total distributions | — | — | — | — | |||
Net asset value end of period | 10.07 | 10.06 | 10.06 | 10.07 | |||
Net assets end of period (000s) | $24,655 | $ 252 | $ 254 | $ 30 | |||
| Ratios and Supplemental Data (%) | |||||||
Total returnb | 0.70% c | 0.60% c | 0.60% c | 0.70% c | |||
Ratio of total expenses to average net assets2 | 3.41 d | 3.66 d | 3.78 d | 3.33 d | |||
Ratio of net expenses to average net assetsa | 0.88 d | 1.13 d | 1.25 d | 0.80 d | |||
Ratio of net investment income to average net assetsa | 0.60 d | 0.35 d | 0.23 d | 0.48 d | |||
Portfolio turnover | 9 c | 9 c | 9 c | 9 c | |||
| 1 | Includes both short-term and long-term capital gains |
| 2 | Percentage does not reflect reduction for credit balance arrangements (see Note 2 of the accompanying Notes to Financial Statements). |
| a | Reflects the Adviser’s waiver, if any, of its management fees and/or other operating expenses |
| b | The total returns would have been lower had certain expenses not been waived during the periods shown. |
| c | Unannualized |
| d | Annualized |
| e | Amounts are allocated based on shares outstanding during the period. |
| f | For the period March 1, 2016 (inception) through October 31, 2016 |
| g | For the period February 1, 2014 (inception) through October 31, 2014 |
| h | For the period August 1, 2017 (inception) through October 31, 2017 |
| i | The amount shown for a share outstanding does not correspond with the aggregate net investment income (loss) for the period due to the timing of sales and purchases in relation to fluctuating market values of the investments of the Fund. |
The accompanying notes are an integral part of the Financial Statements.
83
[THIS PAGE INTENTIONALLY LEFT BLANK]
84
Harbor Domestic Equity Funds
Notes to Financial Statements—October 31, 2017
Notes to Financial Statements—October 31, 2017
Note 1—Organizational Matters
Harbor Funds (the “Trust”) is registered under the Investment Company Act of 1940, as amended (the “Investment Company Act”), as an open-end management investment company. As of October 31, 2017 the Trust consists of 31 separate portfolios. The portfolios covered by this report are: Harbor Capital Appreciation Fund, Harbor Mid Cap Growth Fund, Harbor Small Cap Growth Fund, Harbor Small Cap Growth Opportunities Fund, Harbor Large Cap Value Fund, Harbor Mid Cap Value Fund, Harbor Small Cap Value Fund, and Harbor Small Cap Value Opportunities Fund (individually or collectively referred to as a “Fund” or the “Funds," respectively). Harbor Capital Advisors, Inc. (the “Adviser” or “Harbor Capital”) is the investment adviser for the Funds.
The Funds currently offer four classes of shares, designated as Institutional Class, Administrative Class, Investor Class, and Retirement Class. The shares of each class represent an interest in the same portfolio of investments of the Funds and have equal rights with respect to voting, redemptions, dividends, and liquidations, except that: (i) certain expenses, subject to the approval of the Trust’s Board of Trustees (the “Board of Trustees”), may be applied differently to each class of shares in accordance with current regulations of the Securities and Exchange Commission (“SEC”) and the Internal Revenue Service; and (ii) shareholders of a class that bears distribution and service expenses under terms of a distribution plan have exclusive voting rights as to that distribution plan.
Note 2—Significant Accounting Policies
The following is a summary of significant accounting policies followed by the Trust in the preparation of its financial statements. Each Fund follows the investment company reporting requirements under U.S. Generally Accepted Accounting Principles (“U.S. GAAP”), which includes the accounting and reporting guidelines under Accounting Standards Topic 946, Financial Services-Investment Companies. The preparation of financial statements in accordance with U.S. GAAP requires management to make estimates and assumptions that affect the reported amounts and disclosures in the financial statements. Actual results may differ from those estimates.
Security Valuation
The Trust’s valuation procedures permit the Funds to use a variety of valuation methodologies, consider a number of subjective factors, analyze applicable facts and circumstances and, in general, exercise judgment, when valuing Fund investments. The methodology used for a specific type of investment may vary based on the circumstances and relevant considerations, including available market data.
Equity securities (including common stock, preferred stock, and convertible preferred stock), exchange-traded notes and financial derivative instruments (such as futures contracts, options contracts, including rights and warrants and centrally cleared swap agreements) that are traded or cleared on a national securities exchange or system (except securities listed on the National Association of Securities Dealers Automated Quotation (“NASDAQ”) system and United Kingdom securities) are valued at the last sale price on a national exchange or system on which they are principally traded or cleared as of the valuation date. Securities listed on the NASDAQ system or a United Kingdom exchange are valued at the official closing price of those securities. In the case of securities for which there are no sales on the valuation day, (i) securities traded principally on a U.S. exchange, including NASDAQ, are valued at the mean between the closing bid and ask price; and (ii) securities traded principally on a foreign exchange, including United Kingdom securities, are valued at the official bid price determined as of the close of the primary exchange. Securities of open-end registered investment companies that are held by a Fund are valued at net asset value. To the extent these securities are actively traded and fair valuation adjustments are not applied, they are normally categorized as Level 1 in the fair value hierarchy. Equity securities traded on inactive markets or valued by reference to similar instruments are normally categorized as Level 2 in the fair value hierarchy. For more information on the fair value hierarchy, please refer to the Fair Value Measurements and Disclosures section in Note 2.
Short-term securities with a remaining maturity of less than 60 days at the time of acquisition that are held by a Fund are valued at amortized cost to the extent amortized cost represents fair value. Securities that use similar valuation techniques and inputs as described above are normally categorized as Level 2 in the fair value hierarchy.
When reliable market quotations or evaluated prices supplied by a pricing vendor are not readily available or are not believed to accurately reflect fair value, securities are priced at their fair value as determined by the Trust’s Valuation Committee (the “Valuation Committee”) pursuant to procedures adopted, and subject to oversight, by the Board of Trustees. The Valuation
85
Harbor Domestic Equity Funds
Notes to Financial Statements—Continued
Notes to Financial Statements—Continued
Note 2—Significant Accounting Policies—Continued
Committee is comprised of a trustee and officers of the Trust and employees of Harbor Capital with relevant experience or responsibilities. Each security for which the Valuation Committee determines a fair value, including the basis for the fair value decision, is reviewed by the Board of Trustees at its regularly scheduled board meetings.
When a fair valuation method is applied by the Valuation Committee or a Fund’s subadviser, securities will be priced by a method that the Valuation Committee or subadviser believes accurately reflects fair value. Securities valued using fair valuation methods that incorporate significant unobservable inputs are normally categorized as Level 3 in the fair value hierarchy. Examples of possible fair valuation methodologies used in determining the fair value of securities categorized as Level 3 in the fair value hierarchy include, but are not limited to, benchmark pricing and indicative market quotations.
When benchmark pricing is used, the base price of a debt security is set and then subsequently adjusted in proportion to the market value changes of an index or similar security (the “benchmark security”) that trades in an active market or for which other observable inputs are available. The base price may be a broker-dealer quote, transaction price, or an internal value as derived by analysis of market data. The base price of the security may be reset on a periodic basis based on the availability of market data and procedures approved by a Fund’s subadviser. If the benchmark security is categorized as Level 2 in the fair value hierarchy due to the lack of an active market for that security, any security adjusted in proportion to the market value of the benchmark security may be categorized as Level 3 in the fair value hierarchy. Significant changes in the unobservable inputs of the benchmark pricing process (i.e., the base price) would result in direct and proportional changes in the fair value of the security. The reasonability of the fair value is reviewed by the subadviser on a periodic basis and may be amended as the availability of market data indicates a material change.
If evaluated pricing through a third-party pricing vendor is not available or deemed not to be indicative of fair value, a Fund’s subadviser may elect to obtain indicative market quotations (“broker quotes”) directly from a broker-dealer or passed through from a third-party pricing vendor. Indicative market quotations are typically received from established market participants. In the event that the source of fair value is from a single-sourced broker quote, but the subadviser does not have the transparency to view the underlying inputs that support the market quotation, these securities are categorized as Level 3 in the fair value hierarchy. Significant changes in the broker quote would have direct and proportional changes in the fair value of the security.
A Fund may also use fair value pricing if the value of some or all of the Fund’s securities have been materially affected by events occurring before the Fund’s pricing time but after the close of the primary markets or exchanges on which the security is traded. This most commonly occurs with foreign securities, but may occur with other securities as well. In such cases, the Fund may apply a fair value factor supplied by the pricing vendor to a foreign security’s market close value to reflect changes in value that may have occurred between the close of the primary market or exchange on which the security is traded and the Fund’s pricing time. That factor may be derived using observable inputs such as a comparison of the trading patterns of a foreign security to intraday trading in the U.S. markets that are highly correlated to the foreign security or other information that becomes available after the close of the foreign market on which the security principally traded. When fair value pricing is employed, the prices of securities used by a Fund to calculate its net asset value may differ from market quotations, official closing prices or evaluated prices for the same securities, which means that the Fund may value those securities higher or lower than another given fund that uses market quotations, official closing prices or evaluated prices supplied by a pricing vendor in its calculation of net asset value. Securities valued using observable inputs, such as those described above, are normally categorized as Level 2 of the fair value hierarchy.
Fair Value Measurements and Disclosures
Various inputs may be used to determine the value of each Fund’s investments, which are summarized in three broad categories defined as Level 1, Level 2, and Level 3. The inputs or methodologies used for valuing securities are not necessarily indicative of the risk associated with investing in those securities. The assignment of an investment to Levels 1, 2, or 3 is based on the lowest level of significant inputs used to determine its fair value.
| Level 1– | Quoted prices in active markets for identical securities. |
| Level 2– | Other significant observable inputs (including quoted prices for similar securities, interest rates, prepayment speeds, credit risk, etc.). |
| Level 3– | Significant unobservable inputs are used in situations where quoted prices or other observable inputs are not available or are deemed unreliable. Significant unobservable inputs may include each Fund’s own assumptions. |
86
Harbor Domestic Equity Funds
Notes to Financial Statements—Continued
Notes to Financial Statements—Continued
Note 2—Significant Accounting Policies—Continued
Transfers between levels, if any, are recognized as of the last day in the fiscal quarter of the period in which the event or change in circumstances that caused the reclassification occurred. For fair valuations using significant unobservable inputs, a reconciliation of the beginning to ending balances for reported fair values is provided that presents changes attributable to realized and unrealized gains and losses and purchases, sales, and transfers in/out of the Level 3 category during the period. A table that includes a categorization of investments into Levels 1, 2, or 3, transfers between levels, if any, and a Level 3 reconciliation, including details of significant unobservable inputs used, when applicable, can be found at the end of each Fund’s Portfolio of Investments schedule.
Each Fund used observable inputs in its valuation methodologies whenever they were available and deemed reliable.
U.S. Government Securities
U.S. government securities include securities issued by U.S. government agencies or government-sponsored enterprises that may not be guaranteed by the U.S. Treasury. The Government National Mortgage Association (“GNMA” or “Ginnie Mae”), a wholly owned U.S. government corporation, is authorized to guarantee, with the full faith and credit of the U.S. government, the timely payment of principal and interest on securities issued by institutions approved by GNMA and backed by pools of mortgages insured by the Federal Housing Administration or guaranteed by the Department of Veterans Affairs. Government-related guarantors are not backed by the full faith and credit of the U.S. government and include the Federal National Mortgage Association (“FNMA” or “Fannie Mae”) and the Federal Home Loan Mortgage Corporation (“FHLMC” or “Freddie Mac”). On September 7, 2008, the Federal Housing Finance Agency placed Fannie Mae and Freddie Mac in conservatorship, while the U.S. Treasury agreed to purchase preferred stock as needed to ensure that both Fannie Mae and Freddie Mac maintain a positive net worth (guaranteeing up to $100 billion for each entity). As a consequence, certain fixed income securities of Fannie Mae and Freddie Mac have more explicit U.S. government support. No assurance can be given as to whether the U.S. government will continue to support Fannie Mae and Freddie Mac. In addition, the future of Fannie Mae and Freddie Mac is uncertain because Congress has been considering proposals as to whether Fannie Mae and Freddie Mac should be nationalized, privatized, restructured or eliminated altogether. Fannie Mae and Freddie Mac are also the subject of continuing legal actions and investigations, which may have an adverse effect on these entities.
Repurchase Agreements
In a repurchase agreement, a Fund buys a security at one price and simultaneously agrees to sell it back at a higher price. Such agreements must be adequately collateralized to cover the counterparty’s obligation to the Fund to close out the repurchase agreement. During the year, each Fund entered into repurchase agreements with domestic or foreign banks or with a member firm of the Financial Industry Regulatory Authority, Inc., or an affiliate of a member firm that is a primary dealer in U.S. government securities. Each repurchase agreement counterparty must meet the minimum credit quality requirements applicable to the respective Fund and any other appropriate counterparty criteria as determined by the Fund’s subadviser. The minimum credit quality requirements are those applicable to a Fund’s purchase of securities such that if a Fund is permitted to only purchase securities that are rated investment-grade (or the equivalent if unrated), a Fund could only enter into repurchase agreements with counterparties that have debt outstanding that is rated investment-grade (or the equivalent if unrated). The securities are regularly monitored to ensure that the collateral is adequate. A Fund seeks to further mitigate its counterparty risk by entering into master repurchase agreements with its counterparties. The master repurchase agreements provide that, in the event of a counterparty’s default, including bankruptcy, the Fund may terminate any repurchase agreements with that counterparty, determine the net amount owned, and sell or retain the collateral up to the net amount owed to the Fund. A counterparty’s default may cause the Fund to suffer losses, including loss of interest on or principal of the securities and costs associated with delay and enforcement of the terms of the master repurchase agreement.
Foreign Currency Spot Contracts
A foreign currency spot contract is an agreement between two parties to buy and sell currencies at the current market rate for settlement within two business days. During the year, Harbor Capital Appreciation Fund and Harbor Mid Cap Growth Fund used foreign currency spot contracts to facilitate transactions in foreign securities or to convert foreign currency receipts into U.S. dollars.
87
Harbor Domestic Equity Funds
Notes to Financial Statements—Continued
Notes to Financial Statements—Continued
Note 2—Significant Accounting Policies—Continued
The foreign currency spot contract is marked-to-market daily for settlements beyond one day, and any change in market value is recorded as an unrealized gain or loss. When the contract is closed, the Fund records a realized gain or loss equal to the difference between the value on the open and close date. Risk of losses may arise from changes in the value of the foreign currency or if the counterparties do not perform under the contract’s terms. The maximum potential loss from such contracts is the aggregate face value in U.S. dollars at the time the contract was opened.
Foreign Currency Translations
Purchases and sales of securities are translated into U.S. dollars at the current exchange rate on the respective dates of the transactions. Income and withholding taxes are translated at the prevailing exchange rate when accrued or incurred. The accounting records of the Funds are maintained in U.S. dollars. Investment securities and other assets and liabilities denominated in a foreign currency, when applicable, are translated into U.S. dollars based on the current exchange rates at year end.
Reported net realized gains and losses on foreign currency transactions, when applicable, represent net gains and losses from sales and maturities of foreign currency contracts, disposition of foreign currencies, currency gains and losses realized between the trade and settlement dates on securities transactions, and the difference between the amount of investment income accrued and tax reclaims receivable and the U.S. dollar amount actually received. The effects of changes in foreign currency exchange rates on investments in securities, when applicable, are included in the net realized and unrealized gain or loss on investments in the Statement of Operations.
Investment Income
Dividends declared on portfolio securities are accrued on the ex-dividend date. For foreign securities, certain dividends are recorded after the ex-dividend date, but as soon as the respective Fund is notified of such dividends. Interest income is accrued daily as earned. Discounts and premiums on fixed income securities are amortized over the life of the respective securities using the effective yield method.
Securities Transactions
Securities transactions are accounted for on the trade date (the date the order to buy or sell is executed). Realized gains or losses on security transactions are determined on the basis of identified cost.
Proceeds from Litigation
Each Fund may receive proceeds from shareholder litigation settlements involving current and/or previously held portfolio holdings. Any proceeds received from litigation involving portfolio holdings are reflected in the Statements of Operations in realized gain/(loss) if the security has been disposed of by a Fund, or in unrealized gain/(loss) if the security is still held by a Fund.
Distribution to Shareholders
Distributions on Fund shares are recorded on the ex-dividend date.
Expenses
Expenses incurred by the Trust are charged directly to the Fund that incurred such expense whenever possible. With respect to expenses incurred by any two or more Harbor Funds where amounts cannot be identified on a fund by fund basis, such expenses are generally allocated in proportion to the average net assets or the number of shareholders of each Fund.
Custodian
Each Fund has credit balance arrangements with its custodian whereby positive balances in demand deposit accounts used by the transfer and shareholder servicing agent for clearing shareholder transactions in the Fund generate credits that are applied against gross custody expenses. Such custodial expense reductions, if any, are reflected on the respective Fund’s accompanying Statement of Operations.
88
Harbor Domestic Equity Funds
Notes to Financial Statements—Continued
Notes to Financial Statements—Continued
Note 2—Significant Accounting Policies—Continued
Class Allocations
Income, common expenses and realized and unrealized gains/(losses) are determined at the Fund level and allocated daily to each class of shares based on the applicable net assets of the respective classes. Distribution and service fees, if any, and transfer agent fees are calculated daily at the class level based on the applicable net assets of each class and the expense rate(s) applicable to each class.
Taxes
Each Fund is treated as a separate entity for federal tax purposes. Each Fund’s policy is to meet the requirements of Subchapter M of the Internal Revenue Code applicable to regulated investment companies and to distribute to its shareholders all of its taxable income within the prescribed time. It is also the intention of each Fund to distribute an amount sufficient to avoid imposition of any excise tax under Section 4982 of the Internal Revenue Code. Therefore, no provision has been made for federal taxes on income, capital gains or unrealized appreciation of securities held or excise taxes on income and capital gains.
Each Fund may be subject to taxes imposed by countries in which they invest. Such taxes are generally based on income and/or capital gains earned or repatriated. Taxes are accrued and applied to net investment income, net realized gains and unrealized appreciation as such income and/or gains are earned.
Management has analyzed each Fund’s tax positions for all open tax years (in particular, U.S. federal income tax returns for the tax years ended October 31, 2014–2016), including all positions expected to be taken upon filing the 2017 tax return, in all material jurisdictions where each Fund operates, and has concluded that no provision for income tax is required in the Funds' financial statements. Each Fund will recognize interest and penalties, if any, related to unrecognized tax benefits as income tax expense in the Statement of Operations.
Note 3—Investment Portfolio Transactions
Purchases and sales of investments, other than short-term securities, for each Fund for the year ended October 31, 2017 are as follows:
| Purchases (000s) | Sales (000s) | ||
| GROWTH FUNDS | |||
Harbor Capital Appreciation Fund | $13,859,602 | $17,168,202* | |
Harbor Mid Cap Growth Fund | 312,536 | 528,439 | |
Harbor Small Cap Growth Fund | 533,746 | 560,647 | |
Harbor Small Cap Growth Opportunities Fund | 221,189 | 159,866 | |
| VALUE FUNDS | |||
Harbor Large Cap Value Fund | $ 344,187 | $ 85,683 | |
Harbor Mid Cap Value Fund | 238,010 | 204,061 | |
Harbor Small Cap Value Fund | 216,556 | 69,155 | |
Harbor Small Cap Value Opportunities Fund | 26,769 | 2,221 |
| * | Sales for this Fund include $107,715 in connection with an in-kind redemption of the Fund’s capital shares. |
In-Kind Redemption Transaction
In accordance with the Trust’s prospectus, the Funds may distribute portfolio securities rather than cash as payment for a redemption of Fund shares. For financial reporting purposes, the Fund recognizes a gain or loss on the securities distributed related to the in-kind redemption. Such gains and losses on in-kind redemptions are not taxable to shareholders. For the year ended October 31, 2017, Harbor Capital Appreciation Fund realized gains of $58,783,000 upon the disposition of portfolio securities in connection with an in-kind redemption of Fund shares.
89
Harbor Domestic Equity Funds
Notes to Financial Statements—Continued
Notes to Financial Statements—Continued
Note 3—Investment Portfolio Transactions—Continued
Securities Lending
Each Fund may engage in securities lending, whereby a Fund lends its securities to financial institutions in order to increase its income. The Trust has engaged State Street Bank and Trust Company to act as its agent (the “Lending Agent”) with respect to the lending of portfolio securities of the Funds, pursuant to the terms and conditions of a Securities Lending Authorization Agreement (the “SLA Agreement”). Securities loans are required to be secured at all times during the term of the loan by cash collateral that is at least equal to the value of the loaned securities determined at the close of each business day. Any additional collateral that may be required to secure a loan is delivered to the Fund on the next business day. This collateral is recognized as the gross liability for securities loaned in the Statement of Assets and Liabilities. The cash collateral is invested in the State Street Navigator Securities Lending Government Money Market Portfolio (the “Navigator Portfolio”), a money market mutual fund that seeks to provide income while maintaining a stable net asset value of $1.00. There is no assurance that the Navigator Portfolio will maintain a stable net asset value and the Funds are subject to the risk of loss on the cash collateral invested. A portion of the earnings generated by the investment of the cash collateral is rebated to the borrower for the use of the cash collateral and these earnings (less any rebate) are then divided between the Fund and the Lending Agent, as a fee for its services, according to agreed-upon rates. The Lending Agent and the Fund will share in any shortfall in the rebate due to the borrower, according to agreed-upon rates. In addition to receiving a fee from the borrower based on the demand for securities loaned and earning income on the investment of the cash collateral, the Fund receives substitute interest, dividends, or other amounts on the loaned securities, during the term of a loan. Net securities lending income is disclosed as such in the Statements of Operations.
Loans may be terminated at the option of the borrower or the Funds. Upon termination of the loan, the borrower will return to the Fund securities that are identical to the loaned securities. The Funds bear the risk of delay in recovery of, or loss of rights in, the securities loaned and the risk that the value of the collateral falls below the value of the securities on loan. Each Fund seeks to mitigate this risk through the SLA Agreement, which provides that in the event of default, the Lending Agent may apply the proceeds of the cash collateral from the loaned securities toward the purchase of replacement securities. If such proceeds are insufficient or the collateral is unavailable, the Lending Agent will purchase replacement securities at its sole expense, or if unable to do so, the Lending Agent may credit to the Fund’s account an amount equal to the fair value of the unreturned loaned securities.
During the year, Harbor Capital Appreciation Fund engaged in securities lending. The value at October 31, 2017 of equity securities loaned and related cash collateral for Harbor Capital Appreciation Fund was $86,225,000 and $90,739,000, respectively. As the securities loans are subject to termination by the Fund or the borrower at any time, the remaining contractual maturities of each securities lending transaction is considered to be overnight and continuous.
Note 4—Fees and Other Transactions with Affiliates
Investment Adviser
Harbor Capital is a wholly-owned subsidiary of Robeco Groep N.V. (“Robeco”). Robeco is wholly-owned by ORIX Corporation (“ORIX”). Harbor Capital is the Funds’ investment adviser and is also responsible for administrative and other services.
90
Harbor Domestic Equity Funds
Notes to Financial Statements—Continued
Notes to Financial Statements—Continued
Note 4—Fees and Other Transactions with Affiliates—Continued
Each Fund has a separate advisory agreement with Harbor Capital. The agreements provide for management fees based on an annual percentage rate of average daily net assets as follows:
| Contractual Rate | Actual Rate | ||
| Growth Funds | |||
Harbor Capital Appreciation Fund | 0.60% a | 0.55% | |
Harbor Mid Cap Growth Fund | 0.75 | 0.75 | |
Harbor Small Cap Growth Fund | 0.75 | 0.75 | |
Harbor Small Cap Growth Opportunities Fund | 0.75 | 0.75 | |
| Value Funds | |||
Harbor Large Cap Value Fund | 0.60% | 0.60% | |
Harbor Mid Cap Value Fund | 0.75 b | 0.73 | |
Harbor Small Cap Value Fund | 0.75 | 0.75 | |
Harbor Small Cap Value Opportunities Fund | 0.75 | 0.75 |
| a | The Adviser has contractually agreed to reduce the management fee to 0.56% on assets between $5 billion and $10 billion, 0.54% on assets between $10 billion and $20 billion and 0.53% on assets over $20 billion through February 28, 2018. |
| b | The Adviser has contractually agreed to reduce the management fee to 0.70% on assets over $500 million through February 28, 2018. |
Harbor Capital has from time to time voluntarily or contractually agreed not to impose a portion of its management fees and/or to bear a portion of the expenses incurred in the operation of certain Funds in order to limit Fund expenses. Such waivers, if any, are reflected on the accompanying Statements of Operations. During the period, the following expense limitation agreements were in effect:
| • | Harbor Large Cap Value Fund. For the period March 1, 2017 through October 31, 2017, Harbor Capital contractually agreed to limit the operating expenses, excluding interest expense (if any), to 0.68%, 0.93%, 1.05% and 0.60% for the Institutional Class, Administrative Class, Investor Class and Retirement Class, respectively. For the period November 1, 2016 through February 28, 2017, Harbor Capital contractually agreed to limit the operating expenses, excluding interest expense (if any), to 0.68%, 0.93%, 1.05% and 0.63% for the Institutional Class, Administrative Class, Investor Class and Retirement Class, respectively. These contractual expense limitations are effective through February 28, 2018. |
| • | Harbor Small Cap Value Opportunities Fund. For the period August 1, 2016 through October 31, 2017, Harbor Capital contractually agreed to limit the operating expenses, excluding interest expense (if any), to 0.88%, 1.13%, 1.25% and 0.80% for the Institutional Class, Administrative Class, Investor Class and Retirement Class, respectively. These contractual expense limitations are effective through February 28, 2019. |
All expense limitation agreements include the transfer agent fee waiver discussed in the Transfer Agent note.
Distributor
Harbor Funds Distributors, Inc. (“Harbor Funds Distributors” or the “Distributor”), a wholly-owned subsidiary of Harbor Capital, is the distributor for Harbor Funds’ shares. Under the Trust’s current distribution plans pursuant to Rule 12b-1 under the Investment Company Act with respect to each Fund’s Administrative and Investor Class shares (the “12b-1 Plan”) as applicable, each Fund pays the Distributor compensation at the annual rate of 0.25% of the average daily net assets of its Administrative and Investor Class shares. Pursuant to the 12b-1 Plan the Distributor is compensated for financing any activity that is primarily intended to result in the sale of Administrative and Investor Class shares of each Fund or for recordkeeping services or the servicing of shareholder accounts in the Administrative and Investor Class shares of each Fund. Such activities include, but are not limited to: printing of prospectuses and statements of additional information and reports for prospective shareholders (i.e., other than existing shareholders); preparation and distribution of advertising material and sales literature; expenses of organizing and conducting sales seminars; supplemental payments to dealers or other institutions such as asset-based sales charges, payments of recordkeeping fees under recordkeeping arrangements, or payments of service fees under shareholder service arrangements; and costs of administering the 12b-1 Plan.
91
Harbor Domestic Equity Funds
Notes to Financial Statements—Continued
Notes to Financial Statements—Continued
Note 4—Fees and Other Transactions with Affiliates—Continued
Amounts payable by a Fund under the 12b-1 Plan need not be directly related to the expenses actually incurred by the Distributor on behalf of each Fund. The 12b-1 Plan does not obligate each Fund to reimburse the Distributor for the actual expenses the Distributor may incur in fulfilling its obligations under the 12b-1 Plan. Thus, even if the Distributor’s actual expenses exceed the fee payable to the Distributor at any given time, each Fund will not be obligated to pay more than that fee. If the Distributor’s expenses are less than the fee it receives, the Distributor will retain the difference.
The fees attributable to each Fund’s respective class are shown on the accompanying Statement of Operations.
Transfer Agent
Harbor Services Group, Inc. (“Harbor Services Group”), a wholly-owned subsidiary of Harbor Capital, is the transfer and shareholder servicing agent for the Funds. The transfer agency and service agreement is reviewed and approved annually by the Board of Trustees and provides currently for compensation up to the following amounts per class of each Fund:
| Transfer Agent Feesa | |
Institutional Class | 0.09% of the average daily net assets of all Institutional Class shares |
Administrative Class | 0.09% of the average daily net assets of all Administrative Class shares |
Investor Class | 0.21% of the average daily net assets of all Investor Class shares |
Retirement Class | 0.01% of the average daily net assets of all Retirement Class shares |
| a | For the period November 1, 2016 through February 28, 2017, the Transfer Agent Fees were 0.08% for the Institutional and Administrative Class shares, 0.20% for the Investor Class shares, and 0.03% for the Retirement Class shares. |
Harbor Services Group has voluntarily waived a portion of its transfer agent fees during the year ended October 31, 2017. Fees incurred for these transfer agent services are shown on each Fund’s Statement of Operations. The voluntary waiver may be discontinued at any time.
Affiliated Transactions
The Investment Company Act permits purchase and sale transactions among affiliated investment companies subject to an exemptive rule. Harbor Funds has adopted policies and procedures pursuant to such rule. During the year, the Funds did not enter into any transactions with any other Harbor fund.
Shareholders
On October 31, 2017, Harbor Capital, Harbor Funds Distributors, and Harbor Services Group, collectively held the following shares of beneficial interest in each Fund:
| Number of Shares Owned by Harbor Capital, Harbor Funds Distributors, and Harbor Services Group | Percentage of Outstanding Shares | ||||||||||
| Institutional Class | Administrative Class | Investor Class | Retirement Class | Total | |||||||
| GROWTH FUNDS | |||||||||||
Harbor Capital Appreciation Fund | — | — | — | 35,203 | 35,203 | 0.0% | |||||
Harbor Mid Cap Growth Fund | — | — | — | 111,933 | 111,933 | 0.3 | |||||
Harbor Small Cap Growth Fund | — | — | — | 61,568 | 61,568 | 0.1 | |||||
Harbor Small Cap Growth Opportunities Fund | — | — | — | 39,812 | 39,812 | 0.2 | |||||
| VALUE FUNDS | |||||||||||
Harbor Large Cap Value Fund | — | — | — | 85,132 | 85,132 | 0.2 | |||||
Harbor Mid Cap Value Fund | — | — | — | 50,470 | 50,470 | 0.1 | |||||
Harbor Small Cap Value Fund | — | — | — | 27,469 | 27,469 | 0.1 | |||||
Harbor Small Cap Value Opportunities Fund | 2,449,000 | 25,000 | 25,000 | 1,012 | 2,500,012 | 99.9 | |||||
92
Harbor Domestic Equity Funds
Notes to Financial Statements—Continued
Notes to Financial Statements—Continued
Note 4—Fees and Other Transactions with Affiliates—Continued
Independent Trustees
The fees and expenses of the Independent Trustees are shown on each Fund’s Statement of Operations. The Independent Trustees’ remuneration for the Funds totaled $787,000 for the year ended October 31, 2017.
The Board of Trustees has adopted a Deferred Compensation Plan for Independent Trustees (the “Plan”), which enables Trustees to elect to defer receipt of all or a portion of the annual compensation they are entitled to receive from the Trust. For purposes of determining the amount owed to a Trustee under the Plan, deferred amounts are treated as though they had been invested in shares of the Fund(s) selected by the Trustee. While not required to do so, each Fund makes an investment equal to the Trustee’s investment election. The deferred compensation liability and the offsetting deferred compensation investment asset are included as a component of “Other Accrued Expenses” and “Other assets”, respectively, in the Statement of Assets and Liabilities. Such amounts fluctuate with changes in the market value of the selected securities. The deferred compensation and related mark-to-market impact liability and an offsetting investment asset will remain on each Fund’s Statement of Assets and Liabilities until distributed in accordance with the Plan.
Indemnification
Under the Trust’s organizational documents, its officers and Trustees are indemnified against certain liabilities arising out of the performance of their duties to the Trust. In addition, in the normal course of business the Trust enters into contracts that provide general indemnities to other parties. The Trust’s maximum exposure under these arrangements is unknown as this would involve future claims that may be made against the Trust that have not yet occurred. The risk of material loss as a result of such indemnification claims is considered remote.
NOTE 5—TAX INFORMATION
The amount and character of income and net realized gains to be distributed are determined in accordance with income tax rules and regulations, which may differ from U.S. GAAP. These differences are attributable to permanent book and tax accounting differences that were primarily due to tax treatment of net investment losses, distributions from investments in real estate investment trust securities, disposition of passive foreign investment companies' securities, tax treatment of redemption in-kind distribution, use of equalization and foreign currency transactions. Reclassifications are made to each Fund’s capital account to reflect income and net realized gains available for distribution (or available capital loss carryovers) under income tax rules and regulations. The amounts reclassified on the Statements of Assets and Liabilities for the year ended October 31, 2017 are as follows:
| Undistributed Net Investment Income/(Loss) (000s) | Accumulated Net Realized Gain/(Loss) (000s) | Paid in Capital (000s) | |||
| GROWTH FUNDS | |||||
Harbor Capital Appreciation Fund | $(6,485) | $(523,877) | $530,362 | ||
Harbor Mid Cap Growth Fund | 4,486 | (15,350) | 10,864 | ||
Harbor Small Cap Growth Fund | 3,005 | (20,198) | 17,193 | ||
Harbor Small Cap Growth Opportunities Fund | 2,421 | (3,047) | 626 | ||
| VALUE FUNDS | |||||
Harbor Large Cap Value Fund | $ (974) | $ (4,740) | $ 5,714 | ||
Harbor Mid Cap Value Fund | (4,876) | (1,466) | 6,342 | ||
Harbor Small Cap Value Fund | (1,160) | (1,492) | 2,652 | ||
Harbor Small Cap Value Opportunities Fund | — | — | — |
The tax composition of each Fund’s distributions is as follows:
93
Harbor Domestic Equity Funds
Notes to Financial Statements—Continued
Notes to Financial Statements—Continued
NOTE 5—TAX INFORMATION—Continued
| As of October 31, 2017 | As of October 31, 2016 | ||||||||||
| Ordinary Income (000s) | Long-Term Capital Gains (000s) | Total (000s) | Ordinary Income (000s) | Long-Term Capital Gains (000s) | Total (000s) | ||||||
| GROWTH FUNDS | |||||||||||
Harbor Capital Appreciation Fund | $23,203 | $1,405,454 | $1,428,657 | $18,442 | $1,737,714 | $1,756,156 | |||||
Harbor Mid Cap Growth Fund | — | — | — | 2,712 | 64,267 | 66,979 | |||||
Harbor Small Cap Growth Fund | — | 2,924 | 2,924 | 1,813 | 67,213 | 69,026 | |||||
Harbor Small Cap Growth Opportunities Fund | — | — | — | 4,587 | 2,482 | 7,069 | |||||
| VALUE FUNDS | |||||||||||
Harbor Large Cap Value Fund | $ 4,885 | $ 13,304 | $ 18,189 | $ 7,430 | $ 8,019 | $ 15,449 | |||||
Harbor Mid Cap Value Fund | 16,082 | 9,807 | 25,889 | 13,063 | 7,648 | 20,711 | |||||
Harbor Small Cap Value Fund | 3,023 | — | 3,023 | 6,240 | 25,027 | 31,267 | |||||
Harbor Small Cap Value Opportunities Fund | — | — | — | N/A | N/A | N/A | |||||
As of October 31, 2017, the components of each Fund’s distributable earnings on a tax basis are as follows:
| Undistributed Ordinary Income (000s) | Undistributed Long-Term Capital Gains (000s) | Unrealized Appreciation/ (Depreciation) (000s) | |||
| GROWTH FUNDS | |||||
Harbor Capital Appreciation Fund | $36,525 | $3,005,814 | $12,295,931 | ||
Harbor Mid Cap Growth Fund | 9,833 | 25,409 | 83,700 | ||
Harbor Small Cap Growth Fund | 10,089 | 57,274 | 143,383 | ||
Harbor Small Cap Growth Opportunities Fund | 2,422 | 14,702 | 25,855 | ||
| VALUE FUNDS | |||||
Harbor Large Cap Value Fund | $ 1,600 | $ 21,200 | $ 148,912 | ||
Harbor Mid Cap Value Fund | 15,152 | 17,327 | 136,187 | ||
Harbor Small Cap Value Fund | 44 | 23,200 | 517,231 | ||
Harbor Small Cap Value Opportunities Fund | 114 | — | 50 |
The identified cost for federal income tax purposes of investments owned by each Fund and its respective gross unrealized appreciation and depreciation at October 31, 2017 are as follows:
| Identified Cost (000s) | Gross Unrealized | Net Unrealized Appreciation/ (Depreciation) (000s) | |||||
| Appreciation (000s) | (Depreciation) (000s) | ||||||
| GROWTH FUNDS | |||||||
Harbor Capital Appreciation Fund | $16,607,825 | $12,381,067 | $(85,136) | $12,295,931 | |||
Harbor Mid Cap Growth Fund | 319,345 | 91,409 | (7,709) | 83,700 | |||
Harbor Small Cap Growth Fund | 572,072 | 162,997 | (19,614) | 143,383 | |||
Harbor Small Cap Growth Opportunities Fund | 277,649 | 51,656 | (25,801) | 25,855 | |||
| VALUE FUNDS | |||||||
Harbor Large Cap Value Fund | $ 624,531 | $ 161,062 | $(12,150) | $ 148,912 | |||
Harbor Mid Cap Value Fund | 850,735 | 204,827 | (68,640) | 136,187 | |||
Harbor Small Cap Value Fund | 663,173 | 530,601 | (13,370) | 517,231 | |||
Harbor Small Cap Value Opportunities Fund | 25,122 | 1,148 | (1,098) | 50 | |||
Note 6—Legal Proceedings
Tribune Company
Harbor Mid Cap Value Fund has been named as a defendant and/or as a putative member of a proposed defendant class in Kirschner v. FitzSimons (In re Tribune Co.), No. 12-2652 (S.D.N.Y.) (the “FitzSimons action”); Deutsche Bank v. Ohlson Enterprises, No. 12-0064 (S.D.N.Y.) (the “Deutsche Bank action”); and Niese v. ABN AMRO Clearing Chicago LLC, No.
94
Harbor Domestic Equity Funds
Notes to Financial Statements—Continued
Notes to Financial Statements—Continued
Note 6—Legal Proceedings—Continued
12-0555 (S.D.N.Y.) (the “Niese action”), as a result of its ownership of shares in the Tribune Company (“Tribune”) in 2007, when Tribune effected a leveraged buyout transaction (“LBO”) by which Tribune converted to a privately-held company. The plaintiffs in these lawsuits have asserted claims for fraudulent conveyance against Harbor Mid Cap Value Fund and other former Tribune shareholders.
All three lawsuits have been consolidated with the majority of the other Tribune-related lawsuits in the multidistrict litigation proceeding In re Tribune Co. Fraudulent Conveyance Litig., No. 11-2296 (S.D.N.Y.) (the “MDL Proceeding”).
On September 23, 2013, the District Court granted the defendants’ omnibus motion to dismiss the Deutsche Bank and Niese actions, on the basis that the plaintiffs lacked standing. The plaintiffs appealed. On March 29, 2016, the U.S. Court of Appeals for the Second Circuit issued its opinion on the appeal, affirming the district court’s dismissal of those lawsuits. The appeals court held that while the plaintiffs have standing under the U.S. Bankruptcy Code, their claims were preempted by Section 546(e) of the Bankruptcy Code—the statutory safe harbor for settlement payments. Plaintiffs sought rehearing en banc, which the Second Circuit denied. On September 9, 2016, the plaintiffs filed a petition for writ of certiorari in the U.S. Supreme Court challenging the Second Circuit’s decision, which the shareholder defendants opposed. The Supreme Court has not yet granted or denied the petition for certiorari.
On May 23, 2014, the defendants filed motions to dismiss the FitzSimons action, including a global motion to dismiss Count I, which is the claim brought against former Tribune shareholders for intentional fraudulent conveyance under U.S. federal law. On January 6, 2017, the United States District Court for the Southern District of New York granted the shareholder defendants’ motion to dismiss and denied plaintiff’s request to amend the complaint. The Court’s order is not immediately appealable, but the Court issued an order stating that it intends to permit an interlocutory appeal of the dismissal order, but will wait to do so until it has resolved outstanding motions to dismiss filed by other defendants. Accordingly, the timing of the appeal is uncertain. On July 18, 2017, the plaintiff submitted a letter to the District Court seeking leave to amend its complaint to add a constructive fraudulent transfer claim. The Court denied the plaintiff’s request without prejudice to renewal of the request in the event of an intervening change in the law.
None of these lawsuits alleges any wrongdoing on the part of Harbor Mid Cap Value Fund. Harbor Mid Cap Value Fund held shares of Tribune and tendered these shares as part of Tribune’s LBO. The value of the proceeds received by Harbor Mid Cap Value Fund was approximately $299,000. Harbor Mid Cap Value Fund’s cost basis in the shares of Tribune was approximately $262,000. At this stage of the proceedings, Harbor Mid Cap Value Fund is not able to make a reliable prediction as to the outcome of these lawsuits or the effect, if any, on the Fund’s net asset value.
Note 7—Subsequent Events
Through the date the financial statements were issued, there were no subsequent events or transactions that would have materially impacted the financial statements or related disclosures as presented herein.
95
Harbor Domestic Equity Funds
Report of Independent Registered Public Accounting Firm
Report of Independent Registered Public Accounting Firm
The Board of Trustees and Shareholders of
Harbor Funds
We have audited the accompanying statements of assets and liabilities, including the portfolios of investments, of Harbor Capital Appreciation Fund, Harbor Mid Cap Growth Fund, Harbor Small Cap Growth Fund, Harbor Small Cap Growth Opportunities Fund, Harbor Large Cap Value Fund, Harbor Mid Cap Value Fund, Harbor Small Cap Value Fund and Harbor Small Cap Value Opportunities (eight of the portfolios constituting the Harbor Funds (the Trust)) as of October 31, 2017, and the related statements of operations, the statements of changes in net assets and the financial highlights for each of the periods indicated therein. These financial statements and financial highlights are the responsibility of the Trust’s management. Our responsibility is to express an opinion on these financial statements and financial highlights based on our audits.
We conducted our audits in accordance with the standards of the Public Company Accounting Oversight Board (United States). Those standards require that we plan and perform the audit to obtain reasonable assurance about whether the financial statements and financial highlights are free of material misstatement. We were not engaged to perform an audit of the Trust’s internal control over financial reporting. Our audits included consideration of internal control over financial reporting as a basis for designing audit procedures that are appropriate in the circumstances, but not for the purpose of expressing an opinion on the effectiveness of the Trust’s internal control over financial reporting. Accordingly, we express no such opinion. An audit also includes examining, on a test basis, evidence supporting the amounts and disclosures in the financial statements and financial highlights, assessing the accounting principles used and significant estimates made by management, and evaluating the overall financial statement presentation. Our procedures included confirmation of securities owned as of October 31, 2017, by correspondence with the custodian and brokers, or by other appropriate auditing procedures where replies from brokers were not received. We believe that our audits provide a reasonable basis for our opinion.
In our opinion, the financial statements and financial highlights referred to above present fairly, in all material respects, the financial position of Harbor Capital Appreciation Fund, Harbor Mid Cap Growth Fund, Harbor Small Cap Growth Fund, Harbor Small Cap Growth Opportunities Fund, Harbor Large Cap Value Fund, Harbor Mid Cap Value Fund, Harbor Small Cap Value Fund and Harbor Small Cap Value Opportunities of the Harbor Funds at October 31, 2017, the results of their operations, the changes in their net assets and the financial highlights for each of the periods indicated therein, in conformity with U.S. generally accepted accounting principles.

Chicago, Illinois
December 21, 2017
December 21, 2017
96
Harbor Domestic Equity Funds
Fees and Expenses Example (Unaudited)
Fees and Expenses Example (Unaudited)
Example
As a shareholder of a Fund, you incur two types of costs: (1) transaction costs, including redemption fees (if any) and (2) ongoing costs, including management fees, distribution and service (12b-1) fees (if any), and other Fund expenses. This example is intended to help you understand your ongoing costs (in dollars) of investing in a Fund and to compare these costs with the ongoing costs of investing in other mutual funds.
The example is based on an investment of $1,000 invested at the beginning of the period and held for the entire period May 1, 2017 through October 31, 2017.
Actual Expenses
The first line of the table below provides information about actual account values and actual expenses for each share class. You may use the information in the respective class line, together with the amount you invested, to estimate the expenses that you paid over the period. Simply divide your account value by $1,000 (for example, an $8,600 account value divided by $1,000 = 8.6), then multiply the result by the number in the first line of the respective class under the heading entitled “Expenses Paid During Period” to estimate the expenses you paid on your account during this period.
Hypothetical Example for Comparison Purposes
The second line of the table for each share class below provides information about hypothetical account values and hypothetical expenses based on the respective Fund/Class’s actual expense ratio and an assumed rate of return of 5% per year before expenses, which is not the respective Fund/Class’s actual return. The hypothetical account values and expenses may not be used to estimate the actual ending account balance or expenses you paid for the period. You may use this information to compare the ongoing costs of investing in a Fund to other funds. To do so, compare this 5% hypothetical example with the 5% hypothetical examples that appear in the shareholder reports of the other funds.
Please note that the expenses shown in the table are meant to highlight your ongoing costs only and do not reflect any transactional costs, such as redemption fees. Therefore, the second line of the table is useful in comparing ongoing costs only, and will not help you determine the relative total costs of owning different funds. In addition, if these transactional costs were included, your costs would have been higher.
| Annualized Expense Ratios* | Expenses Paid During Period** | Beginning Account Value May 1, 2017 | Ending Account Value October 31, 2017 | |||||
| Harbor Capital Appreciation Fund | ||||||||
| Institutional Class | 0.65% | |||||||
| Actual | $3.56 | $1,000 | $1,168.10 | |||||
| Hypothetical (5% return) | 3.31 | 1,000 | 1,021.85 | |||||
| Administrative Class | 0.90% | |||||||
| Actual | $4.92 | $1,000 | $1,166.60 | |||||
| Hypothetical (5% return) | 4.58 | 1,000 | 1,020.55 | |||||
| Investor Class | 1.02% | |||||||
| Actual | $5.57 | $1,000 | $1,165.90 | |||||
| Hypothetical (5% return) | 5.19 | 1,000 | 1,019.93 | |||||
| Retirement Class | 0.59% | |||||||
| Actual | $3.22 | $1,000 | $1,168.40 | |||||
| Hypothetical (5% return) | 3.01 | 1,000 | 1,022.16 | |||||
97
Harbor Domestic Equity Funds
Fees and Expenses Example—Continued
Fees and Expenses Example—Continued
| Annualized Expense Ratios* | Expenses Paid During Period** | Beginning Account Value May 1, 2017 | Ending Account Value October 31, 2017 | |||||
| Harbor Mid Cap Growth Fund | ||||||||
| Institutional Class | 0.87% | |||||||
| Actual | $4.72 | $1,000 | $1,148.10 | |||||
| Hypothetical (5% return) | 4.43 | 1,000 | 1,020.71 | |||||
| Administrative Class | 1.12% | |||||||
| Actual | $6.06 | $1,000 | $1,146.30 | |||||
| Hypothetical (5% return) | 5.70 | 1,000 | 1,019.42 | |||||
| Investor Class | 1.24% | |||||||
| Actual | $6.71 | $1,000 | $1,145.70 | |||||
| Hypothetical (5% return) | 6.31 | 1,000 | 1,018.80 | |||||
| Retirement Class | 0.81% | |||||||
| Actual | $4.38 | $1,000 | $1,149.10 | |||||
| Hypothetical (5% return) | 4.13 | 1,000 | 1,021.02 | |||||
| Harbor Small Cap Growth Fund | ||||||||
| Institutional Class | 0.85% | |||||||
| Actual | $4.46 | $1,000 | $1,082.70 | |||||
| Hypothetical (5% return) | 4.33 | 1,000 | 1,020.81 | |||||
| Administrative Class | 1.10% | |||||||
| Actual | $5.77 | $1,000 | $1,077.60 | |||||
| Hypothetical (5% return) | 5.60 | 1,000 | 1,019.52 | |||||
| Investor Class | 1.22% | |||||||
| Actual | $6.40 | $1,000 | $1,081.00 | |||||
| Hypothetical (5% return) | 6.21 | 1,000 | 1,018.90 | |||||
| Retirement Class | 0.79% | |||||||
| Actual | $4.14 | $1,000 | $1,082.60 | |||||
| Hypothetical (5% return) | 4.02 | 1,000 | 1,021.12 | |||||
| Harbor Small Cap Growth Opportunities Fund | ||||||||
| Institutional Class | 0.88% | |||||||
| Actual | $4.52 | $1,000 | $1,037.10 | |||||
| Hypothetical (5% return) | 4.48 | 1,000 | 1,020.66 | |||||
| Administrative Class | 1.13% | |||||||
| Actual | $5.80 | $1,000 | $1,036.40 | |||||
| Hypothetical (5% return) | 5.75 | 1,000 | 1,019.37 | |||||
| Investor Class | 1.25% | |||||||
| Actual | $6.41 | $1,000 | $1,035.90 | |||||
| Hypothetical (5% return) | 6.36 | 1,000 | 1,018.75 | |||||
| Retirement Class | 0.81% | |||||||
| Actual | $4.16 | $1,000 | $1,037.90 | |||||
| Hypothetical (5% return) | 4.13 | 1,000 | 1,021.02 | |||||
98
Harbor Domestic Equity Funds
Fees and Expenses Example—Continued
Fees and Expenses Example—Continued
| Annualized Expense Ratios* | Expenses Paid During Period** | Beginning Account Value May 1, 2017 | Ending Account Value October 31, 2017 | |||||
| Harbor Large Cap Value Fund | ||||||||
| Institutional Class | 0.68% | |||||||
| Actual | $3.59 | $1,000 | $1,091.40 | |||||
| Hypothetical (5% return) | 3.47 | 1,000 | 1,021.69 | |||||
| Administrative Class | 0.93% | |||||||
| Actual | $4.90 | $1,000 | $1,090.60 | |||||
| Hypothetical (5% return) | 4.74 | 1,000 | 1,020.40 | |||||
| Investor Class | 1.05% | |||||||
| Actual | $5.53 | $1,000 | $1,090.00 | |||||
| Hypothetical (5% return) | 5.35 | 1,000 | 1,019.78 | |||||
| Retirement Class | 0.60% | |||||||
| Actual | $3.16 | $1,000 | $1,092.60 | |||||
| Hypothetical (5% return) | 3.06 | 1,000 | 1,022.10 | |||||
| Harbor Mid Cap Value Fund | ||||||||
| Institutional Class | 0.84% | |||||||
| Actual | $4.30 | $1,000 | $1,034.60 | |||||
| Hypothetical (5% return) | 4.28 | 1,000 | 1,020.86 | |||||
| Administrative Class | 1.09% | |||||||
| Actual | $5.58 | $1,000 | $1,033.00 | |||||
| Hypothetical (5% return) | 5.55 | 1,000 | 1,019.57 | |||||
| Investor Class | 1.21% | |||||||
| Actual | $6.20 | $1,000 | $1,032.40 | |||||
| Hypothetical (5% return) | 6.16 | 1,000 | 1,018.95 | |||||
| Retirement Class | 0.77% | |||||||
| Actual | $3.95 | $1,000 | $1,034.60 | |||||
| Hypothetical (5% return) | 3.92 | 1,000 | 1,021.23 | |||||
| Harbor Small Cap Value Fund | ||||||||
| Institutional Class | 0.87% | |||||||
| Actual | $4.65 | $1,000 | $1,117.80 | |||||
| Hypothetical (5% return) | 4.43 | 1,000 | 1,020.71 | |||||
| Administrative Class | 1.12% | |||||||
| Actual | $5.98 | $1,000 | $1,116.40 | |||||
| Hypothetical (5% return) | 5.70 | 1,000 | 1,019.42 | |||||
| Investor Class | 1.24% | |||||||
| Actual | $6.61 | $1,000 | $1,115.70 | |||||
| Hypothetical (5% return) | 6.31 | 1,000 | 1,018.80 | |||||
| Retirement Class | 0.81% | |||||||
| Actual | $4.32 | $1,000 | $1,118.10 | |||||
| Hypothetical (5% return) | 4.13 | 1,000 | 1,021.02 | |||||
99
Harbor Domestic Equity Funds
Fees and Expenses Example—Continued
Fees and Expenses Example—Continued
| Annualized Expense Ratios* | Expenses Paid During Period** | Beginning Account Value May 1, 2017 | Ending Account Value October 31, 2017 | |||||
| Harbor Small Cap Value Opportunities Fund | ||||||||
| Institutional Class | 0.88% | |||||||
| Actual*** | $2.23 | $1,000 | $1,007.00 | |||||
| Hypothetical (5% return) | 4.48 | 1,000 | 1,020.66 | |||||
| Administrative Class | 1.13% | |||||||
| Actual*** | $2.86 | $1,000 | $1,006.00 | |||||
| Hypothetical (5% return) | 5.75 | 1,000 | 1,019.37 | |||||
| Investor Class | 1.25% | |||||||
| Actual*** | $3.16 | $1,000 | $1,006.00 | |||||
| Hypothetical (5% return) | 6.36 | 1,000 | 1,018.75 | |||||
| Retirement Class | 0.80% | |||||||
| Actual*** | $2.03 | $1,000 | $1,007.00 | |||||
| Hypothetical (5% return) | 4.08 | 1,000 | 1,021.07 | |||||
| * | Reflective of all fee waivers and expense reimbursements (excluding interest expense, if any) |
| ** | Expenses are equal to the Fund’s annualized expense ratio, multiplied by the average account value over the period, multiplied by 184/365 (to reflect the one-half year period). |
| *** | Fund has less than six months of operating history. Expenses are equal to the Class’s annualized net expense ratio, multiplied by the average account value over the period, multiplied by 92/365 (to reflect the period since the commencement of operations). The expense amounts reported under Hypothetical (5% return) are not comparable to the amounts reported using actual fund return. |
100
Harbor Domestic Equity Funds
Additional Information (Unaudited)
Additional Information (Unaudited)
Additional Tax Information
The Funds designate the following portions of their distributions from investment company taxable income for the fiscal year as qualifying for the dividends received deduction for corporate shareholders.
| Percentage of Distribution | |
| GROWTH FUNDS | |
Harbor Capital Appreciation Fund | 100% |
Harbor Mid Cap Growth Fund | 18 |
Harbor Small Cap Growth Fund | 19 |
Harbor Small Cap Growth Opportunities Fund | 100 |
| VALUE FUNDS | |
Harbor Large Cap Value Fund | 100% |
Harbor Mid Cap Value Fund | 64 |
Harbor Small Cap Value Fund | 100 |
Harbor Small Cap Value Opportunities Fund | 37 |
Pursuant to Section 852 of the Internal Revenue Code, the Funds designate the following capital gain dividends for the year ended October 31, 2017:
| Amount (000s) | |
| GROWTH FUNDS | |
Harbor Capital Appreciation Fund | $1,870,930 |
Harbor Mid Cap Growth Fund | 10,864 |
Harbor Small Cap Growth Fund | 20,116 |
Harbor Small Cap Growth Opportunities Fund | 626 |
| VALUE FUNDS | |
Harbor Large Cap Value Fund | $ 18,240 |
Harbor Mid Cap Value Fund | 16,761 |
Harbor Small Cap Value Fund | 2,549 |
For the fiscal year ended October 31, 2017, the Funds designate up to the maximum amount of such dividends allowable pursuant to the Internal Revenue Code as qualified dividend income eligible for reduced tax rates. These lower rates range from 0% to 20% depending on an individual’s tax bracket. If the Funds pay a distribution during calendar year 2017, complete information will be reported in conjunction with Form 1099-DIV.
Shareholders who own shares through a taxable Harbor Funds account and that received distributions from a Fund during calendar year 2017 will receive a Form 1099-DIV in January 2018 that will show the tax character of those distributions.
Proxy Voting
Harbor Funds has adopted Proxy Voting Policies and Procedures under which proxies relating to securities held by the Harbor funds are voted. In addition, Harbor Funds files Form N-PX, with its complete proxy voting record for the 12 months ended June 30th, no later than August 31st of each year. A description of Harbor Funds’ Proxy Voting Policies and Procedures and the proxy voting records (Form N-PX) are available (i) upon request, by calling Harbor Funds toll-free at 800-422-1050; (ii) on Harbor Funds’ website at harborfunds.com; and (iii) on the SEC’s website at sec.gov.
Householding
Harbor Funds has adopted a policy that allows it to send only one copy of a Fund’s prospectus, proxy materials, annual report and semi-annual report to certain shareholders residing at the same household. This reduces Fund expenses, which benefits you and other shareholders. If you need additional copies or do not want your mailings to be “householded,” please call the Shareholder Servicing Agent at 800-422-1050. Individual copies will be sent within thirty (30) days after the Shareholder Servicing Agent receives your instructions. Your consent to householding is considered valid until revoked.
101
Harbor Domestic Equity Funds
Additional Information—Continued
Additional Information—Continued
Quarterly Portfolio Disclosures
Harbor Funds files a complete portfolio of investments with the SEC for the first and third quarters of each fiscal year on Form N-Q. The Funds' Form N-Q is available (i) without charge, upon request, by calling Harbor Funds toll-free at 800-422-1050, (ii) on Harbor Funds’ website at harborfunds.com, and (iii) on the SEC’s website at sec.gov. The form may also be viewed and copied at the SEC’s Public Reference Room in Washington, DC. Information regarding the operations of the Public Reference Room may also be obtained by calling 800-SEC-0330.
ADVISORY AGREEMENT APPROVALS
FACTORS CONSIDERED BY THE TRUSTEES IN APPROVING THE INVESTMENT ADVISORY AGREEMENT AND SUBADVISORY AGREEMENT OF THE Harbor small cap value opportunities fund
The Investment Company Act of 1940 requires that the Investment Advisory and Subadvisory Agreement of the Fund be approved initially, and following an initial two-year term, at least annually, by the Board of Trustees, including a majority of the Independent Trustees voting separately.
At an in-person meeting of the Board of Trustees held on May 7 and 8, 2017 (the “Meeting”), the Board, including the Independent Trustees voting separately, considered and approved an Investment Advisory Agreement with Harbor Capital Advisors, Inc., the adviser to the series of Harbor Funds, and a Subadvisory Agreement with Sapience Investments, LLC (“Sapience” or the “Subadviser”) with respect to Harbor Small Cap Value Opportunities Fund (the “Fund”), a newly formed series of Harbor Funds.
In evaluating the Investment Advisory Agreement and the Subadvisory Agreement, the Trustees reviewed materials furnished by the Adviser and the Subadviser, including information about their respective affiliates, personnel, and operations, and also relied upon their knowledge of the Adviser resulting from their quarterly meetings, periodic telephonic meetings and other prior communications. In connection with the Meeting, which had been called for the purpose of considering the Investment Advisory Agreement and Subadvisory Agreement, the Trustees, including the Independent Trustees, requested and received materials and presentations relating to the services to be rendered by the Adviser and Subadviser. The Trustees also discussed with representatives of the Adviser, at the Meeting and at prior meetings, Harbor Funds’ operations and the Adviser’s ability, consistent with the “manager of managers” structure of Harbor Funds, to (i) identify and recommend to the Trustees a subadviser for the Fund, (ii) monitor and oversee the performance and investment capabilities of the Subadviser, and (iii) recommend the replacement of a subadviser where appropriate.
At the Meeting, the Trustees, including the Independent Trustees voting separately, determined that, in the exercise of their business judgment, the terms of the Investment Advisory Agreement and the Subadvisory Agreement with respect to Harbor Small Cap Value Opportunities Fund were fair and reasonable and approved the Investment Advisory Agreement and the Subadvisory Agreement for an initial two year term as being in the best interests of the Fund and its future shareholders.
In their deliberations, the Independent Trustees had the opportunity to meet privately without representatives of the Adviser or the Subadviser present and were represented throughout the process by legal counsel to the Independent Trustees and the Harbor Funds.
In considering the approval of the Fund’s proposed Investment Advisory Agreement and Subadvisory Agreement, the Board, including the Independent Trustees, evaluated a number of factors it considered relevant to its determination. The Board did not identify any single factor as all-important or controlling, and individual Trustees did not necessarily attribute the same weight or importance to each factor.
Among the factors considered by the Trustees in approving the new Investment Advisory Agreement and Subadvisory Agreement were the following:
| • | the nature, extent, and quality of the services expected to be provided by the Adviser and Sapience, including the background, education, expertise and experience of the investment professionals of the Adviser and Sapience to provide services to the Fund; |
| • | the favorable history, reputation, qualifications and background of the Adviser and Sapience, as well as the qualifications of their personnel; |
| • | the fees proposed to be charged by the Adviser and Sapience for investment advisory and subadvisory services, respectively, including the portion of the fee to be retained by the Adviser, after payment of Sapience’s fee, for the investment advisory and related services the Adviser would provide, including but not limited to, subadviser oversight, administration and manager of managers services; |
| • | the proposed fee and expense ratios of the Fund relative to the fees and expense ratios of similar investment companies; |
102
Harbor Domestic Equity Funds
Additional Information—Continued
Additional Information—Continued
ADVISORY AGREEMENT APPROVALS—Continued
| • | the investment performance of Sapience in managing other accounts in a style similar to the style to be utilized in managing the Fund relative to the performance of a benchmark index; |
| • | information received at regular meetings throughout the year related to services rendered by the Adviser; |
| • | the compensation to be received by Harbor Services Group and Harbor Funds Harbor Funds Distributors in consideration of the services each will provide to the Fund; |
| • | any “fall out” benefits that might inure to the Adviser and its affiliates as a result of their relationship with the Fund; |
| • | information received at regular meetings throughout the year related to the Adviser’s profitability; |
| • | the expected profitability of the Adviser with respect to the Fund, including the effect of revenues of Harbor Services Group and Harbor Funds Distributors on such profitability; and |
| • | the extent to which economies of scale might be realized as the Fund grows, and the extent to which the Fund’s proposed advisory fee level reflects any economies of scale for the benefit of fund investors. |
Nature, Extent, and Quality of Services
In discussing the nature, extent, and quality of the services to be provided by the Adviser, the reasonableness of the overall compensation provided under the proposed advisory agreement and other considerations, the Trustees considered the Adviser’s ability, consistent with the manager of managers structure of Harbor Funds, to identify and recommend to the Trustees quality subadvisers for the Harbor Funds, to monitor and oversee the performance and investment capabilities of each subadviser, and to recommend the replacement of a subadviser where appropriate. The Trustees specifically considered the Adviser’s history as a manager of managers, including its history of replacing subadvisers for particular Harbor Funds in circumstances in which the Board and the Adviser had determined that a change in subadviser was in the best interests of a Fund and its shareholders, whether as a result of (i) long-term underperformance not explained by market conditions or market cycles relative to the subadviser’s investment style, (ii) prolonged style inconsistency, (iii) material adverse changes in management or personnel, or (iv) other factors, such as if the Adviser were to identify another subadviser believed to better serve the shareholders than the existing subadviser.
The Board evaluated the nature, extent, and quality of the Adviser’s proposed services in light of the Board’s actual experience with the Adviser, as well as materials provided by the Adviser concerning the financial and other resources devoted by the Adviser to the Harbor Funds generally, including the breadth and depth of experience and expertise of the investment, accounting, administrative, legal and compliance professionals dedicated to the Funds’ operations. The Trustees determined that the Adviser has the expertise and resources to identify, select, oversee and monitor subadvisers and to operate effectively as the manager of managers for the Fund.
In discussing the nature, extent, and quality of the services to be provided by Sapience, the Trustees considered the collective expertise and experience of the professionals who had formed Sapience and the favorable record they had generated in the small cap value equity asset class both at Sapience and at prior firms. The Trustees also noted the experience of the proposed portfolio manager of the Fund in this asset class and the favorable record generated by him both at Sapience and at prior firms. In considering Sapience’s performance, the Trustees noted that Sapience’s record in its small cap value equity strategy was favorable compared to its benchmark and peers.
Advisory Fees and Expense Ratios
The Trustees observed that the data available concerning comparative fees and expense ratios showed that the Fund’s proposed advisory fee was below the median and average management fees of the peer group of funds presented to the Board for comparison purposes using Morningstar data. The Trustees also reviewed and determined to be reasonable, in relation to the services provided by each party, the split between the advisory fee to be paid to the Adviser and the subadvisory fee to be paid to Sapience and specifically the net advisory fee to be retained by the Adviser at various asset levels.
It was further noted that the Fund’s proposed Institutional Class net expense ratio was below the average and median expense ratios of the peer group of funds presented to the Board for comparison purposes using Morningstar data. The Trustees observed that the incremental expenses of the Administrative Class and Investor Class relative to the Institutional Class data they considered would be comprised solely of Rule 12b-1 or transfer agent service fees, which the Board had reviewed separately, while the lower expenses of the Retirement Class would be comprised solely of lower transfer agent service fees given the more limited shareholder base that can invest in this share class and the fact that this share class only permits shareholders to invest through an individual account with a value of $1 million or greater or through an omnibus account maintained by a financial intermediary.
103
Harbor Domestic Equity Funds
Additional Information—Continued
Additional Information—Continued
ADVISORY AGREEMENT APPROVALS—Continued
Profitability
The Trustees also noted that the Adviser expected to operate the Fund initially at a loss (and had agreed to reduce or waive a portion of its advisory fee and/or absorb fund expenses while paying Sapience its fee and/or paying or reimbursing fund expenses).
Economies of Scale
The Trustees also concluded that breakpoints in the Fund’s advisory fee were not necessary at the present time in light of, among other things, the Adviser’s forward looking approach to setting the contractual flat fee, its absorbing fund expenses during the initial period of the Fund’s operations while paying Sapience its full subadvisory fee and the uncertainty surrounding the aspects of the Fund’s future asset growth. It was agreed, however, that the Board would consider the issue of breakpoints in the Fund’s fee schedule at least annually after the initial two-year contract term as part of its annual investment contract review process for all of the Harbor Funds.
Special meeting of shareholders
At a special meeting of the shareholders of the Harbor Funds held on September 22, 2017, shareholders elected six trustees to the Board of Trustees of Harbor Funds. Scott M. Amero, Robert A. Kasdin, and Ann M. Spruill were previously appointed as Trustees but had not been elected by shareholders. Raymond J. Ball, Donna J. Dean, and Randall A. Hack continue to serve on the Board.
| Trustee | For | Withhold | ||
Scott M. Amero | 1,047,869,265 | 14,860,642 | ||
Joseph L. Dowling III | 1,046,335,272 | 16,394,636 | ||
Robert A. Kasdin | 1,047,514,035 | 15,215,872 | ||
Charles F. McCain | 1,047,667,935 | 15,061,973 | ||
Kathryn L. Quirk | 1,046,812,694 | 15,917,214 | ||
Ann M. Spruill | 1,047,274,165 | 15,455,742 |
At a special meeting of the shareholders of the Harbor Funds held on September 22, 2017, shareholders approved an amendment to each Fund’s fundamental investment restriction regarding borrowing.
| Fund Name | For | Against | Abstain | Broker Non-Vote | ||||
Harbor Capital Appreciation Fund | 142,353,929 | 2,957,892 | 1,689,674 | 52,704,661 | ||||
Harbor Mid Cap Growth Fund | 16,799,131 | 101,416 | 126,561 | 2,643,556 | ||||
Harbor Small Cap Growth Fund | 24,028,401 | 1,237,054 | 1,259,855 | 4,414,467 | ||||
Harbor Small Cap Growth Opportunities Funda | 8,633,141 | 88,030 | 3,263 | 5,103,486 | ||||
Harbor Large Cap Value Fund | 19,495,478 | 211,707 | 134,246 | 6,067,830 | ||||
Harbor Mid Cap Value Fundb | 8,355,328 | 2,110,563 | 624,123 | 2,643,556 | ||||
Harbor Small Cap Value Fund | 17,167,909 | 75,221 | 100,517 | 6,359,775 |
At a special meeting of the shareholders of the Harbor Funds held on September 22, 2017, shareholders approved an amendment to each Fund’s fundamental investment restriction regarding lending.
| Fund Name | For | Against | Abstain | Broker Non-Vote | |||||
Harbor Capital Appreciation Fund | 142,284,847 | 2,976,773 | 1,739,879 | 52,704,661 | |||||
Harbor Mid Cap Growth Fund | 16,780,264 | 103,545 | 143,299 | 2,643,556 | |||||
Harbor Small Cap Growth Fund | 23,959,954 | 1,308,364 | 1,256,993 | 4,414,467 | |||||
Harbor Small Cap Growth Opportunities Funda | 8,631,453 | 89,718 | 3,263 | 5,103,486 | |||||
Harbor Large Cap Value Fund | 19,502,706 | 211,025 | 127,703 | 6,067,830 | |||||
Harbor Mid Cap Value Fundb | 8,335,279 | 2,129,914 | 624,824 | 2,643,556 | |||||
Harbor Small Cap Value Fund | 17,158,984 | 83,086 | 101,574 | 6,359,775 |
| a | Meeting held on October 18, 2017 |
| b | Meeting held on November 15, 2017 |
104
Harbor Domestic Equity Funds
Additional Information—Continued
Additional Information—Continued
Trustees and Officers
As of December 2017
The business and affairs of the Trust shall be managed by or under the direction of the Trustees, and they shall have all powers necessary or desirable to carry out that responsibility. The Trustees shall have full power and authority to take or refrain from taking any action and to execute any contracts and instruments that they may consider necessary or desirable in the management of the Trust. Any determination made by the Trustees in good faith as to what is in the interests of the Trust shall be conclusive. Information pertaining to the Trustees and Officers of Harbor Funds is set forth below. The address of each Trustee and Officer is: [Name of Trustee or Officer] c/o Harbor Funds, 111 South Wacker Drive, 34th Floor, Chicago, IL 60606-4302.
The Harbor Fund’s Statement of Additional Information includes additional information about the Trust’s Trustees and is available without charge by calling 800-422-1050 or at the Trust’s website at harborfunds.com.
| Name (Age) Position(s) with Fund | Term of Office and Length of Time Served1 | Principal Occupation(s) During Past Five Years | Number of Portfolios In Fund Complex Overseen By Trustee | Other Directorships Of Public Companies and Other Registered Investment Companies Held by Trustee During Past Five Years |
INDEPENDENT TRUSTEES | ||||
| Scott M. Amero (54) Trustee | Since 2014 | Chairman (2015-Present) and Trustee (2011-2015), Rare (conservation nonprofit); Trustee, Berkshire School (2014-Present); Vice Chairman and Global Chief Investment Officer, Fixed Income (2010), Vice Chairman and Global Chief Investment Officer, Fixed Income, and Co-Head, Fixed Income Portfolio Management (2007-2010), BlackRock, Inc., (publicly traded investment management firm). | 32 | None |
| Raymond J. Ball (73) Trustee | Since 2006 | Sidney Davidson Distinguished Service Professor of Accounting, University of Chicago Booth School of Business (2000-Present); Academic Affiliate, Analysis Group (litigation consulting firm) (2000-Present); Financial Reporting Faculty Advisory Group of the Institute of Chartered Accountants in England and Wales (2008-Present); and Advisory Board of the Center for Accounting Research & Education at University of Notre Dame (2006-Present). | 32 | None |
| Donna J. Dean (66) Trustee | Since 2010 | Chief Investment Officer of the Rockefeller Foundation (a private foundation) (1995-Present). | 32 | None |
| Joseph L. Dowling III (53) Trustee | Since 2017 | Chief Investment Officer, Brown University (2013-Present); Advisory Board Member, Stage Point Capital (private mortgage specialist) (2016-Present); Advisory Board Member, Harbor Funds (2016-2017); and Founder and Managing Member, Narragansett Asset Management (private investment management firm) (1998-2013). | 32 | Director of Integrated Electrical Services (2011-Present). |
| Randall A. Hack (70) Trustee | Since 2010 | Founder and Senior Managing Director of Capstone Capital LLC (private investment firm) (2003-Present); Director of Tower Development Corporation (cell tower developer) (2009-2016); and Advisory Director of Berkshire Partners (private equity firm) (2002-2013). | 32 | None |
| Robert Kasdin (59) Trustee | Since 2014 | Senior Vice President and Chief Operating Officer, Johns Hopkins Medicine (2015-Present); Senior Executive Vice President, Columbia University (2002-2015); Trustee and Co-Chair of the Finance Committee, National September 11 Memorial & Museum at the World Trade Center (2005-Present); Director, Apollo Commercial Real Estate Finance, Inc. (2014-Present); and Director, Noranda Aluminum Holdings Corp. (2007-2014). | 32 | Director of Noranda Aluminum Holdings Corporation (2007-2014); and Director of Apollo Commercial Real Estate Finance, Inc. (2014-Present). |
105
Harbor Domestic Equity Funds
Additional Information—Continued
Additional Information—Continued
Trustees and Officers—Continued
| Name (Age) Position(s) with Fund | Term of Office and Length of Time Served1 | Principal Occupation(s) During Past Five Years | Number of Portfolios In Fund Complex Overseen By Trustee | Other Directorships Of Public Companies and Other Registered Investment Companies Held by Trustee During Past Five Years |
INDEPENDENT TRUSTEES—Continued | ||||
| Kathryn L. Quirk (65) Trustee | Since 2017 | Retired; Vice President, Senior Compliance Officer and Head, U.S. Regulatory Compliance, Goldman Sachs Asset Management (2013-2017); Deputy Chief Legal Officer, Asset Management, and Vice President and Corporate Counsel, Prudential Insurance Company of America (2010-2012); Co-Chief Legal Officer, Prudential Investment Management, Inc., and Chief Legal Officer, Prudential Investments and Prudential Mutual Funds (2008-2012); Vice President and Corporate Counsel and Chief Legal Officer, Mutual Funds, Prudential Insurance Company of America, and Chief Legal Officer, Prudential Investments (2005-2008); Vice President and Corporate Counsel and Chief Legal Officer, Mutual Funds, Prudential Insurance Company of America (2004-2005); Member, Management Committee (2000-2002), General Counsel and Chief Compliance Officer, Zurich Scudder Investments, Inc. (1997-2002). | 32 | None |
| Ann M. Spruill (63) Trustee | Since 2014 | Partner (1993-2008), member of Executive Committee (1996-2008), Member Board of Directors (2002-2008), Grantham, Mayo, Van Otterloo & Co, LLC (private investment management firm) (with the firm since 1990); Member Investment Committee and Chair of Global Equities, Museum of Fine Arts, Boston (2000-Present); and Trustee, Financial Accounting Foundation (2014-Present). | 32 | None |
INTERESTED TRUSTEE | ||||
| Charles F. McCain (48)* Chairman, Trustee and President | Since 2017 | Chief Executive Officer (2017-Present), Director (2007-Present), President and Chief Operating Officer (2017), Executive Vice President and General Counsel (2004-2017), and Chief Compliance Officer (2004-2014), Harbor Capital Advisors, Inc.; Director (2007-Present) and Chief Compliance Officer (2004-2017), Harbor Services Group, Inc.; and Chief Executive Officer (2017-Present), Director (2007-Present), Chief Compliance Officer and Executive Vice President (2007-2017), Harbor Funds Distributors, Inc. | 32 | None |
| Name (Age) Position(s) with Fund | Term of Office and Length of Time Served1 | Principal Occupation(s) During Past Five Years |
FUND OFFICERS NOT LISTED ABOVE** | ||
| Erik D. Ojala (42) Chief Compliance Officer and Secretary | Since 2017 Since 2007 | Executive Vice President and General Counsel (2017-Present) and Secretary (2010-Present); Senior Vice President and Associate General Counsel (2007-2017), Harbor Capital Advisors, Inc.; Director, Executive Vice President and Chief Compliance Officer (2017-Present), Harbor Funds Distributors, Inc.; and Director (2017-Present) and Assistant Secretary (2014-Present), Harbor Services Group, Inc. |
| Anmarie S. Kolinski (46) Treasurer | Since 2007 | Executive Vice President and Chief Financial Officer (2007-Present), Harbor Capital Advisors, Inc.; Chief Financial Officer (2007-Present), Harbor Services Group, Inc.; and Chief Financial Officer (2015-Present) and Treasurer (2012-Present), Harbor Funds Distributors, Inc. |
| Brian L. Collins (49) Vice President | Since 2005 | Executive Vice President and Chief Investment Officer (2004-Present), Harbor Capital Advisors, Inc. |
| Charles P. Ragusa (58) Vice President | Since 2007 | Executive Vice President (2007-Present), Harbor Capital Advisors, Inc.; President (2007-Present), Harbor Services Group, Inc.; and Executive Vice President and AML Compliance Officer (2007-Present) and OFAC Officer (2015-Present), Harbor Funds Distributors, Inc. |
| Jodie L. Crotteau (45) Assistant Secretary | Since 2014 | Senior Vice President and Chief Compliance Officer, Harbor Capital Advisors, Inc. (2014-Present); Chief Compliance Officer and Secretary (2017-present) and Assistant Secretary (2015-2016), Harbor Services Group, Inc.; Assistant Secretary (2016-present), Harbor Funds Distributors, Inc.; Vice President and Chief Compliance Officer, Grosvenor Registered Funds (2011-2014); and Vice President, Grosvenor Capital Management, L.P. (2010-2014). |
106
Harbor Domestic Equity Funds
Additional Information—Continued
Additional Information—Continued
Trustees and Officers—Continued
| Name (Age) Position(s) with Fund | Term of Office and Length of Time Served1 | Principal Occupation(s) During Past Five Years |
FUND OFFICERS NOT LISTED ABOVE**—Continued | ||
| Lana M. Lewandowski (38) AML Compliance Officer and Assistant Secretary | Since 2017 | Legal & Compliance Manager (2016-Present) and Legal Specialist (2012-2015), Harbor Capital Advisors, Inc. |
| Lora A. Kmieciak (53) Assistant Treasurer | Since 2017 | Senior Vice President – Fund Administration and Analysis (2017-Present) and Senior Vice President - Business Analysis (2015-2017), Harbor Capital Advisors, Inc.; and Assurance Executive Director (1999-2015), Ernst & Young LLP. |
| John M. Paral (49) Assistant Treasurer | Since 2013 | Director of Fund Administration and Analysis (2017-Present), Vice President (2012-Present) and Financial Reporting Manager (2007-2017), Harbor Capital Advisors, Inc. |
| 1 | Each Trustee serves for an indefinite term, until his successor is elected. Each Officer is elected annually. |
| * | Mr. McCain is deemed an “Interested Trustee” due to his affiliation with the Adviser and Distributor of Harbor Funds. |
| ** | Officers of the Funds are “interested persons” as defined in the Investment Company Act. |
107
This privacy statement is not part of this report
Harbor’s Privacy Statement
The following privacy statement is issued by Harbor Funds and each series of Harbor Funds and its affiliates, Harbor Capital Advisors, Inc., Harbor Services Group, Inc. and Harbor Funds Distributors, Inc. These measures reflect our commitment to maintaining the privacy of your confidential information. We appreciate the confidence you have shown by entrusting us with your assets.
Personal Information
It is our policy to respect the privacy of current and former shareholders and to protect personal information entrusted to us. We do not sell your personal information to anyone.
In the course of providing products and services, we collect non-public personal information about you from the following sources: applications, forms, our website (including any information captured through our use of “cookies”), through mobile applications, by telephone and in correspondence and transactions with us, our affiliates or other parties.
The non-public personal information collected may include name, address, e-mail address, telephone/fax numbers, account number, social security or taxpayer identification number, investment activity, and bank account information.
When you visit us through our website or a mobile application, we may collect technical and navigational information, such as computer browser type, Internet protocol address, pages visited and average time spent on our website. We may use this information to alert you to software compatibility issues, or to improve our web design and functionality. We use “cookies” and similar files that may be placed on your hard drive for security purposes, to facilitate site navigation and to personalize the appearance of our site.
Information Sharing
We occasionally disclose non-public personal information about our current or former shareholders with affiliated and non-affiliated parties, as permitted or required by law or regulation. In the normal course of servicing our shareholders, information we collect may be shared with non-affiliated companies that perform support services on our behalf or to other firms that assist us in providing you with products and services, such as custodians, transfer agents, broker-dealers and marketing service firms, as well as with other financial institutions. These companies may not use the information for any other purpose and we require them to keep the information they handle confidential. We may also share information with affiliates that are engaged in a variety of financial services in order to better service your account(s).
When information is shared with third parties, they are not permitted to use the information for any purpose other than to assist our servicing of your account(s) or as permitted by law.
If you close your account(s) or if we lose contact with you, we will continue to share information in accordance with our current privacy policy and practices.
Access to Information
Access to non-public personal information is limited to employees, agents or other parties who need to know that information to perform their jobs, such as servicing your account(s), resolving problems or informing you of new products or services.
Security
We maintain physical, electronic and procedural safeguards that comply with industry standards to protect your non-public personal information.
For shareholders accessing information through our website or a mobile application, various forms of Internet security, such as data encryption firewall barriers, user names and passwords, and other tools are used. For additional information regarding our security measures, visit the terms and conditions of use on our website at harborfunds.com. If you have any questions or concerns about how we maintain the privacy of your non-public personal information, please contact us at 800-422-1050 Monday through Friday, between the hours of 8:00 a.m. and 6:00 p.m. Eastern time.
We recommend that you read and retain this notice for your personal files.
Eff. November 2013
108
Glossary
Benchmark Descriptions
Bloomberg Barclays U.S. Aggregate Bond Index—The Bloomberg Barclays U.S. Aggregate Bond Index is an unmanaged index of investment-grade fixed-rate debt issues with maturities of at least one year. This unmanaged index does not reflect fees and expenses and is not available for direct investment.
Bloomberg Barclays U.S. TIPS Index—The Bloomberg Barclays U.S. TIPS Index is an unmanaged market index comprised of all U.S. Treasury Inflation Protected Securities rated investment grade (Baa3 or better), have at least one year to final maturity, and at least $250 million par amount outstanding. This unmanaged index does not reflect fees and expenses and is not available for direct investment.
Bloomberg Commodity Index Total ReturnSM—The Bloomberg Commodity Index Total ReturnSM is a broadly diversified index that tracks the commodities markets through commodity futures contracts. This unmanaged index does not reflect fees and expenses and is not available for direct investment.
ICE BofAML All U.S. Convertibles Ex Mandatory Index—The BofA Merrill Lynch All U.S. Convertibles Ex Mandatory Index is broadly representative of the U.S. convertible securities market, consisting of publicly traded issues, denominated in U.S. dollars, of all credit qualities, and excluding mandatory (equity-linked) convertibles. This unmanaged index does not reflect fees and expenses and is not available for direct investment.
ICE BofAML U.S. Dollar 3-Month LIBOR Constant Maturity Index—The ICE BofAML U.S. Dollar 3-Month LIBOR Constant Maturity Index tracks the performance of a synthetic asset paying Libor to a stated maturity. The index is based on the assumed purchase at par of a synthetic instrument having exactly its stated maturity and with a coupon equal to that day’s fixing rate. That issue is assumed to be sold the following business day (priced at a yield equal to the current day fixing rate) and rolled into a new instrument. This unmanaged index does not reflect fees and expenses and is not available for direct investment.
ICE BofAML 3-Month U.S. Treasury Bill Index—The ICE BofAML 3-Month U.S. Treasury Bill Index is comprised of a single U.S. Treasury Bill issue purchased at the beginning of each month and held for a full month, at which time that issue is sold and rolled into a newly selected issue. The issue selected each month is that having a maturity date closest to, but not beyond 90 days from the rebalance date.
ICE BofAML U.S. High Yield Index (H0A0)—The ICE BofAML U.S. High Yield Index (H0A0) is an unmanaged index that tracks the performance of below investment grade U.S. dollar-denominated corporate bonds publicly issued in the U.S. domestic market. All bonds are U.S. dollar denominated and rated Split BBB and below. This unmanaged index does not reflect fees and expenses and is not available for direct investment.
ICE BofAML U.S. Non-Distressed High Yield Index—The ICE BofAML U.S. Non-Distressed High Yield Index is a subset of the ICE BofAML U.S. High Yield Index (H0A0) including all securities with an option-adjusted spread less than 1,000 basis points. The unmanaged index does not reflect fees and expenses and is not available for direct investment.
MSCI All Country World Index—The MSCI All Country World Index is a free float-adjusted market capitalization weighted index that is designed to measure the equity market performance of developed and emerging markets. This unmanaged index does not reflect fees and expenses and is not available for direct investment.
MSCI All Country World Ex. U.S. (ND) Index—The MSCI All Country World Ex. U.S.is a free float-adjusted market capitalization weighted index that is designed to measure equity market performance in the global developed and emerging markets, excluding the United States. This unmanaged index does not reflect fees and expenses and is not available for direct investment.
MSCI EAFE (ND) Index—The MSCI EAFE (ND) Index is an unmanaged index generally representative of major overseas stock markets. This unmanaged index does not reflect fees and expenses and is not available for direct investment.
MSCI EAFE Small Cap (ND) Index—The MSCI EAFE Small Cap (ND) Index is an equity index which captures small cap representation across developed market countries around the world, excluding the U.S. and Canada. This unmanaged index does not reflect fees and expenses and is not available for direct investment.
MSCI Emerging Markets (ND) Index—The MSCI Emerging Markets (ND) Index is a market capitalization weighted index of equity securities in more than 20 emerging market economies. This unmanaged index does not reflect fees and expenses and is not available for direct investment.
MSCI World (ND) Index—The MSCI World (ND) Index is a free float-adjusted market capitalization index that is designed to measure global developed market equity performance. This unmanaged index does not reflect fees and expenses and is not available for direct investment.
109
Glossary—Continued
Benchmark Descriptions—Continued
Russell 1000® Index—The Russell 1000® Index is an unmanaged index generally representative of the U.S. market for larger capitalization stocks as it includes the largest 1000 securities in the Russell 3000® Index by market capitalization. This unmanaged index does not reflect fees and expenses and is not available for direct investment. The Russell 1000® Index and Russell® are trademarks of Frank Russell Company.
Russell 1000® Growth Index—The Russell 1000® Growth Index is an unmanaged index generally representative of the U.S. market for larger capitalization growth stocks. This unmanaged index does not reflect fees and expenses and is not available for direct investment. The Russell 1000® Growth Index and Russell® are trademarks of Frank Russell Company.
Russell 1000® Value Index—The Russell 1000® Value Index is an unmanaged index generally representative of the U.S. market for larger capitalization value stocks. This unmanaged index does not reflect fees and expenses and is not available for direct investment. The Russell 1000® Value Index and Russell® are trademarks of Frank Russell Company.
Russell 2000® Index—The Russell 2000® Index measures the performance of the small-cap segment of the U.S. equity universe. The Russell 2000® Index is a subset of the Russell 3000® Index representing approximately 10% of the total market capitalization of that index. It includes approximately 2,000 of the smallest securities based on a combination of their market cap and current index membership. The Russell 2000® Index is constructed to provide a comprehensive and unbiased small-cap barometer and is completely reconstituted annually to ensure larger stocks do not distort the performance and characteristics of the true small-cap opportunity set. This unmanaged index does not reflect fees and expenses and is not available for direct investment. The Russell 3000® Index and Russell® are trademarks of Frank Russell Company.
Russell 2000® Growth Index—The Russell 2000® Growth Index is an unmanaged index representing the smallest 2,000 stocks with the highest price-to-book ratio and future earnings. This unmanaged index does not reflect fees and expenses and is not available for direct investment. The Russell 2000® Growth Index and Russell® are trademarks of Frank Russell Company.
Russell 2000® Value Index—The Russell 2000® Value Index is an unmanaged index representing the smallest 2,000 stocks with the lowest price-to-book ratio and future earnings. This unmanaged index does not reflect fees and expenses and is not available for direct investment. The Russell 2000® Value Index and Russell® are trademarks of Frank Russell Company.
Russell 3000® Index—The Russell 3000® Index measures the performance of the largest 3,000 U.S. companies representing approximately 98% of the investable U.S. equity market. The Russell 3000® Index is constructed to provide a comprehensive, unbiased and stable barometer of the broad market and is completely reconstituted annually to ensure new and growing equities are reflected. This unmanaged index does not reflect fees and expenses and is not available for direct investment. The Russell 3000® Index and Russell® are trademarks of Frank Russell Company.
Russell 3000® Growth Index—The Russell 3000® Growth Index measures the performance of the broad growth segment of the U.S. equity universe. It includes those Russell 3000® companies with higher price-to-book ratios and higher forecasted growth values. The Russell 3000® Growth Index is constructed to provide a comprehensive, unbiased, and stable barometer of the broad growth market. The index is completely reconstituted annually to ensure new and growing equities are included and that the represented companies continue to reflect growth characteristics. This unmanaged index does not reflect fees and expenses and is not available for direct investment. The Russell 3000® Growth Index and Russell® are trademarks of Frank Russell Company.
Russell 3000® Value Index—The Russell 3000® Value Index measures the performance of the broad value segment of U.S. equity value universe. It includes those Russell 3000® companies with lower price-to-book ratios and lower forecasted growth values. The Russell 3000® Value Index is constructed to provide a comprehensive, unbiased, and stable barometer of the broad value market. The index is completely reconstituted annually to ensure new and growing equities are included and that the represented companies continue to reflect value characteristics. This unmanaged index does not reflect fees and expenses and is not available for direct investment. The Russell 3000® Value Index and Russell® are trademarks of Frank Russell Company.
Russell Midcap® Index—The Russell Midcap® Index is an unmanaged index generally representative of the U.S. market for medium capitalization stocks. This unmanaged index does not reflect fees and expenses and is not available for direct investment. The Russell Midcap® Index and Russell® are trademarks of Frank Russell Company.
Russell Midcap® Growth Index—The Russell Midcap® Growth Index is an unmanaged index generally representative of the U.S. market for medium capitalization growth stocks. This unmanaged index does not reflect fees and expenses and is not available for direct investment. The Russell Midcap® Growth Index and Russell® are trademarks of Frank Russell Company.
110
Glossary—Continued
Benchmark Descriptions—Continued
Russell Midcap® Value Index—The Russell Midcap® Value Index is an unmanaged index generally representative of the U.S. market for medium capitalization value stocks. This unmanaged index does not reflect fees and expenses and is not available for direct investment. The Russell Midcap® Value Index and Russell® are trademarks of Frank Russell Company.
S&P 500 Index—The S&P 500 Index is an unmanaged index generally representative of the U.S. stock market. This unmanaged index does not reflect fees and expenses and is not available for direct investment.
Financial Terms
12b-1 Fee—A mutual fund fee, named for the SEC rule that permits it, used to pay for broker-dealer compensation and other distribution costs. If a fund has a 12b-1 fee, it will be disclosed in the fee table of a fund’s prospectus.
ADR—ADR after the name of a foreign holding stands for American Depositary Receipts representing ownership of foreign securities. ADRs are issued by U.S. banking institutions.
Average Market Cap—The average market capitalization of a fund’s equity portfolio gives you a measure of the size of the companies in which the fund invests. Market capitalization is calculated by multiplying the number of a company’s shares outstanding by its price per share.
Average Market Coupon—A calculation from a fund’s portfolio by weighting the coupon of each bond by its relative size in the portfolio.
Beta—A measure of market-related risk. The beta of every index is 1.00, no matter how volatile the index is. A beta less than one means the portfolio is less volatile than the index. A beta higher than one indicates more volatility than the index.
Bottom-Up Equity Management Style—A management style that de-emphasizes the significance of economic and market cycles, focusing instead on the analysis of individual stocks.
Capital Gains Distribution—Profits distributed to shareholders resulting from the sale of securities held in the fund’s portfolio.
Credit Risk—The possibility that a bond issuer may not be able to pay interest and repay its debt.
CUSIP Number—Identification number assigned to every stock, corporate bond and municipal bond by the Committee on Uniform Securities Identification Procedures (CUSIP), which is established by the American Bankers Association.
Diversification—The practice of investing broadly across securities of a number of issuers to reduce risk.
Duration—A common gauge of the price sensitivity of a fixed income asset or portfolio to a change in interest rates.
Emerging Markets—Emerging markets are countries with relatively young stock and bond markets. Examples include Brazil and Thailand. Typically, emerging-markets investments have the potential for losses and gains larger than those of developed-market investments.
Expense Ratio—The Fund’s total annual operating expenses (including management fees, distribution (12b-1) fees and other expenses) expressed as a percentage of average net assets.
Family of Funds—A group of mutual funds, each typically with its own investment objective, managed or distributed by the same company that hold themselves out to investors as related companies for the purposes of investment and investor services.
GDR—GDR after the name of a holding stands for Global Depositary Receipt representing ownership of foreign securities. GDRs are issued by either U.S. or non-U.S. banking organizations. SADR after the name of a holding stands for South African Depositary Receipts representing ownership of South African securities listed on the Johannesburg Stock Exchange. SDR after the name of a holding stands for Swedish Depository Receipts representing ownership of foreign securities in Sweden. NVDR after the name of a holding stands for Non-Voting Depositary Receipts representing ownership of a listed security in the Stock Exchange of Thailand.
Inception Date—The date on which the Fund commenced operations.
Investment Objective—The goal that an investor and mutual fund pursue together (e.g., current income, long-term capital growth, etc.).
111
Glossary—Continued
Financial Terms—Continued
Median Market Cap—An indicator of the size of companies in which a fund invests; the midpoint of market capitalization (market price x shares outstanding) of a fund’s stocks, weighted by the proportion of the fund’s assets invested in each stock. Stocks representing half of the fund’s assets have market capitalizations above the median, and the rest are below it.
Net Asset Value (NAV)—The per share value of a mutual fund, determined by subtracting the fund’s liabilities from its assets and dividing by the number of shares outstanding. Mutual funds calculate their NAVs at least once each business day.
No-Load Fund—A mutual fund whose shares are sold without a sales commission and without a 12b-1 fee of more than 0.25% per year. Harbor funds are no-load.
Open-End Management Company—The legal name for a mutual fund, indicating that it stands ready to redeem (buy back) its shares from investors on any business day. Harbor Funds is an open-end investment company.
Operating Expenses—Business costs paid from a fund’s assets before earnings are distributed to shareholders. These include management fees and 12b-1 fees and other expenses.
Portfolio Manager—A specialist employed by a mutual fund’s adviser or subadviser to invest the fund’s assets in accordance with predetermined investment objectives.
Portfolio Turnover—A measure of the trading activity in a fund’s investment portfolio (how often securities are bought and sold by a fund). Funds with high turnover rates incur higher transaction costs and may be more likely to distribute capital gains (which may be taxable to investors).
Price to Book Ratio (P/B)—A ratio used to compare a stock’s market value to its book value. It is calculated by dividing the current closing price of the stock by the latest quarter’s book value. For a fund, the weighted average price/book ratio of the stocks it holds.
Price to Earnings Ratio (P/E)—The ratio of a stock’s current price to its per-share earnings over the past year. For a fund, the weighted average P/E of the stocks it holds. P/E is an indicator of market expectations about corporate prospects; the higher the P/E, the greater the market expectations are for a company’s future growth.
Prospectus—The official document that describes a mutual fund to prospective investors. The prospectus contains information required by the SEC, such as investment objectives and policies, risks, services and fees.
Record Date—The date on which a shareholder must officially own shares in order to be entitled to a dividend.
Redemption Fee—Fee charged to shareholders by a mutual fund when they sell shares within a specified period after purchase. The time limit and size of fee vary among funds. The fee is paid to the fund, not the fund’s investment adviser. Its purpose is to protect long-term investors from the impact of short-term traders.
REITs (Real Estate Investment Trust)—REITs invest in real estate or loans secured by real estate and issue shares in such investments. A REIT is similar to a closed-end mutual fund.
Repurchase Agreement (Repo)—A form of short-term borrowing for dealers in government securities. The dealer sells the government securities to investors, usually on an overnight basis, and buys them back the following day. For the party selling the security (and agreeing to repurchase it in the future), it is a repo. For the party on the other end of the transaction (buying the security and agreeing to sell back in the future), it is a reverse repurchase agreement.
Risk/Reward (or Return)—The relationship between the degree of risk associated with an investment and its return potential. Typically, the higher the potential return of an investment, the greater the risk.
Statement of Additional Information (SAI)—The supplementary document to a prospectus that contains more detailed information about a mutual fund; also known as “Part B” of a fund’s registration statement.
TBAs—A term used to describe a forward mortgage-backed securities trade. Pass-through securities issued by Freddie Mac, Fannie Mae and Ginnie Mae trade in the TBA market. The term TBA is derived from the fact that the actual mortgage- backed security that will be delivered to fulfill a TBA trade is not designated at the time the trade is made. The securities are “to be announced” 48 hours prior to the established trade settlement date.
Treasury Inflation-Protected Securities (TIPS)—TIPS are securities in which the principal amount is adjusted for inflation and interest payments are applied to the inflation-adjusted principal.
112
Glossary—Continued
Financial Terms—Continued
Top-Down Equity Management Style—Investment style that begins with an assessment of the overall economic environment and makes a general asset allocation decision regarding various sectors of the financial markets and various industries.
Total Return—Return on an investment over a specified period, including price appreciation (or depreciation) plus any income, expressed as an average annual compound of return.
Weighted Average Duration—Duration is a time measure of a bond’s interest-rate sensitivity, based on the weighted average of the time periods over which a bond’s cash flows accrue to the bondholder. Time periods are weighted by multiplying by the present value of its cash flow divided by the bond’s price. (A bond’s cash flows consist of coupon payments and repayment of capital.) A bond’s duration will almost always be shorter than its maturity, with the exception of zero-coupon bonds, for which maturity and duration are equal.
Weighted Average Maturity—The average length of time until principal must be repaid for all bonds in a mutual fund portfolio on a dollar weighted basis.
Yield—A measure of net income (dividends and interest) earned by the securities in the fund’s portfolio less fund expenses during a specified period. A fund’s yield is expressed as a percentage of the maximum offering price per share on a specified date.
Yield to Maturity—The term used to describe the rate of return an investor will receive if a long-term, interest-bearing security, such as a bond, is held to its maturity date. Yield to maturity is greater than the coupon rate if the bond is selling at a discount and less than the coupon rate if it is selling at a premium.
113
Notes
Notes

| 111 South Wacker Drive, 34th Floor | Chicago, IL 60606-4302 | 800-422-1050 | harborfunds.com |
Trustees & Officers
Charles F. McCain
Chairman, President & Trustee
Chairman, President & Trustee
Scott M. Amero
Trustee
Trustee
Raymond J. Ball
Trustee
Trustee
Donna J. Dean
Trustee
Trustee
Joseph L. Dowling, III
Trustee
Trustee
Randall A. Hack
Trustee
Trustee
Robert Kasdin
Trustee
Trustee
Kathryn L. Quirk
Trustee
Trustee
Ann M. Spruill
Trustee
Trustee
Anmarie S. Kolinski
Treasurer
Treasurer
Erik D. Ojala
Chief Compliance Officer
& Secretary
Chief Compliance Officer
& Secretary
Brian L. Collins
Vice President
Vice President
Charles P. Ragusa
Vice President
Vice President
Jodie L. Crotteau
Assistant Secretary
Assistant Secretary
Lana M. Lewandowski
AML Compliance Officer
& Assistant Secretary
AML Compliance Officer
& Assistant Secretary
Lora A. Kmieciak
Assistant Treasurer
Assistant Treasurer
John M. Paral
Assistant Treasurer
Assistant Treasurer
Investment Adviser
Harbor Capital Advisors, Inc.
111 South Wacker Drive
34th Floor
Chicago, IL 60606-4302
312-443-4400
111 South Wacker Drive
34th Floor
Chicago, IL 60606-4302
312-443-4400
Distributor
Harbor Funds Distributors, Inc.
111 South Wacker Drive
34th Floor
Chicago, IL 60606-4302
312-443-4600
111 South Wacker Drive
34th Floor
Chicago, IL 60606-4302
312-443-4600
Shareholder Services
Harbor Services Group, Inc.
P.O. Box 804660
Chicago, IL 60680-4108
800-422-1050
P.O. Box 804660
Chicago, IL 60680-4108
800-422-1050
Custodian
State Street Bank & Trust Company
State Street Financial Center
1 Lincoln Street
Boston, MA 02111-2900
State Street Financial Center
1 Lincoln Street
Boston, MA 02111-2900
FD.AR.DE.1017
Table of Contents


Annual Report
October 31, 2017
Harbor Strategic Growth Fund
| Institutional Class | Administrative Class | Investor Class | Retirement Class |
| MVSGX | HSRGX | HISWX | HNGSX |
Table of Contents
| 1 | |
| Harbor Strategic Growth Fund | |
| 3 | |
| 5 | |
| 6 | |
| 7 | |
| Financial Statements | |
| 10 | |
| 11 | |
| 12 | |
| 15 | |
| 18 | |
| 27 |
This document must be preceded or accompanied by a Prospectus.
Letter from the Chairman
 Charles F. McCain Chairman |
Dear Fellow Shareholder:
I am honored to be writing my first shareholder letter to you as Chairman of the Board of Trustees of Harbor Funds. David Van Hooser, our long-standing Chairman, retired from the Board of Trustees on September 22, 2017 after 17 years of distinguished service. Over that 17 year tenure, I have admired how Dave has maintained a singular focus on serving the best interests of Harbor Funds and its shareholders. He has served as an example to me and the other women and men who work diligently to support Harbor Funds. I remain committed to carrying on the responsibility that Dave so fully embraced to place the interests of Harbor Funds and its shareholders first.
We have also had other changes on the Board of Trustees over the past year. Rodger Smith, our long-standing Lead Independent Trustee, retired from the Board on December 31, 2016 after a 29 year tenure. He was replaced as Lead Independent Trustee by Randy Hack, who has served on the Board since 2010. Shareholders also elected two new independent Trustees to the Board on September 22, 2017 in Katie Quirk and Joe Dowling. With their election, eight of the nine members of the Board are independent of Harbor Capital Advisors, the investment adviser to Harbor Funds.
Market review
U.S. equities generally had strong returns for the fiscal year ended October 31, 2017. The period began with a U.S. election that fueled a market rally based upon optimism that promises of tax cuts, infrastructure spending and a business-friendly approach to regulation could lead to improved economic growth and higher corporate earnings.
As the fiscal year continued, U.S. stocks advanced despite rising interest rates, falling oil prices and political uncertainty, as corporate earnings exceeded expectations. Better-than-expected economic growth and job gains drove U.S. equity indexes to record levels toward the end of the period, while oil prices stabilized and the Federal Reserve stayed on track to continue raising short-term interest rates while laying the groundwork for gradually reducing its U.S. Treasury bond balance sheet holdings.
The Russell 3000® Index, a measure of the broad U.S. stock market, had a return of 23.98% for the fiscal year. Growth stocks outperformed value stocks by a significant margin, and small cap stocks outperformed both large cap and mid cap stocks.
Comments by the portfolio managers of the Harbor Strategic Growth Fund can be found in the pages preceding the Fund’s portfolio of investments. As always, we recommend that shareholders maintain a long-term perspective in evaluating all of their investments, including those in Harbor Funds.
| Returns For Periods Ended October 31, 2017 | ||||||||
| Annualized | ||||||||
| Domestic Equities | 1 Year | 5 Years | 10 Years | 30 Years | ||||
Russell 3000® (entire U.S. stock market) | 23.98% | 15.12% | 7.61% | 10.60% | ||||
S&P 500 (large cap stocks) | 23.63 | 15.18 | 7.51 | 10.50 | ||||
Russell Midcap® (mid cap stocks) | 21.09 | 14.87 | 8.09 | 12.11 | ||||
Russell 2000® (small cap stocks) | 27.85 | 14.49 | 7.63 | 10.45 | ||||
Russell 3000® Growth (growth stocks) | 29.80 | 16.71 | 9.05 | 10.16 | ||||
Russell 3000® Value (value stocks) | 18.30 | 13.48 | 6.07 | 10.68 | ||||
| International & Global | ||||||||
MSCI EAFE (ND) (foreign stocks) | 23.44% | 8.53% | 1.10% | 5.62% | ||||
MSCI EAFE Small Cap (ND) (foreign small cap stocks) | 27.51 | 13.03 | 4.18 | N/A | ||||
MSCI World (ND) (global stocks) | 22.77 | 11.56 | 4.10 | 7.44 | ||||
MSCI All Country World Ex. U.S. (ND) (foreign stocks) | 23.64 | 7.29 | 0.92 | N/A | ||||
MSCI Emerging Markets (ND) (emerging market stocks) | 26.45 | 4.83 | 0.60 | N/A | ||||
| Strategic Markets | ||||||||
Bloomberg Commodity Index Total ReturnSM (commodities) | 2.35% | -9.37% | -6.93% | N/A | ||||
| Fixed Income | ||||||||
ICE BofAML U.S. Non-Distressed High Yield (domestic high-yield bonds) | 8.62% | 6.33% | 6.69% | N/A | ||||
Bloomberg Barclays U.S. Aggregate Bond (domestic bonds) | 0.90 | 2.04 | 4.19 | 6.43% | ||||
Bloomberg Barclays U.S. TIPS (domestic inflation-linked bonds) | -0.11 | -0.11 | 3.81 | N/A | ||||
ICE BofAML U.S. 3-Month Treasury Bill (proxy for money market returns) | 0.72 | 0.24 | 0.45 | 3.35 | ||||
Stay focused on the long-term
Major U.S. indexes hit record levels toward the end of the fiscal year, supported by continued earnings gains and favorable economic data. Against this backdrop, the third calendar quarter of 2017 marked the eighth consecutive quarter of gains for U.S. equities.
With equities having rallied for an extended period, it is reasonable to question whether the market’s advance might be due for a slowdown or even a reversal in the near future. For even the most experienced investment professionals, it is difficult to reliably predict the movements of stock prices or bond prices with certainty, particularly in the shorter-term.
1
We always encourage shareholders to take a long-term perspective with all of their investments. While past performance is never a guarantee of future results, over the long term, the returns of equities and debt securities have historically helped many investors achieve their financial objectives. We encourage all investors to maintain a diversified portfolio of equities, debt and cash in an allocation consistent with their long-term financial goals and comfort with risk.
Harbor Funds offers a variety of equity, strategic markets and fixed income funds to help you achieve your financial goals.
Thank you for investing with Harbor Funds.
December 21, 2017
 |
| Charles F. McCain |
| Chairman |
2
Harbor Strategic Growth Fund
Managers' Commentary (Unaudited)
Managers' Commentary (Unaudited)
Subadviser
Mar Vista Investment Partners, LLC
11150 Santa Monica Boulevard, Suite 320
Los Angeles, CA 90025
Portfolio Managers
Silas A. Myers, CFA
Since 2017
Since 2017
Brian L. Massey, CFA
Since 2017
Since 2017
Joshua J. Honeycutt, CFA
Since 2017
Jeffrey B. Prestine
Since 2017
Since 2017
Mar Vista has subadvised the Fund since 2017.*
Investment Objective
The Fund seeks long-term growth of capital.

Silas A. Myers, CFA

Brian L. Massey, CFA

Joshua J. Honeycutt, CFA

Jeffrey B. Prestine
Management’s Discussion of
Fund Performance
Fund Performance
MARKET REVIEW
For the 12-month period ended October 31, 2017, the Russell 1000® Growth Index was up 29.71%. The favorable macro environment is fostering incessant stock appreciation that is largely outpacing the growth of underlying business values and, in our estimate, these elevated expectations leave little room for disappointment. A broad swath of economic data continues to support a synchronized global economic recovery. Job growth, industrial production and inflation statistics generally remain in the “Goldilocks” -not too hot, not too cold - zone helping interest rates, credit spreads and volatility remain remarkably subdued and creating a favorable environment for most risk assets.
Besides the growing labor shortages, uncertainties over U.S. trade policies, firing of North Korean missiles and low market volatility, the market seems to be comfortable with accelerating global growth and low interest rates justifying elevated valuations. The most recent U.S. GDP report showed a sequential acceleration of growth to 3% with the consumer being the main driver. Inflation measured by the GDP price index remains below 2% but has been steadily rising over the past two years. The most recent unemployment report showed the unemployment rate at 4.1% with a gain of 261,000 jobs. The rising probability of U.S. corporate tax reform has also added momentum to the markets.
PERFORMANCE
For the 12-month period ended October 31, 2017**, the Harbor Strategic Growth Fund (Institutional Class) returned 22.90%. The Institutional Class returns prior to March 6, 2017 are that of the Predecessor Fund. The Fund’s Administrative Class, Investor Class, and Retirement Class shares commenced operations on March 6, 2017 and returned 12.29%, 12.23%, and 12.53%, respectively, for the period March 6, 2017 through October 31, 2017. Stock selection within the Financials, Consumer Discretionary, Industrials, and Health Care sectors drove the Fund’s underperformance relative to the benchmark. The Fund’s sector overweight in Energy, underweight in Information Technology and cash position also detracted from performance.
Allergan, a global pharmaceutical company, struggled with concerns over cash flows falling short of expectations, aggressive capital allocation, pipeline vitality and patent risks for key products. The Fund’s Energy holdings, Core Laboratories and Schlumberger, declined due to weaker oil prices, concerns over the Organization of Petroleum Exporting Countries’ (OPEC) compliance and the growing supply from U.S. shale. O’Reilly Automotive, an automotive supply retailer, fell on a report that Amazon may enter the auto parts market and that new and used auto prices have peaked. Concerns over general weakness in global consumer goods brands and the negative impact of private label offerings led to Mondelez’s underperformance.
Strong contributors to performance included Mettler-Toledo, whose revenue and operating profit growth exceeded expectations. We believe that the company’s durable competitive position across an array of measurement tool segments and nearly flawless execution should continue to drive growth. Unilever’s improvements in business mix, margins and capital allocation also drove favorable stock returns. Dollar Tree’s stock rose after reporting improved store economics for both the Dollar Tree and Family Dollar platforms.
| * | On March 6, 2017, the Fund acquired all of the assets and substantially all of the liabilities of the Mar Vista Strategic Growth Fund (the “Predecessor Fund”). For the period November 1, 2011 (inception of the Predecessor Fund) to January 20, 2015, Mar Vista served as the Predecessor Fund’s subadviser and for the period January 20, 2015 to March 6, 2017, Mar Vista served as investment adviser to the Predecessor Fund. |
| ** | Effective July 1, 2017, the Fund changed its fiscal year end date from June 30 to October 31. |
3
Harbor Strategic Growth Fund
Managers' Commentary—Continued
Managers' Commentary—Continued
| TOP TEN HOLDINGS (% of net assets) | |
| Oracle Corp. | 5.0% |
| Berkshire Hathaway Inc. Class B | 4.9% |
| Markel Corp. | 4.8% |
| American Tower Corp. | 4.7% |
| Honeywell International Inc. | 4.4% |
| Alphabet Inc. Class C | 4.1% |
| Dollar Tree Inc. | 3.8% |
| Intuit Inc. | 3.5% |
| Unilever NV | 3.3% |
| Apple Inc. | 3.2% |
OUTLOOK & STRATEGY
From an absolute viewpoint, current market conditions are, in our view, favorable for our approach. The combination of low and stable interest rates with modest global economic growth typically bodes well for higher quality businesses. From a relative viewpoint, the Fund’s more conservative positioning compared to the mega-cap high-growth areas of the benchmark hurt performance. Three traditional growth sectors account for nearly 70% of the Russell 1000® Growth Index: Information Technology (37%), Consumer Discretionary (18%) and Health Care (14%). However, they represent only 41% of the Fund. Mar Vista’s portfolio construction process focuses on bottom-up factors independent of benchmark weights. The resulting sector exposures represent the areas in which we are finding more favorable risk-reward opportunities in from sustained growth companies, and are not an expressed opinion on the sectors from a macro level.
Over time, the expected returns of the Fund should reflect two components: (1) the compounding nature of the Fund’s businesses and (2) the discount we are paying relative to fair value. There will be times when the sentiment pendulum swings towards optimism; leading to higher valuations that exceeded the underlying intrinsic value growth, and margins of safety contract. Conversely, fear and skepticism often drive down stock prices more than expected, providing opportunities for both higher expected returns and less risk. Judged by the Fund’s relatively narrow average margin of safety, or discount to intrinsic value, we think the pendulum sits on the more optimistic side of the scale. The 7% portfolio average discount continues to be at the extreme low end of the last decade in our opinion and the number of stocks that are trading below our estimate of fair value is smaller than is typical.
We claim no special skill in predicting the market’s direction but, in the fullness of time, we believe a patient, high-conviction portfolio comprised of competitively advantaged serial compounders with stock prices that represent an appropriate margin of safety should generate excess risk-adjusted returns. In an environment with growing optimism, we remain diligent, conservative and patient as we deploy capital.
This report contains the current opinions of Mar Vista Investment Partners, LLC as of the date of this report and should not be considered as investment advice or a recommendation of any particular security, strategy or investment product. Such opinions are subject to change without notice and securities described herein may no longer be included in, or may at any time be removed from, the Fund’s portfolio. This report is distributed for informational purposes only. Information contained herein has been obtained from sources believed reliable, but not guaranteed.
Equity securities, such as common stocks, are affected by company specific events and by movements in the overall stock markets in which those securities principally trade, among other factors. An adverse company specific event, or downturn in those stock markets, can depress the value of a particular company’s equity securities. For information on the different share classes and the risks associated with an investment in the Fund, please refer to the current prospectus.
4
Harbor Strategic Growth Fund
Fund Summary—October 31, 2017 (Unaudited)
Fund Summary—October 31, 2017 (Unaudited)
| INSTITUTIONAL CLASS | |
| Fund # | 2040 |
| Cusip | 411512353 |
| Ticker | MVSGX |
| Inception Date | 11/01/2011 |
| Net Expense Ratio | 0.70% a,b |
| Total Net Assets (000s) | $56,026 |
| ADMINISTRATIVE CLASS | |
| Fund # | 2240 |
| Cusip | 411512338 |
| Ticker | HSRGX |
| Inception Date | 03/06/2017 |
| Net Expense Ratio | 0.95% a,b |
| Total Net Assets (000s) | $12 |
| INVESTOR CLASS | |
| Fund # | 2440 |
| Cusip | 411512361 |
| Ticker | HISWX |
| Inception Date | 03/06/2017 |
| Net Expense Ratio | 1.07% a,b |
| Total Net Assets (000s) | $75 |
| RETIREMENT CLASS | |
| Fund # | 2540 |
| Cusip | 411512346 |
| Ticker | HNGSX |
| Inception Date | 03/06/2017 |
| Net Expense Ratio | 0.62% a,b |
| Total Net Assets (000s) | $435 |
Portfolio Statistics
| Portfolio | Benchmark | ||
| Weighted Average Market Cap (MM) | $169,318 | $225,048 | |
| Price/Earning Ratio (P/E) | 36.1x | 31.8x | |
| Price/Book Ratio (P/B) | 5.4x | 7.9x | |
| Beta vs. Russell 1000® Growth Index | 0.85 | N/A | |
| Portfolio Turnover (Period Ended 10/31/2017) | 9% c | N/A |
Sector Allocation (% of investments)
(Excludes cash and short-term investments)

| a | Annualized |
| b | Reflects an expense limitation agreement (excluding acquired fund fees and expenses and interest expense, if any) effective through February 28, 2019 |
| c | Unannualized |
5
Harbor Strategic Growth Fund
Fund Performance Summary (Unaudited)
Fund Performance Summary (Unaudited)
The graph compares a $50,000 investment in the Institutional Class shares of the Fund with the performance of the Russell 1000® Growth Index. The Fund’s performance assumes the reinvestment of all dividend and capital gain distributions.
CHANGE IN A $50,000 INVESTMENT
For the period 11/01/2011 through 10/31/2017

| TOTAL RETURNS For the periods ended 10/31/2017 | 1 Year | Annualized | Inception Date | Final Value of a $50,000 Investment | ||||||||||
| 5 Years | Life of Class | |||||||||||||
| Harbor Strategic Growth Fund | ||||||||||||||
Institutional Class | 22.90% | 14.98% | 14.92% | 11/01/2011 | $115,154 | |||||||||
Administrative Class1 | N/A | N/A | 12.29 | 03/06/2017 | 56,146 | |||||||||
Investor Class1 | N/A | N/A | 12.23 | 03/06/2017 | 56,116 | |||||||||
Retirement Class1 | N/A | N/A | 12.53 | 03/06/2017 | 56,265 | |||||||||
| Comparative Index | ||||||||||||||
Russell 1000® Growth2 | 29.71% | 16.83% | 16.18% | — | $122,977 | |||||||||
As stated in the Fund’s current prospectus, the expense ratios were 0.70% (Net) and 0.91% (Gross) (Institutional Class); 0.95% (Net) and 1.16% (Gross) (Administrative Class); 1.07% (Net) and 1.28% (Gross) (Investor Class); and 0.62% (Net) and 0.83% (Gross) (Retirement Class). The net expense ratios reflect an expense limitation agreement (excluding interest expense, if any) effective through 02/28/2019. The expense ratios in the prospectus may differ from the actual expense ratios for the period disclosed within this report. The expense ratios shown in the prospectus are based on the prior fiscal year, adjusted to reflect changes, if any, in contractual arrangements that occurred prior to the date of the prospectus (or supplement thereto, if applicable).
Performance data shown represents past performance and is no guarantee of future results. Past performance is net of management fees and expenses and reflects reinvested dividends and distributions, but does not reflect the deduction of taxes that a shareholder would pay on Fund distributions or upon the redemption of Fund shares. Past performance reflects the beneficial effect of any expense waivers or reimbursements, without which returns would have been lower. Investment returns and principal value will fluctuate and when redeemed may be worth more or less than their original cost. Returns for periods less than one year are not annualized. Current performance may be higher or lower and is available through the most recent month end at harborfunds.com or by calling 800-422-1050. The Fund acquired the assets and assumed the known liabilities of the Mar Vista Strategic Growth Fund (the “Predecessor Fund”) on March 6, 2017. The Fund is the performance successor of the reorganization. This means that the Predecessor Fund’s performance and financial history will be used by the Fund going forward from the date of reorganization. In the reorganization, former shareholders of the Predecessor Fund received Institutional Class shares of the Fund. Accordingly, the performance of the Institutional Class of the Fund for periods prior to the reorganization is the performance of the Predecessor Fund. The performance of the Predecessor Fund has not been restated to reflect the estimated annual operating expenses of the Institutional Class shares of the Fund, which are lower than those of the Predecessor Fund. Because the Fund has different fees and expenses than the Predecessor Fund, the Fund would also have had different performance results.
| 1 | The “Life of Class” return represents unannualized values. |
| 2 | The “Life of Class” return and “Final Value of a $50,000 Investment” as shown reflects the period 11/01/2011 through 10/31/2017. |
6
Harbor Strategic Growth Fund
Portfolio of Investments—October 31, 2017
Portfolio of Investments—October 31, 2017
Value, Cost, and Principal Amounts in Thousands
Equity Holdings (% of net assets)
(Excludes net cash and short-term investments of 2.4%)

| COMMON STOCKS—97.6% | |||
| Shares | Value | ||
| AEROSPACE & DEFENSE—3.1% | |||
| 6,272 | TransDigm Group Inc. | $ 1,741 | |
| AIR FREIGHT & LOGISTICS—2.6% | |||
| 20,843 | XPO Logistics Inc.* | 1,446 | |
| BANKS—4.4% | |||
| 8,924 | First Republic Bank | 869 | |
| 29,604 | U.S. Bancorp. | 1,610 | |
| 2,479 | |||
| BEVERAGES—2.2% | |||
| 11,291 | PepsiCo Inc. | 1,245 | |
| CAPITAL MARKETS—2.5% | |||
| 9,897 | Moody's Corp. | 1,410 | |
| CHEMICALS—4.6% | |||
| 12,449 | Ecolab Inc. | 1,626 | |
| 6,719 | Praxair Inc. | 982 | |
| 2,608 | |||
| COMMON STOCKS—Continued | |||
| Shares | Value | ||
| DIVERSIFIED FINANCIAL SERVICES—4.9% | |||
| 14,851 | Berkshire Hathaway Inc. Class B* | $ 2,776 | |
| ELECTRICAL EQUIPMENT—2.9% | |||
| 33,481 | Sensata Technologies Holding NV* | 1,638 | |
| ENERGY EQUIPMENT & SERVICES—4.3% | |||
| 11,716 | Core Laboratories NV | 1,171 | |
| 19,970 | Schlumberger Ltd. | 1,278 | |
| 2,449 | |||
| EQUITY REAL ESTATE INVESTMENT TRUSTS (REITs)—4.7% | |||
| 18,590 | American Tower Corp. | 2,671 | |
| FOOD PRODUCTS—1.9% | |||
| 26,556 | Mondelez International Inc. | 1,100 | |
| HOTELS, RESTAURANTS & LEISURE—2.6% | |||
| 26,864 | Starbucks Corp. | 1,473 | |
| INDUSTRIAL CONGLOMERATES—7.3% | |||
| 17,226 | Honeywell International Inc. | 2,483 | |
| 6,438 | Roper Technologies Inc. | 1,662 | |
| 4,145 | |||
| INSURANCE—4.8% | |||
| 2,506 | Markel Corp.* | 2,717 | |
| INTERNET & DIRECT MARKETING RETAIL—2.0% | |||
| 1,029 | Amazon.com Inc.* | 1,137 | |
| INTERNET SOFTWARE & SERVICES—6.3% | |||
| 2,299 | Alphabet Inc. Class C* | 2,337 | |
| 6,804 | Facebook Inc.* | 1,225 | |
| 3,562 | |||
| IT SERVICES—2.6% | |||
| 13,134 | Visa Inc. | 1,445 | |
| LIFE SCIENCES TOOLS & SERVICES—2.2% | |||
| 1,855 | Mettler-Toledo International Inc. (SWS)* | 1,266 | |
| MACHINERY—2.3% | |||
| 18,203 | Fortive Corp. | 1,315 | |
| MEDIA—1.8% | |||
| 10,338 | Walt Disney Co. | 1,011 | |
| MULTILINE RETAIL—3.8% | |||
| 23,351 | Dollar Tree Inc.* | 2,131 | |
| PERSONAL PRODUCTS—3.3% | |||
| 32,180 | Unilever NV (NET) | 1,865 | |
| PHARMACEUTICALS—4.2% | |||
| 3,857 | Allergan plc (IE) | 683 | |
| 11,933 | Johnson & Johnson | 1,664 | |
| 2,347 | |||
| ROAD & RAIL—1.3% | |||
| 6,980 | Kansas City Southern | 728 | |
| SOFTWARE—10.7% | |||
| 7,296 | Adobe Systems Inc.* | 1,278 | |
| 13,048 | Intuit Inc. | 1,970 | |
| 55,283 | Oracle Corp. | 2,814 | |
| 6,062 | |||
7
Harbor Strategic Growth Fund
Portfolio of Investments—Continued
Portfolio of Investments—Continued
Value, Cost, and Principal Amounts in Thousands
| COMMON STOCKS—Continued | |||
| Shares | Value | ||
| SPECIALTY RETAIL—1.1% | |||
| 2,827 | O'Reilly Automotive Inc.* | $ 596 | |
| TECHNOLOGY HARDWARE, STORAGE & PERIPHERALS—3.2% | |||
| 10,560 | Apple Inc. | 1,785 | |
| TOTAL COMMON STOCKS | |||
(Cost $45,156) | 55,148 | ||
| SHORT-TERM INVESTMENTS—3.2% | |||
| (Cost $1,826) | |||
| Principal Amount | |||
| REPURCHASE AGREEMENTS | |||
| $ | 1,826 | Repurchase Agreement with Fixed Income Clearing Corp. dated October 31, 2017 due November 01, 2017 at 0.001% collateralized by U.S. Treasury Notes (value $1,863) | 1,826 |
| TOTAL INVESTMENTS—100.8% | |||
(Cost $46,982) | 56,974 | ||
CASH AND OTHER ASSETS, LESS LIABILITIES—(0.8)% | (426) | ||
TOTAL NET ASSETS—100.0% | $56,548 | ||
FAIR VALUE MEASUREMENTS
Repurchase Agreements valued at $1,826 are classified as Level 2. All other holdings at October 31, 2017 (as disclosed in the preceding Portfolio of Investments) are classified as Level 1. There were no Level 3 holdings at June 30, 2017 or October 31, 2017 and no transfers between levels during the period.
For more information on valuation inputs and their aggregation into the levels identified above, please refer to the Fair Value Measurements and Disclosures in Note 2 of the accompanying Notes to Financial Statements.
| * | Non-income producing security |
| IE | Ireland |
| NET | Netherlands |
| SWS | Switzerland |
The accompanying notes are an integral part of the Financial Statements.
8
[THIS PAGE INTENTIONALLY LEFT BLANK]
9
Harbor Strategic Growth Fund
Statement of Assets and Liabilities—October 31, 2017
Statement of Assets and Liabilities—October 31, 2017
(All amounts in thousands, except per share amounts)
| Harbor Strategic Growth Fund | ||
| ASSETS | ||
Investments, at identified cost* | $46,982 | |
Investments, at value | $55,148 | |
Repurchase agreements | 1,826 | |
Cash | 1 | |
| Receivables for: | ||
Capital shares sold | 38 | |
Dividends | 8 | |
Withholding tax | 1 | |
Prepaid registration fees | 9 | |
Other assets | 26 | |
Total Assets | 57,057 | |
| LIABILITIES | ||
| Payables for: | ||
Investments purchased | 369 | |
Capital shares reacquired | 41 | |
| Accrued expenses: | ||
Administrative fees | 7 | |
Management fees | 28 | |
Transfer agent fees | 1 | |
Trustees' fees and expenses | 1 | |
Other | 62 | |
Total Liabilities | 509 | |
NET ASSETS | $56,548 | |
| Net Assets Consist of: | ||
Paid-in capital | 45,701 | |
Accumulated undistributed net investment income/(loss) | 77 | |
Accumulated net realized gain/(loss) | 778 | |
Unrealized appreciation/(depreciation) of investments | 9,992 | |
| 56,548 | ||
| NET ASSET VALUE PER SHARE BY CLASS | ||
| Institutional Class | ||
Net assets | $56,026 | |
Shares of beneficial interest1 | 2,972 | |
Net asset value per share2 | $ 18.85 | |
| Administrative Class | ||
Net assets | $ 12 | |
Shares of beneficial interest1 | 1 | |
Net asset value per share2 | $ 18.82 | |
| Investor Class | ||
Net assets | $ 75 | |
Shares of beneficial interest1 | 4 | |
Net asset value per share2 | $ 18.81 | |
| Retirement Class | ||
Net assets | $ 435 | |
Shares of beneficial interest1 | 23 | |
Net asset value per share2 | $ 18.86 | |
| * | Including repurchase agreements and short-term investments |
| 1 | Par value $0.01 (unlimited authorizations) |
| 2 | Per share amounts can be recalculated to the amounts disclosed herein when total net assets and shares of beneficial interest are not rounded to thousands. |
The accompanying notes are an integral part of the Financial Statements.
10
Harbor Strategic Growth Fund
StatementS of Operations
StatementS of Operations
(All amounts in thousands)
| Harbor Strategic Growth Fund | ||
| July 1, 2017 through October 31, 2017 | July 1, 2015 through June 30, 2016 | |
| Investment Income | ||
Dividends | $ 143 | $ 449 |
Interest. | 1 | — |
Foreign taxes withheld | (3) | (6) |
Total Investment Income | 141 | 443 |
| Operating Expenses | ||
Management fees | 85 | 200 |
| 12b-1 fees: | ||
Administrative Class | — | — |
Investor Class | — | — |
Administrative fees | — | 24 |
Compliance fees | — | 8 |
Shareholder communications | 3 | 3 |
Custodian fees | 3 | 10 |
| Transfer agent fees: | ||
Institutional Class | 13 | 30 |
Administrative Class | — | — |
Investor Class | — | — |
Retirement Class | — | — |
Professional fees | 1 | 68 |
Trustees' fees and expenses | — | 7 |
Registration fees | 57 | 62 |
Miscellaneous | 5 | 12 |
Total expenses | 167 | 424 |
Transfer agent fees waived | (1) | (1) |
Other expenses reimbursed | (67) | (185) |
Net expenses | 99 | 238 |
Net Investment Income/(Loss) | 42 | 205 |
| Realized and Change in Net Unrealized Gain/(Loss) on Investment Transactions | ||
| Net realized gain/(loss) on: | ||
Investments | 144 | 773 |
| Change in net unrealized appreciation/(depreciation) on: | ||
Investments | 2,754 | 3,139 |
Net gain/(loss) on investment transactions | 2,898 | 3,912 |
Net Increase/(Decrease) in Net Assets Resulting from Operations | $2,940 | $4,117 |
The accompanying notes are an integral part of the Financial Statements.
11
Harbor Strategic Growth Fund
Statements of Changes In Net Assets
Statements of Changes In Net Assets
(All amounts in thousands)
| Harbor Strategic Growth Fund | |||
| July 1, 2017 through October 31, 2017 | July 1, 2016 through June 30, 2017 | July 1, 2015 through June 30, 2016 | |
| INCREASE/(DECREASE) IN NET ASSETS | |||
| Operations: | |||
Net investment income/(loss) | $ 42 | $ 205 | $ 44 |
Net realized gain/(loss) on investments | 144 | 773 | 283 |
Change in net unrealized appreciation/(depreciation) of investments | 2,754 | 3,139 | 874 |
Net increase/(decrease) in assets resulting from operations | 2,940 | 4,117 | 1,201 |
| Distributions to Shareholders | |||
Net investment income: | |||
Institutional Class | — | (193) | (16) |
Administrative Class | — | — | N/A |
Investor Class | — | — | N/A |
Retirement Class | — | — | N/A |
Net realized gain on investments: | |||
Institutional Class | — | (205) | (737) |
Administrative Class | — | — | N/A |
Investor Class | — | — | N/A |
Retirement Class | — | — | N/A |
Total distributions to shareholders | — | (398) | (753) |
Net Increase/(Decrease) Derived from Capital Share Transactions | 21,393 | 3,108 | 4,400 |
Net increase/(decrease) in net assets | 24,333 | 6,827 | 4,848 |
| Net Assets | |||
Beginning of period | 32,215 | 25,388 | 20,540 |
End of period* | $56,548 | $32,215 | $25,388 |
* Includes accumulated undistributed net investment income/(loss) of: | $ 77 | $ 39 | $ 28 |
The accompanying notes are an integral part of the Financial Statements.
12
Harbor Strategic Growth Fund
Statements of Changes in Net Assets—Capital Stock Activity
Statements of Changes in Net Assets—Capital Stock Activity
(All amounts in thousands)
| Harbor Strategic Growth Fund | |||
| July 1, 2017 through October 31, 2017 | July 1, 2016 through June 30, 2017 | July 1, 2016 through June 30, 2017 | |
| AMOUNT ($) | |||
| Institutional Class | |||
Net proceeds from sale of shares | $22,972 | $ 8,515 | $10,211 |
Net proceeds from redemption fees | — | — | — |
Reinvested distributions | — | 346 | 591 |
Cost of shares reacquired | (1,724) | (6,094) | (6,402) |
Net increase/(decrease) in net assets | $21,248 | $ 2,767 | $ 4,400 |
| Administrative Class | |||
Net proceeds from sale of shares | $ 1 | $ 11* | N/A |
Cost of shares reacquired | — | (1)* | N/A |
Net increase/(decrease) in net assets | $ 1 | $ 10* | N/A |
| Investor Class | |||
Net proceeds from sale of shares | $ 56 | $ 22* | N/A |
Cost of shares reacquired | (7) | —* | N/A |
Net increase/(decrease) in net assets | $ 49 | $ 22* | N/A |
| Retirement Class | |||
Net proceeds from sale of shares | $ 96 | $ 311* | N/A |
Cost of shares reacquired | (1) | (2)* | N/A |
Net increase/(decrease) in net assets | $ 95 | $ 309* | N/A |
| * | For the period March 6, 2017 (commencement of operations) through June 30, 2017 |
The accompanying notes are an integral part of the Financial Statements.
13
| Harbor Strategic Growth Fund | |||
| July 1, 2017 through October 31, 2017 | July 1, 2016 through June 30, 2017 | July 1, 2015 through June 30, 2016 | |
| SHARES | |||
| Institutional Class | |||
Shares sold | 1,263 | 525 | 693 |
Shares issued due to reinvestment of distributions | — | 22 | 39 |
Shares reacquired | (95) | (377) | (433) |
Net increase/(decrease) in shares outstanding | 1,168 | 170 | 299 |
Beginning of period | 1,804 | 1,634 | 1,335 |
End of period | 2,972 | 1,804 | 1,634 |
| Administrative Class | |||
Shares sold | — | 1* | N/A |
Shares issued due to reinvestment of distributions | — | — | N/A |
Shares reacquired | — | — | N/A |
Net increase/(decrease) in shares outstanding | — | 1* | N/A |
Beginning of period | 1 | — | N/A |
End of period | 1 | 1* | N/A |
| Investor Class | |||
Shares sold | 3 | 1* | N/A |
Shares issued due to reinvestment of distributions | — | — | N/A |
Shares reacquired | — | — | N/A |
Net increase/(decrease) in shares outstanding | 3 | 1* | N/A |
Beginning of period | 1 | — | N/A |
End of period | 4 | 1* | N/A |
| Retirement Class | |||
Shares sold | 5 | 18* | N/A |
Shares issued due to reinvestment of distributions | — | — | N/A |
Shares reacquired | — | — | N/A |
Net increase/(decrease) in shares outstanding | 5 | 18* | N/A |
Beginning of period | 18 | — | N/A |
End of period | 23 | 18* | N/A |
| * | For the period March 6, 2017 (commencement of operations) through June 30, 2017 |
14
Harbor Strategic Growth Fund Financial Highlights
Selected Data for a Share Outstanding for the Periods Presented
Selected Data for a Share Outstanding for the Periods Presented
| HARBOR STRATEGIC GROWTH FUND | ||||||
| Institutional Class | ||||||
| 4-Month Period Ended October 31, 2017g | Year Ended June 30, | |||||
| 2017 | 2016 | 2015 | 2014 | 2013 | ||
Net asset value beginning of period | $ 17.66 | $ 15.54 | $ 15.39 | $ 15.41 | $ 12.80 | $11.00 |
| Income from Investment Operations | ||||||
Net investment income/(loss)a | 0.03 e | 0.12 e | 0.03 e | 0.04 e | 0.08 e | 0.10 e |
Net realized and unrealized gains/(losses) on investments | 1.16 | 2.22 | 0.63 | 1.11 | 3.35 | 1.92 |
Total from investment operations | 1.19 | 2.34 | 0.66 | 1.15 | 3.43 | 2.02 |
| Less Distributions | ||||||
Dividends from net investment income | — | (0.11) | (0.01) | (0.06) | (0.15) | (0.13) |
Distributions from net realized capital gains1 | — | (0.11) | (0.50) | (1.11) | (0.67) | (0.09) |
Total distributions | — | (0.22) | (0.51) | (1.17) | (0.82) | (0.22) |
Proceeds from redemption fees | N/A | — * | — * | — * | — * | — * |
Net asset value end of period | 18.85 | 17.66 | 15.54 | 15.39 | 15.41 | 12.80 |
Net assets end of period (000s) | $56,026 | $31,866 | $25,388 | $20,540 | $13,678 | $8,665 |
| Ratios and Supplemental Data (%) | ||||||
Total returnb | 6.74% c | 15.21% | 4.44% | 7.67% | 27.71% | 18.55% |
Ratio of total expenses to average net assets2 | 1.18 d | 1.48 | 1.74 | 2.23 | 2.79 | 3.99 |
Ratio of net expenses to average net assetsa | 0.70 d | 0.83 | 0.90 | 0.90 | 0.90 | 0.90 |
Ratio of net investment income to average net assetsa | 0.29 d | 0.71 | 0.19 | 0.18 | 0.58 | 0.82 |
Portfolio turnover | 9 c | 21 | 40 | 33 | 31 | 59 |
| Investor Class | ||
| 4-Month Period Ended October 31, 2017g | Period Ended June 30, 2017f | |
Net asset value beginning of period | $17.64 | $16.76 |
| Income from Investment Operations | ||
Net investment income/(loss)a | 0.02 e | 0.01 e |
Net realized and unrealized gains/(losses) on investments | 1.15 | 0.87 |
Total from investment operations | 1.17 | 0.88 |
| Less Distributions | ||
Dividends from net investment income | — | — |
Distributions from net realized capital gains1 | — | — |
Total distributions | — | — |
Net asset value end of period | 18.81 | 17.64 |
Net assets end of period (000s) | $ 75 | $ 22 |
| Ratios and Supplemental Data (%) | ||
Total returnb | 6.63% c | 5.25% c |
Ratio of total expenses to average net assets2 | 1.55 d | 2.03 d |
Ratio of net expenses to average net assetsa | 1.07 d | 1.07 d |
Ratio of net investment income to average net assetsa | 0.05 d | 0.13 d |
Portfolio turnover | 9 c | 21 c |
See page 17 for notes to the Financial Highlights.
The accompanying notes are an integral part of the Financial Statements.
15
| Administrative Class | |
| 4-Month Period Ended October 31, 2017g | Period Ended June 30, 2017f |
| $17.65 | $16.76 |
| 0.01 e | 0.01 e |
| 1.16 | 0.88 |
| 1.17 | 0.89 |
| — | — |
| — | — |
| — | — |
| — | — |
| 18.82 | 17.65 |
| $ 12 | $ 11 |
| 6.63% c | 5.31% c |
| 1.43 d | 1.93 d |
| 0.95 d | 0.95 d |
| 0.10 d | 0.19 d |
| 9 c | 21 c |
| Retirement Class | |
| 4-Month Period Ended October 31, 2017g | Period Ended June 30, 2017f |
| $17.67 | $16.76 |
| 0.05 e | 0.03 e |
| 1.14 | 0.88 |
| 1.19 | 0.91 |
| — | — |
| — | — |
| — | — |
| 18.86 | 17.67 |
| $ 435 | $ 316 |
| 6.73% c | 5.43% c |
| 1.10 d | 1.52 d |
| 0.62 d | 0.62 d |
| 0.42 d | 0.58 d |
| 9 c | 21 c |
16
Harbor Strategic Growth Fund Financial Highlights—Continued
Selected Data for a Share Outstanding for the Periods Presented
Selected Data for a Share Outstanding for the Periods Presented
| * | Less than $0.01 |
| 1 | Includes both short-term and long-term capital gains |
| 2 | Percentage does not reflect reduction for credit balance arrangements (see Note 2 of the accompanying Notes to Financial Statements) |
| a | Reflects the Adviser’s waiver, if any, of its management fees and/or other operating expenses |
| b | The total returns would have been lower had certain expenses not been waived during the periods shown. |
| c | Unannualized |
| d | Annualized |
| e | Amounts are allocated based upon average shares outstanding during the period. |
| f | For the period March 6, 2017 (commencement of operations) through June 30, 2017 |
| g | For the period July 1, 2017 through October 31, 2017 |
The accompanying notes are an integral part of the Financial Statements.
17
Harbor Strategic Growth Fund
Notes to Financial Statements—October 31, 2017
Notes to Financial Statements—October 31, 2017
Note 1—Organizational Matters
Harbor Funds (the “Trust”) is registered under the Investment Company Act of 1940, as amended (the “Investment Company Act”), as an open-end management investment company. As of October 31, 2017 the Trust consists of 31 separate portfolios. The portfolio covered by this report is Harbor Strategic Growth Fund (referred to as the “Fund”). Harbor Capital Advisors, Inc. (the “Adviser” or “Harbor Capital”) is the investment adviser for the Fund.
The Fund currently offers four classes of shares, designated as Institutional Class, Administrative Class, Investor Class, and Retirement Class. The shares of each class represent an interest in the same portfolio of investments of the Fund and have equal rights with respect to voting, redemptions, dividends, and liquidations, except that: (i) certain expenses, subject to the approval of the Trust’s Board of Trustees (the “Board of Trustees”), may be applied differently to each class of shares in accordance with current regulations of the Securities and Exchange Commission (“SEC”) and the Internal Revenue Service; and (ii) shareholders of a class that bears distribution and service expenses under terms of a distribution plan have exclusive voting rights as to that distribution plan.
Effective July 1, 2017, the Harbor Strategic Growth Fund began operating on an October 31 fiscal year end.
Reorganization
On March 6, 2017 (the “Reorganization Date”), the Fund, a newly organized series of the Trust with no investment operations prior to the Reorganization Date, acquired all of the assets of the Mar Vista Strategic Growth Fund (the “Predecessor Fund”) in exchange for Institutional Class shares of the Fund and assumption by the Fund of substantially all of the Predecessor Fund’s liabilities. The exchange was accomplished as a tax-free reorganization (the “Reorganization”) in accordance with the Agreement and Plan of Reorganization (the “Reorganization Agreement”), which was approved by the shareholders of the Predecessor Fund on February 24, 2017. Under the Reorganization, all outstanding shares of the Predecessor Fund were exchanged for Institutional Class shares of the Fund. The exchange was based on values of the Predecessor Fund as of the close of business on the immediately preceding business day, March 3, 2017 (the “Valuation Date”). For financial reporting purposes, assets received were recorded at fair value; however, the cost basis of investments received were carried forward to align ongoing reporting from the Predecessor Fund’s unrealized gains and losses with amounts distributable to shareholders for tax purposes. The Fund has substantially similar investment objectives, principal investment strategies, and risks as the Predecessor Fund, and the investment adviser and portfolio management team of the Predecessor Fund serves as subadviser to the Fund.
The Fund is the surviving legal entity, but has adopted the performance and financial history of the Predecessor Fund, which is included in these financial statements. The following is a summary of the shares issued to the Predecessor Fund in the Reorganization and the net unrealized gains as of the Valuation Date:
| Predecessor Fund’s Shares Outstanding at Valuation Date (000s) | Predecessor Fund’s Net Assets at Valuation Date (000s) | Institutional Class Shares’ Net Asset Value Per Share Issued | Institutional Class Shares Issued in the Reorganization (000s) | Net Unrealized Appreciation (000s) | ||||
| 1,753 | $29,486 | $16.82 | 1,753 | $6,499 |
Because the Fund was a newly organized series with no investment operations prior to the Reorganization Date, it is not practicable to present pro forma results of operations of the combined entity for the entire period ended June 30, 2017 as though the acquisition had occurred as of the beginning of the period (rather than on the actual Reorganization Date) or separate the amounts of revenue and earnings of the Predecessor Fund that have been included in the Fund’s accompanying Statement of Operations for the period from the Reorganization Date through June 30, 2017.
Note 2—Significant Accounting Policies
The following is a summary of significant accounting policies followed by the Trust in the preparation of its financial statements. The Fund follows the investment company reporting requirements under U.S. Generally Accepted Accounting Principles (“U.S. GAAP”), which includes the accounting and reporting guidelines under Accounting Standards Topic 946, Financial Services-Investment Companies. The preparation of financial statements in accordance with U.S. GAAP requires management to make estimates and assumptions that affect the reported amounts and disclosures in the financial statements. Actual results may differ from those estimates.
18
Harbor Strategic Growth Fund
Notes to Financial Statements—Continued
Notes to Financial Statements—Continued
Note 2—Significant Accounting Policies—Continued
Security Valuation
The Trust’s valuation procedures permit the Fund to use a variety of valuation methodologies, consider a number of subjective factors, analyze applicable facts and circumstances and, in general, exercise judgment, when valuing Fund investments. The methodology used for a specific type of investment may vary based on the circumstances and relevant considerations, including available market data.
Equity securities (including common stock, preferred stock, and convertible preferred stock), exchange-traded notes and financial derivative instruments (such as futures contracts, options contracts, including rights and warrants and centrally cleared swap agreements) that are traded or cleared on a national securities exchange or system (except securities listed on the National Association of Securities Dealers Automated Quotation (“NASDAQ”) system and United Kingdom securities) are valued at the last sale price on a national exchange or system on which they are principally traded or cleared as of the valuation date. Securities listed on the NASDAQ system or a United Kingdom exchange are valued at the official closing price of those securities. In the case of securities for which there are no sales on the valuation day, (i) securities traded principally on a U.S. exchange, including NASDAQ, are valued at the mean between the closing bid and ask price; and (ii) securities traded principally on a foreign exchange are valued at the official bid price determined as of the close of the primary exchange. Securities of open-end registered investment companies that are held by the Fund are valued at net asset value. To the extent these securities are actively traded and fair valuation adjustments are not applied, they are normally categorized as Level 1 in the fair value hierarchy. Equity securities traded on inactive markets or valued by reference to similar instruments are normally categorized as Level 2 in the fair value hierarchy. For more information on the fair value hierarchy, please refer to the Fair Value Measurements and Disclosures section in Note 2.
Short-term securities with a remaining maturity of less than 60 days at the time of acquisition that are held by the Fund are valued at amortized cost to the extent amortized cost represents fair value. Securities that use similar valuation techniques and inputs as described above are normally categorized as Level 2 in the fair value hierarchy.
When reliable market quotations or evaluated prices supplied by a pricing vendor are not readily available or are not believed to accurately reflect fair value, securities are priced at their fair value as determined by the Trust’s Valuation Committee (the “Valuation Committee”) pursuant to procedures adopted, and subject to oversight, by the Board of Trustees. The Valuation Committee is comprised of a trustee and officers of the Trust and employees of Harbor Capital with relevant experience or responsibilities. Each security for which the Valuation Committee determines a fair value, including the basis for the fair value decision, is reviewed by the Board of Trustees at its regularly scheduled board meetings.
When a fair valuation method is applied by the Valuation Committee or the Fund’s subadviser, securities will be priced by a method that the Valuation Committee or subadviser believes accurately reflects fair value. Securities valued using fair valuation methods that incorporate significant unobservable inputs are normally categorized as Level 3 in the fair value hierarchy. Examples of possible fair valuation methodologies used in determining the fair value of securities categorized as Level 3 in the fair value hierarchy include, but are not limited to, benchmark pricing and indicative market quotations.
When benchmark pricing is used, the base price of a debt security is set and then subsequently adjusted in proportion to the market value changes of an index or similar security (the “benchmark security”) that trades in an active market or for which other observable inputs are available. The base price may be a broker-dealer quote, transaction price, or an internal value as derived by analysis of market data. The base price of the security may be reset on a periodic basis based on the availability of market data and procedures approved by the Fund’s subadviser. If the benchmark security is categorized as Level 2 in the fair value hierarchy due to the lack of an active market for that security, any security adjusted in proportion to the market value of the benchmark security may be categorized as Level 3 in the fair value hierarchy. Significant changes in the unobservable inputs of the benchmark pricing process (i.e., the base price) would result in direct and proportional changes in the fair value of the security. The reasonability of the fair value is reviewed by the subadviser on a periodic basis and may be amended as the availability of market data indicates a material change.
If evaluated pricing through a third-party pricing vendor is not available or deemed not to be indicative of fair value, the Fund’s subadviser may elect to obtain indicative market quotations (“broker quotes”) directly from a broker-dealer or passed through from a third-party pricing vendor. Indicative market quotations are typically received from established market participants. In the event that the source of fair value is from a single-sourced broker quote, but the subadviser does not have the transparency to view the underlying inputs that support the market quotation, these securities are categorized as Level 3 in the fair value hierarchy. Significant changes in the broker quote would have direct and proportional changes in the fair value of the security.
19
Harbor Strategic Growth Fund
Notes to Financial Statements—Continued
Notes to Financial Statements—Continued
Note 2—Significant Accounting Policies—Continued
The Fund may also use fair value pricing if the value of some or all of the Fund’s securities have been materially affected by events occurring before the Fund’s pricing time but after the close of the primary markets or exchanges on which the security is traded. This most commonly occurs with foreign securities, but may occur with other securities as well. In such cases, the Fund may apply a fair value factor supplied by the pricing vendor to a foreign security’s market close value to reflect changes in value that may have occurred between the close of the primary market or exchange on which the security is traded and the Fund’s pricing time. That factor may be derived using observable inputs such as a comparison of the trading patterns of a foreign security to intraday trading in the U.S. markets that are highly correlated to the foreign security or other information that becomes available after the close of the foreign market on which the security principally traded. When fair value pricing is employed, the prices of securities used by the Fund to calculate its net asset value may differ from market quotations, official closing prices or evaluated prices for the same securities, which means that the Fund may value those securities higher or lower than another given fund that uses market quotations, official closing prices or evaluated prices supplied by a pricing vendor in its calculation of net asset value. Securities valued using observable inputs, such as those described above, are normally categorized as Level 2 of the fair value hierarchy.
Fair Value Measurements and Disclosures
Various inputs may be used to determine the value of the Fund’s investments, which are summarized in three broad categories defined as Level 1, Level 2, and Level 3. The inputs or methodologies used for valuing securities are not necessarily indicative of the risk associated with investing in those securities. The assignment of an investment to Levels 1, 2, or 3 is based on the lowest level of significant inputs used to determine its fair value.
| Level 1– | Quoted prices in active markets for identical securities. |
| Level 2– | Other significant observable inputs (including quoted prices for similar securities, interest rates, prepayment speeds, credit risk, etc.). |
| Level 3– | Significant unobservable inputs are used in situations where quoted prices or other observable inputs are not available or are deemed unreliable. Significant unobservable inputs may include the Fund’s own assumptions. |
Transfers between levels, if any, are recognized as of the last day in the fiscal quarter of the period in which the event or change in circumstances that caused the reclassification occurred. For fair valuations using significant unobservable inputs, a reconciliation of the beginning to ending balances for reported fair values is provided that presents changes attributable to realized and unrealized gains and losses and purchases, sales, and transfers in/out of the Level 3 category during the period. A table that includes a categorization of investments into Levels 1, 2, or 3, transfers between levels, if any, and a Level 3 reconciliation, including details of significant unobservable inputs used, when applicable, can be found at the end of the Fund’s Portfolio of Investments schedule.
The Fund used observable inputs in its valuation methodologies whenever they were available and deemed reliable.
U.S. Government Securities
U.S. government securities include securities issued by U.S. government agencies or government-sponsored enterprises that may not be guaranteed by the U.S. Treasury. The Government National Mortgage Association (“GNMA” or “Ginnie Mae”), a wholly owned U.S. government corporation, is authorized to guarantee, with the full faith and credit of the U.S. government, the timely payment of principal and interest on securities issued by institutions approved by GNMA and backed by pools of mortgages insured by the Federal Housing Administration or guaranteed by the Department of Veterans Affairs. Government-related guarantors are not backed by the full faith and credit of the U.S. government and include the Federal National Mortgage Association (“FNMA” or “Fannie Mae”) and the Federal Home Loan Mortgage Corporation (“FHLMC” or “Freddie Mac”). On September 7, 2008, the Federal Housing Finance Agency placed Fannie Mae and Freddie Mac in conservatorship, while the U.S. Treasury agreed to purchase preferred stock as needed to ensure that both Fannie Mae and Freddie Mac maintain a positive net worth (guaranteeing up to $100 billion for each entity). As a consequence, certain fixed income securities of Fannie Mae and Freddie Mac have more explicit U.S. government support. No assurance can be given as to whether the U.S. government will continue to support Fannie Mae and Freddie Mac. In addition, the future of Fannie Mae and Freddie Mac is uncertain because Congress has been considering proposals as to whether Fannie Mae and Freddie Mac should be nationalized, privatized, restructured or eliminated altogether. Fannie Mae and Freddie Mac are also the subject of continuing legal actions and investigations, which may have an adverse effect on these entities.
20
Harbor Strategic Growth Fund
Notes to Financial Statements—Continued
Notes to Financial Statements—Continued
Note 2—Significant Accounting Policies—Continued
Repurchase Agreements
In a repurchase agreement, the Fund buys a security at one price and simultaneously agrees to sell it back at a higher price. Such agreements must be adequately collateralized to cover the counterparty’s obligation to the Fund to close out the repurchase agreement. During the period, the Fund entered into repurchase agreements with domestic or foreign banks or with a member firm of the Financial Industry Regulatory Authority, Inc., or an affiliate of a member firm that is a primary dealer in U.S. government securities. Each repurchase agreement counterparty must meet the minimum credit quality requirements applicable to the Fund and any other appropriate counterparty criteria as determined by the Fund’s subadviser. The minimum credit quality requirements are those applicable to the Fund’s purchase of securities such that if the Fund is permitted to only purchase securities that are rated investment-grade (or the equivalent if unrated), the Fund could only enter into repurchase agreements with counterparties that have debt outstanding that is rated investment-grade (or the equivalent if unrated). The securities are regularly monitored to ensure that the collateral is adequate. The Fund seeks to further mitigate its counterparty risk by entering into master repurchase agreements with its counterparties. The master repurchase agreements provide that, in the event of a counterparty’s default, including bankruptcy, the Fund may terminate any repurchase agreements with that counterparty, determine the net amount owned, and sell or retain the collateral up to the net amount owed to the Fund. A counterparty’s default may cause the Fund to suffer losses, including loss of interest on or principal of the securities and costs associated with delay and enforcement of the terms of the master repurchase agreement.
Foreign Currency Translations
Purchases and sales of securities are translated into U.S. dollars at the current exchange rate on the respective dates of the transactions. Income and withholding taxes are translated at the prevailing exchange rate when accrued or incurred. The accounting records of the Fund are maintained in U.S. dollars. Investment securities and other assets and liabilities denominated in a foreign currency, when applicable, are translated into U.S. dollars based on the current exchange rates at period end.
Reported net realized gains and losses on foreign currency transactions, when applicable, represent net gains and losses from sales and maturities of foreign currency contracts, disposition of foreign currencies, currency gains and losses realized between the trade and settlement dates on securities transactions, and the difference between the amount of investment income accrued and tax reclaims receivable and the U.S. dollar amount actually received. The effects of changes in foreign currency exchange rates on investments in securities, when applicable, are included in the net realized and unrealized gain or loss on investments in the Statement of Operations.
Investment Income
Dividends declared on portfolio securities are accrued on the ex-dividend date. For foreign securities, certain dividends are recorded after the ex-dividend date, but as soon as the Fund is notified of such dividends. Interest income is accrued daily as earned. Discounts and premiums on fixed income securities are amortized over the life of the respective securities using the effective yield method.
Securities Transactions
Securities transactions are accounted for on the trade date (the date the order to buy or sell is executed). Realized gains or losses on security transactions are determined on the basis of identified cost.
Proceeds from Litigation
The Fund may receive proceeds from shareholder litigation settlements involving current and/or previously held portfolio holdings. Any proceeds received from litigation involving portfolio holdings are reflected in the Statements of Operations in realized gain/(loss) if the security has been disposed of by the Fund, or in unrealized gain/(loss) if the security is still held by the Fund.
Distribution to Shareholders
Distributions on Fund shares are recorded on the ex-dividend date.
21
Harbor Strategic Growth Fund
Notes to Financial Statements—Continued
Notes to Financial Statements—Continued
Note 2—Significant Accounting Policies—Continued
Expenses
Expenses incurred by the Trust are charged directly to the Fund that incurred such expense whenever possible. With respect to expenses incurred by any two or more Harbor Funds where amounts cannot be identified on a fund by fund basis, such expenses are generally allocated in proportion to the average net assets or the number of shareholders of each Fund.
Custodian
The Fund has credit balance arrangements with its custodian whereby positive balances in demand deposit accounts used by the transfer and shareholder servicing agent for clearing shareholder transactions in the Fund generate credits that are applied against gross custody expenses. Such custodial expense reductions, if any, are reflected on the Fund’s accompanying Statement of Operations.
Class Allocations
Income, common expenses and realized and unrealized gains/(losses) are determined at the Fund level and allocated daily to each class of shares based on the applicable net assets of the respective classes. Distribution and service fees, if any, and transfer agent fees are calculated daily at the class level based on the applicable net assets of each class and the expense rate(s) applicable to each class.
Taxes
The Fund is treated as a separate entity for federal tax purposes. The Fund’s policy is to meet the requirements of Subchapter M of the Internal Revenue Code applicable to regulated investment companies and to distribute to its shareholders all of its taxable income within the prescribed time. It is also the intention of the Fund to distribute an amount sufficient to avoid imposition of any excise tax under Section 4982 of the Internal Revenue Code. Therefore, no provision has been made for federal taxes on income, capital gains or unrealized appreciation of securities held or excise taxes on income and capital gains.
The Fund may be subject to taxes imposed by countries in which it invests. Such taxes are generally based on income and/or capital gains earned or repatriated. Taxes are accrued and applied to net investment income, net realized gains and unrealized appreciation as such income and/or gains are earned.
The U.S. federal income tax returns for the tax years ended June 30, 2014, 2015, 2016 and the period ended March 3, 2017 remain subject to examination by the Internal Revenue Service. Management has analyzed the Fund’s tax positions expected to be taken upon filing the October 31, 2017 tax return, in all material jurisdictions where the Fund operates, and has concluded that no provision for income tax is required in the Fund’s financial statements. The Fund will recognize interest and penalties, if any, related to unrecognized tax benefits as income tax expense in the Statements of Operations.
Note 3—Investment Portfolio Transactions
Purchases and sales of investments, other than short-term securities, for the Fund for the period ended October 31, 2017 are as follows:
| Purchases (000s) | Sales (000s) | ||
Harbor Strategic Growth Fund | $25,120 | $3,560 |
Note 4—Fees and Other Transactions with Affiliates
Investment Adviser
Harbor Capital is a wholly-owned subsidiary of Robeco Groep N.V. (“Robeco”). Robeco is wholly-owned by ORIX Corporation (“ORIX”). Harbor Capital is the Fund’s investment adviser and is also responsible for administrative and other services.
22
Harbor Strategic Growth Fund
Notes to Financial Statements—Continued
Notes to Financial Statements—Continued
Note 4—Fees and Other Transactions with Affiliates—Continued
The Fund has an advisory agreement with Harbor Capital. The agreement provides for management fees based on an annual percentage rate of average daily net assets as follows:
| Contractual Rate | |
Harbor Strategic Growth Fund | 0.60% a |
| a | Reflects the period March 6, 2017 (date of Reorganization) through October 31, 2017. |
Harbor Capital has from time to time voluntarily or contractually agreed not to impose a portion of its management fees and/or to bear a portion of the expenses incurred in the operation of the Fund in order to limit Fund expenses. Such waivers, if any, are reflected on the accompanying Statements of Operations. For the period March 1, 2017 through February 28, 2019, Harbor Capital has contractually agreed to limit the operating expenses of the Fund (excluding acquired fund fees and expenses and interest expense, if any), to 0.70%, 0.95%, 1.07% and 0.62% for the Institutional Class, Administrative Class, Investor Class, and Retirement Class, respectively.
All expense limitation agreements include the transfer agent fee waiver discussed in the Transfer Agent note.
Prior to the Reorganization, pursuant to a separate investment advisory agreement, Mar Vista Investment Partners, LLC (“Mar Vista”) served as investment adviser to the Predecessor Fund and earned a fee for such services based on 0.75% of average daily net assets of the Predecessor Fund.
Prior to the Reorganization, Mar Vista had contractually agreed to waive its fees and/or absorb expenses of the Predecessor Fund to ensure that the net annual operating expenses (excluding acquired fund fees and expenses, taxes, brokerage commissions, interest, and extraordinary expenses) did not exceed 0.90% of average daily net assets of the Predecessor Fund. Pursuant to this agreement, $92,000 of expenses were waived and/or reimbursed by Mar Vista during the period July 1, 2016 through March 3, 2017.
Distributor
Harbor Funds Distributors, Inc. (“Harbor Funds Distributors” or the “Distributor”), a wholly-owned subsidiary of Harbor Capital, is the distributor for Harbor Funds’ shares. Under the Trust’s current distribution plans pursuant to Rule 12b-1 under the Investment Company Act with respect to the Fund’s Administrative and Investor Class shares (the “12b-1 Plan”), the Fund pays the Distributor compensation at the annual rate of 0.25% of the average daily net assets of its Administrative and Investor Class shares. Pursuant to the 12b-1 Plan the Distributor is compensated for financing any activity that is primarily intended to result in the sale of Administrative and Investor Class shares of the Fund or for recordkeeping services or the servicing of shareholder accounts in the Administrative and Investor Class shares of the Fund. Such activities include, but are not limited to: printing of prospectuses and statements of additional information and reports for prospective shareholders (i.e., other than existing shareholders); preparation and distribution of advertising material and sales literature; expenses of organizing and conducting sales seminars; supplemental payments to dealers or other institutions such as asset-based sales charges, payments of recordkeeping fees under recordkeeping arrangements, or payments of service fees under shareholder service arrangements; and costs of administering the 12b-1 Plan.
Amounts payable by the Fund under the 12b-1 Plan need not be directly related to the expenses actually incurred by the Distributor on behalf of the Fund. The 12b-1 Plan does not obligate the Fund to reimburse the Distributor for the actual expenses the Distributor may incur in fulfilling its obligations under the 12b-1 Plan. Thus, even if the Distributor’s actual expenses exceed the fee payable to the Distributor at any given time, the Fund will not be obligated to pay more than that fee. If the Distributor’s expenses are less than the fee it receives, the Distributor will retain the difference.
The fees attributable to each respective class of the Fund are shown on the accompanying Statements of Operations.
Prior to the Reorganization, Quasar Distributors, LLC (“Quasar”) served as the Predecessor Fund’s principal underwriter. Quasar is an affiliate of the Predecessor Fund’s Administrator.
23
Harbor Strategic Growth Fund
Notes to Financial Statements—Continued
Notes to Financial Statements—Continued
Note 4—Fees and Other Transactions with Affiliates—Continued
Transfer Agent
Harbor Services Group, Inc. (“Harbor Services Group”), a wholly-owned subsidiary of Harbor Capital, is the transfer and shareholder servicing agent for the Fund. The transfer agency and service agreement is reviewed and approved annually by the Board of Trustees and provides currently for compensation up to the following amounts per class of the Fund:
| Transfer Agent Feesa | |
Institutional Class | 0.09% of the average daily net assets of all Institutional Class shares |
Administrative Class | 0.09% of the average daily net assets of all Administrative Class shares |
Investor Class | 0.21% of the average daily net assets of all Investor Class shares |
Retirement Class | 0.01% of the average daily net assets of all Retirement Class shares |
| a | For the period March 6, 2017 (date of Reorganization) through October 31, 2017. |
Harbor Services Group has voluntarily waived a portion of its transfer agent fees during the periods ended June 30, and October 31, 2017. Fees incurred for these transfer agent services are shown on the Fund’s Statement of Operations. The voluntary waiver may be discontinued at any time.
Prior to the Reorganization, U.S. Bancorp Fund Services, LLC (the “Prior Administrator”) served as the Predecessor Fund’s Administrator under an Administration Agreement. The Prior Administrator prepared various federal and state regulatory filings, reports and returns for the Predecessor Fund; prepared reports and materials to be supplied to the Predecessor Fund’s Trustees; monitored the activities of the Predecessor Fund’s custodian, transfer agent and accountants; coordinated the preparation and payment of the Predecessor Fund’s expenses and reviewed the Predecessor Fund’s expense accruals. U.S. Bancorp Fund Services, LLC also served as the fund accountant and transfer agent to the Predecessor Fund. Vigilant Compliance, LLC served as the Chief Compliance Officer to the Predecessor Fund. U.S. Bank N.A., an affiliate of U.S. Bancorp Fund Services, served as the Predecessor Fund’s custodian. For the period July 1, 2016 through March 3, 2017, the Predecessor Fund incurred the following expenses for administration, fund accounting, transfer agency, custody and Chief Compliance Officer fees:
| Amount (000s) | |
Administration & Fund Accounting | $24 |
Custody | 4 |
Transfer Agencya | 25 |
Chief Compliance Officer | 8 |
| a | Does not include out-of-pocket expenses |
Affiliated Transactions
The Investment Company Act permits purchase and sale transactions among affiliated investment companies subject to an exemptive rule. Harbor Funds has adopted policies and procedures pursuant to such rule. During the period, the Fund did not enter into any transactions with any other Harbor fund.
Shareholders
On October 31, 2017, Harbor Capital, Harbor Funds Distributors, and Harbor Services Group, collectively held the following shares of beneficial interest in the Fund:
| Number of Shares Owned by Harbor Capital, Harbor Funds Distributors, and Harbor Services Group | Percentage of Outstanding Shares | ||||||||||
| Institutional Class | Administrative Class | Investor Class | Retirement Class | Total | |||||||
Harbor Strategic Growth Fund | 1,099,721 | 603 | 603 | 10,133 | 1,111,060 | 37.0% | |||||
24
Harbor Strategic Growth Fund
Notes to Financial Statements—Continued
Notes to Financial Statements—Continued
Note 4—Fees and Other Transactions with Affiliates—Continued
Independent Trustees
The fees and expenses of the independent trustees are shown on the Fund’s Statements of Operations. Prior to the Reorganization, the Predecessor Fund incurred Independent Trustees’ remuneration of $7,000 for the period ended March 3, 2017. The Independent Trustees' remuneration for the Fund totaled $1,000 for the period ended October 31, 2017.
The Board of Trustees has adopted a Deferred Compensation Plan for Independent Trustees (the “Plan”), which enables Trustees to elect to defer receipt of all or a portion of the annual compensation they are entitled to receive from the Trust. For purposes of determining the amount owed to a Trustee under the Plan, deferred amounts are treated as though they had been invested in shares of the Fund(s) selected by the Trustee. While not required to do so, the Fund makes an investment equal to the Trustee’s investment election. The deferred compensation liability and the offsetting deferred compensation investment asset are included as a component of “Other Accrued Expenses” and “Other assets”, respectively, in the Statement of Assets and Liabilities. Such amounts fluctuate with changes in the market value of the selected Funds. The deferred compensation and related mark-to-market impact liability and an offsetting investment asset will remain on the Fund’s Statement of Assets and Liabilities until distributed in accordance with the Plan.
Redemption Fee
The Fund does not charge a redemption fee, however the Predecessor Fund charged a 0.75% redemption fee on shares of the Predecessor Fund that were redeemed within 60 days from their date of purchase. Redemption fees were recorded as paid-in capital. For the period July 1, 2016 through March 3, 2017, redemption fee proceeds for the Predecessor Fund totaled $100.
Indemnification
Under the Trust’s organizational documents, its officers and Trustees are indemnified against certain liabilities arising out of the performance of their duties to the Trust. In addition, in the normal course of business the Trust enters into contracts that provide general indemnities to other parties. The Trust’s maximum exposure under these arrangements is unknown as this would involve future claims that may be made against the Trust that have not yet occurred. The risk of material loss as a result of such indemnification claims is considered remote.
25
Harbor Strategic Growth Fund
Notes to Financial Statements—Continued
Notes to Financial Statements—Continued
NOTE 5—TAX INFORMATION
The Reorganization is intended to be treated for tax purposes as a reorganization described in Section 368(a)(1)(D) of the Internal Revenue Code. Accordingly, the Predecessor Fund made a final ordinary income dividend and capital gain distribution prior to the Reorganization Date and has filed its final tax return. The Fund has an October 31, tax year end. The amount and character of income and net realized gains to be distributed are determined in accordance with income tax rules and regulations, which may differ from U.S. GAAP. These differences are attributable to permanent book and tax accounting differences that were primarily due to tax treatment of wash sales from the Predecessor Fund and use of equalization. Reclassifications are made to the Fund’s capital account to reflect income and net realized gains available for distribution (or available capital loss carryovers) under income tax rules and regulations. The amounts reclassified on the Statement of Assets and Liabilities for the period ended October 31, 2017 are as follows:
| Undistributed Net Investment Income/(Loss) (000s) | Accumulated Net Realized Gain/(Loss) (000s) | Paid in Capital (000s) | |||
Harbor Strategic Growth Fund | $(4) | $(67) | $71 |
The tax composition of the Fund’s distributions is as follows:
| As of October 31, 2017 | As of June 30, 2017 | ||||||||||
| Ordinary Income (000s) | Long-Term Capital Gains (000s) | Total (000s) | Ordinary Income (000s) | Long-Term Capital Gains (000s) | Total (000s) | ||||||
Harbor Strategic Growth Fund | $— | $— | $— | $193 | $205 | $398 | |||||
As of October 31, 2017, the components of the Fund’s distributable earnings on a tax basis are as follows:
| Undistributed Ordinary Income (000s) | Undistributed Long-Term Capital Gains (000s) | Net Unrealized Appreciation/ (Depreciation) (000s) | |||
Harbor Strategic Growth Fund | $132 | $1,034 | $9,682 |
The identified cost for federal income tax purposes of investments owned by the Fund and its respective gross unrealized appreciation and depreciation at October 31, 2017 are as follows:
| Identified Cost (000s) | Gross Unrealized | Net Unrealized Appreciation/ (Depreciation) (000s) | |||||
| Appreciation (000s) | (Depreciation) (000s) | ||||||
Harbor Strategic Growth Fund | $47,292 | $10,099 | $(417) | $9,682 | |||
Note 6—Subsequent Events
Through the date the financial statements were issued, there were no subsequent events or transactions that would have materially impacted the financial statements or related disclosures as presented herein.
26
Harbor Strategic Growth Fund
Report of Independent Registered Public Accounting Firm
Report of Independent Registered Public Accounting Firm
The Board of Trustees and Shareholders of
Harbor Funds
We have audited the accompanying statement of assets and liabilities of Harbor Strategic Growth Fund (one of the portfolios constituting the Harbor Funds (the Trust)), including the portfolio of investments, as of October 31, 2017, and the related statement of operations, the statement of changes in net assets, and the financial highlights for the periods indicated therein. These financial statements and financial highlights are the responsibility of the Trust’s management. Our responsibility is to express an opinion on these financial statements and financial highlights based on our audits. The statement of changes in net assets and the financial highlights for the periods presented through June 30, 2016, were audited by other auditors whose report dated August 26, 2016, expressed an unqualified opinion on that statement and those financial highlights.
We conducted our audits in accordance with the standards of the Public Company Accounting Oversight Board (United States). Those standards require that we plan and perform the audit to obtain reasonable assurance about whether the financial statements and financial highlights are free of material misstatement. We were not engaged to perform an audit of the Trust’s internal control over financial reporting. Our audits included consideration of internal control over financial reporting as a basis for designing audit procedures that are appropriate in the circumstances, but not for the purpose of expressing an opinion on the effectiveness of the Trust’s internal control over financial reporting. Accordingly, we express no such opinion. An audit also includes examining, on a test basis, evidence supporting the amounts and disclosures in the financial statements and financial highlights, assessing the accounting principles used and significant estimates made by management, and evaluating the overall financial statement presentation. Our procedures included confirmation of securities owned as of October 31, 2017, by correspondence with the custodian and brokers. We believe that our audits provide a reasonable basis for our opinion.
In our opinion, the financial statements and financial highlights referred to above present fairly, in all material respects, the financial position of Harbor Strategic Growth Fund at October 31, 2017, the results of its operations, the changes in its net assets, and the financial highlights for each of the periods indicated therein in conformity with U.S. generally accepted accounting principles.

Chicago, Illinois
December 21, 2017
December 21, 2017
27
Harbor Strategic Growth Fund
Fees and Expenses Example (Unaudited)
Fees and Expenses Example (Unaudited)
Example
As a shareholder of the Fund, you incur two types of costs: (1) transaction costs, including redemption fees (if any) and (2) ongoing costs, including management fees, distribution and service (12b-1) fees (if any), and other Fund expenses. This example is intended to help you understand your ongoing costs (in dollars) of investing in the Fund and to compare these costs with the ongoing costs of investing in other mutual funds.
The example is based on an investment of $1,000 invested at the beginning of the period and held for the entire period May 1, 2017 through October 31, 2017.
Actual Expenses
The first line of the table below provides information about actual account values and actual expenses for each share class. You may use the information in the respective class line, together with the amount you invested, to estimate the expenses that you paid over the period. Simply divide your account value by $1,000 (for example, an $8,600 account value divided by $1,000 = 8.6), then multiply the result by the number in the first line of the respective class under the heading entitled “Expenses Paid During Period” to estimate the expenses you paid on your account during this period.
Hypothetical Example for Comparison Purposes
The second line of the table for each share class below provides information about hypothetical account values and hypothetical expenses based on the respective Fund/Class’s actual expense ratio and an assumed rate of return of 5% per year before expenses, which is not the respective Fund/Class’s actual return. The hypothetical account values and expenses may not be used to estimate the actual ending account balance or expenses you paid for the period. You may use this information to compare the ongoing costs of investing in the Fund to other funds. To do so, compare this 5% hypothetical example with the 5% hypothetical examples that appear in the shareholder reports of the other funds.
Please note that the expenses shown in the table are meant to highlight your ongoing costs only and do not reflect any transactional costs, such as redemption fees. Therefore, the second line of the table is useful in comparing ongoing costs only, and will not help you determine the relative total costs of owning different funds. In addition, if these transactional costs were included, your costs would have been higher.
| Annualized Expense Ratios* | Expenses Paid During Period** | Beginning Account Value May 1, 2017 | Ending Account Value October 31, 2017 | |||||
| Harbor Strategic Growth Fund | ||||||||
| Institutional Class | 0.70% | |||||||
| Actual | $3.70 | 1,000 | $1,095.90 | |||||
| Hypothetical (5% return) | 3.57 | 1,000 | 1,021.59 | |||||
| Administrative Class | 0.95% | |||||||
| Actual | $5.02 | 1,000 | $1,094.20 | |||||
| Hypothetical (5% return) | 4.84 | 1,000 | 1,020.30 | |||||
| Investor Class | 1.07% | |||||||
| Actual | $5.64 | 1,000 | $1,094.20 | |||||
| Hypothetical (5% return) | 5.45 | 1,000 | 1,019.68 | |||||
| Retirement Class | 0.62% | |||||||
| Actual | $3.28 | 1,000 | $1,096.50 | |||||
| Hypothetical (5% return) | 3.16 | 1,000 | 1,022.00 | |||||
| * | Reflective of all fee waivers and expense reimbursements |
| ** | Expenses are equal to the Fund’s annualized net expense ratio, multiplied by the average account value over the period, multiplied by 184/365 (to reflect the one-half year period). |
28
Harbor Strategic Growth Fund
Additional Information (Unaudited)
Additional Information (Unaudited)
Additional Tax Information
The Funds designate the following portions of their distributions from investment company taxable income for the fiscal period as qualifying for the dividends received deduction for corporate shareholders.
| Percentage of Distribution | |
Harbor Strategic Growth Fund | 100% |
Pursuant to Section 852 of the Internal Revenue Code, the Funds designate the following capital gain dividends for the period ended October 31, 2017:
| Amount (000s) | |
Harbor Strategic Growth Fund | $63 |
Proxy Voting
Harbor Funds has adopted Proxy Voting Policies and Procedures under which proxies relating to securities held by the Harbor funds are voted. In addition, Harbor Funds files Form N-PX, with its complete proxy voting record for the 12 months ended June 30th, no later than August 31st of each year. A description of Harbor Funds’ Proxy Voting Policies and Procedures and the proxy voting records (Form N-PX) are available (i) upon request, by calling Harbor Funds toll-free at 800-422-1050; (ii) on Harbor Funds’ website at harborfunds.com; and (iii) on the SEC’s website at sec.gov.
Householding
Harbor Funds has adopted a policy that allows it to send only one copy of the Fund’s prospectus, proxy materials, annual report and semi-annual report to certain shareholders residing at the same household. This reduces Fund expenses, which benefits you and other shareholders. If you need additional copies or do not want your mailings to be “householded,” please call the Shareholder Servicing Agent at 800-422-1050. Individual copies will be sent within thirty (30) days after the Shareholder Servicing Agent receives your instructions. Your consent to householding is considered valid until revoked.
Quarterly Portfolio Disclosures
Harbor Funds files a complete portfolio of investments with the SEC for the first and third quarters of each fiscal year on Form N-Q. The Fund’s Form N-Q is available (i) without charge, upon request, by calling Harbor Funds toll-free at 800-422-1050, (ii) on Harbor Funds’ website at harborfunds.com, and (iii) on the SEC’s website at sec.gov. The form may also be viewed and copied at the SEC’s Public Reference Room in Washington, DC. Information regarding the operations of the Public Reference Room may also be obtained by calling 800-SEC-0330.
Special meeting of shareholders
At a special meeting of the shareholders of the Harbor Funds held on September 22, 2017, shareholders elected six trustees to the Board of Trustees of Harbor Funds. Scott M. Amero, Robert A. Kasdin, and Ann M. Spruill were previously appointed as Trustees but had not been elected by shareholders. Raymond J. Ball, Donna J. Dean, and Randall A. Hack continue to serve on the Board.
| Trustee | For | Withhold | ||
Scott M. Amero | 1,047,869,265 | 14,860,642 | ||
Joseph L. Dowling III | 1,046,335,272 | 16,394,636 | ||
Robert A. Kasdin | 1,047,514,035 | 15,215,872 | ||
Charles F. McCain | 1,047,667,935 | 15,061,973 | ||
Kathryn L. Quirk | 1,046,812,694 | 15,917,214 | ||
Ann M. Spruill | 1,047,274,165 | 15,455,742 |
29
Harbor Strategic Growth Fund
Additional Information—Continued
Additional Information—Continued
Special meeting of shareholders—Continued
At a special meeting of the shareholders of the Harbor Funds held on September 22, 2017, shareholders approved an amendment to each Fund’s fundamental investment restriction regarding borrowing.
| Fund Name | For | Against | Abstain | Broker Non-Vote | ||||
Harbor Strategic Growth Funda | 910,417 | 12,112 | 6,367 | 630,438 |
At a special meeting of the shareholders of the Harbor Funds held on September 22, 2017, shareholders approved an amendment to each Fund’s fundamental investment restriction regarding lending.
| Fund Name | For | Against | Abstain | Broker Non-Vote | ||||
Harbor Strategic Growth Funda | 909,963 | 12,566 | 6,367 | 630,438 |
| a | Meeting held on October 18, 2017 |
30
Harbor Strategic Growth Fund
Additional Information—Continued
Additional Information—Continued
Trustees and Officers
As of December 2017
The business and affairs of the Trust shall be managed by or under the direction of the Trustees, and they shall have all powers necessary or desirable to carry out that responsibility. The Trustees shall have full power and authority to take or refrain from taking any action and to execute any contracts and instruments that they may consider necessary or desirable in the management of the Trust. Any determination made by the Trustees in good faith as to what is in the interests of the Trust shall be conclusive. Information pertaining to the Trustees and Officers of Harbor Funds is set forth below. The address of each Trustee and Officer is: [Name of Trustee or Officer] c/o Harbor Funds, 111 South Wacker Drive, 34th Floor, Chicago, IL 60606-4302.
The Harbor Fund’s Statement of Additional Information includes additional information about the Trust’s Trustees and is available without charge by calling 800-422-1050 or at the Trust’s website at harborfunds.com.
| Name (Age) Position(s) with Fund | Term of Office and Length of Time Served1 | Principal Occupation(s) During Past Five Years | Number of Portfolios In Fund Complex Overseen By Trustee | Other Directorships Of Public Companies and Other Registered Investment Companies Held by Trustee During Past Five Years |
INDEPENDENT TRUSTEES | ||||
| Scott M. Amero (54) Trustee | Since 2014 | Chairman (2015-Present) and Trustee (2011-2015), Rare (conservation nonprofit); Trustee, Berkshire School (2014-Present); Vice Chairman and Global Chief Investment Officer, Fixed Income (2010), Vice Chairman and Global Chief Investment Officer, Fixed Income, and Co-Head, Fixed Income Portfolio Management (2007-2010), BlackRock, Inc., (publicly traded investment management firm). | 32 | None |
| Raymond J. Ball (73) Trustee | Since 2006 | Sidney Davidson Distinguished Service Professor of Accounting, University of Chicago Booth School of Business (2000-Present); Academic Affiliate, Analysis Group (litigation consulting firm) (2000-Present); Financial Reporting Faculty Advisory Group of the Institute of Chartered Accountants in England and Wales (2008-Present); and Advisory Board of the Center for Accounting Research & Education at University of Notre Dame (2006-Present). | 32 | None |
| Donna J. Dean (66) Trustee | Since 2010 | Chief Investment Officer of the Rockefeller Foundation (a private foundation) (1995-Present). | 32 | None |
| Joseph L. Dowling III (53) Trustee | Since 2017 | Chief Investment Officer, Brown University (2013-Present); Advisory Board Member, Stage Point Capital (private mortgage specialist) (2016-Present); Advisory Board Member, Harbor Funds (2016-2017); and Founder and Managing Member, Narragansett Asset Management (private investment management firm) (1998-2013). | 32 | Director of Integrated Electrical Services (2011-Present). |
| Randall A. Hack (70) Trustee | Since 2010 | Founder and Senior Managing Director of Capstone Capital LLC (private investment firm) (2003-Present); Director of Tower Development Corporation (cell tower developer) (2009-2016); and Advisory Director of Berkshire Partners (private equity firm) (2002-2013). | 32 | None |
| Robert Kasdin (59) Trustee | Since 2014 | Senior Vice President and Chief Operating Officer, Johns Hopkins Medicine (2015-Present); Senior Executive Vice President, Columbia University (2002-2015); Trustee and Co-Chair of the Finance Committee, National September 11 Memorial & Museum at the World Trade Center (2005-Present); Director, Apollo Commercial Real Estate Finance, Inc. (2014-Present); and Director, Noranda Aluminum Holdings Corp. (2007-2014). | 32 | Director of Noranda Aluminum Holdings Corporation (2007-2014); and Director of Apollo Commercial Real Estate Finance, Inc. (2014-Present). |
31
Harbor Strategic Growth Fund
Additional Information—Continued
Additional Information—Continued
Trustees and Officers—Continued
| Name (Age) Position(s) with Fund | Term of Office and Length of Time Served1 | Principal Occupation(s) During Past Five Years | Number of Portfolios In Fund Complex Overseen By Trustee | Other Directorships Of Public Companies and Other Registered Investment Companies Held by Trustee During Past Five Years |
INDEPENDENT TRUSTEES—Continued | ||||
| Kathryn L. Quirk (65) Trustee | Since 2017 | Retired; Vice President, Senior Compliance Officer and Head, U.S. Regulatory Compliance, Goldman Sachs Asset Management (2013-2017); Deputy Chief Legal Officer, Asset Management, and Vice President and Corporate Counsel, Prudential Insurance Company of America (2010-2012); Co-Chief Legal Officer, Prudential Investment Management, Inc., and Chief Legal Officer, Prudential Investments and Prudential Mutual Funds (2008-2012); Vice President and Corporate Counsel and Chief Legal Officer, Mutual Funds, Prudential Insurance Company of America, and Chief Legal Officer, Prudential Investments (2005-2008); Vice President and Corporate Counsel and Chief Legal Officer, Mutual Funds, Prudential Insurance Company of America (2004-2005); Member, Management Committee (2000-2002), General Counsel and Chief Compliance Officer, Zurich Scudder Investments, Inc. (1997-2002). | 32 | None |
| Ann M. Spruill (63) Trustee | Since 2014 | Partner (1993-2008), member of Executive Committee (1996-2008), Member Board of Directors (2002-2008), Grantham, Mayo, Van Otterloo & Co, LLC (private investment management firm) (with the firm since 1990); Member Investment Committee and Chair of Global Equities, Museum of Fine Arts, Boston (2000-Present); and Trustee, Financial Accounting Foundation (2014-Present). | 32 | None |
INTERESTED TRUSTEE | ||||
| Charles F. McCain (48)* Chairman, Trustee and President | Since 2017 | Chief Executive Officer (2017-Present), Director (2007-Present), President and Chief Operating Officer (2017), Executive Vice President and General Counsel (2004-2017), and Chief Compliance Officer (2004-2014), Harbor Capital Advisors, Inc.; Director (2007-Present) and Chief Compliance Officer (2004-2017), Harbor Services Group, Inc.; and Chief Executive Officer (2017-Present), Director (2007-Present), Chief Compliance Officer and Executive Vice President (2007-2017), Harbor Funds Distributors, Inc. | 32 | None |
| Name (Age) Position(s) with Fund | Term of Office and Length of Time Served1 | Principal Occupation(s) During Past Five Years |
FUND OFFICERS NOT LISTED ABOVE** | ||
| Erik D. Ojala (42) Chief Compliance Officer and Secretary | Since 2017 Since 2007 | Executive Vice President and General Counsel (2017-Present) and Secretary (2010-Present); Senior Vice President and Associate General Counsel (2007-2017), Harbor Capital Advisors, Inc.; Director, Executive Vice President and Chief Compliance Officer (2017-Present), Harbor Funds Distributors, Inc.; and Director (2017-Present) and Assistant Secretary (2014-Present), Harbor Services Group, Inc. |
| Anmarie S. Kolinski (46) Treasurer | Since 2007 | Executive Vice President and Chief Financial Officer (2007-Present), Harbor Capital Advisors, Inc.; Chief Financial Officer (2007-Present), Harbor Services Group, Inc.; and Chief Financial Officer (2015-Present) and Treasurer (2012-Present), Harbor Funds Distributors, Inc. |
| Brian L. Collins (49) Vice President | Since 2005 | Executive Vice President and Chief Investment Officer (2004-Present), Harbor Capital Advisors, Inc. |
| Charles P. Ragusa (58) Vice President | Since 2007 | Executive Vice President (2007-Present), Harbor Capital Advisors, Inc.; President (2007-Present), Harbor Services Group, Inc.; and Executive Vice President and AML Compliance Officer (2007-Present) and OFAC Officer (2015-Present), Harbor Funds Distributors, Inc. |
| Jodie L. Crotteau (45) Assistant Secretary | Since 2014 | Senior Vice President and Chief Compliance Officer, Harbor Capital Advisors, Inc. (2014-Present); Chief Compliance Officer and Secretary (2017-present) and Assistant Secretary (2015-2016), Harbor Services Group, Inc.; Assistant Secretary (2016-present), Harbor Funds Distributors, Inc.; Vice President and Chief Compliance Officer, Grosvenor Registered Funds (2011-2014); and Vice President, Grosvenor Capital Management, L.P. (2010-2014). |
32
Harbor Strategic Growth Fund
Additional Information—Continued
Additional Information—Continued
Trustees and Officers—Continued
| Name (Age) Position(s) with Fund | Term of Office and Length of Time Served1 | Principal Occupation(s) During Past Five Years |
FUND OFFICERS NOT LISTED ABOVE**—Continued | ||
| Lana M. Lewandowski (38) AML Compliance Officer and Assistant Secretary | Since 2017 | Legal & Compliance Manager (2016-Present) and Legal Specialist (2012-2015), Harbor Capital Advisors, Inc. |
| Lora A. Kmieciak (53) Assistant Treasurer | Since 2017 | Senior Vice President – Fund Administration and Analysis (2017-Present) and Senior Vice President - Business Analysis (2015-2017), Harbor Capital Advisors, Inc.; and Assurance Executive Director (1999-2015), Ernst & Young LLP. |
| John M. Paral (49) Assistant Treasurer | Since 2013 | Director of Fund Administration and Analysis (2017-Present), Vice President (2012-Present) and Financial Reporting Manager (2007-2017), Harbor Capital Advisors, Inc. |
| 1 | Each Trustee serves for an indefinite term, until his successor is elected. Each Officer is elected annually. |
| * | Mr. McCain is deemed an “Interested Trustee” due to his affiliation with the Adviser and Distributor of Harbor Funds. |
| ** | Officers of the Funds are “interested persons” as defined in the Investment Company Act. |
33
This privacy statement is not part of this report
Harbor’s Privacy Statement
The following privacy statement is issued by Harbor Funds and each series of Harbor Funds and its affiliates, Harbor Capital Advisors, Inc., Harbor Services Group, Inc. and Harbor Funds Distributors, Inc. These measures reflect our commitment to maintaining the privacy of your confidential information. We appreciate the confidence you have shown by entrusting us with your assets.
Personal Information
It is our policy to respect the privacy of current and former shareholders and to protect personal information entrusted to us. We do not sell your personal information to anyone.
In the course of providing products and services, we collect non-public personal information about you from the following sources: applications, forms, our website (including any information captured through our use of “cookies”), through mobile applications, by telephone and in correspondence and transactions with us, our affiliates or other parties.
The non-public personal information collected may include name, address, e-mail address, telephone/fax numbers, account number, social security or taxpayer identification number, investment activity, and bank account information.
When you visit us through our website or a mobile application, we may collect technical and navigational information, such as computer browser type, Internet protocol address, pages visited and average time spent on our website. We may use this information to alert you to software compatibility issues, or to improve our web design and functionality. We use “cookies” and similar files that may be placed on your hard drive for security purposes, to facilitate site navigation and to personalize the appearance of our site.
Information Sharing
We occasionally disclose non-public personal information about our current or former shareholders with affiliated and non-affiliated parties, as permitted or required by law or regulation. In the normal course of servicing our shareholders, information we collect may be shared with non-affiliated companies that perform support services on our behalf or to other firms that assist us in providing you with products and services, such as custodians, transfer agents, broker-dealers and marketing service firms, as well as with other financial institutions. These companies may not use the information for any other purpose and we require them to keep the information they handle confidential. We may also share information with affiliates that are engaged in a variety of financial services in order to better service your account(s).
When information is shared with third parties, they are not permitted to use the information for any purpose other than to assist our servicing of your account(s) or as permitted by law.
If you close your account(s) or if we lose contact with you, we will continue to share information in accordance with our current privacy policy and practices.
Access to Information
Access to non-public personal information is limited to employees, agents or other parties who need to know that information to perform their jobs, such as servicing your account(s), resolving problems or informing you of new products or services.
Security
We maintain physical, electronic and procedural safeguards that comply with industry standards to protect your non-public personal information.
For shareholders accessing information through our website or a mobile application, various forms of Internet security, such as data encryption firewall barriers, user names and passwords, and other tools are used. For additional information regarding our security measures, visit the terms and conditions of use on our website at harborfunds.com. If you have any questions or concerns about how we maintain the privacy of your non-public personal information, please contact us at 800-422-1050 Monday through Friday, between the hours of 8:00 a.m. and 6:00 p.m. Eastern time.
We recommend that you read and retain this notice for your personal files.
Eff. November 2013
34
Glossary
Benchmark Descriptions
Bloomberg Barclays U.S. Aggregate Bond Index—The Bloomberg Barclays U.S. Aggregate Bond Index is an unmanaged index of investment-grade fixed-rate debt issues with maturities of at least one year. This unmanaged index does not reflect fees and expenses and is not available for direct investment.
Bloomberg Barclays U.S. TIPS Index—The Bloomberg Barclays U.S. TIPS Index is an unmanaged market index comprised of all U.S. Treasury Inflation Protected Securities rated investment grade (Baa3 or better), have at least one year to final maturity, and at least $250 million par amount outstanding. This unmanaged index does not reflect fees and expenses and is not available for direct investment.
Bloomberg Commodity Index Total ReturnSM—The Bloomberg Commodity Index Total ReturnSM is a broadly diversified index that tracks the commodities markets through commodity futures contracts. This unmanaged index does not reflect fees and expenses and is not available for direct investment.
ICE BofAML All U.S. Convertibles Ex Mandatory Index—The BofA Merrill Lynch All U.S. Convertibles Ex Mandatory Index is broadly representative of the U.S. convertible securities market, consisting of publicly traded issues, denominated in U.S. dollars, of all credit qualities, and excluding mandatory (equity-linked) convertibles. This unmanaged index does not reflect fees and expenses and is not available for direct investment.
ICE BofAML U.S. Dollar 3-Month LIBOR Constant Maturity Index—The ICE BofAML U.S. Dollar 3-Month LIBOR Constant Maturity Index tracks the performance of a synthetic asset paying Libor to a stated maturity. The index is based on the assumed purchase at par of a synthetic instrument having exactly its stated maturity and with a coupon equal to that day’s fixing rate. That issue is assumed to be sold the following business day (priced at a yield equal to the current day fixing rate) and rolled into a new instrument. This unmanaged index does not reflect fees and expenses and is not available for direct investment.
ICE BofAML 3-Month U.S. Treasury Bill Index—The ICE BofAML 3-Month U.S. Treasury Bill Index is comprised of a single U.S. Treasury Bill issue purchased at the beginning of each month and held for a full month, at which time that issue is sold and rolled into a newly selected issue. The issue selected each month is that having a maturity date closest to, but not beyond 90 days from the rebalance date.
ICE BofAML U.S. High Yield Index (H0A0)—The ICE BofAML U.S. High Yield Index (H0A0) is an unmanaged index that tracks the performance of below investment grade U.S. dollar-denominated corporate bonds publicly issued in the U.S. domestic market. All bonds are U.S. dollar denominated and rated Split BBB and below. This unmanaged index does not reflect fees and expenses and is not available for direct investment.
ICE BofAML U.S. Non-Distressed High Yield Index—The ICE BofAML U.S. Non-Distressed High Yield Index is a subset of the ICE BofAML U.S. High Yield Index (H0A0) including all securities with an option-adjusted spread less than 1,000 basis points. The unmanaged index does not reflect fees and expenses and is not available for direct investment.
MSCI All Country World Index—The MSCI All Country World Index is a free float-adjusted market capitalization weighted index that is designed to measure the equity market performance of developed and emerging markets. This unmanaged index does not reflect fees and expenses and is not available for direct investment.
MSCI All Country World Ex. U.S. (ND) Index—The MSCI All Country World Ex. U.S.is a free float-adjusted market capitalization weighted index that is designed to measure equity market performance in the global developed and emerging markets, excluding the United States. This unmanaged index does not reflect fees and expenses and is not available for direct investment.
MSCI EAFE (ND) Index—The MSCI EAFE (ND) Index is an unmanaged index generally representative of major overseas stock markets. This unmanaged index does not reflect fees and expenses and is not available for direct investment.
MSCI EAFE Small Cap (ND) Index—The MSCI EAFE Small Cap (ND) Index is an equity index which captures small cap representation across developed market countries around the world, excluding the U.S. and Canada. This unmanaged index does not reflect fees and expenses and is not available for direct investment.
MSCI Emerging Markets (ND) Index—The MSCI Emerging Markets (ND) Index is a market capitalization weighted index of equity securities in more than 20 emerging market economies. This unmanaged index does not reflect fees and expenses and is not available for direct investment.
MSCI World (ND) Index—The MSCI World (ND) Index is a free float-adjusted market capitalization index that is designed to measure global developed market equity performance. This unmanaged index does not reflect fees and expenses and is not available for direct investment.
35
Glossary—Continued
Benchmark Descriptions—Continued
Russell 1000® Index—The Russell 1000® Index is an unmanaged index generally representative of the U.S. market for larger capitalization stocks as it includes the largest 1000 securities in the Russell 3000® Index by market capitalization. This unmanaged index does not reflect fees and expenses and is not available for direct investment. The Russell 1000® Index and Russell® are trademarks of Frank Russell Company.
Russell 1000® Growth Index—The Russell 1000® Growth Index is an unmanaged index generally representative of the U.S. market for larger capitalization growth stocks. This unmanaged index does not reflect fees and expenses and is not available for direct investment. The Russell 1000® Growth Index and Russell® are trademarks of Frank Russell Company.
Russell 1000® Value Index—The Russell 1000® Value Index is an unmanaged index generally representative of the U.S. market for larger capitalization value stocks. This unmanaged index does not reflect fees and expenses and is not available for direct investment. The Russell 1000® Value Index and Russell® are trademarks of Frank Russell Company.
Russell 2000® Index—The Russell 2000® Index measures the performance of the small-cap segment of the U.S. equity universe. The Russell 2000® Index is a subset of the Russell 3000® Index representing approximately 10% of the total market capitalization of that index. It includes approximately 2,000 of the smallest securities based on a combination of their market cap and current index membership. The Russell 2000® Index is constructed to provide a comprehensive and unbiased small-cap barometer and is completely reconstituted annually to ensure larger stocks do not distort the performance and characteristics of the true small-cap opportunity set. This unmanaged index does not reflect fees and expenses and is not available for direct investment. The Russell 3000® Index and Russell® are trademarks of Frank Russell Company.
Russell 2000® Growth Index—The Russell 2000® Growth Index is an unmanaged index representing the smallest 2,000 stocks with the highest price-to-book ratio and future earnings. This unmanaged index does not reflect fees and expenses and is not available for direct investment. The Russell 2000® Growth Index and Russell® are trademarks of Frank Russell Company.
Russell 2000® Value Index—The Russell 2000® Value Index is an unmanaged index representing the smallest 2,000 stocks with the lowest price-to-book ratio and future earnings. This unmanaged index does not reflect fees and expenses and is not available for direct investment. The Russell 2000® Value Index and Russell® are trademarks of Frank Russell Company.
Russell 3000® Index—The Russell 3000® Index measures the performance of the largest 3,000 U.S. companies representing approximately 98% of the investable U.S. equity market. The Russell 3000® Index is constructed to provide a comprehensive, unbiased and stable barometer of the broad market and is completely reconstituted annually to ensure new and growing equities are reflected. This unmanaged index does not reflect fees and expenses and is not available for direct investment. The Russell 3000® Index and Russell® are trademarks of Frank Russell Company.
Russell 3000® Growth Index—The Russell 3000® Growth Index measures the performance of the broad growth segment of the U.S. equity universe. It includes those Russell 3000® companies with higher price-to-book ratios and higher forecasted growth values. The Russell 3000® Growth Index is constructed to provide a comprehensive, unbiased, and stable barometer of the broad growth market. The index is completely reconstituted annually to ensure new and growing equities are included and that the represented companies continue to reflect growth characteristics. This unmanaged index does not reflect fees and expenses and is not available for direct investment. The Russell 3000® Growth Index and Russell® are trademarks of Frank Russell Company.
Russell 3000® Value Index—The Russell 3000® Value Index measures the performance of the broad value segment of U.S. equity value universe. It includes those Russell 3000® companies with lower price-to-book ratios and lower forecasted growth values. The Russell 3000® Value Index is constructed to provide a comprehensive, unbiased, and stable barometer of the broad value market. The index is completely reconstituted annually to ensure new and growing equities are included and that the represented companies continue to reflect value characteristics. This unmanaged index does not reflect fees and expenses and is not available for direct investment. The Russell 3000® Value Index and Russell® are trademarks of Frank Russell Company.
Russell Midcap® Index—The Russell Midcap® Index is an unmanaged index generally representative of the U.S. market for medium capitalization stocks. This unmanaged index does not reflect fees and expenses and is not available for direct investment. The Russell Midcap® Index and Russell® are trademarks of Frank Russell Company.
Russell Midcap® Growth Index—The Russell Midcap® Growth Index is an unmanaged index generally representative of the U.S. market for medium capitalization growth stocks. This unmanaged index does not reflect fees and expenses and is not available for direct investment. The Russell Midcap® Growth Index and Russell® are trademarks of Frank Russell Company.
36
Glossary—Continued
Benchmark Descriptions—Continued
Russell Midcap® Value Index—The Russell Midcap® Value Index is an unmanaged index generally representative of the U.S. market for medium capitalization value stocks. This unmanaged index does not reflect fees and expenses and is not available for direct investment. The Russell Midcap® Value Index and Russell® are trademarks of Frank Russell Company.
S&P 500 Index—The S&P 500 Index is an unmanaged index generally representative of the U.S. stock market. This unmanaged index does not reflect fees and expenses and is not available for direct investment.
Financial Terms
12b-1 Fee—A mutual fund fee, named for the SEC rule that permits it, used to pay for broker-dealer compensation and other distribution costs. If a fund has a 12b-1 fee, it will be disclosed in the fee table of a fund’s prospectus.
ADR—ADR after the name of a foreign holding stands for American Depositary Receipts representing ownership of foreign securities. ADRs are issued by U.S. banking institutions.
Average Market Cap—The average market capitalization of a fund’s equity portfolio gives you a measure of the size of the companies in which the fund invests. Market capitalization is calculated by multiplying the number of a company’s shares outstanding by its price per share.
Average Market Coupon—A calculation from a fund’s portfolio by weighting the coupon of each bond by its relative size in the portfolio.
Beta—A measure of market-related risk. The beta of every index is 1.00, no matter how volatile the index is. A beta less than one means the portfolio is less volatile than the index. A beta higher than one indicates more volatility than the index.
Bottom-Up Equity Management Style—A management style that de-emphasizes the significance of economic and market cycles, focusing instead on the analysis of individual stocks.
Capital Gains Distribution—Profits distributed to shareholders resulting from the sale of securities held in the fund’s portfolio.
Credit Risk—The possibility that a bond issuer may not be able to pay interest and repay its debt.
CUSIP Number—Identification number assigned to every stock, corporate bond and municipal bond by the Committee on Uniform Securities Identification Procedures (CUSIP), which is established by the American Bankers Association.
Diversification—The practice of investing broadly across securities of a number of issuers to reduce risk.
Duration—A common gauge of the price sensitivity of a fixed income asset or portfolio to a change in interest rates.
Emerging Markets—Emerging markets are countries with relatively young stock and bond markets. Examples include Brazil and Thailand. Typically, emerging-markets investments have the potential for losses and gains larger than those of developed-market investments.
Expense Ratio—The Fund’s total annual operating expenses (including management fees, distribution (12b-1) fees and other expenses) expressed as a percentage of average net assets.
Family of Funds—A group of mutual funds, each typically with its own investment objective, managed or distributed by the same company that hold themselves out to investors as related companies for the purposes of investment and investor services.
GDR—GDR after the name of a holding stands for Global Depositary Receipt representing ownership of foreign securities. GDRs are issued by either U.S. or non-U.S. banking organizations. SADR after the name of a holding stands for South African Depositary Receipts representing ownership of South African securities listed on the Johannesburg Stock Exchange. SDR after the name of a holding stands for Swedish Depository Receipts representing ownership of foreign securities in Sweden. NVDR after the name of a holding stands for Non-Voting Depositary Receipts representing ownership of a listed security in the Stock Exchange of Thailand.
Inception Date—The date on which the Fund commenced operations.
Investment Objective—The goal that an investor and mutual fund pursue together (e.g., current income, long-term capital growth, etc.).
37
Glossary—Continued
Financial Terms—Continued
Median Market Cap—An indicator of the size of companies in which a fund invests; the midpoint of market capitalization (market price x shares outstanding) of a fund’s stocks, weighted by the proportion of the fund’s assets invested in each stock. Stocks representing half of the fund’s assets have market capitalizations above the median, and the rest are below it.
Net Asset Value (NAV)—The per share value of a mutual fund, determined by subtracting the fund’s liabilities from its assets and dividing by the number of shares outstanding. Mutual funds calculate their NAVs at least once each business day.
No-Load Fund—A mutual fund whose shares are sold without a sales commission and without a 12b-1 fee of more than 0.25% per year. Harbor funds are no-load.
Open-End Management Company—The legal name for a mutual fund, indicating that it stands ready to redeem (buy back) its shares from investors on any business day. Harbor Funds is an open-end investment company.
Operating Expenses—Business costs paid from a fund’s assets before earnings are distributed to shareholders. These include management fees and 12b-1 fees and other expenses.
Portfolio Manager—A specialist employed by a mutual fund’s adviser or subadviser to invest the fund’s assets in accordance with predetermined investment objectives.
Portfolio Turnover—A measure of the trading activity in a fund’s investment portfolio (how often securities are bought and sold by a fund). Funds with high turnover rates incur higher transaction costs and may be more likely to distribute capital gains (which may be taxable to investors).
Price to Book Ratio (P/B)—A ratio used to compare a stock’s market value to its book value. It is calculated by dividing the current closing price of the stock by the latest quarter’s book value. For a fund, the weighted average price/book ratio of the stocks it holds.
Price to Earnings Ratio (P/E)—The ratio of a stock’s current price to its per-share earnings over the past year. For a fund, the weighted average P/E of the stocks it holds. P/E is an indicator of market expectations about corporate prospects; the higher the P/E, the greater the market expectations are for a company’s future growth.
Prospectus—The official document that describes a mutual fund to prospective investors. The prospectus contains information required by the SEC, such as investment objectives and policies, risks, services and fees.
Record Date—The date on which a shareholder must officially own shares in order to be entitled to a dividend.
Redemption Fee—Fee charged to shareholders by a mutual fund when they sell shares within a specified period after purchase. The time limit and size of fee vary among funds. The fee is paid to the fund, not the fund’s investment adviser. Its purpose is to protect long-term investors from the impact of short-term traders.
REITs (Real Estate Investment Trust)—REITs invest in real estate or loans secured by real estate and issue shares in such investments. A REIT is similar to a closed-end mutual fund.
Repurchase Agreement (Repo)—A form of short-term borrowing for dealers in government securities. The dealer sells the government securities to investors, usually on an overnight basis, and buys them back the following day. For the party selling the security (and agreeing to repurchase it in the future), it is a repo. For the party on the other end of the transaction (buying the security and agreeing to sell back in the future), it is a reverse repurchase agreement.
Risk/Reward (or Return)—The relationship between the degree of risk associated with an investment and its return potential. Typically, the higher the potential return of an investment, the greater the risk.
Statement of Additional Information (SAI)—The supplementary document to a prospectus that contains more detailed information about a mutual fund; also known as “Part B” of a fund’s registration statement.
TBAs—A term used to describe a forward mortgage-backed securities trade. Pass-through securities issued by Freddie Mac, Fannie Mae and Ginnie Mae trade in the TBA market. The term TBA is derived from the fact that the actual mortgage- backed security that will be delivered to fulfill a TBA trade is not designated at the time the trade is made. The securities are “to be announced” 48 hours prior to the established trade settlement date.
Treasury Inflation-Protected Securities (TIPS)—TIPS are securities in which the principal amount is adjusted for inflation and interest payments are applied to the inflation-adjusted principal.
38
Glossary—Continued
Financial Terms—Continued
Top-Down Equity Management Style—Investment style that begins with an assessment of the overall economic environment and makes a general asset allocation decision regarding various sectors of the financial markets and various industries.
Total Return—Return on an investment over a specified period, including price appreciation (or depreciation) plus any income, expressed as an average annual compound of return.
Weighted Average Duration—Duration is a time measure of a bond’s interest-rate sensitivity, based on the weighted average of the time periods over which a bond’s cash flows accrue to the bondholder. Time periods are weighted by multiplying by the present value of its cash flow divided by the bond’s price. (A bond’s cash flows consist of coupon payments and repayment of capital.) A bond’s duration will almost always be shorter than its maturity, with the exception of zero-coupon bonds, for which maturity and duration are equal.
Weighted Average Maturity—The average length of time until principal must be repaid for all bonds in a mutual fund portfolio on a dollar weighted basis.
Yield—A measure of net income (dividends and interest) earned by the securities in the fund’s portfolio less fund expenses during a specified period. A fund’s yield is expressed as a percentage of the maximum offering price per share on a specified date.
Yield to Maturity—The term used to describe the rate of return an investor will receive if a long-term, interest-bearing security, such as a bond, is held to its maturity date. Yield to maturity is greater than the coupon rate if the bond is selling at a discount and less than the coupon rate if it is selling at a premium.
39

| 111 South Wacker Drive, 34th Floor | Chicago, IL 60606-4302 | 800-422-1050 | harborfunds.com |
Trustees & Officers
Charles F. McCain
Chairman, President & Trustee
Chairman, President & Trustee
Scott M. Amero
Trustee
Trustee
Raymond J. Ball
Trustee
Trustee
Donna J. Dean
Trustee
Trustee
Joseph L. Dowling, III
Trustee
Trustee
Randall A. Hack
Trustee
Trustee
Robert Kasdin
Trustee
Trustee
Kathryn L. Quirk
Trustee
Trustee
Ann M. Spruill
Trustee
Trustee
Anmarie S. Kolinski
Treasurer
Treasurer
Erik D. Ojala
Chief Compliance Officer
& Secretary
Chief Compliance Officer
& Secretary
Brian L. Collins
Vice President
Vice President
Charles P. Ragusa
Vice President
Vice President
Jodie L. Crotteau
Assistant Secretary
Assistant Secretary
Lana M. Lewandowski
AML Compliance Officer
& Assistant Secretary
AML Compliance Officer
& Assistant Secretary
Lora A. Kmieciak
Assistant Treasurer
Assistant Treasurer
John M. Paral
Assistant Treasurer
Assistant Treasurer
Investment Adviser
Harbor Capital Advisors, Inc.
111 South Wacker Drive
34th Floor
Chicago, IL 60606-4302
312-443-4400
111 South Wacker Drive
34th Floor
Chicago, IL 60606-4302
312-443-4400
Distributor
Harbor Funds Distributors, Inc.
111 South Wacker Drive
34th Floor
Chicago, IL 60606-4302
312-443-4600
111 South Wacker Drive
34th Floor
Chicago, IL 60606-4302
312-443-4600
Shareholder Services
Harbor Services Group, Inc.
P.O. Box 804660
Chicago, IL 60680-4108
800-422-1050
P.O. Box 804660
Chicago, IL 60680-4108
800-422-1050
Custodian
State Street Bank & Trust Company
State Street Financial Center
1 Lincoln Street
Boston, MA 02111-2900
State Street Financial Center
1 Lincoln Street
Boston, MA 02111-2900
FD.AR.HSGF.1017
Table of Contents


Annual Report
October 31, 2017
International & Global Funds
| Institutional Class | Administrative Class | Investor Class | Retirement Class | |
| Harbor International Fund | HAINX | HRINX | HIINX | HNINX |
| Harbor Diversified International All Cap Fund | HAIDX | HRIDX | HIIDX | HNIDX |
| Harbor International Growth Fund | HAIGX | HRIGX | HIIGX | HNGFX |
| Harbor International Small Cap Fund | HAISX | HRISX | HIISX | HNISX |
| Harbor Global Leaders Fund | HGGAX | HRGAX | HGGIX | HNGIX |
| Harbor Emerging Markets Equity Fund | HAEMX | HREMX | HIEEX | HNEMX |
Table of Contents
| 1 | |
| 3 | |
| Harbor International Fund | |
| 5 | |
| 7 | |
| 8 | |
| 9 | |
| Harbor Diversified International All Cap Fund | |
| 13 | |
| 15 | |
| 16 | |
| 17 | |
| Harbor International Growth Fund | |
| 24 | |
| 26 | |
| 27 | |
| 28 | |
| Harbor International Small Cap Fund | |
| 31 | |
| 34 | |
| 35 | |
| 36 | |
| Harbor Global Leaders Fund | |
| 40 | |
| 42 | |
| 43 | |
| 44 | |
| Harbor Emerging Markets Equity Fund | |
| 46 | |
| 48 | |
| 49 | |
| 50 | |
| Financial Statements | |
| 54 | |
| 55 | |
| 57 | |
| 63 | |
| 76 | |
| 88 | |
| 89 | |
| Additional Information | |
| 92 | |
| 92 | |
| 92 | |
| 93 | |
| 93 | |
| 94 | |
| 97 | |
| 98 |
This document must be preceded or accompanied by a Prospectus.
Harbor International & Global Funds
Annual Report Overview (Unaudited)
Annual Report Overview (Unaudited)
The Funds' fiscal year ended October 31, 2017. Performance data shown represents past performance and is no guarantee of future results. Past performance is net of management fees and expenses and reflects reinvested dividends and distributions, but does not reflect the deduction of taxes that a shareholder would pay on Fund distributions or upon the redemption of Fund shares. Past performance reflects the beneficial effect of any expense waivers or reimbursements, without which returns would have been lower. Investment returns and principal value will fluctuate and when redeemed may be worth more or less than their original cost. Returns for periods less than one year are not annualized. Current performance may be higher or lower than what is shown here and is available through the most recent month end at harborfunds.com or by calling 800-422-1050.
For information on the different share classes, please refer to the current prospectus. The returns of the unmanaged indices shown in this report assume the reinvestment of dividends but do not reflect fees and expenses and are not available for direct investment.
| Total Return Year Ended October 31, 2017 | |||||||
| HARBOR INTERNATIONAL & GLOBAL FUNDS | Institutional Class | Administrative Class | Investor Class | Retirement Class | |||
Harbor International Fund | 18.24% | 17.93% | 17.79% | 18.30% | |||
Harbor Diversified International All Cap Fund | 22.29 | 21.91 | 21.82 | 22.35 | |||
Harbor International Growth Fund | 23.38 | 23.08 | 22.89 | 23.52 | |||
Harbor International Small Cap Fund | 30.59 | 30.25 | 30.10 | 30.67 | |||
Harbor Global Leaders Fund | 24.74 | 24.48 | 24.28 | 24.84 | |||
Harbor Emerging Markets Equity Fund | 27.54 | 27.04 | 27.00 | 27.62 | |||
| COMMONLY USED MARKET INDICES | Total Return Year Ended October 31, 2017 |
MSCI EAFE (ND) (foreign stocks) | 23.44% |
MSCI All Country World Ex. U.S. (ND) (foreign stocks) | 23.64 |
MSCI EAFE Small Cap (ND) (foreign small cap stocks) | 27.51 |
MSCI All Country World (ND) (global equity) | 23.20 |
MSCI Emerging Markets (ND) (emerging market stocks) | 26.45 |
1
Harbor International & Global Funds
Annual Report Overview—Continued
Annual Report Overview—Continued
| EXPENSE RATIOS1 | Morningstar Average2 | ||||||||||
| INTERNATIONAL AND GLOBAL FUNDS | 2013 | 2014 | 2015 | 2016 | 2017 | ||||||
| Harbor International Fund | |||||||||||
Institutional Class | 0.74% | 0.73% | 0.74% | 0.77% | 0.80% | 0.95% | |||||
Administrative Class | 0.99 | 0.98 | 0.99 | 1.02 | 1.05 | 1.35 | |||||
Investor Class | 1.11 | 1.10 | 1.11 | 1.14 | 1.17 | 1.36 | |||||
Retirement Class | N/A | N/A | N/A | 0.72 a | 0.73 | 0.88 | |||||
| Harbor Diversified International All Cap Fund | |||||||||||
Institutional Class | N/A | N/A | N/A | 0.85% b | 0.85% | 0.95% | |||||
Administrative Class | N/A | N/A | N/A | 1.10 b | 1.10 | 1.35 | |||||
Investor Class | N/A | N/A | N/A | 1.22 b | 1.22 | 1.36 | |||||
Retirement Class | N/A | N/A | N/A | 0.80 a | 0.77 | 0.88 | |||||
| Harbor International Growth Fund | |||||||||||
Institutional Class | 0.89% | 0.85% | 0.85% | 0.85% | 0.85% | 0.96% | |||||
Administrative Class | 1.14 | 1.10 | 1.10 | 1.10 | 1.10 | 1.34 | |||||
Investor Class | 1.26 | 1.22 | 1.22 | 1.22 | 1.22 | 1.37 | |||||
Retirement Class | N/A | N/A | N/A | 0.80 a | 0.77 | 0.90 | |||||
| Harbor International Small Cap Fund | |||||||||||
Institutional Class | N/A | N/A | N/A | 0.95% c | 0.95% | 1.26% | |||||
Administrative Class | N/A | N/A | N/A | 1.20 c | 1.20 | 1.58 | |||||
Investor Class | N/A | N/A | N/A | 1.32 c | 1.32 | 1.60 | |||||
Retirement Class | N/A | N/A | N/A | 0.90 c | 0.87 | 1.22 | |||||
| Harbor Global Leaders Fund | |||||||||||
Institutional Class | 0.90% | 0.90% | 0.90% | 0.90% | 0.90% | 0.97% | |||||
Administrative Class | 1.15 | 1.15 | 1.15 | 1.15 | 1.15 | 1.25 | |||||
Investor Class | 1.27 | 1.27 | 1.27 | 1.27 | 1.27 | 1.31 | |||||
Retirement Class | N/A | N/A | N/A | 0.85 a | 0.83 | 0.91 | |||||
| Harbor Emerging Markets Equity Fund | |||||||||||
Institutional Class | N/A | 1.25% | 1.17% | 1.15% | 1.15% | 1.23% | |||||
Administrative Class | N/A | 1.50 | 1.43 | 1.40 | 1.40 | 1.62 | |||||
Investor Class | N/A | 1.62 | 1.55 | 1.52 | 1.52 | 1.62 | |||||
Retirement Class | N/A | N/A | N/A | 1.10 a | 1.08 | 1.20 | |||||
| 1 | Harbor Funds’ expense ratios are for the fiscal years ended October 31 (unless otherwise noted) and are shown net of all expense offsets, waivers and reimbursements (see Financial Highlights). |
| 2 | The Morningstar Average includes all actively managed no-load funds in the October 31, 2017 Morningstar Universe with the same investment style as the comparable Harbor Funds portfolio and with the following additional characteristics for each Harbor Funds share class: Institutional Class contains funds with 12b-1 fees less than or equal to 0.25%; Administrative Class contains funds with 12b-1 fees and which are restricted primarily for use by retirement plans; Investor Class contains funds with 12b-1 fees and a minimum investment less than $50,000; and Retirement Class contains funds with no 12b-1 fees. |
| a | Annualized figures for the period March 1, 2016 (commencement of operations) through October 31, 2016 |
| b | Annualized figures for the period November 2, 2015 (inception) through October 31, 2016 |
| c | Annualized figures for the period February 1, 2016 (inception) through October 31, 2016 |
2
Letter from the Chairman
 Charles F. McCain Chairman |
Dear Fellow Shareholder:
I am honored to be writing my first shareholder letter to you as Chairman of the Board of Trustees of Harbor Funds. David Van Hooser, our long-standing Chairman, retired from the Board of Trustees on September 22, 2017 after 17 years of distinguished service. Over that 17 year tenure, I have admired how Dave has maintained a singular focus on serving the best interests of Harbor Funds and its shareholders. He has served as an example to me and the other women and men who work diligently to support Harbor Funds. I remain committed to carrying on the responsibility that Dave so fully embraced to place the interests of Harbor Funds and its shareholders first.
We have also had other changes on the Board of Trustees over the past year. Rodger Smith, our long-standing Lead Independent Trustee, retired from the Board on December 31, 2016 after a 29 year tenure. He was replaced as Lead Independent Trustee by Randy Hack, who has served on the Board since 2010. Shareholders also elected two new independent Trustees to the Board on September 22, 2017 in Katie Quirk and Joe Dowling. With their election, eight of the nine members of the Board are independent of Harbor Capital Advisors, the investment adviser to Harbor Funds.
market review
International equities in the aggregate posted double digit returns in the fiscal year ended October 31, 2017. The MSCI All Country World Ex U.S. (ND) Index, a measure of the equity markets outside the U.S., had a return of 23.64%.
Early in the fiscal year, the U.S. election raised investors’ hopes for increased infrastructure spending, tax cuts and reduced regulation, sparking a global market rally. International markets continued their expansion in the second and third quarters of 2017 amid strong forecasts for global economic growth and improved business confidence. Emerging-market equities outgained their developed-market peers on the strength of a resurgence in growth-oriented sectors, including Information Technology and Consumer Discretionary.
Global equities benefited from a rosy macroeconomic picture during the fiscal year, with the United States posting its strongest quarterly Gross Domestic Product (GDP) growth in more than two years, consumer confidence and unemployment numbers in Europe moving in positive directions, and growth expectations improving in emerging markets. The MSCI World (ND) Index, a measure of the global equity markets, posted a gain of 22.77%.
Comments by the portfolio managers of each Harbor international and global equity fund can be found in the pages preceding each Fund’s portfolio of investments. As always, we recommend that shareholders maintain a long-term perspective in evaluating all of their investments, including those in Harbor Funds.
| Returns For Periods Ended October 31, 2017 | ||||||||
| Annualized | ||||||||
| International & Global | 1 Year | 5 Years | 10 Years | 30 Years | ||||
MSCI EAFE (ND) (foreign stocks) | 23.44% | 8.53% | 1.10% | 5.62% | ||||
MSCI EAFE Small Cap (ND) (foreign small cap stocks) | 27.51 | 13.03 | 4.18 | N/A | ||||
MSCI World (ND) (global stocks) | 22.77 | 11.56 | 4.10 | 7.44 | ||||
MSCI All Country World Ex. U.S. (ND) (foreign stocks) | 23.64 | 7.29 | 0.92 | N/A | ||||
MSCI Emerging Markets (ND) (emerging market stocks) | 26.45 | 4.83 | 0.60 | N/A | ||||
| Domestic Equities | ||||||||
Russell 3000® (entire U.S. stock market) | 23.98% | 15.12% | 7.61% | 10.60% | ||||
S&P 500 (large cap stocks) | 23.63 | 15.18 | 7.51 | 10.50 | ||||
Russell Midcap® (mid cap stocks) | 21.09 | 14.87 | 8.09 | 12.11 | ||||
Russell 2000® (small cap stocks) | 27.85 | 14.49 | 7.63 | 10.45 | ||||
Russell 3000® Growth (growth stocks) | 29.80 | 16.71 | 9.05 | 10.16 | ||||
Russell 3000® Value (value stocks) | 18.30 | 13.48 | 6.07 | 10.68 | ||||
| Strategic Markets | ||||||||
Bloomberg Commodity Index Total ReturnSM (commodities) | 2.35% | -9.37% | -6.93% | N/A | ||||
| Fixed Income | ||||||||
ICE BofAML U.S. Non-Distressed High Yield (domestic high-yield bonds) | 8.62% | 6.33% | 6.69% | N/A | ||||
Bloomberg Barclays U.S. Aggregate Bond (domestic bonds) | 0.90 | 2.04 | 4.19 | 6.43% | ||||
Bloomberg Barclays U.S. TIPS (domestic inflation-linked bonds) | -0.11 | -0.11 | 3.81 | N/A | ||||
ICE BofAML U.S. 3-Month Treasury Bill (proxy for money market returns) | 0.72 | 0.24 | 0.45 | 3.35 | ||||
Stay focused on the long-term
Major U.S. indexes hit record levels toward the end of the fiscal year, supported by continued earnings gains and favorable economic data. Against this backdrop, the third calendar quarter of 2017 marked the eighth consecutive quarter of gains for U.S. equities.
3
With equities having rallied for an extended period, it is reasonable to question whether the market’s advance might be due for a slowdown or even a reversal in the near future. For even the most experienced investment professionals, it is difficult to reliably predict the movements of stock prices or bond prices with certainty, particularly in the shorter-term.
We always encourage shareholders to take a long term perspective with all of their investments. While past performance is never a guarantee of future results, over the long term, the returns of equities and debt securities have historically helped many investors achieve their financial objectives. We encourage all investors to maintain a diversified portfolio of equities, debt and cash in an allocation consistent with their long-term financial goals and comfort with risk.
Harbor Funds offers a variety of equity, strategic markets and fixed income funds to help you achieve your financial goals.
Thank you for investing with Harbor Funds.
December 21, 2017
 |
| Charles F. McCain |
| Chairman |
4
Harbor International Fund
Managers' Commentary (Unaudited)
Managers' Commentary (Unaudited)
Subadviser
Northern Cross, LLC
125 Summer Street
Suite 1410
Suite 1410
Boston, MA 02110
Portfolio Managers
Howard Appleby, CFA
Since 2009
Since 2009
Jean-Francois Ducrest
Since 2009
Since 2009
James LaTorre, CFA
Since 2009
Since 2009
Northern Cross, LLC has subadvised the Fund since 2009.
Investment Objective
The Fund seeks long-term total return, principally from growth of capital.

Howard Appleby, CFA

Jean-Francois Ducrest

James LaTorre, CFA
Management’s Discussion of
Fund Performance
Fund Performance
MARKET REVIEW
Shares of companies based in developed overseas markets posted strong gains in fiscal 2017, as the MSCI EAFE (ND) Index recorded a return of 23.44% for the 12 months ended October 31, 2017. (All international and global returns are in U.S. dollars.)
In the first half of the fiscal year, the U.S. elections brought the hope of increased infrastructure spending, possibly lower tax rates and reduced regulation, sparking investor optimism worldwide. Strong European equity returns led international equities, while Japanese equity returns lagged. Emerging markets advanced on improved economic growth.
International markets continued their expansion in the second and third quarters of 2017 against a supportive backdrop of an ongoing industrial recovery in China and improving economic activity in Europe. Chinese economic growth boosted returns in market segments globally, from European and Japanese industrial exporters to hard commodities.
The fiscal year finished out with another monthly gain for international equities in October, underpinned by robust global growth. The Eurozone’s improving economic measures – including falling unemployment and rising consumer confidence – propelled equity gains for European markets. In addition, the European Central Bank (ECB) announced a nine-month extension of its quantitative easing program at its October meeting.
For U.S.-based investors, the performance of international equities was enhanced by a weakening of the U.S. dollar versus the Euro and other major currencies in the second half of the fiscal year, which had a positive impact on MSCI EAFE (ND) Index returns.
In this environment, all sectors in the benchmark gained for the fiscal year, with Information Technology, Materials and Financials outperforming their peers. Telecommunication Services was the weakest performer and the only sector in the index that did not have a double-digit return.
PERFORMANCE
Harbor International Fund returned 18.24% (Institutional Class), 17.93% (Administrative Class), 17.79% (Investor Class), and 18.30% (Retirement Class) for fiscal 2017, lagging the 23.44% return of the MSCI EAFE (ND) Index.
Both stock selection and sector allocations weighed on relative results overall in fiscal 2017. Health Care detracted the most from relative returns, due to the combination of a substantial overweight allocation to one of the weaker performing sectors in the benchmark and steep losses by two holdings. Shares of Israeli generic drug producer Teva Pharmaceutical Industries declined along with its earnings expectations. Weakness in the company’s U.S. generics business raised concerns over the need for additional capital. Also declining in the sector, was United Kingdom-based pharmaceutical holding Shire.
Stock selection made Energy a detractor as well. While Energy stocks in the benchmark posted strong gains, the Fund only had two holdings in the sector, one of which – U.S.-based oilfield services company Schlumberger – had a negative return for the fiscal year.
5
Harbor International Fund
Managers' Commentary—Continued
Managers' Commentary—Continued
| TOP TEN HOLDINGS (% of Net Assets) | |
| Las Vegas Sands Corp. | 6.4% |
| Schlumberger Ltd. | 3.7% |
| Alibaba Group Holding Ltd. ADR | 3.4% |
| Wynn Resorts Ltd. | 3.2% |
| Vivendi SA | 3.0% |
| Bayer AG | 2.8% |
| Fanuc Corp. | 2.7% |
| Reckitt Benckiser Group plc | 2.3% |
| Atlas Copco AB Class A | 2.2% |
| Heineken NV | 2.2% |
The largest positive contribution to relative returns came from stock selection in Information Technology, as Chinese e-commerce company Alibaba Group Holdings and Netherlands-based semiconductor equipment producer ASML Holding both gained on strong results. An underweight allocation to Telecommunication Services contributed to relative returns. Stock selection in Industrials was also positive as Atlas Copco, a maker of industrial compressors, rose during the year.
Country weightings had a positive effect on relative returns. Notably, an out-of-benchmark allocation to China contributed, as did a lack of exposure to Australia and an underweight to Japan, as both of those countries underperformed the benchmark overall. Stock selection had the greatest negative impact in the United Kingdom and Israel, due to the Health Care holdings Shire and Teva Pharmaceutical Industries, respectively. Stock selection in Sweden and the Netherlands was positive.
OUTLOOK & STRATEGY
As of October 31, 2017, the Fund’s largest overweights relative to the MSCI EAFE (ND) Index were in the Consumer Discretionary, Health Care, and Consumer Staples sectors. Relative to the benchmark MSCI EAFE (ND) Index, the biggest underweights were in Financials, Industrials, Telecommunication Services, and Materials. The Fund’s largest country overweights were in the U.S., France, and Colombia, while the biggest underweights were in Japan, Australia, and the United Kingdom. Sector and country exposures are primarily a reflection of our bottom-up stock selection process rather than a major element of investment strategy.
A key element of our investment philosophy is the belief that thorough and patient due diligence provides the best opportunities to invest in companies that will deliver long-term profit-margin expansion. We continue to focus on seeking companies with long-term catalysts, a process that we believe leads to consistency and sustainability of individual stock performance.
As of the end of the fiscal year, we did not consider equity valuations to be attractive across the board; in our view, this skepticism justifies a selective and idiosyncratic approach to new ideas in the Fund.
This report contains the current opinions of Northern Cross, LLC as of the date of this report and should not be considered as investment advice or a recommendation of any particular security, strategy or investment product. Such opinions are subject to change without notice and securities described herein may no longer be included in, or may at any time be removed from, the Fund’s portfolio. This report is distributed for informational purposes only. Information contained herein has been obtained from sources believed reliable, but not guaranteed.
Investing in international and emerging markets poses special risks, including potentially greater price volatility due to social, political and economic factors, as well as currency exchange rate fluctuations. These risks are more severe for securities of issuers in emerging market regions. For information on the different share classes and the risks associated with an investment in the Fund, please refer to the current prospectus.
6
Harbor International Fund
Fund Summary—October 31, 2017 (Unaudited)
Fund Summary—October 31, 2017 (Unaudited)
| INSTITUTIONAL CLASS | |
| Fund # | 2011 |
| Cusip | 411511306 |
| Ticker | HAINX |
| Inception Date | 12/29/1987 |
| Net Expense Ratio | 0.80% a |
| Total Net Assets (000s) | $27,401,853 |
| ADMINISTRATIVE CLASS | |
| Fund # | 2211 |
| Cusip | 411511652 |
| Ticker | HRINX |
| Inception Date | 11/01/2002 |
| Net Expense Ratio | 1.05% a |
| Total Net Assets (000s) | $398,584 |
| INVESTOR CLASS | |
| Fund # | 2411 |
| Cusip | 411511645 |
| Ticker | HIINX |
| Inception Date | 11/01/2002 |
| Net Expense Ratio | 1.17% a |
| Total Net Assets (000s) | $1,798,228 |
| RETIREMENT CLASS | |
| Fund # | 2511 |
| Cusip | 411512445 |
| Ticker | HNINX |
| Inception Date | 03/01/2016 |
| Net Expense Ratio | 0.73% a |
| Total Net Assets (000s) | $2,657,442 |
Portfolio Statistics
| Portfolio | Benchmark | ||
| Number of Countries | 20 | 24 | |
| Weighted Average Market Cap (MM) | $73,780 | $62,944 | |
| Price/Earning Ratio (P/E) | 27.4x | 19.6x | |
| Price/Book Ratio (P/B) | 3.0x | 2.3x | |
| Beta vs. MSCI EAFE (ND) Index | 0.99 | N/A | |
| Portfolio Turnover (Year Ended 10/31/2017) | 13% | N/A |
Sector Allocation (% of investments)
(Excludes cash and short-term investments)

REGION BREAKDOWN (% of investments)
(Excludes cash and short-term investments)

| a | Reflects a contractual management fee waiver effective through February 28, 2018 |
7
Harbor International Fund
Fund Performance Summary (Unaudited)
Fund Performance Summary (Unaudited)
The graph compares a $50,000 investment in the Institutional Class shares of the Fund with the performance of the MSCI EAFE (ND) Index. The Fund’s performance assumes the reinvestment of all dividend and capital gain distributions.
CHANGE IN A $50,000 INVESTMENT
For the period 11/01/2007 through 10/31/2017

| TOTAL RETURNS For the periods ended 10/31/2017 | 1 Year | Annualized | Inception Date | Final Value of a $50,000 Investment | ||||||||||
| 5 Years | 10 Years | |||||||||||||
| Harbor International Fund | ||||||||||||||
Institutional Class | 18.24% | 6.14% | 1.34% | 12/29/1987 | $57,100 | |||||||||
Administrative Class | 17.93 | 5.87 | 1.08 | 11/01/2002 | 55,681 | |||||||||
Investor Class | 17.79 | 5.75 | 0.96 | 11/01/2002 | 55,023 | |||||||||
Retirement Class1 | 18.30 | 6.16 | 1.35 | 03/01/2016 | 57,148 | |||||||||
| Comparative Index | ||||||||||||||
MSCI EAFE (ND) | 23.44% | 8.53% | 1.10% | — | $55,795 | |||||||||
As stated in the Fund’s current prospectus, the expense ratios were 0.79% (Net) and 0.80% (Gross) (Institutional Class); 1.04% (Net) and 1.05% (Gross) (Administrative Class); 1.16% (Net) and 1.17% (Gross) (Investor Class); and 0.71% (Net) and 0.72% (Gross). The net expense ratios reflect a contractual management fee waiver through 02/28/2018. The expense ratios in the prospectus may differ from the actual expense ratios for the period disclosed within this report. The expense ratios shown in the prospectus are based on the prior fiscal year, adjusted to reflect changes, if any, in contractual arrangements that occurred prior to the date of the prospectus (or supplement thereto, if applicable).
Performance data shown represents past performance and is no guarantee of future results. Past performance is net of management fees and expenses and reflects reinvested dividends and distributions, but does not reflect the deduction of taxes that a shareholder would pay on Fund distributions or upon the redemption of Fund shares. Past performance reflects the beneficial effect of any expense waivers or reimbursements, without which returns would have been lower. Investment returns and principal value will fluctuate and when redeemed may be worth more or less than their original cost. Returns for periods less than one year are not annualized. Current performance may be higher or lower and is available through the most recent month end at harborfunds.com or by calling 800-422-1050.
| 1 | Retirement Class shares commenced operations on March 1, 2016. The performance attributed to the Retirement Class shares prior to that date is that of the Institutional Class shares. Performance prior to March 1, 2016 has not been adjusted to reflect the lower expenses of Retirement Class shares. During this period, Retirement Class shares would have had returns similar to, but somewhat higher than, Institutional Class shares due to the fact that Retirement Class shares represent interests in the same portfolio as Institutional Class shares but are subject to lower expenses. |
8
Harbor International Fund
Portfolio of Investments—October 31, 2017
Portfolio of Investments—October 31, 2017
Value, Cost, and Principal Amounts in Thousands
Total Investments by Country (% of net assets)
(Excludes net cash and short-term investments of 2.7%)

| COMMON STOCKS—96.9% | |||
| Shares | Value | ||
| AEROSPACE & DEFENSE—2.0% | |||
| 50,948,148 | Rolls-Royce Holdings plc (UK)* | $ 658,402 | |
| AUTO COMPONENTS—2.0% | |||
| 4,533,489 | Cie Generale des Etablissements Michelin (FR) | 656,206 | |
| BANKS—6.3% | |||
| 60,827,865 | Banco Bilbao Vizcaya Argentaria SA (SP) | 531,907 | |
| 12,909,237 | Bancolombia SA ADR (COL)1 | 487,324 | |
| 4,157,416 | Bawag Group AG (AUT)*,2 | 220,346 | |
| 3,455,732 | Erste Group Bank AG (AUT) | 148,337 | |
| 63,585,684 | Standard Chartered plc (UK)* | 633,305 | |
| 2,021,219 | |||
| BEVERAGES—8.4% | |||
| 8,761,000 | AmBev SA (BR) | 55,973 | |
| 8,799,909 | AmBev SA ADR (BR)1 | 55,703 | |
| 4,922,119 | Anheuser-Busch InBev SA (BEL) | 603,556 | |
| 2,893,028 | Becle SAB de CV (MEX)* | 4,621 | |
| 17,616,700 | Diageo plc (UK) | 601,589 | |
| 7,393,357 | Heineken NV (NET) | 720,355 | |
| 4,358,853 | Pernod Ricard SA (FR)3 | 653,584 | |
| 436,900 | Sapporo Holdings Ltd. (JP) | 13,845 | |
| 2,709,226 | |||
| BIOTECHNOLOGY—2.2% | |||
| 14,339,753 | Shire plc (UK) | 706,313 | |
| CAPITAL MARKETS—2.3% | |||
| 2,600,182 | Deutsche Boerse AG (GER) | 269,287 | |
| 27,121,382 | UBS Group AG (SWS)* | 461,419 | |
| 730,706 | |||
| COMMON STOCKS—Continued | |||
| Shares | Value | ||
| CHEMICALS—4.3% | |||
| 6,871,396 | Bayer AG (GER) | $ 893,823 | |
| 2,264,319 | Linde AG (GER)* | 487,823 | |
| 1,381,646 | |||
| CONSTRUCTION MATERIALS—2.5% | |||
| 85,152,553 | Cementos Argos SA (COL) | 310,709 | |
| 24,495,290 | Grupo Argos SA (COL) | 159,756 | |
| 5,777,146 | LafargeHolcim Ltd. (SWS)* | 326,206 | |
| 796,671 | |||
| DIVERSIFIED FINANCIAL SERVICES—2.1% | |||
| 14,847,660 | Grupo Aval Acciones y Valores SA ADR (COL)1 | 123,532 | |
| 20,169,521 | Grupo de Inversiones Suramericana SA (COL) | 256,060 | |
| 6,028,372 | Investor AB (SW) | 298,686 | |
| 678,278 | |||
| DIVERSIFIED TELECOMMUNICATION SERVICES—0.5% | |||
| 45,597,960 | Telecom Italia RSP (IT) | 32,396 | |
| 142,499,491 | Telecom Italia SpA (IT)* | 123,302 | |
| 155,698 | |||
| ELECTRICAL EQUIPMENT—1.9% | |||
| 6,977,072 | Schneider Electric SE (FR) | 613,014 | |
| ENERGY EQUIPMENT & SERVICES—3.7% | |||
| 18,813,393 | Schlumberger Ltd. (US) | 1,204,057 | |
| EQUITY REAL ESTATE INVESTMENT TRUSTS (REITs)—3.2% | |||
| 157,838,892 | Fibra Uno Administracion SA de CV (MEX) | 247,645 | |
| 10,528,928 | Great Portland Estates plc (UK) | 86,976 | |
| 12,682,720 | Land Securities Group plc (UK) | 162,894 | |
| 2,174,795 | Unibail-Rodamco SE (FR) | 544,367 | |
| 1,041,882 | |||
| FOOD PRODUCTS—1.5% | |||
| 5,805,086 | Nestlé SA (SWS) | 488,431 | |
| HEALTH CARE EQUIPMENT & SUPPLIES—5.6% | |||
| 62,421,940 | ConvaTec Group plc (UK)2 | 162,410 | |
| 4,699,353 | Essilor International SA (FR) | 594,951 | |
| 9,409,750 | Hoya Corp. (JP) | 511,238 | |
| 14,126,498 | Olympus Corp. (JP) | 525,713 | |
| 1,794,312 | |||
| HEALTH CARE PROVIDERS & SERVICES—1.4% | |||
| 5,205,927 | Fresenius SE & Co. KGaA (GER) | 435,820 | |
| HOTELS, RESTAURANTS & LEISURE—9.7% | |||
| 32,666,210 | Las Vegas Sands Corp. (US) | 2,070,384 | |
| 10,654,156 | MGM China Holdings Ltd. (CHN) | 24,035 | |
| 7,003,897 | Wynn Resorts Ltd. (US) | 1,033,005 | |
| 3,127,424 | |||
| HOUSEHOLD PRODUCTS—2.3% | |||
| 8,462,572 | Reckitt Benckiser Group plc (UK) | 757,118 | |
| INSURANCE—5.5% | |||
| 2,487,519 | Allianz SE (GER) | 580,733 | |
| 17,617,919 | AXA SA (FR) | 531,857 | |
| 15,468,091 | Tokio Marine Holdings Inc. (JP) | 666,786 | |
| 1,779,376 | |||
| INTERNET SOFTWARE & SERVICES—3.4% | |||
| 5,940,375 | Alibaba Group Holding Ltd. ADR (CHN)*,1 | 1,098,316 | |
9
Harbor International Fund
Portfolio of Investments—Continued
Portfolio of Investments—Continued
Value, Cost, and Principal Amounts in Thousands
| COMMON STOCKS—Continued | |||
| Shares | Value | ||
| MACHINERY—6.2% | |||
| 16,355,184 | Atlas Copco AB Class A (SW)3 | $ 717,199 | |
| 3,668,292 | Fanuc Corp. (JP) | 857,734 | |
| 561,316 | SMC Corp. (JP) | 214,737 | |
| 8,626,450 | Weir Group plc (UK) | 223,638 | |
| 2,013,308 | |||
| MEDIA—6.3% | |||
| 6,535,977 | Dentsu Inc. (JP) | 279,569 | |
| 10,271,955 | Grupo Televisa SAB ADR (MEX)1 | 224,853 | |
| 5,096,534 | JCDecaux SA (FR) | 194,964 | |
| 5,723,576 | Liberty Global plc Class A (UK)* | 176,572 | |
| 5,234,688 | Liberty Global plc Class C (UK)* | 156,465 | |
| 605,323 | Liberty Global plc LiLAC Class A (UK)* | 13,148 | |
| 715,996 | Liberty Global plc LiLAC Class C (UK)* | 15,752 | |
| 39,171,744 | Vivendi SA (FR) | 972,704 | |
| 2,034,027 | |||
| METALS & MINING—0.3% | |||
| 6,329,002 | Barrick Gold Corp. (CAN) | 91,454 | |
| OIL, GAS & CONSUMABLE FUELS—0.7% | |||
| 10,933,700 | Statoil ASA (NOR)3 | 222,146 | |
| PERSONAL PRODUCTS—1.8% | |||
| 2,534,330 | L'Oreal SA (FR) | 564,049 | |
| PHARMACEUTICALS—4.5% | |||
| 7,514,882 | Novartis AG (SWS) | 619,822 | |
| 10,913,942 | Novo Nordisk AS (DEN) | 543,392 | |
| 21,049,470 | Teva Pharmaceutical Industries Ltd. ADR (IL)1 | 290,483 | |
| 1,453,697 | |||
| SEMICONDUCTORS & SEMICONDUCTOR EQUIPMENT—1.9% | |||
| 3,448,719 | ASML Holding NV (NET) | 622,250 | |
| SOFTWARE—1.6% | |||
| 4,540,541 | SAP SE (GER) | 518,813 | |
| TEXTILES, APPAREL & LUXURY GOODS—1.8% | |||
| 5,525,582 | Cie Financiere Richemont SA (SWS) | 509,383 | |
| 124,717 | Hermes International (FR) | 64,741 | |
| 574,124 | |||
| TOBACCO—1.0% | |||
| 9,978,010 | Japan Tobacco Inc. (JP) | 330,274 | |
| TOTAL COMMON STOCKS | |||
(Cost $21,990,554) | 31,258,257 | ||
| PREFERRED STOCKS—0.4% | |||
| Shares | Value | ||
| AEROSPACE & DEFENSE—0.0% | |||
| 2,403,609,204 | Rolls-Royce Holdings plc (UK)* | $ 3,192x | |
| CONSTRUCTION MATERIALS—0.2% | |||
| 12,490,019 | Grupo Argos SA (COL) | 75,547 | |
| DIVERSIFIED FINANCIAL SERVICES—0.2% | |||
| 4,581,621 | Grupo de Inversiones Suramericana SA (COL) | 56,569 | |
| TOTAL PREFERRED STOCKS | |||
(Cost $135,952) | 135,308 | ||
| SHORT-TERM INVESTMENTS—4.0% | |||
| Principal Amount | |||
| COMMERCIAL PAPER—1.7% | |||
| Exxon Mobil Corp. | |||
| $ | 100,000 | 1.060%—11/06/2017 | 100,000 |
| General Electric Co. | |||
| 300,000 | 1.080%—11/01/2017 | 300,000 | |
| Toyota Motor Credit | |||
| 150,000 | 1.110%—11/03/2017 | 150,000 | |
| 550,000 | |||
| REPURCHASE AGREEMENTS—0.9% | |||
| 279,781 | Repurchase Agreement with Fixed Income Clearing Corp. dated October 31, 2017 due November 01, 2017 at 0.001% collateralized by U.S. Treasury Notes (value $285,379) | 279,781 | |
| Shares | |||
| INVESTMENT COMPANY-SECURITIES LENDING INVESTMENT FUND—1.4% | |||
| 450,732,932 | State Street Navigator Securities Lending Government Money Market Portfolio (1-day yield of 1.000%)4 | 450,733 | |
| TOTAL SHORT-TERM INVESTMENTS | |||
(Cost $1,280,514) | 1,280,514 | ||
| TOTAL INVESTMENTS—101.3% | |||
(Cost $23,407,020) | 32,674,079 | ||
CASH AND OTHER ASSETS, LESS LIABILITIES—(1.3)% | (417,972) | ||
TOTAL NET ASSETS—100.0% | $32,256,107 | ||
RIGHTS/WARRANTS OPEN AT OCTOBER 31, 2017
| Description | No. of Contracts | Strike Price | Expiration Date | Cost (000s) | Value (000s) | |||||
Genting Bhd | 30,633,782 | MYR$ 9.05 | 12/18/2018 | $ 14,434 | $10,999 |
10
Harbor International Fund
Portfolio of Investments—Continued
Portfolio of Investments—Continued
FAIR VALUE MEASUREMENTS
The following table summarizes the Fund’s investments as of October 31, 2017 based on the inputs used to value them.
| Asset Category | Quoted Prices Level 1 (000s) | Other Significant Observable Inputs Level 2 (000s) | Significant Unobservable Inputs Level 3 (000s) | Total (000s) | ||||
| Investments in Securities | ||||||||
| Common Stocks | ||||||||
Europe | $1,070,105 | $19,050,344 | $20,120,449 | |||||
Latin America | 1,926,177 | — | $ — | 1,926,177 | ||||
Middle East/Central Asia | 290,483 | — | — | 290,483 | ||||
North America | 4,398,900 | — | — | 4,398,900 | ||||
Pacific Basin | 1,098,316 | 3,423,932 | — | 4,522,248 | ||||
| Preferred Stocks | ||||||||
Europe | — | 3,192 | 3,192 | |||||
Latin America | 132,116 | — | — | 132,116 | ||||
| Short-Term Investments | ||||||||
Commercial Paper | — | 550,000 | — | 550,000 | ||||
Repurchase Agreements | — | 279,781 | — | 279,781 | ||||
Investment Company-Securities Lending Investment Fund | 450,733 | — | — | 450,733 | ||||
Total Investments in Securities | $9,366,830 | $23,304,057 | $3,192 | $32,674,079 | ||||
| Financial Derivative Instruments - Assets | ||||||||
Rights/Warrants | $ 10,999 | $ — | $ — | $ 10,999 | ||||
Total Investments | $9,377,829 | $23,304,057 | $3,192 | $32,685,078 |
The following is a rollforward of the Fund’s Level 3 investments during the year ended October 31, 2017.
| Valuation Description | Balance Beginning at 11/01/2016 (000s) | Purchases (000s) | Sales (000s) | Discount/ (Premium) (000s) | Total Realized Gain/(Loss)w (000s) | Change in Unrealized Appreciation/ (Depreciation)w (000s) | Transfers In Level 3 (000s) | Transfers Out of Level 3 (000s) | Ending Balance as of 10/31/2017w (000s) | |||||||||
Preferred Stocks | $4,508 | $3,185 | $(4,521) | $— | $— | $20 | $— | $— | $3,192 |
Of the Level 2 investments presented above, certain Common Stocks valued at $603,556,000 were catorgized in Level 1 at October 31, 2016. Transfers from Level 1 to Level 2 were a result of exchange traded securities where quoted prices from an active market were available (Level 1), and have become unavailable (Level 2).
The following is a summary of significant unobservable inputs used in the fair valuations of assets and liabilities categorized within Level 3 of the fair value hierarchy.
| Valuation Descriptions | Ending Balance as of 10/31/2017 (000s) | Valuation Technique | Unobservable Inputs | Input Value(s) | ||||
| Investments in Securities | ||||||||
| Preferred Stocks | ||||||||
Rolls-Royce Holdings plc (UK)* | $3,192 | Market Approach | Pre-Traded Price | £ 0.001 |
For more information on valuation inputs and their aggregation into the levels used in the table above, please refer to the Fair Value Measurements and Disclosures in Note 2 of the accompanying Notes to Portfolios of Investments.
AFFILIATED TRANSACTIONS
Certain of the Fund’s investments are in companies that are considered to be affiliated companies of the Fund because the Fund owned more than 5% of the outstanding voting securities of the company during the year ended October 31, 2017. Transactions during the period in securities of these companies were as follows:
| Security Name | Beginning Balance as of 11/01/2016 (000s) | Purchases (000s) | Sales (000s) | Net Realized Gain/(Loss) (000s) | Change in Unrealized Appreciation/ (Depreciation) (000s) | Net Dividend Income (000s) | Ending Balance as of 10/31/2017 (000s) | |||||||
Wynn Resorts Ltd. (US) | $1,015,042 | $ – | $(423,323) | $35,270 | $406,016 | $188,528 | $1,033,005 | |||||||
Cementos Argos SA (COL) | 314,001 | 24,166 | – | – | (27,458) | 6,029 | 310,709 | |||||||
| $1,329,043 | $24,166 | $(423,323) | $35,270 | $378,558 | $194,557 | $1,343,714 |
11
Harbor International Fund
Portfolio of Investments—Continued
Portfolio of Investments—Continued
| * | Non-income producing security | ||
| 1 | ADR after the name of a foreign holding stands for American Depositary Receipts representing ownership of foreign securities. ADRs are issued by U.S. banking institutions. | ||
| 2 | Securities purchased in a transaction exempt from registration under Rule 144A of the Securities Act of 1933. These securities may be resold in transactions exempt from registration, normally to qualified institutional buyers. The Fund has no right to demand registration of these securities. These securities are priced by an independent pricing service in accordance with Harbor Funds Valuation Procedures. At October 31, 2017, the aggregate value of these securities was $382,756,000 or 1% of net assets. | ||
| 3 | All or a portion of this security was out on loan as of October 31, 2017. | ||
| 4 | Represents the investment of collateral received from securities lending activities. | ||
| w | Amounts in this category are included in the “Realized and Change in Unrealized Gain/(Loss) on Investment Transactions” section of the Statement of Operations. The net unrealized appreciation/(depreciation) per investment type is below: | ||
| Valuation Description | Unrealized Gain/(Loss) as of 10/31/2017 (000s) | ||
Preferred Stocks | $7 | ||
| x | Fair Valued in accordance with Harbor Funds Valuation Procedures using pre-traded price which is a Level 3 input | ||
| £ | British Pound | ||
| € | Euro | ||
| MYR$ | Malaysian Ringgit | ||
The accompanying notes are an integral part of the Financial Statements.
12
Harbor Diversified International All Cap Fund
Managers' Commentary (Unaudited)
Managers' Commentary (Unaudited)
Subadviser
Marathon Asset Management LLP
Orion House
5 Upper St. Martin’s Lane
London, WC2H 9EA
England
London, WC2H 9EA
England
Portfolio Managers
Neil M. Ostrer
Since 2015
Since 2015
William J. Arah
Since 2015
Since 2015
Charles Carter
Since 2015
Since 2015
Nick Longhurst
Since 2015
Since 2015
Michael Godfrey
Since 2015
Since 2015
David Cull
Since 2015
Since 2015
Robert Anstey
Since 2015
Since 2015
Simon Somerville
Since 2016
Since 2016
Marathon Asset Management LLP (operating as Marathon-London in the U.S.) has subadvised the Fund since 2015.
Investment Objective
The Fund seeks long-term growth of capital.
Management’s Discussion of
Fund Performance
Fund Performance
Market Review
Non-U.S. equity markets rallied sharply over the twelve-month period ended October 31, 2017, with the MSCI All Country World Ex. U.S. (ND) Index returning 23.64% (all international and global returns are in U.S. dollars). European markets, which constituted 44.15% of the Index on average over the period, led the broad rally (returning 27.01% during the period), followed closely by global emerging markets, which constituted 23.66% of the Index on average over the period and returned 26.45%. The Japanese equity market lagged the overall index (in U.S. dollar terms) due to a weaker Japanese Yen but nonetheless appreciated notably over the period (returning 17.80%). Broadly speaking, improving economic indicators (particularly in Europe) coupled with continued accommodative monetary policy helped propel markets higher. More acutely, progress with respect to supply-side reforms in China along with positive earnings momentum across several key developing and developed markets are examples of more tangible factors driving equity markets higher over the period.
Performance
Harbor Diversified International All Cap Fund returned 22.29% (Institutional Class), 21.91% (Administrative Class), 21.82% (Investor Class), and 22.35% (Retirement Class), underperforming the 23.64% return of the MSCI All Country World Ex. U.S. (ND) Index over the twelve-month period, with a positive contribution from stock selection more than offset by the combined negative influence due to currency exposure and (to a lesser extent) regional allocation. More specifically, the Fund’s residual cash and overweight exposure to the weaker Japanese Yen were two of the largest negative influences on relative performance, while stock selection within Europe also contributed negatively (mainly due to not owning large benchmark constituents in the Financials and Industrial sectors). Conversely, stock selection within emerging markets (particularly in Russia and Brazil) was the largest positive contribution to relative performance. The Fund’s underweight exposure to the Pacific ex-Japan region and stock selection within that region also added value over the period.
From a sector standpoint, the Fund’s aggregate overweight to the outperforming Industrial sector and stock selection within both the Consumer Staples and Telecommunication Services were all positive contributors. Conversely, the Fund’s notable underweight to the outperforming Financials sector and stock selection within that sector contributed negatively during the twelve-month period. Not owning a few of the larger Information Technology sector constituents (particularly in China) also exerted a negative influence on relative performance.
The regional positioning of the Fund was moved broadly in line with the benchmark during the course of the second and third quarters of 2017 to reflect our focus on bottom-up stock selection and the lack of severe dislocations across international equity markets of which we could otherwise, in our view, take advantage. Nevertheless, the Fund’s turnover remained low (with an implied average holding period of over 6 years) and consistent with the long-term, supply-side orientation of the investment philosophy and process that we employ.
Outlook & Strategy
We continue to believe that accommodative monetary policy and access to cheap credit continues to propel equity markets broadly, with somewhat limited regard to underlying fundamentals at an individual company level and arguably less regard to the legitimacy of forecasted expectations and the degree to which they are being properly discounted. As such the market rally has been accompanied by an equally pronounced expansion of the price-to-earnings ratio valuation of the market. We believe that this multiple expansion is likely to continue so long as those macro monetary policies remain in place. Nevertheless, rather than attempt to predict macro geopolitical and economic forces and their influence on market conditions (which are shorter term in nature), we remain focused on bottom-up stock selection with an aim to invest in
13
Harbor Diversified International All Cap Fund
Managers' Commentary—Continued
Managers' Commentary—Continued
| TOP TEN HOLDINGS (% of Net Assets) | |
| Samsung Electronics Co. Ltd. | 1.5% |
| Fairfax Financial Holdings Ltd. | 1.1% |
| Taiwan Semiconductor Manufacturing Co. Ltd. | 1.1% |
| Intertek Group plc | 1.0% |
| Brookfield Asset Management Inc. | 0.8% |
| Nippon Telegraph & Telephone Corp. | 0.8% |
| Sampo OYJ | 0.8% |
| Vestas Wind Systems AS | 0.8% |
| Compass Group plc | 0.7% |
| Fresenius Medical Care AG & Co. KGaA | 0.7% |
businesses where we believe the capital cycle dynamics and capital allocation decisions by management remain favorable for the creation of sustainable intrinsic value within the business over the longer term.
This report contains the current opinions of Marathon Asset Management LLP as of the date of this report and should not be considered as investment advice or a recommendation of any particular security, strategy or investment product. Such opinions are subject to change without notice and securities described herein may no longer be included in, or may at any time be removed from, the Fund’s portfolio. This report is distributed for informational purposes only. Information contained herein has been obtained from sources believed reliable, but not guaranteed.
Investing in international and emerging markets poses special risks, including potentially greater price volatility due to social, political and economic factors, as well as currency exchange rate fluctuations. These risks are more severe for securities of issuers in emerging market regions. For information on the different share classes and the risks associated with an investment in the Fund, please refer to the current prospectus.
14
Harbor Diversified International All Cap Fund
Fund Summary—October 31, 2017 (Unaudited)
Fund Summary—October 31, 2017 (Unaudited)
| INSTITUTIONAL CLASS | |
| Fund # | 2038 |
| Cusip | 411512593 |
| Ticker | HAIDX |
| Inception Date | 11/02/2015 |
| Net Expense Ratio | 0.85% a |
| Total Net Assets (000s) | $225,473 |
| ADMINISTRATIVE CLASS | |
| Fund # | 2238 |
| Cusip | 411512585 |
| Ticker | HRIDX |
| Inception Date | 11/02/2015 |
| Net Expense Ratio | 1.10% a |
| Total Net Assets (000s) | $310 |
| INVESTOR CLASS | |
| Fund # | 2438 |
| Cusip | 411512577 |
| Ticker | HIIDX |
| Inception Date | 11/02/2015 |
| Net Expense Ratio | 1.22% a |
| Total Net Assets (000s) | $5,195 |
| RETIREMENT CLASS | |
| Fund # | 2538 |
| Cusip | 411512437 |
| Ticker | HNIDX |
| Inception Date | 03/01/2016 |
| Net Expense Ratio | 0.77% a |
| Total Net Assets (000s) | $92,442 |
Portfolio Statistics
| Portfolio | Benchmark | ||
| Number of Countries | 38 | 48 | |
| Weighted Average Market Cap (MM) | $37,944 | $70,182 | |
| Price/Earning Ratio (P/E) | 22.2x | 19.3x | |
| Price/Book Ratio (P/B) | 2.6x | 2.4x | |
| Beta vs. MSCI All Country World Ex. U.S. (ND) Index | 0.81 | N/A | |
| Portfolio Turnover (Year Ended 10/31/2017) | 46% | N/A |
Sector Allocation (% of investments)
(Excludes cash and short-term investments)

REGION BREAKDOWN (% of investments)
(Excludes cash and short-term investments)

| a | Reflects an expense limitation agreement (excluding interest expense, if any) effective through February 28, 2018 |
15
Harbor Diversified International All Cap Fund
Fund Performance Summary (Unaudited)
Fund Performance Summary (Unaudited)
The graph compares a $50,000 investment in the Institutional Class shares of the Fund with the performance of the MSCI All Country World Ex. U.S. (ND) Index. The Fund’s performance assumes the reinvestment of all dividend and capital gain distributions.
CHANGE IN A $50,000 INVESTMENT
For the period 11/02/2015 through 10/31/2017

| TOTAL RETURNS For the periods ended 10/31/2017 | 1 Year | 5 Years | Annualized | Inception Date | Final Value of a $50,000 Investment | |||||||||
| Life of Fund | ||||||||||||||
| Harbor Diversified International All Cap Fund | ||||||||||||||
Institutional Class | 22.29% | N/A | 9.35% | 11/02/2015 | $59,771 | |||||||||
Administrative Class | 21.91 | N/A | 9.05 | 11/02/2015 | 59,441 | |||||||||
Investor Class | 21.82 | N/A | 8.94 | 11/02/2015 | 59,325 | |||||||||
Retirement Class1 | 22.35 | N/A | 9.38 | 03/01/2016 | 59,801 | |||||||||
| Comparative Index | ||||||||||||||
MSCI All Country World Ex. U.S. (ND)2 | 23.64% | N/A | 11.33% | — | $61,958 | |||||||||
As stated in the Fund’s current prospectus, the expense ratios were 0.85% (Net) and 1.23% (Gross) (Institutional Class); 1.10% (Net) and 1.48% (Gross) (Administrative Class); 1.22% (Net) and 1.60% (Gross) (Investor Class); and 0.77% (Net) and 1.15% (Gross) (Retirement Class). The net expense ratios reflect an expense limitation agreement (excluding interest expense, if any) effective through 2/28/2018. The expense ratios in the prospectus may differ from the actual expense ratios for the period disclosed within this report. The expense ratios shown in the prospectus are based on the prior fiscal year, adjusted to reflect changes, if any, in contractual arrangements that occurred prior to the date of the prospectus (or supplement thereto, if applicable).
Performance data shown represents past performance and is no guarantee of future results. Past performance is net of management fees and expenses and reflects reinvested dividends and distributions, but does not reflect the deduction of taxes that a shareholder would pay on Fund distributions or upon the redemption of Fund shares. Past performance reflects the beneficial effect of any expense waivers or reimbursements, without which returns would have been lower. Investment returns and principal value will fluctuate and when redeemed may be worth more or less than their original cost. Returns for periods less than one year are not annualized. Current performance may be higher or lower and is available through the most recent month end at harborfunds.com or by calling 800-422-1050.
| 1 | Retirement Class shares commenced operations on March 1, 2016. The performance attributed to the Retirement Class shares prior to that date is that of the Institutional Class shares. Performance prior to March 1, 2016 has not been adjusted to reflect the lower expenses of Retirement Class shares. During this period, Retirement Class shares would have had returns similar to, but somewhat higher than, Institutional Class shares due to the fact that Retirement Class shares represent interests in the same portfolio as Institutional Class shares but are subject to lower expenses. |
| 2 | The “Life of Fund” return and “Final Value of a $50,000 Investment” as shown reflects the period 11/02/2015 through 10/31/2017. |
16
Harbor Diversified International All Cap Fund
Portfolio of Investments—October 31, 2017
Portfolio of Investments—October 31, 2017
Value, Cost, and Principal Amounts in Thousands
Total Investments by Country (% of net assets)
(Excludes net cash and short-term investments of 3.0%)

| COMMON STOCKS—95.7% | |||
| Shares | Value | ||
| AEROSPACE & DEFENSE—1.6% | |||
| 14,004 | Airbus SE (FR) | $ 1,437 | |
| 136,052 | BAE Systems plc (UK) | 1,072 | |
| 52,378 | Embraer SA (BR)* | 251 | |
| 87,327 | Rolls-Royce Holdings plc (UK)* | 1,128 | |
| COMMON STOCKS—Continued | |||
| Shares | Value | ||
| AEROSPACE & DEFENSE—Continued | |||
| 5,256 | Thales SA (FR) | $ 548 | |
| 31,166 | Zodiac Aerospace (FR) | 891 | |
| �� | 5,327 | ||
| AIR FREIGHT & LOGISTICS—0.3% | |||
| 7,770 | Oesterreichische Post AG (AUT) | 345 | |
| 26,100 | Yamato Holdings Co. Ltd. (JP) | 534 | |
| 879 | |||
| AIRLINES—0.2% | |||
| 27,093 | EasyJet plc (UK) | 482 | |
| 3,000 | Japan Airlines Co. Ltd. (JP) | 103 | |
| 585 | |||
| AUTO COMPONENTS—0.7% | |||
| 12,910 | Magna International Inc. (CAN) | 704 | |
| 421,788 | Nemak SAB de CV (MEX)1 | 318 | |
| 16,890 | Nokian Renkaat OYJ (FIN) | 774 | |
| 18,100 | Sumitomo Electric Industries Ltd. (JP) | 308 | |
| 500 | Toyota Industries Corp. (JP) | 31 | |
| 2,135 | |||
| AUTOMOBILES—1.4% | |||
| 11,590 | Bayerische Motoren Werke AG (GER) | 1,189 | |
| 6,681 | Hyundai Motor Co. (S. KOR) | 961 | |
| 12,700 | Nissan Motor Co. Ltd. (JP) | 124 | |
| 329,657 | Piaggio & C. SpA (IT) | 1,078 | |
| 5,100 | Subaru Corp. (JP) | 176 | |
| 17,500 | Toyota Motor Corp. (JP) | 1,085 | |
| 4,613 | |||
| BANKS—9.5% | |||
| 116,507 | Alpha Bank AE (GRC)* | 232 | |
| 134,045 | Axis Bank Ltd. (IND) | 1,088 | |
| 13,364 | Banco Santander SA (SP) | 91 | |
| 19,666 | Bancolombia SA ADR (COL) | 742 | |
| 190,300 | Bangkok Bank PCL (THA) | 1,106 | |
| 132,459 | Bank of Ireland Group plc (IE)* | 1,038 | |
| 140,219 | Bankia SA (SP) | 669 | |
| 402,200 | Barclays plc (UK) | 992 | |
| 8,646 | BGEO Group plc (UK) | 408 | |
| 20,336 | BNP Paribas SA (FR) | 1,587 | |
| 5,916 | Danske Bank AS (DEN) | 226 | |
| 16,317 | DBS Group Holdings Ltd. (SGP) | 272 | |
| 24,897 | DNB ASA (NOR) | 480 | |
| 254,900 | Equity Group Holdings Ltd. (KEN) | 94 | |
| 22,000 | Fukuoka Financial Group Inc. (JP) | 113 | |
| 18,403 | Hana Financial Group Inc. (S. KOR) | 788 | |
| 196,442 | HSBC Holdings plc (HK) | 1,919 | |
| 75,862 | Intesa Sanpaolo SpA (IT) | 255 | |
| 60,200 | Kasikornbank PCL (THA) | 399 | |
| 13,792 | Komercni Banka AS (CZ) | 593 | |
| 1,171,103 | Lloyds Banking Group plc (UK) | 1,061 | |
| 28,400 | Mitsubishi UFJ Financial Group Inc. (JP) | 193 | |
| 469,000 | Mizuho Financial Group Inc. (JP) | 852 | |
| 41,677 | Nordea Bank AB (SW) | 504 | |
| 243,400 | Resona Holdings Inc. (JP) | 1,316 | |
| 11,008 | Royal Bank of Canada (CAN) | 861 | |
| 31,143 | Sberbank of Russia PJSC ADR (RUS) | 447 | |
| 51,958 | Shinhan Financial Group Co. Ltd. (S. KOR) | 2,334 | |
| 78,075 | Standard Bank Group Ltd. (S. AFR) | 907 | |
| 112,585 | Standard Chartered plc (UK)* | 1,121 | |
| 41,400 | Sumitomo Mitsui Financial Group Inc. (JP) | 1,659 | |
17
Harbor Diversified International All Cap Fund
Portfolio of Investments—Continued
Portfolio of Investments—Continued
Value, Cost, and Principal Amounts in Thousands
| COMMON STOCKS—Continued | |||
| Shares | Value | ||
| BANKS—Continued | |||
| 12,100 | Sumitomo Mitsui Trust Holdings Inc. (JP) | $ 478 | |
| 103,600 | Svenska Handelsbanken AB (SW) | 1,485 | |
| 15,902 | Toronto-Dominion Bank (CAN) | 904 | |
| 440,767 | Turkiye Garanti Bankasi AS (TUR) | 1,214 | |
| 77,378 | Unicredit SpA (IT)* | 1,479 | |
| 40,415 | United Overseas Bank Ltd. (SGP) | 730 | |
| 30,637 | |||
| BEVERAGES—3.9% | |||
| 14,414 | Anheuser-Busch InBev SA (BEL) | 1,767 | |
| 7,229 | Carlsberg AS (DEN) | 826 | |
| 412,666 | China Resources Beer Holdings Co. Ltd. (CHN)* | 1,191 | |
| 77,518 | Cia Cervecerias Unidas SA (CL) | 1,104 | |
| 126,805 | Coca-Cola Amatil Ltd. (AUS) | 792 | |
| 36,907 | Davide Campari-Milano SpA (IT) | 295 | |
| 48,723 | Diageo plc (UK) | 1,664 | |
| 41,400 | East African Breweries Ltd. (KEN) | 98 | |
| 17,891 | Heineken NV (NET) | 1,743 | |
| 17,867 | Hite Jinro Co. Ltd. (S. KOR) | 425 | |
| 87,300 | Kirin Holdings Co. Ltd. (JP) | 2,096 | |
| 3,000 | Suntory Beverage & Food Ltd. (JP) | 138 | |
| 128,000 | Tsingtao Brewery Co. Ltd. (CHN) | 536 | |
| 12,675 | |||
| BUILDING PRODUCTS—1.6% | |||
| 103,291 | Assa Abloy AB Class B (SW) | 2,178 | |
| 4,773 | Geberit AG (SWS) | 2,161 | |
| 33,800 | LIXIL Group Corp. (JP) | 931 | |
| 5,270 | |||
| CAPITAL MARKETS—2.7% | |||
| 118,697 | 3i Group plc (UK) | 1,515 | |
| 39,743 | Banco Btg Pactual SA (BR)* | 267 | |
| 63,531 | Brookfield Asset Management Inc. (CAN) | 2,665 | |
| 8,039 | Close Brothers Group plc (UK) | 148 | |
| 66,702 | IG Group Holdings plc (UK) | 579 | |
| 58,574 | Jupiter Fund Management plc (UK) | 462 | |
| 103,337 | Nex Group plc (UK) | 870 | |
| 126,100 | Nomura Holdings Inc. (JP) | 722 | |
| 34,493 | St. James's Place plc (UK) | 539 | |
| 62,656 | UBS Group AG (SWS)* | 1,066 | |
| 8,833 | |||
| CHEMICALS—3.0% | |||
| 15,514 | Akzo Nobel NV (NET) | 1,401 | |
| 16,630 | BASF SE (GER) | 1,818 | |
| 99,638 | DuluxGroup Ltd. (AUS) | 563 | |
| 19,556 | Enaex SA (CL) | 260 | |
| 6,500 | Nissan Chemical Industries Ltd. (JP)* | 242 | |
| 58,417 | Orica Ltd. (AUS) | 936 | |
| 40,212 | PhosAgro PJSC GDR (RUS)2 | 553 | |
| 60,000 | Sumitomo Chemical Co. Ltd. (JP) | 422 | |
| 6,647 | Symrise AG (GER) | 518 | |
| 119,160 | Tikkurila OYJ (FIN) | 2,355 | |
| 74,900 | Toray Industries Inc. (JP) | 758 | |
| 9,826 | |||
| COMMERCIAL SERVICES & SUPPLIES—2.3% | |||
| 1,300 | AEON Delight Co. Ltd. (JP) | 49 | |
| 774,444 | Cleanaway Waste Management Ltd. (AUS) | 891 | |
| 23,078 | Edenred (FR) | 665 | |
| 14,678 | Elis SA (FR) | 383 | |
| 302,460 | G4S plc (UK) | 1,129 | |
| COMMON STOCKS—Continued | |||
| Shares | Value | ||
| COMMERCIAL SERVICES & SUPPLIES—Continued | |||
| 122,433 | HomeServe plc (UK) | $ 1,392 | |
| 5,599 | ISS AS (DEN) | 237 | |
| 36,185 | Ritchie Bros Auctioneers Inc. (CAN) | 1,015 | |
| 5,690 | S-1 Corp. (S. KOR) | 466 | |
| 6,200 | Secom Co. Ltd. (JP) | 472 | |
| 435,428 | Serco Group plc (UK)* | 674 | |
| 7,373 | |||
| COMMUNICATIONS EQUIPMENT—0.1% | |||
| 47,435 | Telefonaktiebolaget LM Ericsson (SW) | 298 | |
| CONSTRUCTION & ENGINEERING—0.9% | |||
| 18,793 | Boskalis Westminster NV (NET) | 672 | |
| 17,500 | Maeda Corp. (JP) | 219 | |
| 95,400 | Obayashi Corp. (JP) | 1,249 | |
| 52,300 | Shimizu Corp. (JP) | 616 | |
| 1,800 | SHO-BOND Holdings Co. Ltd. (JP) | 111 | |
| 2,867 | |||
| CONSTRUCTION MATERIALS—0.4% | |||
| 4,331 | CRH plc (IE) | 163 | |
| 1,327 | Imerys SA (FR) | 121 | |
| 3,048 | Vicat SA (FR) | 236 | |
| 26,523 | Wienerberger AG (AUT) | 680 | |
| 1,200 | |||
| CONSUMER FINANCE—0.4% | |||
| 7,700 | AEON Financial Service Co. Ltd. (JP) | 166 | |
| 106,038 | International Personal Finance plc (UK) | 284 | |
| 121,887 | Non-Standard Finance plc (UK)1 | 123 | |
| 31,761 | Provident Financial plc (UK) | 393 | |
| 16,143 | Shriram Transport Finance Co. Ltd. (IND) | 292 | |
| 1,258 | |||
| CONTAINERS & PACKAGING—0.2% | |||
| 16,285 | Amcor Ltd. (AUS) | 198 | |
| 31,539 | Orora Ltd. (AUS) | 82 | |
| 24,500 | Toyo Seikan Group Holdings Ltd. (JP) | 433 | |
| 713 | |||
| DISTRIBUTORS—0.1% | |||
| 16,739 | Inchcape plc (UK) | 174 | |
| DIVERSIFIED FINANCIAL SERVICES—0.1% | |||
| 518,000 | First Pacific Co. Ltd. (HK) | 395 | |
| DIVERSIFIED TELECOMMUNICATION SERVICES—1.8% | |||
| 17,766 | BCE Inc. (CAN) | 820 | |
| 68,444 | Deutsche Telekom AG (GER) | 1,239 | |
| 270,243 | Koninklijke KPN NV (NET) | 930 | |
| 52,100 | Nippon Telegraph & Telephone Corp. (JP) | 2,519 | |
| 73,035 | Spark New Zealand Ltd. (NZ) | 184 | |
| 72,486 | Telkom SA SOC Ltd. (S. AFR) | 272 | |
| 5,964 | |||
| ELECTRIC UTILITIES—0.2% | |||
| 59,700 | Tohoku Electric Power Co. Inc. (JP) | 783 | |
| ELECTRICAL EQUIPMENT—1.8% | |||
| 27,807 | Legrand SA (FR) | 2,064 | |
| 950,850 | TECO Electric and Machinery Co. Ltd. (TW) | 888 | |
18
Harbor Diversified International All Cap Fund
Portfolio of Investments—Continued
Portfolio of Investments—Continued
Value, Cost, and Principal Amounts in Thousands
| COMMON STOCKS—Continued | |||
| Shares | Value | ||
| ELECTRICAL EQUIPMENT—Continued | |||
| 6,600 | Ushio Inc. (JP) | $ 92 | |
| 29,613 | Vestas Wind Systems AS (DEN) | 2,614 | |
| 5,658 | |||
| ELECTRONIC EQUIPMENT, INSTRUMENTS & COMPONENTS—2.0% | |||
| 8,500 | Azbil Corp. (JP) | 371 | |
| 284,000 | Chroma ATE Inc. (TW) | 1,385 | |
| 132,735 | Delta Electronics Inc. (TW) | 639 | |
| 251,000 | Hitachi Ltd. (JP) | 1,999 | |
| 15,000 | Kyocera Corp. (JP) | 1,003 | |
| 4,200 | Nippon Signal Co. Ltd. (JP) | 46 | |
| 3,800 | Omron Corp. (JP) | 213 | |
| 21,454 | Spectris plc (UK) | 729 | |
| 2,300 | TDK Corp. (JP) | 177 | |
| 6,562 | |||
| ENERGY EQUIPMENT & SERVICES—0.4% | |||
| 27,017 | John Wood Group plc (UK) | 255 | |
| 5,639 | Petrofac Ltd. (UK) | 31 | |
| 178,309 | Saipem SpA (IT)* | 750 | |
| 4,295 | Technipfmc plc (FR) | 117 | |
| 14,863 | Vallourec SA (FR)* | 81 | |
| 1,234 | |||
| EQUITY REAL ESTATE INVESTMENT TRUSTS (REITs)—0.4% | |||
| 110,963 | Grivalia Properties REIC AE (GRC) | 1,158 | |
| FOOD & STAPLES RETAILING—2.0% | |||
| 24,157 | Alimentation Couche-Tard Inc. (CAN) | 1,133 | |
| 54,491 | Almacenes Exito SA (COL) | 293 | |
| 20,200 | Dairy Farm International Holdings Ltd. (HK) | 165 | |
| 42,360 | Koninklijke Ahold Delhaize NV (NET) | 797 | |
| 28,911 | Loblaw Cos. Ltd. (CAN) | 1,492 | |
| 2,400 | Matsumotokiyoshi Holdings Co. Ltd. (JP) | 173 | |
| 149,650 | Metcash Ltd. (AUS)* | 309 | |
| 74,703 | O'Key Group SA GDR (RUS)*,2 | 179 | |
| 35,000 | Seven & I Holdings Co. Ltd. (JP) | 1,411 | |
| 159,191 | Tesco plc (UK) | 383 | |
| 6,335 | |||
| FOOD PRODUCTS—2.0% | |||
| 403,000 | China Mengniu Dairy Co. Ltd. (CHN) | 1,117 | |
| 69,845 | Devro plc (UK) | 226 | |
| 75,620 | Industrias Bachoco SAB de CV (MEX) | 372 | |
| 3,140 | Lotte Confectionery Co. Ltd. (S. KOR) | 209 | |
| 7,000 | NH Foods Ltd. (JP) | 201 | |
| 59,300 | Nippon Suisan Kaisha Ltd. (JP) | 363 | |
| 12,189 | PGG Wrightson Ltd. (NZ) | 5 | |
| 678,255 | Tingyi Cayman Islands Holding Corp. (CHN) | 1,069 | |
| 8,700 | Toyo Suisan Kaisha Ltd. (JP) | 335 | |
| 66,938 | Ulker Biskuvi Sanayi AS (TUR) | 357 | |
| 12,634 | Viscofan SA (SP) | 765 | |
| 1,750,000 | Want Want China Holdings Ltd. (CHN) | 1,433 | |
| 6,452 | |||
| GAS UTILITIES—0.1% | |||
| 6,500 | Tokyo Gas Co. Ltd. (JP) | 162 | |
| HEALTH CARE EQUIPMENT & SUPPLIES—2.2% | |||
| 25,555 | Coloplast AS (DEN) | 2,249 | |
| 366,845 | ConvaTec Group plc (UK)*,1 | 955 | |
| 46,191 | GN Store Nord AS (DEN) | 1,529 | |
| 174,693 | Sigma Healthcare Ltd. (AUS) | 101 | |
| COMMON STOCKS—Continued | |||
| Shares | Value | ||
| HEALTH CARE EQUIPMENT & SUPPLIES—Continued | |||
| 10,977 | Smith & Nephew plc (UK) | $ 207 | |
| 3,780 | Sonova Holding AG (SWS) | 682 | |
| 155,400 | Top Glove Corp. Bhd (MAL) | 235 | |
| 45,039 | William Demant Holding AS (DEN)* | 1,300 | |
| 7,258 | |||
| HEALTH CARE PROVIDERS & SERVICES—1.0% | |||
| 36,900 | Alfresa Holdings Corp. (JP) | 705 | |
| 24,551 | Fresenius Medical Care AG & Co. KGaA (GER) | 2,377 | |
| 3,082 | |||
| HOTELS, RESTAURANTS & LEISURE—3.7% | |||
| 628,000 | Ajisen China Holdings Ltd. (CHN) | 295 | |
| 15,046 | Carnival plc (UK) | 992 | |
| 109,094 | Compass Group plc (UK) | 2,395 | |
| 240,900 | GL Ltd. (SGP) | 164 | |
| 48,178 | GVC Holdings plc (UK)* | 600 | |
| 244,712 | Hongkong & Shanghai Hotels Ltd. (HK) | 397 | |
| 194,104 | Merlin Entertainments plc (UK)1 | 976 | |
| 15,755 | OPAP SA (GRC) | 177 | |
| 12,923 | Paddy Power Betfair plc (UK) | 1,323 | |
| 157,720 | SSP Group plc (UK) | 1,225 | |
| 619,940 | Thomas Cook Group plc (UK) | 986 | |
| 147,513 | Tsogo Sun Holdings Ltd. (S. AFR) | 217 | |
| 69,099 | TUI AG (US) | 1,249 | |
| 21,717 | Yum China Holdings Inc. (US) | 876 | |
| 11,872 | |||
| HOUSEHOLD DURABLES—0.9% | |||
| 23,986 | Barratt Developments plc (UK) | 209 | |
| 11,000 | Casio Computer Co. Ltd. (JP) | 162 | |
| 72,086 | GUD Holdings Ltd. (AUS) | 659 | |
| 42,327 | McCarthy & Stone plc (UK)*,1 | 90 | |
| 241,000 | MRV Engenharia e Participacoes SA (BR) | 932 | |
| 42,200 | Nikon Corp. (JP) | 801 | |
| 8,300 | Sekisui Chemical Co. Ltd. (JP) | 168 | |
| 3,021 | |||
| HOUSEHOLD PRODUCTS—0.7% | |||
| 24,416 | Reckitt Benckiser Group plc (UK) | 2,184 | |
| INDEPENDENT POWER & RENEWABLE ELECTRICITY PRODUCERS—0.1% | |||
| 355,707 | Energy Development Corp. (PHIL) | 40 | |
| 1,203,300 | Lopez Holdings Corp. (PHIL) | 135 | |
| 175 | |||
| INDUSTRIAL CONGLOMERATES—2.6% | |||
| 175,000 | CK Hutchison Holdings Ltd. (HK) | 2,223 | |
| 11,274 | DCC plc (UK) | 1,069 | |
| 30,600 | Jardine Matheson Holdings Ltd. (HK) | 1,960 | |
| 29,564 | Koninklijke Philips NV (NET) | 1,205 | |
| 9,705 | LG Corp. (S. KOR) | 746 | |
| 392,306 | Quinenco SA (CL) | 1,214 | |
| 8,417 | |||
| INSURANCE—4.9% | |||
| 32,486 | Admiral Group plc (UK) | 830 | |
| 27,945 | AXA SA (FR) | 844 | |
| 94,300 | Dai-ichi Life Holdings Inc. (JP) | 1,801 | |
| 6,602 | Fairfax Financial Holdings Ltd. (CAN) | 3,477 | |
| 49,900 | Great Eastern Holdings Ltd. (SGP) | 960 | |
| 1,450 | Hannover Rueck SE (GER) | 182 | |
| 278 | Helvetia Holding AG (SWS) | 149 | |
19
Harbor Diversified International All Cap Fund
Portfolio of Investments—Continued
Portfolio of Investments—Continued
Value, Cost, and Principal Amounts in Thousands
| COMMON STOCKS—Continued | |||
| Shares | Value | ||
| INSURANCE—Continued | |||
| 47,500 | Japan Post Holdings Co. Ltd. (JP) | $ 550 | |
| 39,200 | MS&AD Insurance Group Holdings Inc. (JP) | 1,332 | |
| 150,806 | Old Mutual plc (S. AFR) | 380 | |
| 116,477 | Porto Seguro SA (BR)* | 1,271 | |
| 37,205 | QBE Insurance Group Ltd. (AUS) | 305 | |
| 46,718 | Sampo OYJ (FIN) | 2,445 | |
| 1,630 | Samsung Fire & Marine Insurance Co. Ltd. (S. KOR) | 398 | |
| 17,900 | Sompo Holdings Inc. (JP) | 719 | |
| 6,100 | Tokio Marine Holdings Inc. (JP) | 263 | |
| 15,906 | |||
| INTERNET & CATALOG RETAIL—0.0% | |||
| 452 | Zooplus AG (GER)* | 75 | |
| INTERNET & DIRECT MARKETING RETAIL—0.3% | |||
| 71,440 | B2W Cia Digital (BR)* | 464 | |
| 1,739 | CJ O Shopping Co. Ltd. (S. KOR) | 307 | |
| 1,844 | GS Home Shopping Inc. (S. KOR) | 346 | |
| 1,117 | |||
| INTERNET SOFTWARE & SERVICES—2.7% | |||
| 35,013 | Auto Trader Group plc (UK)1 | 159 | |
| 8,949 | Baidu Inc. ADR (CHN)* | 2,183 | |
| 60,375 | Carsales.Com Ltd. (AUS) | 634 | |
| 58,465 | Just Eat plc (UK)* | 606 | |
| 78,640 | Moneysupermarket.com Group plc (UK) | 339 | |
| 90,520 | Pchome Online Inc. (TW) | 524 | |
| 36,989 | Rightmove plc (UK) | 2,041 | |
| 63,917 | Yandex NV (RUS)* | 2,162 | |
| 8,648 | |||
| IT SERVICES—1.0% | |||
| 15,945 | Genpact Ltd. (US) | 486 | |
| 114,500 | NTT Data Corp. (JP) | 1,334 | |
| 2,500 | OBIC Co. Ltd. (JP) | 165 | |
| 4,400 | SCSK Corp. (JP) | 190 | |
| 117,755 | Wipro Ltd. (IND) | 536 | |
| 121,926 | Worldpay Group plc (UK)1 | 657 | |
| 3,368 | |||
| LEISURE PRODUCTS—0.6% | |||
| 13,247 | Amer Sports OYJ (FIN) | 330 | |
| 35,200 | Bandai Namco Holdings Inc. (JP) | 1,206 | |
| 308,000 | Goodbaby International Holdings Ltd. (HK) | 168 | |
| 2,679 | Spin Master Corp. (CAN)*,1 | 99 | |
| 1,803 | |||
| LIFE SCIENCES TOOLS & SERVICES—0.4% | |||
| 2,017 | Eurofins Scientific SE (FR) | 1,262 | |
| 1,880 | Gerresheimer AG (GER) | 150 | |
| 1,412 | |||
| MACHINERY—2.5% | |||
| 4,299 | Andritz AG (AUT) | 243 | |
| 149,175 | CNH Industrial NV (IT) | 1,903 | |
| 3,200 | Daifuku Co. Ltd. (JP) | 156 | |
| 3,776 | GEA Group AG (GER) | 183 | |
| 600 | Hoshizaki Corp. (JP) | 57 | |
| 8,338 | Hyundai Elevator Co. Ltd. (S. KOR)* | 408 | |
| 4,600 | IMI plc (UK) | 75 | |
| 10,900 | Kubota Corp. (JP) | 205 | |
| 16,500 | Mitsubishi Heavy Industries Ltd. (JP) | 646 | |
| 26,723 | Rotork plc (UK) | 93 | |
| COMMON STOCKS—Continued | |||
| Shares | Value | ||
| MACHINERY—Continued | |||
| 67,132 | Sandvik AB (SW) | $ 1,225 | |
| 12,860 | Stabilus SA (GER)* | 1,175 | |
| 7,524 | Wartsila OYJ Abp (FIN) | 484 | |
| 609,000 | Yungtay Engineering Co. Ltd. (TW) | 1,211 | |
| 8,064 | |||
| MARINE—0.3% | |||
| 4,293,272 | Cia Sud Americana de Vapores SA (CL)* | 244 | |
| 176,078 | Grindrod Ltd. (S. AFR)* | 194 | |
| 64,088 | Irish Continental Group plc (IE) | 427 | |
| 865 | |||
| MEDIA—3.1% | |||
| 12,351 | Axel Springer SE (GER) | 832 | |
| 595,900 | Bec World PCL (THA) | 312 | |
| 12,336 | CTS Eventim AG & Co. KGaA (GER) | 510 | |
| 43,687 | Daily Mail & General Trust plc (UK) | 402 | |
| 701,177 | Fairfax Media Ltd. (AUS) | 591 | |
| 49,600 | Fuji Media Holdings Inc. (JP) | 765 | |
| 23,470 | Grupo Televisa SAB ADR (MEX) | 514 | |
| 70,322 | Informa plc (UK) | 651 | |
| 456,344 | ITV plc (UK) | 997 | |
| 9,356 | JCDecaux SA (FR) | 358 | |
| 4,188,421 | Media Nusantara Citra TBK PT (IDR) | 482 | |
| 34,911 | Mediaset Espana Comunicacion SA (SP) | 379 | |
| 12,153 | Modern Times Group Mortgage AB Class B (SW) | 464 | |
| 39,820 | Nippon Television Holdings Inc. (JP) | 719 | |
| 10,082 | Schibsted ASA Class A (NOR) | 260 | |
| 10,082 | Schibsted ASA Class B (NOR) | 237 | |
| 23,236 | Sky plc (UK)* | 291 | |
| 148,100 | Television Broadcasts Ltd. (HK) | 560 | |
| 40,785 | WPP plc (UK) | 721 | |
| 10,045 | |||
| METALS & MINING—3.6% | |||
| 44,395 | Acerinox SA (SP) | 638 | |
| 561,281 | Alumina Ltd. (AUS) | 1,007 | |
| 16,618 | Anglo American Platinum Ltd. (S. AFR)* | 462 | |
| 39,034 | Anglo American plc (S. AFR) | 731 | |
| 52,147 | Antofagasta plc (UK) | 661 | |
| 21,211 | ArcelorMittal SA (FR)* | 607 | |
| 47,344 | Barrick Gold Corp. (CAN) | 684 | |
| 17,495 | BHP Billiton Ltd. (AUS) | 360 | |
| 33,029 | BHP Billiton plc (UK) | 598 | |
| 121,229 | BlueScope Steel Ltd. (AUS) | 1,194 | |
| 31,834 | Cia de Minas Buenaventura SAA ADR (PER) | 439 | |
| 8,752 | Franco-Nevada Corp. (CAN) | 696 | |
| 237,954 | Glencore plc (UK)* | 1,148 | |
| 32,791 | Iluka Resources Ltd. (AUS) | 236 | |
| 24,600 | JFE Holdings Inc. (JP) | 529 | |
| 45,981 | Newcrest Mining Ltd. (AUS) | 786 | |
| 16,373 | Rio Tinto plc (UK) | 774 | |
| 11,550 | |||
| MULTILINE RETAIL—0.4% | |||
| 40,400 | Isetan Mitsukoshi Holdings Ltd. (JP) | 440 | |
| 2,450 | Lotte Shopping Co. Ltd. (S. KOR) | 492 | |
| 8,400 | Marui Group Co. Ltd. (JP) | 129 | |
| 400 | Ryohin Keikaku Co. Ltd. (JP) | 118 | |
| 1,179 | |||
20
Harbor Diversified International All Cap Fund
Portfolio of Investments—Continued
Portfolio of Investments—Continued
Value, Cost, and Principal Amounts in Thousands
| COMMON STOCKS—Continued | |||
| Shares | Value | ||
| MULTI-UTILITIES—0.1% | |||
| 15,244 | Centrica plc (UK) | $ 34 | |
| 27,792 | National Grid plc (UK) | 335 | |
| 369 | |||
| OIL, GAS & CONSUMABLE FUELS—2.8% | |||
| 307,967 | BP plc (UK) | 2,089 | |
| 17,903 | Caltex Australia Ltd. (AUS) | 470 | |
| 67,917 | Canadian Natural Resources Ltd. (CAN) | 2,370 | |
| 8,700 | Lukoil PJSC ADR (RUS) | 461 | |
| 25,278 | PrairieSky Royalty Ltd. (CAN) | 673 | |
| 55,603 | Royal Dutch Shell plc (UK) | 1,769 | |
| 29,291 | Santos Ltd. (AUS)* | 101 | |
| 31,409 | Statoil ASA (NOR) | 638 | |
| 7,313 | Total SA (FR) | 408 | |
| 8,979 | |||
| PERSONAL PRODUCTS—1.9% | |||
| 260,608 | Asaleo Care Ltd. (AUS) | 296 | |
| 93,467 | Hengan International Group Co. Ltd. (CHN) | 922 | |
| 17,400 | Kao Corp. (JP) | 1,052 | |
| 146,768 | Natura Cosmeticos SA (BR) | 1,389 | |
| 9,600 | Shiseido Co. Ltd. (JP) | 396 | |
| 36,742 | Unilever plc (UK) | 2,082 | |
| 6,137 | |||
| PHARMACEUTICALS—2.0% | |||
| 38,907 | Haw Par Corp. Ltd. (SGP) | 348 | |
| 19,438 | Novartis AG (SWS) | 1,603 | |
| 32,539 | Novo Nordisk AS (DEN) | 1,620 | |
| 6,600 | Otsuka Holdings Co. Ltd. (JP) | 276 | |
| 8,454 | Roche Holding AG (SWS) | 1,954 | |
| 3,324 | Sanofi SA (FR) | 315 | |
| 2,500 | Sawai Pharmaceutical Co. Ltd. (JP) | 142 | |
| 15,000 | Sumitomo Dainippon Pharma Co. Ltd. (JP) | 214 | |
| 211 | Virbac SA (FR)* | 27 | |
| 6,499 | |||
| PROFESSIONAL SERVICES—3.7% | |||
| 17,968 | Adecco Group AG (SWS) | 1,426 | |
| 147,832 | ALS Ltd. (AUS) | 888 | |
| 101,980 | Capita plc (UK) | 710 | |
| 4,721 | DKSH Holding AG (SWS) | 396 | |
| 51,876 | Experian plc (UK) | 1,093 | |
| 417,105 | Hays plc (UK) | 1,032 | |
| 44,548 | Intertek Group plc (UK) | 3,209 | |
| 42,167 | IPH Ltd. (AUS) | 189 | |
| 5,800 | Nomura Co. Ltd. (JP) | 121 | |
| 25,691 | Pagegroup plc (UK) | 160 | |
| 7,600 | Persol Holdings Co Ltd. (JP) | 188 | |
| 2,956 | Randstad Holding NV (NET) | 182 | |
| 72,206 | RELX plc (UK) | 1,662 | |
| 2,300 | TechnoPro Holdings Inc. (JP) | 105 | |
| 3,459 | Teleperformance (FR) | 505 | |
| 11,866 | |||
| REAL ESTATE MANAGEMENT & DEVELOPMENT—0.5% | |||
| 9,500 | CK Asset Holdings Ltd. (HK) | 78 | |
| 4,100 | Daiwa House Industry Co. Ltd. (JP) | 150 | |
| 155,115 | LPS Brasil Consultoria de Imoveis SA (BR)* | 268 | |
| 35,000 | Mitsubishi Estate Co. Ltd. (JP) | 635 | |
| 19,283 | New World Development Co. Ltd. (HK) | 29 | |
| COMMON STOCKS—Continued | |||
| Shares | Value | ||
| REAL ESTATE MANAGEMENT & DEVELOPMENT—Continued | |||
| 43,700 | NTT Urban Development Corp. (JP) | $ 452 | |
| 31,476 | United Industrial Corp. Ltd. (SGP) | 76 | |
| 1,688 | |||
| ROAD & RAIL—1.6% | |||
| 6,490 | Canadian Pacific Railway Ltd. (CAN) | 1,125 | |
| 13,700 | East Japan Railway Co. (JP) | 1,329 | |
| 50,661 | Globaltrans Investment plc GDR (RUS)2 | 468 | |
| 24,932 | National Express Group plc (UK) | 122 | |
| 9,900 | Senko Co. Ltd. (JP) | 72 | |
| 129,186 | Stagecoach Group plc (UK) | 286 | |
| 26,300 | West Japan Railway Co. (JP) | 1,854 | |
| 5,256 | |||
| SEMICONDUCTORS & SEMICONDUCTOR EQUIPMENT—1.8% | |||
| 1,913 | ASML Holding NV (NET) | 345 | |
| 38,000 | Renesas Electronics Corp. (JP)* | 491 | |
| 17,698 | SK Hynix Inc. (S. KOR) | 1,305 | |
| 447,000 | Taiwan Semiconductor Manufacturing Co. Ltd. (TW) | 3,614 | |
| 1,200 | Tokyo Electron Ltd. (JP) | 211 | |
| 5,966 | |||
| SOFTWARE—0.7% | |||
| 1,877 | Constellation Software Inc. (CAN) | 1,068 | |
| 23,565 | Playtech plc (UK) | 308 | |
| 104,100 | TOTVS SA (BR) | 1,037 | |
| 2,413 | |||
| SPECIALTY RETAIL—1.2% | |||
| 1,861,300 | Esprit Holdings Ltd. (HK)* | 1,126 | |
| 3,158 | Fielmann AG (GER) | 278 | |
| 68,746 | Fourlis Holdings SA (GRC)* | 446 | |
| 26,302 | JUMBO SA (GRC)* | 423 | |
| 97,183 | Pets at Home Group plc (UK) | 227 | |
| 33,737 | WH Smith plc (UK) | 917 | |
| 108,100 | Yamada Denki Co. Ltd. (JP) | 575 | |
| 3,992 | |||
| TECHNOLOGY HARDWARE, STORAGE & PERIPHERALS—2.6% | |||
| 42,600 | FUJIFILM Holdings Corp. (JP) | 1,743 | |
| 28,821 | Logitech International SA (SWS) | 1,030 | |
| 22,400 | NEC Corp. (JP) | 615 | |
| 9,580 | Neopost SA (FR) | 353 | |
| 1,916 | Samsung Electronics Co. Ltd. (S. KOR) | 4,723 | |
| 8,464 | |||
| TEXTILES, APPAREL & LUXURY GOODS—2.5% | |||
| 5,227 | adidas AG (GER) | 1,163 | |
| 16,873 | Cie Financiere Richemont SA (SWS) | 1,555 | |
| 54,253 | Cie Financiere Richemont SA ADR (S. AFR) | 500 | |
| 13,569 | Gildan Activewear Inc. (CAN) | 415 | |
| 1,348,500 | Li Ning Co. Ltd. (CHN)* | 1,178 | |
| 29,010 | Luxottica Group SpA (IT) | 1,663 | |
| 33,000 | Onward Holdings Co. Ltd. (JP) | 278 | |
| 278,954 | Ruentex Industries Ltd. (TW)* | 447 | |
| 71,000 | Shenzhou International Group Holdings Ltd. (CHN) | 607 | |
| 236,246 | Stella International Holdings Ltd. (HK) | 385 | |
| 34,000 | Texwinca Holdings Ltd. (HK) | 21 | |
| 8,212 | |||
| TOBACCO—0.2% | |||
| 1,719 | British American Tobacco plc (UK) | 111 | |
21
Harbor Diversified International All Cap Fund
Portfolio of Investments—Continued
Portfolio of Investments—Continued
Value, Cost, and Principal Amounts in Thousands
| COMMON STOCKS—Continued | |||
| Shares | Value | ||
| TOBACCO—Continued | |||
| 1,700 | Japan Tobacco Inc. (JP) | $ 56 | |
| 9,224 | Swedish Match AB (SW) | 348 | |
| 515 | |||
| TRADING COMPANIES & DISTRIBUTORS—1.1% | |||
| 17,688 | Brenntag AG (GER) | 1,003 | |
| 61,536 | Bunzl plc (UK) | 1,917 | |
| 10,100 | ITOCHU Corp. (JP) | 177 | |
| 25,100 | Mitsubishi Corp. (JP) | 588 | |
| 3,685 | |||
| TRANSPORTATION INFRASTRUCTURE—0.6% | |||
| 100,144 | China Merchants Port Holdings Co. Ltd. (CHN) | 313 | |
| 170,950 | Global Ports Investments plc GDR (RUS)*,2 | 650 | |
| 53,385 | Groupe Eurotunnel SE (FR) | 671 | |
| 12,300 | Mitsubishi Logistics Corp. (JP) | 318 | |
| 1,952 | |||
| WIRELESS TELECOMMUNICATION SERVICES—1.3% | |||
| 130,733 | Bharti Airtel Ltd. (IND) | 1,006 | |
| 6,623 | Millicom International Cellular SA SDR (SW)2 | 424 | |
| 60,310 | MTN Group Ltd. (S. AFR) | 524 | |
| 15,887 | Rogers Communications Inc. (CAN) | 824 | |
| 64,248 | SmarTone Telecommunications Holdings Ltd. (HK) | 80 | |
| 9,100 | SoftBank Group Corp. (JP) | 806 | |
| 141,151 | Vodafone Group plc (UK) | 404 | |
| 4,068 | |||
| TOTAL COMMON STOCKS | |||
(Cost $274,641) | 309,468 | ||
| PREFERRED STOCKS—1.3% | |||
| AEROSPACE & DEFENSE—0.0% | |||
| 4,017,042 | Rolls-Royce Holdings plc (UK)* | 5 x | |
| PREFERRED STOCKS—Continued | |||
| Shares | Value | ||
| AUTOMOBILES—0.4% | |||
| 6,297 | Volkswagen AG (GER) | $ 1,153 | |
| BANKS—0.4% | |||
| 56,738 | Banco Bradesco SA (BR)* | 602 | |
| 234,870 | Itausa - Investimentos Itau SA (BR) | 752 | |
| 1,354 | |||
| TEXTILES, APPAREL & LUXURY GOODS—0.5% | |||
| 337,554 | Alpargatas SA (BR)* | 1,785 | |
| TOTAL PREFERRED STOCKS | |||
(Cost $3,393) | 4,297 | ||
| SHORT-TERM INVESTMENTS—2.4% | |||
| (Cost $7,782) | |||
| Principal Amount | |||
| REPURCHASE AGREEMENTS | |||
| $ | 7,782 | Repurchase Agreement with Fixed Income Clearing Corp. dated October 31, 2017 due November 01, 2017 at 0.001% collateralized by U.S. Treasury Notes (value $7,939) | 7,782 |
| TOTAL INVESTMENTS—99.4% | |||
(Cost $285,816) | 321,547 | ||
CASH AND OTHER ASSETS, LESS LIABILITIES—0.6% | 1,873 | ||
TOTAL NET ASSETS—100.0% | $323,420 | ||
RIGHTS/WARRANTS OPEN AT OCTOBER 31, 2017
| Description | No. of Contracts | Strike Price | Expiration Date | Cost (000s) | Value (000s) | |||||
Banco Santander SA | 13,364 | € 4.85 | 11/3/2017 | $ 1 | $ 1 | |||||
Compania Sudamericana de Vapores SA | 824,513 | CLP$ —3 | 11/8/2017 | — | 7 | |||||
Total Rights/Warrants | $ 8 | |||||||||
FAIR VALUE MEASUREMENTS
The following table summarizes the Fund’s investments as of October 31, 2017 based on the inputs used to value them.
| Asset Category | Quoted Prices Level 1 (000s) | Other Significant Observable Inputs Level 2 (000s) | Significant Unobservable Inputs Level 3 (000s) | Total (000s) | ||||
| Investments in Securities | ||||||||
| Common Stocks | ||||||||
Africa | $ — | $ 4,378 | $— | $ 4,378 | ||||
Europe | 4,920 | 152,035 | — | 156,955 | ||||
Latin America | 8,802 | 2,578 | — | 11,380 | ||||
Middle East/Central Asia | — | 2,922 | — | 2,922 | ||||
North America | 22,387 | — | — | 22,387 |
22
Harbor Diversified International All Cap Fund
Portfolio of Investments—Continued
Portfolio of Investments—Continued
FAIR VALUE MEASUREMENTS—Continued
| Asset Category | Quoted Prices Level 1 (000s) | Other Significant Observable Inputs Level 2 (000s) | Significant Unobservable Inputs Level 3 (000s) | Total (000s) | ||||
Pacific Basin | $ 2,183 | $109,263 | $— | $111,446 | ||||
| Preferred Stocks | ||||||||
Europe | — | 1,153 | 5 | 1,158 | ||||
Latin America | 3,139 | — | — | 3,139 | ||||
| Short-Term Investments | ||||||||
Repurchase Agreements | — | 7,782 | — | 7,782 | ||||
Total Investments in Securities | $41,431 | $280,111 | $ 5 | $321,547 | ||||
| Financial Derivative Instruments - Assets | ||||||||
Rights/Warrants | $ 1 | $ 7 | $— | $ 8 | ||||
Total Financial Derivative Instruments - Assets | $ 1 | $ 7 | $— | $ 8 | ||||
Total Investments | $41,432 | $280,118 | $ 5 | $321,555 |
The following is a rollforward of the Fund’s Level 3 investments during the year ended October 31, 2017.
| Valuation Description | Balance Beginning at 11/01/2016 (000s) | Purchases (000s) | Sales (000s) | Discount/ (Premium) (000s) | Total Realized Gain/(Loss)w (000s) | Change in Unrealized Appreciation/ (Depreciation)w (000s) | Transfers In Level 3 (000s) | Transfers Out of Level 3 (000s) | Ending Balance as of 10/31/2017w (000s) | |||||||||
Preferred Stocks | $3 | $5 | $(3) | $— | $— | $— | $— | $— | $5 |
Of the Level 2 investments presented above, certain Common Stocks valued at $2,722,000 were catorgized in Level 1 at October 31, 2016. Transfers from Level 1 to Level 2 were a result of exchange traded securities where quoted prices from an active market were available (Level 1), and have become unavailable (Level 2).
The following is a summary of significant unobservable inputs used in the fair valuations of assets and liabilities categorized within Level 3 of the fair value hierarchy.
| Valuation Descriptions | Ending Balance as of 10/31/2017 (000s) | Valuation Technique | Unobservable Inputs | Input Value(s) | ||||
| Investments in Securities | ||||||||
| Preferred Stocks | ||||||||
Rolls-Royce Holdings plc (UK)* | $5 | Market Approach | Pre-Traded Price | £ 0.001 |
For more information on valuation inputs and their aggregation into the levels used in the table above, please refer to the Fair Value Measurements and Disclosures in Note 2 of the accompanying Notes to Financial Statements.
| * | Non-income producing security | ||
| 1 | ADR after the name of a foreign holding stands for American Depositary Receipts representing ownership of foreign securities. ADRs are issued by U.S. banking institutions. | ||
| 2 | GDR after the name of a holding stands for Global Depositary Receipts representing ownership of foreign securities. GDRs are issued by either U.S. or non-U.S. banking institutions. Country specific examples of this type of depositary receipt, if any, are denoted using different abbreviations. SADR after the name of a holding stands for South African Depositary Receipts representing ownership of South African securities listed on the Johannesburg Stock Exchange. SDR after the name of a holding stands for Swedish Depository Receipts representing ownership of foreign securities in Sweden. NVDR after the name of a holding stands for Non-Voting Depositary Receipts representing ownership of a listed security in the Stock Exchange of Thailand. | ||
| 3 | Rights redeemable for 1 ordinary share per 142 rights | ||
| w | Amounts in this category are included in the “Realized and Change in Unrealized Gain/(Loss) on Investment Transactions” section of the Statement of Operations. The net unrealized appreciation/(depreciation) per investment type is below: | ||
| Valuation Description | Unrealized Gain/(Loss) as of 10/31/2017 (000s) | ||
Preferred Stocks | $– | ||
| x | Fair Valued in accordance with Harbor Funds Valuation Procedures using pre-traded price which is a Level 3 input | ||
| £ | British Pound | ||
| € | Euro | ||
| CLP$ | Chilean Peso | ||
The accompanying notes are an integral part of the Financial Statements.
23
Harbor International Growth Fund
Managers' Commentary (Unaudited)
Managers' Commentary (Unaudited)
Subadviser
Baillie Gifford Overseas Limited
Calton Square
1 Greenside Row
Edinburgh, Scotland
United Kingdom
EH1 3AN
United Kingdom
EH1 3AN
Portfolio Managers
Gerard Callahan
Since 2013
Since 2013
Iain Campbell
Since 2013
Since 2013
Joe Faraday, CFA
Since 2013
Since 2013
Moritz Sitte, CFA
Since 2014
Since 2014
Sophie Earnshaw, CFA
Since 2014
Since 2014
Tom Walsh, CFA
Since 2014
Since 2014
Baillie Gifford Overseas Limited has subadvised the Fund since 2013.
Investment Objective
The Fund seeks long-term growth of capital.

Gerard Callahan

Iain Campbell

Joe Faraday, CFA

Moritz Sitte, CFA

Sophie Earnshaw, CFA

Tom Walsh, CFA
Management’s Discussion of
Fund Performance
Fund Performance
Market Review
The MSCI All Country World Ex. U.S. (ND) Index, a measure of stocks in both developed and emerging overseas markets, returned 23.64%, for the 12 months ended October 31, 2017 (all international and global returns are in U.S. dollars).
The political backdrop to the last twelve months has been an eventful one. The election of Donald Trump as U.S. President in November 2016 was followed later in the period by elections in Austria, the Netherlands, France, and Germany. These produced results which, following the U.K.’s referendum on membership in the European Union and the U.S. election, were almost surprising in that they did not herald unexpected political changes. However, uncertainty does persist in the U.K. following its decision to leave the European Union in two years’ time; the formal process to do so was triggered at the end of March 2017. The lack of clarity over what the future will hold was compounded by the result of a snap general election in the U.K. in June, which saw a reduction in the size of the government’s majority.
The world’s economies grew steadily through the period. Despite the uncertainty surrounding its future relationship with the European Union, the U.K. has not seen a significant negative impact on its economy. That said, British sterling has not returned to the levels seen prior to the referendum. In Continental Europe, following a long period of weakness, worries about deflation are receding and its economies appear to be returning to stronger health.
Further afield, the Emerging Markets have generally continued to show strength. In South Korea, there was a change in leadership with the appointment of Moon Jae-in as President following the impeachment of his predecessor. China’s transition towards a more balanced economy is continuing and it appears likely that the country will achieve its GDP target for 2017.
The rising tensions in North Korea have been among the more worrying events seen in the period, although markets have so far taken a sanguine view of these.
Performance
The Fund returned 23.38% (Institutional Class), 23.08% (Investor Class), 22.89% (Administrative Class), and 23.52% (Retirement Class) for the twelve months ended October 31, 2017, underperforming the 23.64% return of the MSCI All Country World Ex. U.S. (ND) Index.
We continue to focus on the bottom-up analysis of company fundamentals rather than on broader economic or market related issues. We endeavor not to be distracted by short-term news. The Fund’s performance over the period has often been a reflection of stock selection.
Regionally, the bottom-up investment approach that we follow has resulted in the Fund having overweight positions during the period in Asia, the U.K. and Emerging Markets. It has been underweight in Canada and Europe. The largest positive regional contributions to relative performance came from the U.K. and Canada, while Asia detracted.
24
Harbor International Growth Fund
Managers' Commentary—Continued
Managers' Commentary—Continued
| TOP TEN HOLDINGS (% of Net Assets) | |
| Taiwan Semiconductor Manufacturing Co. Ltd. ADR | 3.0% |
| Naspers Ltd. | 2.8% |
| Cochlear Ltd. | 2.2% |
| Hargreaves Lansdown plc | 2.2% |
| Alibaba Group Holding Ltd. ADR | 2.1% |
| Mettler-Toledo International Inc. | 2.1% |
| MS&AD Insurance Group Holdings Inc. | 2.1% |
| Kao Corp. | 2.0% |
| Novo Nordisk AS | 2.0% |
| Samsung Electronics Co. Ltd. | 2.0% |
Turning to the sectoral positioning of the Fund, it has been most overweight in the Consumer Discretionary, Consumer Staples, and Information Technology areas. The main underweights have been in Financials, Energy, and Materials. During the period, the largest contributions to relative performance came from the Health Care and Telecom Services sectors, while the Consumer Discretionary and Financials areas were the main detractors.
Given our stock picking approach to portfolio construction, it is relevant to look at the contribution to relative performance that came from individual stocks. In the period, the largest individual contributors to performance were Mettler-Toledo, Hargreaves Lansdown, and Intertek.
Mettler-Toledo is a Swiss manufacturer of precision measurement equipment and is the world’s leading supplier of precision weight instruments to laboratories and industrial users. The company reported strong trading during the period, with both sales and profits growing more rapidly than the market had expected. Hargreaves Lansdown is a British online financial platform and has continued to see strong net flows, has a strong brand, and we are encouraged by the strong presence that the company has maintained in the rapidly growing defined contribution market. Intertek is a testing and inspection certification business listed in the U.K. which provides quality and safety assurance across a range of industries. Share price performance of Intertek has benefited during the period from a rerating and the company is optimistic that further growth will come from increased regulation and rising consumer expectations.
The main stock detractors were Shimano, Kakaku.com, and Brambles. Brambles is a global logistics company based in Australia, which provides pallet pooling services through its CHEP division. It has recently faced increased competitive pressures in the U.S. pallet market. Shimano, a Japanese manufacturer of cycling equipment used globally, has seen a slowdown in the demand for sports bicycles in Europe and China. Kakaku.com, a Japanese provider of price comparison websites and an online restaurant listing business, has experienced weakness in the price comparison website part of its business.
Outlook & Strategy
The last twelve months has been an eventful period for politics around the world. However, we have maintained our long-term stock picking approach in managing the Fund. Despite the potential distractions in the news around us, we continue to focus on individual company analysis and we have had little difficulty in finding interesting ideas to consider for inclusion in the Fund’s portfolio. We believe that exciting stock opportunities will continue to be available to us and that our approach of building the Fund’s portfolio from the bottom up, rather than making top down judgments, will remain a sound one.
This report contains the current opinions of Baillie Gifford Overseas Limited as of the date of this report and should not be considered as investment advice or a recommendation of any particular security, strategy or investment product. Such opinions are subject to change without notice and securities described herein may no longer be included in, or may at any time be removed from, the Fund’s portfolio. This report is distributed for informational purposes only. Information contained herein has been obtained from sources believed reliable, but not guaranteed.
Investing in international and emerging markets poses special risks, including potentially greater price volatility due to social, political and economic factors, as well as currency exchange rate fluctuations. These risks are more severe for securities of issuers in emerging market regions. For information on the different share classes and the risks associated with an investment in the Fund, please refer to the current prospectus.
25
Harbor International Growth Fund
Fund Summary—October 31, 2017 (Unaudited)
Fund Summary—October 31, 2017 (Unaudited)
| INSTITUTIONAL CLASS | |
| Fund # | 2017 |
| Cusip | 411511801 |
| Ticker | HAIGX |
| Inception Date | 11/01/1993 |
| Net Expense Ratio | 0.85% a |
| Total Net Assets (000s) | $362,035 |
| ADMINISTRATIVE CLASS | |
| Fund # | 2217 |
| Cusip | 411511637 |
| Ticker | HRIGX |
| Inception Date | 11/01/2002 |
| Net Expense Ratio | 1.10% a |
| Total Net Assets (000s) | $466 |
| INVESTOR CLASS | |
| Fund # | 2417 |
| Cusip | 411511629 |
| Ticker | HIIGX |
| Inception Date | 11/01/2002 |
| Net Expense Ratio | 1.22% a |
| Total Net Assets (000s) | $14,913 |
| RETIREMENT CLASS | |
| Fund # | 2517 |
| Cusip | 411512429 |
| Ticker | HNGFX |
| Inception Date | 03/01/2016 |
| Net Expense Ratio | 0.77% a |
| Total Net Assets (000s) | $24,872 |
Portfolio Statistics
| Portfolio | Benchmark | ||
| Number of Countries | 25 | 48 | |
| Weighted Average Market Cap (MM) | $52,835 | $70,182 | |
| Price/Earning Ratio (P/E) | 26.2x | 19.3x | |
| Price/Book Ratio (P/B) | 5.1x | 2.4x | |
| Beta vs. MSCI All Country World Ex. U.S. (ND) Index | 0.98 | N/A | |
| Portfolio Turnover (Year Ended 10/31/2017) | 13% | N/A |
Sector Allocation (% of investments)
(Excludes cash and short-term investments)

REGION BREAKDOWN (% of investments)
(Excludes cash and short-term investments)

| a | Reflects an expense limitation agreement (excluding interest expense, if any) effective through February 28, 2018 |
26
Harbor International Growth Fund
Fund Performance Summary (Unaudited)
Fund Performance Summary (Unaudited)
The graph compares a $50,000 investment in the Institutional Class shares of the Fund with the performance of the MSCI All Country World Ex. U.S. (ND) Index. The Fund’s performance assumes the reinvestment of all dividend and capital gain distributions.
CHANGE IN A $50,000 INVESTMENT
For the period 11/01/2007 through 10/31/2017

| TOTAL RETURNS For the periods ended 10/31/2017 | 1 Year | Annualized | Inception Date | Final Value of a $50,000 Investment | ||||||||||
| 5 Years | 10 Years | |||||||||||||
| Harbor International Growth Fund | ||||||||||||||
Institutional Class | 23.38% | 8.67% | 0.57% | 11/01/1993 | $52,913 | |||||||||
Administrative Class | 23.08 | 8.41 | 0.31 | 11/01/2002 | 51,581 | |||||||||
Investor Class | 22.89 | 8.27 | 0.19 | 11/01/2002 | 50,962 | |||||||||
Retirement Class1 | 23.52 | 8.71 | 0.59 | 03/01/2016 | 53,014 | |||||||||
| Comparative Index | ||||||||||||||
MSCI All Country World Ex. U.S. (ND) | 23.64% | 7.29% | 0.92% | — | $54,772 | |||||||||
As stated in the Fund’s current prospectus, the expense ratios were 0.85% (Net) and 0.91% (Gross) (Institutional Class); 1.10% (Net) and 1.16% (Gross) (Administrative Class); 1.22% (Net) and 1.28% (Gross) (Investor Class); and 0.77% (Net) and 0.83% (Gross). The net expense ratios reflect an expense limitation agreement (excluding interest expense, if any) effective through 02/28/2018. The expense ratios in the prospectus may differ from the actual expense ratios for the period disclosed within this report. The expense ratios shown in the prospectus are based on the prior fiscal year, adjusted to reflect changes, if any, in contractual arrangements that occurred prior to the date of the prospectus (or supplement thereto, if applicable).
Performance data shown represents past performance and is no guarantee of future results. Past performance is net of management fees and expenses and reflects reinvested dividends and distributions, but does not reflect the deduction of taxes that a shareholder would pay on Fund distributions or upon the redemption of Fund shares. Past performance reflects the beneficial effect of any expense waivers or reimbursements, without which returns would have been lower. Investment returns and principal value will fluctuate and when redeemed may be worth more or less than their original cost. Returns for periods less than one year are not annualized. Current performance may be higher or lower and is available through the most recent month end at harborfunds.com or by calling 800-422-1050.
| 1 | Retirement Class shares commenced operations on March 1, 2016. The performance attributed to the Retirement Class shares prior to that date is that of the Institutional Class shares. Performance prior to March 1, 2016 has not been adjusted to reflect the lower expenses of Retirement Class shares. During this period, Retirement Class shares would have had returns similar to, but somewhat higher than, Institutional Class shares due to the fact that Retirement Class shares represent interests in the same portfolio as Institutional Class shares but are subject to lower expenses. |
27
Harbor International Growth Fund
Portfolio of Investments—October 31, 2017
Portfolio of Investments—October 31, 2017
Value, Cost, and Principal Amounts in Thousands
Total Investments by Country (% of net assets)
(Excludes net cash and short-term investments of 0.3%)

| COMMON STOCKS—99.3% | |||
| Shares | Value | ||
| AUTO COMPONENTS—0.9% | |||
| 67,400 | Denso Corp. (JP) | $ 3,712 | |
| AUTOMOBILES—1.0% | |||
| 194,971 | Mahindra & Mahindra Ltd. GDR (IND)1 | 4,066 | |
| BANKS—4.9% | |||
| 481,400 | Public Bank BHD (MAL) | 2,326 | |
| 161,500 | Suruga Bank Ltd. (JP) | 3,677 | |
| 465,200 | Svenska Handelsbanken AB (SW) | 6,668 | |
| 390,527 | United Overseas Bank Ltd. (SGP) | 7,055 | |
| 19,726 | |||
| BEVERAGES—4.7% | |||
| 57,151 | Carlsberg AS (DEN) | 6,529 | |
| 3,973,900 | Thai Beverage PCL (THA) | 2,856 | |
| 414,670 | Treasury Wine Estates Ltd. (AUS) | 4,978 | |
| 1,114,000 | Tsingtao Brewery Co. Ltd. (CHN) | 4,665 | |
| 19,028 | |||
| BIOTECHNOLOGY—0.1% | |||
| 297,339 | Mesoblast Ltd. (AUS)* | 305 | |
| CAPITAL MARKETS—5.2% | |||
| 428,089 | Hargreaves Lansdown plc (UK) | 8,992 | |
| COMMON STOCKS—Continued | |||
| Shares | Value | ||
| CAPITAL MARKETS—Continued | |||
| 405,800 | Japan Exchange Group Inc. (JP) | $ 7,316 | |
| 578,142 | Jupiter Fund Management plc (UK) | 4,562 | |
| 20,870 | |||
| CHEMICALS—4.0% | |||
| 202,491 | Asian Paints Ltd. (IND) | 3,701 | |
| 120,310 | Johnson Matthey plc (UK) | 5,402 | |
| 122,804 | Novozymes AS (DEN) | 6,785 | |
| 15,888 | |||
| COMMERCIAL SERVICES & SUPPLIES—1.0% | |||
| 553,094 | Brambles Ltd. (AUS) | 4,011 | |
| DIVERSIFIED FINANCIAL SERVICES—1.5% | |||
| 124,633 | Investor AB (SW) | 6,175 | |
| ELECTRICAL EQUIPMENT—1.5% | |||
| 83,636 | Legrand SA (FR) | 6,207 | |
| ELECTRONIC EQUIPMENT, INSTRUMENTS & COMPONENTS—2.2% | |||
| 680,000 | Delta Electronics Inc. (TW) | 3,272 | |
| 618,853 | Hon Hai Precision Industry Co. Ltd. GDR (TW)1 | 4,630 | |
| 1,945,000 | PAX Global Technology Ltd. (CHN) | 984 | |
| 8,886 | |||
| ENERGY EQUIPMENT & SERVICES—0.6% | |||
| 250,588 | John Wood Group plc (UK) | 2,370 | |
| FOOD & STAPLES RETAILING—5.8% | |||
| 409,464 | Clicks Group Ltd. (S. AFR) | 4,586 | |
| 506,030 | Distribuidora Internacional de Alimentacion SA (SP)2 | 2,475 | |
| 233,170 | Jeronimo Martins SGPS SA (PT)* | 4,236 | |
| 59,390 | Magnit PJSC GDR (RUS)*,1 | 1,681 | |
| 1,880,200 | Puregold Price Club Inc. (PHIL) | 1,858 | |
| 173,600 | Raia Drogasil SA (BR)* | 4,150 | |
| 40,900 | Sugi Holdings Co. Ltd. (JP) | 2,076 | |
| 934,700 | Wal-Mart de Mexico SAB de CV (MEX) | 2,093 | |
| 23,155 | |||
| FOOD PRODUCTS—1.4% | |||
| 67,996 | Nestlé SA (SWS) | 5,721 | |
| HEALTH CARE EQUIPMENT & SUPPLIES—3.3% | |||
| 64,486 | Cochlear Ltd. (AUS) | 8,687 | |
| 121,900 | Olympus Corp. (JP) | 4,536 | |
| 13,223 | |||
| HOTELS, RESTAURANTS & LEISURE—0.5% | |||
| 660,000 | Cafe de Coral Holdings Ltd. (HK) | 2,031 | |
| HOUSEHOLD PRODUCTS—1.2% | |||
| 140,700 | Pigeon Corp. (JP) | 4,993 | |
| INDUSTRIAL CONGLOMERATES—1.6% | |||
| 65,800 | Jardine Matheson Holdings Ltd. (SGP) | 4,215 | |
| 52,300 | Jardine Strategic Holdings Ltd. (SGP) | 2,194 | |
| 6,409 | |||
| INSURANCE—5.4% | |||
| 492,800 | AIA Group Ltd. (HK) | 3,713 | |
| 8,178 | Fairfax Financial Holdings Ltd. (CAN) | 4,307 | |
| 242,900 | MS&AD Insurance Group Holdings Inc. (JP) | 8,252 | |
| 21,739 | Samsung Fire & Marine Insurance Co. Ltd. (S. KOR) | 5,305 | |
| 21,577 | |||
28
Harbor International Growth Fund
Portfolio of Investments—Continued
Portfolio of Investments—Continued
Value, Cost, and Principal Amounts in Thousands
| COMMON STOCKS—Continued | |||
| Shares | Value | ||
| INTERNET & DIRECT MARKETING RETAIL—6.7% | |||
| 73,304 | ASOS plc (UK)* | $ 5,545 | |
| 102,910 | Ctrip.com International Ltd. ADR (CHN)*,3 | 4,928 | |
| 100,902 | JD.com Inc. ADR (CHN)*,3 | 3,786 | |
| 55,596 | MakeMyTrip Ltd. (IND)* | 1,518 | |
| 328,200 | Rakuten Inc. (JP)* | 3,512 | |
| 153,551 | Zalando SE (GER)*,4 | 7,730 | |
| 27,019 | |||
| INTERNET SOFTWARE & SERVICES—9.0% | |||
| 44,626 | Alibaba Group Holding Ltd. ADR (CHN)*,3 | 8,251 | |
| 1,010,716 | Auto Trader Group plc (UK)4 | 4,596 | |
| 31,716 | Baidu Inc. ADR (CHN)*,3 | 7,737 | |
| 280,000 | Kakaku.com Inc. (JP) | 3,845 | |
| 3,500 | Naver Corp. (S. KOR) | 2,797 | |
| 122,549 | Rightmove plc (UK) | 6,761 | |
| 20,424 | Shopify Inc. (CAN)* | 2,032 | |
| 36,019 | |||
| LEISURE PRODUCTS—1.1% | |||
| 33,200 | Shimano Inc. (JP) | 4,543 | |
| LIFE SCIENCES TOOLS & SERVICES—2.1% | |||
| 12,133 | Mettler-Toledo International Inc. (SWS)* | 8,282 | |
| MACHINERY—7.3% | |||
| 75,780 | Atlas Copco AB Class A (SW)2 | 3,323 | |
| 156,158 | Atlas Copco AB Class B (SW) | 6,199 | |
| 90,051 | Kone OYJ (FIN) | 4,874 | |
| 27,991 | Schindler Holding AG (SWS) | 6,343 | |
| 17,500 | SMC Corp. (JP) | 6,695 | |
| 78,314 | Weir Group plc (UK) | 2,030 | |
| 29,464 | |||
| MEDIA—2.8% | |||
| 46,516 | Naspers Ltd. (S. AFR) | 11,333 | |
| PERSONAL PRODUCTS—4.5% | |||
| 130,200 | Kao Corp. (JP) | 7,868 | |
| 145,700 | Shiseido Co. Ltd. (JP) | 6,010 | |
| 74,372 | Unilever plc (UK) | 4,215 | |
| 18,093 | |||
| PHARMACEUTICALS—2.1% | |||
| 165,144 | Novo Nordisk AS (DEN) | 8,222 | |
| PROFESSIONAL SERVICES—3.3% | |||
| 491,586 | Capita plc (UK) | 3,423 | |
| 76,795 | Intertek Group plc (UK) | 5,532 | |
| 310,511 | SEEK Ltd. (AUS) | 4,373 | |
| 13,328 | |||
| SEMICONDUCTORS & SEMICONDUCTOR EQUIPMENT—5.3% | |||
| 128,500 | Advantest Corp. (JP) | 2,935 | |
| 648,870 | Imagination Technologies Group plc (UK)* | 1,556 | |
| 177,624 | Infineon Technologies AG (GER) | 4,913 | |
| 279,917 | Taiwan Semiconductor Manufacturing Co. Ltd. ADR (TW)3 | 11,849 | |
| 21,253 | |||
| COMMON STOCKS—Continued | |||
| Shares | Value | ||
| SPECIALTY RETAIL—1.4% | |||
| 148,170 | Industria de Diseno Textil SA (SP)2 | $ 5,538 | |
| TECHNOLOGY HARDWARE, STORAGE & PERIPHERALS—2.0% | |||
| 3,294 | Samsung Electronics Co. Ltd. (S. KOR) | 8,120 | |
| TEXTILES, APPAREL & LUXURY GOODS—4.9% | |||
| 32,376 | adidas AG (GER) | 7,206 | |
| 165,539 | Burberry Group plc (UK) | 4,181 | |
| 55,746 | Cie Financiere Richemont SA (SWS) | 5,139 | |
| 8,543 | Swatch Group AG (SWS) | 3,349 | |
| 19,875 | |||
| TOTAL COMMON STOCKS | |||
(Cost $332,359) | 399,442 | ||
| PREFERRED STOCKS—0.5% | |||
| (Cost $1,914) | |||
| HEALTH CARE EQUIPMENT & SUPPLIES—0.5% | |||
| 18,863 | Sartorius AG (GER) | 1,762 | |
| SHORT-TERM INVESTMENTS—2.0% | |||
| Principal Amount | |||
| REPURCHASE AGREEMENTS—0.3% | |||
| $ | 1,434 | Repurchase Agreement with Fixed Income Clearing Corp. dated October 31, 2017 due November 01, 2017 at 0.001% collateralized by U.S. Treasury Notes (value $1,466) | 1,434 |
| Shares | |||
| INVESTMENT COMPANY-SECURITIES LENDING INVESTMENT FUND—1.7% | |||
| 6,723,403 | State Street Navigator Securities Lending Government Money Market Portfolio (1-day yield of 1.000%)5 | 6,723 | |
| TOTAL SHORT-TERM INVESTMENTS | |||
(Cost $8,157) | 8,157 | ||
| TOTAL INVESTMENTS—101.8% | |||
(Cost $342,430) | 409,361 | ||
CASH AND OTHER ASSETS, LESS LIABILITIES—(1.8)% | (7,075) | ||
TOTAL NET ASSETS—100.0% | $402,286 | ||
29
Harbor International Growth Fund
Portfolio of Investments—Continued
Portfolio of Investments—Continued
FAIR VALUE MEASUREMENTS
The following table summarizes the Fund’s investments as of October 31, 2017 based on the inputs used to value them.
| Asset Category | Quoted Prices Level 1 (000s) | Other Significant Observable Inputs Level 2 (000s) | Significant Unobservable Inputs Level 3 (000s) | Total (000s) | ||||
| Common Stocks | ||||||||
Africa | $ — | $ 15,919 | $— | $ 15,919 | ||||
Europe | 8,282 | 168,479 | — | 176,761 | ||||
Latin America | 6,243 | — | — | 6,243 | ||||
Middle East/Central Asia | 1,518 | 7,767 | — | 9,285 | ||||
North America | 6,339 | — | — | 6,339 | ||||
Pacific Basin | 36,551 | 148,344 | — | 184,895 | ||||
| Preferred Stocks | ||||||||
Europe | — | 1,762 | — | 1,762 | ||||
| Short-Term Investments | ||||||||
Repurchase Agreements | — | 1,434 | — | 1,434 | ||||
Investment Company-Securities Lending Investment Fund | 6,723 | — | — | 6,723 | ||||
Total Investments in Securities | $65,656 | $343,705 | $— | $409,361 |
There were no Level 3 holdings at October 31, 2017 or 2016, and no transfers between levels during the year.
For more information on valuation inputs and their aggregation into the levels used in the table above, please refer to the Fair Value Measurements and Disclosures in Note 2 of the accompanying Notes to Financial Statements.
| * | Non-income producing security |
| 1 | GDR after the name of a holding stands for Global Depositary Receipts representing ownership of foreign securities. GDRs are issued by either U.S. or non-U.S. banking institutions. Country specific examples of this type of depositary receipt, if any, are denoted using different abbreviations. SADR after the name of a holding stands for South African Depositary Receipts representing ownership of South African securities listed on the Johannesburg Stock Exchange. SDR after the name of a holding stands for Swedish Depository Receipts representing ownership of foreign securities in Sweden. NVDR after the name of a holding stands for Non-Voting Depositary Receipts representing ownership of a listed security in the Stock Exchange of Thailand. |
| 2 | All or a portion of this security was out on loan as of October 31, 2017. |
| 3 | ADR after the name of a foreign holding stands for American Depositary Receipts representing ownership of foreign securities. ADRs are issued by U.S. banking institutions. |
| 4 | Securities purchased in a transaction exempt from registration under Rule 144A of the Securities Act of 1933. These securities may be resold in transactions exempt from registration, normally to qualified institutional buyers. The Fund has no right to demand registration of these securities. These securities are priced by an independent pricing service in accordance with Harbor Funds Valuation Procedures. At October 31, 2017, the aggregate value of these securities was $12,326,000 or 3% of net assets. |
| 5 | Represents the investment of collateral received from securities lending activities. |
The accompanying notes are an integral part of the Financial Statements.
30
Harbor International Small Cap Fund
Managers' Commentary (Unaudited)
Managers' Commentary (Unaudited)
Subadviser
Baring International Investment Limited
155 Bishopsgate
London, EC2M 3XY
United Kingdom
United Kingdom
Portfolio Managers
Nicholas M. Williams
Since 2016
Since 2016
Colin C. Riddles
Since 2016
Since 2016
Rosemary C. Simmonds, CFA
Since 2016
Since 2016
Barings has subadvised the Fund since 2016.
Investment Objective
The Fund seeks long-term growth of capital.

Nicholas M. Williams

Colin C. Riddles

Rosemary C. Simmonds, CFA
Management’s Discussion of
Fund Performance
Fund Performance
Market Review
During the twelve-month period ended October 31, 2017 the MSCI EAFE Small Cap (ND) Index (the Index) rose by 27.51% (all international and global returns are in U.S. dollars).
This gain in the Index reflects continued and sustained improvement in economic data across many of the economies represented in the MSCI EAFE Small Cap (ND) Index at a time when Central Banks have maintained policy settings to boost lending and economic growth in Europe, Australia and Japan. As economic news from the U.S. has also been generally positive, surveys of business sentiment and businesses’ confidence in future trade prospects have strengthened, supporting expectations of strong profit growth from smaller companies. These positive developments, resulting in falling unemployment and stronger construction activity, also helped strengthen consumer confidence, most markedly in the Euro-zone and Japan. In this generally positive context, the U.K. economy has faced greater challenges: following the Brexit referendum in the summer of 2016, and the subsequent weakness in the Pound Sterling, inflation rates have risen and business and consumer confidence has deteriorated.
Political developments have in general been positively received by equity market investors: general election results in France, Germany and Japan have seen success at the polls for the candidates perceived by most investors as most business-friendly. Furthermore, despite North Korea tensions and a range of other flashpoints and terrorism-related actions, developments in corporate profitability and sales have remained relatively positive through the period under review.
In this context, the returns from the countries and sectors that constitute the MSCI EAFE Small Cap (ND) Index have generally been positive. European smaller companies, for example, have typically performed strongly, benefiting from positive trends in economic activity across the continent. Gains in U.K. and Japanese smaller companies in general slightly lagged behind the return from the Index, while Asia-Pacific smaller companies, which also rose over the period, made the most limited gains. This relative under-performance by Asia-Pacific equities in part reflects continuing muted gains in the Energy sector, which is well represented among Australian smaller companies and performed poorly as oil prices had very limited gains, while Energy services companies continue to experience weak demand for new exploration and production services. The Real Estate sector also proved to be a prominent laggard, while the Information Technology sector performed very strongly over the period.
Performance
Harbor International Small Cap Fund outperformed the return of its benchmark during the period. The Fund returned 30.59% (Institutional Class), 30.25% (Administrative Class), 30.10% (Investor Class), and 30.67% (Retirement Class) compared with the MSCI EAFE Small Cap (ND) Index return of 27.51%.
The pleasing relative return over the period to the end of October primarily reflects our stock selection in Japanese and U.K. smaller companies. Asset allocation within the Fund, which is the result of our stock selection decisions, had a very limited impact on the relative performance over the period.
Our investment strategy is to focus on bottom up stock selection, using a quality growth at a reasonable price analysis framework. In other words, we look to identify companies with quality characteristics such as strong balance sheets and high levels of profitability and earnings
31
Harbor International Small Cap Fund
Managers' Commentary—Continued
Managers' Commentary—Continued
| TOP TEN HOLDINGS (% of Net Assets) | |
| Relo Group Inc. | 1.4% |
| SSP Group plc | 1.4% |
| Kyudenko Corp. | 1.3% |
| Nihon M&A Center Inc. | 1.3% |
| RPC Group plc | 1.3% |
| ASM International NV | 1.2% |
| HomeServe plc | 1.2% |
| Nabtesco Corp. | 1.2% |
| Sophos Group plc | 1.2% |
| THK Co. Ltd. | 1.2% |
growth potential, where the current valuation does not fully reflect these attributes. The region and sector positioning of the portfolio will be dictated by these individual stock selection decisions rather than by asset allocation decisions.
These stock selection decisions resulted in an exposure to the Japanese equity market marginally lower than Japan’s weight in the Index. A number of the Fund’s Japanese holdings performed very strongly over the period, benefiting both from the stronger economic backdrop in Japan, but also from sound management decisions and a focus on business activities with strong underlying demand growth. Daifuku, for example, a provider of warehouse and airport infrastructure equipment, has improved profitability and built a very strong order backlog on rising demand from internet retailers for advanced warehouse logistics.
Exposure to the U.K. in the Fund was typically slightly above the weight of the country in the Index over the period, reflecting stock selection opportunities among U.K. smaller companies rather than any positive view of the U.K. economy. Sophos Group, the specialist cyber-security group, benefited from increased demand for its software products and services as awareness of cyber threats was boosted by both regulatory developments and the Wannacry virus.
Exposure to the Asia-Pacific region was typically limited during the period. To some extent this reflects very limited exposure to Australian Mining and Energy sector companies, while exposure to Hong Kong has reflected investments in companies such as Samsonite, which has continued to develop its leading position in travel luggage through a process of acquisitions of competing brands.
Meanwhile, the Fund’s weighting in Europe, excluding U.K., has been similar to the weighting of the region in the Index over the period. French smaller companies were well-represented in the Fund but the exposure was reduced as positions were trimmed in some French holdings such as Trigano, the caravan, RV and camper van group, as price targets were achieved. The European smaller companies in the Information Technology sector have also typically performed strongly. Temenos, for example, the Swiss provider of core banking software, has won new clients and improved profitability.
Outlook & Strategy
Given the strong gains made by the MSCI EAFE Small Cap (ND) Index in the twelve months under review, it would be reasonable to anticipate increased volatility in the coming year. Although economic news flow remains positive, and business confidence in Japan and Europe are consistent with above trend rates of economic growth, valuations of international smaller companies are, in aggregate, above their long-term averages. While these valuation levels are merited by rising sales and profits growth resulting from economic strength, profit margins could be challenged by rising inflationary pressures in labor costs and raw materials. Furthermore, while strengthening economic data across much of the world has been accompanied by very benign inflation data, speculation that central banks are likely to raise interest rates, or at least reduce quantitative easing programs, is likely to intensify. More positively, however, the recent apparent acceleration in the trajectory of economic growth in the U.S., and the accompanying strength in the U.S. dollar, are usually positive indicators for the outlook for international smaller companies.
Looking forward, therefore, we maintain our quality growth at a reasonable price investment approach, and aim to identify those companies where we believe the valuations do not reflect their underlying competitive and balance sheet strengths, and their potential to generate profit growth through further improvements in their returns and business models. Our view is that in the long-term this approach should help mitigate the risks of smaller company investment and allow us to identify companies with undiscounted growth opportunities and attractive valuations.
32
Harbor International Small Cap Fund
Managers' Commentary—Continued
Managers' Commentary—Continued
This report contains the current opinions of Baring International Investment Limited as of the date of this report and should not be considered as investment advice or a recommendation of any particular security, strategy or investment product. Such opinions are subject to change without notice and securities described herein may no longer be included in, or may at any time be removed from, the Fund’s portfolio. This report is distributed for informational purposes only. Information contained herein has been obtained from sources believed reliable, but not guaranteed.
Investing in international and emerging markets poses special risks, including potentially greater price volatility due to social, political and economic factors, as well as currency exchange rate fluctuations. These risks are more severe for securities of issuers in emerging market regions. For information on the different share classes and the risks associated with an investment in the Fund, please refer to the current prospectus.
Stocks of small cap companies pose special risks, including possible illiquidity and greater price volatility than stocks of larger, more established companies. Equity securities, such as common stocks, are affected by company specific events and by movements in the overall stock markets in which those securities principally trade, among other factors. An adverse company specific event, or downturn in those stock markets, can depress the value of a particular company’s equity securities. For information on the different share classes and the risks associated with an investment in the Fund, please refer to the current prospectus.
33
Harbor International Small Cap Fund
Fund Summary—October 31, 2017 (Unaudited)
Fund Summary—October 31, 2017 (Unaudited)
| INSTITUTIONAL CLASS | |
| Fund # | 2039 |
| Cusip | 411512569 |
| Ticker | HAISX |
| Inception Date | 02/01/2016 |
| Net Expense Ratio | 0.95% a |
| Total Net Assets (000s) | $38,818 |
| ADMINISTRATIVE CLASS | |
| Fund # | 2239 |
| Cusip | 411512551 |
| Ticker | HRISX |
| Inception Date | 02/01/2016 |
| Net Expense Ratio | 1.20% a |
| Total Net Assets (000s) | $371 |
| INVESTOR CLASS | |
| Fund # | 2439 |
| Cusip | 411512544 |
| Ticker | HIISX |
| Inception Date | 02/01/2016 |
| Net Expense Ratio | 1.32% a |
| Total Net Assets (000s) | $540 |
| RETIREMENT CLASS | |
| Fund # | 2539 |
| Cusip | 411512536 |
| Ticker | HNISX |
| Inception Date | 02/01/2016 |
| Net Expense Ratio | 0.87% a |
| Total Net Assets (000s) | $7,671 |
Portfolio Statistics
| Portfolio | Benchmark | ||
| Number of Countries | 19 | 25 | |
| Weighted Average Market Cap (MM) | $3,385 | $2,861 | |
| Price/Earning Ratio (P/E) | 23.3x | 20.9x | |
| Price/Book Ratio (P/B) | 3.5x | 2.4x | |
| Beta vs. MSCI EAFE Small Cap (ND) Index | 0.77 | N/A | |
| Portfolio Turnover (Year Ended 10/31/2017) | 44% | N/A |
Sector Allocation (% of investments)
(Excludes cash and short-term investments)

REGION BREAKDOWN (% of investments)
(Excludes cash and short-term investments)

| a | Reflects an expense limitation agreement (excluding interest expense, if any) effective through February 28, 2018 |
34
Harbor International Small Cap Fund
Fund Performance Summary (Unaudited)
Fund Performance Summary (Unaudited)
The graph compares a $50,000 investment in the Institutional Class shares of the Fund with the performance of the MSCI EAFE Small Cap (ND) Index. The Fund’s performance assumes the reinvestment of all dividend and capital gain distributions.
CHANGE IN A $50,000 INVESTMENT
For the period 02/01/2016 through 10/31/2017

| TOTAL RETURNS For the periods ended 10/31/2017 | 1 Year | 5 Years | Annualized | Inception Date | Final Value of a $50,000 Investment | |||||||||
| Life of Fund | ||||||||||||||
| Harbor International Small Cap Fund | ||||||||||||||
Institutional Class | 30.59% | N/A | 21.55% | 02/01/2016 | $70,324 | |||||||||
Administrative Class | 30.25 | N/A | 21.24 | 02/01/2016 | 70,009 | |||||||||
Investor Class | 30.10 | N/A | 21.09 | 02/01/2016 | 69,863 | |||||||||
Retirement Class | 30.67 | N/A | 21.59 | 02/01/2016 | 70,363 | |||||||||
| Comparative Index | ||||||||||||||
MSCI EAFE Small Cap (ND) | 27.51% | N/A | 21.94% | — | $70,723 | |||||||||
As stated in the Fund’s current prospectus, the expense ratios were 0.95% (Net) and 2.56% (Gross) (Institutional Class); 1.20% (Net) and 2.81% (Gross) (Administrative Class); 1.32% (Net) and 2.93% (Gross) (Investor Class); and 0.87% (Net) and 2.48% (Gross) (Retirement Class). The net expense ratios reflect an expense limitation agreement (excluding interest expense, if any) effective through 2/28/2018. The expense ratios in the prospectus may differ from the actual expense ratios for the period disclosed within this report. The expense ratios shown in the prospectus are based on the prior fiscal year, adjusted to reflect changes, if any, in contractual arrangements that occurred prior to the date of the prospectus (or supplement thereto, if applicable).
Performance data shown represents past performance and is no guarantee of future results. Past performance is net of management fees and expenses and reflects reinvested dividends and distributions, but does not reflect the deduction of taxes that a shareholder would pay on Fund distributions or upon the redemption of Fund shares. Past performance reflects the beneficial effect of any expense waivers or reimbursements, without which returns would have been lower. Investment returns and principal value will fluctuate and when redeemed may be worth more or less than their original cost. Returns for periods less than one year are not annualized. Current performance may be higher or lower and is available through the most recent month end at harborfunds.com or by calling 800-422-1050.
35
Harbor International Small Cap Fund
Portfolio of Investments—October 31, 2017
Portfolio of Investments—October 31, 2017
Value, Cost, and Principal Amounts in Thousands
Total Investments by Country (% of net assets)
(Excludes net cash and short-term investments of 2.5%)

| COMMON STOCKS—97.5% | |||
| Shares | Value | ||
| AUTO COMPONENTS—2.8% | |||
| 8,400 | Nifco Inc. (JP) | $ 548 | |
| 23,494 | Saf-Holland SA (LUX) | 466 | |
| 338,000 | Xinyi Glass Holdings Ltd. (HK) | 328 | |
| 1,342 | |||
| BANKS—2.5% | |||
| 106,000 | Fukuoka Financial Group Inc. (JP) | 547 | |
| 18,300 | Suruga Bank Ltd. (JP) | 417 | |
| 10,611 | TBC Bank Group plc (UK)* | 241 | |
| 1,205 | |||
| CAPITAL MARKETS—2.3% | |||
| 9,299 | Euronext NV (NET) | 553 | |
| 42,691 | Intermediate Capital Group plc (UK) | 551 | |
| 1,104 | |||
| CHEMICALS—4.3% | |||
| 93,180 | Incitec Pivot Ltd. (AUS) | 273 | |
| 10,700 | Kansai Paint Co. Ltd. (JP) | 275 | |
| 69,851 | Nufarm Ltd. (AUS) | 486 | |
| 45,000 | Okamoto Industries Inc. (JP) | 490 | |
| 81,219 | Synthomer plc (UK) | 528 | |
| 2,052 | |||
| COMMERCIAL SERVICES & SUPPLIES—6.0% | |||
| 14,200 | AEON Delight Co. Ltd. (JP) | 532 | |
| 62,456 | Bravida Holding AB (SW) | 426 | |
| 50,813 | HomeServe plc (UK) | 578 | |
| 14,417 | Intrum Justitia AB (SW) | 505 | |
| COMMON STOCKS—Continued | |||
| Shares | Value | ||
| COMMERCIAL SERVICES & SUPPLIES—Continued | |||
| 104,046 | Prosegur Cash SA (SP)* | $ 339 | |
| 19,500 | Sato Holdings Corp. (JP) | 475 | |
| 2,855 | |||
| COMMUNICATIONS EQUIPMENT—1.1% | |||
| 23,479 | Ascom Holding AG (SWS) | 537 | |
| CONSTRUCTION & ENGINEERING—3.1% | |||
| 6,881 | FLSmidth & Co. (DEN) | 472 | |
| 14,400 | Kyudenko Corp. (JP) | 636 | |
| 68,068 | Maire Tecnimont SpA (IT) | 381 | |
| 1,489 | |||
| CONSTRUCTION MATERIALS—1.0% | |||
| 17,616 | Wienerberger AG (AUT) | 452 | |
| CONSUMER FINANCE—2.6% | |||
| 91,739 | Arrow Global Group plc (UK) | 517 | |
| 3,027 | Cembra Money Bank AG (SWS)* | 271 | |
| 28,080 | Credit Corp. Group Ltd. (AUS) | 432 | |
| 1,220 | |||
| CONTAINERS & PACKAGING—2.9% | |||
| 62,139 | DS Smith plc (UK) | 430 | |
| 119,860 | Orora Ltd. (AUS) | 312 | |
| 50,248 | RPC Group plc (UK) | 629 | |
| 1,371 | |||
| DIVERSIFIED CONSUMER SERVICES—1.0% | |||
| 14,585 | Dignity plc (UK) | 470 | |
| DIVERSIFIED FINANCIAL SERVICES—0.7% | |||
| 5,347 | KBC Ancora (BEL)* | 319 | |
| DIVERSIFIED TELECOMMUNICATION SERVICES—0.6% | |||
| 38,621 | Infrastrutture Wireless Italiane SpA (IT)* | 264 | |
| ELECTRICAL EQUIPMENT—0.9% | |||
| 8,100 | Mabuchi Motor Co. Ltd. (JP) | 425 | |
| ELECTRONIC EQUIPMENT, INSTRUMENTS & COMPONENTS—2.1% | |||
| 2,944 | Barco NV (BEL) | 302 | |
| 7,300 | Iriso Electronics Co. Ltd. (JP) | 412 | |
| 13,000 | Shimadzu Corp. (JP) | 270 | |
| 984 | |||
| ENERGY EQUIPMENT & SERVICES—0.9% | |||
| 18,771 | TGS-NOPEC Geophysical Co. (NOR) | 432 | |
| FOOD & STAPLES RETAILING—1.0% | |||
| 18,099 | MARR SpA (IT) | 462 | |
| FOOD PRODUCTS—4.0% | |||
| 6,679 | AAK AB (SW) | 540 | |
| 105,913 | Costa Group Holdings Ltd. (AUS) | 504 | |
| 7,900 | Ezaki Glico Co. Ltd. (JP) | 438 | |
| 50,212 | Tate & Lyle plc (UK) | 431 | |
| 1,913 | |||
| HEALTH CARE EQUIPMENT & SUPPLIES—1.9% | |||
| 9,901 | Carl Zeiss Meditec AG (GER) | 528 | |
| 4,209 | Diasorin SpA (IT) | 383 | |
| 911 | |||
36
Harbor International Small Cap Fund
Portfolio of Investments—Continued
Portfolio of Investments—Continued
Value, Cost, and Principal Amounts in Thousands
| COMMON STOCKS—Continued | |||
| Shares | Value | ||
| HEALTH CARE PROVIDERS & SERVICES—3.9% | |||
| 34,642 | Amplifon SpA (IT) | $ 526 | |
| 36,578 | Attendo AB (SW) | 430 | |
| 9,012 | NMC Health plc (UK) | 346 | |
| 42,991 | UDG Healthcare plc (IE) | 528 | |
| 1,830 | |||
| HEALTH CARE TECHNOLOGY—0.5% | |||
| 4,286 | CompuGroup Medical SE (GER) | 247 | |
| HOTELS, RESTAURANTS & LEISURE—3.0% | |||
| 84,808 | Dalata Hotel Group plc (IE)* | 529 | |
| 7,840 | Elior Group SA (FR) | 223 | |
| 84,952 | SSP Group plc (UK) | 660 | |
| 1,412 | |||
| HOUSEHOLD DURABLES—1.7% | |||
| 30,939 | GUD Holdings Ltd. (AUS) | 283 | |
| 31,200 | Sumitomo Forestry Co. Ltd. (JP) | 525 | |
| 808 | |||
| HOUSEHOLD PRODUCTS—2.0% | |||
| 165,185 | McBride plc (UK)* | 472 | |
| 13,700 | Pigeon Corp. (JP) | 486 | |
| 958 | |||
| INDEPENDENT POWER & RENEWABLE ELECTRICITY PRODUCERS—0.8% | |||
| 40,600 | Erex Co. Ltd. (JP) | 402 | |
| INDUSTRIAL CONGLOMERATES—0.4% | |||
| 987 | Daetwyler Holding AG (SWS) | 166 | |
| INSURANCE—2.2% | |||
| 78,086 | Beazley plc (UK) | 524 | |
| 59,730 | Storebrand ASA (NOR)* | 511 | |
| 1,035 | |||
| IT SERVICES—3.2% | |||
| 80,308 | Link Administration Holdings Ltd. (AUS) | 507 | |
| 10,900 | SCSK Corp. (JP) | 470 | |
| 11,186 | Worldline SA (FR)* | 547 | |
| 1,524 | |||
| LEISURE PRODUCTS—1.0% | |||
| 21,144 | Thule Group AB (SW) | 473 | |
| LIFE SCIENCES TOOLS & SERVICES—1.0% | |||
| 5,827 | Gerresheimer AG (GER) | 466 | |
| MACHINERY—11.5% | |||
| 7,678 | Cargotec OYJ (FIN) | 453 | |
| 21,300 | CKD Corp. (JP) | 420 | |
| 8,200 | Daifuku Co. Ltd. (JP) | 400 | |
| 136,000 | Haitian International Holdings Ltd. (CYM ) | 407 | |
| 2,900 | Hoshizaki Corp. (JP) | 274 | |
| 14,800 | Minebea Mitsumi Inc. (JP) | 271 | |
| 93,121 | Morgan Advanced Materials plc (UK) | 388 | |
| 15,000 | Nabtesco Corp. (JP) | 596 | |
| 22,800 | OSG Corp. (JP) | 494 | |
| 4,014 | SFS Group AG (SWS)* | 476 | |
| 2,798 | Stabilus SA (GER)* | 256 | |
| 15,300 | THK Co. Ltd. (JP)* | 558 | |
| 23,208 | Valmet OYJ (FIN) | 450 | |
| 5,443 | |||
| COMMON STOCKS—Continued | |||
| Shares | Value | ||
| MEDIA—2.4% | |||
| 53,759 | Ascential plc (UK) | $ 240 | |
| 53,095 | Cineworld Group plc (UK) | 468 | |
| 6,550 | Kinepolis Group NV (BEL) | 443 | |
| 1,151 | |||
| MULTILINE RETAIL—1.1% | |||
| 97,226 | B&M European Value Retail SA (LUX) | 513 | |
| MULTI-UTILITIES—1.1% | |||
| 155,667 | Hera SpA (IT) | 501 | |
| OIL, GAS & CONSUMABLE FUELS—0.6% | |||
| 5,650 | Gaztransport Et Technigaz SA (FR) | 277 | |
| PERSONAL PRODUCTS—0.9% | |||
| 11,545 | Ontex Group NV (BEL) | 406 | |
| PROFESSIONAL SERVICES—6.0% | |||
| 34,188 | Applus Services SA (SP) | 478 | |
| 4,563 | DKSH Holding AG (SWS) | 383 | |
| 12,600 | Nihon M&A Center Inc. (JP) | 603 | |
| 22,200 | Persol Holdings Co Ltd. (JP) | 550 | |
| 12,000 | TechnoPro Holdings Inc. (JP) | 550 | |
| 1,805 | Teleperformance (FR) | 264 | |
| 2,828 | |||
| REAL ESTATE MANAGEMENT & DEVELOPMENT—2.0% | |||
| 4,598 | Nexity SA (FR) | 283 | |
| 27,100 | Relo Group Inc. (JP) | 671 | |
| 954 | |||
| SEMICONDUCTORS & SEMICONDUCTOR EQUIPMENT—1.2% | |||
| 8,568 | ASM International NV (NET) | 574 | |
| SOFTWARE—1.8% | |||
| 67,080 | Sophos Group plc (UK) | 553 | |
| 2,660 | Temenos Group AG (SWS) | 307 | |
| 860 | |||
| SPECIALTY RETAIL—3.1% | |||
| 9,700 | ABC-Mart Inc. (JP) | 489 | |
| 4,000 | Hikari Tsushin Inc. (JP) | 518 | |
| 100,473 | JD Sports Fashion plc (UK) | 477 | |
| 1,484 | |||
| TEXTILES, APPAREL & LUXURY GOODS—0.7% | |||
| 77,700 | Samsonite International SA (HK) | 325 | |
| THRIFTS & MORTGAGE FINANCE—1.0% | |||
| 11,753 | Aareal Bank AG (GER) | 489 | |
| TRADING COMPANIES & DISTRIBUTORS—2.7% | |||
| 33,776 | Ahlsell AB (SW)* | 223 | |
| 8,743 | IMCD Group NV (NET) | 550 | |
| 15,600 | Kanamoto Co. Ltd. (JP) | 513 | |
| 1,286 | |||
| TOTAL COMMON STOCKS | |||
(Cost $38,702) | 46,219 | ||
37
Harbor International Small Cap Fund
Portfolio of Investments—Continued
Portfolio of Investments—Continued
Value, Cost, and Principal Amounts in Thousands
| PREFERRED STOCKS—0.0% | |||
| Shares | Value | ||
| (Cost $6) | |||
| HOUSEHOLD PRODUCTS—0.0% | |||
| 4,790,365 | McBride plc (UK)* | $ 6x | |
| SHORT-TERM INVESTMENTS—3.4% | |||
| (Cost $1,634) | |||
| Principal Amount | |||
| REPURCHASE AGREEMENTS | |||
| $ | 1,634 | Repurchase Agreement with Fixed Income Clearing Corp. dated October 31, 2017 due November 01, 2017 at 0.001% collateralized by U.S. Treasury Notes (market value $1,669) | 1,634 |
| TOTAL INVESTMENTS—100.9% | |||
(Cost $40,342) | 47,859 | ||
CASH AND OTHER ASSETS, LESS LIABILITIES—(0.9)% | (459) | ||
TOTAL NET ASSETS—100.0% | $47,400 | ||
FAIR VALUE MEASUREMENTS
The following table summarizes the Fund’s investments as of October 31, 2017 based on the inputs used to value them.
| Asset Category | Quoted Prices Level 1 (000s) | Other Significant Observable Inputs Level 2 (000s) | Significant Unobservable Inputs Level 3 (000s) | Total (000s) | ||||
| Common Stocks | ||||||||
Europe | $— | $28,106 | $— | $28,106 | ||||
Latin America | — | 407 | — | 407 | ||||
Pacific Basin | — | 17,706 | — | 17,706 | ||||
| Preferred Stocks | ||||||||
Europe | — | — | 6 | 6 | ||||
| Short-Term Investments | ||||||||
Repurchase Agreements | — | 1,634 | — | 1,634 | ||||
Total Investments in Securities | $— | $47,853 | $ 6 | $47,859 |
The following is a rollforward of the Fund’s Level 3 investments during the year ended October 31, 2017.
| Valuation Description | Balance Beginning at 11/01/2016 (000s) | Purchases (000s) | Sales (000s) | Discount/ (Premium) (000s) | Total Realized Gain/(Loss)w (000s) | Change in Unrealized Appreciation/ (Depreciation)w (000s) | Transfers In Level 3 (000s) | Transfers Out of Level 3 (000s) | Ending Balance as of 10/31/2017w (000s) | |||||||||
Preferred Stocks | $2 | $6 | $(2) | $— | $— | $— | $— | $— | $6 |
There were no transfers between levels during the year.
38
Harbor International Small Cap Fund
Portfolio of Investments—Continued
Portfolio of Investments—Continued
FAIR VALUE MEASUREMENTS—Continued
The following is a summary of significant unobservable inputs used in the fair valuations of assets and liabilities categorized within Level 3 of the fair value hierarchy.
| Valuation Descriptions | Ending Balance as of 10/31/2017 (000s) | Valuation Technique | Unobservable Inputs | Input Value(s) | ||||
| Investments in Securities | ||||||||
| Preferred Stocks | ||||||||
McBride plc (UK)* | $6 | Market Approach | Pre-Traded Price | £ 0.001 |
For more information on valuation inputs and their aggregation into the levels used in the table above, please refer to the Fair Value Measurements and Disclosures in Note 2 of the accompanying Notes to Financial Statements.
| * | Non-income producing security | ||
| w | Amounts in this category are included in the “Realized and Change in Unrealized Gain/(Loss) on Investment Transactions” section of the Statement of Operations. The net unrealized appreciation/(depreciation) per invesstment type is below: | ||
| Valuation Description | Unrealized Gain/(Loss) as of 10/31/2017 (000s) | ||
Preferred Stocks | $– | ||
| x | Fair Valued in accordance with Harbor Funds Valuation Procedures using pre-traded price which is a Level 3 input | ||
| £ | British Pound | ||
The accompanying notes are an integral part of the Financial Statements.
39
Harbor Global Leaders Fund
Manager’s Commentary (Unaudited)
Manager’s Commentary (Unaudited)
Subadviser
Sands Capital Management, LLC
1000 Wilson Boulevard
Suite 3000
Suite 3000
Arlington, VA 22209
Portfolio Manager
Sunil H. Thakor, CFA
Since 2017
Since 2017
Sands Capital has subadvised the Fund since 2017.
Investment Objective
The Fund seeks long-term growth of capital.

Sunil H. Thakor, CFA
Management’s Discussion of
Fund Performance
Fund Performance
Market Review
Global equities steamed ahead in the second and third quarter amid robust earnings and low volatility. U.S. large cap growth continues to outperform value, as consumer confidence remains on an upward trend and the economy steadily grows. The U.S. posted its strongest quarterly GDP growth in over two years, with support from consumer spending and business activity. Additionally, the U.S. Federal Reserve’s decision to maintain low interest rates combined with possible expansionary U.S. fiscal policy are creating tailwinds for stocks of U.S. businesses.
The global macroeconomic picture appears healthy. The Organization for Economic Cooperation and Development (OECD) reported that all 45 countries that it tracks will grow this year—the first time since 2007. Remarkably, 33 are expected to accelerate their growth over the prior year. In Europe, economic confidence is at a 10-year high and unemployment is at an 8-year low. The Japanese economy is growing at a healthy 4 percent rate, and growth expectations in emerging markets economies are improving. Firming economic data in China supported gains, while a weaker U.S. dollar, accommodative global monetary policy, and higher oil prices bolstered emerging market equities.
Performance
During the period from November 1, 2016 to February 28, 2017, the Fund’s performance was negatively impacted by its holdings in Domino’s Pizza Enterprises and Anheuser-Busch Inbev. On March 1, 2017, Sands Capital Management was appointed subadviser to the Fund. For the year ended October 31, 2017, the Fund returned 24.74% (Institutional Class), 24.48% (Administrative Class), 24.28% (Investor Class), and 24.84% (Retirement Class) versus the 23.20% return for the MSCI All Country World (ND). We believe that strong business fundamentals were the primary drivers of investment results, backed by a supportive macroeconomic environment. Many of the businesses beat expectations or underpinned what we expect to be continued long-term, above-average growth.
On an absolute basis, the largest contributors to investment results were Alibaba, Safran, Tencent, Taiwan Semiconductor, and Visa. We believe Alibaba’s recent efforts to set a clear standard of service, improve logistics, and overhaul its advertising system have translated into strong overall business performance and are expected to lead to higher, more sustainable growth over time. The Fund’s strong contributions from other holdings such as Safran, a global leader in aerospace, and Visa, a global payments processing company, reflect its focus on global companies with strong competitive positions.
On an absolute basis, the largest detractors to investment results were Allergan, Celgene, O’Reilly Automotive, Nike, and Ross Stores. Shares of Nike sold off after its wholesale partners reported poor quarterly business results. While this news weighed on Nike’s share price, it did not affect our outlook for the business. The company’s direct-to-consumer (DTC) and international businesses are what matter most to us over the long-term. Nike’s recent results demonstrate strong progress in both these areas, with DTC and China each growing in excess of 10 percent over the prior year. E-commerce was a particular bright spot within DTC, reporting yearly sales growth near 20 percent. Longer-term, we expect Nike’s continued shift toward DTC and international expansion to sustain above-average annualized earnings growth.
Outlook & Strategy
We seek to identify leading growth businesses for the Fund that we believe meet six investment criteria. They are: sustainable, above-average earnings growth; leadership position in a promising business space; significant competitive advantages or unique business franchise; clear mission and value-added focus; financial strength; and rational valuation relative to the market and business prospects. The criteria tend to lead us to innovative companies whose above-average growth is supported by powerful secular tailwinds. Typically, these growth companies are in the Consumer, Technology, and Healthcare sectors.
40
Harbor Global Leaders Fund
Manager’s Commentary—Continued
Manager’s Commentary—Continued
| TOP TEN HOLDINGS (% of Net Assets) | |
| Visa Inc. | 4.9% |
| TransDigm Group Inc. | 4.5% |
| Alibaba Group Holding Ltd. ADR | 4.3% |
| HDFC Bank Ltd. ADR | 4.0% |
| Taiwan Semiconductor Manufacturing Co. Ltd. ADR | 4.0% |
| Alimentation Couche-Tard Inc. | 3.9% |
| Safran SA | 3.8% |
| American Tower Corp. | 3.7% |
| Starbucks Corp. | 3.5% |
| Zoetis Inc. | 3.3% |
We are optimistic about the health and growth of the businesses owned in the Fund. Regardless of changes in the macroeconomic environment, we believe these businesses are capable of producing above-average growth over the long-term.
This report contains the current opinions of Sands Capital Management, LLC as of the date of this report and should not be considered as investment advice or a recommendation of any particular security, strategy or investment product. Such opinions are subject to change without notice and securities described herein may no longer be included in, or may at any time be removed from, the Fund’s portfolio. This report is distributed for informational purposes only. Information contained herein has been obtained from sources believed reliable, but not guaranteed.
Investing in international and emerging markets poses special risks, including potentially greater price volatility due to social, political and economic factors, as well as currency exchange rate fluctuations. These risks are more severe for securities of issuers in emerging market regions. For information on the different share classes and the risks associated with an investment in the Fund, please refer to the current prospectus.
41
Harbor Global Leaders Fund
Fund Summary—October 31, 2017 (Unaudited)
Fund Summary—October 31, 2017 (Unaudited)
| INSTITUTIONAL CLASS | |
| Fund # | 2030 |
| Cusip | 411512874 |
| Ticker | HGGAX |
| Inception Date | 03/01/2009 |
| Net Expense Ratio | 0.90% a |
| Total Net Assets (000s) | $29,034 |
| ADMINISTRATIVE CLASS | |
| Fund # | 2230 |
| Cusip | 411512866 |
| Ticker | HRGAX |
| Inception Date | 03/01/2009 |
| Net Expense Ratio | 1.15% a |
| Total Net Assets (000s) | $1,204 |
| INVESTOR CLASS | |
| Fund # | 2430 |
| Cusip | 411512858 |
| Ticker | HGGIX |
| Inception Date | 03/01/2009 |
| Net Expense Ratio | 1.27% a |
| Total Net Assets (000s) | $11,364 |
| RETIREMENT CLASS | |
| Fund # | 2530 |
| Cusip | 411512411 |
| Ticker | HNGIX |
| Inception Date | 03/01/2016 |
| Net Expense Ratio | 0.83% a |
| Total Net Assets (000s) | $4,376 |
Portfolio Statistics
| Portfolio | Benchmark | ||
| Number of Countries | 11 | 49 | |
| Weighted Average Market Cap (MM) | $115,715 | $128,789 | |
| Price/Earning Ratio (P/E) | 31.9x | 23.0x | |
| Price/Book Ratio (P/B) | 6.6x | 3.2x | |
| Beta vs. MSCI All Country World (ND) Index | 0.95 | N/A | |
| Portfolio Turnover (Year Ended 10/31/2017) | 123% | N/A |
Sector Allocation (% of investments)
(Excludes cash and short-term investments)

REGION BREAKDOWN (% of investments)
(Excludes cash and short-term investments)

| a | Reflects an expense limitation agreement (excluding interest expense, if any) effective through February 28, 2018 |
42
Harbor Global Leaders Fund
Fund Performance Summary (Unaudited)
Fund Performance Summary (Unaudited)
The graph compares a $50,000 investment in the Institutional Class shares of the Fund with the performance of the MSCI All Country World (ND) Index. The Fund’s performance assumes the reinvestment of all dividend and capital gain distributions.
CHANGE IN A $50,000 INVESTMENT
For the period 03/01/2009 through 10/31/2017

| TOTAL RETURNS For the periods ended 10/31/2017 | 1 Year | Annualized | Inception Date | Final Value of a $50,000 Investment | ||||||||||
| 5 Years | Life of Fund | |||||||||||||
| Harbor Global Leaders Fund | ||||||||||||||
Institutional Class | 24.74% | 13.11% | 17.40% | 03/01/2009 | $200,956 | |||||||||
Administrative Class | 24.48 | 12.82 | 17.11 | 03/01/2009 | 196,671 | |||||||||
Investor Class | 24.28 | 12.69 | 16.97 | 03/01/2009 | 194,601 | |||||||||
Retirement Class1 | 24.84 | 13.13 | 17.41 | 03/01/2016 | 201,114 | |||||||||
| Comparative Index | ||||||||||||||
MSCI All Country World (ND)2 | 23.20% | 10.80% | 14.31% | — | $159,468 | |||||||||
As stated in the Fund’s current prospectus, the expense ratios were 0.90% (Net) and 1.05% (Gross) (Institutional Class); 1.15% (Net) and 1.30% (Gross) (Administrative Class); 1.27% (Net) and 1.42% (Gross) (Investor Class); and 0.82% (Net) and 0.97% (Retirement Class). The net expense ratios reflect an expense limitation agreement (excluding interest expense, if any) effective through 02/28/2018. The expense ratios in the prospectus may differ from the actual expense ratios for the period disclosed within this report. The expense ratios shown in the prospectus are based on the prior fiscal year, adjusted to reflect changes, if any, in contractual arrangements that occurred prior to the date of the prospectus (or supplement thereto, if applicable).
Performance data shown represents past performance and is no guarantee of future results. Past performance is net of management fees and expenses and reflects reinvested dividends and distributions, but does not reflect the deduction of taxes that a shareholder would pay on Fund distributions or upon the redemption of Fund shares. Past performance reflects the beneficial effect of any expense waivers or reimbursements, without which returns would have been lower. Investment returns and principal value will fluctuate and when redeemed may be worth more or less than their original cost. Returns for periods less than one year are not annualized. Current performance may be higher or lower and is available through the most recent month end at harborfunds.com or by calling 800-422-1050.
| 1 | Retirement Class shares commenced operations on March 1, 2016. The performance attributed to the Retirement Class shares prior to that date is that of the Institutional Class shares. Performance prior to March 1, 2016 has not been adjusted to reflect the lower expenses of Retirement Class shares. During this period, Retirement Class shares would have had returns similar to, but somewhat higher than, Institutional Class shares due to the fact that Retirement Class shares represent interests in the same portfolio as Institutional Class shares but are subject to lower expenses. |
| 2 | The “Life of Fund” return and “Final Value of $50,000 Investment” as shown reflects the period 03/01/2009 through 10/31/2017. |
43
Harbor Global Leaders Fund
Portfolio of Investments—October 31, 2017
Portfolio of Investments—October 31, 2017
Value, Cost, and Principal Amounts in Thousands
Total Investments by Country (% of net assets)
(Excludes net cash and short-term investments of 0.8%)

| COMMON STOCKS—99.2% | |||
| Shares | Value | ||
| AEROSPACE & DEFENSE—8.2% | |||
| 16,300 | Safran SA (FR) | $ 1,717 | |
| 7,465 | TransDigm Group Inc. (US) | 2,071 | |
| 3,788 | |||
| BANKS—4.0% | |||
| 19,700 | HDFC Bank Ltd. ADR (IND)1 | 1,818 | |
| BEVERAGES—2.3% | |||
| 12,020 | Fomento Economico Mexicano SAB de CV ADR (MEX)1 | 1,055 | |
| BIOTECHNOLOGY—1.8% | |||
| 8,075 | Celgene Corp. (US)* | 815 | |
| CAPITAL MARKETS—5.2% | |||
| 21,200 | Intercontinental Exchange Inc. (US) | 1,401 | |
| 6,950 | Moody's Corp. (US) | 990 | |
| 2,391 | |||
| ELECTRONIC EQUIPMENT, INSTRUMENTS & COMPONENTS—3.0% | |||
| 2,490 | Keyence Corp. (JP) | 1,382 | |
| EQUITY REAL ESTATE INVESTMENT TRUSTS (REITs)—3.7% | |||
| 11,800 | American Tower Corp. (US) | 1,695 | |
| FOOD & STAPLES RETAILING—3.9% | |||
| 38,675 | Alimentation Couche-Tard Inc. (CAN) | 1,813 | |
| HEALTH CARE EQUIPMENT & SUPPLIES—2.3% | |||
| 8,450 | Essilor International SA (FR) | 1,070 | |
| HEALTH CARE PROVIDERS & SERVICES—2.7% | |||
| 12,800 | Fresenius Medical Care AG & Co. KGaA (GER) | 1,239 | |
| HOTELS, RESTAURANTS & LEISURE—5.6% | |||
| 208,800 | Sands China Ltd. (CHN) | 985 | |
| 29,295 | Starbucks Corp. (US) | 1,607 | |
| 2,592 | |||
| INTERNET & DIRECT MARKETING RETAIL—2.8% | |||
| 675 | Priceline Group Inc. (US)* | 1,291 | |
| INTERNET SOFTWARE & SERVICES—11.1% | |||
| 10,650 | Alibaba Group Holding Ltd. ADR (CHN)*,1 | 1,969 | |
| 1,375 | Alphabet Inc. Class A (US)* | 1,421 | |
| COMMON STOCKS—Continued | |||
| Shares | Value | ||
| INTERNET SOFTWARE & SERVICES—Continued | |||
| 11,850 | Rightmove plc (UK) | $ 654 | |
| 23,925 | Tencent Holdings Ltd. (CHN) | 1,075 | |
| 5,119 | |||
| IT SERVICES—4.9% | |||
| 20,339 | Visa Inc. (US) | 2,237 | |
| MEDIA—1.3% | |||
| 13,450 | Live Nation Entertainment Inc. (US)* | 589 | |
| MULTILINE RETAIL—3.8% | |||
| 12,950 | Dollar General Corp. (US) | 1,047 | |
| 16,375 | Don Quijote Holdings Co. Ltd. (JP) | 687 | |
| 1,734 | |||
| PHARMACEUTICALS—7.3% | |||
| 5,540 | Allergan plc (US) | 982 | |
| 14,250 | Bristol-Myers Squibb Co. (US) | 878 | |
| 23,625 | Zoetis Inc. (US) | 1,508 | |
| 3,368 | |||
| PROFESSIONAL SERVICES—4.4% | |||
| 38,150 | Recruit Holdings Co. Ltd. (JP) | 935 | |
| 12,975 | Verisk Analytics Inc. (US)* | 1,104 | |
| 2,039 | |||
| ROAD & RAIL—1.8% | |||
| 7,190 | Union Pacific Corp. (US) | 833 | |
| SEMICONDUCTORS & SEMICONDUCTOR EQUIPMENT—4.0% | |||
| 43,075 | Taiwan Semiconductor Manufacturing Co. Ltd. ADR (TW)1 | 1,823 | |
| SOFTWARE—6.9% | |||
| 8,190 | Adobe Systems Inc. (US)* | 1,435 | |
| 9,570 | Dassault Systemes SE (FR) | 1,016 | |
| 4,625 | Intuit Inc. (US) | 698 | |
| 3,149 | |||
| SPECIALTY RETAIL—3.9% | |||
| 24,025 | Industria de Diseno Textil SA (SP) | 898 | |
| 14,200 | Ross Stores Inc. (US) | 902 | |
| 1,800 | |||
| TEXTILES, APPAREL & LUXURY GOODS—4.3% | |||
| 3,460 | LVMH Moet Hennessy Louis Vuitton SE (FR) | 1,032 | |
| 16,950 | NIKE Inc. (US) | 932 | |
| 1,964 | |||
| TOTAL COMMON STOCKS | |||
(Cost $38,360) | 45,604 | ||
44
Harbor Global Leaders Fund
Portfolio of Investments—Continued
Portfolio of Investments—Continued
Value, Cost, and Principal Amounts in Thousands
| SHORT-TERM INVESTMENTS—0.9% | |||
| (Cost $415) | |||
| Principal Amount | Value | ||
| REPURCHASE AGREEMENTS | |||
| $ | 415 | Repurchase Agreement with Fixed Income Clearing Corp. dated October 31, 2017 due November 01, 2017 at 0.001% collateralized by U.S. Treasury Notes (value $426) | $ 415 |
| TOTAL INVESTMENTS—100.1% | |||
(Cost $38,775) | 46,019 | ||
CASH AND OTHER ASSETS, LESS LIABILITIES—(0.1)% | (41) | ||
TOTAL NET ASSETS—100.0% | $45,978 | ||
FAIR VALUE MEASUREMENTS
The following table summarizes the Fund’s investments as of October 31, 2017 based on the inputs used to value them.
| Asset Category | Quoted Prices Level 1 (000s) | Other Significant Observable Inputs Level 2 (000s) | Significant Unobservable Inputs Level 3 (000s) | Total (000s) | ||||
| Common Stocks | ||||||||
Europe | $ — | $ 7,626 | $— | $ 7,626 | ||||
Latin America | 1,055 | — | — | 1,055 | ||||
Middle East/Central Asia | 1,818 | — | — | 1,818 | ||||
North America | 26,249 | — | — | 26,249 | ||||
Pacific Basin | 3,792 | 5,064 | — | 8,856 | ||||
| Short-Term Investments | ||||||||
Repurchase Agreements | — | 415 | — | 415 | ||||
Total Investments in Securities | $32,914 | $13,105 | $— | $46,019 |
There were no Level 3 holdings at October 31, 2017 or 2016, and no transfers between levels during the year.
For more information on valuation inputs and their aggregation into the levels used in the table above, please refer to the Fair Value Measurements and Disclosures in Note 2 of the accompanying Notes to Financial Statements.
| * | Non-income producing security |
| 1 | ADR after the name of a foreign holding stands for American Depositary Receipts representing ownership of foreign securities. ADRs are issued by U.S. banking institutions. |
The accompanying notes are an integral part of the Financial Statements.
45
Harbor Emerging Markets Equity Fund
Managers' Commentary (Unaudited)
Managers' Commentary (Unaudited)
Subadviser
Oaktree Capital Management, L.P.
333 South Grand Avenue
28th Floor
28th Floor
Los Angeles, CA 90071
Portfolio Managers
Frank Carroll
Since 2013
Since 2013
Tim Jensen
Since 2013
Since 2013
Oaktree has subadvised the Fund since 2013.
Investment Objective
The Fund seeks long-term growth of capital.

Frank Carroll

Tim Jensen
Management’s Discussion of
Fund Performance
Fund Performance
Market Review
Emerging market equities performed well during the twelve months-ended October 31, 2017. Stronger-than-expected economic growth, rising earnings expectations, strengthening currencies and several individual country factors contributed to the emerging markets’ strength.
Expectations of stronger growth in the U.S. and Europe, in addition to continued growth in China, supported commodity prices and raised hopes for an acceleration of global trade growth. Consensus 2017 earnings estimates for emerging markets companies were raised continuously during this period, largely on the back of upward revisions relating to technology, materials and energy companies. This is in sharp contrast to the prior five years, when earnings expectations were revised downward during the early part of each calendar year. President Trump’s victory initially triggered a U.S. dollar rally, particularly against the currencies of countries perceived to be most vulnerable to trade restrictions, such as the Mexican peso. However, the U.S. dollar peaked in December and subsequently declined relative to developed and most emerging markets currencies. The Mexican peso fell sharply after the election but rallied as fears about the North American Free Trade Agreement’s (NAFTA) future diminished.
Nearly all markets were positive during the period. China performed well thanks to strong economic and company data, slowing capital outflows, and a stable currency. South Korea benefited from strong foreign fund inflows, positive earnings revisions, particularly in the technology sector, and relieved political concerns with the conclusion of President Park’s impeachment process. India fell sharply in November after the government demonetized large currency notes in an effort to tax its informal economy, but recovered nicely as the growth impact of demonetization was less than feared, and after the ruling Bharatiya Janata Party’s (BJP) victories in state elections. Russia rallied sharply early in the period on oil-price strength and potentially better relations with the U.S. under a Trump administration; however, this performance trailed off after the oil price faded, a stronger ruble crimped exporters’ profit margins and concerns were raised over Russian collusion in the U.S. presidential elections.
According to data compiled by Emerging Portfolio Fund Research (EPFR), emerging markets funds experienced strong positive inflows. After many years of heavy outflows, this stretch of positive inflows has been a welcome development and an encouraging sign for the markets.
Performance
The Harbor Emerging Markets Equity Fund returned 27.54% (Institutional Class), 27.04% (Administrative Class), 27.00% (Investor Class), and 27.62% (Retirement Class) for the twelve-months ended October 31, 2017, compared to the 26.45% return of the MSCI Emerging Markets (ND) Index. The Fund’s performance during the year was primarily driven by strong stock selection in Brazil, South Korea, Russia and India, while stock selection in China hurt relative performance. We were helped by our overweight exposures to China and our avoidance of Malaysia, but our overweight to Brazil detracted from performance. By sector, strong stock selection among Consumer Discretionary, Financials, Energy and Information Technology contributed positively, while selection among Materials and Real Estate detracted.
Outlook & Strategy
Emerging markets equities have performed very well since early 2016 and the asset class is attracting inflows. Valuations are not stretched, as price-to-book value and price-to-earnings multiples are near the asset class’s long-term averages. They also continue to represent discounts to developed markets. Earnings revisions continued to be strong through the second quarter
46
Harbor Emerging Markets Equity Fund
Managers' Commentary—Continued
Managers' Commentary—Continued
| TOP TEN HOLDINGS (% of Net Assets) | |
| Samsung Electronics Co. Ltd. | 6.9% |
| Taiwan Semiconductor Manufacturing Co. Ltd. ADR | 6.1% |
| Tencent Holdings Ltd. | 5.1% |
| Alibaba Group Holding Ltd. ADR | 4.5% |
| Itau Unibanco Holding SA ADR | 3.3% |
| China Construction Bank Corp. | 3.1% |
| ICICI Bank Ltd. ADR | 2.7% |
| Vale SA ADR | 2.7% |
| China Overseas Land & Investment Ltd. | 2.4% |
| China Pacific Insurance Group Co. Ltd. | 2.1% |
reporting season, traditionally the weakest time of the year for emerging markets earnings revisions. Technology stocks have dominated the upward revisions, but there was some broadening out to other sectors during the quarter.
We approach investing from a bottom-up perspective. We analyze a company’s fundamentals and weigh our conclusions against the valuation the market places on the stock. We are value-biased but try to remain flexible and opportunistic; we may own some growth stocks that we believe in even though valuations might make us uncomfortable. We believe lower valuations reflect lower expectations, and therefore create a margin of safety when we identify a company we think will beat consensus expectations. There was a major style shift in emerging markets equities during the early part of the fiscal year. Value stocks outperformed sharply from the market trough, while high-quality, defensive growth stocks trailed the benchmark. Growth stocks shifted back into favor and outperformed value during the last six months of this twelve-month period. The Fund currently has a portfolio of stocks that we believe are attractively valued, have strong balance sheets and generate strong free cash flows.
The Fund holds a significant overweight exposure to Financials and a smaller overweight to Materials and Energy. We believe there is significant upside to emerging markets Financials given their low prevailing valuations, improving non-performing loan dynamics and unsynchronized but generally improving economic growth across most of the markets we invest in. The Fund remains underweight consumer names, largely on concerns about high valuation. By country, the Fund has significant overweight exposures to Brazil, China and Russia while underweight Korea, Taiwan and Malaysia.
This report contains the current opinions of Oaktree Capital Management, L.P. as of the date of this report and should not be considered as investment advice or a recommendation of any particular security, strategy or investment product. Such opinions are subject to change without notice and securities described herein may no longer be included in, or may at any time be removed from, the Fund’s portfolio. This report is distributed for informational purposes only. Information contained herein has been obtained from sources believed reliable, but not guaranteed.
Investing in international and emerging markets poses special risks, including potentially greater price volatility due to social, political and economic factors, as well as currency exchange rate fluctuations. These risks are more severe for securities of issuers in emerging market regions. For information on the different share classes and the risks associated with an investment in the Fund, please refer to the current prospectus.
47
Harbor Emerging Markets Equity Fund
Fund Summary—October 31, 2017 (Unaudited)
Fund Summary—October 31, 2017 (Unaudited)
| INSTITUTIONAL CLASS | |
| Fund # | 2036 |
| Cusip | 411512692 |
| Ticker | HAEMX |
| Inception Date | 11/01/2013 |
| Net Expense Ratio | 1.15% a |
| Total Net Assets (000s) | $51,849 |
| ADMINISTRATIVE CLASS | |
| Fund # | 2236 |
| Cusip | 411512684 |
| Ticker | HREMX |
| Inception Date | 11/01/2013 |
| Net Expense Ratio | 1.40% a |
| Total Net Assets (000s) | $275 |
| INVESTOR CLASS | |
| Fund # | 2436 |
| Cusip | 411512676 |
| Ticker | HIEEX |
| Inception Date | 11/01/2013 |
| Net Expense Ratio | 1.52% a |
| Total Net Assets (000s) | $700 |
| RETIREMENT CLASS | |
| Fund # | 2536 |
| Cusip | 411512395 |
| Ticker | HNEMX |
| Inception Date | 03/01/2016 |
| Net Expense Ratio | 1.08% a |
| Total Net Assets (000s) | $4,232 |
Portfolio Statistics
| Portfolio | Benchmark | ||
| Number of Countries | 15 | 27 | |
| Weighted Average Market Cap (MM) | $117,624 | $97,576 | |
| Price/Earning Ratio (P/E) | 16.0x | 18.5x | |
| Price/Book Ratio (P/B) | 2.2x | 2.6x | |
| Beta vs. MSCI Emerging Markets (ND) Index | 1.08 | N/A | |
| Portfolio Turnover (Year Ended 10/31/2017) | 59% | N/A |
Sector Allocation (% of investments)
(Excludes cash and short-term investments)
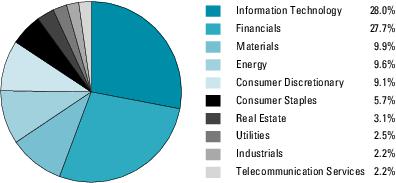
REGION BREAKDOWN (% of investments)
(Excludes cash and short-term investments)

| a | Reflects an expense limitation agreement (excluding interest expense, if any) effective through February 28, 2018 |
48
Harbor Emerging Markets Equity Fund
Fund Performance Summary (Unaudited)
Fund Performance Summary (Unaudited)
The graph compares a $50,000 investment in the Institutional Class shares of the Fund with the performance of the MSCI Emerging Markets (ND) Index. The Fund’s performance assumes the reinvestment of all dividend and capital gain distributions.
CHANGE IN A $50,000 INVESTMENT
For the period 11/01/2013 through 10/31/2017

| TOTAL RETURNS For the periods ended 10/31/2017 | 1 Year | 5 Years | Annualized | Inception Date | Final Value of a $50,000 Investment | |||||||||
| Life of Fund | ||||||||||||||
| Harbor Emerging Markets Equity Fund | ||||||||||||||
Institutional Class | 27.54% | N/A | 2.70% | 11/01/2013 | $55,614 | |||||||||
Administrative Class | 27.04 | N/A | 2.42 | 11/01/2013 | 55,021 | |||||||||
Investor Class | 27.00 | N/A | 2.30 | 11/01/2013 | 54,769 | |||||||||
Retirement Class1 | 27.62 | N/A | 2.71 | 03/01/2016 | 55,650 | |||||||||
| Comparative Index | ||||||||||||||
MSCI Emerging Markets (ND)2 | 26.45% | N/A | 4.41% | — | $59,424 | |||||||||
As stated in the Fund’s current prospectus, the expense ratios were 1.15% (Net) and 1.50% (Gross) (Institutional Class); 1.40% (Net) and 1.75% (Gross) (Administrative Class); 1.52% (Net) and 1.87% (Gross) (Investor Class); and 1.07% (Net) and 1.42% (Gross) (Retirement Class). The net expense ratios reflect an expense limitation agreement (excluding interest expense, if any) effective through 2/28/2018. The expense ratios in the prospectus may differ from the actual expense ratios for the period disclosed within this report. The expense ratios shown in the prospectus are based on the prior fiscal year, adjusted to reflect changes, if any, in contractual arrangements that occurred prior to the date of the prospectus (or supplement thereto, if applicable).
Performance data shown represents past performance and is no guarantee of future results. Past performance is net of management fees and expenses and reflects reinvested dividends and distributions, but does not reflect the deduction of taxes that a shareholder would pay on Fund distributions or upon the redemption of Fund shares. Past performance reflects the beneficial effect of any expense waivers or reimbursements, without which returns would have been lower. Investment returns and principal value will fluctuate and when redeemed may be worth more or less than their original cost. Returns for periods less than one year are not annualized. Current performance may be higher or lower and is available through the most recent month end at harborfunds.com or by calling 800-422-1050.
| 1 | Retirement Class shares commenced operations on March 1, 2016. The performance attributed to the Retirement Class shares prior to that date is that of the Institutional Class shares. Performance prior to March 1, 2016 has not been adjusted to reflect the lower expenses of Retirement Class shares. During this period, Retirement Class shares would have had returns similar to, but somewhat higher than, Institutional Class shares due to the fact that Retirement Class shares represent interests in the same portfolio as Institutional Class shares but are subject to lower expenses. |
| 2 | The “Life of Fund” return and “Final Value of $50,000 Investment” shown reflects the period 11/01/2013 through 10/31/2017. |
49
Harbor Emerging Markets Equity Fund
Portfolio of Investments—October 31, 2017
Portfolio of Investments—October 31, 2017
Value, Cost, and Principal Amounts in Thousands
Total Investments by Country (% of net assets)
(Excludes net cash and short-term investments of 1.5%)

| COMMON STOCKS—98.3% | |||
| Shares | Value | ||
| AIRLINES—1.0% | |||
| 22,694 | Azul SA ADR (BR)*,1 | $ 574 | |
| AUTOMOBILES—2.7% | |||
| 330,000 | Brilliance China Automotive Holdings Ltd. (CHN) | 836 | |
| 4,976 | Hyundai Motor Co. (S. KOR) | 716 | |
| 1,552 | |||
| BANKS—22.0% | |||
| 362,948 | Alpha Bank AE (GRC)* | 724 | |
| 743,100 | Bank Rakyat Indonesia Persero Tbk PT (IDR) | 855 | |
| 1,978,000 | China Construction Bank Corp. (CHN) | 1,768 | |
| 194,000 | China Merchants Bank Co. Ltd. (CHN) | 741 | |
| 93,337 | Grupo Financiero Banorte SAB de CV (MEX)* | 553 | |
| 27,813 | Hana Financial Group Inc. (S. KOR) | 1,190 | |
| 169,134 | ICICI Bank Ltd. ADR (IND)1 | 1,548 | |
| 1,351,000 | Industrial & Commercial Bank of China Ltd. (CHN) | 1,075 | |
| 149,225 | Itau Unibanco Holding SA ADR (BR)1 | 1,911 | |
| 10,886 | OTP Bank plc (HUN) | 439 | |
| 63,197 | Sberbank of Russia PJSC ADR (RUS)1 | 907 | |
| 208,607 | Turkiye Halk Bankasi AS (TUR) | 609 | |
| 138,200 | United Bank Ltd. (PAK) | 235 | |
| 12,555 | |||
| BEVERAGES—1.2% | |||
| 106,227 | AmBev SA ADR (BR)*,1 | 672 | |
| CAPITAL MARKETS—0.8% | |||
| 522,000 | China Galaxy Securities Co. Ltd. (CHN) | 455 | |
| CHEMICALS—1.5% | |||
| 231,334 | Alpek SAB de CV (MEX)* | 243 | |
| 34,411 | PhosAgro PJSC GDR (RUS)2 | 473 | |
| 2,684,000 | Tianhe Chemicals Group Ltd. (CHN)*,3 | 151 x | |
| 867 | |||
| CONSTRUCTION & ENGINEERING—1.1% | |||
| 748,000 | China Railway Group Ltd. (CHN) | 601 | |
| COMMON STOCKS—Continued | |||
| Shares | Value | ||
| CONSTRUCTION MATERIALS—3.9% | |||
| 195,500 | Anhui Conch Cement Co. Ltd. (CHN) | $ 838 | |
| 77,435 | Cemex SAB de CV ADR (MEX)*,1 | 628 | |
| 567,700 | Semen Indonesia Persero TBK PT (IDR) | 456 | |
| 1,829,800 | West China Cement Ltd. (CHN)* | 291 | |
| 2,213 | |||
| DIVERSIFIED TELECOMMUNICATION SERVICES—1.8% | |||
| 2,098,000 | China Telecom Corp. Ltd. (CHN) | 1,052 | |
| ELECTRONIC EQUIPMENT, INSTRUMENTS & COMPONENTS—1.5% | |||
| 57,406 | Delta Electronics Inc. (TW) | 276 | |
| 161,000 | Hon Hai Precision Industry Co. Ltd. (TW) | 599 | |
| 875 | |||
| ENERGY EQUIPMENT & SERVICES—0.7% | |||
| 428,000 | China Oilfield Services Ltd. (CHN) | 380 | |
| FOOD PRODUCTS—2.8% | |||
| 78,084 | BRF SA ADR (BR)*,1 | 1,052 | |
| 732,900 | Charoen Pokphand Foods PCL (THA) | 573 | |
| 1,625 | |||
| HOTELS, RESTAURANTS & LEISURE—2.5% | |||
| 49,192 | China International Travel Service Corp. Ltd. (CHN) | 307 | |
| 52,145 | CVC Brasil Operadora e Agencia de Viagens SA (BR) | 689 | |
| 90,418 | Sands China Ltd. (CHN) | 427 | |
| 1,423 | |||
| INDEPENDENT POWER & RENEWABLE ELECTRICITY PRODUCERS—2.5% | |||
| 690,000 | China Longyuan Power Group Corp. Ltd. (CHN) | 512 | |
| 1,784,400 | Datang International Power Generation Co. Ltd. (CHN)* | 602 | |
| 692,000 | Huadian Power International Corp. Ltd. (CHN) | 287 | |
| 1,401 | |||
| INSURANCE—3.3% | |||
| 191,000 | China Life Insurance Co. Ltd. (CHN) | 633 | |
| 249,400 | China Pacific Insurance Group Co. Ltd. (CHN) | 1,232 | |
| 1,865 | |||
| INTERNET & DIRECT MARKETING RETAIL—1.1% | |||
| 12,801 | Ctrip.com International Ltd. ADR (CHN)*,1 | 613 | |
| INTERNET SOFTWARE & SERVICES—9.7% | |||
| 14,025 | Alibaba Group Holding Ltd. ADR (CHN)*,1 | 2,593 | |
| 2,876 | Sea Ltd. ADR (SGP)*,1 | 43 | |
| 64,900 | Tencent Holdings Ltd. (CHN) | 2,917 | |
| 5,553 | |||
| IT SERVICES—1.3% | |||
| 18,560 | Tata Consultancy Services Ltd. (IND) | 751 | |
| MEDIA—1.7% | |||
| 3,952 | Naspers Ltd. (S. AFR) | 963 | |
| METALS & MINING—4.3% | |||
| 63,573 | AngloGold Ashanti Ltd. ADR (S. AFR)1 | 591 | |
| 1,701 | Polyus PJSC GDR (RUS)2 | 70 | |
| 7,050 | Polyus PJSC GDR (RUS)*,2,3 | 290 | |
| 155,318 | Vale SA ADR (BR)*,1 | 1,520 | |
| 2,471 | |||
| OIL, GAS & CONSUMABLE FUELS—8.8% | |||
| 204,500 | China Shenhua Energy Co. Ltd. (CHN) | 489 | |
| 4,226 | CNOOC Ltd. ADR (CHN)1 | 578 | |
50
Harbor Emerging Markets Equity Fund
Portfolio of Investments—Continued
Portfolio of Investments—Continued
Value, Cost, and Principal Amounts in Thousands
| COMMON STOCKS—Continued | |||
| Shares | Value | ||
| OIL, GAS & CONSUMABLE FUELS—Continued | |||
| 21,193 | Lukoil PJSC ADR (RUS)1 | $ 1,126 | |
| 118,234 | Petroleo Brasileiro SA ADR (BR)*,1 | 1,212 | |
| 53,617 | Reliance Industries Ltd. (IND) | 782 | |
| 151,615 | Rosneft Oil Co PJSC GDR (RUS)2 | 831 | |
| 5,018 | |||
| PERSONAL PRODUCTS—1.6% | |||
| 3,203 | Amorepacific Corp. (S. KOR) | 899 | |
| PROFESSIONAL SERVICES—0.1% | |||
| 6,435 | L&T Technology Services Ltd. (IND)*,3 | 82 | |
| REAL ESTATE MANAGEMENT & DEVELOPMENT—3.0% | |||
| 424,000 | China Overseas Land & Investment Ltd. (CHN) | 1,377 | |
| 173,500 | Shimao Property Holdings Ltd. (CHN) | 363 | |
| 1,740 | |||
| SEMICONDUCTORS & SEMICONDUCTOR EQUIPMENT—8.1% | |||
| 81,685 | Taiwan Semiconductor Manufacturing Co. Ltd. ADR (TW)1 | 3,458 | |
| 2,231,000 | United Microelectronics Corp. (TW) | 1,151 | |
| 4,609 | |||
| SPECIALTY RETAIL—1.0% | |||
| 45,047 | Mr Price Group Ltd. (S. AFR) | 558 | |
| TECHNOLOGY HARDWARE, STORAGE & PERIPHERALS—6.9% | |||
| 1,587 | Samsung Electronics Co. Ltd. (S. KOR) | 3,912 | |
| THRIFTS & MORTGAGE FINANCE—1.1% | |||
| 31,762 | Indiabulls Housing Finance Ltd. (IND) | 610 | |
| WIRELESS TELECOMMUNICATION SERVICES—0.3% | |||
| 660,300 | Sarana Menara Nusantara TBK PT (IDR)* | 200 | |
| TOTAL COMMON STOCKS | |||
(Cost $44,740) | 56,089 | ||
| PARTICIPATION (EQUITY LINKED) NOTES—0.2% | |||
| Principal Amount | |||
| BANKS—0.2% | |||
| United Bank Ltd. (PAK)*,3 | |||
| $ | 57,045 | $0.01––06/19/2019 | 97 |
| OIL, GAS & CONSUMABLE FUELS—0.0% | |||
| Reliance Industries Ltd. (IND)* | |||
| 34 | $0.01––07/10/2019 | 1 | |
| TOTAL PARTICIPATION (EQUITY LINKED) NOTES | |||
(Cost $95) | 98 | ||
| SHORT-TERM INVESTMENTS—2.1% | |||
| (Cost $1,195) | |||
| Principal Amount | Value | ||
| REPURCHASE AGREEMENTS | |||
| $ | 1,195 | Repurchase Agreement with Fixed Income Clearing Corp. dated October 31, 2017 due November 01, 2017 at 0.001% collateralized by U.S. Treasury Notes (value $1,224) | $ 1,195 |
| TOTAL INVESTMENTS—100.6% | |||
(Cost $46,030) | 57,382 | ||
CASH AND OTHER ASSETS, LESS LIABILITIES—(0.6)% | (326) | ||
TOTAL NET ASSETS—100.0% | $57,056 | ||
51
Harbor Emerging Markets Equity Fund
Portfolio of Investments—Continued
Portfolio of Investments—Continued
FAIR VALUE MEASUREMENTS
The following table summarizes the Fund’s investments as of October 31, 2017 based on the inputs used to value them.
| Asset Category | Quoted Prices Level 1 (000s) | Other Significant Observable Inputs Level 2 (000s) | Significant Unobservable Inputs Level 3 (000s) | Total (000s) | ||||
| Common Stocks | ||||||||
Africa | $ 591 | $ 1,521 | $ — | $ 2,112 | ||||
Europe | — | 5,468 | — | 5,468 | ||||
Latin America | 9,099 | — | — | 9,099 | ||||
Middle East/Central Asia | 1,548 | 2,460 | — | 4,008 | ||||
Pacific Basin | 7,242 | 28,009 | 151 | 35,402 | ||||
| Participation (Equity Linked) Notes | ||||||||
Middle East/Central Asia | — | 98 | — | 98 | ||||
| Short-Term Investments | ||||||||
Repurchase Agreements | — | 1,195 | — | 1,195 | ||||
Total Investments in Securities | $18,480 | $38,751 | $151 | $57,382 |
The following is a rollforward of the Fund’s Level 3 investments during the year ended October 31, 2017.
| Valuation Description | Balance Beginning at 11/01/2016 (000s) | Purchases (000s) | Sales (000s) | Discount/ (Premium) (000s) | Total Realized Gain/(Loss)w (000s) | Change in Unrealized Appreciation/ (Depreciation)w (000s) | Transfers In Level 3 (000s) | Transfers Out of Level 3 (000s) | Ending Balance as of 10/31/2017w (000s) | |||||||||
Common Stocks | $242 | $— | $— | $— | $— | $(91) | $— | $— | $151 |
Of the Level 2 investments presented above, certain Common Stocks valued at $82,000 were catorgized in Level 1 at October 31, 2016. Transfers from Level 1 to Level 2 were a result of exchange traded securities where quoted prices from an active market were available (Level 1), and have become unavailable (Level 2).
The following is a summary of significant unobservable inputs used in the fair valuations of assets and liabilities categorized within Level 3 of the fair value hierarchy.
| Valuation Descriptions | Ending Balance as of 10/31/2017 (000s) | Valuation Technique | Unobservable Inputs | Input Value(s) | ||||
| Investments in Securities | ||||||||
| Common Stocks | ||||||||
Tianhe Chemicals Group Ltd. (CHN)* | $151 | Market Approach | Liquidity Discount | HK$ 0.44 |
For more information on valuation inputs and their aggregation into the levels used in the table above, please refer to the Fair Value Measurements and Disclosures in Note 2 of the accompanying Notes to Financial Statements.
| * | Non-income producing security | ||
| 1 | ADR after the name of a foreign holding stands for American Depositary Receipts representing ownership of foreign securities. ADRs are issued by U.S. banking institutions. | ||
| 2 | GDR after the name of a holding stands for Global Depositary Receipts representing ownership of foreign securities. GDRs are issued by either U.S. or non-U.S. banking institutions. Country specific examples of this type of depositary receipt, if any, are denoted using different abbreviations. SADR after the name of a holding stands for South African Depositary Receipts representing ownership of South African securities listed on the Johannesburg Stock Exchange. SDR after the name of a holding stands for Swedish Depository Receipts representing ownership of foreign securities in Sweden. NVDR after the name of a holding stands for Non-Voting Depositary Receipts representing ownership of a listed security in the Stock Exchange of Thailand. | ||
| 3 | Securities purchased in a transaction exempt from registration under Rule 144A of the Securities Act of 1933. These securities may be resold in transactions exempt from registration, normally to qualified institutional buyers. The Fund has no right to demand registration of these securities. These securities are priced by an independent pricing service in accordance with Harbor Funds Valuation Procedures. At October 31, 2017, the aggregate value of these securities was $620,000 or 1% of net assets. | ||
| w | Amounts in this category are included in the “Realized and Change in Unrealized Gain/(Loss) on Investment Transactions” section of the Statement of Operations. The net unrealized appreciation/(depreciation) per investment type is below: | ||
| Valuation Description | Unrealized Gain/(Loss) as of 10/31/2017 (000s) | ||
Common Stocks. | $(361) | ||
| x | Fair Valued in accordance with Harbor Funds Valuation Procedures using pre-traded price which is a Level 3 input | ||
| HK$ | Hong Kong Dollar | ||
The accompanying notes are an integral part of the Financial Statements.
52
[THIS PAGE INTENTIONALLY LEFT BLANK]
53
Harbor International & Global Funds
StatementS of Assets and Liabilities—October 31, 2017
StatementS of Assets and Liabilities—October 31, 2017
(All amounts in thousands, except per share amounts)
| Harbor International Fund | Harbor Diversified International All Cap Fund | Harbor International Growth Fund | Harbor International Small Cap Fund | Harbor Global Leaders Fund | Harbor Emerging Markets Equity Fund | |||||||
| ASSETS | ||||||||||||
Investments, at identified cost* | $23,407,020 | $285,816 | $342,430 | $40,342 | $38,775 | $46,030 | ||||||
Investments, at value(Including securities loaned of $426,931, $0, $6,410, $0, $0, and $0) | $32,394,298 | $313,765 | $407,927 | $46,225 | $45,604 | $56,187 | ||||||
Repurchase agreements | 279,781 | 7,782 | 1,434 | 1,634 | 415 | 1,195 | ||||||
Cash | 6 | 1 | 1 | — | — | 1 | ||||||
Foreign currency, at value (cost: $30,251,$1,311,$0,$0, $21 and $0) | 30,264 | 1,302 | — | — | 21 | — | ||||||
| Receivables for: | ||||||||||||
Investments sold | 114,905 | 18 | — | — | — | — | ||||||
Foreign currency spot contracts | 354 | — | — | — | — | — | ||||||
Capital shares sold | 9,654 | 287 | 58 | 3 | 6 | 1 | ||||||
Dividends | 35,936 | 653 | 679 | 76 | 20 | 49 | ||||||
Interest | 112 | — | — | — | — | — | ||||||
Securities lending income | 24 | — | 5 | — | — | — | ||||||
Purchased options, at value (cost: $14,434,$1,$0,$0,$0 and $0) | 10,999 | 8 | — | — | — | — | ||||||
Withholding tax | 33,917 | 128 | 448 | 17 | 20 | — | ||||||
Prepaid registration fees | 47 | 34 | 33 | 9 | 10 | 35 | ||||||
Other assets | 3,028 | 68 | 115 | — | 53 | 17 | ||||||
Total Assets | 32,913,325 | 324,046 | 410,700 | 47,964 | 46,149 | 57,485 | ||||||
| LIABILITIES | ||||||||||||
| Payables for: | ||||||||||||
Investments purchased | 121,882 | 115 | — | 490 | 88 | 235 | ||||||
Foreign currency spot contracts | 220 | — | — | 1 | — | — | ||||||
Capital shares reacquired | 49,506 | 58 | 1,107 | — | 15 | 12 | ||||||
Collateral for securities loaned | 450,733 | — | 6,723 | — | — | — | ||||||
| Accrued expenses: | ||||||||||||
Management fees | 18,907 | 203 | 251 | 32 | 29 | 46 | ||||||
12b-1 fees | 473 | 1 | 3 | — | 3 | — | ||||||
Transfer agent fees | 2,249 | 17 | 27 | 3 | 4 | 4 | ||||||
Trustees' fees and expenses | 223 | 1 | 2 | — | — | — | ||||||
Other | 13,025 | 231 | 301 | 38 | 32 | 132 | ||||||
Total Liabilities | 657,218 | 626 | 8,414 | 564 | 171 | 429 | ||||||
NET ASSETS | $32,256,107 | $323,420 | $402,286 | $47,400 | $45,978 | $57,056 | ||||||
| Net Assets Consist of: | ||||||||||||
Paid-in capital | $21,580,451 | $277,610 | $333,424 | $39,336 | $34,759 | $52,007 | ||||||
Accumulated undistributed net investment income/(loss) | 255,234 | 2,412 | 2,739 | 149 | 15 | 414 | ||||||
Accumulated net realized gain/(loss) | 1,156,655 | 7,705 | (727) | 398 | 3,960 | (6,644) | ||||||
Unrealized appreciation/(depreciation) of investments and translation of assets and liabilities in foreign currencies | 9,267,202 | 35,685 | 66,850 | 7,517 | 7,244 | 11,279 | ||||||
Unrealized appreciation/(depreciation) of other financial instruments | (3,435) | 8 | — | — | — | — | ||||||
| $32,256,107 | $323,420 | $402,286 | $47,400 | $45,978 | $57,056 | |||||||
| NET ASSET VALUE PER SHARE BY CLASS | ||||||||||||
| Institutional Class | ||||||||||||
Net assets | $27,401,853 | $225,473 | $362,035 | $38,818 | $29,034 | $51,849 | ||||||
Shares of beneficial interest1 | 392,035 | 19,129 | 23,069 | 2,793 | 1,147 | 4,788 | ||||||
Net asset value per share2 | $ 69.90 | $ 11.79 | $ 15.69 | $ 13.90 | $ 25.31 | $ 10.83 | ||||||
| Administrative Class | ||||||||||||
Net assets | $ 398,584 | $ 310 | $ 466 | $ 371 | $ 1,204 | $ 275 | ||||||
Shares of beneficial interest1 | 5,729 | 26 | 30 | 27 | 48 | 25 | ||||||
Net asset value per share2 | $ 69.57 | $ 11.76 | $ 15.67 | $ 13.87 | $ 24.97 | $ 10.80 | ||||||
| Investor Class | ||||||||||||
Net assets | $ 1,798,228 | $ 5,195 | $ 14,913 | $ 540 | $11,364 | $ 700 | ||||||
Shares of beneficial interest1 | 26,009 | 444 | 958 | 39 | 460 | 65 | ||||||
Net asset value per share2 | $ 69.14 | $ 11.71 | $ 15.57 | $ 13.86 | $ 24.72 | $ 10.78 | ||||||
| Retirement Class | ||||||||||||
Net assets | $ 2,657,442 | $ 92,442 | $ 24,872 | $ 7,671 | $ 4,376 | $ 4,232 | ||||||
Shares of beneficial interest1 | 38,012 | 7,842 | 1,583 | 552 | 173 | 391 | ||||||
Net asset value per share2 | $ 69.91 | $ 11.79 | $ 15.71 | $ 13.90 | $ 25.33 | $ 10.83 | ||||||
| * | Including repurchase agreements and short-term investments |
| 1 | Par value $0.01 (unlimited authorizations) |
| 2 | Per share amounts can be recalculated to the amounts disclosed herein when total net assets and shares of beneficial interest are not rounded to thousands. |
The accompanying notes are an integral part of the Financial Statements.
54
Harbor International & Global Funds
StatementS of Operations—Year Ended October 31, 2017
StatementS of Operations—Year Ended October 31, 2017
(All amounts in thousands)
| Harbor International Fund | Harbor Diversified International All Cap Fund | Harbor International Growth Fund | Harbor International Small Cap Fund | Harbor Global Leaders Fund | Harbor Emerging Markets Equity Fund | |
| Investment Income | ||||||
Dividends | $ 851,906 | $ 5,929 | $ 6,680 | $ 496 | $ 445 | $ 1,245 |
Net securities lending income | 4,130 | 1 | 28 | 1 | 2 | — |
Interest | 5,718 | 4 | 4 | 1 | 1 | 1 |
Foreign taxes withheld | (72,582) | (497) | (654) | (46) | (28) | (144) |
Total Investment Income | 789,172 | 5,437 | 6,058 | 452 | 420 | 1,102 |
| Operating Expenses | ||||||
Management fees | 235,554 | 1,689 | 2,555 | 220 | 302 | 449 |
| 12b-1 fees: | ||||||
Administrative Class | 1,139 | 1 | 1 | 1 | 3 | 1 |
Investor Class | 4,948 | 8 | 35 | 1 | 24 | 2 |
Shareholder communications | 3,533 | 23 | 30 | 5 | 7 | 5 |
Custodian fees | 7,716 | 388 | 124 | 43 | 24 | 86 |
| Transfer agent fees: | ||||||
Institutional Class | 26,237 | 170 | 271 | 21 | 23 | 38 |
Administrative Class | 395 | — | — | — | 1 | — |
Investor Class | 4,089 | 7 | 29 | 1 | 19 | 1 |
Retirement Class | 222 | 3 | 2 | — | — | — |
Professional fees | 1,022 | 36 | 18 | 9 | 41 | 20 |
Trustees' fees and expenses | 1,004 | 6 | 9 | 1 | 1 | 1 |
Registration fees | 232 | 60 | 62 | 57 | 65 | 61 |
Miscellaneous | 358 | 13 | 14 | 11 | 11 | 11 |
Total expenses | 286,449 | 2,404 | 3,150 | 370 | 521 | 675 |
Management fees waived | (2,078) | — | — | — | — | — |
Transfer agent fees waived | (3,020) | (18) | (30) | (3) | (3) | (4) |
Other expenses reimbursed | — | (479) | (184) | (120) | (120) | (127) |
Net expenses | 281,351 | 1,907 | 2,936 | 247 | 398 | 544 |
Net Investment Income/(Loss) | 507,821 | 3,530 | 3,122 | 205 | 22 | 558 |
| Realized and Change in Net Unrealized Gain/(Loss) on Investment Transactions | ||||||
| Net realized gain/(loss) on: | ||||||
Investments (net of foreign capital gains tax: $0, $43, $2, $0, $0, and $24) | 1,794,073 | 12,678 | 7,691 | 793 | 6,970 | 2,362 |
Purchased options | — | — | — | 11 | — | — |
Foreign currency transactions | (9,684) | (84) | (87) | (7) | (4) | (19) |
Redemption in-kind | 174,061 | — | — | — | — | — |
| Change in net unrealized appreciation/(depreciation) on: | ||||||
Investments (net of foreign capital gains tax accrual: $0, $37, $70, $0, $0, and $73) | 3,299,483 | 30,597 | 62,983 | 6,182 | 1,806 | 8,546 |
Purchased options | 1,652 | 8 | — | — | — | — |
Translations of assets and liabilities in foreign currencies | 3,179 | 9 | 18 | 1 | 1 | — |
Net gain/(loss) on investment transactions | 5,262,764 | 43,208 | 70,605 | 6,980 | 8,773 | 10,889 |
Net Increase/(Decrease) in Net Assets Resulting from Operations | $5,770,585 | $46,738 | $73,727 | $7,185 | $8,795 | $11,447 |
The accompanying notes are an integral part of the Financial Statements.
55
[THIS PAGE INTENTIONALLY LEFT BLANK]
56
Harbor International & Global Funds
Statements of Changes In Net Assets
Statements of Changes In Net Assets
(All amounts in thousands)
| Harbor International Fund | Harbor Diversified International All Cap Fund | Harbor International Growth Fund | ||||||
| November 1, 2016 through October 31, 2017 | November 1, 2015 through October 31, 2016 | November 1, 2016 through October 31, 2017 | November 2, 2015a through October 31, 2016 | November 1, 2016 through October 31, 2017 | November 1, 2015 through October 31, 2016 | |||
| INCREASE/(DECREASE) IN NET ASSETS | ||||||||
| Operations: | ||||||||
Net investment income/(loss) | $ 507,821 | $ 647,931 | $ 3,530 | $ 2,348 | $ 3,122 | $ 3,803 | ||
Net realized gain/(loss) on investments | 1,958,450 | (101,090) | 12,594 | (2,906) | 7,604 | (4,939) | ||
Change in net unrealized appreciation/(depreciation) of investments | 3,304,314 | (2,292,960) | 30,614 | 5,079 | 63,001 | 8,148 | ||
Net increase/(decrease) in assets resulting from operations | 5,770,585 | (1,746,119) | 46,738 | 4,521 | 73,727 | 7,012 | ||
| Distributions to Shareholders | ||||||||
| Net investment income: | ||||||||
Institutional Class | (621,061) | (663,480) | (2,150) | (21) | (3,507) | (2,643) | ||
Administrative Class | (7,902) | (11,261) | (3) | — | (3) | (1) | ||
Investor Class | (31,061) | (39,315) | (23) | — | (119) | (96) | ||
Retirement Class | (16,825) | — | (24) | — | (32) | — | ||
| Net realized gain on investments: | ||||||||
Institutional Class | — | (1,087,932) | — | — | — | — | ||
Administrative Class | — | (21,975) | — | — | — | — | ||
Investor Class | — | (89,647) | — | — | — | — | ||
Retirement Class | — | — | — | — | — | — | ||
Total distributions to shareholders | (676,849) | (1,913,610) | (2,200) | (21) | (3,661) | (2,740) | ||
Net Increase/(Decrease) Derived from Capital Share Transactions | (9,478,305) | (5,484,241) | 126,258 | 148,124 | 38,423 | 18,757 | ||
Net increase/(decrease) in net assets | (4,384,569) | (9,143,970) | 170,796 | 152,624 | 108,489 | 23,029 | ||
| Net Assets | ||||||||
Beginning of period | 36,640,676 | 45,784,646 | 152,624 | — | 293,797 | 270,768 | ||
End of period* | $32,256,107 | $36,640,676 | $323,420 | $152,624 | $402,286 | $293,797 | ||
* Includes accumulated undistributed net investment income/(loss) of: | $ 255,234 | $ 329,584 | $ 2,412 | $ 1,687 | $ 2,739 | $ 3,291 | ||
| a | Commencement of operations. |
The accompanying notes are an integral part of the Financial Statements.
57
| Harbor International Small Cap Fund | Harbor Global Leaders Fund | Harbor Emerging Markets Equity Fund | |||||
| November 1, 2016 through October 31, 2017 | February 1, 2016a through October 31, 2016 | November 1, 2016 through October 31, 2017 | November 1, 2015 through October 31, 2016 | November 1, 2016 through October 31, 2017 | November 1, 2015 through October 31, 2016 | ||
| $ 205 | $ 177 | $ 22 | $ (33) | $ 558 | $ 338 | ||
| 797 | (338) | 6,966 | (2,275) | 2,343 | (5,773) | ||
| 6,183 | 1,334 | 1,807 | 738 | 8,546 | 9,206 | ||
| 7,185 | 1,173 | 8,795 | (1,570) | 11,447 | 3,771 | ||
| (197) | — | — | — | (397) | (339) | ||
| (2) | — | — | — | (2) | (1) | ||
| (2) | — | — | — | (4) | (2) | ||
| (7) | — | — | — | (16) | — | ||
| — | — | — | (1,124) | — | — | ||
| — | — | — | (37) | — | — | ||
| — | — | — | (446) | — | — | ||
| — | — | — | — | — | — | ||
| (208) | — | — | (1,607) | (419) | (342) | ||
| 21,735 | 17,515 | (1,913) | (7,020) | 7,604 | (7,535) | ||
| 28,712 | 18,688 | 6,882 | (10,197) | 18,632 | (4,106) | ||
| 18,688 | — | 39,096 | 49,293 | 38,424 | 42,530 | ||
| $47,400 | $18,688 | $45,978 | $ 39,096 | $57,056 | $38,424 | ||
| $ 149 | $ 199 | $ 15 | $ (1) | $ 414 | $ 319 | ||
58
Harbor International & Global Funds
Statements of Changes in Net Assets—Capital Stock Activity
Statements of Changes in Net Assets—Capital Stock Activity
(All amounts in thousands)
| Harbor International Fund | Harbor Diversified International All Cap Fund | Harbor International Growth Fund | ||||||
| November 1, 2016 through October 31, 2017 | November 1, 2015 through October 31, 2016 | November 1, 2016 through October 31, 2017 | November 2, 2015a through October 31, 2016 | November 1, 2016 through October 31, 2017 | November 1, 2015 through October 31, 2016 | |||
| AMOUNT ($) | ||||||||
| Institutional Class | ||||||||
Net proceeds from sale of shares | $ 3,763,185 | $ 6,472,181 | $ 174,975 | $215,224 | $ 71,320 | $ 57,542 | ||
Reinvested distributions | 537,811 | 1,536,571 | 2,114 | 21 | 3,417 | 2,591 | ||
Cost of shares reacquired | (14,157,214) | (12,709,358) | (141,031) | (69,472) | (53,734) | (40,817) | ||
Cost of shares reacquired through redemption in-kind | (451,183) | — | — | — | — | — | ||
Net increase/(decrease) in net assets | $(10,307,401) | $ (4,700,606) | $ 36,058 | $145,773 | $ 21,003 | $ 19,316 | ||
| Administrative Class | ||||||||
Net proceeds from sale of shares | $ 141,969 | $ 120,940 | $ 10 | $ 253 | $ 480 | $ 367 | ||
Reinvested distributions | 7,713 | 31,538 | 3 | — | 3 | 1 | ||
Cost of shares reacquired | (327,979) | (397,568) | — | — | (431) | (375) | ||
Net increase/(decrease) in net assets | $ (178,297) | $ (245,090) | $ 13 | $ 253 | $ 52 | $ (7) | ||
| Investor Class | ||||||||
Net proceeds from sale of shares | $ 230,111 | $ 394,564 | $ 4,689 | $ 334 | $ 2,335 | $ 1,793 | ||
Reinvested distributions | 30,486 | 126,893 | 23 | — | 117 | 95 | ||
Cost of shares reacquired | (942,361) | (1,797,732) | (574) | — | (3,837) | (4,556) | ||
Net increase/(decrease) in net assets | $ (681,764) | $ (1,276,275) | $ 4,138 | $ 334 | $ (1,385) | $ (2,668) | ||
| Retirement Class | ||||||||
Net proceeds from sale of shares | $ 2,467,439 | $ 785,702 | $ 87,798 | $ 1,780 | $ 20,877 | $ 2,316 | ||
Reinvested distributions | 16,825 | — | 23 | — | 32 | — | ||
Cost of shares reacquired | (795,107) | (47,972) | (1,773) | (16) | (2,156) | (200) | ||
Net increase/(decrease) in net assets | $ 1,689,157 | $ 737,730 | $ 86,048 | $ 1,764 | $ 18,753 | $ 2,116 | ||
| a | Commencement of operations |
The accompanying notes are an integral part of the Financial Statements.
59
| Harbor International Small Cap Fund | Harbor Global Leaders Fund | Harbor Emerging Markets Equity Fund | |||||
| November 1, 2016 through October 31, 2017 | February 1, 2016a through October 31, 2016 | November 1, 2016 through October 31, 2017 | November 1, 2015 through October 31, 2016 | November 1, 2016 through October 31, 2017 | November 1, 2015 through October 31, 2016 | ||
| $16,678 | $16,564 | $ 2,658 | $ 2,664 | $12,422 | $ 4,774 | ||
| 197 | — | — | 1,101 | 397 | 339 | ||
| (1,932) | (184) | (5,092) | (10,475) | (7,659) | (13,818) | ||
| — | — | — | — | — | — | ||
| $14,943 | $16,380 | $(2,434) | $ (6,710) | $ 5,160 | $ (8,705) | ||
| $ 27 | $ 245 | $ 142 | $ 297 | $ — | $ — | ||
| 2 | — | — | 37 | 2 | 1 | ||
| — | — | (450) | (193) | — | — | ||
| $ 29 | $ 245 | $ (308) | $ 141 | $ 2 | $ 1 | ||
| $ 135 | $ 473 | $ 2,647 | $ 1,793 | $ 637 | $ 1,116 | ||
| 2 | — | — | 446 | 4 | 2 | ||
| (1) | (198) | (3,934) | (4,323) | (566) | (1,092) | ||
| $ 136 | $ 275 | $(1,287) | $ (2,084) | $ 75 | $ 26 | ||
| $ 6,743 | $ 615 | $ 2,512 | $ 1,732 | $ 2,375 | $ 1,162 | ||
| 7 | — | — | — | 15 | — | ||
| (123) | — | (396) | (99) | (23) | (19) | ||
| $ 6,627 | $ 615 | $ 2,116 | $ 1,633 | $ 2,367 | $ 1,143 | ||
60
Harbor International & Global Funds
Statements of Changes in Net Assets—Capital Stock Activity—Continued
Statements of Changes in Net Assets—Capital Stock Activity—Continued
(All amounts in thousands)
| Harbor International Fund | Harbor Diversified International All Cap Fund | Harbor International Growth Fund | ||||||
| November 1, 2016 through October 31, 2017 | November 1, 2015 through October 31, 2016 | November 1, 2016 through October 31, 2017 | November 2, 2015a through October 31, 2016 | November 1, 2016 through October 31, 2017 | November 1, 2015 through October 31, 2016 | |||
| SHARES | ||||||||
| Institutional Class | ||||||||
Shares sold | 58,718 | 109,758 | 16,414 | 22,533 | 5,171 | 4,573 | ||
Shares issued due to reinvestment of distributions | 9,241 | 26,048 | 220 | 2 | 282 | 212 | ||
Shares reacquired | (219,793) | (212,523) | (12,889) | (7,151) | (3,920) | (3,274) | ||
Shares reacquired through redemption in-kind | (6,735) | — | — | — | — | — | ||
Net increase/(decrease) in shares outstanding | (158,569) | (76,717) | 3,745 | 15,384 | 1,533 | 1,511 | ||
Beginning of period | 550,604 | 627,321 | 15,384 | — | 21,536 | 20,025 | ||
End of period | 392,035 | 550,604 | 19,129 | 15,384 | 23,069 | 21,536 | ||
| Administrative Class | ||||||||
Shares sold | 2,183 | 2,042 | 1 | 25 | 34 | 30 | ||
Shares issued due to reinvestment of distributions | 133 | 536 | — | — | — | — | ||
Shares reacquired | (5,098) | (6,804) | — | — | (30) | (30) | ||
Net increase/(decrease) in shares outstanding | (2,782) | (4,226) | 1 | 25 | 4 | — | ||
Beginning of period | 8,511 | 12,737 | 25 | — | 26 | 26 | ||
End of period | 5,729 | 8,511 | 26 | 25 | 30 | 26 | ||
| Investor Class | ||||||||
Shares sold | 3,644 | 6,701 | 462 | 34 | 169 | 145 | ||
Shares issued due to reinvestment of distributions | 528 | 2,169 | 3 | — | 10 | 8 | ||
Shares reacquired | (14,877) | (30,082) | (55) | — | (274) | (368) | ||
Net increase/(decrease) in shares outstanding | (10,705) | (21,212) | 410 | 34 | (95) | (215) | ||
Beginning of period | 36,714 | 57,926 | 34 | — | 1,053 | 1,268 | ||
End of period | 26,009 | 36,714 | 444 | 34 | 958 | 1,053 | ||
| Retirement Class | ||||||||
Shares sold | 37,073 | 13,062 | 7,818 | 185 | 1,542 | 198 | ||
Shares issued due to reinvestment of distributions | 289 | — | 2 | — | 2 | — | ||
Shares reacquired | (11,616) | (796) | (161) | (2) | (144) | (15) | ||
Net increase/(decrease) in shares outstanding | 25,746 | 12,266 | 7,659 | 183 | 1,400 | 183 | ||
Beginning of period | 12,266 | — | 183 | 0 | 183 | — | ||
End of period | 38,012 | 12,266 | 7,842 | 183 | 1,583 | 183 | ||
| a | Commencement of operations |
The accompanying notes are an integral part of the Financial Statements.
61
| Harbor International Small Cap Fund | Harbor Global Leaders Fund | Harbor Emerging Markets Equity Fund | |||||
| November 1, 2016 through October 31, 2017 | February 1, 2016a through October 31, 2016 | November 1, 2016 through October 31, 2017 | November 1, 2015 through October 31, 2016 | November 1, 2016 through October 31, 2017 | November 1, 2015 through October 31, 2016 | ||
| 1,303 | 1,644 | 120 | 130 | 1,328 | 653 | ||
| 19 | — | — | 52 | 48 | 46 | ||
| (155) | (18) | (228) | (503) | (823) | (1,780) | ||
| — | — | — | — | — | — | ||
| 1,167 | 1,626 | (108) | (321) | 553 | (1,081) | ||
| 1,626 | — | 1,255 | 1,576 | 4,235 | 5,316 | ||
| 2,793 | 1,626 | 1,147 | 1,255 | 4,788 | 4,235 | ||
| 2 | 25 | 6 | 14 | — | — | ||
| — | — | — | 2 | — | — | ||
| — | — | (20) | (9) | — | — | ||
| 2 | 25 | (14) | 7 | — | — | ||
| 25 | — | 62 | 55 | 25 | 25 | ||
| 27 | 25 | 48 | 62 | 25 | 25 | ||
| 12 | 47 | 111 | 89 | 64 | 154 | ||
| — | — | — | 21 | 1 | — | ||
| — | (20) | (187) | (211) | (56) | (150) | ||
| 12 | 27 | (76) | (101) | 9 | 4 | ||
| 27 | — | 536 | 637 | 56 | 52 | ||
| 39 | 27 | 460 | 536 | 65 | 56 | ||
| 504 | 58 | 106 | 89 | 237 | 157 | ||
| 1 | — | — | — | 2 | — | ||
| (11) | — | (17) | (5) | (3) | (2) | ||
| 494 | 58 | 89 | 84 | 236 | 155 | ||
| 58 | — | 84 | — | 155 | — | ||
| 552 | 58 | 173 | 84 | 391 | 155 | ||
62
Harbor International & Global Funds Financial Highlights
Selected Data for a Share Outstanding for the Periods Presented
Selected Data for a Share Outstanding for the Periods Presented
| HARBOR INTERNATIONAL FUND | |||||
| Institutional Class | |||||
| Year Ended October 31, | 2017 | 2016 | 2015 | 2014 | 2013 |
Net asset value beginning of period | $ 60.30 | $ 65.67 | $ 68.09 | $ 70.79 | $ 59.12 |
| Income from Investment Operations | |||||
Net investment income/(loss)a | 0.97 e | 0.99 e | 1.22 e | 1.25 | 1.24 |
Net realized and unrealized gains/(losses) on investments | 9.79 | (3.51) | (2.22) | (2.45) | 11.69 |
Total from investment operations | 10.76 | (2.52) | (1.00) | (1.20) | 12.93 |
| Less Distributions | |||||
Dividends from net investment income | (1.16) | (1.08) | (1.42) | (1.50) | (1.26) |
Distributions from net realized capital gains1 | — | (1.77) | — | — | — |
Total distributions | (1.16) | (2.85) | (1.42) | (1.50) | (1.26) |
Proceeds from redemption fees | — | — | — | — | — * |
Net asset value end of period | 69.90 | 60.30 | 65.67 | 68.09 | 70.79 |
Net assets end of period (000s) | $27,401,853 | $33,201,899 | $41,195,827 | $43,385,100 | $39,828,959 |
| Ratios and Supplemental Data (%) | |||||
Total returnb | 18.24% | (3.74)% | (1.48)% | (1.69)% | 22.19% |
Ratio of total expenses to average net assets2 | 0.81 | 0.79 | 0.76 | 0.76 | 0.76 |
Ratio of net expenses to average net assetsa | 0.80 | 0.77 | 0.74 | 0.73 | 0.74 |
Ratio of net investment income to average net assetsa | 1.51 | 1.66 | 1.80 | 1.78 | 1.96 |
Portfolio turnover | 13 | 14 | 25 | 11 | 10 |
| Investor Class | |||||
| Year Ended October 31, | 2017 | 2016 | 2015 | 2014 | 2013 |
Net asset value beginning of period | $ 59.61 | $ 64.86 | $ 67.23 | $ 69.92 | $ 58.42 |
| Income from Investment Operations | |||||
Net investment income/(loss)a | 0.72 e | 0.73 e | 0.96 e | 1.07 | 1.01 |
Net realized and unrealized gains/(losses) on investments | 9.71 | (3.43) | (2.19) | (2.51) | 11.54 |
Total from investment operations | 10.43 | (2.70) | (1.23) | (1.44) | 12.55 |
| Less Distributions | |||||
Dividends from net investment income | (0.90) | (0.78) | (1.14) | (1.25) | (1.05) |
Distributions from net realized capital gains1 | — | (1.77) | — | — | — |
Total distributions | (0.90) | (2.55) | (1.14) | (1.25) | (1.05) |
Proceeds from redemption fees | — | — | — | — | — * |
Net asset value end of period | 69.14 | 59.61 | 64.86 | 67.23 | 69.92 |
Net assets end of period (000s) | $ 1,798,228 | $ 2,188,360 | $ 3,756,852 | $ 4,786,270 | $ 5,279,866 |
| Ratios and Supplemental Data (%) | |||||
Total returnb | 17.79% | (4.09)% | (1.84)% | (2.05)% | 21.76% |
Ratio of total expenses to average net assets2 | 1.18 | 1.16 | 1.13 | 1.13 | 1.13 |
Ratio of net expenses to average net assetsa | 1.17 | 1.14 | 1.11 | 1.10 | 1.11 |
Ratio of net investment income to average net assetsa | 1.13 | 1.23 | 1.43 | 1.46 | 1.60 |
Portfolio turnover | 13 | 14 | 25 | 11 | 10 |
See page 75 for notes to the Financial Highlights.
The accompanying notes are an integral part of the Financial Statements.
63
| Administrative Class | ||||
| 2017 | 2016 | 2015 | 2014 | 2013 |
| $ 59.99 | $ 65.32 | $ 67.48 | $ 70.18 | $ 58.63 |
| 0.79 e | 0.79 e | 1.04 e | 1.91 i | 1.03 |
| 9.77 | (3.44) | (2.20) | (3.27) | 11.63 |
| 10.56 | (2.65) | (1.16) | (1.36) | 12.66 |
| (0.98) | (0.91) | (1.00) | (1.34) | (1.11) |
| — | (1.77) | — | — | — |
| (0.98) | (2.68) | (1.00) | (1.34) | (1.11) |
| — | — | — | — | — * |
| 69.57 | 59.99 | 65.32 | 67.48 | 70.18 |
| $398,584 | $510,575 | $831,967 | $961,478 | $2,896,387 |
| 17.93% | (3.97)% | (1.73)% | (1.93)% | 21.87% |
| 1.06 | 1.04 | 1.01 | 1.01 | 1.01 |
| 1.05 | 1.02 | 0.99 | 0.98 | 0.99 |
| 1.22 | 1.33 | 1.54 | 1.85 | 1.66 |
| 13 | 14 | 25 | 11 | 10 |
| Retirement Class | |
| 2017 | 2016 f |
| $ 60.32 | $ 57.14 |
| 0.94 e | 0.68 e |
| 9.85 | 2.50 |
| 10.79 | 3.18 |
| (1.20) | — |
| — | — |
| (1.20) | — |
| — | — |
| 69.91 | 60.32 |
| $2,657,442 | $739,842 |
| 18.30% | 5.57% c |
| 0.74 | 0.75 d |
| 0.73 | 0.72 d |
| 1.42 | 1.68 d |
| 13 | 14 |
64
Harbor International & Global Funds Financial Highlights—Continued
Selected Data for a Share Outstanding for the Periods Presented
Selected Data for a Share Outstanding for the Periods Presented
| HARBOR DIVERSIFIED INTERNATIONAL ALL CAP FUND | |||||
| Institutional Class | Administrative Class | ||||
| Year Ended October 31, | 2017 | 2016 g | 2017 | 2016 g | |
Net asset value beginning of period | $ 9.77 | $ 10.00 | $ 9.75 | $10.00 | |
| Income from Investment Operations | |||||
Net investment income/(loss)a | 0.17 e | 0.20 e | 0.14 e | 0.13 e | |
Net realized and unrealized gains/(losses) on investments | 1.98 | (0.42) | 1.97 | (0.38) | |
Total from investment operations | 2.15 | (0.22) | 2.11 | (0.25) | |
| Less Distributions | |||||
Dividends from net investment income | (0.13) | (0.01) | (0.10) | — * | |
Distributions from net realized capital gains1 | — | — | — | — | |
Total distributions | (0.13) | (0.01) | (0.10) | — * | |
Net asset value end of period | 11.79 | 9.77 | 11.76 | 9.75 | |
Net assets end of period (000s) | $225,473 | $150,263 | $ 310 | $ 246 | |
| Ratios and Supplemental Data (%) | |||||
Total returnb | 22.29% | (2.25)% c | 21.91% | (2.49)% c | |
Ratio of total expenses to average net assets2 | 1.07 | 1.22 d | 1.32 | 1.46 d | |
Ratio of net expenses to average net assetsa | 0.85 | 0.85 d | 1.10 | 1.10 d | |
Ratio of net investment income to average net assetsa | 1.59 | 2.13 d | 1.29 | 1.39 d | |
Portfolio turnover | 46 | 68 c | 46 | 68 c | |
| Investor Class | Retirement Class | ||||
| Year Ended October 31, | 2017 | 2016 g | 2017 | 2016 f | |
Net asset value beginning of period | $ 9.74 | $ 10.00 | $ 9.77 | $ 9.21 | |
| Income from Investment Operations | |||||
Net investment income/(loss)a | 0.14 e | 0.12 e | 0.14 e | 0.06 e | |
Net realized and unrealized gains/(losses) on investments | 1.96 | (0.38) | 2.01 | 0.50 | |
Total from investment operations | 2.10 | (0.26) | 2.15 | 0.56 | |
| Less Distributions | |||||
Dividends from net investment income | (0.13) | — | (0.13) | — | |
Distributions from net realized capital gains1 | — | — | — | — | |
Total distributions | (0.13) | — | (0.13) | — | |
Net asset value end of period | 11.71 | 9.74 | 11.79 | 9.77 | |
Net assets end of period (000s) | $ 5,195 | $ 329 | $92,442 | $1,786 | |
| Ratios and Supplemental Data (%) | |||||
Total returnb | 21.82% | (2.60)% c | 22.35% | 6.08% c | |
Ratio of total expenses to average net assets2 | 1.44 | 1.59 d | 0.99 | 1.17 d | |
Ratio of net expenses to average net assetsa | 1.22 | 1.22 d | 0.77 | 0.80 d | |
Ratio of net investment income to average net assetsa | 1.31 | 1.28 d | 1.27 | 0.97 d | |
Portfolio turnover | 46 | 68 c | 46 | 68 c | |
See page 75 for notes to the Financial Highlights.
The accompanying notes are an integral part of the Financial Statements.
65
[THIS PAGE INTENTIONALLY LEFT BLANK]
66
Harbor International & Global Funds Financial Highlights—Continued
Selected Data for a Share Outstanding for the Periods Presented
Selected Data for a Share Outstanding for the Periods Presented
| HARBOR INTERNATIONAL GROWTH FUND | |||||
| Institutional Class | |||||
| Year Ended October 31, | 2017 | 2016 | 2015 | 2014 | 2013 j |
Net asset value beginning of period | $ 12.89 | $ 12.71 | $ 12.75 | $ 13.01 | $ 11.60 |
| Income from Investment Operations | |||||
Net investment income/(loss)a | 0.13 e | 0.17 e | 0.15 e | 0.16 | 0.44 |
Net realized and unrealized gains/(losses) on investments | 2.84 | 0.14 | — * | (0.23) | 1.67 |
Total from investment operations | 2.97 | 0.31 | 0.15 | (0.07) | 2.11 |
| Less Distributions | |||||
Dividends from net investment income | (0.17) | (0.13) | (0.19) | (0.19) | (0.70) |
Distributions from net realized capital gains1 | — | — | — | — | — |
Total distributions | (0.17) | (0.13) | (0.19) | (0.19) | (0.70) |
Proceeds from redemption fees | — | — | — | — | — * |
Net asset value end of period | 15.69 | 12.89 | 12.71 | 12.75 | 13.01 |
Net assets end of period (000s) | $362,035 | $277,638 | $254,461 | $196,062 | $196,412 |
| Ratios and Supplemental Data (%) | |||||
Total returnb | 23.38% | 2.46% | 1.22% | (0.54)% | 19.09% |
Ratio of total expenses to average net assets2 | 0.91 | 0.90 | 0.89 | 0.88 | 0.93 |
Ratio of net expenses to average net assetsa | 0.85 | 0.85 | 0.85 | 0.85 | 0.89 |
Ratio of net investment income to average net assetsa | 0.92 | 1.36 | 1.19 | 1.23 | 1.38 |
Portfolio turnover | 13 | 19 | 20 | 30 | 166 |
| Investor Class | |||||
| Year Ended October 31, | 2017 | 2016 | 2015 | 2014 | 2013 j |
Net asset value beginning of period | $ 12.79 | $ 12.60 | $ 12.64 | $ 12.89 | $ 11.50 |
| Income from Investment Operations | |||||
Net investment income/(loss)a | 0.07 e | 0.12 e | 0.10 e | — * | 0.06 |
Net realized and unrealized gains/(losses) on investments | 2.82 | 0.15 | — * | (0.11) | 1.99 |
Total from investment operations | 2.89 | 0.27 | 0.10 | (0.11) | 2.05 |
| Less Distributions | |||||
Dividends from net investment income | (0.11) | (0.08) | (0.14) | (0.14) | (0.66) |
Distributions from net realized capital gains1 | — | — | — | — | — |
Total distributions | (0.11) | (0.08) | (0.14) | (0.14) | (0.66) |
Proceeds from redemption fees | — | — | — | — | — * |
Net asset value end of period | 15.57 | 12.79 | 12.60 | 12.64 | 12.89 |
Net assets end of period (000s) | $ 14,913 | $ 13,466 | $ 15,978 | $ 17,429 | $ 20,458 |
| Ratios and Supplemental Data (%) | |||||
Total returnb | 22.89% | 2.15% | 0.81% | (0.85)% | 18.60% |
Ratio of total expenses to average net assets2 | 1.28 | 1.27 | 1.26 | 1.25 | 1.30 |
Ratio of net expenses to average net assetsa | 1.22 | 1.22 | 1.22 | 1.22 | 1.26 |
Ratio of net investment income to average net assetsa | 0.54 | 0.99 | 0.79 | 0.87 | 0.98 |
Portfolio turnover | 13 | 19 | 20 | 30 | 166 |
See page 75 for notes to the Financial Highlights.
The accompanying notes are an integral part of the Financial Statements.
67
| Administrative Class | ||||
| 2017 | 2016 | 2015 | 2014 | 2013 j |
| $12.87 | $12.63 | $12.66 | $12.93 | $11.52 |
| 0.09 e | 0.16 e | 0.15 e | (0.08) | 0.01 |
| 2.84 | 0.12 | (0.03) | (0.03) | 2.07 |
| 2.93 | 0.28 | 0.12 | (0.11) | 2.08 |
| (0.13) | (0.04) | (0.15) | (0.16) | (0.67) |
| — | — | — | — | — |
| (0.13) | (0.04) | (0.15) | (0.16) | (0.67) |
| — | — | — | — | — * |
| 15.67 | 12.87 | 12.63 | 12.66 | 12.93 |
| $ 466 | $ 333 | $ 329 | $ 675 | $ 919 |
| 23.08% | 2.21% | 0.96% | (0.83)% | 18.89% |
| 1.16 | 1.15 | 1.14 | 1.13 | 1.18 |
| 1.10 | 1.10 | 1.10 | 1.10 | 1.14 |
| 0.66 | 1.25 | 1.20 | 1.08 | 1.09 |
| 13 | 19 | 20 | 30 | 166 |
| Retirement Class | |
| 2017 | 2016 f |
| $ 12.90 | $11.76 |
| 0.17 e | 0.09 e |
| 2.81 | 1.05 |
| 2.98 | 1.14 |
| (0.17) | — |
| — | — |
| (0.17) | — |
| — | — |
| 15.71 | 12.90 |
| $24,872 | $2,360 |
| 23.52% | 9.69% c |
| 0.84 | 0.86 d |
| 0.77 | 0.80 d |
| 1.19 | 1.06 d |
| 13 | 19 |
68
Harbor International & Global Funds Financial Highlights—Continued
Selected Data for a Share Outstanding for the Periods Presented
Selected Data for a Share Outstanding for the Periods Presented
| HARBOR INTERNATIONAL SMALL CAP FUND | |||||
| Institutional Class | Administrative Class | ||||
| Year Ended October 31, | 2017 | 2016 h | 2017 | 2016 h | |
Net asset value beginning of period | $ 10.77 | $ 10.00 | $10.75 | $10.00 | |
| Income from Investment Operations | |||||
Net investment income/(loss)a | 0.10 e | 0.11 e | 0.07 e | 0.09 e | |
Net realized and unrealized gains/(losses) on investments | 3.15 | 0.66 | 3.15 | 0.66 | |
Total from investment operations | 3.25 | 0.77 | 3.22 | 0.75 | |
| Less Distributions | |||||
Dividends from net investment income | (0.12) | — | (0.10) | — | |
Distributions from net realized capital gains1 | — | — | — | — | |
Total distributions | (0.12) | — | (0.10) | — | |
Net asset value end of period | 13.90 | 10.77 | 13.87 | 10.75 | |
Net assets end of period (000s) | $38,818 | $17,509 | $ 371 | $ 263 | |
| Ratios and Supplemental Data (%) | |||||
Total returnb | 30.59% | 7.70% c | 30.25% | 7.50% c | |
Ratio of total expenses to average net assets2 | 1.42 | 2.55 d | 1.67 | 2.80 d | |
Ratio of net expenses to average net assetsa | 0.95 | 0.95 d | 1.20 | 1.20 d | |
Ratio of net investment income to average net assetsa | 0.81 | 1.40 d | 0.59 | 1.16 d | |
Portfolio turnover | 44 | 35 c | 44 | 35 c | |
| Investor Class | Retirement Class | ||||
| Year Ended October 31, | 2017 | 2016 h | 2017 | 2016 h | |
Net asset value beginning of period | $ 10.74 | $ 10.00 | $10.77 | $10.00 | |
| Income from Investment Operations | |||||
Net investment income/(loss)a | 0.06 e | 0.10 e | 0.08 e | 0.06 e | |
Net realized and unrealized gains/(losses) on investments | 3.14 | 0.64 | 3.18 | 0.71 | |
Total from investment operations | 3.20 | 0.74 | 3.26 | 0.77 | |
| Less Distributions | |||||
Dividends from net investment income | (0.08) | — | (0.13) | — | |
Distributions from net realized capital gains1 | — | — | — | — | |
Total distributions | (0.08) | — | (0.13) | — | |
Net asset value end of period | 13.86 | 10.74 | 13.90 | 10.77 | |
Net assets end of period (000s) | $ 540 | $ 287 | $7,671 | $ 629 | |
| Ratios and Supplemental Data (%) | |||||
Total returnb | 30.10% | 7.40% c | 30.67% | 7.70% c | |
Ratio of total expenses to average net assets2 | 1.79 | 2.92 d | 1.35 | 2.50 d | |
Ratio of net expenses to average net assetsa | 1.32 | 1.32 d | 0.87 | 0.90 d | |
Ratio of net investment income to average net assetsa | 0.53 | 1.33 d | 0.60 | 0.73 d | |
Portfolio turnover | 44 | 35 c | 44 | 35 c | |
See page 75 for notes to the Financial Highlights.
The accompanying notes are an integral part of the Financial Statements.
69
[THIS PAGE INTENTIONALLY LEFT BLANK]
70
Harbor International & Global Funds Financial Highlights—Continued
Selected Data for a Share Outstanding for the Periods Presented
Selected Data for a Share Outstanding for the Periods Presented
| HARBOR GLOBAL LEADERS FUND | |||||
| Institutional Class | |||||
| Year Ended October 31, | 2017 k | 2016 | 2015 | 2014 | 2013 |
Net asset value beginning of period | $ 20.29 | $ 21.83 | $ 23.79 | $ 23.78 | $ 17.99 |
| Income from Investment Operations | |||||
Net investment income/(loss)a | 0.03 e | 0.01 e | (0.01) e | 0.05 | 0.08 |
Net realized and unrealized gains/(losses) on investments | 4.99 | (0.83) | 0.65 | 2.18 | 6.26 |
Total from investment operations | 5.02 | (0.82) | 0.64 | 2.23 | 6.34 |
| Less Distributions | |||||
Dividends from net investment income | — | — | (0.03) | (0.07) | (0.06) |
Distributions from net realized capital gains1 | — | (0.72) | (2.57) | (2.15) | (0.49) |
Total distributions | — | (0.72) | (2.60) | (2.22) | (0.55) |
Proceeds from redemption fees | — | — | — | — | — * |
Net asset value end of period | 25.31 | 20.29 | 21.83 | 23.79 | 23.78 |
Net assets end of period (000s) | $29,034 | $25,471 | $34,402 | $26,601 | $24,734 |
| Ratios and Supplemental Data (%) | |||||
Total returnb | 24.74% | (3.90)% | 2.97% | 10.08% | 36.24% |
Ratio of total expenses to average net assets2 | 1.21 | 1.04 | 1.01 | 1.08 | 1.24 |
Ratio of net expenses to average net assetsa | 0.90 | 0.90 | 0.90 | 0.90 | 0.90 |
Ratio of net investment income to average net assetsa | 0.14 | 0.04 | (0.06) | 0.22 | 0.44 |
Portfolio turnover | 123 | 76 | 106 | 141 | 110 |
| Investor Class | |||||
| Year Ended October 31, | 2017 k | 2016 | 2015 | 2014 | 2013 |
Net asset value beginning of period | $ 19.89 | $ 21.49 | $ 23.51 | $ 23.54 | $ 17.83 |
| Income from Investment Operations | |||||
Net investment income/(loss)a | (0.06) e | (0.07) e | (0.10) e | (0.03) | 0.01 |
Net realized and unrealized gains/(losses) on investments | 4.89 | (0.81) | 0.65 | 2.15 | 6.20 |
Total from investment operations | 4.83 | (0.88) | 0.55 | 2.12 | 6.21 |
| Less Distributions | |||||
Dividends from net investment income | — | — | — | — * | (0.01) |
Distributions from net realized capital gains1 | — | (0.72) | (2.57) | (2.15) | (0.49) |
Total distributions | — | (0.72) | (2.57) | (2.15) | (0.50) |
Net asset value end of period | 24.72 | 19.89 | 21.49 | 23.51 | 23.54 |
Net assets end of period (000s) | $11,364 | $10,659 | $13,693 | $ 8,584 | $ 5,988 |
| Ratios and Supplemental Data (%) | |||||
Total returnb | 24.28% | (4.25)% | 2.57% | 9.68% | 35.76% |
Ratio of total expenses to average net assets2 | 1.58 | 1.41 | 1.38 | 1.45 | 1.61 |
Ratio of net expenses to average net assetsa | 1.27 | 1.27 | 1.27 | 1.27 | 1.27 |
Ratio of net investment income to average net assetsa | (0.25) | (0.35) | (0.44) | (0.17) | 0.04 |
Portfolio turnover | 123 | 76 | 106 | 141 | 110 |
See page 75 for notes to the Financial Highlights.
The accompanying notes are an integral part of the Financial Statements.
71
| Administrative Class | ||||
| 2017 k | 2016 | 2015 | 2014 | 2013 |
| $20.06 | $21.65 | $23.63 | $23.65 | $17.90 |
| (0.04) e | (0.05) e | (0.07) e | 0.01 | 0.04 |
| 4.95 | (0.82) | 0.66 | 2.14 | 6.22 |
| 4.91 | (0.87) | 0.59 | 2.15 | 6.26 |
| — | — | — | (0.02) | (0.02) |
| — | (0.72) | (2.57) | (2.15) | (0.49) |
| — | (0.72) | (2.57) | (2.17) | (0.51) |
| — | — | — | — | — * |
| 24.97 | 20.06 | 21.65 | 23.63 | 23.65 |
| $1,204 | $1,253 | $1,198 | $ 802 | $ 562 |
| 24.48% | (4.17)% | 2.74% | 9.77% | 35.89% |
| 1.46 | 1.29 | 1.26 | 1.33 | 1.49 |
| 1.15 | 1.15 | 1.15 | 1.15 | 1.15 |
| (0.13) | (0.23) | (0.31) | (0.01) | 0.17 |
| 123 | 76 | 106 | 141 | 110 |
| Retirement Class | |
| 2017 k | 2016 f |
| $20.29 | $19.79 |
| 0.08 e | (0.03) e |
| 4.96 | 0.53 |
| 5.04 | 0.50 |
| — | — |
| — | — |
| — | — |
| 25.33 | 20.29 |
| $4,376 | $1,713 |
| 24.84% | 2.53% c |
| 1.13 | 1.00 d |
| 0.83 | 0.85 d |
| 0.32 | (0.18) d |
| 123 | 76 |
72
Harbor International & Global Funds Financial Highlights—Continued
Selected Data for a Share Outstanding for the Periods Presented
Selected Data for a Share Outstanding for the Periods Presented
| HARBOR EMERGING MARKETS EQUITY FUND | ||||
| Institutional Class | ||||
| Year Ended October 31, | 2017 | 2016 | 2015 | 2014 |
Net asset value beginning of period | $ 8.59 | $ 7.89 | $ 10.05 | $ 10.00 |
| Income from Investment Operations | ||||
Net investment income/(loss)a | 0.11 e | 0.07 e | 0.08 e | 0.05 |
Net realized and unrealized gains/(losses) on investments | 2.22 | 0.71 | (2.19) | — * |
Total from investment operations | 2.33 | 0.78 | (2.11) | 0.05 |
| Less Distributions | ||||
Dividends from net investment income | (0.09) | (0.08) | (0.05) | — |
Distributions from net realized capital gains1 | — | — | — | — |
Total distributions | (0.09) | (0.08) | (0.05) | — |
Net asset value end of period | 10.83 | 8.59 | 7.89 | 10.05 |
Net assets end of period (000s) | $51,849 | $36,390 | $41,927 | $27,294 |
| Ratios and Supplemental Data (%) | ||||
Total returnb | 27.54% | 9.99% | (21.10)% | 0.50% |
Ratio of total expenses to average net assets2 | 1.43 | 1.49 | 1.47 | 2.34 d |
Ratio of net expenses to average net assetsa | 1.15 | 1.15 | 1.17 | 1.25 d |
Ratio of net investment income to average net assetsa | 1.13 | 0.93 | 0.90 | 0.78 d |
Portfolio turnover | 59 | 49 | 58 | 50 c |
| Investor Class | ||||
| Year Ended October 31, | 2017 | 2016 | 2015 | 2014 |
Net asset value beginning of period | $ 8.56 | $ 7.85 | $ 10.01 | $ 10.00 |
| Income from Investment Operations | ||||
Net investment income/(loss)a | 0.07 e | 0.05 e | 0.04 e | 0.03 |
Net realized and unrealized gains/(losses) on investments | 2.22 | 0.70 | (2.18) | (0.02) |
Total from investment operations | 2.29 | 0.75 | (2.14) | 0.01 |
| Less Distributions | ||||
Dividends from net investment income | (0.07) | (0.04) | (0.02) | — |
Distributions from net realized capital gains1 | — | — | — | — |
Total distributions | (0.07) | (0.04) | (0.02) | — |
Net asset value end of period | 10.78 | 8.56 | 7.85 | 10.01 |
Net assets end of period (000s) | $ 700 | $ 482 | $ 406 | $ 454 |
| Ratios and Supplemental Data (%) | ||||
Total returnb | 27.00% | 9.69% | (21.45)% | 0.10% |
Ratio of total expenses to average net assets2 | 1.80 | 1.86 | 1.84 | 2.71 d |
Ratio of net expenses to average net assetsa | 1.52 | 1.52 | 1.55 | 1.62 d |
Ratio of net investment income to average net assetsa | 0.75 | 0.69 | 0.40 | 0.45 d |
Portfolio turnover | 59 | 49 | 58 | 50 c |
See page 75 for notes to the Financial Highlights.
The accompanying notes are an integral part of the Financial Statements.
73
| Administrative Class | |||
| 2017 | 2016 | 2015 | 2014 |
| $ 8.58 | $ 7.87 | $ 10.03 | $10.00 |
| 0.08 e | 0.05 e | 0.04 e | 0.05 |
| 2.22 | 0.71 | (2.18) | (0.02) |
| 2.30 | 0.76 | (2.14) | 0.03 |
| (0.08) | (0.05) | (0.02) | — |
| — | — | — | — |
| (0.08) | (0.05) | (0.02) | — |
| 10.80 | 8.58 | 7.87 | 10.03 |
| $ 275 | $ 217 | $ 197 | $ 250 |
| 27.04% | 9.81% | (21.36)% | 0.30% |
| 1.68 | 1.74 | 1.72 | 2.59 d |
| 1.40 | 1.40 | 1.43 | 1.50 d |
| 0.85 | 0.69 | 0.49 | 0.47 d |
| 59 | 49 | 58 | 50 c |
| Retirement Class | |
| 2017 | 2016 f |
| $ 8.59 | $ 6.90 |
| 0.13 e | 0.05 e |
| 2.21 | 1.64 |
| 2.34 | 1.69 |
| (0.10) | — |
| — | — |
| (0.10) | — |
| 10.83 | 8.59 |
| $4,232 | $1,335 |
| 27.62% | 24.49% c |
| 1.35 | 1.45 d |
| 1.08 | 1.10 d |
| 1.32 | 0.95 d |
| 59 | 49 |
74
Harbor International & Global Funds Financial Highlights—Continued
Selected Data for a Share Outstanding for the Periods Presented
Selected Data for a Share Outstanding for the Periods Presented
| * | Less than $0.01 |
| 1 | Includes both short-term and long-term capital gains |
| 2 | Percentage does not reflect reduction for credit balance arrangements (see Note 2 of the accompanying Notes to Financial Statements) |
| a | Reflects the Adviser’s waiver, if any, of its management fees and/or other operating expenses |
| b | The total returns would have been lower had certain expenses not been waived during the periods shown. |
| c | Unannualized |
| d | Annualized |
| e | Amounts are allocated based on average shares outstanding during the period. |
| f | For the period March 1, 2016 (inception) through October 31, 2016 |
| g | For the period November 2, 2015 (inception) through October 31, 2016 |
| h | For the period February 1, 2016 (inception) through October 31, 2016 |
| i | The amount shown for a share outstanding does not correspond with the aggregate net investment income/(loss) for the period due to the timing of the sales and purchases of shares in relation to fluctuating market values of the investments of the Fund. |
| j | Effective May 21, 2013, Harbor International Growth Fund appointed Baillie Gifford Overseas Limited as its Subadviser. |
| k | Effective March 1, 2017, Harbor Global Leaders Fund appointed Sands Capital Management, LLC as its subadviser. |
The accompanying notes are an integral part of the Financial Statements.
75
Harbor International & Global Funds
Notes to Financial Statements—October 31, 2017
Notes to Financial Statements—October 31, 2017
Note 1—Organizational Matters
Harbor Funds (the “Trust”) is registered under the Investment Company Act of 1940, as amended (the “Investment Company Act”), as an open-end management investment company. As of October 31, 2017 the Trust consists of 31 separate portfolios. The portfolios covered by this report are: Harbor International Fund, Harbor Diversified International All Cap Fund, Harbor International Growth Fund, Harbor International Small Cap Fund, Harbor Global Leaders Fund and Harbor Emerging Markets Equity Fund (individually or collectively referred to as a “Fund” or the “Funds," respectively). Harbor Capital Advisors, Inc. (the “Adviser” or “Harbor Capital”) is the investment adviser for the Funds.
The Funds currently offer four classes of shares, designated as Institutional Class, Administrative Class, Investor Class, and Retirement Class. The shares of each class represent an interest in the same portfolio of investments of the Funds and have equal rights with respect to voting, redemptions, dividends, and liquidations, except that: (i) certain expenses, subject to the approval of the Trust’s Board of Trustees (the “Board of Trustees”), may be applied differently to each class of shares in accordance with current regulations of the Securities and Exchange Commission (“SEC”) and the Internal Revenue Service; and (ii) shareholders of a class that bears distribution and service expenses under terms of a distribution plan have exclusive voting rights as to that distribution plan.
Note 2—Significant Accounting Policies
The following is a summary of significant accounting policies followed by the Trust in the preparation of its financial statements. Each Fund follows the investment company reporting requirements under U.S. Generally Accepted Accounting Principles (“U.S. GAAP”), which includes the accounting and reporting guidelines under Accounting Standards Topic 946, Financial Services-Investment Companies. The preparation of financial statements in accordance with U.S. GAAP requires management to make estimates and assumptions that affect the reported amounts and disclosures in the financial statements. Actual results may differ from those estimates.
Security Valuation
The Trust’s valuation procedures permit the Funds to use a variety of valuation methodologies, consider a number of subjective factors, analyze applicable facts and circumstances and, in general, exercise judgment, when valuing Fund investments. The methodology used for a specific type of investment may vary based on the circumstances and relevant considerations, including available market data.
Equity securities (including common stock, preferred stock, and convertible preferred stock), exchange-traded notes and financial derivative instruments (such as futures contracts, options contracts, including rights and warrants and centrally cleared swap agreements) that are traded or cleared on a national securities exchange or system (except securities listed on the National Association of Securities Dealers Automated Quotation (“NASDAQ”) system and United Kingdom securities) are valued at the last sale price on a national exchange or system on which they are principally traded or cleared as of the valuation date. Securities listed on the NASDAQ system or a United Kingdom exchange are valued at the official closing price of those securities. In the case of securities for which there are no sales on the valuation day, (i) securities traded principally on a U.S. exchange, including NASDAQ, are valued at the mean between the closing bid and ask price; and (ii) securities traded principally on a foreign exchange, including United Kingdom securities, are valued at the official bid price determined as of the close of the primary exchange. Securities of open-end registered investment companies that are held by a Fund are valued at net asset value. To the extent these securities are actively traded and fair valuation adjustments are not applied, they are normally categorized as Level 1 in the fair value hierarchy. Equity securities traded on inactive markets or valued by reference to similar instruments are normally categorized as Level 2 in the fair value hierarchy. For more information on the fair value hierarchy, please refer to the Fair Value Measurements and Disclosures section in Note 2.
Participation notes are valued at the last sale price of the underlying local shares on the national exchange on which they trade. Such securities are normally categorized as Level 2 in the fair value hierarchy.
Short-term securities with a remaining maturity of less than 60 days at the time of acquisition that are held by a Fund are valued at amortized cost to the extent amortized cost represents fair value. Securities that use similar valuation techniques and inputs as described above are normally categorized as Level 2 in the fair value hierarchy.
76
Harbor International & Global Funds
Notes to Financial Statements—Continued
Notes to Financial Statements—Continued
Note 2—Significant Accounting Policies—Continued
Over-the-counter (“OTC”) financial derivative instruments, such as forward currency contracts, options contracts, and swap agreements, derive their value from underlying asset prices, indices, reference rates and other inputs, or a combination of these factors. These instruments are valued using evaluated prices furnished by a pricing vendor selected by the Board of Trustees. In certain cases, when a valuation is not readily available from a pricing vendor, the Fund’s subadviser provides a valuation, typically using its own proprietary models. Depending on the instrument and the terms of the transaction, the value of the derivative instrument can be determined by a pricing vendor or subadviser using a series of techniques, including simulation pricing models. The pricing models use inputs, such as issuer details, indices, spreads, interest rates, yield curves, dividends and exchange rates, that are observed from actively quoted markets. Derivative instruments that use valuation techniques and inputs similar to those described above are normally categorized as Level 2 in the fair value hierarchy.
When reliable market quotations or evaluated prices supplied by a pricing vendor are not readily available or are not believed to accurately reflect fair value, securities are priced at their fair value as determined by the Trust’s Valuation Committee (the “Valuation Committee”) pursuant to procedures adopted, and subject to oversight, by the Board of Trustees. The Valuation Committee is comprised of a trustee and officers of the Trust and employees of Harbor Capital with relevant experience or responsibilities. Each security for which the Valuation Committee determines a fair value, including the basis for the fair value decision, is reviewed by the Board of Trustees at its regularly scheduled board meetings.
When a fair valuation method is applied by the Valuation Committee or a Fund’s subadviser, securities will be priced by a method that the Valuation Committee or subadviser believes accurately reflects fair value. Securities valued using fair valuation methods that incorporate significant unobservable inputs are normally categorized as Level 3 in the fair value hierarchy. Examples of possible fair valuation methodologies used in determining the fair value of securities categorized as Level 3 in the fair value hierarchy include, but are not limited to, benchmark pricing and indicative market quotations.
When benchmark pricing is used, the base price of a debt security is set and then subsequently adjusted in proportion to the market value changes of an index or similar security (the “benchmark security”) that trades in an active market or for which other observable inputs are available. The base price may be a broker-dealer quote, transaction price, or an internal value as derived by analysis of market data. The base price of the security may be reset on a periodic basis based on the availability of market data and procedures approved by a Fund’s subadviser. If the benchmark security is categorized as Level 2 in the fair value hierarchy due to the lack of an active market for that security, any security adjusted in proportion to the market value of the benchmark security may be categorized as Level 3 in the fair value hierarchy. Significant changes in the unobservable inputs of the benchmark pricing process (i.e., the base price) would result in direct and proportional changes in the fair value of the security. The reasonability of the fair value is reviewed by the subadviser on a periodic basis and may be amended as the availability of market data indicates a material change.
If evaluated pricing through a third-party pricing vendor is not available or deemed not to be indicative of fair value, a Fund’s subadviser may elect to obtain indicative market quotations (“broker quotes”) directly from a broker-dealer or passed through from a third-party pricing vendor. Indicative market quotations are typically received from established market participants. In the event that the source of fair value is from a single-sourced broker quote, but the subadviser does not have the transparency to view the underlying inputs that support the market quotation, these securities are categorized as Level 3 in the fair value hierarchy. Significant changes in the broker quote would have direct and proportional changes in the fair value of the security.
A Fund may also use fair value pricing if the value of some or all of the Fund’s securities have been materially affected by events occurring before the Fund’s pricing time but after the close of the primary markets or exchanges on which the security is traded. This most commonly occurs with foreign securities, but may occur with other securities as well. In such cases, the Fund may apply a fair value factor supplied by the pricing vendor to a foreign security’s market close value to reflect changes in value that may have occurred between the close of the primary market or exchange on which the security is traded and the Fund’s pricing time. That factor may be derived using observable inputs such as a comparison of the trading patterns of a foreign security to intraday trading in the U.S. markets that are highly correlated to the foreign security or other information that becomes available after the close of the foreign market on which the security principally traded. When fair value pricing is employed, the prices of securities used by a Fund to calculate its net asset value may differ from market quotations, official closing prices or evaluated prices for the same securities, which means that the Fund may value those securities higher or lower than another given fund that uses market quotations, official closing prices or evaluated prices supplied by a pricing vendor in its calculation of net asset value. Securities valued using observable inputs, such as those described above, are normally categorized as Level 2 of the fair value hierarchy.
77
Harbor International & Global Funds
Notes to Financial Statements—Continued
Notes to Financial Statements—Continued
Note 2—Significant Accounting Policies—Continued
Fair Value Measurements and Disclosures
Various inputs may be used to determine the value of each Fund’s investments, which are summarized in three broad categories defined as Level 1, Level 2, and Level 3. The inputs or methodologies used for valuing securities are not necessarily indicative of the risk associated with investing in those securities. The assignment of an investment to Levels 1, 2, or 3 is based on the lowest level of significant inputs used to determine its fair value.
| Level 1– | Quoted prices in active markets for identical securities. |
| Level 2– | Other significant observable inputs (including quoted prices for similar securities, interest rates, prepayment speeds, credit risk, etc.). |
| Level 3– | Significant unobservable inputs are used in situations where quoted prices or other observable inputs are not available or are deemed unreliable. Significant unobservable inputs may include each Fund’s own assumptions. |
Transfers between levels, if any, are recognized as of the last day in the fiscal quarter of the period in which the event or change in circumstances that caused the reclassification occurred. For fair valuations using significant unobservable inputs, a reconciliation of the beginning to ending balances for reported fair values is provided that presents changes attributable to realized and unrealized gains and losses and purchases, sales, and transfers in/out of the Level 3 category during the period. A table that includes a categorization of investments into Levels 1, 2, or 3, transfers between levels, if any, and a Level 3 reconciliation, including details of significant unobservable inputs used, when applicable, can be found at the end of each Fund’s Portfolio of Investments schedule.
Each Fund used observable inputs in its valuation methodologies whenever they were available and deemed reliable.
U.S. Government Securities
U.S. government securities include securities issued by U.S. government agencies or government-sponsored enterprises that may not be guaranteed by the U.S. Treasury. The Government National Mortgage Association (“GNMA” or “Ginnie Mae”), a wholly owned U.S. government corporation, is authorized to guarantee, with the full faith and credit of the U.S. government, the timely payment of principal and interest on securities issued by institutions approved by GNMA and backed by pools of mortgages insured by the Federal Housing Administration or guaranteed by the Department of Veterans Affairs. Government-related guarantors are not backed by the full faith and credit of the U.S. government and include the Federal National Mortgage Association (“FNMA” or “Fannie Mae”) and the Federal Home Loan Mortgage Corporation (“FHLMC” or “Freddie Mac”). On September 7, 2008, the Federal Housing Finance Agency placed Fannie Mae and Freddie Mac in conservatorship, while the U.S. Treasury agreed to purchase preferred stock as needed to ensure that both Fannie Mae and Freddie Mac maintain a positive net worth (guaranteeing up to $100 billion for each entity). As a consequence, certain fixed income securities of Fannie Mae and Freddie Mac have more explicit U.S. government support. No assurance can be given as to whether the U.S. government will continue to support Fannie Mae and Freddie Mac. In addition, the future of Fannie Mae and Freddie Mac is uncertain because Congress has been considering proposals as to whether Fannie Mae and Freddie Mac should be nationalized, privatized, restructured or eliminated altogether. Fannie Mae and Freddie Mac are also the subject of continuing legal actions and investigations, which may have an adverse effect on these entities.
Repurchase Agreements
In a repurchase agreement, a Fund buys a security at one price and simultaneously agrees to sell it back at a higher price. Such agreements must be adequately collateralized to cover the counterparty’s obligation to the Fund to close out the repurchase agreement. During the year, each Fund entered into repurchase agreements with domestic or foreign banks or with a member firm of the Financial Industry Regulatory Authority, Inc., or an affiliate of a member firm that is a primary dealer in U.S. government securities. Each repurchase agreement counterparty must meet the minimum credit quality requirements applicable to the respective Fund and any other appropriate counterparty criteria as determined by the Fund’s subadviser. The minimum credit quality requirements are those applicable to a Fund’s purchase of securities such that if a Fund is permitted to only purchase securities that are rated investment-grade (or the equivalent if unrated), a Fund could only enter into repurchase agreements with counterparties that have debt outstanding that is rated investment-grade (or the equivalent if unrated). The securities are regularly monitored to ensure that the collateral is adequate. A Fund seeks to further mitigate its counterparty risk by entering into master repurchase agreements with its counterparties. The master repurchase agreements provide that, in the event of a counterparty’s default, including bankruptcy, the Fund may terminate any repurchase agreements with that
78
Harbor International & Global Funds
Notes to Financial Statements—Continued
Notes to Financial Statements—Continued
Note 2—Significant Accounting Policies—Continued
counterparty, determine the net amount owned, and sell or retain the collateral up to the net amount owed to the Fund. A counterparty’s default may cause the Fund to suffer losses, including loss of interest on or principal of the securities and costs associated with delay and enforcement of the terms of the master repurchase agreement.
Options
An option, including rights and warrants, is a contract that offers the buyer the right, but not the obligation, to buy (call) or sell (put) a security or other financial asset at an agreed-upon price (the strike price) during a certain period of time or on a specific date (exercise date). During the year, each Fund purchased option contracts to manage their exposure to equity prices. Purchased call options tend to increase a Fund’s exposure to the underlying instrument. Purchased put options tend to decrease a Fund’s exposure to the underlying instrument.
When a Fund purchases an option, it pays a premium. If a purchased option expires, a Fund realizes a loss in the amount of the premium. If a Fund enters into a closing sale transaction, it realizes a gain or loss, depending on whether the proceeds from the sale are greater or less than the cost of the option. If a call option is exercised by a Fund, the cost of the securities acquired by exercising the call is increased by the premium paid to buy the call. If a put option is exercised by a Fund, it realizes a gain or loss from the sale of the underlying security and the proceeds from such sale are decreased by the premium originally paid. The risk associated with purchasing options is limited to the premium paid. A Fund’s maximum risk of loss from counterparty credit risk is also limited to the premium paid for the contract.
Participation Notes
Participation notes are equity-linked securities which can be used to gain exposure to emerging markets. These instruments represent interests in securities listed on certain foreign exchanges and thus present similar risks to investing directly in such equity securities. These instruments are issued by a broker-dealer evidencing ownership of shares listed on a foreign stock exchange. Accordingly, the participation notes also expose investors to counterparty risk which is the risk that the entity issuing the note may not be able to honor its financial commitments. A Fund’s participation notes are not subject to any master netting agreements. Participation notes may be more volatile and less liquid than holding the underlying security directly. A Participation note is intended to reflect the performance of the underlying equity securities on a one-to-one basis. During the year, Harbor Emerging Markets Equity Fund invested in participation notes to gain exposure to certain foreign markets. The Fund is entitled to receive dividends or other distributions paid on the underlying securities from the broker-dealer. The Fund however is not entitled to the same rights as an owner of the underlying securities, such as voting rights.
Foreign Currency Spot Contracts
A foreign currency spot contract is an agreement between two parties to buy and sell currencies at the current market rate for settlement within two business days. During the year, each Fund used foreign currency spot contracts to facilitate transactions in foreign securities or to convert foreign currency receipts into U.S. dollars.
The foreign currency spot contract is marked-to-market daily for settlements beyond one day, and any change in market value is recorded as an unrealized gain or loss. When the contract is closed, the Fund records a realized gain or loss equal to the difference between the value on the open and close date. Risk of losses may arise from changes in the value of the foreign currency or if the counterparties do not perform under the contract’s terms. The maximum potential loss from such contracts is the aggregate face value in U.S. dollars at the time the contract was opened.
Foreign Currency Translations
Purchases and sales of securities are translated into U.S. dollars at the current exchange rate on the respective dates of the transactions. Income and withholding taxes are translated at the prevailing exchange rate when accrued or incurred. The accounting records of the Funds are maintained in U.S. dollars. Investment securities and other assets and liabilities denominated in a foreign currency, when applicable, are translated into U.S. dollars based on the current exchange rates at year end.
79
Harbor International & Global Funds
Notes to Financial Statements—Continued
Notes to Financial Statements—Continued
Note 2—Significant Accounting Policies—Continued
Reported net realized gains and losses on foreign currency transactions, when applicable, represent net gains and losses from sales and maturities of foreign currency contracts, disposition of foreign currencies, currency gains and losses realized between the trade and settlement dates on securities transactions, and the difference between the amount of investment income accrued and tax reclaims receivable and the U.S. dollar amount actually received. The effects of changes in foreign currency exchange rates on investments in securities, when applicable, are included in the net realized and unrealized gain or loss on investments in the Statement of Operations.
Investment Income
Dividends declared on portfolio securities are accrued on the ex-dividend date. For foreign securities, certain dividends are recorded after the ex-dividend date, but as soon as the respective Fund is notified of such dividends. Interest income is accrued daily as earned. Discounts and premiums on fixed income securities are amortized over the life of the respective securities using the effective yield method.
Securities Transactions
Securities transactions are accounted for on the trade date (the date the order to buy or sell is executed). Realized gains or losses on security transactions are determined on the basis of identified cost.
Proceeds from Litigation
Each Fund may receive proceeds from shareholder litigation settlements involving current and/or previously held portfolio holdings. Any proceeds received from litigation involving portfolio holdings are reflected in the Statements of Operations in realized gain/(loss) if the security has been disposed of by a Fund, or in unrealized gain/(loss) if the security is still held by a Fund.
Distribution to Shareholders
Distributions on Fund shares are recorded on the ex-dividend date.
Expenses
Expenses incurred by the Trust are charged directly to the Fund that incurred such expense whenever possible. With respect to expenses incurred by any two or more Harbor Funds where amounts cannot be identified on a fund by fund basis, such expenses are generally allocated in proportion to the average net assets or the number of shareholders of each Fund.
Custodian
Each Fund has credit balance arrangements with its custodian whereby positive balances in demand deposit accounts used by the transfer and shareholder servicing agent for clearing shareholder transactions in the Fund generate credits that are applied against gross custody expenses. Such custodial expense reductions, if any, are reflected on the respective Fund’s accompanying Statement of Operations.
Class Allocations
Income, common expenses and realized and unrealized gains/(losses) are determined at the Fund level and allocated daily to each class of shares based on the applicable net assets of the respective classes. Distribution and service fees, if any, and transfer agent fees are calculated daily at the class level based on the applicable net assets of each class and the expense rate(s) applicable to each class.
80
Harbor International & Global Funds
Notes to Financial Statements—Continued
Notes to Financial Statements—Continued
Note 2—Significant Accounting Policies—Continued
Taxes
Each Fund is treated as a separate entity for federal tax purposes. Each Fund’s policy is to meet the requirements of Subchapter M of the Internal Revenue Code applicable to regulated investment companies and to distribute to its shareholders all of its taxable income within the prescribed time. It is also the intention of each Fund to distribute an amount sufficient to avoid imposition of any excise tax under Section 4982 of the Internal Revenue Code. Therefore, no provision has been made for federal taxes on income, capital gains or unrealized appreciation of securities held or excise taxes on income and capital gains.
Each Fund may be subject to taxes imposed by countries in which they invest. Such taxes are generally based on income and/or capital gains earned or repatriated. Taxes are accrued and applied to net investment income, net realized gains and unrealized appreciation as such income and/or gains are earned.
Management has analyzed each Fund’s tax positions for all open tax years (in particular, U.S. federal income tax returns for the tax years ended October 31, 2014–2016), including all positions expected to be taken upon filing the 2017 tax return, in all material jurisdictions where each Fund operates, and has concluded that no provision for income tax is required in the Funds' financial statements. Each Fund will recognize interest and penalties, if any, related to unrecognized tax benefits as income tax expense in the Statement of Operations.
Note 3—Investment Portfolio Transactions
Purchases and sales of investments, other than short-term securities, for each Fund for the year ended October 31, 2017 are as follows:
| Purchases (000s) | Sales (000s) | ||
Harbor International Fund | $4,344,219 | $13,904,329* | |
Harbor Diversified International All Cap Fund | 222,269 | 99,489 | |
Harbor International Growth Fund | 83,508 | 42,386 | |
Harbor International Small Cap Fund | 32,525 | 11,075 | |
Harbor Global Leaders Fund | 48,668 | 49,924 | |
Harbor Emerging Markets Equity Fund | 34,418 | 27,047 |
| * | Sales for this Fund include $428,982 in connection with an in-kind redemption of the Fund’s capital shares. |
In-Kind Redemption Transaction
In accordance with the Trust’s prospectus, the Funds may distribute portfolio securities rather than cash as payment for a redemption of Fund shares. For financial reporting purposes, the Fund recognizes a gain or loss on the securities distributed related to the in-kind redemption. Such gains and losses on in-kind redemptions are not taxable to shareholders. For the year ended October 31, 2017, Harbor International Fund realized gains of $174,061,000 upon the disposition of portfolio securities in connection with an in-kind redemption of Fund shares.
Securities Lending
Each Fund may engage in securities lending, whereby a Fund lends its securities to financial institutions in order to increase its income. The Trust has engaged State Street Bank and Trust Company to act as its agent (the “Lending Agent”) with respect to the lending of portfolio securities of the Funds, pursuant to the terms and conditions of a Securities Lending Authorization Agreement (the “SLA Agreement”). Securities loans are required to be secured at all times during the term of the loan by cash collateral that is at least equal to the value of the loaned securities determined at the close of each business day. Any additional collateral that may be required to secure a loan is delivered to the Fund on the next business day. This collateral is recognized as the gross liability for securities loaned in the Statement of Assets and Liabilities. The cash collateral is invested in the State Street Navigator Securities Lending Government Money Market Portfolio (the “Navigator Portfolio”), a money market mutual fund that seeks to provide income while maintaining a stable net asset value of $1.00. There is no assurance that the Navigator Portfolio will maintain a stable net asset value and the Funds are subject to the risk of loss on the cash collateral invested. A portion of the earnings generated by the investment of the cash collateral is rebated to the borrower for the use of the cash collateral and these earnings (less any rebate) are then divided between the Fund and the Lending Agent, as a fee for its services,
81
Harbor International & Global Funds
Notes to Financial Statements—Continued
Notes to Financial Statements—Continued
Note 3—Investment Portfolio Transactions—Continued
according to agreed-upon rates. The Lending Agent and the Fund will share in any shortfall in the rebate due to the borrower, according to agreed-upon rates. In addition to receiving a fee from the borrower based on the demand for securities loaned and earning income on the investment of the cash collateral, the Fund receives substitute interest, dividends, or other amounts on the loaned securities, during the term of a loan. Net securities lending income is disclosed as such in the Statements of Operations.
Loans may be terminated at the option of the borrower or the Funds. Upon termination of the loan, the borrower will return to the Fund securities that are identical to the loaned securities. The Funds bear the risk of delay in recovery of, or loss of rights in, the securities loaned and the risk that the value of the collateral falls below the value of the securities on loan. Each Fund seeks to mitigate this risk through the SLA Agreement, which provides that in the event of default, the Lending Agent may apply the proceeds of the cash collateral from the loaned securities toward the purchase of replacement securities. If such proceeds are insufficient or the collateral is unavailable, the Lending Agent will purchase replacement securities at its sole expense, or if unable to do so, the Lending Agent may credit to the Fund’s account an amount equal to the fair value of the unreturned loaned securities.
During the year, Harbor International Fund, Harbor Diversified International All Cap Fund, Harbor International Growth Fund, Harbor International Small Cap Fund, and Harbor Global Leaders Fund engaged in securities lending. The value at October 31, 2017 of equity securities loaned and related cash collateral for Harbor International Fund was $426,931,000 and $450,733,000, respectively. The value at October 31, 2017 of equity securities loaned and related cash collateral for Harbor International Growth Fund was $6,410,000 and $6,723,000, respectively. As the securities loans are subject to termination by the Fund or the borrower at any time, the remaining contractual maturities of each securities lending transaction is considered to be overnight and continuous.
Note 4—Fees and Other Transactions with Affiliates
Investment Adviser
Harbor Capital is a wholly-owned subsidiary of Robeco Groep N.V. (“Robeco”). Robeco is wholly-owned by ORIX Corporation (“ORIX”). Harbor Capital is the Funds’ investment adviser and is also responsible for administrative and other services.
Each Fund has a separate advisory agreement with Harbor Capital. The agreements provide for management fees based on an annual percentage rate of average daily net assets as follows:
| Contractual Rate | Actual Rate | ||
Harbor International Fund | 0.75%, 0.65%a | 0.68% | |
Harbor Diversified International All Cap Fund | 0.75 | 0.75 | |
Harbor International Growth Fund | 0.75 | 0.75 | |
Harbor International Small Cap Fund | 0.85 | 0.85 | |
Harbor Global Leaders Fund | 0.75 | 0.75 | |
Harbor Emerging Markets Equity Fund | 0.95 | 0.95 |
| a | The management fee rate is 0.75% on assets up to $12 billion and 0.65% on assets in excess of $12 billion. The Adviser contractually agreed to reduce the management fee to 0.63% on assets between $24 billion and $36 billion, 0.58% on assets between $36 billion and $48 billion, and 0.57% on assets over $48 billion through February 28, 2018. |
Harbor Capital has from time to time voluntarily or contractually agreed not to impose a portion of its management fees and/or to bear a portion of the expenses incurred in the operation of certain Funds in order to limit Fund expenses. Such waivers, if any, are reflected on the accompanying Statements of Operations. During the period, the following expense limitation agreements were in effect:
| • | Harbor Diversified International All Cap Fund. For the period March 1, 2017 through October 31, 2017, Harbor Capital contractually agreed to limit the operating expenses, excluding interest expense (if any), to 0.85%, 1.10%, 1.22% and 0.77% for the Institutional Class, Administrative Class, Investor Class and Retirement Class, respectively. For the period November 1, 2016 through February 28, 2017, Harbor Capital contractually agreed to limit the operating expenses, excluding interest expense (if any), to 0.85%, 1.10%, 1.22% and 0.80% for the Institutional Class, Administrative Class, Investor Class and Retirement Class, respectively. These contractual expense limitations are effective through February 28, 2018. |
82
Harbor International & Global Funds
Notes to Financial Statements—Continued
Notes to Financial Statements—Continued
Note 4—Fees and Other Transactions with Affiliates—Continued
| • | Harbor International Growth Fund. For the period March 1, 2017 through October 31, 2017, Harbor Capital contractually agreed to limit the operating expenses, excluding interest expense (if any), to 0.85%, 1.10%, 1.22% and 0.77% for the Institutional Class, Administrative Class, Investor Class and Retirement Class, respectively. For the period November 1, 2016 through February 28, 2017, Harbor Capital contractually agreed to limit the operating expenses, excluding interest expense (if any), to 0.85%, 1.10%, 1.22% and 0.80% for the Institutional Class, Administrative Class, Investor Class and Retirement Class, respectively. These contractual expense limitations are effective through February 28, 2018. |
| • | Harbor International Small Cap Fund. For the period March 1, 2017 through October 31, 2017, Harbor Capital contractually agreed to limit the operating expenses, excluding interest expense (if any), to 0.95%, 1.20%, 1.32% and 0.87% for the Institutional Class, Administrative Class, Investor Class and Retirement Class, respectively. For the period November 1, 2016 through February 28, 2017, Harbor Capital contractually agreed to limit the operating expenses, excluding interest expense (if any), to 0.95%, 1.20%, 1.32% and 0.90% for the Institutional Class, Administrative Class, Investor Class and Retirement Class, respectively. These contractual expense limitations are effective through February 28, 2018. |
| • | Harbor Global Leaders Fund. For the period March 1, 2017 through October 31, 2017, Harbor Capital contractually agreed to limit the operating expenses, excluding interest expense (if any), to 0.90%, 1.15%, 1.27% and 0.82% for the Institutional Class, Administrative Class, Investor Class and Retirement Class, respectively. For the period November 1, 2016 through February 28, 2017, Harbor Capital contractually agreed to limit the operating expenses, excluding interest expense (if any), to 0.90%, 1.15%, 1.27% and 0.85% for the Institutional Class, Administrative Class, Investor Class and Retirement Class, respectively. These contractual expense limitations are effective through February 28, 2018. |
| • | Harbor Emerging Markets Equity Fund. For the period March 1, 2017 through October 31, 2017, Harbor Capital contractually agreed to limit the operating expenses, excluding interest expense (if any), to 1.15%, 1.40%, 1.52% and 1.07% for the Institutional Class, Administrative Class, Investor Class and Retirement Class, respectively. For the period November 1, 2016 through February 28, 2017, Harbor Capital contractually agreed to limit the operating expenses, excluding interest expense (if any), to 1.15%, 1.40%, 1.52% and 1.10% for the Institutional Class, Administrative Class, Investor Class and Retirement Class, respectively. These contractual expense limitations are effective through February 28, 2018. |
All expense limitation agreements include the transfer agent fee waiver discussed in the Transfer Agent note.
Distributor
Harbor Funds Distributors, Inc. (“Harbor Funds Distributors” or the “Distributor”), a wholly-owned subsidiary of Harbor Capital, is the distributor for Harbor Funds’ shares. Under the Trust’s current distribution plans pursuant to Rule 12b-1 under the Investment Company Act with respect to each Fund’s Administrative and Investor Class shares (the “12b-1 Plan”) as applicable, each Fund pays the Distributor compensation at the annual rate of 0.25% of the average daily net assets of its Administrative and Investor Class shares. Pursuant to the 12b-1 Plan the Distributor is compensated for financing any activity that is primarily intended to result in the sale of Administrative and Investor Class shares of each Fund or for recordkeeping services or the servicing of shareholder accounts in the Administrative and Investor Class shares of each Fund. Such activities include, but are not limited to: printing of prospectuses and statements of additional information and reports for prospective shareholders (i.e., other than existing shareholders); preparation and distribution of advertising material and sales literature; expenses of organizing and conducting sales seminars; supplemental payments to dealers or other institutions such as asset-based sales charges, payments of recordkeeping fees under recordkeeping arrangements, or payments of service fees under shareholder service arrangements; and costs of administering the 12b-1 Plan.
Amounts payable by a Fund under the 12b-1 Plan need not be directly related to the expenses actually incurred by the Distributor on behalf of each Fund. The 12b-1 Plan does not obligate each Fund to reimburse the Distributor for the actual expenses the Distributor may incur in fulfilling its obligations under the 12b-1 Plan. Thus, even if the Distributor’s actual expenses exceed the fee payable to the Distributor at any given time, each Fund will not be obligated to pay more than that fee. If the Distributor’s expenses are less than the fee it receives, the Distributor will retain the difference.
The fees attributable to each Fund’s respective class are shown on the accompanying Statement of Operations.
83
Harbor International & Global Funds
Notes to Financial Statements—Continued
Notes to Financial Statements—Continued
Note 4—Fees and Other Transactions with Affiliates—Continued
Transfer Agent
Harbor Services Group, Inc. (“Harbor Services Group”), a wholly-owned subsidiary of Harbor Capital, is the transfer and shareholder servicing agent for the Funds. The transfer agency and service agreement is reviewed and approved annually by the Board of Trustees and provides currently for compensation up to the following amounts per class of each Fund:
| Transfer Agent Feesa | |
Institutional Class | 0.09% of the average daily net assets of all Institutional Class shares |
Administrative Class | 0.09% of the average daily net assets of all Administrative Class shares |
Investor Class | 0.21% of the average daily net assets of all Investor Class shares |
Retirement Class | 0.01% of the average daily net assets of all Retirement Class shares |
| a | For the period November 1, 2016 through February 28, 2017, the Transfer Agent Fees were 0.08% for the Institutional and Administrative Class shares, 0.20% for the Investor Class shares, and 0.03% for the Retirement Class shares. |
Harbor Services Group has voluntarily waived a portion of its transfer agent fees during the year ended October 31, 2017. Fees incurred for these transfer agent services are shown on each Fund’s Statement of Operations. The voluntary waiver may be discontinued at any time.
Affiliated Transactions
The Investment Company Act permits purchase and sale transactions among affiliated investment companies subject to an exemptive rule. Harbor Funds has adopted policies and procedures pursuant to such rule. During the year, the Funds did not enter into any transactions with any other Harbor fund.
Shareholders
On October 31, 2017, Harbor Capital, Harbor Funds Distributors, and Harbor Services Group, collectively held the following shares of beneficial interest in each Fund:
| Number of Shares Owned by Harbor Capital, Harbor Funds Distributors, and Harbor Services Group | Percentage of Outstanding Shares | ||||||||||
| Institutional Class | Administrative Class | Investor Class | Retirement Class | Total | |||||||
Harbor International Fund | — | — | — | 19,129 | 19,129 | 0.0% | |||||
Harbor Diversified International All Cap Fund | 4,005,004 | 25,272 | 25,331 | 65,240 | 4,120,487 | 15.0 | |||||
Harbor International Growth Fund | — | — | — | 81,211 | 81,211 | 0.3 | |||||
Harbor International Small Cap Fund | 1,467,200 | 24,733 | 24,699 | 37,506 | 1,554,138 | 45.6 | |||||
Harbor Global Leaders Fund | 428,748 | 23,629 | 23,617 | 35,245 | 511,239 | 28.0 | |||||
Harbor Emerging Markets Equity Fund | 1,283,805 | 25,473 | 25,403 | 91,568 | 1,426,249 | 27.1 | |||||
Independent Trustees
The fees and expenses of the Independent Trustees are shown on each Fund’s Statement of Operations. The Independent Trustees’ remuneration for the Funds totaled $934,000 for the year ended October 31, 2017.
The Board of Trustees has adopted a Deferred Compensation Plan for Independent Trustees (the “Plan”), which enables Trustees to elect to defer receipt of all or a portion of the annual compensation they are entitled to receive from the Trust. For purposes of determining the amount owed to a Trustee under the Plan, deferred amounts are treated as though they had been invested in shares of the Fund(s) selected by the Trustee. While not required to do so, each Fund makes an investment equal to the Trustee’s investment election. The deferred compensation liability and the offsetting deferred compensation investment asset are included as a component of “Other Accrued Expenses” and “Other assets”, respectively, in the Statement of Assets and Liabilities. Such amounts fluctuate with changes in the market value of the selected securities. The deferred compensation and related mark-to-market impact liability and an offsetting investment asset will remain on each Fund’s Statement of Assets and Liabilities until distributed in accordance with the Plan.
84
Harbor International & Global Funds
Notes to Financial Statements—Continued
Notes to Financial Statements—Continued
Note 4—Fees and Other Transactions with Affiliates—Continued
Indemnification
Under the Trust’s organizational documents, its officers and Trustees are indemnified against certain liabilities arising out of the performance of their duties to the Trust. In addition, in the normal course of business the Trust enters into contracts that provide general indemnities to other parties. The Trust’s maximum exposure under these arrangements is unknown as this would involve future claims that may be made against the Trust that have not yet occurred. The risk of material loss as a result of such indemnification claims is considered remote.
NOTE 5—TAX INFORMATION
The amount and character of income and net realized gains to be distributed are determined in accordance with income tax rules and regulations, which may differ from U.S. GAAP. These differences are attributable to permanent book and tax accounting differences that were primarily due to tax treatment of net investment losses, disposition of passive foreign investment companies' securities, use of equalization, expiration of capital loss carryforwards, and foreign currency transactions. Reclassifications are made to each Fund’s capital account to reflect income and net realized gains available for distribution (or available capital loss carryovers) under income tax rules and regulations. The amounts reclassified on the Statements of Assets and Liabilities for the year ended October 31, 2017 are as follows:
| Undistributed Net Investment Income/(Loss) (000s) | Accumulated Net Realized Gain/(Loss) (000s) | Paid in Capital (000s) | |||
Harbor International Fund | $94,678 | $(436,914) | $ 342,236 | ||
Harbor Diversified International All Cap Fund | (605) | (2,281) | 2,886 | ||
Harbor International Growth Fund | (13) | 163,057 | (163,044) | ||
Harbor International Small Cap Fund | (47) | (39) | 86 | ||
Harbor Global Leaders Fund | (6) | (484) | 490 | ||
Harbor Emerging Markets Equity Fund | (44) | 44 | — |
The tax composition of each Fund’s distributions is as follows:
| As of October 31, 2017 | As of October 31, 2016 | ||||||||||
| Ordinary Income (000s) | Long-Term Capital Gains (000s) | Total (000s) | Ordinary Income (000s) | Long-Term Capital Gains (000s) | Total (000s) | ||||||
Harbor International Fund | $676,849 | $— | $676,849 | $714,056 | $1,199,554 | $1,913,610 | |||||
Harbor Diversified International All Cap Fund | 2,200 | — | 2,200 | 21 | — | 21 | |||||
Harbor International Growth Fund | 3,661 | — | 3,661 | 2,740 | — | 2,740 | |||||
Harbor International Small Cap Fund | 208 | — | 208 | — | — | — | |||||
Harbor Global Leaders Fund | — | — | — | — | 1,607 | 1,607 | |||||
Harbor Emerging Markets Equity Fund | 419 | — | 419 | 342 | — | 342 | |||||
As of October 31, 2017, the components of each Fund’s distributable earnings on a tax basis are as follows:
| Undistributed Ordinary Income (000s) | Undistributed Long-Term Capital Gains (000s) | Unrealized Appreciation/ (Depreciation) (000s) | |||
Harbor International Fund | $546,283 | $1,331,544 | $8,803,481 | ||
Harbor Diversified International All Cap Fund | 3,754 | 10,352 | 31,797 | ||
Harbor International Growth Fund | 4,567 | — | 64,463 | ||
Harbor International Small Cap Fund | 315 | 399 | 7,356 | ||
Harbor Global Leaders Fund | 16 | 4,064 | 7,141 | ||
Harbor Emerging Markets Equity Fund | 493 | — | 10,474 |
85
Harbor International & Global Funds
Notes to Financial Statements—Continued
Notes to Financial Statements—Continued
NOTE 5—TAX INFORMATION—Continued
At October 31, 2017, the Fund in the following table had capital loss carryforwards for federal tax purposes which will reduce the Fund’s taxable income arising from future net realized gains on investment to the extent permitted by the Internal Revenue Code. Use of the capital loss carryforwards will reduce the amount of the distribution to shareholders which would otherwise be necessary to relieve the Fund of any federal tax liability. The capital loss carryforwards do not expire.
| Capital Loss Carryforward | |||||
| Short-Term (000s) | Long-Term (000s) | Total (000s) | |||
Harbor Emerging Markets Equity Fund | $3,240 | $2,599 | $5,839 | ||
The identified cost for federal income tax purposes of investments owned by each Fund and its respective gross unrealized appreciation and depreciation at October 31, 2017 are as follows:
| Identified Cost (000s) | Gross Unrealized | Net Unrealized Appreciation/ (Depreciation) (000s) | |||||
| Appreciation (000s) | (Depreciation) (000s) | ||||||
Harbor International Fund | $23,911,989 | $10,037,617 | $(1,234,136) | $8,803,481 | |||
Harbor Diversified International All Cap Fund | 291,025 | 35,951 | (4,154) | 31,797 | |||
Harbor International Growth Fund | 344,816 | 81,424 | (16,961) | 64,463 | |||
Harbor International Small Cap Fund | 40,503 | 7,469 | (113) | 7,356 | |||
Harbor Global Leaders Fund | 38,899 | 7,922 | (781) | 7,141 | |||
Harbor Emerging Markets Equity Fund* | 46,835 | 11,572 | (1,098) | 10,474 | |||
| * | Capital loss carryforwards are available which may reduce taxable income from future net realized gain on investments. |
Note 6—Derivatives
Each Fund’s derivative holdings do not qualify for hedge accounting treatment and as such are recorded at current fair value. For a discussion of risks related to these investments please refer to the descriptions of each type of derivative instrument in Note 2— Significant Accounting Policies.
Each Fund’s derivative instruments outstanding as of the year ended October 31, 2017, if any, as disclosed in the Portfolios of Investments, and the related amounts of realized and changes in unrealized gains and losses on derivative instruments during the year as disclosed in the Statements of Operations, are indicators of the volume of derivative activity for each Fund.
Derivative Instruments
At October 31, 2017, the fair values of derivatives, by primary risk exposure, were reflected in the Statement of Assets and Liabilities as follows:
HARBOR INTERNATIONAL FUND
| Statement of Assets and Liabilities Caption | Equity Contracts (000s) | |
Purchased options (rights/warrants) | $10,999 |
HARBOR DIVERSIFIED INTERNATIONAL ALL CAP FUND
| Statement of Assets and Liabilities Caption | Equity Contracts (000s) | |
Purchased options (rights/warrants) | $8 |
86
Harbor International & Global Funds
Notes to Financial Statements—Continued
Notes to Financial Statements—Continued
Note 6—Derivatives—Continued
Realized net gain/(loss) and the change in unrealized appreciation/(depreciation) on derivatives, by primary risk exposure, for the year ended October 31, 2017, were:
HARBOR INTERNATIONAL FUND
| Change in Unrealized Appreciation/(Depreciation) on Derivatives | Equity Contracts (000s) | |
Purchased options (rights/warrants) | $1,652 |
HARBOR DIVERSIFIED INTERNATIONAL ALL CAP FUND
| Change in Unrealized Appreciation/(Depreciation) on Derivatives | Equity Contracts (000s) | |
Purchased options (rights/warrants) | $8 |
HARBOR INTERNATIONAL SMALL CAP FUND
| Net Realized Gain/(Loss) on Derivatives | Equity Contracts (000s) | |
Purchased options (rights/warrants) | $11 |
Note 7—Subsequent Events
Effective November 19, 2017, Harbor Capital contractually agreed to extend the management fee waiver currently in effect and to further waive a portion of its management fee such that the operating expenses, excluding interest expense, if any, of the Harbor International Fund are limited to 0.72%, 0.97%, 1.09%, and 0.64%, for the Institutional Class, Administrative Class, Investor Class and Retirement Class, respectively. These contractual expense limitations are effective through February 28, 2019.
87
Harbor International & Global Funds
Report of Independent Registered Public Accounting Firm
Report of Independent Registered Public Accounting Firm
The Board of Trustees and Shareholders of
Harbor Funds
We have audited the accompanying statements of assets and liabilities, including the portfolios of investments, of Harbor International Fund, Harbor Diversified International All Cap Fund, Harbor International Growth Fund, Harbor International Small Cap Fund, Harbor Global Leaders Fund (formerly Harbor Global Growth Fund) and Harbor Emerging Markets Equity Fund, (six of the portfolios constituting the Harbor Funds (the Trust)) as of October 31, 2017, and the related statement of operations for the year then ended, the statements of changes in net assets for each of the two periods in the period then ended, and the financial highlights for each of the periods indicated therein. These financial statements and financial highlights are the responsibility of the Trust’s management. Our responsibility is to express an opinion on these financial statements and financial highlights based on our audits.
We conducted our audits in accordance with the standards of the Public Company Accounting Oversight Board (United States). Those standards require that we plan and perform the audit to obtain reasonable assurance about whether the financial statements and financial highlights are free of material misstatement. We were not engaged to perform an audit of the Trust’s internal control over financial reporting. Our audits included consideration of internal control over financial reporting as a basis for designing audit procedures that are appropriate in the circumstances, but not for the purpose of expressing an opinion on the effectiveness of the Trust’s internal control over financial reporting. Accordingly, we express no such opinion. An audit also includes examining, on a test basis, evidence supporting the amounts and disclosures in the financial statements and financial highlights, assessing the accounting principles used and significant estimates made by management, and evaluating the overall financial statement presentation. Our procedures included confirmation of securities owned as of October 31, 2017, by correspondence with the custodian and brokers, or by other appropriate auditing procedures where replies from brokers were not received. We believe that our audits provide a reasonable basis for our opinion.
In our opinion, the financial statements and financial highlights referred to above present fairly, in all material respects, the financial position of Harbor International Fund, Harbor Diversified International All Cap Fund, Harbor International Small Cap Fund, Harbor International Growth Fund, Harbor Global Leaders Fund, and Harbor Emerging Markets Equity Fund, of the Harbor Funds at October 31, 2017, the results of their operations for the year then ended, the changes in their net assets for each of the two periods in the period then ended, and the financial highlights for each of the periods indicated therein, in conformity with U.S. generally accepted accounting principles.

Chicago, Illinois
December 21, 2017
December 21, 2017
88
Harbor International & Global Funds
Fees and Expenses Example (Unaudited)
Fees and Expenses Example (Unaudited)
Example
As a shareholder of a Fund, you incur two types of costs: (1) transaction costs, including redemption fees (if any) and (2) ongoing costs, including management fees, distribution and service (12b-1) fees (if any), and other Fund expenses. This example is intended to help you understand your ongoing costs (in dollars) of investing in a Fund and to compare these costs with the ongoing costs of investing in other mutual funds.
The example is based on an investment of $1,000 invested at the beginning of the period and held for the entire period May 1, 2017 through October 31, 2017.
Actual Expenses
The first line of the table below provides information about actual account values and actual expenses for each share class. You may use the information in the respective class line, together with the amount you invested, to estimate the expenses that you paid over the period. Simply divide your account value by $1,000 (for example, an $8,600 account value divided by $1,000 = 8.6), then multiply the result by the number in the first line of the respective class under the heading entitled “Expenses Paid During Period” to estimate the expenses you paid on your account during this period.
Hypothetical Example for Comparison Purposes
The second line of the table for each share class below provides information about hypothetical account values and hypothetical expenses based on the respective Fund/Class’s actual expense ratio and an assumed rate of return of 5% per year before expenses, which is not the respective Fund/Class’s actual return. The hypothetical account values and expenses may not be used to estimate the actual ending account balance or expenses you paid for the period. You may use this information to compare the ongoing costs of investing in a Fund to other funds. To do so, compare this 5% hypothetical example with the 5% hypothetical examples that appear in the shareholder reports of the other funds.
Please note that the expenses shown in the table are meant to highlight your ongoing costs only and do not reflect any transactional costs, such as redemption fees. Therefore, the second line of the table is useful in comparing ongoing costs only, and will not help you determine the relative total costs of owning different funds. In addition, if these transactional costs were included, your costs would have been higher.
| Annualized Expense Ratios* | Expenses Paid During Period** | Beginning Account Value May 1, 2017 | Ending Account Value October 31, 2017 | |||||
| Harbor International Fund | ||||||||
| Institutional Class | 0.80% | |||||||
| Actual | $4.17 | $1,000 | $1,067.80 | |||||
| Hypothetical (5% return) | 4.08 | 1,000 | 1,021.07 | |||||
| Administrative Class | 1.05% | |||||||
| Actual | $5.47 | $1,000 | $1,066.40 | |||||
| Hypothetical (5% return) | 5.35 | 1,000 | 1,019.78 | |||||
| Investor Class | 1.17% | |||||||
| Actual | $6.09 | $1,000 | $1,065.80 | |||||
| Hypothetical (5% return) | 5.95 | 1,000 | 1,019.16 | |||||
| Retirement Class | 0.73% | |||||||
| Actual | $3.81 | $1,000 | $1,068.10 | |||||
| Hypothetical (5% return) | 3.72 | 1,000 | 1,021.43 | |||||
89
Harbor International & Global Funds
Fees and Expenses Example—Continued
Fees and Expenses Example—Continued
| Annualized Expense Ratios* | Expenses Paid During Period** | Beginning Account Value May 1, 2017 | Ending Account Value October 31, 2017 | |||||
| Harbor Diversified International All Cap Fund | ||||||||
| Institutional Class | 0.85% | |||||||
| Actual | $4.50 | $1,000 | $1,100.80 | |||||
| Hypothetical (5% return) | 4.33 | 1,000 | 1,020.81 | |||||
| Administrative Class | 1.10% | |||||||
| Actual | $5.83 | $1,000 | $1,099.10 | |||||
| Hypothetical (5% return) | 5.60 | 1,000 | 1,019.52 | |||||
| Investor Class | 1.22% | |||||||
| Actual | $6.45 | $1,000 | $1,098.50 | |||||
| Hypothetical (5% return) | 6.21 | 1,000 | 1,018.90 | |||||
| Retirement Class | 0.77% | |||||||
| Actual | $4.08 | $1,000 | $1,101.90 | |||||
| Hypothetical (5% return) | 3.92 | 1,000 | 1,021.23 | |||||
| Harbor International Growth Fund | ||||||||
| Institutional Class | 0.85% | |||||||
| Actual | $4.56 | $1,000 | $1,128.80 | |||||
| Hypothetical (5% return) | 4.33 | 1,000 | 1,020.81 | |||||
| Administrative Class | 1.10% | |||||||
| Actual | $5.90 | $1,000 | $1,127.30 | |||||
| Hypothetical (5% return) | 5.60 | 1,000 | 1,019.52 | |||||
| Investor Class | 1.22% | |||||||
| Actual | $6.54 | $1,000 | $1,126.60 | |||||
| Hypothetical (5% return) | 6.21 | 1,000 | 1,018.90 | |||||
| Retirement Class | 0.77% | |||||||
| Actual | $4.13 | $1,000 | $1,129.40 | |||||
| Hypothetical (5% return) | 3.92 | 1,000 | 1,021.23 | |||||
| Harbor International Small Cap Fund | ||||||||
| Institutional Class | 0.95% | |||||||
| Actual | $5.16 | $1,000 | $1,155.40 | |||||
| Hypothetical (5% return) | 4.84 | 1,000 | 1,020.30 | |||||
| Administrative Class | 1.20% | |||||||
| Actual | $6.52 | $1,000 | $1,153.90 | |||||
| Hypothetical (5% return) | 6.11 | 1,000 | 1,019.00 | |||||
| Investor Class | 1.32% | |||||||
| Actual | $7.16 | $1,000 | $1,153.10 | |||||
| Hypothetical (5% return) | 6.72 | 1,000 | 1,018.38 | |||||
| Retirement Class | 0.87% | |||||||
| Actual | $4.73 | $1,000 | $1,155.40 | |||||
| Hypothetical (5% return) | 4.43 | 1,000 | 1,020.71 | |||||
90
Harbor International & Global Funds
Fees and Expenses Example—Continued
Fees and Expenses Example—Continued
| Annualized Expense Ratios* | Expenses Paid During Period** | Beginning Account Value May 1, 2017 | Ending Account Value October 31, 2017 | |||||
| Harbor Global Leaders Fund | ||||||||
| Institutional Class | 0.90% | |||||||
| Actual | $4.80 | $1,000 | $1,116.00 | |||||
| Hypothetical (5% return) | 4.58 | 1,000 | 1,020.55 | |||||
| Administrative Class | 1.15% | |||||||
| Actual | $6.13 | $1,000 | $1,114.70 | |||||
| Hypothetical (5% return) | 5.85 | 1,000 | 1,019.26 | |||||
| Investor Class | 1.27% | |||||||
| Actual | $6.76 | $1,000 | $1,114.00 | |||||
| Hypothetical (5% return) | 6.46 | 1,000 | 1,018.64 | |||||
| Retirement Class | 0.83% | |||||||
| Actual | $4.42 | $1,000 | $1,116.40 | |||||
| Hypothetical (5% return) | 4.23 | 1,000 | 1,020.92 | |||||
| Harbor Emerging Markets Equity Fund | ||||||||
| Institutional Class | 1.15% | |||||||
| Actual | $6.22 | $1,000 | $1,146.00 | |||||
| Hypothetical (5% return) | 5.85 | 1,000 | 1,019.26 | |||||
| Administrative Class | 1.40% | |||||||
| Actual | $7.57 | $1,000 | $1,144.10 | |||||
| Hypothetical (5% return) | 7.12 | 1,000 | 1,017.97 | |||||
| Investor Class | 1.52% | |||||||
| Actual | $8.21 | $1,000 | $1,144.40 | |||||
| Hypothetical (5% return) | 7.73 | 1,000 | 1,017.35 | |||||
| Retirement Class | 1.08% | |||||||
| Actual | $5.84 | $1,000 | $1,147.20 | |||||
| Hypothetical (5% return) | 5.50 | 1,000 | 1,019.62 | |||||
| * | Reflective of all fee waivers and expense reimbursements (excluding interest expense, if any) |
| ** | Expenses are equal to the Fund’s annualized expense ratio, multiplied by the average account value over the period, multiplied by 184/365 (to reflect the one-half year period). |
91
Harbor International & Global Funds
Additional Information (Unaudited)
Additional Information (Unaudited)
Additional Tax Information
The Funds designate the following portions of their distributions from investment company taxable income for the fiscal year as qualifying for the dividends received deduction for corporate shareholders.
| Percentage of Distribution | |
Harbor International Fund | 18% |
Harbor Global Leaders Fund | 100 |
Pursuant to Section 852 of the Internal Revenue Code, the Funds designate the following capital gain dividends for the year ended October 31, 2017:
| Amount (000s) | |
Harbor International Fund | $129,773 |
Harbor Diversified International All Cap Fund | 2,032 |
Harbor International Small Cap Fund | 45 |
Harbor Global Leaders Fund | 488 |
For the fiscal year ended October 31, 2017, the Funds designate up to the maximum amount of such dividends allowable pursuant to the Internal Revenue Code as qualified dividend income eligible for reduced tax rates. These lower rates range from 0% to 20% depending on an individual’s tax bracket. If the Funds pay a distribution during calendar year 2017, complete information will be reported in conjunction with Form 1099-DIV.
The Funds designate the following for Federal income tax purposes:
| Foreign Taxes Paid (000s) | Foreign Source Earned Income (000s) | ||
Harbor International Fund | $52,386 | $605,327 | |
Harbor Diversified International All Cap Fund | 483 | 6,196 | |
Harbor International Growth Fund | 513 | 6,303 | |
Harbor International Small Cap Fund | 40 | 480 | |
Harbor Emerging Markets Equity Fund | 107 | 1,407 |
Shareholders who own shares through a taxable Harbor Funds account and that received distributions from a Fund during calendar year 2017 will receive a Form 1099-DIV in January 2018 that will show the tax character of those distributions.
Proxy Voting
Harbor Funds has adopted Proxy Voting Policies and Procedures under which proxies relating to securities held by the Harbor funds are voted. In addition, Harbor Funds files Form N-PX, with its complete proxy voting record for the 12 months ended June 30th, no later than August 31st of each year. A description of Harbor Funds’ Proxy Voting Policies and Procedures and the proxy voting records (Form N-PX) are available (i) upon request, by calling Harbor Funds toll-free at 800-422-1050; (ii) on Harbor Funds’ website at harborfunds.com; and (iii) on the SEC’s website at sec.gov.
Householding
Harbor Funds has adopted a policy that allows it to send only one copy of a Fund’s prospectus, proxy materials, annual report and semi-annual report to certain shareholders residing at the same household. This reduces Fund expenses, which benefits you and other shareholders. If you need additional copies or do not want your mailings to be “householded,” please call the Shareholder Servicing Agent at 800-422-1050. Individual copies will be sent within thirty (30) days after the Shareholder Servicing Agent receives your instructions. Your consent to householding is considered valid until revoked.
92
Harbor International & Global Funds
Additional Information—Continued
Additional Information—Continued
Quarterly Portfolio Disclosures
Harbor Funds files a complete portfolio of investments with the SEC for the first and third quarters of each fiscal year on Form N-Q. The Funds' Form N-Q is available (i) without charge, upon request, by calling Harbor Funds toll-free at 800-422-1050, (ii) on Harbor Funds’ website at harborfunds.com, and (iii) on the SEC’s website at sec.gov. The form may also be viewed and copied at the SEC’s Public Reference Room in Washington, DC. Information regarding the operations of the Public Reference Room may also be obtained by calling 800-SEC-0330.
Special meeting of shareholders
At a special meeting of the shareholders of the Harbor Funds held on September 22, 2017, shareholders elected six trustees to the Board of Trustees of Harbor Funds. Scott M. Amero, Robert A. Kasdin, and Ann M. Spruill were previously appointed as Trustees but had not been elected by shareholders. Raymond J. Ball, Donna J. Dean, and Randall A. Hack continue to serve on the Board.
| Trustee | For | Withhold | ||
Scott M. Amero | 1,047,869,265 | 14,860,642 | ||
Joseph L. Dowling III | 1,046,335,272 | 16,394,636 | ||
Robert A. Kasdin | 1,047,514,035 | 15,215,872 | ||
Charles F. McCain | 1,047,667,935 | 15,061,973 | ||
Kathryn L. Quirk | 1,046,812,694 | 15,917,214 | ||
Ann M. Spruill | 1,047,274,165 | 15,455,742 |
At a special meeting of the shareholders of the Harbor Funds held on September 22, 2017, shareholders approved an amendment to each Fund’s fundamental investment restriction regarding borrowing.
| Fund Name | For | Against | Abstain | Broker Non-Vote | ||||
Harbor International Fund | 228,652,198 | 3,642,933 | 1,613,958 | 62,567,089 | ||||
Harbor Diversified International All Cap Fund | 10,314,719 | 1,632 | 392,336 | 1,670,443 | ||||
Harbor International Growth Fund | 10,654,250 | 1,129,867 | 98,743 | 3,352,577 | ||||
Harbor International Small Cap Fund | 1,744,039 | - | 768 | 159,666 | ||||
Harbor Global Leaders Fund | 960,681 | 9,796 | 9,144 | 379,449 | ||||
Harbor Emerging Markets Equity Fund | 3,516,287 | 1,431 | - | 407,794 |
At a special meeting of the shareholders of the Harbor Funds held on September 22, 2017, shareholders approved an amendment to each Fund’s fundamental investment restriction regarding lending.
| Fund Name | For | Against | Abstain | Broker Non-Vote | ||||
Harbor International Fund | 228,660,850 | 3,611,426 | 1,636,813 | 62,567,089 | ||||
Harbor Diversified International All Cap Fund | 10,314,719 | 1,632 | 392,336 | 1,670,443 | ||||
Harbor International Growth Fund | 10,689,133 | 1,127,410 | 66,315 | 3,352,577 | ||||
Harbor International Small Cap Fund | 1,744,039 | - | 768 | 159,666 | ||||
Harbor Global Leaders Fund | 960,681 | 10,642 | 8,298 | 379,449 | ||||
Harbor Emerging Markets Equity Fund | 3,516,287 | 1,431 | - | 407,794 |
93
Harbor International & Global Funds
Additional Information—Continued
Additional Information—Continued
Trustees and Officers
As of December 2017
The business and affairs of the Trust shall be managed by or under the direction of the Trustees, and they shall have all powers necessary or desirable to carry out that responsibility. The Trustees shall have full power and authority to take or refrain from taking any action and to execute any contracts and instruments that they may consider necessary or desirable in the management of the Trust. Any determination made by the Trustees in good faith as to what is in the interests of the Trust shall be conclusive. Information pertaining to the Trustees and Officers of Harbor Funds is set forth below. The address of each Trustee and Officer is: [Name of Trustee or Officer] c/o Harbor Funds, 111 South Wacker Drive, 34th Floor, Chicago, IL 60606-4302.
The Harbor Fund’s Statement of Additional Information includes additional information about the Trust’s Trustees and is available without charge by calling 800-422-1050 or at the Trust’s website at harborfunds.com.
| Name (Age) Position(s) with Fund | Term of Office and Length of Time Served1 | Principal Occupation(s) During Past Five Years | Number of Portfolios In Fund Complex Overseen By Trustee | Other Directorships Of Public Companies and Other Registered Investment Companies Held by Trustee During Past Five Years |
INDEPENDENT TRUSTEES | ||||
| Scott M. Amero (54) Trustee | Since 2014 | Chairman (2015-Present) and Trustee (2011-2015), Rare (conservation nonprofit); Trustee, Berkshire School (2014-Present); Vice Chairman and Global Chief Investment Officer, Fixed Income (2010), Vice Chairman and Global Chief Investment Officer, Fixed Income, and Co-Head, Fixed Income Portfolio Management (2007-2010), BlackRock, Inc., (publicly traded investment management firm). | 32 | None |
| Raymond J. Ball (73) Trustee | Since 2006 | Sidney Davidson Distinguished Service Professor of Accounting, University of Chicago Booth School of Business (2000-Present); Academic Affiliate, Analysis Group (litigation consulting firm) (2000-Present); Financial Reporting Faculty Advisory Group of the Institute of Chartered Accountants in England and Wales (2008-Present); and Advisory Board of the Center for Accounting Research & Education at University of Notre Dame (2006-Present). | 32 | None |
| Donna J. Dean (66) Trustee | Since 2010 | Chief Investment Officer of the Rockefeller Foundation (a private foundation) (1995-Present). | 32 | None |
| Joseph L. Dowling III (53) Trustee | Since 2017 | Chief Investment Officer, Brown University (2013-Present); Advisory Board Member, Stage Point Capital (private mortgage specialist) (2016-Present); Advisory Board Member, Harbor Funds (2016-2017); and Founder and Managing Member, Narragansett Asset Management (private investment management firm) (1998-2013). | 32 | Director of Integrated Electrical Services (2011-Present). |
| Randall A. Hack (70) Trustee | Since 2010 | Founder and Senior Managing Director of Capstone Capital LLC (private investment firm) (2003-Present); Director of Tower Development Corporation (cell tower developer) (2009-2016); and Advisory Director of Berkshire Partners (private equity firm) (2002-2013). | 32 | None |
| Robert Kasdin (59) Trustee | Since 2014 | Senior Vice President and Chief Operating Officer, Johns Hopkins Medicine (2015-Present); Senior Executive Vice President, Columbia University (2002-2015); Trustee and Co-Chair of the Finance Committee, National September 11 Memorial & Museum at the World Trade Center (2005-Present); Director, Apollo Commercial Real Estate Finance, Inc. (2014-Present); and Director, Noranda Aluminum Holdings Corp. (2007-2014). | 32 | Director of Noranda Aluminum Holdings Corporation (2007-2014); and Director of Apollo Commercial Real Estate Finance, Inc. (2014-Present). |
94
Harbor International & Global Funds
Additional Information—Continued
Additional Information—Continued
Trustees and Officers—Continued
| Name (Age) Position(s) with Fund | Term of Office and Length of Time Served1 | Principal Occupation(s) During Past Five Years | Number of Portfolios In Fund Complex Overseen By Trustee | Other Directorships Of Public Companies and Other Registered Investment Companies Held by Trustee During Past Five Years |
INDEPENDENT TRUSTEES—Continued | ||||
| Kathryn L. Quirk (65) Trustee | Since 2017 | Retired; Vice President, Senior Compliance Officer and Head, U.S. Regulatory Compliance, Goldman Sachs Asset Management (2013-2017); Deputy Chief Legal Officer, Asset Management, and Vice President and Corporate Counsel, Prudential Insurance Company of America (2010-2012); Co-Chief Legal Officer, Prudential Investment Management, Inc., and Chief Legal Officer, Prudential Investments and Prudential Mutual Funds (2008-2012); Vice President and Corporate Counsel and Chief Legal Officer, Mutual Funds, Prudential Insurance Company of America, and Chief Legal Officer, Prudential Investments (2005-2008); Vice President and Corporate Counsel and Chief Legal Officer, Mutual Funds, Prudential Insurance Company of America (2004-2005); Member, Management Committee (2000-2002), General Counsel and Chief Compliance Officer, Zurich Scudder Investments, Inc. (1997-2002). | 32 | None |
| Ann M. Spruill (63) Trustee | Since 2014 | Partner (1993-2008), member of Executive Committee (1996-2008), Member Board of Directors (2002-2008), Grantham, Mayo, Van Otterloo & Co, LLC (private investment management firm) (with the firm since 1990); Member Investment Committee and Chair of Global Equities, Museum of Fine Arts, Boston (2000-Present); and Trustee, Financial Accounting Foundation (2014-Present). | 32 | None |
INTERESTED TRUSTEE | ||||
| Charles F. McCain (48)* Chairman, Trustee and President | Since 2017 | Chief Executive Officer (2017-Present), Director (2007-Present), President and Chief Operating Officer (2017), Executive Vice President and General Counsel (2004-2017), and Chief Compliance Officer (2004-2014), Harbor Capital Advisors, Inc.; Director (2007-Present) and Chief Compliance Officer (2004-2017), Harbor Services Group, Inc.; and Chief Executive Officer (2017-Present), Director (2007-Present), Chief Compliance Officer and Executive Vice President (2007-2017), Harbor Funds Distributors, Inc. | 32 | None |
| Name (Age) Position(s) with Fund | Term of Office and Length of Time Served1 | Principal Occupation(s) During Past Five Years |
FUND OFFICERS NOT LISTED ABOVE** | ||
| Erik D. Ojala (42) Chief Compliance Officer and Secretary | Since 2017 Since 2007 | Executive Vice President and General Counsel (2017-Present) and Secretary (2010-Present); Senior Vice President and Associate General Counsel (2007-2017), Harbor Capital Advisors, Inc.; Director, Executive Vice President and Chief Compliance Officer (2017-Present), Harbor Funds Distributors, Inc.; and Director (2017-Present) and Assistant Secretary (2014-Present), Harbor Services Group, Inc. |
| Anmarie S. Kolinski (46) Treasurer | Since 2007 | Executive Vice President and Chief Financial Officer (2007-Present), Harbor Capital Advisors, Inc.; Chief Financial Officer (2007-Present), Harbor Services Group, Inc.; and Chief Financial Officer (2015-Present) and Treasurer (2012-Present), Harbor Funds Distributors, Inc. |
| Brian L. Collins (49) Vice President | Since 2005 | Executive Vice President and Chief Investment Officer (2004-Present), Harbor Capital Advisors, Inc. |
| Charles P. Ragusa (58) Vice President | Since 2007 | Executive Vice President (2007-Present), Harbor Capital Advisors, Inc.; President (2007-Present), Harbor Services Group, Inc.; and Executive Vice President and AML Compliance Officer (2007-Present) and OFAC Officer (2015-Present), Harbor Funds Distributors, Inc. |
| Jodie L. Crotteau (45) Assistant Secretary | Since 2014 | Senior Vice President and Chief Compliance Officer, Harbor Capital Advisors, Inc. (2014-Present); Chief Compliance Officer and Secretary (2017-present) and Assistant Secretary (2015-2016), Harbor Services Group, Inc.; Assistant Secretary (2016-present), Harbor Funds Distributors, Inc.; Vice President and Chief Compliance Officer, Grosvenor Registered Funds (2011-2014); and Vice President, Grosvenor Capital Management, L.P. (2010-2014). |
95
Harbor International & Global Funds
Additional Information—Continued
Additional Information—Continued
Trustees and Officers—Continued
| Name (Age) Position(s) with Fund | Term of Office and Length of Time Served1 | Principal Occupation(s) During Past Five Years |
FUND OFFICERS NOT LISTED ABOVE**—Continued | ||
| Lana M. Lewandowski (38) AML Compliance Officer and Assistant Secretary | Since 2017 | Legal & Compliance Manager (2016-Present) and Legal Specialist (2012-2015), Harbor Capital Advisors, Inc. |
| Lora A. Kmieciak (53) Assistant Treasurer | Since 2017 | Senior Vice President – Fund Administration and Analysis (2017-Present) and Senior Vice President - Business Analysis (2015-2017), Harbor Capital Advisors, Inc.; and Assurance Executive Director (1999-2015), Ernst & Young LLP. |
| John M. Paral (49) Assistant Treasurer | Since 2013 | Director of Fund Administration and Analysis (2017-Present), Vice President (2012-Present) and Financial Reporting Manager (2007-2017), Harbor Capital Advisors, Inc. |
| 1 | Each Trustee serves for an indefinite term, until his successor is elected. Each Officer is elected annually. |
| * | Mr. McCain is deemed an “Interested Trustee” due to his affiliation with the Adviser and Distributor of Harbor Funds. |
| ** | Officers of the Funds are “interested persons” as defined in the Investment Company Act. |
96
This privacy statement is not part of this report
Harbor’s Privacy Statement
The following privacy statement is issued by Harbor Funds and each series of Harbor Funds and its affiliates, Harbor Capital Advisors, Inc., Harbor Services Group, Inc. and Harbor Funds Distributors, Inc. These measures reflect our commitment to maintaining the privacy of your confidential information. We appreciate the confidence you have shown by entrusting us with your assets.
Personal Information
It is our policy to respect the privacy of current and former shareholders and to protect personal information entrusted to us. We do not sell your personal information to anyone.
In the course of providing products and services, we collect non-public personal information about you from the following sources: applications, forms, our website (including any information captured through our use of “cookies”), through mobile applications, by telephone and in correspondence and transactions with us, our affiliates or other parties.
The non-public personal information collected may include name, address, e-mail address, telephone/fax numbers, account number, social security or taxpayer identification number, investment activity, and bank account information.
When you visit us through our website or a mobile application, we may collect technical and navigational information, such as computer browser type, Internet protocol address, pages visited and average time spent on our website. We may use this information to alert you to software compatibility issues, or to improve our web design and functionality. We use “cookies” and similar files that may be placed on your hard drive for security purposes, to facilitate site navigation and to personalize the appearance of our site.
Information Sharing
We occasionally disclose non-public personal information about our current or former shareholders with affiliated and non-affiliated parties, as permitted or required by law or regulation. In the normal course of servicing our shareholders, information we collect may be shared with non-affiliated companies that perform support services on our behalf or to other firms that assist us in providing you with products and services, such as custodians, transfer agents, broker-dealers and marketing service firms, as well as with other financial institutions. These companies may not use the information for any other purpose and we require them to keep the information they handle confidential. We may also share information with affiliates that are engaged in a variety of financial services in order to better service your account(s).
When information is shared with third parties, they are not permitted to use the information for any purpose other than to assist our servicing of your account(s) or as permitted by law.
If you close your account(s) or if we lose contact with you, we will continue to share information in accordance with our current privacy policy and practices.
Access to Information
Access to non-public personal information is limited to employees, agents or other parties who need to know that information to perform their jobs, such as servicing your account(s), resolving problems or informing you of new products or services.
Security
We maintain physical, electronic and procedural safeguards that comply with industry standards to protect your non-public personal information.
For shareholders accessing information through our website or a mobile application, various forms of Internet security, such as data encryption firewall barriers, user names and passwords, and other tools are used. For additional information regarding our security measures, visit the terms and conditions of use on our website at harborfunds.com. If you have any questions or concerns about how we maintain the privacy of your non-public personal information, please contact us at 800-422-1050 Monday through Friday, between the hours of 8:00 a.m. and 6:00 p.m. Eastern time.
We recommend that you read and retain this notice for your personal files.
Eff. November 2013
97
Glossary
Benchmark Descriptions
Bloomberg Barclays U.S. Aggregate Bond Index—The Bloomberg Barclays U.S. Aggregate Bond Index is an unmanaged index of investment-grade fixed-rate debt issues with maturities of at least one year. This unmanaged index does not reflect fees and expenses and is not available for direct investment.
Bloomberg Barclays U.S. TIPS Index—The Bloomberg Barclays U.S. TIPS Index is an unmanaged market index comprised of all U.S. Treasury Inflation Protected Securities rated investment grade (Baa3 or better), have at least one year to final maturity, and at least $250 million par amount outstanding. This unmanaged index does not reflect fees and expenses and is not available for direct investment.
Bloomberg Commodity Index Total ReturnSM—The Bloomberg Commodity Index Total ReturnSM is a broadly diversified index that tracks the commodities markets through commodity futures contracts. This unmanaged index does not reflect fees and expenses and is not available for direct investment.
ICE BofAML All U.S. Convertibles Ex Mandatory Index—The BofA Merrill Lynch All U.S. Convertibles Ex Mandatory Index is broadly representative of the U.S. convertible securities market, consisting of publicly traded issues, denominated in U.S. dollars, of all credit qualities, and excluding mandatory (equity-linked) convertibles. This unmanaged index does not reflect fees and expenses and is not available for direct investment.
ICE BofAML U.S. Dollar 3-Month LIBOR Constant Maturity Index—The ICE BofAML U.S. Dollar 3-Month LIBOR Constant Maturity Index tracks the performance of a synthetic asset paying Libor to a stated maturity. The index is based on the assumed purchase at par of a synthetic instrument having exactly its stated maturity and with a coupon equal to that day’s fixing rate. That issue is assumed to be sold the following business day (priced at a yield equal to the current day fixing rate) and rolled into a new instrument. This unmanaged index does not reflect fees and expenses and is not available for direct investment.
ICE BofAML 3-Month U.S. Treasury Bill Index—The ICE BofAML 3-Month U.S. Treasury Bill Index is comprised of a single U.S. Treasury Bill issue purchased at the beginning of each month and held for a full month, at which time that issue is sold and rolled into a newly selected issue. The issue selected each month is that having a maturity date closest to, but not beyond 90 days from the rebalance date.
ICE BofAML U.S. High Yield Index (H0A0)—The ICE BofAML U.S. High Yield Index (H0A0) is an unmanaged index that tracks the performance of below investment grade U.S. dollar-denominated corporate bonds publicly issued in the U.S. domestic market. All bonds are U.S. dollar denominated and rated Split BBB and below. This unmanaged index does not reflect fees and expenses and is not available for direct investment.
ICE BofAML U.S. Non-Distressed High Yield Index—The ICE BofAML U.S. Non-Distressed High Yield Index is a subset of the ICE BofAML U.S. High Yield Index (H0A0) including all securities with an option-adjusted spread less than 1,000 basis points. The unmanaged index does not reflect fees and expenses and is not available for direct investment.
MSCI All Country World Index—The MSCI All Country World Index is a free float-adjusted market capitalization weighted index that is designed to measure the equity market performance of developed and emerging markets. This unmanaged index does not reflect fees and expenses and is not available for direct investment.
MSCI All Country World Ex. U.S. (ND) Index—The MSCI All Country World Ex. U.S.is a free float-adjusted market capitalization weighted index that is designed to measure equity market performance in the global developed and emerging markets, excluding the United States. This unmanaged index does not reflect fees and expenses and is not available for direct investment.
MSCI EAFE (ND) Index—The MSCI EAFE (ND) Index is an unmanaged index generally representative of major overseas stock markets. This unmanaged index does not reflect fees and expenses and is not available for direct investment.
MSCI EAFE Small Cap (ND) Index—The MSCI EAFE Small Cap (ND) Index is an equity index which captures small cap representation across developed market countries around the world, excluding the U.S. and Canada. This unmanaged index does not reflect fees and expenses and is not available for direct investment.
MSCI Emerging Markets (ND) Index—The MSCI Emerging Markets (ND) Index is a market capitalization weighted index of equity securities in more than 20 emerging market economies. This unmanaged index does not reflect fees and expenses and is not available for direct investment.
MSCI World (ND) Index—The MSCI World (ND) Index is a free float-adjusted market capitalization index that is designed to measure global developed market equity performance. This unmanaged index does not reflect fees and expenses and is not available for direct investment.
98
Glossary—Continued
Benchmark Descriptions—Continued
Russell 1000® Index—The Russell 1000® Index is an unmanaged index generally representative of the U.S. market for larger capitalization stocks as it includes the largest 1000 securities in the Russell 3000® Index by market capitalization. This unmanaged index does not reflect fees and expenses and is not available for direct investment. The Russell 1000® Index and Russell® are trademarks of Frank Russell Company.
Russell 1000® Growth Index—The Russell 1000® Growth Index is an unmanaged index generally representative of the U.S. market for larger capitalization growth stocks. This unmanaged index does not reflect fees and expenses and is not available for direct investment. The Russell 1000® Growth Index and Russell® are trademarks of Frank Russell Company.
Russell 1000® Value Index—The Russell 1000® Value Index is an unmanaged index generally representative of the U.S. market for larger capitalization value stocks. This unmanaged index does not reflect fees and expenses and is not available for direct investment. The Russell 1000® Value Index and Russell® are trademarks of Frank Russell Company.
Russell 2000® Index—The Russell 2000® Index measures the performance of the small-cap segment of the U.S. equity universe. The Russell 2000® Index is a subset of the Russell 3000® Index representing approximately 10% of the total market capitalization of that index. It includes approximately 2,000 of the smallest securities based on a combination of their market cap and current index membership. The Russell 2000® Index is constructed to provide a comprehensive and unbiased small-cap barometer and is completely reconstituted annually to ensure larger stocks do not distort the performance and characteristics of the true small-cap opportunity set. This unmanaged index does not reflect fees and expenses and is not available for direct investment. The Russell 3000® Index and Russell® are trademarks of Frank Russell Company.
Russell 2000® Growth Index—The Russell 2000® Growth Index is an unmanaged index representing the smallest 2,000 stocks with the highest price-to-book ratio and future earnings. This unmanaged index does not reflect fees and expenses and is not available for direct investment. The Russell 2000® Growth Index and Russell® are trademarks of Frank Russell Company.
Russell 2000® Value Index—The Russell 2000® Value Index is an unmanaged index representing the smallest 2,000 stocks with the lowest price-to-book ratio and future earnings. This unmanaged index does not reflect fees and expenses and is not available for direct investment. The Russell 2000® Value Index and Russell® are trademarks of Frank Russell Company.
Russell 3000® Index—The Russell 3000® Index measures the performance of the largest 3,000 U.S. companies representing approximately 98% of the investable U.S. equity market. The Russell 3000® Index is constructed to provide a comprehensive, unbiased and stable barometer of the broad market and is completely reconstituted annually to ensure new and growing equities are reflected. This unmanaged index does not reflect fees and expenses and is not available for direct investment. The Russell 3000® Index and Russell® are trademarks of Frank Russell Company.
Russell 3000® Growth Index—The Russell 3000® Growth Index measures the performance of the broad growth segment of the U.S. equity universe. It includes those Russell 3000® companies with higher price-to-book ratios and higher forecasted growth values. The Russell 3000® Growth Index is constructed to provide a comprehensive, unbiased, and stable barometer of the broad growth market. The index is completely reconstituted annually to ensure new and growing equities are included and that the represented companies continue to reflect growth characteristics. This unmanaged index does not reflect fees and expenses and is not available for direct investment. The Russell 3000® Growth Index and Russell® are trademarks of Frank Russell Company.
Russell 3000® Value Index—The Russell 3000® Value Index measures the performance of the broad value segment of U.S. equity value universe. It includes those Russell 3000® companies with lower price-to-book ratios and lower forecasted growth values. The Russell 3000® Value Index is constructed to provide a comprehensive, unbiased, and stable barometer of the broad value market. The index is completely reconstituted annually to ensure new and growing equities are included and that the represented companies continue to reflect value characteristics. This unmanaged index does not reflect fees and expenses and is not available for direct investment. The Russell 3000® Value Index and Russell® are trademarks of Frank Russell Company.
Russell Midcap® Index—The Russell Midcap® Index is an unmanaged index generally representative of the U.S. market for medium capitalization stocks. This unmanaged index does not reflect fees and expenses and is not available for direct investment. The Russell Midcap® Index and Russell® are trademarks of Frank Russell Company.
Russell Midcap® Growth Index—The Russell Midcap® Growth Index is an unmanaged index generally representative of the U.S. market for medium capitalization growth stocks. This unmanaged index does not reflect fees and expenses and is not available for direct investment. The Russell Midcap® Growth Index and Russell® are trademarks of Frank Russell Company.
99
Glossary—Continued
Benchmark Descriptions—Continued
Russell Midcap® Value Index—The Russell Midcap® Value Index is an unmanaged index generally representative of the U.S. market for medium capitalization value stocks. This unmanaged index does not reflect fees and expenses and is not available for direct investment. The Russell Midcap® Value Index and Russell® are trademarks of Frank Russell Company.
S&P 500 Index—The S&P 500 Index is an unmanaged index generally representative of the U.S. stock market. This unmanaged index does not reflect fees and expenses and is not available for direct investment.
Financial Terms
12b-1 Fee—A mutual fund fee, named for the SEC rule that permits it, used to pay for broker-dealer compensation and other distribution costs. If a fund has a 12b-1 fee, it will be disclosed in the fee table of a fund’s prospectus.
ADR—ADR after the name of a foreign holding stands for American Depositary Receipts representing ownership of foreign securities. ADRs are issued by U.S. banking institutions.
Average Market Cap—The average market capitalization of a fund’s equity portfolio gives you a measure of the size of the companies in which the fund invests. Market capitalization is calculated by multiplying the number of a company’s shares outstanding by its price per share.
Average Market Coupon—A calculation from a fund’s portfolio by weighting the coupon of each bond by its relative size in the portfolio.
Beta—A measure of market-related risk. The beta of every index is 1.00, no matter how volatile the index is. A beta less than one means the portfolio is less volatile than the index. A beta higher than one indicates more volatility than the index.
Bottom-Up Equity Management Style—A management style that de-emphasizes the significance of economic and market cycles, focusing instead on the analysis of individual stocks.
Capital Gains Distribution—Profits distributed to shareholders resulting from the sale of securities held in the fund’s portfolio.
Credit Risk—The possibility that a bond issuer may not be able to pay interest and repay its debt.
CUSIP Number—Identification number assigned to every stock, corporate bond and municipal bond by the Committee on Uniform Securities Identification Procedures (CUSIP), which is established by the American Bankers Association.
Diversification—The practice of investing broadly across securities of a number of issuers to reduce risk.
Duration—A common gauge of the price sensitivity of a fixed income asset or portfolio to a change in interest rates.
Emerging Markets—Emerging markets are countries with relatively young stock and bond markets. Examples include Brazil and Thailand. Typically, emerging-markets investments have the potential for losses and gains larger than those of developed-market investments.
Expense Ratio—The Fund’s total annual operating expenses (including management fees, distribution (12b-1) fees and other expenses) expressed as a percentage of average net assets.
Family of Funds—A group of mutual funds, each typically with its own investment objective, managed or distributed by the same company that hold themselves out to investors as related companies for the purposes of investment and investor services.
GDR—GDR after the name of a holding stands for Global Depositary Receipt representing ownership of foreign securities. GDRs are issued by either U.S. or non-U.S. banking organizations. SADR after the name of a holding stands for South African Depositary Receipts representing ownership of South African securities listed on the Johannesburg Stock Exchange. SDR after the name of a holding stands for Swedish Depository Receipts representing ownership of foreign securities in Sweden. NVDR after the name of a holding stands for Non-Voting Depositary Receipts representing ownership of a listed security in the Stock Exchange of Thailand.
Inception Date—The date on which the Fund commenced operations.
Investment Objective—The goal that an investor and mutual fund pursue together (e.g., current income, long-term capital growth, etc.).
100
Glossary—Continued
Financial Terms—Continued
Median Market Cap—An indicator of the size of companies in which a fund invests; the midpoint of market capitalization (market price x shares outstanding) of a fund’s stocks, weighted by the proportion of the fund’s assets invested in each stock. Stocks representing half of the fund’s assets have market capitalizations above the median, and the rest are below it.
Net Asset Value (NAV)—The per share value of a mutual fund, determined by subtracting the fund’s liabilities from its assets and dividing by the number of shares outstanding. Mutual funds calculate their NAVs at least once each business day.
No-Load Fund—A mutual fund whose shares are sold without a sales commission and without a 12b-1 fee of more than 0.25% per year. Harbor funds are no-load.
Open-End Management Company—The legal name for a mutual fund, indicating that it stands ready to redeem (buy back) its shares from investors on any business day. Harbor Funds is an open-end investment company.
Operating Expenses—Business costs paid from a fund’s assets before earnings are distributed to shareholders. These include management fees and 12b-1 fees and other expenses.
Portfolio Manager—A specialist employed by a mutual fund’s adviser or subadviser to invest the fund’s assets in accordance with predetermined investment objectives.
Portfolio Turnover—A measure of the trading activity in a fund’s investment portfolio (how often securities are bought and sold by a fund). Funds with high turnover rates incur higher transaction costs and may be more likely to distribute capital gains (which may be taxable to investors).
Price to Book Ratio (P/B)—A ratio used to compare a stock’s market value to its book value. It is calculated by dividing the current closing price of the stock by the latest quarter’s book value. For a fund, the weighted average price/book ratio of the stocks it holds.
Price to Earnings Ratio (P/E)—The ratio of a stock’s current price to its per-share earnings over the past year. For a fund, the weighted average P/E of the stocks it holds. P/E is an indicator of market expectations about corporate prospects; the higher the P/E, the greater the market expectations are for a company’s future growth.
Prospectus—The official document that describes a mutual fund to prospective investors. The prospectus contains information required by the SEC, such as investment objectives and policies, risks, services and fees.
Record Date—The date on which a shareholder must officially own shares in order to be entitled to a dividend.
Redemption Fee—Fee charged to shareholders by a mutual fund when they sell shares within a specified period after purchase. The time limit and size of fee vary among funds. The fee is paid to the fund, not the fund’s investment adviser. Its purpose is to protect long-term investors from the impact of short-term traders.
REITs (Real Estate Investment Trust)—REITs invest in real estate or loans secured by real estate and issue shares in such investments. A REIT is similar to a closed-end mutual fund.
Repurchase Agreement (Repo)—A form of short-term borrowing for dealers in government securities. The dealer sells the government securities to investors, usually on an overnight basis, and buys them back the following day. For the party selling the security (and agreeing to repurchase it in the future), it is a repo. For the party on the other end of the transaction (buying the security and agreeing to sell back in the future), it is a reverse repurchase agreement.
Risk/Reward (or Return)—The relationship between the degree of risk associated with an investment and its return potential. Typically, the higher the potential return of an investment, the greater the risk.
Statement of Additional Information (SAI)—The supplementary document to a prospectus that contains more detailed information about a mutual fund; also known as “Part B” of a fund’s registration statement.
TBAs—A term used to describe a forward mortgage-backed securities trade. Pass-through securities issued by Freddie Mac, Fannie Mae and Ginnie Mae trade in the TBA market. The term TBA is derived from the fact that the actual mortgage- backed security that will be delivered to fulfill a TBA trade is not designated at the time the trade is made. The securities are “to be announced” 48 hours prior to the established trade settlement date.
Treasury Inflation-Protected Securities (TIPS)—TIPS are securities in which the principal amount is adjusted for inflation and interest payments are applied to the inflation-adjusted principal.
101
Glossary—Continued
Financial Terms—Continued
Top-Down Equity Management Style—Investment style that begins with an assessment of the overall economic environment and makes a general asset allocation decision regarding various sectors of the financial markets and various industries.
Total Return—Return on an investment over a specified period, including price appreciation (or depreciation) plus any income, expressed as an average annual compound of return.
Weighted Average Duration—Duration is a time measure of a bond’s interest-rate sensitivity, based on the weighted average of the time periods over which a bond’s cash flows accrue to the bondholder. Time periods are weighted by multiplying by the present value of its cash flow divided by the bond’s price. (A bond’s cash flows consist of coupon payments and repayment of capital.) A bond’s duration will almost always be shorter than its maturity, with the exception of zero-coupon bonds, for which maturity and duration are equal.
Weighted Average Maturity—The average length of time until principal must be repaid for all bonds in a mutual fund portfolio on a dollar weighted basis.
Yield—A measure of net income (dividends and interest) earned by the securities in the fund’s portfolio less fund expenses during a specified period. A fund’s yield is expressed as a percentage of the maximum offering price per share on a specified date.
Yield to Maturity—The term used to describe the rate of return an investor will receive if a long-term, interest-bearing security, such as a bond, is held to its maturity date. Yield to maturity is greater than the coupon rate if the bond is selling at a discount and less than the coupon rate if it is selling at a premium.
102
Notes

| 111 South Wacker Drive, 34th Floor | Chicago, IL 60606-4302 | 800-422-1050 | harborfunds.com |
Trustees & Officers
Charles F. McCain
Chairman, President & Trustee
Chairman, President & Trustee
Scott M. Amero
Trustee
Trustee
Raymond J. Ball
Trustee
Trustee
Donna J. Dean
Trustee
Trustee
Joseph L. Dowling, III
Trustee
Trustee
Randall A. Hack
Trustee
Trustee
Robert Kasdin
Trustee
Trustee
Kathryn L. Quirk
Trustee
Trustee
Ann M. Spruill
Trustee
Trustee
Anmarie S. Kolinski
Treasurer
Treasurer
Erik D. Ojala
Chief Compliance Officer
& Secretary
Chief Compliance Officer
& Secretary
Brian L. Collins
Vice President
Vice President
Charles P. Ragusa
Vice President
Vice President
Jodie L. Crotteau
Assistant Secretary
Assistant Secretary
Lana M. Lewandowski
AML Compliance Officer
& Assistant Secretary
AML Compliance Officer
& Assistant Secretary
Lora A. Kmieciak
Assistant Treasurer
Assistant Treasurer
John M. Paral
Assistant Treasurer
Assistant Treasurer
Investment Adviser
Harbor Capital Advisors, Inc.
111 South Wacker Drive
34th Floor
Chicago, IL 60606-4302
312-443-4400
111 South Wacker Drive
34th Floor
Chicago, IL 60606-4302
312-443-4400
Distributor
Harbor Funds Distributors, Inc.
111 South Wacker Drive
34th Floor
Chicago, IL 60606-4302
312-443-4600
111 South Wacker Drive
34th Floor
Chicago, IL 60606-4302
312-443-4600
Shareholder Services
Harbor Services Group, Inc.
P.O. Box 804660
Chicago, IL 60680-4108
800-422-1050
P.O. Box 804660
Chicago, IL 60680-4108
800-422-1050
Custodian
State Street Bank & Trust Company
State Street Financial Center
1 Lincoln Street
Boston, MA 02111-2900
State Street Financial Center
1 Lincoln Street
Boston, MA 02111-2900
FD.AR.IG.1017
Table of Contents


Annual Report
October 31, 2017
Strategic Markets Funds
| Institutional Class | Administrative Class | |
| Harbor Commodity Real Return Strategy Fund | HACMX | HCMRX |
Table of Contents
| 1 | |
| Strategic Markets Funds | |
| Harbor Commodity Real Return Strategy Fund | |
| 3 | |
| 6 | |
| 7 | |
| Financial Statements | |
| 25 | |
| 26 | |
| 27 | |
| 29 | |
| 31 | |
| 33 | |
| 50 | |
| 51 | |
| Additional Information | |
| 52 | |
| 52 | |
| 52 | |
| 52 | |
| 52 | |
| 54 | |
| 57 | |
| 58 |
This document must be preceded or accompanied by a Prospectus.
Letter from the Chairman
 Charles F. McCain Chairman |
Dear Fellow Shareholder:
As we previously reported to you, the Harbor Commodity Real Return Strategy Fund will cease operations at 4:00 p.m. Eastern time on Friday, January 26, 2018. Assets remaining in Harbor Commodity Real Return Strategy Fund will be liquidated after the close of business on January 26, 2018 and the net proceeds distributed to any remaining shareholders.
We are saddened by this decision to liquidate the Harbor Commodity Real Return Strategy Fund. Unfortunately, after over 9 years in existence, we believe the Fund is not of a sufficient size to remain economically viable. Further, based upon our assessment of market dynamics and investor preferences, we do not believe there is a reasonable likelihood that the Fund would be able to grow sufficiently in the future to achieve a more sustainable asset size.
We understand that many shareholders have been investors in the Fund for a number of years. We have endeavored to provide you with what we hope has been ample advance notice of the liquidation of the Fund to allow you sufficient time to determine how you may best replace this investment in your portfolio. If we can be of any assistance to you through this liquidation, or if you have any questions, please do not hesitate to contact us.
market review
The Harbor Commodity Real Return Strategy Fund has invested in commodity-linked derivative instruments backed by a portfolio of inflation-indexed and other fixed income instruments. Due to the planned liquidation of the Fund, the Fund’s portfolio has transitioned over the course of December 2017 to a portfolio of all or substantially all cash and cash equivalents.
Commodities generally advanced in the fiscal year ended October 31, 2017. The Bloomberg Commodity Index Total ReturnSM had a return of 2.35% for the fiscal year.
Industrial metals (including copper and aluminum) had significant gains for the fiscal year, while precious metals posted relatively flat performance. Livestock (live cattle and lean hogs) generated strong returns.
Oil prices rose earlier in the period, then experienced significant volatility, dropping much lower in June, but gained again to finish the fiscal year roughly where they began. Natural gas declined during the 12-month period.
U.S. Treasury Inflation Protected Securities (TIPS) had slightly negative returns. The Bloomberg Barclays U.S. TIPS Index (an index of U.S. TIPS bonds) had a return of -0.11%.
Comments by the portfolio managers of the Harbor Commodity Real Return Strategy Fund can be found in the pages preceding the Fund’s portfolio of investments. As always, we recommend that shareholders maintain a long-term perspective in evaluating all of their investments, including those in Harbor Funds.
1
| Returns For Periods Ended October 31, 2017 | ||||||||
| Annualized | ||||||||
| Strategic Markets | 1 Year | 5 Years | 10 Years | 30 Years | ||||
Bloomberg Commodity Index Total ReturnSM (commodities) | 2.35% | -9.37% | -6.93% | N/A | ||||
| Domestic Equities | ||||||||
Russell 3000® (entire U.S. stock market) | 23.98% | 15.12% | 7.61% | 10.60% | ||||
S&P 500 (large cap stocks) | 23.63 | 15.18 | 7.51 | 10.50 | ||||
Russell Midcap® (mid cap stocks) | 21.09 | 14.87 | 8.09 | 12.11 | ||||
Russell 2000® (small cap stocks) | 27.85 | 14.49 | 7.63 | 10.45 | ||||
Russell 3000® Growth (growth stocks) | 29.80 | 16.71 | 9.05 | 10.16 | ||||
Russell 3000® Value (value stocks) | 18.30 | 13.48 | 6.07 | 10.68 | ||||
| International & Global | ||||||||
MSCI EAFE (ND) (foreign stocks) | 23.44% | 8.53% | 1.10% | 5.62% | ||||
MSCI EAFE Small Cap (ND) (foreign small cap stocks) | 27.51 | 13.03 | 4.18 | N/A | ||||
MSCI World (ND) (global stocks) | 22.77 | 11.56 | 4.10 | 7.44 | ||||
MSCI All Country World Ex. U.S. (ND) (foreign stocks) | 23.64 | 7.29 | 0.92 | N/A | ||||
MSCI Emerging Markets (ND) (emerging market stocks) | 26.45 | 4.83 | 0.60 | N/A | ||||
| Fixed Income | ||||||||
ICE BofAML U.S. Non-Distressed High Yield (domestic high-yield bonds) | 8.62% | 6.33% | 6.69% | N/A | ||||
Bloomberg Barclays U.S. Aggregate Bond (domestic bonds) | 0.90 | 2.04 | 4.19 | 6.43% | ||||
Bloomberg Barclays U.S. TIPS (domestic inflation-linked bonds) | -0.11 | -0.11 | 3.81 | N/A | ||||
ICE BofAML U.S. 3-Month Treasury Bill (proxy for money market returns) | 0.72 | 0.24 | 0.45 | 3.35 | ||||
stay focused on the long-term
Major U.S. indexes hit record levels toward the end of the fiscal year, supported by continued earnings gains and favorable economic data. Against this backdrop, the third calendar quarter of 2017 marked the eighth consecutive quarter of gains for U.S. equities.
With equities having rallied for an extended period, it is reasonable to question whether the market’s advance might be due for a slowdown or even a reversal in the near future. For even the most experienced investment professionals, it is difficult to reliably predict the movements of stock prices or bond prices with certainty, particularly in the shorter-term.
We always encourage shareholders to take a long-term perspective with all of their investments. While past performance is never a guarantee of future results, over the long term, the returns of equities and debt securities have historically helped many investors achieve their financial objectives. We encourage all investors to maintain a diversified portfolio of equities, debt and cash in an allocation consistent with their long-term financial goals and comfort with risk.
Harbor Funds offers a variety of equity, strategic markets and fixed income funds to help you achieve your financial goals.
Thank you for investing with Harbor Funds.
December 21, 2017
 |
| Charles F. McCain |
| Chairman |
2
Harbor Commodity Real Return Strategy Fund
Managers' Commentary (Unaudited)
Managers' Commentary (Unaudited)
Subadviser
Pacific Investment Management Company LLC (PIMCO)
650 Newport Center Dr.
Newport Beach, CA
92660
Newport Beach, CA
92660
Portfolio Managers
Mihir P. Worah
Since 2008
Since 2008
Nicholas J. Johnson
Since 2015
Since 2015
Jeremie Banet
Since 2015
Since 2015
PIMCO has subadvised the Fund since 2008.
Investment Objective
The Fund seeks maximum real return, consistent with prudent investment management.

Mihir P. Worah

Nicholas J. Johnson

Jeremie Banet
Management’s Discussion of
Fund Performance
Fund Performance
MARKET REVIEW
Commodity markets showed signs of resiliency over the 12 months ended October 31, 2017 as the Bloomberg Commodity Index Total ReturnSM, an unmanaged index of futures contracts on a diversified group of physical commodities, returned 2.35%. Broad commodity indices posted positive returns to finish off the 12 month period, overcoming losses more broadly for much of 2016. Energy led gains, as oil rallied on healthy global demand and market realization of improving balances. Within agriculture, returns were mixed with wheat leading losses as it retraced its recovery since the beginning of the reporting period. Industrial metals pushed higher on positive Chinese economic growth and a weaker U.S. dollar, before taking pause in September. Gold was up on safe haven demand and lower real yields.
Donald Trump stunned many in winning the U.S. presidential election at the end of 2016, but the market reaction was almost as surprising. Most markets focused on the pro-growth and inflationary potential of fiscal stimulus as many risk assets rallied, while inflation expectations and yields rose. Following the election, volatility fell, equities rallied, credit spreads tightened and the dollar strengthened as investors anticipated expansionary fiscal policy, tax cuts, and deregulation. As such, the U.S. Federal Reserve (Fed) raised rates for just the second time in a decade (as widely expected), but with a hawkish tilt as the “blue dots” increased for 2017.
This optimism continued into the new year and solid U.S. economic data, relatively easy financial conditions, and both business and consumer optimism gave the Fed an opportunity to continue on its path toward policy normalization. This second rate hike, though, was perceived by many as more dovish given the largely unchanged views put forth by the Fed. Inflation expectations were generally stable over the period, despite fluctuations in oil prices related to building inventories in the U.S. and concerns over OPEC’s adherence to its production cut agreement.
Over the second half of the fiscal year, geopolitics dominated headlines and contributed to brief bouts of market volatility. Still, robust risk appetite continued, largely underpinned by a solid fundamental backdrop. Despite geopolitical uncertainty, volatility remained relatively low for the most part, equities rallied and credit spreads tightened.
Financial conditions in the U.S. continued to ease even as the Fed raised rates and unveiled details of its plan to gradually reduce its balance sheet. The perception of a hawkish leaning at the Fed’s meeting in September contributed to a rebound in U.S. rates. The Fed confirmed it would begin unwinding its balance sheet and released a more hawkish than anticipated “dot plot”, raising expectations for another rate hike in 2017. More broadly, global central bankers also struck a less accommodative tone as rhetoric from the European Central Bank, Bank of England, and Bank of Canada highlighted positive economic outlooks and suggested the potential for a reduction in “easy” monetary policy in the form of rate hikes, tapering, or balance sheet normalization.
Abroad, Emmanuel Macron’s presidential victory in France, in addition to the non-populist outcome of the Dutch election earlier this year, tempered risks related to more nationalist, anti-EU outcomes in the eurozone. Recent and upcoming elections in Germany and Italy continued to underscore political event risks that remain on the horizon in the eurozone, though we believe fundamentals remain solid amidst a synchronized recovery in growth.
3
Harbor Commodity Real Return Strategy Fund
Managers' Commentary—Continued
Managers' Commentary—Continued
| TOP TEN ISSUERS (% of net assets) | |
| U.S. Treasury | 100.5% |
| U.K. Gilt Inflation Linked | 6.1% |
| Brazil Letras Do Tesouro Nacional | 4.3% |
| Federal National Mortgage Association TBA | 4.0% |
| UBS Group Funding Jersey Ltd. | 2.0% |
| New Zealand Government Bond | 1.7% |
| Federal National Mortgage Association | 1.5% |
| People’s Choice Home Loan Securities Trust | 1.1% |
| Deutsche Bank AG | 0.8% |
| Petrobras Global Finance BV | 0.8% |
PERFORMANCE
Harbor Commodity Real Return Strategy Fund returned 3.13% (Institutional Class) and 2.87% (Administrative Class) for the fiscal year ended October 31, 2017, outperforming the 2.35% return of its benchmark, the Bloomberg Commodity Index Total ReturnSM.
The Fund invests in commodity-linked derivative instruments backed by a portfolio of inflation-indexed bonds and other fixed income securities. The following strategies helped Fund returns for the fiscal year ended October 31, 2017:
| • | Implementation of commodity alpha strategies which seek to exploit mispricings across commodity markets |
| • | A modest allocation to non-agency mortgages as non-agency mortgage backed securities (MBS) performed well amid continued favorable market technicals and stable residential real estate fundamentals |
| • | Positions in the U.K. interest rate markets that benefitted as rates rose over the period |
| • | An allocation to TIPS, or treasury inflation-protected securities, as inflation expectations rose, causing TIPS to outperform. |
Security selection and positioning within high-yield credit were negative or neutral for returns during the fiscal year.
OUTLOOK & STRATEGY
We expect world GDP growth in 2018 to remain steady at 2.75%–3.25%, unchanged from 2017. Overall, we see a low near-term risk of recession, a moderate pickup in underlying inflation in the advanced economies, mildly supportive fiscal policies and only a gradual removal of accommodative central bank policy. However, we do see risks that could upset the calm: the aging U.S. expansion, the coming end of central bank balance sheet expansion, and China’s course following its 19th National Communist Party Congress in October.
In the U.S., we see growth below-consensus at 1.75%–2.25% in 2018, albeit still above trend, as the U.S. expansion matures and slack in the labor market keeps eroding. We believe the disappearing slack should make it difficult to sustain the current pace of job and output growth. We also do not expect a significant acceleration of productivity growth. We forecast core inflation to increase to 2% over the course of 2018, with some upward pressure on wages. We believe the Fed will continue along its trajectory of gradual tightening with two or three rate hikes by the end of 2018.
For the Eurozone, we expect growth will be in a range of 1.75%‒2.25% in 2018, significantly above trend. We believe that a key risk for the outlook is the Italian elections in the first half of 2018, although the political risk looks more contained than earlier this year, as the Euroskeptical parties have toned down their rhetoric. We think core inflation will make only moderate progress toward the ECB target of “below but close to 2%” and forecast inflation in a range of 1.0%–1.5% for 2018. In our view, the ECB is likely to gradually taper its bond purchases over 2018 and keep policy rates at record lows until well into 2019.
In the emerging markets of Brazil, Russia, India and Mexico, we expect growth to rise to 4% in 2018, slightly above consensus, as recoveries in Brazil and Russia become more entrenched. Overall, most emerging economies are, from our perspective, at a different stage of the economic cycle than developed economies and should still benefit from relatively easy global policy conditions. We expect continued disinflation, with headline consumer price indexes falling to around 4.2% in 2018. In China, we expect growth to decelerate in 2018 from the current 6.6% pace. Our wide forecast range of 5.5%–6.5% reflects uncertainty about the leadership’s prospective stance on financial stability, deleveraging and economic growth following the Party Congress. If the leadership continues to focus on suppressing volatility, growth could hold up at higher levels, but if policy pivots, the changes could weigh heavily on growth and lead to greater tolerance for a depreciating Chinese yuan.
Following several years of price corrections, we believe that commodity markets are likely to remain more balanced going forward, with return potential skewed slightly to the upside in select commodities. Within our active commodity strategies, we look to take advantage of relative value opportunities on commodity forward curves and inter-commodity spreads.
With respect to portfolio strategy:
| • | We seek relative value opportunities within commodities while balancing the economic outlook with supply trends; we look to take advantage of relative value opportunities on commodity forward curves and inter-commodity spreads |
4
Harbor Commodity Real Return Strategy Fund
Managers' Commentary—Continued
Managers' Commentary—Continued
Within our active commodity strategies, we plan to be:
| • | Long iron ore versus base metals: we like iron ore for its roll yield, as we believe that the back of the curve is anchored by producer hedging; and tactically look to take advantage of any notable dislocations from the broader base metals complex as we expect mean reversion |
| • | Long higher protein (premium) wheats: these wheats have been priced cheaper relative to other, similar commodities, especially given that supply issues this year are predominantly in the high protein grades |
| • | Short calendar spreads in crude oil: crude oil has flipped into backwardation as OPEC policy is showing signs of success with supply situation continuing to improve; however, we feel the curve is too aggressive in pricing the speed of balances improvement |
Within our collateral portfolio, we plan to be cautious duration overall, while favoring TIPS relative to nominals and looking to take advantage of attractive opportunities in spread sectors.
This report contains the current opinions of Pacific Investment Management Company LLC (PIMCO) as of the date of this report and should not be considered as investment advice or a recommendation of any particular security, strategy or investment product. Such opinions are subject to change without notice and securities described herein may no longer be included in, or may at any time be removed from, the Fund’s portfolio. This report is distributed for informational purposes only. Information contained herein has been obtained from sources believed reliable, but not guaranteed.
The Fund invests in commodity-linked instruments, which may be significantly more volatile than other securities. The use of derivative instruments may add additional risk. It also invests in fixed income securities, which fluctuate in price in response to various factors, including changes in interest rates, changes in market conditions and issuer-specific events. Since the Fund may hold foreign securities, it may be subject to greater risks than funds invested only in the U.S. These risks are more severe for securities of issuers in emerging market regions. The Fund will seek to gain exposure to the commodity markets primarily through investments in leveraged or unleveraged commodity index-linked notes and through investments in the Harbor Cayman Commodity Fund Ltd., a wholly-owned subsidiary of the Fund. For information on the different share classes and the risks associated with an investment in the Fund, please refer to the current prospectus.
5
Harbor Commodity Real Return Strategy Fund
Fund Summary—October 31, 2017 (Unaudited)
Fund Summary—October 31, 2017 (Unaudited)
| INSTITUTIONAL CLASS | |
| Fund # | 2029 |
| Cusip | 411511397 |
| Ticker | HACMX |
| Inception Date | 09/02/2008 |
| Net Expense Ratio | 0.94% a |
| Total Net Assets (000s) | $50,771 |
| ADMINISTRATIVE CLASS | |
| Fund # | 2229 |
| Cusip | 411511389 |
| Ticker | HCMRX |
| Inception Date | 09/02/2008 |
| Net Expense Ratio | 1.19% a |
| Total Net Assets (000s) | $392 |
| Portfolio Statistics | |
| Average Market Coupon | 1.45% |
| Yield to Maturity | 2.40% |
| Weighted Average Maturity | 2.80 years |
| Weighted Average Duration | 2.75 years |
| Portfolio Turnover (Year Ended 10/31/2017) | 1,331% |
| MATURITY PROFILE | ||
| Years to Maturity | % of Investments | |
| 0 to 1 yr. | 12.48% | |
| >1 to 5 | 73.78% | |
| >5 to 10 | 20.39% | |
| >10 to 15 | -6.65% | |
| >15 to 20 | 0.49% | |
| >20 to 25 | 0.06% | |
| >25 yrs. | -0.55% | |
FUND PERFORMANCE
The graph compares a $10,000 investment in the Institutional Class shares of the Fund with the performance of the Bloomberg Commodity Index Total ReturnSM. The Fund’s performance assumes the reinvestment of all dividend and capital gain distributions.
CHANGE IN A $10,000 INVESTMENT
For the period 09/02/2008 through 10/31/2017

| TOTAL RETURNS For the periods ended 10/31/2017 | 1 Year | Annualized | Inception Date | Final Value of a $10,000 Investment | ||||||||||
| 5 Years | Life of Fund | |||||||||||||
| Harbor Commodity Real Return Strategy Fund | ||||||||||||||
Institutional Class | 3.13% | -10.39% | -6.24% | 09/02/2008 | $5,541 | |||||||||
Administrative Class | 2.87 | -10.64 | -6.49 | 09/02/2008 | 5,406 | |||||||||
| Comparative Index | ||||||||||||||
Bloomberg Commodity Index Total ReturnSM | 2.35% | -9.37% | -8.07% | — | $4,626 | |||||||||
As stated in the Fund’s current prospectus, the expense ratios were 0.94% (Net) and 1.53% (Gross) (Institutional Class); and 1.19% (Net) and 1.78% (Gross) (Administrative Class). The net expense ratios reflect an expense limitation agreement (excluding interest expense, if any) effective through 02/28/2018. The expense ratios in the prospectus may differ from the actual expense ratios for the period disclosed within this report. The expense ratios shown in the prospectus are based on the prior fiscal year, adjusted to reflect changes, if any, in contractual arrangements that occurred prior to the date of the prospectus (or supplement thereto, if applicable).
Performance data shown represents past performance and is no guarantee of future results. Past performance is net of management fees and expenses and reflects reinvested dividends and distributions, but does not reflect the deduction of taxes that a shareholder would pay on Fund distributions or upon the redemption of Fund shares. Past performance reflects the beneficial effect of any expense waivers or reimbursements, without which returns would have been lower. Investment returns and principal value will fluctuate and when redeemed may be worth more or less than their original cost. Returns for periods less than one year are not annualized. Current performance may be higher or lower and is available through the most recent month end at harborfunds.com or by calling 800-422-1050.
| a | Reflects an expense limitation agreement (excluding interest expense, if any) effective through February 28, 2018 |
6
Harbor Commodity Real Return Strategy Fund
Consolidated Portfolio of Investments—October 31, 2017
Consolidated Portfolio of Investments—October 31, 2017
Value, Cost, and Principal Amounts in Thousands
Total Investments (% of net assets)
(Excludes net cash, short-term investments and derivative positions of -33.5%)

| ASSET-BACKED SECURITIES—4.9% | |||
| Principal Amount | Value | ||
| Bear Stearns Asset Backed Securities Trust | |||
| Series 2006-2 Cl. M1 | |||
| $ | 200 | 1.658% (1 Month USD Libor + 0.420) 07/25/20361 | $ 200 |
| Countrywide Asset-Backed Certificates | |||
| Series 2005-15 Cl. 1AF6 | |||
| 15 | 4.001%—04/25/20363 | 15 | |
| MASTR Asset Backed Securities Trust | |||
| Series 2006-HE2 Cl. A4 | |||
| 196 | 1.478% (1 Month USD Libor + 0.240) 06/25/20361 | 119 | |
| Morgan Stanley ABS Capital I Inc. Trust | |||
| Series 2006-HE8 Cl. A2FP | |||
| 103 | 1.308% (1 Month USD Libor + 0.070) 10/25/20361 | 61 | |
| Series 2006-HE8 Cl. A1 | |||
| 313 | 1.368% (1 Month USD Libor + 0.130) 10/25/20361 | 290 | |
| 351 | |||
| Navient Student Loan Trust | |||
| Series 2016-7A Cl.A | |||
| 90 | 2.388% (1 Month USD Libor + 1.150) 03/25/20661,2 | 91 | |
| People's Choice Home Loan Securities Trust | |||
| Series 2005-1 Cl. M4 | |||
| 578 | 2.587% (1 Month USD Libor + 0.900) 01/25/20351 | 570 | |
| SLM Student Loan Trust | |||
| Series 2003-2 Cl. A5 | |||
| € | 329 | 0.000%—12/15/20233 | 383 |
| Small Business Administration Participation Certificates | |||
| Series 2007-20K Cl. 1 | |||
| $ | 202 | 5.510%—11/01/2027 | 216 |
| Soundview Home Loan Trust | |||
| Series 2006-OPT2 Cl. A4 | |||
| 200 | 1.518% (1 Month USD Libor + 0.280) 05/25/20361 | 182 | |
| Student Loan Marketing Association | |||
| Series 2013-B Cl. A2A | |||
| 93 | 1.850%—06/17/20302 | 93 | |
| Venture CDO Ltd | |||
| Series 2006-7A Cl. A1A | |||
| 308 | 1.593% (3 Month USD Libor + 0.230) 01/20/20221,2 | 307 | |
| TOTAL ASSET-BACKED SECURITIES | |||
(Cost $2,327) | 2,527 | ||
| COLLATERALIZED MORTGAGE OBLIGATIONS—0.2% | |||
| Bear Stearns Adjustable Rate Mortgage Trust | |||
| Series 2005-12 Cl. 23A1 | |||
| 26 | 3.314%—02/25/20363 | 26 | |
| First Horizon Alternative Mortgage Securities Trust | |||
| Series 2006-FA8 Cl. 1A7 | |||
| 12 | 6.000%—02/25/2037 | 10 | |
| COLLATERALIZED MORTGAGE OBLIGATIONS—Continued | |||
| Principal Amount | Value | ||
| Morgan Stanley Mortgage Loan Trust | |||
| Series 2006-8AR Cl. 6A1 | |||
| $ | 97 | 3.150%—06/25/20363 | $ 98 |
| TOTAL COLLATERALIZED MORTGAGE OBLIGATIONS | |||
(Cost $129) | 134 | ||
| CORPORATE BONDS & NOTES—9.0% | |||
| AUTOMOBILES—0.2% | |||
| American Honda Finance Corp. MTN4 | |||
| 100 | 1.741% (3 Month USD Libor + 0.350) 11/05/20211 | 100 | |
| BANKS—0.9% | |||
| ING Bank NV MTN4 | |||
| 100 | 2.625%—12/05/20222 | 101 | |
| Macquarie Bank Ltd. MTN4 | |||
| 100 | 1.686% (3 Month USD Libor + 0.350) 04/04/20191,2 | 100 | |
| Nordea Kredit Realkreditaktieselskab | |||
| DKK$ | 1 | 2.500%—10/01/2047 | — |
| Nykredit Realkredit AS | |||
| 108 | 2.500%—10/01/2047 | 18 | |
| 72 | 3.000%—10/01/2047 | 12 | |
| 30 | |||
| Royal Bank of Scotland plc MTN4 | |||
| € | 200 | 6.934%—04/09/2018 | 240 |
| 471 | |||
| CAPITAL MARKETS—3.6% | |||
| Credit Suisse Group Funding Guernsey Ltd. | |||
| $ | 250 | 3.800%—09/15/2022 | 260 |
| Deutsche Bank AG | |||
| 400 | 4.250%—10/14/2021 | 419 | |
| Goldman Sachs Group Inc. | |||
| 100 | 2.876% (3 Month USD Libor + 0.821) 10/31/20221 | 100 | |
| UBS Group Funding Jersey Ltd. | |||
| 1,000 | 3.139% (3 Month USD Libor + 1.780) 04/14/20211,2 | 1,038 | |
| 1,817 | |||
| CONSUMER FINANCE—0.6% | |||
| Ally Financial Inc. | |||
| 200 | 3.600%—05/21/2018 | 202 | |
| Navient Corp. MTN4 | |||
| 100 | 5.500%—01/15/2019 | 103 | |
| 305 | |||
| DIVERSIFIED FINANCIAL SERVICES—0.1% | |||
| Brfkredit AS | |||
| DKK$ | 10 | 2.500%—10/01/2047 | 2 |
| 200 | 4.000%—01/01/2018 | 31 | |
| 33 | |||
| Realkredit Danmark AS | |||
| 200 | 1.000%—04/01/2018 | 32 | |
| Realkredit Danmark AS MTN4 | |||
| 67 | 2.500%—07/01/2047 | 11 | |
| 76 | |||
| DIVERSIFIED TELECOMMUNICATION SERVICES—0.2% | |||
| AT&T Inc. | |||
| $ | 100 | 2.009% (3 Month USD Libor + 0.650) 01/15/20201 | 101 |
7
Harbor Commodity Real Return Strategy Fund
Consolidated Portfolio of Investments—Continued
Consolidated Portfolio of Investments—Continued
Value, Cost, and Principal Amounts in Thousands
| CORPORATE BONDS & NOTES—Continued | |||
| Principal Amount | Value | ||
| EQUITY REAL ESTATE INVESTMENT TRUSTS (REITs)—0.4% | |||
| Unibail-Rodamco SE MTN4 | |||
| $ | 200 | 2.129%—04/16/20193 | $ 201 |
| MACHINERY—0.4% | |||
| John Deere Capital Corp. MTN4 | |||
| 200 | 1.613% (3 Month USD Libor + 0.290) 06/22/20201 | 200 | |
| OIL, GAS & CONSUMABLE FUELS—1.9% | |||
| BG Energy Capital plc | |||
| £ | 100 | 6.500%—11/30/20723 | 133 |
| Enbridge Inc. | |||
| $ | 200 | 2.020% (3 Month USD Libor + 0.700) 06/15/20201 | 202 |
| Petrobras Global Finance BV | |||
| 200 | 4.375%—05/20/2023 | 199 | |
| 200 | 6.125%—01/17/2022 | 217 | |
| 416 | |||
| Spectra Energy Partners LP | |||
| 200 | 2.016% (3 Month USD Libor + 0.700) 06/05/20201 | 201 | |
| 952 | |||
| TOBACCO—0.2% | |||
| BAT Capital Corp | |||
| 100 | 1.905% (3 Month USD Libor + 0.590) 08/14/20201,2 | 101 | |
| TRADING COMPANIES & DISTRIBUTORS—0.5% | |||
| International Lease Finance Corp. | |||
| 200 | 8.250%—12/15/2020 | 233 | |
| TOTAL CORPORATE BONDS & NOTES | |||
(Cost $4,470) | 4,557 | ||
| FOREIGN GOVERNMENT OBLIGATIONS—13.4% | |||
| Argentina Pom Politica Monetaria | |||
| ARG$ | 1,300 | 27.095%—06/21/20203 | 81 |
| Argentine Republic Government International Bond | |||
| 200 | 6.875%—01/26/2027 | 218 | |
| Australia Government Bond | |||
| AUD$ | 100 | 3.000%—09/20/20255 | 107 |
| Autonomous Community of Catalonia | |||
| € | 100 | 4.950%—02/11/2020 | 123 |
| Brazil Letras Do Tesouro Nacional | |||
| R$ | 7,200 | 0.000%—01/01/20186 | 2,176 |
| New Zealand Government Bond | |||
| NZD$ | 1,200 | 2.000%—09/20/20255 | 895 |
| Peru Government Bond | |||
| PER$ | 400 | 6.150%—08/12/20322 | 128 |
| U.K. Gilt Inflation Linked5 | |||
| £ | 1,906 | 0.125%—03/22/2026-11/22/2065 | 3,092 |
| TOTAL FOREIGN GOVERNMENT OBLIGATIONS | |||
(Cost $6,873) | 6,820 | ||
| MORTGAGE PASS-THROUGH—5.5% | |||
| Federal National Mortgage Association | |||
| $ | 732 | 4.000%—02/01/2041-12/13/2046 | 768 |
| MORTGAGE PASS-THROUGH—Continued | |||
| Principal Amount | Value | ||
| Federal National Mortgage Association TBA7 | |||
| $ | 2,000 | 3.500%—11/13/2047-12/13/2047 | $ 2,053 |
| TOTAL MORTGAGE PASS-THROUGH | |||
(Cost $2,807) | 2,821 | ||
| U.S. GOVERNMENT OBLIGATIONS—100.5% | |||
| U.S. Treasury Bonds | |||
| 850 | 2.750%—08/15/2047 | 828 | |
| U.S. Treasury Inflation Indexed Bonds5 | |||
| 21,825 | 0.125%—04/15/2019-07/15/2024 | 21,849 | |
| 1,959 | 0.250%—01/15/2025 | 1,938 | |
| 4,197 | 0.375%—07/15/2023-07/15/2025 | 4,234 | |
| 1,933 | 0.625%—07/15/2021-01/15/2024 | 1,971 | |
| 336 | 0.875%—02/15/2047 | 332 | |
| 3,832 | 1.250%—07/15/2020 | 3,985 | |
| 2,823 | 1.375%—07/15/2018-02/15/20448 | 2,868 | |
| 7,358 | 1.875%—07/15/2019 | 7,654 | |
| 3,466 | 2.375%—01/15/2025 | 3,951 | |
| 549 | 2.500%—01/15/20298 | 662 | |
| 49,444 | |||
| U.S. Treasury Notes | |||
| 100 | 1.875%—04/30/2022 | 100 | |
| 100 | 2.000%—02/15/2025 | 98 | |
| 500 | 2.125%—03/31/2024-07/31/20248 | 497 | |
| 410 | 3.000%—05/15/2047 | 420 | |
| 1,115 | |||
| TOTAL U.S. GOVERNMENT OBLIGATIONS | |||
(Cost $50,412) | 51,387 | ||
| SHORT-TERM INVESTMENTS—22.0% | |||
| CERTIFICATES OF DEPOSIT—0.6% | |||
| Barclays plc | |||
| 200 | 1.710% (3 Month USD Libor + 0.460) 03/16/20181 | 200 | |
| 100 | 1.827% (3 Month USD Libor + 0.470) 05/17/20181 | 100 | |
| 300 | |||
| REPURCHASE AGREEMENTS—21.4% | |||
| 1,500 | Repurchase Agreement with Barclays Capital Inc. dated October 31, 2017 due November 01, 2017 at 1.210% collateralized by U.S. Treasury Notes (value $1,527) | 1,500 | |
| 4,100 | Repurchase Agreement with Citigroup Global Markets Inc. dated October 31, 2017 due November 01, 2017 at 1.210% collateralized by U.S. Treasury Notes (value $4,170) | 4,100 | |
8
Harbor Commodity Real Return Strategy Fund
Consolidated Portfolio of Investments—Continued
Consolidated Portfolio of Investments—Continued
Value, Cost, and Principal Amounts in Thousands
| SHORT-TERM INVESTMENTS—Continued | |||
| Principal Amount | Value | ||
| REPURCHASE AGREEMENTS—Continued | |||
| $ | 1,293 | Repurchase Agreement with Fixed Income Clearing Corp. dated October 31, 2017 due November 01, 2017 at 0.001% collateralized by U.S. Treasury Notes (value $1,323) | $ 1,293 |
| 4,100 | Repurchase Agreement with JPMorgan Securities LLC dated October 31, 2017 due November 01, 2017 at 1.220% collateralized by Government National Mortgage Association (value $7,009) | 4,100 | |
| 10,993 | |||
| TOTAL SHORT-TERM INVESTMENTS | |||
(Cost $11,293) | 11,293 | ||
| TOTAL INVESTMENTS—155.5% | |||
(Cost $78,311) | 79,539 | ||
CASH AND OTHER ASSETS, LESS LIABILITIES—(55.5)% | (28,376) | ||
TOTAL NET ASSETS—100.0% | $ 51,163 | ||
FUTURES CONTRACTS OPEN AT OCTOBER 31, 2017
| Description | Number of Contracts | Expiration Date | Current Notional Value (000s) | Unrealized Appreciation/ (Depreciation) (000s) | ||||
Euro-Bund Futures (Short) | 1 | 12/07/2017 | € 163 | $ — | ||||
United Kingdom GILT Futures 90 day (Short) | 13 | 12/27/2017 | £ 1,616 | 46 | ||||
Brent Crude Oil Futures (Long) | 3 | 01/31/2018 | $ 123 | 4 | ||||
Brent Crude Oil Futures (Long) | 1 | 02/28/2018 | 2 | — | ||||
Brent Crude Oil Futures (Long) | 1 | 03/29/2018 | 2 | — | ||||
Brent Crude Oil Futures (Long) | 1 | 04/30/2018 | 2 | — | ||||
Brent Crude Oil Futures (Long) | 1 | 05/31/2018 | 2 | — | ||||
Brent Crude Oil Futures (Long) | 1 | 06/29/2018 | 2 | — | ||||
Brent Crude Oil Futures (Long) | 1 | 07/31/2018 | 2 | — | ||||
Brent Crude Oil Futures (Long) | 1 | 08/31/2018 | 2 | — | ||||
Brent Crude Oil Futures (Long) | 1 | 09/28/2018 | 2 | — | ||||
Brent Crude Oil Futures (Long) | 1 | 10/31/2018 | 2 | — | ||||
Brent Crude Oil Futures (Long) | 1 | 11/30/2018 | 2 | — | ||||
Brent Crude Oil Futures (Long) | 1 | 12/31/2018 | 2 | — | ||||
Brent Crude Oil Futures (Long) | 11 | 10/31/2019 | 624 | 45 | ||||
Brent Crude Oil Futures (Short) | 1 | 11/30/2017 | 61 | — | ||||
Brent Crude Oil Futures (Short) | 1 | 04/30/2018 | 60 | (3) | ||||
Brent Crude Oil Futures (Short) | 1 | 07/31/2018 | 59 | (7) | ||||
Brent Crude Oil Futures (Short) | 1 | 10/31/2018 | 58 | (3) | ||||
Brent Crude Oil Futures (Short) | 2 | 01/31/2019 | 116 | (10) | ||||
Brent Crude Oil Futures (Short) | 4 | 04/30/2019 | 230 | (23) | ||||
Brent Crude Oil Futures (Short) | 6 | 05/14/2020 | 338 | (26) | ||||
Brent Crude Oil Futures (Short) | 1 | 10/30/2020 | 56 | (4) | ||||
Chicago Ethanol Swap Futures (Long) | 1 | 12/29/2017 | 60 | — | ||||
Coffee Futures (Long) | 1 | 03/19/2018 | 48 | (2) | ||||
Coffee Futures (Short) | 1 | 12/18/2017 | 47 | 2 | ||||
Copper Futures (Long) | 1 | 12/18/2017 | 171 | 1 | ||||
Copper Futures (Short) | 2 | 12/27/2017 | 155 | — | ||||
Corn Futures (Long) | 1 | 12/14/2018 | 20 | — | ||||
Corn Futures (Short) | 2 | 12/14/2017 | 35 | 2 | ||||
Corn Futures (Short) | 1 | 09/14/2018 | 19 | 1 | ||||
Gasoil Futures (Long) | 10 | 12/12/2018 | 534 | 30 | ||||
Gasoil Futures (Short) | 5 | 06/12/2018 | 270 | (11) | ||||
Gasoil Futures (Short) | 5 | 06/12/2019 | 264 | (17) | ||||
Gasoline Futures (Short) | 1 | 12/29/2017 | 72 | (6) | ||||
Gasoline Futures (Short) | 1 | 02/28/2018 | 72 | (1) | ||||
Gold Futures (Long) | 1 | 12/27/2018 | 129 | 3 | ||||
Gold Futures (Short) | 1 | 12/27/2017 | 127 | (1) |
9
Harbor Commodity Real Return Strategy Fund
Consolidated Portfolio of Investments—Continued
Consolidated Portfolio of Investments—Continued
FUTURES CONTRACTS—Continued
| Description | Number of Contracts | Expiration Date | Current Notional Value (000s) | Unrealized Appreciation/ (Depreciation) (000s) | ||||
Henry Hub Natural Gas Futures (Short) | 4 | 12/27/2017 | $ 30 | $ (1) | ||||
Henry Hub Natural Gas Futures (Short) | 4 | 01/29/2018 | 30 | (1) | ||||
Henry Hub Natural Gas Futures (Short) | 4 | 02/26/2018 | 30 | (1) | ||||
Henry Hub Natural Gas Futures (Short) | 4 | 03/27/2018 | 29 | 1 | ||||
Henry Hub Natural Gas Futures (Short) | 4 | 04/26/2018 | 28 | 1 | ||||
Henry Hub Natural Gas Futures (Short) | 4 | 05/29/2018 | 29 | 1 | ||||
Henry Hub Natural Gas Futures (Short) | 4 | 06/27/2018 | 29 | — | ||||
Henry Hub Natural Gas Futures (Short) | 4 | 07/27/2018 | 29 | — | ||||
Henry Hub Natural Gas Futures (Short) | 4 | 08/29/2018 | 29 | — | ||||
Henry Hub Natural Gas Futures (Short) | 4 | 09/26/2018 | 29 | — | ||||
Henry Hub Natural Gas Futures (Short) | 4 | 10/29/2018 | 30 | — | ||||
Henry Hub Natural Gas Futures (Short) | 4 | 11/28/2018 | 31 | (2) | ||||
Light Sweet Crude Oil Futures (Long) | 2 | 12/18/2017 | 109 | 1 | ||||
Light Sweet Crude Oil Futures (Long) | 1 | 05/22/2018 | 54 | 2 | ||||
Light Sweet Crude Oil Futures (Long) | 5 | 08/21/2018 | 268 | 21 | ||||
Light Sweet Crude Oil Futures (Long) | 4 | 10/30/2018 | 212 | 5 | ||||
Light Sweet Crude Oil Futures (Long) | 1 | 02/20/2019 | 52 | 2 | ||||
Light Sweet Crude Oil Futures (Long) | 5 | 05/21/2019 | 259 | 7 | ||||
Light Sweet Crude Oil Futures (Long) | 2 | 11/20/2019 | 102 | 4 | ||||
Light Sweet Crude Oil Futures (Long) | 1 | 05/19/2020 | 51 | (2) | ||||
Light Sweet Crude Oil Futures (Short) | 4 | 02/20/2018 | 219 | (11) | ||||
Light Sweet Crude Oil Futures (Short) | 8 | 11/19/2018 | 424 | (23) | ||||
Light Sweet Crude Oil Futures (Short) | 3 | 11/20/2020 | 151 | 4 | ||||
Natural Gas Futures (Long) | 4 | 11/28/2017 | 116 | (10) | ||||
Natural Gas Futures (Long) | 3 | 01/29/2018 | 91 | (8) | ||||
Natural Gas Futures (Long) | 1 | 02/26/2018 | 30 | (3) | ||||
Natural Gas Futures (Long) | 2 | 04/26/2018 | 57 | — | ||||
Natural Gas Futures (Short) | 6 | 12/27/2017 | 182 | 17 | ||||
Natural Gas Futures (Short) | 3 | 03/27/2018 | 86 | — | ||||
Natural Gas Swap Futures (Long) | 12 | 01/29/2018 | 91 | (3) | ||||
Natural Gas Swap Futures (Long) | 8 | 03/27/2018 | 57 | 1 | ||||
Natural Gas Swap Futures (Long) | 4 | 04/26/2018 | 29 | (1) | ||||
Natural Gas Swap Futures (Long) | 4 | 05/29/2018 | 29 | (1) | ||||
Natural Gas Swap Futures (Long) | 4 | 06/27/2018 | 29 | — | ||||
Natural Gas Swap Futures (Long) | 4 | 07/27/2018 | 29 | — | ||||
Natural Gas Swap Futures (Long) | 4 | 08/29/2018 | 29 | — | ||||
Natural Gas Swap Futures (Long) | 4 | 09/26/2018 | 29 | — | ||||
Natural Gas Swap Futures (Long) | 4 | 10/29/2018 | 30 | — | ||||
Natural Gas Swap Futures (Long) | 4 | 11/28/2018 | 31 | 2 | ||||
Natural Gas Swap Futures (Short) | 4 | 12/27/2017 | 30 | 2 | ||||
Platinum Futures (Long) | 2 | 01/29/2018 | 92 | (6) | ||||
Soybean Oil Futures (Long) | 1 | 12/14/2018 | 21 | — | ||||
Soybean Oil Futures (Short) | 1 | 12/14/2017 | 21 | — | ||||
Sugar Futures (Short) | 3 | 02/28/2018 | 50 | — | ||||
U.S. Treasury Bond Futures 30 year (Short) | 3 | 12/19/2017 | 457 | 5 | ||||
U.S. Treasury Note Futures 2 year (Short) | 10 | 12/29/2017 | 2,154 | 9 | ||||
U.S. Treasury Note Futures 5 year (Short) | 40 | 12/29/2017 | 4,687 | 19 | ||||
U.S. Treasury Note Futures 10 year (Long) | 21 | 12/19/2017 | 2,624 | (12) | ||||
Wheat Futures (Long) | 4 | 03/14/2018 | 87 | (15) | ||||
Wheat Futures (Short) | 4 | 03/14/2018 | 87 | 15 | ||||
White Sugar Futures (Long) | 3 | 02/13/2018 | 58 | 2 | ||||
Total Futures Contracts | $ 41 | |||||||
PURCHASED OPTIONS OPEN AT OCTOBER 31, 2017
PURCHASED OPTIONS THAT REQUIRE PERIODIC SETTLEMENT OF VARIATION MARGIN
| Description | Exchange | Strike Price | Expiration Date | Number of Contracts/ Notional | Premiums Paid (000s) | Value (000s) | ||||||
Euro-Bund Futures (Put) | Eurex | € 159.00 | 11/24/2017 | 15 | $ 2 | $ 1 | ||||||
Euro-Bund Futures (Call) | Eurex | 165.00 | 11/24/2017 | 5 | — | — | ||||||
Total Purchased Options that Require Periodic Settlement of Variation Margin | $ 2 | $ 1 | ||||||||||
10
Harbor Commodity Real Return Strategy Fund
Consolidated Portfolio of Investments—Continued
Consolidated Portfolio of Investments—Continued
PURCHASED OPTIONS—Continued
PURCHASED OPTIONS NOT SETTLED THROUGH VARIATION MARGIN
| Description | Counterparty/Exchange | Strike Price | Expiration Date | Number of Contracts/ Notional | Premiums Paid (000s) | Value (000s) | ||||||
Commodity - Natural Gas Futures (Call) | New York Mercantile Exchange | $ 0.50 | 02/23/2018 | 3 | $ 11 | $ 2 | ||||||
Commodity - Natural Gas Futures (Call) | New York Mercantile Exchange | 1.00 | 02/23/2018 | 3 | 8 | 1 | ||||||
Commodity - WTI-Brent Crude Oil Spread Futures (Call) | New York Mercantile Exchange | 2.00 | 10/30/2018 | 1 | 1 | — | ||||||
Eurodollar Futures (Put) | CME Group | 98.25 | 03/19/2018 | 30 | 3 | 2 | ||||||
Federal National Mortgage Assocation Futures 30 year (Call) | Credit Suisse International | 120.00 | 12/06/2017 | 1,500,000 | — | — | ||||||
Federal National Mortgage Assocation Futures 30 year (Put) | Credit Suisse International | 85.00 | 12/06/2017 | 3,500,000 | — | — | ||||||
USD ICE Swap Rate Index 10 year - Cap (Put) | Deutsche Bank AG | 0.260 j | 03/29/2018 | 2,500,000 | 1 | 1 | ||||||
USD ICE Swap Rate Index 10 year - Cap (Put) | Morgan Stanley Capital Services LLC | 0.260 j | 04/03/2018 | 2,600,000 | 1 | 1 | ||||||
U.S. Treasury Bond Option 30 year (Call) | Chicago Board of Trade | $ 182.00 | 12/22/2017 | 2 | — | — | ||||||
U.S. Treasury Bond Option 30 year (Call) | Chicago Board of Trade | 184.00 | 12/22/2017 | 2 | — | — | ||||||
U.S. Treasury Bond Option 30 year (Put) | Chicago Board of Trade | 106.00 | 12/22/2017 | 2 | — | — | ||||||
U.S. Treasury Note Option 2 year (Call) | Chicago Board of Trade | 109.50 | 11/24/2017 | 3 | — | — | ||||||
U.S. Treasury Note Option 2 year (Call) | Chicago Board of Trade | 109.63 | 11/24/2017 | 1 | — | — | ||||||
U.S. Treasury Note Option 2 year (Call) | Chicago Board of Trade | 109.75 | 11/24/2017 | 6 | — | — | ||||||
U.S. Treasury Note Option 5 year (Call) | Chicago Board of Trade | 122.50 | 12/22/2017 | 16 | — | — | ||||||
U.S. Treasury Note Option 5 year (Call) | Chicago Board of Trade | 123.00 | 12/22/2017 | 4 | — | — | ||||||
U.S. Treasury Note Option 5 year (Call) | Chicago Board of Trade | 123.75 | 11/24/2017 | 1 | — | — | ||||||
U.S. Treasury Note Option 5 year (Call) | Chicago Board of Trade | 124.00 | 11/24/2017 | 2 | — | — | ||||||
U.S. Treasury Note Option 5 year (Call) | Chicago Board of Trade | 124.25 | 11/24/2017 | 13 | — | — | ||||||
U.S. Treasury Note Option 5 year (Call) | Chicago Board of Trade | 124.25 | 12/22/2017 | 4 | — | — | ||||||
U.S. Treasury Note Option 5 year (Call) | Chicago Board of Trade | 124.75 | 11/24/2017 | 4 | — | — | ||||||
U.S. Treasury Note Option 5 year (Call) | Chicago Board of Trade | 125.00 | 12/22/2017 | 1 | — | — | ||||||
U.S. Treasury Note Option 10 year (Put) | Chicago Board of Trade | 114.50 | 11/24/2017 | 29 | — | — | ||||||
U.S. Treasury Note Option 10 year (Put) | Chicago Board of Trade | 109.00 | 12/22/2017 | 2 | — | — | ||||||
U.S. Treasury Note Option 10 year (Put) | Chicago Board of Trade | 115.50 | 11/24/2017 | 4 | — | — | ||||||
Total Purchased Options Not Settled Through Variation Margin | $ 25 | $ 7 | ||||||||||
PURCHASED SWAP OPTIONS NOT SETTLED THROUGH VARIATION MARGIN
| Description | Counterparty | Floating Rate Index | Pay/Receive Floating Rate | Strike Index/ Rate | Expiration Date | Number of Contracts/ Notional | Premiums Paid (000s) | Value (000s) | ||||||||
Interest Rate Swap Option 10 year (Put) | Morgan Stanley Capital Services LLC | 3-Month USD-LIBOR | Receive | 2.720% | 07/16/2018 | 150,000 | $ 2 | $ 2 | ||||||||
Interest Rate Swap Option 10 year (Put) | Morgan Stanley Capital Services LLC | 3-Month USD-LIBOR | Receive | 2.770 | 07/16/2018 | 1,000,000 | 12 | 10 | ||||||||
Interest Rate Swap Option 30 year (Call) | Deutsche Bank AG | 3-Month USD-LIBOR | Pay | 2.150 | 06/15/2018 | 250,000 | 25 | 3 | ||||||||
Interest Rate Swap Option 30 year (Put) | Deutsche Bank AG | 3-Month USD-LIBOR | Receive | 2.150 | 06/15/2018 | 250,000 | 25 | 30 | ||||||||
Total Purchased Swap Options Not Settled Through Variation Margin | $64 | $45 | ||||||||||||||
Total Purchased Options | $91 | $53 | ||||||||||||||
WRITTEN OPTIONS OPEN AT OCTOBER 31, 2017
WRITTEN OPTIONS THAT REQUIRE PERIODIC SETTLEMENT OF VARIATION MARGIN
| Description | Exchange | Strike Price | Expiration Date | Number of Contracts/ Notional | Premiums Received (000s) | Value (000s) | ||||||
Euro-Bund Futures (Call) | Eurex | € 164.00 | 11/24/2017 | 5 | $1 | $— | ||||||
Euro-Bund Futures (Put) | Eurex | 158.00 | 11/24/2017 | 16 | 1 | (1) | ||||||
Total Written Options that Require Periodic Settlement of Variation Margin | $2 | $ (1) | ||||||||||
WRITTEN OPTIONS NOT SETTLED THROUGH VARIATION MARGIN
| Description | Counterparty/Exchange | Strike Index/ Rate | Expiration Date | Number of Contracts/ Notional | Premiums Received (000s) | Value (000s) | ||||||
Commodity - Natural Gas Futures (Call) | New York Mercantile Exchange | $ 0.75 | 02/23/2018 | 6 | $17 | $ (4) | ||||||
Commodity - WTI-Brent Crude Oil Spread Futures (Call) | New York Mercantile Exchange | — | 10/30/2018 | 1 | 1 | — | ||||||
Consumer Price All Urban Non-Seasonally Adjusted Index - Cap (Call) | JP Morgan Chase Bank NA | 244.170 j | 05/16/2024 | 200,000 | 1 | — | ||||||
Consumer Price All Urban Non-Seasonally Adjusted Index - Floor (Put) | JP Morgan Chase Bank NA | 234.810 j | 03/24/2020 | 1,600,000 | 18 | (4) |
11
Harbor Commodity Real Return Strategy Fund
Consolidated Portfolio of Investments—Continued
Consolidated Portfolio of Investments—Continued
WRITTEN OPTIONS—Continued
WRITTEN OPTIONS NOT SETTLED THROUGH VARIATION MARGIN—Continued
| Description | Counterparty/Exchange | Strike Index/ Rate | Expiration Date | Number of Contracts/ Notional | Premiums Received (000s) | Value (000s) | ||||||
Eurodollar Futures (Call) | CME Group | $ 98.75 | 03/19/2018 | 30 | $ 4 | $ — | ||||||
Eurozone HICP Ex. Tobacco Index - Cap (Call) | Goldman Sachs Bank USA | 120.720 j | 06/22/2035 | 400,000 | 18 | (4) | ||||||
USD ICE Swap Rate Index 30 year - Cap (Put) | Deutsche Bank AG | 0.230 j | 03/29/2018 | 2,500,000 | 1 | (1) | ||||||
USD ICE Swap Rate Index 30 year - Cap (Put) | Morgan Stanley Capital Services LLC | 0.230 j | 04/03/2018 | 2,600,000 | 1 | (1) | ||||||
U.S. Treasury Bond Option 30 year (Call) | Chicago Board of Trade | $ 155.00 | 11/24/2017 | 1 | 1 | — | ||||||
U.S. Treasury Note Option 10 year (Call) | Chicago Board of Trade | 125.00 | 11/24/2017 | 3 | 1 | (2) | ||||||
U.S. Treasury Note Option 10 year (Call) | Chicago Board of Trade | 125.50 | 11/24/2017 | 4 | 1 | (1) | ||||||
U.S. Treasury Note Option 10 year (Call) | Chicago Board of Trade | 126.50 | 11/24/2017 | 3 | 1 | — | ||||||
U.S. Treasury Note Option 10 year (Call) | Chicago Board of Trade | 127.50 | 11/24/2017 | 4 | 2 | — | ||||||
U.S. Treasury Note Option 10 year (Put) | Chicago Board of Trade | 123.50 | 11/24/2017 | 4 | 1 | (1) | ||||||
U.S. Treasury Note Option 10 year (Put) | Chicago Board of Trade | 124.00 | 11/24/2017 | 4 | 2 | (1) | ||||||
Total Written Options Not Settled Through Variation Margin | $70 | $(19) | ||||||||||
WRITTEN SWAP OPTIONS NOT SETTLED THROUGH VARIATION MARGIN
| Description | Counterparty | Floating Rate Index | Pay/Receive Floating Rate | Strike Rate | Expiration Date | Number of Contracts/ Notional | Premiums Received (000s) | Value (000s) | ||||||||
Interest Rate Swap Option 5 year (Call) | Royal Bank of Scotland plc | 3-Month USD-LIBOR | Receive | 1.800% | 11/07/2017 | 400,000 | $ 4 | $ — | ||||||||
Interest Rate Swap Option 5 year (Put) | Royal Bank of Scotland plc | 3-Month USD-LIBOR | Pay | 2.600 | 11/07/2017 | 400,000 | 4 | (1) | ||||||||
Total Written Swap Options Not Settled Through Variation Margin | $ 8 | $ (1) | ||||||||||||||
Total Written Options | $80 | $(21) | ||||||||||||||
FORWARD CURRENCY CONTRACTS OPEN AT OCTOBER 31, 2017
| Counterparty | Amount to be Delivered (000s) | Amount to be Received (000s) | Settlement Date | Unrealized Appreciation/ (Depreciation) (000s) | ||||
Bank of America NA | $ 100 | ARG$ 1,860 | 02/14/2018 | $ (1) | ||||
Citibank NA | $ 11 | ARG$ 194 | 12/20/2017 | — | ||||
Goldman Sachs Bank USA | $ 48 | ARG$ 885 | 01/12/2018 | — | ||||
HSBC Bank USA | $ 55 | ARG$ 1,027 | 02/14/2018 | — | ||||
BNP Paribas SA | ARG$ 398 | $ 21 | 02/14/2018 | — | ||||
JP Morgan Chase Bank | ARG$ 265 | $ 14 | 02/14/2018 | — | ||||
JP Morgan Chase Bank NA | AUD$ 528 | $ 412 | 11/02/2017 | 8 | ||||
Citibank NA | $ 65 | R$ 211 | 11/03/2017 | — | ||||
Citibank NA | $ 66 | R$ 211 | 12/04/2017 | (2) | ||||
Deutsche Bank AG | $ 102 | R$ 320 | 11/03/2017 | (4) | ||||
Société Générale | $ 33 | R$ 108 | 11/03/2017 | — | ||||
BNP Paribas SA | R$ 420 | $ 116 | 01/03/2018 | (11) | ||||
Citibank NA | R$ 211 | $ 66 | 11/03/2017 | 2 | ||||
Deutsche Bank AG | R$ 320 | $ 98 | 11/03/2017 | — | ||||
Deutsche Bank AG | R$ 5,900 | $ 1,641 | 01/03/2018 | (149) | ||||
JP Morgan Chase Bank | R$ 880 | $ 243 | 01/03/2018 | (24) | ||||
Société Générale | R$ 108 | $ 34 | 11/03/2017 | 1 | ||||
UBS AG | $ 3,223 | £ 2,462 | 11/02/2017 | 47 | ||||
Citibank NA | £ 246 | $ 325 | 11/02/2017 | (2) | ||||
JP Morgan Chase Bank NA | £ 2,216 | $ 2,970 | 11/02/2017 | 27 | ||||
UBS AG | £ 2,462 | $ 3,226 | 12/04/2017 | (47) | ||||
Citibank NA | $ 128 | CAD$ 165 | 11/15/2017 | — | ||||
Goldman Sachs Bank USA | CAD$ 165 | $ 130 | 11/15/2017 | 2 | ||||
Goldman Sachs Bank USA | $ 98 | DKK$ 615 | 01/02/2018 | (1) | ||||
JP Morgan Chase Bank NA | $ 52 | DKK$ 325 | 01/02/2018 | (1) | ||||
Bank of America NA | DKK$ 811 | $ 130 | 01/02/2018 | 3 | ||||
Goldman Sachs Bank USA | DKK$ 208 | $ 30 | 01/02/2018 | (2) | ||||
Goldman Sachs Bank USA | DKK$ 202 | $ 31 | 04/03/2018 | (1) | ||||
JP Morgan Chase Bank NA | DKK$ 350 | $ 56 | 01/02/2018 | 1 | ||||
BNP Paribas SA | $ 902 | € 775 | 11/02/2017 | 1 | ||||
Citibank NA | $ 6 | € 5 | 11/15/2017 | — | ||||
JP Morgan Chase Bank NA | $ 1,101 | € 936 | 11/02/2017 | (11) | ||||
Bank of America NA | € 1,593 | $ 1,872 | 11/02/2017 | 16 |
12
Harbor Commodity Real Return Strategy Fund
Consolidated Portfolio of Investments—Continued
Consolidated Portfolio of Investments—Continued
FORWARD CURRENCY CONTRACTS—Continued
| Counterparty | Amount to be Delivered (000s) | Amount to be Received (000s) | Settlement Date | Unrealized Appreciation/ (Depreciation) (000s) | ||||
BNP Paribas SA | € 775 | $ 903 | 12/04/2017 | $ (1) | ||||
JP Morgan Chase Bank NA | € 118 | $ 139 | 11/02/2017 | 1 | ||||
UBS AG | € 6 | $ 7 | 11/15/2017 | — | ||||
Credit Suisse International | $ 189 | ₹ 12,358 | 12/04/2017 | 2 | ||||
BNP Paribas SA | ₹ 2,407 | $ 37 | 12/04/2017 | — | ||||
Citibank NA | ₹ 1,518 | $ 23 | 12/04/2017 | — | ||||
JP Morgan Chase Bank | ₹ 1,451 | $ 22 | 12/04/2017 | — | ||||
Citibank NA | $ 113 | ¥ 12,700 | 11/02/2017 | (2) | ||||
Citibank NA | $ 52 | MEX$ 990 | 12/15/2017 | (1) | ||||
Citibank NA | MEX$ 275 | $ 15 | 12/15/2017 | — | ||||
Bank of America NA | $ 892 | NZD$ 1,303 | 11/02/2017 | — | ||||
Bank of America NA | NZD$ 1,303 | $ 891 | 12/04/2017 | — | ||||
JP Morgan Chase Bank NA | NZD$ 1,303 | $ 937 | 11/02/2017 | 45 | ||||
Citibank NA | $ 50 | RUS$ 2,936 | 02/16/2018 | (1) | ||||
BNP Paribas SA | ₩ 51,219 | $ 45 | 12/04/2017 | (1) | ||||
Deutsche Bank AG | ₩ 95,642 | $ 84 | 12/04/2017 | (2) | ||||
Total Forward Currency Contracts | $(108) | |||||||
SWAP AGREEMENTS OPEN AT OCTOBER 31, 2017
CENTRALLY CLEARED SWAP AGREEMENTS
INTEREST RATE SWAPS
| Counterparty | Floating Rate Index | Pay/Receive Floating Rate | Fixed Rate | Payment Frequency | Expiration Date | Notional Amount (000s) | Value (000s) | Upfront Premiums (Received)/ Paid (000s) | Unrealized Appreciation/ (Depreciation) (000s) | |||||||||
CME Group | Brazil Cetip Interbank Deposit | Pay | 9.650% | At maturity | 01/02/2025 | R$ 1,700 | $ (4) | $ (1) | $ (3) | |||||||||
LCH Group | Eurostat Eurozone HICP Ex Tobacco NSA | Receive | 1.165 | At maturity | 12/15/2021 | € 140 | 1 | — | 1 | |||||||||
LCH Group | Eurostat Eurozone HICP Ex Tobacco NSA | Pay | 1.385 | At maturity | 12/15/2026 | 150 | (1) | 1 | (2) | |||||||||
LCH Group | French Consumer Price Index Ex Tobacco | Pay | 1.438 | At maturity | 06/15/2027 | 240 | (1) | (1) | — | |||||||||
LCH Group | British Bankers' Association LIBOR GBP 6-Month | Pay | 1.500 | Semiannual | 03/21/2028 | £ 1,390 | (13) | (48) | 35 | |||||||||
LCH Group | British Bankers' Association LIBOR GBP 6-Month | Pay | 1.750 | Semiannual | 03/21/2048 | 200 | (9) | (5) | (4) | |||||||||
LCH Group | UK Retail Prices Index All Items NSA | Pay | 3.400 | At maturity | 06/15/2030 | 800 | 13 | 20 | (7) | |||||||||
LCH Group | UK Retail Prices Index All Items NSA | Pay | 3.300 | At maturity | 12/15/2030 | 100 | (3) | (5) | 2 | |||||||||
LCH Group | UK Retail Prices Index All Items NSA | Pay | 3.470 | At maturity | 09/15/2032 | 1,450 | (12) | 2 | (14) | |||||||||
LCH Group | UK Retail Prices Index All Items NSA | Pay | 3.585 | At maturity | 10/15/2046 | 130 | (7) | (8) | 1 | |||||||||
LCH Group | UK Retail Prices Index All Items NSA | Receive | 3.585 | At maturity | 10/15/2046 | 90 | 5 | 5 | — | |||||||||
LCH Group | UK Retail Prices Index All Items NSA | Receive | 3.427 | At maturity | 03/15/2047 | 100 | 7 | — | 7 | |||||||||
LCH Group | British Bankers' Association LIBOR JPY 6-Month | Receive | 0.300 | Semiannual | 09/20/2027 | ¥ 60,000 | (1) | (1) | — | |||||||||
LCH Group | British Bankers' Association LIBOR JPY 6-Month | Receive | 0.450 | Semiannual | 03/20/2029 | 150,000 | (7) | (9) | 2 | |||||||||
CME Group | Mexico Interbank TIIE 28 Day | Pay | 7.200 | Lunar | 06/05/2024 | MEX$ 2,200 | (1) | — | (1) | |||||||||
CME Group | Mexico Interbank TIIE 28 Day | Pay | 8.040 | Lunar | 12/17/2026 | 500 | 1 | — | 1 |
13
Harbor Commodity Real Return Strategy Fund
Consolidated Portfolio of Investments—Continued
Consolidated Portfolio of Investments—Continued
SWAP AGREEMENTS—Continued
CENTRALLY CLEARED SWAP AGREEMENTS—Continued
INTEREST RATE SWAPS—Continued
| Counterparty | Floating Rate Index | Pay/Receive Floating Rate | Fixed Rate | Payment Frequency | Expiration Date | Notional Amount (000s) | Value (000s) | Upfront Premiums (Received)/ Paid (000s) | Unrealized Appreciation/ (Depreciation) (000s) | |||||||||
CME Group | Mexico Interbank TIIE 28 Day | Pay | 8.280% | Lunar | 11/28/2036 | MEX$ 400 | $ 1 | $ 2 | $ (1) | |||||||||
CME Group | Mexico Interbank TIIE 28 Day | Pay | 8.310 | Lunar | 11/28/2036 | 400 | 1 | 2 | (1) | |||||||||
CME Group | Mexico Interbank TIIE 28 Day | Pay | 7.480 | Lunar | 06/18/2037 | 4,180 | (6) | — | (6) | |||||||||
CME Group | New Zeland 90 Day Bank Bill Futures Rate Agreement | Pay | 3.250 | Semiannual | 03/21/2028 | NZD$ 500 | — | 2 | (2) | |||||||||
CME Group | British Bankers' Association LIBOR USD 3-Month | Pay | 1.250 | Semiannual | 06/21/2019 | $ 2,500 | 13 | 15 | (2) | |||||||||
CME Group | British Bankers' Association LIBOR USD 3-Month | Pay | 2.250 | Semiannual | 12/16/2022 | 4,500 | 63 | 10 | 53 | |||||||||
CME Group | British Bankers' Association LIBOR USD 3-Month | Pay | 2.660 | Semiannual | 10/19/2023 | 400 | 7 | — | 7 | |||||||||
CME Group | British Bankers' Association LIBOR USD 3-Month | Pay | 2.680 | Semiannual | 10/25/2023 | 1,000 | 19 | — | 19 | |||||||||
CME Group | British Bankers' Association LIBOR USD 3-Month | Pay | 2.670 | Semiannual | 11/19/2023 | 300 | 6 | 1 | 5 | |||||||||
CME Group | British Bankers' Association LIBOR USD 3-Month | Pay | 2.680 | Semiannual | 12/12/2023 | 300 | 6 | — | 6 | |||||||||
CME Group | British Bankers' Association LIBOR USD 3-Month | Pay | 2.400 | Semiannual | 03/16/2026 | 5,790 | 37 | (38) | 75 | |||||||||
CME Group | British Bankers' Association LIBOR USD 3-Month | Pay | 2.300 | Semiannual | 04/21/2026 | 1,400 | 16 | (8) | 24 | |||||||||
CME Group | British Bankers' Association LIBOR USD 3-Month | Pay | 2.300 | Semiannual | 04/27/2026 | 1,800 | 20 | (7) | 27 | |||||||||
CME Group | British Bankers' Association LIBOR USD 3-Month | Pay | 2.000 | Semiannual | 07/27/2026 | 1,100 | 28 | 32 | (4) | |||||||||
CME Group | British Bankers' Association LIBOR USD 3-Month | Pay | 2.400 | Semiannual | 12/07/2026 | 3,000 | 28 | 24 | 4 | |||||||||
CME Group | British Bankers' Association LIBOR USD 3-Month | Pay | 2.250 | Semiannual | 12/21/2046 | 1,260 | 93 | 125 | (32) | |||||||||
CME Group | British Bankers' Association LIBOR USD 3-Month | Pay | 2.750 | Semiannual | 12/20/2047 | 200 | 5 | 3 | 2 | |||||||||
CME Group | British Bankers' Association LIBOR USD 3-Month | Pay | 2.950 | Semiannual | 10/19/2048 | 50 | (3) | — | (3) | |||||||||
CME Group | British Bankers' Association LIBOR USD 3-Month | Pay | 2.970 | Semiannual | 10/25/2048 | 100 | (6) | — | (6) | |||||||||
CME Group | British Bankers' Association LIBOR USD 3-Month | Pay | 2.950 | Semiannual | 11/19/2048 | 100 | (6) | — | (6) | |||||||||
CME Group | British Bankers' Association LIBOR USD 3-Month | Pay | 2.950 | Semiannual | 12/12/2048 | 100 | (6) | — | (6) | |||||||||
LCH Group | British Bankers' Association LIBOR USD 3-Month | Pay | 1.750 | Semiannual | 12/21/2026 | 900 | 38 | 42 | (4) |
14
Harbor Commodity Real Return Strategy Fund
Consolidated Portfolio of Investments—Continued
Consolidated Portfolio of Investments—Continued
SWAP AGREEMENTS—Continued
CENTRALLY CLEARED SWAP AGREEMENTS—Continued
INTEREST RATE SWAPS—Continued
| Counterparty | Floating Rate Index | Pay/Receive Floating Rate | Fixed Rate | Payment Frequency | Expiration Date | Notional Amount (000s) | Value (000s) | Upfront Premiums (Received)/ Paid (000s) | Unrealized Appreciation/ (Depreciation) (000s) | |||||||||
LCH Group | Federal Funds Effective Rate US | Pay | 2.000% | Annual | 12/15/2047 | $ 150 | $ 8 | $ — | $ 8 | |||||||||
LCH Group | US Consumer Price Index Urban Consumers NSA | Receive | 1.710 | At maturity | 04/27/2018 | 500 | (1) | — | (1) | |||||||||
LCH Group | US Consumer Price Index Urban Consumers NSA | Receive | 1.580 | At maturity | 05/23/2018 | 2,900 | 7 | 1 | 6 | |||||||||
LCH Group | US Consumer Price Index Urban Consumers NSA | Pay | 1.935 | At maturity | 04/27/2019 | 500 | 1 | — | 1 | |||||||||
LCH Group | US Consumer Price Index Urban Consumers NSA | Receive | 2.026 | At maturity | 11/23/2020 | 300 | — | — | — | |||||||||
LCH Group | US Consumer Price Index Urban Consumers NSA | Receive | 2.021 | At maturity | 11/25/2020 | 300 | — | — | — | |||||||||
LCH Group | US Consumer Price Index Urban Consumers NSA | Receive | 1.550 | At maturity | 07/26/2021 | 200 | 5 | 7 | (2) | |||||||||
LCH Group | US Consumer Price Index Urban Consumers NSA | Receive | 1.602 | At maturity | 09/12/2021 | 150 | 3 | 5 | (2) | |||||||||
LCH Group | US Consumer Price Index Urban Consumers NSA | Pay | 1.730 | At maturity | 07/26/2026 | 200 | (7) | (10) | 3 | |||||||||
LCH Group | US Consumer Price Index Urban Consumers NSA | Pay | 1.762 | At maturity | 08/30/2026 | 400 | (13) | (20) | 7 | |||||||||
LCH Group | US Consumer Price Index Urban Consumers NSA | Pay | 1.800 | At maturity | 09/12/2026 | 200 | (6) | (2) | (4) | |||||||||
LCH Group | US Consumer Price Index Urban Consumers NSA | Pay | 1.801 | At maturity | 09/12/2026 | 150 | (4) | (7) | 3 | |||||||||
LCH Group | US Consumer Price Index Urban Consumers NSA | Pay | 1.805 | At maturity | 09/12/2026 | 100 | (3) | (5) | 2 | |||||||||
LCH Group | US Consumer Price Index Urban Consumers NSA | Pay | 1.780 | At maturity | 09/15/2026 | 100 | (3) | (5) | 2 | |||||||||
LCH Group | US Consumer Price Index Urban Consumers NSA | Pay | 2.102 | At maturity | 07/20/2027 | 500 | (2) | — | (2) | |||||||||
LCH Group | US Consumer Price Index Urban Consumers NSA | Pay | 2.080 | At maturity | 07/25/2027 | 200 | (1) | — | (1) | |||||||||
LCH Group | US Consumer Price Index Urban Consumers NSA | Pay | 2.122 | At maturity | 08/01/2027 | 400 | (1) | — | (1) | |||||||||
LCH Group | US Consumer Price Index Urban Consumers NSA | Pay | 2.180 | At maturity | 09/20/2027 | 90 | — | — | — | |||||||||
LCH Group | US Consumer Price Index Urban Consumers NSA | Pay | 2.150 | At maturity | 09/25/2027 | 100 | — | — | — | |||||||||
LCH Group | US Consumer Price Index Urban Consumers NSA | Pay | 2.156 | At maturity | 10/17/2027 | 200 | — | — | — | |||||||||
Interest Rate Swaps | $186 | |||||||||||||||||
15
Harbor Commodity Real Return Strategy Fund
Consolidated Portfolio of Investments—Continued
Consolidated Portfolio of Investments—Continued
SWAP AGREEMENTS—Continued
CENTRALLY CLEARED SWAP AGREEMENTS
CREDIT DEFAULT SWAPS
| Counterparty | Reference Entity | Buy/ Sellb,c | Pay/Receive Fixed Rate | Expiration Date | Implied Credit Spreadd | Payment Frequency | Notional Amounte (000s) | Value f (000s) | Upfront Premiums (Received)/ Paid (000s) | Unrealized Appreciation/ (Depreciation) (000s) | ||||||||||
ICE Group | iTraxx Europe Series 28 Version 1 | Buy | 1.000% | 12/20/2022 | 0.500% | Quarterly | € 800 | $(25) | $(21) | $ (4) | ||||||||||
ICE Group | Markit iTraxx Europe Indices Series 26 Version 1 | Buy | 1.000 | 12/20/2021 | 0.360 | Quarterly | € 300 | (10) | (5) | (5) | ||||||||||
ICE Group | Canadian Natural Resources Ltd. 3.450% due 11/15/2021 | Buy | 1.000 | 03/20/2018 | 0.121 | Quarterly | $ 100 | — | — | — | ||||||||||
ICE Group | Markit CDX North America High Yield Index Series 29 | Buy | 5.000 | 12/20/2022 | 3.102 | Quarterly | $ 600 | (54) | (48) | (6) | ||||||||||
Credit Default Swaps | $(15) | |||||||||||||||||||
OVER-THE-COUNTER (OTC) SWAP AGREEMENTS
INTEREST RATE SWAPS
| Counterparty | Floating Rate Index | Pay/Receive Fixed Rate | Fixed Rate | Payment Frequency | Expiration Date | Notional Amount (000s) | Value (000s) | Upfront Premiums (Received)/ Paid (000s) | Unrealized Appreciation/ (Depreciation) (000s) | |||||||||
Morgan Stanley Capital Services LLC | US Consumer Price Index Urban Consumers NSA | Receive | 1.810% | At maturity | 07/19/2026 | $ 400 | $(11) | $— | $(11) | |||||||||
Morgan Stanley Capital Services LLC | US Consumer Price Index Urban Consumers NSA | Receive | 1.800 | At maturity | 07/20/2026 | 200 | (6) | — | (6) | |||||||||
Morgan Stanley Capital Services LLC | US Consumer Price Index Urban Consumers NSA | Receive | 1.805 | At maturity | 09/20/2026 | 100 | (3) | — | (3) | |||||||||
Interest Rate Swaps | $(20) | |||||||||||||||||
OVER-THE-COUNTER (OTC) SWAP AGREEMENTS
TOTAL RETURN SWAPS ON INDICES
| Counterparty | Reference Rate | Pay/Receive Fixed Rate | Index | Expiration Date | Payment Frequency | Notional Amount (000s) | Value (000s) | Upfront Premiums (Received)/ Paid (000s) | Unrealized Appreciation/ (Depreciation) (000s) | |||||||||
Citibank NA | 0.17% | Pay | Bloomberg Commodity Index SM | 02/15/2018 | Monthly | $ 6 | $ 2 | $ — | $ 2 | |||||||||
Citibank NA | 0.17 | Pay | Bloomberg Commodity Index SM | 02/15/2018 | Monthly | 5 | (1) | — | (1) | |||||||||
Canadian Imperial Bank of Commerce | — | Pay | Bloomberg Commodity Index SM | 02/15/2018 | Monthly | 5 | 11 | — | 11 | |||||||||
JP Morgan Chase Bank NA | 0.30 | Pay | Bloomberg Commodity Index SM | 02/15/2018 | Monthly | 6 | 17 | — | 17 | |||||||||
JP Morgan Chase Bank NA | 0.17 | Pay | Bloomberg Commodity Index Total Return SM | 02/15/2018 | Monthly | 4 | 12 | — | 12 | |||||||||
BNP Paribas SA | U.S. Treasury Bills | Pay | Bloomberg Commodity Index Total Return SM | 02/15/2018 | Monthly | 2,197 | (6) | — | (6) | |||||||||
BNP Paribas SA | U.S. Treasury Bills | Pay | Bloomberg Commodity Index Total Return SM | 02/15/2018 | Monthly | 2 | 2 | — | 2 | |||||||||
Citibank NA | U.S. Treasury Bills | Pay | Bloomberg Commodity Index Total Return SM | 02/15/2018 | Monthly | 47 | 16 | — | 16 |
16
Harbor Commodity Real Return Strategy Fund
Consolidated Portfolio of Investments—Continued
Consolidated Portfolio of Investments—Continued
SWAP AGREEMENTS—Continued
OVER-THE-COUNTER (OTC) SWAP AGREEMENTS—Continued
TOTAL RETURN SWAPS ON INDICES—Continued
| Counterparty | Reference Rate | Pay/Receive Fixed Rate | Index | Expiration Date | Payment Frequency | Notional Amount (000s) | Value (000s) | Upfront Premiums (Received)/ Paid (000s) | Unrealized Appreciation/ (Depreciation) (000s) | |||||||||
Credit Suisse International | U.S. Treasury Bills | Pay | Bloomberg Commodity Index Total Return SM | 02/15/2018 | Monthly | $12 | $ 5 | $ — | $ 5 | |||||||||
Goldman Sachs International | U.S. Treasury Bills | Pay | Bloomberg Commodity Index Total Return SM | 02/15/2018 | Monthly | 7,471 | (17) | — | (17) | |||||||||
Goldman Sachs International | U.S. Treasury Bills | Pay | Bloomberg Commodity Index Total Return SM | 02/15/2018 | Monthly | 32 | 25 | — | 25 | |||||||||
JP Morgan Chase Bank NA | U.S. Treasury Bills | Pay | Bloomberg Commodity Index Total Return SM | 02/15/2018 | Monthly | 6,581 | (17) | — | (17) | |||||||||
JP Morgan Chase Bank NA | U.S. Treasury Bills | Pay | Bloomberg Commodity Index Total Return SM | 02/15/2018 | Monthly | 7 | 5 | — | 5 | |||||||||
Merrill Lynch International | U.S. Treasury Bills | Pay | Bloomberg Commodity Index Total Return SM | 02/15/2018 | Monthly | — | — | — | — | |||||||||
Morgan Stanley Capital Services LLC | U.S. Treasury Bills | Pay | Bloomberg Commodity Index Total Return SM | 02/15/2018 | Monthly | 211 | 88 | — | 88 | |||||||||
Société Générale Paris | U.S. Treasury Bills | Pay | Bloomberg Commodity Index Total Return SM | 02/15/2018 | Monthly | 9 | 4 | — | 4 | |||||||||
JP Morgan Chase Bank NA | 0.35% | Pay | JP Morgan FNJ Commodity Index | 02/15/2018 | Monthly | 28 | 27 | (3) | 30 | |||||||||
Goldman Sachs International | 0.25 | Pay | S&P GSCI | 02/15/2018 | Monthly | 5 | 34 | — | 34 | |||||||||
BNP Paribas SA | -0.05 | Pay | S&P GSCI Industrial Metals Index Excess Return | 02/15/2018 | Monthly | 359 | 5 | — | 5 | |||||||||
Goldman Sachs International | -0.05 | Pay | S&P GSCI Industrial Metals Index Excess Return | 02/15/2018 | Monthly | 198 | 2 | — | 2 | |||||||||
Total Return Swaps on Indices | $217 | |||||||||||||||||
OVER-THE-COUNTER (OTC) SWAP AGREEMENTS
TOTAL RETURN SWAPS ON COMMODITIES
| Counterparty | Reference Assets | Pay/Receive Fixed Rate | Fixed Price per Unit | Payment Frequency | Expiration Date | Notional Amount (000s) | Value (000s) | Upfront Premiums (Received)/ Paid (000s) | Unrealized Appreciation/ (Depreciation) (000s) | |||||||||
BNP Paribas SA | Calendar Swap on Iron Ore | Receive | $69.20 | At Maturity | 03/31/2018 | $ 1 | $ (6) | $— | $ (6) | |||||||||
Goldman Sachs International | Calendar Swap on Iron Ore | Receive | 72.30 | At Maturity | 03/31/2018 | — | 4 | — | 4 | |||||||||
Goldman Sachs International | Calendar Swap on Iron Ore | Receive | 58.40 | At Maturity | 03/31/2019 | — | (1) | — | (1) | |||||||||
Goldman Sachs International | Calendar Swap on Iron Ore | Receive | 54.70 | At Maturity | 12/31/2019 | — | — | — | — | |||||||||
JP Morgan Chase Bank NA | Calendar Swap on Iron Ore | Receive | 69.70 | At Maturity | 03/31/2018 | — | 3 | — | 3 | |||||||||
JP Morgan Chase Bank NA | Calendar Swap on Iron Ore | Receive | 55.90 | At Maturity | 03/31/2019 | — | — | — | — | |||||||||
JP Morgan Chase Bank NA | Hard Red Winter Wheat February 2018 Futures | Receive | 1.00 | At Maturity | 02/23/2018 | 1 | — | — | — |
17
Harbor Commodity Real Return Strategy Fund
Consolidated Portfolio of Investments—Continued
Consolidated Portfolio of Investments—Continued
SWAP AGREEMENTS—Continued
OVER-THE-COUNTER (OTC) SWAP AGREEMENTS—Continued
TOTAL RETURN SWAPS ON COMMODITIES—Continued
| Counterparty | Reference Assets | Pay/Receive Fixed Rate | Fixed Price per Unit | Payment Frequency | Expiration Date | Notional Amount (000s) | Value (000s) | Upfront Premiums (Received)/ Paid (000s) | Unrealized Appreciation/ (Depreciation) (000s) | |||||||||
Morgan Stanley Capital Services LLC | London Gold Market Fixing Ltd-LBMA PM Fixing Price/USD | Receive | $1,266.20 | At Maturity | 11/29/2018 | $ — | $ (3) | $— | $ (3) | |||||||||
BNP Paribas SA | Naphtha, Euro-Bob Gasoline, Ultra-Low Sulphur Diesel, Fuel Oil vs. Brent Crude Oil | Receive | 5.85 | At Maturity | 12/31/2017 | — | — | — | — | |||||||||
BNP Paribas SA | Naphtha, Euro-Bob Gasoline, Ultra-Low Sulphur Diesel, Fuel Oil vs. Brent Crude Oil | Receive | 6.97 | At Maturity | 12/31/2017 | — | — | — | — | |||||||||
BNP Paribas SA | Naphtha, Euro-Bob Gasoline, Ultra-Low Sulphur Diesel, Fuel Oil vs. Brent Crude Oil | Receive | 7.55 | At Maturity | 03/31/2018 | — | — | — | — | |||||||||
BNP Paribas SA | Naphtha, Euro-Bob Gasoline, Ultra-Low Sulphur Diesel, Fuel Oil vs. Brent Crude Oil | Receive | 12.70 | At Maturity | 12/31/2018 | 2 | (1) | (1) | — | |||||||||
JP Morgan Chase Bank NA | Naphtha, Euro-Bob Gasoline, Ultra-Low Sulphur Diesel, Fuel Oil vs. Brent Crude Oil | Receive | 7.10 | At Maturity | 12/31/2017 | — | — | — | — | |||||||||
JP Morgan Chase Bank NA | Naphtha, Euro-Bob Gasoline, Ultra-Low Sulphur Diesel, Fuel Oil vs. Brent Crude Oil | Receive | 5.10 | At Maturity | 03/31/2018 | — | 1 | — | 1 | |||||||||
Morgan Stanley Capital Services LLC | Naphtha, Euro-Bob Gasoline, Ultra-Low Sulphur Diesel, Fuel Oil vs. Brent Crude Oil | Receive | 5.78 | At Maturity | 12/31/2017 | — | — | — | — | |||||||||
Morgan Stanley Capital Services LLC | Naphtha, Euro-Bob Gasoline, Ultra-Low Sulphur Diesel, Fuel Oil vs. Brent Crude Oil | Receive | 5.90 | At Maturity | 12/31/2017 | — | — | — | — | |||||||||
Morgan Stanley Capital Services LLC | Naphtha, Euro-Bob Gasoline, Ultra-Low Sulphur Diesel, Fuel Oil vs. Brent Crude Oil | Receive | 4.85 | At Maturity | 12/31/2017 | — | 1 | — | 1 | |||||||||
Morgan Stanley Capital Services LLC | Naphtha, Euro-Bob Gasoline, Ultra-Low Sulphur Diesel, Fuel Oil vs. Brent Crude Oil | Receive | 4.74 | At Maturity | 12/31/2017 | — | 1 | — | 1 | |||||||||
Morgan Stanley Capital Services LLC | Naphtha, Euro-Bob Gasoline, Ultra-Low Sulphur Diesel, Fuel Oil vs. Brent Crude Oil | Receive | 6.79 | At Maturity | 12/31/2017 | — | — | — | — | |||||||||
Morgan Stanley Capital Services LLC | Naphtha, Euro-Bob Gasoline, Ultra-Low Sulphur Diesel, Fuel Oil vs. Brent Crude Oil | Receive | 5.82 | At Maturity | 12/31/2017 | — | — | — | — |
18
Harbor Commodity Real Return Strategy Fund
Consolidated Portfolio of Investments—Continued
Consolidated Portfolio of Investments—Continued
SWAP AGREEMENTS—Continued
OVER-THE-COUNTER (OTC) SWAP AGREEMENTS—Continued
TOTAL RETURN SWAPS ON COMMODITIES—Continued
| Counterparty | Reference Assets | Pay/Receive Fixed Rate | Fixed Price per Unit | Payment Frequency | Expiration Date | Notional Amount (000s) | Value (000s) | Upfront Premiums (Received)/ Paid (000s) | Unrealized Appreciation/ (Depreciation) (000s) | |||||||||
Morgan Stanley Capital Services LLC | Naphtha, Euro-Bob Gasoline, Ultra-Low Sulphur Diesel, Fuel Oil vs. Brent Crude Oil | Receive | $ 5.80 | At Maturity | 12/31/2017 | $ — | $— | $— | $— | |||||||||
Morgan Stanley Capital Services LLC | Naphtha, Euro-Bob Gasoline, Ultra-Low Sulphur Diesel, Fuel Oil vs. Brent Crude Oil | Receive | 5.30 | At Maturity | 03/31/2018 | 1 | 1 | — | 1 | |||||||||
Morgan Stanley Capital Services LLC | Naphtha, Euro-Bob Gasoline, Ultra-Low Sulphur Diesel, Fuel Oil vs. Brent Crude Oil | Receive | 4.45 | At Maturity | 03/31/2018 | — | — | — | — | |||||||||
Morgan Stanley Capital Services LLC | Naphtha, Euro-Bob Gasoline, Ultra-Low Sulphur Diesel, Fuel Oil vs. Brent Crude Oil | Receive | 6.22 | At Maturity | 03/31/2018 | 1 | (1) | — | (1) | |||||||||
Morgan Stanley Capital Services LLC | Naphtha, Euro-Bob Gasoline, Ultra-Low Sulphur Diesel, Fuel Oil vs. Brent Crude Oil | Receive | 7.48 | At Maturity | 03/31/2018 | — | — | — | — | |||||||||
Morgan Stanley Capital Services LLC | Naphtha, Euro-Bob Gasoline, Ultra-Low Sulphur Diesel, Fuel Oil vs. Brent Crude Oil | Receive | 5.81 | At Maturity | 12/31/2018 | — | 1 | — | 1 | |||||||||
Morgan Stanley Capital Services LLC | Naphtha, Euro-Bob Gasoline, Ultra-Low Sulphur Diesel, Fuel Oil vs. Brent Crude Oil | Receive | 5.77 | At Maturity | 12/31/2018 | — | 1 | — | 1 | |||||||||
BNP Paribas SA | Platnium London PM Fix/USD vs. LBMA India Gold Price PM USD | Receive | (317.20) | At Maturity | 07/09/2018 | — | (8) | (1) | (7) | |||||||||
Goldman Sachs International | Platnium London PM Fix/USD vs. LBMA India Gold Price PM USD | Receive | (318.90) | At Maturity | 07/06/2018 | — | (4) | — | (4) | |||||||||
Total Return Swaps on Commodities | $ (9) | |||||||||||||||||
OVER-THE-COUNTER (OTC) SWAP AGREEMENTS
VARIANCE SWAPS ON COMMODITIES
| Counterparty | Reference Assets | Pay/Receive Varianceg | Initial Volatility Strike | Payment Frequency | Expiration Date | Notional Amount (000s) | Value (000s) | Upfront Premiums (Received)/ Paid (000s) | Unrealized Appreciation/ (Depreciation) (000s) | |||||||||
Goldman Sachs International | London Gold Market Fixing Ltd-LBMA PM Fixing Price/USD | Pay | $ 0.07 | At Maturity | 07/29/2020 | $ 377 | $16 | $— | $16 |
19
Harbor Commodity Real Return Strategy Fund
Consolidated Portfolio of Investments—Continued
Consolidated Portfolio of Investments—Continued
SWAP AGREEMENTS—Continued
OVER-THE-COUNTER (OTC) SWAP AGREEMENTS
VARIANCE SWAPS ON INDICES
| Counterparty | Reference Assets | Pay/Receive Varianceg | Initial Volatility Strike | Payment Frequency | Expiration Date | Notional Amount (000s) | Value (000s) | Upfront Premiums (Received)/ Paid (000s) | Unrealized Appreciation/ (Depreciation) (000s) | |||||||||
Goldman Sachs International | Intercontinental Exchange LIBOR USD 3-month | Receive | $ — | At Maturity | 03/20/2018 | $ 100 | $ (2) | $— | $ (2) | |||||||||
Goldman Sachs International | London Gold Market Fixing Ltd-LBMA PM Fixing Price/USD | Pay | 0.01% | At Maturity | 01/10/2018 | 44 | — | — | — | |||||||||
JP Morgan Chase Bank NA | London Gold Market Fixing Ltd-LBMA PM Fixing Price/USD | Pay | 0.04 | At Maturity | 07/29/2020 | 21 | — | — | — | |||||||||
JP Morgan Chase Bank NA | London Gold Market Fixing Ltd-LBMA PM Fixing Price/USD | Pay | 0.04 | At Maturity | 07/29/2020 | 356 | (5) | — | (5) | |||||||||
Morgan Stanley Capital Services LLC | London Gold Market Fixing Ltd-LBMA PM Fixing Price/USD | Pay | 0.02 | At Maturity | 12/04/2017 | 102 | — | — | — | |||||||||
Morgan Stanley Capital Services LLC | London Gold Market Fixing Ltd-LBMA PM Fixing Price/USD | Pay | 0.02 | At Maturity | 12/04/2017 | 72 | 1 | — | 1 | |||||||||
Morgan Stanley Capital Services LLC | London Gold Market Fixing Ltd-LBMA PM Fixing Price/USD | Pay | 0.02 | At Maturity | 04/12/2018 | 39 | — | — | — | |||||||||
Morgan Stanley Capital Services LLC | London Gold Market Fixing Ltd-LBMA PM Fixing Price/USD | Pay | 0.02 | At Maturity | 10/25/2018 | 35 | — | — | — | |||||||||
Morgan Stanley Capital Services LLC | London Gold Market Fixing Ltd-LBMA PM Fixing Price/USD | Pay | 0.02 | At Maturity | 10/31/2018 | 281 | — | — | — | |||||||||
Morgan Stanley Capital Services LLC | London Gold Market Fixing Ltd-LBMA PM Fixing Price/USD | Pay | 0.03 | At Maturity | 07/17/2019 | 55 | — | — | — | |||||||||
Morgan Stanley Capital Services LLC | London Gold Market Fixing Ltd-LBMA PM Fixing Price/USD | Pay | 0.03 | At Maturity | 07/26/2019 | 43 | — | — | — | |||||||||
Morgan Stanley Capital Services LLC | London Gold Market Fixing Ltd-LBMA PM Fixing Price/USD | Pay | 0.03 | At Maturity | 10/08/2019 | 29 | — | — | — | |||||||||
Goldman Sachs International | London Silver Market Fixing Ltd-LBMA Fixing Price/USD | Pay | 0.04 | At Maturity | 01/10/2018 | 25 | — | — | — | |||||||||
JP Morgan Chase Bank NA | London Silver Market Fixing Ltd-LBMA Fixing Price/USD | Pay | 0.05 | At Maturity | 10/31/2018 | 22 | — | — | — | |||||||||
Morgan Stanley Capital Services LLC | London Silver Market Fixing Ltd-LBMA Fixing Price/USD | Pay | 0.05 | At Maturity | 04/12/2018 | 23 | — | — | — | |||||||||
Morgan Stanley Capital Services LLC | London Silver Market Fixing Ltd-LBMA Fixing Price/USD | Pay | 0.05 | At Maturity | 10/25/2018 | 22 | — | — | — | |||||||||
Morgan Stanley Capital Services LLC | London Silver Market Fixing Ltd-LBMA Fixing Price/USD | Pay | 0.10 | At Maturity | 10/31/2018 | 194 | — | — | — |
20
Harbor Commodity Real Return Strategy Fund
Consolidated Portfolio of Investments—Continued
Consolidated Portfolio of Investments—Continued
SWAP AGREEMENTS—Continued
OVER-THE-COUNTER (OTC) SWAP AGREEMENTS—Continued
VARIANCE SWAPS ON INDICES—Continued
| Counterparty | Reference Assets | Pay/Receive Varianceg | Initial Volatility Strike | Payment Frequency | Expiration Date | Notional Amount (000s) | Value (000s) | Upfront Premiums (Received)/ Paid (000s) | Unrealized Appreciation/ (Depreciation) (000s) | |||||||||
Morgan Stanley Capital Services LLC | London Silver Market Fixing Ltd-LBMA Fixing Price/USD | Pay | 0.07% | At Maturity | 07/17/2019 | $ 37 | $— | $— | $— | |||||||||
Morgan Stanley Capital Services LLC | London Silver Market Fixing Ltd-LBMA Fixing Price/USD | Pay | 0.07 | At Maturity | 07/26/2019 | 29 | — | — | — | |||||||||
Morgan Stanley Capital Services LLC | London Silver Market Fixing Ltd-LBMA Fixing Price/USD | Pay | 0.07 | At Maturity | 10/08/2019 | 19 | — | — | — | |||||||||
Goldman Sachs International | S&P GSCI Aluminum Index Excess Return | Pay | 0.03 | At Maturity | 08/01/2018 | 29 | — | — | — | |||||||||
Goldman Sachs International | S&P GSCI Copper Index Total Return(SM) | Pay | 0.04 | At Maturity | 08/01/2018 | 3 | — | — | — | |||||||||
JP Morgan Chase Bank NA | S&P GSCI Copper Index Total Return(SM) | Pay | 0.04 | At Maturity | 08/01/2018 | 11 | — | — | — | |||||||||
Société Générale Paris | Soybean Futures October 2018 | Pay | 0.03 | At Maturity | 10/26/2018 | 30 | — | — | — | |||||||||
Variance Swaps on Indices | $ (6) | |||||||||||||||||
OVER-THE-COUNTER (OTC) SWAP AGREEMENTS
CREDIT DEFAULT SWAPS
| Counterparty | Reference Entity | Buy/ Sellb,c | Pay/Receive Fixed Rate | Expiration Date | Implied Credit Spreadd | Payment Frequency | Notional Amounte (000s) | Value f (000s) | Upfront Premiums (Received)/ Paid (000s) | Unrealized Appreciation/ (Depreciation) (000s) | ||||||||||
Deutsche Bank AG | Federative Republic of Brazil 4.250% due 01/07/2025 | Sell | 1.000% | 06/20/2021 | 1.160% | Quarterly | $ 100 | $(1) | $ (9) | $ 8 | ||||||||||
Goldman Sachs International | Federative Republic of Brazil 4.250% due 01/07/2025 | Sell | 1.000 | 06/20/2021 | 1.605 | Quarterly | 200 | (1) | (14) | 13 | ||||||||||
HSBC Bank USA NA | Federative Republic of Brazil 4.250% due 01/07/2025 | Sell | 1.000 | 06/20/2022 | 1.527 | Quarterly | 100 | (2) | (6) | 4 | ||||||||||
Credit Default Swaps | $ 25 | |||||||||||||||||||
Total Swaps | $394 | |||||||||||||||||||
FIXED INCOME INVESTMENTS SOLD SHORT AT OCTOBER 31, 2017 — (0.6)%
| Principal Amount (000s) | Security | Proceeds (000s) | Value (000s) | |||
| $ 300 | Federal National Mortgage Association TBA1 3.000%—12/13/2047 | $301 | $(300) |
21
Harbor Commodity Real Return Strategy Fund
Consolidated Portfolio of Investments—Continued
Consolidated Portfolio of Investments—Continued
FAIR VALUE MEASUREMENTS
The following table summarizes the Fund’s investments as of October 31, 2017 based on the inputs used to value them.
| Asset Category | Quoted Prices Level 1 (000s) | Other Significant Observable Inputs Level 2 (000s) | Significant Unobservable Inputs Level 3 (000s) | Total (000s) | ||||
| Investments in Securities | ||||||||
Asset-Backed Securities | $ — | $ 2,527 | $— | $ 2,527 | ||||
Collateralized Mortgage Obligations | — | 134 | — | 134 | ||||
Corporate Bonds & Notes | — | 4,557 | — | 4,557 | ||||
Foreign Government Obligations | — | 6,820 | — | 6,820 | ||||
Mortgage Pass-Through | — | 2,821 | — | 2,821 | ||||
U.S. Government Obligations | — | 51,387 | — | 51,387 | ||||
| Short-Term Investments | ||||||||
Certificates Of Deposit | — | 300 | — | 300 | ||||
Repurchase Agreements | — | 10,993 | — | 10,993 | ||||
Total Investments in Securities | $ — | $79,539 | $— | $79,539 | ||||
| Financial Derivative Instruments - Assets | ||||||||
Forward Currency Contracts | $ — | $ 156 | $— | $ 156 | ||||
Futures Contracts | 255 | — | — | 255 | ||||
Purchased Options | 6 | 47 | — | 53 | ||||
Swap Agreements | — | 616 | — | 616 | ||||
Total Financial Derivative Instruments - Assets | $ 261 | $ 819 | $— | $ 1,080 | ||||
| Liability Category | ||||||||
Fixed Income Investments Sold Short | $ — | $ (300) | $— | $ (300) | ||||
| Financial Derivative Instruments - Liabilities | ||||||||
Forward Currency Contracts | $ — | $ (264) | $— | $ (264) | ||||
Futures Contracts | (214) | — | — | (214) | ||||
Swap Agreements | — | (222) | — | (222) | ||||
Written Options | (10) | (11) | — | (21) | ||||
Total Financial Derivative Instruments - Liabilities | $(224) | $ (497) | $— | $ (721) | ||||
Total Investments | $ 37 | $79,561 | $— | $79,598 |
There were no Level 3 holdings at October 31, 2017 or 2016, and no transfers between levels during the year.
For more information on valuation inputs and their aggregation into the levels used in the table above, please refer to the Fair Value Measurements and Disclosures in Note 2 of the accompanying Notes to Financial Statements.
The following is a summary of the remaining contractual maturities of transfers accounted for as secured borrowings, by type of security loaned, as of October 31, 2017.
| Overnight and Continuous (000s) | Up to 30 days (000s) | 31-90 days (000s) | Greater Than 90 days (000s) | Total (000s) | |||||
| Sale-Buyback Transactions | |||||||||
U.S. Government Obligations | $— | $26,678 | $7,069 | $— | $33,747 |
22
Harbor Commodity Real Return Strategy Fund
Consolidated Portfolio of Investments—Continued
Consolidated Portfolio of Investments—Continued
| 1 | Variable rate security, the stated rate represents the rate in effect at October 31, 2017. |
| 2 | Securities purchased in a transaction exempt from registration under Rule 144A of the Securities Act of 1933. These securities may be resold in transactions exempt from registration, normally to qualified institutional buyers. The Fund has no right to demand registration of these securities. These securities are priced by an independent pricing service in accordance with Harbor Funds Valuation Procedures. At October 31, 2017, the aggregate value of these securities was $1,959,000 or 4% of net assets. |
| 3 | Floating rate security, the stated rate represents the rate in effect at October 31, 2017. |
| 4 | MTN after the name of a security stands for Medium Term Note. |
| 5 | Inflation-protected securities (“IPS”) are securities in which the principal amount is adjusted for inflation and interest payments are applied to the inflation-adjusted principal. |
| 6 | Zero coupon bond |
| 7 | TBAs are mortgage-backed securities traded under delayed delivery commitments, settling after October 31, 2017. Although the unit price for the trades has been established, the principal value has not been finalized. However, the amount of the commitments will not fluctuate more than 2% from the principal amount. Income on TBAs is not earned until settlement date (see Note 2 of the accompanying Notes to Financial Statements). |
| 8 | At October 31, 2017, a portion of securities held by the Fund were pledged to cover margin requirements for open future contracts, written options on futures contracts and swap options (see Note 2 of the accompanying Notes to Financial Statements). The securities pledged had an aggregate value of $333,000 or less than 1% of net assets. |
| b | If the Fund is a buyer of protection and a credit event occurs, as defined under the terms of that particular swap agreement, the Fund will either (i) receive from the seller of protection an amount equal to the notional amount of the swap and deliver the referenced obligation or underlying securities comprising the referenced index or (ii) receive a net settlement amount in the form of cash or securities equal to the notional amount of the swap less the recovery value of the referenced obligation or underlying securities comprising the referenced index. |
| c | If the Fund is a seller of protection and a credit event occurs, as defined under the terms of that particular swap agreement, the Fund will either (i) pay to the buyer of protection an amount equal to the notional amount of the swap and take delivery of the referenced obligation or underlying securities comprising the referenced index or (ii) pay a net settlement amount in the form of cash or securities equal to the notional amount of the swap less the recovery value of the referenced obligation or underlying securities comprising the referenced index. |
| d | Implied credit spreads, represented in absolute terms, utilized in determining the value of credit default swap agreements on corporate issues or sovereign issues of an emerging country as of period end serve as an indicator of the current status of the payment/performance risk and represent the likelihood or risk of default for the credit derivative. The implied credit spread of a particular referenced entity reflects the cost of buying/selling protection and may include upfront payments required to be made to enter into the agreement. Wider credit spreads represent a deterioration of the referenced entity’s credit soundness and a greater likelihood or risk of default or other credit event occurring as defined under the terms of the agreement. A credit spread identified as “Defaulted” indicates a credit event has occurred for the referenced entity or obligation. |
| e | The maximum potential amount the Fund could be required to make as a seller of credit protection or receive as a buyer of credit protection if a credit event occurs as defined under the terms of that particular swap agreement. |
| f | The quoted market prices and resulting values for credit default swap agreements on asset-backed securities and credit indices serve as an indicator of the current status of the payment/performance risk and represent the likelihood of an expected liability (or profit) for the credit derivative should the notional amount of the swap agreement be closed/sold as of the period end. Increasing values, in absolute terms when compared to the notional amount of the swap, represent a deterioration of the referenced entity’s credit soundness and a greater likelihood or risk of default or other credit event occurring as defined under the terms of the agreement. |
| g | At the maturity date, a net cash flow is exchanged, where the payoff amount is equivalent to the difference between the realized price variance of the underlying asset and the strike price multiplied by the notional amount. As a receiver of the realized price variance, the Fund would receive the payoff amount when the realized price variance of the underlying asset is greater than the strike price and would owe the payoff amount when the variance is less than the strike price. As a payer of the realized price variance, the Fund would owe the payoff amount when the realized price variance of the underlying asset is greater than the strike price and would receive the payoff amount when the variance is less than the strike price. |
| j | Amount represents Index Value |
| ARG$ | Argentine Peso |
| AUD$ | Australian Dollar |
| R$ | Brazilian Real |
| £ | British Pound |
| CAD$ | Canadian Dollar |
| DKK$ | Denmark Krone |
| € | Euro |
| ₹ | Indian Rupee |
| ¥ | Japanese Yen |
| MEX$ | Mexican Peso |
| PER$ | Peruvian Nuevo Sol |
| NZD$ | New Zealand Dollar |
| RUS$ | Russian Ruble |
| ₩ | South Korean Won |
| TRD$ | Turkish Lira |
The accompanying notes are an integral part of the Financial Statements.
23
[THIS PAGE INTENTIONALLY LEFT BLANK]
24
Harbor Strategic Markets Funds
Statement of Assets and Liabilities—October 31, 2017
Statement of Assets and Liabilities—October 31, 2017
(All amounts in thousands, except per share amounts)
| Harbor Commodity Real Return Strategy Fund (Consolidated) | ||
| ASSETS | ||
Investments, at identified cost* | $ 78,311 | |
Investments, at value | $ 68,546 | |
Repurchase agreements | 10,993 | |
Cash-restricted | 105 | |
Cash | 106 | |
Foreign currency, at value (cost: $152) | 148 | |
| Receivables for: | ||
Investments sold | 11,638 | |
Capital shares sold | 11 | |
Interest | 189 | |
Unrealized appreciation on open forward currency contracts | 156 | |
Unrealized appreciation on OTC swap agreements | 313 | |
Variation margin on options and futures contracts | 35 | |
Variation margin on centrally cleared swap agreements | 115 | |
Purchased options not settled through variation margin, at value (premiums paid: $89) | 52 | |
Options sold | 23 | |
Prepaid registration fees | 5 | |
Other assets | 42 | |
Total Assets | 92,477 | |
| LIABILITIES | ||
| Payables for: | ||
Due to broker | 25 | |
Investments purchased | 6,616 | |
Capital shares reacquired | 26 | |
Investments sold short, at value (proceeds: $301) | 300 | |
Written options not settled through variation margin, at value (premiums received: $78) | 20 | |
Swap premiums received | 34 | |
Unrealized depreciation on OTC swap agreements | 90 | |
Sale-buyback financing transactions | 33,747 | |
Variation margin on options and futures contracts | 27 | |
Unrealized depreciation on open forward currency contracts | 264 | |
| Accrued expenses: | ||
Management fees | 35 | |
Transfer agent fees | 3 | |
Trustees' fees and expenses | 1 | |
Other | 126 | |
Total Liabilities | 41,314 | |
NET ASSETS | $ 51,163 | |
| Net Assets Consist of: | ||
Paid-in capital | $ 74,630 | |
Accumulated undistributed net investment income/(loss) | 377 | |
Accumulated net realized gain/(loss) | (24,656) | |
Unrealized appreciation/(depreciation) of investments and translation of assets and liabilities in foreign currencies | 464 | |
Unrealized appreciation/(depreciation) of other financial instruments | 348 | |
| $ 51,163 | ||
| NET ASSET VALUE PER SHARE BY CLASS | ||
| Institutional Class | ||
Net assets | $ 50,771 | |
Shares of beneficial interest1 | 13,449 | |
Net asset value per share2 | $ 3.78 | |
| Administrative Class | ||
Net assets | $ 392 | |
Shares of beneficial interest1 | 104 | |
Net asset value per share2 | $ 3.76 | |
| * | Including repurchase agreements and short-term investments |
| 1 | Par value $0.01 (unlimited authorizations) |
| 2 | Per share amounts can be recalculated to the amounts disclosed herein when total net assets and shares of beneficial interest are not rounded to thousands. |
The accompanying notes are an integral part of the Financial Statements.
25
Harbor Strategic Markets Funds
Statement of Operations—Year Ended October 31, 2017
Statement of Operations—Year Ended October 31, 2017
(All amounts in thousands)
| Harbor Commodity Real Return Strategy Fund (Consolidated) | |
| Investment Income | |
Interest | $2,113 |
Total Investment Income | 2,113 |
| Operating Expenses | |
Management fees | 505 |
| 12b-1 fees: | |
Administrative Class | 1 |
Shareholder communications | 35 |
Custodian fees | 181 |
| Transfer agent fees: | |
Institutional Class | 53 |
Administrative Class | 1 |
Professional fees | 5 |
Trustees' fees and expenses | 2 |
Registration fees | 37 |
Miscellaneous | 7 |
Expenses before interest expense | 827 |
Interest expense | 282 |
Total expenses | 1,109 |
Transfer agent fees waived | (6) |
Other expenses reimbursed | (234) |
Net expenses | 869 |
Net Investment Income/(Loss) | 1,244 |
| Realized and Change in Net Unrealized Gain/(Loss) on Investment Transactions | |
| Net realized gain/(loss) on: | |
Investments | (404) |
Foreign currency transactions | (449) |
Investments sold short | 31 |
Swap agreements | (743) |
Futures contracts | 101 |
Purchased options | (38) |
Written options | 65 |
| Change in net unrealized appreciation/(depreciation) on: | |
Investments | (708) |
Forwards currency contracts | 233 |
Investments sold short | 1 |
Swap agreements | 2,403 |
Futures contracts | (126) |
Purchased options | 101 |
Written options | (66) |
Translations of assets and liabilities in foreign currencies | 2 |
Net gain/(loss) on investment transactions | 403 |
Net Increase/(Decrease) in Net Assets Resulting from Operations | $1,647 |
The accompanying notes are an integral part of the Financial Statements.
26
Harbor Strategic Markets Funds
Statements of Changes In Net Assets
Statements of Changes In Net Assets
(All amounts in thousands)
| Harbor Commodity Real Return Strategy Fund (Consolidated) | ||
| November 1, 2016 through October 31, 2017 | November 1, 2015 through October 31, 2016 | |
| INCREASE/(DECREASE) IN NET ASSETS | ||
| Operations: | ||
Net investment income/(loss) | $ 1,244 | $ 1,404 |
Net realized gain/(loss) on investments | (1,437) | (11,279) |
Change in net unrealized appreciation/(depreciation) of investments | 1,840 | 6,587 |
Net increase/(decrease) in assets resulting from operations | 1,647 | (3,288) |
| Distributions to Shareholders | ||
| Net investment income: | ||
Institutional Class | (631) | (1,967) |
Administrative Class | (4) | (13) |
| Net realized gain on investments: | ||
Institutional Class | — | — |
Administrative Class | — | — |
| Return of capitala: | ||
Institutional Class | — | (596) |
Administrative Class | — | (3) |
Total distributions to shareholders | (635) | (2,579) |
Net Increase/(Decrease) Derived from Capital Share Transactions | (26,260) | (26,750) |
Net increase/(decrease) in net assets | (25,248) | (32,617) |
| Net Assets | ||
Beginning of period | 76,411 | 109,028 |
End of period* | $ 51,163 | $ 76,411 |
* Includes accumulated undistributed net investment income/(loss) of: | $ 377 | $ 164 |
| a | Determined in accordance with federal income tax regulations (see Note 5 in the Notes to Financial Statements) |
The accompanying notes are an integral part of the Financial Statements.
27
Harbor Strategic Markets Funds
Statements of Changes in Net Assets—Capital Stock Activity
Statements of Changes in Net Assets—Capital Stock Activity
(All amounts in thousands)
| Harbor Commodity Real Return Strategy Fund (Consolidated) | ||
| November 1, 2016 through October 31, 2017 | November 1, 2015 through October 31, 2016 | |
| AMOUNT ($) | ||
| Institutional Class | ||
Net proceeds from sale of shares | $ 10,628 | $ 19,388 |
Reinvested distributions | 624 | 2,495 |
Cost of shares reacquired | (37,395) | (48,420) |
Net increase/(decrease) in net assets | $(26,143) | $(26,537) |
| Administrative Class | ||
Net proceeds from sale of shares | $ 111 | $ 74 |
Reinvested distributions | 3 | 16 |
Cost of shares reacquired | (231) | (303) |
Net increase/(decrease) in net assets | $ (117) | $ (213) |
| SHARES | ||
| Institutional Class | ||
Shares sold | 2,844 | 5,503 |
Shares issued due to reinvestment of distributions | 175 | 740 |
Shares reacquired | (10,051) | (13,954) |
Net increase/(decrease) in shares outstanding | (7,032) | (7,711) |
Beginning of period | 20,481 | 28,192 |
End of period | 13,449 | 20,481 |
| Administrative Class | ||
Shares sold | 30 | 21 |
Shares issued due to reinvestment of distributions | 1 | 5 |
Shares reacquired | (63) | (89) |
Net increase/(decrease) in shares outstanding | (32) | (63) |
Beginning of period | 136 | 199 |
End of period | 104 | 136 |
The accompanying notes are an integral part of the Financial Statements.
28
Harbor Strategic Markets Funds
Statement of Cash Flows— Year Ended October 31, 2017
Statement of Cash Flows— Year Ended October 31, 2017
(All amounts in thousands)
| Harbor Commodity Real Return Strategy Fund (Consolidated) | |
| Cash flows provided by operating activities: | |
Net increase in net assets resulting from operations | $ 1,647 |
| Adjustments to reconcile net increase in net assets from operations to net cash used for operating activities: | |
Purchases of long-term securities | (1,168,504) |
Proceeds from sales of long-term securities | 1,192,439 |
Proceeds from short-term portfolio investments, net | 9,672 |
Decrease in receivable for investments sold | 6,288 |
Decrease in foreign spot contracts receivable | 2 |
Decrease in interest receivable | 73 |
Decrease in variation margin on options and futures contracts | 39 |
Increase in variation margin on swap agreements | (84) |
Decrease in options sold | 2 |
Increase in other assets | (26) |
Decrease in payable for investments purchased | (7,480) |
Increase in investments sold short | 301 |
Decrease in foreign currency spot contracts payable | (2) |
Decrease in premiums from written options not settled through variation margin | (185) |
Increase in swap premiums received | 27 |
Decrease in management fees payable | (18) |
Decrease in transfer agent fees payable | (2) |
Increase in other liabilities | 32 |
Net change in unrealized appreciation/(depreciation) on investments | 707 |
Net change in unrealized appreciation/(depreciation) on forwards | (233) |
Net change in unrealized appreciation/(depreciation) on OTC swaps | (2,098) |
Net change in unrealized appreciation/(depreciation) on written options not settled through variation margin | 66 |
Net change in unrealized appreciation/(depreciation) on purchased options not settled through variation margin | (86) |
Net realized loss on investments | 373 |
Net realized loss on purchased options not settled through variation margin | 38 |
Net accretion and earned inflation component .. | (31) |
Net cash provided by operating activities | 32,957 |
| Cash flows used for financing activities: | |
Proceeds from shares sold | 10,738 |
Payment on shares redeemed | (37,706) |
Cash dividends paid | (8) |
Decrease in sale-buyback financing transactions | (6,291) |
Increase in due to broker and cash-restricted | (33) |
Net cash used for financing activities | (33,300) |
Net decrease in cash and foreign currency | (343) |
| Cash and foreign currency: | |
Beginning of period | $ 597 |
End of period | 254 |
Reinvestment of dividends | $ 627 |
| Supplemental disclosure of cash flow information: | |
Interest paid during the year | $ 282 |
The accompanying notes are an integral part of the Financial Statements.
29
[THIS PAGE INTENTIONALLY LEFT BLANK]
30
Harbor Strategic Markets Funds Financial Highlights
Selected Data for a Share Outstanding for the Periods Presented
Selected Data for a Share Outstanding for the Periods Presented
| HARBOR COMMODITY REAL RETURN STRATEGY FUND (CONSOLIDATED) | |||||
| Institutional Class | |||||
| Year Ended October 31, | 2017 | 2016 | 2015 | 2014 | 2013 |
Net asset value beginning of period | $ 3.71 | $ 3.84 | $ 5.58 | $ 6.13 | $ 7.38 |
| Income from Investment Operations | |||||
Net investment income/(loss)a | 0.07 c | 0.06 c | 0.02 c | 0.14 | 0.02 |
Net realized and unrealized gains/(losses) on investments | 0.04 | (0.09) | (1.56) | (0.55) | (1.17) |
Total from investment operations | 0.11 | (0.03) | (1.54) | (0.41) | (1.15) |
| Less Distributions | |||||
Dividends from net investment income | (0.04) | (0.07) | (0.20) | (0.01) | (0.08) |
Distributions from net realized capital gains1 | — | — | — | (0.13) | (0.02) |
Return of capitald | — | (0.03) | — | — | — |
Total distributions | (0.04) | (0.10) | (0.20) | (0.14) | (0.10) |
Proceeds from redemption fees | — | — | — | — | — * |
Net asset value end of period | 3.78 | 3.71 | 3.84 | 5.58 | 6.13 |
Net assets end of period (000s) | $50,771 | $75,908 | $108,267 | $208,996 | $318,937 |
| Ratios and Supplemental Data (%) | |||||
Total returnb | 3.13% | (0.38)% | (28.36)% | (6.82)% | (15.76)% |
Ratio of total expenses to average net assets2 | 1.78 | 1.52 | 1.28 | 1.04 | 1.03 |
Ratio of net expenses to average net assetsa | 1.39 | 1.24 | 1.08 | 0.98 | 0.98 |
Ratio of net expenses excluding interest expense to average net assetsa | 0.94 | 0.94 | 0.94 | 0.94 | 0.94 |
Ratio of net investment income to average net assetsa | 1.99 | 1.73 | 0.36 | 1.23 | 0.45 |
Portfolio turnover | 1,331 | 1,069 | 784 | 635 | 532 |
| * | Less than $0.01 |
| 1 | Includes both short-term and long-term capital gains |
| 2 | Percentage does not reflect reduction for credit balance arrangements (see Note 2 of the accompanying Notes to Financial Statements) |
| a | Reflects the Adviser’s waiver, if any, of its management fees and/or other operating expenses |
| b | The total returns would have been lower had certain expenses not been waived during the periods shown. |
| c | Amounts are allocated based upon average shares outstanding during the period. |
| d | Determined in accordance with federal income tax regulations (see Note 5 of the accompanying Notes to Financial Statements) |
The accompanying notes are an integral part of the Financial Statements.
31
| Administrative Class | ||||
| 2017 | 2016 | 2015 | 2014 | 2013 |
| $ 3.69 | $ 3.82 | $ 5.56 | $ 6.12 | $ 7.37 |
| 0.06 c | 0.05 c | 0.01 c | 0.03 | 0.02 |
| 0.04 | (0.09) | (1.56) | (0.45) | (1.18) |
| 0.10 | (0.04) | (1.55) | (0.42) | (1.16) |
| (0.03) | (0.07) | (0.19) | (0.01) | (0.07) |
| — | — | — | (0.13) | (0.02) |
| — | (0.02) | — | — | — |
| (0.03) | (0.09) | (0.19) | (0.14) | (0.09) |
| — | — | — | — | — * |
| 3.76 | 3.69 | 3.82 | 5.56 | 6.12 |
| $ 392 | $ 503 | $ 761 | $1,236 | $ 1,142 |
| 2.87% | (0.85)% | (28.52)% | (7.06)% | (15.93)% |
| 2.03 | 1.78 | 1.53 | 1.29 | 1.27 |
| 1.64 | 1.49 | 1.33 | 1.23 | 1.23 |
| 1.19 | 1.19 | 1.19 | 1.19 | 1.19 |
| 1.72 | 1.39 | 0.18 | 1.40 | 0.11 |
| 1,331 | 1,069 | 784 | 635 | 532 |
32
Harbor Strategic Markets Funds
Notes to Financial Statements—October 31, 2017
Notes to Financial Statements—October 31, 2017
Note 1—Organizational Matters
Harbor Funds (the “Trust”) is registered under the Investment Company Act of 1940, as amended (the “Investment Company Act”), as an open-end management investment company. As of October 31, 2017 the Trust consists of 31 separate portfolios. The portfolio covered by this report is Harbor Commodity Real Return Strategy Fund (referred to as the “Fund”). Harbor Capital Advisors, Inc. (the “Adviser” or “Harbor Capital”) is the investment adviser for the Fund.
The Fund currently offers two classes of shares, designated as Institutional Class and Administrative Class. The shares of each class represent an interest in the same portfolio of investments of the Fund and have equal rights with respect to voting, redemptions, dividends, and liquidations, except that: (i) certain expenses, subject to the approval of the Trust’s Board of Trustees (the “Board of Trustees”), may be applied differently to each class of shares in accordance with current regulations of the Securities and Exchange Commission (“SEC”) and the Internal Revenue Service; and (ii) shareholders of a class that bears distribution and service expenses under terms of a distribution plan have exclusive voting rights as to that distribution plan.
Note 2—Significant Accounting Policies
The following is a summary of significant accounting policies followed by the Trust in the preparation of its financial statements. The Fund follows the investment company reporting requirements under U.S. Generally Accepted Accounting Principles (“U.S. GAAP”), which includes the accounting and reporting guidelines under Accounting Standards Topic 946, Financial Services-Investment Companies. The preparation of financial statements in accordance with U.S. GAAP requires management to make estimates and assumptions that affect the reported amounts and disclosures in the financial statements. Actual results may differ from those estimates.
Security Valuation
The Trust’s valuation procedures permit the Fund to use a variety of valuation methodologies, consider a number of subjective factors, analyze applicable facts and circumstances and, in general, exercise judgment, when valuing Fund investments. The methodology used for a specific type of investment may vary based on the circumstances and relevant considerations, including available market data.
Equity securities (including common stock, preferred stock, and convertible preferred stock), exchange-traded notes and financial derivative instruments (such as futures contracts, options contracts, including rights and warrants and centrally cleared swap agreements) that are traded or cleared on a national securities exchange or system (except securities listed on the National Association of Securities Dealers Automated Quotation (“NASDAQ”) system and United Kingdom securities) are valued at the last sale price on a national exchange or system on which they are principally traded or cleared as of the valuation date. Securities listed on the NASDAQ system or a United Kingdom exchange are valued at the official closing price of those securities. In the case of securities for which there are no sales on the valuation day, (i) securities traded principally on a U.S. exchange, including NASDAQ, are valued at the mean between the closing bid and ask price; and (ii) securities traded principally on a foreign exchange, including United Kingdom securities, are valued at the official bid price determined as of the close of the primary exchange. Securities of open-end registered investment companies that are held by the Fund are valued at net asset value. To the extent these securities are actively traded and fair valuation adjustments are not applied, they are normally categorized as Level 1 in the fair value hierarchy. Equity securities traded on inactive markets or valued by reference to similar instruments are normally categorized as Level 2 in the fair value hierarchy. For more information on the fair value hierarchy, please refer to the Fair Value Measurements and Disclosures section in Note 2.
Debt securities (including corporate bonds, municipal bonds and notes, U.S. government agencies, U.S. treasury obligations, mortgage-backed and asset-backed securities, foreign government obligations, bank loans, and convertible securities other than short-term securities with a remaining maturity of less than 60 days at the time of acquisition), are valued using evaluated prices furnished by a pricing vendor selected by the Board of Trustees. An evaluated price represents an assessment by the pricing vendor using various market inputs of what the pricing vendor believes is the fair value of a security at a particular point in time. The pricing vendor determines evaluated prices for debt securities that would be transacted at institutional-size quantities using inputs including, but not limited to, (i) recent transaction prices and dealer quotes, (ii) transaction prices for what the pricing vendor believes are securities with similar characteristics, (iii) the pricing vendor’s assessment of the risk inherent in the security taking into account criteria such as credit quality, payment history, liquidity and market conditions, and (iv) various correlations and relationships between security price movements and other factors, such as interest rate changes, which are recognized by institutional traders. In the case of mortgage-backed and asset-backed securities, the inputs used by
33
Harbor Strategic Markets Funds
Notes to Financial Statements—Continued
Notes to Financial Statements—Continued
Note 2—Significant Accounting Policies—Continued
the pricing vendor may also include information about cash flows, prepayment rates, default rates, delinquency and loss assumption, collateral characteristics, credit enhancements and other specific information about the particular offering. Because many debt securities trade infrequently, the pricing vendor will often not have current transaction price information available as an input in determining an evaluated price for a particular security. When current transaction price information is available, it is one input into the pricing vendor’s evaluation process, which means that the evaluated price supplied by the pricing vendor will frequently differ from that transaction price.
Short-term securities with a remaining maturity of less than 60 days at the time of acquisition that are held by the Fund are valued at amortized cost to the extent amortized cost represents fair value. Securities that use similar valuation techniques and inputs as described above are normally categorized as Level 2 in the fair value hierarchy.
Over-the-counter (“OTC”) financial derivative instruments, such as forward currency contracts, options contracts, and swap agreements, derive their value from underlying asset prices, indices, reference rates and other inputs, or a combination of these factors. These instruments are valued using evaluated prices furnished by a pricing vendor selected by the Board of Trustees. In certain cases, when a valuation is not readily available from a pricing vendor, the Fund’s subadviser provides a valuation, typically using its own proprietary models. Depending on the instrument and the terms of the transaction, the value of the derivative instrument can be determined by a pricing vendor or subadviser using a series of techniques, including simulation pricing models. The pricing models use inputs, such as issuer details, indices, spreads, interest rates, yield curves, dividends and exchange rates, that are observed from actively quoted markets. Derivative instruments that use valuation techniques and inputs similar to those described above are normally categorized as Level 2 in the fair value hierarchy.
When reliable market quotations or evaluated prices supplied by a pricing vendor are not readily available or are not believed to accurately reflect fair value, securities are priced at their fair value as determined by the Trust’s Valuation Committee (the “Valuation Committee”) pursuant to procedures adopted, and subject to oversight, by the Board of Trustees. The Valuation Committee is comprised of a trustee and officers of the Trust and employees of Harbor Capital with relevant experience or responsibilities. Each security for which the Valuation Committee determines a fair value, including the basis for the fair value decision, is reviewed by the Board of Trustees at its regularly scheduled board meetings.
When a fair valuation method is applied by the Valuation Committee or the Fund’s subadviser, securities will be priced by a method that the Valuation Committee or subadviser believes accurately reflects fair value. Securities valued using fair valuation methods that incorporate significant unobservable inputs are normally categorized as Level 3 in the fair value hierarchy. Examples of possible fair valuation methodologies used in determining the fair value of securities categorized as Level 3 in the fair value hierarchy include, but are not limited to, benchmark pricing and indicative market quotations.
When benchmark pricing is used, the base price of a debt security is set and then subsequently adjusted in proportion to the market value changes of an index or similar security (the “benchmark security”) that trades in an active market or for which other observable inputs are available. The base price may be a broker-dealer quote, transaction price, or an internal value as derived by analysis of market data. The base price of the security may be reset on a periodic basis based on the availability of market data and procedures approved by the Fund’s subadviser. If the benchmark security is categorized as Level 2 in the fair value hierarchy due to the lack of an active market for that security, any security adjusted in proportion to the market value of the benchmark security may be categorized as Level 3 in the fair value hierarchy. Significant changes in the unobservable inputs of the benchmark pricing process (i.e., the base price) would result in direct and proportional changes in the fair value of the security. The reasonability of the fair value is reviewed by the subadviser on a periodic basis and may be amended as the availability of market data indicates a material change.
If evaluated pricing through a third-party pricing vendor is not available or deemed not to be indicative of fair value, the Fund’s subadviser may elect to obtain indicative market quotations (“broker quotes”) directly from a broker-dealer or passed through from a third-party pricing vendor. Indicative market quotations are typically received from established market participants. In the event that the source of fair value is from a single-sourced broker quote, but the subadviser does not have the transparency to view the underlying inputs that support the market quotation, these securities are categorized as Level 3 in the fair value hierarchy. Significant changes in the broker quote would have direct and proportional changes in the fair value of the security.
The Fund may also use fair value pricing if the value of some or all of the Fund’s securities have been materially affected by events occurring before the Fund’s pricing time but after the close of the primary markets or exchanges on which the security is traded. This most commonly occurs with foreign securities, but may occur with other securities as well. In such cases, the
34
Harbor Strategic Markets Funds
Notes to Financial Statements—Continued
Notes to Financial Statements—Continued
Note 2—Significant Accounting Policies—Continued
Fund may apply a fair value factor supplied by the pricing vendor to a foreign security’s market close value to reflect changes in value that may have occurred between the close of the primary market or exchange on which the security is traded and the Fund’s pricing time. That factor may be derived using observable inputs such as a comparison of the trading patterns of a foreign security to intraday trading in the U.S. markets that are highly correlated to the foreign security or other information that becomes available after the close of the foreign market on which the security principally traded. When fair value pricing is employed, the prices of securities used by the Fund to calculate its net asset value may differ from market quotations, official closing prices or evaluated prices for the same securities, which means that the Fund may value those securities higher or lower than another given fund that uses market quotations, official closing prices or evaluated prices supplied by a pricing vendor in its calculation of net asset value. Securities valued using observable inputs, such as those described above, are normally categorized as Level 2 of the fair value hierarchy.
Fair Value Measurements and Disclosures
Various inputs may be used to determine the value of the Fund’s investments, which are summarized in three broad categories defined as Level 1, Level 2, and Level 3. The inputs or methodologies used for valuing securities are not necessarily indicative of the risk associated with investing in those securities. The assignment of an investment to Levels 1, 2, or 3 is based on the lowest level of significant inputs used to determine its fair value.
| Level 1– | Quoted prices in active markets for identical securities. |
| Level 2– | Other significant observable inputs (including quoted prices for similar securities, interest rates, prepayment speeds, credit risk, etc.). |
| Level 3– | Significant unobservable inputs are used in situations where quoted prices or other observable inputs are not available or are deemed unreliable. Significant unobservable inputs may include the Fund’s own assumptions. |
Transfers between levels, if any, are recognized as of the last day in the fiscal quarter of the period in which the event or change in circumstances that caused the reclassification occurred. For fair valuations using significant unobservable inputs, a reconciliation of the beginning to ending balances for reported fair values is provided that presents changes attributable to realized and unrealized gains and losses and purchases, sales, and transfers in/out of the Level 3 category during the period. A table that includes a categorization of investments into Levels 1, 2, or 3, transfers between levels, if any, and a Level 3 reconciliation, including details of significant unobservable inputs used, when applicable, can be found at the end of the Fund’s Portfolio of Investments schedule.
The Fund used observable inputs in its valuation methodologies whenever they were available and deemed reliable.
Inflation-Indexed Bonds
Inflation-indexed bonds are fixed-income securities whose principal value is periodically adjusted based on the rate of inflation. During the year, the Fund invested in inflation-indexed bonds. The interest rate on these bonds is generally fixed at issuance at a rate lower than typical bonds. Over the life of an inflation-indexed bond, however, interest will be paid based on a principal value that is adjusted for inflation. Any increase in the principal amount of an inflation-indexed bond will be included as interest income even though investors do not receive the principal until maturity.
Mortgage-Related and Other Asset-Backed Securities
Mortgage-backed or asset-backed securities include mortgage pass-through securities, collateralized mortgage obligations (“CMOs”), commercial mortgage-backed securities, CMO residuals, stripped mortgage- backed securities (“SMBSs”) and other securities that directly or indirectly represent a participation in, or are secured by and payable from, mortgage loans on real property. During the year, the Fund invested in mortgage- or other asset-backed securities. The value of some mortgage- or asset-backed securities may be particularly sensitive to changes in prevailing interest rates. Early repayment of principal on some mortgage-related securities may expose the Fund to a lower rate of return upon reinvestment of principal. The value of these securities may fluctuate in response to the market’s perception of the creditworthiness of the issuers. Additionally, although mortgages and mortgage-related securities are generally supported by some form of government or private guarantee and/or insurance, there is no assurance that private guarantors or insurers will meet their obligations.
35
Harbor Strategic Markets Funds
Notes to Financial Statements—Continued
Notes to Financial Statements—Continued
Note 2—Significant Accounting Policies—Continued
U.S. Government Securities
During the year, the Fund invested in U.S. government securities. U.S. government securities include securities issued by U.S. government agencies or government-sponsored enterprises that may not be guaranteed by the U.S. Treasury. The Government National Mortgage Association (“GNMA” or “Ginnie Mae”), a wholly owned U.S. government corporation, is authorized to guarantee, with the full faith and credit of the U.S. government, the timely payment of principal and interest on securities issued by institutions approved by GNMA and backed by pools of mortgages insured by the Federal Housing Administration or guaranteed by the Department of Veterans Affairs. Government-related guarantors are not backed by the full faith and credit of the U.S. government and include the Federal National Mortgage Association (“FNMA” or “Fannie Mae”) and the Federal Home Loan Mortgage Corporation (“FHLMC” or “Freddie Mac”). On September 7, 2008, the Federal Housing Finance Agency placed Fannie Mae and Freddie Mac in conservatorship, while the U.S. Treasury agreed to purchase preferred stock as needed to ensure that both Fannie Mae and Freddie Mac maintain a positive net worth (guaranteeing up to $100 billion for each entity). As a consequence, certain fixed income securities of Fannie Mae and Freddie Mac have more explicit U.S. government support. No assurance can be given as to whether the U.S. government will continue to support Fannie Mae and Freddie Mac. In addition, the future of Fannie Mae and Freddie Mac is uncertain because Congress has been considering proposals as to whether Fannie Mae and Freddie Mac should be nationalized, privatized, restructured or eliminated altogether. Fannie Mae and Freddie Mac are also the subject of continuing legal actions and investigations, which may have an adverse effect on these entities.
Forward Commitments and When-Issued Securities
During the year, the Fund purchased and sold securities on a forward commitment basis, including “TBA” (to be announced) purchase and sale commitments. Purchasing securities on a when-issued or forward commitment basis involves a risk of loss if the value of the security to be purchased declines prior to the settlement date. Although the Fund would generally purchase securities on a when-issued or forward commitment basis with the intention of acquiring securities for its portfolio, the Fund may dispose of a when-issued security or forward commitment prior to settlement if a subadviser deems it appropriate to do so. The Fund may enter into a forward commitment sale to hedge its portfolio positions or to sell securities it owned under a delayed delivery arrangement. Sale proceeds are not received until the contractual settlement date. The Fund may realize short-term gains or losses upon such purchases and sales. These transactions involve a commitment by the Fund to purchase or sell securities at a future date (ordinarily one or two months later). The price of the underlying securities (usually expressed in terms of yield) and the date when the securities will be delivered and paid for (the settlement date) are fixed at the time the transaction is negotiated. When-issued purchase and forward commitment transactions are negotiated directly with the other party, and such commitments are not traded on exchanges.
The value of securities purchased on a when-issued or forward commitment basis and any subsequent fluctuations in their value are reflected in the computation of the Fund’s net asset value starting on the date of the agreement to purchase the securities. The Fund does not earn interest on the securities it has committed to purchase until they are paid for and delivered on the settlement date. When the Fund makes a forward commitment to sell securities it owns, the proceeds to be received upon settlement are included in the Fund’s assets. Fluctuations in the market value of the underlying securities are not reflected in the Fund’s net asset value as long as the commitment to sell remains in effect. Settlement of when-issued purchase and forward commitment transactions generally takes place within two months after the date of the transaction, but the Fund may agree to a longer settlement period.
The Fund will purchase securities on a when-issued basis, or purchase or sell securities on a forward commitment basis, only with the intention of completing the transaction and actually purchasing or selling the securities. If deemed advisable as a matter of investment strategy, however, the Fund may dispose of or renegotiate a commitment after it is entered into. The Fund also may sell securities it has committed to purchase before those securities are delivered to the Fund on the settlement date. The Fund may realize a capital gain or loss in connection with these transactions. When the Fund purchases securities on a when-issued or forward commitment basis, the Fund will maintain in a segregated account with the Fund’s custodian, or set aside or restrict in the subadviser’s records or systems relating to the Fund, cash or liquid assets having a value (determined daily) at least equal to the amount of the Fund’s purchase commitments. In the case of a forward commitment to sell portfolio securities, portfolio holdings will be held in a segregated account with the Fund’s custodian, or set aside or restricted on the subadviser’s records or systems relating to the Fund, while the commitment is outstanding.
36
Harbor Strategic Markets Funds
Notes to Financial Statements—Continued
Notes to Financial Statements—Continued
Note 2—Significant Accounting Policies—Continued
Repurchase Agreements
In a repurchase agreement, the Fund buys a security at one price and simultaneously agrees to sell it back at a higher price. Such agreements must be adequately collateralized to cover the counterparty’s obligation to the Fund to close out the repurchase agreement. During the year, the Fund entered into repurchase agreements with domestic or foreign banks or with a member firm of the Financial Industry Regulatory Authority, Inc., or an affiliate of a member firm that is a primary dealer in U.S. government securities. Each repurchase agreement counterparty must meet the minimum credit quality requirements applicable to the Fund and any other appropriate counterparty criteria as determined by the Fund’s subadviser. The minimum credit quality requirements are those applicable to the Fund’s purchase of securities such that if the Fund is permitted to only purchase securities that are rated investment-grade (or the equivalent if unrated), the Fund could only enter into repurchase agreements with counterparties that have debt outstanding that is rated investment-grade (or the equivalent if unrated). The securities are regularly monitored to ensure that the collateral is adequate. The Fund seeks to further mitigate its counterparty risk by entering into master repurchase agreements with its counterparties. The master repurchase agreements provide that, in the event of a counterparty’s default, including bankruptcy, the Fund may terminate any repurchase agreements with that counterparty, determine the net amount owned, and sell or retain the collateral up to the net amount owed to the Fund. A counterparty’s default may cause the Fund to suffer losses, including loss of interest on or principal of the securities and costs associated with delay and enforcement of the terms of the master repurchase agreement.
Sale-Buybacks
A “sale-buyback” financing transaction consists of a sale of a portfolio security by the Fund to a financial institution (the counterparty) with a simultaneous agreement to repurchase the same or substantially the same security at an agreed-upon price and date. The Fund is not entitled to receive principal and interest payments, if any, made on the security sold to the counterparty during the term of the agreement. During the year, the Fund entered into such financing transactions referred to as sale-buybacks.
The agreed-upon proceeds for securities to be repurchased by the Fund are reflected as a liability on the Statement of Assets and Liabilities. The Fund will recognize net income represented by the price differential between the price received for the transferred security and the agreed-upon repurchase price. This is commonly referred to as the “price drop.” A price drop consists of two components: (i) the foregone interest and inflationary income adjustments, if any, the Fund would have otherwise received had the security not been sold, and (ii) the negotiated financing terms between the Fund and counterparty. Foregone interest and inflationary income adjustments, if any, are recorded as components of interest income on the Statement of Operations. Interest payments based upon negotiated financing terms made by the Fund to counterparties are recorded as a component of interest expense on the Statement of Operations. To cover its obligations under sale-buyback transactions, the Fund will segregate cash or liquid securities, which are marked-to-market daily, with the Fund’s custodian, or set aside or restrict assets in the subadviser’s records or systems relating to the Fund, in an amount not less than the repurchase price, including accrued interest, of the underlying security. Sale-buyback transactions involve the risk that the fair value of the securities sold by the Fund may decline below the repurchase price of the securities and, if the proceeds from the sale-buyback transaction are invested in securities, that the fair value of the securities purchased may decline below the repurchase price of the securities sold. In periods of increased demand for a security, the Fund may receive a fee for use of the security by the counterparty, which may result in additional interest income to the Fund.
The average amount of borrowings outstanding during the year ended October 31, 2017 was $28,163,000 at a weighted average interest rate of 0.998% for the Fund.
A table that includes the remaining maturity period for outstanding sale-buyback transactions and the type of investment collateral pledged can be found at the end of the Fund’s Portfolio of Investments schedule.
Short Sales
During the year, the Fund engaged in short-selling, which obligates the Fund to replace a borrowed security by purchasing it at the market price at the time of replacement. Until the security is replaced, the Fund is required to pay any accrued interest or dividends to the lender and also may be required to pay a premium. The Fund would realize a gain if the security declines in price between the date of the short sale and the date on which such Fund replaces the borrowed security. The Fund would incur a loss as a result of the short sale if the price of the security increases between those dates. Until the Fund replaces the
37
Harbor Strategic Markets Funds
Notes to Financial Statements—Continued
Notes to Financial Statements—Continued
Note 2—Significant Accounting Policies—Continued
borrowed security, subject to pre-arranged exposure levels, it will maintain cash or liquid securities sufficient to cover its short position in a segregated account with the Fund’s custodian or set aside or restricted in the subadviser’s records or systems relating to the Fund. Short sales involve the risk of an unlimited increase in the market price of the borrowed security.
Futures Contracts
A futures contract is an agreement between two parties to buy or sell a specified financial instrument at a set price on a future date. During the year, the Fund used futures contracts to gain exposure to the fixed income asset class with greater efficiency and lower cost than was possible through direct investment, to add value when these securities were attractively priced, or to adjust the portfolio’s sensitivity to changes in interest rates or currency exchange rates. Futures contracts tend to increase or decrease the Fund’s exposure to the underlying instrument or can be used to hedge other Fund investments.
Upon entering into a futures contract, the Fund is required to pledge to the broker an amount of cash, U.S. government securities or other liquid securities equal to the minimum “initial margin” requirements of the exchange. Pursuant to the contract, the Fund agrees to receive from or pay to the broker an amount of cash equal to the daily fluctuation in value of the contract referred to as “variation margin.” Such receipts or payments are recorded by the Fund as unrealized gains or losses. When the contract is closed or expires, the Fund records a realized gain or loss equal to the difference between the value of the contract at the time it was opened and the value at the time it was closed. The Fund may suffer losses if it is unable to close out its position because of an illiquid secondary market. There is no assurance that the Fund will be able to close out its position when the Fund considers it appropriate or desirable to do so. In the event of adverse price movements, the Fund may be required to continue making daily cash payments to maintain its required margin. If the Fund has insufficient cash, it may have to sell portfolio securities to meet daily margin requirements at a time when the Fund would not otherwise elect to do so. In addition, the Fund may be required to deliver or take delivery of instruments. The maximum potential loss on a long futures contract is the U.S. dollar value of the notional amount at the time the contract is opened. The potential loss on a short futures contract is unlimited. There is minimal counterparty risk with futures contracts as they are exchange traded and the exchange’s clearinghouse, as counterparty to all exchange traded futures, guarantees the futures contracts against default.
Options
An option, including rights and warrants, is a contract that offers the buyer the right, but not the obligation, to buy (call) or sell (put) a security or other financial asset at an agreed-upon price (the strike price) during a certain period of time or on a specific date (exercise date). During the year, the Fund purchased and wrote (sold) option contracts to manage its exposure to the bond markets and to fluctuations in interest rates and currency values. Purchased call options tend to increase the Fund’s exposure to the underlying instrument. Purchased put options tend to decrease the Fund’s exposure to the underlying instrument.
When the Fund purchases an option, it pays a premium. If a purchased option expires, the Fund realizes a loss in the amount of the premium. If the Fund enters into a closing sale transaction, it realizes a gain or loss, depending on whether the proceeds from the sale are greater or less than the cost of the option. If a call option is exercised by the Fund, the cost of the securities acquired by exercising the call is increased by the premium paid to buy the call. If a put option is exercised by the Fund, it realizes a gain or loss from the sale of the underlying security and the proceeds from such sale are decreased by the premium originally paid. The risk associated with purchasing options is limited to the premium paid. The Fund’s maximum risk of loss from counterparty credit risk is also limited to the premium paid for the contract.
When the Fund writes an option, it receives a premium. If a written option expires on its stipulated expiration date, or if the Fund enters into a closing purchase transaction, the Fund realizes a gain (or loss, if the cost of a closing purchase transaction exceeds the premium received when the option was written) without regard to any unrealized gain or loss on the underlying security, and the liability related to such option is extinguished. If a written call option is exercised, the Fund realizes a gain or loss from the sale of the underlying security, and the proceeds of the sale are increased by the premium originally received. If a written put option is exercised, the amount of the premium originally received reduces the cost of the security that the Fund purchases upon exercise of the option.
38
Harbor Strategic Markets Funds
Notes to Financial Statements—Continued
Notes to Financial Statements—Continued
Note 2—Significant Accounting Policies—Continued
The risk in writing a call option is that the Fund relinquishes the opportunity to profit if the fair value of the underlying security increases and the option is exercised. In writing a put option, the Fund assumes the risk of incurring a loss if the fair value of the underlying security decreases and the option is exercised. In addition, there is a risk that the Fund may not be able to enter into a closing transaction because of an illiquid secondary market or if the counterparty does not perform under the contract’s terms.
Options on exchange-traded futures contracts are an option contract in which the underlying instrument is a single futures contract. The Fund may write or purchase options on exchange-traded futures contracts in which the Fund agrees to receive from or pay to the broker an amount of cash equal to the daily fluctuation in value of the contract referred to as “variation margin.” Such receipts or payments are recorded by the Fund as unrealized gains or losses. When the contract is closed or expires, the Fund records a realized gain or loss equal to the difference between the value of the contract at the time it was opened and the value at the time it was closed.
Swap Agreements
A swap is a contract between two parties to exchange future cash flows at specified intervals (payment dates) based upon a notional principal amount during the agreed-upon life of the contract. Swaps are marked-to-market daily and changes in value are recorded as unrealized appreciation or depreciation.
Upon entering a swap agreement, any payments received or made at the beginning of the measurement period are reflected as such on the Statement of Assets and Liabilities and represent a reconciling value to compensate for differences between the stated terms of the swap agreement and prevailing market conditions (such as credit spreads, currency exchange rates, interest rates, and other relevant factors). These upfront payments are recorded as realized gains or losses on the Statement of Operations upon termination or maturity of the swap. If a liquidation payment is received or made at the termination of the swap, it is recorded as realized gain or loss on the Statement of Operations. Net periodic payments received or paid by the Fund are included as part of realized gains or losses on the Statement of Operations. The Fund will only enter into swap agreements with counterparties that meet the minimum credit quality requirements applicable to the Fund and any other appropriate counterparty criteria as determined by the Fund’s subadviser. The minimum credit quality requirements are similar to those applicable to the Fund’s purchase of securities, such that if the Fund is permitted to only purchase securities that are rated investment-grade (or the equivalent if unrated), the Fund could only enter into one of the below referenced transactions with counterparties that have debt outstanding that is rated investment-grade (or the equivalent if unrated). Entering into swap agreements involves, to varying degrees, elements of credit risk, market risk and interest rate risk in excess of the amount recognized in the Statement of Assets and Liabilities. Such risks include the possibility that there is not a liquid market for these agreements, that the counterparty to the agreements may default on its obligation to perform, or that there may be unfavorable changes in market conditions or interest rates. The Fund’s maximum risk of loss from counterparty credit risk is the discounted value of the net cash flows to be received from the counterparty over the contract’s remaining life or the value of the contract. This risk is typically mitigated by entering into swap agreements with highly-rated counterparties, the existence of a master netting arrangement between the Fund and the counterparty, and the posting of collateral by the counterparty.
Interest Rate Swaps are agreements between counterparties to exchange cash flows or an exchange of commitments to pay or receive interest with respect to the notional amount of principal. During the year, the Fund used interest rate swap agreements to manage its exposure to interest rate changes. Changes in interest rates can have an effect on the value of bond holdings, the amount of interest income earned and the value of the interest rate swaps held.
Credit Default Swaps are agreements between counterparties to buy or sell protection on a debt security, a basket of securities, or an index of obligations against a defined credit event. Under the terms of a credit default swap, the buyer of protection receives credit protection in exchange for making periodic payments to the seller of protection based on a given percentage applied to a notional principal amount. In return for these payments, the seller acts as the guarantor of the creditworthiness of a reference entity, obligation or index. During the year, the Fund used credit default swap agreements as a seller to gain credit exposure to an issuer or to simulate investments in long bond positions that were either unavailable or less attractively priced in the bond market; the Fund used credit default swap agreements as a buyer to provide a measure of protection against defaults of an issuer. An issuer may represent either a single issuer, a “basket” of issuers, or a credit index. A credit index is a basket of credit instruments or exposures designed to be representative of some part of the credit market as a whole.
39
Harbor Strategic Markets Funds
Notes to Financial Statements—Continued
Notes to Financial Statements—Continued
Note 2—Significant Accounting Policies—Continued
The buyer in a credit default contract is obligated to pay the seller a periodic stream of payments over the term of the contract provided that no credit event occurs. Credit events may include bankruptcy, failure to pay principal, maturity extension, rating downgrade, or write-down. As a seller, if an underlying credit event occurs, the Fund will either pay the buyer an amount equal to the notional amount of the swap and take delivery of the reference obligation (or underlying securities comprising an index), or pay a net settlement amount of cash equal to the notional amount of the swap less the recovery value of the reference obligation (or underlying securities comprising an index). As a buyer, if an underlying credit event occurs, the Fund will either receive from the seller an amount equal to the notional amount of the swap and deliver the reference obligation (or underlying securities comprising an index) or receive a net settlement. The maximum exposure to loss of the notional value as the seller of credit default swaps outstanding at October 31, 2017 for the Fund was $400,000.
Total Return Swaps are agreements between counterparties to exchange the return of a given underlying asset, including any income it generates and appreciation in value, in exchange for a set rate, either fixed or variable. During the year, the Fund used total return swap agreements to gain or mitigate exposure to underlying reference assets, securities, or indices.
Under the terms of a total return swap, one counterparty pays out the total return of a specific referenced asset or index and in return receives a regular stream of payments. To the extent the total return of an asset or index underlying the transaction exceeds or falls short of the offsetting interest rate obligation, the Fund will receive a payment or make a payment to the counterparty.
Variance Swaps are agreements between counterparties to exchange cash flows based upon the measured variance (or the square of volatility) of a specified underlying asset. One party agrees to exchange a strike price (“Fixed Rate”) for the realized price variance (“Floating Rate”) on the underlying asset with respect to the notional amount. During the year, the Fund used variance swap agreements to gain or mitigate exposure to underlying reference assets or securities.
When a variance swap agreement is originated, the strike price is generally set such that the fair value of the swap is zero. At the maturity date, a net cash flow is exchanged where the payoff amount is equal to the difference between the final market price of the asset and the strike price multiplied by the notional amount. As a receiver of the Floating Rate, the Fund receives the payoff amount when the final market price is greater than the strike price and owes the payoff amount when the final market price is less than the strike price. As a payer of the Floating Rate, the Fund owes the payoff amount when the final market price is greater than the strike price, and receives the payoff amount when the final market price is less than the strike price.
Forward Currency Contracts
A forward currency contract is an agreement between two parties to buy and sell currencies at a set price on a future date. During the year, the Fund used forward currency contracts to manage its exposure to changes in exchange rates or as a hedge against foreign exchange risk related to specific transactions or portfolio positions.
The forward currency contract is marked-to-market daily and the change in market value is recorded as an unrealized gain or loss. When the contract is closed, the Fund records a realized gain or loss equal to the difference between the value on the open and close date. Risk of losses may arise from changes in the value of the foreign currency, or if the counterparties do not perform under the contract’s terms. The maximum potential loss from such contracts is the aggregate face value in U.S. dollars at the time the contract was opened. During the year, the Fund entered into collateral agreements with certain counterparties to mitigate counterparty risk associated with forward currency contracts.
Foreign Currency Spot Contracts
A foreign currency spot contract is an agreement between two parties to buy and sell currencies at the current market rate for settlement within two business days. During the year, the Fund used foreign currency spot contracts to facilitate transactions in foreign securities or to convert foreign currency receipts into U.S. dollars.
40
Harbor Strategic Markets Funds
Notes to Financial Statements—Continued
Notes to Financial Statements—Continued
Note 2—Significant Accounting Policies—Continued
The foreign currency spot contract is marked-to-market daily for settlements beyond one day, and any change in market value is recorded as an unrealized gain or loss. When the contract is closed, the Fund records a realized gain or loss equal to the difference between the value on the open and close date. Risk of losses may arise from changes in the value of the foreign currency or if the counterparties do not perform under the contract’s terms. The maximum potential loss from such contracts is the aggregate face value in U.S. dollars at the time the contract was opened.
Foreign Currency Translations
Purchases and sales of securities are translated into U.S. dollars at the current exchange rate on the respective dates of the transactions. Income and withholding taxes are translated at the prevailing exchange rate when accrued or incurred. The accounting records of the Fund are maintained in U.S. dollars. Investment securities and other assets and liabilities denominated in a foreign currency, when applicable, are translated into U.S. dollars based on the current exchange rates at year end.
Reported net realized gains and losses on foreign currency transactions, when applicable, represent net gains and losses from sales and maturities of foreign currency contracts, disposition of foreign currencies, currency gains and losses realized between the trade and settlement dates on securities transactions, and the difference between the amount of investment income accrued and tax reclaims receivable and the U.S. dollar amount actually received. The effects of changes in foreign currency exchange rates on investments in securities, when applicable, are included in the net realized and unrealized gain or loss on investments in the Statement of Operations.
Investment Income
Dividends declared on portfolio securities are accrued on the ex-dividend date. For foreign securities held, certain dividends are recorded after the ex-dividend date, but as soon as the respective Fund is notified of such dividends. Interest income is accrued daily as earned. Discounts and premiums on fixed income securities purchased are amortized over the life of the respective securities using the effective yield method. Paydown gains and losses on mortgage-backed and asset-backed securities are recognized as a component of interest income.
Securities Transactions
Securities transactions are accounted for on the trade date (the date the order to buy or sell is executed). Realized gains or losses on security transactions are determined on the basis of identified cost.
Proceeds from Litigation
The Fund may receive proceeds from shareholder litigation settlements involving current and/or previously held portfolio holdings. Any proceeds received from litigation involving portfolio holdings are reflected in the Statement of Operations in realized gain/(loss) if the security has been disposed of by the Fund, or in unrealized gain/(loss) if the security is still held by the Fund.
Distribution to Shareholders
Distributions on Fund shares are recorded on the ex-dividend date.
Expenses
Expenses incurred by the Trust are charged directly to the Fund that incurred such expense whenever possible. With respect to expenses incurred by any two or more Harbor Funds where amounts cannot be identified on a fund by fund basis, such expenses are generally allocated in proportion to the average net assets or the number of shareholders of each Fund.
41
Harbor Strategic Markets Funds
Notes to Financial Statements—Continued
Notes to Financial Statements—Continued
Note 2—Significant Accounting Policies—Continued
Custodian
The Fund has credit balance arrangements with its custodian whereby positive balances in demand deposit accounts used by the transfer and shareholder servicing agent for clearing shareholder transactions in the Fund generate credits that are applied against gross custody expenses. Such custodial expense reductions, if any, are reflected on the Fund’s accompanying Statement of Operations.
Class Allocations
Income, common expenses and realized and unrealized gains/(losses) are determined at the Fund level and allocated daily to each class of shares based on the applicable net assets of the respective classes. Distribution and service fees, if any, and transfer agent fees are calculated daily at the class level based on the applicable net assets of each class and the expense rate(s) applicable to each class.
Basis for Consolidation
Harbor Cayman Commodity Fund Ltd. (the “Subsidiary”), a Cayman Islands exempted company, was incorporated on August 4, 2008 as a wholly-owned subsidiary acting as an investment vehicle for the Fund in order to gain exposure to certain asset classes consistent with the Fund’s investment objectives and policies specified in its prospectus and statement of additional information. Under the Articles of Association of the Subsidiary, the Fund will remain the sole shareholder of the Subsidiary and retain all rights associated with shares in the Subsidiary. The shares issued by the Subsidiary confer upon a shareholder the right to receive notice of, attend and vote at general meetings of the Subsidiary, rights in a winding-up or repayment of capital and the right to participate in the profits or assets of the Subsidiary. As such, the Fund has consolidated its investment in the Subsidiary into its financial statements and eliminated all intercompany accounts and transactions. Refer to the table below for details regarding the Subsidiary’s structure, incorporation, and relationships as of the year ended October 31, 2017 (amounts in thousands).
Date of Incorporation | 08/04/2008 |
Subscription Agreement | 09/02/2008 |
Consolidated Fund Total Assets | $92,477 |
Subsidary % of Fund Total Assets | 19% |
Subsidiary Financial Statement Information | |
Total assets | $18,024 |
Total liabilities | 1,568 |
Net assets | 16,456 |
Total income | 222 |
Net investment income/(loss) | (66) |
Net realized gain/(loss) | (524) |
Net change in unrealized appreciation/(depreciation) | 1,392 |
Increase/(decrease) in net asset resulting from operations | 802 |
Treatment of Income from Offshore Subsidiary
Direct investment by a mutual fund in certain commodity-linked securities and derivative instruments is limited under Subchapter M of the Internal Revenue Code by the requirement that a mutual fund receive no more than ten percent (10%) of its gross income from such investments in order to receive favorable tax treatment as a regulated investment company. The Fund seeks to gain exposure to commodity markets indirectly by investing in the Subsidiary, which may invest without limitation in commodity-linked securities and derivative instruments. The Internal Revenue Service has issued proposed regulations that, if finalized, would generally treat the Fund’s income inclusion with respect to the Subsidiary as qualifying income only if there is a distribution out of the earnings and profits of the Subsidiary that are attributable to such income inclusion. There can be no assurance that the Internal Revenue Service will not further change its position relating to whether that income derived from the Subsidiary is qualifying income. Furthermore, the tax treatment of the income received from the Subsidiary may potentially be affected by changes in legislation, regulations or other legally binding authority, which could affect the character, timing and amount of the Fund’s taxable income and distributions. If such changes occur, the Fund may need to significantly change its investment strategy and recognize unrealized gains in order to remain qualified for taxation as a regulated investment company, which could adversely affect the Fund.
42
Harbor Strategic Markets Funds
Notes to Financial Statements—Continued
Notes to Financial Statements—Continued
Note 2—Significant Accounting Policies—Continued
Taxes
The Fund is treated as a separate entity for federal tax purposes. The Fund’s policy is to meet the requirements of Subchapter M of the Internal Revenue Code applicable to regulated investment companies and to distribute to its shareholders all of its taxable income within the prescribed time. It is also the intention of the Fund to distribute an amount sufficient to avoid imposition of any excise tax under Section 4982 of the Internal Revenue Code. Therefore, no provision has been made for federal taxes on income, capital gains or unrealized appreciation of securities held or excise taxes on income and capital gains.
The Fund may be subject to taxes imposed by countries in which they invest. Such taxes are generally based on income and/or capital gains earned or repatriated. Taxes are accrued and applied to net investment income, net realized gains and unrealized appreciation as such income and/or gains are earned.
Management has analyzed the Fund’s tax positions for all open tax years (in particular, U.S. federal income tax returns for the tax years ended October 31, 2014–2016), including all positions expected to be taken upon filing the 2017 tax return, in all material jurisdictions where the Fund operates, and has concluded that no provision for income tax is required in the Fund’s financial statements. The Fund will recognize interest and penalties, if any, related to unrecognized tax benefits as income tax expense in the Statement of Operations.
Consolidated Statement of Cash Flows
U.S. GAAP requires entities providing financial statements that report both a statement of assets and liabilities and a statement of operations to also provide a statement of cash flows for each period for which results of operations are provided. Investment companies that meet certain conditions are exempted from this requirement. One of the conditions that must be satisfied is that the fund have little or no debt outstanding during the year. During the year ended October 31, 2017, the Fund entered into repurchase agreements, which are categorized as sale-buyback financing transactions under the Accounting Standards Update (“ASU”) 2011-03, A Reconsideration of Effective Control for Repurchase Agreements (“ASU 2011-03”). ASU 2011-03 refers to the accounting for repurchase agreements and similar agreements that entitle and obligate a transferor to repurchase or redeem financial assets before their maturity. These transactions resulted in debt being recorded on the Fund’s Statement of Assets and Liabilities. Management has determined that the average level of debt outstanding during the year for the Fund requires the Fund to present a Consolidated Statement of Cash Flows.
Investment Company Reporting Modernization
The Fund has adopted the Amendments to Regulation S-X as detailed in the SEC final rule on Investment Company Reporting Modernization (the “Rule”) which requires standardized, enhanced disclosure about derivatives in investment company financial statements, as well as other amendments. The derivative schedules included in the Fund’s Portfolio of Investments have been prepared to incorporate the new columns required by the Rule which became effective as of August 1, 2017. The adoption of the Rule had no impact on the Fund’s net assets or results of operations.
Note 3—Investment Portfolio Transactions
Purchases and sales of investments, other than short-term securities, for the Fund for the year ended October 31, 2017 are as follows:
| Purchases (000s) | Sales (000s) | ||||||
| U.S. Government | Other | U.S. Government | Other | ||||
Harbor Commodity Real Return Strategy Fund (Consolidated) | $1,158,258 | $10,246 | $1,160,433 | $32,006 | |||
43
Harbor Strategic Markets Funds
Notes to Financial Statements—Continued
Notes to Financial Statements—Continued
Note 4—Fees and Other Transactions with Affiliates
Investment Adviser
Harbor Capital is a wholly-owned subsidiary of Robeco Groep N.V. (“Robeco”). Robeco is wholly-owned by ORIX Corporation (“ORIX”). Harbor Capital is the Funds’ investment adviser and is also responsible for administrative and other services.
The Fund has an advisory agreement with Harbor Capital. The agreement provides for management fees based on an annual percentage rate of average daily net assets as follows:
| Contractual Rate | Actual Rate | ||
Harbor Commodity Real Return Strategy Fund (Consolidated) | 0.81% | 0.81% |
Harbor Capital has from time to time voluntarily or contractually agreed not to impose a portion of its management fees and/or to bear a portion of the expenses incurred in the operation of the Fund in order to limit Fund expenses. Such waivers, if any, are reflected on the accompanying Statement of Operations. For the period November 1, 2016 through October 31, 2017, Harbor Capital has contractually agreed to limit the operating expenses, excluding interest expense (if any), to 0.94% and 1.19% for the Institutional Class and Administrative Class, respectively. In addition, Harbor Capital has contractually agreed to waive the management fee it receives from the Fund in an amount equal to the management fee paid to Harbor Capital by the Subsidiary. This waiver may not be terminated by Harbor Capital and will remain in effect for as long as Harbor Capital’s contract with the Subsidiary is in place. The contractual expense limitations are effective through February 28, 2018.
All expense limitation agreements include the transfer agent fee waiver discussed in the Transfer Agent note.
Distributor
Harbor Funds Distributors, Inc. (“Harbor Funds Distributors” or the “Distributor”), a wholly-owned subsidiary of Harbor Capital, is the distributor for Harbor Funds’ shares. Under the Trust’s current distribution plan pursuant to Rule 12b-1 under the Investment Company Act with respect to the Fund’s Administrative Class shares (the “12b-1 Plan”), the Fund pays the Distributor compensation at the annual rate of 0.25% of the average daily net assets of its Administrative Class shares. Pursuant to the 12b-1 Plan the Distributor is compensated for financing any activity that is primarily intended to result in the sale of Administrative Class shares of the Fund or for recordkeeping services or the servicing of shareholder accounts in the Administrative Class shares of the Fund. Such activities include, but are not limited to: printing of prospectuses and statements of additional information and reports for prospective shareholders (i.e., other than existing shareholders); preparation and distribution of advertising material and sales literature; expenses of organizing and conducting sales seminars; supplemental payments to dealers or other institutions such as asset-based sales charges, payments of recordkeeping fees under recordkeeping arrangements, or payments of service fees under shareholder service arrangements; and costs of administering the 12b-1 Plan.
Amounts payable by the Fund under the 12b-1 Plan need not be directly related to the expenses actually incurred by the Distributor on behalf of the Fund. The 12b-1 Plan does not obligate the Fund to reimburse the Distributor for the actual expenses the Distributor may incur in fulfilling its obligations under the 12b-1 Plan. Thus, even if the Distributor’s actual expenses exceed the fee payable to the Distributor at any given time, the Fund will not be obligated to pay more than that fee. If the Distributor’s expenses are less than the fee it receives, the Distributor will retain the difference.
The fees attributable to the Fund’s respective class are shown on the accompanying Statement of Operations.
Transfer Agent
Harbor Services Group, Inc. (“Harbor Services Group”), a wholly-owned subsidiary of Harbor Capital, is the transfer and shareholder servicing agent for the Fund. The transfer agency and service agreement is reviewed and approved annually by the Board of Trustees and provides currently for compensation up to the following amounts per class of the Fund:
| Transfer Agent Feesa | |
Institutional Class | 0.09% of the average daily net assets of all Institutional Class shares |
Administrative Class | 0.09% of the average daily net assets of all Administrative Class shares |
| a | For the period November 1, 2016 through February 28, 2017, the Transfer Agent Fees were 0.08% for the Institutional and Administrative Class shares. |
44
Harbor Strategic Markets Funds
Notes to Financial Statements—Continued
Notes to Financial Statements—Continued
Note 4—Fees and Other Transactions with Affiliates—Continued
Harbor Services Group has voluntarily waived a portion of its transfer agent fees during the year ended October 31, 2017. Fees incurred for these transfer agent services are shown on the Fund’s Statement of Operations. The voluntary waiver may be discontinued at any time.
Affiliated Transactions
The Investment Company Act permits purchase and sale transactions among affiliated investment companies subject to an exemptive rule. Harbor Funds has adopted policies and procedures pursuant to such rule. During the year, the Fund did not enter into any transactions with any other Harbor fund.
Shareholders
On October 31, 2017, Harbor Capital, Harbor Funds Distributors, and Harbor Services Group, collectively held the following shares of beneficial interest in the Fund:
| Number of Shares Owned by Harbor Capital, Harbor Funds Distributors, and Harbor Services Group | Percentage of Outstanding Shares | ||||||
| Institutional Class | Administrative Class | Total | |||||
Harbor Commodity Real Return Strategy Fund (Consolidated) | 81,867 | — | 81,867 | 0.6% | |||
Independent Trustees
The fees and expenses of the Independent Trustees are shown on the Fund’s Statement of Operations. The Independent Trustees’ remuneration for the Fund totaled $2,000 for the year ended October 31, 2017.
The Board of Trustees has adopted a Deferred Compensation Plan for Independent Trustees (the “Plan”), which enables Trustees to elect to defer receipt of all or a portion of the annual compensation they are entitled to receive from the Trust. For purposes of determining the amount owed to a Trustee under the Plan, deferred amounts are treated as though they had been invested in shares of the Fund(s) selected by the Trustee. While not required to do so, the Fund makes an investment equal to the Trustee’s investment election. The deferred compensation liability and the offsetting deferred compensation investment asset are included as a component of “Other Accrued Expenses” and “Other assets”, respectively, in the Statement of Assets and Liabilities. Such amounts fluctuate with changes in the market value of the selected securities. The deferred compensation and related mark-to-market impact liability and an offsetting investment asset will remain on the Fund’s Statement of Assets and Liabilities until distributed in accordance with the Plan.
Indemnification
Under the Trust’s organizational documents, its officers and Trustees are indemnified against certain liabilities arising out of the performance of their duties to the Trust. In addition, in the normal course of business the Trust enters into contracts that provide general indemnities to other parties. The Trust’s maximum exposure under these arrangements is unknown as this would involve future claims that may be made against the Trust that have not yet occurred. The risk of material loss as a result of such indemnification claims is considered remote.
NOTE 5—TAX INFORMATION
The amount and character of income and net realized gains to be distributed are determined in accordance with income tax rules and regulations, which may differ from U.S. GAAP. These differences are attributable to permanent book and tax accounting differences that were primarily due to swap agreements, paydown reclasses, tax treatment of income from controlled foreign corporation, and foreign currency transactions. Reclassifications are made to the Fund’s capital account to reflect income and net realized gains available for distribution (or available capital loss carryovers) under income tax rules and regulations. Distributions
45
Harbor Strategic Markets Funds
Notes to Financial Statements—Continued
Notes to Financial Statements—Continued
NOTE 5—TAX INFORMATION—Continued
classified as a return of capital, if any, are reflected on the Statements of Changes in Net Assets and have been recorded to paid in capital. The amounts reclassified on the Statement of Assets and Liabilities for the year ended October 31, 2017 are as follows:
| Undistributed Net Investment Income/(Loss) (000s) | Accumlated Net Realized Gain/(Loss) (000s) | Paid-In Capital (000s) | |||
Harbor Commodity Real Return Strategy Fund (Consolidated) | $(396) | $985 | $(589) |
The tax composition of the Fund’s distributions is as follows:
| As of October 31, 2017 | As of October 31, 2016 | ||||||||||||
| Ordinary Income (000s) | Long-Term Capital Gains (000s) | Total (000s) | Ordinary Income (000s) | Long-Term Capital Gains (000s) | Return of Capital (000s) | Total (000s) | |||||||
Harbor Commodity Real Return Strategy Fund (Consolidated) | $635 | $— | $635 | $1,980 | $— | $599 | $2,579 | ||||||
As of October 31, 2017, the components of the Fund’s distributable earnings on a tax basis are as follows:
| Undistributed Ordinary Income (000s) | Undistributed Long-Term Capital Gains (000s) | Unrealized Appreciation/ (Depreciation) (000s) | |||
Harbor Commodity Real Return Strategy Fund (Consolidated) | $1,747 | $— | $(1,346) |
At October 31, 2017, the Fund had a capital loss carryforward for federal tax purposes, which will reduce the Fund’s taxable income arising from future net realized gain on investments, if any, to the extent permitted by the Internal Revenue Code. This will reduce the amount of the distribution to shareholders which would otherwise be necessary to relieve the Fund of any federal tax liability. The following capital loss carryforwards do not expire:
| Capital Loss Carryforwards | |||||
| Short-Term (000s) | Long- Term (000s) | Total (000s) | |||
Harbor Commodity Real Return Strategy Fund (Consolidated) | $7,928 | $15,928 | $23,856 | ||
The identified cost for federal income tax purposes of investments owned by the Fund and its respective gross unrealized appreciation and depreciation at October 31, 2017 is as follows:
| Identified Cost (000s) | Gross Unrealized | Net Unrealized Appreciation/ (Depreciation) (000s) | |||||
| Appreciation (000s) | (Depreciation) (000s) | ||||||
Harbor Commodity Real Return Strategy Fund (Consolidated)* | $81,719 | $538 | $(1,884) | $(1,346) | |||
| * | Capital loss carryforwards are available which may reduce taxable income from future net realized gain on investments. |
Note 6—Derivatives
The Fund’s derivative holdings do not qualify for hedge accounting treatment and as such are recorded at current fair value. For a discussion of risks related to these investments please refer to the descriptions of each type of derivative instrument in Note 2— Significant Accounting Policies.
The Fund’s derivative instruments outstanding as of the year ended October 31, 2017, if any, as disclosed in the Portfolio of Investments, and the related amounts of realized and changes in unrealized gains and losses on derivative instruments during the year as disclosed in the Statement of Operations, are indicators of the volume of derivative activity for the Fund.
46
Harbor Strategic Markets Funds
Notes to Financial Statements—Continued
Notes to Financial Statements—Continued
Note 6—Derivatives—Continued
Derivative Instruments
At October 31, 2017, the fair values of derivatives, by primary risk exposure, were reflected in the Statement of Assets and Liabilities as follows:
HARBOR COMMODITY REAL RETURN STRATEGY FUND (CONSOLIDATED)
| Statement of Assets and Liabilities Caption | Interest Rate Contracts (000s) | Foreign Exchange Contracts (000s) | Credit Contracts (000s) | Commodity Contracts (000s) | Total (000s) | ||||||||||
| Assets | |||||||||||||||
Unrealized appreciation on open forward currency contracts | $ — | $ 156 | $ — | $ — | $ 156 | ||||||||||
Unrealized appreciation on OTC swap agreementsb | — | — | 25 | 288 | 313 | ||||||||||
Variation margin on centrally cleared swap agreementsa,b | 303 | — | — | — | 303 | ||||||||||
Variation margin on options and futures contracts (futures)a | 79 | — | — | 176 | 255 | ||||||||||
Variation margin on options and futures contracts (options)a | 1 | — | — | — | 1 | ||||||||||
Purchased options, at value | 49 | — | — | 3 | 52 | ||||||||||
| Liabilities | |||||||||||||||
Unrealized depreciation on open forward currency contracts | $ — | $(264) | $ — | $ — | $(264) | ||||||||||
Unrealized depreciation on OTC swap agreementsb | (22) | — | — | (68) | (90) | ||||||||||
Variation margin on centrally cleared swap agreementsa,b | (117) | — | (15) | — | (132) | ||||||||||
Variation margin on options and futures contracts (futures)a | (12) | — | — | (202) | (214) | ||||||||||
Variation margin on options and futures contracts (options)a | (1) | — | — | — | (1) | ||||||||||
Written options, at value | (16) | — | — | (4) | (20) | ||||||||||
| a | Includes cumulative appreciation/depreciation of contracts as reported in the Portfolio of Investments. Only current day’s variation margin is reported within the Statement of Assets and Liabilities. |
| b | Net of premiums received of $34,000. |
Realized net gain/(loss) and the change in unrealized appreciation/(depreciation) on derivatives, by primary risk exposure, for the year ended October 31, 2017, were:
HARBOR COMMODITY REAL RETURN STRATEGY FUND (CONSOLIDATED)
| Net Realized Gain/(Loss) on Derivatives | Interest Rate Contracts (000s) | Foreign Exchange Contracts (000s) | Credit Contracts (000s) | Commodity Contracts (000s) | Total (000s) | |||||
Forward currency contracts | $ — | $(421) | $ — | $ — | $ (421) | |||||
Futures contracts | (6) | — | — | 107 | 101 | |||||
Purchased options | (38) | — | — | — | (38) | |||||
Written options | 35 | 30 | — | — | 65 | |||||
Swaps agreements | 23 | — | (78) | (688) | (743) | |||||
Net realized gain/(loss) on derivatives | $ 14 | $(391) | $(78) | $(581) | $(1,036) |
| Change in Unrealized Appreciation/(Depreciation) on Derivatives | Interest Rate Contracts (000s) | Foreign Exchange Contracts (000s) | Credit Contracts (000s) | Commodity Contracts (000s) | Total (000s) | |||||
Forward currency contracts | $ — | $233 | $ — | $ — | $ 233 | |||||
Futures contracts | (89) | — | — | (37) | (126) | |||||
Purchased options | 99 | — | — | 2 | 101 | |||||
Written options | (54) | — | (11) | (1) | (66) | |||||
Swaps agreements | 838 | — | 13 | 1,552 | 2,403 | |||||
Change in unrealized appreciation/(depreciation) on derivatives | $794 | $233 | $ 2 | $1,516 | $2,545 |
47
Harbor Strategic Markets Funds
Notes to Financial Statements—Continued
Notes to Financial Statements—Continued
Note 7—OFFSETTING ASSETS AND LIABILITIES
Master Netting Arrangements
As described in further detail below, the Fund may enter into Master Netting Arrangements that govern the terms of certain transactions. Master Netting Arrangements are designed to reduce the counterparty risk associated with relevant transactions by establishing credit protection mechanisms and providing standardization as a means of improving legal certainty. As Master Netting Arrangements are specific to the unique operations of different asset types, they allow the Fund to close out and net its total exposure to a counterparty in the event of a default with respect to all of the transactions governed under a single agreement with that counterparty. Master Netting Arrangements can also help reduce counterparty risk by specifying collateral posting requirements at pre-arranged exposure levels. Securities and cash pledged as collateral are reflected as assets in the Statement of Assets and Liabilities as either a component of investments at value (securities) or cash-restricted. Cash collateral received is not typically held in a segregated account and, as such, is reflected as a liability in the Statement of Assets and Liabilities as due to broker. The fair value of any securities received as collateral is not reflected as a component of net asset value.
For the year ended October 31, 2017, the Fund entered into the following Master Netting Arrangements:
Master Repurchase Agreements and Global Master Repurchase Agreements, which govern repurchase and reverse repurchase transactions between the Fund and select counterparties.
Master Securities Forward Transaction Agreements, which govern the considerations and factors surrounding the settlement of certain forward settling transactions, such as delayed-delivery or sale-buyback transactions by and between the Fund and select counterparties.
International Swaps and Derivatives Association, Inc. Master Agreements and Credit Support Annexes, which govern OTC market traded financial derivative transactions entered into by the Fund and select counterparties.
The following is a summary by counterparty of the gross value of material Borrowings and Other Financing Transactions and collateral (received)/pledged as of October 31, 2017:
HARBOR COMMODITY REAL RETURN STRATEGY FUND (CONSOLIDATED)
| Counterparty | Repurchase Agreement Proceeds to be Received (000s) | Payable for Reverse Repurchase Agreements (000s) | Payable for Sale-Buyback Transactions (000s) | Payable for Short Sale (000s) | Total Borrowings and Other Financing Transactions (000s) | Collateral (Received)/ Pledged (000s) | Net Exposure (000s) | ||||||||||||||
| Harbor Commodity Real Return Strategy Funda | |||||||||||||||||||||
| Master/Global Repurchase Agreement | |||||||||||||||||||||
Fixed Income Clearing Corp. | $ 1,293 | $— | $ — | $ — | $ 1,293 | $(1,293) | $ — | ||||||||||||||
| Master Securities Forward Transactions Agreements | |||||||||||||||||||||
Barclays Capital Inc. | — | — | (14,156) | — | (14,156) | — | (14,156) | ||||||||||||||
BNP Paribas NY | — | — | (19,591) | — | (19,591) | — | (19,591) | ||||||||||||||
Credit Suisse Securities LLC | — | — | — | (100) | (100) | — | (100) | ||||||||||||||
Morgan Stanley Co. Inc. | — | — | — | (200) | (200) | — | (200) | ||||||||||||||
| Harbor Cayman Commodity Fund Ltd. (Subsidiary)a | |||||||||||||||||||||
| Master/Global Repurchase Agreement | |||||||||||||||||||||
Barclays Capital Inc. | 1,500 | — | — | — | 1,500 | (1,500) | — | ||||||||||||||
Citigroup Global Markets Inc. | 4,100 | — | — | — | 4,100 | (4,100) | — | ||||||||||||||
JPMorgan Securities LLC | 4,100 | — | — | — | 4,100 | (4,100) | — | ||||||||||||||
Total Borrowings and Other Financing Transactions | $10,993 | $— | $(33,747) | $(300) | |||||||||||||||||
| a | The Harbor Commodity Real Return Strategy Fund and its subsidiary, Harbor Cayman Commodity Fund Ltd. are recognized as two separate legal entities. As such, exposure cannot be netted. |
Harbor Commodity Real Return Strategy Fund (Consolidated) has not pledged any securities as collateral under the terms of the above Master Repurchase and Master Securities Forward Transactions agreements as of October 31, 2017.
48
Harbor Strategic Markets Funds
Notes to Financial Statements—Continued
Notes to Financial Statements—Continued
Note 7—OFFSETTING ASSETS AND LIABILITIES—Continued
The following is a summary by counterparty of the value of OTC financial derivative instruments and collateral (received)/pledged as governed by International Swaps and Derivatives Association, Inc. master agreements as of October 31, 2017:
HARBOR COMMODITY REAL RETURN STRATEGY FUND (CONSOLIDATED)
| Financial Derivative Assets | Financial Derivative Liabilities | Net Value of OTC Derivatives (000s) | Collateral (Received)/ Pledged* (000s) | Net Exposure (000s) | |||||||||||||||||||||||||||||
| Counterparty | Forward Currency Contracts (000s) | Purchased Options (000s) | Swap Agreements (000s) | Total Over-the- Counter (000s) | Forward Currency Contracts (000s) | Written Options (000s) | Swap Agreements (000s) | Total Over-the- Counter (000s) | |||||||||||||||||||||||||
| Harbor Commodity Real Return Strategy Funda | |||||||||||||||||||||||||||||||||
Bank of America NA | $ 19 | $— | $ — | $ 19 | $ (1) | $ — | $ — | $ (1) | $ 18 | $ — | $ 18 | ||||||||||||||||||||||
BNP Paribas SA | 1 | — | — | 1 | (13) | — | — | (13) | (12) | — | (12) | ||||||||||||||||||||||
Citibank NA | 2 | — | — | 2 | (8) | — | — | (8) | (6) | — | (6) | ||||||||||||||||||||||
Credit Suisse International | 2 | — | — | 2 | — | — | — | — | 2 | — | 2 | ||||||||||||||||||||||
Deutsche Bank AG | — | 34 | 8 | 42 | (155) | (1) | — | (156) | (114) | — | (114) | ||||||||||||||||||||||
Goldman Sachs Bank USA | 2 | — | — | 2 | (4) | (4) | — | (8) | (6) | — | (6) | ||||||||||||||||||||||
Goldman Sachs International | — | — | 13 | 13 | — | — | (2) | (2) | 11 | — | 11 | ||||||||||||||||||||||
HSBC Bank USA NA | — | — | 4 | 4 | — | — | — | — | 4 | — | 4 | ||||||||||||||||||||||
JP Morgan Chase Bank | — | — | — | — | (24) | — | — | (24) | (24) | — | (24) | ||||||||||||||||||||||
JP Morgan Chase Bank NA | 82 | — | — | 82 | (12) | (4) | — | (16) | 66 | — | 66 | ||||||||||||||||||||||
Morgan Stanley Capital Services LLC | — | 13 | — | 13 | — | (1) | (20) | (21) | (8) | — | (8) | ||||||||||||||||||||||
Royal Bank of Scotland plc | — | — | — | — | — | (1) | — | (1) | (1) | — | (1) | ||||||||||||||||||||||
Société Générale | 1 | — | — | 1 | — | — | — | — | 1 | — | 1 | ||||||||||||||||||||||
UBS AG | 47 | — | — | 47 | (47) | — | — | (47) | — | — | — | ||||||||||||||||||||||
| Harbor Cayman Commodity Fund Ltd. (Subsidiary)a | |||||||||||||||||||||||||||||||||
BNP Paribas SA | — | — | 7 | 7 | — | — | (19) | (19) | (12) | — | (12) | ||||||||||||||||||||||
Canadian Imperial Bank of Commerce | — | — | 11 | 11 | — | — | — | — | 11 | — | 11 | ||||||||||||||||||||||
Citibank NA | — | — | 18 | 18 | — | — | (1) | (1) | 17 | — | 17 | ||||||||||||||||||||||
Credit Suisse International | — | — | 5 | 5 | — | — | — | — | 5 | — | 5 | ||||||||||||||||||||||
Goldman Sachs International | — | — | 81 | 81 | — | — | (22) | (22) | 59 | — | 59 | ||||||||||||||||||||||
JP Morgan Chase Bank NA | — | — | 68 | 68 | — | — | (22) | (22) | 46 | — | 46 | ||||||||||||||||||||||
Morgan Stanley Capital Services LLC | — | — | 94 | 94 | — | — | (4) | (4) | 90 | (90) | — | ||||||||||||||||||||||
Société Générale Paris | — | — | 4 | 4 | — | — | — | — | 4 | — | 4 | ||||||||||||||||||||||
Total Over-the-Counter Exposure | $156 | $ 47 | $313 | $516 | $(264) | $(11) | $(90) | $(366) | |||||||||||||||||||||||||
| * | Of the total collateral received and/or pledged listed in the table above, cash of $90 has been received as collateral. |
| a | The Harbor Commodity Real Return Strategy Fund and its subsidiary, Harbor Cayman Commodity Fund Ltd. are recognized as two separate legal entities. As such, exposure cannot be netted. |
Exchange traded and centrally cleared derivatives are not subject to master netting or similar arrangements.
Note 8—Subsequent Events
At a meeting of the Board of Trustees held on November 19 and 20, 2017, the Board of Trustees voted to liquidate and dissolve the Fund. The liquidation of the Fund is expected to occur on January 26, 2018. Because the Fund is liquidating, the Fund is now closed to new investors. Additional information related to the liquidation can be found in the supplements to the Fund’s prospectus and statement of additional information as filed with the Securities and Exchange Commission on November 27, 2017.
49
Harbor Strategic Markets Funds
Report of Independent Registered Public Accounting Firm
Report of Independent Registered Public Accounting Firm
The Board of Trustees and Shareholders of
Harbor Funds
We have audited the accompanying statement of assets and liabilities of Harbor Commodity Real Return Strategy Fund (consolidated) (one of the portfolios constituting the Harbor Funds (the Trust)), including the portfolio of investments, as of October 31, 2017, and the related statements of operations and cash flows for the year then ended, the statement of changes in net assets for each of the two years in the period then ended, and the financial highlights for each of the five years in the period then ended. These financial statements and financial highlights are the responsibility of the Trust’s management. Our responsibility is to express an opinion on these financial statements and financial highlights based on our audits.
We conducted our audits in accordance with the standards of the Public Company Accounting Oversight Board (United States). Those standards require that we plan and perform the audit to obtain reasonable assurance about whether the financial statements and financial highlights are free of material misstatement. We were not engaged to perform an audit of the Trust’s internal control over financial reporting. Our audits included consideration of internal control over financial reporting as a basis for designing audit procedures that are appropriate in the circumstances, but not for the purpose of expressing an opinion on the effectiveness of the Trust’s internal control over financial reporting. Accordingly, we express no such opinion. An audit also includes examining, on a test basis, evidence supporting the amounts and disclosures in the financial statements and financial highlights, assessing the accounting principles used and significant estimates made by management, and evaluating the overall financial statement presentation. Our procedures included confirmation of securities owned as of October 31, 2017, by correspondence with the custodian, agent banks and brokers, or by other appropriate auditing procedures where replies from agent banks and brokers were not received. We believe that our audits provide a reasonable basis for our opinion.
In our opinion, the financial statements and financial highlights referred to above present fairly, in all material respects, the financial position of Harbor Commodity Real Return Strategy Fund (consolidated) at October 31, 2017, the results of its operations and cash flows for the year then ended, the changes in its net assets for each of the two years in the period then ended, and the financial highlights for each of the five years in the period then ended, in conformity with U.S. generally accepted accounting principles.

Chicago, Illinois
December 21, 2017
December 21, 2017
50
Harbor Strategic Markets Funds
Fees and Expenses Example (Unaudited)
Fees and Expenses Example (Unaudited)
Example
As a shareholder of the Fund, you incur two types of costs: (1) transaction costs, including redemption fees (if any) and (2) ongoing costs, including management fees, distribution and service (12b-1) fees (if any), and other Fund expenses. This example is intended to help you understand your ongoing costs (in dollars) of investing in the Fund and to compare these costs with the ongoing costs of investing in other mutual funds.
The example is based on an investment of $1,000 invested at the beginning of the period and held for the entire period May 1, 2017 through October 31, 2017.
Actual Expenses
The first line of the table below provides information about actual account values and actual expenses for each share class. You may use the information in the respective class line, together with the amount you invested, to estimate the expenses that you paid over the period. Simply divide your account value by $1,000 (for example, an $8,600 account value divided by $1,000 = 8.6), then multiply the result by the number in the first line of the respective class under the heading entitled “Expenses Paid During Period” to estimate the expenses you paid on your account during this period.
Hypothetical Example for Comparison Purposes
The second line of the table for each share class below provides information about hypothetical account values and hypothetical expenses based on the respective Fund/Class’s actual expense ratio and an assumed rate of return of 5% per year before expenses, which is not the respective Fund/Class’s actual return. The hypothetical account values and expenses may not be used to estimate the actual ending account balance or expenses you paid for the period. You may use this information to compare the ongoing costs of investing in the Fund to other funds. To do so, compare this 5% hypothetical example with the 5% hypothetical examples that appear in the shareholder reports of the other funds.
Please note that the expenses shown in the table are meant to highlight your ongoing costs only and do not reflect any transactional costs, such as redemption fees. Therefore, the second line of the table is useful in comparing ongoing costs only, and will not help you determine the relative total costs of owning different funds. In addition, if these transactional costs were included, your costs would have been higher.
| Annualized Expense Ratios* | Expenses Paid During Period** | Beginning Account Value May 1, 2017 | Ending Account Value October 31, 2017 | |||||
| Harbor Commodity Real Return Strategy Fund | ||||||||
| Institutional Class | 0.94% | |||||||
| Actual | $4.82 | $1,000 | $1,034.10 | |||||
| Hypothetical (5% return) | 4.79 | 1,000 | 1,020.35 | |||||
| Administrative Class | 1.19% | |||||||
| Actual | $6.09 | $1,000 | $1,031.50 | |||||
| Hypothetical (5% return) | 6.06 | 1,000 | 1,019.06 | |||||
| * | Reflective of all fee waivers and expense reimbursements (excluding interest expense, if any) |
| ** | Expenses are equal to the Fund’s annualized expense ratio, multiplied by the average account value over the period, multiplied by 184/365 (to reflect the one-half year period). |
51
Harbor Strategic Markets Funds
Additional Information (Unaudited)
Additional Information (Unaudited)
Additional Tax Information
For the fiscal year ended October 31, 2017, the Fund designates up to the maximum amount of such dividends allowable pursuant to the Internal Revenue Code as qualified dividend income eligible for reduced tax rates. These lower rates range from 0% to 20% depending on an individual’s tax bracket. If the Fund pays a distribution during calendar year 2017, complete information will be reported in conjunction with Form 1099-DIV.
Shareholders who own shares through a taxable Harbor Funds account and that received distributions from the Fund during calendar year 2017 will receive a Form 1099-DIV in January 2018 that will show the tax character of those distributions.
Proxy Voting
Harbor Funds has adopted Proxy Voting Policies and Procedures under which proxies relating to securities held by the Harbor funds are voted. In addition, Harbor Funds files Form N-PX, with its complete proxy voting record for the 12 months ended June 30th, no later than August 31st of each year. A description of Harbor Funds’ Proxy Voting Policies and Procedures and the proxy voting records (Form N-PX) are available (i) upon request, by calling Harbor Funds toll-free at 800-422-1050; (ii) on Harbor Funds’ website at harborfunds.com; and (iii) on the SEC’s website at sec.gov.
Householding
Harbor Funds has adopted a policy that allows it to send only one copy of the Fund’s prospectus, proxy materials, annual report and semi-annual report to certain shareholders residing at the same household. This reduces Fund expenses, which benefits you and other shareholders. If you need additional copies or do not want your mailings to be “householded,” please call the Shareholder Servicing Agent at 800-422-1050. Individual copies will be sent within thirty (30) days after the Shareholder Servicing Agent receives your instructions. Your consent to householding is considered valid until revoked.
Quarterly Portfolio Disclosures
Harbor Funds files a complete portfolio of investments with the SEC for the first and third quarters of each fiscal year on Form N-Q. The Fund’s Form N-Q is available (i) without charge, upon request, by calling Harbor Funds toll-free at 800-422-1050, (ii) on Harbor Funds’ website at harborfunds.com, and (iii) on the SEC’s website at sec.gov. The form may also be viewed and copied at the SEC’s Public Reference Room in Washington, DC. Information regarding the operations of the Public Reference Room may also be obtained by calling 800-SEC-0330.
Special meeting of shareholders
At a special meeting of the shareholders of the Harbor Funds held on September 22, 2017, shareholders elected six trustees to the Board of Trustees of Harbor Funds. Scott M. Amero, Robert A. Kasdin, and Ann M. Spruill were previously appointed as Trustees but had not been elected by shareholders. Raymond J. Ball, Donna J. Dean, and Randall A. Hack continue to serve on the Board.
| Trustee | For | Withhold | ||
Scott M. Amero | 1,047,869,265 | 14,860,642 | ||
Joseph L. Dowling III | 1,046,335,272 | 16,394,636 | ||
Robert A. Kasdin | 1,047,514,035 | 15,215,872 | ||
Charles F. McCain | 1,047,667,935 | 15,061,973 | ||
Kathryn L. Quirk | 1,046,812,694 | 15,917,214 | ||
Ann M. Spruill | 1,047,274,165 | 15,455,742 |
At a special meeting of the shareholders of the Harbor Funds held on September 22, 2017, shareholders did not approve an amendment to the Fund’s fundamental investment restriction regarding borrowing.
| Fund Name | For | Against | Abstain | Broker Non-Vote | ||||
Harbor Commodity Real Return Strategy Funda | 5,206,476 | 628,422 | 114,556 | 5,056,638 |
52
Harbor Strategic Markets Funds
Additional Information—Continued
Additional Information—Continued
Special meeting of shareholders—Continued
At a special meeting of the shareholders of the Harbor Funds held on September 22, 2017, shareholders did not approve an amendment to the Fund’s fundamental investment restriction regarding lending.
| Fund Name | For | Against | Abstain | Broker Non-Vote | ||||
Harbor Commodity Real Return Strategy Funda | 5,192,936 | 641,547 | 114,971 | 5,056,638 |
| a | Meeting held on November 15, 2017 |
53
Harbor Strategic Markets Funds
Additional Information—Continued
Additional Information—Continued
Trustees and Officers
As of December 2017
The business and affairs of the Trust shall be managed by or under the direction of the Trustees, and they shall have all powers necessary or desirable to carry out that responsibility. The Trustees shall have full power and authority to take or refrain from taking any action and to execute any contracts and instruments that they may consider necessary or desirable in the management of the Trust. Any determination made by the Trustees in good faith as to what is in the interests of the Trust shall be conclusive. Information pertaining to the Trustees and Officers of Harbor Funds is set forth below. The address of each Trustee and Officer is: [Name of Trustee or Officer] c/o Harbor Funds, 111 South Wacker Drive, 34th Floor, Chicago, IL 60606-4302.
The Harbor Fund’s Statement of Additional Information includes additional information about the Trust’s Trustees and is available without charge by calling 800-422-1050 or at the Trust’s website at harborfunds.com.
| Name (Age) Position(s) with Fund | Term of Office and Length of Time Served1 | Principal Occupation(s) During Past Five Years | Number of Portfolios In Fund Complex Overseen By Trustee | Other Directorships Of Public Companies and Other Registered Investment Companies Held by Trustee During Past Five Years |
INDEPENDENT TRUSTEES | ||||
| Scott M. Amero (54) Trustee | Since 2014 | Chairman (2015-Present) and Trustee (2011-2015), Rare (conservation nonprofit); Trustee, Berkshire School (2014-Present); Vice Chairman and Global Chief Investment Officer, Fixed Income (2010), Vice Chairman and Global Chief Investment Officer, Fixed Income, and Co-Head, Fixed Income Portfolio Management (2007-2010), BlackRock, Inc., (publicly traded investment management firm). | 32 | None |
| Raymond J. Ball (73) Trustee | Since 2006 | Sidney Davidson Distinguished Service Professor of Accounting, University of Chicago Booth School of Business (2000-Present); Academic Affiliate, Analysis Group (litigation consulting firm) (2000-Present); Financial Reporting Faculty Advisory Group of the Institute of Chartered Accountants in England and Wales (2008-Present); and Advisory Board of the Center for Accounting Research & Education at University of Notre Dame (2006-Present). | 32 | None |
| Donna J. Dean (66) Trustee | Since 2010 | Chief Investment Officer of the Rockefeller Foundation (a private foundation) (1995-Present). | 32 | None |
| Joseph L. Dowling III (53) Trustee | Since 2017 | Chief Investment Officer, Brown University (2013-Present); Advisory Board Member, Stage Point Capital (private mortgage specialist) (2016-Present); Advisory Board Member, Harbor Funds (2016-2017); and Founder and Managing Member, Narragansett Asset Management (private investment management firm) (1998-2013). | 32 | Director of Integrated Electrical Services (2011-Present). |
| Randall A. Hack (70) Trustee | Since 2010 | Founder and Senior Managing Director of Capstone Capital LLC (private investment firm) (2003-Present); Director of Tower Development Corporation (cell tower developer) (2009-2016); and Advisory Director of Berkshire Partners (private equity firm) (2002-2013). | 32 | None |
| Robert Kasdin (59) Trustee | Since 2014 | Senior Vice President and Chief Operating Officer, Johns Hopkins Medicine (2015-Present); Senior Executive Vice President, Columbia University (2002-2015); Trustee and Co-Chair of the Finance Committee, National September 11 Memorial & Museum at the World Trade Center (2005-Present); Director, Apollo Commercial Real Estate Finance, Inc. (2014-Present); and Director, Noranda Aluminum Holdings Corp. (2007-2014). | 32 | Director of Noranda Aluminum Holdings Corporation (2007-2014); and Director of Apollo Commercial Real Estate Finance, Inc. (2014-Present). |
54
Harbor Strategic Markets Funds
Additional Information—Continued
Additional Information—Continued
Trustees and Officers—Continued
| Name (Age) Position(s) with Fund | Term of Office and Length of Time Served1 | Principal Occupation(s) During Past Five Years | Number of Portfolios In Fund Complex Overseen By Trustee | Other Directorships Of Public Companies and Other Registered Investment Companies Held by Trustee During Past Five Years |
INDEPENDENT TRUSTEES—Continued | ||||
| Kathryn L. Quirk (65) Trustee | Since 2017 | Retired; Vice President, Senior Compliance Officer and Head, U.S. Regulatory Compliance, Goldman Sachs Asset Management (2013-2017); Deputy Chief Legal Officer, Asset Management, and Vice President and Corporate Counsel, Prudential Insurance Company of America (2010-2012); Co-Chief Legal Officer, Prudential Investment Management, Inc., and Chief Legal Officer, Prudential Investments and Prudential Mutual Funds (2008-2012); Vice President and Corporate Counsel and Chief Legal Officer, Mutual Funds, Prudential Insurance Company of America, and Chief Legal Officer, Prudential Investments (2005-2008); Vice President and Corporate Counsel and Chief Legal Officer, Mutual Funds, Prudential Insurance Company of America (2004-2005); Member, Management Committee (2000-2002), General Counsel and Chief Compliance Officer, Zurich Scudder Investments, Inc. (1997-2002). | 32 | None |
| Ann M. Spruill (63) Trustee | Since 2014 | Partner (1993-2008), member of Executive Committee (1996-2008), Member Board of Directors (2002-2008), Grantham, Mayo, Van Otterloo & Co, LLC (private investment management firm) (with the firm since 1990); Member Investment Committee and Chair of Global Equities, Museum of Fine Arts, Boston (2000-Present); and Trustee, Financial Accounting Foundation (2014-Present). | 32 | None |
INTERESTED TRUSTEE | ||||
| Charles F. McCain (48)* Chairman, Trustee and President | Since 2017 | Chief Executive Officer (2017-Present), Director (2007-Present), President and Chief Operating Officer (2017), Executive Vice President and General Counsel (2004-2017), and Chief Compliance Officer (2004-2014), Harbor Capital Advisors, Inc.; Director (2007-Present) and Chief Compliance Officer (2004-2017), Harbor Services Group, Inc.; and Chief Executive Officer (2017-Present), Director (2007-Present), Chief Compliance Officer and Executive Vice President (2007-2017), Harbor Funds Distributors, Inc. | 32 | None |
| Name (Age) Position(s) with Fund | Term of Office and Length of Time Served1 | Principal Occupation(s) During Past Five Years |
FUND OFFICERS NOT LISTED ABOVE** | ||
| Erik D. Ojala (42) Chief Compliance Officer and Secretary | Since 2017 Since 2007 | Executive Vice President and General Counsel (2017-Present) and Secretary (2010-Present); Senior Vice President and Associate General Counsel (2007-2017), Harbor Capital Advisors, Inc.; Director, Executive Vice President and Chief Compliance Officer (2017-Present), Harbor Funds Distributors, Inc.; and Director (2017-Present) and Assistant Secretary (2014-Present), Harbor Services Group, Inc. |
| Anmarie S. Kolinski (46) Treasurer | Since 2007 | Executive Vice President and Chief Financial Officer (2007-Present), Harbor Capital Advisors, Inc.; Chief Financial Officer (2007-Present), Harbor Services Group, Inc.; and Chief Financial Officer (2015-Present) and Treasurer (2012-Present), Harbor Funds Distributors, Inc. |
| Brian L. Collins (49) Vice President | Since 2005 | Executive Vice President and Chief Investment Officer (2004-Present), Harbor Capital Advisors, Inc. |
| Charles P. Ragusa (58) Vice President | Since 2007 | Executive Vice President (2007-Present), Harbor Capital Advisors, Inc.; President (2007-Present), Harbor Services Group, Inc.; and Executive Vice President and AML Compliance Officer (2007-Present) and OFAC Officer (2015-Present), Harbor Funds Distributors, Inc. |
| Jodie L. Crotteau (45) Assistant Secretary | Since 2014 | Senior Vice President and Chief Compliance Officer, Harbor Capital Advisors, Inc. (2014-Present); Chief Compliance Officer and Secretary (2017-present) and Assistant Secretary (2015-2016), Harbor Services Group, Inc.; Assistant Secretary (2016-present), Harbor Funds Distributors, Inc.; Vice President and Chief Compliance Officer, Grosvenor Registered Funds (2011-2014); and Vice President, Grosvenor Capital Management, L.P. (2010-2014). |
55
Harbor Strategic Markets Funds
Additional Information—Continued
Additional Information—Continued
Trustees and Officers—Continued
| Name (Age) Position(s) with Fund | Term of Office and Length of Time Served1 | Principal Occupation(s) During Past Five Years |
FUND OFFICERS NOT LISTED ABOVE**—Continued | ||
| Lana M. Lewandowski (38) AML Compliance Officer and Assistant Secretary | Since 2017 | Legal & Compliance Manager (2016-Present) and Legal Specialist (2012-2015), Harbor Capital Advisors, Inc. |
| Lora A. Kmieciak (53) Assistant Treasurer | Since 2017 | Senior Vice President – Fund Administration and Analysis (2017-Present) and Senior Vice President - Business Analysis (2015-2017), Harbor Capital Advisors, Inc.; and Assurance Executive Director (1999-2015), Ernst & Young LLP. |
| John M. Paral (49) Assistant Treasurer | Since 2013 | Director of Fund Administration and Analysis (2017-Present), Vice President (2012-Present) and Financial Reporting Manager (2007-2017), Harbor Capital Advisors, Inc. |
| 1 | Each Trustee serves for an indefinite term, until his successor is elected. Each Officer is elected annually. |
| * | Mr. McCain is deemed an “Interested Trustee” due to his affiliation with the Adviser and Distributor of Harbor Funds. |
| ** | Officers of the Funds are “interested persons” as defined in the Investment Company Act. |
56
This privacy statement is not part of this report
Harbor’s Privacy Statement
The following privacy statement is issued by Harbor Funds and each series of Harbor Funds and its affiliates, Harbor Capital Advisors, Inc., Harbor Services Group, Inc. and Harbor Funds Distributors, Inc. These measures reflect our commitment to maintaining the privacy of your confidential information. We appreciate the confidence you have shown by entrusting us with your assets.
Personal Information
It is our policy to respect the privacy of current and former shareholders and to protect personal information entrusted to us. We do not sell your personal information to anyone.
In the course of providing products and services, we collect non-public personal information about you from the following sources: applications, forms, our website (including any information captured through our use of “cookies”), through mobile applications, by telephone and in correspondence and transactions with us, our affiliates or other parties.
The non-public personal information collected may include name, address, e-mail address, telephone/fax numbers, account number, social security or taxpayer identification number, investment activity, and bank account information.
When you visit us through our website or a mobile application, we may collect technical and navigational information, such as computer browser type, Internet protocol address, pages visited and average time spent on our website. We may use this information to alert you to software compatibility issues, or to improve our web design and functionality. We use “cookies” and similar files that may be placed on your hard drive for security purposes, to facilitate site navigation and to personalize the appearance of our site.
Information Sharing
We occasionally disclose non-public personal information about our current or former shareholders with affiliated and non-affiliated parties, as permitted or required by law or regulation. In the normal course of servicing our shareholders, information we collect may be shared with non-affiliated companies that perform support services on our behalf or to other firms that assist us in providing you with products and services, such as custodians, transfer agents, broker-dealers and marketing service firms, as well as with other financial institutions. These companies may not use the information for any other purpose and we require them to keep the information they handle confidential. We may also share information with affiliates that are engaged in a variety of financial services in order to better service your account(s).
When information is shared with third parties, they are not permitted to use the information for any purpose other than to assist our servicing of your account(s) or as permitted by law.
If you close your account(s) or if we lose contact with you, we will continue to share information in accordance with our current privacy policy and practices.
Access to Information
Access to non-public personal information is limited to employees, agents or other parties who need to know that information to perform their jobs, such as servicing your account(s), resolving problems or informing you of new products or services.
Security
We maintain physical, electronic and procedural safeguards that comply with industry standards to protect your non-public personal information.
For shareholders accessing information through our website or a mobile application, various forms of Internet security, such as data encryption firewall barriers, user names and passwords, and other tools are used. For additional information regarding our security measures, visit the terms and conditions of use on our website at harborfunds.com. If you have any questions or concerns about how we maintain the privacy of your non-public personal information, please contact us at 800-422-1050 Monday through Friday, between the hours of 8:00 a.m. and 6:00 p.m. Eastern time.
We recommend that you read and retain this notice for your personal files.
Eff. November 2013
57
Glossary
Benchmark Descriptions
Bloomberg Barclays U.S. Aggregate Bond Index—The Bloomberg Barclays U.S. Aggregate Bond Index is an unmanaged index of investment-grade fixed-rate debt issues with maturities of at least one year. This unmanaged index does not reflect fees and expenses and is not available for direct investment.
Bloomberg Barclays U.S. TIPS Index—The Bloomberg Barclays U.S. TIPS Index is an unmanaged market index comprised of all U.S. Treasury Inflation Protected Securities rated investment grade (Baa3 or better), have at least one year to final maturity, and at least $250 million par amount outstanding. This unmanaged index does not reflect fees and expenses and is not available for direct investment.
Bloomberg Commodity Index Total ReturnSM—The Bloomberg Commodity Index Total ReturnSM is a broadly diversified index that tracks the commodities markets through commodity futures contracts. This unmanaged index does not reflect fees and expenses and is not available for direct investment.
ICE BofAML All U.S. Convertibles Ex Mandatory Index—The BofA Merrill Lynch All U.S. Convertibles Ex Mandatory Index is broadly representative of the U.S. convertible securities market, consisting of publicly traded issues, denominated in U.S. dollars, of all credit qualities, and excluding mandatory (equity-linked) convertibles. This unmanaged index does not reflect fees and expenses and is not available for direct investment.
ICE BofAML U.S. Dollar 3-Month LIBOR Constant Maturity Index—The ICE BofAML U.S. Dollar 3-Month LIBOR Constant Maturity Index tracks the performance of a synthetic asset paying Libor to a stated maturity. The index is based on the assumed purchase at par of a synthetic instrument having exactly its stated maturity and with a coupon equal to that day’s fixing rate. That issue is assumed to be sold the following business day (priced at a yield equal to the current day fixing rate) and rolled into a new instrument. This unmanaged index does not reflect fees and expenses and is not available for direct investment.
ICE BofAML 3-Month U.S. Treasury Bill Index—The ICE BofAML 3-Month U.S. Treasury Bill Index is comprised of a single U.S. Treasury Bill issue purchased at the beginning of each month and held for a full month, at which time that issue is sold and rolled into a newly selected issue. The issue selected each month is that having a maturity date closest to, but not beyond 90 days from the rebalance date.
ICE BofAML U.S. High Yield Index (H0A0)—The ICE BofAML U.S. High Yield Index (H0A0) is an unmanaged index that tracks the performance of below investment grade U.S. dollar-denominated corporate bonds publicly issued in the U.S. domestic market. All bonds are U.S. dollar denominated and rated Split BBB and below. This unmanaged index does not reflect fees and expenses and is not available for direct investment.
ICE BofAML U.S. Non-Distressed High Yield Index—The ICE BofAML U.S. Non-Distressed High Yield Index is a subset of the ICE BofAML U.S. High Yield Index (H0A0) including all securities with an option-adjusted spread less than 1,000 basis points. The unmanaged index does not reflect fees and expenses and is not available for direct investment.
MSCI All Country World Index—The MSCI All Country World Index is a free float-adjusted market capitalization weighted index that is designed to measure the equity market performance of developed and emerging markets. This unmanaged index does not reflect fees and expenses and is not available for direct investment.
MSCI All Country World Ex. U.S. (ND) Index—The MSCI All Country World Ex. U.S.is a free float-adjusted market capitalization weighted index that is designed to measure equity market performance in the global developed and emerging markets, excluding the United States. This unmanaged index does not reflect fees and expenses and is not available for direct investment.
MSCI EAFE (ND) Index—The MSCI EAFE (ND) Index is an unmanaged index generally representative of major overseas stock markets. This unmanaged index does not reflect fees and expenses and is not available for direct investment.
MSCI EAFE Small Cap (ND) Index—The MSCI EAFE Small Cap (ND) Index is an equity index which captures small cap representation across developed market countries around the world, excluding the U.S. and Canada. This unmanaged index does not reflect fees and expenses and is not available for direct investment.
MSCI Emerging Markets (ND) Index—The MSCI Emerging Markets (ND) Index is a market capitalization weighted index of equity securities in more than 20 emerging market economies. This unmanaged index does not reflect fees and expenses and is not available for direct investment.
MSCI World (ND) Index—The MSCI World (ND) Index is a free float-adjusted market capitalization index that is designed to measure global developed market equity performance. This unmanaged index does not reflect fees and expenses and is not available for direct investment.
58
Glossary—Continued
Benchmark Descriptions—Continued
Russell 1000® Index—The Russell 1000® Index is an unmanaged index generally representative of the U.S. market for larger capitalization stocks as it includes the largest 1000 securities in the Russell 3000® Index by market capitalization. This unmanaged index does not reflect fees and expenses and is not available for direct investment. The Russell 1000® Index and Russell® are trademarks of Frank Russell Company.
Russell 1000® Growth Index—The Russell 1000® Growth Index is an unmanaged index generally representative of the U.S. market for larger capitalization growth stocks. This unmanaged index does not reflect fees and expenses and is not available for direct investment. The Russell 1000® Growth Index and Russell® are trademarks of Frank Russell Company.
Russell 1000® Value Index—The Russell 1000® Value Index is an unmanaged index generally representative of the U.S. market for larger capitalization value stocks. This unmanaged index does not reflect fees and expenses and is not available for direct investment. The Russell 1000® Value Index and Russell® are trademarks of Frank Russell Company.
Russell 2000® Index—The Russell 2000® Index measures the performance of the small-cap segment of the U.S. equity universe. The Russell 2000® Index is a subset of the Russell 3000® Index representing approximately 10% of the total market capitalization of that index. It includes approximately 2,000 of the smallest securities based on a combination of their market cap and current index membership. The Russell 2000® Index is constructed to provide a comprehensive and unbiased small-cap barometer and is completely reconstituted annually to ensure larger stocks do not distort the performance and characteristics of the true small-cap opportunity set. This unmanaged index does not reflect fees and expenses and is not available for direct investment. The Russell 3000® Index and Russell® are trademarks of Frank Russell Company.
Russell 2000® Growth Index—The Russell 2000® Growth Index is an unmanaged index representing the smallest 2,000 stocks with the highest price-to-book ratio and future earnings. This unmanaged index does not reflect fees and expenses and is not available for direct investment. The Russell 2000® Growth Index and Russell® are trademarks of Frank Russell Company.
Russell 2000® Value Index—The Russell 2000® Value Index is an unmanaged index representing the smallest 2,000 stocks with the lowest price-to-book ratio and future earnings. This unmanaged index does not reflect fees and expenses and is not available for direct investment. The Russell 2000® Value Index and Russell® are trademarks of Frank Russell Company.
Russell 3000® Index—The Russell 3000® Index measures the performance of the largest 3,000 U.S. companies representing approximately 98% of the investable U.S. equity market. The Russell 3000® Index is constructed to provide a comprehensive, unbiased and stable barometer of the broad market and is completely reconstituted annually to ensure new and growing equities are reflected. This unmanaged index does not reflect fees and expenses and is not available for direct investment. The Russell 3000® Index and Russell® are trademarks of Frank Russell Company.
Russell 3000® Growth Index—The Russell 3000® Growth Index measures the performance of the broad growth segment of the U.S. equity universe. It includes those Russell 3000® companies with higher price-to-book ratios and higher forecasted growth values. The Russell 3000® Growth Index is constructed to provide a comprehensive, unbiased, and stable barometer of the broad growth market. The index is completely reconstituted annually to ensure new and growing equities are included and that the represented companies continue to reflect growth characteristics. This unmanaged index does not reflect fees and expenses and is not available for direct investment. The Russell 3000® Growth Index and Russell® are trademarks of Frank Russell Company.
Russell 3000® Value Index—The Russell 3000® Value Index measures the performance of the broad value segment of U.S. equity value universe. It includes those Russell 3000® companies with lower price-to-book ratios and lower forecasted growth values. The Russell 3000® Value Index is constructed to provide a comprehensive, unbiased, and stable barometer of the broad value market. The index is completely reconstituted annually to ensure new and growing equities are included and that the represented companies continue to reflect value characteristics. This unmanaged index does not reflect fees and expenses and is not available for direct investment. The Russell 3000® Value Index and Russell® are trademarks of Frank Russell Company.
Russell Midcap® Index—The Russell Midcap® Index is an unmanaged index generally representative of the U.S. market for medium capitalization stocks. This unmanaged index does not reflect fees and expenses and is not available for direct investment. The Russell Midcap® Index and Russell® are trademarks of Frank Russell Company.
Russell Midcap® Growth Index—The Russell Midcap® Growth Index is an unmanaged index generally representative of the U.S. market for medium capitalization growth stocks. This unmanaged index does not reflect fees and expenses and is not available for direct investment. The Russell Midcap® Growth Index and Russell® are trademarks of Frank Russell Company.
59
Glossary—Continued
Benchmark Descriptions—Continued
Russell Midcap® Value Index—The Russell Midcap® Value Index is an unmanaged index generally representative of the U.S. market for medium capitalization value stocks. This unmanaged index does not reflect fees and expenses and is not available for direct investment. The Russell Midcap® Value Index and Russell® are trademarks of Frank Russell Company.
S&P 500 Index—The S&P 500 Index is an unmanaged index generally representative of the U.S. stock market. This unmanaged index does not reflect fees and expenses and is not available for direct investment.
Financial Terms
12b-1 Fee—A mutual fund fee, named for the SEC rule that permits it, used to pay for broker-dealer compensation and other distribution costs. If a fund has a 12b-1 fee, it will be disclosed in the fee table of a fund’s prospectus.
ADR—ADR after the name of a foreign holding stands for American Depositary Receipts representing ownership of foreign securities. ADRs are issued by U.S. banking institutions.
Average Market Cap—The average market capitalization of a fund’s equity portfolio gives you a measure of the size of the companies in which the fund invests. Market capitalization is calculated by multiplying the number of a company’s shares outstanding by its price per share.
Average Market Coupon—A calculation from a fund’s portfolio by weighting the coupon of each bond by its relative size in the portfolio.
Beta—A measure of market-related risk. The beta of every index is 1.00, no matter how volatile the index is. A beta less than one means the portfolio is less volatile than the index. A beta higher than one indicates more volatility than the index.
Bottom-Up Equity Management Style—A management style that de-emphasizes the significance of economic and market cycles, focusing instead on the analysis of individual stocks.
Capital Gains Distribution—Profits distributed to shareholders resulting from the sale of securities held in the fund’s portfolio.
Credit Risk—The possibility that a bond issuer may not be able to pay interest and repay its debt.
CUSIP Number—Identification number assigned to every stock, corporate bond and municipal bond by the Committee on Uniform Securities Identification Procedures (CUSIP), which is established by the American Bankers Association.
Diversification—The practice of investing broadly across securities of a number of issuers to reduce risk.
Duration—A common gauge of the price sensitivity of a fixed income asset or portfolio to a change in interest rates.
Emerging Markets—Emerging markets are countries with relatively young stock and bond markets. Examples include Brazil and Thailand. Typically, emerging-markets investments have the potential for losses and gains larger than those of developed-market investments.
Expense Ratio—The Fund’s total annual operating expenses (including management fees, distribution (12b-1) fees and other expenses) expressed as a percentage of average net assets.
Family of Funds—A group of mutual funds, each typically with its own investment objective, managed or distributed by the same company that hold themselves out to investors as related companies for the purposes of investment and investor services.
GDR—GDR after the name of a holding stands for Global Depositary Receipt representing ownership of foreign securities. GDRs are issued by either U.S. or non-U.S. banking organizations. SADR after the name of a holding stands for South African Depositary Receipts representing ownership of South African securities listed on the Johannesburg Stock Exchange. SDR after the name of a holding stands for Swedish Depository Receipts representing ownership of foreign securities in Sweden. NVDR after the name of a holding stands for Non-Voting Depositary Receipts representing ownership of a listed security in the Stock Exchange of Thailand.
Inception Date—The date on which the Fund commenced operations.
Investment Objective—The goal that an investor and mutual fund pursue together (e.g., current income, long-term capital growth, etc.).
60
Glossary—Continued
Financial Terms—Continued
Median Market Cap—An indicator of the size of companies in which a fund invests; the midpoint of market capitalization (market price x shares outstanding) of a fund’s stocks, weighted by the proportion of the fund’s assets invested in each stock. Stocks representing half of the fund’s assets have market capitalizations above the median, and the rest are below it.
Net Asset Value (NAV)—The per share value of a mutual fund, determined by subtracting the fund’s liabilities from its assets and dividing by the number of shares outstanding. Mutual funds calculate their NAVs at least once each business day.
No-Load Fund—A mutual fund whose shares are sold without a sales commission and without a 12b-1 fee of more than 0.25% per year. Harbor funds are no-load.
Open-End Management Company—The legal name for a mutual fund, indicating that it stands ready to redeem (buy back) its shares from investors on any business day. Harbor Funds is an open-end investment company.
Operating Expenses—Business costs paid from a fund’s assets before earnings are distributed to shareholders. These include management fees and 12b-1 fees and other expenses.
Portfolio Manager—A specialist employed by a mutual fund’s adviser or subadviser to invest the fund’s assets in accordance with predetermined investment objectives.
Portfolio Turnover—A measure of the trading activity in a fund’s investment portfolio (how often securities are bought and sold by a fund). Funds with high turnover rates incur higher transaction costs and may be more likely to distribute capital gains (which may be taxable to investors).
Price to Book Ratio (P/B)—A ratio used to compare a stock’s market value to its book value. It is calculated by dividing the current closing price of the stock by the latest quarter’s book value. For a fund, the weighted average price/book ratio of the stocks it holds.
Price to Earnings Ratio (P/E)—The ratio of a stock’s current price to its per-share earnings over the past year. For a fund, the weighted average P/E of the stocks it holds. P/E is an indicator of market expectations about corporate prospects; the higher the P/E, the greater the market expectations are for a company’s future growth.
Prospectus—The official document that describes a mutual fund to prospective investors. The prospectus contains information required by the SEC, such as investment objectives and policies, risks, services and fees.
Record Date—The date on which a shareholder must officially own shares in order to be entitled to a dividend.
Redemption Fee—Fee charged to shareholders by a mutual fund when they sell shares within a specified period after purchase. The time limit and size of fee vary among funds. The fee is paid to the fund, not the fund’s investment adviser. Its purpose is to protect long-term investors from the impact of short-term traders.
REITs (Real Estate Investment Trust)—REITs invest in real estate or loans secured by real estate and issue shares in such investments. A REIT is similar to a closed-end mutual fund.
Repurchase Agreement (Repo)—A form of short-term borrowing for dealers in government securities. The dealer sells the government securities to investors, usually on an overnight basis, and buys them back the following day. For the party selling the security (and agreeing to repurchase it in the future), it is a repo. For the party on the other end of the transaction (buying the security and agreeing to sell back in the future), it is a reverse repurchase agreement.
Risk/Reward (or Return)—The relationship between the degree of risk associated with an investment and its return potential. Typically, the higher the potential return of an investment, the greater the risk.
Statement of Additional Information (SAI)—The supplementary document to a prospectus that contains more detailed information about a mutual fund; also known as “Part B” of a fund’s registration statement.
TBAs—A term used to describe a forward mortgage-backed securities trade. Pass-through securities issued by Freddie Mac, Fannie Mae and Ginnie Mae trade in the TBA market. The term TBA is derived from the fact that the actual mortgage- backed security that will be delivered to fulfill a TBA trade is not designated at the time the trade is made. The securities are “to be announced” 48 hours prior to the established trade settlement date.
Treasury Inflation-Protected Securities (TIPS)—TIPS are securities in which the principal amount is adjusted for inflation and interest payments are applied to the inflation-adjusted principal.
61
Glossary—Continued
Financial Terms—Continued
Top-Down Equity Management Style—Investment style that begins with an assessment of the overall economic environment and makes a general asset allocation decision regarding various sectors of the financial markets and various industries.
Total Return—Return on an investment over a specified period, including price appreciation (or depreciation) plus any income, expressed as an average annual compound of return.
Weighted Average Duration—Duration is a time measure of a bond’s interest-rate sensitivity, based on the weighted average of the time periods over which a bond’s cash flows accrue to the bondholder. Time periods are weighted by multiplying by the present value of its cash flow divided by the bond’s price. (A bond’s cash flows consist of coupon payments and repayment of capital.) A bond’s duration will almost always be shorter than its maturity, with the exception of zero-coupon bonds, for which maturity and duration are equal.
Weighted Average Maturity—The average length of time until principal must be repaid for all bonds in a mutual fund portfolio on a dollar weighted basis.
Yield—A measure of net income (dividends and interest) earned by the securities in the fund’s portfolio less fund expenses during a specified period. A fund’s yield is expressed as a percentage of the maximum offering price per share on a specified date.
Yield to Maturity—The term used to describe the rate of return an investor will receive if a long-term, interest-bearing security, such as a bond, is held to its maturity date. Yield to maturity is greater than the coupon rate if the bond is selling at a discount and less than the coupon rate if it is selling at a premium.
62
Notes

| 111 South Wacker Drive, 34th Floor | Chicago, IL 60606-4302 | 800-422-1050 | harborfunds.com |
Trustees & Officers
Charles F. McCain
Chairman, President & Trustee
Chairman, President & Trustee
Scott M. Amero
Trustee
Trustee
Raymond J. Ball
Trustee
Trustee
Donna J. Dean
Trustee
Trustee
Joseph L. Dowling, III
Trustee
Trustee
Randall A. Hack
Trustee
Trustee
Robert Kasdin
Trustee
Trustee
Kathryn L. Quirk
Trustee
Trustee
Ann M. Spruill
Trustee
Trustee
Anmarie S. Kolinski
Treasurer
Treasurer
Erik D. Ojala
Chief Compliance Officer
& Secretary
Chief Compliance Officer
& Secretary
Brian L. Collins
Vice President
Vice President
Charles P. Ragusa
Vice President
Vice President
Jodie L. Crotteau
Assistant Secretary
Assistant Secretary
Lana M. Lewandowski
AML Compliance Officer
& Assistant Secretary
AML Compliance Officer
& Assistant Secretary
Lora A. Kmieciak
Assistant Treasurer
Assistant Treasurer
John M. Paral
Assistant Treasurer
Assistant Treasurer
Investment Adviser
Harbor Capital Advisors, Inc.
111 South Wacker Drive
34th Floor
Chicago, IL 60606-4302
312-443-4400
111 South Wacker Drive
34th Floor
Chicago, IL 60606-4302
312-443-4400
Distributor
Harbor Funds Distributors, Inc.
111 South Wacker Drive
34th Floor
Chicago, IL 60606-4302
312-443-4600
111 South Wacker Drive
34th Floor
Chicago, IL 60606-4302
312-443-4600
Shareholder Services
Harbor Services Group, Inc.
P.O. Box 804660
Chicago, IL 60680-4108
800-422-1050
P.O. Box 804660
Chicago, IL 60680-4108
800-422-1050
Custodian
State Street Bank & Trust Company
State Street Financial Center
1 Lincoln Street
Boston, MA 02111-2900
State Street Financial Center
1 Lincoln Street
Boston, MA 02111-2900
FD.AR.SM.1017
Table of Contents


Annual Report
October 31, 2017
Fixed Income Funds
| Institutional Class | Administrative Class | Investor Class | Retirement Class | |
| Harbor Convertible Securities Fund | HACSX | HRCSX | HICSX | HNCVX |
| Harbor High-Yield Bond Fund | HYFAX | HYFRX | HYFIX | HNHYX |
| Harbor Bond Fund | HABDX | HRBDX | – | – |
| Harbor Real Return Fund | HARRX | HRRRX | – | – |
| Harbor Money Market Fund | HARXX | HRMXX | – | – |
Table of Contents
| 1 | |
| 2 | |
| Fixed Income Funds | |
| Harbor Convertible Securities Fund | |
| 4 | |
| 6 | |
| 7 | |
| 8 | |
| Harbor High-Yield Bond Fund | |
| 12 | |
| 14 | |
| 15 | |
| 16 | |
| Harbor Bond Fund | |
| 27 | |
| 30 | |
| 31 | |
| Harbor Real Return Fund | |
| 46 | |
| 48 | |
| 49 | |
| Harbor Money Market Fund | |
| 60 | |
| 62 | |
| 63 | |
| Financial Statements | |
| 64 | |
| 66 | |
| 68 | |
| 74 | |
| 76 | |
| 84 | |
| 104 | |
| 105 | |
| Additional Information | |
| 107 | |
| 107 | |
| 107 | |
| 107 | |
| 108 | |
| 109 | |
| 112 | |
| 113 |
This document must be preceded or accompanied by a Prospectus.
Harbor Fixed Income Funds
Annual Report Overview (Unaudited)
Annual Report Overview (Unaudited)
The Funds' fiscal year ended October 31, 2017. Performance data shown represents past performance and is no guarantee of future results. Past performance is net of management fees and expenses and reflects reinvested dividends and distributions, but does not reflect the deduction of taxes that a shareholder would pay on Fund distributions or upon the redemption of Fund shares. Past performance reflects the beneficial effect of any expense waivers or reimbursements, without which returns would have been lower. Investment returns and principal value will fluctuate and when redeemed may be worth more or less than their original cost. Returns for periods less than one year are not annualized. Current performance may be higher or lower than what is shown here and is available through the most recent month end at harborfunds.com or by calling 800-422-1050.
For information on the different share classes, please refer to the current prospectus. The returns of the unmanaged indices shown in this report assume the reinvestment of dividends but do not reflect fees and expenses and are not available for direct investment.
| Total Return Year Ended October 31, 2017 | |||||||
| HARBOR FIXED INCOME FUNDS | Institutional Class | Administrative Class | Investor Class | Retirement Class | |||
Harbor Convertible Securities Fund | 8.74% | 8.37% | 8.26% | 8.81% | |||
Harbor High-Yield Bond Fund | 8.16 | 7.98 | 7.79 | 8.23 | |||
Harbor Bond Fund | 2.82 | 2.56 | N/A | N/A | |||
Harbor Real Return Fund | 0.92 | 0.62 | N/A | N/A | |||
Harbor Money Market Fund | 0.73 | 0.73 | N/A | N/A | |||
| COMMONLY USED MARKET INDICES | Total Return Year Ended October 31, 2017 |
ICE BofAML U.S. Convertible Ex Mandatory (domestic convertible bonds) | 20.69% |
ICE BofAML U.S. Non-Distressed High Yield (domestic high-yield bonds) | 8.62 |
ICE BofAML U.S. High Yield (domestic high-yield bonds) | 9.14 |
Bloomberg Barclays U.S. Aggregate Bond (domestic bonds) | 0.90 |
Bloomberg Barclays U.S. TIPS (domestic bonds) | -0.11 |
ICE BofAML U.S. 3-Month Treasury Bill (domestic short-term) | 0.72 |
| EXPENSE RATIOS1 | Morningstar Average2 | ||||||||||
| FIXED INCOME FUNDS | 2013 | 2014 | 2015 | 2016 | 2017 | ||||||
| Harbor Convertible Securities Fund | |||||||||||
Institutional Class | 0.79% | 0.74% | 0.75% | 0.76% | 0.76% | 0.98% | |||||
Administrative Class | 1.04 | 0.99 | 1.00 | 1.01 | 1.00 | 1.31 | |||||
Investor Class | 1.16 | 1.11 | 1.12 | 1.13 | 1.12 | 1.65 | |||||
Retirement Class | N/A | N/A | N/A | 0.71 a | 0.67 | 0.92 | |||||
| Harbor High-Yield Bond Fund | |||||||||||
Institutional Class | 0.64% | 0.64% | 0.65% | 0.66% | 0.67% | 0.78% | |||||
Administrative Class | 0.89 | 0.89 | 0.90 | 0.91 | 0.92 | 1.17 | |||||
Investor Class | 1.01 | 1.01 | 1.02 | 1.03 | 1.04 | 1.18 | |||||
Retirement Class | N/A | N/A | N/A | 0.61 a | 0.61 | 0.74 | |||||
| Harbor Bond Fund | |||||||||||
Institutional Class | 0.53% | 0.54% | 0.52% | 0.51% | 0.51% | 0.65% | |||||
Administrative Class | 0.78 | 0.79 | 0.77 | 0.76 | 0.76 | 0.98 | |||||
| Harbor Real Return Fund | |||||||||||
Institutional Class | 0.59% | 0.60% | 0.58% | 0.55% | 0.54% | 0.52% | |||||
Administrative Class | 0.84 | 0.85 | 0.83 | 0.80 | 0.77 | 0.91 | |||||
| Harbor Money Market Fund | |||||||||||
Institutional Class | 0.00% | 0.00% | 0.00% | 0.00% | 0.00% | 0.75% | |||||
Administrative Class | 0.00 | 0.00 | 0.00 | 0.00 | 0.00 | 0.41 | |||||
| 1 | Harbor Funds’ expense ratios are for the fiscal years ended October 31 (unless otherwise noted) and are shown net of all expense offsets, waivers and reimbursements (see Financial Highlights). |
| 2 | The Morningstar Average includes all actively managed no-load funds in the October 31, 2017 Morningstar Universe with the same investment style as the comparable Harbor Fund and with the following additional characteristics for each Harbor Funds share class: Institutional Class contains funds with 12b-1 fees less than or equal to 0.25%; Administrative Class contains funds with 12b-1 fees and which are restricted primarily for use by retirement plans; Investor Class contains funds with 12b-1 fees and a minimum investment less than $50,000; and Retirement Class contains funds with no 12b-1 fees. |
| a | Annualized figures for the period March 1, 2016 (commencement of operations) through October 31, 2016 |
1
Letter from the Chairman
 Charles F. McCain Chairman |
Dear Fellow Shareholder:
I am honored to be writing my first shareholder letter to you as Chairman of the Board of Trustees of Harbor Funds. David Van Hooser, our long-standing Chairman, retired from the Board of Trustees on September 22, 2017 after 17 years of distinguished service. Over that 17 year tenure, I have admired how Dave has maintained a singular focus on serving the best interests of Harbor Funds and its shareholders. He has served as an example to me and the other women and men who work diligently to support Harbor Funds. I remain committed to carrying on the responsibility that Dave so fully embraced to place the interests of Harbor Funds and its shareholders first.
We have also had other changes on the Board of Trustees over the past year. Rodger Smith, our long-standing Lead Independent Trustee, retired from the Board on December 31, 2016 after a 29 year tenure. He was replaced as Lead Independent Trustee by Randy Hack, who has served on the Board since 2010. Shareholders also elected two new independent Trustees to the Board on September 22, 2017 in Katie Quirk and Joe Dowling. With their election, eight of the nine members of the Board are independent of Harbor Capital Advisors, the investment adviser to Harbor Funds.
Market review
Domestic long-term fixed income markets generally delivered modest positive returns in the fiscal year ended October 31, 2017. The Bloomberg Barclays U.S. Aggregate Bond Index, a diversified benchmark of investment-grade bonds, generated a return of 0.90% for the 12-month period.
The U.S. economy continued to experience solid growth with low inflation. As a result, U.S. Treasury rates remained low, which provided a favorable backdrop for most fixed income asset classes. The perception of a hawkish tilt at the September Federal Reserve (Fed) meeting – at which the Fed confirmed its plans to begin unwinding its balance sheet – contributed to a rebound in yields on U.S. Treasuries.
In other developed markets, central banks shifted toward a less accommodative tone during the period, as rhetoric from the European Central Bank, the Bank of England and the Bank of Canada suggested a move away from easy monetary policy.
U.S. Treasury Inflation Protected Securities (“TIPS”) had slightly negative returns for the fiscal year, underperforming conventional U.S. Treasury bonds.
High yield bonds generally outperformed other fixed income securities in the stable, low-volatility investing environment.
Comments by the portfolio managers of each Harbor fixed income fund can be found in the pages preceding each Fund’s portfolio of investments. As always, we recommend that shareholders maintain a long-term perspective in evaluating all of their investments, including those in Harbor Funds.
2
| Returns For Periods Ended October 31, 2017 | ||||||||
| Annualized | ||||||||
| Fixed Income | 1 Year | 5 Years | 10 Years | 30 Years | ||||
ICE BofAML U.S. Non-Distressed High Yield (domestic high-yield bonds) | 8.62% | 6.33% | 6.69% | N/A | ||||
Bloomberg Barclays U.S. Aggregate Bond (domestic bonds) | 0.90 | 2.04 | 4.19 | 6.43% | ||||
Bloomberg Barclays U.S. TIPS (domestic inflation-linked bonds) | -0.11 | -0.11 | 3.81 | N/A | ||||
ICE BofAML U.S. 3-Month Treasury Bill (proxy for money market returns) | 0.72 | 0.24 | 0.45 | 3.35 | ||||
| Domestic Equities | ||||||||
Russell 3000® (entire U.S. stock market) | 23.98% | 15.12% | 7.61% | 10.60% | ||||
S&P 500 (large cap stocks) | 23.63 | 15.18 | 7.51 | 10.50 | ||||
Russell Midcap® (mid cap stocks) | 21.09 | 14.87 | 8.09 | 12.11 | ||||
Russell 2000® (small cap stocks) | 27.85 | 14.49 | 7.63 | 10.45 | ||||
Russell 3000® Growth (growth stocks) | 29.80 | 16.71 | 9.05 | 10.16 | ||||
Russell 3000® Value (value stocks) | 18.30 | 13.48 | 6.07 | 10.68 | ||||
| International & Global | ||||||||
MSCI EAFE (ND) (foreign stocks) | 23.44% | 8.53% | 1.10% | 5.62% | ||||
MSCI EAFE Small Cap (ND) (foreign small cap stocks) | 27.51 | 13.03 | 4.18 | N/A | ||||
MSCI World (ND) (global stocks) | 22.77 | 11.56 | 4.10 | 7.44 | ||||
MSCI All Country World Ex. U.S. (ND) (foreign stocks) | 23.64 | 7.29 | 0.92 | N/A | ||||
MSCI Emerging Markets (ND) (emerging market stocks) | 26.45 | 4.83 | 0.60 | N/A | ||||
| Strategic Markets | ||||||||
Bloomberg Commodity Index Total ReturnSM (commodities) | 2.35% | -9.37% | -6.93% | N/A | ||||
Stay focused on the long-term
Major U.S. indexes hit record levels toward the end of the fiscal year, supported by continued earnings gains and favorable economic data. Against this backdrop, the third calendar quarter of 2017 marked the eighth consecutive quarter of gains for U.S. equities.
With equities having rallied for an extended period, it is reasonable to question whether the market’s advance might be due for a slowdown or even a reversal in the near future. For even the most experienced investment professionals, it is difficult to reliably predict the movements of stock prices or bond prices with certainty, particularly in the shorter-term.
We always encourage shareholders to take a long term perspective with all of their investments. While past performance is never a guarantee of future results, over the long term, the returns of equities and debt securities have historically helped many investors achieve their financial objectives. We encourage all investors to maintain a diversified portfolio of equities, debt and cash in an allocation consistent with their long-term financial goals and comfort with risk.
Harbor Funds offers a variety of equity, strategic markets and fixed income funds to help you achieve your financial goals.
Thank you for investing with Harbor Funds.
December 21, 2017
 |
| Charles F. McCain |
| Chairman |
3
Harbor Convertible Securities Fund
Managers' Commentary (Unaudited)
Managers' Commentary (Unaudited)
Subadviser
Shenkman Capital Management, Inc.
461 Fifth Avenue
22nd Floor
22nd Floor
New York, NY 10017
Portfolio Managers
Mark Shenkman
Since 2011
Since 2011
Justin W. Slatky
Since 2017
Since 2017
Raymond F. Condon
Since 2011
Since 2011
Jordan Barrow, CFA
Since 2016
Since 2016
Shenkman Capital has subadvised the Fund since 2011.
Investment Objective
The Fund seeks to maximize total returns (i.e., current income and capital appreciation).

Mark Shenkman

Justin W. Slatky

Raymond F. Condon

Jordan Barrow, CFA
Management’s Discussion of
Fund Performance
Fund Performance
Market Review
Since the results of the U.S. Presidential election on November 8, 2016, equity markets have continued to set record highs throughout the Harbor Convertible Securities Fund’s fiscal year ended October 31, 2017 in anticipation of a more business-friendly environment for U.S. corporations and a consequent boost in the economy. The Fund’s benchmark, the ICE BofAML All US Convertible Ex Mandatory Index (“the Index”), returned 20.69% for the fiscal year, with underlying equities returning 29.50% for the same period. It is worth noting that the rally in underlying equities was broad-based and featured positive returns from each sector except Energy, a sector that continues to heal from the dramatic selloff in the first calendar quarter of 2016.
With equity markets establishing record highs, the resurgence of the convertible new issue market has been encouraging with 105 deals raising $39.0B for the fiscal year. This compares favorably with the preceding fiscal year’s total of 80 deals totaling $34.8B. Throughout the fiscal year, the continued strength and variety in new issue activity has provided ample opportunity to further diversify the Fund through selective purchases.
Performance
The Harbor Convertible Securities Fund returned 8.74% (Institutional Class), 8.37% (Administrative Class), 8.26% (Investor Class), and 8.81% (Retirement Class) for the fiscal year, underperforming the 20.69% return of its benchmark during the same period. Generally speaking, having little if any exposure to high delta/deep in-the-money names, which stylistically the Fund tends to underweight/sell due to excess equity sensitivity, negatively impacted the Fund’s relative returns in this strong equity environment due to the high concentration in the Index of such companies – particularly in the outperforming semiconductor industry. During the fiscal year, the Index’s average weight in the most equity-like convertibles (i.e., those with an investment premium of 80%-100%) was 19.58%, and these equity-like convertibles contributed 986 basis points (47.7%) of the Index’s 20.69% return.
Semiconductors was the best performing industry in the Fund, led by the Fund’s positions in Lam Research, a manufacturer of semiconductor processing equipment and Microchip Technology, a manufacturer of microcontrollers essential to the expansion of automotive chip content. Media was the second best performing industry. The Fund’s position in Live Nation, the global leader in the production of live concerts, was the main driver within media. The Fund’s third best industry was IT Services, led by Square, Inc. Square, an enabler of payment processing services for small businesses, has returned 65.2% since issuance in February 2017.
The three largest detracting sectors from the Fund’s performance were pharmaceuticals, energy equipment & services and technology hardware. In pharmaceuticals, Teva, a leading global manufacturer of generic pharmaceuticals, was exposed to industrywide pricing pressures amidst the need to reduce debt following a recent acquisition. We have substantially reduced the size of the Fund’s position. In energy equipment & services, the Fund’s holding in Nabors Industries, a leading operator of land-based oil and gas drilling rigs, had a negative effect. We expect that the company will be well-positioned for a recovery in the drilling cycle as Energy continues to stabilize. In the technology hardware sector, Electronics for Imaging, a leading manufacturer of hardware and software systems for commercial digital printing, experienced a slowdown in its legacy businesses as they awaited new product adoption. We have reduced the size of the Fund’s position.
4
Harbor Convertible Securities Fund
Managers' Commentary—Continued
Managers' Commentary—Continued
| TOP TEN ISSUERS (% of net assets) | |
| Microchip Technology Inc. | 2.3% |
| NRG Yield Inc. | 2.3% |
| On Semiconductor Corp. | 2.1% |
| Ares Capital Corp. | 2.0% |
| BioMarin Pharmaceutical Inc. | 2.0% |
| Macquarie Infrastructure Corp. | 2.0% |
| Two Harbors Investment Corp. | 2.0% |
| Priceline Group Inc. | 1.9% |
| ServiceNow Inc. | 1.9% |
| Citrix Systems Inc. | 1.8% |
Outlook & Strategy
Spurred by the recent resurgence of the new issue calendar, the convertible market has begun to present many new opportunities for credit-oriented convertible managers who seek to adhere to a balanced style. While several existing in-the-money issues have continued to move in an equity-like fashion, recently-issued convertibles have included both new companies as well as existing issuers. This development has allowed us to diversify into new businesses that meet our credit criteria, as well as maintain exposure to repeat issuers by purchasing new issues closer to their bond floors. We believe this trend favors our investment style over the long term, as we generally focus first on investment creditworthiness, with an emphasis on positive risk/reward characteristics.
Looking forward, we believe that the market transition from monetary to fiscal stimulus may enhance opportunities in the convertible securities market. We believe these opportunities will be further supported by a growth-oriented equity environment, positive overall credit conditions and increased new issue activity.
As we enter a period of potentially higher interest rates, as determined by the U.S. Federal Reserve, with associated periods of volatility, we expect that the market is likely to place a premium on securities with attractive risk-versus-reward characteristics, which we believe is endemic to the style that we seek to incorporate in the Fund.
This report contains the current opinions of Shenkman Capital Management, Inc. as of the date of this report and should not be considered as investment advice or a recommendation of any particular security, strategy or investment product. Such opinions are subject to change without notice and securities described herein may no longer be included in, or may at any time be removed from, the Fund’s portfolio. This report is distributed for informational purposes only. Information contained herein has been obtained from sources believed reliable, but not guaranteed.
Convertible securities tend to be of lower credit quality, and the value of a convertible security generally increases and decreases with the value of the underlying common stock, but may also be sensitive to changes in interest rates. A rise in interest rates will likely cause a decrease in the value of convertible securities. Such an event would likely have an adverse effect on the Harbor Convertible Securities Fund. High-yield investing poses additional credit risk related to lower-rated bonds. For information on the different share classes and the risks associated with an investment in the Fund, please refer to the current prospectus.
5
Harbor Convertible Securities Fund
Fund Summary—October 31, 2017 (Unaudited)
Fund Summary—October 31, 2017 (Unaudited)
| INSTITUTIONAL CLASS | |
| Fund # | 2034 |
| Cusip | 411512734 |
| Ticker | HACSX |
| Inception Date | 05/01/2011 |
| Net Expense Ratio | 0.76% a |
| Total Net Assets (000s) | $87,391 |
| ADMINISTRATIVE CLASS | |
| Fund # | 2234 |
| Cusip | 411512726 |
| Ticker | HRCSX |
| Inception Date | 05/01/2011 |
| Net Expense Ratio | 1.00% a |
| Total Net Assets (000s) | $395 |
| INVESTOR CLASS | |
| Fund # | 2434 |
| Cusip | 411512718 |
| Ticker | HICSX |
| Inception Date | 05/01/2011 |
| Net Expense Ratio | 1.12% a |
| Total Net Assets (000s) | $2,015 |
| RETIREMENT CLASS | |
| Fund # | 2534 |
| Cusip | 411512387 |
| Ticker | HNCVX |
| Inception Date | 03/01/2016 |
| Net Expense Ratio | 0.67% a |
| Total Net Assets (000s) | $24,585 |
Portfolio Statistics
| Portfolio | Benchmark | ||
| Average Market Coupon | 1.88% | 2.71% | |
| Yield to Maturity | -0.86% | -1.75% | |
| Current 30-Day Yield (Institutional Class) | 0.33% | 2.20% | |
| Weighted Average Maturity | 5.94 years | 22.77 years | |
| Weighted Average Duration | 2.01 years | 3.40 years | |
| Portfolio Turnover (Year Ended 10/31/2017) | 102% | N/A |
Sector Allocation (% of investments)
(Excludes cash and short-term investments)

MATURITY PROFILE
| Years to Maturity | % of Investments | |
| 0 to 1 yr. | 6.92% | |
| >1 to 5 | 67.51% | |
| >5 to 10 | 23.28% | |
| >10 to 15 | 0.75% | |
| >15 to 20 | 1.54% | |
| >20 to 25 | 0.00% | |
| >25 yrs. | 0.00% |
| a | Reflects a contractual management fee waiver effective through February 28, 2018 |
6
Harbor Convertible Securities Fund
Fund Performance Summary (Unaudited)
Fund Performance Summary (Unaudited)
The graph compares a $50,000 investment in the Institutional Class shares of the Fund with the performance of the ICE BofAML U.S. Convertible Ex Mandatory Index. The Fund’s performance assumes the reinvestment of all dividend and capital gain distributions.
CHANGE IN A $50,000 INVESTMENT
For the period 05/01/2011 through 10/31/2017
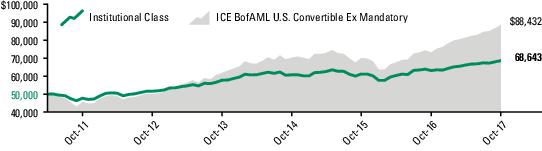
| TOTAL RETURNS For the periods ended 10/31/2017 | 1 Year | Annualized | Inception Date | Final Value of a $50,000 Investment | ||||||||||
| 5 Years | Life of Fund | |||||||||||||
| Harbor Convertible Securities Fund | ||||||||||||||
Institutional Class | 8.74% | 5.85% | 4.99% | 05/01/2011 | $68,643 | |||||||||
Administrative Class | 8.37 | 5.59 | 4.72 | 05/01/2011 | 67,507 | |||||||||
Investor Class | 8.26 | 5.45 | 4.60 | 05/01/2011 | 66,993 | |||||||||
Retirement Class1 | 8.81 | 5.87 | 5.01 | 03/01/2016 | 68,723 | |||||||||
| Comparative Index | ||||||||||||||
ICE BofAML U.S. Convertible Ex Mandatory2 | 20.69% | 12.09% | 9.16% | — | $88,432 | |||||||||
As stated in the Fund’s current prospectus, the expense ratios were 0.73% (Net) and 0.78% (Gross) (Institutional Class); 0.98% (Net) and 1.03% (Gross) (Administrative Class); 1.10% (Net) and 1.15% (Gross) (Investor Class); and 0.65% (Net) and 0.70% (Gross) (Retirement Class). The net expense ratios reflect a contractual management fee waiver effective through 02/28/2018. The expense ratios in the prospectus may differ from the actual expense ratios for the period disclosed within this report. The expense ratios shown in the prospectus are based on the prior fiscal year, adjusted to reflect changes, if any, in contractual arrangements that occurred prior to the date of the prospectus (or supplement thereto, if applicable).
Performance data shown represents past performance and is no guarantee of future results. Past performance is net of management fees and expenses and reflects reinvested dividends and distributions, but does not reflect the deduction of taxes that a shareholder would pay on Fund distributions or upon the redemption of Fund shares. Past performance reflects the beneficial effect of any expense waivers or reimbursements, without which returns would have been lower. Investment returns and principal value will fluctuate and when redeemed may be worth more or less than their original cost. Returns for periods less than one year are not annualized. Current performance may be higher or lower and is available through the most recent month end at harborfunds.com or by calling 800-422-1050. The Fund charges a redemption fee of 1% on redemption of Fund shares that are held for less than 90 days.
| 1 | Retirement Class shares commenced operations on March 1, 2016. The performance attributed to the Retirement Class shares prior to that date is that of the Institutional Class shares. Performance prior to March 1, 2016 has not been adjusted to reflect the lower expenses of Retirement Class shares. During this period, Retirement Class shares would have had returns similar to, but somewhat higher than, Institutional Class shares due to the fact that Retirement Class shares represent interests in the same portfolio as Institutional Class shares but are subject to lower expenses. |
| 2 | The “Life of Fund” return and “Final Value of $50,000 Investment” as shown reflects the period 05/01/2011 through 10/31/2017. |
7
Harbor Convertible Securities Fund
Portfolio of Investments—October 31, 2017
Portfolio of Investments—October 31, 2017
Value, Cost, and Principal Amounts in Thousands
Total Investments (% of net assets)
(Excludes net cash and short-term investments of 0.7%)

| CONVERTIBLE BONDS—98.3% | |||
| Principal Amount | Value | ||
| AUTOMOBILES—1.8% | |||
| Solarcity Corp. | |||
| $ | 630 | 1.625%—11/01/2019 | $ 596 |
| Tesla Motors Inc. | |||
| 816 | 1.250%—03/01/2021 | 912 | |
| 495 | 2.375%—03/15/2022 | 602 | |
| 1,514 | |||
| 2,110 | |||
| BIOTECHNOLOGY—2.9% | |||
| BioMarin Pharmaceutical Inc. | |||
| 1,775 | 0.599%—08/01/2024 | 1,701 | |
| 478 | 1.500%—10/15/2020 | 544 | |
| 2,245 | |||
| CONVERTIBLE BONDS—Continued | |||
| Principal Amount | Value | ||
| BIOTECHNOLOGY—Continued | |||
| Ligand Pharmaceuticals Inc. | |||
| $ | 196 | 0.750%—08/15/2019 | $ 381 |
| Neurocrine Biosciences Inc. | |||
| 610 | 2.250%—05/15/20241 | 700 | |
| 3,326 | |||
| CAPITAL MARKETS—2.0% | |||
| Ares Capital Corp. | |||
| 1,183 | 3.750%—02/01/20221 | 1,209 | |
| 1,046 | 4.375%—01/15/2019 | 1,074 | |
| 2,283 | |||
| COMMUNICATIONS EQUIPMENT—1.5% | |||
| Ciena Corp. | |||
| 261 | 3.750%—10/15/2018 | 309 | |
| Finisar Corp. | |||
| 815 | 0.500%—12/15/20361 | 781 | |
| Lumentum Holdings Inc. | |||
| 500 | 0.250%—03/15/20241 | 636 | |
| 1,726 | |||
| CONSTRUCTION & ENGINEERING—1.7% | |||
| Dycom Industries Inc. | |||
| 577 | 0.750%—09/15/2021 | 673 | |
| Tutor Perini Corp. | |||
| 534 | 2.875%—06/15/2021 | 614 | |
| Vinci SA | |||
| 600 | 0.375%—02/16/2022 | 674 | |
| 1,961 | |||
| DIVERSIFIED TELECOMMUNICATION SERVICES—1.1% | |||
| Inmarsat plc | |||
| 1,200 | 3.875%—09/09/2023 | 1,287 | |
| ELECTRONIC EQUIPMENT, INSTRUMENTS & COMPONENTS—0.6% | |||
| OSI Systems Inc. | |||
| 644 | 1.250%—09/01/20221 | 680 | |
| ENERGY EQUIPMENT & SERVICES—1.9% | |||
| Ensco Jersey Finance Ltd. | |||
| 820 | 3.000%—01/31/20241 | 695 | |
| Nabors Industries Inc. | |||
| 810 | 0.750%—01/15/20241 | 599 | |
| Weatherford International Ltd. | |||
| 870 | 5.875%—07/01/2021 | 880 | |
| 2,174 | |||
| EQUITY REAL ESTATE INVESTMENT TRUSTS (REITs)—4.6% | |||
| Empire State Realty OP LP | |||
| 219 | 2.625%—08/15/20191 | 240 | |
| Extra Space Storage LP | |||
| 1,276 | 3.125%—10/01/20351 | 1,393 | |
| National Health Investors Inc. | |||
| 494 | 3.250%—04/01/2021 | 565 | |
| Spirit Realty Capital Inc. | |||
| 622 | 2.875%—05/15/2019 | 622 | |
| Starwood Waypoint Homes | |||
| 35 | 3.000%—07/01/2019 | 43 | |
| 1,385 | 3.500%—01/15/20221 | 1,557 | |
| 1,600 | |||
8
Harbor Convertible Securities Fund
Portfolio of Investments—Continued
Portfolio of Investments—Continued
Value, Cost, and Principal Amounts in Thousands
| CONVERTIBLE BONDS—Continued | |||
| Principal Amount | Value | ||
| EQUITY REAL ESTATE INVESTMENT TRUSTS (REITs)—Continued | |||
| VEREIT Inc. | |||
| $ | 850 | 3.000%—08/01/2018 | $ 853 |
| 5,273 | |||
| HEALTH CARE EQUIPMENT & SUPPLIES—2.7% | |||
| Dexcom Inc. | |||
| 895 | 0.750%—05/15/20221 | 796 | |
| Nuvasive Inc. | |||
| 800 | 2.250%—03/15/2021 | 930 | |
| Wright Medical Group Inc. | |||
| 1,219 | 2.000%—02/15/2020 | 1,326 | |
| 3,052 | |||
| HEALTH CARE PROVIDERS & SERVICES—1.5% | |||
| Brookdale Senior Living Inc. | |||
| 585 | 2.750%—06/15/2018 | 584 | |
| Molina Healthcare Inc. | |||
| 906 | 1.625%—08/15/2044 | 1,123 | |
| 1,707 | |||
| HEALTH CARE TECHNOLOGY—2.7% | |||
| Allscripts Healthcare Solutions Inc. | |||
| 1,750 | 1.250%—07/01/2020 | 1,820 | |
| Medidata Solutions Inc. | |||
| 979 | 1.000%—08/01/2018 | 1,305 | |
| 3,125 | |||
| HOTELS, RESTAURANTS & LEISURE—1.4% | |||
| Caesars Entertainment Corp. | |||
| 161 | 5.000%—10/01/2024 | 317 | |
| China Lodging Group Ltd. | |||
| 725 | 0.375%—11/01/2022 | 732 | |
| Marriott Vacations Worldwide Corp. | |||
| 530 | 1.500%—09/15/20221 | 574 | |
| 1,623 | |||
| HOUSEHOLD DURABLES—1.2% | |||
| CalAtlantic Group Inc. | |||
| 816 | 0.250%—06/01/2019 | 819 | |
| 362 | 1.625%—05/15/2018 | 571 | |
| 1,390 | |||
| INDEPENDENT POWER & RENEWABLE ELECTRICITY PRODUCERS—3.6% | |||
| Nextera Energy Partners LP | |||
| 1,497 | 1.500%—09/15/20201 | 1,460 | |
| NRG Yield Inc. | |||
| 1,449 | 3.250%—06/01/20201 | 1,453 | |
| 1,119 | 3.500%—02/01/20191 | 1,144 | |
| 2,597 | |||
| 4,057 | |||
| INDUSTRIAL CONGLOMERATES—0.8% | |||
| Siemens Financieringsmaatschappij NV | |||
| 750 | 1.650%—08/16/2019 | 929 | |
| INTERNET & DIRECT MARKETING RETAIL—5.9% | |||
| Ctrip.Com International Ltd. | |||
| 517 | 1.250%—09/15/2022 | 540 | |
| 1,101 | 1.990%—07/01/2025 | 1,279 | |
| 1,819 | |||
| Liberty Expedia Holdings Inc. | |||
| 1,095 | 1.000%—06/30/20471 | 1,122 | |
| CONVERTIBLE BONDS—Continued | |||
| Principal Amount | Value | ||
| INTERNET & DIRECT MARKETING RETAIL—Continued | |||
| Priceline Group Inc. | |||
| $ | 580 | 0.350%—06/15/2020 | $ 864 |
| 1,033 | 0.900%—09/15/2021 | 1,235 | |
| 2,099 | |||
| Vipshop Holdings Ltd. | |||
| 851 | 1.500%—03/15/2019 | 838 | |
| Wayfair Inc. | |||
| 900 | 0.375%—09/01/20221 | 881 | |
| 6,759 | |||
| INTERNET SOFTWARE & SERVICES—6.7% | |||
| Akamai Technologies Inc. | |||
| 594 | 0.000%—02/15/20192 | 585 | |
| Altaba Inc. | |||
| 267 | 0.000%—12/01/20182 | 368 | |
| Envestnet Inc. | |||
| 604 | 1.750%—12/15/2019 | 651 | |
| Gogo Inc. | |||
| 979 | 3.750%—03/01/2020 | 874 | |
| IAC Financeco Inc. | |||
| 870 | 0.875%—10/01/20221 | 941 | |
| Twitter Inc. | |||
| 2,127 | 1.000%—09/15/2021 | 1,966 | |
| Web.com Group Inc. | |||
| 244 | 1.000%—08/15/2018 | 244 | |
| Weibo Corp. | |||
| 770 | 1.250%—11/15/20221 | 804 | |
| Zillow Group Inc. | |||
| 1,088 | 2.000%—12/01/20211 | 1,198 | |
| 7,631 | |||
| IT SERVICES—2.9% | |||
| Blackhawk Network Holdings Inc. | |||
| 1,507 | 1.500%—01/15/2022 | 1,514 | |
| Euronet Worldwide Inc. | |||
| 432 | 1.500%—10/01/2044 | 591 | |
| Square Inc. | |||
| 700 | 0.375%—03/01/20221 | 1,187 | |
| 3,292 | |||
| LIFE SCIENCES TOOLS & SERVICES—0.9% | |||
| Qiagen NV | |||
| 800 | 0.375%—03/19/2019 | 976 | |
| MACHINERY—2.1% | |||
| Chart Industries Inc. | |||
| 500 | 2.000%—08/01/2018 | 502 | |
| Greenbrier Companies Inc. | |||
| 545 | 2.875%—02/01/20241 | 640 | |
| Navistar International Corp. | |||
| 1,163 | 4.750%—04/15/2019 | 1,267 | |
| 2,409 | |||
| MEDIA—6.2% | |||
| Dish Network Corp. | |||
| 633 | 2.375%—03/15/20241 | 610 | |
| 1,276 | 3.375%—08/15/2026 | 1,379 | |
| 1,989 | |||
| Liberty Interactive LLC | |||
| 830 | 1.750%—09/30/20461 | 941 | |
| Liberty Media Corp. | |||
| 625 | 1.000%—01/30/20231 | 749 | |
9
Harbor Convertible Securities Fund
Portfolio of Investments—Continued
Portfolio of Investments—Continued
Value, Cost, and Principal Amounts in Thousands
| CONVERTIBLE BONDS—Continued | |||
| Principal Amount | Value | ||
| MEDIA—Continued | |||
| $ | 517 | 1.375%—10/15/2023 | $ 622 |
| 1,061 | 2.250%—09/30/2046 | 1,116 | |
| 2,487 | |||
| Live Nation Entertainment Inc. | |||
| 1,264 | 2.500%—05/15/2019 | 1,677 | |
| 7,094 | |||
| METALS & MINING—0.8% | |||
| Royal Gold Inc. | |||
| 867 | 2.875%—06/15/2019 | 954 | |
| MORTGAGE REAL ESTATE INVESTMENT TRUSTS (REITs)—3.8% | |||
| Starwood Property Trust Inc. | |||
| 2,022 | 4.375%—04/01/2023 | 2,062 | |
| Two Harbors Investment Corp. | |||
| 2,184 | 6.250%—01/15/2022 | 2,288 | |
| 4,350 | |||
| OIL, GAS & CONSUMABLE FUELS—3.3% | |||
| Chesapeake Energy Corp. | |||
| 1,014 | 5.500%—09/15/20261 | 903 | |
| Oasis Petroleum Inc. | |||
| 347 | 2.625%—09/15/2023 | 383 | |
| PDC Energy Inc. | |||
| 303 | 1.125%—09/15/2021 | 298 | |
| SM Energy Co. | |||
| 357 | 1.500%—07/01/2021 | 344 | |
| Total SA MTN3 | |||
| 1,200 | 0.500%—12/02/2022 | 1,241 | |
| Whiting Petroleum Corp. | |||
| 715 | 1.250%—04/01/2020 | 645 | |
| 3,814 | |||
| PHARMACEUTICALS—2.1% | |||
| Jazz Investments I Ltd. | |||
| 1,685 | 1.875%—08/15/2021 | 1,740 | |
| Pacira Pharmaceuticals Inc. | |||
| 565 | 2.375%—04/01/20221 | 526 | |
| Teva Pharmaceutical Finance Co. LLC | |||
| 91 | 0.250%—02/01/2026 | 80 | |
| 2,346 | |||
| SEMICONDUCTORS & SEMICONDUCTOR EQUIPMENT—12.7% | |||
| Advanced Micro Devices Inc. | |||
| 192 | 2.125%—09/01/2026 | 303 | |
| Inphi Corp. | |||
| 596 | 0.750%—09/01/2021 | 622 | |
| Integrated Device Technology Inc. | |||
| 1,369 | 0.875%—11/15/2022 | 1,580 | |
| Intel Corp. | |||
| 1,046 | 3.493%—12/15/2035 | 1,757 | |
| Lam Research Corp. | |||
| 213 | 1.250%—05/15/2018 | 737 | |
| Microchip Technology Inc. | |||
| 365 | 1.625%—02/15/2025 | 673 | |
| 1,515 | 1.625%—02/15/20271 | 1,915 | |
| 2,588 | |||
| Micron Technology Inc. | |||
| 547 | 3.000%—11/15/2043 | 851 | |
| ON Semiconductor Corp. | |||
| 1,819 | 1.000%—12/01/2020 | 2,354 | |
| CONVERTIBLE BONDS—Continued | |||
| Principal Amount | Value | ||
| SEMICONDUCTORS & SEMICONDUCTOR EQUIPMENT—Continued | |||
| Silicon Laboratories Inc. | |||
| $ | 1,040 | 1.375%—03/01/20221 | $ 1,252 |
| Stmicroelectronics NV | |||
| 1,400 | 0.250%—07/03/2024 | 1,806 | |
| Teradyne Inc. | |||
| 450 | 1.250%—12/15/20231 | 651 | |
| 14,501 | |||
| SOFTWARE—15.3% | |||
| Citrix Systems Inc. | |||
| 1,709 | 0.500%—04/15/2019 | 2,100 | |
| FireEye Inc. | |||
| 1,609 | 1.625%—06/01/2035 | 1,505 | |
| Hubspot Inc. | |||
| 861 | 0.250%—06/01/20221 | 973 | |
| Nice Systems Inc. | |||
| 538 | 1.250%—01/15/20241 | 622 | |
| Nuance Communications Inc. | |||
| 1,781 | 1.000%—12/15/2035 | 1,644 | |
| Proofpoint Inc. | |||
| 1,281 | 0.750%—06/15/2020 | 1,657 | |
| Red Hat Inc. | |||
| 626 | 0.250%—10/01/2019 | 1,041 | |
| Rovi Corp. | |||
| 833 | 0.500%—03/01/2020 | 813 | |
| Salesforce.com Inc. | |||
| 737 | 0.250%—04/01/2018 | 1,134 | |
| ServiceNow Inc. | |||
| 169 | 0.000%—11/01/20182 | 290 | |
| 1,645 | 0.000%—06/01/20221,2 | 1,853 | |
| 2,143 | |||
| Verint Systems Inc. | |||
| 2,083 | 1.500%—06/01/2021 | 2,050 | |
| Workday Inc. | |||
| 1,175 | 0.250%—10/01/20221 | 1,191 | |
| 410 | 1.500%—07/15/2020 | 601 | |
| 1,792 | |||
| 17,474 | |||
| TECHNOLOGY HARDWARE, STORAGE & PERIPHERALS—0.7% | |||
| Electronics For Imaging Inc. | |||
| 837 | 0.750%—09/01/2019 | 818 | |
| THRIFTS & MORTGAGE FINANCE—0.9% | |||
| Lendingtree Inc. | |||
| 700 | 0.625%—06/01/20221 | 994 | |
| TRANSPORTATION INFRASTRUCTURE—2.0% | |||
| Macquarie Infrastructure Corp. | |||
| 1,176 | 2.000%—10/01/2023 | 1,134 | |
| 1,073 | 2.875%—07/15/2019 | 1,133 | |
| 2,267 | |||
| TOTAL CONVERTIBLE BONDS | |||
(Cost $108,200) | 112,382 | ||
| CORPORATE BONDS & NOTES—1.0% | |||
| HEALTH CARE PROVIDERS & SERVICES—1.0% | |||
| Centene Corp. | |||
| 655 | 5.625%—02/15/2021 | 681 | |
10
Harbor Convertible Securities Fund
Portfolio of Investments—Continued
Portfolio of Investments—Continued
Value, Cost, and Principal Amounts in Thousands
| CORPORATE BONDS & NOTES—Continued | |||
| Principal Amount | Value | ||
| HEALTH CARE PROVIDERS & SERVICES—Continued | |||
| HCA Inc. | |||
| $ | 463 | 6.500%—02/15/2020 | $ 500 |
| TOTAL CORPORATE BONDS & NOTES | |||
(Cost $1,178) | 1,181 | ||
| SHORT-TERM INVESTMENTS—1.2% | |||
| (Cost $1,368) | |||
| REPURCHASE AGREEMENTS | |||
| 1,368 | Repurchase Agreement with Fixed Income Clearing Corp. dated October 31, 2017 due November 01, 2017 at 0.001% collateralized by U.S. Treasury Notes (value $1,397) | 1,368 | |
| TOTAL INVESTMENTS—100.5% | |||
(Cost $110,746) | 114,931 | ||
CASH AND OTHER ASSETS, LESS LIABILITIES—(0.5)% | (545) | ||
TOTAL NET ASSETS—100.0% | $114,386 | ||
FAIR VALUE MEASUREMENTS
All holdings at October 31, 2017 (as disclosed in the preceding Portfolio of Investments) are classified as Level 2. There were no Level 3 holdings at October 31, 2017 or 2016, and no transfers between levels during the year.
For more information on valuation inputs and their aggregation into the levels identified above, please refer to the Fair Value Measurements and Disclosures in Note 2 of the accompanying Notes to Financial Statements.
| 1 | Securities purchased in a transaction exempt from registration under Rule 144A of the Securities Act of 1933. These securities may be resold in transactions exempt from registration, normally to qualified institutional buyers. The Fund has no right to demand registration of these securities. These securities are priced by an independent pricing service in accordance with Harbor Funds Valuation Procedures. At October 31, 2017, the aggregate value of these securities was $33,870,000 or 30% of net assets. |
| 2 | Zero coupon bond. |
| 3 | MTN after the name of a security stands for Medium Term Note. |
The accompanying notes are an integral part of the Financial Statements.
11
Harbor High-Yield Bond Fund
Managers' Commentary (Unaudited)
Managers' Commentary (Unaudited)
Subadviser
Shenkman Capital Management, Inc.
461 Fifth Avenue
22nd Floor
22nd Floor
New York, NY 10017
Portfolio Managers
Mark Shenkman
Since 2002
Since 2002
Justin W. Slatky
Since 2012
Since 2012
Eric Dobbin
Since 2012
Since 2012
Steven N. Schweitzer
Since 2012
Since 2012
Robert Kricheff
Since 2015
Since 2015
Neil Wechsler
Since 2017
Since 2017
Shenkman Capital has subadvised the Fund since 2002.
Investment Objective
The Fund seeks total returns (i.e., current income and capital appreciation).
Mark Shenkman
Justin W. Slatky

Eric Dobbin

Steven N. Schweitzer

Robert Kricheff

Neil Wechsler
Management’s Discussion of
Fund Performance
Fund Performance
Market review
The high-yield market experienced intermittent slumps during the year as concerns about a possible nuclear conflict on the Korean Peninsula, political turmoil in Washington, D.C., and sporadic periods of weakness in crude oil prices pressured the market. Each time, however, the weakness was short-lived as investors refocused their attention on positive factors and hopes that the potential passage of a comprehensive tax reform package would accelerate growth and boost the financial markets. The ICE BofAML US Non-Distressed High Yield Index (the “Index”) returned 8.62% for the 12 months ended October 31, 2017. With the “risk-on” environment resurfacing, triple-C rated credits within the Index surged by 12.27% for the period, well above the single-B and double-B gains of 8.97% and 7.71%, respectively. Default rates plunged from approximately 3% as of October 31, 2016 to 1% as of October 31, 2017. The J.P. Morgan U.S. High-Yield trailing twelve-month default rate is now at its lowest level since March 2014 as of October 31, 2017. Not surprisingly, approximately half of this year’s defaults have occurred in the Retail and Energy sectors.
As is typical over the summer months, July and August saw a somewhat lower level of new issuance than the first six months of the year. Immediately following the Labor Day holiday weekend, however, the new issuance floodgates opened. With interest rates trending at low levels and pent-up demand for bonds following the late-August doldrums, a plethora of companies sought to opportunistically access the high-yield market to refinance existing debt and extend maturities. New issuance volume remained at high levels with most of the proceeds being used for refinancing purposes, and new issue credit quality was relatively high. Notably, with crude oil prices improving throughout the year, there was a meaningful increase in new issuance tied to the Energy sector.
Lastly, with economic growth showing encouraging signs and corporate profitability displaying improvement, the rating agencies noted improving credit metrics, as 82 companies receiving rating upgrades versus just 47 receiving downgrades in the third quarter of 2017.
performance
The Harbor High-Yield Bond Fund gained 8.16% (Institutional Class), 7.98% (Administrative Class), 7.79% (Investor Class), and 8.23% (Retirement Class) during the year ended October 31, 2017, underperforming the Index return of 8.62%. The performance was achieved with slightly lower duration and yield than the Fund’s benchmark, the ICE BofAML US Non-Distressed High Yield Index. The Fund’s security selection in Utilities: gas and underweight in Financials: banking slightly detracted from performance, while security selection and overweight in Telecom: Satellites and security selection in Financials: services contributed to relative performance.
Over the period, the Fund strategically increased exposure to BB-rated credits, the highest rating bucket in the high-yield universe. While we expect a continuation of a “modest growth” expansion cycle, we have started to see some more pockets of volatility and believe the Fund is well-positioned for both of these trends as of the end of the period.
12
Harbor High-Yield Bond Fund
Managers' Commentary—Continued
Managers' Commentary—Continued
| TOP TEN ISSUERS (% of net assets) | |
| HCA Inc. | 1.6% |
| Numericable-SFR SA | 1.1% |
| Sprint Corp. | 1.1% |
| Valeant Pharmaceuticals International Inc. | 1.1% |
| Navient Corp. | 1.0% |
| Tenet Healthcare Corp. | 1.0% |
| CCO Holdings LLC | 0.9% |
| Chesapeake Energy Corp. | 0.9% |
| DISH DBS Corp. | 0.9% |
| Cequel Communications Holdings I LLC | 0.8% |
Outlook & Strategy
The “devil is in the details” as to which aspects of corporate and personal tax reform will ultimately come to fruition, when and if those changes are enacted, and how those revisions will impact the federal deficit, but even a diluted plan could provide some uplift to corporate profitability, consumer confidence, and economic results. Meanwhile, the Federal Reserve (Fed) has now taken the first modest step toward reducing the size of its $4.5 trillion balance sheet and appears likely to raise rates again before the calendar year is over. However, we believe the Fed will continue to move at a glacial pace, its balance sheet should decline slowly and predictably, and rate hikes should be clearly telegraphed. With solid economic momentum, both in the U.S. and abroad, improving corporate earnings, default rates lingering near multi-year lows and likely to stay there, and the absence of aggressive Fed hikes causing a sudden end to the current expansion, we believe that the high-yield market should continue to hold up well in what is still a relatively low global interest rate environment.
This report contains the current opinions of Shenkman Capital Management, Inc. as of the date of this report and should not be considered as investment advice or a recommendation of any particular security, strategy or investment product. Such opinions are subject to change without notice and securities described herein may no longer be included in, or may at any time be removed from, the Fund’s portfolio. This report is distributed for informational purposes only. Information contained herein has been obtained from sources believed reliable, but not guaranteed.
Fixed income investments are affected by interest rate changes and the creditworthiness of the issues held by the Fund. A rise in interest rates will cause a decrease in the value of fixed income securities. Such an event would have an adverse effect on the Harbor High-Yield Bond Fund. High-yield investing poses additional credit risk related to lower-rated bonds. For information on the different share classes and the risks associated with an investment in the Fund, please refer to the current prospectus.
13
Harbor High-Yield Bond Fund
Fund Summary—October 31, 2017 (Unaudited)
Fund Summary—October 31, 2017 (Unaudited)
| INSTITUTIONAL CLASS | |
| Fund # | 2024 |
| Cusip | 411511553 |
| Ticker | HYFAX |
| Inception Date | 12/01/2002 |
| Net Expense Ratio | 0.67% a |
| Total Net Assets (000s) | $1,387,213 |
| ADMINISTRATIVE CLASS | |
| Fund # | 2224 |
| Cusip | 411511546 |
| Ticker | HYFRX |
| Inception Date | 12/01/2002 |
| Net Expense Ratio | 0.92% a |
| Total Net Assets (000s) | $1,753 |
| INVESTOR CLASS | |
| Fund # | 2424 |
| Cusip | 411511538 |
| Ticker | HYFIX |
| Inception Date | 12/01/2002 |
| Net Expense Ratio | 1.04% a |
| Total Net Assets (000s) | $42,753 |
| RETIREMENT CLASS | |
| Fund # | 2524 |
| Cusip | 411512379 |
| Ticker | HNHYX |
| Inception Date | 03/01/2016 |
| Net Expense Ratio | 0.61% a |
| Total Net Assets (000s) | $41,975 |
Portfolio Statistics
| Portfolio | Benchmark | ||
| Average Market Coupon | 6.18% | 6.42% | |
| Yield to Maturity | 5.57% | 6.02% | |
| Current 30-Day Yield (Institutional Class) | 4.01% | 6.32% | |
| Weighted Average Maturity | 5.89 years | 6.32 years | |
| Weighted Average Duration | 2.94 years | 3.62 years | |
| Beta vs. ICE BofAML U.S. Non-Distressed High Yield Index | 1.16 | N/A | |
| Portfolio Turnover (Year Ended 10/31/2017) | 56% | N/A |
Sector Allocation (% of investments)
(Excludes cash and short-term investments)

MATURITY PROFILE
| Years to Maturity | % of Investments | |
| 0 to 1 yr. | 1.90% | |
| >1 to 5 | 40.84% | |
| >5 to 10 | 54.70% | |
| >10 to 15 | 1.09% | |
| >15 to 20 | 0.28% | |
| >20 to 25 | 1.19% | |
| >25 yrs. | 0.00% |
| a | Reflects a contractual management fee waiver effective through February 28, 2018 |
14
Harbor High-Yield Bond Fund
Fund Performance Summary (Unaudited)
Fund Performance Summary (Unaudited)
The graph compares a $50,000 investment in the Institutional Class shares of the Fund with the performance of the ICE BofAML U.S. High Yield Index and the ICE BofAML US Non-Distressed High Yield Index. The Fund’s performance assumes the reinvestment of all dividend and capital gain distributions.
CHANGE IN A $50,000 INVESTMENT
For the period 11/01/2007 through 10/31/2017

| TOTAL RETURNS For the periods ended 10/31/2017 | 1 Year | Annualized | Inception Date | Final Value of a $50,000 Investment | ||||||||||
| 5 Years | 10 Years | |||||||||||||
| Harbor High-Yield Bond Fund | ||||||||||||||
Institutional Class | 8.16% | 4.85% | 6.15% | 12/01/2002 | $ 90,812 | |||||||||
Administrative Class | 7.98 | 4.61 | 5.90 | 12/01/2002 | 88,705 | |||||||||
Investor Class | 7.79 | 4.47 | 5.76 | 12/01/2002 | 87,564 | |||||||||
Retirement Class1 | 8.23 | 4.89 | 6.17 | 03/01/2016 | 90,998 | |||||||||
| Comparative Indices | ||||||||||||||
ICE BofAML U.S. Non-Distressed High Yield | 8.62% | 6.33% | 6.69% | — | $ 95,535 | |||||||||
ICE BofAML U.S. High Yield | 9.14 | 6.29 | 7.69 | — | 104,922 | |||||||||
As stated in the Fund’s current prospectus, the expense ratios were 0.67% (Net) and 0.71% (Gross) (Institutional Class); 0.92% (Net) and 0.96% (Gross) (Administrative Class); 1.04% (Net) and 1.08% (Gross) (Investor Class); and 0.59% (Net) and 0.63% (Gross) (Retirement Class). The net expense ratios reflect a contractual management fee waiver effective through 02/28/2018. The expense ratios in the prospectus may differ from the actual expense ratios for the period disclosed within this report. The expense ratios shown in the prospectus are based on the prior fiscal year, adjusted to reflect changes, if any, in contractual arrangements that occurred prior to the date of the prospectus (or supplement thereto, if applicable).
Performance data shown represents past performance and is no guarantee of future results. Past performance is net of management fees and expenses and reflects reinvested dividends and distributions, but does not reflect the deduction of taxes that a shareholder would pay on Fund distributions or upon the redemption of Fund shares. Past performance reflects the beneficial effect of any expense waivers or reimbursements, without which returns would have been lower. Investment returns and principal value will fluctuate and when redeemed may be worth more or less than their original cost. Returns for periods less than one year are not annualized. Current performance may be higher or lower and is available through the most recent month end at harborfunds.com or by calling 800-422-1050. The Fund charges a redemption fee of 1% on redemption of Fund shares that are held for less than 90 days.
| 1 | Retirement Class shares commenced operations on March 1, 2016. The performance attributed to the Retirement Class shares prior to that date is that of the Institutional Class shares. Performance prior to March 1, 2016 has not been adjusted to reflect the lower expenses of Retirement Class shares. During this period, Retirement Class shares would have had returns similar to, but somewhat higher than, Institutional Class shares due to the fact that Retirement Class shares represent interests in the same portfolio as Institutional Class shares but are subject to lower expenses. |
15
Harbor High-Yield Bond Fund
Portfolio of Investments—October 31, 2017
Portfolio of Investments—October 31, 2017
Value, Cost, and Principal Amounts in Thousands
Total Investments (% of net assets)
(Excludes net cash and short-term investments of 3.2%)


| BANK LOAN OBLIGATIONS—4.1% | |||
| Principal Amount | Value | ||
| CHEMICALS—0.3% | |||
| Solenis International LP | |||
| Second-Lien Term Loan | |||
| $ | 5,000 | 8.131% (3 Month USD Libor + 6.750) 07/31/20221 | $ 4,998 |
| COMMERCIAL SERVICES & SUPPLIES—0.9% | |||
| Brand Energy & Infrastructure Services Inc. | |||
| 9,416 | 5.631% (3 Month USD Libor + 4.250) 06/21/20241 | 9,480 | |
| Granite Acquisition Inc. | |||
| Term Loan B | |||
| 3,662 | 5.381% (3 Month USD Libor + 4.000) 12/17/20211 | 3,708 | |
| Term Loan C | |||
| 91 | 5.381% (3 Month USD Libor + 4.000) 12/17/20211 | 92 | |
| 3,800 | |||
| 13,280 | |||
| ELECTRICAL EQUIPMENT—0.4% | |||
| Cortes NP Acquisition Corp. | |||
| Term Loan B | |||
| 5,322 | 5.381% (3 Month USD Libor + 4.000) 11/30/20231 | 5,347 | |
| FOOD & STAPLES RETAILING—0.1% | |||
| Clover Merger Sub Inc. | |||
| Initial Term Loans | |||
| 2,235 | 9.131% (3 Month USD Libor + 7.750) 08/15/20251 | 2,179 | |
| HOTELS, RESTAURANTS & LEISURE—0.2% | |||
| Amaya Holdings BV | |||
| 2,687 | 4.881% (3 Month USD Libor + 3.500) 08/01/20211 | 2,708 | |
| Second-Lien Term Loan B | |||
| 591 | 8.381% (3 Month USD Libor + 7.000) 08/01/20221 | 597 | |
| 3,305 | |||
| INTERNET SOFTWARE & SERVICES—0.2% | |||
| Ancestry.com Inc. | |||
| 1,168 | 4.631% (3 Month USD Libor + 3.250) 10/19/20231 | 1,180 | |
| 1,422 | 9.631% (3 Month USD Libor + 8.250) 10/19/20241 | 1,458 | |
| 2,638 | |||
| OIL, GAS & CONSUMABLE FUELS—0.8% | |||
| California Resources Corporation | |||
| Term Loan | |||
| 3,050 | 11.756% (3 Month USD Libor + 10.375) 12/31/20211 | 3,274 | |
| Chesapeake Energy Corp. | |||
| 8,000 | 8.881% (3 Month USD Libor + 7.500) 08/23/20211 | 8,614 | |
| 11,888 | |||
16
Harbor High-Yield Bond Fund
Portfolio of Investments—Continued
Portfolio of Investments—Continued
Value, Cost, and Principal Amounts in Thousands
| BANK LOAN OBLIGATIONS—Continued | |||
| Principal Amount | Value | ||
| SOFTWARE—0.3% | |||
| Greeneden US Holdings II LLC | |||
| Term Loan B 2 | |||
| $ | 4,020 | 5.381% (3 Month USD Libor + 3.750) 12/01/20231 | $ 4,045 |
| SPECIALTY RETAIL—0.9% | |||
| Ascena Retail Group Inc. | |||
| Term Loan B | |||
| 7,653 | 5.881% (3 Month USD Libor + 4.500) 08/21/20221 | 6,675 | |
| Bass Pro Group LLC | |||
| 6,150 | 6.381% (3 Month USD Libor + 5.000) 09/25/20241 | 5,992 | |
| 12,667 | |||
| TOTAL BANK LOAN OBLIGATIONS | |||
(Cost $59,735) | 60,347 | ||
| CORPORATE BONDS & NOTES—92.7% | |||
| AEROSPACE & DEFENSE—2.2% | |||
| Bombardier Inc. | |||
| 6,550 | 6.000%—10/15/20222 | 6,484 | |
| 2,000 | 6.125%—01/15/20232 | 2,004 | |
| 8,488 | |||
| KLX Inc. | |||
| 225 | 5.875%—12/01/20222 | 236 | |
| Moog Inc. | |||
| 10,000 | 5.250%—12/01/20222 | 10,400 | |
| Orbital ATK Inc. | |||
| 2,000 | 5.500%—10/01/2023 | 2,135 | |
| TransDigm Inc. | |||
| 6,820 | 6.500%—07/15/2024-05/15/2025 | 7,058 | |
| Triumph Group Inc. | |||
| 3,670 | 5.250%—06/01/2022 | 3,652 | |
| 615 | 7.750%—08/15/20252 | 659 | |
| 4,311 | |||
| 32,628 | |||
| AIR FREIGHT & LOGISTICS—0.5% | |||
| Park Aerospace Holdings Ltd. | |||
| 225 | 5.250%—08/15/20222 | 235 | |
| 325 | 5.500%—02/15/20242 | 338 | |
| 573 | |||
| XPO Logistics Inc. | |||
| 6,000 | 6.500%—06/15/20222 | 6,323 | |
| 6,896 | |||
| AUTO COMPONENTS—1.3% | |||
| American Axle & Manufacturing Inc. | |||
| 925 | 6.500%—04/01/20272 | 947 | |
| 5,000 | 6.625%—10/15/2022 | 5,184 | |
| 6,131 | |||
| American Tire Distributors Inc. | |||
| 2,700 | 10.250%—03/01/20222 | 2,828 | |
| Delphi Jersey Holdings plc | |||
| 3,495 | 5.000%—10/01/20252 | 3,530 | |
| Goodyear Tire & Rubber Co. | |||
| 3,155 | 4.875%—03/15/2027 | 3,218 | |
| ZF North America Capital Inc. | |||
| 3,000 | 4.000%—04/29/20202 | 3,109 | |
| 18,816 | |||
| CORPORATE BONDS & NOTES—Continued | |||
| Principal Amount | Value | ||
| AUTOMOBILES—0.4% | |||
| Jaguar Land Rover Automotive plc | |||
| $ | 2,020 | 4.500%—10/01/20272 | $ 2,005 |
| Tesla Inc. | |||
| 4,115 | 5.300%—08/15/20252 | 3,976 | |
| 5,981 | |||
| BANKS—0.6% | |||
| Royal Bank of Scotland Group plc | |||
| 5,000 | 5.125%—05/28/2024 | 5,357 | |
| 3,320 | 6.000%—12/19/2023 | 3,703 | |
| 9,060 | |||
| BEVERAGES—0.2% | |||
| Cott Holdings Inc. | |||
| 2,500 | 5.500%—04/01/20252 | 2,584 | |
| BIOTECHNOLOGY—0.1% | |||
| Avantor Inc. | |||
| 1,785 | 6.000%—10/01/20242 | 1,823 | |
| BUILDING PRODUCTS—1.9% | |||
| Griffon Corp. | |||
| 7,500 | 5.250%—03/01/2022 | 7,648 | |
| 2,660 | 5.250%—03/01/20222 | 2,712 | |
| 10,360 | |||
| Masonite International Corp. | |||
| 600 | 5.625%—03/15/20232 | 632 | |
| RSI Home Products Inc. | |||
| 1,660 | 6.500%—03/15/20232 | 1,747 | |
| Standard Industries Inc. | |||
| 230 | 5.125%—02/15/20212 | 238 | |
| 5,000 | 5.500%—02/15/20232 | 5,288 | |
| 5,526 | |||
| Summit Materials LLC | |||
| 7,870 | 6.125%—07/15/2023 | 8,205 | |
| 310 | 8.500%—04/15/2022 | 348 | |
| 8,553 | |||
| USG Corp. | |||
| 1,700 | 4.875%—06/01/20272 | 1,768 | |
| 28,586 | |||
| CHEMICALS—2.7% | |||
| A Schulman Inc. | |||
| 4,240 | 6.875%—06/01/2023 | 4,489 | |
| Alpha 3 BV / Alpha US BidCo Inc. | |||
| 2,000 | 6.250%—02/01/20252 | 2,060 | |
| Consolidated Energy Finance SA | |||
| 965 | 6.750%—10/15/20192 | 983 | |
| Koppers Inc. | |||
| 1,135 | 6.000%—02/15/20252 | 1,220 | |
| Nova Chemicals Corp. | |||
| 1,325 | 5.250%—06/01/20272 | 1,351 | |
| 3,100 | 4.875%—06/01/20242 | 3,166 | |
| 3,000 | 5.250%—08/01/20232 | 3,105 | |
| 7,622 | |||
| Platform Specialty Products Corp. | |||
| 7,140 | 6.500%—02/01/20222 | 7,417 | |
| 1,150 | 10.375%—05/01/20212 | 1,250 | |
| 8,667 | |||
17
Harbor High-Yield Bond Fund
Portfolio of Investments—Continued
Portfolio of Investments—Continued
Value, Cost, and Principal Amounts in Thousands
| CORPORATE BONDS & NOTES—Continued | |||
| Principal Amount | Value | ||
| CHEMICALS—Continued | |||
| PQ Corp. | |||
| $ | 4,500 | 6.750%—11/15/20222 | $ 4,883 |
| Tronox Finance LLC | |||
| 4,255 | 7.500%—03/15/20222 | 4,484 | |
| Univar USA Inc. | |||
| 5,000 | 6.750%—07/15/20232 | 5,288 | |
| 39,696 | |||
| COMMERCIAL SERVICES & SUPPLIES—3.3% | |||
| Advanced Disposal Services Inc. | |||
| 4,050 | 5.625%—11/15/20242 | 4,222 | |
| Brand Energy & Infrastructure Services Inc. | |||
| 2,200 | 8.500%—07/15/20252 | 2,332 | |
| Brink's Co. | |||
| 2,445 | 4.625%—10/15/20272 | 2,439 | |
| Carlson Travel Inc. | |||
| 1,350 | 6.750%—12/15/20232 | 1,340 | |
| Clean Harbors Inc. | |||
| 5,000 | 5.125%—06/01/2021 | 5,081 | |
| Covanta Holding Corp. | |||
| 1,025 | 5.875%—07/01/2025 | 1,017 | |
| 6,500 | 6.375%—10/01/2022 | 6,728 | |
| 7,745 | |||
| Garda World Security Corp. | |||
| 5,000 | 7.250%—11/15/20212 | 5,131 | |
| GFL Environmental Inc. | |||
| 2,000 | 5.625%—05/01/20222 | 2,085 | |
| 2,300 | 9.875%—02/01/20212 | 2,458 | |
| 4,543 | |||
| GW Honos Security Corp. | |||
| 1,550 | 8.750%—05/15/20252 | 1,655 | |
| Harland Clarke Holdings Corp. | |||
| 1,415 | 8.375%—08/15/20222 | 1,495 | |
| Kar Auction Services Inc. | |||
| 1,425 | 5.125%—06/01/20252 | 1,478 | |
| LSC Communications Inc. | |||
| 2,235 | 8.750%—10/15/20232 | 2,305 | |
| NuStar Logistics LP | |||
| 2,000 | 6.750%—02/01/2021 | 2,180 | |
| RR Donnelley & Sons Co. | |||
| 4,125 | 6.000%—04/01/2024 | 3,867 | |
| 1,250 | 6.500%—11/15/2023 | 1,206 | |
| 5,073 | |||
| Wrangler Buyer Corp. | |||
| 1,555 | 6.000%—10/01/20252 | 1,598 | |
| 48,617 | |||
| COMMUNICATIONS EQUIPMENT—1.0% | |||
| Commscope Inc. | |||
| 400 | 5.000%—06/15/20212 | 410 | |
| Commscope Technologies LLC | |||
| 570 | 5.000%—03/15/20272 | 556 | |
| Hughes Satellite Systems Corp. | |||
| 1,500 | 6.500%—06/15/2019 | 1,597 | |
| 2,500 | 6.625%—08/01/2026 | 2,644 | |
| 4,250 | 7.625%—06/15/2021 | 4,786 | |
| 9,027 | |||
| Telesat Canada | |||
| 2,000 | 8.875%—11/15/20242 | 2,245 | |
| CORPORATE BONDS & NOTES—Continued | |||
| Principal Amount | Value | ||
| COMMUNICATIONS EQUIPMENT—Continued | |||
| Viasat Inc. | |||
| $ | 2,035 | 5.625%—09/15/20252 | $ 2,067 |
| 14,305 | |||
| CONSTRUCTION & ENGINEERING—0.5% | |||
| AECOM | |||
| 2,650 | 5.125%—03/15/2027 | 2,733 | |
| 5,000 | 5.750%—10/15/2022 | 5,244 | |
| 7,977 | |||
| CONSUMER FINANCE—2.3% | |||
| Ally Financial Inc. | |||
| 800 | 4.125%—03/30/2020 | 828 | |
| 3,015 | 4.625%—05/19/2022 | 3,196 | |
| 750 | 4.750%—09/10/2018 | 767 | |
| 880 | 5.750%—11/20/2025 | 976 | |
| 2,230 | 7.500%—09/15/2020 | 2,517 | |
| 1,883 | 8.000%—11/01/2031 | 2,498 | |
| 10,782 | |||
| Navient Corp. | |||
| 2,500 | 5.000%—10/26/2020 | 2,581 | |
| 1,335 | 6.750%—06/25/2025 | 1,400 | |
| 2,000 | 7.250%—09/25/2023 | 2,176 | |
| 6,157 | |||
| Navient Corp. MTN3 | |||
| 2,655 | 5.500%—01/25/2023 | 2,698 | |
| 5,005 | 7.250%—01/25/2022 | 5,449 | |
| 8,147 | |||
| OneMain Financial Holdings Inc. | |||
| 2,000 | 6.750%—12/15/20192 | 2,078 | |
| Springleaf Finance Corp. | |||
| 1,500 | 6.000%—06/01/2020 | 1,577 | |
| 1,000 | 6.125%—05/15/2022 | 1,058 | |
| 3,000 | 7.750%—10/01/2021 | 3,382 | |
| 6,017 | |||
| 33,181 | |||
| CONTAINERS & PACKAGING—2.9% | |||
| Ard Finance SA | |||
| 4,500 | 7.125%—09/15/2023 | 4,804 | |
| Ardagh Packaging Finance plc | |||
| 2,970 | 6.000%—06/30/2021-02/15/20252 | 3,129 | |
| Berry Plastics Corp. | |||
| 2,650 | 5.500%—05/15/2022 | 2,753 | |
| Bway Holding Co. | |||
| 1,600 | 5.500%—04/15/20242 | 1,670 | |
| 6,035 | 7.250%—04/15/20252 | 6,276 | |
| 7,946 | |||
| Cascades Inc. | |||
| 7,025 | 5.500%—07/15/20222 | 7,271 | |
| 4,050 | 5.750%—07/15/20232 | 4,273 | |
| 11,544 | |||
| Flex Acquisition Co. Inc. | |||
| 2,950 | 6.875%—01/15/20252 | 3,055 | |
| Reynolds Group Issuer Inc. | |||
| 1,000 | 5.750%—10/15/2020 | 1,019 | |
| Signode Industrial Group Lux SA | |||
| 7,500 | 6.375%—05/01/20222 | 7,828 | |
| 42,078 | |||
18
Harbor High-Yield Bond Fund
Portfolio of Investments—Continued
Portfolio of Investments—Continued
Value, Cost, and Principal Amounts in Thousands
| CORPORATE BONDS & NOTES—Continued | |||
| Principal Amount | Value | ||
| DIVERSIFIED FINANCIAL SERVICES—0.7% | |||
| Dae Funding LLC | |||
| $ | 470 | 4.000%—08/01/20202 | $ 478 |
| 3,960 | 4.500%—08/01/20222 | 4,025 | |
| 4,260 | 5.000%—08/01/20242 | 4,361 | |
| 8,864 | |||
| Virtu Financial | |||
| 1,700 | 6.750%—06/15/20222 | 1,772 | |
| 10,636 | |||
| DIVERSIFIED TELECOMMUNICATION SERVICES—4.1% | |||
| Altice Financing SA | |||
| 550 | 6.500%—01/15/20222 | 570 | |
| 2,100 | 7.500%—05/15/20262 | 2,313 | |
| 2,883 | |||
| CenturyLink Inc. | |||
| 3,000 | 5.625%—04/01/2020 | 3,139 | |
| 2,150 | 5.800%—03/15/2022 | 2,190 | |
| 1,675 | 7.500%—04/01/2024 | 1,784 | |
| 7,113 | |||
| Frontier Communications Corp. | |||
| 3,725 | 7.125%—01/15/2023 | 2,879 | |
| 210 | 7.625%—04/15/2024 | 162 | |
| 1,170 | 10.500%—09/15/2022 | 1,029 | |
| 1,640 | 11.000%—09/15/2025 | 1,396 | |
| 5,466 | |||
| GCI Inc. | |||
| 7,000 | 6.750%—06/01/2021 | 7,184 | |
| 2,460 | 6.875%—04/15/2025 | 2,675 | |
| 9,859 | |||
| Inmarsat Finance plc | |||
| 9,700 | 4.875%—05/15/20222 | 9,944 | |
| 725 | 6.500%—10/01/20242 | 783 | |
| 10,727 | |||
| Intelsat Jackson Holdings SA | |||
| 1,000 | 5.500%—08/01/2023 | 856 | |
| 1,625 | 7.250%—10/15/2020 | 1,572 | |
| 5,915 | 7.500%—04/01/2021 | 5,634 | |
| 8,062 | |||
| Level 3 Communications Inc. | |||
| 1,925 | 5.750%—12/01/2022 | 1,983 | |
| Level 3 Financing Inc. | |||
| 1,100 | 6.125%—01/15/2021 | 1,123 | |
| Telecom Italia Capital SA | |||
| 625 | 6.000%—09/30/2034 | 703 | |
| 775 | 6.375%—11/15/2033 | 903 | |
| 1,606 | |||
| Telecom Italia SpA | |||
| 2,875 | 5.303%—05/30/20242 | 3,109 | |
| Zayo Group LLC | |||
| 8,000 | 6.000%—04/01/2023 | 8,450 | |
| 60,381 | |||
| ELECTRIC UTILITIES—0.3% | |||
| Talen Energy Supply LLC | |||
| 1,000 | 6.500%—06/01/2025 | 870 | |
| 3,000 | 9.500%—07/15/20222 | 3,098 | |
| 3,968 | |||
| CORPORATE BONDS & NOTES—Continued | |||
| Principal Amount | Value | ||
| ELECTRONIC EQUIPMENT, INSTRUMENTS & COMPONENTS—0.7% | |||
| Anixter Inc. | |||
| $ | 9,000 | 5.125%—10/01/2021 | $ 9,630 |
| 750 | 5.500%—03/01/2023 | 822 | |
| 10,452 | |||
| ENERGY EQUIPMENT & SERVICES—1.9% | |||
| Archrock Partners LP | |||
| 3,000 | 6.000%—04/01/2021-10/01/2022 | 2,997 | |
| Hornbeck Offshore Services Inc. | |||
| 3,940 | 5.000%—03/01/2021 | 2,108 | |
| Precision Drilling Corp. | |||
| 1,405 | 6.625%—11/15/2020 | 1,423 | |
| Pride International LLC | |||
| 1,000 | 7.875%—08/15/2040 | 840 | |
| 1,100 | 8.500%—06/15/2019 | 1,171 | |
| 2,011 | |||
| Transocean Inc. | |||
| 1,565 | 6.800%—03/15/2038 | 1,279 | |
| 1,335 | 7.500%—01/15/20262 | 1,380 | |
| 2,659 | |||
| Trinidad Drilling Ltd. | |||
| 2,375 | 6.625%—02/15/20252 | 2,322 | |
| Unit Corp. | |||
| 4,900 | 6.625%—05/15/2021 | 4,943 | |
| Weatherford International Ltd. | |||
| 2,000 | 7.750%—06/15/2021 | 2,068 | |
| 5,900 | 8.250%—06/15/2023 | 5,944 | |
| 1,000 | 9.875%—02/15/2024 | 1,075 | |
| 9,087 | |||
| 27,550 | |||
| EQUITY REAL ESTATE INVESTMENT TRUSTS (REITs)—3.1% | |||
| Communications Sales & Leasing Inc. | |||
| 1,035 | 7.125%—12/15/20242 | 960 | |
| 1,195 | 8.250%—10/15/2023 | 1,153 | |
| 2,113 | |||
| Corecivic Inc. | |||
| 2,080 | 4.750%—10/15/2027 | 2,091 | |
| CyrusOne LP | |||
| 1,555 | 5.000%—03/15/20242 | 1,635 | |
| 440 | 5.375%—03/15/20272 | 471 | |
| 2,106 | |||
| Equinix Inc. | |||
| 2,740 | 5.375%—05/15/2027 | 2,942 | |
| FelCor Lodging LP | |||
| 5,650 | 5.625%—03/01/2023 | 5,869 | |
| 2,315 | 6.000%—06/01/2025 | 2,506 | |
| 8,375 | |||
| GEO Group Inc. | |||
| 2,650 | 5.875%—01/15/2022 | 2,753 | |
| Iron Mountain Inc. | |||
| 1,345 | 4.875%—09/15/20272 | 1,375 | |
| 5,000 | 5.750%—08/15/2024 | 5,150 | |
| 6,525 | |||
| Kennedy-Wilson Inc. | |||
| 5,000 | 5.875%—04/01/2024 | 5,194 | |
| Ladder Capital Finance LLC | |||
| 2,510 | 5.250%—10/01/20252 | 2,507 | |
19
Harbor High-Yield Bond Fund
Portfolio of Investments—Continued
Portfolio of Investments—Continued
Value, Cost, and Principal Amounts in Thousands
| CORPORATE BONDS & NOTES—Continued | |||
| Principal Amount | Value | ||
| EQUITY REAL ESTATE INVESTMENT TRUSTS (REITs)—Continued | |||
| MPT Operating Partnership LP | |||
| $ | 1,430 | 5.000%—10/15/2027 | $ 1,473 |
| 1,500 | 6.375%—03/01/2024 | 1,629 | |
| 3,102 | |||
| Qualitytech LP | |||
| 1,505 | 4.750%—11/15/20252 | 1,540 | |
| RHP Hotel Properties LP | |||
| 3,000 | 5.000%—04/15/2021 | 3,090 | |
| Sabra Health Care LP | |||
| 1,800 | 5.500%—02/01/2021 | 1,857 | |
| SBA Communications Corp. | |||
| 1,745 | 4.000%—10/01/20222 | 1,780 | |
| 45,975 | |||
| FOOD & STAPLES RETAILING—1.0% | |||
| Albertsons Companies LLC | |||
| 7,700 | 5.750%—03/15/2025 | 6,815 | |
| 2,250 | 6.625%—06/15/2024 | 2,126 | |
| 8,941 | |||
| Rite Aid Corp. | |||
| 5,620 | 6.125%—04/01/20232 | 5,262 | |
| 14,203 | |||
| FOOD PRODUCTS—0.6% | |||
| Dean Foods Co. | |||
| 215 | 6.500%—03/15/20232 | 216 | |
| Dole Food Co. Inc. | |||
| 3,725 | 7.250%—06/15/20252 | 4,041 | |
| Post Holdings Inc. | |||
| 4,500 | 6.000%—12/15/20222 | 4,731 | |
| 8,988 | |||
| GAS UTILITIES—1.1% | |||
| Amerigas Partners LP | |||
| 950 | 5.500%—05/20/2025 | 976 | |
| 2,850 | 5.750%—05/20/2027 | 2,925 | |
| 3,901 | |||
| Ferrellgas LP | |||
| 6,550 | 6.500%—05/01/2021 | 6,239 | |
| 4,005 | 6.750%—06/15/2023 | 3,745 | |
| 9,984 | |||
| Suburban Propane Partners LP | |||
| 1,600 | 5.875%—03/01/2027 | 1,596 | |
| 15,481 | |||
| HEALTH CARE EQUIPMENT & SUPPLIES—0.3% | |||
| Hill-Rom Holdings Inc. | |||
| 1,700 | 5.000%—02/15/20252 | 1,747 | |
| Hologic Inc. | |||
| 2,590 | 5.250%—07/15/20222 | 2,713 | |
| 4,460 | |||
| HEALTH CARE PROVIDERS & SERVICES—7.6% | |||
| Acadia Healthcare Co. Inc. | |||
| 1,000 | 5.125%—07/01/2022 | 1,025 | |
| 5,200 | 6.500%—03/01/2024 | 5,505 | |
| 6,530 | |||
| Air Medical Merger Sub Corp. | |||
| 4,330 | 6.375%—05/15/20232 | 4,200 | |
| CORPORATE BONDS & NOTES—Continued | |||
| Principal Amount | Value | ||
| HEALTH CARE PROVIDERS & SERVICES—Continued | |||
| Centene Corp. | |||
| $ | 2,000 | 4.750%—01/15/2025 | $ 2,070 |
| 7,750 | 5.625%—02/15/2021 | 8,060 | |
| 10,130 | |||
| Community Health Systems Inc. | |||
| 1,000 | 5.125%—08/01/2021 | 972 | |
| 5,750 | 6.250%—03/31/2023 | 5,542 | |
| 6,514 | |||
| DaVita HealthCare Partners Inc. | |||
| 3,425 | 5.000%—05/01/2025 | 3,382 | |
| DaVita Inc. | |||
| 250 | 5.125%—07/15/2024 | 251 | |
| 3,730 | 5.750%—08/15/2022 | 3,849 | |
| 4,100 | |||
| Envision Healthcare Corp. | |||
| 7,150 | 5.125%—07/01/20222 | 7,293 | |
| HCA Holdings Inc. | |||
| 2,500 | 6.250%—02/15/2021 | 2,694 | |
| HCA Inc. | |||
| 2,600 | 4.500%—02/15/2027 | 2,633 | |
| 2,700 | 4.750%—05/01/2023 | 2,832 | |
| 6,770 | 5.500%—06/15/2047 | 6,905 | |
| 6,050 | 5.875%—05/01/2023-02/15/2026 | 6,478 | |
| 2,350 | 6.500%—02/15/2020 | 2,538 | |
| 21,386 | |||
| MEDNAX Inc. | |||
| 625 | 5.250%—12/01/20232 | 652 | |
| Molina Healthcare Inc. | |||
| 2,500 | 4.875%—06/15/20252 | 2,487 | |
| 2,000 | 5.375%—11/15/2022 | 2,091 | |
| 4,578 | |||
| RegionalCare Hospital Partners Holdings Inc. | |||
| 6,400 | 8.250%—05/01/20232 | 6,752 | |
| Sterigenics-Nordion Topco LLC | |||
| 7,025 | 8.125%—11/01/20212 | 7,174 | |
| TeamHealth Holdings Inc. | |||
| 3,010 | 6.375%—02/01/20252 | 2,784 | |
| Tenet Healthcare Corp. | |||
| 750 | 4.375%—10/01/2021 | 751 | |
| 5,876 | 4.625%—07/15/20242 | 5,803 | |
| 1,390 | 6.875%—11/15/2031 | 1,181 | |
| 1,150 | 7.500%—01/01/20222 | 1,215 | |
| 4,740 | 8.125%—04/01/2022 | 4,764 | |
| 13,714 | |||
| Thc Escrow Corp. III | |||
| 770 | 5.125%—05/01/20252 | 753 | |
| Wellcare Health Plans Inc. | |||
| 4,875 | 5.250%—04/01/2025 | 5,143 | |
| West Street Merger Sub Inc. | |||
| 4,100 | 6.375%—09/01/20252 | 4,177 | |
| 111,956 | |||
| HOTELS, RESTAURANTS & LEISURE—2.1% | |||
| Brinker International Inc. | |||
| 2,500 | 3.875%—05/15/2023 | 2,469 | |
| 1,075 | 5.000%—10/01/20242 | 1,077 | |
| 3,546 | |||
20
Harbor High-Yield Bond Fund
Portfolio of Investments—Continued
Portfolio of Investments—Continued
Value, Cost, and Principal Amounts in Thousands
| CORPORATE BONDS & NOTES—Continued | |||
| Principal Amount | Value | ||
| HOTELS, RESTAURANTS & LEISURE—Continued | |||
| CRC Escrow Issuer LLC | |||
| $ | 2,130 | 5.250%—10/15/20252 | $ 2,149 |
| Eldorado Resorts Inc. | |||
| 1,005 | 6.000%—04/01/2025 | 1,065 | |
| ESH Hospitality Inc. | |||
| 4,050 | 5.250%—05/01/20252 | 4,197 | |
| Hilton Worldwide Finance LLC | |||
| 300 | 4.625%—04/01/2025 | 310 | |
| Landry's Inc. | |||
| 2,935 | 6.750%—10/15/20242 | 2,994 | |
| Melco Resorts Finance Ltd. | |||
| 3,525 | 4.875%—06/06/20252 | 3,566 | |
| MGM Growth Properties Operating Partnership LP | |||
| 695 | 4.500%—01/15/20282 | 695 | |
| New Red Finance Inc. | |||
| 2,000 | 5.000%—10/15/20252 | 2,040 | |
| Pinnacle Entertainment Inc. | |||
| 1,750 | 5.625%—05/01/2024 | 1,816 | |
| Scientific Games International Inc. | |||
| 1,330 | 5.000%—10/15/20252 | 1,353 | |
| 850 | 6.250%—09/01/2020 | 862 | |
| 3,000 | 6.625%—05/15/2021 | 3,116 | |
| 565 | 7.000%—01/01/20222 | 599 | |
| 5,930 | |||
| Viking Cruises Ltd. | |||
| 2,025 | 5.875%—09/15/20272 | 2,045 | |
| 30,353 | |||
| HOUSEHOLD DURABLES—1.5% | |||
| Calatlantic Group Inc. | |||
| 1,075 | 5.000%—06/15/2027 | 1,131 | |
| 475 | 5.250%—06/01/2026 | 508 | |
| 400 | 5.875%—11/15/2024 | 447 | |
| 1,270 | 8.375%—05/15/2018 | 1,315 | |
| 3,401 | |||
| Kronos Acquisition Holdings Inc. | |||
| 6,050 | 9.000%—08/15/20232 | 5,844 | |
| Lennar Corp. | |||
| 500 | 4.125%—12/01/2018 | 509 | |
| 6,410 | 4.500%—11/15/2019-04/30/2024 | 6,646 | |
| 7,155 | |||
| M/I Homes Inc. | |||
| 1,205 | 5.625%—08/01/2025 | 1,231 | |
| Tri Pointe Group Inc. | |||
| 1,400 | 4.875%—07/01/2021 | 1,470 | |
| 2,125 | 5.250%—06/01/2027 | 2,175 | |
| 3,645 | |||
| 21,276 | |||
| HOUSEHOLD PRODUCTS—1.2% | |||
| Energizer Holdings Inc. | |||
| 4,000 | 5.500%—06/15/20252 | 4,210 | |
| First Quality Finance Co. Inc. | |||
| 10,000 | 4.625%—05/15/20212 | 10,150 | |
| Prestige Brands Inc. | |||
| 3,650 | 5.375%—12/15/20212 | 3,768 | |
| 18,128 | |||
| INDEPENDENT POWER & RENEWABLE ELECTRICITY PRODUCERS—2.1% | |||
| AES Corp. | |||
| 1,950 | 5.125%—09/01/2027 | 2,007 | |
| CORPORATE BONDS & NOTES—Continued | |||
| Principal Amount | Value | ||
| INDEPENDENT POWER & RENEWABLE ELECTRICITY PRODUCERS—Continued | |||
| $ | 4,500 | 5.500%—04/15/2025 | $ 4,781 |
| 300 | 6.000%—05/15/2026 | 325 | |
| 7,113 | |||
| Calpine Corp. | |||
| 1,670 | 5.500%—02/01/2024 | 1,605 | |
| 3,395 | 5.750%—01/15/2025 | 3,240 | |
| 4,845 | |||
| Dynegy Inc. | |||
| 4,750 | 7.375%—11/01/2022 | 5,100 | |
| 3,175 | 8.000%—01/15/20252 | 3,488 | |
| 150 | 8.125%—01/30/20262 | 167 | |
| 8,755 | |||
| Nextera Energy Operating Partners LP | |||
| 1,450 | 4.250%—09/15/20242 | 1,468 | |
| 1,000 | 4.500%—09/15/20272 | 1,009 | |
| 2,477 | |||
| NRG Energy Inc. | |||
| 5,600 | 6.250%—07/15/2022-05/01/2024 | 5,963 | |
| 1,475 | 6.625%—01/15/2027 | 1,578 | |
| 7,541 | |||
| 30,731 | |||
| INSURANCE—0.8% | |||
| AssuredPartners Inc. | |||
| 2,205 | 7.000%—08/15/20252 | 2,304 | |
| NFP Corp. | |||
| 5,100 | 6.875%—07/15/20252 | 5,317 | |
| Usis Merger Sub Inc. | |||
| 4,375 | 6.875%—05/01/20252 | 4,550 | |
| 12,171 | |||
| INTERNET & DIRECT MARKETING RETAIL—0.2% | |||
| NetFlix Inc. | |||
| 3,035 | 4.875%—04/15/20282 | 3,020 | |
| INTERNET SOFTWARE & SERVICES—0.1% | |||
| Verisign Inc. | |||
| 1,575 | 4.750%—07/15/2027 | 1,636 | |
| IT SERVICES—1.4% | |||
| Alliance Data Systems Corp. | |||
| 2,500 | 5.375%—08/01/20222 | 2,562 | |
| 2,600 | 6.375%—04/01/20202 | 2,636 | |
| 5,198 | |||
| Alliance Data Systems Corp. MTN3 | |||
| 3,175 | 5.875%—11/01/20212 | 3,294 | |
| First Data Corp. | |||
| 1,995 | 5.375%—08/15/20232 | 2,080 | |
| 1,850 | 5.750%—01/15/20242 | 1,943 | |
| 4,023 | |||
| WEX Inc. | |||
| 7,805 | 4.750%—02/01/20232 | 8,039 | |
| 20,554 | |||
| LEISURE PRODUCTS—0.1% | |||
| Vista Outdoor Inc. | |||
| 1,500 | 5.875%—10/01/2023 | 1,556 | |
21
Harbor High-Yield Bond Fund
Portfolio of Investments—Continued
Portfolio of Investments—Continued
Value, Cost, and Principal Amounts in Thousands
| CORPORATE BONDS & NOTES—Continued | |||
| Principal Amount | Value | ||
| LIFE SCIENCES TOOLS & SERVICES—0.7% | |||
| Eagle Holding Co. II LLC | |||
| $ | 3,000 | 7.625%—05/15/20222 | $ 3,105 |
| inVentiv Group Holdings Inc. | |||
| 1,200 | 7.500%—10/01/20242 | 1,329 | |
| Jaguar Holding Co. II | |||
| 2,500 | 6.375%—08/01/20232 | 2,616 | |
| Quintiles IMS Inc. | |||
| 495 | 5.000%—10/15/20262 | 527 | |
| Quintiles Transnational Corp. | |||
| 2,350 | 4.875%—05/15/20232 | 2,456 | |
| 10,033 | |||
| MACHINERY—0.2% | |||
| Allison Transmission Inc. | |||
| 1,200 | 4.750%—10/01/20272 | 1,215 | |
| CNH Industrial Capital LLC | |||
| 150 | 4.375%—04/05/2022 | 159 | |
| EnPro Industries Inc. | |||
| 1,925 | 5.875%—09/15/20222 | 2,024 | |
| 3,398 | |||
| MEDIA—12.8% | |||
| Altice Luxembourg SA | |||
| 3,800 | 7.750%—05/15/20222 | 4,028 | |
| AMC Entertainment Holdings Inc. | |||
| 1,125 | 5.750%—06/15/2025 | 1,100 | |
| 1,925 | 5.875%—11/15/2026 | 1,884 | |
| 2,984 | |||
| AMC Networks Inc. | |||
| 2,990 | 4.750%—08/01/2025 | 2,994 | |
| Block Communications Inc. | |||
| 2,550 | 6.875%—02/15/20252 | 2,767 | |
| Cable One Inc. | |||
| 2,885 | 5.750%—06/15/20222 | 3,022 | |
| Cablevision Systems Corp. | |||
| 8,850 | 8.000%—04/15/2020 | 9,823 | |
| CBS Radio Inc. | |||
| 1,750 | 7.250%—11/01/20242 | 1,840 | |
| CCO Holdings LLC | |||
| 2,000 | 5.000%—02/01/20282 | 1,995 | |
| 8,200 | 5.125%—05/01/2023-05/01/20272 | 8,400 | |
| 5,250 | 5.250%—03/15/2021-09/30/2022 | 5,415 | |
| 3,500 | 5.875%—04/01/20242 | 3,736 | |
| 19,546 | |||
| Cequel Communications Holdings I LLC | |||
| 6,000 | 5.125%—12/15/20212 | 6,135 | |
| 6,000 | 6.375%—09/15/20202 | 6,136 | |
| 12,271 | |||
| Clear Channel Worldwide Holdings Inc. | |||
| 5,700 | 7.625%—03/15/2020 | 5,714 | |
| CSC Holdings LLC | |||
| 1,250 | 5.250%—06/01/2024 | 1,248 | |
| 630 | 10.875%—10/15/20252 | 773 | |
| 2,021 | |||
| DISH DBS Corp. | |||
| 5,000 | 5.000%—03/15/2023 | 4,850 | |
| 6,330 | 5.875%—11/15/2024 | 6,362 | |
| 3,325 | 6.750%—06/01/2021 | 3,499 | |
| 14,711 | |||
| CORPORATE BONDS & NOTES—Continued | |||
| Principal Amount | Value | ||
| MEDIA—Continued | |||
| MDC Partners Inc. | |||
| $ | 3,485 | 6.500%—05/01/20242 | $ 3,572 |
| Mediacom Broadband LLC | |||
| 2,800 | 5.500%—04/15/2021 | 2,873 | |
| 2,000 | 6.375%—04/01/2023 | 2,090 | |
| 4,963 | |||
| Midcontinent Finance Corp. | |||
| 4,370 | 6.875%—08/15/20232 | 4,709 | |
| Nexstar Broadcasting Inc. | |||
| 5,000 | 6.125%—02/15/20222 | 5,213 | |
| Outfront Media Capital LLC | |||
| 1,400 | 5.875%—03/15/2025 | 1,488 | |
| Radiate HoldCo LLC | |||
| 5,300 | 6.625%—02/15/20252 | 5,221 | |
| Regal Entertainment Group | |||
| 510 | 5.750%—02/01/2025 | 523 | |
| SFR Group SA | |||
| 11,050 | 6.000%—05/15/20222 | 11,533 | |
| 200 | 6.250%—05/15/20242 | 210 | |
| 4,250 | 7.375%—05/01/20262 | 4,585 | |
| 16,328 | |||
| Sinclair Television Group Inc. | |||
| 4,000 | 6.125%—10/01/2022 | 4,140 | |
| Sirius XM Radio Inc. | |||
| 7,500 | 6.000%—07/15/20242 | 8,025 | |
| Time Inc. | |||
| 8,000 | 5.750%—04/15/20222 | 8,110 | |
| 1,515 | 7.500%—10/15/20252 | 1,524 | |
| 9,634 | |||
| Townsquare Media Inc. | |||
| 5,000 | 6.500%—04/01/20232 | 5,100 | |
| Tribune Media Co. | |||
| 11,300 | 5.875%—07/15/2022 | 11,780 | |
| Univision Communications Inc. | |||
| 4,775 | 5.125%—02/15/20252 | 4,757 | |
| 1,509 | 6.750%—09/15/20222 | 1,568 | |
| 6,325 | |||
| UPCB Finance IV Ltd. | |||
| 7,500 | 5.375%—01/15/20252 | 7,706 | |
| Virgin Media Secured Finance plc | |||
| 1,070 | 5.500%—08/15/20262 | 1,122 | |
| WMG Acquisition Corp. | |||
| 1,700 | 5.625%—04/15/20222 | 1,770 | |
| 5,000 | 6.750%—04/15/20222 | 5,280 | |
| 7,050 | |||
| Ziggo Bond Finance BV | |||
| 3,255 | 5.875%—01/15/20252 | 3,365 | |
| 187,985 | |||
| METALS & MINING—5.2% | |||
| AK Steel Corp. | |||
| 825 | 6.375%—10/15/2025 | 815 | |
| 2,050 | 7.000%—03/15/2027 | 2,075 | |
| 2,890 | |||
| Alcoa Nederland Holding BV | |||
| 2,000 | 6.750%—09/30/20242 | 2,233 | |
| 975 | 7.000%—09/30/20262 | 1,116 | |
| 3,349 | |||
22
Harbor High-Yield Bond Fund
Portfolio of Investments—Continued
Portfolio of Investments—Continued
Value, Cost, and Principal Amounts in Thousands
| CORPORATE BONDS & NOTES—Continued | |||
| Principal Amount | Value | ||
| METALS & MINING—Continued | |||
| Alliance Resource Operating Partners | |||
| $ | 2,825 | 7.500%—05/01/20252 | $ 2,994 |
| Anglo American Capital plc | |||
| 2,550 | 4.750%—04/10/20272 | 2,700 | |
| 2,650 | 9.375%—04/08/20192 | 2,920 | |
| 5,620 | |||
| ArcelorMittal SA | |||
| 1,690 | 7.250%—03/01/2041 | 2,083 | |
| Big River Steel LLC | |||
| 2,050 | 7.250%—09/01/20252 | 2,204 | |
| BlueScope Steel Finance Ltd. | |||
| 3,000 | 6.500%—05/15/20212 | 3,143 | |
| Commercial Metals Co. | |||
| 1,070 | 5.375%—07/15/2027 | 1,107 | |
| Constellium NV | |||
| 5,285 | 5.750%—05/15/20242 | 5,351 | |
| 4,040 | 6.625%—03/01/20252 | 4,202 | |
| 9,553 | |||
| FMG Resources August 2006 Pty Ltd. | |||
| 3,810 | 4.750%—05/15/20222 | 3,905 | |
| 3,075 | 5.125%—05/15/20242 | 3,175 | |
| 3,985 | 9.750%—03/01/20222 | 4,463 | |
| 11,543 | |||
| Freeport-McMoRan Inc. | |||
| 5,000 | 3.875%—03/15/2023 | 4,956 | |
| 2,430 | 5.400%—11/14/2034 | 2,382 | |
| 1,435 | 5.450%—03/15/2043 | 1,356 | |
| 8,694 | |||
| Grinding Media Inc. | |||
| 3,375 | 7.375%—12/15/20232 | 3,679 | |
| Hudbay Minerals Inc. | |||
| 1,600 | 7.250%—01/15/20232 | 1,732 | |
| 700 | 7.625%—01/15/20252 | 775 | |
| 2,507 | |||
| Kinross Gold Corp. | |||
| 1,230 | 4.500%—07/15/20272 | 1,248 | |
| Novelis Corp. | |||
| 1,120 | 5.875%—09/30/20262 | 1,157 | |
| 3,105 | 6.250%—08/15/20242 | 3,284 | |
| 4,441 | |||
| Steel Dynamics Inc. | |||
| 300 | 5.125%—10/01/2021 | 309 | |
| SunCoke Energy Partners LP | |||
| 2,975 | 7.500%—06/15/20252 | 3,139 | |
| Teck Resources Ltd. | |||
| 7,800 | 4.750%—01/15/2022 | 8,268 | |
| 76,771 | |||
| MORTGAGE REAL ESTATE INVESTMENT TRUSTS (REITs)—0.1% | |||
| Starwood Property Trust Inc. | |||
| 2,000 | 5.000%—12/15/2021 | 2,100 | |
| OIL, GAS & CONSUMABLE FUELS—10.3% | |||
| Ascent Resources Utica Holdings LLC | |||
| 1,950 | 10.000%—04/01/20222 | 2,126 | |
| Baytex Energy Corp. | |||
| 550 | 5.125%—06/01/20212 | 524 | |
| 6,025 | 5.625%—06/01/20242 | 5,633 | |
| 6,157 | |||
| CORPORATE BONDS & NOTES—Continued | |||
| Principal Amount | Value | ||
| OIL, GAS & CONSUMABLE FUELS—Continued | |||
| Cheniere Corpus Christi Holdings LLC | |||
| $ | 2,075 | 5.125%—06/30/20272 | $ 2,145 |
| 3,910 | 5.875%—03/31/2025 | 4,247 | |
| 6,392 | |||
| Cheniere Energy Partners LP | |||
| 3,485 | 5.250%—10/01/20252 | 3,598 | |
| Chesapeake Energy Corp. | |||
| 3,939 | 8.000%—12/15/2022-06/15/20272 | 4,091 | |
| Consol Mining Corp. | |||
| 1,800 | 11.000%—11/15/20252 | 1,854 | |
| Continental Resources Inc. | |||
| 2,010 | 4.500%—04/15/2023 | 2,040 | |
| 1,405 | 4.900%—06/01/2044 | 1,316 | |
| 3,356 | |||
| Crestwood Midstream Partners LP | |||
| 1,050 | 5.750%—04/01/2025 | 1,082 | |
| Crownrock Finance Inc. | |||
| 1,920 | 5.625%—10/15/20252 | 1,954 | |
| Denbury Resources Inc. | |||
| 4,900 | 5.500%—05/01/2022 | 3,099 | |
| 4,450 | 9.000%—05/15/20212 | 4,372 | |
| 7,471 | |||
| Energy Transfer Equity LP | |||
| 1,000 | 7.500%—10/15/2020 | 1,130 | |
| Extraction Oil & Gas Holdings LLC | |||
| 1,665 | 7.375%—05/15/20242 | 1,782 | |
| 1,515 | 7.875%—07/15/20212 | 1,613 | |
| 3,395 | |||
| Genesis Energy LP | |||
| 2,050 | 5.750%—02/15/2021 | 2,092 | |
| 750 | 6.000%—05/15/2023 | 755 | |
| 455 | 6.500%—10/01/2025 | 463 | |
| 4,500 | 6.750%—08/01/2022 | 4,669 | |
| 7,979 | |||
| Global Partners LP | |||
| 1,450 | 7.000%—06/15/2023 | 1,475 | |
| Great Western Petroleum LLC | |||
| 1,000 | 9.000%—09/30/20212 | 1,030 | |
| Gulfport Energy Corp. | |||
| 1,500 | 6.000%—10/15/2024 | 1,508 | |
| 1,205 | 6.375%—01/15/20262 | 1,219 | |
| 2,727 | |||
| Jonah Energy LLC | |||
| 420 | 7.250%—10/15/20252 | 421 | |
| Jupiter Resources Inc. | |||
| 3,500 | 8.500%—10/01/20222 | 2,511 | |
| Murphy Oil Corp. | |||
| 6,165 | 4.700%—12/01/2022 | 6,227 | |
| 1,900 | 6.125%—12/01/2042 | 1,883 | |
| 8,110 | |||
| NGL Energy Partners LP | |||
| 2,535 | 5.125%—07/15/2019 | 2,542 | |
| 1,215 | 6.875%—10/15/2021 | 1,227 | |
| 4,425 | 7.500%—11/01/2023 | 4,436 | |
| 8,205 | |||
23
Harbor High-Yield Bond Fund
Portfolio of Investments—Continued
Portfolio of Investments—Continued
Value, Cost, and Principal Amounts in Thousands
| CORPORATE BONDS & NOTES—Continued | |||
| Principal Amount | Value | ||
| OIL, GAS & CONSUMABLE FUELS—Continued | |||
| NGPL Pipeco LLC | |||
| $ | 555 | 4.375%—08/15/20222 | $ 573 |
| 2,085 | 4.875%—08/15/20272 | 2,163 | |
| 2,736 | |||
| Oasis Petroleum Inc. | |||
| 3,890 | 6.875%—03/15/2022-01/15/2023 | 3,999 | |
| QEP Resources Inc. | |||
| 50 | 5.250%—05/01/2023 | 49 | |
| 500 | 6.875%—03/01/2021 | 534 | |
| 583 | |||
| Range Resources Corp. | |||
| 4,565 | 5.875%—07/01/2022 | 4,702 | |
| Rockies Express Pipeline LLC | |||
| 2,830 | 6.000%—01/15/20192 | 2,943 | |
| 1,365 | 6.875%—04/15/20402 | 1,529 | |
| 4,472 | |||
| Rose Rock Midstream LP | |||
| 5,500 | 5.625%—07/15/2022-11/15/2023 | 5,423 | |
| Sanchez Energy Corp. | |||
| 200 | 6.125%—01/15/2023 | 168 | |
| 8,650 | 7.750%—06/15/2021 | 8,088 | |
| 8,256 | |||
| SemGroup Corp. | |||
| 2,750 | 6.375%—03/15/20252 | 2,723 | |
| SM Energy Co. | |||
| 350 | 6.125%—11/15/2022 | 354 | |
| Southwestern Energy Co. | |||
| 1,025 | 7.500%—04/01/2026 | 1,065 | |
| 1,005 | 7.750%—10/01/2027 | 1,046 | |
| 2,111 | |||
| Summit Midstream Holdings LLC | |||
| 2,150 | 5.750%—04/15/2025 | 2,204 | |
| Sunoco LP | |||
| 6,500 | 6.250%—04/15/2021 | 6,825 | |
| Tallgrass Energy Finance Corp. | |||
| 4,500 | 5.500%—09/15/20242 | 4,674 | |
| Targa Resources Partners LP | |||
| 660 | 5.000%—01/15/20282 | 665 | |
| Tesoro Logistics LP | |||
| 5,390 | 5.500%—10/15/2019 | 5,700 | |
| Whiting Petroleum Corp. | |||
| 3,525 | 5.000%—03/15/2019 | 3,573 | |
| 4,083 | 5.750%—03/15/2021 | 4,124 | |
| 7,697 | |||
| Wildhorse Resource Development Corp. | |||
| 3,725 | 6.875%—02/01/20252 | 3,706 | |
| Williams Cos. Inc. | |||
| 670 | 8.750%—03/15/2032 | 886 | |
| WPX Energy Inc. | |||
| 7,950 | 8.250%—08/01/2023 | 8,993 | |
| 151,773 | |||
| PHARMACEUTICALS—1.6% | |||
| Endo Finance LLC | |||
| 2,500 | 5.375%—01/15/20232 | 2,025 | |
| 500 | 7.250%—01/15/20222 | 462 | |
| 2,487 | |||
| CORPORATE BONDS & NOTES—Continued | |||
| Principal Amount | Value | ||
| PHARMACEUTICALS—Continued | |||
| Mallinckrodt International Finance SA | |||
| $ | 2,000 | 4.750%—04/15/2023 | $ 1,695 |
| 1,000 | 5.625%—10/15/20232 | 939 | |
| 800 | 5.750%—08/01/20222 | 787 | |
| 3,421 | |||
| Valeant Pharmaceuticals International Inc. | |||
| 4,195 | 5.375%—03/15/20202 | 4,148 | |
| 3,225 | 5.500%—11/01/20252 | 3,302 | |
| 2,300 | 5.625%—12/01/20212 | 2,107 | |
| 3,365 | 6.375%—10/15/20202 | 3,352 | |
| 1,775 | 6.500%—03/15/20222 | 1,888 | |
| 3,500 | 7.500%—07/15/20212 | 3,461 | |
| 18,258 | |||
| 24,166 | |||
| PROFESSIONAL SERVICES—1.1% | |||
| Camelot Finance SA | |||
| 8,565 | 7.875%—10/15/20242 | 9,229 | |
| Nielsen Co. Luxembourg Sarl | |||
| 1,625 | 5.500%—10/01/20212 | 1,678 | |
| Nielsen Finance LLC. | |||
| 1,500 | 4.500%—10/01/2020 | 1,524 | |
| 1,850 | 5.000%—04/15/20222 | 1,910 | |
| 3,434 | |||
| Tempo Acquisition LLC | |||
| 2,125 | 6.750%—06/01/20252 | 2,157 | |
| 16,498 | |||
| REAL ESTATE MANAGEMENT & DEVELOPMENT—0.4% | |||
| Realogy Group LLC | |||
| 5,500 | 5.250%—12/01/20212 | 5,699 | |
| ROAD & RAIL—1.1% | |||
| Avis Budget Car Rental LLC | |||
| 2,000 | 5.125%—06/01/20222 | 2,018 | |
| 1,000 | 5.250%—03/15/20252 | 981 | |
| 1,000 | 5.500%—04/01/2023 | 1,016 | |
| 4,015 | |||
| Herc Rentals Inc. | |||
| 2,340 | 7.500%—06/01/20222 | 2,545 | |
| 2,911 | 7.750%—06/01/20242 | 3,209 | |
| 5,754 | |||
| Hertz Corp. | |||
| 1,300 | 5.875%—10/15/2020 | 1,298 | |
| 4,475 | 7.625%—06/01/20222 | 4,677 | |
| 5,975 | |||
| 15,744 | |||
| SEMICONDUCTORS & SEMICONDUCTOR EQUIPMENT—0.6% | |||
| Advanced Micro Devices Inc. | |||
| 2,850 | 7.000%—07/01/2024 | 3,028 | |
| 2,300 | 7.500%—08/15/2022 | 2,608 | |
| 5,636 | |||
| Micron Technology Inc. | |||
| 3,500 | 5.250%—01/15/20242 | 3,697 | |
| 125 | 5.500%—02/01/2025 | 133 | |
| 3,830 | |||
| 9,466 | |||
24
Harbor High-Yield Bond Fund
Portfolio of Investments—Continued
Portfolio of Investments—Continued
Value, Cost, and Principal Amounts in Thousands
| CORPORATE BONDS & NOTES—Continued | |||
| Principal Amount | Value | ||
| SOFTWARE—1.3% | |||
| CDK Global Inc. | |||
| $ | 500 | 3.800%—10/15/2019 | $ 514 |
| Infor Software Parent LLC | |||
| 6,286 | 7.125%—05/01/20212 | 6,490 | |
| Infor US Inc. | |||
| 3,500 | 6.500%—05/15/2022 | 3,674 | |
| Informatica LLC | |||
| 2,305 | 7.125%—07/15/20232 | 2,357 | |
| Nuance Communications Inc. | |||
| 28 | 5.375%—08/15/20202 | 28 | |
| 2,275 | 5.625%—12/15/20262 | 2,429 | |
| 3,000 | 6.000%—07/01/2024 | 3,252 | |
| 5,709 | |||
| Symantec Corp. | |||
| 1,000 | 5.000%—04/15/20252 | 1,048 | |
| 19,792 | |||
| SPECIALTY RETAIL—1.2% | |||
| Asbury Automotive Group Inc. | |||
| 200 | 6.000%—12/15/2024 | 212 | |
| Lithia Motors Inc. | |||
| 995 | 5.250%—08/01/20252 | 1,046 | |
| Penske Automotive Group Inc. | |||
| 4,000 | 5.750%—10/01/2022 | 4,129 | |
| PetSmart Inc. | |||
| 4,625 | 5.875%—06/01/20252 | 4,047 | |
| 10,250 | 7.125%—03/15/20232 | 7,841 | |
| 11,888 | |||
| 17,275 | |||
| TECHNOLOGY HARDWARE, STORAGE & PERIPHERALS—0.6% | |||
| Diamond 1 Finance Corp. | |||
| 1,965 | 5.875%—06/15/20212 | 2,063 | |
| EMC Corp. | |||
| 345 | 2.650%—06/01/2020 | 341 | |
| NCR Corp. | |||
| 3,500 | 5.875%—12/15/2021 | 3,631 | |
| 900 | 6.375%—12/15/2023 | 961 | |
| 4,592 | |||
| Seagate HDD Cayman | |||
| 2,000 | 4.875%—03/01/20242 | 2,028 | |
| 9,024 | |||
| TEXTILES, APPAREL & LUXURY GOODS—0.1% | |||
| Hanesbrands Inc. | |||
| 1,175 | 4.625%—05/15/20242 | 1,215 | |
| THRIFTS & MORTGAGE FINANCE—1.1% | |||
| Nationstar Mortgage LLC | |||
| 4,750 | 6.500%—08/01/2018-07/01/2021 | 4,821 | |
| 747 | 7.875%—10/01/2020 | 764 | |
| 5,585 | |||
| Quicken Loans Inc. | |||
| 10,000 | 5.750%—05/01/20252 | 10,650 | |
| 16,235 | |||
| TRADING COMPANIES & DISTRIBUTORS—0.8% | |||
| Aircastle Ltd. | |||
| 1,940 | 6.250%—12/01/2019 | 2,081 | |
| CORPORATE BONDS & NOTES—Continued | |||
| Principal Amount | Value | ||
| TRADING COMPANIES & DISTRIBUTORS—Continued | |||
| CD&R Waterworks Merger Sub LLC | |||
| $ | 1,835 | 6.125%—08/15/20252 | $ 1,862 |
| United Rentals North America Inc. | |||
| 495 | 4.625%—10/15/2025 | 508 | |
| 1,975 | 4.875%—01/15/2028 | 1,990 | |
| 1,325 | 5.500%—05/15/2027 | 1,421 | |
| 3,950 | 5.750%—11/15/2024 | 4,202 | |
| 8,121 | |||
| 12,064 | |||
| WIRELESS TELECOMMUNICATION SERVICES—2.7% | |||
| Softbank Corp. | |||
| 1,210 | 4.500%—04/15/20202 | 1,252 | |
| Sprint Capital Corp. | |||
| 2,635 | 6.875%—11/15/2028 | 2,818 | |
| Sprint Communications Inc. | |||
| 6,500 | 6.000%—11/15/2022 | 6,841 | |
| 2,210 | 7.000%—08/15/2020 | 2,393 | |
| 1,050 | 9.000%—11/15/20182 | 1,114 | |
| 10,348 | |||
| Sprint Corp. | |||
| 4,990 | 7.125%—06/15/2024 | 5,406 | |
| 4,250 | 7.250%—09/15/2021 | 4,643 | |
| 2,975 | 7.625%—02/15/2025 | 3,288 | |
| 2,375 | 7.875%—09/15/2023 | 2,660 | |
| 15,997 | |||
| T-Mobile USA Inc. | |||
| 600 | 4.000%—04/15/2022 | 622 | |
| 850 | 5.125%—04/15/2025 | 892 | |
| 850 | 5.375%—04/15/2027 | 922 | |
| 1,000 | 6.000%—03/01/2023 | 1,056 | |
| 300 | 6.125%—01/15/2022 | 313 | |
| 5,500 | 6.500%—01/15/2024-01/15/2026 | 6,041 | |
| 9,846 | |||
| 40,261 | |||
| TOTAL CORPORATE BONDS & NOTES | |||
(Cost $1,324,583) | 1,365,202 | ||
| SHORT-TERM INVESTMENTS—0.7% | |||
| (Cost $10,568) | |||
| REPURCHASE AGREEMENTS | |||
| 10,568 | Repurchase Agreement with Fixed Income Clearing Corp. dated October 31, 2017 due November 01, 2017 at 0.001% collateralized by U.S. Treasury Notes (value $10,784) | 10,568 | |
| TOTAL INVESTMENTS—97.5% | |||
(Cost $1,394,886) | 1,436,117 | ||
CASH AND OTHER ASSETS, LESS LIABILITIES—2.5% | 37,577 | ||
TOTAL NET ASSETS—100.0% | $1,473,694 | ||
25
Harbor High-Yield Bond Fund
Portfolio of Investments—Continued
Portfolio of Investments—Continued
FAIR VALUE MEASUREMENTS
All holdings at October 31, 2017 (as disclosed in the preceding Portfolio of Investments) are classified as Level 2. There were no Level 3 holdings at October 31, 2017 or 2016, and no transfers between levels during the year.
For more information on valuation inputs and their aggregation into the levels identified above, please refer to the Fair Value Measurements and Disclosures in Note 2 of the accompanying Notes to Financial Statements.
| 1 | Variable rate security, the stated rate represents the rate in effect at October 31, 2017. |
| 2 | Securities purchased in a transaction exempt from registration under Rule 144A of the Securities Act of 1933. These securities may be resold in transactions exempt from registration, normally to qualified institutional buyers. The Fund has no right to demand registration of these securities. These securities are priced by an independent pricing service in accordance with Harbor Funds Valuation Procedures. At October 31, 2017, the aggregate value of these securities was $705,939,000 or 48% of net assets. |
| 3 | MTN after the name of a security stands for Medium Term Note. |
The accompanying notes are an integral part of the Financial Statements.
26
Harbor Bond Fund
Managers' Commentary (Unaudited)
Managers' Commentary (Unaudited)
Subadviser
Pacific Investment Management Company LLC (PIMCO)
650 Newport Center Dr.
Newport Beach, CA
92660
Newport Beach, CA
92660
Portfolio Managers
Scott A. Mather
Since 2014
Since 2014
Mark R. Kiesel
Since 2014
Since 2014
Mihir P. Worah
Since 2014
Since 2014
PIMCO has subadvised the Fund since 1987.
Investment Objective
The Fund seeks total return.

Scott A. Mather

Mark R. Kiesel

Mihir P. Worah
Management’s Discussion of
Fund Performance
Fund Performance
MARKET REVIEW
The coordinated efforts of global central banks to normalize policy continued to be a focus for fixed income markets for the fiscal year ended October 31, 2017. Overall, markets continued to be resilient to a myriad of geopolitical events, with volatility generally remaining below the long-term average.
To start the fiscal year, Donald Trump stunned many in winning the U.S. presidential election at the end of 2016, but the market reaction was almost as surprising. Most markets focused on the pro-growth and inflationary potential of fiscal stimulus as many risk assets rallied while inflation expectations and yields rose. Following the election, volatility fell, equities rallied, credit spreads tightened and the dollar strengthened as investors anticipated expansionary fiscal policy, tax cuts, and deregulation. As such, the U.S. Federal Reserve (Fed) raised rates for just the second time in a decade (as widely expected), but with a hawkish tilt as the “blue dots” increased for 2017.
This optimism continued into the new year and solid U.S. economic data, relatively easy financial conditions, and both business and consumer optimism gave the Fed an opportunity to continue on its path toward policy normalization. This rate hike, though, was perceived by many as more dovish given the largely unchanged views put forth by the Fed. Inflation expectations were generally stable over the period, despite fluctuations in oil prices related to building inventories in the U.S. and concerns over OPEC’s adherence to its production cut agreement.
Over the second half of the fiscal year, geopolitics dominated headlines and contributed to brief bouts of market volatility. Still, robust risk appetite continued, largely underpinned by a solid fundamental backdrop. Despite geopolitical uncertainty, volatility remained relatively low for the most part, equities rallied and credit spreads tightened.
Financial conditions in the U.S. continued to ease even as the Fed raised rates and unveiled details of its plan to gradually reduce its balance sheet. The perception of a hawkish leaning at the September Fed meeting contributed to a rebound in yields on U.S. Treasuries. The Fed confirmed it would begin unwinding its balance sheet and released a more hawkish than anticipated “dot plot”, raising expectations for another rate hike this year. More broadly, global central bankers also struck a less accommodative tone as rhetoric from the European Central Bank (ECB), Bank of England, and Bank of Canada highlighted positive economic outlooks and suggested the potential for a reduction in “easy” monetary policy in the form of rate hikes, tapering, or balance sheet normalization.
Abroad, Emmanuel Macron’s presidential victory in France, in addition to the non-populist outcome of the Dutch election earlier this year, tempered risks related to more nationalist, anti-EU outcomes in the eurozone. Recent and upcoming elections in Germany and Italy continued to underscore political event risks that remain on the horizon in the eurozone, though we believe fundamentals remain solid amidst a synchronized recovery in growth.
PERFORMANCE
Harbor Bond Fund outperformed the Bloomberg Barclays U.S. Aggregate Bond Index for the 12 months ended October 31, 2017. The Fund returned 2.82% (Institutional Class) and 2.56% (Administrative Class) for the fiscal year, compared with the benchmark’s return of 0.90%. The Fund outperformed the index for the 3-year, 5-year and 10-year periods ended October 31, 2017.
27
Harbor Bond Fund
Managers' Commentary—Continued
Managers' Commentary—Continued
| TOP TEN ISSUERS (% of net assets) | |
| Federal National Mortgage Association TBA | 32.6% |
| U.S. Treasury | 26.8% |
| Japan Treasury Discount Bill | 10.0% |
| Federal National Mortgage Association | 7.2% |
| Nykredit Realkredit AS | 5.9% |
| Federal National Mortgage Association REMIC | 3.6% |
| Federal Home Loan Mortgage Corp. TBA | 3.3% |
| Brazil Letras Do Tesouro Nacional | 3.0% |
| Nordea Kredit Realkreditaktieselskab | 1.7% |
| Government National Mortgage Association TBA | 1.6% |
The following strategies helped the Fund’s returns for fiscal year 2017:
| • | Tactical exposure to non-agency mortgage-backed securities, which continued to provide attractive yield and price appreciation amid strong investor demand and a recovery in the housing sector |
| • | An allocation to high-yield bonds, as the sector outperformed over the fiscal year |
| • | An allocation to TIPS, or treasury inflation-protected securities, as inflation expectations rose, causing TIPS to outperform |
| • | A long exposure to a basket of developed market currencies, particularly the euro and the yen, as both currencies appreciated during the fiscal year, |
The following strategies were negative or neutral for the Fund’s returns:
| • | An underweight to investment grade credit as this sector outperformed given continued spread tightening |
| • | A short to a basket of Asian emerging market currencies, including the South Korean won and the Singapore dollar, as they appreciated over the period. |
OUTLOOK & STRATEGY
We expect world GDP growth in 2018 to remain steady at 2.75%–3.25%, unchanged from 2017. Overall, we see a low near-term risk of recession, a moderate pickup in underlying inflation in the advanced economies, mildly supportive fiscal policies and only a gradual removal of accommodative central bank policy. However, we do see risks that could upset the calm: the aging U.S. expansion, the coming end of central bank balance sheet expansion, and China’s course following its 19th National Communist Party Congress in October.
In the U.S., we see growth below-consensus at 1.75%–2.25% in 2018, albeit still above trend, as the U.S. expansion matures and slack in the labor market keeps eroding. We believe the disappearing slack should make it difficult to sustain the current pace of job and output growth, and we also do not expect a significant acceleration of productivity growth. We forecast core inflation to increase to 2% over the course of 2018, with some upward pressure on wages. We believe the Fed will continue along its trajectory of gradual tightening with two or three rate hikes by the end of 2018.
For the Eurozone, we expect growth will be in a range of 1.75%‒2.25% in 2018, significantly above trend. We believe that a key risk for the outlook is the Italian elections in the first half of 2018, although the political risk looks more contained than earlier this year, as the Euroskeptical parties have toned down their rhetoric. We think core inflation will make only moderate progress toward the ECB’s target of “below but close to 2%” and forecast inflation in a range of 1.0%–1.5% for 2018. In our view, the ECB is likely to gradually taper its bond purchases over 2018 and keep policy rates at record lows until well into 2019.
In the emerging markets of Brazil, Russia, India and Mexico, we expect growth to rise to 4% in 2018, slightly above consensus, as recoveries in Brazil and Russia become more entrenched. Overall, most emerging economies are, from our perspective, at a different stage of the economic cycle than developed economies and should still benefit from relatively easy global policy conditions. We expect continued disinflation, with headline consumer price indexes falling to around 4.2% in 2018. In China, we expect growth to decelerate in 2018 from the current 6.6% pace. Our wide forecast range of 5.5%–6.5% reflects uncertainty about the leadership’s prospective stance on financial stability, deleveraging and economic growth following the Party Congress. If the leadership continues to focus on suppressing volatility, growth could hold up at higher levels, but if policy pivots, the changes could weigh heavily on growth and lead to greater tolerance for a depreciating Chinese yuan.
With respect to portfolio strategy:
| • | We are modestly underweight duration overall. The Fund is overweight to U.S. duration and has short duration exposure in other developed regions, including the eurozone, the U.K. and Japan. We expect rates in the U.S. to be relatively range bound but positioning in Japan serves as a cheap hedge against global rates moving higher. U.K. and eurozone rates may also face pressure as their central banks shift towards reducing accommodation. |
| • | We continue to have a favorable view of TIPS but have tactically moderated positioning to reflect some technical headwinds. TIPS are still attractive as inflation expectations embedded in markets remain low. They are attractively-priced hedges against upside surprises in inflation over the medium-term. |
| • | We remain underweight investment grade corporates but have more diversified credit exposures in other sectors and are more focused on security selection over generic beta exposure, while holding positions in mortgage credit and select high-yield issues. |
28
Harbor Bond Fund
Managers' Commentary—Continued
Managers' Commentary—Continued
| • | We remain tactical with currency positioning. While we expect to maintain net long developed market currency positioning versus a basket of Asian emerging market currencies, the composition of relative value exposures may change tactically as market conditions evolve. The Fund also has long exposures to the Brazilian real and the Mexican peso, which are benefitting from higher central bank policy rates, improving commodity prices, and declining inflation pressures. |
This report contains the current opinions of Pacific Investment Management Company LLC (PIMCO) as of the date of this report and should not be considered as investment advice or a recommendation of any particular security, strategy or investment product. Such opinions are subject to change without notice and securities described herein may no longer be included in, or may at any time be removed from, the Fund’s portfolio. This report is distributed for informational purposes only. Information contained herein has been obtained from sources believed reliable, but not guaranteed.
Fixed income investments are affected by interest rate changes and the creditworthiness of the issues held by the Fund. A rise in interest rates will cause a decrease in the value of fixed income securities. Such an event would have an adverse effect on the Fund. The use of derivative instruments may add additional risk. There may be a greater risk that the Fund could lose money due to prepayment and extension risks because the Fund invests heavily at times in mortgage-related securities. The Fund may engage in active and frequent trading to achieve its principal investment strategies. References to securities that are backed by the full faith and credit of the U.S. Government do not apply to the shares of the Fund. For information on the different share classes and the risks associated with an investment in the Fund, please refer to the current prospectus.
29
Harbor Bond Fund
Fund Summary—October 31, 2017 (Unaudited)
Fund Summary—October 31, 2017 (Unaudited)
| INSTITUTIONAL CLASS | |
| Fund # | 2014 |
| Cusip | 411511108 |
| Ticker | HABDX |
| Inception Date | 12/29/1987 |
| Net Expense Ratio | 0.51% a |
| Total Net Assets (000s) | $2,159,390 |
| ADMINISTRATIVE CLASS | |
| Fund # | 2214 |
| Cusip | 411511686 |
| Ticker | HRBDX |
| Inception Date | 11/01/2002 |
| Net Expense Ratio | 0.76% a |
| Total Net Assets (000s) | $30,376 |
| Portfolio Statistics | |||
| Portfolio | Benchmark | ||
| Average Market Coupon | 2.49% | 3.06% | |
| Yield to Maturity | 3.74% | 2.57% | |
| Current 30-Day Yield (Institutional Class) | 2.37% | 2.60% | |
| Weighted Average Maturity | 7.20 years | 8.25 years | |
| Weighted Average Duration | 5.00 years | 5.96 years | |
| Portfolio Turnover (Year Ended 10/31/2017) | 654% | N/A | |
| MATURITY PROFILE | ||
| Years to Maturity | % of Investments | |
| 0 to 1 yr. | -14.60% | |
| >1 to 5 | 83.98% | |
| >5 to 10 | 21.32% | |
| >10 to 15 | 0.29% | |
| >15 to 20 | 0.00% | |
| >20 to 25 | 3.25% | |
| >25 yrs. | 5.76% | |
FUND PERFORMANCE
The graph compares a $10,000 investment in the Institutional Class shares of the Fund with the performance of the Bloomberg Barclays U.S. Aggregate Bond Index. The Fund’s performance assumes the reinvestment of all dividend and capital gain distributions.
CHANGE IN A $10,000 INVESTMENT
For the period 11/01/2007 through 10/31/2017

| TOTAL RETURNS For the periods ended 10/31/2017 | 1 Year | Annualized | Inception Date | Final Value of a $10,000 Investment | ||||||||||
| 5 Years | 10 Years | |||||||||||||
| Harbor Bond Fund | ||||||||||||||
Institutional Class | 2.82% | 2.43% | 5.16% | 12/29/1987 | $16,543 | |||||||||
Administrative Class | 2.56 | 2.17 | 4.90 | 11/01/2002 | 16,140 | |||||||||
| Comparative Index | ||||||||||||||
Bloomberg Barclays U.S. Aggregate Bond | 0.90% | 2.04% | 4.19% | — | $15,070 | |||||||||
As stated in the Fund’s current prospectus, the expense ratios were 0.51% (Net) and 0.61% (Gross) (Institutional Class); and 0.76% (Net) and 0.86% (Gross) (Administrative Class). The net expense ratios reflect a contractual management fee waiver and an expense limitation agreement (excluding interest expense, if any) effective through 02/28/2018. The expense ratios in the prospectus may differ from the actual expense ratios for the period disclosed within this report. The expense ratios shown in the prospectus are based on the prior fiscal year, adjusted to reflect changes, if any, in contractual arrangements that occurred prior to the date of the prospectus (or supplement thereto, if applicable).
Performance data shown represents past performance and is no guarantee of future results. Past performance is net of management fees and expenses and reflects reinvested dividends and distributions, but does not reflect the deduction of taxes that a shareholder would pay on Fund distributions or upon the redemption of Fund shares. Past performance reflects the beneficial effect of any expense waivers or reimbursements, without which returns would have been lower. Investment returns and principal value will fluctuate and when redeemed may be worth more or less than their original cost. Returns for periods less than one year are not annualized. Current performance may be higher or lower and is available through the most recent month end at harborfunds.com or by calling 800-422-1050.
| a | Reflects a contractual management fee waiver and an expense limitation agreement (excluding interest expense, if any), each effective through February 28, 2018 |
30
Harbor Bond Fund
Portfolio of Investments—October 31, 2017
Portfolio of Investments—October 31, 2017
Value, Cost, and Principal Amounts in Thousands
Total Investments (% of net assets)
(Excludes net cash, short-term investments and derivative positions of -43.0%)

| ASSET-BACKED SECURITIES—9.7% | |||
| Principal Amount | Value | ||
| Allegro CLO I Ltd.1 | |||
| Series 2013 Cl. 1A | |||
| $ | 6,500 | 2.531% (3 Month USD Libor + 1.220) 01/30/20262,3 | $ 6,529 |
| Apidos CLO XVIII1 | |||
| Series 2014 Cl. 18A | |||
| 4,000 | 2.483% (3 Month USD Libor + 1.120) 07/22/20262,3 | 4,010 | |
| Arbor Realty Commercial Real Estate Notes Ltd. | |||
| Series 2017-FL1 Cl. A | |||
| 6,800 | 2.539% (1 Month USD Libor + 1.300) 04/15/20272,3 | 6,909 | |
| Argent Securities Inc. | |||
| Series 2006-W4 Cl. A2C | |||
| 6,778 | 1.398% (1 Month USD Libor + 0.160) 05/25/20362 | 2,676 | |
| Series 2005-W2 Cl. A2C | |||
| 2,823 | 1.598% (1 Month USD Libor + 0.360) 10/25/20352 | 2,837 | |
| Series 2004-W11 Cl. M3 | |||
| 939 | 2.363% (1 Month USD Libor + 0.750) 11/25/20342 | 921 | |
| 6,434 | |||
| Asset Backed Securities Corp. Home Equity Loan Trust | |||
| Series 2003-HE4 Cl. M1 | |||
| 6,034 | 2.479% (1 Month USD Libor + 0.830) 08/15/20332 | 6,075 | |
| Cent CLO 21 Ltd.1 | |||
| Series 2014 Cl. A1BR | |||
| 5,700 | 2.527% (3 Month USD Libor + 1.210) 07/27/20262,3 | 5,722 | |
| Countrywide Asset-Backed Certificates | |||
| Series 2006-21 Cl. 2A3 | |||
| 2,418 | 1.388% (1 Month USD Libor + 0.150) 05/25/20372 | 2,357 | |
| Series 2006-ABC1 Cl. A3 | |||
| 4,649 | 1.478% (1 Month USD Libor + 0.240) 05/25/20362 | 2,616 | |
| Series 2006-2 Cl. M1 | |||
| 1,200 | 1.638% (1 Month USD Libor + 0.400) 06/25/20362 | 1,176 | |
| Series 2001-BC3 Cl. A | |||
| 171 | 1.718% (1 Month USD Libor + 0.240) 12/25/20312 | 138 | |
| 6,287 | |||
| Dryden XXV Senior Loan Fund | |||
| Series 2012-25A Cl. APR | |||
| 5,500 | 2.259% (3 Month USD Libor + 0.900) 10/15/20272,3 | 5,500 | |
| ASSET-BACKED SECURITIES—Continued | |||
| Principal Amount | Value | ||
| First Franklin Mortgage Loan Trust | |||
| Series 2006-FF10 Cl. A4 | |||
| $ | 636 | 1.388% (1 Month USD Libor + 0.150) 07/25/20362 | $ 635 |
| Flagship VII Ltd. | |||
| Series 2013 Cl. 7A | |||
| 4,600 | 2.427% (3 Month USD Libor + 1.120) 01/20/20262,3 | 4,624 | |
| Ford Credit Auto Lease Trust | |||
| Series 2017-A Cl. A2B | |||
| 4,600 | 1.379% (1 Month USD Libor + 0.140) 11/15/20192 | 4,602 | |
| Series 2017-A Cl. A2A | |||
| 3,300 | 1.560%—11/15/2019 | 3,300 | |
| 7,902 | |||
| Fortress Credit BSL II Ltd. | |||
| Series 2013-2A Cl. A1FR | |||
| 6,800 | 2.456% (3 Month USD Libor + 1.150) 10/19/20252,3 | 6,831 | |
| GM Financial Consumer Automobiles Receivables Trust | |||
| Series 2017-1A Cl. A2A | |||
| 5,500 | 1.510%—03/16/20203 | 5,497 | |
| GSAA Trust | |||
| Series 2006-20 Cl. 1A2 | |||
| 5,124 | 1.418% (1 Month USD Libor + 0.180) 12/25/20462 | 3,126 | |
| Series 2007-9 Cl. A1A | |||
| 2,048 | 6.000%—08/25/2047 | 1,904 | |
| 5,030 | |||
| GSAMP Trust | |||
| Series 2007-FM1 Cl. 2A2 | |||
| 123 | 1.308% (1 Month USD Libor + 0.070) 12/25/20362 | 66 | |
| Home Equity Asset Trust | |||
| Series 2005-2 Cl. M4 | |||
| 3,044 | 1.937% (1 Month USD Libor + 0.700) 07/25/20352 | 3,069 | |
| HSI Asset Securitization Corp. Trust | |||
| Series 2006-HE2 Cl. 2A3 | |||
| 5,645 | 1.408% (1 Month USD Libor + 0.170) 12/25/20362 | 2,552 | |
| IXIS Real Estate Capital Trust | |||
| Series 2005-HE1 Cl. M4 | |||
| 3,333 | 2.288% (1 Month USD Libor + 1.050) 06/25/20352 | 3,131 | |
| JPMorgan Mortgage Acquisition Corp. | |||
| Series 2006-HE1 Cl.A4 | |||
| 4,531 | 1.528% (1 Month USD Libor + 0.290) 01/25/20362 | 4,471 | |
| JPMorgan Mortgage Acquisition Trust | |||
| Series 2007-HE1 Cl. AF3 | |||
| 1,068 | 6.174%—05/25/20354 | 794 | |
| Kitty Hawk CLO LLC1 | |||
| Series 2015 Cl. 1A | |||
| 4,000 | 2.569% (3 Month USD Libor + 1.210) 04/15/20272,3 | 4,020 | |
| MASTR Asset Backed Securities Trust | |||
| Series 2006-HE2 Cl. A4 | |||
| 6,213 | 1.478% (1 Month USD Libor + 0.240) 06/25/20362 | 3,773 | |
| Mid-State Trust | |||
| Series 2004-1 Cl. A | |||
| 1,337 | 6.005%—08/15/2037 | 1,455 | |
31
Harbor Bond Fund
Portfolio of Investments—Continued
Portfolio of Investments—Continued
Value, Cost, and Principal Amounts in Thousands
| ASSET-BACKED SECURITIES—Continued | |||
| Principal Amount | Value | ||
| Morgan Stanley ABS Capital I Inc. Trust | |||
| Series 2006-HE8 Cl. A1 | |||
| $ | 2,239 | 1.368% (1 Month USD Libor + 0.130) 10/25/20362 | $ 2,074 |
| Series 2007-HE1 Cl. A2C | |||
| 2,407 | 1.388% (1 Month USD Libor + 0.150) 11/25/20362 | 1,631 | |
| 3,705 | |||
| Morgan Stanley Dean Witter Capital I | |||
| Series 2002-HE1 Cl. M1 | |||
| 1,403 | 2.138% (1 Month USD Libor + 0.600) 07/25/20322 | 1,416 | |
| Navient Student Loan Trust | |||
| Series 2017-3A Cl. A1 | |||
| 5,504 | 1.538% (1 Month USD Libor + 0.300) 07/26/20662,3 | 5,513 | |
| Novastar Mortgage Funding Trust | |||
| Series 2007-2 Cl. A2C | |||
| 6,105 | 1.418% (1 Month USD Libor + 0.180) 09/25/20372 | 5,108 | |
| OneMain Financial Issuance Trust | |||
| Series 2017-1A Cl. A1 | |||
| 5,500 | 2.370%—09/14/20323 | 5,491 | |
| Option One Mortgage Loan Trust | |||
| Series 2007-6 Cl. 2A4 | |||
| 4,987 | 1.488% (1 Month USD Libor + 0.250) 07/25/20372 | 3,228 | |
| OZLM Funding V Ltd. | |||
| Series 2013 Cl. 5A | |||
| 5,700 | 2.483% (3 Month USD Libor + 1.130) 01/17/20262,3 | 5,730 | |
| Park Place Securities Inc. | |||
| Series 2005-WCW3 Cl. M1 | |||
| 8,274 | 1.718% (1 Month USD Libor + 0.480) 08/25/20352 | 8,261 | |
| People's Financial Realty Mortgage Securities Trust | |||
| Series 2006-1 Cl. 1A2 | |||
| 4,891 | 1.368% (1 Month USD Libor + 0.130) 09/25/20362 | 1,578 | |
| RAMP Trust | |||
| Series 2004-RS8 Cl. MII1 | |||
| 750 | 2.137% (1 Month USD Libor + 0.600) 08/25/20342 | 736 | |
| RASC Trust | |||
| Series 2005-EMX3 Cl. M5 | |||
| 3,400 | 1.888% (1 Month USD Libor + 0.650) 09/25/20352 | 3,230 | |
| Securitized Asset Backed Receivables LLC Trust | |||
| Series 2005-FR5 Cl. M1 | |||
| 13,852 | 1.898% (1 Month USD Libor + 0.440) 08/25/20352 | 8,886 | |
| SG Mortgage Securities Trust | |||
| Series 2006-OPT2 Cl. A3D | |||
| 6,900 | 1.448% (1 Month USD Libor + 0.210) 10/25/20362 | 4,840 | |
| Small Business Administration Participation Certificates | |||
| Series 2003-20I Cl. 1 | |||
| 65 | 5.130%—09/01/2023 | 69 | |
| Series 2009-20A Cl. 1 | |||
| 2,942 | 5.720%—01/01/2029 | 3,209 | |
| Series 2008-20H Cl. 1 | |||
| 5,968 | 6.020%—08/01/2028 | 6,557 | |
| ASSET-BACKED SECURITIES—Continued | |||
| Principal Amount | Value | ||
| Series 2001-20A Cl. 1 | |||
| $ | 80 | 6.290%—01/01/2021 | $ 84 |
| 9,919 | |||
| Soundview Home Loan Trust | |||
| Series 2006-WF2 Cl. A1 | |||
| 1,400 | 1.368% (1 Month USD Libor + 0.130) 12/25/20362 | 1,399 | |
| Specialty Underwriting & Residential Finance Trust | |||
| Series 2006-BC4 Cl. A2B | |||
| 3,267 | 1.348% (1 Month USD Libor + 0.110) 09/25/20372 | 1,598 | |
| Structured Asset Securities Co. | |||
| Series 2007-MN1A Cl. A1 | |||
| 24,705 | 1.468% (1 Month USD Libor + 0.230) 01/25/20372,3 | 17,231 | |
| Student Loan Marketing Association Student Loan Marketing Association | |||
| Series 2013-B Cl. A2A | |||
| 6,162 | 1.850%—06/17/20303 | 6,160 | |
| Telos CLO Ltd.1 | |||
| Series 2014 Cl. 6A | |||
| 4,500 | 2.623% (3 Month USD Libor + 1.270) 01/17/20272,3 | 4,518 | |
| Venture XVI CLO Ltd.1 | |||
| Series 2014 Cl. 16A | |||
| 6,800 | 2.424% (3 Month USD Libor + 1.120) 04/15/20262,3 | 6,820 | |
| Volt LXI LLC | |||
| Series 2017-NPL8 Cl. A1 | |||
| 5,131 | 3.125%—06/25/20473,4 | 5,158 | |
| TOTAL ASSET-BACKED SECURITIES | |||
(Cost $200,784) | 211,841 | ||
| COLLATERALIZED MORTGAGE OBLIGATIONS—8.0% | |||
| Adjustable Rate Mortgage Trust | |||
| Series 2006-3 Cl. 4A2 | |||
| 3,404 | 1.358% (1 Month USD Libor + 0.120) 08/25/20362 | 2,192 | |
| Alba plc | |||
| Series 2007-1 Cl. A3 | |||
| £ | 3,072 | 0.503%—03/17/20395 | 3,935 |
| Banc of America Funding Corp. | |||
| Series 2007-C Cl. 7A5 | |||
| $ | 1,397 | 1.539% (1 Month USD Libor + 0.300) 05/20/20472 | 1,272 |
| Banc of America Merrill Lynch Commercial Mortgage Securities Trust | |||
| Series 2016-ASHF Cl. A | |||
| 7,000 | 3.139% (1 Month USD Libor + 1.900) 12/15/20332,3 | 7,047 | |
| BCAP LLC Trust | |||
| Series 2007-AA2 Cl. 12A1 | |||
| 9,250 | 1.448% (1 Month USD Libor + 0.210) 05/25/20472 | 8,729 | |
| Series 2011-RR5 Cl. 12A1 | |||
| 649 | 5.028%—03/26/20373,4 | 640 | |
| Series 2011-RR4 Cl. 8A1 | |||
| 2,738 | 5.250%—02/26/20363,5 | 2,329 | |
| Series 2011-RR5 Cl. 5A1 | |||
| 3,377 | 5.250%—08/26/20373,5 | 3,480 | |
| 15,178 | |||
32
Harbor Bond Fund
Portfolio of Investments—Continued
Portfolio of Investments—Continued
Value, Cost, and Principal Amounts in Thousands
| COLLATERALIZED MORTGAGE OBLIGATIONS—Continued | |||
| Principal Amount | Value | ||
| Bear Stearns Adjustable Rate Mortgage Trust | |||
| Series 2000-2 Cl. A1 | |||
| $ | 20 | 2.779%—11/25/20305 | $ 19 |
| Series 2004-10 Cl. 12A3 | |||
| 44 | 3.346%—01/25/20355 | 45 | |
| Series 2004-1 Cl. 12A5 | |||
| 420 | 3.633%—04/25/20345 | 422 | |
| Series 2006-4 Cl. 1A1 | |||
| 658 | 3.676%—10/25/20365 | 635 | |
| 1,121 | |||
| Bear Stearns Alt-A Trust | |||
| Series 2005-4 Cl. 1A1 | |||
| 300 | 1.678% (1 Month USD Libor + 0.220) 07/25/20352 | 302 | |
| BX Trust | |||
| Series 2017 Cl. A | |||
| 6,800 | 2.159%—07/15/20343,5 | 6,829 | |
| Chase Mortgage Finance Corp. | |||
| Series 2006-A1 Cl. 4A1 | |||
| 2,364 | 3.551%—09/25/20365 | 2,322 | |
| Countrywide Alternative Loan Trust | |||
| Series 2005-59 Cl. 1A1 | |||
| 8,391 | 1.569% (1 Month USD Libor + 0.330) 11/20/20352 | 7,962 | |
| Series 2006-6BC Cl. 1A2 | |||
| 4,407 | 1.637% (1 Month USD Libor + 0.400) 05/25/20362 | 3,556 | |
| Series 2005-84 Cl. 1A1 | |||
| 3,632 | 3.269%—02/25/20365 | 3,121 | |
| Series 2005-20CB Cl. 2A5 | |||
| 2,900 | 5.500%—07/25/2035 | 2,682 | |
| Series 2006-36T2 Cl. 1A4 | |||
| 1,397 | 5.750%—12/25/2036 | 1,035 | |
| Series 2006-39CB Cl. 1A20 | |||
| 5,873 | 6.000%—01/25/2037 | 5,743 | |
| 24,099 | |||
| Countrywide Home Loan Mortgage Pass Through Trust | |||
| Series 2007-HY5 Cl. 1A1 | |||
| 1,309 | 3.780%—09/25/20475 | 1,277 | |
| Credit Suisse First Boston Mortgage Securities Corp. | |||
| Series 2006-C2 Cl. A3 | |||
| 450 | 6.000%—11/25/2035 | 382 | |
| Deutsche Alt-A Securities Inc. Mortgage Loan Trust | |||
| Series 2007-AR2 Cl. A1 | |||
| 6,451 | 1.388% (1 Month USD Libor + 0.150) 03/25/20372 | 5,881 | |
| DSLA Mortgage Loan Trust | |||
| Series 2006-AR1 Cl. 1A1A | |||
| 3,024 | 1.809% (Fed 12 Month Treasury Average CMT + 0.920) 03/19/20462 | 2,763 | |
| Eurohome UK Mortgages plc | |||
| Series 2007-1 Cl. A | |||
| £ | 2,804 | 0.477%—06/15/20445 | 3,612 |
| First Horizon Asset Securities Inc. | |||
| Series 2005-AR6 Cl. 4A1 | |||
| $ | 1,721 | 3.125%—02/25/20365 | 1,678 |
| First Nationwide Trust | |||
| Series 2001-3 Cl. 1A1 | |||
| 1 | 6.750%—08/21/2031 | — | |
| COLLATERALIZED MORTGAGE OBLIGATIONS—Continued | |||
| Principal Amount | Value | ||
| GS Mortgage Securities Corp. Trust | |||
| Series 2016-RENT Cl. A | |||
| $ | 6,900 | 3.203%—02/10/20293 | $ 7,033 |
| GSMPS Mortgage Loan Trust | |||
| Series 2006-RP2 Cl. 1AF1 | |||
| 6,270 | 1.637% (1 Month USD Libor + 0.400) 04/25/20362,3 | 5,525 | |
| GSR Mortgage Loan Trust | |||
| Series 2005-AR7 Cl. 6A1 | |||
| 472 | 3.407%—11/25/20355 | 468 | |
| Series 2005-AR3 Cl. 3A1 | |||
| 795 | 3.630%—05/25/20355 | 754 | |
| Series 2006-2F Cl. 2A13 | |||
| 2,279 | 5.750%—02/25/2036 | 2,231 | |
| 3,453 | |||
| HarborView Mortgage Loan Trust | |||
| Series 2004-8 Cl. 2A3 | |||
| 1,001 | 2.058% (1 Month USD Libor + 0.410) 11/19/20342 | 894 | |
| HomeBanc Mortgage Trust | |||
| Series 2006-H2 Cl. A2 | |||
| 5,426 | 1.418% (1 Month USD Libor + 0.180) 12/25/20362 | 5,353 | |
| Homestar Mortgage Acceptance Corp. | |||
| Series 2004-5 Cl. M3 | |||
| 1,532 | 2.963% (1 Month USD Libor + 1.150) 10/25/20342 | 1,521 | |
| IndyMac ARM Trust | |||
| Series 2001-H2 Cl. A2 | |||
| 7 | 2.557%—01/25/20325 | 6 | |
| IndyMac IMSC Mortgage Loan Trust | |||
| Series 2007-F2 Cl. 2A1 | |||
| 3,018 | 6.500%—07/25/2037 | 2,002 | |
| IndyMac INDX Mortgage Loan Trust | |||
| Series 2005-AR31 Cl. 1A1 | |||
| 1,643 | 3.269%—01/25/20365 | 1,496 | |
| Series 2007-AR13 Cl. 4A1 | |||
| 16,350 | 3.314%—07/25/20375 | 13,957 | |
| 15,453 | |||
| JP Morgan Chase Commercial Mortgage Securities Corp. | |||
| Series 2016-WPT Cl. A | |||
| 5,000 | 2.677% (1 Month USD Libor + 1.450) 10/15/20332,3 | 5,025 | |
| JP Morgan Mortgage Trust | |||
| Series 2006-A6 Cl. 1A4L | |||
| 3,767 | 3.558%—10/25/20365 | 3,351 | |
| Series 2006-S1 Cl. 3A1 | |||
| 1,005 | 5.500%—04/25/2036 | 1,029 | |
| 4,380 | |||
| JP Morgan Re-REMIC6 | |||
| Series 2009-7 Cl. 11A1 | |||
| 89 | 3.611%—09/27/20363,5 | 92 | |
| Mansard Mortgages plc | |||
| Series 2007-2X Cl. A1 | |||
| £ | 1,342 | 0.977%—12/15/20495 | 1,755 |
| Merrill Lynch Alternative Note Asset Trust | |||
| Series 2007-F1 Cl. 2A6 | |||
| $ | 701 | 6.000%—03/25/2037 | 572 |
| Merrill Lynch Mortgage Investors Inc. | |||
| Series 2005-3 Cl. 4A | |||
| 65 | 1.487% (1 Month USD Libor + 0.250) 11/25/20352 | 62 | |
33
Harbor Bond Fund
Portfolio of Investments—Continued
Portfolio of Investments—Continued
Value, Cost, and Principal Amounts in Thousands
| COLLATERALIZED MORTGAGE OBLIGATIONS—Continued | |||
| Principal Amount | Value | ||
| Morgan Stanley Bank of America Merrill Lynch Trust | |||
| Series 2015-C22 Cl. ASB | |||
| $ | 6,000 | 3.040%—04/15/2048 | $ 6,136 |
| Provident Funding Mortgage Loan Trust | |||
| Series 2005-2 Cl. 3A | |||
| 3,678 | 3.687%—10/25/20355 | 3,688 | |
| Residential Accredit Loans Inc. | |||
| Series 2006-QA7 Cl. 2A1 | |||
| 5,178 | 1.423% (1 Month USD Libor + 0.185) 08/25/20362 | 4,762 | |
| Series 2007-QS4 Cl. 3A9 | |||
| 2,565 | 6.000%—03/25/2037 | 2,299 | |
| 7,061 | |||
| Residential Asset Securitization Trust | |||
| Series 2007-A8 Cl. 2A1 | |||
| 19,123 | 6.250%—08/25/2037 | 9,810 | |
| Residential Funding Mortgage Securities I | |||
| Series 2007-SA1 Cl. 2A2 | |||
| 356 | 4.032%—02/25/20375 | 288 | |
| Series 2006-SA1 Cl. 2A1 | |||
| 363 | 4.412%—02/25/20365 | 332 | |
| 620 | |||
| RMAC Securities plc | |||
| Series 2006-NS4X Cl. A3A | |||
| £ | 2,020 | 0.462%—06/12/20445 | 2,596 |
| Structured Adjustable Rate Mortgage Loan Trust | |||
| Series 2007-1 Cl. 1A1 | |||
| $ | 2,865 | 1.388% (1 Month USD Libor + 0.150) 02/25/20372 | 2,413 |
| Series 2001-21A Cl. 3A1 | |||
| 771 | 3.584%—04/25/20355 | 772 | |
| 3,185 | |||
| Structured Asset Mortgage Investments Inc. | |||
| Series 2005-AR5 Cl. A2 | |||
| 595 | 1.487% (1 Month USD Libor + 0.250) 07/19/20352 | 584 | |
| Suntrust Adjustable Rate Mortgage Loan Trust | |||
| Series 2007-S1 Cl. 1A | |||
| 930 | 3.675%—01/25/20375 | 885 | |
| Washington Mutual Mortgage Pass Through Certificates Trust | |||
| Series 2005-AR13 Cl. A1A1 | |||
| 287 | 1.528% (1 Month USD Libor + 0.290) 10/25/20452 | 289 | |
| Series 2005-AR6 Cl. 2A1A | |||
| 596 | 1.698% (1 Month USD Libor + 0.230) 04/25/20452 | 587 | |
| Series 2006-AR11 Cl. 3A1A | |||
| 2,565 | 1.809% (Fed 12 Month Treasury Average CMT + 0.920) 09/25/20462 | 2,379 | |
| 3,255 | |||
| Wells Fargo Mortgage Backed Securities Trust | |||
| Series 2006-AR10 Cl. 1A1 | |||
| 3,951 | 3.304%—07/25/20365 | 3,855 | |
| TOTAL COLLATERALIZED MORTGAGE OBLIGATIONS | |||
(Cost $157,458) | 174,691 | ||
| CORPORATE BONDS & NOTES—28.6% | |||
| Principal Amount | Value | ||
| AUTOMOBILES—1.1% | |||
| Ford Motor Credit Co. LLC | |||
| $ | 5,000 | 2.551%—10/05/2018 | $ 5,032 |
| 1,550 | 3.200%—01/15/2021 | 1,586 | |
| 10,050 | 8.125%—01/15/2020 | 11,268 | |
| 17,886 | |||
| General Motors Financial Co. Inc. | |||
| 2,800 | 3.150%—01/15/2020 | 2,853 | |
| 800 | 3.200%—07/13/2020 | 818 | |
| 1,400 | 6.750%—06/01/2018 | 1,439 | |
| 5,110 | |||
| Volkswagen Group of America Finance LLC | |||
| 1,700 | 1.650%—05/22/20183 | 1,698 | |
| 24,694 | |||
| BANKS—14.2% | |||
| Banco Espirito Santo SA MTN7 | |||
| € | 3,500 | 0.000%—01/15/2018* | 1,182 |
| Bank of America Corp. MTN7 | |||
| $ | 18,300 | 2.393% (3 Month USD Libor + 1.070) 03/22/20182 | 18,363 |
| 4,030 | 5.650%—05/01/2018 | 4,108 | |
| 7,800 | 6.875%—04/25/2018 | 7,991 | |
| 30,462 | |||
| Barclays Bank plc | |||
| 1,700 | 7.750% (USD Swap Semi 30/360 5Y + 6.833) 04/10/20232 | 1,740 | |
| £ | 3,600 | 14.000%—06/15/20195,8 | 5,636 |
| 7,376 | |||
| Barclays plc | |||
| $ | 6,300 | 3.419% (3 Month USD Libor + 2.110) 08/10/20212 | 6,612 |
| 5,200 | 3.684%—01/10/2023 | 5,316 | |
| € | 2,300 | 6.500%—09/15/20195,8 | 2,887 |
| £ | 2,400 | 7.000%—06/15/20495,8 | 3,374 |
| 18,189 | |||
| BB&T Corp. MTN7 | |||
| $ | 19,500 | 2.180% (3 Month USD Libor + 0.860) 06/15/20182 | 19,584 |
| BBVA Bancomer SA | |||
| 1,200 | 6.500%—03/10/20213 | 1,316 | |
| CIT Group Inc. | |||
| 600 | 3.875%—02/19/2019 | 611 | |
| 100 | 5.375%—05/15/2020 | 107 | |
| 334 | 5.500%—02/15/20193 | 350 | |
| 1,068 | |||
| Citigroup Inc. | |||
| 3,500 | 1.700%—04/27/2018 | 3,499 | |
| 3,000 | 2.350%—08/02/2021 | 2,987 | |
| 4,000 | 2.746% (3 Month USD Libor + 1.430) 09/01/20232 | 4,111 | |
| 6,800 | 2.750%—04/25/2022 | 6,827 | |
| 17,424 | |||
| JP Morgan Chase & Co. | |||
| 5,500 | 2.400%—06/07/2021 | 5,511 | |
| 4,500 | 2.550%—03/01/2021 | 4,530 | |
| 5,000 | 2.750%—06/23/2020 | 5,079 | |
| 15,120 | |||
34
Harbor Bond Fund
Portfolio of Investments—Continued
Portfolio of Investments—Continued
Value, Cost, and Principal Amounts in Thousands
| CORPORATE BONDS & NOTES—Continued | |||
| Principal Amount | Value | ||
| BANKS—Continued | |||
| KBC Bank NV | |||
| $ | 3,600 | 8.000%—01/25/20235 | $ 3,654 |
| Lloyds Bank plc | |||
| 7,300 | 12.000% (3 Month USD Libor + 11.756) 12/16/20242,3,8 | 9,887 | |
| Lloyds Banking Group plc | |||
| £ | 4,200 | 7.000%—12/29/20495,8 | 5,948 |
| National Australia Bank Ltd. | |||
| $ | 950 | 2.250%—03/16/20213 | 948 |
| Nordea Kredit Realkreditaktieselskab | |||
| DKK$ | 239,648 | 1.000%—10/01/2018 | 38,058 |
| Nykredit Realkredit AS | |||
| 590,600 | 1.000%—04/01/2018-10/01/2018 | 93,546 | |
| 80,700 | 2.000%—04/01/2018-10/01/2018 | 12,830 | |
| 106,376 | |||
| Royal Bank of Canada | |||
| $ | 4,300 | 2.300%—03/22/2021 | 4,311 |
| Sumitomo Mitsui Financial Group Inc. | |||
| 6,900 | 2.997% (3 Month USD Libor + 1.680) 03/09/20212 | 7,121 | |
| Sumitomo Mitsui Trust Bank Ltd. | |||
| 8,100 | 1.764% (1 Month USD Libor + 0.440) 09/19/20192,3 | 8,109 | |
| Wells Fargo & Co. | |||
| 3,100 | 2.610% (3 Month USD Libor + 1.230) 10/31/20232 | 3,191 | |
| 11,500 | 7.980% (3 Month USD Libor + 3.770) 03/15/20182,8 | 11,751 | |
| 14,942 | |||
| 311,075 | |||
| BIOTECHNOLOGY—0.2% | |||
| Baxalta Inc. | |||
| 5,200 | 2.875%—06/23/2020 | 5,278 | |
| BUILDING PRODUCTS—0.0% | |||
| Owens Corning | |||
| 300 | 4.200%—12/01/2024 | 316 | |
| CAPITAL MARKETS—4.9% | |||
| Blackstone CQP Holdco LP | |||
| 3,900 | 6.000%—08/18/20213 | 3,906 | |
| 8,000 | 6.500%—03/20/20213 | 8,101 | |
| 12,007 | |||
| BM & FBOVESPA SA | |||
| 1,300 | 5.500%—07/16/2020 | 1,373 | |
| Credit Suisse Group Funding Guernsey Ltd. | |||
| 8,900 | 3.750%—03/26/2025 | 9,155 | |
| 3,445 | 3.800%—09/15/2022 | 3,583 | |
| 12,738 | |||
| Deutsche Bank AG | |||
| 3,500 | 2.329% (3 Month USD Libor + 0.970) 07/13/20202 | 3,515 | |
| Deutsche Bank AG MTN7 | |||
| 13,700 | 2.850%—05/10/2019 | 13,824 | |
| E*Trade Financial Corp. | |||
| 5,100 | 2.950%—08/24/2022 | 5,107 | |
| Goldman Sachs Group Inc. | |||
| 7,700 | 2.160% (3 Month USD Libor + 0.780) 10/31/20222 | 7,701 | |
| Morgan Stanley MTN7 | |||
| 1,700 | 2.125%—04/25/2018 | 1,703 | |
| CORPORATE BONDS & NOTES—Continued | |||
| Principal Amount | Value | ||
| CAPITAL MARKETS—Continued | |||
| $ | 11,700 | 2.647% (3 Month USD Libor + 1.280) 04/25/20182 | $ 11,763 |
| 8,508 | 5.625%—09/23/2019 | 9,051 | |
| 22,517 | |||
| Piper Jaffray Cos. | |||
| 2,000 | 5.060%—10/09/20183 | 2,041 | |
| UBS AG | |||
| 8,000 | 1.897% (3 Month USD Libor + 0.580) 06/08/20202,3 | 8,041 | |
| UBS AG MTN7 | |||
| 6,800 | 1.637% (3 Month USD Libor + 0.320) 12/07/20182,3 | 6,815 | |
| 1,800 | 2.166% (3 Month USD Libor + 0.850) 06/01/20202 | 1,823 | |
| 8,638 | |||
| UBS Group Funding Jersey Ltd. | |||
| 8,500 | 3.000%—04/15/20213 | 8,634 | |
| 106,136 | |||
| CONSUMER FINANCE—1.0% | |||
| Capital One Financial Corp. | |||
| 5,500 | 1.832% (3 Month USD Libor + 0.450) 10/30/20202 | 5,506 | |
| 5,400 | 2.400%—10/30/2020 | 5,401 | |
| 10,907 | |||
| Discover Bank | |||
| 2,900 | 2.600%—11/13/2018 | 2,918 | |
| Discover Financial Services | |||
| 5,000 | 5.500% (3 Month USD Libor + 3.076) 12/31/20992,8 | 5,106 | |
| OneMain Financial Holdings Inc. | |||
| 1,600 | 6.750%—12/15/20193 | 1,662 | |
| 1,500 | 7.250%—12/15/20213 | 1,562 | |
| 3,224 | |||
| 22,155 | |||
| DIVERSIFIED FINANCIAL SERVICES—2.7% | |||
| Brfkredit AS | |||
| DKK$ | 12,300 | 1.000%—04/01/2018 | 1,938 |
| Cantor Fitzgerald LP | |||
| $ | 5,400 | 6.500%—06/17/20223 | 6,050 |
| Depository Trust & Clearing Corp. | |||
| 3,000 | 4.875% (3 Month USD Libor + 3.167) 06/15/20202,3,8 | 3,120 | |
| Leaseplan Corp. NV | |||
| 7,300 | 2.875%—01/22/20193 | 7,312 | |
| Nykredit Realkredit AS | |||
| DKK$ | 137,900 | 2.000%—04/01/2018 | 21,819 |
| Realkredit Danmark AS | |||
| 66,600 | 1.000%—04/01/2018 | 10,495 | |
| Rio Oil Finance Trust | |||
| $ | 1,791 | 9.250%—07/06/20243 | 1,945 |
| 6,665 | 9.750%—01/06/20273 | 7,190 | |
| 9,135 | |||
| 59,869 | |||
| DIVERSIFIED TELECOMMUNICATION SERVICES—1.5% | |||
| AT&T Inc. | |||
| 6,400 | 2.800%—02/17/2021 | 6,496 | |
35
Harbor Bond Fund
Portfolio of Investments—Continued
Portfolio of Investments—Continued
Value, Cost, and Principal Amounts in Thousands
| CORPORATE BONDS & NOTES—Continued | |||
| Principal Amount | Value | ||
| DIVERSIFIED TELECOMMUNICATION SERVICES—Continued | |||
| $ | 5,000 | 3.600%—02/17/2023 | $ 5,175 |
| 5,000 | 4.450%—05/15/2021 | 5,355 | |
| 17,026 | |||
| Verizon Communications Inc. | |||
| 2,070 | 2.946%—03/15/2022 | 2,103 | |
| 12,695 | 3.376%—02/15/20253 | 12,792 | |
| 14,895 | |||
| 31,921 | |||
| ELECTRIC UTILITIES—0.3% | |||
| FirstEnergy Corp. | |||
| 5,840 | 4.250%—03/15/2023 | 6,187 | |
| ENERGY EQUIPMENT & SERVICES—0.2% | |||
| Odebrecht Drilling Norbe VIII/IX Ltd. | |||
| 5,291 | 0.000%—06/30/2022*,3 | 3,212 | |
| Odebrecht Offshore Drilling Finance Ltd. | |||
| 3,774 | 0.000%—10/1/2023*,3 | 1,391 | |
| 165 | 0.000%—10/01/2023*,3 | 64 | |
| 1,455 | |||
| 4,667 | |||
| EQUITY REAL ESTATE INVESTMENT TRUSTS (REITs)—0.2% | |||
| AvalonBay Communities Inc. MTN7 | |||
| 4,400 | 3.450%—06/01/2025 | 4,537 | |
| FOOD & STAPLES RETAILING—0.0% | |||
| CVS Pass-Through Trust | |||
| 585 | 6.943%—01/10/2030 | 696 | |
| HEALTH CARE EQUIPMENT & SUPPLIES—0.2% | |||
| Boston Scientific Corp. | |||
| 4,900 | 2.850%—05/15/2020 | 4,972 | |
| MORTGAGE REAL ESTATE INVESTMENT TRUSTS (REITs)—0.5% | |||
| ERP Operating LP | |||
| 5,500 | 3.375%—06/01/2025 | 5,630 | |
| Simon Property Group LP | |||
| 6,000 | 2.500%—09/01/2020 | 6,058 | |
| 11,688 | |||
| OIL, GAS & CONSUMABLE FUELS—0.4% | |||
| Enbridge Inc. | |||
| 5,500 | 1.750% (3 Month USD Libor + 0.400) 01/10/20202 | 5,495 | |
| Genesis Energy LP | |||
| 2,100 | 5.625%—06/15/2024 | 2,090 | |
| 7,585 | |||
| PHARMACEUTICALS—0.2% | |||
| Teva Pharmaceutical Finance Netherlands III BV | |||
| 4,334 | 1.400%—07/20/2018 | 4,312 | |
| REAL ESTATE MANAGEMENT & DEVELOPMENT—0.2% | |||
| Tesco Property Finance 5 plc | |||
| £ | 2,268 | 5.661%—10/13/2041 | 3,558 |
| TECHNOLOGY HARDWARE, STORAGE & PERIPHERALS—0.2% | |||
| Dell International LLC | |||
| $ | 4,000 | 5.450%—06/15/20233 | 4,387 |
| CORPORATE BONDS & NOTES—Continued | |||
| Principal Amount | Value | ||
| TOBACCO—0.5% | |||
| BAT Capital Corp | |||
| $ | 1,500 | 1.905% (3 Month USD Libor + 0.590) 08/14/20202,3 | $ 1,508 |
| 6,500 | 2.195% (3 Month USD Libor + 0.880) 08/15/20222,3 | 6,565 | |
| 8,073 | |||
| Imperial Brands Finance plc | |||
| 2,000 | 2.050%—02/11/20183 | 2,001 | |
| 10,074 | |||
| WIRELESS TELECOMMUNICATION SERVICES—0.1% | |||
| Sprint Capital Corp. | |||
| 1,700 | 6.900%—05/01/2019 | 1,798 | |
| TOTAL CORPORATE BONDS & NOTES | |||
(Cost $625,914) | 625,905 | ||
| ESCROW— 0.0% | |||
| (Cost $15) | |||
| Shares | |||
| AUTOMOBILES—0.0% | |||
| 36,000 | General Motors Co. Escrow | — x | |
| FOREIGN GOVERNMENT OBLIGATIONS—17.0% | |||
| Principal Amount | |||
| Brazil Letras Do Tesouro Nacional | |||
| R$ | 217,300 | 0.000%—01/01/2018-07/01/20189 | 63,723 |
| Brazil Notas Do Tesouro Nacional Série F | |||
| 79,600 | 10.000%—01/01/2023 | 25,562 | |
| Bundesrepublik Deutschland | |||
| € | 2,100 | 2.500%—07/04/2044 | 3,214 |
| 3,100 | 3.250%—07/04/2042 | 5,316 | |
| 8,530 | |||
| Hellenic Railways Organization SA | |||
| 3,500 | 5.014%—12/27/2017 | 4,062 | |
| Japan Bank For International Cooperation | |||
| $ | 6,800 | 2.375%—07/21/2022 | 6,799 |
| Japan Finance Organization For Municipalities MTN7 | |||
| 6,800 | 2.625%—04/20/20223 | 6,824 | |
| Japan International Cooperation Agency | |||
| 6,900 | 2.750%—04/27/2027 | 6,860 | |
| Japan Treasury Discount Bill | |||
| ¥ | 24,750,000 | 0.000%—11/06/2017-01/29/20189 | 217,699 |
| Province of Ontario Canada | |||
| $ | 6,100 | 1.650%—09/27/2019 | 6,074 |
| CAD$ | 5,600 | 3.150%—06/02/2022 | 4,555 |
| $ | 3,800 | 4.000%—10/07/2019 | 3,949 |
| 2,300 | 4.400%—04/14/2020 | 2,431 | |
| 17,009 | |||
36
Harbor Bond Fund
Portfolio of Investments—Continued
Portfolio of Investments—Continued
Value, Cost, and Principal Amounts in Thousands
| FOREIGN GOVERNMENT OBLIGATIONS—Continued | |||
| Principal Amount | Value | ||
| Province of Quebec Canada | |||
| CAD$ | 4,700 | 3.500%—07/29/2020-12/01/2022 | $ 4,082 |
| 13,900 | 4.250%—12/01/2021 | 11,741 | |
| 15,823 | |||
| TOTAL FOREIGN GOVERNMENT OBLIGATIONS | |||
(Cost $385,853) | 372,891 | ||
| MORTGAGE PASS-THROUGH—52.0% | |||
| Federal Home Loan Mortgage Corp. | |||
| $ | 9 | 3.050% (US Treasury Yield Curve Rate T Note 1 Year CMT + 2.209) 06/01/20242 | 10 |
| 46 | 3.339% (US Treasury Yield Curve Rate T Note 1 Year CMT + 2.250) 08/01/20352 | 49 | |
| 368 | 4.500%—12/01/2040-09/01/2041 | 394 | |
| 1,259 | 5.500%—02/01/2038-07/01/2038 | 1,402 | |
| 4,842 | 6.000%—01/01/2029-05/01/2040 | 5,466 | |
| 7,321 | |||
| Federal Home Loan Mortgage Corp. Multifamily Structured Pass Through Certificates | |||
| 19,141 | 1.278%—08/25/20225 | 969 | |
| Federal Home Loan Mortgage Corp. REMIC6 | |||
| 7,158 | 1.634% (1 Month USD Libor + 0.400) 06/15/20412 | 7,183 | |
| 28 | 1.684% (1 Month USD Libor + 0.450) 11/15/20302 | 28 | |
| 58 | 8.000%—08/15/2022 | 64 | |
| 8 | 9.000%—12/15/2020 | 8 | |
| 7,283 | |||
| Federal Home Loan Mortgage Corp. Structured Pass Through Securities | |||
| Series T-63 Cl. 1A1 | |||
| 130 | 2.089% (Fed 12 Month Treasury Average CMT + 1.200) 02/25/20452 | 132 | |
| Series E3 Cl. A | |||
| 107 | 3.269%—08/15/20325 | 111 | |
| 243 | |||
| Federal Home Loan Mortgage Corp. TBA10 | |||
| 38,000 | 3.500%—12/13/2046 | 38,991 | |
| 14,000 | 4.000%—11/14/2046 | 14,693 | |
| 15,000 | 4.500%—11/12/2045-12/13/2046 | 16,016 | |
| 69,700 | |||
| Federal Housing Authority Project | |||
| 1 | 7.400%—02/01/2021 | 1 y | |
| Federal National Mortgage Association | |||
| 241 | 2.289% (Fed 12 Month Treasury Average CMT + 1.400) 10/01/20402 | 245 | |
| 5,300 | 2.310%—08/01/2022 | 5,304 | |
| 10,938 | 2.475%—04/01/2019 | 11,003 | |
| 6,000 | 2.870%—09/01/2027 | 6,025 | |
| 1,203 | 3.000%—02/01/2021-11/01/2025 | 1,234 | |
| 446 | 3.330%—11/01/2021 | 462 | |
| 75 | 3.387% (12 Month USD Libor + 1.674) 05/01/20352 | 79 | |
| 1,277 | 3.448% (12 Month USD Libor + 1.693) 08/01/20352 | 1,343 | |
| 162 | 3.500%—03/01/2026-05/01/2027 | 169 | |
| 1,166 | 3.580% (12 Month USD Libor + 1.715) 06/01/20352 | 1,228 | |
| 88,697 | 4.000%—04/01/2018-12/13/2046 | 92,930 | |
| 11,388 | 4.500%—01/01/2018-10/01/2042 | 11,988 | |
| MORTGAGE PASS-THROUGH—Continued | |||
| Principal Amount | Value | ||
| $ | 6,897 | 5.000%—12/01/2022-07/01/2044 | $ 7,515 |
| 36,373 | 5.500%—02/01/2023-09/01/2041 | 40,516 | |
| 10,887 | 6.000%—03/01/2023-06/01/2040 | 12,320 | |
| 192,361 | |||
| Federal National Mortgage Association REMIC6 | |||
| Series 2015-38 Cl. DF | |||
| 7,834 | 1.542% (1 Month USD Libor + 0.310) 06/25/20552 | 7,827 | |
| Series 2006-5 Cl. 3A2 | |||
| 104 | 3.288%—05/25/20355 | 109 | |
| Series 2011-98 Cl. ZL | |||
| 69,036 | 3.500%—10/25/2041 | 69,192 | |
| Series 2003-25 Cl. KP | |||
| 644 | 5.000%—04/25/2033 | 704 | |
| Series 2003-W1 Cl. 1A1 | |||
| 202 | 6.500%—12/25/20425 | 218 | |
| 78,050 | |||
| Federal National Mortgage Association TBA10 | |||
| 274,000 | 3.000%—01/17/2028-12/13/2047 | 273,859 | |
| 236,000 | 3.500%—12/19/2031-12/13/2047 | 242,697 | |
| 106,000 | 4.000%—11/13/2047 | 111,234 | |
| 82,000 | 4.500%—12/13/2046-11/13/2047 | 87,649 | |
| 715,439 | |||
| Government National Mortgage Association | |||
| 28,373 | 5.000%—08/15/2033-11/20/2047 | 30,813 | |
| Government National Mortgage Association II | |||
| 159 | 2.125% (US Treasury Yield Curve Rate T Note 1 Year CMT + 7.500) 08/20/2022-07/20/20272 | 163 | |
| 120 | 2.250% (US Treasury Yield Curve Rate T Note 1 Year CMT + 7.500) 10/20/2025-11/20/20292 | 124 | |
| 354 | 2.375% (US Treasury Yield Curve Rate T Note 1 Year CMT + 3.000) 01/20/2025-02/20/20322 | 368 | |
| 23 | 2.500% (US Treasury Yield Curve Rate T Note 1 Year CMT + 1.500) 12/20/20242 | 23 | |
| 27 | 2.625% (US Treasury Yield Curve Rate T Note 1 Year CMT + 1.500) 05/20/20242 | 27 | |
| 705 | |||
| Government National Mortgage Association TBA10 | |||
| 2,000 | 3.000%—11/21/2046 | 2,023 | |
| 9,000 | 3.500%—11/21/2046 | 9,336 | |
| 24,000 | 4.000%—12/21/2046-11/20/2047 | 25,193 | |
| 36,552 | |||
| TOTAL MORTGAGE PASS-THROUGH | |||
(Cost $1,135,655) | 1,139,437 | ||
| MUNICIPAL BONDS—1.1% | |||
| Chicago Transit Authority | |||
| 170 | 6.300%—12/01/2021 | 181 | |
| City of Chicago, IL | |||
| 5,800 | 7.750%—01/01/2042 | 6,340 | |
| Clark County, NV | |||
| 4,000 | 6.350%—07/01/2029 | 4,280 | |
| University of California | |||
| 12,270 | 4.858%—05/15/2112 | 13,413 | |
| TOTAL MUNICIPAL BONDS | |||
(Cost $22,089) | 24,214 | ||
37
Harbor Bond Fund
Portfolio of Investments—Continued
Portfolio of Investments—Continued
Value, Cost, and Principal Amounts in Thousands
| U.S. GOVERNMENT OBLIGATIONS—26.6% | |||
| Principal Amount | Value | ||
| U.S. Treasury Bonds | |||
| $ | 19,600 | 2.250%—08/15/2046 | $ 17,172 |
| 34,200 | 2.500%—02/15/2045-02/15/2046 | 31,794 | |
| 4,800 | 2.750%—08/15/2047 | 4,676 | |
| 16,800 | 2.875%—05/15/2043 | 16,883 | |
| 9,400 | 3.000%—05/15/2042 | 9,698 | |
| 69,800 | 3.125%—02/15/2042-08/15/2044 | 73,418 | |
| 1,800 | 3.625%—02/15/2044 | 2,061 | |
| 4,200 | 4.250%—05/15/2039 | 5,239 | |
| 10,500 | 4.375%—05/15/2040 | 13,338 | |
| 12,000 | 4.625%—02/15/2040 | 15,740 | |
| 190,019 | |||
| U.S. Treasury Notes | |||
| 16,800 | 1.375%—03/31/202011 | 16,682 | |
| 21,000 | 1.750%—09/30/202211 | 20,732 | |
| 25,100 | 1.875%—07/31/2022 | 24,953 | |
| 94,000 | 2.000%—08/31/2021-12/31/202111 | 94,353 | |
| 51,300 | 2.125%—09/30/2024 | 50,972 | |
| 147,200 | 2.250%—11/15/2024-08/15/202711 | 146,151 | |
| 38,300 | 2.375%—05/15/2027 | 38,319 | |
| 392,162 | |||
| TOTAL U.S. GOVERNMENT OBLIGATIONS | |||
(Cost $593,231) | 582,181 | ||
| SHORT-TERM INVESTMENTS—11.5% | |||
| BANKER'S ACCEPTANCE—0.4% | |||
| Bank of Nova Scotia | |||
| 7,100 | 1.000%—11/27/2017 | 5,499 | |
| Toronto Dominion Bank | |||
| 4,400 | 1.000%—11/20/2017 | 3,409 | |
| 8,908 | |||
| CERTIFICATES OF DEPOSIT—1.7% | |||
| Barclays plc | |||
| 28,800 | 1.940%—09/04/2018 | 28,843 | |
| Mizuho Bank Ltd. | |||
| 9,500 | 2.010% (3 Month USD Libor + 0.700) 12/12/20172 | 9,500 | |
| 38,343 | |||
| COMMERCIAL PAPER—3.4% | |||
| Arrow Electronics Inc. | |||
| 5,500 | 1.800%—11/14/20173 | 5,496 | |
| Deutsche Telekom AG | |||
| 5,000 | 1.630%—01/30/2018 | 4,979 | |
| Electricite de France SA | |||
| 9,200 | 1.870%—01/05/2018 | 9,175 | |
| SHORT-TERM INVESTMENTS—Continued | |||
| Principal Amount | Value | ||
| COMMERCIAL PAPER—Continued | |||
| Enbridge Energy Prtns | |||
| $ | 5,000 | 2.250%—12/05/20173 | $ 4,989 |
| ENI Finance USA Inc. | |||
| 5,000 | 1.500%—12/06/2017 | 4,993 | |
| Entergy Corp. | |||
| 5,200 | 1.650%—11/17/2017 | 5,196 | |
| Enterprise Prods Oper LLC | |||
| 400 | 1.410%—11/20/2017 | 400 | |
| Glencore Funding LLC | |||
| 6,600 | 1.650%—01/17/2018 | 6,576 | |
| ING US Funding LLC | |||
| 5,100 | 1.430% (1 Month USD Libor + 0.190) 07/23/20182 | 5,100 | |
| Southern Co. Gas Capital | |||
| 5,500 | 1.520%—01/03/2018 | 5,486 | |
| Toyota Industries Comm | |||
| 7,000 | 1.375%—02/22/2018 | 6,971 | |
| Transcanada American | |||
| 15,300 | 1.550%—12/11/2017 | 15,274 | |
| 74,635 | |||
| REPURCHASE AGREEMENTS—5.7% | |||
| 95,400 | Repurchase Agreement with Barclays Capital Inc. dated October 31, 2017 due November 01, 2017 at 1.180% collateralized by U.S. Treasury Notes (value $96,371) | 95,400 | |
| 14,689 | Repurchase Agreement with Fixed Income Clearing Corp. dated October 31, 2017 due November 01, 2017 at 0.001% collateralized by U.S. Treasury Notes (value $14,984) | 14,689 | |
| 13,800 | Repurchase Agreement with Paribas dated October 31, 2017 due November 01, 2017 at 1.200% collateralized by U.S. Treasury Inflation Indexed Bonds (value $14,008) | 13,800 | |
| 123,889 | |||
| U.S. GOVERNMENT OBLIGATIONS—0.3% | |||
| U.S. Treasury Bills | |||
| 5,749 | 1.035%—01/04/2018 | 5,738 | |
| TOTAL SHORT-TERM INVESTMENTS | |||
(Cost $251,573) | 251,513 | ||
| TOTAL INVESTMENTS—154.5% | |||
(Cost $3,372,572) | 3,382,673 | ||
CASH AND OTHER ASSETS, LESS LIABILITIES—(54.5)% | (1,192,907) | ||
TOTAL NET ASSETS—100.0% | $ 2,189,766 | ||
FUTURES CONTRACTS OPEN AT OCTOBER 31, 2017
| Description | Number of Contracts | Expiration Date | Current Notional Value (000s) | Unrealized Appreciation/ (Depreciation) (000s) | ||||
Canadian Government Bond Futures 10 year (Short) | 195 | 12/18/2017 | CAD$ 26,799 | $ 72 | ||||
Euro-BTP Futures (Short) | 198 | 12/07/2017 | € 27,639 | (493) | ||||
Euro-BUND Futures (Long) | 777 | 12/07/2017 | 126,457 | 594 | ||||
Euro-OAT Futures (Short) | 1,052 | 12/07/2017 | 165,648 | (1,679) | ||||
Euro-Schatz Futures (Short) | 321 | 12/07/2017 | 36,037 | (35) | ||||
United Kingdom GILT Futures 90 day (Short) | 237 | 12/27/2017 | £ 29,466 | 828 |
38
Harbor Bond Fund
Portfolio of Investments—Continued
Portfolio of Investments—Continued
FUTURES CONTRACTS—Continued
| Description | Number of Contracts | Expiration Date | Current Notional Value (000s) | Unrealized Appreciation/ (Depreciation) (000s) | ||||
Japanese Government Bond Futures 10 year (Long) | 5 | 12/13/2017 | ¥ 752,350 | $ (21) | ||||
Eurodollar Futures-CME 90 day (Short) | 1,826 | 12/18/2017 | $ 449,607 | 610 | ||||
Eurodollar Futures-CME 90 day (Short) | 583 | 03/19/2018 | 143,345 | 237 | ||||
Eurodollar Futures-CME 90 day (Short) | 361 | 06/18/2018 | 88,657 | 166 | ||||
Eurodollar Futures-CME 90 day (Short) | 589 | 12/17/2018 | 144,415 | 198 | ||||
Eurodollar Futures-CME 90 day (Short) | 265 | 03/18/2019 | 64,938 | 34 | ||||
Eurodollar Futures-CME 90 day (Short) | 950 | 06/17/2019 | 232,667 | 75 | ||||
Eurodollar Futures-CME 90 day (Short) | 440 | 09/16/2019 | 107,712 | 93 | ||||
U.S. Treasury Bond Futures 30 year (Short) | 492 | 12/19/2017 | 75,015 | 1,172 | ||||
U.S. Treasury Note Futures 5 year (Long) | 5,409 | 12/29/2017 | 633,867 | (5,760) | ||||
U.S. Treasury Note Futures 10 year (Long) | 959 | 12/19/2017 | 119,815 | (484) | ||||
Ultra U.S. Treasury Bond Futures 30 year (Long) | 368 | 12/19/2017 | 60,639 | (1,061) | ||||
Total Futures Contracts | $(5,454) | |||||||
PURCHASED OPTIONS OPEN AT OCTOBER 31, 2017
PURCHASED OPTIONS THAT REQUIRE PERIODIC SETTLEMENT OF VARIATION MARGIN
| Description | Exchange | Strike Price | Expiration Date | Number of Contracts/ Notional | Premiums Paid (000s) | Value (000s) | ||||||
Euro-Bund Futures (Put) | Eurex | € 145.00 | 11/24/2017 | 829 | $11 | $10 | ||||||
Total Purchased Options that Require Periodic Settlement of Variation Margin | $11 | $10 | ||||||||||
PURCHASED OPTIONS NOT SETTLED THROUGH VARIATION MARGIN
| Description | Counterparty/Exchange | Strike Price | Expiration Date | Number of Contracts/ Notional | Premiums Paid (000s) | Value (000s) | ||||||
Eurodollar Futures (Put) | CME Group | $ 98.25 | 03/19/2018 | 1,090 | $ 96 | $ 61 | ||||||
Federal National Mortgage Association Futures 30 year (Put) | JP Morgan Chase Bank NA | 72.00 | 12/06/2017 | 32,900,000 | 1 | — | ||||||
U.S. Treasury Note Option 5 year (Put) | Chicago Board of Trade | 106.50 | 11/24/2017 | 196 | 2 | — | ||||||
U.S. Treasury Note Option 5 year (Put) | Chicago Board of Trade | 111.75 | 11/24/2017 | 3,122 | 27 | 3 | ||||||
U.S. Treasury Note Option 5 year (Put) | Chicago Board of Trade | 112.25 | 11/24/2017 | 3,421 | 29 | 4 | ||||||
U.S. Treasury Note Option 10 year (Put) | Chicago Board of Trade | 107.50 | 11/24/2017 | 4 | — | — | ||||||
U.S. Treasury Note Option 10 year (Put) | Chicago Board of Trade | 114.00 | 11/24/2017 | 271 | 2 | — | ||||||
U.S. Treasury Note Option 10 year (Put) | Chicago Board of Trade | 114.50 | 11/24/2017 | 210 | 2 | — | ||||||
Total Purchased Options Not Settled Through Variation Margin | $159 | $ 68 | ||||||||||
PURCHASED SWAP OPTIONS NOT SETTLED THROUGH VARIATION MARGIN
| Description | Counterparty | Floating Rate Index | Pay/Receive Floating Rate | Strike Price | Expiration Date | Number of Contracts/ Notional | Premiums Paid (000s) | Value (000s) | ||||||||
Interest Rate Swap Option 30 year (Put) | Goldman Sachs Bank USA | 3-Month USD-LIBOR | Receive | 2.930% | 08/20/2018 | 6,000,000 | $ 637 | $161 | ||||||||
Interest Rate Swap Option 30 year (Put) | Goldman Sachs Bank USA | 3-Month USD-LIBOR | Receive | 2.940 | 08/20/2018 | 5,300,000 | 518 | 120 | ||||||||
Interest Rate Swap Option 30 year (Put) | Morgan Stanley Capital Services LLC | 3-Month USD-LIBOR | Receive | 2.910 | 08/20/2018 | 16,600,000 | 1,637 | 410 | ||||||||
Total Purchased Swap Options Not Settled Through Variation Margin | $2,792 | $691 | ||||||||||||||
Total Purchased Options | $2,962 | $769 | ||||||||||||||
WRITTEN OPTIONS OPEN AT OCTOBER 31, 2017
WRITTEN OPTIONS NOT SETTLED THROUGH VARIATION MARGIN
| Description | Counterparty/Exchange | Strike Index/Rate | Expiration Date | Number of Contracts/ Notional | Premiums Received (000s) | Value (000s) | ||||||
Consumer Price All Urban Non-Seasonally Adjusted Index - Floor (Put) | Citibank NA | 215.950 j | 03/12/2020 | 14,100,000 | $ 119 | $ — | ||||||
Consumer Price All Urban Non-Seasonally Adjusted Index - Floor (Put) | Citibank NA | 216.690 j | 04/07/2020 | 33,900,000 | 302 | — |
39
Harbor Bond Fund
Portfolio of Investments—Continued
Portfolio of Investments—Continued
WRITTEN OPTIONS—Continued
WRITTEN OPTIONS NOT SETTLED THROUGH VARIATION MARGIN—Continued
| Description | Counterparty/Exchange | Strike Index/Rate | Expiration Date | Number of Contracts/ Notional | Premiums Received (000s) | Value (000s) | ||||||
Consumer Price All Urban Non-Seasonally Adjusted Index - Floor (Put) | Citibank NA | $��� 217.970j | 09/29/2020 | 15,100,000 | $ 195 | $ — | ||||||
Consumer Price All Urban Non-Seasonally Adjusted Index - Floor (Put) | Deutsche Bank AG | 215.950 j | 03/10/2020 | 5,100,000 | 38 | — | ||||||
Consumer Price All Urban Non-Seasonally Adjusted Index - Floor (Put) | Deutsche Bank AG | 218.010 j | 10/13/2020 | 15,600,000 | 153 | — | ||||||
Currency Option U.S. Dollar vs. Brazilian Real (Call) | Credit Suisse International | $ 6.30 | 01/11/2018 | 7,900,000 | 421 | — | ||||||
Currency Option U.S. Dollar vs. Brazilian Real (Call) | Credit Suisse International | 3.48 | 01/30/2018 | 6,200,000 | 64 | (60) | ||||||
Currency Option U.S. Dollar vs. Brazilian Real (Call) | Deutsche Bank AG | 3.35 | 11/30/2017 | 3,200,000 | 22 | (22) | ||||||
Currency Option U.S. Dollar vs. Brazilian Real (Call) | Goldman Sachs Bank USA | 3.40 | 01/03/2018 | 4,000,000 | 38 | (41) | ||||||
Currency Option U.S. Dollar vs. Brazilian Real (Call) | Goldman Sachs Bank USA | 3.40 | 12/27/2017 | 9,700,000 | 91 | (87) | ||||||
Currency Option U.S. Dollar vs. Brazilian Real (Call) | Goldman Sachs Bank USA | 3.41 | 12/28/2017 | 4,900,000 | 39 | (44) | ||||||
Currency Option U.S. Dollar vs. South Korean Won (Call) | Société Générale Paris | 1,169.00 | 11/09/2017 | 4,200,000 | 29 | (1) | ||||||
Currency Option U.S. Dollar vs. South Korean Won (Call) | UBS AG Stamford | 1,168.00 | 11/09/2017 | 9,000,000 | 63 | (2) | ||||||
Eurodollar Futures (Call) | CME Group | 98.75 | 03/19/2018 | 1,090 | 116 | (7) | ||||||
Total Written Options Not Settled Through Variation Margin | $1,690 | $(264) | ||||||||||
WRITTEN SWAP OPTIONS NOT SETTLED THROUGH VARIATION MARGIN
| Description | Counterparty | Floating Rate Index | Pay/Receive Floating Rate | Strike Rate | Expiration Date | Number of Contracts/ Notional | Premiums Received (000s) | Value (000s) | ||||||||
Interest Rate Swap Option 5 year (Put) | Goldman Sachs Bank USA | 3-Month USD-LIBOR | Pay | 2.800% | 08/20/2018 | 49,600,000 | $1,155 | $(137) | ||||||||
Interest Rate Swap Option 5 year (Put) | Morgan Stanley Capital Services LLC | 3-Month USD-LIBOR | Pay | 2.800 | 08/20/2018 | 72,800,000 | 1,625 | (200) | ||||||||
Total Written Swap Options Not Settled Through Variation Margin | $2,780 | $(337) | ||||||||||||||
Total Written Options | $4,470 | $(601) | ||||||||||||||
FORWARD CURRENCY CONTRACTS OPEN AT OCTOBER 31, 2017
| Counterparty | Amount to be Delivered (000s) | Amount to be Received (000s) | Settlement Date | Unrealized Appreciation/ (Depreciation) (000s) | ||||
BNP Paribas SA | $ 7,760 | AUD$ 10,161 | 12/04/2017 | $ 14 | ||||
JP Morgan Chase Bank NA | $ 7,903 | AUD$ 10,161 | 11/02/2017 | (127) | ||||
BNP Paribas SA | AUD$ 10,161 | $ 7,763 | 11/02/2017 | (14) | ||||
BNP Paribas SA | $ 19,906 | R$ 68,400 | 04/03/2018 | 613 | ||||
Citibank NA | $ 1,240 | R$ 3,911 | 11/03/2017 | (45) | ||||
Citibank NA | $ 1,226 | R$ 3,911 | 12/04/2017 | (36) | ||||
Deutsche Bank AG | $ 3,184 | R$ 10,406 | 11/03/2017 | (5) | ||||
Goldman Sachs Bank USA | $ 3,136 | R$ 10,276 | 11/03/2017 | 4 | ||||
JP Morgan Chase Bank | $ 7,839 | R$ 25,000 | 01/03/2018 | (257) | ||||
JP Morgan Chase Bank | $ 480 | R$ 1,653 | 01/03/2018 | 21 | ||||
BNP Paribas SA | R$ 1,653 | $ 483 | 01/03/2018 | (18) | ||||
Citibank NA | R$ 3,911 | $ 1,230 | 11/03/2017 | 36 | ||||
Citibank NA | R$ 83,900 | $ 24,960 | 07/03/2018 | 74 | ||||
Deutsche Bank AG | R$ 10,406 | $ 3,176 | 11/03/2017 | (4) | ||||
Goldman Sachs Bank USA | R$ 10,276 | $ 3,145 | 11/03/2017 | 6 | ||||
Goldman Sachs Bank USA | R$ 54,500 | $ 16,225 | 07/03/2018 | 60 | ||||
HSBC Bank USA | R$ 28,500 | $ 8,446 | 04/03/2018 | (104) | ||||
JP Morgan Chase Bank | R$ 35,600 | $ 9,764 | 01/03/2018 | (1,033) | ||||
JP Morgan Chase Bank | R$ 140,800 | $ 41,756 | 04/03/2018 | (482) | ||||
JP Morgan Chase Bank | R$ 56,700 | $ 16,862 | 07/03/2018 | 44 | ||||
Barclays Bank plc | $ 18,702 | £ 14,041 | 11/15/2017 | (46) | ||||
Goldman Sachs Bank USA | $ 1,183 | £ 872 | 11/15/2017 | (24) | ||||
JP Morgan Chase Bank NA | $ 1,851 | £ 1,392 | 11/15/2017 | (2) | ||||
BNP Paribas SA | £ 3,351 | $ 4,334 | 11/15/2017 | (119) | ||||
Citibank NA | £ 7,079 | $ 9,261 | 11/15/2017 | (145) | ||||
Goldman Sachs Bank USA | £ 7,620 | $ 9,930 | 11/15/2017 | (195) | ||||
Goldman Sachs Bank USA | £ 12,848 | $ 17,443 | 11/15/2017 | 371 | ||||
JP Morgan Chase Bank NA | £ 13,909 | $ 17,989 | 11/15/2017 | (492) | ||||
Citibank NA | $ 5,728 | CAD$ 7,345 | 11/02/2017 | (34) | ||||
Goldman Sachs Bank USA | $ 10,013 | CAD$ 12,927 | 11/02/2017 | 7 | ||||
Goldman Sachs Bank USA | $ 3,696 | CAD$ 4,747 | 12/04/2017 | (15) |
40
Harbor Bond Fund
Portfolio of Investments—Continued
Portfolio of Investments—Continued
FORWARD CURRENCY CONTRACTS—Continued
| Counterparty | Amount to be Delivered (000s) | Amount to be Received (000s) | Settlement Date | Unrealized Appreciation/ (Depreciation) (000s) | ||||
JP Morgan Chase Bank NA | $ 3,764 | CAD$ 4,833 | 11/01/2017 | $ (17) | ||||
JP Morgan Chase Bank NA | $ 12,497 | CAD$ 16,082 | 11/02/2017 | (31) | ||||
UBS AG | $ 5,695 | CAD$ 7,345 | 12/04/2017 | — | ||||
BNP Paribas SA | CAD$ 7,094 | $ 5,496 | 12/04/2017 | (4) | ||||
Citibank NA | CAD$ 25,046 | $ 20,137 | 11/02/2017 | 722 | ||||
Goldman Sachs Bank USA | CAD$ 12,927 | $ 10,016 | 12/04/2017 | (7) | ||||
JP Morgan Chase Bank NA | CAD$ 3,963 | $ 3,138 | 11/02/2017 | 66 | ||||
UBS AG | CAD$ 7,345 | $ 5,694 | 11/02/2017 | — | ||||
Goldman Sachs Bank USA | DKK$ 165,215 | $ 26,746 | 04/03/2018 | 629 | ||||
Goldman Sachs Bank USA | DKK$ 81,978 | $ 13,412 | 07/02/2018 | 373 | ||||
Goldman Sachs Bank USA | DKK$ 12,005 | $ 1,971 | 10/01/2018 | 49 | ||||
Société Générale | DKK$ 139,535 | $ 22,482 | 07/02/2018 | 287 | ||||
Société Générale | DKK$ 433,353 | $ 71,330 | 10/01/2018 | 1,964 | ||||
UBS AG | DKK$ 34,790 | $ 5,554 | 01/02/2018 | 86 | ||||
UBS AG | DKK$ 183,270 | $ 29,383 | 04/03/2018 | 412 | ||||
UBS AG | DKK$ 70,933 | $ 11,465 | 07/02/2018 | 182 | ||||
UBS AG | DKK$ 25,415 | $ 4,100 | 10/01/2018 | 32 | ||||
BNP Paribas SA | $ 15,431 | € 12,970 | 11/15/2017 | (311) | ||||
BNP Paribas SA | $ 32,855 | € 28,226 | 11/15/2017 | 51 | ||||
Citibank NA | $ 40,457 | € 34,364 | 11/15/2017 | (396) | ||||
JP Morgan Chase Bank NA | $ 14,817 | € 12,384 | 11/15/2017 | (380) | ||||
UBS AG | $ 2,309 | € 1,952 | 11/15/2017 | (33) | ||||
Citibank NA | € 2,698 | $ 3,233 | 11/15/2017 | 88 | ||||
Deutsche Bank AG | € 15,666 | $ 18,704 | 11/15/2017 | 441 | ||||
Goldman Sachs Bank USA | € 949 | $ 1,104 | 11/15/2017 | (2) | ||||
JP Morgan Chase Bank NA | € 58,077 | $ 69,646 | 11/15/2017 | 1,940 | ||||
Credit Suisse International | $ 328 | ₹ 21,478 | 12/04/2017 | 3 | ||||
Citibank NA | $ 2,732 | ¥ 307,500 | 11/15/2017 | (26) | ||||
Deutsche Bank AG | $ 14,595 | ¥ 1,657,000 | 11/15/2017 | (13) | ||||
Deutsche Bank AG | $ 2,733 | ¥ 311,500 | 11/15/2017 | 8 | ||||
Goldman Sachs Bank USA | $ 57,958 | ¥ 6,332,500 | 11/15/2017 | (2,230) | ||||
JP Morgan Chase Bank NA | $ 71,692 | ¥ 7,985,100 | 11/15/2017 | (1,421) | ||||
JP Morgan Chase Bank NA | $ 16,087 | ¥ 1,835,300 | 11/15/2017 | 64 | ||||
BNP Paribas SA | ¥ 5,550,000 | $ 50,695 | 11/13/2017 | 1,858 | ||||
BNP Paribas SA | ¥ 3,872,800 | $ 34,635 | 11/15/2017 | 553 | ||||
BNP Paribas SA | ¥ 1,600,000 | $ 14,287 | 01/10/2018 | 163 | ||||
Citibank NA | ¥ 1,370,000 | $ 12,430 | 11/06/2017 | 379 | ||||
JP Morgan Chase Bank NA | ¥ 800,000 | $ 7,261 | 11/06/2017 | 223 | ||||
JP Morgan Chase Bank NA | ¥ 621,400 | $ 5,462 | 11/15/2017 | (6) | ||||
JP Morgan Chase Bank NA | ¥ 11,865,200 | $ 108,206 | 11/15/2017 | 3,789 | ||||
JP Morgan Chase Bank NA | ¥ 4,860,000 | $ 44,661 | 11/20/2017 | 1,882 | ||||
JP Morgan Chase Bank NA | ¥ 1,220,000 | $ 10,886 | 01/10/2018 | 116 | ||||
JP Morgan Chase Bank NA | ¥ 3,460,000 | $ 30,944 | 01/22/2018 | 381 | ||||
JP Morgan Chase Bank NA | ¥ 3,600,000 | $ 32,028 | 01/29/2018 | 217 | ||||
UBS AG | ¥ 1,051,000 | $ 9,337 | 11/15/2017 | 88 | ||||
UBS AG | ¥ 1,220,000 | $ 10,972 | 11/27/2017 | 230 | ||||
UBS AG | ¥ 1,070,000 | $ 9,641 | 12/18/2017 | 207 | ||||
Citibank NA | $ 2,560 | MEX$ 49,326 | 12/15/2017 | (8) | ||||
Deutsche Bank AG | $ 10,984 | MEX$ 212,792 | 12/15/2017 | 27 | ||||
HSBC Bank USA | $ 36,848 | MEX$ 710,465 | 12/15/2017 | (85) | ||||
JP Morgan Chase Bank NA | NZD$ 826 | $ 594 | 11/02/2017 | 29 | ||||
Citibank NA | $ 20,219 | SGD$ 27,446 | 12/04/2017 | (78) | ||||
Citibank NA | $ 4,450 | SGD$ 6,066 | 12/04/2017 | 2 | ||||
HSBC Bank USA | $ 3,271 | SGD$ 4,467 | 12/04/2017 | 7 | ||||
Goldman Sachs Bank USA | SGD$ 53,201 | $ 39,087 | 12/04/2017 | 47 | ||||
Citibank NA | $ 1 | ₩ 1,146 | 12/04/2017 | — | ||||
Credit Suisse International | $ 1 | ₩ 1,146 | 12/04/2017 | — | ||||
Goldman Sachs Bank USA | $ 1,879 | ₩ 2,152,770 | 12/04/2017 | 47 | ||||
HSBC Bank USA | $ 6,859 | ₩ 7,754,923 | 12/04/2017 | 78 | ||||
UBS AG | ₩ 78,255,113 | $ 68,884 | 12/04/2017 | (1,116) | ||||
Goldman Sachs Bank USA | $ 9,247 | TWD$ 276,948 | 12/18/2017 | (30) | ||||
Royal Bank of Scotland plc | $ 11,453 | TWD$ 342,674 | 12/18/2017 | (48) | ||||
Société Générale | TWD$ 2,070,584 | $ 68,642 | 12/04/2017 | (212) | ||||
Total Forward Currency Contracts | $ 9,319 | |||||||
41
Harbor Bond Fund
Portfolio of Investments—Continued
Portfolio of Investments—Continued
SWAP AGREEMENTS OPEN AT OCTOBER 31, 2017
CENTRALLY CLEARED SWAP AGREEMENTS
INTEREST RATE SWAPS
| Counterparty | Floating Rate Index | Pay/Receive Floating Rate | Fixed Rate | Payment Frequency | Expiration Date | Notional Amount (000s) | Value (000s) | Upfront Premiums (Received)/ Paid (000s) | Unrealized Appreciation/ (Depreciation) (000s) | |||||||||
CME Group | Brazil Cetip Interbank Deposit | Pay | 8.180% | At maturity | 01/02/2020 | R$ 139,700 | $(108) | $ 16 | $ (124) | |||||||||
CME Group | Brazil Cetip Interbank Deposit | Pay | 8.220 | At maturity | 01/02/2020 | 314,900 | (175) | (97) | (78) | |||||||||
CME Group | Canada Bankers Acceptances-CDOR 3-Month | Receive | 2.700 | Semiannual | 12/19/2024 | CAD$ 6,500 | (220) | (535) | 315 | |||||||||
CME Group | Canada Bankers Acceptances-CDOR 3-Month | Receive | 1.750 | Semiannual | 12/16/2046 | 1,900 | 255 | (25) | 280 | |||||||||
LCH Group | EUR-EURIBOR-Act/ 360-Bloomberg 6-Month | Pay | 1.500 | Annual | 03/21/2048 | € 5,500 | (111) | (193) | 82 | |||||||||
LCH Group | British Bankers' Association LIBOR GBP 6-Month | Receive | 1.000 | Semiannual | 03/21/2023 | £ 39,300 | 448 | (359) | 807 | |||||||||
LCH Group | British Bankers' Association LIBOR GBP 6-Month | Receive | 1.500 | Semiannual | 03/21/2028 | 34,000 | (310) | (882) | 572 | |||||||||
LCH Group | British Bankers' Association LIBOR GBP 6-Month | Receive | 1.750 | Semiannual | 03/21/2048 | 10,500 | (499) | (419) | (80) | |||||||||
CME Group | British Bankers' Association LIBOR JPY 6-Month | Receive | 0.300 | Semiannual | 03/18/2026 | ¥ 12,590,000 | (688) | (718) | 30 | |||||||||
LCH Group | British Bankers' Association LIBOR JPY 6-Month | Receive | 0.300 | Semiannual | 09/20/2027 | 2,180,000 | (33) | (114) | 81 | |||||||||
CME Group | British Bankers' Association LIBOR USD 3-Month | Receive | 2.000 | Semiannual | 12/16/2019 | $ 46,700 | (438) | (1,240) | 802 | |||||||||
CME Group | British Bankers' Association LIBOR USD 3-Month | Receive | 1.250 | Semiannual | 06/21/2020 | 73,300 | 994 | 1,702 | (708) | |||||||||
CME Group | British Bankers' Association LIBOR USD 3-Month | Receive | 2.500 | Semiannual | 12/20/2027 | 35,600 | (331) | (1,019) | 688 | |||||||||
Interest Rate Swaps | $2,667 | |||||||||||||||||
CENTRALLY CLEARED SWAP AGREEMENTS
CREDIT DEFAULT SWAPS
| Counterparty | Reference Entity | Buy/ Sellb,c | Pay/Receive Fixed Rate | Expiration Date | Implied Credit Spreadd | Payment Frequency | Notional Amounte (000s) | Value f (000s) | Upfront Premiums (Received)/ Paid (000s) | Unrealized Appreciation/ (Depreciation) (000s) | ||||||||||
ICE Group | TESCO PLC 6.000% due 12/14/2029 | Buy | 1.000% | 06/20/2022 | 1.320% | Quarterly | € 5,000 | $ 30 | $(245) | $275 | ||||||||||
ICE Group | Volkswagen International Finance 5.380% due 05/22/2018 | Buy | 1.000 | 12/20/2017 | 0.131 | Quarterly | € 2,100 | 6 | 16 | (10) | ||||||||||
ICE Group | MetLife, Inc. 4.750% due 02/08/2021 | Buy | 1.000 | 06/20/2021 | 0.400 | Quarterly | $ 2,100 | 55 | 12 | 43 | ||||||||||
ICE Group | MetLife, Inc. 4.750% due 02/08/2021 | Buy | 1.000 | 12/20/2021 | 0.486 | Quarterly | $ 6,900 | 185 | 2 | 183 | ||||||||||
ICE Group | The Goldman Sachs Group, Inc. 5.950% due 01/18/2018 | Buy | 1.000 | 09/20/2020 | 0.439 | Quarterly | $ 8,000 | 154 | 127 | 27 | ||||||||||
Credit Default Swaps | $518 | |||||||||||||||||||
42
Harbor Bond Fund
Portfolio of Investments—Continued
Portfolio of Investments—Continued
SWAP AGREEMENTS—Continued
OVER-THE-COUNTER (OTC) SWAP AGREEMENTS
CREDIT DEFAULT SWAPS
| Counterparty | Reference Entity | Buy/ Sellb,c | Pay/Receive Fixed Rate | Expiration Date | Implied Credit Spreadd | Payment Frequency | Notional Amounte (000s) | Value f (000s) | Upfront Premiums (Received)/ Paid (000s) | Unrealized Appreciation/ (Depreciation) (000s) | ||||||||||
BNP Paribas SA | Petroleo Brasileiro SA Petrobras 8.380% due 12/10/2018 | Sell | 1.000% | 06/20/2018 | 0.721% | Quarterly | $ 900 | $ 4 | $(131) | $ 135 | ||||||||||
Goldman Sachs International | Petroleo Brasileiro SA Petrobras 8.380% due 12/10/2018 | Sell | 1.000 | 12/20/2019 | 1.407 | Quarterly | 400 | 2 | (42) | 44 | ||||||||||
HSBC Bank USA NA | Petroleo Brasileiro SA Petrobras 8.380% due 12/10/2018 | Sell | 1.000 | 03/20/2020 | 1.528 | Quarterly | 200 | 1 | (36) | 37 | ||||||||||
JP Morgan Chase Bank NA | Petroleo Brasileiro SA Petrobras 8.380% due 12/10/2018 | Sell | 1.000 | 12/20/2019 | 1.407 | Quarterly | 2,100 | 10 | (237) | 247 | ||||||||||
Credit Default Swaps | $ 463 | |||||||||||||||||||
Total Swaps | $3,648 | |||||||||||||||||||
FIXED INCOME INVESTMENTS SOLD SHORT AT OCTOBER 31, 2017 — (1.1)%
| Principal Amount (000s) | Security | Proceeds (000s) | Value (000s) | |||
| $ 21,500 | Federal National Mortgage Association TBA10 6.000%—11/13/2047 | $24,198 | $(24,139) |
FAIR VALUE MEASUREMENTS
The following table summarizes the Fund’s investments as of October 31, 2017 based on the inputs used to value them.
| Asset Category | Quoted Prices Level 1 (000s) | Other Significant Observable Inputs Level 2 (000s) | Significant Unobservable Inputs Level 3 (000s) | Total (000s) | ||||
| Investments in Securities | ||||||||
Asset-Backed Securities | $ — | $ 211,841 | $— | $ 211,841 | ||||
Collateralized Mortgage Obligations | — | 174,691 | — | 174,691 | ||||
Corporate Bonds & Notes | — | 625,905 | — | 625,905 | ||||
Escrow | — | — | — | — | ||||
Foreign Government Obligations | — | 372,891 | — | 372,891 | ||||
Mortgage Pass-Through | — | 1,139,436 | 1 | 1,139,437 | ||||
Municipal Bonds | — | 24,214 | — | 24,214 | ||||
U.S. Government Obligations | — | 582,181 | — | 582,181 | ||||
| Short-Term Investments | ||||||||
Banker’s Acceptance | — | 8,908 | — | 8,908 | ||||
Certificates of Deposit | — | 38,343 | — | 38,343 | ||||
Commercial Paper | — | 74,635 | — | 74,635 | ||||
Repurchase Agreements | — | 123,889 | — | 123,889 | ||||
U.S. Government Obligations | — | 5,738 | — | 5,738 | ||||
Total Investments in Securities | $ — | $3,382,672 | $ 1 | $3,382,673 | ||||
| Financial Derivative Instruments - Assets | ||||||||
Forward Currency Contracts | $ — | $ 18,970 | $— | $ 18,970 | ||||
Futures Contracts | 4,079 | — | — | 4,079 | ||||
Purchased Options | 78 | 691 | — | 769 | ||||
Swap Agreements | — | 4,648 | — | 4,648 | ||||
Total Financial Derivative Instruments - Assets | $ 4,157 | $ 24,309 | $— | $ 28,466 | ||||
| Liability Category | ||||||||
Fixed Income Investments Sold Short | $ — | $ (24,139) | $— | $ (24,139) | ||||
| Financial Derivative Instruments - Liabilities | ||||||||
Forward Currency Contracts | $ — | $ (9,651) | $— | $ (9,651) | ||||
Futures Contracts | (9,533) | — | — | (9,533) |
43
Harbor Bond Fund
Portfolio of Investments—Continued
Portfolio of Investments—Continued
FAIR VALUE MEASUREMENTS—Continued
| Liability Category | Quoted Prices Level 1 (000s) | Other Significant Observable Inputs Level 2 (000s) | Significant Unobservable Inputs Level 3 (000s) | Total (000s) | ||||
Swap Agreements | $ — | $ (1,000) | $— | $ (1,000) | ||||
Written Options | (7) | (594) | — | (601) | ||||
Total Financial Derivative Instruments - Liabilities | $(9,540) | $ (11,245) | $— | $ (20,785) | ||||
Total Investments | $(5,383) | $3,371,597 | $ 1 | $3,366,215 |
The following is a rollforward of the Fund’s Level 3 investments during the year ended October 31, 2017.
| Valuation Description | Balance Beginning at 11/01/2016 (000s) | Purchases (000s) | Sales (000s) | Discount/ (Premium) (000s) | Total Realized Gain/(Loss)w (000s) | Change in Unrealized Appreciation/ (Depreciation)w (000s) | Transfers In Level 3 (000s) | Transfers Out of Level 3 (000s) | Ending Balance as of 10/31/2017w (000s) | |||||||||
Corporate Bonds & Notes | $23,331 | $— | $(23,750) | $— | $475 | $(56) | $— | $— | $— | |||||||||
Escrow | — | — | — | — | — | — | — | — | — | |||||||||
Mortgage Pass-Through | 5 | — | (4) | — | 1 | (1) | — | — | 1 | |||||||||
| $23,336 | $— | $(23,754) | $— | $476 | $(57) | $— | $— | $ 1 |
There were no transfers between levels during the year.
The following is a summary of significant unobservable inputs used in the fair valuations of assets and liabilities categorized within Level 3 of the fair value hierarchy.
| Valuation Descriptions | Ending Balance as of 10/31/2017 (000s) | Valuation Technique | Unobservable Inputs | Input Value(s) | ||||
| Investments in Securities | ||||||||
| Escrow | ||||||||
General Motors Co. Escrow | $ — | Cash Available in Relation to Claims | Estimated Recovery Value | $ 0.00 | ||||
| Mortgage Pass-Through | ||||||||
Federal Housing Authority Project | $ 1 | Income Approach | Base Price | 100.40 | ||||
| $ 1 |
For more information on valuation inputs and their aggregation into the levels used in the table above, please refer to the Fair Value Measurements and Disclosures in Note 2 of the accompanying Notes to Financial Statements.
The following is a summary of the remaining contractual maturities of transfers accounted for as secured borrowings, by type of security loaned, as of October 31, 2017.
| Overnight and Continuous (000s) | Up to 30 days (000s) | 31-90 days (000s) | Greater Than 90 days (000s) | Total (000s) | |||||
| Sale-Buyback Transactions | |||||||||
U.S. Government Obligations | $95,381 | $— | $— | $159,649 | $255,030 |
44
Harbor Bond Fund
Portfolio of Investments—Continued
Portfolio of Investments—Continued
| * | Security in Default. | ||
| 1 | CLO after the name of a security stands for Collateralized Loan Obligation. | ||
| 2 | Variable rate security, the stated rate represents the rate in effect at October 31, 2017. | ||
| 3 | Securities purchased in a transaction exempt from registration under Rule 144A of the Securities Act of 1933. These securities may be resold in transactions exempt from registration, normally to qualified institutional buyers. The Fund has no right to demand registration of these securities. These securities are priced by an independent pricing service in accordance with Harbor Funds Valuation Procedures. At October 31, 2017, the aggregate value of these securities was $282,179,000 or 13% of net assets. | ||
| 4 | Step coupon security, the stated rate represents the rate in effect at October 31, 2017. | ||
| 5 | Floating rate security, the stated rate represents the rate in effect at October 31, 2017. | ||
| 6 | REMICs are CMOs which can hold mortgages secured by any type of real property and issue multiple-class securities backed by those mortgages. | ||
| 7 | MTN after the name of a security stands for Medium Term Note. | ||
| 8 | Perpetuity bond, the maturity date represents the next callable date. | ||
| 9 | Zero coupon bond. | ||
| 10 | TBAs are mortgage-backed securities traded under delayed delivery commitments, settling after October 31, 2017. Although the unit price for the trades has been established, the principal value has not been finalized. However, the amount of the commitments will not fluctuate more than 2% from the principal amount. Income on TBAs is not earned until settlement date (see Note 2 of the accompanying Notes to Financial Statements). | ||
| 11 | At October 31, 2017, a portion of securities held by the Fund were pledged to cover margin requirements for open future contracts, written options on futures contracts and swap options (see Note 2 of the accompanying Notes to Financial Statements). The securities pledged had an aggregate value of $24,733,000 or 1% of net assets. | ||
| b | If the Fund is a buyer of protection and a credit event occurs, as defined under the terms of that particular swap agreement, the Fund will either (i) receive from the seller of protection an amount equal to the notional amount of the swap and deliver the referenced obligation or underlying securities comprising the referenced index or (ii) receive a net settlement amount in the form of cash or securities equal to the notional amount of the swap less the recovery value of the referenced obligation or underlying securities comprising the referenced index. | ||
| c | If the Fund is a seller of protection and a credit event occurs, as defined under the terms of that particular swap agreement, the Fund will either (i) pay to the buyer of protection an amount equal to the notional amount of the swap and take delivery of the referenced obligation or underlying securities comprising the referenced index or (ii) pay a net settlement amount in the form of cash or securities equal to the notional amount of the swap less the recovery value of the referenced obligation or underlying securities comprising the referenced index. | ||
| d | Implied credit spreads, represented in absolute terms, utilized in determining the value of credit default swap agreements on corporate issues or sovereign issues of an emerging country as of period end serve as an indicator of the current status of the payment/performance risk and represent the likelihood or risk of default for the credit derivative. The implied credit spread of a particular referenced entity reflects the cost of buying/selling protection and may include upfront payments required to be made to enter into the agreement. Wider credit spreads represent a deterioration of the referenced entity’s credit soundness and a greater likelihood or risk of default or other credit event occurring as defined under the terms of the agreement. A credit spread identified as “Defaulted” indicates a credit event has occurred for the referenced entity or obligation. | ||
| e | The maximum potential amount the Fund could be required to make as a seller of credit protection or receive as a buyer of credit protection if a credit event occurs as defined under the terms of that particular swap agreement. | ||
| f | The quoted market prices and resulting values for credit default swap agreements on asset-backed securities and credit indices serve as an indicator of the current status of the payment/performance risk and represent the likelihood of an expected liability (or profit) for the credit derivative should the notional amount of the swap agreement be closed/sold as of the period end. Increasing values, in absolute terms when compared to the notional amount of the swap, represent a deterioration of the referenced entity’s credit soundness and a greater likelihood or risk of default or other credit event occurring as defined under the terms of the agreement. | ||
| j | Amount represents Index Value. | ||
| w | Amounts in this category are included in the “Realized and Change in Unrealized Gain/(Loss) on Investment Transactions” section of the Statement of Operations. The net unrealized appreciation/(depreciation) per investment type is below: | ||
| Valuation Description | Unrealized Gain/(Loss) as of 10/31/2017 (000s) | ||
Escrow | $(15) | ||
Mortgage Pass-Through | — | ||
| $(15) | |||
| x | Fair Valued in accordance with Harbor Funds Valuation Procedures using estimated recovery value which is a Level 3 input. | ||
| y | Fair Valued by subadviser in accordance with Harbor Funds Valuation Procedures using quoted prices from other actively traded securities with similar terms which is a Level 3 input. | ||
| AUD$ | Australian Dollar | ||
| R$ | Brazilian Real | ||
| £ | British Pound | ||
| CAD$ | Canadian Dollar | ||
| ¥ | Chinese Yuan | ||
| DKK$ | Denmark Krone | ||
| € | Euro | ||
| ₹ | Indian Rupee | ||
| MEX$ | Mexican Peso | ||
| NZD$ | New Zealand Dollar | ||
| SGD$ | Singapore Dollar | ||
| R | South African Rand | ||
| ₩ | South Korean Won | ||
| TWD$ | New Taiwan Dollar | ||
The accompanying notes are an integral part of the Financial Statements.
45
Harbor Real Return Fund
Managers' Commentary (Unaudited)
Managers' Commentary (Unaudited)
Subadviser
Pacific Investment Management Company LLC (PIMCO)
650 Newport Center Dr.
Newport Beach, CA
92660
Newport Beach, CA
92660
Portfolio Managers
Mihir P. Worah
Since 2007
Since 2007
Jeremie Banet
Since 2015
Since 2015
PIMCO has subadvised the Fund since 2005.
Investment Objective
The Fund seeks maximum real return, consistent with preservation of real capital.
Mihir P. Worah

Jeremie Banet
Management’s Discussion of
Fund Performance
Fund Performance
MARKET REVIEW
The coordinated efforts of global central banks to normalize policy continued to be a focus for fixed income markets for the fiscal year ended October 31, 2017. Overall, markets continued to be resilient to a myriad of geopolitical events, with volatility generally remaining below the long-term average.
To start the fiscal year, Donald Trump stunned many in winning the U.S. presidential election at the end of 2016, but the market reaction was almost as surprising. Most markets focused on the pro-growth and inflationary potential of fiscal stimulus as many risk assets rallied, while inflation expectations and yields rose. Following the election, volatility fell, equities rallied, credit spreads tightened and the dollar strengthened as investors anticipated expansionary fiscal policy, tax cuts, and deregulation. As such, the U.S. Federal Reserve (Fed) raised rates for just the second time in a decade (as widely expected), but with a hawkish tilt as the “blue dots” increased for 2017.
This optimism continued into the new year and solid U.S. economic data, relatively easy financial conditions, and both business and consumer optimism gave the Fed an opportunity to continue on its path toward policy normalization. This second rate hike, though, was perceived by many as more dovish given the largely unchanged views put forth by the Fed. Inflation expectations were generally stable over the period, despite fluctuations in oil prices related to building inventories in the U.S. and concerns over OPEC’s adherence to its production cut agreement.
Over the second half of the fiscal year, geopolitics dominated headlines and contributed to brief bouts of market volatility. Still, robust risk appetite continued, largely underpinned by a solid fundamental backdrop. Despite geopolitical uncertainty, volatility remained relatively low for the most part, equities rallied and credit spreads tightened.
Financial conditions in the U.S. continued to ease even as the Fed raised rates and unveiled details of its plan to gradually reduce its balance sheet. The perception of a hawkish leaning at the September Federal Reserve meeting contributed to a rebound in U.S. rates. The Fed confirmed it would begin unwinding its balance sheet and released a more hawkish than anticipated “dot plot”, raising expectations for another rate hike in 2017. More broadly, global central bankers also struck a less accommodative tone as rhetoric from the European Central Bank (ECB), Bank of England, and Bank of Canada highlighted positive economic outlooks and suggested the potential for a reduction in “easy” monetary policy in the form of rate hikes, tapering, or balance sheet normalization.
Abroad, Emmanuel Macron’s presidential victory in France, in addition to the non-populist outcome of the Dutch election earlier this year, tempered risks related to more nationalist, anti-EU outcomes in the eurozone. Recent and upcoming elections in Germany and Italy continued to underscore political event risks that remain on the horizon in the eurozone, though we believe fundamentals remain solid amidst a synchronized recovery in growth.
PERFORMANCE
Harbor Real Return Fund returned 0.92% (Institutional Class) and 0.62% (Administrative Class) for fiscal 2017, compared with the -0.11% return of the Bloomberg Barclays U.S. TIPS Index, the Fund’s benchmark.
The following strategies helped the Fund’s returns during the fiscal year:
| • | A modest allocation to non-agency mortgages as non-agency mortgage backed securities performed well amid continued favorable market technicals and stable residential real estate fundamentals |
46
Harbor Real Return Fund
Managers' Commentary—Continued
Managers' Commentary—Continued
| TOP TEN ISSUERS (% of net assets) | |
| U.S. Treasury | 118.0% |
| Federal National Mortgage Association | 6.2% |
| Federal National Mortgage Association TBA | 3.0% |
| U.K. Gilt Inflation Linked | 2.6% |
| Japan Treasury Discount Bill | 1.9% |
| New Zealand Government Bond | 1.2% |
| Lavender Trust | 0.9% |
| Japan Government CPI Linked Bond | 0.8% |
| Navient Corp. | 0.8% |
| Long Beach Mortgage Loan Trust | 0.7% |
| • | An allocation to select U.S. dollar-denominated emerging market debt, as these positions outperformed over the period |
| • | Nominal interest rate strategies in the U.S., specifically an underweight to longer-dated maturities, as yields rose during the 2017 fiscal year. |
Security selection and positioning within high-yield credit were negative or neutral for returns during the fiscal year.
OUTLOOK & STRATEGY
We expect world GDP growth in 2018 to remain steady at 2.75%–3.25%, unchanged from 2017. Overall, we see a low near-term risk of recession, a moderate pickup in underlying inflation in the advanced economies, mildly supportive fiscal policies and only a gradual removal of accommodative central bank policy. However, we do see risks that could upset the calm: the aging U.S. expansion, the coming end of central bank balance sheet expansion, and China’s course following its 19th National Communist Party Congress in October.
In the U.S., we see growth below-consensus at 1.75%–2.25% in 2018, albeit still above trend, as the U.S. expansion matures and slack in the labor market keeps eroding. We believe the disappearing slack should make it difficult to sustain the current pace of job and output growth, and we also do not expect a significant acceleration of productivity growth. We forecast core inflation to increase to 2% over the course of 2018, with some upward pressure on wages. We believe the Fed will continue along its trajectory of gradual tightening with two or three rate hikes by the end of 2018.
For the Eurozone, we expect growth will be in a range of 1.75%‒2.25% in 2018, significantly above trend. We believe that a key risk for the outlook is the Italian elections in the first half of 2018, although the political risk looks more contained than earlier this year, as the Euroskeptical parties have toned down their rhetoric. We think core inflation will make only moderate progress toward the ECB’s target of “below but close to 2%” and forecast inflation in a range of 1.0%–1.5% for 2018. In our view, the ECB is likely to gradually taper its bond purchases over 2018 and keep policy rates at record lows until well into 2019.
In the emerging markets of Brazil, Russia, India and Mexico, we expect growth to rise to 4% in 2018, slightly above consensus, as recoveries in Brazil and Russia become more entrenched. Overall, most emerging economies are, from our perspective, at a different stage of the economic cycle than developed economies and should still benefit from relatively easy global policy conditions. We expect continued disinflation, with headline consumer price indexes falling to around 4.2% in 2018. In China, we expect growth to decelerate in 2018 from the current 6.6% pace. Our wide forecast range of 5.5%–6.5% reflects uncertainty about the leadership’s prospective stance on financial stability, deleveraging and economic growth following the Party Congress. If the leadership continues to focus on suppressing volatility, growth could hold up at higher levels, but if policy pivots, the changes could weigh heavily on growth and lead to greater tolerance for a depreciating Chinese yuan.
With respect to portfolio strategy:
| • | We maintained an underweight duration position overall at October 31, 2017, sourced primarily in U.K. and Japanese rates. We favor rate exposure in countries offering higher real yields, including inflation-linked bonds in New Zealand |
| • | Within TIPS, we favor the belly of the real yield curve given higher real rates; we plan to seek attractive security mispricings, including taking exposure in off-the-run vs. on-the-run issues given relative cheapness |
| • | U.K. long-dated breakevens appear rich to us while U.S. breakevens remains attractively priced; we plan to pursue this opportunity by going overweight U.S. versus short exposure to U.K. breakevens |
| • | Within currency, we are long select emerging market countries, including the Brazilian real and Indian rupee. |
This report contains the current opinions of Pacific Investment Management Company LLC (PIMCO) as of the date of this report and should not be considered as investment advice or a recommendation of any particular security, strategy or investment product. Such opinions are subject to change without notice and securities described herein may no longer be included in, or may at any time be removed from, the Fund’s portfolio. This report is distributed for informational purposes only. Information contained herein has been obtained from sources believed reliable, but not guaranteed.
Fixed income securities are affected by interest rate changes and the creditworthiness of the issues held by the Fund. A rise in interest rates will cause a decrease in the value of fixed income securities. Such an event would have an adverse effect on the Fund. The use of derivative instruments may add additional risk. For information on the different share classes and the risks associated with an investment in the Fund, please refer to the current prospectus.
47
Harbor Real Return Fund
Fund Summary—October 31, 2017 (Unaudited)
Fund Summary—October 31, 2017 (Unaudited)
| INSTITUTIONAL CLASS | |
| Fund # | 2025 |
| Cusip | 411511520 |
| Ticker | HARRX |
| Inception Date | 12/01/2005 |
| Net Expense Ratio | 0.54% a |
| Total Net Assets (000s) | $99,929 |
| ADMINISTRATIVE CLASS | |
| Fund # | 2225 |
| Cusip | 411511512 |
| Ticker | HRRRX |
| Inception Date | 12/01/2005 |
| Net Expense Ratio | 0.77% a |
| Total Net Assets (000s) | $1,461 |
| Portfolio Statistics | |||
| Portfolio | Benchmark | ||
| Average Market Coupon | 1.40% | 0.73% | |
| Yield to Maturity | 2.90% | 2.35% | |
| Current 30-Day Yield (Institutional Class) | 0.13% | 0.77% | |
| Weighted Average Maturity | 7.85 years | 8.36 years | |
| Weighted Average Duration | 7.47 years | 7.74 years | |
| Portfolio Turnover (Year Ended 10/31/2017) | 758% | N/A | |
| MATURITY PROFILE | ||
| Years to Maturity | % of Investments | |
| 0 to 1 yr. | 19.54% | |
| >1 to 5 | 15.68% | |
| >5 to 10 | 52.21% | |
| >10 to 15 | 0.52% | |
| >15 to 20 | 0.14% | |
| >20 to 25 | 2.21% | |
| >25 yrs. | 9.70% | |
FUND PERFORMANCE
The graph compares a $10,000 investment in the Institutional Class shares of the Fund with the performance of the Bloomberg Barclays U.S. TIPS Index. The Fund’s performance assumes the reinvestment of all dividend and capital gain distributions.
CHANGE IN A $10,000 INVESTMENT
For the period 11/01/2007 through 10/31/2017

| TOTAL RETURNS For the periods ended 10/31/2017 | 1 Year | Annualized | Inception Date | Final Value of a $10,000 Investment | ||||||||||
| 5 Years | 10 Years | |||||||||||||
| Harbor Real Return Fund | ||||||||||||||
Institutional Class | 0.92% | -0.38% | 3.81% | 12/01/2005 | $14,530 | |||||||||
Administrative Class | 0.62 | -0.64 | 3.54 | 12/01/2005 | 14,155 | |||||||||
| Comparative Index | ||||||||||||||
Bloomberg Barclays U.S. TIPS | -0.11% | -0.11% | 3.81% | — | $14,530 | |||||||||
As stated in the Fund’s current prospectus, the expense ratios were 0.54% (Net) and 0.88% (Gross) (Institutional Class); and 0.79% (Net) and 1.13% (Gross) (Administrative Class). The net expense ratios reflect an expense limitation agreement (excluding interest expense, if any) effective through 02/28/2018. The expense ratios in the prospectus may differ from the actual expense ratios for the period disclosed within this report. The expense ratios shown in the prospectus are based on the prior fiscal year, adjusted to reflect changes, if any, in contractual arrangements that occurred prior to the date of the prospectus (or supplement thereto, if applicable).
Performance data shown represents past performance and is no guarantee of future results. Past performance is net of management fees and expenses and reflects reinvested dividends and distributions, but does not reflect the deduction of taxes that a shareholder would pay on Fund distributions or upon the redemption of Fund shares. Past performance reflects the beneficial effect of any expense waivers or reimbursements, without which returns would have been lower. Investment returns and principal value will fluctuate and when redeemed may be worth more or less than their original cost. Returns for periods less than one year are not annualized. Current performance may be higher or lower and is available through the most recent month end at harborfunds.com or by calling 800-422-1050.
| a | Reflects an expense limitation agreement (excluding interest expense, if any) effective through February 28, 2018 |
48
Harbor Real Return Fund
Portfolio of Investments—October 31, 2017
Portfolio of Investments—October 31, 2017
Value, Cost, and Principal Amounts in Thousands
Total Investments (% of net assets)
(Excludes net cash, short-term investments and derivative positions of -44.7%)

| ASSET-BACKED SECURITIES—2.0% | |||
| Principal Amount | Value | ||
| Countrywide Asset-Backed Certificates | |||
| Series 2006-19 Cl. 2A3 | |||
| $ | 100 | 1.488% (1 Month USD Libor + 0.250) 03/25/20371 | $ 91 |
| Fremont Home Loan Trust | |||
| Series 2006-C Cl. 1A1 | |||
| 27 | 1.373% (1 Month USD Libor + 0.135) 10/25/20361 | 25 | |
| GSAMP Trust | |||
| Series 2004-WF Cl. M2 | |||
| 126 | 2.888% (1 Month USD Libor + 1.100) 10/25/20341 | 123 | |
| Long Beach Mortgage Loan Trust | |||
| Series 2006-WL3 Cl. 2A4 | |||
| 300 | 1.538% (1 Month USD Libor + 0.300) 01/25/20361 | 237 | |
| Series 2005-WL2 Cl. M2 | |||
| 500 | 1.973% (1 Month USD Libor + 0.490) 08/25/20351 | 501 | |
| 738 | |||
| MASTR Asset Backed Securities Trust | |||
| Series 2006-HE2 Cl. A4 | |||
| 196 | 1.478% (1 Month USD Libor + 0.240) 06/25/20361 | 119 | |
| Morgan Stanley ABS Capital I Inc. Trust | |||
| Series 2006-HE8 Cl. A2FP | |||
| 103 | 1.308% (1 Month USD Libor + 0.070) 10/25/20361 | 61 | |
| Morgan Stanley Mortgage Loan Trust | |||
| Series 2006-15XS Cl. A6A | |||
| 118 | 5.910%—11/25/20362 | 56 | |
| Navient Student Loan Trust | |||
| Series 2016-7A Cl.A | |||
| 180 | 2.388% (1 Month USD Libor + 1.150) 03/25/20661,3 | 183 | |
| Saxon Asset Securities Trust | |||
| Series 2003-1 Cl. AF7 | |||
| 73 | 4.034%—06/25/20332 | 74 | |
| Soundview Home Loan Trust | |||
| Series 2006-OPT2 Cl. A4 | |||
| 200 | 1.518% (1 Month USD Libor + 0.280) 05/25/20361 | 182 | |
| Volt LXII LLC | |||
| Series 2017-NPL9 Cl. A1 | |||
| 99 | 0.000%—09/25/20472,3 | 99 | |
| WhiteHorse VI Ltd | |||
| Series 2012 1A Cl. A1R | |||
| 312 | 2.511% (3 Month USD Libor + 1.200) 02/03/20251,3 | 313 | |
| TOTAL ASSET-BACKED SECURITIES | |||
(Cost $1,875) | 2,064 | ||
| BANK LOAN OBLIGATIONS—0.1% | |||
| (Cost $97) | |||
| Petroleo Global Trading Term Loan | |||
| 100 | 3.450%—02/19/2020 | 98 | |
| COLLATERALIZED MORTGAGE OBLIGATIONS—1.6% | |||
| Principal Amount | Value | ||
| Alliance Bancorp Trust | |||
| Series 2007 Cl. OA1 | |||
| $ | 73 | 1.478% (1 Month USD Libor + 0.240) 07/25/20371 | $ 61 |
| Bear Stearns Adjustable Rate Mortgage Trust | |||
| Series 2005-12 Cl. 23A1 | |||
| 52 | 3.314%—02/25/20364 | 51 | |
| Series 2006-2 Cl. 3A2 | |||
| 28 | 3.674%—07/25/20364 | 27 | |
| 78 | |||
| Citigroup Mortgage Loan Trust Inc. | |||
| Series 2005-12 Cl. 2A1 | |||
| 376 | 2.034% (1 Month USD Libor + 0.800) 08/25/20351,3 | 344 | |
| Countrywide Home Loan Mortgage Pass Through Trust | |||
| Series 2004-HYB5 Cl. 2A1 | |||
| 23 | 3.483%—04/20/20354 | 23 | |
| First Horizon Alternative Mortgage Securities Trust | |||
| Series 2006-FA8 Cl. 1A7 | |||
| 12 | 6.000%—02/25/2037 | 10 | |
| Lavender Trust | |||
| Series 2010-RR2A Cl. A4 | |||
| 1,137 | 6.250%—10/26/20363 | 956 | |
| Morgan Stanley Mortgage Loan Trust | |||
| Series 2006-8AR Cl. 6A1 | |||
| 97 | 3.150%—06/25/20364 | 98 | |
| Residential Asset Securitization Trust | |||
| Series 2006-R1 Cl. A2 | |||
| 53 | 1.637% (1 Month USD Libor + 0.400) 01/25/20461 | 26 | |
| Washington Mutual Mortgage Pass Through Certificates Trust | |||
| Series 2003-AR9 Cl. 2A | |||
| 22 | 3.356%—09/25/20334 | 22 | |
| TOTAL COLLATERALIZED MORTGAGE OBLIGATIONS | |||
(Cost $1,430) | 1,618 | ||
| CORPORATE BONDS & NOTES—5.8% | |||
| AUTOMOBILES—0.1% | |||
| American Honda Finance Corp. MTN5 | |||
| 100 | 1.741% (3 Month USD Libor + 0.350) 11/05/20211 | 100 | |
| BANKS—0.9% | |||
| ING Bank NV MTN5 | |||
| 100 | 2.625%—12/05/20223 | 101 | |
| Santander Holdings USA Inc. | |||
| 600 | 2.767% (3 Month USD Libor + 1.450) 11/24/20171 | 600 | |
| Toronto Dominion Bank | |||
| 200 | 2.250%—03/15/20213 | 200 | |
| 901 | |||
| CAPITAL MARKETS—1.7% | |||
| Deutsche Bank AG | |||
| 500 | 4.250%—10/14/2021 | 524 | |
| Goldman Sachs Group Inc. | |||
| 500 | 2.520% (3 Month USD Libor + 1.200) 09/15/20201 | 510 | |
| 100 | 2.876% (3 Month USD Libor + 0.821) 10/31/20221 | 100 | |
| 610 | |||
| UBS AG | |||
| 300 | 1.897% (3 Month USD Libor + 0.580) 06/08/20201,3 | 301 | |
| UBS AG MTN5 | |||
| 300 | 1.637% (3 Month USD Libor + 0.320) 12/07/20181,3 | 301 | |
| 1,736 | |||
49
Harbor Real Return Fund
Portfolio of Investments—Continued
Portfolio of Investments—Continued
Value, Cost, and Principal Amounts in Thousands
| CORPORATE BONDS & NOTES—Continued | |||
| Principal Amount | Value | ||
| CONSUMER FINANCE—1.3% | |||
| Ally Financial Inc. | |||
| $ | 100 | 3.500%—01/27/2019 | $ 102 |
| 300 | 3.600%—05/21/2018 | 302 | |
| 100 | 4.750%—09/10/2018 | 102 | |
| 506 | |||
| Navient Corp. MTN5 | |||
| 740 | 3.978% (US CPI Urban Consumers YoY + 2.250) 05/03/20191,6 | 737 | |
| 100 | 5.500%—01/15/2019 | 104 | |
| 841 | |||
| 1,347 | |||
| DIVERSIFIED TELECOMMUNICATION SERVICES—0.2% | |||
| AT&T Inc. | |||
| 100 | 2.009% (3 Month USD Libor + 0.650) 01/15/20201 | 101 | |
| 100 | 5.150%—02/14/2050 | 99 | |
| 200 | |||
| HEALTH CARE EQUIPMENT & SUPPLIES—0.2% | |||
| Boston Scientific Corp. | |||
| 200 | 2.850%—05/15/2020 | 203 | |
| INTERNET SOFTWARE & SERVICES—0.1% | |||
| eBay Inc. | |||
| 100 | 2.750%—01/30/2023 | 100 | |
| MULTI-UTILITIES—0.1% | |||
| Sempra Energy | |||
| 100 | 1.732% (3 Month USD Libor + 0.450) 03/15/20211 | 100 | |
| OIL, GAS & CONSUMABLE FUELS—0.8% | |||
| Enbridge Inc. | |||
| 100 | 1.750% (3 Month USD Libor + 0.400) 01/10/20201 | 100 | |
| Petrobras Global Finance BV | |||
| 425 | 5.299%—01/27/20253 | 427 | |
| 200 | 7.375%—01/17/2027 | 222 | |
| 649 | |||
| 749 | |||
| TOBACCO—0.1% | |||
| BAT Capital Corp | |||
| 100 | 1.905% (3 Month USD Libor + 0.590) 08/14/20201,3 | 101 | |
| TRADING COMPANIES & DISTRIBUTORS—0.3% | |||
| AerCap Ireland Capital Ltd. | |||
| 300 | 4.625%—10/30/2020 | 319 | |
| TOTAL CORPORATE BONDS & NOTES | |||
(Cost $5,705) | 5,856 | ||
| FOREIGN GOVERNMENT OBLIGATIONS—7.6% | |||
| Argentina Bonar Bonds | |||
| ARG$ | 118 | 23.826%—04/03/20224 | 7 |
| Argentina Pom Politica Monetaria | |||
| 2,500 | 27.095%—06/21/20204 | 156 | |
| Argentine Republic Government International Bond | |||
| $ | 300 | 6.875%—01/26/2027 | 328 |
| Australia Government Bond | |||
| AUD$ | 200 | 3.000%—09/20/20256 | 214 |
| Canadian Government RRB Bonds | |||
| CAD$ | 297 | 4.250%—12/01/20266 | 311 |
| FOREIGN GOVERNMENT OBLIGATIONS—Continued | |||
| Principal Amount | Value | ||
| Japan Government CPI Linked Bond6 | |||
| ¥ | 90,392 | 0.100%—03/10/2027 | $ 838 |
| Japan Treasury Discount Bill | |||
| 220,000 | 0.000%—11/06/20177 | 1,935 | |
| Mexican Bonos | |||
| MEX$ | 2,386 | 7.750%—05/29/2031 | 128 |
| New Zealand Government Bond | |||
| NZD$ | 1,600 | 2.000%—09/20/20256 | 1,194 |
| U.K. Gilt Inflation Linked6 | |||
| £ | 1,528 | 0.125%—03/22/2026-11/22/2065 | 2,539 |
| TOTAL FOREIGN GOVERNMENT OBLIGATIONS | |||
(Cost $7,806) | 7,650 | ||
| MORTGAGE PASS-THROUGH—9.8% | |||
| Federal Home Loan Mortgage Corp. REMIC8 | |||
| $ | 258 | 1.834% (1 Month USD Libor + 0.600) 12/15/20371 | 261 |
| Federal National Mortgage Association | |||
| 6,000 | 4.000%—12/13/2046 | 6,287 | |
| Federal National Mortgage Association REMIC8 | |||
| 49 | 1.587% (1 Month USD Libor + 0.350) 07/25/20371 | 49 | |
| 73 | 1.617% (1 Month USD Libor + 0.380) 07/25/20371 | 74 | |
| 36 | 1.677% (1 Month USD Libor + 0.440) 05/25/20361 | 36 | |
| 178 | 1.917% (1 Month USD Libor + 0.680) 02/25/20411 | 181 | |
| 340 | |||
| Federal National Mortgage Association TBA9 | |||
| 3,000 | 3.500%—12/13/2047 | 3,078 | |
| TOTAL MORTGAGE PASS-THROUGH | |||
(Cost $9,974) | 9,966 | ||
| U.S. GOVERNMENT OBLIGATIONS—117.8% | |||
| U.S. Treasury Bonds | |||
| 1,580 | 2.750%—08/15/2047 | 1,539 | |
| U.S. Treasury Inflation Indexed Bonds6 | |||
| 16,677 | 0.125%—04/15/2019-07/15/202410 | 16,668 | |
| 2,985 | 0.250%—01/15/2025 | 2,953 | |
| 6,010 | 0.375%—07/15/2023-07/15/2025 | 6,035 | |
| 12,571 | 0.625%—07/15/2021-02/15/2043 | 12,785 | |
| 1,801 | 0.750%—02/15/2042-02/15/2045 | 1,738 | |
| 1,637 | 0.875%—02/15/2047 | 1,618 | |
| 466 | 1.000%—02/15/2046 | 475 | |
| 450 | 1.250%—07/15/2020 | 468 | |
| 6,984 | 1.375%—02/15/2044 | 7,725 | |
| 12,072 | 1.875%—07/15/2019 | 12,557 | |
| 1,102 | 2.000%—01/15/2026 | 1,237 | |
| 1,954 | 2.125%—01/15/2019-02/15/2041 | 2,202 | |
| 33,677 | 2.375%—01/15/2025-01/15/2027 | 38,473 | |
| 3,579 | 2.500%—01/15/2029 | 4,315 | |
| 577 | 3.625%—04/15/2028 | 754 | |
| 149 | 3.875%—04/15/2029 | 203 | |
| 110,206 | |||
| U.S. Treasury Notes | |||
| 500 | 2.000%—05/31/2024-02/15/2025 | 492 | |
| 1,200 | 2.125%—03/31/2024-07/31/2024 | 1,193 | |
| 100 | 2.250%—11/15/2024 | 100 | |
| 800 | 2.500%—05/15/2024 | 815 | |
50
Harbor Real Return Fund
Portfolio of Investments—Continued
Portfolio of Investments—Continued
Value, Cost, and Principal Amounts in Thousands
| U.S. GOVERNMENT OBLIGATIONS—Continued | |||
| Principal Amount | Value | ||
| $ | 4,500 | 2.750%—02/15/2024 | $ 4,653 |
| 440 | 3.000%—05/15/2047 | 451 | |
| 7,704 | |||
| TOTAL U.S. GOVERNMENT OBLIGATIONS | |||
(Cost $120,385) | 119,449 | ||
| SHORT-TERM INVESTMENTS—0.9% | |||
| CERTIFICATES OF DEPOSIT—0.8% | |||
| Barclays plc | |||
| 300 | 1.781% (3 Month USD Libor + 0.460) 03/16/20181 | 300 | |
| 200 | 1.827% (3 Month USD Libor + 0.470) 05/17/20181 | 200 | |
| 300 | 1.940%—09/04/2018 | 301 | |
| 801 | |||
| SHORT-TERM INVESTMENTS—Continued | |||
| Principal Amount | Value | ||
| REPURCHASE AGREEMENTS—0.1% | |||
| $ | 109 | Repurchase Agreement with Fixed Income Clearing Corp. dated October 31, 2017 due November 01, 2017 at 0.001% collateralized by U.S. Treasury Notes (value $114) | $ 109 |
| TOTAL SHORT-TERM INVESTMENTS | |||
(Cost $909) | 910 | ||
| TOTAL INVESTMENTS—145.6% | |||
(Cost $148,181) | 147,611 | ||
CASH AND OTHER ASSETS, LESS LIABILITIES—(45.6)% | (46,221) | ||
TOTAL NET ASSETS—100.0% | $101,390 | ||
FUTURES CONTRACTS OPEN AT OCTOBER 31, 2017
| Description | Number of Contracts | Expiration Date | Current Notional Value (000s) | Unrealized Appreciation/ (Depreciation) (000s) | ||||
United Kingdom GILT Futures 90 day (Short) | 16 | 12/27/2017 | £ 1,989 | $ 57 | ||||
U.S. Treasury Bond Futures 30 year (Short) | 25 | 12/19/2017 | $ 3,812 | 70 | ||||
U.S. Treasury Note Futures 2 year (Short) | 21 | 12/29/2017 | 4,522 | 19 | ||||
U.S. Treasury Note Futures 5 year (Short) | 95 | 12/29/2017 | 11,133 | 56 | ||||
U.S. Treasury Note Futures 10 year (Long) | 28 | 12/19/2017 | 3,498 | (12) | ||||
Ultra U.S. Treasury Bond Futures 30 year (Long) | 4 | 12/19/2017 | 659 | (9) | ||||
Total Futures Contracts | $181 | |||||||
PURCHASED OPTIONS OPEN AT OCTOBER 31, 2017
PURCHASED OPTIONS THAT REQUIRE PERIODIC SETTLEMENT OF VARIATION MARGIN
| Description | Exchange | Strike Price | Expiration Date | Number of Contracts/ Notional | Premiums Paid (000s) | Value (000s) | ||||||
Euro-Bund Futures (Call) | Eurex | € 165.00 | 11/24/2017 | 9 | $1 | $— | ||||||
Euro-Bund Futures (Put) | Eurex | 159.00 | 11/24/2017 | 28 | 4 | 3 | ||||||
Total Purchased Options that Require Periodic Settlement of Variation Margin | $5 | $ 3 | ||||||||||
PURCHASED OPTIONS NOT SETTLED THROUGH VARIATION MARGIN
| Description | Counterparty/Exchange | Strike Index/ Rate | Expiration Date | Number of Contracts/ Notional | Premiums Paid (000s) | Value (000s) | ||||||
Eurodollar Futures (Put) | CME Group | $ 98.25 | 03/19/2018 | 55 | $ 5 | $ 3 | ||||||
Federal National Mortgage Association Futures 30 year (Call) | JP Morgan Chase Bank NA | 122.00 | 12/06/2017 | 1,000,000 | — | — | ||||||
USD ICE Swap Rate Index 10 year - Cap (Put) | Deutsche Bank AG | 0.260 j | 03/29/2018 | 4,900,000 | 2 | 1 | ||||||
USD ICE Swap Rate Index 10 year - Cap (Put) | Morgan Stanley Capital Services LLC | 0.260 j | 04/03/2018 | 5,300,000 | 3 | 2 | ||||||
Total Purchased Options Not Settled Through Variation Margin | $ 10 | $ 6 | ||||||||||
PURCHASED SWAP OPTIONS NOT SETTLED THROUGH VARIATION MARGIN
| Description | Counterparty | Floating Rate Index | Pay/Receive Floating Rate | Strike Price | Expiration Date | Number of Contracts/ Notional | Premiums Paid (000s) | Value (000s) | ||||||||
Interest Rate Swap Option 10 year (Put) | Morgan Stanley Capital Services LLC | 3-Month USD-LIBOR | Receive | 2.770% | 07/16/2018 | 1,350,000 | $ 16 | $13 | ||||||||
Interest Rate Swap Option 30 year (Call) | Deutsche Bank AG | 3-Month USD-LIBOR | Pay | 2.150 | 06/15/2018 | 350,000 | 35 | 3 |
51
Harbor Real Return Fund
Portfolio of Investments—Continued
Portfolio of Investments—Continued
PURCHASED OPTIONS—Continued
PURCHASED SWAP OPTIONS NOT SETTLED THROUGH VARIATION MARGIN—Continued
| Description | Counterparty | Floating Rate Index | Pay/Receive Floating Rate | Strike Price | Expiration Date | Number of Contracts/ Notional | Premiums Paid (000s) | Value (000s) | ||||||||
Interest Rate Swap Option 30 year (Put) | Deutsche Bank AG | 3-Month USD-LIBOR | Receive | 2.150% | 06/15/2018 | 350,000 | $ 35 | $42 | ||||||||
Total Purchased Swap Options Not Settled Through Variation Margin | $ 86 | $58 | ||||||||||||||
Total Purchased Options | $101 | $67 | ||||||||||||||
WRITTEN OPTIONS OPEN AT OCTOBER 31, 2017
WRITTEN OPTIONS THAT REQUIRE PERIODIC SETTLEMENT OF VARIATION MARGIN
| Description | Exchange | Strike Price | Expiration Date | Number of Contracts/ Notional | Premiums Received (000s) | Value (000s) | ||||||
Euro-Bund Futures (Call) | Eurex | € 164.00 | 11/24/2017 | 9 | $2 | $ (2) | ||||||
Euro-Bund Futures (Put) | Eurex | 158.00 | 11/24/2017 | 30 | 2 | — | ||||||
Total Written Options that Require Periodic Settlement of Variation Margin | $4 | $ (2) | ||||||||||
WRITTEN OPTIONS NOT SETTLED THROUGH VARIATION MARGIN
| Description | Counterparty/Exchange | Strike Index/ Rate | Expiration Date | Number of Contracts/ Notional | Premiums Received (000s) | Value (000s) | ||||||
Consumer Price All Urban Non-Seasonally Adjusted Index - Cap (Call) | JP Morgan Chase Bank NA | 243.270 j | 04/22/2024 | 4,000,000 | $ 29 | $ (1) | ||||||
Consumer Price All Urban Non-Seasonally Adjusted Index - Cap (Call) | JP Morgan Chase Bank NA | 244.170 j | 05/16/2024 | 300,000 | 2 | — | ||||||
Consumer Price All Urban Non-Seasonally Adjusted Index - Floor (Put) | Citibank NA | 216.690 j | 04/07/2020 | 3,600,000 | 32 | — | ||||||
Consumer Price All Urban Non-Seasonally Adjusted Index - Floor (Put) | Citibank NA | 217.970 j | 09/29/2020 | 500,000 | 7 | — | ||||||
Consumer Price All Urban Non-Seasonally Adjusted Index - Floor (Put) | Deutsche Bank AG | 233.550 j | 01/22/2018 | 600,000 | 6 | — | ||||||
Consumer Price All Urban Non-Seasonally Adjusted Index - Floor (Put) | JP Morgan Chase Bank NA | 234.810 j | 03/24/2020 | 1,700,000 | 19 | (4) | ||||||
Consumer Price All Urban Non-Seasonally Adjusted Index - Floor (Put) | JP Morgan Chase Bank NA | 238.640 j | 10/02/2020 | 1,000,000 | 19 | (3) | ||||||
Eurodollar Futures (Call) | CME Group | $ 98.75 | 03/19/2018 | 55 | 6 | — | ||||||
Eurozone HICP Ex. Tobacco Index - Cap (Call) | Goldman Sachs Bank USA | 120.720 j | 06/22/2035 | 400,000 | 18 | (5) | ||||||
Federal National Mortgage Association Futures 30 year (Call) | Credit Suisse International | $ 103.16 | 12/06/2017 | 1,000,000 | 2 | (1) | ||||||
Federal National Mortgage Association Futures 30 year (Call) | Credit Suisse International | 103.31 | 11/06/2017 | 1,000,000 | 2 | — | ||||||
Federal National Mortgage Association Futures 30 year (Put) | Credit Suisse International | 102.16 | 12/06/2017 | 1,000,000 | 3 | (2) | ||||||
Federal National Mortgage Association Futures 30 year (Put) | Credit Suisse International | 102.31 | 11/06/2017 | 1,000,000 | 1 | — | ||||||
USD ICE Swap Rate Index 30 year - Cap (Put) | Deutsche Bank AG | 0.230 j | 03/29/2018 | 4,900,000 | 2 | (2) | ||||||
USD ICE Swap Rate Index 30 year - Cap (Put) | Morgan Stanley Capital Services LLC | 0.230 j | 04/03/2018 | 5,300,000 | 2 | (2) | ||||||
U.S. Treasury Bond Option 30 year (Call) | Chicago Board of Trade | $ 155.00 | 11/24/2017 | 2 | 2 | (1) | ||||||
U.S. Treasury Note Option 10 year (Call) | Chicago Board of Trade | 125.00 | 11/24/2017 | 5 | 2 | (2) | ||||||
U.S. Treasury Note Option 10 year (Call) | Chicago Board of Trade | 125.50 | 11/24/2017 | 8 | 2 | (2) | ||||||
U.S. Treasury Note Option 10 year (Call) | Chicago Board of Trade | 126.50 | 11/24/2017 | 5 | 1 | — | ||||||
U.S. Treasury Note Option 10 year (Call) | Chicago Board of Trade | 127.50 | 11/24/2017 | 9 | 6 | — | ||||||
U.S. Treasury Note Option 10 year (Put) | Chicago Board of Trade | 123.50 | 11/24/2017 | 8 | 2 | (1) | ||||||
U.S. Treasury Note Option 10 year (Put) | Chicago Board of Trade | 124.00 | 11/24/2017 | 8 | 3 | (1) | ||||||
Total Written Options Not Settled Through Variation Margin | $168 | $(27) | ||||||||||
WRITTEN SWAP OPTIONS NOT SETTLED THROUGH VARIATION MARGIN
| Description | Counterparty | Floating Rate Index | Pay/Receive Floating Rate | Strike Price | Expiration Date | Number of Contracts/ Notional | Premiums Received (000s) | Value (000s) | ||||||||
Interest Rate Swap Option 5 year (Call) | Royal Bank of Scotland plc | 3-Month USD-LIBOR | Receive | 1.800% | 11/07/2017 | 600,000 | $ 5 | $ — | ||||||||
Interest Rate Swap Option 5 year (Put) | Royal Bank of Scotland plc | 3-Month USD-LIBOR | Pay | 2.600 | 11/07/2017 | 600,000 | 5 | (3) | ||||||||
Total Written Swap Options Not Settled Through Variation Margin | $ 10 | $ (3) | ||||||||||||||
Total Written Options | $182 | $(32) | ||||||||||||||
52
Harbor Real Return Fund
Portfolio of Investments—Continued
Portfolio of Investments—Continued
FORWARD CURRENCY CONTRACTS OPEN AT OCTOBER 31, 2017
| Counterparty | Amount to be Delivered (000s) | Amount to be Received (000s) | Settlement Date | Unrealized Appreciation/ (Depreciation) (000s) | ||||
Citibank NA | $ 24 | ARG$ 423 | 12/20/2017 | $ — | ||||
Goldman Sachs Bank USA | $ 116 | ARG$ 2,133 | 01/12/2018 | — | ||||
Goldman Sachs Bank USA | $ 200 | ARG$ 3,720 | 02/14/2018 | (2) | ||||
HSBC Bank USA | $ 90 | ARG$ 1,684 | 02/14/2018 | — | ||||
BNP Paribas SA | ARG$ 795 | $ 42 | 02/14/2018 | — | ||||
JP Morgan Chase Bank | ARG$ 531 | $ 28 | 02/14/2018 | — | ||||
JP Morgan Chase Bank NA | AUD$ 900 | $ 703 | 11/02/2017 | 14 | ||||
Citibank NA | $ 226 | R$ 712 | 11/03/2017 | (8) | ||||
Citibank NA | $ 156 | R$ 499 | 12/04/2017 | (5) | ||||
Société Générale | $ 65 | R$ 213 | 11/03/2017 | — | ||||
Citibank NA | R$ 213 | $ 65 | 11/03/2017 | — | ||||
Citibank NA | R$ 499 | $ 157 | 11/03/2017 | 5 | ||||
Société Générale | R$ 213 | $ 67 | 11/03/2017 | 2 | ||||
UBS AG | $ 2,511 | £ 1,918 | 11/02/2017 | 36 | ||||
BNP Paribas SA | £ 60 | $ 79 | 11/02/2017 | (1) | ||||
Citibank NA | £ 198 | $ 261 | 11/02/2017 | (2) | ||||
Credit Suisse International | £ 89 | $ 119 | 11/02/2017 | 1 | ||||
JP Morgan Chase Bank NA | £ 1,571 | $ 2,106 | 11/02/2017 | 19 | ||||
UBS AG | £ 1,918 | $ 2,513 | 12/04/2017 | (37) | ||||
JP Morgan Chase Bank NA | $ 260 | CAD$ 335 | 11/02/2017 | (1) | ||||
JP Morgan Chase Bank NA | CAD$ 742 | $ 594 | 11/02/2017 | 18 | ||||
Citibank NA | $ 72 | COL$ 215,245 | 11/01/2017 | (1) | ||||
Citibank NA | COL$ 215,245 | $ 71 | 11/01/2017 | — | ||||
Citibank NA | COL$ 215,245 | $ 72 | 01/31/2018 | 2 | ||||
JP Morgan Chase Bank NA | $ 246 | € 209 | 11/02/2017 | (2) | ||||
Citibank NA | € 230 | $ 271 | 11/02/2017 | 3 | ||||
JP Morgan Chase Bank NA | € 216 | $ 254 | 11/02/2017 | 2 | ||||
Credit Suisse International | $ 359 | ₹ 23,487 | 12/04/2017 | 3 | ||||
BNP Paribas SA | ₹ 4,749 | $ 73 | 12/04/2017 | — | ||||
Citibank NA | ₹ 2,903 | $ 44 | 12/04/2017 | (1) | ||||
JP Morgan Chase Bank | ₹ 2,771 | $ 42 | 12/04/2017 | (1) | ||||
Citibank NA | $ 160 | ¥ 17,900 | 11/02/2017 | (2) | ||||
JP Morgan Chase Bank NA | $ 613 | ¥ 69,900 | 11/02/2017 | 2 | ||||
Citibank NA | ¥ 140,000 | $ 1,270 | 11/06/2017 | 39 | ||||
Goldman Sachs Bank USA | ¥ 87,800 | $ 781 | 11/02/2017 | 9 | ||||
JP Morgan Chase Bank NA | ¥ 80,000 | $ 726 | 11/06/2017 | 22 | ||||
JP Morgan Chase Bank NA | ¥ 69,900 | $ 614 | 12/04/2017 | (2) | ||||
Goldman Sachs Bank USA | $ 101 | MEX$ 1,915 | 12/15/2017 | (2) | ||||
Goldman Sachs Bank USA | MEX$ 2,881 | $ 160 | 12/15/2017 | 11 | ||||
JP Morgan Chase Bank NA | MEX$ 447 | $ 24 | 12/15/2017 | 1 | ||||
Citibank NA | $ 1,182 | NZD$ 1,722 | 11/02/2017 | (3) | ||||
Citibank NA | NZD$ 1,722 | $ 1,181 | 12/04/2017 | 3 | ||||
JP Morgan Chase Bank NA | NZD$ 1,722 | $ 1,238 | 11/02/2017 | 59 | ||||
Citibank NA | $ 103 | RUS$ 5,984 | 02/16/2018 | (2) | ||||
BNP Paribas SA | $ 97 | R 1,373 | 12/06/2017 | — | ||||
Citibank NA | $ 102 | R 1,373 | 11/06/2017 | (5) | ||||
BNP Paribas SA | R 1,373 | $ 97 | 11/06/2017 | — | ||||
BNP Paribas SA | ₩ 103,576 | $ 91 | 12/04/2017 | (2) | ||||
Deutsche Bank AG | ₩ 186,730 | $ 164 | 12/04/2017 | (3) | ||||
Total Forward Currency Contracts | $169 | |||||||
SWAP AGREEMENTS OPEN AT OCTOBER 31, 2017
CENTRALLY CLEARED SWAP AGREEMENTS
INTEREST RATE SWAPS
| Counterparty | Floating Rate Index | Pay/Receive Floating Rate | Fixed Rate | Payment Frequency | Expiration Date | Notional Amount (000s) | Value (000s) | Upfront Premiums (Received)/Paid (000s) | Unrealized Appreciation/ (Depreciation) (000s) | |||||||||
CME Group | Brazil Cetip Interbank Deposit | Pay | 9.650% | At maturity | 01/02/2025 | R$ 3,400 | $ (9) | $ (3) | $ (6) | |||||||||
LCH Group | Eurostat Eurozone HICP Ex Tobacco NSA | Receive | 1.165 | At maturity | 12/15/2021 | € 140 | 1 | — | 1 |
53
Harbor Real Return Fund
Portfolio of Investments—Continued
Portfolio of Investments—Continued
SWAP AGREEMENTS—Continued
CENTRALLY CLEARED SWAP AGREEMENTS—Continued
INTEREST RATE SWAPS—Continued
| Counterparty | Floating Rate Index | Pay/Receive Floating Rate | Fixed Rate | Payment Frequency | Expiration Date | Notional Amount (000s) | Value (000s) | Upfront Premiums (Received)/Paid (000s) | Unrealized Appreciation/ (Depreciation) (000s) | |||||||||
LCH Group | Eurostat Eurozone HICP Ex Tobacco NSA | Pay | 1.385% | At maturity | 12/15/2026 | € 330 | $ (2) | $ 1 | $ (3) | |||||||||
LCH Group | French Consumer Price Index Ex Tobacco | Pay | 1.438 | At maturity | 06/15/2027 | 400 | (2) | — | (2) | |||||||||
LCH Group | British Bankers' Association LIBOR GBP 6-Month | Pay | 1.500 | Semiannual | 03/21/2028 | £ 1,000 | (9) | (34) | 25 | |||||||||
LCH Group | British Bankers' Association LIBOR GBP 6-Month | Pay | 1.750 | Semiannual | 03/21/2048 | 300 | (14) | (7) | (7) | |||||||||
LCH Group | UK Retail Prices Index All Items NSA | Pay | 3.350 | At maturity | 05/15/2030 | 610 | 6 | (7) | 13 | |||||||||
LCH Group | UK Retail Prices Index All Items NSA | Pay | 3.400 | At maturity | 06/15/2030 | 600 | 10 | 9 | 1 | |||||||||
LCH Group | UK Retail Prices Index All Items NSA | Pay | 3.100 | At maturity | 06/15/2031 | 300 | (32) | (36) | 4 | |||||||||
LCH Group | UK Retail Prices Index All Items NSA | Pay | 3.470 | At maturity | 09/15/2032 | 1,540 | (13) | 2 | (15) | |||||||||
LCH Group | UK Retail Prices Index All Items NSA | Pay | 3.358 | At maturity | 04/15/2035 | 200 | (3) | (4) | 1 | |||||||||
LCH Group | UK Retail Prices Index All Items NSA | Receive | 3.585 | At maturity | 10/15/2046 | 240 | (13) | (15) | 2 | |||||||||
LCH Group | UK Retail Prices Index All Items NSA | Receive | 3.428 | At maturity | 03/15/2047 | 40 | 3 | — | 3 | |||||||||
CME Group | British Bankers' Association LIBOR JPY 6-Month | Receive | 1.000 | Semiannual | 09/18/2023 | ¥ 40,000 | (18) | (15) | (3) | |||||||||
LCH Group | British Bankers' Association LIBOR JPY 6-Month | Pay | 0.300 | Semiannual | 09/20/2027 | 130,000 | (2) | (2) | — | |||||||||
LCH Group | British Bankers' Association LIBOR JPY 6-Month | Pay | 0.300 | Semiannual | 03/20/2028 | 10,000 | — | — | — | |||||||||
LCH Group | British Bankers' Association LIBOR JPY 6-Month | Pay | 0.450 | Semiannual | 03/20/2029 | 340,000 | (15) | (19) | 4 | |||||||||
CME Group | Mexico Interbank TIIE 28 Day | Pay | 7.200 | Lunar | 06/05/2024 | MEX$ 4,600 | (1) | — | (1) | |||||||||
CME Group | Mexico Interbank TIIE 28 Day | Pay | 8.310 | Lunar | 11/28/2036 | 1,300 | 5 | 7 | (2) | |||||||||
CME Group | Mexico Interbank TIIE 28 Day | Pay | 7.480 | Lunar | 06/18/2037 | 1,450 | (2) | — | (2) | |||||||||
CME Group | New Zeland 90 Day Bank Bill Futures Rate Agreement | Pay | 3.250 | Semiannual | 03/21/2028 | NZD$ 600 | — | 2 | (2) | |||||||||
CME Group | British Bankers' Association LIBOR USD 3-Month | Pay | 1.250 | Semiannual | 06/15/2018 | $ 1,000 | 1 | 4 | (3) | |||||||||
CME Group | British Bankers' Association LIBOR USD 3-Month | Pay | 1.250 | Semiannual | 06/21/2019 | 9,300 | 49 | 56 | (7) | |||||||||
CME Group | British Bankers' Association LIBOR USD 3-Month | Pay | 2.680 | Semiannual | 10/25/2023 | 1,000 | 19 | — | 19 | |||||||||
CME Group | British Bankers' Association LIBOR USD 3-Month | Pay | 2.670 | Semiannual | 11/19/2023 | 1,000 | 18 | — | 18 | |||||||||
CME Group | British Bankers' Association LIBOR USD 3-Month | Pay | 2.680 | Semiannual | 12/12/2023 | 1,000 | 18 | — | 18 | |||||||||
CME Group | British Bankers' Association LIBOR USD 3-Month | Pay | 2.500 | Semiannual | 12/19/2023 | 800 | 8 | (6) | 14 |
54
Harbor Real Return Fund
Portfolio of Investments—Continued
Portfolio of Investments—Continued
SWAP AGREEMENTS—Continued
CENTRALLY CLEARED SWAP AGREEMENTS—Continued
INTEREST RATE SWAPS—Continued
| Counterparty | Floating Rate Index | Pay/Receive Floating Rate | Fixed Rate | Payment Frequency | Expiration Date | Notional Amount (000s) | Value (000s) | Upfront Premiums (Received)/Paid (000s) | Unrealized Appreciation/ (Depreciation) (000s) | |||||||||
CME Group | British Bankers' Association LIBOR USD 3-Month | Pay | 2.500% | Semiannual | 02/22/2026 | $ 3,160 | $ 5 | $ — | $ 5 | |||||||||
CME Group | British Bankers' Association LIBOR USD 3-Month | Pay | 2.400 | Semiannual | 03/16/2026 | 2,900 | 19 | — | 19 | |||||||||
CME Group | British Bankers' Association LIBOR USD 3-Month | Pay | 2.300 | Semiannual | 04/21/2026 | 1,700 | 19 | (10) | 29 | |||||||||
CME Group | British Bankers' Association LIBOR USD 3-Month | Pay | 2.300 | Semiannual | 04/27/2026 | 2,000 | 23 | (7) | 30 | |||||||||
CME Group | British Bankers' Association LIBOR USD 3-Month | Pay | 1.850 | Semiannual | 07/27/2026 | 600 | 19 | (2) | 21 | |||||||||
CME Group | British Bankers' Association LIBOR USD 3-Month | Pay | 2.000 | Semiannual | 07/27/2026 | 3,500 | 89 | 53 | 36 | |||||||||
CME Group | British Bankers' Association LIBOR USD 3-Month | Pay | 2.400 | Semiannual | 12/07/2026 | 6,000 | 56 | 48 | 8 | |||||||||
CME Group | British Bankers' Association LIBOR USD 3-Month | Pay | 2.750 | Semiannual | 12/20/2047 | 1,170 | 29 | 36 | (7) | |||||||||
CME Group | British Bankers' Association LIBOR USD 3-Month | Pay | 2.970 | Semiannual | 10/25/2048 | 200 | (13) | — | (13) | |||||||||
CME Group | British Bankers' Association LIBOR USD 3-Month | Pay | 2.950 | Semiannual | 11/19/2048 | 100 | (6) | — | (6) | |||||||||
CME Group | British Bankers' Association LIBOR USD 3-Month | Pay | 2.950 | Semiannual | 12/12/2048 | 100 | (6) | — | (6) | |||||||||
CME Group | British Bankers' Association LIBOR USD 3-Month | Pay | 2.750 | Semiannual | 12/19/2048 | 100 | (1) | 3 | (4) | |||||||||
LCH Group | British Bankers' Association LIBOR USD 3-Month | Pay | 1.750 | Semiannual | 12/21/2026 | 1,570 | 66 | (46) | 112 | |||||||||
LCH Group | Federal Funds Effective Rate US | Pay | 2.000 | Annual | 12/15/2047 | 300 | 16 | — | 16 | |||||||||
LCH Group | US Consumer Price Index Urban Consumers NSA | Receive | 1.710 | At maturity | 04/27/2018 | 900 | (1) | — | (1) | |||||||||
LCH Group | US Consumer Price Index Urban Consumers NSA | Receive | 1.680 | At maturity | 04/28/2018 | 1,500 | (1) | — | (1) | |||||||||
LCH Group | US Consumer Price Index Urban Consumers NSA | Pay | 2.078 | At maturity | 03/29/2019 | 3,300 | 18 | — | 18 | |||||||||
LCH Group | US Consumer Price Index Urban Consumers NSA | Pay | 1.935 | At maturity | 04/27/2019 | 900 | 3 | — | 3 | |||||||||
LCH Group | US Consumer Price Index Urban Consumers NSA | Receive | 2.026 | At maturity | 11/23/2020 | 500 | — | — | — | |||||||||
LCH Group | US Consumer Price Index Urban Consumers NSA | Receive | 2.021 | At maturity | 11/25/2020 | 400 | — | — | — | |||||||||
LCH Group | US Consumer Price Index Urban Consumers NSA | Receive | 1.550 | At maturity | 07/26/2021 | 300 | 7 | 10 | (3) | |||||||||
LCH Group | US Consumer Price Index Urban Consumers NSA | Receive | 1.602 | At maturity | 09/12/2021 | 310 | 6 | 9 | (3) | |||||||||
LCH Group | US Consumer Price Index Urban Consumers NSA | Pay | 2.063 | At maturity | 05/12/2025 | 100 | 1 | — | 1 | |||||||||
LCH Group | US Consumer Price Index Urban Consumers NSA | Pay | 1.730 | At maturity | 07/26/2026 | 300 | (11) | (16) | 5 | |||||||||
LCH Group | US Consumer Price Index Urban Consumers NSA | Pay | 1.800 | At maturity | 09/12/2026 | 200 | (6) | (2) | (4) |
55
Harbor Real Return Fund
Portfolio of Investments—Continued
Portfolio of Investments—Continued
SWAP AGREEMENTS—Continued
CENTRALLY CLEARED SWAP AGREEMENTS—Continued
INTEREST RATE SWAPS—Continued
| Counterparty | Floating Rate Index | Pay/Receive Floating Rate | Fixed Rate | Payment Frequency | Expiration Date | Notional Amount (000s) | Value (000s) | Upfront Premiums (Received)/Paid (000s) | Unrealized Appreciation/ (Depreciation) (000s) | |||||||||
LCH Group | US Consumer Price Index Urban Consumers NSA | Pay | 1.801% | At maturity | 09/12/2026 | $ 310 | $ (9) | $(15) | $ 6 | |||||||||
LCH Group | US Consumer Price Index Urban Consumers NSA | Pay | 1.805 | At maturity | 09/12/2026 | 200 | (6) | (10) | 4 | |||||||||
LCH Group | US Consumer Price Index Urban Consumers NSA | Pay | 1.780 | At maturity | 09/15/2026 | 200 | (6) | (10) | 4 | |||||||||
LCH Group | US Consumer Price Index Urban Consumers NSA | Pay | 2.067 | At maturity | 07/25/2027 | 400 | (3) | — | (3) | |||||||||
LCH Group | US Consumer Price Index Urban Consumers NSA | Pay | 2.180 | At maturity | 09/20/2027 | 170 | — | — | — | |||||||||
LCH Group | US Consumer Price Index Urban Consumers NSA | Pay | 2.150 | At maturity | 09/25/2027 | 200 | — | — | — | |||||||||
LCH Group | US Consumer Price Index Urban Consumers NSA | Pay | 2.156 | At maturity | 10/17/2027 | 400 | (1) | — | (1) | |||||||||
Interest Rate Swaps | $335 | |||||||||||||||||
CENTRALLY CLEARED SWAP AGREEMENTS
CREDIT DEFAULT SWAPS
| Counterparty | Reference Entity | Buy/ Sellb,c | Pay/Receive Fixed Rate | Expiration Date | Implied Credit Spreadd | Payment Frequency | Notional Amounte (000s) | Value f (000s) | Upfront Premiums (Received)/Paid (000s) | Unrealized Appreciation/ (Depreciation) (000s) | ||||||||||
ICE Group | iTraxx Europe Series 28 Version 1 | Buy | 1.000% | 12/20/2022 | 0.500% | Quarterly | € 1,500 | $ (47) | $ (40) | $ (7) | ||||||||||
ICE Group | Markit iTraxx Europe Indices Series 26 Version 1 | Buy | 1.000 | 12/20/2021 | 0.360 | Quarterly | € 500 | (16) | (8) | (8) | ||||||||||
ICE Group | Markit CDX North America High Yield Index Series 29 | Buy | 5.000 | 12/20/2022 | 3.102 | Quarterly | $ 1,400 | (126) | (110) | (16) | ||||||||||
Credit Default Swaps | $(31) | |||||||||||||||||||
OVER-THE-COUNTER (OTC) SWAP AGREEMENTS
INTEREST RATE SWAPS
| Counterparty | Floating Rate Index | Pay/Receive Floating Rate | Fixed Rate | Payment Frequency | Expiration Date | Notional Amount (000s) | Value (000s) | Upfront Premiums (Received)/Paid (000s) | Unrealized Appreciation/ (Depreciation) (000s) | |||||||||
Deutsche Bank AG | US Consumer Price Index Urban Consumers NSA | Receive | 2.500% | At maturity | 07/15/2022 | $ 300 | $(28) | $ 7 | $ (35) | |||||||||
Morgan Stanley Capital Services LLC | US Consumer Price Index Urban Consumers NSA | Pay | 1.788 | At maturity | 07/18/2026 | 1,200 | (38) | (1) | (37) | |||||||||
Morgan Stanley Capital Services LLC | US Consumer Price Index Urban Consumers NSA | Pay | 1.000 | At maturity | 07/20/2026 | 1,200 | (36) | — | (36) | |||||||||
Morgan Stanley Capital Services LLC | US Consumer Price Index Urban Consumers NSA | Pay | 1.805 | At maturity | 09/20/2026 | 100 | (3) | — | (3) | |||||||||
Interest Rate Swaps | $(111) | |||||||||||||||||
56
Harbor Real Return Fund
Portfolio of Investments—Continued
Portfolio of Investments—Continued
SWAP AGREEMENTS—Continued
OVER-THE-COUNTER (OTC) SWAP AGREEMENTS
VARIANCE SWAPS ON INDICES
| Counterparty | Reference Assets | Pay/Receive Varianceg | Initial Volatility Strike | Payment Frequency | Expiration Date | Notional Amount (000s) | Value (000s) | Upfront Premiums (Received)/Paid (000s) | Unrealized Appreciation/ (Depreciation) (000s) | |||||||||
Goldman Sachs International | Intercontinental Exchange LIBOR USD 3-month | Receive | $ — | At Maturity | 03/20/2018 | $ 100 | $(2) | $— | $(2) |
OVER-THE-COUNTER (OTC) SWAP AGREEMENTS
CREDIT DEFAULT SWAPS
| Counterparty | Reference Entity | Buy/ Sellb,c | Pay/Receive Fixed Rate | Expiration Date | Implied Credit Spreadd | Payment Frequency | Notional Amounte (000s) | Value f (000s) | Upfront Premiums (Received)/Paid (000s) | Unrealized Appreciation/ (Depreciation) (000s) | ||||||||||
Credit Suisse International | Federative Republic of Brazil 4.250% due 01/07/2025 | Sell | 1.000% | 06/20/2021 | 1.160% | Quarterly | $ 200 | $ (1) | $(14) | $ 13 | ||||||||||
Deutsche Bank AG | Federative Republic of Brazil 4.250% due 01/07/2025 | Sell | 1.000 | 06/20/2021 | 1.160 | Quarterly | 100 | — | (8) | 8 | ||||||||||
HSBC Bank USA NA | Federative Republic of Brazil 4.250% due 01/07/2025 | Sell | 1.000 | 03/20/2018 | 0.429 | Quarterly | 300 | 1 | — | 1 | ||||||||||
HSBC Bank USA NA | Federative Republic of Brazil 4.250% due 01/07/2025 | Sell | 1.000 | 06/20/2022 | 1.527 | Quarterly | 100 | (2) | (6) | 4 | ||||||||||
JP Morgan Chase Bank NA | Federative Republic of Brazil 4.250% due 01/07/2025 | Sell | 1.000 | 06/20/2021 | 1.160 | Quarterly | 100 | — | (7) | 7 | ||||||||||
Goldman Sachs International | Markit CMBX North America AAA Indices | Sell | 0.500 | 10/17/2057 | 0.000 | Monthly | 100 | — | (5) | 5 | ||||||||||
Goldman Sachs International | Markit CMBX North America AAA Indices | Sell | 0.500 | 09/17/2058 | 0.000 | Monthly | 100 | — | (6) | 6 | ||||||||||
Credit Default Swaps | $ 44 | |||||||||||||||||||
Total Swaps | $235 | |||||||||||||||||||
FIXED INCOME INVESTMENTS SOLD SHORT AT OCTOBER 31, 2017 — (4.0)%
| Principal Amount (000s) | Security | Proceeds (000s) | Value (000s) | |||
| $ 3,000 | Federal National Mortgage Association TBA1 3.000%—12/13/2047 | $ 3,000 | $ (2,997) | |||
| 1,000 | Federal National Mortgage Association TBA1 3.500%—11/13/2047 | 1,029 | (1,028) | |||
| 80 | U.S. Treasury Notes 3.000%— 5/15/2047 | 81 | (82) | |||
Total Fixed Income Investments Sold Short | $ 4,110 | $ (4,107) |
57
Harbor Real Return Fund
Portfolio of Investments—Continued
Portfolio of Investments—Continued
FAIR VALUE MEASUREMENTS
The following table summarizes the Fund’s investments as of October 31, 2017 based on the inputs used to value them.
| Asset Category | Quoted Prices Level 1 (000s) | Other Significant Observable Inputs Level 2 (000s) | Significant Unobservable Inputs Level 3 (000s) | Total (000s) | ||||
| Investments in Securities | ||||||||
Asset-Backed Securities | $ — | $ 2,064 | $— | $ 2,064 | ||||
Bank Loan Obligations | — | 98 | — | 98 | ||||
Collateralized Mortgage Obligations | — | 1,618 | — | 1,618 | ||||
Corporate Bonds & Notes | — | 5,856 | — | 5,856 | ||||
Foreign Government Obligations | — | 7,650 | — | 7,650 | ||||
Mortgage Pass-Through | — | 9,966 | — | 9,966 | ||||
U.S. Government Obligations | — | 119,449 | — | 119,449 | ||||
| Short-Term Investments | ||||||||
Certificates Of Deposit | — | 801 | — | 801 | ||||
Repurchase Agreements | — | 109 | — | 109 | ||||
Total Investments in Securities | $ — | $147,611 | $— | $147,611 | ||||
| Financial Derivative Instruments - Assets | ||||||||
Forward Currency Contracts | $ — | $ 251 | $— | $ 251 | ||||
Futures Contracts | 202 | — | — | 202 | ||||
Purchased Options | 6 | 61 | — | 67 | ||||
Swap Agreements | — | 484 | — | 484 | ||||
Total Financial Derivative Instruments - Assets | $208 | $ 796 | $— | $ 1,004 | ||||
| Liability Category | ||||||||
Fixed Income Investments Sold Short | $ — | $ (4,107) | $— | $ (4,107) | ||||
| Financial Derivative Instruments - Liabilities | ||||||||
Forward Currency Contracts | $ — | $ (82) | $— | $ (82) | ||||
Futures Contracts | (21) | — | — | (21) | ||||
Swap Agreements | — | (249) | — | (249) | ||||
Written Options | (9) | (23) | — | (32) | ||||
Total Financial Derivative Instruments - Liabilities | $ (30) | $ (354) | $— | $ (384) | ||||
Total Investments | $178 | $143,946 | $— | $144,124 |
The following is a rollforward of the Fund’s Level 3 investments during the year ended October 31, 2017.
| Valuation Description | Balance Beginning at 11/01/2016 (000s) | Purchases (000s) | Sales (000s) | Discount/ (Premium) (000s) | Total Realized Gain/(Loss)w (000s) | Change in Unrealized Appreciation/ (Depreciation)w (000s) | Transfers In Level 3 (000s) | Transfers Out of Level 3 (000s) | Ending Balance as of 10/31/2017w (000s) | |||||||||
Asset-Backed Securities | $500 | $— | $(189) | $— | $— | $2 | $— | $(313) h | $— |
There were no transfers between Levels 1 and 2 during the year.
For more information on valuation inputs and their aggregation into the levels used in the table above, please refer to the Fair Value Measurements and Disclosures in Note 2 of the accompanying Notes to Financial Statements.
The following is a summary of the remaining contractual maturities of transfers accounted for as secured borrowings, by type of security loaned, as of October 31, 2017.
| Overnight and Continuous (000s) | Up to 30 days (000s) | 31-90 days (000s) | Greater Than 90 days (000s) | Total (000s) | |||||
| Sale-Buyback Transactions | |||||||||
U.S. Government Obligations | $— | $33,723 | $— | $4,757 | $38,480 |
58
Harbor Real Return Fund
Portfolio of Investments—Continued
Portfolio of Investments—Continued
| 1 | Variable rate security, the stated rate represents the rate in effect at October 31, 2017. | ||
| 2 | Step coupon security, the stated rate represents the rate in effect at October 31, 2017. | ||
| 3 | Securities purchased in a transaction exempt from registration under Rule 144A of the Securities Act of 1933. These securities may be resold in transactions exempt from registration, normally to qualified institutional buyers. The Fund has no right to demand registration of these securities. These securities are priced by an independent pricing service in accordance with Harbor Funds Valuation Procedures. At October 31, 2017, the aggregate value of these securities was $3,326,000 or 3% of net assets. | ||
| 4 | Floating rate security, the stated rate represents the rate in effect at October 31, 2017. | ||
| 5 | MTN after the name of a security stands for Medium Term Note. | ||
| 6 | Inflation-protected securities (“IPS”) are securities in which the principal amount is adjusted for inflation and interest payments are applied to the inflation-adjusted principal. | ||
| 7 | Zero coupon bond. | ||
| 8 | REMICs are CMOs which can hold mortgages secured by any type of real property and issue multiple-class securities backed by those mortgages. | ||
| 9 | TBAs are mortgage-backed securities traded under delayed delivery commitments, settling after October 31, 2017. Although the unit price for the trades has been established, the principal value has not been finalized. However, the amount of the commitments will not fluctuate more than 2% from the principal amount. Income on TBAs is not earned until settlement date (see Note 2 of the accompanying Notes to Financial Statements). | ||
| 10 | At October 31, 2017, a portion of securities held by the Fund were pledged to cover margin requirements for open future contracts, written options on futures contracts and swap options (see Note 2 of the accompanying Notes to Financial Statements). The securities pledged had an aggregate value of $250,000 or less than 1% of net assets. | ||
| b | If the Fund is a buyer of protection and a credit event occurs, as defined under the terms of that particular swap agreement, the Fund will either (i) receive from the seller of protection an amount equal to the notional amount of the swap and deliver the referenced obligation or underlying securities comprising the referenced index or (ii) receive a net settlement amount in the form of cash or securities equal to the notional amount of the swap less the recovery value of the referenced obligation or underlying securities comprising the referenced index. | ||
| c | If the Fund is a seller of protection and a credit event occurs, as defined under the terms of that particular swap agreement, the Fund will either (i) pay to the buyer of protection an amount equal to the notional amount of the swap and take delivery of the referenced obligation or underlying securities comprising the referenced index or (ii) pay a net settlement amount in the form of cash or securities equal to the notional amount of the swap less the recovery value of the referenced obligation or underlying securities comprising the referenced index. | ||
| d | Implied credit spreads, represented in absolute terms, utilized in determining the value of credit default swap agreements on corporate issues or sovereign issues of an emerging country as of period end serve as an indicator of the current status of the payment/performance risk and represent the likelihood or risk of default for the credit derivative. The implied credit spread of a particular referenced entity reflects the cost of buying/selling protection and may include upfront payments required to be made to enter into the agreement. Wider credit spreads represent a deterioration of the referenced entity’s credit soundness and a greater likelihood or risk of default or other credit event occurring as defined under the terms of the agreement. A credit spread identified as “Defaulted” indicates a credit event has occurred for the referenced entity or obligation. | ||
| e | The maximum potential amount the Fund could be required to make as a seller of credit protection or receive as a buyer of credit protection if a credit event occurs as defined under the terms of that particular swap agreement. | ||
| f | The quoted market prices and resulting values for credit default swap agreements on asset-backed securities and credit indices serve as an indicator of the current status of the payment/performance risk and represent the likelihood of an expected liability (or profit) for the credit derivative should the notional amount of the swap agreement be closed/sold as of the period end. Increasing values, in absolute terms when compared to the notional amount of the swap, represent a deterioration of the referenced entity’s credit soundness and a greater likelihood or risk of default or other credit event occurring as defined under the terms of the agreement. | ||
| g | At the maturity date, a net cash flow is exchanged, where the payoff amount is equivalent to the difference between the realized price variance of the underlying asset and the strike price multiplied by the notional amount. As a receiver of the realized price variance, the Fund would receive the payoff amount when the realized price variance of the underlying asset is greater than the strike price and would owe the payoff amount when the variance is less than the strike price. As a payer of the realized price variance, the Fund would owe the payoff amount when the realized price variance of the underlying asset is greater than the strike price and would receive the payoff amount when the variance is less than the strike price. | ||
| h | Transferred from Level 3 to Level 2 due to the availability of observable market data for pricing input. | ||
| j | Amount represents Index Value. | ||
| w | Amounts in this category are included in the “Realized and Change in Unrealized Gain/(Loss) on Investment Transactions” section of the Statement of Operations. The net unrealized appreciation/(depreciation) per investment type is below: | ||
| Valuation Description | Unrealized Gain/(Loss) as of 10/31/2017 (000s) | ||
Asset-Backed Securities | $1 | ||
| $1 | |||
| ARG$ | Argentine Peso | ||
| AUD$ | Australian Dollar | ||
| R$ | Brazilian Real | ||
| £ | British Pound | ||
| CAD$ | Canadian Dollar | ||
| COL$ | Colombian Peso | ||
| € | Euro | ||
| ₹ | Indian Rupee | ||
| ¥ | Japanese Yen | ||
| MEX$ | Mexican Peso | ||
| NZD$ | New Zealand Dollar | ||
| PLN$ | Polish Zloty | ||
| R | South African Rand | ||
| ₩ | South Korean Won | ||
The accompanying notes are an integral part of the Financial Statements.
59
Harbor Money Market Fund
Manager’s Commentary (Unaudited)
Manager’s Commentary (Unaudited)
Subadviser
BNP Paribas Asset Management USA, Inc.
200 Park Avenue
New York, NY 10166
Portfolio Manager
Kenneth O’Donnell, CFA
Since 2003
Since 2003
BNP (formerly Fisher Francis Trees & Watts, Inc.) has subadvised the Fund since 1987.
Investment Objective
The Fund seeks to provide current income while maintaining liquidity and a stable share price of $1.

Kenneth O’Donnell
Management’s Discussion of
Fund Performance
Fund Performance
Market Review
Global economic growth rebounded in the twelve months ended October 31, 2017 with advances in both emerging and advanced economies. The U.S. economy expanded at an above trend pace while Europe and Japan experienced a rebound in growth coupled with a decline in deflationary pressures. This pattern of improving global growth trends was a welcome sign for many central banks as they looked to unwind post crisis-era stimulus measures.
In late 2016, the Federal Reserve (Fed) commenced with the second tightening of monetary policy in the cycle. Volatility decreased as markets discounted the future path of interest rates. Despite expectation for a slow pace of normalization, two additional rate hikes closely followed at the March and June Federal Open Market Committee (FOMC) meetings. Currently, markets generally expect the next increase in short term interest rates to occur in December 2017. Federal Reserve Chair Janet Yellen continued to assert that monetary policy remains accommodative and that further tightening will continue at a gradual pace. This increasingly transparent Fed has served to suppress volatility in the front end of the yield curve.
Short term U.S. Treasury Note yields increased during the fiscal year as markets discounted the path of Fed policy. In contrast to the front-end, intermediate yields remained in a tight range flattening the slope of the yield curve. Money market yields climbed throughout the year while remaining anchored to monetary policy rates. The increase was welcomed by money market investors who have endured several years of low returns.
Performance
Despite the low interest rate environment, Harbor Money Market Fund provided competitive returns. For the 12 months ended October 31, 2017, the Fund returned 0.73% (Institutional and Administrative Classes). This compared favorably with the return of 0.72% for the Fund’s benchmark, the ICE BofAML U.S. 3-Month Treasury Bill Index. The duration of the portfolio, a measure of its sensitivity to changes in interest rates, was maintained at approximately 40 days with some variability throughout the 12-month period.
Outlook & Strategy
Looking ahead, we expect monetary policy to become less accommodative in 2018 as interest rate policy normalizes. We believe that the stimulus burden will shift from monetary to fiscal policy across advanced economies as the impact of non-traditional central bank policy measures wanes. We expect that real, or inflation-adjusted, economic growth in the U.S. will average approximately 2.5% and that wage pressures will emerge throughout the year as incremental gains in the labor sector push the economy well through estimates of full employment. We also believe that business investment will recover and provide additional support for a sustainable trajectory of domestic growth.
The Fed’s policy stance will depend on the evolution of global financial conditions. In our opinion the Fed will likely continue on the slow path to policy normalization with the target Federal Funds rate serving as the primary metric. We expect the next tightening to occur late in December followed by three additional steps in the following calendar year. We do not expect any changes in the tools used to manage short-term interest rates, i.e. interest paid on banking reserves and the overnight fixed-rate reserve purchase agreement program, or reverse repo facility. We believe that money market yields are likely to increase steadily in the coming year as short-term markets continue to incorporate future expectations for the path of monetary policy. We also do not expect the Fed to alter the prescribed path of balance sheet reduction as detailed earlier in the year. We believe that the portfolio will continue to benefit from policy tightening and that the transparency of the FOMC will provide us with
60
Harbor Money Market Fund
Manager’s Commentary—Continued
Manager’s Commentary—Continued
| TOP ISSUERS (% of net assets) | |
| U.S. Treasury | 41.0% |
| Federal Home Loan Bank | 32.4% |
| Federal National Mortgage Association | 19.0% |
| Federal Home Loan Mortgage Corp. | 7.3% |
the opportunity to tactically adjust the Fund’s duration profile as short-term interest rates rise.
This report contains the current opinions of BNP Paribas Asset Management USA, Inc. as of the date of this report and should not be considered as investment advice or a recommendation of any particular security, strategy or investment product. Such opinions are subject to change without notice and securities described herein may no longer be included in, or may at any time be removed from, the Fund’s portfolio. This report is distributed for informational purposes only. Information contained herein has been obtained from sources believed reliable, but not guaranteed.
You could lose money by investing in Harbor Money Market Fund. Although the Fund seeks to preserve the value of your investment at $1.00 per share, it cannot guarantee it will do so. An investment in the Fund is not insured or guaranteed by the FDIC or any other government agency. The Fund’s sponsor has no legal obligation to provide financial support to the Fund and you should not expect the sponsor to provide financial support to the Fund at any time. For information on the different share classes and the risks associated with an investment in the Fund, please refer to the current prospectus.
61
Harbor Money Market Fund
Fund Summary—October 31, 2017 (Unaudited)
Fund Summary—October 31, 2017 (Unaudited)
| INSTITUTIONAL CLASS | |
| Fund # | 2015 |
| Cusip | 411511405 |
| Ticker | HARXX |
| Inception Date | 12/29/1987 |
| Net Expense Ratio | 0.00% a |
| Total Net Assets (000s) | $169,637 |
| ADMINISTRATIVE CLASS | |
| Fund # | 2215 |
| Cusip | 411511660 |
| Ticker | HRMXX |
| Inception Date | 11/01/2002 |
| Net Expense Ratio | 0.00% a |
| Total Net Assets (000s) | $1,545 |
Portfolio Statistics
| Portfolio | Benchmark | ||
| Yield to Maturity | 0.97% | 1.02% | |
| Weighted Average Maturity | 0.09 years | 0.16 years | |
| Weighted Average Duration | 0.09 years | 0.16 years |
FUND PERFORMANCE
The graph compares a $10,000 investment in the Institutional Class shares of the Fund with the performance of the ICE BofAML 3-Month U.S. Treasury Bill Index. The Fund’s performance assumes the reinvestment of all dividend and capital gain distributions.
CHANGE IN A $10,000 INVESTMENT
For the period 11/01/2007 through 10/31/2017

| TOTAL RETURNS For the periods ended 10/31/2017 | 1 Year | Annualized | Inception Date | Final Value of a $10,000 Investment | ||||||||||
| 5 Years | 10 Years | |||||||||||||
| Harbor Money Market Fund | ||||||||||||||
Institutional Class | 0.73% | 0.25% | 0.50% | 12/29/1987 | $10,514 | |||||||||
Administrative Class | 0.73 | 0.25 | 0.47 | 11/01/2002 | 10,479 | |||||||||
| Comparative Index | ||||||||||||||
ICE BofAML U.S. 3-Month Treasury Bill | 0.72% | 0.24% | 0.45% | — | $10,458 | |||||||||
| Current 7-day subsidizedb SEC yield for period ended 10/31/2017: | Institutional Class: 1.03% | Administrative Class: 1.03% |
| Current 7-day unsubsidizedc SEC yield for period ended 10/31/2017: | Institutional Class: 0.67% | Administrative Class: 0.42% |
Performance data shown represents past performance and is no guarantee of future results. Past performance is net of management fees and expenses and reflects reinvested dividends and distributions, but does not reflect the deduction of taxes that a shareholder would pay on Fund distributions or upon the redemption of Fund shares. Past performance reflects the beneficial effect of any expense waivers or reimbursements, without which returns would have been lower. Investment returns and principal value will fluctuate and when redeemed may be worth more or less than their original cost. Returns for periods less than one year are not annualized. Current performance may be higher or lower and is available through the most recent month end at harborfunds.com or by calling 800-422-1050. Voluntary waivers and reimbursements may be discontinued at any time without notice. Current yield excludes gains and losses as defined by the Securities and Exchange Commission. The current yield more closely reflects the current earnings of the Fund than the total return.
| a | Reflects a contractual management fee waiver and an expense limitation agreement (excluding interest expense, if any) effective through February 28, 2018, as well as a voluntary fee waiver that may be discontinued at any time |
| b | Reflects reimbursement or waivers currently in effect |
| c | Does not reflect reimbursements or waivers currently in effect |
62
Harbor Money Market Fund
Portfolio of Investments—October 31, 2017
Portfolio of Investments—October 31, 2017
Value, Cost, and Principal Amounts in Thousands
Total Investments (% of net assets)
(Excludes net cash of 0.2%)

| GOVERNMENT AGENCY DEBT—58.7%† | |||
| Principal Amount | Value | ||
| Federal Home Loan Bank Discount Notes | |||
| $ | 6,050 | 1.010%—11/14/2017 | $ 6,048 |
| 20,258 | 1.015%—11/08/2017-11/27/2017 | 20,247 | |
| 3,000 | 1.020%—11/09/2017 | 2,999 | |
| 6,000 | 1.023%—11/29/2017 | 5,995 | |
| 15,000 | 1.024%—11/20/2017-12/01/2017 | 14,990 | |
| 5,300 | 1.080%—01/05/2018 | 5,290 | |
| 55,569 | |||
| Federal Home Loan Mortgage Corp. Discount Notes | |||
| 8,000 | 0.995%—11/22/2017 | 7,995 | |
| 4,400 | 0.997%—11/02/2017 | 4,400 | |
| 12,395 | |||
| Federal National Mortgage Association Discount Notes | |||
| 5,816 | 0.846%—11/22/2017 | 5,813 | |
| 7,150 | 0.980%—11/15/2017 | 7,147 | |
| 6,000 | 0.995%—11/27/2017 | 5,996 | |
| 7,000 | 1.000%—12/04/2017 | 6,993 | |
| 1,600 | 1.050%—01/05/2018 | 1,597 | |
| 5,000 | 1.060%—01/08/2018 | 4,990 | |
| 32,536 | |||
| TOTAL GOVERNMENT AGENCY DEBT | |||
(Cost $100,500) | 100,500 | ||
| TREASURY DEBT—41.0%† | |||
| Principal Amount | Value | ||
| U.S. Treasury Bills | |||
| $ | 10,750 | 0.968%—12/07/2017 | $ 10,739 |
| 13,000 | 0.972%—11/30/2017 | 12,990 | |
| 5,700 | 0.983%—11/16/2017 | 5,698 | |
| 12,000 | 0.997%—11/24/2017 | 11,992 | |
| 10,000 | 1.029%—01/11/2018 | 9,980 | |
| 9,975 | 1.035%—01/04/2018 | 9,957 | |
| 8,950 | 1.061%—01/18/2018 | 8,929 | |
| TOTAL TREASURY DEBT | |||
(Cost $70,285) | 70,285 | ||
| REPURCHASE AGREEMENTS—0.1% | |||
| (Cost $134) | |||
| Principal Amount | |||
| $ | 134 | Repurchase Agreement with Fixed Income Clearing Corp. dated October 31, 2017 due November 01, 2017 at 0.001% collateralized by U.S. Treasury Notes (value $142) | 134 |
| TOTAL INVESTMENTS—99.8% | |||
(Cost $170,919) | 170,919 | ||
CASH AND OTHER ASSETS, LESS LIABILITIES—0.2% | 263 | ||
TOTAL NET ASSETS—100.0% | $171,182 | ||
FAIR VALUE MEASUREMENTS
All holdings at October 31, 2017 (as disclosed in the preceding Portfolio of Investments) are classified as Level 2. There were no Level 3 holdings at October 31, 2017 or 2016, and no transfers between levels during the year.
For more information on valuation inputs and their aggregation into the levels identified above, please refer to the Fair Value Measurements and Disclosures in Note 2 of the accompanying Notes to Financial Statements.
| † | Coupon represents yield to maturity |
The accompanying notes are an integral part of the Financial Statements.
63
Harbor Fixed Income Funds
StatementS of Assets and Liabilities—October 31, 2017
StatementS of Assets and Liabilities—October 31, 2017
(All amounts in thousands, except per share amounts)
| Harbor Convertible Securities Fund | Harbor High-Yield Bond Fund | Harbor Bond Fund | Harbor Real Return Fund | Harbor Money Market Fund | |
| ASSETS | |||||
Investments, at identified cost* | $110,746 | $1,394,886 | $3,372,572 | $148,181 | $170,919 |
Investments, at value | $113,563 | $1,425,549 | $3,258,784 | $147,502 | $170,785 |
Repurchase agreements | 1,368 | 10,568 | 123,889 | 109 | 134 |
Cash-restricted | — | — | 367 | 681 | — |
Cash | — | 94 | 271 | 1 | 1 |
Foreign currency, at value (cost: $0, $0, $3,341, $232 and $0) | — | — | 3,330 | 230 | — |
| Receivables for: | |||||
Investments sold | 921 | 22,744 | 591,724 | 19,367 | — |
Foreign currency spot contracts | — | — | 77 | — | — |
Capital shares sold | 5 | 2,373 | 1,024 | 68 | 383 |
Interest | 470 | 22,392 | 10,437 | 562 | — |
Unrealized appreciation on open forward currency contracts | — | — | 18,970 | 251 | — |
Unrealized appreciation on OTC swap agreements | — | — | 463 | 44 | — |
Variation margin on options and futures contracts | — | — | 6,180 | 15 | — |
Variation margin on centrally cleared swap agreements | — | — | 81 | 3 | — |
Purchased options not settled through variation margin, at value (premiums paid: $0, $0, $2,951, $96 and $0) | — | — | 759 | 64 | — |
Options sold | — | — | 163 | 23 | — |
Prepaid registration fees | 9 | 38 | 25 | 25 | 20 |
Other assets | 17 | 118 | 519 | 38 | 38 |
Total Assets | 116,353 | 1,483,876 | 4,017,063 | 168,983 | 171,361 |
| LIABILITIES | |||||
| Payables for: | |||||
Due to broker | — | — | 10,633 | — | — |
Investments purchased | 1,749 | 8,239 | 1,513,226 | 24,273 | — |
Foreign currency spot contracts | — | — | 1,240 | — | — |
Capital shares reacquired | 26 | 604 | 4,214 | 344 | 100 |
Interest on investments sold short | — | — | — | 1 | — |
Investments sold short, at value (proceeds: $0, $0, $24,198, $4,110 and $0) | — | — | 24,139 | 4,107 | — |
Written options not settled through variation margin, at value (premiums received: $0, $0, $4,470, $178 and $0) | — | — | 601 | 30 | — |
Swap premiums received | — | — | 446 | 39 | — |
Unrealized depreciation on OTC swap agreements | — | — | — | 113 | — |
Sale-buyback financing transactions | — | — | 255,030 | 38,480 | — |
Variation margin on options and futures contracts | — | — | 6,339 | 1 | — |
Unrealized depreciation on open forward currency contracts | — | — | 9,651 | 82 | — |
| Accrued expenses: | |||||
Management fees | 72 | 705 | 844 | 41 | 26 |
12b-1 fees | 1 | 10 | 7 | — | 1 |
Transfer agent fees | 8 | 103 | 149 | 7 | 12 |
Trustees' fees and expenses | 2 | 14 | 17 | 1 | 1 |
Other | 109 | 507 | 761 | 74 | 39 |
Total Liabilities | 1,967 | 10,182 | 1,827,297 | 67,593 | 179 |
NET ASSETS | $114,386 | $1,473,694 | $2,189,766 | $101,390 | $171,182 |
| Net Assets Consist of: | |||||
Paid-in capital | $101,198 | $1,500,280 | $2,217,667 | $131,644 | $171,148 |
Accumulated undistributed net investment income/(loss) | (147) | 8,810 | 18,676 | 1,144 | 34 |
Accumulated net realized gain/(loss) | 9,150 | (76,626) | (64,746) | (31,527) | — |
Unrealized appreciation/(depreciation) of investments and translation of assets and liabilities in foreign currencies | 4,185 | 41,230 | 8,981 | (571) | — |
Unrealized appreciation/(depreciation) of other financial instruments | — | — | 9,188 | 700 | — |
| $114,386 | $1,473,694 | $2,189,766 | $101,390 | $171,182 | |
The accompanying notes are an integral part of the Financial Statements.
64
| Harbor Convertible Securities Fund | Harbor High-Yield Bond Fund | Harbor Bond Fund | Harbor Real Return Fund | Harbor Money Market Fund | ||||||
| NET ASSET VALUE PER SHARE BY CLASS | ||||||||||
| Institutional Class | ||||||||||
Net assets | $87,391 | $1,387,213 | $2,159,390 | $99,929 | $169,637 | |||||
Shares of beneficial interest1 | 7,754 | 135,806 | 184,942 | 10,612 | 169,637 | |||||
Net asset value per share2 | $ 11.27 | $ 10.21 | $ 11.68 | $ 9.42 | $ 1.00 | |||||
| Administrative Class | ||||||||||
Net assets | $ 395 | $ 1,753 | $ 30,376 | $ 1,461 | $ 1,545 | |||||
Shares of beneficial interest1 | 35 | 171 | 2,599 | 155 | 1,545 | |||||
Net asset value per share2 | $ 11.26 | $ 10.25 | $ 11.69 | $ 9.42 | $ 1.00 | |||||
| Investor Class | ||||||||||
Net assets | $ 2,015 | $ 42,753 | N/A | N/A | N/A | |||||
Shares of beneficial interest1 | 179 | 4,175 | N/A | N/A | N/A | |||||
Net asset value per share2 | $ 11.25 | $ 10.24 | N/A | N/A | N/A | |||||
| Retirement Class | ||||||||||
Net assets | $24,585 | $ 41,975 | N/A | N/A | N/A | |||||
Shares of beneficial interest1 | 2,182 | 4,106 | N/A | N/A | N/A | |||||
Net asset value per share2 | $ 11.27 | $ 10.22 | N/A | N/A | N/A | |||||
| * | Including repurchase agreements and short-term investments |
| 1 | Par value $0.01 (unlimited authorizations) |
| 2 | Per share amounts can be recalculated to the amounts disclosed herein when total net assets and shares of beneficial interest are not rounded to thousands. |
65
Harbor Fixed Income Funds
StatementS of Operations—Year Ended October 31, 2017
StatementS of Operations—Year Ended October 31, 2017
(All amounts in thousands)
| Harbor Convertible Securities Fund | Harbor High-Yield Bond Fund | Harbor Bond Fund | Harbor Real Return Fund | Harbor Money Market Fund | |
| Investment Income | |||||
Interest | $ 6,153 | $102,448 | $ 84,068 | $ 3,460 | $1,089 |
Consent fee income | 3 | 263 | — | — | — |
Foreign taxes withheld | — | — | (50) | — | — |
Total Investment Income | 6,156 | 102,711 | 84,018 | 3,460 | 1,089 |
| Operating Expenses | |||||
Management fees | 2,064 | 10,101 | 10,930 | 504 | 304 |
| 12b-1 fees: | |||||
Administrative Class | 1 | 10 | 83 | 5 | 4 |
Investor Class | 6 | 174 | N/A | N/A | N/A |
Shareholder communications | 47 | 262 | 252 | 21 | 6 |
Custodian fees | 35 | 85 | 295 | 73 | 23 |
| Transfer agent fees: | |||||
Institutional Class | 260 | 1,372 | 1,944 | 90 | 131 |
Administrative Class | 1 | 4 | 29 | 1 | 1 |
Investor Class | 5 | 143 | N/A | N/A | N/A |
Retirement Class | 1 | 3 | N/A | N/A | N/A |
Professional fees | 12 | 51 | 69 | 3 | 7 |
Trustees' fees and expenses | 11 | 53 | 69 | 3 | 4 |
Registration fees | 62 | 73 | 62 | 32 | 42 |
Miscellaneous | 14 | 28 | 31 | 7 | 8 |
Expenses before interest expense | 2,519 | 12,359 | 13,764 | 739 | 530 |
Interest expense | — | — | 697 | 346 | — |
Total expenses | 2,519 | 12,359 | 14,461 | 1,085 | 530 |
Management fees waived | (91) | (674) | (638) | — | (304) |
Transfer agent fees waived | (28) | (152) | (209) | (9) | (14) |
Other expenses reimbursed | — | — | (1,221) | (158) | (212) |
Net expenses | 2,400 | 11,533 | 12,393 | 918 | — |
Net Investment Income/(Loss) | 3,756 | 91,178 | 71,625 | 2,542 | 1,089 |
| Realized and Change in Net Unrealized Gain/(Loss) on Investment Transactions | |||||
| Net realized gain/(loss) on: | |||||
Investments | 26,914 | 31,901 | (11,827) | (187) | — |
Foreign currency transactions | — | — | 3,406 | 810 | — |
Investments sold short | — | — | 389 | 2 | — |
Swap agreements | — | — | (1,498) | (484) | — |
Futures contracts | — | — | (9,040) | (213) | — |
Purchased options | — | — | (1,600) | (29) | — |
Written options | — | — | 6,308 | 82 | — |
| Change in net unrealized appreciation/(depreciation) on: | |||||
Investments | (3,408) | 8,088 | (52,106) | (3,170) | — |
Forwards currency contracts | — | — | 4,351 | (147) | — |
Investments sold short | — | — | 69 | 4 | — |
Swap agreements | — | — | 50,162 | 1,392 | — |
Futures contracts | — | — | 3 | 117 | — |
Purchased options | — | — | 521 | 165 | — |
Written options | — | — | (843) | (91) | — |
Translations of assets and liabilities in foreign currencies | — | — | (1,221) | (14) | — |
Net gain/(loss) on investment transactions | 23,506 | 39,989 | (12,926) | (1,763) | — |
Net Increase/(Decrease) in Net Assets Resulting from Operations | $27,262 | $131,167 | $ 58,699 | $ 779 | $1,089 |
The accompanying notes are an integral part of the Financial Statements.
66
[THIS PAGE INTENTIONALLY LEFT BLANK]
67
Harbor Fixed Income Funds
Statements of Changes In Net Assets
Statements of Changes In Net Assets
(All amounts in thousands)
| Harbor Convertible Securities Fund | Harbor High-Yield Bond Fund | ||||
| November 1, 2016 through October 31, 2017 | November 1, 2015 through October 31, 2016 | November 1, 2016 through October 31, 2017 | November 1, 2015 through October 31, 2016 | ||
| INCREASE/(DECREASE) IN NET ASSETS | |||||
| Operations: | |||||
Net investment income/(loss) | $ 3,756 | $ 4,152 | $ 91,178 | $ 94,071 | |
Net realized gain/(loss) on investments | 26,914 | (9,260) | 31,901 | (85,774) | |
Change in net unrealized appreciation/(depreciation) of investments | (3,408) | 13,769 | 8,088 | 104,959 | |
Net increase/(decrease) in assets resulting from operations | 27,262 | 8,661 | 131,167 | 113,256 | |
| Distributions to Shareholders | |||||
| Net investment income: | |||||
Institutional Class | (5,060) | (7,671) | (88,164) | (87,833) | |
Administrative Class | (5) | (7) | (210) | (223) | |
Investor Class | (30) | (32) | (3,528) | (4,226) | |
Retirement Class | (173) | (9) | (1,550) | (42) | |
| Net realized gain on investments: | |||||
Institutional Class | — | (6,871) | — | — | |
Administrative Class | — | (7) | — | — | |
Investor Class | — | (34) | — | — | |
Retirement Class | — | — | — | — | |
Total distributions to shareholders | (5,268) | (14,631) | (93,452) | (92,324) | |
Net Increase/(Decrease) Derived from Capital Share Transactions | (333,925) | 56,629 | (475,537) | 328,505 | |
Net increase/(decrease) in net assets | (311,931) | 50,659 | (437,822) | 349,437 | |
| Net Assets | |||||
Beginning of period | 426,317 | 375,658 | 1,911,516 | 1,562,079 | |
End of period* | $ 114,386 | $426,317 | $1,473,694 | $1,911,516 | |
* Includes accumulated undistributed net investment income/(loss) of: | $ (147) | $ (1,178) | $ 8,810 | $ 11,084 | |
The accompanying notes are an integral part of the Financial Statements.
68
| Harbor Bond Fund | Harbor Real Return Fund | Harbor Money Market Fund | |||||
| November 1, 2016 through October 31, 2017 | November 1, 2015 through October 31, 2016 | November 1, 2016 through October 31, 2017 | November 1, 2015 through October 31, 2016 | November 1, 2016 through October 31, 2017 | November 1, 2015 through October 31, 2016 | ||
| $ 71,625 | $ 85,711 | $ 2,542 | $ 1,918 | $ 1,089 | $ 443 | ||
| (13,862) | 24,402 | (19) | (6,353) | — | — | ||
| 936 | 12,245 | (1,744) | 10,477 | — | — | ||
| 58,699 | 122,358 | 779 | 6,042 | 1,089 | 443 | ||
| (66,863) | (111,734) | (1,578) | (2,275) | (1,099) | (476) | ||
| (931) | (1,912) | (16) | (55) | (11) | (5) | ||
| — | — | — | — | — | — | ||
| — | — | — | — | — | — | ||
| (33,573) | (22,480) | — | — | — | — | ||
| (538) | (439) | — | — | — | — | ||
| — | — | — | — | — | — | ||
| — | — | — | — | — | — | ||
| (101,905) | (136,565) | (1,594) | (2,330) | (1,110) | (481) | ||
| (243,730) | (441,670) | (9,177) | (25,971) | 31,950 | (39,217) | ||
| (286,936) | (455,877) | (9,992) | (22,259) | 31,929 | (39,255) | ||
| 2,476,702 | 2,932,579 | 111,382 | 133,641 | 139,253 | 178,508 | ||
| $2,189,766 | $2,476,702 | $101,390 | $111,382 | $171,182 | $139,253 | ||
| $ 18,676 | $ 16,767 | $ 1,144 | $ (522) | $ 34 | $ 55 | ||
69
Harbor Fixed Income Funds
Statements of Changes in Net Assets—Capital Stock Activity
Statements of Changes in Net Assets—Capital Stock Activity
(All amounts in thousands)
| Harbor Convertible Securities Fund | Harbor High-Yield Bond Fund | ||||
| November 1, 2016 through October 31, 2017 | November 1, 2015 through October 31, 2016 | November 1, 2016 through October 31, 2017 | November 1, 2015 through October 31, 2016 | ||
| AMOUNT ($) | |||||
| Institutional Class | |||||
Net proceeds from sale of shares | $ 118,396 | $ 177,327 | $ 298,904 | $ 901,011 | |
Net proceeds from redemption fees | 5 | 2 | 32 | 27 | |
Reinvested distributions | 1,599 | 3,868 | 46,533 | 46,534 | |
Cost of shares reacquired | (475,619) | (126,893) | (811,755) | (611,877) | |
Net increase/(decrease) in net assets | $(355,619) | $ 54,304 | $(466,286) | $ 335,695 | |
| Administrative Class | |||||
Net proceeds from sale of shares | $ 50 | $ 6 | $ 817 | $ 628 | |
Reinvested distributions | 5 | 14 | 203 | 223 | |
Cost of shares reacquired | (81) | — | (3,992) | (542) | |
Net increase/(decrease) in net assets | $ (26) | $ 20 | $ (2,972) | $ 309 | |
| Investor Class | |||||
Net proceeds from sale of shares | $ 2,678 | $ 693 | $ 22,940 | $ 42,066 | |
Net proceeds from redemption fees | — | — | 1 | 2 | |
Reinvested distributions | 30 | 66 | 3,502 | 4,191 | |
Cost of shares reacquired | (2,902) | (586) | (72,679) | (55,542) | |
Net increase/(decrease) in net assets | $ (194) | $ 173 | $ (46,236) | $ (9,283) | |
| Retirement Class | |||||
Net proceeds from sale of shares | $ 22,088 | $ 2,206 | $ 42,380 | $ 1,826 | |
Net proceeds from redemption fees | 1 | — | 1 | — | |
Reinvested distributions | 173 | 9 | 1,501 | 42 | |
Cost of shares reacquired | (348) | (83) | (3,925) | (84) | |
Net increase/(decrease) in net assets | $ 21,914 | $ 2,132 | $ 39,957 | $ 1,784 | |
The accompanying notes are an integral part of the Financial Statements.
70
| Harbor Bond Fund | Harbor Real Return Fund | Harbor Money Market Fund | |||||
| November 1, 2016 through October 31, 2017 | November 1, 2015 through October 31, 2016 | November 1, 2016 through October 31, 2017 | November 1, 2015 through October 31, 2016 | November 1, 2016 through October 31, 2017 | November 1, 2015 through October 31, 2016 | ||
| $ 297,400 | $ 301,167 | $ 13,033 | $ 11,200 | $ 632,718 | $ 579,783 | ||
| — | — | — | — | — | — | ||
| 96,574 | 129,049 | 1,531 | 2,204 | 1,095 | 474 | ||
| (630,922) | (852,459) | (22,733) | (38,609) | (601,142) | (620,014) | ||
| $(236,948) | $(422,243) | $ (8,169) | $(25,205) | $ 32,671 | $ (39,757) | ||
| $ 7,619 | $ 6,631 | $ 172 | $ 419 | $ 2,553 | $ 2,643 | ||
| 1,464 | 2,345 | 16 | 55 | 11 | 5 | ||
| (15,865) | (28,403) | (1,196) | (1,240) | (3,285) | (2,108) | ||
| $ (6,782) | $ (19,427) | $ (1,008) | $ (766) | $ (721) | $ 540 | ||
| N/A | N/A | N/A | N/A | N/A | N/A | ||
| N/A | N/A | N/A | N/A | N/A | N/A | ||
71
Harbor Fixed Income Funds
Statements of Changes in Net Assets—Capital Stock Activity—Continued
Statements of Changes in Net Assets—Capital Stock Activity—Continued
(All amounts in thousands)
| Harbor Convertible Securities Fund | Harbor High-Yield Bond Fund | ||||
| November 1, 2016 through October 31, 2017 | November 1, 2015 through October 31, 2016 | November 1, 2016 through October 31, 2017 | November 1, 2015 through October 31, 2016 | ||
| SHARES | |||||
| Institutional Class | |||||
Shares sold | 10,860 | 17,034 | 29,512 | 94,211 | |
Shares issued due to reinvestment of distributions | 148 | 383 | 4,624 | 4,844 | |
Shares reacquired | (43,282) | (12,521) | (80,242) | (63,167) | |
Net increase/(decrease) in shares outstanding | (32,274) | 4,896 | (46,106) | 35,888 | |
Beginning of period | 40,028 | 35,132 | 181,912 | 146,024 | |
End of period | 7,754 | 40,028 | 135,806 | 181,912 | |
| Administrative Class | |||||
Shares sold | 5 | 1 | 80 | 65 | |
Shares issued due to reinvestment of distributions | — | 1 | 20 | 23 | |
Shares reacquired | (7) | — | (392) | (56) | |
Net increase/(decrease) in shares outstanding | (2) | 2 | (292) | 32 | |
Beginning of period | 37 | 35 | 463 | 431 | |
End of period | 35 | 37 | 171 | 463 | |
| Investor Class | |||||
Shares sold | 244 | 68 | 2,260 | 4,293 | |
Shares issued due to reinvestment of distributions | 3 | 7 | 348 | 437 | |
Shares reacquired | (262) | (56) | (7,139) | (5,704) | |
Net increase/(decrease) in shares outstanding | (15) | 19 | (4,531) | (974) | |
Beginning of period | 194 | 175 | 8,706 | 9,680 | |
End of period | 179 | 194 | 4,175 | 8,706 | |
| Retirement Class | |||||
Shares sold | 1,988 | 217 | 4,160 | 187 | |
Shares issued due to reinvestment of distributions | 16 | 1 | 149 | 4 | |
Shares reacquired | (32) | (8) | (386) | (8) | |
Net increase/(decrease) in shares outstanding | 1,972 | 210 | 3,923 | 183 | |
Beginning of period | 210 | — | 183 | — | |
End of period | 2,182 | 210 | 4,106 | 183 | |
The accompanying notes are an integral part of the Financial Statements.
72
| Harbor Bond Fund | Harbor Real Return Fund | Harbor Money Market Fund | |||||
| November 1, 2016 through October 31, 2017 | November 1, 2015 through October 31, 2016 | November 1, 2016 through October 31, 2017 | November 1, 2015 through October 31, 2016 | November 1, 2016 through October 31, 2017 | November 1, 2015 through October 31, 2016 | ||
| 25,632 | 25,652 | 1,389 | 1,205 | 632,718 | 579,725 | ||
| 8,483 | 11,133 | 164 | 249 | 1,095 | 474 | ||
| (54,503) | (72,530) | (2,424) | (4,225) | (601,142) | (620,014) | ||
| (20,388) | (35,745) | (871) | (2,771) | 32,671 | (39,815) | ||
| 205,330 | 241,075 | 11,483 | 14,254 | 136,966 | 176,781 | ||
| 184,942 | 205,330 | 10,612 | 11,483 | 169,637 | 136,966 | ||
| 659 | 563 | 18 | 45 | 2,553 | 2,642 | ||
| 129 | 203 | 2 | 6 | 11 | 5 | ||
| (1,376) | (2,429) | (128) | (135) | (3,285) | (2,108) | ||
| (588) | (1,663) | (108) | (84) | (721) | 539 | ||
| 3,187 | 4,850 | 263 | 347 | 2,266 | 1,727 | ||
| 2,599 | 3,187 | 155 | 263 | 1,545 | 2,266 | ||
| N/A | N/A | N/A | N/A | N/A | N/A | ||
| N/A | N/A | N/A | N/A | N/A | N/A | ||
73
Harbor Fixed Income Funds
Statement of Cash Flows— Year Ended October 31, 2017
Statement of Cash Flows— Year Ended October 31, 2017
(All amounts in thousands)
| Harbor Real Return Fund | |
| Cash flows from operating activities: | |
Net increase in net assets resulting from operations | $ 779 |
| Adjustments to reconcile net increase in net assets from operations to net cash provided by operating activities: | |
Purchases of long-term securities | (1,001,300) |
Proceeds from sales of long-term securities | 992,364 |
Proceeds from short-term portfolio investments, net | 5,466 |
Increase in receivable for investments sold | (5,007) |
Decrease in foreign spot contracts receivable | 7 |
Decrease in interest receivable | 57 |
Decrease in variation margin on options and futures contracts | 4 |
Decrease in variation margin on swap agreements | 33 |
Decrease in options sold | 3 |
Increase in prepaid registration fees | (2) |
Increase in other assets | (30) |
Increase in payable for investments purchased | 7,694 |
Increase in interest on investments sold short | 1 |
Increase in investments sold short | 4,110 |
Decrease in premiums from written options not settled through variation margin | (248) |
Increase in swap premiums received | 4 |
Increase in variation margin on options and futures contracts | 1 |
Decrease in management fees payable | (4) |
Increase in other liabilities | 20 |
Net change in unrealized appreciation/(depreciation) on investments | 3,166 |
Net change in unrealized appreciation/(depreciation) on forwards | 147 |
Net change in unrealized appreciation/(depreciation) on OTC swaps | (827) |
Net change in unrealized appreciation/(depreciation) on purchased options not settled through variation margin | (153) |
Net change in unrealized appreciation/(depreciation) on written options not settled through variation margin | 89 |
Net realized loss on investments | 185 |
Net realized loss on purchased options | 29 |
Net amortization and earned inflation component .. | 635 |
Net cash provided by operating activities | 7,223 |
| Cash flows from financing activities: | |
Proceeds from shares sold | 13,159 |
Payment on shares redeemed | (23,662) |
Cash dividends paid | (47) |
Increase in sale-buyback financing transactions | 2,906 |
Decrease in due to broker | (26) |
Decrease in cash-restricted | 412 |
Net cash used for financing activities | (7,258) |
Net decrease in cash and foreign currency | (35) |
| Cash and foreign currency: | |
Beginning of period | $ 266 |
End of period | 231 |
Reinvestment of dividends | $ 1,547 |
| Supplemental disclosure of cash flow information: | |
Interest paid during the year | $ 346 |
The accompanying notes are an integral part of the Financial Statements.
74
[THIS PAGE INTENTIONALLY LEFT BLANK]
75
Harbor Fixed Income Funds Financial Highlights
Selected Data for a Share Outstanding for the Periods Presented
Selected Data for a Share Outstanding for the Periods Presented
| HARBOR CONVERTIBLE SECURITIES FUND | |||||
| Institutional Class | |||||
| Year Ended October 31, | 2017 | 2016 | 2015 | 2014 | 2013 |
Net asset value beginning of period | $ 10.53 | $ 10.63 | $ 11.20 | $ 10.95 | $ 10.01 |
| Income from Investment Operations | |||||
Net investment income/(loss)a | 0.13 e | 0.12 e | 0.15 e | 0.19 | 0.20 |
Net realized and unrealized gains/(losses) on investments | 0.78 | 0.19 | (0.08) | 0.38 | 0.96 |
Total from investment operations | 0.91 | 0.31 | 0.07 | 0.57 | 1.16 |
| Less Distributions | |||||
Dividends from net investment income | (0.17) | (0.22) | (0.22) | (0.21) | (0.22) |
Distributions from net realized capital gains1 | — | (0.19) | (0.42) | (0.11) | — |
Total distributions | (0.17) | (0.41) | (0.64) | (0.32) | (0.22) |
Proceeds from redemption fees | — * | — * | — * | — * | — * |
Net asset value end of period | 11.27 | 10.53 | 10.63 | 11.20 | 10.95 |
Net assets end of period (000s) | $87,391 | $421,671 | $373,421 | $353,370 | $267,251 |
| Ratios and Supplemental Data (%) | |||||
Total returnb | 8.74% | 3.12% | 0.72% | 5.23% | 11.80% |
Ratio of total expenses to average net assets2 | 0.79 | 0.77 | 0.75 | 0.74 | 0.79 |
Ratio of net expenses to average net assetsa | 0.76 | 0.76 | 0.75 | 0.74 | 0.79 |
Ratio of net investment income to average net assetsa | 1.18 | 1.15 | 1.37 | 1.58 | 1.82 |
Portfolio turnover | 102 | 102 | 81 | 54 | 45 |
| Investor Class | |||||
| Year Ended October 31, | 2017 | 2016 | 2015 | 2014 | 2013 |
Net asset value beginning of period | $ 10.52 | $ 10.61 | $ 11.18 | $ 10.94 | $ 10.00 |
| Income from Investment Operations | |||||
Net investment income/(loss)a | 0.09 e | 0.08 e | 0.11 e | 0.11 | 0.16 |
Net realized and unrealized gains/(losses) on investments | 0.77 | 0.20 | (0.08) | 0.40 | 0.97 |
Total from investment operations | 0.86 | 0.28 | 0.03 | 0.51 | 1.13 |
| Less Distributions | |||||
Dividends from net investment income | (0.13) | (0.18) | (0.18) | (0.16) | (0.19) |
Distributions from net realized capital gains1 | — | (0.19) | (0.42) | (0.11) | — |
Total distributions | (0.13) | (0.37) | (0.60) | (0.27) | (0.19) |
Proceeds from redemption fees | — * | — * | — * | — * | — * |
Net asset value end of period | 11.25 | 10.52 | 10.61 | 11.18 | 10.94 |
Net assets end of period (000s) | $ 2,015 | $ 2,039 | $ 1,861 | $ 1,941 | $ 2,452 |
| Ratios and Supplemental Data (%) | |||||
Total returnb | 8.26% | 2.85% | 0.35% | 4.76% | 11.41% |
Ratio of total expenses to average net assets2 | 1.16 | 1.14 | 1.12 | 1.11 | 1.16 |
Ratio of net expenses to average net assetsa | 1.12 | 1.13 | 1.12 | 1.11 | 1.16 |
Ratio of net investment income to average net assetsa | 0.81 | 0.77 | 1.00 | 1.24 | 1.49 |
Portfolio turnover | 102 | 102 | 81 | 54 | 45 |
See page 82 for notes to the Financial Highlights.
The accompanying notes are an integral part of the Financial Statements.
76
| Administrative Class | ||||
| 2017 | 2016 | 2015 | 2014 | 2013 |
| $10.53 | $10.62 | $11.19 | $10.94 | $10.00 |
| 0.10 e | 0.09 e | 0.12 e | 0.13 | 0.16 |
| 0.77 | 0.20 | (0.08) | 0.41 | 0.98 |
| 0.87 | 0.29 | 0.04 | 0.54 | 1.14 |
| (0.14) | (0.19) | (0.19) | (0.18) | (0.20) |
| — | (0.19) | (0.42) | (0.11) | — |
| (0.14) | (0.38) | (0.61) | (0.29) | (0.20) |
| — * | — * | — * | — * | — * |
| 11.26 | 10.53 | 10.62 | 11.19 | 10.94 |
| $ 395 | $ 392 | $ 376 | $ 306 | $ 427 |
| 8.37% | 2.96% | 0.47% | 4.97% | 11.55% |
| 1.04 | 1.02 | 1.00 | 0.99 | 1.04 |
| 1.00 | 1.01 | 1.00 | 0.99 | 1.04 |
| 0.93 | 0.90 | 1.11 | 1.35 | 1.61 |
| 102 | 102 | 81 | 54 | 45 |
| Retirement Class | |
| 2017 | 2016 f |
| $ 10.53 | $ 9.78 |
| 0.14 e | 0.08 e |
| 0.78 | 0.75 |
| 0.92 | 0.83 |
| (0.18) | (0.08) |
| — | — |
| (0.18) | (0.08) |
| — * | — |
| 11.27 | 10.53 |
| $24,585 | $2,215 |
| 8.81% | 8.51% c |
| 0.72 | 0.73 d |
| 0.67 | 0.71 d |
| 1.24 | 1.13 d |
| 102 | 102 |
77
Harbor Fixed Income Funds Financial Highlights—Continued
Selected Data for a Share Outstanding for the Periods Presented
Selected Data for a Share Outstanding for the Periods Presented
| HARBOR HIGH-YIELD BOND FUND | |||||
| Institutional Class | |||||
| Year Ended October 31, | 2017 | 2016 | 2015 | 2014 | 2013 |
Net asset value beginning of period | $ 9.99 | $ 10.00 | $ 10.85 | $ 11.19 | $ 11.15 |
| Income from Investment Operations | |||||
Net investment income/(loss)a | 0.55 e | 0.53 e | 0.57 e | 0.60 | 0.64 |
Net realized and unrealized gains/(losses) on investments | 0.24 | (0.02) | (0.66) | (0.05) | 0.06 |
Total from investment operations | 0.79 | 0.51 | (0.09) | 0.55 | 0.70 |
| Less Distributions | |||||
Dividends from net investment income | (0.57) | (0.52) | (0.54) | (0.62) | (0.64) |
Distributions from net realized capital gains1 | — | — | (0.22) | (0.27) | (0.02) |
Total distributions | (0.57) | (0.52) | (0.76) | (0.89) | (0.66) |
Proceeds from redemption fees | — * | — * | — * | — * | — * |
Net asset value end of period | 10.21 | 9.99 | 10.00 | 10.85 | 11.19 |
Net assets end of period (000s) | $1,387,213 | $1,817,902 | $1,460,808 | $1,707,788 | $1,880,044 |
| Ratios and Supplemental Data (%) | |||||
Total returnb | 8.16% | 5.46% | (0.79)% | 5.10% | 6.55% |
Ratio of total expenses to average net assets2 | 0.72 | 0.70 | 0.69 | 0.68 | 0.68 |
Ratio of net expenses to average net assetsa | 0.67 | 0.66 | 0.65 | 0.64 | 0.64 |
Ratio of net investment income to average net assetsa | 5.43 | 5.43 | 5.51 | 5.43 | 5.56 |
Portfolio turnover | 56 | 58 | 49 | 48 | 57 |
| Investor Class | |||||
| Year Ended October 31, | 2017 | 2016 | 2015 | 2014 | 2013 |
Net asset value beginning of period | $ 10.01 | $ 10.02 | $ 10.87 | $ 11.21 | $ 11.16 |
| Income from Investment Operations | |||||
Net investment income/(loss)a | 0.52 e | 0.49 e | 0.53 e | 0.59 | 0.66 |
Net realized and unrealized gains/(losses) on investments | 0.24 | (0.02) | (0.66) | (0.08) | 0.01 |
Total from investment operations | 0.76 | 0.47 | (0.13) | 0.51 | 0.67 |
| Less Distributions | |||||
Dividends from net investment income | (0.53) | (0.48) | (0.50) | (0.58) | (0.60) |
Distributions from net realized capital gains1 | — | — | (0.22) | (0.27) | (0.02) |
Total distributions | (0.53) | (0.48) | (0.72) | (0.85) | (0.62) |
Proceeds from redemption fees | — * | — * | — * | — * | — * |
Net asset value end of period | 10.24 | 10.01 | 10.02 | 10.87 | 11.21 |
Net assets end of period (000s) | $ 42,753 | $ 87,155 | $ 96,957 | $ 100,194 | $ 114,564 |
| Ratios and Supplemental Data (%) | |||||
Total returnb | 7.79% | 5.02% | (1.15)% | 4.70% | 6.22% |
Ratio of total expenses to average net assets2 | 1.09 | 1.07 | 1.06 | 1.05 | 1.05 |
Ratio of net expenses to average net assetsa | 1.04 | 1.03 | 1.02 | 1.01 | 1.01 |
Ratio of net investment income to average net assetsa | 5.08 | 5.09 | 5.14 | 5.06 | 5.19 |
Portfolio turnover | 56 | 58 | 49 | 48 | 57 |
See page 82 for notes to the Financial Highlights.
The accompanying notes are an integral part of the Financial Statements.
78
| Administrative Class | ||||
| 2017 | 2016 | 2015 | 2014 | 2013 |
| $10.01 | $10.02 | $10.87 | $11.21 | $11.16 |
| 0.53 e | 0.51 e | 0.55 e | 0.60 | 0.70 |
| 0.25 | (0.02) | (0.67) | (0.08) | (0.02) |
| 0.78 | 0.49 | (0.12) | 0.52 | 0.68 |
| (0.54) | (0.50) | (0.51) | (0.59) | (0.61) |
| — | — | (0.22) | (0.27) | (0.02) |
| (0.54) | (0.50) | (0.73) | (0.86) | (0.63) |
| — * | — * | — * | — * | — * |
| 10.25 | 10.01 | 10.02 | 10.87 | 11.21 |
| $1,753 | $4,631 | $4,314 | $4,773 | $5,519 |
| 7.98% | 5.18% | (1.03)% | 4.82% | 6.33% |
| 0.97 | 0.95 | 0.94 | 0.93 | 0.93 |
| 0.92 | 0.91 | 0.90 | 0.89 | 0.89 |
| 5.20 | 5.20 | 5.26 | 5.18 | 5.32 |
| 56 | 58 | 49 | 48 | 57 |
| Retirement Class | |
| 2017 | 2016 f |
| $ 10.00 | $ 9.40 |
| 0.55 e | 0.36 e |
| 0.25 | 0.61 |
| 0.80 | 0.97 |
| (0.58) | (0.37) |
| — | — |
| (0.58) | (0.37) |
| — * | — * |
| 10.22 | 10.00 |
| $41,975 | $1,828 |
| 8.23% | 10.49% c |
| 0.65 | 0.66 d |
| 0.61 | 0.61 d |
| 5.44 | 5.38 d |
| 56 | 58 |
79
Harbor Fixed Income Funds Financial Highlights—Continued
Selected Data for a Share Outstanding for the Periods Presented
Selected Data for a Share Outstanding for the Periods Presented
| HARBOR BOND FUND | |||||
| Institutional Class | |||||
| Year Ended October 31, | 2017 | 2016 | 2015 | 2014 | 2013 |
Net asset value beginning of period | $ 11.88 | $ 11.92 | $ 12.28 | $ 12.22 | $ 13.03 |
| Income from Investment Operations | |||||
Net investment income/(loss)a | 0.36 e | 0.37 e | 0.34 e | 0.25 | 0.30 |
Net realized and unrealized gains/(losses) on investments | (0.04) | 0.16 | (0.18) | 0.16 | (0.30) |
Total from investment operations | 0.32 | 0.53 | 0.16 | 0.41 | — * |
| Less Distributions | |||||
Dividends from net investment income | (0.35) | (0.48) | (0.41) | (0.35) | (0.30) |
Distributions from net realized capital gains1 | (0.17) | (0.09) | (0.11) | — | (0.51) |
Total distributions | (0.52) | (0.57) | (0.52) | (0.35) | (0.81) |
Net asset value end of period | 11.68 | 11.88 | 11.92 | 12.28 | 12.22 |
Net assets end of period (000s) | $2,159,390 | $2,438,815 | $2,874,705 | $4,125,889 | $6,626,361 |
| Ratios and Supplemental Data (%) | |||||
Total returnb | 2.82% | 4.70% | 1.32% | 3.40% | (0.05)% |
Ratio of total expenses to average net assets2 | 0.63 | 0.60 | 0.58 | 0.56 | 0.56 |
Ratio of net expenses to average net assetsa | 0.54 | 0.53 | 0.52 | 0.54 | 0.53 |
Ratio of net expenses excluding interest expense to average net assetsa | 0.51 | 0.51 | 0.52 | 0.54 | 0.53 |
Ratio of net investment income to average net assetsa | 3.15 | 3.16 | 2.80 | 1.90 | 2.36 |
Portfolio turnover | 654 | 592 | 586 | 439 | 446 |
| HARBOR REAL RETURN FUND | |||||
| Institutional Class | |||||
| Year Ended October 31, | 2017 | 2016 | 2015 | 2014 | 2013 |
Net asset value beginning of period | $ 9.48 | $ 9.15 | $ 10.18 | $ 10.41 | $ 11.54 |
| Income from Investment Operations | |||||
Net investment income/(loss)a | 0.23 e | 0.15 e | 0.10 e | 0.40 | 0.10 |
Net realized and unrealized gains/(losses) on investments | (0.14) | 0.35 | (0.43) | (0.20) | (0.84) |
Total from investment operations | 0.09 | 0.50 | (0.33) | 0.20 | (0.74) |
| Less Distributions | |||||
Dividends from net investment income | (0.15) | (0.17) | (0.70) | (0.03) | (0.18) |
Distributions from net realized capital gains1 | — | — | — | (0.40) | (0.21) |
Total distributions | (0.15) | (0.17) | (0.70) | (0.43) | (0.39) |
Net asset value end of period | 9.42 | 9.48 | 9.15 | 10.18 | 10.41 |
Net assets end of period (000s) | $ 99,929 | $ 108,890 | $ 130,467 | $ 169,969 | $ 404,689 |
| Ratios and Supplemental Data (%) | |||||
Total returnb | 0.92% | 5.55% | (3.32)% | 2.07% | (6.67)% |
Ratio of total expenses to average net assets2 | 1.03 | 0.87 | 0.77 | 0.63 | 0.61 |
Ratio of net expenses to average net assetsa | 0.87 | 0.73 | 0.68 | 0.62 | 0.61 |
Ratio of net expenses excluding interest expense to average net assetsa | 0.54 | 0.55 | 0.58 | 0.60 | 0.59 |
Ratio of net investment income to average net assetsa | 2.42 | 1.63 | 1.06 | 1.91 | 0.92 |
Portfolio turnover | 758 | 611 | 531 | 427 | 285 |
See page 82 for notes to the Financial Highlights.
The accompanying notes are an integral part of the Financial Statements.
80
| Administrative Class | ||||
| 2017 | 2016 | 2015 | 2014 | 2013 |
| $ 11.89 | $ 11.93 | $ 12.28 | $ 12.23 | $ 13.03 |
| 0.34 e | 0.34 e | 0.30 e | 0.22 | 0.27 |
| (0.05) | 0.16 | (0.16) | 0.15 | (0.29) |
| 0.29 | 0.50 | 0.14 | 0.37 | (0.02) |
| (0.32) | (0.45) | (0.38) | (0.32) | (0.27) |
| (0.17) | (0.09) | (0.11) | — | (0.51) |
| (0.49) | (0.54) | (0.49) | (0.32) | (0.78) |
| 11.69 | 11.89 | 11.93 | 12.28 | 12.23 |
| $30,376 | $37,887 | $57,874 | $102,591 | $138,575 |
| 2.56% | 4.42% | 1.13% | 3.05% | (0.23)% |
| 0.88 | 0.85 | 0.83 | 0.81 | 0.81 |
| 0.79 | 0.78 | 0.77 | 0.79 | 0.78 |
| 0.76 | 0.76 | 0.77 | 0.79 | 0.78 |
| 2.90 | 2.89 | 2.47 | 1.66 | 2.11 |
| 654 | 592 | 586 | 439 | 446 |
| Administrative Class | ||||
| 2017 | 2016 | 2015 | 2014 | 2013 |
| $ 9.46 | $ 9.15 | $ 10.17 | $ 10.41 | $ 11.55 |
| 0.21 e | 0.13 e | 0.08 e | 0.21 | 0.06 |
| (0.15) | 0.34 | (0.42) | (0.03) | (0.84) |
| 0.06 | 0.47 | (0.34) | 0.18 | (0.78) |
| (0.10) | (0.16) | (0.68) | (0.02) | (0.15) |
| — | — | — | (0.40) | (0.21) |
| (0.10) | (0.16) | (0.68) | (0.42) | (0.36) |
| 9.42 | 9.46 | 9.15 | 10.17 | 10.41 |
| $ 1,461 | $ 2,492 | $ 3,174 | $ 3,481 | $ 3,542 |
| 0.62% | 5.26% | (3.47)% | 1.81% | (6.94)% |
| 1.26 | 1.12 | 1.02 | 0.88 | 0.86 |
| 1.10 | 0.98 | 0.93 | 0.87 | 0.86 |
| 0.77 | 0.80 | 0.83 | 0.85 | 0.84 |
| 2.19 | 1.38 | 0.90 | 2.08 | 0.69 |
| 758 | 611 | 531 | 427 | 285 |
81
Harbor Fixed Income Funds Financial Highlights—Continued
Selected Data for a Share Outstanding for the Periods Presented
Selected Data for a Share Outstanding for the Periods Presented
| HARBOR MONEY MARKET FUND | |||||
| Institutional Class | |||||
| Year Ended October 31, | 2017 | 2016 | 2015 | 2014 | 2013 |
Net asset value beginning of period | $ 1.00 | $ 1.00 | $ 1.00 | $ 1.00 | $ 1.00 |
| Income from Investment Operations | |||||
Net investment income/(loss)a | 0.01 e | — *,e | — *,e | — * | — * |
Net realized and unrealized gains/(losses) on investments | — | — | — | — | — |
Total from investment operations | 0.01 | — * | — * | — * | — * |
| Less Distributions | |||||
Dividends from net investment income | (0.01) | — * | — * | — * | — * |
Distributions from net realized capital gains1 | — | — | — | — | — |
Total distributions | (0.01) | — * | — * | — * | — * |
Net asset value end of period | 1.00 | 1.00 | 1.00 | 1.00 | 1.00 |
Net assets end of period (000s) | $169,637 | $136,986 | $176,781 | $157,801 | $137,042 |
| Ratios and Supplemental Data (%) | |||||
Total returnb | 0.73% | 0.30% | 0.08% | 0.06% | 0.09% |
Ratio of total expenses to average net assets2 | 0.35 | 0.36 | 0.32 | 0.30 | 0.31 |
Ratio of net expenses to average net assetsa | — | — | — | — | — |
Ratio of net investment income to average net assetsa | 0.72 | 0.27 | 0.08 | 0.06 | 0.09 |
| * | Less than $0.01 |
| 1 | Includes both short-term and long-term capital gains |
| 2 | Percentage does not reflect reduction for credit balance arrangements (see Note 2 of the accompanying Notes to Financial Statements) |
| a | Reflects the Adviser’s waiver, if any, of its management fees and/or other operating expenses |
| b | The total returns would have been lower had certain expenses not been waived during the periods shown. |
| c | Unannualized |
| d | Annualized |
| e | Amounts are allocated based upon average shares outstanding during the period |
| f | For the period March 1, 2016 (inception) through October 31, 2016 |
The accompanying notes are an integral part of the Financial Statements.
82
| Administrative Class | ||||
| 2017 | 2016 | 2015 | 2014 | 2013 |
| $ 1.00 | $ 1.00 | $ 1.00 | $ 1.00 | $1.00 |
| 0.01 e | — *,e | — *,e | — * | — * |
| — | — | — | — | — |
| 0.01 | — * | — * | — * | — * |
| (0.01) | — * | — * | — * | — * |
| — | — | — | — | — |
| (0.01) | — * | — * | — * | — * |
| 1.00 | 1.00 | 1.00 | 1.00 | 1.00 |
| $1,545 | $2,267 | $1,727 | $2,177 | $ 376 |
| 0.73% | 0.30% | 0.08% | 0.06% | 0.09% |
| 0.60 | 0.61 | 0.57 | 0.55 | 0.56 |
| — | — | — | — | — |
| 0.70 | 0.28 | 0.07 | 0.06 | 0.09 |
83
Harbor Fixed Income Funds
Notes to Financial Statements—October 31, 2017
Notes to Financial Statements—October 31, 2017
Note 1—Organizational Matters
Harbor Funds (the “Trust”) is registered under the Investment Company Act of 1940, as amended (the “Investment Company Act”), as an open-end management investment company. As of October 31, 2017 the Trust consists of 31 separate portfolios. The portfolios covered by this report are: Harbor Convertible Securities Fund, Harbor High-Yield Bond Fund, Harbor Bond Fund, Harbor Real Return Fund, and Harbor Money Market Fund (individually or collectively referred to as a “Fund” or the “Funds," respectively). Harbor Capital Advisors, Inc. (the “Adviser” or “Harbor Capital”) is the investment adviser for the Funds.
The Funds currently offer up to four classes of shares, designated as Institutional Class, Administrative Class, Investor Class, and Retirement Class. The shares of each class represent an interest in the same portfolio of investments of the Funds and have equal rights with respect to voting, redemptions, dividends, and liquidations, except that: (i) certain expenses, subject to the approval of the Trust’s Board of Trustees (the “Board of Trustees”), may be applied differently to each class of shares in accordance with current regulations of the Securities and Exchange Commission (“SEC”) and the Internal Revenue Service; and (ii) shareholders of a class that bears distribution and service expenses under terms of a distribution plan have exclusive voting rights as to that distribution plan.
Note 2—Significant Accounting Policies
The following is a summary of significant accounting policies followed by the Trust in the preparation of its financial statements. Each Fund follows the investment company reporting requirements under U.S. Generally Accepted Accounting Principles (“U.S. GAAP”), which includes the accounting and reporting guidelines under Accounting Standards Topic 946, Financial Services-Investment Companies. The preparation of financial statements in accordance with U.S. GAAP requires management to make estimates and assumptions that affect the reported amounts and disclosures in the financial statements. Actual results may differ from those estimates.
Security Valuation
The Trust’s valuation procedures permit the Funds to use a variety of valuation methodologies, consider a number of subjective factors, analyze applicable facts and circumstances and, in general, exercise judgment, when valuing Fund investments. The methodology used for a specific type of investment may vary based on the circumstances and relevant considerations, including available market data.
Equity securities (including common stock, preferred stock, and convertible preferred stock), exchange-traded notes and financial derivative instruments (such as futures contracts, options contracts, including rights and warrants and centrally cleared swap agreements) that are traded or cleared on a national securities exchange or system (except securities listed on the National Association of Securities Dealers Automated Quotation (“NASDAQ”) system and United Kingdom securities) are valued at the last sale price on a national exchange or system on which they are principally traded or cleared as of the valuation date. Securities listed on the NASDAQ system or a United Kingdom exchange are valued at the official closing price of those securities. In the case of securities for which there are no sales on the valuation day, (i) securities traded principally on a U.S. exchange, including NASDAQ, are valued at the mean between the closing bid and ask price; and (ii) securities traded principally on a foreign exchange, including United Kingdom securities, are valued at the official bid price determined as of the close of the primary exchange. Securities of open-end registered investment companies that are held by a Fund are valued at net asset value. To the extent these securities are actively traded and fair valuation adjustments are not applied, they are normally categorized as Level 1 in the fair value hierarchy. Equity securities traded on inactive markets or valued by reference to similar instruments are normally categorized as Level 2 in the fair value hierarchy. For more information on the fair value hierarchy, please refer to the Fair Value Measurements and Disclosures section in Note 2.
Debt securities (including corporate bonds, municipal bonds and notes, U.S. government agencies, U.S. treasury obligations, mortgage-backed and asset-backed securities, foreign government obligations, bank loans, and convertible securities other than short-term securities with a remaining maturity of less than 60 days at the time of acquisition), are valued using evaluated prices furnished by a pricing vendor selected by the Board of Trustees. An evaluated price represents an assessment by the pricing vendor using various market inputs of what the pricing vendor believes is the fair value of a security at a particular point in time. The pricing vendor determines evaluated prices for debt securities that would be transacted at institutional-size quantities using inputs including, but not limited to, (i) recent transaction prices and dealer quotes, (ii) transaction prices for what the pricing vendor believes are securities with similar characteristics, (iii) the pricing vendor’s assessment of the risk
84
Harbor Fixed Income Funds
Notes to Financial Statements—Continued
Notes to Financial Statements—Continued
Note 2—Significant Accounting Policies—Continued
inherent in the security taking into account criteria such as credit quality, payment history, liquidity and market conditions, and (iv) various correlations and relationships between security price movements and other factors, such as interest rate changes, which are recognized by institutional traders. In the case of mortgage-backed and asset-backed securities, the inputs used by the pricing vendor may also include information about cash flows, prepayment rates, default rates, delinquency and loss assumption, collateral characteristics, credit enhancements and other specific information about the particular offering. Because many debt securities trade infrequently, the pricing vendor will often not have current transaction price information available as an input in determining an evaluated price for a particular security. When current transaction price information is available, it is one input into the pricing vendor’s evaluation process, which means that the evaluated price supplied by the pricing vendor will frequently differ from that transaction price. Securities held by Harbor Money Market Fund are valued at amortized cost, which the Adviser has determined, pursuant to the Board of Trustees’ authorization, approximates fair value. Under this method, investments purchased at a discount or premium are valued by accreting or amortizing the difference between the original purchase price and the maturity value of the issue over the period to effective maturity.
Short-term securities with a remaining maturity of less than 60 days at the time of acquisition that are held by a Fund are valued at amortized cost to the extent amortized cost represents fair value. Securities that use similar valuation techniques and inputs as described above are normally categorized as Level 2 in the fair value hierarchy.
Over-the-counter (“OTC”) financial derivative instruments, such as forward currency contracts, options contracts, and swap agreements, derive their value from underlying asset prices, indices, reference rates and other inputs, or a combination of these factors. These instruments are valued using evaluated prices furnished by a pricing vendor selected by the Board of Trustees. In certain cases, when a valuation is not readily available from a pricing vendor, the Fund’s subadviser provides a valuation, typically using its own proprietary models. Depending on the instrument and the terms of the transaction, the value of the derivative instrument can be determined by a pricing vendor or subadviser using a series of techniques, including simulation pricing models. The pricing models use inputs, such as issuer details, indices, spreads, interest rates, yield curves, dividends and exchange rates, that are observed from actively quoted markets. Derivative instruments that use valuation techniques and inputs similar to those described above are normally categorized as Level 2 in the fair value hierarchy.
When reliable market quotations or evaluated prices supplied by a pricing vendor are not readily available or are not believed to accurately reflect fair value, securities are priced at their fair value as determined by the Trust’s Valuation Committee (the “Valuation Committee”) pursuant to procedures adopted, and subject to oversight, by the Board of Trustees. The Valuation Committee is comprised of a trustee and officers of the Trust and employees of Harbor Capital with relevant experience or responsibilities. Each security for which the Valuation Committee determines a fair value, including the basis for the fair value decision, is reviewed by the Board of Trustees at its regularly scheduled board meetings.
When a fair valuation method is applied by the Valuation Committee or a Fund’s subadviser, securities will be priced by a method that the Valuation Committee or subadviser believes accurately reflects fair value. Securities valued using fair valuation methods that incorporate significant unobservable inputs are normally categorized as Level 3 in the fair value hierarchy. Examples of possible fair valuation methodologies used in determining the fair value of securities categorized as Level 3 in the fair value hierarchy include, but are not limited to, benchmark pricing and indicative market quotations.
When benchmark pricing is used, the base price of a debt security is set and then subsequently adjusted in proportion to the market value changes of an index or similar security (the “benchmark security”) that trades in an active market or for which other observable inputs are available. The base price may be a broker-dealer quote, transaction price, or an internal value as derived by analysis of market data. The base price of the security may be reset on a periodic basis based on the availability of market data and procedures approved by a Fund’s subadviser. If the benchmark security is categorized as Level 2 in the fair value hierarchy due to the lack of an active market for that security, any security adjusted in proportion to the market value of the benchmark security may be categorized as Level 3 in the fair value hierarchy. Significant changes in the unobservable inputs of the benchmark pricing process (i.e., the base price) would result in direct and proportional changes in the fair value of the security. The reasonability of the fair value is reviewed by the subadviser on a periodic basis and may be amended as the availability of market data indicates a material change.
If evaluated pricing through a third-party pricing vendor is not available or deemed not to be indicative of fair value, a Fund’s subadviser may elect to obtain indicative market quotations (“broker quotes”) directly from a broker-dealer or passed through from a third-party pricing vendor. Indicative market quotations are typically received from established market participants.
85
Harbor Fixed Income Funds
Notes to Financial Statements—Continued
Notes to Financial Statements—Continued
Note 2—Significant Accounting Policies—Continued
In the event that the source of fair value is from a single-sourced broker quote, but the subadviser does not have the transparency to view the underlying inputs that support the market quotation, these securities are categorized as Level 3 in the fair value hierarchy. Significant changes in the broker quote would have direct and proportional changes in the fair value of the security.
A Fund may also use fair value pricing if the value of some or all of the Fund’s securities have been materially affected by events occurring before the Fund’s pricing time but after the close of the primary markets or exchanges on which the security is traded. This most commonly occurs with foreign securities, but may occur with other securities as well. In such cases, the Fund may apply a fair value factor supplied by the pricing vendor to a foreign security’s market close value to reflect changes in value that may have occurred between the close of the primary market or exchange on which the security is traded and the Fund’s pricing time. That factor may be derived using observable inputs such as a comparison of the trading patterns of a foreign security to intraday trading in the U.S. markets that are highly correlated to the foreign security or other information that becomes available after the close of the foreign market on which the security principally traded. When fair value pricing is employed, the prices of securities used by a Fund to calculate its net asset value may differ from market quotations, official closing prices or evaluated prices for the same securities, which means that the Fund may value those securities higher or lower than another given fund that uses market quotations, official closing prices or evaluated prices supplied by a pricing vendor in its calculation of net asset value. Securities valued using observable inputs, such as those described above, are normally categorized as Level 2 of the fair value hierarchy.
Fair Value Measurements and Disclosures
Various inputs may be used to determine the value of each Fund’s investments, which are summarized in three broad categories defined as Level 1, Level 2, and Level 3. The inputs or methodologies used for valuing securities are not necessarily indicative of the risk associated with investing in those securities. The assignment of an investment to Levels 1, 2, or 3 is based on the lowest level of significant inputs used to determine its fair value.
| Level 1– | Quoted prices in active markets for identical securities. |
| Level 2– | Other significant observable inputs (including quoted prices for similar securities, interest rates, prepayment speeds, credit risk, etc.). |
| Level 3– | Significant unobservable inputs are used in situations where quoted prices or other observable inputs are not available or are deemed unreliable. Significant unobservable inputs may include each Fund’s own assumptions. |
Transfers between levels, if any, are recognized as of the last day in the fiscal quarter of the period in which the event or change in circumstances that caused the reclassification occurred. For fair valuations using significant unobservable inputs, a reconciliation of the beginning to ending balances for reported fair values is provided that presents changes attributable to realized and unrealized gains and losses and purchases, sales, and transfers in/out of the Level 3 category during the period. A table that includes a categorization of investments into Levels 1, 2, or 3, transfers between levels, if any, and a Level 3 reconciliation, including details of significant unobservable inputs used, when applicable, can be found at the end of each Fund’s Portfolio of Investments schedule.
Each Fund used observable inputs in its valuation methodologies whenever they were available and deemed reliable.
Loan Participations and Assignments
Loan participations and loan assignments are direct debt instruments, which are interests in amounts owed by corporate, governmental, or other borrowers to lenders or lending syndicates. During the year, Harbor High-Yield Bond Fund, Harbor Bond Fund, and Harbor Real Return Fund invested in loan participations and assignments. A Fund’s investments in loans may be in the form of participation in loans or assignments of all or a portion of loans from third parties. A loan is often administered by a bank or other financial institution (the “agent”) that acts as agent for all holders. The agent administers the terms of the loan, as specified in the loan agreement. When investing in a loan participation, the Fund has the right to receive payments of principal, interest and any fees to which it is entitled, only from the agent selling the loan agreement and only upon receipt by the agent of payments from the borrower. As a result, the Fund may be subject to the credit risk of both the borrower and the agent that is selling the loan agreement. When the Fund purchases assignments from the agent, it acquires direct rights against the borrower on the loan.
86
Harbor Fixed Income Funds
Notes to Financial Statements—Continued
Notes to Financial Statements—Continued
Note 2—Significant Accounting Policies—Continued
Harbor High-Yield Bond Fund entered into unfunded loan commitments during the year, which are contractual obligations for future funding. Unfunded loan commitments may include revolving credit facilities, which may obligate the Fund to supply additional cash to the borrower on demand. Unfunded loan commitments represent a future obligation in full, even though a percentage of the notional loan amounts will never be utilized by the borrower. The funded portion of these credit agreements are presented on the Portfolio of Investments. Unfunded loan commitments are marked to market daily and any unrealized appreciation or depreciation is included in the Statement of Assets and Liabilities and the Statement of Operations.
Harbor High-Yield Bond Fund may receive a commitment fee based on the undrawn portion of the underlying line of credit portion of an unfunded loan commitment. In certain circumstances, a Fund that has entered into an unfunded loan commitment may receive a prepayment penalty fee upon the prepayment of a loan by a borrower. Fees earned are recorded as a component of interest income on the Statement of Operations.
As of October 31, 2017, Harbor High-Yield Bond Fund had $8,040,000 in unfunded loan commitments outstanding.
Inflation-Indexed Bonds
Inflation-indexed bonds are fixed-income securities whose principal value is periodically adjusted based on the rate of inflation. During the year, Harbor Bond Fund and Harbor Real Return Fund invested in inflation-indexed bonds. The interest rate on these bonds is generally fixed at issuance at a rate lower than typical bonds. Over the life of an inflation-indexed bond, however, interest will be paid based on a principal value that is adjusted for inflation. Any increase in the principal amount of an inflation-indexed bond will be included as interest income even though investors do not receive the principal until maturity.
Mortgage-Related and Other Asset-Backed Securities
Mortgage-backed or asset-backed securities include mortgage pass-through securities, collateralized mortgage obligations (“CMOs”), commercial mortgage-backed securities, CMO residuals, stripped mortgage- backed securities (“SMBSs”) and other securities that directly or indirectly represent a participation in, or are secured by and payable from, mortgage loans on real property. During the year, Harbor Bond Fund and Harbor Real Return Fund invested in mortgage- or other asset-backed securities. The value of some mortgage- or asset-backed securities may be particularly sensitive to changes in prevailing interest rates. Early repayment of principal on some mortgage-related securities may expose a Fund to a lower rate of return upon reinvestment of principal. The value of these securities may fluctuate in response to the market’s perception of the creditworthiness of the issuers. Additionally, although mortgages and mortgage-related securities are generally supported by some form of government or private guarantee and/or insurance, there is no assurance that private guarantors or insurers will meet their obligations.
U.S. Government Securities
During the year, Harbor Bond Fund, Harbor Real Return Fund and Harbor Money Market Fund invested in U.S. government securities. U.S. government securities include securities issued by U.S. government agencies or government-sponsored enterprises that may not be guaranteed by the U.S. Treasury. The Government National Mortgage Association (“GNMA” or “Ginnie Mae”), a wholly owned U.S. government corporation, is authorized to guarantee, with the full faith and credit of the U.S. government, the timely payment of principal and interest on securities issued by institutions approved by GNMA and backed by pools of mortgages insured by the Federal Housing Administration or guaranteed by the Department of Veterans Affairs. Government-related guarantors are not backed by the full faith and credit of the U.S. government and include the Federal National Mortgage Association (“FNMA” or “Fannie Mae”) and the Federal Home Loan Mortgage Corporation (“FHLMC” or “Freddie Mac”). On September 7, 2008, the Federal Housing Finance Agency placed Fannie Mae and Freddie Mac in conservatorship, while the U.S. Treasury agreed to purchase preferred stock as needed to ensure that both Fannie Mae and Freddie Mac maintain a positive net worth (guaranteeing up to $100 billion for each entity). As a consequence, certain fixed income securities of Fannie Mae and Freddie Mac have more explicit U.S. government support. No assurance can be given as to whether the U.S. government will continue to support Fannie Mae and Freddie Mac. In addition, the future of Fannie Mae and Freddie Mac is uncertain because Congress has been considering proposals as to whether Fannie Mae and Freddie Mac should be nationalized, privatized, restructured or eliminated altogether. Fannie Mae and Freddie Mac are also the subject of continuing legal actions and investigations, which may have an adverse effect on these entities.
87
Harbor Fixed Income Funds
Notes to Financial Statements—Continued
Notes to Financial Statements—Continued
Note 2—Significant Accounting Policies—Continued
Forward Commitments and When-Issued Securities
During the year, Harbor Bond Fund and Harbor Real Return Fund purchased and sold securities on a forward commitment basis, including “TBA” (to be announced) purchase and sale commitments. Purchasing securities on a when-issued or forward commitment basis involves a risk of loss if the value of the security to be purchased declines prior to the settlement date. Although a Fund would generally purchase securities on a when-issued or forward commitment basis with the intention of acquiring securities for its portfolio, a Fund may dispose of a when-issued security or forward commitment prior to settlement if a subadviser deems it appropriate to do so. Each Fund may enter into a forward commitment sale to hedge its portfolio positions or to sell securities it owned under a delayed delivery arrangement. Sale proceeds are not received until the contractual settlement date. A Fund may realize short-term gains or losses upon such purchases and sales. These transactions involve a commitment by a Fund to purchase or sell securities at a future date (ordinarily one or two months later). The price of the underlying securities (usually expressed in terms of yield) and the date when the securities will be delivered and paid for (the settlement date) are fixed at the time the transaction is negotiated. When-issued purchase and forward commitment transactions are negotiated directly with the other party, and such commitments are not traded on exchanges.
The value of securities purchased on a when-issued or forward commitment basis and any subsequent fluctuations in their value are reflected in the computation of a Fund’s net asset value starting on the date of the agreement to purchase the securities. A Fund does not earn interest on the securities it has committed to purchase until they are paid for and delivered on the settlement date. When a Fund makes a forward commitment to sell securities it owns, the proceeds to be received upon settlement are included in the Fund’s assets. Fluctuations in the market value of the underlying securities are not reflected in a Fund’s net asset value as long as the commitment to sell remains in effect. Settlement of when-issued purchase and forward commitment transactions generally takes place within two months after the date of the transaction, but a Fund may agree to a longer settlement period.
A Fund will purchase securities on a when-issued basis, or purchase or sell securities on a forward commitment basis, only with the intention of completing the transaction and actually purchasing or selling the securities. If deemed advisable as a matter of investment strategy, however, a Fund may dispose of or renegotiate a commitment after it is entered into. A Fund also may sell securities it has committed to purchase before those securities are delivered to a Fund on the settlement date. A Fund may realize a capital gain or loss in connection with these transactions. When a Fund purchases securities on a when-issued or forward commitment basis, the Fund will maintain in a segregated account with the Fund’s custodian, or set aside or restrict in the subadviser’s records or systems relating to the Fund, cash or liquid assets having a value (determined daily) at least equal to the amount of the Fund’s purchase commitments. In the case of a forward commitment to sell portfolio securities, portfolio holdings will be held in a segregated account with the Fund’s custodian, or set aside or restricted on the subadviser’s records or systems relating to the Fund, while the commitment is outstanding.
Repurchase Agreements
In a repurchase agreement, a Fund buys a security at one price and simultaneously agrees to sell it back at a higher price. Such agreements must be adequately collateralized to cover the counterparty’s obligation to the Fund to close out the repurchase agreement. During the year, each Fund entered into repurchase agreements with domestic or foreign banks or with a member firm of the Financial Industry Regulatory Authority, Inc., or an affiliate of a member firm that is a primary dealer in U.S. government securities. Each repurchase agreement counterparty must meet the minimum credit quality requirements applicable to the respective Fund and any other appropriate counterparty criteria as determined by the Fund’s subadviser. The minimum credit quality requirements are those applicable to a Fund’s purchase of securities such that if a Fund is permitted to only purchase securities that are rated investment-grade (or the equivalent if unrated), a Fund could only enter into repurchase agreements with counterparties that have debt outstanding that is rated investment-grade (or the equivalent if unrated). The securities are regularly monitored to ensure that the collateral is adequate. A Fund seeks to further mitigate its counterparty risk by entering into master repurchase agreements with its counterparties. The master repurchase agreements provide that, in the event of a counterparty’s default, including bankruptcy, the Fund may terminate any repurchase agreements with that counterparty, determine the net amount owned, and sell or retain the collateral up to the net amount owed to the Fund. A counterparty’s default may cause the Fund to suffer losses, including loss of interest on or principal of the securities and costs associated with delay and enforcement of the terms of the master repurchase agreement.
88
Harbor Fixed Income Funds
Notes to Financial Statements—Continued
Notes to Financial Statements—Continued
Note 2—Significant Accounting Policies—Continued
Sale-Buybacks
A “sale-buyback” financing transaction consists of a sale of a portfolio security by a Fund to a financial institution (the counterparty) with a simultaneous agreement to repurchase the same or substantially the same security at an agreed-upon price and date. The Fund is not entitled to receive principal and interest payments, if any, made on the security sold to the counterparty during the term of the agreement. During the year, Harbor Bond Fund and Harbor Real Return Fund entered into such financing transactions referred to as sale-buybacks.
The agreed-upon proceeds for securities to be repurchased by the Fund are reflected as a liability on the Statement of Assets and Liabilities. The Fund will recognize net income represented by the price differential between the price received for the transferred security and the agreed-upon repurchase price. This is commonly referred to as the “price drop.” A price drop consists of two components: (i) the foregone interest and inflationary income adjustments, if any, the Fund would have otherwise received had the security not been sold, and (ii) the negotiated financing terms between the Fund and counterparty. Foregone interest and inflationary income adjustments, if any, are recorded as components of interest income on the Statement of Operations. Interest payments based upon negotiated financing terms made by the Fund to counterparties are recorded as a component of interest expense on the Statement of Operations. To cover its obligations under sale-buyback transactions, a Fund will segregate cash or liquid securities, which are marked-to-market daily, with the Fund’s custodian, or set aside or restrict assets in the subadviser’s records or systems relating to the Fund, in an amount not less than the repurchase price, including accrued interest, of the underlying security. Sale-buyback transactions involve the risk that the fair value of the securities sold by a Fund may decline below the repurchase price of the securities and, if the proceeds from the sale-buyback transaction are invested in securities, that the fair value of the securities purchased may decline below the repurchase price of the securities sold. In periods of increased demand for a security, the Fund may receive a fee for use of the security by the counterparty, which may result in additional interest income to the Fund.
The average amount of borrowings outstanding during the year ended October 31, 2017 was $76,698,000 at a weighted average interest rate of 0.898% for the Harbor Bond Fund and $33,504,000 at a weighted average interest rate of 1.033% for the Harbor Real Return Fund.
A table that includes the remaining maturity period for outstanding sale-buyback transactions and the type of investment collateral pledged can be found at the end of each Fund’s Portfolio of Investments schedule.
Short Sales
During the year, Harbor Bond Fund and Harbor Real Return Fund engaged in short-selling, which obligates a Fund to replace a borrowed security by purchasing it at the market price at the time of replacement. Until the security is replaced, such Fund is required to pay any accrued interest or dividends to the lender and also may be required to pay a premium. A Fund would realize a gain if the security declines in price between the date of the short sale and the date on which such Fund replaces the borrowed security. A Fund would incur a loss as a result of the short sale if the price of the security increases between those dates. Until a Fund replaces the borrowed security, subject to pre-arranged exposure levels, it will maintain cash or liquid securities sufficient to cover its short position in a segregated account with the Fund’s custodian or set aside or restricted in the subadviser’s records or systems relating to the Fund. Short sales involve the risk of an unlimited increase in the market price of the borrowed security.
Futures Contracts
A futures contract is an agreement between two parties to buy or sell a specified financial instrument at a set price on a future date. During the year, Harbor Bond Fund and Harbor Real Return Fund used futures contracts to gain exposure to the fixed income asset class with greater efficiency and lower cost than was possible through direct investment, to add value when these securities were attractively priced, or to adjust the portfolio’s sensitivity to changes in interest rates or currency exchange rates. Futures contracts tend to increase or decrease a Fund’s exposure to the underlying instrument or can be used to hedge other Fund investments.
Upon entering into a futures contract, a Fund is required to pledge to the broker an amount of cash, U.S. government securities or other liquid securities equal to the minimum “initial margin” requirements of the exchange. Pursuant to the contract, a Fund agrees to receive from or pay to the broker an amount of cash equal to the daily fluctuation in value of the contract referred to as “variation margin.” Such receipts or payments are recorded by a Fund as unrealized gains or losses. When the
89
Harbor Fixed Income Funds
Notes to Financial Statements—Continued
Notes to Financial Statements—Continued
Note 2—Significant Accounting Policies—Continued
contract is closed or expires, a Fund records a realized gain or loss equal to the difference between the value of the contract at the time it was opened and the value at the time it was closed. A Fund may suffer losses if it is unable to close out its position because of an illiquid secondary market. There is no assurance that a Fund will be able to close out its position when the Fund considers it appropriate or desirable to do so. In the event of adverse price movements, a Fund may be required to continue making daily cash payments to maintain its required margin. If a Fund has insufficient cash, it may have to sell portfolio securities to meet daily margin requirements at a time when the Fund would not otherwise elect to do so. In addition, a Fund may be required to deliver or take delivery of instruments. The maximum potential loss on a long futures contract is the U.S. dollar value of the notional amount at the time the contract is opened. The potential loss on a short futures contract is unlimited. There is minimal counterparty risk with futures contracts as they are exchange traded and the exchange’s clearinghouse, as counterparty to all exchange traded futures, guarantees the futures contracts against default.
Options
An option, including rights and warrants, is a contract that offers the buyer the right, but not the obligation, to buy (call) or sell (put) a security or other financial asset at an agreed-upon price (the strike price) during a certain period of time or on a specific date (exercise date). During the year, Harbor Bond Fund and Harbor Real Return Fund purchased and wrote (sold) option contracts to manage their respective exposure to the bond markets and to fluctuations in interest rates and currency values. Purchased call options tend to increase a Fund’s exposure to the underlying instrument. Purchased put options tend to decrease a Fund’s exposure to the underlying instrument.
When a Fund purchases an option, it pays a premium. If a purchased option expires, a Fund realizes a loss in the amount of the premium. If a Fund enters into a closing sale transaction, it realizes a gain or loss, depending on whether the proceeds from the sale are greater or less than the cost of the option. If a call option is exercised by a Fund, the cost of the securities acquired by exercising the call is increased by the premium paid to buy the call. If a put option is exercised by a Fund, it realizes a gain or loss from the sale of the underlying security and the proceeds from such sale are decreased by the premium originally paid. The risk associated with purchasing options is limited to the premium paid. A Fund’s maximum risk of loss from counterparty credit risk is also limited to the premium paid for the contract.
When a Fund writes an option, it receives a premium. If a written option expires on its stipulated expiration date, or if a Fund enters into a closing purchase transaction, the Fund realizes a gain (or loss, if the cost of a closing purchase transaction exceeds the premium received when the option was written) without regard to any unrealized gain or loss on the underlying security, and the liability related to such option is extinguished. If a written call option is exercised, a Fund realizes a gain or loss from the sale of the underlying security, and the proceeds of the sale are increased by the premium originally received. If a written put option is exercised, the amount of the premium originally received reduces the cost of the security that a Fund purchases upon exercise of the option.
The risk in writing a call option is that a Fund relinquishes the opportunity to profit if the fair value of the underlying security increases and the option is exercised. In writing a put option, a Fund assumes the risk of incurring a loss if the fair value of the underlying security decreases and the option is exercised. In addition, there is a risk that a Fund may not be able to enter into a closing transaction because of an illiquid secondary market or if the counterparty does not perform under the contract’s terms.
Options on exchange-traded futures contracts are an option contract in which the underlying instrument is a single futures contract. A Fund may write or purchase options on exchange-traded futures contracts in which a Fund agrees to receive from or pay to the broker an amount of cash equal to the daily fluctuation in value of the contract referred to as “variation margin.” Such receipts or payments are recorded by a Fund as unrealized gains or losses. When the contract is closed or expires, a Fund records a realized gain or loss equal to the difference between the value of the contract at the time it was opened and the value at the time it was closed.
Swap Agreements
A swap is a contract between two parties to exchange future cash flows at specified intervals (payment dates) based upon a notional principal amount during the agreed-upon life of the contract. Swaps are marked-to-market daily and changes in value are recorded as unrealized appreciation or depreciation.
90
Harbor Fixed Income Funds
Notes to Financial Statements—Continued
Notes to Financial Statements—Continued
Note 2—Significant Accounting Policies—Continued
Upon entering a swap agreement, any payments received or made at the beginning of the measurement period are reflected as such on the Statements of Assets and Liabilities and represent a reconciling value to compensate for differences between the stated terms of the swap agreement and prevailing market conditions (such as credit spreads, currency exchange rates, interest rates, and other relevant factors). These upfront payments are recorded as realized gains or losses on the Statements of Operations upon termination or maturity of the swap. If a liquidation payment is received or made at the termination of the swap, it is recorded as realized gain or loss on the Statements of Operations. Net periodic payments received or paid by the Fund are included as part of realized gains or losses on the Statements of Operations. A Fund will only enter into swap agreements with counterparties that meet the minimum credit quality requirements applicable to the Fund and any other appropriate counterparty criteria as determined by the Fund’s subadviser. The minimum credit quality requirements are similar to those applicable to a Fund’s purchase of securities, such that if the Fund is permitted to only purchase securities that are rated investment-grade (or the equivalent if unrated), the Fund could only enter into one of the below referenced transactions with counterparties that have debt outstanding that is rated investment-grade (or the equivalent if unrated). Entering into swap agreements involves, to varying degrees, elements of credit risk, market risk and interest rate risk in excess of the amount recognized in the Statements of Assets and Liabilities. Such risks include the possibility that there is not a liquid market for these agreements, that the counterparty to the agreements may default on its obligation to perform, or that there may be unfavorable changes in market conditions or interest rates. The Fund’s maximum risk of loss from counterparty credit risk is the discounted value of the net cash flows to be received from the counterparty over the contract’s remaining life or the value of the contract. This risk is typically mitigated by entering into swap agreements with highly-rated counterparties, the existence of a master netting arrangement between the Fund and the counterparty, and the posting of collateral by the counterparty.
Interest Rate Swaps are agreements between counterparties to exchange cash flows or an exchange of commitments to pay or receive interest with respect to the notional amount of principal. During the year, Harbor Bond Fund and Harbor Real Return Fund used interest rate swap agreements to manage their respective exposure to interest rate changes. Changes in interest rates can have an effect on the value of bond holdings, the amount of interest income earned and the value of the interest rate swaps held.
Credit Default Swaps are agreements between counterparties to buy or sell protection on a debt security, a basket of securities, or an index of obligations against a defined credit event. Under the terms of a credit default swap, the buyer of protection receives credit protection in exchange for making periodic payments to the seller of protection based on a given percentage applied to a notional principal amount. In return for these payments, the seller acts as the guarantor of the creditworthiness of a reference entity, obligation or index. During the year, Harbor Bond Fund and Harbor Real Return Fund used credit default swap agreements as a seller to gain credit exposure to an issuer or to simulate investments in long bond positions that were either unavailable or less attractively priced in the bond market; the Funds used credit default swap agreements as a buyer to provide a measure of protection against defaults of an issuer. An issuer may represent either a single issuer, a “basket” of issuers, or a credit index. A credit index is a basket of credit instruments or exposures designed to be representative of some part of the credit market as a whole.
The buyer in a credit default contract is obligated to pay the seller a periodic stream of payments over the term of the contract provided that no credit event occurs. Credit events may include bankruptcy, failure to pay principal, maturity extension, rating downgrade, or write-down. As a seller, if an underlying credit event occurs, a Fund will either pay the buyer an amount equal to the notional amount of the swap and take delivery of the reference obligation (or underlying securities comprising an index), or pay a net settlement amount of cash equal to the notional amount of the swap less the recovery value of the reference obligation (or underlying securities comprising an index). As a buyer, if an underlying credit event occurs, a Fund will either receive from the seller an amount equal to the notional amount of the swap and deliver the reference obligation (or underlying securities comprising an index) or receive a net settlement. The maximum exposure to loss of the notional value as the seller of credit default swaps outstanding at October 31, 2017 for Harbor Bond Fund and Harbor Real Return Fund was $3,600,000 and $1,000,000, respectively.
Variance Swaps are agreements between counterparties to exchange cash flows based upon the measured variance (or the square of volatility) of a specified underlying asset. One party agrees to exchange a strike price (“Fixed Rate”) for the realized price variance (“Floating Rate”) on the underlying asset with respect to the notional amount. During the year, Harbor Bond Fund and Harbor Real Return Fund used variance swap agreements to gain or mitigate exposure to underlying reference assets or securities. When a variance swap agreement is originated, the strike price is generally set such that the fair value of the swap is zero. At the maturity date, a net cash flow is exchanged where the payoff amount is equal to the difference between the final market price of the asset and the strike price multiplied by the notional amount. As a receiver of the Floating Rate,
91
Harbor Fixed Income Funds
Notes to Financial Statements—Continued
Notes to Financial Statements—Continued
Note 2—Significant Accounting Policies—Continued
a Fund receives the payoff amount when the final market price is greater than the strike price and owes the payoff amount when the final market price is less than the strike price. As a payer of the Floating Rate, a Fund owes the payoff amount when the final market price is greater than the strike price, and receives the payoff amount when the final market price is less than the strike price.
Forward Currency Contracts
A forward currency contract is an agreement between two parties to buy and sell currencies at a set price on a future date. During the year, Harbor Bond Fund and Harbor Real Return Fund used forward currency contracts to manage their respective exposure to changes in exchange rates or as a hedge against foreign exchange risk related to specific transactions or portfolio positions.
The forward currency contract is marked-to-market daily and the change in market value is recorded as an unrealized gain or loss. When the contract is closed, the Fund records a realized gain or loss equal to the difference between the value on the open and close date. Risk of losses may arise from changes in the value of the foreign currency, or if the counterparties do not perform under the contract’s terms. The maximum potential loss from such contracts is the aggregate face value in U.S. dollars at the time the contract was opened. During the year, Harbor Bond Fund and Harbor Real Return Fund entered into collateral agreements with certain counterparties to mitigate counterparty risk associated with forward currency contracts.
Foreign Currency Spot Contracts
A foreign currency spot contract is an agreement between two parties to buy and sell currencies at the current market rate for settlement within two business days. During the year, Harbor Bond Fund and Harbor Real Return Fund used foreign currency spot contracts to facilitate transactions in foreign securities or to convert foreign currency receipts into U.S. dollars.
The foreign currency spot contract is marked-to-market daily for settlements beyond one day, and any change in market value is recorded as an unrealized gain or loss. When the contract is closed, the Fund records a realized gain or loss equal to the difference between the value on the open and close date. Risk of losses may arise from changes in the value of the foreign currency or if the counterparties do not perform under the contract’s terms. The maximum potential loss from such contracts is the aggregate face value in U.S. dollars at the time the contract was opened.
Foreign Currency Translations
Purchases and sales of securities are translated into U.S. dollars at the current exchange rate on the respective dates of the transactions. Income and withholding taxes are translated at the prevailing exchange rate when accrued or incurred. The accounting records of the Funds are maintained in U.S. dollars. Investment securities and other assets and liabilities denominated in a foreign currency, when applicable, are translated into U.S. dollars based on the current exchange rates at year end.
Reported net realized gains and losses on foreign currency transactions, when applicable, represent net gains and losses from sales and maturities of foreign currency contracts, disposition of foreign currencies, currency gains and losses realized between the trade and settlement dates on securities transactions, and the difference between the amount of investment income accrued and tax reclaims receivable and the U.S. dollar amount actually received. The effects of changes in foreign currency exchange rates on investments in securities, when applicable, are included in the net realized and unrealized gain or loss on investments in the Statement of Operations.
Investment Income
Dividends declared on portfolio securities are accrued on the ex-dividend date. For foreign securities held, certain dividends are recorded after the ex-dividend date, but as soon as the respective Fund is notified of such dividends. Interest income is accrued daily as earned. Discounts and premiums on fixed income securities purchased are amortized over the life of the respective securities using the effective yield method. Paydown gains and losses on mortgage-backed and asset-backed securities are recognized as a component of interest income. Consent fees relating to corporate actions from investments held are recorded as income upon receipt.
92
Harbor Fixed Income Funds
Notes to Financial Statements—Continued
Notes to Financial Statements—Continued
Note 2—Significant Accounting Policies—Continued
Securities Transactions
Securities transactions are accounted for on the trade date (the date the order to buy or sell is executed). Realized gains or losses on security transactions are determined on the basis of identified cost.
Proceeds from Litigation
Each Fund may receive proceeds from shareholder litigation settlements involving current and/or previously held portfolio holdings. Any proceeds received from litigation involving portfolio holdings are reflected in the Statements of Operations in realized gain/(loss) if the security has been disposed of by a Fund, or in unrealized gain/(loss) if the security is still held by a Fund.
Distribution to Shareholders
Distributions on Fund shares are recorded on the ex-dividend date.
Expenses
Expenses incurred by the Trust are charged directly to the Fund that incurred such expense whenever possible. With respect to expenses incurred by any two or more Harbor Funds where amounts cannot be identified on a fund by fund basis, such expenses are generally allocated in proportion to the average net assets or the number of shareholders of each Fund.
Custodian
Each Fund has credit balance arrangements with its custodian whereby positive balances in demand deposit accounts used by the transfer and shareholder servicing agent for clearing shareholder transactions in the Fund generate credits that are applied against gross custody expenses. Such custodial expense reductions, if any, are reflected on the respective Fund’s accompanying Statement of Operations.
Class Allocations
Income, common expenses and realized and unrealized gains/(losses) are determined at the Fund level and allocated daily to each class of shares based on the applicable net assets of the respective classes. Distribution and service fees, if any, and transfer agent fees are calculated daily at the class level based on the applicable net assets of each class and the expense rate(s) applicable to each class.
Taxes
Each Fund is treated as a separate entity for federal tax purposes. Each Fund’s policy is to meet the requirements of Subchapter M of the Internal Revenue Code applicable to regulated investment companies and to distribute to its shareholders all of its taxable income within the prescribed time. It is also the intention of each Fund to distribute an amount sufficient to avoid imposition of any excise tax under Section 4982 of the Internal Revenue Code. Therefore, no provision has been made for federal taxes on income, capital gains or unrealized appreciation of securities held or excise taxes on income and capital gains.
Each Fund may be subject to taxes imposed by countries in which they invest. Such taxes are generally based on income and/or capital gains earned or repatriated. Taxes are accrued and applied to net investment income, net realized gains and unrealized appreciation as such income and/or gains are earned.
Management has analyzed each Fund’s tax positions for all open tax years (in particular, U.S. federal income tax returns for the tax years ended October 31, 2014–2016), including all positions expected to be taken upon filing the 2017 tax return, in all material jurisdictions where each Fund operates, and has concluded that no provision for income tax is required in the Funds' financial statements. Each Fund will recognize interest and penalties, if any, related to unrecognized tax benefits as income tax expense in the Statement of Operations.
93
Harbor Fixed Income Funds
Notes to Financial Statements—Continued
Notes to Financial Statements—Continued
Note 2—Significant Accounting Policies—Continued
Statement of Cash Flows
U.S. GAAP requires entities providing financial statements that report both a statement of assets and liabilities and a statement of operations to also provide a statement of cash flows for each period for which results of operations are provided. Investment companies that meet certain conditions are exempted from this requirement. One of the conditions that must be satisfied is that the fund have little or no debt outstanding during the year. During the year ended October 31, 2017, Harbor Bond Fund and Harbor Real Return Fund entered into repurchase agreements, which are categorized as sale-buyback financing transactions under the Accounting Standards Update (“ASU”) 2011-03, A Reconsideration of Effective Control for Repurchase Agreements (“ASU 2011-03”). ASU 2011-03 refers to the accounting for repurchase agreements and similar agreements that entitle and obligate a transferor to repurchase or redeem financial assets before their maturity. These transactions resulted in debt being recorded on each Fund’s Statement of Assets and Liabilities. Management has determined that the average level of debt outstanding during the year for Harbor Real Return Fund requires the Fund to present a Statement of Cash Flows.
Investment Company Reporting Modernization
The Funds have adopted the Amendments to Regulation S-X as detailed in the SEC final rule on Investment Company Reporting Modernization (the “Rule”) which requires standardized, enhanced disclosure about derivatives in investment company financial statements, as well as other amendments. The derivative schedules included in a Fund’s Portfolio of Investments have been prepared to incorporate the new columns required by the Rule which became effective as of August 1, 2017. The adoption of the Rule had no impact on any Fund’s net assets or results of operations.
New Accounting Pronouncements
In November 2016, the Financial Accounting Standards Board (“FASB”) issued an Accounting Standards Update (“ASU”) 2016-18, Restricted Cash, which amends the Accounting Standards Codification (“ASC”) 230, Statement of Cash Flows, to provide guidance on the classification and presentation of changes in restricted cash and restricted cash equivalents on the Statement of Cash Flows. The ASU is effective for annual periods beginning after December 15, 2017, and interim periods within those annual periods. At this time, management is evaluating the implications of these changes on the financial statements.
In March 2017, the FASB issued ASU 2017-08, Premium Amortization on Purchased Callable Debt Securities, which provides guidance related to the amortization period for certain purchased callable debt securities held at a premium. The ASU is effective for annual periods beginning after December 15, 2018, and interim periods within those annual periods. At this time, management is evaluating the implications of these changes on the financial statements.
Note 3—Investment Portfolio Transactions
Purchases and sales of investments, other than short-term securities, for each Fund for the year ended October 31, 2017 are as follows:
| Purchases (000s) | Sales (000s) | ||||||
| U.S. Government | Other | U.S. Government | Other | ||||
Harbor Convertible Securities Fund | $ — | $ 310,706 | $ — | $ 631,945 | |||
Harbor High-Yield Bond Fund | — | 905,788 | — | 1,364,632 | |||
Harbor Bond Fund | 18,624,538 | 1,157,921 | 19,159,003 | 966,823 | |||
Harbor Real Return Fund | 981,307 | 19,993 | 965,634 | 26,730 | |||
Note 4—Fees and Other Transactions with Affiliates
Investment Adviser
Harbor Capital is a wholly-owned subsidiary of Robeco Groep N.V. (“Robeco”). Robeco is wholly-owned by ORIX Corporation (“ORIX”). Harbor Capital is the Funds’ investment adviser and is also responsible for administrative and other services.
94
Harbor Fixed Income Funds
Notes to Financial Statements—Continued
Notes to Financial Statements—Continued
Note 4—Fees and Other Transactions with Affiliates—Continued
Each Fund has a separate advisory agreement with Harbor Capital. The agreements provide for management fees based on an annual percentage rate of average daily net assets as follows:
| Contractual Rate | Actual Rate | ||
Harbor Convertible Securities Fund | 0.65% a | 0.62% | |
Harbor High-Yield Bond Fund | 0.60 b | 0.56% | |
Harbor Bond Fund | 0.48 c | 0.45% | |
Harbor Real Return Fund | 0.48 | 0.48% | |
Harbor Money Market Fund | 0.20 d | 0.18% |
| a | Effective March 1, 2017, the Adviser has contractually agreed to reduce the management fee to 0.60% through February 28, 2018. |
| b | The Adviser has contractually agreed to reduce the management fee to 0.56% through February 28, 2018. |
| c | The Adviser has contractually agreed to reduce the management fee to 0.43% on assets between $1 billion and $3 billion and to 0.405% on assets over $3 billion through February 28, 2018. |
| d | The Adviser has contractually agreed to reduce the management fee to 0.18% through February 28, 2018. |
Harbor Capital has from time to time voluntarily or contractually agreed not to impose a portion of its management fees and/or to bear a portion of the expenses incurred in the operation of certain Funds in order to limit Fund expenses. Such waivers, if any, are reflected on the accompanying Statements of Operations. During the period, the following expense limitation agreements were in effect:
| • | Harbor Bond Fund. For the period November 1, 2016 through October 31, 2017, Harbor Capital contractually agreed to limit the operating expenses, excluding interest expense (if any), to 0.51% and 0.76% for the Institutional Class and Administrative Class, respectively. These contractual expense limitations are effective through February 28, 2018. |
| • | Harbor Real Return Fund. For the period November 1, 2016 through October 31, 2017, Harbor Capital contractually agreed to limit the operating expenses, excluding interest expense (if any), to 0.54% and 0.79% for the Institutional Class and Administrative Class, respectively. These contractual expense limitations are effective through February 28, 2018. |
| • | Harbor Money Market Fund. For the period November 1, 2016 through October 31, 2017, Harbor Capital contractually agreed to limit the operating expenses, excluding interest expense (if any), to 0.28% and 0.53% for the Institutional Class and Administrative Class, respectively. These contractual expense limitations are effective through February 28, 2018. Since December 9, 2009, Harbor Capital has voluntarily reimbursed all expenses of Harbor Money Market Fund resulting in actual expense ratios for the year ended October 31, 2017 to 0.00% and 0.00% for the Institutional Class and Administrative Class, respectively. |
All expense limitation agreements include the transfer agent fee waiver discussed in the Transfer Agent note.
Distributor
Harbor Funds Distributors, Inc. (“Harbor Funds Distributors” or the “Distributor”), a wholly-owned subsidiary of Harbor Capital, is the distributor for Harbor Funds’ shares. Under the Trust’s current distribution plans pursuant to Rule 12b-1 under the Investment Company Act with respect to each Fund’s Administrative and Investor Class shares (the “12b-1 Plan”) as applicable, each Fund pays the Distributor compensation at the annual rate of 0.25% of the average daily net assets of its Administrative and Investor Class shares. Pursuant to the 12b-1 Plan the Distributor is compensated for financing any activity that is primarily intended to result in the sale of Administrative and Investor Class shares of each Fund or for recordkeeping services or the servicing of shareholder accounts in the Administrative and Investor Class shares of each Fund. Such activities include, but are not limited to: printing of prospectuses and statements of additional information and reports for prospective shareholders (i.e., other than existing shareholders); preparation and distribution of advertising material and sales literature; expenses of organizing and conducting sales seminars; supplemental payments to dealers or other institutions such as asset-based sales charges, payments of recordkeeping fees under recordkeeping arrangements, or payments of service fees under shareholder service arrangements; and costs of administering the 12b-1 Plan.
95
Harbor Fixed Income Funds
Notes to Financial Statements—Continued
Notes to Financial Statements—Continued
Note 4—Fees and Other Transactions with Affiliates—Continued
Amounts payable by a Fund under the 12b-1 Plan need not be directly related to the expenses actually incurred by the Distributor on behalf of each Fund. The 12b-1 Plan does not obligate each Fund to reimburse the Distributor for the actual expenses the Distributor may incur in fulfilling its obligations under the 12b-1 Plan. Thus, even if the Distributor’s actual expenses exceed the fee payable to the Distributor at any given time, each Fund will not be obligated to pay more than that fee. If the Distributor’s expenses are less than the fee it receives, the Distributor will retain the difference.
The fees attributable to each Fund’s respective class are shown on the accompanying Statement of Operations.
Transfer Agent
Harbor Services Group, Inc. (“Harbor Services Group”), a wholly-owned subsidiary of Harbor Capital, is the transfer and shareholder servicing agent for the Funds. The transfer agency and service agreement is reviewed and approved annually by the Board of Trustees and provides currently for compensation up to the following amounts per class of each Fund:
| Transfer Agent Feesa | |
Institutional Class | 0.09% of the average daily net assets of all Institutional Class shares |
Administrative Class | 0.09% of the average daily net assets of all Administrative Class shares |
Investor Class | 0.21% of the average daily net assets of all Investor Class shares |
Retirement Class | 0.01% of the average daily net assets of all Retirement Class shares |
| a | For the period November 1, 2016 through February 28, 2017, the Transfer Agent Fees were 0.08% for the Institutional and Administrative Class shares, 0.20% for the Investor Class shares, and 0.03% for the Retirement Class shares. |
Harbor Services Group has voluntarily waived a portion of its transfer agent fees during the year ended October 31, 2017. Fees incurred for these transfer agent services are shown on each Fund’s Statement of Operations. The voluntary waiver may be discontinued at any time.
Affiliated Transactions
The Investment Company Act permits purchase and sale transactions among affiliated investment companies subject to an exemptive rule. Harbor Funds has adopted policies and procedures pursuant to such rule. During the year, the Funds did not enter into any transactions with any other Harbor fund.
Shareholders
On October 31, 2017, Harbor Capital, Harbor Funds Distributors, and Harbor Services Group, collectively held the following shares of beneficial interest in each Fund:
| Number of Shares Owned by Harbor Capital, Harbor Funds Distributors, and Harbor Services Group | Percentage of Outstanding Shares | ||||||||||
| Institutional Class | Administrative Class | Investor Class | Retirement Class | Total | |||||||
Harbor Convertible Securities Fund | — | 29,976 | 29,775 | 135,145 | 194,896 | 1.9% | |||||
Harbor High-Yield Bond Fund | — | — | — | 64,190 | 64,190 | 0.0 | |||||
Harbor Bond Fund | 43,100 | — | N/A | N/A | 43,100 | 0.0 | |||||
Harbor Real Return Fund | 15,912 | — | N/A | N/A | 15,912 | 0.1 | |||||
Harbor Money Market Fund | 94,959,450 | 25,440 | N/A | N/A | 94,984,890 | 55.5 | |||||
Independent Trustees
The fees and expenses of the Independent Trustees are shown on each Fund’s Statement of Operations. The Independent Trustees’ remuneration for the Funds totaled $128,000 for the year ended October 31, 2017.
96
Harbor Fixed Income Funds
Notes to Financial Statements—Continued
Notes to Financial Statements—Continued
Note 4—Fees and Other Transactions with Affiliates—Continued
The Board of Trustees has adopted a Deferred Compensation Plan for Independent Trustees (the “Plan”), which enables Trustees to elect to defer receipt of all or a portion of the annual compensation they are entitled to receive from the Trust. For purposes of determining the amount owed to a Trustee under the Plan, deferred amounts are treated as though they had been invested in shares of the Fund(s) selected by the Trustee. While not required to do so, each Fund makes an investment equal to the Trustee’s investment election. The deferred compensation liability and the offsetting deferred compensation investment asset are included as a component of “Other Accrued Expenses” and “Other assets”, respectively, in the Statement of Assets and Liabilities. Such amounts fluctuate with changes in the market value of the selected securities. The deferred compensation and related mark-to-market impact liability and an offsetting investment asset will remain on each Fund’s Statement of Assets and Liabilities until distributed in accordance with the Plan.
Redemption Fee
A 1% redemption fee is charged on shares of Harbor Convertible Securities Fund and Harbor High-Yield Bond Fund that are redeemed within 90 days from their date of purchase. All redemption fees are recorded by the Fund as paid-in capital. For the year ended October 31, 2017 redemption fee proceeds are as follows:
| Amount (000s) | |
Harbor Convertible Securities Fund | $ 6 |
Harbor High-Yield Bond Fund | 34 |
Indemnification
Under the Trust’s organizational documents, its officers and Trustees are indemnified against certain liabilities arising out of the performance of their duties to the Trust. In addition, in the normal course of business the Trust enters into contracts that provide general indemnities to other parties. The Trust’s maximum exposure under these arrangements is unknown as this would involve future claims that may be made against the Trust that have not yet occurred. The risk of material loss as a result of such indemnification claims is considered remote.
NOTE 5—TAX INFORMATION
The amount and character of income and net realized gains to be distributed are determined in accordance with income tax rules and regulations, which may differ from U.S. GAAP. These differences are attributable to permanent book and tax accounting differences that were primarily due to tax treatment of net investment losses, swap agreement transactions, paydown reclasses, use of equalization, tax treatment of contingent payment debt instruments, and foreign currency transactions. Reclassifications are made to each Fund’s capital account to reflect income and net realized gains available for distribution (or available capital loss carryovers) under income tax rules and regulations. The amounts reclassified on the Statements of Assets and Liabilities for the year ended October 31, 2017 are as follows:
| Undistributed Net Investment Income/(Loss) (000s) | Accumulated Net Realized Gain/(Loss) (000s) | Paid-In Capital (000s) | |||
Harbor Convertible Securities Fund | $ 2,543 | $(8,572) | $6,029 | ||
Harbor High-Yield Bond Fund | — | — | — | ||
Harbor Bond Fund | (1,922) | 1,922 | — | ||
Harbor Real Return Fund | 718 | (716) | (2) | ||
Harbor Money Market Fund | — | — | — |
The tax composition of each Fund’s distributions is as follows:
97
Harbor Fixed Income Funds
Notes to Financial Statements—Continued
Notes to Financial Statements—Continued
NOTE 5—TAX INFORMATION—Continued
| As of October 31, 2017 | As of October 31, 2016 | ||||||||||
| Ordinary Income (000s) | Long-Term Capital Gains (000s) | Total (000s) | Ordinary Income (000s) | Long-Term Capital Gains (000s) | Total (000s) | ||||||
Harbor Convertible Securities Fund | $ 5,268 | $— | $ 5,268 | $ 7,719 | $6,912 | $ 14,631 | |||||
Harbor High-Yield Bond Fund | 93,452 | — | 93,452 | 92,324 | — | 92,324 | |||||
Harbor Bond Fund | 101,905 | — | 101,905 | 136,565 | — | 136,565 | |||||
Harbor Real Return Fund | 1,594 | — | 1,594 | 2,330 | — | 2,330 | |||||
Harbor Money Market Fund | 1,110 | — | 1,110 | 481 | — | 481 | |||||
As of October 31, 2017, the components of each Fund’s distributable earnings on a tax basis are as follows:
| Undistributed Ordinary Income (000s) | Undistributed Long-Term Capital Gains (000s) | Unrealized Appreciation/ (Depreciation) (000s) | |||
Harbor Convertible Securities Fund | $ 9,918 | $— | $ 3,287 | ||
Harbor High-Yield Bond Fund | 8,897 | — | 40,965 | ||
Harbor Bond Fund | 26,001 | — | (4,817) | ||
Harbor Real Return Fund | 1,507 | — | (2,968) | ||
Harbor Money Market Fund | 42 | — | — |
At October 31, 2017, the Funds in the following table had capital loss carryforwards for federal tax purposes which will reduce each Fund’s taxable income arising from future net realized gains on investments to the extent permitted by the Internal Revenue Code. Use of the capital loss carryforwards will reduce the amount of the distribution to shareholders which would otherwise be necessary to relieve each Fund of any federal tax liability. The capital loss carryforwards do not expire.
| Capital Loss Carryfoward | |||||
| Short-Term (000s) | Long- Term (000s) | Total (000s) | |||
Harbor High-Yield Bond Fund | $ 4,340 | $72,024 | $76,364 | ||
Harbor Bond Fund | 19,914 | 29,089 | 49,003 | ||
Harbor Real Return Fund | 4,683 | 24,096 | 28,779 | ||
The identified cost for federal income tax purposes of investments owned by each Fund and its respective gross unrealized appreciation and depreciation at October 31, 2017 are as follows:
| Identified Cost (000s) | Gross Unrealized | Net Unrealized Appreciation/ (Depreciation) (000s) | |||||
| Appreciation (000s) | (Depreciation) (000s) | ||||||
Harbor Convertible Securities Fund | $ 111,644 | $ 4,904 | $ (1,617) | $ 3,287 | |||
Harbor High-Yield Bond Fund* | 1,395,152 | 55,203 | (14,238) | 40,965 | |||
Harbor Bond Fund* | 3,403,301 | 60,649 | (65,466) | (4,817) | |||
Harbor Real Return Fund* | 151,117 | 2,086 | (5,054) | (2,968) | |||
Harbor Money Market Fund | 170,919 | — | — | — | |||
| * | Capital loss carryforwards are available which may reduce taxable income from future net realized gain on investments. |
Note 6—Derivatives
Each Fund’s derivative holdings do not qualify for hedge accounting treatment and as such are recorded at current fair value. For a discussion of risks related to these investments please refer to the descriptions of each type of derivative instrument in Note 2— Significant Accounting Policies.
98
Harbor Fixed Income Funds
Notes to Financial Statements—Continued
Notes to Financial Statements—Continued
Note 6—Derivatives—Continued
Each Fund’s derivative instruments outstanding as of the year ended October 31, 2017, if any, as disclosed in the Portfolios of Investments, and the related amounts of realized and changes in unrealized gains and losses on derivative instruments during the year as disclosed in the Statements of Operations, are indicators of the volume of derivative activity for each Fund.
Derivative Instruments
At October 31, 2017, the fair values of derivatives, by primary risk exposure, were reflected in the Statement of Assets and Liabilities as follows:
HARBOR BOND FUND
| Statement of Assets and Liabilities Caption | Interest Rate Contracts (000s) | Foreign Exchange Contracts (000s) | Credit Contracts (000s) | Total (000s) | ||||||||
| Assets | ||||||||||||
Unrealized appreciation on open forward currency contracts | $ — | $18,970 | $ — | $18,970 | ||||||||
Unrealized appreciation on OTC swap agreementsb | — | — | 463 | 463 | ||||||||
Variation margin on centrally cleared swap agreementsa,b | 3,657 | — | 528 | 4,185 | ||||||||
Variation margin on options and futures contracts (futures)a | 4,079 | — | — | 4,079 | ||||||||
Variation margin on options and futures contracts (options)a | 10 | — | — | 10 | ||||||||
Purchased options, at value | 759 | — | — | 759 | ||||||||
| Liabilities | ||||||||||||
Unrealized depreciation on open forward currency contracts | $ — | $ (9,651) | $ — | $ (9,651) | ||||||||
Variation margin on centrally cleared swap agreementsa,b | (990) | — | (10) | (1,000) | ||||||||
Variation margin on options and futures contracts (futures)a | (9,533) | — | — | (9,533) | ||||||||
Written options, at value | (344) | (257) | — | (601) | ||||||||
HARBOR REAL RETURN FUND
| Statement of Assets and Liabilities Caption | Interest Rate Contracts (000s) | Foreign Exchange Contracts (000s) | Credit Contracts (000s) | Total (000s) | ||||||||
| Assets | ||||||||||||
Unrealized appreciation on open forward currency contracts | $ — | $251 | $ — | $ 251 | ||||||||
Unrealized appreciation on OTC swap agreementsb | — | — | 44 | 44 | ||||||||
Variation margin on centrally cleared swap agreementsa,b | 440 | — | — | 440 | ||||||||
Variation margin on options and futures contracts (futures)a | 202 | — | — | 202 | ||||||||
Variation margin on options and futures contracts (options)a | 3 | — | — | 3 | ||||||||
Purchased options, at value | 64 | — | — | 64 | ||||||||
| Liabilities | ||||||||||||
Unrealized depreciation on open forward currency contracts | $ — | $ (82) | $ — | $ (82) | ||||||||
Unrealized depreciation on OTC swap agreementsb | (113) | — | — | (113) | ||||||||
Variation margin on centrally cleared swap agreementsa,b | (105) | — | (31) | (136) | ||||||||
Variation margin on options and futures contracts (futures)a | (21) | — | — | (21) | ||||||||
Variation margin on options and futures contracts (options)a | (2) | — | — | (2) | ||||||||
Written options, at value | (30) | — | — | (30) | ||||||||
| a | Includes cumulative appreciation/depreciation of contracts as reported in the Portfolio of Investments. Only current day’s variation margin is reported within the Statement of Assets and Liabilities. |
| b | Net of premiums received of $446,000 and $39,000 for Harbor Bond Fund and Harbor Real Return Fund, respectively. |
99
Harbor Fixed Income Funds
Notes to Financial Statements—Continued
Notes to Financial Statements—Continued
Note 6—Derivatives—Continued
Realized net gain/(loss) and the change in unrealized appreciation/(depreciation) on derivatives, by primary risk exposure, for the year ended October 31, 2017, were:
HARBOR BOND FUND
| Net Realized Gain/(Loss) on Derivatives | Interest Rate Contracts (000s) | Foreign Exchange Contracts (000s) | Credit Contracts (000s) | Total (000s) | ||||
Forward currency contracts | $ — | $4,630 | $ — | $ 4,630 | ||||
Futures contracts | (9,040) | — | — | (9,040) | ||||
Purchased options | (1,600) | — | — | (1,600) | ||||
Written options | 2,621 | 3,687 | — | 6,308 | ||||
Swaps agreements | (3,803) | — | 2,305 | (1,498) | ||||
Net realized gain/(loss) on derivatives | $(11,822) | $8,317 | $2,305 | $(1,200) |
| Change in Unrealized Appreciation/(Depreciation) on Derivatives | Interest Rate Contracts (000s) | Foreign Exchange Contracts (000s) | Credit Contracts (000s) | Total (000s) | ||||
Forward currency contracts | $ — | $4,351 | $ — | $ 4,351 | ||||
Futures contracts | 3 | — | — | 3 | ||||
Purchased options | 521 | — | — | 521 | ||||
Written options | (769) | (74) | — | (843) | ||||
Swaps agreements | 50,362 | — | (200) | 50,162 | ||||
Change in unrealized appreciation/(depreciation) on derivatives | $50,117 | $4,277 | $(200) | $54,194 |
HARBOR REAL RETURN FUND
| Net Realized Gain/(Loss) on Derivatives | Interest Rate Contracts (000s) | Foreign Exchange Contracts (000s) | Credit Contracts (000s) | Total (000s) | ||||
Forward currency contracts | $ — | $751 | $ — | $ 751 | ||||
Futures contracts | (213) | — | — | (213) | ||||
Purchased options | (29) | — | — | (29) | ||||
Written options | 55 | 27 | — | 82 | ||||
Swaps agreements | (401) | — | (83) | (484) | ||||
Net realized gain/(loss) on derivatives | $(588) | $778 | $(83) | $ 107 |
| Change in Unrealized Appreciation/(Depreciation) on Derivatives | Interest Rate Contracts (000s) | Foreign Exchange Contracts (000s) | Credit Contracts (000s) | Total (000s) | ||||
Forward currency contracts | $ — | $(147) | $— | $ (147) | ||||
Futures contracts | 117 | — | — | 117 | ||||
Purchased options | 165 | — | — | 165 | ||||
Written options | (75) | (15) | (1) | (91) | ||||
Swaps agreements | 1,389 | — | 3 | 1,392 | ||||
Change in unrealized appreciation/(depreciation) on derivatives | $1,596 | $(162) | $ 2 | $1,436 |
Note 7—OFFSETTING ASSETS AND LIABILITIES
Master Netting Arrangements
As described in further detail below, each Fund may enter into Master Netting Arrangements that govern the terms of certain transactions. Master Netting Arrangements are designed to reduce the counterparty risk associated with relevant transactions by establishing credit protection mechanisms and providing standardization as a means of improving legal certainty. As Master Netting Arrangements are specific to the unique operations of different asset types, they allow a Fund to close out and net its
100
Harbor Fixed Income Funds
Notes to Financial Statements—Continued
Notes to Financial Statements—Continued
Note 7—OFFSETTING ASSETS AND LIABILITIES—Continued
total exposure to a counterparty in the event of a default with respect to all of the transactions governed under a single agreement with that counterparty. Master Netting Arrangements can also help reduce counterparty risk by specifying collateral posting requirements at pre-arranged exposure levels. Securities and cash pledged as collateral are reflected as assets in the Statement of Assets and Liabilities as either a component of investments at value (securities) or cash-restricted. Cash collateral received is not typically held in a segregated account and, as such, is reflected as a liability in the Statement of Assets and Liabilities as due to broker. The fair value of any securities received as collateral is not reflected as a component of net asset value.
For the year ended October 31, 2017, the following Master Netting Arrangements have been entered into by one or more of the Funds:
Master Repurchase Agreements and Global Master Repurchase Agreements, which govern repurchase and reverse repurchase transactions between the Fund and select counterparties. As of October 31, 2017, each Fund had investment exposures subject to the terms of these agreements.
Master Securities Forward Transaction Agreements, which govern the considerations and factors surrounding the settlement of certain forward settling transactions, such as delayed-delivery or sale-buyback transactions by and between the Fund and select counterparties. As of October 31, 2017, Harbor Bond Fund and Harbor Real Return Fund had investment exposures subject to the terms of these agreements.
International Swaps and Derivatives Association, Inc. Master Agreements and Credit Support Annexes, which govern over-the-counter market traded financial derivative transactions entered into by the Fund and select counterparties. As of October 31, 2017, Harbor Bond Fund and Harbor Real Return Fund had investment exposures subject to the terms of these agreements.
The following is a summary by counterparty of the gross value of material Borrowings and Other Financing Transactions and collateral (received)/pledged as of October 31, 2017:
HARBOR BOND FUND
| Counterparty | Repurchase Agreement Proceeds to be Received (000s) | Payable for Reverse Repurchase Agreements (000s) | Payable for Sale-Buyback Transactions (000s) | Payable for Short Sale (000s) | Total Borrowings and Other Financing Transactions (000s) | Collateral (Received)/ Pledged (000s) | Net Exposure (000s) | ||||||||||||||
| Master/Global Repurchase Agreement | |||||||||||||||||||||
Barclays Capital Inc. | $ 95,400 | $— | $ — | $ — | $ 95,400 | $(95,400) | $ — | ||||||||||||||
Fixed Income Clearing Corp. | 14,689 | — | — | — | 14,689 | (14,689) | — | ||||||||||||||
BNP Paribas NY | 13,800 | — | — | — | 13,800 | (13,800) | — | ||||||||||||||
| Master Securities Forward Transactions Agreements | |||||||||||||||||||||
Barclays Capital Inc. | — | — | (95,380) | — | (95,380) | — | (95,380) | ||||||||||||||
Credit Suisse Securities LLC | — | — | — | (24,139) | (24,139) | — | (24,139) | ||||||||||||||
UBS Securities LLC | — | — | (159,650) | — | (159,650) | 959 | (158,691) | ||||||||||||||
Total Borrowings and Other Financing Transactions | $123,889 | $— | $(255,030) | $(24,139) | |||||||||||||||||
HARBOR REAL RETURN FUND
| Counterparty | Repurchase Agreement Proceeds to be Received (000s) | Payable for Reverse Repurchase Agreements (000s) | Payable for Sale-Buyback Transactions (000s) | Payable for Short Sale (000s) | Total Borrowings and Other Financing Transactions (000s) | Collateral (Received)/ Pledged (000s) | Net Exposure (000s) | ||||||||||||||
| Master/Global Repurchase Agreement | |||||||||||||||||||||
Fixed Income Clearing Corp. | $109 | $— | $ — | $ — | $ 109 | $(109) | $ — | ||||||||||||||
101
Harbor Fixed Income Funds
Notes to Financial Statements—Continued
Notes to Financial Statements—Continued
Note 7—OFFSETTING ASSETS AND LIABILITIES—Continued
HARBOR REAL RETURN FUND—Continued
| Counterparty | Repurchase Agreement Proceeds to be Received (000s) | Payable for Reverse Repurchase Agreements (000s) | Payable for Sale-Buyback Transactions (000s) | Payable for Short Sale (000s) | Total Borrowings and Other Financing Transactions (000s) | Collateral (Received)/ Pledged (000s) | Net Exposure (000s) | ||||||||||||||
| Master Securities Forward Transactions Agreements | |||||||||||||||||||||
Barclays Capital Inc. | $ — | $— | $(32,857) | $(1,030) | $(33,887) | $ — | (33,887) | ||||||||||||||
BNP Paribas NY | — | — | (866) | — | (866) | — | (866) | ||||||||||||||
Credit Suisse Securities LLC | — | — | — | (1,798) | (1,798) | — | (1,798) | ||||||||||||||
Goldman Sachs & Co. LLC | — | — | — | (1,028) | (1,028) | — | (1,028) | ||||||||||||||
JP Morgan Chase Bank | — | — | — | (7) | (7) | — | (7) | ||||||||||||||
Merrill Lynch | — | — | — | (44) | (44) | — | (44) | ||||||||||||||
Morgan Stanley Co. Inc. | — | — | — | (200) | (200) | — | (200) | ||||||||||||||
UBS Securities LLC | — | — | (4,757) | — | (4,757) | — | (4,757) | ||||||||||||||
Total Borrowings and Other Financing Transactions | $109 | $— | $(38,480) | $(4,107) | |||||||||||||||||
The following is a summary by counterparty of the value of OTC financial derivative instruments and collateral (received)/pledged as governed by International Swaps and Derivatives Association, Inc. master agreements as of October 31, 2017.
HARBOR BOND FUND
| Financial Derivative Assets | Financial Derivative Liabilities | Net Value of OTC Derivatives (000s) | Collateral (Received)/ Pledged* (000s) | Net Exposure (000s) | ||||||||||||||||||
| Counterparty | Forward Currency Contracts (000s) | Purchased Options (000s) | Swap Agreements (000s) | Total Over-the- Counter (000s) | Forward Currency Contracts (000s) | Written Options (000s) | Swap Agreements (000s) | Total Over-the- Counter (000s) | ||||||||||||||
Barclays Bank plc | $ — | $ — | $ — | $ — | $ (46) | $ — | $— | $ (46) | $ (46) | $ 46 | $ — | |||||||||||
BNP Paribas SA | 3,252 | — | 135 | 3,387 | (466) | — | — | (466) | 2,921 | (2,620) | 301 | |||||||||||
Citibank NA | 1,301 | — | — | 1,301 | (768) | — | — | (768) | 533 | (410) | 123 | |||||||||||
Credit Suisse International | 3 | — | — | 3 | — | (60) | — | (60) | (57) | 57 | — | |||||||||||
Deutsche Bank AG | 476 | — | — | 476 | (22) | (22) | — | (44) | 432 | (432) | — | |||||||||||
Goldman Sachs Bank USA | 1,593 | 281 | — | 1,874 | (2,503) | (309) | — | (2,812) | (938) | 591 | (347) | |||||||||||
Goldman Sachs International | — | — | 44 | 44 | — | — | — | — | 44 | — | 44 | |||||||||||
HSBC Bank USA | 85 | — | — | 85 | (189) | — | — | (189) | (104) | — | (104) | |||||||||||
HSBC Bank USA NA | — | — | 37 | 37 | — | — | — | — | 37 | — | 37 | |||||||||||
JP Morgan Chase Bank | 65 | — | — | 65 | (1,772) | — | — | (1,772) | (1,707) | — | (1,707) | |||||||||||
JP Morgan Chase Bank NA | 8,707 | — | 247 | 8,954 | (2,476) | — | — | (2,476) | 6,478 | (4,340) | 2,138 | |||||||||||
Morgan Stanley Capital Services LLC | — | 410 | — | 410 | — | (200) | — | (200) | 210 | (210) | — | |||||||||||
Royal Bank of Scotland plc | — | — | — | — | (48) | — | — | (48) | (48) | — | (48) | |||||||||||
Société Générale | 2,251 | — | — | 2,251 | (212) | — | — | (212) | 2,039 | — | 2,039 | |||||||||||
Société Générale Paris | — | — | — | — | — | (1) | — | (1) | (1) | — | (1) | |||||||||||
UBS AG | 1,237 | — | — | 1,237 | (1,149) | — | — | (1,149) | 88 | — | 88 | |||||||||||
UBS AG Stamford | — | — | — | — | — | (2) | — | (2) | (2) | — | (2) | |||||||||||
Total Over-the-Counter Exposure | $18,970 | $691 | $463 | $20,124 | $(9,651) | $(594) | $— | $(10,245) | ||||||||||||||
| * | Of the total collateral received and/or pledged listed in the table above, $8,012 cash has been received as collateral. |
102
Harbor Fixed Income Funds
Notes to Financial Statements—Continued
Notes to Financial Statements—Continued
Note 7—OFFSETTING ASSETS AND LIABILITIES—Continued
HARBOR REAL RETURN FUND
| Financial Derivative Assets | Financial Derivative Liabilities | Net Value of OTC Derivatives (000s) | Collateral (Received)/ Pledged* (000s) | Net Exposure (000s) | ||||||||||||||||||
| Counterparty | Forward Currency Contracts (000s) | Purchased Options (000s) | Swap Agreements (000s) | Total Over-the- Counter (000s) | Forward Currency Contracts (000s) | Written Options (000s) | Swap Agreements (000s) | Total Over-the- Counter (000s) | ||||||||||||||
BNP Paribas SA | $ — | $— | $— | $ — | $ (3) | $ — | $ — | $ (3) | $ (3) | $— | $ (3) | |||||||||||
Citibank NA | 52 | — | — | 52 | (29) | — | — | (29) | 23 | — | 23 | |||||||||||
Credit Suisse International | 4 | — | 13 | 17 | — | (3) | — | (3) | 14 | — | 14 | |||||||||||
Deutsche Bank AG | — | 46 | 8 | 54 | (3) | (2) | (35) | (40) | 14 | — | 14 | |||||||||||
Goldman Sachs Bank USA | 20 | — | — | 20 | (4) | (5) | — | (9) | 11 | — | 11 | |||||||||||
Goldman Sachs International | — | — | 11 | 11 | — | — | (2) | (2) | 9 | — | 9 | |||||||||||
HSBC Bank USA NA | — | — | 5 | 5 | — | — | — | — | 5 | — | 5 | |||||||||||
JP Morgan Chase Bank | — | — | — | — | (1) | — | — | (1) | (1) | — | (1) | |||||||||||
JP Morgan Chase Bank NA | 137 | — | 7 | 144 | (5) | (8) | — | (13) | 131 | — | 131 | |||||||||||
Morgan Stanley Capital Services LLC | — | 15 | — | 15 | — | (2) | (76) | (78) | (63) | — | (63) | |||||||||||
Royal Bank of Scotland plc | — | — | — | — | — | (3) | — | (3) | (3) | — | (3) | |||||||||||
Société Générale | 2 | — | — | 2 | — | — | — | — | 2 | — | 2 | |||||||||||
UBS AG | 36 | — | — | 36 | (37) | — | — | (37) | (1) | — | (1) | |||||||||||
Total Over-the-Counter Exposure | $251 | $ 61 | $ 44 | $356 | $(82) | $(23) | $(113) | $(218) | ||||||||||||||
| * | Of the total collateral received and/or pledged listed in the table above, no cash has been received as collateral. |
Exchange traded and centrally cleared derivatives are not subject to master netting or similar arrangements.
Note 8—Subsequent Events
Effective December 1, 2017, Harbor Capital began reducing its voluntary expense waiver for the Harbor Money Market Fund and may further reduce the voluntary waiver throughout 2018.
103
Harbor Fixed Income Funds
Report of Independent Registered Public Accounting Firm
Report of Independent Registered Public Accounting Firm
The Board of Trustees and Shareholders of
Harbor Funds
We have audited the accompanying statements of assets and liabilities, including the portfolios of investments, of Harbor Convertible Securities Fund, Harbor High-Yield Bond Fund, Harbor Bond Fund, Harbor Real Return Fund, and Harbor Money Market Fund (five of the portfolios constituting the Harbor Funds (the Trust)) as of October 31, 2017, and the related statements of operations and cash flows (Harbor Real Return Fund only) for the year then ended, the statements of changes in net assets for each of the two years in the period then ended, and the financial highlights for each of the periods indicated therein. These financial statements and financial highlights are the responsibility of the Trust’s management. Our responsibility is to express an opinion on these financial statements and financial highlights based on our audits.
We conducted our audits in accordance with the standards of the Public Company Accounting Oversight Board (United States). Those standards require that we plan and perform the audit to obtain reasonable assurance about whether the financial statements and financial highlights are free of material misstatement. We were not engaged to perform an audit of the Trust’s internal control over financial reporting. Our audits included consideration of internal control over financial reporting as a basis for designing audit procedures that are appropriate in the circumstances, but not for the purpose of expressing an opinion on the effectiveness of the Trust’s internal control over financial reporting. Accordingly, we express no such opinion. An audit also includes examining, on a test basis, evidence supporting the amounts and disclosures in the financial statements and financial highlights, assessing the accounting principles used and significant estimates made by management, and evaluating the overall financial statement presentation. Our procedures included confirmation of securities owned as of October 31, 2017, by correspondence with the custodian, agent banks and brokers, or by other appropriate auditing procedures where replies from agent banks and brokers were not received. We believe that our audits provide a reasonable basis for our opinion.
In our opinion, the financial statements and financial highlights referred to above present fairly, in all material respects, the financial position of Harbor Convertible Securities Fund, Harbor High-Yield Bond Fund, Harbor Bond Fund, Harbor Real Return Fund, and Harbor Money Market Fund of the Harbor Funds at October 31, 2017, the results of their operations and cash flows (Harbor Real Return Fund only) for the year then ended, the changes in their net assets for each of the two years in the period then ended, and the financial highlights for each of the periods indicated therein, in conformity with U.S. generally accepted accounting principles.

Chicago, Illinois
December 21, 2017
December 21, 2017
104
Harbor Fixed Income Funds
Fees and Expenses Example (Unaudited)
Fees and Expenses Example (Unaudited)
Example
As a shareholder of a Fund, you incur two types of costs: (1) transaction costs, including redemption fees (if any) and (2) ongoing costs, including management fees, distribution and service (12b-1) fees (if any), and other Fund expenses. This example is intended to help you understand your ongoing costs (in dollars) of investing in a Fund and to compare these costs with the ongoing costs of investing in other mutual funds.
The example is based on an investment of $1,000 invested at the beginning of the period and held for the entire period May 1, 2017 through October 31, 2017.
Actual Expenses
The first line of the table below provides information about actual account values and actual expenses for each share class. You may use the information in the respective class line, together with the amount you invested, to estimate the expenses that you paid over the period. Simply divide your account value by $1,000 (for example, an $8,600 account value divided by $1,000 = 8.6), then multiply the result by the number in the first line of the respective class under the heading entitled “Expenses Paid During Period” to estimate the expenses you paid on your account during this period.
Hypothetical Example for Comparison Purposes
The second line of the table for each share class below provides information about hypothetical account values and hypothetical expenses based on the respective Fund/Class’s actual expense ratio and an assumed rate of return of 5% per year before expenses, which is not the respective Fund/Class’s actual return. The hypothetical account values and expenses may not be used to estimate the actual ending account balance or expenses you paid for the period. You may use this information to compare the ongoing costs of investing in a Fund to other funds. To do so, compare this 5% hypothetical example with the 5% hypothetical examples that appear in the shareholder reports of the other funds.
Please note that the expenses shown in the table are meant to highlight your ongoing costs only and do not reflect any transactional costs, such as redemption fees. Therefore, the second line of the table is useful in comparing ongoing costs only, and will not help you determine the relative total costs of owning different funds. In addition, if these transactional costs were included, your costs would have been higher.
| Annualized Expense Ratios* | Expenses Paid During Period** | Beginning Account Value May 1, 2017 | Ending Account Value October 31, 2017 | |||||
| Harbor Convertible Securities Fund | ||||||||
| Institutional Class | 0.76% | |||||||
| Actual | $3.90 | $1,000 | $1,036.60 | |||||
| Hypothetical (5% return) | 3.87 | 1,000 | 1,021.28 | |||||
| Administrative Class | 1.00% | |||||||
| Actual | $5.13 | $1,000 | $1,035.20 | |||||
| Hypothetical (5% return) | 5.09 | 1,000 | 1,020.04 | |||||
| Investor Class | 1.12% | |||||||
| Actual | $5.75 | $1,000 | $1,034.90 | |||||
| Hypothetical (5% return) | 5.70 | 1,000 | 1,019.42 | |||||
| Retirement Class | 0.67% | |||||||
| Actual | $3.44 | $1,000 | $1,037.00 | |||||
| Hypothetical (5% return) | 3.41 | 1,000 | 1,021.74 | |||||
105
Harbor Fixed Income Funds
Fees and Expenses Example—Continued
Fees and Expenses Example—Continued
| Annualized Expense Ratios* | Expenses Paid During Period** | Beginning Account Value May 1, 2017 | Ending Account Value October 31, 2017 | |||||
| Harbor High-Yield Bond Fund | ||||||||
| Institutional Class | 0.67% | |||||||
| Actual | $3.43 | $1,000 | $1,029.90 | |||||
| Hypothetical (5% return) | 3.41 | 1,000 | 1,021.74 | |||||
| Administrative Class | 0.92% | |||||||
| Actual | $4.71 | $1,000 | $1,029.60 | |||||
| Hypothetical (5% return) | 4.69 | 1,000 | 1,020.45 | |||||
| Investor Class | 1.04% | |||||||
| Actual | $5.31 | $1,000 | $1,028.30 | |||||
| Hypothetical (5% return) | 5.29 | 1,000 | 1,019.83 | |||||
| Retirement Class | 0.61% | |||||||
| Actual | $3.13 | $1,000 | $1,030.30 | |||||
| Hypothetical (5% return) | 3.11 | 1,000 | 1,022.05 | |||||
| Harbor Bond Fund | ||||||||
| Institutional Class | 0.51% | |||||||
| Actual | $2.60 | $1,000 | $1,024.40 | |||||
| Hypothetical (5% return) | 2.60 | 1,000 | 1,022.57 | |||||
| Administrative Class | 0.76% | |||||||
| Actual | $3.87 | $1,000 | $1,022.20 | |||||
| Hypothetical (5% return) | 3.87 | 1,000 | 1,021.28 | |||||
| Harbor Real Return Fund | ||||||||
| Institutional Class | 0.54% | |||||||
| Actual | $2.73 | $1,000 | $1,004.50 | |||||
| Hypothetical (5% return) | 2.75 | 1,000 | 1,022.41 | |||||
| Administrative Class | 0.77% | |||||||
| Actual | $3.89 | $1,000 | $1,003.60 | |||||
| Hypothetical (5% return) | 3.92 | 1,000 | 1,021.23 | |||||
| Harbor Money Market Fund | ||||||||
| Institutional Class | 0.00% | |||||||
| Actual | $0.00 | $1,000 | $1,004.70 | |||||
| Hypothetical (5% return) | 0.00 | 1,000 | 1,025.21 | |||||
| Administrative Class | 0.00% | |||||||
| Actual | $0.00 | $1,000 | $1,004.70 | |||||
| Hypothetical (5% return) | 0.00 | 1,000 | 1,025.21 | |||||
| * | Reflective of all fee waivers and expense reimbursements (excluding interest expense, if any) |
| ** | Expenses are equal to the Fund’s annualized expense ratio, multiplied by the average account value over the period, multiplied by 184/365 (to reflect the one-half year period). |
106
Harbor Fixed Income Funds
Additional Information (Unaudited)
Additional Information (Unaudited)
Additional Tax Information
The Funds designate the following portions of their distributions from investment company taxable income for the fiscal year as qualifying for the dividends received deduction for corporate shareholders.
| Percentage of Distribution | |
Harbor Convertible Securities Fund | 3% |
Pursuant to Section 852 of the Internal Revenue Code, the Funds designate the following capital gain dividends for the year ended October 31, 2017:
| Amount (000s) | |
Harbor Convertible Securities Fund | $ 4,707 |
Harbor Bond Fund | 34,111 |
For the fiscal year ended October 31, 2017, the Funds designate up to the maximum amount of such dividends allowable pursuant to the Internal Revenue Code as qualified dividend income eligible for reduced tax rates. These lower rates range from 0% to 20% depending on an individual’s tax bracket. If the Funds pay a distribution during calendar year 2017, complete information will be reported in conjunction with Form 1099-DIV.
Shareholders who own shares through a taxable Harbor Funds account and that received distributions from a Fund during calendar year 2017 will receive a Form 1099-DIV in January 2018 that will show the tax character of those distributions.
Proxy Voting
Harbor Funds has adopted Proxy Voting Policies and Procedures under which proxies relating to securities held by the Harbor funds are voted. In addition, Harbor Funds files Form N-PX, with its complete proxy voting record for the 12 months ended June 30th, no later than August 31st of each year. A description of Harbor Funds’ Proxy Voting Policies and Procedures and the proxy voting records (Form N-PX) are available (i) upon request, by calling Harbor Funds toll-free at 800-422-1050; (ii) on Harbor Funds’ website at harborfunds.com; and (iii) on the SEC’s website at sec.gov.
Householding
Harbor Funds has adopted a policy that allows it to send only one copy of a Fund’s prospectus, proxy materials, annual report and semi-annual report to certain shareholders residing at the same household. This reduces Fund expenses, which benefits you and other shareholders. If you need additional copies or do not want your mailings to be “householded,” please call the Shareholder Servicing Agent at 800-422-1050. Individual copies will be sent within thirty (30) days after the Shareholder Servicing Agent receives your instructions. Your consent to householding is considered valid until revoked.
Quarterly Portfolio Disclosures
Harbor Funds files a complete portfolio of investments with the SEC for the first and third quarters of each fiscal year on Form N-Q. The Funds' Form N-Q is available (i) without charge, upon request, by calling Harbor Funds toll-free at 800-422-1050, (ii) on Harbor Funds’ website at harborfunds.com, and (iii) on the SEC’s website at sec.gov. The form may also be viewed and copied at the SEC’s Public Reference Room in Washington, DC. Information regarding the operations of the Public Reference Room may also be obtained by calling 800-SEC-0330.
107
Harbor Fixed Income Funds
Additional Information—Continued
Additional Information—Continued
Special meeting of shareholders
At a special meeting of the shareholders of the Harbor Funds held on September 22, 2017, shareholders elected six trustees to the Board of Trustees of Harbor Funds. Scott M. Amero, Robert A. Kasdin, and Ann M. Spruill were previously appointed as Trustees but had not been elected by shareholders. Raymond J. Ball, Donna J. Dean, and Randall A. Hack continue to serve on the Board.
| Trustee | For | Withhold | ||
Scott M. Amero | 1,047,869,265 | 14,860,642 | ||
Joseph L. Dowling III | 1,046,335,272 | 16,394,636 | ||
Robert A. Kasdin | 1,047,514,035 | 15,215,872 | ||
Charles F. McCain | 1,047,667,935 | 15,061,973 | ||
Kathryn L. Quirk | 1,046,812,694 | 15,917,214 | ||
Ann M. Spruill | 1,047,274,165 | 15,455,742 |
At a special meeting of the shareholders of the Harbor Funds held on September 22, 2017, shareholders approved an amendment to each Fund’s fundamental investment restriction regarding borrowing.
| Fund Name | For | Against | Abstain | Broker Non-Vote | ||||
Harbor Convertible Securities Fund | 18,790,592 | 3,444,688 | 2,418 | 1,310,336 | ||||
Harbor High-Yield Bond Fund | 106,310,802 | 232,560 | 151,173 | 20,951,685 | ||||
Harbor Bond Fund | 85,601,369 | 3,272,756 | 1,704,846 | 35,727,141 | ||||
Harbor Real Return Funda | 4,763,427 | 196,593 | 60,854 | 3,381,084 | ||||
Harbor Money Market Fund | 75,782,877 | 2,004,219 | 807,882 | 1,040,284 |
At a special meeting of the shareholders of the Harbor Funds held on September 22, 2017, shareholders approved an amendment to each Fund’s fundamental investment restriction regarding lending.
| Fund Name | For | Against | Abstain | Broker Non-Vote | ||||
Harbor Convertible Securities Fund | 18,790,592 | 3,444,688 | 2,418 | 1,310,336 | ||||
Harbor High-Yield Bond Fund | 106,305,737 | 227,656 | 161,143 | 20,951,685 | ||||
Harbor Bond Fund | 85,655,964 | 3,226,234 | 1,696,772 | 35,727,141 | ||||
Harbor Real Return Funda | 4,763,710 | 196,275 | 60,890 | 3,381,084 | ||||
Harbor Money Market Fund | 75,776,728 | 2,010,074 | 808,175 | 1,040,284 |
| a | Meeting held on October 18, 2017 |
108
Harbor Fixed Income Funds
Additional Information—Continued
Additional Information—Continued
Trustees and Officers
As of December 2017
The business and affairs of the Trust shall be managed by or under the direction of the Trustees, and they shall have all powers necessary or desirable to carry out that responsibility. The Trustees shall have full power and authority to take or refrain from taking any action and to execute any contracts and instruments that they may consider necessary or desirable in the management of the Trust. Any determination made by the Trustees in good faith as to what is in the interests of the Trust shall be conclusive. Information pertaining to the Trustees and Officers of Harbor Funds is set forth below. The address of each Trustee and Officer is: [Name of Trustee or Officer] c/o Harbor Funds, 111 South Wacker Drive, 34th Floor, Chicago, IL 60606-4302.
The Harbor Fund’s Statement of Additional Information includes additional information about the Trust’s Trustees and is available without charge by calling 800-422-1050 or at the Trust’s website at harborfunds.com.
| Name (Age) Position(s) with Fund | Term of Office and Length of Time Served1 | Principal Occupation(s) During Past Five Years | Number of Portfolios In Fund Complex Overseen By Trustee | Other Directorships Of Public Companies and Other Registered Investment Companies Held by Trustee During Past Five Years |
INDEPENDENT TRUSTEES | ||||
| Scott M. Amero (54) Trustee | Since 2014 | Chairman (2015-Present) and Trustee (2011-2015), Rare (conservation nonprofit); Trustee, Berkshire School (2014-Present); Vice Chairman and Global Chief Investment Officer, Fixed Income (2010), Vice Chairman and Global Chief Investment Officer, Fixed Income, and Co-Head, Fixed Income Portfolio Management (2007-2010), BlackRock, Inc., (publicly traded investment management firm). | 32 | None |
| Raymond J. Ball (73) Trustee | Since 2006 | Sidney Davidson Distinguished Service Professor of Accounting, University of Chicago Booth School of Business (2000-Present); Academic Affiliate, Analysis Group (litigation consulting firm) (2000-Present); Financial Reporting Faculty Advisory Group of the Institute of Chartered Accountants in England and Wales (2008-Present); and Advisory Board of the Center for Accounting Research & Education at University of Notre Dame (2006-Present). | 32 | None |
| Donna J. Dean (66) Trustee | Since 2010 | Chief Investment Officer of the Rockefeller Foundation (a private foundation) (1995-Present). | 32 | None |
| Joseph L. Dowling III (53) Trustee | Since 2017 | Chief Investment Officer, Brown University (2013-Present); Advisory Board Member, Stage Point Capital (private mortgage specialist) (2016-Present); Advisory Board Member, Harbor Funds (2016-2017); and Founder and Managing Member, Narragansett Asset Management (private investment management firm) (1998-2013). | 32 | Director of Integrated Electrical Services (2011-Present). |
| Randall A. Hack (70) Trustee | Since 2010 | Founder and Senior Managing Director of Capstone Capital LLC (private investment firm) (2003-Present); Director of Tower Development Corporation (cell tower developer) (2009-2016); and Advisory Director of Berkshire Partners (private equity firm) (2002-2013). | 32 | None |
| Robert Kasdin (59) Trustee | Since 2014 | Senior Vice President and Chief Operating Officer, Johns Hopkins Medicine (2015-Present); Senior Executive Vice President, Columbia University (2002-2015); Trustee and Co-Chair of the Finance Committee, National September 11 Memorial & Museum at the World Trade Center (2005-Present); Director, Apollo Commercial Real Estate Finance, Inc. (2014-Present); and Director, Noranda Aluminum Holdings Corp. (2007-2014). | 32 | Director of Noranda Aluminum Holdings Corporation (2007-2014); and Director of Apollo Commercial Real Estate Finance, Inc. (2014-Present). |
109
Harbor Fixed Income Funds
Additional Information—Continued
Additional Information—Continued
Trustees and Officers—Continued
| Name (Age) Position(s) with Fund | Term of Office and Length of Time Served1 | Principal Occupation(s) During Past Five Years | Number of Portfolios In Fund Complex Overseen By Trustee | Other Directorships Of Public Companies and Other Registered Investment Companies Held by Trustee During Past Five Years |
INDEPENDENT TRUSTEES—Continued | ||||
| Kathryn L. Quirk (65) Trustee | Since 2017 | Retired; Vice President, Senior Compliance Officer and Head, U.S. Regulatory Compliance, Goldman Sachs Asset Management (2013-2017); Deputy Chief Legal Officer, Asset Management, and Vice President and Corporate Counsel, Prudential Insurance Company of America (2010-2012); Co-Chief Legal Officer, Prudential Investment Management, Inc., and Chief Legal Officer, Prudential Investments and Prudential Mutual Funds (2008-2012); Vice President and Corporate Counsel and Chief Legal Officer, Mutual Funds, Prudential Insurance Company of America, and Chief Legal Officer, Prudential Investments (2005-2008); Vice President and Corporate Counsel and Chief Legal Officer, Mutual Funds, Prudential Insurance Company of America (2004-2005); Member, Management Committee (2000-2002), General Counsel and Chief Compliance Officer, Zurich Scudder Investments, Inc. (1997-2002). | 32 | None |
| Ann M. Spruill (63) Trustee | Since 2014 | Partner (1993-2008), member of Executive Committee (1996-2008), Member Board of Directors (2002-2008), Grantham, Mayo, Van Otterloo & Co, LLC (private investment management firm) (with the firm since 1990); Member Investment Committee and Chair of Global Equities, Museum of Fine Arts, Boston (2000-Present); and Trustee, Financial Accounting Foundation (2014-Present). | 32 | None |
INTERESTED TRUSTEE | ||||
| Charles F. McCain (48)* Chairman, Trustee and President | Since 2017 | Chief Executive Officer (2017-Present), Director (2007-Present), President and Chief Operating Officer (2017), Executive Vice President and General Counsel (2004-2017), and Chief Compliance Officer (2004-2014), Harbor Capital Advisors, Inc.; Director (2007-Present) and Chief Compliance Officer (2004-2017), Harbor Services Group, Inc.; and Chief Executive Officer (2017-Present), Director (2007-Present), Chief Compliance Officer and Executive Vice President (2007-2017), Harbor Funds Distributors, Inc. | 32 | None |
| Name (Age) Position(s) with Fund | Term of Office and Length of Time Served1 | Principal Occupation(s) During Past Five Years |
FUND OFFICERS NOT LISTED ABOVE** | ||
| Erik D. Ojala (42) Chief Compliance Officer and Secretary | Since 2017 Since 2007 | Executive Vice President and General Counsel (2017-Present) and Secretary (2010-Present); Senior Vice President and Associate General Counsel (2007-2017), Harbor Capital Advisors, Inc.; Director, Executive Vice President and Chief Compliance Officer (2017-Present), Harbor Funds Distributors, Inc.; and Director (2017-Present) and Assistant Secretary (2014-Present), Harbor Services Group, Inc. |
| Anmarie S. Kolinski (46) Treasurer | Since 2007 | Executive Vice President and Chief Financial Officer (2007-Present), Harbor Capital Advisors, Inc.; Chief Financial Officer (2007-Present), Harbor Services Group, Inc.; and Chief Financial Officer (2015-Present) and Treasurer (2012-Present), Harbor Funds Distributors, Inc. |
| Brian L. Collins (49) Vice President | Since 2005 | Executive Vice President and Chief Investment Officer (2004-Present), Harbor Capital Advisors, Inc. |
| Charles P. Ragusa (58) Vice President | Since 2007 | Executive Vice President (2007-Present), Harbor Capital Advisors, Inc.; President (2007-Present), Harbor Services Group, Inc.; and Executive Vice President and AML Compliance Officer (2007-Present) and OFAC Officer (2015-Present), Harbor Funds Distributors, Inc. |
| Jodie L. Crotteau (45) Assistant Secretary | Since 2014 | Senior Vice President and Chief Compliance Officer, Harbor Capital Advisors, Inc. (2014-Present); Chief Compliance Officer and Secretary (2017-present) and Assistant Secretary (2015-2016), Harbor Services Group, Inc.; Assistant Secretary (2016-present), Harbor Funds Distributors, Inc.; Vice President and Chief Compliance Officer, Grosvenor Registered Funds (2011-2014); and Vice President, Grosvenor Capital Management, L.P. (2010-2014). |
110
Harbor Fixed Income Funds
Additional Information—Continued
Additional Information—Continued
Trustees and Officers—Continued
| Name (Age) Position(s) with Fund | Term of Office and Length of Time Served1 | Principal Occupation(s) During Past Five Years |
FUND OFFICERS NOT LISTED ABOVE**—Continued | ||
| Lana M. Lewandowski (38) AML Compliance Officer and Assistant Secretary | Since 2017 | Legal & Compliance Manager (2016-Present) and Legal Specialist (2012-2015), Harbor Capital Advisors, Inc. |
| Lora A. Kmieciak (53) Assistant Treasurer | Since 2017 | Senior Vice President – Fund Administration and Analysis (2017-Present) and Senior Vice President - Business Analysis (2015-2017), Harbor Capital Advisors, Inc.; and Assurance Executive Director (1999-2015), Ernst & Young LLP. |
| John M. Paral (49) Assistant Treasurer | Since 2013 | Director of Fund Administration and Analysis (2017-Present), Vice President (2012-Present) and Financial Reporting Manager (2007-2017), Harbor Capital Advisors, Inc. |
| 1 | Each Trustee serves for an indefinite term, until his successor is elected. Each Officer is elected annually. |
| * | Mr. McCain is deemed an “Interested Trustee” due to his affiliation with the Adviser and Distributor of Harbor Funds. |
| ** | Officers of the Funds are “interested persons” as defined in the Investment Company Act. |
111
This privacy statement is not part of this report
Harbor’s Privacy Statement
The following privacy statement is issued by Harbor Funds and each series of Harbor Funds and its affiliates, Harbor Capital Advisors, Inc., Harbor Services Group, Inc. and Harbor Funds Distributors, Inc. These measures reflect our commitment to maintaining the privacy of your confidential information. We appreciate the confidence you have shown by entrusting us with your assets.
Personal Information
It is our policy to respect the privacy of current and former shareholders and to protect personal information entrusted to us. We do not sell your personal information to anyone.
In the course of providing products and services, we collect non-public personal information about you from the following sources: applications, forms, our website (including any information captured through our use of “cookies”), through mobile applications, by telephone and in correspondence and transactions with us, our affiliates or other parties.
The non-public personal information collected may include name, address, e-mail address, telephone/fax numbers, account number, social security or taxpayer identification number, investment activity, and bank account information.
When you visit us through our website or a mobile application, we may collect technical and navigational information, such as computer browser type, Internet protocol address, pages visited and average time spent on our website. We may use this information to alert you to software compatibility issues, or to improve our web design and functionality. We use “cookies” and similar files that may be placed on your hard drive for security purposes, to facilitate site navigation and to personalize the appearance of our site.
Information Sharing
We occasionally disclose non-public personal information about our current or former shareholders with affiliated and non-affiliated parties, as permitted or required by law or regulation. In the normal course of servicing our shareholders, information we collect may be shared with non-affiliated companies that perform support services on our behalf or to other firms that assist us in providing you with products and services, such as custodians, transfer agents, broker-dealers and marketing service firms, as well as with other financial institutions. These companies may not use the information for any other purpose and we require them to keep the information they handle confidential. We may also share information with affiliates that are engaged in a variety of financial services in order to better service your account(s).
When information is shared with third parties, they are not permitted to use the information for any purpose other than to assist our servicing of your account(s) or as permitted by law.
If you close your account(s) or if we lose contact with you, we will continue to share information in accordance with our current privacy policy and practices.
Access to Information
Access to non-public personal information is limited to employees, agents or other parties who need to know that information to perform their jobs, such as servicing your account(s), resolving problems or informing you of new products or services.
Security
We maintain physical, electronic and procedural safeguards that comply with industry standards to protect your non-public personal information.
For shareholders accessing information through our website or a mobile application, various forms of Internet security, such as data encryption firewall barriers, user names and passwords, and other tools are used. For additional information regarding our security measures, visit the terms and conditions of use on our website at harborfunds.com. If you have any questions or concerns about how we maintain the privacy of your non-public personal information, please contact us at 800-422-1050 Monday through Friday, between the hours of 8:00 a.m. and 6:00 p.m. Eastern time.
We recommend that you read and retain this notice for your personal files.
Eff. November 2013
112
Glossary
Benchmark Descriptions
Bloomberg Barclays U.S. Aggregate Bond Index—The Bloomberg Barclays U.S. Aggregate Bond Index is an unmanaged index of investment-grade fixed-rate debt issues with maturities of at least one year. This unmanaged index does not reflect fees and expenses and is not available for direct investment.
Bloomberg Barclays U.S. TIPS Index—The Bloomberg Barclays U.S. TIPS Index is an unmanaged market index comprised of all U.S. Treasury Inflation Protected Securities rated investment grade (Baa3 or better), have at least one year to final maturity, and at least $250 million par amount outstanding. This unmanaged index does not reflect fees and expenses and is not available for direct investment.
Bloomberg Commodity Index Total ReturnSM—The Bloomberg Commodity Index Total ReturnSM is a broadly diversified index that tracks the commodities markets through commodity futures contracts. This unmanaged index does not reflect fees and expenses and is not available for direct investment.
ICE BofAML All U.S. Convertibles Ex Mandatory Index—The BofA Merrill Lynch All U.S. Convertibles Ex Mandatory Index is broadly representative of the U.S. convertible securities market, consisting of publicly traded issues, denominated in U.S. dollars, of all credit qualities, and excluding mandatory (equity-linked) convertibles. This unmanaged index does not reflect fees and expenses and is not available for direct investment.
ICE BofAML U.S. Dollar 3-Month LIBOR Constant Maturity Index—The ICE BofAML U.S. Dollar 3-Month LIBOR Constant Maturity Index tracks the performance of a synthetic asset paying Libor to a stated maturity. The index is based on the assumed purchase at par of a synthetic instrument having exactly its stated maturity and with a coupon equal to that day’s fixing rate. That issue is assumed to be sold the following business day (priced at a yield equal to the current day fixing rate) and rolled into a new instrument. This unmanaged index does not reflect fees and expenses and is not available for direct investment.
ICE BofAML 3-Month U.S. Treasury Bill Index—The ICE BofAML 3-Month U.S. Treasury Bill Index is comprised of a single U.S. Treasury Bill issue purchased at the beginning of each month and held for a full month, at which time that issue is sold and rolled into a newly selected issue. The issue selected each month is that having a maturity date closest to, but not beyond 90 days from the rebalance date.
ICE BofAML U.S. High Yield Index (H0A0)—The ICE BofAML U.S. High Yield Index (H0A0) is an unmanaged index that tracks the performance of below investment grade U.S. dollar-denominated corporate bonds publicly issued in the U.S. domestic market. All bonds are U.S. dollar denominated and rated Split BBB and below. This unmanaged index does not reflect fees and expenses and is not available for direct investment.
ICE BofAML U.S. Non-Distressed High Yield Index—The ICE BofAML U.S. Non-Distressed High Yield Index is a subset of the ICE BofAML U.S. High Yield Index (H0A0) including all securities with an option-adjusted spread less than 1,000 basis points. The unmanaged index does not reflect fees and expenses and is not available for direct investment.
MSCI All Country World Index—The MSCI All Country World Index is a free float-adjusted market capitalization weighted index that is designed to measure the equity market performance of developed and emerging markets. This unmanaged index does not reflect fees and expenses and is not available for direct investment.
MSCI All Country World Ex. U.S. (ND) Index—The MSCI All Country World Ex. U.S.is a free float-adjusted market capitalization weighted index that is designed to measure equity market performance in the global developed and emerging markets, excluding the United States. This unmanaged index does not reflect fees and expenses and is not available for direct investment.
MSCI EAFE (ND) Index—The MSCI EAFE (ND) Index is an unmanaged index generally representative of major overseas stock markets. This unmanaged index does not reflect fees and expenses and is not available for direct investment.
MSCI EAFE Small Cap (ND) Index—The MSCI EAFE Small Cap (ND) Index is an equity index which captures small cap representation across developed market countries around the world, excluding the U.S. and Canada. This unmanaged index does not reflect fees and expenses and is not available for direct investment.
MSCI Emerging Markets (ND) Index—The MSCI Emerging Markets (ND) Index is a market capitalization weighted index of equity securities in more than 20 emerging market economies. This unmanaged index does not reflect fees and expenses and is not available for direct investment.
MSCI World (ND) Index—The MSCI World (ND) Index is a free float-adjusted market capitalization index that is designed to measure global developed market equity performance. This unmanaged index does not reflect fees and expenses and is not available for direct investment.
113
Glossary—Continued
Benchmark Descriptions—Continued
Russell 1000® Index—The Russell 1000® Index is an unmanaged index generally representative of the U.S. market for larger capitalization stocks as it includes the largest 1000 securities in the Russell 3000® Index by market capitalization. This unmanaged index does not reflect fees and expenses and is not available for direct investment. The Russell 1000® Index and Russell® are trademarks of Frank Russell Company.
Russell 1000® Growth Index—The Russell 1000® Growth Index is an unmanaged index generally representative of the U.S. market for larger capitalization growth stocks. This unmanaged index does not reflect fees and expenses and is not available for direct investment. The Russell 1000® Growth Index and Russell® are trademarks of Frank Russell Company.
Russell 1000® Value Index—The Russell 1000® Value Index is an unmanaged index generally representative of the U.S. market for larger capitalization value stocks. This unmanaged index does not reflect fees and expenses and is not available for direct investment. The Russell 1000® Value Index and Russell® are trademarks of Frank Russell Company.
Russell 2000® Index—The Russell 2000® Index measures the performance of the small-cap segment of the U.S. equity universe. The Russell 2000® Index is a subset of the Russell 3000® Index representing approximately 10% of the total market capitalization of that index. It includes approximately 2,000 of the smallest securities based on a combination of their market cap and current index membership. The Russell 2000® Index is constructed to provide a comprehensive and unbiased small-cap barometer and is completely reconstituted annually to ensure larger stocks do not distort the performance and characteristics of the true small-cap opportunity set. This unmanaged index does not reflect fees and expenses and is not available for direct investment. The Russell 3000® Index and Russell® are trademarks of Frank Russell Company.
Russell 2000® Growth Index—The Russell 2000® Growth Index is an unmanaged index representing the smallest 2,000 stocks with the highest price-to-book ratio and future earnings. This unmanaged index does not reflect fees and expenses and is not available for direct investment. The Russell 2000® Growth Index and Russell® are trademarks of Frank Russell Company.
Russell 2000® Value Index—The Russell 2000® Value Index is an unmanaged index representing the smallest 2,000 stocks with the lowest price-to-book ratio and future earnings. This unmanaged index does not reflect fees and expenses and is not available for direct investment. The Russell 2000® Value Index and Russell® are trademarks of Frank Russell Company.
Russell 3000® Index—The Russell 3000® Index measures the performance of the largest 3,000 U.S. companies representing approximately 98% of the investable U.S. equity market. The Russell 3000® Index is constructed to provide a comprehensive, unbiased and stable barometer of the broad market and is completely reconstituted annually to ensure new and growing equities are reflected. This unmanaged index does not reflect fees and expenses and is not available for direct investment. The Russell 3000® Index and Russell® are trademarks of Frank Russell Company.
Russell 3000® Growth Index—The Russell 3000® Growth Index measures the performance of the broad growth segment of the U.S. equity universe. It includes those Russell 3000® companies with higher price-to-book ratios and higher forecasted growth values. The Russell 3000® Growth Index is constructed to provide a comprehensive, unbiased, and stable barometer of the broad growth market. The index is completely reconstituted annually to ensure new and growing equities are included and that the represented companies continue to reflect growth characteristics. This unmanaged index does not reflect fees and expenses and is not available for direct investment. The Russell 3000® Growth Index and Russell® are trademarks of Frank Russell Company.
Russell 3000® Value Index—The Russell 3000® Value Index measures the performance of the broad value segment of U.S. equity value universe. It includes those Russell 3000® companies with lower price-to-book ratios and lower forecasted growth values. The Russell 3000® Value Index is constructed to provide a comprehensive, unbiased, and stable barometer of the broad value market. The index is completely reconstituted annually to ensure new and growing equities are included and that the represented companies continue to reflect value characteristics. This unmanaged index does not reflect fees and expenses and is not available for direct investment. The Russell 3000® Value Index and Russell® are trademarks of Frank Russell Company.
Russell Midcap® Index—The Russell Midcap® Index is an unmanaged index generally representative of the U.S. market for medium capitalization stocks. This unmanaged index does not reflect fees and expenses and is not available for direct investment. The Russell Midcap® Index and Russell® are trademarks of Frank Russell Company.
Russell Midcap® Growth Index—The Russell Midcap® Growth Index is an unmanaged index generally representative of the U.S. market for medium capitalization growth stocks. This unmanaged index does not reflect fees and expenses and is not available for direct investment. The Russell Midcap® Growth Index and Russell® are trademarks of Frank Russell Company.
114
Glossary—Continued
Benchmark Descriptions—Continued
Russell Midcap® Value Index—The Russell Midcap® Value Index is an unmanaged index generally representative of the U.S. market for medium capitalization value stocks. This unmanaged index does not reflect fees and expenses and is not available for direct investment. The Russell Midcap® Value Index and Russell® are trademarks of Frank Russell Company.
S&P 500 Index—The S&P 500 Index is an unmanaged index generally representative of the U.S. stock market. This unmanaged index does not reflect fees and expenses and is not available for direct investment.
Financial Terms
12b-1 Fee—A mutual fund fee, named for the SEC rule that permits it, used to pay for broker-dealer compensation and other distribution costs. If a fund has a 12b-1 fee, it will be disclosed in the fee table of a fund’s prospectus.
ADR—ADR after the name of a foreign holding stands for American Depositary Receipts representing ownership of foreign securities. ADRs are issued by U.S. banking institutions.
Average Market Cap—The average market capitalization of a fund’s equity portfolio gives you a measure of the size of the companies in which the fund invests. Market capitalization is calculated by multiplying the number of a company’s shares outstanding by its price per share.
Average Market Coupon—A calculation from a fund’s portfolio by weighting the coupon of each bond by its relative size in the portfolio.
Beta—A measure of market-related risk. The beta of every index is 1.00, no matter how volatile the index is. A beta less than one means the portfolio is less volatile than the index. A beta higher than one indicates more volatility than the index.
Bottom-Up Equity Management Style—A management style that de-emphasizes the significance of economic and market cycles, focusing instead on the analysis of individual stocks.
Capital Gains Distribution—Profits distributed to shareholders resulting from the sale of securities held in the fund’s portfolio.
Credit Risk—The possibility that a bond issuer may not be able to pay interest and repay its debt.
CUSIP Number—Identification number assigned to every stock, corporate bond and municipal bond by the Committee on Uniform Securities Identification Procedures (CUSIP), which is established by the American Bankers Association.
Diversification—The practice of investing broadly across securities of a number of issuers to reduce risk.
Duration—A common gauge of the price sensitivity of a fixed income asset or portfolio to a change in interest rates.
Emerging Markets—Emerging markets are countries with relatively young stock and bond markets. Examples include Brazil and Thailand. Typically, emerging-markets investments have the potential for losses and gains larger than those of developed-market investments.
Expense Ratio—The Fund’s total annual operating expenses (including management fees, distribution (12b-1) fees and other expenses) expressed as a percentage of average net assets.
Family of Funds—A group of mutual funds, each typically with its own investment objective, managed or distributed by the same company that hold themselves out to investors as related companies for the purposes of investment and investor services.
GDR—GDR after the name of a holding stands for Global Depositary Receipt representing ownership of foreign securities. GDRs are issued by either U.S. or non-U.S. banking organizations. SADR after the name of a holding stands for South African Depositary Receipts representing ownership of South African securities listed on the Johannesburg Stock Exchange. SDR after the name of a holding stands for Swedish Depository Receipts representing ownership of foreign securities in Sweden. NVDR after the name of a holding stands for Non-Voting Depositary Receipts representing ownership of a listed security in the Stock Exchange of Thailand.
Inception Date—The date on which the Fund commenced operations.
Investment Objective—The goal that an investor and mutual fund pursue together (e.g., current income, long-term capital growth, etc.).
115
Glossary—Continued
Financial Terms—Continued
Median Market Cap—An indicator of the size of companies in which a fund invests; the midpoint of market capitalization (market price x shares outstanding) of a fund’s stocks, weighted by the proportion of the fund’s assets invested in each stock. Stocks representing half of the fund’s assets have market capitalizations above the median, and the rest are below it.
Net Asset Value (NAV)—The per share value of a mutual fund, determined by subtracting the fund’s liabilities from its assets and dividing by the number of shares outstanding. Mutual funds calculate their NAVs at least once each business day.
No-Load Fund—A mutual fund whose shares are sold without a sales commission and without a 12b-1 fee of more than 0.25% per year. Harbor funds are no-load.
Open-End Management Company—The legal name for a mutual fund, indicating that it stands ready to redeem (buy back) its shares from investors on any business day. Harbor Funds is an open-end investment company.
Operating Expenses—Business costs paid from a fund’s assets before earnings are distributed to shareholders. These include management fees and 12b-1 fees and other expenses.
Portfolio Manager—A specialist employed by a mutual fund’s adviser or subadviser to invest the fund’s assets in accordance with predetermined investment objectives.
Portfolio Turnover—A measure of the trading activity in a fund’s investment portfolio (how often securities are bought and sold by a fund). Funds with high turnover rates incur higher transaction costs and may be more likely to distribute capital gains (which may be taxable to investors).
Price to Book Ratio (P/B)—A ratio used to compare a stock’s market value to its book value. It is calculated by dividing the current closing price of the stock by the latest quarter’s book value. For a fund, the weighted average price/book ratio of the stocks it holds.
Price to Earnings Ratio (P/E)—The ratio of a stock’s current price to its per-share earnings over the past year. For a fund, the weighted average P/E of the stocks it holds. P/E is an indicator of market expectations about corporate prospects; the higher the P/E, the greater the market expectations are for a company’s future growth.
Prospectus—The official document that describes a mutual fund to prospective investors. The prospectus contains information required by the SEC, such as investment objectives and policies, risks, services and fees.
Record Date—The date on which a shareholder must officially own shares in order to be entitled to a dividend.
Redemption Fee—Fee charged to shareholders by a mutual fund when they sell shares within a specified period after purchase. The time limit and size of fee vary among funds. The fee is paid to the fund, not the fund’s investment adviser. Its purpose is to protect long-term investors from the impact of short-term traders.
REITs (Real Estate Investment Trust)—REITs invest in real estate or loans secured by real estate and issue shares in such investments. A REIT is similar to a closed-end mutual fund.
Repurchase Agreement (Repo)—A form of short-term borrowing for dealers in government securities. The dealer sells the government securities to investors, usually on an overnight basis, and buys them back the following day. For the party selling the security (and agreeing to repurchase it in the future), it is a repo. For the party on the other end of the transaction (buying the security and agreeing to sell back in the future), it is a reverse repurchase agreement.
Risk/Reward (or Return)—The relationship between the degree of risk associated with an investment and its return potential. Typically, the higher the potential return of an investment, the greater the risk.
Statement of Additional Information (SAI)—The supplementary document to a prospectus that contains more detailed information about a mutual fund; also known as “Part B” of a fund’s registration statement.
TBAs—A term used to describe a forward mortgage-backed securities trade. Pass-through securities issued by Freddie Mac, Fannie Mae and Ginnie Mae trade in the TBA market. The term TBA is derived from the fact that the actual mortgage- backed security that will be delivered to fulfill a TBA trade is not designated at the time the trade is made. The securities are “to be announced” 48 hours prior to the established trade settlement date.
Treasury Inflation-Protected Securities (TIPS)—TIPS are securities in which the principal amount is adjusted for inflation and interest payments are applied to the inflation-adjusted principal.
116
Glossary—Continued
Financial Terms—Continued
Top-Down Equity Management Style—Investment style that begins with an assessment of the overall economic environment and makes a general asset allocation decision regarding various sectors of the financial markets and various industries.
Total Return—Return on an investment over a specified period, including price appreciation (or depreciation) plus any income, expressed as an average annual compound of return.
Weighted Average Duration—Duration is a time measure of a bond’s interest-rate sensitivity, based on the weighted average of the time periods over which a bond’s cash flows accrue to the bondholder. Time periods are weighted by multiplying by the present value of its cash flow divided by the bond’s price. (A bond’s cash flows consist of coupon payments and repayment of capital.) A bond’s duration will almost always be shorter than its maturity, with the exception of zero-coupon bonds, for which maturity and duration are equal.
Weighted Average Maturity—The average length of time until principal must be repaid for all bonds in a mutual fund portfolio on a dollar weighted basis.
Yield—A measure of net income (dividends and interest) earned by the securities in the fund’s portfolio less fund expenses during a specified period. A fund’s yield is expressed as a percentage of the maximum offering price per share on a specified date.
Yield to Maturity—The term used to describe the rate of return an investor will receive if a long-term, interest-bearing security, such as a bond, is held to its maturity date. Yield to maturity is greater than the coupon rate if the bond is selling at a discount and less than the coupon rate if it is selling at a premium.
117
Notes

| 111 South Wacker Drive, 34th Floor | Chicago, IL 60606-4302 | 800-422-1050 | harborfunds.com |
Trustees & Officers
Charles F. McCain
Chairman, President & Trustee
Chairman, President & Trustee
Scott M. Amero
Trustee
Trustee
Raymond J. Ball
Trustee
Trustee
Donna J. Dean
Trustee
Trustee
Joseph L. Dowling, III
Trustee
Trustee
Randall A. Hack
Trustee
Trustee
Robert Kasdin
Trustee
Trustee
Kathryn L. Quirk
Trustee
Trustee
Ann M. Spruill
Trustee
Trustee
Anmarie S. Kolinski
Treasurer
Treasurer
Erik D. Ojala
Chief Compliance Officer
& Secretary
Chief Compliance Officer
& Secretary
Brian L. Collins
Vice President
Vice President
Charles P. Ragusa
Vice President
Vice President
Jodie L. Crotteau
Assistant Secretary
Assistant Secretary
Lana M. Lewandowski
AML Compliance Officer
& Assistant Secretary
AML Compliance Officer
& Assistant Secretary
Lora A. Kmieciak
Assistant Treasurer
Assistant Treasurer
John M. Paral
Assistant Treasurer
Assistant Treasurer
Investment Adviser
Harbor Capital Advisors, Inc.
111 South Wacker Drive
34th Floor
Chicago, IL 60606-4302
312-443-4400
111 South Wacker Drive
34th Floor
Chicago, IL 60606-4302
312-443-4400
Distributor
Harbor Funds Distributors, Inc.
111 South Wacker Drive
34th Floor
Chicago, IL 60606-4302
312-443-4600
111 South Wacker Drive
34th Floor
Chicago, IL 60606-4302
312-443-4600
Shareholder Services
Harbor Services Group, Inc.
P.O. Box 804660
Chicago, IL 60680-4108
800-422-1050
P.O. Box 804660
Chicago, IL 60680-4108
800-422-1050
Custodian
State Street Bank & Trust Company
State Street Financial Center
1 Lincoln Street
Boston, MA 02111-2900
State Street Financial Center
1 Lincoln Street
Boston, MA 02111-2900
FD.AR.FI.1017
Table of Contents


Annual Report
October 31, 2017
Target Retirement Funds
| Institutional Class | |
| Harbor Target Retirement Income | HARAX |
| Harbor Target Retirement 2015 Fund | HARGX |
| Harbor Target Retirement 2020 Fund | HARJX |
| Harbor Target Retirement 2025 Fund | HARMX |
| Harbor Target Retirement 2030 Fund | HARPX |
| Harbor Target Retirement 2035 Fund | HARUX |
| Harbor Target Retirement 2040 Fund | HARYX |
| Harbor Target Retirement 2045 Fund | HACCX |
| Harbor Target Retirement 2050 Fund | HAFFX |
| Harbor Target Retirement 2055 Fund | HATRX |
Table of Contents
This document must be preceded or accompanied by a Prospectus.
Letter from the Chairman
 Charles F. McCain Chairman |
Dear Fellow Shareholder:
I am honored to be writing my first shareholder letter to you as Chairman of the Board of Trustees of Harbor Funds. David Van Hooser, our long-standing Chairman, retired from the Board of Trustees on September 22, 2017 after 17 years of distinguished service. Over that 17 year tenure, I have admired how Dave has maintained a singular focus on serving the best interests of Harbor Funds and its shareholders. He has served as an example to me and the other women and men who work diligently to support Harbor Funds. I remain committed to carrying on the responsibility that Dave so fully embraced to place the interests of Harbor Funds and its shareholders first.
We have also had other changes on the Board of Trustees over the past year. Rodger Smith, our long-standing Lead Independent Trustee, retired from the Board on December 31, 2016 after a 29 year tenure. He was replaced as Lead Independent Trustee by Randy Hack, who has served on the Board since 2010. Shareholders also elected two new independent Trustees to the Board on September 22, 2017 in Katie Quirk and Joe Dowling. With their election, eight of the nine members of the Board are independent of Harbor Capital Advisors, the investment adviser to Harbor Funds.
market review
The Harbor Target Retirement Funds invest in a diversified portfolio of Harbor equity and fixed income funds. In the fiscal year ended October 31, 2017, most equity funds had double digit gains while most fixed income funds had single digit or modest returns.
The fiscal year began with a global market rally fueled by optimism that the new U.S. administration might implement tax cuts, infrastructure spending and reduced regulation. Better-than-expected corporate earnings, economic growth and job gains drove U.S. stocks higher throughout the remainder of the 12-month period. The Russell 3000® Index, a measure of the broad U.S. stock market, had a return of 23.98% for the fiscal year.
International markets expanded through fiscal 2017 against a supportive backdrop of an ongoing industrial recovery in China and improving economic activity in Europe. Emerging markets outperformed their developed market peers. The MSCI All Country World Ex U.S. (ND) Index, a measure of the equity markets outside the U.S., had a return of 23.64%.
U.S. Treasury rates remained low, which provided a favorable backdrop for most fixed income asset classes, although the high-yield market performed significantly better than investment-grade bonds. The Bloomberg Barclays U.S. Aggregate Bond Index (an index of U.S. investment grade bonds) returned 0.90% for the fiscal year, whereas the ICE BofAML U.S. Non-Distressed High Yield Index had a return of 8.62%.
Comments by the portfolio managers of the Harbor Target Retirement Funds can be found in the following pages. As always, we recommend that shareholders maintain a long-term perspective in evaluating all of their investments, including those in Harbor Funds.
1
| Returns For Periods Ended October 31, 2017 | ||||||||
| Annualized | ||||||||
| Domestic Equities | 1 Year | 5 Years | 10 Years | 30 Years | ||||
Russell 3000® (entire U.S. stock market) | 23.98% | 15.12% | 7.61% | 10.60% | ||||
S&P 500 (large cap stocks) | 23.63 | 15.18 | 7.51 | 10.50 | ||||
Russell Midcap® (mid cap stocks) | 21.09 | 14.87 | 8.09 | 12.11 | ||||
Russell 2000® (small cap stocks) | 27.85 | 14.49 | 7.63 | 10.45 | ||||
Russell 3000® Growth (growth stocks) | 29.80 | 16.71 | 9.05 | 10.16 | ||||
Russell 3000® Value (value stocks) | 18.30 | 13.48 | 6.07 | 10.68 | ||||
| International & Global | ||||||||
MSCI EAFE (ND) (foreign stocks) | 23.44% | 8.53% | 1.10% | 5.62% | ||||
MSCI EAFE Small Cap (ND) (foreign small cap stocks) | 27.51 | 13.03 | 4.18 | N/A | ||||
MSCI World (ND) (global stocks) | 22.77 | 11.56 | 4.10 | 7.44 | ||||
MSCI All Country World Ex. U.S. (ND) (foreign stocks) | 23.64 | 7.29 | 0.92 | N/A | ||||
MSCI Emerging Markets (ND) (emerging market stocks) | 26.45 | 4.83 | 0.60 | N/A | ||||
| Strategic Markets | ||||||||
Bloomberg Commodity Index Total ReturnSM (commodities) | 2.35% | -9.37% | -6.93% | N/A | ||||
| Fixed Income | ||||||||
ICE BofAML U.S. Non-Distressed High Yield (domestic high-yield bonds) | 8.62% | 6.33% | 6.69% | N/A | ||||
Bloomberg Barclays U.S. Aggregate Bond (domestic bonds) | 0.90 | 2.04 | 4.19 | 6.43% | ||||
Bloomberg Barclays U.S. TIPS (domestic inflation-linked bonds) | -0.11 | -0.11 | 3.81 | N/A | ||||
ICE BofAML U.S. 3-Month Treasury Bill (proxy for money market returns) | 0.72 | 0.24 | 0.45 | 3.35 | ||||
Stay focused on the long-term
Major U.S. indexes hit record levels toward the end of the fiscal year, supported by continued earnings gains and favorable economic data. Against this backdrop, the third calendar quarter of 2017 marked the eighth consecutive quarter of gains for U.S. equities.
With equities having rallied for an extended period, it is reasonable to question whether the market’s advance might be due for a slowdown or even a reversal in the near future. For even the most experienced investment professionals, it is difficult to reliably predict the movements of stock prices or bond prices with certainty, particularly in the shorter-term.
We always encourage shareholders to take a long-term perspective with all of their investments. While past performance is never a guarantee of future results, over the long term, the returns of equities and debt securities have historically helped many investors achieve their financial objectives. We encourage all investors to maintain a diversified portfolio of equities, debt and cash in an allocation consistent with their long-term financial goals and comfort with risk.
Harbor Funds offers a variety of equity, strategic markets and fixed income funds to help you achieve your financial goals.
Thank you for investing with Harbor Funds.
December 21, 2017
 |
| Charles F. McCain |
| Chairman |
2
Harbor Target Retirement Funds
Managers Commentary (Unaudited)
Managers Commentary (Unaudited)
Adviser
Harbor Capital Advisors, Inc.
111 South Wacker Dr. 34th Floor
Chicago, IL 60606
Portfolio Managers
Brian L. Collins, CFA
Since Inception
Since Inception
Paul C. Herbert, CFA, CAIA
Since Inception
Linda M. Molenda
Since Inception
Since Inception
Harbor Capital has managed the Funds since inception.
Market Review
Most securities markets delivered positive results during the fiscal year ended October 31, 2017, though stocks resoundingly outperformed bonds. Many of the broad global equity markets flourished with gains above 20%, while returns for most fixed income markets were generally modest to flat.
The Russell 3000® Index, an index of U.S. stocks, increased by 23.98%. It is noteworthy that most categories within the domestic equity market--large, medium, or small cap; growth or value--posted double-digit returns during the fiscal period. Growth stocks outperformed value stocks and returns from small cap stocks bounded ahead of returns from large cap stocks. Small cap growth stocks, as measured by the Russell 2000® Growth Index, led the way with a return of 31.00%. The S&P 500 Index, an index of large-cap U.S. stocks, gained 23.63%. Ten of the S&P 500’s 11 sectors posted gains during the year, led by Information Technology (+39%), Financials (+37%) and Materials (+29%). Telecommunications Services (-1%) was the only sector that declined.
Non-U.S. stocks performed in-line with U.S. stocks during the fiscal period. The stocks of non-U.S. developed market companies, as measured by the MSCI EAFE (ND) Index, gained 23.44%. The MSCI Emerging Markets (ND) Index, a benchmark of developing markets’ equities, turned in a robust gain of 26.45% (all international and global returns are in U.S. dollars). Most large developed and emerging countries delivered attractive double-digit returns. The returns for all eleven sectors within both indices were positive, with the Information Technology sector taking the lead (+40% for EAFE and +52% in Emerging Markets).
Bonds of various types posted mixed results during the period. The Bloomberg Barclays U.S. Aggregate Bond Index, which tracks U.S. investment grade bonds, increased by a modest 0.90%. Inflation-protected U.S. government bonds, measured by the Bloomberg Barclays U.S. TIPS Index, finished the fiscal year period down 0.11%. The ICE BofAML U.S. Non-Distressed High Yield Index, representing higher-quality bonds in the U.S. below-investment grade corporate bond market, rose 8.62%.
Performance
Performance of the Funds within the Harbor Target Retirement Fund series for the twelve-month period ended October 31, 2017 was positive in absolute terms and compared with each Fund’s Composite Index benchmark. As expected based on market returns, the Funds’ absolute results varied based upon their allocations to equities or fixed income. The most conservative Fund, Harbor Target Retirement Income Fund, with a target equity allocation of 20%, rose 7.17%. Harbor Target Retirement 2055 Fund, with a target equity allocation of 93%, advanced by 23.34%. Please refer to the tables in this section below for the results of each Target Retirement Fund, common benchmarks, and the respective Composite Indexes.
Consistent with the results of the market benchmarks, the Funds’ equity fund holdings delivered the highest absolute performance during the period while their fixed income fund holdings provided smaller gains.
The performance of the fixed income fund holdings was positive across the lineup for the twelve-month period. Harbor Bond Fund, the largest fixed income underlying fund position, gained 2.82%, outperforming the Bloomberg Barclays U.S. Aggregate Bond Index by 1.92%. (All underlying fund returns cited are for the respective fund’s Institutional Class shares.) Harbor Bond Fund benefited from its allocation to out-of-benchmark-sector positions such as non-agency mortgage-backed securities, high-yield bonds, and developed market currencies, particularly the Euro and the Japanese Yen as both currencies appreciated during the fiscal year. Harbor High-Yield Bond Fund, the second largest fixed income underlying fund position, gained 8.16% but lagged its benchmark the ICE BofAML U.S. Non-Distressed High Yield Bond Index by 0.46% due to the Harbor High-Yield Bond Fund’s higher-quality emphasis, defensive interest-rate positioning, and security selection in the Oil & Gas and Retail sectors.
Turning to domestic equity fund performance, each of the equity fund holdings had double-digit returns ranging from 19.16% to 33.00%, with most underlying funds being ahead of their benchmark on a relative basis. Harbor Large Cap Value Fund, the Fund’s largest U.S. equity fund holding, gained 26.00% to outperform the Russell 1000® Value by 8.22%. Strong stock
3
Harbor Target Retirement Funds
Managers Commentary—Continued
Managers Commentary—Continued
selection particularly in the Information Technology, Industrials, Financials and Consumer Discretionary sectors drove the Harbor Large Cap Value Fund’s results. Harbor Capital Appreciation Fund, the Funds’ second largest U.S. equity fund holding, returned 32.52%, beating its benchmark by 2.81%. Its relative performance was helped by stock selection in the Consumer Discretionary and Information Technology sectors plus the portfolio’s underweight to the Consumer Staples sector.
The international and global stock funds held by the Funds were also strong absolute performers, with returns ranging from 18.24% to 24.74%. Unlike the U.S. stock funds, most of these underlying funds trailed their benchmarks. Harbor International Fund, Harbor Diversified International All Cap Fund, and Harbor International Growth Fund trailed their benchmarks by 5.20%, 1.35% and 0.26%, respectively. Performance impacts from various country allocations, sector weights and stock selection decisions were mixed across the three funds. Common detractors included an overweight position in Japan for the Harbor Diversified International All Cap Fund and Harbor International Growth Fund, plus stock selection and an underweight to the Financials sector for all three underlying funds. The Financials sector is the largest sector weight in the benchmarks and it was also one of the top three performing sectors during the fiscal period.
| HARBOR TARGET RETIREMENT FUNDS | Total Return Year Ended October 31, 2017 |
Harbor Target Retirement Income Fund | 7.17% |
Harbor Target Retirement 2015 Fund | 8.43 |
Harbor Target Retirement 2020 Fund | 10.77 |
Harbor Target Retirement 2025 Fund | 12.38 |
Harbor Target Retirement 2030 Fund | 14.18 |
Harbor Target Retirement 2035 Fund | 16.31 |
Harbor Target Retirement 2040 Fund | 18.26 |
Harbor Target Retirement 2045 Fund | 20.37 |
Harbor Target Retirement 2050 Fund | 22.40 |
Harbor Target Retirement 2055 Fund | 23.34 |
| COMMONLY USED MARKET INDICES | Total Return Year Ended October 31, 2017 |
Bloomberg Barclays U.S. Aggregate Bond (domestic bonds) | 0.90% |
MSCI EAFE (ND) (foreign stocks) | 23.44 |
Russell 3000® (entire U.S. stock market) | 23.98 |
| HARBOR TARGET RETIREMENT FUND INDICES | Total Return Year Ended October 31, 2017 |
Composite Index Income | 5.97% |
Composite Index 2015 | 7.30 |
Composite Index 2020 | 9.81 |
Composite Index 2025 | 11.53 |
Composite Index 2030 | 13.27 |
Composite Index 2035 | 15.24 |
Composite Index 2040 | 17.10 |
Composite Index 2045 | 19.11 |
Composite Index 2050 | 21.17 |
Composite Index 2055 | 22.13 |
4
Harbor Target Retirement Funds
Managers Commentary—Continued
Managers Commentary—Continued
Underlying Harbor Funds Performance (Institutional Class Shares)
| Total Return for the Year Ended October 31, 2017 | |||||||||||||||||
| EQUITY | One Year | Five Yearsa | Ten Yearsa | Since Inceptiona | Current 7-Day SEC Yield | Inception Date | Expense Ratios* | ||||||||||
| Subsidized b | Unsubsidized c | Net | Gross | ||||||||||||||
Harbor Capital Appreciation Fund | 32.52% | 17.88% | 9.42% | 11.73% | N/A | N/A | 12/29/1987 | 0.65% d | 0.70% | ||||||||
Harbor Mid Cap Growth Fund | 31.00 | 14.51 | 6.51 | 4.61 | N/A | N/A | 11/01/2000 | 0.87 | 0.87 | ||||||||
Harbor Small Cap Growth Fund | 26.72 | 15.42 | 8.13 | 8.70 | N/A | N/A | 11/01/2000 | 0.86 | 0.86 | ||||||||
Harbor Large Cap Value Fund | 26.00 | 16.36 | 7.31 | 10.22 | N/A | N/A | 12/29/1987 | 0.68 e | 0.73 | ||||||||
Harbor Mid Cap Value Fund | 19.16 | 15.57 | 8.36 | 8.34 | N/A | N/A | 03/01/2002 | 0.86 d | 0.87 | ||||||||
Harbor Small Cap Value Fund | 33.00 | 17.12 | 8.52 | 11.12 | N/A | N/A | 12/14/2001 | 0.87 | 0.87 | ||||||||
Harbor International Fund | 18.24 | 6.14 | 1.34 | 10.77 | N/A | N/A | 12/29/1987 | 0.79 d | 0.80 | ||||||||
Harbor Diversified International All Cap Fund | 22.29 | N/A | N/A | 9.35 | N/A | N/A | 11/02/2015 | 0.85 e | 1.23 | ||||||||
Harbor International Growth Fund | 23.38 | 8.67 | 0.57 | 4.02 | N/A | N/A | 11/01/1993 | 0.85 e | 0.91 | ||||||||
Harbor Global Leaders Fund | 24.74 | 13.11 | N/A | 17.40 | N/A | N/A | 03/01/2009 | 0.90 e | 1.05 | ||||||||
| FIXED INCOME | |||||||||||||||||
Harbor High-Yield Bond Fund | 8.16% | 4.85% | 6.15% | 7.14% | N/A | N/A | 12/01/2002 | 0.67% d,e | 0.71% | ||||||||
Harbor Bond Fund | 2.82 | 2.43 | 5.16 | 7.09 | N/A | N/A | 12/29/1987 | 0.51 e | 0.61 | ||||||||
Harbor Real Return Fund | 0.92 | -0.38 | 3.81 | 3.87 | N/A | N/A | 12/01/2005 | 0.54 e | 0.88 | ||||||||
| SHORT-TERM | |||||||||||||||||
Harbor Money Market Fund | 0.73% | 0.25% | 0.50% | 3.21% | 1.03% | 0.67% | 12/29/1987 | 0.28% d,e | 0.37% | ||||||||
Outlook
Fiscal year 2017 may be remembered for the very strong performance of equity markets relative to fixed-income markets. Stocks’ wide outperformance relative to bonds during the past 12 months continues a trend that has now lasted for several years. Very long-term results, and intuition, suggest that stocks should be expected to deliver returns over many years that are superior to bond returns.
However, at this point it may be helpful to remember that there is a place for other types of investments such as bonds and short-term investments in investors’ portfolios. Though these options do not have the same long-term return potential that stocks possess, we believe bonds and cash instruments offer other benefits such as different return patterns than stocks, lower absolute volatility, ballast during challenging equity market environments, and current income potential.
The takeaway from the preceding paragraphs should not be that stocks’ future prospects are dimming or that bonds and cash are about to begin a long period of outstanding gains relative to their histories, or even the reverse. Instead, it is our view that it is prudent to take a long-term perspective rather than to overreact to conditions than may prove transitory, and of course to maintain broadly diversified portfolios. We believe that broad diversification of the Funds’ portfolios, not just across asset classes, but also within the equity and fixed-income groups, as well as skilled active management by the subadvisers of the underlying Harbor funds, should enable the Funds to meet their objectives.
This report contains the current opinions of Harbor Capital Advisors, Inc. as of the date of this report and should not be considered as investment advice or a recommendation of any particular security, strategy or investment product. Such opinions are subject to change without notice and securities described herein may no longer be included in, or may at any time be removed from, the Fund’s portfolio. This report is distributed for informational purposes only. Information contained herein has been obtained from sources believed reliable, but not guaranteed.
Performance data shown represents past performance and is no guarantee of future results. Past performance is net of management fees and expenses and reflects reinvested dividends and distributions, but does not reflect the deduction of taxes that a shareholder would pay on Fund distributions or on the redemption of Fund shares. Past performance reflects the beneficial effect of any expense waivers or reimbursements, without which returns would have been lower. Investment returns and principal value will fluctuate and when redeemed may be worth more or less than their original cost. Returns for periods less than one year are not annualized. Current performance may be higher or lower and is available through the most recent month end at harborfunds.com or by calling 800-422-1050.
The Funds invest in a variety of underlying Harbor funds that are subject to risks associated with their particular investment strategies. By investing in several underlying funds, the Funds have partial exposure to the risks of many different areas of the market. Investments in the Funds are not guaranteed. An investor may experience losses. There is no guarantee that the Funds will provide adequate income through retirement. For information on the different share classes and the risks associated with an investment in the Funds, please refer to the current prospectus.
| * | All mutual funds have expense ratios which represent what shareholders pay for operating expenses and management fees. Expense ratios are expressed as an annualized percentage of a fund’s average net assets paid out in expenses. Net expense ratios reflect adjustments due to voluntary or contractual fee waivers or expense reimbursements. Expense ratio information is as of the fund’s current prospectus, as revised and supplemented to date. |
| a | Annualized |
| b | Reflects reimbursements or waivers in effect during the period |
| c | Does not reflect reimbursements or waivers currently in effect |
| d | Reflects a contractual management fee waiver effective through February 28, 2018 |
| e | Reflects an expense limitation agreement (excluding interest expense, if any) effective through February 28, 2018 |
5
Harbor Target Retirement Funds
Asset allocation framework (Unaudited)
Asset allocation framework (Unaudited)
Target Asset Allocation (glide path)
Harbor Target Retirement Funds - Target Asset Allocation

Over time, the allocation to asset classes and underlying Harbor funds will change in a predetermined manner as shown in the glide path above. The glide path shows the shifting of the asset allocations over time and illustrates how each Target Retirement Fund’s (except Harbor Target Retirement Income Fund) asset mix becomes more conservative as time elapses.
The principal value of the Funds is not guaranteed at any time, including the target retirement date.
Investment Styles
The Harbor Target Retirement Funds are constructed based on Harbor Capital Advisors’ investment experience that, over the long term, stocks generally provide greater growth opportunities and greater risk than bonds, and bonds generally provide more income and lower volatility than stocks. The year in the Fund name refers to the approximate year (the target date) when an investor in the Fund would leave the work force and enter retirement and likely stop making new investments in the Fund. The Harbor Target Retirement Income Fund is designed for investors currently in retirement. The year-specific Target Retirement Funds strive to produce more income and lower volatility as the target year approaches.
Harbor Capital Advisors allocates each Fund’s assets among the underlying Harbor funds based on the Fund’s investment objectives and policies. The asset allocation for each Fund (other than the Harbor Target Retirement Income Fund) will change over time as the target date indicated in the Fund’s name draws closer.
| HARBOR TARGET RETIREMENT FUNDS - ACTUAL ALLOCATION AS OF October 31, 2017 | |||||||||||||||||||
| 2055 Fund | 2050 Fund | 2045 Fund | 2040 Fund | 2035 Fund | 2030 Fund | 2025 Fund | 2020 Fund | 2015 Fund | Income Fund | ||||||||||
| Equity | |||||||||||||||||||
| Harbor Capital Appreciation Fund | 12% | 11% | 10% | 8% | 7% | 6% | 5% | 4% | 3% | 3% | |||||||||
| Harbor Mid Cap Growth Fund | 6 | 6 | 5 | 5 | 4 | 3 | 3 | 2 | 2 | 1 | |||||||||
| Harbor Small Cap Growth Fund | 5 | 5 | 5 | 4 | 4 | 3 | 3 | 2 | 2 | 1 | |||||||||
| Harbor Large Cap Value Fund | 14 | 13 | 11 | 10 | 9 | 7 | 6 | 5 | 4 | 3 | |||||||||
| Harbor Mid Cap Value Fund | 9 | 9 | 7 | 7 | 6 | 5 | 4 | 3 | 2 | 2 | |||||||||
| Harbor Small Cap Value Fund | 7 | 6 | 6 | 5 | 4 | 4 | 3 | 3 | 2 | 1 | |||||||||
| Harbor International Fund | 12 | 11 | 10 | 9 | 7 | 6 | 5 | 5 | 3 | 3 | |||||||||
| Harbor Diversified International All Cap Fund | 11 | 11 | 10 | 9 | 7 | 6 | 5 | 4 | 3 | 2 | |||||||||
| Harbor International Growth Fund | 12 | 11 | 10 | 9 | 8 | 6 | 5 | 5 | 3 | 3 | |||||||||
| Harbor Global Leaders Fund | 5 | 5 | 4 | 3 | 3 | 2 | 2 | 2 | 1 | 1 | |||||||||
| Total Equity | 93 | 88 | 78 | 69 | 59 | 48 | 41 | 35 | 25 | 20 | |||||||||
| Fixed Income | |||||||||||||||||||
| Harbor High-Yield Bond Fund | 3% | 5% | 9% | 12% | 16% | 19% | 20% | 17% | 14% | 13% | |||||||||
| Harbor Bond Fund | 4 | 7 | 12 | 17 | 21 | 26 | 29 | 32 | 37 | 39 | |||||||||
| Harbor Real Return Fund | 0 | 0 | 1 | 2 | 4 | 7 | 10 | 12 | 15 | 18 | |||||||||
| Total Fixed Income | 7 | 12 | 22 | 31 | 41 | 52 | 59 | 61 | 66 | 70 | |||||||||
| Short-Term | |||||||||||||||||||
| Harbor Money Market Fund | 0% | 0% | 0% | 0% | 0% | 0% | 0% | 4% | 9% | 10% | |||||||||
| Total Short-Term | 0 | 0 | 0 | 0 | 0 | 0 | 0 | 4 | 9 | 10 | |||||||||
| 100% | 100% | 100% | 100% | 100% | 100% | 100% | 100% | 100% | 100% | ||||||||||
6
Harbor Target Retirement Income Fund
Fund Summary —October 31, 2017 (Unaudited)
Fund Summary —October 31, 2017 (Unaudited)
Asset Allocation (% of investments)

| Equity Funds | 20.1% | |
| Harbor Large Cap Value Fund | 3.0% | |
| Harbor Capital Appreciation Fund | 2.6% | |
| Harbor Diversified International All Cap Fund | 2.5% | |
| Harbor International Fund | 2.5% | |
| Harbor International Growth Fund | 2.5% | |
| Harbor Mid Cap Value Fund | 2.0% | |
| Harbor Small Cap Value Fund | 1.4% | |
| Harbor Mid Cap Growth Fund | 1.3% | |
| Harbor Small Cap Growth Fund | 1.2% | |
| Harbor Global Leaders Fund | 1.1% |
| Fixed Income Funds | 69.9% | |
| Harbor Bond Fund | 39.3% | |
| Harbor Real Return Fund | 17.6% | |
| Harbor High-Yield Bond Fund | 13.0% | |
| Short-Term Investments | 10.0% | |
| Harbor Money Market Fund | 10.0% |
FUND PERFORMANCE
The graph compares a $10,000 investment in the Institutional Class shares of the Fund with the performance of the broad based market indices. The Fund’s performance assumes the reinvestment of all dividend and capital gain distributions.
CHANGE IN A $10,000 INVESTMENT
For the period 01/02/2009 through 10/31/2017

| TOTAL RETURNS For the periods ended 10/31/2017 | 1 Year | Annualized | Inception Date | Final Value of a $10,000 Investment | ||||||||||
| 5 Years | Life of Fund | |||||||||||||
| Harbor Target Retirement Income Fund | ||||||||||||||
Institutional Class | 7.17% | 4.05% | 6.18% | 01/02/2009 | $16,982 | |||||||||
| Comparative Indices | ||||||||||||||
Bloomberg Barclays U.S. Aggregate Bond | 0.90% | 2.04% | 3.91% | — | $14,027 | |||||||||
MSCI EAFE (ND) | 23.44 | 8.53 | 8.68 | — | 20,847 | |||||||||
Russell 3000® | 23.98 | 15.12 | 15.24 | — | 34,981 | |||||||||
Composite Index Income | 5.97 | 3.96 | 5.84 | — | 16,509 | |||||||||
As stated in the Fund’s current prospectus, the expense ratio was 0.61% (Institutional Class). The Adviser has contractually agreed to limit the Fund’s operating expenses to: (i) the amount of the acquired funds’ fees and expenses; (ii) compensation of the Independent Trustees; and (iii) certain other expenses such as extraordinary items. The expense ratio in the prospectus may differ from the actual expense ratio for the period disclosed within this report. The expense ratio shown in the prospectus is based on the prior fiscal year, adjusted to reflect changes, if any, in contractual arrangements that occurred prior to the date of the prospectus (or supplement thereto, if applicable).
Performance data shown represents past performance and is no guarantee of future results. Past performance is net of management fees and expenses and reflects reinvested dividends and distributions, but does not reflect the deduction of taxes that a shareholder would pay on Fund distributions or upon the redemption of Fund shares. Past performance reflects the beneficial effect of any expense waivers or reimbursements, without which returns would have been lower. Investment returns and principal value will fluctuate and when redeemed may be worth more or less than their original cost. Returns for periods less than one year are not annualized. Current performance may be higher or lower and is available through the most recent month end at harborfunds.com or by calling 800-422-1050. See the Glossary at the end of this report for a description of the Composite Index.
7
Harbor Target Retirement Income Fund†
Portfolio of Investments—October 31, 2017
Portfolio of Investments—October 31, 2017
Value and Cost in Thousands
| EQUITY FUNDS—20.1% | |||
| Shares | Value | ||
| 4,730 | Harbor Capital Appreciation Fund | $ 356 | |
| 16,135 | Harbor Mid Cap Growth Fund | 181 | |
| 10,706 | Harbor Small Cap Growth Fund | 161 | |
| 27,678 | Harbor Large Cap Value Fund | 412 | |
| 11,443 | Harbor Mid Cap Value Fund | 267 | |
| 5,429 | Harbor Small Cap Value Fund | 196 | |
| 4,956 | Harbor International Fund | 347 | |
| 29,394 | Harbor Diversified International All Cap Fund | 347 | |
| 22,126 | Harbor International Growth Fund | 347 | |
| 5,853 | Harbor Global Leaders Fund | 148 | |
| TOTAL EQUITY FUNDS | |||
(Cost $2,217) | 2,762 | ||
| FIXED INCOME FUNDS—69.9% | |||
| 175,483 | Harbor High-Yield Bond Fund | 1,792 | |
| FIXED INCOME FUNDS—Continued | |||
| | Shares | Value | |
| 462,372 | Harbor Bond Fund | $ 5,401 | |
| 256,822 | Harbor Real Return Fund | 2,419 | |
| TOTAL FIXED INCOME FUNDS | |||
(Cost $9,846) | 9,612 | ||
| SHORT-TERM INVESTMENTS—10.0% | |||
| (Cost $1,372) | |||
| 1,372,356 | Harbor Money Market Fund | 1,372 | |
| TOTAL INVESTMENTS—100.0% | |||
(Cost $13,435) | 13,746 | ||
CASH AND OTHER ASSETS, LESS LIABILITIES—0.0% | — a | ||
TOTAL NET ASSETS—100.0% | $13,746 | ||
Fair Value Measurements
All holdings at October 31, 2017 (as disclosed in the preceding Portfolio of Investments) are classified as Level 1. There were no Level 3 holdings at October 31, 2017 or 2016, and no transfers between levels during the year.
For more information on valuation inputs and their aggregation into the levels identified above, please refer to Fair Value Measurements and Disclosures in Note 2 of the accompanying Notes to Financial Statements.
| † | The Harbor Target Retirement Income Fund is investing in Institutional Class shares of affiliated Harbor Funds. |
| a | Rounds to less than $1,000 |
The accompanying notes are an integral part of the Financial Statements.
8
Harbor Target Retirement 2015 Fund
Fund Summary —October 31, 2017 (Unaudited)
Fund Summary —October 31, 2017 (Unaudited)
Asset Allocation (% of investments)

| Equity Funds | 24.9% | |
| Harbor Large Cap Value Fund | 3.7% | |
| Harbor International Fund | 3.2% | |
| Harbor Capital Appreciation Fund | 3.1% | |
| Harbor Diversified International All Cap Fund | 3.1% | |
| Harbor International Growth Fund | 3.1% | |
| Harbor Mid Cap Value Fund | 2.4% | |
| Harbor Small Cap Value Fund | 1.8% | |
| Harbor Mid Cap Growth Fund | 1.7% | |
| Harbor Small Cap Growth Fund | 1.5% | |
| Harbor Global Leaders Fund | 1.3% |
| Fixed Income Funds | 66.3% | |
| Harbor Bond Fund | 37.1% | |
| Harbor Real Return Fund | 15.5% | |
| Harbor High-Yield Bond Fund | 13.7% | |
| Short-Term Investments | 8.8% | |
| Harbor Money Market Fund | 8.8% |
FUND PERFORMANCE
The graph compares a $10,000 investment in the Institutional Class shares of the Fund with the performance of the broad based market indices. The Fund’s performance assumes the reinvestment of all dividend and capital gain distributions.
CHANGE IN A $10,000 INVESTMENT
For the period 01/02/2009 through 10/31/2017

| TOTAL RETURNS For the periods ended 10/31/2017 | 1 Year | Annualized | Inception Date | Final Value of a $10,000 Investment | ||||||||||
| 5 Years | Life of Fund | |||||||||||||
| Harbor Target Retirement 2015 Fund | ||||||||||||||
Institutional Class | 8.43% | 4.91% | 7.43% | 01/02/2009 | $18,823 | |||||||||
| Comparative Indices | ||||||||||||||
Bloomberg Barclays U.S. Aggregate Bond | 0.90% | 2.04% | 3.91% | — | $14,027 | |||||||||
MSCI EAFE (ND) | 23.44 | 8.53 | 8.68 | — | 20,847 | |||||||||
Russell 3000® | 23.98 | 15.12 | 15.24 | — | 34,981 | |||||||||
Composite Index 2015 | 7.30 | 4.82 | 7.09 | — | 18,307 | |||||||||
As stated in the Fund’s current prospectus, the expense ratio was 0.62% (Institutional Class). The Adviser has contractually agreed to limit the Fund’s operating expenses to: (i) the amount of the acquired funds’ fees and expenses; (ii) compensation of the Independent Trustees; and (iii) certain other expenses such as extraordinary items. The expense ratio in the prospectus may differ from the actual expense ratio for the period disclosed within this report. The expense ratio shown in the prospectus is based on the prior fiscal year, adjusted to reflect changes, if any, in contractual arrangements that occurred prior to the date of the prospectus (or supplement thereto, if applicable).
Performance data shown represents past performance and is no guarantee of future results. Past performance is net of management fees and expenses and reflects reinvested dividends and distributions, but does not reflect the deduction of taxes that a shareholder would pay on Fund distributions or upon the redemption of Fund shares. Past performance reflects the beneficial effect of any expense waivers or reimbursements, without which returns would have been lower. Investment returns and principal value will fluctuate and when redeemed may be worth more or less than their original cost. Returns for periods less than one year are not annualized. Current performance may be higher or lower and is available through the most recent month end at harborfunds.com or by calling 800-422-1050. See the Glossary at the end of this report for a description of the Composite Index.
9
Harbor Target Retirement 2015 Fund†
Portfolio of Investments—October 31, 2017
Portfolio of Investments—October 31, 2017
Value and Cost in Thousands
| EQUITY FUNDS—24.9% | |||
| Shares | Value | ||
| 2,617 | Harbor Capital Appreciation Fund | $ 197 | |
| 9,290 | Harbor Mid Cap Growth Fund | 105 | |
| 6,249 | Harbor Small Cap Growth Fund | 94 | |
| 15,575 | Harbor Large Cap Value Fund | 232 | |
| 6,525 | Harbor Mid Cap Value Fund | 152 | |
| 3,133 | Harbor Small Cap Value Fund | 113 | |
| 2,824 | Harbor International Fund | 197 | |
| 16,715 | Harbor Diversified International All Cap Fund | 197 | |
| 12,536 | Harbor International Growth Fund | 197 | |
| 3,210 | Harbor Global Leaders Fund | 81 | |
| TOTAL EQUITY FUNDS | |||
(Cost $1,250) | 1,565 | ||
| FIXED INCOME FUNDS—66.3% | |||
| 84,611 | Harbor High-Yield Bond Fund | 864 | |
| FIXED INCOME FUNDS—Continued | |||
| | Shares | Value | |
| 199,459 | Harbor Bond Fund | $2,330 | |
| 103,604 | Harbor Real Return Fund | 976 | |
| TOTAL FIXED INCOME FUNDS | |||
(Cost $4,194) | 4,170 | ||
| SHORT-TERM INVESTMENTS—8.8% | |||
| (Cost $553) | |||
| 553,313 | Harbor Money Market Fund | 553 | |
| TOTAL INVESTMENTS—100.0% | |||
(Cost $5,997) | 6,288 | ||
CASH AND OTHER ASSETS, LESS LIABILITIES—0.0% | — a | ||
TOTAL NET ASSETS—100.0% | $6,288 | ||
Fair Value Measurements
All holdings at October 31, 2017 (as disclosed in the preceding Portfolio of Investments) are classified as Level 1. There were no Level 3 holdings at October 31, 2017 or 2016, and no transfers between levels during the year.
For more information on valuation inputs and their aggregation into the levels identified above, please refer to Fair Value Measurements and Disclosures in Note 2 of the accompanying Notes to Financial Statements.
| † | The Harbor Target Retirement 2015 Fund is investing in Institutional Class shares of affiliated Harbor Funds. |
| a | Rounds to less than $1,000 |
The accompanying notes are an integral part of the Financial Statements.
10
Harbor Target Retirement 2020 Fund
Fund Summary —October 31, 2017 (Unaudited)
Fund Summary —October 31, 2017 (Unaudited)
Asset Allocation (% of investments)

| Equity Funds | 34.5% | |
| Harbor Large Cap Value Fund | 5.0% | |
| Harbor Diversified International All Cap Fund | 4.4% | |
| Harbor International Fund | 4.4% | |
| Harbor International Growth Fund | 4.4% | |
| Harbor Capital Appreciation Fund | 4.3% | |
| Harbor Mid Cap Value Fund | 3.3% | |
| Harbor Small Cap Value Fund | 2.5% | |
| Harbor Mid Cap Growth Fund | 2.4% | |
| Harbor Small Cap Growth Fund | 2.1% | |
| Harbor Global Leaders Fund | 1.7% |
| Fixed Income Funds | 61.3% | |
| Harbor Bond Fund | 32.7% | |
| Harbor High-Yield Bond Fund | 16.9% | |
| Harbor Real Return Fund | 11.7% | |
| Short-Term Investments | 4.2% | |
| Harbor Money Market Fund | 4.2% |
FUND PERFORMANCE
The graph compares a $10,000 investment in the Institutional Class shares of the Fund with the performance of the broad based market indices. The Fund’s performance assumes the reinvestment of all dividend and capital gain distributions.
CHANGE IN A $10,000 INVESTMENT
For the period 01/02/2009 through 10/31/2017

| TOTAL RETURNS For the periods ended 10/31/2017 | 1 Year | Annualized | Inception Date | Final Value of a $10,000 Investment | ||||||||||
| 5 Years | Life of Fund | |||||||||||||
| Harbor Target Retirement 2020 Fund | ||||||||||||||
Institutional Class | 10.77% | 5.76% | 8.17% | 01/02/2009 | $19,998 | |||||||||
| Comparative Indices | ||||||||||||||
Bloomberg Barclays U.S. Aggregate Bond | 0.90% | 2.04% | 3.91% | — | $14,027 | |||||||||
MSCI EAFE (ND) | 23.44 | 8.53 | 8.68 | — | 20,847 | |||||||||
Russell 3000® | 23.98 | 15.12 | 15.24 | — | 34,981 | |||||||||
Composite Index 2020 | 9.81 | 5.69 | 7.85 | — | 19,487 | |||||||||
As stated in the Fund’s current prospectus, the expense ratio was 0.66% (Institutional Class). The Adviser has contractually agreed to limit the Fund’s operating expenses to: (i) the amount of the acquired funds’ fees and expenses; (ii) compensation of the Independent Trustees; and (iii) certain other expenses such as extraordinary items. The expense ratio in the prospectus may differ from the actual expense ratio for the period disclosed within this report. The expense ratio shown in the prospectus is based on the prior fiscal year, adjusted to reflect changes, if any, in contractual arrangements that occurred prior to the date of the prospectus (or supplement thereto, if applicable).
Performance data shown represents past performance and is no guarantee of future results. Past performance is net of management fees and expenses and reflects reinvested dividends and distributions, but does not reflect the deduction of taxes that a shareholder would pay on Fund distributions or upon the redemption of Fund shares. Past performance reflects the beneficial effect of any expense waivers or reimbursements, without which returns would have been lower. Investment returns and principal value will fluctuate and when redeemed may be worth more or less than their original cost. Returns for periods less than one year are not annualized. Current performance may be higher or lower and is available through the most recent month end at harborfunds.com or by calling 800-422-1050. See the Glossary at the end of this report for a description of the Composite Index.
11
Harbor Target Retirement 2020 Fund†
Portfolio of Investments—October 31, 2017
Portfolio of Investments—October 31, 2017
Value and Cost in Thousands
| EQUITY FUNDS—34.5% | |||
| Shares | Value | ||
| 15,982 | Harbor Capital Appreciation Fund | $ 1,204 | |
| 58,019 | Harbor Mid Cap Growth Fund | 652 | |
| 39,096 | Harbor Small Cap Growth Fund | 589 | |
| 93,736 | Harbor Large Cap Value Fund | 1,394 | |
| 39,691 | Harbor Mid Cap Value Fund | 926 | |
| 19,417 | Harbor Small Cap Value Fund | 702 | |
| 17,292 | Harbor International Fund | 1,209 | |
| 102,574 | Harbor Diversified International All Cap Fund | 1,209 | |
| 77,018 | Harbor International Growth Fund | 1,208 | |
| 18,895 | Harbor Global Leaders Fund | 478 | |
| TOTAL EQUITY FUNDS | |||
(Cost $7,805) | 9,571 | ||
| FIXED INCOME FUNDS—61.3% | |||
| 460,112 | Harbor High-Yield Bond Fund | 4,698 | |
| FIXED INCOME FUNDS—Continued | |||
| | Shares | Value | |
| 776,040 | Harbor Bond Fund | $ 9,064 | |
| 344,633 | Harbor Real Return Fund | 3,246 | |
| TOTAL FIXED INCOME FUNDS | |||
(Cost $17,189) | 17,008 | ||
| SHORT-TERM INVESTMENTS—4.2% | |||
| (Cost $1,163) | |||
| 1,162,866 | Harbor Money Market Fund | 1,163 | |
| TOTAL INVESTMENTS—100.0% | |||
(Cost $26,157) | 27,742 | ||
CASH AND OTHER ASSETS, LESS LIABILITIES—0.0% | — a | ||
TOTAL NET ASSETS—100.0% | $27,742 | ||
Fair Value Measurements
All holdings at October 31, 2017 (as disclosed in the preceding Portfolio of Investments) are classified as Level 1. There were no Level 3 holdings at October 31, 2017 or 2016, and no transfers between levels during the year.
For more information on valuation inputs and their aggregation into the levels identified above, please refer to Fair Value Measurements and Disclosures in Note 2 of the accompanying Notes to Financial Statements.
| † | The Harbor Target Retirement 2020 Fund is investing in Institutional Class shares of affiliated Harbor Funds. |
| a | Rounds to less than $1,000 |
The accompanying notes are an integral part of the Financial Statements.
12
Harbor Target Retirement 2025 Fund
Fund Summary —October 31, 2017 (Unaudited)
Fund Summary —October 31, 2017 (Unaudited)
Asset Allocation (% of investments)

| Equity Funds | 40.5% | |
| Harbor Large Cap Value Fund | 5.9% | |
| Harbor Capital Appreciation Fund | 5.1% | |
| Harbor Diversified International All Cap Fund | 5.1% | |
| Harbor International Fund | 5.1% | |
| Harbor International Growth Fund | 5.1% | |
| Harbor Mid Cap Value Fund | 3.9% | |
| Harbor Small Cap Value Fund | 3.0% | |
| Harbor Mid Cap Growth Fund | 2.8% | |
| Harbor Small Cap Growth Fund | 2.5% | |
| Harbor Global Leaders Fund | 2.0% |
| Fixed Income Funds | 59.5% | |
| Harbor Bond Fund | 29.7% | |
| Harbor High-Yield Bond Fund | 20.2% | |
| Harbor Real Return Fund | 9.6% |
FUND PERFORMANCE
The graph compares a $10,000 investment in the Institutional Class shares of the Fund with the performance of the broad based market indices. The Fund’s performance assumes the reinvestment of all dividend and capital gain distributions.
CHANGE IN A $10,000 INVESTMENT
For the period 01/02/2009 through 10/31/2017

| TOTAL RETURNS For the periods ended 10/31/2017 | 1 Year | Annualized | Inception Date | Final Value of a $10,000 Investment | ||||||||||
| 5 Years | Life of Fund | |||||||||||||
| Harbor Target Retirement 2025 Fund | ||||||||||||||
Institutional Class | 12.38% | 6.41% | 8.75% | 01/02/2009 | $20,982 | |||||||||
| Comparative Indices | ||||||||||||||
Bloomberg Barclays U.S. Aggregate Bond | 0.90% | 2.04% | 3.91% | — | $14,027 | |||||||||
MSCI EAFE (ND) | 23.44 | 8.53 | 8.68 | — | 20,847 | |||||||||
Russell 3000® | 23.98 | 15.12 | 15.24 | — | 34,981 | |||||||||
Composite Index 2025 | 11.53 | 6.37 | 8.56 | — | 20,655 | |||||||||
As stated in the Fund’s current prospectus, the expense ratio was 0.69% (Institutional Class). The Adviser has contractually agreed to limit the Fund’s operating expenses to: (i) the amount of the acquired funds’ fees and expenses; (ii) compensation of the Independent Trustees; and (iii) certain other expenses such as extraordinary items. The expense ratio in the prospectus may differ from the actual expense ratio for the period disclosed within this report. The expense ratio shown in the prospectus is based on the prior fiscal year, adjusted to reflect changes, if any, in contractual arrangements that occurred prior to the date of the prospectus (or supplement thereto, if applicable).
Performance data shown represents past performance and is no guarantee of future results. Past performance is net of management fees and expenses and reflects reinvested dividends and distributions, but does not reflect the deduction of taxes that a shareholder would pay on Fund distributions or upon the redemption of Fund shares. Past performance reflects the beneficial effect of any expense waivers or reimbursements, without which returns would have been lower. Investment returns and principal value will fluctuate and when redeemed may be worth more or less than their original cost. Returns for periods less than one year are not annualized. Current performance may be higher or lower and is available through the most recent month end at harborfunds.com or by calling 800-422-1050. See the Glossary at the end of this report for a description of the Composite Index.
13
Harbor Target Retirement 2025 Fund†
Portfolio of Investments—October 31, 2017
Portfolio of Investments—October 31, 2017
Value and Cost in Thousands
| EQUITY FUNDS—40.5% | |||
| Shares | Value | ||
| 14,289 | Harbor Capital Appreciation Fund | $ 1,076 | |
| 52,487 | Harbor Mid Cap Growth Fund | 590 | |
| 35,469 | Harbor Small Cap Growth Fund | 534 | |
| 83,749 | Harbor Large Cap Value Fund | 1,245 | |
| 35,690 | Harbor Mid Cap Value Fund | 833 | |
| 17,510 | Harbor Small Cap Value Fund | 633 | |
| 15,562 | Harbor International Fund | 1,088 | |
| 92,192 | Harbor Diversified International All Cap Fund | 1,087 | |
| 69,193 | Harbor International Growth Fund | 1,086 | |
| 16,698 | Harbor Global Leaders Fund | 422 | |
| TOTAL EQUITY FUNDS | |||
(Cost $7,197) | 8,594 | ||
| FIXED INCOME FUNDS—59.5% | |||
| | Shares | Value | |
| 420,255 | Harbor High-Yield Bond Fund | $ 4,291 | |
| 539,326 | Harbor Bond Fund | 6,299 | |
| 215,858 | Harbor Real Return Fund | 2,034 | |
| TOTAL FIXED INCOME FUNDS | |||
(Cost $12,647) | 12,624 | ||
| TOTAL INVESTMENTS—100.0% | |||
(Cost $19,844) | 21,218 | ||
CASH AND OTHER ASSETS, LESS LIABILITIES—0.0% | — a | ||
TOTAL NET ASSETS—100.0% | $21,218 | ||
Fair Value Measurements
All holdings at October 31, 2017 (as disclosed in the preceding Portfolio of Investments) are classified as Level 1. There were no Level 3 holdings at October 31, 2017 or 2016, and no transfers between levels during the year.
For more information on valuation inputs and their aggregation into the levels identified above, please refer to Fair Value Measurements and Disclosures in Note 2 of the accompanying Notes to Financial Statements.
| † | The Harbor Target Retirement 2025 Fund is investing in Institutional Class shares of affiliated Harbor Funds. |
| a | Rounds to less than $1,000 |
The accompanying notes are an integral part of the Financial Statements.
14
Harbor Target Retirement 2030 Fund
Fund Summary —October 31, 2017 (Unaudited)
Fund Summary —October 31, 2017 (Unaudited)
Asset Allocation (% of investments)

| Equity Funds | 48.4% | |
| Harbor Large Cap Value Fund | 7.1% | |
| Harbor Diversified International All Cap Fund | 6.1% | |
| Harbor International Fund | 6.1% | |
| Harbor International Growth Fund | 6.1% | |
| Harbor Capital Appreciation Fund | 6.0% | |
| Harbor Mid Cap Value Fund | 4.7% | |
| Harbor Small Cap Value Fund | 3.6% | |
| Harbor Mid Cap Growth Fund | 3.3% | |
| Harbor Small Cap Growth Fund | 3.0% | |
| Harbor Global Leaders Fund | 2.4% |
| Fixed Income Funds | 51.6% | |
| Harbor Bond Fund | 25.8% | |
| Harbor High-Yield Bond Fund | 19.1% | |
| Harbor Real Return Fund | 6.7% |
FUND PERFORMANCE
The graph compares a $10,000 investment in the Institutional Class shares of the Fund with the performance of the broad based market indices. The Fund’s performance assumes the reinvestment of all dividend and capital gain distributions.
CHANGE IN A $10,000 INVESTMENT
For the period 01/02/2009 through 10/31/2017

| TOTAL RETURNS For the periods ended 10/31/2017 | 1 Year | Annualized | Inception Date | Final Value of a $10,000 Investment | ||||||||||
| 5 Years | Life of Fund | |||||||||||||
| Harbor Target Retirement 2030 Fund | ||||||||||||||
Institutional Class | 14.18% | 7.30% | 9.46% | 01/02/2009 | $22,217 | |||||||||
| Comparative Indices | ||||||||||||||
Bloomberg Barclays U.S. Aggregate Bond | 0.90% | 2.04% | 3.91% | — | $14,027 | |||||||||
MSCI EAFE (ND) | 23.44 | 8.53 | 8.68 | — | 20,847 | |||||||||
Russell 3000® | 23.98 | 15.12 | 15.24 | — | 34,981 | |||||||||
Composite Index 2030 | 13.27 | 7.20 | 9.31 | — | 21,944 | |||||||||
As stated in the Fund’s current prospectus, the expense ratio was 0.70% (Institutional Class). The Adviser has contractually agreed to limit the Fund’s operating expenses to: (i) the amount of the acquired funds’ fees and expenses; (ii) compensation of the Independent Trustees; and (iii) certain other expenses such as extraordinary items. The expense ratio in the prospectus may differ from the actual expense ratio for the period disclosed within this report. The expense ratio shown in the prospectus is based on the prior fiscal year, adjusted to reflect changes, if any, in contractual arrangements that occurred prior to the date of the prospectus (or supplement thereto, if applicable).
Performance data shown represents past performance and is no guarantee of future results. Past performance is net of management fees and expenses and reflects reinvested dividends and distributions, but does not reflect the deduction of taxes that a shareholder would pay on Fund distributions or upon the redemption of Fund shares. Past performance reflects the beneficial effect of any expense waivers or reimbursements, without which returns would have been lower. Investment returns and principal value will fluctuate and when redeemed may be worth more or less than their original cost. Returns for periods less than one year are not annualized. Current performance may be higher or lower and is available through the most recent month end at harborfunds.com or by calling 800-422-1050. See the Glossary at the end of this report for a description of the Composite Index.
15
Harbor Target Retirement 2030 Fund†
Portfolio of Investments—October 31, 2017
Portfolio of Investments—October 31, 2017
Value and Cost in Thousands
| EQUITY FUNDS—48.4% | |||
| Shares | Value | ||
| 22,918 | Harbor Capital Appreciation Fund | $ 1,726 | |
| 84,583 | Harbor Mid Cap Growth Fund | 951 | |
| 57,317 | Harbor Small Cap Growth Fund | 863 | |
| 135,386 | Harbor Large Cap Value Fund | 2,013 | |
| 57,937 | Harbor Mid Cap Value Fund | 1,352 | |
| 28,341 | Harbor Small Cap Value Fund | 1,024 | |
| 25,095 | Harbor International Fund | 1,754 | |
| 148,704 | Harbor Diversified International All Cap Fund | 1,753 | |
| 111,530 | Harbor International Growth Fund | 1,750 | |
| 26,685 | Harbor Global Leaders Fund | 676 | |
| TOTAL EQUITY FUNDS | |||
(Cost $11,305) | 13,862 | ||
| FIXED INCOME FUNDS—51.6% | |||
| | Shares | Value | |
| 534,561 | Harbor High-Yield Bond Fund | $ 5,458 | |
| 631,169 | Harbor Bond Fund | 7,372 | |
| 204,499 | Harbor Real Return Fund | 1,926 | |
| TOTAL FIXED INCOME FUNDS | |||
(Cost $14,871) | 14,756 | ||
| TOTAL INVESTMENTS—100.0% | |||
(Cost $26,176) | 28,618 | ||
CASH AND OTHER ASSETS, LESS LIABILITIES—0.0% | — a | ||
TOTAL NET ASSETS—100.0% | $28,618 | ||
Fair Value Measurements
All holdings at October 31, 2017 (as disclosed in the preceding Portfolio of Investments) are classified as Level 1. There were no Level 3 holdings at October 31, 2017 or 2016, and no transfers between levels during the year.
For more information on valuation inputs and their aggregation into the levels identified above, please refer to Fair Value Measurements and Disclosures in Note 2 of the accompanying Notes to Financial Statements.
| † | The Harbor Target Retirement 2030 Fund is investing in Institutional Class shares of affiliated Harbor Funds. |
| a | Rounds to less than $1,000 |
The accompanying notes are an integral part of the Financial Statements.
16
Harbor Target Retirement 2035 Fund
Fund Summary —October 31, 2017 (Unaudited)
Fund Summary —October 31, 2017 (Unaudited)
Asset Allocation (% of investments)

| Equity Funds | 59.1% | |
| Harbor Large Cap Value Fund | 8.5% | |
| Harbor Capital Appreciation Fund | 7.5% | |
| Harbor Diversified International All Cap Fund | 7.5% | |
| Harbor International Fund | 7.5% | |
| Harbor International Growth Fund | 7.5% | |
| Harbor Mid Cap Value Fund | 5.7% | |
| Harbor Small Cap Value Fund | 4.3% | |
| Harbor Mid Cap Growth Fund | 4.0% | |
| Harbor Small Cap Growth Fund | 3.7% | |
| Harbor Global Leaders Fund | 2.9% |
| Fixed Income Funds | 40.9% | |
| Harbor Bond Fund | 21.3% | |
| Harbor High-Yield Bond Fund | 15.7% | |
| Harbor Real Return Fund | 3.9% |
FUND PERFORMANCE
The graph compares a $10,000 investment in the Institutional Class shares of the Fund with the performance of the broad based market indices. The Fund’s performance assumes the reinvestment of all dividend and capital gain distributions.
CHANGE IN A $10,000 INVESTMENT
For the period 01/02/2009 through 10/31/2017

| TOTAL RETURNS For the periods ended 10/31/2017 | 1 Year | Annualized | Inception Date | Final Value of a $10,000 Investment | ||||||||||
| 5 Years | Life of Fund | |||||||||||||
| Harbor Target Retirement 2035 Fund | ||||||||||||||
Institutional Class | 16.31% | 8.37% | 10.15% | 01/02/2009 | $23,479 | |||||||||
| Comparative Indices | ||||||||||||||
Bloomberg Barclays U.S. Aggregate Bond | 0.90% | 2.04% | 3.91% | — | $14,027 | |||||||||
MSCI EAFE (ND) | 23.44 | 8.53 | 8.68 | — | 20,847 | |||||||||
Russell 3000® | 23.98 | 15.12 | 15.24 | — | 34,981 | |||||||||
Composite Index 2035 | 15.24 | 8.13 | 10.01 | — | 23,229 | |||||||||
As stated in the Fund’s current prospectus, the expense ratio was 0.72% (Institutional Class). The Adviser has contractually agreed to limit the Fund’s operating expenses to: (i) the amount of the acquired funds’ fees and expenses; (ii) compensation of the Independent Trustees; and (iii) certain other expenses such as extraordinary items. The expense ratio in the prospectus may differ from the actual expense ratio for the period disclosed within this report. The expense ratio shown in the prospectus is based on the prior fiscal year, adjusted to reflect changes, if any, in contractual arrangements that occurred prior to the date of the prospectus (or supplement thereto, if applicable).
Performance data shown represents past performance and is no guarantee of future results. Past performance is net of management fees and expenses and reflects reinvested dividends and distributions, but does not reflect the deduction of taxes that a shareholder would pay on Fund distributions or upon the redemption of Fund shares. Past performance reflects the beneficial effect of any expense waivers or reimbursements, without which returns would have been lower. Investment returns and principal value will fluctuate and when redeemed may be worth more or less than their original cost. Returns for periods less than one year are not annualized. Current performance may be higher or lower and is available through the most recent month end at harborfunds.com or by calling 800-422-1050. See the Glossary at the end of this report for a description of the Composite Index.
17
Harbor Target Retirement 2035 Fund†
Portfolio of Investments—October 31, 2017
Portfolio of Investments—October 31, 2017
Value and Cost in Thousands
| EQUITY FUNDS—59.1% | |||
| Shares | Value | ||
| 14,924 | Harbor Capital Appreciation Fund | $ 1,124 | |
| 54,233 | Harbor Mid Cap Growth Fund | 609 | |
| 36,510 | Harbor Small Cap Growth Fund | 550 | |
| 86,204 | Harbor Large Cap Value Fund | 1,282 | |
| 36,759 | Harbor Mid Cap Value Fund | 858 | |
| 18,043 | Harbor Small Cap Value Fund | 652 | |
| 16,022 | Harbor International Fund | 1,120 | |
| 95,120 | Harbor Diversified International All Cap Fund | 1,121 | |
| 71,496 | Harbor International Growth Fund | 1,122 | |
| 17,213 | Harbor Global Leaders Fund | 436 | |
| TOTAL EQUITY FUNDS | |||
(Cost $7,365) | 8,874 | ||
| FIXED INCOME FUNDS—40.9% | |||
| | Shares | Value | |
| 230,732 | Harbor High-Yield Bond Fund | $ 2,356 | |
| 273,767 | Harbor Bond Fund | 3,198 | |
| 61,311 | Harbor Real Return Fund | 577 | |
| TOTAL FIXED INCOME FUNDS | |||
(Cost $6,128) | 6,131 | ||
| TOTAL INVESTMENTS—100.0% | |||
(Cost $13,493) | 15,005 | ||
CASH AND OTHER ASSETS, LESS LIABILITIES—0.0% | — a | ||
TOTAL NET ASSETS—100.0% | $15,005 | ||
Fair Value Measurements
All holdings at October 31, 2017 (as disclosed in the preceding Portfolio of Investments) are classified as Level 1. There were no Level 3 holdings at October 31, 2017 or 2016, and no transfers between levels during the year.
For more information on valuation inputs and their aggregation into the levels identified above, please refer to Fair Value Measurements and Disclosures in Note 2 of the accompanying Notes to Financial Statements.
| † | The Harbor Target Retirement 2035 Fund is investing in Institutional Class shares of affiliated Harbor Funds. |
| a | Rounds to less than $1,000 |
The accompanying notes are an integral part of the Financial Statements.
18
Harbor Target Retirement 2040 Fund
Fund Summary —October 31, 2017 (Unaudited)
Fund Summary —October 31, 2017 (Unaudited)
Asset Allocation (% of investments)

| Equity Funds | 68.7% | |
| Harbor Large Cap Value Fund | 10.0% | |
| Harbor Capital Appreciation Fund | 8.7% | |
| Harbor Diversified International All Cap Fund | 8.7% | |
| Harbor International Fund | 8.7% | |
| Harbor International Growth Fund | 8.7% | |
| Harbor Mid Cap Value Fund | 6.6% | |
| Harbor Small Cap Value Fund | 5.0% | |
| Harbor Mid Cap Growth Fund | 4.7% | |
| Harbor Small Cap Growth Fund | 4.2% | |
| Harbor Global Leaders Fund | 3.4% |
| Fixed Income Funds | 31.3% | |
| Harbor Bond Fund | 17.0% | |
| Harbor High-Yield Bond Fund | 12.0% | |
| Harbor Real Return Fund | 2.3% |
FUND PERFORMANCE
The graph compares a $10,000 investment in the Institutional Class shares of the Fund with the performance of the broad based market indices. The Fund’s performance assumes the reinvestment of all dividend and capital gain distributions.
CHANGE IN A $10,000 INVESTMENT
For the period 01/02/2009 through 10/31/2017

| TOTAL RETURNS For the periods ended 10/31/2017 | 1 Year | Annualized | Inception Date | Final Value of a $10,000 Investment | ||||||||||
| 5 Years | Life of Fund | |||||||||||||
| Harbor Target Retirement 2040 Fund | ||||||||||||||
Institutional Class | 18.26% | 9.49% | 10.78% | 01/02/2009 | $24,698 | |||||||||
| Comparative Indices | ||||||||||||||
Bloomberg Barclays U.S. Aggregate Bond | 0.90% | 2.04% | 3.91% | — | $14,027 | |||||||||
MSCI EAFE (ND) | 23.44 | 8.53 | 8.68 | — | 20,847 | |||||||||
Russell 3000® | 23.98 | 15.12 | 15.24 | — | 34,981 | |||||||||
Composite Index 2040 | 17.10 | 9.14 | 10.71 | — | 24,562 | |||||||||
As stated in the Fund’s current prospectus, the expense ratio was 0.74% (Institutional Class). The Adviser has contractually agreed to limit the Fund’s operating expenses to: (i) the amount of the acquired funds’ fees and expenses; (ii) compensation of the Independent Trustees; and (iii) certain other expenses such as extraordinary items. The expense ratio in the prospectus may differ from the actual expense ratio for the period disclosed within this report. The expense ratio shown in the prospectus is based on the prior fiscal year, adjusted to reflect changes, if any, in contractual arrangements that occurred prior to the date of the prospectus (or supplement thereto, if applicable).
Performance data shown represents past performance and is no guarantee of future results. Past performance is net of management fees and expenses and reflects reinvested dividends and distributions, but does not reflect the deduction of taxes that a shareholder would pay on Fund distributions or upon the redemption of Fund shares. Past performance reflects the beneficial effect of any expense waivers or reimbursements, without which returns would have been lower. Investment returns and principal value will fluctuate and when redeemed may be worth more or less than their original cost. Returns for periods less than one year are not annualized. Current performance may be higher or lower and is available through the most recent month end at harborfunds.com or by calling 800-422-1050. See the Glossary at the end of this report for a description of the Composite Index.
19
Harbor Target Retirement 2040 Fund†
Portfolio of Investments—October 31, 2017
Portfolio of Investments—October 31, 2017
Value and Cost in Thousands
| EQUITY FUNDS—68.7% | |||
| Shares | Value | ||
| 28,885 | Harbor Capital Appreciation Fund | $ 2,175 | |
| 103,807 | Harbor Mid Cap Growth Fund | 1,167 | |
| 69,709 | Harbor Small Cap Growth Fund | 1,050 | |
| 167,647 | Harbor Large Cap Value Fund | 2,493 | |
| 70,967 | Harbor Mid Cap Value Fund | 1,656 | |
| 34,662 | Harbor Small Cap Value Fund | 1,253 | |
| 30,859 | Harbor International Fund | 2,157 | |
| 183,574 | Harbor Diversified International All Cap Fund | 2,164 | |
| 137,953 | Harbor International Growth Fund | 2,164 | |
| 33,899 | Harbor Global Leaders Fund | 858 | |
| TOTAL EQUITY FUNDS | |||
(Cost $13,746) | 17,137 | ||
| FIXED INCOME FUNDS—31.3% | |||
| | Shares | Value | |
| 292,384 | Harbor High-Yield Bond Fund | $ 2,985 | |
| 363,445 | Harbor Bond Fund | 4,245 | |
| 60,751 | Harbor Real Return Fund | 573 | |
| TOTAL FIXED INCOME FUNDS | |||
(Cost $7,843) | 7,803 | ||
| TOTAL INVESTMENTS—100.0% | |||
(Cost $21,589) | 24,940 | ||
CASH AND OTHER ASSETS, LESS LIABILITIES—0.0% | — a | ||
TOTAL NET ASSETS—100.0% | $24,940 | ||
Fair Value Measurements
All holdings at October 31, 2017 (as disclosed in the preceding Portfolio of Investments) are classified as Level 1. There were no Level 3 holdings at October 31, 2017 or 2016, and no transfers between levels during the year.
For more information on valuation inputs and their aggregation into the levels identified above, please refer to Fair Value Measurements and Disclosures in Note 2 of the accompanying Notes to Financial Statements.
| † | The Harbor Target Retirement 2040 Fund is investing in Institutional Class shares of affiliated Harbor Funds. |
| a | Rounds to less than $1,000 |
The accompanying notes are an integral part of the Financial Statements.
20
Harbor Target Retirement 2045 Fund
Fund Summary —October 31, 2017 (Unaudited)
Fund Summary —October 31, 2017 (Unaudited)
Asset Allocation (% of investments)

| Equity Funds | 78.1% | |
| Harbor Large Cap Value Fund | 11.4% | |
| Harbor Capital Appreciation Fund | 9.9% | |
| Harbor Diversified International All Cap Fund | 9.9% | |
| Harbor International Fund | 9.9% | |
| Harbor International Growth Fund | 9.8% | |
| Harbor Mid Cap Value Fund | 7.5% | |
| Harbor Small Cap Value Fund | 5.7% | |
| Harbor Mid Cap Growth Fund | 5.3% | |
| Harbor Small Cap Growth Fund | 4.7% | |
| Harbor Global Leaders Fund | 4.0% |
| Fixed Income Funds | 21.9% | |
| Harbor Bond Fund | 11.8% | |
| Harbor High-Yield Bond Fund | 8.7% | |
| Harbor Real Return Fund | 1.4% |
FUND PERFORMANCE
The graph compares a $10,000 investment in the Institutional Class shares of the Fund with the performance of the broad based market indices. The Fund’s performance assumes the reinvestment of all dividend and capital gain distributions.
CHANGE IN A $10,000 INVESTMENT
For the period 01/02/2009 through 10/31/2017

| TOTAL RETURNS For the periods ended 10/31/2017 | 1 Year | Annualized | Inception Date | Final Value of a $10,000 Investment | ||||||||||
| 5 Years | Life of Fund | |||||||||||||
| Harbor Target Retirement 2045 Fund | ||||||||||||||
Institutional Class | 20.37% | 10.49% | 11.30% | 01/02/2009 | $25,735 | |||||||||
| Comparative Indices | ||||||||||||||
Bloomberg Barclays U.S. Aggregate Bond | 0.90% | 2.04% | 3.91% | — | $14,027 | |||||||||
MSCI EAFE (ND) | 23.44 | 8.53 | 8.68 | — | 20,847 | |||||||||
Russell 3000® | 23.98 | 15.12 | 15.24 | — | 34,981 | |||||||||
Composite Index 2045 | 19.11 | 10.04 | 11.29 | — | 25,723 | |||||||||
As stated in the Fund’s current prospectus, the expense ratio was 0.75% (Institutional Class). The Adviser has contractually agreed to limit the Fund’s operating expenses to: (i) the amount of the acquired funds’ fees and expenses; (ii) compensation of the Independent Trustees; and (iii) certain other expenses such as extraordinary items. The expense ratio in the prospectus may differ from the actual expense ratio for the period disclosed within this report. The expense ratio shown in the prospectus is based on the prior fiscal year, adjusted to reflect changes, if any, in contractual arrangements that occurred prior to the date of the prospectus (or supplement thereto, if applicable).
Performance data shown represents past performance and is no guarantee of future results. Past performance is net of management fees and expenses and reflects reinvested dividends and distributions, but does not reflect the deduction of taxes that a shareholder would pay on Fund distributions or upon the redemption of Fund shares. Past performance reflects the beneficial effect of any expense waivers or reimbursements, without which returns would have been lower. Investment returns and principal value will fluctuate and when redeemed may be worth more or less than their original cost. Returns for periods less than one year are not annualized. Current performance may be higher or lower and is available through the most recent month end at harborfunds.com or by calling 800-422-1050. See the Glossary at the end of this report for a description of the Composite Index.
21
Harbor Target Retirement 2045 Fund†
Portfolio of Investments—October 31, 2017
Portfolio of Investments—October 31, 2017
Value and Cost in Thousands
| EQUITY FUNDS—78.1% | |||
| Shares | Value | ||
| 13,018 | Harbor Capital Appreciation Fund | $ 981 | |
| 46,154 | Harbor Mid Cap Growth Fund | 519 | |
| 30,965 | Harbor Small Cap Growth Fund | 466 | |
| 75,737 | Harbor Large Cap Value Fund | 1,126 | |
| 31,937 | Harbor Mid Cap Value Fund | 745 | |
| 15,430 | Harbor Small Cap Value Fund | 558 | |
| 13,908 | Harbor International Fund | 972 | |
| 82,423 | Harbor Diversified International All Cap Fund | 972 | |
| 61,887 | Harbor International Growth Fund | 971 | |
| 15,465 | Harbor Global Leaders Fund | 391 | |
| TOTAL EQUITY FUNDS | |||
(Cost $6,447) | 7,701 | ||
| FIXED INCOME FUNDS—21.9% | |||
| | Shares | Value | |
| 84,147 | Harbor High-Yield Bond Fund | $ 859 | |
| 99,818 | Harbor Bond Fund | 1,166 | |
| 14,553 | Harbor Real Return Fund | 137 | |
| TOTAL FIXED INCOME FUNDS | |||
(Cost $2,141) | 2,162 | ||
| TOTAL INVESTMENTS—100.0% | |||
(Cost $8,588) | 9,863 | ||
CASH AND OTHER ASSETS, LESS LIABILITIES—0.0% | — a | ||
TOTAL NET ASSETS—100.0% | $9,863 | ||
Fair Value Measurements
All holdings at October 31, 2017 (as disclosed in the preceding Portfolio of Investments) are classified as Level 1. There were no Level 3 holdings at October 31, 2017 or 2016, and no transfers between levels during the year.
For more information on valuation inputs and their aggregation into the levels identified above, please refer to Fair Value Measurements and Disclosures in Note 2 of the accompanying Notes to Financial Statements.
| † | The Harbor Target Retirement 2045 Fund is investing in Institutional Class shares of affiliated Harbor Funds. |
| a | Rounds to less than $1,000 |
The accompanying notes are an integral part of the Financial Statements.
22
Harbor Target Retirement 2050 Fund
Fund Summary —October 31, 2017 (Unaudited)
Fund Summary —October 31, 2017 (Unaudited)
Asset Allocation (% of investments)

| Equity Funds | 87.7% | |
| Harbor Large Cap Value Fund | 12.9% | |
| Harbor Capital Appreciation Fund | 11.2% | |
| Harbor International Fund | 11.1% | |
| Harbor Diversified International All Cap Fund | 11.0% | |
| Harbor International Growth Fund | 11.0% | |
| Harbor Mid Cap Value Fund | 8.5% | |
| Harbor Small Cap Value Fund | 6.3% | |
| Harbor Mid Cap Growth Fund | 5.9% | |
| Harbor Small Cap Growth Fund | 5.3% | |
| Harbor Global Leaders Fund | 4.5% |
| Fixed Income Funds | 12.3% | |
| Harbor Bond Fund | 6.8% | |
| Harbor High-Yield Bond Fund | 5.5% |
FUND PERFORMANCE
The graph compares a $10,000 investment in the Institutional Class shares of the Fund with the performance of the broad based market indices. The Fund’s performance assumes the reinvestment of all dividend and capital gain distributions.
CHANGE IN A $10,000 INVESTMENT
For the period 01/02/2009 through 10/31/2017

| TOTAL RETURNS For the periods ended 10/31/2017 | 1 Year | Annualized | Inception Date | Final Value of a $10,000 Investment | ||||||||||
| 5 Years | Life of Fund | |||||||||||||
| Harbor Target Retirement 2050 Fund | ||||||||||||||
Institutional Class | 22.40% | 11.42% | 11.78% | 01/02/2009 | $26,736 | |||||||||
| Comparative Indices | ||||||||||||||
Bloomberg Barclays U.S. Aggregate Bond | 0.90% | 2.04% | 3.91% | — | $14,027 | |||||||||
MSCI EAFE (ND) | 23.44 | 8.53 | 8.68 | — | 20,847 | |||||||||
Russell 3000® | 23.98 | 15.12 | 15.24 | — | 34,981 | |||||||||
Composite Index 2050 | 21.17 | 10.88 | 11.75 | — | 26,688 | |||||||||
As stated in the Fund’s current prospectus, the expense ratio was 0.77% (Institutional Class). The Adviser has contractually agreed to limit the Fund’s operating expenses to: (i) the amount of the acquired funds’ fees and expenses; (ii) compensation of the Independent Trustees; and (iii) certain other expenses such as extraordinary items. The expense ratio in the prospectus may differ from the actual expense ratio for the period disclosed within this report. The expense ratio shown in the prospectus is based on the prior fiscal year, adjusted to reflect changes, if any, in contractual arrangements that occurred prior to the date of the prospectus (or supplement thereto, if applicable).
Performance data shown represents past performance and is no guarantee of future results. Past performance is net of management fees and expenses and reflects reinvested dividends and distributions, but does not reflect the deduction of taxes that a shareholder would pay on Fund distributions or upon the redemption of Fund shares. Past performance reflects the beneficial effect of any expense waivers or reimbursements, without which returns would have been lower. Investment returns and principal value will fluctuate and when redeemed may be worth more or less than their original cost. Returns for periods less than one year are not annualized. Current performance may be higher or lower and is available through the most recent month end at harborfunds.com or by calling 800-422-1050. See the Glossary at the end of this report for a description of the Composite Index.
23
Harbor Target Retirement 2050 Fund†
Portfolio of Investments—October 31, 2017
Portfolio of Investments—October 31, 2017
Value and Cost in Thousands
| EQUITY FUNDS—87.7% | |||
| Shares | Value | ||
| 33,875 | Harbor Capital Appreciation Fund | $ 2,551 | |
| 119,243 | Harbor Mid Cap Growth Fund | 1,340 | |
| 80,046 | Harbor Small Cap Growth Fund | 1,205 | |
| 197,631 | Harbor Large Cap Value Fund | 2,939 | |
| 83,006 | Harbor Mid Cap Value Fund | 1,936 | |
| 40,028 | Harbor Small Cap Value Fund | 1,447 | |
| 36,074 | Harbor International Fund | 2,522 | |
| 213,720 | Harbor Diversified International All Cap Fund | 2,520 | |
| 160,544 | Harbor International Growth Fund | 2,519 | |
| 40,610 | Harbor Global Leaders Fund | 1,028 | |
| TOTAL EQUITY FUNDS | |||
(Cost $16,292) | 20,007 | ||
| FIXED INCOME FUNDS—12.3% | |||
| | Shares | Value | |
| 123,956 | Harbor High-Yield Bond Fund | $ 1,265 | |
| 132,592 | Harbor Bond Fund | 1,549 | |
| TOTAL FIXED INCOME FUNDS | |||
(Cost $2,784) | 2,814 | ||
| TOTAL INVESTMENTS—100.0% | |||
(Cost $19,076) | 22,821 | ||
CASH AND OTHER ASSETS, LESS LIABILITIES—0.0% | — a | ||
TOTAL NET ASSETS—100.0% | $22,821 | ||
Fair Value Measurements
All holdings at October 31, 2017 (as disclosed in the preceding Portfolio of Investments) are classified as Level 1. There were no Level 3 holdings at October 31, 2017 or 2016, and no transfers between levels during the year.
For more information on valuation inputs and their aggregation into the levels identified above, please refer to Fair Value Measurements and Disclosures in Note 2 of the accompanying Notes to Financial Statements.
| † | The Harbor Target Retirement 2050 Fund is investing in Institutional Class shares of affiliated Harbor Funds. |
| a | Rounds to less than $1,000 |
The accompanying notes are an integral part of the Financial Statements.
24
Harbor Target Retirement 2055 Fund
Fund Summary —October 31, 2017 (Unaudited)
Fund Summary —October 31, 2017 (Unaudited)
Asset Allocation (% of investments)
| Equity Funds | 93.0% | |
| Harbor Large Cap Value Fund | 13.7% | |
| Harbor Capital Appreciation Fund | 11.8% | |
| Harbor International Fund | 11.8% | |
| Harbor Diversified International All Cap Fund | 11.7% | |
| Harbor International Growth Fund | 11.7% | |
| Harbor Mid Cap Value Fund | 9.0% | |
| Harbor Small Cap Value Fund | 6.7% | |
| Harbor Mid Cap Growth Fund | 6.2% | |
| Harbor Small Cap Growth Fund | 5.6% | |
| Harbor Global Leaders Fund | 4.8% |
| Fixed Income Funds | 7.0% | |
| Harbor Bond Fund | 3.9% | |
| Harbor High-Yield Bond Fund | 3.1% |
FUND PERFORMANCE
The graph compares a $10,000 investment in the Institutional Class shares of the Fund with the performance of the broad based market indices. The Fund’s performance assumes the reinvestment of all dividend and capital gain distributions.
CHANGE IN A $10,000 INVESTMENT
For the period 11/01/2014 through 10/31/2017

| TOTAL RETURNS For the periods ended 10/31/2017 | 1 Year | 5 Years | Annualized | Inception Date | Final Value of a $10,000 Investment | |||||||||
| Life of Fund | ||||||||||||||
| Harbor Target Retirement 2055 Fund | ||||||||||||||
Institutional Class | 23.34% | N/A | 8.55% | 11/01/2014 | $12,790 | |||||||||
| Comparative Indices | ||||||||||||||
Bloomberg Barclays U.S. Aggregate Bond | 0.90% | N/A | 2.40% | — | $10,737 | |||||||||
MSCI EAFE (ND) | 23.44 | N/A | 6.08 | — | 11,937 | |||||||||
Russell 3000® | 23.98 | N/A | 10.53 | — | 13,504 | |||||||||
Composite Index 2055 | 22.13 | N/A | 7.85 | — | 12,546 | |||||||||
As stated in the Fund’s current prospectus, the expense ratio was 0.78% (Institutional Class). The Adviser has contractually agreed to limit the Fund’s operating expenses to: (i) the amount of the acquired funds’ fees and expenses; (ii) compensation of the Independent Trustees; and (iii) certain other expenses such as extraordinary items. The expense ratio in the prospectus may differ from the actual expense ratio for the period disclosed within this report. The expense ratio shown in the prospectus is based on the prior fiscal year, adjusted to reflect changes, if any, in contractual arrangements that occurred prior to the date of the prospectus (or supplement thereto, if applicable).
Performance data shown represents past performance and is no guarantee of future results. Past performance is net of management fees and expenses and reflects reinvested dividends and distributions, but does not reflect the deduction of taxes that a shareholder would pay on Fund distributions or upon the redemption of Fund shares. Past performance reflects the beneficial effect of any expense waivers or reimbursements, without which returns would have been lower. Investment returns and principal value will fluctuate and when redeemed may be worth more or less than their original cost. Returns for periods less than one year are not annualized. Current performance may be higher or lower and is available through the most recent month end at harborfunds.com or by calling 800-422-1050. See the Glossary at the end of this report for a description of the Composite Index.
25
Harbor Target Retirement 2055 Fund†
Portfolio of Investments—October 31, 2017
Portfolio of Investments—October 31, 2017
Value and Cost in Thousands
| EQUITY FUNDS—93.0% | |||
| Shares | Value | ||
| 4,273 | Harbor Capital Appreciation Fund | $ 322 | |
| 15,045 | Harbor Mid Cap Growth Fund | 169 | |
| 10,095 | Harbor Small Cap Growth Fund | 152 | |
| 25,145 | Harbor Large Cap Value Fund | 374 | |
| 10,539 | Harbor Mid Cap Value Fund | 246 | |
| 5,048 | Harbor Small Cap Value Fund | 182 | |
| 4,586 | Harbor International Fund | 321 | |
| 27,162 | Harbor Diversified International All Cap Fund | 320 | |
| 20,376 | Harbor International Growth Fund | 320 | |
| 5,207 | Harbor Global Leaders Fund | 132 | |
| TOTAL EQUITY FUNDS | |||
(Cost $2,191) | 2,538 | ||
| FIXED INCOME FUNDS—7.0% | |||
| | Shares | Value | |
| 8,386 | Harbor High-Yield Bond Fund | $ 85 | |
| 8,966 | Harbor Bond Fund | 105 | |
| TOTAL FIXED INCOME FUNDS | |||
(Cost $188) | 190 | ||
| TOTAL INVESTMENTS—100.0% | |||
(Cost $2,379) | 2,728 | ||
CASH AND OTHER ASSETS, LESS LIABILITIES—0.0% | — a | ||
TOTAL NET ASSETS—100.0% | $2,728 | ||
Fair Value Measurements
All holdings at October 31, 2017 (as disclosed in the preceding Portfolio of Investments) are classified as Level 1. There were no Level 3 holdings at October 31, 2017 or 2016, and no transfers between levels during the year.
For more information on valuation inputs and their aggregation into the levels identified above, please refer to Fair Value Measurements and Disclosures in Note 2 of the accompanying Notes to Financial Statements.
| † | The Harbor Target Retirement 2055 Fund is investing in Institutional Class shares of affiliated Harbor Funds. |
| a | Rounds to less than $1,000 |
The accompanying notes are an integral part of the Financial Statements.
26
[THIS PAGE INTENTIONALLY LEFT BLANK]
27
Harbor Target Retirement Funds
StatementS of Assets and Liabilities—October 31, 2017
StatementS of Assets and Liabilities—October 31, 2017
(All amounts in thousands, except per share amounts)
| Harbor Target Retirement Income Fund | Harbor Target Retirement 2015 Fund | Harbor Target Retirement 2020 Fund | Harbor Target Retirement 2025 Fund | Harbor Target Retirement 2030 Fund | Harbor Target Retirement 2035 Fund | Harbor Target Retirement 2040 Fund | Harbor Target Retirement 2045 Fund | Harbor Target Retirement 2050 Fund | Harbor Target Retirement 2055 Fund | |||||||||||
| ASSETS | ||||||||||||||||||||
Investments, at identified cost | $13,435 | $5,997 | $26,157 | $19,844 | $26,176 | $13,493 | $21,589 | $8,588 | $19,076 | $2,379 | ||||||||||
Investments in affiliated funds, at value | $13,746 | $6,288 | $27,742 | $21,218 | $28,618 | $15,005 | $24,940 | $9,863 | $22,821 | $2,728 | ||||||||||
| Receivables for: | ||||||||||||||||||||
Investments in affiliated funds sold | — | — | — | — | — | — | 1 | — | 2 | — | ||||||||||
Capital shares sold | 21 | — | — | — | 92 | — | — | 5 | 1 | — | ||||||||||
Distributions from affiliated funds | 1 | — | 1 | — | — | — | — | — | — | — | ||||||||||
Total Assets | 13,768 | 6,288 | 27,743 | 21,218 | 28,710 | 15,005 | 24,941 | 9,868 | 22,824 | 2,728 | ||||||||||
| LIABILITIES | ||||||||||||||||||||
| Payables for: | ||||||||||||||||||||
Investments in affiliated funds purchased | 22 | — | 1 | — | 72 | — | — | 5 | — | — | ||||||||||
Capital shares reacquired | — | — | — | — | 20 | — | 1 | — | 3 | — | ||||||||||
Total Liabilities | 22 | — | 1 | — | 92 | — | 1 | 5 | 3 | — | ||||||||||
NET ASSETS | $13,746 | $6,288 | $27,742 | $21,218 | $28,618 | $15,005 | $24,940 | $9,863 | $22,821 | $2,728 | ||||||||||
| Net Assets Consist of: | ||||||||||||||||||||
Paid-in capital | $13,793 | $6,332 | $26,795 | $19,964 | $26,239 | $13,704 | $21,382 | $8,503 | $18,605 | $2,374 | ||||||||||
Accumulated undistributed net investment income/(loss) | 20 | 94 | 384 | 279 | 379 | 150 | 198 | 57 | 88 | 5 | ||||||||||
Accumulated net realized gain/(loss) | (378) | (429) | (1,022) | (399) | (442) | (361) | 9 | 28 | 383 | — | ||||||||||
Unrealized appreciation/(depreciation) of investments | 311 | 291 | 1,585 | 1,374 | 2,442 | 1,512 | 3,351 | 1,275 | 3,745 | 349 | ||||||||||
| $13,746 | $6,288 | $27,742 | $21,218 | $28,618 | $15,005 | $24,940 | $9,863 | $22,821 | $2,728 | |||||||||||
| NET ASSET VALUE PER SHARE BY CLASS | ||||||||||||||||||||
| Institutional Class | ||||||||||||||||||||
Net assets | $13,746 | $6,288 | $27,742 | $21,218 | $28,618 | $15,005 | $24,940 | $9,863 | $22,821 | $2,728 | ||||||||||
Shares of beneficial interest1 | 1,486 | 571 | 2,802 | 1,663 | 3,093 | 1,039 | 2,681 | 639 | 2,191 | 228 | ||||||||||
Net asset value per share2 | $ 9.25 | $11.02 | $ 9.90 | $ 12.76 | $ 9.25 | $ 14.44 | $ 9.30 | $15.43 | $ 10.42 | $11.97 | ||||||||||
| 1 | Par value $0.01 (unlimited authorizations). |
| 2 | Per share amounts can be recalculated to the amounts disclosed herein when total net assets and shares of beneficial interest are not rounded to thousands. |
The accompanying notes are an integral part of the Financial Statements.
28
Harbor Target Retirement Funds
StatementS of Operations—Year Ended October 31, 2017
StatementS of Operations—Year Ended October 31, 2017
(All amounts in thousands)
| Harbor Target Retirement Income Fund | Harbor Target Retirement 2015 Fund | Harbor Target Retirement 2020 Fund | Harbor Target Retirement 2025 Fund | Harbor Target Retirement 2030 Fund | Harbor Target Retirement 2035 Fund | Harbor Target Retirement 2040 Fund | Harbor Target Retirement 2045 Fund | Harbor Target Retirement 2050 Fund | Harbor Target Retirement 2055 Fund | |
| Investment Income | ||||||||||
Dividends from affiliated funds | $337 | $155 | $ 646 | $ 427 | $ 631 | $ 271 | $ 396 | $ 133 | $ 264 | $ 19 |
Total Investment Income | 337 | 155 | 646 | 427 | 631 | 271 | 396 | 133 | 264 | 19 |
| Operating Expenses | ||||||||||
| 12b-1 fees: | ||||||||||
Administrative Classa | — | — | — | — | — | — | — | — | — | — |
Investor Classa | — | — | — | — | — | — | — | — | — | — |
| Transfer agent fees: | — | — | — | — | — | — | — | — | — | — |
Investor Classa | — | — | — | — | — | — | — | — | — | — |
Total expensesa | — | — | — | — | — | — | — | — | — | — |
Expenses waiveda | — | — | — | — | — | — | — | — | — | — |
Net expenses | — | — | — | — | — | — | — | — | — | — |
Net Investment Income/(Loss) | 337 | 155 | 646 | 427 | 631 | 271 | 396 | 133 | 264 | 19 |
| Realized and Change in Net Unrealized Gain/(Loss) on Investment Transactions | ||||||||||
| Net realized gain/(loss) on: | ||||||||||
Sale of affiliated funds | (91) | (22) | (64) | (18) | 233 | (83) | 301 | 104 | 555 | 19 |
Distributions received from affiliated funds | 115 | 59 | 235 | 131 | 242 | 128 | 228 | 93 | 244 | 18 |
| Change in net unrealized appreciation/(depreciation) on: | ||||||||||
Affiliated funds | 583 | 325 | 1,887 | 1,534 | 2,527 | 1,668 | 2,796 | 1,292 | 3,142 | 356 |
Net gain/(loss) on investment transactions | 607 | 362 | 2,058 | 1,647 | 3,002 | 1,713 | 3,325 | 1,489 | 3,941 | 393 |
Net Increase/(Decrease) in Net Assets Resulting from Operations | $944 | $517 | $2,704 | $2,074 | $3,633 | $1,984 | $3,721 | $1,622 | $4,205 | $412 |
| a | Rounds to less than $1,000 |
The accompanying notes are an integral part of the Financial Statements.
29
[THIS PAGE INTENTIONALLY LEFT BLANK]
30
Harbor Target Retirement Funds
Statements of Changes In Net Assets
Statements of Changes In Net Assets
(All amounts in thousands)
| Harbor Target Retirement Income Fund | Harbor Target Retirement 2015 Fund | Harbor Target Retirement 2020 Fund | Harbor Target Retirement 2025 Fund | ||||||||
| November 1, 2016 through October 31, 2017 | November 1, 2015 through October 31, 2016 | November 1, 2016 through October 31, 2017 | November 1, 2015 through October 31, 2016 | November 1, 2016 through October 31, 2017 | November 1, 2015 through October 31, 2016 | November 1, 2016 through October 31, 2017 | November 1, 2015 through October 31, 2016 | ||||
| INCREASE/(DECREASE) IN NET ASSETS | |||||||||||
| Operations: | |||||||||||
Net investment income/(loss) | $ 337 | $ 396 | $ 155 | $ 203 | $ 646 | $ 727 | $ 427 | $ 324 | |||
Net realized gain/(loss) on sale of affiliated funds | (91) | (254) | (22) | (287) | (64) | (692) | (18) | (240) | |||
Realized gain distributions received from affiliated funds | 115 | 157 | 59 | 107 | 235 | 443 | 131 | 214 | |||
Change in net unrealized appreciation/(depreciation) on affiliated funds | 583 | 201 | 325 | 211 | 1,887 | 343 | 1,534 | 120 | |||
Net increase/(decrease) in assets resulting from operations | 944 | 500 | 517 | 234 | 2,704 | 821 | 2,074 | 418 | |||
| Distributions to Shareholders | |||||||||||
| Net investment income: | |||||||||||
Institutional Class | (410) | (449) | (179) | (261) | (682) | (859) | (349) | (352) | |||
Administrative Class | — | (1) | — | (1) | — | (1) | (1) | — | |||
Investor Class | — | — | — | — | — | — | (1) | (1) | |||
| Net realized gain on investments: | |||||||||||
Institutional Class | (51) | (466) | — | (218) | (304) | (1,705) | (180) | (501) | |||
Administrative Class | — | (1) | — | (1) | — | (1) | — | (1) | |||
Investor Class | — | — | — | — | — | (1) | — | (1) | |||
Total distributions to shareholders | (461) | (917) | (179) | (481) | (986) | (2,567) | (531) | (856) | |||
Net Increase/(Decrease) Derived from Capital Share Transactions | (574) | (900) | (659) | (955) | 569 | (123) | 5,344 | 3,246 | |||
Net increase/(decrease) in net assets | (91) | (1,317) | (321) | (1,202) | 2,287 | (1,869) | 6,887 | 2,808 | |||
| Net Assets | |||||||||||
Beginning of period | 13,837 | 15,154 | 6,609 | 7,811 | 25,455 | 27,324 | 14,331 | 11,523 | |||
End of period* | $13,746 | $13,837 | $6,288 | $ 6,609 | $27,742 | $25,455 | $21,218 | $14,331 | |||
* Includes accumulated undistributed net investment income/(loss) of: | $ 20 | $ 15 | $ 94 | $ 83 | $ 384 | $ 301 | $ 279 | $ 145 | |||
The accompanying notes are an integral part of the Financial Statements.
31
| Harbor Target Retirement 2030 Fund | Harbor Target Retirement 2035 Fund | Harbor Target Retirement 2040 Fund | Harbor Target Retirement 2045 Fund | Harbor Target Retirement 2050 Fund | Harbor Target Retirement 2055 Fund | |||||||||||
| November 1, 2016 through October 31, 2017 | November 1, 2015 through October 31, 2016 | November 1, 2016 through October 31, 2017 | November 1, 2015 through October 31, 2016 | November 1, 2016 through October 31, 2017 | November 1, 2015 through October 31, 2016 | November 1, 2016 through October 31, 2017 | November 1, 2015 through October 31, 2016 | November 1, 2016 through October 31, 2017 | November 1, 2015 through October 31, 2016 | November 1, 2016 through October 31, 2017 | November 1, 2015 through October 31, 2016 | |||||
| $ 631 | $ 605 | $ 271 | $ 222 | $ 396 | $ 385 | $ 133 | $ 95 | $ 264 | $ 247 | $ 19 | $ 11 | |||||
| 233 | (100) | (83) | (220) | 301 | 128 | 104 | 3 | 555 | 414 | 19 | (33) | |||||
| 242 | 528 | 128 | 229 | 228 | 564 | 93 | 180 | 244 | 672 | 18 | 31 | |||||
| 2,527 | (414) | 1,668 | 91 | 2,796 | (703) | 1,292 | (148) | 3,142 | (1,123) | 356 | 3 | |||||
| 3,633 | 619 | 1,984 | 322 | 3,721 | 374 | 1,622 | 130 | 4,205 | 210 | 412 | 12 | |||||
| (590) | (700) | (255) | (238) | (386) | (451) | (121) | (106) | (260) | (305) | (18) | (12) | |||||
| (1) | (1) | (1) | — | (1) | — | — | — | — | (1) | — | — | |||||
| — | (1) | (1) | — | (1) | — | — | — | — | — | — | — | |||||
| (855) | (1,477) | (224) | (403) | (930) | (1,314) | (272) | (272) | (1,219) | (1,978) | (28) | (3) | |||||
| (1) | (1) | — | (1) | (1) | (2) | (1) | (1) | (2) | (3) | — | — | |||||
| (1) | (1) | — | (1) | (1) | (1) | (1) | (1) | (1) | (2) | — | — | |||||
| (1,448) | (2,181) | (481) | (643) | (1,320) | (1,768) | (395) | (380) | (1,482) | (2,289) | (46) | (15) | |||||
| 1,760 | 1,113 | 1,966 | 2,811 | 3,049 | 1,039 | 1,383 | 1,938 | 1,326 | 1,587 | 1,102 | 481 | |||||
| 3,945 | (449) | 3,469 | 2,490 | 5,450 | (355) | 2,610 | 1,688 | 4,049 | (492) | 1,468 | 478 | |||||
| 24,673 | 25,122 | 11,536 | 9,046 | 19,490 | 19,845 | 7,253 | 5,565 | 18,772 | 19,264 | 1,260 | 782 | |||||
| $28,618 | $24,673 | $15,005 | $11,536 | $24,940 | $19,490 | $9,863 | $7,253 | $22,821 | $18,772 | $2,728 | $1,260 | |||||
| $ 379 | $ 252 | $ 150 | $ 99 | $ 198 | $ 139 | $ 57 | $ 31 | $ 88 | $ 62 | $ 5 | $ 3 | |||||
32
Harbor Target Retirement Funds
Statements of Changes in Net Assets—Capital Stock Activity
Statements of Changes in Net Assets—Capital Stock Activity
(All amounts in thousands)
| Harbor Target Retirement Income Fund | Harbor Target Retirement 2015 Fund | Harbor Target Retirement 2020 Fund | Harbor Target Retirement 2025 Fund | ||||||||
| November 1, 2016 through October 31, 2017 | November 1, 2015 through October 31, 2016 | November 1, 2016 through October 31, 2017 | November 1, 2015 through October 31, 2016 | November 1, 2016 through October 31, 2017 | November 1, 2015 through October 31, 2016 | November 1, 2016 through October 31, 2017 | November 1, 2015 through October 31, 2016 | ||||
| AMOUNT ($) | |||||||||||
| Institutional Class | |||||||||||
Net proceeds from sale of shares | $ 1,411 | $ 1,979 | $ 1,101 | $ 1,226 | $ 5,095 | $ 5,082 | $ 7,504 | $ 4,503 | |||
Reinvested distributions | 460 | 915 | 178 | 479 | 985 | 2,563 | 529 | 853 | |||
Cost of shares reacquired | (2,413) | (3,796) | (1,902) | (2,662) | (5,473) | (7,771) | (2,649) | (2,112) | |||
Net increase/(decrease) in net assets | $ (542) | $ (902) | $ (623) | $ (957) | $ 607 | $ (126) | $ 5,384 | $ 3,244 | |||
| Administrative Class | |||||||||||
Net proceeds from sale of shares | $ — | $ — | $ — | $ — | $ — | $ — | $ — | $ — | |||
Reinvested distributions | — | 1 | — | 1 | — | 2 | 1 | 1 | |||
Cost of shares reacquired | (16) | — | (18) | — | (19) | — | (21) | — | |||
Net increase/(decrease) in net assets | $ (16) | $ 1 | $ (18) | $ 1 | $ (19) | $ 2 | $ (20) | $ 1 | |||
| Investor Class | |||||||||||
Net proceeds from sale of shares | $ — | $ — | $ — | $ — | $ — | $ — | $ — | $ — | |||
Reinvested distributions | — | 1 | — | 1 | — | 1 | 1 | 1 | |||
Cost of shares reacquired | (16) | — | (18) | — | (19) | — | (21) | — | |||
Net increase/(decrease) in net assets | $ (16) | $ 1 | $ (18) | $ 1 | $ (19) | $ 1 | $ (20) | $ 1 | |||
The accompanying notes are an integral part of the Financial Statements.
33
| Harbor Target Retirement 2030 Fund | Harbor Target Retirement 2035 Fund | Harbor Target Retirement 2040 Fund | Harbor Target Retirement 2045 Fund | Harbor Target Retirement 2050 Fund | Harbor Target Retirement 2055 Fund | |||||||||||
| November 1, 2016 through October 31, 2017 | November 1, 2015 through October 31, 2016 | November 1, 2016 through October 31, 2017 | November 1, 2015 through October 31, 2016 | November 1, 2016 through October 31, 2017 | November 1, 2015 through October 31, 2016 | November 1, 2016 through October 31, 2017 | November 1, 2015 through October 31, 2016 | November 1, 2016 through October 31, 2017 | November 1, 2015 through October 31, 2016 | November 1, 2016 through October 31, 2017 | November 1, 2015 through October 31, 2016 | |||||
| $ 6,126 | $ 4,715 | $ 3,780 | $ 4,330 | $ 4,661 | $ 4,210 | $ 3,106 | $ 2,976 | $ 4,814 | $ 3,233 | $1,585 | $ 847 | |||||
| 1,445 | 2,177 | 479 | 641 | 1,316 | 1,763 | 393 | 378 | 1,479 | 2,283 | 45 | 15 | |||||
| (5,769) | (5,783) | (2,249) | (2,162) | (2,882) | (4,937) | (2,068) | (1,418) | (4,917) | (3,934) | (504) | (381) | |||||
| $ 1,802 | $ 1,109 | $ 2,010 | $ 2,809 | $ 3,095 | $ 1,036 | $ 1,431 | $ 1,936 | $ 1,376 | $ 1,582 | $1,126 | $ 481 | |||||
| $ — | $ — | $ — | $ — | $ — | $ — | $ — | $ — | $ — | $ — | $ — | $ — | |||||
| 1 | 2 | 1 | 1 | 1 | 2 | 1 | 1 | 2 | 3 | — | — | |||||
| (22) | — | (23) | — | (24) | — | (25) | — | (27) | — | (12) | — | |||||
| $ (21) | $ 2 | $ (22) | $ 1 | $ (23) | $ 2 | $ (24) | $ 1 | $ (25) | $ 3 | $ (12) | $ — | |||||
| $ — | $ — | $ — | $ — | $ — | $ — | $ — | $ — | $ — | $ — | $ — | $ — | |||||
| 1 | 2 | 1 | 1 | 1 | 1 | 1 | 1 | 1 | 2 | — | — | |||||
| (22) | — | (23) | — | (24) | — | (25) | — | (26) | — | (12) | — | |||||
| $ (21) | $ 2 | $ (22) | $ 1 | $ (23) | $ 1 | $ (24) | $ 1 | $ (25) | $ 2 | $ (12) | $ — | |||||
34
Harbor Target Retirement Funds
Statements of Changes in Net Assets—Capital Stock Activity—Continued
Statements of Changes in Net Assets—Capital Stock Activity—Continued
(All amounts in thousands)
| Harbor Target Retirement Income Fund | Harbor Target Retirement 2015 Fund | Harbor Target Retirement 2020 Fund | Harbor Target Retirement 2025 Fund | ||||||||
| November 1, 2016 through October 31, 2017 | November 1, 2015 through October 31, 2016 | November 1, 2016 through October 31, 2017 | November 1, 2015 through October 31, 2016 | November 1, 2016 through October 31, 2017 | November 1, 2015 through October 31, 2016 | November 1, 2016 through October 31, 2017 | November 1, 2015 through October 31, 2016 | ||||
| SHARES | |||||||||||
| Institutional Class | |||||||||||
Shares sold | 156 | 226 | 103 | 121 | 537 | 561 | 623 | 391 | |||
Shares issued due to reinvestment of distributions | 52 | 107 | 18 | 49 | 110 | 293 | 46 | 77 | |||
Shares reacquired | (268) | (432) | (179) | (263) | (581) | (863) | (220) | (186) | |||
Net increase/(decrease) in shares outstanding | (60) | (99) | (58) | (93) | 66 | (9) | 449 | 282 | |||
Beginning of period | 1,546 | 1,645 | 629 | 722 | 2,736 | 2,745 | 1,214 | 932 | |||
End of period | 1,486 | 1,546 | 571 | 629 | 2,802 | 2,736 | 1,663 | 1,214 | |||
| Administrative Class | |||||||||||
Shares sold | — | — | — | — | — | — | — | — | |||
Shares issued due to reinvestment of distributions | — | — | — | 1 | — | — | — | 1 | |||
Shares reacquired | (2) | — | (2) | — | (2) | — | (2) | — | |||
Net increase/(decrease) in shares outstanding | (2) | — | (2) | 1 | (2) | — | (2) | 1 | |||
Beginning of period | 2 | 2 | 2 | 1 | 2 | 2 | 2 | 1 | |||
End of period | — | 2 | — | 2 | — | 2 | — | 2 | |||
| Investor Class | |||||||||||
Shares sold | — | — | — | — | — | — | — | — | |||
Shares issued due to reinvestment of distributions | — | — | — | 1 | — | — | — | 1 | |||
Shares reacquired | (2) | — | (2) | — | (2) | — | (2) | — | |||
Net increase/(decrease) in shares outstanding | (2) | — | (2) | 1 | (2) | — | (2) | 1 | |||
Beginning of period | 2 | 2 | 2 | 1 | 2 | 2 | 2 | 1 | |||
End of period | — | 2 | — | 2 | — | 2 | — | 2 | |||
The accompanying notes are an integral part of the Financial Statements.
35
| Harbor Target Retirement 2030 Fund | Harbor Target Retirement 2035 Fund | Harbor Target Retirement 2040 Fund | Harbor Target Retirement 2045 Fund | Harbor Target Retirement 2050 Fund | Harbor Target Retirement 2055 Fund | |||||||||||
| November 1, 2016 through October 31, 2017 | November 1, 2015 through October 31, 2016 | November 1, 2016 through October 31, 2017 | November 1, 2015 through October 31, 2016 | November 1, 2016 through October 31, 2017 | November 1, 2015 through October 31, 2016 | November 1, 2016 through October 31, 2017 | November 1, 2015 through October 31, 2016 | November 1, 2016 through October 31, 2017 | November 1, 2015 through October 31, 2016 | November 1, 2016 through October 31, 2017 | November 1, 2015 through October 31, 2016 | |||||
| 700 | 561 | 280 | 345 | 539 | 514 | 219 | 225 | 503 | 357 | 145 | 87 | |||||
| 176 | 270 | 38 | 53 | 164 | 222 | 30 | 30 | 169 | 262 | 5 | 2 | |||||
| (647) | (697) | (168) | (173) | (332) | (615) | (143) | (109) | (511) | (439) | (46) | (41) | |||||
| 229 | 134 | 150 | 225 | 371 | 121 | 106 | 146 | 161 | 180 | 104 | 48 | |||||
| 2,864 | 2,730 | 889 | 664 | 2,310 | 2,189 | 533 | 387 | 2,030 | 1,850 | 124 | 76 | |||||
| 3,093 | 2,864 | 1,039 | 889 | 2,681 | 2,310 | 639 | 533 | 2,191 | 2,030 | 228 | 124 | |||||
| — | — | — | — | — | — | — | — | — | — | — | — | |||||
| — | — | — | 1 | — | — | — | 1 | — | — | — | — | |||||
| (2) | — | (2) | — | (2) | — | (2) | — | (2) | — | (1) | — | |||||
| (2) | — | (2) | 1 | (2) | — | (2) | 1 | (2) | — | (1) | — | |||||
| 2 | 2 | 2 | 1 | 2 | 2 | 2 | 1 | 2 | 2 | 1 | 1 | |||||
| — | 2 | — | 2 | — | 2 | — | 2 | — | 2 | — | 1 | |||||
36
Harbor Target Retirement Funds Financial Highlights
Selected Data for a Share Outstanding for the Periods Presented
Selected Data for a Share Outstanding for the Periods Presented
HARBOR TARGET RETIREMENT INCOME FUND
| Institutional Class | |||||
| Year Ended October 31, | 2017 | 2016 | 2015 | 2014 | 2013 |
Net asset value beginning of period | $ 8.93 | $ 9.19 | $ 9.75 | $ 9.83 | $ 9.95 |
| Income from Investment Operations | |||||
Net investment income/(loss) | 0.22 a | 0.25 a | 0.34 a | 0.22 | 0.23 |
Net realized and unrealized gains/(losses) on investments | 0.40 | 0.08 | (0.30) | 0.19 | 0.20 |
Total from investment operations | 0.62 | 0.33 | 0.04 | 0.41 | 0.43 |
| Less Distributions | |||||
Dividends from net investment income | (0.27) | (0.29) | (0.35) | (0.28) | (0.38) |
Distributions from net realized capital gains1 | (0.03) | (0.30) | (0.25) | (0.21) | (0.17) |
Total distributions | (0.30) | (0.59) | (0.60) | (0.49) | (0.55) |
Net asset value end of period | 9.25 | 8.93 | 9.19 | 9.75 | 9.83 |
Net assets end of period (000s) | $13,746 | $13,805 | $15,124 | $17,410 | $15,510 |
| Ratios and Supplemental Data (%) | |||||
Total return | 7.17% | 3.91% | 0.46% | 4.32% | 4.49% |
Ratio of total expenses to average net assets2 | — | — | — | — | — |
Ratio of net investment income to average net assets2 | 2.46 | 2.87 | 3.57 | 2.14 | 2.36 |
Portfolio turnover3 | 16 | 26 | 24 | 20 | 28 |
HARBOR TARGET RETIREMENT 2015 FUND
| Institutional Class | |||||
| Year Ended October 31, | 2017 | 2016 | 2015 | 2014 | 2013 |
Net asset value beginning of period | $10.45 | $10.77 | $11.68 | $ 11.87 | $ 11.52 |
| Income from Investment Operations | |||||
Net investment income/(loss) | 0.26 a | 0.29 a | 0.36 a | 0.24 | 0.28 |
Net realized and unrealized gains/(losses) on investments | 0.60 | 0.05 | (0.35) | 0.29 | 0.60 |
Total from investment operations | 0.86 | 0.34 | 0.01 | 0.53 | 0.88 |
| Less Distributions | |||||
Dividends from net investment income | (0.29) | (0.36) | (0.39) | (0.31) | (0.44) |
Distributions from net realized capital gains1 | — | (0.30) | (0.53) | (0.41) | (0.09) |
Total distributions | (0.29) | (0.66) | (0.92) | (0.72) | (0.53) |
Net asset value end of period | 11.02 | 10.45 | 10.77 | 11.68 | 11.87 |
Net assets end of period (000s) | $6,288 | $6,574 | $7,778 | $11,200 | $10,654 |
| Ratios and Supplemental Data (%) | |||||
Total return | 8.43% | 3.59% | 0.13% | 4.73% | 7.89% |
Ratio of total expenses to average net assets2 | — | — | — | — | — |
Ratio of net investment income to average net assets2 | 2.43 | 2.82 | 3.26 | 2.08 | 2.43 |
Portfolio turnover3 | 22 | 32 | 26 | 38 | 48 |
See page 41 for notes to the Financial Highlights.
The accompanying notes are an integral part of the Financial Statements.
37
HARBOR TARGET RETIREMENT 2020 FUND
| Institutional Class | |||||
| Year Ended October 31, | 2017 | 2016 | 2015 | 2014 | 2013 |
Net asset value beginning of period | $ 9.29 | $ 9.94 | $ 10.63 | $ 10.78 | $ 10.43 |
| Income from Investment Operations | |||||
Net investment income/(loss) | 0.23 a | 0.26 a | 0.32 a | 0.23 | 0.26 |
Net realized and unrealized gains/(losses) on investments | 0.73 | 0.04 | (0.30) | 0.29 | 0.68 |
Total from investment operations | 0.96 | 0.30 | 0.02 | 0.52 | 0.94 |
| Less Distributions | |||||
Dividends from net investment income | (0.24) | (0.32) | (0.34) | (0.30) | (0.40) |
Distributions from net realized capital gains1 | (0.11) | (0.63) | (0.37) | (0.37) | (0.19) |
Total distributions | (0.35) | (0.95) | (0.71) | (0.67) | (0.59) |
Net asset value end of period | 9.90 | 9.29 | 9.94 | 10.63 | 10.78 |
Net assets end of period (000s) | $27,742 | $25,419 | $27,290 | $31,124 | $27,397 |
| Ratios and Supplemental Data (%) | |||||
Total return | 10.77% | 3.56% | 0.30% | 5.06% | 9.43% |
Ratio of total expenses to average net assets2 | — | — | — | — | — |
Ratio of net investment income to average net assets2 | 2.44 | 2.83 | 3.19 | 2.18 | 2.56 |
Portfolio turnover3 | 29 | 33 | 28 | 19 | 36 |
HARBOR TARGET RETIREMENT 2025 FUND
| Institutional Class | |||||
| Year Ended October 31, | 2017 | 2016 | 2015 | 2014 | 2013 |
Net asset value beginning of period | $ 11.78 | $ 12.32 | $ 13.48 | $ 13.44 | $12.69 |
| Income from Investment Operations | |||||
Net investment income/(loss) | 0.29 a | 0.31 a | 0.37 a | 0.29 | 0.34 |
Net realized and unrealized gains/(losses) on investments | 1.12 | 0.05 | (0.36) | 0.40 | 1.04 |
Total from investment operations | 1.41 | 0.36 | 0.01 | 0.69 | 1.38 |
| Less Distributions | |||||
Dividends from net investment income | (0.28) | (0.37) | (0.41) | (0.36) | (0.45) |
Distributions from net realized capital gains1 | (0.15) | (0.53) | (0.76) | (0.29) | (0.18) |
Total distributions | (0.43) | (0.90) | (1.17) | (0.65) | (0.63) |
Net asset value end of period | 12.76 | 11.78 | 12.32 | 13.48 | 13.44 |
Net assets end of period (000s) | $21,218 | $14,293 | $11,487 | $10,612 | $8,728 |
| Ratios and Supplemental Data (%) | |||||
Total return | 12.38% | 3.39% | 0.11% | 5.37% | 11.33% |
Ratio of total expenses to average net assets2 | — | — | — | — | — |
Ratio of net investment income to average net assets2 | 2.42 | 2.69 | 2.91 | 2.06 | 2.44 |
Portfolio turnover3 | 24 | 25 | 25 | 33 | 32 |
The accompanying notes are an integral part of the Financial Statements.
38
Harbor Target Retirement Funds Financial Highlights—Continued
Selected Data for a Share Outstanding for the Periods Presented
Selected Data for a Share Outstanding for the Periods Presented
HARBOR TARGET RETIREMENT 2030 FUND
| Institutional Class | |||||
| Year Ended October 31, | 2017 | 2016 | 2015 | 2014 | 2013 |
Net asset value beginning of period | $ 8.60 | $ 9.19 | $ 10.04 | $ 10.22 | $ 9.56 |
| Income from Investment Operations | |||||
Net investment income/(loss) | 0.20 a | 0.21 a | 0.24 a | 0.21 | 0.25 |
Net realized and unrealized gains/(losses) on investments | 0.96 | 0.01 | (0.23) | 0.35 | 1.04 |
Total from investment operations | 1.16 | 0.22 | 0.01 | 0.56 | 1.29 |
| Less Distributions | |||||
Dividends from net investment income | (0.21) | (0.26) | (0.28) | (0.27) | (0.33) |
Distributions from net realized capital gains1 | (0.30) | (0.55) | (0.58) | (0.47) | (0.30) |
Total distributions | (0.51) | (0.81) | (0.86) | (0.74) | (0.63) |
Net asset value end of period | 9.25 | 8.60 | 9.19 | 10.04 | 10.22 |
Net assets end of period (000s) | $28,618 | $24,634 | $25,084 | $24,727 | $23,994 |
| Ratios and Supplemental Data (%) | |||||
Total return | 14.18% | 2.96% | 0.13% | 5.79% | 14.19% |
Ratio of total expenses to average net assets2 | — | — | — | — | — |
Ratio of net investment income to average net assets2 | 2.30 | 2.54 | 2.55 | 1.99 | 2.42 |
Portfolio turnover3 | 29 | 31 | 24 | 22 | 31 |
HARBOR TARGET RETIREMENT 2035 FUND
| Institutional Class | |||||
| Year Ended October 31, | 2017 | 2016 | 2015 | 2014 | 2013 |
Net asset value beginning of period | $ 12.93 | $ 13.56 | $14.92 | $14.52 | $13.01 |
| Income from Investment Operations | |||||
Net investment income/(loss) | 0.28 a | 0.27 a | 0.30 a | 0.29 | 0.33 |
Net realized and unrealized gains/(losses) on investments | 1.75 | 0.04 | (0.26) | 0.58 | 1.85 |
Total from investment operations | 2.03 | 0.31 | 0.04 | 0.87 | 2.18 |
| Less Distributions | |||||
Dividends from net investment income | (0.28) | (0.35) | (0.36) | (0.33) | (0.40) |
Distributions from net realized capital gains1 | (0.24) | (0.59) | (1.04) | (0.14) | (0.27) |
Total distributions | (0.52) | (0.94) | (1.40) | (0.47) | (0.67) |
Net asset value end of period | 14.44 | 12.93 | 13.56 | 14.92 | 14.52 |
Net assets end of period (000s) | $15,005 | $11,496 | $9,007 | $7,708 | $5,397 |
| Ratios and Supplemental Data (%) | |||||
Total return | 16.31% | 2.70% | 0.34% | 6.19% | 17.43% |
Ratio of total expenses to average net assets2 | — | — | — | — | — |
Ratio of net investment income to average net assets2 | 2.06 | 2.17 | 2.17 | 1.64 | 2.08 |
Portfolio turnover3 | 26 | 26 | 22 | 39 | 12 |
See page 41 for notes to the Financial Highlights.
The accompanying notes are an integral part of the Financial Statements.
39
HARBOR TARGET RETIREMENT 2040 FUND
| Institutional Class | |||||
| Year Ended October 31, | 2017 | 2016 | 2015 | 2014 | 2013 |
Net asset value beginning of period | $ 8.42 | $ 9.05 | $ 9.84 | $ 10.01 | $ 9.19 |
| Income from Investment Operations | |||||
Net investment income/(loss) | 0.15 a | 0.17 a | 0.18 a | 0.17 | 0.22 |
Net realized and unrealized gains/(losses) on investments | 1.30 | (0.01) | (0.10) | 0.46 | 1.52 |
Total from investment operations | 1.45 | 0.16 | 0.08 | 0.63 | 1.74 |
| Less Distributions | |||||
Dividends from net investment income | (0.17) | (0.20) | (0.22) | (0.23) | (0.26) |
Distributions from net realized capital gains1 | (0.40) | (0.59) | (0.65) | (0.57) | (0.66) |
Total distributions | (0.57) | (0.79) | (0.87) | (0.80) | (0.92) |
Net asset value end of period | 9.30 | 8.42 | 9.05 | 9.84 | 10.01 |
Net assets end of period (000s) | $24,940 | $19,448 | $19,805 | $18,933 | $17,963 |
| Ratios and Supplemental Data (%) | |||||
Total return | 18.26% | 2.36% | 0.94% | 6.77% | 20.63% |
Ratio of total expenses to average net assets2 | — | — | — | — | — |
Ratio of net investment income to average net assets2 | 1.78 | 2.03 | 1.96 | 1.59 | 2.24 |
Portfolio turnover3 | 21 | 30 | 18 | 22 | 22 |
HARBOR TARGET RETIREMENT 2045 FUND
| Institutional Class | |||||
| Year Ended October 31, | 2017 | 2016 | 2015 | 2014 | 2013 |
Net asset value beginning of period | $13.51 | $14.25 | $15.17 | $14.85 | $12.42 |
| Income from Investment Operations | |||||
Net investment income/(loss) | 0.21 a | 0.21 a | 0.23 a | 0.23 | 0.29 |
Net realized and unrealized gains/(losses) on investments | 2.42 | 0.01 | (0.06) | 0.80 | 2.58 |
Total from investment operations | 2.63 | 0.22 | 0.17 | 1.03 | 2.87 |
| Less Distributions | |||||
Dividends from net investment income | (0.22) | (0.27) | (0.29) | (0.31) | (0.31) |
Distributions from net realized capital gains1 | (0.49) | (0.69) | (0.80) | (0.40) | (0.13) |
Total distributions | (0.71) | (0.96) | (1.09) | (0.71) | (0.44) |
Net asset value end of period | 15.43 | 13.51 | 14.25 | 15.17 | 14.85 |
Net assets end of period (000s) | $9,863 | $7,211 | $5,523 | $4,239 | $3,340 |
| Ratios and Supplemental Data (%) | |||||
Total return | 20.37% | 1.91% | 1.23% | 7.17% | 23.75% |
Ratio of total expenses to average net assets2 | — | — | — | — | — |
Ratio of net investment income to average net assets2 | 1.50 | 1.58 | 1.56 | 1.37 | 1.82 |
Portfolio turnover3 | 32 | 24 | 15 | 21 | 20 |
The accompanying notes are an integral part of the Financial Statements.
40
Harbor Target Retirement Funds Financial Highlights—Continued
Selected Data for a Share Outstanding for the Periods Presented
Selected Data for a Share Outstanding for the Periods Presented
HARBOR TARGET RETIREMENT 2050 FUND
| Institutional Class | |||||
| Year Ended October 31, | 2017 | 2016 | 2015 | 2014 | 2013 |
Net asset value beginning of period | $ 9.23 | $ 10.39 | $ 11.40 | $ 11.46 | $ 10.17 |
| Income from Investment Operations | |||||
Net investment income/(loss) | 0.12 a | 0.12 a | 0.14 a | 0.15 | 0.22 |
Net realized and unrealized gains/(losses) on investments | 1.81 | (0.03) | 0.05 | 0.67 | 2.20 |
Total from investment operations | 1.93 | 0.09 | 0.19 | 0.82 | 2.42 |
| Less Distributions | |||||
Dividends from net investment income | (0.13) | (0.17) | (0.19) | (0.23) | (0.24) |
Distributions from net realized capital gains1 | (0.61) | (1.08) | (1.01) | (0.65) | (0.89) |
Total distributions | (0.74) | (1.25) | (1.20) | (0.88) | (1.13) |
Net asset value end of period | 10.42 | 9.23 | 10.39 | 11.40 | 11.46 |
Net assets end of period (000s) | $22,821 | $18,728 | $19,221 | $20,434 | $19,170 |
| Ratios and Supplemental Data (%) | |||||
Total return | 22.40% | 1.51% | 1.83% | 7.61% | 26.12% |
Ratio of total expenses to average net assets2 | — | — | — | — | — |
Ratio of net investment income to average net assets2 | 1.27 | 1.34 | 1.35 | 1.17 | 1.88 |
Portfolio turnover3 | 33 | 24 | 24 | 23 | 17 |
HARBOR TARGET RETIREMENT 2055 FUND
| Institutional Class | |||
| Year Ended October 31, | 2017 | 2016 | 2015 |
Net asset value beginning of period | $10.02 | $10.08 | $10.00 |
| Income from Investment Operations | |||
Net investment income/(loss) | 0.10 a | 0.11 a | 0.05 a |
Net realized and unrealized gains/(losses) on investments | 2.17 | 0.01 | 0.18 |
Total from investment operations | 2.27 | 0.12 | 0.23 |
| Less Distributions | |||
Dividends from net investment income | (0.12) | (0.14) | (0.15) |
Distributions from net realized capital gains1 | (0.20) | (0.04) | — |
Total distributions | (0.32) | (0.18) | (0.15) |
Net asset value end of period | 11.97 | 10.02 | 10.08 |
Net assets end of period (000s) | $2,728 | $1,240 | $ 762 |
| Ratios and Supplemental Data (%) | |||
Total return | 23.34% | 1.38% | 2.28% |
Ratio of total expenses to average net assets2 | — | — | — |
Ratio of net investment income to average net assets2 | 0.95 | 1.13 | 0.52 |
Portfolio turnover3 | 32 | 33 | 15 |
| * | Less than $0.01. |
| 1 | Includes both short-term and long-term capital gains. |
| 2 | Ratios of income and expenses to average net assets represents the expenses paid by the Fund but does not include the acquired fund fees and expenses from underlying funds. |
| 3 | Amounts do not include the activity of the underlying funds. |
| a | Amounts are allocated based upon average shares outstanding during the period. |
The accompanying notes are an integral part of the Financial Statements.
41
Harbor Target Retirement Funds
Notes to Financial Statements—October 31, 2017
Notes to Financial Statements—October 31, 2017
Note 1—Organizational Matters
Harbor Funds (the “Trust”) is registered under the Investment Company Act of 1940, as amended (the “Investment Company Act”), as an open-end management investment company. As of October 31, 2017 the Trust consists of 31 separate portfolios. The portfolios covered by this report are: Harbor Target Retirement Income Fund, Harbor Target Retirement 2015 Fund, Harbor Target Retirement 2020 Fund, Harbor Target Retirement 2025 Fund, Harbor Target Retirement 2030 Fund, Harbor Target Retirement 2035 Fund, Harbor Target Retirement 2040 Fund, Harbor Target Retirement 2045 Fund, Harbor Target Retirement 2050 Fund and Harbor Target Retirement 2055 Fund (individually referred to as a “Fund” and collectively referred to as the “Funds” or “Target Retirement Funds”). The Funds invest in a combination of other affiliated funds of the Trust (the “Underlying Funds”). Harbor Capital Advisors, Inc. (the “Adviser” or “Harbor Capital”) is the investment adviser for the Funds and the Underlying Funds. The Underlying Funds are managed by the subadvisers, none of which is affiliated with the Adviser.
The Funds currently offer one class of shares, designated as Institutional Class. The Funds previously offered two additional classes of shares, the Administrative Class and Investor Class, each class representing an interest in the same portfolio of investments of the respective Fund. As of October 31, 2017, all shares of the Administrative Class and Investor Class shares had been fully redeemed and therefore no shares of either of those classes remained outstanding. The Funds do not currently intend to continue to offer those classes of shares.
Note 2—Significant Accounting Policies
The following is a summary of significant accounting policies followed by the Trust in the preparation of its financial statements. Each Fund follows the investment company reporting requirements under U.S. Generally Accepted Accounting Principles (“U.S. GAAP”), which includes the accounting and reporting guidelines under Accounting Standards Topic 946, Financial Services-Investment Companies. The preparation of financial statements in accordance with U.S. GAAP requires management to make estimates and assumptions that affect the reported amounts and disclosures in the financial statements. Actual results may differ from those estimates.
Security Valuation
The holdings of each Target Retirement Fund consist entirely of Institutional Class shares of the Underlying Funds, which are valued at their respective net asset values each business day and are categorized as Level 1 in the fair value hierarchy. For more information on the fair value hierarchy, please refer to the following Fair Value Measurements and Disclosures section.
Fair Value Measurements and Disclosures
Various inputs may be used to determine the value of each Fund’s investments, which are summarized in three broad categories defined as Level 1, Level 2, and Level 3. The inputs or methodologies used for valuing securities are not necessarily indicative of the risk associated with investing in those securities. The assignment of an investment to Levels 1, 2, or 3 is based on the lowest level of significant inputs used to determine its fair value.
| Level 1– | Quoted prices in active markets for identical securities. |
| Level 2– | Other significant observable inputs (including quoted prices for similar securities, interest rates, prepayment speeds, credit risk, etc.). |
| Level 3– | Significant unobservable inputs are used in situations where quoted prices or other observable inputs are not available or are deemed unreliable. Significant unobservable inputs may include each Fund’s own assumptions. |
Transfers between levels, if any, are recognized as of the last day in the fiscal quarter of the period in which the event or change in circumstances that caused the reclassification occurred. For fair valuations using significant unobservable inputs, a reconciliation of the beginning to ending balances for reported fair values is provided that presents changes attributable to realized and unrealized gains and losses and purchases, sales, and transfers in/out of the Level 3 category during the period. A table that includes a categorization of investments into Levels 1, 2, or 3, transfers between levels, if any, and a Level 3 reconciliation, including details of significant unobservable inputs used, when applicable, can be found at the end of each Fund’s Portfolio of Investments schedule.
Each Fund used observable inputs in its valuation methodologies whenever they were available and deemed reliable.
42
Harbor Target Retirement Funds
Notes to Financial Statements—Continued
Notes to Financial Statements—Continued
Note 2—Significant Accounting Policies—Continued
Description of the Underlying Funds
In pursuing its investment objectives and strategies, each of the Underlying Funds is permitted to engage in a wide range of investment practices. Further information about the Underlying Funds is contained in the statement of additional information, as well as the prospectuses of each of the Underlying Funds. The accounting policies of each of the Underlying Funds are disclosed in each Underlying Fund’s respective shareholder report. Because each Fund invests in the Underlying Funds, shareholders of each Fund will be affected by the investment practices of the Underlying Funds in direct proportion to the amount of assets each Fund allocates to the Underlying Funds.
Investment Transactions and Income
Securities transactions are accounted for on the trade date (the date the order to buy or sell is executed). Income and capital gain distributions received from the Underlying Funds are recorded on the ex-dividend date. Gains and losses on securities sold are determined on the basis of identified cost.
Distribution to Shareholders
Distributions on Fund shares are recorded on the ex-dividend date.
Expenses
Expenses incurred by the Trust are charged directly to the Fund that incurred such expense whenever possible. With respect to expenses incurred by any two or more Harbor Funds where amounts cannot be identified on a fund by fund basis, such expenses are generally allocated in proportion to the average net assets or the number of shareholders of each fund. Expenses included in the accompanying financial statements reflect the expenses of each Target Retirement Fund and do not include any expenses associated with the Underlying Funds.
Class Allocations
Income, common expenses and realized and unrealized gains/(losses) are determined at the Fund level and allocated daily to each class of shares based on the applicable net assets of the respective classes. Distribution and service fees, if any, and transfer agent fees are calculated daily at the class level based on the applicable net assets of each class and the expense rate(s) applicable to each class.
Taxes
Each Fund is treated as a separate entity for federal tax purposes. Each Fund’s policy is to meet the requirements of Subchapter M of the Internal Revenue Code applicable to regulated investment companies and to distribute to its shareholders all of its taxable income within the prescribed time. It is also the intention of each Fund to distribute an amount sufficient to avoid imposition of any excise tax under Section 4982 of the Internal Revenue Code. Therefore, no provision has been made for federal taxes on income, capital gains or unrealized appreciation of securities held or excise taxes on income and capital gains.
All investment transactions for the Funds are in affiliated Underlying Funds. The Underlying Funds may be subject to taxes imposed by countries in which they invest. Such taxes are generally based on income and/or capital gains earned or repatriated. Taxes are accrued and applied to net investment income, net realized gains and unrealized appreciation as such income and/or gains are earned.
Management has analyzed each Fund’s tax positions for all open tax years (in particular, U.S. federal income tax returns for the tax years ended October 31, 2014–2016), including all positions expected to be taken upon filing the 2017 tax return, in all material jurisdictions where the Funds operate, and has concluded that no provision for income tax is required in any Fund’s financial statements. The Funds will recognize interest and penalties, if any, related to unrecognized tax benefits as income tax expense in the Statements of Operations.
43
Harbor Target Retirement Funds
Notes to Financial Statements—Continued
Notes to Financial Statements—Continued
Note 2—Significant Accounting Policies—Continued
Related Parties
The Funds do not invest in the Underlying Funds for the purpose of exercising management or control; however, investments by the Funds may represent a significant portion of an Underlying Fund’s net assets. At October 31, 2017, each Fund held 10% or fewer of the outstanding shares of any Underlying Fund. In aggregate, the Funds held 10% of Harbor Global Leaders Fund and 12% of Harbor Real Return Fund.
Note 3—Investment Portfolio Transactions
Purchases and sales of investments, investment income, realized and unrealized gains or losses for each Fund for the year ended October 31, 2017 are as follows:
| Purchases of affiliated funds (000s) | Sales of affiliated funds (000s) | Investment income from affiliated funds (000s) | Net Realized Gain/(Loss) | ||||||||
| Harbor Target Retirement Income Fund | Change in Unrealized Gain/(Loss) from affiliated funds (000s) | Distributions received from affiliated funds (000s) | Sale of affiliated funds (000s) | ||||||||
| Underlying Funds | |||||||||||
Harbor Capital Appreciation Fund | $ 51 | $ 122 | $ — | $ 68 | $ 20 | $ 12 | |||||
Harbor Mid Cap Growth Fund | 22 | 64 | — | 54 | — | (4) | |||||
Harbor Small Cap Growth Fund | 25 | 60 | — | 41 | 1 | (3) | |||||
Harbor Large Cap Value Fund | 58 | 139 | 4 | 58 | 13 | 21 | |||||
Harbor Mid Cap Value Fund | 58 | 101 | 4 | 19 | 4 | 22 | |||||
Harbor Small Cap Value Fund | 34 | 90 | 1 | 39 | — | 18 | |||||
Harbor International Fund | 63 | 373 | 12 | 84 | — | (32) | |||||
Harbor Diversified International Fund | 354 | 65 | — | 51 | — | 6 | |||||
Harbor International Growth Fund | 45 | 184 | 5 | 55 | — | 14 | |||||
Harbor Global Leaders Fund | 14 | 42 | — | 33 | — | (1) | |||||
Harbor High-Yield Bond Fund | 248 | 300 | 102 | 64 | — | (25) | |||||
Harbor Bond Fund | 708 | 690 | 161 | (25) | 77 | (62) | |||||
Harbor Real Return Fund | 281 | 297 | 38 | 42 | — | (57) | |||||
Harbor Money Market Fund | 167 | 184 | 10 | — | — | — | |||||
Total | $2,128 | $2,711 | $337 | $583 | $115 | $(91) | |||||
44
Harbor Target Retirement Funds
Notes to Financial Statements—Continued
Notes to Financial Statements—Continued
Note 3—Investment Portfolio Transactions—Continued
| Purchases of affiliated funds (000s) | Sales of affiliated funds (000s) | Investment income from affiliated funds (000s) | Net Realized Gain/(Loss) | ||||||||
| Harbor Target Retirement 2015 Fund | Change in Unrealized Gain/(Loss) from affiliated funds (000s) | Distributions received from affiliated funds (000s) | Sale of affiliated funds (000s) | ||||||||
| Underlying Funds | |||||||||||
Harbor Capital Appreciation Fund | $ 38 | $ 103 | $ — | $ 38 | $ 13 | $ 7 | |||||
Harbor Mid Cap Growth Fund | 16 | 52 | — | 29 | — | — | |||||
Harbor Small Cap Growth Fund | 16 | 45 | — | 24 | 1 | (1) | |||||
Harbor Large Cap Value Fund | 39 | 111 | 2 | 30 | 9 | 15 | |||||
Harbor Mid Cap Value Fund | 34 | 75 | 3 | 17 | 2 | 7 | |||||
Harbor Small Cap Value Fund | 20 | 63 | — | 23 | — | 11 | |||||
Harbor International Fund | 41 | 256 | 7 | 51 | — | (19) | |||||
Harbor Diversified International Fund | 213 | 47 | — | 27 | — | 4 | |||||
Harbor International Growth Fund | 29 | 138 | 4 | 33 | — | 8 | |||||
Harbor Global Leaders Fund | 11 | 40 | — | 18 | — | — | |||||
Harbor Commodity Real Return Fund | 3 | 85 | — | 2 | — | 2 | |||||
Harbor High-Yield Bond Fund | 145 | 229 | 50 | 39 | — | (19) | |||||
Harbor Bond Fund | 490 | 507 | 70 | (14) | 34 | (24) | |||||
Harbor Real Return Fund | 220 | 199 | 15 | 8 | — | (13) | |||||
Harbor Money Market Fund | 118 | 107 | 4 | — | — | — | |||||
Total | $1,433 | $2,057 | $155 | $325 | $ 59 | $(22) | |||||
| Purchases of affiliated funds (000s) | Sales of affiliated funds (000s) | Investment income from affiliated funds (000s) | Net Realized Gain/(Loss) | ||||||||
| Harbor Target Retirement 2020 Fund | Change in Unrealized Gain/(Loss) from affiliated funds (000s) | Distributions received from affiliated funds (000s) | Sale of affiliated funds (000s) | ||||||||
| Underlying Funds | |||||||||||
Harbor Capital Appreciation Fund | $ 248 | $ 364 | $ 1 | $ 213 | $ 63 | $ 47 | |||||
Harbor Mid Cap Growth Fund | 137 | 183 | — | 174 | — | (9) | |||||
Harbor Small Cap Growth Fund | 145 | 165 | — | 132 | 2 | (6) | |||||
Harbor Large Cap Value Fund | 225 | 346 | 13 | 171 | 42 | 81 | |||||
Harbor Mid Cap Value Fund | 237 | 262 | 13 | 38 | 12 | 91 | |||||
Harbor Small Cap Value Fund | 145 | 226 | 2 | 135 | — | 50 | |||||
Harbor International Fund | 267 | 1,087 | 37 | 297 | — | (118) | |||||
Harbor Diversified International Fund | 1,243 | 215 | — | 166 | — | 15 | |||||
Harbor International Growth Fund | 223 | 528 | 18 | 199 | — | 32 | |||||
Harbor Global Leaders Fund | 67 | 130 | — | 100 | — | 1 | |||||
Harbor Commodity Real Return Fund | 37 | 723 | — | 107 | — | (74) | |||||
Harbor Convertible Securities Fund | 32 | 803 | 5 | (4) | — | 17 | |||||
Harbor High-Yield Bond Fund | 1,033 | 665 | 251 | 152 | — | (55) | |||||
Harbor Bond Fund | 2,594 | 1,277 | 250 | (20) | 116 | (92) | |||||
Harbor Real Return Fund | 792 | 435 | 48 | 27 | — | (44) | |||||
Harbor Money Market Fund | 587 | 141 | 8 | — | — | — | |||||
Total | $8,012 | $7,550 | $646 | $1,887 | $235 | $ (64) | |||||
45
Harbor Target Retirement Funds
Notes to Financial Statements—Continued
Notes to Financial Statements—Continued
Note 3—Investment Portfolio Transactions—Continued
| Purchases of affiliated funds (000s) | Sales of affiliated funds (000s) | Investment income from affiliated funds (000s) | Net Realized Gain/(Loss) | ||||||||
| Harbor Target Retirement 2025 Fund | Change in Unrealized Gain/(Loss) from affiliated funds (000s) | Distributions received from affiliated funds (000s) | Sale of affiliated funds (000s) | ||||||||
| Underlying Funds | |||||||||||
Harbor Capital Appreciation Fund | $ 355 | $ 186 | $ 1 | $ 194 | $ 40 | $ 23 | |||||
Harbor Mid Cap Growth Fund | 207 | 102 | — | 142 | — | (12) | |||||
Harbor Small Cap Growth Fund | 214 | 95 | — | 102 | 2 | (6) | |||||
Harbor Large Cap Value Fund | 433 | 202 | 10 | 153 | 26 | 44 | |||||
Harbor Mid Cap Value Fund | 366 | 164 | 8 | 54 | 7 | 42 | |||||
Harbor Small Cap Value Fund | 250 | 151 | 1 | 110 | — | 33 | |||||
Harbor International Fund | 457 | 723 | 24 | 231 | — | (84) | |||||
Harbor Diversified International Fund | 1,004 | 66 | — | 144 | — | 5 | |||||
Harbor International Growth Fund | 339 | 288 | 11 | 180 | — | 11 | |||||
Harbor Global Leaders Fund | 113 | 61 | — | 82 | — | (3) | |||||
Harbor Commodity Real Return Fund | 81 | 617 | — | 66 | — | (40) | |||||
Harbor Convertible Securities Fund | 95 | 778 | 4 | (4) | — | 17 | |||||
Harbor High-Yield Bond Fund | 1,949 | 290 | 194 | 93 | — | (24) | |||||
Harbor Bond Fund | 2,917 | 421 | 147 | (15) | 56 | (17) | |||||
Harbor Real Return Fund | 874 | 139 | 27 | 2 | — | (7) | |||||
Total | $9,654 | $4,283 | $427 | $1,534 | $131 | $(18) | |||||
| Purchases of affiliated funds (000s) | Sales of affiliated funds (000s) | Investment income from affiliated funds (000s) | Net Realized Gain/(Loss) | ||||||||
| Harbor Target Retirement 2030 Fund | Change in Unrealized Gain/(Loss) from affiliated funds (000s) | Distributions received from affiliated funds (000s) | Sale of affiliated funds (000s) | ||||||||
| Underlying Funds | |||||||||||
Harbor Capital Appreciation Fund | $ 315 | $ 417 | $ 1 | $ 319 | $ 84 | $ 69 | |||||
Harbor Mid Cap Growth Fund | 178 | 208 | — | 248 | — | (7) | |||||
Harbor Small Cap Growth Fund | 193 | 177 | — | 190 | 3 | (8) | |||||
Harbor Large Cap Value Fund | 334 | 390 | 19 | 182 | 56 | 180 | |||||
Harbor Mid Cap Value Fund | 375 | 316 | 18 | 32 | 16 | 151 | |||||
Harbor Small Cap Value Fund | 237 | 292 | 3 | 198 | — | 68 | |||||
Harbor International Fund | 336 | 1,368 | 49 | 338 | — | (72) | |||||
Harbor Diversified International Fund | 1,720 | 237 | — | 246 | — | 25 | |||||
Harbor International Growth Fund | 291 | 645 | 24 | 295 | — | 50 | |||||
Harbor Global Leaders Fund | 78 | 158 | — | 121 | — | 25 | |||||
Harbor Commodity Real Return Fund | 82 | 1,256 | — | 206 | — | (150) | |||||
Harbor Convertible Securities Fund | 58 | 1,052 | 6 | (5) | — | 23 | |||||
Harbor High-Yield Bond Fund | 1,826 | 544 | 284 | 157 | — | (56) | |||||
Harbor Bond Fund | 2,574 | 786 | 199 | (5) | 83 | (53) | |||||
Harbor Real Return Fund | 636 | 202 | 28 | 5 | — | (12) | |||||
Total | $9,233 | $8,048 | $631 | $2,527 | $242 | $ 233 | |||||
46
Harbor Target Retirement Funds
Notes to Financial Statements—Continued
Notes to Financial Statements—Continued
Note 3—Investment Portfolio Transactions—Continued
| Purchases of affiliated funds (000s) | Sales of affiliated funds (000s) | Investment income from affiliated funds (000s) | Net Realized Gain/(Loss) | ||||||||
| Harbor Target Retirement 2035 Fund | Change in Unrealized Gain/(Loss) from affiliated funds (000s) | Distributions received from affiliated funds (000s) | Sale of affiliated funds (000s) | ||||||||
| Underlying Funds | |||||||||||
Harbor Capital Appreciation Fund | $ 269 | $ 190 | $ 1 | $ 207 | $ 49 | $ 21 | |||||
Harbor Mid Cap Growth Fund | 164 | 111 | — | 156 | — | (15) | |||||
Harbor Small Cap Growth Fund | 163 | 96 | — | 114 | 2 | (8) | |||||
Harbor Large Cap Value Fund | 309 | 212 | 11 | 182 | 33 | 31 | |||||
Harbor Mid Cap Value Fund | 282 | 167 | 10 | 79 | 9 | 27 | |||||
Harbor Small Cap Value Fund | 176 | 142 | 2 | 128 | — | 28 | |||||
Harbor International Fund | 302 | 769 | 29 | 254 | — | (101) | |||||
Harbor Diversified International Fund | 1,052 | 88 | — | 151 | — | 6 | |||||
Harbor International Growth Fund | 260 | 332 | 14 | 194 | — | 6 | |||||
Harbor Global Leaders Fund | 85 | 76 | — | 88 | — | (3) | |||||
Harbor Commodity Real Return Fund | 33 | 633 | — | 81 | — | (52) | |||||
Harbor Convertible Securities Fund | 11 | 181 | 1 | (5) | — | 8 | |||||
Harbor High-Yield Bond Fund | 850 | 179 | 114 | 56 | — | (16) | |||||
Harbor Bond Fund | 1,162 | 243 | 81 | (16) | 35 | (14) | |||||
Harbor Real Return Fund | 226 | 42 | 8 | (1) | — | (1) | |||||
Total | $5,344 | $3,461 | $271 | $1,668 | $128 | $ (83) | |||||
| Purchases of affiliated funds (000s) | Sales of affiliated funds (000s) | Investment income from affiliated funds (000s) | Net Realized Gain/(Loss) | ||||||||
| Harbor Target Retirement 2040 Fund | Change in Unrealized Gain/(Loss) from affiliated funds (000s) | Distributions received from affiliated funds (000s) | Sale of affiliated funds (000s) | ||||||||
| Underlying Funds | |||||||||||
Harbor Capital Appreciation Fund | $ 346 | $ 248 | $ 2 | $ 361 | $ 96 | $ 89 | |||||
Harbor Mid Cap Growth Fund | 192 | 130 | — | 283 | — | (7) | |||||
Harbor Small Cap Growth Fund | 209 | 116 | — | 214 | 4 | (8) | |||||
Harbor Large Cap Value Fund | 392 | 254 | 22 | 313 | 64 | 106 | |||||
Harbor Mid Cap Value Fund | 405 | 220 | 20 | 88 | 18 | 118 | |||||
Harbor Small Cap Value Fund | 245 | 218 | 3 | 231 | — | 74 | |||||
Harbor International Fund | 408 | 1,396 | 57 | 337 | — | (35) | |||||
Harbor Diversified International Fund | 1,962 | 109 | — | 303 | — | 8 | |||||
Harbor International Growth Fund | 336 | 549 | 27 | 344 | — | 51 | |||||
Harbor Global Leaders Fund | 102 | 97 | — | 141 | — | 31 | |||||
Harbor Commodity Real Return Fund | 36 | 930 | — | 144 | — | (103) | |||||
Harbor High-Yield Bond Fund | 854 | 142 | 148 | 68 | — | (15) | |||||
Harbor Bond Fund | 1,311 | 181 | 109 | (30) | 46 | (7) | |||||
Harbor Real Return Fund | 168 | 23 | 8 | (1) | — | (1) | |||||
Total | $6,966 | $4,613 | $396 | $2,796 | $228 | $ 301 | |||||
47
Harbor Target Retirement Funds
Notes to Financial Statements—Continued
Notes to Financial Statements—Continued
Note 3—Investment Portfolio Transactions—Continued
| Purchases of affiliated funds (000s) | Sales of affiliated funds (000s) | Investment income from affiliated funds (000s) | Net Realized Gain/(Loss) | ||||||||
| Harbor Target Retirement 2045 Fund | Change in Unrealized Gain/(Loss) from affiliated funds (000s) | Distributions received from affiliated funds (000s) | Sale of affiliated funds (000s) | ||||||||
| Underlying Funds | |||||||||||
Harbor Capital Appreciation Fund | $ 272 | $ 196 | $ 1 | 170 | $ 43 | $ 36 | |||||
Harbor Mid Cap Growth Fund | 136 | 95 | — | 132 | — | (8) | |||||
Harbor Small Cap Growth Fund | 139 | 86 | — | 98 | 2 | (6) | |||||
Harbor Large Cap Value Fund | 317 | 210 | 10 | 125 | 28 | 64 | |||||
Harbor Mid Cap Value Fund | 266 | 154 | 9 | 43 | 8 | 48 | |||||
Harbor Small Cap Value Fund | 160 | 133 | 1 | 110 | — | 25 | |||||
Harbor International Fund | 333 | 716 | 25 | 208 | — | (72) | |||||
Harbor Diversified International Fund | 974 | 144 | — | 129 | — | 13 | |||||
Harbor International Growth Fund | 286 | 344 | 12 | 156 | — | 24 | |||||
Harbor Global Leaders Fund | 93 | 72 | — | 75 | — | 4 | |||||
Harbor Commodity Real Return Fund | 27 | 332 | — | 23 | — | (9) | |||||
Harbor High-Yield Bond Fund | 379 | 130 | 43 | 22 | — | (7) | |||||
Harbor Bond Fund | 575 | 188 | 30 | 2 | 12 | (9) | |||||
Harbor Real Return Fund | 78 | 22 | 2 | (1) | — | 1 | |||||
Total | $4,035 | $2,822 | $133 | $1,292 | $ 93 | $104 | |||||
| Purchases of affiliated funds (000s) | Sales of affiliated funds (000s) | Investment income from affiliated funds (000s) | Net Realized Gain/(Loss) | ||||||||
| Harbor Target Retirement 2050 Fund | Change in Unrealized Gain/(Loss) from affiliated funds (000s) | Distributions received from affiliated funds (000s) | Sale of affiliated funds (000s) | ||||||||
| Underlying Funds | |||||||||||
Harbor Capital Appreciation Fund | $ 502 | $ 540 | $ 2 | $ 403 | $121 | $ 135 | |||||
Harbor Mid Cap Growth Fund | 275 | 299 | — | 355 | — | (27) | |||||
Harbor Small Cap Growth Fund | 279 | 263 | — | 266 | 5 | (18) | |||||
Harbor Large Cap Value Fund | 529 | 543 | 26 | 275 | 80 | 238 | |||||
Harbor Mid Cap Value Fund | 494 | 403 | 25 | 44 | 22 | 211 | |||||
Harbor Small Cap Value Fund | 289 | 369 | 4 | 270 | — | 99 | |||||
Harbor International Fund | 589 | 2,000 | 71 | 517 | — | (158) | |||||
Harbor Diversified International Fund | 2,447 | 295 | — | 347 | — | 21 | |||||
Harbor International Growth Fund | 498 | 928 | 34 | 399 | — | 68 | |||||
Harbor Global Leaders Fund | 163 | 197 | — | 162 | — | 47 | |||||
Harbor Commodity Real Return Fund | 53 | 723 | — | 69 | — | (38) | |||||
Harbor High-Yield Bond Fund | 509 | 167 | 63 | 33 | — | (10) | |||||
Harbor Bond Fund | 678 | 226 | 39 | 2 | 16 | (13) | |||||
Total | $7,305 | $6,953 | $264 | $3,142 | �� | $244 | $ 555 | ||||
48
Harbor Target Retirement Funds
Notes to Financial Statements—Continued
Notes to Financial Statements—Continued
Note 3—Investment Portfolio Transactions—Continued
| Purchases of affiliated funds (000s) | Sales of affiliated funds (000s) | Investment income from affiliated funds (000s) | Net Realized Gain/(Loss) | ||||||||
| Harbor Target Retirement 2055 Fund | Change in Unrealized Gain/(Loss) from affiliated funds (000s) | Distributions received from affiliated funds (000s) | Sale of affiliated funds (000s) | ||||||||
| Underlying Funds | |||||||||||
Harbor Capital Appreciation Fund | $ 178 | $ 59 | $— | $ 56 | $ 9 | $ 3 | |||||
Harbor Mid Cap Growth Fund | 93 | 30 | — | 33 | — | — | |||||
Harbor Small Cap Growth Fund | 86 | 24 | — | 24 | — | (1) | |||||
Harbor Large Cap Value Fund | 206 | 53 | 2 | 45 | 6 | 6 | |||||
Harbor Mid Cap Value Fund | 150 | 38 | 2 | 20 | 2 | 2 | |||||
Harbor Small Cap Value Fund | 98 | 32 | — | 30 | — | 5 | |||||
Harbor International Fund | 210 | 177 | 6 | 45 | — | (8) | |||||
Harbor Diversified International Fund | 317 | 37 | — | 36 | — | 3 | |||||
Harbor International Growth Fund | 180 | 86 | 3 | 46 | — | 5 | |||||
Harbor Global Leaders Fund | 69 | 19 | — | 21 | — | 1 | |||||
Harbor Commodity Real Return Fund | 9 | 48 | — | (1) | — | 3 | |||||
Harbor High-Yield Bond Fund | 55 | 10 | 4 | 1 | — | — | |||||
Harbor Bond Fund | 69 | 13 | 2 | — | 1 | — | |||||
Total | $1,720 | $626 | $ 19 | $356 | $ 18 | $ 19 | |||||
Note 4—Fees and Other Transactions with Affiliates
Investment Adviser
Harbor Capital is a wholly-owned subsidiary of Robeco Groep N.V. (“Robeco”). Robeco is wholly-owned by ORIX Corporation (“ORIX”). Harbor Capital is the Funds’ investment adviser and is also responsible for administrative and other services. The Funds do not pay any fees for the services of Harbor Capital.
Each Fund has a separate advisory agreement with Harbor Capital. Pursuant to this agreement, Harbor Capital pays all expenses of each Fund, excluding: (i) the amount of acquired funds’ fees and expenses; (ii) compensation of the Independent Trustees; (iii) certain other expenses such as extraordinary items; and (iv) (a) for the Administrative and Investor Classes, distribution and service (12b-1) fees and (b) for the Investor Class, certain transfer agent fees.
Distributor
Harbor Funds Distributors, Inc. (“Harbor Funds Distributors” or the “Distributor”), a wholly-owned subsidiary of Harbor Capital, is the distributor for Harbor Funds’ shares. Under the Trust’s current distribution plans pursuant to Rule 12b-1 under the Investment Company Act with respect to each Fund’s Administrative and Investor Class shares (the “12b-1 Plan”) as applicable, each Fund pays the Distributor compensation at the annual rate of 0.25% of the average daily net assets of its Administrative and Investor Class shares. Pursuant to the 12b-1 Plan the Distributor is compensated for financing any activity that is primarily intended to result in the sale of Administrative and Investor Class shares of each Fund or for recordkeeping services or the servicing of shareholder accounts in the Administrative and Investor Class shares of each Fund. Such activities include, but are not limited to: printing of prospectuses and statements of additional information and reports for prospective shareholders (i.e., other than existing shareholders); preparation and distribution of advertising material and sales literature; expenses of organizing and conducting sales seminars; supplemental payments to dealers or other institutions such as asset-based sales charges, payments of recordkeeping fees under recordkeeping arrangements, or payments of service fees under shareholder service arrangements; and costs of administering the 12b-1 Plan.
Amounts payable by a Fund under the 12b-1 Plan need not be directly related to the expenses actually incurred by the Distributor on behalf of each Fund. The 12b-1 Plan does not obligate each Fund to reimburse the Distributor for the actual expenses the Distributor may incur in fulfilling its obligations under the 12b-1 Plan. Thus, even if the Distributor’s actual expenses exceed the fee payable to the Distributor at any given time, each Fund will not be obligated to pay more than that fee. If the Distributor’s expenses are less than the fee it receives, the Distributor will retain the difference.
49
Harbor Target Retirement Funds
Notes to Financial Statements—Continued
Notes to Financial Statements—Continued
Note 4—Fees and Other Transactions with Affiliates—Continued
Harbor Funds Distributors voluntarily waived its 12b-1 fees for the Target Retirement Funds during the year ended October 31, 2017. Fees incurred and the related waiver for these services are shown on each Fund’s Statement of Operations. The voluntary waiver may be discontinued at any time.
Transfer Agent
Harbor Services Group, Inc. (“Harbor Services Group”), a wholly-owned subsidiary of Harbor Capital, is the transfer and shareholder servicing agent for the Funds. The transfer agency and service agreement is reviewed and approved annually by the Board of Trustees and provides currently for compensation up to the following amounts per class of each Fund:
| Transfer Agent Fees | |
Institutional Class | 0.00% of the average daily net assets of all Institutional shares |
Administrative Class | 0.00% of the average daily net assets of all Administrative shares |
Investor Class | 0.12% of the average daily net assets of all Investor shares |
Harbor Services Group has voluntarily waived its transfer agent fees during the year ended October 31, 2017. Fees incurred for these transfer agent services are shown on each Fund’s Statement of Operations. The voluntary waiver may be discontinued at any time.
Shareholders
On October 31, 2017, Harbor Capital, Harbor Funds Distributors, and Harbor Services Group, collectively held the following shares of beneficial interest in each Fund:
| Number of Shares Owned by Harbor Capital, Harbor Funds Distributors, and Harbor Services Group | Percentage of Outstanding Shares | ||||
| Institutional Class | Total | ||||
Harbor Target Retirement 2020 Fund | 13,976 | 13,976 | 0.5% | ||
Harbor Target Retirement 2025 Fund | 81,007 | 81,007 | 4.9 | ||
Harbor Target Retirement 2030 Fund | 31,268 | 31,268 | 1.0 | ||
Harbor Target Retirement 2035 Fund | 23,357 | 23,357 | 2.2 | ||
Harbor Target Retirement 2040 Fund | 139 | 139 | 0.0 | ||
Harbor Target Retirement 2045 Fund | 1,576 | 1,576 | 0.2 | ||
Harbor Target Retirement 2050 Fund | 11,710 | 11,710 | 0.5 | ||
Harbor Target Retirement 2055 Fund | 6,182 | 6,182 | 2.7 | ||
Independent Trustees
The Independent Trustees’ received no remuneration from the Target Retirement Funds for the year ended October 31, 2017.
Indemnification
Under the Trust’s organizational documents, its officers and Trustees are indemnified against certain liabilities arising out of the performance of their duties to the Trust. In addition, in the normal course of business the Trust enters into contracts that provide general indemnities to other parties. The Trust’s maximum exposure under these arrangements is unknown as this would involve future claims that may be made against the Trust that have not yet occurred. The risk of material loss as a result of such indemnification claims is considered remote.
NOTE 5—TAX INFORMATION
The amount and character of income and net realized gains to be distributed are determined in accordance with income tax rules and regulations, which may differ from U.S. GAAP. These differences are attributable to permanent book and tax accounting differences that were primarily due to tax treatment of distributions from investments in Underlying Funds. Reclassifications
50
Harbor Target Retirement Funds
Notes to Financial Statements—Continued
Notes to Financial Statements—Continued
NOTE 5—TAX INFORMATION—Continued
are made to each Fund’s capital account to reflect income and net realized gains available for distribution (or available capital loss carryovers) under income tax rules and regulations. The amounts reclassified on the Statements of Assets and Liabilities for the year ended October 31, 2017 are as follows:
| Undistributed Net Investment Income/(Loss) (000s) | Accumulated Net Realized Gain/(Loss) (000s) | Paid-In Capital (000s) | |||
Harbor Target Retirement Income Fund | $ 78 | $ (78) | $— | ||
Harbor Target Retirement 2015 Fund | 35 | (35) | — | ||
Harbor Target Retirement 2020 Fund | 119 | (119) | — | ||
Harbor Target Retirement 2025 Fund | 58 | (58) | — | ||
Harbor Target Retirement 2030 Fund | 87 | (87) | — | ||
Harbor Target Retirement 2035 Fund | 37 | (37) | — | ||
Harbor Target Retirement 2040 Fund | 51 | (51) | — | ||
Harbor Target Retirement 2045 Fund | 14 | (14) | — | ||
Harbor Target Retirement 2050 Fund | 22 | (22) | — | ||
Harbor Target Retirement 2055 Fund | 1 | (1) | — |
The tax composition of each Fund’s distributions is as follows:
| As of October 31, 2017 | As of October 31, 2016 | ||||||||||
| Ordinary Income (000s) | Long-Term Capital Gains (000s) | Total (000s) | Ordinary Income (000s) | Long-Term Capital Gains (000s) | Total (000s) | ||||||
Harbor Target Retirement Income Fund | $410 | $ 51 | $ 461 | $450 | $ 467 | $ 917 | |||||
Harbor Target Retirement 2015 Fund | 179 | — | 179 | 262 | 219 | 481 | |||||
Harbor Target Retirement 2020 Fund | 682 | 304 | 986 | 865 | 1,702 | 2,567 | |||||
Harbor Target Retirement 2025 Fund | 351 | 180 | 531 | 353 | 503 | 856 | |||||
Harbor Target Retirement 2030 Fund | 591 | 857 | 1,448 | 702 | 1,479 | 2,181 | |||||
Harbor Target Retirement 2035 Fund | 257 | 224 | 481 | 238 | 405 | 643 | |||||
Harbor Target Retirement 2040 Fund | 388 | 932 | 1,320 | 451 | 1,317 | 1,768 | |||||
Harbor Target Retirement 2045 Fund | 121 | 274 | 395 | 106 | 274 | 380 | |||||
Harbor Target Retirement 2050 Fund | 260 | 1,222 | 1,482 | 306 | 1,983 | 2,289 | |||||
Harbor Target Retirement 2055 Fund | 18 | 28 | 46 | 12 | 3 | 15 | |||||
As of October 31, 2017, the components of each Fund’s distributable earnings on a tax basis are as follows:
| Undistributed Ordinary Income (000s) | Undistributed Long-Term Capital Gains (000s) | Unrealized Appreciation/ (Depreciation) (000s) | |||
Harbor Target Retirement Income Fund | $ 28 | $ 82 | $ (155) | ||
Harbor Target Retirement 2015 Fund | 93 | — | (76) | ||
Harbor Target Retirement 2020 Fund | 385 | — | 624 | ||
Harbor Target Retirement 2025 Fund | 280 | — | 991 | ||
Harbor Target Retirement 2030 Fund | 410 | 38 | 1,930 | ||
Harbor Target Retirement 2035 Fund | 150 | — | 1,230 | ||
Harbor Target Retirement 2040 Fund | 213 | 252 | 3,096 | ||
Harbor Target Retirement 2045 Fund | 76 | 113 | 1,172 | ||
Harbor Target Retirement 2050 Fund | 112 | 537 | 3,568 | ||
Harbor Target Retirement 2055 Fund | 10 | 33 | 310 |
51
Harbor Target Retirement Funds
Notes to Financial Statements—Continued
Notes to Financial Statements—Continued
NOTE 5—TAX INFORMATION—Continued
At October 31, 2017, the Funds in the following table had capital loss carryforwards for federal tax purposes which will reduce the Fund’s taxable income arising from future net realized gains on investments to the extent permitted by the Internal Revenue Code. Use of the capital loss carryforwards will reduce the amount of the distribution to shareholders which would otherwise be necessary to relieve each Fund of any federal tax liability. The capital loss carryforwards do not expire.
| Capital Loss Carryforward | |||||
| Short-Term (000s) | Long- Term (000s) | Total (000s) | |||
Harbor Target Retirement 2015 Fund | $— | $61 | $61 | ||
Harbor Target Retirement 2020 Fund | — | 60 | 60 | ||
Harbor Target Retirement 2025 Fund | — | 17 | 17 | ||
Harbor Target Retirement 2035 Fund | — | 78 | 78 | ||
The identified cost for federal income tax purposes of investments owned by each Fund and its respective gross unrealized appreciation and depreciation at October 31, 2017 are as follows:
| Identified Cost (000s) | Gross Unrealized | Net Unrealized Appreciation/ (Depreciation) (000s) | |||||
| Appreciation (000s) | (Depreciation) (000s) | ||||||
Harbor Target Retirement Income Fund | $13,901 | $ 79 | $(234) | $ (155) | |||
Harbor Target Retirement 2015 Fund* | 6,364 | — | (76) | (76) | |||
Harbor Target Retirement 2020 Fund* | 27,119 | 804 | (180) | 624 | |||
Harbor Target Retirement 2025 Fund* | 20,227 | 1,032 | (41) | 991 | |||
Harbor Target Retirement 2030 Fund | 26,688 | 2,060 | (130) | 1,930 | |||
Harbor Target Retirement 2035 Fund* | 13,775 | 1,259 | (29) | 1,230 | |||
Harbor Target Retirement 2040 Fund | 21,844 | 3,143 | (47) | 3,096 | |||
Harbor Target Retirement 2045 Fund | 8,691 | 1,172 | — | 1,172 | |||
Harbor Target Retirement 2050 Fund | 19,253 | 3,568 | — | 3,568 | |||
Harbor Target Retirement 2055 Fund | 2,418 | 310 | — | 310 | |||
| * | Capital loss carryforwards are available which may reduce taxable income from future net realized gain on investments. |
Note 6—Subsequent Events
Through the date the financial statements were issued, there were no subsequent events or transactions that would have materially impacted the financial statements or related disclosures as presented herein.
52
Harbor Target Retirement Funds
Report of Independent Registered Public Accounting Firm
Report of Independent Registered Public Accounting Firm
The Board of Trustees and Shareholders of
Harbor Funds
We have audited the accompanying statements of assets and liabilities, including the portfolios of investments, of Harbor Target Retirement Income Fund, Harbor Target Retirement 2015 Fund, Harbor Target Retirement 2020 Fund, Harbor Target Retirement 2025 Fund, Harbor Target Retirement 2030 Fund, Harbor Target Retirement 2035 Fund, Harbor Target Retirement 2040 Fund, Harbor Target Retirement 2045 Fund, Harbor Target Retirement 2050 Fund, and Harbor Target Retirement 2055 Fund (ten of the portfolios constituting the Harbor Funds (the Trust)) as of October 31, 2017, and the related statements of operations for the year then ended, the statements of changes in net assets for each of the two years in the period then ended, and the financial highlights for each of the periods indicated therein. These financial statements and financial highlights are the responsibility of the Trust’s management. Our responsibility is to express an opinion on these financial statements and financial highlights based on our audits.
We conducted our audits in accordance with the standards of the Public Company Accounting Oversight Board (United States). Those standards require that we plan and perform the audit to obtain reasonable assurance about whether the financial statements and financial highlights are free of material misstatement. We were not engaged to perform an audit of the Trust’s internal control over financial reporting. Our audits included consideration of internal control over financial reporting as a basis for designing audit procedures that are appropriate in the circumstances, but not for the purpose of expressing an opinion on the effectiveness of the Trust’s internal control over financial reporting. Accordingly, we express no such opinion. An audit also includes examining, on a test basis, evidence supporting the amounts and disclosures in the financial statements and financial highlights, assessing the accounting principles used and significant estimates made by management, and evaluating the overall financial statement presentation. Our procedures included confirmation of securities owned as of October 31, 2017, by correspondence with the custodian and the shareholder servicing agent. We believe that our audits provide a reasonable basis for our opinion.
In our opinion, the financial statements and financial highlights referred to above present fairly, in all material respects, the financial position of Harbor Target Retirement Income Fund, Harbor Target Retirement 2015 Fund, Harbor Target Retirement 2020 Fund, Harbor Target Retirement 2025 Fund, Harbor Target Retirement 2030 Fund, Harbor Target Retirement 2035 Fund, Harbor Target Retirement 2040 Fund, Harbor Target Retirement 2045 Fund, Harbor Target Retirement 2050 Fund, and Harbor Target Retirement 2055 Fund of the Harbor Funds at October 31, 2017, the results of their operations for the year then ended, the changes in their net assets for each of the two years in the period then ended and the financial highlights for each of the periods indicated therein, in conformity with U.S. generally accepted accounting principles.

Chicago, Illinois
December 21, 2017
December 21, 2017
53
Harbor Target Retirement Funds
Fees and Expenses Example (Unaudited)
Fees and Expenses Example (Unaudited)
Example
As a shareholder of a Fund, you incur two types of costs: (1) transaction costs, including redemption fees (if any) and (2) ongoing costs, including management fees, distribution and service (12b-1) fees (if any), and other Fund expenses. This example is intended to help you understand your ongoing costs (in dollars) of investing in a Fund and to compare these costs with the ongoing costs of investing in other mutual funds.
The example is based on an investment of $1,000 invested at the beginning of the period and held for the entire period May 1, 2017 through October 31, 2017.
Actual Expenses
The first line of the table below provides information about actual account values and actual expenses for each share class. You may use the information in the respective class line, together with the amount you invested, to estimate the expenses that you paid over the period. Simply divide your account value by $1,000 (for example, an $8,600 account value divided by $1,000 = 8.6), then multiply the result by the number in the first line of the respective class under the heading entitled “Expenses Paid During Period” to estimate the expenses you paid on your account during this period.
Hypothetical Example for Comparison Purposes
The second line of the table for each share class below provides information about hypothetical account values and hypothetical expenses based on the respective Fund/Class’s actual expense ratio and an assumed rate of return of 5% per year before expenses, which is not the respective Fund/Class’s actual return. The hypothetical account values and expenses may not be used to estimate the actual ending account balance or expenses you paid for the period. You may use this information to compare the ongoing costs of investing in a Fund to other funds. To do so, compare this 5% hypothetical example with the 5% hypothetical examples that appear in the shareholder reports of the other funds.
Please note that the expenses shown in the table are meant to highlight your ongoing costs only and do not reflect any transactional costs, such as redemption fees. Therefore, the second line of the table is useful in comparing ongoing costs only, and will not help you determine the relative total costs of owning different funds. In addition, if these transactional costs were included, your costs would have been higher.
| Annualized Expense Ratios | Expenses Paid During Period* | Beginning Account Value May 1, 2017 | Ending Account Value October 31, 2017 | |||||
| Harbor Target Retirement Income Fund | ||||||||
| Institutional Class | 0.00% | |||||||
| Actual | $0.00** | $1,000 | $1,035.50 | |||||
| Hypothetical (5% return) | 0.00 | 1,000 | 1,025.21 | |||||
| Harbor Target Retirement 2015 Fund | ||||||||
| Institutional Class | 0.00% | |||||||
| Actual | $0.00** | $1,000 | $1,040.60 | |||||
| Hypothetical (5% return) | 0.00 | 1,000 | 1,025.21 | |||||
| Harbor Target Retirement 2020 Fund | ||||||||
| Institutional Class | 0.00% | |||||||
| Actual | $0.00** | $1,000 | $1,049.80 | |||||
| Hypothetical (5% return) | 0.00 | 1,000 | 1,025.21 | |||||
| Harbor Target Retirement 2025 Fund | ||||||||
| Institutional Class | 0.00% | |||||||
| Actual | $0.00** | $1,000 | $1,055.40 | |||||
| Hypothetical (5% return) | 0.00 | 1,000 | 1,025.21 | |||||
| Harbor Target Retirement 2030 Fund | ||||||||
| Institutional Class | 0.00% | |||||||
| Actual | $0.00** | $1,000 | $1,062.00 | |||||
| Hypothetical (5% return) | 0.00 | 1,000 | 1,025.21 | |||||
54
Harbor Target Retirement Funds
Fees and Expenses Example—Continued
Fees and Expenses Example—Continued
| Annualized Expense Ratios | Expenses Paid During Period* | Beginning Account Value May 1, 2017 | Ending Account Value October 31, 2017 | |||||
| Harbor Target Retirement 2035 Fund | ||||||||
| Institutional Class | 0.00% | |||||||
| Actual | $0.00** | $1,000 | $1,071.20 | |||||
| Hypothetical (5% return) | 0.00 | 1,000 | 1,025.21 | |||||
| Harbor Target Retirement 2040 Fund | ||||||||
| Institutional Class | 0.00% | |||||||
| Actual | $0.00** | $1,000 | $1,078.90 | |||||
| Hypothetical (5% return) | 0.00 | 1,000 | 1,025.21 | |||||
| Harbor Target Retirement 2045 Fund | ||||||||
| Institutional Class | 0.00% | |||||||
| Actual | $0.00** | $1,000 | $1,087.40 | |||||
| Hypothetical (5% return) | 0.00 | 1,000 | 1,025.21 | |||||
| Harbor Target Retirement 2050 Fund | ||||||||
| Institutional Class | 0.00% | |||||||
| Actual | $0.00** | $1,000 | $1,095.70 | |||||
| Hypothetical (5% return) | 0.00 | 1,000 | 1,025.21 | |||||
| Harbor Target Retirement 2055 Fund | ||||||||
| Institutional Class | 0.00% | |||||||
| Actual | $0.00** | $1,000 | $1,099.20 | |||||
| Hypothetical (5% return) | 0.00 | 1,000 | 1,025.21 | |||||
| * | Expenses are equal to the Fund’s annualized expense ratio, multiplied by the average account value over the period, multiplied by 184/365 (to reflect the one-half year period). |
| ** | Transfer agent fees and 12b-1 fees have been waived for the reporting period. |
55
Harbor Target Retirement Funds
Additional Information (Unaudited)
Additional Information (Unaudited)
Additional Tax Information
Pursuant to Section 852 of the Internal Revenue Code, the Funds designate the following capital gain dividends for the year ended October 31, 2017:
| Amount (000s) | |
Harbor Target Retirement Income Fund | $ 51 |
Harbor Target Retirement 2015 Fund | — |
Harbor Target Retirement 2020 Fund | 304 |
Harbor Target Retirement 2025 Fund | 181 |
Harbor Target Retirement 2030 Fund | 856 |
Harbor Target Retirement 2035 Fund | 224 |
Harbor Target Retirement 2040 Fund | 932 |
Harbor Target Retirement 2045 Fund | 273 |
Harbor Target Retirement 2050 Fund | 1,222 |
Harbor Target Retirement 2055 Fund | 28 |
Proxy Voting
Harbor Funds has adopted Proxy Voting Policies and Procedures under which proxies relating to securities held by the Harbor funds are voted. In addition, Harbor Funds files Form N-PX, with its complete proxy voting record for the 12 months ended June 30th, no later than August 31st of each year. A description of Harbor Funds’ Proxy Voting Policies and Procedures and the proxy voting records (Form N-PX) are available (i) upon request, by calling Harbor Funds toll-free at 800-422-1050; (ii) on Harbor Funds’ website at harborfunds.com; and (iii) on the SEC’s website at sec.gov.
Householding
Harbor Funds has adopted a policy that allows it to send only one copy of a Fund’s prospectus, proxy materials, annual report and semi-annual report to certain shareholders residing at the same household. This reduces Fund expenses, which benefits you and other shareholders. If you need additional copies or do not want your mailings to be “householded,” please call the Shareholder Servicing Agent at 800-422-1050. Individual copies will be sent within thirty (30) days after the Shareholder Servicing Agent receives your instructions. Your consent to householding is considered valid until revoked.
Quarterly Portfolio Disclosures
Harbor Funds files a complete portfolio of investments with the SEC for the first and third quarters of each fiscal year on Form N-Q. The Funds' Form N-Q is available (i) without charge, upon request, by calling Harbor Funds toll-free at 800-422-1050, (ii) on Harbor Funds’ website at harborfunds.com, and (iii) on the SEC’s website at sec.gov. The form may also be viewed and copied at the SEC’s Public Reference Room in Washington, DC. Information regarding the operations of the Public Reference Room may also be obtained by calling 800-SEC-0330.
56
Harbor Target Retirement Funds
Additional Information—Continued
Additional Information—Continued
Special meeting of shareholders
At a special meeting of the shareholders of the Harbor Funds held on September 22, 2017, shareholders elected six trustees to the Board of Trustees of Harbor Funds. Scott M. Amero, Robert A. Kasdin, and Ann M. Spruill were previously appointed as Trustees but had not been elected by shareholders. Raymond J. Ball, Donna J. Dean, and Randall A. Hack continue to serve on the Board.
| Trustee | For | Withhold | ||
Scott M. Amero | 1,047,869,265 | 14,860,642 | ||
Joseph L. Dowling III | 1,046,335,272 | 16,394,636 | ||
Robert A. Kasdin | 1,047,514,035 | 15,215,872 | ||
Charles F. McCain | 1,047,667,935 | 15,061,973 | ||
Kathryn L. Quirk | 1,046,812,694 | 15,917,214 | ||
Ann M. Spruill | 1,047,274,165 | 15,455,742 |
At a special meeting of the shareholders of the Harbor Funds held on September 22, 2017, shareholders approved an amendment to each Fund’s fundamental investment restriction regarding borrowing.
| Fund Name | For | Against | Abstain | Broker Non-Vote | ||||
Harbor Target Retirement Income Fund | 1,512,041 | - | - | - | ||||
Harbor Target Retirement 2015 Fund | 580,094 | - | - | - | ||||
Harbor Target Retirement 2020 Fund | 2,817,680 | - | - | - | ||||
Harbor Target Retirement 2025 Fund | 1,514,721 | - | - | - | ||||
Harbor Target Retirement 2030 Fund | 3,147,718 | - | - | - | ||||
Harbor Target Retirement 2035 Fund | 961,496 | - | - | - | ||||
Harbor Target Retirement 2040 Fund | 2,551,273 | - | - | - | ||||
Harbor Target Retirement 2045 Fund | 632,365 | - | - | - | ||||
Harbor Target Retirement 2050 Fund | 2,097,942 | - | - | - | ||||
Harbor Target Retirement 2055 Fund | 181,834 | - | - | - |
At a special meeting of the shareholders of the Harbor Funds held on September 22, 2017, shareholders approved an amendment to each Fund’s fundamental investment restriction regarding lending.
| Fund Name | For | Against | Abstain | Broker Non-Vote | ||||
Harbor Target Retirement Income Fund | 1,512,041 | - | - | - | ||||
Harbor Target Retirement 2015 Fund | 580,094 | - | - | - | ||||
Harbor Target Retirement 2020 Fund | 2,817,680 | - | - | - | ||||
Harbor Target Retirement 2025 Fund | 1,514,721 | - | - | - | ||||
Harbor Target Retirement 2030 Fund | 3,147,718 | - | - | - | ||||
Harbor Target Retirement 2035 Fund | 961,496 | - | - | - | ||||
Harbor Target Retirement 2040 Fund | 2,551,273 | - | - | - | ||||
Harbor Target Retirement 2045 Fund | 632,365 | - | - | - | ||||
Harbor Target Retirement 2050 Fund | 2,097,942 | - | - | - | ||||
Harbor Target Retirement 2055 Fund | 181,834 | - | - | - |
57
Harbor Target Retirement Funds
Additional Information—Continued
Additional Information—Continued
Trustees and Officers
As of December 2017
The business and affairs of the Trust shall be managed by or under the direction of the Trustees, and they shall have all powers necessary or desirable to carry out that responsibility. The Trustees shall have full power and authority to take or refrain from taking any action and to execute any contracts and instruments that they may consider necessary or desirable in the management of the Trust. Any determination made by the Trustees in good faith as to what is in the interests of the Trust shall be conclusive. Information pertaining to the Trustees and Officers of Harbor Funds is set forth below. The address of each Trustee and Officer is: [Name of Trustee or Officer] c/o Harbor Funds, 111 South Wacker Drive, 34th Floor, Chicago, IL 60606-4302.
The Harbor Fund’s Statement of Additional Information includes additional information about the Trust’s Trustees and is available without charge by calling 800-422-1050 or at the Trust’s website at harborfunds.com.
| Name (Age) Position(s) with Fund | Term of Office and Length of Time Served1 | Principal Occupation(s) During Past Five Years | Number of Portfolios In Fund Complex Overseen By Trustee | Other Directorships Of Public Companies and Other Registered Investment Companies Held by Trustee During Past Five Years |
INDEPENDENT TRUSTEES | ||||
| Scott M. Amero (54) Trustee | Since 2014 | Chairman (2015-Present) and Trustee (2011-2015), Rare (conservation nonprofit); Trustee, Berkshire School (2014-Present); Vice Chairman and Global Chief Investment Officer, Fixed Income (2010), Vice Chairman and Global Chief Investment Officer, Fixed Income, and Co-Head, Fixed Income Portfolio Management (2007-2010), BlackRock, Inc., (publicly traded investment management firm). | 32 | None |
| Raymond J. Ball (73) Trustee | Since 2006 | Sidney Davidson Distinguished Service Professor of Accounting, University of Chicago Booth School of Business (2000-Present); Academic Affiliate, Analysis Group (litigation consulting firm) (2000-Present); Financial Reporting Faculty Advisory Group of the Institute of Chartered Accountants in England and Wales (2008-Present); and Advisory Board of the Center for Accounting Research & Education at University of Notre Dame (2006-Present). | 32 | None |
| Donna J. Dean (66) Trustee | Since 2010 | Chief Investment Officer of the Rockefeller Foundation (a private foundation) (1995-Present). | 32 | None |
| Joseph L. Dowling III (53) Trustee | Since 2017 | Chief Investment Officer, Brown University (2013-Present); Advisory Board Member, Stage Point Capital (private mortgage specialist) (2016-Present); Advisory Board Member, Harbor Funds (2016-2017); and Founder and Managing Member, Narragansett Asset Management (private investment management firm) (1998-2013). | 32 | Director of Integrated Electrical Services (2011-Present). |
| Randall A. Hack (70) Trustee | Since 2010 | Founder and Senior Managing Director of Capstone Capital LLC (private investment firm) (2003-Present); Director of Tower Development Corporation (cell tower developer) (2009-2016); and Advisory Director of Berkshire Partners (private equity firm) (2002-2013). | 32 | None |
| Robert Kasdin (59) Trustee | Since 2014 | Senior Vice President and Chief Operating Officer, Johns Hopkins Medicine (2015-Present); Senior Executive Vice President, Columbia University (2002-2015); Trustee and Co-Chair of the Finance Committee, National September 11 Memorial & Museum at the World Trade Center (2005-Present); Director, Apollo Commercial Real Estate Finance, Inc. (2014-Present); and Director, Noranda Aluminum Holdings Corp. (2007-2014). | 32 | Director of Noranda Aluminum Holdings Corporation (2007-2014); and Director of Apollo Commercial Real Estate Finance, Inc. (2014-Present). |
58
Harbor Target Retirement Funds
Additional Information—Continued
Additional Information—Continued
Trustees and Officers—Continued
| Name (Age) Position(s) with Fund | Term of Office and Length of Time Served1 | Principal Occupation(s) During Past Five Years | Number of Portfolios In Fund Complex Overseen By Trustee | Other Directorships Of Public Companies and Other Registered Investment Companies Held by Trustee During Past Five Years |
INDEPENDENT TRUSTEES—Continued | ||||
| Kathryn L. Quirk (65) Trustee | Since 2017 | Retired; Vice President, Senior Compliance Officer and Head, U.S. Regulatory Compliance, Goldman Sachs Asset Management (2013-2017); Deputy Chief Legal Officer, Asset Management, and Vice President and Corporate Counsel, Prudential Insurance Company of America (2010-2012); Co-Chief Legal Officer, Prudential Investment Management, Inc., and Chief Legal Officer, Prudential Investments and Prudential Mutual Funds (2008-2012); Vice President and Corporate Counsel and Chief Legal Officer, Mutual Funds, Prudential Insurance Company of America, and Chief Legal Officer, Prudential Investments (2005-2008); Vice President and Corporate Counsel and Chief Legal Officer, Mutual Funds, Prudential Insurance Company of America (2004-2005); Member, Management Committee (2000-2002), General Counsel and Chief Compliance Officer, Zurich Scudder Investments, Inc. (1997-2002). | 32 | None |
| Ann M. Spruill (63) Trustee | Since 2014 | Partner (1993-2008), member of Executive Committee (1996-2008), Member Board of Directors (2002-2008), Grantham, Mayo, Van Otterloo & Co, LLC (private investment management firm) (with the firm since 1990); Member Investment Committee and Chair of Global Equities, Museum of Fine Arts, Boston (2000-Present); and Trustee, Financial Accounting Foundation (2014-Present). | 32 | None |
INTERESTED TRUSTEE | ||||
| Charles F. McCain (48)* Chairman, Trustee and President | Since 2017 | Chief Executive Officer (2017-Present), Director (2007-Present), President and Chief Operating Officer (2017), Executive Vice President and General Counsel (2004-2017), and Chief Compliance Officer (2004-2014), Harbor Capital Advisors, Inc.; Director (2007-Present) and Chief Compliance Officer (2004-2017), Harbor Services Group, Inc.; and Chief Executive Officer (2017-Present), Director (2007-Present), Chief Compliance Officer and Executive Vice President (2007-2017), Harbor Funds Distributors, Inc. | 32 | None |
| Name (Age) Position(s) with Fund | Term of Office and Length of Time Served1 | Principal Occupation(s) During Past Five Years |
FUND OFFICERS NOT LISTED ABOVE** | ||
| Erik D. Ojala (42) Chief Compliance Officer and Secretary | Since 2017 Since 2007 | Executive Vice President and General Counsel (2017-Present) and Secretary (2010-Present); Senior Vice President and Associate General Counsel (2007-2017), Harbor Capital Advisors, Inc.; Director, Executive Vice President and Chief Compliance Officer (2017-Present), Harbor Funds Distributors, Inc.; and Director (2017-Present) and Assistant Secretary (2014-Present), Harbor Services Group, Inc. |
| Anmarie S. Kolinski (46) Treasurer | Since 2007 | Executive Vice President and Chief Financial Officer (2007-Present), Harbor Capital Advisors, Inc.; Chief Financial Officer (2007-Present), Harbor Services Group, Inc.; and Chief Financial Officer (2015-Present) and Treasurer (2012-Present), Harbor Funds Distributors, Inc. |
| Brian L. Collins (49) Vice President | Since 2005 | Executive Vice President and Chief Investment Officer (2004-Present), Harbor Capital Advisors, Inc. |
| Charles P. Ragusa (58) Vice President | Since 2007 | Executive Vice President (2007-Present), Harbor Capital Advisors, Inc.; President (2007-Present), Harbor Services Group, Inc.; and Executive Vice President and AML Compliance Officer (2007-Present) and OFAC Officer (2015-Present), Harbor Funds Distributors, Inc. |
| Jodie L. Crotteau (45) Assistant Secretary | Since 2014 | Senior Vice President and Chief Compliance Officer, Harbor Capital Advisors, Inc. (2014-Present); Chief Compliance Officer and Secretary (2017-present) and Assistant Secretary (2015-2016), Harbor Services Group, Inc.; Assistant Secretary (2016-present), Harbor Funds Distributors, Inc.; Vice President and Chief Compliance Officer, Grosvenor Registered Funds (2011-2014); and Vice President, Grosvenor Capital Management, L.P. (2010-2014). |
59
Harbor Target Retirement Funds
Additional Information—Continued
Additional Information—Continued
Trustees and Officers—Continued
| Name (Age) Position(s) with Fund | Term of Office and Length of Time Served1 | Principal Occupation(s) During Past Five Years |
FUND OFFICERS NOT LISTED ABOVE**—Continued | ||
| Lana M. Lewandowski (38) AML Compliance Officer and Assistant Secretary | Since 2017 | Legal & Compliance Manager (2016-Present) and Legal Specialist (2012-2015), Harbor Capital Advisors, Inc. |
| Lora A. Kmieciak (53) Assistant Treasurer | Since 2017 | Senior Vice President – Fund Administration and Analysis (2017-Present) and Senior Vice President - Business Analysis (2015-2017), Harbor Capital Advisors, Inc.; and Assurance Executive Director (1999-2015), Ernst & Young LLP. |
| John M. Paral (49) Assistant Treasurer | Since 2013 | Director of Fund Administration and Analysis (2017-Present), Vice President (2012-Present) and Financial Reporting Manager (2007-2017), Harbor Capital Advisors, Inc. |
| 1 | Each Trustee serves for an indefinite term, until his successor is elected. Each Officer is elected annually. |
| * | Mr. McCain is deemed an “Interested Trustee” due to his affiliation with the Adviser and Distributor of Harbor Funds. |
| ** | Officers of the Funds are “interested persons” as defined in the Investment Company Act. |
60
This privacy statement is not part of this report
Harbor’s Privacy Statement
The following privacy statement is issued by Harbor Funds and each series of Harbor Funds and its affiliates, Harbor Capital Advisors, Inc., Harbor Services Group, Inc. and Harbor Funds Distributors, Inc. These measures reflect our commitment to maintaining the privacy of your confidential information. We appreciate the confidence you have shown by entrusting us with your assets.
Personal Information
It is our policy to respect the privacy of current and former shareholders and to protect personal information entrusted to us. We do not sell your personal information to anyone.
In the course of providing products and services, we collect non-public personal information about you from the following sources: applications, forms, our website (including any information captured through our use of “cookies”), through mobile applications, by telephone and in correspondence and transactions with us, our affiliates or other parties.
The non-public personal information collected may include name, address, e-mail address, telephone/fax numbers, account number, social security or taxpayer identification number, investment activity, and bank account information.
When you visit us through our website or a mobile application, we may collect technical and navigational information, such as computer browser type, Internet protocol address, pages visited and average time spent on our website. We may use this information to alert you to software compatibility issues, or to improve our web design and functionality. We use “cookies” and similar files that may be placed on your hard drive for security purposes, to facilitate site navigation and to personalize the appearance of our site.
Information Sharing
We occasionally disclose non-public personal information about our current or former shareholders with affiliated and non-affiliated parties, as permitted or required by law or regulation. In the normal course of servicing our shareholders, information we collect may be shared with non-affiliated companies that perform support services on our behalf or to other firms that assist us in providing you with products and services, such as custodians, transfer agents, broker-dealers and marketing service firms, as well as with other financial institutions. These companies may not use the information for any other purpose and we require them to keep the information they handle confidential. We may also share information with affiliates that are engaged in a variety of financial services in order to better service your account(s).
When information is shared with third parties, they are not permitted to use the information for any purpose other than to assist our servicing of your account(s) or as permitted by law.
If you close your account(s) or if we lose contact with you, we will continue to share information in accordance with our current privacy policy and practices.
Access to Information
Access to non-public personal information is limited to employees, agents or other parties who need to know that information to perform their jobs, such as servicing your account(s), resolving problems or informing you of new products or services.
Security
We maintain physical, electronic and procedural safeguards that comply with industry standards to protect your non-public personal information.
For shareholders accessing information through our website or a mobile application, various forms of Internet security, such as data encryption firewall barriers, user names and passwords, and other tools are used. For additional information regarding our security measures, visit the terms and conditions of use on our website at harborfunds.com. If you have any questions or concerns about how we maintain the privacy of your non-public personal information, please contact us at 800-422-1050 Monday through Friday, between the hours of 8:00 a.m. and 6:00 p.m. Eastern time.
We recommend that you read and retain this notice for your personal files.
Eff. November 2013
61
Glossary
Benchmark Descriptions
Bloomberg Barclays U.S. Aggregate Bond Index—The Bloomberg Barclays U.S. Aggregate Bond Index is an unmanaged index of investment-grade fixed-rate debt issues with maturities of at least one year. This unmanaged index does not reflect fees and expenses and is not available for direct investment.
Bloomberg Barclays U.S. TIPS Index—The Bloomberg Barclays U.S. TIPS Index is an unmanaged market index comprised of all U.S. Treasury Inflation Protected Securities rated investment grade (Baa3 or better), have at least one year to final maturity, and at least $250 million par amount outstanding. This unmanaged index does not reflect fees and expenses and is not available for direct investment.
Bloomberg Commodity Index Total ReturnSM—The Bloomberg Commodity Index Total ReturnSM is a broadly diversified index that tracks the commodities markets through commodity futures contracts. This unmanaged index does not reflect fees and expenses and is not available for direct investment.
ICE BofAML All U.S. Convertibles Ex Mandatory Index—The BofA Merrill Lynch All U.S. Convertibles Ex Mandatory Index is broadly representative of the U.S. convertible securities market, consisting of publicly traded issues, denominated in U.S. dollars, of all credit qualities, and excluding mandatory (equity-linked) convertibles. This unmanaged index does not reflect fees and expenses and is not available for direct investment.
ICE BofAML U.S. Dollar 3-Month LIBOR Constant Maturity Index—The ICE BofAML U.S. Dollar 3-Month LIBOR Constant Maturity Index tracks the performance of a synthetic asset paying Libor to a stated maturity. The index is based on the assumed purchase at par of a synthetic instrument having exactly its stated maturity and with a coupon equal to that day’s fixing rate. That issue is assumed to be sold the following business day (priced at a yield equal to the current day fixing rate) and rolled into a new instrument. This unmanaged index does not reflect fees and expenses and is not available for direct investment.
ICE BofAML 3-Month U.S. Treasury Bill Index—The ICE BofAML 3-Month U.S. Treasury Bill Index is comprised of a single U.S. Treasury Bill issue purchased at the beginning of each month and held for a full month, at which time that issue is sold and rolled into a newly selected issue. The issue selected each month is that having a maturity date closest to, but not beyond 90 days from the rebalance date.
ICE BofAML U.S. High Yield Index (H0A0)—The ICE BofAML U.S. High Yield Index (H0A0) is an unmanaged index that tracks the performance of below investment grade U.S. dollar-denominated corporate bonds publicly issued in the U.S. domestic market. All bonds are U.S. dollar denominated and rated Split BBB and below. This unmanaged index does not reflect fees and expenses and is not available for direct investment.
ICE BofAML U.S. Non-Distressed High Yield Index—The ICE BofAML U.S. Non-Distressed High Yield Index is a subset of the ICE BofAML U.S. High Yield Index (H0A0) including all securities with an option-adjusted spread less than 1,000 basis points. The unmanaged index does not reflect fees and expenses and is not available for direct investment.
MSCI All Country World Index—The MSCI All Country World Index is a free float-adjusted market capitalization weighted index that is designed to measure the equity market performance of developed and emerging markets. This unmanaged index does not reflect fees and expenses and is not available for direct investment.
MSCI All Country World Ex. U.S. (ND) Index—The MSCI All Country World Ex. U.S.is a free float-adjusted market capitalization weighted index that is designed to measure equity market performance in the global developed and emerging markets, excluding the United States. This unmanaged index does not reflect fees and expenses and is not available for direct investment.
MSCI EAFE (ND) Index—The MSCI EAFE (ND) Index is an unmanaged index generally representative of major overseas stock markets. This unmanaged index does not reflect fees and expenses and is not available for direct investment.
MSCI EAFE Small Cap (ND) Index—The MSCI EAFE Small Cap (ND) Index is an equity index which captures small cap representation across developed market countries around the world, excluding the U.S. and Canada. This unmanaged index does not reflect fees and expenses and is not available for direct investment.
MSCI Emerging Markets (ND) Index—The MSCI Emerging Markets (ND) Index is a market capitalization weighted index of equity securities in more than 20 emerging market economies. This unmanaged index does not reflect fees and expenses and is not available for direct investment.
MSCI World (ND) Index—The MSCI World (ND) Index is a free float-adjusted market capitalization index that is designed to measure global developed market equity performance. This unmanaged index does not reflect fees and expenses and is not available for direct investment.
62
Glossary—Continued
Benchmark Descriptions—Continued
Russell 1000® Index—The Russell 1000® Index is an unmanaged index generally representative of the U.S. market for larger capitalization stocks as it includes the largest 1000 securities in the Russell 3000® Index by market capitalization. This unmanaged index does not reflect fees and expenses and is not available for direct investment. The Russell 1000® Index and Russell® are trademarks of Frank Russell Company.
Russell 1000® Growth Index—The Russell 1000® Growth Index is an unmanaged index generally representative of the U.S. market for larger capitalization growth stocks. This unmanaged index does not reflect fees and expenses and is not available for direct investment. The Russell 1000® Growth Index and Russell® are trademarks of Frank Russell Company.
Russell 1000® Value Index—The Russell 1000® Value Index is an unmanaged index generally representative of the U.S. market for larger capitalization value stocks. This unmanaged index does not reflect fees and expenses and is not available for direct investment. The Russell 1000® Value Index and Russell® are trademarks of Frank Russell Company.
Russell 2000® Index—The Russell 2000® Index measures the performance of the small-cap segment of the U.S. equity universe. The Russell 2000® Index is a subset of the Russell 3000® Index representing approximately 10% of the total market capitalization of that index. It includes approximately 2,000 of the smallest securities based on a combination of their market cap and current index membership. The Russell 2000® Index is constructed to provide a comprehensive and unbiased small-cap barometer and is completely reconstituted annually to ensure larger stocks do not distort the performance and characteristics of the true small-cap opportunity set. This unmanaged index does not reflect fees and expenses and is not available for direct investment. The Russell 3000® Index and Russell® are trademarks of Frank Russell Company.
Russell 2000® Growth Index—The Russell 2000® Growth Index is an unmanaged index representing the smallest 2,000 stocks with the highest price-to-book ratio and future earnings. This unmanaged index does not reflect fees and expenses and is not available for direct investment. The Russell 2000® Growth Index and Russell® are trademarks of Frank Russell Company.
Russell 2000® Value Index—The Russell 2000® Value Index is an unmanaged index representing the smallest 2,000 stocks with the lowest price-to-book ratio and future earnings. This unmanaged index does not reflect fees and expenses and is not available for direct investment. The Russell 2000® Value Index and Russell® are trademarks of Frank Russell Company.
Russell 3000® Index—The Russell 3000® Index measures the performance of the largest 3,000 U.S. companies representing approximately 98% of the investable U.S. equity market. The Russell 3000® Index is constructed to provide a comprehensive, unbiased and stable barometer of the broad market and is completely reconstituted annually to ensure new and growing equities are reflected. This unmanaged index does not reflect fees and expenses and is not available for direct investment. The Russell 3000® Index and Russell® are trademarks of Frank Russell Company.
Russell 3000® Growth Index—The Russell 3000® Growth Index measures the performance of the broad growth segment of the U.S. equity universe. It includes those Russell 3000® companies with higher price-to-book ratios and higher forecasted growth values. The Russell 3000® Growth Index is constructed to provide a comprehensive, unbiased, and stable barometer of the broad growth market. The index is completely reconstituted annually to ensure new and growing equities are included and that the represented companies continue to reflect growth characteristics. This unmanaged index does not reflect fees and expenses and is not available for direct investment. The Russell 3000® Growth Index and Russell® are trademarks of Frank Russell Company.
Russell 3000® Value Index—The Russell 3000® Value Index measures the performance of the broad value segment of U.S. equity value universe. It includes those Russell 3000® companies with lower price-to-book ratios and lower forecasted growth values. The Russell 3000® Value Index is constructed to provide a comprehensive, unbiased, and stable barometer of the broad value market. The index is completely reconstituted annually to ensure new and growing equities are included and that the represented companies continue to reflect value characteristics. This unmanaged index does not reflect fees and expenses and is not available for direct investment. The Russell 3000® Value Index and Russell® are trademarks of Frank Russell Company.
Russell Midcap® Index—The Russell Midcap® Index is an unmanaged index generally representative of the U.S. market for medium capitalization stocks. This unmanaged index does not reflect fees and expenses and is not available for direct investment. The Russell Midcap® Index and Russell® are trademarks of Frank Russell Company.
Russell Midcap® Growth Index—The Russell Midcap® Growth Index is an unmanaged index generally representative of the U.S. market for medium capitalization growth stocks. This unmanaged index does not reflect fees and expenses and is not available for direct investment. The Russell Midcap® Growth Index and Russell® are trademarks of Frank Russell Company.
63
Glossary—Continued
Benchmark Descriptions—Continued
Russell Midcap® Value Index—The Russell Midcap® Value Index is an unmanaged index generally representative of the U.S. market for medium capitalization value stocks. This unmanaged index does not reflect fees and expenses and is not available for direct investment. The Russell Midcap® Value Index and Russell® are trademarks of Frank Russell Company.
S&P 500 Index—The S&P 500 Index is an unmanaged index generally representative of the U.S. stock market. This unmanaged index does not reflect fees and expenses and is not available for direct investment.
Composite Index Income—The Composite Index Income is derived by applying the Fund’s target asset allocation to the results of the underlying funds’ benchmarks: Russell 1000® Growth Index, Russell Midcap® Growth Index, Russell 2000® Growth Index, Russell 1000® Value Index, Russell Midcap® Value Index, Russell 2000® Value Index, MSCI EAFE (ND) Index, MSCI All Country World Ex. U.S. (ND) Index (prior to May 28, 2013, the MSCI EAFE Growth (ND) Index), MSCI All Country World (ND) Index, BofA Merrill Lynch U.S. Non-Distressed High Yield Index (prior to March 31, 2015, the BofA Merrill Lynch U.S. High Yield Index), Bloomberg Barclays U.S. Aggregate Bond Index, Bloomberg Barclays U.S. TIPS Index, BofA Merrill Lynch 3-Month U.S. Treasury Bill Index. The weights of the Composite Index Income match the Fund’s historical target asset allocation and are adjusted as changes are made to this asset allocation. Refer to the Target Retirement Funds Prospectus for the Fund’s target asset allocation. This unmanaged index does not reflect fees and expenses and is not available for direct investment.
Composite Index 2015—The Composite Index 2015 is derived by applying the Fund’s target asset allocation to the results of the underlying funds’ benchmarks: Russell 1000® Growth Index, Russell Midcap® Growth Index, Russell 2000® Growth Index, Russell 1000® Value Index, Russell Midcap® Value Index, Russell 2000® Value Index, MSCI EAFE (ND) Index, MSCI All Country World Ex. U.S. (ND) Index (prior to May 28, 2013, the MSCI EAFE Growth (ND) Index), MSCI All Country World (ND) Index, Bloomberg Commodity Index Total ReturnSM, BofA Merrill Lynch U.S. Non-Distressed High Yield Index (prior to March 31, 2015, the BofA Merrill Lynch U.S. High Yield Index), Bloomberg Barclays U.S. Aggregate Bond Index, Bloomberg Barclays U.S. TIPS Index, BofA Merrill Lynch 3-Month U.S. Treasury Bill Index. The weights of the Composite Index 2015 match the Fund’s historical target asset allocation and are adjusted as changes are made to this asset allocation. Refer to the Target Retirement Funds Prospectus for the Fund’s target asset allocation. This unmanaged index does not reflect fees and expenses and is not available for direct investment.
Composite Index 2020—The Composite Index 2020 is derived by applying the Fund’s target asset allocation to the results of the underlying funds’ benchmarks: Russell 1000® Growth Index, Russell Midcap® Growth Index, Russell 2000® Growth Index, Russell 1000® Value Index, Russell Midcap® Value Index, Russell 2000® Value Index, MSCI EAFE (ND) Index, MSCI All Country World Ex. U.S. (ND) Index (prior to May 28, 2013, the MSCI EAFE Growth (ND) Index), MSCI All Country World (ND) Index, Bloomberg Commodity Index Total ReturnSM, BofA Merrill Lynch All U.S. Convertibles Ex Mandatory Index, BofA Merrill Lynch U.S. Non-Distressed High Yield Index (prior to March 31, 2015, the BofA Merrill Lynch U.S. High Yield Index), Bloomberg Barclays U.S. Aggregate Bond Index, Bloomberg Barclays U.S. TIPS Index, BofA Merrill Lynch 3-Month U.S. Treasury Bill Index. The weights of the Composite Index 2020 match the Fund’s historical target asset allocation and are adjusted as changes are made to this asset allocation. Refer to the Target Retirement Funds Prospectus for the Fund’s target asset allocation. This unmanaged index does not reflect fees and expenses and is not available for direct investment.
Composite Index 2025—The Composite Index 2025 is derived by applying the Fund’s target asset allocation to the results of the underlying funds’ benchmarks: Russell 1000® Growth Index, Russell Midcap® Growth Index, Russell 2000® Growth Index, Russell 1000® Value Index, Russell Midcap® Value Index, Russell 2000® Value Index, MSCI EAFE (ND) Index, MSCI All Country World Ex. U.S. (ND) Index (prior to May 28, 2013, the MSCI EAFE Growth (ND) Index), MSCI All Country World (ND) Index, Bloomberg Commodity Index Total ReturnSM, BofA Merrill Lynch All U.S. Convertibles Ex Mandatory Index, BofA Merrill Lynch U.S. Non-Distressed High Yield Index (prior to March 31, 2015, the BofA Merrill Lynch U.S. High Yield Index), Bloomberg Barclays U.S. Aggregate Bond Index, Bloomberg Barclays U.S. TIPS Index. The weights of the Composite Index 2025 match the Fund’s historical target asset allocation and are adjusted as changes are made to this asset allocation. Refer to the Target Retirement Funds Prospectus for the Fund’s target asset allocation. This unmanaged index does not reflect fees and expenses and is not available for direct investment.
Composite Index 2030—The Composite Index 2030 is derived by applying the Fund’s target asset allocation to the results of the underlying funds’ benchmarks: Russell 1000® Growth Index, Russell Midcap® Growth Index, Russell 2000® Growth Index, Russell 1000® Value Index, Russell Midcap® Value Index, Russell 2000® Value Index, MSCI EAFE (ND) Index, MSCI All Country World Ex. U.S. (ND) Index (prior to May 28, 2013, the MSCI EAFE Growth (ND) Index), MSCI All Country World (ND) Index, Bloomberg Commodity Index Total ReturnSM, BofA Merrill Lynch All U.S. Convertibles Ex Mandatory Index, BofA Merrill Lynch U.S. Non-Distressed High Yield Index (prior to March 31, 2015, the BofA Merrill Lynch U.S. High Yield
64
Glossary—Continued
Benchmark Descriptions—Continued
Index), Bloomberg Barclays U.S. Aggregate Bond Index, Bloomberg Barclays U.S. TIPS Index. The weights of the Composite Index 2030 match the Fund’s historical target asset allocation and are adjusted as changes are made to this asset allocation. Refer to the Target Retirement Funds Prospectus for the Fund’s target asset allocation. This unmanaged index does not reflect fees and expenses and is not available for direct investment.
Composite Index 2035—The Composite Index 2035 is derived by applying the Fund’s target asset allocation to the results of the underlying funds’ benchmarks: Russell 1000® Growth Index, Russell Midcap® Growth Index, Russell 2000® Growth Index, Russell 1000® Value Index, Russell Midcap® Value Index, Russell 2000® Value Index, MSCI EAFE (ND) Index, MSCI All Country World Ex. U.S. (ND) Index (prior to May 28, 2013, the MSCI EAFE Growth (ND) Index), MSCI All Country World (ND) Index, Bloomberg Commodity Index Total ReturnSM, BofA Merrill Lynch All U.S. Convertibles Ex Mandatory Index, BofA Merrill Lynch U.S. Non-Distressed High Yield Index (prior to March 31, 2015, the BofA Merrill Lynch U.S. High Yield Index), Bloomberg Barclays U.S. Aggregate Bond Index, Bloomberg Barclays U.S. TIPS Index. The weights of the Composite Index 2035 match the Fund’s historical target asset allocation and are adjusted as changes are made to this asset allocation. Refer to the Target Retirement Funds Prospectus for the Fund’s target asset allocation. This unmanaged index does not reflect fees and expenses and is not available for direct investment.
Composite Index 2040—The Composite Index 2040 is derived by applying the Fund’s target asset allocation to the results of the underlying funds’ benchmarks: Russell 1000® Growth Index, Russell Midcap® Growth Index, Russell 2000® Growth Index, Russell 1000® Value Index, Russell Midcap® Value Index, Russell 2000® Value Index, MSCI EAFE (ND) Index, MSCI All Country World Ex. U.S. (ND) Index (prior to May 28, 2013, the MSCI EAFE Growth (ND) Index), MSCI All Country World (ND) Index, Bloomberg Commodity Index Total ReturnSM, BofA Merrill Lynch U.S. Non-Distressed High Yield Index (prior to March 31, 2015, the BofA Merrill Lynch U.S. High Yield Index), Bloomberg Barclays U.S. Aggregate Bond Index, Bloomberg Barclays U.S. TIPS Index. The weights of the Composite Index 2040 match the Fund’s historical target asset allocation and are adjusted as changes are made to this asset allocation. Refer to the Target Retirement Funds Prospectus for the Fund’s target asset allocation. This unmanaged index does not reflect fees and expenses and is not available for direct investment.
Composite Index 2045—The Composite Index 2045 is derived by applying the Fund’s target asset allocation to the results of the underlying funds’ benchmarks: Russell 1000® Growth Index, Russell Midcap® Growth Index, Russell 2000® Growth Index, Russell 1000® Value Index, Russell Midcap® Value Index, Russell 2000® Value Index, MSCI EAFE (ND) Index, MSCI All Country World Ex. U.S. (ND) Index (prior to May 28, 2013, the MSCI EAFE Growth (ND) Index), MSCI All Country World (ND) Index, Bloomberg Commodity Index Total ReturnSM, BofA Merrill Lynch U.S. Non-Distressed High Yield Index (prior to March 31, 2015, the BofA Merrill Lynch U.S. High Yield Index), Bloomberg Barclays U.S. Aggregate Bond Index, Bloomberg Barclays U.S. TIPS Index. The weights of the Composite Index 2045 match the Fund’s historical target asset allocation and are adjusted as changes are made to this asset allocation. Refer to the Target Retirement Funds Prospectus for the Fund’s target asset allocation. This unmanaged index does not reflect fees and expenses and is not available for direct investment.
Composite Index 2050—The Composite Index 2050 is derived by applying the Fund’s target asset allocation to the results of the underlying funds’ benchmarks: Russell 1000® Growth Index, Russell Midcap® Growth Index, Russell 2000® Growth Index, Russell 1000® Value Index, Russell Midcap® Value Index, Russell 2000® Value Index, MSCI EAFE (ND) Index, MSCI All Country World Ex. U.S. (ND) Index (prior to May 28, 2013, the MSCI EAFE Growth (ND) Index), MSCI All Country World (ND) Index, Bloomberg Commodity Index Total ReturnSM, BofA Merrill Lynch U.S. Non-Distressed High Yield Index (prior to March 31, 2015, the BofA Merrill Lynch U.S. High Yield Index), Bloomberg Barclays U.S. Aggregate Bond Index. The weights of the Composite Index 2050 match the Fund’s historical target asset allocation and are adjusted as changes are made to this asset allocation. Refer to the Target Retirement Funds Prospectus for the Fund’s target asset allocation. This unmanaged index does not reflect fees and expenses and is not available for direct investment.
Composite Index 2055—The Composite Index 2055 is derived by applying the Fund’s target asset allocation to the results of the underlying funds’ benchmarks: Russell 1000® Growth Index, Russell Midcap® Growth Index, Russell 2000® Growth Index, Russell 1000® Value Index, Russell Midcap® Value Index, Russell 2000® Value Index, MSCI EAFE (ND) Index, MSCI All Country World Ex. U.S. (ND) Index (prior to May 28, 2013, the MSCI EAFE Growth (ND) Index), MSCI All Country World (ND) Index, Bloomberg Commodity Index Total ReturnSM, BofA Merrill Lynch U.S. Non-Distressed High Yield Index (prior to March 31, 2015, the BofA Merrill Lynch U.S. High Yield Index), Bloomberg Barclays U.S. Aggregate Bond Index. The weights of the Composite Index 2055 match the Fund’s historical target asset allocation and are adjusted as changes are made to this asset allocation. Refer to the Target Retirement Funds Prospectus for the Fund’s target asset allocation. This unmanaged index does not reflect fees and expenses and is not available for direct investment.
65
Glossary—Continued
Financial Terms
12b-1 Fee—A mutual fund fee, named for the SEC rule that permits it, used to pay for broker-dealer compensation and other distribution costs. If a fund has a 12b-1 fee, it will be disclosed in the fee table of a fund’s prospectus.
ADR—ADR after the name of a foreign holding stands for American Depositary Receipts representing ownership of foreign securities. ADRs are issued by U.S. banking institutions.
Average Market Cap—The average market capitalization of a fund’s equity portfolio gives you a measure of the size of the companies in which the fund invests. Market capitalization is calculated by multiplying the number of a company’s shares outstanding by its price per share.
Average Market Coupon—A calculation from a fund’s portfolio by weighting the coupon of each bond by its relative size in the portfolio.
Beta—A measure of market-related risk. The beta of every index is 1.00, no matter how volatile the index is. A beta less than one means the portfolio is less volatile than the index. A beta higher than one indicates more volatility than the index.
Bottom-Up Equity Management Style—A management style that de-emphasizes the significance of economic and market cycles, focusing instead on the analysis of individual stocks.
Capital Gains Distribution—Profits distributed to shareholders resulting from the sale of securities held in the fund’s portfolio.
Credit Risk—The possibility that a bond issuer may not be able to pay interest and repay its debt.
CUSIP Number—Identification number assigned to every stock, corporate bond and municipal bond by the Committee on Uniform Securities Identification Procedures (CUSIP), which is established by the American Bankers Association.
Diversification—The practice of investing broadly across securities of a number of issuers to reduce risk.
Duration—A common gauge of the price sensitivity of a fixed income asset or portfolio to a change in interest rates.
Emerging Markets—Emerging markets are countries with relatively young stock and bond markets. Examples include Brazil and Thailand. Typically, emerging-markets investments have the potential for losses and gains larger than those of developed-market investments.
Expense Ratio—The Fund’s total annual operating expenses (including management fees, distribution (12b-1) fees and other expenses) expressed as a percentage of average net assets.
Family of Funds—A group of mutual funds, each typically with its own investment objective, managed or distributed by the same company that hold themselves out to investors as related companies for the purposes of investment and investor services.
GDR—GDR after the name of a holding stands for Global Depositary Receipt representing ownership of foreign securities. GDRs are issued by either U.S. or non-U.S. banking organizations. SADR after the name of a holding stands for South African Depositary Receipts representing ownership of South African securities listed on the Johannesburg Stock Exchange. SDR after the name of a holding stands for Swedish Depository Receipts representing ownership of foreign securities in Sweden. NVDR after the name of a holding stands for Non-Voting Depositary Receipts representing ownership of a listed security in the Stock Exchange of Thailand.
Inception Date—The date on which the Fund commenced operations.
Investment Objective—The goal that an investor and mutual fund pursue together (e.g., current income, long-term capital growth, etc.).
Median Market Cap—An indicator of the size of companies in which a fund invests; the midpoint of market capitalization (market price x shares outstanding) of a fund’s stocks, weighted by the proportion of the fund’s assets invested in each stock. Stocks representing half of the fund’s assets have market capitalizations above the median, and the rest are below it.
Net Asset Value (NAV)—The per share value of a mutual fund, determined by subtracting the fund’s liabilities from its assets and dividing by the number of shares outstanding. Mutual funds calculate their NAVs at least once each business day.
No-Load Fund—A mutual fund whose shares are sold without a sales commission and without a 12b-1 fee of more than 0.25% per year. Harbor funds are no-load.
Open-End Management Company—The legal name for a mutual fund, indicating that it stands ready to redeem (buy back) its shares from investors on any business day. Harbor Funds is an open-end investment company.
66
Glossary—Continued
Financial Terms—Continued
Operating Expenses—Business costs paid from a fund’s assets before earnings are distributed to shareholders. These include management fees and 12b-1 fees and other expenses.
Portfolio Manager—A specialist employed by a mutual fund’s adviser or subadviser to invest the fund’s assets in accordance with predetermined investment objectives.
Portfolio Turnover—A measure of the trading activity in a fund’s investment portfolio (how often securities are bought and sold by a fund). Funds with high turnover rates incur higher transaction costs and may be more likely to distribute capital gains (which may be taxable to investors).
Price to Book Ratio (P/B)—A ratio used to compare a stock’s market value to its book value. It is calculated by dividing the current closing price of the stock by the latest quarter’s book value. For a fund, the weighted average price/book ratio of the stocks it holds.
Price to Earnings Ratio (P/E)—The ratio of a stock’s current price to its per-share earnings over the past year. For a fund, the weighted average P/E of the stocks it holds. P/E is an indicator of market expectations about corporate prospects; the higher the P/E, the greater the market expectations are for a company’s future growth.
Prospectus—The official document that describes a mutual fund to prospective investors. The prospectus contains information required by the SEC, such as investment objectives and policies, risks, services and fees.
Record Date—The date on which a shareholder must officially own shares in order to be entitled to a dividend.
Redemption Fee—Fee charged to shareholders by a mutual fund when they sell shares within a specified period after purchase. The time limit and size of fee vary among funds. The fee is paid to the fund, not the fund’s investment adviser. Its purpose is to protect long-term investors from the impact of short-term traders.
REITs (Real Estate Investment Trust)—REITs invest in real estate or loans secured by real estate and issue shares in such investments. A REIT is similar to a closed-end mutual fund.
Repurchase Agreement (Repo)—A form of short-term borrowing for dealers in government securities. The dealer sells the government securities to investors, usually on an overnight basis, and buys them back the following day. For the party selling the security (and agreeing to repurchase it in the future), it is a repo. For the party on the other end of the transaction (buying the security and agreeing to sell back in the future), it is a reverse repurchase agreement.
Risk/Reward (or Return)—The relationship between the degree of risk associated with an investment and its return potential. Typically, the higher the potential return of an investment, the greater the risk.
Statement of Additional Information (SAI)—The supplementary document to a prospectus that contains more detailed information about a mutual fund; also known as “Part B” of a fund’s registration statement.
TBAs—A term used to describe a forward mortgage-backed securities trade. Pass-through securities issued by Freddie Mac, Fannie Mae and Ginnie Mae trade in the TBA market. The term TBA is derived from the fact that the actual mortgage- backed security that will be delivered to fulfill a TBA trade is not designated at the time the trade is made. The securities are “to be announced” 48 hours prior to the established trade settlement date.
Treasury Inflation-Protected Securities (TIPS)—TIPS are securities in which the principal amount is adjusted for inflation and interest payments are applied to the inflation-adjusted principal.
Top-Down Equity Management Style—Investment style that begins with an assessment of the overall economic environment and makes a general asset allocation decision regarding various sectors of the financial markets and various industries.
Total Return—Return on an investment over a specified period, including price appreciation (or depreciation) plus any income, expressed as an average annual compound of return.
Weighted Average Duration—Duration is a time measure of a bond’s interest-rate sensitivity, based on the weighted average of the time periods over which a bond’s cash flows accrue to the bondholder. Time periods are weighted by multiplying by the present value of its cash flow divided by the bond’s price. (A bond’s cash flows consist of coupon payments and repayment of capital.) A bond’s duration will almost always be shorter than its maturity, with the exception of zero-coupon bonds, for which maturity and duration are equal.
Weighted Average Maturity—The average length of time until principal must be repaid for all bonds in a mutual fund portfolio on a dollar weighted basis.
67
Glossary—Continued
Financial Terms—Continued
Yield—A measure of net income (dividends and interest) earned by the securities in the fund’s portfolio less fund expenses during a specified period. A fund’s yield is expressed as a percentage of the maximum offering price per share on a specified date.
Yield to Maturity—The term used to describe the rate of return an investor will receive if a long-term, interest-bearing security, such as a bond, is held to its maturity date. Yield to maturity is greater than the coupon rate if the bond is selling at a discount and less than the coupon rate if it is selling at a premium.
68

| 111 South Wacker Drive, 34th Floor | Chicago, IL 60606-4302 | 800-422-1050 | harborfunds.com |
Trustees & Officers
Charles F. McCain
Chairman, President & Trustee
Chairman, President & Trustee
Scott M. Amero
Trustee
Trustee
Raymond J. Ball
Trustee
Trustee
Donna J. Dean
Trustee
Trustee
Joseph L. Dowling, III
Trustee
Trustee
Randall A. Hack
Trustee
Trustee
Robert Kasdin
Trustee
Trustee
Kathryn L. Quirk
Trustee
Trustee
Ann M. Spruill
Trustee
Trustee
Anmarie S. Kolinski
Treasurer
Treasurer
Erik D. Ojala
Chief Compliance Officer
& Secretary
Chief Compliance Officer
& Secretary
Brian L. Collins
Vice President
Vice President
Charles P. Ragusa
Vice President
Vice President
Jodie L. Crotteau
Assistant Secretary
Assistant Secretary
Lana M. Lewandowski
AML Compliance Officer
& Assistant Secretary
AML Compliance Officer
& Assistant Secretary
Lora A. Kmieciak
Assistant Treasurer
Assistant Treasurer
John M. Paral
Assistant Treasurer
Assistant Treasurer
Investment Adviser
Harbor Capital Advisors, Inc.
111 South Wacker Drive
34th Floor
Chicago, IL 60606-4302
312-443-4400
111 South Wacker Drive
34th Floor
Chicago, IL 60606-4302
312-443-4400
Distributor
Harbor Funds Distributors, Inc.
111 South Wacker Drive
34th Floor
Chicago, IL 60606-4302
312-443-4600
111 South Wacker Drive
34th Floor
Chicago, IL 60606-4302
312-443-4600
Shareholder Services
Harbor Services Group, Inc.
P.O. Box 804660
Chicago, IL 60680-4108
800-422-1050
P.O. Box 804660
Chicago, IL 60680-4108
800-422-1050
Custodian
State Street Bank & Trust Company
State Street Financial Center
1 Lincoln Street
Boston, MA 02111-2900
State Street Financial Center
1 Lincoln Street
Boston, MA 02111-2900
FD.AR.TR.1017
Table of Contents
ITEM 2 – CODE OF ETHICS
| (a) | The Registrant has adopted a code of ethics that applies to the Registrant’s principal executive officer, principal financial officer, principal accounting officer or controller, or persons performing similar functions, regardless of whether these individuals are employed by the Registrant or a third party (the “Code of Ethics”). |
| (c) | The Registrant has not amended its Code of Ethics during the period covered by this report. |
| (d) | The Registrant has not granted any waivers, including an implicit waiver, from any provisions of its Code of Ethics during the period covered by this report. |
ITEM 3 – AUDIT COMMITTEE FINANCIAL EXPERT
The Registrant’s Board has determined that Raymond J. Ball, a member of the Audit Committee of the Board of Trustees, is an audit committee financial expert as defined by the Securities and Exchange Commission (the “SEC”). Mr. Ball is the Sidney Davidson Distinguished Service Professor of Accounting at the University of Chicago Booth School of Business and a frequent lecturer and researcher on accounting, financial market and related business matters. Mr. Ball is deemed “independent” as defined by the SEC for purposes of audit committee financial expert determinations.
ITEM 4 – PRINCIPAL ACCOUNTANT FEES AND SERVICES
Items 4(a)—4(d): Audit, Audit-Related, Tax and All Other Fees
Fees billed by Ernst & Young:
| Fiscal Year Ended October 31, 2017 | Fiscal Year Ended October 31, 2016 | ||||||||||
| All fees and services to the Trust that were pre-approved | All fees and services to service affiliates that were pre-approved | All other fees and services to service affiliates that did not require pre-approval | All fees and services to the Trust that were pre-approved | All fees and services to service affiliates that were pre-approved | All other fees and services to service affiliates that did not require pre-approval | ||||||
| (a) Audit Fees. | $770,169 | N/A | N/A | $699,400 | N/A | N/A | |||||
| (b) Audit-Related Fees. | $ 3,0001 | $51,250 2 | N/A | $ 3,0001 | $51,250 2 | N/A | |||||
| (c) Tax Fees. | $345,618 3 | $ 04 | N/A | $492,550 3 | $ 8,4004 | N/A | |||||
| (d) All Other Fees. | $ 16,8505 | $ 2,5506 | N/A | $ 19,5505 | $ 2,7606 | N/A | |||||
| 1 | Includes fees related to the issuance of consents for N-1A filings. |
| 2 | Includes fees related to the procedures performed for Harbor Services Group, Inc. required by Rule 17Ad-13(a)(3) of the Securities Exchange Act of 1934. |
| 3 | Includes fees related to tax compliance, including foreign tax reclaim filings. |
| 4 | Includes fees billed in connection with tax consulting services provided to Harbor Capital Advisors, Inc. (the “Adviser”). |
| 5 | Includes fees billed in connection with the Registrant’s subscription to the Ernst & Young PFIC Analyzer, a database used to determine whether foreign equity securities are passive foreign investment companies. |
| 6 | Includes fees billed in connection with the Adviser’s subscription to Ernst & Young Online, a database of accounting rules and regulations. |
| (e) | (1) | Pre-Approval Policies. |
The policy of the Registrant’s Audit Committee is to consider and, if appropriate, approve before the principal accountant is engaged for such services, all specific audit, review and non-audit services (other than certain de minimis non-audit services) provided to the Registrant. In making a determination, the Audit Committee considers whether the services are consistent with maintaining the principal accountant’s independence.
In the event of a contingency situation in which the principal accountant is needed to provide services in between scheduled Audit Committee meetings, the Audit Committee is authorized to delegate one or more members of the Committee the responsibility for considering and, if appropriate, pre-approving audit or permitted non-audit services in an amount sufficient to complete services and to determine if such services would be consistent with maintaining the accountant’s independence. Such member(s) are required to report to the full Audit Committee as to the nature and amount of such services and fees pre-approved at the next scheduled Audit Committee meeting. The Audit Committee would again consider whether such services and fees are consistent with maintaining the principal accountant’s independence.
The Registrant’s Audit Committee is informed at least annually of all audit and non-audit services provided by the principal accountant to the Registrant.
| (2) | None of the principal accountant’s fees or services rendered to the Registrant, the Adviser or Harbor Services Group, Inc. were approved pursuant to the waiver provision of paragraph (c)(7)(i)(C) of Rule 2-01 of Regulation S-X. |
| (f) | Not applicable. |
| (g) | Aggregate Non-Audit Fees. |
| Aggregate Non-Audit Fees of the Registrant | |
| Fiscal Year Ended October 31, 2017: $365,468 | |
| Fiscal Year Ended October 31, 2016: $515,100 | |
| Aggregate Non-Audit Fees of Other Entities Required to be Pre-approved Pursuant to Paragraph (c)(7)(ii) of Rule 2-01 of Regulation S-X | |
| Fiscal Year Ended October 31, 2017: $53,800 | |
| Fiscal Year Ended October 31, 2016: $62,440 | |
| (h) | For the most recent fiscal year, the Audit Committee has determined that the provision of all non-audit services to service affiliates was compatible with maintaining the principal accountant’s independence. |
ITEM 5 – AUDIT COMMITTEE OF LISTED REGISTRANTS
Not applicable.
ITEM 6 – INVESTMENTS
| (a) | The Registrant has elected to include the schedule of investments in securities of unaffiliated issuers as part of the report to shareholders filed under Item 1 of this report on Form N-CSR. |
| (b) | Not applicable. |
ITEM 7 – DISCLOSURE OF PROXY VOTING POLICIES AND PROCEDURES FOR CLOSED-END MANAGEMENT INVESTMENT COMPANIES
Not applicable.
ITEM 8 – PORTFOLIO MANAGERS OF CLOSED-END MANAGEMENT INVESTMENT COMPANIES
Not applicable.
ITEM 9 – PURCHASES OF EQUITY SECURITIES BY CLOSED-END MANAGEMENT INVESTMENT COMPANY AND AFFILIATED PURCHASERS
Not applicable.
ITEM 10 – SUBMISSION OF MATTERS TO A VOTE OF SECURITY HOLDERS
There were no material changes to the procedures by which shareholders may recommend nominees to the Registrant’s Board of Trustees since the date of the Registrant’s prior report on Form N-CSR.
ITEM 11 – CONTROLS AND PROCEDURES
| (a) | The Registrant’s Principal Executive and Principal Financial Officers concluded that the Registrant’s disclosure controls and procedures (as defined in Rule 30a-3(c) under the 1940 Act) are effective, based on the evaluation of these disclosure controls and procedures as of a date within 90 days of the filing of this report. |
| (b) | There was no change in the Registrant’s internal control over financial reporting (as defined in Rule 30a-3(d) under the 1940 Act) that occurred during the second fiscal quarter of the period covered by this report that has materially affected, or is reasonably likely to materially affect, the Registrant’s internal control over financial reporting. |
ITEM 12 – EXHIBITS
| (a)(1) | Code of Ethics referred to in Item 2 is attached hereto. |
| (a)(2) | A separate certification for each principal executive officer and principal financial officer of the Registrant as required by Rule 30a-2(a) under the 1940 Act (17 CFR 270.30a-2(a)) is attached hereto. |
| (b) | Certification as required by Section 1350 of Chapter 63 of Title 18 of the United States Code (18 U.S.C. 1350) is attached hereto. |
SIGNATURES
Pursuant to the requirements of the Securities Exchange Act of 1934 and the Investment Company Act of 1940, the Registrant has duly caused this report to be signed this 21st day of December, 2017 on its behalf by the undersigned, thereunto duly authorized.
HARBOR FUNDS
By: /s/Charles F. McCain, Esq.
Charles F. McCain, Esq.
Chairman, President and Trustee
(Principal Executive Officer)
Chairman, President and Trustee
(Principal Executive Officer)
Pursuant to the requirements of the Securities Exchange Act of 1934 and the Investment Company Act of 1940, this report has been signed below by the following persons on behalf of the Registrant and in the capacities and on the dates indicated.
| By: | /s/Charles F. McCain, Esq. Charles F. McCain, Esq. | Chairman, President and Trustee (Principal Executive Officer) | December 21, 2017 |
| By: | /s/Anmarie S. Kolinski Anmarie S. Kolinski | Treasurer (Principal Financial and Accounting Officer) | December 21, 2017 |
Exhibit Index
| Number | Description | |
| 99.CODE ETH | Code of Business Conduct and Ethics. | |
| 99.CERT1 | Certification for each principal executive officer and principal financial officer of the Registrant as required by Rule 30a-2(a) under the 1940 Act (17 CFR 270.30a-2(a)). | |
| 99.CERT2 | Certification for each principal executive officer and principal financial officer of the Registrant as required by Rule 30a-2(a) under the 1940 Act (17 CFR 270.30a-2(a)). | |
| 99.906CERT | Certification as required by Section 1350 of Chapter 63 of Title 18 of the United States Code (18 U.S.C. 1350). |