UNITED STATES
SECURITIES AND EXCHANGE COMMISSION
Washington, D.C. 20549
Form N-CSR
CERTIFIED SHAREHOLDER REPORT OF
REGISTERED MANAGEMENT INVESTMENT COMPANIES
Investment Company Act file number: 811-4676
Harbor Funds
(Exact name of Registrant as specified in charter)
111 South Wacker Drive, 34th Floor
Chicago, Illinois 60606-4302
(Address of principal executive offices) (Zip code)
Charles F. McCain, Esq. HARBOR FUNDS 111 South Wacker Drive, 34th Floor Chicago, Illinois 60606-4302 | Christopher P. Harvey, Esq. DECHERT LLP One International Place – 40th Floor 100 Oliver Street Boston, MA 02110-2605 |
(Name and address of agent for service)
Registrant’s telephone number, including area code: (312) 443-4400
Date of fiscal year end: October 31
Date of reporting period: October 31, 2023
ITEM 1 – REPORTS TO STOCKHOLDERS
The following are copies of reports transmitted to shareholders pursuant to Rule 30e-1 under the Investment Company Act of 1940, as amended (the “1940 Act”) (17 CFR 270.30e-1):
Annual Report
Harbor Funds
October 31, 2023
Harbor Capital Appreciation Fund |
Harbor Convertible Securities Fund |
Harbor Core Bond Fund |
Harbor Core Plus Fund |
Harbor Disruptive Innovation Fund |
Harbor Diversified International All Cap Fund |
Harbor International Fund |
Harbor International Core Fund (formerly, Harbor Overseas Fund) |
Harbor International Growth Fund |
Harbor International Small Cap Fund |
Harbor Large Cap Value Fund |
Harbor Mid Cap Fund |
Harbor Mid Cap Value Fund |
Harbor Small Cap Growth Fund |
Harbor Small Cap Value Fund |
Table of Contents
Harbor Funds | |
Harbor Capital Appreciation Fund | |
Manager’s Commentary | |
Portfolio of Investments | |
Harbor Convertible Securities Fund | |
Manager’s Commentary | |
Portfolio of Investments | |
Harbor Core Bond Fund | |
Manager’s Commentary | |
Portfolio of Investments | |
Harbor Core Plus Fund | |
Manager’s Commentary | |
Portfolio of Investments | |
Harbor Disruptive Innovation Fund | |
Manager’s Commentary | |
Portfolio of Investments | |
Harbor Diversified International All Cap Fund | |
Manager’s Commentary | |
Portfolio of Investments | |
Harbor International Fund | |
Manager’s Commentary | |
Portfolio of Investments | |
Harbor International Core Fund | |
Manager’s Commentary | |
Portfolio of Investments | |
Harbor International Growth Fund | |
Manager’s Commentary | |
Portfolio of Investments | |
Harbor International Small Cap Fund | |
Manager’s Commentary | |
Portfolio of Investments | |
Harbor Large Cap Value Fund | |
Manager’s Commentary | |
Portfolio of Investments | |
Harbor Mid Cap Fund | |
Manager’s Commentary | |
Portfolio of Investments | |
Harbor Mid Cap Value Fund | |
Manager’s Commentary | |
Portfolio of Investments | |
Harbor Small Cap Growth Fund | |
Manager’s Commentary | |
Portfolio of Investments | |
Harbor Small Cap Value Fund | |
Manager’s Commentary | |
Portfolio of Investments | |
Financial Statements | |
Statements of Assets and Liabilities |
Table of Contents
Statements of Operations | |
Statements of Changes in Net Assets | |
Financial Highlights | |
Notes to Financial Statements | |
Report of Independent Registered Public Accounting Firm | |
Fees and Expenses Example | |
Additional Information | |
Additional Tax Information | |
Proxy Voting | |
Householding | |
Quarterly Portfolio Disclosures | |
Trustees and Officers | |
Harbor’s Privacy Statement | 170 |
This material is intended for the Funds’ shareholders. It may be distributed to prospective investors only if it is preceded or accompanied by the current prospectus. Prospective investors should carefully consider the investment objectives, risks, charges and expenses of a Harbor Fund before investing. To obtain a summary prospectus or prospectus for this and other information, visit harborcapital.com or call 800-422-1050. Read it carefully before investing.
Harbor Funds Distributors, Inc. is the Distributor of the Harbor Funds.
Harbor Capital Appreciation FundMANAGER’S COMMENTARY (Unaudited)
SUBADVISOR
Jennison Associates LLC
Management’s Discussion of
Fund Performance
Fund Performance
MARKET REVIEW
The past year has been dominated by the Federal Reserve’s (the “Fed”) historic campaign of interest rate hikes, which has continued since March 2022. The success of this effort to lower inflation, along with clearing of the supply chain, resilient consumer spending and, most important, healthy earnings, drove strong equity market performance over the past twelve months. In the last three months, however, market sentiment fell due to sustained upward pressure on interest rates, dysfunction in the U.S. federal government, U.S. labor strikes, and geopolitical instability—including the tragic events in the Middle East.
PERFORMANCE
Harbor Capital Appreciation Fund returned 22.93% (Retirement Class), 22.84% (Institutional Class), 22.52% (Administrative Class), and 22.39% (Investor Class) in the year ended October 31, 2023, outperforming the 18.95% return of the Russell 1000® Growth Index and 10.14% return of the S&P 500 Index during the same period.
Positions in technology were strong contributors to portfolio returns over the 12-month period. The top performer was Nvidia. This semiconductor designer and manufacturer is the leader in accelerated computing, which is a critical element in the progression of artificial intelligence (“AI”). Broadcom, another producer of semiconductors and infrastructure software, was lifted by strong results and positive AI sentiment.
The strategy also saw strong returns in health care holdings, Eli Lilly and Novo Nordisk. Both companies are benefiting from demand growth for their diabetes and obesity medications. Uber rose sharply over the past six months as its mobility business generated a record level of riders, drivers, and margins.
On the negative side, Tesla’s stock price fell and partially recovered over the past 12 months, but the stock was still down for the full period. It remains a meaningful position in our strategy. Atlassian, a collaboration software company, was a detractor due to a disappointing slowdown in revenue. Adyen, a payments platform company, also disappointed as competition increased and growth rates slowed. Both positions were eliminated from the portfolio.
OUTLOOK & STRATEGY
Sentiment in the near term is clouded by uncertainties due to—but not limited to—geopolitical conflict, a potential shutdown of the U.S. federal government, auto strikes, the restart of student loan repayments, and the lagged effect on financing costs and spending intentions from interest rates that are at 15-year highs.
Over the past year, technology spending trends have been dominated by cost optimization, rationalization of past customer investments to drive efficiencies, and headcount reductions. We expect greater stability in spending activity and investment intentions moving into 2024. The broad categories of cloud adoption, data mining and analytics, and the still-nascent development and adoption of generative AI capabilities remain at the forefront of longer-term investment plans across a wide range of industries.
As always, we are focused on the long term as we evaluate companies that we believe have compelling growth opportunities.
⬤
2
Harbor Capital Appreciation FundMANAGER’S COMMENTARY—Continued
CHANGE IN A $50,000 INVESTMENT
For the period 11/01/2013 through 10/31/2023
The graph compares a $50,000 investment in the Institutional Class shares of the Fund with the performance of the Russell 1000® Growth Index and the S&P 500 Index. The Fund’s performance assumes the reinvestment of all dividend and capital gain distributions.
TOTAL RETURNS | |||
For the periods ended 10/31/2023 | |||
Annualized | |||
1 Year | 5 Years | 10 Years | |
Harbor Capital Appreciation Fund | |||
Retirement Class1 | 22.93% | 12.54% | 13.01% |
Institutional Class | 22.84 | 12.44 | 12.94 |
Administrative Class | 22.52 | 12.17 | 12.66 |
Investor Class | 22.39 | 12.03 | 12.53 |
Comparative Index | |||
Russell 1000® Growth Index | 18.95% | 14.22% | 13.82% |
S&P 500 Index | 10.14 | 11.01 | 11.18 |
As stated in the Fund’s prospectus dated March 1, 2023, the expense ratios were 0.59% (Net) and 0.64% (Gross) (Retirement Class); 0.67% (Net) and 0.72% (Gross) (Institutional Class); 0.92% (Net) and 0.97% (Gross) (Administrative Class); and 1.03% (Net) and 1.08% (Gross) (Investor Class). The net expense ratios reflect a contractual management fee waiver effective through 02/29/2024. The expense ratios in the prospectus may differ from the actual expense ratios for the period disclosed within this report. The expense ratios shown in the prospectus are adjusted to reflect changes, if any, in contractual arrangements that occurred prior to the date of the prospectus (or supplement thereto, if applicable).
The Russell 1000® Growth Index is an unmanaged index generally representative of the U.S. market for larger capitalization growth stocks. The S&P 500 Index is an unmanaged index generally representative of the U.S. market for large capitalization equities. These unmanaged indices do not reflect fees and expenses and are not available for direct investment. The Russell 1000® Growth Index and Russell® are trademarks of Frank Russell Company.
Performance data shown represents past performance and is no guarantee of future results. Past performance is net of management fees and expenses and reflects reinvested dividends and distributions. Past performance reflects the beneficial effect of any expense waivers or reimbursements, without which returns would have been lower. Investment returns and principal value will fluctuate and when redeemed may be worth more or less than their original cost. Returns for periods less than one year are not annualized. Current performance may be higher or lower and is available through the most recent month end at harborcapital.com or by calling 800-422-1050.
1 Retirement Class shares commenced operations on March 1, 2016. The performance attributed to the Retirement Class shares prior to that date is that of the Institutional Class shares. Performance prior to March 1, 2016 has not been adjusted to reflect the lower expenses of Retirement Class shares. During this period, Retirement Class shares would have had returns similar to, but potentially higher than, Institutional Class shares due to the fact that Retirement Class shares represent interests in the same portfolio as Institutional Class shares but are subject to lower expenses.
This report contains the current opinions of Jennison Associates LLC as of the date of this report and should not be considered as investment advice or a recommendation of any particular security, strategy or investment product. Such opinions are subject to change without notice and securities described herein may no longer be included in, or may at any time be removed from, the Fund’s portfolio. This report is distributed for informational purposes only. Information contained herein has been obtained from sources believed reliable, but not guaranteed.
There is no guarantee that the investment objective of the Fund will be achieved. Stock markets are volatile and equity values can decline significantly in response to adverse issuer, political, regulatory, market and economic conditions. Since the Fund may hold foreign securities, it may be subject to greater risks than funds invested only in the U.S. These risks are more severe for securities of issuers in emerging markets regions. For information on the different share classes and the risks associated with an investment in the Fund, please refer to the current prospectus.
⬤
3
Harbor Capital Appreciation FundPORTFOLIO OF INVESTMENTS—October 31, 2023
SECTOR ALLOCATION (% of investments) - Unaudited
PORTFOLIO OF INVESTMENTS
Value and Cost in Thousands
COMMON STOCKS—99.2% | ||
Shares | Value | |
AUTOMOBILE COMPONENTS—0.3% | ||
1,666,849 | Mobileye Global, Inc. Class A (Israel)* | $59,457 |
AUTOMOBILES—4.0% | ||
4,530,783 | Tesla, Inc. * | 909,962 |
BIOTECHNOLOGY—1.7% | ||
286,914 | Argenx SE ADR (Netherlands)*,1 | 134,726 |
697,677 | Vertex Pharmaceuticals, Inc. * | 252,636 |
387,362 | ||
BROADLINE RETAIL—9.4% | ||
12,833,499 | Amazon.com, Inc. * | 1,708,010 |
331,394 | MercadoLibre, Inc. (Brazil)* | 411,174 |
2,119,184 | ||
CAPITAL MARKETS—0.9% | ||
375,575 | Goldman Sachs Group, Inc. | 114,028 |
318,881 | Moody’s Corp. | 98,216 |
212,244 | ||
CONSUMER STAPLES DISTRIBUTION & RETAIL—2.1% | ||
836,027 | Costco Wholesale Corp. | 461,855 |
ENTERTAINMENT—1.9% | ||
1,041,941 | Netflix, Inc. * | 428,957 |
FINANCIAL SERVICES—6.1% | ||
1,738,505 | Mastercard, Inc. Class A | 654,286 |
3,048,101 | Visa, Inc. Class A | 716,609 |
1,370,895 | ||
GROUND TRANSPORTATION—1.8% | ||
9,378,281 | Uber Technologies, Inc. * | 405,892 |
HEALTH CARE EQUIPMENT & SUPPLIES—1.3% | ||
161,097 | Dexcom, Inc. * | 14,310 |
1,033,404 | Intuitive Surgical, Inc. * | 270,979 |
285,289 | ||
HEALTH CARE PROVIDERS & SERVICES—1.8% | ||
761,185 | UnitedHealth Group, Inc. | 407,660 |
HOTELS, RESTAURANTS & LEISURE—2.3% | ||
1,265,448 | Airbnb, Inc. Class A* | 149,690 |
75,269 | Chipotle Mexican Grill, Inc. Class A* | 146,187 |
COMMON STOCKS—Continued | ||
Shares | Value | |
HOTELS, RESTAURANTS & LEISURE—Continued | ||
1,206,714 | Marriott International, Inc. Class A | $227,538 |
523,415 | ||
INTERACTIVE MEDIA & SERVICES—8.7% | ||
4,525,188 | Alphabet, Inc. Class A* | 561,485 |
4,500,910 | Alphabet, Inc. Class C* | 563,964 |
2,752,561 | Meta Platforms, Inc. Class A* | 829,264 |
1,954,713 | ||
IT SERVICES—2.2% | ||
753,674 | MongoDB, Inc. * | 259,708 |
1,548,335 | Snowflake, Inc. Class A* | 224,710 |
484,418 | ||
MEDIA—0.7% | ||
2,304,401 | Trade Desk, Inc. Class A* | 163,520 |
PERSONAL CARE PRODUCTS—1.1% | ||
608,028 | L’Oreal SA (France) | 255,573 |
PHARMACEUTICALS—7.9% | ||
4,794,942 | AstraZeneca PLC ADR (United Kingdom)1 | 303,184 |
1,674,451 | Eli Lilly & Co. | 927,529 |
5,775,443 | Novo Nordisk AS ADR (Denmark)1 | 557,734 |
1,788,447 | ||
SEMICONDUCTORS & SEMICONDUCTOR EQUIPMENT—14.6% | ||
6,397,447 | Advanced Micro Devices, Inc. * | 630,149 |
1,714,043 | ARM Holdings PLC ADR*,1 | 84,485 |
295,747 | ASML Holding NV New York Registry Shares (Netherlands) | 177,096 |
668,001 | Broadcom, Inc. | 562,036 |
1,712,793 | Micron Technology, Inc. | 114,534 |
4,260,276 | NVIDIA Corp. | 1,737,341 |
3,305,641 | ||
SOFTWARE—16.8% | ||
878,676 | Adobe, Inc. * | 467,508 |
1,213,466 | Cadence Design Systems, Inc. * | 291,050 |
1,325,527 | Crowdstrike Holdings, Inc. Class A* | 234,314 |
242,486 | HubSpot, Inc. * | 102,758 |
5,782,404 | Microsoft Corp. | 1,955,089 |
2,203,914 | Salesforce, Inc. * | 442,612 |
523,926 | ServiceNow, Inc. * | 304,846 |
3,798,177 |
⬤
4
Harbor Capital Appreciation FundPORTFOLIO OF INVESTMENTS—Continued
Value and Cost in Thousands
COMMON STOCKS—Continued | ||
Shares | Value | |
SPECIALIZED REITS—0.9% | ||
1,119,432 | American Tower Corp. | $199,472 |
SPECIALTY RETAIL—3.1% | ||
703,610 | Home Depot, Inc. | 200,311 |
260,360 | O’Reilly Automotive, Inc. * | 242,249 |
2,974,742 | TJX Cos., Inc. | 261,986 |
704,546 | ||
TECHNOLOGY HARDWARE, STORAGE & PERIPHERALS—5.2% | ||
6,933,683 | Apple, Inc. | 1,184,065 |
TEXTILES, APPAREL & LUXURY GOODS—4.4% | ||
1,085,074 | Lululemon Athletica, Inc. * | 426,955 |
486,755 | LVMH Moet Hennessy Louis Vuitton SE (France) | 348,483 |
2,059,274 | NIKE, Inc. Class B | 211,631 |
987,069 | ||
TOTAL COMMON STOCKS (Cost $11,544,033) | 22,397,813 |
PREFERRED STOCKS—0.5% | ||
Shares | Value | |
(Cost $102,148) | ||
AUTOMOBILES—0.5% | ||
1,263,241 | Dr Ing hc F Porsche AG (Germany)2 | $110,717 |
TOTAL INVESTMENTS—99.7% (Cost $11,646,181) | 22,508,530 | |
CASH AND OTHER ASSETS, LESS LIABILITIES—0.3% | 68,299 | |
TOTAL NET ASSETS—100% | $22,576,829 |
FAIR VALUE MEASUREMENTS
As of October 31, 2023, the investments in Dr. Ing. h.c.F. Porsche AG, L’Oreal SA, and LVMH Moet Hennessy Loius Vuitton SE (as disclosed in the preceding Portfolio of Investments) were classified as Level 2 and all other investments were classified as Level 1.
For more information on valuation inputs and their aggregation into the levels identified above, please refer to the Fair Value Measurements and Disclosures in Note 2 of the accompanying Notes to Financial Statements.
*
Non-income producing security
1
Depositary receipts such as American Depositary Receipts (ADRs), Global Depositary Receipts (GDRs) and other country specific depositary receipts are certificates evidencing ownership of shares of a foreign issuer. These certificates are issued by depositary banks and generally trade on an established market in the U.S. or elsewhere.
2
Securities purchased in a transaction exempt from registration under Rule 144A of the Securities Act of 1933. These securities may be resold in transactions exempt from registration, normally to qualified institutional buyers. The Fund has no right to demand registration of these securities. As of October 31, 2023, the aggregate value of these securities was $110,717 or less than 1% of net assets.
The accompanying notes are an integral part of the Financial Statements.
⬤
5
Harbor Convertible Securities FundMANAGER’S COMMENTARY (Unaudited)
SUBADVISOR
BlueCove Limited
Management’s Discussion of
Fund Performance
Fund Performance
MARKET REVIEW
During the earlier part of the twelve-month period ended October 31, 2023, equities experienced a strong rally as markets anticipated the end to the rate hiking cycle. This occurred despite the U.S. Treasury rate curve hitting a multi-decade level of inversion, signalling a weaker economic outlook, and the U.S. Federal Reserve (the “Fed”) indicating that higher rates would persist. The rally was interrupted in March of 2023 after the failure of two large regional U.S. banks, with markets considering the potential for more accommodative central bank action to contain further contagion in the banking system. Despite coming into calendar year 2023 with U.S. fourth quarter of 2022 earnings showing a contraction in operating margins and earnings, sentiment shifted in subsequent quarters as earnings reports surprised to the upside. However, lending conditions continued to tighten with a continued rise in interest rates against a backdrop of resilient growth. Since late July of 2023, the Fed has kept rates on hold, pausing to observe the effects of recent hikes amidst strong risk on sentiment. Risk markets trended upwards as the U.S. consumer remained strong against a backdrop of declining inflationary pressures and resilient economic growth. Economic data generally remained robust, and the market’s anticipation of a recession waned. Toward period end, volatility increased as the yield on the U.S. 10-year Treasury continued to rise, causing a decline in risk assets under the expectation that rates would remain higher for longer. U.S. equities closed up 10% and U.S. convertible bonds returned -0.5% over the period. The increased market volatility toward period end was supportive of the Fund’s security selection focus.
PERFORMANCE
Harbor Convertible Securities Fund returned -0.73% (Retirement Class), -0.83% (Institutional Class), -1.47% (Administrative Class), and -1.23% (Investor Class) in the year ended October 31, 2023, while the ICE BofA U.S. Convertible Bond Index (the “Index”) returned -0.48% during the same period.
Since BlueCove took over as subadvisor on March 1, 2023, the Fund posted modestly positive gains from security selection with strong contributions from Consumer Non-Cyclical, Basic Industry, and Communications companies offset by losses in Consumer Cyclicals, Electric, and Technology names. The best performing positions were overweights to BridgeBio Pharma and Palo Alto Networks and an underweight to Wolfspeed. These positions were reduced during the period. The weakest performance came from overweights to Porch Group, Enphase Energy, and NextEra Energy Capital. These positions were held during this period. Sector positioning varied with expectations for security selection opportunities, with the Fund reducing risk in Utility, Auto, and Consumer Goods companies and increasing risk to Real Estate, Basic Industry, and Financial Services companies. The Fund maintained a broadly neutral position to the risk exposures of the Index..
OUTLOOK & STRATEGY
The impact of key supports to growth through 2023 – fiscal stimulus and post-pandemic excess consumer savings – are fading. At the same time, tightening lending conditions have a lagged impact on credit growth and financial conditions that we expect will drag on growth over the next 6-12 months. The on-going conflict in Ukraine, and response by Israel to terrorist action in early October, underline a period characterised by elevated geopolitical risks. An increase in market volatility can be a positive backdrop for convertible bond returns as an asset class and in our view, supports a scientific approach to security selection which seeks to capture this volatility through company-specific insights.
⬤
6
Harbor Convertible Securities FundMANAGER’S COMMENTARY—Continued
CHANGE IN A $10,000 INVESTMENT
For the period 11/01/2013 through 10/31/2023
The graph compares a $10,000 investment in the Institutional Class shares of the Fund with the performance of the ICE BofA U.S. Convertible Bond Index and the ICE BofA U.S. Convertible Ex Mandatory Index. The Fund’s performance assumes the reinvestment of all dividend and capital gain distributions.
TOTAL RETURNS | |||
For the periods ended 10/31/2023 | |||
Annualized | |||
1 Year | 5 Years | 10 Years | |
Harbor Convertible Securities Fund | |||
Retirement Class1 | -0.73% | 5.44% | 4.77% |
Institutional Class | -0.83 | 5.33 | 4.71 |
Administrative Class | -1.47 | 5.00 | 4.39 |
Investor Class | -1.23 | 4.97 | 4.32 |
Comparative Index | |||
ICE BofA U.S. Convertible Bond Index2 | -0.48% | 8.73% | 8.12% |
ICE BofA U.S. Convertible Ex Mandatory Index | -0.08 | 9.06 | 8.66 |
As stated in the Fund’s prospectus dated March 1, 2023, the expense ratios were 0.63% (Net) and 0.66% (Gross) (Retirement Class), 0.71% (Net) and 0.74% (Gross) (Institutional Class), 0.96% (Net) and 0.99% (Gross) (Administrative Class), and 1.07% (Net) and 1.10% (Gross) (Investor Class). The net expense ratios reflect an expense limitation agreement (excluding interest expense, if any) effective through 02/29/2024. The expense ratios in the prospectus may differ from the actual expense ratios for the period disclosed within this report. The expense ratios shown in the prospectus are adjusted to reflect changes, if any, in contractual arrangements that occurred prior to the date of the prospectus (or supplement thereto, if applicable).
The ICE BofA U.S. Convertible Bond Index is a market-capitalization weighted index that tracks the performance of publicly issued U.S. dollar denominated convertible securities of U.S. companies. Convertible securities where the underlying is a basket of equities qualify for inclusion in the index, as do mandatory and convertible preferred securities. This unmanaged index does not reflect fees and expenses and is not available for direct investment. The ICE BofA U.S. Convertible Ex Mandatory Index is broadly representative of the U.S. convertible securities market, consisting of publicly traded issues, denominated in U.S. Dollars, of all credit qualities, and excluding mandatory (equity-linked) convertibles. This unmanaged index does not reflect fees and expenses and is not available for direct investment.
Performance data shown represents past performance and is no guarantee of future results. Past performance is net of management fees and expenses and reflects reinvested dividends and distributions. Past performance reflects the beneficial effect of any expense waivers or reimbursements, without which returns would have been lower. Investment returns and principal value will fluctuate and when redeemed may be worth more or less than their original cost. Returns for periods less than one year are not annualized. Current performance may be higher or lower and is available through the most recent month end at harborcapital.com or by calling 800-422-1050.
⬤
7
Harbor Convertible Securities FundMANAGER’S COMMENTARY—Continued
1 Retirement Class shares commenced operations on March 1, 2016. The performance attributed to the Retirement Class shares prior to that date is that of the Institutional Class shares. Performance prior to March 1, 2016 has not been adjusted to reflect the lower expenses of Retirement Class shares. During this period, Retirement Class shares would have had returns similar to, but potentially higher than, Institutional Class shares due to the fact that Retirement Class shares represent interests in the same portfolio as Institutional Class shares but are subject to lower expenses.
2 Effective March 1, 2023, the Fund’s benchmark index changed from the ICE BofA U.S. Convertible Ex Mandatory to the ICE BofA U.S. Convertible Bond Index as the Adviser believes this index is a more appropriate comparison in light of the Fund’s new investment strategy.
This report contains the current opinions of BlueCove Limited as of the date of this report and should not be considered as investment advice or a recommendation of any particular security, strategy or investment product. Such opinions are subject to change without notice and securities described herein may no longer be included in, or may at any time be removed from, the Fund’s portfolio. This report is distributed for informational purposes only. Information contained herein has been obtained from sources believed reliable, but not guaranteed.
There is no guarantee that the investment objective of the Fund will be achieved. Convertible securities tend to be of lower credit quality, and the value of a convertible security generally increases and decreases with the value of the underlying common stock, but may also be sensitive to changes in interest rates. As interest rates rise, the values of convertible securities held by the Fund are likely to decrease and reduce the value of the Fund’s portfolio. Credit risk is higher for the Fund because it invests primarily in convertible securities of companies with debt rated below investment grade. High yield investing poses additional credit risk related to lower-rated bonds. For information on the different share classes and the risks associated with an investment in the Fund, please refer to the current prospectus.
⬤
8
Harbor Convertible Securities FundPORTFOLIO OF INVESTMENTS—October 31, 2023
SECTOR ALLOCATION (% of investments) - Unaudited
PORTFOLIO OF INVESTMENTS
Principal Amounts, Value and Cost in Thousands
Convertible Bonds—91.1% | ||
Principal Amount | Value | |
Automobiles—1.1% | ||
$200 | Fisker, Inc. 2.500%—09/15/20261 | $79 |
200 | Rivian Automotive, Inc. 4.625%—03/15/20291 | 211 |
290 | ||
Biotechnology—3.0% | ||
Bridgebio Pharma, Inc. | ||
100 | 2.250%—02/01/2029 | 74 |
100 | 2.500%—03/15/2027 | 95 |
169 | ||
100 | Cytokinetics, Inc. 3.500%—07/01/20271 | 92 |
200 | Guardant Health, Inc. 0.000%—11/15/20272 | 135 |
100 | Insmed, Inc. 0.750%—06/01/2028 | 97 |
300 | Ionis Pharmaceuticals, Inc. 0.000%—04/01/20262 | 291 |
784 | ||
Commercial Services & Supplies—5.0% | ||
200 | Alarm.com Holdings, Inc. 0.000%—01/15/20262 | 172 |
400 | Block, Inc. 0.250%—11/01/2027 | 301 |
100 | Marathon Digital Holdings, Inc. 1.000%—12/01/2026 | 71 |
100 | Sabre Global, Inc. 4.000%—04/15/2025 | 91 |
300 | Shift4 Payments, Inc. 0.500%—08/01/2027 | 236 |
200 | Stride, Inc. 1.125%—09/01/2027 | 237 |
200 | Tetra Tech, Inc. 2.250%—08/15/20281 | 195 |
1,303 | ||
Construction & Engineering—1.8% | ||
200 | Fluor Corp. 1.125%—08/15/20291 | 193 |
Convertible Bonds—Continued | ||
Principal Amount | Value | |
Construction & Engineering—Continued | ||
$200 | Granite Construction, Inc. 2.750%—11/01/2024 | $263 |
456 | ||
Diversified REITs—3.5% | ||
100 | GEO Corrections Holdings, Inc. 6.500%—02/23/20261 | 121 |
100 | Uniti Group, Inc. 7.500%—12/01/20271 | 87 |
300 | Ventas Realty LP 3.750%—06/01/20261 | 295 |
400 | Welltower OP LLC 2.750%—05/15/20281 | 412 |
915 | ||
Electric Utilities—2.6% | ||
300 | CMS Energy Corp. 3.375%—05/01/20281 | 285 |
100 | NRG Energy, Inc. 2.750%—06/01/2048 | 112 |
200 | Ormat Technologies, Inc. 2.500%—07/15/20271 | 181 |
100 | Southern Co. 3.875%—12/15/20251 | 99 |
677 | ||
Electronic Equipment, Instruments & Components—1.6% | ||
200 | Itron, Inc. 0.000%—03/15/20262 | 170 |
200 | PAR Technology Corp. 1.500%—10/15/2027 | 153 |
100 | Vishay Intertechnology, Inc. 2.250%—09/15/20301 | 92 |
415 | ||
Energy Equipment & Services—1.2% | ||
100 | Array Technologies, Inc. 1.000%—12/01/2028 | 96 |
100 | Enphase Energy, Inc. 0.250%—03/01/2025 | 123 |
⬤
9
Harbor Convertible Securities FundPORTFOLIO OF INVESTMENTS—Continued
Principal Amounts, Value and Cost in Thousands
Convertible Bonds—Continued | ||
Principal Amount | Value | |
Energy Equipment & Services—Continued | ||
$200 | Sunnova Energy International, Inc. 2.625%—02/15/20281 | $98 |
317 | ||
Entertainment—1.8% | ||
500 | DraftKings Holdings, Inc. 0.000%—03/15/20282 | 376 |
100 | Live Nation Entertainment, Inc. 3.125%—01/15/20291 | 101 |
477 | ||
Financial Services—5.5% | ||
500 | Coinbase Global, Inc. 0.500%—06/01/2026 | 381 |
300 | EZCORP, Inc. 3.750%—12/15/20291 | 287 |
200 | New Mountain Finance Corp. 7.500%—10/15/20251 | 201 |
300 | SoFi Technologies, Inc. 0.000%—10/15/20261,2 | 227 |
500 | Upstart Holdings, Inc. 0.250%—08/15/2026 | 318 |
1,414 | ||
Food Products—0.7% | ||
200 | Post Holdings, Inc. 2.500%—08/15/20271 | 191 |
Health Care Providers & Services—6.6% | ||
200 | Alphatec Holdings, Inc. 0.750%—08/01/2026 | 171 |
300 | CONMED Corp. 2.250%—06/15/2027 | 281 |
Exact Sciences Corp. | ||
300 | 0.375%—03/15/2027 | 262 |
400 | 0.375%—03/01/2028 | 333 |
595 | ||
300 | Haemonetics Corp. 0.000%—03/01/20262 | 259 |
200 | Integer Holdings Corp. 2.125%—02/15/20281 | 220 |
100 | Lantheus Holdings, Inc. 2.625%—12/15/20271 | 111 |
100 | Teladoc Health, Inc. 1.250%—06/01/2027 | 78 |
1,715 | ||
Hotels, Restaurants & Leisure—1.8% | ||
200 | Cheesecake Factory, Inc. 0.375%—06/15/2026 | 167 |
100 | Cracker Barrel Old Country Store, Inc. 0.625%—06/15/2026 | 83 |
300 | Shake Shack, Inc. 0.000%—03/01/20282 | 221 |
471 | ||
Internet & Catalog Retail—11.1% | ||
500 | Airbnb, Inc. 0.000%—03/15/20262 | 433 |
100 | Booking Holdings, Inc. 0.750%—05/01/2025 | 153 |
Convertible Bonds—Continued | ||
Principal Amount | Value | |
Internet & Catalog Retail—Continued | ||
Okta, Inc. | ||
$300 | 0.125%—09/01/2025 | $269 |
300 | 0.375%—06/15/2026 | 259 |
528 | ||
100 | Opendoor Technologies, Inc. 0.250%—08/15/20261 | 65 |
300 | Palo Alto Networks, Inc. 0.375%—06/01/2025 | 734 |
300 | Snap, Inc. 0.000%—05/01/20272 | 225 |
Wayfair, Inc. | ||
400 | 1.000%—08/15/2026 | 302 |
200 | 3.500%—11/15/20281 | 233 |
535 | ||
200 | Zillow Group, Inc. 0.750%—09/01/2024 | 207 |
2,880 | ||
Leisure Products—5.0% | ||
Carnival Corp. | ||
100 | 5.750%—10/01/2024 | 130 |
200 | 5.750%—12/01/20271 | 238 |
368 | ||
200 | Liberty TripAdvisor Holdings, Inc. 0.500%—06/30/20511 | 159 |
NCL Corp. Ltd. | ||
200 | 1.125%—02/15/2027 | 156 |
300 | 2.500%—02/15/2027 | 241 |
397 | ||
200 | Royal Caribbean Cruises Ltd. 6.000%—08/15/20251 | 366 |
1,290 | ||
Machinery—1.5% | ||
200 | Axon Enterprise, Inc. 0.500%—12/15/20271 | 216 |
200 | John Bean Technologies Corp. 0.250%—05/15/2026 | 179 |
395 | ||
Media—3.9% | ||
DISH Network Corp. | ||
600 | 0.000%—12/15/20252 | 369 |
100 | 3.375%—08/15/2026 | 52 |
421 | ||
100 | Liberty Broadband Corp. 3.125%—03/31/20531 | 100 |
Liberty Media Corp. | ||
100 | 2.375%—09/30/20531 | 97 |
200 | 2.750%—12/01/20491 | 185 |
282 | ||
200 | Liberty Media Corp.-Liberty Formula One 2.250%—08/15/20271 | 201 |
1,004 |
⬤
10
Harbor Convertible Securities FundPORTFOLIO OF INVESTMENTS—Continued
Principal Amounts, Value and Cost in Thousands
Convertible Bonds—Continued | ||
Principal Amount | Value | |
Metals & Mining—2.0% | ||
$100 | ATI, Inc. 3.500%—06/15/2025 | $248 |
100 | U.S. Steel Corp. 5.000%—11/01/2026 | 256 |
504 | ||
Oil, Gas & Consumable Fuels—3.1% | ||
300 | Helix Energy Solutions Group, Inc. 6.750%—02/15/2026 | 470 |
100 | Northern Oil & Gas, Inc. 3.625%—04/15/20291 | 118 |
200 | Oil States International, Inc. 4.750%—04/01/2026 | 210 |
798 | ||
Passenger Airlines—1.4% | ||
100 | American Airlines Group, Inc. 6.500%—07/01/2025 | 102 |
400 | JetBlue Airways Corp. 0.500%—04/01/2026 | 249 |
351 | ||
Personal Care Products—0.6% | ||
200 | Beauty Health Co. 1.250%—10/01/20261 | 151 |
Pharmaceuticals—2.9% | ||
100 | Collegium Pharmaceutical, Inc. 2.875%—02/15/20291 | 86 |
400 | Dexcom, Inc. 0.375%—05/15/20281 | 354 |
300 | MannKind Corp. 2.500%—03/01/2026 | 323 |
763 | ||
Real Estate Management & Development—0.9% | ||
300 | Redfin Corp. 0.000%—10/15/20252 | 244 |
Semiconductors & Semiconductor Equipment—2.8% | ||
200 | Microchip Technology, Inc. 0.125%—11/15/2024 | 203 |
ON Semiconductor Corp. | ||
100 | 0.000%—05/01/20272 | 131 |
300 | 0.500%—03/01/20291 | 264 |
395 | ||
Wolfspeed, Inc. | ||
100 | 0.250%—02/15/2028 | 62 |
100 | 1.875%—12/01/20291 | 60 |
122 | ||
720 | ||
Software—18.7% | ||
300 | Akamai Technologies, Inc. 0.375%—09/01/2027 | 306 |
Bentley Systems, Inc. | ||
300 | 0.125%—01/15/2026 | 286 |
100 | 0.375%—07/01/2027 | 85 |
371 |
Convertible Bonds—Continued | ||
Principal Amount | Value | |
Software—Continued | ||
$100 | Bill.com Holdings, Inc. 0.000%—12/01/20252 | $95 |
400 | Ceridian HCM Holding, Inc. 0.250%—03/15/2026 | 350 |
200 | Cloudflare, Inc. 0.000%—08/15/20262 | 168 |
100 | DigitalOcean Holdings, Inc. 0.000%—12/01/20262 | 75 |
100 | Dropbox, Inc. 0.000%—03/01/20262 | 94 |
300 | Envestnet, Inc. 0.750%—08/15/2025 | 274 |
400 | Fastly, Inc. 0.000%—03/15/20262 | 339 |
300 | Guidewire Software, Inc. 1.250%—03/15/2025 | 302 |
400 | MicroStrategy, Inc. 0.000%—02/15/20272 | 291 |
200 | MongoDB, Inc. 0.250%—01/15/2026 | 341 |
300 | Nutanix, Inc. 0.250%—10/01/2027 | 270 |
500 | Pegasystems, Inc. 0.750%—03/01/2025 | 460 |
500 | Porch Group, Inc. 0.750%—09/15/20261 | 70 |
100 | Progress Software Corp. 1.000%—04/15/2026 | 102 |
Rapid7, Inc. | ||
100 | 0.250%—03/15/2027 | 85 |
100 | 2.250%—05/01/2025 | 103 |
188 | ||
Splunk, Inc. | ||
300 | 1.125%—09/15/2025 | 323 |
100 | 1.125%—06/15/2027 | 95 |
418 | ||
100 | Unity Software, Inc. 0.000%—11/15/20262 | 79 |
100 | Verint Systems, Inc. 0.250%—04/15/2026 | 85 |
200 | Workiva, Inc. 1.250%—08/15/20281 | 182 |
4,860 | ||
Specialty Retail—1.0% | ||
300 | Greenbrier Cos., Inc. 2.875%—04/15/2028 | 261 |
Total Convertible Bonds (Cost $25,254) | 23,646 |
Convertible Preferred Stocks—7.3% | ||
Shares | ||
Banks—2.7% | ||
100 | Bank of America Corp.—7.250% | 105 |
550 | Wells Fargo & Co.—7.500% | 581 |
686 |
⬤
11
Harbor Convertible Securities FundPORTFOLIO OF INVESTMENTS—Continued
Principal Amounts, Value and Cost in Thousands
Convertible Preferred Stocks—Continued | ||
Shares | Value | |
Diversified REITs—1.1% | ||
12,400 | RLJ Lodging Trust—1.950% | $293 |
Electric Utilities—1.2% | ||
8,200 | NextEra Energy, Inc.—6.926% | 308 |
Machinery—1.0% | ||
1,300 | Chart Industries, Inc.—6.750% | 64 |
1,900 | RBC Bearings, Inc.—5.000% | 200 |
264 | ||
Oil, Gas & Consumable Fuels—1.3% | ||
7,200 | El Paso Energy Capital Trust I—4.750% | 330 |
Total Convertible Preferred Stocks (Cost $2,078) | 1,881 | |
TOTAL INVESTMENTS—98.4% (Cost $27,332) | 25,527 | |
CASH AND OTHER ASSETS, LESS LIABILITIES—1.6% | 423 | |
TOTAL NET ASSETS—100.0% | $25,950 |
FAIR VALUE MEASUREMENTS
As of October 31, 2023, the investments in Convertible Preferred Stocks (as disclosed in the preceding Portfolio of Investments) were classified as Level 1 and all other investments were classified as Level 2.
For more information on valuation inputs and their aggregation into the levels identified above, please refer to the Fair Value Measurements and Disclosures in Note 2 of the accompanying Notes to Financial Statements.
1
Securities purchased in a transaction exempt from registration under Rule 144A of the Securities Act of 1933. These securities may be resold in transactions exempt from registration, normally to qualified institutional buyers. The Fund has no right to demand registration of these securities. As of October 31, 2023, the aggregate value of these securities was $6,923 or 27% of net assets.
2
Zero coupon bond
The accompanying notes are an integral part of the Financial Statements.
⬤
12
Harbor Core Bond FundMANAGER’S COMMENTARY (Unaudited)
SUBADVISOR
Income Research + Management
Management’s Discussion of
Fund Performance
Fund Performance
MARKET REVIEW
During the reporting period there was a lot of market volatility. We saw the collapse of Silicon Valley Bank kick off a mini-banking crisis in March, effectively halting new bond issuance. In the following quarters, we saw increased uncertainty regarding the federal debt ceiling and even more volatility following Fitch’s downgrade of the United States’ credit rating. Amid all of these, we saw persistent pressures from stubbornly high inflation. All this market volatility and uncertainty led to muted positive absolute performance for the portfolio.
PERFORMANCE
Harbor Core Bond Fund returned 0.63% (Retirement Class) and 0.55% (Institutional Class) in the year ended October 31, 2023, outperforming the Bloomberg U.S. Aggregate Bond Index (the “Index”) which returned 0.36% during the same period.
On an absolute basis, the portfolio’s allocation to spread product detracted the most to the one-year return. Within securitized, the portfolio’s exposure to non-corporates, Agency residential mortgage-backed securities and residential mortgage-backed securities (“RMBS”), detracted the most from relative performance. Within corporates, security selection within the Financials, Industrials and Utilities all detracted from relative performance. On the other hand, the Fund’s underweight to Treasuries and overweight to Financials relative to the benchmark, as well as its security selection in the asset-backed securities (“ABS”), commercial mortgage-backed securities (“CMBS”), and Industrials sectors, drove strong positive returns. Holdings that dragged down performance in the Fund included a New York State municipal bond and an Agency RMBS pool, while the top performers were Canadian Pacific Kansas City, Warner Brothers and Oracle Corporation.
Compared to the Index, the Fund holds an approximately 26.5% underweight to Government securities and an overweight to spread sectors, with an approximately 1.4% Credit overweight and an approximately 12.8% Securitized overweight at the end of the reporting period. Within credit, the Fund holds an overweight to Communication, Insurance and Finance Companies. The Fund has an underweight to Consumer and does not have any exposure to Credit non-Corporate securities.
Over the last year, we have grown more cautious on the markets, given increased risks paired with tighter spreads, especially in the long end. We increased the Fund’s Treasury allocation while decreasing the Fund’s credit, securitized and municipal exposure. U.S. Treasury exposure increased due to rotating out of high-quality spread products at attractive levels amid a tight credit market. Within credit, we’ve taken advantage of trimming positions when attractive opportunities arise paired with a cautious risk posture. We’ve trimmed exposure within industrials, specifically Capital Goods, Consumer, and Other Industrials while increasing exposure in Financials, specifically high-quality banking names. Within securitized, we decreased the Fund’s exposure by trimming RMBS, CMBS and Agency CMBS. While lowering overall ABS exposure, we took advantage of attractive opportunities to add high quality ideas in dealer floorplan and credit card deals. Municipal exposure was trimmed, driven by the reduction in exposure to general obligation bonds.
The overall theme at IR+M is to take advantage of higher spreads and yields to add incremental risk to the portfolio. Overall, our investment strategy centers around several core principles: bottom-up security selection, a value orientation, appropriate diversification, and risk control. We do not maintain an outlook on rates and did not change our view as a result of events
⬤
13
Harbor Core Bond FundMANAGER’S COMMENTARY—Continued
CHANGE IN A $10,000 INVESTMENT
For the period 06/01/2018 through 10/31/2023
The graph compares a $10,000 investment in the Institutional Class shares of the Fund with the performance of the Bloomberg U.S. Aggregate Bond Index. The Fund’s performance assumes the reinvestment of all dividend and capital gain distributions.
TOTAL RETURNS | |||
For the periods ended 10/31/2023 | |||
Annualized | |||
1 Year | 5 Years | Life of Fund | |
Harbor Core Bond Fund | |||
Retirement Class1 | 0.63% | 0.17% | 0.03% |
Institutional Class1 | 0.55 | 0.09 | -0.05 |
Comparative Index | |||
Bloomberg U.S. Aggregate Bond Index1 | 0.36% | -0.06% | -0.22% |
As stated in the Fund’s prospectus dated March 1, 2023, the expense ratios were 0.26% (Net) and 0.36% (Gross) (Retirement Class) and 0.34% (Net) and 0.44% (Gross) (Institutional Class). The net expense ratios reflect an expense limitation agreement (excluding interest expense, if any) effective through 02/29/2024. The expense ratios in the prospectus may differ from the actual expense ratios for the period disclosed within this report. The expense ratios shown in the prospectus are adjusted to reflect changes, if any, in contractual arrangements that occurred prior to the date of the prospectus (or supplement thereto, if applicable).
The Bloomberg U.S. Aggregate Bond Index is an unmanaged index of investment-grade fixed-rate debt issues with maturities of at least one year. This unmanaged index does not reflect fees and expenses and is not available for direct investment.
Performance data shown represents past performance and is no guarantee of future results. Past performance is net of management fees and expenses and reflects reinvested dividends and distributions. Past performance reflects the beneficial effect of any expense waivers or reimbursements, without which returns would have been lower. Investment returns and principal value will fluctuate and when redeemed may be worth more or less than their original cost. Returns for periods less than one year are not annualized. Current performance may be higher or lower and is available through the most recent month end at harborcapital.com or by calling 800-422-1050.
that took place over the reporting period. We remain committed to our disciplined, bottom-up approach while keeping our portfolios duration-neutral to their respective benchmarks and actively managing portfolio risks.
OUTLOOK & STRATEGY
Entering the fourth quarter, rising net interest costs combined with recent spending increases and tax cuts have weakened the U.S. fiscal position. This combination of tight monetary policy and loose fiscal policy could have varying impacts across different sectors of the economy, which creates the potential for dispersion in risk assets. Despite concerns about fundamental data, corporate yields held up well during the quarter and fixed income assets in general are enjoying a strong demand boosted by yields that remain historically high; the usual seasonal influx of new bond issuance in September was well absorbed by market participants.
We pride ourselves on being bottom-up security selectors. We remain methodical in adding any additional risk at a time when the market could turn in either direction. We believe that the securities that do make it in portfolios are fundamentally sound to withstand market weakness but are also attractively priced should spreads tighten.
1 The “Life of Fund” return as shown reflects the period 06/01/2018 (commencement of operations) through 10/31/2023.
This report contains the current opinions of Income Research + Management as of the date of this report and should not be considered as investment advice or a recommendation of any particular security, strategy or investment product. Such opinions are subject to change without notice and securities described herein may no longer be included in, or may at any time be removed from, the Fund’s portfolio. This report is distributed for informational purposes only. Information contained herein has been obtained from sources believed reliable, but not guaranteed.
There is no guarantee that the investment objective of the Fund will be achieved. Fixed income investments are affected by interest rate changes and the creditworthiness of the issues held by the Fund. As interest rates rise, the values of fixed income securities held by the Fund are likely to decrease and reduce the value of the Fund’s portfolio. There may be a greater risk that the Fund could lose money due to prepayment and extension risks because the Fund invests heavily at times in mortgage-related and/or asset backed securities. For information on the different share classes and the risks associated with an investment in the Fund, please refer to the current prospectus.
⬤
14
Harbor Core Bond FundPORTFOLIO OF INVESTMENTS—October 31, 2023
INVESTMENT ALLOCATION (% of investments) - Unaudited
PORTFOLIO OF INVESTMENTS
Principal Amounts, Value and Cost in Thousands
Asset-Backed Securities—13.9% | ||
Principal Amount | Value | |
$385 | Aligned Data Centers Issuer LLC Series 2021-1A Cl. A2 1.937%—08/15/20461 | $336 |
514 | American Tower Trust I 5.490%—03/15/20281 | 505 |
410 | AMSR Trust Series 2021-SFR3 Cl. A 1.476%—10/17/20381 | 356 |
366 | BA Credit Card Trust Series 2022-A2 Cl. A2 5.000%—04/15/2028 | 362 |
136 | CF Hippolyta Issuer LLC Series 2020-1 Cl. A1 1.690%—07/15/20601 | 123 |
314 | CIFC Funding Ltd. Series 2018-3A Cl. A 6.757% (3 Month USD Term SOFR + 1.362%) 07/18/20311,2 | 313 |
167 | DB Master Finance LLC Series 2021-1A Cl. A2I 2.045%—11/20/20511 | 147 |
291 | Discover Card Execution Note Trust Series 2022-A4 Cl. A 5.030%—10/15/2027 | 288 |
479 | Domino’s Pizza Master Issuer LLC Series 2021-1A Cl. A2I 2.662%—04/25/20511 | 401 |
FirstKey Homes Trust | ||
357 | Series 2020-SFR2 Cl. A 1.266%—10/19/20371 | 324 |
371 | Series 2021-SFR1 Cl. A 1.538%—08/17/20381 | 325 |
649 | ||
250 | Ford Credit Auto Owner Trust Series 2020-1 Cl. A 2.040%—08/15/20311 | 237 |
288 | GM Financial Consumer Automobile Receivables Trust Series 2022-3 Cl. A4 3.710%—12/16/2027 | 275 |
Asset-Backed Securities—Continued | ||
Principal Amount | Value | |
Home Partners of America Trust | ||
$250 | Series 2020-2 Cl. A 1.532%—01/17/20411 | $206 |
538 | Series 2022-1 Cl. A 3.930%—04/17/20391 | 500 |
706 | ||
362 | Mercedes-Benz Auto Receivables Trust Series 2022-1 Cl. A4 5.250%—02/15/2029 | 358 |
Navient Private Education Refi Loan Trust | ||
117 | Series 2021-A Cl. A 0.840%—05/15/20691 | 100 |
260 | Series 2021-BA Cl. A 0.940%—07/15/20691 | 221 |
321 | ||
322 | NextGear Floorplan Master Owner Trust Series 2023-1A Cl. A2 5.740%—03/15/20281 | 321 |
447 | Palmer Square CLO Ltd. Series 2013-2A Cl. A1A3 6.664% (3 Month USD Term SOFR + 1.262%) 10/17/20311,2 | 444 |
320 | Palmer Square Loan Funding Ltd. Series 2022-2A Cl. A1 6.664% (3 Month USD Term SOFR + 1.270%) 10/15/20301,2 | 319 |
PFS Financing Corp. | ||
232 | Series 2022-D Cl. A 4.270%—08/15/20271 | 225 |
522 | Series 2023-A Cl. A 5.800%—03/15/20281 | 521 |
746 | ||
Progress Residential Trust | ||
439 | Series 2019-SFR3 Cl. A 2.271%—09/17/20361 | 424 |
412 | Series 2019-SFR4 Cl. A 2.687%—10/17/20361 | 399 |
823 | ||
202 | Sabey Data Center Issuer LLC Series 2020-1 Cl. A2 3.812%—04/20/20451 | 192 |
⬤
15
Harbor Core Bond FundPORTFOLIO OF INVESTMENTS—Continued
Principal Amounts, Value and Cost in Thousands
Asset-Backed Securities—Continued | ||
Principal Amount | Value | |
$520 | SBA Small Business Investment Cos. Series 2023-10A Cl. 1 5.168%—03/10/2033 | $506 |
SBA Tower Trust | ||
705 | 2.593%—10/15/20561 | 527 |
230 | 6.599%—01/15/20281 | 230 |
757 | ||
185 | Stack Infrastructure Issuer LLC Series 2019-2A Cl. A2 3.080%—10/25/20441 | 178 |
192 | Store Master Funding I-VII Series 2018-1A Cl. A1 3.960%—10/20/20481 | 187 |
163 | Store Master Funding I-VII & XIV Series 2019-1 Cl. A1 2.820%—11/20/20491 | 146 |
614 | Taco Bell Funding LLC Series 2021-1A Cl. A2II 2.294%—08/25/20511 | 498 |
U.S. Small Business Administration | ||
64 | Series 2012-20C Cl. 1 2.510%—03/01/2032 | 58 |
101 | Series 2017-20H Cl. 1 2.750%—08/01/2037 | 88 |
180 | Series 2014-20K Cl. 1 2.800%—11/01/2034 | 162 |
180 | Series 2015-20H Cl. 1 2.820%—08/01/2035 | 160 |
145 | Series 2017-20J Cl. 1 2.850%—10/01/2037 | 126 |
175 | Series 2018-20B Cl. 1 3.220%—02/01/2038 | 155 |
278 | Series 2018-20G Cl. 1 3.540%—07/01/2038 | 248 |
396 | Series 2022-25E Cl. 1 3.940%—05/01/2047 | 350 |
296 | Series 2023-25B Cl. 1 4.610%—02/01/2048 | 275 |
371 | Series 2022-25L Cl. 1 4.710%—12/01/2047 | 346 |
360 | Series 2023-25A Cl. 1 4.910%—01/01/2048 | 338 |
510 | Series 2023-25C Cl. 1 4.930%—03/01/2048 | 481 |
350 | Series 2022-25K Cl. 1 5.130%—11/01/2047 | 333 |
525 | Series 2023-25I CL. 1 5.410%—09/01/2048 | 505 |
3,625 | ||
251 | Vantage Data Centers LLC Series 2020-2A Cl. A2 1.992%—09/15/20451 | 210 |
Wendy’s Funding LLC | ||
199 | Series 2021-1A Cl. A2I 2.370%—06/15/20511 | 162 |
370 | Series 2019-1A Cl. A2I 3.783%—06/15/20491 | 344 |
506 | ||
Total Asset-Backed Securities (Cost $15,728) | 14,835 |
Collateralized Mortgage Obligations—5.9% | ||
Principal Amount | Value | |
$387 | Benchmark Mortgage Trust Series 2021-B26 Cl. A3 2.391%—06/15/2054 | $317 |
BX Commercial Mortgage Trust | ||
403 | Series 2021-VOLT Cl. A 6.149% (1 Month USD Term SOFR + 0.814%) 09/15/20361,2 | 391 |
347 | Series 2019-XL Cl. A 6.369% (1 Month USD Term SOFR + 1.034%) 10/15/20361,2 | 345 |
736 | ||
COMM Mortgage Trust | ||
387 | Series 2016-COR1 Cl. A3 2.826%—10/10/2049 | 352 |
216 | Series 2014-CR21 Cl. A3 3.528%—12/10/2047 | 210 |
434 | Series 2014-UBS3 Cl. A3 3.546%—06/10/2047 | 429 |
991 | ||
318 | Flagstar Mortgage Trust Series 2021-8INV Cl. A3 2.500%—09/25/20511,2 | 234 |
233 | FRESB Mortgage Trust Series 2019-SB63 Cl. A5H 2.550% (30 day USD SOFR Average) 02/25/20392 | 230 |
550 | GS Mortgage Securities Trust Series 2016-GS3 Cl. A4 2.850%—10/10/2049 | 498 |
102 | GS Mortgage-Backed Securities Corp. Trust Series 2020-PJ4 Cl. A2 3.000%—01/25/20511,2 | 82 |
160 | GS Mortgage-Backed Securities Trust Series 2020-INV1 Cl. A14 2.924%—10/25/20501,2 | 123 |
120 | MetLife Securitization Trust Series 2020-INV1 Cl. A2A 2.500%—05/25/20501,2 | 92 |
Morgan Stanley Bank of America Merrill Lynch Trust | ||
260 | Series 2015-C25 Cl. A4 3.372%—10/15/2048 | 247 |
600 | Series 2015-C26 Cl. A5 3.531%—10/15/2048 | 567 |
814 | ||
PSMC Trust | ||
454 | Series 2021-2 Cl. A3 2.500%—05/25/20511,2 | 381 |
51 | Series 2020-2 Cl. A2 3.000%—05/25/20501,2 | 43 |
424 | ||
Seasoned Credit Risk Transfer Trust | ||
139 | Series 2020-2 Cl. MA 2.000%—11/25/2059 | 120 |
234 | Series 2021-1 Cl. MA 2.000%—09/25/2060 | 197 |
262 | Series 2021-3 Cl. MA 2.000%—03/25/2061 | 219 |
165 | Series 2020-3 Cl. MA 2.000%—05/25/2060 | 142 |
153 | Series 2020-1 Cl. MA 2.500%—08/25/2059 | 135 |
⬤
16
Harbor Core Bond FundPORTFOLIO OF INVESTMENTS—Continued
Principal Amounts, Value and Cost in Thousands
Collateralized Mortgage Obligations—Continued | ||
Principal Amount | Value | |
$54 | Series 2017-2 Cl. MA 3.000%—08/25/2056 | $48 |
108 | Series 2018-1 Cl. MA 3.000%—05/25/2057 | 97 |
169 | Series 2019-2 Cl. MA 3.500%—08/25/2058 | 154 |
1,112 | ||
334 | Tricon American Homes Series 2020-SFR1 Cl. A 1.499%—07/17/20381 | 297 |
380 | Wells Fargo Commercial Mortgage Trust Series 2015-C31 Cl. A4 3.695%—11/15/2048 | 360 |
Total Collateralized Mortgage Obligations (Cost $6,955) | 6,310 |
Corporate Bonds & Notes—29.6% | ||
AEROSPACE & DEFENSE—0.6% | ||
361 | BAE Systems PLC 3.400%—04/15/20301 | 309 |
235 | Lockheed Martin Corp. 4.700%—05/15/2046 | 194 |
148 | Northrop Grumman Corp. 5.250%—05/01/2050 | 129 |
632 | ||
AUTO COMPONENTS—0.4% | ||
490 | Aptiv PLC/Aptiv Corp. 3.250%—03/01/2032 | 393 |
AUTOMOBILES—0.8% | ||
General Motors Financial Co., Inc. | ||
454 | 2.400%—10/15/2028 | 375 |
240 | 4.300%—04/06/2029 | 213 |
588 | ||
345 | Volkswagen Group of America Finance LLC 4.600%—06/08/20291 | 317 |
905 | ||
BANKS—4.9% | ||
Bank of America Corp. | ||
440 | 2.572%—10/20/20323 | 330 |
132 | 3.311%—04/22/20423 | 88 |
418 | ||
505 | Bank of America Corp. MTN 4.948%—07/22/20283 | 480 |
310 | Barclays PLC 5.304%—08/09/20263 | 303 |
513 | Capital One Financial Corp. 5.468%—02/01/20293 | 477 |
Citigroup, Inc. | ||
171 | 3.400%—05/01/2026 | 161 |
239 | 3.520%—10/27/20283 | 215 |
279 | 4.412%—03/31/20313 | 247 |
623 | ||
448 | Credit Suisse AG 7.950%—01/09/2025 | 454 |
212 | HSBC Holdings PLC 7.390%—11/03/20283 | 217 |
Corporate Bonds & Notes—Continued | ||
Principal Amount | Value | |
BANKS—Continued | ||
JPMorgan Chase & Co. | ||
$586 | 4.203%—07/23/20293 | $538 |
250 | 4.493%—03/24/20313 | 226 |
764 | ||
500 | Lloyds Banking Group PLC 2.438%—02/05/20263 | 474 |
310 | Mitsubishi UFJ Financial Group, Inc. 5.017%—07/20/20283 | 297 |
418 | National Securities Clearing Corp. 5.000%—05/30/20281 | 406 |
340 | Toronto-Dominion Bank 1.950%—01/12/2027 | 300 |
5,213 | ||
BIOTECHNOLOGY—0.3% | ||
310 | AbbVie, Inc. 4.500%—05/14/2035 | 271 |
BUILDING PRODUCTS—0.1% | ||
193 | Carlisle Cos., Inc. 2.750%—03/01/2030 | 156 |
CAPITAL MARKETS—2.6% | ||
300 | Bank of New York Mellon Corp. MTN 5.802%—10/25/20283 | 296 |
Blackstone Holdings Finance Co. LLC | ||
173 | 2.800%—09/30/20501 | 89 |
356 | 3.500%—09/10/20491 | 213 |
302 | ||
301 | Goldman Sachs Group, Inc. 3.800%—03/15/2030 | 260 |
54 | KKR Group Finance Co. II LLC 5.500%—02/01/20431 | 45 |
170 | KKR Group Finance Co. III LLC 5.125%—06/01/20441 | 135 |
493 | Macquarie Group Ltd. 1.340%—01/12/20271,3 | 440 |
Morgan Stanley MTN | ||
665 | 3.125%—07/27/2026 | 615 |
295 | 3.622%—04/01/20313 | 250 |
865 | ||
500 | UBS Group AG 4.125%—04/15/20261 | 474 |
2,817 | ||
COMMERCIAL SERVICES & SUPPLIES—0.4% | ||
300 | Moody’s Corp. 3.250%—05/20/2050 | 182 |
230 | Waste Management, Inc. 4.150%—04/15/2032 | 203 |
385 | ||
DIVERSIFIED REITS—0.9% | ||
533 | Federal Realty OP LP 1.250%—02/15/2026 | 479 |
540 | Healthpeak OP LLC 3.250%—07/15/2026 | 505 |
984 |
⬤
17
Harbor Core Bond FundPORTFOLIO OF INVESTMENTS—Continued
Principal Amounts, Value and Cost in Thousands
Corporate Bonds & Notes—Continued | ||
Principal Amount | Value | |
DIVERSIFIED TELECOMMUNICATION SERVICES—1.1% | ||
AT&T, Inc. | ||
$240 | 2.300%—06/01/2027 | $212 |
504 | 6.852% (3 Month USD Term SOFR + 1.442%) 06/12/20242 | 507 |
719 | ||
Verizon Communications, Inc. | ||
435 | 2.355%—03/15/2032 | 325 |
162 | 4.500%—08/10/2033 | 141 |
466 | ||
1,185 | ||
ELECTRIC UTILITIES—2.6% | ||
275 | Berkshire Hathaway Energy Co. 6.125%—04/01/2036 | 268 |
526 | DTE Energy Co. 4.875%—06/01/2028 | 501 |
330 | Duke Energy Florida LLC 3.800%—07/15/2028 | 307 |
200 | Eversource Energy 2.900%—10/01/2024 | 194 |
Exelon Corp. | ||
62 | 4.700%—04/15/2050 | 47 |
243 | 5.100%—06/15/2045 | 197 |
244 | ||
630 | Florida Power & Light Co. 2.450%—02/03/2032 | 492 |
158 | Northern States Power Co. 4.500%—06/01/2052 | 121 |
Southern Co. | ||
230 | 3.250%—07/01/2026 | 215 |
308 | 4.250%—07/01/2036 | 250 |
465 | ||
230 | Xcel Energy, Inc. 3.400%—06/01/2030 | 195 |
2,787 | ||
ENTERTAINMENT—0.2% | ||
300 | Warnermedia Holdings, Inc. 5.141%—03/15/2052 | 212 |
EQUITY REAL ESTATE INVESTMENT TRUSTS (REITS)—0.3% | ||
Alexandria Real Estate Equities, Inc. | ||
290 | 2.000%—05/18/2032 | 204 |
115 | 4.750%—04/15/2035 | 98 |
302 | ||
FINANCIAL SERVICES—0.9% | ||
322 | American Express Co. 5.043%—05/01/20343 | 289 |
198 | Berkshire Hathaway Finance Corp. 3.850%—03/15/2052 | 138 |
PNC Financial Services Group, Inc. | ||
410 | 5.068% (3 Month USD Term SOFR + 1.933%) 01/24/20342 | 361 |
163 | 6.875%—10/20/20343 | 163 |
524 | ||
951 |
Corporate Bonds & Notes—Continued | ||
Principal Amount | Value | |
HEALTH CARE PROVIDERS & SERVICES—2.0% | ||
$320 | Cigna Group 3.400%—03/01/2027 | $297 |
232 | CommonSpirit Health 4.187%—10/01/2049 | 162 |
CVS Pass-Through Trust | ||
166 | 5.773%—01/10/20331 | 161 |
76 | 5.880%—01/10/2028 | 74 |
485 | 8.353%—07/10/20311 | 502 |
737 | ||
425 | Elevance Health, Inc. 4.750%—02/15/2033 | 386 |
590 | PeaceHealth Obligated Group 1.375%—11/15/2025 | 538 |
2,120 | ||
INSURANCE—2.3% | ||
419 | AIA Group Ltd. 3.600%—04/09/20291 | 377 |
325 | Equitable Financial Life Global Funding 1.400%—07/07/20251 | 300 |
150 | Five Corners Funding Trust 4.419%—11/15/20231 | 150 |
420 | GA Global Funding Trust 3.850%—04/11/20251 | 404 |
530 | Liberty Mutual Group, Inc. 4.569%—02/01/20291 | 492 |
276 | Lincoln National Corp. 3.400%—01/15/2031 | 216 |
Massachusetts Mutual Life Insurance Co. | ||
180 | 3.375%—04/15/20501 | 110 |
160 | 5.672%—12/01/20521 | 140 |
250 | ||
340 | Metropolitan Life Global Funding I 3.300%—03/21/20291 | 297 |
2,486 | ||
INTERNET & CATALOG RETAIL—0.2% | ||
371 | Amazon.com, Inc. 4.100%—04/13/2062 | 267 |
MEDIA—1.0% | ||
498 | Charter Communications Operating LLC/Charter Communications Operating Capital 6.384%—10/23/2035 | 450 |
360 | Comcast Corp. 2.350%—01/15/2027 | 326 |
400 | Cox Communications, Inc. 1.800%—10/01/20301 | 298 |
1,074 | ||
MULTI-UTILITIES—0.7% | ||
PG&E Wildfire Recovery Funding LLC | ||
97 | 3.594%—06/01/2032 | 91 |
310 | 4.022%—06/01/2033 | 290 |
183 | 4.722%—06/01/2039 | 165 |
546 | ||
257 | Rogers Communications, Inc. 5.450%—10/01/2043 | 211 |
757 |
⬤
18
Harbor Core Bond FundPORTFOLIO OF INVESTMENTS—Continued
Principal Amounts, Value and Cost in Thousands
Corporate Bonds & Notes—Continued | ||
Principal Amount | Value | |
OIL, GAS & CONSUMABLE FUELS—1.8% | ||
$560 | Columbia Pipelines Operating Co. LLC 6.036%—11/15/20331 | $532 |
310 | Dominion Energy, Inc. 5.250%—08/01/2033 | 283 |
505 | Energy Transfer LP 3.900%—07/15/2026 | 477 |
474 | Occidental Petroleum Corp. 0.000%—10/10/20364 | 245 |
192 | Schlumberger Holdings Corp. 3.900%—05/17/20281 | 177 |
230 | Southern Co. Gas Capital Corp. 1.750%—01/15/2031 | 170 |
1,884 | ||
PASSENGER AIRLINES—1.3% | ||
249 | Air Canada Pass-Through Trust 3.600%—09/15/20281 | 230 |
319 | Delta Air Lines Pass-Through Trust 3.625%—01/30/2029 | 294 |
United Airlines Pass-Through Trust | ||
202 | 3.100%—01/07/2030 | 180 |
784 | 4.000%—10/11/2027 | 738 |
918 | ||
1,442 | ||
PROFESSIONAL SERVICES—0.2% | ||
295 | Verisk Analytics, Inc. 3.625%—05/15/2050 | 189 |
ROAD & RAIL—0.5% | ||
190 | Canadian Pacific Railway Co. 6.125%—09/15/2115 | 171 |
155 | Norfolk Southern Corp. 4.837%—10/01/2041 | 128 |
191 | Ryder System, Inc. MTN 5.250%—06/01/2028 | 184 |
483 | ||
SEMICONDUCTORS & SEMICONDUCTOR EQUIPMENT—0.9% | ||
272 | Broadcom, Inc. 4.110%—09/15/2028 | 250 |
NXP BV/NXP Funding LLC/NXP USA, Inc. | ||
265 | 2.700%—05/01/2025 | 252 |
450 | 3.150%—05/01/2027 | 407 |
659 | ||
909 | ||
SOFTWARE—0.5% | ||
Oracle Corp. | ||
340 | 1.650%—03/25/2026 | 308 |
343 | 3.950%—03/25/2051 | 223 |
531 | ||
SPECIALTY RETAIL—0.9% | ||
Lowe’s Cos., Inc. | ||
77 | 3.700%—04/15/2046 | 51 |
199 | 5.000%—04/15/2040 | 166 |
117 | 5.625%—04/15/2053 | 101 |
318 |
Corporate Bonds & Notes—Continued | ||
Principal Amount | Value | |
SPECIALTY RETAIL—Continued | ||
$637 | Penske Truck Leasing Co. LP/PTL Finance Corp. 5.550%—05/01/20281 | $614 |
932 | ||
TRADING COMPANIES & DISTRIBUTORS—0.6% | ||
201 | AerCap Ireland Capital DAC/AerCap Global Aviation Trust 3.000%—10/29/2028 | 169 |
510 | Ferguson Finance PLC 3.250%—06/02/20301 | 425 |
594 | ||
WATER UTILITIES—0.2% | ||
238 | Aquarion Co. 4.000%—08/15/20241 | 233 |
WIRELESS TELECOMMUNICATION SERVICES—0.4% | ||
511 | T-Mobile USA, Inc. 5.050%—07/15/2033 | 462 |
Total Corporate Bonds & Notes (Cost $34,737) | 31,556 |
Mortgage Pass-Through—24.9% | ||
Federal Home Loan Mortgage Corp. | ||
219 | 2.000%—06/01/2050 | 167 |
2,578 | 2.500%—03/01/2051-05/01/2052 | 2,007 |
2,227 | 3.000%—01/01/2033-08/01/2050 | 1,859 |
942 | 3.500%—05/01/2042 | 828 |
684 | 4.000%—12/01/2037-02/01/2046 | 632 |
127 | 4.500%—03/01/2049 | 116 |
831 | 5.000%—10/01/2052-05/01/2053 | 771 |
135 | 5.048% (12 Month USD IBOR Consumer Cash Fallback + 1.597%) 06/01/20472 | 135 |
751 | 5.500%—12/01/2052-07/01/2053 | 717 |
7,232 | ||
Federal National Mortgage Association | ||
2,742 | 2.000%—08/01/2050-04/01/2051 | 2,045 |
4,562 | 2.500%—03/01/2035-04/01/2052 | 3,635 |
3,372 | 3.000%—02/01/2035-08/01/2050 | 2,865 |
1,351 | 3.500%—05/01/2037-06/01/2050 | 1,200 |
3,350 | 4.000%—03/01/2038-09/01/2049 | 2,988 |
2,406 | 4.500%—05/01/2046-08/01/2052 | 2,194 |
1,729 | 5.000%—07/01/2050-08/01/2053 | 1,609 |
1,013 | 5.500%—11/01/2052 | 963 |
137 | 6.917% (Fed 12 Month Treasury Average Constant Maturity Treasury + 2.292%) 12/01/20362 | 137 |
17,636 | ||
Government National Mortgage Association | ||
806 | 2.500%—01/20/2051 | 645 |
369 | 4.000%—09/20/2041-09/15/2046 | 336 |
801 | 4.500%—01/15/2042-08/20/2047 | 740 |
1,721 | ||
Total Mortgage Pass-Through (Cost $30,012) | 26,589 |
⬤
19
Harbor Core Bond FundPORTFOLIO OF INVESTMENTS—Continued
Principal Amounts, Value and Cost in Thousands
Municipal Bonds—1.8% | ||
Principal Amount | Value | |
$145 | Metropolitan Water Reclamation District of Greater Chicago 5.720%—12/01/2038 | $142 |
83 | Michigan State University 4.165%—08/15/2122 | 56 |
440 | New York City Transitional Finance Authority Future Tax Secured Revenue 3.950%—08/01/2032 | 384 |
555 | New York State Urban Development Corp. 5.770%—03/15/2039 | 549 |
530 | Sales Tax Securitization Corp. 4.637%—01/01/2040 | 465 |
300 | State of California 7.500%—04/01/2034 | 336 |
Total Municipal Bonds (Cost $2,194) | 1,932 |
U.S. Government Obligations—22.2% | ||
U.S. Treasury Bonds | ||
1,103 | 2.250%—02/15/2052 | 635 |
635 | 2.375%—02/15/2042 | 420 |
4,591 | 3.000%—08/15/2052 | 3,150 |
U.S. Government Obligations—Continued | ||
Principal Amount | Value | |
$6,303 | 3.375%—08/15/2042 | $4,879 |
1,542 | 3.625%—05/15/2053 | 1,202 |
3,262 | 3.875%—05/15/2043 | 2,710 |
230 | 4.125%—08/15/2053 | 197 |
13,193 | ||
579 | U.S. Treasury Inflation-Indexed Notes 0.125%—01/15/2030 | 500 |
U.S. Treasury Notes | ||
754 | 3.375%—05/15/2033 | 667 |
779 | 3.500%—01/31/2028 | 739 |
2,933 | 3.625%—05/31/2028 | 2,789 |
903 | 3.875%—08/15/2033 | 831 |
5,139 | 4.375%—08/31/2028 | 5,041 |
10,067 | ||
Total U.S. Government Obligations (Cost $26,281) | 23,760 | |
TOTAL INVESTMENTS—98.3% (Cost $115,907) | 104,982 | |
CASH AND OTHER ASSETS, LESS LIABILITIES—1.7% | 1,785 | |
TOTAL NET ASSETS—100.0% | $106,767 |
FAIR VALUE MEASUREMENTS
All investments as of October 31, 2023 (as disclosed in the preceding Portfolio of Investments) were classified as Level 2.
For more information on valuation inputs and their aggregation into the levels identified above, please refer to the Fair Value Measurements and Disclosures in Note 2 of the accompanying Notes to Financial Statements.
1
Securities purchased in a transaction exempt from registration under Rule 144A of the Securities Act of 1933. These securities may be resold in transactions exempt from registration, normally to qualified institutional buyers. The Fund has no right to demand registration of these securities. As of October 31, 2023, the aggregate value of these securities was $19,279 or 18% of net assets.
2
Variable or floating rate security; the stated rate represents the rate in effect as of October 31, 2023. The variable rate for such securities may be based on the indicated reference rate and spread or on an underlying asset or pool of assets rather than a reference rate and may be determined by current interest rates, prepayments or other financial indicators.
3
Rate changes from fixed to variable rate at a specified date prior to its final maturity. Stated rate is fixed rate currently in effect and stated date is the final maturity date.
4
Zero coupon bond
CLO
Collateralized Loan Obligation
MTN
Medium Term Loan
The accompanying notes are an integral part of the Financial Statements.
⬤
20
Harbor Core Plus FundMANAGER’S COMMENTARY (Unaudited)
SUBADVISOR
Income Research + Management
Management’s Discussion of
Fund Performance
Fund Performance
MARKET REVIEW
During the reporting period there was a lot of market volatility. We saw the collapse of Silicon Valley Bank kick off a mini-banking crisis in March, effectively halting new bond issuance. In the following quarters, we saw increased uncertainty regarding the federal debt ceiling and even more volatility following Fitch’s downgrade of the United States’ credit rating. Amid all of these, we saw persistent pressures from stubbornly high inflation. All this market volatility and uncertainty led to muted positive absolute performance for the portfolio.
PERFORMANCE
Harbor Core Plus Fund returned 1.43% (Retirement Class), 1.35% (Institutional Class), and 1.10% (Administrative Class) in the year ended October 31, 2023, outperforming the Bloomberg U.S. Aggregate Bond Index (the “Index”) which returned 0.36% during the same period.
On an absolute basis, the portfolio’s allocation to spread product detracted the most to the one-year return. Within securitized, the portfolio’s overweight to commercial mortgage-backed securities (“CMBS”) and asset-backed securities (“ABS”) relative to the benchmark were the largest detractor of relative performance. On the other hand, the Fund’s underweight to Treasuries and overweight to Financials and Industrials were the largest contributors from an asset allocation standpoint. Security selection in the ABS, residential mortgage-backed securities (“RMBS”), Financials, and Industrials sectors, drove strong positive returns. Holdings that dragged down performance in the Fund included Occidental Petroleum and a Morgan Stanley ABS bond, while the top performers were Ares Management Corp and Aircastle Ltd.
Compared to the Index, the Fund holds an approximately 23.7% underweight to Government securities and an overweight to spread sectors, with an approximately 4% Credit overweight and an approximately 19.8% Securitized overweight at the end of the reporting period. Within credit, the Fund holds an overweight to Electric, Industrial and Finance Companies. The Fund has an underweight to Insurance and Banks. It does not have any exposure to Credit non-Corporate securities.
Over the last year, we have grown more cautious on the markets, given increased risks paired with tighter spreads, especially in the long end. We increased the Fund’s Treasury allocation and decreased the Fund’s credit, securitized and taxable municipal allocation. U.S. Treasury exposure increased due to rotating out of high-quality spread products at attractive levels amid a tight credit market. Over the past year we have built a meaningful position in Small Business Administration loans (which are guaranteed by the full faith and credit of the U.S. Treasury), which we find an attractive opportunity given spread levels. Within credit, we’ve trimmed exposure to consumer, real estate investment trusts, capital goods and technology. We continue to favor corporate issuers who can weather inflation and/or pass rising costs along to the consumer. Within securitized, we trimmed our collateralized loan obligations and other ABS exposure while increasing exposure to autos, dealer floorplan and rate reduction deals. We’ve also added to our RMBS and Agency RMBS exposure, specifically through the addition of agency fixed-rate pass-throughs.
The overall theme at IR+M is to take advantage of higher spreads and yields to add incremental risk to the portfolio. Overall, our investment strategy centers around several core principles: bottom-up security selection, a value orientation, appropriate diversification, and risk control. We do not maintain an outlook on rates and did not change our view as a result of events
⬤
21
Harbor Core Plus FundMANAGER’S COMMENTARY—Continued
CHANGE IN A $10,000 INVESTMENT
For the period 11/01/2013 through 10/31/2023
The graph compares a $10,000 investment in the Institutional Class shares of the Fund with the performance of the Bloomberg U.S. Aggregate Bond Index. The Fund’s performance assumes the reinvestment of all dividend and capital gain distributions.
TOTAL RETURNS | |||
For the periods ended 10/31/2023 | |||
Annualized | |||
1 Year | 5 Years | 10 Years | |
Harbor Core Plus Fund | |||
Retirement Class1 | 1.43% | 0.40% | 1.24% |
Institutional Class | 1.35 | 0.28 | 1.19 |
Administrative Class | 1.10 | 0.03 | 0.93 |
Comparative Index | |||
Bloomberg U.S. Aggregate Bond Index | 0.36% | -0.06% | 0.88% |
As stated in the Fund’s prospectus dated March 1, 2023, the expense ratios were 0.30% (Net) and 0.31% (Gross) (Retirement Class); 0.38% (Net) and 0.39% (Gross) (Institutional Class); and 0.63% (Net) and 0.64% (Gross) (Administrative Class). The net expense ratios reflect an expense limitation agreement (excluding interest expense, if any) effective through 02/29/2024. The expense ratios in the prospectus may differ from the actual expense ratios for the period disclosed within this report. The expense ratios shown in the prospectus are adjusted to reflect changes, if any, in contractual arrangements that occurred prior to the date of the prospectus (or supplement thereto, if applicable).
The Bloomberg U.S. Aggregate Bond Index is an unmanaged index of investment-grade fixed-rate debt issues with maturities of at least one year. This unmanaged index does not reflect fees and expenses and is not available for direct investment.
Performance data shown represents past performance and is no guarantee of future results. Past performance is net of management fees and expenses and reflects reinvested dividends and distributions. Past performance reflects the beneficial effect of any expense waivers or reimbursements, without which returns would have been lower. Investment returns and principal value will fluctuate and when redeemed may be worth more or less than their original cost. Returns for periods less than one year are not annualized. Current performance may be higher or lower and is available through the most recent month end at harborcapital.com or by calling 800-422-1050.
that took place over the reporting period. We remain committed to our disciplined, bottom-up approach while keeping our portfolios duration-neutral to their respective benchmarks and actively managing portfolio risks.
OUTLOOK & STRATEGY
Entering the fourth quarter, rising net interest costs combined with recent spending increases and tax cuts have weakened the U.S. fiscal position. This combination of tight monetary policy and loose fiscal policy could have varying impacts across different sectors of the economy, which creates the potential for dispersion in risk assets. Despite concerns about fundamental data, corporate yields held in well during the quarter and fixed income assets in general are enjoying a strong demand boosted by yields that remain historically high; the usual seasonal influx of new bond issuance in September was well absorbed by market participants.
We pride ourselves on being bottom-up security selectors. We remain methodical in adding any additional risk at a time when the market could turn in either direction. We believe that the securities that do make it in portfolios are fundamentally sound to withstand market weakness but are also attractively priced should spreads tighten.
1 Retirement Class shares commenced operations on June 1, 2018. The performance attributed to the Retirement Class shares prior to that date is that of the Institutional Class shares. Performance prior to June 1, 2018 has not been adjusted to reflect the lower expenses of Retirement Class shares. During this period, Retirement Class shares would have had returns similar to, but potentially higher than, Institutional Class shares due to the fact that Retirement Class shares represent interests in the same portfolio as Institutional Class shares but are subject to lower expenses.
This report contains the current opinions of Income Research + Management as of the date of this report and should not be considered as investment advice or a recommendation of any particular security, strategy or investment product. Such opinions are subject to change without notice and securities described herein may no longer be included in, or may at any time be removed from, the Fund’s portfolio. This report is distributed for informational purposes only. Information contained herein has been obtained from sources believed reliable, but not guaranteed.
There is no guarantee that the investment objective of the Fund will be achieved. Fixed income investments are affected by interest rate changes and the creditworthiness of the issues held by the Fund. As interest rates rise, the values of fixed income securities held by the Fund are likely to decrease and reduce the value of the Fund’s portfolio. There may be a greater risk that the Fund could lose money due to prepayment and extension risks because the Fund invests heavily at times in mortgage-related and/or asset backed securities. For information on the different share classes and the risks associated with an investment in the Fund, please refer to the current prospectus.
⬤
22
Harbor Core Plus FundPORTFOLIO OF INVESTMENTS—October 31, 2023
INVESTMENT ALLOCATION (% of investments) - Unaudited
PORTFOLIO OF INVESTMENTS
Principal Amounts, Value and Cost in Thousands
Asset-Backed Securities—14.3% | ||
Principal Amount | Value | |
$3,125 | Air Canada Pass-Through Trust Series 2017-1 Series 2017-1AA Cl. PTT 3.300%—07/15/20311 | $2,708 |
3,582 | Aligned Data Centers Issuer LLC Series 2021-1A Cl. A2 1.937%—08/15/20461 | 3,125 |
1,347 | American Airlines Pass-Through Trust Series 2015-2 Cl. AA 3.600%—03/22/2029 | 1,230 |
3,029 | American Tower Trust I 5.490%—03/15/20281 | 2,978 |
3,291 | AMMC CLO XII Ltd. Series 2013-12A Cl. AR2 6.577% (3 Month USD Term SOFR + 1.212%) 11/10/20301,2 | 3,284 |
3,231 | Apidos CLO XXVI Ltd. Series 2017-26A Cl. A1AR 6.557% (3 Month USD Term SOFR + 1.162%) 07/18/20291,2 | 3,230 |
4,000 | ARES LII CLO Ltd. Series 2019-52A Cl. A1R 6.724% (3 Month USD Term SOFR + 1.312%) 04/22/20311,2 | 3,981 |
3,815 | Birch Grove CLO Ltd. Series 19A Cl. AR 6.801% (3 Month USD Term SOFR + 1.392%) 06/15/20311,2 | 3,804 |
1,734 | CF Hippolyta Issuer LLC Series 2021-1A Cl. A1 1.530%—03/15/20611 | 1,520 |
4,439 | Citizens Auto Receivable Trust Series 2023-2 Cl. A3 5.830%—02/15/20281 | 4,417 |
2,245 | DB Master Finance LLC Series 2021-1A Cl. A2II 2.493%—11/20/20511 | 1,880 |
1,316 | Domino’s Pizza Master Issuer LLC Series 2021-1A Cl. A2I 2.662%—04/25/20511 | 1,102 |
7,310 | FirstKey Homes Trust Series 2021-SFR1 Cl. A 1.538%—08/17/20381 | 6,421 |
3,941 | GMF Floorplan Owner Revolving Trust Series 2023-2 Cl. A 5.340%—06/15/20301 | 3,872 |
Asset-Backed Securities—Continued | ||
Principal Amount | Value | |
$3,138 | GSAA Home Equity Trust Series 2006-20 Cl. 1A2 5.799% (1 Month USD Term SOFR + 0.474%) 12/25/20462 | $870 |
3,195 | Home Partners of America Trust Series 2022-1 Cl. A 3.930%—04/17/20391 | 2,969 |
550 | IXIS Real Estate Capital Trust Series 2005-HE1 Cl. M4 6.489% (1 Month USD Term SOFR + 1.164%) 06/25/20352 | 550 |
3,764 | JetBlue Pass-Through Trust Series 2020-1 Cl. A 4.000%—05/15/2034 | 3,334 |
645 | JP Morgan Mortgage Acquisition Trust3 Series 2007-HE1 Cl. AF3 4.285%—05/25/2035 | 408 |
Morgan Stanley ABS Capital I, Inc. Trust | ||
1,507 | Series 2007-HE1 Cl. A2C 5.589% (1 Month USD Term SOFR + 0.264%) 11/25/20362 | 837 |
2,851 | Series 2007-HE6 Cl. A3 5.619% (1 Month USD Term SOFR + 0.294%) 05/25/20372 | 2,343 |
3,180 | ||
2,641 | Palmer Square Loan Funding Ltd. Series 2021-4A Cl. A1 6.456% (3 Month USD Term SOFR + 1.062%) 10/15/20291,2 | 2,626 |
2,863 | PFS Financing Corp. Series 2023-B Cl. A 5.270%—05/15/20281 | 2,813 |
Planet Fitness Master Issuer LLC | ||
4,311 | Series 2022-1A Cl. A2I 3.251%—12/05/20511 | 3,851 |
2,223 | Series 2018-1A Cl. A2II 4.666%—09/05/20481 | 2,134 |
5,985 | ||
3,034 | SBA Tower Trust 6.599%—01/15/20281 | 3,033 |
⬤
23
Harbor Core Plus FundPORTFOLIO OF INVESTMENTS—Continued
Principal Amounts, Value and Cost in Thousands
Asset-Backed Securities—Continued | ||
Principal Amount | Value | |
ServiceMaster Funding LLC | ||
$3,093 | Series 2021-1 Cl. A2I 2.865%—07/30/20511 | $2,505 |
355 | Series 2020-1 Cl. A2II 3.337%—01/30/20511 | 271 |
2,776 | ||
3,413 | Servpro Master Issuer, LLC Series 2021-1A Cl. A2 2.394%—04/25/20511 | 2,796 |
2,301 | Specialty Underwriting & Residential Finance Trust Series 2006-BC4 Cl. A2B 5.659% (1 Month USD Term SOFR + 0.334%) 09/25/20372 | 729 |
7,000 | Stack Infrastructure Issuer LLC Series 2021-1A Cl. A2 1.877%—03/26/20461 | 6,223 |
6,878 | Taco Bell Funding LLC Series 2021-1A Cl. A2I 1.946%—08/25/20511 | 5,945 |
5,177 | Tricon Residential Trust Series 2023-SFR1 Cl. A 5.100%—07/17/20401 | 4,925 |
5,000 | Trinity Rail Leasing LLC Series 2020-2A Cl. A2 2.560%—11/19/20501 | 4,264 |
U.S. Small Business Administration | ||
5,062 | Series 2023-25E Cl. 1 4.620%—05/01/2048 | 4,680 |
4,942 | Series 2023-25F Cl. 1 4.930%—06/01/2048 | 4,633 |
2,961 | Series 2023-25H Cl. 1 5.150%—08/01/2048 | 2,817 |
5,068 | Series 2023-25G Cl. 1 5.180%—07/01/2048 | 4,825 |
567 | Series 2009-20A Cl. 1 5.720%—01/01/2029 | 550 |
4,716 | Series 2023-25J Cl. 1 5.820%—10/01/2048 | 4,650 |
845 | Series 2008-20H Cl. 1 6.020%—08/01/2028 | 819 |
22,974 | ||
1,117 | United Airlines Pass-Through Trust Series 2019-2 Cl. AA 2.700%—11/01/2033 | 909 |
6,810 | VB-S1 Issuer LLC Series 2022-1A Cl. C2I 3.156%—02/15/20521 | 5,926 |
6,843 | Wendy’s Funding LLC Series 2021-1A Cl. A2I 2.370%—06/15/20511 | 5,561 |
Total Asset-Backed Securities (Cost $142,927) | 132,348 |
Collateralized Mortgage Obligations—10.2% | ||
3,415 | Angel Oak Mortgage Trust Series 2022-1 Cl. A1 2.881%—12/25/20661,3 | 2,876 |
5,441 | Argent Securities Trust Series 2006-W4 Cl. A2C 5.759% (1 Month USD Term SOFR + 0.434%) 05/25/20362 | 1,308 |
Collateralized Mortgage Obligations—Continued | ||
Principal Amount | Value | |
$553 | Argent Securities, Inc. Asset-Backed Pass-Through Certificates Series 2004-W11 Cl. M3 6.564% (1 Month USD Term SOFR + 1.239%) 11/25/20342 | $539 |
6,656 | Banc of America Alternative Loan Trust Series 2006-7 Cl. A3 5.913%—10/25/20362 | 1,878 |
401 | Banc of America Funding Trust Series 2007-C Cl. 7A5 6.054% (1 Month USD Term SOFR + 0.714%) 05/20/20472 | 358 |
4,948 | Bank5 Series 2023-5YR2 Cl. A3 6.656%—07/15/20562 | 4,999 |
BCAP LLC Trust | ||
139 | Series 2011-RR5 Cl. 12A1 4.526%—03/26/20371,3 | 134 |
1,226 | Series 2011-RR4 Cl. 8A1 5.250%—02/26/20361,2 | 502 |
2,786 | Series 2007-AA2 Cl. 12A1 5.859% (1 Month USD Term SOFR + 0.534%) 05/25/20472 | 2,595 |
3,231 | ||
Bear Stearns ARM Trust | ||
8 | Series 2000-2 Cl. A1 2.815%—11/25/20302 | 8 |
128 | Series 2004-1 Cl. 12A5 4.179%—04/25/20342 | 115 |
123 | ||
BX Commercial Mortgage Trust | ||
1,429 | Series 2021-VOLT Cl. A 6.149% (1 Month USD Term SOFR + 0.814%) 09/15/20361,2 | 1,386 |
3,337 | Series 2022-LP2 Cl. A 6.347% (1 Month USD Term SOFR + 1.013%) 02/15/20391,2 | 3,243 |
4,629 | ||
3,390 | Citigroup Commercial Mortgage Trust Series 2015-GC27 Cl. A5 3.137%—02/10/2048 | 3,267 |
6,500 | COMM Mortgage Trust Series 2014-LC17 Cl. A5 3.917%—10/10/2047 | 6,340 |
Countrywide Alternative Loan Trust | ||
1,203 | Series 2005-20CB Cl. 2A5 5.500%—07/25/2035 | 782 |
1,611 | Series 2006-6CB Cl. 1A2 5.500% (1 Month USD Term SOFR + 0.514%) 05/25/20362 | 1,243 |
2,854 | Series 2008-1R Cl. 2A3 6.000%—08/25/2037 | 1,407 |
3,432 | ||
163 | Countrywide Asset-Backed Certificates Trust Series 2006-2 Cl. M1 6.039% (1 Month USD Term SOFR + 0.714%) 06/25/20362 | 162 |
186 | CSFB Mortgage-Backed Pass-Through Certificates Series 2005-10 Cl. 9A1 6.000%—11/25/2035 | 128 |
⬤
24
Harbor Core Plus FundPORTFOLIO OF INVESTMENTS—Continued
Principal Amounts, Value and Cost in Thousands
Collateralized Mortgage Obligations—Continued | ||
Principal Amount | Value | |
$2,502 | Deutsche Alt-A Securities INC Series 2007-AR2 Cl. A1 5.739% (1 Month USD Term SOFR + 0.414%) 03/25/20372 | $2,193 |
779 | DSLA Mortgage Loan Trust Series 2006-AR1 Cl. 1A1A 5.720% (Fed 12 Month Treasury Average Constant Maturity Treasury + 0.920%) 03/19/20462 | 616 |
8,000 | First Franklin Mortgage Loan Trust Series 2006-FF14 Cl. A6 5.749% (1 Month USD Term SOFR + 0.424%) 10/25/20362 | 6,164 |
113 | First Horizon Asset Securities, Inc. Series 2005-AR6 Cl. 4A1 4.147%—02/25/20362 | 104 |
— | FNT Mortgage-Backed Pass-Through Trust Series 2001-3 Cl. 1A1 6.750%—08/21/2031 | — |
3,888 | GS Mortgage Securities Trust Series 2015-GC30 Cl. A3 3.119%—05/10/2050 | 3,730 |
2,942 | GSMPS Mortgage Loan Trust Series 2006-RP2 Cl. 1AF1 5.839% (1 Month USD Term SOFR + 0.514%) 04/25/20361,2 | 2,398 |
178 | GSR Mortgage Loan Trust Series 2005-AR3 Cl. 3A1 5.364%—05/25/20352 | 129 |
2 | IndyMac ARM Trust Series 2001-H2 Cl. A2 5.555%—01/25/20322 | 2 |
547 | IndyMac INDX Mortgage Loan Trust Series 2005-AR31 Cl. 1A1 3.479%—01/25/20362 | 473 |
JP Morgan Mortgage Trust | ||
880 | Series 2006-A6 Cl. 1A4L 4.172%—10/25/20362 | 634 |
27 | Series 2006-S1 Cl. 3A1 5.500%—04/25/2036 | 26 |
4,674 | Series 2023-4 Cl. 1A4A 5.500%—11/25/20531,2 | 4,488 |
5,148 | ||
423 | Merrill Lynch Alternative Note Asset Trust Series 2007-F1 Cl. 2A6 6.000%—03/25/2037 | 152 |
1,954 | MetLife Securitization Trust Series 2018-1A Cl. A 3.750%—03/25/20571,2 | 1,785 |
2,180 | Morgan Stanley Bank of America Merrill Lynch Trust Series 2014-C14 Cl. A5 4.064%—02/15/2047 | 2,170 |
1,985 | OBX Trust Series 2018-1 Cl. A2 6.089% (1 Month USD Term SOFR + 0.764%) 06/25/20571,2 | 1,884 |
17,461 | Residential Asset Securitization Trust Series 2007-A8 Cl. 2A1 6.250%—08/25/2037 | 4,028 |
134 | RFMSI Trust Series 2007-SA1 Cl. 2A2 4.704%—02/25/20372 | 90 |
Collateralized Mortgage Obligations—Continued | ||
Principal Amount | Value | |
$1,303 | Saxon Asset Securities Trust Series 2006-3 Cl. A3 5.779% (1 Month USD Term SOFR + 0.454%) 10/25/20462 | $1,257 |
Sequoia Mortgage Trust | ||
4,628 | Series 2023-1 Cl. A4 5.000%—01/25/20531,2 | 4,458 |
4,204 | Series 2023-2 Cl. A4 5.000%—03/25/20531,2 | 3,979 |
8,437 | ||
222 | STARM Mortgage Loan Trust Series 2007-S1 Cl. 1A 5.388%—01/25/20372 | 159 |
50 | Structured Adjustable Rate Mortgage Loan Trust Series 2005-7 Cl. 3A1 5.493%—04/25/20352 | 49 |
4,307 | Towd Point Mortgage Trust Series 2019-1 Cl. A1 3.750%—03/25/20581,2 | 3,999 |
2,317 | Tricon American Homes Series 2020-SFR1 Cl. A 1.499%—07/17/20381 | 2,058 |
WaMu Mortgage Pass-Through Certificates Trust | ||
1,443 | Series 2006-AR8 Cl. 1A4 4.410%—08/25/20462 | 1,243 |
142 | Series 2005-AR6 Cl. 2A1A 5.899% (1 Month USD Term SOFR + 0.574%) 04/25/20452 | 134 |
68 | Series 2005-AR13 Cl. A1A1 6.019% (1 Month USD Term SOFR + 0.694%) 10/25/20452 | 63 |
1,440 | ||
7,117 | Wells Fargo Commercial Mortgage Trust Series 2018-C48 Cl. A5 4.302%—01/15/2052 | 6,479 |
6,450 | WFRBS Commercial Mortgage Trust Series 2014-C23 Cl. A5 3.917%—10/15/2057 | 6,241 |
Total Collateralized Mortgage Obligations (Cost $110,628) | 94,455 |
Corporate Bonds & Notes—30.9% | ||
AEROSPACE & DEFENSE—0.4% | ||
5,391 | BAE Systems PLC 1.900%—02/15/20311 | 4,071 |
AUTO COMPONENTS—0.6% | ||
5,000 | Aptiv PLC/Aptiv Corp. 4.150%—05/01/2052 | 3,295 |
1,980 | ZF North America Capital, Inc. 6.875%—04/14/20281 | 1,921 |
5,216 | ||
AUTOMOBILES—0.9% | ||
Ford Motor Credit Co. LLC | ||
4,000 | 3.375%—11/13/2025 | 3,737 |
1,900 | 6.950%—03/06/2026 | 1,905 |
5,642 | ||
2,352 | General Motors Financial Co., Inc. 5.800%—06/23/2028 | 2,280 |
7,922 |
⬤
25
Harbor Core Plus FundPORTFOLIO OF INVESTMENTS—Continued
Principal Amounts, Value and Cost in Thousands
Corporate Bonds & Notes—Continued | ||
Principal Amount | Value | |
BANKS—2.2% | ||
Citigroup, Inc. | ||
$4,700 | 2.572%—06/03/20314 | $3,682 |
4,605 | 3.875%—02/18/20262 | 3,872 |
7,554 | ||
2,850 | HSBC Holdings PLC 7.390%—11/03/20284 | 2,925 |
4,000 | JPMorgan Chase & Co. 1.470%—09/22/20274 | 3,486 |
4,110 | National Securities Clearing Corp. 5.000%—05/30/20281 | 3,992 |
3,001 | Truist Financial Corp. MTN 6.123%—10/28/20334 | 2,780 |
20,737 | ||
BUILDING PRODUCTS—0.2% | ||
2,412 | Carlisle Cos., Inc. 2.200%—03/01/2032 | 1,767 |
CAPITAL MARKETS—4.3% | ||
4,500 | Ares Finance Co. IV LLC 3.650%—02/01/20521 | 2,629 |
5,800 | BlackRock TCP Capital Corp. 2.850%—02/09/2026 | 5,205 |
6,000 | Blackstone Holdings Finance Co. LLC 3.200%—01/30/20521 | 3,388 |
5,700 | Blue Owl Credit Income Corp. 4.700%—02/08/2027 | 5,175 |
6,096 | Brookfield Capital Finance LLC 6.087%—06/14/2033 | 5,755 |
5,800 | Golub Capital BDC, Inc. 2.500%—08/24/2026 | 5,077 |
2,816 | Hercules Capital, Inc. 2.625%—09/16/2026 | 2,454 |
3,010 | KKR Group Finance Co. VII LLC 3.625%—02/25/20501 | 1,802 |
3,000 | KKR Group Finance Co. X LLC 3.250%—12/15/20511 | 1,662 |
1,709 | Oaktree Specialty Lending Corp. 2.700%—01/15/2027 | 1,461 |
5,500 | Sixth Street Specialty Lending, Inc. 2.500%—08/01/2026 | 4,855 |
39,463 | ||
COMMERCIAL SERVICES & SUPPLIES—1.0% | ||
1,838 | Allegion U.S. Holding Co., Inc. 5.411%—07/01/2032 | 1,681 |
4,851 | Element Fleet Management Corp. 6.271%—06/26/20261 | 4,826 |
3,519 | Triton Container International Ltd. 2.050%—04/15/20261 | 3,129 |
9,636 | ||
CONSUMER FINANCE—0.5% | ||
2,451 | FirstCash, Inc. 4.625%—09/01/20281 | 2,152 |
2,856 | Rocket Mortgage LLC/Rocket Mortgage Co.-Issuer, Inc. 2.875%—10/15/20261 | 2,490 |
4,642 |
Corporate Bonds & Notes—Continued | ||
Principal Amount | Value | |
DIVERSIFIED FINANCIAL SERVICES—0.1% | ||
$916 | National Rural Utilities Cooperative Finance Corp. 8.562% (3 Month USD Term SOFR + 3.172%) 04/30/20432 | $898 |
DIVERSIFIED TELECOMMUNICATION SERVICES—0.2% | ||
2,915 | Verizon Communications, Inc. 3.700%—03/22/2061 | 1,779 |
ELECTRIC UTILITIES—1.9% | ||
4,171 | CMS Energy Corp. 3.750%—12/01/20504 | 3,012 |
3,073 | DTE Electric Securitization Funding II LLC 5.969%—03/01/2033 | 3,085 |
Exelon Corp. | ||
3,100 | 4.050%—04/15/2030 | 2,740 |
1,500 | 5.625%—06/15/2035 | 1,396 |
4,136 | ||
Jersey Central Power & Light Co. | ||
900 | 4.300%—01/15/20261 | 865 |
1,600 | 4.700%—04/01/20241 | 1,590 |
2,455 | ||
2,877 | New England Power Co. 5.936%—11/25/20521 | 2,583 |
2,865 | NRG Energy, Inc. 7.000%—03/15/20331 | 2,711 |
17,982 | ||
ENTERTAINMENT—0.1% | ||
2,000 | Warnermedia Holdings, Inc. 5.141%—03/15/2052 | 1,416 |
EQUITY REAL ESTATE INVESTMENT TRUSTS (REITS)—2.8% | ||
1,400 | Agree LP 2.900%—10/01/2030 | 1,116 |
2,100 | Alexandria Real Estate Equities, Inc. 2.750%—12/15/2029 | 1,716 |
4,905 | Boston Properties LP 2.750%—10/01/2026 | 4,339 |
5,922 | Corporate Office Properties LP 2.000%—01/15/2029 | 4,503 |
EPR Properties | ||
1,900 | 4.500%—06/01/2027 | 1,678 |
600 | 4.950%—04/15/2028 | 523 |
2,201 | ||
5,000 | Equinix, Inc. 1.000%—09/15/2025 | 4,555 |
4,500 | GLP Capital LP/GLP Financing II, Inc. 4.000%—01/15/2030 | 3,760 |
4,700 | Spirit Realty LP 3.400%—01/15/2030 | 3,871 |
26,061 | ||
FINANCIAL SERVICES—1.5% | ||
3,249 | Charles Schwab Corp. 5.643%—05/19/20294 | 3,129 |
3,662 | Macquarie Airfinance Holdings Ltd. 8.125%—03/30/20291 | 3,611 |
1,738 | Navient Corp. 5.000%—03/15/2027 | 1,528 |
2,800 | OneMain Finance Corp. 6.875%—03/15/2025 | 2,766 |
⬤
26
Harbor Core Plus FundPORTFOLIO OF INVESTMENTS—Continued
Principal Amounts, Value and Cost in Thousands
Corporate Bonds & Notes—Continued | ||
Principal Amount | Value | |
FINANCIAL SERVICES—Continued | ||
$2,846 | PNC Financial Services Group, Inc. 6.875%—10/20/20344 | $2,845 |
13,879 | ||
HEALTH CARE PROVIDERS & SERVICES—1.5% | ||
CVS Pass-Through Trust | ||
359 | 6.943%—01/10/2030 | 362 |
4,264 | 7.507%—01/10/20321 | 4,343 |
4,705 | ||
4,000 | HCA, Inc. 5.375%—09/01/2026 | 3,913 |
2,400 | IQVIA, Inc. 5.700%—05/15/20281 | 2,307 |
3,347 | Pediatrix Medical Group, Inc. 5.375%—02/15/20301 | 2,891 |
13,816 | ||
INDUSTRIAL CONGLOMERATES—0.8% | ||
4,540 | Ashtead Capital, Inc. 5.550%—05/30/20331 | 4,072 |
3,800 | Textron, Inc. 2.450%—03/15/2031 | 2,965 |
7,037 | ||
INSURANCE—0.8% | ||
4,000 | GA Global Funding Trust 1.950%—09/15/20281 | 3,241 |
1,687 | Global Atlantic Fin Co. 7.950%—06/15/20331 | 1,570 |
3,026 | SBL Holdings, Inc. 5.000%—02/18/20311 | 2,289 |
7,100 | ||
LEISURE PRODUCTS—0.5% | ||
4,637 | Acushnet Co. 7.375%—10/15/20281 | 4,650 |
MEDIA—0.9% | ||
Charter Communications Operating LLC/Charter Communications Operating Capital | ||
4,775 | 5.375%—05/01/2047 | 3,456 |
2,400 | 6.384%—10/23/2035 | 2,170 |
5,626 | ||
2,623 | Paramount Global 4.000%—01/15/2026 | 2,490 |
8,116 | ||
METALS & MINING—0.5% | ||
5,267 | Anglo American Capital PLC 3.875%—03/16/20291 | 4,668 |
OIL, GAS & CONSUMABLE FUELS—1.9% | ||
5,589 | Cheniere Energy Partners LP 5.950%—06/30/20331 | 5,234 |
3,209 | Columbia Pipelines Operating Co. LLC 6.036%—11/15/20331 | 3,049 |
3,145 | Enbridge, Inc. 5.750%—07/15/20804 | 2,625 |
1,094 | Hess Midstream Operations LP 5.500%—10/15/20301 | 994 |
Corporate Bonds & Notes—Continued | ||
Principal Amount | Value | |
OIL, GAS & CONSUMABLE FUELS—Continued | ||
$2,020 | New Fortress Energy, Inc. 6.750%—09/15/20251 | $1,876 |
7,629 | Occidental Petroleum Corp. 0.000%—10/10/20365 | 3,934 |
17,712 | ||
PHARMACEUTICALS—0.4% | ||
1,500 | Takeda Pharmaceutical Co. Ltd. 2.050%—03/31/2030 | 1,186 |
3,000 | Teva Pharmaceutical Finance Netherlands III BV 6.750%—03/01/2028 | 2,871 |
4,057 | ||
PROFESSIONAL SERVICES—0.2% | ||
1,642 | KBR, Inc. 4.750%—09/30/20281 | 1,437 |
ROAD & RAIL—0.7% | ||
3,800 | Norfolk Southern Corp. 4.050%—08/15/2052 | 2,635 |
4,077 | Ryder System, Inc. MTN 5.250%—06/01/2028 | 3,927 |
6,562 | ||
SEMICONDUCTORS & SEMICONDUCTOR EQUIPMENT—1.4% | ||
Broadcom, Inc. | ||
6,904 | 3.137%—11/15/20351 | 4,873 |
4,003 | 3.469%—04/15/20341 | 3,051 |
7,924 | ||
1,230 | KLA Corp. 5.650%—11/01/2034 | 1,186 |
4,600 | NXP BV/NXP Funding LLC/NXP USA, Inc. 3.875%—06/18/2026 | 4,352 |
13,462 | ||
SOFTWARE—0.6% | ||
3,500 | Oracle Corp. 3.600%—04/01/2040 | 2,405 |
3,600 | VMware, Inc. 4.650%—05/15/2027 | 3,449 |
5,854 | ||
SPECIALTY RETAIL—1.1% | ||
2,900 | Group 1 Automotive, Inc. 4.000%—08/15/20281 | 2,499 |
2,956 | Lithia Motors, Inc. 3.875%—06/01/20291 | 2,449 |
2,113 | Lowe’s Cos., Inc. 5.625%—04/15/2053 | 1,827 |
3,612 | Macy’s Retail Holdings LLC 5.875%—03/15/20301 | 3,060 |
9,835 | ||
TRADING COMPANIES & DISTRIBUTORS—2.0% | ||
6,200 | Aircastle Ltd. 2.850%—01/26/20281 | 5,175 |
5,300 | Aviation Capital Group LLC 4.125%—08/01/20251 | 5,051 |
4,800 | Ferguson Finance PLC 4.650%—04/20/20321 | 4,223 |
⬤
27
Harbor Core Plus FundPORTFOLIO OF INVESTMENTS—Continued
Principal Amounts, Value and Cost in Thousands
Corporate Bonds & Notes—Continued | ||
Principal Amount | Value | |
TRADING COMPANIES & DISTRIBUTORS—Continued | ||
$3,875 | LKQ Corp. 5.750%—06/15/2028 | $3,757 |
18,206 | ||
WIRELESS TELECOMMUNICATION SERVICES—0.9% | ||
1,118 | American Tower Corp. 3.650%—03/15/2027 | 1,030 |
4,000 | Crown Castle, Inc. 3.700%—06/15/2026 | 3,762 |
4,000 | T-Mobile USA, Inc. 5.050%—07/15/2033 | 3,616 |
8,408 | ||
Total Corporate Bonds & Notes (Cost $322,386) | 286,389 |
Mortgage Pass-Through—26.8% | ||
Federal Home Loan Mortgage Corp. | ||
29,642 | 2.500%—07/01/2050-05/01/2052 | 22,986 |
19,665 | 3.000%—02/01/2033-01/01/2050 | 16,682 |
208 | 3.500%—01/01/2026-02/01/2035 | 194 |
12,228 | 4.000%—03/01/2025-11/01/2048 | 10,810 |
150 | 4.500%—12/01/2040-09/01/2041 | 138 |
3 | 5.386% (U.S. Treasury Yield Curve Rate T Note 1 Year Constant Maturity Treasury + 2.250%) 08/01/20352 | 3 |
395 | 5.500%—02/01/2038-07/01/2038 | 389 |
1,264 | 6.000%—01/01/2029-05/01/2040 | 1,267 |
52,469 | ||
Federal Home Loan Mortgage Corp. REMIC6 | ||
3,803 | Series 4628 Cl. CI 3.000%—05/15/2035 | 335 |
4,242 | Series 4118 Cl. IO 4.000%—10/15/2042 | 717 |
1,269 | Series 4989 Cl. FA 4.717% (30 day USD SOFR Average + 0.464%) 08/15/20402 | 1,218 |
1,217 | Series 4989 Cl. FB 5.059% (30 day USD SOFR Average + 0.464%) 10/15/20402 | 1,164 |
— | Series 2266 Cl. F 5.885% (30 day USD SOFR Average + 0.564%) 11/15/20302 | — |
3,434 | ||
Federal Home Loan Mortgage Corp. Structured Pass-Through Certificates | ||
9 | Series E3 Cl. A 4.513%—08/15/20322 | 9 |
42 | Series T-63 Cl. 1A1 6.000% (Fed 12 Month Treasury Average Constant Maturity Treasury + 1.200%) 02/25/20452 | 39 |
48 | ||
Federal National Mortgage Association | ||
3,763 | 2.000%—02/01/2051 | 2,789 |
43,653 | 2.500%—04/01/2035-04/01/2052 | 35,144 |
32,002 | 3.000%—11/01/2025-12/01/2050 | 26,528 |
19,925 | 3.500%—12/01/2025-01/01/2051 | 17,085 |
38,780 | 4.000%—02/01/2024-07/01/2051 | 34,642 |
27,361 | 4.500%—03/01/2024-12/01/2050 | 25,012 |
4,068 | 5.000%—10/01/2031-08/01/2053 | 3,807 |
Mortgage Pass-Through—Continued | ||
Principal Amount | Value | |
$9,512 | 5.500%—01/01/2025-09/01/2041 | $9,347 |
190 | 5.739% (U.S. Treasury Yield Curve Rate T Note 1 Year Constant Maturity Treasury + 1.715%) 06/01/20352 | 194 |
14 | 5.835% (U.S. Treasury Yield Curve Rate T Note 1 Year Constant Maturity Treasury + 1.710%) 05/01/20352 | 14 |
242 | 5.943% (U.S. Treasury Yield Curve Rate T Note 1 Year Constant Maturity Treasury + 1.693%) 08/01/20352 | 239 |
3,023 | 6.000%—06/01/2027-06/01/2040 | 3,016 |
54 | 6.026% (Fed 12 Month Treasury Average Constant Maturity Treasury + 1.400%) 10/01/20402 | 53 |
157,870 | ||
Federal National Mortgage Association Interest STRIPS | ||
7,344 | Series 304 Cl. C45 3.000%—12/15/2027 | 281 |
5,248 | Series 407 Cl. 7 5.000%—03/25/2041 | 1,169 |
1,450 | ||
9,443 | Federal National Mortgage Association REMIC6 Series 2017-70 Cl. AS 0.000%—09/25/20572,5 | 412 |
Federal National Mortgage Association REMIC6 | ||
4,727 | Series 2011-98 Cl. ZL 3.500%—10/25/2041 | 4,151 |
2,911 | Series 2016-102 Cl. JI 3.500%—02/25/2046 | 198 |
7,567 | Series 2020-27 Cl. IM 3.500%—05/25/2035 | 726 |
6,761 | Series 2020-44 Cl. AI 4.000%—07/25/2050 | 1,338 |
21 | Series 2006-5 Cl. 3A2 4.855%—05/25/20352 | 21 |
182 | Series 2003-25 Cl. KP 5.000%—04/25/2033 | 174 |
2,569 | Series 2015-30 Cl. EI 5.000%—05/25/2045 | 422 |
1,703 | Series 2016-33 Cl. NI 5.000%—07/25/2034 | 285 |
1,475 | Series 2015-38 Cl. DF 5.378% (30 day USD SOFR Average + 0.424%) 06/25/20552 | 1,427 |
2,090 | Series 2011-59 Cl. YI 6.000%—07/25/2041 | 368 |
9,110 | ||
88 | Federal National Mortgage Association REMIC Trust6 Series 2003-W1 Cl. 1A1 4.798%—12/25/20422 | 82 |
Government National Mortgage Association | ||
11 | 2.625% (U.S. Treasury Yield Curve Rate T Note 1 Year Constant Maturity Treasury + 1.500%) 07/20/20272 | 10 |
28 | 2.750% —10/20/2025-11/20/20292 | 27 |
4 | 3.000% —07/20/2024-10/20/20252 | 4 |
547 | 3.000%—11/15/2049 | 459 |
99 | 3.625% —01/20/2025-02/20/20322 | 98 |
4,071 | 4.000%—09/15/2049-03/15/2050 | 3,705 |
⬤
28
Harbor Core Plus FundPORTFOLIO OF INVESTMENTS—Continued
Principal Amounts, Value and Cost in Thousands
Mortgage Pass-Through—Continued | ||
Principal Amount | Value | |
$1,151 | 4.500%—02/20/2049 | $1,056 |
16,929 | 5.000%—08/15/2033-06/15/2050 | 16,449 |
21,808 | ||
Government National Mortgage Association REMIC6 | ||
3,570 | Series 2010-47 Cl. SK 1.146% (1 Month USD Term SOFR + 6.486%) 07/20/20372 | 147 |
3,411 | Series 2007-41 Cl. SM 1.246% (1 Month USD Term SOFR + 6.586%) 07/20/20372 | 247 |
4,418 | Series 2020-4 Cl. DI 4.000%—03/20/2041 | 656 |
4,361 | Series 2014-2 Class A 5.000%—01/16/2044 | 853 |
589 | Series 2015-180 Cl. CI 5.000%—12/16/2045 | 103 |
701 | Series 2017-163 Cl. IE 5.500%—02/20/2039 | 137 |
328 | Series 2016-136 Cl. IA 6.000%—10/20/2038 | 47 |
2,190 | ||
Total Mortgage Pass-Through (Cost $291,253) | 248,873 |
Municipal Bonds—0.4% | ||
(Cost $3,900) | ||
3,900 | New York State Urban Development Corp. 1.496%—03/15/2027 | 3,434 |
U.S. Government Obligations—16.5% | ||
Principal Amount | Value | |
U.S. Treasury Bonds | ||
$72,236 | 1.750%—08/15/2041 | $42,908 |
31,207 | 2.000%—08/15/2051 | 16,879 |
9,447 | 2.250%—02/15/2052 | 5,440 |
7,730 | 2.375%—02/15/2042 | 5,107 |
11,543 | 3.000%—08/15/2052 | 7,920 |
19,242 | 3.375%—08/15/2042 | 14,894 |
16,561 | 3.625%—05/15/2053 | 12,912 |
14,923 | 3.875%—05/15/2043 | 12,397 |
118,457 | ||
U.S. Treasury Notes | ||
21,459 | 3.375%—05/15/2033 | 18,978 |
4,909 | 3.625%—05/31/2028 | 4,669 |
2,957 | 3.875%—08/15/2033 | 2,722 |
8,232 | 4.375%—08/31/2028 | 8,076 |
34,445 | ||
Total U.S. Government Obligations (Cost $204,999) | 152,902 | |
TOTAL INVESTMENTS—99.1% (Cost $1,076,093) | 918,401 | |
CASH AND OTHER ASSETS, LESS LIABILITIES—0.9% | 8,604 | |
TOTAL NET ASSETS—100.0% | $927,005 |
FAIR VALUE MEASUREMENTS
All investments as of October 31, 2023 (as disclosed in the preceding Portfolio of Investments) were classified as Level 2.
For more information on valuation inputs and their aggregation into the levels identified above, please refer to the Fair Value Measurements and Disclosures in Note 2 of the accompanying Notes to Financial Statements.
1
Securities purchased in a transaction exempt from registration under Rule 144A of the Securities Act of 1933. These securities may be resold in transactions exempt from registration, normally to qualified institutional buyers. The Fund has no right to demand registration of these securities. As of October 31, 2023, the aggregate value of these securities was $247,778 or 27% of net assets.
2
Variable or floating rate security; the stated rate represents the rate in effect as of October 31, 2023. The variable rate for such securities may be based on the indicated reference rate and spread or on an underlying asset or pool of assets rather than a reference rate and may be determined by current interest rates, prepayments or other financial indicators.
3
Step coupon security; the stated rate represents the rate in effect at October 31, 2023.
4
Rate changes from fixed to variable rate at a specified date prior to its final maturity. Stated rate is fixed rate currently in effect and stated date is the final maturity date.
5
Zero coupon bond
6
REMICs are collateralized mortgage obligations which can hold mortgages secured by any type of real property and issue multiple-class securities backed by those mortgages.
CLO
Collateralized Loan Obligation
MTN
Medium Term Loan
The accompanying notes are an integral part of the Financial Statements.
⬤
29
Harbor Disruptive Innovation FundMANAGER’S COMMENTARY (Unaudited)
ADVISER
Harbor Capital Advisors, Inc.
Management’s Discussion of
Fund Performance
Fund Performance
MARKET REVIEW
U.S. Markets started the year facing inflation fears and the Federal Reserve’s (the “Fed”) reaction was the central storyline all year as policy transitioned from highly accommodative to tightened across the globe. The market provided mixed results for U.S. equity markets, with indices initially surpassing the highs of the year before reversing course. The Fed’s policy trajectory was a central focus during the period as investors broadly expected a pause in interest rate hikes that was confirmed in September. Over the course of the year, there was also a growing acceptance of the Fed’s higher-for-longer mantra leading to the swift rise in longer-dated yields. Questions also began to percolate about the health of the consumer and the durability of their spending power given the rise in oil, planned resumption of student loan payments, dramatically higher borrowing costs, and the exhaustion of COVID-era savings. Consequently, cracks began to emerge in the key pillars of the argument supporting a soft-landing which drove a shift in risk tolerances towards quality, shorter duration equities.
PERFORMANCE
Harbor Disruptive Innovation Fund returned 2.06% (Retirement Class), 1.85% (Institutional Class), 1.37% (Administrative Class), and 1.22% (Investor Class) in the year ended October 31, 2023, while the S&P 500 Index (the “Index”) returned 10.14% during the same period.
The Fund lagged the Index during the period and faced notable headwinds from both a stock specific and factor perspective. The Fund’s exposure to less profitable companies than the benchmark holdings proved a meaningful headwind during the year, particularly Health Care companies. Within Health Care, investments within the Biotech segment experienced declines as investor preference shifted away from higher valuation companies and focused more on quality. Shares of Ascendis Pharma sold off during the year as investors reacted negatively to the news that the Food and Drug Administration identified deficiencies in the company’s new drug application for TransCon. Given the market’s prevailing short-term focus and low appetite for increased risk, the stock reacted negatively during the period. In addition, the Fund’s underweight investment in NVIDIA contributed negatively to relative returns as the stock was up over 200% for the year. Relative results were also hindered from performance within the Communication Services sector, notably from a relative underweight to Meta Platforms and Alphabet. Performance within the Consumer Discretionary sector was additive to performance over the year as delivery companies such as DoorDash and Deliveroo as well as the ecommerce company, MercadoLibre, all outperformed the market. From a factor standpoint the Fund’s overweight to companies that are more sensitive to market movements than the overall market (i.e., Beta) contributed positively to performance.
OUTLOOK & STRATEGY
U.S. economic growth likely reaccelerated in the third quarter on the back of strong consumption. While this spending was frontloaded and momentum waned over the period, we believe the strong labor market remains a bedrock for consumers. The labor market’s gradual transition from overheating to full employment remains on track. We see signs of slack emerging at the margin with fewer workers quitting, slowing wage gains, and less demand for temporary help. However, continued monthly job increases and low unemployment claims run counter to any fears of broader weakness. The steady string of good news on inflation is challenging the Fed’s message discipline. We believe that acknowledged progress is lagging actual progress despite the near-term upside risk posed by energy prices.
⬤
30
Harbor Disruptive Innovation FundMANAGER’S COMMENTARY—Continued
CHANGE IN A $50,000 INVESTMENT
For the period 11/01/2013 through 10/31/2023
The graph compares a $50,000 investment in the Institutional Class shares of the Fund with the performance of the S&P 500 Index and the Russell 3000® Growth Index. The Fund’s performance assumes the reinvestment of all dividend and capital gain distributions.
TOTAL RETURNS | |||
For the periods ended 10/31/2023 | |||
Annualized | |||
1 Year | 5 Years | 10 Years | |
Harbor Disruptive Innovation Fund | |||
Retirement Class1 | 2.06% | 4.14% | 7.20% |
Institutional Class | 1.85 | 4.04 | 7.13 |
Administrative Class | 1.37 | 3.74 | 6.84 |
Investor Class | 1.22 | 3.61 | 6.72 |
Comparative Index | |||
S&P 500 Index | 10.14% | 11.01% | 11.18% |
Russell 3000® Growth Index | 17.32 | 13.49 | 13.27 |
As stated in the Fund’s prospectus dated March 1, 2023, the expense ratios were 0.75% (Net) and 0.83% (Gross) (Retirement Class); 0.83% (Net) and 0.91% (Gross) (Institutional Class); 1.08% (Net) and 1.16% (Gross) (Administrative Class) and 1.19% (Net) and 1.27% (Gross) (Investor Class). The net expense ratios reflect an expense limitation agreement (excluding interest expense, if any) effective through 02/29/2024. The expense ratios in the prospectus may differ from the actual expense ratios for the period disclosed within this report. The expense ratios shown in the prospectus are adjusted to reflect changes, if any, in contractual arrangements that occurred prior to the date of the prospectus (or supplement thereto, if applicable).
The S&P 500 Index is an unmanaged index generally representative of the U.S. market for large capitalization equities. This unmanaged index does not reflect fees and expenses and is not available for direct investment.The Russell 3000® Growth Index measures the performance of the broad growth segment of the US equity universe. It includes Russell 3000® Index companies with higher price-to-book ratios and higher forecasted growth values. It is market-capitalization weighted. This unmanaged index does not reflect fees and expenses and is not available for direct investment. The Russell 3000® Growth Index and Russell® are trademarks of Frank Russell Company.
Performance data shown represents past performance and is no guarantee of future results. Past performance is net of management fees and expenses and reflects reinvested dividends and distributions. Past performance reflects the beneficial effect of any expense waivers or reimbursements, without which returns would have been lower. Investment returns and principal value will fluctuate and when redeemed may be worth more or less than their original cost. Returns for periods less than one year are not annualized. Current performance may be higher or lower and is available through the most recent month end at harborcapital.com or by calling 800-422-1050.
1 Retirement Class shares commenced operations on March 1, 2016. The performance attributed to the Retirement Class shares prior to that date is that of the Institutional Class shares. Performance prior to March 1, 2016 has not been adjusted to reflect the lower expenses of Retirement Class shares. During this period, Retirement Class shares would have had returns similar to, but potentially higher than, Institutional Class shares due to the fact that Retirement Class shares represent interests in the same portfolio as Institutional Class shares but are subject to lower expenses.
This report contains the current opinions of Harbor Capital Advisors, Inc. as of the date of this report and should not be considered as investment advice or a recommendation of any particular security, strategy or investment product. Such opinions are subject to change without notice and securities described herein may no longer be included in, or may at any time be removed from, the Fund’s portfolio. This report is distributed for informational purposes only. Information contained herein has been obtained from sources believed reliable, but not guaranteed.
There is no guarantee that the investment objective of the Fund will be achieved. Stock markets are volatile and equity values can decline significantly in response to adverse issuer, political, regulatory, market and economic conditions. Since the Fund may hold foreign securities, it may be subject to greater risks than funds invested only in the U.S. These risks are more severe for securities of issuers in emerging markets regions. For information on the different share classes and the risks associated with an investment in the Fund, please refer to the current prospectus.
⬤
31
Harbor Disruptive Innovation FundPORTFOLIO OF INVESTMENTS—October 31, 2023
SECTOR ALLOCATION (% of investments) - Unaudited
PORTFOLIO OF INVESTMENTS
Value and Cost in Thousands
COMMON STOCKS—97.6% | ||
Shares | Value | |
AUTOMOBILES—0.9% | ||
2,609 | Tesla, Inc. * | $524 |
BIOTECHNOLOGY—10.5% | ||
3,619 | 89bio, Inc. * | 27 |
105,591 | Adaptimmune Therapeutics PLC ADR*,1 | 57 |
7,190 | Alkermes PLC * | 174 |
54,774 | Allogene Therapeutics, Inc. * | 155 |
16,242 | Arrowhead Pharmaceuticals, Inc. * | 400 |
9,028 | Ascendis Pharma AS ADR (Denmark)*,1 | 806 |
230,761 | Autolus Therapeutics PLC ADR (United Kingdom)*,1 | 651 |
23,699 | Avidity Biosciences, Inc. * | 122 |
19,821 | Bicycle Therapeutics PLC ADR (United Kingdom)*,1 | 298 |
55,334 | C4 Therapeutics, Inc. * | 83 |
11,457 | Fate Therapeutics, Inc. * | 21 |
14,536 | Freeline Therapeutics Holdings PLC ADR (United Kingdom)*,1 | 73 |
10,309 | Intellia Therapeutics, Inc. * | 258 |
52,941 | Iovance Biotherapeutics, Inc. * | 202 |
4,622 | Krystal Biotech, Inc. * | 540 |
11,765 | Kymera Therapeutics, Inc. * | 137 |
4,497 | Legend Biotech Corp. ADR*,1 | 297 |
143,270 | Magenta Therapeutics, Inc. - CVR * | — x |
4,359 | Moderna, Inc. * | 331 |
108,979 | Precision BioSciences, Inc. * | 34 |
25,157 | REGENXBIO, Inc. * | 324 |
34,786 | Repare Therapeutics, Inc. (Canada)* | 118 |
24,315 | Replimune Group, Inc. * | 354 |
41,337 | Rocket Pharmaceuticals, Inc. * | 748 |
1,244 | Sarepta Therapeutics, Inc. * | 84 |
21,806 | Synlogic, Inc. * | 41 |
20,394 | uniQure NV (Netherlands)* | 116 |
6,451 | ||
BROADLINE RETAIL—5.7% | ||
13,038 | Amazon.com, Inc. * | 1,735 |
1,423 | MercadoLibre, Inc. (Brazil)* | 1,766 |
3,501 | ||
CHEMICALS—2.7% | ||
4,259 | Linde PLC | 1,628 |
CONSUMER STAPLES DISTRIBUTION & RETAIL—1.5% | ||
234,339 | Dada Nexus Ltd. ADR (China)*,1 | 900 |
ELECTRICAL EQUIPMENT—0.3% | ||
719 | Hubbell, Inc. Class B | 194 |
COMMON STOCKS—Continued | ||
Shares | Value | |
ELECTRONIC EQUIPMENT, INSTRUMENTS & COMPONENTS—0.6% | ||
10,481 | Cognex Corp. | $377 |
ENTERTAINMENT—0.3% | ||
3,824 | Sea Ltd. ADR (Singapore)*,1 | 160 |
FINANCIAL SERVICES—5.6% | ||
1,085 | Adyen NV (Netherlands)*,2 | 732 |
24,050 | Block, Inc. * | 968 |
11,946 | Fiserv, Inc. * | 1,359 |
22,394 | Toast, Inc. Class A* | 358 |
3,417 | ||
HEALTH CARE EQUIPMENT & SUPPLIES—3.1% | ||
742 | Cooper Cos., Inc. | 231 |
9,869 | Dexcom, Inc. * | 877 |
582 | IDEXX Laboratories, Inc. * | 233 |
1,564 | Inspire Medical Systems, Inc. * | 230 |
1,278 | Insulet Corp. * | 169 |
2,865 | Lantheus Holdings, Inc. * | 185 |
1,925 | ||
HEALTH CARE PROVIDERS & SERVICES—0.2% | ||
167,374 | Invitae Corp. * | 101 |
HOTELS, RESTAURANTS & LEISURE—5.1% | ||
4,958 | Airbnb, Inc. Class A* | 587 |
399 | Chipotle Mexican Grill, Inc. Class A* | 775 |
598,123 | Deliveroo PLC Class A (United Kingdom)*,2 | 946 |
11,099 | DoorDash, Inc. Class A* | 832 |
3,140 | ||
INSURANCE—2.6% | ||
10,249 | Progressive Corp. | 1,620 |
INTERACTIVE MEDIA & SERVICES—2.9% | ||
9,028 | Alphabet, Inc. Class A* | 1,120 |
2,134 | Meta Platforms, Inc. Class A* | 643 |
1,763 | ||
IT SERVICES—5.5% | ||
14,783 | Cloudflare, Inc. Class A* | 838 |
1,244 | MongoDB, Inc. * | 429 |
7,756 | Okta, Inc. * | 523 |
20,081 | Shopify, Inc. Class A (Canada)* | 947 |
4,394 | Snowflake, Inc. Class A* | 638 |
3,375 |
⬤
32
Harbor Disruptive Innovation FundPORTFOLIO OF INVESTMENTS—Continued
Value and Cost in Thousands
COMMON STOCKS—Continued | ||
Shares | Value | |
LIFE SCIENCES TOOLS & SERVICES—4.4% | ||
7,620 | Danaher Corp. | $1,463 |
1,837 | ICON PLC * | 448 |
1,001 | Lonza Group AG (Switzerland) | 351 |
995 | Thermo Fisher Scientific, Inc. | 442 |
2,704 | ||
MACHINERY—1.0% | ||
5,091 | Chart Industries, Inc. * | 592 |
PHARMACEUTICALS—1.4% | ||
13,652 | Arvinas, Inc. * | 220 |
8,084 | Catalent, Inc. * | 278 |
673 | Eli Lilly & Co. | 373 |
871 | ||
SEMICONDUCTORS & SEMICONDUCTOR EQUIPMENT—13.9% | ||
16,105 | Advanced Micro Devices, Inc. * | 1,586 |
4,474 | Applied Materials, Inc. | 592 |
2,517 | ASML Holding NV (Netherlands) | 1,513 |
3,177 | Lam Research Corp. | 1,869 |
7,087 | Lattice Semiconductor Corp. * | 394 |
5,159 | Microchip Technology, Inc. | 368 |
2,104 | NVIDIA Corp. | 858 |
9,317 | Texas Instruments, Inc. | 1,323 |
8,503 | ||
SOFTWARE—25.2% | ||
311,799 | Agora, Inc. ADR (China)*,1 | 917 |
2,081 | Atlassian Corp. Class A* | 376 |
6,921 | Cadence Design Systems, Inc. * | 1,660 |
18,135 | CCC Intelligent Solutions Holdings, Inc. * | 195 |
5,811 | Datadog, Inc. Class A* | 474 |
COMMON STOCKS—Continued | ||
Shares | Value | |
SOFTWARE—Continued | ||
6,003 | Dynatrace, Inc. * | $268 |
9,975 | Fortinet, Inc. * | 570 |
1,449 | HubSpot, Inc. * | 614 |
9,642 | Microsoft Corp. | 3,260 |
1,244 | Nice Ltd. ADR (Israel)*,1 | 192 |
2,328 | Palo Alto Networks, Inc. * | 566 |
9,250 | Procore Technologies, Inc. * | 565 |
4,451 | Salesforce, Inc. * | 894 |
38,575 | Samsara, Inc. Class A* | 890 |
3,046 | ServiceNow, Inc. * | 1,772 |
14,654 | Smartsheet, Inc. Class A* | 579 |
5,672 | Splunk, Inc. * | 835 |
2,351 | Workday, Inc. Class A* | 498 |
2,043 | Zscaler, Inc. * | 324 |
15,449 | ||
SPECIALTY RETAIL—1.2% | ||
488,741 | Farfetch Ltd. Class A (United Kingdom)* | 733 |
TRADING COMPANIES & DISTRIBUTORS—1.6% | ||
2,462 | United Rentals, Inc. | 1,000 |
WIRELESS TELECOMMUNICATION SERVICES—1.4% | ||
6,189 | T-Mobile U.S., Inc. * | 890 |
TOTAL COMMON STOCKS (Cost $61,625) | 59,818 | |
TOTAL INVESTMENTS—97.6% (Cost $61,625) | 59,818 | |
CASH AND OTHER ASSETS, LESS LIABILITIES—2.4% | 1,468 | |
TOTAL NET ASSETS—100% | $61,286 |
FAIR VALUE MEASUREMENTS
As of October 31, 2023, the investment in Magenta Therapeutics, Inc.-CVR (as disclosed in the preceding Portfolio of Investments) was classified as Level 3, the investments in Adyen NV, ASML Holding NV, Deliveroo PLC, and Lonza Group AG (as disclosed in the preceding Portfolio of Investments) were classified as Level 2 and all other investments were classified as Level 1.
For more information on valuation inputs and their aggregation into the levels identified above, please refer to the Fair Value Measurements and Disclosures in Note 2 of the accompanying Notes to Financial Statements.
The following is a rollforward of the Fund’s Level 3 investments during the year ended October 31, 2023. Transfers into or out of Level 3, if any, are recognized as of the last day in the fiscal quarter of the period in which the event or change in circumstances that caused the reclassification occurred.
Valuation Description | Beginning Balance as of 11/01/2022 (000s) | Purchases (000s) | Sales (000s) | Discount/ (Premium) (000s) | Total Realized Gain/(Loss) (000s) | Change in Unrealized Appreciation/ (Depreciation) (000s) | Transfers Into Level 3h (000s) | Transfers Out of Level 3 (000s) | Ending Balance as of 10/31/2023 (000s) | Unrealized Gain/(Loss) as of 10/31/2023 (000s) |
Common Stock | $— | $— | $— | $— | $— | $— | $— | $— | $— | $— |
⬤
33
Harbor Disruptive Innovation FundPORTFOLIO OF INVESTMENTS—Continued
FAIR VALUE MEASUREMENTS—Continued
The following is a summary of significant unobservable inputs used in the fair valuations of assets and liabilities categorized within Level 3 of the fair value hierarchy.
Valuation Descriptions | Ending Balance as of 10/31/23 (000s) | Valuation Technique | Unobservable Input(s) | Input Value(s) |
Investments in Securities | ||||
Common Stocks | ||||
Magenta Therapeutics, Inc. - CVR* | $— | Market Approach | Estimated Recovery Value | USD 0.00 |
*
Non-income producing security
x
Fair valued in accordance with Harbor Funds' Valuation Procedures.
h
Transferred into Level 3 due to the unavailability of observable market data for pricing or transferred out of Level 3 due to availability of observable market data for pricing
1
Depositary receipts such as American Depositary Receipts (ADRs), Global Depositary Receipts (GDRs) and other country specific depositary receipts are certificates evidencing ownership of shares of a foreign issuer. These certificates are issued by depositary banks and generally trade on an established market in the U.S. or elsewhere.
2
Securities purchased in a transaction exempt from registration under Rule 144A of the Securities Act of 1933. These securities may be resold in transactions exempt from registration, normally to qualified institutional buyers. The Fund has no right to demand registration of these securities. As of October 31, 2023, the aggregate value of these securities was $1,678 or 3% of net assets.
The accompanying notes are an integral part of the Financial Statements.
⬤
34
Harbor Diversified International All Cap FundMANAGER’S COMMENTARY (Unaudited)
SUBADVISOR
Marathon Asset Management Limited
Management’s Discussion of
Fund Performance
Fund Performance
MARKET REVIEW
The period since October 31, 2022 was an improvement on the previous year, with most equity markets generating a positive return. Inflation has moderated in most markets over the period, at least partially in reaction to the unprecedented series of interest rate increases that have been enacted. Market participants generally viewed this as likely to lead to interest rate cuts in the near future through much of the period, buoying equities, but this ebullience has fallen away since August as investors have begun to accept the sincerity of central bankers who have said for some time that rates are likely to remain “higher for longer” than most investors appeared to believe. This resulted in the benchmark index declining from August to the end of the review period and, other than for a handful of mega-cap companies that investors expect to benefit most from the development of Artificial Intelligence (“AI”), a significant swing in favor of Value stocks and away from Growth (which had experienced something of a resurgence in the first half of 2023).
The MSCI All Country World Ex-United States Index (the “Index”) returned 12.07% (in USD terms) over the 12-month period ended October 31, 2023. Regionally, Japan (which constituted 14.23% of the Index on average over the period) and Europe (which averaged 42.06% of the Index) outperformed, returning 16.79% and 15.74% (in USD terms) respectively. Pacific ex Japan (which averaged 7.64% of the Index) underperformed, generating a return of only 5.13% (in USD terms) and Canada (also 7.64% of the Index on average) fell by 1.24%. Emerging Markets (which averaged 28% of the Index) returned 10.80%. Finally, the Middle East region (which contains only Israel and represented 0.44% of the Index on average) suffered a sharp fall in the final weeks of the period following the terrorist attack on the country, resulting in a return of -17.98%.
There is a clear split in performance at the sector level over the period; however, it does not fully conform to the usual Value versus Growth narrative. Several sectors that predominantly contain Value stocks outperformed; however, so did some sectors usually considered to be Growth oriented, such as Information Technology (“IT”) and Consumer Discretionary. Value stocks might be expected to outperform in the “rising-rates” environment seen over the review period; although, IT would usually lag, and Consumer Discretionary typically declines as consumers tighten their belts. This time though, IT performance has been driven by investor enthusiasm for all things AI related and Consumer Discretionary was already depressed due to a COVID-related hangover – many companies in this sector have managed to shore up balance sheets that had looked precarious due to the impact of anti-COVID policies between 2020 and 2022. Conversely, Health Care, Real Estate, Consumer Staples, Materials and Utilities all lagged. Health Care was a beneficiary of the COVID era, and has underperformed since vaccination requirements have abated. Real Estate is an interest rate sensitive sector, and the unprecedented rise in rates in the largest markets over the review period has depressed returns. Consumer Staples are generally expected to perform comparatively well in an inflationary environment; however, the sudden sharp rise in the cost of living appears to have resulted in consumers “trading down” from the brands these companies offer at a higher pace than in a typical downturn, whilst rising costs have squeezed profit margins. In Canada, two large Utilities suffered from idiosyncratic issues, and their prices fell by more than 50% over the period, reducing performance for this usually Value-focused sector. In Materials, several precious metals miners have struggled as rising interest rates make precious metals a less compelling investment option because they pay no interest, and power supply issues in South Africa (where many mining companies are listed or have operations) have also held the sector back.
PERFORMANCE
Harbor Diversified International All Cap Fund returned 12.38% (Retirement Class), 12.28% (Institutional Class), 12.06% (Administrative Class), and 11.87% (Investor Class) in the year ended October 31, 2023, while the Index returned 12.07% during the same period.
Stock selection was positive, particularly in Canada and Japan but lagged in Europe and Emerging Markets. At the sector level, stock selection was positive in most sectors, but underperformance from Consumer Discretionary and Industrials names moderated returns somewhat. Positioning between sectors was also generally positive, particularly the underweight to Health Care, and contributed to outperformance.
Amongst the top relative performers over the period we find several Financials. Canada’s Fairfax Financial is an insurance company with a large asset management arm which follows a Value focused approach and which has benefitted from the style’s return to favour. Italian bank UniCredit, which outperformed following a statement by the Chief Executive Officer that the business will be able to continue pay-outs to shareholders at the current rate for at least the next two years. The company has been returning around 60% of annual capital generated for some time, through a combination of dividends and share buybacks.
Less positively, Chinese automobile dealer Zhongsheng Group performed poorly as the country’s rebound following the end of harsh anti-COVID measures continues to be weak. The company is also grappling with how to address the change in consumer habits with the shift towards electric vehicles; these are more frequently (pre)ordered directly from the manufacturer rather than utilising a dealership model as has been the case for
⬤
35
Harbor Diversified International All Cap FundMANAGER’S COMMENTARY—Continued
CHANGE IN A $50,000 INVESTMENT
For the period 11/02/2015 through 10/31/2023
The graph compares a $50,000 investment in the Institutional Class shares of the Fund with the performance of the MSCI All Country World Ex. U.S. (ND) Index. The Fund’s performance assumes the reinvestment of all dividend and capital gain distributions.
TOTAL RETURNS | |||
For the periods ended 10/31/2023 | |||
Annualized | |||
1 Year | 5 Years | Life of Fund | |
Harbor Diversified International All Cap Fund | |||
Retirement Class1,2 | 12.38% | 4.09% | 3.69% |
Institutional Class1 | 12.28 | 4.01 | 3.62 |
Administrative Class1 | 12.06 | 3.74 | 3.37 |
Investor Class1 | 11.87 | 3.62 | 3.24 |
Comparative Index | |||
MSCI All Country World Ex. U.S. (ND) Index1 | 12.07% | 3.46% | 3.80% |
As stated in the Fund’s prospectus dated March 1, 2023, the expense ratios were 0.72% (Net) and 0.84% (Gross) (Retirement Class); 0.80% (Net) and 0.92% (Gross) (Institutional Class); 1.05% (Net) and 1.17% (Gross) (Administrative Class); 1.16% (Net) and 1.28% (Gross) (Investor Class). The net expense ratios reflect an expense limitation agreement (excluding interest expense, if any) effective through 02/29/2024. The expense ratios in the prospectus may differ from the actual expense ratios for the period disclosed within this report. The expense ratios shown in the prospectus are adjusted to reflect changes, if any, in contractual arrangements that occurred prior to the date of the prospectus (or supplement thereto, if applicable).
The MSCI All Country World Ex. U.S. (ND) Index is a free float-adjusted market capitalization weighted index that is designed to measure equity market performance in the global developed and emerging markets, excluding the U.S. This unmanaged index does not reflect fees and expenses and is not available for direct investment.
Performance data shown represents past performance and is no guarantee of future results. Past performance is net of management fees and expenses and reflects reinvested dividends and distributions. Past performance reflects the beneficial effect of any expense waivers or reimbursements, without which returns would have been lower. Investment returns and principal value will fluctuate and when redeemed may be worth more or less than their original cost. Returns for periods less than one year are not annualized. Current performance may be higher or lower and is available through the most recent month end at harborcapital.com or by calling 800-422-1050.
traditional cars. The business continues to build out its servicing and maintenance offering with excess cashflow being allocated towards buying back stock at the presently depressed valuation levels. African Rainbow Minerals, a South African miner, also lagged as power and infrastructure challenges continue to weigh on the South African Mining sector. While these issues may persist for a while, the company is seeking to create its own generating capacity and maintains a substantial net cash position on its balance sheet whilst offering a 10% dividend yield to shareholders.
OUTLOOK & STRATEGY
We remain committed to the implementation of our bottom-up analytical efforts within the capital cycle investment framework and, therefore, the Fund is seeking to invest in companies that in our view, exhibit favorable supply side dynamics with management teams that have a track record of allocating capital efficiently. Developments over the last several years, including the pandemic and outbreak of war in Europe, highlight the shortfalls of expending too much energy on forecasted outlooks; the portfolio managers are not looking to react to market volatility, rather placing emphasis on their longstanding investment process.
1 The “Life of Fund” return as shown reflects the period 11/02/2015 (commencement of operations) through 10/31/2023.
2 Retirement Class shares commenced operations on March 1, 2016. The performance attributed to the Retirement Class shares prior to that date is that of the Institutional Class shares. Performance prior to March 1, 2016 has not been adjusted to reflect the lower expenses of Retirement Class shares. During this period, Retirement Class shares would have had returns similar to, but potentially higher than, Institutional Class shares due to the fact that Retirement Class shares represent interests in the same portfolio as Institutional Class shares but are subject to lower expenses.
This report contains the current opinions of Marathon Asset Management Limited as of the date of this report and should not be considered as investment advice or a recommendation of any particular security, strategy or investment product. Such opinions are subject to change without notice and securities described herein may no longer be included in, or may at any time be removed from, the Fund’s portfolio. This report is distributed for informational purposes only. Information contained herein has been obtained from sources believed reliable, but not guaranteed.
There is no guarantee that the investment objective of the Fund will be achieved. Stock markets are volatile and equity values can decline significantly in response to adverse issuer, political, regulatory, market and economic conditions. Investing in international and emerging markets poses special risks, including potentially greater price volatility due to social, political and economic factors, as well as currency exchange rate fluctuations. These risks are more severe for securities of issuers in emerging market regions. For information on the different share classes and the risks associated with an investment in the Fund, please refer to the current prospectus.
⬤
36
Harbor Diversified International All Cap FundPORTFOLIO OF INVESTMENTS—October 31, 2023
REGION BREAKDOWN (% of investments) - Unaudited
(Excludes derivatives)
The Fund’s Portfolio of Investments include investments denominated in foreign currencies. As of October 31, 2023, there was no foreign currency denomination comprised more than 25% of the Fund’s net assets.
PORTFOLIO OF INVESTMENTS
Value and Cost in Thousands
COMMON STOCKS—98.8% | ||
Shares | Value | |
AEROSPACE & DEFENSE—1.3% | ||
17,871 | Airbus SE (France) | $2,396 |
403,815 | BAE Systems PLC (United Kingdom) | 5,430 |
104,749 | Melrose Industries PLC (United Kingdom) | 596 |
1,169,921 | Rolls-Royce Holdings PLC (United Kingdom)* | 3,080 |
11,502 | ||
AIR FREIGHT & LOGISTICS—0.2% | ||
30,937 | Oesterreichische Post AG (Austria) | 986 |
133,500 | Senko Group Holdings Co. Ltd. (Japan) | 920 |
1,906 | ||
AUTOMOBILE COMPONENTS—0.7% | ||
96,200 | Bridgestone Corp. (Japan) | 3,641 |
104,008 | Dowlais Group PLC (United Kingdom) | 126 |
236,058 | Gestamp Automocion SA (Spain)1 | 869 |
319,214 | Johnson Electric Holdings Ltd. (Hong Kong) | 396 |
26,150 | Magna International, Inc. (Canada) | 1,257 |
6,289 | ||
AUTOMOBILES—0.3% | ||
32,309 | Bayerische Motoren Werke AG (Germany) | 3,005 |
COMMON STOCKS—Continued | ||
Shares | Value | |
BANKS—12.4% | ||
66,185 | ANZ Group Holdings Ltd. (Australia) | $1,044 |
22,628,100 | Bank Central Asia Tbk. PT (Indonesia) | 12,466 |
565,954 | Bank of Ireland Group PLC (Ireland) | 5,072 |
49,840 | Bank of Nova Scotia (Canada) | 2,018 |
3,548,749 | Barclays PLC (United Kingdom) | 5,696 |
112,062 | BNP Paribas SA (France) | 6,444 |
1,242,895 | CaixaBank SA (Spain) | 5,053 |
56,140 | Capitec Bank Holdings Ltd. (South Africa) | 4,988 |
74,595 | Close Brothers Group PLC (United Kingdom) | 724 |
188,447 | DBS Group Holdings Ltd. (Singapore) | 4,527 |
171,512 | DNB Bank ASA (Norway) | 3,094 |
55,400 | Fukuoka Financial Group, Inc. (Japan) | 1,464 |
989,900 | Grupo Financiero Banorte SAB de CV Class O (Mexico) | 8,019 |
216,569 | HDFC Bank Ltd. ADR (India)2 | 12,247 |
131,162 | HSBC Holdings PLC (Hong Kong) | 942 |
9,542,907 | Lloyds Banking Group PLC (United Kingdom) | 4,645 |
1,153,700 | Resona Holdings, Inc. (Japan) | 6,165 |
205,783 | Shinhan Financial Group Co. Ltd. (South Korea) | 5,289 |
423,074 | Standard Chartered PLC (United Kingdom) | 3,244 |
12,500 | Sumitomo Mitsui Financial Group, Inc. (Japan) | 603 |
136,000 | Sumitomo Mitsui Trust Holdings, Inc. (Japan) | 5,100 |
⬤
37
Harbor Diversified International All Cap FundPORTFOLIO OF INVESTMENTS—Continued
Value and Cost in Thousands
COMMON STOCKS—Continued | ||
Shares | Value | |
BANKS—Continued | ||
359,714 | Svenska Handelsbanken AB Class A (Sweden) | $3,067 |
355,843 | UniCredit SpA (Italy) | 8,921 |
51,882 | United Overseas Bank Ltd. (Singapore) | 1,023 |
111,855 | ||
BEVERAGES—3.6% | ||
678,000 | Arca Continental SAB de CV (Mexico) | 6,084 |
50,300 | Asahi Group Holdings Ltd. (Japan) | 1,819 |
20,251 | Carlsberg AS Class B (Denmark) | 2,413 |
33,237 | Coca-Cola Europacific Partners PLC (United States) | 1,945 |
250,579 | Davide Campari-Milano NV (Italy) | 2,770 |
161,259 | Diageo PLC (United Kingdom) | 6,098 |
53,398 | Heineken NV (Netherlands) | 4,798 |
439,200 | Kirin Holdings Co. Ltd. (Japan) | 6,172 |
32,099 | ||
BIOTECHNOLOGY—0.5% | ||
28,658 | CSL Ltd. (Australia) | 4,235 |
BROADLINE RETAIL—1.3% | ||
46,779 | Naspers Ltd. Class N (South Africa) | 7,313 |
335,273 | Vipshop Holdings Ltd. ADR (China)*,2 | 4,781 |
12,094 | ||
BUILDING PRODUCTS—0.9% | ||
210,941 | Assa Abloy AB Class B (Sweden) | 4,496 |
361,337 | Fletcher Building Ltd. (New Zealand) | 911 |
6,452 | Geberit AG (Switzerland) | 3,004 |
8,411 | ||
CAPITAL MARKETS—2.9% | ||
338,884 | 3i Group PLC (United Kingdom) | 7,990 |
2,979,300 | B3 SA - Brasil Bolsa Balcao (Brazil) | 6,559 |
40,663 | Brookfield Asset Management Ltd. Class A (Canada) | 1,166 |
163,087 | Brookfield Corp. Class A (Canada) | 4,751 |
95,714 | IG Group Holdings PLC (United Kingdom) | 744 |
447,231 | Jupiter Fund Management PLC (United Kingdom) | 427 |
2,077 | Macquarie Group Ltd. (Australia) | 213 |
705,800 | Nomura Holdings, Inc. (Japan) | 2,727 |
38,179 | Rathbones Group PLC (United Kingdom) | 696 |
90,128 | St. James’s Place PLC (United Kingdom) | 703 |
25,976 | ||
CHEMICALS—1.2% | ||
199,200 | Air Water, Inc. (Japan) | 2,512 |
110,618 | BASF SE (Germany) | 5,111 |
39,000 | Nissan Chemical Corp. (Japan) | 1,591 |
29,700 | Sumitomo Bakelite Co. Ltd. (Japan) | 1,321 |
10,535 | ||
COMMERCIAL SERVICES & SUPPLIES—0.9% | ||
24,859 | Befesa SA (Germany)1 | 727 |
155,517 | Brambles Ltd. (Australia) | 1,298 |
733,105 | Cleanaway Waste Management Ltd. (Australia) | 1,044 |
55,300 | Daiei Kankyo Co. Ltd. (Japan) | 764 |
67,146 | Elis SA (France) | 1,101 |
14,100 | Secom Co. Ltd. (Japan) | 979 |
1,091,774 | Serco Group PLC (United Kingdom) | 1,897 |
7,810 | ||
CONSTRUCTION & ENGINEERING—1.3% | ||
180,800 | INFRONEER Holdings, Inc. (Japan) | 1,907 |
376,900 | Obayashi Corp. (Japan) | 3,229 |
213,700 | Penta-Ocean Construction Co. Ltd. (Japan) | 1,256 |
137,494 | SNC-Lavalin Group, Inc. (Canada) | 3,819 |
COMMON STOCKS—Continued | ||
Shares | Value | |
CONSTRUCTION & ENGINEERING—Continued | ||
44,055 | Taisei Corp. (Japan) | $1,494 |
11,705 | ||
CONSTRUCTION MATERIALS—1.1% | ||
31,547 | CRH PLC (Ireland) | 1,693 |
58,843 | Holcim AG (Switzerland) | 3,638 |
144,400 | Taiheiyo Cement Corp. (Japan) | 2,475 |
99,151 | Wienerberger AG (Austria) | 2,402 |
10,208 | ||
CONSUMER FINANCE—0.2% | ||
320,035 | International Personal Finance PLC (United Kingdom) | 509 |
90,900 | Marui Group Co. Ltd. (Japan) | 1,438 |
166,468 | Vanquis Banking Group PLC (United Kingdom) | 234 |
2,181 | ||
CONSUMER STAPLES DISTRIBUTION & RETAIL—2.7% | ||
98,665 | Alimentation Couche-Tard, Inc. (Canada) | 5,371 |
284,664 | Bid Corp. Ltd. (South Africa) | 6,045 |
69,294 | HelloFresh SE (Germany)* | 1,516 |
123,753 | Koninklijke Ahold Delhaize NV (Netherlands) | 3,664 |
58,643 | Loblaw Cos. Ltd. (Canada) | 4,796 |
44,700 | MatsukiyoCocokara & Co. (Japan) | 784 |
208,303 | Metcash Ltd. (Australia) | 488 |
32,500 | Seven & i Holdings Co. Ltd. (Japan) | 1,191 |
213,859 | Tesco PLC (United Kingdom) | 702 |
140,921 | X5 Retail Group NV GDR (Russia)*,2 | — x |
24,557 | ||
CONTAINERS & PACKAGING—0.4% | ||
328,728 | DS Smith PLC (United Kingdom) | 1,140 |
138,300 | Toyo Seikan Group Holdings Ltd. (Japan) | 2,325 |
3,465 | ||
DISTRIBUTORS—0.3% | ||
314,167 | Inchcape PLC (United Kingdom) | 2,547 |
DIVERSIFIED TELECOMMUNICATION SERVICES—1.5% | ||
36,132 | BCE, Inc. (Canada) | 1,342 |
1,044,906 | Koninklijke KPN NV (Netherlands) | 3,512 |
7,194,300 | Nippon Telegraph & Telephone Corp. (Japan) | 8,466 |
13,320 | ||
ELECTRIC UTILITIES—0.1% | ||
19,222 | Orsted AS (Denmark)1 | 929 |
ELECTRICAL EQUIPMENT—2.8% | ||
152,784 | ABB Ltd. (Switzerland) | 5,133 |
243,131 | Havells India Ltd. (India) | 3,649 |
43,410 | Legrand SA (France) | 3,755 |
252,500 | Mitsubishi Electric Corp. (Japan) | 2,895 |
27,527 | Schneider Electric SE (France) | 4,235 |
270,985 | Vestas Wind Systems AS (Denmark) | 5,874 |
25,541 | ||
ELECTRONIC EQUIPMENT, INSTRUMENTS & COMPONENTS—1.2% | ||
728,315 | Delta Electronics, Inc. (Taiwan) | 6,564 |
23,800 | Kyocera Corp. (Japan) | 1,173 |
59,500 | TDK Corp. (Japan) | 2,226 |
60,100 | Topcon Corp. (Japan) | 548 |
10,511 | ||
ENERGY EQUIPMENT & SERVICES—0.2% | ||
268,479 | John Wood Group PLC (United Kingdom)* | 465 |
54,472 | Technip Energies NV (France) | 1,193 |
1,658 |
⬤
38
Harbor Diversified International All Cap FundPORTFOLIO OF INVESTMENTS—Continued
Value and Cost in Thousands
COMMON STOCKS—Continued | ||
Shares | Value | |
ENTERTAINMENT—0.1% | ||
17,040 | CTS Eventim AG & Co. KGaA (Germany) | $1,032 |
FINANCIAL SERVICES—0.9% | ||
273,462 | AMP Ltd. (Australia) | 182 |
567,818 | Chailease Holding Co. Ltd. (Taiwan) | 3,080 |
91,731 | Edenred SE (France) | 4,883 |
8,145 | ||
FOOD PRODUCTS—1.2% | ||
894,000 | First Pacific Co. Ltd. (Hong Kong) | 339 |
607,392 | Marico Ltd. (India) | 3,903 |
57,100 | Megmilk Snow Brand Co. Ltd. (Japan) | 920 |
54,200 | NH Foods Ltd. (Japan) | 1,626 |
53,100 | Toyo Suisan Kaisha Ltd. (Japan) | 2,450 |
22,591 | Viscofan SA (Spain) | 1,306 |
10,544 | ||
GROUND TRANSPORTATION—1.3% | ||
65,847 | Canadian Pacific Kansas City Ltd. (Canada) | 4,675 |
7,700 | East Japan Railway Co. (Japan) | 400 |
609,858 | Localiza Rent a Car SA (Brazil)* | 6,153 |
637,235 | Mobico Group PLC (United Kingdom) | 486 |
11,714 | ||
HEALTH CARE EQUIPMENT & SUPPLIES—2.2% | ||
44,904 | Coloplast AS Class B (Denmark) | 4,683 |
1,104,784 | ConvaTec Group PLC (United Kingdom)1 | 2,745 |
65,677 | Demant AS (Denmark) | 2,506 |
25,103 | EssilorLuxottica SA (France) | 4,546 |
38,716 | Getinge AB Class B (Sweden) | 697 |
63,190 | Koninklijke Philips NV (Netherlands)* | 1,202 |
68,183 | Smith & Nephew PLC (United Kingdom) | 763 |
11,451 | Sonova Holding AG (Switzerland) | 2,714 |
19,856 | ||
HEALTH CARE PROVIDERS & SERVICES—0.8% | ||
52,642 | Amplifon SpA (Italy) | 1,488 |
87,426 | Fresenius Medical Care AG & Co. KGaA (Germany) | 2,905 |
96,600 | Medipal Holdings Corp. (Japan) | 1,624 |
49,800 | Ship Healthcare Holdings, Inc. (Japan) | 769 |
6,786 | ||
HOTELS, RESTAURANTS & LEISURE—3.1% | ||
73,628 | Aristocrat Leisure Ltd. (Australia) | 1,810 |
269,357 | Compass Group PLC (United Kingdom) | 6,791 |
297,629 | Entain PLC (United Kingdom) | 3,379 |
48,414 | Flutter Entertainment PLC (Ireland)* | 7,604 |
372,000 | Galaxy Entertainment Group Ltd. (Hong Kong) | 2,091 |
23,630 | InterContinental Hotels Group PLC (United Kingdom) | 1,674 |
137,935 | Playtech PLC (United Kingdom)* | 659 |
1,456,355 | SSP Group PLC (United Kingdom)* | 3,187 |
215,658 | TUI AG (Germany)* | 1,088 |
28,283 | ||
HOUSEHOLD DURABLES—1.3% | ||
173,408 | Barratt Developments PLC (United Kingdom) | 875 |
51,542 | GN Store Nord AS (Denmark) | 860 |
944,715 | Midea Group Co. Ltd. Class A (China) | 6,834 |
54,000 | Sekisui Chemical Co. Ltd. (Japan) | 740 |
21,600 | Sony Group Corp. (Japan) | 1,796 |
489,701 | Taylor Wimpey PLC (United Kingdom) | 661 |
11,766 | ||
HOUSEHOLD PRODUCTS—0.6% | ||
75,690 | Reckitt Benckiser Group PLC (United Kingdom) | 5,064 |
COMMON STOCKS—Continued | ||
Shares | Value | |
INDUSTRIAL CONGLOMERATES—1.3% | ||
263,500 | CK Hutchison Holdings Ltd. (Hong Kong) | $1,334 |
40,515 | DCC PLC (United Kingdom) | 2,251 |
78,400 | Hitachi Ltd. (Japan) | 4,969 |
47,700 | Jardine Matheson Holdings Ltd. (Hong Kong) | 1,933 |
163,100 | Nisshinbo Holdings, Inc. (Japan) | 1,180 |
11,667 | ||
INSURANCE—6.2% | ||
65,887 | Admiral Group PLC (United Kingdom) | 1,958 |
1,870,200 | AIA Group Ltd. (Hong Kong) | 16,240 |
192,000 | Dai-ichi Life Holdings, Inc. (Japan) | 4,056 |
14,395 | Fairfax Financial Holdings Ltd. (Canada) | 11,979 |
71,300 | Great Eastern Holdings Ltd. (Singapore) | 900 |
10,920 | Hannover Rueck SE (Germany) | 2,411 |
145,748 | Hiscox Ltd. (United Kingdom) | 1,664 |
197,100 | Japan Post Holdings Co. Ltd. (Japan) | 1,745 |
97,089 | Mandatum OYJ (Finland)* | 375 |
19,350 | Prudential PLC (Hong Kong) | 202 |
222,115 | Prudential PLC (United Kingdom) | 2,323 |
348,557 | QBE Insurance Group Ltd. (Australia) | 3,456 |
97,089 | Sampo OYJ Class A (Finland) | 3,818 |
191,800 | Tokio Marine Holdings, Inc. (Japan) | 4,291 |
55,418 | ||
INTERACTIVE MEDIA & SERVICES—1.1% | ||
230,915 | Auto Trader Group PLC (United Kingdom)1 | 1,747 |
39,619 | Baidu, Inc. ADR (China)*,2 | 4,160 |
39,353 | carsales.com Ltd. (Australia) | 694 |
533,155 | Rightmove PLC (United Kingdom) | 3,074 |
9,675 | ||
IT SERVICES—2.5% | ||
11,861 | Alten SA (France) | 1,401 |
313,918 | Infosys Ltd. ADR (India)2 | 5,155 |
64,200 | NEC Corp. (Japan) | 3,091 |
89,500 | NET One Systems Co. Ltd. (Japan) | 1,366 |
38,400 | NS Solutions Corp. (Japan) | 1,115 |
4,125 | Reply SpA (Italy) | 389 |
106,100 | SCSK Corp. (Japan) | 1,811 |
38,157 | Softcat PLC (United Kingdom) | 588 |
194,226 | Tata Consultancy Services Ltd. (India) | 7,870 |
22,786 | ||
LEISURE PRODUCTS—0.5% | ||
8,851 | MIPS AB (Sweden) | 219 |
136,400 | Sega Sammy Holdings, Inc. (Japan) | 2,133 |
105,511 | Spin Master Corp. (Canada)1 | 2,522 |
4,874 | ||
LIFE SCIENCES TOOLS & SERVICES—0.4% | ||
37,890 | Eurofins Scientific SE (France) | 1,922 |
14,460 | Gerresheimer AG (Germany) | 1,349 |
3,271 | ||
MACHINERY—4.5% | ||
30,956 | Alfa Laval AB (Sweden) | 1,003 |
29,501 | ANDRITZ AG (Austria) | 1,358 |
356,364 | CNH Industrial NV (Italy) | 3,949 |
75,900 | Daifuku Co. Ltd. (Japan) | 1,254 |
179,736 | Fluidra SA (Spain) | 3,169 |
28,890 | GEA Group AG (Germany) | 988 |
106,892 | Iveco Group NV (Italy)* | 901 |
37,000 | Komatsu Ltd. (Japan) | 850 |
69,200 | Kubota Corp. (Japan) | 931 |
93,200 | Mitsubishi Heavy Industries Ltd. (Japan) | 4,800 |
47,800 | Miura Co. Ltd. (Japan) | 927 |
118,400 | NSK Ltd. (Japan) | 637 |
⬤
39
Harbor Diversified International All Cap FundPORTFOLIO OF INVESTMENTS—Continued
Value and Cost in Thousands
COMMON STOCKS—Continued | ||
Shares | Value | |
MACHINERY—Continued | ||
256,221 | Rotork PLC (United Kingdom) | $916 |
114,599 | Sandvik AB (Sweden) | 1,952 |
1,885,700 | Sany Heavy Industry Co. Ltd. Class A (China) | 3,729 |
22,826 | Stabilus SE (Germany) | 1,449 |
609,500 | Techtronic Industries Co. Ltd. (Hong Kong) | 5,565 |
23,100 | Toyota Industries Corp. (Japan) | 1,712 |
93,378 | Wartsila OYJ Abp (Finland) | 1,114 |
1,992,000 | Weichai Power Co. Ltd. Class H (China) | 2,982 |
40,186 | ||
MARINE TRANSPORTATION—0.1% | ||
207,747 | Irish Continental Group PLC (Ireland) | 948 |
MEDIA—1.3% | ||
191,500 | Fuji Media Holdings, Inc. (Japan) | 1,902 |
103,134 | Future PLC (United Kingdom) | 1,114 |
77,700 | Hakuhodo DY Holdings, Inc. (Japan) | 630 |
2,047,600 | ITV PLC (United Kingdom) | 1,594 |
61,418 | JCDecaux SE (France)* | 961 |
136,020 | Nippon Television Holdings, Inc. (Japan) | 1,323 |
16,594 | Schibsted ASA Class A (Norway) | 332 |
7,586 | Schibsted ASA Class B (Norway) | 141 |
85,500 | TBS Holdings, Inc. (Japan) | 1,394 |
64,491 | Viaplay Group AB Class B (Sweden) | 138 |
216,416 | WPP PLC (United Kingdom) | 1,864 |
11,393 | ||
METALS & MINING—5.3% | ||
89,660 | Acerinox SA (Spain) | 874 |
399,025 | African Rainbow Minerals Ltd. (South Africa) | 3,289 |
150,808 | ArcelorMittal SA (France)* | 3,337 |
257,466 | Barrick Gold Corp. (Canada) | 4,112 |
198,957 | BHP Group Ltd. (Australia) | 5,632 |
94,423 | BlueScope Steel Ltd. (Australia) | 1,132 |
35,800 | Dowa Holdings Co. Ltd. (Japan) | 1,094 |
608,613 | Evolution Mining Ltd. (Australia) | 1,361 |
222,105 | First Quantum Minerals Ltd. (Canada) | 2,574 |
22,687 | Franco-Nevada Corp. (Canada) | 2,760 |
1,258,729 | Glencore PLC (United Kingdom) | 6,667 |
18,907 | Newmont Corp. CDI (Australia)*,2 | 725 |
220,299 | Pilbara Minerals Ltd. (Australia) | 517 |
67,199 | Rio Tinto PLC (United Kingdom) | 4,287 |
320,373 | Severstal PAO GDR (Russia)*,2 | — x |
100,488 | Southern Copper Corp. (Peru) | 7,125 |
64,800 | Sumitomo Metal Mining Co. Ltd. (Japan) | 1,820 |
47,306 | ||
OIL, GAS & CONSUMABLE FUELS—4.8% | ||
2,429,991 | BP PLC (United Kingdom) | 14,838 |
100,673 | Canadian Natural Resources Ltd. (Canada) | 6,393 |
187,577 | Equinor ASA (Norway) | 6,288 |
221,800 | Inpex Corp. (Japan) | 3,218 |
199,824 | PrairieSky Royalty Ltd. (Canada) | 3,509 |
358,602 | PRIO SA (Brazil)* | 3,393 |
573,141 | Santos Ltd. (Australia) | 2,797 |
119,213 | Woodside Energy Group Ltd. (Australia) | 2,596 |
43,032 | ||
PAPER & FOREST PRODUCTS—0.5% | ||
358,000 | Oji Holdings Corp. (Japan) | 1,531 |
51,226 | Stella-Jones, Inc. (Canada) | 2,683 |
4,214 | ||
PASSENGER AIRLINES—1.1% | ||
128,728 | Air Canada (Canada)* | 1,553 |
65,085 | Copa Holdings SA Class A (Panama) | 5,314 |
312,309 | easyJet PLC (United Kingdom) | 1,394 |
COMMON STOCKS—Continued | ||
Shares | Value | |
PASSENGER AIRLINES—Continued | ||
578,115 | Qantas Airways Ltd. (Australia)* | $1,811 |
10,072 | ||
PERSONAL CARE PRODUCTS—0.5% | ||
558,335 | Dabur India Ltd. (India) | 3,546 |
301,709 | L’Occitane International SA (Hong Kong) | 776 |
4,322 | ||
PHARMACEUTICALS—3.4% | ||
204,978 | Novo Nordisk AS Class B (Denmark) | 19,776 |
38,099 | Roche Holding AG (Switzerland) | 9,818 |
64,300 | Tsumura & Co. (Japan) | 1,151 |
30,745 | ||
PROFESSIONAL SERVICES—2.5% | ||
157,193 | ALS Ltd. (Australia) | 1,076 |
1,559,704 | Capita PLC (United Kingdom)* | 318 |
97,119 | Experian PLC (United Kingdom) | 2,946 |
645,043 | Hays PLC (United Kingdom) | 756 |
92,116 | Intertek Group PLC (United Kingdom) | 4,290 |
98,366 | IPH Ltd. (Australia) | 427 |
380,704 | Pagegroup PLC (United Kingdom) | 1,745 |
572,000 | Persol Holdings Co. Ltd. (Japan) | 858 |
34,557 | Randstad NV (Netherlands) | 1,789 |
208,334 | RELX PLC (United Kingdom) | 7,277 |
110,419 | RWS Holdings PLC (United Kingdom) | 279 |
11,700 | TechnoPro Holdings, Inc. (Japan) | 232 |
5,847 | Teleperformance SE (France) | 673 |
22,666 | ||
REAL ESTATE MANAGEMENT & DEVELOPMENT—0.7% | ||
158,500 | Daiwa House Industry Co. Ltd. (Japan) | 4,360 |
243,000 | Swire Pacific Ltd. Class A (Hong Kong) | 1,552 |
5,912 | ||
SEMICONDUCTORS & SEMICONDUCTOR EQUIPMENT—3.5% | ||
17,796 | ASML Holding NV (Netherlands)* | 10,698 |
41,800 | ASMPT Ltd. (Hong Kong) | 354 |
149,000 | MediaTek, Inc. (Taiwan) | 3,889 |
201,400 | Renesas Electronics Corp. (Japan)* | 2,645 |
830,000 | Taiwan Semiconductor Manufacturing Co. Ltd. (Taiwan) | 13,556 |
31,142 | ||
SOFTWARE—0.9% | ||
3,343 | Constellation Software, Inc. (Canada) | 6,701 |
9,998 | Lumine Group, Inc. (Canada)* | 126 |
19,200 | Oracle Corp. (Japan) | 1,362 |
8,189 | ||
SPECIALTY RETAIL—1.2% | ||
70,000 | ABC-Mart, Inc. (Japan) | 1,084 |
1,384,700 | Esprit Holdings Ltd. (Hong Kong)* | 59 |
291,628 | Pets at Home Group PLC (United Kingdom) | 997 |
62,600 | USS Co. Ltd. (Japan) | 1,094 |
86,627 | WH Smith PLC (United Kingdom) | 1,224 |
1,763,000 | Zhongsheng Group Holdings Ltd. (China) | 4,071 |
140,400 | ZOZO, Inc. (Japan) | 2,670 |
11,199 | ||
TECHNOLOGY HARDWARE, STORAGE & PERIPHERALS—2.0% | ||
674,529 | Advantech Co. Ltd. (Taiwan) | 6,927 |
16,376 | Logitech International SA (Switzerland) | 1,289 |
13,339 | Quadient SA (France) | 279 |
196,348 | Samsung Electronics Co. Ltd. (South Korea) | 9,773 |
18,268 |
⬤
40
Harbor Diversified International All Cap FundPORTFOLIO OF INVESTMENTS—Continued
Value and Cost in Thousands
COMMON STOCKS—Continued | ||
Shares | Value | |
TEXTILES, APPAREL & LUXURY GOODS—2.1% | ||
15,615 | adidas AG (Germany) | $2,777 |
44,597 | Cie Financiere Richemont SA Class A (Switzerland) | 5,261 |
91,898 | Gildan Activewear, Inc. (Canada) | 2,610 |
487,000 | Li Ning Co. Ltd. (China) | 1,492 |
458,100 | Samsonite International SA (Hong Kong)*,1 | 1,419 |
494,700 | Shenzhou International Group Holdings Ltd. (China) | 4,859 |
436,570 | Stella International Holdings Ltd. (Hong Kong) | 493 |
18,911 | ||
TRADING COMPANIES & DISTRIBUTORS—1.9% | ||
558,600 | BOC Aviation Ltd. (China)1 | 3,435 |
51,996 | Brenntag SE (Germany) | 3,867 |
88,323 | Bunzl PLC (United Kingdom) | 3,151 |
85,759 | Finning International, Inc. (Canada) | 2,298 |
65,000 | ITOCHU Corp. (Japan) | 2,341 |
52,617 | Rexel SA (France) | 1,075 |
44,355 | Richelieu Hardware Ltd. (Canada) | 1,327 |
17,494 | ||
TRANSPORTATION INFRASTRUCTURE—0.8% | ||
63,868 | Getlink SE (France) | 1,031 |
376,077 | Grupo Aeroportuario del Pacifico SAB de CV Class B (Mexico) | 4,391 |
COMMON STOCKS—Continued | ||
Shares | Value | |
TRANSPORTATION INFRASTRUCTURE—Continued | ||
52,000 | Mitsubishi Logistics Corp. (Japan) | $1,360 |
6,782 | ||
WIRELESS TELECOMMUNICATION SERVICES—0.2% | ||
30,000 | KDDI Corp. (Japan) | 898 |
29,485 | Rogers Communications, Inc. Class B (Canada) | 1,092 |
1,990 | ||
TOTAL COMMON STOCKS (Cost $868,589) | 887,991 |
PREFERRED STOCKS—0.2% | ||
(Cost $2,991) | ||
AUTOMOBILES—0.2% | ||
19,199 | Volkswagen AG (Germany) | 2,036 |
TOTAL INVESTMENTS—99.0% (Cost $871,580) | 890,027 | |
CASH AND OTHER ASSETS, LESS LIABILITIES—1.0% | 9,025 | |
TOTAL NET ASSETS—100% | $899,052 |
RIGHTS/WARRANTS | |||||
Description | Shares | Strike Price | Expiration Date | Cost (000s) | Value (000s) |
Constellation Software, Inc. (Canada)* | 3,982 | CAD 0.00 | 03/31/2040 | $— | $—x |
Localiza Rent a Car SA (Brazil)* | 4,471 | BRL 47.13 | 11/09/2023 | — | 6 |
Total Rights/Warrants | $6 |
⬤
41
Harbor Diversified International All Cap FundPORTFOLIO OF INVESTMENTS—Continued
FAIR VALUE MEASUREMENTS
The following table summarizes the Fund’s investments as of October 31, 2023 based on the inputs used to value them.
Asset Category | Quoted Prices Level 1 (000s) | Other Significant Observable Inputs Level 2 (000s) | Significant Unobservable Inputs Level 3 (000s) | Total (000s) |
Investments in Securities | ||||
Common Stocks | ||||
Africa | $— | $21,635 | $— | $21,635 |
Europe | 375 | 380,369 | — | 380,744 |
Latin America | 47,038 | — | — | 47,038 |
Middle East/Central Asia | 17,402 | 34,030 | — | 51,432 |
North America | 83,379 | — | — | 83,379 |
Pacific Basin | 9,666 | 294,097 | — | 303,763 |
Preferred Stocks | ||||
Europe | — | 2,036 | — | 2,036 |
Total Investments in Securities | $157,860 | $732,167 | $— | $890,027 |
Financial Derivative Instruments - Assets | ||||
Rights/Warrants | $6 | $— | $— | $6 |
Total Investments | $157,866 | $732,167 | $— | $890,033 |
For more information on valuation inputs and their aggregation into the levels identified above, please refer to the Fair Value Measurements and Disclosures in Note 2 of the accompanying Notes to Portfolios of Investments.
The following is a rollforward of the Fund’s Level 3 investments during the year ended October 31, 2023. Transfers into or out of Level 3, if any, are recognized as of the last day in the fiscal quarter of the period in which the event or change in circumstances that caused the reclassification occurred.
Valuation Description | Beginning Balance as of 11/01/2022 (000s) | Purchases (000s) | Sales (000s) | Discount/ (Premium) (000s) | Total Realized Gain/(Loss) (000s) | Change in Unrealized Appreciation/ (Depreciation) (000s) | Transfers Into Level 3h (000s) | Transfers Out of Level 3 (000s) | Ending Balance as of 10/31/2023 (000s) | Unrealized Gain/(Loss) as of 10/31/2023 (000s) |
Common Stock | $— | $— | $— | $— | $— | $— | $— | $— | $— | $(11,174) |
Rights/Warrants | — | — | — | — | — | — | — | — | — | — |
$— | $— | $— | $— | $— | $— | $— | $— | $— | $(11,174 ) |
⬤
42
Harbor Diversified International All Cap FundPORTFOLIO OF INVESTMENTS—Continued
FAIR VALUE MEASUREMENTS—Continued
The following is a summary of significant unobservable inputs used in the fair valuations of assets and liabilities categorized within Level 3 of the fair value hierarchy.
Valuation Descriptions | Ending Balance as of 10/31/23 (000s) | Valuation Technique | Unobservable Input(s) | Input Value(s) |
Investments in Securities | ||||
Common Stocks | ||||
Severstal PAO GDR (Russia)* | $— | Market Approach | Estimated Recovery Value | USD 0.00 |
X5 Retail Group NV GDR (Russia)* | — | Market Approach | Estimated Recovery Value | USD 0.00 |
$— | ||||
Financial Derivative Instruments | ||||
Rights/Warrants | ||||
Constellation Software, Inc. (Canada)* | $— | Market Approach | Estimated Recovery Value | CAD 0.00 |
*
Non-income producing security
x
Fair valued in accordance with Harbor Funds' Valuation Procedures.
h
Transferred into Level 3 due to the unavailability of observable market data for pricing or transferred out of Level 3 due to availability of observable market data for pricing
1
Securities purchased in a transaction exempt from registration under Rule 144A of the Securities Act of 1933. These securities may be resold in transactions exempt from registration, normally to qualified institutional buyers. The Fund has no right to demand registration of these securities. As of October 31, 2023, the aggregate value of these securities was $14,393 or 2% of net assets.
2
Depositary receipts such as American Depositary Receipts (ADRs), Global Depositary Receipts (GDRs) and other country specific depositary receipts are certificates evidencing ownership of shares of a foreign issuer. These certificates are issued by depositary banks and generally trade on an established market in the U.S. or elsewhere.
BRL
Brazilian Real
CAD
Canadian Dollar
The accompanying notes are an integral part of the Financial Statements.
⬤
43
Harbor International FundMANAGER’S COMMENTARY (Unaudited)
SUBADVISOR
Marathon Asset Management Limited
Management’s Discussion of
Fund Performance
Fund Performance
MARKET REVIEW
The period since October 31, 2022 was an improvement on the previous year, with most equity markets generating a positive return. Inflation has moderated in most markets over the period, at least partially in reaction to the unprecedented series of interest rate increases that have been enacted. Market participants generally viewed this as likely to lead to interest rate cuts in the near future through much of the period, buoying equities, but this ebullience has fallen away since August as investors have begun to accept the sincerity of central bankers who have said for some time that rates are likely to remain “higher for longer” than most investors appeared to believe. This resulted in the benchmark index declining from August to the end of the review period and, other than for a handful of mega-cap companies that investors expect to benefit most from the development of Artificial Intelligence (“AI”), a significant swing in favour of Value stocks and away from Growth (which had experienced something of a resurgence in the first half of 2023).
The MSCI EAFE Index (the “Index”) returned 14.40% (in USD terms) over the 12-month period ended October 31, 2023. Regionally, Japan (which constituted 22.11% of the Index on average over the period) and Europe (which averaged 65.34% of the Index) outperformed, returning 16.79% and 15.74% (in USD terms) respectively. Pacific ex Japan (which averaged 11.86% of the Index) underperformed, generating a return of only 5.13% (in USD terms). The Middle East region (which contains only Israel and represented 0.68% of the Index on average) suffered a sharp fall in the final weeks of the period following the terrorist attack on the country, resulting in a return of -17.98%.
There is a clear split in performance at the sector level over the period; however, it does not fully conform to the usual Value versus Growth narrative. Several sectors that predominantly contain Value stocks outperformed; however, so did some sectors usually considered to be Growth oriented, such as Information Technology (“IT”) and Consumer Discretionary. Value stocks might be expected to outperform in the “rising-rates” environment seen over the review period; although IT would usually lag, and Consumer Discretionary typically declines as consumers tighten their belts. This time though, IT performance has been driven by investor enthusiasm for all things AI-related and Consumer Discretionary was already depressed due to a COVID-related hangover – many companies in this sector have managed to shore up balance sheets that had looked precarious due to the impact of anti-COVID policies between 2020 and 2022. Conversely, Health Care, Real Estate, Consumer Staples and Communication Services all lagged. The first and last of these sectors were beneficiaries of the COVID era, and have underperformed since restrictions eased and vaccination requirements have abated. Real Estate is an interest rate sensitive sector, and the unprecedented rise in rates in the largest markets over the review period has depressed returns. Consumer Staples are generally expected to perform comparatively well in an inflationary environment; however, the sudden sharp rise in the cost of living appears to have resulted in consumers “trading down” from the brands these companies offer at a higher pace than in a typical downturn, whilst rising costs have squeezed profit margins.
PERFORMANCE
Harbor International Fund returned 15.24% (Retirement Class), 15.14% (Institutional Class), 14.88% (Administrative Class), and 14.71% (Investor Class) in the year ended October 31, 2023, outperforming the 14.40% return of the Index during the same period.
Stock selection was positive, particularly in Japan, but lagged in Europe. Regional positioning was also beneficial, with the underweight to Pacific ex-Japan and lack of exposure to the Middle East (Israel) adding value. At the sector level, stock selection was positive in most sectors, but underperformance from Consumer Discretionary and Industrials names neutralised returns. Positioning between sectors (which is a result of stock selection rather than a top-down
⬤
44
Harbor International FundMANAGER’S COMMENTARY—Continued
CHANGE IN A $50,000 INVESTMENT
For the period 11/01/2013 through 10/31/2023
The graph compares a $50,000 investment in the Institutional Class shares of the Fund with the performance of the MSCI EAFE (ND) Index. The Fund’s performance assumes the reinvestment of all dividend and capital gain distributions.
TOTAL RETURNS | |||
For the periods ended 10/31/2023 | |||
Annualized | |||
1 Year | 5 Years | 10 Years | |
Harbor International Fund | |||
Retirement Class1 | 15.24% | 4.56% | 2.04% |
Institutional Class | 15.14 | 4.48 | 1.99 |
Administrative Class | 14.88 | 4.22 | 1.73 |
Investor Class | 14.71 | 4.10 | 1.61 |
Comparative Index | |||
MSCI EAFE (ND) Index | 14.40% | 4.10% | 3.05% |
As stated in the Fund’s prospectus dated March 1, 2023, the expense ratios were 0.69% (Net) and 0.81% (Gross) (Retirement Class); 0.77% (Net) and 0.89% (Gross) (Institutional Class); 1.02% (Net) and 1.14% (Gross) (Administrative Class); and 1.13% (Net) and 1.25% (Gross) (Investor Class). The net expense ratios reflect an expense limitation agreement (excluding interest expense, if any) effective through 02/29/2024. The expense ratios in the prospectus may differ from the actual expense ratios for the period disclosed within this report. The expense ratios shown in the prospectus are adjusted to reflect changes, if any, in contractual arrangements that occurred prior to the date of the prospectus (or supplement thereto, if applicable).
The MSCI EAFE (ND) Index is an unmanaged index generally representative of major overseas stock markets. This unmanaged index does not reflect fees and expenses and is not available for direct investment
Performance data shown represents past performance and is no guarantee of future results. Past performance is net of management fees and expenses and reflects reinvested dividends and distributions. Past performance reflects the beneficial effect of any expense waivers or reimbursements, without which returns would have been lower. Investment returns and principal value will fluctuate and when redeemed may be worth more or less than their original cost. Returns for periods less than one year are not annualized. Current performance may be higher or lower and is available through the most recent month end at harborcapital.com or by calling 800-422-1050.
allocation decision) therefore drove returns, particularly the underweight to Health Care and overweight to Industrials.
Amongst the top relative performers over the period we find Italian bank UniCredit, which outperformed following a statement by the Chief Executive Officer that the business will be able to continue pay-outs to shareholders at the current rate for at least the next two years. The company has been returning around 60% of annual capital generated for some time. 3i Group, the U.K. based private equity company, also outperformed after having announced strong results and an increased dividend in early May. These were driven almost entirely by the company’s ownership of Dutch non-food discount retailer, Action, which has benefitted from consumers seeking better value in the current economic environment.
Amongst the positions which materially underperformed, Equinor, the Norwegian oil and gas major, is prominent. The stock fell following a moderation in oil and gas prices (on average) over the period; reducing likely earnings in the coming year and altering assumptions about the value of investment projects. The Norwegian government also found safety issues at a long-delayed project, pushing production even further into the future. U.K.-listed gaming stock, Entain, fell after the company issued a somewhat contradictory statement citing significantly softer trading conditions since the early summer, but maintaining forward guidance for the year. More broadly, many of the companies’ listed peers have also issued downbeat statements or revised guidance downwards, pointing to tougher times ahead for the industry as the cost of living continues to climb in its core markets.
OUTLOOK & STRATEGY
We remain committed to the implementation of our bottom-up analytical efforts within the capital cycle investment framework and, therefore, the Fund is seeking to invest in companies that in our view, exhibit favorable supply side dynamics with management teams that have a track record of allocating capital efficiently. Developments over the last several years, including the pandemic and outbreak of war in both Europe and, more recently, Israel, highlight the shortfalls of expending too much energy on forecasted outlooks; the portfolio managers are not looking to react to market volatility, rather placing emphasis on their longstanding investment process.
1 Retirement Class shares commenced operations on March 1, 2016. The performance attributed to the Retirement Class shares prior to that date is that of the Institutional Class shares. Performance prior to March 1, 2016 has not been adjusted to reflect the lower expenses of Retirement Class shares. During this period, Retirement Class shares would have had returns similar to, but potentially higher than, Institutional Class shares due to the fact that Retirement Class shares represent interests in the same portfolio as Institutional Class shares but are subject to lower expenses.
This report contains the current opinions of Marathon Asset Management Limited as of the date of this report and should not be considered as investment advice or a recommendation of any particular security, strategy or investment product. Such opinions are subject to change without notice and securities described herein may no longer be included in, or may at any time be removed from, the Fund’s portfolio. This report is distributed for informational purposes only. Information contained herein has been obtained from sources believed reliable, but not guaranteed.
There is no guarantee that the investment objective of the Fund will be achieved. Stock markets are volatile and equity values can decline significantly in response to adverse issuer, political, regulatory, market and economic conditions. Investing in international and emerging markets poses special risks, including potentially greater price volatility due to social, political and economic factors, as well as currency exchange rate fluctuations. These risks are more severe for securities of issuers in emerging market regions. For information on the different share classes and the risks associated with an investment in the Fund, please refer to the current prospectus.
⬤
45
Harbor International FundPORTFOLIO OF INVESTMENTS—October 31, 2023
REGION BREAKDOWN (% of investments) - Unaudited
(Excludes derivatives)
The Fund’s Portfolio of Investments include investments denominated in foreign currencies. As of October 31, 2023, there was no foreign currency denomination comprised more than 25% of the Fund’s net assets.
PORTFOLIO OF INVESTMENTS
Value and Cost in Thousands
COMMON STOCKS—98.2% | ||
Shares | Value | |
AEROSPACE & DEFENSE—1.9% | ||
95,946 | Airbus SE (France) | $12,864 |
2,122,846 | BAE Systems PLC (United Kingdom) | 28,545 |
561,342 | Melrose Industries PLC (United Kingdom) | 3,196 |
6,186,816 | Rolls-Royce Holdings PLC (United Kingdom)* | 16,285 |
60,890 | ||
AIR FREIGHT & LOGISTICS—0.3% | ||
161,598 | Oesterreichische Post AG (Austria) | 5,152 |
704,000 | Senko Group Holdings Co. Ltd. (Japan) | 4,850 |
10,002 | ||
AUTOMOBILE COMPONENTS—0.9% | ||
501,800 | Bridgestone Corp. (Japan) | 18,991 |
568,546 | Dowlais Group PLC (United Kingdom)* | 692 |
1,256,696 | Gestamp Automocion SA (Spain)1 | 4,624 |
91,530 | Hankook Tire & Technology Co. Ltd. (South Korea) | 2,597 |
899,527 | Johnson Electric Holdings Ltd. (Hong Kong) | 1,116 |
28,020 | ||
AUTOMOBILES—0.6% | ||
170,838 | Bayerische Motoren Werke AG (Germany) | 15,889 |
COMMON STOCKS—Continued | ||
Shares | Value | |
AUTOMOBILES—Continued | ||
11,485 | Hyundai Motor Co. (South Korea) | $1,447 |
17,336 | ||
BANKS—11.4% | ||
183,792 | ANZ Group Holdings Ltd. (Australia) | 2,898 |
157,064 | Axis Bank Ltd. (India) | 1,851 |
12,703,200 | Bank Central Asia Tbk. PT (Indonesia) | 6,998 |
2,988,352 | Bank of Ireland Group PLC (Ireland) | 26,781 |
18,751,368 | Barclays PLC (United Kingdom) | 30,097 |
591,375 | BNP Paribas SA (France) | 34,006 |
6,583,866 | CaixaBank SA (Spain) | 26,767 |
31,281 | Capitec Bank Holdings Ltd. (South Africa) | 2,779 |
390,062 | Close Brothers Group PLC (United Kingdom) | 3,787 |
553,134 | DBS Group Holdings Ltd. (Singapore) | 13,288 |
900,247 | DNB Bank ASA (Norway) | 16,242 |
292,800 | Fukuoka Financial Group, Inc. (Japan) | 7,740 |
550,800 | Grupo Financiero Banorte SAB de CV Class O (Mexico) | 4,462 |
123,176 | Hana Financial Group, Inc. (South Korea) | 3,582 |
120,670 | HDFC Bank Ltd. ADR (India)2 | 6,824 |
361,969 | HSBC Holdings PLC (Hong Kong) | 2,601 |
50,370,130 | Lloyds Banking Group PLC (United Kingdom) | 24,515 |
⬤
46
Harbor International FundPORTFOLIO OF INVESTMENTS—Continued
Value and Cost in Thousands
COMMON STOCKS—Continued | ||
Shares | Value | |
BANKS—Continued | ||
5,978,100 | Resona Holdings, Inc. (Japan) | $31,943 |
115,558 | Shinhan Financial Group Co. Ltd. (South Korea) | 2,970 |
1,593,537 | Standard Chartered PLC (United Kingdom) | 12,218 |
65,900 | Sumitomo Mitsui Financial Group, Inc. (Japan) | 3,177 |
712,800 | Sumitomo Mitsui Trust Holdings, Inc. (Japan) | 26,728 |
1,908,212 | Svenska Handelsbanken AB Class A (Sweden) | 16,269 |
1,872,751 | UniCredit SpA (Italy) | 46,949 |
155,000 | United Overseas Bank Ltd. (Singapore) | 3,057 |
358,529 | ||
BEVERAGES—4.5% | ||
378,400 | Arca Continental SAB de CV (Mexico) | 3,395 |
260,200 | Asahi Group Holdings Ltd. (Japan) | 9,412 |
105,952 | Carlsberg AS Class B (Denmark) | 12,627 |
175,417 | Coca-Cola Europacific Partners PLC (United States) | 10,264 |
1,310,050 | Davide Campari-Milano NV (Italy) | 14,481 |
853,380 | Diageo PLC (United Kingdom) | 32,271 |
281,024 | Heineken NV (Netherlands) | 25,248 |
2,291,300 | Kirin Holdings Co. Ltd. (Japan) | 32,200 |
7,381,600 | Thai Beverage PCL (Singapore) | 2,916 |
142,814 | ||
BIOTECHNOLOGY—0.4% | ||
88,142 | CSL Ltd. (Australia) | 13,027 |
BROADLINE RETAIL—0.2% | ||
26,198 | Naspers Ltd. Class N (South Africa)* | 4,096 |
187,124 | Vipshop Holdings Ltd. ADR (China)*,2 | 2,668 |
6,764 | ||
BUILDING PRODUCTS—1.3% | ||
1,111,821 | Assa Abloy AB Class B (Sweden) | 23,699 |
1,097,967 | Fletcher Building Ltd. (New Zealand) | 2,767 |
34,220 | Geberit AG (Switzerland) | 15,933 |
42,399 | ||
CAPITAL MARKETS—2.4% | ||
1,776,858 | 3i Group PLC (United Kingdom) | 41,894 |
1,656,900 | B3 SA - Brasil Bolsa Balcao (Brazil) | 3,648 |
505,018 | IG Group Holdings PLC (United Kingdom) | 3,923 |
2,331,099 | Jupiter Fund Management PLC (United Kingdom) | 2,227 |
6,387 | Macquarie Group Ltd. (Australia) | 656 |
3,688,100 | Nomura Holdings, Inc. (Japan) | 14,249 |
201,160 | Rathbones Group PLC (United Kingdom) | 3,670 |
475,639 | St. James’s Place PLC (United Kingdom) | 3,708 |
73,975 | ||
CHEMICALS—1.8% | ||
1,031,000 | Air Water, Inc. (Japan) | 13,000 |
583,575 | BASF SE (Germany) | 26,965 |
205,800 | Nissan Chemical Corp. (Japan) | 8,394 |
153,300 | Sumitomo Bakelite Co. Ltd. (Japan) | 6,821 |
55,180 | ||
COMMERCIAL SERVICES & SUPPLIES—1.1% | ||
132,803 | Befesa SA (Germany)1 | 3,885 |
471,935 | Brambles Ltd. (Australia) | 3,939 |
2,214,966 | Cleanaway Waste Management Ltd. (Australia) | 3,155 |
292,000 | Daiei Kankyo Co. Ltd. (Japan) | 4,031 |
351,242 | Elis SA (France) | 5,760 |
74,200 | Secom Co. Ltd. (Japan) | 5,154 |
5,769,541 | Serco Group PLC (United Kingdom) | 10,024 |
35,948 | ||
CONSTRUCTION & ENGINEERING—1.3% | ||
948,300 | INFRONEER Holdings, Inc. (Japan) | 10,003 |
1,932,900 | Obayashi Corp. (Japan) | 16,557 |
COMMON STOCKS—Continued | ||
Shares | Value | |
CONSTRUCTION & ENGINEERING—Continued | ||
1,111,200 | Penta-Ocean Construction Co. Ltd. (Japan) | $6,533 |
230,174 | Taisei Corp. (Japan) | 7,806 |
40,899 | ||
CONSTRUCTION MATERIALS—1.7% | ||
166,240 | CRH PLC (Ireland) | 8,922 |
312,048 | Holcim AG (Switzerland)* | 19,293 |
751,700 | Taiheiyo Cement Corp. (Japan) | 12,882 |
513,783 | Wienerberger AG (Austria) | 12,448 |
53,545 | ||
CONSUMER FINANCE—0.4% | ||
1,676,481 | International Personal Finance PLC (United Kingdom) | 2,668 |
479,400 | Marui Group Co. Ltd. (Japan) | 7,581 |
942,779 | Vanquis Banking Group PLC (United Kingdom) | 1,325 |
11,574 | ||
CONSUMER STAPLES DISTRIBUTION & RETAIL—1.5% | ||
158,331 | Bid Corp. Ltd. (South Africa) | 3,362 |
366,154 | HelloFresh SE (Germany)* | 8,009 |
652,175 | Koninklijke Ahold Delhaize NV (Netherlands) | 19,312 |
234,900 | MatsukiyoCocokara & Co. (Japan) | 4,121 |
643,524 | Metcash Ltd. (Australia) | 1,507 |
169,800 | Seven & i Holdings Co. Ltd. (Japan) | 6,221 |
1,128,294 | Tesco PLC (United Kingdom) | 3,702 |
95,013 | X5 Retail Group NV GDR (Russia)*,2 | — x |
46,234 | ||
CONTAINERS & PACKAGING—0.6% | ||
1,746,307 | DS Smith PLC (United Kingdom) | 6,057 |
723,000 | Toyo Seikan Group Holdings Ltd. (Japan) | 12,155 |
18,212 | ||
DISTRIBUTORS—0.4% | ||
1,650,812 | Inchcape PLC (United Kingdom) | 13,384 |
DIVERSIFIED TELECOMMUNICATION SERVICES—2.0% | ||
5,468,892 | Koninklijke KPN NV (Netherlands) | 18,382 |
37,664,300 | Nippon Telegraph & Telephone Corp. (Japan) | 44,322 |
62,704 | ||
ELECTRIC UTILITIES—0.2% | ||
101,909 | Orsted AS (Denmark)1 | 4,924 |
ELECTRICAL EQUIPMENT—3.7% | ||
796,551 | ABB Ltd. (Switzerland) | 26,762 |
136,558 | Havells India Ltd. (India) | 2,049 |
229,114 | Legrand SA (France) | 19,820 |
1,320,900 | Mitsubishi Electric Corp. (Japan) | 15,146 |
143,940 | Schneider Electric SE (France) | 22,146 |
1,418,049 | Vestas Wind Systems AS (Denmark)* | 30,736 |
116,659 | ||
ELECTRONIC EQUIPMENT, INSTRUMENTS & COMPONENTS—0.8% | ||
408,000 | Delta Electronics, Inc. (Taiwan) | 3,677 |
125,200 | Kyocera Corp. (Japan) | 6,171 |
310,100 | TDK Corp. (Japan) | 11,603 |
317,700 | Topcon Corp. (Japan) | 2,897 |
24,348 | ||
ENERGY EQUIPMENT & SERVICES—0.3% | ||
1,452,402 | John Wood Group PLC (United Kingdom)* | 2,515 |
286,974 | Technip Energies NV (France) | 6,288 |
8,803 |
⬤
47
Harbor International FundPORTFOLIO OF INVESTMENTS—Continued
Value and Cost in Thousands
COMMON STOCKS—Continued | ||
Shares | Value | |
ENTERTAINMENT—0.2% | ||
89,996 | CTS Eventim AG & Co. KGaA (Germany) | $5,449 |
FINANCIAL SERVICES—0.9% | ||
817,724 | AMP Ltd. (Australia) | 545 |
319,895 | Chailease Holding Co. Ltd. (Taiwan)* | 1,735 |
480,431 | Edenred SE (France) | 25,574 |
27,854 | ||
FOOD PRODUCTS—1.2% | ||
2,438,000 | First Pacific Co. Ltd. (Hong Kong) | 923 |
340,448 | Marico Ltd. (India) | 2,188 |
292,700 | Megmilk Snow Brand Co. Ltd. (Japan) | 4,718 |
282,100 | NH Foods Ltd. (Japan) | 8,464 |
1,452,000 | Tingyi Cayman Islands Holding Corp. (China) | 1,927 |
276,600 | Toyo Suisan Kaisha Ltd. (Japan) | 12,760 |
119,021 | Viscofan SA (Spain) | 6,880 |
37,860 | ||
GROUND TRANSPORTATION—0.3% | ||
40,500 | East Japan Railway Co. (Japan) | 2,104 |
339,073 | Localiza Rent a Car SA (Brazil) | 3,421 |
3,331,686 | Mobico Group PLC (United Kingdom) | 2,538 |
8,063 | ||
HEALTH CARE EQUIPMENT & SUPPLIES—3.3% | ||
236,815 | Coloplast AS Class B (Denmark) | 24,696 |
5,835,785 | ConvaTec Group PLC (United Kingdom)1 | 14,502 |
346,282 | Demant AS (Denmark)* | 13,214 |
132,411 | EssilorLuxottica SA (France) | 23,977 |
204,164 | Getinge AB Class B (Sweden) | 3,676 |
333,207 | Koninklijke Philips NV (Netherlands) | 6,338 |
359,229 | Smith & Nephew PLC (United Kingdom) | 4,020 |
60,809 | Sonova Holding AG (Switzerland) | 14,413 |
104,836 | ||
HEALTH CARE PROVIDERS & SERVICES—1.1% | ||
278,583 | Amplifon SpA (Italy) | 7,874 |
458,614 | Fresenius Medical Care AG & Co. KGaA (Germany) | 15,238 |
497,200 | Medipal Holdings Corp. (Japan) | 8,359 |
261,900 | Ship Healthcare Holdings, Inc. (Japan) | 4,044 |
35,515 | ||
HOTELS, RESTAURANTS & LEISURE—4.6% | ||
2,389,000 | Ajisen China Holdings Ltd. (China) | 253 |
220,501 | Aristocrat Leisure Ltd. (Australia) | 5,420 |
1,422,331 | Compass Group PLC (United Kingdom) | 35,859 |
1,579,244 | Entain PLC (United Kingdom) | 17,928 |
253,564 | Flutter Entertainment PLC (Ireland)* | 39,824 |
1,118,000 | Galaxy Entertainment Group Ltd. (Hong Kong)* | 6,285 |
123,519 | InterContinental Hotels Group PLC (United Kingdom) | 8,753 |
721,058 | Playtech PLC (United Kingdom)* | 3,443 |
7,539,613 | SSP Group PLC (United Kingdom)* | 16,501 |
1,137,776 | TUI AG (Germany)* | 5,740 |
74,608 | Yum China Holdings, Inc. (China) | 3,921 |
143,927 | ||
HOUSEHOLD DURABLES—0.9% | ||
906,616 | Barratt Developments PLC (United Kingdom) | 4,572 |
270,977 | GN Store Nord AS (Denmark)* | 4,522 |
529,600 | Midea Group Co. Ltd. Class A (China) | 3,831 |
283,700 | Sekisui Chemical Co. Ltd. (Japan) | 3,886 |
113,300 | Sony Group Corp. (Japan) | 9,419 |
2,583,844 | Taylor Wimpey PLC (United Kingdom) | 3,490 |
29,720 | ||
HOUSEHOLD PRODUCTS—0.8% | ||
398,771 | Reckitt Benckiser Group PLC (United Kingdom) | 26,681 |
COMMON STOCKS—Continued | ||
Shares | Value | |
INDUSTRIAL CONGLOMERATES—1.7% | ||
795,000 | CK Hutchison Holdings Ltd. (Hong Kong) | $4,024 |
212,270 | DCC PLC (United Kingdom) | 11,792 |
408,800 | Hitachi Ltd. (Japan) | 25,912 |
143,000 | Jardine Matheson Holdings Ltd. (Hong Kong) | 5,795 |
9,969 | LG Corp. (South Korea) | 571 |
844,800 | Nisshinbo Holdings, Inc. (Japan) | 6,111 |
54,205 | ||
INSURANCE—4.9% | ||
347,960 | Admiral Group PLC (United Kingdom) | 10,339 |
2,598,400 | AIA Group Ltd. (Hong Kong) | 22,564 |
1,004,600 | Dai-ichi Life Holdings, Inc. (Japan) | 21,222 |
190,400 | Great Eastern Holdings Ltd. (Singapore) | 2,403 |
57,024 | Hannover Rueck SE (Germany) | 12,592 |
762,106 | Hiscox Ltd. (United Kingdom) | 8,702 |
1,032,900 | Japan Post Holdings Co. Ltd. (Japan) | 9,142 |
512,004 | Mandatum OYJ (Finland)* | 1,978 |
355,500 | Ping An Insurance Group Co. of China Ltd. Class H (China) | 1,803 |
52,550 | Prudential PLC (Hong Kong) | 548 |
978,101 | Prudential PLC (United Kingdom) | 10,227 |
1,057,274 | QBE Insurance Group Ltd. (Australia) | 10,484 |
512,004 | Sampo OYJ Class A (Finland) | 20,137 |
1,010,300 | Tokio Marine Holdings, Inc. (Japan) | 22,603 |
154,744 | ||
INTERACTIVE MEDIA & SERVICES—1.0% | ||
1,221,822 | Auto Trader Group PLC (United Kingdom)1 | 9,242 |
43,889 | Baidu, Inc. ADR (China)*,2 | 4,608 |
118,714 | carsales.com Ltd. (Australia) | 2,093 |
2,822,433 | Rightmove PLC (United Kingdom) | 16,276 |
32,219 | ||
IT SERVICES—1.9% | ||
62,487 | Alten SA (France) | 7,382 |
174,990 | Infosys Ltd. ADR (India)2 | 2,873 |
336,800 | NEC Corp. (Japan) | 16,217 |
466,900 | NET One Systems Co. Ltd. (Japan) | 7,126 |
197,800 | NS Solutions Corp. (Japan) | 5,744 |
21,929 | Reply SpA (Italy) | 2,069 |
555,700 | SCSK Corp. (Japan) | 9,486 |
201,375 | Softcat PLC (United Kingdom) | 3,102 |
109,298 | Tata Consultancy Services Ltd. (India) | 4,429 |
58,428 | ||
LEISURE PRODUCTS—0.4% | ||
47,059 | MIPS AB (Sweden) | 1,160 |
711,500 | Sega Sammy Holdings, Inc. (Japan) | 11,128 |
12,288 | ||
LIFE SCIENCES TOOLS & SERVICES—0.5% | ||
200,692 | Eurofins Scientific SE (France) | 10,182 |
75,597 | Gerresheimer AG (Germany) | 7,051 |
17,233 | ||
MACHINERY—5.0% | ||
158,099 | Alfa Laval AB (Sweden) | 5,124 |
155,467 | ANDRITZ AG (Austria) | 7,156 |
1,880,307 | CNH Industrial NV (Italy) | 20,838 |
399,000 | Daifuku Co. Ltd. (Japan) | 6,593 |
933,197 | Fluidra SA (Spain) | 16,453 |
151,009 | GEA Group AG (Germany) | 5,165 |
569,608 | Iveco Group NV (Italy)* | 4,801 |
195,300 | Komatsu Ltd. (Japan) | 4,487 |
357,000 | Kubota Corp. (Japan) | 4,801 |
486,500 | Mitsubishi Heavy Industries Ltd. (Japan) | 25,057 |
251,800 | Miura Co. Ltd. (Japan) | 4,882 |
621,800 | NSK Ltd. (Japan) | 3,347 |
⬤
48
Harbor International FundPORTFOLIO OF INVESTMENTS—Continued
Value and Cost in Thousands
COMMON STOCKS—Continued | ||
Shares | Value | |
MACHINERY—Continued | ||
1,339,584 | Rotork PLC (United Kingdom) | $4,790 |
605,712 | Sandvik AB (Sweden) | 10,317 |
1,061,100 | Sany Heavy Industry Co. Ltd. Class A (China) | 2,098 |
120,137 | Stabilus SE (Germany) | 7,628 |
639,500 | Techtronic Industries Co. Ltd. (Hong Kong) | 5,838 |
121,100 | Toyota Industries Corp. (Japan) | 8,975 |
492,710 | Wartsila OYJ Abp (Finland) | 5,880 |
1,124,000 | Weichai Power Co. Ltd. Class H (China) | 1,682 |
155,912 | ||
MARINE TRANSPORTATION—0.2% | ||
1,112,101 | Irish Continental Group PLC (Ireland) | 5,074 |
MEDIA—1.9% | ||
984,200 | Fuji Media Holdings, Inc. (Japan) | 9,775 |
544,957 | Future PLC (United Kingdom) | 5,884 |
396,500 | Hakuhodo DY Holdings, Inc. (Japan) | 3,218 |
10,876,302 | ITV PLC (United Kingdom) | 8,469 |
355,400 | JCDecaux SE (France)* | 5,560 |
708,000 | Nippon Television Holdings, Inc. (Japan) | 6,888 |
88,221 | Schibsted ASA Class A (Norway) | 1,767 |
40,001 | Schibsted ASA Class B (Norway) | 742 |
439,600 | TBS Holdings, Inc. (Japan) | 7,166 |
334,353 | Viaplay Group AB Class B (Sweden)* | 717 |
1,125,954 | WPP PLC (United Kingdom) | 9,696 |
59,882 | ||
METALS & MINING—4.2% | ||
475,677 | Acerinox SA (Spain) | 4,634 |
221,595 | African Rainbow Minerals Ltd. (South Africa) | 1,826 |
796,035 | ArcelorMittal SA (France) | 17,614 |
643,682 | BHP Group Ltd. (Australia) | 18,221 |
282,326 | BlueScope Steel Ltd. (Australia) | 3,384 |
183,900 | Dowa Holdings Co. Ltd. (Japan) | 5,622 |
1,807,093 | Evolution Mining Ltd. (Australia) | 4,042 |
124,339 | First Quantum Minerals Ltd. (Canada) | 1,441 |
6,710,104 | Glencore PLC (United Kingdom) | 35,542 |
56,664 | Newmont Corp. CDI (Australia)*,2 | 2,171 |
657,673 | Pilbara Minerals Ltd. (Australia) | 1,545 |
355,657 | Rio Tinto PLC (United Kingdom) | 22,691 |
217,215 | Severstal PAO GDR (Russia)*,2 | — x |
56,256 | Southern Copper Corp. (Peru) | 3,989 |
337,700 | Sumitomo Metal Mining Co. Ltd. (Japan) | 9,487 |
132,209 | ||
OIL, GAS & CONSUMABLE FUELS—4.7% | ||
12,825,388 | BP PLC (United Kingdom) | 78,312 |
993,996 | Equinor ASA (Norway) | 33,322 |
1,157,700 | Inpex Corp. (Japan) | 16,799 |
201,606 | PRIO SA (Brazil)* | 1,907 |
1,817,580 | Santos Ltd. (Australia) | 8,869 |
365,329 | Woodside Energy Group Ltd. (Australia) | 7,957 |
147,166 | ||
PAPER & FOREST PRODUCTS—0.3% | ||
1,862,700 | Oji Holdings Corp. (Japan) | 7,967 |
PASSENGER AIRLINES—0.5% | ||
36,247 | Copa Holdings SA Class A (Panama) | 2,960 |
1,630,211 | easyJet PLC (United Kingdom)* | 7,272 |
1,709,820 | Qantas Airways Ltd. (Australia)* | 5,357 |
15,589 | ||
PERSONAL CARE PRODUCTS—0.1% | ||
313,547 | Dabur India Ltd. (India) | 1,992 |
910,500 | L’Occitane International SA (Hong Kong) | 2,340 |
4,332 |
COMMON STOCKS—Continued | ||
Shares | Value | |
PHARMACEUTICALS—5.2% | ||
1,080,141 | Novo Nordisk AS Class B (Denmark) | $104,208 |
201,715 | Roche Holding AG (Switzerland) | 51,984 |
331,500 | Tsumura & Co. (Japan) | 5,931 |
162,123 | ||
PROFESSIONAL SERVICES—3.7% | ||
484,069 | ALS Ltd. (Australia) | 3,313 |
8,237,166 | Capita PLC (United Kingdom)* | 1,680 |
515,510 | Experian PLC (United Kingdom) | 15,640 |
3,403,289 | Hays PLC (United Kingdom) | 3,988 |
485,737 | Intertek Group PLC (United Kingdom) | 22,623 |
296,138 | IPH Ltd. (Australia) | 1,287 |
1,996,609 | Pagegroup PLC (United Kingdom) | 9,150 |
3,022,700 | Persol Holdings Co. Ltd. (Japan) | 4,532 |
185,103 | Randstad NV (Netherlands) | 9,585 |
1,104,128 | RELX PLC (United Kingdom) | 38,565 |
587,054 | RWS Holdings PLC (United Kingdom) | 1,485 |
61,900 | TechnoPro Holdings, Inc. (Japan) | 1,226 |
30,867 | Teleperformance SE (France) | 3,551 |
116,625 | ||
REAL ESTATE MANAGEMENT & DEVELOPMENT—0.9% | ||
833,700 | Daiwa House Industry Co. Ltd. (Japan) | 22,931 |
737,000 | Swire Pacific Ltd. Class A (Hong Kong) | 4,708 |
27,639 | ||
SEMICONDUCTORS & SEMICONDUCTOR EQUIPMENT—1.7% | ||
49,292 | ASML Holding NV (Netherlands) | 29,631 |
125,100 | ASMPT Ltd. (Hong Kong) | 1,060 |
84,000 | MediaTek, Inc. (Taiwan) | 2,192 |
1,052,400 | Renesas Electronics Corp. (Japan)* | 13,824 |
467,000 | Taiwan Semiconductor Manufacturing Co. Ltd. (Taiwan) | 7,627 |
54,334 | ||
SOFTWARE—0.2% | ||
100,300 | Oracle Corp. (Japan) | 7,115 |
SPECIALTY RETAIL—1.3% | ||
367,600 | ABC-Mart, Inc. (Japan) | 5,694 |
3,987,400 | Esprit Holdings Ltd. (Hong Kong)* | 169 |
1,543,647 | Pets at Home Group PLC (United Kingdom) | 5,278 |
328,600 | USS Co. Ltd. (Japan) | 5,743 |
461,379 | WH Smith PLC (United Kingdom) | 6,517 |
991,000 | Zhongsheng Group Holdings Ltd. (China) | 2,288 |
737,800 | ZOZO, Inc. (Japan) | 14,029 |
39,718 | ||
TECHNOLOGY HARDWARE, STORAGE & PERIPHERALS—0.7% | ||
378,557 | Advantech Co. Ltd. (Taiwan) | 3,888 |
86,463 | Logitech International SA (Switzerland) | 6,805 |
70,916 | Quadient SA (France) | 1,483 |
221,568 | Samsung Electronics Co. Ltd. (South Korea) | 11,028 |
23,204 | ||
TEXTILES, APPAREL & LUXURY GOODS—1.8% | ||
82,346 | adidas AG (Germany) | 14,642 |
32,404 | Cie Financiere Richemont SA Class A (South Africa) | 3,855 |
236,088 | Cie Financiere Richemont SA Class A (Switzerland) | 27,853 |
273,500 | Li Ning Co. Ltd. (China) | 838 |
1,378,200 | Samsonite International SA (Hong Kong)*,1 | 4,268 |
277,418 | Shenzhou International Group Holdings Ltd. (China) | 2,725 |
948,521 | Stella International Holdings Ltd. (Hong Kong) | 1,071 |
55,252 | ||
TRADING COMPANIES & DISTRIBUTORS—1.8% | ||
312,700 | BOC Aviation Ltd. (China)1 | 1,923 |
274,537 | Brenntag SE (Germany) | 20,415 |
⬤
49
Harbor International FundPORTFOLIO OF INVESTMENTS—Continued
Value and Cost in Thousands
COMMON STOCKS—Continued | ||
Shares | Value | |
TRADING COMPANIES & DISTRIBUTORS—Continued | ||
466,411 | Bunzl PLC (United Kingdom) | $16,640 |
342,500 | ITOCHU Corp. (Japan) | 12,337 |
277,137 | Rexel SA (France) | 5,660 |
56,975 | ||
TRANSPORTATION INFRASTRUCTURE—0.5% | ||
336,926 | Getlink SE (France) | 5,441 |
210,622 | Grupo Aeroportuario del Pacifico SAB de CV Class B (Mexico) | 2,459 |
268,200 | Mitsubishi Logistics Corp. (Japan) | 7,016 |
14,916 | ||
WIRELESS TELECOMMUNICATION SERVICES—0.1% | ||
154,500 | KDDI Corp. (Japan) | 4,622 |
TOTAL COMMON STOCKS (Cost $2,835,961) | 3,085,846 |
PREFERRED STOCKS—0.3% | ||
Shares | Value | |
(Cost $15,546) | ||
AUTOMOBILES—0.3% | ||
100,236 | Volkswagen AG (Germany) | $10,630 |
TOTAL INVESTMENTS—98.5% (Cost $2,851,507) | 3,096,476 | |
CASH AND OTHER ASSETS, LESS LIABILITIES—1.5% | 46,732 | |
TOTAL NET ASSETS—100% | $3,143,208 |
RIGHTS/WARRANTS | |||||
Description | Shares | Strike Price | Expiration Date | Cost (000s) | Value (000s) |
Cie Financiere Richemont SA (South Africa)* | 74,788 | CHF 67.00 | 11/22/2023 | $— | $49 |
Localiza Rent a Car SA (Brazil)* | 2,506 | BRL 47.13 | 11/09/2023 | — | 4 |
Total Rights/Warrants | $53 |
⬤
50
Harbor International FundPORTFOLIO OF INVESTMENTS—Continued
FAIR VALUE MEASUREMENTS
The following table summarizes the Fund’s investments as of October 31, 2023 based on the inputs used to value them.
Asset Category | Quoted Prices Level 1 (000s) | Other Significant Observable Inputs Level 2 (000s) | Significant Unobservable Inputs Level 3 (000s) | Total (000s) |
Investments in Securities | ||||
Common Stocks | ||||
Africa | $— | $15,918 | $— | $15,918 |
Europe | 1,978 | 1,972,113 | — | 1,974,091 |
Latin America | 26,241 | — | — | 26,241 |
Middle East/Central Asia | 9,697 | 34,704 | — | 44,401 |
North America | 11,705 | — | — | 11,705 |
Pacific Basin | 13,368 | 1,000,122 | — | 1,013,490 |
Preferred Stocks | ||||
Europe | — | 10,630 | — | 10,630 |
Total Investments in Securities | $62,989 | $3,033,487 | $— | $3,096,476 |
Financial Derivative Instruments - Assets | ||||
Rights/Warrants | $53 | $— | $— | $53 |
Total Investments | $63,042 | $3,033,487 | $— | $3,096,529 |
For more information on valuation inputs and their aggregation into the levels identified above, please refer to the Fair Value Measurements and Disclosures in Note 2 of the accompanying Notes to Portfolios of Investments.
The following is a rollforward of the Fund’s Level 3 investments during the year ended October 31, 2023. Transfers into or out of Level 3, if any, are recognized as of the last day in the fiscal quarter of the period in which the event or change in circumstances that caused the reclassification occurred.
Valuation Description | Beginning Balance as of 11/01/2022 (000s) | Purchases (000s) | Sales (000s) | Discount/ (Premium) (000s) | Total Realized Gain/(Loss) (000s) | Change in Unrealized Appreciation/ (Depreciation) (000s) | Transfers Into Level 3 (000s) | Transfers Out of Level 3 (000s) | Ending Balance as of 10/31/2023 (000s) | Unrealized Gain/(Loss) as of 10/31/2023 (000s) |
Common Stock | $— | $— | $— | $— | $— | $— | $— | $— | $— | $(7,678) |
The following is a summary of significant unobservable inputs used in the fair valuations of assets and liabilities categorized within Level 3 of the fair value hierarchy.
Valuation Descriptions | Ending Balance as of 10/31/23 (000s) | Valuation Technique | Unobservable Input(s) | Input Value(s) |
Investments in Securities | ||||
Common Stocks | ||||
Severstal PAO GDR (Russia)* | $— | Market Approach | Estimated Recovery Value | USD 0.00 |
X5 Retail Group NV GDR (Russia)* | — | Market Approach | Estimated Recovery Value | USD 0.00 |
$— |
*
Non-income producing security
x
Fair valued in accordance with Harbor Funds' Valuation Procedures.
1
Securities purchased in a transaction exempt from registration under Rule 144A of the Securities Act of 1933. These securities may be resold in transactions exempt from registration, normally to qualified institutional buyers. The Fund has no right to demand registration of these securities. As of October 31, 2023, the aggregate value of these securities was $43,368 or 1% of net assets.
2
Depositary receipts such as American Depositary Receipts (ADRs), Global Depositary Receipts (GDRs) and other country specific depositary receipts are certificates evidencing ownership of shares of a foreign issuer. These certificates are issued by depositary banks and generally trade on an established market in the U.S. or elsewhere.
BRL
Brazilian Real
CHF
Swiss Franc
The accompanying notes are an integral part of the Financial Statements.
⬤
51
Harbor International Core FundMANAGER’S COMMENTARY (Unaudited)
SUBADVISOR
Acadian Asset Management LLC
Management’s Discussion of
Fund Performance
Fund Performance
MARKET REVIEW
Over the past 12-month period ended October 31, 2023, the global equity market has experienced a dynamic and eventful period. In the fourth quarter of 2022, equities surged, fueled by a strong performance in October and November, though December saw a slight sell-off. Both developed and emerging markets performed well, driven by factors like cooling inflation, a robust job market, and a weakened U.S. dollar. The anticipation of a slowdown in rate hikes by the Federal Reserve also buoyed investor sentiment. Central banks globally responded with measures to ease rate increases. Eurozone inflation softened due to declining energy prices but concerns about persistently high global inflation persisted.
In the first quarter of 2023, equities gained with both developed and emerging markets continuing their strong performance. Central banks maintained rate hikes in response to inflation levels remaining above target rates. Geopolitical tensions, particularly in Russia-Ukraine and U.S.-China relations, added an extra layer of uncertainty. The reopening of the Chinese economy provided a significant boost, and despite weak economic forecasts and banking turmoil, stocks gained due to reduced inflation fears and falling energy prices. However, the shutdown of Silicon Valley Bank and the subsequent financial turbulence rattled the markets.
The second quarter of 2023 for in global equities was marked by fluctuations in April and May, and a strong rally in June. Although global inflation concerns diminished with falling energy prices, core inflation remained persistent, leading major central banks to maintain a hawkish stance. Japanese equities stood out within developed markets due to supportive policies from the Bank of Japan, in contrast to the continuous rate hikes pursued by other developed markets. The debt ceiling impasse in the U.S. affected investor sentiment, and Chinese equities exerted pressure on emerging market returns. However, a significant rally in June was driven by anticipation of additional economic stimulus.
In the third quarter of 2023, global equities experienced a decline. Modest increases in July were followed by a downturn in August and September, primarily due to rising interest rates and a surge in oil prices. Challenges were exacerbated by the possibility of a U.S. government shutdown, keeping investors on the sidelines. China’s macroeconomic weaknesses, particularly in the property sector, weighed heavily on global markets. Japanese equities continued to outperform, benefiting from the Bank of Japan’s accommodative policy, while core inflation remained resistant to decline. These quarters collectively illustrate the intricate interplay of global economic forces, central bank policies, geopolitical tensions, and industry-specific events in shaping equity market performance.
PERFORMANCE
Harbor International Core Fund returned 8.35% (Retirement Class), 8.31% (Institutional Class), and 7.80% (Investor Class) for the year ended October 31, 2023, while the MSCI EAFE (ND) Index returned 14.40% during the same period.
Performance relative to the benchmark was driven by both favorable stock selection in countries and sectors, as well as country allocations.
From a stock selection perspective, the Fund benefited from selections in Spain consumer discretionary and Danish health care stocks, respectively led by positions in Industria de Diseno Textil and Novo Nordisk. Both securities were up for the year and added 63 basis points (“bps”) and 50 bps of positive contribution, respectively.
⬤
52
Harbor International Core FundMANAGER’S COMMENTARY—Continued
CHANGE IN A $50,000 INVESTMENT
For the period 03/01/2019 through 10/31/2023
The graph compares a $50,000 investment in the Institutional Class shares of the Fund with the performance of the MSCI EAFE (ND) Index. The Fund’s performance assumes the reinvestment of all dividend and capital gain distributions.
TOTAL RETURNS | |||
For the periods ended 10/31/2023 | |||
Annualized | |||
1 Year | 5 Years | Life of Fund | |
Harbor International Core Fund | |||
Retirement Class1 | 8.35% | N/A | 4.88% |
Institutional Class1 | 8.31 | N/A | 4.80 |
Investor Class1 | 7.80 | N/A | 4.40 |
Comparative Index | |||
MSCI EAFE (ND) Index1 | 14.40% | N/A | 3.55% |
As stated in the Fund’s prospectus dated March 1, 2023, the expense ratios were 0.77% (Net) and 1.16% (Gross) (Retirement Class); 0.85% (Net) and 1.24% (Gross) (Institutional Class); 1.10% (Net) and 1.49% (Gross) (Administrative Class); and 1.21% (Net) and 1.60% (Gross)(Investor Class). The net expense ratios reflect an expense limitation agreement (excluding interest expense, if any) effective through 02/29/2024. The expense ratios in the prospectus may differ from the actual expense ratios for the period disclosed within this report. The expense ratios shown in the prospectus are adjusted to reflect changes, if any, in contractual arrangements that occurred prior to the date of the prospectus (or supplement thereto, if applicable).
The MSCI EAFE (ND) Index is an unmanaged index generally representative of major overseas stock markets. This unmanaged index does not reflect fees and expenses and is not available for direct investment.
Performance data shown represents past performance and is no guarantee of future results. Past performance is net of management fees and expenses and reflects reinvested dividends and distributions. Past performance reflects the beneficial effect of any expense waivers or reimbursements, without which returns would have been lower. Investment returns and principal value will fluctuate and when redeemed may be worth more or less than their original cost. Returns for periods less than one year are not annualized. Current performance may be higher or lower and is available through the most recent month end at harborcapital.com or by calling 800-422-1050.
Selections in Australia and the materials sector added 90 bps of negative contribution to return. Two securities had the largest negative contribution which are Equinor and Roche Holding which both underperformed within the portfolio for the year.
OUTLOOK & STRATEGY
Globally, most economies continue to grow despite a range of headwinds, including high rates and persistent inflation. This growth has not been equally distributed, however, with Germany in a modest recession, and China struggling to regain its former footing. Inflation continues to soften in many major economies but remains well above central banks’ targets. In the U.K., the decline has been particularly sharp, with inflation falling in August. In the euro area, inflation ticked lower in August as well. In the U.S., however, surging gas prices lifted inflation in August. As a group, emerging markets started raising interest rates sooner and thus have more room to cut rates to stimulate growth. Europe’s declines in inflation coincide with an apparent end of rate hikes. The European Central Bank raised rates in September, the highest level in the ECB’s quarter-century of existence but indicated that may be enough. For its part, the Bank of England held rates steady at its latest meeting – the first such outcome after two years of increases. The Federal Reserve kept rates unchanged at its September meeting but currently projects one further rate hike this year. Whether interest rates have already reached their peak or still have further to go, they are expected to fall from their current, “restrictive” level at a pace much slower than that at which they rose. Additionally, oil prices rose steadily through the quarter as OPEC supply cuts began to bite.
We update our investment process on a continuous basis across model enhancements, risk controls and implementation. We believe our targeted focus, along with our disciplined and granular process, should allow us to add value for our clients.
1 The “Life of Fund” return as shown reflects the period 03/01/2019 (commencement of operations) through 10/31/2023.
This report contains the current opinions of Acadian Asset Management LLC as of the date of this report and should not be considered as investment advice or a recommendation of any particular security, strategy or investment product. Such opinions are subject to change without notice and securities described herein may no longer be included in, or may at any time be removed from, the Fund’s portfolio. This report is distributed for informational purposes only. Information contained herein has been obtained from sources believed reliable, but not guaranteed.
There is no guarantee that the investment objective of the Fund will be achieved. Stock markets are volatile and equity values can decline significantly in response to adverse issuer, political, regulatory, market and economic conditions. Investing in international and emerging markets poses special risks, including potentially greater price volatility due to social, political and economic factors, as well as currency exchange rate fluctuations. These risks are more severe for securities of issuers in emerging market regions. For information on the different share classes and the risks associated with an investment in the Fund, please refer to the current prospectus.
⬤
53
Harbor International Core FundPORTFOLIO OF INVESTMENTS—October 31, 2023
REGION BREAKDOWN (% of investments) - Unaudited
(Excludes short-term investments)
The Fund’s Portfolio of Investments include investments denominated in foreign currencies. As of October 31, 2023, 27.95% of the Fund’s investments were denominated in Euros. No other foreign currency denomination comprised more than 25% of the Fund’s net assets.
PORTFOLIO OF INVESTMENTS
Value and Cost in Thousands
COMMON STOCKS—99.2% | ||
Shares | Value | |
AEROSPACE & DEFENSE—1.9% | ||
1,128 | Dassault Aviation SA (France) | $224 |
27,811 | Leonardo SpA (Italy) | 420 |
2,713 | MDA Ltd. (United States)* | 22 |
12,645 | QinetiQ Group PLC (United Kingdom) | 51 |
226,758 | Rolls-Royce Holdings PLC (United Kingdom)* | 597 |
8,671 | Thales SA (France) | 1,280 |
2,594 |
COMMON STOCKS—Continued | ||
Shares | Value | |
AIR FREIGHT & LOGISTICS—0.6% | ||
4,934 | DSV AS (Denmark) | $737 |
23,727 | Gulf Warehousing Co. (Qatar) | 20 |
5,800 | KRS Corp. (Japan) | 37 |
794 | ||
AUTOMOBILE COMPONENTS—0.2% | ||
8,172 | Bulten AB (Sweden) | 46 |
⬤
54
Harbor International Core FundPORTFOLIO OF INVESTMENTS—Continued
Value and Cost in Thousands
COMMON STOCKS—Continued | ||
Shares | Value | |
AUTOMOBILE COMPONENTS—Continued | ||
8,700 | Ichikoh Industries Ltd. (Japan) | $30 |
28,000 | Johnson Electric Holdings Ltd. (Hong Kong) | 35 |
8,986 | Martinrea International, Inc. (Canada) | 74 |
6,500 | Thai Stanley Electric PCL NVDR (Thailand)1 | 32 |
217 | ||
AUTOMOBILES—4.3% | ||
39,200 | Honda Motor Co. Ltd. (Japan) | 402 |
331,400 | Nissan Motor Co. Ltd. (Japan) | 1,275 |
168,686 | Stellantis NV (United States) | 3,152 |
49,000 | Subaru Corp. (Japan) | 848 |
2,200 | Suzuki Motor Corp. (Japan) | 85 |
5,762 | ||
BANKS—4.9% | ||
124,035 | ANZ Group Holdings Ltd. (Australia) | 1,956 |
5,700 | Awa Bank Ltd. (Japan) | 95 |
5,613 | Banca Popolare di Sondrio SPA (Italy) | 30 |
150,900 | Bangkok Bank PCL NVDR (Thailand)1 | 661 |
741,065 | Bank Danamon Indonesia Tbk. PT (Indonesia) | 128 |
27,805 | CaixaBank SA (Spain) | 113 |
2,463,000 | China Construction Bank Corp. Class H (China) | 1,393 |
32,260 | Commercial Bank of Dubai PSC (United Arab Emirates) | 41 |
4,300 | Ehime Bank Ltd. (Japan) | 32 |
69,850 | Emirates NBD Bank PJSC (United Arab Emirates) | 322 |
7,317 | Erste Group Bank AG (Austria) | 262 |
53,361 | Faisal Islamic Bank of Egypt (Egypt) | 53 |
22,400 | Hyakugo Bank Ltd. (Japan) | 85 |
3,700 | Musashino Bank Ltd. (Japan) | 70 |
22,000 | North Pacific Bank Ltd. (Japan) | 57 |
14,933 | Raiffeisen Bank International AG (Austria)* | 216 |
3,400 | Shikoku Bank Ltd. (Japan) | 24 |
28,128 | Skandinaviska Enskilda Banken AB Class A (Sweden) | 314 |
72,025 | Standard Chartered PLC (United Kingdom) | 552 |
1,633,800 | TMBThanachart Bank PCL NVDR (Thailand)1 | 76 |
11,100 | Towa Bank Ltd. (Japan) | 50 |
6,530 | ||
BEVERAGES—0.1% | ||
56,842 | Australian Vintage Ltd. (Australia) | 14 |
3,442 | Coca-Cola HBC AG (Italy) | 89 |
14,638 | Ginebra San Miguel, Inc. (Philippines) | 44 |
147 | ||
BIOTECHNOLOGY—0.0% | ||
6,200 | Takara Bio, Inc. (Japan) | 55 |
BROADLINE RETAIL—0.6% | ||
16,308 | Max Stock Ltd. (Israel) | 25 |
1,820 | MINISO Group Holding Ltd. ADR (China)1 | 46 |
54,816 | Vipshop Holdings Ltd. ADR (China)*,1 | 782 |
853 | ||
BUILDING PRODUCTS—1.4% | ||
300 | BRC Asia Ltd. (Singapore) | — |
31,743 | Cie de Saint-Gobain SA (France) | 1,728 |
5,400 | Maezawa Kasei Industries Co. Ltd. (Japan) | 53 |
1,300 | Nichias Corp. (Japan) | 26 |
4,400 | Okabe Co. Ltd. (Japan) | 20 |
255 | ROCKWOOL AS Class B (Denmark) | 57 |
1,900 | Shin Nippon Air Technologies Co. Ltd. (Japan) | 29 |
1,913 | ||
CAPITAL MARKETS—4.0% | ||
318 | Cie Financiere Tradition SA (Switzerland) | 40 |
9,234 | Deutsche Boerse AG (Germany) | 1,520 |
2,082 | Fiducian Group Ltd. (Australia) | 7 |
COMMON STOCKS—Continued | ||
Shares | Value | |
CAPITAL MARKETS—Continued | ||
2,256 | Foresight Group Holdings Ltd. (United Kingdom) | $10 |
5,971 | Futu Holdings Ltd. ADR (Hong Kong)*,1 | 331 |
83,841 | Investec PLC (United Kingdom) | 465 |
4,100 | IwaiCosmo Holdings, Inc. (Japan) | 49 |
41,100 | Japan Exchange Group, Inc. (Japan) | 813 |
131,408 | Man Group PLC (United Kingdom) | 351 |
230 | Partners Group Holding AG (Switzerland) | 243 |
32,767 | Schroders PLC (United Kingdom) | 148 |
1,352 | Titanium OYJ (Finland) | 23 |
27,500 | TMX Group Ltd. (Canada) | 573 |
33,313 | UBS Group AG (Switzerland) | 783 |
5,356 | ||
CHEMICALS—1.0% | ||
2,500 | Achilles Corp. (Japan) | 26 |
1,200 | Asahi Yukizai Corp. (Japan) | 29 |
5,600 | Carlit Holdings Co. Ltd. (Japan) | 36 |
2,900 | Dai Nippon Toryo Co. Ltd. (Japan) | 18 |
89,325 | Danakali Ltd. (Australia)* | 23 x |
2,900 | Fujimori Kogyo Co. Ltd. (Japan) | 73 |
800 | Hodogaya Chemical Co. Ltd. (Japan) | 16 |
2,800 | Ishihara Sangyo Kaisha Ltd. (Japan) | 26 |
4,600 | Koatsu Gas Kogyo Co. Ltd. (Japan) | 23 |
492 | KPX Chemical Co. Ltd. (South Korea) | 16 |
2,800 | Kyowa Leather Cloth Co. Ltd. (Japan) | 12 |
2,000 | MORESCO Corp. (Japan) | 16 |
4,200 | Nihon Parkerizing Co. Ltd. (Japan) | 30 |
2,200 | Nippon Carbide Industries Co., Inc. (Japan) | 25 |
1,300 | Okura Industrial Co. Ltd. (Japan) | 24 |
80,933 | Orica Ltd. (Australia) | 756 |
7,100 | Riken Technos Corp. (Japan) | 41 |
5,600 | Sekisui Kasei Co. Ltd. (Japan) | 16 |
600 | Soken Chemical & Engineering Co. Ltd. (Japan) | 9 |
1,100 | Sumitomo Seika Chemicals Co. Ltd. (Japan) | 34 |
9,600 | Tokuyama Corp. (Japan) | 146 |
1,395 | ||
COMMERCIAL SERVICES & SUPPLIES—0.8% | ||
4,000 | Aeon Delight Co. Ltd. (Japan) | 88 |
800 | Ajis Co. Ltd. (Japan) | 12 |
4,000 | Azienda Bresciana Petroli Nocivelli SpA (Italy) | 16 |
48,769 | Brambles Ltd. (Australia) | 407 |
1,074 | Cewe Stiftung & Co. KGAA (Germany) | 97 |
340 | Fursys, Inc. (South Korea) | 7 |
2,746 | GL Events SACA (France) | 47 |
17,217 | Johnson Service Group PLC (United Kingdom) | 27 |
14,200 | Kokuyo Co. Ltd. (Japan) | 220 |
1,800 | Kyodo Printing Co. Ltd. (Japan) | 38 |
8,961 | Mears Group PLC (United Kingdom) | 28 |
5,900 | Prestige International, Inc. (Japan) | 24 |
1,900 | Sato Holdings Corp. (Japan) | 26 |
1,501 | SPIE SA (France) | 40 |
2,500 | Takara & Co. Ltd. (Japan) | 40 |
1,117 | ||
COMMUNICATIONS EQUIPMENT—0.0% | ||
1,712 | EVS Broadcast Equipment SA (Belgium) | 48 |
CONSTRUCTION & ENGINEERING—0.5% | ||
8,889 | ACS Actividades de Construccion y Servicios SA (Spain) | 321 |
336,000 | Analogue Holdings Ltd. (Hong Kong) | 57 |
13,188 | Boustead Singapore Ltd. (Singapore) | 8 |
305 | Burkhalter Holding AG (Switzerland) | 29 |
18,032 | Costain Group PLC (United Kingdom) | 11 |
5,000 | Dai-Ichi Cutter Kogyo KK (Japan) | 40 |
424 | HOCHTIEF AG (Germany) | 44 |
3,816 | Lycopodium Ltd. (Australia) | 22 |
⬤
55
Harbor International Core FundPORTFOLIO OF INVESTMENTS—Continued
Value and Cost in Thousands
COMMON STOCKS—Continued | ||
Shares | Value | |
CONSTRUCTION & ENGINEERING—Continued | ||
905 | Morgan Sindall Group PLC (United Kingdom) | $21 |
3,722 | Orascom Construction PLC (United Arab Emirates) | 20 |
133,009 | SRG Global Ltd. (Australia) | 52 |
3,600 | Tobishima Corp. (Japan) | 33 |
7,700 | Tomoe Corp. (Japan) | 30 |
5,400 | Toyo Engineering Corp. (Japan)* | 21 |
709 | ||
CONSTRUCTION MATERIALS—2.8% | ||
4,100 | Asia Pile Holdings Corp. (Japan) | 20 |
13,352 | Breedon Group PLC (United Kingdom) | 51 |
3,663 | Buzzi SpA (Italy) | 97 |
22,877 | Heidelberg Materials AG (Germany) | 1,661 |
75,220 | James Hardie Industries PLC CDI (United States)*,1 | 1,877 |
12,394 | Qatar National Cement Co. QSC (Qatar) | 12 |
4,000 | Shinagawa Refractories Co. Ltd. (Japan) | 39 |
33,984 | Sigmaroc PLC (United Kingdom)* | 20 |
29,705 | Wagners Holding Co. Ltd. (Australia)* | 17 |
3,794 | ||
CONSUMER STAPLES DISTRIBUTION & RETAIL—0.3% | ||
3,400 | Axial Retailing, Inc. (Japan) | 87 |
9,200 | Beshom Holdings Bhd. (Malaysia) | 2 |
16,210 | Eurocash SA (Poland) | 54 |
19,800 | Kitwave Group PLC (United Kingdom) | 60 |
500 | Lawson, Inc. (Japan) | 24 |
2,600 | Mitsubishi Shokuhin Co. Ltd. (Japan) | 69 |
3,600 | Orsero SpA (Italy) | 56 |
2,700 | Qol Holdings Co. Ltd. (Japan) | 31 |
1,300 | Toho Co. Ltd. (Japan) | 27 |
410 | ||
CONTAINERS & PACKAGING—0.1% | ||
18,631 | Orora Ltd. (Australia) | 29 |
6,177 | Pro-Pacific Packaging Ltd. (Australia)* | 1 |
39,400 | PSC Corp. Ltd. (Singapore) | 9 |
1,900 | Richards Packaging Income Fund (Canada) | 46 |
9,900 | Thantawan Industry PCL NVDR (Thailand)1 | 7 |
579 | Vetropack Holding AG Class A (Switzerland) | 23 |
115 | ||
DISTRIBUTORS—0.0% | ||
52,861 | Smiths News PLC (United Kingdom) | 31 |
DIVERSIFIED CONSUMER SERVICES—0.1% | ||
1,533 | JLS Co. Ltd. (South Korea) | 8 |
30,798 | Me Group International PLC (United Kingdom) | 53 |
2,713 | MegaStudy Co. Ltd. (South Korea) | 22 |
3,700 | Tear Corp. (Japan) | 11 |
94 | ||
DIVERSIFIED TELECOMMUNICATION SERVICES—0.0% | ||
604 | Magyar Telekom Telecommunications PLC ADR (Hungary)1 | 5 |
3,800 | Vision, Inc. (Japan)* | 34 |
39 | ||
ELECTRIC UTILITIES—0.2% | ||
1,171 | BKW AG (Switzerland) | 197 |
ELECTRICAL EQUIPMENT—1.7% | ||
43,332 | ABB Ltd. (Switzerland) | 1,456 |
5,600 | Chiyoda Integre Co. Ltd. (Japan) | 103 |
59,300 | Mitsubishi Electric Corp. (Japan) | 680 |
2,500 | Sinfonia Technology Co. Ltd. (Japan) | 26 |
51,000 | Xingye Alloy Materials Group Ltd. (China)* | 7 |
2,272 |
COMMON STOCKS—Continued | ||
Shares | Value | |
ELECTRONIC EQUIPMENT, INSTRUMENTS & COMPONENTS—0.6% | ||
7,300 | Celestica, Inc. (Canada)* | $170 |
2,300 | Daitron Co. Ltd. (Japan) | 44 |
77,905 | DataTec Ltd. (South Africa) | 148 |
1,000 | Kaga Electronics Co. Ltd. (Japan) | 40 |
4,200 | Macnica Holdings, Inc. (Japan) | 171 |
11,300 | Maxell Ltd. (Japan) | 121 |
265 | Nedap NV (Netherlands) | 16 |
2,700 | Nihon Denkei Co. Ltd. (Japan) | 33 |
3,800 | Osaki Electric Co. Ltd. (Japan) | 16 |
12,592 | Rakon Ltd. (New Zealand) | 5 |
2,700 | Sigma Koki Co. Ltd. (Japan) | 26 |
2,700 | SMK Corp. (Japan) | 44 |
2,000 | Sun-Wa Technos Corp. (Japan) | 29 |
863 | ||
ENERGY EQUIPMENT & SERVICES—0.5% | ||
55,749 | CES Energy Solutions Corp. (Canada) | 146 |
13,597 | Hunting PLC (United Kingdom) | 48 |
62,210 | MMA Offshore Ltd. (Australia)* | 50 |
10,553 | Pason Systems, Inc. (Canada) | 101 |
23,013 | PHX Energy Services Corp. (Canada) | 122 |
9,418 | Technip Energies NV (France) | 206 |
673 | ||
ENTERTAINMENT—1.4% | ||
7,900 | Ateam, Inc. (Japan) | 32 |
14,200 | Capcom Co. Ltd. (Japan) | 457 |
46,000 | IGG, Inc. (Singapore)* | 16 |
1,300 | Nexon Co. Ltd. (Japan) | 24 |
7,748 | Spotify Technology SA (United States)* | 1,277 |
2,461 | Universal Music Group NV (Netherlands) | 60 |
1,866 | ||
FINANCIAL SERVICES—0.3% | ||
26,741 | Banca Mediolanum SpA (Italy) | 218 |
95,700 | Pacific Century Regional Developments Ltd. (Singapore) | 20 |
4,874 | Washington H Soul Pattinson & Co. Ltd. (Australia) | 104 |
2,200 | Zenkoku Hosho Co. Ltd. (Japan) | 70 |
412 | ||
FOOD PRODUCTS—0.3% | ||
469,500 | CCK Consolidated Holdings Bhd. (Malaysia) | 78 |
1,500,000 | China Starch Holdings Ltd. (China) | 26 |
39,400 | Delfi Ltd. (Singapore) | 36 |
797 | Industrial Milk Co. (Ukraine)* | 2 |
58,700 | Kawan Food Bhd. (Malaysia) | 23 |
37,800 | Kim Loong Resources Bhd. (Malaysia) | 15 |
561 | Maeil Holdings Co. Ltd. (South Korea) | 4 |
5,437 | PGG Wrightson Ltd. (New Zealand) | 10 |
27,953 | Ridley Corp. Ltd. (Australia) | 39 |
1,562 | Sajodaerim Corp. (South Korea) | 32 |
356,800 | Salim Ivomas Pratama Tbk. PT (Indonesia) | 8 |
98,600 | Sarawak Plantation Bhd. (Malaysia) | 42 |
17,200 | Ta Ann Holdings Bhd. (Malaysia) | 12 |
4,600 | Warabeya Nichiyo Holdings Co. Ltd. (Japan) | 106 |
433 | ||
GAS UTILITIES—0.0% | ||
4,400 | Hiroshima Gas Co. Ltd. (Japan) | 12 |
GROUND TRANSPORTATION—0.3% | ||
4,400 | Alps Logistics Co. Ltd. (Japan) | 46 |
341,700 | BTS Rail Mass Transit Growth Infrastructure Fund (Thailand)* | 25 |
1,900 | Chilled & Frozen Logistics Holdings Co. Ltd. (Japan) | 18 |
50,609 | Firstgroup PLC (United Kingdom) | 97 |
220 | Jungfraubahn Holding AG (Switzerland) | 37 |
36,910 | Lindsay Australia Ltd. (Australia) | 23 |
⬤
56
Harbor International Core FundPORTFOLIO OF INVESTMENTS—Continued
Value and Cost in Thousands
COMMON STOCKS—Continued | ||
Shares | Value | |
GROUND TRANSPORTATION—Continued | ||
1,000 | Maruzen Showa Unyu Co. Ltd. (Japan) | $25 |
3,400 | Mullen Group Ltd. (Canada) | 32 |
14,007 | PKP Cargo SA (Poland)* | 51 |
1,800 | Seino Holdings Co. Ltd. (Japan) | 26 |
380 | ||
HEALTH CARE EQUIPMENT & SUPPLIES—0.7% | ||
3,169 | Cochlear Ltd. (Australia) | 486 |
8,720 | Demant AS (Denmark)* | 333 |
2,200 | Fukuda Denshi Co. Ltd. (Japan) | 78 |
897 | ||
HEALTH CARE PROVIDERS & SERVICES—0.2% | ||
3,943 | Dedicare AB Class B (Sweden) | 34 |
19,831 | Humana AB (Sweden)* | 50 |
4,800 | Japan Medical Dynamic Marketing, Inc. (Japan) | 23 |
60,000 | Ladprao General Hospital PCL NVDR (Thailand)1 | 8 |
2,000 | Medipal Holdings Corp. (Japan) | 34 |
6,322 | Orion OYJ (Finland) | 7 |
830 | Orion OYJ Class B (Finland) | 1 |
10,598 | Viemed Healthcare, Inc. (United States)* | 67 |
9,200 | Vital KSK Holdings, Inc. (Japan) | 62 |
286 | ||
HEALTH CARE TECHNOLOGY—0.3% | ||
211 | Ascom Holding AG (Switzerland) | 2 |
7,502 | Pro Medicus Ltd. (Australia) | 358 |
300 | Software Service, Inc. (Japan) | 17 |
377 | ||
HOTELS, RESTAURANTS & LEISURE—1.8% | ||
34,860 | Aristocrat Leisure Ltd. (Australia) | 857 |
4,523 | Betsson AB Class B (Sweden)* | 45 |
400,400 | Champ Resto Indonesia Tbk. PT (Indonesia) | 32 |
83,100 | Jaya Bersama Indo Tbk. PT (Indonesia)* | — x |
43,700 | Kimly Ltd. (Singapore) | 10 |
32,104 | La Francaise des Jeux SAEM (France)2 | 1,036 |
1,152 | Trip.com Group Ltd. ADR (China)*,1 | 39 |
8,233 | Whitbread PLC (United Kingdom) | 334 |
2,500 | Yossix Holdings Co. Ltd. (Japan) | 47 |
61,600 | Zen Corp. Group PCL NVDR (Thailand)1 | 17 |
2,417 | ||
HOUSEHOLD DURABLES—0.1% | ||
5 | Dom Development SA (Poland) | — |
3,800 | JANOME Corp. (Japan) | 18 |
2,700 | Nihon Trim Co. Ltd. (Japan) | 53 |
5,900 | Panasonic Holdings Corp. (Japan) | 52 |
10,993 | Toya SA (Poland)* | 17 |
140 | ||
INDUSTRIAL CONGLOMERATES—0.2% | ||
3,100 | Hitachi Ltd. (Japan) | 196 |
14,034 | Qatar Industrial Manufacturing Co. QSC (Qatar) | 12 |
208 | ||
INSURANCE—2.7% | ||
1,600 | Allianz Malaysia Bhd. (Malaysia) | 5 |
730 | Allianz SE (Germany) | 171 |
39,721 | Assicurazioni Generali SpA (Italy) | 789 |
291,200 | Asuransi Tugu Pratama Indonesia Tbk. PT (Indonesia) | 21 |
21,539 | Chesnara PLC (United Kingdom) | 66 |
116,000 | China Pacific Insurance Group Co. Ltd. Class H (China) | 286 |
14,100 | Dai-ichi Life Holdings, Inc. (Japan) | 298 |
40,600 | Japan Post Insurance Co. Ltd. (Japan) | 782 |
2,700 | MS&AD Insurance Group Holdings, Inc. (Japan) | 99 |
COMMON STOCKS—Continued | ||
Shares | Value | |
INSURANCE—Continued | ||
2,878 | Muenchener Rueckversicherungs-Gesellschaft AG in Muenchen (Germany) | $1,155 |
3,672 | ||
INTERACTIVE MEDIA & SERVICES—0.2% | ||
1,184 | Autohome, Inc. ADR (China)1 | 32 |
2,833 | JOYY, Inc. ADR (China)1 | 110 |
13,600 | Kakaku.com, Inc. (Japan) | 131 |
273 | ||
IT SERVICES—4.0% | ||
2,100 | AGS Corp. (Japan) | 10 |
4,958 | Atea ASA (Sweden)* | 52 |
4,334 | B3 Consulting Group AB (Sweden) | 31 |
1,400 | Business Brain Showa-Ota, Inc. (Japan) | 20 |
800 | CDS Co. Ltd. (Japan) | 9 |
640 | ComArch SA (Poland) | 23 |
4,200 | Core Corp. (Japan) | 47 |
5,900 | Fujitsu Ltd. (Japan) | 764 |
7,700 | Future Corp. (Japan) | 88 |
2,600 | ID Holdings Corp. (Japan) | 25 |
40,100 | NEC Corp. (Japan) | 1,931 |
1,600 | Obic Co. Ltd. (Japan) | 236 |
1,500 | Oro Co. Ltd. (Japan) | 21 |
12,600 | Otsuka Corp. (Japan) | 505 |
1,900 | SCSK Corp. (Japan) | 32 |
571 | Sopra Steria Group SACA (France) | 102 |
3,300 | TechMatrix Corp. (Japan) | 33 |
8,400 | TIS, Inc. (Japan) | 180 |
4,200 | Ubicom Holdings, Inc. (Japan) | 32 |
1,500 | VINX Corp. (Japan) | 12 |
15,419 | Wix.com Ltd. (Israel)* | 1,232 |
700 | Zuken, Inc. (Japan) | 17 |
5,402 | ||
LEISURE PRODUCTS—0.2% | ||
1,500 | Sankyo Co. Ltd. (Japan) | 62 |
12,200 | Sega Sammy Holdings, Inc. (Japan) | 191 |
3,600 | Tomy Co. Ltd. (Japan) | 50 |
303 | ||
MACHINERY—5.9% | ||
7,300 | Daihatsu Diesel Manufacturing Co. Ltd. (Japan) | 40 |
18,020 | Daimler Truck Holding AG (Germany) | 566 |
13,379 | Deutz AG (Germany) | 54 |
5,396 | Duerr AG (Germany) | 111 |
54 | Exail Technologies SA (France)* | 1 |
268 | Exel Industries SA Class A (France) | 13 |
6,776 | GEA Group AG (Germany) | 232 |
1,691 | Georg Fischer AG (Switzerland) | 88 |
1,327 | Grenevia SA (Poland)* | 1 |
11,747 | Iveco Group NV (Italy)* | 99 |
2,600 | Iwaki Co. Ltd. (Japan) | 31 |
9,839 | Knorr-Bremse AG (Germany) | 550 |
3,700 | Maezawa Industries, Inc. (Japan) | 23 |
14,300 | Miura Co. Ltd. (Japan) | 277 |
8,800 | Nippon Thompson Co. Ltd. (Japan) | 31 |
2,200 | Nitto Kohki Co. Ltd. (Japan) | 28 |
371 | Palfinger AG (Austria) | 9 |
247 | Rational AG (Germany) | 141 |
600 | Rix Corp. (Japan) | 13 |
6,900 | Schindler Holding AG (Switzerland) | 1,396 |
22,380 | SKF AB Class B (Sweden) | 363 |
4,700 | Sodick Co. Ltd. (Japan) | 24 |
3,000 | Toyo Machinery & Metal Co. Ltd. (Japan) | 12 |
9,561 | Vesuvius PLC (United Kingdom) | 47 |
152,882 | Volvo AB Class B (Sweden) | 3,029 |
⬤
57
Harbor International Core FundPORTFOLIO OF INVESTMENTS—Continued
Value and Cost in Thousands
COMMON STOCKS—Continued | ||
Shares | Value | |
MACHINERY—Continued | ||
55,108 | Wartsila OYJ Abp (Finland) | $658 |
52,300 | Yangzijiang Shipbuilding Holdings Ltd. (China) | 55 |
7,892 | ||
MARINE TRANSPORTATION—3.8% | ||
1,212 | AP Moller - Maersk AS Class B (Denmark) | 2,019 |
40,373 | Hoegh Autoliners ASA (Norway) | 326 |
23,300 | Kawasaki Kisen Kaisha Ltd. (Japan) | 799 |
5,696 | Kuehne & Nagel International AG (Switzerland) | 1,536 |
1,228,800 | Marco Polo Marine Ltd. (Singapore)* | 46 |
341,700 | Samudera Shipping Line Ltd. (Singapore) | 154 |
75,000 | SITC International Holdings Co. Ltd. (China) | 116 |
1,029 | Stolt-Nielsen Ltd. (Norway) | 34 |
2,303 | Western Bulk Chartering AS (Norway) | 5 |
1,724 | Wilson ASA (Norway)* | 10 x |
5,045 | ||
MEDIA—0.7% | ||
1,200 | AlphaPolis Co. Ltd. (Japan)* | 18 |
4,842 | Bloomsbury Publishing PLC (United Kingdom) | 23 |
1,900 | FAN Communications, Inc. (Japan) | 5 |
8,000 | Hakuhodo DY Holdings, Inc. (Japan) | 65 |
960 | HighCo (France) | 5 |
22,681 | NZME Ltd. (New Zealand) | 11 |
158,443 | Pico Far East Holdings Ltd. (Hong Kong) | 28 |
6,600 | Proto Corp. (Japan) | 54 |
33,805 | PRT Co. Ltd. (Australia)* | — x |
8,535 | Publicis Groupe SA (France) | 650 |
16,315 | SKY Network Television Ltd. (New Zealand) | 27 |
886 | ||
METALS & MINING—3.6% | ||
1,595 | Anglo American PLC (South Africa) | 41 |
233,117 | Base Resources Ltd. (Australia) | 20 |
67,085 | BlueScope Steel Ltd. (Australia) | 804 |
20,142 | Boryszew SA (Poland) | 29 |
34,873 | ElvalHalcor SA (Greece) | 62 |
17,744 | Gem Diamonds Ltd. (United Kingdom)* | 2 |
105,087 | Iluka Resources Ltd. (Australia) | 485 |
6,948 | Major Drilling Group International, Inc. (Canada)* | 37 |
35,973 | Perenti Ltd. (Australia)* | 24 |
37,573 | Rio Tinto PLC ADR (Australia)1 | 2,418 |
93,363 | Sierra Rutile Holdings Ltd. (Australia)* | 10 |
148,422 | South32 Ltd. (Australia) | 318 |
5,100 | Stelco Holdings, Inc. (Canada) | 144 |
39,616 | thyssenkrupp AG (Germany) | 276 |
2,200 | Topy Industries Ltd. (Japan) | 35 |
3,984 | Torex Gold Resources, Inc. (Canada)* | 38 |
5,500 | Tree Island Steel Ltd. (Canada) | 11 |
3,359 | Zimplats Holdings Ltd. (Australia) | 43 |
4,797 | ||
MULTI-UTILITIES—3.3% | ||
98,993 | A2A SpA (Italy) | 186 |
884,402 | Centrica PLC (United Kingdom) | 1,693 |
193,765 | E.ON SE (Germany) | 2,305 |
45,600 | Sembcorp Industries Ltd. (Singapore) | 153 |
169,100 | YTL Power International Bhd. (Malaysia) | 75 |
4,412 | ||
OIL, GAS & CONSUMABLE FUELS—8.4% | ||
250,300 | ABM Investama Tbk. PT (Indonesia) | 60 |
1,395,100 | Adaro Energy Indonesia Tbk. PT (Indonesia) | 225 |
16,384 | Ampol Ltd. (Australia) | 332 |
36,669 | Awilco LNG AS (Norway)* | 28 |
551,700 | Baramulti Suksessarana Tbk. PT (Indonesia) | 140 |
99,203 | BP PLC ADR (United Kingdom)1 | 3,629 |
COMMON STOCKS—Continued | ||
Shares | Value | |
OIL, GAS & CONSUMABLE FUELS—Continued | ||
214,500 | Bukit Asam Tbk. PT (Indonesia) | $34 |
55,295 | Channel Infrastructure NZ Ltd. (New Zealand) | 46 |
787 | E1 Corp. (South Korea) | 34 |
53,488 | Eni SpA (Italy) | 874 |
28,226 | Golden Energy Mines Tbk. PT (Indonesia) | 10 |
507,155 | Horizon Oil Ltd. (Australia) | 50 |
162,500 | Lanna Resources PCL NVDR (Thailand)1 | 66 |
3,518 | Lubelski Wegiel Bogdanka SA (Poland) | 31 |
1,400 | MEG Energy Corp. (Canada)* | 28 |
78,747 | New Hope Corp. Ltd. (Australia) | 290 |
9,646 | OKEA ASA (Norway) | 33 |
1,254,000 | PetroChina Co. Ltd. Class H (China) | 819 |
577,000 | Petron Corp. (Philippines) | 33 |
136,800 | PTT Exploration & Production PCL NVDR (Thailand)1 | 625 |
14,991 | Repsol SA (Spain) | 220 |
866,500 | Resource Alam Indonesia Tbk PT (Indonesia) | 22 |
97,542 | Shell PLC (Netherlands) | 3,143 |
80,800 | United Tractors Tbk. PT (Indonesia) | 128 |
83,223 | Whitehaven Coal Ltd. (Australia) | 392 |
11,292 | ||
PAPER & FOREST PRODUCTS—0.1% | ||
1,311 | Midway Ltd. (Australia)* | 1 |
21,100 | Supremex, Inc. (Canada) | 64 |
65 | ||
PASSENGER AIRLINES—1.8% | ||
103,975 | Air Arabia PJSC (United Arab Emirates) | 74 |
112,697 | Air New Zealand Ltd. (New Zealand) | 44 |
46,914 | Deutsche Lufthansa AG (Germany)* | 329 |
108,173 | International Consolidated Airlines Group SA (United Kingdom)* | 190 |
130,912 | Qantas Airways Ltd. (Australia)* | 410 |
316,400 | Singapore Airlines Ltd. (Singapore) | 1,413 |
2,460 | ||
PERSONAL CARE PRODUCTS—0.1% | ||
477 | Interparfums SA (France) | 23 |
1,100 | Kobayashi Pharmaceutical Co. Ltd. (Japan) | 45 |
68 | ||
PHARMACEUTICALS—10.9% | ||
21,427 | Hikma Pharmaceuticals PLC (Jordan) | 496 |
1,436 | Ipsen SA (France) | 170 |
31,700 | Nippon Shinyaku Co. Ltd. (Japan) | 1,286 |
13,303 | Novartis AG (Switzerland) | 1,245 |
53,904 | Novo Nordisk AS Class B (Denmark) | 5,201 |
15,500 | Ono Pharmaceutical Co. Ltd. (Japan) | 268 |
284 | Orion OYJ Class A (Finland) | 11 |
25,900 | Otsuka Holdings Co. Ltd. (Japan) | 871 |
13,785 | Recordati Industria Chimica e Farmaceutica SpA (Italy) | 638 |
7,148 | Roche Holding AG (Switzerland) | 1,842 |
2,660 | Sandoz Group AG (Switzerland)* | 69 |
19,000 | Santen Pharmaceutical Co. Ltd. (Japan) | 165 |
8,600 | Sawai Group Holdings Co. Ltd. (Japan) | 274 |
5,600 | Seikagaku Corp. (Japan) | 29 |
37,900 | Shionogi & Co. Ltd. (Japan) | 1,765 |
26,500 | Sumitomo Pharma Co. Ltd. (Japan) | 81 |
3,200 | Taisho Pharmaceutical Holdings Co. Ltd. (Japan) | 127 |
274 | Vetoquinol SA (France) | 23 |
1,500 | ZERIA Pharmaceutical Co. Ltd. (Japan) | 20 |
14,581 | ||
PROFESSIONAL SERVICES—3.5% | ||
600 | Abist Co. Ltd. (Japan) | 12 |
613 | Bertrandt AG (Germany) | 30 |
3,529 | Brunel International NV (Netherlands) | 49 |
1,700 | Career Design Center Co. Ltd. (Japan) | 22 |
⬤
58
Harbor International Core FundPORTFOLIO OF INVESTMENTS—Continued
Value and Cost in Thousands
COMMON STOCKS—Continued | ||
Shares | Value | |
PROFESSIONAL SERVICES—Continued | ||
1,800 | Creek & River Co. Ltd. (Japan) | $23 |
5,300 | en Japan, Inc. (Japan) | 79 |
4,214 | Experian PLC (United Kingdom) | 128 |
1,745 | Impellam Group PLC (United Kingdom) | 13 |
1,100 | JAC Recruitment Co. Ltd. (Japan) | 18 |
2,600 | Matching Service Japan Co. Ltd. (Japan) | 20 |
2,400 | MEITEC Group Holdings, Inc. (Japan) | 42 |
989 | Pagegroup PLC (United Kingdom) | 4 |
32,700 | Persol Holdings Co. Ltd. (Japan) | 49 |
18,700 | Recruit Holdings Co. Ltd. (Japan) | 536 |
5,300 | SIGMAXYZ Holdings, Inc. (Japan) | 49 |
2,400 | SMS Co. Ltd. (Japan) | 38 |
8,500 | Space Co. Ltd. (Japan) | 51 |
3,412 | SThree PLC (United Kingdom) | 15 |
6,185 | Wilmington PLC (United Kingdom) | 25 |
26,555 | Wolters Kluwer NV (Netherlands) | 3,407 |
1,600 | YAMADA Consulting Group Co. Ltd. (Japan) | 17 |
4,627 | ||
REAL ESTATE MANAGEMENT & DEVELOPMENT—0.3% | ||
4,596,500 | Agung Podomoro Land Tbk. PT (Indonesia)* | 39 |
946 | Almogim Holdings Ltd. (Israel) | 1 |
292,649 | Deyaar Development PJSC (United Arab Emirates)* | 47 |
23,367 | Emaar Development PJSC (United Arab Emirates) | 40 |
107,325 | Emaar Properties PJSC (United Arab Emirates) | 196 |
116,681 | Ever Reach Group Holdings Co. Ltd. (China)* | 3 |
998 | K Wah International Holdings Ltd. (Hong Kong) | — |
1,077 | Melcor Developments Ltd. (Canada) | 9 |
20,963 | Modern Land China Co. Ltd. (China)* | — |
2,400 | Propnex Ltd. (Singapore) | 1 |
336 | ||
SEMICONDUCTORS & SEMICONDUCTOR EQUIPMENT—0.8% | ||
1,378 | ChipMOS Technologies, Inc. ADR (Taiwan)1 | 35 |
2,400 | Disco Corp. (Japan) | 424 |
4,800 | Japan Electronic Materials Corp. (Japan) | 44 |
3,100 | Megachips Corp. (Japan) | 80 |
4,700 | Mimasu Semiconductor Industry Co. Ltd. (Japan) | 76 |
4,600 | Optorun Co. Ltd. (Japan) | 53 |
900 | RS Technologies Co. Ltd. (Japan) | 14 |
2,500 | Sanken Electric Co. Ltd. (Japan) | 124 |
3,400 | SCREEN Holdings Co. Ltd. (Japan) | 158 |
1,172 | SUESS MicroTec SE (Germany) | 20 |
900 | Tera Probe, Inc. (Japan) | 27 |
1,500 | Tokyo Seimitsu Co. Ltd. (Japan) | 70 |
1,125 | ||
SOFTWARE—6.2% | ||
2,388 | Altium Ltd. (Australia) | 60 |
14,454 | Check Point Software Technologies Ltd. (Israel)* | 1,940 |
8,560 | Computer Modelling Group Ltd. (Canada) | 57 |
14,600 | Coveo Solutions, Inc. (Canada)* | 102 |
3,500 | Cybozu, Inc. (Japan) | 44 |
1,100 | Digital Arts, Inc. (Japan) | 30 |
8,085 | Enghouse Systems Ltd. (Canada) | 190 |
3,700 | Intelligent Wave, Inc. (Japan) | 21 |
5,400 | ISB Corp. (Japan) | 51 |
5,370 | Monday.com Ltd. (United States)* | 698 |
600 | NTT Data Intramart Corp. (Japan) | 7 |
1,200 | Oracle Corp. (Japan) | 85 |
123,543 | Sage Group PLC (United Kingdom) | 1,460 |
23,407 | SAP SE (Germany) | 3,140 |
1,800 | Soliton Systems KK (Japan) | 13 |
13,642 | Symbio Holdings Ltd. (Australia) | 24 |
1,801 | Telcoware Co. Ltd. (South Korea) | 13 |
3,545 | Text SA (Poland) | 95 |
7,200 | Trend Micro, Inc. (Japan) | 271 |
COMMON STOCKS—Continued | ||
Shares | Value | |
SOFTWARE—Continued | ||
1,400 | WingArc1st, Inc. (Japan) | $25 |
8,326 | ||
SPECIALTY RETAIL—3.3% | ||
5,000 | Adastria Co. Ltd. (Japan) | 105 |
6,743 | Autosports Group Ltd. (Australia) | 11 |
441 | Castro Model Ltd. (Israel)* | 4 |
847 | Delta Israel Brands Ltd. (Israel) | 7 |
4,300 | Fuji Corp. (Japan) | 48 |
62,718 | H & M Hennes & Mauritz AB Class B (Sweden)3 | 842 |
93,277 | Industria de Diseno Textil SA (Spain)3 | 3,220 |
6,986 | Naturhouse Health SAU (Spain) | 11 |
152,900 | Padini Holdings Bhd. (Malaysia) | 127 |
70 | Samse SACA (France) | 12 |
4,387 | ||
TECHNOLOGY HARDWARE, STORAGE & PERIPHERALS—1.5% | ||
30,700 | Brother Industries Ltd. (Japan) | 479 |
27,600 | Konica Minolta, Inc. (Japan)* | 77 |
2,258 | Logitech International SA (Switzerland) | 178 |
75,300 | Ricoh Co. Ltd. (Japan) | 610 |
44,800 | Seiko Epson Corp. (Japan) | 622 |
14,394 | Tobii Dynavox AB (Sweden)* | 43 |
1,100 | Toshiba TEC Corp. (Japan) | 24 |
6,000 | Wacom Co. Ltd. (Japan) | 21 |
2,054 | ||
TEXTILES, APPAREL & LUXURY GOODS—4.8% | ||
1,381 | Bijou Brigitte AG (Germany) | 51 |
1,779 | Hermes International SCA (France) | 3,319 |
12,252 | Pandora AS (Denmark) | 1,390 |
6,380 | Swatch Group AG (Switzerland) | 1,633 |
6,393 | ||
TOBACCO—0.1% | ||
652,400 | Wismilak Inti Makmur Tbk. PT (Indonesia) | 147 |
TRADING COMPANIES & DISTRIBUTORS—0.8% | ||
60,000 | APAC Resources Ltd. (Hong Kong) | 8 |
2,000 | Chori Co. Ltd. (Japan) | 39 |
2,900 | Gecoss Corp. (Japan) | 18 |
5,800 | Hanwa Co. Ltd. (Japan) | 175 |
2,853 | Howden Joinery Group PLC (United Kingdom) | 22 |
2,349 | Jacquet Metals SACA (France) | 37 |
2,200 | Kanaden Corp. (Japan) | 22 |
800 | Nanyo Corp. (Japan) | 11 |
252,987 | New Times Energy Corp. Ltd. (Hong Kong)* | 3 |
900 | Nice Corp. (Japan) | 8 |
2,300 | Parker Corp. (Japan) | 12 |
34,095 | Rexel SA (France) | 696 |
1,700 | Sugimoto & Co. Ltd. (Japan) | 23 |
500 | Tsubakimoto Kogyo Co. Ltd. (Japan) | 17 |
1,091 | ||
TRANSPORTATION INFRASTRUCTURE—0.0% | ||
91,000 | Qilu Expressway Co. Ltd. (China) | 27 |
TOTAL COMMON STOCKS (Cost $133,718) | 133,067 |
EXCHANGE-TRADED FUNDS—0.1% | ||
(Cost $113) | ||
CAPITAL MARKETS—0.1% | ||
1,715 | iShares MSCI EAFE ETF (United States) | 115 |
⬤
59
Harbor International Core FundPORTFOLIO OF INVESTMENTS—Continued
Value and Cost in Thousands
PREFERRED STOCKS—0.1% | ||
Shares | Value | |
AUTOMOBILE COMPONENTS—0.0% | ||
6,114 | Schaeffler AG (Germany) | $32 |
CHEMICALS—0.0% | ||
611 | FUCHS SE (Germany) | 25 |
MACHINERY—0.1% | ||
173 | KSB SE & Co. KGaA (Germany) | 96 |
TOTAL PREFERRED STOCKS (Cost $115) | 153 | |
SHORT-TERM INVESTMENTS—0.6% | ||
(Cost $851) |
851,263 | State Street Navigator Securities Lending Government Money Market Portfolio (1 day yield of 5.360%) | 851 |
TOTAL INVESTMENTS—100.0% (Cost $134,797) | 134,186 | |
CASH AND OTHER ASSETS, LESS LIABILITIES—(0.0)% | (19 ) | |
TOTAL NET ASSETS—100% | $134,167 |
⬤
60
Harbor International Core FundPORTFOLIO OF INVESTMENTS—Continued
FAIR VALUE MEASUREMENTS
The following table summarizes the Fund’s investments as of October 31, 2023 based on the inputs used to value them.
Asset Category | Quoted Prices Level 1 (000s) | Other Significant Observable Inputs Level 2 (000s) | Significant Unobservable Inputs Level 3 (000s) | Total (000s) |
Common Stocks | ||||
Africa | $— | $242 | $— | $242 |
Europe | 3,703 | 70,616 | 10 | 74,329 |
Middle East/Central Asia | 3,172 | 821 | — | 3,993 |
North America | 4,008 | 5,029 | — | 9,037 |
Pacific Basin | 3,793 | 41,650 | 23 | 45,466 |
Exchange-Traded Funds | ||||
North America | 115 | — | — | 115 |
Preferred Stocks | ||||
Europe | — | 153 | — | 153 |
Short-Term Investments | ||||
Investment Company-Securities Lending Investment Fund | 851 | — | — | 851 |
Total Investments in Securities | $15,642 | $118,511 | $33 | $134,186 |
For more information on valuation inputs and their aggregation into the levels identified above, please refer to the Fair Value Measurements and Disclosures in Note 2 of the accompanying Notes to Portfolios of Investments.
The following is a rollforward of the Fund’s Level 3 investments during the year ended October 31, 2023. Transfers into or out of Level 3, if any, are recognized as of the last day in the fiscal quarter of the period in which the event or change in circumstances that caused the reclassification occurred.
Valuation Description | Beginning Balance as of 11/01/2022 (000s) | Purchases (000s) | Sales (000s) | Discount/ (Premium) (000s) | Total Realized Gain/(Loss) (000s) | Change in Unrealized Appreciation/ (Depreciation) (000s) | Transfers Into Level 3h (000s) | Transfers Out of Level 3h (000s) | Ending Balance as of 10/31/2023 (000s) | Unrealized Gain/(Loss) as of 10/31/2023 (000s) |
Common Stock | $— | $— | $— | $— | $— | $— | $33 | $— | $33 | $(4) |
The following is a summary of significant unobservable inputs used in the fair valuations of assets and liabilities categorized within Level 3 of the fair value hierarchy.
Valuation Descriptions | Ending Balance as of 10/31/23 (000s) | Valuation Technique | Unobservable Input(s) | Input Value(s) |
Investments in Securities | ||||
Common Stocks | ||||
Danakali Ltd. (Australia)* | $23 | Market Approach | Last Traded Price | AUD 0.41 |
Jaya Bersama Indo Tbk. PT (Indonesia)* | — | Market Approach | Estimated Recovery Value | IDR 0.00 |
Wilson ASA (Norway)*. | 10 | Market Approach | Last Traded Price | NOK 65.60 |
$33 |
*
Non-income producing security
x
Fair valued in accordance with Harbor Funds' Valuation Procedures.
h
Transferred into Level 3 due to the unavailability of observable market data for pricing or transferred out of Level 3 due to availability of observable market data for pricing
1
Depositary receipts such as American Depositary Receipts (ADRs), Global Depositary Receipts (GDRs) and other country specific depositary receipts are certificates evidencing ownership of shares of a foreign issuer. These certificates are issued by depositary banks and generally trade on an established market in the U.S. or elsewhere.
2
Securities purchased in a transaction exempt from registration under Rule 144A of the Securities Act of 1933. These securities may be resold in transactions exempt from registration, normally to qualified institutional buyers. The Fund has no right to demand registration of these securities. As of October 31, 2023, the aggregate value of these securities was $1,036 or 1% of net assets.
3
All or a portion of this security was out of loan as of October 31, 2023.
AUD
Australian Dollar
IDR
Indonesian Rupiah
NOK
Norwegian Krone
The accompanying notes are an integral part of the Financial Statements.
⬤
61
Harbor International Growth FundMANAGER’S COMMENTARY (Unaudited)
SUBADVISOR
Baillie Gifford Overseas Limited
Management’s Discussion of
Fund Performance
Fund Performance
MARKET REVIEW
Higher interest rates have continued to be a feature of the economic background in many developed markets, reflecting the determination of central banks to bring inflation down from elevated levels. The Bank of England and the European Central Bank have followed a broadly similar path to the Federal Reserve in the U.S. However, Japan has been notable in not following suit. Inflation is rising there, albeit from low levels, and interest rates have so far remained comparatively low, although the country has begun to make some changes to its Yield Curve Control policy to permit modestly higher market interest rates.
China’s economy has been slower to recover from pandemic-related restrictions than many had expected. One effect of this has been to soften demand for luxury businesses, which often sell their products within China, and which are also exposed to consumption by Chinese travelers overseas.
Value stocks have performed strongly relative to growth since the summer of 2023. This trend has been particularly evident in Japan, where the weaker Yen has boosted the fortunes of exporters. Some underperforming businesses in Japan have also benefited from a push by the Tokyo Stock Exchange to demonstrate better use of capital.
Though we are mindful of these macro influences, we endeavour not to be distracted by short-term considerations. We prefer to approach portfolio construction by considering company fundamentals rather than macroeconomic issues. We aim to find good quality stocks that can produce above average earnings and that have the potential to outperform over the long term.
PERFORMANCE
Harbor International Growth Fund returned 5.41% (Retirement Class), 5.25% (Institutional Class), 5.03% (Administrative Class), and 4.90% (Investor Class) for the year ended October 31, 2023, while the MSCI All Country World Ex U.S. (ND) Index returned 12.07% during the same period.
The Fund underperformed in Developed Asia, Europe ex-U.K., and the U.K. but outperformed in Canada and Emerging Markets.
Where sectors are concerned, the main detractors included Health Care, Industrials, and Financials. Communication Services, Real Estate, and Utilities were among the sectors that contributed most positively to relative performance. At the end of October 2023, the Fund was most overweight in the Consumer Discretionary and Consumer Staples sectors, while the most underweight positions were in Financials and Materials.
The Fund’s regional and sectoral positions are outputs of our bottom-up investment process. Given this fundamental approach, it is particularly relevant to consider the individual company holdings that impacted performance. The largest individual detractors from performance included Olympus, Adyen, and Mettler Toledo. The main contributors during the period included Spotify, Games Workshop, and MercadoLibre.
Olympus of Japan is a healthcare business that specialises in the production of endoscopes. Although its results have been respectable, the company has been the subject of regulatory concern in the U.S. over instances of contamination linked to its endoscopes. We believe it is committed to investment over the next three years to address this. Adyen of the Netherlands is a payment processing business whose culture we admire. The company’s shares fell sharply towards the end of the period in response to a reported slowdown in growth and concerns over competition in the U.S. Growth continues to be robust, and the company continues to invest. We will continue to monitor the business, as with all the Fund’s holdings, but we remain supportive of management. Mettler Toledo is a Swiss-U.S. business which leads in
⬤
62
Harbor International Growth FundMANAGER’S COMMENTARY—Continued
CHANGE IN A $50,000 INVESTMENT
For the period 11/01/2013 through 10/31/2023
The graph compares a $50,000 investment in the Institutional Class shares of the Fund with the performance of the MSCI All Country World Ex. U.S. (ND) Index. The Fund’s performance assumes the reinvestment of all dividend and capital gain distributions.
TOTAL RETURNS | |||
For the periods ended 10/31/2023 | |||
Annualized | |||
1 Year | 5 Years | 10 Years | |
Harbor International Growth Fund | |||
Retirement Class1 | 5.41% | 2.09% | 2.24% |
Institutional Class | 5.25 | 2.00 | 2.18 |
Administrative Class | 5.03 | 1.76 | 1.91 |
Investor Class | 4.90 | 1.64 | 1.81 |
Comparative Index | |||
MSCI All Country World Ex. U.S. (ND) Index | 12.07% | 3.46% | 2.54% |
As stated in the Fund’s prospectus dated March 1, 2023, the expense ratios were 0.77% (Net) and 0.83% (Gross) (Retirement Class); 0.85% (Net) and 0.91% (Gross) (Institutional Class); 1.10% (Net) and 1.16% (Gross) (Administrative Class); and 1.21% (Net) and 1.27% (Gross) (Investor Class). The net expense ratios reflect an expense limitation agreement (excluding interest expense, if any) effective through 02/29/2024. The expense ratios in the prospectus may differ from the actual expense ratios for the period disclosed within this report. The expense ratios shown in the prospectus are adjusted to reflect changes, if any, in contractual arrangements that occurred prior to the date of the prospectus (or supplement thereto, if applicable).
The MSCI All Country World Ex. U.S. (ND) Index is a free float-adjusted market capitalization weighted index that is designed to measure equity market performance in the global developed and emerging markets, excluding the U.S. This unmanaged index does not reflect fees and expenses and is not available for direct investment.
Performance data shown represents past performance and is no guarantee of future results. Past performance is net of management fees and expenses and reflects reinvested dividends and distributions. Past performance reflects the beneficial effect of any expense waivers or reimbursements, without which returns would have been lower. Investment returns and principal value will fluctuate and when redeemed may be worth more or less than their original cost. Returns for periods less than one year are not annualized. Current performance may be higher or lower and is available through the most recent month end at harborcapital.com or by calling 800-422-1050.
the manufacture of weighing and measuring equipment. Its Chinese business has been negatively affected by uncertain business conditions in China but we continue to believe that Mettler Toledo is a company whose potential remains underappreciated by the market.
Spotify of Sweden, which provides music streaming services, has seen strong user and top line growth. We are encouraged by the company’s progress in managing costs, with the focus of management increasingly on improving profitability. Games Workshop, listed in the U.K., produces fantasy miniatures and games, and operates the Warhammer franchise. The company has reported strong revenues and profits, demonstrating the strong pricing power we believe it possesses. Its addressable market is extending beyond the U.K. to the U.S. and the Far East. MercadoLibre is Latin America’s leading ecommerce and fintech business. We have been impressed by its progress, seen especially during the year in its insurance business.
OUTLOOK & STRATEGY
Macroeconomic and geopolitical headwinds have continued to be a feature of the past year. Our focus remains on identifying well managed, good quality companies whose earnings have the potential, in our view, to grow strongly over the long term. This is the investment approach we have followed with our clients over many years. We remain positive that the Fund will be rewarded through the share prices of the companies in which it invests.
1 Retirement Class shares commenced operations on March 1, 2016. The performance attributed to the Retirement Class shares prior to that date is that of the Institutional Class shares. Performance prior to March 1, 2016 has not been adjusted to reflect the lower expenses of Retirement Class shares. During this period, Retirement Class shares would have had returns similar to, but potentially higher than, Institutional Class shares due to the fact that Retirement Class shares represent interests in the same portfolio as Institutional Class shares but are subject to lower expenses.
This report contains the current opinions of Baillie Gifford Overseas Limited as of the date of this report and should not be considered as investment advice or a recommendation of any particular security, strategy or investment product. Such opinions are subject to change without notice and securities described herein may no longer be included in, or may at any time be removed from, the Fund’s portfolio. This report is distributed for informational purposes only. Information contained herein has been obtained from sources believed reliable, but not guaranteed.
There is no guarantee that the investment objective of the Fund will be achieved. Stock markets are volatile and equity values can decline significantly in response to adverse issuer, political, regulatory, market and economic conditions. Investing in international and emerging markets poses special risks, including potentially greater price volatility due to social, political and economic factors, as well as currency exchange rate fluctuations. These risks are more severe for securities of issuers in emerging market regions. For information on the different share classes and the risks associated with an investment in the Fund, please refer to the current prospectus.
⬤
63
Harbor International Growth FundPORTFOLIO OF INVESTMENTS—October 31, 2023
REGION BREAKDOWN (% of investments) - Unaudited
The Fund’s Portfolio of Investments include investments denominated in foreign currencies. As of October 31, 2023, there was no foreign currency denomination comprised more than 25% of the Fund’s net assets.
PORTFOLIO OF INVESTMENTS
Value and Cost in Thousands
COMMON STOCKS—100.6% | ||
Shares | Value | |
AIR FREIGHT & LOGISTICS—1.0% | ||
18,476 | DSV AS (Denmark) | $2,761 |
AUTOMOBILE COMPONENTS—0.8% | ||
160,860 | Denso Corp. (Japan) | 2,375 |
BANKS—4.7% | ||
339,919 | HDFC Bank Ltd. (India) | 6,025 |
382,607 | United Overseas Bank Ltd. (Singapore) | 7,547 |
13,572 | ||
BEVERAGES—4.2% | ||
82,040 | Anheuser-Busch InBev SA (Belgium) | 4,668 |
32,622 | Remy Cointreau SA (France) | 3,707 |
301,130 | United Spirits Ltd. (India)* | 3,728 |
12,103 | ||
BIOTECHNOLOGY—0.7% | ||
145,643 | BeiGene Ltd. (China)* | 2,091 |
BROADLINE RETAIL—6.8% | ||
429,636 | Alibaba Group Holding Ltd. (China)* | 4,423 |
117,038 | Coupang, Inc. Class A (South Korea)* | 1,990 |
5,407 | MercadoLibre, Inc. (Brazil)* | 6,709 |
238,786 | Prosus NV (China)* | 6,694 |
19,816 |
COMMON STOCKS—Continued | ||
Shares | Value | |
CAPITAL MARKETS—2.1% | ||
285,198 | Hargreaves Lansdown PLC (United Kingdom) | $2,456 |
100,900 | Hong Kong Exchanges & Clearing Ltd. (Hong Kong) | 3,530 |
5,986 | ||
CHEMICALS—2.7% | ||
27,048 | Air Liquide SA (France) | 4,635 |
469,600 | Nippon Paint Holdings Co. Ltd. (Japan) | 3,157 |
7,792 | ||
CONSUMER STAPLES DISTRIBUTION & RETAIL—6.2% | ||
37,800 | Cosmos Pharmaceutical Corp. (Japan) | 3,934 |
218,057 | Jeronimo Martins SGPS SA (Portugal) | 5,027 |
923,487 | Raia Drogasil SA (Brazil) | 4,726 |
31,420 | Sugi Holdings Co. Ltd. (Japan) | 1,272 |
825,655 | Wal-Mart de Mexico SAB de CV (Mexico) | 2,958 |
17,917 | ||
ELECTRICAL EQUIPMENT—1.6% | ||
94,400 | Contemporary Amperex Technology Co. Ltd. Class A (China) | 2,397 |
56,980 | NIDEC Corp. (Japan) | 2,090 |
4,487 | ||
ELECTRONIC EQUIPMENT, INSTRUMENTS & COMPONENTS—2.9% | ||
10,040 | Keyence Corp. (Japan) | 3,886 |
⬤
64
Harbor International Growth FundPORTFOLIO OF INVESTMENTS—Continued
Value and Cost in Thousands
COMMON STOCKS—Continued | ||
Shares | Value | |
ELECTRONIC EQUIPMENT, INSTRUMENTS & COMPONENTS—Continued | ||
260,880 | Murata Manufacturing Co. Ltd. (Japan) | $4,469 |
8,355 | ||
ENTERTAINMENT—1.8% | ||
23,463 | Spotify Technology SA (United States)* | 3,866 |
47,102 | Ubisoft Entertainment SA (France)* | 1,343 |
5,209 | ||
FINANCIAL SERVICES—5.3% | ||
3,426 | Adyen NV (Netherlands)*,1 | 2,311 |
45,294 | EXOR NV (Netherlands) | 3,887 |
313,377 | Investor AB Class B (Sweden) | 5,753 |
143,111 | Jio Financial Services Ltd. (India)* | 375 |
381,573 | Wise PLC Class A (United Kingdom)* | 3,101 |
15,427 | ||
GROUND TRANSPORTATION—1.3% | ||
53,631 | Canadian Pacific Kansas City Ltd. (Canada) | 3,808 |
HEALTH CARE EQUIPMENT & SUPPLIES—3.7% | ||
13,156 | Cochlear Ltd. (Australia) | 2,017 |
360,380 | Olympus Corp. (Japan) | 4,813 |
78,040 | Sysmex Corp. (Japan) | 3,738 |
10,568 | ||
HOTELS, RESTAURANTS & LEISURE—1.5% | ||
53,249 | MakeMyTrip Ltd. (India)* | 2,062 |
707,208 | Trainline PLC (United Kingdom)*,1 | 2,236 |
4,298 | ||
HOUSEHOLD PRODUCTS—1.3% | ||
109,800 | Unicharm Corp. (Japan) | 3,731 |
INSURANCE—2.8% | ||
574,760 | AIA Group Ltd. (Hong Kong) | 4,991 |
636,600 | Ping An Insurance Group Co. of China Ltd. Class H (China) | 3,229 |
8,220 | ||
INTERACTIVE MEDIA & SERVICES—5.1% | ||
823,730 | Auto Trader Group PLC (United Kingdom)1 | 6,231 |
164,698 | Baidu, Inc. Class A (China)* | 2,162 |
791,400 | LY Corp. (Japan) | 2,018 |
750,712 | Rightmove PLC (United Kingdom) | 4,329 |
14,740 | ||
IT SERVICES—1.7% | ||
101,127 | Shopify, Inc. Class A (Canada)* | 4,772 |
LEISURE PRODUCTS—2.6% | ||
34,147 | Games Workshop Group PLC (United Kingdom) | 4,105 |
24,180 | Shimano, Inc. (Japan) | 3,480 |
7,585 | ||
LIFE SCIENCES TOOLS & SERVICES—2.5% | ||
5,951 | Lonza Group AG (Switzerland) | 2,084 |
5,287 | Mettler-Toledo International, Inc. (United States)* | 5,209 |
7,293 | ||
MACHINERY—8.5% | ||
573,211 | Atlas Copco AB Class A (Sweden) | 7,422 |
261,040 | Epiroc AB Class B (Sweden) | 3,625 |
11,780 | SMC Corp. (Japan) | 5,440 |
COMMON STOCKS—Continued | ||
Shares | Value | |
MACHINERY—Continued | ||
468,300 | Techtronic Industries Co. Ltd. (Hong Kong) | $4,275 |
188,296 | Weir Group PLC (United Kingdom) | 3,911 |
24,673 | ||
OIL, GAS & CONSUMABLE FUELS—1.3% | ||
135,875 | Reliance Industries Ltd. (India) | 3,738 |
PERSONAL CARE PRODUCTS—2.3% | ||
39,140 | Kao Corp. (Japan) | 1,428 |
164,720 | Shiseido Co. Ltd. (Japan) | 5,224 |
6,652 | ||
PROFESSIONAL SERVICES—3.4% | ||
157,436 | Experian PLC (United Kingdom) | 4,776 |
53,372 | Intertek Group PLC (United Kingdom) | 2,486 |
94,100 | Recruit Holdings Co. Ltd. (Japan) | 2,698 |
9,960 | ||
SEMICONDUCTORS & SEMICONDUCTOR EQUIPMENT—8.5% | ||
12,949 | ASML Holding NV (Netherlands)* | 7,784 |
9,344 | SOITEC (France)* | 1,395 |
138,725 | Taiwan Semiconductor Manufacturing Co. Ltd. ADR (Taiwan)2 | 11,973 |
26,600 | Tokyo Electron Ltd. (Japan) | 3,515 |
24,667 | ||
SOFTWARE—3.3% | ||
41,105 | Nemetschek SE (Germany) | 3,072 |
32,217 | Topicus.com, Inc. (Netherlands)* | 2,121 |
65,588 | Xero Ltd. (New Zealand)* | 4,484 |
9,677 | ||
SPECIALTY RETAIL—0.4% | ||
176,680 | Auto1 Group SE (Germany)*,1 | 1,040 |
TEXTILES, APPAREL & LUXURY GOODS—7.0% | ||
16,747 | adidas AG (Germany) | 2,978 |
127,630 | Burberry Group PLC (United Kingdom) | 2,630 |
47,733 | Cie Financiere Richemont SA Class A (Switzerland) | 5,631 |
6,173 | Kering SA (France) | 2,511 |
448,400 | Li Ning Co. Ltd. (China) | 1,374 |
7,366 | LVMH Moet Hennessy Louis Vuitton SE (France) | 5,274 |
20,398 | ||
TRADING COMPANIES & DISTRIBUTORS—2.6% | ||
65,478 | Ashtead Group PLC (United Kingdom) | 3,755 |
30,048 | IMCD NV (Netherlands) | 3,618 |
7,373 | ||
TOTAL COMMON STOCKS (Cost $264,208) | 291,084 |
PREFERRED STOCKS—1.5% | ||
(Cost $1,795) | ||
LIFE SCIENCES TOOLS & SERVICES—1.5% | ||
17,401 | Sartorius AG (Germany) | 4,361 |
TOTAL INVESTMENTS—102.1% (Cost $266,003) | 295,445 | |
CASH AND OTHER ASSETS, LESS LIABILITIES—(2.1)% | (5,980 ) | |
TOTAL NET ASSETS—100% | $289,465 |
⬤
65
Harbor International Growth FundPORTFOLIO OF INVESTMENTS—Continued
FAIR VALUE MEASUREMENTS
The following table summarizes the Fund’s investments as of October 31, 2023 based on the inputs used to value them.
Asset Category | Quoted Prices Level 1 (000s) | Other Significant Observable Inputs Level 2 (000s) | Significant Unobservable Inputs Level 3 (000s) | Total (000s) |
Common Stocks | ||||
Europe | $2,121 | $120,541 | $— | $122,662 |
Latin America | 14,393 | — | — | 14,393 |
Middle East/Central Asia | 4,427 | 13,492 | — | 17,919 |
North America | 17,655 | — | — | 17,655 |
Pacific Basin | 11,973 | 106,482 | — | 118,455 |
Preferred Stocks | ||||
Europe | — | 4,361 | — | 4,361 |
Total Investments in Securities | $50,569 | $244,876 | $— | $295,445 |
For more information on valuation inputs and their aggregation into the levels identified above, please refer to the Fair Value Measurements and Disclosures in Note 2 of the accompanying Notes to Financial Statements.
*
Non-income producing security
1
Securities purchased in a transaction exempt from registration under Rule 144A of the Securities Act of 1933. These securities may be resold in transactions exempt from registration, normally to qualified institutional buyers. The Fund has no right to demand registration of these securities. As of October 31, 2023, the aggregate value of these securities was $11,818 or 4% of net assets.
2
Depositary receipts such as American Depositary Receipts (ADRs), Global Depositary Receipts (GDRs) and other country specific depositary receipts are certificates evidencing ownership of shares of a foreign issuer. These certificates are issued by depositary banks and generally trade on an established market in the U.S. or elsewhere.
The accompanying notes are an integral part of the Financial Statements.
⬤
66
Harbor International Small Cap FundMANAGER’S COMMENTARY (Unaudited)
SUBADVISOR
Cedar Street Asset Management LLC
Management’s Discussion of
Fund Performance
Fund Performance
MARKET REVIEW
During the fiscal year ended October 31, 2023, financial markets once again experienced significant volatility. Government bond yields in the U.S. and many developed countries rose to their highest levels in over a decade. In addition, non-U.S. developed market equities broadly outperformed U.S. equities as the MSCI EAFE Index’s 11.3% gain outperformed the S&P 500 Index’s 8.3% return. Similarly, the MSCI EAFE Small Cap Index’s 3.7% gain handily outperformed the Russell 2000 Index’s decline of -10%. Given persistent commentary in the financial press about the “Magnificent Seven” (the seven dominant tech platform stocks: Apple, Alphabet, Amazon, Meta, Microsoft, Nvidia, Tesla) as a “safe” haven and the U.S. economy’s persistent growth relative to weaker Europe and Japan, U.S. equity market underperformance during the period is likely surprising to many, in our view.
It is often difficult to pinpoint precise causes for equity market performance, but we believe the U.S. dollar’s (“USD”) 4% decline during the period likely contributed to non-U.S. equity outperformance. We would also point out that non-U.S. equities are trading at a significant discount to U.S. equities. The MSCI EAFE Index trades at 11.8x P/E and 1.56x P/B multiples with a 3.45% dividend yield. The S&P 500 Index trades at 19.1x P/E and 4.0x P/B multiples with a 1.65% dividend yield. Valuation on its own is often not enough to drive investment behavior, in our view, but when valuation is considered in the context of opportunity cost, we believe it can impact investor behavior.
With 10-year U.S. Treasury bonds yielding 4.93% on October 31, 2023, investors are able to buy a risk-free asset with a more compelling yield, in our view, than the 1.65% offered by the S&P 500. In theory, an asset with relatively higher risk, such as the securities comprising the S&P 500, should have to offer investors a higher rate of return to compensate for the greater risk. Historically, the majority of the S&P 500’s returns have been generated by dividends, not capital appreciation. In the aftermath of the pandemic, when 10-year Treasury yields were around 0.5%, investors likely viewed investing in U.S. equities as their best option. Today, in uncertain times, we believe there appear to be plenty of alternatives that offer better yields and greater margins of safety than U.S. equities.
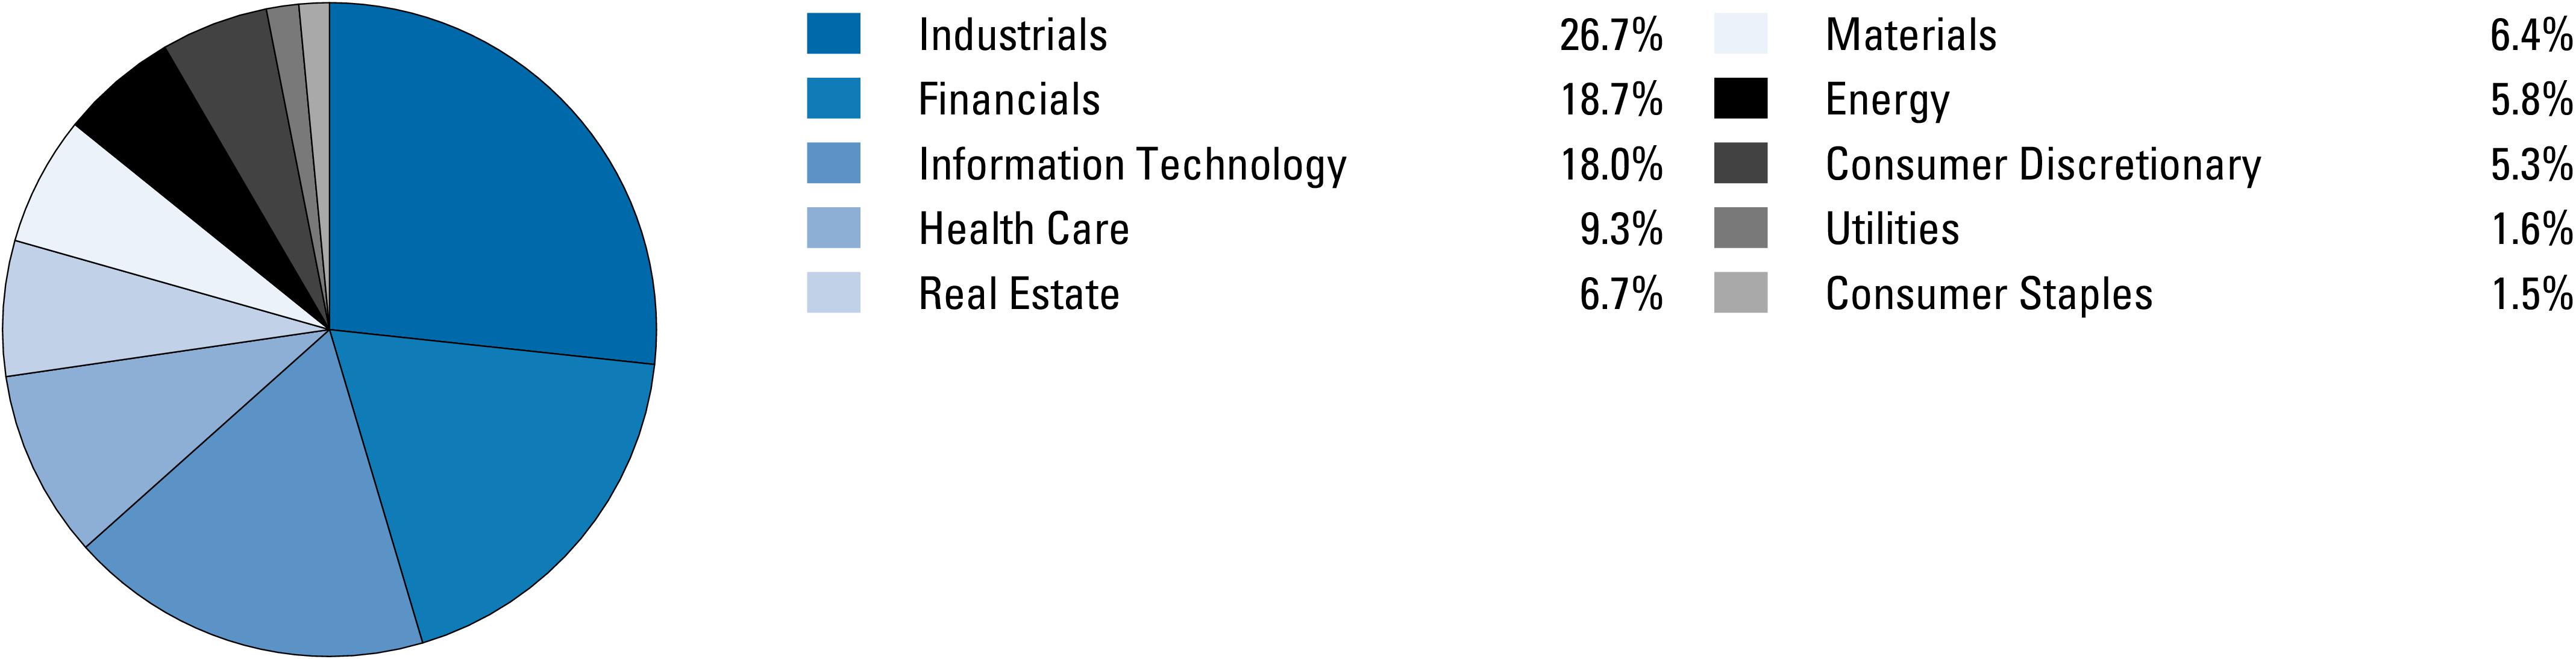
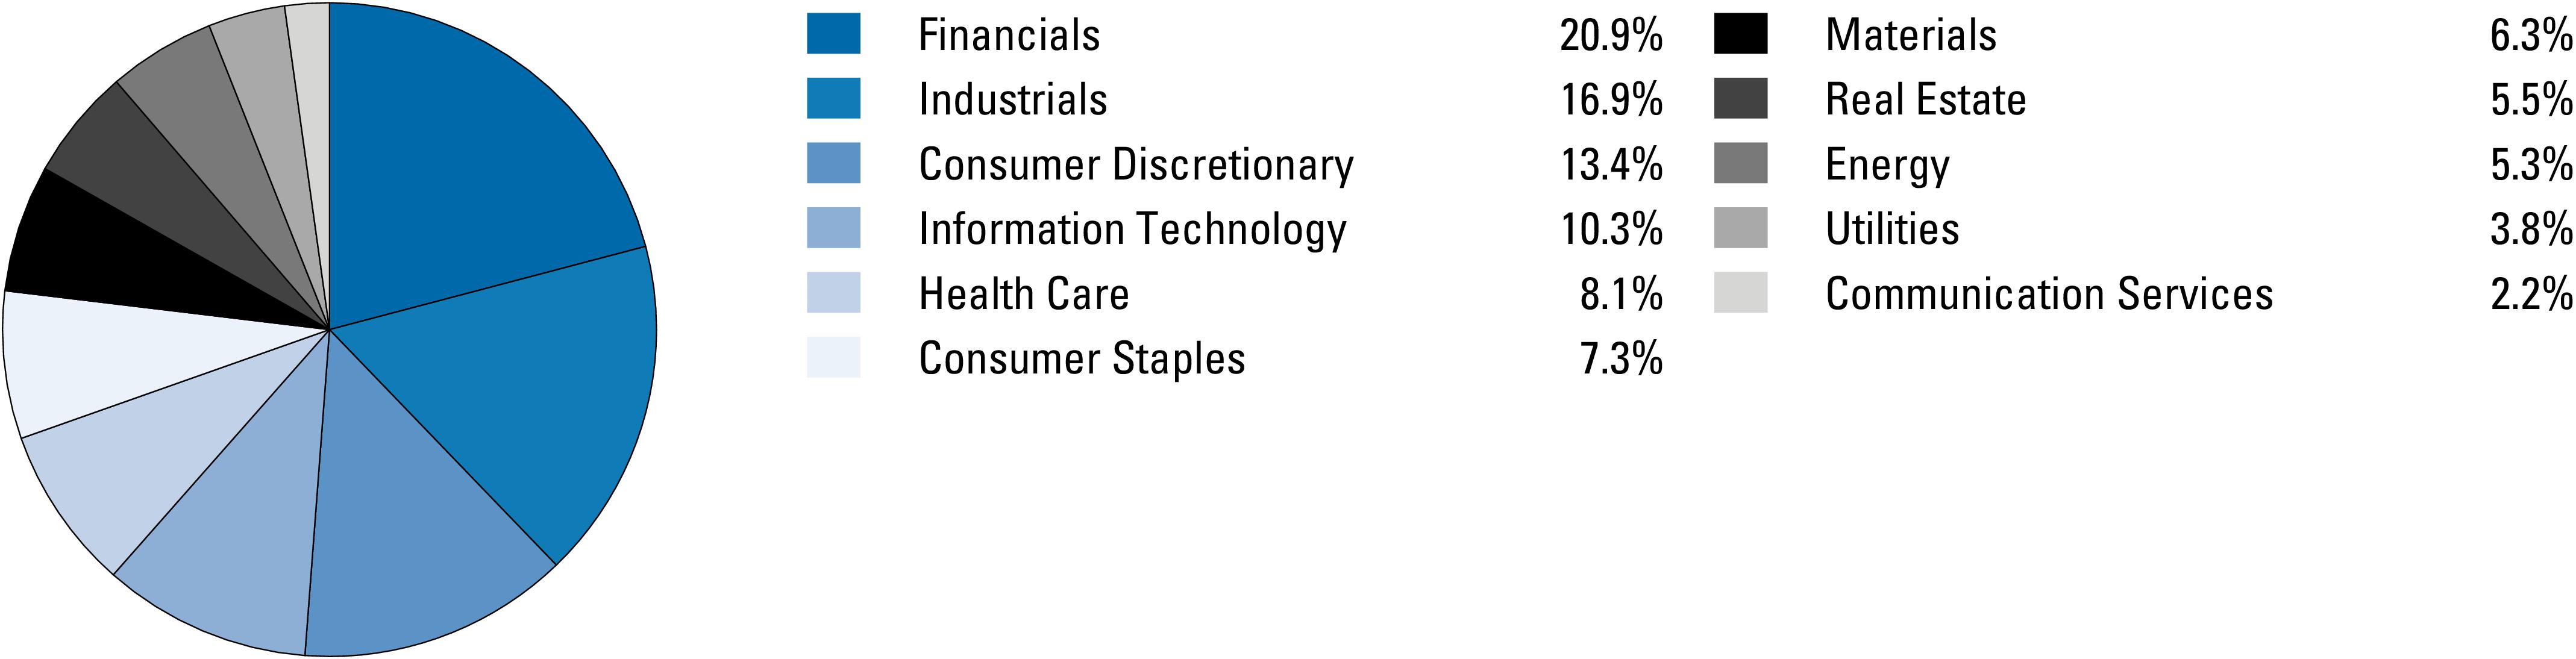
Non-U.S. developed market small caps were also impacted by elevated bond yields. At the sector level, the top performing sectors, Financials and Consumer Staples, are often favored during a rising rate environment. Financials tend to benefit, at least in theory, from improved spreads as rates rise. Consumer Staples, meanwhile, are often highly sought after during inflationary periods because their products typically have inelastic demand and prices are easily passed on to customers. Meanwhile, Real Estate was the worst performing sector as rising rates will likely have a significant impact on affordability, in our view.
One unexpected dynamic during the period was the significant outperformance of the larger cap segment (companies with market capitalization of greater than $5 billion) of the MSCI EAFE Small Cap Index. Although this segment makes up only approximately 10% of the index, it contributed more than half of the index’s return for the year. Meanwhile, the segment of companies with less than $2 billion market cap generated a loss for the index. Consistent with the rising interest rate environment, we believe larger cap companies within the small cap universe, benefitted from liquidity and size factor dynamics during the year.
PERFORMANCE
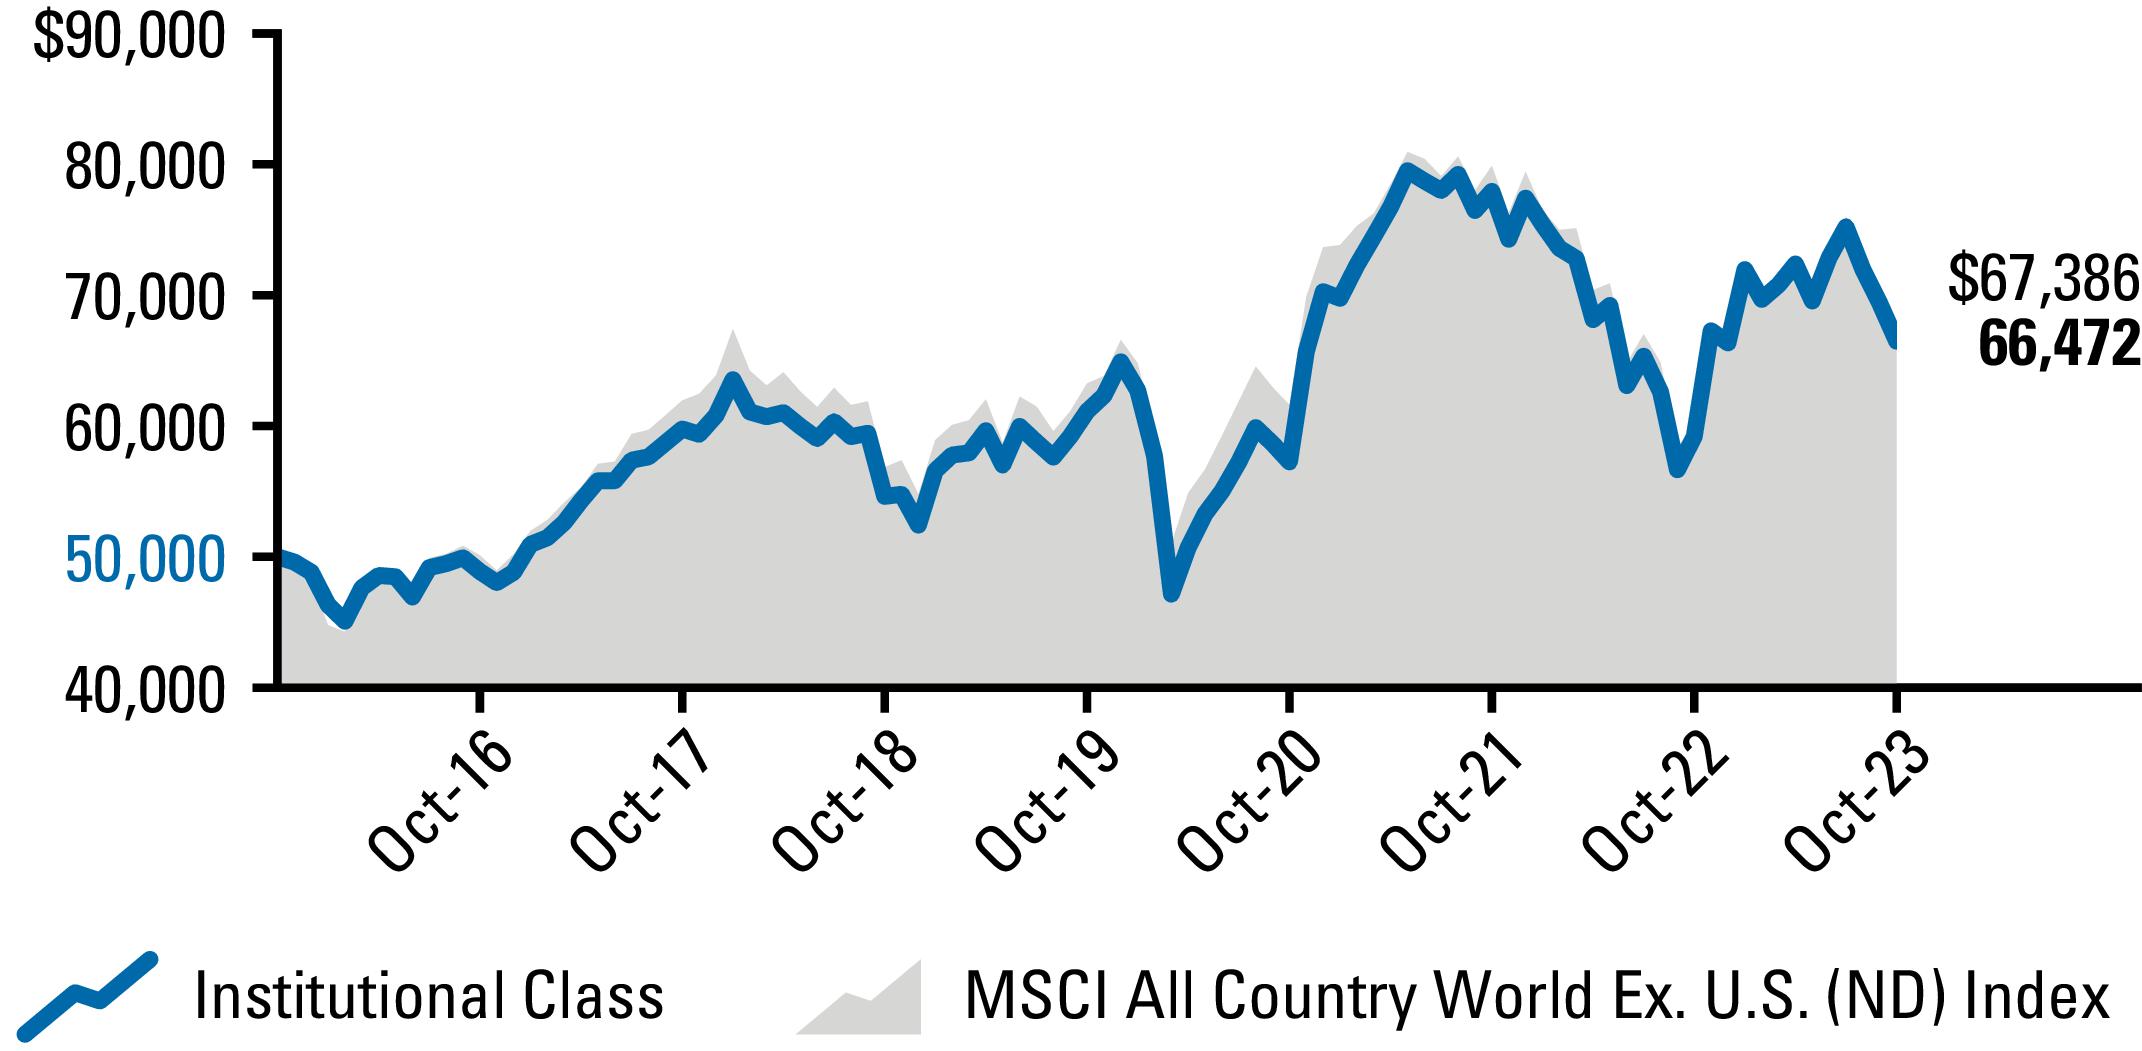
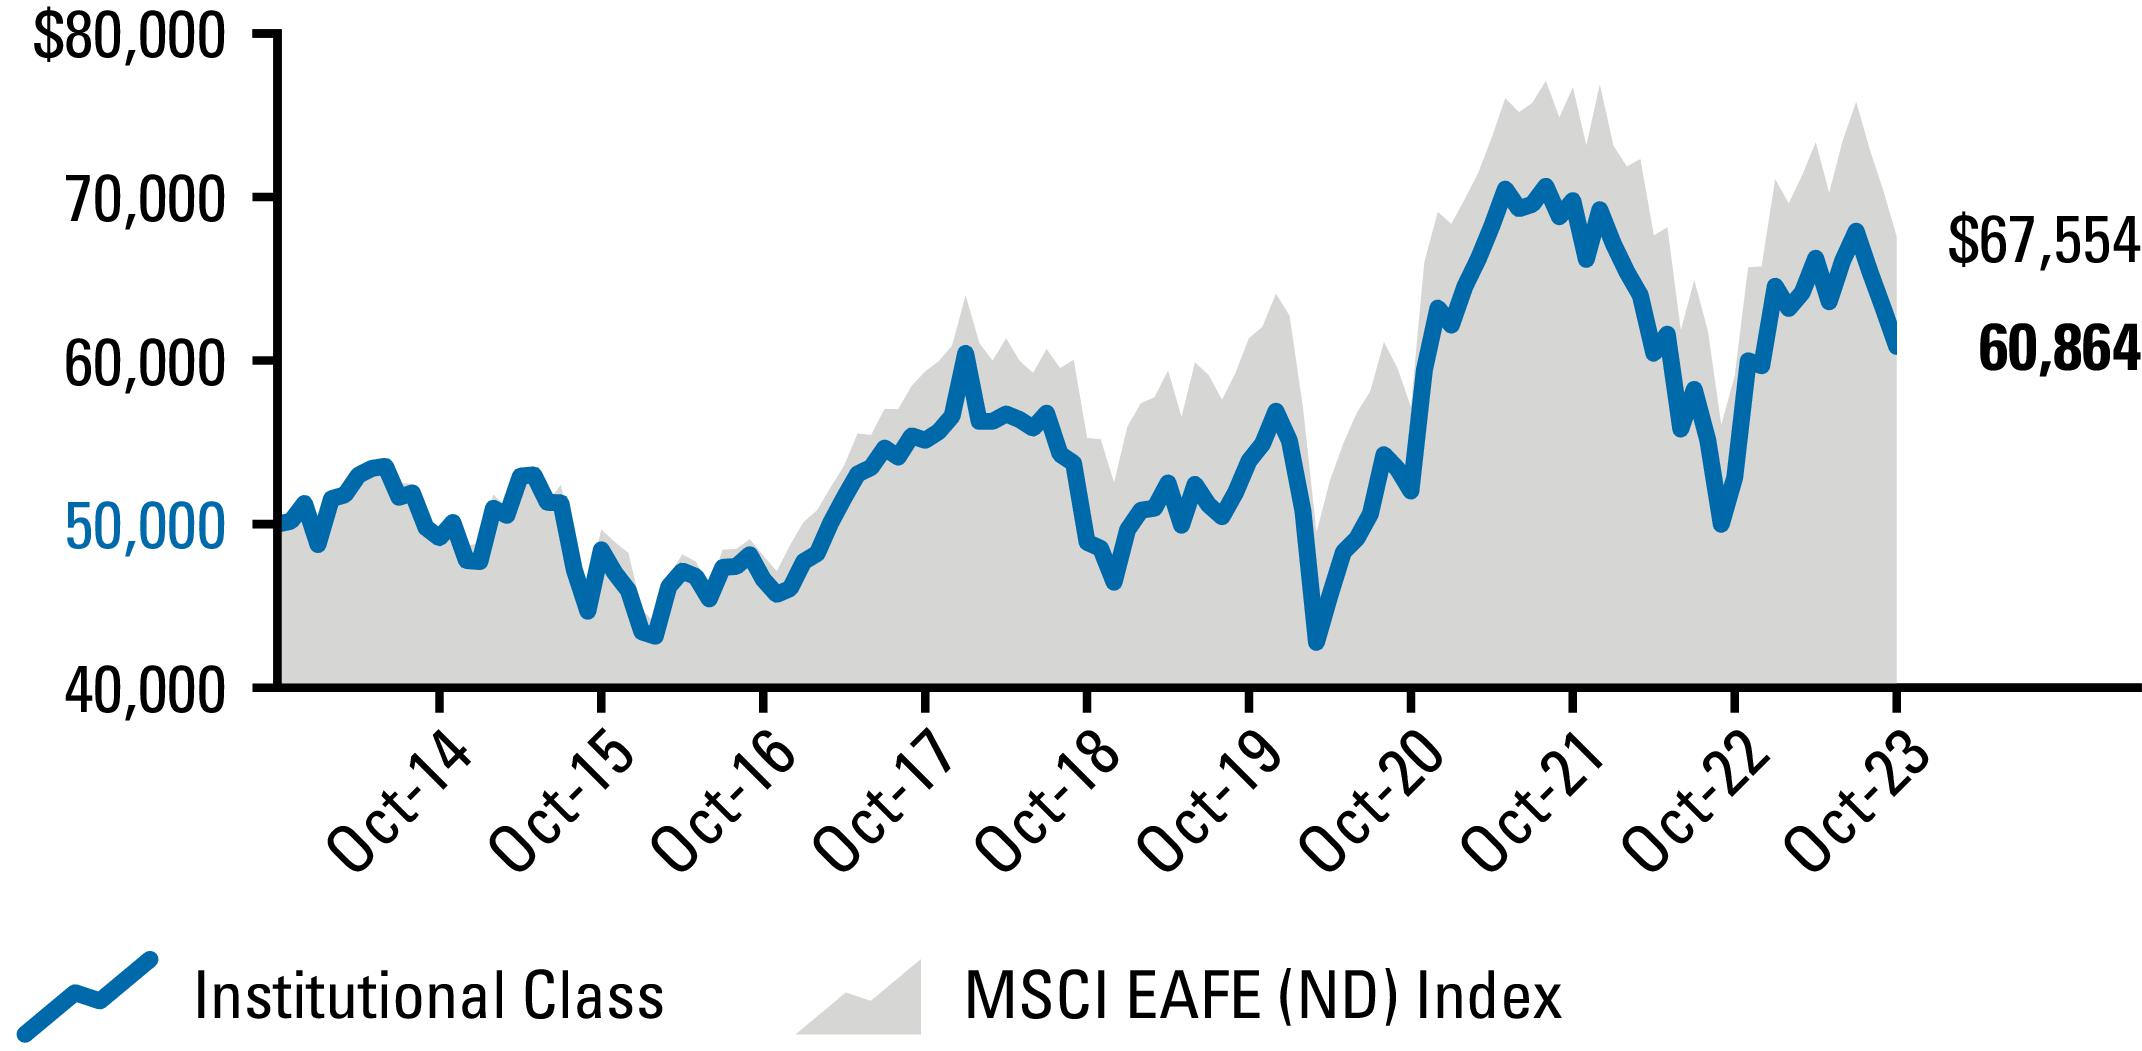
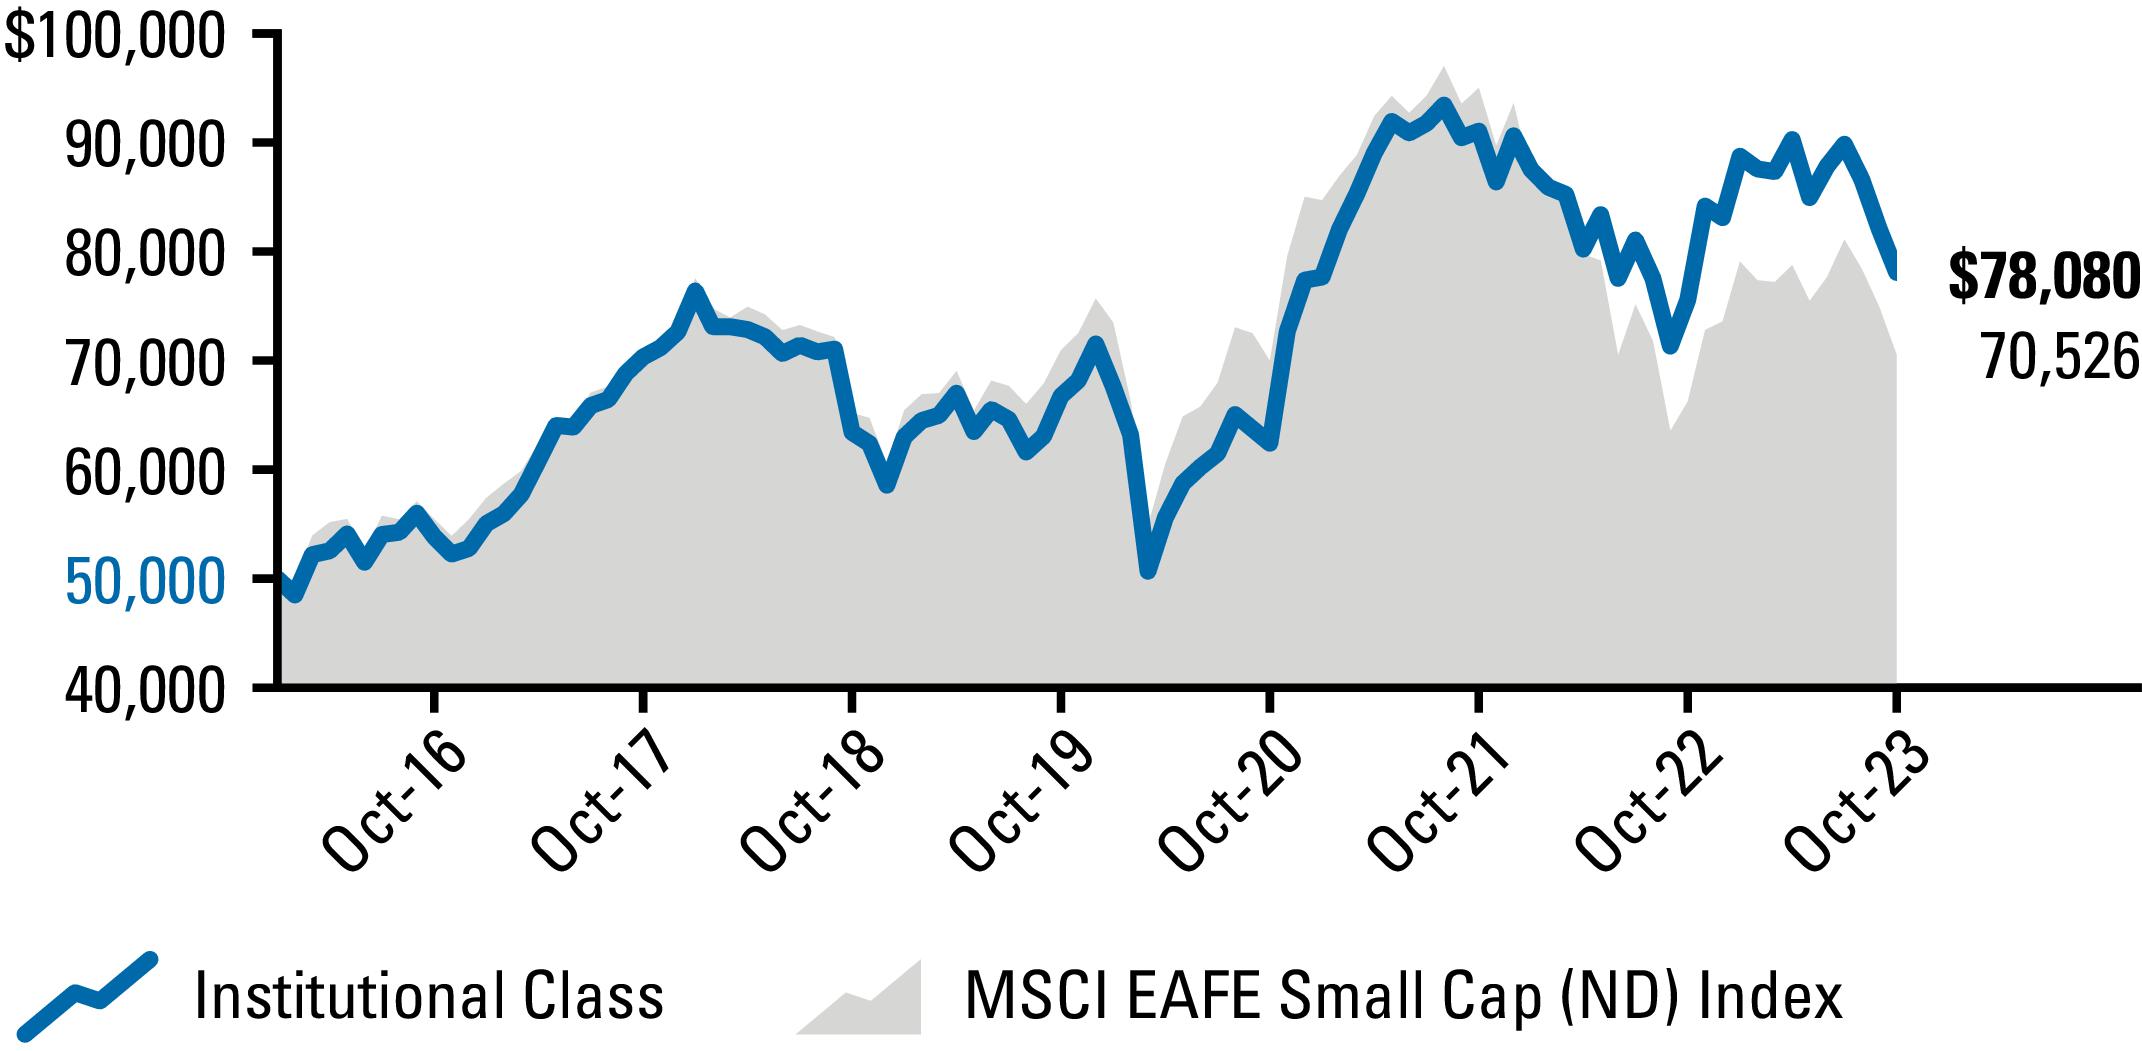
Harbor International Small Cap Fund returned 3.47% (Retirement Class), 3.33% (Institutional Class), 3.21% (Administrative Class), and 2.98% (Investor Class), while the MSCI EAFE Small Cap (ND) Index returned 6.47% during the same period.
The negative relative performance was primarily driven by the macroeconomic environment described above that favored factor exposure to deep value, high dividend, high leverage, and larger market capitalization companies. Although the Fund maintains a strong valuation discipline, it also tends to maintain higher quality attributes and a smaller market capitalization focus. Our analysis indicates that more than half of the benchmark’s return during the period was driven by the 10% of companies with market capitalization greater than $5 billion.
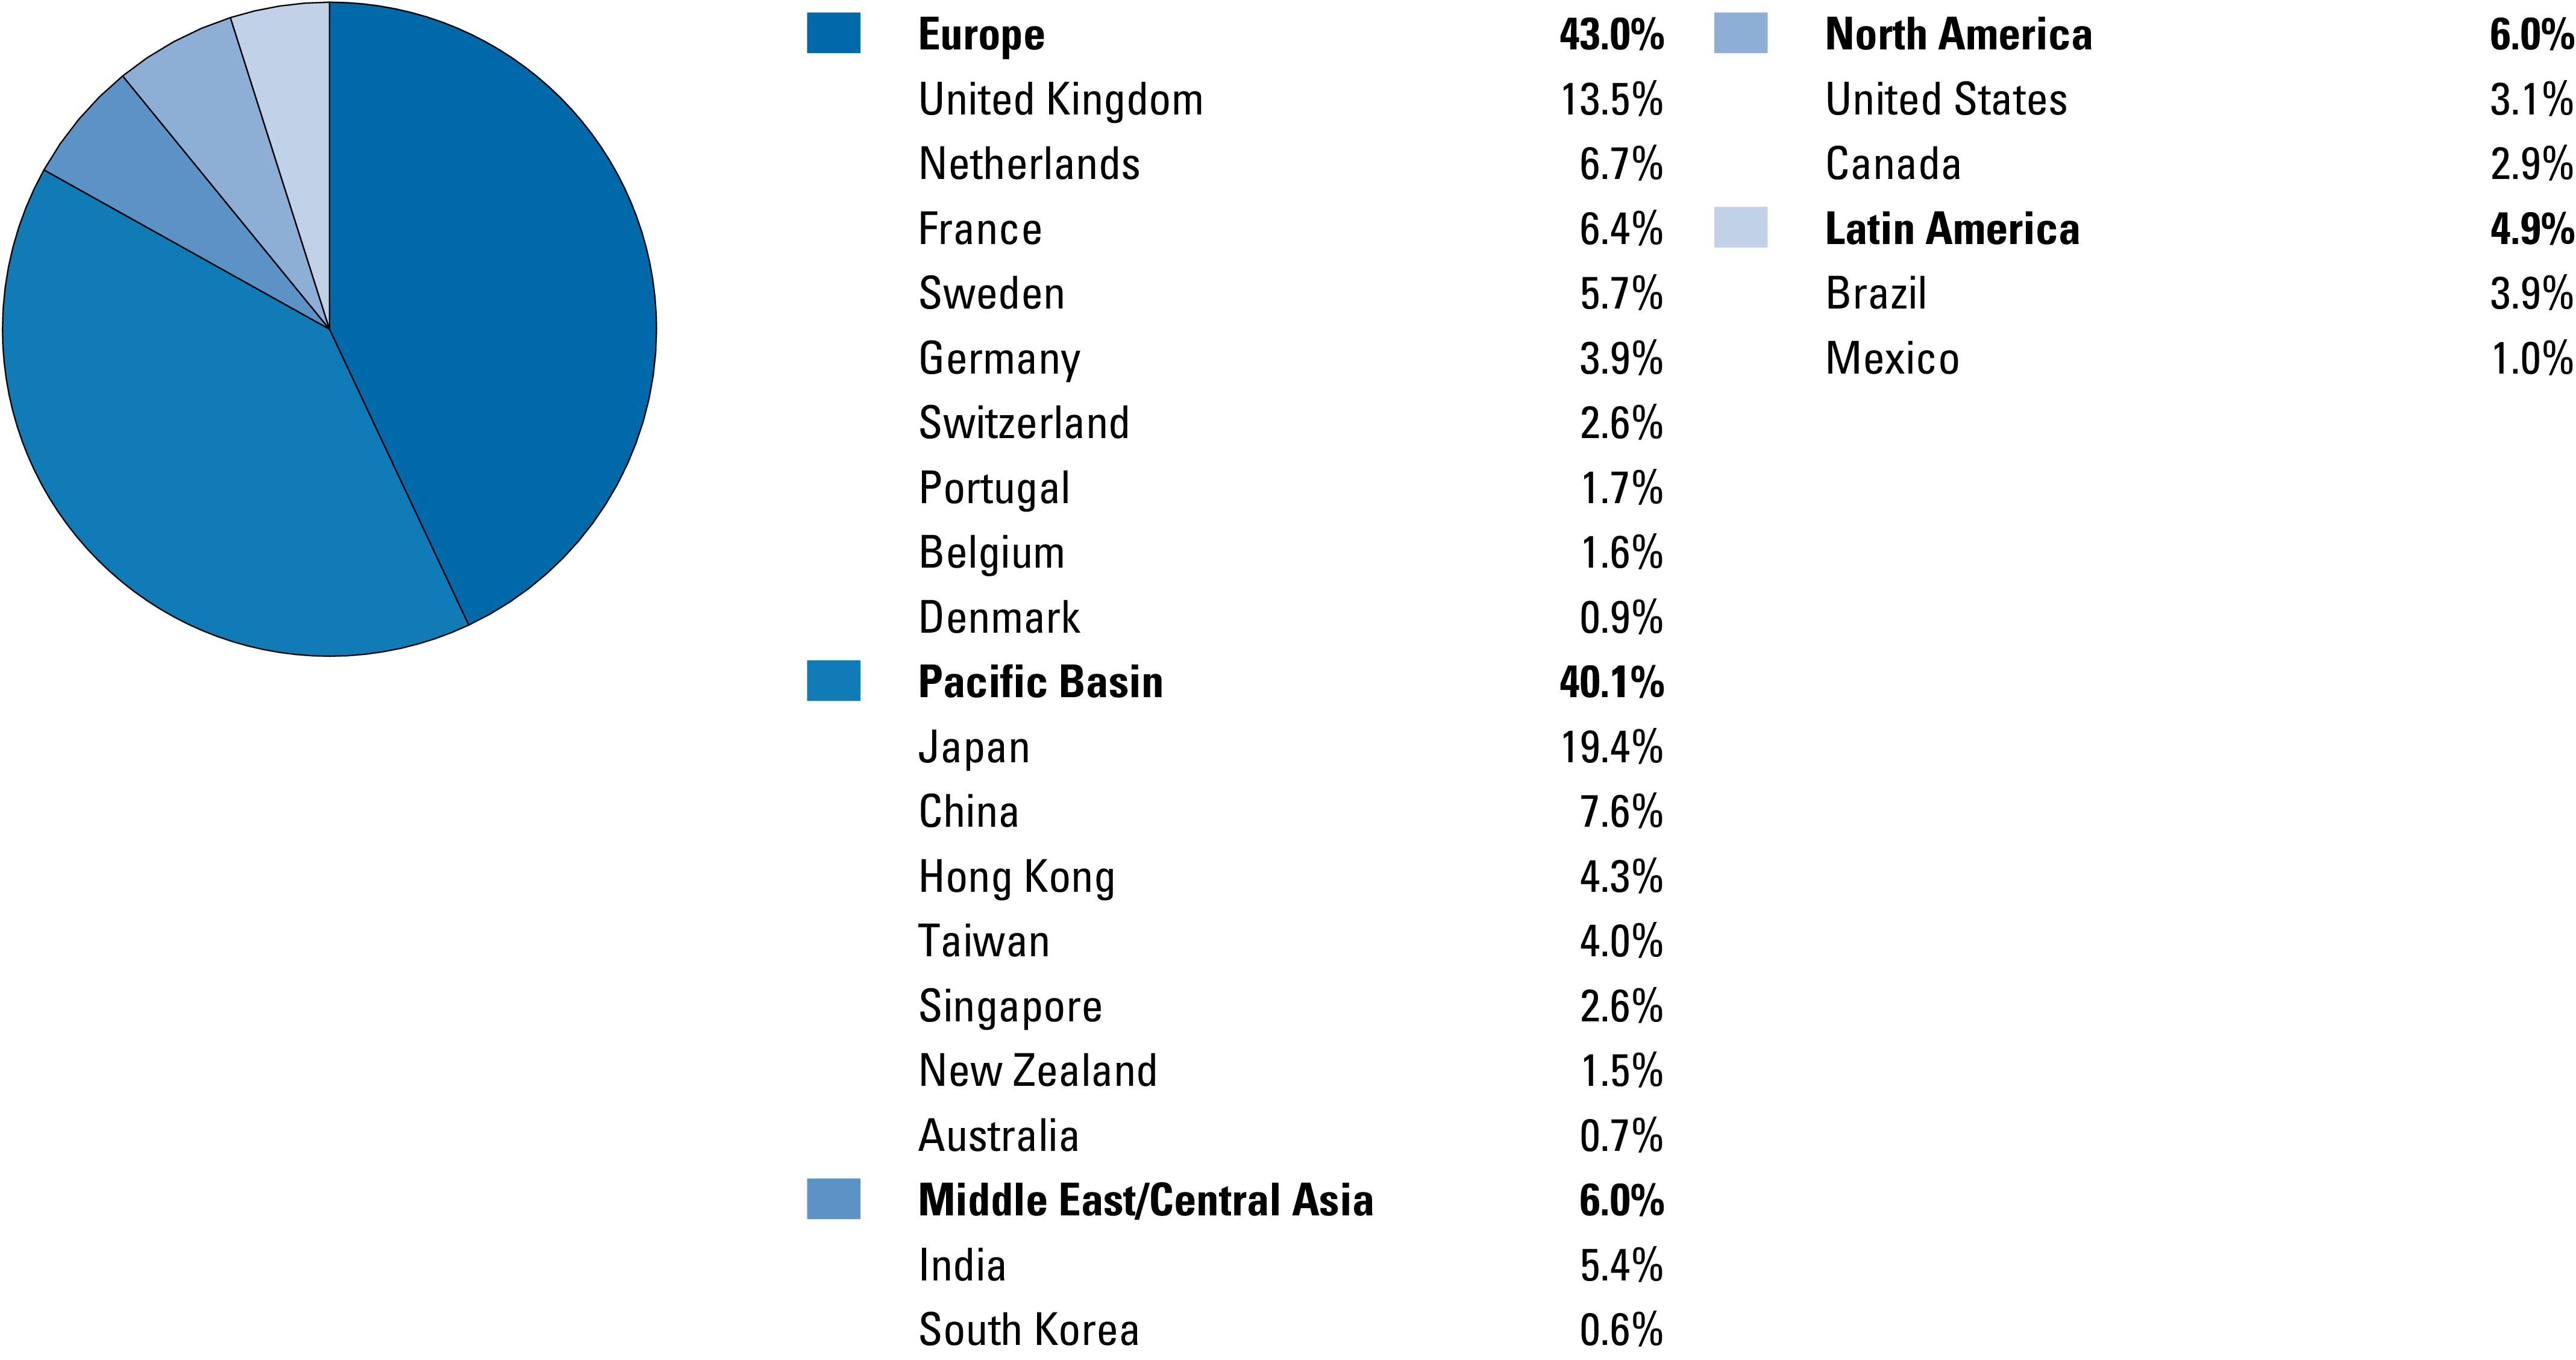
On a relative basis, poor stock selection in Japan (where the size and quality factor dynamics described above manifested themselves, in our view) was the predominant detractor to Fund performance. However, good stock selection in Belgium and France somewhat offset negative effects in Japan.
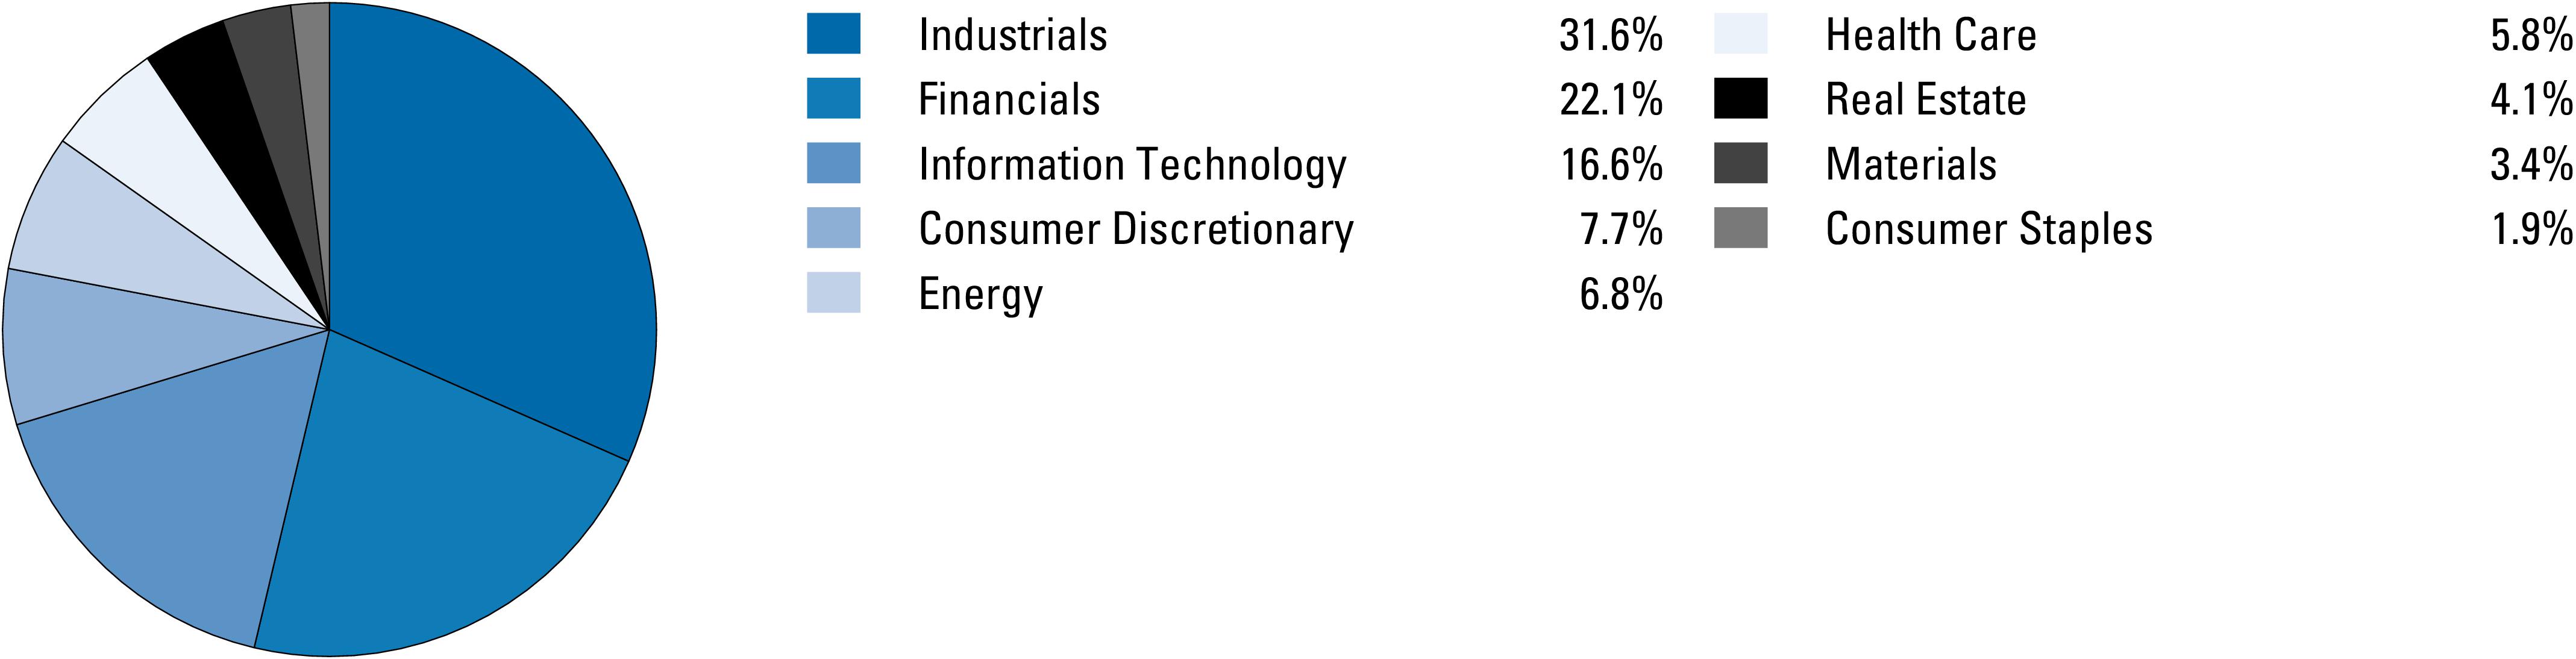
During the period under review, from a sector perspective, the main detractors to Fund performance were stock selection in Financials and Technology sectors, offset somewhat by positive stock selection in Energy and allocation effects in Real Estate. The Fund has not allocated to Real Estate for some time now due to our continued belief that the sector will face challenges in a rising interest rate environment, combined with our inability to identify favorable risk-reward opportunities that suit the Fund.
The Fund’s top contributors are broadly diversified across countries and sectors, including Energy, Consumer
⬤
67
Harbor International Small Cap FundMANAGER’S COMMENTARY—Continued
CHANGE IN A $50,000 INVESTMENT
For the period 02/01/2016 through 10/31/2023
The graph compares a $50,000 investment in the Institutional Class shares of the Fund with the performance of the MSCI EAFE Small Cap (ND) Index. The Fund’s performance assumes the reinvestment of all dividend and capital gain distributions.
TOTAL RETURNS | |||
For the periods ended 10/31/2023 | |||
Annualized | |||
1 Year | 5 Years | Life of Fund | |
Harbor International Small Cap Fund | |||
Retirement Class1 | 3.47% | 4.33% | 6.00% |
Institutional Class1 | 3.33 | 4.25 | 5.92 |
Administrative Class1 | 3.21 | 4.00 | 5.66 |
Investor Class1 | 2.98 | 3.85 | 5.53 |
Comparative Index | |||
MSCI EAFE Small Cap (ND) Index1 | 6.47% | 1.58% | 4.54% |
As stated in the Fund’s prospectus dated June 1, 2023, the expense ratios were 0.85% (Net) and 1.11% (Gross) (Retirement Class); 0.93% (Net) and 1.19% (Gross) (Institutional Class); 1.18% (Net) and 1.44% (Gross) (Administrative Class); and 1.29% (Net) and 1.55% (Gross) (Investor Class). The net expense ratios reflect an expense limitation agreement (excluding interest expense, if any) effective through 05/31/2024. The expense ratios in the prospectus may differ from the actual expense ratios for the period disclosed within this report. The expense ratios shown in the prospectus are adjusted to reflect changes, if any, in contractual arrangements that occurred prior to the date of the prospectus (or supplement thereto, if applicable).
The MSCI EAFE Small Cap (ND) Index is an equity index which captures small cap representation across developed market countries around the world, excluding the U.S. and Canada. This unmanaged index does not reflect fees and expenses and is not available for direct investment.
Performance data shown represents past performance and is no guarantee of future results. Past performance is net of management fees and expenses and reflects reinvested dividends and distributions. Past performance reflects the beneficial effect of any expense waivers or reimbursements, without which returns would have been lower. Investment returns and principal value will fluctuate and when redeemed may be worth more or less than their original cost. Returns for periods less than one year are not annualized. Current performance may be higher or lower and is available through the most recent month end at harborcapital.com or by calling 800-422-1050.
Discretionary, Technology, and Health Care names in Europe and Asia. Technip Energies uses its engineering prowess to help companies with complex projects in energy transition. Meanwhile, XFAB Silicon Foundries and Aryzta both entered the Fund as special situations, but we believe they are now beginning to resonate. Interestingly, both are outsourced providers of, in our view, essential products: semiconductors for automobiles and baked goods, respectively.
Meanwhile, the Fund’s top detractors include companies experiencing painful industry transitions that, we believe, need time to play out. Anritsu provides test equipment for mobile communications networks and the 5G wireless transition has not played out the way management had hoped, in our view. TomTom and Transcontinental are two businesses that are using strong cash flows from declining legacy businesses to fund new, fast-growing businesses, but these transitions tend to take time to play out and can be more nuanced from a financial metrics perspective than companies that are not going through similar transitions.
As always, country and sector allocations continue to be driven by company-specific factors and we have not significantly modified our exposures.
OUTLOOK & STRATEGY
In our view, macroeconomic uncertainty is likely to continue to drive interest rate volatility as financial markets attempt to adjust to an environment of “higher for longer” rates. Bond yields in the U.S. and many of the Fund’s key markets have not been this high in over a decade.
With persistently tighter monetary conditions (i.e., “higher for longer”), we continue to believe that companies with the combination of good underlying businesses, limited balance sheet leverage, and compelling valuations are likely to outperform.
In addition, we expect some level of mean reversion between the USD and other major currencies in the months/quarters ahead as the current dynamic appears to be unsustainable from a current account perspective. As such, we also believe that non-U.S. equities could see a benefit from currency translation.
In our view, given current market conditions, investors with the ability to deploy USD are in a seemingly favorable position to benefit two ways in the current environment: buying cheaper assets and doing so with the increased purchasing power of the USD. During the period, deep value, larger cap, and highly levered segments of non-U.S. equities outperformed smaller, better-quality segments as many factor-based and quantitative investors sought exposure to factors which are perceived to benefit from recent interest date dynamics, in our view. We believe these top-down approaches are rarely sustained as company fundamentals tend to reassert themselves, especially in a market environment with heightened interest rate volatility. In addition, after more than two years of sustained underperformance, we believe the contrarian opportunity in non-U.S, developed market small caps is improving.
1 The “Life of Fund” return as shown reflects the period 02/01/2016 (commencement of operations) through 10/31/2023.
This report contains the current opinions of Cedar Street Asset Management LLC as of the date of this report and should not be considered as investment advice or a recommendation of any particular security, strategy or investment product. Such opinions are subject to change without notice and securities described herein may no longer be included in, or may at any time be removed from, the Fund’s portfolio. This report is distributed for informational purposes only. Information contained herein has been obtained from sources believed reliable, but not guaranteed.
There is no guarantee that the investment objective of the Fund will be achieved. Stock markets are volatile and equity values can decline significantly in response to adverse issuer, political, regulatory, market and economic conditions. Stocks of small cap companies pose special risks, including possible illiquidity and greater price volatility than stocks of larger, more established companies. Investing in international and emerging markets poses special risks, including potentially greater price volatility due to social, political and economic factors, as well as currency exchange rate fluctuations. These risks are more severe for securities of issuers in emerging market regions. For information on the different share classes and the risks associated with an investment in the Fund, please refer to the current prospectus.
⬤
68
Harbor International Small Cap FundPORTFOLIO OF INVESTMENTS—October 31, 2023
REGION BREAKDOWN (% of investments) - Unaudited
The Fund’s Portfolio of Investments include investments denominated in foreign currencies. As of October 31, 2023, 28.80% of the Fund’s investments were denominated in Euros and 25.27% were denominated in Japanese Yen. No other foreign currency denomination comprised more than 25% of the Fund’s net assets.
PORTFOLIO OF INVESTMENTS
Value and Cost in Thousands
COMMON STOCKS—97.0% | ||
Shares | Value | |
AIR FREIGHT & LOGISTICS—3.0% | ||
176,077 | Sankyu, Inc. (Japan) | $5,302 |
13,969,817 | Singapore Post Ltd. (Singapore) | 4,588 |
9,890 | ||
AUTOMOBILE COMPONENTS—1.0% | ||
2,560,730 | Johnson Electric Holdings Ltd. (Hong Kong) | 3,177 |
BANKS—1.3% | ||
2,383,787 | Virgin Money U.K. PLC (United Kingdom) | 4,331 |
BEVERAGES—1.7% | ||
429,166 | AG Barr PLC (United Kingdom) | 2,565 |
1,745,278 | C&C Group PLC (Ireland) | 2,957 |
5,522 | ||
BUILDING PRODUCTS—2.1% | ||
1,430,909 | Genuit Group PLC (United Kingdom) | 4,617 |
1,026,699 | Reliance Worldwide Corp. Ltd. (United States) | 2,288 |
6,905 | ||
CAPITAL MARKETS—1.8% | ||
3,062,018 | TP ICAP Group PLC (United Kingdom) | 5,863 |
CHEMICALS—1.9% | ||
88,147 | Neo Performance Materials, Inc. (Canada) | 435 |
COMMON STOCKS—Continued | ||
Shares | Value | |
CHEMICALS—Continued | ||
339,185 | Victrex PLC (United Kingdom) | $5,683 |
6,118 | ||
COMMERCIAL SERVICES & SUPPLIES—5.2% | ||
391,502 | ISS AS (Denmark) | 5,666 |
210,539 | Loomis AB Class B (Sweden) | 5,469 |
3,533,646 | Serco Group PLC (United Kingdom) | 6,140 |
17,275 | ||
CONSTRUCTION & ENGINEERING—1.9% | ||
486,358 | Raito Kogyo Co. Ltd. (Japan) | 6,295 |
CONSUMER FINANCE—1.7% | ||
83,369 | Cembra Money Bank AG (Switzerland) | 5,748 |
CONSUMER STAPLES DISTRIBUTION & RETAIL—1.7% | ||
489,358 | Qol Holdings Co. Ltd. (Japan) | 5,649 |
CONTAINERS & PACKAGING—5.0% | ||
507,648 | Fuji Seal International, Inc. (Japan) | 5,655 |
189,354 | Huhtamaki Oyj (Finland) | 6,509 |
593,681 | Transcontinental, Inc. Class A (Canada) | 4,371 |
16,535 | ||
DISTRIBUTORS—5.1% | ||
1,352,089 | Bapcor Ltd. (Australia) | 4,602 |
⬤
69
Harbor International Small Cap FundPORTFOLIO OF INVESTMENTS—Continued
Value and Cost in Thousands
COMMON STOCKS—Continued | ||
Shares | Value | |
DISTRIBUTORS—Continued | ||
708,952 | Inchcape PLC (United Kingdom) | $5,748 |
196,848 | PALTAC Corp. (Japan) | 6,381 |
16,731 | ||
ELECTRICAL EQUIPMENT—1.3% | ||
131,146 | Mersen SA (France) | 4,354 |
ELECTRONIC EQUIPMENT, INSTRUMENTS & COMPONENTS—7.0% | ||
486,699 | Anritsu Corp. (Japan) | 3,623 |
10,068 | AT&S Austria Technologie & Systemtechnik AG (Austria) | 253 |
81,912 | Landis & Gyr Group AG (Switzerland) | 6,077 |
398,767 | Optex Group Co. Ltd. (Japan) | 4,483 |
456,653 | Topcon Corp. (Japan) | 4,164 |
517,370 | Venture Corp. Ltd. (Singapore) | 4,417 |
23,017 | ||
FINANCIAL SERVICES—1.5% | ||
957,422 | Illimity Bank SpA (Italy) | 4,880 |
FOOD PRODUCTS—7.9% | ||
147,215 | Ariake Japan Co. Ltd. (Japan) | 4,656 |
3,342,292 | Aryzta AG (Switzerland)* | 6,126 |
506,943 | AustAsia Group Ltd. (China)* | 106 |
1,198,451 | Elders Ltd. (Australia) | 4,522 |
343,867 | Glanbia PLC (Ireland) | 5,416 |
149,205 | Morinaga & Co. Ltd. (Japan) | 5,381 |
26,207 | ||
GAS UTILITIES—1.9% | ||
288,203 | Rubis SCA (France) | 6,275 |
GROUND TRANSPORTATION—1.4% | ||
1,115,063 | Redde Northgate PLC (United Kingdom) | 4,561 |
HEALTH CARE EQUIPMENT & SUPPLIES—5.5% | ||
313,504 | Ansell Ltd. (Australia) | 4,236 |
1,671,038 | Arjo AB Class B (Sweden) | 5,588 |
478,017 | Eiken Chemical Co. Ltd. (Japan) | 4,715 |
127,320 | Jeol Ltd. (Japan) | 3,595 |
18,134 | ||
HEALTH CARE PROVIDERS & SERVICES—1.9% | ||
364,667 | Fagron (Belgium) | 6,409 |
HOTELS, RESTAURANTS & LEISURE—2.7% | ||
401,539 | Resorttrust, Inc. (Japan) | 5,778 |
867,862 | Round One Corp. (Japan) | 3,148 |
8,926 | ||
INDUSTRIAL CONGLOMERATES—0.2% | ||
29,494 | Indus Holding AG (Germany) | 574 |
INSURANCE—5.5% | ||
158,671 | ASR Nederland NV (Netherlands) | 5,922 |
418,156 | Coface SA (France) | 5,045 |
COMMON STOCKS—Continued | ||
Shares | Value | |
INSURANCE—Continued | ||
1,283,388 | Direct Line Insurance Group PLC (United Kingdom)* | $2,366 |
2,243,858 | Mapfre SA (Spain) | 4,664 |
17,997 | ||
IT SERVICES—1.7% | ||
264,090 | TietoEVRY OYJ (Finland) | 5,541 |
LEISURE PRODUCTS—1.7% | ||
240,089 | Spin Master Corp. (Canada)1 | 5,739 |
MACHINERY—8.6% | ||
210,803 | Construcciones y Auxiliar de Ferrocarriles SA (Spain) | 6,297 |
725,147 | Husqvarna AB Class B (Sweden) | 4,699 |
470,526 | METAWATER Co. Ltd. (Japan) | 5,932 |
877,956 | Morgan Advanced Materials PLC (United Kingdom) | 2,405 |
237,540 | Nabtesco Corp. (Japan) | 4,207 |
274,482 | Norma Group SE (Germany) | 4,843 |
28,383 | ||
MEDIA—4.1% | ||
811,225 | Atresmedia Corp. de Medios de Comunicacion SA (Spain) | 3,040 |
203,266 | Criteo SA ADR (France)*,2 | 5,746 |
138,838 | RTL Group SA (Luxembourg) | 4,856 |
13,642 | ||
PERSONAL CARE PRODUCTS—1.6% | ||
703,653 | Ontex Group NV (Belgium)* | 5,149 |
PROFESSIONAL SERVICES—1.5% | ||
286,604 | Tinexta Spa (Italy) | 4,939 |
SEMICONDUCTORS & SEMICONDUCTOR EQUIPMENT—1.6% | ||
567,842 | X-FAB Silicon Foundries SE (Belgium)*,1 | 5,141 |
SOFTWARE—2.8% | ||
422,140 | Computer Engineering & Consulting Ltd. (Japan) | 4,356 |
806,347 | TomTom NV (Netherlands)* | 4,831 |
9,187 | ||
TEXTILES, APPAREL & LUXURY GOODS—1.6% | ||
6,534,562 | Coats Group PLC (United Kingdom) | 5,370 |
TRADING COMPANIES & DISTRIBUTORS—1.6% | ||
874,857 | BOC Aviation Ltd. (China)1 | 5,380 |
TOTAL COMMON STOCKS (Cost $359,511) | 319,844 | |
TOTAL INVESTMENTS—97.0% (Cost $359,511) | 319,844 | |
CASH AND OTHER ASSETS, LESS LIABILITIES—3.0% | 9,834 | |
TOTAL NET ASSETS—100% | $329,678 |
⬤
70
Harbor International Small Cap FundPORTFOLIO OF INVESTMENTS—Continued
FAIR VALUE MEASUREMENTS
The following table summarizes the Fund’s investments as of October 31, 2023 based on the inputs used to value them.
Asset Category | Quoted Prices Level 1 (000s) | Other Significant Observable Inputs Level 2 (000s) | Significant Unobservable Inputs Level 3 (000s) | Total (000s) |
Common Stocks | ||||
Europe | $7,127 | $185,536 | $— | $192,663 |
North America | 10,545 | 2,288 | — | 12,833 |
Pacific Basin | — | 114,348 | — | 114,348 |
Total Investments in Securities | $17,672 | $302,172 | $— | $319,844 |
For more information on valuation inputs and their aggregation into the levels identified above, please refer to the Fair Value Measurements and Disclosures in Note 2 of the accompanying Notes to Financial Statements.
*
Non-income producing security
1
Securities purchased in a transaction exempt from registration under Rule 144A of the Securities Act of 1933. These securities may be resold in transactions exempt from registration, normally to qualified institutional buyers. The Fund has no right to demand registration of these securities. As of October 31, 2023, the aggregate value of these securities was $16,260 or 5% of net assets.
2
Depositary receipts such as American Depositary Receipts (ADRs), Global Depositary Receipts (GDRs) and other country specific depositary receipts are certificates evidencing ownership of shares of a foreign issuer. These certificates are issued by depositary banks and generally trade on an established market in the U.S. or elsewhere.
The accompanying notes are an integral part of the Financial Statements.
⬤
71
Harbor Large Cap Value FundMANAGER’S COMMENTARY (Unaudited)
SUBADVISOR
Aristotle Capital Management, LLC
Management’s Discussion of
Fund Performance
Fund Performance
MARKET REVIEW
U.S. equity markets and the economy have been remarkably resilient during the last year in the face of multiple headwinds including a regional banking crisis, the highest interest rates in recent memory and large-scale labor strikes across industries. For the one-year period that ended October 31, 2023, the S&P 500 Index returned 10.60%, though the breadth of performance was limited with 80.52% of the period’s return attributed to 6 of the “Magnificent 7” stocks largely in the Communication Services and Information Technology sectors. In terms of style, growth-oriented stocks outperformed on a relative basis with the Russell 1000 Growth Index beating its value counterpart by over 19.95% during the period.
Rising interest rates and their effects on markets and the economy were a headwind during the year. In January 2023, the average year-end forecast from seven major banks for the yield on the 10-year U.S. Treasury note was 3.61%. As the Federal Reserve (“Fed”) continued an interest rate hiking cycle to reduce inflation expectations, yields rose across the U.S. Treasury yield curve with shorter-term maturities selling off more than longer maturities until long-dated bonds fell sharply in the last two months of the period with the 10-year yield at 4.88% by the end of October. An inverted yield curve was one of the contributing factors to the depositor exodus at the heart of the regional banking crisis in March, which ultimately prompted the closure of Silicon Valley Bank, Signature Bank and First Republic Bank. While the road has been bumpy, the Fed’s campaign against inflation has borne fruit over the last year, as the U.S. Consumer Price Index (“CPI”) declined from 7.7% year-over-year in October 2022 to 3.7% in September 2023 with the ultimate target of 2%.
Many U.S. economic indicators were positive during the period, with the U.S. gross domestic product annual growth rate rising each quarter to end at 2.9% year-over-year in September 2023 despite prior forecasts of a potential recession starting in the third quarter. Employment remained a bright spot, as the unemployment rate was range-bound between 3.4% and 3.8% although the August and September readings printed at the higher end of the range at 3.8%. Non-farm payrolls reflected this strength as new jobs were added in each of the last twelve months with the second largest print in September at 336,000. Labor strikes were a factor during the period, with more days of idleness from work stoppages involving 1,000 or more workers in 2023 than in the last 20 years according to the U.S Bureau of Labor Statistics.
PERFORMANCE
Harbor Large Cap Value Fund returned 3.12% (Retirement Class), 3.06% (Institutional Class), 2.74% (Administrative Class), and 2.60% (Investor Class) for the year ended October 31, 2023, outperforming the 0.13% return of the Russell 1000® Value Index (the “Index”).
The Fund’s outperformance relative to the Index can be attributed to both security selection and sector allocation. Security selection in the Information Technology and Consumer Discretionary sectors, as well as an overweight to the Information Technology sector, contributed the most to relative performance. Conversely, an underweight to the Communication Services sector, as well as security selection in the Materials and Financials sectors, detracted the most from relative performance.
Software company, Microsoft, was the top contributor to relative return during the period. Microsoft has been a beneficiary of the market’s excitement for Generative AI in 2023. In our view, Microsoft has been well-positioned to benefit from a number of longer-term secular trends, and this is just the most recent example. The company is focused on integrating Generative AI capabilities across its offerings, including the recently unveiled Copilot suite of products. Furthermore, we believe momentum from Generative AI should reaccelerate growth in Microsoft’s Azure business, as new offerings generate additional end-user workloads. While not one of our initial catalysts for investing in Microsoft, we believe this is an example of a by-product of investing in quality businesses. Microsoft continues to execute well across its businesses
⬤
72
Harbor Large Cap Value FundMANAGER’S COMMENTARY—Continued
CHANGE IN A $50,000 INVESTMENT
For the period 11/01/2013 through 10/31/2023
The graph compares a $50,000 investment in the Institutional Class shares of the Fund with the performance of the Russell 1000®Value Index. The Fund’s performance assumes the reinvestment of all dividend and capital gain distributions.
TOTAL RETURNS | |||
For the periods ended 10/31/2023 | |||
Annualized | |||
1 Year | 5 Years | 10 Years | |
Harbor Large Cap Value Fund | |||
Retirement Class1 | 3.12% | 9.35% | 9.99% |
Institutional Class | 3.06 | 9.27 | 9.93 |
Administrative Class | 2.74 | 8.98 | 9.63 |
Investor Class | 2.60 | 8.86 | 9.52 |
Comparative Index | |||
Russell 1000®Value Index | 0.13% | 6.60% | 7.60% |
As stated in the Fund’s prospectus dated March 1, 2023, the expense ratios were 0.61% (Net) and 0.64% (Gross) (Retirement Class); 0.69% (Net) and 0.72% (Gross) (Institutional Class); 0.94% (Net) and 0.97% (Gross) (Administrative Class); and 1.05% (Net) and 1.08% (Gross) (Investor Class). The net expense ratios reflect an expense limitation agreement (excluding interest expense, if any) effective through 02/29/2024. The expense ratios in the prospectus may differ from the actual expense ratios for the period disclosed within this report. The expense ratios shown in the prospectus are adjusted to reflect changes, if any, in contractual arrangements that occurred prior to the date of the prospectus (or supplement thereto, if applicable).
The Russell 1000® Value Index is an unmanaged index generally representative of the U.S. market for larger capitalization value stocks. This unmanaged index does not reflect fees and expenses and is not available for direct investment. The Russell 1000® Value Index and Russell® are trademarks of Frank Russell Company.
Performance data shown represents past performance and is no guarantee of future results. Past performance is net of management fees and expenses and reflects reinvested dividends and distributions. Past performance reflects the beneficial effect of any expense waivers or reimbursements, without which returns would have been lower. Investment returns and principal value will fluctuate and when redeemed may be worth more or less than their original cost. Returns for periods less than one year are not annualized. Current performance may be higher or lower and is available through the most recent month end at harborcapital.com or by calling 800-422-1050.
while benefiting from the acceleration of businesses’ digital transformation. We continue to believe Microsoft’s combination of size, profitability and growth to be incredibly rare.
Corteva Agriscience, one of the world’s largest seed and crop protection companies, was the largest detractor for the period. While the company was a top contributor in 2022, the destocking of inventory built up during COVID weighed on company shares in the past year. While short-term changes in commodity prices may impact the share price, as long-term investors, we do not attempt to predict these movements. Instead, we remain focused on the fundamentals of what we believe to be a quality business, with a respected brand and strong patented seed and crop protection solutions for farmers. We believe the company’s ongoing mix shift to higher-margin, premium products, a catalyst we previously identified, will continue to aid both sales and profit growth.
OUTLOOK & STRATEGY
Rather than attempting to predict short-term market dynamics, at Aristotle Capital, we stay focused on understanding company fundamentals while carefully monitoring the long-term evolution of our portfolio of holdings. Our approach to understanding individual businesses reveals more insightful conclusions than would undue time spent concentrating on ever-changing and often unclear macroeconomic signals. While we strive to remain macro aware, our goal instead is to invest in businesses which are run by what we believe are capable and proven management teams that have the skill to navigate changing factors such as inflation, interest rates and government policy. We also analyze how such factors could alter the fundamentals of a business and whether those impacts are long term in nature.
We aim to find companies that we believe have high-quality characteristics that can succeed over full market cycles. It is our belief that a disciplined, research-oriented approach to finding great companies, as well as a consistent, well-executed portfolio management process, is how we can add the most value for our clients.
1 Retirement Class shares commenced operations on March 1, 2016. The performance attributed to the Retirement Class shares prior to that date is that of the Institutional Class shares. Performance prior to March 1, 2016 has not been adjusted to reflect the lower expenses of Retirement Class shares. During this period, Retirement Class shares would have had returns similar to, but potentially higher than, Institutional Class shares due to the fact that Retirement Class shares represent interests in the same portfolio as Institutional Class shares but are subject to lower expenses.
This report contains the current opinions of Aristotle Capital Management, LLC as of the date of this report and should not be considered as investment advice or a recommendation of any particular security, strategy or investment product. Such opinions are subject to change without notice and securities described herein may no longer be included in, or may at any time be removed from, the Fund’s portfolio. This report is distributed for informational purposes only. Information contained herein has been obtained from sources believed reliable, but not guaranteed.
There is no guarantee that the investment objective of the Fund will be achieved. Stock markets are volatile and equity values can decline significantly in response to adverse issuer, political, regulatory, market and economic conditions. Since the Fund may hold foreign securities, it may be subject to greater risks than funds invested only in the U.S. These risks are more severe for securities of issuers in emerging markets regions. For information on the different share classes and the risks associated with an investment in the Fund, please refer to the current prospectus.
⬤
73
Harbor Large Cap Value FundPORTFOLIO OF INVESTMENTS—October 31, 2023
SECTOR ALLOCATION (% of investments) - Unaudited
PORTFOLIO OF INVESTMENTS
Value and Cost in Thousands
COMMON STOCKS—97.3% | ||
Shares | Value | |
AEROSPACE & DEFENSE—2.3% | ||
158,000 | General Dynamics Corp. | $38,127 |
AUTOMOBILE COMPONENTS—1.9% | ||
2,156,000 | Cie Generale des Etablissements Michelin SCA ADR (France)1 | 31,866 |
BANKS—7.8% | ||
375,000 | Commerce Bancshares, Inc. | 16,448 |
278,000 | Cullen/Frost Bankers, Inc. | 25,295 |
3,235,000 | Mitsubishi UFJ Financial Group, Inc. ADR (Japan)1 | 27,174 |
247,000 | PNC Financial Services Group, Inc. | 28,274 |
1,065,000 | U.S. Bancorp | 33,952 |
131,143 | ||
BEVERAGES—4.3% | ||
689,000 | Coca-Cola Co. | 38,922 |
143,000 | Constellation Brands, Inc. Class A | 33,483 |
72,405 | ||
BIOTECHNOLOGY—2.6% | ||
171,000 | Amgen, Inc. | 43,725 |
CAPITAL MARKETS—5.0% | ||
153,000 | Ameriprise Financial, Inc. | 48,129 |
383,000 | Blackstone, Inc. | 35,370 |
83,499 | ||
CHEMICALS—7.5% | ||
1,097,000 | Corteva, Inc. | 52,810 |
221,000 | Ecolab, Inc. | 37,070 |
404,000 | RPM International, Inc. | 36,873 |
126,753 | ||
COMMERCIAL SERVICES & SUPPLIES—0.2% | ||
60,000 | Veralto Corp. * | 4,140 |
CONSTRUCTION MATERIALS—3.0% | ||
125,000 | Martin Marietta Materials, Inc. | 51,118 |
CONSUMER FINANCE—2.3% | ||
387,000 | Capital One Financial Corp. | 39,199 |
CONSUMER STAPLES DISTRIBUTION & RETAIL—1.9% | ||
481,000 | Sysco Corp. | 31,982 |
ELECTRIC UTILITIES—2.2% | ||
626,000 | Xcel Energy, Inc. | 37,103 |
COMMON STOCKS—Continued | ||
Shares | Value | |
ELECTRONIC EQUIPMENT, INSTRUMENTS & COMPONENTS—2.1% | ||
92,000 | Teledyne Technologies, Inc. * | $34,462 |
GAS UTILITIES—2.5% | ||
383,000 | Atmos Energy Corp. | 41,234 |
HEALTH CARE EQUIPMENT & SUPPLIES—3.8% | ||
511,000 | Alcon, Inc. (Switzerland) | 36,444 |
380,000 | Medtronic PLC | 26,813 |
63,257 | ||
HOUSEHOLD DURABLES—5.4% | ||
458,000 | Lennar Corp. Class A | 48,859 |
7,126 | Lennar Corp. Class B | 703 |
494,000 | Sony Group Corp. ADR (Japan)1 | 41,027 |
90,589 | ||
HOUSEHOLD PRODUCTS—2.2% | ||
252,000 | Procter & Gamble Co. | 37,808 |
INDUSTRIAL CONGLOMERATES—2.3% | ||
209,000 | Honeywell International, Inc. | 38,301 |
LIFE SCIENCES TOOLS & SERVICES—2.2% | ||
196,000 | Danaher Corp. | 37,636 |
MACHINERY—7.0% | ||
282,000 | Oshkosh Corp. | 24,740 |
152,000 | Parker-Hannifin Corp. | 56,074 |
391,000 | Xylem, Inc. | 36,574 |
117,388 | ||
OIL, GAS & CONSUMABLE FUELS—4.7% | ||
1,544,000 | Coterra Energy, Inc. | 42,460 |
322,000 | Phillips 66 | 36,731 |
79,191 | ||
PHARMACEUTICALS—2.5% | ||
410,000 | Merck & Co., Inc. | 42,107 |
RESIDENTIAL REITS—1.9% | ||
480,000 | Equity LifeStyle Properties, Inc. | 31,584 |
SEMICONDUCTORS & SEMICONDUCTOR EQUIPMENT—4.9% | ||
639,000 | Microchip Technology, Inc. | 45,554 |
341,000 | QUALCOMM, Inc. | 37,166 |
82,720 |
⬤
74
Harbor Large Cap Value FundPORTFOLIO OF INVESTMENTS—Continued
Value and Cost in Thousands
COMMON STOCKS—Continued | ||
Shares | Value | |
SOFTWARE—13.3% | ||
117,000 | Adobe, Inc. * | $62,251 |
165,000 | ANSYS, Inc. * | 45,913 |
195,000 | Autodesk, Inc. * | 38,538 |
230,000 | Microsoft Corp. | 77,765 |
224,467 | ||
SPECIALIZED REITS—1.5% | ||
277,000 | Crown Castle, Inc. | 25,755 |
TOTAL COMMON STOCKS (Cost $1,211,099) | 1,637,559 | |
TOTAL INVESTMENTS—97.3% (Cost $1,211,099) | 1,637,559 | |
CASH AND OTHER ASSETS, LESS LIABILITIES—2.7% | 45,513 | |
TOTAL NET ASSETS—100% | $1,683,072 |
FAIR VALUE MEASUREMENTS
All investments as of October 31, 2023 (as disclosed in the preceding Portfolio of Investments) were classified as Level 1.
For more information on valuation inputs and their aggregation into the levels identified above, please refer to the Fair Value Measurements and Disclosures in Note 2 of the accompanying Notes to Financial Statements.
*
Non-income producing security
1
Depositary receipts such as American Depositary Receipts (ADRs), Global Depositary Receipts (GDRs) and other country specific depositary receipts are certificates evidencing ownership of shares of a foreign issuer. These certificates are issued by depositary banks and generally trade on an established market in the U.S. or elsewhere.
The accompanying notes are an integral part of the Financial Statements.
⬤
75
Harbor Mid Cap FundMANAGER’S COMMENTARY (Unaudited)
SUBADVISOR
EARNEST Partners, LLC
Management’s Discussion of
Fund Performance
Fund Performance
MARKET REVIEW
The U.S. equity markets, represented by the S&P 500® Index posted a 10.2% return during the 12-months ending October 31, 2023. The performance of the U.S. mid cap market, represented by the Russell Midcap® Index, lagged large cap stock, and declined 1% during the period.
The broad rally in global equity markets stalled after a strong first half of the year as investors began to focus on long-term economic growth prospects and the posture of the Federal Reserve (the “Fed”) in its fight against inflation. Energy emerged as the star performer during the quarter, gaining momentum as travel demand continued to remain strong and several OPEC countries extended supply restrictions through the end of next year. Rate-sensitive industries such as Consumer Discretionary, Real Estate, and Utilities, encountered headwinds in the wake of the Fed’s persistent commitment to maintaining higher interest rates for an extended period. These businesses typically hold lots of debt on their balance sheets which means that they may face higher financing costs. Additionally, Utilities and REITs are often viewed as bond-proxies by many investors and are competing for investors’ capital with government securities that are offering over 5% annualized rates. Many of the stocks within the tech-heavy NASDAQ 100 (Amazon and Tesla are both within Consumer Discretionary) saw a pullback after the index gained over 40% during the first half of the year on the back of optimism surrounding artificial intelligence and related industries. The Fed continued to play a central role in the financial landscape, although investors have shifted their focus to metrics beyond the Consumer Price Index (the “CPI”), which has been steadily declining. Following CPI readings of 3.0% in June, 3.2% in July and 3.7% in August, the Fed hiked rates by an additional 25 bps to the range of 5.25% to 5.5%, underlining the central bank’s continued commitment to managing inflation, while also asserting that the economy was strong enough to support further rate increases. In September, the Fed paused, although the board was split on whether it was going to hike again through the end of the year. The central bank is projecting a Fed Funds Rate of 5.1% by the end of 2024 and 3.9% by the end of 2025.
PERFORMANCE
Harbor Mid Cap Fund returned -0.46% (Retirement Class), -0.56% (Institutional Class), and -0.86% (Investor Class) in the year ended October 31, 2023, outperforming the Russell Midcap® Index (the “Index”), which returned -1.01% during the same period.
The Fund performed in-line against the Index during the period. Positive stock selection was a contributor to the relative results. Contributing to performance was Packaging Corporation of America. Headquartered in Lake Forest, Illinois, Packaging Corporation of America is one of the largest producers of containerboard, corrugated packaging, and uncoated freesheet white paper in the United States. The company’s shares rose over 25% in the period after exceeding both management’s guidance and analyst estimates for per-share earnings by more than 20%. Robust demand combined with supply shortages have resulted in the company’s ability to implement price increases that are outpacing rising input costs. We believe that Packaging Corporation of America is well positioned to gain additional market share given its focus on smaller customers growing at a faster rate than the broader industry along with those with specific box design requirements who tend to be less price sensitive. As the most vertically integrated operator with the highest margins among its competitors, we believe PKG will continue to gain share from smaller operators and grow earnings ahead of market expectations.
Detracting from performance was Sysco Corporation. Sysco Corporation, headquartered in Houston, Texas, is the leading provider of distribution services for the foodservice food-away-from-home industry. Sysco caters to a wide range of customers such as restaurants, schools, healthcare facilities and entertainment venues. Sysco shares pulled back about 23% during the period, despite beating consensus earnings estimates. Despite experiencing broad
⬤
76
Harbor Mid Cap FundMANAGER’S COMMENTARY—Continued
CHANGE IN A $50,000 INVESTMENT
For the period 12/01/2019 through 10/31/2023
The graph compares a $50,000 investment in the Institutional Class shares of the Fund with the performance of the Russell Midcap® Index. The Fund’s performance assumes the reinvestment of all dividend and capital gain distributions.
TOTAL RETURNS | |||
For the periods ended 10/31/2023 | |||
Annualized | |||
1 Year | 5 Years | Life of Fund | |
Harbor Mid Cap Fund | |||
Retirement Class1 | -0.46% | N/A | 6.31% |
Institutional Class1 | -0.56 | N/A | 6.22 |
Investor Class1 | -0.86 | N/A | 5.86 |
Comparative Index | |||
Russell Midcap® Index1 | -1.01% | N/A | 4.73% |
As stated in the Fund’s prospectus dated March 1, 2023, the expense ratios were 0.80% (Net) and 0.92% (Gross) (Retirement Class); 0.88% (Net) and 1.00% (Gross) (Institutional Class); 1.13% (Net) and 1.25% (Gross) (Administrative Class); and 1.24% (Net) and 1.36% (Gross) (Investor Class). The net expense ratios reflect an expense limitation agreement (excluding interest expense, if any) effective through 02/29/2024. The expense ratios in the prospectus may differ from the actual expense ratios for the period disclosed within this report. The expense ratios shown in the prospectus are adjusted to reflect changes, if any, in contractual arrangements that occurred prior to the date of the prospectus (or supplement thereto, if applicable).
The Russell Midcap® Index is an unmanaged index generally representative of the U.S. market for medium capitalization stocks. This unmanaged index does not reflect fees and expenses and is not available for direct investment. The Russell Midcap® Index and Russell® are trademarks of Frank Russell Company.
Performance data shown represents past performance and is no guarantee of future results. Past performance is net of management fees and expenses and reflects reinvested dividends and distributions. Past performance reflects the beneficial effect of any expense waivers or reimbursements, without which returns would have been lower. Investment returns and principal value will fluctuate and when redeemed may be worth more or less than their original cost. Returns for periods less than one year are not annualized. Current performance may be higher or lower and is available through the most recent month end at harborcapital.com or by calling 800-422-1050.
based sales growth across business lines, led by its Travel and Leisure business line, the company continues to manage through input cost inflation, which is weighing on near term outlook for earnings. Despite short term headwinds, as the leading provider of distribution services to the food-away-from-home industry, we believe that Sysco is well positioned to continue to grow earnings as the consumption of food-away-from-home continues to increase and larger operators continue to take share from smaller operators.
OUTLOOK & STRATEGY
As of October 31, 2023, the Fund had an overweight in the Industrials, Information Technology, and Financials and an underweight in Consumer Staples, Consumer Discretionary, Utilities and Health Care. The Fund’s relative overweight and underweight positions are an outgrowth of where EARNEST Partners believes it is finding good individual investment opportunities.
In managing the Fund, EARNEST Partners seeks companies with share prices that we believe do not fully reflect their earnings growth outlook. Going forward, we will continue to employ our three-step investment methodology: screen the broad universe to identify stocks that are best positioned to outperform, measure and manage downside risk to the benchmark, and perform in-depth, thorough, fundamental research to find what we believe are the best stocks to include in the Fund.
1 The “Life of Fund” return as shown reflects the period 12/01/2019 (commencement of operations) through 10/31/2023.
This report contains the current opinions of EARNEST Partners, LLC as of the date of this report and should not be considered as investment advice or a recommendation of any particular security, strategy or investment product. Such opinions are subject to change without notice and securities described herein may no longer be included in, or may at any time be removed from, the Fund’s portfolio. This report is distributed for informational purposes only. Information contained herein has been obtained from sources believed reliable, but not guaranteed.
There is no guarantee that the investment objective of the Fund will be achieved. Stock markets are volatile and equity values can decline significantly in response to adverse issuer, political, regulatory, market and economic conditions. Since the Fund may hold foreign securities, it may be subject to greater risks than funds invested only in the U.S. These risks are more severe for securities of issuers in emerging markets regions. For information on the different share classes and the risks associated with an investment in the Fund, please refer to the current prospectus.
⬤
77
Harbor Mid Cap FundPORTFOLIO OF INVESTMENTS—October 31, 2023
SECTOR ALLOCATION (% of investments) - Unaudited
PORTFOLIO OF INVESTMENTS
Value and Cost in Thousands
COMMON STOCKS—96.4% | ||
Shares | Value | |
AEROSPACE & DEFENSE—6.5% | ||
7,584 | General Dynamics Corp. | $1,830 |
20,669 | Hexcel Corp. | 1,280 |
70,921 | Spirit AeroSystems Holdings, Inc. Class A* | 1,603 |
13,631 | Woodward, Inc. | 1,700 |
6,413 | ||
BANKS—1.5% | ||
150,225 | KeyCorp | 1,535 |
BUILDING PRODUCTS—2.2% | ||
42,484 | Masco Corp. | 2,213 |
CAPITAL MARKETS—7.6% | ||
18,870 | Houlihan Lokey, Inc. Class A | 1,897 |
18,896 | Intercontinental Exchange, Inc. | 2,030 |
20,929 | Raymond James Financial, Inc. | 1,998 |
28,305 | Stifel Financial Corp. | 1,613 |
7,538 | ||
CHEMICALS—3.7% | ||
8,627 | Albemarle Corp. | 1,094 |
18,818 | Eastman Chemical Co. | 1,406 |
25,621 | Scotts Miracle-Gro Co. | 1,139 |
3,639 | ||
COMMERCIAL SERVICES & SUPPLIES—4.1% | ||
20,773 | Republic Services, Inc. Class A | 3,085 |
23,040 | Stericycle, Inc. * | 950 |
4,035 | ||
COMMUNICATIONS EQUIPMENT—1.1% | ||
26,872 | Lumentum Holdings, Inc. * | 1,054 |
CONSUMER STAPLES DISTRIBUTION & RETAIL—1.5% | ||
21,841 | Sysco Corp. | 1,452 |
CONTAINERS & PACKAGING—2.5% | ||
8,914 | Packaging Corp. of America | 1,364 |
36,750 | Sealed Air Corp. | 1,132 |
2,496 | ||
ELECTRICAL EQUIPMENT—1.4% | ||
43,475 | Sensata Technologies Holding PLC | 1,386 |
ELECTRONIC EQUIPMENT, INSTRUMENTS & COMPONENTS—3.5% | ||
14,100 | Arrow Electronics, Inc. * | 1,599 |
COMMON STOCKS—Continued | ||
Shares | Value | |
ELECTRONIC EQUIPMENT, INSTRUMENTS & COMPONENTS—Continued | ||
15,560 | Keysight Technologies, Inc. * | $1,899 |
3,498 | ||
ENERGY EQUIPMENT & SERVICES—2.5% | ||
39,409 | ChampionX Corp. | 1,214 |
30,990 | Helmerich & Payne, Inc. | 1,226 |
2,440 | ||
FINANCIAL SERVICES—1.6% | ||
14,622 | Global Payments, Inc. | 1,553 |
GROUND TRANSPORTATION—1.4% | ||
47,898 | CSX Corp. | 1,430 |
HEALTH CARE EQUIPMENT & SUPPLIES—1.3% | ||
41,233 | DENTSPLY SIRONA, Inc. | 1,254 |
HEALTH CARE PROVIDERS & SERVICES—3.5% | ||
9,513 | Cencora, Inc. | 1,761 |
8,601 | Laboratory Corp. of America Holdings | 1,718 |
3,479 | ||
HOTELS, RESTAURANTS & LEISURE—2.3% | ||
15,951 | Darden Restaurants, Inc. | 2,321 |
HOUSEHOLD DURABLES—2.0% | ||
18,583 | DR Horton, Inc. | 1,940 |
INDUSTRIAL REITS—1.6% | ||
60,312 | Americold Realty Trust, Inc. | 1,581 |
INSURANCE—7.3% | ||
15,586 | Progressive Corp. | 2,464 |
14,465 | Reinsurance Group of America, Inc. | 2,162 |
11,631 | RenaissanceRe Holdings Ltd. (Bermuda) | 2,554 |
7,180 | ||
IT SERVICES—2.4% | ||
23,066 | Akamai Technologies, Inc. * | 2,383 |
LIFE SCIENCES TOOLS & SERVICES—3.0% | ||
15,847 | Agilent Technologies, Inc. | 1,638 |
4,743 | Bio-Rad Laboratories, Inc. Class A* | 1,306 |
2,944 |
⬤
78
Harbor Mid Cap FundPORTFOLIO OF INVESTMENTS—Continued
Value and Cost in Thousands
COMMON STOCKS—Continued | ||
Shares | Value | |
MACHINERY—5.1% | ||
6,594 | Cummins, Inc. | $1,426 |
13,240 | Dover Corp. | 1,721 |
7,506 | Snap-on, Inc. | 1,936 |
5,083 | ||
MULTI-UTILITIES—1.5% | ||
18,531 | WEC Energy Group, Inc. | 1,508 |
OFFICE REITS—1.1% | ||
20,251 | Boston Properties, Inc. | 1,085 |
OIL, GAS & CONSUMABLE FUELS—3.2% | ||
71,885 | Coterra Energy, Inc. | 1,977 |
25,777 | Murphy Oil Corp. | 1,156 |
3,133 | ||
PHARMACEUTICALS—1.2% | ||
35,734 | Catalent, Inc. * | 1,229 |
PROFESSIONAL SERVICES—1.6% | ||
9,539 | Broadridge Financial Solutions, Inc. | 1,628 |
REAL ESTATE MANAGEMENT & DEVELOPMENT—2.2% | ||
31,042 | CBRE Group, Inc. Class A* | 2,152 |
SEMICONDUCTORS & SEMICONDUCTOR EQUIPMENT—5.2% | ||
11,546 | Applied Materials, Inc. | 1,528 |
24,813 | Entegris, Inc. | 2,185 |
COMMON STOCKS—Continued | ||
Shares | Value | |
SEMICONDUCTORS & SEMICONDUCTOR EQUIPMENT—Continued | ||
16,394 | Skyworks Solutions, Inc. | $1,422 |
5,135 | ||
SOFTWARE—5.1% | ||
7,298 | ANSYS, Inc. * | 2,031 |
6,437 | Synopsys, Inc. * | 3,022 |
5,053 | ||
SPECIALIZED REITS—1.6% | ||
7,454 | SBA Communications Corp. | 1,555 |
SPECIALTY RETAIL—0.8% | ||
8,839 | TJX Cos., Inc. | 778 |
TRADING COMPANIES & DISTRIBUTORS—3.3% | ||
47,463 | Air Lease Corp. Class A | 1,644 |
15,862 | GATX Corp. | 1,659 |
3,303 | ||
TOTAL COMMON STOCKS (Cost $97,223) | 95,406 | |
TOTAL INVESTMENTS—96.4% (Cost $97,223) | 95,406 | |
CASH AND OTHER ASSETS, LESS LIABILITIES—3.6% | 3,614 | |
TOTAL NET ASSETS—100% | $99,020 |
FAIR VALUE MEASUREMENTS
All investments as of October 31, 2023 (as disclosed in the preceding Portfolio of Investments) were classified as Level 1.
For more information on valuation inputs and their aggregation into the levels identified above, please refer to the Fair Value Measurements and Disclosures in Note 2 of the accompanying Notes to Financial Statements.
*
Non-income producing security
The accompanying notes are an integral part of the Financial Statements.
⬤
79
Harbor Mid Cap Value FundMANAGER’S COMMENTARY (Unaudited)
SUBADVISOR
LSV Asset Management
Management’s Discussion of
Fund Performance
Fund Performance
MARKET REVIEW
The broad U.S. equity market as measured by the S&P 500 Index was up 10.14% for the twelve months ended October 31, 2023. Returns were driven by a small group of mega-cap technology stocks that dominated for most of the period. Over the first half of 2023, the technology heavy Nasdaq Composite Index was up over 30%, its best start to the year since 1983. While the market rewarded the mega-cap growth stocks in the period, smaller stocks and value-oriented stocks lagged behind. The biggest style difference was among large cap stocks where growth outperformed value by nearly 20%. Among mid-cap stocks, value trailed growth by just under 7% as the Russell Midcap® Value Index was down 3.56% while the Russell Midcap® Growth Index was up 3.35%.
Equity markets posted positive results throughout most of the period as strong economic data and moderating inflation prompted hopes that the Federal Reserve (“the Fed”) would ease the pace of interest rate hikes. Markets declined in early March as the collapse of Silicon Valley Bank and Signature Bank led to a sell-off in financials and particularly regional bank stocks. However, the market quickly recovered again led by mega cap growth stocks in the technology sector including Apple and Microsoft and Google and Meta in the Communications Services sector. Gross domestic product growth continued to be positive over the period exceeding market expectations and the labor market remained strong with unemployment moving slightly higher but remaining under 4%. From a sector perspective, Industrial and Energy stocks were the only two sectors in the Russell Midcap® Value Index to post gains while more defensive sectors of the market including Consumer Staples and Health Care lagged. Communication Services and Real Estate stocks also struggled over the trailing year.
PERFORMANCE
Harbor Mid Cap Value Fund returned 0.86% (Retirement Class), 0.76% (Institutional Class), 0.55% (Administrative Class), and 0.39% (Investor Class) for the year ended October 31, 2023, outperforming the -3.56% return of the Russell Midcap® Value Index during the same period.
While the broad equity market as measured by the S&P 500 advanced just over 10% for the trailing year, mid and small cap stocks lagged significantly. In addition, value stocks struggled relative to growth stocks across all market cap ranges. Attribution analysis indicates that stock selection added significant value in the period while the Fund’s sector allocation detracted somewhat. The Fund’s underweight to Industrials, which was the top performing sector, had a negative impact on relative performance. In addition, the Fund’s overweight to Consumer Staples also detracted somewhat. Stock selection added value in several sectors particularly in the Industrials and Health Care sectors. Stock selection was also positive in the Consumer Discretionary, Health Care, Technology and Financial sectors.
Top contributors in the Industrials sector included Owens Corning, Triton International, Allison Transmissions and Snap-On Inc. In the Consumer Discretionary sector, homebuilders PulteGroup and Toll Brothers as well as Group 1 Automotive added value. Other top contributors included Jabil in the Technology sector, Utilities holding Vistra Corp, Sprouts Farmers Market in the Consumer Staples sector and Marathon Petroleum in the Energy sector. Detractors included Financial holdings Lincoln National Corp, Citizens Financial Group, Zions Bancorporation and Regions Financial, Consumer Discretionary holdings Harley Davidson, Foot Locker and Macy’s, Devon Energy in the Energy sector and Utilities holding UGI Corp.
OUTLOOK & STRATEGY
Sector weightings are a residual of our bottom-up stock selection process subject to minimum and maximum exposures to sectors and industries. The Fund’s most significant sector exposures
⬤
80
Harbor Mid Cap Value FundMANAGER’S COMMENTARY—Continued
CHANGE IN A $50,000 INVESTMENT
For the period 11/01/2013 through 10/31/2023
The graph compares a $50,000 investment in the Institutional Class shares of the Fund with the performance of the Russell Midcap® Value Index. The Fund’s performance assumes the reinvestment of all dividend and capital gain distributions.
TOTAL RETURNS | |||
For the periods ended 10/31/2023 | |||
Annualized | |||
1 Year | 5 Years | 10 Years | |
Harbor Mid Cap Value Fund | |||
Retirement Class1 | 0.86% | 5.58% | 6.18% |
Institutional Class | 0.76 | 5.50 | 6.12 |
Administrative Class | 0.55 | 5.24 | 5.86 |
Investor Class | 0.39 | 5.11 | 5.73 |
Comparative Index | |||
Russell Midcap® Value Index | -3.56% | 5.69% | 6.89% |
As stated in the Fund’s prospectus dated March 1, 2023, the expense ratios were 0.77% (Net) and 0.81% (Gross) (Retirement Class); 0.85% (Net) and 0.89% (Gross) (Institutional Class); 1.10% (Net) and 1.14% (Gross) (Administrative Class); and 1.21% (Net) and 1.25% (Gross) (Investor Class). Additionally, the Adviser has contractually agreed to reduce the management fee to 0.70% on assets between $350 million and $1 billion and 0.65% on assets over $1 billion through 02/29/2024. The expense ratios in the prospectus may differ from the actual expense ratios for the period disclosed within this report. The expense ratios shown in the prospectus are adjusted to reflect changes, if any, in contractual arrangements that occurred prior to the date of the prospectus (or supplement thereto, if applicable).
The Russell Midcap® Value Index is an unmanaged index generally representative of the U.S. market for medium capitalization value stocks. This unmanaged index does not reflect fees and expenses and is not available for direct investment. The Russell Midcap® Value Index and Russell® are trademarks of Frank Russell Company.
Performance data shown represents past performance and is no guarantee of future results. Past performance is net of management fees and expenses and reflects reinvested dividends and distributions. Past performance reflects the beneficial effect of any expense waivers or reimbursements, without which returns would have been lower. Investment returns and principal value will fluctuate and when redeemed may be worth more or less than their original cost. Returns for periods less than one year are not annualized. Current performance may be higher or lower and is available through the most recent month end at harborcapital.com or by calling 800-422-1050.
on an absolute basis are to Financials, Industrials, Technology and Consumer Discretionary stocks. Relative to the value benchmark, the Fund is overweight the Consumer Staples, Consumer Discretionary and Financial sectors. The Fund is underweight Utilities and Real Estate. The most significant changes in sector weights over the last twelve months were an increase in the relative exposure to Industrial and Financial stocks and a decrease to Materials and Consumer Staples.
The Fund’s portfolio continues to trade at attractive valuations relative to the benchmark and relative to history. The Fund is trading at 8.5x forward earnings compared to 13.9x for the value benchmark and 6.2x cash flow compared to 10.3x for the Index.
Even though equity markets sold off late in the period, the broad U.S. equity market as measured by the S&P 500 was up over 10% over the trailing twelve months. However, the market advance has been driven by a small group of mega-cap growth stocks while value stocks and smaller cap stocks have been left behind. We believe this presents significant opportunity to those who are willing to be contrarian and take advantage of the attractive valuations that can be found among stocks that are trading at lower multiples of cash flow and earnings. We find the overall market to be trading above historical averages but as you move down in capitalization and away from the top 10 names that make up over 30% of the S&P 500 and toward companies that are trading at attractive multiples of cash flow and earnings, we find stocks to be trading well below historical averages. While we can offer little in the way of near-term guidance, we remain optimistic that the extremely attractive deep value positioning of the Fund will be rewarded over time.
1 Retirement Class shares commenced operations on March 1, 2016. The performance attributed to the Retirement Class shares prior to that date is that of the Institutional Class shares. Performance prior to March 1, 2016 has not been adjusted to reflect the lower expenses of Retirement Class shares. During this period, Retirement Class shares would have had returns similar to, but potentially higher than, Institutional Class shares due to the fact that Retirement Class shares represent interests in the same portfolio as Institutional Class shares but are subject to lower expenses.
This report contains the current opinions of LSV Asset Management as of the date of this report and should not be considered as investment advice or a recommendation of any particular security, strategy or investment product. Such opinions are subject to change without notice and securities described herein may no longer be included in, or may at any time be removed from, the Fund’s portfolio. This report is distributed for informational purposes only. Information contained herein has been obtained from sources believed reliable, but not guaranteed.
There is no guarantee that the investment objective of the Fund will be achieved. Stock markets are volatile and equity values can decline significantly in response to adverse issuer, political, regulatory, market and economic conditions. Since the Fund may hold foreign securities, it may be subject to greater risks than funds invested only in the U.S. These risks are more severe for securities of issuers in emerging markets regions. For information on the different share classes and the risks associated with an investment in the Fund, please refer to the current prospectus.
⬤
81
Harbor Mid Cap Value FundPORTFOLIO OF INVESTMENTS—October 31, 2023
SECTOR ALLOCATION (% of investments) - Unaudited
PORTFOLIO OF INVESTMENTS
Value and Cost in Thousands
COMMON STOCKS—99.3% | ||
Shares | Value | |
AEROSPACE & DEFENSE—1.5% | ||
3,700 | Huntington Ingalls Industries, Inc. | $813 |
8,585 | Moog, Inc. Class A | 996 |
26,100 | Textron, Inc. | 1,984 |
3,793 | ||
AUTOMOBILE COMPONENTS—1.3% | ||
137,900 | American Axle & Manufacturing Holdings, Inc. * | 931 |
36,000 | BorgWarner, Inc. | 1,328 |
68,900 | Goodyear Tire & Rubber Co. * | 820 |
7,200 | Phinia, Inc. | 186 |
3,265 | ||
AUTOMOBILES—1.0% | ||
62,200 | Harley-Davidson, Inc. | 1,670 |
9,800 | Thor Industries, Inc. | 862 |
2,532 | ||
BANKS—3.1% | ||
83,200 | Citizens Financial Group, Inc. | 1,949 |
42,800 | Fifth Third Bancorp | 1,015 |
114,600 | KeyCorp | 1,171 |
147,700 | Regions Financial Corp. | 2,146 |
45,500 | Zions Bancorp NA | 1,404 |
7,685 | ||
BEVERAGES—1.5% | ||
63,900 | Molson Coors Beverage Co. Class B | 3,692 |
BIOTECHNOLOGY—1.2% | ||
121,700 | Ironwood Pharmaceuticals, Inc. Class A* | 1,092 |
8,800 | United Therapeutics Corp. * | 1,961 |
3,053 | ||
BROADLINE RETAIL—1.1% | ||
30,000 | eBay, Inc. | 1,177 |
20,400 | Kohl’s Corp. | 460 |
82,300 | Macy’s, Inc. | 1,002 |
2,639 | ||
BUILDING PRODUCTS—1.3% | ||
29,300 | Owens Corning | 3,322 |
CAPITAL MARKETS—3.2% | ||
9,700 | Ameriprise Financial, Inc. | 3,051 |
60,800 | Bank of New York Mellon Corp. | 2,584 |
COMMON STOCKS—Continued | ||
Shares | Value | |
CAPITAL MARKETS—Continued | ||
34,300 | State Street Corp. | $2,217 |
7,852 | ||
CHEMICALS—2.6% | ||
36,300 | Chemours Co. | 875 |
14,300 | Eastman Chemical Co. | 1,069 |
34,500 | Huntsman Corp. | 805 |
16,170 | Ingevity Corp. * | 651 |
48,500 | Koppers Holdings, Inc. | 1,774 |
12,600 | LyondellBasell Industries NV Class A | 1,137 |
6,311 | ||
CONSUMER FINANCE—3.1% | ||
110,800 | Ally Financial, Inc. | 2,680 |
10,900 | Discover Financial Services | 895 |
166,600 | Navient Corp. | 2,651 |
46,400 | Synchrony Financial | 1,301 |
7,527 | ||
CONSUMER STAPLES DISTRIBUTION & RETAIL—3.6% | ||
14,329 | Ingles Markets, Inc. Class A | 1,150 |
87,900 | Kroger Co. | 3,988 |
71,500 | Sprouts Farmers Market, Inc. * | 3,004 |
31,500 | Walgreens Boots Alliance, Inc. | 664 |
8,806 | ||
CONTAINERS & PACKAGING—2.6% | ||
33,400 | Berry Global Group, Inc. | 1,837 |
21,200 | Greif, Inc. Class A | 1,346 |
78,400 | O-I Glass, Inc. * | 1,212 |
18,500 | Silgan Holdings, Inc. | 741 |
34,600 | Westrock Co. | 1,243 |
6,379 | ||
DIVERSIFIED CONSUMER SERVICES—0.6% | ||
36,800 | H&R Block, Inc. | 1,511 |
ELECTRIC UTILITIES—1.2% | ||
68,700 | NRG Energy, Inc. | 2,912 |
ELECTRICAL EQUIPMENT—1.6% | ||
20,200 | Atkore, Inc. * | 2,511 |
8,200 | Encore Wire Corp. | 1,466 |
3,977 |
⬤
82
Harbor Mid Cap Value FundPORTFOLIO OF INVESTMENTS—Continued
Value and Cost in Thousands
COMMON STOCKS—Continued | ||
Shares | Value | |
ELECTRONIC EQUIPMENT, INSTRUMENTS & COMPONENTS—5.2% | ||
23,300 | Arrow Electronics, Inc. * | $2,643 |
24,200 | Avnet, Inc. | 1,121 |
38,500 | Jabil, Inc. | 4,728 |
4,500 | Methode Electronics, Inc. | 103 |
31,200 | Sanmina Corp. * | 1,587 |
10,300 | TD SYNNEX Corp. | 944 |
69,800 | Vishay Intertechnology, Inc. | 1,552 |
12,678 | ||
FINANCIAL SERVICES—3.5% | ||
79,987 | Banco Latinoamericano de Comercio Exterior SA (Panama) | 1,806 |
132,900 | MGIC Investment Corp. | 2,238 |
19,700 | PennyMac Financial Services, Inc. | 1,324 |
77,000 | Radian Group, Inc. | 1,951 |
117,600 | Western Union Co. | 1,328 |
8,647 | ||
FOOD PRODUCTS—2.2% | ||
24,900 | Archer-Daniels-Midland Co. | 1,782 |
47,700 | Conagra Brands, Inc. | 1,305 |
23,800 | Ingredion, Inc. | 2,227 |
5,314 | ||
GAS UTILITIES—1.2% | ||
37,500 | National Fuel Gas Co. | 1,911 |
47,700 | UGI Corp. | 992 |
2,903 | ||
GROUND TRANSPORTATION—1.0% | ||
26,268 | Ryder System, Inc. | 2,562 |
HEALTH CARE PROVIDERS & SERVICES—4.5% | ||
41,800 | Cardinal Health, Inc. | 3,804 |
33,800 | Centene Corp. * | 2,331 |
13,100 | DaVita, Inc. * | 1,012 |
3,800 | Laboratory Corp. of America Holdings | 759 |
4,600 | McKesson Corp. | 2,095 |
8,200 | Universal Health Services, Inc. Class B | 1,032 |
11,033 | ||
HEALTH CARE REITS—1.4% | ||
114,400 | Medical Properties Trust, Inc. | 547 |
50,900 | Omega Healthcare Investors, Inc. | 1,685 |
80,100 | Sabra Health Care REIT, Inc. | 1,092 |
3,324 | ||
HOTEL & RESORT REITS—0.3% | ||
102,411 | Service Properties Trust | 742 |
HOTELS, RESTAURANTS & LEISURE—0.5% | ||
56,500 | Bloomin' Brands, Inc. | 1,319 |
HOUSEHOLD DURABLES—4.1% | ||
49,557 | Ethan Allen Interiors, Inc. | 1,301 |
11,400 | Meritage Homes Corp. | 1,300 |
48,400 | PulteGroup, Inc. | 3,562 |
34,500 | Toll Brothers, Inc. | 2,439 |
13,300 | Whirlpool Corp. | 1,391 |
9,993 | ||
INDEPENDENT POWER AND RENEWABLE ELECTRICITY PRODUCERS—1.4% | ||
102,900 | Vistra Corp. | 3,367 |
INSURANCE—7.6% | ||
37,800 | Aflac, Inc. | 2,953 |
9,200 | American Financial Group, Inc. | 1,006 |
45,280 | American International Group, Inc. | 2,776 |
COMMON STOCKS—Continued | ||
Shares | Value | |
INSURANCE—Continued | ||
21,800 | First American Financial Corp. | $1,122 |
58,900 | Hartford Financial Services Group, Inc. | 4,326 |
35,800 | Lincoln National Corp. | 779 |
129,100 | Old Republic International Corp. | 3,535 |
20,900 | Universal Insurance Holdings, Inc. | 327 |
37,000 | Unum Group | 1,809 |
18,633 | ||
IT SERVICES—0.6% | ||
73,300 | DXC Technology Co. * | 1,478 |
LEISURE PRODUCTS—0.5% | ||
19,500 | Brunswick Corp. | 1,355 |
LIFE SCIENCES TOOLS & SERVICES—0.1% | ||
4,800 | Fortrea Holdings, Inc. * | 136 |
MACHINERY—8.7% | ||
32,700 | AGCO Corp. | 3,749 |
55,400 | Allison Transmission Holdings, Inc. | 2,793 |
81,300 | CNH Industrial NV (United Kingdom) | 893 |
17,600 | Cummins, Inc. | 3,807 |
66,900 | Gates Industrial Corp. PLC * | 731 |
36,600 | Mueller Industries, Inc. | 1,380 |
22,600 | PACCAR, Inc. | 1,865 |
15,100 | Snap-on, Inc. | 3,895 |
22,700 | Timken Co. | 1,569 |
70,400 | Titan International, Inc. * | 800 |
21,482 | ||
MEDIA—2.1% | ||
64,500 | Fox Corp. Class A | 1,960 |
15,600 | Nexstar Media Group, Inc. Class A | 2,186 |
78,300 | TEGNA, Inc. | 1,136 |
5,282 | ||
METALS & MINING—0.8% | ||
7,420 | Reliance Steel & Aluminum Co. | 1,887 |
MORTGAGE REAL ESTATE INVESTMENT TRUSTS (REITS)—0.3% | ||
41,650 | Annaly Capital Management, Inc. | 650 |
OFFICE REITS—1.0% | ||
99,400 | Brandywine Realty Trust | 372 |
240,078 | Franklin Street Properties Corp. | 418 |
52,750 | Office Properties Income Trust | 237 |
139,000 | Paramount Group, Inc. | 595 |
138,248 | Piedmont Office Realty Trust, Inc. Class A | 720 |
2,342 | ||
OIL, GAS & CONSUMABLE FUELS—5.3% | ||
48,800 | APA Corp. | 1,938 |
33,200 | Devon Energy Corp. | 1,546 |
42,400 | HF Sinclair Corp. | 2,348 |
18,300 | Marathon Petroleum Corp. | 2,768 |
19,500 | Phillips 66 | 2,225 |
13,200 | Scorpio Tankers, Inc. (Monaco) | 741 |
10,700 | Valero Energy Corp. | 1,359 |
3,636 | Vitesse Energy, Inc. | 86 |
13,011 | ||
PAPER & FOREST PRODUCTS—0.4% | ||
20,900 | Sylvamo Corp. | 926 |
PASSENGER AIRLINES—1.3% | ||
36,000 | Alaska Air Group, Inc. * | 1,139 |
33,100 | Delta Air Lines, Inc. | 1,034 |
⬤
83
Harbor Mid Cap Value FundPORTFOLIO OF INVESTMENTS—Continued
Value and Cost in Thousands
COMMON STOCKS—Continued | ||
Shares | Value | |
PASSENGER AIRLINES—Continued | ||
31,500 | United Airlines Holdings, Inc. * | $1,103 |
3,276 | ||
PHARMACEUTICALS—2.2% | ||
26,800 | Jazz Pharmaceuticals PLC * | 3,404 |
13,800 | Prestige Consumer Healthcare, Inc. * | 819 |
142,800 | Viatris, Inc. | 1,271 |
5,494 | ||
PROFESSIONAL SERVICES—1.2% | ||
27,500 | ManpowerGroup, Inc. | 1,924 |
19,800 | SS&C Technologies Holdings, Inc. | 995 |
2,919 | ||
RETAIL REITS—2.8% | ||
121,600 | Brixmor Property Group, Inc. | 2,528 |
15,800 | Simon Property Group, Inc. | 1,736 |
95,800 | SITE Centers Corp. | 1,117 |
70,800 | Tanger Factory Outlet Centers, Inc. | 1,597 |
6,978 | ||
SEMICONDUCTORS & SEMICONDUCTOR EQUIPMENT—1.9% | ||
113,200 | Amkor Technology, Inc. | 2,361 |
20,900 | Diodes, Inc. * | 1,360 |
45,900 | Photronics, Inc. * | 843 |
4,564 | ||
SOFTWARE—0.6% | ||
55,300 | Dropbox, Inc. Class A* | 1,454 |
COMMON STOCKS—Continued | ||
Shares | Value | |
SPECIALTY RETAIL—3.4% | ||
16,400 | Best Buy Co., Inc. | $1,096 |
9,500 | Dick’s Sporting Goods, Inc. | 1,016 |
67,500 | Foot Locker, Inc. | 1,417 |
6,800 | Group 1 Automotive, Inc. | 1,716 |
36,200 | ODP Corp. * | 1,626 |
11,200 | Penske Automotive Group, Inc. | 1,602 |
8,473 | ||
TECHNOLOGY HARDWARE, STORAGE & PERIPHERALS—2.1% | ||
147,900 | HP, Inc. | 3,894 |
93,900 | Xerox Holdings Corp. | 1,206 |
5,100 | ||
TEXTILES, APPAREL & LUXURY GOODS—0.6% | ||
16,000 | Capri Holdings Ltd. * | 819 |
28,100 | G-III Apparel Group Ltd. * | 718 |
1,537 | ||
TOTAL COMMON STOCKS (Cost $234,261) | 244,115 | |
TOTAL INVESTMENTS—99.3% (Cost $234,261) | 244,115 | |
CASH AND OTHER ASSETS, LESS LIABILITIES—0.7% | 1,684 | |
TOTAL NET ASSETS—100% | $245,799 |
FAIR VALUE MEASUREMENTS
All investments as of October 31, 2023 (as disclosed in the preceding Portfolio of Investments) were classified as Level 1.
For more information on valuation inputs and their aggregation into the levels identified above, please refer to the Fair Value Measurements and Disclosures in Note 2 of the accompanying Notes to Financial Statements.
*
Non-income producing security
The accompanying notes are an integral part of the Financial Statements.
⬤
84
Harbor Small Cap Growth FundMANAGER’S COMMENTARY (Unaudited)
SUBADVISOR
Westfield Capital Management Company, L.P.
Management’s Discussion of
Fund Performance
Fund Performance
MARKET REVIEW
U.S. equities closed out 2022 much the way they started, with a series of lower highs and lower lows amidst high volatility. After stocks surged in January 2023 on the hopes of more expansionary monetary policy by the U.S. Federal Reserve (the “Fed”) and a perceived soft-landing coming to pass, indexes reversed course in February 2023, as data showed persistent inflation and more aggressive Fed commentary. Then, almost 12 months into the interest rate raising cycle, financial balance sheet concerns emerged in the banking system which ultimately led to the collapse of Silicon Valley Bank. In the second quarter of 2023, cap-weighted broad market indices such as the S&P 500 and NASDAQ surged, driven predominantly by robust gains from a select group of mega cap tech stocks aptly named the ‘Magnificent 7.’ The third quarter of 2023 provided mixed results for U.S. equity markets, with indices initially surpassing the previous highs of the year before reversing course to end the quarter lower. The Fed policy trajectory was a central focus as investors broadly expected a pause in interest rate hikes that was confirmed in September 2023. There was also a growing acceptance of the Fed’s higher-for-longer mantra leading to the swift rise in longer-dated yields. Questions also began to percolate about the health of the consumer and the durability of their spending power given the rise in oil, planned resumption of student loan payments, dramatically higher borrowing costs, and the exhaustion of COVID-era savings. Consequently, challenges to the argument supporting a soft-landing drove a shift in risk tolerances towards quality, shorter duration equities.
PERFORMANCE
Harbor Small Cap Growth Fund returned -3.63% (Retirement Class), -3.66% (Institutional Class), -3.84% (Administrative Class), and -4.02% (Investor Class) in the year ended October 31, 2023, outperforming the Russell 2000® Growth Index, which returned -7.63% during the same period.
Relative outperformance was broad based with six sectors adding double digit returns to relative results. Most notable was relative strength in Information Technology and Health Care, which offset relative weakness in Consumer Discretionary.
Information Technology was the largest contributor to relative performance, adding 278 basis points (“bps”) of relative returns to the Fund. The relative outperformance was broad based with contributions from four different industry groups, most notably within Software and IT Services. Samsara, Inc., a telematics software provider, was the top contributor to relative performance within the sector. During both the first and second quarters, the company released strong earnings results and raised their guidance, which was well received by investors. We believe Samsara is in the early stages of digitizing a large Total Addressable Market with limited competition.
Health Care was another strong contributor, adding 214 bps to relative results, led by investments within Biotechnology. Prometheus Biosciences, a clinical stage biotechnology company focusing on novel therapeutic and diagnostic products, was the top contributor to relative returns. It was announced in mid-April that the company entered into a definitive agreement to be acquired by Merck for $200 per share, a 75% premium to the stock’s prior closing price. This news followed the company’s release of updated phase 2 data in March detailing impressive efficacy for their PRA023 treatment for ulcerative colitis and Crohn’s disease. We exited the Fund’s position following news of the acquisition.
Consumer Discretionary was the largest source of relative weakness, costing 100 bps. National Vision Holdings, one of the largest optical retailers within the U.S, was the top detracting name within the sector over the period. The share price came under significant pressure following a fourth quarter sales and earnings shortfall and further disappointing 2023 outlook from the company. A lack of new optometrists coupled with unusually volatile demand trends
⬤
85
Harbor Small Cap Growth FundMANAGER’S COMMENTARY—Continued
CHANGE IN A $50,000 INVESTMENT
For the period 11/01/2013 through 10/31/2023
The graph compares a $50,000 investment in the Institutional Class shares of the Fund with the performance of the Russell 2000® Growth Index. The Fund’s performance assumes the reinvestment of all dividend and capital gain distributions.
TOTAL RETURNS | |||
For the periods ended 10/31/2023 | |||
Annualized | |||
1 Year | 5 Years | 10 Years | |
Harbor Small Cap Growth Fund | |||
Retirement Class1 | -3.63% | 7.49% | 8.26% |
Institutional Class | -3.66 | 7.42 | 8.19 |
Administrative Class | -3.84 | 7.14 | 7.89 |
Investor Class | -4.02 | 7.03 | 7.80 |
Comparative Index | |||
Russell 2000® Growth Index | -7.63% | 2.68% | 5.67% |
As stated in the Fund’s prospectus dated March 1, 2023, the expense ratios were 0.80% (Retirement Class); 0.88% (Institutional Class); 1.13% (Administrative Class); and 1.24% (Investor Class). The expense ratios in the prospectus may differ from the actual expense ratios for the period disclosed within this report. The expense ratios shown in the prospectus are adjusted to reflect changes, if any, in contractual arrangements that occurred prior to the date of the prospectus (or supplement thereto, if applicable).
The Russell 2000® Growth Index is an unmanaged index representing the smallest 2000 stocks with the highest price-to-book ratio and future earnings. This unmanaged index does not reflect fees and expenses and is not available for direct investment. The Russell 2000® Growth Index and Russell® are trademarks of Frank Russell Company.
Performance data shown represents past performance and is no guarantee of future results. Past performance is net of management fees and expenses and reflects reinvested dividends and distributions. Past performance reflects the beneficial effect of any expense waivers or reimbursements, without which returns would have been lower. Investment returns and principal value will fluctuate and when redeemed may be worth more or less than their original cost. Returns for periods less than one year are not annualized. Current performance may be higher or lower and is available through the most recent month end at harborcapital.com or by calling 800-422-1050.
for eyeglasses provided significant headwinds to operating performance for National Vision and their core customer base. Given the headwinds, we decided to exit the Fund’s position during the period.
OUTLOOK & STRATEGY
Looking ahead, we are incrementally more cautious today than we were three months ago as the evolving macro backdrop increasingly warrants a more balanced posture between growth and durability. Historical precedents suggest a low likelihood of a so-called “soft landing”, with the more likely outcome being a period of slowing economic growth, both in the U.S. and around the globe. Disinflationary trends, once pointed to as evidence of the “soft-landing” scenario playing out, are being offset by rising borrowing costs, the exhaustion of surplus consumer savings, and a restrictive lending posture by U.S. banks. All the while, we remain encouraged by the quality of the businesses in which we invest and will remain focused on seeking to allocate capital prudently in this turbulent market environment.
1 Retirement Class shares commenced operations on March 1, 2016. The performance attributed to the Retirement Class shares prior to that date is that of the Institutional Class shares. Performance prior to March 1, 2016 has not been adjusted to reflect the lower expenses of Retirement Class shares. During this period, Retirement Class shares would have had returns similar to, but potentially higher than, Institutional Class shares due to the fact that Retirement Class shares represent interests in the same portfolio as Institutional Class shares but are subject to lower expenses.
This report contains the current opinions of Westfield Capital Management Company, L.P. as of the date of this report and should not be considered as investment advice or a recommendation of any particular security, strategy or investment product. Such opinions are subject to change without notice and securities described herein may no longer be included in, or may at any time be removed from, the Fund’s portfolio. This report is distributed for informational purposes only. Information contained herein has been obtained from sources believed reliable, but not guaranteed.
There is no guarantee that the investment objective of the Fund will be achieved. Stock markets are volatile and equity values can decline significantly in response to adverse issuer, political, regulatory, market and economic conditions. Stocks of small cap companies pose special risks, including possible illiquidity and greater price volatility than stocks of larger, more established companies. For information on the different share classes and the risks associated with an investment in the Fund, please refer to the current prospectus.
⬤
86
Harbor Small Cap Growth FundPORTFOLIO OF INVESTMENTS—October 31, 2023
SECTOR ALLOCATION (% of investments) - Unaudited
PORTFOLIO OF INVESTMENTS
Value and Cost in Thousands
COMMON STOCKS—95.0% | ||
Shares | Value | |
AEROSPACE & DEFENSE—2.0% | ||
314,296 | Hexcel Corp. | $19,461 |
AUTOMOBILE COMPONENTS—1.3% | ||
111,530 | Visteon Corp. * | 12,840 |
BANKS—1.0% | ||
137,900 | Wintrust Financial Corp. | 10,300 |
BIOTECHNOLOGY—11.3% | ||
677,980 | 89bio, Inc. * | 5,017 |
584,437 | Alkermes PLC * | 14,137 |
365,150 | Ascendis Pharma AS ADR (Denmark)*,1 | 32,612 |
565,820 | Cerevel Therapeutics Holdings, Inc. * | 13,382 |
163,640 | CRISPR Therapeutics AG (Switzerland)* | 6,370 x |
163,639 | MoonLake Immunotherapeutics Class A* | 8,478 |
928,455 | Rocket Pharmaceuticals, Inc. * | 16,805 |
308,021 | Vaxcyte, Inc. * | 14,816 |
111,617 | ||
BUILDING PRODUCTS—2.8% | ||
226,720 | AAON, Inc. | 12,352 |
595,110 | AZEK Co., Inc. * | 15,592 |
27,944 | ||
CAPITAL MARKETS—1.1% | ||
392,143 | StepStone Group, Inc. Class A | 11,098 |
CHEMICALS—3.3% | ||
491,320 | Avient Corp. | 15,536 |
651,400 | Axalta Coating Systems Ltd. * | 17,086 |
32,622 | ||
COMMERCIAL SERVICES & SUPPLIES—2.4% | ||
307,180 | Casella Waste Systems, Inc. Class A* | 23,177 |
COMMUNICATIONS EQUIPMENT—2.5% | ||
347,780 | Calix, Inc. * | 11,518 |
88,723 | F5, Inc. * | 13,450 |
24,968 | ||
CONSTRUCTION & ENGINEERING—1.9% | ||
8,741 | Comfort Systems USA, Inc. | 1,584 |
422,689 | WillScot Mobile Mini Holdings Corp. * | 16,658 |
18,242 |
COMMON STOCKS—Continued | ||
Shares | Value | |
ELECTRICAL EQUIPMENT—1.5% | ||
460,560 | Sensata Technologies Holding PLC | $14,683 |
ELECTRONIC EQUIPMENT, INSTRUMENTS & COMPONENTS—3.3% | ||
107,760 | Fabrinet (Thailand)* | 16,703 |
112,370 | Insight Enterprises, Inc. * | 16,102 |
32,805 | ||
ENERGY EQUIPMENT & SERVICES—3.0% | ||
365,770 | ChampionX Corp. | 11,266 |
1,405,506 | Patterson-UTI Energy, Inc. | 17,850 |
29,116 | ||
FINANCIAL SERVICES—6.1% | ||
787,838 | Flywire Corp. * | 21,185 |
1,169,716 | Marqeta, Inc. Class A* | 6,047 |
342,340 | Shift4 Payments, Inc. Class A* | 15,241 |
107,971 | WEX, Inc. * | 17,975 |
60,448 | ||
GROUND TRANSPORTATION—2.2% | ||
59,850 | Saia, Inc. * | 21,456 |
HEALTH CARE EQUIPMENT & SUPPLIES—5.6% | ||
290,130 | Haemonetics Corp. * | 24,728 |
104,210 | Inspire Medical Systems, Inc. * | 15,335 |
242,100 | Lantheus Holdings, Inc. * | 15,640 |
55,703 | ||
HEALTH CARE PROVIDERS & SERVICES—2.2% | ||
780,507 | Option Care Health, Inc. * | 21,643 |
HEALTH CARE TECHNOLOGY—1.5% | ||
1,146,070 | Veradigm, Inc. * | 15,117 |
HOTELS, RESTAURANTS & LEISURE—4.7% | ||
154,012 | Churchill Downs, Inc. | 16,916 |
113,620 | Texas Roadhouse, Inc. Class A | 11,537 |
96,470 | Wingstop, Inc. | 17,632 |
46,085 | ||
HOUSEHOLD DURABLES—3.7% | ||
193,973 | M/I Homes, Inc. * | 15,919 |
176,607 | Meritage Homes Corp. | 20,137 |
36,056 |
⬤
87
Harbor Small Cap Growth FundPORTFOLIO OF INVESTMENTS—Continued
Value and Cost in Thousands
COMMON STOCKS—Continued | ||
Shares | Value | |
INDUSTRIAL REITS—1.1% | ||
327,480 | STAG Industrial, Inc. | $10,879 |
INSURANCE—4.4% | ||
51,814 | Kinsale Capital Group, Inc. | 17,301 |
218,356 | Palomar Holdings, Inc. * | 10,935 |
77,782 | Primerica, Inc. | 14,869 |
43,105 | ||
LEISURE PRODUCTS—1.4% | ||
209,883 | BRP, Inc. | 14,192 |
LIFE SCIENCES TOOLS & SERVICES—1.3% | ||
45,699 | Bio-Rad Laboratories, Inc. Class A* | 12,580 |
MACHINERY—4.4% | ||
268,684 | ITT, Inc. | 25,081 |
107,350 | Lincoln Electric Holdings, Inc. | 18,765 |
43,846 | ||
OIL, GAS & CONSUMABLE FUELS—2.5% | ||
650,770 | Northern Oil & Gas, Inc. | 24,951 |
PHARMACEUTICALS—1.3% | ||
1,060,486 | Innoviva, Inc. * | 13,161 |
PROFESSIONAL SERVICES—1.6% | ||
286,678 | WNS Holdings Ltd. ADR (India)*,1 | 15,572 |
COMMON STOCKS—Continued | ||
Shares | Value | |
SEMICONDUCTORS & SEMICONDUCTOR EQUIPMENT—4.1% | ||
115,723 | Camtek Ltd. (Israel)* | $6,087 |
178,490 | Impinj, Inc. * | 11,532 |
252,570 | Kulicke & Soffa Industries, Inc. (Singapore) | 10,510 |
92,070 | Universal Display Corp. | 12,814 |
40,943 | ||
SOFTWARE—9.0% | ||
867,771 | CCC Intelligent Solutions Holdings, Inc. * | 9,346 |
290,020 | Dynatrace, Inc. * | 12,967 |
747,869 | Samsara, Inc. Class A* | 17,253 |
887,650 | SentinelOne, Inc. Class A* | 13,874 |
561,010 | Smartsheet, Inc. Class A* | 22,182 |
305,930 | Tenable Holdings, Inc. * | 12,883 |
88,505 | ||
TECHNOLOGY HARDWARE, STORAGE & PERIPHERALS—0.5% | ||
19,196 | Super Micro Computer, Inc. * | 4,597 |
TOTAL COMMON STOCKS (Cost $952,563) | 937,712 | |
TOTAL INVESTMENTS—95.0% (Cost $952,563) | 937,712 | |
CASH AND OTHER ASSETS, LESS LIABILITIES—5.0% | 49,327 | |
TOTAL NET ASSETS—100% | $987,039 |
FAIR VALUE MEASUREMENTS
As of October 31, 2023, the investment in CRISPR Therapeutics AG (as disclosed in the preceding Portfolio of Investments) was classified as Level 3 and all other investments were classified as Level 1.
For more information on valuation inputs and their aggregation into the levels identified above, please refer to the Fair Value Measurements and Disclosures in Note 2 of the accompanying Notes to Financial Statements.
The following is a rollforward of the Fund’s Level 3 investments during the year ended October 31, 2023. Transfers into or out of Level 3, if any, are recognized as of the last day in the fiscal quarter of the period in which the event or change in circumstances that caused the reclassification occurred.
Valuation Description | Beginning Balance as of 11/01/2022 (000s) | Purchases (000s) | Sales (000s) | Discount/ (Premium) (000s) | Total Realized Gain/(Loss) (000s) | Change in Unrealized Appreciation/ (Depreciation) (000s) | Transfers Into Level 3h (000s) | Transfers Out of Level 3 (000s) | Ending Balance as of 10/31/2023 (000s) | Unrealized Gain/(Loss) as of 10/31/2023 (000s) |
Common Stock | $— | $— | $— | $— | $— | $— | $6,370 | $— | $6,370 | $(2,742) |
⬤
88
Harbor Small Cap Growth FundPORTFOLIO OF INVESTMENTS—Continued
FAIR VALUE MEASUREMENTS—Continued
The following is a summary of significant unobservable inputs used in the fair valuations of assets and liabilities categorized within Level 3 of the fair value hierarchy.
Valuation Descriptions | Ending Balance as of 10/31/23 (000s) | Valuation Technique | Unobservable Input(s) | Input Value(s) |
Investments in Securities | ||||
Common Stocks | ||||
CRISPR Therapeutics AG (Switzerland)* | $6,370 | Market Approach | Last Traded Price | USD 38.93 |
*
Non-income producing security
x
Fair valued in accordance with Harbor Funds' Valuation Procedures.
h
Transferred into Level 3 due to the unavailability of observable market data for pricing or transferred out of Level 3 due to availability of observable market data for pricing
1
Depositary receipts such as American Depositary Receipts (ADRs), Global Depositary Receipts (GDRs) and other country specific depositary receipts are certificates evidencing ownership of shares of a foreign issuer. These certificates are issued by depositary banks and generally trade on an established market in the U.S. or elsewhere.
The accompanying notes are an integral part of the Financial Statements.
⬤
89
Harbor Small Cap Value FundMANAGER’S COMMENTARY (Unaudited)
SUBADVISOR
EARNEST Partners LLC
Management’s Discussion of
Fund Performance
Fund Performance
MARKET REVIEW
The U.S. equity markets, represented by the S&P 500® Index posted a 10.2% return during the 12-months ending October 31, 2023. The U.S. small cap market, represented by the Russell 2000 Value® Index, lagged large cap stock, and declined 9.9% during the period.
The broad rally in global equity markets stalled after a strong first half of the year as investors began to focus on long-term economic growth prospects and the posture of the Federal Reserve (the “Fed”) in its fight against inflation. Energy emerged as the star performer during the quarter, gaining momentum as travel demand continued to remain strong and several OPEC countries extended supply restrictions through the end of next year. Rate-sensitive industries such as Consumer Discretionary, Real Estate, and Utilities, encountered headwinds in the wake of the Fed’s persistent commitment to maintaining higher interest rates for an extended period. These businesses typically hold lots of debt on their balance sheets which means that they may face higher financing costs. Additionally, Utilities and REITs are often viewed as bond-proxies by many investors and are competing for investors’ capital with government securities that are offering over 5% annualized rates. Many of the stocks within the tech-heavy NASDAQ 100 (Amazon and Tesla are both within Consumer Discretionary) saw a pullback after the Index gained over 40% during the first half of the year on the back of optimism surrounding artificial intelligence and related industries. The Fed continued to play a central role in the financial landscape, although investors have shifted their focus to metrics beyond the Consumer Price Index (“CPI”), which has been steadily declining. Following CPI readings of 3.0% in June, 3.2% in July and 3.7% in August, the Fed hiked rates by an additional 25 bps to the range of 5.25% to 5.5%, underlining the central bank’s continued commitment to managing inflation, while also asserting that the economy was strong enough to support further rate increases. In September, the Fed paused, although the board was split on whether it was going to hike again through the end of the year. The central bank is projecting a Fed Funds Rate of 5.1% by the end of 2024 and 3.9% by the end of 2025.
PERFORMANCE
Harbor Small Cap Value Fund returned -4.29% (Retirement Class), -4.36% (Institutional Class), -4.62% (Administrative Class), and -4.72% (Investor Class) in the year ended October 31, 2023, outperforming the Russell 2000 ® Value Index (the “Index”), which returned -9.93% during the same period.
Despite the broader Index contraction, the Fund was able to protect against the downside and outperformed the Index in the period. Positive stock selection was a contributor to the relative results. While the strategy’s relative underweight to Energy, the best performing sector in the Index during the period, detracted the most from relative results, the portfolio’s Energy stocks outperformed their Index counterparts. The portfolio’s overweight to Industrials and Information Technology was additive to relative results.
Contributing to performance was Moog. Moog designs, manufactures, and provides system integration of precision motion and fluid controls within the industrial, aerospace and defense industries. The company’s products include, but are not limited to, flight control systems for high-performance aircraft, management controls for space stations and satellites, and controls for automated industrial machinery. Moog shares gained over 30% in the period as the company saw revenue grow 10% year-over-year and beat consensus estimates by 7%. Despite experiencing operational pressures that caused year-over-year margins to compress by 30bps, the company continues to experience pricing power across business lines which bodes well for sustained top line growth. With commercial and defense aviation entering a replacement cycle, we believe Moog is well positioned to benefit from the anticipated capital investment. The company has key contracts with Boeing, Airbus, Embraer and Gulfstream and the company’s reputation for quality makes it a vendor of choice across the industry. We believe this increased output
⬤
90
Harbor Small Cap Value FundMANAGER’S COMMENTARY—Continued
CHANGE IN A $50,000 INVESTMENT
For the period 11/01/2013 through 10/31/2023
The graph compares a $50,000 investment in the Institutional Class shares of the Fund with the performance of the Russell 2000® Value Index. The Fund’s performance assumes the reinvestment of all dividend and capital gain distributions.
TOTAL RETURNS | |||
For the periods ended 10/31/2023 | |||
Annualized | |||
1 Year | 5 Years | 10 Years | |
Harbor Small Cap Value Fund | |||
Retirement Class1 | -4.29% | 6.22% | 7.45% |
Institutional Class | -4.36 | 6.15 | 7.39 |
Administrative Class | -4.62 | 5.87 | 7.11 |
Investor Class | -4.72 | 5.75 | 6.99 |
Comparative Index | |||
Russell 2000® Value Index | -9.93% | 3.26% | 5.20% |
As stated in the Fund’s prospectus dated March 1, 2023, the expense ratios were 0.80% (Retirement Class); 0.88% (Institutional Class); 1.13% (Administrative Class); and 1.24% (Investor Class). The expense ratios in the prospectus may differ from the actual expense ratios for the period disclosed within this report. The expense ratios shown in the prospectus are adjusted to reflect changes, if any, in contractual arrangements that occurred prior to the date of the prospectus (or supplement thereto, if applicable).
The Russell 2000® Value Index is an unmanaged index representing the smallest 2000 stocks with the lowest price-to-book ratio and future earnings. This unmanaged index does not reflect fees and expenses and is not available for direct investment. The Russell 2000® Value Index and Russell® are trademarks of Frank Russell Company.
Performance data shown represents past performance and is no guarantee of future results. Past performance is net of management fees and expenses and reflects reinvested dividends and distributions. Past performance reflects the beneficial effect of any expense waivers or reimbursements, without which returns would have been lower. Investment returns and principal value will fluctuate and when redeemed may be worth more or less than their original cost. Returns for periods less than one year are not annualized. Current performance may be higher or lower and is available through the most recent month end at harborcapital.com or by calling 800-422-1050.
supports higher utilization of Moog’s production capacity and we expect it to further drive margin expansion and grow earnings over our investment period.
Detracting from performance was Darling Ingredients Inc. Darling Ingredients is a developer and producer of sustainable natural ingredients sourced from bio-nutrients. The company operates through three segments: Feed Ingredients, Food Ingredients, and Fuel Ingredients. It offers ingredients and specialty solutions for customers in various industries including the pharmaceutical, food/pet food, industrial and energy industries. Despite Darling Ingredients reporting a 26% year-over-year earnings per share increase, shares contracted more than 50% in the period. Management, however, continues to hold a favorable earnings outlook, emphasizing leverage reduction while planning increased capital outlays for sustainable aviation fuel initiatives and capacity expansion. We believe Darling Ingredients’ performance reflects the strength of its legacy business lines combined with an underappreciated opportunity in the rapidly expanding renewable diesel space. Given Darling Ingredients’ first mover advantage and market leading position within renewables, we believe the company is well positioned to capitalize on market opportunities and grow earnings.
OUTLOOK & STRATEGY
As of October 31, 2023, the Fund had an overweight in the Industrials and Information Technology sectors and an underweight in Financials, Real Estate, Consumer Staples, Consumer Discretionary, and Energy. The portfolio has no exposure to Utilities or Communication Services. The Fund’s relative overweight and underweight positions are an outgrowth of where EARNEST Partners believes it is finding good individual investment opportunities.
In managing the Fund, EARNEST Partners seeks companies with share prices that we believe do not fully reflect their earnings growth outlook. Going forward, we will continue to employ our three-step investment methodology: screen the broad universe to identify stocks that are best positioned to outperform, measure and manage downside risk to the benchmark, and perform in-depth, thorough, fundamental research to find what we believe are the best stocks to include in the Fund.
1 Retirement Class shares commenced operations on March 1, 2016. The performance attributed to the Retirement Class shares prior to that date is that of the Institutional Class shares. Performance prior to March 1, 2016 has not been adjusted to reflect the lower expenses of Retirement Class shares. During this period, Retirement Class shares would have had returns similar to, but potentially higher than, Institutional Class shares due to the fact that Retirement Class shares represent interests in the same portfolio as Institutional Class shares but are subject to lower expenses.
This report contains the current opinions of EARNEST Partners LLC as of the date of this report and should not be considered as investment advice or a recommendation of any particular security, strategy or investment product. Such opinions are subject to change without notice and securities described herein may no longer be included in, or may at any time be removed from, the Fund’s portfolio. This report is distributed for informational purposes only. Information contained herein has been obtained from sources believed reliable, but not guaranteed.
There is no guarantee that the investment objective of the Fund will be achieved. Stock markets are volatile and equity values can decline significantly in response to adverse issuer, political, regulatory, market and economic conditions. Stocks of small cap companies pose special risks, including possible illiquidity and greater price volatility than stocks of larger, more established companies. For information on the different share classes and the risks associated with an investment in the Fund, please refer to the current prospectus.
⬤
91
Harbor Small Cap Value FundPORTFOLIO OF INVESTMENTS—October 31, 2023
SECTOR ALLOCATION (% of investments) - Unaudited
PORTFOLIO OF INVESTMENTS
Value and Cost in Thousands
COMMON STOCKS—96.6% | ||
Shares | Value | |
AEROSPACE & DEFENSE—7.3% | ||
809,588 | AAR Corp. * | $48,057 |
790,019 | Hexcel Corp. | 48,918 |
412,063 | Moog, Inc. Class A | 47,820 |
144,795 | ||
BANKS—10.3% | ||
821,329 | Enterprise Financial Services Corp. | 28,558 |
1,126,043 | First Merchants Corp. | 30,752 |
811,265 | Heartland Financial USA, Inc. | 22,229 |
604,955 | SouthState Corp. | 39,987 |
1,446,971 | Trustmark Corp. | 29,099 |
838,103 | United Bankshares, Inc. | 23,836 |
1,299,925 | United Community Banks, Inc. | 28,715 |
203,176 | ||
CAPITAL MARKETS—4.9% | ||
681,553 | Houlihan Lokey, Inc. Class A | 68,510 |
501,520 | Stifel Financial Corp. | 28,586 |
97,096 | ||
CHEMICALS—3.3% | ||
580,913 | Cabot Corp. | 38,619 |
608,309 | Scotts Miracle-Gro Co. | 27,033 |
65,652 | ||
COMMERCIAL SERVICES & SUPPLIES—3.3% | ||
873,885 | Casella Waste Systems, Inc. Class A* | 65,935 |
CONSUMER FINANCE—2.4% | ||
427,159 | FirstCash Holdings, Inc. | 46,526 |
ELECTRICAL EQUIPMENT—1.9% | ||
429,954 | EnerSys | 36,796 |
ELECTRONIC EQUIPMENT, INSTRUMENTS & COMPONENTS—7.2% | ||
351,120 | Advanced Energy Industries, Inc. | 30,638 |
728,518 | CTS Corp. | 27,254 |
165,496 | Littelfuse, Inc. | 35,858 |
661,425 | Methode Electronics, Inc. | 15,127 |
332,110 | Plexus Corp. * | 32,653 |
141,530 | ||
ENERGY EQUIPMENT & SERVICES—6.5% | ||
1,497,290 | Archrock, Inc. | 18,971 |
1,252,960 | Core Laboratories, Inc. | 26,838 |
444,491 | DMC Global, Inc. * | 8,423 |
COMMON STOCKS—Continued | ||
Shares | Value | |
ENERGY EQUIPMENT & SERVICES—Continued | ||
828,598 | Helmerich & Payne, Inc. | $32,788 |
1,894,816 | Oceaneering International, Inc. * | 41,667 |
128,687 | ||
FOOD PRODUCTS—1.9% | ||
823,007 | Darling Ingredients, Inc. * | 36,451 |
GROUND TRANSPORTATION—1.4% | ||
290,177 | Ryder System, Inc. | 28,304 |
HEALTH CARE EQUIPMENT & SUPPLIES—4.4% | ||
458,469 | CONMED Corp. | 44,683 |
508,788 | Integer Holdings Corp. * | 41,298 |
85,981 | ||
HEALTH CARE PROVIDERS & SERVICES—1.2% | ||
2,092,181 | Pediatrix Medical Group, Inc. * | 23,976 |
HOTEL & RESORT REITS—0.7% | ||
1,190,899 | Pebblebrook Hotel Trust | 14,207 |
HOTELS, RESTAURANTS & LEISURE—4.0% | ||
1,181,954 | Cheesecake Factory, Inc. | 36,723 |
374,603 | Cracker Barrel Old Country Store, Inc. | 24,859 |
4,992,271 | Sabre Corp. * | 17,473 |
79,055 | ||
HOUSEHOLD DURABLES—2.8% | ||
251,599 | Helen of Troy Ltd. * | 24,737 |
268,931 | Meritage Homes Corp. | 30,664 |
55,401 | ||
INDUSTRIAL REITS—1.9% | ||
1,141,139 | STAG Industrial, Inc. | 37,909 |
INSURANCE—3.8% | ||
527,239 | Horace Mann Educators Corp. | 16,729 |
329,315 | Reinsurance Group of America, Inc. | 49,223 |
443,373 | United Fire Group, Inc. | 8,930 |
74,882 | ||
MACHINERY—10.5% | ||
444,491 | Albany International Corp. Class A | 36,275 |
1,251,283 | Flowserve Corp. | 45,947 |
650,243 | Franklin Electric Co., Inc. | 56,389 |
514,938 | SPX Technologies, Inc. * | 41,257 |
⬤
92
Harbor Small Cap Value FundPORTFOLIO OF INVESTMENTS—Continued
Value and Cost in Thousands
COMMON STOCKS—Continued | ||
Shares | Value | |
MACHINERY—Continued | ||
389,698 | Timken Co. | $26,936 |
206,804 | ||
OFFICE REITS—1.3% | ||
1,105,356 | COPT Defense Properties | 25,202 |
PROFESSIONAL SERVICES—4.2% | ||
1,051,123 | Parsons Corp. * | 59,441 |
217,493 | TriNet Group, Inc. * | 22,347 |
81,788 | ||
SEMICONDUCTORS & SEMICONDUCTOR EQUIPMENT—6.1% | ||
1,020,372 | Amkor Technology, Inc. | 21,285 |
404,235 | Diodes, Inc. * | 26,308 |
263,340 | Entegris, Inc. | 23,184 |
1,432,434 | FormFactor, Inc. * | 48,531 |
119,308 |
COMMON STOCKS—Continued | ||
Shares | Value | |
SOFTWARE—2.8% | ||
1,304,957 | Box, Inc. Class A* | $32,441 |
630,674 | Envestnet, Inc. * | 23,335 |
55,776 | ||
TEXTILES, APPAREL & LUXURY GOODS—0.6% | ||
1,403,360 | Wolverine World Wide, Inc. | 11,297 |
TRADING COMPANIES & DISTRIBUTORS—1.9% | ||
362,861 | GATX Corp. | 37,948 |
TOTAL COMMON STOCKS (Cost $1,572,271) | 1,904,482 | |
TOTAL INVESTMENTS—96.6% (Cost $1,572,271) | 1,904,482 | |
CASH AND OTHER ASSETS, LESS LIABILITIES—3.4% | 67,437 | |
TOTAL NET ASSETS—100% | $1,971,919 |
FAIR VALUE MEASUREMENTS
All investments as of October 31, 2023 (as disclosed in the preceding Portfolio of Investments) were classified as Level 1.
For more information on valuation inputs and their aggregation into the levels identified above, please refer to the Fair Value Measurements and Disclosures in Note 2 of the accompanying Notes to Financial Statements.
*
Non-income producing security
The accompanying notes are an integral part of the Financial Statements.
⬤
93
Harbor FundsSTATEMENTS OF ASSETS AND LIABILITIES—October 31, 2023
(All amounts in thousands, except per share amounts)
Harbor Capital Appreciation Fund | Harbor Convertible Securities Fund | Harbor Core Bond Fund | Harbor Core Plus Fund | Harbor Disruptive Innovation Fund | |
Assets | |||||
Investments, at identified cost | $11,646,181 | $27,332 | $115,907 | $1,076,093 | $61,625 |
Investments, at value (Including securities loaned of $0, $0, $0, $0, and $0) | $22,508,530 | $25,527 | $104,982 | $918,401 | $59,818 |
Cash | 78,787 | 778 | 2,788 | 11,729 | 1,394 |
Foreign currency, at value (cost: $0, $0, $0, $3, and $0) | — | — | — | 1 | — |
Receivables for: | |||||
Investment sold | 53,060 | — | 236 | 356 | 190 |
Capital shares sold | 15,447 | 1 | 548 | 238 | 3 |
Dividends | 959 | — | — | — | 12 |
Interest | — | 90 | 824 | 7,660 | — |
Rights/Warrants, at value (cost: $0, $0, $0, $0, and $0) | — | — | — | — | — |
Withholding tax | 1,975 | — | — | — | 1 |
Prepaid registration fees | 33 | — | — | 16 | 22 |
Other assets | 3,040 | 60 | 16 | 342 | 68 |
Total Assets | 22,661,831 | 26,456 | 109,394 | 938,743 | 61,508 |
Liabilities | |||||
Payables for: | |||||
Investments purchased | 24,520 | — | 2,556 | 10,052 | 61 |
Capital shares reacquired | 43,315 | 430 | — | 873 | 10 |
Collateral for securities loaned | — | — | — | — | — |
Accrued expenses: | |||||
Management fees | 10,956 | 11 | 21 | 199 | 39 |
12b-1 fees | 220 | — | — | 2 | 3 |
Transfer agent fees | 1,471 | 2 | 4 | 77 | 6 |
Trustees’ fees and expenses | 3,407 | 25 | 6 | 438 | 59 |
Other | 1,113 | 38 | 40 | 97 | 44 |
Total Liabilities | 85,002 | 506 | 2,627 | 11,738 | 222 |
NET ASSETS | $22,576,829 | $25,950 | $106,767 | $927,005 | $61,286 |
Net Assets Consist of: | |||||
Paid-in capital | $12,261,557 | $42,783 | $124,760 | $1,186,273 | $193,890 |
Total distributable earnings/(loss) | 10,315,272 | (16,833 ) | (17,993 ) | (259,268 ) | (132,604 ) |
$22,576,829 | $25,950 | $106,767 | $927,005 | $61,286 | |
The accompanying notes are an integral part of the Financial Statements.
⬤
95
Harbor Capital Appreciation Fund | Harbor Convertible Securities Fund | Harbor Core Bond Fund | Harbor Core Plus Fund | Harbor Disruptive Innovation Fund | |
NET ASSET VALUE PER SHARE BY CLASS | |||||
Retirement Class | |||||
Net assets | $7,562,038 | $10,174 | $64,662 | $13,726 | $9,761 |
Shares of beneficial interest1 | 92,063 | 1,080 | 7,749 | 1,444 | 2,191 |
Net asset value per share2 | $82.14 | $9.42 | $8.34 | $9.50 | $4.46 |
Institutional Class | |||||
Net assets | $14,002,664 | $15,052 | $42,105 | $905,615 | $36,134 |
Shares of beneficial interest1 | 170,930 | 1,598 | 5,048 | 95,412 | 8,219 |
Net asset value per share2 | $81.92 | $9.42 | $8.34 | $9.49 | $4.40 |
Administrative Class | |||||
Net assets | $199,055 | $71 | N/A | $7,664 | $1,521 |
Shares of beneficial interest1 | 2,535 | 8 | N/A | 807 | 410 |
Net asset value per share2 | $78.51 | $9.40 | N/A | $9.50 | $3.71 |
Investor Class | |||||
Net assets | $813,072 | $653 | N/A | N/A | $13,870 |
Shares of beneficial interest1 | 10,770 | 70 | N/A | N/A | 4,184 |
Net asset value per share2 | $75.49 | $9.38 | N/A | N/A | $3.31 |
1 | Par value $0.01 (unlimited authorizations) |
2 | Per share amounts can be recalculated to the amounts disclosed herein when total net assets and shares of beneficial interest are not rounded to thousands. |
⬤
96
Harbor FundsSTATEMENTS OF ASSETS AND LIABILITIES— October 31, 2023 —Continued
(All amounts in thousands, except per share amounts)
Harbor Diversified International All Cap Fund | Harbor International Fund | Harbor International Core Fund | Harbor International Growth Fund | Harbor International Small Cap Fund | |
Assets | |||||
Investments, at identified cost | $871,580 | $2,851,507 | $134,797 | $266,003 | $359,511 |
Investments, at value (Including securities loaned of $0, $0, $1,194, $0, and $0) | $890,027 | $3,096,476 | $134,186 | $295,445 | $319,844 |
Cash | 3,492 | 34,014 | 196 | 2,529 | 8,117 |
Foreign currency, at value (cost: $2,564, $12,043, $89, $0, and $110) | 2,533 | 11,891 | 87 | — | 109 |
Receivables for: | |||||
Investment sold | 2,450 | 22,802 | 111 | — | 1,401 |
Capital shares sold | 445 | 2,509 | 53 | 890 | 57 |
Dividends | 2,215 | 9,942 | 373 | 288 | 1,049 |
Securities Lending Income | 1 | — | — | — | 4 |
Rights/Warrants, at value (cost: $0, $0, $0, $0, and $0) | 6 | 53 | — | — | — |
Withholding tax | 777 | 4,821 | 315 | 201 | 88 |
Prepaid registration fees | 28 | 22 | — | 20 | — |
Other assets | 127 | 3,717 | 32 | 97 | 68 |
Total Assets | 902,101 | 3,186,247 | 135,353 | 299,470 | 330,737 |
Liabilities | |||||
Payables for: | |||||
Investments purchased | 1,654 | 5,118 | — | — | — |
Capital shares reacquired | 330 | 20,083 | 88 | 9,402 | 610 |
Collateral for securities loaned | — | — | 851 | — | — |
Accrued expenses: | |||||
Tax compliance fee payable (see Note 2) | — | 10,668 | — | — | — |
Management fees | 586 | 2,050 | 89 | 194 | 250 |
12b-1 fees | 4 | 55 | 2 | 1 | 1 |
Transfer agent fees | 35 | 251 | 11 | 21 | 20 |
Trustees’ fees and expenses | 57 | 3,457 | 4 | 75 | 11 |
Other | 383 | 1,357 | 141 | 312 | 167 |
Total Liabilities | 3,049 | 43,039 | 1,186 | 10,005 | 1,059 |
NET ASSETS | $899,052 | $3,143,208 | $134,167 | $289,465 | $329,678 |
Net Assets Consist of: | |||||
Paid-in capital | $929,189 | $3,379,284 | $138,943 | $267,012 | $362,182 |
Total distributable earnings/(loss) | (30,137 ) | (236,076 ) | (4,776 ) | 22,453 | (32,504 ) |
$899,052 | $3,143,208 | $134,167 | $289,465 | $329,678 | |
The accompanying notes are an integral part of the Financial Statements.
⬤
97
Harbor Diversified International All Cap Fund | Harbor International Fund | Harbor International Core Fund | Harbor International Growth Fund | Harbor International Small Cap Fund | |
NET ASSET VALUE PER SHARE BY CLASS | |||||
Retirement Class | |||||
Net assets | $610,787 | $535,873 | $21,125 | $67,602 | $130,744 |
Shares of beneficial interest1 | 56,603 | 13,401 | 2,004 | 5,026 | 10,257 |
Net asset value per share2 | $10.79 | $39.99 | $10.54 | $13.45 | $12.75 |
Institutional Class | |||||
Net assets | $270,054 | $2,354,695 | $103,206 | $215,566 | $194,128 |
Shares of beneficial interest1 | 25,026 | 58,668 | 9,805 | 16,063 | 15,233 |
Net asset value per share2 | $10.79 | $40.14 | $10.53 | $13.42 | $12.74 |
Administrative Class | |||||
Net assets | $8,506 | $10,643 | N/A | $96 | $418 |
Shares of beneficial interest1 | 791 | 263 | N/A | 7 | 33 |
Net asset value per share2 | $10.75 | $40.45 | N/A | $13.37 | $12.71 |
Investor Class | |||||
Net assets | $9,705 | $241,997 | $9,836 | $6,201 | $4,388 |
Shares of beneficial interest1 | 908 | 6,098 | 942 | 467 | 346 |
Net asset value per share2 | $10.69 | $39.68 | $10.44 | $13.28 | $12.67 |
⬤
98
Harbor FundsSTATEMENTS OF ASSETS AND LIABILITIES— October 31, 2023 —Continued
(All amounts in thousands, except per share amounts)
Harbor Large Cap Value Fund | Harbor Mid Cap Fund | Harbor Mid Cap Value Fund | Harbor Small Cap Growth Fund | Harbor Small Cap Value Fund | |
Assets | |||||
Investments, at identified cost | $1,211,099 | $97,223 | $234,261 | $952,563 | $1,572,271 |
Investments, at value (Including securities loaned of $0, $0, $0, $0, and $0) | $1,637,559 | $95,406 | $244,115 | $937,712 | $1,904,482 |
Cash | 44,931 | 3,687 | 1,629 | 42,812 | 69,357 |
Receivables for: | |||||
Investment sold | — | — | — | 21,111 | — |
Capital shares sold | 1,047 | 14 | 100 | 2,390 | 1,149 |
Dividends | 1,184 | 33 | 305 | 39 | 802 |
Rights/Warrants, at value (cost: $0, $0, $0, $0, and $0) | — | — | — | — | — |
Withholding tax | 458 | — | — | — | — |
Prepaid registration fees | 20 | 28 | 12 | 21 | 18 |
Other assets | 135 | 14 | 83 | 101 | 146 |
Total Assets | 1,685,334 | 99,182 | 246,244 | 1,004,186 | 1,975,954 |
Liabilities | |||||
Payables for: | |||||
Investments purchased | — | — | — | 15,663 | — |
Capital shares reacquired | 1,042 | 54 | 135 | 576 | 2,280 |
Collateral for securities loaned | — | — | — | — | — |
Accrued expenses: | |||||
Management fees | 904 | 64 | 161 | 652 | 1,290 |
12b-1 fees | 6 | — | 6 | 2 | 8 |
Transfer agent fees | 73 | 4 | 22 | 60 | 131 |
Trustees’ fees and expenses | 120 | 3 | 71 | 117 | 180 |
Other | 117 | 37 | 50 | 77 | 146 |
Total Liabilities | 2,262 | 162 | 445 | 17,147 | 4,035 |
NET ASSETS | $1,683,072 | $99,020 | $245,799 | $987,039 | $1,971,919 |
Net Assets Consist of: | |||||
Paid-in capital | $1,202,479 | $101,454 | $215,476 | $1,098,002 | $1,515,082 |
Total distributable earnings/(loss) | 480,593 | (2,434 ) | 30,323 | (110,963 ) | 456,837 |
$1,683,072 | $99,020 | $245,799 | $987,039 | $1,971,919 | |
The accompanying notes are an integral part of the Financial Statements.
⬤
99
Harbor Large Cap Value Fund | Harbor Mid Cap Fund | Harbor Mid Cap Value Fund | Harbor Small Cap Growth Fund | Harbor Small Cap Value Fund | |
NET ASSET VALUE PER SHARE BY CLASS | |||||
Retirement Class | |||||
Net assets | $1,038,551 | $67,565 | $13,024 | $369,393 | $572,582 |
Shares of beneficial interest1 | 54,631 | 5,639 | 585 | 34,095 | 16,295 |
Net asset value per share2 | $19.01 | $11.98 | $22.25 | $10.83 | $35.14 |
Institutional Class | |||||
Net assets | $617,342 | $30,896 | $205,100 | $609,724 | $1,362,890 |
Shares of beneficial interest1 | 32,463 | 2,581 | 9,218 | 56,806 | 38,812 |
Net asset value per share2 | $19.02 | $11.97 | $22.25 | $10.73 | $35.12 |
Administrative Class | |||||
Net assets | $2,979 | N/A | $3,302 | $419 | $3,435 |
Shares of beneficial interest1 | 157 | N/A | 147 | 46 | 99 |
Net asset value per share2 | $19.02 | N/A | $22.54 | $9.19 | $34.77 |
Investor Class | |||||
Net assets | $24,200 | $559 | $24,373 | $7,503 | $33,012 |
Shares of beneficial interest1 | 1,257 | 47 | 1,096 | 905 | 976 |
Net asset value per share2 | $19.25 | $11.91 | $22.23 | $8.29 | $33.82 |
1 | Par value $0.01 (unlimited authorizations) |
2 | Per share amounts can be recalculated to the amounts disclosed herein when total net assets and shares of beneficial interest are not rounded to thousands. |
⬤
100
Harbor FundsSTATEMENTS OF OPERATIONS—Year Ended October 31, 2023
(All amounts in thousands)
Harbor Capital Appreciation Fund | Harbor Convertible Securities Fund | Harbor Core Bond Fund | Harbor Core Plus Fund | |
Investment Income | ||||
Dividends | $140,891 | $185 | $— | $— |
Interest | 4,954 | 1,580 | 3,961 | 41,767 |
Net securities lending income | — | — | — | — |
Consent fee income | — | — | — | 56 |
Foreign taxes withheld | (1,781 ) | — | — | — |
Foreign tax reclaims, net of applicable tax compliance fee (see Note 2) | — | — | — | — |
Total Investment Income | 144,064 | 1,765 | 3,961 | 41,823 |
Operating Expenses | ||||
Management fees | 136,928 | 335 | 220 | 2,470 |
12b-1 fees: | ||||
Administrative Class | 498 | 1 | N/A | 25 |
Investor Class | 2,032 | 3 | N/A | N/A |
Shareholder communications | 636 | 12 | 9 | 43 |
Custodian fees | 796 | 31 | 29 | 84 |
Transfer agent fees: | ||||
Retirement Class | 1,509 | 4 | 13 | 3 |
Institutional Class | 14,264 | 38 | 33 | 965 |
Administrative Class | 199 | — | N/A | 10 |
Investor Class | 1,707 | 2 | N/A | N/A |
Professional fees | 1,369 | 102 | 27 | 82 |
Trustees’ fees and expenses | 1,197 | 3 | 5 | 52 |
Registration fees | 203 | 54 | 29 | 52 |
Miscellaneous | 532 | 12 | 7 | 30 |
Total Operating Expenses | 161,870 | 597 | 372 | 3,816 |
Management fees waived | (9,975 ) | (17 ) | — | — |
Transfer agent fees waived | (510 ) | (1 ) | (2 ) | (21 ) |
Other expenses reimbursed | — | (147 ) | (95 ) | (24 ) |
Custodian fees reduction | (43 ) | (2 ) | (— ) | (2 ) |
Net expenses | 151,342 | 430 | 275 | 3,769 |
Net Investment Income/(Loss) | (7,278 ) | 1,335 | 3,686 | 38,054 |
Net Realized and Change in Net Unrealized Gain/(Loss) on Investment Transactions | ||||
Net realized gain/(loss) on: | ||||
Investments (net of foreign capital gains tax: $0, $0, $0, $0, $0, $(12), $(2), $0, $259, $0, $0, $0, $0, $0 and $0) | 636,066 | (10,216 ) | (1,633 ) | (30,189 ) |
In-kind redemptions | 133,428 | — | — | — |
Foreign currency transactions | (457 ) | — | — | — |
Rights/Warrants | — | — | — | — |
Change in net unrealized appreciation/(depreciation) on: | ||||
Investments (net of foreign capital gains tax accrual: $0, $0, $0, $0, $0, $0, $0, $0, $(192), $0, $0, $0, $0, $0 and $0) | 3,883,072 | 12,555 | (2,594 ) | 4,972 |
Foreign currency transactions | (3 ) | — | — | 20 |
Rights/Warrants | — | — | — | — |
Net gain/(loss) on investment transactions | 4,652,106 | 2,339 | (4,227 ) | (25,197 ) |
Net Increase/(Decrease) in Net Assets Resulting from Operations | $4,644,828 | $3,674 | $(541 ) | $12,857 |
The accompanying notes are an integral part of the Financial Statements.
⬤
101
Harbor Disruptive Innovation Fund | Harbor Diversified International All Cap Fund | Harbor International Fund | Harbor International Core Fund | Harbor International Growth Fund | Harbor International Small Cap Fund | Harbor Large Cap Value Fund | Harbor Mid Cap Fund | Harbor Mid Cap Value Fund | Harbor Small Cap Growth Fund | Harbor Small Cap Value Fund |
$252 | $29,788 | $109,226 | $5,585 | $4,897 | $9,709 | $40,341 | $1,512 | $8,166 | $6,715 | $31,510 |
79 | 490 | 1,591 | 54 | 117 | 617 | 1,703 | 95 | 81 | 1,686 | 2,605 |
— | 86 | 361 | 23 | 4 | 9 | — | — | — | — | — |
— | — | — | — | — | — | — | — | — | — | — |
(3 ) | (2,743 ) | (8,327 ) | (559 ) | (455 ) | (940 ) | (378 ) | — | — | (14 ) | (1 ) |
— | — | 3,189 | — | — | — | — | — | — | — | — |
328 | 27,621 | 106,040 | 5,103 | 4,563 | 9,395 | 41,666 | 1,607 | 8,247 | 8,387 | 34,114 |
592 | 7,206 | 25,499 | 1,040 | 2,722 | 2,310 | 11,698 | 720 | 2,163 | 7,583 | 16,211 |
5 | 22 | 29 | N/A | — | 1 | 8 | N/A | 9 | 1 | 19 |
40 | 24 | 675 | 22 | 19 | 10 | 66 | 2 | 69 | 20 | 90 |
13 | 25 | 157 | 14 | 14 | 34 | 51 | 12 | 28 | 32 | 124 |
52 | 235 | 468 | 143 | 85 | 123 | 52 | 14 | 31 | 41 | 68 |
3 | 130 | 116 | 5 | 16 | 17 | 246 | 14 | 5 | 72 | 124 |
53 | 294 | 2,539 | 107 | 277 | 180 | 690 | 25 | 235 | 644 | 1,496 |
2 | 9 | 11 | N/A | — | 1 | 3 | N/A | 3 | 1 | 8 |
34 | 20 | 567 | 18 | 16 | 8 | 56 | 2 | 58 | 16 | 76 |
30 | 131 | 299 | 78 | 82 | 52 | 146 | 28 | 40 | 81 | 153 |
5 | 51 | 180 | 7 | 19 | 15 | 104 | 5 | 15 | 54 | 116 |
53 | 58 | 111 | 54 | 55 | 87 | 81 | 44 | 56 | 90 | 98 |
12 | 30 | 86 | 11 | 18 | 11 | 61 | 10 | 16 | 31 | 61 |
894 | 8,235 | 30,737 | 1,499 | 3,323 | 2,849 | 13,262 | 876 | 2,728 | 8,666 | 18,644 |
— | — | — | — | — | — | — | — | — | — | — |
(2 ) | (21 ) | (72 ) | (3 ) | (7 ) | (8 ) | (40 ) | (2 ) | (6 ) | (22 ) | (46 ) |
(137 ) | (987 ) | (3,944 ) | (304 ) | (265 ) | (331 ) | (647 ) | (83 ) | (179 ) | — | — |
(— ) | (1 ) | (5 ) | (1 ) | (1 ) | (2 ) | (3 ) | (— ) | (1 ) | (3 ) | (5 ) |
755 | 7,226 | 26,716 | 1,191 | 3,050 | 2,508 | 12,572 | 791 | 2,542 | 8,641 | 18,593 |
(427 ) | 20,395 | 79,324 | 3,912 | 1,513 | 6,887 | 29,094 | 816 | 5,705 | (254 ) | 15,521 |
(39,204 ) | (19,638 ) | (62,094 ) | (1,339 ) | 3,930 | 2,094 | 61,367 | 1,960 | 17,452 | (49,138 ) | 162,096 |
— | — | — | — | — | — | — | — | — | — | — |
(4 ) | 137 | 1,078 | (24 ) | (89 ) | (254 ) | — | — | — | — | — |
— | (1 ) | 5 | — | — | — | — | — | — | — | — |
43,100 | 98,549 | 443,518 | 4,020 | 20,060 | (29,549 ) | (20,439 ) | (3,850 ) | (18,488 ) | 5,961 | (267,514 ) |
— | 54 | 437 | 1 | 37 | (4 ) | — | — | — | — | — |
— | 6 | 16 | — | — | — | — | — | — | — | — |
3,892 | 79,107 | 382,960 | 2,658 | 23,938 | (27,713 ) | 40,928 | (1,890 ) | (1,036 ) | (43,177 ) | (105,418 ) |
$3,465 | $99,502 | $462,284 | $6,570 | $25,451 | $(20,826 ) | $70,022 | $(1,074 ) | $4,669 | $(43,431 ) | $(89,897 ) |
⬤
102
Harbor FundsSTATEMENTS OF CHANGES IN NET ASSETS
(All amounts in thousands)
Harbor Capital Appreciation Fund | Harbor Convertible Securities Fund | Harbor Core Bond Fund | ||||
November 1, 2022 | November 1, 2021 | November 1, 2022 | November 1, 2021 | November 1, 2022 | November 1, 2021 | |
through | through | through | through | through | through | |
October 31, 2023 | October 31, 2022 | October 31, 2023 | October 31, 2022 | October 31, 2023 | October 31, 2022 | |
INCREASE/(DECREASE) IN NET ASSETS | ||||||
Operations: | ||||||
Net investment income/(loss) | $(7,278) | $(43,377) | $1,335 | $503 | $3,686 | $1,820 |
Net realized gain/(loss) on investments | 769,037 | 165,694 | (10,216) | (4,062) | (1,633) | (4,988) |
Change in net unrealized appreciation/(depreciation) of investments | 3,883,069 | (14,648,695) | 12,555 | (31,493) | (2,594) | (11,308) |
Net increase/(decrease) in assets resulting from operations | 4,644,828 | (14,526,378) | 3,674 | (35,052) | (541) | (14,476) |
Distributions to Shareholders | ||||||
Retirement Class | — | (1,774,533) | (508)* | (5,078) | (2,566) | (864) |
Institutional Class | — | (4,236,598) | (1,002)* | (20,117) | (1,364) | (1,726) |
Administrative Class | — | (64,010) | (2)* | (10) | N/A | N/A |
Investor Class | — | (245,539) | (27)* | (352) | N/A | N/A |
Total distributions to shareholders | — | (6,320,680) | (1,539) | (25,557) | (3,930) | (2,590) |
Net Increase/(Decrease) Derived from Capital Share Transactions | (3,752,107) | 263,781 | (138,907) | 17,371 | 41,861 | (56,045) |
Net increase/(decrease) in net assets | 892,721 | (20,583,277) | (136,772) | (43,238) | 37,390 | (73,111) |
Net Assets | ||||||
Beginning of period | 21,684,108 | 42,267,385 | 162,722 | 205,960 | 69,377 | 142,488 |
End of period | $22,576,829 | $21,684,108 | $25,950 | $162,722 | $106,767 | $69,377 |
* | Includes return of capital of $36 for Retirement Class, $79 for Institutional Class, $1 for Administrative Class and $3 for Investor Class, determined in accordance with federal income tax regulations, see Note 5 in the Notes to Financial Statements for more information |
The accompanying notes are an integral part of the Financial Statements.
⬤
103
Harbor Core Plus Fund | Harbor Disruptive Innovation Fund | Harbor Diversified International All Cap Fund | Harbor International Fund | Harbor International Core Fund | |||||
November 1, 2022 | November 1, 2021 | November 1, 2022 | November 1, 2021 | November 1, 2022 | November 1, 2021 | November 1, 2022 | November 1, 2021 | November 1, 2022 | November 1, 2021 |
through | through | through | through | through | through | through | through | through | through |
October 31, 2023 | October 31, 2022 | October 31, 2023 | October 31, 2022 | October 31, 2023 | October 31, 2022 | October 31, 2023 | October 31, 2022 | October 31, 2023 | October 31, 2022 |
$38,054 | $35,812 | $(427) | $(515) | $20,395 | $19,600 | $79,324 | $98,461 | $3,912 | $2,572 |
(30,189) | (47,933) | (39,208) | (89,319) | (19,502) | (11,363) | (61,011) | (1,372) | (1,363) | (6,072) |
4,992 | (199,083) | 43,100 | (42,370) | 98,609 | (272,409) | 443,971 | (1,118,338) | 4,021 | (11,551) |
12,857 | (211,204) | 3,465 | (132,204) | 99,502 | (264,172) | 462,284 | (1,021,249) | 6,570 | (15,051) |
(555) | (4,079) | — | (23,847) | (9,126) | (59,014) | (17,968) | (18,874) | (556) | (1,921) |
(40,890) | (43,520) | — | (77,166) | (3,990) | (22,740) | (81,213) | (68,529) | (2,010) | (3,283) |
(402) | (541) | — | (2,270) | (102) | (638) | (332) | (269) | N/A | N/A |
N/A | N/A | — | (25,465) | (93) | (661) | (7,757) | (6,320) | (62) | (12) |
(41,847) | (48,140) | — | (128,748) | (13,311) | (83,053) | (107,270) | (93,992) | (2,628) | (5,216) |
7,966 | (358,945) | (50,399) | 21,971 | 5,125 | (50,281) | (228,641) | (438,491) | 39,765 | 57,654 |
(21,024) | (618,289) | (46,934) | (238,981) | 91,316 | (397,506) | 126,373 | (1,553,732) | 43,707 | 37,387 |
948,029 | 1,566,318 | 108,220 | 347,201 | 807,736 | 1,205,242 | 3,016,835 | 4,570,567 | 90,460 | 53,073 |
$927,005 | $948,029 | $61,286 | $108,220 | $899,052 | $807,736 | $3,143,208 | $3,016,835 | $134,167 | $90,460 |
⬤
104
Harbor FundsSTATEMENTS OF CHANGES IN NET ASSETS —Continued
(All amounts in thousands)
Harbor International Growth Fund | Harbor International Small Cap Fund | Harbor Large Cap Value Fund | ||||
November 1, 2022 | November 1, 2021 | November 1, 2022 | November 1, 2021 | November 1, 2022 | November 1, 2021 | |
through | through | through | through | through | through | |
October 31, 2023 | October 31, 2022 | October 31, 2023 | October 31, 2022 | October 31, 2023 | October 31, 2022 | |
INCREASE/(DECREASE) IN NET ASSETS | ||||||
Operations: | ||||||
Net investment income/(loss) | $1,513 | $1,312 | $6,887 | $1,648 | $29,094 | $28,002 |
Net realized gain/(loss) on investments | 3,841 | (3,649) | 1,840 | 2,143 | 61,367 | 88,519 |
Change in net unrealized appreciation/(depreciation) of investments | 20,097 | (308,631) | (29,553) | (16,401) | (20,439) | (435,986) |
Net increase/(decrease) in assets resulting from operations | 25,451 | (310,968) | (20,826) | (12,610) | 70,022 | (319,465) |
Distributions to Shareholders | ||||||
Retirement Class | — | (11,011) | (1,029) | (731) | (69,791) | (52,480) |
Institutional Class | — | (55,495) | (2,528) | (3,330) | (37,634) | (36,416) |
Administrative Class | — | (36) | (11) | (31) | (163) | (126) |
Investor Class | — | (992) | (29) | (121) | (1,276) | (979) |
Total distributions to shareholders | — | (67,534) | (3,597) | (4,213) | (108,864) | (90,001) |
Net Increase/(Decrease) Derived from Capital Share Transactions | (82,177) | (146,117) | 228,498 | 80,999 | (385,812) | (40,120) |
Net increase/(decrease) in net assets | (56,726) | (524,619) | 204,075 | 64,176 | (424,654) | (449,586) |
Net Assets | ||||||
Beginning of period | 346,191 | 870,810 | 125,603 | 61,427 | 2,107,726 | 2,557,312 |
End of period | $289,465 | $346,191 | $329,678 | $125,603 | $1,683,072 | $2,107,726 |
The accompanying notes are an integral part of the Financial Statements.
⬤
105
Harbor Mid Cap Fund | Harbor Mid Cap Value Fund | Harbor Small Cap Growth Fund | Harbor Small Cap Value Fund | ||||
November 1, 2022 | November 1, 2021 | November 1, 2022 | November 1, 2021 | November 1, 2022 | November 1, 2021 | November 1, 2022 | November 1, 2021 |
through | through | through | through | through | through | through | through |
October 31, 2023 | October 31, 2022 | October 31, 2023 | October 31, 2022 | October 31, 2023 | October 31, 2022 | October 31, 2023 | October 31, 2022 |
$816 | $395 | $5,705 | $7,372 | $(254) | $(1,568) | $15,521 | $8,959 |
1,960 | 54 | 17,452 | 29,401 | (49,138) | 40,115 | 162,096 | 142,404 |
(3,850) | (6,927) | (18,488) | (49,490) | 5,961 | (301,227) | (267,514) | (335,267) |
(1,074) | (6,478) | 4,669 | (12,717) | (43,431) | (262,680) | (89,897) | (183,904) |
(2,210) | (799) | (2,850) | (756) | (14,253) | (83,797) | (39,751) | (32,266) |
(657) | (507) | (18,642) | (4,476) | (26,126) | (148,196) | (97,525) | (107,712) |
N/A | N/A | (232) | (37) | (33) | (230) | (577) | (624) |
(25) | (17) | (2,052) | (306) | (406) | (2,234) | (2,454) | (3,413) |
(2,892) | (1,323) | (23,776) | (5,575) | (40,818) | (234,457) | (140,307) | (144,015) |
13,968 | 35,025 | (52,335) | (111,979) | 156,624 | 281,609 | 60,619 | (229,263) |
10,002 | 27,224 | (71,442) | (130,271) | 72,375 | (215,528) | (169,585) | (557,182) |
89,018 | 61,794 | 317,241 | 447,512 | 914,664 | 1,130,192 | 2,141,504 | 2,698,686 |
$99,020 | $89,018 | $245,799 | $317,241 | $987,039 | $914,664 | $1,971,919 | $2,141,504 |
⬤
106
Harbor FundsSTATEMENTS OF CHANGES IN NET ASSETS—CAPITAL STOCK ACTIVITY
(All amounts in thousands)
Harbor Capital Appreciation Fund | Harbor Convertible Securities Fund | Harbor Core Bond Fund | ||||
November 1, 2022 | November 1, 2021 | November 1, 2022 | November 1, 2021 | November 1, 2022 | November 1, 2021 | |
through | through | through | through | through | through | |
October 31, 2023 | October 31, 2022 | October 31, 2023 | October 31, 2022 | October 31, 2023 | October 31, 2022 | |
AMOUNT ($) | ||||||
Retirement Class | ||||||
Net proceeds from sale of shares | $1,316,173 | $2,201,220 | $10,283 | $333 | $34,739 | $20,943 |
Reinvested distributions | — | 1,592,630 | 508 | 5,077 | 2,504 | 817 |
Cost of shares reacquired | (2,356,701) | (2,000,911) | (34,815) | (687) | (10,931) | (11,313) |
Cost of shares reacquired through in-kind redemptions | (39,540) | (104,908) | — | — | — | — |
Net increase/(decrease) in net assets | $(1,080,068) | $1,688,031 | $(24,024) | $4,723 | $26,312 | $10,447 |
Institutional Class | ||||||
Net proceeds from sale of shares | $1,724,855 | $2,793,878 | $4,967 | $41,896 | $19,992 | $5,104 |
Reinvested distributions | — | 4,073,379 | 974 | 19,729 | 1,343 | 1,708 |
Cost of shares reacquired | (4,036,989) | (6,101,128) | (119,422) | (49,025) | (5,786) | (73,304) |
Cost of shares reacquired through in-kind redemptions | (186,116) | (2,160,346) | — | — | — | — |
Net increase/(decrease) in net assets | $(2,498,250) | $(1,394,217) | $(113,481) | $12,600 | $15,549 | $(66,492) |
Administrative Class | ||||||
Net proceeds from sale of shares | $30,898 | $50,951 | $7,134 | $— | N/A | N/A |
Reinvested distributions | — | 59,341 | 2 | 10 | N/A | N/A |
Cost of shares reacquired | (59,393) | (142,425) | (7,154) | — | N/A | N/A |
Net increase/(decrease) in net assets | $(28,495) | $(32,133) | $(18) | $10 | N/A | N/A |
Investor Class | ||||||
Net proceeds from sale of shares | $97,140 | $137,419 | $1,373 | $363 | N/A | N/A |
Reinvested distributions | — | 240,718 | 27 | 352 | N/A | N/A |
Cost of shares reacquired | (242,434) | (376,037) | (2,784) | (677) | N/A | N/A |
Net increase/(decrease) in net assets | $(145,294) | $2,100 | $(1,384) | $38 | N/A | N/A |
The accompanying notes are an integral part of the Financial Statements.
⬤
107
Harbor Core Plus Fund | Harbor Disruptive Innovation Fund | Harbor Diversified International All Cap Fund | Harbor International Fund | Harbor International Core Fund | |||||
November 1, 2022 | November 1, 2021 | November 1, 2022 | November 1, 2021 | November 1, 2022 | November 1, 2021 | November 1, 2022 | November 1, 2021 | November 1, 2022 | November 1, 2021 |
through | through | through | through | through | through | through | through | through | through |
October 31, 2023 | October 31, 2022 | October 31, 2023 | October 31, 2022 | October 31, 2023 | October 31, 2022 | October 31, 2023 | October 31, 2022 | October 31, 2023 | October 31, 2022 |
�� | |||||||||
$5,497 | $24,136 | $3,543 | $9,859 | $93,594 | $118,341 | $123,435 | $98,153 | $1,109 | $10,846 |
551 | 4,079 | — | 23,286 | 9,017 | 58,029 | 16,714 | 18,178 | 556 | 1,921 |
(4,268) | (167,693) | (10,773) | (30,096) | (92,617) | (251,456) | (117,165) | (347,322) | (3,047) | (4,158) |
— | — | — | — | — | — | — | — | — | — |
$1,780 | $(139,478) | $(7,230) | $3,049 | $9,994 | $(75,086) | $22,984 | $(230,991) | $(1,382) | $8,609 |
$167,639 | $92,911 | $4,883 | $40,752 | $27,173 | $69,833 | $247,937 | $1,135,261 | $65,081 | $54,089 |
39,380 | 41,739 | — | 55,436 | 3,287 | 19,287 | 76,238 | 63,912 | 1,714 | 3,014 |
(197,418) | (351,268) | (44,085) | (86,214) | (36,145) | (66,997) | (540,215) | (1,368,732) | (33,464) | (10,449) |
— | — | — | — | — | — | — | — | — | — |
$9,601 | $(216,618) | $(39,202) | $9,974 | $(5,685) | $22,123 | $(216,040) | $(169,559) | $33,331 | $46,654 |
$469 | $1,569 | $109 | $442 | $1,379 | $1,298 | $1,176 | $1,230 | N/A | N/A |
402 | 538 | — | 2,269 | 102 | 638 | 326 | 265 | N/A | N/A |
(4,286) | (4,956) | (1,128) | (1,000) | (1,222) | (730) | (2,466) | (2,727) | N/A | N/A |
$(3,415) | $(2,849) | $(1,019) | $1,711 | $259 | $1,206 | $(964) | $(1,232) | N/A | N/A |
N/A | N/A | $1,756 | $10,514 | $1,555 | $1,955 | $15,783 | $15,131 | $10,701 | $2,615 |
N/A | N/A | — | 23,829 | 93 | 661 | 7,669 | 6,246 | 62 | 12 |
N/A | N/A | (4,704) | (27,106) | (1,091) | (1,140) | (58,073) | (58,086) | (2,947) | (236) |
N/A | N/A | $(2,948) | $7,237 | $557 | $1,476 | $(34,621) | $(36,709) | $7,816 | $2,391 |
⬤
108
Harbor FundsSTATEMENTS OF CHANGES IN NET ASSETS—CAPITAL STOCK ACTIVITY —Continued
(All amounts in thousands)
Harbor International Growth Fund | Harbor International Small Cap Fund | Harbor Large Cap Value Fund | ||||
November 1, 2022 | November 1, 2021 | November 1, 2022 | November 1, 2021 | November 1, 2022 | November 1, 2021 | |
through | through | through | through | through | through | |
October 31, 2023 | October 31, 2022 | October 31, 2023 | October 31, 2022 | October 31, 2023 | October 31, 2022 | |
AMOUNT ($) | ||||||
Retirement Class | ||||||
Net proceeds from sale of shares | $2,937 | $7,637 | $124,572 | $26,387 | $146,234 | $348,261 |
Reinvested distributions | — | 9,892 | 1,029 | 731 | 50,642 | 35,373 |
Cost of shares reacquired | (12,216) | (27,149) | (13,960) | (3,508) | (457,930) | (291,879) |
Cost of shares reacquired through in-kind redemptions | — | — | — | — | — | — |
Net increase/(decrease) in net assets | $(9,279) | $(9,620) | $111,641 | $23,610 | $(261,054) | $91,755 |
Institutional Class | ||||||
Net proceeds from sale of shares | $24,268 | $63,120 | $174,075 | $64,841 | $71,710 | $178,362 |
Reinvested distributions | — | 39,092 | 2,447 | 3,197 | 33,259 | 31,988 |
Cost of shares reacquired | (96,060) | (237,968) | (63,303) | (10,241) | (227,334) | (342,873) |
Cost of shares reacquired through in-kind redemptions | — | — | — | — | — | — |
Net increase/(decrease) in net assets | $(71,792) | $(135,756) | $113,219 | $57,797 | $(122,365) | $(132,523) |
Administrative Class | ||||||
Net proceeds from sale of shares | $18 | $24 | $— | $36 | $66 | $95 |
Reinvested distributions | — | 36 | 11 | 31 | 162 | 125 |
Cost of shares reacquired | (88) | (347) | (33) | — | (414) | (315) |
Net increase/(decrease) in net assets | $(70) | $(287) | $(22) | $67 | $(186) | $(95) |
Investor Class | ||||||
Net proceeds from sale of shares | $533 | $582 | $5,099 | $570 | $2,598 | $7,760 |
Reinvested distributions | — | 983 | 29 | 121 | 1,207 | 931 |
Cost of shares reacquired | (1,569) | (2,019) | (1,468) | (1,166) | (6,012) | (7,948) |
Net increase/(decrease) in net assets | $(1,036) | $(454) | $3,660 | $(475) | $(2,207) | $743 |
The accompanying notes are an integral part of the Financial Statements.
⬤
109
Harbor Mid Cap Fund | Harbor Mid Cap Value Fund | Harbor Small Cap Growth Fund | Harbor Small Cap Value Fund | ||||
November 1, 2022 | November 1, 2021 | November 1, 2022 | November 1, 2021 | November 1, 2022 | November 1, 2021 | November 1, 2022 | November 1, 2021 |
through | through | through | through | through | through | through | through |
October 31, 2023 | October 31, 2022 | October 31, 2023 | October 31, 2022 | October 31, 2023 | October 31, 2022 | October 31, 2023 | October 31, 2022 |
$10,788 | $45,026 | $2,980 | $6,964 | $131,318 | $60,506 | $141,561 | $175,100 |
2,210 | 798 | 2,844 | 756 | 13,969 | 81,741 | 25,422 | 21,850 |
(10,101) | (12,252) | (35,194) | (18,313) | (54,015) | (51,731) | (128,371) | (123,005) |
— | — | — | — | — | — | — | — |
$2,897 | $33,572 | $(29,370) | $(10,593) | $91,272 | $90,516 | $38,612 | $73,945 |
$13,414 | $9,725 | $36,672 | $57,830 | $166,648 | $221,233 | $291,121 | $288,779 |
657 | 507 | 17,471 | 4,303 | 24,279 | 140,465 | 88,682 | 99,186 |
(2,745) | (8,807) | (75,154) | (160,855) | (126,598) | (173,419) | (350,991) | (671,440) |
— | — | — | — | — | — | — | — |
$11,326 | $1,425 | $(21,011) | $(98,722) | $64,329 | $188,279 | $28,812 | $(283,475) |
N/A | N/A | $697 | $652 | $26 | $91 | $627 | $1,029 |
N/A | N/A | 142 | 23 | 33 | 230 | 511 | 557 |
N/A | N/A | (613) | (1,080) | (256) | (189) | (6,102) | (2,834) |
N/A | N/A | $226 | $(405) | $(197) | $132 | $(4,964) | $(1,248) |
$79 | $242 | $2,397 | $5,569 | $2,116 | $2,086 | $4,905 | $4,759 |
25 | 17 | 1,961 | 293 | 396 | 2,183 | 2,316 | 3,282 |
(359) | (231) | (6,538) | (8,121) | (1,292) | (1,587) | (9,062) | (26,526) |
$(255) | $28 | $(2,180) | $(2,259) | $1,220 | $2,682 | $(1,841) | $(18,485) |
⬤
110
Harbor FundsSTATEMENTS OF CHANGES IN NET ASSETS—CAPITAL STOCK ACTIVITY —Continued
(All amounts in thousands)
Harbor Capital Appreciation Fund | Harbor Convertible Securities Fund | Harbor Core Bond Fund | ||||
November 1, 2022 | November 1, 2021 | November 1, 2022 | November 1, 2021 | November 1, 2022 | November 1, 2021 | |
through | through | through | through | through | through | |
October 31, 2023 | October 31, 2022 | October 31, 2023 | October 31, 2022 | October 31, 2023 | October 31, 2022 | |
SHARES | ||||||
Retirement Class | ||||||
Shares sold | 17,515 | 24,726 | 1,015 | 30 | 3,916 | 2,385 |
Shares issued due to reinvestment of distributions | — | 16,588 | 51 | 445 | 283 | 84 |
Shares reacquired | (31,369) | (24,703) | (3,418) | (56) | (1,232) | (1,132) |
Shares reacquired through in-kind redemptions | (474) | (1,382) | — | — | — | — |
Net increase/(decrease) in shares outstanding | (14,328) | 15,229 | (2,352) | 419 | 2,967 | 1,337 |
Institutional Class | ||||||
Shares sold | 23,132 | 33,349 | 494 | 3,995 | 2,308 | 501 |
Shares issued due to reinvestment of distributions | — | 42,475 | 98 | 1,729 | 152 | 171 |
Shares reacquired | (53,439) | (73,341) | (11,915) | (4,626) | (660) | (7,405) |
Shares reacquired through in-kind redemptions | (2,541) | (30,336) | — | — | — | — |
Net increase/(decrease) in shares outstanding | (32,848) | (27,853) | (11,323) | 1,098 | 1,800 | (6,733) |
Administrative Class | ||||||
Shares sold | 427 | 633 | 738 | — | N/A | N/A |
Shares issued due to reinvestment of distributions | — | 643 | — | 1 | N/A | N/A |
Shares reacquired | (817) | (1,779) | (737) | — | N/A | N/A |
Net increase/(decrease) in shares outstanding | (390) | (503) | 1 | 1 | N/A | N/A |
Investor Class | ||||||
Shares sold | 1,378 | 1,763 | 134 | 34 | N/A | N/A |
Shares issued due to reinvestment of distributions | — | 2,705 | 3 | 31 | N/A | N/A |
Shares reacquired | (3,533) | (4,883) | (280) | (61) | N/A | N/A |
Net increase/(decrease) in shares outstanding | (2,155) | (415) | (143) | 4 | N/A | N/A |
The accompanying notes are an integral part of the Financial Statements.
⬤
111
Harbor Core Plus Fund | Harbor Disruptive Innovation Fund | Harbor Diversified International All Cap Fund | Harbor International Fund | Harbor International Core Fund | |||||
November 1, 2022 | November 1, 2021 | November 1, 2022 | November 1, 2021 | November 1, 2022 | November 1, 2021 | November 1, 2022 | November 1, 2021 | November 1, 2022 | November 1, 2021 |
through | through | through | through | through | through | through | through | through | through |
October 31, 2023 | October 31, 2022 | October 31, 2023 | October 31, 2022 | October 31, 2023 | October 31, 2022 | October 31, 2023 | October 31, 2022 | October 31, 2023 | October 31, 2022 |
550 | 2,119 | 754 | 1,653 | 8,139 | 10,154 | 2,969 | 2,586 | 102 | 919 |
55 | 350 | — | 3,230 | 849 | 4,733 | 434 | 402 | 53 | 157 |
(427) | (15,525) | (2,305) | (5,607) | (8,163) | (20,840) | (2,844) | (8,148) | (277) | (358) |
— | — | — | — | — | — | — | — | — | — |
178 | (13,056) | (1,551) | (724) | 825 | (5,953) | 559 | (5,160) | (122) | 718 |
16,607 | 8,400 | 1,056 | 6,128 | 2,443 | 5,624 | 5,951 | 28,770 | 5,966 | 5,060 |
3,923 | 3,725 | — | 7,775 | 309 | 1,573 | 1,971 | 1,406 | 164 | 246 |
(19,729) | (31,555) | (9,741) | (12,431) | (3,176) | (5,799) | (13,037) | (34,392) | (3,035) | (968) |
— | — | — | — | — | — | — | — | — | — |
801 | (19,430) | (8,685) | 1,472 | (424) | 1,398 | (5,115) | (4,216) | 3,095 | 4,338 |
47 | 140 | 28 | 98 | 124 | 108 | 28 | 30 | N/A | N/A |
40 | 48 | — | 375 | 10 | 52 | 8 | 6 | N/A | N/A |
(427) | (471) | (300) | (213) | (107) | (65) | (59) | (66) | N/A | N/A |
(340) | (283) | (272) | 260 | 27 | 95 | (23) | (30) | N/A | N/A |
N/A | N/A | 494 | 1,688 | 137 | 172 | 376 | 370 | 972 | 249 |
N/A | N/A | — | 4,405 | 9 | 54 | 200 | 139 | 6 | 1 |
N/A | N/A | (1,325) | (5,652) | (100) | (99) | (1,403) | (1,378) | (271) | (22) |
N/A | N/A | (831) | 441 | 46 | 127 | (827) | (869) | 707 | 228 |
⬤
112
Harbor FundsSTATEMENTS OF CHANGES IN NET ASSETS—CAPITAL STOCK ACTIVITY —Continued
(All amounts in thousands)
Harbor International Growth Fund | Harbor International Small Cap Fund | Harbor Large Cap Value Fund | ||||
November 1, 2022 | November 1, 2021 | November 1, 2022 | November 1, 2021 | November 1, 2022 | November 1, 2021 | |
through | through | through | through | through | through | |
October 31, 2023 | October 31, 2022 | October 31, 2023 | October 31, 2022 | October 31, 2023 | October 31, 2022 | |
SHARES | ||||||
Retirement Class | ||||||
Shares sold | 192 | 474 | 8,789 | 2,025 | 7,483 | 16,962 |
Shares issued due to reinvestment of distributions | — | 488 | 77 | 50 | 2,711 | 1,628 |
Shares reacquired | (815) | (1,584) | (1,012) | (256) | (23,556) | (13,983) |
Shares reacquired through in-kind redemptions | — | — | — | — | — | — |
Net increase/(decrease) in shares outstanding | (623) | (622) | 7,854 | 1,819 | (13,362) | 4,607 |
Institutional Class | ||||||
Shares sold | 1,621 | 3,777 | 12,277 | 4,917 | 3,675 | 8,415 |
Shares issued due to reinvestment of distributions | — | 1,931 | 183 | 220 | 1,778 | 1,474 |
Shares reacquired | (6,517) | (14,928) | (4,632) | (747) | (11,519) | (16,559) |
Shares reacquired through in-kind redemptions | — | — | — | — | — | — |
Net increase/(decrease) in shares outstanding | (4,896) | (9,220) | 7,828 | 4,390 | (6,066) | (6,670) |
Administrative Class | ||||||
Shares sold | 1 | 2 | — | 3 | 3 | 4 |
Shares issued due to reinvestment of distributions | — | 2 | 1 | 2 | 9 | 6 |
Shares reacquired | (6) | (20) | (3) | — | (21) | (14) |
Net increase/(decrease) in shares outstanding | (5) | (16) | (2) | 5 | (9) | (4) |
Investor Class | ||||||
Shares sold | 35 | 35 | 360 | 42 | 132 | 368 |
Shares issued due to reinvestment of distributions | — | 48 | 2 | 8 | 64 | 42 |
Shares reacquired | (104) | (128) | (106) | (80) | (302) | (376) |
Net increase/(decrease) in shares outstanding | (69) | (45) | 256 | (30) | (106) | 34 |
The accompanying notes are an integral part of the Financial Statements.
⬤
113
Harbor Mid Cap Fund | Harbor Mid Cap Value Fund | Harbor Small Cap Growth Fund | Harbor Small Cap Value Fund | ||||
November 1, 2022 | November 1, 2021 | November 1, 2022 | November 1, 2021 | November 1, 2022 | November 1, 2021 | November 1, 2022 | November 1, 2021 |
through | through | through | through | through | through | through | through |
October 31, 2023 | October 31, 2022 | October 31, 2023 | October 31, 2022 | October 31, 2023 | October 31, 2022 | October 31, 2023 | October 31, 2022 |
866 | 3,697 | 126 | 282 | 10,867 | 4,693 | 3,745 | 4,452 |
186 | 56 | 129 | 31 | 1,297 | 5,657 | 724 | 548 |
(802) | (921) | (1,492) | (740) | (4,521) | (3,906) | (3,379) | (3,074) |
— | — | — | — | — | — | — | — |
250 | 2,832 | (1,237) | (427) | 7,643 | 6,444 | 1,090 | 1,926 |
1,043 | 705 | 1,561 | 2,335 | 14,335 | 17,184 | 7,664 | 7,235 |
55 | 36 | 792 | 178 | 2,273 | 9,796 | 2,524 | 2,486 |
(214) | (678) | (3,250) | (6,634) | (10,783) | (12,362) | (9,242) | (16,748) |
— | — | — | — | — | — | — | — |
884 | 63 | (897) | (4,121) | 5,825 | 14,618 | 946 | (7,027) |
N/A | N/A | 30 | 26 | 3 | 8 | 17 | 26 |
N/A | N/A | 7 | 1 | 4 | 19 | 15 | 14 |
N/A | N/A | (26) | (43) | (25) | (17) | (168) | (73) |
N/A | N/A | 11 | (16) | (18) | 10 | (136) | (33) |
7 | 17 | 103 | 228 | 236 | 201 | 137 | 122 |
2 | 1 | 89 | 12 | 48 | 193 | 68 | 85 |
(29) | (17) | (282) | (341) | (145) | (149) | (246) | (666) |
(20) | 1 | (90) | (101) | 139 | 245 | (41) | (459) |
⬤
114
Harbor Funds Financial HighlightsSELECTED DATA FOR A SHARE OUTSTANDING FOR THE PERIODS PRESENTED
HARBOR CAPITAL APPRECIATION FUND
Retirement Class | |||||
Year Ended October 31, | 2023 | 2022 | 2021 | 2020 | 2019 |
Net asset value beginning of period | $66.82 | $124.89 | $99.19 | $75.79 | $73.98 |
Income from Investment Operations | |||||
Net investment income/(loss)a,b | 0.03 | (0.06) | (0.27) | (0.08) | 0.13 |
Net realized and unrealized gain/(loss) on investments | 15.29 | (39.22) | 38.73 | 30.27 | 8.54 |
Total from investment operations | 15.32 | (39.28) | 38.46 | 30.19 | 8.67 |
Less Distributions | |||||
Dividends from net investment income | — | — | — | (0.12) | (0.21) |
Distributions from net realized capital gains | — | (18.79) | (12.76) | (6.67) | (6.65) |
Total distributions | — | (18.79) | (12.76) | (6.79) | (6.86) |
Net asset value end of period | $82.14 | $66.82 | $124.89 | $99.19 | $75.79 |
Net assets end of period (000s) | $7,562,038 | $7,108,919 | $11,385,191 | $9,549,061 | $6,970,617 |
Ratios and Supplemental Data (%) | |||||
Total returnc | 22.93% | (36.03)% | 41.33% | 42.79% | 13.73% |
Ratio of total expenses to average net assets^ | 0.64 | 0.64 | 0.63 | 0.64 | 0.63 |
Ratio of net expenses to average net assetsa | 0.59 | 0.58 | 0.57 | 0.58 | 0.58 |
Ratio of net investment income/(loss) to average net assetsa | 0.04 | (0.07) | (0.25) | (0.09) | 0.18 |
Portfolio turnover | 27 | 34 | 48 | 51 | 40 |
Administrative Class | |||||
Year Ended October 31, | 2023 | 2022 | 2021 | 2020 | 2019 |
Net asset value beginning of period | $64.08 | $120.94 | $96.68 | $74.15 | $72.54 |
Income from Investment Operations | |||||
Net investment income/(loss)a,b | (0.21) | (0.33) | (0.61) | (0.34) | (0.09) |
Net realized and unrealized gain/(loss) on investments | 14.64 | (37.74) | 37.63 | 29.54 | 8.35 |
Total from investment operations | 14.43 | (38.07) | 37.02 | 29.20 | 8.26 |
Less Distributions | |||||
Dividends from net investment income | — | — | — | — | — |
Distributions from net realized capital gains | — | (18.79) | (12.76) | (6.67) | (6.65) |
Total distributions | — | (18.79) | (12.76) | (6.67) | (6.65) |
Net asset value end of period | $78.51 | $64.08 | $120.94 | $96.68 | $74.15 |
Net assets end of period (000s) | $199,055 | $187,390 | $414,600 | $420,324 | $345,550 |
Ratios and Supplemental Data (%) | |||||
Total returnc | 22.52% | (36.23)% | 40.86% | 42.32% | 13.35% |
Ratio of total expenses to average net assets^ | 0.97 | 0.97 | 0.96 | 0.97 | 0.96 |
Ratio of net expenses to average net assetsa | 0.92 | 0.91 | 0.90 | 0.91 | 0.91 |
Ratio of net investment income/(loss) to average net assetsa | (0.29) | (0.41) | (0.57) | (0.41) | (0.13) |
Portfolio turnover | 27 | 34 | 48 | 51 | 40 |
⬤
115
Harbor Funds Financial HighlightsSELECTED DATA FOR A SHARE OUTSTANDING FOR THE PERIODS PRESENTED
HARBOR CAPITAL APPRECIATION FUND—Continued
Institutional Class | |||||
Year Ended October 31, | 2023 | 2022 | 2021 | 2020 | 2019 |
Net asset value beginning of period | $66.69 | $124.78 | $99.18 | $75.78 | $73.97 |
Income from Investment Operations | |||||
Net investment income/(loss)a,b | (0.03) | (0.13) | (0.36) | (0.14) | 0.08 |
Net realized and unrealized gain/(loss) on investments | 15.26 | (39.17) | 38.72 | 30.26 | 8.53 |
Total from investment operations | 15.23 | (39.30) | 38.36 | 30.12 | 8.61 |
Less Distributions | |||||
Dividends from net investment income | — | — | — | (0.05) | (0.15) |
Distributions from net realized capital gains | — | (18.79) | (12.76) | (6.67) | (6.65) |
Total distributions | — | (18.79) | (12.76) | (6.72) | (6.80) |
Net asset value end of period | $81.92 | $66.69 | $124.78 | $99.18 | $75.78 |
Net assets end of period (000s) | $14,002,664 | $13,590,549 | $28,902,862 | $25,579,181 | $21,311,587 |
Ratios and Supplemental Data (%) | |||||
Total returnc | 22.84% | (36.08)% | 41.22% | 42.68% | 13.63% |
Ratio of total expenses to average net assets^ | 0.72 | 0.72 | 0.71 | 0.72 | 0.71 |
Ratio of net expenses to average net assetsa | 0.67 | 0.66 | 0.65 | 0.66 | 0.66 |
Ratio of net investment income/(loss) to average net assetsa | (0.04) | (0.16) | (0.33) | (0.16) | 0.11 |
Portfolio turnover | 27 | 34 | 48 | 51 | 40 |
Investor Class | |||||
Year Ended October 31, | 2023 | 2022 | 2021 | 2020 | 2019 |
Net asset value beginning of period | $61.68 | $117.30 | $94.19 | $72.48 | $71.15 |
Income from Investment Operations | |||||
Net investment income/(loss)a,b | (0.28) | (0.40) | (0.72) | (0.43) | (0.17) |
Net realized and unrealized gain/(loss) on investments | 14.09 | (36.43) | 36.59 | 28.81 | 8.15 |
Total from investment operations | 13.81 | (36.83) | 35.87 | 28.38 | 7.98 |
Less Distributions | |||||
Dividends from net investment income | — | — | — | — | — |
Distributions from net realized capital gains | — | (18.79) | (12.76) | (6.67) | (6.65) |
Total distributions | — | (18.79) | (12.76) | (6.67) | (6.65) |
Net asset value end of period | $75.49 | $61.68 | $117.30 | $94.19 | $72.48 |
Net assets end of period (000s) | $813,072 | $797,250 | $1,564,732 | $1,282,355 | $1,083,896 |
Ratios and Supplemental Data (%) | |||||
Total returnc | 22.39% | (36.31)% | 40.71% | 42.15% | 13.21% |
Ratio of total expenses to average net assets^ | 1.08 | 1.08 | 1.08 | 1.09 | 1.08 |
Ratio of net expenses to average net assetsa | 1.03 | 1.02 | 1.01 | 1.03 | 1.03 |
Ratio of net investment income/(loss) to average net assetsa | (0.40) | (0.52) | (0.69) | (0.53) | (0.25) |
Portfolio turnover | 27 | 34 | 48 | 51 | 40 |
The accompanying notes are an integral part of the Financial Statements.
⬤
116
Harbor Funds Financial HighlightsSELECTED DATA FOR A SHARE OUTSTANDING FOR THE PERIODS PRESENTED
HARBOR CONVERTIBLE SECURITIES FUND
Retirement Class | |||||
Year Ended October 31, | 2023d | 2022 | 2021 | 2020 | 2019 |
Net asset value beginning of period | $9.82 | $13.69 | $12.49 | $10.82 | $10.47 |
Income from Investment Operations | |||||
Net investment income/(loss)a,b | 0.24 | 0.04 | 0.02 | 0.07 | 0.10 |
Net realized and unrealized gain/(loss) on investments | (0.32) | (2.22) | 2.43 | 2.02 | 0.92 |
Total from investment operations | (0.08) | (2.18) | 2.45 | 2.09 | 1.02 |
Less Distributions | |||||
Dividends from net investment income | (0.28) | (0.08) | (0.09) | (0.09) | (0.18) |
Distributions from net realized capital gains | — | (1.61) | (1.16) | (0.33) | (0.49) |
Return of capital | (0.04) | — | — | — | — |
Total distributions | (0.32) | (1.69) | (1.25) | (0.42) | (0.67) |
Proceeds from redemption fees | — | — | —* | —* | —* |
Net asset value end of period | $9.42 | $9.82 | $13.69 | $12.49 | $10.82 |
Net assets end of period (000s) | $10,174 | $33,711 | $41,250 | $34,307 | $24,697 |
Ratios and Supplemental Data (%) | |||||
Total returnc | (0.73)% | (17.59)% | 20.23% | 19.93% | 10.48% |
Ratio of total expenses to average net assets^ | 0.98 | 0.74 | 0.73 | 0.74 | 0.74 |
Ratio of net expenses to average net assetsa | 0.69 | 0.68 | 0.67 | 0.69 | 0.69 |
Ratio of net investment income/(loss) to average net assetsa | 2.40 | 0.35 | 0.15 | 0.60 | 0.98 |
Portfolio turnover | 127 | 66 | 50 | 101 | 74 |
Administrative Class | |||||
Year Ended October 31, | 2023d | 2022 | 2021 | 2020 | 2019 |
Net asset value beginning of period | $9.78 | $13.63 | $12.46 | $10.80 | $10.44 |
Income from Investment Operations | |||||
Net investment income/(loss)a,b | 0.27 | —* | (0.02) | 0.03 | 0.07 |
Net realized and unrealized gain/(loss) on investments | (0.42) | (2.20) | 2.42 | 2.01 | 0.91 |
Total from investment operations | (0.15) | (2.20) | 2.40 | 2.04 | 0.98 |
Less Distributions | |||||
Dividends from net investment income | (0.21) | (0.04) | (0.07) | (0.05) | (0.13) |
Distributions from net realized capital gains | — | (1.61) | (1.16) | (0.33) | (0.49) |
Return of capital | (0.02) | — | — | — | — |
Total distributions | (0.23) | (1.65) | (1.23) | (0.38) | (0.62) |
Proceeds from redemption fees | — | — | —* | —* | —* |
Net asset value end of period | $9.40 | $9.78 | $13.63 | $12.46 | $10.80 |
Net assets end of period (000s) | $71 | $70 | $85 | $70 | $59 |
Ratios and Supplemental Data (%) | |||||
Total returnc | (1.47)% | (17.84)% | 19.87% | 19.48% | 10.11% |
Ratio of total expenses to average net assets^ | 1.24 | 1.07 | 1.06 | 1.07 | 1.07 |
Ratio of net expenses to average net assetsa | 0.97 | 1.01 | 1.00 | 1.02 | 1.02 |
Ratio of net investment income/(loss) to average net assetsa | 2.71 | 0.02 | (0.18) | 0.29 | 0.64 |
Portfolio turnover | 127 | 66 | 50 | 101 | 74 |
⬤
117
Harbor Funds Financial HighlightsSELECTED DATA FOR A SHARE OUTSTANDING FOR THE PERIODS PRESENTED
HARBOR CONVERTIBLE SECURITIES FUND—Continued
Institutional Class | |||||
Year Ended October 31, | 2023d | 2022 | 2021 | 2020 | 2019 |
Net asset value beginning of period | $9.82 | $13.68 | $12.48 | $10.83 | $10.48 |
Income from Investment Operations | |||||
Net investment income/(loss)a,b | 0.23 | 0.03 | 0.01 | 0.06 | 0.09 |
Net realized and unrealized gain/(loss) on investments | (0.32) | (2.21) | 2.43 | 2.00 | 0.92 |
Total from investment operations | (0.09) | (2.18) | 2.44 | 2.06 | 1.01 |
Less Distributions | |||||
Dividends from net investment income | (0.28) | (0.07) | (0.08) | (0.08) | (0.17) |
Distributions from net realized capital gains | — | (1.61) | (1.16) | (0.33) | (0.49) |
Return of capital | (0.03) | — | — | — | — |
Total distributions | (0.31) | (1.68) | (1.24) | (0.41) | (0.66) |
Proceeds from redemption fees | — | — | —* | —* | —* |
Net asset value end of period | $9.42 | $9.82 | $13.68 | $12.48 | $10.83 |
Net assets end of period (000s) | $15,052 | $126,865 | $161,772 | $117,269 | $114,130 |
Ratios and Supplemental Data (%) | |||||
Total returnc | (0.83)% | (17.62)% | 20.18% | 19.63% | 10.39% |
Ratio of total expenses to average net assets^ | 1.06 | 0.82 | 0.81 | 0.82 | 0.82 |
Ratio of net expenses to average net assetsa | 0.77 | 0.76 | 0.75 | 0.77 | 0.77 |
Ratio of net investment income/(loss) to average net assetsa | 2.31 | 0.27 | 0.06 | 0.55 | 0.89 |
Portfolio turnover | 127 | 66 | 50 | 101 | 74 |
Investor Class | |||||
Year Ended October 31, | 2023d | 2022 | 2021 | 2020 | 2019 |
Net asset value beginning of period | $9.77 | $13.62 | $12.46 | $10.80 | $10.45 |
Income from Investment Operations | |||||
Net investment income/(loss)a,b | 0.24 | (0.01) | (0.04) | 0.02 | 0.05 |
Net realized and unrealized gain/(loss) on investments | (0.36) | (2.20) | 2.43 | 2.00 | 0.92 |
Total from investment operations | (0.12) | (2.21) | 2.39 | 2.02 | 0.97 |
Less Distributions | |||||
Dividends from net investment income | (0.24) | (0.03) | (0.07) | (0.03) | (0.13) |
Distributions from net realized capital gains | — | (1.61) | (1.16) | (0.33) | (0.49) |
Return of capital | (0.03) | — | — | — | — |
Total distributions | (0.27) | (1.64) | (1.23) | (0.36) | (0.62) |
Proceeds from redemption fees | — | — | —* | —* | —* |
Net asset value end of period | $9.38 | $9.77 | $13.62 | $12.46 | $10.80 |
Net assets end of period (000s) | $653 | $2,076 | $2,853 | $2,420 | $2,066 |
Ratios and Supplemental Data (%) | |||||
Total returnc | (1.23)% | (17.92)% | 19.76% | 19.33% | 9.99% |
Ratio of total expenses to average net assets^ | 1.40 | 1.18 | 1.17 | 1.19 | 1.19 |
Ratio of net expenses to average net assetsa | 1.12 | 1.12 | 1.11 | 1.14 | 1.14 |
Ratio of net investment income/(loss) to average net assetsa | 2.46 | (0.10) | (0.29) | 0.17 | 0.52 |
Portfolio turnover | 127 | 66 | 50 | 101 | 74 |
The accompanying notes are an integral part of the Financial Statements.
⬤
118
Harbor Funds Financial HighlightsSELECTED DATA FOR A SHARE OUTSTANDING FOR THE PERIODS PRESENTED
HARBOR CORE BOND FUND
Retirement Class | |||||
Year Ended October 31, | 2023 | 2022 | 2021 | 2020 | 2019 |
Net asset value beginning of period | $8.64 | $10.61 | $11.06 | $10.64 | $9.84 |
Income from Investment Operations | |||||
Net investment income/(loss)a,b | 0.34 | 0.22 | 0.19 | 0.26 | 0.31 |
Net realized and unrealized gain/(loss) on investments | (0.27) | (1.90) | (0.19) | 0.50 | 0.79 |
Total from investment operations | 0.07 | (1.68) | — | 0.76 | 1.10 |
Less Distributions | |||||
Dividends from net investment income | (0.37) | (0.29) | (0.23) | (0.27) | (0.30) |
Distributions from net realized capital gains | — | — | (0.22) | (0.07) | — |
Total distributions | (0.37) | (0.29) | (0.45) | (0.34) | (0.30) |
Net asset value end of period | $8.34 | $8.64 | $10.61 | $11.06 | $10.64 |
Net assets end of period (000s) | $64,662 | $41,312 | $36,557 | $29,428 | $5,298 |
Ratios and Supplemental Data (%) | |||||
Total returnc | 0.63% | (16.14)% | (0.01)% | 7.36% | 11.34% |
Ratio of total expenses to average net assets^ | 0.36 | 0.37 | 0.43 | 0.43 | 0.45 |
Ratio of net expenses to average net assetsa | 0.26 | 0.27 | 0.37 | 0.37 | 0.37 |
Ratio of net investment income/(loss) to average net assetsa | 3.88 | 2.28 | 1.77 | 2.35 | 2.98 |
Portfolio turnover | 71 | 60 | 47 | 70 | 61 |
Institutional Class | |||||
Year Ended October 31, | 2023 | 2022 | 2021 | 2020 | 2019 |
Net asset value beginning of period | $8.64 | $10.61 | $11.06 | $10.64 | $9.84 |
Income from Investment Operations | |||||
Net investment income/(loss)a,b | 0.34 | 0.20 | 0.18 | 0.26 | 0.30 |
Net realized and unrealized gain/(loss) on investments | (0.28) | (1.89) | (0.19) | 0.50 | 0.79 |
Total from investment operations | 0.06 | (1.69) | (0.01) | 0.76 | 1.09 |
Less Distributions | |||||
Dividends from net investment income | (0.36) | (0.28) | (0.22) | (0.27) | (0.29) |
Distributions from net realized capital gains | — | — | (0.22) | (0.07) | — |
Total distributions | (0.36) | (0.28) | (0.44) | (0.34) | (0.29) |
Net asset value end of period | $8.34 | $8.64 | $10.61 | $11.06 | $10.64 |
Net assets end of period (000s) | $42,105 | $28,065 | $105,931 | $86,173 | $79,458 |
Ratios and Supplemental Data (%) | |||||
Total returnc | 0.55% | (16.21)% | (0.09)% | 7.28% | 11.26% |
Ratio of total expenses to average net assets^ | 0.44 | 0.45 | 0.51 | 0.51 | 0.53 |
Ratio of net expenses to average net assetsa | 0.34 | 0.36 | 0.45 | 0.45 | 0.45 |
Ratio of net investment income/(loss) to average net assetsa | 3.79 | 2.03 | 1.70 | 2.35 | 2.89 |
Portfolio turnover | 71 | 60 | 47 | 70 | 61 |
The accompanying notes are an integral part of the Financial Statements.
⬤
119
Harbor Funds Financial HighlightsSELECTED DATA FOR A SHARE OUTSTANDING FOR THE PERIODS PRESENTED
HARBOR CORE PLUS FUND
Retirement Class | |||||
Year Ended October 31, | 2023 | 2022e | 2021 | 2020 | 2019 |
Net asset value beginning of period | $9.78 | $12.06 | $12.35 | $11.90 | $11.09 |
Income from Investment Operations | |||||
Net investment income/(loss)a,b | 0.40 | 0.32 | 0.32 | 0.31 | 0.38 |
Net realized and unrealized gain/(loss) on investments | (0.24) | (2.18) | (0.21) | 0.49 | 0.80 |
Total from investment operations | 0.16 | (1.86) | 0.11 | 0.80 | 1.18 |
Less Distributions | |||||
Dividends from net investment income | (0.44) | (0.40) | (0.27) | (0.35) | (0.37) |
Distributions from net realized capital gains | — | (0.02) | (0.13) | — | — |
Total distributions | (0.44) | (0.42) | (0.40) | (0.35) | (0.37) |
Net asset value end of period | $9.50 | $9.78 | $12.06 | $12.35 | $11.90 |
Net assets end of period (000s) | $13,726 | $12,389 | $172,699 | $166,740 | $12,802 |
Ratios and Supplemental Data (%) | |||||
Total returnc | 1.43% | (15.78)% | 0.88% | 6.82% | 10.84% |
Ratio of total expenses to average net assets^ | 0.30 | 0.42 | 0.53 | 0.58 | 1.06 |
Ratio of net expenses to average net assetsa | 0.30 | 0.36 | 0.43 | 0.48 | 0.96 |
Ratio of net expenses excluding interest expense to average net assetsa | 0.30 | 0.36 | 0.43 | 0.43 | 0.43 |
Ratio of net investment income/(loss) to average net assetsa | 3.94 | 2.83 | 2.63 | 2.56 | 3.30 |
Portfolio turnover | 55 | 219 | 370 | 558 | 644 |
Administrative Class | |||||
Year Ended October 31, | 2023 | 2022e | 2021 | 2020 | 2019 |
Net asset value beginning of period | $9.78 | $12.08 | $12.37 | $11.92 | $11.11 |
Income from Investment Operations | |||||
Net investment income/(loss)a,b | 0.36 | 0.29 | 0.28 | 0.28 | 0.35 |
Net realized and unrealized gain/(loss) on investments | (0.24) | (2.21) | (0.21) | 0.48 | 0.79 |
Total from investment operations | 0.12 | (1.92) | 0.07 | 0.76 | 1.14 |
Less Distributions | |||||
Dividends from net investment income | (0.40) | (0.36) | (0.23) | (0.31) | (0.33) |
Distributions from net realized capital gains | — | (0.02) | (0.13) | — | — |
Total distributions | (0.40) | (0.38) | (0.36) | (0.31) | (0.33) |
Net asset value end of period | $9.50 | $9.78 | $12.08 | $12.37 | $11.92 |
Net assets end of period (000s) | $7,664 | $11,223 | $17,270 | $18,302 | $19,498 |
Ratios and Supplemental Data (%) | |||||
Total returnc | 1.10% | (16.20)% | 0.54% | 6.44% | 10.44% |
Ratio of total expenses to average net assets^ | 0.63 | 0.71 | 0.86 | 0.97 | 1.39 |
Ratio of net expenses to average net assetsa | 0.63 | 0.67 | 0.76 | 0.87 | 1.29 |
Ratio of net expenses excluding interest expense to average net assetsa | 0.63 | 0.67 | 0.76 | 0.76 | 0.76 |
Ratio of net investment income/(loss) to average net assetsa | 3.58 | 2.64 | 2.29 | 2.32 | 3.01 |
Portfolio turnover | 55 | 219 | 370 | 558 | 644 |
⬤
120
Harbor Funds Financial HighlightsSELECTED DATA FOR A SHARE OUTSTANDING FOR THE PERIODS PRESENTED
HARBOR CORE PLUS FUND—Continued
Institutional Class | |||||
Year Ended October 31, | 2023 | 2022e | 2021 | 2020 | 2019 |
Net asset value beginning of period | $9.77 | $12.07 | $12.36 | $11.91 | $11.10 |
Income from Investment Operations | |||||
Net investment income/(loss)a,b | 0.39 | 0.32 | 0.31 | 0.31 | 0.37 |
Net realized and unrealized gain/(loss) on investments | (0.24) | (2.21) | (0.21) | 0.48 | 0.80 |
Total from investment operations | 0.15 | (1.89) | 0.10 | 0.79 | 1.17 |
Less Distributions | |||||
Dividends from net investment income | (0.43) | (0.39) | (0.26) | (0.34) | (0.36) |
Distributions from net realized capital gains | — | (0.02) | (0.13) | — | — |
Total distributions | (0.43) | (0.41) | (0.39) | (0.34) | (0.36) |
Net asset value end of period | $9.49 | $9.77 | $12.07 | $12.36 | $11.91 |
Net assets end of period (000s) | $905,615 | $924,416 | $1,376,349 | $1,844,961 | $1,958,600 |
Ratios and Supplemental Data (%) | |||||
Total returnc | 1.35% | (15.99)% | 0.79% | 6.72% | 10.74% |
Ratio of total expenses to average net assets^ | 0.38 | 0.46 | 0.61 | 0.73 | 1.14 |
Ratio of net expenses to average net assetsa | 0.38 | 0.42 | 0.51 | 0.62 | 1.04 |
Ratio of net expenses excluding interest expense to average net assetsa | 0.38 | 0.42 | 0.51 | 0.51 | 0.51 |
Ratio of net investment income/(loss) to average net assetsa | 3.85 | 2.88 | 2.52 | 2.58 | 3.23 |
Portfolio turnover | 55 | 219 | 370 | 558 | 644 |
The accompanying notes are an integral part of the Financial Statements.
⬤
121
Harbor Funds Financial HighlightsSELECTED DATA FOR A SHARE OUTSTANDING FOR THE PERIODS PRESENTED
HARBOR DISRUPTIVE INNOVATION FUND
Retirement Class | |||||
Year Ended October 31, | 2023 | 2022 | 2021f | 2020 | 2019 |
Net asset value beginning of period | $4.37 | $14.40 | $12.93 | $10.91 | $10.88 |
Income from Investment Operations | |||||
Net investment income/(loss)a,b | (0.02) | (0.01) | (0.08) | (0.06) | (0.04) |
Net realized and unrealized gain/(loss) on investments | 0.11 | (4.60) | 3.48 | 4.25 | 1.85 |
Total from investment operations | 0.09 | (4.61) | 3.40 | 4.19 | 1.81 |
Less Distributions | |||||
Dividends from net investment income | — | — | — | — | — |
Distributions from net realized capital gains | — | (5.42) | (1.93) | (2.17) | (1.78) |
Total distributions | — | (5.42) | (1.93) | (2.17) | (1.78) |
Net asset value end of period | $4.46 | $4.37 | $14.40 | $12.93 | $10.91 |
Net assets end of period (000s) | $9,761 | $16,353 | $64,310 | $64,242 | $31,265 |
Ratios and Supplemental Data (%) | |||||
Total returnc | 2.06% | (46.85)% | 27.41% | 46.03% | 21.38% |
Ratio of total expenses to average net assets^ | 0.91 | 0.83 | 0.85 | 0.83 | 0.82 |
Ratio of net expenses to average net assetsa | 0.75 | 0.52 | 0.74 | 0.79 | 0.81 |
Ratio of net investment income/(loss) to average net assetsa | (0.36) | (0.15) | (0.56) | (0.53) | (0.37) |
Portfolio turnover | 72 | 75 | 182 | 113 | 70 |
Administrative Class | |||||
Year Ended October 31, | 2023 | 2022 | 2021f | 2020 | 2019 |
Net asset value beginning of period | $3.66 | $13.08 | $11.93 | $10.26 | $10.37 |
Income from Investment Operations | |||||
Net investment income/(loss)a,b | (0.03) | (0.03) | (0.11) | (0.08) | (0.06) |
Net realized and unrealized gain/(loss) on investments | 0.08 | (3.97) | 3.19 | 3.92 | 1.73 |
Total from investment operations | 0.05 | (4.00) | 3.08 | 3.84 | 1.67 |
Less Distributions | |||||
Dividends from net investment income | — | — | — | — | — |
Distributions from net realized capital gains | — | (5.42) | (1.93) | (2.17) | (1.78) |
Total distributions | — | (5.42) | (1.93) | (2.17) | (1.78) |
Net asset value end of period | $3.71 | $3.66 | $13.08 | $11.93 | $10.26 |
Net assets end of period (000s) | $1,521 | $2,492 | $5,518 | $3,666 | $2,687 |
Ratios and Supplemental Data (%) | |||||
Total returnc | 1.37% | (46.96)% | 26.98% | 45.42% | 21.04% |
Ratio of total expenses to average net assets^ | 1.24 | 1.16 | 1.17 | 1.16 | 1.15 |
Ratio of net expenses to average net assetsa | 1.08 | 0.86 | 1.06 | 1.12 | 1.14 |
Ratio of net investment income/(loss) to average net assetsa | (0.69) | (0.48) | (0.88) | (0.84) | (0.66) |
Portfolio turnover | 72 | 75 | 182 | 113 | 70 |
⬤
122
Harbor Funds Financial HighlightsSELECTED DATA FOR A SHARE OUTSTANDING FOR THE PERIODS PRESENTED
HARBOR DISRUPTIVE INNOVATION FUND—Continued
Institutional Class | |||||
Year Ended October 31, | 2023 | 2022 | 2021f | 2020 | 2019 |
Net asset value beginning of period | $4.32 | $14.31 | $12.87 | $10.88 | $10.86 |
Income from Investment Operations | |||||
Net investment income/(loss)a,b | (0.02) | (0.01) | (0.09) | (0.06) | (0.05) |
Net realized and unrealized gain/(loss) on investments | 0.10 | (4.56) | 3.46 | 4.22 | 1.85 |
Total from investment operations | 0.08 | (4.57) | 3.37 | 4.16 | 1.80 |
Less Distributions | |||||
Dividends from net investment income | — | — | — | — | — |
Distributions from net realized capital gains | — | (5.42) | (1.93) | (2.17) | (1.78) |
Total distributions | — | (5.42) | (1.93) | (2.17) | (1.78) |
Net asset value end of period | $4.40 | $4.32 | $14.31 | $12.87 | $10.88 |
Net assets end of period (000s) | $36,134 | $72,988 | $220,842 | $236,863 | $198,544 |
Ratios and Supplemental Data (%) | |||||
Total returnc | 1.85% | (46.87)% | 27.29% | 45.84% | 21.32% |
Ratio of total expenses to average net assets^ | 0.99 | 0.91 | 0.93 | 0.91 | 0.90 |
Ratio of net expenses to average net assetsa | 0.83 | 0.61 | 0.82 | 0.87 | 0.89 |
Ratio of net investment income/(loss) to average net assetsa | (0.44) | (0.24) | (0.64) | (0.58) | (0.48) |
Portfolio turnover | 72 | 75 | 182 | 113 | 70 |
Investor Class | |||||
Year Ended October 31, | 2023 | 2022 | 2021f | 2020 | 2019 |
Net asset value beginning of period | $3.27 | $12.36 | $11.37 | $9.88 | $10.07 |
Income from Investment Operations | |||||
Net investment income/(loss)a,b | (0.03) | (0.03) | (0.12) | (0.09) | (0.08) |
Net realized and unrealized gain/(loss) on investments | 0.07 | (3.64) | 3.04 | 3.75 | 1.67 |
Total from investment operations | 0.04 | (3.67) | 2.92 | 3.66 | 1.59 |
Less Distributions | |||||
Dividends from net investment income | — | — | — | — | — |
Distributions from net realized capital gains | — | (5.42) | (1.93) | (2.17) | (1.78) |
Total distributions | — | (5.42) | (1.93) | (2.17) | (1.78) |
Net asset value end of period | $3.31 | $3.27 | $12.36 | $11.37 | $9.88 |
Net assets end of period (000s) | $13,870 | $16,387 | $56,531 | $36,399 | $20,891 |
Ratios and Supplemental Data (%) | |||||
Total returnc | 1.22% | (47.05)% | 26.88% | 45.32% | 20.83% |
Ratio of total expenses to average net assets^ | 1.35 | 1.27 | 1.29 | 1.28 | 1.27 |
Ratio of net expenses to average net assetsa | 1.19 | 0.96 | 1.17 | 1.24 | 1.26 |
Ratio of net investment income/(loss) to average net assetsa | (0.80) | (0.59) | (0.99) | (0.96) | (0.85) |
Portfolio turnover | 72 | 75 | 182 | 113 | 70 |
The accompanying notes are an integral part of the Financial Statements.
⬤
123
Harbor Funds Financial HighlightsSELECTED DATA FOR A SHARE OUTSTANDING FOR THE PERIODS PRESENTED
HARBOR DIVERSIFIED INTERNATIONAL ALL CAP FUND
Retirement Class | |||||
Year Ended October 31, | 2023 | 2022 | 2021 | 2020 | 2019 |
Net asset value beginning of period | $9.75 | $13.83 | $10.25 | $11.17 | $10.41 |
Income from Investment Operations | |||||
Net investment income/(loss)a,b | 0.25 | 0.23 | 0.21 | 0.14 | 0.26 |
Net realized and unrealized gain/(loss) on investments | 0.95 | (3.36) | 3.50 | (0.81) | 0.92 |
Total from investment operations | 1.20 | (3.13) | 3.71 | (0.67) | 1.18 |
Less Distributions | |||||
Dividends from net investment income | (0.16) | (0.23) | (0.13) | (0.25) | (0.13) |
Distributions from net realized capital gains | — | (0.72) | — | — | (0.29) |
Total distributions | (0.16) | (0.95) | (0.13) | (0.25) | (0.42) |
Net asset value end of period | $10.79 | $9.75 | $13.83 | $10.25 | $11.17 |
Net assets end of period (000s) | $610,787 | $543,857 | $853,454 | $533,318 | $499,288 |
Ratios and Supplemental Data (%) | |||||
Total returnc | 12.38% | (24.03)% | 36.32% | (6.25)% | 11.99% |
Ratio of total expenses to average net assets^ | 0.82 | 0.84 | 0.84 | 0.85 | 0.87 |
Ratio of net expenses to average net assetsa | 0.72 | 0.72 | 0.71 | 0.70 | 0.68 |
Ratio of net investment income/(loss) to average net assetsa | 2.16 | 1.98 | 1.54 | 1.32 | 2.42 |
Portfolio turnover | 19 | 24 | 51 | 25 | 22 |
Administrative Class | |||||
Year Ended October 31, | 2023 | 2022 | 2021 | 2020 | 2019 |
Net asset value beginning of period | $9.71 | $13.77 | $10.22 | $11.14 | $10.39 |
Income from Investment Operations | |||||
Net investment income/(loss)a,b | 0.21 | 0.20 | 0.16 | 0.10 | 0.22 |
Net realized and unrealized gain/(loss) on investments | 0.96 | (3.35) | 3.48 | (0.80) | 0.92 |
Total from investment operations | 1.17 | (3.15) | 3.64 | (0.70) | 1.14 |
Less Distributions | |||||
Dividends from net investment income | (0.13) | (0.19) | (0.09) | (0.22) | (0.10) |
Distributions from net realized capital gains | — | (0.72) | — | — | (0.29) |
Total distributions | (0.13) | (0.91) | (0.09) | (0.22) | (0.39) |
Net asset value end of period | $10.75 | $9.71 | $13.77 | $10.22 | $11.14 |
Net assets end of period (000s) | $8,506 | $7,419 | $9,213 | $6,446 | $6,800 |
Ratios and Supplemental Data (%) | |||||
Total returnc | 12.06% | (24.24)% | 35.76% | (6.54)% | 11.58% |
Ratio of total expenses to average net assets^ | 1.15 | 1.17 | 1.17 | 1.18 | 1.20 |
Ratio of net expenses to average net assetsa | 1.05 | 1.05 | 1.04 | 1.03 | 1.01 |
Ratio of net investment income/(loss) to average net assetsa | 1.81 | 1.73 | 1.17 | 0.99 | 2.06 |
Portfolio turnover | 19 | 24 | 51 | 25 | 22 |
⬤
124
Harbor Funds Financial HighlightsSELECTED DATA FOR A SHARE OUTSTANDING FOR THE PERIODS PRESENTED
HARBOR DIVERSIFIED INTERNATIONAL ALL CAP FUND—Continued
Institutional Class | |||||
Year Ended October 31, | 2023 | 2022 | 2021 | 2020 | 2019 |
Net asset value beginning of period | $9.75 | $13.82 | $10.25 | $11.17 | $10.41 |
Income from Investment Operations | |||||
Net investment income/(loss)a,b | 0.24 | 0.23 | 0.19 | 0.13 | 0.25 |
Net realized and unrealized gain/(loss) on investments | 0.96 | (3.36) | 3.50 | (0.81) | 0.92 |
Total from investment operations | 1.20 | (3.13) | 3.69 | (0.68) | 1.17 |
Less Distributions | |||||
Dividends from net investment income | (0.16) | (0.22) | (0.12) | (0.24) | (0.12) |
Distributions from net realized capital gains | — | (0.72) | — | — | (0.29) |
Total distributions | (0.16) | (0.94) | (0.12) | (0.24) | (0.41) |
Net asset value end of period | $10.79 | $9.75 | $13.82 | $10.25 | $11.17 |
Net assets end of period (000s) | $270,054 | $248,130 | $332,503 | $247,212 | $257,860 |
Ratios and Supplemental Data (%) | |||||
Total returnc | 12.28% | (24.04)% | 36.12% | (6.33)% | 11.90% |
Ratio of total expenses to average net assets^ | 0.90 | 0.92 | 0.92 | 0.93 | 0.95 |
Ratio of net expenses to average net assetsa | 0.80 | 0.80 | 0.79 | 0.78 | 0.76 |
Ratio of net investment income/(loss) to average net assetsa | 2.06 | 1.99 | 1.43 | 1.25 | 2.34 |
Portfolio turnover | 19 | 24 | 51 | 25 | 22 |
Investor Class | |||||
Year Ended October 31, | 2023 | 2022 | 2021 | 2020 | 2019 |
Net asset value beginning of period | $9.66 | $13.70 | $10.17 | $11.08 | $10.33 |
Income from Investment Operations | |||||
Net investment income/(loss)a,b | 0.19 | 0.18 | 0.14 | 0.09 | 0.21 |
Net realized and unrealized gain/(loss) on investments | 0.96 | (3.33) | 3.47 | (0.80) | 0.91 |
Total from investment operations | 1.15 | (3.15) | 3.61 | (0.71) | 1.12 |
Less Distributions | |||||
Dividends from net investment income | (0.12) | (0.17) | (0.08) | (0.20) | (0.08) |
Distributions from net realized capital gains | — | (0.72) | — | — | (0.29) |
Total distributions | (0.12) | (0.89) | (0.08) | (0.20) | (0.37) |
Net asset value end of period | $10.69 | $9.66 | $13.70 | $10.17 | $11.08 |
Net assets end of period (000s) | $9,705 | $8,330 | $10,072 | $7,037 | $9,122 |
Ratios and Supplemental Data (%) | |||||
Total returnc | 11.87% | (24.32)% | 35.56% | (6.58)% | 11.43% |
Ratio of total expenses to average net assets^ | 1.26 | 1.28 | 1.29 | 1.30 | 1.32 |
Ratio of net expenses to average net assetsa | 1.16 | 1.16 | 1.15 | 1.15 | 1.13 |
Ratio of net investment income/(loss) to average net assetsa | 1.71 | 1.60 | 1.07 | 0.86 | 1.99 |
Portfolio turnover | 19 | 24 | 51 | 25 | 22 |
The accompanying notes are an integral part of the Financial Statements.
⬤
125
Harbor Funds Financial HighlightsSELECTED DATA FOR A SHARE OUTSTANDING FOR THE PERIODS PRESENTED
HARBOR INTERNATIONAL FUND
Retirement Class | |||||
Year Ended October 31, | 2023 | 2022 | 2021 | 2020 | 2019 |
Net asset value beginning of period | $35.91 | $48.47 | $36.52 | $39.00 | $58.31 |
Income from Investment Operations | |||||
Net investment income/(loss)a,b | 1.01 | 1.09 | 0.72 | 0.91 | 0.91 |
Net realized and unrealized gain/(loss) on investments | 4.41 | (12.60) | 11.73 | (2.10) | 1.62 |
Total from investment operations | 5.42 | (11.51) | 12.45 | (1.19) | 2.53 |
Less Distributions | |||||
Dividends from net investment income | (1.34) | (1.05) | (0.50) | (1.29) | (0.97) |
Distributions from net realized capital gains | — | — | — | — | (20.87) |
Total distributions | (1.34) | (1.05) | (0.50) | (1.29) | (21.84) |
Net asset value end of period | $39.99 | $35.91 | $48.47 | $36.52 | $39.00 |
Net assets end of period (000s) | $535,873 | $461,129 | $872,647 | $871,743 | $1,299,776 |
Ratios and Supplemental Data (%) | |||||
Total returnc | 15.24% | (24.19)% | 34.23% | (3.35)% | 10.29% |
Ratio of total expenses to average net assets^ | 0.81 | 0.81 | 0.80 | 1.61g | 0.80 |
Ratio of net expenses to average net assetsa | 0.69 | 0.69 | 0.69 | 0.69g | 0.67 |
Ratio of net investment income/(loss) to average net assetsa | 2.41 | 2.57 | 1.55 | 2.52g | 2.33 |
Portfolio turnover | 18 | 14 | 21 | 12 | 12 |
Administrative Class | |||||
Year Ended October 31, | 2023 | 2022 | 2021 | 2020 | 2019 |
Net asset value beginning of period | $36.29 | $48.95 | $36.78 | $39.26 | $58.08 |
Income from Investment Operations | |||||
Net investment income/(loss)a,b | 0.88 | 1.02 | 0.57 | 0.47 | 0.76 |
Net realized and unrealized gain/(loss) on investments | 4.48 | (12.80) | 11.84 | (1.81) | 1.70 |
Total from investment operations | 5.36 | (11.78) | 12.41 | (1.34) | 2.46 |
Less Distributions | |||||
Dividends from net investment income | (1.20) | (0.87) | (0.24) | (1.14) | (0.41) |
Distributions from net realized capital gains | — | — | — | — | (20.87) |
Total distributions | (1.20) | (0.87) | (0.24) | (1.14) | (21.28) |
Net asset value end of period | $40.45 | $36.29 | $48.95 | $36.78 | $39.26 |
Net assets end of period (000s) | $10,643 | $10,375 | $15,464 | $15,825 | $70,981 |
Ratios and Supplemental Data (%) | |||||
Total returnc | 14.88% | (24.46)% | 33.80% | (3.67)% | 9.94% |
Ratio of total expenses to average net assets^ | 1.14 | 1.14 | 1.14 | 1.65g | 1.13 |
Ratio of net expenses to average net assetsa | 1.02 | 1.02 | 1.02 | 1.02g | 1.00 |
Ratio of net investment income/(loss) to average net assetsa | 2.08 | 2.40 | 1.22 | 1.61g | 1.94 |
Portfolio turnover | 18 | 14 | 21 | 12 | 12 |
⬤
126
Harbor Funds Financial HighlightsSELECTED DATA FOR A SHARE OUTSTANDING FOR THE PERIODS PRESENTED
HARBOR INTERNATIONAL FUND—Continued
Institutional Class | |||||
Year Ended October 31, | 2023 | 2022 | 2021 | 2020 | 2019 |
Net asset value beginning of period | $36.04 | $48.64 | $36.64 | $39.12 | $58.31 |
Income from Investment Operations | |||||
Net investment income/(loss)a,b | 0.99 | 1.12 | 0.70 | 0.92 | 0.84 |
Net realized and unrealized gain/(loss) on investments | 4.42 | (12.71) | 11.76 | (2.15) | 1.67 |
Total from investment operations | 5.41 | (11.59) | 12.46 | (1.23) | 2.51 |
Less Distributions | |||||
Dividends from net investment income | (1.31) | (1.01) | (0.46) | (1.25) | (0.83) |
Distributions from net realized capital gains | — | — | — | — | (20.87) |
Total distributions | (1.31) | (1.01) | (0.46) | (1.25) | (21.70) |
Net asset value end of period | $40.14 | $36.04 | $48.64 | $36.64 | $39.12 |
Net assets end of period (000s) | $2,354,695 | $2,298,600 | $3,307,683 | $2,750,824 | $3,814,616 |
Ratios and Supplemental Data (%) | |||||
Total returnc | 15.14% | (24.25)% | 34.15% | (3.43)% | 10.18% |
Ratio of total expenses to average net assets^ | 0.89 | 0.89 | 0.89 | 1.76g | 0.88 |
Ratio of net expenses to average net assetsa | 0.77 | 0.77 | 0.77 | 0.77g | 0.75 |
Ratio of net investment income/(loss) to average net assetsa | 2.35 | 2.68 | 1.50 | 2.52g | 2.11 |
Portfolio turnover | 18 | 14 | 21 | 12 | 12 |
Investor Class | |||||
Year Ended October 31, | 2023 | 2022 | 2021 | 2020 | 2019 |
Net asset value beginning of period | $35.63 | $48.08 | $36.22 | $38.65 | $57.66 |
Income from Investment Operations | |||||
Net investment income/(loss)a,b | 0.83 | 0.95 | 0.52 | 0.75 | 0.70 |
Net realized and unrealized gain/(loss) on investments | 4.37 | (12.57) | 11.64 | (2.12) | 1.65 |
Total from investment operations | 5.20 | (11.62) | 12.16 | (1.37) | 2.35 |
Less Distributions | |||||
Dividends from net investment income | (1.15) | (0.83) | (0.30) | (1.06) | (0.49) |
Distributions from net realized capital gains | — | — | — | — | (20.87) |
Total distributions | (1.15) | (0.83) | (0.30) | (1.06) | (21.36) |
Net asset value end of period | $39.68 | $35.63 | $48.08 | $36.22 | $38.65 |
Net assets end of period (000s) | $241,997 | $246,731 | $374,773 | $323,686 | $510,270 |
Ratios and Supplemental Data (%) | |||||
Total returnc | 14.71% | (24.53)% | 33.66% | (3.79)% | 9.80% |
Ratio of total expenses to average net assets^ | 1.25 | 1.25 | 1.25 | 2.10g | 1.25 |
Ratio of net expenses to average net assetsa | 1.13 | 1.13 | 1.13 | 1.14g | 1.12 |
Ratio of net investment income/(loss) to average net assetsa | 1.99 | 2.28 | 1.13 | 2.06g | 1.80 |
Portfolio turnover | 18 | 14 | 21 | 12 | 12 |
The accompanying notes are an integral part of the Financial Statements.
⬤
127
Harbor Funds Financial HighlightsSELECTED DATA FOR A SHARE OUTSTANDING FOR THE PERIODS PRESENTED
HARBOR INTERNATIONAL CORE FUND
Retirement Class | |||||
Year Ended October 31, | 2023 | 2022 | 2021 | 2020 | 2019h |
Net asset value beginning of period | $9.98 | $14.02 | $10.12 | $10.31 | $10.00 |
Income from Investment Operations | |||||
Net investment income/(loss)a,b | 0.31 | 0.46 | 0.28 | 0.17 | 0.24 |
Net realized and unrealized gain/(loss) on investments | 0.52 | (3.14) | 3.79 | (0.09) | 0.07 |
Total from investment operations | 0.83 | (2.68) | 4.07 | 0.08 | 0.31 |
Less Distributions | |||||
Dividends from net investment income | (0.27) | (0.36) | (0.17) | (0.27) | — |
Distributions from net realized capital gains | — | (1.00) | — | — | — |
Total distributions | (0.27) | (1.36) | (0.17) | (0.27) | — |
Net asset value end of period | $10.54 | $9.98 | $14.02 | $10.12 | $10.31 |
Net assets end of period (000s) | $21,125 | $21,221 | $19,742 | $13,790 | $13,090 |
Ratios and Supplemental Data (%) | |||||
Total returnc | 8.35% | (20.93)% | 40.51% | 0.64% | 3.10%i |
Ratio of total expenses to average net assets^ | 0.99 | 1.16 | 1.19 | 1.35 | 1.79j |
Ratio of net expenses to average net assetsa | 0.77 | 0.77 | 0.77 | 0.77 | 0.77j |
Ratio of net investment income/(loss) to average net assetsa | 2.85 | 4.05 | 2.14 | 1.73 | 3.61j |
Portfolio turnover | 120 | 100 | 108 | 80 | 73i |
Institutional Class | |||||
Year Ended October 31, | 2023 | 2022 | 2021 | 2020 | 2019h |
Net asset value beginning of period | $9.97 | $14.01 | $10.11 | $10.31 | $10.00 |
Income from Investment Operations | |||||
Net investment income/(loss)a,b | 0.31 | 0.43 | 0.29 | 0.17 | 0.24 |
Net realized and unrealized gain/(loss) on investments | 0.51 | (3.12) | 3.77 | (0.11) | 0.07 |
Total from investment operations | 0.82 | (2.69) | 4.06 | 0.06 | 0.31 |
Less Distributions | |||||
Dividends from net investment income | (0.26) | (0.35) | (0.16) | (0.26) | — |
Distributions from net realized capital gains | — | (1.00) | — | — | — |
Total distributions | (0.26) | (1.35) | (0.16) | (0.26) | — |
Net asset value end of period | $10.53 | $9.97 | $14.01 | $10.11 | $10.31 |
Net assets end of period (000s) | $103,206 | $66,908 | $33,230 | $13,226 | $13,131 |
Ratios and Supplemental Data (%) | |||||
Total returnc | 8.31% | (21.00)% | 40.46% | 0.48% | 3.10%i |
Ratio of total expenses to average net assets^ | 1.07 | 1.24 | 1.27 | 1.43 | 1.87j |
Ratio of net expenses to average net assetsa | 0.85 | 0.85 | 0.85 | 0.85 | 0.85j |
Ratio of net investment income/(loss) to average net assetsa | 2.82 | 3.85 | 2.16 | 1.65 | 3.54j |
Portfolio turnover | 120 | 100 | 108 | 80 | 73i |
⬤
128
Harbor Funds Financial HighlightsSELECTED DATA FOR A SHARE OUTSTANDING FOR THE PERIODS PRESENTED
HARBOR INTERNATIONAL CORE FUND—Continued
Investor Class | |||||
Year Ended October 31, | 2023 | 2022 | 2021 | 2020 | 2019h |
Net asset value beginning of period | $9.92 | $13.96 | $10.08 | $10.28 | $10.00 |
Income from Investment Operations | |||||
Net investment income/(loss)a,b | 0.30 | 0.38 | 0.23 | 0.14 | 0.21 |
Net realized and unrealized gain/(loss) on investments | 0.47 | (3.10) | 3.78 | (0.11) | 0.07 |
Total from investment operations | 0.77 | (2.72) | 4.01 | 0.03 | 0.28 |
Less Distributions | |||||
Dividends from net investment income | (0.25) | (0.32) | (0.13) | (0.23) | — |
Distributions from net realized capital gains | — | (1.00) | — | — | — |
Total distributions | (0.25) | (1.32) | (0.13) | (0.23) | — |
Net asset value end of period | $10.44 | $9.92 | $13.96 | $10.08 | $10.28 |
Net assets end of period (000s) | $9,836 | $2,331 | $101 | $35 | $31 |
Ratios and Supplemental Data (%) | |||||
Total returnc | 7.80% | (21.29)% | 39.98% | 0.14% | 2.80%i |
Ratio of total expenses to average net assets^ | 1.43 | 1.60 | 1.63 | 1.80 | 2.24j |
Ratio of net expenses to average net assetsa | 1.21 | 1.21 | 1.21 | 1.22 | 1.22j |
Ratio of net investment income/(loss) to average net assetsa | 2.77 | 3.67 | 1.73 | 1.41 | 3.17j |
Portfolio turnover | 120 | 100 | 108 | 80 | 73i |
The accompanying notes are an integral part of the Financial Statements.
⬤
129
Harbor Funds Financial HighlightsSELECTED DATA FOR A SHARE OUTSTANDING FOR THE PERIODS PRESENTED
HARBOR INTERNATIONAL GROWTH FUND
Retirement Class | |||||
Year Ended October 31, | 2023 | 2022 | 2021 | 2020 | 2019 |
Net asset value beginning of period | $12.76 | $23.53 | $19.10 | $16.14 | $13.70 |
Income from Investment Operations | |||||
Net investment income/(loss)a,b | 0.07 | 0.06 | 0.02 | 0.03 | 0.30 |
Net realized and unrealized gain/(loss) on investments | 0.62 | (8.96) | 4.56 | 3.25 | 2.25 |
Total from investment operations | 0.69 | (8.90) | 4.58 | 3.28 | 2.55 |
Less Distributions | |||||
Dividends from net investment income | — | (0.14) | (0.15) | (0.32) | (0.11) |
Distributions from net realized capital gains | — | (1.73) | — | — | — |
Total distributions | — | (1.87) | (0.15) | (0.32) | (0.11) |
Net asset value end of period | $13.45 | $12.76 | $23.53 | $19.10 | $16.14 |
Net assets end of period (000s) | $67,602 | $72,107 | $147,545 | $163,202 | $143,276 |
Ratios and Supplemental Data (%) | |||||
Total returnc | 5.41% | (40.76)% | 24.00% | 20.56% | 18.81% |
Ratio of total expenses to average net assets^ | 0.85 | 0.83 | 0.81 | 0.83 | 0.83 |
Ratio of net expenses to average net assetsa | 0.77 | 0.77 | 0.77 | 0.77 | 0.77 |
Ratio of net investment income/(loss) to average net assetsa | 0.49 | 0.34 | 0.08 | 0.19 | 2.01 |
Portfolio turnover | 14 | 18 | 12 | 24 | 16 |
Administrative Class | |||||
Year Ended October 31, | 2023 | 2022 | 2021 | 2020 | 2019 |
Net asset value beginning of period | $12.73 | $23.42 | $19.05 | $16.10 | $13.66 |
Income from Investment Operations | |||||
Net investment income/(loss)a,b | 0.01 | (0.02) | (0.06) | (0.02) | 0.22 |
Net realized and unrealized gain/(loss) on investments | 0.63 | (8.91) | 4.54 | 3.24 | 2.28 |
Total from investment operations | 0.64 | (8.93) | 4.48 | 3.22 | 2.50 |
Less Distributions | |||||
Dividends from net investment income | — | (0.03) | (0.11) | (0.27) | (0.06) |
Distributions from net realized capital gains | — | (1.73) | — | — | — |
Total distributions | — | (1.76) | (0.11) | (0.27) | (0.06) |
Net asset value end of period | $13.37 | $12.73 | $23.42 | $19.05 | $16.10 |
Net assets end of period (000s) | $96 | $148 | $662 | $507 | $390 |
Ratios and Supplemental Data (%) | |||||
Total returnc | 5.03% | (40.93)% | 23.54% | 20.17% | 18.45% |
Ratio of total expenses to average net assets^ | 1.18 | 1.16 | 1.14 | 1.16 | 1.16 |
Ratio of net expenses to average net assetsa | 1.10 | 1.10 | 1.10 | 1.10 | 1.10 |
Ratio of net investment income/(loss) to average net assetsa | 0.10 | (0.09) | (0.24) | (0.15) | 1.50 |
Portfolio turnover | 14 | 18 | 12 | 24 | 16 |
⬤
130
Harbor Funds Financial HighlightsSELECTED DATA FOR A SHARE OUTSTANDING FOR THE PERIODS PRESENTED
HARBOR INTERNATIONAL GROWTH FUND—Continued
Institutional Class | |||||
Year Ended October 31, | 2023 | 2022 | 2021 | 2020 | 2019 |
Net asset value beginning of period | $12.75 | $23.50 | $19.08 | $16.13 | $13.69 |
Income from Investment Operations | |||||
Net investment income/(loss)a,b | 0.06 | 0.04 | —* | 0.02 | 0.26 |
Net realized and unrealized gain/(loss) on investments | 0.61 | (8.94) | 4.55 | 3.24 | 2.28 |
Total from investment operations | 0.67 | (8.90) | 4.55 | 3.26 | 2.54 |
Less Distributions | |||||
Dividends from net investment income | — | (0.12) | (0.13) | (0.31) | (0.10) |
Distributions from net realized capital gains | — | (1.73) | — | — | — |
Total distributions | — | (1.85) | (0.13) | (0.31) | (0.10) |
Net asset value end of period | $13.42 | $12.75 | $23.50 | $19.08 | $16.13 |
Net assets end of period (000s) | $215,566 | $267,148 | $709,080 | $600,240 | $414,528 |
Ratios and Supplemental Data (%) | |||||
Total returnc | 5.25% | (40.78)% | 23.92% | 20.42% | 18.73% |
Ratio of total expenses to average net assets^ | 0.93 | 0.91 | 0.89 | 0.91 | 0.91 |
Ratio of net expenses to average net assetsa | 0.85 | 0.85 | 0.85 | 0.85 | 0.85 |
Ratio of net investment income/(loss) to average net assetsa | 0.41 | 0.21 | 0.01 | 0.11 | 1.75 |
Portfolio turnover | 14 | 18 | 12 | 24 | 16 |
Investor Class | |||||
Year Ended October 31, | 2023 | 2022 | 2021 | 2020 | 2019 |
Net asset value beginning of period | $12.66 | $23.30 | $18.93 | $16.00 | $13.58 |
Income from Investment Operations | |||||
Net investment income/(loss)a,b | 0.01 | (0.02) | (0.11) | (0.04) | 0.21 |
Net realized and unrealized gain/(loss) on investments | 0.61 | (8.89) | 4.54 | 3.22 | 2.26 |
Total from investment operations | 0.62 | (8.91) | 4.43 | 3.18 | 2.47 |
Less Distributions | |||||
Dividends from net investment income | — | — | (0.06) | (0.25) | (0.05) |
Distributions from net realized capital gains | — | (1.73) | — | — | — |
Total distributions | — | (1.73) | (0.06) | (0.25) | (0.05) |
Net asset value end of period | $13.28 | $12.66 | $23.30 | $18.93 | $16.00 |
Net assets end of period (000s) | $6,201 | $6,788 | $13,523 | $32,757 | $34,238 |
Ratios and Supplemental Data (%) | |||||
Total returnc | 4.90% | (41.00)% | 23.41% | 20.06% | 18.29% |
Ratio of total expenses to average net assets^ | 1.29 | 1.27 | 1.26 | 1.28 | 1.28 |
Ratio of net expenses to average net assetsa | 1.21 | 1.21 | 1.22 | 1.22 | 1.22 |
Ratio of net investment income/(loss) to average net assetsa | 0.06 | (0.10) | (0.49) | (0.27) | 1.40 |
Portfolio turnover | 14 | 18 | 12 | 24 | 16 |
The accompanying notes are an integral part of the Financial Statements.
⬤
131
Harbor Funds Financial HighlightsSELECTED DATA FOR A SHARE OUTSTANDING FOR THE PERIODS PRESENTED
HARBOR INTERNATIONAL SMALL CAP FUND
Retirement Class | |||||
Year Ended October 31, | 2023 | 2022 | 2021 | 2020 | 2019k |
Net asset value beginning of period | $12.65 | $16.39 | $11.37 | $12.49 | $12.38 |
Income from Investment Operations | |||||
Net investment income/(loss)a,b | 0.35 | 0.27 | 0.28 | 0.07 | 0.24 |
Net realized and unrealized gain/(loss) on investments | 0.10 | (2.91) | 4.91 | (0.82) | 0.35 |
Total from investment operations | 0.45 | (2.64) | 5.19 | (0.75) | 0.59 |
Less Distributions | |||||
Dividends from net investment income | (0.15) | (0.28) | (0.17) | (0.37) | (0.10) |
Distributions from net realized capital gains | (0.20) | (0.82) | — | — | (0.38) |
Total distributions | (0.35) | (1.10) | (0.17) | (0.37) | (0.48) |
Net asset value end of period | $12.75 | $12.65 | $16.39 | $11.37 | $12.49 |
Net assets end of period (000s) | $130,744 | $30,387 | $9,559 | $5,525 | $19,408 |
Ratios and Supplemental Data (%) | |||||
Total returnc | 3.47% | (16.94)% | 45.95% | (6.36)% | 5.23% |
Ratio of total expenses to average net assets^ | 0.99 | 1.11 | 1.17 | 1.37 | 1.24 |
Ratio of net expenses to average net assetsa | 0.86 | 0.88 | 0.88 | 0.88 | 0.88 |
Ratio of net investment income/(loss) to average net assetsa | 2.51 | 2.04 | 1.79 | 0.64 | 1.98 |
Portfolio turnover | 26 | 23 | 43 | 39 | 178 |
Administrative Class | |||||
Year Ended October 31, | 2023 | 2022 | 2021 | 2020 | 2019k |
Net asset value beginning of period | $12.60 | $16.33 | $11.34 | $12.46 | $12.34 |
Income from Investment Operations | |||||
Net investment income/(loss)a,b | 0.30 | 0.29 | 0.20 | 0.06 | 0.15 |
Net realized and unrealized gain/(loss) on investments | 0.12 | (2.97) | 4.93 | (0.85) | 0.40 |
Total from investment operations | 0.42 | (2.68) | 5.13 | (0.79) | 0.55 |
Less Distributions | |||||
Dividends from net investment income | (0.11) | (0.23) | (0.14) | (0.33) | (0.05) |
Distributions from net realized capital gains | (0.20) | (0.82) | — | — | (0.38) |
Total distributions | (0.31) | (1.05) | (0.14) | (0.33) | (0.43) |
Net asset value end of period | $12.71 | $12.60 | $16.33 | $11.34 | $12.46 |
Net assets end of period (000s) | $418 | $436 | $487 | $333 | $356 |
Ratios and Supplemental Data (%) | |||||
Total returnc | 3.21% | (17.25)% | 45.44% | (6.65)% | 4.90% |
Ratio of total expenses to average net assets^ | 1.32 | 1.44 | 1.50 | 1.70 | 1.57 |
Ratio of net expenses to average net assetsa | 1.20 | 1.21 | 1.21 | 1.21 | 1.21 |
Ratio of net investment income/(loss) to average net assetsa | 2.13 | 2.12 | 1.30 | 0.49 | 1.25 |
Portfolio turnover | 26 | 23 | 43 | 39 | 178 |
⬤
132
Harbor Funds Financial HighlightsSELECTED DATA FOR A SHARE OUTSTANDING FOR THE PERIODS PRESENTED
HARBOR INTERNATIONAL SMALL CAP FUND—Continued
Institutional Class | |||||
Year Ended October 31, | 2023 | 2022 | 2021 | 2020 | 2019k |
Net asset value beginning of period | $12.65 | $16.39 | $11.37 | $12.49 | $12.37 |
Income from Investment Operations | |||||
Net investment income/(loss)a,b | 0.36 | 0.32 | 0.24 | 0.09 | 0.19 |
Net realized and unrealized gain/(loss) on investments | 0.07 | (2.97) | 4.95 | (0.86) | 0.40 |
Total from investment operations | 0.43 | (2.65) | 5.19 | (0.77) | 0.59 |
Less Distributions | |||||
Dividends from net investment income | (0.14) | (0.27) | (0.17) | (0.35) | (0.09) |
Distributions from net realized capital gains | (0.20) | (0.82) | — | — | (0.38) |
Total distributions | (0.34) | (1.09) | (0.17) | (0.35) | (0.47) |
Net asset value end of period | $12.74 | $12.65 | $16.39 | $11.37 | $12.49 |
Net assets end of period (000s) | $194,128 | $93,640 | $49,419 | $25,716 | $25,758 |
Ratios and Supplemental Data (%) | |||||
Total returnc | 3.33% | (17.00)% | 45.87% | (6.48)% | 5.25% |
Ratio of total expenses to average net assets^ | 1.07 | 1.19 | 1.25 | 1.45 | 1.32 |
Ratio of net expenses to average net assetsa | 0.94 | 0.96 | 0.96 | 0.96 | 0.96 |
Ratio of net investment income/(loss) to average net assetsa | 2.55 | 2.32 | 1.53 | 0.76 | 1.60 |
Portfolio turnover | 26 | 23 | 43 | 39 | 178 |
Investor Class | |||||
Year Ended October 31, | 2023 | 2022 | 2021 | 2020 | 2019k |
Net asset value beginning of period | $12.58 | $16.32 | $11.34 | $12.45 | $12.34 |
Income from Investment Operations | |||||
Net investment income/(loss)a,b | 0.33 | 0.23 | 0.18 | 0.04 | 0.13 |
Net realized and unrealized gain/(loss) on investments | 0.07 | (2.92) | 4.93 | (0.84) | 0.40 |
Total from investment operations | 0.40 | (2.69) | 5.11 | (0.80) | 0.53 |
Less Distributions | |||||
Dividends from net investment income | (0.11) | (0.23) | (0.13) | (0.31) | (0.04) |
Distributions from net realized capital gains | (0.20) | (0.82) | — | — | (0.38) |
Total distributions | (0.31) | (1.05) | (0.13) | (0.31) | (0.42) |
Net asset value end of period | $12.67 | $12.58 | $16.32 | $11.34 | $12.45 |
Net assets end of period (000s) | $4,388 | $1,140 | $1,962 | $398 | $428 |
Ratios and Supplemental Data (%) | |||||
Total returnc | 2.98% | (17.29)% | 45.25% | (6.76)% | 4.70% |
Ratio of total expenses to average net assets^ | 1.43 | 1.55 | 1.61 | 1.82 | 1.69 |
Ratio of net expenses to average net assetsa | 1.30 | 1.32 | 1.32 | 1.33 | 1.33 |
Ratio of net investment income/(loss) to average net assetsa | 2.37 | 1.66 | 1.16 | 0.36 | 1.10 |
Portfolio turnover | 26 | 23 | 43 | 39 | 178 |
The accompanying notes are an integral part of the Financial Statements.
⬤
133
Harbor Funds Financial HighlightsSELECTED DATA FOR A SHARE OUTSTANDING FOR THE PERIODS PRESENTED
HARBOR LARGE CAP VALUE FUND
Retirement Class | |||||
Year Ended October 31, | 2023 | 2022 | 2021 | 2020 | 2019 |
Net asset value beginning of period | $19.50 | $23.23 | $17.11 | $16.33 | $14.37 |
Income from Investment Operations | |||||
Net investment income/(loss)a,b | 0.30 | 0.26 | 0.19 | 0.18 | 0.18 |
Net realized and unrealized gain/(loss) on investments | 0.27 | (3.16) | 6.62 | 0.76 | 2.17 |
Total from investment operations | 0.57 | (2.90) | 6.81 | 0.94 | 2.35 |
Less Distributions | |||||
Dividends from net investment income | (0.35) | (0.22) | (0.17) | (0.16) | (0.16) |
Distributions from net realized capital gains | (0.71) | (0.61) | (0.52) | — | (0.23) |
Total distributions | (1.06) | (0.83) | (0.69) | (0.16) | (0.39) |
Net asset value end of period | $19.01 | $19.50 | $23.23 | $17.11 | $16.33 |
Net assets end of period (000s) | $1,038,551 | $1,326,142 | $1,472,349 | $655,562 | $457,908 |
Ratios and Supplemental Data (%) | |||||
Total returnc | 3.12% | (12.82)% | 40.62% | 5.80% | 16.92% |
Ratio of total expenses to average net assets^ | 0.65 | 0.64 | 0.64 | 0.64 | 0.65 |
Ratio of net expenses to average net assetsa | 0.61 | 0.61 | 0.61 | 0.61 | 0.61 |
Ratio of net investment income/(loss) to average net assetsa | 1.53 | 1.26 | 0.90 | 1.08 | 1.19 |
Portfolio turnover | 8 | 24 | 13 | 26 | 11 |
Administrative Class | |||||
Year Ended October 31, | 2023 | 2022 | 2021 | 2020 | 2019 |
Net asset value beginning of period | $19.50 | $23.21 | $17.11 | $16.33 | $14.36 |
Income from Investment Operations | |||||
Net investment income/(loss)a,b | 0.23 | 0.19 | 0.13 | 0.13 | 0.14 |
Net realized and unrealized gain/(loss) on investments | 0.27 | (3.14) | 6.59 | 0.75 | 2.17 |
Total from investment operations | 0.50 | (2.95) | 6.72 | 0.88 | 2.31 |
Less Distributions | |||||
Dividends from net investment income | (0.27) | (0.15) | (0.10) | (0.10) | (0.11) |
Distributions from net realized capital gains | (0.71) | (0.61) | (0.52) | — | (0.23) |
Total distributions | (0.98) | (0.76) | (0.62) | (0.10) | (0.34) |
Net asset value end of period | $19.02 | $19.50 | $23.21 | $17.11 | $16.33 |
Net assets end of period (000s) | $2,979 | $3,228 | $3,941 | $11,502 | $12,195 |
Ratios and Supplemental Data (%) | |||||
Total returnc | 2.74% | (13.06)% | 40.05% | 5.42% | 16.60% |
Ratio of total expenses to average net assets^ | 0.98 | 0.97 | 0.97 | 0.97 | 0.98 |
Ratio of net expenses to average net assetsa | 0.94 | 0.94 | 0.94 | 0.94 | 0.94 |
Ratio of net investment income/(loss) to average net assetsa | 1.19 | 0.92 | 0.64 | 0.78 | 0.91 |
Portfolio turnover | 8 | 24 | 13 | 26 | 11 |
⬤
134
Harbor Funds Financial HighlightsSELECTED DATA FOR A SHARE OUTSTANDING FOR THE PERIODS PRESENTED
HARBOR LARGE CAP VALUE FUND—Continued
Institutional Class | |||||
Year Ended October 31, | 2023 | 2022 | 2021 | 2020 | 2019 |
Net asset value beginning of period | $19.50 | $23.23 | $17.11 | $16.33 | $14.37 |
Income from Investment Operations | |||||
Net investment income/(loss)a,b | 0.28 | 0.25 | 0.18 | 0.17 | 0.17 |
Net realized and unrealized gain/(loss) on investments | 0.28 | (3.17) | 6.61 | 0.76 | 2.17 |
Total from investment operations | 0.56 | (2.92) | 6.79 | 0.93 | 2.34 |
Less Distributions | |||||
Dividends from net investment income | (0.33) | (0.20) | (0.15) | (0.15) | (0.15) |
Distributions from net realized capital gains | (0.71) | (0.61) | (0.52) | — | (0.23) |
Total distributions | (1.04) | (0.81) | (0.67) | (0.15) | (0.38) |
Net asset value end of period | $19.02 | $19.50 | $23.23 | $17.11 | $16.33 |
Net assets end of period (000s) | $617,342 | $751,476 | $1,049,830 | $880,755 | $761,262 |
Ratios and Supplemental Data (%) | |||||
Total returnc | 3.06% | (12.90)% | 40.52% | 5.72% | 16.83% |
Ratio of total expenses to average net assets^ | 0.73 | 0.72 | 0.72 | 0.72 | 0.73 |
Ratio of net expenses to average net assetsa | 0.69 | 0.69 | 0.69 | 0.69 | 0.69 |
Ratio of net investment income/(loss) to average net assetsa | 1.45 | 1.17 | 0.84 | 1.02 | 1.12 |
Portfolio turnover | 8 | 24 | 13 | 26 | 11 |
Investor Class | |||||
Year Ended October 31, | 2023 | 2022 | 2021 | 2020 | 2019 |
Net asset value beginning of period | $19.72 | $23.46 | $17.28 | $16.48 | $14.49 |
Income from Investment Operations | |||||
Net investment income/(loss)a,b | 0.22 | 0.17 | 0.10 | 0.11 | 0.12 |
Net realized and unrealized gain/(loss) on investments | 0.26 | (3.18) | 6.68 | 0.76 | 2.19 |
Total from investment operations | 0.48 | (3.01) | 6.78 | 0.87 | 2.31 |
Less Distributions | |||||
Dividends from net investment income | (0.24) | (0.12) | (0.08) | (0.07) | (0.09) |
Distributions from net realized capital gains | (0.71) | (0.61) | (0.52) | — | (0.23) |
Total distributions | (0.95) | (0.73) | (0.60) | (0.07) | (0.32) |
Net asset value end of period | $19.25 | $19.72 | $23.46 | $17.28 | $16.48 |
Net assets end of period (000s) | $24,200 | $26,880 | $31,192 | $23,527 | $35,622 |
Ratios and Supplemental Data (%) | |||||
Total returnc | 2.60% | (13.15)% | 39.96% | 5.32% | 16.39% |
Ratio of total expenses to average net assets^ | 1.09 | 1.08 | 1.08 | 1.09 | 1.10 |
Ratio of net expenses to average net assetsa | 1.05 | 1.05 | 1.05 | 1.06 | 1.06 |
Ratio of net investment income/(loss) to average net assetsa | 1.09 | 0.81 | 0.47 | 0.67 | 0.79 |
Portfolio turnover | 8 | 24 | 13 | 26 | 11 |
The accompanying notes are an integral part of the Financial Statements.
⬤
135
Harbor Funds Financial HighlightsSELECTED DATA FOR A SHARE OUTSTANDING FOR THE PERIODS PRESENTED
HARBOR MID CAP FUND
Retirement Class | ||||
Year Ended October 31, | 2023 | 2022 | 2021 | 2020l |
Net asset value beginning of period | $12.45 | $14.52 | $10.57 | $10.00 |
Income from Investment Operations | ||||
Net investment income/(loss)a,b | 0.11 | 0.09 | 0.05 | 0.05 |
Net realized and unrealized gain/(loss) on investments | (0.17) | (1.84) | 3.93 | 0.53 |
Total from investment operations | (0.06) | (1.75) | 3.98 | 0.58 |
Less Distributions | ||||
Dividends from net investment income | (0.07) | (0.05) | (0.03) | (0.01) |
Distributions from net realized capital gains | (0.34) | (0.27) | — | — |
Total distributions | (0.41) | (0.32) | (0.03) | (0.01) |
Net asset value end of period | $11.98 | $12.45 | $14.52 | $10.57 |
Net assets end of period (000s) | $67,565 | $67,079 | $37,135 | $5,148 |
Ratios and Supplemental Data (%) | ||||
Total returnc | (0.46)% | (12.36)% | 37.61% | 5.86%i |
Ratio of total expenses to average net assets^ | 0.89 | 0.92 | 0.93 | 2.28j |
Ratio of net expenses to average net assetsa | 0.80 | 0.80 | 0.80 | 0.80j |
Ratio of net investment income/(loss) to average net assetsa | 0.88 | 0.65 | 0.40 | 0.54j |
Portfolio turnover | 19 | 42 | 11 | 9i |
Institutional Class | ||||
Year Ended October 31, | 2023 | 2022 | 2021 | 2020l |
Net asset value beginning of period | $12.44 | $14.51 | $10.56 | $10.00 |
Income from Investment Operations | ||||
Net investment income/(loss)a,b | 0.10 | 0.09 | 0.04 | 0.04 |
Net realized and unrealized gain/(loss) on investments | (0.17) | (1.85) | 3.93 | 0.53 |
Total from investment operations | (0.07) | (1.76) | 3.97 | 0.57 |
Less Distributions | ||||
Dividends from net investment income | (0.06) | (0.04) | (0.02) | (0.01) |
Distributions from net realized capital gains | (0.34) | (0.27) | — | — |
Total distributions | (0.40) | (0.31) | (0.02) | (0.01) |
Net asset value end of period | $11.97 | $12.44 | $14.51 | $10.56 |
Net assets end of period (000s) | $30,896 | $21,105 | $23,710 | $5,411 |
Ratios and Supplemental Data (%) | ||||
Total returnc | (0.56)% | (12.43)% | 37.54% | 5.75%i |
Ratio of total expenses to average net assets^ | 0.97 | 1.00 | 1.01 | 2.36j |
Ratio of net expenses to average net assetsa | 0.88 | 0.88 | 0.88 | 0.88j |
Ratio of net investment income/(loss) to average net assetsa | 0.79 | 0.64 | 0.27 | 0.46j |
Portfolio turnover | 19 | 42 | 11 | 9i |
⬤
136
Harbor Funds Financial HighlightsSELECTED DATA FOR A SHARE OUTSTANDING FOR THE PERIODS PRESENTED
HARBOR MID CAP FUND—Continued
Investor Class | ||||
Year Ended October 31, | 2023 | 2022 | 2021 | 2020l |
Net asset value beginning of period | $12.37 | $14.44 | $10.54 | $10.00 |
Income from Investment Operations | ||||
Net investment income/(loss)a,b | 0.05 | 0.04 | (0.01) | 0.01 |
Net realized and unrealized gain/(loss) on investments | (0.16) | (1.84) | 3.91 | 0.53 |
Total from investment operations | (0.11) | (1.80) | 3.90 | 0.54 |
Less Distributions | ||||
Dividends from net investment income | (0.01) | —* | —* | —* |
Distributions from net realized capital gains | (0.34) | (0.27) | — | — |
Total distributions | (0.35) | (0.27) | —* | —* |
Net asset value end of period | $11.91 | $12.37 | $14.44 | $10.54 |
Net assets end of period (000s) | $559 | $834 | $949 | $455 |
Ratios and Supplemental Data (%) | ||||
Total returnc | (0.86)% | (12.72)% | 37.00% | 5.42%i |
Ratio of total expenses to average net assets^ | 1.33 | 1.36 | 1.38 | 2.73j |
Ratio of net expenses to average net assetsa | 1.24 | 1.24 | 1.24 | 1.25j |
Ratio of net investment income/(loss) to average net assetsa | 0.44 | 0.28 | (0.06) | 0.07j |
Portfolio turnover | 19 | 42 | 11 | 9i |
The accompanying notes are an integral part of the Financial Statements.
⬤
137
Harbor Funds Financial HighlightsSELECTED DATA FOR A SHARE OUTSTANDING FOR THE PERIODS PRESENTED
HARBOR MID CAP VALUE FUND
Retirement Class | |||||
Year Ended October 31, | 2023 | 2022 | 2021 | 2020 | 2019 |
Net asset value beginning of period | $23.93 | $24.97 | $16.83 | $20.82 | $21.39 |
Income from Investment Operations | |||||
Net investment income/(loss)a,b | 0.50 | 0.49 | 0.42 | 0.43 | 0.48 |
Net realized and unrealized gain/(loss) on investments | (0.31) | (1.18) | 8.21 | (3.73) | 0.47 |
Total from investment operations | 0.19 | (0.69) | 8.63 | (3.30) | 0.95 |
Less Distributions | |||||
Dividends from net investment income | (0.42) | (0.35) | (0.49) | (0.54) | (0.37) |
Distributions from net realized capital gains | (1.45) | — | — | (0.15) | (1.15) |
Total distributions | (1.87) | (0.35) | (0.49) | (0.69) | (1.52) |
Net asset value end of period | $22.25 | $23.93 | $24.97 | $16.83 | $20.82 |
Net assets end of period (000s) | $13,024 | $43,591 | $56,156 | $29,897 | $102,945 |
Ratios and Supplemental Data (%) | |||||
Total returnc | 0.86% | (2.80)% | 51.99% | (16.55)% | 5.53% |
Ratio of total expenses to average net assets^ | 0.83 | 0.81 | 0.81 | 0.82 | 0.80 |
Ratio of net expenses to average net assetsa | 0.77 | 0.77 | 0.78 | 0.80 | 0.77 |
Ratio of net investment income/(loss) to average net assetsa | 2.11 | 2.00 | 1.78 | 2.39 | 2.39 |
Portfolio turnover | 10 | 9 | 18 | 4 | 11 |
Administrative Class | |||||
Year Ended October 31, | 2023 | 2022 | 2021 | 2020 | 2019 |
Net asset value beginning of period | $24.20 | $25.24 | $16.98 | $20.98 | $21.52 |
Income from Investment Operations | |||||
Net investment income/(loss)a,b | 0.40 | 0.41 | 0.34 | 0.36 | 0.42 |
Net realized and unrealized gain/(loss) on investments | (0.27) | (1.20) | 8.31 | (3.77) | 0.48 |
Total from investment operations | 0.13 | (0.79) | 8.65 | (3.41) | 0.90 |
Less Distributions | |||||
Dividends from net investment income | (0.34) | (0.25) | (0.39) | (0.44) | (0.29) |
Distributions from net realized capital gains | (1.45) | — | — | (0.15) | (1.15) |
Total distributions | (1.79) | (0.25) | (0.39) | (0.59) | (1.44) |
Net asset value end of period | $22.54 | $24.20 | $25.24 | $16.98 | $20.98 |
Net assets end of period (000s) | $3,302 | $3,291 | $3,828 | $4,945 | $18,508 |
Ratios and Supplemental Data (%) | |||||
Total returnc | 0.55% | (3.14)% | 51.53% | (16.85)% | 5.19% |
Ratio of total expenses to average net assets^ | 1.16 | 1.14 | 1.14 | 1.15 | 1.13 |
Ratio of net expenses to average net assetsa | 1.10 | 1.10 | 1.11 | 1.13 | 1.10 |
Ratio of net investment income/(loss) to average net assetsa | 1.69 | 1.67 | 1.46 | 1.98 | 2.08 |
Portfolio turnover | 10 | 9 | 18 | 4 | 11 |
⬤
138
Harbor Funds Financial HighlightsSELECTED DATA FOR A SHARE OUTSTANDING FOR THE PERIODS PRESENTED
HARBOR MID CAP VALUE FUND—Continued
Institutional Class | |||||
Year Ended October 31, | 2023 | 2022 | 2021 | 2020 | 2019 |
Net asset value beginning of period | $23.93 | $24.97 | $16.83 | $20.82 | $21.38 |
Income from Investment Operations | |||||
Net investment income/(loss)a,b | 0.47 | 0.47 | 0.40 | 0.40 | 0.47 |
Net realized and unrealized gain/(loss) on investments | (0.30) | (1.18) | 8.21 | (3.73) | 0.47 |
Total from investment operations | 0.17 | (0.71) | 8.61 | (3.33) | 0.94 |
Less Distributions | |||||
Dividends from net investment income | (0.40) | (0.33) | (0.47) | (0.51) | (0.35) |
Distributions from net realized capital gains | (1.45) | — | — | (0.15) | (1.15) |
Total distributions | (1.85) | (0.33) | (0.47) | (0.66) | (1.50) |
Net asset value end of period | $22.25 | $23.93 | $24.97 | $16.83 | $20.82 |
Net assets end of period (000s) | $205,100 | $242,004 | $355,431 | $277,767 | $520,629 |
Ratios and Supplemental Data (%) | |||||
Total returnc | 0.76% | (2.88)% | 51.87% | (16.64)% | 5.48% |
Ratio of total expenses to average net assets^ | 0.91 | 0.89 | 0.89 | 0.90 | 0.88 |
Ratio of net expenses to average net assetsa | 0.85 | 0.85 | 0.86 | 0.88 | 0.85 |
Ratio of net investment income/(loss) to average net assetsa | 2.01 | 1.93 | 1.71 | 2.25 | 2.33 |
Portfolio turnover | 10 | 9 | 18 | 4 | 11 |
Investor Class | |||||
Year Ended October 31, | 2023 | 2022 | 2021 | 2020 | 2019 |
Net asset value beginning of period | $23.90 | $24.93 | $16.80 | $20.78 | $21.31 |
Income from Investment Operations | |||||
Net investment income/(loss)a,b | 0.39 | 0.39 | 0.32 | 0.34 | 0.39 |
Net realized and unrealized gain/(loss) on investments | (0.30) | (1.18) | 8.20 | (3.74) | 0.48 |
Total from investment operations | 0.09 | (0.79) | 8.52 | (3.40) | 0.87 |
Less Distributions | |||||
Dividends from net investment income | (0.31) | (0.24) | (0.39) | (0.43) | (0.25) |
Distributions from net realized capital gains | (1.45) | — | — | (0.15) | (1.15) |
Total distributions | (1.76) | (0.24) | (0.39) | (0.58) | (1.40) |
Net asset value end of period | $22.23 | $23.90 | $24.93 | $16.80 | $20.78 |
Net assets end of period (000s) | $24,373 | $28,355 | $32,097 | $26,785 | $58,928 |
Ratios and Supplemental Data (%) | |||||
Total returnc | 0.39% | (3.20)% | 51.26% | (16.94)% | 5.08% |
Ratio of total expenses to average net assets^ | 1.27 | 1.25 | 1.25 | 1.27 | 1.25 |
Ratio of net expenses to average net assetsa | 1.21 | 1.21 | 1.22 | 1.25 | 1.22 |
Ratio of net investment income/(loss) to average net assetsa | 1.65 | 1.57 | 1.36 | 1.89 | 1.95 |
Portfolio turnover | 10 | 9 | 18 | 4 | 11 |
The accompanying notes are an integral part of the Financial Statements.
⬤
139
Harbor Funds Financial HighlightsSELECTED DATA FOR A SHARE OUTSTANDING FOR THE PERIODS PRESENTED
HARBOR SMALL CAP GROWTH FUND
Retirement Class | |||||
Year Ended October 31, | 2023 | 2022 | 2021 | 2020 | 2019 |
Net asset value beginning of period | $11.78 | $19.95 | $15.91 | $13.18 | $14.39 |
Income from Investment Operations | |||||
Net investment income/(loss)a,b | —* | (0.01) | (0.07) | (0.04) | (0.01) |
Net realized and unrealized gain/(loss) on investments | (0.44) | (3.94) | 5.41 | 3.25 | 1.56 |
Total from investment operations | (0.44) | (3.95) | 5.34 | 3.21 | 1.55 |
Less Distributions | |||||
Dividends from net investment income | — | — | — | — | — |
Distributions from net realized capital gains | (0.51) | (4.22) | (1.30) | (0.48) | (2.76) |
Total distributions | (0.51) | (4.22) | (1.30) | (0.48) | (2.76) |
Net asset value end of period | $10.83 | $11.78 | $19.95 | $15.91 | $13.18 |
Net assets end of period (000s) | $369,393 | $311,509 | $399,174 | $348,997 | $281,603 |
Ratios and Supplemental Data (%) | |||||
Total returnc | (3.63)% | (23.72)% | 34.40% | 24.93% | 16.23% |
Ratio of total expenses to average net assets^ | 0.80 | 0.80 | 0.79 | 0.81 | 0.80 |
Ratio of net expenses to average net assetsa | 0.80 | 0.79 | 0.78 | 0.80 | 0.80 |
Ratio of net investment income/(loss) to average net assetsa | 0.03 | (0.11) | (0.37) | (0.27) | (0.12) |
Portfolio turnover | 83 | 75 | 71 | 95 | 74 |
Administrative Class | |||||
Year Ended October 31, | 2023 | 2022 | 2021 | 2020 | 2019 |
Net asset value beginning of period | $10.10 | $17.80 | $14.36 | $11.98 | $13.39 |
Income from Investment Operations | |||||
Net investment income/(loss)a,b | (0.03) | (0.05) | (0.12) | (0.08) | (0.05) |
Net realized and unrealized gain/(loss) on investments | (0.37) | (3.43) | 4.86 | 2.94 | 1.40 |
Total from investment operations | (0.40) | (3.48) | 4.74 | 2.86 | 1.35 |
Less Distributions | |||||
Dividends from net investment income | — | — | — | — | — |
Distributions from net realized capital gains | (0.51) | (4.22) | (1.30) | (0.48) | (2.76) |
Total distributions | (0.51) | (4.22) | (1.30) | (0.48) | (2.76) |
Net asset value end of period | $9.19 | $10.10 | $17.80 | $14.36 | $11.98 |
Net assets end of period (000s) | $419 | $648 | $965 | $866 | $395 |
Ratios and Supplemental Data (%) | |||||
Total returnc | (3.84)% | (24.00)% | 33.91% | 24.49% | 15.87% |
Ratio of total expenses to average net assets^ | 1.13 | 1.13 | 1.12 | 1.14 | 1.13 |
Ratio of net expenses to average net assetsa | 1.13 | 1.12 | 1.11 | 1.13 | 1.12 |
Ratio of net investment income/(loss) to average net assetsa | (0.30) | (0.44) | (0.69) | (0.62) | (0.44) |
Portfolio turnover | 83 | 75 | 71 | 95 | 74 |
⬤
140
Harbor Funds Financial HighlightsSELECTED DATA FOR A SHARE OUTSTANDING FOR THE PERIODS PRESENTED
HARBOR SMALL CAP GROWTH FUND—Continued
Institutional Class | |||||
Year Ended October 31, | 2023 | 2022 | 2021 | 2020 | 2019 |
Net asset value beginning of period | $11.68 | $19.84 | $15.84 | $13.13 | $14.35 |
Income from Investment Operations | |||||
Net investment income/(loss)a,b | (0.01) | (0.03) | (0.08) | (0.05) | (0.03) |
Net realized and unrealized gain/(loss) on investments | (0.43) | (3.91) | 5.38 | 3.24 | 1.57 |
Total from investment operations | (0.44) | (3.94) | 5.30 | 3.19 | 1.54 |
Less Distributions | |||||
Dividends from net investment income | — | — | — | — | — |
Distributions from net realized capital gains | (0.51) | (4.22) | (1.30) | (0.48) | (2.76) |
Total distributions | (0.51) | (4.22) | (1.30) | (0.48) | (2.76) |
Net asset value end of period | $10.73 | $11.68 | $19.84 | $15.84 | $13.13 |
Net assets end of period (000s) | $609,724 | $595,476 | $721,405 | $633,535 | $440,553 |
Ratios and Supplemental Data (%) | |||||
Total returnc | (3.66)% | (23.81)% | 34.29% | 24.87% | 16.18% |
Ratio of total expenses to average net assets^ | 0.88 | 0.88 | 0.87 | 0.89 | 0.88 |
Ratio of net expenses to average net assetsa | 0.88 | 0.87 | 0.86 | 0.88 | 0.87 |
Ratio of net investment income/(loss) to average net assetsa | (0.05) | (0.19) | (0.45) | (0.35) | (0.20) |
Portfolio turnover | 83 | 75 | 71 | 95 | 74 |
Investor Class | |||||
Year Ended October 31, | 2023 | 2022 | 2021 | 2020 | 2019 |
Net asset value beginning of period | $9.18 | $16.60 | $13.47 | $11.28 | $12.79 |
Income from Investment Operations | |||||
Net investment income/(loss)a,b | (0.04) | (0.06) | (0.13) | (0.08) | (0.06) |
Net realized and unrealized gain/(loss) on investments | (0.34) | (3.14) | 4.56 | 2.75 | 1.31 |
Total from investment operations | (0.38) | (3.20) | 4.43 | 2.67 | 1.25 |
Less Distributions | |||||
Dividends from net investment income | — | — | — | — | — |
Distributions from net realized capital gains | (0.51) | (4.22) | (1.30) | (0.48) | (2.76) |
Total distributions | (0.51) | (4.22) | (1.30) | (0.48) | (2.76) |
Net asset value end of period | $8.29 | $9.18 | $16.60 | $13.47 | $11.28 |
Net assets end of period (000s) | $7,503 | $7,031 | $8,648 | $6,811 | $6,670 |
Ratios and Supplemental Data (%) | |||||
Total returnc | (4.02)% | (24.05)% | 33.84% | 24.32% | 15.81% |
Ratio of total expenses to average net assets^ | 1.24 | 1.24 | 1.23 | 1.26 | 1.25 |
Ratio of net expenses to average net assetsa | 1.24 | 1.23 | 1.23 | 1.25 | 1.24 |
Ratio of net investment income/(loss) to average net assetsa | (0.40) | (0.55) | (0.81) | (0.71) | (0.57) |
Portfolio turnover | 83 | 75 | 71 | 95 | 74 |
The accompanying notes are an integral part of the Financial Statements.
⬤
141
Harbor Funds Financial HighlightsSELECTED DATA FOR A SHARE OUTSTANDING FOR THE PERIODS PRESENTED
HARBOR SMALL CAP VALUE FUND
Retirement Class | |||||
Year Ended October 31, | 2023 | 2022 | 2021 | 2020 | 2019 |
Net asset value beginning of period | $39.47 | $45.11 | $31.65 | $33.55 | $33.60 |
Income from Investment Operations | |||||
Net investment income/(loss)a,b | 0.30 | 0.18 | 0.12 | 0.21 | 0.21 |
Net realized and unrealized gain/(loss) on investments | (2.02) | (3.38) | 13.54 | (1.59) | 2.84 |
Total from investment operations | (1.72) | (3.20) | 13.66 | (1.38) | 3.05 |
Less Distributions | |||||
Dividends from net investment income | (0.15) | (0.08) | (0.20) | (0.20) | (0.15) |
Distributions from net realized capital gains | (2.46) | (2.36) | — | (0.32) | (2.95) |
Total distributions | (2.61) | (2.44) | (0.20) | (0.52) | (3.10) |
Net asset value end of period | $35.14 | $39.47 | $45.11 | $31.65 | $33.55 |
Net assets end of period (000s) | $572,582 | $600,143 | $599,016 | $300,473 | $230,861 |
Ratios and Supplemental Data (%) | |||||
Total returnc | (4.29)% | (7.16)% | 43.19% | (4.22)% | 10.98% |
Ratio of total expenses to average net assets^ | 0.80 | 0.80 | 0.79 | 0.80 | 0.80 |
Ratio of net expenses to average net assetsa | 0.80 | 0.79 | 0.78 | 0.80 | 0.80 |
Ratio of net investment income/(loss) to average net assetsa | 0.78 | 0.46 | 0.27 | 0.67 | 0.67 |
Portfolio turnover | 21 | 15 | 17 | 17 | 27 |
Administrative Class | |||||
Year Ended October 31, | 2023 | 2022 | 2021 | 2020 | 2019 |
Net asset value beginning of period | $39.06 | $44.72 | $31.41 | $33.30 | $33.36 |
Income from Investment Operations | |||||
Net investment income/(loss)a,b | 0.18 | 0.05 | (0.02) | 0.10 | 0.11 |
Net realized and unrealized gain/(loss) on investments | (2.00) | (3.35) | 13.42 | (1.57) | 2.82 |
Total from investment operations | (1.82) | (3.30) | 13.40 | (1.47) | 2.93 |
Less Distributions | |||||
Dividends from net investment income | (0.01) | — | (0.09) | (0.10) | (0.04) |
Distributions from net realized capital gains | (2.46) | (2.36) | — | (0.32) | (2.95) |
Total distributions | (2.47) | (2.36) | (0.09) | (0.42) | (2.99) |
Net asset value end of period | $34.77 | $39.06 | $44.72 | $31.41 | $33.30 |
Net assets end of period (000s) | $3,435 | $9,177 | $11,962 | $10,082 | $6,537 |
Ratios and Supplemental Data (%) | |||||
Total returnc | (4.62)% | (7.45)% | 42.72% | (4.54)% | 10.59% |
Ratio of total expenses to average net assets^ | 1.13 | 1.13 | 1.12 | 1.13 | 1.13 |
Ratio of net expenses to average net assetsa | 1.13 | 1.12 | 1.11 | 1.13 | 1.12 |
Ratio of net investment income/(loss) to average net assetsa | 0.47 | 0.13 | (0.04) | 0.32 | 0.35 |
Portfolio turnover | 21 | 15 | 17 | 17 | 27 |
⬤
142
Harbor Funds Financial HighlightsSELECTED DATA FOR A SHARE OUTSTANDING FOR THE PERIODS PRESENTED
HARBOR SMALL CAP VALUE FUND—Continued
Institutional Class | |||||
Year Ended October 31, | 2023 | 2022 | 2021 | 2020 | 2019 |
Net asset value beginning of period | $39.44 | $45.07 | $31.63 | $33.53 | $33.57 |
Income from Investment Operations | |||||
Net investment income/(loss)a,b | 0.27 | 0.15 | 0.09 | 0.18 | 0.19 |
Net realized and unrealized gain/(loss) on investments | (2.01) | (3.38) | 13.52 | (1.58) | 2.84 |
Total from investment operations | (1.74) | (3.23) | 13.61 | (1.40) | 3.03 |
Less Distributions | |||||
Dividends from net investment income | (0.12) | (0.04) | (0.17) | (0.18) | (0.12) |
Distributions from net realized capital gains | (2.46) | (2.36) | — | (0.32) | (2.95) |
Total distributions | (2.58) | (2.40) | (0.17) | (0.50) | (3.07) |
Net asset value end of period | $35.12 | $39.44 | $45.07 | $31.63 | $33.53 |
Net assets end of period (000s) | $1,362,890 | $1,493,462 | $2,023,164 | $1,350,681 | $1,346,098 |
Ratios and Supplemental Data (%) | |||||
Total returnc | (4.36)% | (7.22)% | 43.11% | (4.33)% | 10.91% |
Ratio of total expenses to average net assets^ | 0.88 | 0.88 | 0.87 | 0.88 | 0.88 |
Ratio of net expenses to average net assetsa | 0.88 | 0.87 | 0.86 | 0.88 | 0.87 |
Ratio of net investment income/(loss) to average net assetsa | 0.70 | 0.38 | 0.20 | 0.59 | 0.60 |
Portfolio turnover | 21 | 15 | 17 | 17 | 27 |
Investor Class | |||||
Year Ended October 31, | 2023 | 2022 | 2021 | 2020 | 2019 |
Net asset value beginning of period | $38.09 | $43.72 | $30.71 | $32.56 | $32.68 |
Income from Investment Operations | |||||
Net investment income/(loss)a,b | 0.13 | 0.01 | (0.06) | 0.07 | 0.08 |
Net realized and unrealized gain/(loss) on investments | (1.94) | (3.28) | 13.12 | (1.55) | 2.75 |
Total from investment operations | (1.81) | (3.27) | 13.06 | (1.48) | 2.83 |
Less Distributions | |||||
Dividends from net investment income | — | — | (0.05) | (0.05) | — |
Distributions from net realized capital gains | (2.46) | (2.36) | — | (0.32) | (2.95) |
Total distributions | (2.46) | (2.36) | (0.05) | (0.37) | (2.95) |
Net asset value end of period | $33.82 | $38.09 | $43.72 | $30.71 | $32.56 |
Net assets end of period (000s) | $33,012 | $38,722 | $64,544 | $51,370 | $57,931 |
Ratios and Supplemental Data (%) | |||||
Total returnc | (4.72)% | (7.56)% | 42.56% | (4.67)% | 10.48% |
Ratio of total expenses to average net assets^ | 1.24 | 1.24 | 1.23 | 1.25 | 1.25 |
Ratio of net expenses to average net assetsa | 1.24 | 1.23 | 1.23 | 1.25 | 1.24 |
Ratio of net investment income/(loss) to average net assetsa | 0.34 | 0.01 | (0.15) | 0.23 | 0.24 |
Portfolio turnover | 21 | 15 | 17 | 17 | 27 |
The accompanying notes are an integral part of the Financial Statements.
⬤
143
Harbor Funds Financial HighlightsSELECTED DATA FOR A SHARE OUTSTANDING FOR THE PERIODS PRESENTED
* | Less than $0.01 |
^ | Percentage does not reflect reduction for credit balance arrangements (see the “Custodian” section in Note 2 of the accompanying Notes to Financial Statements) |
a | Reflects the Adviser’s waiver, if any, of its management fees and/or other operating expenses |
b | Amounts are based on average daily shares outstanding during the period. |
c | The total returns would have been lower had certain expenses not been waived during the periods shown. |
d | Effective March 1, 2023, the Board of Trustees appointed BlueCove Limited as the subadvisor to the Fund. |
e | Effective February 2, 2022, the Board of Trustees appointed Income Research+Management as the subadvisor to the Fund. |
f | Effective September 1, 2021, the Board of Trustees appointed Harbor Capital Advisors, Inc. to manage the Fund’s assets based upon model portfolios provided by multiple non-discretionary subadvisors. |
g | The net investment income ratio includes dividends and interest income and related tax compliance fee and interest expense, from foreign tax reclaims and interest received by the Fund. The ratios of total expenses to average net assets include the tax compliance fee and related interest expense due to this receipt of foreign tax reclaims and interest income by the Fund. For the year ended October 31, 2020, the ratios of net expenses to average net assets including tax compliance fee for the Retirement Class, Institutional Class, Administrative Class, and Investor Class were 1.49%, 1.64%, 1.53%, and 1.98%, respectively. |
h | For the period March 1, 2019 (inception) through October 31, 2019 |
i | Unannualized |
j | Annualized |
k | Effective May 23, 2019, the Board of Trustees appointed Cedar Street Asset Management LLC as subadvisor to the Fund. |
l | For the period December 1, 2019 (inception) through October 31, 2020 |
The accompanying notes are an integral part of the Financial Statements.
⬤
144
Harbor FundsNotes to Financial Statements—October 31, 2023
NOTE 1—ORGANIZATIONAL MATTERS
Harbor Funds (the “Trust”) is registered under the Investment Company Act of 1940, as amended (the “Investment Company Act”), as an open-end management investment company. As of October 31, 2023, the Trust consists of the following separate portfolios (individually or collectively referred to as a “Fund” or the “Funds,” respectively). Harbor Capital Advisors, Inc. (the “Adviser” or “Harbor Capital”) is the investment adviser for the Funds.
Harbor Capital Appreciation Fund |
Harbor Convertible Securities Fund |
Harbor Core Bond Fund |
Harbor Core Plus Fund |
Harbor Disruptive Innovation Fund |
Harbor Diversified International All Cap Fund |
Harbor International Fund |
Harbor International Core Fund (formerly, Harbor Overseas Fund) |
Harbor International Growth Fund |
Harbor International Small Cap Fund |
Harbor Large Cap Value Fund |
Harbor Mid Cap Fund |
Harbor Mid Cap Value Fund |
Harbor Small Cap Growth Fund |
Harbor Small Cap Value Fund |
Effective March 1, 2023, Harbor Overseas Fund was renamed Harbor International Core Fund.
The Funds currently offer up to four classes of shares, designated as Retirement Class, Institutional Class, Administrative Class and Investor Class. The shares of each class represent an interest in the same portfolio of investments of the Funds and have equal rights with respect to voting, redemptions, dividends, and liquidations, except that: (i) subject to the approval of the Trust’s Board of Trustees (the “Board of Trustees”), certain expenses may be applied differently to each class of shares in accordance with current regulations of the U.S. Securities and Exchange Commission (“SEC”) and the Internal Revenue Service; and (ii) shareholders of a class that bears distribution and service expenses under terms of a distribution plan have exclusive voting rights as to that distribution plan.
NOTE 2—SIGNIFICANT ACCOUNTING POLICIES
The following is a summary of significant accounting policies followed by the Trust in the preparation of its financial statements. Each Fund follows the investment company reporting requirements under U.S. Generally Accepted Accounting Principles (“U.S. GAAP”), which includes the accounting and reporting guidelines under Accounting Standards Codification (“ASC”) Topic 946, Financial Services-Investment Companies. The preparation of financial statements in accordance with U.S. GAAP requires management to make estimates and assumptions that affect the reported amounts and disclosures in the financial statements. Actual results may differ from those estimates.
Security Valuation
Investments are valued pursuant to valuation procedures approved by the Board of Trustees. The valuation procedures permit the Adviser to use a variety of valuation methodologies, consider a number of subjective factors, analyze applicable facts and circumstances and, in general, exercise judgment, when valuing Fund investments. The methodology used for a specific type of investment may vary based on the circumstances and relevant considerations, including available market data.
Equity securities (including common stock, preferred stock, and convertible preferred stock), exchange-traded funds and financial derivative instruments (such as rights and warrants) that are traded on a national securities exchange or system (except securities listed on the National Association of Securities Dealers Automated Quotation (“NASDAQ”) system and United Kingdom securities) are valued at the last sale price on a national exchange or system on which they are principally traded as of the valuation date. Securities listed on the NASDAQ system or a United Kingdom exchange are valued at the official closing price of those securities. In the case of securities for which there are no sales on the valuation day, (i) securities traded principally on a U.S. exchange, including NASDAQ, are valued at the mean (or average) of the closing bid and ask price; and (ii) securities traded principally on a foreign exchange, including United Kingdom securities, are valued at the official bid price determined as of the close of the primary exchange. Shares of open-end registered investment companies that are held by a Fund are valued at net asset value. To the extent these securities are actively traded and fair valuation adjustments are not applied, they are normally categorized as Level 1 in the fair value hierarchy. Equity securities traded on inactive markets or valued by reference to similar instruments are normally categorized as Level 2 in the fair value hierarchy. For more information on the fair value hierarchy, please refer to the Fair Value Measurements and Disclosures section.
⬤
145
Harbor FundsNotes to Financial Statements—Continued
NOTE 2—SIGNIFICANT ACCOUNTING POLICIES—Continued
Debt securities (including corporate bonds, municipal bonds and notes, U.S. government agencies, U.S. treasury obligations, mortgage-backed and asset-backed securities, and convertible securities, other than short-term securities, with a remaining maturity of less than 60 days at the time of acquisition) are valued using evaluated prices furnished by a pricing vendor. An evaluated price represents an assessment by the pricing vendor using various market inputs of what the pricing vendor believes is the fair value of a security at a particular point in time. The pricing vendor determines evaluated prices for debt securities that would be transacted at institutional-size quantities using inputs including, but not limited to, (i) recent transaction prices and dealer quotes, (ii) transaction prices for what the pricing vendor believes are securities with similar characteristics, (iii) the pricing vendor’s assessment of the risk inherent in the security taking into account criteria such as credit quality, payment history, liquidity and market conditions, and (iv) various correlations and relationships between security price movements and other factors, such as interest rate changes, which are recognized by institutional traders. In the case of asset-backed and mortgage-backed securities, the inputs used by the pricing vendor may also include information about cash flows, prepayment rates, default rates, delinquency and loss assumption, collateral characteristics, credit enhancements and other specific information about the particular offering. Because many debt securities trade infrequently, the pricing vendor will often not have current transaction price information available as an input in determining an evaluated price for a particular security. When current transaction price information is available, it is one input into the pricing vendor’s evaluation process, which means that the evaluated price supplied by the pricing vendor will frequently differ from that transaction price. Securities that use similar valuation techniques and inputs as described above are normally categorized as Level 2 in the fair value hierarchy.
Short-term securities with a remaining maturity of less than 60 days at the time of acquisition that are held by a Fund are valued at amortized cost to the extent amortized cost represents fair value. Such securities are normally categorized as Level 2 in the fair value hierarchy.
A Fund may also use fair value pricing if the value of some or all of the Fund’s securities have been materially affected by events occurring before the Fund’s pricing time but after the close of the primary markets or exchanges on which the security is traded. This most commonly occurs with foreign securities, but may occur with other securities as well. In such cases, the Fund may apply a fair value factor supplied by the pricing vendor to a foreign security’s market close value to reflect changes in value that may have occurred between the close of the primary market or exchange on which the security is traded and the Fund’s pricing time. That factor may be derived using observable inputs such as a comparison of the trading patterns of a foreign security to intraday trading in the U.S. markets that are highly correlated to the foreign security or other information that becomes available after the close of the foreign market on which the security principally traded. When fair value pricing is employed, the prices of securities used by a Fund to calculate its net asset value may differ from market quotations, official closing prices or evaluated prices for the same securities, which means that the Fund may value those securities higher or lower than another given fund that uses market quotations, official closing prices or evaluated prices supplied by a pricing vendor in its calculation of net asset value. Securities valued using observable inputs, such as those described above, are normally categorized as Level 2 of the fair value hierarchy.
When reliable market quotations or evaluated prices supplied by a pricing vendor are not readily available or are not believed to accurately reflect fair value, securities fair value determinations are made by the Adviser as designated by the Board of Trustees pursuant to the Investment Company Act. Fair value determinations for investments which incorporate significant unobservable inputs are normally categorized as Level 3 in the fair value hierarchy.
Fair Value Measurements and Disclosures
Various inputs may be used to determine the value of each Fund’s investments, which are summarized in three broad categories defined as Level 1, Level 2, and Level 3. The inputs or methodologies used for valuing investments are not necessarily indicative of the risk associated with investing in those investments. The assignment of an investment to Levels 1, 2, or 3 is based on the lowest level of significant inputs used to determine its fair value.
Level 1–Quoted prices in active markets for identical securities.
Level 2–Other significant observable inputs (including quoted prices for similar securities, interest rates, prepayment speeds, credit risk, etc.).
Level 3–Significant unobservable inputs are used in situations where quoted prices or other observable inputs are not available or are deemed unreliable. Significant unobservable inputs may include each Fund’s own assumptions.
The categorization of investments into Levels 1, 2, or 3, and a summary of significant unobservable inputs used for Level 3 investments, when applicable, can be found at the end of each Fund’s Portfolio of Investments schedule.
⬤
146
Harbor FundsNotes to Financial Statements—Continued
NOTE 2—SIGNIFICANT ACCOUNTING POLICIES—Continued
Each Fund used observable inputs in its valuation methodologies whenever they were available and deemed reliable.
Investment Income
Dividends declared on portfolio securities are accrued on the ex-dividend date. Dividend information on certain foreign securities may not be available on the ex-dividend date, therefore, such dividends will be recorded as soon as reliable information becomes available. Distributions from real estate investment trust securities are recorded as dividend income, and may be reclassified as capital gains and/or return of capital, based on the information reported by the issuer, when available. Interest income is accrued daily as earned. Discounts and premiums on fixed income securities are amortized over the life of the respective securities (except for premiums on certain callable debt securities that amortized to the earliest call date) using the effective yield method. Paydown gains and losses on mortgage-backed and asset-backed securities are recognized as a component of interest income. Inflation adjustments to the face amount of inflation-indexed securities are included in interest income. Consent fees relating to corporate actions from investments held are recorded as income upon receipt.
Expenses
Expenses are charged directly to the Fund that incurred such expense whenever possible. With respect to expenses incurred
by any two or more Harbor funds where amounts cannot be identified on a fund by fund basis, such expenses are generally
allocated in proportion to the average net assets or the number of shareholders of each Fund.
by any two or more Harbor funds where amounts cannot be identified on a fund by fund basis, such expenses are generally
allocated in proportion to the average net assets or the number of shareholders of each Fund.
Class Allocations
Income, common expenses and realized and unrealized gains/(losses) are determined at the Fund level and allocated daily to each class of shares based on the applicable net assets of the respective classes. Distribution and service fees, if any, and transfer agent fees are calculated daily at the class level based on the applicable net assets of each class and the expense rate(s) applicable to each class.
Securities Transactions
Securities transactions are accounted for on the trade date (the date the order to buy or sell is executed). Realized gains or losses on security transactions are determined on the basis of identified cost.
Distribution to Shareholders
Distributions on Fund shares are recorded on the ex-dividend date.
Taxes
Each Fund is treated as a separate entity for U.S. federal tax purposes. Each Fund’s policy is to meet the requirements of Subchapter M of the Internal Revenue Code of 1986, as amended (the “Internal Revenue Code”) applicable to regulated investment companies and to distribute to its shareholders all of its taxable income within the prescribed time. It is also the intention of each Fund to distribute an amount sufficient to avoid imposition of any excise tax under Section 4982 of the Internal Revenue Code. Therefore, no provision has been made for U.S. federal taxes on income, capital gains or unrealized appreciation of securities held or excise taxes on income and capital gains.
Each Fund may be subject to taxes imposed by foreign countries in which it invests. Such taxes are provided for in accordance with each Fund’s understanding of the applicable foreign country’s tax law and are generally based on income and/or capital gains earned or repatriated. Taxes are accrued and applied to net investment income, net realized gains and unrealized appreciation as such income and/or gains are earned. Certain Funds have filed for additional foreign tax reclaims related to prior years. These additional foreign tax reclaims are recorded as income when both the amount is known and significant contingencies or uncertainties regarding collectability are removed.
Management has analyzed each Fund’s tax positions for all open tax years (in particular, U.S. federal income tax returns for the tax years ended October 31, 2020–2022, including all positions expected to be taken upon filing the 2023 tax return, in all material jurisdictions where each Fund operates, and has concluded that no provision for income tax is required in the Funds’ financial statements. Each Fund will recognize interest and penalties, if any, related to unrecognized tax benefits as income tax expense in its Statement of Operations.
During 2020 and 2022, Harbor International Fund received payments, including interest, from member countries of the European Union (“EU”) based on foreign tax reclaims relating to amounts withheld on dividends received by the Fund during fiscal years October 31, 2009 through 2021. A portion of the foreign tax reclaims and interest received is due to the Internal Revenue
⬤
147
Harbor FundsNotes to Financial Statements—Continued
NOTE 2—SIGNIFICANT ACCOUNTING POLICIES—Continued
Service (“IRS”), in the form of a tax compliance fee based on the percentage of foreign tax credits previously passed through to the Fund’s shareholders. The estimated amount due to the IRS, including interest, is included in tax compliance fee payable in the Fund’s Statement of Asset and Liabilities. The Fund filed a closing agreement with the IRS related to the amount received in 2020 and in December 2022, the agreement was finalized and the related tax compliance fee, including interest,was paid to the IRS. The Fund has filed a closing agreement with the IRS relating to the amounts received in 2022. The actual tax compliance and related interest due to the IRS will be determined based on the final closing agreement with the IRS and may differ from estimates.
Custodian
Each Fund has credit balance arrangements with its custodian whereby positive balances in demand deposit accounts used by the transfer and shareholder servicing agent for clearing shareholder transactions in the Fund generate credits that are applied against gross custody expenses. Such custodial expense reductions, if any, are reflected on the respective Fund’s accompanying Statement of Operations.
Foreign Currency Translations
Purchases and sales of securities are translated into U.S. dollars at the current exchange rate on the respective dates of the transactions. Income and withholding taxes are translated at the prevailing exchange rate when accrued or incurred. The accounting records of the Funds are maintained in U.S. dollars. Investment securities and other assets and liabilities denominated in a foreign currency, when applicable, are translated into U.S. dollars based on the current exchange rates at year end.
Reported net realized gains and losses on foreign currency transactions, when applicable, represent net gains and losses from sales and maturities of foreign currency contracts, disposition of foreign currencies, currency gains and losses realized between the trade and settlement dates on securities transactions, and the difference between the amount of investment income accrued and tax reclaims receivable and the U.S. dollar amount actually received. The effects of changes in foreign currency exchange rates on investments in securities, when applicable, are included in the net realized and unrealized gain or loss on investments in the Statements of Operations.
Proceeds from Litigation
Each Fund may receive proceeds from shareholder litigation settlements involving current and/or previously held portfolio holdings. Any proceeds received from litigation involving portfolio holdings are reflected in the Statements of Operations in realized gain/(loss) if the security has been disposed of by a Fund, or in unrealized gain/(loss) if the security is still held by a Fund.
Inflation Indexed Bonds
Inflation-indexed bonds are fixed-income securities whose principal value is periodically adjusted based on the rate of inflation. The interest rate on these bonds is generally fixed at issuance at a rate lower than typical bonds. Over the life of an inflation-indexed bond, however, interest will be paid based on a principal value that is adjusted for inflation. Any increase or decrease in the principal amount of an inflation-indexed bond will be included as interest income even though investors do not receive the principal until maturity.
During the year, Harbor Core Bond Fund and Harbor Core Plus Fund invested in inflation-indexed bonds.
Rights and Warrants
Rights represent a privilege offered to holders of record of issued securities to subscribe (usually on a pro rata basis) for additional securities of the same class, of a different class or of a different issuer. Warrants are contracts that generally give the holder the right, but not the obligation, to buy a stated number of shares of common stock at a specified price at any time during the life of the warrant. Rights and warrants are typically written by the issuer of the security underlying the right or warrant. Although some rights and warrants may be non-transferable, others may be traded over-the-counter or on an exchange.
A Fund may acquire rights or warrants in order to gain exposure to the underlying security without owning the security, including, for example, cases where the Fund hopes to lock in the price today of a security it may wish to purchase in the future. In order for a warrant to be profitable, the market price of the underlying security must rise sufficiently above the exercise price to cover any premium and transaction costs. The value of a right or warrant may not necessarily change with the value of the underlying securities. When a Fund acquires rights or warrants, it runs the risk that it will lose its entire investment in the rights or warrants, unless the Fund exercises the right or warrant, acquires the underlying securities, or enters into a closing transaction before expiration. Rights and warrants cease to have value if they are not exercised prior to their expiration date.
⬤
148
Harbor FundsNotes to Financial Statements—Continued
NOTE 2—SIGNIFICANT ACCOUNTING POLICIES—Continued
If the price of the underlying security does not rise to an extent sufficient to cover any premium and transaction costs, the Fund will lose part or all of its investment. Any premiums or purchase price paid for rights or other warrants that expire are treated as realized losses. If a Fund enters into a closing sale transaction, it realizes a gain or loss, depending on whether the proceeds from the sale are greater or less than the cost of the rights or warrants.
During the year, Harbor Diversified International All Cap Fund and Harbor International Fund held rights/warrants as a result of their investments in underlying securities.
Other Matters
The Funds in the normal course of business invest in financial instruments where the risk of potential loss exists due to changes in the market, economic, political and regulatory developments, as well as events such as war, terrorism or spread of infectious disease (market risk) or failure or inability of the counterparty to a transaction to perform (credit and counterparty risk). In addition, certain Funds invest in foreign securities and as such are also subject to foreign currencies and foreign securities risks. Each Fund’s prospectus provides further details regarding the Fund’s principal risks.
NOTE 3—INVESTMENT PORTFOLIO TRANSACTIONS
Investment Portfolio Transactions
Purchases and sales of investments, other than short-term securities, U.S. government obligations, for each Fund for the year ended October 31, 2023 were as follows:
Purchases (000s) | Sales (000s) | |
Harbor Capital Appreciation Fund | $6,138,963 | $9,547,038 * |
Harbor Convertible Securities Fund | 70,469 | 202,312 |
Harbor Core Bond Fund | 123,386 | 65,262 |
Harbor Core Plus Fund | 536,815 | 531,472 |
Harbor Disruptive Innovation Fund | 59,872 | 107,659 |
Harbor Diversified International All Cap Fund | 201,787 | 175,354 |
Harbor International Fund | 610,182 | 855,173 |
Harbor International Core Fund | 204,456 | 162,413 |
Harbor International Growth Fund | 48,608 | 121,248 |
Harbor International Small Cap Fund | 297,682 | 64,575 |
Harbor Large Cap Value Fund | 143,656 | 597,370 |
Harbor Mid Cap Fund | 26,741 | 17,435 |
Harbor Mid Cap Value Fund | 28,715 | 97,167 |
Harbor Small Cap Growth Fund | 862,371 | 807,414 |
Harbor Small Cap Value Fund | 448,032 | 495,716 |
* | Sales for this Fund include $224,789 in connection with in-kind redemptions of the Fund’s capital shares. |
In-Kind Redemption Transactions
In accordance with the Trust’s prospectus, the Funds may distribute portfolio securities rather than cash as payment for a redemption of Fund shares. For financial reporting purposes, a Fund recognizes a gain or loss on the securities distributed related to the in-kind redemption. Such Fund-level gains and losses on in-kind redemptions are not taxable to shareholders. For the years ended October 31, 2023 and 2022, Harbor Capital Appreciation Fund realized gains of $133,428,000 and $1,270,427,000, respectively, upon the disposition of portfolio securities in connection with in-kind redemption’s of the Fund’s shares.
Securities Lending
Each Fund may engage in securities lending, whereby a Fund lends its securities to financial institutions in order to increase its income. The Trust has engaged State Street Bank and Trust Company to act as its agent (the “Lending Agent”) with respect to the lending of portfolio securities of the Funds, pursuant to the terms and conditions of a Securities Lending Authorization Agreement (the “SLA Agreement”). Securities loans are required to be secured at all times during the term of the loan by collateral that is at least equal to the value of the loaned securities determined at the close of each business day. Collateral
⬤
149
Harbor FundsNotes to Financial Statements—Continued
NOTE 3—INVESTMENT PORTFOLIO TRANSACTIONS—Continued
may consist of cash and/or securities issued by the U.S. Treasury. Any additional collateral that may be required to secure a loan is delivered to the Fund on the next business day. Cash collateral is recognized as the gross liability for securities loaned in the Statements of Assets and Liabilities. Non-cash collateral is not disclosed in the Funds' Statements of Assets and Liabilities as it is held by the Lending Agent on behalf of the Funds, and the Funds do not have the ability to rehypothecate those securities. Cash collateral is invested in the State Street Navigator Securities Lending Government Money Market Portfolio (the “Navigator Portfolio”), a money market mutual fund that seeks to provide income while maintaining a stable net asset value of $1.00. There is no assurance that the Navigator Portfolio will maintain a stable net asset value and the Funds are subject to the risk of loss on the cash collateral invested. A portion of the earnings generated by the investment of the cash collateral is rebated to the borrower for the use of the cash collateral and these earnings (less any rebate) are then divided between the Fund and the Lending Agent, as a fee for its services, according to agreed-upon rates. The Lending Agent and a Fund will share in any shortfall in the rebate due to the borrower, according to agreed-upon rates.
In addition to receiving a fee from the borrower based on the demand for securities loaned and earning income on the investment of the cash collateral, a Fund receives substitute interest, dividends, or other amounts on the loaned securities, during the term of a loan. Net securities lending income is disclosed as such in the Statements of Operations and represents the income earned from the non-cash collateral and the investment of cash collateral, net of fee rebates paid to the borrower and net of fees paid to the Lending Agent.
Loans may be terminated at the option of the borrower or the Funds. Upon termination of the loan, the borrower will return to the Fund securities that are identical to the loaned securities. The Funds bear the risk of delay in recovery of, or loss of rights in, the securities loaned and the risk that the value of the collateral falls below the value of the securities on loan. Each Fund seeks to mitigate this risk through the SLA Agreement, which provides that in the event of default, the Lending Agent may apply the proceeds of the cash collateral from the loaned securities toward the purchase of replacement securities. If such proceeds are insufficient or the collateral is unavailable, the Lending Agent will purchase replacement securities at its sole expense, or if unable to do so, the Lending Agent may credit to the Fund’s account an amount equal to the fair value of the unreturned loaned securities. As the securities loans are subject to termination by the Fund or the borrower at any time, the remaining contractual maturities of each securities lending transaction is considered to be overnight and continuous.
The following table shows the Funds that engaged in securities lending during the year and summarizes the value of equity securities loaned and related cash and non-cash collateral as of October 31, 2023.
Value of Securities on Loan (000s) | Cash Collateral (000s) | Non-Cash Collateral (000s) | |
Harbor Diversified International All Cap Fund | $— | $— | $— |
Harbor International Fund | — | — | — |
Harbor International Core Fund | 1,194 | 851 | 404 |
Harbor International Growth Fund | — | — | — |
Harbor International Small Cap Fund | — | — | — |
NOTE 4—FEES AND OTHER TRANSACTIONS WITH AFFILIATES
Investment Adviser
Harbor Capital is a wholly owned subsidiary of ORIX Corporation. Harbor Capital is the Funds’ investment adviser and is also responsible for administrative and other services.
⬤
150
Harbor FundsNotes to Financial Statements—Continued
NOTE 4—FEES AND OTHER TRANSACTIONS WITH AFFILIATES—Continued
Each Fund has a separate advisory agreement with Harbor Capital. The agreements provide for management fees based on an annual percentage rate of average daily net assets as follows:
Contractual Rate | Actual Rate | |
Harbor Capital Appreciation Fund | 0.60%a | 0.56% |
Harbor Convertible Securities Fund | 0.50b | 0.56 |
Harbor Core Bond Fund | 0.23 | 0.23 |
Harbor Core Plus Fund | 0.25 | 0.25 |
Harbor Disruptive Innovation Fund | 0.70 | 0.70 |
Harbor Diversified International All Cap Fund | 0.75 | 0.75 |
Harbor International Fund | 0.75c | 0.75 |
Harbor International Core Fund | 0.75 | 0.75 |
Harbor International Growth Fund | 0.75 | 0.75 |
Harbor International Small Cap Fund | 0.85 | 0.85 |
Harbor Large Cap Value Fund | 0.60d | 0.60 |
Harbor Mid Cap Fund | 0.75 | 0.75 |
Harbor Mid Cap Value Fund | 0.75e | 0.75 |
Harbor Small Cap Growth Fund | 0.75 | 0.75 |
Harbor Small Cap Value Fund | 0.75 | 0.75 |
a | The Adviser has contractually agreed to reduce the management fee to 0.56% on assets between $5 billion and $10 billion, 0.54% on assets between $10 billion and $20 billion and 0.53% on assets over $20 billion through February 29, 2024. |
b | For the period November 1, 2022 through February 28, 2023, the management fee was 0.65%. In addition, the Adviser contractually agreed to reduce the management fee to 0.60% through February 28, 2023. Effective March 1, 2023, the contractual management fee was reduced to 0.50%. |
c | The management fee is 0.75% on assets up to $12 billion and 0.65% on assets in excess of $12 billion. |
d | The management fee rate is 0.60% on assets up to $4 billion and 0.55% on assets over $4 billion. |
e | The Adviser has contractually agreed to reduce the management fee to 0.70% on assets between $350 million and $1 billion and 0.65% on assets over $1 billion through February 29, 2024. |
Harbor Capital has from time to time voluntarily or contractually agreed not to impose a portion of its management fees and/or to bear a portion of the expenses incurred in the operation of certain Funds in order to limit Fund expenses. Such waivers, if any, are reflected on the accompanying Statements of Operations. Interest expense, if any, is excluded from contractual limitations. During the year, the following expense limitation agreements were in effect:
Retirement Class | Institutional Class | Administrative Class | Investor Class | Expense Limitation Agreement Expiration Date | |
Harbor Convertible Securities Fund1 | 0.63% | 0.71% | 0.96% | 1.07% | 02/29/2024 |
Harbor Core Bond Fund | 0.26 | 0.34 | N/A | N/A | 02/29/2024 |
Harbor Core Plus Fund | 0.30 | 0.38 | 0.63 | N/A | 02/29/2024 |
Harbor Disruptive Innovation Fund | 0.75 | 0.83 | 1.08 | 1.19 | 02/29/2024 |
Harbor Diversified International All Cap Fund | 0.72 | 0.80 | 1.05 | 1.16 | 02/29/2024 |
Harbor International Fund | 0.69 | 0.77 | 1.02 | 1.13 | 02/29/2024 |
Harbor International Core Fund | 0.77 | 0.85 | 1.10 | 1.21 | 02/29/2024 |
Harbor International Growth Fund | 0.77 | 0.85 | 1.10 | 1.21 | 02/29/2024 |
Harbor International Small Cap Fund2 | 0.85 | 0.93 | 1.18 | 1.29 | 05/31/2024 |
Harbor Large Cap Value Fund | 0.61 | 0.69 | 0.94 | 1.05 | 02/29/2024 |
Harbor Mid Cap Fund | 0.80 | 0.88 | 1.13 | 1.24 | 02/29/2024 |
Harbor Mid Cap Value Fund | 0.77 | 0.85 | 1.10 | 1.21 | 02/29/2024 |
1 | The operating expense limitation for the Fund was effective March 1, 2023. |
2 | For the period November 1, 2022 through May 31, 2023, Harbor Capital voluntarily limited the operating expenses for the Retirement Class, Institutional Class, Administrative Class and Investor Class to 0.88%, 0.96%, 1.21% and 1.32%, respectively. |
All expense limitation agreements include the transfer agent fee waiver discussed in the Transfer Agent note.
Distributor
Harbor Funds Distributors, Inc. (the “Distributor”), a wholly-owned subsidiary of Harbor Capital, is the distributor for Harbor Funds’ shares. Under the Trust’s current distribution plan pursuant to Rule 12b-1 under the Investment Company Act with respect to each Fund’s Administrative and Investor Class shares (each, a “12b-1 Plan”) as applicable, each Fund pays the
⬤
151
Harbor FundsNotes to Financial Statements—Continued
NOTE 4—FEES AND OTHER TRANSACTIONS WITH AFFILIATES—Continued
Distributor compensation at the annual rate of 0.25% of the average daily net assets of its Administrative and Investor Class shares. Pursuant to each 12b-1 Plan, the Distributor is compensated for financing any activity that is primarily intended to result in the sale of Administrative and Investor Class shares of each Fund or for recordkeeping services or the servicing of shareholder accounts in a Administrative and Investor Class shares of each Fund. Such activities include, but are not limited to: printing of prospectuses and statements of additional information and reports for prospective shareholders (i.e., other than existing shareholders); preparation and distribution of advertising material and sales literature; expenses of organizing and conducting sales seminars; supplemental payments to dealers or other institutions such as asset-based sales charges, payments of recordkeeping fees under recordkeeping arrangements, or payments of service fees under shareholder service arrangements; and costs of administering each 12b-1 Plan.
Amounts payable by a Fund under each 12b-1 Plan need not be directly related to the expenses actually incurred by the Distributor on behalf of each Fund. Each 12b-1 Plan does not obligate each Fund to reimburse the Distributor for the actual expenses the Distributor may incur in fulfilling its obligations under each 12b-1 Plan. Thus, even if the Distributor’s actual expenses exceed the fee payable to the Distributor at any given time, each Fund will not be obligated to pay more than that fee. If the Distributor’s expenses are less than the fee it receives, the Distributor will retain the difference.
The fees attributable to each Fund’s respective class are shown on the accompanying Statements of Operations.
Transfer Agent
Harbor Services Group, Inc. (“Harbor Services Group”), a wholly-owned subsidiary of Harbor Capital, is the transfer and shareholder servicing agent for the Funds. The transfer agency and service agreement is reviewed and approved annually by the Board of Trustees and provides currently for compensation up to the following amounts per class of each Fund:
Transfer Agent Fees | |
Retirement Class | 0.02% of the average daily net assets of all Retirement Class shares |
Institutional Class | 0.10% of the average daily net assets of all Institutional Class shares |
Administrative Class | 0.10% of the average daily net assets of all Administrative Class shares |
Investor Class | 0.21% of the average daily net assets of all Investor Class shares |
Harbor Services Group voluntarily waived a portion of its transfer agent fees during the year ended October 31, 2023. Fees incurred for these transfer agent services are shown on each Fund’s Statement of Operations. The voluntary waiver may be discontinued at any time.
Affiliated Transactions
The Investment Company Act permits purchase and sale transactions among affiliated investment companies subject to an exemptive rule. The Trust has adopted policies and procedures pursuant to such rule. During the year, the Funds did not enter into any transactions with any other Harbor fund.
Shareholders
As of October 31, 2023, Harbor Capital and its wholly owned subsidiaries collectively held 10% or more of the following shares of beneficial interest in each of the following Funds:
Number of Shares Owned by Harbor Capital and Subsidiaries | ||||||
Retirement Class | Institutional Class | Administrative Class | Investor Class | Total | Percentage of Outstanding Shares | |
Harbor Convertible Securities Fund | 1,043,757 | — | — | — | 1,043,757 | 37.9 % |
Harbor International Core Fund | 1,353,772 | — | N/A | 3,514 | 1,357,286 | 10.6 |
Independent Trustees
The fees and expenses of the Independent Trustees are included in “Trustees’ fees and expenses” on each Fund’s Statement of Operations.
The Board of Trustees has adopted a Deferred Compensation Plan for Independent Trustees (the “Plan”), which enables Trustees to elect to defer receipt of all or a portion of the annual compensation they are entitled to receive from the Trust. For purposes of determining the amount owed to a Trustee under the Plan, deferred amounts are treated as though they had been invested in shares of the Fund(s) selected by the Trustee. While not required to do so, each Fund makes an investment equal to the
⬤
152
Harbor FundsNotes to Financial Statements—Continued
NOTE 4—FEES AND OTHER TRANSACTIONS WITH AFFILIATES—Continued
Trustee’s investment election. The deferred compensation liability and the offsetting deferred compensation investment asset are included as a component of “Accrued expenses – Trustees’ fees and expenses” and “Other assets”, respectively, in the Statements of Assets and Liabilities. Such amounts fluctuate with changes in the value of the selected Fund(s). The deferred compensation and related mark-to-market impact liability and an offsetting investment asset will remain on each Fund’s Statement of Assets and Liabilities until distributed in accordance with the Plan.
Indemnification
Under the Trust’s organizational documents, its officers and Trustees are indemnified against certain liabilities arising out of the performance of their duties to the Trust. In addition, in the normal course of business the Trust enters into contracts that provide general indemnities to other parties. The Trust’s maximum exposure under these arrangements is unknown as this would involve future claims that may be made against the Trust that have not yet occurred. The risk of material loss as a result of such indemnification claims is considered remote.
NOTE 5—TAX INFORMATION
The amount and character of income and net realized gains to be distributed are determined in accordance with income tax rules and regulations, which may differ from U.S. GAAP. These differences are attributable to permanent book and tax accounting differences that were primarily due to the tax treatment of bonds in default, net investment losses, redemption in-kind distributions, and the use of equalization. Reclassifications, if any, are made to each Fund’s capital account to reflect income and net realized gains available for distribution (or available capital loss carryovers) under income tax rules and regulations. Distributions classified as a return of capital, if any, are reflected on the Statements of Changes in Net Assets and have been recorded to paid in capital. The amounts reclassified on the Statements of Assets and Liabilities for the year ended October 31, 2023 were as follows:
Total Distributable Earnings/(Loss) (000s) | Paid in Capital (000s) | |
Harbor Capital Appreciation Fund | $(118,200 ) | $118,200 |
Harbor Convertible Securities Fund | — | — |
Harbor Core Bond Fund | — | — |
Harbor Core Plus Fund | (6 ) | 6 |
Harbor Disruptive Innovation Fund | 338 | (338 ) |
Harbor Diversified International All Cap Fund | — | — |
Harbor International Fund | — | — |
Harbor International Core Fund | (26 ) | 26 |
Harbor International Growth Fund | (786 ) | 786 |
Harbor International Small Cap Fund | (1,180 ) | 1,180 |
Harbor Large Cap Value Fund | (6,433 ) | 6,433 |
Harbor Mid Cap Fund | (240 ) | 240 |
Harbor Mid Cap Value Fund | (3,542 ) | 3,542 |
Harbor Small Cap Growth Fund | (23 ) | 23 |
Harbor Small Cap Value Fund | (27,743 ) | 27,743 |
⬤
153
Harbor FundsNotes to Financial Statements—Continued
NOTE 5—TAX INFORMATION—Continued
The tax composition of each Fund’s distributions was as follows:
As of October 31, 2023 | As of October 31, 2022 | |||||
Ordinary Income (000s) | Long-Term Capital Gains (000s) | Total (000s) | Ordinary Income (000s) | Long-Term Capital Gains (000s) | Total (000s) | |
Harbor Capital Appreciation Fund | $— | $— | $— | $— | $6,320,680 | $6,320,680 |
Harbor Convertible Securities Fund | 1,539 * | — | 1,539 | 14,535 | 11,022 | 25,557 |
Harbor Core Bond Fund | 3,930 | — | 3,930 | 2,590 | — | 2,590 |
Harbor Core Plus Fund | 41,847 | — | 41,847 | 48,140 | — | 48,140 |
Harbor Disruptive Innovation Fund | — | — | — | 50,635 | 78,113 | 128,748 |
Harbor Diversified International All Cap Fund | 13,311 | — | 13,311 | 27,163 | 55,890 | 83,053 |
Harbor International Fund | 107,270 | — | 107,270 | 93,992 | — | 93,992 |
Harbor International Core Fund | 2,628 | — | 2,628 | 1,713 | 3,503 | 5,216 |
Harbor International Growth Fund | — | — | — | 6,574 | 60,959 | 67,533 |
Harbor International Small Cap Fund | 1,859 | 1,738 | 3,597 | 2,107 | 2,106 | 4,213 |
Harbor Large Cap Value Fund | 33,715 | 75,149 | 108,864 | 29,773 | 60,228 | 90,001 |
Harbor Mid Cap Fund | 1,194 | 1,698 | 2,892 | 495 | 828 | 1,323 |
Harbor Mid Cap Value Fund | 5,294 | 18,482 | 23,776 | 5,575 | — | 5,575 |
Harbor Small Cap Growth Fund | 2,030 | 38,788 | 40,818 | 59,575 | 174,882 | 234,457 |
Harbor Small Cap Value Fund | 8,911 | 131,396 | 140,307 | 2,934 | 141,081 | 144,015 |
* | Includes return of capital of $119 |
As of October 31, 2023, the components of each Fund’s distributable earnings on a tax basis were as follows:
Undistributed Ordinary Income (000s) | Undistributed Long-Term Capital Gains (000s) | Unrealized Appreciation/ (Depreciation) (000s) | Accumulated Capital and Other Losses (000s) | Other Temporary Differences (000s) | Total Distributable Earnings/(Loss) (000s) | |
Harbor Capital Appreciation Fund | $— | $— | $10,562,015 | $(244,423 ) | $(2,320 ) | $10,315,272 |
Harbor Convertible Securities Fund | — | — | (2,131 ) | (14,684 ) | (18 ) | (16,833 ) |
Harbor Core Bond Fund | 297 | — | (10,988 ) | (7,298 ) | (4 ) | (17,993 ) |
Harbor Core Plus Fund | 4,287 | — | (158,594 ) | (104,679 ) | (282 ) | (259,268 ) |
Harbor Disruptive Innovation Fund | — | — | (17,527 ) | (115,037 ) | (40 ) | (132,604 ) |
Harbor Diversified International All Cap Fund | 23,180 | — | (26,255 ) | (26,818 ) | (244 ) | (30,137 ) |
Harbor International Fund | 117,381 | — | 103,465 | (469,903 ) | 12,981 | (236,076 ) |
Harbor International Core Fund | 3,749 | — | (1,328 ) | (7,156 ) | (41 ) | (4,776 ) |
Harbor International Growth Fund | 794 | — | 22,406 | (671 ) | (76 ) | 22,453 |
Harbor International Small Cap Fund | 6,410 | 924 | (39,755 ) | — | (83 ) | (32,504 ) |
Harbor Large Cap Value Fund | 6,364 | 47,334 | 426,978 | — | (83 ) | 480,593 |
Harbor Mid Cap Fund | 817 | 1,826 | (5,075 ) | — | (2 ) | (2,434 ) |
Harbor Mid Cap Value Fund | 3,542 | 14,798 | 12,038 | — | (55 ) | 30,323 |
Harbor Small Cap Growth Fund | 633 | — | (28,359 ) | (83,169 ) | (68 ) | (110,963 ) |
Harbor Small Cap Value Fund | 15,926 | 124,345 | 316,688 | — | (122 ) | 456,837 |
As of October 31, 2023, for federal income tax purposes, the following Fund had a qualified late year loss deferral to offset fiscal year 2024 ordinary income:
Qualified Late Year Ordinary Loss Deferral (000s) | |
Harbor Capital Appreciation Fund | $19,901 |
Harbor Disruptive Innovation Fund | 363 |
⬤
154
Harbor FundsNotes to Financial Statements—Continued
NOTE 5—TAX INFORMATION—Continued
As of October 31, 2023, each Fund in the following table had capital loss carryforwards for federal tax purposes which will reduce each Fund’s taxable income arising from future net realized gains on investments to the extent permitted by the Internal Revenue Code. Use of the capital loss carryforwards will reduce the amount of the distribution to shareholders which would otherwise be necessary to relieve each Fund of any federal tax liability. The capital loss carryforwards do not expire.
Capital Loss Carryforward | |||
Short-Term (000s) | Long-Term (000s) | Total (000s) | |
Harbor Capital Appreciation Fund | $(224,522 ) | $— | $(224,522 ) |
Harbor Convertible Securities Fund | (7,437 ) | (7,247 ) | (14,684 ) |
Harbor Core Bond Fund | (3,709 ) | (3,589 ) | (7,298 ) |
Harbor Core Plus Fund | (46,061 ) | (58,618 ) | (104,679 ) |
Harbor Disruptive Innovation Fund | (69,705 ) | (44,969 ) | (114,674 ) |
Harbor Diversified International All Cap Fund | (2,576 ) | (24,242 ) | (26,818 ) |
Harbor International Fund | (414,143 ) | (55,760 ) | (469,903 ) |
Harbor International Core Fund | (7,089 ) | (67 ) | (7,156 ) |
Harbor International Growth Fund | (671 ) | — | (671 ) |
Harbor Small Cap Growth Fund* | (24,386 ) | (58,783 ) | (83,169 ) |
* | A portion of the capital loss carryforward is subject to an annual limitation under the Internal Revenue Code and related regulations. |
The identified cost for federal income tax purposes of investments owned by each Fund and its respective gross unrealized appreciation and depreciation as of October 31, 2023 were as follows:
Identified Cost (000s) | Gross Unrealized | Net Unrealized Appreciation/ (Depreciation) (000s) | ||
Appreciation (000s) | (Depreciation) (000s) | |||
Harbor Capital Appreciation Fund | $11,946,474 | $10,963,347 | $(401,332 ) | $10,562,015 |
Harbor Convertible Securities Fund | 27,658 | 562 | (2,693 ) | (2,131 ) |
Harbor Core Bond Fund | 115,970 | 39 | (11,027 ) | (10,988 ) |
Harbor Core Plus Fund | 1,076,973 | 4,155 | (162,749 ) | (158,594 ) |
Harbor Disruptive Innovation Fund | 77,344 | 7,475 | (25,002 ) | (17,527 ) |
Harbor Diversified International All Cap Fund | 918,794 | 86,162 | (112,417 ) | (26,255 ) |
Harbor International Fund | 3,004,809 | 437,083 | (333,618 ) | 103,465 |
Harbor International Core Fund | 135,593 | 8,829 | (10,157 ) | (1,328 ) |
Harbor International Growth Fund | 272,845 | 59,131 | (36,725 ) | 22,406 |
Harbor International Small Cap Fund | 359,694 | 7,000 | (46,755 ) | (39,755 ) |
Harbor Large Cap Value Fund | 1,210,581 | 507,424 | (80,446 ) | 426,978 |
Harbor Mid Cap Fund | 100,481 | 8,337 | (13,412 ) | (5,075 ) |
Harbor Mid Cap Value Fund | 232,077 | 58,376 | (46,338 ) | 12,038 |
Harbor Small Cap Growth Fund | 966,071 | 74,237 | (102,596 ) | (28,359 ) |
Harbor Small Cap Value Fund | 1,587,794 | 532,903 | (216,215 ) | 316,688 |
NOTE 6—DERIVATIVES
Each Fund’s derivative holdings do not qualify for hedge accounting treatment and as such are recorded at current fair value. For a discussion of risks related to these investments please refer to the descriptions of each type of derivative instrument in Note 2— Significant Accounting Policies.
Each Fund’s derivative instruments outstanding as of the year ended October 31, 2023, if any, as disclosed in the Portfolio of Investments, and the related amounts of net realized and changes in net unrealized gains and losses on derivative instruments during the year as disclosed in the Statement of Operations, are indicators of the volume of derivative activity for each Fund.
⬤
155
Harbor FundsNotes to Financial Statements—Continued
NOTE 6—DERIVATIVES—Continued
Derivative Instruments
As of October 31, 2023, the fair values of derivatives, by primary risk exposure, were reflected in the Statement of Assets and Liabilities as follows:
Harbor Diversified International All Cap Fund | |
Statement of Assets and Liabilities Caption | Equity Contracts (000s) |
Rights/Warrants | $6 |
Harbor International Fund | |
Statement of Assets and Liabilities Caption | Equity Contracts (000s) |
Rights/Warrants | $53 |
Net realized gain/(loss) and the change in net unrealized appreciation/(depreciation) on derivatives, by primary risk exposure, for the year ended October 31, 2023, were:
Harbor Diversified International All Cap Fund | |
Equity Contracts (000s) | |
Net realized gain/(loss) on derivatives | |
Rights/Warrants | $(1 ) |
Equity Contracts (000s) | |
Change in net unrealized appreciation/(depreciation) on derivatives | |
Rights/Warrants | $6 |
Harbor International Fund | |
Equity Contracts (000s) | |
Net realized gain/(loss) on derivatives | |
Rights/Warrants | $5 |
Equity Contracts (000s) | |
Change in net unrealized appreciation/(depreciation) on derivatives | |
Rights/Warrants | $16 |
NOTE 7—SUBSEQUENT EVENTS
Through the date the financial statements were issued, there were no subsequent events or transactions that would have materially impacted the financial statements or related disclosures as presented herein.
⬤
156
Report of Independent Registered Public Accounting Firm
The Board of Trustees and Shareholders of
Harbor Funds
Opinion on the Financial Statements
We have audited the accompanying statements of assets and liabilities of Harbor Capital Appreciation Fund, Harbor Convertible Securities Fund, Harbor Core Bond Fund, Harbor Core Plus Fund, Harbor Disruptive Innovation Fund, Harbor Diversified International All Cap Fund, Harbor International Fund, Harbor International Core Fund (formerly, Harbor Overseas Fund), Harbor International Growth Fund, Harbor International Small Cap Fund, Harbor Large Cap Value Fund, Harbor Mid Cap Fund, Harbor Mid Cap Value Fund, Harbor Small Cap Growth Fund, and Harbor Small Cap Value Fund (collectively referred to as the “Funds”), (fifteen of the funds constituting Harbor Funds (the “Trust”)), including the portfolios of investments, as of October 31, 2023, and the related statements of operations and changes in net assets, and the financial highlights for each of the periods indicated in the table below and the related notes (collectively referred to as the “financial statements”). In our opinion, the financial statements present fairly, in all material respects, the financial position of each of the Funds at October 31, 2023, the results of their operations, changes in net assets and financial highlights for each of the periods indicated in the table below, in conformity with U.S. generally accepted accounting principles.
Individual fund comprising the Harbor Funds | Statement of operations | Statement of changes in net assets | Financial highlights |
Harbor Capital Appreciation Fund Harbor Convertible Securities Fund Harbor Core Bond Fund Harbor Core Plus Fund Harbor Disruptive Innovation Fund Harbor Diversified International All Cap Fund Harbor International Fund Harbor International Growth Fund Harbor International Small Cap Fund Harbor Large Cap Value Fund Harbor Mid Cap Value Fund Harbor Small Cap Growth Fund Harbor Small Cap Value Fund | For the year ended October 31, 2023 | For each of the two years in the period ended October 31, 2023 | For each of the five years in the period ended October 31, 2023 |
Harbor International Core Fund (formerly, Harbor Overseas Fund) | For the year ended October 31, 2023 | For each of the two years in the period ended October 31, 2023 | For each of the four years in the period ended October 31, 2023 and for the period from March 1, 2019 (inception) through October 31, 2019 |
Harbor Mid Cap Fund | For the year ended October 31, 2023 | For each of the two years in the period ended October 31, 2023 | For each of the three years in the period ended October 31, 2023 and the period from December 1, 2019 (inception) through October 31, 2020 |
Basis for Opinion
These financial statements are the responsibility of the Trust’s management. Our responsibility is to express an opinion on each of the Funds’ financial statements based on our audits. We are a public accounting firm registered with the Public Company Accounting Oversight Board (United States) (“PCAOB”) and are required to be independent with respect to the Trust in accordance with the U.S. federal securities laws and the applicable rules and regulations of the Securities and Exchange Commission and the PCAOB.
We conducted our audits in accordance with the standards of the PCAOB. Those standards require that we plan and perform the audit to obtain reasonable assurance about whether the financial statements are free of material misstatement, whether due to error or fraud. The Trust is not required to have, nor were we engaged to perform, an audit of the Trust’s internal control over financial reporting. As part of our audits we are required to obtain an understanding of internal control over financial reporting but not for the purpose of expressing an opinion on the effectiveness of the Trust’s internal control over financial reporting. Accordingly, we express no such opinion.
Our audits included performing procedures to assess the risks of material misstatement of the financial statements, whether due to error or fraud, and performing procedures that respond to those risks. Such procedures included examining, on a test basis, evidence regarding the amounts and disclosures in the financial statements. Our procedures included confirmation of securities owned as of October 31, 2023, by correspondence with the custodian, brokers and others; when replies were not
⬤
157
Report of Independent Registered Public Accounting Firm—Continued
received from brokers or others, we performed other auditing procedures. Our audits also included evaluating the accounting principles used and significant estimates made by management, as well as evaluating the overall presentation of the financial statements. We believe that our audits provide a reasonable basis for our opinion.
We have served as the auditor of one or more Harbor fund investment companies since 2000.
Chicago, Illinois
December 21, 2023
December 21, 2023
⬤
158
Harbor FundsFEES AND EXPENSES EXAMPLE (Unaudited)
Example
As a shareholder of a Fund, you incur two types of costs: (1) transaction costs, including redemption fees (if any) and (2) ongoing costs, including management fees, distribution and service (12b-1) fees (if any), and other Fund expenses. This example is intended to help you understand your ongoing costs (in dollars) of investing in a Fund and to compare these costs with the ongoing costs of investing in other mutual funds.
The example is based on an investment of $1,000 invested at the beginning of the period and held for the entire period May 1, 2023 through October 31, 2023.
Actual Expenses
The first line of the table below provides information about actual account values and actual expenses for each share class. You may use the information in the respective class line, together with the amount you invested, to estimate the expenses that you paid over the period. Simply divide your account value by $1,000 (for example, an $8,600 account value divided by $1,000 = 8.6), then multiply the result by the number in the first line of the respective class under the heading entitled “Expenses Paid During Period” to estimate the expenses you paid on your account during this period.
Hypothetical Example for Comparison Purposes
The second line of the table for each share class below provides information about hypothetical account values and hypothetical expenses based on the respective Fund/Class’s actual expense ratio and an assumed rate of return of 5% per year before expenses, which is not the respective Fund/Class’s actual return. The hypothetical account values and expenses may not be used to estimate the actual ending account balance or expenses you paid for the period. You may use this information to compare the ongoing costs of investing in a Fund to other funds. To do so, compare this 5% hypothetical example with the 5% hypothetical examples that appear in the shareholder reports of the other funds.
Please note that the expenses shown in the table are meant to highlight your ongoing costs only and do not reflect any transactional costs, such as redemption fees. Therefore, the second line of the table is useful in comparing ongoing costs only, and will not help you determine the relative total costs of owning different funds. In addition, if these transactional costs were included, your costs would have been higher.
Annualized Expense Ratios* | Expenses Paid During Period** | Beginning Account Value (May 1, 2023) | Ending Account Value (October 31, 2023) | |
Harbor Capital Appreciation Fund | ||||
Retirement Class | 0.59% | |||
Actual | $3.11 | $1,000.00 | $1,090.50 | |
Hypothetical (5% return) | 3.01 | 1,000.00 | 1,022.16 | |
Institutional Class | 0.67% | |||
Actual | $3.53 | $1,000.00 | $1,090.10 | |
Hypothetical (5% return) | 3.41 | 1,000.00 | 1,021.74 | |
Administrative Class | 0.92% | |||
Actual | $4.84 | $1,000.00 | $1,088.80 | |
Hypothetical (5% return) | 4.69 | 1,000.00 | 1,020.45 | |
Investor Class | 1.03% | |||
Actual | $5.42 | $1,000.00 | $1,088.10 | |
Hypothetical (5% return) | 5.24 | 1,000.00 | 1,019.88 |
⬤
159
Harbor FundsFEES AND EXPENSES EXAMPLE (Unaudited)—Continued
Annualized Expense Ratios* | Expenses Paid During Period** | Beginning Account Value (May 1, 2023) | Ending Account Value (October 31, 2023) | |
Harbor Convertible Securities Fund | ||||
Retirement Class | 0.69% | |||
Actual | $3.45 | $1,000.00 | $986.49 | |
Hypothetical (5% return) | 3.52 | 1,000.00 | 1,021.64 | |
Institutional Class | 0.77% | |||
Actual | $3.85 | $1,000.00 | $986.04 | |
Hypothetical (5% return) | 3.92 | 1,000.00 | 1,021.23 | |
Administrative Class | 0.97% | |||
Actual | $4.89 | $1,000.00 | $1,000.27 | |
Hypothetical (5% return) | 4.94 | 1,000.00 | 1,020.19 | |
Investor Class | 1.12% | |||
Actual | $5.60 | $1,000.00 | $984.51 | |
Hypothetical (5% return) | 5.70 | 1,000.00 | 1,019.42 | |
Harbor Core Bond Fund | ||||
Retirement Class | 0.26% | |||
Actual | $1.27 | $1,000.00 | $939.10 | |
Hypothetical (5% return) | 1.33 | 1,000.00 | 1,023.89 | |
Institutional Class | 0.34% | |||
Actual | $1.66 | $1,000.00 | $938.70 | |
Hypothetical (5% return) | 1.73 | 1,000.00 | 1,023.49 | |
Harbor Core Plus Fund | ||||
Retirement Class | 0.30% | |||
Actual | $1.47 | $1,000.00 | $942.30 | |
Hypothetical (5% return) | 1.53 | 1,000.00 | 1,023.69 | |
Institutional Class | 0.38% | |||
Actual | $1.86 | $1,000.00 | $941.90 | |
Hypothetical (5% return) | 1.94 | 1,000.00 | 1,023.29 | |
Administrative Class | 0.63% | |||
Actual | $3.08 | $1,000.00 | $940.70 | |
Hypothetical (5% return) | 3.21 | 1,000.00 | 1,022.03 | |
Harbor Disruptive Innovation Fund | ||||
Retirement Class | 0.75% | |||
Actual | $3.70 | $1,000.00 | $959.10 | |
Hypothetical (5% return) | 3.82 | 1,000.00 | 1,021.33 | |
Institutional Class | 0.83% | |||
Actual | $4.10 | $1,000.00 | $958.60 | |
Hypothetical (5% return) | 4.23 | 1,000.00 | 1,020.92 | |
Administrative Class | 1.08% | |||
Actual | $5.33 | $1,000.00 | $956.20 | |
Hypothetical (5% return) | 5.50 | 1,000.00 | 1,019.62 | |
Investor Class | 1.19% | |||
Actual | $5.86 | $1,000.00 | $953.90 | |
Hypothetical (5% return) | 6.06 | 1,000.00 | 1,019.06 |
⬤
160
Harbor FundsFEES AND EXPENSES EXAMPLE (Unaudited)—Continued
Annualized Expense Ratios* | Expenses Paid During Period** | Beginning Account Value (May 1, 2023) | Ending Account Value (October 31, 2023) | |
Harbor Diversified International All Cap Fund | ||||
Retirement Class | 0.72% | |||
Actual | $3.48 | $1,000.00 | $919.10 | |
Hypothetical (5% return) | 3.67 | 1,000.00 | 1,021.48 | |
Institutional Class | 0.80% | |||
Actual | $3.87 | $1,000.00 | $918.30 | |
Hypothetical (5% return) | 4.08 | 1,000.00 | 1,021.07 | |
Administrative Class | 1.05% | |||
Actual | $5.08 | $1,000.00 | $918.00 | |
Hypothetical (5% return) | 5.35 | 1,000.00 | 1,019.78 | |
Investor Class | 1.16% | |||
Actual | $5.60 | $1,000.00 | $916.80 | |
Hypothetical (5% return) | 5.90 | 1,000.00 | 1,019.21 | |
Harbor International Fund | ||||
Retirement Class | 0.69% | |||
Actual | $3.34 | $1,000.00 | $918.90 | |
Hypothetical (5% return) | 3.52 | 1,000.00 | 1,021.64 | |
Institutional Class | 0.77% | |||
Actual | $3.72 | $1,000.00 | $918.50 | |
Hypothetical (5% return) | 3.92 | 1,000.00 | 1,021.23 | |
Administrative Class | 1.02% | |||
Actual | $4.93 | $1,000.00 | $917.40 | |
Hypothetical (5% return) | 5.19 | 1,000.00 | 1,019.93 | |
Investor Class | 1.13% | |||
Actual | $5.46 | $1,000.00 | $916.80 | |
Hypothetical (5% return) | 5.75 | 1,000.00 | 1,019.37 | |
Harbor International Core Fund | ||||
Retirement Class | 0.77% | |||
Actual | $3.78 | $1,000.00 | $948.70 | |
Hypothetical (5% return) | 3.92 | 1,000.00 | 1,021.23 | |
Institutional Class | 0.85% | |||
Actual | $4.17 | $1,000.00 | $948.60 | |
Hypothetical (5% return) | 4.33 | 1,000.00 | 1,020.81 | |
Investor Class | 1.21% | |||
Actual | $5.94 | $1,000.00 | $946.50 | |
Hypothetical (5% return) | 6.16 | 1,000.00 | 1,018.95 |
⬤
161
Harbor FundsFEES AND EXPENSES EXAMPLE (Unaudited)—Continued
Annualized Expense Ratios* | Expenses Paid During Period** | Beginning Account Value (May 1, 2023) | Ending Account Value (October 31, 2023) | |
Harbor International Growth Fund | ||||
Retirement Class | 0.77% | |||
Actual | $3.60 | $1,000.00 | $854.00 | |
Hypothetical (5% return) | 3.92 | 1,000.00 | 1,021.23 | |
Institutional Class | 0.85% | |||
Actual | $3.97 | $1,000.00 | $853.70 | |
Hypothetical (5% return) | 4.33 | 1,000.00 | 1,020.81 | |
Administrative Class | 1.10% | |||
Actual | $5.14 | $1,000.00 | $852.70 | |
Hypothetical (5% return) | 5.60 | 1,000.00 | 1,019.52 | |
Investor Class | 1.21% | |||
Actual | $5.65 | $1,000.00 | $852.40 | |
Hypothetical (5% return) | 6.16 | 1,000.00 | 1,018.95 | |
Harbor International Small Cap Fund | ||||
Retirement Class | 0.86% | |||
Actual | $4.04 | $1,000.00 | $865.60 | |
Hypothetical (5% return) | 4.38 | 1,000.00 | 1,020.76 | |
Institutional Class | 0.94% | |||
Actual | $4.42 | $1,000.00 | $864.90 | |
Hypothetical (5% return) | 4.79 | 1,000.00 | 1,020.35 | |
Administrative Class | 1.20% | |||
Actual | $5.64 | $1,000.00 | $864.60 | |
Hypothetical (5% return) | 6.11 | 1,000.00 | 1,019.00 | |
Investor Class | 1.30% | |||
Actual | $6.11 | $1,000.00 | $863.70 | |
Hypothetical (5% return) | 6.61 | 1,000.00 | 1,018.49 | |
Harbor Large Cap Value Fund | ||||
Retirement Class | 0.61% | |||
Actual | $3.06 | $1,000.00 | $990.70 | |
Hypothetical (5% return) | 3.11 | 1,000.00 | 1,022.05 | |
Institutional Class | 0.69% | |||
Actual | $3.46 | $1,000.00 | $990.80 | |
Hypothetical (5% return) | 3.52 | 1,000.00 | 1,021.64 | |
Administrative Class | 0.94% | |||
Actual | $4.71 | $1,000.00 | $989.10 | |
Hypothetical (5% return) | 4.79 | 1,000.00 | 1,020.35 | |
Investor Class | 1.05% | |||
Actual | $5.26 | $1,000.00 | $988.60 | |
Hypothetical (5% return) | 5.35 | 1,000.00 | 1,019.78 |
⬤
162
Harbor FundsFEES AND EXPENSES EXAMPLE (Unaudited)—Continued
Annualized Expense Ratios* | Expenses Paid During Period** | Beginning Account Value (May 1, 2023) | Ending Account Value (October 31, 2023) | |
Harbor Mid Cap Fund | ||||
Retirement Class | 0.80% | |||
Actual | $3.97 | $1,000.00 | $968.50 | |
Hypothetical (5% return) | 4.08 | 1,000.00 | 1,021.07 | |
Institutional Class | 0.88% | |||
Actual | $4.36 | $1,000.00 | $967.70 | |
Hypothetical (5% return) | 4.48 | 1,000.00 | 1,020.66 | |
Investor Class | 1.24% | |||
Actual | $6.15 | $1,000.00 | $966.70 | |
Hypothetical (5% return) | 6.31 | 1,000.00 | 1,018.80 | |
Harbor Mid Cap Value Fund | ||||
Retirement Class | 0.77% | |||
Actual | $3.86 | $1,000.00 | $991.10 | |
Hypothetical (5% return) | 3.92 | 1,000.00 | 1,021.32 | |
Institutional Class | 0.85% | |||
Actual | $4.27 | $1,000.00 | $990.70 | |
Hypothetical (5% return) | 4.33 | 1,000.00 | 1,020.92 | |
Administrative Class | 1.10% | |||
Actual | $5.52 | $1,000.00 | $989.90 | |
Hypothetical (5% return) | 5.60 | 1,000.00 | 1,019.52 | |
Investor Class | 1.21% | |||
Actual | $6.07 | $1,000.00 | $988.90 | |
Hypothetical (5% return) | 6.16 | 1,000.00 | 1,018.95 | |
Harbor Small Cap Growth Fund | ||||
Retirement Class | 0.80% | |||
Actual | $3.88 | $1,000.00 | $924.10 | |
Hypothetical (5% return) | 4.08 | 1,000.00 | 1,021.07 | |
Institutional Class | 0.88% | |||
Actual | $4.27 | $1,000.00 | $924.20 | |
Hypothetical (5% return) | 4.48 | 1,000.00 | 1,020.66 | |
Administrative Class | 1.13% | |||
Actual | $5.48 | $1,000.00 | $922.70 | |
Hypothetical (5% return) | 5.75 | 1,000.00 | 1,019.37 | |
Investor Class | 1.24% | |||
Actual | $6.01 | $1,000.00 | $922.10 | |
Hypothetical (5% return) | 6.31 | 1,000.00 | 1,018.80 |
⬤
163
Harbor FundsFEES AND EXPENSES EXAMPLE (Unaudited)—Continued
Annualized Expense Ratios* | Expenses Paid During Period** | Beginning Account Value (May 1, 2023) | Ending Account Value (October 31, 2023) | |
Harbor Small Cap Value Fund | ||||
Retirement Class | 0.80% | |||
Actual | $3.94 | $1,000.00 | $953.10 | |
Hypothetical (5% return) | 4.08 | 1,000.00 | 1,021.07 | |
Institutional Class | 0.88% | |||
Actual | $4.33 | $1,000.00 | $952.80 | |
Hypothetical (5% return) | 4.48 | 1,000.00 | 1,020.66 | |
Administrative Class | 1.13% | |||
Actual | $5.56 | $1,000.00 | $951.60 | |
Hypothetical (5% return) | 5.75 | 1,000.00 | 1,019.37 | |
Investor Class | 1.24% | |||
Actual | $6.10 | $1,000.00 | $950.80 | |
Hypothetical (5% return) | 6.31 | 1,000.00 | 1,018.80 |
* | Reflective of all fee waivers and expense reimbursements |
** | Expenses are equal to the Fund’s annualized net expense ratio, multiplied by the average account value over the period, multiplied by 184/365 (to reflect the one-half year period). |
⬤
164
Harbor FundsADDITIONAL INFORMATION (Unaudited)
Additional Tax Information
The Funds designate the following portions of their distributions from investment company taxable income for the fiscal year ended October 31, 2023 as qualifying for the dividends received deduction for corporate shareholders.
Percentage of Distribution | |
Harbor Convertible Securities Fund | 13 % |
Harbor Diversified International All Cap Fund | 2 |
Harbor Large Cap Value Fund | 98 |
Harbor Mid Cap Fund | 100 |
Harbor Mid Cap Value Fund | 100 |
Harbor Small Cap Growth Fund | 86 |
Harbor Small Cap Value Fund | 100 |
Pursuant to Section 852 of the Internal Revenue Code, the Funds designate the following capital gain dividends for the fiscal year ended October 31, 2023:
Amount (000s) | |
Harbor International Small Cap Fund | $1,901 |
Harbor Large Cap Value Fund | 80,892 |
Harbor Mid Cap Fund | 1,866 |
Harbor Mid Cap Value Fund | 21,439 |
Harbor Small Cap Growth Fund | 38,788 |
Harbor Small Cap Value Fund | 156,441 |
For the fiscal year ended October 31, 2023, each Fund designates up to the maximum amount of such dividends allowable pursuant to the Internal Revenue Code as qualified dividend income eligible for reduced tax rates. These lower rates range from 0% to 20% depending on an individual’s tax bracket. If a Fund pays a distribution during calendar year 2023, complete information will be reported in conjunction with Form 1099-DIV.
For the fiscal year ended October 31, 2023, each Fund, if applicable, designates up to the maximum amount of such dividends allowable pursuant to the Internal Revenue Code 163 (j) as interest income eligible for income inclusion for corporate shareholders.
The Funds designate the following foreign taxes paid and foreign source income for Federal income tax purposes:
Foreign Taxes Paid (000s) | Foreign Source Earned Income (000s) | |
Harbor Diversified International All Cap Fund | $2,144 | $29,369 |
Harbor International Fund | 6,670 | 109,859 |
Harbor International Core Fund | 452 | 5,585 |
Harbor International Growth Fund | 615 | 4,896 |
Harbor International Small Cap Fund | 643 | 9,709 |
Shareholders who own shares through a taxable Harbor Funds account and that received distributions from a Fund during calendar year 2023 will receive a Form 1099-DIV in January 2024 that will show the tax character of those distributions.
Proxy Voting
Harbor Funds has adopted Proxy Voting Policies and Procedures under which proxies relating to securities held by the Harbor funds are voted. In addition, Harbor Funds files Form N-PX, with its complete proxy voting record for the 12 months ended June 30th, no later than August 31st of each year. A description of Harbor Funds’ Proxy Voting Policies and Procedures and the proxy voting records (Form N-PX) are available (i) without charge, upon request, by calling Harbor toll-free at 800-422-1050; (ii) on Harbor’s website at harborcapital.com; and (iii) on the SEC’s website at sec.gov.
⬤
165
Harbor FundsADDITIONAL INFORMATION—Continued
Householding
Harbor Funds has adopted a policy that allows it to send only one copy of a Fund’s prospectus, proxy materials, annual report and semi-annual report to certain shareholders residing at the same household. This reduces Fund expenses, which benefits you and other shareholders. If you need additional copies or do not want your mailings to be “householded,” please call the Shareholder Servicing Agent at 800-422-1050. Individual copies will be sent within thirty (30) days after the Shareholder Servicing Agent receives your instructions. Your consent to householding is considered valid until revoked.
Quarterly Portfolio Disclosures
The Funds file a complete portfolio of investments for their first and third fiscal quarters with the SEC as an exhibit to Form N-PORT. The Funds’ Form N-PORT exhibit is available (i) without charge, upon request, by calling Harbor toll-free at 800-422-1050, (ii) on Harbor’s website at harborcapital.com, and (iii) on the SEC’s website at sec.gov.
⬤
166
Harbor FundsADDITIONAL INFORMATION—Continued
Trustees and Officers
AS OF DECEMBER 2023
The business and affairs of the Trust shall be managed by or under the direction of the Trustees, and they shall have all powers necessary or desirable to carry out that responsibility. The Trustees shall have full power and authority to take or refrain from taking any action and to execute any contracts and instruments that they may consider necessary or desirable in the management of the Trust. Any determination made by the Trustees in good faith as to what is in the interests of the Trust shall be conclusive. The Trustees serve on the Board of Trustees of Harbor Funds and Harbor ETF Trust.
Information pertaining to the Trustees and Officers of Harbor Funds is set forth below. The address of each Trustee and Officer is: [Name of Trustee or Officer] c/o Harbor Funds, 111 South Wacker Drive, 34th Floor, Chicago, IL 60606-4302.
Harbor Funds' Statement of Additional Information includes additional information about the Trust’s Trustees and is available without charge by calling 800-422-1050 or at the Trust’s website at harborcapital.com.
Name (Age) Position(s) with Fund | Term of Office and Length of Time Served1 | Principal Occupation(s) During Past Five Years | Number of Portfolios In Fund Complex Overseen By Trustee | Other Directorships Of Public Companies and Other Registered Investment Companies Held by Trustee During Past Five Years |
INDEPENDENT TRUSTEES | ||||
Scott M. Amero (60) Trustee | Since 2014 | Chairman (2015-2020) and Trustee (2011-Present), Rare (conservation nonprofit); Trustee, Root Capital (2022-Present); Trustee, Adventure Scientists (conservation nonprofit) (2020-Present); Trustee, The Nature Conservancy, Massachusetts Chapter (2018-Present); Vice Chairman and Global Chief Investment Officer, Fixed Income (2010), Vice Chairman and Global Chief Investment Officer, Fixed Income, and Co-Head, Fixed Income Portfolio Management (2007-2010), BlackRock, Inc. (publicly traded investment management firm). | 29 | None |
Donna J. Dean (71) Trustee | Since 2010 | Chief Investment Officer of the Rockefeller Foundation (a private foundation) (2001-2019). | 29 | None |
Robert Kasdin (65) Trustee | Since 2014 | Trustee, Barnard College (2023-Present); Senior Vice President and Chief Operating Officer (2015-2022) and Chief Financial Officer (2018-2022), Johns Hopkins Medicine; Senior Executive Vice President, Columbia University (2002-2015); Trustee and Member of the Finance Committee, National September 11 Memorial & Museum at the World Trade Center (2005-2019); Director, Apollo Commercial Real Estate Finance, Inc. (2014-Present); and Director, The Y in Central Maryland (2018-2022). | 29 | Director of Apollo Commercial Real Estate Finance, Inc. (2014-Present). |
Kathryn L. Quirk (71) Trustee | Since 2017 | Member, Independent Directors Council, Governing Council (2023-present); Vice President, Senior Compliance Officer and Head, U.S. Regulatory Compliance, Goldman Sachs Asset Management (2013-2017); Deputy Chief Legal Officer, Asset Management, and Vice President and Corporate Counsel, Prudential Insurance Company of America (2010-2012); Co-Chief Legal Officer, Prudential Investment Management, Inc., and Chief Legal Officer, Prudential Investments and Prudential Mutual Funds (2008-2012); Vice President and Corporate Counsel and Chief Legal Officer, Mutual Funds, Prudential Insurance Company of America, and Chief Legal Officer, Prudential Investments (2005-2008);Vice President and Corporate Counsel and Chief Legal Officer, Mutual Funds, Prudential Insurance Company of America (2004-2005);Member,Management Committee (2000-2002), General Counsel and Chief Compliance Officer, Zurich Scudder Investments, Inc. (1997-2002); Member, Board of Directors and Co-Chair, Governance Committee, Just World International Inc. (nonprofit) (2020-2023). | 29 | None |
Douglas J. Skinner (61) Trustee | Since 2020 | Professor of Accounting (2005-Present), Deputy Dean for Faculty (2015-2016, 2017-Present), Interim Dean (2016-2017), University of Chicago Booth School of Business. | 29 | None |
⬤
167
Harbor FundsADDITIONAL INFORMATION—Continued
Trustees and Officers—Continued
Name (Age) Position(s) with Fund | Term of Office and Length of Time Served1 | Principal Occupation(s) During Past Five Years | Number of Portfolios In Fund Complex Overseen By Trustee | Other Directorships Of Public Companies and Other Registered Investment Companies Held by Trustee During Past Five Years |
INDEPENDENT TRUSTEES—Continued | ||||
Ann M. Spruill (69) Trustee | Since 2014 | Partner (1993-2008), member of Executive Committee (1996-2008), Member Board of Directors (2002-2008), Grantham, Mayo, Van Otterloo & Co, LLC (private investment management firm) (with the firm since 1990); Member Investment Committee and Chair of Global Public Equities, Museum of Fine Arts, Boston (2000-2020); and Trustee, Financial Accounting Foundation (2014-2020). | 29 | None |
Landis Zimmerman (64) Trustee | Since 2022 | Independent, non-fiduciary advisor, Gore Creek Asset Management (2006-Present); Member, Japan Science and Technology Agency Investment Advisory Committee (2021-Present); Chief Investment Officer of the Howard Hughes Medical Institute (2004-2021). | 29 | None |
INTERESTED TRUSTEE | ||||
Charles F. McCain (54)* Chairman, Trustee and President | Since 2017 | Chief Executive Officer (2017-Present), Director (2007-Present), President and Chief Operating Officer (2017), Executive Vice President and General Counsel (2004-2017),and Chief Compliance Officer (2004-2014), Harbor Capital Advisors, Inc.; Director and Chairperson (2019-Present), Harbor Trust Company, Inc.; Director (2007-Present) and Chief Compliance Officer (2004-2017), Harbor Services Group, Inc.; Chief Executive Officer (2017- Present), Director (2007-Present), Chief Compliance Officer and Executive Vice President (2007-2017), Harbor Funds Distributors, Inc.; Chief Compliance Officer, Harbor Funds (2004-2017); and Chairman, President and Trustee, Harbor ETF Trust (2021-Present). | 29 | None |
Name (Age) Position(s) with Fund | Term of Office and Length of Time Served1 | Principal Occupation(s) During Past Five Years |
FUND OFFICERS NOT LISTED ABOVE** | ||
Diana R. Podgorny (44) Chief Legal Officer, Chief Compliance Officer, and Secretary | Since 2023 | Executive Vice President, General Counsel and Secretary (2023-Present); Senior Vice President and Deputy General Counsel (2022-2023), Senior Vice President and Assistant General Counsel (2020-2022), and Vice President and Assistant General Counsel (2017-2020), Harbor Capital Advisors, Inc.; Director and Vice President (2020-Present), Harbor Trust Company, Inc.; Secretary, Harbor Funds (2018-Present); Chief Legal Officer and Chief Compliance Officer (2023-Present) and Secretary, Harbor ETF Trust (2021-Present). |
Richard C. Sarhaddi (49) Deputy Chief Compliance Officer and Vice President | Since 2023 | Senior Vice President and Chief Compliance Officer (2023-Present), Harbor Capital Advisors, Inc. and Harbor Services Group, Inc.;Director and Chief Compliance Officer (2023-Present),Harbor Trust Company Inc.; Deputy Chief Compliance Officer and Vice President (2023-Present), Harbor Funds; Deputy Chief Compliance Officer and Vice President (2023-present), Harbor ETF Trust. Vanguard Personalized Indexing Management, LLC; Head of U.S. Direct Investor Advice Compliance, (2018-2023), The Vanguard Group, Inc.; Director & Lead Counsel, Digital Services / Intelligent Portfolios (2015-2018), Charles Schwab & Co., Inc. |
John M. Paral (55) Treasurer | Since 2022 | Senior Vice President – Fund Administration and Analysis (2022-Present), Director of Fund Administration and Analysis (2017-2022), Vice President (2012-Present) and Financial Reporting Manager (2007-2017), Harbor Capital Advisors, Inc.; Treasurer (2022-Present) and Assistant Treasurer (2013-2022), Harbor Funds; and Treasurer (2022-Present) and Assistant Treasurer (2021-2022), Harbor ETF Trust. |
Gregg M. Boland (60) Vice President and AML Compliance Officer | Since 2022 | Executive Vice President (2020-Present),Vice President (2019-2020), Harbor Capital Advisors, Inc.; President (2019-Present), Senior Vice President – Operations (2016-2019), and Vice President – Operations (2007-2015), Harbor Services Group, Inc.; Senior Vice President, AML Compliance Officer, and OFAC Officer (2019-Present), Harbor Funds Distributors, Inc.; Vice President, Harbor Funds (2019-Present) and Vice President, Harbor ETF Trust (2021-Present). |
Kristof M. Gleich (44) Vice President | Since 2019 | President (2018-Present) and Chief Investment Officer (2020), Harbor Capital Advisors, Inc.; Director, Vice Chairperson, President (2019-Present) and Chief Investment Officer (2020-Present), Harbor Trust Company, Inc.; Vice President, Harbor Funds (2019-Present); Vice President, Harbor ETF Trust (2021-Present); and Managing Director, Global Head of Manager Selection (2010-2018), JP Morgan Chase & Co. |
⬤
168
Harbor FundsADDITIONAL INFORMATION—Continued
Trustees and Officers—Continued
Name (Age) Position(s) with Fund | Term of Office and Length of Time Served1 | Principal Occupation(s) During Past Five Years |
FUND OFFICERS NOT LISTED ABOVE**—Continued | ||
Diane Johnson (58) Vice President | Since 2022 | Vice President (2022-Present) and Tax Director (2009-Present), Harbor Capital Advisors, Inc.; Vice President (2022-Present), Harbor Funds; and Vice President (2022-Present), Harbor ETF Trust. |
Lora A. Kmieciak (59) Vice President | Since 2022 | Executive Vice President and Chief Financial Officer (2022-Present), Senior Vice President – Fund Administration and Analysis (2017-2022) and Senior Vice President - Business Analysis (2015-2017), Harbor Capital Advisors, Inc.; Vice President (2020-2022) and Director (2022-Present), Harbor Trust Company, Inc.; Assistant Treasurer (2017-2022), Harbor Funds; and Assistant Treasurer (2021-2022) and Vice President (2022-Present), Harbor ETF Trust. |
Meredith S. Dykstra (39) Assistant Secretary | Since 2023 | Senior Counsel (2022-Present), Vice President (2015-Present) and Legal Counsel (2015-2022), Harbor Capital Advisors, Inc.; Assistant Secretary (2023-Present), Harbor Trust Company, Inc.; Assistant Secretary (2023-Present),Harbor Funds; and Assistant Secretary (2023-Present), Harbor ETF Trust. |
Lana M. Lewandowski (44) Assistant Secretary | Since 2017 | Vice President and Compliance Director (2022-Present), Legal&Compliance Manager (2016-2022) and Legal Specialist (2012-2015), Harbor Capital Advisors, Inc.; AML Compliance Officer (2017-2022) and Assistant Secretary (2017-Present), Harbor Funds; and AML Compliance Officer (2021-2022) and Assistant Secretary (2021-Present), Harbor ETF Trust. |
1 | Each Trustee serves for an indefinite term, until his or her successor is elected. Each Officer is elected annually. |
* | Mr. McCain is deemed an “Interested Trustee” due to his affiliation with the Adviser. |
** | Officers of the Funds are “interested persons” as defined in the Investment Company Act. |
⬤
169
THIS PRIVACY STATEMENT IS NOT PART OF THIS REPORTHarbor’s Privacy Statement
Rev. 09/2021
FACTS | WHAT DOES HARBOR DO WITH YOUR PERSONAL INFORMATION? |
Why? | Financial companies choose how they share your personal information. Federal law gives consumers the right to limit some but not all sharing. Federal law also requires us to tell you how we collect, share, and protect your personal information. Please read this notice carefully to understand what we do. |
What? | The types of personal information we collect and share depend on the product or service you have with us. This information can include: ◾ Social Security number ◾ Account balances and transaction history ◾ Assets and investment experience ◾ Wire transfer instructions When you are no longer our customer, we continue to share your information as described in this notice. |
How? | All financial companies need to share customers’ personal information to run their everyday business. In the section below, we list the reasons financial companies can share their customers’ personal information; the reasons Harbor chooses to share; and whether you can limit this sharing. |
Reasons we can share your personal information | Does Harbor share? | Can you limit this sharing? |
For our everyday business purposes— such as to process your transactions, maintain your account(s), respond to court orders and legal investigations, or report to credit bureaus | Yes | No |
For our marketing purposes— to offer our products and services to you | Yes | No |
For joint marketing with other financial companies | No | We don’t share |
For our affiliates’ everyday business purposes— information about your transactions and experiences | Yes | No |
For our affiliates’ everyday business purposes— information about your creditworthiness | No | We don’t share |
For nonaffiliates to market to you | No | We don’t share |
Questions? | Call 800-422-1050 or go to harborcapital.com |
⬤
170
Harbor’s Privacy Statement—Continued
Page 2 | ||
Who we are | ||
Who is providing this notice? | Harbor Capital Advisors, Inc.; Harbor Services Group; Inc.; Harbor Funds Distributors, Inc., Harbor Trust Company, Inc., Harbor Funds, Harbor ETF Trust (collectively, “Harbor”) | |
What we do | ||
How does Harbor protect my personal information? | To protect your personal information from unauthorized access and use, we use security measures that comply with federal law. These measures include computer safeguards and secured files and buildings. We maintain physical, electronic and procedural safeguards designed to protect your personal information; however, please be aware that no data security measures can guarantee 100% security. | |
How does Harbor collect my personal information? | We collect your personal information, for example, when you ◾ Open an account or make transactions on your account ◾ Give us your contact information or income information ◾ Tell us about your investment or retirement portfolio We also collect your personal information from others, such as credit bureaus, affiliates, or other companies. | |
Why can’t I limit all sharing? | Federal law gives you the right to limit only ◾ sharing for affiliates’ everyday business purposes—information about your creditworthiness ◾ affiliates from using your information to market to you ◾ sharing for nonaffiliates to market to you State laws and individual companies may give you additional rights to limit sharing. | |
Definitions | ||
Affiliates | Companies related by common ownership or control.They can be financial and nonfinancial companies. ◾ Our affiliates include the financial companies providing this notice, as well as other companies under our parent company, ORIX Corporation. | |
Nonaffiliates | Companies not related by common ownership or control. They can be financial and nonfinancial companies. ◾ Nonaffiliates we share with can include companies that perform support services on our behalf or other firms that assist us in providing you with products and services, such as custodians, transfer agents, broker-dealers and marketing service firms (to support our marketing to you), as well as other financial institutions. | |
Joint marketing | A formal agreement between nonaffiliated financial companies that together market financial products or services to you. ◾ Harbor doesn’t jointly market. | |
Other important information | ||
Notice to investors in California and Vermont | Under California and Vermont law, we will not share information we collect about you with outside companies, unless the law allows. For example, we may share information with your consent, to service your accounts, and in connection with legal proceedings. We will limit sharing among our companies to the extent required by applicable law. |
We recommend that you read and retain this notice for your personal files.
⬤
171
ITEM 2 – CODE OF ETHICS
(a)
The Registrant has adopted a code of ethics that applies to the Registrant’s principal executive officer, principal financial officer, principal accounting officer or controller, or persons performing similar functions, regardless of whether these individuals are employed by the Registrant or a third party (the “Code of Ethics”).
(c)
The Registrant has not amended its Code of Ethics during the period covered by this report.
(d)
The Registrant has not granted any waivers, including an implicit waiver, from any provisions of its Code of Ethics during the period covered by this report.
ITEM 3 – AUDIT COMMITTEE FINANCIAL EXPERT
The Registrant’s Board has determined that Douglas J. Skinner, a member of the Audit Committee of the Board of Trustees, is an audit committee financial expert as defined by the Securities and Exchange Commission (the “SEC”). Mr. Skinner is the Eric J. Gleacher Distinguished Service Professor of Accounting and Deputy Dean for Faculty at the University of Chicago Booth School of Business, where his prior positions include John P. and Lillian A. Gould Professor of Accounting, Neubauer Family Faculty Fellow, Interim Dean, and Executive Director of the Accounting Research Center. Mr. Skinner is deemed “independent” as defined by the SEC for purposes of audit committee financial expert determinations.
ITEM 4 – PRINCIPAL ACCOUNTANT FEES AND SERVICES
Items 4(a)—4(d): Audit, Audit-Related, Tax and All Other Fees
Fees billed by Ernst & Young (“EY”):
Fiscal Year Ended October 31, 2023 | Fiscal Year Ended October 31, 2022 | |||||
All fees and services to the Trust that were pre-approved | All fees and services to service affiliates that were pre-approved | All other fees and services to service affiliates that did not require pre-approval | All fees and services to the Trust that were pre-approved | All fees and services to service affiliates that were pre-approved | All other fees and services to service affiliates that did not require pre-approval | |
(a) Audit Fees. | $707,096 | N/A | N/A | $926,263 | N/A | N/A |
(b) Audit-Related Fees. | $6,125 1 | $48,300 2 | N/A | $9,250 1 | $46,000 2 | N/A |
(c) Tax Fees. | $631,413 3 | $0 | N/A | $663,398 3 | $0 | N/A |
(d) All Other Fees. | $91,053 4 | N/A | N/A | $113,866 4 | $1,776 5 | N/A |
1
Includes fees related to the issuance of consents for N-1A filings.
2
Includes fees related to the procedures performed for Harbor Services Group, Inc. required by Rule 17Ad-13(a)(3) of the Securities Exchange Act of 1934.
3
Includes fees related to tax compliance, including foreign tax reclaim filings and tax research and equalization.
4
Includes fees billed in connection with the Registrant’s subscription to the EY PFIC Analyzer, a database used to determine whether foreign equity securities are passive foreign investment companies. Also, for the Registrant’s subscription to the Rapid Security Analyzer, a tool used to determine which foreign equity securities per their respective country has an ASC 740 capital gain exposure.
5
Includes fees billed in connection with the Adviser’s subscription to EY Atlas, a global platform and research tool for accessing accounting and auditing content, including external standards, EY interpretations and thought leadership.
(e)
(1)
Pre-Approval Policies.
The policy of the Registrant’s Audit Committee is to consider and, if appropriate, approve before the principal accountant is engaged for such services, all specific audit, review and non-audit services (other than certain de minimis non-audit services) provided to the Registrant. In making a determination, the Audit Committee considers whether the services are consistent with maintaining the principal accountant’s independence.
In the event of a contingency situation in which the principal accountant is needed to provide services in between scheduled Audit Committee meetings, the Audit Committee is authorized to delegate one or more members of the Committee the responsibility for considering and, if appropriate, pre-approving audit or permitted non-audit services in an amount sufficient to complete services and to determine if such services would be consistent with maintaining the accountant’s independence. Such member(s) are required to report to the full Audit Committee as to the nature and amount of such services and fees pre-approved at the next scheduled Audit Committee meeting. The Audit Committee would again consider whether such services and fees are consistent with maintaining the principal accountant’s independence.
The Registrant’s Audit Committee is informed at least annually of all audit and non-audit services provided by the principal accountant to the Registrant.
(2)
None of the principal accountant’s fees or services rendered to the Registrant, the Adviser or Harbor Services Group, Inc. were approved pursuant to the waiver provision of paragraph (c)(7)(i)(C) of Rule 2-01 of Regulation S-X.
(f)
Not applicable
(g)
Aggregate Non-Audit Fees.
Aggregate Non-Audit Fees of the Registrant
Fiscal Year Ended October 31, 2023: $728,591
Fiscal Year Ended October 31, 2022: $786,514
Aggregate Non-Audit Fees of Other Entities Required to be Pre-approved Pursuant to Paragraph (c)(7)(ii) of Rule 2-01 of Regulation S-X
Fiscal Year Ended October 31, 2023: $48,300
Fiscal Year Ended October 31, 2022: $47,776
(h)
For the most recent fiscal year, the Audit Committee has determined that the provision of all non-audit services to service affiliates was compatible with maintaining the principal accountant’s independence.
ITEM 5 – AUDIT COMMITTEE OF LISTED REGISTRANTS
Not applicable
ITEM 6 – INVESTMENTS
(a)
The Registrant has elected to include the schedule of investments in securities of unaffiliated issuers as part of the report to shareholders filed under Item 1 of this report on Form N-CSR.
(b)
Not applicable
ITEM 7 – DISCLOSURE OF PROXY VOTING POLICIES AND PROCEDURES FOR CLOSED-END MANAGEMENT INVESTMENT COMPANIES
Not applicable
ITEM 8 – PORTFOLIO MANAGERS OF CLOSED-END MANAGEMENT INVESTMENT COMPANIES
Not applicable
ITEM 9 – PURCHASES OF EQUITY SECURITIES BY CLOSED-END MANAGEMENT INVESTMENT COMPANY AND AFFILIATED PURCHASERS
Not applicable
ITEM 10 – SUBMISSION OF MATTERS TO A VOTE OF SECURITY HOLDERS
There were no material changes to the procedures by which shareholders may recommend nominees to the Registrant’s Board of Trustees since the date of the Registrant’s prior report on Form N-CSR.
ITEM 11 – CONTROLS AND PROCEDURES
(a)
The Registrant’s Principal Executive and Principal Financial Officers concluded that the Registrant’s disclosure controls and procedures (as defined in Rule 30a-3(c) under the 1940 Act) are effective, based on the evaluation of these disclosure controls and procedures as of a date within 90 days of the filing of this report.
(b)
There was no change in the Registrant’s internal control over financial reporting (as defined in Rule 30a-3(d) under the 1940 Act) that occurred during the second fiscal quarter of the period covered by this report that has materially affected, or is reasonably likely to materially affect, the Registrant’s internal control over financial reporting.
ITEM 12 – DISCLOSURE OF SECURITIES LENDING ACTIVITIES FOR CLOSED-END MANAGEMENT INVESTMENT COMPANIES
Not applicable
ITEM 13 – EXHIBITS
(a)(1) | |
(a)(2) | |
(b) |
SIGNATURES
Pursuant to the requirements of the Securities Exchange Act of 1934 and the Investment Company Act of 1940, the Registrant has duly caused this report to be signed December 21, 2023 on its behalf by the undersigned, thereunto duly authorized.
HARBOR FUNDS
By: /s/ Charles F. McCain
Charles F. McCain
Chairman, President and Trustee
(Principal Executive Officer)
Chairman, President and Trustee
(Principal Executive Officer)
Pursuant to the requirements of the Securities Exchange Act of 1934 and the Investment Company Act of 1940, this report has been signed below by the following persons on behalf of the Registrant and in the capacities and on the dates indicated.
By: | /s/ Charles F. McCain Charles F. McCain | Chairman, President and Trustee (Principal Executive Officer) | December 21, 2023 |
By: | /s/ John M. Paral John M. Paral | Treasurer (Principal Financial and Accounting Officer) | December 21, 2023 |
Exhibit Index
Number | Description |
99.CODE ETH | Code of Business Conduct and Ethics. |
99.CERT1 | Certification for each principal executive officer and principal financial officer of the Registrant as required by Rule 30a-2(a) under the 1940 Act (17 CFR 270.30a-2(a)). |
99.CERT2 | Certification for each principal executive officer and principal financial officer of the Registrant as required by Rule 30a-2(a) under the 1940 Act (17 CFR 270.30a-2(a)). |
99.906CERT | Certification as required by Section 1350 of Chapter 63 of Title 18 of the United States Code (18 U.S.C. 1350). |