UNITED STATES
SECURITIES AND EXCHANGE COMMISSION
Washington, D.C. 20549
Form N-CSR
CERTIFIED SHAREHOLDER REPORT OF
REGISTERED MANAGEMENT INVESTMENT COMPANIES
Investment Company Act file number: 811-4676
Harbor Funds
(Exact name of Registrant as specified in charter)
111 South Wacker Drive, 34th Floor
Chicago, Illinois 60606-4302
(Address of principal executive offices) (Zip code)
Charles F. McCain, Esq. HARBOR FUNDS 111 South Wacker Drive, 34th Floor Chicago, Illinois 60606-4302 | Christopher P. Harvey, Esq. DECHERT LLP One International Place – 40th Floor 100 Oliver Street Boston, MA 02110-2605 |
(Name and address of agent for service)
Registrant’s telephone number, including area code: (312) 443-4400
Date of fiscal year end: October 31
Date of reporting period: October 31, 2021
ITEM 1 – REPORTS TO STOCKHOLDERS
The following are copies of reports transmitted to shareholders pursuant to Rule 30e-1 under the Investment Company Act of 1940, as amended (the “1940 Act”) (17 CFR 270.30e-1):
Annual Report
DOMESTIC EQUITY FUNDS
October 31, 2021
Domestic Equity Funds | Retirement Class | Institutional Class | Administrative Class | Investor Class |
Harbor Capital Appreciation Fund | HNACX | HACAX | HRCAX | HCAIX |
Harbor Disruptive Innovation Fund (formerly known as Harbor Mid Cap Growth Fund) | HNMGX | HAMGX | HRMGX | HIMGX |
Harbor Large Cap Value Fund | HNLVX | HAVLX | HRLVX | HILVX |
Harbor Mid Cap Fund | HMCRX | HMCLX | HMCDX | HMCNX |
Harbor Mid Cap Value Fund | HNMVX | HAMVX | HRMVX | HIMVX |
Harbor Small Cap Growth Fund | HNSGX | HASGX | HRSGX | HISGX |
Harbor Small Cap Value Fund | HNVRX | HASCX | HSVRX | HISVX |
Harbor Strategic Growth Fund | HNGSX | MVSGX | HSRGX | HISWX |
Table of Contents
1 | |
2 | |
4 | |
6 | |
9 | |
11 | |
13 | |
15 | |
17 | |
19 | |
21 | |
24 | |
26 | |
28 | |
30 | |
32 | |
34 | |
36 | |
37 | |
38 | |
44 | |
61 | |
73 | |
74 | |
77 | |
77 | |
77 | |
77 | |
78 | |
80 | |
83 |
This document must be preceded or accompanied by a Prospectus.
Letter from the Chairman
Charles F. McCain
Chairman
Chairman
Dear Fellow Shareholder:
Over the past year we have experienced bouts of both real optimism and real disappointment. As summer began, there was a sense that we had finally turned the corner on COVID-19 with widespread vaccine availability and rapidly declining rates of new infections. We dared to dream about what a post-COVID-19 return to normalcy could look like. And then the delta variant arrived bringing a frustrating and sustained rise in new cases across the world. With all the loss that so many had experienced already from COVID-19, could we maintain our collective resolve in the face of this significant setback?
Fortunately, as summer turned to fall, we witnessed the resilience of the human spirit. We were better prepared as a nation this time to handle this delta variant surge, although our progress has certainly been uneven. We benefited from higher vaccination rates, generous federal stimulus programs that lifted consumer spending across the income spectrum and a return to in-person schooling for most that helped both children and families re-establish routines.
Through all these ups and downs, U.S. and global equity markets posted strong returns over the past 12 months. Value stocks led growth over the one-year period but lagged over longer time periods. Similarly, small caps outperformed large caps, while large caps continued to lead over longer time periods. In contrast, bond markets faced headwinds from rising interest rates, pushing Treasury bonds and the Bloomberg U.S. Aggregate Bond Index into negative territory. Corporate bonds were a lone bright spot, managing to post positive results for the fiscal year.
Investors continue to seek income wherever they can find it in today’s low-yield environment. However, over the course of the past year, interest rates have been increasing, with the 10-year U.S. Treasury yield more than doubling since it bottomed in August 2020. Rising rates have been in response to the likely prospect of the Fed beginning to taper its asset purchases soon, and potentially raising rates by the middle of 2022.
As we close out fiscal year 2021, there are four significant issues that must be addressed going forward: the supply shortages stemming from burgeoning consumer demand and supply-chain disruptions, ongoing labor shortages, rising prices (and the specter of inflation), and the persistence of the Delta and other potential new variants.
Harbor believes that the trajectory of the economic recovery will remain uneven for the foreseeable future, given the headwinds mentioned above. That’s why it’s so important for investors to focus on practical solutions to manage inevitable market volatility. Drawing upon the expertise of experienced, active portfolio managers is one way to help investors to achieve their long-term investment goals. We’re confident that Harbor together with our investment partners will continue to execute our strategies in a disciplined and thoughtful manner to benefit shareholders over the long haul.
In fact, we believe that a challenging and volatile market environment is actually good news for active managers, because it allows us to add potential value and pull ahead of the pack. Our research shows that the difference between top-performing and bottom-performing active managers, across major asset classes from U.S. large cap and small cap to foreign large cap and emerging markets, is at its highest level in 20 years.
I hope you and your families will fare well over the coming year. Thank you for your confidence and continued investment in Harbor Funds.
December 21, 2021
Charles F. McCain |
Chairman |
1
Harbor Capital Appreciation Fund
Manager’s Commentary (Unaudited)
Subadviser
Jennison Associates LLC
466 Lexington Avenue
New York, NY 10017
New York, NY 10017
Portfolio Managers
Spiros “Sig” Segalas
Since 1990
Since 1990
Kathleen A. McCarragher
Since 2013
Since 2013
Blair A. Boyer
Since 2019
Since 2019
Natasha Kuhlkin, CFA
Since 2019
Since 2019
Jennison Associates has subadvised the Fund since 1990.
Investment Objective
The Fund seeks long-term growth of capital.
Management’s Discussion of
Fund Performance
Fund Performance
MARKET REVIEW
This fiscal year marked the recovery from the COVID-19 lockdowns in the U.S., with announcements around a full vaccine rollout at the start of the period boosting investor confidence and contributing to a stair-step rally that lasted the full year. The market responded to the rebound in economic activity and near-record earnings growth. All of the major U.S. stock indices ended the period at all-time highs.
PERFORMANCE
Harbor Capital Appreciation Fund advanced 41.33% (Retirement Class), 41.22% (Institutional Class), 40.86% (Administrative Class) and 40.71% (Investor Class) in the year ended October 31, 2021, while the Russell 1000® Growth Index, returned 43.21%. The S&P 500 Index returned 42.91%.
All sectors in the growth benchmark posted positive returns in the period. Information Technology, Communication Services and Consumer Discretionary were the most important contributors to the Fund’s returns.
Tesla, the top contributor to the Fund’s return over the period, is a name held in the Fund since 2013. The company continues to exceed expectations around production, deliveries and profit margins, yet we believe the opportunity for scale and consistent margin improvements is not fully reflected in the market. We believe Tesla will capture an important share of the rapidly accelerating demand for electric vehicles globally over the next several years.
A number of the Fund’s top ten holdings in the Information Technology sector have posted record results over the past year, as the digitization of the economy accelerates, demand patterns shift in favor of e-commerce, and enterprises migrate a growing share of their business functions to the cloud. Nvidia, the leader in advanced graphics chips and a holding since 2016, is benefiting from strong secular growth across a number of business lines, including datacenter, automotive and gaming, and the company’s results have repeatedly exceeded consensus estimates this year. Microsoft and Alphabet, stocks we have held in the Fund for several years, were the strongest performers among the mega-cap tech names, on impressive growth and profitability in their diversified portfolios of consumer and enterprise businesses. Shopify, a Fund holding since 2019, is a Canadian-based SaaS (Software as a Service) company facilitating e-commerce for nearly two million merchants and an important beneficiary of the drive to establish an online direct-to-consumer presence. The company’s customers range from small- and medium-sized businesses up to some of the world’s largest consumer brands.
That said, not all of the Funds’ investments have gone as planned. In those cases, our goal is to mitigate the negative impact of the positions that don’t work out. We achieve this through our practice of cutting our exposure to a stock once we recognize that company or industry fundamentals are trending in the wrong direction or if we have reason to question our confidence in multi-year forecasts.
This was the case with Chinese gaming and e-commerce giants, Tencent and Alibaba during the period. The cancellation of the IPO of Alibaba affiliate Ant Financial, late last year and a series of regulatory actions against a number of large companies undermined sentiment and led to a significant sell-off in Chinese stocks. As fundamental investors focused on long-term growth and profitability, we are not comfortable with the lack of visibility and the risk of further government action. Therefore, the Fund exited both Tencent and Alibaba and ended the period with no direct exposure to Chinese stocks.
2
Harbor Capital Appreciation Fund
Manager’s Commentary—Continued
CHANGE IN A $50,000 INVESTMENT
For the period 11/01/2011 through 10/31/2021
The graph compares a $50,000 investment in the Institutional Class shares of the Fund with the performance of the Russell 1000® Growth Index and the S&P 500 Index. The Fund’s performance assumes the reinvestment of all dividend and capital gain distributions.
TOTAL RETURNS
For the periods ended 10/31/2021
1 Year | Annualized | |||||
5 Years | 10 Years | |||||
Harbor Capital Appreciation Fund | ||||||
Retirement Class1 | 41.33% | 27.22% | 20.01% | |||
Institutional Class | 41.22 | 27.13 | 19.96 | |||
Administrative Class | 40.86 | 26.81 | 19.66 | |||
Investor Class | 40.71 | 26.66 | 19.52 | |||
Comparative Indices | ||||||
Russell 1000® Growth | 43.21% | 25.49% | 19.42% | |||
S&P 500 | 42.91 | 18.93 | 16.21 |
As stated in the Fund’s prospectus dated March 1, 2021, the expense ratios were 0.59% (Net) and 0.64% (Gross) (Retirement Class); 0.67% (Net) and 0.72% (Gross) (Institutional Class); 0.92% (Net) and 0.97% (Gross) (Administrative Class); and 1.03% (Net) and 1.08% (Gross) (Investor Class). The net expense ratios reflect a contractual management fee waiver effective through 02/28/2022. The expense ratios in the prospectus may differ from the actual expense ratios for the period disclosed within this report. The expense ratios shown in the prospectus are based on the prior fiscal year, adjusted to reflect changes, if any, in contractual arrangements that occurred prior to the date of the prospectus (or supplement thereto, if applicable).
Performance data shown represents past performance and is no guarantee of future results. Past performance is net of management fees and expenses and reflects reinvested dividends and distributions. Past performance reflects the beneficial effect of any expense waivers or reimbursements, without which returns would have been lower. Investment returns and principal value will fluctuate and when redeemed may be worth more or less than their original cost. Returns for periods less than one year are not annualized. Current performance may be higher or lower and is available through the most recent month end at harborcapital.com or by calling 800-422-1050.
OUTLOOK & STRATEGY
Investors are facing a complex landscape heading into the final months of 2021 and into 2022. Profit growth has been exceptionally strong for the market overall, yet many companies have more recently reported pressures from rising wages and supply chain bottlenecks.
We believe corporate profit growth will return to pre-COVID-19 trend levels over the course of next year. While these levels are respectable in absolute terms, they represent a meaningful slowdown from the COVID-19-driven highs reached over the past 18 months.
We remain optimistic that the Fund’s holdings are well-positioned to navigate this complex landscape. In our view, the Fund is widely invested in companies with market-leading positions, strong cash flow generation and often-disruptive business models that should allow them to deliver superior growth longer than the market currently expects.
1
Retirement Class shares commenced operations on March 1, 2016. The performance attributed to the Retirement Class shares prior to that date is that of the Institutional Class shares. Performance prior to March 1, 2016 has not been adjusted to reflect the lower expenses of Retirement Class shares. During this period, Retirement Class shares would have had returns similar to, but potentially higher than, Institutional Class shares due to the fact that Retirement Class shares represent interests in the same portfolio as Institutional Class shares but are subject to lower expenses.
This report contains the current opinions of Jennison Associates LLC as of the date of this report and should not be considered as investment advice or a recommendation of any particular security, strategy or investment product. Such opinions are subject to change without notice and securities described herein may no longer be included in, or may at any time be removed from, the Fund���s portfolio. This report is distributed for informational purposes only. Information contained herein has been obtained from sources believed reliable, but not guaranteed.
There is no guarantee that the investment objective of the Fund will be achieved. Stock markets are volatile and equity values can decline significantly in response to adverse issuer, political, regulatory, market and economic conditions. Since the Fund may hold foreign securities, it may be subject to greater risks than funds invested only in the U.S. These risks are more severe for securities of issuers in emerging markets regions. For information on the different share classes and the risks associated with an investment in the Fund, please refer to the current prospectus.
3
Harbor Capital Appreciation Fund
Portfolio of Investments—October 31, 2021
SECTOR ALLOCATION (% of investments) - Unaudited
Portfolio of Investments
Value, Cost, and Principal Amounts in Thousands
COMMON STOCKS—100.0% | |||
Shares | Value | ||
AUTOMOBILES—7.8% | |||
2,957,699 | Tesla Inc.* | $3,294,877 | |
BIOTECHNOLOGY—0.5% | |||
694,939 | BioNTech SE ADR (Germany)*,1 | 193,700 | |
CAPITAL MARKETS—2.1% | |||
740,788 | Goldman Sachs Group Inc. | 306,205 | |
2,720,709 | KKR & Co. Inc.* | 216,759 | |
728,124 | S&P Global Inc. | 345,247 | |
868,211 | |||
ENTERTAINMENT—4.6% | |||
1,993,401 | Netflix Inc.* | 1,376,065 | |
2,568,520 | Roblox Corp.* | 215,807 | |
1,082,260 | Sea Ltd. ADR (Singapore)*,1 | 371,832 | |
1,963,704 | |||
FOOD & STAPLES RETAILING—1.3% | |||
1,101,576 | Costco Wholesale Corp. | 541,469 | |
HEALTH CARE EQUIPMENT & SUPPLIES—2.2% | |||
1,371,381 | Danaher Corp. | 427,555 | |
503,483 | Dexcom Inc.* | 313,776 | |
578,254 | Intuitive Surgical Inc.* | 208,825 | |
950,156 | |||
HEALTH CARE PROVIDERS & SERVICES—0.9% | |||
833,485 | UnitedHealth Group Inc. | 383,795 | |
HOTELS, RESTAURANTS & LEISURE—2.8% | |||
2,709,893 | Airbnb Inc.* | 462,470 | |
276,465 | Chipotle Mexican Grill Inc.* | 491,840 | |
1,537,902 | Marriott International Inc.* | 246,095 | |
1,200,405 | |||
INTERACTIVE MEDIA & SERVICES—12.2% | |||
466,967 | Alphabet Inc. Class A* | 1,382,652 | |
467,003 | Alphabet Inc. Class C* | 1,384,856 | |
3,286,742 | Match Group Inc.* | 495,575 | |
3,655,568 | Meta Platforms Inc.* | 1,182,832 | |
11,158,445 | Snap Inc.* | 586,711 | |
1,708,006 | ZoomInfo Technologies Inc.* | 114,812 | |
5,147,438 |
COMMON STOCKS—Continued | |||
Shares | Value | ||
INTERNET & DIRECT MARKETING RETAIL—7.2% | |||
771,595 | Amazon.com Inc.* | $2,602,150 | |
305,476 | MercadoLibre Inc. (Argentina)* | 452,416 | |
3,054,566 | |||
IT SERVICES—15.5% | |||
291,113 | Adyen NV (Netherlands)*,2 | 878,378 | |
1,834,629 | Mastercard Inc. | 615,555 | |
949,958 | Okta Inc.* | 234,811 | |
2,474,888 | PayPal Holdings Inc.* | 575,634 | |
1,155,243 | Shopify Inc. (Canada)* | 1,694,430 | |
918,509 | Snowflake Inc.* | 325,005 | |
3,658,414 | Square Inc.* | 931,066 | |
1,428,115 | Twilio Inc.* | 416,096 | |
4,235,493 | Visa Inc. | 896,950 | |
6,567,925 | |||
MULTILINE RETAIL—1.3% | |||
2,093,144 | Target Corp. | 543,422 | |
PERSONAL PRODUCTS—1.8% | |||
2,312,026 | Estée Lauder Companies Inc. | 749,859 | |
PHARMACEUTICALS—1.8% | |||
2,934,261 | Eli Lilly & Co. | 747,532 | |
ROAD & RAIL—1.2% | |||
11,279,496 | Uber Technologies Inc.* | 494,267 | |
SEMICONDUCTORS & SEMICONDUCTOR EQUIPMENT—6.3% | |||
8,341,340 | NVIDIA Corp. | 2,132,630 | |
4,503,207 | Taiwan Semiconductor Manufacturing Co. Ltd. ADR (Taiwan)1 | 512,015 | |
2,644,645 | |||
SOFTWARE—17.6% | |||
2,347,027 | Adobe Inc.* | 1,526,412 | |
2,012,196 | Atlassian Corp. plc (Australia)* | 921,847 | |
2,675,068 | CrowdStrike Holdings Inc.* | 753,834 | |
1,599,112 | DocuSign Inc.* | 445,017 | |
302,189 | HubSpot Inc.* | 244,843 | |
6,424,351 | Microsoft Corp. | 2,130,443 | |
3,156,431 | salesforce.com Inc.* | 945,951 |
4
Harbor Capital Appreciation Fund
Portfolio of Investments—Continued
Value, Cost, and Principal Amounts in Thousands
COMMON STOCKS—Continued | |||
Shares | Value | ||
SOFTWARE—Continued | |||
3,293,026 | Trade Desk Inc.* | $246,681 | |
822,813 | Workday Inc.* | 238,599 | |
7,453,627 | |||
SPECIALTY RETAIL—2.3% | |||
854,901 | Carvana Co.* | 259,189 | |
1,152,646 | Home Depot Inc. | 428,485 | |
4,674,780 | TJX Companies Inc. | 306,151 | |
993,825 | |||
TECHNOLOGY HARDWARE, STORAGE & PERIPHERALS—4.8% | |||
13,611,100 | Apple Inc. | 2,038,943 | |
TEXTILES, APPAREL & LUXURY GOODS—5.8% | |||
650,366 | Kering SA (France) | 488,122 |
COMMON STOCKS—Continued | |||
Shares | Value | ||
TEXTILES, APPAREL & LUXURY GOODS—Continued | |||
1,201,574 | Lululemon Athletica Inc. (Canada)* | $559,946 | |
994,606 | LVMH Moet Hennessy Louis Vuitton SE (France) | 779,892 | |
3,731,056 | NIKE Inc. | 624,168 | |
2,452,128 | |||
TOTAL COMMON STOCKS | |||
(Cost $20,656,560) | 42,284,494 | ||
TOTAL INVESTMENTS—100.0% | |||
(Cost $20,656,560) | 42,284,494 | ||
CASH AND OTHER ASSETS, LESS LIABILITIES—0.0% | (17,109) | ||
TOTAL NET ASSETS—100.0% | $42,267,385 |
FAIR VALUE MEASUREMENTS
As of October 31, 2021, the investments in Adyen NV, Kering SA, and LVMH Moet Hennessy Louis Vuitton SE (as disclosed in the preceding Portfolio of Investments) were classified as Level 2 and all other investments were classified as Level 1. There were no Level 3 investments at October 31, 2021 or 2020.
For more information on valuation inputs and their aggregation into the levels identified above, please refer to the Fair Value Measurements and Disclosures in Note 2 of the accompanying Notes to Financial Statements.
*
Non-income producing security
1
Depositary receipts such as American Depositary Receipts (ADRs), Global Depositary Receipts (GDRs) and other country specific depositary receipts are certificates evidencing ownership of shares of a foreign issuer. These certificates are issued by depositary banks and generally trade on an established market in the U.S. or elsewhere.
2
Securities purchased in a transaction exempt from registration under Rule 144A of the Securities Act of 1933. These securities may be resold in transactions exempt from registration, normally to qualified institutional buyers. The Fund has no right to demand registration of these securities. At October 31, 2021, the aggregate value of these securities was $878,378 or 2% of net assets.
The accompanying notes are an integral part of the Financial Statements.
5
Harbor Disruptive Innovation Fund
Manager’s Commentary (Unaudited)
Adviser
Harbor Capital Advisors, Inc.
111 South Wacker Drive, 34th Floor
Chicago, IL 60606-4302
SubadviserS
4BIO Partners LLP
NZS Capital, LLC
Sands Capital Management, LLC
Tekne Capital Management, LLC
Westfield Capital Management Company, L.P
Portfolio Managers
Spenser P. Lerner, CFA
Since 2021
Since 2021
Kristof Gleich, CFA
Since 2021
Since 2021
Harbor Capital has advised the Fund since 2000.*
Investment Objective
The Fund seeks long-term growth of capital.
*
Effective September 1, 2021, the Board of Trustees appointed Harbor Capital Advisors, Inc (the “Adviser”) to manage the Fund’s assets based upon model portfolios provided by multiple non-discretionary subadvisers.
MARKET REVIEW
U.S. equities surged during the period ended October 31, 2021 as investors responded favorably to positive COVID-19 vaccine news and developments, as well as a broad resurgence in economic activity. U.S. equities, as measured by the S&P 500 Index, returned 42.9% during the year. Throughout the period, investors generally reacted positively to improving economic conditions given enhancements in U.S. retail sales, unemployment, manufacturing data and other meaningful impacts given continued vaccination uptake and economic reopening. Throughout the period, U.S. equities experienced underlying stylistic turbulence as investors balanced shorter-term influences attributed to post-pandemic reopening relative to the longer-term implications of economic normalization. In addition, investors remained wary of risks associated with elevated levels of inflation, increased potential of monetary policy tightening, COVID-19 Delta variant risk and mounting geopolitical tensions in the Asia-Pacific region. Overall, markets ended the period on solid footing as stronger company fundamentals, consumer balance sheets and economic activity overshadowed post-pandemic pressure points.
Performance
Harbor Disruptive Innovation Fund returned 27.41% (Retirement Class), 27.29% (Institutional Class), 26.98% (Administrative Class) and 26.88% (Investor Class) over the year ended October 31, 2021, underperforming the S&P 500 Index, which returned 42.91%, the Russell 3000® Growth Index at 42.81% and the Russell Midcap® Growth Index at 39.43%.
Leading up to the conversion of the Harbor Mid Cap Growth Fund to the Harbor Disruptive Innovation Fund, the strategy underperformed the Russell Midcap® Growth Index. Stock selection and allocation effects were both negative. In particular, selection effects within the Information Technology sector, as well as the Health Care sector, detracted from overall performance. Consumer Discretionary was the largest detractor to overall portfolio performance from an allocation standpoint. The worst performing sector was Information Technology. The Fund’s overweight to software company, Splunk Inc., was the largest detractor during the period. A bright spot in the portfolio was a selection in the Consumer Discretionary sector where an overweight to DraftKings, an e-sports business, contributed favorably to results.
Following the two months since the conversion, the Fund underperformed both the S&P 500 and Russell 3000 Growth benchmarks from September 1, 2021 through October 31, 2021. The underperformance was driven by the portfolio’s overweight to the Biotech sector. The overall strategy generated positive stock selection since the transition, which was driven by the Communication Services, Health Care and Information Technology sectors.
6
Harbor Disruptive Innovation Fund
Manager’s Commentary—Continued
CHANGE IN A $50,000 INVESTMENT
For the period 11/01/2011 through 10/31/2021
The graph compares a $50,000 investment in the Institutional Class shares of the Fund with the performance of the Russell Midcap® Growth Index. The Fund’s performance assumes the reinvestment of all dividend and capital gain distributions.
TOTAL RETURNS
For the periods ended 10/31/2021
1 Year | Annualized | |||||
5 Years | 10 Years | |||||
Harbor Disruptive Innovation Fund | ||||||
Retirement Class1 | 27.41% | 26.18% | 18.01% | |||
Institutional Class | 27.29 | 26.07 | 17.96 | |||
Administrative Class | 26.98 | 25.76 | 17.66 | |||
Investor Class | 26.88 | 25.63 | 17.53 | |||
Comparative Indices | ||||||
S&P 500 | 42.91% | 18.93% | 16.21% | |||
Russell 3000® Growth | 42.81 | 24.96 | 19.08 | |||
Russell Midcap® Growth2 | 39.43 | 21.90 | 16.86 |
As stated in the Fund’s prospectus dated March 1, 2021, as supplemented on May, 19, 2021, the expense ratios were 0.50% (Net) and 0.78% (Gross) (Retirement Class); 0.58% (Net) and 0.86% (Gross) (Institutional Class); 0.83% (Net) and 1.11% (Gross) (Administrative Class); and 0.94% (Net) and 1.22% (Gross) (Investor Class). The Adviser has contractually agreed to limit the Fund’s operating expenses, excluding interest expense (if any) to 0.50%, 0.58%, 0.83%, and 0.94% for the Retirement Class, Institutional Class, Administrative Class and Investor Class, respectively, through August 31, 2022. The expense ratios in the prospectus may differ from the actual expense ratios for the period disclosed within this report. The expense ratios shown in the prospectus are based on the prior fiscal year, adjusted to reflect changes, if any, in contractual arrangements that occurred prior to the date of the prospectus (or supplement thereto, if applicable).
Performance data shown represents past performance and is no guarantee of future results. Past performance is net of management fees and expenses and reflects reinvested dividends and distributions. Past performance reflects the beneficial effect of any expense waivers or reimbursements, without which returns would have been lower. Investment returns and principal value will fluctuate and when redeemed may be worth more or less than their original cost. Returns for periods less than one year are not annualized. Current performance may be higher or lower and is available through the most recent month end at harborcapital.com or by calling 800-422-1050.
OUTLOOK & STRATEGY
As economic growth potentially decelerates into 2022 and 2023, we believe broad market earnings growth will revert to more normal levels. In a backdrop of slowing economic expansion, investors are likely, in our view, to increasingly seek out companies with strong or accelerating earnings growth in a general scarcity of growth environment. We believe companies addressing unmet needs and displacing pre-existing goods and industry leaders are poised to generate greater levels of earnings and cash flow growth over a long-term horizon. Overall, we remain focused on companies we believe to be leading-edge and believe these companies are well-positioned looking ahead.
7
Harbor Disruptive Innovation Fund
Manager’s Commentary—Continued
1 | Retirement Class shares commenced operations on March 1, 2016. The performance attributed to the Retirement Class shares prior to that date is that of the Institutional Class shares. Performance prior to March 1, 2016 has not been adjusted to reflect the lower expenses of Retirement Class shares. During this period, Retirement Class shares would have had returns similar to, but potentially higher than, Institutional Class shares due to the fact that Retirement Class shares represent interests in the same portfolio as Institutional Class shares but are subject to lower expenses. |
2 | Effective September 1, 2021, the Fund’s benchmark index changed from the Russell Midcap® Growth Index to the S&P 500 Index as the Adviser believes this index is a more appropriate comparison in light of the Fund’s new name and investment strategy. |
This report contains the current opinions of Harbor Capital Advisors, Inc. as of the date of this report and should not be considered as investment advice or a recommendation of any particular security, strategy or investment product. Such opinions are subject to change without notice and securities described herein may no longer be included in, or may at any time be removed from, the Fund’s portfolio. This report is distributed for informational purposes only. Information contained herein has been obtained from sources believed reliable, but not guaranteed.
There is no guarantee that the investment objective of the Fund will be achieved. Stock markets are volatile and equity values can decline significantly in response to adverse issuer, political, regulatory, market and economic conditions.Since the Fund may hold foreign securities, it may be subject to greater risks than funds invested only in the U.S. These risks are more severe for securities of issuers in emerging markets regions. For information on the different share classes and the risks associated with an investment in the Fund, please refer to the current prospectus.
8
Harbor Disruptive Innovation Fund
Portfolio of Investments—October 31, 2021
SECTOR ALLOCATION (% of investments) - Unaudited
Portfolio of Investments
Value, Cost, and Principal Amounts in Thousands
COMMON STOCKS—95.5% | |||
Shares | Value | ||
AUTOMOBILES—3.9% | |||
12,213 | Tesla Inc.* | $13,605 | |
BANKS—0.4% | |||
1,989 | SVB Financial Group* | 1,427 | |
BIOTECHNOLOGY—11.4% | |||
10,208 | Acceleron Pharma Inc.* | 1,778 | |
111,016 | Akouos Inc.* | 1,035 | |
132,343 | Allogene Therapeutics Inc.* | 2,282 | |
29,214 | Arrowhead Pharmaceuticals Inc.* | 1,864 | |
18,101 | Ascendis Pharma AS ADR (Denmark)*,1 | 2,744 | |
238,609 | Autolus Therapeutics plc ADR (United Kingdom)*,1 | 1,331 | |
66,258 | Avidity Biosciences Inc.* | 1,491 | |
45,712 | Bicycle Therapeutics plc ADR (United Kingdom)*,1 | 2,350 | |
14,872 | Blueprint Medicines Corp.* | 1,673 | |
145,766 | Cabaletta Bio Inc.* | 1,993 | |
59,921 | Dicerna Pharmaceuticals Inc.* | 1,247 | |
18,088 | Fate Therapeutics Inc.* | 973 | |
192,647 | Freeline Therapeutics Holdings plc ADR (United Kingdom)*,1 | 574 | |
18,230 | Invitae Corp.* | 483 | |
60,481 | Iovance Biotherapeutics Inc.* | 1,470 | |
126,478 | Ironwood Pharmaceuticals Inc.* | 1,615 | |
21,323 | Krystal Biotech Inc.* | 1,068 | |
321,217 | LogicBio Therapeutics Inc.* | 1,172 | |
222,957 | Magenta Therapeutics Inc.* | 1,427 | |
336,390 | Orchard Therapeutics plc ADR (United Kingdom)*,1 | 646 | |
138,686 | Precision BioSciences Inc.* | 1,316 | |
46,517 | REGENXBIO Inc.* | 1,649 | |
45,458 | Replimune Group Inc.* | 1,342 | |
98,299 | Rocket Pharmaceuticals Inc.* | 2,920 | |
481,797 | Synlogic Inc.* | 1,233 | |
108,636 | TCR2 Therapeutics Inc.* | 684 | |
39,959 | UniQure NV (Netherlands)* | 1,218 | |
39,578 | |||
BUILDING PRODUCTS—0.7% | |||
22,601 | Trex Co. Inc.* | 2,405 | |
CAPITAL MARKETS—1.8% | |||
19,894 | Coinbase Global Inc.* | 6,355 | |
CONTAINERS & PACKAGING—1.8% | |||
69,029 | Ball Corp. | 6,315 |
COMMON STOCKS—Continued | |||
Shares | Value | ||
ELECTRIC UTILITIES—0.2% | |||
8,838 | NextEra Energy Inc. | $754 | |
ELECTRICAL EQUIPMENT—1.4% | |||
62,529 | Amphenol Corp. | 4,800 | |
ENTERTAINMENT—3.3% | |||
3,685 | Roku Inc.* | 1,123 | |
29,754 | Sea Ltd. ADR (Singapore)*,1 | 10,223 | |
11,346 | |||
HEALTH CARE EQUIPMENT & SUPPLIES—2.8% | |||
1,305 | Align Technology Inc.* | 815 | |
2,577 | Dexcom Inc.* | 1,606 | |
1,794 | IDEXX Laboratories Inc.* | 1,195 | |
6,066 | Insulet Corp.* | 1,881 | |
3,751 | Masimo Corp.* | 1,064 | |
12,817 | Tandem Diabetes Care Inc.* | 1,747 | |
2,968 | The Cooper Companies Inc. | 1,237 | |
9,545 | |||
HEALTH CARE PROVIDERS & SERVICES—0.6% | |||
8,708 | Amedisys Inc.* | 1,475 | |
13,045 | Oak Street Health Inc.* | 616 | |
2,091 | |||
HOTELS, RESTAURANTS & LEISURE—0.6% | |||
1,234 | Chipotle Mexican Grill Inc.* | 2,195 | |
INTERACTIVE MEDIA & SERVICES—5.8% | |||
1,468 | Alphabet Inc. Class A* | 4,347 | |
9,197 | Meta Platforms Inc.* | 2,976 | |
89,871 | Tencent Holdings Ltd. ADR (China)1 | 5,463 | |
135,619 | Twitter Inc.* | 7,261 | |
20,047 | |||
INTERNET & DIRECT MARKETING RETAIL—8.7% | |||
3,227 | Amazon.com Inc.* | 10,883 | |
183,914 | Coupang Inc. (South Korea)* | 5,473 | |
49,380 | DoorDash Inc.* | 9,619 | |
2,851 | MercadoLibre Inc. (Argentina)* | 4,223 | |
30,198 |
9
Harbor Disruptive Innovation Fund
Portfolio of Investments—Continued
Value, Cost, and Principal Amounts in Thousands
COMMON STOCKS—Continued | |||
Shares | Value | ||
IT SERVICES—12.8% | |||
2,134 | Adyen NV (Netherlands)*,2 | $6,439 | |
13,423 | Okta Inc.* | 3,318 | |
14,513 | PayPal Holdings Inc.* | 3,376 | |
4,797 | Shopify Inc. (Canada)* | 7,036 | |
12,460 | Snowflake Inc.* | 4,409 | |
42,763 | Square Inc.* | 10,883 | |
30,589 | Twilio Inc.* | 8,912 | |
44,373 | |||
LEISURE PRODUCTS—1.9% | |||
70,020 | Peloton Interactive Inc.* | 6,403 | |
LIFE SCIENCES TOOLS & SERVICES—1.9% | |||
1,565 | Bio-Rad Laboratories Inc.* | 1,244 | |
10,436 | ICON plc (Ireland)* | 2,993 | |
2,298 | Lonza Group AG (Switzerland) | 1,888 | |
15,916 | Pacific Biosciences of California Inc.* | 421 | |
6,546 | |||
MEDIA—1.2% | |||
114,693 | ViacomCBS Inc. | 4,154 | |
PHARMACEUTICALS—1.1% | |||
22,604 | Arvinas Inc.* | 1,957 | |
14,390 | Catalent Inc.* | 1,984 | |
3,941 | |||
PROFESSIONAL SERVICES—0.5% | |||
14,513 | TransUnion | 1,673 | |
REAL ESTATE MANAGEMENT & DEVELOPMENT—1.0% | |||
64,750 | Redfin Corp.* | 3,324 | |
SEMICONDUCTORS & SEMICONDUCTOR EQUIPMENT—11.0% | |||
12,948 | Advanced Micro Devices Inc.* | 1,557 | |
20,416 | Applied Materials Inc. | 2,790 | |
15,534 | Lam Research Corp. | 8,754 | |
82,934 | Microchip Technology Inc. | 6,145 | |
39,045 | NVIDIA Corp. | 9,983 |
COMMON STOCKS—Continued | |||
Shares | Value | ||
SEMICONDUCTORS & SEMICONDUCTOR EQUIPMENT—Continued | |||
39,986 | Taiwan Semiconductor Manufacturing Co. Ltd. ADR (Taiwan)1 | $4,546 | |
23,860 | Texas Instruments Inc. | 4,473 | |
38,248 | |||
SOFTWARE—17.1% | |||
12,852 | Atlassian Corp. plc (Australia)* | 5,888 | |
6,088 | Autodesk Inc.* | 1,933 | |
15,633 | Cadence Design Systems Inc.* | 2,706 | |
19,536 | Cloudflare Inc.* | 3,804 | |
3,816 | DocuSign Inc.* | 1,062 | |
25,961 | Lightspeed Commerce Inc. (Canada)* | 2,536 | |
34,246 | Microsoft Corp. | 11,357 | |
62,693 | SailPoint Technologies Holdings Inc.* | 3,008 | |
24,538 | salesforce.com Inc.* | 7,354 | |
12,351 | ServiceNow Inc.* | 8,618 | |
14,637 | Workday Inc.* | 4,244 | |
15,557 | Zendesk Inc.* | 1,584 | |
19,500 | Zoom Video Communications Inc.* | 5,356 | |
59,450 | |||
SPECIALTY RETAIL—2.0% | |||
23,160 | Carvana Co.* | 7,022 | |
TRADING COMPANIES & DISTRIBUTORS—0.8% | |||
50,682 | Fastenal Co. | 2,893 | |
WIRELESS TELECOMMUNICATION SERVICES—0.8% | |||
25,423 | T-Mobile US Inc.* | 2,924 | |
TOTAL COMMON STOCKS | |||
(Cost $334,149) | 331,612 | ||
TOTAL INVESTMENTS—95.5% | |||
(Cost $334,149) | 331,612 | ||
CASH AND OTHER ASSETS, LESS LIABILITIES—4.5% | 15,589 | ||
TOTAL NET ASSETS—100.0% | $347,201 |
FAIR VALUE MEASUREMENTS
As of October 31, 2021, the investments in Adyen NV and Lonza Group AG (as disclosed in the preceding Portfolio of Investments) were classified as Level 2 and all other investments were classified as Level 1. There were no Level 3 investments at October 31, 2021 or 2020.
For more information on valuation inputs and their aggregation into the levels identified above, please refer to the Fair Value Measurements and Disclosures in Note 2 of the accompanying Notes to Financial Statements.
*
Non-income producing security
1
Depositary receipts such as American Depositary Receipts (ADRs), Global Depositary Receipts (GDRs) and other country specific depositary receipts are certificates evidencing ownership of shares of a foreign issuer. These certificates are issued by depositary banks and generally trade on an established market in the U.S. or elsewhere.
2
Securities purchased in a transaction exempt from registration under Rule 144A of the Securities Act of 1933. These securities may be resold in transactions exempt from registration, normally to qualified institutional buyers. The Fund has no right to demand registration of these securities. At October 31, 2021, the aggregate value of these securities was $6,439 or 2% of net assets.
The accompanying notes are an integral part of the Financial Statements.
10
Harbor Large Cap Value Fund
Manager’s Commentary (Unaudited)
Subadviser
Aristotle Capital Management, LLC
11100 Santa
Monica Boulevard
Suite 1700
Los Angeles, CA 90025
Monica Boulevard
Suite 1700
Los Angeles, CA 90025
Portfolio ManagerS
Howard Gleicher, CFA
Since 2012
Since 2012
Gregory D. Padilla, CFA
Since 2018
Since 2018
Aristotle has subadvised the Fund since 2012.
Investment Objective
The Fund seeks long-term total return.
Management’s Discussion of
Fund Performance
Fund Performance
Market Review
U.S. equity markets marched higher during the past year as improving economic data, positive progress on COVID-19 and reflationary pressures led the way. For the one-year period ended October 31, 2021, the S&P 500 returned 42.91%, advancing in 10 of 12 months. In terms of style, value outperformed slightly with the Russell 1000® Value Index outperforming its growth counterpart by 0.55% during the period.
The approval and distribution of vaccines to protect against COVID-19, resulting in a decrease in infections and the relaxation of quarantine mandates, helped to fuel positive momentum in the first half of 2021. With the help of additional fiscal stimulus in the U.S. and accommodative monetary policy from the Federal Reserve (“Fed”), the economy rebounded strongly in the first half of the year. As a result, GDP growth peaked in the second quarter with the U.S. economy expanding at a 6.7% annual pace.
After making significant progress against the spread of COVID-19 in the first half of the year, Delta, a more contagious variant of the virus, spread throughout the country (and the world) during the third quarter. In line with the uncertain backdrop caused by the Delta variant, economic data was mixed. The unemployment rate continued to decline, falling to 4.8% in September, which was the lowest level since the pandemic began. However, nonfarm payroll figures in August and September fell well below expectations after strong numbers in July.
U.S. equity markets closed out the reporting period near record highs, with the S&P 500 logging its strongest monthly advance of the year in October. Elevated inflation and the end of stimulative monetary policy from global central banks were among the biggest worries for markets at the end of October. While inflation remains elevated, with core consumer price index up 4.0% on a 12-month basis, it rose just 0.2% in September and 0.1% in August, its softest monthly increase since February. Correspondingly, the Fed kept monetary policy intact at the September meeting but indicated that a tapering of its $120 billion per month asset-purchase plan may soon be warranted. Despite the uncertainty regarding the COVID-19 environment, corporate earnings posted an impressive rebound. Companies across various industries highlighted strong demand, while topics such as supply constraints, labor shortages and rising input costs were also commonly cited.
Performance
For the year ended October 31, 2021, the Harbor Large Cap Value Fund posted a total return of 40.62% (Retirement Class), 40.52% (Institutional Class), 40.05% (Administrative Class) and 39.96% (Investor Class) underperforming the 43.76% return of the Russell 1000® Value Index.
The majority of the Fund’s underperformance relative to the Russell 1000® Value Index during the year can be attributed to security selection, while sector allocation also detracted modestly. Security selection in the Energy, Health Care and Materials sectors detracted the most from relative performance. Conversely, security selection in Industrials, coupled with underweight positions in Utilities and Communication Services, contributed the most to relative performance.
Credit card company, Capital One Financial, was the top contributor to relative return during the period. Shares of Capital One advanced as the company posted strong earnings throughout the period, driven by strong credit results and rebounding spending volumes in the Credit Card segment. The company also reported positive stress test results in the second quarter that will allow Capital One to lower its capital requirement and return excess capital to shareholders. Earlier in the year, Capital One’s Board of Directors authorized a common stock repurchase program of up to $7.5 billion while restoring its dividend to the previous 40 cents per share. While the company has certainly benefitted in the short term from an
11
Harbor Large Cap Value Fund
Manager’s Commentary—Continued
CHANGE IN A $50,000 INVESTMENT
For the period 11/01/2011 through 10/31/2021
The graph compares a $50,000 investment in the Institutional Class shares of the Fund with the performance of the Russell 1000® Value Index. The Fund’s performance assumes the reinvestment of all dividend and capital gain distributions.
TOTAL RETURNS
For the periods ended 10/31/2021
1 Year | Annualized | |||||
5 Years | 10 Years | |||||
Harbor Large Cap Value Fund | �� | |||||
Retirement Class1 | 40.62% | 17.05% | 15.89% | |||
Institutional Class | 40.52 | 16.97 | 15.84 | |||
Administrative Class | 40.05 | 16.65 | 15.53 | |||
Investor Class | 39.96 | 16.52 | 15.40 | |||
Comparative Index | ||||||
Russell 1000® Value | 43.76% | 12.39% | 12.85% |
As stated in the Fund’s prospectus dated March 1, 2021, the expense ratios were 0.61% (Net) and 0.64% (Gross) (Retirement Class); 0.69% (Net) and 0.72% (Gross) (Institutional Class); 0.94% (Net) and 0.97% (Gross) (Administrative Class); and 1.05% (Net) and 1.08% (Gross) (Investor Class). The net expense ratios reflect an expense limitation agreement (excluding interest expense, if any) effective through 02/28/2022. The expense ratios in the prospectus may differ from the actual expense ratios for the period disclosed within this report. The expense ratios shown in the prospectus are based on the prior fiscal year, adjusted to reflect changes, if any, in contractual arrangements that occurred prior to the date of the prospectus (or supplement thereto, if applicable).
Performance data shown represents past performance and is no guarantee of future results. Past performance is net of management fees and expenses and reflects reinvested dividends and distributions. Past performance reflects the beneficial effect of any expense waivers or reimbursements, without which returns would have been lower. Investment returns and principal value will fluctuate and when redeemed may be worth more or less than their original cost. Returns for periods less than one year are not annualized. Current performance may be higher or lower and is available through the most recent month end at harborcapital.com or by calling 800-422-1050.
improving macroeconomic environment, we believe the catalysts we have previously identified are company-specific and, in our opinion, include a continued strong presence in credit cards with potential to gain market share, robust profitability profile with improvements as the credit card industry normalizes its share relative to other payment methods and the deployment of free cash flow for shareholder-beneficial strategies.
Biopharmaceutical company, Amgen, was the top detractor during the period. Shares of Amgen fell in the third quarter as the company reported declining sales, with patient visits and lab test procedure trends remaining below pre-COVID-19 levels, and disappointing pipeline data. Correspondingly, the company lowered its earnings per share guidance for the full year. Near the end of 2020, Amgen, in partnership with biopharmaceutical companies Cytokinetics and Servier, announced underwhelming results for GALACTIC-HF, a Phase 3 clinical trial of omecamtiv mecarbil in patients with heart failure that did not meet its secondary endpoint. Nevertheless, we believe in Amgen’s ability to navigate the difficult environment, continue to win market share and execute on profitability initiatives. We believe the company’s demonstrated history of developing novel treatments, its robust biosimilar portfolio and improvements to operational efficiency should continue to propel the company in the long run.
Outlook & Strategy
1
Retirement Class shares commenced operations on March 1, 2016. The performance attributed to the Retirement Class shares prior to that date is that of the Institutional Class shares. Performance prior to March 1, 2016 has not been adjusted to reflect the lower expenses of Retirement Class shares. During this period, Retirement Class shares would have had returns similar to, but potentially higher than, Institutional Class shares due to the fact that Retirement Class shares represent interests in the same portfolio as Institutional Class shares but are subject to lower expenses.
This report contains the current opinions of Aristotle Capital Management, LLC as of the date of this report and should not be considered as investment advice or a recommendation of any particular security, strategy or investment product. Such opinions are subject to change without notice and securities described herein may no longer be included in, or may at any time be removed from, the Fund’s portfolio. This report is distributed for informational purposes only. Information contained herein has been obtained from sources believed reliable, but not guaranteed.
There is no guarantee that the investment objective of the Fund will be achieved. Stock markets are volatile and equity values can decline significantly in response to adverse issuer, political, regulatory, market and economic conditions. Since the Fund may hold foreign securities, it may be subject to greater risks than funds invested only in the U.S. These risks are more severe for securities of issuers in emerging markets regions. For information on the different share classes and the risks associated with an investment in the Fund, please refer to the current prospectus.
12
Harbor Large Cap Value Fund
Portfolio of Investments—October 31, 2021
SECTOR ALLOCATION (% of investments) - Unaudited
Portfolio of Investments
Value, Cost, and Principal Amounts in Thousands
COMMON STOCKS—96.7% | |||
Shares | Value | ||
AEROSPACE & DEFENSE—1.7% | |||
216,091 | General Dynamics Corp. | $43,812 | |
AUTO COMPONENTS—2.2% | |||
1,815,793 | Cie Generale des Etablissements Michelin SCA ADR (France)1 | 57,089 | |
BANKS—7.6% | |||
453,190 | Commerce Bancshares Inc. | 31,954 | |
363,000 | Cullen/Frost Bankers Inc. | 47,009 | |
303,157 | East West Bancorp Inc. | 24,095 | |
4,595,000 | Mitsubishi UFJ Financial Group Inc. ADR (Japan)1 | 25,319 | |
317,137 | PNC Financial Services Group Inc. | 66,925 | |
195,302 | |||
BEVERAGES—2.3% | |||
908,389 | Coca-Cola Co. | 51,206 | |
36,241 | Constellation Brands Inc. | 7,857 | |
59,063 | |||
BIOTECHNOLOGY—2.0% | |||
241,000 | Amgen Inc. | 49,880 | |
BUILDING PRODUCTS—2.7% | |||
935,413 | Johnson Controls International plc | 68,631 | |
CAPITAL MARKETS—2.7% | |||
227,000 | Ameriprise Financial Inc. | 68,583 | |
CHEMICALS—6.8% | |||
1,513,000 | Corteva Inc. | 65,286 | |
275,000 | Ecolab Inc. | 61,110 | |
546,236 | RPM International Inc. | 47,632 | |
174,028 | |||
CONSTRUCTION MATERIALS—2.6% | |||
172,000 | Martin Marietta Materials Inc. | 67,568 | |
CONSUMER FINANCE—3.0% | |||
502,000 | Capital One Financial Corp. | 75,817 | |
EQUITY REAL ESTATE INVESTMENT TRUSTS (REITs)—4.7% | |||
332,150 | Crown Castle International Corp. | 59,887 |
COMMON STOCKS—Continued | |||
Shares | Value | ||
EQUITY REAL ESTATE INVESTMENT TRUSTS (REITs)—Continued | |||
355,146 | Equity Lifestyle Properties Inc. | $30,013 | |
151,066 | Sun Communities Inc. | 29,606 | |
119,506 | |||
FOOD & STAPLES RETAILING—0.9% | |||
466,000 | Walgreens Boots Alliance Inc. | 21,911 | |
FOOD PRODUCTS—1.6% | |||
511,249 | Tyson Foods Inc. | 40,885 | |
HEALTH CARE EQUIPMENT & SUPPLIES—8.7% | |||
680,000 | Alcon Inc. (Switzerland) | 56,685 | |
359,159 | Danaher Corp. | 111,975 | |
455,000 | Medtronic plc (Ireland) | 54,536 | |
223,196 | |||
HOUSEHOLD DURABLES—6.0% | |||
703,000 | Lennar Corp. Class A | 70,251 | |
7,126 | Lennar Corp. Class B | 585 | |
705,339 | Sony Corp. ADR (Japan)1 | 81,671 | |
152,507 | |||
HOUSEHOLD PRODUCTS—2.0% | |||
359,646 | Procter & Gamble Co. | 51,426 | |
INDUSTRIAL CONGLOMERATES—2.3% | |||
271,000 | Honeywell International Inc. | 59,246 | |
INSURANCE—4.0% | |||
238,099 | Chubb Ltd. (Switzerland) | 46,520 | |
459,181 | Cincinnati Financial Corp | 55,763 | |
102,283 | |||
INTERACTIVE MEDIA & SERVICES—2.0% | |||
977,500 | Twitter Inc.* | 52,335 | |
IT SERVICES—2.1% | |||
226,098 | PayPal Holdings Inc.* | 52,588 | |
MACHINERY—5.1% | |||
10,358 | Oshkosh Corp. | 1,109 | |
212,000 | Parker-Hannifin Corp. | 62,877 | |
514,000 | Xylem Inc. | 67,123 | |
131,109 |
13
Harbor Large Cap Value Fund
Portfolio of Investments—Continued
Value, Cost, and Principal Amounts in Thousands
COMMON STOCKS—Continued | |||
Shares | Value | ||
OIL, GAS & CONSUMABLE FUELS—3.3% | |||
2,377,000 | Coterra Energy Inc. | $50,678 | |
442,180 | Phillips 66 | 33,066 | |
83,744 | |||
PHARMACEUTICALS—3.0% | |||
1,442,596 | Elanco Animal Health Inc.* | 47,433 | |
346,967 | Novartis AG ADR (Switzerland)1 | 28,715 | |
76,148 | |||
SEMICONDUCTORS & SEMICONDUCTOR EQUIPMENT—5.0% | |||
898,386 | Microchip Technology Inc. | 66,562 | |
463,200 | QUALCOMM Inc. | 61,624 | |
128,186 | |||
SOFTWARE—12.4% | |||
168,076 | Adobe Inc.* | 109,310 |
COMMON STOCKS—Continued | |||
Shares | Value | ||
SOFTWARE—Continued | |||
223,000 | ANSYS Inc.* | $84,646 | |
371,166 | Microsoft Corp. | 123,086 | |
317,042 | |||
TOTAL COMMON STOCKS | |||
(Cost $1,589,000) | 2,471,885 | ||
TOTAL INVESTMENTS—96.7% | |||
(Cost $1,589,000) | 2,471,885 | ||
CASH AND OTHER ASSETS, LESS LIABILITIES—3.3% | 85,427 | ||
TOTAL NET ASSETS—100.0% | $2,557,312 |
FAIR VALUE MEASUREMENTS
All investments at October 31, 2021 (as disclosed in the preceding Portfolio of Investments) were classified as Level 1. There were no Level 3 investments at October 31, 2021 or 2020.
For more information on valuation inputs and their aggregation into the levels identified above, please refer to the Fair Value Measurements and Disclosures in Note 2 of the accompanying Notes to Financial Statements.
*
Non-income producing security
1
Depositary receipts such as American Depositary Receipts (ADRs), Global Depositary Receipts (GDRs) and other country specific depositary receipts are certificates evidencing ownership of shares of a foreign issuer. These certificates are issued by depositary banks and generally trade on an established market in the U.S. or elsewhere.
The accompanying notes are an integral part of the Financial Statements.
14
Harbor Mid Cap Fund
Manager’s Commentary (Unaudited)
Subadviser
EARNEST Partners, LLC
1180 Peachtree St. NE
Suite 2300
Atlanta, GA 30309
Suite 2300
Atlanta, GA 30309
Portfolio Manager
Paul E. Viera
Since 2019
Since 2019
EARNEST Partners, LLC has subadvised the Fund since 2019.
Investment Objective
The Fund seeks long-term total return.
Management’s Discussion of
Fund Performance
Fund Performance
MARKET REVIEW
The U.S. equity markets, represented by the S&P 500 Index, were strongly positive during the 12-month period ended October 31, 2021, posting nearly 43% return. However, the U.S. mid cap market, represented by the Russell Midcap® Index, advanced even more finishing the period up by 45%.
Capital markets continued to charge higher as investors received clarity on the economic impact from the COVID-19 pandemic and began to look forward to how a post-COVID-19 environment would support future earnings growth. U.S. Congressional attention shifted away from COVID-19 stimulus and towards the proposed infrastructure bill that was negotiated last quarter, along with raising the debt ceiling and funding the federal budget. The proposed $1.2 trillion infrastructure bill provides for $579 billion in new spending on transportation, roads/bridges and utilities. Since the pandemic began, Congress approved approximately $5.3 trillion in stimulus that included forgivable small business loans, direct payments to households, expanded unemployment benefits and vaccine funding. Previously, the Fed enacted an array of stimulative measures that included short-term rate reductions to near-zero and repurchases of U.S. Treasuries, mortgages and corporate debt. The Fed stated that it would “maintain an accommodative stance” until its goals of 2% long-term inflation and maximum employment are achieved. In its latest statement, the Fed maintained that it will continue to hold rates near zero and provide stimulus by continuing its monthly purchases of Treasury securities and agency mortgage-backed securities. However, it noted that strengthening economic activity and continued progress on vaccinations provide justification for allowing inflation to run “moderately above 2% for some time,” and that a reduction in the pace of asset repurchases may soon be warranted. In further statements, the Fed expressed that these reductions could begin as soon as its next meeting in November but stated that recent inflation trends (about 5% year-over-year since May) appear to be transitory.
Performance
Harbor Mid Cap Fund posted a return of 37.61% (Retirement Class), 37.54% (Institutional Class) and 37.00% (Investor Class) for the year ended October 31, 2021, underperforming the 45.40% return of the Russell Midcap® Index.
Contributing to performance for the period, CBRE is a top global commercial real estate services firm. The company helps owners, tenants and investors with their real estate needs from property management to property sales and leasing brokerage, with the breadth to cover property types from office buildings to shopping malls. Despite continued pressure in the office market, CBRE reported revenue and earnings that beat expectations; this helped push shares ahead of the index and more than doubled over the period. CBRE is benefiting from a secular and global push towards facility management outsourcing. In particular, the company is seeing strong transactional service growth in Asia due to this trend. Going forward, we believe CBRE’s strong position in facility management and weakened competitors will lead to increased market share in the brokerage business. Additionally, in our view, CBRE’s diversified global exposure, solid execution and prudent management provide an opportunity to grow earnings over the next market cycle.
Detracting from performance, Reinsurance Group of America (“RGA”) is one of the largest and most sophisticated life reinsurers in the world. RGA focuses on growing its business by partnering with primary insurance companies and helping them underwrite difficult risk that they may not have the expertise to underwrite on their own. During the period, RGA shares underperformed due to elevated COVID-19 claims in the period. While there was a short-term increase in claims, the longevity offset was $11 million, which is lower than expected. The company also expects the COVID-19 vaccination rollout to lower mortality claim costs for the remainder of 2021. The shares rose a modest 4% during the period, trailing the Index.
15
Harbor Mid Cap Fund
Manager’s Commentary—Continued
CHANGE IN A $50,000 INVESTMENT
For the period 12/01/2019 through 10/31/2021
The graph compares a $50,000 investment in the Institutional Class shares of the Fund with the performance of the Russell Midcap® Index. The Fund’s performance assumes the reinvestment of all dividend and capital gain distributions.
TOTAL RETURNS
For the periods ended 10/31/2021
1 Year | 5 Years | Annualized | ||||
Life of Fund | ||||||
Harbor Mid Cap Fund | ||||||
Retirement Class1 | 37.61% | N/A | 21.67% | |||
Institutional Class1 | 37.54 | N/A | 21.58 | |||
Investor Class1 | 37.00 | N/A | 21.13 | |||
Comparative Index | ||||||
Russell Midcap®1 | 45.40% | N/A | 21.89% |
As stated in the Fund’s prospectus dated March 1, 2021, the expense ratios were 0.80% (Net) and 1.05% (Gross) (Retirement Class); 0.88% (Net) and 1.13% (Gross) (Institutional Class); 1.13% (Net) and 1.38% (Gross) (Administrative Class); and 1.24% (Net) and 1.49% (Gross) (Investor Class). The net expense ratios reflect an expense limitation agreement (excluding interest expense, if any) effective through 02/28/2022. The expense ratios in the prospectus may differ from the actual expense ratios for the period disclosed within this report. The expense ratios shown in the prospectus are based on the prior fiscal year, adjusted to reflect changes, if any, in contractual arrangements that occurred prior to the date of the prospectus (or supplement thereto, if applicable).
Performance data shown represents past performance and is no guarantee of future results. Past performance is net of management fees and expenses and reflects reinvested dividends and distributions. Past performance reflects the beneficial effect of any expense waivers or reimbursements, without which returns would have been lower. Investment returns and principal value will fluctuate and when redeemed may be worth more or less than their original cost. Returns for periods less than one year are not annualized. Current performance may be higher or lower and is available through the most recent month end at harborcapital.com or by calling 800-422-1050.
Due to high capital requirements and the long-term nature of potential clients' liabilities, we believe there are few global competitors in the industry. In our view, RGA’s scale and growth strategy should continue to drive earnings and gain market share.
OUTLOOK & STRATEGY
As of October 31, 2021, the Fund had an overweight in the Industrials, Health Care, Information Technology and Financials sectors, and an underweight in Consumer Staples, Consumer Discretionary and Utilities. We believe the Fund’s relative overweight and underweight positions are an outgrowth of where EARNEST Partners is finding good individual investment opportunities.
1
The “Life of Fund” return as shown reflects the period 12/01/2019 through 10/31/2021.
This report contains the current opinions of EARNEST Partners, LLC as of the date of this report and should not be considered as investment advice or a recommendation of any particular security, strategy or investment product. Such opinions are subject to change without notice and securities described herein may no longer be included in, or may at any time be removed from, the Fund’s portfolio. This report is distributed for informational purposes only. Information contained herein has been obtained from sources believed reliable, but not guaranteed.
There is no guarantee that the investment objective of the Fund will be achieved. Stock markets are volatile and equity values can decline significantly in response to adverse issuer, political, regulatory, market and economic conditions.Since the Fund may hold foreign securities, it may be subject to greater risks than funds invested only in the U.S. These risks are more severe for securities of issuers in emerging markets regions. For information on the different share classes and the risks associated with an investment in the Fund, please refer to the current prospectus.
16
Harbor Mid Cap Fund
Portfolio of Investments—October 31, 2021
SECTOR ALLOCATION (% of investments) - Unaudited
Portfolio of Investments
Value, Cost, and Principal Amounts in Thousands
COMMON STOCKS—98.9% | |||
Shares | Value | ||
AEROSPACE & DEFENSE—1.4% | |||
4,282 | General Dynamics Corp. | $868 | |
BANKS—1.8% | |||
47,295 | KeyCorp | 1,100 | |
BUILDING PRODUCTS—1.8% | |||
17,203 | Masco Corp. | 1,128 | |
CAPITAL MARKETS—8.5% | |||
10,654 | Houlihan Lokey Inc. | 1,194 | |
11,748 | Intercontinental Exchange Inc. | 1,627 | |
12,994 | Raymond James Financial Inc. | 1,281 | |
15,982 | Stifel Financial Corp. | 1,164 | |
5,266 | |||
CHEMICALS—4.6% | |||
5,886 | Albemarle Corp. | 1,474 | |
6,504 | Eastman Chemical Co. | 677 | |
4,621 | Scotts Miracle-Gro Co. | 686 | |
2,837 | |||
COMMERCIAL SERVICES & SUPPLIES—4.2% | |||
12,818 | Republic Services Inc. | 1,725 | |
13,009 | Stericycle Inc.* | 871 | |
2,596 | |||
CONTAINERS & PACKAGING—2.8% | |||
5,033 | Packaging Corp. of America | 692 | |
17,924 | Sealed Air Corp. | 1,063 | |
1,755 | |||
ELECTRICAL EQUIPMENT—1.8% | |||
20,411 | Sensata Technologies Holding plc (United Kingdom)* | 1,125 | |
ELECTRONIC EQUIPMENT, INSTRUMENTS & COMPONENTS—4.4% | |||
8,417 | Arrow Electronics Inc.* | 974 | |
9,595 | Keysight Technologies Inc.* | 1,728 | |
2,702 | |||
ENTERTAINMENT—1.6% | |||
12,656 | Activision Blizzard Inc. | 990 | |
EQUITY REAL ESTATE INVESTMENT TRUSTS (REITs)—4.5% | |||
30,786 | Americold Realty Trust | ��� 907 |
COMMON STOCKS—Continued | |||
Shares | Value | ||
EQUITY REAL ESTATE INVESTMENT TRUSTS (REITs)—Continued | |||
8,064 | Boston Properties Inc. | $917 | |
2,722 | SBA Communications Corp. | 940 | |
2,764 | |||
FOOD & STAPLES RETAILING—1.3% | |||
10,331 | Sysco Corp. | 794 | |
HEALTH CARE EQUIPMENT & SUPPLIES—1.3% | |||
13,789 | Dentsply Sirona Inc. | 789 | |
HEALTH CARE PROVIDERS & SERVICES—2.5% | |||
5,371 | AmerisourceBergen Corp. | 655 | |
3,090 | Laboratory Corp. of America Holdings* | 887 | |
1,542 | |||
HOTELS, RESTAURANTS & LEISURE—2.3% | |||
9,992 | Darden Restaurants Inc. | 1,440 | |
HOUSEHOLD DURABLES—2.7% | |||
18,366 | D.R. Horton Inc. | 1,639 | |
INSURANCE—4.2% | |||
5,607 | Reinsurance Group of America Inc. | 662 | |
5,609 | Renaissance Holdings Ltd. (Bermuda) | 795 | |
11,729 | The Progressive Corp. | 1,113 | |
2,570 | |||
IT SERVICES—5.7% | |||
7,843 | Akamai Technologies Inc.* | 827 | |
10,949 | Black Knight Inc.* | 768 | |
5,386 | Broadridge Financial Solutions Inc. | 961 | |
6,813 | Global Payments Inc. | 974 | |
3,530 | |||
LIFE SCIENCES TOOLS & SERVICES—6.3% | |||
8,947 | Agilent Technologies Inc. | 1,409 | |
1,957 | Bio-Rad Laboratories Inc.* | 1,555 | |
10,257 | Syneos Health Inc.* | 958 | |
3,922 | |||
MACHINERY—5.8% | |||
3,723 | Cummins Inc. | 893 | |
5,577 | Dover Corp. | 943 |
17
Harbor Mid Cap Fund
Portfolio of Investments—Continued
Value, Cost, and Principal Amounts in Thousands
COMMON STOCKS—Continued | |||
Shares | Value | ||
MACHINERY—Continued | |||
4,238 | Snap-on Inc. | $861 | |
7,593 | Woodward Inc. | 858 | |
3,555 | |||
MULTILINE RETAIL—2.4% | |||
13,583 | Dollar Tree Inc.* | 1,464 | |
MULTI-UTILITIES—1.2% | |||
8,535 | WEC Energy Group Inc. | 769 | |
OIL, GAS & CONSUMABLE FUELS—4.2% | |||
26,210 | Continental Resources Inc. | 1,279 | |
62,383 | Coterra Energy Inc. | 1,330 | |
2,609 | |||
REAL ESTATE MANAGEMENT & DEVELOPMENT—3.0% | |||
17,527 | CBRE Group Inc.* | 1,824 | |
ROAD & RAIL—1.6% | |||
27,773 | CSX Corp. | 1,004 | |
SEMICONDUCTORS & SEMICONDUCTOR EQUIPMENT—7.7% | |||
7,968 | Applied Materials Inc. | 1,089 | |
8,108 | CMC Materials Inc. | 1,041 | |
9,256 | Skyworks Solutions Inc. | 1,547 | |
5,945 | Xilinx Inc. | 1,070 | |
4,747 |
COMMON STOCKS—Continued | |||
Shares | Value | ||
SOFTWARE—6.0% | |||
4,120 | ANSYS Inc.* | $1,564 | |
21,927 | CDK Global Inc. | 954 | |
3,635 | Synopsys Inc.* | 1,211 | |
3,729 | |||
SPECIALTY RETAIL—0.9% | |||
8,841 | TJX Companies Inc. | 579 | |
TRADING COMPANIES & DISTRIBUTORS—2.4% | |||
20,662 | Air Lease Corp. | 828 | |
7,152 | GATX Corp. | 678 | |
1,506 | |||
TOTAL COMMON STOCKS | |||
(Cost $52,183) | 61,143 | ||
TOTAL INVESTMENTS—98.9% | |||
(Cost $52,183) | 61,143 | ||
CASH AND OTHER ASSETS, LESS LIABILITIES—1.1% | 651 | ||
TOTAL NET ASSETS—100.0% | $61,794 |
FAIR VALUE MEASUREMENTS
All investments at October 31, 2021 (as disclosed in the preceding Portfolio of Investments) were classified as Level 1. There were no Level 3 investments at October 31, 2021 or 2020.
For more information on valuation inputs and their aggregation into the levels identified above, please refer to the Fair Value Measurements and Disclosures in Note 2 of the accompanying Notes to Financial Statements.
*
Non-income producing security
The accompanying notes are an integral part of the Financial Statements.
18
Harbor Mid Cap Value Fund
Manager’s Commentary (Unaudited)
Subadviser
LSV Asset Management
155 North Wacker Dr.
Suite 4600
Chicago, IL 60606
Suite 4600
Chicago, IL 60606
Portfolio Managers
Josef Lakonishok, Ph.D.
Since 2004
Since 2004
Menno Vermeulen, CFA
Since 2004
Since 2004
Puneet Mansharamani, CFA
Since 2006
Since 2006
Greg Sleight
Since 2014
Since 2014
Guy Lakonishok, CFA
Since 2014
Since 2014
LSV has subadvised the Fund since 2004.
Investment Objective
The Fund seeks long-term total return.
Management’s Discussion of
Fund Performance
Fund Performance
Market Review
The broad U.S. equity market, as measured by the S&P 500 Index, finished up 42.91% for the year ended October 31, 2021. Global equity markets rallied over the last 12 months, fueled by positive news on vaccines to fight COVID-19, continued government stimulus in the U.S. and accommodative monetary policies around the world. Small cap stocks led the way in the period as the Russell 2000® Index returned 50.80%. Value stocks outperformed growth stocks, particularly among small and midcap stocks. The value advantage among midcap stocks was nearly 10% as the Russell Midcap® Value Index returned 48.60% while the Russell Midcap® Growth Index advanced 39.43%.
After several years of relative underperformance, value stocks staged a comeback over the trailing 12 months, particularly over the first half of the period, fueled by optimism for a sustained increase in economic growth. The optimism was driven by the successful rollout of effective COVID-19 vaccines, accommodative monetary policies and continued fiscal stimulus in the U.S. However, the rally in value stocks slowed in the second half of the period as an uptick in COVID-19 cases due to the Delta variant, supply chain issues and higher inflation readings weighed on value stocks. The Fed indicated its desire to begin to wind down its bond purchase program, but despite higher inflation, does not plan to begin to raise rates until 2022, continuing its accommodative stance. From a sector perspective, Energy stocks more than doubled over the last year as oil prices moved from below $40/barrel to over $80/barrel. Financials stocks also handily outperformed the value benchmark. Defensive sectors of the market, including Utilities, Health Care and Consumer Staples, lagged.
Performance
Harbor Mid Cap Value Fund returned 51.99% (Retirement Class), 51.87% (Institutional Class), 51.53% (Administrative Class) and 51.26% (Investor Class) compared to 48.60% for the Russell Midcap® Value Index for the year ended October 31, 2021. The most significant contributor to the relative outperformance in the period was the rebound for value stocks in the first half of the period. After a difficult period for value stocks from early 2018 through late 2020, value stocks staged a recovery after vaccines were introduced in November 2020 to help combat COVID-19. The rebound in value-oriented stocks and sectors had a positive impact on relative results given the Fund’s attractive valuation characteristics. Small cap stocks also surged in the period leading the market as the Russell 2000® Index was up just over 50%. The rally in smaller stocks also helped drive the relative results given the Fund’s tilt to smaller companies compared to the benchmark.
While sector allocation had little impact on relative results overall in the period, the Fund’s overweight to Financials and underweight to Utilities added value. However, this was offset by our underweight to Energy, the best performing sector in the period, and our overweight to Consumer Staples, which lagged. Stock selection added value in several sectors, including the Consumer Discretionary, Consumer Staples, Financial and Communication Services sectors. This was somewhat offset by poor selection in the Materials sector.
Top contributors in the Consumer Discretionary sector included department stores, Kohl’s Corp and Macy’s, as well as Dick’s Sporting Goods and Penske Auto Group. Among Financials, student loan servicer, Navient Corp, regional bank holding, Zion’s Bancorporation, and Ameriprise Financial all added value. Other top contributors included Seagate Technology in the Technology sector, Energy holdings Devon Energy and Valero Energy and aerospace and defense holding Textron. Detractors in the period included Jazz Pharmaceuticals in the Health Care sector, Industrial holdings Allison Transmission and Meritor, Whirlpool and Big Lots in the Consumer Discretionary sector and underweights to Freeport-McMoRan in the Materials sector and Occidental Petroleum in the Energy sector.
19
Harbor Mid Cap Value Fund
Manager’s Commentary—Continued
CHANGE IN A $50,000 INVESTMENT
For the period 11/01/2011 through 10/31/2021
The graph compares a $50,000 investment in the Institutional Class shares of the Fund with the performance of the Russell Midcap® Value Index. The Fund’s performance assumes the reinvestment of all dividend and capital gain distributions.
TOTAL RETURNS
For the periods ended 10/31/2021
1 Year | Annualized | |||||
5 Years | 10 Years | |||||
Harbor Mid Cap Value Fund | ||||||
Retirement Class1 | 51.99% | 8.73% | 11.65% | |||
Institutional Class | 51.87 | 8.65 | 11.61 | |||
Administrative Class | 51.53 | 8.38 | 11.33 | |||
Investor Class | 51.26 | 8.24 | 11.20 | |||
Comparative Index | ||||||
Russell Midcap® Value | 48.60% | 12.30% | 13.18% |
As stated in the Fund’s prospectus dated March 1, 2021, the expense ratios were 0.77% (Net) and 0.82% (Gross) (Retirement Class); 0.85% (Net) and 0.90% (Gross) (Institutional Class); 1.10% (Net) and 1.15% (Gross) (Administrative Class); and 1.21% (Net) and 1.26% (Gross) (Investor Class). The net expense ratios reflect a contractual management fee waiver effective through 02/28/2022. Additionally, the Adviser has contractually agreed to limit the Fun’s operating expenses, excluding interest expense (if any), to 0.77%, 0.85%, 1.10%, and 1.21% for the Retirement Class, Institutional Class, Administrative Class, and Investor Class, respectively, through February 28, 2022. The expense ratios in the prospectus may differ from the actual expense ratios for the period disclosed within this report. The expense ratios shown in the prospectus are based on the prior fiscal year, adjusted to reflect changes, if any, in contractual arrangements that occurred prior to the date of the prospectus (or supplement thereto, if applicable).
Performance data shown represents past performance and is no guarantee of future results. Past performance is net of management fees and expenses and reflects reinvested dividends and distributions. Past performance reflects the beneficial effect of any expense waivers or reimbursements, without which returns would have been lower. Investment returns and principal value will fluctuate and when redeemed may be worth more or less than their original cost. Returns for periods less than one year are not annualized. Current performance may be higher or lower and is available through the most recent month end at harborcapital.com or by calling 800-422-1050.
Outlook & Strategy
The Subadviser’s portfolio decision-making process is quantitative and driven by: (1) a proprietary model which ranks securities on fundamental measures of value and indicators of near-term appreciation potential and (2) a portfolio construction process that controls for risk while maximizing the expected return of the portfolio. The objective of the model is to pick what we believe to be undervalued stocks with high near-term appreciation potential.
Sector weightings are a residual of our bottom-up stock selection process subject to minimum and maximum exposures to sectors and industries. The Fund’s most significant sector exposures on an absolute basis are to Financials, Industrials and Consumer Discretionary stocks. Relative to the value benchmark, the Fund’s portfolio is overweight the Financial, Consumer Staples and Consumer Discretionary sectors. The Fund is underweight Industrials, Utilities, Real Estate and Energy. The most significant changes in sector weights over the last 12 months were an increase in the relative exposure to Information Technology and Communication Services stocks and a decrease to Health Care stocks.
We believe the Fund’s portfolio continues to trade at attractive valuations relative to the benchmark and relative to history. The Fund’s portfolio is trading at 10.2x forward earnings compared to 18.3x for the value benchmark and 7.6x cash flow compared to 14.4x for the Russell Midcap® Value Index.
While the ‘recovery trade’ that favored value stocks in general, and the Harbor Mid Cap Value Fund in particular, has slowed in recent months due in part to the spread of the COVID-19 Delta variant in the summer, we believe the fundamentals of a longer term value recovery remain in place. We believe the continued vaccination rollout worldwide, the likelihood of additional fiscal stimulus, rising interest rates and historically wide valuation spreads are all favorable dynamics for value stocks going forward. The Fund’s portfolio continues to trade at an approximately 40% discount to the Russell Midcap® Value Index. We believe the Fund, in our opinion, is not only cheap from a valuation standpoint but that the Fund is invested in quality companies that are seeing increasing earnings and profit margins, particularly among Financials and other cyclical areas of the market. We continue to find what we believe to be attractive stocks across multiple sectors, particularly within the Financial, Consumer Discretionary and Consumer Staples sectors.
1
Retirement Class shares commenced operations on March 1, 2016. The performance attributed to the Retirement Class shares prior to that date is that of the Institutional Class shares. Performance prior to March 1, 2016 has not been adjusted to reflect the lower expenses of Retirement Class shares. During this period, Retirement Class shares would have had returns similar to, but potentially higher than, Institutional Class shares due to the fact that Retirement Class shares represent interests in the same portfolio as Institutional Class shares but are subject to lower expenses.
This report contains the current opinions of LSV Asset Management as of the date of this report and should not be considered as investment advice or a recommendation of any particular security, strategy or investment product. Such opinions are subject to change without notice and securities described herein may no longer be included in, or may at any time be removed from, the Fund’s portfolio. This report is distributed for informational purposes only. Information contained herein has been obtained from sources believed reliable, but not guaranteed.
There is no guarantee that the investment objective of the Fund will be achieved. Stock markets are volatile and equity values can decline significantly in response to adverse issuer, political, regulatory, market and economic conditions.Since the Fund may hold foreign securities, it may be subject to greater risks than funds invested only in the U.S. These risks are more severe for securities of issuers in emerging markets regions. For information on the different share classes and the risks associated with an investment in the Fund, please refer to the current prospectus.
20
Harbor Mid Cap Value Fund
Portfolio of Investments—October 31, 2021
SECTOR ALLOCATION (% of investments) - Unaudited
Portfolio of Investments
Value, Cost, and Principal Amounts in Thousands
COMMON STOCKS—99.5% | |||
Shares | Value | ||
AEROSPACE & DEFENSE—1.5% | |||
9,300 | Huntington Ingalls Industries Inc. | $1,885 | |
14,800 | L3Harris Technologies Inc. | 3,412 | |
18,600 | Textron Inc. | 1,374 | |
6,671 | |||
AIR FREIGHT & LOGISTICS—1.1% | |||
58,200 | Atlas Air Worldwide Holdings Inc.* | 4,721 | |
AIRLINES—0.8% | |||
39,500 | Alaska Air Group Inc.* | 2,086 | |
31,500 | United Airlines Holdings Inc.* | 1,453 | |
3,539 | |||
AUTO COMPONENTS—1.9% | |||
187,400 | American Axle & Manufacturing Holdings Inc.* | 1,702 | |
58,900 | BorgWarner Inc. | 2,655 | |
68,900 | Goodyear Tire & Rubber Co.* | 1,317 | |
15,400 | Lear Corp. | 2,646 | |
8,320 | |||
AUTOMOBILES—0.6% | |||
70,000 | Harley-Davidson Inc. | 2,554 | |
BANKS—5.9% | |||
140,200 | Citizens Financial Group Inc. | 6,643 | |
124,000 | Fifth Third Bancorp | 5,398 | |
171,400 | KeyCorp | 3,988 | |
209,000 | Regions Financial Corp. | 4,949 | |
89,800 | Zions Bancorporation | 5,657 | |
26,635 | |||
BEVERAGES—1.1% | |||
110,500 | Molson Coors Beverage Co. | 4,872 | |
BIOTECHNOLOGY—0.9% | |||
196,000 | Ironwood Pharmaceuticals Inc.* | 2,503 | |
7,603 | United Therapeutics Corp.* | 1,450 | |
3,953 | |||
BUILDING PRODUCTS—1.0% | |||
47,400 | Owens Corning | 4,428 |
COMMON STOCKS—Continued | |||
Shares | Value | ||
CAPITAL MARKETS—1.8% | |||
14,600 | Ameriprise Financial Inc. | $4,411 | |
71,900 | Lazard Ltd. (Bermuda) | 3,522 | |
7,933 | |||
CHEMICALS—4.9% | |||
45,000 | Cabot Corp. | 2,401 | |
18,100 | Celanese Corp. | 2,923 | |
112,122 | Chemours Co. | 3,142 | |
38,100 | Eastman Chemical Co. | 3,964 | |
114,500 | Huntsman Corp. | 3,730 | |
52,300 | Koppers Holdings Inc.* | 1,835 | |
28,000 | LyondellBasell Industries NV | 2,599 | |
21,500 | Trinseo plc (Luxembourg) | 1,205 | |
21,799 | |||
CONSUMER FINANCE—2.5% | |||
117,500 | Ally Financial Inc. | 5,610 | |
17,900 | Discover Financial Services | 2,028 | |
186,688 | Navient Corp. | 3,678 | |
11,316 | |||
CONTAINERS & PACKAGING—3.3% | |||
35,800 | Berry Global Group Inc.* | 2,346 | |
46,100 | Graphic Packaging Holding Co. | 919 | |
61,100 | Greif Inc. | 3,952 | |
158,830 | O-I Glass Inc.* | 2,073 | |
55,200 | Silgan Holdings Inc. | 2,219 | |
72,300 | WestRock Co. | 3,477 | |
14,986 | |||
DIVERSIFIED CONSUMER SERVICES—0.4% | |||
87,800 | H&R Block Inc. | 2,026 | |
DIVERSIFIED FINANCIAL SERVICES—0.7% | |||
79,987 | Banco Latinoamericano de Comercio Exterior SA (Panama) | 1,451 | |
24,300 | Voya Financial Inc. | 1,695 | |
3,146 | |||
ELECTRIC UTILITIES—1.4% | |||
24,500 | Edison International | 1,542 |
21
Harbor Mid Cap Value Fund
Portfolio of Investments—Continued
Value, Cost, and Principal Amounts in Thousands
COMMON STOCKS—Continued | |||
Shares | Value | ||
ELECTRIC UTILITIES—Continued | |||
78,000 | NRG Energy Inc. | $3,111 | |
55,000 | PPL Corp. | 1,584 | |
6,237 | |||
ELECTRICAL EQUIPMENT—0.7% | |||
31,200 | Atkore Inc.* | 2,949 | |
ELECTRONIC EQUIPMENT, INSTRUMENTS & COMPONENTS—4.1% | |||
38,800 | Arrow Electronics Inc.* | 4,491 | |
48,100 | Avnet Inc. | 1,833 | |
53,900 | Jabil Inc. | 3,232 | |
61,800 | Methode Electronics Inc. | 2,600 | |
40,600 | Sanmina Corp.* | 1,533 | |
13,988 | SYNNEX Corp. | 1,469 | |
125,800 | TTM Technologies Inc.* | 1,666 | |
69,800 | Vishay Intertechnology Inc. | 1,341 | |
18,165 | |||
EQUITY REAL ESTATE INVESTMENT TRUSTS (REITs)—7.3% | |||
136,200 | Brandywine Realty Trust | 1,805 | |
121,600 | Brixmor Property Group Inc. | 2,850 | |
429,000 | Franklin Street Properties Corp. | 1,931 | |
40,900 | Gaming and Leisure Properties Inc. | 1,983 | |
160,589 | Hersha Hospitality Trust* | 1,434 | |
88,234 | Industrial Logistics Properties Trust | 2,478 | |
55,600 | Iron Mountain Inc. | 2,538 | |
114,400 | Medical Properties Trust Inc. | 2,440 | |
52,750 | Office Properties Income Trust | 1,351 | |
86,200 | Omega Healthcare Investors Inc. | 2,531 | |
139,000 | Paramount Group Inc. | 1,179 | |
138,248 | Piedmont Office Realty Trust Inc. | 2,455 | |
63,300 | Plymouth Industrial REIT Inc. | 1,618 | |
138,200 | Sabra Health Care REIT Inc. | 1,956 | |
124,400 | Service Properties Trust | 1,340 | |
95,800 | SITE Centers Corp. | 1,522 | |
82,900 | Tanger Factory Outlet Centers Inc. | 1,393 | |
32,804 | |||
FOOD & STAPLES RETAILING—2.7% | |||
51,800 | Ingles Markets Inc. | 3,584 | |
166,300 | Kroger Co. | 6,656 | |
80,000 | Sprouts Farmers Market Inc.* | 1,771 | |
12,011 | |||
FOOD PRODUCTS—3.8% | |||
37,700 | Archer Daniels Midland Co. | 2,422 | |
71,900 | Conagra Brands Inc. | 2,315 | |
32,200 | Ingredion Inc. | 3,066 | |
32,100 | JM Smucker Co. | 3,944 | |
68,100 | Tyson Foods Inc. | 5,446 | |
17,193 | |||
GAS UTILITIES—0.7% | |||
55,800 | National Fuel Gas Co. | 3,205 | |
HEALTH CARE PROVIDERS & SERVICES—3.5% | |||
59,300 | Cardinal Health Inc. | 2,835 | |
35,100 | DaVita Inc.* | 3,624 | |
6,400 | Laboratory Corp. of America Holdings* | 1,837 | |
24,700 | McKesson Corp. | 5,134 | |
19,000 | Universal Health Services Inc. | 2,358 | |
15,788 |
COMMON STOCKS—Continued | |||
Shares | Value | ||
HOTELS, RESTAURANTS & LEISURE—0.4% | |||
30,500 | Travel + Leisure Co. | $1,657 | |
HOUSEHOLD DURABLES—4.2% | |||
101,478 | Ethan Allen Interiors Inc. | 2,355 | |
26,100 | Meritage Homes Corp.* | 2,837 | |
68,100 | PulteGroup Inc. | 3,274 | |
72,600 | Toll Brothers Inc. | 4,369 | |
27,300 | Whirlpool Corp. | 5,756 | |
18,591 | |||
INDEPENDENT POWER AND RENEWABLE ELECTRICITY PRODUCERS—1.4% | |||
314,400 | Vistra Corp. | 6,159 | |
INSURANCE—7.5% | |||
55,600 | Aflac Inc. | 2,984 | |
43,800 | Allstate Corp. | 5,417 | |
23,200 | American Financial Group Inc. | 3,156 | |
13,700 | Hanover Insurance Group Inc. | 1,726 | |
85,700 | Hartford Financial Services Group Inc. | 6,250 | |
57,600 | Lincoln National Corp. | 4,156 | |
129,100 | Old Republic International Corp. | 3,335 | |
58,400 | Principal Financial Group Inc. | 3,918 | |
75,200 | Universal Insurance Holdings Inc. | 1,111 | |
64,400 | Unum Group | 1,640 | |
33,693 | |||
INTERACTIVE MEDIA & SERVICES—0.5% | |||
19,300 | Ziff Davis Inc.* | 2,476 | |
INTERNET & DIRECT MARKETING RETAIL—1.2% | |||
69,300 | eBay Inc. | 5,317 | |
IT SERVICES—1.1% | |||
79,600 | DXC Technology Co.* | 2,592 | |
117,600 | Western Union Co. | 2,143 | |
4,735 | |||
LEISURE PRODUCTS—0.8% | |||
23,300 | Brunswick Corp. | 2,169 | |
17,894 | Sturm Ruger & Co. Inc. | 1,411 | |
3,580 | |||
MACHINERY—6.4% | |||
38,800 | AGCO Corp. | 4,742 | |
100,600 | Allison Transmission Holdings Inc. | 3,356 | |
17,600 | Cummins Inc. | 4,221 | |
135,300 | Meritor Inc.* | 3,293 | |
31,900 | Oshkosh Corp. | 3,413 | |
20,600 | Snap-on Inc. | 4,186 | |
55,500 | Timken Co. | 3,938 | |
89,100 | Wabash National Corp. | 1,384 | |
28,533 | |||
MEDIA—2.6% | |||
82,500 | AMC Networks Inc.* | 3,282 | |
38,400 | Fox Corp. | 1,526 | |
18,100 | Nexstar Media Group Inc. | 2,714 | |
144,100 | TEGNA Inc. | 2,833 | |
32,300 | ViacomCBS Inc. | 1,170 | |
11,525 | |||
METALS & MINING—1.2% | |||
35,800 | Reliance Steel & Aluminum Co. | 5,233 |
22
Harbor Mid Cap Value Fund
Portfolio of Investments—Continued
Value, Cost, and Principal Amounts in Thousands
COMMON STOCKS—Continued | |||
Shares | Value | ||
MORTGAGE REAL ESTATE INVESTMENT TRUSTS (REITs)—1.0% | |||
166,600 | Annaly Capital Management Inc. | $1,410 | |
298,300 | MFA Financial Inc. | 1,345 | |
93,400 | PennyMac Mortgage Investment Trust | 1,882 | |
4,637 | |||
MULTILINE RETAIL—1.1% | |||
48,600 | Big Lots Inc. | 2,150 | |
99,500 | Macy's Inc. | 2,634 | |
4,784 | |||
MULTI-UTILITIES—0.6% | |||
93,150 | MDU Resources Group Inc. | 2,863 | |
OIL, GAS & CONSUMABLE FUELS—2.4% | |||
93,200 | Devon Energy Corp. | 3,736 | |
65,800 | HollyFrontier Corp. | 2,224 | |
34,700 | Marathon Petroleum Corp. | 2,288 | |
32,800 | Valero Energy Corp. | 2,536 | |
10,784 | |||
PHARMACEUTICALS—1.9% | |||
36,100 | Jazz Pharmaceuticals plc (Ireland)* | 4,803 | |
110,150 | Lannett Co. Inc.* | 301 | |
36,200 | Prestige Consumer Healthcare Inc.* | 2,171 | |
93,493 | Viatris Inc. | 1,248 | |
8,523 | |||
PROFESSIONAL SERVICES—0.6% | |||
27,500 | ManpowerGroup Inc. | 2,658 | |
SEMICONDUCTORS & SEMICONDUCTOR EQUIPMENT—1.8% | |||
137,800 | Amkor Technology Inc. | 3,021 | |
16,000 | Diodes Inc.* | 1,537 | |
21,100 | Qorvo Inc.* | 3,550 | |
8,108 | |||
SOFTWARE—0.1% | |||
6,433 | Consensus Cloud Solutions Inc.* | 407 |
COMMON STOCKS—Continued | |||
Shares | Value | ||
SPECIALTY RETAIL—4.5% | |||
31,000 | Best Buy Co. Inc. | $3,789 | |
29,600 | Dick's Sporting Goods Inc. | 3,677 | |
81,800 | Foot Locker Inc. | 3,899 | |
18,600 | Group 1 Automotive Inc. | 3,344 | |
36,200 | ODP Corp.* | 1,568 | |
36,800 | Penske Automotive Group Inc. | 3,903 | |
20,180 | |||
TECHNOLOGY HARDWARE, STORAGE & PERIPHERALS—3.3% | |||
242,314 | HP Inc. | 7,349 | |
66,400 | Seagate Technology Holdings plc (Ireland) | 5,914 | |
93,900 | Xerox Holdings Corp. | 1,672 | |
14,935 | |||
TEXTILES, APPAREL & LUXURY GOODS—0.2% | |||
17,700 | Capri Holdings Ltd. (Virgin Islands)* | 942 | |
THRIFTS & MORTGAGE FINANCE—1.2% | |||
132,900 | MGIC Investment Corp. | 2,148 | |
19,700 | PennyMac Financial Services Inc. | 1,222 | |
91,913 | Radian Group Inc. | 2,194 | |
5,564 | |||
TRADING COMPANIES & DISTRIBUTORS—0.9% | |||
65,642 | Triton International Ltd. (Bermuda) | 4,082 | |
TOTAL COMMON STOCKS | |||
(Cost $367,385) | 445,217 | ||
TOTAL INVESTMENTS—99.5% | |||
(Cost $367,385) | 445,217 | ||
CASH AND OTHER ASSETS, LESS LIABILITIES—0.5% | 2,295 | ||
TOTAL NET ASSETS—100.0% | $447,512 |
FAIR VALUE MEASUREMENTS
All investments at October 31, 2021 (as disclosed in the preceding Portfolio of Investments) were classified as Level 1. There were no Level 3 investments at October 31, 2021 or 2020.
For more information on valuation inputs and their aggregation into the levels identified above, please refer to the Fair Value Measurements and Disclosures in Note 2 of the accompanying Notes to Financial Statements.
*
Non-income producing security
The accompanying notes are an integral part of the Financial Statements.
23
Harbor Small Cap Growth Fund
Manager’s Commentary (Unaudited)
Subadviser
Westfield Capital Management Company, L.P.
One Financial Center
23rd Floor
Boston, MA 02111
23rd Floor
Boston, MA 02111
Portfolio Managers
William A. Muggia
Lead Portfolio Manager
Since 2000
Lead Portfolio Manager
Since 2000
Richard D. Lee, CFA
Since 2018
Since 2018
Ethan J. Meyers, CFA
Since 2000
Since 2000
John M. Montgomery
Since 2011
Since 2011
Westfield has subadvised the Fund since 2000.
Investment Objective
The Fund seeks long-term growth of capital.
Management’s Discussion of
Fund Performance
Fund Performance
Market Review
After a volatile start to the year, the second quarter marked the fifth consecutive quarterly gain since the first quarter of 2020. Reversing the trend from the end of the first quarter, pro-cyclical stocks and value, as a factor, underperformed the secular growth stocks. U.S. equities finished the third quarter primarily lower as investors digested a myriad of concerns including the COVID-19 Delta variant, ‘peak everything,’ persistent supply chain disruptions and rising input costs. As worries mounted over the summer months, cyclicality was shunned in favor of reliable growth stocks. All the while, the 10-year Treasury continued to fall back towards its trend having risen too far too fast earlier in the year. Complicating matters was a consistent stream of news out of China impacting U.S. markets ranging from increased regulation of gaming and leisure to banning trading in cryptocurrencies and lastly the Evergrande liquidity scare which roiled markets for a period. On the policy front, the Fed began telegraphing their plans for tapering of bond purchases, while additional stimulus measures and a bipartisan infrastructure bill continued to be a subject of debate in U.S. Congress.
Performance
Harbor Small Cap Growth Fund returned 34.40% (Retirement Class), 34.29% (Institutional Class), 33.91% (Administrative Class) and 33.84% (Investor Class) for the year ended October 31, 2021, underperforming its benchmark, the Russell 2000® Growth Index, which returned 38.45%. Relative weakness in Health Care and Communication Services offset relative strength in Materials and Financials.
Health Care was the largest relative detractor during the period, costing the Fund 452 basis points (“bps”) of relative performance. Turning Point Therapeutics, Inc., a targeted precision oncology company, was the worst relative performer in the sector over the period. Turning Point underperformed due to competition fears as well as a data release for their gastric and non-small cell lung cancer that missed expectations. Looking forward, we believe Turning Point has a number of catalysts over the next six months in addition to several high-quality assets that we believe will drive growth. Amedisys Inc., one of the largest home health care providers in the U.S., also weighed on relative results. The stock underperformed after the company slightly missed earnings expectations and cut forward guidance as a result of weakness in their hospice segment. However, we believe the set up from here remains compelling following their recent acquisition of at-home-health care provider, Contessa, which, in our opinion, looks to be tracking ahead of schedule.
Communication Services also detracted from relative results, costing the Fund 51 bps. Social video game developer Zynga Inc. was the top relative detractor from performance. The stock performance weighed on relative results after the company missed consensus expectations on Q2 earnings and lowered its forward guidance for the remainder of the year. The company has experienced some moderated usage among its players and is having some difficulties navigating Apple’s new customer data protection rules in their iOS operating system. Moving forward, we continue to the current valuation is at a relative trough compared to peers and, in our opinion, confident positive future results will aid in stabilizing the stock.
Materials was the top source of relative strength during the period, adding 97 bps to relative returns. Ranpak Holdings Corp., a manufacturer of fiber packaging equipment and products, was the top relative performer over the period. We believe Rankpak has benefitted from industry tailwinds and secular drivers, including ongoing material substitution, growing eCommerce volume and automation of packaging process. In our opinion, Ranpak has an attractive business model (razor/razor blade model) with high market share, an asset light model and a defensive business that holds up well in recessionary environments.
24
Harbor Small Cap Growth Fund
Manager’s Commentary—Continued
CHANGE IN A $50,000 INVESTMENT
For the period 11/01/2011 through 10/31/2021
The graph compares a $50,000 investment in the Institutional Class shares of the Fund with the performance of the Russell 2000® Growth Index. The Fund’s performance assumes the reinvestment of all dividend and capital gain distributions.
TOTAL RETURNS
For the periods ended 10/31/2021
1 Year | Annualized | |||||
5 Years | 10 Years | |||||
Harbor Small Cap Growth Fund | ||||||
Retirement Class1 | 34.40% | 21.06% | 16.22% | |||
Institutional Class | 34.29 | 20.98 | 16.17 | |||
Administrative Class | 33.91 | 20.59 | 15.85 | |||
Investor Class | 33.84 | 20.54 | 15.74 | |||
Comparative Index | ||||||
Russell 2000® Growth | 38.45% | 17.90% | 14.57% |
As stated in the Fund’s prospectus dated March 1, 2021, the expense ratios were 0.81% (Retirement Class); 0.89% (Institutional Class); 1.14% (Administrative Class); and 1.25% (Investor Class). The expense ratios in the prospectus may differ from the actual expense ratios for the period disclosed within this report. The expense ratios shown in the prospectus are based on the prior fiscal year, adjusted to reflect changes, if any, in contractual arrangements that occurred prior to the date of the prospectus (or supplement thereto, if applicable).
Performance data shown represents past performance and is no guarantee of future results. Past performance is net of management fees and expenses and reflects reinvested dividends and distributions. Past performance reflects the beneficial effect of any expense waivers or reimbursements, without which returns would have been lower. Investment returns and principal value will fluctuate and when redeemed may be worth more or less than their original cost. Returns for periods less than one year are not annualized. Current performance may be higher or lower and is available through the most recent month end at harborcapital.com or by calling 800-422-1050.
Financials was another positive contributor, adding 72 bps of relative performance. First Citizens BancShares, a Carolinas-based regional bank with a national presence, was the largest contributor to relative results. This historically underfollowed stock by Wall Street benefitted from an immediately accretive merger with the under-appreciated CIT Bank and the up-tick in sell-side coverage which followed. Additionally, the rise in interest rates has acted as a tailwind, and we believe investors will continue to acknowledge the compelling value of First Citizens upon increased coverage and further clarity on the post-merger outlook for the joint entity.
Outlook & Strategy
Moving forward, we believe that stocks of companies with strong underlying earnings growth that trade at reasonable valuations will be favored at the expense of high multiple momentum growth stocks. If the market environment plays out like we think it will, with rising interest rates and rising inflation, earnings multiples are likely to compress with the most pronounced impact being felt by those companies with the longest duration assets most heavily influenced by discount rates. In addition, we believe falling equity correlations are increasing the importance and impact of good stock picking. As we believe persistent inflation is likely for the foreseeable future, our focus will remain on high-quality operators with pricing power which are positioned advantageously for uncertain input costs and continued supply chain disruptions.
1
Retirement Class shares commenced operations on March 1, 2016. The performance attributed to the Retirement Class shares prior to that date is that of the Institutional Class shares. Performance prior to March 1, 2016 has not been adjusted to reflect the lower expenses of Retirement Class shares. During this period, Retirement Class shares would have had returns similar to, but potentially higher than, Institutional Class shares due to the fact that Retirement Class shares represent interests in the same portfolio as Institutional Class shares but are subject to lower expenses.
This report contains the current opinions of Westfield Capital Management Company, L.P. as of the date of this report and should not be considered as investment advice or a recommendation of any particular security, strategy or investment product. Such opinions are subject to change without notice and securities described herein may no longer be included in, or may at any time be removed from, the Fund’s portfolio. This report is distributed for informational purposes only. Information contained herein has been obtained from sources believed reliable, but not guaranteed.
There is no guarantee that the investment objective of the Fund will be achieved. Stock markets are volatile and equity values can decline significantly in response to adverse issuer, political, regulatory, market and economic conditions. Stocks of small cap companies pose special risks, including possible illiquidity and greater price volatility than stocks of larger, more established companies. For information on the different share classes and the risks associated with an investment in the Fund, please refer to the current prospectus.
25
Harbor Small Cap Growth Fund
Portfolio of Investments—October 31, 2021
SECTOR ALLOCATION (% of investments) - Unaudited
Portfolio of Investments
Value, Cost, and Principal Amounts in Thousands
COMMON STOCKS—95.8% | |||
Shares | Value | ||
AEROSPACE & DEFENSE—1.5% | |||
300,506 | Hexcel Corp.* | $17,051 | |
AUTO COMPONENTS—0.8% | |||
495,730 | Mister Car Wash Inc.* | 9,092 | |
BANKS—2.2% | |||
49,577 | Silvergate Capital Corp.* | 7,765 | |
144,950 | Western Alliance Bancorp* | 16,827 | |
24,592 | |||
BIOTECHNOLOGY—13.6% | |||
156,346 | Acceleron Pharma Inc.* | 27,232 | |
141,560 | Ascendis Pharma AS ADR (Denmark)*,1 | 21,462 | |
235,086 | Blueprint Medicines Corp.* | 26,445 | |
218,480 | Bridgebio Pharma Inc.* | 10,789 | |
144,114 | Fate Therapeutics Inc.* | 7,753 | |
605,090 | Invitae Corp.* | 16,035 | |
1,659,909 | Ironwood Pharmaceuticals Inc.* | 21,197 | |
329,123 | Rocket Pharmaceuticals Inc.* | 9,778 | |
322,988 | Turning Point Therapeutics Inc.* | 13,430 | |
154,121 | |||
BUILDING PRODUCTS—3.8% | |||
216,175 | Advanced Drainage Systems Inc. | 24,385 | |
170,690 | Trex Co. Inc.* | 18,161 | |
42,546 | |||
CHEMICALS—2.7% | |||
310,720 | Avient Corp. | 16,741 | |
452,290 | Axalta Coating Systems Ltd. (Bermuda)* | 14,107 | |
30,848 | |||
CONTAINERS & PACKAGING—1.7% | |||
545,809 | Ranpak Holdings Corp.* | 18,809 | |
ELECTRICAL EQUIPMENT—4.2% | |||
315,320 | Atkore Inc.* | 29,807 | |
131,539 | Encore Wire Corp. | 17,634 | |
47,441 | |||
ENTERTAINMENT—1.3% | |||
1,937,420 | Zynga Inc.* | 14,298 |
COMMON STOCKS—Continued | |||
Shares | Value | ||
EQUITY REAL ESTATE INVESTMENT TRUSTS (REITs)—5.4% | |||
487,550 | American Assets Trust Inc. | $18,444 | |
123,160 | PS Business Parks Inc. | 21,886 | |
433,890 | Spirit Realty Capital Inc. | 21,230 | |
61,560 | |||
HEALTH CARE EQUIPMENT & SUPPLIES—4.2% | |||
395,300 | Haemonetics Corp.* | 27,161 | |
151,780 | Tandem Diabetes Care Inc.* | 20,692 | |
47,853 | |||
HEALTH CARE PROVIDERS & SERVICES—4.0% | |||
104,764 | Amedisys Inc.* | 17,740 | |
1,018,030 | Option Care Health Inc.* | 27,823 | |
45,563 | |||
HOTELS, RESTAURANTS & LEISURE—4.6% | |||
99,150 | Churchill Downs Inc. | 22,805 | |
1,838,781 | Playa Hotels & Resorts NV (Netherlands)* | 15,648 | |
78,196 | Wingstop Inc.* | 13,486 | |
51,939 | |||
HOUSEHOLD DURABLES—2.1% | |||
90,970 | TopBuild Corp.* | 23,377 | |
INSURANCE—3.7% | |||
403,225 | BRP Group Inc.* | 14,718 | |
131,855 | Palomar Holdings Inc.* | 12,058 | |
87,352 | Primerica Inc. | 14,696 | |
41,472 | |||
IT SERVICES—3.6% | |||
296,418 | Flywire Corp.* | 14,062 | |
168,140 | Shift4 Payments Inc.* | 10,615 | |
176,318 | WNS Holdings Ltd. ADR (India)*,1 | 15,659 | |
40,336 | |||
LEISURE PRODUCTS—1.4% | |||
177,333 | BRP Inc. (Canada) | 15,632 | |
LIFE SCIENCES TOOLS & SERVICES—2.6% | |||
24,531 | Bio-Rad Laboratories Inc.* | 19,494 | |
398,112 | Pacific Biosciences of California Inc.* | 10,542 | |
30,036 |
26
Harbor Small Cap Growth Fund
Portfolio of Investments—Continued
Value, Cost, and Principal Amounts in Thousands
COMMON STOCKS—Continued | |||
Shares | Value | ||
MACHINERY—5.0% | |||
213,114 | ITT Inc. | $20,048 | |
140,030 | Lincoln Electric Holdings Inc. | 19,940 | |
229,463 | Timken Co. | 16,280 | |
56,268 | |||
OIL, GAS & CONSUMABLE FUELS—1.7% | |||
364,380 | PDC Energy Inc. | 19,061 | |
PHARMACEUTICALS—4.1% | |||
1,565,370 | Innoviva Inc.* | 27,316 | |
359,781 | Pacira BioSciences Inc.* | 18,809 | |
46,125 | |||
PROFESSIONAL SERVICES—0.4% | |||
97,610 | Upwork Inc.* | 4,599 | |
ROAD & RAIL—2.7% | |||
99,660 | Saia Inc.* | 31,158 | |
SEMICONDUCTORS & SEMICONDUCTOR EQUIPMENT—4.7% | |||
86,880 | MKS Instruments Inc. | 13,036 | |
153,313 | Semtech Corp.* | 13,036 | |
220,267 | Silicon Motion Technology Corp. ADR (Taiwan)1 | 15,729 | |
207,492 | SMART Global Holdings Inc.* | 11,093 | |
52,894 | |||
SOFTWARE—7.0% | |||
262,680 | Anaplan Inc.* | 17,129 | |
103,740 | Blackline Inc.* | 13,162 |
COMMON STOCKS—Continued | |||
Shares | Value | ||
SOFTWARE—Continued | |||
65,420 | Five9 Inc.* | $10,337 | |
281,594 | Mimecast Ltd. (Jersey)* | 21,244 | |
246,840 | Smartsheet Inc.* | 17,034 | |
78,906 | |||
SPECIALTY RETAIL—4.1% | |||
89,440 | Five Below Inc.* | 17,646 | |
471,705 | National Vision Holdings Inc.* | 29,076 | |
46,722 | |||
TECHNOLOGY HARDWARE, STORAGE & PERIPHERALS—2.7% | |||
223,845 | NCR Corp.* | 8,851 | |
797,253 | Pure Storage Inc.* | 21,414 | |
30,265 | |||
TOTAL COMMON STOCKS | |||
(Cost $802,150) | 1,082,564 | ||
TOTAL INVESTMENTS—95.8% | |||
(Cost $802,150) | 1,082,564 | ||
CASH AND OTHER ASSETS, LESS LIABILITIES—4.2% | 47,628 | ||
TOTAL NET ASSETS—100.0% | $1,130,192 |
FAIR VALUE MEASUREMENTS
All investments at October 31, 2021 (as disclosed in the preceding Portfolio of Investments) were classified as Level 1. There were no Level 3 investments at October 31, 2021 or 2020.
For more information on valuation inputs and their aggregation into the levels identified above, please refer to the Fair Value Measurements and Disclosures in Note 2 of the accompanying Notes to Financial Statements.
*
Non-income producing security
1
Depositary receipts such as American Depositary Receipts (ADRs), Global Depositary Receipts (GDRs) and other country specific depositary receipts are certificates evidencing ownership of shares of a foreign issuer. These certificates are issued by depositary banks and generally trade on an established market in the U.S. or elsewhere.
The accompanying notes are an integral part of the Financial Statements.
27
Harbor Small Cap Value Fund
Manager’s Commentary (Unaudited)
Subadviser
EARNEST Partners LLC
1180 Peachtree St. NE
Suite 2300
Atlanta, GA 30309
Suite 2300
Atlanta, GA 30309
Portfolio Manager
Paul E. Viera
Since 2001
Since 2001
EARNEST Partners has subadvised the Fund since 2001.
Investment Objective
The Fund seeks long-term total return.
Management’s Discussion of
Fund Performance
Fund Performance
Market Review
The U.S. equity markets, represented by the S&P 500 Index were strongly positive during the 12-month period ended October 31, 2021, posting nearly 43% return. However, the U.S. small cap value market, represented by the Russell 2000® Value Index, advanced even more, finishing the period up massive 64%.
Capital markets continued to charge higher as investors received clarity on the economic impact from the COVID-19 pandemic and began to look forward to how a post-COVID-19 environment would support future earnings growth. U.S. Congressional attention shifted away from COVID-19 stimulus and towards the proposed infrastructure bill that was negotiated last quarter, along with raising the debt ceiling and funding the federal budget. The proposed $1.2 trillion infrastructure bill provides for $579 billion in new spending on transportation, roads/bridges and utilities. Since the pandemic began, Congress approved approximately $5.3 trillion in stimulus that included forgivable small business loans, direct payments to households, expanded unemployment benefits and vaccine funding. Previously, the Fed enacted an array of stimulative measures that included short-term rate reductions to near-zero and repurchases of U.S. Treasuries, mortgages and corporate debt. The Fed stated that it would “maintain an accommodative stance” until its goals of 2% long-term inflation and maximum employment are achieved. In its latest statement, the Fed maintained that it will continue to hold rates near zero and provide stimulus by continuing its monthly purchases of Treasury securities and agency mortgage-backed securities. However, it noted that strengthening economic activity and continued progress on vaccinations provide justification for allowing inflation to run “moderately above 2% for some time,” and that a reduction in the pace of asset repurchases may soon be warranted. In further statements, the Fed expressed that these reductions could begin as soon as its next meeting in November but stated that recent inflation trends (about 5% year-over-year since May) appear to be transitory.
Performance
Harbor Small Cap Value Fund posted a return of 43.19% (Retirement Class), 43.11% (Institutional Class), 42.72% (Administrative Class) and 42.56% (Investor Class) for the year ended October 31, 2021, underperforming the 64.30% return of the Russell 2000® Value Index.
Relative underperformance was a result of security selection, i.e., not owning some of the highest returning names in the Index for the first quarter of 2021. Many of these names had fallen sharply during 2020 and bounced back as investors embraced higher risk during the first quarter in light of an improving economy. Additionally, the small cap value index benefitted significantly from several holdings that retail investors drove higher based on social media campaigns to squeeze short sellers. For example, the best performing stock in the quarter was GameStop, which returned over 900%, while having negative earnings and poor fundamentals. AMC Theatres was another example of a brick-and-mortar retail business that performed strongly during the quarter despite declining fundamentals, as retail investors sought short-term trading gains.
Contributing to performance was Darling Ingredients Inc., a company that develops and produces sustainable natural ingredients from sourced bio-nutrients. The company operates through three segments: feed ingredients, food ingredients, and fuel ingredients. It offers ingredients and specialty solutions for customers in various industries, including the pharmaceutical, food/pet food, industrial and energy industries. The company converts animal by-product streams into specialty ingredients such as collagen, edible fats and animal proteins. Darling shares nearly doubled in the period as the company beat consensus earnings estimates as each of the company’s three business lines exceeded expectations. On the strength of operations, management raised guidance for 2021 and 2022 by ~20% and ~15%, respectively. Darling’s performance reflects the strength of its legacy business lines combined with an underappreciated
28
Harbor Small Cap Value Fund
Manager’s Commentary—Continued
CHANGE IN A $50,000 INVESTMENT
For the period 11/01/2011 through 10/31/2021
The graph compares a $50,000 investment in the Institutional Class shares of the Fund with the performance of the Russell 2000® Value Index. The Fund’s performance assumes the reinvestment of all dividend and capital gain distributions.
TOTAL RETURNS
For the periods ended 10/31/2021
1 Year | Annualized | |||||
5 Years | 10 Years | |||||
Harbor Small Cap Value Fund | ||||||
Retirement Class1 | 43.19% | 13.94% | 13.31% | |||
Institutional Class | 43.11 | 13.86 | 13.26 | |||
Administrative Class | 42.72 | 13.57 | 12.97 | |||
Investor Class | 42.56 | 13.43 | 12.84 | |||
Comparative Index | ||||||
Russell 2000® Value | 64.30% | 12.61% | 12.12% |
As stated in the Fund’s prospectus dated March 1, 2021, the expense ratios were 0.80% (Retirement Class); 0.88% (Institutional Class); 1.13% (Administrative Class); and 1.24% (Investor Class). The expense ratios in the prospectus may differ from the actual expense ratios for the period disclosed within this report. The expense ratios shown in the prospectus are based on the prior fiscal year, adjusted to reflect changes, if any, in contractual arrangements that occurred prior to the date of the prospectus (or supplement thereto, if applicable).
Performance data shown represents past performance and is no guarantee of future results. Past performance is net of management fees and expenses and reflects reinvested dividends and distributions. Past performance reflects the beneficial effect of any expense waivers or reimbursements, without which returns would have been lower. Investment returns and principal value will fluctuate and when redeemed may be worth more or less than their original cost. Returns for periods less than one year are not annualized. Current performance may be higher or lower and is available through the most recent month end at harborcapital.com or by calling 800-422-1050.
opportunity in the rapidly expanding renewable diesel space. We believe that, given Darling’s first mover advantage and market leading position within the renewable business, the company is well-positioned to capitalize on market opportunities and grow earnings.
Detracting from performance, CMC Materials supplies consumable materials including polishing slurries and polishing pads to semiconductor manufacturers and pipeline companies. The company’s products help its customers produce smaller, faster and more complex integrated circuit devices with fewer defects. CMC Materials underperformed during the period due to the continued impact of the pandemic on the demand for the company’s industrial materials products. The stock fell 9% during the period. As oil demand starts to normalize, it is our view that the performance materials business will begin to return. We believe the company is well-positioned for long-term robust semiconductor demand due to its capacity expansion investment. We believe its acquisition of International Test Solutions could also expand growth opportunities in critical consumables and services used in the semiconductor packaging and test areas.
Outlook & Strategy
As of October 31, 2021, the Fund had an overweight in the Industrials, Materials, Health Care, Information Technology and Telecommunications sectors, and an underweight in Financials, Real Estate, Consumer Staples, Consumer Discretionary and Utilities. The Fund had a market weight to Energy. We believe the Fund’s relative overweight and underweight positions are an outgrowth of where EARNEST Partners is finding good individual investment opportunities.
1
Retirement Class shares commenced operations on March 1, 2016. The performance attributed to the Retirement Class shares prior to that date is that of the Institutional Class shares. Performance prior to March 1, 2016 has not been adjusted to reflect the lower expenses of Retirement Class shares. During this period, Retirement Class shares would have had returns similar to, but potentially higher than, Institutional Class shares due to the fact that Retirement Class shares represent interests in the same portfolio as Institutional Class shares but are subject to lower expenses.
This report contains the current opinions of EARNEST Partners LLC as of the date of this report and should not be considered as investment advice or a recommendation of any particular security, strategy or investment product. Such opinions are subject to change without notice and securities described herein may no longer be included in, or may at any time be removed from, the Fund’s portfolio. This report is distributed for informational purposes only. Information contained herein has been obtained from sources believed reliable, but not guaranteed.
There is no guarantee that the investment objective of the Fund will be achieved. Stock markets are volatile and equity values can decline significantly in response to adverse issuer, political, regulatory, market and economic conditions. Stocks of small cap companies pose special risks, including possible illiquidity and greater price volatility than stocks of larger, more established companies. For information on the different share classes and the risks associated with an investment in the Fund, please refer to the current prospectus.
29
Harbor Small Cap Value Fund
Portfolio of Investments—October 31, 2021
SECTOR ALLOCATION (% of investments) - Unaudited
Portfolio of Investments
Value, Cost, and Principal Amounts in Thousands
COMMON STOCKS—98.2% | |||
Shares | Value | ||
AEROSPACE & DEFENSE—7.2% | |||
96,619 | AAR Corp.* | $3,417 | |
976,045 | Hexcel Corp.* | 55,381 | |
442,087 | Moog Inc. | 33,391 | |
1,179,819 | Parsons Corp.* | 40,869 | |
137,484 | Teledyne Technologies Inc.* | 61,760 | |
194,818 | |||
BANKS—8.6% | |||
837,202 | Enterprise Financial Services Corp. | 39,365 | |
978,808 | First Merchants Corp. | 40,699 | |
817,170 | Heartland Financial USA Inc. | 40,956 | |
581,621 | South State Corp. | 45,419 | |
826,150 | Trustmark Corp. | 26,280 | |
1,035,450 | United Bankshares Inc. | 38,301 | |
231,020 | |||
BIOTECHNOLOGY—2.7% | |||
655,532 | Emergent BioSolutions Inc.* | 31,249 | |
1,389,810 | Myriad Genetics Inc.* | 42,765 | |
74,014 | |||
CAPITAL MARKETS—7.2% | |||
842,037 | Houlihan Lokey Inc. | 94,376 | |
566,608 | Raymond James Financial Inc. | 55,862 | |
619,613 | Stifel Financial Corp. | 45,151 | |
195,389 | |||
CHEMICALS—3.4% | |||
717,700 | Cabot Corp. | 38,289 | |
357,814 | Scotts Miracle-Gro Co. | 53,121 | |
91,410 | |||
COMMERCIAL SERVICES & SUPPLIES—4.6% | |||
1,079,659 | Casella Waste Systems Inc.* | 93,628 | |
2,479,830 | Steelcase Inc. | 29,510 | |
123,138 | |||
CONSUMER FINANCE—2.2% | |||
679,018 | FirstCash Inc. | 60,073 | |
ELECTRICAL EQUIPMENT—1.6% | |||
531,195 | EnerSys | 42,517 |
COMMON STOCKS—Continued | |||
Shares | Value | ||
ELECTRONIC EQUIPMENT, INSTRUMENTS & COMPONENTS—5.3% | |||
204,466 | Littelfuse Inc. | $60,226 | |
472,481 | Plexus Corp.* | 41,257 | |
1,125,249 | Sanmina Corp.* | 42,478 | |
143,961 | |||
ENERGY EQUIPMENT & SERVICES—1.1% | |||
395,806 | Core Laboratories NV (Netherlands) | 10,295 | |
458,665 | DMC Global Inc.* | 19,163 | |
29,458 | |||
EQUITY REAL ESTATE INVESTMENT TRUSTS (REITs)—4.8% | |||
1,365,634 | Corporate Office Properties Trust | 37,036 | |
1,793,214 | Pebblebrook Hotel Trust | 40,276 | |
1,224,719 | STAG Industrial Inc. | 53,312 | |
130,624 | |||
FOOD PRODUCTS—3.7% | |||
1,190,871 | Darling Ingredients Inc.* | 100,652 | |
HEALTH CARE EQUIPMENT & SUPPLIES—3.5% | |||
482,151 | CONMED Corp. | 70,529 | |
1,267,546 | Meridian Bioscience Inc.* | 23,843 | |
94,372 | |||
HEALTH CARE PROVIDERS & SERVICES—4.7% | |||
2,346,513 | MEDNAX Inc.* | 63,896 | |
216,273 | Molina Healthcare Inc.* | 63,956 | |
127,852 | |||
HOTELS, RESTAURANTS & LEISURE—1.6% | |||
332,256 | Cracker Barrel Old Country Store Inc. | 44,246 | |
HOUSEHOLD DURABLES—1.8% | |||
438,633 | Meritage Homes Corp.* | 47,684 | |
INSURANCE—2.6% | |||
651,388 | Horace Mann Educators Corp. | 25,521 | |
285,975 | Reinsurance Group of America Inc. | 33,768 | |
547,773 | United Fire Group Inc. | 11,191 | |
70,480 |
30
Harbor Small Cap Value Fund
Portfolio of Investments—Continued
Value, Cost, and Principal Amounts in Thousands
COMMON STOCKS—Continued | |||
Shares | Value | ||
IT SERVICES—3.5% | |||
557,444 | ManTech International Corp. | $48,063 | |
4,538,987 | Sabre Corp.* | 47,114 | |
95,177 | |||
MACHINERY—7.8% | |||
549,155 | Albany International Corp. | 44,289 | |
865,523 | Altra Industrial Motion Corp. | 45,137 | |
803,355 | Franklin Electric Co. Inc. | 69,394 | |
707,339 | Timken Co. | 50,186 | |
209,006 | |||
OIL, GAS & CONSUMABLE FUELS—0.8% | |||
2,544,071 | Archrock Inc. | 20,836 | |
PHARMACEUTICALS—3.6% | |||
695,538 | Catalent Inc.* | 95,887 | |
ROAD & RAIL—1.7% | |||
528,432 | Ryder System Inc. | 44,890 | |
SEMICONDUCTORS & SEMICONDUCTOR EQUIPMENT—9.6% | |||
433,798 | Advanced Energy Industries Inc. | 39,831 | |
415,147 | CMC Materials Inc. | 53,292 |
COMMON STOCKS—Continued | |||
Shares | Value | ||
SEMICONDUCTORS & SEMICONDUCTOR EQUIPMENT—Continued | |||
388,142 | Entegris Inc. | $54,643 | |
1,769,728 | FormFactor Inc.* | 70,400 | |
76,564 | Monolithic Power Systems Inc. | 40,231 | |
258,397 | |||
SOFTWARE—1.5% | |||
1,612,919 | Box Inc.* | 41,662 | |
TEXTILES, APPAREL & LUXURY GOODS—1.5% | |||
1,227,482 | Wolverine World Wide Inc. | 40,716 | |
TRADING COMPANIES & DISTRIBUTORS—1.6% | |||
448,304 | GATX Corp. | 42,522 | |
TOTAL COMMON STOCKS | |||
(Cost $1,715,809) | 2,650,801 | ||
TOTAL INVESTMENTS—98.2% | |||
(Cost $1,715,809) | 2,650,801 | ||
CASH AND OTHER ASSETS, LESS LIABILITIES—1.8% | 47,885 | ||
TOTAL NET ASSETS—100.0% | $2,698,686 |
FAIR VALUE MEASUREMENTS
All investments at October 31, 2021 (as disclosed in the preceding Portfolio of Investments) were classified as Level 1. There were no Level 3 investments at October 31, 2021 or 2020.
For more information on valuation inputs and their aggregation into the levels identified above, please refer to the Fair Value Measurements and Disclosures in Note 2 of the accompanying Notes to Financial Statements.
*
Non-income producing security
The accompanying notes are an integral part of the Financial Statements.
31
Harbor Strategic Growth Fund
Manager’s Commentary (Unaudited)
Subadviser
Mar Vista Investment Partners, LLC
11150 Santa Monica Boulevard, Suite 320
Los Angeles, CA 90025
Portfolio Managers
Silas A. Myers, CFA
Since 2017
Since 2017
Brian L. Massey, CFA
Since 2017
Since 2017
Joshua J. Honeycutt, CFA
Since 2017
Since 2017
Jeffrey B. Prestine
Since 2017
Since 2017
Mar Vista has subadvised the Fund since 2017.*
Investment Objective
The Fund seeks long-term growth of capital.
*
On March 6, 2017, the Fund acquired all of the assets and substantially all of the liabilities of the Mar Vista Strategic Growth Fund (the “Predecessor Fund”). For the period November 1, 2011 (inception of the Predecessor Fund) to January 20, 2015, Mar Vista served as the Predecessor Fund’s subadviser and for the period January 20, 2015 to March 6, 2017, Mar Vista served as investment adviser to the Predecessor Fund.
MARKET REVIEW
For the year ended October 31, 2021, the Russell 1000® Growth Index was up 43.21%. During the period, the market continued its upward climb despite concerns about limited supplies, labor shortages, increasing wages, the COVID-19 Delta variant and ongoing political stalemates regarding tax policy, debt limits, two massive spending bills and a more hawkish Fed.
Most recently, the robust earnings season stretched already lofty equity valuations, leaving many investors to question their capacity for further expansion. After the September sell-off, October returns were impressive, with the Russell 1000® Growth Index up 8.66% for the month. Performance across all sectors in the Russell 1000® Growth Index was more balanced for this 12-month period versus last year. All sectors were in double-digit return territory, with the worst performing sector, Materials, posting a 19.7% return. Last year, Energy, Industrials, Utilities and Financials had performance of -28.7%, -1.3%, 2.0% and 4.5%, respectively. For the 12-month period ended October 31, 2021, those same sectors were up 97.4%, 30.1%, 19.7% and 53.4%, respectively. Nevertheless, those sectors represented a small percentage of overall index performance. The largest sectors (Information Technology, Consumer Discretionary, Health Care and Communication Services) increased their concentration within the index, and now represent 85.7% of the index versus 81.8% one year ago. To illustrate the concentration of the Russell 1000® Growth Index at a more granular level, the largest five stocks (Facebook, Apple, Amazon, Microsoft and Alphabet) are now 36.7% of the index.
PERFORMANCE
Harbor Strategic Growth Fund returned 39.66% (Retirement Class), 39.56% (Institutional Class), 39.17% (Administrative Class) and 39.06% (Investor Class) while the Russell 1000® Growth Index returned 43.21% for the year ended October 31, 2021. At the sector level, the Fund’s relative underweight within Information Technology and overweight Materials were the biggest detractors from relative performance. Positive contributors to performance included Intuit, Alphabet, First Republic Bank, Charles Schwab and Microsoft. The largest detractors for the period included Unilever, Vontier, Air Products & Chemicals, Starbucks and Ecolab.
During the period, we purchased Air Products & Chemicals and Netflix, and sold Comcast and O’Reilly Automotive. We initiated a new position in Air Products & Chemicals during the fourth quarter of 2020. The company is the premier industrial gas company in a global oligopoly. It possesses opportunities for growth in packaged and merchant gases, onsite gas production, green hydrogen production, coal gasification and carbon recapture. Approximately 52% of Air Products’ revenue is secured by take-or-pay contracts with over 15-year terms that include price escalators. In our view, this contractual revenue with pricing power validates Air Products’ wide economic moat. Netflix was purchased in May 2021 when the stock pulled back due to a slowdown in its subscriber growth, offering us the opportunity to own, what we believe to be, this wide moat, vertically integrated streaming business with a global scale and continued investments in technology and content. We sold Comcast and O’Reilly Automotive as we believe the stocks had achieved our estimate of intrinsic value.
Our sector weight in Financials increased on an absolute and relative basis, during the 12-month period, as a result of strong performance in Charles Schwab and First Republic Bank. In addition, our sale of O’Reilly decreased our relative and absolute weight within the Consumer Discretionary sector. Similarly, our Materials weight increased due to the purchase of Air Products and Chemicals.
32
Harbor Strategic Growth Fund
Manager’s Commentary—Continued
CHANGE IN A $50,000 INVESTMENT
For the period 11/01/2011 through 10/31/2021
The graph compares a $50,000 investment in the Institutional Class shares of the Fund with the performance of the Russell 1000® Growth Index. The Fund’s performance assumes the reinvestment of all dividend and capital gain distributions.
TOTAL RETURNS
For the periods ended 10/31/2021
1 Year | Annualized | |||||
5 Years | Life of Class | |||||
Harbor Strategic Growth Fund | ||||||
Retirement Class1 | 39.66% | N/A | 18.48% | |||
Institutional Class2 | 39.56 | 19.12 | 16.21 | |||
Administrative Class1 | 39.17 | N/A | 18.08 | |||
Investor Class1 | 39.06 | N/A | 17.61 | |||
Comparative Index | ||||||
Russell 1000® Growth2 | 43.21% | 25.49% | 19.42% |
As stated in the Fund’s prospectus dated March 1, 2021, the expense ratios were 0.63% (Net) and 0.72% (Gross) (Retirement Class); 0.71% (Net) and 0.80% (Gross) (Institutional Class); 0.96% (Net) and 1.05% (Gross) (Administrative Class); and 1.07% (Net) and 1.16% (Gross) (Investor Class). The net expense ratios reflect an expense limitation agreement (excluding interest expense, if any) effective through 02/28/2022. The expense ratios in the prospectus may differ from the actual expense ratios for the period disclosed within this report. The expense ratios shown in the prospectus are based on the prior fiscal year, adjusted to reflect changes, if any, in contractual arrangements that occurred prior to the date of the prospectus (or supplement thereto, if applicable).
Performance data shown represents past performance and is no guarantee of future results. Past performance is net of management fees and expenses and reflects reinvested dividends and distributions. Past performance reflects the beneficial effect of any expense waivers or reimbursements, without which returns would have been lower. Investment returns and principal value will fluctuate and when redeemed may be worth more or less than their original cost. Returns for periods less than one year are not annualized. Current performance may be higher or lower and is available through the most recent month end at harborcapital.com or by calling 800-422-1050.
OUTLOOK & STRATEGY
A strong earnings season and pent-up consumer demand drove markets higher over the course of the third quarter 2021. These tailwinds have begun to subside and we expect this to continue over the coming months as we still face uncertainty around the COVID-19 Delta variant, upcoming hurdles within Washington and stretched equity valuations, coupled with peak liquidity and dovishness by central banks. We believe heightened volatility may prove to be a catalyst for a fundamental shift in investor risk appetite, and shine a light on long-undervalued pockets of the market. In uncertain and volatile environments, we believe an acute focus on a quality blend of growth and value has historically been a successful recipe for success. We continue to maintain our belief that future portfolio returns should closely correlate with our companies’ intrinsic value growth. As always, we are diligently working to identify investment opportunities that represent adequate discounts to intrinsic value.
Our team claims no special skill in predicting the market’s direction but, in the fullness of time, we believe a patient, high-conviction portfolio comprised of competitively advantaged serial compounders with stock prices that represent an appropriate discount to intrinsic value should generate excess risk-adjusted returns. In an environment with growing optimism, we will remain diligent, conservative and patient as we deploy capital within our wide-moat universe.
1
The “Life of Class” return as shown reflects the period 03/06/2017 through 10/31/2021.
2
The “Life of Class” return as shown reflects the period 11/01/2011 through 10/31/2021.
This report contains the current opinions of Mar Vista Investment Partners, LLC as of the date of this report and should not be considered as investment advice or a recommendation of any particular security, strategy or investment product. Such opinions are subject to change without notice and securities described herein may no longer be included in, or may at any time be removed from, the Fund’s portfolio. This report is distributed for informational purposes only. Information contained herein has been obtained from sources believed reliable, but not guaranteed.
There is no guarantee that the investment objective of the Fund will be achieved. Stock markets are volatile and equity values can decline significantly in response to adverse issuer, political, regulatory, market and economic conditions. Since the Fund may hold foreign securities, it may be subject to greater risks than funds invested only in the U.S. These risks are more severe for securities of issuers in emerging markets regions. For information on the different share classes and the risks associated with an investment in the Fund, please refer to the current prospectus.
33
Harbor Strategic Growth Fund
Portfolio of Investments—October 31, 2021
SECTOR ALLOCATION (% of investments) - Unaudited
Portfolio of Investments
Value, Cost, and Principal Amounts in Thousands
COMMON STOCKS—98.2% | |||
Shares | Value | ||
AEROSPACE & DEFENSE—1.2% | |||
2,413 | TransDigm Group Inc.* | $1,505 | |
BANKS—6.5% | |||
27,706 | First Republic Bank | 5,994 | |
31,246 | U.S. Bancorp. | 1,886 | |
7,880 | |||
BEVERAGES—1.7% | |||
12,468 | PepsiCo Inc. | 2,015 | |
CAPITAL MARKETS—6.7% | |||
49,180 | Charles Schwab Corp. | 4,034 | |
10,215 | Moody's Corp. | 4,129 | |
8,163 | |||
CHEMICALS—6.2% | |||
12,627 | Air Products & Chemicals Inc. | 3,786 | |
6,667 | Ecolab Inc. | 1,481 | |
7,011 | Linde plc (Ireland) | 2,238 | |
7,505 | |||
DIVERSIFIED FINANCIAL SERVICES—4.5% | |||
19,142 | Berkshire Hathaway Inc. Class B* | 5,494 | |
ELECTRICAL EQUIPMENT—4.2% | |||
28,830 | Amphenol Corp. | 2,213 | |
83,376 | Vontier Corp. | 2,821 | |
5,034 | |||
ENTERTAINMENT—2.5% | |||
4,412 | Netflix Inc.* | 3,046 | |
EQUITY REAL ESTATE INVESTMENT TRUSTS (REITs)—3.3% | |||
14,278 | American Tower Corp. | 4,026 | |
HEALTH CARE EQUIPMENT & SUPPLIES—1.2% | |||
4,000 | Teleflex Inc. | 1,428 | |
HOTELS, RESTAURANTS & LEISURE—1.0% | |||
11,304 | Starbucks Corp. | 1,199 |
COMMON STOCKS—Continued | |||
Shares | Value | ||
INDUSTRIAL CONGLOMERATES—4.9% | |||
16,579 | Honeywell International Inc. | $3,625 | |
4,637 | Roper Technologies Inc. | 2,262 | |
5,887 | |||
INSURANCE—3.5% | |||
3,196 | Markel Corp.* | 4,197 | |
INTERACTIVE MEDIA & SERVICES—7.1% | |||
1,886 | Alphabet Inc. Class C* | 5,593 | |
9,218 | Meta Platforms Inc.* | 2,982 | |
8,575 | |||
INTERNET & DIRECT MARKETING RETAIL—4.0% | |||
1,437 | Amazon.com Inc.* | 4,846 | |
IT SERVICES—2.5% | |||
14,249 | Visa Inc. | 3,017 | |
LIFE SCIENCES TOOLS & SERVICES—2.4% | |||
1,986 | Mettler-Toledo International Inc.* | 2,941 | |
MACHINERY—2.0% | |||
31,433 | Fortive Corp. | 2,380 | |
PERSONAL PRODUCTS—1.6% | |||
36,251 | Unilever plc ADR (United Kingdom)1 | 1,942 | |
PHARMACEUTICALS—2.9% | |||
21,757 | Johnson & Johnson | 3,544 | |
SEMICONDUCTORS & SEMICONDUCTOR EQUIPMENT—3.0% | |||
49,798 | Microchip Technology Inc. | 3,690 | |
SOFTWARE—17.8% | |||
7,415 | Adobe Inc.* | 4,823 | |
9,957 | Intuit Inc. | 6,233 | |
15,238 | Microsoft Corp. | 5,053 | |
10,074 | salesforce.com Inc.* | 3,019 | |
16,524 | SAP SE ADR (Germany)1 | 2,392 | |
21,520 | |||
TECHNOLOGY HARDWARE, STORAGE & PERIPHERALS—4.8% | |||
38,935 | Apple Inc. | 5,832 |
34
Harbor Strategic Growth Fund
Portfolio of Investments—Continued
Value, Cost, and Principal Amounts in Thousands
COMMON STOCKS—Continued | |||
Shares | Value | ||
TEXTILES, APPAREL & LUXURY GOODS—2.7% | |||
19,552 | NIKE Inc. | $3,271 | |
TOTAL COMMON STOCKS | |||
(Cost $58,515) | 118,937 | ||
TOTAL INVESTMENTS—98.2% | |||
(Cost $58,515) | 118,937 | ||
CASH AND OTHER ASSETS, LESS LIABILITIES—1.8% | 2,171 | ||
TOTAL NET ASSETS—100.0% | $121,108 |
FAIR VALUE MEASUREMENTS
All investments at October 31, 2021 (as disclosed in the preceding Portfolio of Investments) were classified as Level 1. There were no Level 3 investments at October 31, 2021 or 2020.
For more information on valuation inputs and their aggregation into the levels identified above, please refer to the Fair Value Measurements and Disclosures in Note 2 of the accompanying Notes to Financial Statements.
*
Non-income producing security
1
Depositary receipts such as American Depositary Receipts (ADRs), Global Depositary Receipts (GDRs) and other country specific depositary receipts are certificates evidencing ownership of shares of a foreign issuer. These certificates are issued by depositary banks and generally trade on an established market in the U.S. or elsewhere.
The accompanying notes are an integral part of the Financial Statements.
35
Harbor Domestic Equity Funds
StatementS of Assets and Liabilities—October 31, 2021
(All amounts in thousands, except per share amounts)
Harbor Capital Appreciation Fund | Harbor Disruptive Innovation Fund | Harbor Large Cap Value Fund | Harbor Mid Cap Fund | Harbor Mid Cap Value Fund | Harbor Small Cap Growth Fund | Harbor Small Cap Value Fund | Harbor Strategic Growth Fund | |||||||||
ASSETS | ||||||||||||||||
Investments, at identified cost | $20,656,560 | $334,149 | $1,589,000 | $52,183 | $367,385 | $802,150 | $1,715,809 | $58,515 | ||||||||
Investments, at value | $42,284,494 | $331,612 | $2,471,885 | $61,143 | $445,217 | $1,082,564 | $2,650,801 | $118,937 | ||||||||
Cash | 28,167 | 16,109 | 85,760 | 868 | 1,911 | 43,357 | 48,854 | 2,220 | ||||||||
Receivables for: | ||||||||||||||||
Investments sold | 330,536 | 4,629 | 7,728 | — | 1,390 | 7,536 | — | — | ||||||||
Capital shares sold | 14,909 | 75 | 1,555 | 12 | 152 | 443 | 1,291 | 1 | ||||||||
Dividends | 1,693 | 42 | 1,070 | 20 | 353 | — | 925 | 25 | ||||||||
Withholding tax | — | — | 391 | — | — | — | — | 10 | ||||||||
Prepaid registration fees | 54 | 35 | 33 | 31 | 21 | 30 | 45 | 9 | ||||||||
Other assets | 3,985 | 226 | 142 | 5 | 96 | 131 | 178 | 10 | ||||||||
Total Assets | 42,663,838 | 352,728 | 2,568,564 | 62,079 | 449,140 | 1,134,061 | 2,702,094 | 121,212 | ||||||||
LIABILITIES | ||||||||||||||||
Payables for: | ||||||||||||||||
Investments purchased | 345,912 | 4,719 | 8,962 | 235 | 931 | 2,841 | 78 | — | ||||||||
Capital shares reacquired | 22,801 | 421 | 694 | — | 244 | 73 | 1,129 | 19 | ||||||||
Accrued expenses: | ||||||||||||||||
Management fees | 18,855 | 206 | 1,279 | 38 | 283 | 705 | 1,696 | 60 | ||||||||
12b-1 fees | 404 | 13 | 7 | — | 8 | 2 | 16 | — | ||||||||
Transfer agent fees | 2,448 | 27 | 92 | 2 | 33 | 57 | 165 | 6 | ||||||||
Trustees’ fees and expenses | 4,428 | 84 | 123 | 1 | 98 | 142 | 201 | 7 | ||||||||
Other | 1,605 | 57 | 95 | 9 | 31 | 49 | 123 | 12 | ||||||||
Total Liabilities | 396,453 | 5,527 | 11,252 | 285 | 1,628 | 3,869 | 3,408 | 104 | ||||||||
NET ASSETS | $42,267,385 | $347,201 | $2,557,312 | $61,794 | $447,512 | $1,130,192 | $2,698,686 | $121,108 | ||||||||
Net Assets Consist of: | ||||||||||||||||
Paid-in capital | $14,515,222 | $215,199 | $1,602,526 | $51,616 | $371,748 | $658,693 | $1,643,504 | $50,892 | ||||||||
Total distributable earnings/(loss) | 27,752,163 | 132,002 | 954,786 | 10,178 | 75,764 | 471,499 | 1,055,182 | 70,216 | ||||||||
$42,267,385 | $347,201 | $2,557,312 | $61,794 | $447,512 | $1,130,192 | $2,698,686 | $121,108 | |||||||||
NET ASSET VALUE PER SHARE BY CLASS | ||||||||||||||||
Retirement Class | ||||||||||||||||
Net assets | $11,385,191 | $64,310 | $1,472,349 | $37,135 | $56,156 | $399,174 | $599,016 | $7,731 | ||||||||
Shares of beneficial interest1 | 91,162 | 4,466 | 63,386 | 2,557 | 2,249 | 20,008 | 13,279 | 232 | ||||||||
Net asset value per share2 | $124.89 | $14.40 | $23.23 | $14.52 | $24.97 | $19.95 | $45.11 | $33.33 | ||||||||
Institutional Class | ||||||||||||||||
Net assets | $28,902,862 | $220,842 | $1,049,830 | $23,710 | $355,431 | $721,405 | $2,023,164 | $112,425 | ||||||||
Shares of beneficial interest1 | 231,631 | 15,432 | 45,199 | 1,634 | 14,236 | 36,363 | 44,893 | 3,377 | ||||||||
Net asset value per share2 | $124.78 | $14.31 | $23.23 | $14.51 | $24.97 | $19.84 | $45.07 | $33.29 | ||||||||
Administrative Class | ||||||||||||||||
Net assets | $414,600 | $5,518 | $3,941 | N/A | $3,828 | $965 | $11,962 | $52 | ||||||||
Shares of beneficial interest1 | 3,428 | 422 | 170 | N/A | 152 | 54 | 268 | 2 | ||||||||
Net asset value per share2 | $120.94 | $13.08 | $23.21 | N/A | $25.24 | $17.80 | $44.72 | $33.18 | ||||||||
Investor Class | ||||||||||||||||
Net assets | $1,564,732 | $56,531 | $31,192 | $949 | $32,097 | $8,648 | $64,544 | $900 | ||||||||
Shares of beneficial interest1 | 13,340 | 4,574 | 1,329 | 66 | 1,287 | 521 | 1,476 | 28 | ||||||||
Net asset value per share2 | $117.30 | $12.36 | $23.46 | $14.44 | $24.93 | $16.60 | $43.72 | $32.62 |
1
Par value $0.01 (unlimited authorizations)
2
Per share amounts can be recalculated to the amounts disclosed herein when total net assets and shares of beneficial interest are not rounded to thousands.
The accompanying notes are an integral part of the Financial Statements.
36
Harbor Domestic Equity Funds
StatementS of Operations—Year Ended October 31, 2021
(All amounts in thousands)
Harbor Capital Appreciation Fund | Harbor Disruptive Innovation Fund | Harbor Large Cap Value Fund | Harbor Mid Cap Fund | Harbor Mid Cap Value Fund | Harbor Small Cap Growth Fund | Harbor Small Cap Value Fund | Harbor Strategic Growth Fund | |
Investment Income | ||||||||
Dividends | $136,498 | $804 | $34,055 | $518 | $11,257 | $4,851 | $26,760 | $960 |
Interest | 75 | 4 | 41 | 1 | 4 | 15 | 39 | 2 |
Foreign taxes withheld | (4,593) | (5) | (423) | — | (5) | (14) | (1) | — |
Total Investment Income | 131,980 | 803 | 33,673 | 519 | 11,256 | 4,852 | 26,798 | 962 |
Operating Expenses | ||||||||
Management fees | 244,596 | 3,309 | 13,313 | 330 | 3,286 | 8,711 | 18,901 | 709 |
12b-1 fees: | ||||||||
Administrative Class | 1,126 | 13 | 13 | N/A | 11 | 2 | 32 | — |
Investor Class | 3,640 | 147 | 73 | 2 | 81 | 21 | 162 | 2 |
Shareholder communications | 653 | 50 | 49 | 7 | 27 | 17 | 123 | 9 |
Custodian fees | 1,415 | 32 | 67 | 10 | 24 | 59 | 72 | 12 |
Transfer agent fees: | ||||||||
Retirement Class | 2,152 | 16 | 215 | 5 | 11 | 84 | 101 | 1 |
Institutional Class | 28,102 | 303 | 1,112 | 16 | 348 | 734 | 1,935 | 110 |
Administrative Class | 450 | 5 | 5 | N/A | 4 | 1 | 13 | — |
Investor Class | 3,105 | 125 | 62 | 2 | 69 | 18 | 138 | 2 |
Professional fees | 1,412 | 185 | 72 | 1 | 17 | 40 | 81 | 17 |
Trustees' fees and expenses | 1,438 | 16 | 73 | 1 | 15 | 40 | 83 | 4 |
Registration fees | 330 | 76 | 117 | 46 | 62 | 69 | 157 | 63 |
Miscellaneous | 487 | 13 | 29 | 8 | 12 | 21 | 31 | 9 |
Total expenses | 288,906 | 4,290 | 15,200 | 428 | 3,967 | 9,817 | 21,829 | 938 |
Management fees waived | (22,536) | (115) | — | — | (44) | — | — | — |
Transfer agent fees waived | (3,365) | (37) | (186) | (4) | (36) | (96) | (211) | (10) |
Other expenses reimbursed | — | (331) | (442) | (55) | (41) | — | — | (92) |
Net expenses | 263,005 | 3,807 | 14,572 | 369 | 3,846 | 9,721 | 21,618 | 836 |
Net Investment Income/(Loss) | (131,025) | (3,004) | 19,101 | 150 | 7,410 | (4,869) | 5,180 | 126 |
Net Realized and Change in Net Unrealized Gain/(Loss) on Investment Transactions | ||||||||
Net realized gain/(loss) on: | ||||||||
Investments | 8,264,965 | 190,116 | 80,096 | 1,346 | 13,180 | 274,401 | 176,834 | 11,433 |
In-kind redemptions | 2,664,550 | — | — | — | — | — | — | — |
Foreign currency transactions | (670) | (15) | — | — | — | — | — | — |
Purchased options | — | 80 | — | — | — | — | — | — |
Change in net unrealized appreciation/(depreciation) on: | ||||||||
Investments | 3,117,822 | (90,544) | 573,558 | 8,160 | 143,579 | 59,863 | 573,211 | 27,401 |
Translations of assets and liabilities in foreign currencies | (31) | — | — | — | — | — | — | — |
Net gain/(loss) on investment transactions | 14,046,636 | 99,637 | 653,654 | 9,506 | 156,759 | 334,264 | 750,045 | 38,834 |
Net Increase/(Decrease) in Net Assets Resulting from Operations | $13,915,611 | $96,633 | $672,755 | $9,656 | $164,169 | $329,395 | $755,225 | $38,960 |
The accompanying notes are an integral part of the Financial Statements.
37
Harbor Domestic Equity Funds
Statements of Changes In Net Assets
(All amounts in thousands)
Harbor Capital Appreciation Fund | Harbor Disruptive Innovation Fund | Harbor Large Cap Value Fund | ||||
November 1, 2020 through October 31, 2021 | November 1, 2019 through October 31, 2020 | November 1, 2020 through October 31, 2021 | November 1, 2019 through October 31, 2020 | November 1, 2020 through October 31, 2021 | November 1, 2019 through October 31, 2020 | |
INCREASE/(DECREASE) IN NET ASSETS | ||||||
Operations: | ||||||
Net investment income/(loss) | $(131,025) | $(53,535) | $(3,004) | $(1,680) | $19,101 | $14,033 |
Net realized gain/(loss) on investments | 10,928,845 | 5,943,736 | 190,181 | 69,847 | 80,096 | 56,241 |
Change in net unrealized appreciation/(depreciation) of investments | 3,117,791 | 5,967,186 | (90,544) | 39,517 | 573,558 | 38,926 |
Net increase/(decrease) in assets resulting from operations | 13,915,611 | 11,857,387 | 96,633 | 107,684 | 672,755 | 109,200 |
Distributions to Shareholders | ||||||
Retirement Class | (1,223,020) | (618,547) | (9,924) | (6,194) | (28,308) | (5,049) |
Institutional Class | (3,192,095) | (1,854,118) | (37,666) | (39,106) | (35,749) | (7,208) |
Administrative Class | (54,447) | (30,561) | (619) | (555) | (396) | (73) |
Investor Class | (170,722) | (98,181) | (8,824) | (4,732) | (801) | (132) |
Total distributions to shareholders | (4,640,284) | (2,601,407) | (57,033) | (50,587) | (65,254) | (12,462) |
Net Increase/(Decrease) Derived from Capital Share Transactions | (3,838,863) | (2,136,709) | (33,569) | 30,686 | 378,465 | 207,621 |
Net increase/(decrease) in net assets | 5,436,464 | 7,119,271 | 6,031 | 87,783 | 985,966 | 304,359 |
Net Assets | ||||||
Beginning of period | 36,830,921 | 29,711,650 | 341,170 | 253,387 | 1,571,346 | 1,266,987 |
End of period | $42,267,385 | $36,830,921 | $347,201 | $341,170 | $2,557,312 | $1,571,346 |
a
Inception
The accompanying notes are an integral part of the Financial Statements.
38
Harbor Mid Cap Fund | Harbor Mid Cap Value Fund | Harbor Small Cap Growth Fund | Harbor Small Cap Value Fund | Harbor Strategic Growth Fund | |||||
November 1, 2020 through October 31, 2021 | December 1, 2019a through October 31, 2020 | November 1, 2020 through October 31, 2021 | November 1, 2019 through October 31, 2020 | November 1, 2020 through October 31, 2021 | November 1, 2019 through October 31, 2020 | November 1, 2020 through October 31, 2021 | November 1, 2019 through October 31, 2020 | November 1, 2020 through October 31, 2021 | November 1, 2019 through October 31, 2020 |
$150 | $45 | $7,410 | $10,477 | $(4,869) | $(2,718) | $5,180 | $9,385 | $126 | $391 |
1,346 | (189) | 13,180 | (23,673) | 274,401 | 95,253 | 176,834 | (45,312) | 11,433 | 4,310 |
8,160 | 800 | 143,579 | (90,873) | 59,863 | 119,273 | 573,211 | (36,478) | 27,401 | 8,635 |
9,656 | 656 | 164,169 | (104,069) | 329,395 | 211,808 | 755,225 | (72,405) | 38,960 | 13,336 |
(56) | (3) | (924) | (3,052) | (28,740) | (10,182) | (1,918) | (4,051) | (224) | (98) |
(11) | (3) | (7,543) | (15,499) | (51,890) | (15,949) | (7,391) | (19,292) | (3,610) | (1,932) |
N/A | N/A | (109) | (490) | (76) | (17) | (30) | (88) | (1) | 1 |
— | — | (617) | (1,654) | (667) | (295) | (86) | (633) | (17) | (7) |
(67) | (6) | (9,193) | (20,695) | (81,373) | (26,443) | (9,425) | (24,065) | (3,852) | (2,036) |
41,191 | 10,364 | (46,858) | (236,852) | (108,039) | 75,623 | 240,280 | 167,649 | (21,908) | (15,442) |
50,780 | 11,014 | 108,118 | (361,616) | 139,983 | 260,988 | 986,080 | 71,179 | 13,200 | (4,142) |
11,014 | — | 339,394 | 701,010 | 990,209 | 729,221 | 1,712,606 | 1,641,427 | 107,908 | 112,050 |
$61,794 | $11,014 | $447,512 | $339,394 | $1,130,192 | $990,209 | $2,698,686 | $1,712,606 | $121,108 | $107,908 |
39
Harbor Domestic Equity Funds
Statements of Changes in Net Assets—Capital Stock Activity
(All amounts in thousands)
Harbor Capital Appreciation Fund | Harbor Disruptive Innovation Fund | Harbor Large Cap Value Fund | ||||
November 1, 2020 through October 31, 2021 | November 1, 2019 through October 31, 2020 | November 1, 2020 through October 31, 2021 | November 1, 2019 through October 31, 2020 | November 1, 2020 through October 31, 2021 | November 1, 2019 through October 31, 2020 | |
AMOUNT ($) | ||||||
Retirement Class | ||||||
Net proceeds from sale of shares | $2,389,246 | $2,114,924 | $32,043 | $25,383 | $692,481 | $319,834 |
Reinvested distributions | 1,112,207 | 551,856 | 9,728 | 6,194 | 24,265 | 3,751 |
Cost of shares reacquired | (4,135,764) | (2,310,156) | (49,815) | (15,585) | (174,378) | (167,747) |
Net increase/(decrease) in net assets | $(634,311) | $356,624 | $(8,044) | $15,992 | $542,368 | $155,838 |
Institutional Class | ||||||
Net proceeds from sale of shares | $3,786,458 | $4,000,724 | $135,900 | $85,884 | $414,990 | $426,035 |
Reinvested distributions | 3,040,583 | 1,758,584 | 29,565 | 27,491 | 25,913 | 5,445 |
Cost of shares reacquired | (5,949,255) | (7,160,313) | (209,072) | (111,020) | (594,474) | (366,117) |
Cost of shares reacquired through in-kind redemptions | (3,942,327) | (948,692) | — | — | — | — |
Net increase/(decrease) in net assets | $(3,064,541) | $(2,349,697) | $(43,607) | $2,355 | $(153,571) | $65,363 |
Administrative Class | ||||||
Net proceeds from sale of shares | $123,033 | $87,311 | $1,798 | $337 | $479 | $658 |
Reinvested distributions | 51,536 | 28,968 | 612 | 542 | 396 | 73 |
Cost of shares reacquired | (278,791) | (149,315) | (1,027) | (480) | (10,449) | (2,003) |
Net increase/(decrease) in net assets | $(104,222) | $(33,036) | $1,383 | $399 | $(9,574) | $(1,272) |
Investor Class | ||||||
Net proceeds from sale of shares | $286,891 | $270,132 | $48,858 | $23,375 | $7,234 | $5,661 |
Reinvested distributions | 167,709 | 96,628 | 8,628 | 4,641 | 775 | 130 |
Cost of shares reacquired | (490,389) | (477,360) | (40,787) | (16,076) | (8,767) | (18,099) |
Net increase/(decrease) in net assets | $(35,789) | $(110,600) | $16,699 | $11,940 | $(758) | $(12,308) |
a
Inception
The accompanying notes are an integral part of the Financial Statements.
40
Harbor Mid Cap Fund | Harbor Mid Cap Value Fund | Harbor Small Cap Growth Fund | Harbor Small Cap Value Fund | Harbor Strategic Growth Fund | |||||
November 1, 2020 through October 31, 2021 | December 1, 2019a through October 31, 2020 | November 1, 2020 through October 31, 2021 | November 1, 2019 through October 31, 2020 | November 1, 2020 through October 31, 2021 | November 1, 2019 through October 31, 2020 | November 1, 2020 through October 31, 2021 | November 1, 2019 through October 31, 2020 | November 1, 2020 through October 31, 2021 | November 1, 2019 through October 31, 2020 |
$31,072 | $4,902 | $29,369 | $30,057 | $65,042 | $81,574 | $267,607 | $156,404 | $672 | $2,451 |
56 | 3 | 923 | 3,047 | 28,102 | 9,807 | 1,313 | 2,583 | 224 | 98 |
(5,150) | (33) | (21,119) | (86,865) | (130,204) | (88,256) | (109,819) | (78,104) | (1,742) | (1,739) |
$25,978 | $4,872 | $9,173 | $(53,761) | $(37,060) | $3,125 | $159,101 | $80,883 | $(846) | $810 |
$15,309 | $5,116 | $98,494 | $97,779 | $133,378 | $198,667 | $682,727 | $506,813 | $13,781 | $16,227 |
11 | 2 | 7,300 | 14,723 | 49,341 | 15,322 | 6,427 | 16,697 | 3,446 | 1,836 |
(389) | (6) | (152,183) | (265,068) | (253,829) | (140,747) | (597,683) | (440,065) | (38,500) | (34,344) |
— | — | — | — | — | — | — | — | — | — |
$14,931 | $5,112 | $(46,389) | $(152,566) | $(71,110) | $73,242 | $91,471 | $83,445 | $(21,273) | $(16,281) |
N/A | N/A | $1,360 | $2,443 | $139 | $516 | $3,183 | $5,655 | $38 | $2 |
N/A | N/A | 89 | 459 | 76 | 17 | 29 | 86 | 1 | — |
N/A | N/A | (4,527) | (13,858) | (321) | (230) | (5,544) | (2,853) | (20) | — |
N/A | N/A | $(3,078) | $(10,956) | $(106) | $303 | $(2,332) | $2,888 | $19 | $2 |
$590 | $394 | $10,083 | $8,714 | $2,733 | $5,269 | $11,816 | $28,011 | $245 | $168 |
— | — | 595 | 1,601 | 652 | 294 | 83 | 621 | 17 | 6 |
(308) | (14) | (17,242) | (29,884) | (3,148) | (6,610) | (19,859) | (28,199) | (70) | (147) |
$282 | $380 | $(6,564) | $(19,569) | $237 | $(1,047) | $(7,960) | $433 | $192 | $27 |
41
Harbor Domestic Equity Funds
Statements of Changes in Net Assets—Capital Stock Activity—Continued
(All amounts in thousands)
Harbor Capital Appreciation Fund | Harbor Disruptive Innovation Fund | Harbor Large Cap Value Fund | ||||
November 1, 2020 through October 31, 2021 | November 1, 2019 through October 31, 2020 | November 1, 2020 through October 31, 2021 | November 1, 2019 through October 31, 2020 | November 1, 2020 through October 31, 2021 | November 1, 2019 through October 31, 2020 | |
SHARES | ||||||
Retirement Class | ||||||
Shares sold | 21,785 | 24,367 | 2,309 | 2,912 | 31,967 | 20,337 |
Shares issued due to reinvestment of distributions | 10,669 | 7,403 | 726 | 662 | 1,253 | 228 |
Shares reacquired | (37,566) | (27,474) | (3,539) | (1,469) | (8,155) | (10,280) |
Net increase/(decrease) in shares outstanding | (5,112) | 4,296 | (504) | 2,105 | 25,065 | 10,285 |
Institutional Class | ||||||
Shares sold | 34,845 | 48,185 | 9,890 | 8,232 | 19,767 | 27,030 |
Shares issued due to reinvestment of distributions | 29,172 | 23,573 | 2,218 | 2,950 | 1,335 | 331 |
Shares reacquired | (54,624) | (84,852) | (15,082) | (11,020) | (27,387) | (22,489) |
Shares reacquired through in-kind redemptions | (35,668) | (10,241) | — | — | — | — |
Net increase/(decrease) in shares outstanding | (26,275) | (23,335) | (2,974) | 162 | (6,285) | 4,872 |
Administrative Class | ||||||
Shares sold | 1,186 | 1,067 | 145 | 33 | 25 | 42 |
Shares issued due to reinvestment of distributions | 509 | 397 | 50 | 63 | 21 | 4 |
Shares reacquired | (2,615) | (1,777) | (80) | (51) | (549) | (121) |
Net increase/(decrease) in shares outstanding | (920) | (313) | 115 | 45 | (503) | (75) |
Investor Class | ||||||
Shares sold | 2,817 | 3,290 | 4,063 | 2,271 | 336 | 349 |
Shares issued due to reinvestment of distributions | 1,706 | 1,359 | 747 | 562 | 40 | 8 |
Shares reacquired | (4,798) | (5,989) | (3,437) | (1,746) | (409) | (1,157) |
Net increase/(decrease) in shares outstanding | (275) | (1,340) | 1,373 | 1,087 | (33) | (800) |
a
Inception
The accompanying notes are an integral part of the Financial Statements.
42
Harbor Mid Cap Fund | Harbor Mid Cap Value Fund | Harbor Small Cap Growth Fund | Harbor Small Cap Value Fund | Harbor Strategic Growth Fund | |||||
November 1, 2020 through October 31, 2021 | December 1, 2019a through October 31, 2020 | November 1, 2020 through October 31, 2021 | November 1, 2019 through October 31, 2020 | November 1, 2020 through October 31, 2021 | November 1, 2019 through October 31, 2020 | November 1, 2020 through October 31, 2021 | November 1, 2019 through October 31, 2020 | November 1, 2020 through October 31, 2021 | November 1, 2019 through October 31, 2020 |
2,445 | 491 | 1,345 | 1,582 | 3,479 | 6,248 | 6,313 | 5,105 | 23 | 104 |
4 | — | 46 | 144 | 1,558 | 715 | 33 | 75 | 8 | 4 |
(379) | (4) | (918) | (4,893) | (6,960) | (6,395) | (2,559) | (2,569) | (62) | (76) |
2,070 | 487 | 473 | (3,167) | (1,923) | 568 | 3,787 | 2,611 | (31) | 32 |
1,149 | 513 | 4,193 | 6,148 | 7,149 | 15,543 | 16,047 | 17,130 | 472 | 714 |
1 | — | 366 | 696 | 2,749 | 1,120 | 163 | 482 | 128 | 80 |
(28) | (1) | (6,827) | (15,347) | (13,526) | (10,218) | (14,020) | (15,058) | (1,318) | (1,477) |
— | — | — | — | — | — | — | — | — | — |
1,122 | 512 | (2,268) | (8,503) | (3,628) | 6,445 | 2,190 | 2,554 | (718) | (683) |
N/A | N/A | 61 | 137 | 8 | 44 | 74 | 218 | 1 | — |
N/A | N/A | 4 | 22 | 5 | 1 | 1 | 3 | — | — |
N/A | N/A | (204) | (749) | (19) | (18) | (128) | (96) | — | — |
N/A | N/A | (139) | (590) | (6) | 27 | (53) | 125 | 1 | — |
45 | 44 | 439 | 490 | 175 | 487 | 287 | 909 | 9 | 8 |
— | — | 29 | 75 | 43 | 25 | 2 | 18 | 1 | — |
(22) | (1) | (776) | (1,807) | (203) | (598) | (486) | (1,033) | (3) | (6) |
23 | 43 | (308) | (1,241) | 15 | (86) | (197) | (106) | 7 | 2 |
43
Harbor Domestic Equity Funds Financial Highlights
Selected Data for a Share Outstanding for the Periods Presented
HARBOR CAPITAL APPRECIATION FUND | |||||
Retirement Class | |||||
Year Ended October 31, | 2021 | 2020 | 2019 | 2018 | 2017 |
Net asset value beginning of period | $99.19 | $75.79 | $73.98 | $75.34 | $60.37 |
Income from Investment Operations | |||||
Net investment income/(loss)a,e | (0.27) | (0.08) | 0.13 | 0.23 | 0.16 |
Net realized and unrealized gain/(loss) on investments | 38.73 | 30.27 | 8.54 | 6.50 | 18.40 |
Total from investment operations | 38.46 | 30.19 | 8.67 | 6.73 | 18.56 |
Less Distributions | |||||
Dividends from net investment income | — | (0.12) | (0.21) | (0.17) | (0.10) |
Distributions from net realized capital gains | (12.76) | (6.67) | (6.65) | (7.92) | (3.49) |
Total distributions | (12.76) | (6.79) | (6.86) | (8.09) | (3.59) |
Net asset value end of period | 124.89 | 99.19 | 75.79 | 73.98 | 75.34 |
Net assets end of period (000s) | $11,385,191 | $9,549,061 | $6,970,617 | $5,393,675 | $2,892,484 |
Ratios and Supplemental Data (%) | |||||
Total returnb | 41.33% | 42.79% | 13.73% | 9.50% | 32.62% |
Ratio of total expenses to average net assets^ | 0.63 | 0.64 | 0.63 | 0.62 | 0.63 |
Ratio of net expenses to average net assetsa | 0.57 | 0.58 | 0.58 | 0.57 | 0.59 |
Ratio of net investment income/(loss) to average net assetsa | (0.25) | (0.09) | 0.18 | 0.30 | 0.23 |
Portfolio turnover | 48 | 51 | 40 | 40 | 52 |
Administrative Class | |||||
Year Ended October 31, | 2021 | 2020 | 2019 | 2018 | 2017 |
Net asset value beginning of period | $96.68 | $74.15 | $72.54 | $74.08 | $59.50 |
Income from Investment Operations | |||||
Net investment income/(loss)a,e | (0.61) | (0.34) | (0.09) | (0.01) | (0.04) |
Net realized and unrealized gain/(loss) on investments | 37.63 | 29.54 | 8.35 | 6.39 | 18.11 |
Total from investment operations | 37.02 | 29.20 | 8.26 | 6.38 | 18.07 |
Less Distributions | |||||
Dividends from net investment income | — | — | — | — | — |
Distributions from net realized capital gains | (12.76) | (6.67) | (6.65) | (7.92) | (3.49) |
Total distributions | (12.76) | (6.67) | (6.65) | (7.92) | (3.49) |
Net asset value end of period | 120.94 | 96.68 | 74.15 | 72.54 | 74.08 |
Net assets end of period (000s) | $414,600 | $420,324 | $345,550 | $448,241 | $493,860 |
Ratios and Supplemental Data (%) | |||||
Total returnb | 40.86% | 42.32% | 13.35% | 9.16% | 32.20% |
Ratio of total expenses to average net assets^ | 0.96 | 0.97 | 0.96 | 0.95 | 0.96 |
Ratio of net expenses to average net assetsa | 0.90 | 0.91 | 0.91 | 0.90 | 0.90 |
Ratio of net investment income/(loss) to average net assetsa | (0.57) | (0.41) | (0.13) | (0.01) | (0.06) |
Portfolio turnover | 48 | 51 | 40 | 40 | 52 |
See page 60 for notes to the Financial Highlights.
The accompanying notes are an integral part of the Financial Statements.
44
Institutional Class | ||||
2021 | 2020 | 2019 | 2018 | 2017 |
$99.18 | $75.78 | $73.97 | $75.32 | $60.36 |
(0.36) | (0.14) | 0.08 | 0.18 | 0.13 |
38.72 | 30.26 | 8.53 | 6.50 | 18.38 |
38.36 | 30.12 | 8.61 | 6.68 | 18.51 |
— | (0.05) | (0.15) | (0.11) | (0.06) |
(12.76) | (6.67) | (6.65) | (7.92) | (3.49) |
(12.76) | (6.72) | (6.80) | (8.03) | (3.55) |
124.78 | 99.18 | 75.78 | 73.97 | 75.32 |
$28,902,862 | $25,579,181 | $21,311,587 | $22,366,214 | $23,896,840 |
41.22% | 42.68% | 13.63% | 9.44% | 32.52% |
0.71 | 0.72 | 0.71 | 0.70 | 0.71 |
0.65 | 0.66 | 0.66 | 0.65 | 0.65 |
(0.33) | (0.16) | 0.11 | 0.23 | 0.20 |
48 | 51 | 40 | 40 | 52 |
Investor Class | ||||
2021 | 2020 | 2019 | 2018 | 2017 |
$94.19 | $72.48 | $71.15 | $72.88 | $58.66 |
(0.72) | (0.43) | (0.17) | (0.10) | (0.11) |
36.59 | 28.81 | 8.15 | 6.29 | 17.82 |
35.87 | 28.38 | 7.98 | 6.19 | 17.71 |
— | — | — | — | — |
(12.76) | (6.67) | (6.65) | (7.92) | (3.49) |
(12.76) | (6.67) | (6.65) | (7.92) | (3.49) |
117.30 | 94.19 | 72.48 | 71.15 | 72.88 |
$1,564,732 | $1,282,355 | $1,083,896 | $1,327,790 | $1,531,809 |
40.71% | 42.15% | 13.21% | 9.03% | 32.04% |
1.08 | 1.09 | 1.08 | 1.07 | 1.08 |
1.01 | 1.03 | 1.03 | 1.02 | 1.02 |
(0.69) | (0.53) | (0.25) | (0.13) | (0.17) |
48 | 51 | 40 | 40 | 52 |
45
Harbor Domestic Equity Funds Financial Highlights—Continued
Selected Data for a Share Outstanding for the Periods Presented
HARBOR DISRUPTIVE INNOVATION FUND | |||||
Retirement Class | |||||
Year Ended October 31, | 2021i | 2020 | 2019 | 2018 | 2017 |
Net asset value beginning of period | $12.93 | $10.91 | $10.88 | $11.25 | $8.58 |
Income from Investment Operations | |||||
Net investment income/(loss)a,e | (0.08) | (0.06) | (0.04) | (0.03) | 0.01 |
Net realized and unrealized gain/(loss) on investments | 3.48 | 4.25 | 1.85 | 0.88 | 2.66 |
Total from investment operations | 3.40 | 4.19 | 1.81 | 0.85 | 2.67 |
Less Distributions | |||||
Dividends from net investment income | — | — | — | — | — |
Distributions from net realized capital gains | (1.93) | (2.17) | (1.78) | (1.22) | — |
Total distributions | (1.93) | (2.17) | (1.78) | (1.22) | — |
Net asset value end of period | 14.40 | 12.93 | 10.91 | 10.88 | 11.25 |
Net assets end of period (000s) | $64,310 | $64,242 | $31,265 | $144,137 | $127,446 |
Ratios and Supplemental Data (%) | |||||
Total returnb | 27.41% | 46.03% | 21.38% | 8.02% | 31.12% |
Ratio of total expenses to average net assets^ | 0.85 | 0.83 | 0.82 | 0.80 | 0.81 |
Ratio of net expenses to average net assetsa | 0.74 | 0.79 | 0.81 | 0.80 | 0.81 |
Ratio of net investment income/(loss) to average net assetsa | (0.56) | (0.53) | (0.37) | (0.28) | 0.07 |
Portfolio turnover | 182 | 113 | 70 | 85 | 87 |
Administrative Class | |||||
Year Ended October 31, | 2021i | 2020 | 2019 | 2018 | 2017 |
Net asset value beginning of period | $11.93 | $10.26 | $10.37 | $10.81 | $8.27 |
Income from Investment Operations | |||||
Net investment income/(loss)a,e | (0.11) | (0.08) | (0.06) | (0.06) | (0.04) |
Net realized and unrealized gain/(loss) on investments | 3.19 | 3.92 | 1.73 | 0.84 | 2.58 |
Total from investment operations | 3.08 | 3.84 | 1.67 | 0.78 | 2.54 |
Less Distributions | |||||
Dividends from net investment income | — | — | — | — | — |
Distributions from net realized capital gains | (1.93) | (2.17) | (1.78) | (1.22) | — |
Total distributions | (1.93) | (2.17) | (1.78) | (1.22) | — |
Net asset value end of period | 13.08 | 11.93 | 10.26 | 10.37 | 10.81 |
Net assets end of period (000s) | $5,518 | $3,666 | $2,687 | $26,936 | $110,114 |
Ratios and Supplemental Data (%) | |||||
Total returnb | 26.98% | 45.42% | 21.04% | 7.68% | 30.71% |
Ratio of total expenses to average net assets^ | 1.17 | 1.16 | 1.15 | 1.13 | 1.13 |
Ratio of net expenses to average net assetsa | 1.06 | 1.12 | 1.14 | 1.12 | 1.12 |
Ratio of net investment income/(loss) to average net assetsa | (0.88) | (0.84) | (0.66) | (0.55) | (0.45) |
Portfolio turnover | 182 | 113 | 70 | 85 | 87 |
See page 60 for notes to the Financial Highlights.
The accompanying notes are an integral part of the Financial Statements.
46
Institutional Class | ||||
2021i | 2020 | 2019 | 2018 | 2017 |
$12.87 | $10.88 | $10.86 | $11.24 | $8.58 |
(0.09) | (0.06) | (0.05) | (0.04) | (0.01) |
3.46 | 4.22 | 1.85 | 0.88 | 2.67 |
3.37 | 4.16 | 1.80 | 0.84 | 2.66 |
— | — | — | — | — |
(1.93) | (2.17) | (1.78) | (1.22) | — |
(1.93) | (2.17) | (1.78) | (1.22) | — |
14.31 | 12.87 | 10.88 | 10.86 | 11.24 |
$220,842 | $236,863 | $198,544 | $158,680 | $145,914 |
27.29% | 45.84% | 21.32% | 7.94% | 31.00% |
0.93 | 0.91 | 0.90 | 0.88 | 0.88 |
0.82 | 0.87 | 0.89 | 0.87 | 0.87 |
(0.64) | (0.58) | (0.48) | (0.36) | (0.14) |
182 | 113 | 70 | 85 | 87 |
Investor Class | ||||
2021i | 2020 | 2019 | 2018 | 2017 |
$11.37 | $9.88 | $10.07 | $10.54 | $8.07 |
(0.12) | (0.09) | (0.08) | (0.08) | (0.04) |
3.04 | 3.75 | 1.67 | 0.83 | 2.51 |
2.92 | 3.66 | 1.59 | 0.75 | 2.47 |
— | — | — | — | — |
(1.93) | (2.17) | (1.78) | (1.22) | — |
(1.93) | (2.17) | (1.78) | (1.22) | — |
12.36 | 11.37 | 9.88 | 10.07 | 10.54 |
$56,531 | $36,399 | $20,891 | $16,929 | $20,121 |
26.88% | 45.32% | 20.83% | 7.57% | 30.61% |
1.29 | 1.28 | 1.27 | 1.25 | 1.25 |
1.17 | 1.24 | 1.26 | 1.24 | 1.24 |
(0.99) | (0.96) | (0.85) | (0.72) | (0.48) |
182 | 113 | 70 | 85 | 87 |
47
Harbor Domestic Equity Funds Financial Highlights—Continued
Selected Data for a Share Outstanding for the Periods Presented
HARBOR LARGE CAP VALUE FUND | |||||
Retirement Class | |||||
Year Ended October 31, | 2021 | 2020 | 2019 | 2018 | 2017 |
Net asset value beginning of period | $17.11 | $16.33 | $14.37 | $14.87 | $12.32 |
Income from Investment Operations | |||||
Net investment income/(loss)a,e | 0.19 | 0.18 | 0.18 | 0.17 | 0.12 |
Net realized and unrealized gain/(loss) on investments | 6.62 | 0.76 | 2.17 | (0.13) | 3.00 |
Total from investment operations | 6.81 | 0.94 | 2.35 | 0.04 | 3.12 |
Less Distributions | |||||
Dividends from net investment income | (0.17) | (0.16) | (0.16) | (0.13) | (0.14) |
Distributions from net realized capital gains | (0.52) | — | (0.23) | (0.41) | (0.43) |
Total distributions | (0.69) | (0.16) | (0.39) | (0.54) | (0.57) |
Net asset value end of period | 23.23 | 17.11 | 16.33 | 14.37 | 14.87 |
Net assets end of period (000s) | $1,472,349 | $655,562 | $457,908 | $313,721 | $143,966 |
Ratios and Supplemental Data (%) | |||||
Total returnb | 40.62% | 5.80% | 16.92% | 0.18% | 26.08% |
Ratio of total expenses to average net assets^ | 0.64 | 0.64 | 0.65 | 0.64 | 0.64 |
Ratio of net expenses to average net assetsa | 0.61 | 0.61 | 0.61 | 0.60 | 0.60 |
Ratio of net investment income/(loss) to average net assetsa | 0.90 | 1.08 | 1.19 | 1.12 | 0.83 |
Portfolio turnover | 13 | 26 | 11 | 15 | 16 |
Administrative Class | |||||
Year Ended October 31, | 2021 | 2020 | 2019 | 2018 | 2017 |
Net asset value beginning of period | $17.11 | $16.33 | $14.36 | $14.84 | $12.30 |
Income from Investment Operations | |||||
Net investment income/(loss)a,e | 0.13 | 0.13 | 0.14 | 0.13 | 0.10 |
Net realized and unrealized gain/(loss) on investments | 6.59 | 0.75 | 2.17 | (0.15) | 2.99 |
Total from investment operations | 6.72 | 0.88 | 2.31 | (0.02) | 3.09 |
Less Distributions | |||||
Dividends from net investment income | (0.10) | (0.10) | (0.11) | (0.05) | (0.12) |
Distributions from net realized capital gains | (0.52) | — | (0.23) | (0.41) | (0.43) |
Total distributions | (0.62) | (0.10) | (0.34) | (0.46) | (0.55) |
Net asset value end of period | 23.21 | 17.11 | 16.33 | 14.36 | 14.84 |
Net assets end of period (000s) | $3,941 | $11,502 | $12,195 | $15,460 | $53,006 |
Ratios and Supplemental Data (%) | |||||
Total returnb | 40.05% | 5.42% | 16.60% | (0.23)% | 25.77% |
Ratio of total expenses to average net assets^ | 0.97 | 0.97 | 0.98 | 0.97 | 0.97 |
Ratio of net expenses to average net assetsa | 0.94 | 0.94 | 0.94 | 0.93 | 0.93 |
Ratio of net investment income/(loss) to average net assetsa | 0.64 | 0.78 | 0.91 | 0.84 | 0.70 |
Portfolio turnover | 13 | 26 | 11 | 15 | 16 |
See page 60 for notes to the Financial Highlights.
The accompanying notes are an integral part of the Financial Statements.
48
Institutional Class | ||||
2021 | 2020 | 2019 | 2018 | 2017 |
$17.11 | $16.33 | $14.37 | $14.87 | $12.32 |
0.18 | 0.17 | 0.17 | 0.16 | 0.15 |
6.61 | 0.76 | 2.17 | (0.13) | 2.97 |
6.79 | 0.93 | 2.34 | 0.03 | 3.12 |
(0.15) | (0.15) | (0.15) | (0.12) | (0.14) |
(0.52) | — | (0.23) | (0.41) | (0.43) |
(0.67) | (0.15) | (0.38) | (0.53) | (0.57) |
23.23 | 17.11 | 16.33 | 14.37 | 14.87 |
$1,049,830 | $880,755 | $761,262 | $605,040 | $498,360 |
40.52% | 5.72% | 16.83% | 0.11% | 26.00% |
0.72 | 0.72 | 0.73 | 0.72 | 0.72 |
0.69 | 0.69 | 0.69 | 0.68 | 0.68 |
0.84 | 1.02 | 1.12 | 1.05 | 1.10 |
13 | 26 | 11 | 15 | 16 |
Investor Class | ||||
2021 | 2020 | 2019 | 2018 | 2017 |
$17.28 | $16.48 | $14.49 | $14.99 | $12.42 |
0.10 | 0.11 | 0.12 | 0.11 | 0.10 |
6.68 | 0.76 | 2.19 | (0.14) | 2.99 |
6.78 | 0.87 | 2.31 | (0.03) | 3.09 |
(0.08) | (0.07) | (0.09) | (0.06) | (0.09) |
(0.52) | — | (0.23) | (0.41) | (0.43) |
(0.60) | (0.07) | (0.32) | (0.47) | (0.52) |
23.46 | 17.28 | 16.48 | 14.49 | 14.99 |
$31,192 | $23,527 | $35,622 | $45,548 | $71,374 |
39.96% | 5.32% | 16.39% | (0.27)% | 25.52% |
1.08 | 1.09 | 1.10 | 1.09 | 1.09 |
1.05 | 1.06 | 1.06 | 1.05 | 1.05 |
0.47 | 0.67 | 0.79 | 0.70 | 0.75 |
13 | 26 | 11 | 15 | 16 |
49
Harbor Domestic Equity Funds Financial Highlights—Continued
Selected Data for a Share Outstanding for the Periods Presented
HARBOR MID CAP FUND | ||||||
Retirement Class | Institutional Class | Investor Class | ||||
Year Ended October 31, | 2021 | 2020h | 2021 | 2020h | 2021 | 2020h |
Net asset value beginning of period | $10.57 | $10.00 | $10.56 | $10.00 | $10.54 | $10.00 |
Income from Investment Operations | ||||||
Net investment income/(loss)a,e | 0.05 | 0.05 | 0.04 | 0.04 | (0.01) | 0.01 |
Net realized and unrealized gain/(loss) on investments | 3.93 | 0.53 | 3.93 | 0.53 | 3.91 | 0.53 |
Total from investment operations | 3.98 | 0.58 | 3.97 | 0.57 | 3.90 | 0.54 |
Less Distributions | ||||||
Dividends from net investment income | (0.03) | (0.01) | (0.02) | (0.01) | —* | —* |
Distributions from net realized capital gains | — | — | — | — | — | — |
Total distributions | (0.03) | (0.01) | (0.02) | (0.01) | —* | —* |
Net asset value end of period | 14.52 | 10.57 | 14.51 | 10.56 | 14.44 | 10.54 |
Net assets end of period (000s) | $37,135 | $5,148 | $23,710 | $5,411 | $949 | $455 |
Ratios and Supplemental Data (%) | ||||||
Total returnb | 37.61% | 5.86%c | 37.54% | 5.75%c | 37.00% | 5.42%c |
Ratio of total expenses to average net assets^ | 0.93 | 2.28d | 1.01 | 2.36d | 1.38 | 2.73d |
Ratio of net expenses to average net assetsa | 0.80 | 0.80d | 0.88 | 0.88d | 1.24 | 1.25d |
Ratio of net investment income/(loss) to average net assetsa | 0.40 | 0.54d | 0.27 | 0.46d | (0.06) | 0.07d |
Portfolio turnover | 11 | 9c | 11 | 9c | 11 | 9c |
See page 60 for notes to the Financial Highlights.
The accompanying notes are an integral part of the Financial Statements.
50
Harbor Domestic Equity Funds Financial Highlights—Continued
Selected Data for a Share Outstanding for the Periods Presented
HARBOR MID CAP VALUE FUND | |||||
Retirement Class | |||||
Year Ended October 31, | 2021 | 2020 | 2019 | 2018 | 2017 |
Net asset value beginning of period | $16.83 | $20.82 | $21.39 | $23.33 | $20.17 |
Income from Investment Operations | |||||
Net investment income/(loss)a,e | 0.42 | 0.43 | 0.48 | 0.50 | 0.40 |
Net realized and unrealized gain/(loss) on investments | 8.21 | (3.73) | 0.47 | (1.52) | 3.43 |
Total from investment operations | 8.63 | (3.30) | 0.95 | (1.02) | 3.83 |
Less Distributions | |||||
Dividends from net investment income | (0.49) | (0.54) | (0.37) | (0.33) | (0.36) |
Distributions from net realized capital gains | — | (0.15) | (1.15) | (0.59) | (0.31) |
Total distributions | (0.49) | (0.69) | (1.52) | (0.92) | (0.67) |
Net asset value end of period | 24.97 | 16.83 | 20.82 | 21.39 | 23.33 |
Net assets end of period (000s) | $56,156 | $29,897 | $102,945 | $103,552 | $89,942 |
Ratios and Supplemental Data (%) | |||||
Total returnb | 51.99% | (16.55)% | 5.53% | (4.75)% | 19.22% |
Ratio of total expenses to average net assets^ | 0.81 | 0.82 | 0.80 | 0.79 | 0.80 |
Ratio of net expenses to average net assetsa | 0.78 | 0.80 | 0.77 | 0.76 | 0.77 |
Ratio of net investment income/(loss) to average net assetsa | 1.78 | 2.39 | 2.39 | 2.15 | 1.79 |
Portfolio turnover | 18 | 4 | 11 | 24 | 22 |
Administrative Class | |||||
Year Ended October 31, | 2021 | 2020 | 2019 | 2018 | 2017 |
Net asset value beginning of period | $16.98 | $20.98 | $21.52 | $23.47 | $20.30 |
Income from Investment Operations | |||||
Net investment income/(loss)a,e | 0.34 | 0.36 | 0.42 | 0.43 | 0.34 |
Net realized and unrealized gain/(loss) on investments | 8.31 | (3.77) | 0.48 | (1.54) | 3.45 |
Total from investment operations | 8.65 | (3.41) | 0.90 | (1.11) | 3.79 |
Less Distributions | |||||
Dividends from net investment income | (0.39) | (0.44) | (0.29) | (0.25) | (0.31) |
Distributions from net realized capital gains | — | (0.15) | (1.15) | (0.59) | (0.31) |
Total distributions | (0.39) | (0.59) | (1.44) | (0.84) | (0.62) |
Net asset value end of period | 25.24 | 16.98 | 20.98 | 21.52 | 23.47 |
Net assets end of period (000s) | $3,828 | $4,945 | $18,508 | $42,557 | $48,809 |
Ratios and Supplemental Data (%) | |||||
Total returnb | 51.53% | (16.85)% | 5.19% | (5.06)% | 18.84% |
Ratio of total expenses to average net assets^ | 1.14 | 1.15 | 1.13 | 1.12 | 1.12 |
Ratio of net expenses to average net assetsa | 1.11 | 1.13 | 1.10 | 1.08 | 1.09 |
Ratio of net investment income/(loss) to average net assetsa | 1.46 | 1.98 | 2.08 | 1.83 | 1.51 |
Portfolio turnover | 18 | 4 | 11 | 24 | 22 |
See page 60 for notes to the Financial Highlights.
The accompanying notes are an integral part of the Financial Statements.
52
Institutional Class | ||||
2021 | 2020 | 2019 | 2018 | 2017 |
$16.83 | $20.82 | $21.38 | $23.33 | $20.17 |
0.40 | 0.40 | 0.47 | 0.49 | 0.39 |
8.21 | (3.73) | 0.47 | (1.54) | 3.43 |
8.61 | (3.33) | 0.94 | (1.05) | 3.82 |
(0.47) | (0.51) | (0.35) | (0.31) | (0.35) |
— | (0.15) | (1.15) | (0.59) | (0.31) |
(0.47) | (0.66) | (1.50) | (0.90) | (0.66) |
24.97 | 16.83 | 20.82 | 21.38 | 23.33 |
$355,431 | $277,767 | $520,629 | $714,309 | $739,122 |
51.87% | (16.64)% | 5.48% | (4.85)% | 19.16% |
0.89 | 0.90 | 0.88 | 0.87 | 0.87 |
0.86 | 0.88 | 0.85 | 0.83 | 0.84 |
1.71 | 2.25 | 2.33 | 2.09 | 1.76 |
18 | 4 | 11 | 24 | 22 |
Investor Class | ||||
2021 | 2020 | 2019 | 2018 | 2017 |
$16.80 | $20.78 | $21.31 | $23.23 | $20.09 |
0.32 | 0.34 | 0.39 | 0.40 | 0.31 |
8.20 | (3.74) | 0.48 | (1.53) | 3.41 |
8.52 | (3.40) | 0.87 | (1.13) | 3.72 |
(0.39) | (0.43) | (0.25) | (0.20) | (0.27) |
— | (0.15) | (1.15) | (0.59) | (0.31) |
(0.39) | (0.58) | (1.40) | (0.79) | (0.58) |
24.93 | 16.80 | 20.78 | 21.31 | 23.23 |
$32,097 | $26,785 | $58,928 | $82,539 | $110,094 |
51.26% | (16.94)% | 5.08% | (5.20)% | 18.71% |
1.25 | 1.27 | 1.25 | 1.24 | 1.24 |
1.22 | 1.25 | 1.22 | 1.20 | 1.21 |
1.36 | 1.89 | 1.95 | 1.71 | 1.40 |
18 | 4 | 11 | 24 | 22 |
53
Harbor Domestic Equity Funds Financial Highlights—Continued
Selected Data for a Share Outstanding for the Periods Presented
HARBOR SMALL CAP GROWTH FUND | |||||
Retirement Class | |||||
Year Ended October 31, | 2021 | 2020 | 2019 | 2018 | 2017 |
Net asset value beginning of period | $15.91 | $13.18 | $14.39 | $15.08 | $11.95 |
Income from Investment Operations | |||||
Net investment income/(loss)a,e | (0.07) | (0.04) | (0.01) | (0.05) | (0.04) |
Net realized and unrealized gain/(loss) on investments | 5.41 | 3.25 | 1.56 | 0.82 | 3.23 |
Total from investment operations | 5.34 | 3.21 | 1.55 | 0.77 | 3.19 |
Less Distributions | |||||
Dividends from net investment income | — | — | — | — | — |
Distributions from net realized capital gains | (1.30) | (0.48) | (2.76) | (1.46) | (0.06) |
Total distributions | (1.30) | (0.48) | (2.76) | (1.46) | (0.06) |
Net asset value end of period | 19.95 | 15.91 | 13.18 | 14.39 | 15.08 |
Net assets end of period (000s) | $399,174 | $348,997 | $281,603 | $306,026 | $189,516 |
Ratios and Supplemental Data (%) | |||||
Total returnb | 34.40% | 24.93% | 16.23% | 5.11% | 26.78% |
Ratio of total expenses to average net assets^ | 0.79 | 0.81 | 0.80 | 0.79 | 0.79 |
Ratio of net expenses to average net assetsa | 0.78 | 0.80 | 0.80 | 0.79 | 0.79 |
Ratio of net investment income/(loss) to average net assetsa | (0.37) | (0.27) | (0.12) | (0.33) | (0.26) |
Portfolio turnover | 71 | 95 | 74 | 99 | 83 |
Administrative Class | |||||
Year Ended October 31, | 2021 | 2020 | 2019 | 2018 | 2017 |
Net asset value beginning of period | $14.36 | $11.98 | $13.39 | $14.17 | $11.30 |
Income from Investment Operations | |||||
Net investment income/(loss)a,e | (0.12) | (0.08) | (0.05) | (0.09) | (0.07) |
Net realized and unrealized gain/(loss) on investments | 4.86 | 2.94 | 1.40 | 0.77 | 3.00 |
Total from investment operations | 4.74 | 2.86 | 1.35 | 0.68 | 2.93 |
Less Distributions | |||||
Dividends from net investment income | — | — | — | — | — |
Distributions from net realized capital gains | (1.30) | (0.48) | (2.76) | (1.46) | (0.06) |
Total distributions | (1.30) | (0.48) | (2.76) | (1.46) | (0.06) |
Net asset value end of period | 17.80 | 14.36 | 11.98 | 13.39 | 14.17 |
Net assets end of period (000s) | $965 | $866 | $395 | $769 | $719 |
Ratios and Supplemental Data (%) | |||||
Total returnb | 33.91% | 24.49% | 15.87% | 4.76% | 26.02% |
Ratio of total expenses to average net assets^ | 1.12 | 1.14 | 1.13 | 1.12 | 1.11 |
Ratio of net expenses to average net assetsa | 1.11 | 1.13 | 1.12 | 1.11 | 1.10 |
Ratio of net investment income/(loss) to average net assetsa | (0.69) | (0.62) | (0.44) | (0.65) | (0.56) |
Portfolio turnover | 71 | 95 | 74 | 99 | 83 |
See page 60 for notes to the Financial Highlights.
The accompanying notes are an integral part of the Financial Statements.
54
Institutional Class | ||||
2021 | 2020 | 2019 | 2018 | 2017 |
$15.84 | $13.13 | $14.35 | $15.06 | $11.94 |
(0.08) | (0.05) | (0.03) | (0.06) | (0.04) |
5.38 | 3.24 | 1.57 | 0.81 | 3.22 |
5.30 | 3.19 | 1.54 | 0.75 | 3.18 |
— | — | — | — | — |
(1.30) | (0.48) | (2.76) | (1.46) | (0.06) |
(1.30) | (0.48) | (2.76) | (1.46) | (0.06) |
19.84 | 15.84 | 13.13 | 14.35 | 15.06 |
$721,405 | $633,535 | $440,553 | $400,389 | $509,889 |
34.29% | 24.87% | 16.18% | 4.97% | 26.72% |
0.87 | 0.89 | 0.88 | 0.87 | 0.86 |
0.86 | 0.88 | 0.87 | 0.86 | 0.85 |
(0.45) | (0.35) | (0.20) | (0.40) | (0.30) |
71 | 95 | 74 | 99 | 83 |
Investor Class | ||||
2021 | 2020 | 2019 | 2018 | 2017 |
$13.47 | $11.28 | $12.79 | $13.62 | $10.84 |
(0.13) | (0.08) | (0.06) | (0.11) | (0.08) |
4.56 | 2.75 | 1.31 | 0.74 | 2.92 |
4.43 | 2.67 | 1.25 | 0.63 | 2.84 |
— | — | — | — | — |
(1.30) | (0.48) | (2.76) | (1.46) | (0.06) |
(1.30) | (0.48) | (2.76) | (1.46) | (0.06) |
16.60 | 13.47 | 11.28 | 12.79 | 13.62 |
$8,648 | $6,811 | $6,670 | $7,076 | $7,913 |
33.84% | 24.32% | 15.81% | 4.58% | 26.29% |
1.23 | 1.26 | 1.25 | 1.24 | 1.23 |
1.23 | 1.25 | 1.24 | 1.23 | 1.22 |
(0.81) | (0.71) | (0.57) | (0.77) | (0.67) |
71 | 95 | 74 | 99 | 83 |
55
Harbor Domestic Equity Funds Financial Highlights—Continued
Selected Data for a Share Outstanding for the Periods Presented
HARBOR SMALL CAP VALUE FUND | |||||
Retirement Class | |||||
Year Ended October 31, | 2021 | 2020 | 2019 | 2018 | 2017 |
Net asset value beginning of period | $31.65 | $33.55 | $33.60 | $36.16 | $27.29 |
Income from Investment Operations | |||||
Net investment income/(loss)a,e | 0.12 | 0.21 | 0.21 | 0.17 | 0.06 |
Net realized and unrealized gain/(loss) on investments | 13.54 | (1.59) | 2.84 | (1.98) | 8.94 |
Total from investment operations | 13.66 | (1.38) | 3.05 | (1.81) | 9.00 |
Less Distributions | |||||
Dividends from net investment income | (0.20) | (0.20) | (0.15) | (0.06) | (0.13) |
Distributions from net realized capital gains | — | (0.32) | (2.95) | (0.69) | — |
Total distributions | (0.20) | (0.52) | (3.10) | (0.75) | (0.13) |
Net asset value end of period | 45.11 | 31.65 | 33.55 | 33.60 | 36.16 |
Net assets end of period (000s) | $599,016 | $300,473 | $230,861 | $155,036 | $57,196 |
Ratios and Supplemental Data (%) | |||||
Total returnb | 43.19% | (4.22)% | 10.98% | (5.18)% | 33.06% |
Ratio of total expenses to average net assets^ | 0.79 | 0.80 | 0.80 | 0.79 | 0.81 |
Ratio of net expenses to average net assetsa | 0.78 | 0.80 | 0.80 | 0.79 | 0.81 |
Ratio of net investment income/(loss) to average net assetsa | 0.27 | 0.67 | 0.67 | 0.45 | 0.17 |
Portfolio turnover | 17 | 17 | 27 | 22 | 8 |
Administrative Class | |||||
Year Ended October 31, | 2021 | 2020 | 2019 | 2018 | 2017 |
Net asset value beginning of period | $31.41 | $33.30 | $33.36 | $35.97 | $27.16 |
Income from Investment Operations | |||||
Net investment income/(loss)a,e | (0.02) | 0.10 | 0.11 | 0.06 | (0.02) |
Net realized and unrealized gain/(loss) on investments | 13.42 | (1.57) | 2.82 | (1.98) | 8.88 |
Total from investment operations | 13.40 | (1.47) | 2.93 | (1.92) | 8.86 |
Less Distributions | |||||
Dividends from net investment income | (0.09) | (0.10) | (0.04) | — | (0.05) |
Distributions from net realized capital gains | — | (0.32) | (2.95) | (0.69) | — |
Total distributions | (0.09) | (0.42) | (2.99) | (0.69) | (0.05) |
Net asset value end of period | 44.72 | 31.41 | 33.30 | 33.36 | 35.97 |
Net assets end of period (000s) | $11,962 | $10,082 | $6,537 | $7,253 | $4,462 |
Ratios and Supplemental Data (%) | |||||
Total returnb | 42.72% | (4.54)% | 10.59% | (5.50)% | 32.67% |
Ratio of total expenses to average net assets^ | 1.12 | 1.13 | 1.13 | 1.12 | 1.13 |
Ratio of net expenses to average net assetsa | 1.11 | 1.13 | 1.12 | 1.11 | 1.12 |
Ratio of net investment income/(loss) to average net assetsa | (0.04) | 0.32 | 0.35 | 0.16 | (0.05) |
Portfolio turnover | 17 | 17 | 27 | 22 | 8 |
See page 60 for notes to the Financial Highlights.
The accompanying notes are an integral part of the Financial Statements.
56
Institutional Class | ||||
2021 | 2020 | 2019 | 2018 | 2017 |
$31.63 | $33.53 | $33.57 | $36.14 | $27.27 |
0.09 | 0.18 | 0.19 | 0.15 | 0.08 |
13.52 | (1.58) | 2.84 | (2.00) | 8.90 |
13.61 | (1.40) | 3.03 | (1.85) | 8.98 |
(0.17) | (0.18) | (0.12) | (0.03) | (0.11) |
— | (0.32) | (2.95) | (0.69) | — |
(0.17) | (0.50) | (3.07) | (0.72) | (0.11) |
45.07 | 31.63 | 33.53 | 33.57 | 36.14 |
$2,023,164 | $1,350,681 | $1,346,098 | $1,149,857 | $1,081,412 |
43.11% | (4.33)% | 10.91% | (5.28)% | 33.00% |
0.87 | 0.88 | 0.88 | 0.87 | 0.88 |
0.86 | 0.88 | 0.87 | 0.86 | 0.87 |
0.20 | 0.59 | 0.60 | 0.40 | 0.24 |
17 | 17 | 27 | 22 | 8 |
Investor Class | ||||
2021 | 2020 | 2019 | 2018 | 2017 |
$30.71 | $32.56 | $32.68 | $35.29 | $26.65 |
(0.06) | 0.07 | 0.08 | 0.01 | (0.05) |
13.12 | (1.55) | 2.75 | (1.93) | 8.71 |
13.06 | (1.48) | 2.83 | (1.92) | 8.66 |
(0.05) | (0.05) | — | — | (0.02) |
— | (0.32) | (2.95) | (0.69) | — |
(0.05) | (0.37) | (2.95) | (0.69) | (0.02) |
43.72 | 30.71 | 32.56 | 32.68 | 35.29 |
$64,544 | $51,370 | $57,931 | $70,819 | $37,548 |
42.56% | (4.67)% | 10.48% | (5.60)% | 32.49% |
1.23 | 1.25 | 1.25 | 1.24 | 1.25 |
1.23 | 1.25 | 1.24 | 1.23 | 1.24 |
(0.15) | 0.23 | 0.24 | 0.03 | (0.16) |
17 | 17 | 27 | 22 | 8 |
57
Harbor Domestic Equity Funds Financial Highlights—Continued
Selected Data for a Share Outstanding for the Periods Presented
HARBOR STRATEGIC GROWTH FUND | ||||||
Retirement Class | ||||||
Year Ended October 31, | Year Ended June 30, | |||||
2021 | 2020 | 2019 | 2018 | 2017g | 2017f | |
Net asset value beginning of period | $24.67 | $22.31 | $19.65 | $18.86 | $17.67 | $16.76 |
Income from Investment Operations | ||||||
Net investment income/(loss)a,e | 0.05 | 0.09 | 0.12 | 0.07 | 0.05 | 0.03 |
Net realized and unrealized gain/(loss) on investments | 9.52 | 2.69 | 3.10 | 1.11 | 1.14 | 0.88 |
Total from investment operations | 9.57 | 2.78 | 3.22 | 1.18 | 1.19 | 0.91 |
Less Distributions | ||||||
Dividends from net investment income | (0.12) | (0.11) | (0.08) | (0.04) | — | — |
Distributions from net realized capital gains | (0.79) | (0.31) | (0.48) | (0.35) | — | — |
Total distributions | (0.91) | (0.42) | (0.56) | (0.39) | — | — |
Proceeds from redemption fees | N/A | N/A | N/A | N/A | N/A | N/A |
Net asset value end of period | 33.33 | 24.67 | 22.31 | 19.65 | 18.86 | 17.67 |
Net assets end of period (000s) | $7,731 | $6,488 | $5,152 | $3,584 | $435 | $316 |
Ratios and Supplemental Data (%) | ||||||
Total returnb | 39.66% | 12.60% | 17.04% | 6.34% | 6.73%c | 5.43%c |
Ratio of total expenses to average net assets^ | 0.72 | 0.72 | 0.71 | 0.76 | 1.10d | 1.52d |
Ratio of net expenses to average net assetsa | 0.63 | 0.63 | 0.63 | 0.62 | 0.62d | 0.62d |
Ratio of net investment income/(loss) to average net assetsa | 0.18 | 0.40 | 0.60 | 0.33 | 0.42d | 0.58d |
Portfolio turnover | 9 | 22 | 26 | 15 | 9c | 21c |
Administrative Class | ||||||
Year Ended October 31, | Year Ended June 30, | |||||
2021 | 2020 | 2019 | 2018 | 2017g | 2017f | |
Net asset value beginning of period | $24.58 | $22.24 | $19.58 | $18.82 | $17.65 | $16.76 |
Income from Investment Operations | ||||||
Net investment income/(loss)a,e | (0.05) | 0.02 | 0.05 | 0.01 | 0.01 | 0.01 |
Net realized and unrealized gain/(loss) on investments | 9.49 | 2.67 | 3.10 | 1.10 | 1.16 | 0.88 |
Total from investment operations | 9.44 | 2.69 | 3.15 | 1.11 | 1.17 | 0.89 |
Less Distributions | ||||||
Dividends from net investment income | (0.05) | (0.04) | (0.01) | — | — | — |
Distributions from net realized capital gains | (0.79) | (0.31) | (0.48) | (0.35) | — | — |
Total distributions | (0.84) | (0.35) | (0.49) | (0.35) | — | — |
Net asset value end of period | 33.18 | 24.58 | 22.24 | 19.58 | 18.82 | 17.65 |
Net assets end of period (000s) | $52 | $22 | $18 | $16 | $12 | $11 |
Ratios and Supplemental Data (%) | ||||||
Total returnb | 39.17% | 12.21% | 16.70% | 5.96% | 6.63%c | 5.31%c |
Ratio of total expenses to average net assets^ | 1.05 | 1.05 | 1.04 | 1.09 | 1.43d | 1.93d |
Ratio of net expenses to average net assetsa | 0.96 | 0.96 | 0.96 | 0.95 | 0.95d | 0.95d |
Ratio of net investment income/(loss) to average net assetsa | (0.17) | 0.08 | 0.26 | 0.03 | 0.10d | 0.19d |
Portfolio turnover | 9 | 22 | 26 | 15 | 9c | 21c |
See page 60 for notes to the Financial Highlights.
The accompanying notes are an integral part of the Financial Statements.
58
Institutional Class | |||||
Year Ended October 31, | Year Ended June 30, | ||||
2021 | 2020 | 2019 | 2018 | 2017g | 2017 |
$24.64 | $22.28 | $19.63 | $18.85 | $17.66 | $15.54 |
0.03 | 0.08 | 0.11 | 0.06 | 0.03 | 0.12 |
9.51 | 2.68 | 3.08 | 1.11 | 1.16 | 2.22 |
9.54 | 2.76 | 3.19 | 1.17 | 1.19 | 2.34 |
(0.10) | (0.09) | (0.06) | (0.04) | — | (0.11) |
(0.79) | (0.31) | (0.48) | (0.35) | — | (0.11) |
(0.89) | (0.40) | (0.54) | (0.39) | — | (0.22) |
N/A | N/A | N/A | N/A | N/A | —* |
33.29 | 24.64 | 22.28 | 19.63 | 18.85 | 17.66 |
$112,425 | $100,895 | $106,463 | $66,197 | $56,026 | $31,866 |
39.56% | 12.54% | 16.91% | 6.26% | 6.74%c | 15.21% |
0.80 | 0.80 | 0.79 | 0.84 | 1.18d | 1.48 |
0.71 | 0.71 | 0.71 | 0.70 | 0.70d | 0.83 |
0.11 | 0.35 | 0.51 | 0.28 | 0.29d | 0.71 |
9 | 22 | 26 | 15 | 9c | 21 |
Investor Class | |||||
Year Ended October 31, | Year Ended June 30, | ||||
2021 | 2020 | 2019 | 2018 | 2017g | 2017f |
$24.17 | $21.87 | $19.54 | $18.81 | $17.64 | $16.76 |
(0.08) | (0.01) | 0.03 | (0.02) | 0.02 | 0.01 |
9.34 | 2.63 | 2.79 | 1.10 | 1.15 | 0.87 |
9.26 | 2.62 | 2.82 | 1.08 | 1.17 | 0.88 |
(0.02) | (0.01) | (0.01) | — | — | — |
(0.79) | (0.31) | (0.48) | (0.35) | — | — |
(0.81) | (0.32) | (0.49) | (0.35) | — | — |
32.62 | 24.17 | 21.87 | 19.54 | 18.81 | 17.64 |
$900 | $503 | $417 | $322 | $75 | $22 |
39.06% | 12.12% | 14.99% | 5.80% | 6.63%c | 5.25%c |
1.16 | 1.17 | 1.16 | 1.21 | 1.55d | 2.03d |
1.07 | 1.08 | 1.08 | 1.07 | 1.07d | 1.07d |
(0.27) | (0.04) | 0.14 | (0.11) | 0.05d | 0.13d |
9 | 22 | 26 | 15 | 9c | 21c |
59
Harbor Domestic Equity Funds Financial Highlights—Continued
Selected Data for a Share Outstanding for the Periods Presented
* | Less than $0.01 |
^ | Percentage does not reflect reduction for credit balance arrangements (see the “Custodian” section in Note 2 of the accompanying Notes to Financial Statements) |
a | Reflects the Adviser’s waiver, if any, of its management fees and/or other operating expenses |
b | The total returns would have been lower had certain expenses not been waived during the periods shown. |
c | Unannualized |
d | Annualized |
e | Amounts are based on average daily shares outstanding during the period. |
f | For the period March 6, 2017 (commencement of operations) through June 30, 2017 |
g | For the period July 1, 2017 through October 31, 2017 |
h | For the period December 1, 2019 (inception) through October 31, 2020 |
i | Effective September 1, 2021, the Fund changed its name and Harbor Capital Advisors, Inc. was appointed by the Board of Trustees to manage the Fund’s assets based upon model portfolios provided by multiple non-discretionary subadvisers. |
The accompanying notes are an integral part of the Financial Statements.
60
Harbor Domestic Equity Funds
Notes to Financial Statements—October 31, 2021
Note 1—Organizational Matters
Harbor Funds (the “Trust”) is registered under the Investment Company Act of 1940, as amended (the “Investment Company Act”), as an open-end management investment company. As of October 31, 2021, the Trust consists of 31 separate portfolios. The portfolios covered by this report are: Harbor Capital Appreciation Fund, Harbor Disruptive Innovation Fund (formerly, Harbor Mid Cap Growth Fund), Harbor Large Cap Value Fund, Harbor Mid Cap Fund, Harbor Mid Cap Value Fund, Harbor Small Cap Growth Fund, Harbor Small Cap Value Fund, and Harbor Strategic Growth Fund (individually or collectively referred to as a “Fund” or the “Funds," respectively). Harbor Capital Advisors, Inc. (the “Adviser” or “Harbor Capital”) is the investment adviser for the Funds.
Harbor Disruptive Innovation Fund changed its name and investment strategy as described in its Prospectus dated September 1, 2021.
The Funds currently offer four classes of shares, designated as Retirement Class, Institutional Class, Administrative Class and Investor Class. The shares of each class represent an interest in the same portfolio of investments of the Funds and have equal rights with respect to voting, redemptions, dividends, and liquidations, except that: (i) subject to the approval of the Trust’s Board of Trustees (the “Board of Trustees”), certain expenses may be applied differently to each class of shares in accordance with current regulations of the U.S. Securities and Exchange Commission (“SEC”) and the Internal Revenue Service; and (ii) shareholders of a class that bears distribution and service expenses under terms of a distribution plan have exclusive voting rights as to that distribution plan.
Reorganization
Harbor Small Cap Growth Opportunities Fund (the “Target Fund”), a series of the Trust, was reorganized with and into Harbor Small Cap Growth Fund the (“the Acquiring Fund”), also a series of the Trust (the “Reorganization”) effective May 15, 2020 (the “Reorganization Date”). The Reorganization was accomplished by the transfer of the assets and the liabilities of the Target Fund to the Acquiring Fund in exchange for shares of the Acquiring Fund, the pro-rata distribution of such shares to the shareholders of the Target Fund, and liquidation and termination of the Target Fund on the Reorganization Date.
The following table shows by each share class the number of shares and value of the Acquiring Fund that was exchanged for shares of the Target Fund outstanding as of the Reorganization Date. The Acquiring Fund Shares Exchanged and related Value noted below are included in the Net proceeds from sale of shares and Shares sold in the Acquiring Fund’s Statement of Changes in Net Assets.
Share Class | Acquiring Fund Shares Exchanged (000s) | Acquiring Fund Exchanged Shares Value (000s) | Target Fund Outstanding Shares (000s) |
Retirement Class | 2,471 | $31,052 | 3,746 |
Institutional Class | 8,331 | 104,255 | 12,622 |
Administrative Class | 16 | 184 | 23 |
Investor Class | 24 | 255 | 32 |
Note 2—Significant Accounting Policies
The following is a summary of significant accounting policies followed by the Trust in the preparation of its financial statements. Each Fund follows the investment company reporting requirements under U.S. Generally Accepted Accounting Principles (“U.S. GAAP”), which includes the accounting and reporting guidelines under Accounting Standards Codification (“ASC”) Topic 946, Financial Services-Investment Companies. The preparation of financial statements in accordance with U.S. GAAP requires management to make estimates and assumptions that affect the reported amounts and disclosures in the financial statements. Actual results may differ from those estimates.
Security Valuation
The Trust’s valuation procedures permit the Funds to use a variety of valuation methodologies, consider a number of subjective factors, analyze applicable facts and circumstances and, in general, exercise judgment, when valuing Fund investments. The methodology used for a specific type of investment may vary based on the circumstances and relevant considerations, including available market data.
61
Harbor Domestic Equity Funds
Notes to Financial Statements—Continued
Note 2—Significant Accounting Policies—Continued
Equity securities (including common stock, preferred stock, and convertible preferred stock), exchange-traded funds and financial derivative instruments (such as futures contracts and options contracts, including rights and warrants) that are traded on a national securities exchange or system (except securities listed on the National Association of Securities Dealers Automated Quotation (“NASDAQ”) system and United Kingdom securities) are valued at the last sale price on a national exchange or system on which they are principally traded as of the valuation date. Securities listed on the NASDAQ system or a United Kingdom exchange are valued at the official closing price of those securities. In the case of securities for which there are no sales on the valuation day, (i) securities traded principally on a U.S. exchange, including NASDAQ, are valued at the mean between the closing bid and ask price; and (ii) securities traded principally on a foreign exchange, including United Kingdom securities, are valued at the official bid price determined as of the close of the primary exchange. Shares of open-end registered investment companies that are held by a Fund are valued at net asset value. To the extent these securities are actively traded and fair valuation adjustments are not applied, they are normally categorized as Level 1 in the fair value hierarchy. Equity securities traded on inactive markets or valued by reference to similar instruments are normally categorized as Level 2 in the fair value hierarchy. For more information on the fair value hierarchy, please refer to the Fair Value Measurements and Disclosures section.
Short-term securities with a remaining maturity of less than 60 days at the time of acquisition that are held by a Fund are valued at amortized cost to the extent amortized cost represents fair value. Such securities are normally categorized as Level 2 in the fair value hierarchy.
Over-the-counter financial derivative instruments, such as forward currency contracts, options contracts, and swap agreements (including centrally cleared swaps), derive their value from underlying asset prices, indices, reference rates and other inputs, or a combination of these factors. These instruments are valued using evaluated prices furnished by a pricing vendor selected by the Board of Trustees. In certain cases, when a valuation is not readily available from a pricing vendor, the Fund’s subadviser provides a valuation, typically using its own proprietary models. Depending on the instrument and the terms of the transaction, the value of the derivative instrument can be determined by a pricing vendor or subadviser using a series of techniques, including simulation pricing models. The pricing models use inputs, such as issuer details, indices, spreads, interest rates, yield curves, dividends and exchange rates, that are observed from actively quoted markets. Derivative instruments that use valuation techniques and inputs similar to those described above are normally categorized as Level 2 in the fair value hierarchy.
A Fund may also use fair value pricing if the value of some or all of the Fund’s securities have been materially affected by events occurring before the Fund’s pricing time but after the close of the primary markets or exchanges on which the security is traded. This most commonly occurs with foreign securities, but may occur with other securities as well. In such cases, the Fund may apply a fair value factor supplied by the pricing vendor to a foreign security’s market close value to reflect changes in value that may have occurred between the close of the primary market or exchange on which the security is traded and the Fund’s pricing time. That factor may be derived using observable inputs such as a comparison of the trading patterns of a foreign security to intraday trading in the U.S. markets that are highly correlated to the foreign security or other information that becomes available after the close of the foreign market on which the security principally traded. When fair value pricing is employed, the prices of securities used by a Fund to calculate its net asset value may differ from market quotations, official closing prices or evaluated prices for the same securities, which means that the Fund may value those securities higher or lower than another given fund that uses market quotations, official closing prices or evaluated prices supplied by a pricing vendor in its calculation of net asset value. Securities valued using observable inputs, such as those described above, are normally categorized as Level 2 of the fair value hierarchy.
When reliable market quotations or evaluated prices supplied by a pricing vendor are not readily available or are not believed to accurately reflect fair value, securities are priced at their fair value as determined by the Trust’s Valuation Committee (the “Valuation Committee”) pursuant to procedures adopted, and subject to oversight, by the Board of Trustees. The Valuation Committee is comprised of a trustee and officers of the Trust and employees of Harbor Capital with relevant experience or responsibilities. Each security for which the Valuation Committee determines a fair value, including the basis for the fair value decision, is reviewed by the Board of Trustees at its regularly scheduled board meetings. Securities valued using fair valuation methods that incorporate significant unobservable inputs are normally categorized as Level 3 in the fair value hierarchy.
62
Harbor Domestic Equity Funds
Notes to Financial Statements—Continued
Note 2—Significant Accounting Policies—Continued
Fair Value Measurements and Disclosures
Various inputs may be used to determine the value of each Fund’s investments, which are summarized in three broad categories defined as Level 1, Level 2, and Level 3. The inputs or methodologies used for valuing investments are not necessarily indicative of the risk associated with investing in those investments. The assignment of an investment to Levels 1, 2, or 3 is based on the lowest level of significant inputs used to determine its fair value.
Level 1– | Quoted prices in active markets for identical securities. |
Level 2– | Other significant observable inputs (including quoted prices for similar securities, interest rates, prepayment speeds, credit risk, etc.). |
Level 3– | Significant unobservable inputs are used in situations where quoted prices or other observable inputs are not available or are deemed unreliable. Significant unobservable inputs may include each Fund’s own assumptions. |
The categorization of investments into Levels 1, 2, or 3, and a summary of significant unobservable inputs used for Level 3 investments, when applicable, can be found at the end of each Fund’s Portfolio of Investments schedule. For fair valuations using significant unobservable inputs, if any, a reconciliation of the beginning to ending balances for reported fair values is provided at the end of each Fund’s Portfolio of Investments schedule that presents changes attributable to realized and unrealized gains and losses and purchases, sales, and transfers in/out of the Level 3 category during the year.
Each Fund used observable inputs in its valuation methodologies whenever they were available and deemed reliable.
Investment Income
Dividends declared on portfolio securities are accrued on the ex-dividend date. For foreign securities, certain dividends are recorded after the ex-dividend date, but as soon as the respective Fund is notified of such dividends. Interest income is accrued daily as earned. Discounts and premiums on fixed income securities are amortized over the life of the respective securities (except for premiums on certain callable debt securities that are amortized to the earliest call date) using the effective yield method. Distributions from real estate investment trust securities are recorded as dividend income, and may be reclassified as capital gains and/or return of capital, based on the information reported by the issuer, when available.
Expenses
Expenses are charged directly to the Fund that incurred such expense whenever possible. With respect to expenses incurred by any two or more Harbor funds where amounts cannot be identified on a fund by fund basis, such expenses are generally allocated in proportion to the average net assets or the number of shareholders of each Fund.
Class Allocations
Income, common expenses and realized and unrealized gains/(losses) are determined at the Fund level and allocated daily to each class of shares based on the applicable net assets of the respective classes. Distribution and service fees, if any, and transfer agent fees are calculated daily at the class level based on the applicable net assets of each class and the expense rate(s) applicable to each class.
Securities Transactions
Securities transactions are accounted for on the trade date (the date the order to buy or sell is executed). Realized gains or losses on security transactions are determined on the basis of identified cost.
Distribution to Shareholders
Distributions on Fund shares are recorded on the ex-dividend date.
63
Harbor Domestic Equity Funds
Notes to Financial Statements—Continued
Note 2—Significant Accounting Policies—Continued
Taxes
Each Fund is treated as a separate entity for U.S. federal tax purposes. Each Fund’s policy is to meet the requirements of Subchapter M of the Internal Revenue Code of 1986, as amended (the “Internal Revenue Code”) applicable to regulated investment companies and to distribute to its shareholders all of its taxable income within the prescribed time. It is also the intention of each Fund to distribute an amount sufficient to avoid imposition of any excise tax under Section 4982 of the Internal Revenue Code. Therefore, no provision has been made for U.S. federal taxes on income, capital gains or unrealized appreciation of securities held or excise taxes on income and capital gains.
Each Fund may be subject to taxes imposed by foreign countries in which they invest. Such taxes are generally based on income and/or capital gains earned or repatriated. Taxes are accrued and applied to net investment income, net realized gains and unrealized appreciation as such income and/or gains are earned.
Management has analyzed each Fund’s tax positions for all open tax years (in particular, U.S. federal income tax returns for the tax years ended October 31, 2018–2020), including all positions expected to be taken upon filing the 2021 tax return, in all material jurisdictions where each Fund operates, and has concluded that no provision for income tax is required in the Funds’ financial statements. Each Fund will recognize interest and penalties, if any, related to unrecognized tax benefits as income tax expense in the Statement of Operations.
Custodian
Each Fund has credit balance arrangements with its custodian whereby positive balances in demand deposit accounts used by the transfer and shareholder servicing agent for clearing shareholder transactions in the Fund generate credits that are applied against gross custody expenses. Such custodial expense reductions, if any, are reflected on the respective Fund’s accompanying Statement of Operations.
Foreign Currency Contracts
A foreign currency spot contract is an agreement between two parties to buy and sell currencies at the current market rate for settlement within two business days. A forward currency contract is an agreement between two parties to buy and sell currencies at a set price on a future date.
Foreign currency contracts are fair valued daily and any change in fair value is recorded as an unrealized gain or loss. When the contract is closed, the Fund records a realized gain or loss equal to the difference between the value on the open and close date. Risk of losses may arise from changes in the value of the foreign currency or if the counterparties do not perform under the contract’s terms. The maximum potential loss from such contracts is the aggregate face value in U.S. dollars at the time the contract was opened.
During the year, Harbor Capital Appreciation Fund, Harbor Disruptive Innovation Fund, and Harbor Small Cap Growth Fund used foreign currency spot contracts to facilitate transactions in foreign securities or to convert foreign currency receipts into U.S. dollars.
Foreign Currency Translations
Purchases and sales of securities are translated into U.S. dollars at the current exchange rate on the respective dates of the transactions. Income and withholding taxes are translated at the prevailing exchange rate when accrued or incurred. The accounting records of the Funds are maintained in U.S. dollars. Investment securities and other assets and liabilities denominated in a foreign currency, when applicable, are translated into U.S. dollars based on the current exchange rates at year end.
Reported net realized gains and losses on foreign currency transactions, when applicable, represent net gains and losses from sales and maturities of foreign currency contracts, disposition of foreign currencies, currency gains and losses realized between the trade and settlement dates on securities transactions, and the difference between the amount of investment income accrued and tax reclaims receivable and the U.S. dollar amount actually received. The effects of changes in foreign currency exchange rates on investments in securities, when applicable, are included in the net realized and unrealized gain or loss on investments in the Statements of Operations.
64
Harbor Domestic Equity Funds
Notes to Financial Statements—Continued
Note 2—Significant Accounting Policies—Continued
Proceeds from Litigation
Each Fund may receive proceeds from shareholder litigation settlements involving current and/or previously held portfolio holdings. Any proceeds received from litigation involving portfolio holdings are reflected in the Statements of Operations in realized gain/(loss) if the security has been disposed of by a Fund, or in unrealized gain/(loss) if the security is still held by a Fund.
Rights and Warrants
Rights represent a privilege offered to holders of record of issued securities to subscribe (usually on a pro rata basis) for additional securities of the same class, of a different class or of a different issuer. Warrants are contracts that generally give the holder the right, but not the obligation, to buy a stated number of shares of common stock at a specified price at any time during the life of the warrant. Rights and warrants are typically written by the issuer of the security underlying the right or warrant. Although some rights and warrants may be non-transferable, others may be traded over-the-counter or on an exchange.
A Fund may acquire rights or warrants in order to gain exposure to the underlying security without owning the security, including, for example, cases where the Fund hopes to lock in the price today of a security it may wish to purchase in the future. In order for a warrant to be profitable, the market price of the underlying security must rise sufficiently above the exercise price to cover any premium and transaction costs. The value of a right or warrant may not necessarily change with the value of the underlying securities. When a Fund acquires rights or warrants, it runs the risk that it will lose its entire investment in the rights or warrants, unless the Fund exercises the right or warrant, acquires the underlying securities, or enters into a closing transaction before expiration. Rights and warrants cease to have value if they are not exercised prior to their expiration date. If the price of the underlying security does not rise to an extent sufficient to cover any premium and transaction costs, the Fund will lose part or all of its investment. Any premiums or purchase price paid for rights or other warrants that expire are treated as realized losses. If a Fund enters into a closing sale transaction, it realizes a gain or loss, depending on whether the proceeds from the sale are greater or less than the cost of the rights or warrants.
Rights or warrants outstanding at the end of the year, if any, are disclosed at the end of each applicable Fund’s Portfolio of Investments and are included in “Purchased options” in the Statements of Assets and Liabilities. Realized gain/(loss) and unrealized appreciation/(depreciation) recognized during the year are included in “Purchased options” in the Statements of Operations.
During the year, Harbor Disruptive Innovation Fund held rights/warrants as a result of their investments in underlying securities.
Repurchase Agreements
In a repurchase agreement, a Fund buys a security at one price and simultaneously agrees to sell it back at a higher price. Such agreements must be adequately collateralized to cover the counterparty’s obligation to a Fund to close out the repurchase agreement. Each repurchase agreement counterparty must meet the minimum credit quality requirements applicable to the respective Fund and any other appropriate counterparty criteria as determined by a Fund’s subadviser. The minimum credit quality requirements are those applicable to a Fund’s purchase of securities such that if a Fund is permitted to only purchase securities that are rated investment-grade (or the equivalent if unrated), a Fund could only enter into repurchase agreements with counterparties that have debt outstanding that is rated investment-grade (or the equivalent if unrated). The securities are regularly monitored to ensure that the collateral is adequate. A Fund seeks to further mitigate its counterparty risk by entering into master repurchase agreements with its counterparties. The master repurchase agreements provide that, in the event of a counterparty’s default, including bankruptcy, a Fund may terminate any repurchase agreements with that counterparty, determine the net amount owned, and sell or retain the collateral up to the net amount owed to a Fund. A counterparty’s default may cause a Fund to suffer losses, including loss of interest on or principal of the securities and costs associated with delay and enforcement of the terms of the master repurchase agreement.
During the year, Harbor Disruptive Innovation Fund entered into repurchase agreements with domestic or foreign banks or with a member firm of the Financial Industry Regulatory Authority, Inc., or an affiliate of a member firm that is a primary dealer in U.S. government securities.
65
Harbor Domestic Equity Funds
Notes to Financial Statements—Continued
Note 3—Investment Portfolio Transactions
Investment Portfolio Transactions
Purchases and sales of investments, other than short-term securities, for each Fund for the year ended October 31, 2021 were as follows:
Purchases (000s) | Sales (000s) | |
Harbor Capital Appreciation Fund | $19,243,068 | $22,761,652* |
Harbor Disruptive Innovation Fund | 771,308 | 866,195 |
Harbor Large Cap Value Fund | 590,012 | 279,252 |
Harbor Mid Cap Fund | 45,570 | 4,687 |
Harbor Mid Cap Value Fund | 74,655 | 121,223 |
Harbor Small Cap Growth Fund | 791,875 | 1,015,659 |
Harbor Small Cap Value Fund | 680,724 | 416,913 |
Harbor Strategic Growth Fund | 10,554 | 33,755 |
* | Sales for this Fund include $3,930,186 in connection with in-kind redemptions of the Fund’s capital shares. |
In-Kind Redemption Transactions
In accordance with the Trust’s prospectus, the Funds may distribute portfolio securities rather than cash as payment for a redemption of Fund shares. For financial reporting purposes, a Fund recognizes a gain or loss on the securities distributed related to the in-kind redemption. Such Fund-level gains and losses on in-kind redemptions are not taxable to shareholders. For the years ended October 31, 2021 and 2020, Harbor Capital Appreciation Fund realized gains of $2,664,550,000 and $654,292,000, respectively, upon the disposition of portfolio securities in connection with in-kind redemptions of the Fund’s shares.
Note 4—FEES AND OTHER Transactions with Affiliates
Investment Adviser
Harbor Capital is a wholly owned subsidiary of ORIX Corporation. Harbor Capital is the Funds’ investment adviser and is also responsible for administrative and other services.
Each Fund has a separate advisory agreement with Harbor Capital. The agreements provide for management fees based on an annual percentage rate of average daily net assets as follows:
Contractual Rate | Actual Rate | |
Harbor Capital Appreciation Fund | 0.60%a | 0.54% |
Harbor Disruptive Innovation Fund | 0.70b | 0.72 |
Harbor Large Cap Value Fund | 0.60c | 0.60 |
Harbor Mid Cap Fund | 0.75 | 0.75 |
Harbor Mid Cap Value Fund | 0.75d | 0.74 |
Harbor Small Cap Growth Fund | 0.75 | 0.75 |
Harbor Small Cap Value Fund | 0.75 | 0.75 |
Harbor Strategic Growth Fund | 0.60 | 0.60 |
a | The Adviser has contractually agreed to reduce the management fee to 0.56% on assets between $5 billion and $10 billion, 0.54% on assets between $10 billion and $20 billion and 0.53% on assets over $20 billion through February 28, 2022. |
b | For the period November 1, 2020 through August 31, 2021, the Adviser had contractually agreed to reduce the management fee from 0.75% to 0.72%. Effective September 1, 2021, the Adviser reduced the contractual management fee to 0.70%. |
c | The management fee rate is 0.60% on assets up to $4 billion and 0.55% on assets over $4 billion. |
d | The Adviser has contractually agreed to reduce the management fee to 0.70% on assets between $350 million and $1 billion and 0.65% on assets over $1 billion through February 28, 2022. |
66
Harbor Domestic Equity Funds
Notes to Financial Statements—Continued
Note 4—FEES AND OTHER Transactions with Affiliates—Continued
Harbor Capital has from time to time voluntarily or contractually agreed not to impose a portion of its management fees and/or to bear a portion of the expenses incurred in the operation of certain Funds in order to limit Fund expenses. Such waivers, if any, are reflected on the accompanying Statements of Operations. Interest expense, if any, is excluded from contractual limitations. During the year, the following expense limitation agreements were in effect:
Retirement Class | Institutional Class | Administrative Class | Investor Class | Expense Limitation Agreement Expiration Date | |
Harbor Disruptive Innovation Fund1 | 0.50% | 0.58% | 0.83% | 0.94% | 08/31/2022 |
Harbor Large Cap Value Fund2 | 0.61 | 0.69 | 0.94 | 1.05 | 02/28/2022 |
Harbor Mid Cap Fund2 | 0.80 | 0.88 | 1.13 | 1.24 | 02/28/2022 |
Harbor Mid Cap Value Fund3 | 0.77 | 0.85 | 1.10 | 1.21 | 02/28/2022 |
Harbor Strategic Growth Fund2 | 0.63 | 0.71 | 0.96 | 1.07 | 02/28/2022 |
1 | The operating expense limitation for the Fund was effective September 1, 2021. |
2 | For the period November 1, 2020 through February 28, 2021, the operating expense limitation for the Investor Class for Harbor Large Cap Value Fund, Harbor Mid Cap Fund and Harbor Strategic Growth Fund were 1.06%, 1.25% and 1.08%, respectively. |
3 | The operating expense limitation for the Fund was effective March 1, 2021. |
All expense limitation agreements include the transfer agent fee waiver discussed in the Transfer Agent note.
Distributor
Harbor Funds Distributors, Inc. (the “Distributor”), a wholly-owned subsidiary of Harbor Capital, is the distributor for Harbor Funds’ shares. Under the Trust’s current distribution plan pursuant to Rule 12b-1 under the Investment Company Act with respect to each Fund’s Administrative and Investor Class shares (each, a “12b-1 Plan”) as applicable, each Fund pays the Distributor compensation at the annual rate of 0.25% of the average daily net assets of its Administrative and Investor Class shares. Pursuant to each 12b-1 Plan, the Distributor is compensated for financing any activity that is primarily intended to result in the sale of Administrative and Investor Class shares of each Fund or for recordkeeping services or the servicing of shareholder accounts in a Administrative and Investor Class shares of each Fund. Such activities include, but are not limited to: printing of prospectuses and statements of additional information and reports for prospective shareholders (i.e., other than existing shareholders); preparation and distribution of advertising material and sales literature; expenses of organizing and conducting sales seminars; supplemental payments to dealers or other institutions such as asset-based sales charges, payments of recordkeeping fees under recordkeeping arrangements, or payments of service fees under shareholder service arrangements; and costs of administering each 12b-1 Plan.
Amounts payable by a Fund under each 12b-1 Plan need not be directly related to the expenses actually incurred by the Distributor on behalf of each Fund. Each 12b-1 Plan does not obligate each Fund to reimburse the Distributor for the actual expenses the Distributor may incur in fulfilling its obligations under each 12b-1 Plan. Thus, even if the Distributor’s actual expenses exceed the fee payable to the Distributor at any given time, each Fund will not be obligated to pay more than that fee. If the Distributor’s expenses are less than the fee it receives, the Distributor will retain the difference.
The fees attributable to each Fund’s respective class are shown on the accompanying Statements of Operations.
67
Harbor Domestic Equity Funds
Notes to Financial Statements—Continued
Note 4—FEES AND OTHER Transactions with Affiliates—Continued
Transfer Agent
Harbor Services Group, Inc. (“Harbor Services Group”), a wholly-owned subsidiary of Harbor Capital, is the transfer and shareholder servicing agent for the Funds. The transfer agency and service agreement is reviewed and approved annually by the Board of Trustees and provides currently for compensation up to the following amounts per class of each Fund:
Transfer Agent Fees | |
Retirement Class | 0.02% of the average daily net assets of all Retirement Class shares |
Institutional Class | 0.10% of the average daily net assets of all Institutional Class shares |
Administrative Class | 0.10% of the average daily net assets of all Administrative Class shares |
Investor Class1 | 0.21% of the average daily net assets of all Investor Class shares |
1 | For the period November 1, 2020 through February 28, 2021, Harbor Services Group received compensation up to 0.22% for the Investor Class. |
Harbor Services Group voluntarily waived a portion of its transfer agent fees during the year ended October 31, 2021. Fees incurred for these transfer agent services are shown on each Fund’s Statement of Operations. The voluntary waiver may be discontinued at any time.
Affiliated Transactions
The Investment Company Act permits purchase and sale transactions among affiliated investment companies subject to an exemptive rule. Harbor Funds has adopted policies and procedures pursuant to such rule. During the year, the Funds did not enter into any transactions with any other Harbor fund.
Shareholders
As of October 31, 2021, Harbor Capital and its wholly owned subsidiaries collectively held the following shares of beneficial interest in each of the following Funds:
Number of Shares Owned by Harbor Capital and Subsidiaries | Percentage of Outstanding Shares | |||||
Retirement Class | Institutional Class | Administrative Class | Investor Class | Total | ||
Harbor Capital Appreciation Fund | 33,151 | — | — | — | 33,151 | 0.0% |
Harbor Disruptive Innovation Fund | 114,667 | — | — | — | 114,667 | 0.5 |
Harbor Large Cap Value Fund | 75,005 | — | — | — | 75,005 | 0.1 |
Harbor Mid Cap Fund | 483,537 | 474,659 | N/A | 3,001 | 961,196 | 22.6 |
Harbor Mid Cap Value Fund | 73,119 | — | — | — | 73,119 | 0.4 |
Harbor Small Cap Growth Fund | 88,804 | — | — | — | 88,804 | 0.2 |
Harbor Small Cap Value Fund | 33,979 | — | — | — | 33,979 | 0.1 |
Harbor Strategic Growth Fund | 36,127 | — | — | — | 36,127 | 1.0 |
Independent Trustees
The fees and expenses of the Independent Trustees are included in “Trustees’ fees and expenses” on each Fund’s Statement of Operations.
The Board of Trustees has adopted a Deferred Compensation Plan for Independent Trustees (the “Plan”), which enables Trustees to elect to defer receipt of all or a portion of the annual compensation they are entitled to receive from the Trust. For purposes of determining the amount owed to a Trustee under the Plan, deferred amounts are treated as though they had been invested in shares of the Fund(s) selected by the Trustee. While not required to do so, each Fund makes an investment equal to the Trustee’s investment election. The deferred compensation liability and the offsetting deferred compensation investment asset are included as a component of “Accrued expenses – Trustees’ fees and expenses” and “Other assets”, respectively, in the Statements of Assets and Liabilities. Such amounts fluctuate with changes in the value of the selected Fund(s). The deferred compensation and related mark-to-market impact liability and an offsetting investment asset will remain on each Fund’s Statement of Assets and Liabilities until distributed in accordance with the Plan.
68
Harbor Domestic Equity Funds
Notes to Financial Statements—Continued
Note 4—FEES AND OTHER Transactions with Affiliates—Continued
Indemnification
Under the Trust’s organizational documents, its officers and Trustees are indemnified against certain liabilities arising out of the performance of their duties to the Trust. In addition, in the normal course of business the Trust enters into contracts that provide general indemnities to other parties. The Trust’s maximum exposure under these arrangements is unknown as this would involve future claims that may be made against the Trust that have not yet occurred. The risk of material loss as a result of such indemnification claims is considered remote.
NOTE 5—TAX INFORMATION
The amount and character of income and net realized gains to be distributed are determined in accordance with income tax rules and regulations, which may differ from U.S. GAAP. These differences are attributable to permanent book and tax accounting differences that were primarily due to the tax treatment of net investment losses, redemption in-kind distributions, and the use of equalization. Reclassifications, if any, are made to each Fund’s capital account to reflect income and net realized gains available for distribution (or available capital loss carryovers) under income tax rules and regulations. The amounts reclassified on the Statements of Assets and Liabilities for the year ended October 31, 2021 were as follows:
Total Distributable Earnings/(Loss) (000s) | Paid in Capital (000s) | |
Harbor Capital Appreciation Fund | $(4,513,674) | $4,513,674 |
Harbor Disruptive Innovation Fund | (49,986) | 49,986 |
Harbor Large Cap Value Fund | (14,093) | 14,093 |
Harbor Mid Cap Fund | (61) | 61 |
Harbor Mid Cap Value Fund | — | — |
Harbor Small Cap Growth Fund | (34,552) | 34,552 |
Harbor Small Cap Value Fund | (12,738) | 12,738 |
Harbor Strategic Growth Fund | (1,561) | 1,561 |
The tax composition of each Fund’s distributions was as follows:
As of October 31, 2021 | As of October 31, 2020 | |||||
Ordinary Income (000s) | Long-Term Capital Gains (000s) | Total (000s) | Ordinary Income (000s) | Long-Term Capital Gains (000s) | Total (000s) | |
Harbor Capital Appreciation Fund | $— | $4,640,284 | $4,640,284 | $24,458 | $2,576,949 | $2,601,407 |
Harbor Disruptive Innovation Fund | 22,241 | 34,792 | 57,033 | — | 50,587 | 50,587 |
Harbor Large Cap Value Fund | 16,261 | 48,993 | 65,254 | 12,462 | — | 12,462 |
Harbor Mid Cap Fund | 67 | — | 67 | 6 | — | 6 |
Harbor Mid Cap Value Fund | 9,193 | 9,193 | 16,282 | 4,413 | 20,695 | |
Harbor Small Cap Growth Fund | 29,612 | 51,761 | 81,373 | — | 26,443 | 26,443 |
Harbor Small Cap Value Fund | 8,533 | 892 | 9,425 | 8,542 | 15,523 | 24,065 |
Harbor Strategic Growth Fund | 439 | 3,413 | 3,852 | 458 | 1,578 | 2,036 |
69
Harbor Domestic Equity Funds
Notes to Financial Statements—Continued
NOTE 5—TAX INFORMATION—Continued
As of October 31, 2021, the components of each Fund’s distributable earnings on a tax basis were as follows:
Undistributed Ordinary Income (000s) | Undistributed Long-Term Capital Gains (000s) | Unrealized Appreciation/ (Depreciation) (000s) | Accumulated Capital and Other Losses (000s) | Other Temporary Differences (000s) | Total Distributable Earnings/ (Loss) (000s) | |
Harbor Capital Appreciation Fund | $— | $6,320,677 | $21,560,050 | $(126,000) | $(2,564) | $27,752,163 |
Harbor Disruptive Innovation Fund | 53,630 | 82,731 | (4,313) | — | (46) | 132,002 |
Harbor Large Cap Value Fund | 11,640 | 60,228 | 882,987 | — | (69) | 954,786 |
Harbor Mid Cap Fund | 407 | 827 | 8,944 | 10,178 | ||
Harbor Mid Cap Value Fund | 3,507 | — | 80,343 | (8,024) | (62) | 75,764 |
Harbor Small Cap Growth Fund | 59,953 | 174,504 | 274,941 | (37,831) | (68) | 471,499 |
Harbor Small Cap Value Fund | — | 141,083 | 914,214 | — | (115) | 1,055,182 |
Harbor Strategic Growth Fund | 460 | 9,379 | 60,381 | — | (4) | 70,216 |
As of October 31, 2021, for federal income tax purposes, the following Fund had a qualified late year loss deferral to offset fiscal year 2022 ordinary income:
Qualified Late Year Ordinary Loss Deferral (000s) | |
Harbor Capital Appreciation Fund | $126,000 |
As of October 31, 2021, the Funds in the following table had capital loss carryforwards for federal tax purposes which will reduce each Fund’s taxable income arising from future net realized gains on investments to the extent permitted by the Internal Revenue Code. Use of the capital loss carryforwards will reduce the amount of the distribution to shareholders which would otherwise be necessary to relieve each Fund of any federal tax liability. The capital loss carryforwards do not expire.
Capital Loss Carryfoward | |||
Short-Term (000s) | Long-Term (000s) | Total (000s) | |
Harbor Mid Cap Value Fund | $— | $8,024 | $8,024 |
Harbor Small Cap Growth Fund* | 995 | 36,836 | 37,831 |
* | A portion of the Harbor Small Cap Growth Fund capital loss carryforward is subject to an annual limitation under the Internal Revenue Code and related regulations. |
The identified cost for federal income tax purposes of investments owned by each Fund and its respective gross unrealized appreciation and depreciation as of October 31, 2021 were as follows:
Identified Cost (000s) | Gross Unrealized | Net Unrealized Appreciation/ (Depreciation) (000s) | ||
Appreciation (000s) | (Depreciation) (000s) | |||
Harbor Capital Appreciation Fund | $20,724,444 | $21,792,011 | $(231,961) | $21,560,050 |
Harbor Disruptive Innovation Fund | 335,925 | 17,058 | (21,371) | (4,313) |
Harbor Large Cap Value Fund | 1,588,898 | 887,761 | (4,774) | 882,987 |
Harbor Mid Cap Fund | 52,199 | 10,301 | (1,357) | 8,944 |
Harbor Mid Cap Value Fund* | 364,874 | 128,124 | (47,781) | 80,343 |
Harbor Small Cap Growth Fund* | 807,350 | 304,331 | (29,390) | 274,941 |
Harbor Small Cap Value Fund | 1,736,588 | 972,983 | (58,769) | 914,214 |
Harbor Strategic Growth Fund | 58,556 | 60,417 | (36) | 60,381 |
* | Capital loss carryforwards are available, which may reduce taxable income from future net realized gain on investments. |
70
Harbor Domestic Equity Funds
Notes to Financial Statements—Continued
Note 6—Derivatives
Each Fund’s derivative holdings do not qualify for hedge accounting treatment and as such are recorded at current fair value. For a discussion of risks related to these investments please refer to the descriptions of each type of derivative instrument in Note 2— Significant Accounting Policies.
Each Fund’s derivative instruments outstanding as of the year ended October 31, 2021, if any, as disclosed in the Portfolio of Investments, and the related amounts of net realized and changes in net unrealized gains and losses on derivative instruments during the year as disclosed in the Statement of Operations, are indicators of the volume of derivative activity for each Fund.
Derivative Instruments
Net realized gain/(loss) on derivatives, by primary risk exposure, for the year ended October 31, 2021, were:
HARBOR DISRUPTIVE INNOVATION FUND
Net realized gain/(loss) on derivatives | Equity Contracts (000s) |
Purchased options (rights/warrants) | $80 |
Note 7—Legal Proceedings
Tribune Company
Harbor Mid Cap Value Fund has been named as a defendant and/or as a putative member of a proposed defendant class in Kirschner v. FitzSimons (In re Tribune Co.), No. 12-2652 (S.D.N.Y.) (the “FitzSimons action”); Deutsche Bank v. Ohlson Enterprises, No. 12-0064 (S.D.N.Y.) (the “Deutsche Bank action”); and Niese v. ABN AMRO Clearing Chicago LLC, No. 12-0555 (S.D.N.Y.) (the “Niese action”), as a result of its ownership of shares in the Tribune Company (“Tribune”) in 2007, when Tribune effected a leveraged buyout transaction (“LBO”) by which Tribune converted to a privately-held company. The plaintiffs in these lawsuits have asserted claims for fraudulent conveyance against Harbor Mid Cap Value Fund and other former Tribune shareholders.
All three lawsuits have been consolidated with the majority of the other Tribune-related lawsuits in the multidistrict litigation proceeding In re Tribune Co. Fraudulent Conveyance Litig., No. 11-2296 (S.D.N.Y.) (the “MDL Proceeding”).
On September 23, 2013, the District Court granted the defendants’ omnibus motion to dismiss the Deutsche Bank and Niese actions, on the basis that the plaintiffs lacked standing. The plaintiffs appealed. On March 29, 2016, the U.S. Court of Appeals for the Second Circuit issued its opinion on the appeal, affirming the district court’s dismissal of those lawsuits. The appeals court held that while the plaintiffs have standing under the U.S. Bankruptcy Code, as amended (the “Bankruptcy Code”), their claims were preempted by Section 546(e) of the Bankruptcy Code—the statutory safe harbor for settlement payments. On September 9, 2016, the plaintiffs filed a petition for writ of certiorari in the U.S. Supreme Court challenging the Second Circuit’s decision, which the shareholder defendants opposed. On April 3, 2018, Justice Kennedy and Justice Thomas issued a “Statement” related to the petition for certiorari suggesting that the Second Circuit and/or District Court may want to take steps to reexamine the application of the Section 546(e) safe harbor to the previously dismissed state law constructive fraudulent transfer claims based on the Supreme Court’s decision in Merit Management Group LP v. FTI Consulting, Inc. On April 10, 2018, plaintiffs filed in the Second Circuit a motion for that court to recall its mandate, vacate its prior decision, and remand to the district court for further proceedings consistent with Merit Management. On May 15, 2018, the Second Circuit issued an order recalling the mandate “in anticipation of further panel review.” On December 19, 2019, the court issued an amended opinion that again affirmed the district court’s ruling on the basis that plaintiffs’ claims were preempted by Section 546(e) of the Bankruptcy Code. On July 6, 2020, plaintiffs filed a new petition for a writ of certiorari in the U.S. Supreme Court. The Supreme Court denied the petition for certiorari on April 19, 2021.
On May 23, 2014, the defendants filed motions to dismiss the FitzSimons action, including a global motion to dismiss Count I, which is the claim brought against former Tribune shareholders for intentional fraudulent conveyance under U.S. federal law. On January 6, 2017, the United States District Court for the Southern District of New York granted the shareholder defendants’ motion to dismiss and denied plaintiff’s request to amend the complaint. On March 8, 2018, plaintiff renewed his
71
Harbor Domestic Equity Funds
Notes to Financial Statements—Continued
Note 7—Legal Proceedings—Continued
request for leave to file a motion to amend the complaint to assert a constructive fraudulent transfer claim based on the Supreme Court’s ruling in Merit Management. The shareholder defendants opposed that request. On April 9, 2019, the plaintiff filed a renewed motion to amend the complaint to add constructive fraudulent conveyance claims under federal law against certain shareholder defendants. The court denied the motion to amend on April 23, 2019. On July 12, 2019, Plaintiff filed a notice of appeal with respect to the dismissal of his intentional fraudulent conveyance claim and the District Court’s denial of his motion for leave to amend. On August 20, 2021, the Second Circuit affirmed the District Court’s orders: (1) dismissing the intentional fraudulent conveyance claims against the shareholder-defendants; and (2) denying the plaintiff leave to amend the complaint to add a constructive fraudulent conveyance claim against the shareholder-defendants. Plaintiff filed a petition for rehearing en banc on September 3, 2021. On October 7, 2021, the Second Circuit denied the petition.
None of these lawsuits alleges any wrongdoing on the part of Harbor Mid Cap Value Fund. Harbor Mid Cap Value Fund held shares of Tribune and tendered these shares as part of Tribune’s LBO. The value of the proceeds received by Harbor Mid Cap Value Fund was approximately $299,000. Harbor Mid Cap Value Fund’s cost basis in the shares of Tribune was approximately $262,000. At this stage of the proceedings, Harbor Mid Cap Value Fund is not able to make a reliable prediction as to the outcome of these lawsuits or the effect, if any, on the Fund’s net asset value.
Note 8—Subsequent Events
Through the date the financial statements were issued, there were no subsequent events or transactions that would have materially impacted the financial statements or related disclosures as presented herein.
72
Harbor Domestic Equity Funds
Report of Independent Registered Public Accounting Firm
The Board of Trustees and Shareholders of
Harbor Funds
Harbor Funds
Opinion on the Financial Statements
We have audited the accompanying statements of assets and liabilities of Harbor Capital Appreciation Fund, Harbor Disruptive Innovation Fund (formerly known as Harbor Mid Cap Growth Fund), Harbor Large Cap Value Fund, Harbor Mid Cap Fund, Harbor Mid Cap Value Fund, Harbor Small Cap Growth Fund, Harbor Small Cap Value Fund and Harbor Strategic Growth Fund (collectively referred to as the “Funds”), (eight of the funds constituting Harbor Funds (the “Trust”)), including the portfolios of investments, as of October 31, 2021, and the related statements of operations and changes in net assets, and the financial highlights for each of the periods indicated in the table below and the related notes (collectively referred to as the “financial statements”). In our opinion, the financial statements present fairly, in all material respects, the financial position of each of the Funds (eight of the funds constituting the Trust) at October 31, 2021, the results of their operations, changes in net assets and financial highlights for each of the periods indicated in the table below, in conformity with U.S. generally accepted accounting principles.
Individual fund comprising the Harbor Funds | Statement of operations | Statement of changes in net assets | Financial highlights |
Harbor Capital Appreciation Fund Harbor Disruptive and Innovation Fund (formerly known as Harbor Mid Cap Growth Fund) Harbor Large Cap Value Fund Harbor Mid Cap Value Fund Harbor Small Cap Growth Fund Harbor Small Cap Value Fund | For the year ended October 31, 2021 | For each of the two years in the period ended October 31, 2021 | For each of the five years in the period ended October 31, 2021 |
Harbor Mid Cap Fund | For the year ended October 31, 2021 | For the year ended October 31, 2021 and the period from December 1, 2019 (inception) through October 31, 2020 | For the year ended October 31, 2021 and the period from December 1, 2019 (inception) through October 31, 2020 |
Harbor Strategic Growth Fund | For the year ended October 31, 2021 | For each of the two years in the period ended October 31, 2021 | For each of the three years in the period ended October 31, 2021, the period from July 1, 2017, and the period from July 1, 2016 to June 30, 2017 |
Basis for Opinion
These financial statements are the responsibility of the Trust’s management. Our responsibility is to express an opinion on each of the Funds’ financial statements based on our audits. We are a public accounting firm registered with the Public Company Accounting Oversight Board (United States) (“PCAOB”) and are required to be independent with respect to the Trust in accordance with the U.S. federal securities laws and the applicable rules and regulations of the Securities and Exchange Commission and the PCAOB.
We conducted our audits in accordance with the standards of the PCAOB. Those standards require that we plan and perform the audit to obtain reasonable assurance about whether the financial statements are free of material misstatement, whether due to error or fraud. The Trust is not required to have, nor were we engaged to perform, an audit of the Trust’s internal control over financial reporting. As part of our audits we are required to obtain an understanding of internal control over financial reporting, but not for the purpose of expressing an opinion on the effectiveness of the Trust’s internal control over financial reporting. Accordingly, we express no such opinion.
Our audits included performing procedures to assess the risks of material misstatement of the financial statements, whether due to error or fraud, and performing procedures that respond to those risks. Such procedures included examining, on a test basis, evidence regarding the amounts and disclosures in the financial statements. Our procedures included confirmation of securities owned as of October 31, 2021, by correspondence with the custodian and brokers or by other appropriate auditing procedures where replies from brokers were not received. Our audits also included evaluating the accounting principles used and significant estimates made by management, as well as evaluating the overall presentation of the financial statements. We believe that our audits provide a reasonable basis for our opinion.
We have served as the auditor of one or more Harbor Funds investment companies since 2000.
Chicago, Illinois
December 21, 2021
December 21, 2021
73
Harbor Domestic Equity Funds
Fees and Expenses Example (Unaudited)
Example
As a shareholder of a Fund, you incur two types of costs: (1) transaction costs, including redemption fees (if any) and (2) ongoing costs, including management fees, distribution and service (12b-1) fees (if any), and other Fund expenses. This example is intended to help you understand your ongoing costs (in dollars) of investing in a Fund and to compare these costs with the ongoing costs of investing in other mutual funds.
The example is based on an investment of $1,000 invested at the beginning of the period and held for the entire period May 1, 2021 through October 31, 2021.
Actual Expenses
The first line of the table below provides information about actual account values and actual expenses for each share class. You may use the information in the respective class line, together with the amount you invested, to estimate the expenses that you paid over the period. Simply divide your account value by $1,000 (for example, an $8,600 account value divided by $1,000 = 8.6), then multiply the result by the number in the first line of the respective class under the heading entitled “Expenses Paid During Period” to estimate the expenses you paid on your account during this period.
Hypothetical Example for Comparison Purposes
The second line of the table for each share class below provides information about hypothetical account values and hypothetical expenses based on the respective Fund/Class’s actual expense ratio and an assumed rate of return of 5% per year before expenses, which is not the respective Fund/Class’s actual return. The hypothetical account values and expenses may not be used to estimate the actual ending account balance or expenses you paid for the period. You may use this information to compare the ongoing costs of investing in a Fund to other funds. To do so, compare this 5% hypothetical example with the 5% hypothetical examples that appear in the shareholder reports of the other funds.
Please note that the expenses shown in the table are meant to highlight your ongoing costs only and do not reflect any transactional costs, such as redemption fees. Therefore, the second line of the table is useful in comparing ongoing costs only, and will not help you determine the relative total costs of owning different funds. In addition, if these transactional costs were included, your costs would have been higher.
Annualized Expense Ratios* | Expenses Paid During Period** | Beginning Account Value May 1, 2021 | Ending Account Value October 31, 2021 | |||||
Harbor Capital Appreciation Fund | ||||||||
Retirement Class | 0.57% | |||||||
Actual | $3.09 | $1,000 | $1,151.70 | |||||
Hypothetical (5% return) | 2.91 | 1,000 | 1,022.26 | |||||
Institutional Class | 0.65% | |||||||
Actual | $3.53 | $1,000 | $1,151.20 | |||||
Hypothetical (5% return) | 3.31 | 1,000 | 1,021.85 | |||||
Administrative Class | 0.90% | |||||||
Actual | $4.88 | $1,000 | $1,149.70 | |||||
Hypothetical (5% return) | 4.58 | 1,000 | 1,020.55 | |||||
Investor Class | 1.01% | |||||||
Actual | $5.47 | $1,000 | $1,149.20 | |||||
Hypothetical (5% return) | 5.14 | 1,000 | 1,019.99 |
74
Harbor Domestic Equity Funds
Fees and Expenses Example—Continued
Annualized Expense Ratios* | Expenses Paid During Period** | Beginning Account Value May 1, 2021 | Ending Account Value October 31, 2021 | |||||
Harbor Disruptive Innovation Fund | ||||||||
Retirement Class | 0.74% | |||||||
Actual | $3.77 | $1,000 | $1,020.55 | |||||
Hypothetical (5% return) | 3.77 | 1,000 | 1,021.38 | |||||
Institutional Class | 0.82% | |||||||
Actual | $4.17 | $1,000 | $1,019.96 | |||||
Hypothetical (5% return) | 4.18 | 1,000 | 1,020.97 | |||||
Administrative Class | 1.06% | |||||||
Actual | $5.39 | $1,000 | $1,018.69 | |||||
Hypothetical (5% return) | 5.40 | 1,000 | 1,019.73 | |||||
Investor Class | 1.17% | |||||||
Actual | $5.95 | $1,000 | $1,018.12 | |||||
Hypothetical (5% return) | 5.95 | 1,000 | 1,019.16 | |||||
Harbor Large Cap Value Fund | ||||||||
Retirement Class | 0.61% | |||||||
Actual | $3.18 | $1,000 | $1,062.10 | |||||
Hypothetical (5% return) | 3.11 | 1,000 | 1,022.05 | |||||
Institutional Class | 0.69% | |||||||
Actual | $3.59 | $1,000 | $1,062.20 | |||||
Hypothetical (5% return) | 3.52 | 1,000 | 1,021.64 | |||||
Administrative Class | 0.94% | |||||||
Actual | $4.88 | $1,000 | $1,060.40 | |||||
Hypothetical (5% return) | 4.79 | 1,000 | 1,020.35 | |||||
Investor Class | 1.05% | |||||||
Actual | $5.45 | $1,000 | $1,059.70 | |||||
Hypothetical (5% return) | 5.35 | 1,000 | 1,019.78 | |||||
Harbor Mid Cap Fund | ||||||||
Retirement Class | 0.80% | |||||||
Actual | $4.10 | $1,000 | $1,035.70 | |||||
Hypothetical (5% return) | 4.08 | 1,000 | 1,021.07 | |||||
Institutional Class | 0.88% | |||||||
Actual | $4.52 | $1,000 | $1,035.70 | |||||
Hypothetical (5% return) | 4.48 | 1,000 | 1,020.66 | |||||
Investor Class | 1.24% | |||||||
Actual | $6.35 | $1,000 | $1,032.90 | |||||
Hypothetical (5% return) | 6.31 | 1,000 | 1,018.80 | |||||
Harbor Mid Cap Value Fund | ||||||||
Retirement Class | 0.78% | |||||||
Actual | $3.93 | $1,000 | $998.00 | |||||
Hypothetical (5% return) | 3.97 | 1,000 | 1,021.17 | |||||
Institutional Class | 0.86% | |||||||
Actual | $4.34 | $1,000 | $998.00 | |||||
Hypothetical (5% return) | 4.38 | 1,000 | 1,020.76 | |||||
Administrative Class | 1.11% | |||||||
Actual | $5.59 | $1,000 | $996.40 | |||||
Hypothetical (5% return) | 5.65 | 1,000 | 1,019.47 | |||||
Investor Class | 1.22% | |||||||
Actual | $6.14 | $1,000 | $996.00 | |||||
Hypothetical (5% return) | 6.21 | 1,000 | 1,018.90 |
75
Harbor Domestic Equity Funds
Fees and Expenses Example—Continued
Annualized Expense Ratios* | Expenses Paid During Period** | Beginning Account Value May 1, 2021 | Ending Account Value October 31, 2021 | |||||
Harbor Small Cap Growth Fund | ||||||||
Retirement Class | 0.78% | |||||||
Actual | $3.98 | $1,000 | $1,025.20 | |||||
Hypothetical (5% return) | 3.97 | 1,000 | 1,021.17 | |||||
Institutional Class | 0.86% | |||||||
Actual | $4.39 | $1,000 | $1,025.30 | |||||
Hypothetical (5% return) | 4.38 | 1,000 | 1,020.76 | |||||
Administrative Class | 1.11% | |||||||
Actual | $5.67 | $1,000 | $1,023.60 | |||||
Hypothetical (5% return) | 5.65 | 1,000 | 1,019.47 | |||||
Investor Class | 1.23% | |||||||
Actual | $6.27 | $1,000 | $1,023.40 | |||||
Hypothetical (5% return) | 6.26 | 1,000 | 1,018.85 | |||||
Harbor Small Cap Value Fund | ||||||||
Retirement Class | 0.78% | |||||||
Actual | $3.93 | $1,000 | $998.00 | |||||
Hypothetical (5% return) | 3.97 | 1,000 | 1,021.17 | |||||
Institutional Class | 0.86% | |||||||
Actual | $4.34 | $1,000 | $997.80 | |||||
Hypothetical (5% return) | 4.38 | 1,000 | 1,020.76 | |||||
Administrative Class | 1.11% | |||||||
Actual | $5.59 | $1,000 | $996.40 | |||||
Hypothetical (5% return) | 5.65 | 1,000 | 1,019.47 | |||||
Investor Class | 1.23% | |||||||
Actual | $6.19 | $1,000 | $995.70 | |||||
Hypothetical (5% return) | 6.26 | 1,000 | 1,018.85 | |||||
Harbor Strategic Growth Fund | ||||||||
Retirement Class | 0.63% | |||||||
Actual | $3.35 | $1,000 | $1,109.90 | |||||
Hypothetical (5% return) | 3.21 | 1,000 | 1,021.95 | |||||
Institutional Class | 0.71% | |||||||
Actual | $3.78 | $1,000 | $1,109.70 | |||||
Hypothetical (5% return) | 3.62 | 1,000 | 1,021.54 | |||||
Administrative Class | 0.96% | |||||||
Actual | $5.10 | $1,000 | $1,107.80 | |||||
Hypothetical (5% return) | 4.89 | 1,000 | 1,020.24 | |||||
Investor Class | 1.07% | |||||||
Actual | $5.68 | $1,000 | $1,107.60 | |||||
Hypothetical (5% return) | 5.45 | 1,000 | 1,019.68 |
*
Reflective of all fee waivers and expense reimbursements
**
Expenses are equal to the Fund’s annualized net expense ratio, multiplied by the average account value over the period, multiplied by 184/365 (to reflect the one-half year period).
76
Harbor Domestic Equity Funds
Additional Information (Unaudited)
Additional Tax Information
The Funds designate the following portions of their distributions from investment company taxable income for the fiscal year ended October 31, 2021 as qualifying for the dividends received deduction for corporate shareholders.
Percentage of Distribution | |
Harbor Disruptive Innovation Fund | 1% |
Harbor Large Cap Value Fund | 96 |
Harbor Mid Cap Fund | 100 |
Harbor Mid Cap Value Fund | 100 |
Harbor Small Cap Growth Fund | 3 |
Harbor Small Cap Value Fund | 100 |
Harbor Strategic Growth Fund | 100 |
Pursuant to Section 852 of the Internal Revenue Code, the Funds designate the following capital gain dividends for the fiscal year ended October 31, 2021:
Amount (000s) | |
Harbor Capital Appreciation Fund | $6,560,166 |
Harbor Disruptive Innovation Fund | 65,119 |
Harbor Large Cap Value Fund | 60,803 |
Harbor Mid Cap Value Fund | 41 |
Harbor Small Cap Growth Fund | 77,478 |
Harbor Small Cap Value Fund | 13,631 |
Harbor Strategic Growth Fund | 4,917 |
For the fiscal year ended October 31, 2021, each Fund designates up to the maximum amount of such dividends allowable pursuant to the Internal Revenue Code as qualified dividend income eligible for reduced tax rates. These lower rates range from 0% to 20% depending on an individual’s tax bracket. If a Fund pays a distribution during calendar year 2021, complete information will be reported in conjunction with Form 1099-DIV.
Shareholders who own shares through a taxable Harbor Funds account and that received distributions from a Fund during calendar year 2021 will receive a Form 1099-DIV in January 2022 that will show the tax character of those distributions.
Proxy Voting
Harbor Funds has adopted Proxy Voting Policies and Procedures under which proxies relating to securities held by the Harbor funds are voted. In addition, Harbor Funds files Form N-PX, with its complete proxy voting record for the 12 months ended June 30th, no later than August 31st of each year. A description of Harbor Funds’ Proxy Voting Policies and Procedures and the proxy voting records (Form N-PX) are available (i) without charge, upon request, by calling Harbor toll-free at 800-422-1050; (ii) on Harbor’s website at harborcapital.com; and (iii) on the SEC’s website at sec.gov.
Householding
Harbor Funds has adopted a policy that allows it to send only one copy of a Fund’s prospectus, proxy materials, annual report and semi-annual report to certain shareholders residing at the same household. This reduces Fund expenses, which benefits you and other shareholders. If you need additional copies or do not want your mailings to be “householded,” please call the Shareholder Servicing Agent at 800-422-1050. Individual copies will be sent within thirty (30) days after the Shareholder Servicing Agent receives your instructions. Your consent to householding is considered valid until revoked.
Quarterly Portfolio Disclosures
The Funds file a complete portfolio of investments for their first and third fiscal quarters with the SEC as an exhibit to Form N-PORT. The Funds’ Form N-PORT exhibit is available (i) without charge, upon request, by calling Harbor toll-free at 800-422-1050, (ii) on Harbor’s website at harborcapital.com, and (iii) on the SEC’s website at sec.gov.
77
Harbor Domestic Equity Funds
Additional Information—Continued
ADVISORY AGREEMENT APPROVALS
FACTORS CONSIDERED BY THE TRUSTEES IN APPROVING THE investment ADVISORY AGREEMENT and NON-DISCRETIONARY MODEL PORTFOLIO PROVIDER AGREEMENTS OF Harbor DISRUPTIVE INNOVATION FUND (FORMERLY, HARBOR MID CAP GROWTH FUND)
The Investment Company Act of 1940, as amended, requires that each subadvisory agreement be approved initially, and following an initial two-year term, at least annually, by the Harbor Funds Board of Trustees (the “Board” or the “Trustees”), including a majority of the Independent Trustees voting separately.
At a meeting of the Board held on May 16-17, 2021, the Board approved a change in Harbor Mid Cap Growth Fund’s (the “Fund”) name and principal investment strategy, together with certain related changes. As a result, Wellington Management Company LLP (“Wellington”) no longer serves as the Fund’s subadviser and the Fund now employs a multi-manager approach to seek to achieve its investment objective, whereby Harbor Capital Advisors, Inc. (“Harbor Capital” or the “Adviser”), the Fund’s investment adviser, manages the Fund’s assets based upon model portfolios provided by the following non-discretionary subadvisers: 4BIO Partners LLP (“4BIO Capital”), NZS Capital, LLC (“NZS Capital”), Sands Capital Management, LLC (“Sands Capital”), Tekne Capital Management, LLC (“Tekne”) and Westfield Capital Management Company, L.P. (“Westfield”) (each a “Subadviser” and collectively the “Subadvisers”)
At the meeting, the Board, including the Independent Trustees voting separately, unanimously determined, in the exercise of their business judgment, that it was in the best interests of the Fund and its shareholders (i) to change the Fund’s principal investment strategy to invest in disruptive and innovative companies of any market capitalization, (ii) to change the Fund’s name to Harbor Disruptive Innovation Fund, and (iii) to permit the Fund to employ a multi-manager approach to achieve its investment objective, whereby Harbor Capital will manage the Fund’s assets based upon model portfolios provided by the Subadvisers, and that the terms of each new non-discretionary model portfolio provider agreement (“Subadvisory Agreement”) among Harbor Funds, on behalf of the Fund, Harbor Capital and the relevant Subadviser were fair and reasonable. Accordingly, the Trustees approved the new Subadvisory Agreements for an initial two-year term. In connection with their approval of these changes, the Trustees also approved an amended and restated Investment Advisory Agreement for the Fund with Harbor Capital to reduce the contractual management fee rate payable by the Fund. In their deliberations, the Independent Trustees had the opportunity to meet privately without representatives of Harbor Capital or each Subadviser present and were represented throughout the process by legal counsel to the Independent Trustees and the Fund.
The Trustees considered that Wellington, the subadviser to the Fund, had informed Harbor Capital of its intention to resign as subadviser to the Fund in 2021 to serve as subadviser to another third-party fund utilizing the same investment strategy and investment team as those of the Fund. The Trustees considered that over several recent months, Harbor Capital had evaluated various alternatives with respect to the Fund and had determined to recommend repositioning the Fund into a multi-manager, disruption innovation-themed Fund and change its name to Harbor Disruptive Innovation Fund. Harbor Capital would be responsible for selecting, overseeing and evaluating the Subadvisers to provide investment research and management services with respect to the Fund, for actively managing allocations and reallocations of the Fund’s assets among such Subadvisers, and for managing the assets of the Fund that may not be allocated to a Subadviser. Each proposed Subadviser will perform a non-discretionary role pursuant to which it will provide a model portfolio to Harbor Capital representing its investment recommendations, based upon which Harbor Capital would purchase and sell securities for the Fund.
The Trustees considered that, in recommending the five Subadvisers, Harbor Capital had conducted research on asset managers across the disruption innovation-theme universe and also relied on knowledge built from its ongoing monitoring of managers comparable to its subadvisers. That research led to the identification of 4BIO Capital, NZS Capital, Sands Capital, Tekne, and Westfield as firms in which Harbor Capital has a high degree of investment conviction. The Board considered that Harbor Capital believes that the five Subadvisers will provide the investment approach needed to help the Fund become both sustainable and vibrant over the long term. At an educational session held on April 9, 2021, a special meeting held on April 30, 2021 and at the meeting held on May 16-17, 2021, the Trustees received presentations by Harbor Capital containing information about the investment philosophy and process, proposed approach to managing the Fund’s assets, operational and trading capabilities, compliance and risk control framework with respect to such capabilities, and the professional background and experience of the proposed portfolio managers for the Fund and other investment and operations personnel. At the May 16-17, 2021 meeting, the Trustees also received presentations by each of the proposed Subadvisers containing information about their investment firms and their experience, investment philosophy and process, and operational capabilities.
Specific Factors
In considering the Fund’s proposed amended and restated Investment Advisory Agreement and the Subadvisory Agreements, the Board, including the Independent Trustees, evaluated a number of factors it considered relevant to its determination. The Board did not identify any single factor as all-important or controlling, and individual Trustees did not necessarily attribute the same weight or importance to each factor.
Among the factors considered by the Trustees were the following:
78
Harbor Domestic Equity Funds
Additional Information—Continued
ADVISORY AGREEMENT APPROVALS—Continued
That the current subadviser was expected to resign later in 2021;
Harbor Capital’s views regarding the advantages of the proposed strategy, including its attractiveness to investors seeking exposure to disruptive innovative companies and trends and its potential for favorable returns over a full market cycle;
The nature, extent, and quality of the combined services proposed to be provided by the Adviser and each Subadviser under the new strategy, including the background, education, expertise and experience of the investment professionals of: (i) Harbor Capital who would utilize the Subadviser’s model portfolios to manage the Fund’s portfolio; and (ii) the Subadvisers who would construct those model portfolios;
The extensive investment in new and existing personnel, systems and other resources Harbor Capital had made to support its management of the Fund under the new arrangement with the Subadvisers;
The qualifications and background of each Subadviser and of the Subadviser’s personnel;
The proposed fee to be charged by each Subadviser to Harbor Capital for subadvisory and model portfolio services, including the impact of any differences between the current and proposed subadvisory fees on the portion of the advisory fee to be retained by Harbor Capital, after payment of the Subadviser’s fee, for the investment management, trading, Subadviser model oversight, administration and manager-of-managers services Harbor Capital would provide;
That Harbor Capital had agreed to (i) reduce its contractual management fee rate; and (ii) lower the Fund’s expense caps through at least August 31, 2022, resulting in a significant reduction in the Fund’s net expense ratios;
The expected impact of the implementation of each Subadvisory Agreement, together with reduction in Harbor Capital’s management fee and related expense limitation undertakings on the profitability of Harbor Capital with respect to the Fund; and
Any “fall out” benefits that might inure to Harbor Capital, each Subadviser and their affiliates as a result of the implementation of the each Subadvisory Agreement.
In evaluating the nature, extent, and quality of the services to be provided by Harbor Capital, the reasonableness of the overall compensation provided under the amended and restated Investment Advisory Agreement and other considerations, the Trustees considered Harbor Capital’s ability, consistent with the manager-of-managers structure of Harbor Funds, to identify and recommend to the Trustees quality subadvisers for the Harbor Funds, to monitor and oversee the performance and investment capabilities of each subadviser, with respect to multi-manager Harbor Funds, to actively manage allocations and reallocations of a fund’s assets among the underlying subadvisers, and to recommend the replacement of a subadviser when appropriate. The Trustees also considered as relevant to their determination the depth, knowledge and experience level of the investment team, the quality of the investment process and the culture of each Subadviser.
The Board discussed the presentations by each Subadviser and the merits of appointing each Subadviser as subadviser to the Fund.
The Board considered the potential tax and financial impacts of liquidating portfolio holdings and realizing gains and incurring brokerage costs in transitioning the portfolio, and potential options for mitigating the tax consequences to Fund shareholders. The Trustees evaluated the tax ramifications of proposed changes with respect to the estimated level of net realized and unrealized gains in the portfolio following the portfolio transition based on certain assumptions with respect to the market value of the portfolio securities and expected redemptions in the portfolio. The Board considered the portion of portfolio holdings that will likely be replaced as a result of the proposed changes and the manner in which Harbor Capital proposed to manage the portfolio transition.
The Trustees also discussed other potential options for the Fund.
Subadvisory Fee. In considering the proposed subadvisory fee payable to each Subadviser pursuant to the relevant new Subadvisory Agreement, the Trustees compared the proposed fee to the fee payable to Wellington under the prior subadvisory agreement. The Trustees noted that, based on the Fund’s assets as of May 14, 2021, the effective aggregate annual fee rate for the Fund under the new Subadvisory Agreements was higher than the effective annual fee rate paid by the Adviser to Wellington under the prior subadvisory agreement. The Trustees also considered that Harbor Capital would, effective as of the effective date of the changes, (i) reduce the Fund’s contractual management fee rate and (ii) implement expense caps for the Fund through August 31, 2022, which will collectively result in a significant reduction in the Fund’s net expense ratios.
The Trustees noted that, although they were being asked to approve the amended and restated Investment Advisory Agreement for the Fund to implement the advisory fee reduction, the Trustees would nonetheless have the opportunity to perform a full review of such agreement in connection with their annual review of investment advisory and subadvisory agreements.
As a result of these deliberations, the Trustees voted to approve the new Subadvisory Agreements with each Subadviser and the amended and restated Investment Advisory Agreement for the Fund.
79
Harbor Domestic Equity Funds
Additional Information—Continued
Trustees and Officers
As of December 2021
The business and affairs of the Trust shall be managed by or under the direction of the Trustees, and they shall have all powers necessary or desirable to carry out that responsibility. The Trustees shall have full power and authority to take or refrain from taking any action and to execute any contracts and instruments that they may consider necessary or desirable in the management of the Trust. Any determination made by the Trustees in good faith as to what is in the interests of the Trust shall be conclusive. Information pertaining to the Trustees and Officers of Harbor Funds is set forth below. The address of each Trustee and Officer is: [Name of Trustee or Officer] c/o Harbor Funds, 111 South Wacker Drive, 34th Floor, Chicago, IL 60606-4302.
Harbor Funds' Statement of Additional Information includes additional information about the Trust’s Trustees and is available without charge by calling 800-422-1050 or at the Trust’s website at harborcapital.com.
Name (Age) Position(s) with Fund | Term of Office and Length of Time Served1 | Principal Occupation(s) During Past Five Years | Number of Portfolios In Fund Complex Overseen By Trustee | Other Directorships Of Public Companies and Other Registered Investment Companies Held by Trustee During Past Five Years |
INDEPENDENT TRUSTEES | ||||
Scott M. Amero (58) Trustee | Since 2014 | Chairman (2015-2020) and Trustee (2011-Present), Rare (conservation nonprofit); Trustee, Berkshire School (2014-Present); Trustee, The Nature Conservancy, Massachusetts Chapter (2018-Present); Vice Chairman and Global Chief Investment Officer, Fixed Income (2010), Vice Chairman and Global Chief Investment Officer, Fixed Income, and Co-Head, Fixed Income Portfolio Management (2007-2010), BlackRock, Inc. (publicly traded investment management firm). | 34 | None |
Donna J. Dean (70) Trustee | Since 2010 | Chief Investment Officer of the Rockefeller Foundation (a private foundation) (2001-2019). | 34 | None |
Randall A. Hack (74) Trustee | Since 2010 | Founder and Senior Managing Director of Capstone Capital LLC (private investment firm) (2003-Present); Director of Tower Development Corporation (cell tower developer) (2009-2016); Advisory Director of Berkshire Partners (private equity firm) (2002-2013); Founder and Senior Managing Director of Nassau Capital, LLC (private investment firm, investing solely on behalf of the Princeton Endowment) (1995-2001); and President of The Princeton University Investment Company (1990-1994). | 34 | None |
Robert Kasdin (63) Trustee | Since 2014 | Senior Vice President and Chief Operating Officer (2015-Present) and Chief Financial Officer (2018-Present), Johns Hopkins Medicine; Senior Executive Vice President, Columbia University (2002-2015); Trustee and Member of the Finance Committee, National September 11 Memorial & Museum at the World Trade Center (2005-2019); Director, Apollo Commercial Real Estate Finance, Inc. (2014-Present); and Director and Executive Committee Member, The Y in Central Maryland (2018-Present). | 34 | Director of Apollo Commercial Real Estate Finance, Inc. (2014-Present). |
Kathryn L. Quirk (69) Trustee | Since 2017 | Vice President, Senior Compliance Officer and Head, U.S. Regulatory Compliance, Goldman Sachs Asset Management (2013-2017); Deputy Chief Legal Officer, Asset Management, and Vice President and Corporate Counsel, Prudential Insurance Company of America (2010-2012); Co-Chief Legal Officer, Prudential Investment Management, Inc., and Chief Legal Officer, Prudential Investments and Prudential Mutual Funds (2008-2012); Vice President and Corporate Counsel and Chief Legal Officer, Mutual Funds, Prudential Insurance Company of America, and Chief Legal Officer, Prudential Investments (2005-2008); Vice President and Corporate Counsel and Chief Legal Officer, Mutual Funds, Prudential Insurance Company of America (2004-2005); Member, Management Committee (2000-2002), General Counsel and Chief Compliance Officer, Zurich Scudder Investments, Inc. (1997-2002). | 34 | None |
Douglas J. Skinner (59) Trustee | Since 2020 | Professor of Accounting (2005-Present), Deputy Dean for Faculty (2015-2016, 2017-Present), Interim Dean (2016-2017), University of Chicago Booth School of Business. | 34 | None |
80
Harbor Domestic Equity Funds
Additional Information—Continued
Trustees and Officers—Continued
Name (Age) Position(s) with Fund | Term of Office and Length of Time Served1 | Principal Occupation(s) During Past Five Years | Number of Portfolios In Fund Complex Overseen By Trustee | Other Directorships Of Public Companies and Other Registered Investment Companies Held by Trustee During Past Five Years |
INDEPENDENT TRUSTEES—Continued | ||||
Ann M. Spruill (67) Trustee | Since 2014 | Partner (1993-2008), member of Executive Committee (1996-2008), Member Board of Directors (2002-2008), Grantham, Mayo, Van Otterloo & Co, LLC (private investment management firm) (with the firm since 1990); Member Investment Committee and Chair of Global Public Equities, Museum of Fine Arts, Boston (2000-2020); and Trustee, Financial Accounting Foundation (2014-2020). | 34 | None |
INTERESTED TRUSTEE | ||||
Charles F. McCain (52)* Chairman, Trustee and President | Since 2017 | Chief Executive Officer (2017-Present), Director (2007-Present), President and Chief Operating Officer (2017), Executive Vice President and General Counsel (2004-2017), and Chief Compliance Officer (2004-2014), Harbor Capital Advisors, Inc.; Director and Chairperson (2019-Present), Harbor Trust Company, Inc.; Director (2007-Present) and Chief Compliance Officer (2004-2017), Harbor Services Group, Inc.; Chief Executive Officer (2017-Present), Director (2007-Present), Chief Compliance Officer and Executive Vice President (2007-2017), Harbor Funds Distributors, Inc.; and Chief Compliance Officer, Harbor Funds (2004-2017). | 34 | None |
Name (Age) Position(s) with Fund | Term of Office and Length of Time Served1 | Principal Occupation(s) During Past Five Years |
FUND OFFICERS NOT LISTED ABOVE** | ||
Erik D. Ojala (46) Chief Compliance Officer | Since 2017 | Executive Vice President and General Counsel (2017-Present) and Secretary (2010-Present); Senior Vice President and Associate General Counsel (2007-2017), Harbor Capital Advisors, Inc.; Director and Secretary (2019-Present), Harbor Trust Company, Inc.; Director, Executive Vice President (2017-Present) and Chief Compliance Officer (2017-2021), Harbor Funds Distributors, Inc.; Director (2017-Present) and Assistant Secretary (2014-Present), Harbor Services Group, Inc.; and AML Compliance Officer (2010-2017) and Vice President and Secretary (2007-2017), Harbor Funds. |
Anmarie S. Kolinski (50) Treasurer | Since 2007 | Executive Vice President and Chief Financial Officer (2007-Present), Harbor Capital Advisors, Inc.; Director and Treasurer (2019-Present), Harbor Trust Company, Inc.; Chief Financial Officer (2007-Present), Harbor Services Group, Inc.; and Chief Financial Officer (2015-Present) and Treasurer (2012-Present), Harbor Funds Distributors, Inc. |
Kristof M. Gleich (42) Vice President | Since 2019 | President (2018-Present) and Chief Investment Officer (2020), Harbor Capital Advisors, Inc.; Director, Vice Chairperson, President (2019-Present) and Chief Investment Officer (2020-Present), Harbor Trust Company, Inc.; and Managing Director, Global Head of Manager Selection (2010-2018), JP Morgan Chase & Co. |
Gregg M. Boland (58) Vice President | Since 2019 | Executive Vice President (2020-Present), Vice President (2019-2020), Harbor Capital Advisors, Inc.; President (2019-Present), Senior Vice President – Operations (2016-2019), and Vice President – Operations (2007-2015), Harbor Services Group, Inc.; and Senior Vice President, AML Compliance Officer, and OFAC Officer (2019-Present), Harbor Funds Distributors, Inc. |
Diana R. Podgorny (42) Secretary | Since 2018 | Senior Vice President and Assistant General Counsel (2020-Present), Vice President and Assistant General Counsel (2017-2020), Harbor Capital Advisors, Inc.; Director and Vice President (2020 – Present), Harbor Trust Company, Inc.; Vice President and Counsel, AMG Funds LLC (2016-2017); Assistant Secretary, AMG Funds, AMG Funds I, AMG Funds II and AMG Funds III (2016-2017); Assistant Secretary, AMG Funds IV (2010-2017); and Vice President and Counsel, Aston Asset Management, LLC (2010-2016). |
Jodie L. Crotteau (49) Assistant Secretary | Since 2014 | Senior Vice President and Chief Compliance Officer, Harbor Capital Advisors, Inc. (2014-Present); Chief Compliance Officer and AML/OFAC Officer (2019-Present), Harbor Trust Company, Inc.; Chief Compliance Officer and Secretary (2017-present) and Assistant Secretary (2015-2016), Harbor Services Group, Inc.; Chief Compliance Officer (2021-present) and Assistant Secretary (2016-present), Harbor Funds Distributors, Inc.; Vice President and Chief Compliance Officer, Grosvenor Registered Funds (2011-2014); and Vice President, Grosvenor Capital Management, L.P. (2010-2014). |
81
Harbor Domestic Equity Funds
Additional Information—Continued
Trustees and Officers—Continued
Name (Age) Position(s) with Fund | Term of Office and Length of Time Served1 | Principal Occupation(s) During Past Five Years |
FUND OFFICERS NOT LISTED ABOVE**—Continued | ||
Lana M. Lewandowski (42) AML Compliance Officer and Assistant Secretary | Since 2017 | Legal & Compliance Manager (2016-Present) and Legal Specialist (2012-2015), Harbor Capital Advisors, Inc. |
Lora A. Kmieciak (57) Assistant Treasurer | Since 2017 | Senior Vice President – Fund Administration and Analysis (2017-Present), Senior Vice President - Business Analysis (2015-2017), Harbor Capital Advisors, Inc.; Vice President (2020 – Present), Harbor Trust Company, Inc.; and Assurance Executive Director, Ernst & Young LLP (1999-2015). |
John M. Paral (53) Assistant Treasurer | Since 2013 | Director of Fund Administration and Analysis (2017-Present), Vice President (2012-Present) and Financial Reporting Manager (2007-2017), Harbor Capital Advisors, Inc. |
1
Each Trustee serves for an indefinite term, until his or her successor is elected. Each Officer is elected annually.
*
Mr. McCain is deemed an “Interested Trustee” due to his affiliation with the Adviser and Distributor of Harbor Funds.
**
Officers of the Funds are “interested persons” as defined in the Investment Company Act.
82
This Privacy Statement Is Not Part of This Report
Harbor’s Privacy Statement
Rev. 09/2021
FACTS | WHAT DOES HARBOR DO WITH YOUR PERSONAL INFORMATION? |
Why? | Financial companies choose how they share your personal information. Federal law gives consumers the right to limit some but not all sharing. Federal law also requires us to tell you how we collect, share, and protect your personal information. Please read this notice carefully to understand what we do. |
What? | The types of personal information we collect and share depend on the product or service you have with us. This information can include: ■ Social Security number ■ Account balances and transaction history ■ Assets and investment experience ■ Wire transfer instructions When you are no longer our customer, we continue to share your information as described in this notice. |
How? | All financial companies need to share customers' personal information to run their everyday business. In the section below, we list the reasons financial companies can share their customers' personal information; the reasons Harbor chooses to share; and whether you can limit this sharing. |
Reasons we can share your personal information | Does Harbor share? | Can you limit this sharing? |
For our everyday business purposes— such as to process your transactions, maintain your account(s), respond to court orders and legal investigations, or report to credit bureaus | Yes | No |
For our marketing purposes— to offer our products and services to you | Yes | No |
For joint marketing with other financial companies | No | We don’t share |
For our affiliates’ everyday business purposes— information about your transactions and experiences | Yes | No |
For our affiliates’ everyday business purposes— information about your creditworthiness | No | We don’t share |
For nonaffiliates to market to you | No | We don’t share |
Questions? | Call 800-422-1050 or go to harborcapital.com |
83
Harbor’s Privacy Statement—Continued
Page 2 | ||
Who we are | ||
Who is providing this notice? | Harbor Capital Advisors, Inc.; Harbor Services Group; Inc.; Harbor Funds Distributors, Inc., Harbor Trust Company, Inc., Harbor Funds, Harbor ETF Trust (collectively, “Harbor”) | |
What we do | ||
How does Harbor protect my personal information? | To protect your personal information from unauthorized access and use, we use security measures that comply with federal law. These measures include computer safeguards and secured files and buildings. We maintain physical, electronic and procedural safeguards designed to protect your personal information; however, please be aware that no data security measures can guarantee 100% security. | |
How does Harbor collect my personal information? | We collect your personal information, for example, when you ■ Open an account or make transactions on your account ■ Give us your contact information or income information ■ Tell us about your investment or retirement portfolio We also collect your personal information from others, such as credit bureaus, affiliates, or other companies. | |
Why can’t I limit all sharing? | Federal law gives you the right to limit only ■ sharing for affiliates’ everyday business purposes—information about your creditworthiness ■ affiliates from using your information to market to you ■ sharing for nonaffiliates to market to you State laws and individual companies may give you additional rights to limit sharing. | |
Definitions | ||
Affiliates | Companies related by common ownership or control. They can be financial and nonfinancial companies. ■ Our affiliates include the financial companies providing this notice, as well as other companies under our parent company, ORIX Corporation. | |
Nonaffiliates | Companies not related by common ownership or control. They can be financial and nonfinancial companies. ■ Nonaffiliates we share with can include companies that perform support services on our behalf or other firms that assist us in providing you with products and services, such as custodians, transfer agents, broker-dealers and marketing service firms (to support our marketing to you), as well as other financial institutions. | |
Joint marketing | A formal agreement between nonaffiliated financial companies that together market financial products or services to you. ■ Harbor doesn’t jointly market. | |
Other important information | ||
Notice to investors in California and Vermont | Under California and Vermont law, we will not share information we collect about you with outside companies, unless the law allows. For example, we may share information with your consent, to service your accounts, and in connection with legal proceedings. We will limit sharing among our companies to the extent required by applicable law. |
We recommend that you read and retain this notice for your personal files.
84
[THIS PAGE INTENTIONALLY LEFT BLANK]
86
For more information |
Trustees & Officers
Charles F. McCain Chairman, President & Trustee Scott M. Amero Trustee Donna J. Dean Trustee Randall A. Hack Trustee Robert Kasdin Trustee Kathryn L. Quirk Trustee Douglas J. Skinner Trustee Ann M. Spruill Trustee Erik D. Ojala Chief Compliance Officer Anmarie S. Kolinski Treasurer Kristof M. Gleich Vice President Gregg M. Boland Vice President Diana R. Podgorny Secretary Jodie L. Crotteau Assistant Secretary Lana M. Lewandowski AML Compliance Officer & Assistant Secretary Lora A. Kmieciak Assistant Treasurer John M. Paral Assistant Treasurer |
Investment Adviser
Harbor Capital Advisors, Inc.
111 South Wacker Drive, 34th Floor
Chicago, IL 60606-4302
312-443-4400
111 South Wacker Drive, 34th Floor
Chicago, IL 60606-4302
312-443-4400
Distributor
Harbor Funds Distributors, Inc.
111 South Wacker Drive, 34th Floor
Chicago, IL 60606-4302
312-443-4600
111 South Wacker Drive, 34th Floor
Chicago, IL 60606-4302
312-443-4600
Shareholder Services
Harbor Services Group, Inc.
P.O. Box 804660
Chicago, IL 60680-4108
800-422-1050
P.O. Box 804660
Chicago, IL 60680-4108
800-422-1050
FD.AR.DE.1021
Annual Report
INTERNATIONAL & GLOBAL FUNDS
October 31, 2021
International & Global Funds | Retirement Class | Institutional Class | Administrative Class | Investor Class |
Harbor Diversified International All Cap Fund | HNIDX | HAIDX | HRIDX | HIIDX |
Harbor Emerging Markets Equity Fund | HNEMX | HAEMX | HREMX | HIEEX |
Harbor Focused International Fund | HNFRX | HNFSX | HNFDX | HNFIX |
Harbor Global Leaders Fund | HNGIX | HGGAX | HRGAX | HGGIX |
Harbor International Fund | HNINX | HAINX | HRINX | HIINX |
Harbor International Growth Fund | HNGFX | HAIGX | HRIGX | HIIGX |
Harbor International Small Cap Fund | HNISX | HAISX | HRISX | HIISX |
Harbor Overseas Fund | HAORX | HAOSX | HAOAX | HAONX |
Table of Contents
1 | |
2 | |
4 | |
11 | |
13 | |
16 | |
18 | |
20 | |
22 | |
24 | |
26 | |
33 | |
35 | |
38 | |
41 | |
44 | |
46 | |
53 | |
55 | |
56 | |
62 | |
78 | |
90 | |
91 | |
94 | |
94 | |
94 | |
95 | |
96 | |
99 |
This document must be preceded or accompanied by a Prospectus.
Letter from the Chairman
Charles F. McCain
Chairman
Chairman
Dear Fellow Shareholder:
Over the past year we have experienced bouts of both real optimism and real disappointment. As summer began, there was a sense that we had finally turned the corner on COVID-19 with widespread vaccine availability and rapidly declining rates of new infections. We dared to dream about what a post-COVID-19 return to normalcy could look like. And then the delta variant arrived bringing a frustrating and sustained rise in new cases across the world. With all the loss that so many had experienced already from COVID-19, could we maintain our collective resolve in the face of this significant setback?
Fortunately, as summer turned to fall, we witnessed the resilience of the human spirit. We were better prepared as a nation this time to handle this delta variant surge, although our progress has certainly been uneven. We benefited from higher vaccination rates, generous federal stimulus programs that lifted consumer spending across the income spectrum and a return to in-person schooling for most that helped both children and families re-establish routines.
Through all these ups and downs, U.S. and global equity markets posted strong returns over the past 12 months. Value stocks led growth over the one-year period but lagged over longer time periods. Similarly, small caps outperformed large caps, while large caps continued to lead over longer time periods. In contrast, bond markets faced headwinds from rising interest rates, pushing Treasury bonds and the Bloomberg U.S. Aggregate Bond Index into negative territory. Corporate bonds were a lone bright spot, managing to post positive results for the fiscal year.
Investors continue to seek income wherever they can find it in today’s low-yield environment. However, over the course of the past year, interest rates have been increasing, with the 10-year U.S. Treasury yield more than doubling since it bottomed in August 2020. Rising rates have been in response to the likely prospect of the Fed beginning to taper its asset purchases soon, and potentially raising rates by the middle of 2022.
As we close out fiscal year 2021, there are four significant issues that must be addressed going forward: the supply shortages stemming from burgeoning consumer demand and supply-chain disruptions, ongoing labor shortages, rising prices (and the specter of inflation), and the persistence of the Delta and other potential new variants.
Harbor believes that the trajectory of the economic recovery will remain uneven for the foreseeable future, given the headwinds mentioned above. That’s why it’s so important for investors to focus on practical solutions to manage inevitable market volatility. Drawing upon the expertise of experienced, active portfolio managers is one way to help investors to achieve their long-term investment goals. We’re confident that Harbor together with our investment partners will continue to execute our strategies in a disciplined and thoughtful manner to benefit shareholders over the long haul.
In fact, we believe that a challenging and volatile market environment is actually good news for active managers, because it allows us to add potential value and pull ahead of the pack. Our research shows that the difference between top-performing and bottom-performing active managers, across major asset classes from U.S. large cap and small cap to foreign large cap and emerging markets, is at its highest level in 20 years.
I hope you and your families will fare well over the coming year. Thank you for your confidence and continued investment in Harbor Funds.
December 21, 2021
Charles F. McCain |
Chairman |
1
Harbor Diversified International All Cap Fund
Manager’s Commentary (Unaudited)
Subadviser
Marathon Asset Management Limited
Orion House
5 Upper St. Martin’s Lane
London, WC2H 9EA
England
5 Upper St. Martin’s Lane
London, WC2H 9EA
England
Portfolio Managers
Neil M. Ostrer
Since 2015
Since 2015
Charles Carter
Since 2015
Since 2015
Nick Longhurst
Since 2015
Since 2015
William J. Arah
Since 2015
Since 2015
Simon Somerville
Since 2016
Since 2016
Alex Duffy
Since 2021
Since 2021
Robert Anstey, CFA
Since 2015
Since 2015
Justin Hill
Since 2021
Since 2021
Marathon Asset Management Limited (Marathon-London) has subadvised the Fund since 2015.
Investment Objective
The Fund seeks long-term growth of capital.
Management’s Discussion of
Fund Performance
Fund Performance
Market Review
The period since October 31, 2020, displayed strong market performance. There was a notable change in style leadership in equity markets that took place around November 9, 2020 with the announcement of an effective COVID-19 vaccine. For years, the market has been led mainly by mega-cap companies, which are typically either growth businesses or reliable income generators (“bond proxies”). This began to change in November, initially in Europe and subsequently spreading to all other major markets. The value area of the market and smaller capitalization companies (and particularly those businesses which are both) began to outperform. The trend has not been constant over the period, with growth outpacing value from late-June to mid-August, and the disparity in valuations between the growth and value segments of the market remains high from a historical perspective, reflecting the extremes that had been reached.
Cyclical industries, such as Energy, Financials and Information Technology have been the key beneficiaries over the period, with more defensive sectors, including Consumer Staples and Utilities, performing relatively weakly. However, Communication Services was the weakest sector, as a number of Chinese Internet stocks performed poorly. Many of these companies have been hit by increasing regulatory scrutiny and state intervention over the course of 2021, which may have led to a negative impact on share prices.
The MSCI All Country World Ex-United States (ACWI ex-U.S.) Index performed well and returned 29.66% (in USD terms) over the 12-month period to October 31st. On a regional basis, Canada, which averaged 6.78% of the index, led the way returning 49.05% (in USD terms), followed by European markets, which returned 40.93% (in USD terms) and averaged 39.77% of the MSCI ACWI ex-U.S. Index over the period. Developed Asian ex-Japan markets (Australia, Hong Kong, Singapore and New Zealand), which constituted 7.30% of the Index on average over the period, were also strong performers during the 12-month period returning 30.60% (in USD terms). Japanese and Emerging Markets performance was not so strong in absolute terms, returning 19.88% (in USD terms with an average weight of 15.20% of the Index) and 16.96% (in USD terms with an average weight of 30.58% of the Index) respectively. However, Emerging Markets performance largely reflects the drag from China, which at 11.49% of the ACWI ex-US represents more than a third of the Emerging Markets exposure in the Fund and which fell by -9.21% (in USD terms) over the period.
Performance
Harbor Diversified International All Cap Fund returned 36.32% (Retirement Class), 36.12% (Institutional Class), 35.76% (Administrative Class) and 35.56% (Investor Class), while the MSCI All Country World Ex. U.S. (ND) Index returned 29.66% during the annual period ended October 31, 2021. Returns were driven by stock selection in Emerging Markets and Canada. Looking at sector effects, stock selection was the driver of returns once again, with sector allocations effects resulting in a small drag. Currency was also supportive as the U.S. Dollar weakened. The portfolio’s overweight in Industrials and its underweight position to Utilities were beneficial to performance, but the underweight to Energy and overweight to Consumer Staples were not. Stock selection was particularly strong amongst stocks in the Consumer Discretionary, Communication Services and Financials sectors.
At the stock level, shares in BlackBerry, the technology company once famed for its handsets, soared during the first quarter of 2021. Amateur online investors, informally known as ‘Reddit traders’, placed ‘bets’ against short sellers of the stock via a ‘short squeeze’ trading strategy, along with the likes of GameStop, resulting in the share price rising dramatically. This resulted in the valuation substantially exceeding Marathon’s target, and anything reasonably supported by fundamental analysis, so the position was sold. The position in Greek bank, Eurobank Ergasias, performed strongly over the period. The company announced good results, progress on non-performing loans, surprisingly high levels of re-payment resumption for loans put into moratorium during the COVID-19 lockdowns and even plans to look abroad for potential acquisitions. Shares in U.K.-domiciled Entain benefited from a takeover bid at the beginning
2
Harbor Diversified International All Cap Fund
Manager’s Commentary—Continued
CHANGE IN A $50,000 INVESTMENT
For the period 11/02/2015 through 10/31/2021
The graph compares a $50,000 investment in the Institutional Class shares of the Fund with the performance of the MSCI All Country World Ex. U.S. (ND) Index. The Fund’s performance assumes the reinvestment of all dividend and capital gain distributions.
TOTAL RETURNS
For the periods ended 10/31/2021
1 Year | Annualized | |||||
5 Years | Life of Fund | |||||
Harbor Diversified International All Cap Fund | ||||||
Retirement Class1,2 | 36.32% | 9.87% | 7.76% | |||
Institutional Class1 | 36.12 | 9.78 | 7.68 | |||
Administrative Class1 | 35.76 | 9.50 | 7.41 | |||
Investor Class1 | 35.56 | 9.38 | 7.29 | |||
Comparative Index | ||||||
MSCI All Country World Ex. U.S. (ND) | 29.66% | 9.77% | 8.12% |
As stated in the Fund’s prospectus dated March 1, 2021, the expense ratios were 0.72% (Net) and 0.85% (Gross) (Retirement Class); 0.80% (Net) and 0.93% (Gross) (Institutional Class); 1.05% (Net) and 1.18% (Gross) (Administrative Class); 1.16% (Net) and 1.29% (Gross) (Investor Class). The net expense ratios reflect an expense limitation agreement (excluding interest expense, if any) effective through 02/28/2022. The expense ratios in the prospectus may differ from the actual expense ratios for the period disclosed within this report. The expense ratios shown in the prospectus are based on the prior fiscal year, adjusted to reflect changes, if any, in contractual arrangements that occurred prior to the date of the prospectus (or supplement thereto, if applicable).
Performance data shown represents past performance and is no guarantee of future results. Past performance is net of management fees and expenses and reflects reinvested dividends and distributions. Past performance reflects the beneficial effect of any expense waivers or reimbursements, without which returns would have been lower. Investment returns and principal value will fluctuate and when redeemed may be worth more or less than their original cost. Returns for periods less than one year are not annualized. Current performance may be higher or lower and is available through the most recent month end at harborcapital.com or by calling 800-422-1050.
of 2021 prior to a new bid from recently listed U.S. e-sports business, DraftKings, in the third quarter. Whether this bid is ultimately successful or not, it illustrates a key part of our ongoing investment thesis for the industry, which appears ripe for consolidation in our view. Not holding Alibaba and Tencent was also a major contributor to outperformance over the year. Anti-trust investigations, fines and regulatory measures imposed by the Chinese government caused many investors to reassess their holdings in these businesses and their share prices fell substantially as a result.
Amongst stocks which negatively impacted performance over the period we find Barrick Gold, the Canadian gold miner. The gold price weakened over the course of 2021 to date after a strong 2020, and Barrick’s share price has followed it, weighing on the portfolio. HomeServe, the U.K.-based building maintenance business, also impacted returns. Danish medical device maker, Coloplast, performed comparatively poorly over the period. While profits have been resilient, Coloplast has seen some impact from a decline in elective procedures, and, though shares have increased in value, they have not matched the pace of the index. ASML Holding, the Dutch lithography company in which the portfolio is underweight, developed a new way to create more efficient semiconductor chips, extreme ultraviolet lithography, and has had a solid run, which we believe is a result of its effective monopoly on this technology.
Outlook & Strategy
Marathon London remains committed to the implementation of our bottom-up analytical efforts within the capital cycle investment framework and, therefore, are seeking to invest in companies that exhibit favorable supply side dynamics with management teams that have a track record of allocating capital efficiently. Developments over the last two years highlight the shortfalls of expending too much energy on forecasted outlooks; the Portfolio Managers are not looking to react to market volatility, rather placing emphasis on trusting the longstanding investment process that they have been committed to over their 35 plus year history with low levels of investment turnover. Having said that, the reversal in the prevailing trend from growth and large cap to value and smaller cap names has been very clear. It remains to be seen whether the rotation represents an ongoing change in the long-term trend or a short-term interruption to it. However, in your manager’s view, history suggests that valuation differentials, which remain historically high, may revert to the mean (then overshoot) given time.
1
The “Life of Fund” return as shown reflects the period 11/02/2015 through 10/31/2021.
2
Retirement Class shares commenced operations on March 1, 2016. The performance attributed to the Retirement Class shares prior to that date is that of the Institutional Class shares. Performance prior to March 1, 2016 has not been adjusted to reflect the lower expenses of Retirement Class shares. During this period, Retirement Class shares would have had returns similar to, but potentially higher than, Institutional Class shares due to the fact that Retirement Class shares represent interests in the same portfolio as Institutional Class shares but are subject to lower expenses.
All international and global returns are in U.S. Dollars.
This report contains the current opinions of Marathon Asset Management Limited as of the date of this report and should not be considered as investment advice or a recommendation of any particular security, strategy or investment product. Such opinions are subject to change without notice and securities described herein may no longer be included in, or may at any time be removed from, the Fund’s portfolio. This report is distributed for informational purposes only. Information contained herein has been obtained from sources believed reliable, but not guaranteed.
There is no guarantee that the investment objective of the Fund will be achieved. Stock markets are volatile and equity values can decline significantly in response to adverse issuer, political, regulatory, market and economic conditions. Investing in international and emerging markets poses special risks, including potentially greater price volatility due to social, political and economic factors, as well as currency exchange rate fluctuations. These risks are more severe for securities of issuers in emerging market regions. For information on the different share classes and the risks associated with an investment in the Fund, please refer to the current prospectus.
3
Harbor Diversified International All Cap Fund
Portfolio of Investments—October 31, 2021
REGION BREAKDOWN (% of investments) -Unaudited
(Excludes short-term investments)
The Fund’s Portfolio of Investments include investments denominated in foreign currencies. As of October 31, 2021, there was no foreign currency denomination that comprised more than 25% of the Fund’s net assets.
Portfolio of Investments
Value, Cost, and Principal Amounts in Thousands
COMMON STOCKS—96.9% | |||
Shares | Value | ||
AEROSPACE & DEFENSE—0.8% | |||
20,233 | Airbus SE (France)* | $2,596 | |
350,775 | BAE Systems plc (United Kingdom) | 2,645 | |
1,538,715 | Rolls-Royce Holdings plc (United Kingdom)* | 2,777 | |
13,505 | Thales SA (France) | 1,246 | |
9,264 | |||
AIR FREIGHT & LOGISTICS—0.1% | |||
26,915 | Oesterreichische Post AG (Austria) | 1,136 | |
AIRLINES—0.5% | |||
171,854 | Air Canada (Canada)* | 3,082 |
COMMON STOCKS—Continued | |||
Shares | Value | ||
AIRLINES—Continued | |||
247,779 | EasyJet plc (United Kingdom)* | $2,112 | |
330,426 | Qantas Airways Ltd. (Australia)* | 1,338 | |
6,532 | |||
AUTO COMPONENTS—0.9% | |||
53,700 | Bridgestone Corp. (Japan) | 2,376 | |
269,165 | Gestamp Automocion SA (Spain)*,1 | 1,204 | |
47,125 | GUD Holdings Ltd. (Australia) | 436 | |
209,127 | Johnson Electric Holdings Ltd. (Hong Kong) | 463 | |
15,600 | Koito Manufacturing Co. Ltd. (Japan) | 885 | |
35,017 | Magna International Inc. (Canada) | 2,848 |
4
Harbor Diversified International All Cap Fund
Portfolio of Investments—Continued
Value, Cost, and Principal Amounts in Thousands
COMMON STOCKS—Continued | |||
Shares | Value | ||
AUTO COMPONENTS—Continued | |||
64,400 | Sumitomo Electric Industries Ltd. (Japan) | $ 855 | |
16,800 | Toyota Industries Corp. (Japan) | 1,428 | |
10,495 | |||
AUTOMOBILES—0.8% | |||
31,117 | Bayerische Motoren Werke AG (Germany) | 3,144 | |
377,800 | Toyota Motor Corp. (Japan) | 6,666 | |
9,810 | |||
BANKS—8.7% | |||
225,885 | Australia & New Zealand Banking Group Ltd. (Australia) | 4,807 | |
19,765,500 | Bank Central Asia TBK PT (Indonesia) | 10,452 | |
681,194 | Bank of Ireland Group plc (Ireland)* | 4,058 | |
67,101 | Bank of Nova Scotia (Canada) | 4,399 | |
3,619,785 | Barclays plc (United Kingdom) | 9,989 | |
122,297 | BNP Paribas SA (France) | 8,186 | |
974,512 | CaixaBank SA (Spain) | 2,801 | |
32,809 | Capitec Bank Holdings Ltd. (South Africa) | 3,665 | |
40,901 | Close Brothers Group plc (United Kingdom) | 806 | |
23,790 | Danske Bank AS (Denmark) | 403 | |
198,847 | DBS Group Holdings Ltd. (Singapore) | 4,647 | |
96,753 | DNB Bank ASA (Norway)2 | 2,302 | |
41,400 | Fukuoka Financial Group Inc. (Japan) | 744 | |
225,621 | HDFC Bank Ltd. ADR (India)3 | 16,224 | |
221,962 | HSBC Holdings plc (Hong Kong) | 1,336 | |
288,135 | Intesa Sanpaolo SpA (Italy) | 819 | |
10,824,311 | Lloyds Banking Group plc (United Kingdom) | 7,408 | |
1,129,100 | Resona Holdings Inc. (Japan) | 4,242 | |
314,701 | Standard Chartered plc (United Kingdom) | 2,128 | |
54,100 | Sumitomo Mitsui Financial Group Inc. (Japan) | 1,755 | |
81,200 | Sumitomo Mitsui Trust Holdings Inc. (Japan) | 2,671 | |
316,831 | Svenska Handelsbanken AB (Sweden) | 3,632 | |
366,905 | UniCredit SpA (Italy) | 4,850 | |
128,682 | United Overseas Bank Ltd. (Singapore) | 2,558 | |
104,882 | |||
BEVERAGES—2.2% | |||
38,822 | Anheuser-Busch InBev SA (Belgium) | 2,375 | |
2,500 | Asahi Group Holdings Ltd. (Japan) | 113 | |
17,766 | Carlsberg AS (Denmark) | 2,933 | |
32,571 | Coca-Cola Europacific Partners plc (United States)* | 1,715 | |
140,683 | Davide Campari-Milano NV (Italy) | 1,998 | |
112,388 | Diageo plc (United Kingdom) | 5,591 | |
290,734 | East African Breweries Ltd. (Kenya)* | 437 | |
45,594 | Heineken NV (Netherlands) | 5,047 | |
304,200 | Kirin Holdings Co. Ltd. (Japan) | 5,295 | |
4,280 | Pernod Ricard SA (France) | 985 | |
17,000 | Suntory Beverage & Food Ltd. (Japan) | 660 | |
27,149 | |||
BUILDING PRODUCTS—1.4% | |||
227,961 | Assa Abloy AB Class B (Sweden) | 6,689 | |
8,697 | Geberit AG (Switzerland) | 6,792 | |
257,789 | GWA Group Ltd. (Australia) | 529 | |
106,800 | LIXIL Group Corp. (Japan) | 2,744 | |
16,754 | |||
CAPITAL MARKETS—2.7% | |||
333,276 | 3i Group plc (United Kingdom) | 6,224 | |
218,259 | Brookfield Asset Management Inc. (Canada) | 13,178 | |
125,900 | Daiwa Securities Group Inc. (Japan) | 707 | |
154,095 | IG Group Holdings plc (United Kingdom) | 1,672 |
COMMON STOCKS—Continued | |||
Shares | Value | ||
CAPITAL MARKETS—Continued | |||
4,874 | Industrivarden AB Class A (Sweden) | $ 161 | |
21,500 | JAFCO Group Co. Ltd. (Japan) | 1,362 | |
8,400 | Japan Exchange Group Inc. (Japan) | 199 | |
505,612 | Jupiter Fund Management plc (United Kingdom) | 1,732 | |
589,400 | Nomura Holdings Inc. (Japan) | 2,807 | |
21,768 | Rathbone Brothers plc (United Kingdom) | 585 | |
143,423 | St. James's Place plc (United Kingdom) | 3,098 | |
34,348 | UBS Group AG (Switzerland) | 625 | |
32,350 | |||
CHEMICALS—1.0% | |||
136,200 | Air Water Inc. (Japan) | 2,084 | |
62,013 | BASF SE (Germany) | 4,463 | |
30,800 | Nissan Chemical Corp. (Japan) | 1,714 | |
1,600 | Nitto Denko Corp. (Japan) | 125 | |
88,952 | Orica Ltd. (Australia) | 1,021 | |
400 | Shin-Etsu Chemical Co. Ltd. (Japan) | 71 | |
18,400 | Sumitomo Bakelite Co. Ltd. (Japan) | 827 | |
19,700 | Tokyo Ohka Kogyo Co. Ltd. (Japan) | 1,253 | |
11,558 | |||
COMMERCIAL SERVICES & SUPPLIES—1.6% | |||
12,900 | AEON Delight Co. Ltd. (Japan) | 396 | |
266,416 | Brambles Ltd. (Australia) | 2,021 | |
1,302,720 | Cleanaway Waste Management Ltd. (Australia) | 2,649 | |
27,464 | Elis SA (France)* | 521 | |
352,397 | HomeServe plc (United Kingdom) | 4,117 | |
81,896 | Ritchie Bros Auctioneers Inc. (Canada) | 5,598 | |
16,100 | Secom Co. Ltd. (Japan) | 1,098 | |
1,264,476 | Serco Group plc (United Kingdom) | 2,184 | |
14,800 | Sohgo Security Services Co. Ltd. (Japan) | 633 | |
19,217 | |||
CONSTRUCTION & ENGINEERING—1.0% | |||
51,923 | Boskalis Westminster NV (Netherlands) | 1,549 | |
22,728 | Ferrovial SA (Spain) | 717 | |
173,400 | Infroneer Holdings Inc. (Japan) | 1,436 | |
391,100 | Obayashi Corp. (Japan) | 3,302 | |
259,500 | Penta-Ocean Construction Co. Ltd. (Japan) | 1,788 | |
137,600 | Snc-Lavalin Group Inc. (Canada) | 3,701 | |
12,493 | |||
CONSTRUCTION MATERIALS—1.1% | |||
17,534 | CRH plc (Ireland) | 839 | |
276,374 | Fletcher Building Ltd. (New Zealand) | 1,421 | |
59,893 | Holcim Ltd. (Switzerland)* | 2,988 | |
6,220 | Imerys SA (France) | 270 | |
40,171 | James Hardie Industries PLC CDI (Australia)*,3 | 1,578 | |
149,400 | Taiheiyo Cement Corp. (Japan) | 3,174 | |
9,655 | Vicat SA (France) | 412 | |
86,431 | Wienerberger AG (Austria) | 3,060 | |
13,742 | |||
CONSUMER FINANCE—0.2% | |||
355,187 | International Personal Finance plc (United Kingdom) | 619 | |
391,191 | Non-Standard Finance plc (United Kingdom)*,1 | 21 | |
257,393 | Provident Financial plc (United Kingdom)* | 1,300 | |
1,940 |
5
Harbor Diversified International All Cap Fund
Portfolio of Investments—Continued
Value, Cost, and Principal Amounts in Thousands
COMMON STOCKS—Continued | |||
Shares | Value | ||
CONTAINERS & PACKAGING—0.4% | |||
574,387 | DS Smith plc (United Kingdom) | $3,013 | |
133,500 | Toyo Seikan Group Holdings Ltd. (Japan) | 1,585 | |
4,598 | |||
DISTRIBUTORS—0.2% | |||
268,442 | Inchcape plc (United Kingdom) | 3,030 | |
DIVERSIFIED FINANCIAL SERVICES—1.1% | |||
1,475,834 | AMP Ltd. (Australia)* | 1,207 | |
794,050 | Chailease Holding Co. Ltd. (Taiwan) | 7,605 | |
169,801 | Challenger Ltd. (Australia) | 892 | |
22,838 | Macquarie Group Ltd. (Australia) | 3,372x | |
13,076 | |||
DIVERSIFIED TELECOMMUNICATION SERVICES—1.5% | |||
48,187 | BCE Inc. (Canada) | 2,481 | |
87,773 | Deutsche Telekom AG (Germany) | 1,632 | |
751,130 | Koninklijke KPN NV (Netherlands) | 2,244 | |
284,600 | Nippon Telegraph & Telephone Corp. (Japan) | 7,974 | |
907,800 | Singapore Telecommunications Ltd. (Singapore) | 1,684 | |
659,306 | Telstra Corp. Ltd. (Australia) | 1,906 | |
17,921 | |||
ELECTRIC UTILITIES—0.3% | |||
27,376 | Orsted AS (Denmark)1 | 3,867 | |
ELECTRICAL EQUIPMENT—2.8% | |||
116,714 | ABB Ltd. (Switzerland) | 3,861 | |
286,478 | Havells India Ltd. (India)* | 4,860 | |
60,037 | Legrand SA (France) | 6,550 | |
7,100 | Mabuchi Motor Co. Ltd. (Japan) | 245 | |
63,900 | Mitsubishi Electric Corp. (Japan) | 858 | |
28,831 | Schneider Electric SE (France) | 4,971 | |
971,850 | TECO Electric and Machinery Co. Ltd. (Taiwan) | 1,056 | |
276,991 | Vestas Wind Systems AS (Denmark) | 11,974 | |
34,375 | |||
ELECTRONIC EQUIPMENT, INSTRUMENTS & COMPONENTS—1.0% | |||
138,000 | Chroma ATE Inc. (Taiwan) | 901 | |
684,315 | Delta Electronics Inc. (Taiwan) | 6,041 | |
25,100 | Kyocera Corp. (Japan) | 1,469 | |
12,000 | Omron Corp. (Japan) | 1,148 | |
4,900 | Shimadzu Corp. (Japan) | 199 | |
58,900 | TDK Corp. (Japan) | 2,141 | |
11,899 | |||
ENERGY EQUIPMENT & SERVICES—0.3% | |||
308,623 | John Wood Group plc (United Kingdom)* | 900 | |
50,013 | Petrofac Ltd. (United Kingdom)* | 89 | |
12,503 | Petrofac Ltd. (United Kingdom)* | 2x | |
1,102,634 | Saipem SpA (Italy)* | 2,416 | |
6,362 | Technip Energies NV (France)* | 98 | |
31,091 | TechnipFMC plc (France)* | 231 | |
3,736 | |||
ENTERTAINMENT—0.9% | |||
27,008 | CTS Eventim AG & Co. KGaA (Germany)* | 1,964 | |
5,900 | Konami Holdings Corp. (Japan) | 325 | |
61,213 | Modern Times Group MTG AB Class B (Sweden)* | 702 | |
1,300 | Nexon Co. Ltd. (Japan) | 22 | |
2,200 | Nintendo Co. Ltd. (Japan) | 971 |
COMMON STOCKS—Continued | |||
Shares | Value | ||
ENTERTAINMENT—Continued | |||
17,358 | Sea Ltd. ADR (Singapore)*,3 | $5,964 | |
22,500 | Toho Co. Ltd. (Japan) | 1,057 | |
11,005 | |||
FOOD & STAPLES RETAILING—3.0% | |||
131,758 | Alimentation Couche-Tard Inc. (Canada) | 4,942 | |
244,287 | Bid Corp. Ltd. (South Africa) | 5,236 | |
263,418 | Clicks Group Ltd. (South Africa) | 4,817 | |
110,547 | Koninklijke Ahold Delhaize NV (Netherlands) | 3,596 | |
78,423 | Loblaw Cos. Ltd. (Canada) | 5,898 | |
23,600 | Matsumotokiyoshi Holdings Co. Ltd. (Japan) | 1,046 | |
268,987 | Metcash Ltd. (Australia) | 829 | |
73,000 | Seven & I Holdings Co. Ltd. (Japan) | 3,065 | |
18,500 | Sundrug Co. Ltd. (Japan) | 542 | |
568,894 | Tesco plc (United Kingdom) | 2,101 | |
108,019 | X5 Retail Group NV GDR (Russia)3 | 3,677 | |
35,749 | |||
FOOD PRODUCTS—1.9% | |||
10,400 | Calbee Inc. (Japan) | 268 | |
1,676,000 | China Mengniu Dairy Co. Ltd. (China)* | 10,664 | |
1,810,300 | Delfi Ltd. (Singapore) | 1,033 | |
221,035 | Devro plc (United Kingdom) | 652 | |
824,000 | First Pacific Co. Ltd. (Hong Kong) | 329 | |
24,600 | Fuji Oil Holdings Inc. (Japan) | 577 | |
50,700 | Megmilk Snow Brand Co. Ltd. (Japan) | 981 | |
7,300 | Meiji Holdings Co. Ltd. (Japan) | 461 | |
36,700 | NH Foods Ltd. (Japan) | 1,290 | |
104,500 | Nippon Suisan Kaisha Ltd. (Japan) | 594 | |
55,500 | Toyo Suisan Kaisha Ltd. (Japan) | 2,391 | |
31,188 | Viscofan SA (Spain) | 2,133 | |
20,300 | Yakult Honsha Co. Ltd. (Japan) | 1,026 | |
22,399 | |||
HEALTH CARE EQUIPMENT & SUPPLIES—2.5% | |||
46,179 | Coloplast AS Class B (Denmark) | 7,542 | |
1,194,132 | ConvaTec Group plc (United Kingdom)1 | 3,494 | |
88,703 | Demant AS (Denmark)* | 4,300 | |
52,328 | Getinge AB Class B (Sweden) | 2,342 | |
64,752 | GN Store Nord AS (Denmark) | 3,935 | |
1,000 | Hoya Corp. (Japan) | 147 | |
34,700 | Japan Lifeline Co. Ltd. (Japan) | 374 | |
69,571 | Koninklijke Philips NV (Netherlands) | 3,282 | |
11,500 | Olympus Corp. (Japan) | 249 | |
37,801 | Smith & Nephew plc (United Kingdom) | 653 | |
8,259 | Sonova Holding AG (Switzerland) | 3,422 | |
29,740 | |||
HEALTH CARE PROVIDERS & SERVICES—0.7% | |||
61,500 | Alfresa Holdings Corp. (Japan) | 867 | |
27,223 | Amplifon SpA (Italy) | 1,385 | |
63,147 | Fresenius Medical Care AG & Co. KGaA (Germany) | 4,195 | |
87,700 | MediPAL Holdings Corp. (Japan) | 1,587 | |
15,900 | Ship Healthcare Holdings Inc. (Japan) | 417 | |
8,451 | |||
HOTELS, RESTAURANTS & LEISURE—2.9% | |||
37,777 | Aristocrat Leisure Ltd. (Australia) | 1,340 | |
45,540 | Carnival plc (United Kingdom)* | 919 | |
301,244 | Compass Group plc (United Kingdom)* | 6,393 | |
272,471 | Entain plc (United Kingdom)* | 7,635 | |
43,916 | Flutter Entertainment plc (United Kingdom)* | 8,288 | |
299,000 | Galaxy Entertainment Group Ltd. (Hong Kong)* | 1,609 |
6
Harbor Diversified International All Cap Fund
Portfolio of Investments—Continued
Value, Cost, and Principal Amounts in Thousands
COMMON STOCKS—Continued | |||
Shares | Value | ||
HOTELS, RESTAURANTS & LEISURE—Continued | |||
10,456 | InterContinental Hotels Group plc (United Kingdom)* | $ 732 | |
53,984 | Playtech plc (United Kingdom)* | 514 | |
1,251,243 | SSP Group plc (United Kingdom)* | 4,408 | |
805,473 | TUI AG (Germany)* | 2,679 | |
34,517 | |||
HOUSEHOLD DURABLES—0.4% | |||
95,536 | Barratt Developments plc (United Kingdom) | 867 | |
47,700 | Casio Computer Co. Ltd. (Japan) | 675 | |
4,800 | Rinnai Corp. (Japan) | 493 | |
65,400 | Sekisui Chemical Co. Ltd. (Japan) | 1,075 | |
1,200 | Sony Group Corp. (Japan) | 139 | |
787,046 | Taylor Wimpey plc (United Kingdom) | 1,665 | |
4,914 | |||
HOUSEHOLD PRODUCTS—0.4% | |||
14,500 | Lion Corp. (Japan) | 242 | |
61,854 | Reckitt Benckiser Group plc (United Kingdom) | 5,021 | |
5,263 | |||
INDUSTRIAL CONGLOMERATES—1.8% | |||
69,000 | CK Hutchison Holdings Ltd. (Hong Kong) | 463 | |
35,029 | DCC plc (United Kingdom) | 2,923 | |
247,300 | Hitachi Ltd. (Japan) | 14,250 | |
54,900 | Jardine Matheson Holdings Ltd. (Hong Kong) | 3,189 | |
109,600 | Nisshinbo Holdings Inc. (Japan) | 846 | |
21,671 | |||
INSURANCE—6.1% | |||
75,823 | Admiral Group plc (United Kingdom) | 2,978 | |
1,898,200 | AIA Group Ltd. (Hong Kong) | 21,273 | |
184,033 | AXA SA (France) | 5,354 | |
1,097 | Brookfield Asset Management Reinsurance Partners Ltd. (Canada)* | 68 | |
289,500 | Dai-ichi Life Holdings Inc. (Japan) | 6,091 | |
19,240 | Fairfax Financial Holdings Ltd. (Canada) | 7,792 | |
87,900 | Great Eastern Holdings Ltd. (Singapore) | 1,404 | |
6,180 | Hannover Rueck SE (Germany) | 1,128 | |
5,478 | Helvetia Holding AG (Switzerland) | 652 | |
80,823 | Hiscox Ltd. (United Kingdom) | 919 | |
433,600 | Japan Post Holdings Co. Ltd. (Japan) | 3,332 | |
25,400 | MS&AD Insurance Group Holdings Inc. (Japan) | 821 | |
1,038,472 | Porto Seguro SA (Brazil)* | 4,295 | |
74,617 | Prudential plc (United Kingdom) | 1,519 | |
21,050 | Prudential plc (Hong Kong) | 428 | |
347,210 | QBE Insurance Group Ltd. (Australia) | 3,109 | |
114,270 | Sampo OYJ (Finland) | 6,075 | |
62,200 | Sompo Holdings Inc. (Japan) | 2,697 | |
46,800 | T&D Holdings Inc. (Japan) | 600 | |
48,400 | Tokio Marine Holdings Inc. (Japan) | 2,549 | |
73,084 | |||
INTERACTIVE MEDIA & SERVICES—1.6% | |||
269,706 | Auto Trader Group plc (United Kingdom)1 | 2,236 | |
38,669 | Baidu Inc. ADR (China)*,3 | 6,274 | |
120,955 | Carsales.com Ltd. (Australia) | 2,263 | |
138,693 | Domain Holdings Australia Ltd. (Australia) | 602 | |
792,148 | Rightmove plc (United Kingdom) | 7,488 | |
18,863 | |||
INTERNET & DIRECT MARKETING RETAIL—1.9% | |||
97,326 | HelloFresh SE (Germany)* | 7,887 | |
26,519 | Just Eat Takeaway.com NV (Netherlands)*,1 | 1,905 |
COMMON STOCKS—Continued | |||
Shares | Value | ||
INTERNET & DIRECT MARKETING RETAIL—Continued | |||
60,919 | Naspers Ltd. (South Africa) | $10,317 | |
101,244 | Vipshop Holdings Ltd. ADR (China)*,3 | 1,130 | |
3,028 | Zooplus AG (Germany)* | 1,680 | |
5,800 | ZOZO Inc. (Japan) | 186 | |
23,105 | |||
IT SERVICES—3.4% | |||
16,109 | Alten SA (France) | 2,596 | |
2,406,625 | Capita plc (United Kingdom)* | 1,562 | |
75,021 | Edenred (France) | 4,060 | |
333,373 | Infosys Ltd. ADR (India)3 | 7,428 | |
64,500 | NEC Corp. (Japan) | 3,303 | |
45,200 | NET One Systems Co. Ltd. (Japan) | 1,482 | |
3,600 | Nomura Research Institute Ltd. (Japan) | 144 | |
33,900 | NS Solutions Corp. (Japan) | 1,140 | |
216,900 | NTT Data Corp. (Japan) | 4,351 | |
7,500 | Otsuka Corp. (Japan) | 369 | |
6,512 | Reply SpA (Italy) | 1,264 | |
102,200 | SCSK Corp. (Japan) | 2,068 | |
245,079 | Tata Consultancy Services Ltd. (India) | 11,160 | |
40,927 | |||
LEISURE PRODUCTS—1.1% | |||
21,000 | Bandai Namco Holdings Inc. (Japan) | 1,605 | |
517,386 | Giant Manufacturing Co. Ltd. (Taiwan) | 6,009 | |
141,600 | Sega Sammy Holdings Inc. (Japan) | 2,014 | |
117,385 | Spin Master Corp. (Canada)*,1 | 4,063 | |
13,691 | |||
LIFE SCIENCES TOOLS & SERVICES—0.5% | |||
43,799 | Eurofins Scientific SE (France) | 5,169 | |
7,968 | Gerresheimer AG (Germany) | 731 | |
5,900 | |||
MACHINERY—3.3% | |||
16,428 | Andritz AG (Austria) | 933 | |
377,055 | CNH Industrial NV (Italy) | 6,495 | |
14,200 | Daifuku Co. Ltd. (Japan) | 1,307 | |
96,383 | Fluidra SA (Spain)* | 3,681 | |
15,959 | GEA Group AG (Germany) | 786 | |
4,200 | Hoshizaki Corp. (Japan) | 353 | |
5,800 | Makita Corp. (Japan) | 269 | |
105,500 | NSK Ltd. (Japan) | 709 | |
142,285 | Rotork plc (United Kingdom) | 688 | |
155,928 | Sandvik AB (Sweden) | 3,954 | |
31,002 | Stabilus SA (Germany) | 2,328 | |
505,000 | Techtronic Industries Co. Ltd. (Hong Kong) | 10,376 | |
107,356 | Wartsila OYJ ABP (Finland) | 1,489 | |
3,874,000 | Weichai Power Co. Ltd. (China) | 6,934 | |
40,302 | |||
MARINE—0.1% | |||
219,528 | Irish Continental Group plc (Ireland)* | 1,079 | |
MEDIA—1.8% | |||
51,057 | Daily Mail & General Trust plc (United Kingdom) | 725 | |
45,559 | Euromoney Institutional Investor plc (United Kingdom) | 652 | |
176,400 | Fuji Media Holdings Inc. (Japan) | 1,828 | |
58,500 | Hakuhodo DY Holdings Inc. (Japan) | 954 | |
127,906 | Informa plc (United Kingdom)* | 910 | |
2,400,411 | ITV plc (United Kingdom)* | 3,533 | |
90,783 | JCDecaux SA (France)* | 2,368 | |
46,541 | MediaSet Espana Comunicacion SA (Spain)* | 243 |
7
Harbor Diversified International All Cap Fund
Portfolio of Investments—Continued
Value, Cost, and Principal Amounts in Thousands
COMMON STOCKS—Continued | |||
Shares | Value | ||
MEDIA—Continued | |||
154,320 | Nippon Television Holdings Inc. (Japan) | $1,662 | |
44,865 | Nordic Entertainment Group AB (Sweden)* | 2,602 | |
26,261 | Schibsted ASA Class A (Norway) | 1,357 | |
11,282 | Schibsted ASA Class B (Norway) | 512 | |
19,800 | TBS Holdings Inc. (Japan) | 313 | |
239,721 | WPP plc (United Kingdom) | 3,465 | |
21,124 | |||
METALS & MINING—5.7% | |||
133,076 | Acerinox SA (Spain) | 1,853 | |
273,655 | African Rainbow Minerals Ltd. (South Africa) | 3,654 | |
34,566 | Anglo American Platinum Ltd. (South Africa) | 3,502 | |
166,167 | ArcelorMittal SA (France) | 5,620 | |
343,815 | Barrick Gold Corp. (Canada) | 6,309 | |
122,857 | BHP Group Ltd. (Australia) | 3,375 | |
101,885 | BlueScope Steel Ltd. (Australia) | 1,592 | |
505,624 | Evolution Mining Ltd. (Australia) | 1,373 | |
206,939 | First Quantum Minerals Ltd. (Canada) | 4,899 | |
30,303 | Franco-Nevada Corp. (Canada) | 4,324 | |
1,307,484 | Glencore plc (United Kingdom)* | 6,538 | |
134,082 | Newcrest Mining Ltd. (Australia) | 2,512 | |
43,800 | Nippon Steel Corp. (Japan) | 768 | |
75,683 | Rio Tinto plc (United Kingdom) | 4,719 | |
362,785 | Severstal PJSC GDR (Russia)3 | 8,293 | |
133,889 | Southern Copper Corp. (Peru) | 8,032 | |
24,800 | Sumitomo Metal Mining Co. Ltd. (Japan) | 962 | |
68,325 | |||
MULTILINE RETAIL—0.1% | |||
57,600 | Marui Group Co. Ltd. (Japan) | 1,130 | |
OIL, GAS & CONSUMABLE FUELS—2.9% | |||
963,566 | Beach Energy Ltd. (Australia) | 1,012 | |
2,847,448 | BP plc (United Kingdom) | 13,642 | |
184,226 | Canadian Natural Resources Ltd. (Canada) | 7,830 | |
262,524 | Equinor ASA (Norway) | 6,652 | |
204,501 | Oil Search Ltd. (Australia) | 662 | |
267,132 | PrairieSky Royalty Ltd. (Canada) | 3,287 | |
306,559 | Santos Ltd. (Australia) | 1,610 | |
34,695 | |||
PAPER & FOREST PRODUCTS—0.2% | |||
423,700 | Oji Holdings Corp. (Japan) | 2,100 | |
PERSONAL PRODUCTS—1.5% | |||
499,715 | Dabur India Ltd. (India) | 3,931 | |
800 | Kao Corp. (Japan) | 45 | |
1,000 | Kose Corp. (Japan) | 116 | |
316,209 | L'Occitane International SA (Hong Kong) | 1,131 | |
16,000 | Mandom Corp. (Japan) | 233 | |
543,166 | Marico Ltd. (India)* | 4,123 | |
9,900 | Rohto Pharmaceutical Co. Ltd. (Japan) | 303 | |
87,509 | Unilever plc (United Kingdom) | 4,685 | |
1,330,000 | Uni-President Enterprises Corp. (Taiwan) | 3,191 | |
17,758 | |||
PHARMACEUTICALS—2.6% | |||
1,258,219 | Genomma Lab Internacional SAB de CV (Mexico)* | 1,209 | |
121,060 | Novo Nordisk AS (Denmark) | 13,275 | |
15,000 | Otsuka Holdings Co. Ltd. (Japan) | 593 | |
35,458 | Roche Holding AG (Switzerland) | 13,736 | |
9,700 | Sawai Group Holdings Co. Ltd. (Japan) | 428 |
COMMON STOCKS—Continued | |||
Shares | Value | ||
PHARMACEUTICALS—Continued | |||
28,100 | Takeda Pharmaceutical Co. Ltd. (Japan) | $ 789 | |
58,300 | Tsumura & Co. (Japan) | 1,817 | |
31,847 | |||
PROFESSIONAL SERVICES—2.7% | |||
69,703 | Adecco Group AG (Switzerland) | 3,512 | |
152,126 | ALS Ltd. (Australia) | 1,526 | |
75,646 | Experian plc (United Kingdom) | 3,468 | |
1,905,964 | Hays plc (United Kingdom) | 4,319 | |
102,085 | Intertek Group plc (United Kingdom) | 6,836 | |
107,086 | IPH Ltd. (Australia) | 695 | |
66,200 | Nomura Co. Ltd. (Japan) | 653 | |
134,822 | PageGroup plc (United Kingdom)* | 1,223 | |
37,200 | Persol Holdings Co. Ltd. (Japan) | 1,000 | |
11,721 | Randstad NV (Netherlands) | 842 | |
171,882 | RELX plc (United Kingdom) | 5,330 | |
78,730 | RWS Holdings plc (United Kingdom) | 669 | |
20,800 | TechnoPro Holdings Inc. (Japan) | 665 | |
5,427 | Teleperformance (France) | 2,267 | |
33,005 | |||
REAL ESTATE MANAGEMENT & DEVELOPMENT—0.3% | |||
2,700 | Daito Trust Construction Co. Ltd. (Japan) | 335 | |
59,700 | Daiwa House Industry Co. Ltd. (Japan) | 1,970 | |
81,376 | Singapore Land Group Ltd (Singapore) | 163 | |
168,000 | Swire Pacific Ltd. (Hong Kong) | 1,056 | |
3,524 | |||
ROAD & RAIL—0.8% | |||
88,034 | Canadian Pacific Railway Ltd. (Canada) | 6,814 | |
21,100 | East Japan Railway Co. (Japan) | 1,314 | |
175,831 | National Express Group plc (United Kingdom)* | 550 | |
81,400 | Senko Group Holdings Co. Ltd. (Japan) | 724 | |
9,402 | |||
SEMICONDUCTORS & SEMICONDUCTOR EQUIPMENT—4.2% | |||
67,400 | ASM Pacific Technology Ltd. (Hong Kong) | 729 | |
14,827 | ASML Holding NV (Netherlands) | 12,053 | |
207,000 | MediaTek Inc. (Taiwan) | 6,813 | |
176,100 | Renesas Electronics Corp. (Japan)* | 2,166 | |
29,600 | ROHM Co. Ltd. (Japan) | 2,707 | |
76,294 | SK Hynix Inc. (South Korea) | 6,725 | |
905,000 | Taiwan Semiconductor Manufacturing Co. Ltd. (Taiwan) | 19,205 | |
50,398 | |||
SOFTWARE—0.7% | |||
4,473 | Constellation Software Inc. (Canada) | 7,861 | |
2,600 | Oracle Corp. Japan (Japan) | 246 | |
8,107 | |||
SPECIALTY RETAIL—1.6% | |||
12,400 | ABC-Mart Inc. (Japan) | 596 | |
4,319,700 | Esprit Holdings Ltd. (Hong Kong)* | 370 | |
223,173 | Fourlis Holdings SA (Greece)* | 992 | |
2,374,878 | Pepkor Holdings Ltd. (South Africa)*,1 | 3,745 | |
250,037 | Pets at Home Group plc (United Kingdom) | 1,650 | |
25,900 | USS Co. Ltd. (Japan) | 417 | |
121,091 | WH Smith plc (United Kingdom)* | 2,592 | |
1,029,000 | Zhongsheng Group Holdings Ltd (China) | 9,278 | |
19,640 |
8
Harbor Diversified International All Cap Fund
Portfolio of Investments—Continued
Value, Cost, and Principal Amounts in Thousands
COMMON STOCKS—Continued | |||
Shares | Value | ||
TECHNOLOGY HARDWARE, STORAGE & PERIPHERALS—1.7% | |||
635,000 | Advantech Co. Ltd. (Taiwan) | $8,305 | |
22,549 | Logitech International SA (Switzerland) | 1,886 | |
21,001 | Quadient SA (France) | 502 | |
171,709 | Samsung Electronics Co Ltd. (South Korea) | 10,281 | |
20,974 | |||
TEXTILES, APPAREL & LUXURY GOODS—3.4% | |||
14,633 | Adidas AG (Germany) | 4,789 | |
60,300 | ASICS Corp. (Japan) | 1,503 | |
44,254 | Cie Financiere Richemont SA (Switzerland) | 5,476 | |
33,068 | EssilorLuxottica SA (France) | 6,842 | |
61,492 | Gildan Activewear Inc. (Canada) | 2,259 | |
746,500 | Li Ning Co. Ltd. (China) | 8,238 | |
96,900 | Onward Holdings Co. Ltd. (Japan) | 286 | |
298,800 | Samsonite International SA (Hong Kong)*,1 | 643 | |
416,900 | Shenzhou International Group Holdings Ltd. (China) | 8,982 | |
1,701,746 | Stella International Holdings Ltd. (Hong Kong) | 2,033 | |
41,051 | |||
THRIFTS & MORTGAGE FINANCE—1.0% | |||
326,255 | Housing Development Finance Corp. Ltd. (India)* | 12,425 | |
TOBACCO—0.2% | |||
15,503 | British American Tobacco plc (United Kingdom) | 539 | |
1,200 | Japan Tobacco Inc. (Japan) | 24 | |
263,161 | Swedish Match AB (Sweden) | 2,320 | |
2,883 | |||
TRADING COMPANIES & DISTRIBUTORS—1.5% | |||
390,400 | BOC Aviation Ltd. (China)1 | 3,416 | |
53,769 | Brenntag SE (Germany) | 5,116 | |
122,556 | Bunzl plc (United Kingdom) | 4,530 | |
114,480 | Finning International Inc. (Canada) | 3,389 | |
64,800 | ITOCHU Corp. (Japan) | 1,848 | |
18,299 |
COMMON STOCKS—Continued | |||
Shares | Value | ||
TRANSPORTATION INFRASTRUCTURE—0.5% | |||
102,103 | Getlink SE (France) | $1,572 | |
282,559 | Grupo Aeroportuario del Pacifico SAB de CV Class B (Mexico)* | 3,568 | |
41,100 | Mitsubishi Logistics Corp. (Japan) | 1,148 | |
6,288 | |||
WIRELESS TELECOMMUNICATION SERVICES—0.4% | |||
82,800 | KDDI Corp. (Japan) | 2,532 | |
39,385 | Rogers Communications Inc. (Canada) | 1,832 | |
4,364 | |||
TOTAL COMMON STOCKS | |||
(Cost $976,219) | 1,167,823 | ||
PREFERRED STOCKS—0.3% | |||
(Cost $2,636) | |||
AUTOMOBILES—0.3% | |||
15,383 | Volkswagen AG (Germany) | 3,452 | |
SHORT-TERM INVESTMENTS—0.2% | |||
(Cost $2,427) | |||
INVESTMENT COMPANY-SECURITIES LENDING INVESTMENT FUND—0.2% | |||
2,427,315 | State Street Navigator Securities Lending Government Money Market Portfolio (1-day yield of 0.030%)4 | 2,427 | |
TOTAL INVESTMENTS—97.4% | |||
(Cost $981,282) | 1,173,702 | ||
CASH AND OTHER ASSETS, LESS LIABILITIES—2.6% | 31,540 | ||
TOTAL NET ASSETS—100.0% | $1,205,242 |
FAIR VALUE MEASUREMENTS
The following table summarizes the Fund’s investments as of October 31, 2021 based on the inputs used to value them.
Asset Category | Quoted Prices Level 1 (000s) | Other Significant Observable Inputs Level 2 (000s) | Significant Unobservable Inputs Level 3 (000s) | Total (000s) |
Common Stocks | ||||
Africa | $— | $35,373 | $— | $35,373 |
Europe | 11,970 | 510,455 | — | 522,425 |
Latin America | 17,104 | — | — | 17,104 |
Middle East/Central Asia | 23,652 | 36,499 | — | 60,151 |
North America | 108,569 | — | — | 108,569 |
Pacific Basin | 14,804 | 406,025 | 3,372 | 424,201 |
Preferred Stocks | ||||
Europe | — | 3,452 | — | 3,452 |
Short-Term Investments | ||||
Investment Company-Securities Lending Investment Fund | 2,427 | — | — | 2,427 |
Total Investments in Securities | $178,526 | $991,804 | $3,372 | $1,173,702 |
For more information on valuation inputs and their aggregation into the levels used in the table above, please refer to the Fair Value Measurements and Disclosures in Note 2 of the accompanying Notes to Financial Statements.
9
Harbor Diversified International All Cap Fund
Portfolio of Investments—Continued
FAIR VALUE MEASUREMENTS—Continued
The following is a rollforward of the Fund’s Level 3 investments during the year ended October 31, 2021. Transfers into or out of Level 3 are recognized as of the last day in the fiscal quarter of the period in which the event or change in circumstances that caused the reclassification occured.
Valuation Description | Beginning Balance as of 11/01/2020 (000s) | Purchases (000s) | Sales (000s) | Discount/ (Premium) (000s) | Total Realized Gain/(Loss) (000s) | Change in Unrealized Appreciation/ (Depreciation) (000s) | Transfers Into Level 3h (000s) | Transfers Out of Level 3 (000s) | Ending Balance as of 10/31/2021 (000s) | Unrealized Gain/ Loss as of 10/31/2021 (000s) |
Common Stocks | $— | $— | $— | $— | $— | $— | $3,372 | $— | $3,372 | $761 |
The following is a summary of significant unobservable inputs used in the fair valuations of assets and liabilities categorized within Level 3 of the fair value hierarchy.
Valuation Descriptions | Ending Balance as of 10/31/2021 (000s) | Valuation Technique | Unobservable Input(s) | Input Value(s) |
Investments in Securities | ||||
Common Stocks | ||||
Macquarie Group Ltd. (Australia) | $ 3,372 | Market Approach | Last Traded Price | AUD 196.25 |
*
Non-income producing security
x
Fair valued in accordance with Harbor Funds' Valuation Procedures.
1
Securities purchased in a transaction exempt from registration under Rule 144A of the Securities Act of 1933. These securities may be resold in transactions exempt from registration, normally to qualified institutional buyers. The Fund has no right to demand registration of these securities. At October 31, 2021, the aggregate value of these securities was $24,594 or 2% of net assets.
2
All or a portion of this security was out on loan as of October 31, 2021.
3
Depositary receipts such as American Depositary Receipts (ADRs), Global Depositary Receipts (GDRs) and other country specific depositary receipts are certificates evidencing ownership of shares of a foreign issuer. These certificates are issued by depositary banks and generally trade on an established market in the U.S. or elsewhere.
4
Represents the investment of collateral received from securities lending activities
h
Transferred from Level 2 to Level 3 due to the unavailability of observable market data for pricing
AUD
Australian Dollar
The accompanying notes are an integral part of the Financial Statements.
10
Harbor Emerging Markets Equity Fund
Manager’s Commentary (Unaudited)
Subadviser
Marathon Asset Management Limited
Orion House
5 Upper St. Martin’s Lane
London, WC2H 9EA
England
5 Upper St. Martin’s Lane
London, WC2H 9EA
England
Portfolio Manager
Alex Duffy
Since 2021
Since 2021
Marathon Asset Management Limited (Marathon-London) has subadvised the Fund since 2020.
Investment Objective
The Fund seeks long-term growth of capital.
Management’s Discussion of
Fund Performance
Fund Performance
Market Review
The period since October 31, 2020, has seen positive performance by Emerging Markets, with The MSCI Emerging Markets (EM) Index generating 16.96% (in USD terms) over the period, though it was the worst performing “global region” under MSCI’s definitions. However, the performance of the index was impacted particularly by China, the worst performing country within the index and a notable weight on global returns over the period following substantial state intervention and increased regulation. China represented an average of 37.54% of the index over the period and returned -9.21% (USD terms). The impact of China can be seen looking at the return of the MSCI Emerging Markets ex-China Index over the period, which was up 37.08% (USD terms), only slightly less than the global Developed markets average return (as measured by the MSCI World Index) of 40.43% (USD terms).
A number of events in China have weighed on the market. First, the Chinese government undertook an anti-trust review against Alibaba and other internet giants, levying substantial fines against several. Then there was a crackdown on the for-profit online tutoring sector, with contagion spreading to other sectors that appear to be walking the regulatory line. Then issues became apparent at Evergrande, China’s second largest property developer when the company missed a payment on some of its USD denominated debt. Though not yet technically in default, the fear of contagion from such a large default impacted the market. Finally, the government became increasingly critical of wealth inequality over the period and made negative statements about gambling and conspicuous wealth, impacting the gaming and luxury goods industries globally, and hitting domestic players particularly hard.
There was a notable change in style leadership that took place around November 9th, 2020 with the announcement of an effective COVID-19 vaccine. For years the market has been led by mega-cap growth or high-dividend companies. This began to change in November when the value area of the market and smaller capitalization companies began to perform more strongly. The events in China mentioned above cemented the trend, with the biggest falls occurring amongst the country’s Internet giants. Cyclical industries such as Materials, Information Technology, Industrials, Financials and Energy have been strong over the period, with more defensive sectors, including Real Estate and Consumer Staples, performing relatively weakly. However, the worst performing sector was cyclical Consumer Discretionary, due in large part to the woes of the giant Chinese Internet retailers.
Performance
Harbor Emerging Markets Equity Fund returned 35.64% (Retirement Class), 35.37% (Institutional Class), 34.96% (Administrative Class) and 34.94% (Investor Class) outperforming the MSCI Emerging Markets (ND) Index, which returned 16.96% during the annual period ended October 31, 2021. Returns were driven by stock selection over the period, particularly in Asia where the Fund’s large underweight to a poorly performing China (the largest country in the Index) also helped. Stock selection in Emerging EMEA, particularly in Greece and South Africa, was also value additive. Emerging Americas proved a more difficult market over the period, as stock selection lagged in Brazil amidst a resurgence of the COVID-19 virus; however, an underweight position to the country, and its weakening currency offset this negative, and positioning elsewhere in the region, particularly the overweight position in Mexico, led to strong returns overall.
Stock selection within sectors drove returns, with relative positioning and currency effects also somewhat beneficial. The Fund’s aggregate underweight exposure to the Consumer Discretionary and Communication Service sectors (which underperformed relative to the MSCI Emerging Markets Index) contributed positively. However, its underweight position in Energy and Materials were negatives. Stock selection was notably strong in the Consumer Discretionary, Financials and Communication Services sectors, and contributed positively to outperformance in all other sectors except Health Care and Real Estate.
11
Harbor Emerging Markets Equity Fund
Manager’s Commentary—Continued
CHANGE IN A $50,000 INVESTMENT
For the period 11/01/2013 through 10/31/2021
The graph compares a $50,000 investment in the Institutional Class shares of the Fund with the performance of the MSCI Emerging Markets (ND) Index. The Fund’s performance assumes the reinvestment of all dividend and capital gain distributions.
TOTAL RETURNS
For the periods ended 10/31/2021
1 Year | Annualized | |||||
5 Years | Life of Fund | |||||
Harbor Emerging Markets Equity Fund | ||||||
Retirement Class1,2 | 35.64% | 12.51% | 5.82% | |||
Institutional Class1 | 35.37 | 12.40 | 5.75 | |||
Administrative Class1 | 34.96 | 12.39 | 5.66 | |||
Investor Class1 | 34.94 | 11.99 | 5.37 | |||
Comparative Index | ||||||
MSCI Emerging Markets (ND)1 | 16.96% | 9.39% | 4.96% |
As stated in the Fund’s prospectus dated March 1, 2021, as supplemented on August 13, 2021, the expense ratios were 0.88% (Net) and 1.84% (Gross) (Retirement Class); 0.96% (Net) and 1.92% (Gross) (Institutional Class); 1.21% (Net) and 2.17% (Gross) (Administrative Class); and 1.32% (Net) and 2.28% (Gross) (Investor Class). The net expense ratios reflect an expense limitation agreement (excluding interest expense, if any) effective through 02/28/2022. The expense ratios in the prospectus may differ from the actual expense ratios for the period disclosed within this report. The expense ratios shown in the prospectus are based on the prior fiscal year, adjusted to reflect changes, if any, in contractual arrangements that occurred prior to the date of the prospectus (or supplement thereto, if applicable).
Performance data shown represents past performance and is no guarantee of future results. Past performance is net of management fees and expenses and reflects reinvested dividends and distributions. Past performance reflects the beneficial effect of any expense waivers or reimbursements, without which returns would have been lower. Investment returns and principal value will fluctuate and when redeemed may be worth more or less than their original cost. Returns for periods less than one year are not annualized. Current performance may be higher or lower and is available through the most recent month end at harborcapital.com or by calling 800-422-1050.
At the stock level, Alibaba, the Chinese Internet retailer, which the Fund avoided, has contributed most strongly to outperformance, with the stock falling by -44.98% (USD terms) for the reasons mentioned in the Market Review. Tencent was a similar story, though their peer, Baidu, Inc., in which the Fund does have a holding, bucked this trend, and performed reasonably strongly as it was less impacted by regulatory action than its peers. Banking groups across the global emerging universe were a strong driver of returns, particularly Eurobank Ergasias in Greece but also including portfolio holdings, such as Axis Bank in India, PT Bank Central Asia in Indonesia and Kasikornbank in Thailand. Banks have benefitted from a more supportive environment with higher yields improving their profitability, fewer COVID-19 losses than anticipated and a general turn in sentiment towards the industry. Conversely, not holding some of the large banks, including Russia’s Sberbank and ICICI Bank of India, held back performance. Kangji Medical, the Chinese medical equipment business, performed poorly over the year. Despite substantial earnings growth, investor enthusiasm waned since its IPO in June 2020, and the stock has de-rated. Weichai Power, a Chinese diesel engine manufacturer, also underperformed despite strong results as investors looked to greener businesses.
Outlook & Strategy
1
The “Life of Fund” return as shown reflects the period 11/01/2013 through October 31, 2021.
2
Retirement Class shares commenced operations on March 1, 2016. The performance attributed to the Retirement Class shares prior to that date is that of the Institutional Class shares. Performance prior to March 1, 2016 has not been adjusted to reflect the lower expenses of Retirement Class shares. During this period, Retirement Class shares would have had returns similar to, but potentially higher than, Institutional Class shares due to the fact that Retirement Class shares represent interests in the same portfolio as Institutional Class shares but are subject to lower expenses.
All international and global returns are in U.S. Dollars.
This report contains the current opinions of Marathon Asset Management Limited as of the date of this report and should not be considered as investment advice or a recommendation of any particular security, strategy or investment product. Such opinions are subject to change without notice and securities described herein may no longer be included in, or may at any time be removed from, the Fund’s portfolio. This report is distributed for informational purposes only. Information contained herein has been obtained from sources believed reliable, but not guaranteed.
There is no guarantee that the investment objective of the Fund will be achieved. Stock markets are volatile and equity values can decline significantly in response to adverse issuer, political, regulatory, market and economic conditions. Investing in international and emerging markets poses special risks, including potentially greater price volatility due to social, political and economic factors, as well as currency exchange rate fluctuations. These risks are more severe for securities of issuers in emerging market regions. For information on the different share classes and the risks associated with an investment in the Fund, please refer to the current prospectus.
12
Harbor Emerging Markets Equity Fund
Portfolio of Investments—October 31, 2021
REGION BREAKDOWN (% of investments) -Unaudited
The Fund’s Portfolio of Investments include investments denominated in foreign currencies. As of October 31, 2021, there was no foreign currency denomination that comprised more than 25% of the Fund’s net assets.
Portfolio of Investments
Value, Cost, and Principal Amounts in Thousands
COMMON STOCKS—97.4% | |||
Shares | Value | ||
BANKS—9.1% | |||
2,623,500 | Bank Central Asia TBK PT (Indonesia) | $1,387 | |
4,354 | Capitec Bank Holdings Ltd. (South Africa) | 486 | |
29,947 | HDFC Bank Ltd. ADR (India)1 | 2,154 | |
4,027 | |||
BEVERAGES—0.1% | |||
40,500 | East African Breweries Ltd. (Kenya)* | 61 | |
CHEMICALS—0.5% | |||
12,800 | SKSHU Paint Co. Ltd. (China) | 223 | |
2,684,000 | Tianhe Chemicals Group Ltd. (Hong Kong)* | —x | |
223 | |||
DIVERSIFIED FINANCIAL SERVICES—2.3% | |||
105,500 | Chailease Holding Co. Ltd. (Taiwan) | 1,010 | |
ELECTRICAL EQUIPMENT—1.8% | |||
38,023 | Havells India Ltd. (India)* | 645 | |
132,000 | TECO Electric and Machinery Co. Ltd. (Taiwan) | 144 | |
789 | |||
ELECTRONIC EQUIPMENT, INSTRUMENTS & COMPONENTS—2.1% | |||
20,000 | Chroma ATE Inc. (Taiwan) | 131 | |
90,000 | Delta Electronics Inc. (Taiwan) | 794 | |
925 | |||
ENTERTAINMENT—1.8% | |||
2,304 | Sea Ltd. ADR (Singapore)*,1 | 792 | |
FOOD & STAPLES RETAILING—4.1% | |||
32,792 | Bid Corp. Ltd. (South Africa) | 703 | |
34,963 | Clicks Group Ltd. (South Africa) | 639 | |
14,337 | X5 Retail Group NV GDR (Russia)1 | 488 | |
1,830 |
COMMON STOCKS—Continued | |||
Shares | Value | ||
FOOD PRODUCTS—3.4% | |||
225,000 | China Mengniu Dairy Co. Ltd. (China)* | $1,432 | |
170,700 | Delfi Ltd. (Singapore) | 97 | |
1,529 | |||
HOUSEHOLD DURABLES—2.4% | |||
100,266 | Midea Group Co. Ltd. (China) | 1,076 | |
INSURANCE—6.5% | |||
206,200 | AIA Group Ltd. (Hong Kong) | 2,311 | |
139,624 | Porto Seguro SA (Brazil)* | 577 | |
2,888 | |||
INTERACTIVE MEDIA & SERVICES—1.9% | |||
5,134 | Baidu Inc. ADR (China)*,1 | 833 | |
INTERNET & DIRECT MARKETING RETAIL—3.4% | |||
8,117 | Naspers Ltd. (South Africa) | 1,375 | |
13,437 | Vipshop Holdings Ltd. ADR (China)*,1 | 150 | |
1,525 | |||
IT SERVICES—5.5% | |||
44,247 | Infosys Ltd. ADR (India)1 | 986 | |
32,528 | Tata Consultancy Services Ltd. (India) | 1,481 | |
2,467 | |||
LEISURE PRODUCTS—1.8% | |||
67,628 | Giant Manufacturing Co. Ltd. (Taiwan) | 785 | |
MACHINERY—5.1% | |||
65,000 | Techtronic Industries Co. Ltd. (Hong Kong) | 1,335 | |
516,000 | Weichai Power Co. Ltd. (China) | 924 | |
2,259 | |||
METALS & MINING—8.5% | |||
36,315 | African Rainbow Minerals Ltd. (South Africa) | 485 | |
4,588 | Anglo American Platinum Ltd. (South Africa) | 465 | |
27,599 | First Quantum Minerals Ltd. (Canada) | 653 |
13
Harbor Emerging Markets Equity Fund
Portfolio of Investments—Continued
Value, Cost, and Principal Amounts in Thousands
COMMON STOCKS—Continued | |||
Shares | Value | ||
METALS & MINING—Continued | |||
48,151 | Severstal PJSC GDR (Russia)1 | $1,101 | |
17,770 | Southern Copper Corp. (Peru) | 1,066 | |
3,770 | |||
PERSONAL PRODUCTS—3.4% | |||
66,324 | Dabur India Ltd. (India) | 522 | |
72,016 | Marico Ltd. (India)* | 547 | |
177,000 | Uni-President Enterprises Corp. (Taiwan) | 424 | |
1,493 | |||
PHARMACEUTICALS—0.4% | |||
191,217 | Genomma Lab Internacional SAB de CV (Mexico)* | 184 | |
SEMICONDUCTORS & SEMICONDUCTOR EQUIPMENT—12.3% | |||
1,337 | ASML Holding NV (Netherlands) | 1,087 | |
28,000 | MediaTek Inc. (Taiwan) | 921 | |
10,126 | SK Hynix Inc. (South Korea) | 893 | |
120,000 | Taiwan Semiconductor Manufacturing Co. Ltd. (Taiwan) | 2,546 | |
5,447 | |||
SPECIALTY RETAIL—4.2% | |||
33,844 | Fourlis Holdings SA (Greece)* | 150 | |
315,204 | Pepkor Holdings Ltd. (South Africa)*,2 | 497 | |
136,500 | Zhongsheng Group Holdings Ltd (China) | 1,231 | |
1,878 | |||
TECHNOLOGY HARDWARE, STORAGE & PERIPHERALS—5.5% | |||
84,000 | Advantech Co. Ltd. (Taiwan) | 1,099 | |
22,790 | Samsung Electronics Co Ltd. (South Korea) | 1,364 | |
2,463 | |||
TEXTILES, APPAREL & LUXURY GOODS—5.6% | |||
99,500 | Li Ning Co. Ltd. (China) | 1,098 | |
55,300 | Shenzhou International Group Holdings Ltd. (China) | 1,192 | |
150,000 | Stella International Holdings Ltd. (Hong Kong) | 179 | |
2,469 | |||
THRIFTS & MORTGAGE FINANCE—3.7% | |||
43,302 | Housing Development Finance Corp. Ltd. (India)* | 1,649 | |
TRADING COMPANIES & DISTRIBUTORS—1.0% | |||
51,400 | BOC Aviation Ltd. (China)2 | 450 | |
TRANSPORTATION INFRASTRUCTURE—1.0% | |||
35,846 | Grupo Aeroportuario del Pacifico SAB de CV Class B (Mexico)* | 453 | |
TOTAL COMMON STOCKS | |||
(Cost $41,981) | 43,275 | ||
TOTAL INVESTMENTS—97.4% | |||
(Cost $41,981) | 43,275 | ||
CASH AND OTHER ASSETS, LESS LIABILITIES—2.6% | 1,154 | ||
TOTAL NET ASSETS—100.0% | $44,429 |
14
Harbor Emerging Markets Equity Fund
Portfolio of Investments—Continued
FAIR VALUE MEASUREMENTS
The following table summarizes the Fund’s investments as of October 31, 2021 based on the inputs used to value them.
Asset Category | Quoted Prices Level 1 (000s) | Other Significant Observable Inputs Level 2 (000s) | Significant Unobservable Inputs Level 3 (000s) | Total (000s) |
Common Stocks | ||||
Africa | $— | $4,711 | $— | $4,711 |
Europe | 1,589 | 1,237 | — | 2,826 |
Latin America | 2,280 | — | — | 2,280 |
Middle East/Central Asia | 3,140 | 4,844 | — | 7,984 |
North America | 653 | — | — | 653 |
Pacific Basin | 1,775 | 23,046 | — | 24,821 |
Total Investments | $9,437 | $33,838 | $— | $43,275 |
For more information on valuation inputs and their aggregation into the levels used in the table above, please refer to the Fair Value Measurements and Disclosures in Note 2 of the accompanying Notes to Financial Statements.
The following is a rollforward of the Fund’s Level 3 investments during the year ended October 31, 2021.
Valuation Description | Beginning Balance as of 11/01/2020 (000s) | Purchases (000s) | Sales (000s) | Discount/ (Premium) (000s) | Total Realized Gain/(Loss) (000s) | Change in Unrealized Appreciation/ (Depreciation) (000s) | Transfers Into Level 3 (000s) | Transfers Out of Level 3 (000s) | Ending Balance as of 10/31/2021 (000s) | Unrealized Gain/ Loss as of 10/31/2021 (000s) |
Common Stocks | $— | $— | $— | $— | $— | $— | $— | $— | $— | $(512) |
The following is a summary of significant unobservable inputs used in the fair valuations of assets and liabilities categorized within Level 3 of the fair value hierarchy.
Valuation Descriptions | Ending Balance as of 10/31/2021 (000s) | Valuation Technique | Unobservable Input(s) | Input Value(s) |
Investments in Securities | ||||
Common Stocks | ||||
Tianhe Chemicals Group Ltd. (Hong Kong)* | $ — | Market Approach | Estimated Recovery Value | HKD 0.00 |
*
Non-income producing security
x
Fair valued in accordance with Harbor Funds' Valuation Procedures.
1
Depositary receipts such as American Depositary Receipts (ADRs), Global Depositary Receipts (GDRs) and other country specific depositary receipts are certificates evidencing ownership of shares of a foreign issuer. These certificates are issued by depositary banks and generally trade on an established market in the U.S. or elsewhere.
2
Securities purchased in a transaction exempt from registration under Rule 144A of the Securities Act of 1933. These securities may be resold in transactions exempt from registration, normally to qualified institutional buyers. The Fund has no right to demand registration of these securities. At October 31, 2021, the aggregate value of these securities was $947 or 2% of net assets.
HKD
Hong Kong Dollar
The accompanying notes are an integral part of the Financial Statements.
15
Harbor Focused International Fund
Manager’s Commentary (Unaudited)
Subadviser
Comgest Asset Management International Limited
46 St. Stephen’s Green
Dublin 2
Ireland
Dublin 2
Ireland
Portfolio Managers
Richard Mercado, CFA
Since 2019
Since 2019
Laure Négiar, CFA
Since 2019
Since 2019
Zak Smerczak, CFA
Since 2019
Since 2019
Alexandre Narboni
Since 2019
Since 2019
Comgest Asset Management International Limited has subadvised the Fund since 2019.
Investment Objective
The Fund seeks long-term growth of capital.
Management’s Discussion of
Fund Performance
Fund Performance
Market Review
The 12-month period under review ended October 31, 2021 marked almost the exact start, and potential finish, of the long-awaited value recovery. While many investors had waited years for value to, once again prove its merit, its eventual return was not all that surprising on the back of economies reopening and optimism returning post the rollout of a COVID-19 vaccine. The broad International market, as measured by the MSCI All Country World Ex. US Index, advanced strongly, returning 29.66% over the period. Europe produced the strongest market return of 41.75%, while the Emerging Markets lagged with its 17.45% gain. Growing questions around the regulatory environment in China weighed on Emerging Markets results. Unsurprisingly, in such a value-led rally, Energy and Financials were the top performing sectors, returning 72% and 49% respectively, and Information Technology continued to prove it is well-placed to perform in a variety of market environments, returning 42%. Communication Services was the clear laggard, as the only sector to produce a single digit return during the period, returning 5.5%.
Performance
Harbor Focused International Fund returned 22.25% (Retirement Class), 22.10% (Institutional Class) and 21.65% (Investor Class), while the MSCI All Country World Ex. U.S. (ND) Index returned 29.66% during the year ended October 31, 2021. Given the Fund’s quality growth focus, which typically produces a more durable return stream and stronger downside protection, its underperformance in a value-led rally was not unexpected. Setting aside any style headwinds, the Fund outperformed in Europe thanks to strong stock selection, a tribute to our focus on sustainable franchises. However, selection in China detracted owing to broad weakness across China on the back of growing regulatory uncertainty. At the sector level, outperformance across the Health Care, Information Technology and Consumer Staples sectors was not enough to offset the relative weakness experienced in Financials, Communication Services and Energy.
Among the Fund’s top contributors were Novo Nordisk, Taiwan Semiconductor Manufacturing Co. (“TSMC”), and Straumann. Novo Nordisk is a healthcare company primarily focused on diabetes (insulin) and obesity care. The company raised its full-year guidance thanks to strong uptake of its newly launched obesity drug, Wegovy. TSMC is the world’s leading chip foundry and remains well-positioned to capture the growth of electronics in our everyday lives. Straumann is a leader in dental implants and regenerative solutions. We are encouraged by the diversification dynamics of the top contributors, with each being driven by different demand sources.
Given the broad-based weakness in China, it is understandable that the Fund’s largest detractors were Alibaba, Autohome and Tencent, all China-based. Alibaba, the dominant player in online and mobile marketplaces, and Tencent the dominant player in online games, were hit by the tide of regulation emanating from the Chinese government, namely the new data privacy laws and restrictions for online gaming. While these risks could develop into thesis breakers, at this stage we view them as less stock-specific and more manageable. We remain in close contact with the management teams to assess the potential long-term impacts and will respond accordingly if we feel their business model advantages are being negatively impacted. Autohome, a leading auto website in China, suffered from a deterioration in its competitive advantage, along with the broad weakness; as a result, we sold the stock.
16
Harbor Focused International Fund
Manager’s Commentary—Continued
CHANGE IN A $50,000 INVESTMENT
For the period 06/01/2019 through 10/31/2021
The graph compares a $50,000 investment in the Institutional Class shares of the Fund with the performance of the MSCI All Country World Ex. U.S. (ND) Index. The Fund’s performance assumes the reinvestment of all dividend and capital gain distributions.
TOTAL RETURNS
For the periods ended 10/31/2021
1 Year | 5 Years | Annualized | ||||
Life of Fund | ||||||
Harbor Focused International Fund | ||||||
Retirement Class1 | 22.25% | N/A | 17.23% | |||
Institutional Class1 | 22.10 | N/A | 17.14 | |||
Investor Class1 | 21.65 | N/A | 16.71 | |||
Comparative Index | ||||||
MSCI All Country World Ex. U.S. (ND)1 | 29.66% | N/A | 13.57% |
As stated in the Fund’s prospectus dated March 1, 2021, the expense ratios were 0.77% (Net) and 1.01% (Gross) (Retirement Class); 0.85% (Net) and 1.09% (Gross) (Institutional Class); 1.10% (Net) and 1.34% (Gross) (Administrative Class); 1.21% (Net) and 1.45% (Gross) (Investor Class). The net expense ratios reflect an expense limitation agreement (excluding interest expense, if any) effective through 02/28/2022. The expense ratios in the prospectus may differ from the actual expense ratios for the period disclosed within this report. The expense ratios shown in the prospectus are based on the prior fiscal year, adjusted to reflect changes, if any, in contractual arrangements that occurred prior to the date of the prospectus (or supplement thereto, if applicable).
Performance data shown represents past performance and is no guarantee of future results. Past performance is net of management fees and expenses and reflects reinvested dividends and distributions. Past performance reflects the beneficial effect of any expense waivers or reimbursements, without which returns would have been lower. Investment returns and principal value will fluctuate and when redeemed may be worth more or less than their original cost. Returns for periods less than one year are not annualized. Current performance may be higher or lower and is available through the most recent month end at harborcapital.com or by calling 800-422-1050.
Outlook & Strategy
Valuations across the board remain a core area of focus and debate among the team. The Fund is constructed on a bottom-up basis and reflects a continuous competition for capital, which we believe is a fortunate position to be in in this environment. We are privileged to have decades of company-specific research at our disposal to assist in navigating this valuation debate. Our experience and expertise in Europe, Japan and India offers a counterbalance to the ongoing questions surrounding China. As long-term minded investors, we believe China presents a potential opportunity, while the uncertainty of the unknown reinforces the importance of stock-specific decisions. We believe our over 25-year presence in Hong Kong and time-tested approach in the region should prove advantageous to the Fund as we review the fundamental opportunities in China and calibrate them against the potential regulatory risks.
If consensus estimates prove correct, global earnings could be up by more than 40% in 2021, with the Energy sector leading the way. Within this context, the value rally that has dominated the 12-month period under review is not surprising. However, we see a similar pace of earnings growth for the broader market as unlikely going forward. We remain focused on finding and confirming the structural advantages of company-specific business models and investing in them at attractive valuations. We believe owning these types of stocks on a conviction-weighted basis puts the Fund in the best position possible for compound earnings growth and risk-adjusted returns.
Much academic literature has been dedicated to proving that value rallies can be powerful, but often short-lived. As experienced investors, we prefer to draw on history as a guide and focus on the long-term rather than try to time short-term market movements. We do not veer from our quality growth approach, knowing that following a disciplined process is the recipe for success over the long term. Drawing on our experiences from the 2016 Q4 value rally, it is our view that this more recent rally will normalize as well, and that earnings growth will resume its poll position in leading the market.
1
The “Life of Fund” return as shown reflects the period 06/01/2019 through 10/31/2021.
All international and global returns are in U.S. Dollars.
This report contains the current opinions of Comgest Asset Management International Limited as of the date of this report and should not be considered as investment advice or a recommendation of any particular security, strategy or investment product. Such opinions are subject to change without notice and securities described herein may no longer be included in, or may at any time be removed from, the Fund’s portfolio. This report is distributed for informational purposes only. Information contained herein has been obtained from sources believed reliable, but not guaranteed.
There is no guarantee that the investment objective of the Fund will be achieved. Stock markets are volatile and equity values can decline significantly in response to adverse issuer, political, regulatory, market and economic conditions. Investing in international and emerging markets poses special risks, including potentially greater price volatility due to social, political and economic factors, as well as currency exchange rate fluctuations. These risks are more severe for securities of issuers in emerging market regions. For information on the different share classes and the risks associated with an investment in the Fund, please refer to the current prospectus.
17
Harbor Focused International Fund
Portfolio of Investments—October 31, 2021
REGION BREAKDOWN (% of investments) -Unaudited
The Fund’s Portfolio of Investments include investments denominated in foreign currencies. As of October 31, 2021, 28% of the Fund’s investments were denominated in Japanese Yen. No other foreign currency denomination comprised more than 25% of the Fund’s net assets.
Portfolio of Investments
Value, Cost, and Principal Amounts in Thousands
COMMON STOCKS—97.2% | |||
Shares | Value | ||
AEROSPACE & DEFENSE—1.7% | |||
3,549 | MTU Aero Engines AG (Germany) | $790 | |
BEVERAGES—7.1% | |||
4,336 | Kweichow Moutai Co. Ltd. Class A (China) | 1,237 | |
9,357 | Pernod Ricard SA (France) | 2,153 | |
3,390 | |||
BUILDING PRODUCTS—2.8% | |||
6,100 | Daikin Industries Ltd. (Japan) | 1,336 | |
CHEMICALS—3.8% | |||
10,200 | Shin-Etsu Chemical Co. Ltd. (Japan) | 1,819 | |
ELECTRONIC EQUIPMENT, INSTRUMENTS & COMPONENTS—4.5% | |||
13,100 | Hamamatsu Photonics KK (Japan) | 778 | |
2,300 | Keyence Corp. (Japan) | 1,388 | |
2,166 | |||
ENTERTAINMENT—3.3% | |||
80,405 | NetEase Inc. (China) | 1,560 | |
FOOD PRODUCTS—4.8% | |||
346,438 | Inner Mongolia Yili Industrial Group Co. Ltd. Class A (China) | 2,322 | |
HEALTH CARE EQUIPMENT & SUPPLIES—7.4% | |||
4,772 | Alcon Inc. (Switzerland) | 396 | |
14,300 | Hoya Corp. (Japan) | 2,105 | |
512 | Straumann Holding AG (Switzerland) | 1,066 | |
3,567 | |||
HOUSEHOLD DURABLES—2.8% | |||
11,500 | Sony Group Corp. (Japan) | 1,332 | |
INSURANCE—3.4% | |||
145,945 | AIA Group Ltd. (Hong Kong) | 1,636 | |
INTERACTIVE MEDIA & SERVICES—3.3% | |||
26,308 | Tencent Holdings Ltd. (China) | 1,600 |
COMMON STOCKS—Continued | |||
Shares | Value | ||
INTERNET & DIRECT MARKETING RETAIL—2.9% | |||
68,528 | Alibaba Group Holding Ltd. (China)* | $1,409 | |
IT SERVICES—1.5% | |||
230 | Adyen NV (Netherlands)*,1 | 694 | |
LEISURE PRODUCTS—2.9% | |||
5,000 | Shimano Inc. (Japan) | 1,395 | |
MACHINERY—2.4% | |||
12,500 | Daifuku Co. Ltd. (Japan) | 1,151 | |
PERSONAL PRODUCTS—3.6% | |||
3,782 | L'Oreal SA (France) | 1,730 | |
PHARMACEUTICALS—8.3% | |||
24,948 | Novo Nordisk AS (Denmark) | 2,736 | |
3,261 | Roche Holding AG (Switzerland) | 1,263 | |
3,999 | |||
PROFESSIONAL SERVICES—6.8% | |||
49,062 | Experian plc (United Kingdom) | 2,250 | |
15,100 | Recruit Holdings Co. Ltd. (Japan) | 1,004 | |
3,254 | |||
SEMICONDUCTORS & SEMICONDUCTOR EQUIPMENT—6.8% | |||
1,405 | ASML Holding NV (Netherlands) | 1,142 | |
18,624 | Taiwan Semiconductor Manufacturing Co. Ltd. ADR (Taiwan)2 | 2,118 | |
3,260 | |||
SOFTWARE—3.6% | |||
13,482 | Dassault Systemes SE (France) | 787 | |
6,326 | SAP SE (Germany) | 916 | |
1,703 | |||
SPECIALTY RETAIL—2.2% | |||
1,600 | Fast Retailing Co. Ltd. (Japan) | 1,062 |
18
Harbor Focused International Fund
Portfolio of Investments—Continued
Value, Cost, and Principal Amounts in Thousands
COMMON STOCKS—Continued | |||
Shares | Value | ||
TEXTILES, APPAREL & LUXURY GOODS—6.5% | |||
8,433 | EssilorLuxottica SA (France) | $1,745 | |
1,763 | LVMH Moet Hennessy Louis Vuitton SE (France) | 1,382 | |
3,127 | |||
THRIFTS & MORTGAGE FINANCE—4.8% | |||
60,468 | Housing Development Finance Corp. Ltd. (India)* | 2,303 | |
TOTAL COMMON STOCKS | |||
(Cost $34,981) | 46,605 | ||
TOTAL INVESTMENTS—97.2% | |||
(Cost $34,981) | 46,605 | ||
CASH AND OTHER ASSETS, LESS LIABILITIES—2.8% | 1,330 | ||
TOTAL NET ASSETS—100.0% | $47,935 |
FAIR VALUE MEASUREMENTS
The following table summarizes the Fund’s investments as of October 31, 2021 based on the inputs used to value them.
Asset Category | Quoted Prices Level 1 (000s) | Other Significant Observable Inputs Level 2 (000s) | Significant Unobservable Inputs Level 3 (000s) | Total (000s) |
Common Stocks | ||||
Europe | $— | $19,050 | $— | $19,050 |
Middle East/Central Asia | — | 2,303 | — | 2,303 |
Pacific Basin | 2,118 | 23,134 | — | 25,252 |
Total Investments in Securities | $2,118 | $44,487 | $— | $46,605 |
There were no Level 3 Investments at October 31, 2021 or 2020.
For more information on valuation inputs and their aggregation into the levels used in the table, please refer to the Fair Value Measurements and Disclosures in Note 2 of the accompanying Notes to Financial Statements.
*
Non-income producing security
1
Securities purchased in a transaction exempt from registration under Rule 144A of the Securities Act of 1933. These securities may be resold in transactions exempt from registration, normally to qualified institutional buyers. The Fund has no right to demand registration of these securities. At October 31, 2021, the aggregate value of these securities was $694 or 1% of net assets.
2
Depositary receipts such as American Depositary Receipts (ADRs), Global Depositary Receipts (GDRs) and other country specific depositary receipts are certificates evidencing ownership of shares of a foreign issuer. These certificates are issued by depositary banks and generally trade on an established market in the U.S. or elsewhere.
The accompanying notes are an integral part of the Financial Statements.
19
Harbor Global Leaders Fund
Manager’s Commentary (Unaudited)
Subadviser
Sands Capital Management, LLC
1000 Wilson Boulevard
Suite 3000
Arlington, VA 22209
Suite 3000
Arlington, VA 22209
Portfolio Managers
Sunil H. Thakor, CFA
Since 2017
Since 2017
Michael F. Raab, CFA
Since 2019
Since 2019
Sands Capital has subadvised the Fund since 2017.
Investment Objective
The Fund seeks long-term growth of capital.
Management’s Discussion of
Fund Performance
Fund Performance
Market Review
Global equities (as measured by the MSCI All Country World Index) posted gains for the 12-month period ended October 31, 2021, with broad-based positive returns across geographies and sectors. The index was driven higher by growth equities, with a rotation from value to growth picking up steam in June. Mega-cap technology businesses drove the index’s return for the period, with shifting market direction leading investors to big tech amid a “flight to certainty.” The U.S. & Canada were the top-contributing countries, and Information Technology and Health Care were the top contributing sectors. Utilities was the only sector that detracted from the index’s results. For the period, the U.S./Canada and Western Europe were the top regional contributors, while Latin America and Eastern Europe were the top detractors from global equity returns. Gains were led by the fast-growing Communication Services and Information Technology sectors while Financials and Industrials were the largest sector detractors.
Performance
Harbor Global Leaders Fund returned 33.12% (Retirement Class), 33.02% (Institutional Class), 32.71% (Administrative Class) and 32.53% (Investor Class) versus the 37.28% return for the MSCI All Country World (ND) Index during the annual period ended October 31, 2021. The Fund’s underperformance for the period was driven by both allocation and security selection. Emerging Asia was the top regional contributor to relative results, while the U.S./Canada was the top relative detractor. From a sector perspective, Communication Services and Information Technology contributed most to relative results, while Industrials and Financials were the top relative detractors.
On an absolute basis, the largest individual contributors to the Fund’s investment results were Sea, Cloudflare, Intuit, IQVIA and Microsoft. Intuit’s small-to-medium business customers were ultimately less affected by the COVID-19 pandemic than initially feared. By the end of 2020, almost every key performance indicator related to customer retention, user acquisition and payment and payroll volumes were above pre-pandemic levels. We believe this is a testament to the company’s diverse customer base and the critical nature of the QuickBooks solutions for small-to-medium businesses. In December 2020, the company closed its $7 billion acquisition of Credit Karma—a broad consumer finance platform with high engagement—which we believe will be value accretive. Early performance indicators have surpassed expectations, driven primarily by product innovation, a quick rebound from the pandemic, and apparent cross-sell synergies between Credit Karma and the company’s more seasonal consumer tax product, TurboTax. The TurboTax business continues to report growth in revenue and engagements—benefiting from the trend away from manually assisted tax filing to a more software-driven approach. After several years of roughly flat margins due to investment in growth and customer acquisition, margins have started to expand at a more consistent pace, which we believe will help accelerate earnings growth.
The largest absolute individual detractors from investment results were Zur Rose, MonotaRO, Coupa Software, Chegg and Adobe. MonotaRO shares traded lower during the period, along with Japanese markets broadly, after multiple states of emergency were declared in the country in response to renewed COVID-19 outbreaks. Investor sentiments remain muted after second-quarter 2021 earnings slightly missed guidance, despite revenue and operating profit both exceeding 20% year-over-year. While the sales from large corporate customers appear to have recovered from the initial shocks of the pandemic, the demand from small independent business customers has stalled. In an effort to broaden its total addressable market, the company has focused on initiatives to appeal to small, individual, nonbusiness customers, which we believe will contribute more substantially to overall demand once the effects of the pandemic
20
Harbor Global Leaders Fund
Manager’s Commentary—Continued
CHANGE IN A $50,000 INVESTMENT
For the period 11/01/2011 through 10/31/2021
The graph compares a $50,000 investment in the Institutional Class shares of the Fund with the performance of the MSCI All Country World (ND) Index. The Fund’s performance assumes the reinvestment of all dividend and capital gain distributions.
TOTAL RETURNS
For the periods ended 10/31/2021
1 Year | Annualized | |||||
5 Years | 10 Years | |||||
Harbor Global Leaders Fund | ||||||
Retirement Class1 | 33.12% | 21.40% | 16.06% | |||
Institutional Class | 33.02 | 21.29 | 16.01 | |||
Administrative Class | 32.71 | 21.00 | 15.72 | |||
Investor Class | 32.53 | 20.85 | 15.58 | |||
Comparative Index | ||||||
MSCI All Country World (ND) | 37.28% | 14.72% | 11.32% |
As stated in the Fund’s prospectus dated March 1, 2021, the expense ratios were 0.78% (Net) and 0.90% (Gross) (Retirement Class); 0.86% (Net) and 0.98% (Institutional Class); 1.11% (Net) and 1.23% (Gross) (Administrative Class); and 1.22% (Net) and 1.34% (Gross) (Investor Class). The Adviser has contractually agreed to waive 0.05% of its management fee and to limit the Total Annual Fund Operating Expenses, excluding interest expense (if any), effective through 02/28/2022. The expense ratios in the prospectus may differ from the actual expense ratios for the period disclosed within this report. The expense ratios shown in the prospectus are based on the prior fiscal year, adjusted to reflect changes, if any, in contractual arrangements that occurred prior to the date of the prospectus (or supplement thereto, if applicable).
Performance data shown represents past performance and is no guarantee of future results. Past performance is net of management fees and expenses and reflects reinvested dividends and distributions. Past performance reflects the beneficial effect of any expense waivers or reimbursements, without which returns would have been lower. Investment returns and principal value will fluctuate and when redeemed may be worth more or less than their original cost. Returns for periods less than one year are not annualized. Current performance may be higher or lower and is available through the most recent month end at harborcapital.com or by calling 800-422-1050.
normalize. We estimate online penetration to still be in the low single digits today. We expect the maintenance, repair and overhaul (“MRO”) industry in Japan will continue to undergo a structural shift from physical to online stores. MonotaRO—as the country’s largest online MRO—is well-positioned, in our view, to continue to take market share with its high number of stock-keeping units, fast delivery, strong customer relationships and robust data systems. Our investment case remains intact, and we maintain conviction in the long-term durability of the business’ growth.
Outlook & Strategy
The Subadviser acknowledges that its approach isn’t going to work in all market environments, and that it expected a reversal of its strong 2020 investment results as COVID-19 vaccines were broadly distributed, the global economy cyclically recovered and as fiscal stimulus increased.
History shows the Subadviser two things: prices tend to track compounded earnings growth over the long term, and most value creation accrues to a select group of companies. Therefore, the Subadviser will continue to focus its efforts on finding the select few companies that it believes can generate above-average earnings growth over the next five years.
1
Retirement Class shares commenced operations on March 1, 2016. The performance attributed to the Retirement Class shares prior to that date is that of the Institutional Class shares. Performance prior to March 1, 2016 has not been adjusted to reflect the lower expenses of Retirement Class shares. During this period, Retirement Class shares would have had returns similar to, but potentially higher than, Institutional Class shares due to the fact that Retirement Class shares represent interests in the same portfolio as Institutional Class shares but are subject to lower expenses.
All international and global returns are in U.S. Dollars.
This report contains the current opinions of Sands Capital Management, LLC as of the date of this report and should not be considered as investment advice or a recommendation of any particular security, strategy or investment product. Such opinions are subject to change without notice and securities described herein may no longer be included in, or may at any time be removed from, the Fund’s portfolio. This report is distributed for informational purposes only. Information contained herein has been obtained from sources believed reliable, but not guaranteed.
There is no guarantee that the investment objective of the Fund will be achieved. Stock markets are volatile and equity values can decline significantly in response to adverse issuer, political, regulatory, market and economic conditions. Investing in international and emerging markets poses special risks, including potentially greater price volatility due to social, political and economic factors, as well as currency exchange rate fluctuations. These risks are more severe for securities of issuers in emerging market regions. For information on the different share classes and the risks associated with an investment in the Fund, please refer to the current prospectus.
21
Harbor Global Leaders Fund
Portfolio of Investments—October 31, 2021
REGION BREAKDOWN (% of investments) -Unaudited
The Fund’s Portfolio of Investments include investments denominated in foreign currencies. As of October 31, 2021, there was no foreign currency denomination that comprised more than 25% of the Fund’s net assets.
Portfolio of Investments
Value, Cost, and Principal Amounts in Thousands
COMMON STOCKS—99.2% | |||
Shares | Value | ||
AEROSPACE & DEFENSE—4.7% | |||
26,173 | Safran SA (France) | $3,522 | |
5,094 | TransDigm Group Inc. (United States)* | 3,178 | |
6,700 | |||
AUTO COMPONENTS—2.6% | |||
21,064 | Aptiv plc (United States)* | 3,642 | |
BANKS—2.4% | |||
47,573 | HDFC Bank Ltd. ADR (India)1 | 3,421 | |
BIOTECHNOLOGY—2.2% | |||
13,787 | CSL Ltd. (Australia) | 3,137 | |
CAPITAL MARKETS—4.8% | |||
155,348 | Allfunds Group plc (Netherlands)* | 3,136 | |
26,674 | Intercontinental Exchange Inc. (United States) | 3,693 | |
6,829 | |||
COMMERCIAL SERVICES & SUPPLIES—2.8% | |||
487,184 | Rentokil Initial plc (United Kingdom) | 3,921 | |
DIVERSIFIED CONSUMER SERVICES—5.3% | |||
16,023 | Bright Horizons Family Solutions Inc. (United States)* | 2,660 | |
82,422 | Chegg Inc. (United States)* | 4,899 | |
7,559 | |||
ELECTRONIC EQUIPMENT, INSTRUMENTS & COMPONENTS—4.1% | |||
9,760 | Keyence Corp. (Japan) | 5,891 | |
ENTERTAINMENT—3.0% | |||
12,465 | Sea Ltd. ADR (Singapore)*,1 | 4,283 | |
FOOD & STAPLES RETAILING—6.1% | |||
153,413 | Alimentation Couche-Tard Inc. (Canada) | 5,754 | |
8,366 | Zur Rose Group AG (Switzerland)* | 2,976 | |
8,730 | |||
HEALTH CARE EQUIPMENT & SUPPLIES—2.1% | |||
12,602 | Steris plc (United States) | 2,946 | |
HEALTH CARE PROVIDERS & SERVICES—2.4% | |||
7,577 | UnitedHealth Group Inc. (United States) | 3,489 |
COMMON STOCKS—Continued | |||
Shares | Value | ||
INDUSTRIAL CONGLOMERATES—4.4% | |||
12,909 | Roper Technologies Inc. (United States) | $6,298 | |
INSURANCE—3.8% | |||
484,900 | AIA Group Ltd. (Hong Kong) | 5,434 | |
INTERACTIVE MEDIA & SERVICES—2.7% | |||
11,082 | Naver Corp. (South Korea) | 3,853 | |
IT SERVICES—7.9% | |||
35,389 | Cloudflare Inc. (United States)* | 6,891 | |
20,759 | Visa Inc. (United States) | 4,396 | |
11,287 | |||
LIFE SCIENCES TOOLS & SERVICES—7.3% | |||
3,355 | Bio-Techne Corp. (United States) | 1,757 | |
18,330 | Iqvia Holdings Inc. (United States)* | 4,792 | |
4,682 | Lonza Group AG (Switzerland) | 3,847 | |
10,396 | |||
MEDIA—3.3% | |||
7,058 | Charter Communications Inc. (United States)* | 4,763 | |
MULTILINE RETAIL—2.7% | |||
10,780 | Dollar General Corp. (United States) | 2,388 | |
72,700 | Pan Pacific International Holdings Corp. (Japan) | 1,526 | |
3,914 | |||
PHARMACEUTICALS—2.1% | |||
13,994 | Zoetis Inc. (United States) | 3,026 | |
PROFESSIONAL SERVICES—5.6% | |||
50,216 | CoStar Group Inc. (United States)* | 4,321 | |
54,750 | Recruit Holdings Co. Ltd. (Japan) | 3,642 | |
7,963 | |||
SEMICONDUCTORS & SEMICONDUCTOR EQUIPMENT—6.2% | |||
41,336 | Taiwan Semiconductor Manufacturing Co. Ltd. ADR (Taiwan)1 | 4,700 | |
22,238 | Texas Instruments Inc. (United States) | 4,169 | |
8,869 |
22
Harbor Global Leaders Fund
Portfolio of Investments—Continued
Value, Cost, and Principal Amounts in Thousands
COMMON STOCKS—Continued | |||
Shares | Value | ||
SOFTWARE—8.8% | |||
7,772 | Coupa Software Inc. (United States)* | $1,770 | |
9,390 | Intuit Inc. (United States) | 5,878 | |
14,851 | Microsoft Corp. (United States) | 4,925 | |
12,573 | |||
TRADING COMPANIES & DISTRIBUTORS—1.8% | |||
111,300 | Monotaro Co. Ltd. (Japan) | 2,537 | |
TOTAL COMMON STOCKS | |||
(Cost $90,719) | 141,461 | ||
TOTAL INVESTMENTS—99.2% | |||
(Cost $90,719) | 141,461 | ||
CASH AND OTHER ASSETS, LESS LIABILITIES—0.8% | 1,087 | ||
TOTAL NET ASSETS—100.0% | $142,548 |
FAIR VALUE MEASUREMENTS
The following table summarizes the Fund’s investments as of October 31, 2021 based on the inputs used to value them.
Asset Category | Quoted Prices Level 1 (000s) | Other Significant Observable Inputs Level 2 (000s) | Significant Unobservable Inputs Level 3 (000s) | Total (000s) |
Common Stocks | ||||
Europe | $2,946 | $17,402 | $— | $20,348 |
Middle East/Central Asia | 3,421 | — | — | 3,421 |
North America | 82,689 | — | — | 82,689 |
Pacific Basin | 8,983 | 26,020 | — | 35,003 |
Total Investments in Securities | $98,039 | $43,422 | $— | $141,461 |
There were no Level 3 Investments at October 31, 2021 or 2020.
For more information on valuation inputs and their aggregation into the levels used in the table above, please refer to the Fair Value Measurements and Disclosures in Note 2 of the accompanying Notes to Financial Statements.
*
Non-income producing security
1
Depositary receipts such as American Depositary Receipts (ADRs), Global Depositary Receipts (GDRs) and other country specific depositary receipts are certificates evidencing ownership of shares of a foreign issuer. These certificates are issued by depositary banks and generally trade on an established market in the U.S. or elsewhere.
The accompanying notes are an integral part of the Financial Statements.
23
Harbor International Fund
Manager’s Commentary (Unaudited)
Subadviser
Marathon Asset Management Limited
Orion House
5 Upper St. Martin’s Lane
London, WC2H 9EA
England
5 Upper St. Martin’s Lane
London, WC2H 9EA
England
Portfolio Managers
Neil M. Ostrer
Since 2018
Since 2018
Charles Carter
Since 2018
Since 2018
Nick Longhurst
Since 2018
Since 2018
William J. Arah
Since 2018
Since 2018
Simon Somerville
Since 2018
Since 2018
Alex Duffy
Since 2021
Since 2021
Justin Hill
Since 2021
Since 2021
Marathon Asset Management Limited (Marathon-London) has subadvised the Fund since 2018.
Investment Objective
The Fund seeks long-term total return, principally from growth of capital.
Management’s Discussion of
Fund Performance
Fund Performance
MARKET REVIEW
The period since October 31, 2020, displayed strong market performance. There was a notable change in style leadership in equity markets that took place around November 9, 2020 with the announcement of an effective COVID-19 vaccine. For years, the market has been led mainly by mega-cap companies which are either growth businesses or reliable income generators (“bond proxies”). This began to change in November, initially in Europe and subsequently spreading to all other major markets. The value area of the market and smaller capitalization companies (and particularly those businesses which are both) began to outperform. The trend has not been constant over the period, with growth outpacing value from late-June to mid-August, and the disparity in valuations between the growth and value segments of the market remains high from a historical perspective reflecting the extremes that had been reached.
Cyclical industries, such as Energy, Financials and Information Technology have been the key beneficiaries over the period, with more defensive sectors, including Consumer Staples and Utilities, performing relatively weakly. However, Communication Services was the weakest sector, as a number of stocks in the entertainment/computer games industry performed poorly. Although listed in developed markets many of these stocks have relied on Chinese sales; however, the Chinese government further cracked down on the amount of time children are permitted to spend gaming online.
The MSCI EAFE Index performed well and returned 34.18% (in USD terms) over the 12-month period to October 31, 2021. On a regional basis European markets which returned 40.93% (in USD terms) and averaged 39.77% of the MSCI EAFE Index over the period, led the way. Developed Asian ex-Japan markets (Australia, Hong Kong, Singapore and New Zealand), which constituted 11.65% of the Index on average over the period, were also strong performers during the 12-month period returning 30.60% (in USD terms). Japanese performance was not so strong in absolute terms, returning 19.88% (in USD terms) with an average weight of 15.20% of the Index.
PERFORMANCE
Harbor International Fund returned 34.23% (Retirement Class), 34.15% (Institutional Class), 33.80% (Administrative Class) and 33.66% (Investor Class) outperforming the MSCI EAFE (ND) Index, which returned 34.18% during the annual period ended October 31, 2021. Returns were driven by stock selection in the off-benchmark Emerging Markets allocation and in Japan. Looking at sector effects, stock selection was the driver of returns once again, with sector allocations effects resulting in a small drag. Currency was also supportive as the U.S. Dollar weakened. The portfolio’s underweight positions in Utilities and Health Care were beneficial to performance, but the overweight to Communication Services and underweight to Financials were not. Stock selection was particularly strong amongst stocks in the Communication Services and Materials sectors but lagged in Industrials.
At the stock level, positions in bank groups Barclays and Bank of Ireland were amongst the strongest contributors. Bank of Ireland has seen foreign competitors withdraw from the Irish banking market. The business has been able to buy out the Irish operations or loan books of some of these former competitors selectively and performed well as a result. Similarly, the Barclays share price has doubled from its 2020 lows as conditions improved. Shares in U.K.-domiciled Entain had already generated strong returns, having benefited from a takeover bid at the beginning of 2021 prior to a new bid from recently listed U.S. e-sports business, DraftKings, in the third quarter. Whether this bid is ultimately successful or not, it illustrates a key part of our ongoing investment thesis for the industry, which appears ripe for consolidation in our view. Hitachi, the industrial conglomerate and Marathon London’s largest position in the Japanese market, performed well over the period. The company announced several acquisitions and disposals as well as improved earnings forecasts for the year ahead and the
24
Harbor International Fund
Manager’s Commentary—Continued
CHANGE IN A $50,000 INVESTMENT
For the period 11/01/2011 through 10/31/2021
The graph compares a $50,000 investment in the Institutional Class shares of the Fund with the performance of the MSCI EAFE (ND) Index. The Fund’s performance assumes the reinvestment of all dividend and capital gain distributions.
TOTAL RETURNS
For the periods ended 10/31/2021
1 Year | Annualized | |||||
5 Years | 10 Years | |||||
Harbor International Fund | ||||||
Retirement Class1 | 34.23% | 8.48% | 6.34% | |||
Institutional Class | 34.15 | 8.40 | 6.29 | |||
Administrative Class | 33.80 | 8.13 | 6.03 | |||
Investor Class | 33.66 | 8.00 | 5.90 | |||
Comparative Index | ||||||
MSCI EAFE (ND) | 34.18% | 9.79% | 7.37% |
As stated in the Fund’s prospectus dated March 1, 2021, the expense ratios were 0.69% (Net) and 0.81% (Gross) (Retirement Class); 0.77% (Net) and 0.89% (Gross) (Institutional Class); 1.02% (Net) and 1.14% (Gross) (Administrative Class); and 1.13% (Net) and 1.25% (Gross) (Investor Class). The management fee rate is 0.75% on assets up to $12 billion and 0.65% on assets in excess of $12 billion. The net expense ratios reflect a contractual management fee waiver effective through 02/28/2022. The expense ratios in the prospectus may differ from the actual expense ratios for the period disclosed within this report. The expense ratios shown in the prospectus are based on the prior fiscal year, adjusted to reflect changes, if any, in contractual arrangements that occurred prior to the date of the prospectus (or supplement thereto, if applicable).
Performance data shown represents past performance and is no guarantee of future results. Past performance is net of management fees and expenses and reflects reinvested dividends and distributions. Past performance reflects the beneficial effect of any expense waivers or reimbursements, without which returns would have been lower. Investment returns and principal value will fluctuate and when redeemed may be worth more or less than their original cost. Returns for periods less than one year are not annualized. Current performance may be higher or lower and is available through the most recent month end at harborcapital.com or by calling 800-422-1050.
market may also be recognizing the substantial improvements that have been made to corporate governance over the past several years. Not holding large cap defensive bond proxies, such as Swiss-based index heavyweights Nestlé and Novartis, also enhanced performance as they underperformed notably over the period.
In terms of positions which negatively impacted performance over the period, the portfolio’s underweight allocation to Dutch lithography business, ASML Holding, weighed on returns. ASML is the only producer of the extreme ultraviolet lithography machines used in certain types of semiconductor manufacturing. In the first quarter the company signed a very large multi-year order, which is likely to boost future earnings and added to the stock’s appeal to the market. Danish medical device maker Coloplast performed comparatively poorly over the period. While profits have been resilient, Coloplast has seen some impact from a decline in elective procedures, and the shares have not matched the pace of the index. HomeServe, the U.K.-based subscription home repair business, also impacted returns. Despite earnings meeting expectations, and improved guidance for the year ahead, investors reacted negatively to the falling number of U.K. clients subscribing to the company’s products and fewer clients remaining with the service at the end of their discounted trial periods. Avoiding French luxury goods business LVMH hurt relative performance over the year. The stock soared following good news on online sales and dividend increases; however, recent performance has been poor.
OUTLOOK & STRATEGY
1
Retirement Class shares commenced operations on March 1, 2016. The performance attributed to the Retirement Class shares prior to that date is that of the Institutional Class shares. Performance prior to March 1, 2016 has not been adjusted to reflect the lower expenses of Retirement Class shares. During this period, Retirement Class shares would have had returns similar to, but potentially higher than, Institutional Class shares due to the fact that Retirement Class shares represent interests in the same portfolio as Institutional Class shares but are subject to lower expenses.
All international and global returns are in U.S. Dollars.
This report contains the current opinions of Marathon Asset Management Limited as of the date of this report and should not be considered as investment advice or a recommendation of any particular security, strategy or investment product. Such opinions are subject to change without notice and securities described herein may no longer be included in, or may at any time be removed from, the Fund’s portfolio. This report is distributed for informational purposes only. Information contained herein has been obtained from sources believed reliable, but not guaranteed.
There is no guarantee that the investment objective of the Fund will be achieved. Stock markets are volatile and equity values can decline significantly in response to adverse issuer, political, regulatory, market and economic conditions. Investing in international and emerging markets poses special risks, including potentially greater price volatility due to social, political and economic factors, as well as currency exchange rate fluctuations. These risks are more severe for securities of issuers in emerging market regions. For information on the different share classes and the risks associated with an investment in the Fund, please refer to the current prospectus.
25
Harbor International Fund
Portfolio of Investments—October 31, 2021
REGION BREAKDOWN (% of investments) -Unaudited
(Excludes derivatives)
The Fund’s Portfolio of Investments include investments denominated in foreign currencies. As of October 31, 2021, 26% of the Fund’s investments were denominated in British Pound. No other foreign currency denomination comprised more than 25% of the Fund’s net assets.
Portfolio of Investments
Value, Cost, and Principal Amounts in Thousands
COMMON STOCKS—99.2% | |||
Shares | Value | ||
AEROSPACE & DEFENSE—1.2% | |||
123,579 | Airbus SE (France)* | $15,853 | |
2,110,612 | BAE Systems plc (United Kingdom) | 15,915 | |
9,204,333 | Rolls-Royce Holdings plc (United Kingdom)* | 16,612 | |
79,660 | Thales SA (France) | 7,351 | |
55,731 | |||
AIR FREIGHT & LOGISTICS—0.1% | |||
158,709 | Oesterreichische Post AG (Austria) | 6,701 | |
AIRLINES—0.4% | |||
1,461,084 | EasyJet plc (United Kingdom)* | 12,454 | |
1,008,087 | Qantas Airways Ltd. (Australia)* | 4,083 | |
16,537 |
COMMON STOCKS—Continued | |||
Shares | Value | ||
AUTO COMPONENTS—0.9% | |||
313,600 | Bridgestone Corp. (Japan) | $13,873 | |
1,615,688 | Gestamp Automocion SA (Spain)*,1 | 7,224 | |
81,663 | GUD Holdings Ltd. (Australia) | 756 | |
43,712 | Hankook Tire & Technology Co. Ltd. (South Korea) | 1,549 | |
659,870 | Johnson Electric Holdings Ltd. (Hong Kong) | 1,460 | |
90,700 | Koito Manufacturing Co. Ltd. (Japan) | 5,146 | |
374,900 | Sumitomo Electric Industries Ltd. (Japan) | 4,976 | |
97,700 | Toyota Industries Corp. (Japan) | 8,306 | |
43,290 | |||
AUTOMOBILES—1.3% | |||
186,692 | Bayerische Motoren Werke AG (Germany) | 18,863 |
26
Harbor International Fund
Portfolio of Investments—Continued
Value, Cost, and Principal Amounts in Thousands
COMMON STOCKS—Continued | |||
Shares | Value | ||
AUTOMOBILES—Continued | |||
10,347 | Hyundai Motor Co. (South Korea) | $1,851 | |
2,195,200 | Toyota Motor Corp. (Japan) | 38,732 | |
59,446 | |||
BANKS—9.0% | |||
822,158 | Australia & New Zealand Banking Group Ltd. (Australia) | 17,496 | |
481,403 | Axis Bank Ltd. (India)* | 4,810 | |
13,264,500 | Bank Central Asia TBK PT (Indonesia) | 7,014 | |
4,088,464 | Bank of Ireland Group plc (Ireland)* | 24,356 | |
21,813,552 | Barclays plc (United Kingdom) | 60,194 | |
737,004 | BNP Paribas SA (France) | 49,333 | |
5,913,781 | CaixaBank SA (Spain) | 17,000 | |
22,062 | Capitec Bank Holdings Ltd. (South Africa) | 2,465 | |
241,006 | Close Brothers Group plc (United Kingdom) | 4,747 | |
140,182 | Danske Bank AS (Denmark) | 2,372 | |
740,434 | DBS Group Holdings Ltd. (Singapore) | 17,302 | |
581,921 | DNB Bank ASA (Norway)2 | 13,848 | |
242,300 | Fukuoka Financial Group Inc. (Japan) | 4,353 | |
123,422 | Hana Financial Group Inc. (South Korea) | 4,759 | |
151,417 | HDFC Bank Ltd. ADR (India)3 | 10,888 | |
691,169 | HSBC Holdings plc (Hong Kong) | 4,161 | |
1,697,823 | Intesa Sanpaolo SpA (Italy) | 4,825 | |
520,400 | Kasikornbank PCL (Thailand) | 2,219 | |
65,297,983 | Lloyds Banking Group plc (United Kingdom) | 44,689 | |
6,571,000 | Resona Holdings Inc. (Japan) | 24,685 | |
1,077,002 | Standard Chartered plc (United Kingdom) | 7,284 | |
317,900 | Sumitomo Mitsui Financial Group Inc. (Japan) | 10,316 | |
472,700 | Sumitomo Mitsui Trust Holdings Inc. (Japan) | 15,549 | |
1,908,008 | Svenska Handelsbanken AB (Sweden) | 21,870 | |
2,220,396 | UniCredit SpA (Italy) | 29,352 | |
385,900 | United Overseas Bank Ltd. (Singapore) | 7,671 | |
413,558 | |||
BEVERAGES—3.6% | |||
233,405 | Anheuser-Busch InBev SA (Belgium) | 14,277 | |
14,800 | Asahi Group Holdings Ltd. (Japan) | 672 | |
104,762 | Carlsberg AS (Denmark) | 17,298 | |
196,505 | Coca-Cola Europacific Partners plc (United States)* | 10,346 | |
828,970 | Davide Campari-Milano NV (Italy) | 11,775 | |
675,783 | Diageo plc (United Kingdom) | 33,621 | |
273,094 | Heineken NV (Netherlands) | 30,228 | |
1,769,600 | Kirin Holdings Co. Ltd. (Japan) | 30,801 | |
25,220 | Pernod Ricard SA (France) | 5,802 | |
98,800 | Suntory Beverage & Food Ltd. (Japan) | 3,834 | |
9,710,600 | Thai Beverage PCL (Singapore) | 5,112 | |
163,766 | |||
BUILDING PRODUCTS—2.2% | |||
1,365,166 | Assa Abloy AB Class B (Sweden) | 40,058 | |
52,219 | Geberit AG (Switzerland) | 40,780 | |
796,921 | GWA Group Ltd. (Australia) | 1,636 | |
620,800 | LIXIL Group Corp. (Japan) | 15,948 | |
98,422 | |||
CAPITAL MARKETS—2.5% | |||
1,984,634 | 3i Group plc (United Kingdom) | 37,063 | |
732,400 | Daiwa Securities Group Inc. (Japan) | 4,115 | |
941,197 | IG Group Holdings plc (United Kingdom) | 10,213 | |
29,353 | Industrivarden AB Class A (Sweden) | 968 | |
125,800 | JAFCO Group Co. Ltd. (Japan) | 7,970 | |
48,800 | Japan Exchange Group Inc. (Japan) | 1,156 | |
2,619,026 | Jupiter Fund Management plc (United Kingdom) | 8,970 |
COMMON STOCKS—Continued | |||
Shares | Value | ||
CAPITAL MARKETS—Continued | |||
3,418,600 | Nomura Holdings Inc. (Japan) | $16,281 | |
128,265 | Rathbone Brothers plc (United Kingdom) | 3,449 | |
876,014 | St. James's Place plc (United Kingdom) | 18,924 | |
202,391 | UBS Group AG (Switzerland) | 3,684 | |
112,793 | |||
CHEMICALS—1.4% | |||
794,200 | Air Water Inc. (Japan) | 12,151 | |
374,514 | BASF SE (Germany) | 26,955 | |
179,200 | Nissan Chemical Corp. (Japan) | 9,974 | |
9,300 | Nitto Denko Corp. (Japan) | 727 | |
271,141 | Orica Ltd. (Australia) | 3,113 | |
2,400 | Shin-Etsu Chemical Co. Ltd. (Japan) | 428 | |
107,600 | Sumitomo Bakelite Co. Ltd. (Japan) | 4,836 | |
115,100 | Tokyo Ohka Kogyo Co. Ltd. (Japan) | 7,317 | |
65,501 | |||
COMMERCIAL SERVICES & SUPPLIES—1.5% | |||
75,400 | AEON Delight Co. Ltd. (Japan) | 2,316 | |
752,164 | Brambles Ltd. (Australia) | 5,706 | |
4,015,133 | Cleanaway Waste Management Ltd. (Australia) | 8,166 | |
161,829 | Elis SA (France)* | 3,073 | |
2,101,555 | HomeServe plc (United Kingdom) | 24,549 | |
94,100 | Secom Co. Ltd. (Japan) | 6,415 | |
7,597,410 | Serco Group plc (United Kingdom) | 13,124 | |
85,800 | Sohgo Security Services Co. Ltd. (Japan) | 3,671 | |
67,020 | |||
CONSTRUCTION & ENGINEERING—1.1% | |||
310,998 | Boskalis Westminster NV (Netherlands) | 9,275 | |
133,926 | Ferrovial SA (Spain) | 4,228 | |
1,011,100 | Infroneer Holdings Inc. (Japan) | 8,375 | |
2,275,500 | Obayashi Corp. (Japan) | 19,210 | |
1,510,600 | Penta-Ocean Construction Co. Ltd. (Japan) | 10,409 | |
51,497 | |||
CONSTRUCTION MATERIALS—1.6% | |||
103,318 | CRH plc (Ireland) | 4,944 | |
1,126,751 | Fletcher Building Ltd. (New Zealand) | 5,795 | |
361,256 | Holcim Ltd. (Switzerland)* | 18,020 | |
36,653 | Imerys SA (France) | 1,589 | |
127,266 | James Hardie Industries PLC CDI (Australia)*,3 | 5,000 | |
869,300 | Taiheiyo Cement Corp. (Japan) | 18,469 | |
56,954 | Vicat SA (France) | 2,431 | |
509,677 | Wienerberger AG (Austria) | 18,043 | |
74,291 | |||
CONSUMER FINANCE—0.3% | |||
2,130,390 | International Personal Finance plc (United Kingdom) | 3,710 | |
2,290,775 | Non-Standard Finance plc (United Kingdom)*,1 | 121 | |
1,547,337 | Provident Financial plc (United Kingdom)* | 7,817 | |
11,648 | |||
CONTAINERS & PACKAGING—0.6% | |||
3,461,048 | DS Smith plc (United Kingdom) | 18,156 | |
776,900 | Toyo Seikan Group Holdings Ltd. (Japan) | 9,225 | |
27,381 | |||
DISTRIBUTORS—0.4% | |||
1,623,825 | Inchcape plc (United Kingdom) | 18,327 | |
DIVERSIFIED FINANCIAL SERVICES—0.5% | |||
3,532,349 | AMP Ltd. (Australia)* | 2,890 |
27
Harbor International Fund
Portfolio of Investments—Continued
Value, Cost, and Principal Amounts in Thousands
COMMON STOCKS—Continued | |||
Shares | Value | ||
DIVERSIFIED FINANCIAL SERVICES—Continued | |||
533,900 | Chailease Holding Co. Ltd. (Taiwan) | $5,113 | |
502,634 | Challenger Ltd. (Australia) | 2,640 | |
78,355 | Macquarie Group Ltd. (Australia) | 11,568x | |
22,211 | |||
DIVERSIFIED TELECOMMUNICATION SERVICES—1.8% | |||
536,107 | Deutsche Telekom AG (Germany) | 9,970 | |
4,494,784 | Koninklijke KPN NV (Netherlands) | 13,430 | |
1,653,600 | Nippon Telegraph & Telephone Corp. (Japan) | 46,332 | |
2,775,200 | Singapore Telecommunications Ltd. (Singapore) | 5,149 | |
2,029,233 | Telstra Corp. Ltd. (Australia) | 5,865 | |
80,746 | |||
ELECTRIC UTILITIES—0.5% | |||
165,216 | Orsted AS (Denmark)1 | 23,336 | |
ELECTRICAL EQUIPMENT—3.8% | |||
699,083 | ABB Ltd. (Switzerland) | 23,128 | |
192,640 | Havells India Ltd. (India)* | 3,268 | |
361,641 | Legrand SA (France) | 39,451 | |
41,400 | Mabuchi Motor Co. Ltd. (Japan) | 1,427 | |
372,000 | Mitsubishi Electric Corp. (Japan) | 4,996 | |
173,179 | Schneider Electric SE (France) | 29,859 | |
574,000 | TECO Electric and Machinery Co. Ltd. (Taiwan) | 624 | |
1,655,845 | Vestas Wind Systems AS (Denmark) | 71,582 | |
174,335 | |||
ELECTRONIC EQUIPMENT, INSTRUMENTS & COMPONENTS—0.8% | |||
324,000 | Chroma ATE Inc. (Taiwan) | 2,116 | |
457,000 | Delta Electronics Inc. (Taiwan) | 4,034 | |
146,700 | Kyocera Corp. (Japan) | 8,589 | |
69,900 | Omron Corp. (Japan) | 6,685 | |
28,100 | Shimadzu Corp. (Japan) | 1,141 | |
342,500 | TDK Corp. (Japan) | 12,451 | |
35,016 | |||
ENERGY EQUIPMENT & SERVICES—0.5% | |||
1,820,481 | John Wood Group plc (United Kingdom)* | 5,309 | |
294,248 | Petrofac Ltd. (United Kingdom)* | 521 | |
73,562 | Petrofac Ltd. (United Kingdom)* | 14x | |
6,633,206 | Saipem SpA (Italy)* | 14,533 | |
37,459 | Technip Energies NV (France)* | 577 | |
183,203 | TechnipFMC plc (France)* | 1,363 | |
22,317 | |||
ENTERTAINMENT—0.7% | |||
164,964 | CTS Eventim AG & Co. KGaA (Germany)* | 11,998 | |
34,100 | Konami Holdings Corp. (Japan) | 1,877 | |
360,970 | Modern Times Group MTG AB Class B (Sweden)* | 4,139 | |
7,200 | Nexon Co. Ltd. (Japan) | 123 | |
12,600 | Nintendo Co. Ltd. (Japan) | 5,565 | |
11,608 | Sea Ltd. ADR (Singapore)*,3 | 3,988 | |
130,500 | Toho Co. Ltd. (Japan) | 6,131 | |
33,821 | |||
FOOD & STAPLES RETAILING—1.6% | |||
163,334 | Bid Corp. Ltd. (South Africa) | 3,501 | |
177,134 | Clicks Group Ltd. (South Africa) | 3,240 | |
661,523 | Koninklijke Ahold Delhaize NV (Netherlands) | 21,521 | |
137,200 | Matsumotokiyoshi Holdings Co. Ltd. (Japan) | 6,083 | |
984,891 | Metcash Ltd. (Australia) | 3,035 | |
425,100 | Seven & I Holdings Co. Ltd. (Japan) | 17,848 | |
107,800 | Sundrug Co. Ltd. (Japan) | 3,155 |
COMMON STOCKS—Continued | |||
Shares | Value | ||
FOOD & STAPLES RETAILING—Continued | |||
3,426,087 | Tesco plc (United Kingdom) | $12,650 | |
72,243 | X5 Retail Group NV GDR (Russia)3 | 2,459 | |
73,492 | |||
FOOD PRODUCTS—1.7% | |||
60,500 | Calbee Inc. (Japan) | 1,559 | |
1,214,000 | China Mengniu Dairy Co. Ltd. (China)* | 7,724 | |
1,334,610 | Devro plc (United Kingdom) | 3,936 | |
2,546,000 | First Pacific Co. Ltd. (Hong Kong) | 1,017 | |
143,100 | Fuji Oil Holdings Inc. (Japan) | 3,358 | |
313,600 | Megmilk Snow Brand Co. Ltd. (Japan) | 6,068 | |
42,400 | Meiji Holdings Co. Ltd. (Japan) | 2,676 | |
212,500 | NH Foods Ltd. (Japan) | 7,473 | |
607,500 | Nippon Suisan Kaisha Ltd. (Japan) | 3,453 | |
3,514,000 | Tingyi Cayman Islands Holding Corp. (China) | 6,559 | |
322,800 | Toyo Suisan Kaisha Ltd. (Japan) | 13,909 | |
187,894 | Viscofan SA (Spain) | 12,848 | |
2,787,000 | Want Want China Holdings Ltd. (China) | 2,161 | |
118,600 | Yakult Honsha Co. Ltd. (Japan) | 5,993 | |
78,734 | |||
HEALTH CARE EQUIPMENT & SUPPLIES—3.9% | |||
275,934 | Coloplast AS Class B (Denmark) | 45,065 | |
7,151,292 | ConvaTec Group plc (United Kingdom)1 | 20,926 | |
532,790 | Demant AS (Denmark)* | 25,828 | |
319,618 | Getinge AB Class B (Sweden) | 14,303 | |
386,358 | GN Store Nord AS (Denmark) | 23,478 | |
5,500 | Hoya Corp. (Japan) | 810 | |
201,400 | Japan Lifeline Co. Ltd. (Japan) | 2,169 | |
424,931 | Koninklijke Philips NV (Netherlands) | 20,046 | |
67,400 | Olympus Corp. (Japan) | 1,460 | |
�� 222,742 | Smith & Nephew plc (United Kingdom) | 3,847 | |
50,447 | Sonova Holding AG (Switzerland) | 20,904 | |
178,836 | |||
HEALTH CARE PROVIDERS & SERVICES—1.1% | |||
358,600 | Alfresa Holdings Corp. (Japan) | 5,055 | |
166,273 | Amplifon SpA (Italy) | 8,461 | |
379,259 | Fresenius Medical Care AG & Co. KGaA (Germany) | 25,194 | |
510,600 | MediPAL Holdings Corp. (Japan) | 9,238 | |
93,000 | Ship Healthcare Holdings Inc. (Japan) | 2,443 | |
50,391 | |||
HOTELS, RESTAURANTS & LEISURE—4.6% | |||
2,983,000 | Ajisen China Holdings Ltd. (China) | 510 | |
114,998 | Aristocrat Leisure Ltd. (Australia) | 4,079 | |
272,387 | Carnival plc (United Kingdom)* | 5,498 | |
1,805,397 | Compass Group plc (United Kingdom)* | 38,312 | |
1,630,661 | Entain plc (United Kingdom)* | 45,693 | |
262,400 | Flutter Entertainment plc (Ireland)* | 49,517 | |
907,000 | Galaxy Entertainment Group Ltd. (Hong Kong)* | 4,880 | |
61,614 | InterContinental Hotels Group plc (United Kingdom)* | 4,316 | |
318,095 | Playtech plc (United Kingdom)* | 3,026 | |
7,506,150 | SSP Group plc (United Kingdom)* | 26,445 | |
4,844,162 | TUI AG (Germany)* | 16,111 | |
171,486 | Yum China Holdings Inc. (China) | 9,788 | |
208,175 | |||
HOUSEHOLD DURABLES—0.6% | |||
562,940 | Barratt Developments plc (United Kingdom) | 5,110 | |
278,100 | Casio Computer Co. Ltd. (Japan) | 3,936 | |
27,000 | Rinnai Corp. (Japan) | 2,772 | |
380,300 | Sekisui Chemical Co. Ltd. (Japan) | 6,248 |
28
Harbor International Fund
Portfolio of Investments—Continued
Value, Cost, and Principal Amounts in Thousands
COMMON STOCKS—Continued | |||
Shares | Value | ||
HOUSEHOLD DURABLES—Continued | |||
6,700 | Sony Group Corp. (Japan) | $ 776 | |
4,807,209 | Taylor Wimpey plc (United Kingdom) | 10,171 | |
29,013 | |||
HOUSEHOLD PRODUCTS—0.7% | |||
84,600 | Lion Corp. (Japan) | 1,409 | |
370,930 | Reckitt Benckiser Group plc (United Kingdom) | 30,113 | |
31,522 | |||
INDUSTRIAL CONGLOMERATES—2.6% | |||
153,000 | CK Hutchison Holdings Ltd. (Hong Kong) | 1,026 | |
206,557 | DCC plc (United Kingdom) | 17,235 | |
1,439,600 | Hitachi Ltd. (Japan) | 82,956 | |
165,000 | Jardine Matheson Holdings Ltd. (Hong Kong) | 9,584 | |
27,321 | LG Corp. (South Korea) | 2,136 | |
634,800 | Nisshinbo Holdings Inc. (Japan) | 4,900 | |
3,601,200 | Sime Darby Berhad (Malaysia) | 1,976 | |
119,813 | |||
INSURANCE—5.4% | |||
456,149 | Admiral Group plc (United Kingdom) | 17,919 | |
2,060,400 | AIA Group Ltd. (Hong Kong) | 23,091 | |
1,112,083 | AXA SA (France) | 32,354 | |
1,686,300 | Dai-ichi Life Holdings Inc. (Japan) | 35,477 | |
265,200 | Great Eastern Holdings Ltd. (Singapore) | 4,235 | |
36,415 | Hannover Rueck SE (Germany) | 6,649 | |
32,282 | Helvetia Holding AG (Switzerland) | 3,841 | |
476,246 | Hiscox Ltd. (United Kingdom) | 5,418 | |
2,523,400 | Japan Post Holdings Co. Ltd. (Japan) | 19,390 | |
148,900 | MS&AD Insurance Group Holdings Inc. (Japan) | 4,811 | |
576,000 | Ping An Insurance Group Co. of China Ltd. (China) | 4,126 | |
699,746 | Porto Seguro SA (Brazil)* | 2,894 | |
341,932 | Prudential plc (United Kingdom) | 6,963 | |
66,750 | Prudential plc (Hong Kong) | 1,359 | |
962,690 | QBE Insurance Group Ltd. (Australia) | 8,619 | |
686,269 | Sampo OYJ (Finland) | 36,483 | |
362,700 | Sompo Holdings Inc. (Japan) | 15,729 | |
273,200 | T&D Holdings Inc. (Japan) | 3,504 | |
284,900 | Tokio Marine Holdings Inc. (Japan) | 15,006 | |
247,868 | |||
INTERACTIVE MEDIA & SERVICES—1.7% | |||
1,590,920 | Auto Trader Group plc (United Kingdom)1 | 13,189 | |
55,572 | Baidu Inc. ADR (China)*,3 | 9,016 | |
369,578 | Carsales.com Ltd. (Australia) | 6,916 | |
455,784 | Domain Holdings Australia Ltd. (Australia) | 1,980 | |
4,750,955 | Rightmove plc (United Kingdom) | 44,909 | |
76,010 | |||
INTERNET & DIRECT MARKETING RETAIL—1.7% | |||
582,018 | HelloFresh SE (Germany)* | 47,166 | |
156,371 | Just Eat Takeaway.com NV (Netherlands)*,1 | 11,233 | |
40,940 | Naspers Ltd. (South Africa) | 6,933 | |
61,629 | Trip.com Group Ltd. ADR (China)*,3 | 1,760 | |
67,704 | Vipshop Holdings Ltd. ADR (China)*,3 | 756 | |
17,843 | Zooplus AG (Germany)* | 9,901 | |
34,500 | ZOZO Inc. (Japan) | 1,107 | |
78,856 | |||
IT SERVICES—3.2% | |||
96,951 | Alten SA (France) | 15,623 | |
14,505,181 | Capita plc (United Kingdom)* | 9,415 | |
442,344 | Edenred (France) | 23,936 |
COMMON STOCKS—Continued | |||
Shares | Value | ||
IT SERVICES—Continued | |||
224,175 | Infosys Ltd. ADR (India)3 | $4,994 | |
375,100 | NEC Corp. (Japan) | 19,206 | |
263,400 | NET One Systems Co. Ltd. (Japan) | 8,638 | |
21,400 | Nomura Research Institute Ltd. (Japan) | 857 | |
198,500 | NS Solutions Corp. (Japan) | 6,672 | |
1,262,500 | NTT Data Corp. (Japan) | 25,327 | |
44,300 | Otsuka Corp. (Japan) | 2,182 | |
39,774 | Reply SpA (Italy) | 7,720 | |
596,500 | SCSK Corp. (Japan) | 12,071 | |
164,802 | Tata Consultancy Services Ltd. (India) | 7,505 | |
144,146 | |||
LEISURE PRODUCTS—0.6% | |||
122,600 | Bandai Namco Holdings Inc. (Japan) | 9,369 | |
346,000 | Giant Manufacturing Co. Ltd. (Taiwan) | 4,018 | |
824,500 | Sega Sammy Holdings Inc. (Japan) | 11,725 | |
25,112 | |||
LIFE SCIENCES TOOLS & SERVICES—0.8% | |||
258,360 | Eurofins Scientific SE (France) | 30,490 | |
46,951 | Gerresheimer AG (Germany) | 4,308 | |
34,798 | |||
MACHINERY—3.3% | |||
96,803 | Andritz AG (Austria) | 5,498 | |
2,254,023 | CNH Industrial NV (Italy) | 38,827 | |
82,800 | Daifuku Co. Ltd. (Japan) | 7,623 | |
577,299 | Fluidra SA (Spain)* | 22,049 | |
94,036 | GEA Group AG (Germany) | 4,632 | |
23,300 | Hoshizaki Corp. (Japan) | 1,959 | |
34,200 | Makita Corp. (Japan) | 1,587 | |
613,800 | NSK Ltd. (Japan) | 4,125 | |
838,407 | Rotork plc (United Kingdom) | 4,053 | |
937,511 | Sandvik AB (Sweden) | 23,774 | |
186,557 | Stabilus SA (Germany) | 14,009 | |
371,000 | Techtronic Industries Co. Ltd. (Hong Kong) | 7,622 | |
633,261 | Wartsila OYJ ABP (Finland) | 8,782 | |
2,604,000 | Weichai Power Co. Ltd. (China) | 4,661 | |
149,201 | |||
MARINE—0.1% | |||
1,294,271 | Irish Continental Group plc (Ireland)* | 6,363 | |
MEDIA—2.7% | |||
301,173 | Daily Mail & General Trust plc (United Kingdom) | 4,275 | |
268,739 | Euromoney Institutional Investor plc (United Kingdom) | 3,844 | |
1,028,000 | Fuji Media Holdings Inc. (Japan) | 10,656 | |
345,800 | Hakuhodo DY Holdings Inc. (Japan) | 5,638 | |
753,681 | Informa plc (United Kingdom)* | 5,362 | |
14,459,137 | ITV plc (United Kingdom)* | 21,281 | |
547,144 | JCDecaux SA (France)* | 14,275 | |
915,800 | Nippon Television Holdings Inc. (Japan) | 9,866 | |
264,565 | Nordic Entertainment Group AB (Sweden)* | 15,341 | |
160,397 | Schibsted ASA Class A (Norway) | 8,287 | |
68,909 | Schibsted ASA Class B (Norway) | 3,126 | |
114,900 | TBS Holdings Inc. (Japan) | 1,817 | |
1,456,631 | WPP plc (United Kingdom) | 21,055 | |
124,823 | |||
METALS & MINING—3.8% | |||
807,030 | Acerinox SA (Spain) | 11,236 | |
183,138 | African Rainbow Minerals Ltd. (South Africa) | 2,445 | |
23,118 | Anglo American Platinum Ltd. (South Africa) | 2,342 |
29
Harbor International Fund
Portfolio of Investments—Continued
Value, Cost, and Principal Amounts in Thousands
COMMON STOCKS—Continued | |||
Shares | Value | ||
METALS & MINING—Continued | |||
998,695 | ArcelorMittal SA (France) | $33,776 | |
530,614 | BHP Group Ltd. (Australia) | 14,574 | |
314,865 | BlueScope Steel Ltd. (Australia) | 4,920 | |
1,537,304 | Evolution Mining Ltd. (Australia) | 4,174 | |
138,738 | First Quantum Minerals Ltd. (Canada) | 3,284 | |
7,878,413 | Glencore plc (United Kingdom)* | 39,397 | |
372,235 | Newcrest Mining Ltd. (Australia) | 6,974 | |
254,200 | Nippon Steel Corp. (Japan) | 4,457 | |
459,439 | Rio Tinto plc (United Kingdom) | 28,647 | |
242,628 | Severstal PJSC GDR (Russia)3 | 5,546 | |
89,544 | Southern Copper Corp. (Peru) | 5,372 | |
144,200 | Sumitomo Metal Mining Co. Ltd. (Japan) | 5,594 | |
172,738 | |||
MULTILINE RETAIL—0.1% | |||
336,700 | Marui Group Co. Ltd. (Japan) | 6,607 | |
OIL, GAS & CONSUMABLE FUELS—2.9% | |||
3,232,177 | Beach Energy Ltd. (Australia) | 3,396 | |
17,144,541 | BP plc (United Kingdom) | 82,138 | |
1,582,596 | Equinor ASA (Norway) | 40,100 | |
600,151 | Oil Search Ltd. (Australia) | 1,944 | |
1,096,605 | Santos Ltd. (Australia) | 5,758 | |
133,336 | |||
PAPER & FOREST PRODUCTS—0.3% | |||
2,461,800 | Oji Holdings Corp. (Japan) | 12,203 | |
PERSONAL PRODUCTS—1.0% | |||
25,253 | AMOREPACIFIC Group (South Korea) | 1,075 | |
336,031 | Dabur India Ltd. (India) | 2,643 | |
4,500 | Kao Corp. (Japan) | 255 | |
6,400 | Kose Corp. (Japan) | 743 | |
1,111,250 | L'Occitane International SA (Hong Kong) | 3,975 | |
93,100 | Mandom Corp. (Japan) | 1,353 | |
363,345 | Marico Ltd. (India)* | 2,758 | |
58,600 | Rohto Pharmaceutical Co. Ltd. (Japan) | 1,790 | |
526,746 | Unilever plc (United Kingdom) | 28,203 | |
866,000 | Uni-President Enterprises Corp. (Taiwan) | 2,078 | |
44,873 | |||
PHARMACEUTICALS—4.0% | |||
724,149 | Novo Nordisk AS (Denmark) | 79,406 | |
88,000 | Otsuka Holdings Co. Ltd. (Japan) | 3,480 | |
213,291 | Roche Holding AG (Switzerland) | 82,628 | |
56,400 | Sawai Group Holdings Co. Ltd. (Japan) | 2,488 | |
163,600 | Takeda Pharmaceutical Co. Ltd. (Japan) | 4,592 | |
339,700 | Tsumura & Co. (Japan) | 10,587 | |
183,181 | |||
PROFESSIONAL SERVICES—4.2% | |||
421,970 | Adecco Group AG (Switzerland) | 21,259 | |
372,347 | ALS Ltd. (Australia) | 3,735 | |
462,037 | Experian plc (United Kingdom) | 21,185 | |
11,567,572 | Hays plc (United Kingdom) | 26,215 | |
612,492 | Intertek Group plc (United Kingdom) | 41,017 | |
377,295 | IPH Ltd. (Australia) | 2,451 | |
386,800 | Nomura Co. Ltd. (Japan) | 3,814 | |
794,433 | PageGroup plc (United Kingdom)* | 7,209 | |
216,800 | Persol Holdings Co. Ltd. (Japan) | 5,827 | |
69,068 | Randstad NV (Netherlands) | 4,962 | |
1,035,646 | RELX plc (United Kingdom) | 32,113 | |
480,876 | RWS Holdings plc (United Kingdom) | 4,084 |
COMMON STOCKS—Continued | |||
Shares | Value | ||
PROFESSIONAL SERVICES—Continued | |||
121,600 | TechnoPro Holdings Inc. (Japan) | $3,886 | |
33,148 | Teleperformance (France) | 13,846 | |
191,603 | |||
REAL ESTATE MANAGEMENT & DEVELOPMENT—0.4% | |||
17,400 | Daito Trust Construction Co. Ltd. (Japan) | 2,157 | |
347,300 | Daiwa House Industry Co. Ltd. (Japan) | 11,458 | |
513,000 | Swire Pacific Ltd. (Hong Kong) | 3,225 | |
16,840 | |||
ROAD & RAIL—0.3% | |||
123,800 | East Japan Railway Co. (Japan) | 7,711 | |
1,036,076 | National Express Group plc (United Kingdom)* | 3,242 | |
389,700 | Senko Group Holdings Co. Ltd. (Japan) | 3,466 | |
14,419 | |||
SEMICONDUCTORS & SEMICONDUCTOR EQUIPMENT—1.8% | |||
208,500 | ASM Pacific Technology Ltd. (Hong Kong) | 2,256 | |
34,957 | ASML Holding NV (Netherlands) | 28,417 | |
139,000 | MediaTek Inc. (Taiwan) | 4,575 | |
1,022,100 | Renesas Electronics Corp. (Japan)* | 12,573 | |
172,200 | ROHM Co. Ltd. (Japan) | 15,746 | |
84,970 | SK Hynix Inc. (South Korea) | 7,490 | |
606,000 | Taiwan Semiconductor Manufacturing Co. Ltd. (Taiwan) | 12,859 | |
83,916 | |||
SOFTWARE—0.0% | |||
16,000 | Oracle Corp. Japan (Japan) | 1,514 | |
SPECIALTY RETAIL—0.9% | |||
72,800 | ABC-Mart Inc. (Japan) | 3,499 | |
10,699,900 | Esprit Holdings Ltd. (Hong Kong)* | 917 | |
1,588,289 | Pepkor Holdings Ltd. (South Africa)*,1 | 2,504 | |
1,514,458 | Pets at Home Group plc (United Kingdom) | 9,994 | |
168,400 | USS Co. Ltd. (Japan) | 2,714 | |
731,342 | WH Smith plc (United Kingdom)* | 15,656 | |
688,000 | Zhongsheng Group Holdings Ltd (China) | 6,203 | |
41,487 | |||
TECHNOLOGY HARDWARE, STORAGE & PERIPHERALS—0.7% | |||
426,000 | Advantech Co. Ltd. (Taiwan) | 5,571 | |
137,726 | Logitech International SA (Switzerland) | 11,521 | |
128,272 | Quadient SA (France) | 3,067 | |
216,168 | Samsung Electronics Co Ltd. (South Korea) | 12,943 | |
33,102 | |||
TEXTILES, APPAREL & LUXURY GOODS—2.9% | |||
87,692 | Adidas AG (Germany) | 28,702 | |
351,000 | ASICS Corp. (Japan) | 8,747 | |
265,494 | Cie Financiere Richemont SA (Switzerland) | 32,855 | |
388,988 | Cie Financiere Richemont SA ADR (South Africa)3 | 4,804 | |
198,869 | EssilorLuxottica SA (France) | 41,145 | |
501,500 | Li Ning Co. Ltd. (China) | 5,534 | |
564,200 | Onward Holdings Co. Ltd. (Japan) | 1,669 | |
966,000 | Samsonite International SA (Hong Kong)*,1 | 2,078 | |
278,718 | Shenzhou International Group Holdings Ltd. (China) | 6,005 | |
1,608,000 | Stella International Holdings Ltd. (Hong Kong) | 1,921 | |
133,460 | |||
THRIFTS & MORTGAGE FINANCE—0.2% | |||
219,389 | Housing Development Finance Corp. Ltd. (India)* | 8,355 |
30
Harbor International Fund
Portfolio of Investments—Continued
Value, Cost, and Principal Amounts in Thousands
COMMON STOCKS—Continued | |||
Shares | Value | ||
TOBACCO—0.4% | |||
91,353 | British American Tobacco plc (United Kingdom) | $3,178 | |
6,700 | Japan Tobacco Inc. (Japan) | 131 | |
1,552,316 | Swedish Match AB (Sweden) | 13,687 | |
16,996 | |||
TRADING COMPANIES & DISTRIBUTORS—1.6% | |||
263,500 | BOC Aviation Ltd. (China)1 | 2,306 | |
322,210 | Brenntag SE (Germany) | 30,654 | |
738,186 | Bunzl plc (United Kingdom) | 27,283 | |
376,900 | ITOCHU Corp. (Japan) | 10,750 | |
70,993 | |||
TRANSPORTATION INFRASTRUCTURE—0.4% | |||
623,638 | Getlink SE (France) | 9,599 | |
186,295 | Grupo Aeroportuario del Pacifico SAB de CV Class B (Mexico)* | 2,353 | |
239,400 | Mitsubishi Logistics Corp. (Japan) | 6,685 | |
18,637 | |||
WIRELESS TELECOMMUNICATION SERVICES—0.3% | |||
484,300 | KDDI Corp. (Japan) | 14,810 | |
TOTAL COMMON STOCKS | |||
(Cost $3,620,479) | 4,533,914 | ||
PREFERRED STOCKS—0.5% | |||
Shares | Value | ||
AUTOMOBILES—0.5% | |||
92,483 | Volkswagen AG (Germany) | $20,756 | |
PERSONAL PRODUCTS—0.0% | |||
10,039 | AMOREPACIFIC Group (South Korea) | 334 | |
TOTAL PREFERRED STOCKS | |||
(Cost $15,434) | 21,090 | ||
TOTAL INVESTMENTS—99.7% | |||
(Cost $3,635,913) | 4,555,004 | ||
CASH AND OTHER ASSETS, LESS LIABILITIES—0.3% | 15,563 | ||
TOTAL NET ASSETS—100.0% | $4,570,567 |
RIGHTS/WARRANTS
Description | No. of Contracts | Strike Price | Expiration Date | Cost (000s) | Value (000s) |
Cie Financiere Richemont SA | 805,198 | CHF 67.00 | 09/12/2023 | $ — | $44 |
FAIR VALUE MEASUREMENTS
The following table summarizes the Fund’s investments as of October 31, 2021 based on the inputs used to value them.
Asset Category | Quoted Prices Level 1 (000s) | Other Significant Observable Inputs Level 2 (000s) | Significant Unobservable Inputs Level 3 (000s) | Total (000s) |
Common Stocks | ||||
Africa | $— | $28,234 | $— | $28,234 |
Europe | 8,005 | 3,002,209 | — | 3,010,214 |
Latin America | 10,619 | — | — | 10,619 |
Middle East/Central Asia | 15,882 | 29,339 | — | 45,221 |
North America | 13,630 | — | — | 13,630 |
Pacific Basin | 35,902 | 1,378,526 | 11,568 | 1,425,996 |
Preferred Stocks | ||||
Europe | — | 20,756 | — | 20,756 |
Pacific Basin | — | 334 | — | 334 |
Total Investments in Securities | $84,038 | $4,459,398 | $11,568 | $4,555,004 |
Financial Derivatives Instruments - Assets | ||||
Rights/Warrants | $44 | $— | $— | $44 |
Total Investments | $84,082 | $4,459,398 | $11,568 | $4,555,048 |
For more information on valuation inputs and their aggregation into the levels used in the table above, please refer to the Fair Value Measurements and Disclosures in Note 2 of the accompanying Notes to Financial Statements.
31
Harbor International Fund
Portfolio of Investments—Continued
FAIR VALUE MEASUREMENTS—Continued
The following is a rollforward of the Fund’s Level 3 investments during the year ended October 31, 2021. Transfers into or out of Level 3 are recognized as of the last day in the fiscal quarter of the period in which the event or change in circumstances that caused the reclassification occured.
Valuation Description | Beginning Balance as of 11/01/2020 (000s) | Purchases (000s) | Sales (000s) | Discount/ (Premium) (000s) | Total Realized Gain/(Loss) (000s) | Change in Unrealized Appreciation/ (Depreciation) (000s) | Transfers Into Level 3h (000s) | Transfers Out of Level 3 (000s) | Ending Balance as of 10/31/2021 (000s) | Unrealized Gain/Loss as of 10/31/2021 (000s) |
Common Stocks | $— | $— | $— | $— | $— | $— | $11,568 | $— | $11,568 | $2,567 |
The following is a summary of significant unobservable inputs used in the fair valuations of assets and liabilities categorized within Level 3 of the fair value hierarchy.
Valuation Descriptions | Ending Balance as of 10/31/2021 (000s) | Valuation Technique | Unobservable Input(s) | Input Value(s) |
Investments in Securities | ||||
Common Stocks | ||||
Macquarie Group Ltd. (Australia) | $ 11,568 | Market Approach | Last Traded Price | AUD 196.25 |
*
Non-income producing security
x
Fair valued in accordance with Harbor Funds' Valuation Procedures.
1
Securities purchased in a transaction exempt from registration under Rule 144A of the Securities Act of 1933. These securities may be resold in transactions exempt from registration, normally to qualified institutional buyers. The Fund has no right to demand registration of these securities. At October 31, 2021, the aggregate value of these securities was $82,917 or 2% of net assets.
2
All or a portion of this security was out on loan as of October 31, 2021.
3
Depositary receipts such as American Depositary Receipts (ADRs), Global Depositary Receipts (GDRs) and other country specific depositary receipts are certificates evidencing ownership of shares of a foreign issuer. These certificates are issued by depositary banks and generally trade on an established market in the U.S. or elsewhere.
h
Transferred from Level 2 to Level 3 due to the unavailability of observable market data for pricing
AUD
Australian Dollar
CHF
Swiss Franc
The accompanying notes are an integral part of the Financial Statements.
32
Harbor International Growth Fund
Manager’s Commentary (Unaudited)
Subadviser
Baillie Gifford Overseas Limited
Calton Square
1 Greenside Row
Edinburgh, Scotland
United Kingdom
EH1 3AN
1 Greenside Row
Edinburgh, Scotland
United Kingdom
EH1 3AN
Portfolio Managers
Gerard Callahan
Since 2013
Since 2013
Iain Campbell
Since 2013
Since 2013
Joe Faraday, CFA
Since 2013
Since 2013
Moritz Sitte, CFA
Since 2014
Since 2014
Sophie Earnshaw, CFA
Since 2014
Since 2014
Baillie Gifford Overseas Limited has subadvised the Fund since 2013.
Investment Objective
The Fund seeks long-term growth of capital.
Management’s Discussion of
Fund Performance
Fund Performance
Market Review
The Harbor International Growth Fund underperformed its benchmark during the 12-month period ended October 31, 2021. The MSCI All Country World Ex U.S. (ND) Index, a basket of stocks in both developed and emerging overseas markets, returned 29.66%.
After a period during 2020 when the COVID-19 pandemic boosted the performance of capital-light, online businesses, the announcement of effective vaccines from November 2020 saw a change in market conditions, with growth businesses enjoying less of a tailwind.
As the immediate consequences of the pandemic have receded, the thoughts of policymakers and market participants have increasingly turned to the possibility that inflation will increase – and, if it does, the question of whether this will be a short-term phenomenon or a longer lasting one.
We endeavor not to be distracted by short-term considerations and prefer to approach portfolio construction by considering company fundamentals rather than macroeconomic issues. We aim to find good quality stocks that can produce above average earnings and that have the potential to outperform over the long term.
Performance
Harbor International Growth Fund returned 24.00% (Retirement Class), 23.92% (Institutional Class), 23.54% (Administrative Class) and 23.41% (Investor Class) for the annual period ended October 31, 2021, underperforming the 29.66% return of the MSCI All Country World Ex. U.S. (ND) Index. During this period, the Fund underperformed in each of the regions that make up the benchmark index other than Emerging Markets and Europe (ex-U.K.).
Where sectors are concerned, the main detractors from the Fund’s relative performance were Financials, Consumer Discretionary and Energy. The main sector contributors to performance were Information Technology, Industrials and Health Care. At the end of October 2021, the Fund was most overweight in the Consumer Discretionary and Industrials sectors, while it had no exposure to Utilities or Real Estate.
Our regional and sectoral positions are outputs of our bottom-up investment process. Given this fundamental approach, it is particularly relevant to consider the individual company holdings that impacted performance. The largest individual detractors from performance included Kingspan, Zalando and Alibaba. The main contributors during the period included NIBE, Sartorius and ASML Holding.
Kingspan, which makes insulation panels for buildings, was sold during the period. The company became embroiled in a controversy related to a tragic fire in a London high rise building in 2017. The company had no role in the design or planning of the cladding system used, and its products accounted for only a small fraction of those used on the building, but the subsequent inquiry into the event has revealed serious shortcomings in its approach to product-safety testing and the marketing of some of its building insulation materials. We engaged with the company in relation to these issues but found some of its responses underwhelming. Bearing in mind the potential future reputational consequences, and given concerns about the company’s culture, we subsequently decided to dispose of the holding. Zalando is an ecommerce company which specializes in fashion retail. It is the European leader in this segment. We believe it
33
Harbor International Growth Fund
Manager’s Commentary—Continued
CHANGE IN A $50,000 INVESTMENT
For the period 11/01/2011 through 10/31/2021
The graph compares a $50,000 investment in the Institutional Class shares of the Fund with the performance of the MSCI All Country World Ex. U.S. (ND) Index. The Fund’s performance assumes the reinvestment of all dividend and capital gain distributions.
TOTAL RETURNS
For the periods ended 10/31/2021
1 Year | Annualized | |||||
5 Years | 10 Years | |||||
Harbor International Growth Fund | ||||||
Retirement Class1 | 24.00% | 14.13% | 9.54% | |||
Institutional Class | 23.92 | 14.04 | 9.49 | |||
Administrative Class | 23.54 | 13.75 | 9.21 | |||
Investor Class | 23.41 | 13.61 | 9.08 | |||
Comparative Index | ||||||
MSCI All Country World Ex. U.S. (ND) | 29.66% | 9.77% | 6.66% |
As stated in the Fund’s prospectus dated March 1, 2021, the expense ratios were 0.77% (Net) and 0.83% (Gross) (Retirement Class); 0.85% (Net) and 0.91% (Gross) (Institutional Class); 1.10% (Net) and 1.16% (Gross) (Administrative Class); and 1.21% (Net) and 1.27% (Gross) (Investor Class). The net expense ratios reflect an expense limitation agreement (excluding interest expense, if any) effective through 02/28/2022. The expense ratios in the prospectus may differ from the actual expense ratios for the period disclosed within this report. The expense ratios shown in the prospectus are based on the prior fiscal year, adjusted to reflect changes, if any, in contractual arrangements that occurred prior to the date of the prospectus (or supplement thereto, if applicable).
Performance data shown represents past performance and is no guarantee of future results. Past performance is net of management fees and expenses and reflects reinvested dividends and distributions. Past performance reflects the beneficial effect of any expense waivers or reimbursements, without which returns would have been lower. Investment returns and principal value will fluctuate and when redeemed may be worth more or less than their original cost. Returns for periods less than one year are not annualized. Current performance may be higher or lower and is available through the most recent month end at harborcapital.com or by calling 800-422-1050.
has a large potential market as fashion sales move to online. Zalando has increasingly been investing in logistics infrastructure to enable it to supply third-party brands to its customers, rather than focusing on its own. Although the lift provided by the COVID-19 pandemic restrictions may now be receding, there are plenty of growth opportunities for the company in the long run, in our view. Alibaba operates a platform which dominates the e-commerce market in China. Recent results have been below expectations and the market has been concerned that the Chinese government may be less supportive of internet businesses than in the past.
NIBE is a Swedish heating technology company that aims to provide world-class solutions in sustainable energy. Its shares have performed well recently following strong organic growth and the business has benefitted from some of its acquisitions. Sartorius produces single-use equipment used in the manufacturing of biological products, such as antibodies and vaccines. The company is exposed to the attractive area of biological drugs and we believe it to be well-positioned to benefit from the structural shift from reusable to single-use biomanufacturing technology. ASML is one of the world’s largest manufacturers of equipment used in the production of semiconductors and, in particular, high-end lithography equipment. The company has continued to report solid results and its management has increased their guidance for this year’s earnings.
Outlook & Strategy
1
Retirement Class shares commenced operations on March 1, 2016. The performance attributed to the Retirement Class shares prior to that date is that of the Institutional Class shares. Performance prior to March 1, 2016 has not been adjusted to reflect the lower expenses of Retirement Class shares. During this period, Retirement Class shares would have had returns similar to, but potentially higher than, Institutional Class shares due to the fact that Retirement Class shares represent interests in the same portfolio as Institutional Class shares but are subject to lower expenses.
All international and global returns are in U.S. Dollars.
This report contains the current opinions of Baillie Gifford Overseas Limited as of the date of this report and should not be considered as investment advice or a recommendation of any particular security, strategy or investment product. Such opinions are subject to change without notice and securities described herein may no longer be included in, or may at any time be removed from, the Fund’s portfolio. This report is distributed for informational purposes only. Information contained herein has been obtained from sources believed reliable, but not guaranteed.
There is no guarantee that the investment objective of the Fund will be achieved. Stock markets are volatile and equity values can decline significantly in response to adverse issuer, political, regulatory, market and economic conditions. Investing in international and emerging markets poses special risks, including potentially greater price volatility due to social, political and economic factors, as well as currency exchange rate fluctuations. These risks are more severe for securities of issuers in emerging market regions. For information on the different share classes and the risks associated with an investment in the Fund, please refer to the current prospectus.
34
Harbor International Growth Fund
Portfolio of Investments—October 31, 2021
REGION BREAKDOWN (% of investments) -Unaudited
The Fund’s Portfolio of Investments include investments denominated in foreign currencies. As of October 31, 2021, there was no foreign currency denomination that comprised more than 25% of the Fund’s net assets.
Portfolio of Investments
Value, Cost, and Principal Amounts in Thousands
COMMON STOCKS—95.9% | |||
Shares | Value | ||
AUTO COMPONENTS—0.8% | |||
95,140 | Denso Corp. (Japan) | $6,897 | |
AUTOMOBILES—0.8% | |||
165,760 | Suzuki Motor Corp. (Japan) | 7,392 | |
BANKS—1.1% | |||
500,007 | United Overseas Bank Ltd. (Singapore) | 9,939 | |
BEVERAGES—2.4% | |||
61,288 | Remy Cointreau SA (France) | 12,381 | |
5,233,740 | Thai Beverage PCL (Thailand) | 2,755 | |
434,926 | United Spirits Ltd. (India)* | 5,543 | |
20,679 | |||
BIOTECHNOLOGY—1.1% | |||
19,775 | BeiGene Ltd. ADR (China)*,1 | 7,074 | |
165,704 | Burning Rock Biotech Ltd. ADR (China)*,1 | 2,335 | |
9,409 | |||
BUILDING PRODUCTS—2.7% | |||
1,574,632 | NIBE Industrier AB (Sweden) | 23,421 | |
CAPITAL MARKETS—1.3% | |||
517,848 | Hargreaves Lansdown plc (United Kingdom) | 10,897 |
COMMON STOCKS—Continued | |||
Shares | Value | ||
CHEMICALS—2.6% | |||
404,353 | Asian Paints Ltd. (India)* | $16,800 | |
163,893 | Johnson Matthey plc (United Kingdom) | 6,126 | |
22,926 | |||
COMMERCIAL SERVICES & SUPPLIES—0.5% | |||
345,202 | HomeServe plc (United Kingdom) | 4,032 | |
DIVERSIFIED FINANCIAL SERVICES—1.1% | |||
434,360 | Investor AB Class B (Sweden) | 10,022 | |
ELECTRICAL EQUIPMENT—2.7% | |||
104,756 | Contemporary Amperex Technology Co. Ltd. (China) | 10,494 | |
120,380 | Nidec Corp. (Japan) | 13,333 | |
23,827 | |||
ELECTRONIC EQUIPMENT, INSTRUMENTS & COMPONENTS—2.6% | |||
17,840 | Keyence Corp. (Japan) | 10,768 | |
156,460 | Murata Manufacturing Co. Ltd. (Japan) | 11,606 | |
22,374 | |||
ENTERTAINMENT—2.0% | |||
42,712 | Spotify Technology SA (Sweden)* | 12,361 | |
89,214 | Ubisoft Entertainment SA (France)* | 4,671 | |
17,032 |
35
Harbor International Growth Fund
Portfolio of Investments—Continued
Value, Cost, and Principal Amounts in Thousands
COMMON STOCKS—Continued | |||
Shares | Value | ||
FOOD & STAPLES RETAILING—2.8% | |||
410,708 | Jeronimo Martins SGPS SA (Portugal) | $9,305 | |
1,654,180 | Raia Drogasil SA (Brazil)* | 6,815 | |
59,220 | Sugi Holdings Co. Ltd. (Japan) | 4,240 | |
1,155,089 | Wal-Mart de Mexico SAB de CV (Mexico) | 4,024 | |
24,384 | |||
HEALTH CARE EQUIPMENT & SUPPLIES—4.8% | |||
72,685 | Cochlear Ltd. (Australia) | 12,158 | |
625,780 | Olympus Corp. (Japan) | 13,556 | |
131,640 | Sysmex Corp. (Japan) | 16,322 | |
42,036 | |||
HOUSEHOLD PRODUCTS—0.3% | |||
128,640 | Pigeon Corp. (Japan) | 2,979 | |
INSURANCE—2.4% | |||
1,070,960 | AIA Group Ltd. (Hong Kong) | 12,002 | |
211,083 | ICICI Lombard General Insurance Co Ltd. (India)2 | 4,206 | |
615,600 | Ping An Insurance Group Co. of China Ltd. (China) | 4,410 | |
20,618 | |||
INTERACTIVE MEDIA & SERVICES—6.7% | |||
1,393,907 | Auto Trader Group plc (United Kingdom)2 | 11,556 | |
36,836 | Baidu Inc. ADR (China)*,1 | 5,976 | |
240,640 | Kakaku.com Inc. (Japan) | 7,986 | |
25,730 | Naver Corp. (South Korea) | 8,946 | |
1,563,130 | Rightmove plc (United Kingdom) | 14,776 | |
1,407,600 | Z Holdings Corp. (Japan) | 8,738 | |
57,978 | |||
INTERNET & DIRECT MARKETING RETAIL—12.4% | |||
79,825 | Alibaba Group Holding Ltd. ADR (China)*,1 | 13,166 | |
80,251 | ASOS plc (United Kingdom)* | 2,725 | |
190,632 | AUTO1 Group SE (Germany)*,2 | 7,500 | |
109,904 | Coupang Inc. (South Korea)* | 3,271 | |
61,216 | Games Workshop Group plc (United Kingdom) | 8,086 | |
100,258 | MakeMyTrip Ltd. (India)* | 3,175 | |
384,340 | Meituan Class B (China)*,2 | 13,079 | |
8,396 | MercadoLibre Inc. (Argentina)* | 12,435 | |
61,257 | Naspers Ltd. (South Africa) | 10,374 | |
59,038 | Prosus NV (Netherlands)* | 5,200 | |
1,297,447 | Trainline plc (United Kingdom)*,2 | 5,637 | |
134,536 | Trip.com Group Ltd. ADR (China)*,1 | 3,842 | |
206,510 | Zalando SE (Germany)*,2 | 19,511 | |
108,001 | |||
IT SERVICES—4.8% | |||
226,878 | Bechtle AG (Germany) | 17,019 | |
14,014 | Shopify Inc. (Canada)* | 20,555 | |
413,086 | Wise plc (United Kingdom)* | 4,622 | |
42,196 | |||
LEISURE PRODUCTS—1.4% | |||
42,880 | Shimano Inc. (Japan) | 11,964 | |
LIFE SCIENCES TOOLS & SERVICES—2.1% | |||
12,201 | Mettler-Toledo International Inc. (Switzerland)* | 18,068 | |
MACHINERY—8.8% | |||
186,835 | Atlas Copco AB Class A (Sweden) | 12,032 | |
83,469 | Atlas Copco AB Class B (Sweden) | 4,524 | |
456,365 | Epiroc AB Class B (Sweden) | 9,695 | |
121,481 | Kone OYJ Class B (Finland) | 8,285 |
COMMON STOCKS—Continued | |||
Shares | Value | ||
MACHINERY—Continued | |||
8,522 | Rational AG (Germany) | $8,458 | |
21,480 | SMC Corp. (Japan) | 12,819 | |
792,800 | Techtronic Industries Co. Ltd. (Hong Kong) | 16,288 | |
202,406 | Weir Group plc (United Kingdom) | 4,801 | |
76,902 | |||
PERSONAL PRODUCTS—1.9% | |||
77,740 | Kao Corp. (Japan) | 4,397 | |
162,120 | Shiseido Co. Ltd. (Japan) | 10,818 | |
421,107 | Yatsen Holding Ltd. ADR (China)*,1 | 1,179 | |
16,394 | |||
PROFESSIONAL SERVICES—2.1% | |||
99,319 | Intertek Group plc (United Kingdom) | 6,651 | |
171,700 | Recruit Holdings Co. Ltd. (Japan) | 11,421 | |
18,072 | |||
SEMICONDUCTORS & SEMICONDUCTOR—1.2% | |||
692,200 | Longi Green Energy Technology Co. Ltd. (China)* | 10,554 | |
SEMICONDUCTORS & SEMICONDUCTOR EQUIPMENT—6.9% | |||
37,863 | ASML Holding NV (Netherlands) | 30,779 | |
257,813 | Taiwan Semiconductor Manufacturing Co. Ltd. ADR (Taiwan)1 | 29,313 | |
60,092 | |||
SOFTWARE—2.5% | |||
72,341 | Nemetschek SE (Germany) | 8,306 | |
117,807 | Xero Ltd. (New Zealand)* | 13,433 | |
21,739 | |||
SPECIALTY RETAIL—1.3% | |||
318,423 | Industria de Diseno Textil SA (Spain) | 11,535 | |
TEXTILES, APPAREL & LUXURY GOODS—7.5% | |||
30,057 | Adidas AG (Germany) | 9,838 | |
228,911 | Burberry Group plc (United Kingdom) | 6,050 | |
114,969 | Cie Financiere Richemont SA (Switzerland) | 14,227 | |
11,031 | Kering SA (France) | 8,279 | |
1,498,900 | Li Ning Co. Ltd. (China) | 16,540 | |
13,666 | LVMH Moet Hennessy Louis Vuitton SE (France) | 10,716 | |
65,650 | |||
THRIFTS & MORTGAGE FINANCE—2.1% | |||
479,322 | Housing Development Finance Corp. Ltd. (India)* | 18,254 | |
TRADING COMPANIES & DISTRIBUTORS—1.5% | |||
57,135 | IMCD NV (Netherlands) | 12,687 | |
WIRELESS TELECOMMUNICATION SERVICES—0.7% | |||
115,280 | SoftBank Group Corp. (Japan) | 6,241 | |
TOTAL COMMON STOCKS | |||
(Cost $532,415) | 835,191 | ||
36
Harbor International Growth Fund
Portfolio of Investments—Continued
Value, Cost, and Principal Amounts in Thousands
PREFERRED STOCKS—2.5% | |||
(Cost $4,669) | |||
Shares | Value | ||
HEALTH CARE EQUIPMENT & SUPPLIES—2.5% | |||
33,462 | Sartorius AG (Germany) | $21,675 | |
TOTAL INVESTMENTS—98.4% | |||
(Cost $537,084) | 856,866 | ||
CASH AND OTHER ASSETS, LESS LIABILITIES—1.6% | 13,944 | ||
TOTAL NET ASSETS—100.0% | $870,810 |
FAIR VALUE MEASUREMENTS
The following table summarizes the Fund’s investments as of October 31, 2021 based on the inputs used to value them.
Asset Category | Quoted Prices Level 1 (000s) | Other Significant Observable Inputs Level 2 (000s) | Significant Unobservable Inputs Level 3 (000s) | Total (000s) |
Common Stocks | ||||
Africa | $— | $10,374 | $— | $10,374 |
Europe | 30,429 | 344,350 | — | 374,779 |
Latin America | 23,274 | — | — | 23,274 |
Middle East/Central Asia | 3,175 | 44,803 | — | 47,978 |
North America | 20,555 | — | — | 20,555 |
Pacific Basin | 66,156 | 292,075 | — | 358,231 |
Preferred Stocks | ||||
Europe | — | 21,675 | — | 21,675 |
Total Investments in Securities | $143,589 | $713,277 | $— | $856,866 |
For more information on valuation inputs and their aggregation into the levels used in the table above, please refer to the Fair Value Measurements and Disclosures in Note 2 of the accompanying Notes to Financial Statements.
The following is a rollforward of the Fund’s Level 3 investments during the year ended October 31, 2021.
Valuation Description | Beginning Balance as of 11/01/2020 (000s) | Purchases (000s) | Sales (000s) | Discount/ (Premium) (000s) | Total Realized Gain/(Loss) (000s) | Change in Unrealized Appreciation/ (Depreciation) (000s) | Transfers Into Level 3 (000s) | Transfers Out of Level 3 (000s) | Ending Balance as of 10/31/2021 (000s) | Unrealized Gain/ Loss as of 10/31/2021 (000s) |
Common Stocks | $6,629 | $438 | $(10,429) | $— | $4,408 | $(1,046) | $— | $— | $— | $— |
*
Non-income producing security
1
Depositary receipts such as American Depositary Receipts (ADRs), Global Depositary Receipts (GDRs) and other country specific depositary receipts are certificates evidencing ownership of shares of a foreign issuer. These certificates are issued by depositary banks and generally trade on an established market in the U.S. or elsewhere.
2
Securities purchased in a transaction exempt from registration under Rule 144A of the Securities Act of 1933. These securities may be resold in transactions exempt from registration, normally to qualified institutional buyers. The Fund has no right to demand registration of these securities. At October 31, 2021, the aggregate value of these securities was $61,489 or 7% of net assets.
The accompanying notes are an integral part of the Financial Statements.
37
Harbor International Small Cap Fund
Manager’s Commentary (Unaudited)
Subadviser
Cedar Street Asset Management LLC
455 North Cityfront Plaza Drive
Suite 1710
Chicago, IL 60611
Suite 1710
Chicago, IL 60611
Portfolio Managers
Jonathan P. Brodsky
Since 2019
Since 2019
Waldemar A. Mozes
Since 2019
Since 2019
Cedar Street has subadvised the Fund since 2019.
Investment Objective
The Fund seeks long-term growth of capital.
Management’s Discussion of
Fund Performance
Fund Performance
Market Review
During the fiscal year ended October 31, 2021, non-U.S. small capitalization stocks rebounded sharply from the COVID-19-induced losses of the previous fiscal year. Catalysts for such a rebound are typically only identifiable in hindsight. However, on November 9, 2020, global equity markets witnessed, in our view, one of the clearest turning points in recent memory with the announcement of a highly effective COVID-19 vaccine. Suddenly, the mere availability of a vaccine meant that markets could begin discounting stocks based on their future prospects rather than lockdowns. Also supportive of global equities, in our view, was the accommodative stance of most central banks as they kept rates near historic lows for most of the year while they also pumped $30 trillion of assets into the global economy. Various government-funded fiscal programs added trillions more stimulus to the global economy, providing what we believed to be ample capital to satisfy almost any speculative capital market thirst.
Other notable market reversals included the relative outperformance of value style equities versus growth style equities such as the MSCI EAFE Small Cap (ND) Value Index’s 39% gain versus the 32% gain of the MSCI EAFE Small Cap (ND) Growth Index. This was the first such outperformance by the value segment of the benchmark since the fiscal year ending October 31, 2016, and only the third since the Global Financial Crisis (“GFC”) in 2009. Likewise, the performance spread between value factors and growth factors in major non-U.S. developed markets exceeded 30% points, reversing most of the nearly 50% points of underperformance of the prior fiscal year.
We view these reversals as somewhat surprising given that the underperformance of value style equities relative to growth style equities in the post-GFC era has been widely attributed, at least in part, to central bank easing. This seeming contradiction can potentially be explained by the other notable reversal of fiscal year 2021: bond yields.
The yield on the 10-year U.S. Treasury rose during the fiscal year from 0.84% to 1.55%. Despite our focus on non-U.S. markets, we highlight the U.S. Treasury due to its status as the global benchmark for risk-free rates. Many developed market 10-year government bonds in Europe and Asia also experienced similar reversals. Global GDP growth, which is expected to reach nearly 6% in calendar year 2021 for the first time in decades, is one potential reason why bond yields rose. Another significant reason, in our view, is the reversal in perceptions about inflation.
A system as complex as the global economy cannot be turned off and on like a switch. In the earlier part of the fiscal year, the high headline numbers from some measures of inflation were potentially the product of low base effects that occurred when much of the global economy was in lockdown in Spring 2020. This is the so-called “transitory” argument. But the latest figures, as of October 2021, from the Federal Reserve (“Fed”) and other central banks, indicate persistent inflationary pressures with headline figures that are their highest in decades. Adjusted figures, which strip out volatile pandemic-specific impacts, are well above the Fed’s targets. In China, the world’s largest exporter (including the biggest exporter of deflation), producer prices are at a 25-year high, which we believe likely indicates future inflationary pressures throughout the supply chain. While in Germany, a country known for resistance to inflation, headline figures show the highest rate of inflation since the introduction of the Euro.
In our view, the evidence seems compelling that inflationary pressures are no longer “transitory” and developed market central banks are likely going to join the array of emerging markets central banks in tightening before too long. A rising interest rate environment erodes long-dated
38
Harbor International Small Cap Fund
Manager’s Commentary—Continued
CHANGE IN A $50,000 INVESTMENT
For the period 02/01/2016 through 10/31/2021
The graph compares a $50,000 investment in the Institutional Class shares of the Fund with the performance of the MSCI EAFE Small Cap (ND) Index. The Fund’s performance assumes the reinvestment of all dividend and capital gain distributions.
TOTAL RETURNS
For the periods ended 10/31/2021
1 Year | Annualized | |||||
5 Years | Life of Fund | |||||
Harbor International Small Cap Fund | ||||||
Retirement Class1 | 45.95% | 11.16% | 11.06% | |||
Institutional Class1 | 45.87 | 11.07 | 10.99 | |||
Administrative Class1 | 45.44 | 10.78 | 10.70 | |||
Investor Class1 | 45.25 | 10.65 | 10.57 | |||
Comparative Index | ||||||
MSCI EAFE Small Cap (ND)1 | 35.77% | 11.37% | 11.82% |
As stated in the Fund’s prospectus dated March 1, 2021, the expense ratios were 0.88% (Net) and 1.37% (Gross) (Retirement Class); 0.96% (Net) and 1.45% (Gross) (Institutional Class); 1.21% (Net) and 1.70% (Gross) (Administrative Class); and 1.32% (Net) and 1.81% (Gross) (Investor Class). The net expense ratios reflect an expense limitation agreement (excluding interest expense, if any) effective through 02/28/2022. The expense ratios in the prospectus may differ from the actual expense ratios for the period disclosed within this report. The expense ratios shown in the prospectus are based on the prior fiscal year, adjusted to reflect changes, if any, in contractual arrangements that occurred prior to the date of the prospectus (or supplement thereto, if applicable).
Performance data shown represents past performance and is no guarantee of future results. Past performance is net of management fees and expenses and reflects reinvested dividends and distributions. Past performance reflects the beneficial effect of any expense waivers or reimbursements, without which returns would have been lower. Investment returns and principal value will fluctuate and when redeemed may be worth more or less than their original cost. Returns for periods less than one year are not annualized. Current performance may be higher or lower and is available through the most recent month end at harborcapital.com or by calling 800-422-1050.
terminal cash flows via higher discount rates, which has been supportive of elevated multiples for growth-oriented strategies. On the flipside, well-capitalized value equities are less prone to multiple contraction in a rising rate environment due to their lower valuations and their business models.
Performance
Harbor International Small Cap Fund returned 45.95% (Retirement Class), 45.87% (Institutional Class), 45.44% (Administrative Class) and 45.25% (Investor Class) compared to the MSCI EAFE Small Cap (ND) Index, which returned 35.77% during the year ended October 31, 2021.
The relative outperformance over the period was broad-based and primarily reflects what we believe to be positive stock selection effects in the U.K. and continental Europe. From a sector perspective, stock selection in Consumers and Technology were the main contributors to returns, offset somewhat by our lack of exposure to the Real Estate sector.
During the period under review, the main detractors to Fund performance spanned the globe and were companies that experienced company-specific issues. For example, Service Stream in Australia experienced a significant decline when its major customer unexpectedly reduced the share of projects awarded to its telecom support services business. We exited Service Stream due to a structural shift in our underlying thesis that was no longer supported by valuation.
The Fund’s top contributors include several U.K.-listed companies such as Redde Northgate, a van leasing and insurance services business operating in the U.K. and Spain and benefitting from high demand for fleet services and the resale value of its used commercial vehicles. Maire Technimont is an engineering services firm focused on natural gas and downstream energy transition projects. Demand for the company’s services continues to grow as energy bottlenecks become more apparent post-lockdown and the company’s experience in green hydrogen attracts more customers. As always, country and sector allocations continue to be driven by company-specific factors and we have not significantly modified our exposures.
Outlook & Strategy
In our view, inflation has taken the baton from the COVID-19 pandemic as the dominant macroeconomic concern for markets. Although neither the Fed nor the European Central Bank have admitted it, our view of available data suggests inflation is no longer transitory. We believe few financial market participants have direct experience dealing with inflation which likely means a continuation of the equity and bond market volatility we experienced in the final weeks of the fiscal year.
Meanwhile, a new geopolitical era is dawning with relatively new leaders in the U.S., Germany and Japan, and a Chinese president establishing a level of authority that has not been considered in decades.
Heading into uncharted territory on so many fronts, we believe our non-U.S., small cap value asset class is well-positioned from a relative, absolute value and fundamentals basis.
39
Harbor International Small Cap Fund
Manager’s Commentary—Continued
1 | The “Life of Fund” return as shown reflects the period 02/01/2016 through 10/31/2021. |
All international and global returns are in U.S. Dollars.
This report contains the current opinions of Cedar Street Asset Management LLC as of the date of this report and should not be considered as investment advice or a recommendation of any particular security, strategy or investment product. Such opinions are subject to change without notice and securities described herein may no longer be included in, or may at any time be removed from, the Fund’s portfolio. This report is distributed for informational purposes only. Information contained herein has been obtained from sources believed reliable, but not guaranteed.
There is no guarantee that the investment objective of the Fund will be achieved. Stock markets are volatile and equity values can decline significantly in response to adverse issuer, political, regulatory, market and economic conditions. Investing in international and emerging markets poses special risks, including potentially greater price volatility due to social, political and economic factors, as well as currency exchange rate fluctuations. These risks are more severe for securities of issuers in emerging market regions. For information on the different share classes and the risks associated with an investment in the Fund, please refer to the current prospectus.
40
Harbor International Small Cap Fund
Portfolio of Investments—October 31, 2021
REGION BREAKDOWN (% of investments) -Unaudited
The Fund’s Portfolio of Investments include investments denominated in foreign currencies. As of October 31, 2021, 33% of the Fund’s investments were denominated in Euro. No other foreign currency denomination comprised more than 25% of the Fund’s net assets.
Portfolio of Investments
Value, Cost, and Principal Amounts in Thousands
COMMON STOCKS—94.3% | |||
Shares | Value | ||
AEROSPACE & DEFENSE—2.0% | |||
75,029 | Hensoldt AG (Germany)* | $1,214 | |
AUTO COMPONENTS—1.5% | |||
427,380 | Johnson Electric Holdings Ltd. (Hong Kong) | 946 | |
BANKS—1.8% | |||
394,880 | Virgin Money UK plc (United Kingdom)* | 1,097 | |
BEVERAGES—1.6% | |||
277,584 | C&C Group plc (Ireland)* | 982 | |
CAPITAL MARKETS—2.7% | |||
55,954 | Intertrust NV (Netherlands)*,1 | 846 | |
384,667 | TP ICAP Group plc (Jersey) | 817 | |
1,663 | |||
CHEMICALS—5.3% | |||
39,700 | KH Neochem Co. Ltd. (Japan) | 1,020 | |
79,026 | Neo Performance Materials Inc. (Canada) | 1,218 | |
31,716 | Victrex plc (United Kingdom) | 992 | |
3,230 | |||
COMMERCIAL SERVICES & SUPPLIES—4.1% | |||
48,156 | ISS AS (Denmark)* | 961 |
COMMON STOCKS—Continued | |||
Shares | Value | ||
COMMERCIAL SERVICES & SUPPLIES—Continued | |||
38,808 | Loomis AB (Sweden) | $1,047 | |
198,527 | Mears Group PLC (United Kingdom) | 539 | |
2,547 | |||
CONSTRUCTION & ENGINEERING—3.5% | |||
265,507 | Maire Tecnimont SpA (Italy) | 1,144 | |
55,453 | Raito Kogyo Co. Ltd. (Japan) | 986 | |
2,130 | |||
CONSUMER FINANCE—2.0% | |||
3,404 | Cembra Money Bank AG (Switzerland) | 227 | |
189,867 | Resurs Holding AB (Sweden)1 | 1,023 | |
1,250 | |||
CONTAINERS & PACKAGING—1.6% | |||
39,600 | BillerudKorsnas AB (Sweden) | 829 | |
57,904 | Orora Ltd. (Australia) | 145 | |
974 | |||
DISTRIBUTORS—1.9% | |||
26,915 | PALTAC Corp. (Japan) | 1,192 | |
ELECTRICAL EQUIPMENT—1.4% | |||
23,083 | Mersen SA (France) | 866 |
41
Harbor International Small Cap Fund
Portfolio of Investments—Continued
Value, Cost, and Principal Amounts in Thousands
COMMON STOCKS—Continued | |||
Shares | Value | ||
ELECTRONIC EQUIPMENT, INSTRUMENTS & COMPONENTS—9.3% | |||
43,009 | Amano Corp. (Japan) | $1,064 | |
51,663 | Daiwabo Holdings Co. Ltd. (Japan) | 910 | |
16,644 | Landis+Gyr Group AG (Switzerland)* | 1,144 | |
37,400 | Nohmi Bosai Ltd. (Japan) | 686 | |
67,572 | Optex Group Co. Ltd. (Japan) | 861 | |
72,820 | Venture Corp. Ltd. (Singapore) | 1,017 | |
5,682 | |||
ENERGY EQUIPMENT & SERVICES—1.8% | |||
72,433 | Technip Energies NV (France)* | 1,115 | |
FOOD & STAPLES RETAILING—1.5% | |||
61,768 | Qol Holdings Co. Ltd. (Japan) | 918 | |
FOOD PRODUCTS—7.3% | |||
697,540 | Aryzta AG (Switzerland)* | 912 | |
89,559 | Elders Ltd. (Australia) | 814 | |
55,201 | Glanbia plc (Ireland) | 901 | |
1,653,382 | Japfa Ltd. (Singapore) | 843 | |
28,887 | Morinaga & Co. Ltd. (Japan) | 1,021 | |
4,491 | |||
HEALTH CARE PROVIDERS & SERVICES—2.0% | |||
24,763 | BML Inc. (Japan) | 870 | |
101,517 | Healius Ltd. (Australia) | 372 | |
1,242 | |||
HOTELS, RESTAURANTS & LEISURE—3.4% | |||
56,010 | RESORTTRUST, Inc. (Japan) | 993 | |
90,588 | Round One Corp. (Japan) | 1,090 | |
2,083 | |||
INDUSTRIAL CONGLOMERATES—1.1% | |||
16,819 | Indus Holding AG (Germany) | 662 | |
INSURANCE—7.4% | |||
26,184 | ASR Nederland NV (Netherlands) | 1,224 | |
84,743 | Coface SA (France) | 1,211 | |
280,664 | Direct Line Insurance Group plc (United Kingdom) | 1,122 | |
464,181 | Mapfre SA (Spain) | 983 | |
4,540 | |||
INTERNET & DIRECT MARKETING RETAIL—1.7% | |||
63,979 | TAKKT AG (Germany) | 1,045 | |
IT SERVICES—1.7% | |||
33,296 | Tietoevry OYJ (Finland) | 1,021 | |
MACHINERY—3.2% | |||
9,679 | Krones AG (Germany) | 997 | |
58,889 | OSG Corp. (Japan) | 980 | |
1,977 | |||
MARINE—0.2% | |||
1,822 | Clarkson plc (United Kingdom) | 100 | |
MEDIA—3.9% | |||
206,067 | Atresmedia Corp. de Medios de Comunicacion SA (Spain)* | 840 | |
22,243 | Criteo SA ADR (France)*,2 | 735 | |
13,693 | RTL Group SA (Luxembourg) | 791 | |
2,366 |
COMMON STOCKS—Continued | |||
Shares | Value | ||
OIL, GAS & CONSUMABLE FUELS—1.6% | |||
932,423 | Beach Energy Ltd. (Australia) | $980 | |
PAPER & FOREST PRODUCTS—1.8% | |||
290,253 | Navigator Co. SA (Portugal) | 1,134 | |
PERSONAL PRODUCTS—1.4% | |||
88,576 | Ontex Group NV (Belgium)* | 835 | |
PROFESSIONAL SERVICES—1.0% | |||
48,843 | BeNext-Yumeshin Group Co. (Japan) | 637 | |
ROAD & RAIL—1.6% | |||
182,840 | Redde Northgate plc (United Kingdom) | 995 | |
SEMICONDUCTORS & SEMICONDUCTOR EQUIPMENT—3.3% | |||
37,808 | Tower Semiconductor Ltd. (Israel)* | 1,205 | |
83,162 | X-FAB Silicon Foundries SE (Belgium)*,1 | 830 | |
2,035 | |||
SOFTWARE—3.5% | |||
86,445 | Computer Engineering & Consulting Ltd. (Japan) | 1,029 | |
131,986 | TomTom NV (Netherlands)* | 1,134 | |
2,163 | |||
SPECIALTY RETAIL—1.1% | |||
35,340 | Matas AS (Denmark) | 692 | |
TEXTILES, APPAREL & LUXURY GOODS—1.6% | |||
1,125,698 | Coats Group plc (United Kingdom) | 993 | |
TRADING COMPANIES & DISTRIBUTORS—1.6% | |||
45,196 | Kanamoto Co. Ltd. (Japan) | 968 | |
TRANSPORTATION INFRASTRUCTURE—1.9% | |||
268,267 | ENAV SpA (Italy)*,1 | 1,177 | |
TOTAL COMMON STOCKS | |||
(Cost $51,670) | 57,942 | ||
TOTAL INVESTMENTS—94.3% | |||
(Cost $51,670) | 57,942 | ||
CASH AND OTHER ASSETS, LESS LIABILITIES—5.7% | 3,485 | ||
TOTAL NET ASSETS—100.0% | $61,427 |
42
Harbor International Small Cap Fund
Portfolio of Investments—Continued
FAIR VALUE MEASUREMENTS
The following table summarizes the Fund’s investments as of October 31, 2021 based on the inputs used to value them.
Asset Category | Quoted Prices Level 1 (000s) | Other Significant Observable Inputs Level 2 (000s) | Significant Unobservable Inputs Level 3 (000s) | Total (000s) |
Common Stocks | ||||
Europe | $803 | $34,374 | $— | $35,177 |
Middle East/Central Asia | 1,205 | — | — | 1,205 |
North America | 1,218 | — | — | 1,218 |
Pacific Basin | — | 20,342 | — | 20,342 |
Total Investments in Securities | $3,226 | $54,716 | $— | $57,942 |
There were no Level 3 Investments at October 31, 2021 or 2020.
For more information on valuation inputs and their aggregation into the levels used in the table above, please refer to the Fair Value Measurements and Disclosures in Note 2 of the accompanying Notes to Financial Statements.
*
Non-income producing security
1
Securities purchased in a transaction exempt from registration under Rule 144A of the Securities Act of 1933. These securities may be resold in transactions exempt from registration, normally to qualified institutional buyers. The Fund has no right to demand registration of these securities. At October 31, 2021, the aggregate value of these securities was $3,876 or 6% of net assets.
2
Depositary receipts such as American Depositary Receipts (ADRs), Global Depositary Receipts (GDRs) and other country specific depositary receipts are certificates evidencing ownership of shares of a foreign issuer. These certificates are issued by depositary banks and generally trade on an established market in the U.S. or elsewhere.
The accompanying notes are an integral part of the Financial Statements.
43
Harbor Overseas Fund
Manager’s Commentary (Unaudited)
Subadviser
Acadian Asset Management LLC
260 Franklin Street
Boston, MA 02110
Boston, MA 02110
Portfolio Managers
Brendan O. Bradley, Ph.D.
Since 2019
Since 2019
Ryan D. Taliaferro, Ph.D.
Since 2019
Since 2019
Harry Gakidis, Ph.D.
Since 2019
Since 2019
Acadian has subadvised the Fund since 2019.
Investment Objective
The Fund seeks long-term growth of capital.
Management’s Discussion of
Fund Performance
Fund Performance
MARKET REVIEW
As 2020 came to a close, equities rallied on COVID-19 vaccine-induced optimism. Investors rotated away from COVID-19 pandemic winners, such as online retail, and towards the most beaten-down segments, including hotels, airlines and financials. In the first-quarter of 2021, market optimism stood in stark contrast to the same period a year ago as vaccines began slowly rolling out across the globe. Sentiment was further buoyed by sustained policy support in many major economies and the beginnings of a return to normalcy. Good news was tempered, however, by the arrival of more virulent variants of COVID-19, which dampened expectations of a full and durable recovery. Yield curves steepened after major banks signaled that they would allow inflation to overshoot targets, raising concerns about inflationary pressures worldwide. Commodity prices rallied on rising rates, massive stimulus spending globally and on better-than-expected pickup in economic activity. In the second quarter, global equities continued their ascent, however, pent-up consumer demand continued to disrupt supply chains and stoke inflation worries as the quick rebound in some economies and aggressive stimulus spending plans exerted upward pressure on prices. Supply chain constraints further intensified price hikes as manufacturers rushed to restock depleted inventories amid the demand, creating windows of scarcity and heightening costs. In the third quarter, global economic recovery slowed. The continued spread of COVID-19 closed ports and factories worldwide, causing raw material shortages and supply-side bottlenecks. This led to surges in the prices of global goods and record inflation levels in some parts of the globe. To stifle potentially runaway inflation, many central banks announced or signaled the beginning of quantitative easing.
PERFORMANCE
Harbor Overseas Fund returned 40.51% (Retirement Class), 40.46% (Institutional Class) and 39.98% (Investor Class) compared to the MSCI EAFE (ND) Index return of 34.18% during the year ended October 31, 2021. Performance relative to the benchmark was driven by both favorable stock selection in countries and sectors, as well as country allocations.
Acadian’s investment philosophy is centered on the belief that markets are inefficient and that these inefficiencies are driven in part by behavioral biases that result in mispricing opportunities. Acadian applies fundamental insights in a systematic manner to exploit security mispricings and identify attractive investment opportunities. Further, we believe that a successful investment approach must be multi-faceted and adaptive in nature, acknowledging that risk/reward relationships evolve over time and that markets may reward different characteristics during specific periods of a market cycle. These observations suggest that adding value in a consistent fashion can be best achieved by assessing the value of information at different points in time and applying these insights in an objective, quantitative manner across a broad opportunity set, in our view. To realize these insights, Acadian employs a dynamic investment strategy which seeks to adapt to the current market environment and utilizes a disciplined, systematic approach to stock selection.
From a stock selection perspective, the Fund benefitted from selections in Australian materials and German Health Care stocks, respectively led by positions in mining company, South32, and health care and life science company, Merck KGaA. Shares of Merck KGaA jumped in August after it raised its full-year outlook, driven in part by forecast-beating second quarter profit owing to demand for laboratory gear and supplies from companies producing COVID-19 vaccines and treatments.
Conversely, selections in Japan in Information Technology were less successful, owing in part to positions in precision tools maker, Disco Corporation, and semiconductor and electronics manufacturer, Tokyo Electron.
44
Harbor Overseas Fund
Manager’s Commentary—Continued
CHANGE IN A $50,000 INVESTMENT
For the 03/01/2019 through 10/31/2021
The graph compares a $50,000 investment in the Institutional Class shares of the Fund with the performance of the MSCI EAFE (ND) Index. The Fund’s performance assumes the reinvestment of all dividend and capital gain distributions.
TOTAL RETURNS
For the periods ended 10/31/2021
1 Year | 5 Years | Annualized | ||||
Life of Fund | ||||||
Harbor Overseas Fund | ||||||
Retirement Class1 | 40.51% | N/A | 15.16% | |||
Institutional Class1 | 40.46 | N/A | 15.07 | |||
Investor Class1 | 39.98 | N/A | 14.66 | |||
Comparative Index | ||||||
MSCI EAFE (ND)1 | 34.18% | N/A | 11.46% |
As stated in the Fund’s prospectus dated March 1, 2021, the expense ratios were 0.77% (Net) and 1.35% (Gross) (Retirement Class); 0.85% (Net) and 1.43% (Gross) (Institutional Class); 1.10% (Net) and 1.68% (Gross) (Administrative Class); and 1.21% (Net) and 1.79% (Gross) (Investor Class). The net expense ratios reflect an expense limitation agreement (excluding interest expense, if any) effective through 02/28/2022. The expense ratios in the prospectus may differ from the actual expense ratios for the period disclosed within this report. The expense ratios shown in the prospectus are based on the prior fiscal year, adjusted to reflect changes, if any, in contractual arrangements that occurred prior to the date of the prospectus (or supplement thereto, if applicable).
Performance data shown represents past performance and is no guarantee of future results. Past performance is net of management fees and expenses and reflects reinvested dividends and distributions. Past performance reflects the beneficial effect of any expense waivers or reimbursements, without which returns would have been lower. Investment returns and principal value will fluctuate and when redeemed may be worth more or less than their original cost. Returns for periods less than one year are not annualized. Current performance may be higher or lower and is available through the most recent month end at harborcapital.com or by calling 800-422-1050.
In following a systematic investment process, Acadian continually evaluates the effectiveness of stock selection based on attributes we believe predict future stock prices. Acadian prefers to invest in stocks that are cheaper than their peers because we believe that prices deviate from intrinsic values due to investor irrationality and market frictions. For this period, our preference for stocks with cheaper valuations was rewarded. The portfolio’s exposure to stocks with other attractive fundamental attributes, such as robust earnings, strong cash flow growth and quality balance sheets, also yielded favorable results.
OUTLOOK & STRATEGY
The global economic recovery continues to progress, though a worldwide resurgence of COVID-19 infections associated with the Delta variant suggests the pandemic may extend well into 2022. The evolution of the pandemic continues to shroud the economic outlook in uncertainty, and while vaccines have proven to be effective, there are marked differences in vaccination rates and policy support across countries.
While the global economy is expected to grow, momentum has slowed. Sizable uncertainty remains, and risks are skewed to the downside as COVID-19 has reemerged as a dominant factor, swaths of the population remain unvaccinated, and many governments have depleted their fiscal firepower. Some economies, particularly emerging nations, have not only exhausted their fiscal arsenal, but have redirected monetary tools to quell rising inflation rather than stimulate growth. Inflation remains a headwind to growth, and if transitory inflation morphs into a more pervasive pressure, it could prompt more widespread preemptive actions by central banks. While some of the inflationary pressures emanated from unusual pandemic-related developments, such as transient supply-demand mismatches and supply-side bottlenecks, the precipitous rise suggests there may be a more persistent element.
Acadian continuously updates our investment process across model enhancements, risk controls and implementation. We believe the robustness and granularity of our investment process, as well as our disciplined, objective and systematic approach, will allow us to add value for our clients over the long term.
1
The “Life of Fund” return as shown reflects the period 03/01/2019 through 10/31/2021.
All international and global returns are in U.S. Dollars.
This report contains the current opinions of Acadian Asset Management LLC as of the date of this report and should not be considered as investment advice or a recommendation of any particular security, strategy or investment product. Such opinions are subject to change without notice and securities described herein may no longer be included in, or may at any time be removed from, the Fund’s portfolio. This report is distributed for informational purposes only. Information contained herein has been obtained from sources believed reliable, but not guaranteed.
There is no guarantee that the investment objective of the Fund will be achieved. Stock markets are volatile and equity values can decline significantly in response to adverse issuer, political, regulatory, market and economic conditions. Investing in international and emerging markets poses special risks, including potentially greater price volatility due to social, political and economic factors, as well as currency exchange rate fluctuations. These risks are more severe for securities of issuers in emerging market regions. For information on the different share classes and the risks associated with an investment in the Fund, please refer to the current prospectus.
45
Harbor Overseas Fund
Portfolio of Investments—October 31, 2021
REGION BREAKDOWN (% of investments) -Unaudited
(Excludes derivatives)
The Fund’s Portfolio of Investments include investments denominated in foreign currencies. As of October 31, 2021, 26% of the Fund’s investments were denominated in Euro. No other foreign currency denomination comprised more than 25% of the Fund’s net assets.
Portfolio of Investments
Value, Cost, and Principal Amounts in Thousands
COMMON STOCKS—97.1% | |||
Shares | Value | ||
AIR FREIGHT & LOGISTICS—3.4% | |||
4,763 | CTT-Correios de Portugal SA (Portugal) | $26 | |
14,236 | Deutsche Post AG (Germany) | 881 | |
3,834 | DSV AS (Denmark) | 891 | |
261 | Mainfreight Ltd. (New Zealand) | 17 | |
1,815 | |||
AUTO COMPONENTS—1.2% | |||
1,692 | DTR Automotive Corp. (South Korea) | 84 | |
13,800 | Inoue Rubber Thailand PCL NVDR (Thailand)1 | 7 | |
28,000 | Johnson Electric Holdings Ltd. (Hong Kong) | 62 | |
400 | Linamar Corp. (Canada) | 22 | |
400 | Magna International Inc. (Canada) | 33 | |
3,100 | Mahle-Metal Leve SA (Brazil) | 19 | |
5,106 | Metair Investments Ltd. (South Africa) | 10 | |
7,500 | Sumitomo Rubber Industries Ltd. (Japan) | 92 |
COMMON STOCKS—Continued | |||
Shares | Value | ||
AUTO COMPONENTS—Continued | |||
3,800 | Suncall Corp. (Japan) | $15 | |
18,800 | Yokohama Rubber Co. Ltd. (Japan) | 318 | |
662 | |||
AUTOMOBILES—1.6% | |||
7,558 | Bayerische Motoren Werke AG (Germany) | 764 | |
10,400 | Mazda Motor Corp. (Japan) | 93 | |
857 | |||
BANKS—3.7% | |||
88,736 | Bank Leumi Le-Israel BM (Israel)* | 848 | |
7,842 | BNK Financial Group Inc. (South Korea) | 59 | |
30,289 | Commercial Bank of Dubai PSC (United Arab Emirates) | 33 | |
44,468 | Faisal Islamic Bank of Egypt (Egypt)* | 46 |
46
Harbor Overseas Fund
Portfolio of Investments—Continued
Value, Cost, and Principal Amounts in Thousands
COMMON STOCKS—Continued | |||
Shares | Value | ||
BANKS—Continued | |||
34,200 | Japan Post Bank Co. Ltd. (Japan) | $267 | |
13,214 | Qatar National Bank QPSC (Qatar) | 74 | |
1,429 | Shinhan Financial Group Co. Ltd. (South Korea) | 47 | |
16,953 | Societe Generale SA (France) | 566 | |
1,940 | |||
BEVERAGES—0.2% | |||
54,133 | Australian Vintage Ltd. (Australia) | 34 | |
16,198 | Ginebra San Miguel Inc. (Philippines) | 33 | |
1,605 | Kofola Ceskoslovensko AS (Czech Republic)* | 23 | |
90 | |||
BIOTECHNOLOGY—1.3% | |||
138 | BioNTech SE ADR (Germany)*,1 | 39 | |
1,478 | Genmab AS (Denmark)* | 664 | |
703 | |||
BUILDING PRODUCTS—4.0% | |||
10,800 | BRC Asia Ltd. (Singapore) | 11 | |
11,262 | Compagnie de Saint-Gobain (France) | 777 | |
7,826 | Deceuninck NV (Belgium) | 33 | |
1,376 | FM Mattsson Mora Group AB (Sweden) | 40 | |
987 | Geberit AG (Switzerland) | 771 | |
1,880 | Inwido AB (Sweden) | 35 | |
5,400 | Maezawa Kasei Industries Co. Ltd. (Japan) | 61 | |
5,888 | Norcros plc (United Kingdom) | 27 | |
4,400 | Okabe Co. Ltd. (Japan) | 26 | |
3,500 | Onoken Co. Ltd. (Japan) | 52 | |
97,898 | RAS Al Khaimah Ceramics (United Arab Emirates) | 73 | |
24 | Rockwool International AS (Denmark) | 11 | |
50,000 | Xinyi Glass Holdings Ltd. (Hong Kong) | 141 | |
465 | Zehnder Group AG (Switzerland) | 50 | |
2,108 | |||
CAPITAL MARKETS—4.4% | |||
2,900 | Alaris Equity Partners Income Unit (Canada) | 44 | |
87,100 | Asia Plus Group Holdings PCL NVDR (Thailand)1 | 10 | |
24,400 | CI Financial Corp (Canada) | 556 | |
313 | Cie Financiere Tradition SA (Switzerland) | 38 | |
35,747 | Deutsche Bank AG (Germany)* | 459 | |
5,328 | Equita Group SpA (Italy) | 23 | |
13,585 | Euroz Ltd. (Australia) | 17 | |
2,082 | Fiducian Group Ltd. (Australia) | 14 | |
361,000 | Guotai Junan International Holdings Ltd. (Hong Kong) | 52 | |
69,244 | Investec plc (United Kingdom) | 313 | |
4,100 | IwaiCosmo Holdings Inc. (Japan) | 48 | |
11,000 | Marusan Securities Co. Ltd. (Japan) | 58 | |
2,595 | Numis Corp. plc (United Kingdom) | 12 | |
374 | Partners Group Holding AG (Switzerland) | 653 | |
2,296 | Ratos AB NPV SER A (Sweden) | 14 | |
2,377 | Titanium OYJ (Finland) | 43 | |
2,354 | |||
CHEMICALS—1.5% | |||
2,900 | DAI Nippon Toryo Co. Ltd. (Japan) | 22 | |
574 | KPX Chemical Co. Ltd. (South Korea) | 28 | |
1,197 | Kumho Petrochemical Co. Ltd. (South Korea) | 176 | |
2,800 | Kyowa Leather Cloth Co. Ltd. (Japan) | 17 | |
3,426 | Misr Fertilizers Production Co. SAE (Egypt) | 22 | |
2,000 | Moresco Corp. (Japan) | 21 | |
5,500 | Neo Performance Materials Inc. (Canada) | 85 | |
1,100 | Nihon Kagaku Sangyo Co. Ltd. (Japan) | 13 | |
2,200 | Nippon Carbide Industries Co. Inc. (Japan)* | 27 |
COMMON STOCKS—Continued | |||
Shares | Value | ||
CHEMICALS—Continued | |||
3,513 | NOROO Holdings Co. Ltd. (South Korea) | $37 | |
728 | PCC Rokita SA (Poland) | 17 | |
1,600 | Sakai Chemical Industry Co. Ltd. (Japan) | 30 | |
600 | Soken Chemical & Engineering Co. Ltd. (Japan) | 9 | |
8,119 | Thrace Plastics Holding And Co. (Greece) | 69 | |
2,015 | UNID Co. Ltd. (South Korea) | 201 | |
774 | |||
COMMERCIAL SERVICES & SUPPLIES—0.6% | |||
4,000 | Azienda Bresciana Petroli Nocivelli SpA (Italy)* | 19 | |
340 | Fursys Inc. (South Korea) | 11 | |
14,200 | Kokuyo Co. Ltd. (Japan) | 216 | |
1,000 | Nakamoto Packs Co. Ltd. (Japan) | 15 | |
700 | Pilot Corp. (Japan) | 26 | |
800 | SECOM Co. Ltd. (Japan) | 55 | |
342 | |||
COMMUNICATIONS EQUIPMENT—0.2% | |||
5,931 | ADVA Optical Networking SE (Germany)* | 79 | |
CONSTRUCTION & ENGINEERING—0.3% | |||
122,000 | Analogue Holdings Ltd. (Hong Kong) | 28 | |
24,388 | Boustead Singapore Ltd. (Singapore) | 19 | |
305 | Burkhalter Holding AG (Switzerland) | 22 | |
2,516 | Hwasung Industrial Co. Ltd. (South Korea) | 29 | |
197,200 | Naim Holdings BHD (Malaysia)* | 32 | |
3,722 | Orascom Construction plc (United Arab Emirates) | 17 | |
147 | |||
CONSTRUCTION MATERIALS—2.0% | |||
33,448 | Fletcher Building Ltd. (New Zealand) | 172 | |
18,932 | James Hardie Industries PLC CDI (Australia)*,1 | 744 | |
12,394 | Qatar National Cement Co. QPSC (Qatar) | 17 | |
19,932 | Steppe Cement Ltd. (Malaysia)* | 12 | |
29,705 | Wagners Holding Co. Ltd. (Australia)* | 40 | |
338,819 | West China Cement Ltd. (China) | 59 | |
1,044 | |||
CONSUMER FINANCE—0.3% | |||
14,100 | AEON Financial Service Co. Ltd. (Japan) | 179 | |
CONTAINERS & PACKAGING—0.3% | |||
10,200 | BP Plastics Holding BHD (Malaysia) | 7 | |
22,037 | CPMC Holdings Ltd. (Hong Kong) | 11 | |
39,400 | Hanwell Holdings Ltd. (Singapore) | 12 | |
28,882 | Mpact Ltd. (South Africa)* | 64 | |
11,718 | Orora Ltd. (Australia) | 29 | |
75,337 | Pro-Pac Packaging Ltd. (Australia) | 13 | |
136 | |||
DIVERSIFIED CONSUMER SERVICES—0.1% | |||
2,200 | Asante Inc. (Japan) | 34 | |
7,627 | Shine Justice Ltd. (Australia) | 7 | |
3,700 | Tear Corp. (Japan) | 16 | |
57 | |||
DIVERSIFIED FINANCIAL SERVICES—0.5% | |||
4,627 | Kinnevik AB (Sweden)* | 182 | |
16,843 | M&G plc (United Kingdom) | 46 | |
51,100 | Pacific Century Regional Developments Ltd. (Singapore) | 14 | |
17,600 | UOB-Kay Hian Holdings Ltd. (Singapore) | 21 | |
263 |
47
Harbor Overseas Fund
Portfolio of Investments—Continued
Value, Cost, and Principal Amounts in Thousands
COMMON STOCKS—Continued | |||
Shares | Value | ||
DIVERSIFIED TELECOMMUNICATION SERVICES—0.1% | |||
1,800 | KT Corp. (South Korea) | $47 | |
604 | Magyar Telekom Telecommunications plc ADR (Hungary)1 | 4 | |
118 | Telefonica SA (Spain) | 1 | |
52 | |||
ELECTRICAL EQUIPMENT—1.5% | |||
42,900 | Mitsubishi Electric Corp. (Japan) | 576 | |
562 | Somfy SA (France) | 110 | |
2,200 | Takaoka Toko Co. Ltd. (Japan) | 29 | |
360,000 | Time Interconnect Technology Ltd. (Hong Kong) | 22 | |
51,000 | Xingye Alloy Materials Group Ltd. (Hong Kong)* | 7 | |
5,546 | Zumtobel Group AG (Austria) | 57 | |
801 | |||
ELECTRONIC EQUIPMENT, INSTRUMENTS & COMPONENTS—1.3% | |||
77,905 | Datatec Ltd. (South Africa)* | 212 | |
10,065 | Eroad Ltd. (New Zealand)* | 38 | |
13,314 | Hon Hai Precision Industry Co. Ltd. GDR (Taiwan)1 | 104 | |
320 | Nedap NV (Netherlands) | 22 | |
1,800 | Nihon Denkei Co. Ltd. (Japan) | 30 | |
9,700 | Nissha Co. Ltd. (Japan) | 159 | |
39 | Schaffner Holding AG (Switzerland) | 12 | |
2,700 | Sigma Koki Co. Ltd. (Japan) | 42 | |
3,300 | Topcon Corp. (Japan) | 59 | |
678 | |||
ENERGY EQUIPMENT & SERVICES—0.1% | |||
149,000 | Hilong Holding Ltd. (Hong Kong)* | 6 | |
9,000 | PHX Energy Services Corp. (Canada) | 36 | |
42 | |||
ENTERTAINMENT—0.4% | |||
7,300 | Capcom Co. Ltd. (Japan) | 197 | |
10,000 | IGG Inc. (Singapore) | 9 | |
206 | |||
FOOD & STAPLES RETAILING—1.0% | |||
2,000 | Axial Retailing Inc. (Japan) | 63 | |
8,800 | Empire Co. Ltd. Class A (Canada) | 263 | |
336 | Hawesko Holding AG (Germany) | 23 | |
4,247 | Kesko OYJ Class B (Finland) | 138 | |
3,500 | Medical System Network Co. Ltd. (Japan) | 23 | |
400 | Nishimoto Co. Ltd. (Japan) | 15 | |
525 | |||
FOOD PRODUCTS—1.5% | |||
121 | Dongwon Industries Co. Ltd. (South Korea) | 24 | |
18,055 | Finsbury Food Group plc (United Kingdom) | 23 | |
2,757 | Industrial Milk Co. (Luxembourg) | 24 | |
52,300 | JBS SA (Brazil) | 362 | |
720 | LOTTE Confectionery Co. Ltd. (South Korea) | 79 | |
298 | LOTTE Food Co. Ltd. (South Korea) | 97 | |
900 | Maeil Holdings Co. Ltd. (South Korea) | 8 | |
663 | Nestlé SA (Switzerland) | 87 | |
119 | Neto ME Holdings Ltd. (Israel) | 6 | |
6,397 | PGG Wrightson Ltd. (New Zealand)* | 21 | |
12,189 | RCL Foods Ltd. (South Africa) | 10 | |
1,562 | Sajodaerim Corp. (South Korea) | 37 | |
6,284 | Seeka Ltd. (New Zealand) | 24 | |
68 | Ter Beke SA (Belgium) | 9 | |
811 |
COMMON STOCKS—Continued | |||
Shares | Value | ||
GAS UTILITIES—0.1% | |||
351 | Samchully Co. Ltd. (South Korea) | $28 | |
HEALTH CARE EQUIPMENT & SUPPLIES—5.4% | |||
5,435 | Alcon Inc. (Switzerland) | 451 | |
653 | Carl Zeiss Meditec AG (Germany) | 132 | |
303 | Coltene Holding AG (Switzerland)* | 38 | |
763 | Demant AS (Denmark)* | 37 | |
56 | Diasorin SpA (Italy) | 13 | |
13,243 | EKF Diagnostics Holdings plc (United Kingdom)* | 15 | |
1,100 | Fukuda Denshi Co. Ltd. (Japan) | 93 | |
12,359 | Getinge AB Class B (Sweden) | 553 | |
1,735 | GN Store Nord AS (Denmark) | 105 | |
924 | Ion Beam Applications (Belgium) | 18 | |
36 | Paul Hartmann AG (Germany) | 15 | |
1,700 | Seed Co. Ltd. (Japan) | 9 | |
1,554 | Sonova Holding AG (Switzerland) | 644 | |
336 | Straumann Holding AG (Switzerland) | 699 | |
97,200 | UG Healthcare Corp. Ltd. (Singapore) | 23 | |
2,969 | Viemed Healthcare Inc. (Canada)* | 17 | |
2,862 | |||
HEALTH CARE PROVIDERS & SERVICES—0.9% | |||
60,000 | Ladprao General Hospital NVDR (Thailand)1 | 11 | |
6,322 | Oriola Corp. Class A (Finland) | 14 | |
951 | Oriola OYJ (Finland) | 2 | |
13,929 | Sonic Healthcare Ltd. (Australia) | 423 | |
450 | |||
HEALTH CARE TECHNOLOGY—0.2% | |||
1,114 | Nexus AG (Germany) | 97 | |
HOTELS, RESTAURANTS & LEISURE—0.0% | |||
83,100 | Jaya Bersama Indo TBK PT (Indonesia)* | 1 x | |
628 | Kindred Group plc SDR (Malta)1 | 9 | |
3,700 | Shidax Corp. (Japan)* | 14 | |
24 | |||
HOUSEHOLD DURABLES—0.9% | |||
477 | Amica SA (Poland) | 15 | |
849 | Decora SA (Poland) | 8 | |
577 | Dom Development SA (Poland) | 19 | |
87 | Dorel Industries Inc. (Canada)* | 2 | |
21,635 | Emak SpA (Italy) | 50 | |
2,242 | Fiskars OYJ Abp (Finland) | 55 | |
1,300 | Iida Group Holdings Co. Ltd. (Japan) | 32 | |
20,900 | Nikon Corp. (Japan) | 230 | |
1,000 | Panasonic Manufacturing Malaysia BHD (Malaysia) | 7 | |
100 | Rinnai Corp. (Japan) | 10 | |
698 | Surteco Group SE (Germany) | 30 | |
12,780 | Toya SA (Poland) | 27 | |
485 | |||
HOUSEHOLD PRODUCTS—0.0% | |||
17,202 | McBride plc (United Kingdom)* | 16 | |
INDUSTRIAL CONGLOMERATES—0.0% | |||
14,034 | Qatar Industrial Manufacturing Co QSC (Qatar) | 12 | |
INSURANCE—1.3% | |||
11,400 | Allianz Malaysia BHD (Malaysia) | 36 | |
4,223 | European Reliance General Insurance Co. SA (Greece) | 23 |
48
Harbor Overseas Fund
Portfolio of Investments—Continued
Value, Cost, and Principal Amounts in Thousands
COMMON STOCKS—Continued | |||
Shares | Value | ||
INSURANCE—Continued | |||
3,400 | Great Eastern Holdings Ltd. (Singapore) | $54 | |
11,000 | Tokio Marine Holdings Inc. (Japan) | 580 | |
693 | |||
INTERACTIVE MEDIA & SERVICES—0.0% | |||
1,800 | Oricon Inc. (Japan) | 16 | |
INTERNET & DIRECT MARKETING RETAIL—0.0% | |||
11,000 | Hai-O Enterprise BHD (Malaysia)* | 5 | |
763 | Vente-Unique.com SA (France) | 15 | |
20 | |||
IT SERVICES—2.1% | |||
800 | CDS Co. Ltd. (Japan) | 11 | |
819 | Comarch SA (Poland) | 46 | |
1,500 | Core Corp. (Japan) | 21 | |
266 | Digia OYJ (Finland) | 2 | |
952 | Endava plc ADR (United Kingdom)*,1 | 151 | |
4,200 | Fujitsu Ltd. (Japan) | 726 | |
13,611 | Wise plc (United Kingdom)* | 152 | |
1,109 | |||
LEISURE PRODUCTS—0.4% | |||
1,000 | BRP Inc. (Canada) | 88 | |
1,467 | Harvia OYJ (Finland) | 90 | |
2,027 | Rapala VMC OYJ (Finland)* | 21 | |
1,500 | Sankyo Co. Ltd. (Japan) | 36 | |
235 | |||
LIFE SCIENCES TOOLS & SERVICES—4.0% | |||
4,402 | Ergomed plc (United Kingdom)* | 87 | |
5,905 | Eurofins Scientific SE (France) | 697 | |
2,238 | ICON plc (Ireland)* | 642 | |
1,305 | Sartorius Stedim Biotech (France) | 719 | |
2,145 | |||
MACHINERY—3.3% | |||
1,900 | Alinco Inc. (Japan) | 17 | |
3,623 | Andritz AG (Austria) | 206 | |
37,044 | CNH Industrial NV (Italy) | 638 | |
7,300 | Daihatsu Diesel Manufacturing Co Ltd. (Japan) | 38 | |
268 | Exel Industries (France)* | 22 | |
69,237 | Famur SA (Poland)* | 54 | |
3,300 | Freund Corp. (Japan) | 24 | |
54 | Groupe Gorge SA (France) | 1 | |
1,300 | Nichias Corp. (Japan) | 32 | |
1,224 | Nilfisk Holding AS (Denmark)* | 43 | |
371 | Palfinger AG (Austria) | 16 | |
600 | Rix Corp. (Japan) | 8 | |
2,424 | Semperit AG Holding (Austria)* | 82 | |
16,897 | Skellerup Holdings Ltd. (New Zealand) | 75 | |
21,500 | Techtronic Industries Co. Ltd. (Hong Kong) | 442 | |
2,200 | Tokyo Keiki Inc. (Japan) | 19 | |
2,600 | Torishima Pump Manufacturing Co. Ltd. (Japan) | 20 | |
1,737 | |||
MARINE—3.3% | |||
238 | AP Moller - Maersk AS (Denmark) | 690 | |
2,191 | Kuehne + Nagel International AG (Switzerland) | 690 | |
167,000 | Samudera Shipping Line Ltd. (Singapore)* | 68 | |
96,000 | SITC International Holdings Co. Ltd. (Hong Kong) | 324 | |
1,772 |
COMMON STOCKS—Continued | |||
Shares | Value | ||
MEDIA—2.0% | |||
4,842 | Bloomsbury Publishing plc (United Kingdom) | $24 | |
578 | Cogeco Inc. (Canada) | 38 | |
4,472 | Corus Entertainment Inc. (Canada) | 20 | |
1,900 | FAN Communications Inc. (Japan) | 8 | |
85 | GTN Ltd. (Australia)* | — | |
2,451 | HighCo SA (France) | 16 | |
116,627 | ITV plc (United Kingdom)* | 172 | |
542 | North Media AS (Denmark) | 10 | |
34,282 | NZME Ltd. (New Zealand)* | 29 | |
140,000 | Pico Far East Holdings Ltd. (Hong Kong)* | 23 | |
8,968 | Publicis Groupe SA (France) | 602 | |
6,768 | WPP plc (United Kingdom) | 98 | |
1,040 | |||
METALS & MINING—7.8% | |||
1,215 | Alumetal SA (Poland) | 17 | |
15,423 | Anglo American plc (United Kingdom) | 587 | |
22,947 | Base Resources Ltd. (Australia) | 5 | |
7,640 | BHP Group plc (United Kingdom) | 202 | |
17,444 | Boryszew SA (Poland)* | 14 | |
27,813 | Evraz plc (United Kingdom) | 236 | |
17,744 | Gem Diamonds Ltd. (United Kingdom)* | 13 | |
147,514 | Glencore plc (United Kingdom)* | 738 | |
31,596 | IGO Ltd. (Australia) | 231 | |
62,009 | Lynas Rare Earths Ltd. (Australia)* | 346 | |
26,518 | MACA Ltd. (Australia) | 15 | |
9,196 | Mineral Resources Ltd. (Australia) | 270 | |
1,932 | OZ Minerals Ltd. (Australia) | 37 | |
426 | POSCO (South Korea) | 108 | |
13,063 | Sandfire Resources Ltd. (Australia) | 55 | |
205,299 | South32 Ltd. (Australia) | 554 | |
140 | Stalprodukt SA (Poland) | 10 | |
9,600 | Stelco Holdings Inc. (Canada) | 333 | |
217 | Ternium SA ADR (Luxembourg)1 | 10 | |
7,629 | Voestalpine AG (Austria) | 290 | |
143,000 | Xiwang Special Steel Co. Ltd. (Hong Kong)* | 9 | |
1,873 | Zimplats Holdings Ltd. (Guernsey) | 33 | |
4,113 | |||
OIL, GAS & CONSUMABLE FUELS—5.1% | |||
250,300 | ABM Investama TBK PT (Indonesia)* | 26 | |
34,426 | BP plc ADR (United Kingdom)1 | 991 | |
13,600 | CES Energy Solutions Corp. (Canada) | 21 | |
7,000 | Crew Energy Inc. (Canada)* | 17 | |
67,210 | Eni SpA (Italy) | 963 | |
3,453 | Hargreaves Services plc (United Kingdom) | 20 | |
172,474 | Horizon Oil Ltd. (Australia)* | 12 | |
18,000 | Kelt Exploration Ltd. (Canada)* | 73 | |
6,820 | Lubelski Wegiel Bogdanka SA (Poland)* | 69 | |
95,664 | Pharos Energy plc (United Kingdom)* | 26 | |
33,000 | Pine Cliff Energy Ltd. (Canada)* | 22 | |
13,400 | Tourmaline Oil Corp. (Canada) | 484 | |
2,724 | |||
PAPER & FOREST PRODUCTS—0.6% | |||
9,212 | Arctic Paper SA (Poland)* | 19 | |
22,200 | Cascades Inc. (Canada) | 257 | |
1,311 | Midway Ltd. (Australia)* | 1 | |
25,869 | Western Forest Products Inc. (Canada) | 45 | |
322 |
49
Harbor Overseas Fund
Portfolio of Investments—Continued
Value, Cost, and Principal Amounts in Thousands
COMMON STOCKS—Continued | |||
Shares | Value | ||
PERSONAL PRODUCTS—0.1% | |||
5,300 | Apollo Healthcare Corp. (Canada)* | $ 8 | |
1,700 | Cota Co. Ltd. (Japan) | 24 | |
32 | |||
PHARMACEUTICALS—8.1% | |||
1,436 | Ipsen SA (France) | 149 | |
4,263 | Merck KGaA (Germany) | 1,007 | |
11,934 | Novo Nordisk AS (Denmark) | 1,309 | |
284 | Orion OYJ Class A (Finland) | 12 | |
4,382 | Roche Holding AG (Switzerland) | 1,698 | |
562 | Vetoquinol SA (France) | 96 | |
4,271 | |||
PROFESSIONAL SERVICES—3.0% | |||
600 | Abist Co. Ltd. (Japan) | 15 | |
4,262 | Adecco Group AG (Switzerland) | 215 | |
424 | BayCurrent Consulting Inc. (Japan) | 176 | |
1,745 | Impellam Group plc (United Kingdom)* | 12 | |
4,200 | Recruit Holdings Co. Ltd. (Japan) | 280 | |
800 | Sigmaxyz Holdings Inc. (Japan) | 19 | |
3,500 | Space Co. Ltd. (Japan) | 29 | |
8,292 | Wolters Kluwer NV (Netherlands) | 868 | |
1,614 | |||
REAL ESTATE MANAGEMENT & DEVELOPMENT—0.9% | |||
3,100 | Daito Trust Construction Co. Ltd. (Japan) | 384 | |
116,681 | Ever Reach Group Holdings Co. Ltd. (Hong Kong)* | 17 | |
998 | K Wah International Holdings Ltd. (Hong Kong) | 1 | |
75,300 | KSL Holdings BHD (Malaysia)* | 12 | |
100 | Mainstreet Equity Corp. (Canada)* | 9 | |
2,077 | Melcor Developments Ltd. (Canada) | 24 | |
20,963 | Modern Land China Co. Ltd. (Hong Kong) | 1 x | |
32,500 | Propnex Ltd. (Singapore) | 46 | |
494 | |||
SEMICONDUCTORS & SEMICONDUCTOR EQUIPMENT—5.7% | |||
2,108 | ASML Holding NV (Netherlands) | 1,714 | |
1,700 | Disco Corp. (Japan) | 458 | |
1,400 | MegaChips Corp. (Japan) | 44 | |
3,300 | ROHM Co. Ltd. (Japan) | 302 | |
4,600 | SCREEN Holdings Co. Ltd. (Japan) | 428 | |
1,500 | Tokyo Seimitsu Co. Ltd. (Japan) | 61 | |
3,007 | |||
SOFTWARE—3.8% | |||
2,018 | Atlassian Corp. plc (Australia)* | 925 | |
208 | Check Point Software Technologies Ltd. (Israel)* | 25 | |
4,783 | F-Secure OYJ (Finland) | 27 | |
7,926 | Gentrack Group Ltd. (New Zealand)* | 11 | |
5,400 | ISB Corp. (Japan) | 59 | |
600 | NTT Data Intramart Corp. (Japan) | 14 | |
5,817 | SAP SE (Germany) | 842 | |
1,801 | Telcoware Co. Ltd. (South Korea) | 17 | |
1,300 | Trend Micro Inc. (Japan) | 73 | |
1,993 | |||
SPECIALTY RETAIL—1.0% | |||
3,500 | AT Group Co. Ltd. (Japan) | 41 | |
6,743 | Autosports Group Ltd. (Australia) | 12 | |
1,100 | BMTC Group Inc. (Canada) | 12 | |
3,499 | Briscoe Group Ltd. (New Zealand) | 17 | |
10,315 | Carasso Motors Ltd. (Israel)* | 61 | |
1,100 | Himaraya Co. Ltd. (Japan) | 10 |
COMMON STOCKS—Continued | |||
Shares | Value | ||
SPECIALTY RETAIL—Continued | |||
29,420 | Kingfisher plc (United Kingdom) | $135 | |
6,400 | K's Holdings Corp (Japan) | 66 | |
138,500 | Maxi-Cash Financial Services Corp. Ltd. (Singapore) | 18 | |
6,986 | Naturhouse Health SAU (Spain)* | 16 | |
70 | Samse SA (France) | 17 | |
3,598 | Turners Automotive Group Ltd. (New Zealand) | 11 | |
25,100 | Yamada Holdings Co. Ltd. (Japan) | 96 | |
512 | |||
TECHNOLOGY HARDWARE, STORAGE & PERIPHERALS—3.5% | |||
5,300 | Brother Industries Ltd. (Japan) | 102 | |
29,300 | Canon Inc. (Japan) | 666 | |
1,712 | EVS Broadcast Equipment SA (Belgium) | 40 | |
7,710 | Gefran SpA (Italy) | 101 | |
5,309 | Logitech International SA (Switzerland) | 444 | |
28,900 | Seiko Epson Corp. (Japan) | 515 | |
1,868 | |||
TEXTILES, APPAREL & LUXURY GOODS—0.6% | |||
3,800 | Gildan Activewear Inc. (Canada) | 140 | |
467 | Marimekko OYJ (Finland) | 45 | |
6,810 | New Wave Group AB (Sweden) | 115 | |
600 | Rhythm Co. Ltd. (Japan) | 7 | |
55 | Swatch Group AG (Switzerland) | 15 | |
322 | |||
TRADING COMPANIES & DISTRIBUTORS—1.1% | |||
80,000 | Apac Resources Ltd. (Hong Kong) | 13 | |
4,911 | Ashtead Group plc (United Kingdom) | 412 | |
38,601 | Ferreycorp SAA (Peru) | 19 | |
829 | Ferronordic AB (Sweden) | 28 | |
1,116 | Jacquet Metals SA (France) | 27 | |
800 | Nanyo Corp. (Japan) | 14 | |
900 | Nice Corp. (Japan) | 15 | |
2,300 | Parker Corp (Japan) | 10 | |
479 | Rexel SA (France) | 10 | |
1,165 | Sanistal AS (Denmark)* | 14 | |
4,007 | TIM SA (Poland) | 43 | |
605 | |||
TRANSPORTATION INFRASTRUCTURE—0.4% | |||
11,000 | Orient Overseas International Ltd. (Hong Kong) | 202 | |
91,000 | Qilu Expressway Co. Ltd. (China) | 28 | |
6,580 | Stalexport Autostrady SA (Poland) | 6 | |
236 | |||
WIRELESS TELECOMMUNICATION SERVICES—0.0% | |||
500 | Trilogy International Partners Inc. (Canada)* | 1 | |
TOTAL COMMON STOCKS | |||
(Cost $44,797) | 51,520 | ||
PREFERRED STOCKS—1.4% | |||
AUTO COMPONENTS—0.1% | |||
6,114 | Schaeffler AG (Germany) | 49 | |
CHEMICALS—0.4% | |||
24,700 | Braskem SA (Brazil)* | 238 |
50
Harbor Overseas Fund
Portfolio of Investments—Continued
Value, Cost, and Principal Amounts in Thousands
PREFERRED STOCKS—Continued | |||
Shares | Value | ||
HOUSEHOLD DURABLES—0.7% | |||
6,335 | LG Electronics Inc. (South Korea) | $348 | |
9,700 | Whirlpool SA (Brazil)* | 15 | |
363 | |||
MACHINERY—0.2% | |||
220 | Jungheinrich AG (Germany) | 11 | |
173 | KSB SE & Co KGaA (Germany) | 72 | |
83 | |||
TOTAL PREFERRED STOCKS | |||
(Cost $549) | 733 | ||
TOTAL INVESTMENTS—98.5% | |||
(Cost $45,346) | 52,253 | ||
CASH AND OTHER ASSETS, LESS LIABILITIES—1.5% | 820 | ||
TOTAL NET ASSETS—100.0% | $53,073 |
FORWARD CURRENCY CONTRACTS
Counterparty | Amount to be Delivered (000s) | Amount to be Received (000s) | Settlement Date | Unrealized Appreciation/ (Depreciation) (000s) |
State Street Bank and Trust Co. | $ 21 | ZAR 310 | 11/02/2021 | $ — |
51
Harbor Overseas Fund
Portfolio of Investments—Continued
FAIR VALUE MEASUREMENTS
The following table summarizes the Fund’s investments as of October 31, 2021 based on the inputs used to value them.
Asset Category | Quoted Prices Level 1 (000s) | Other Significant Observable Inputs Level 2 (000s) | Significant Unobservable Inputs Level 3 (000s) | Total (000s) |
Common Stocks | ||||
Africa | $— | $364 | $— | $364 |
Europe | 1,837 | 29,188 | — | 31,025 |
Latin America | 400 | — | — | 400 |
Middle East/Central Asia | 25 | 1,141 | — | 1,166 |
North America | 2,650 | — | — | 2,650 |
Pacific Basin | 925 | 14,988 | 2 | 15,915 |
Preferred Stocks | ||||
Europe | — | 132 | — | 132 |
Latin America | 253 | — | — | 253 |
Pacific Basin | — | 348 | — | 348 |
Total Investments in Securities | $6,090 | $46,161 | $2 | $52,253 |
Liability Category | ||||
Financial Derivative Instruments - Liabilities | ||||
Forward Currency Contracts | $— | $— | $— | $— |
Total Investments | $6,090 | $46,161 | $2 | $52,253 |
For more information on valuation inputs and their aggregation into the levels used in the table above, please refer to the Fair Value Measurements and Disclosures in Note 2 of the accompanying Notes to Financial Statements.
The following is a rollforward of the Fund’s Level 3 investments during the year ended October 31, 2021. Transfers into or out of Level 3 are recognized as of the last day in the fiscal quarter of the period in which the event or change in circumstances that caused the reclassification occured.
Valuation Description | Beginning Balance as of 11/01/2020 (000s) | Purchases (000s) | Sales (000s) | Discount/ (Premium) (000s) | Total Realized Gain/(Loss) (000s) | Change in Unrealized Appreciation/ (Depreciation) (000s) | Transfers Into Level 3h (000s) | Transfers Out of Level 3 (000s) | Ending Balance as of 10/31/2021 (000s) | Unrealized Gain/ Loss as of 10/31/2021 (000s) |
Common Stocks | $— | $— | $— | $— | $— | $— | $2 | $— | $2 | $(11) |
Preferred Stocks | — | — | — | — | — | — | — | — | — | — |
$— | $— | $— | $— | $— | $— | $2 | $— | $2 | $(11) |
The following is a summary of significant unobservable inputs used in the fair valuations of assets and liabilities categorized within Level 3 of the fair value hierarchy.
Valuation Descriptions | Ending Balance as of 10/31/2021 (000s) | Valuation Technique | Unobservable Input(s) | Input Value(s) |
Investments in Securities | ||||
Common Stocks | ||||
Jaya Bersama Indo TBK PT (Indonesia)* | $ 1 | Market Approach | Last Traded Price | IDR 176.00 |
Modern Land China Co. Ltd. (Hong Kong) | 1 | Market Approach | Last Traded Price | HKD 0.38 |
$2 |
*
Non-income producing security
x
Fair valued in accordance with Harbor Funds' Valuation Procedures.
1
Depositary receipts such as American Depositary Receipts (ADRs), Global Depositary Receipts (GDRs) and other country specific depositary receipts are certificates evidencing ownership of shares of a foreign issuer. These certificates are issued by depositary banks and generally trade on an established market in the U.S. or elsewhere.
h
Transferred from Level 2 to Level 3 due to the unavailability of observable market data for pricing
HKD
Hong Kong Dollar
IDR
Indonesian Rupiah
ZAR
South African Rand
The accompanying notes are an integral part of the Financial Statements.
52
Harbor International & Global Funds
StatementS of Assets and Liabilities—October 31, 2021
(All amounts in thousands, except per share amounts)
Harbor Diversified International All Cap Fund | Harbor Emerging Markets Equity Fund | Harbor Focused International Fund | Harbor Global Leaders Fund | Harbor International Fund | Harbor International Growth Fund | Harbor International Small Cap Fund | Harbor Overseas Fund | |
ASSETS | ||||||||
Investments, at identified cost | $981,282 | $41,981 | $34,981 | $90,719 | $3,635,913 | $537,084 | $51,670 | $45,346 |
Investments, at value (Including securities loaned of $2,254, $0, $0, $0, $13,888, $0, $0 and $0) | $1,173,702 | $43,275 | $46,605 | $141,461 | $4,555,004 | $856,866 | $57,942 | $52,253 |
Cash | 29,587 | 947 | 1,568 | 1,015 | 61,247 | 15,409 | 3,429 | 705 |
Foreign currency, at value (cost: $1,348, $21, $3, $0, $8,865, $163, $22 and $36) | 1,345 | 21 | 3 | — | 8,849 | 162 | 22 | 36 |
Receivables for: | ||||||||
Investments sold | 4,288 | 204 | — | — | 18,789 | — | 182 | 55 |
Foreign currency spot contracts | — | — | — | — | — | — | — | 1 |
Capital shares sold | 291 | 1 | — | 242 | 1,141 | 151 | 34 | 83 |
Dividends | 2,778 | 55 | 41 | 44 | 13,707 | 755 | 115 | 64 |
Purchased options, at value (cost: $0, $0, $0, $0, $0, $0, $0 and $0) | — | — | — | — | 44 | — | — | — |
Withholding tax | 629 | — | 32 | 5 | 4,475 | 279 | 41 | 72 |
Prepaid registration fees | 35 | 34 | 6 | 10 | 34 | 31 | 9 | 6 |
Other assets | 139 | 30 | 11 | 11 | 5,044 | 103 | 13 | 14 |
Total Assets | 1,212,794 | 44,567 | 48,266 | 142,788 | 4,668,334 | 873,756 | 61,787 | 53,289 |
LIABILITIES | ||||||||
Payables for: | ||||||||
Investments purchased | 3,507 | — | 180 | — | 17,463 | — | 266 | 133 |
Foreign currency spot contracts | 9 | — | 1 | — | 54 | — | 2 | — |
Capital shares reacquired | 125 | — | — | 102 | 30,978 | 84 | — | 1 |
Collateral for securities loaned | 2,427 | — | — | — | — | — | — | — |
Accrued expenses: | ||||||||
Tax compliance fee payable (see Note 2) | — | — | — | — | 39,581 | — | — | — |
Management fees | 767 | 32 | 30 | 83 | 2,921 | 541 | 44 | 33 |
12b-1 fees | 4 | 1 | — | 6 | 83 | 3 | 1 | — |
Transfer agent fees | 33 | 3 | 2 | 11 | 320 | 54 | 4 | 3 |
Trustees’ fees and expenses | 61 | 8 | 1 | 9 | 4,715 | 105 | 4 | 1 |
Other | 619 | 94 | 117 | 29 | 1,652 | 2,159 | 39 | 45 |
Total Liabilities | 7,552 | 138 | 331 | 240 | 97,767 | 2,946 | 360 | 216 |
NET ASSETS | $1,205,242 | $44,429 | $47,935 | $142,548 | $4,570,567 | $870,810 | $61,427 | $53,073 |
Net Assets Consist of: | ||||||||
Paid-in capital | $971,643 | $30,457 | $34,420 | $79,858 | $4,046,416 | $498,550 | $51,122 | $41,370 |
Total distributable earnings/(loss) | 233,599 | 13,972 | 13,515 | 62,690 | 524,151 | 372,260 | 10,305 | 11,703 |
$1,205,242 | $44,429 | $47,935 | $142,548 | $4,570,567 | $870,810 | $61,427 | $53,073 | |
The accompanying notes are an integral part of the Financial Statements.
53
Harbor Diversified International All Cap Fund | Harbor Emerging Markets Equity Fund | Harbor Focused International Fund | Harbor Global Leaders Fund | Harbor International Fund | Harbor International Growth Fund | Harbor International Small Cap Fund | Harbor Overseas Fund | |||||||||
NET ASSET VALUE PER SHARE BY CLASS | ||||||||||||||||
Retirement Class | ||||||||||||||||
Net assets | $853,454 | $18,760 | $22,546 | $24,324 | $872,647 | $147,545 | $9,559 | $19,742 | ||||||||
Shares of beneficial interest1 | 61,731 | 1,683 | 1,566 | 582 | 18,002 | 6,271 | 584 | 1,408 | ||||||||
Net asset value per share2 | $13.83 | $11.15 | $14.40 | $41.81 | $48.47 | $23.53 | $16.39 | $14.02 | ||||||||
Institutional Class | ||||||||||||||||
Net assets | $332,503 | $18,810 | $25,276 | $90,307 | $3,307,683 | $709,080 | $49,419 | $33,230 | ||||||||
Shares of beneficial interest1 | 24,052 | 1,685 | 1,756 | 2,167 | 67,999 | 30,179 | 3,015 | 2,372 | ||||||||
Net asset value per share2 | $13.82 | $11.16 | $14.39 | $41.67 | $48.64 | $23.50 | $16.39 | $14.01 | ||||||||
Administrative Class | ||||||||||||||||
Net assets | $9,213 | $20 | N/A | $1,757 | $15,464 | $662 | $487 | N/A | ||||||||
Shares of beneficial interest1 | 669 | 2 | N/A | 43 | 316 | 28 | 30 | N/A | ||||||||
Net asset value per share2 | $13.77 | $11.46 | N/A | $40.63 | $48.95 | $23.42 | $16.33 | N/A | ||||||||
Investor Class | ||||||||||||||||
Net assets | $10,072 | $6,839 | $113 | $26,160 | $374,773 | $13,523 | $1,962 | $101 | ||||||||
Shares of beneficial interest1 | 735 | 617 | 8 | 656 | 7,794 | 581 | 120 | 7 | ||||||||
Net asset value per share2 | $13.70 | $11.09 | $14.31 | $39.90 | $48.08 | $23.30 | $16.32 | $13.96 |
1
Par value $0.01 (unlimited authorizations)
2
Per share amounts can be recalculated to the amounts disclosed herein when total net assets and shares of beneficial interest are not rounded to thousands.
54
Harbor International & Global Funds
StatementS of Operations—Year Ended October 31, 2021
(All amounts in thousands)
Harbor Diversified International All Cap Fund | Harbor Emerging Markets Equity Fund | Harbor Focused International Fund | Harbor Global Leaders Fund | Harbor International Fund | Harbor International Growth Fund | Harbor International Small Cap Fund | Harbor Overseas Fund | |
Investment Income | ||||||||
Dividends | $27,588 | $1,166 | $522 | $762 | $115,736 | $8,311 | $1,378 | $1,394 |
Interest | 3 | 1 | 1 | 1 | 352 | 10 | — | — |
Net securities lending income | 27 | — | 1 | — | 123 | — | — | 3 |
Foreign taxes withheld | (2,542) | (153) | (53) | (34) | (8,947) | (837) | (127) | (124) |
Tax compliance fee (see Note 2) | — | — | — | — | (181) | — | — | — |
Total Investment Income | 25,076 | 1,014 | 471 | 729 | 107,083 | 7,484 | 1,251 | 1,273 |
Operating Expenses | ||||||||
Management fees | 8,399 | 400 | 353 | 1,035 | 35,369 | 6,560 | 421 | 322 |
12b-1 fees: | ||||||||
Administrative Class | 21 | — | N/A | 5 | 43 | 2 | 1 | N/A |
Investor Class | 24 | 15 | — | 61 | 959 | 54 | 3 | — |
Shareholder communications | 27 | 23 | 7 | 12 | 279 | 22 | 8 | 9 |
Custodian fees | 603 | 149 | 31 | 28 | 814 | 194 | 58 | 87 |
Transfer agent fees: | ||||||||
Retirement Class | 158 | 5 | 5 | 5 | 197 | 31 | 2 | 4 |
Institutional Class | 314 | 19 | 24 | 87 | 3,329 | 696 | 39 | 25 |
Administrative Class | 8 | — | N/A | 2 | 17 | 1 | 1 | N/A |
Investor Class | 20 | 12 | — | 52 | 818 | 46 | 2 | — |
Professional fees | 75 | 42 | 17 | 17 | 220 | 41 | 16 | 27 |
Trustees' fees and expenses | 39 | 1 | 2 | 5 | 162 | 30 | 2 | 1 |
Registration fees | 63 | 57 | 45 | 61 | 86 | 61 | 56 | 47 |
Miscellaneous | 19 | 9 | 9 | 10 | 62 | 19 | 8 | 9 |
Total expenses | 9,770 | 732 | 493 | 1,380 | 42,355 | 7,757 | 617 | 531 |
Management fees waived | (108) | — | — | (69) | — | — | — | — |
Transfer agent fees waived | (94) | (4) | (4) | (11) | (391) | (72) | (4) | (3) |
Other expenses reimbursed | (1,292) | (274) | (107) | (39) | (5,005) | (296) | (138) | (177) |
Net expenses | 8,276 | 454 | 382 | 1,261 | 36,959 | 7,389 | 475 | 351 |
Net Investment Income/(Loss) | 16,800 | 560 | 89 | (532) | 70,124 | 95 | 776 | 922 |
Net Realized and Change in Net Unrealized Gain/(Loss) on Investment Transactions | ||||||||
Net realized gain/(loss) on: | ||||||||
Investments(net of foreign capital gains tax: $539, $334, $7, $0, $3, $259, $0 and $0) | 85,710 | 14,475 | 2,015 | 15,036 | 256,816 | 72,726 | 5,709 | 4,720 |
Foreign currency transactions | (398) | (39) | (29) | 8 | (857) | (256) | (13) | 514 |
Purchased options | 70 | 2 | — | — | 282 | — | — | — |
Change in net unrealized appreciation/(depreciation) on: | ||||||||
Investments(net of foreign capital gains tax accrual: $203, $38, $91, $0, $0, $1,995, $0 and $0) | 189,053 | (241) | 6,669 | 23,318 | 978,554 | 119,370 | 8,383 | 5,843 |
Forwards currency contracts | — | — | — | 1 | — | — | — | — |
Purchased options | 1,266 | — | — | — | 11,681 | — | — | — |
Translations of assets and liabilities in foreign currencies | (68) | (3) | (1) | (1) | (1,102) | (2) | 5 | (2) |
Net gain/(loss) on investment transactions | 275,633 | 14,194 | 8,654 | 38,362 | 1,245,374 | 191,838 | 14,084 | 11,075 |
Net Increase/(Decrease) in Net Assets Resulting from Operations | $292,433 | $14,754 | $8,743 | $37,830 | $1,315,498 | $191,933 | $14,860 | $11,997 |
The accompanying notes are an integral part of the Financial Statements.
55
Harbor International & Global Funds
Statements of Changes In Net Assets
(All amounts in thousands)
Harbor Diversified International All Cap Fund | Harbor Emerging Markets Equity Fund | Harbor Focused International Fund | ||||
November 1, 2020 through October 31, 2021 | November 1, 2019 through October 31, 2020 | November 1, 2020 through October 31, 2021 | November 1, 2019 through October 31, 2020 | November 1, 2020 through October 31, 2021 | November 1, 2019 through October 31, 2020 | |
INCREASE/(DECREASE) IN NET ASSETS | ||||||
Operations: | ||||||
Net investment income/(loss) | $16,800 | $10,169 | $560 | $978 | $89 | $145 |
Net realized gain/(loss) on investments | 85,382 | (27,922) | 14,438 | 13,644 | 1,986 | 461 |
Change in net unrealized appreciation/(depreciation) of investments | 190,251 | (20,746) | (244) | (8,081) | 6,668 | 3,063 |
Net increase/(decrease) in assets resulting from operations | 292,433 | (38,499) | 14,754 | 6,541 | 8,743 | 3,669 |
Distributions to Shareholders | ||||||
Retirement Class | (6,946) | (11,421) | (5,910) | (746) | (306) | (89) |
Institutional Class | (2,843) | (5,596) | (4,058) | (710) | (308) | (83) |
Administrative Class | (61) | (134) | (6) | — | N/A | N/A |
Investor Class | (54) | (171) | (1,342) | (6) | — | — |
Total distributions to shareholders | (9,904) | (17,322) | (11,316) | (1,462) | (614) | (172) |
Net Increase/(Decrease) Derived from Capital Share Transactions | 128,700 | 76,764 | (8,535) | (55,020) | 1,799 | 6,947 |
Net increase/(decrease) in net assets | 411,229 | 20,943 | (5,097) | (49,941) | 9,928 | 10,444 |
Net Assets | ||||||
Beginning of period | 794,013 | 773,070 | 49,526 | 99,467 | 38,007 | 27,563 |
End of period | $1,205,242 | $794,013 | $44,429 | $49,526 | $47,935 | $38,007 |
The accompanying notes are an integral part of the Financial Statements.
56
Harbor Global Leaders Fund | Harbor International Fund | Harbor International Growth Fund | Harbor International Small Cap Fund | Harbor Overseas Fund | |||||
November 1, 2020 through October 31, 2021 | November 1, 2019 through October 31, 2020 | November 1, 2020 through October 31, 2021 | November 1, 2019 through October 31, 2020 | November 1, 2020 through October 31, 2021 | November 1, 2019 through October 31, 2020 | November 1, 2020 through October 31, 2021 | November 1, 2019 through October 31, 2020 | November 1, 2020 through October 31, 2021 | November 1, 2019 through October 31, 2020 |
$(532) | $(66) | $70,124 | $115,585 | $95 | $781 | $776 | $258 | $922 | $447 |
15,044 | 13,905 | 256,241 | (79,825) | 72,470 | 5,287 | 5,696 | (1,227) | 5,234 | (438) |
23,318 | 7,804 | 989,133 | (238,021) | 119,368 | 118,503 | 8,388 | (2,237) | 5,841 | 104 |
37,830 | 21,643 | 1,315,498 | (202,261) | 191,933 | 124,571 | 14,860 | (3,206) | 11,997 | 113 |
(1,703) | (750) | (11,372) | (41,892) | (1,144) | (2,810) | (82) | (453) | (229) | (345) |
(6,506) | (4,438) | (33,787) | (117,395) | (4,238) | (7,466) | (375) | (724) | (209) | (333) |
(169) | (108) | (98) | (1,880) | (4) | (7) | (4) | (9) | N/A | N/A |
(1,826) | (1,182) | (2,615) | (13,236) | (98) | (524) | (5) | (11) | — | (1) |
(10,204) | (6,478) | (47,872) | (174,403) | (5,484) | (10,807) | (466) | (1,197) | (438) | (679) |
(3,833) | (2,882) | (659,137) | (1,356,901) | (112,345) | 90,510 | 15,061 | (9,575) | 14,463 | 1,365 |
23,793 | 12,283 | 608,489 | (1,733,565) | 74,104 | 204,274 | 29,455 | (13,978) | 26,022 | 799 |
118,755 | 106,472 | 3,962,078 | 5,695,643 | 796,706 | 592,432 | 31,972 | 45,950 | 27,051 | 26,252 |
$142,548 | $118,755 | $4,570,567 | $3,962,078 | $870,810 | $796,706 | $61,427 | $31,972 | $53,073 | $27,051 |
57
Harbor International & Global Funds
Statements of Changes in Net Assets—Capital Stock Activity
(All amounts in thousands)
Harbor Diversified International All Cap Fund | Harbor Emerging Markets Equity Fund | Harbor Focused International Fund | ||||
November 1, 2020 through October 31, 2021 | November 1, 2019 through October 31, 2020 | November 1, 2020 through October 31, 2021 | November 1, 2019 through October 31, 2020 | November 1, 2020 through October 31, 2021 | November 1, 2019 through October 31, 2020 | |
AMOUNT ($) | ||||||
Retirement Class | ||||||
Net proceeds from sale of shares | $329,434 | $166,286 | $766 | $4,762 | $2,345 | $2,612 |
Reinvested distributions | 6,749 | 11,169 | 5,910 | 746 | 306 | 89 |
Cost of shares reacquired | (205,581) | (108,051) | (19,268) | (26,083) | (1,926) | (109) |
Net increase/(decrease) in net assets | $130,602 | $69,404 | $(12,592) | $(20,575) | $725 | $2,592 |
Institutional Class | ||||||
Net proceeds from sale of shares | $163,955 | $58,607 | $9,815 | $22,713 | $1,327 | $4,606 |
Reinvested distributions | 2,530 | 5,290 | 4,057 | 703 | 261 | 83 |
Cost of shares reacquired | (169,472) | (55,658) | (12,044) | (62,021) | (578) | (337) |
Cost of shares reacquired through in-kind redemptions | — | — | — | — | — | — |
Net increase/(decrease) in net assets | $(2,987) | $8,239 | $1,828 | $(38,605) | $1,010 | $4,352 |
Administrative Class | ||||||
Net proceeds from sale of shares | $1,538 | $1,450 | $3 | $17 | N/A | N/A |
Reinvested distributions | 61 | 134 | 6 | — | N/A | N/A |
Cost of shares reacquired | (1,096) | (1,447) | (11) | (1) | N/A | N/A |
Net increase/(decrease) in net assets | $503 | $137 | $(2) | $16 | N/A | N/A |
Investor Class | ||||||
Net proceeds from sale of shares | $1,135 | $1,427 | $3,633 | $5,465 | $64 | $14 |
Reinvested distributions | 54 | 171 | 1,342 | 6 | — | — |
Cost of shares reacquired | (607) | (2,614) | (2,744) | (1,327) | — | (11) |
Net increase/(decrease) in net assets | $582 | $(1,016) | $2,231 | $4,144 | $64 | $3 |
The accompanying notes are an integral part of the Financial Statements.
58
Harbor Global Leaders Fund | Harbor International Fund | Harbor International Growth Fund | Harbor International Small Cap Fund | Harbor Overseas Fund | |||||
November 1, 2020 through October 31, 2021 | November 1, 2019 through October 31, 2020 | November 1, 2020 through October 31, 2021 | November 1, 2019 through October 31, 2020 | November 1, 2020 through October 31, 2021 | November 1, 2019 through October 31, 2020 | November 1, 2020 through October 31, 2021 | November 1, 2019 through October 31, 2020 | November 1, 2020 through October 31, 2021 | November 1, 2019 through October 31, 2020 |
$7,280 | $5,614 | $104,298 | $135,529 | $11,119 | $11,059 | $5,641 | $4,323 | $488 | $799 |
1,611 | 750 | 11,027 | 40,800 | 1,057 | 2,567 | 40 | 453 | 229 | 345 |
(7,102) | (2,238) | (391,374) | (508,810) | (63,195) | (19,502) | (4,199) | (16,747) | (123) | (143) |
$1,789 | $4,126 | $(276,049) | $(332,481) | $(51,019) | $(5,876) | $1,482 | $(11,971) | $594 | $1,001 |
$21,906 | $55,015 | $316,507 | $549,667 | $131,088 | $244,495 | $12,680 | $2,135 | $14,611 | $229 |
6,354 | 4,295 | 31,191 | 108,612 | 3,097 | 6,488 | 335 | 640 | 209 | 333 |
(33,630) | (65,489) | (673,210) | (1,217,444) | (168,482) | (147,966) | (807) | (404) | (1,000) | (203) |
— | — | — | (257,053) | — | — | — | — | — | — |
$(5,370) | $(6,179) | $(325,512) | $(816,218) | $(34,297) | $103,017 | $12,208 | $2,371 | $13,820 | $359 |
$220 | $1,519 | $1,576 | $3,497 | $425 | $170 | $23 | $— | N/A | N/A |
169 | 108 | 97 | 1,870 | 4 | 6 | 4 | 9 | N/A | N/A |
(1,106) | (2,774) | (7,009) | (59,746) | (399) | (128) | (26) | — | N/A | N/A |
$(717) | $(1,147) | $(5,336) | $(54,379) | $30 | $48 | $1 | $9 | N/A | N/A |
$3,452 | $7,868 | $27,319 | $20,346 | $3,075 | $3,835 | $1,716 | $55 | $67 | $10 |
1,826 | 1,182 | 2,584 | 13,114 | 96 | 523 | 5 | 11 | — | 1 |
(4,813) | (8,732) | (82,143) | (187,283) | (30,230) | (11,037) | (351) | (50) | (18) | (6) |
$465 | $318 | $(52,240) | $(153,823) | $(27,059) | $(6,679) | $1,370 | $16 | $49 | $5 |
59
Harbor International & Global Funds
Statements of Changes in Net Assets—Capital Stock Activity—Continued
(All amounts in thousands)
Harbor Diversified International All Cap Fund | Harbor Emerging Markets Equity Fund | Harbor Focused International Fund | ||||
November 1, 2020 through October 31, 2021 | November 1, 2019 through October 31, 2020 | November 1, 2020 through October 31, 2021 | November 1, 2019 through October 31, 2020 | November 1, 2020 through October 31, 2021 | November 1, 2019 through October 31, 2020 | |
SHARES | ||||||
Retirement Class | ||||||
Shares sold | 24,690 | 17,039 | 67 | 481 | 179 | 234 |
Shares issued due to reinvestment of distributions | 544 | 965 | 565 | 65 | 23 | 8 |
Shares reacquired | (15,525) | (10,692) | (1,605) | (2,346) | (138) | (11) |
Net increase/(decrease) in shares outstanding | 9,709 | 7,312 | (973) | (1,800) | 64 | 231 |
Institutional Class | ||||||
Shares sold | 12,409 | 6,153 | 866 | 2,555 | 99 | 419 |
Shares issued due to reinvestment of distributions | 203 | 457 | 387 | 62 | 19 | 7 |
Shares reacquired | (12,674) | (5,585) | (1,038) | (5,680) | (41) | (31) |
Shares reacquired through in-kind redemptions | — | — | — | — | — | — |
Net increase/(decrease) in shares outstanding | (62) | 1,025 | 215 | (3,063) | 77 | 395 |
Administrative Class | ||||||
Shares sold | 116 | 156 | — | 1 | N/A | N/A |
Shares issued due to reinvestment of distributions | 5 | 11 | 1 | — | N/A | N/A |
Shares reacquired | (83) | (147) | (1) | — | N/A | N/A |
Net increase/(decrease) in shares outstanding | 38 | 20 | — | 1 | N/A | N/A |
Investor Class | ||||||
Shares sold | 84 | 150 | 317 | 494 | 5 | 1 |
Shares issued due to reinvestment of distributions | 4 | 15 | 129 | — | — | — |
Shares reacquired | (45) | (296) | (249) | (121) | — | (1) |
Net increase/(decrease) in shares outstanding | 43 | (131) | 197 | 373 | 5 | — |
The accompanying notes are an integral part of the Financial Statements.
60
Harbor Global Leaders Fund | Harbor International Fund | Harbor International Growth Fund | Harbor International Small Cap Fund | Harbor Overseas Fund | |||||
November 1, 2020 through October 31, 2021 | November 1, 2019 through October 31, 2020 | November 1, 2020 through October 31, 2021 | November 1, 2019 through October 31, 2020 | November 1, 2020 through October 31, 2021 | November 1, 2019 through October 31, 2020 | November 1, 2020 through October 31, 2021 | November 1, 2019 through October 31, 2020 | November 1, 2020 through October 31, 2021 | November 1, 2019 through October 31, 2020 |
196 | 174 | 2,222 | 4,230 | 482 | 663 | 357 | 359 | 36 | 75 |
45 | 24 | 253 | 1,021 | 48 | 151 | 3 | 35 | 19 | 33 |
(181) | (73) | (8,345) | (14,706) | (2,803) | (1,146) | (262) | (1,462) | (10) | (14) |
60 | 125 | (5,870) | (9,455) | (2,273) | (332) | 98 | (1,068) | 45 | 94 |
586 | 1,894 | 6,787 | 15,423 | 5,719 | 14,511 | 781 | 183 | 1,117 | 22 |
178 | 140 | 711 | 2,706 | 139 | 383 | 24 | 49 | 18 | 31 |
(908) | (2,078) | (14,570) | (33,390) | (7,135) | (9,143) | (51) | (34) | (71) | (19) |
— | — | — | (7,166) | — | — | — | — | — | — |
(144) | (44) | (7,072) | (22,427) | (1,277) | 5,751 | 754 | 198 | 1,064 | 34 |
6 | 49 | 34 | 95 | 19 | 10 | 2 | — | N/A | N/A |
4 | 4 | 2 | 46 | — | — | 1 | — | N/A | N/A |
(30) | (91) | (150) | (1,519) | (17) | (7) | (2) | — | N/A | N/A |
(20) | (38) | (114) | (1,378) | 2 | 3 | 1 | — | N/A | N/A |
96 | 267 | 590 | 573 | 142 | 238 | 106 | 5 | 5 | 1 |
53 | 40 | 59 | 329 | 4 | 31 | — | 1 | — | — |
(133) | (298) | (1,792) | (5,167) | (1,296) | (677) | (21) | (5) | (2) | — |
16 | 9 | (1,143) | (4,265) | (1,150) | (408) | 85 | 1 | 3 | 1 |
61
Harbor International & Global Funds Financial Highlights
Selected Data for a Share Outstanding for the Periods Presented
HARBOR DIVERSIFIED INTERNATIONAL ALL CAP FUND | |||||
Retirement Class | |||||
Year Ended October 31, | 2021 | 2020 | 2019 | 2018 | 2017 |
Net asset value beginning of period | $10.25 | $11.17 | $10.41 | $11.79 | $9.77 |
Income from Investment Operations | |||||
Net investment income/(loss)a,e | 0.21 | 0.14 | 0.26 | 0.21 | 0.14 |
Net realized and unrealized gain/(loss) on investments | 3.50 | (0.81) | 0.92 | (1.19) | 2.01 |
Total from investment operations | 3.71 | (0.67) | 1.18 | (0.98) | 2.15 |
Less Distributions | |||||
Dividends from net investment income | (0.13) | (0.25) | (0.13) | (0.12) | (0.13) |
Distributions from net realized capital gains | — | — | (0.29) | (0.28) | — |
Total distributions | (0.13) | (0.25) | (0.42) | (0.40) | (0.13) |
Net asset value end of period | 13.83 | 10.25 | 11.17 | 10.41 | 11.79 |
Net assets end of period (000s) | $853,454 | $533,318 | $499,288 | $420,056 | $92,442 |
Ratios and Supplemental Data (%) | |||||
Total returnb | 36.32% | (6.25)% | 11.99% | (8.55)% | 22.35% |
Ratio of total expenses to average net assets^ | 0.84 | 0.85 | 0.87 | 0.90 | 0.99 |
Ratio of net expenses to average net assetsa | 0.71 | 0.70 | 0.68 | 0.74 | 0.77 |
Ratio of net investment income/(loss) to average net assetsa | 1.54 | 1.32 | 2.42 | 1.87 | 1.27 |
Portfolio turnover | 51 | 25 | 22 | 42 | 46 |
Administrative Class | |||||
Year Ended October 31, | 2021 | 2020 | 2019 | 2018 | 2017 |
Net asset value beginning of period | $10.22 | $11.14 | $10.39 | $11.76 | $9.75 |
Income from Investment Operations | |||||
Net investment income/(loss)a,e | 0.16 | 0.10 | 0.22 | 0.22 | 0.14 |
Net realized and unrealized gain/(loss) on investments | 3.48 | (0.80) | 0.92 | (1.22) | 1.97 |
Total from investment operations | 3.64 | (0.70) | 1.14 | (1.00) | 2.11 |
Less Distributions | |||||
Dividends from net investment income | (0.09) | (0.22) | (0.10) | (0.09) | (0.10) |
Distributions from net realized capital gains | — | — | (0.29) | (0.28) | — |
Total distributions | (0.09) | (0.22) | (0.39) | (0.37) | (0.10) |
Net asset value end of period | 13.77 | 10.22 | 11.14 | 10.39 | 11.76 |
Net assets end of period (000s) | $9,213 | $6,446 | $6,800 | $5,734 | $310 |
Ratios and Supplemental Data (%) | |||||
Total returnb | 35.76% | (6.54)% | 11.58% | (8.76)% | 21.91% |
Ratio of total expenses to average net assets^ | 1.17 | 1.18 | 1.20 | 1.23 | 1.32 |
Ratio of net expenses to average net assetsa | 1.04 | 1.03 | 1.01 | 1.06 | 1.10 |
Ratio of net investment income/(loss) to average net assetsa | 1.17 | 0.99 | 2.06 | 1.96 | 1.29 |
Portfolio turnover | 51 | 25 | 22 | 42 | 46 |
See page 76 for notes to the Financial Highlights.
The accompanying notes are an integral part of the Financial Statements.
62
Institutional Class | ||||
2021 | 2020 | 2019 | 2018 | 2017 |
$10.25 | $11.17 | $10.41 | $11.79 | $9.77 |
0.19 | 0.13 | 0.25 | 0.20 | 0.17 |
3.50 | (0.81) | 0.92 | (1.18) | 1.98 |
3.69 | (0.68) | 1.17 | (0.98) | 2.15 |
(0.12) | (0.24) | (0.12) | (0.12) | (0.13) |
— | — | (0.29) | (0.28) | — |
(0.12) | (0.24) | (0.41) | (0.40) | (0.13) |
13.82 | 10.25 | 11.17 | 10.41 | 11.79 |
$332,503 | $247,212 | $257,860 | $238,470 | $225,473 |
36.12% | (6.33)% | 11.90% | (8.62)% | 22.29% |
0.92 | 0.93 | 0.95 | 0.98 | 1.07 |
0.79 | 0.78 | 0.76 | 0.82 | 0.85 |
1.43 | 1.25 | 2.34 | 1.72 | 1.59 |
51 | 25 | 22 | 42 | 46 |
Investor Class | ||||
2021 | 2020 | 2019 | 2018 | 2017 |
$10.17 | $11.08 | $10.33 | $11.71 | $9.74 |
0.14 | 0.09 | 0.21 | 0.15 | 0.14 |
3.47 | (0.80) | 0.91 | (1.17) | 1.96 |
3.61 | (0.71) | 1.12 | (1.02) | 2.10 |
(0.08) | (0.20) | (0.08) | (0.08) | (0.13) |
— | — | (0.29) | (0.28) | — |
(0.08) | (0.20) | (0.37) | (0.36) | (0.13) |
13.70 | 10.17 | 11.08 | 10.33 | 11.71 |
$10,072 | $7,037 | $9,122 | $5,456 | $5,195 |
35.56% | (6.58)% | 11.43% | (8.93)% | 21.82% |
1.29 | 1.30 | 1.32 | 1.35 | 1.44 |
1.15 | 1.15 | 1.13 | 1.19 | 1.22 |
1.07 | 0.86 | 1.99 | 1.34 | 1.31 |
51 | 25 | 22 | 42 | 46 |
63
Harbor International & Global Funds Financial Highlights—Continued
Selected Data for a Share Outstanding for the Periods Presented
HARBOR EMERGING MARKETS EQUITY FUND | |||||
Retirement Class | |||||
Year Ended October 31, | 2021 | 2020k | 2019 | 2018 | 2017 |
Net asset value beginning of period | $10.89 | $11.01 | $9.57 | $10.83 | $8.59 |
Income from Investment Operations | |||||
Net investment income/(loss)a,e | 0.14 | 0.07 | 0.21 | 0.12 | 0.13 |
Net realized and unrealized gain/(loss) on investments | 3.52 | (0.02) | 1.32 | (1.27) | 2.21 |
Total from investment operations | 3.66 | 0.05 | 1.53 | (1.15) | 2.34 |
Less Distributions | |||||
Dividends from net investment income | (0.13) | (0.17) | (0.09) | (0.11) | (0.10) |
Distributions from net realized capital gains | (3.27) | — | — | — | — |
Total distributions | (3.40) | (0.17) | (0.09) | (0.11) | (0.10) |
Net asset value end of period | 11.15 | 10.89 | 11.01 | 9.57 | 10.83 |
Net assets end of period (000s) | $18,760 | $28,935 | $49,052 | $12,146 | $4,232 |
Ratios and Supplemental Data (%) | |||||
Total returnb | 35.64% | 0.36% | 16.21% | (10.71)% | 27.62% |
Ratio of total expenses to average net assets^ | 1.47 | 1.25 | 1.22 | 1.26 | 1.35 |
Ratio of net expenses to average net assetsa | 0.88 | 0.93 | 1.02 | 1.07 | 1.08 |
Ratio of net investment income/(loss) to average net assetsa | 1.24 | 0.63 | 2.05 | 1.16 | 1.32 |
Portfolio turnover | 103 | 122 | 53 | 56 | 59 |
Administrative Class | |||||
Year Ended October 31, | 2021 | 2020k | 2019 | 2018 | 2017 |
Net asset value beginning of period | $11.15 | $11.14 | $9.55 | $10.80 | $8.58 |
Income from Investment Operations | |||||
Net investment income/(loss)a,e | 0.11 | (0.01) | 0.02 | 0.08 | 0.08 |
Net realized and unrealized gain/(loss) on investments | 3.58 | 0.02 | 1.62 | (1.25) | 2.22 |
Total from investment operations | 3.69 | 0.01 | 1.64 | (1.17) | 2.30 |
Less Distributions | |||||
Dividends from net investment income | (0.11) | — | (0.05) | (0.08) | (0.08) |
Distributions from net realized capital gains | (3.27) | — | — | — | — |
Total distributions | (3.38) | — | (0.05) | (0.08) | (0.08) |
Net asset value end of period | 11.46 | 11.15 | 11.14 | 9.55 | 10.80 |
Net assets end of period (000s) | $20 | $21 | $5 | $249 | $275 |
Ratios and Supplemental Data (%) | |||||
Total returnb | 34.96% | 0.09% | 17.30% | (10.91)% | 27.04% |
Ratio of total expenses to average net assets^ | 1.80 | 1.56 | 1.54 | 1.59 | 1.68 |
Ratio of net expenses to average net assetsa | 1.21 | 1.25 | 1.40 | 1.40 | 1.40 |
Ratio of net investment income/(loss) to average net assetsa | 0.94 | (0.12) | 0.16 | 0.77 | 0.85 |
Portfolio turnover | 103 | 122 | 53 | 56 | 59 |
See page 76 for notes to the Financial Highlights.
The accompanying notes are an integral part of the Financial Statements.
64
Institutional Class | ||||
2021 | 2020k | 2019 | 2018 | 2017 |
$10.89 | $11.01 | $9.57 | $10.83 | $8.59 |
0.14 | 0.08 | 0.12 | 0.14 | 0.11 |
3.49 | (0.04) | 1.41 | (1.30) | 2.22 |
3.63 | 0.04 | 1.53 | (1.16) | 2.33 |
(0.09) | (0.16) | (0.09) | (0.10) | (0.09) |
(3.27) | — | — | — | — |
(3.36) | (0.16) | (0.09) | (0.10) | (0.09) |
11.16 | 10.89 | 11.01 | 9.57 | 10.83 |
$18,810 | $16,009 | $49,891 | $58,271 | $51,849 |
35.37% | 0.28% | 16.13% | (10.77)% | 27.54% |
1.55 | 1.33 | 1.30 | 1.34 | 1.43 |
0.96 | 1.01 | 1.12 | 1.15 | 1.15 |
1.23 | 0.74 | 1.13 | 1.28 | 1.13 |
103 | 122 | 53 | 56 | 59 |
Investor Class | ||||
2021 | 2020k | 2019 | 2018 | 2017 |
$10.85 | $10.96 | $9.53 | $10.78 | $8.56 |
0.10 | 0.01 | 0.09 | 0.09 | 0.07 |
3.49 | —* | 1.39 | (1.27) | 2.22 |
3.59 | 0.01 | 1.48 | (1.18) | 2.29 |
(0.08) | (0.12) | (0.05) | (0.07) | (0.07) |
(3.27) | — | — | — | — |
(3.35) | (0.12) | (0.05) | (0.07) | (0.07) |
11.09 | 10.85 | 10.96 | 9.53 | 10.78 |
$6,839 | $4,561 | $519 | $614 | $700 |
34.94% | —% | 15.56% | (11.03)% | 27.00% |
1.91 | 1.69 | 1.67 | 1.71 | 1.80 |
1.32 | 1.37 | 1.49 | 1.52 | 1.52 |
0.85 | 0.14 | 0.87 | 0.82 | 0.75 |
103 | 122 | 53 | 56 | 59 |
65
Harbor International & Global Funds Financial Highlights—Continued
Selected Data for a Share Outstanding for the Periods Presented
HARBOR FOCUSED INTERNATIONAL FUND | ||||||
Retirement Class | Institutional Class | |||||
Year Ended October 31, | 2021 | 2020 | 2019g | 2021 | 2020 | 2019g |
Net asset value beginning of period | $11.94 | $10.78 | $10.00 | $11.93 | $10.78 | $10.00 |
Income from Investment Operations | ||||||
Net investment income/(loss)a,e | 0.03 | 0.06 | 0.03 | 0.02 | 0.05 | 0.02 |
Net realized and unrealized gain/(loss) on investments | 2.61 | 1.17 | 0.75 | 2.61 | 1.16 | 0.76 |
Total from investment operations | 2.64 | 1.23 | 0.78 | 2.63 | 1.21 | 0.78 |
Less Distributions | ||||||
Dividends from net investment income | (0.04) | (0.02) | — | (0.03) | (0.01) | — |
Distributions from net realized capital gains | (0.14) | (0.05) | — | (0.14) | (0.05) | — |
Total distributions | (0.18) | (0.07) | — | (0.17) | (0.06) | — |
Net asset value end of period | 14.40 | 11.94 | 10.78 | 14.39 | 11.93 | 10.78 |
Net assets end of period (000s) | $22,546 | $17,928 | $13,696 | $25,276 | $20,040 | $13,833 |
Ratios and Supplemental Data (%) | ||||||
Total returnb | 22.25% | 11.46% | 7.80%c | 22.10% | 11.40% | 7.80%c |
Ratio of total expenses to average net assets^ | 1.01 | 1.01 | 2.15d | 1.09 | 1.09 | 2.23d |
Ratio of net expenses to average net assetsa | 0.77 | 0.77 | 0.77d | 0.85 | 0.85 | 0.85d |
Ratio of net investment income/(loss) to average net assetsa | 0.23 | 0.50 | 0.60d | 0.15 | 0.41 | 0.52d |
Portfolio turnover | 46 | 33 | 23c | 46 | 33 | 23c |
See page 76 for notes to the Financial Highlights.
The accompanying notes are an integral part of the Financial Statements.
66
Investor Class | ||
2021 | 2020 | 2019g |
$11.89 | $10.76 | $10.00 |
(0.03) | 0.01 | 0.01 |
2.59 | 1.17 | 0.75 |
2.56 | 1.18 | 0.76 |
— | — | — |
(0.14) | (0.05) | — |
(0.14) | (0.05) | — |
14.31 | 11.89 | 10.76 |
$113 | $39 | $34 |
21.65% | 11.03% | 7.60%c |
1.45 | 1.46 | 2.60d |
1.21 | 1.22 | 1.22d |
(0.20) | 0.08 | 0.15d |
46 | 33 | 23c |
67
Harbor International & Global Funds Financial Highlights—Continued
Selected Data for a Share Outstanding for the Periods Presented
HARBOR GLOBAL LEADERS FUND | |||||
Retirement Class | |||||
Year Ended October 31, | 2021 | 2020 | 2019 | 2018 | 2017h |
Net asset value beginning of period | $33.89 | $30.81 | $25.52 | $25.33 | $20.29 |
Income from Investment Operations | |||||
Net investment income/(loss)a,e | (0.09) | 0.02 | 0.13 | 0.02 | 0.08 |
Net realized and unrealized gain/(loss) on investments | 10.84 | 4.89 | 5.76 | 2.40 | 4.96 |
Total from investment operations | 10.75 | 4.91 | 5.89 | 2.42 | 5.04 |
Less Distributions | |||||
Dividends from net investment income | — | (0.09) | — | (0.03) | — |
Distributions from net realized capital gains | (2.83) | (1.74) | (0.60) | (2.20) | — |
Total distributions | (2.83) | (1.83) | (0.60) | (2.23) | — |
Net asset value end of period | 41.81 | 33.89 | 30.81 | 25.52 | 25.33 |
Net assets end of period (000s) | $24,324 | $17,703 | $12,245 | $6,846 | $4,376 |
Ratios and Supplemental Data (%) | |||||
Total returnb | 33.12% | 16.56% | 23.72% | 10.01% | 24.84% |
Ratio of total expenses to average net assets^ | 0.87 | 0.90 | 0.92 | 0.96 | 1.13 |
Ratio of net expenses to average net assetsa | 0.78 | 0.78 | 0.80 | 0.82 | 0.83 |
Ratio of net investment income/(loss) to average net assetsa | (0.24) | 0.07 | 0.46 | 0.09 | 0.32 |
Portfolio turnover | 27 | 55 | 47 | 20 | 123 |
Administrative Class | |||||
Year Ended October 31, | 2021 | 2020 | 2019 | 2018 | 2017h |
Net asset value beginning of period | $33.10 | $30.15 | $25.06 | $24.97 | $20.06 |
Income from Investment Operations | |||||
Net investment income/(loss)a,e | (0.22) | (0.08) | 0.06 | (0.05) | (0.04) |
Net realized and unrealized gain/(loss) on investments | 10.58 | 4.77 | 5.63 | 2.34 | 4.95 |
Total from investment operations | 10.36 | 4.69 | 5.69 | 2.29 | 4.91 |
Less Distributions | |||||
Dividends from net investment income | — | — | — | — | — |
Distributions from net realized capital gains | (2.83) | (1.74) | (0.60) | (2.20) | — |
Total distributions | (2.83) | (1.74) | (0.60) | (2.20) | — |
Net asset value end of period | 40.63 | 33.10 | 30.15 | 25.06 | 24.97 |
Net assets end of period (000s) | $1,757 | $2,067 | $3,050 | $1,111 | $1,204 |
Ratios and Supplemental Data (%) | |||||
Total returnb | 32.71% | 16.13% | 23.35% | 9.61% | 24.48% |
Ratio of total expenses to average net assets^ | 1.20 | 1.23 | 1.25 | 1.29 | 1.46 |
Ratio of net expenses to average net assetsa | 1.11 | 1.11 | 1.13 | 1.15 | 1.15 |
Ratio of net investment income/(loss) to average net assetsa | (0.58) | (0.25) | 0.22 | (0.21) | (0.13) |
Portfolio turnover | 27 | 55 | 47 | 20 | 123 |
See page 76 for notes to the Financial Highlights.
The accompanying notes are an integral part of the Financial Statements.
68
Institutional Class | ||||
2021 | 2020 | 2019 | 2018 | 2017h |
$33.80 | $30.75 | $25.49 | $25.31 | $20.29 |
(0.13) | —* | 0.11 | 0.01 | 0.03 |
10.83 | 4.86 | 5.75 | 2.38 | 4.99 |
10.70 | 4.86 | 5.86 | 2.39 | 5.02 |
— | (0.07) | — | (0.01) | — |
(2.83) | (1.74) | (0.60) | (2.20) | — |
(2.83) | (1.81) | (0.60) | (2.21) | — |
41.67 | 33.80 | 30.75 | 25.49 | 25.31 |
$90,307 | $78,120 | $72,429 | $33,574 | $29,034 |
33.02% | 16.46% | 23.63% | 9.90% | 24.74% |
0.95 | 0.98 | 1.00 | 1.04 | 1.21 |
0.86 | 0.86 | 0.88 | 0.90 | 0.90 |
(0.33) | 0.01 | 0.37 | 0.03 | 0.14 |
27 | 55 | 47 | 20 | 123 |
Investor Class | ||||
2021 | 2020 | 2019 | 2018 | 2017h |
$32.59 | $29.74 | $24.76 | $24.72 | $19.89 |
(0.25) | (0.11) | (0.01) | (0.09) | (0.06) |
10.39 | 4.70 | 5.59 | 2.33 | 4.89 |
10.14 | 4.59 | 5.58 | 2.24 | 4.83 |
— | — | — | — | — |
(2.83) | (1.74) | (0.60) | (2.20) | — |
(2.83) | (1.74) | (0.60) | (2.20) | — |
39.90 | 32.59 | 29.74 | 24.76 | 24.72 |
$26,160 | $20,865 | $18,748 | $12,416 | $11,364 |
32.53% | 16.01% | 23.18% | 9.50% | 24.28% |
1.31 | 1.35 | 1.37 | 1.41 | 1.58 |
1.22 | 1.23 | 1.25 | 1.27 | 1.27 |
(0.69) | (0.35) | (0.03) | (0.35) | (0.25) |
27 | 55 | 47 | 20 | 123 |
69
Harbor International & Global Funds Financial Highlights—Continued
Selected Data for a Share Outstanding for the Periods Presented
HARBOR INTERNATIONAL FUND | |||||
Retirement Class | |||||
Year Ended October 31, | 2021 | 2020 | 2019 | 2018i | 2017 |
Net asset value beginning of period | $36.52 | $39.00 | $58.31 | $69.91 | $60.32 |
Income from Investment Operations | |||||
Net investment income/(loss)a,e | 0.72 | 0.91 | 0.91 | 1.21 | 0.94 |
Net realized and unrealized gain/(loss) on investments | 11.73 | (2.10) | 1.62 | (8.51) | 9.85 |
Total from investment operations | 12.45 | (1.19) | 2.53 | (7.30) | 10.79 |
Less Distributions | |||||
Dividends from net investment income | (0.50) | (1.29) | (0.97) | (1.30) | (1.20) |
Distributions from net realized capital gains | — | — | (20.87) | (3.00) | — |
Total distributions | (0.50) | (1.29) | (21.84) | (4.30) | (1.20) |
Net asset value end of period | 48.47 | 36.52 | 39.00 | 58.31 | 69.91 |
Net assets end of period (000s) | $872,647 | $871,743 | $1,299,776 | $2,703,360 | $2,657,442 |
Ratios and Supplemental Data (%) | |||||
Total returnb | 34.23% | (3.35)% | 10.29% | (11.24)% | 18.30% |
Ratio of total expenses to average net assets^ | 0.80 | 1.61l | 0.80 | 0.74 | 0.74 |
Ratio of net expenses to average net assetsa | 0.69 | 0.69l | 0.67 | 0.64 | 0.73 |
Ratio of net investment income/(loss) to average net assetsa | 1.55 | 2.52l | 2.33 | 1.80 | 1.42 |
Portfolio turnover | 21 | 12 | 12 | 64 | 13 |
Administrative Class | |||||
Year Ended October 31, | 2021 | 2020 | 2019 | 2018i | 2017 |
Net asset value beginning of period | $36.78 | $39.26 | $58.08 | $69.57 | $59.99 |
Income from Investment Operations | |||||
Net investment income/(loss)a,e | 0.57 | 0.47 | 0.76 | 0.88 | 0.79 |
Net realized and unrealized gain/(loss) on investments | 11.84 | (1.81) | 1.70 | (8.37) | 9.77 |
Total from investment operations | 12.41 | (1.34) | 2.46 | (7.49) | 10.56 |
Less Distributions | |||||
Dividends from net investment income | (0.24) | (1.14) | (0.41) | (1.00) | (0.98) |
Distributions from net realized capital gains | — | — | (20.87) | (3.00) | — |
Total distributions | (0.24) | (1.14) | (21.28) | (4.00) | (0.98) |
Net asset value end of period | 48.95 | 36.78 | 39.26 | 58.08 | 69.57 |
Net assets end of period (000s) | $15,464 | $15,825 | $70,981 | $90,009 | $398,584 |
Ratios and Supplemental Data (%) | |||||
Total returnb | 33.80% | (3.67)% | 9.94% | (11.53)% | 17.93% |
Ratio of total expenses to average net assets^ | 1.13 | 1.65l | 1.13 | 1.07 | 1.06 |
Ratio of net expenses to average net assetsa | 1.02 | 1.02l | 1.00 | 0.97 | 1.05 |
Ratio of net investment income/(loss) to average net assetsa | 1.22 | 1.25l | 1.94 | 1.30 | 1.22 |
Portfolio turnover | 21 | 12 | 12 | 64 | 13 |
See page 76 for notes to the Financial Highlights.
The accompanying notes are an integral part of the Financial Statements.
70
Institutional Class | ||||
2021 | 2020 | 2019 | 2018i | 2017 |
$36.64 | $39.12 | $58.31 | $69.90 | $60.30 |
0.70 | 0.92 | 0.84 | 1.04 | 0.97 |
11.76 | (2.15) | 1.67 | (8.39) | 9.79 |
12.46 | (1.23) | 2.51 | (7.35) | 10.76 |
(0.46) | (1.25) | (0.83) | (1.24) | (1.16) |
— | — | (20.87) | (3.00) | — |
(0.46) | (1.25) | (21.70) | (4.24) | (1.16) |
48.64 | 36.64 | 39.12 | 58.31 | 69.90 |
$3,307,683 | $2,750,824 | $3,814,616 | $8,577,147 | $27,401,853 |
34.15% | (3.43)% | 10.18% | (11.31)% | 18.24% |
0.88 | 1.76l | 0.88 | 0.82 | 0.81 |
0.77 | 0.77l | 0.75 | 0.72 | 0.80 |
1.50 | 2.52l | 2.11 | 1.53 | 1.51 |
21 | 12 | 12 | 64 | 13 |
Investor Class | ||||
2021 | 2020 | 2019 | 2018i | 2017 |
$36.22 | $38.65 | $57.66 | $69.14 | $59.61 |
0.52 | 0.75 | 0.70 | 0.81 | 0.72 |
11.64 | (2.12) | 1.65 | (8.33) | 9.71 |
12.16 | (1.37) | 2.35 | (7.52) | 10.43 |
(0.30) | (1.06) | (0.49) | (0.96) | (0.90) |
— | — | (20.87) | (3.00) | — |
(0.30) | (1.06) | (21.36) | (3.96) | (0.90) |
48.08 | 36.22 | 38.65 | 57.66 | 69.14 |
$374,773 | $323,686 | $510,270 | $895,711 | $1,798,228 |
33.66% | (3.79)% | 9.80% | (11.65)% | 17.79% |
1.25 | 2.10l | 1.25 | 1.19 | 1.18 |
1.13 | 1.14l | 1.12 | 1.09 | 1.17 |
1.13 | 2.06l | 1.80 | 1.21 | 1.13 |
21 | 12 | 12 | 64 | 13 |
71
Harbor International & Global Funds Financial Highlights—Continued
Selected Data for a Share Outstanding for the Periods Presented
HARBOR INTERNATIONAL GROWTH FUND | |||||
Retirement Class | |||||
Year Ended October 31, | 2021 | 2020 | 2019 | 2018 | 2017 |
Net asset value beginning of period | $19.10 | $16.14 | $13.70 | $15.71 | $12.90 |
Income from Investment Operations | |||||
Net investment income/(loss)a,e | 0.02 | 0.03 | 0.30 | 0.17 | 0.17 |
Net realized and unrealized gain/(loss) on investments | 4.56 | 3.25 | 2.25 | (1.99) | 2.81 |
Total from investment operations | 4.58 | 3.28 | 2.55 | (1.82) | 2.98 |
Less Distributions | |||||
Dividends from net investment income | (0.15) | (0.32) | (0.11) | (0.19) | (0.17) |
Distributions from net realized capital gains | — | — | — | — | — |
Total distributions | (0.15) | (0.32) | (0.11) | (0.19) | (0.17) |
Net asset value end of period | 23.53 | 19.10 | 16.14 | 13.70 | 15.71 |
Net assets end of period (000s) | $147,545 | $163,202 | $143,276 | $93,815 | $24,872 |
Ratios and Supplemental Data (%) | |||||
Total returnb | 24.00% | 20.56% | 18.81% | (11.74)% | 23.52% |
Ratio of total expenses to average net assets^ | 0.81 | 0.83 | 0.83 | 0.81 | 0.84 |
Ratio of net expenses to average net assetsa | 0.77 | 0.77 | 0.77 | 0.77 | 0.77 |
Ratio of net investment income/(loss) to average net assetsa | 0.08 | 0.19 | 2.01 | 1.07 | 1.19 |
Portfolio turnover | 12 | 24 | 16 | 17 | 13 |
Administrative Class | |||||
Year Ended October 31, | 2021 | 2020 | 2019 | 2018 | 2017 |
Net asset value beginning of period | $19.05 | $16.10 | $13.66 | $15.67 | $12.87 |
Income from Investment Operations | |||||
Net investment income/(loss)a,e | (0.06) | (0.02) | 0.22 | 0.08 | 0.09 |
Net realized and unrealized gain/(loss) on investments | 4.54 | 3.24 | 2.28 | (1.95) | 2.84 |
Total from investment operations | 4.48 | 3.22 | 2.50 | (1.87) | 2.93 |
Less Distributions | |||||
Dividends from net investment income | (0.11) | (0.27) | (0.06) | (0.14) | (0.13) |
Distributions from net realized capital gains | — | — | — | — | — |
Total distributions | (0.11) | (0.27) | (0.06) | (0.14) | (0.13) |
Net asset value end of period | 23.42 | 19.05 | 16.10 | 13.66 | 15.67 |
Net assets end of period (000s) | $662 | $507 | $390 | $330 | $466 |
Ratios and Supplemental Data (%) | |||||
Total returnb | 23.54% | 20.17% | 18.45% | (12.03)% | 23.08% |
Ratio of total expenses to average net assets^ | 1.14 | 1.16 | 1.16 | 1.14 | 1.16 |
Ratio of net expenses to average net assetsa | 1.10 | 1.10 | 1.10 | 1.10 | 1.10 |
Ratio of net investment income/(loss) to average net assetsa | (0.24) | (0.15) | 1.50 | 0.51 | 0.66 |
Portfolio turnover | 12 | 24 | 16 | 17 | 13 |
See page 76 for notes to the Financial Highlights.
The accompanying notes are an integral part of the Financial Statements.
72
Institutional Class | ||||
2021 | 2020 | 2019 | 2018 | 2017 |
$19.08 | $16.13 | $13.69 | $15.69 | $12.89 |
—* | 0.02 | 0.26 | 0.13 | 0.13 |
4.55 | 3.24 | 2.28 | (1.95) | 2.84 |
4.55 | 3.26 | 2.54 | (1.82) | 2.97 |
(0.13) | (0.31) | (0.10) | (0.18) | (0.17) |
— | — | — | — | — |
(0.13) | (0.31) | (0.10) | (0.18) | (0.17) |
23.50 | 19.08 | 16.13 | 13.69 | 15.69 |
$709,080 | $600,240 | $414,528 | $399,911 | $362,035 |
23.92% | 20.42% | 18.73% | (11.75)% | 23.38% |
0.89 | 0.91 | 0.91 | 0.89 | 0.91 |
0.85 | 0.85 | 0.85 | 0.85 | 0.85 |
0.01 | 0.11 | 1.75 | 0.84 | 0.92 |
12 | 24 | 16 | 17 | 13 |
Investor Class | ||||
2021 | 2020 | 2019 | 2018 | 2017 |
$18.93 | $16.00 | $13.58 | $15.57 | $12.79 |
(0.11) | (0.04) | 0.21 | 0.11 | 0.07 |
4.54 | 3.22 | 2.26 | (1.98) | 2.82 |
4.43 | 3.18 | 2.47 | (1.87) | 2.89 |
(0.06) | (0.25) | (0.05) | (0.12) | (0.11) |
— | — | — | — | — |
(0.06) | (0.25) | (0.05) | (0.12) | (0.11) |
23.30 | 18.93 | 16.00 | 13.58 | 15.57 |
$13,523 | $32,757 | $34,238 | $32,225 | $14,913 |
23.41% | 20.06% | 18.29% | (12.12)% | 22.89% |
1.26 | 1.28 | 1.28 | 1.26 | 1.28 |
1.22 | 1.22 | 1.22 | 1.22 | 1.22 |
(0.49) | (0.27) | 1.40 | 0.69 | 0.54 |
12 | 24 | 16 | 17 | 13 |
73
Harbor International & Global Funds Financial Highlights—Continued
Selected Data for a Share Outstanding for the Periods Presented
HARBOR INTERNATIONAL SMALL CAP FUND | |||||
Retirement Class | |||||
Year Ended October 31, | 2021 | 2020 | 2019j | 2018 | 2017 |
Net asset value beginning of period | $11.37 | $12.49 | $12.38 | $13.90 | $10.77 |
Income from Investment Operations | |||||
Net investment income/(loss)a,e | 0.28 | 0.07 | 0.24 | 0.17 | 0.08 |
Net realized and unrealized gain/(loss) on investments | 4.91 | (0.82) | 0.35 | (1.50) | 3.18 |
Total from investment operations | 5.19 | (0.75) | 0.59 | (1.33) | 3.26 |
Less Distributions | |||||
Dividends from net investment income | (0.17) | (0.37) | (0.10) | (0.09) | (0.13) |
Distributions from net realized capital gains | — | — | (0.38) | (0.10) | — |
Total distributions | (0.17) | (0.37) | (0.48) | (0.19) | (0.13) |
Net asset value end of period | 16.39 | 11.37 | 12.49 | 12.38 | 13.90 |
Net assets end of period (000s) | $9,559 | $5,525 | $19,408 | $8,213 | $7,671 |
Ratios and Supplemental Data (%) | |||||
Total returnb | 45.95% | (6.36)% | 5.23% | (9.71)% | 30.67% |
Ratio of total expenses to average net assets^ | 1.17 | 1.37 | 1.24 | 1.07 | 1.35 |
Ratio of net expenses to average net assetsa | 0.88 | 0.88 | 0.88 | 0.87 | 0.87 |
Ratio of net investment income/(loss) to average net assetsa | 1.79 | 0.64 | 1.98 | 1.19 | 0.60 |
Portfolio turnover | 43 | 39 | 178 | 53 | 44 |
Administrative Class | |||||
Year Ended October 31, | 2021 | 2020 | 2019j | 2018 | 2017 |
Net asset value beginning of period | $11.34 | $12.46 | $12.34 | $13.87 | $10.75 |
Income from Investment Operations | |||||
Net investment income/(loss)a,e | 0.20 | 0.06 | 0.15 | 0.11 | 0.07 |
Net realized and unrealized gain/(loss) on investments | 4.93 | (0.85) | 0.40 | (1.49) | 3.15 |
Total from investment operations | 5.13 | (0.79) | 0.55 | (1.38) | 3.22 |
Less Distributions | |||||
Dividends from net investment income | (0.14) | (0.33) | (0.05) | (0.05) | (0.10) |
Distributions from net realized capital gains | — | — | (0.38) | (0.10) | — |
Total distributions | (0.14) | (0.33) | (0.43) | (0.15) | (0.10) |
Net asset value end of period | 16.33 | 11.34 | 12.46 | 12.34 | 13.87 |
Net assets end of period (000s) | $487 | $333 | $356 | $309 | $371 |
Ratios and Supplemental Data (%) | |||||
Total returnb | 45.44% | (6.65)% | 4.90% | (10.06)% | 30.25% |
Ratio of total expenses to average net assets^ | 1.50 | 1.70 | 1.57 | 1.40 | 1.67 |
Ratio of net expenses to average net assetsa | 1.21 | 1.21 | 1.21 | 1.20 | 1.20 |
Ratio of net investment income/(loss) to average net assetsa | 1.30 | 0.49 | 1.25 | 0.76 | 0.59 |
Portfolio turnover | 43 | 39 | 178 | 53 | 44 |
See page 76 for notes to the Financial Highlights.
The accompanying notes are an integral part of the Financial Statements.
74
Institutional Class | ||||
2021 | 2020 | 2019j | 2018 | 2017 |
$11.37 | $12.49 | $12.37 | $13.90 | $10.77 |
0.24 | 0.09 | 0.19 | 0.15 | 0.10 |
4.95 | (0.86) | 0.40 | (1.50) | 3.15 |
5.19 | (0.77) | 0.59 | (1.35) | 3.25 |
(0.17) | (0.35) | (0.09) | (0.08) | (0.12) |
— | — | (0.38) | (0.10) | — |
(0.17) | (0.35) | (0.47) | (0.18) | (0.12) |
16.39 | 11.37 | 12.49 | 12.37 | 13.90 |
$49,419 | $25,716 | $25,758 | $50,358 | $38,818 |
45.87% | (6.48)% | 5.25% | (9.83)% | 30.59% |
1.25 | 1.45 | 1.32 | 1.15 | 1.42 |
0.96 | 0.96 | 0.96 | 0.95 | 0.95 |
1.53 | 0.76 | 1.60 | 1.05 | 0.81 |
43 | 39 | 178 | 53 | 44 |
Investor Class | ||||
2021 | 2020 | 2019j | 2018 | 2017 |
$11.34 | $12.45 | $12.34 | $13.86 | $10.74 |
0.18 | 0.04 | 0.13 | 0.10 | 0.06 |
4.93 | (0.84) | 0.40 | (1.48) | 3.14 |
5.11 | (0.80) | 0.53 | (1.38) | 3.20 |
(0.13) | (0.31) | (0.04) | (0.04) | (0.08) |
— | — | (0.38) | (0.10) | — |
(0.13) | (0.31) | (0.42) | (0.14) | (0.08) |
16.32 | 11.34 | 12.45 | 12.34 | 13.86 |
$1,962 | $398 | $428 | $619 | $540 |
45.25% | (6.76)% | 4.70% | (10.08)% | 30.10% |
1.61 | 1.82 | 1.69 | 1.52 | 1.79 |
1.32 | 1.33 | 1.33 | 1.32 | 1.32 |
1.16 | 0.36 | 1.10 | 0.73 | 0.53 |
43 | 39 | 178 | 53 | 44 |
75
Harbor International & Global Funds Financial Highlights—Continued
Selected Data for a Share Outstanding for the Periods Presented
HARBOR OVERSEAS FUND | ||||||
Retirement Class | Institutional Class | |||||
Year Ended October 31, | 2021 | 2020 | 2019f | 2021 | 2020 | 2019f |
Net asset value beginning of period | $10.12 | $10.31 | $10.00 | $10.11 | $10.31 | $10.00 |
Income from Investment Operations | ||||||
Net investment income/(loss)a,e | 0.28 | 0.17 | 0.24 | 0.29 | 0.17 | 0.24 |
Net realized and unrealized gain/(loss) on investments | 3.79 | (0.09) | 0.07 | 3.77 | (0.11) | 0.07 |
Total from investment operations | 4.07 | 0.08 | 0.31 | 4.06 | 0.06 | 0.31 |
Less Distributions | ||||||
Dividends from net investment income | (0.17) | (0.27) | — | (0.16) | (0.26) | — |
Distributions from net realized capital gains | — | — | — | — | — | — |
Total distributions | (0.17) | (0.27) | — | (0.16) | (0.26) | — |
Net asset value end of period | 14.02 | 10.12 | 10.31 | 14.01 | 10.11 | 10.31 |
Net assets end of period (000s) | $19,742 | $13,790 | $13,090 | $33,230 | $13,226 | $13,131 |
Ratios and Supplemental Data (%) | ||||||
Total returnb | 40.51% | 0.64% | 3.10%c | 40.46% | 0.48% | 3.10%c |
Ratio of total expenses to average net assets^ | 1.19 | 1.35 | 1.79d | 1.27 | 1.43 | 1.87d |
Ratio of net expenses to average net assetsa | 0.77 | 0.77 | 0.77d | 0.85 | 0.85 | 0.85d |
Ratio of net investment income/(loss) to average net assetsa | 2.14 | 1.73 | 3.61d | 2.16 | 1.65 | 3.54d |
Portfolio turnover | 108 | 80 | 73c | 108 | 80 | 73c |
*
Less than $0.01
^
Percentage does not reflect reduction for credit balance arrangements (see the “Custodian” section in Note 2 of the accompanying Notes to Financial Statements)
a
Reflects the Adviser’s waiver, if any, of its management fees and/or other operating expenses
b
The total returns would have been lower had certain expenses not been waived during the periods shown.
c
Unannualized
d
Annualized
e
Amounts are based on average daily shares outstanding during the period.
f
For the period March 1, 2019 (inception) through October 31, 2019
g
For the period June 1, 2019 (inception) through October 31, 2019
h
Effective March 1, 2017, the Board of Trustees appointed Sands Capital Management, LLC as subadviser to Harbor Global Leaders Fund.
i
Effective August 22, 2018, the Board of Trustees appointed Marathon Asset Management LLP as subadviser to Harbor International Fund.
j
Effective May 23, 2019, the Board of Trustees appointed Cedar Street Asset Management LLC as subadviser to Harbor International Small Cap Fund.
k
Effective September 23, 2020, the Board of Trustees appointed Marathon Asset Management LLP as subadviser to Harbor Emerging Markets Equity Fund.
l
The net investment income ratio includes dividends and interest income and related tax compliance fee and interest expense, from foreign tax reclaims and interest received by the Fund. The total and net expense ratios include the tax compliance fee and related interest expense due to this receipt of foreign tax reclaims and interest income by the Fund. For the year ended October 31, 2020, the ratios of net expenses to average net assets including tax compliance fee for the Retirement Class, Institutional Class, Administrative Class, and Investor Class were 1.49%, 1.64%, 1.53%, and 1.98%, respectively.
The accompanying notes are an integral part of the Financial Statements.
76
Investor Class | ||
2021 | 2020 | 2019f |
$10.08 | $10.28 | $10.00 |
0.23 | 0.14 | 0.21 |
3.78 | (0.11) | 0.07 |
4.01 | 0.03 | 0.28 |
(0.13) | (0.23) | — |
— | — | — |
(0.13) | (0.23) | — |
13.96 | 10.08 | 10.28 |
$101 | $35 | $31 |
39.98% | 0.14% | 2.80%c |
1.63 | 1.80 | 2.24d |
1.21 | 1.22 | 1.22d |
1.73 | 1.41 | 3.17d |
108 | 80 | 73c |
77
Harbor International & Global Funds
Notes to Financial Statements—October 31, 2021
Note 1—Organizational Matters
Harbor Funds (the “Trust”) is registered under the Investment Company Act of 1940, as amended (the “Investment Company Act”), as an open-end management investment company. As of October 31, 2021, the Trust consists of 31 separate portfolios. The portfolios covered by this report are: Harbor Diversified International All Cap Fund, Harbor Emerging Markets Equity Fund, Harbor Focused International Fund, Harbor Global Leaders Fund, Harbor International Fund, Harbor International Growth Fund, Harbor International Small Cap Fund, and Harbor Overseas Fund (individually or collectively referred to as a “Fund” or the “Funds," respectively). Harbor Capital Advisors, Inc. (the “Adviser” or “Harbor Capital”) is the investment adviser for the Funds.
The Funds currently offer four classes of shares, designated as Retirement Class, Institutional Class, Administrative Class and Investor Class. The shares of each class represent an interest in the same portfolio of investments of the Funds and have equal rights with respect to voting, redemptions, dividends, and liquidations, except that: (i) subject to the approval of the Trust’s Board of Trustees (the “Board of Trustees”), certain expenses may be applied differently to each class of shares in accordance with current regulations of the U.S. Securities and Exchange Commission (“SEC”) and the Internal Revenue Service; and (ii) shareholders of a class that bears distribution and service expenses under terms of a distribution plan have exclusive voting rights as to that distribution plan.
Note 2—Significant Accounting Policies
The following is a summary of significant accounting policies followed by the Trust in the preparation of its financial statements. Each Fund follows the investment company reporting requirements under U.S. Generally Accepted Accounting Principles (“U.S. GAAP”), which includes the accounting and reporting guidelines under Accounting Standards Codification (“ASC”) Topic 946, Financial Services-Investment Companies. The preparation of financial statements in accordance with U.S. GAAP requires management to make estimates and assumptions that affect the reported amounts and disclosures in the financial statements. Actual results may differ from those estimates.
Security Valuation
The Trust’s valuation procedures permit the Funds to use a variety of valuation methodologies, consider a number of subjective factors, analyze applicable facts and circumstances and, in general, exercise judgment, when valuing Fund investments. The methodology used for a specific type of investment may vary based on the circumstances and relevant considerations, including available market data.
Equity securities (including common stock, preferred stock, and convertible preferred stock), exchange-traded funds and financial derivative instruments (such as futures contracts and options contracts, including rights and warrants) that are traded on a national securities exchange or system (except securities listed on the National Association of Securities Dealers Automated Quotation (“NASDAQ”) system and United Kingdom securities) are valued at the last sale price on a national exchange or system on which they are principally traded as of the valuation date. Securities listed on the NASDAQ system or a United Kingdom exchange are valued at the official closing price of those securities. In the case of securities for which there are no sales on the valuation day, (i) securities traded principally on a U.S. exchange, including NASDAQ, are valued at the mean between the closing bid and ask price; and (ii) securities traded principally on a foreign exchange, including United Kingdom securities, are valued at the official bid price determined as of the close of the primary exchange. Shares of open-end registered investment companies that are held by a Fund are valued at net asset value. To the extent these securities are actively traded and fair valuation adjustments are not applied, they are normally categorized as Level 1 in the fair value hierarchy. Equity securities traded on inactive markets or valued by reference to similar instruments are normally categorized as Level 2 in the fair value hierarchy. For more information on the fair value hierarchy, please refer to the Fair Value Measurements and Disclosures section.
Short-term securities with a remaining maturity of less than 60 days at the time of acquisition that are held by a Fund are valued at amortized cost to the extent amortized cost represents fair value. Such securities are normally categorized as Level 2 in the fair value hierarchy.
Over-the-counter financial derivative instruments, such as forward currency contracts, options contracts, and swap agreements (including centrally cleared swaps), derive their value from underlying asset prices, indices, reference rates and other inputs, or a combination of these factors. These instruments are valued using evaluated prices furnished by a pricing vendor selected by the Board of Trustees. In certain cases, when a valuation is not readily available from a pricing vendor, the Fund’s subadviser
78
Harbor International & Global Funds
Notes to Financial Statements—Continued
Note 2—Significant Accounting Policies—Continued
provides a valuation, typically using its own proprietary models. Depending on the instrument and the terms of the transaction, the value of the derivative instrument can be determined by a pricing vendor or subadviser using a series of techniques, including simulation pricing models. The pricing models use inputs, such as issuer details, indices, spreads, interest rates, yield curves, dividends and exchange rates, that are observed from actively quoted markets. Derivative instruments that use valuation techniques and inputs similar to those described above are normally categorized as Level 2 in the fair value hierarchy.
A Fund may also use fair value pricing if the value of some or all of the Fund’s securities have been materially affected by events occurring before the Fund’s pricing time but after the close of the primary markets or exchanges on which the security is traded. This most commonly occurs with foreign securities, but may occur with other securities as well. In such cases, the Fund may apply a fair value factor supplied by the pricing vendor to a foreign security’s market close value to reflect changes in value that may have occurred between the close of the primary market or exchange on which the security is traded and the Fund’s pricing time. That factor may be derived using observable inputs such as a comparison of the trading patterns of a foreign security to intraday trading in the U.S. markets that are highly correlated to the foreign security or other information that becomes available after the close of the foreign market on which the security principally traded. When fair value pricing is employed, the prices of securities used by a Fund to calculate its net asset value may differ from market quotations, official closing prices or evaluated prices for the same securities, which means that the Fund may value those securities higher or lower than another given fund that uses market quotations, official closing prices or evaluated prices supplied by a pricing vendor in its calculation of net asset value. Securities valued using observable inputs, such as those described above, are normally categorized as Level 2 of the fair value hierarchy.
When reliable market quotations or evaluated prices supplied by a pricing vendor are not readily available or are not believed to accurately reflect fair value, securities are priced at their fair value as determined by the Trust’s Valuation Committee (the “Valuation Committee”) pursuant to procedures adopted, and subject to oversight, by the Board of Trustees. The Valuation Committee is comprised of a trustee and officers of the Trust and employees of Harbor Capital with relevant experience or responsibilities. Each security for which the Valuation Committee determines a fair value, including the basis for the fair value decision, is reviewed by the Board of Trustees at its regularly scheduled board meetings. Securities valued using fair valuation methods that incorporate significant unobservable inputs are normally categorized as Level 3 in the fair value hierarchy.
Fair Value Measurements and Disclosures
Various inputs may be used to determine the value of each Fund’s investments, which are summarized in three broad categories defined as Level 1, Level 2, and Level 3. The inputs or methodologies used for valuing investments are not necessarily indicative of the risk associated with investing in those investments. The assignment of an investment to Levels 1, 2, or 3 is based on the lowest level of significant inputs used to determine its fair value.
Level 1– | Quoted prices in active markets for identical securities. |
Level 2– | Other significant observable inputs (including quoted prices for similar securities, interest rates, prepayment speeds, credit risk, etc.). |
Level 3– | Significant unobservable inputs are used in situations where quoted prices or other observable inputs are not available or are deemed unreliable. Significant unobservable inputs may include each Fund’s own assumptions. |
The categorization of investments into Levels 1, 2, or 3, and a summary of significant unobservable inputs used for Level 3 investments, when applicable, can be found at the end of each Fund’s Portfolio of Investments schedule. For fair valuations using significant unobservable inputs, if any, a reconciliation of the beginning to ending balances for reported fair values is provided at the end of each Fund’s Portfolio of Investments schedule that presents changes attributable to realized and unrealized gains and losses and purchases, sales, and transfers in/out of the Level 3 category during the year.
Each Fund used observable inputs in its valuation methodologies whenever they were available and deemed reliable.
Investment Income
Dividends declared on portfolio securities are accrued on the ex-dividend date. For foreign securities, certain dividends are recorded after the ex-dividend date, but as soon as the respective Fund is notified of such dividends. Interest income is accrued daily as earned. Discounts and premiums on fixed income securities are amortized over the life of the respective securities
79
Harbor International & Global Funds
Notes to Financial Statements—Continued
Note 2—Significant Accounting Policies—Continued
(except for premiums on certain callable debt securities that are amortized to the earliest call date) using the effective yield method. Distributions from real estate investment trust securities are recorded as dividend income, and may be reclassified as capital gains and/or return of capital, based on the information reported by the issuer, when available.
Expenses
Expenses are charged directly to the Fund that incurred such expense whenever possible. With respect to expenses incurred by any two or more Harbor funds where amounts cannot be identified on a fund by fund basis, such expenses are generally allocated in proportion to the average net assets or the number of shareholders of each Fund.
Class Allocations
Income, common expenses and realized and unrealized gains/(losses) are determined at the Fund level and allocated daily to each class of shares based on the applicable net assets of the respective classes. Distribution and service fees, if any, and transfer agent fees are calculated daily at the class level based on the applicable net assets of each class and the expense rate(s) applicable to each class.
Securities Transactions
Securities transactions are accounted for on the trade date (the date the order to buy or sell is executed). Realized gains or losses on security transactions are determined on the basis of identified cost.
Distribution to Shareholders
Distributions on Fund shares are recorded on the ex-dividend date.
Taxes
Each Fund is treated as a separate entity for U.S. federal tax purposes. Each Fund’s policy is to meet the requirements of Subchapter M of the Internal Revenue Code of 1986, as amended (the “Internal Revenue Code”) applicable to regulated investment companies and to distribute to its shareholders all of its taxable income within the prescribed time. It is also the intention of each Fund to distribute an amount sufficient to avoid imposition of any excise tax under Section 4982 of the Internal Revenue Code. Therefore, no provision has been made for U.S. federal taxes on income, capital gains or unrealized appreciation of securities held or excise taxes on income and capital gains.
Each Fund may be subject to taxes imposed by foreign countries in which they invest. Such taxes are generally based on income and/or capital gains earned or repatriated. Taxes are accrued and applied to net investment income, net realized gains and unrealized appreciation as such income and/or gains are earned.
Management has analyzed each Fund’s tax positions for all open tax years (in particular, U.S. federal income tax returns for the tax years ended October 31, 2018–2020), including all positions expected to be taken upon filing the 2021 tax return, in all material jurisdictions where each Fund operates, and has concluded that no provision for income tax is required in the Funds’ financial statements. Each Fund will recognize interest and penalties, if any, related to unrecognized tax benefits as income tax expense in the Statement of Operations.
On August 24, 2020, Harbor International Fund received a payment, including interest, from a member country of the European Union based on foreign tax reclaims relating to amounts withheld on dividends received by the Fund during fiscal years October 31, 2009 through 2014. A portion of the foreign tax reclaims and interest received is due to the Internal Revenue Service (“IRS”), in the form of a tax compliance fee and that amount is based on the percentage of foreign tax credits previously passed through to the Fund’s shareholders in the years dividends were received by the Fund. The estimated amount due to the IRS, including interest, is included in tax compliance fee payable in the Fund’s Statement of Asset and Liabilities. The actual tax compliance and related interest due to the IRS will be determined based on a closing agreement with the IRS and may differ from estimates.
80
Harbor International & Global Funds
Notes to Financial Statements—Continued
Note 2—Significant Accounting Policies—Continued
Custodian
Each Fund has credit balance arrangements with its custodian whereby positive balances in demand deposit accounts used by the transfer and shareholder servicing agent for clearing shareholder transactions in the Fund generate credits that are applied against gross custody expenses. Such custodial expense reductions, if any, are reflected on the respective Fund’s accompanying Statement of Operations.
Foreign Currency Contracts
A foreign currency spot contract is an agreement between two parties to buy and sell currencies at the current market rate for settlement within two business days. A forward currency contract is an agreement between two parties to buy and sell currencies at a set price on a future date.
Foreign currency contracts are fair valued daily and any change in fair value is recorded as an unrealized gain or loss. When the contract is closed, the Fund records a realized gain or loss equal to the difference between the value on the open and close date. Risk of losses may arise from changes in the value of the foreign currency or if the counterparties do not perform under the contract’s terms. The maximum potential loss from such contracts is the aggregate face value in U.S. dollars at the time the contract was opened.
During the year, each Fund used foreign currency spot contracts to facilitate transactions in foreign securities or to convert foreign currency receipts into U.S. dollars. During the year, Harbor Emerging Markets Equity Fund and Harbor Overseas Fund used forward currency contracts to manage their exposure to changes in exchange rates or as a hedge against foreign exchange risk related to specific transactions or portfolio positions.
Foreign Currency Translations
Purchases and sales of securities are translated into U.S. dollars at the current exchange rate on the respective dates of the transactions. Income and withholding taxes are translated at the prevailing exchange rate when accrued or incurred. The accounting records of the Funds are maintained in U.S. dollars. Investment securities and other assets and liabilities denominated in a foreign currency, when applicable, are translated into U.S. dollars based on the current exchange rates at year end.
Reported net realized gains and losses on foreign currency transactions, when applicable, represent net gains and losses from sales and maturities of foreign currency contracts, disposition of foreign currencies, currency gains and losses realized between the trade and settlement dates on securities transactions, and the difference between the amount of investment income accrued and tax reclaims receivable and the U.S. dollar amount actually received. The effects of changes in foreign currency exchange rates on investments in securities, when applicable, are included in the net realized and unrealized gain or loss on investments in the Statements of Operations.
Proceeds from Litigation
Each Fund may receive proceeds from shareholder litigation settlements involving current and/or previously held portfolio holdings. Any proceeds received from litigation involving portfolio holdings are reflected in the Statements of Operations in realized gain/(loss) if the security has been disposed of by a Fund, or in unrealized gain/(loss) if the security is still held by a Fund.
Rights and Warrants
Rights represent a privilege offered to holders of record of issued securities to subscribe (usually on a pro rata basis) for additional securities of the same class, of a different class or of a different issuer. Warrants are contracts that generally give the holder the right, but not the obligation, to buy a stated number of shares of common stock at a specified price at any time during the life of the warrant. Rights and warrants are typically written by the issuer of the security underlying the right or warrant. Although some rights and warrants may be non-transferable, others may be traded over-the-counter or on an exchange.
A Fund may acquire rights or warrants in order to gain exposure to the underlying security without owning the security, including, for example, cases where the Fund hopes to lock in the price today of a security it may wish to purchase in the future. In order for a warrant to be profitable, the market price of the underlying security must rise sufficiently above the exercise price
81
Harbor International & Global Funds
Notes to Financial Statements—Continued
Note 2—Significant Accounting Policies—Continued
to cover any premium and transaction costs. The value of a right or warrant may not necessarily change with the value of the underlying securities. When a Fund acquires rights or warrants, it runs the risk that it will lose its entire investment in the rights or warrants, unless the Fund exercises the right or warrant, acquires the underlying securities, or enters into a closing transaction before expiration. Rights and warrants cease to have value if they are not exercised prior to their expiration date. If the price of the underlying security does not rise to an extent sufficient to cover any premium and transaction costs, the Fund will lose part or all of its investment. Any premiums or purchase price paid for rights or other warrants that expire are treated as realized losses. If a Fund enters into a closing sale transaction, it realizes a gain or loss, depending on whether the proceeds from the sale are greater or less than the cost of the rights or warrants.
Rights or warrants outstanding at the end of the year, if any, are disclosed at the end of each applicable Fund’s Portfolio of Investments and are included in “Purchased options” in the Statements of Assets and Liabilities. Realized gain/(loss) and unrealized appreciation/(depreciation) recognized during the year are included in “Purchased options” in the Statements of Operations.
During the year, Harbor Diversified International All Cap Fund, Harbor Emerging Markets Equity Fund, Harbor International Fund, Harbor International Small Cap Fund, and Harbor Overseas Fund held rights/warrants as a result of their investments in underlying securities.
Note 3—Investment Portfolio Transactions
Investment Portfolio Transactions
Purchases and sales of investments, other than short-term securities, for each Fund for the year ended October 31, 2021 were as follows:
Purchases (000s) | Sales (000s) | |
Harbor Diversified International All Cap Fund | $660,297 | $550,657 |
Harbor Emerging Markets Equity Fund | 47,007 | 67,466 |
Harbor Focused International Fund | 22,468 | 20,461 |
Harbor Global Leaders Fund | 36,867 | 62,803 |
Harbor International Fund | 963,677 | 1,635,936 |
Harbor International Growth Fund | 102,125 | 226,765 |
Harbor International Small Cap Fund | 35,222 | 19,719 |
Harbor Overseas Fund | 59,604 | 45,042 |
In-Kind Redemption Transactions
In accordance with the Trust’s prospectus, the Funds may distribute portfolio securities rather than cash as payment for a redemption of Fund shares. For financial reporting purposes, a Fund recognizes a gain or loss on the securities distributed related to the in-kind redemption. Such Fund-level gains and losses on in-kind redemptions are not taxable to shareholders. There were no in-kind redemptions from the Funds for the year ended October 31, 2021. For the year ended October 31, 2020, Harbor International Fund realized gains of $9,616,000 upon the disposition of portfolio securities in connection with in-kind redemptions of the Fund’s shares.
Securities Lending
Each Fund may engage in securities lending, whereby a Fund lends its securities to financial institutions in order to increase its income. The Trust has engaged State Street Bank and Trust Company to act as its agent (the “Lending Agent”) with respect to the lending of portfolio securities of the Funds, pursuant to the terms and conditions of a Securities Lending Authorization Agreement (the “SLA Agreement”). Securities loans are required to be secured at all times during the term of the loan by collateral that is at least equal to the value of the loaned securities determined at the close of each business day. Collateral may consist of cash and/or securities issued by the U.S. Treasury. Any additional collateral that may be required to secure a loan is delivered to the Fund on the next business day. Cash collateral is recognized as the gross liability for securities loaned in the Statements of Assets and Liabilities. Non-cash collateral is not disclosed in the Funds' Statements of Assets and Liabilities as it is held by the Lending Agent on behalf of the Funds, and the Funds do not have the ability to rehypothecate those securities.
82
Harbor International & Global Funds
Notes to Financial Statements—Continued
Note 3—Investment Portfolio Transactions—Continued
Cash collateral is invested in the State Street Navigator Securities Lending Government Money Market Portfolio (the “Navigator Portfolio”), a money market mutual fund that seeks to provide income while maintaining a stable net asset value of $1.00. There is no assurance that the Navigator Portfolio will maintain a stable net asset value and the Funds are subject to the risk of loss on the cash collateral invested. A portion of the earnings generated by the investment of the cash collateral is rebated to the borrower for the use of the cash collateral and these earnings (less any rebate) are then divided between the Fund and the Lending Agent, as a fee for its services, according to agreed-upon rates. The Lending Agent and a Fund will share in any shortfall in the rebate due to the borrower, according to agreed-upon rates.
In addition to receiving a fee from the borrower based on the demand for securities loaned and earning income on the investment of the cash collateral, a Fund receives substitute interest, dividends, or other amounts on the loaned securities, during the term of a loan. Net securities lending income is disclosed as such in the Statements of Operations and represents the income earned from the non-cash collateral and the investment of cash collateral, net of fee rebates paid to the borrower and net of fees paid to the Lending Agent.
Loans may be terminated at the option of the borrower or the Funds. Upon termination of the loan, the borrower will return to the Fund securities that are identical to the loaned securities. The Funds bear the risk of delay in recovery of, or loss of rights in, the securities loaned and the risk that the value of the collateral falls below the value of the securities on loan. Each Fund seeks to mitigate this risk through the SLA Agreement, which provides that in the event of default, the Lending Agent may apply the proceeds of the cash collateral from the loaned securities toward the purchase of replacement securities. If such proceeds are insufficient or the collateral is unavailable, the Lending Agent will purchase replacement securities at its sole expense, or if unable to do so, the Lending Agent may credit to the Fund’s account an amount equal to the fair value of the unreturned loaned securities. As the securities loans are subject to termination by the Fund or the borrower at any time, the remaining contractual maturities of each securities lending transaction is considered to be overnight and continuous.
The following table shows the Funds that engaged in securities lending during the year and summarizes the value of equity securities loaned and related cash and non-cash collateral as of October 31, 2021.
Value of Securities on Loan (000s) | Cash Collateral (000s) | Non-Cash Collateral (000s) | |
Harbor Diversified International All Cap Fund | $2,254 | $2,427 | $— |
Harbor Focused International Fund | — | — | — |
Harbor International Fund | 13,888 | — | 14,649 |
Harbor International Growth Fund | — | — | — |
Harbor International Small Cap Fund | — | — | — |
Harbor Overseas Fund | — | — | — |
Note 4—FEES AND OTHER Transactions with Affiliates
Investment Adviser
Harbor Capital is a wholly owned subsidiary of ORIX Corporation. Harbor Capital is the Funds’ investment adviser and is also responsible for administrative and other services.
83
Harbor International & Global Funds
Notes to Financial Statements—Continued
Note 4—FEES AND OTHER Transactions with Affiliates—Continued
Each Fund has a separate advisory agreement with Harbor Capital. The agreements provide for management fees based on an annual percentage rate of average daily net assets as follows:
Contractual Rate | Actual Rate | |
Harbor Diversified International All Cap Fund | 0.75%a | 0.74% |
Harbor Emerging Markets Equity Fund | 0.85 | 0.85 |
Harbor Focused International Fund | 0.75 | 0.75 |
Harbor Global Leaders Fund | 0.75b | 0.70 |
Harbor International Fund | 0.75c | 0.75 |
Harbor International Growth Fund | 0.75 | 0.75 |
Harbor International Small Cap Fund | 0.85 | 0.85 |
Harbor Overseas Fund | 0.75 | 0.75 |
a | For the period November 1, 2020 through October 31, 2021, the adviser voluntarily waived a portion of its management fee. |
b | The Adviser has contractually agreed to waive 0.05% of its management fee through February 28, 2022. |
c | The management fee rate is 0.75% on assets up to $12 billion and 0.65% on assets in excess of $12 billion. |
Harbor Capital has from time to time voluntarily or contractually agreed not to impose a portion of its management fees and/or to bear a portion of the expenses incurred in the operation of certain Funds in order to limit Fund expenses. Such waivers, if any, are reflected on the accompanying Statements of Operations. Interest expense, if any, is excluded from contractual limitations. During the year, the following expense limitation agreements were in effect:
Retirement Class | Institutional Class | Administrative Class | Investor Class1 | Expense Limitation Agreement Expiration Date | |
Harbor Diversified International All Cap Fund | 0.72% | 0.80% | 1.05% | 1.16% | 02/28/2022 |
Harbor Emerging Markets Equity Fund | 0.88 | 0.96 | 1.21 | 1.32 | 02/28/2022 |
Harbor Focused International Fund | 0.77 | 0.85 | 1.10 | 1.21 | 02/28/2022 |
Harbor Global Leaders Fund | 0.78 | 0.86 | 1.11 | 1.22 | 02/28/2022 |
Harbor International Fund | 0.69 | 0.77 | 1.02 | 1.13 | 02/28/2022 |
Harbor International Growth Fund | 0.77 | 0.85 | 1.10 | 1.21 | 02/28/2022 |
Harbor International Small Cap Fund | 0.88 | 0.96 | 1.21 | 1.32 | 02/28/2022 |
Harbor Overseas Fund | 0.77 | 0.85 | 1.10 | 1.21 | 02/28/2022 |
1 | For the period November 1, 2020 through February 28, 2021, the operating expense limitation for the Investor Class for Harbor Diversified International All Cap Fund, Harbor Emerging Markets Equity Fund, Harbor Focused International Fund, Harbor Global Leaders Fund, Harbor International Fund, Harbor International Growth Fund, Harbor International Small Cap Fund, and Harbor Overseas Fund were 1.17%, 1.33%, 1.22%, 1.23%, 1.14%, 1.22%, 1.33% and 1.22%, respectively. |
All expense limitation agreements include the transfer agent fee waiver discussed in the Transfer Agent note.
Distributor
Harbor Funds Distributors, Inc. (the “Distributor”), a wholly-owned subsidiary of Harbor Capital, is the distributor for Harbor Funds’ shares. Under the Trust’s current distribution plan pursuant to Rule 12b-1 under the Investment Company Act with respect to each Fund’s Administrative and Investor Class shares (each, a “12b-1 Plan”) as applicable, each Fund pays the Distributor compensation at the annual rate of 0.25% of the average daily net assets of its Administrative and Investor Class shares. Pursuant to each 12b-1 Plan, the Distributor is compensated for financing any activity that is primarily intended to result in the sale of Administrative and Investor Class shares of each Fund or for recordkeeping services or the servicing of shareholder accounts in a Administrative and Investor Class shares of each Fund. Such activities include, but are not limited to: printing of prospectuses and statements of additional information and reports for prospective shareholders (i.e., other than existing shareholders); preparation and distribution of advertising material and sales literature; expenses of organizing and conducting sales seminars; supplemental payments to dealers or other institutions such as asset-based sales charges, payments of recordkeeping fees under recordkeeping arrangements, or payments of service fees under shareholder service arrangements; and costs of administering each 12b-1 Plan.
84
Harbor International & Global Funds
Notes to Financial Statements—Continued
Note 4—FEES AND OTHER Transactions with Affiliates—Continued
Amounts payable by a Fund under each 12b-1 Plan need not be directly related to the expenses actually incurred by the Distributor on behalf of each Fund. Each 12b-1 Plan does not obligate each Fund to reimburse the Distributor for the actual expenses the Distributor may incur in fulfilling its obligations under each 12b-1 Plan. Thus, even if the Distributor’s actual expenses exceed the fee payable to the Distributor at any given time, each Fund will not be obligated to pay more than that fee. If the Distributor’s expenses are less than the fee it receives, the Distributor will retain the difference.
The fees attributable to each Fund’s respective class are shown on the accompanying Statements of Operations.
Transfer Agent
Harbor Services Group, Inc. (“Harbor Services Group”), a wholly-owned subsidiary of Harbor Capital, is the transfer and shareholder servicing agent for the Funds. The transfer agency and service agreement is reviewed and approved annually by the Board of Trustees and provides currently for compensation up to the following amounts per class of each Fund:
Transfer Agent Fees | |
Retirement Class | 0.02% of the average daily net assets of all Retirement Class shares |
Institutional Class | 0.10% of the average daily net assets of all Institutional Class shares |
Administrative Class | 0.10% of the average daily net assets of all Administrative Class shares |
Investor Class1 | 0.21% of the average daily net assets of all Investor Class shares |
1 | For the period November 1, 2020 through February 28, 2021, Harbor Services Group received compensation up to 0.22% for the Investor Class. |
Harbor Services Group voluntarily waived a portion of its transfer agent fees during the year ended October 31, 2021. Fees incurred for these transfer agent services are shown on each Fund’s Statement of Operations. The voluntary waiver may be discontinued at any time.
Affiliated Transactions
The Investment Company Act permits purchase and sale transactions among affiliated investment companies subject to an exemptive rule. Harbor Funds has adopted policies and procedures pursuant to such rule. During the year, the Funds did not enter into any transactions with any other Harbor fund.
Shareholders
As of October 31, 2021, Harbor Capital and its wholly owned subsidiaries collectively held the following shares of beneficial interest in each of the following Funds:
Number of Shares Owned by Harbor Capital and Subsidiaries | Percentage of Outstanding Shares | |||||
Retirement Class | Institutional Class | Administrative Class | Investor Class | Total | ||
Harbor Diversified International All Cap Fund | 107,998 | — | — | — | 107,998 | 0.1% |
Harbor Emerging Markets Equity Fund | 74,754 | — | — | — | 74,754 | 1.9 |
Harbor Focused International Fund | 1,291,092 | 1,272,226 | N/A | 3,047 | 2,566,365 | 77.1 |
Harbor Global Leaders Fund | 34,178 | — | — | — | 34,178 | 1.0 |
Harbor International Fund | 17,594 | — | — | — | 17,594 | 0.0 |
Harbor International Growth Fund | 80,715 | — | — | — | 80,715 | 0.2 |
Harbor International Small Cap Fund | 28,213 | 1,610,955 | 26,909 | 26,746 | 1,692,823 | 45.2 |
Harbor Overseas Fund | 1,304,967 | 1,296,603 | N/A | 3,097 | 2,604,667 | 68.8 |
Independent Trustees
The fees and expenses of the Independent Trustees are included in “Trustees’ fees and expenses” on each Fund’s Statement of Operations.
85
Harbor International & Global Funds
Notes to Financial Statements—Continued
Note 4—FEES AND OTHER Transactions with Affiliates—Continued
The Board of Trustees has adopted a Deferred Compensation Plan for Independent Trustees (the “Plan”), which enables Trustees to elect to defer receipt of all or a portion of the annual compensation they are entitled to receive from the Trust. For purposes of determining the amount owed to a Trustee under the Plan, deferred amounts are treated as though they had been invested in shares of the Fund(s) selected by the Trustee. While not required to do so, each Fund makes an investment equal to the Trustee’s investment election. The deferred compensation liability and the offsetting deferred compensation investment asset are included as a component of “Accrued expenses – Trustees’ fees and expenses” and “Other assets”, respectively, in the Statements of Assets and Liabilities. Such amounts fluctuate with changes in the value of the selected Fund(s). The deferred compensation and related mark-to-market impact liability and an offsetting investment asset will remain on each Fund’s Statement of Assets and Liabilities until distributed in accordance with the Plan.
Indemnification
Under the Trust’s organizational documents, its officers and Trustees are indemnified against certain liabilities arising out of the performance of their duties to the Trust. In addition, in the normal course of business the Trust enters into contracts that provide general indemnities to other parties. The Trust’s maximum exposure under these arrangements is unknown as this would involve future claims that may be made against the Trust that have not yet occurred. The risk of material loss as a result of such indemnification claims is considered remote.
NOTE 5—TAX INFORMATION
The amount and character of income and net realized gains to be distributed are determined in accordance with income tax rules and regulations, which may differ from U.S. GAAP. These differences are attributable to permanent book and tax accounting differences that were primarily due to the use of equalization. Reclassifications, if any, are made to each Fund’s capital account to reflect income and net realized gains available for distribution (or available capital loss carryovers) under income tax rules and regulations. The amounts reclassified on the Statements of Assets and Liabilities for the year ended October 31, 2021 were as follows:
Total Distributable Earnings/(Loss) (000s) | Paid in Capital (000s) | |
Harbor Diversified International All Cap Fund | $(6,132) | $6,132 |
Harbor Emerging Markets Equity Fund | (2,019) | 2,019 |
Harbor Focused International Fund | (71) | 71 |
Harbor Global Leaders Fund | (1,907) | 1,907 |
Harbor International Fund | — | — |
Harbor International Growth Fund | (5,492) | 5,492 |
Harbor International Small Cap Fund | (147) | 147 |
Harbor Overseas Fund | (76) | 76 |
The tax composition of each Fund’s distributions was as follows:
As of October 31, 2021 | As of October 31, 2020 | |||||
Ordinary Income (000s) | Long-Term Capital Gains (000s) | Total (000s) | Ordinary Income (000s) | Long-Term Capital Gains (000s) | Total (000s) | |
Harbor Diversified International All Cap Fund | $9,904 | $— | $9,904 | $17,322 | $— | $17,322 |
Harbor Emerging Markets Equity Fund | 5,068 | 6,248 | 11,316 | 1,462 | — | 1,462 |
Harbor Focused International Fund | 307 | 307 | 614 | 172 | — | 172 |
Harbor Global Leaders Fund | 1,503 | 8,701 | 10,204 | 221 | 6,257 | 6,478 |
Harbor International Fund | 47,872 | — | 47,872 | 174,403 | — | 174,403 |
Harbor International Growth Fund | 5,484 | — | 5,484 | 10,807 | — | 10,807 |
Harbor International Small Cap Fund | 466 | — | 466 | 1,197 | — | 1,197 |
Harbor Overseas Fund | 438 | — | 438 | 679 | — | 679 |
86
Harbor International & Global Funds
Notes to Financial Statements—Continued
NOTE 5—TAX INFORMATION—Continued
As of October 31, 2021, the components of each Fund’s distributable earnings on a tax basis were as follows:
Undistributed Ordinary Income (000s) | Undistributed Long-Term Capital Gains (000s) | Unrealized Appreciation/ (Depreciation) (000s) | Accumulated Capital and Other Losses (000s) | Other Temporary Differences (000s) | Total Distributable Earnings/ (Loss) (000s) | |
Harbor Diversified International All Cap Fund | $25,727 | $55,896 | $152,257 | $— | $(281) | $233,599 |
Harbor Emerging Markets Equity Fund | 10,747 | 2,029 | 1,207 | — | (11) | 13,972 |
Harbor Focused International Fund | 52 | 1,955 | 11,514 | — | (6) | 13,515 |
Harbor Global Leaders Fund | 847 | 11,849 | 49,999 | — | (5) | 62,690 |
Harbor International Fund | 93,991 | — | 797,425 | (424,800) | 57,535 | 524,151 |
Harbor International Growth Fund | 6,574 | 60,959 | 304,871 | — | (144) | 372,260 |
Harbor International Small Cap Fund | 2,003 | 2,106 | 6,199 | — | (3) | 10,305 |
Harbor Overseas Fund | 1,512 | 3,503 | 6,695 | — | (7) | 11,703 |
As of October 31, 2021, each Fund in the following table had capital loss carryforwards for federal tax purposes which will reduce each Fund’s taxable income arising from future net realized gains on investments to the extent permitted by the Internal Revenue Code. Use of the capital loss carryforwards will reduce the amount of the distribution to shareholders which would otherwise be necessary to relieve each Fund of any federal tax liability. The capital loss carryforwards do not expire.
Capital Loss Carryforward | |||
Short-Term (000s) | Long-Term (000s) | Total (000s) | |
Harbor International Fund | $424,800 | $— | $424,800 |
The identified cost for federal income tax purposes of investments owned by each Fund and its respective gross unrealized appreciation and depreciation as of October 31, 2021 are as follows:
Identified Cost (000s) | Gross Unrealized | Net Unrealized Appreciation/ (Depreciation) (000s) | ||
Appreciation (000s) | (Depreciation) (000s) | |||
Harbor Diversified International All Cap Fund | $1,022,575 | $182,807 | $(30,550) | $152,257 |
Harbor Emerging Markets Equity Fund | 42,050 | 3,158 | (1,951) | 1,207 |
Harbor Focused International Fund | 35,002 | 12,232 | (718) | 11,514 |
Harbor Global Leaders Fund | 91,462 | 51,913 | (1,914) | 49,999 |
Harbor International Fund* | 3,766,445 | 1,011,946 | (214,521) | 797,425 |
Harbor International Growth Fund | 550,158 | 329,405 | (24,534) | 304,871 |
Harbor International Small Cap Fund | 51,765 | 7,905 | (1,706) | 6,199 |
Harbor Overseas Fund | 45,594 | 8,058 | (1,363) | 6,695 |
* | Capital loss carryforwards are available, which may reduce taxable income from future net realized gain on investments. |
87
Harbor International & Global Funds
Notes to Financial Statements—Continued
Note 6—Derivatives
Each Fund’s derivative holdings do not qualify for hedge accounting treatment and as such are recorded at current fair value. For a discussion of risks related to these investments please refer to the descriptions of each type of derivative instrument in Note 2— Significant Accounting Policies.
Each Fund’s derivative instruments outstanding as of the year ended October 31, 2021, if any, as disclosed in the Portfolio of Investments, and the related amounts of net realized and changes in net unrealized gains and losses on derivative instruments during the year as disclosed in the Statement of Operations, are indicators of the volume of derivative activity for each Fund.
Derivative Instruments
As of October 31, 2021, the fair values of derivatives, by primary risk exposure, were reflected in the Statement of Assets and Liabilities as follows:
HARBOR INTERNATIONAL FUND
Statement of Assets and Liabilities Caption | Equity Contracts (000s) |
Purchased options (rights/warrants) | $44 |
Net realized gain/(loss) and the change in net unrealized appreciation/(depreciation) on derivatives, by primary risk exposure, for the year ended October 31, 2021, were:
HARBOR DIVERSIFIED INTERNATIONAL ALL CAP FUND
Net realized gain/(loss) on derivatives | Equity Contracts (000s) |
Purchased options (rights/warrants) | $70 |
Change in net unrealized appreciation/(depreciation) on derivatives | Equity Contracts (000s) |
Purchased options (rights/warrants) | $1,266 |
HARBOR EMERGING MARKETS EQUITY FUND
Change in net unrealized appreciation/(depreciation) on derivatives | Equity Contracts (000s) |
Purchased options (rights/warrants) | $2 |
HARBOR GLOBAL LEADERS FUND
Change in net unrealized appreciation/(depreciation) on derivatives | Foreign Exchange Contracts (000s) |
Forward currency contracts | $1 |
HARBOR INTERNATIONAL FUND
Net realized gain/(loss) on derivatives | Equity Contracts (000s) |
Purchased options (rights/warrants) | $282 |
88
Harbor International & Global Funds
Notes to Financial Statements—Continued
Note 6—Derivatives—Continued
HARBOR INTERNATIONAL FUND—Continued
Change in net unrealized appreciation/(depreciation) on derivatives | Equity Contracts (000s) |
Purchased options (rights/warrants) | $11,681 |
Note 7—Subsequent Events
Through the date the financial statements were issued, there were no subsequent events or transactions that would have materially impacted the financial statements or related disclosures as presented herein.
89
Harbor International & Global Funds
Report of Independent Registered Public Accounting Firm
The Board of Trustees and Shareholders of
Harbor Funds
Harbor Funds
Opinion on the Financial Statements
We have audited the accompanying statements of assets and liabilities of Harbor Capital Appreciation Fund, Harbor Disruptive Innovation Fund (formerly known as Harbor Mid Cap Growth Fund), Harbor Large Cap Value Fund, Harbor Mid Cap Fund, Harbor Mid Cap Value Fund, Harbor Small Cap Growth Fund, Harbor Small Cap Value Fund and Harbor Strategic Growth Fund (collectively referred to as the “Funds”), (eight of the funds constituting Harbor Funds (the “Trust”)), including the portfolios of investments, as of October 31, 2021, and the related statements of operations and changes in net assets, and the financial highlights for each of the periods indicated in the table below and the related notes (collectively referred to as the “financial statements”). In our opinion, the financial statements present fairly, in all material respects, the financial position of each of the Funds (eight of the funds constituting the Trust) at October 31, 2021, the results of their operations, changes in net assets and financial highlights for each of the periods indicated in the table below, in conformity with U.S. generally accepted accounting principles.
Individual fund comprising the Harbor Funds | Statement of operations | Statement of changes in net assets | Financial highlights |
Harbor Diversified International All Cap Fund Harbor Emerging Markets Equity Fund Harbor Global Leaders Fund Harbor International Fund Harbor International Growth Fund Harbor International Small Cap Fund | For the year ended October 31, 2021 | For each of the two years in the period ended October 31, 2021 | For each of the five years in the period ended October 31, 2021 |
Harbor Focused International Fund | For the year ended October 31, 2021 | For each of the two years in the period ended October 31, 2021 | For each of the two years in the period ended October 31, 2021 and the period from June 1, 2019 (inception) through October 31, 2019 |
Harbor Overseas Fund | For the year ended October 31, 2021 | For each of the two years in the period ended October 31, 2021 | For each of the two years in the period ended October 31, 2021 and the period from March 1, 2019 (inception) through October 31, 2019 |
Basis for Opinion
These financial statements are the responsibility of the Trust’s management. Our responsibility is to express an opinion on each of the Funds’ financial statements based on our audits. We are a public accounting firm registered with the Public Company Accounting Oversight Board (United States) (“PCAOB”) and are required to be independent with respect to the Trust in accordance with the U.S. federal securities laws and the applicable rules and regulations of the Securities and Exchange Commission and the PCAOB.
We conducted our audits in accordance with the standards of the PCAOB. Those standards require that we plan and perform the audit to obtain reasonable assurance about whether the financial statements are free of material misstatement, whether due to error or fraud. The Trust is not required to have, nor were we engaged to perform, an audit of the Trust’s internal control over financial reporting. As part of our audits we are required to obtain an understanding of internal control over financial reporting, but not for the purpose of expressing an opinion on the effectiveness of the Trust’s internal control over financial reporting. Accordingly, we express no such opinion.
Our audits included performing procedures to assess the risks of material misstatement of the financial statements, whether due to error or fraud, and performing procedures that respond to those risks. Such procedures included examining, on a test basis, evidence regarding the amounts and disclosures in the financial statements. Our procedures included confirmation of securities owned as of October 31, 2021, by correspondence with the custodian and brokers or by other appropriate auditing procedures where replies from brokers were not received. Our audits also included evaluating the accounting principles used and significant estimates made by management, as well as evaluating the overall presentation of the financial statements. We believe that our audits provide a reasonable basis for our opinion.
We have served as the auditor of one or more Harbor Funds investment companies since 2000.
Chicago, Illinois
December 21, 2021
December 21, 2021
90
Harbor International & Global Funds
Fees and Expenses Example (Unaudited)
Example
As a shareholder of a Fund, you incur two types of costs: (1) transaction costs, including redemption fees (if any) and (2) ongoing costs, including management fees, distribution and service (12b-1) fees (if any), and other Fund expenses. This example is intended to help you understand your ongoing costs (in dollars) of investing in a Fund and to compare these costs with the ongoing costs of investing in other mutual funds.
The example is based on an investment of $1,000 invested at the beginning of the period and held for the entire period May 1, 2021 through October 31, 2021.
Actual Expenses
The first line of the table below provides information about actual account values and actual expenses for each share class. You may use the information in the respective class line, together with the amount you invested, to estimate the expenses that you paid over the period. Simply divide your account value by $1,000 (for example, an $8,600 account value divided by $1,000 = 8.6), then multiply the result by the number in the first line of the respective class under the heading entitled “Expenses Paid During Period” to estimate the expenses you paid on your account during this period.
Hypothetical Example for Comparison Purposes
The second line of the table for each share class below provides information about hypothetical account values and hypothetical expenses based on the respective Fund/Class’s actual expense ratio and an assumed rate of return of 5% per year before expenses, which is not the respective Fund/Class’s actual return. The hypothetical account values and expenses may not be used to estimate the actual ending account balance or expenses you paid for the period. You may use this information to compare the ongoing costs of investing in a Fund to other funds. To do so, compare this 5% hypothetical example with the 5% hypothetical examples that appear in the shareholder reports of the other funds.
Please note that the expenses shown in the table are meant to highlight your ongoing costs only and do not reflect any transactional costs, such as redemption fees. Therefore, the second line of the table is useful in comparing ongoing costs only, and will not help you determine the relative total costs of owning different funds. In addition, if these transactional costs were included, your costs would have been higher.
Annualized Expense Ratios* | Expenses Paid During Period** | Beginning Account Value May 1, 2021 | Ending Account Value October 31, 2021 | |||||
Harbor Diversified International All Cap Fund | ||||||||
Retirement Class | 0.71% | |||||||
Actual | $3.61 | $1,000 | $1,016.90 | |||||
Hypothetical (5% return) | 3.62 | 1,000 | 1,021.54 | |||||
Institutional Class | 0.79% | |||||||
Actual | $4.01 | $1,000 | $1,015.40 | |||||
Hypothetical (5% return) | 4.02 | 1,000 | 1,021.12 | |||||
Administrative Class | 1.04% | |||||||
Actual | $5.28 | $1,000 | $1,014.70 | |||||
Hypothetical (5% return) | 5.29 | 1,000 | 1,019.83 | |||||
Investor Class | 1.15% | |||||||
Actual | $5.84 | $1,000 | $1,014.10 | |||||
Hypothetical (5% return) | 5.85 | 1,000 | 1,019.26 |
91
Harbor International & Global Funds
Fees and Expenses Example—Continued
Annualized Expense Ratios* | Expenses Paid During Period** | Beginning Account Value May 1, 2021 | Ending Account Value October 31, 2021 | |||||
Harbor Emerging Markets Equity Fund | ||||||||
Retirement Class | 0.88% | |||||||
Actual | $4.38 | $1,000 | $972.10 | |||||
Hypothetical (5% return) | 4.48 | 1,000 | 1,020.66 | |||||
Institutional Class | 0.96% | |||||||
Actual | $4.77 | $1,000 | $971.30 | |||||
Hypothetical (5% return) | 4.89 | 1,000 | 1,020.24 | |||||
Administrative Class | 1.21% | |||||||
Actual | $6.01 | $1,000 | $970.40 | |||||
Hypothetical (5% return) | 6.16 | 1,000 | 1,018.95 | |||||
Investor Class | 1.32% | |||||||
Actual | $6.55 | $1,000 | $970.30 | |||||
Hypothetical (5% return) | 6.72 | 1,000 | 1,018.38 | |||||
Harbor Focused International Fund | ||||||||
Retirement Class | 0.77% | |||||||
Actual | $4.01 | $1,000 | $1,066.70 | |||||
Hypothetical (5% return) | 3.92 | 1,000 | 1,021.23 | |||||
Institutional Class | 0.85% | |||||||
Actual | $4.42 | $1,000 | $1,065.90 | |||||
Hypothetical (5% return) | 4.33 | 1,000 | 1,020.81 | |||||
Investor Class | 1.21% | |||||||
Actual | $6.29 | $1,000 | $1,063.90 | |||||
Hypothetical (5% return) | 6.16 | 1,000 | 1,018.95 | |||||
Harbor Global Leaders Fund | ||||||||
Retirement Class | 0.78% | |||||||
Actual | $4.16 | $1,000 | $1,116.40 | |||||
Hypothetical (5% return) | 3.97 | 1,000 | 1,021.17 | |||||
Institutional Class | 0.86% | |||||||
Actual | $4.59 | $1,000 | $1,116.00 | |||||
Hypothetical (5% return) | 4.38 | 1,000 | 1,020.76 | |||||
Administrative Class | 1.11% | |||||||
Actual | $5.92 | $1,000 | $1,114.70 | |||||
Hypothetical (5% return) | 5.65 | 1,000 | 1,019.47 | |||||
Investor Class | 1.22% | |||||||
Actual | $6.50 | $1,000 | $1,113.90 | |||||
Hypothetical (5% return) | 6.21 | 1,000 | 1,018.90 | |||||
Harbor International Fund | ||||||||
Retirement Class | 0.69% | |||||||
Actual | $3.52 | $1,000 | $1,023.20 | |||||
Hypothetical (5% return) | 3.52 | 1,000 | 1,021.64 | |||||
Institutional Class | 0.77% | |||||||
Actual | $3.92 | $1,000 | $1,022.70 | |||||
Hypothetical (5% return) | 3.92 | 1,000 | 1,021.23 | |||||
Administrative Class | 1.02% | |||||||
Actual | $5.20 | $1,000 | $1,021.50 | |||||
Hypothetical (5% return) | 5.19 | 1,000 | 1,019.93 | |||||
Investor Class | 1.13% | |||||||
Actual | $5.76 | $1,000 | $1,021.00 | |||||
Hypothetical (5% return) | 5.75 | 1,000 | 1,019.37 |
92
Harbor International & Global Funds
Fees and Expenses Example—Continued
Annualized Expense Ratios* | Expenses Paid During Period** | Beginning Account Value May 1, 2021 | Ending Account Value October 31, 2021 | |||||
Harbor International Growth Fund | ||||||||
Retirement Class | 0.77% | |||||||
Actual | $3.92 | $1,000 | $1,023.00 | |||||
Hypothetical (5% return) | 3.92 | 1,000 | 1,021.23 | |||||
Institutional Class | 0.85% | |||||||
Actual | $4.33 | $1,000 | $1,023.10 | |||||
Hypothetical (5% return) | 4.33 | 1,000 | 1,020.81 | |||||
Administrative Class | 1.10% | |||||||
Actual | $5.61 | $1,000 | $1,021.40 | |||||
Hypothetical (5% return) | 5.60 | 1,000 | 1,019.52 | |||||
Investor Class | 1.22% | |||||||
Actual | $6.21 | $1,000 | $1,021.00 | |||||
Hypothetical (5% return) | 6.21 | 1,000 | 1,018.90 | |||||
Harbor International Small Cap Fund | ||||||||
Retirement Class | 0.88% | |||||||
Actual | $4.49 | $1,000 | $1,022.50 | |||||
Hypothetical (5% return) | 4.48 | 1,000 | 1,020.66 | |||||
Institutional Class | 0.96% | |||||||
Actual | $4.89 | $1,000 | $1,022.50 | |||||
Hypothetical (5% return) | 4.89 | 1,000 | 1,020.24 | |||||
Administrative Class | 1.21% | |||||||
Actual | $6.16 | $1,000 | $1,020.60 | |||||
Hypothetical (5% return) | 6.16 | 1,000 | 1,018.95 | |||||
Investor Class | 1.32% | |||||||
Actual | $6.72 | $1,000 | $1,020.00 | |||||
Hypothetical (5% return) | 6.72 | 1,000 | 1,018.38 | |||||
Harbor Overseas Fund | ||||||||
Retirement Class | 0.77% | |||||||
Actual | $3.98 | $1,000 | $1,053.30 | |||||
Hypothetical (5% return) | 3.92 | 1,000 | 1,021.23 | |||||
Institutional Class | 0.85% | |||||||
Actual | $4.39 | $1,000 | $1,052.60 | |||||
Hypothetical (5% return) | 4.33 | 1,000 | 1,020.81 | |||||
Investor Class | 1.21% | |||||||
Actual | $6.26 | $1,000 | $1,051.20 | |||||
Hypothetical (5% return) | 6.16 | 1,000 | 1,018.95 |
*
Reflective of all fee waivers and expense reimbursements
**
Expenses are equal to the Fund’s annualized net expense ratio, multiplied by the average account value over the period, multiplied by 184/365 (to reflect the one-half year period).
93
Harbor International & Global Funds
Additional Information (Unaudited)
Additional Tax Information
The Funds designate the following portions of their distributions from investment company taxable income for the fiscal year ended October 31, 2021 as qualifying for the dividends received deduction for corporate shareholders.
Percentage of Distribution | |
Harbor Global Leaders Fund | 35% |
Pursuant to Section 852 of the Internal Revenue Code, the Funds designate the following capital gain dividends for the fiscal year ended October 31, 2021:
Amount (000s) | |
Harbor Diversified International All Cap Fund | $4,199 |
Harbor Emerging Markets Equity Fund | 6,569 |
Harbor Focused International Fund | 375 |
Harbor Global Leaders Fund | 10,484 |
Harbor International Growth Fund | 4,957 |
Harbor International Small Cap Fund | 80 |
Harbor Overseas Fund | 53 |
For the fiscal year ended October 31, 2021, each Fund designates up to the maximum amount of such dividends allowable pursuant to the Internal Revenue Code as qualified dividend income eligible for reduced tax rates. These lower rates range from 0% to 20% depending on an individual’s tax bracket. If a Fund pays a distribution during calendar year 2021, complete information will be reported in conjunction with Form 1099-DIV.
The Funds designate the following foreign taxes paid and foreign source income for Federal income tax purposes:
Foreign Taxes Paid (000s) | Foreign Source Earned Income (000s) | |
Harbor Diversified International All Cap Fund | $2,757 | $27,458 |
Harbor Emerging Markets Equity Fund | 487 | 1,148 |
Harbor Focused International Fund | 53 | 522 |
Harbor International Fund | 7,268 | 115,641 |
Harbor International Growth Fund | 1,031 | 8,311 |
Harbor International Small Cap Fund | 119 | 1,378 |
Harbor Overseas Fund | 112 | 1,394 |
Shareholders who own shares through a taxable Harbor Funds account and that received distributions from a Fund during calendar year 2021 will receive a Form 1099-DIV in January 2022 that will show the tax character of those distributions.
Proxy Voting
Harbor Funds has adopted Proxy Voting Policies and Procedures under which proxies relating to securities held by the Harbor funds are voted. In addition, Harbor Funds files Form N-PX, with its complete proxy voting record for the 12 months ended June 30th, no later than August 31st of each year. A description of Harbor Funds’ Proxy Voting Policies and Procedures and the proxy voting records (Form N-PX) are available (i) without charge, upon request, by calling Harbor toll-free at 800-422-1050; (ii) on Harbor’s website at harborcapital.com; and (iii) on the SEC’s website at sec.gov.
Householding
Harbor Funds has adopted a policy that allows it to send only one copy of a Fund’s prospectus, proxy materials, annual report and semi-annual report to certain shareholders residing at the same household. This reduces Fund expenses, which benefits you and other shareholders. If you need additional copies or do not want your mailings to be “householded,” please call the Shareholder Servicing Agent at 800-422-1050. Individual copies will be sent within thirty (30) days after the Shareholder Servicing Agent receives your instructions. Your consent to householding is considered valid until revoked.
94
Harbor International & Global Funds
Additional Information—Continued
Quarterly Portfolio Disclosures
The Funds file a complete portfolio of investments for their first and third fiscal quarters with the SEC as an exhibit to Form N-PORT. The Funds’ Form N-PORT exhibit is available (i) without charge, upon request, by calling Harbor toll-free at 800-422-1050, (ii) on Harbor’s website at harborcapital.com, and (iii) on the SEC’s website at sec.gov.
95
Harbor International & Global Funds
Additional Information—Continued
Trustees and Officers
As of December 2021
The business and affairs of the Trust shall be managed by or under the direction of the Trustees, and they shall have all powers necessary or desirable to carry out that responsibility. The Trustees shall have full power and authority to take or refrain from taking any action and to execute any contracts and instruments that they may consider necessary or desirable in the management of the Trust. Any determination made by the Trustees in good faith as to what is in the interests of the Trust shall be conclusive. Information pertaining to the Trustees and Officers of Harbor Funds is set forth below. The address of each Trustee and Officer is: [Name of Trustee or Officer] c/o Harbor Funds, 111 South Wacker Drive, 34th Floor, Chicago, IL 60606-4302.
Harbor Funds' Statement of Additional Information includes additional information about the Trust’s Trustees and is available without charge by calling 800-422-1050 or at the Trust’s website at harborcapital.com.
Name (Age) Position(s) with Fund | Term of Office and Length of Time Served1 | Principal Occupation(s) During Past Five Years | Number of Portfolios In Fund Complex Overseen By Trustee | Other Directorships Of Public Companies and Other Registered Investment Companies Held by Trustee During Past Five Years |
INDEPENDENT TRUSTEES | ||||
Scott M. Amero (58) Trustee | Since 2014 | Chairman (2015-2020) and Trustee (2011-Present), Rare (conservation nonprofit); Trustee, Berkshire School (2014-Present); Trustee, The Nature Conservancy, Massachusetts Chapter (2018-Present); Vice Chairman and Global Chief Investment Officer, Fixed Income (2010), Vice Chairman and Global Chief Investment Officer, Fixed Income, and Co-Head, Fixed Income Portfolio Management (2007-2010), BlackRock, Inc. (publicly traded investment management firm). | 34 | None |
Donna J. Dean (70) Trustee | Since 2010 | Chief Investment Officer of the Rockefeller Foundation (a private foundation) (2001-2019). | 34 | None |
Randall A. Hack (74) Trustee | Since 2010 | Founder and Senior Managing Director of Capstone Capital LLC (private investment firm) (2003-Present); Director of Tower Development Corporation (cell tower developer) (2009-2016); Advisory Director of Berkshire Partners (private equity firm) (2002-2013); Founder and Senior Managing Director of Nassau Capital, LLC (private investment firm, investing solely on behalf of the Princeton Endowment) (1995-2001); and President of The Princeton University Investment Company (1990-1994). | 34 | None |
Robert Kasdin (63) Trustee | Since 2014 | Senior Vice President and Chief Operating Officer (2015-Present) and Chief Financial Officer (2018-Present), Johns Hopkins Medicine; Senior Executive Vice President, Columbia University (2002-2015); Trustee and Member of the Finance Committee, National September 11 Memorial & Museum at the World Trade Center (2005-2019); Director, Apollo Commercial Real Estate Finance, Inc. (2014-Present); and Director and Executive Committee Member, The Y in Central Maryland (2018-Present). | 34 | Director of Apollo Commercial Real Estate Finance, Inc. (2014-Present). |
Kathryn L. Quirk (69) Trustee | Since 2017 | Vice President, Senior Compliance Officer and Head, U.S. Regulatory Compliance, Goldman Sachs Asset Management (2013-2017); Deputy Chief Legal Officer, Asset Management, and Vice President and Corporate Counsel, Prudential Insurance Company of America (2010-2012); Co-Chief Legal Officer, Prudential Investment Management, Inc., and Chief Legal Officer, Prudential Investments and Prudential Mutual Funds (2008-2012); Vice President and Corporate Counsel and Chief Legal Officer, Mutual Funds, Prudential Insurance Company of America, and Chief Legal Officer, Prudential Investments (2005-2008); Vice President and Corporate Counsel and Chief Legal Officer, Mutual Funds, Prudential Insurance Company of America (2004-2005); Member, Management Committee (2000-2002), General Counsel and Chief Compliance Officer, Zurich Scudder Investments, Inc. (1997-2002). | 34 | None |
Douglas J. Skinner (59) Trustee | Since 2020 | Professor of Accounting (2005-Present), Deputy Dean for Faculty (2015-2016, 2017-Present), Interim Dean (2016-2017), University of Chicago Booth School of Business. | 34 | None |
96
Harbor International & Global Funds
Additional Information—Continued
Trustees and Officers—Continued
Name (Age) Position(s) with Fund | Term of Office and Length of Time Served1 | Principal Occupation(s) During Past Five Years | Number of Portfolios In Fund Complex Overseen By Trustee | Other Directorships Of Public Companies and Other Registered Investment Companies Held by Trustee During Past Five Years |
INDEPENDENT TRUSTEES—Continued | ||||
Ann M. Spruill (67) Trustee | Since 2014 | Partner (1993-2008), member of Executive Committee (1996-2008), Member Board of Directors (2002-2008), Grantham, Mayo, Van Otterloo & Co, LLC (private investment management firm) (with the firm since 1990); Member Investment Committee and Chair of Global Public Equities, Museum of Fine Arts, Boston (2000-2020); and Trustee, Financial Accounting Foundation (2014-2020). | 34 | None |
INTERESTED TRUSTEE | ||||
Charles F. McCain (52)* Chairman, Trustee and President | Since 2017 | Chief Executive Officer (2017-Present), Director (2007-Present), President and Chief Operating Officer (2017), Executive Vice President and General Counsel (2004-2017), and Chief Compliance Officer (2004-2014), Harbor Capital Advisors, Inc.; Director and Chairperson (2019-Present), Harbor Trust Company, Inc.; Director (2007-Present) and Chief Compliance Officer (2004-2017), Harbor Services Group, Inc.; Chief Executive Officer (2017-Present), Director (2007-Present), Chief Compliance Officer and Executive Vice President (2007-2017), Harbor Funds Distributors, Inc.; and Chief Compliance Officer, Harbor Funds (2004-2017). | 34 | None |
Name (Age) Position(s) with Fund | Term of Office and Length of Time Served1 | Principal Occupation(s) During Past Five Years |
FUND OFFICERS NOT LISTED ABOVE** | ||
Erik D. Ojala (46) Chief Compliance Officer | Since 2017 | Executive Vice President and General Counsel (2017-Present) and Secretary (2010-Present); Senior Vice President and Associate General Counsel (2007-2017), Harbor Capital Advisors, Inc.; Director and Secretary (2019-Present), Harbor Trust Company, Inc.; Director, Executive Vice President (2017-Present) and Chief Compliance Officer (2017-2021), Harbor Funds Distributors, Inc.; Director (2017-Present) and Assistant Secretary (2014-Present), Harbor Services Group, Inc.; and AML Compliance Officer (2010-2017) and Vice President and Secretary (2007-2017), Harbor Funds. |
Anmarie S. Kolinski (50) Treasurer | Since 2007 | Executive Vice President and Chief Financial Officer (2007-Present), Harbor Capital Advisors, Inc.; Director and Treasurer (2019-Present), Harbor Trust Company, Inc.; Chief Financial Officer (2007-Present), Harbor Services Group, Inc.; and Chief Financial Officer (2015-Present) and Treasurer (2012-Present), Harbor Funds Distributors, Inc. |
Kristof M. Gleich (42) Vice President | Since 2019 | President (2018-Present) and Chief Investment Officer (2020), Harbor Capital Advisors, Inc.; Director, Vice Chairperson, President (2019-Present) and Chief Investment Officer (2020-Present), Harbor Trust Company, Inc.; and Managing Director, Global Head of Manager Selection (2010-2018), JP Morgan Chase & Co. |
Gregg M. Boland (58) Vice President | Since 2019 | Executive Vice President (2020-Present), Vice President (2019-2020), Harbor Capital Advisors, Inc.; President (2019-Present), Senior Vice President – Operations (2016-2019), and Vice President – Operations (2007-2015), Harbor Services Group, Inc.; and Senior Vice President, AML Compliance Officer, and OFAC Officer (2019-Present), Harbor Funds Distributors, Inc. |
Diana R. Podgorny (42) Secretary | Since 2018 | Senior Vice President and Assistant General Counsel (2020-Present), Vice President and Assistant General Counsel (2017-2020), Harbor Capital Advisors, Inc.; Director and Vice President (2020 – Present), Harbor Trust Company, Inc.; Vice President and Counsel, AMG Funds LLC (2016-2017); Assistant Secretary, AMG Funds, AMG Funds I, AMG Funds II and AMG Funds III (2016-2017); Assistant Secretary, AMG Funds IV (2010-2017); and Vice President and Counsel, Aston Asset Management, LLC (2010-2016). |
Jodie L. Crotteau (49) Assistant Secretary | Since 2014 | Senior Vice President and Chief Compliance Officer, Harbor Capital Advisors, Inc. (2014-Present); Chief Compliance Officer and AML/OFAC Officer (2019-Present), Harbor Trust Company, Inc.; Chief Compliance Officer and Secretary (2017-present) and Assistant Secretary (2015-2016), Harbor Services Group, Inc.; Chief Compliance Officer (2021-present) and Assistant Secretary (2016-present), Harbor Funds Distributors, Inc.; Vice President and Chief Compliance Officer, Grosvenor Registered Funds (2011-2014); and Vice President, Grosvenor Capital Management, L.P. (2010-2014). |
97
Harbor International & Global Funds
Additional Information—Continued
Trustees and Officers—Continued
Name (Age) Position(s) with Fund | Term of Office and Length of Time Served1 | Principal Occupation(s) During Past Five Years |
FUND OFFICERS NOT LISTED ABOVE**—Continued | ||
Lana M. Lewandowski (42) AML Compliance Officer and Assistant Secretary | Since 2017 | Legal & Compliance Manager (2016-Present) and Legal Specialist (2012-2015), Harbor Capital Advisors, Inc. |
Lora A. Kmieciak (57) Assistant Treasurer | Since 2017 | Senior Vice President – Fund Administration and Analysis (2017-Present), Senior Vice President - Business Analysis (2015-2017), Harbor Capital Advisors, Inc.; Vice President (2020 – Present), Harbor Trust Company, Inc.; and Assurance Executive Director, Ernst & Young LLP (1999-2015). |
John M. Paral (53) Assistant Treasurer | Since 2013 | Director of Fund Administration and Analysis (2017-Present), Vice President (2012-Present) and Financial Reporting Manager (2007-2017), Harbor Capital Advisors, Inc. |
1
Each Trustee serves for an indefinite term, until his or her successor is elected. Each Officer is elected annually.
*
Mr. McCain is deemed an “Interested Trustee” due to his affiliation with the Adviser and Distributor of Harbor Funds.
**
Officers of the Funds are “interested persons” as defined in the Investment Company Act.
98
This Privacy Statement Is Not Part of This Report
Harbor’s Privacy Statement
Rev. 09/2021
FACTS | WHAT DOES HARBOR DO WITH YOUR PERSONAL INFORMATION? |
Why? | Financial companies choose how they share your personal information. Federal law gives consumers the right to limit some but not all sharing. Federal law also requires us to tell you how we collect, share, and protect your personal information. Please read this notice carefully to understand what we do. |
What? | The types of personal information we collect and share depend on the product or service you have with us. This information can include: ■ Social Security number ■ Account balances and transaction history ■ Assets and investment experience ■ Wire transfer instructions When you are no longer our customer, we continue to share your information as described in this notice. |
How? | All financial companies need to share customers' personal information to run their everyday business. In the section below, we list the reasons financial companies can share their customers' personal information; the reasons Harbor chooses to share; and whether you can limit this sharing. |
Reasons we can share your personal information | Does Harbor share? | Can you limit this sharing? |
For our everyday business purposes— such as to process your transactions, maintain your account(s), respond to court orders and legal investigations, or report to credit bureaus | Yes | No |
For our marketing purposes— to offer our products and services to you | Yes | No |
For joint marketing with other financial companies | No | We don’t share |
For our affiliates’ everyday business purposes— information about your transactions and experiences | Yes | No |
For our affiliates’ everyday business purposes— information about your creditworthiness | No | We don’t share |
For nonaffiliates to market to you | No | We don’t share |
Questions? | Call 800-422-1050 or go to harborcapital.com |
99
Harbor’s Privacy Statement—Continued
Page 2 | ||
Who we are | ||
Who is providing this notice? | Harbor Capital Advisors, Inc.; Harbor Services Group; Inc.; Harbor Funds Distributors, Inc., Harbor Trust Company, Inc., Harbor Funds, Harbor ETF Trust (collectively, “Harbor”) | |
What we do | ||
How does Harbor protect my personal information? | To protect your personal information from unauthorized access and use, we use security measures that comply with federal law. These measures include computer safeguards and secured files and buildings. We maintain physical, electronic and procedural safeguards designed to protect your personal information; however, please be aware that no data security measures can guarantee 100% security. | |
How does Harbor collect my personal information? | We collect your personal information, for example, when you ■ Open an account or make transactions on your account ■ Give us your contact information or income information ■ Tell us about your investment or retirement portfolio We also collect your personal information from others, such as credit bureaus, affiliates, or other companies. | |
Why can’t I limit all sharing? | Federal law gives you the right to limit only ■ sharing for affiliates’ everyday business purposes—information about your creditworthiness ■ affiliates from using your information to market to you ■ sharing for nonaffiliates to market to you State laws and individual companies may give you additional rights to limit sharing. | |
Definitions | ||
Affiliates | Companies related by common ownership or control. They can be financial and nonfinancial companies. ■ Our affiliates include the financial companies providing this notice, as well as other companies under our parent company, ORIX Corporation. | |
Nonaffiliates | Companies not related by common ownership or control. They can be financial and nonfinancial companies. ■ Nonaffiliates we share with can include companies that perform support services on our behalf or other firms that assist us in providing you with products and services, such as custodians, transfer agents, broker-dealers and marketing service firms (to support our marketing to you), as well as other financial institutions. | |
Joint marketing | A formal agreement between nonaffiliated financial companies that together market financial products or services to you. ■ Harbor doesn’t jointly market. | |
Other important information | ||
Notice to investors in California and Vermont | Under California and Vermont law, we will not share information we collect about you with outside companies, unless the law allows. For example, we may share information with your consent, to service your accounts, and in connection with legal proceedings. We will limit sharing among our companies to the extent required by applicable law. |
We recommend that you read and retain this notice for your personal files.
100
[THIS PAGE INTENTIONALLY LEFT BLANK]
102
For more information |
Trustees & Officers
Charles F. McCain Chairman, President & Trustee Scott M. Amero Trustee Donna J. Dean Trustee Randall A. Hack Trustee Robert Kasdin Trustee Kathryn L. Quirk Trustee Douglas J. Skinner Trustee Ann M. Spruill Trustee Erik D. Ojala Chief Compliance Officer Anmarie S. Kolinski Treasurer Kristof M. Gleich Vice President Gregg M. Boland Vice President Diana R. Podgorny Secretary Jodie L. Crotteau Assistant Secretary Lana M. Lewandowski AML Compliance Officer & Assistant Secretary Lora A. Kmieciak Assistant Treasurer John M. Paral Assistant Treasurer |
Investment Adviser
Harbor Capital Advisors, Inc.
111 South Wacker Drive, 34th Floor
Chicago, IL 60606-4302
312-443-4400
111 South Wacker Drive, 34th Floor
Chicago, IL 60606-4302
312-443-4400
Distributor
Harbor Funds Distributors, Inc.
111 South Wacker Drive, 34th Floor
Chicago, IL 60606-4302
312-443-4600
111 South Wacker Drive, 34th Floor
Chicago, IL 60606-4302
312-443-4600
Shareholder Services
Harbor Services Group, Inc.
P.O. Box 804660
Chicago, IL 60680-4108
800-422-1050
P.O. Box 804660
Chicago, IL 60680-4108
800-422-1050
FD.AR.IG.1021
Annual Report
FIXED INCOME FUNDS
October 31, 2021
Fixed Income Funds | Retirement Class | Institutional Class | Administrative Class | Investor Class |
Harbor Bond Fund | HBFRX | HABDX | HRBDX | – |
Harbor Convertible Securities Fund | HNCVX | HACSX | HRCSX | HICSX |
Harbor Core Bond Fund | HCBRX | HACBX | – | – |
Harbor High-Yield Bond Fund | HNHYX | HYFAX | HYFRX | HYFIX |
Harbor Money Market Fund | – | HARXX | HRMXX | – |
Table of Contents
1 | |
2 | |
5 | |
20 | |
22 | |
27 | |
30 | |
38 | |
40 | |
52 | |
54 | |
55 | |
57 | |
58 | |
64 | |
74 | |
91 | |
92 | |
94 | |
94 | |
94 | |
94 | |
95 | |
98 |
This document must be preceded or accompanied by a Prospectus.
Letter from the Chairman
Charles F. McCain
Chairman
Chairman
Dear Fellow Shareholder:
Over the past year we have experienced bouts of both real optimism and real disappointment. As summer began, there was a sense that we had finally turned the corner on COVID-19 with widespread vaccine availability and rapidly declining rates of new infections. We dared to dream about what a post-COVID-19 return to normalcy could look like. And then the delta variant arrived bringing a frustrating and sustained rise in new cases across the world. With all the loss that so many had experienced already from COVID-19, could we maintain our collective resolve in the face of this significant setback?
Fortunately, as summer turned to fall, we witnessed the resilience of the human spirit. We were better prepared as a nation this time to handle this delta variant surge, although our progress has certainly been uneven. We benefited from higher vaccination rates, generous federal stimulus programs that lifted consumer spending across the income spectrum and a return to in-person schooling for most that helped both children and families re-establish routines.
Through all these ups and downs, U.S. and global equity markets posted strong returns over the past 12 months. Value stocks led growth over the one-year period but lagged over longer time periods. Similarly, small caps outperformed large caps, while large caps continued to lead over longer time periods. In contrast, bond markets faced headwinds from rising interest rates, pushing Treasury bonds and the Bloomberg U.S. Aggregate Bond Index into negative territory. Corporate bonds were a lone bright spot, managing to post positive results for the fiscal year.
Investors continue to seek income wherever they can find it in today’s low-yield environment. However, over the course of the past year, interest rates have been increasing, with the 10-year U.S. Treasury yield more than doubling since it bottomed in August 2020. Rising rates have been in response to the likely prospect of the Fed beginning to taper its asset purchases soon, and potentially raising rates by the middle of 2022.
As we close out fiscal year 2021, there are four significant issues that must be addressed going forward: the supply shortages stemming from burgeoning consumer demand and supply-chain disruptions, ongoing labor shortages, rising prices (and the specter of inflation), and the persistence of the Delta and other potential new variants.
Harbor believes that the trajectory of the economic recovery will remain uneven for the foreseeable future, given the headwinds mentioned above. That’s why it’s so important for investors to focus on practical solutions to manage inevitable market volatility. Drawing upon the expertise of experienced, active portfolio managers is one way to help investors to achieve their long-term investment goals. We’re confident that Harbor together with our investment partners will continue to execute our strategies in a disciplined and thoughtful manner to benefit shareholders over the long haul.
In fact, we believe that a challenging and volatile market environment is actually good news for active managers, because it allows us to add potential value and pull ahead of the pack. Our research shows that the difference between top-performing and bottom-performing active managers, across major asset classes from U.S. large cap and small cap to foreign large cap and emerging markets, is at its highest level in 20 years.
I hope you and your families will fare well over the coming year. Thank you for your confidence and continued investment in Harbor Funds.
December 21, 2021
Charles F. McCain |
Chairman |
1
Harbor Bond Fund
Manager’s Commentary (Unaudited)
Subadviser
Pacific Investment Management Company LLC (PIMCO)
650 Newport Center Dr.
Newport Beach, CA
92660
Newport Beach, CA
92660
Portfolio Managers
Scott A. Mather
Since 2014
Since 2014
Mark R. Kiesel
Since 2014
Since 2014
Mohit Mittal
Since 2019
Since 2019
PIMCO has subadvised the Fund since 1987.
Investment Objective
The Fund seeks total return.
Management’s Discussion of
Fund Performance
Fund Performance
MARKET REVIEW
The last two months of 2020 featured vaccine approvals, more policy stimulus and clarity on the U.S. election outcome - the joint impact of these bolstered market optimism and capped off a year of unprecedented volatility.
Despite mixed trends in infection rates across regions, optimism for a global recovery built in the beginning of 2021 against a backdrop of generally improving economic data, increasing vaccinations and sustained fiscal and monetary support.
Global economic data continued to improve in many regions, with the U.S. a notable standout as consumer sentiment rose, the labor market improved, and manufacturing rebounded strongly – driven by an uptick in demand and a pickup in hiring. However, supply chain disruptions remained an issue for U.S. manufacturers.
Continued growth momentum, advancing COVID-19 vaccination campaigns, and the reopening of some developed nations bolstered market optimism in the first half of 2021, while U.S. inflation hit its highest level in decades.
Global economic data continued to improve across many regions. Within developed countries, particularly the U.S., U.K., and Canada, consumer sentiment rose further and an uptick in demand helped drive a resurgence in COVID-19-sensitive sectors along with greater hiring needs. Vaccinations continued to advance globally, and case counts generally moved lower, although the spread of a new Delta variant with higher infectiousness underscored a key risk for the economic recovery - particularly in countries where vaccination rates remained low.
In the second half of 2021, rising COVID-19 Delta variant cases and supply chain disruptions slowed economic momentum across developed markets, while inflation remained elevated. As a result, many assets experienced volatility.
On the U.S. policy front, the Federal Reserve began the second half of 2021 on a dovish note but pivoted to a more hawkish stance, announcing that it would begin tapering its asset purchases within the calendar year and could even raise rates as early as 2022.
Other notable headlines also contributed to market volatility, particularly President Biden’s withdrawal of U.S. troops from Afghanistan. Additionally, the potential default of Evergrande–one of the largest property developers in China–raised questions about spillover effects and contributed to elevated volatility.
PERFORMANCE
Harbor Bond Fund outperformed the Bloomberg U.S. Aggregate Bond Index for the year ended October 31, 2021. The Fund returned 0.88% (Retirement Class), 0.79% (Institutional Class) and 0.54% (Administrative Class), compared with the benchmark’s return of -0.48%.
The following strategies helped returns for the year ended October 31, 2021:
•
U.S. duration positioning contributed to performance over the fiscal year, including an underweight to intermediate rates as intermediate rates rose more than short and long-end rates over the fiscal year.
•
Positions in non-Agency mortgage-backed securities (“MBS”) contributed to performance as non-Agency MBS spreads tightened over the period.
2
Harbor Bond Fund
Manager’s Commentary—Continued
CHANGE IN A $10,000 INVESTMENT
For the period 11/01/2011 through 10/31/2021
The graph compares a $10,000 investment in the Institutional Class shares of the Fund with the performance of the Bloomberg U.S. Aggregate Bond Index. The Fund’s performance assumes the reinvestment of all dividend and capital gain distributions.
TOTAL RETURNS
For the periods ended 10/31/2021
1 Year | Annualized | |||||
5 Years | 10 Years | |||||
Harbor Bond Fund | ||||||
Retirement Class1 | 0.88% | 3.84% | 3.77% | |||
Institutional Class | 0.79 | 3.80 | 3.74 | |||
Administrative Class | 0.54 | 3.53 | 3.48 | |||
Comparative Index | ||||||
Bloomberg U.S. Aggregate Bond | -0.48% | 3.10% | 3.00% |
As stated in the Fund’s prospectus dated March 1, 2021, the expense ratios were 0.43% (Net) and 0.65% (Gross) (Retirement Class); 0.51% (Net) and 0.73% (Gross) (Institutional Class); and 0.76% (Net) and 0.98% (Gross) (Administrative Class). The net expense ratios reflect a contractual management fee waiver and an expense limitation agreement (excluding interest expense) effective through 02/28/2022. The expense ratios in the prospectus may differ from the actual expense ratios for the period disclosed within this report. The expense ratios shown in the prospectus are based on the prior fiscal year, adjusted to reflect changes, if any, in contractual arrangements that occurred prior to the date of the prospectus (or supplement thereto, if applicable).
Performance data shown represents past performance and is no guarantee of future results. Past performance is net of management fees and expenses and reflects reinvested dividends and distributions. Past performance reflects the beneficial effect of any expense waivers or reimbursements, without which returns would have been lower. Investment returns and principal value will fluctuate and when redeemed may be worth more or less than their original cost. Returns for periods less than one year are not annualized. Current performance may be higher or lower and is available through the most recent month end at harborcapital.com or by calling 800-422-1050.
•
Exposure to high yield corporate credit contributed to performance as the sector outperformed like-duration U.S. Treasuries on the back of a rally in risk assets.
The following strategies were negative or neutral for returns:
•
Local rate exposure in select emerging market countries detracted from performance, particularly rate exposure in Brazil and Peru.
1
Retirement Class shares commenced operations on June 1, 2018. The performance attributed to the Retirement Class shares prior to that date is that of the Institutional Class shares. Performance prior to June 1, 2018 has not been adjusted to reflect the lower expenses of Retirement Class shares. During this period, Retirement Class shares would have had returns similar to, but potentially higher than, Institutional Class shares due to the fact that Retirement Class shares represent interests in the same portfolio as Institutional Class shares but are subject to lower expenses.
Over the secular horizon, we believe the global economy will likely experience more uncertain, volatile and divergent growth and inflation than in the New Normal decade leading up to the pandemic.
In our view, three broad trends should drive major secular transformations: the transition to green energy, the faster adoption of new technologies and an increasing tendency to share gains more widely.
We believe returns across asset classes will likely be lower and more volatile over the secular horizon given starting valuations today and the outlook for disruption, division and divergence. Nevertheless, active investors capable of navigating change should find good alpha opportunities.
Although we see up-side risks to interest rates over the short-term as economies continue to recover, over the secular horizon we believe rates to remain relatively range-bound, enabling lower but positive returns for core bond allocations. We remain generally constructive on equities, but we expect to see substantial differentiation across regions and sectors. In addition, we expect to see attractive return potential in private credit and real estate as a result of the COVID-19 crisis, and we will look to pursue these opportunities.
With respect to portfolio strategy:
•
We are underweight headline duration, reflecting a modest underweight in the U.S along with hedges in select regions such as the U.K. and Japan.
•
We have moderated our curve steepening bias tactically given market moves and the steepening that has occurred since Q3 2020.
•
We remain underweight to investment-grade corporate credit–mindful of the less attractive risk and reward dynamics–though continue to have a bias toward liquid / high quality names while de-emphasizing generic corporate credit exposure.
•
Currency exposure remains low, mainly emphasizing a basket of emerging markets currencies. We will remain tactical overall and continue to seek overshoots/undershoots with better risk/reward properties.
3
Harbor Bond Fund
Manager’s Commentary—Continued
This report contains the current opinions of Pacific Investment Management Company LLC (PIMCO) as of the date of this report and should not be considered as investment advice or a recommendation of any particular security, strategy or investment product. Such opinions are subject to change without notice and securities described herein may no longer be included in, or may at any time be removed from, the Fund’s portfolio. This report is distributed for informational purposes only. Information contained herein has been obtained from sources believed reliable, but not guaranteed.
There is no guarantee that the investment objective of the Fund will be achieved. Fixed income investments are affected by interest rate changes and the creditworthiness of the issues held by the Fund. As interest rates rise, the values of fixed income securities held by the Fund are likely to decrease and reduce the value of the Fund’s portfolio. The use of derivative instruments may add additional risk. There may be a greater risk that the Fund could lose money due to prepayment and extension risks because the Fund invests heavily at times in mortgage-related and/or asset backed securities. The Fund may engage in active and frequent trading to achieve its principal investment strategies. Investing in international and emerging markets poses special risks, including potentially greater price volatility due to social, political and economic factors, as well as currency exchange rate fluctuations. These risks are more severe for securities of issuers in emerging market regions.The Fund may engage in active and frequent trading to achieve its principal investment strategies. References to securities that are backed by the full faith and credit of the U.S. Government do not apply to the shares of the Fund. For information on the different share classes and the risks associated with an investment in the Fund, please refer to the current prospectus.
4
Harbor Bond Fund
Portfolio of Investments—October 31, 2021
Investment Allocation (% of investments) - Unaudited
(Excludes short-term investments and derivative positions)
Portfolio of Investments
Value, Cost, and Principal Amounts in Thousands
ASSET-BACKED SECURITIES—11.6% | |||
Principal Amount | Value | ||
Air Canada Pass-Through Trust | |||
Series 2017-1AA Cl. PTT | |||
$ | 3,555 | 3.300%—07/15/20311 | $3,636 |
Aircastle Ltd. | |||
6,200 | 2.850%—01/26/20281 | 6,247 | |
Alaska Airlines Pass-Through Trust | |||
Series 2020-TR Cl. EETC | |||
3,318 | 4.800%—02/15/20291 | 3,691 | |
American Airlines Pass-Through Trust | |||
Series 15-2 Cl. AA | |||
1,545 | 3.600%—03/22/2029 | 1,604 | |
AMMC CLO 20 Ltd.2 | |||
Series 2017-20A Cl. AR | |||
4,046 | 0.992% (3 Month USD LIBOR + 0.870) 04/17/20291,3 | 4,050 | |
AMMC CLO XII Ltd.2 | |||
Series 2013-12A Cl. AR2 | |||
4,200 | 1.078% (3 Month USD LIBOR + 0.950) 11/10/20301,3 | 4,200 | |
Anchorage Capital CLO 11 Ltd.2 | |||
Series 2019-11A Cl. AR | |||
4,000 | 1.268% (3 Month USD LIBOR + 1.140) 07/22/20321,3 | 4,000 | |
Anchorage Capital CLO Ltd.2 | |||
Series 2020-16A Cl. A | |||
4,100 | 1.532% (3 Month USD LIBOR + 1.400) 10/20/20311,3 | 4,105 | |
Apidos CLO XXVI2 | |||
Series 2017-26A Cl. A1AR | |||
4,000 | 1.022% (3 Month USD LIBOR + 0.900) 07/18/20291,3 | 4,001 | |
Ares LII CLO Ltd.2 | |||
Series 2019-52A Cl. A1R | |||
4,000 | 1.178% (3 Month USD LIBOR + 1.050) 04/22/20311,3 | 4,003 | |
Argent Securities Inc. | |||
Series 2006-W4 Cl. A2C | |||
5,850 | 0.409% (1 Month USD LIBOR + 0.320) 05/25/20363 | 2,106 | |
Series 2004-W11 Cl. M3 | |||
939 | 1.214% (1 Month USD LIBOR + 1.125) 11/25/20343 | 946 | |
3,052 |
ASSET-BACKED SECURITIES—Continued | |||
Principal Amount | Value | ||
Asset Backed Securities Corp. Home Equity Loan Trust | |||
Series 2003-HE4 Cl. M1 | |||
$ | 4,000 | 1.335% (1 Month USD LIBOR + 1.245) 08/15/20333 | $4,040 |
Birch Grove CLO Ltd.2 | |||
Series 19-AR | |||
4,000 | 1.246% (3 Month USD LIBOR + 1.130) 06/15/20311,3 | 4,005 | |
BlueMountain Fuji EUR CLO III DAC2 | |||
Series 3A Cl. A1R | |||
EUR | 3,400 | 0.720% (3 Month EUR LIBOR + 0.720) 01/15/20311,3 | 3,920 |
Carlyle Global Market Strategies CLO Ltd.2 | |||
Series 2013-1A Cl. A1 | |||
$ | 4,300 | 1.075% (3 Month USD LIBOR + 0.950) 08/14/20301,3 | 4,295 |
Carlyle US CLO 2017-1 Ltd.2 | |||
Series 2017-1A Cl. A1R | |||
4,000 | 1.132% (3 Month USD LIBOR + 1.000) 04/20/20311,3 | 4,000 | |
Catamaran CLO Ltd.2 | |||
Series 2014-1A Cl. A1 | |||
4,974 | 1.228% (3 Month USD LIBOR + 1.100) 04/22/20301,3 | 4,981 | |
Countrywide Asset-Backed Certificates | |||
Series 2006-21 Cl. 2A3 | |||
89 | 0.239% (1 Month USD LIBOR + 0.150) 05/25/20373 | 89 | |
Series 2006-ABC1 Cl. A3 | |||
4,335 | 0.569% (1 Month USD LIBOR + 0.480) 05/25/20363 | 3,918 | |
Series 2006-2 Cl. M1 | |||
738 | 0.689% (1 Month USD LIBOR + 0.600) 06/25/20363 | 734 | |
4,741 | |||
Crestline Denali CLO XV Ltd.2 | |||
Series 2017-1A Cl. AR | |||
4,000 | 1.162% (3 Month USD LIBOR + 1.030) 04/20/20301,3 | 4,001 | |
DAE Funding LLC | |||
5,200 | 1.625%—02/15/20241 | 5,176 |
5
Harbor Bond Fund
Portfolio of Investments—Continued
Value, Cost, and Principal Amounts in Thousands
ASSET-BACKED SECURITIES—Continued | |||
Principal Amount | Value | ||
Dryden CLO DAC2 | |||
Series 2017-52A Cl. AR | |||
EUR | 3,000 | 0.860% (3 Month EUR LIBOR + 0.860) 05/15/20341,3 | $3,464 |
Evergreen Credit Card Trust | |||
Series 2019-2 Cl. A | |||
$ | 6,000 | 1.900%—09/16/20241 | 6,085 |
Exantas Capital Corp. | |||
Series 2020-RSO9 Cl. A | |||
251 | 2.664% (30 Day Average SOFR + 2.614) 04/17/20371,3 | 252 | |
First Franklin Mortgage Loan Trust | |||
Series 2006-FF14 Cl. A6 | |||
8,000 | 0.399% (1 Month USD LIBOR + 0.310) 10/25/20363 | 7,113 | |
GSAA Home Equity Trust | |||
Series 2006-20 Cl. 1A2 | |||
3,483 | 0.449% (1 Month USD LIBOR + 0.360) 12/25/20463 | 1,361 | |
Series 2007-9 Cl. A1A | |||
517 | 6.000%—08/25/2047 | 504 | |
1,865 | |||
GSAMP Trust | |||
Series 2007-FM1 Cl. 2A2 | |||
98 | 0.159% (1 Month USD LIBOR + 0.070) 12/25/20363 | 61 | |
HSI Asset Securitization Corp. Trust | |||
Series 2006-HE2 Cl. 2A3 | |||
4,583 | 0.429% (1 Month USD LIBOR + 0.340) 12/25/20363 | 1,794 | |
IXIS Real Estate Capital Trust | |||
Series 2005-HE1 Cl. M4 | |||
1,244 | 1.139% (1 Month USD LIBOR + 1.050) 06/25/20353 | 1,248 | |
JPMorgan Mortgage Acquisition Corp. | |||
Series 2006-ACC1 Cl. M1 | |||
203 | 0.494% (1 Month USD LIBOR + 0.405) 05/25/20363 | 203 | |
Series 2006-HE1 Cl. A4 | |||
816 | 0.669% (1 Month USD LIBOR + 0.580) 01/25/20363 | 818 | |
Series 2007-HE1 Cl. AF3 | |||
765 | 4.214%—05/25/20354 | 632 | |
1,653 | |||
KKR Financial CLO Ltd.2 | |||
Series 18-AR | |||
4,000 | 1.062% (3 Month USD LIBOR + 0.940) 07/18/20301,3 | 4,000 | |
LoanCore Ltd. | |||
Series 2018-CRE1 Cl. A | |||
1,471 | 1.220% (1 Month USD LIBOR + 1.130) 05/15/20281,3 | 1,471 | |
MASTR Asset Backed Securities Trust | |||
Series 2006-HE2 Cl. A4 | |||
4,602 | 0.569% (1 Month USD LIBOR + 0.480) 06/25/20363 | 2,517 | |
MF1 Multi Family Housing Mortgage Trust | |||
Series 2020-FL4 Cl. A | |||
5,100 | 1.864% (30-Day Average SOFR + 1.814) 11/15/20351,3 | 5,129 | |
Mid-State Capital Corp Trust | |||
Series 2004-1 Cl. A | |||
516 | 6.005%—08/15/2037 | 541 |
ASSET-BACKED SECURITIES—Continued | |||
Principal Amount | Value | ||
Morgan Stanley Capital Inc. | |||
Series 2007-HE1 Cl. A2C | |||
$ | 1,771 | 0.239% (1 Month USD LIBOR + 0.150) 11/25/20363 | $1,309 |
Series 2007-HE6 Cl. A3 | |||
3,603 | 0.269% (1 Month USD LIBOR + 0.180) 05/25/20373 | 3,333 | |
4,642 | |||
Nassau Ltd. | |||
Series 2020-1A Cl. A1 | |||
3,000 | 2.282% (3 Month USD LIBOR + 2.150) 07/20/20291,3 | 3,008 | |
Option One Mortgage Loan Trust | |||
Series 2007-6 Cl. 2A4 | |||
3,611 | 0.339% (1 Month USD LIBOR + 0.250) 07/25/20373 | 3,179 | |
Palmer Square Loan Funding Ltd. | |||
Series 2021-4A Cl. A1 | |||
4,000 | 0.925% (3 Month USD LIBOR + 0.800) 10/15/20291,3 | 4,000 | |
Park Place Securities Inc. | |||
Series 2005-WCW3 Cl. M1 | |||
1,658 | 0.809% (1 Month USD LIBOR + 0.720) 08/25/20353 | 1,687 | |
People's Financial Realty Mortgage Securities Trust | |||
Series 2006-1 Cl. 1A2 | |||
4,476 | 0.219% (1 Month USD LIBOR + 0.130) 09/25/20363 | 1,291 | |
RAMP Trust | |||
Series 2004-RS8 Cl. MII1 | |||
97 | 0.989% (1 Month USD LIBOR + 0.600) 08/25/20343 | 97 | |
Santander Drive Auto Receivables Trust | |||
Series 2020-2 Cl. A3 | |||
326 | 0.670%—04/15/2024 | 326 | |
Saxon Asset Securities Trust | |||
Series 2006-3 Cl. A3 | |||
2,935 | 0.259% (1 Month USD LIBOR + 0.170) 10/25/20463 | 2,902 | |
Securitized Asset Backed Receivables LLC Trust | |||
Series 2005-FR5 Cl. M1 | |||
5,735 | 0.749% (1 Month USD LIBOR + 0.660) 08/25/20353 | 4,830 | |
Small Business Administration Participation Certificates | |||
Series 2003-20I Cl. 1 | |||
11 | 5.130%—09/01/2023 | 12 | |
Series 2009-20A Cl. 1 | |||
1,013 | 5.720%—01/01/2029 | 1,103 | |
Series 2008-20H Cl. 1 | |||
1,817 | 6.020%—08/01/2028 | 2,000 | |
3,115 | |||
Sound Point CLO XII Ltd.2 | |||
Series 2016-2A Cl. AR2 | |||
4,993 | 1.182% (3 Month USD LIBOR + 1.050) 10/20/20281,3 | 4,999 | |
Specialty Underwriting & Residential Finance Trust | |||
Series 2006-BC4 Cl. A2B | |||
2,547 | 0.309% (1 Month USD LIBOR + 0.220) 09/25/20373 | 1,289 |
6
Harbor Bond Fund
Portfolio of Investments—Continued
Value, Cost, and Principal Amounts in Thousands
ASSET-BACKED SECURITIES—Continued | |||
Principal Amount | Value | ||
Structured Asset Securities Co. | |||
Series 2007-MN1A Cl. A1 | |||
$ | 17,810 | 0.319% (1 Month USD LIBOR + 0.230) 01/25/20371,3 | $13,051 |
TPG Real Estate Finance Trust | |||
Series 2019-Fl3 Cl. A | |||
5,000 | 1.314% (30 Day Average SOFR + 1.264) 10/15/20341,3 | 4,998 | |
Venture XXVI CLO Ltd.2 | |||
Series 2017-26A Cl. AR | |||
6,200 | 1.232% (3 Month USD LIBOR + 1.100) 01/20/20291,3 | 6,206 | |
Voya CLO Ltd.2 | |||
Series 2016-4A Cl. ARR | |||
3,725 | 1.032% (3 Month USD LIBOR + 0.900) 07/20/20291,3 | 3,724 | |
TOTAL ASSET-BACKED SECURITIES | |||
(Cost $179,655) | 182,285 | ||
COLLATERALIZED MORTGAGE OBLIGATIONS—12.2% | |||
Adjustable Rate Mortgage Trust | |||
Series 2006-3 Cl. 4A2 | |||
2,310 | 0.329% (1 Month USD LIBOR + 0.240) 08/25/20363 | 1,104 | |
Alba plc | |||
Series 2007-1 Cl. A3 | |||
GBP | 2,067 | 0.241% (3 Month GBP LIBOR + 0.170) 03/17/20393 | 2,745 |
Arbor Multifamily Mortgage Trust | |||
Series 2020-MF1 Cl. A5 | |||
$ | 2,900 | 2.756%—05/15/20531 | 3,037 |
Banc of America Alternative Loan Trust | |||
Series 2006 -7 Cl. A3 | |||
7,335 | 5.913%—10/25/20363 | 3,121 | |
Banc of America Funding Corp. | |||
Series 2007-C Cl. 7A5 | |||
578 | 0.686% (1 Month USD LIBOR + 0.600) 05/20/20473 | 587 | |
BCAP LLC Trust | |||
Series 2007-AA2 Cl. 12A1 | |||
3,937 | 0.509% (1 Month USD LIBOR + 0.420) 05/25/20473 | 3,834 | |
Series 2011-RR5 Cl. 12A1 | |||
270 | 4.790%—03/26/20371,4 | 281 | |
Series 2011-RR4 Cl. 8A1 | |||
1,300 | 5.250%—02/26/20361,3 | 792 | |
4,907 | |||
Bear Stearns Adjustable Rate Mortgage Trust | |||
Series 2000-2 Cl. A1 | |||
13 | 2.780%—11/25/20303 | 13 | |
Series 2004-1 Cl. 12A5 | |||
190 | 2.800%—04/25/20343 | 192 | |
Series 2006-4 Cl. 1A1 | |||
147 | 2.808%—10/25/20363 | 145 | |
Series 2004-10 Cl. 12A3 | |||
16 | 2.829%—01/25/20353 | 16 | |
366 | |||
Benchmark Mortgage Trust | |||
Series 2019-B9 Cl. A5 | |||
5,200 | 4.016%—03/15/2052 | 5,873 |
COLLATERALIZED MORTGAGE OBLIGATIONS—Continued | |||
Principal Amount | Value | ||
Chase Mortgage Finance Corp Trust | |||
Series 2006-A1 Cl. 4A1 | |||
$ | 895 | 2.723%—09/25/20363 | $ 811 |
Citigroup Commercial Mortgage Trust | |||
Series 2015-GC33 Cl. A4 | |||
4,900 | 3.778%—09/10/2058 | 5,293 | |
Citigroup Mortgage Loan Trust | |||
Series 2007-10 Cl.2A | |||
2,485 | 3.158%—09/25/20373 | 2,439 | |
COMM Mortgage Trust | |||
Series 2016-787S Cl. A | |||
5,400 | 3.545%—02/10/20361 | 5,759 | |
Countrywide Alternative Loan Trust | |||
Series 2006-6BC Cl. 1A2 | |||
2,078 | 0.489% (1 Month USD LIBOR + 0.400) 05/25/20363 | 1,686 | |
Series 2005-84 Cl. 1A1 | |||
1,186 | 2.206%—02/25/20363 | 1,092 | |
Series 2005-20CB Cl. 2A5 | |||
1,504 | 5.500%—07/25/2035 | 1,277 | |
Series 2006-36T2 Cl. 1A4 | |||
1,024 | 5.750%—12/25/2036 | 644 | |
Series 2006-1R Cl.2A3 | |||
3,104 | 6.000%—08/25/2037 | 2,218 | |
6,917 | |||
Countrywide Home Loan Mortgage Pass Through Trust | |||
Series 2007-HY5 Cl. 1A1 | |||
496 | 3.404%—09/25/20473 | 473 | |
Credit Suisse First Boston Mortgage Securities Corp. | |||
Series 2006-C2 Cl. A3 | |||
248 | 6.000%—11/25/2035 | 206 | |
DC Office Trust | |||
Series 2019-MTC Cl. A | |||
4,900 | 2.965%—09/15/20451 | 5,176 | |
Deutsche Alt-A Securities Inc. Mortgage Loan Trust | |||
Series 2007-AR2 Cl. A1 | |||
3,273 | 0.389% (1 Month USD LIBOR + 0.300) 03/25/20373 | 3,316 | |
DSLA Mortgage Loan Trust | |||
Series 2006-AR1 Cl. 1A1A | |||
1,129 | 1.007% (Fed 12 Month Treasury Average Constant Maturity Treasury + 0.920) 3/19/20463 | 1,006 | |
Eurohome UK Mortgages plc | |||
Series 2007-1 Cl. A | |||
GBP | 1,561 | 0.220% (3 Month GBP LIBOR + 0.150) 06/15/20443 | 2,094 |
First Horizon Asset Securities Inc. | |||
Series 2005-AR6 Cl. 4A1 | |||
$ | 262 | 2.683%—02/25/20363 | 247 |
First Nationwide Trust | |||
Series 2001-3 Cl. 1A1 | |||
— | 6.750%—08/21/2031 | — | |
GSMPS Mortgage Loan Trust | |||
Series 2006-RP2 Cl. 1AF1 | |||
3,771 | 0.489% (1 Month USD LIBOR + 0.400) 04/25/20361,3 | 3,295 | |
GSR Mortgage Loan Trust | |||
Series 2005-AR3 Cl. 3A1 | |||
248 | 2.559%—05/25/20353 | 204 |
7
Harbor Bond Fund
Portfolio of Investments—Continued
Value, Cost, and Principal Amounts in Thousands
COLLATERALIZED MORTGAGE OBLIGATIONS—Continued | |||
Principal Amount | Value | ||
Series 2005-AR7 Cl. 6A1 | |||
$ | 136 | 2.611%—11/25/20353 | $139 |
343 | |||
HarborView Mortgage Loan Trust | |||
Series 2004-8 Cl. 2A3 | |||
408 | 0.900% (1 Month USD LIBOR + 0.820) 11/19/20343 | 369 | |
Hawksmoor Mortgages | |||
Series 2019-1A Cl. A | |||
GBP | 18,897 | 1.100% (3 Month SONIA + 1.050) 05/25/20531,3 | 25,959 |
HomeBanc Mortgage Trust | |||
Series 2006-H2 Cl. A2 | |||
$ | 1,061 | 0.449% (1 Month USD LIBOR + 0.360) 12/25/20363 | 1,064 |
IndyMac ARM Trust | |||
Series 2001-H2 Cl. A2 | |||
2 | 1.544%—01/25/20323 | 2 | |
IndyMac IMSC Mortgage Loan Trust | |||
Series 2007-F2 Cl. 2A1 | |||
2,913 | 6.500%—07/25/2037 | 1,472 | |
IndyMac INDX Mortgage Loan Trust | |||
Series 2007-AR13 Cl. 4A1 | |||
11,408 | 2.824%—07/25/20373 | 9,409 | |
Series 2005-AR31 Cl. 1A1 | |||
804 | 3.031%—01/25/20363 | 806 | |
10,215 | |||
JP Morgan Mortgage Trust | |||
Series 2006-A6 Cl. 1A4L | |||
1,192 | 3.110%—10/25/20363 | 1,020 | |
Series 2006-S1 Cl. 3A1 | |||
159 | 5.500%—04/25/2036 | 163 | |
1,183 | |||
JPMDB Commercial Mortgage Securities Trust | |||
Series 2016-C2 Cl. A4 | |||
4,225 | 3.144%—06/15/2049 | 4,477 | |
Manhattan West | |||
Series 2020-1MW Cl. A | |||
4,900 | 2.130%—09/10/20391 | 4,967 | |
Mansard Mortgages plc | |||
Series 2007-2X Cl. A1 | |||
GBP | 773 | 0.720% (3 Month GBP LIBOR + 0.650) 12/15/20493 | 1,050 |
Merrill Lynch Alternative Note Asset Trust | |||
Series 2007-F1 Cl. 2A6 | |||
$ | 452 | 6.000%—03/25/2037 | 266 |
MetLife Securitization Trust | |||
Series 2018-1A Cl. A | |||
2,861 | 3.750%—03/25/20571,3 | 2,970 | |
Morgan Stanley Bank of America Merrill Lynch Trust | |||
Series 2015-C22 Cl. ASB | |||
4,337 | 3.040%—04/15/2048 | 4,466 | |
Onslow Bay Financial LLC | |||
Series 2018-1 Cl. A2 | |||
3,489 | 0.739% (1 Month USD LIBOR + 0.650) 06/25/20571,3 | 3,500 | |
Ready Capital Mortgage Financing LLC | |||
Series 2020-FL4 Cl. A | |||
5,617 | 2.239% (1 Month USD LIBOR + 2.150) 02/25/20351,3 | 5,637 | |
Residential Accredit Loans Inc. | |||
Series 2007-QS4 Cl. 3A9 | |||
2,289 | 6.000%—03/25/2037 | 2,240 |
COLLATERALIZED MORTGAGE OBLIGATIONS—Continued | |||
Principal Amount | Value | ||
Residential Asset Securitization Trust | |||
Series 2007-A8 Cl. 2A1 | |||
$ | 17,785 | 6.250%—08/25/2037 | $6,891 |
Residential Funding Mortgage Securities I | |||
Series 2007-SA1 Cl. 2A2 | |||
173 | 3.918%—02/25/20373 | 139 | |
Series 2006-SA1 Cl. 2A1 | |||
146 | 4.905%—02/25/20363 | 133 | |
272 | |||
Ripon Mortgages plc | |||
Series 1A Cl. A1 | |||
GBP | 5,427 | 0.868% (3 Month GBP LIBOR + 0.800) 08/20/20561,3 | 7,437 |
RMAC Securities plc | |||
Series 2006-NS4X Cl. A3A | |||
1,375 | 0.237% (3 Month GBP LIBOR + 0.170) 06/12/20443 | 1,831 | |
Structured Adjustable Rate Mortgage Loan Trust | |||
Series 2007-1 Cl. 1A1 | |||
$ | 1,080 | 0.389% (1 Month USD LIBOR + 0.300) 02/25/20373 | 1,104 |
Series 2005-21A Cl. 3A1 | |||
288 | 2.728%—04/25/20353 | 290 | |
1,394 | |||
Structured Asset Mortgage Investments Inc. | |||
Series 2005-AR5 Cl. A2 | |||
210 | 0.580% (1 Month USD LIBOR + 0.500) 07/19/20353 | 205 | |
Suntrust Adjustable Rate Mortgage Loan Trust | |||
Series 2007-S1 Cl. 1A | |||
297 | 2.390%—01/25/20373 | 259 | |
Towd Point Mortgage Funding plc | |||
Series 2019-A13A Cl. A1 | |||
GBP | 13,962 | 0.950% (3 Month SONIA + 0.900) 07/20/20451,3 | 19,170 |
Series 2020-14X Cl.A | |||
5,016 | 0.950% (3 Month SONIA + 0.900) 05/20/20453 | 6,886 | |
Series 2019-GR4A Cl. A1 | |||
4,235 | 1.097% (3 Month GBP LIBOR + 1.025) 10/20/20511,3 | 5,833 | |
31,889 | |||
Washington Mutual Mortgage Pass Through Certificates Trust | |||
Series 2005-AR6 Cl. 2A1A | |||
$ | 214 | 0.549% (1 Month USD LIBOR + 0.460) 04/25/20453 | 213 |
Series 2005-AR13 Cl. A1A1 | |||
104 | 0.669% (1 Month USD LIBOR + 0.580) 10/25/20453 | 104 | |
Series 2006-AR11 Cl. 3A1A | |||
1,156 | 1.007% (Fed 12 Month Treasury Average Constant Maturity Treasury + 0.920) 09/25/20463 | 1,152 | |
Series 2006-AR8 Cl. 1A4 | |||
1,757 | 2.833%—08/25/20463 | 1,763 | |
3,232 |
8
Harbor Bond Fund
Portfolio of Investments—Continued
Value, Cost, and Principal Amounts in Thousands
COLLATERALIZED MORTGAGE OBLIGATIONS—Continued | |||
Principal Amount | Value | ||
Wells Fargo Commercial Mortgage Trust | |||
Series 2018-C48 | |||
$ | 7,117 | 4.302%—01/15/2052 | $8,147 |
TOTAL COLLATERALIZED MORTGAGE OBLIGATIONS | |||
(Cost $183,078) | 190,509 | ||
CORPORATE BONDS & NOTES—37.0% | |||
AEROSPACE & DEFENSE—0.4% | |||
Boeing Co. | |||
6,100 | 1.950%—02/01/2024 | 6,213 | |
AIRLINES—0.3% | |||
Jetblue Airways Corp. | |||
4,353 | 4.000%—05/15/2034 | 4,792 | |
AUTOMOBILES—3.1% | |||
Ford Motor Credit Co. LLC | |||
4,000 | 3.375%—11/13/2025 | 4,115 | |
3,900 | 3.810%—01/09/2024 | 4,041 | |
2,900 | 4.375%—08/06/2023 | 3,020 | |
11,176 | |||
Ford Motor Credit Co. LLC MTN5 | |||
EUR | 5,700 | 1.744%—07/19/2024 | 6,705 |
Hyundai Capital America MTN5 | |||
$ | 5,200 | 0.800%—01/08/20241 | 5,161 |
Nissan Motor Acceptance Corp. | |||
1,900 | 3.875%—09/21/20231 | 1,994 | |
Nissan Motor Acceptance Corp. MTN5 | |||
4,200 | 1.125%—09/16/20241 | 4,168 | |
Nissan Motor Co. Ltd. | |||
2,700 | 3.522%—09/17/20251 | 2,841 | |
3,900 | 4.810%—09/17/20301 | 4,338 | |
7,179 | |||
Volkswagen Group of America Finance LLC | |||
4,700 | 3.350%—05/13/20251 | 4,982 | |
4,800 | 4.750%—11/13/20281 | 5,591 | |
10,573 | |||
Volkswagen International Finance NV | |||
EUR | 1,800 | 0.997% (3 Month EUR LIBOR + 1.550) 11/16/20243 | 2,158 |
49,114 | |||
BANKS—7.6% | |||
Banco Bilbao Vizcaya Argentaria SA | |||
$ | 1,600 | 0.875%—09/18/2023 | 1,603 |
1,500 | 1.125%—09/18/2025 | 1,474 | |
3,077 | |||
Banco Espirito Santo SA MTN5 | |||
EUR | 3,500 | 0.000%—01/15/2049* | 708 |
Banco Santander SA | |||
900 | 6.750%—04/25/20226,7 | 1,070 | |
Bank of America Corp. MTN5 | |||
$ | 4,800 | 0.981%—09/25/20257 | 4,772 |
Banque Federative du Credit Mutuel SA | |||
6,300 | 3.750%—07/20/20231 | 6,632 | |
Barclays plc | |||
4,200 | 3.684%—01/10/2023 | 4,225 |
CORPORATE BONDS & NOTES—Continued | |||
Principal Amount | Value | ||
BANKS—Continued | |||
$ | 3,700 | 4.610%—02/15/20237 | $3,743 |
4,400 | 7.875%—03/15/20226,7 | 4,499 | |
12,467 | |||
Barclays plc MTN5 | |||
GBP | 4,000 | 3.250%—02/12/2027 | 5,799 |
BBVA USA | |||
$ | 2,900 | 2.500%—08/27/2024 | 3,018 |
Citigroup Inc. | |||
4,700 | 2.572%—06/03/20317 | 4,742 | |
Deutsche Bank AG/New York | |||
5,500 | 3.300%—11/16/2022 | 5,648 | |
4,500 | 3.961%—11/26/20257 | 4,814 | |
10,462 | |||
Deutsche Bank AG/New York5 | |||
GBP | 2,700 | 2.625%—12/16/2024 | 3,783 |
Deutsche Bank AG/New York MTN5 | |||
EUR | 3,200 | 1.750%—01/17/2028 | 3,877 |
Intesa Sanpaolo SpA | |||
$ | 2,800 | 4.000%—09/23/20291 | 3,031 |
JPMorgan Chase & Co. | |||
4,000 | 1.470%—09/22/2027 | 3,929 | |
Lloyds Banking Group plc | |||
6,000 | 2.858%—03/17/20237 | 6,052 | |
Lloyds Banking Group plc MTN5 | |||
EUR | 1,500 | 3.500%—04/01/20267 | 1,923 |
Mitsubishi UFJ Financial Group Inc. | |||
$ | 5,800 | 1.412%—07/17/2025 | 5,790 |
Mizuho Financial Group Inc. | |||
5,100 | 0.849%—09/08/20247 | 5,100 | |
4,900 | 2.555%—09/13/20257 | 5,085 | |
10,185 | |||
NatWest Group PLC | |||
700 | 1.595% (3 Month USD LIBOR + 1.470) 05/15/20233 | 705 | |
200 | 4.519%—06/25/20247 | 212 | |
200 | 4.892%—05/18/20297 | 230 | |
1,147 | |||
NatWest Group PLC MTN5 | |||
EUR | 600 | 2.000%—03/04/20257 | 724 |
Nordea Bank Abp | |||
$ | 2,500 | 3.750%—08/30/20231 | 2,637 |
Societe Generale SA MTN5 | |||
4,100 | 4.250%—09/14/20231 | 4,355 | |
Sumitomo Mitsui Financial Group Inc. | |||
5,000 | 1.474%—07/08/2025 | 5,003 | |
UniCredit SpA MTN5 | |||
3,900 | 6.572%—01/14/20221 | 3,944 | |
5,600 | 7.830%—12/04/20231 | 6,356 | |
10,300 | |||
Wells Fargo & Co. MTN5 | |||
EUR | 3,300 | 1.741%—05/04/20307 | 4,026 |
119,509 | |||
BEVERAGES—0.9% | |||
Anheuser-Busch InBev Worldwide Inc. | |||
$ | 5,100 | 4.500%—06/01/2050 | 6,326 |
Bacardi Ltd. | |||
4,700 | 4.450%—05/15/20251 | 5,138 |
9
Harbor Bond Fund
Portfolio of Investments—Continued
Value, Cost, and Principal Amounts in Thousands
CORPORATE BONDS & NOTES—Continued | |||
Principal Amount | Value | ||
BEVERAGES—Continued | |||
Constellation Brands Inc. | |||
$ | 2,600 | 3.700%—12/06/2026 | $2,845 |
14,309 | |||
BUILDING PRODUCTS—0.8% | |||
CRH America Finance Inc. | |||
3,200 | 3.950%—04/04/20281 | 3,565 | |
3,200 | 4.500%—04/04/20481 | 3,999 | |
7,564 | |||
Fortune Brands Home & Security Inc. | |||
4,700 | 3.250%—09/15/2029 | 5,055 | |
Owens Corning | |||
300 | 4.200%—12/01/2024 | 325 | |
12,944 | |||
CAPITAL MARKETS—2.0% | |||
BGC Partners Inc. | |||
6,300 | 5.375%—07/24/2023 | 6,709 | |
Block Financial LLC Co. | |||
3,600 | 3.875%—08/15/2030 | 3,839 | |
Credit Agricole SA MTN5 | |||
4,900 | 3.750%—04/24/20231 | 5,123 | |
Credit Suisse Group AG | |||
5,100 | 2.997%—12/14/20231,7 | 5,219 | |
4,900 | 3.750%—03/26/2025 | 5,247 | |
3,400 | 7.500%—07/17/20236,7 | 3,623 | |
14,089 | |||
UBS Group AG | |||
2,200 | 2.859%—08/15/20231,7 | 2,239 | |
31,999 | |||
CHEMICALS—0.2% | |||
International Flavors & Fragrances Inc. | |||
3,700 | 3.200%—05/01/2023 | 3,814 | |
COMMERCIAL SERVICES & SUPPLIES—0.3% | |||
Sitka Holdings LLC | |||
4,000 | 5.250% (3 Month USD LIBOR + 4.500) 07/06/20261,3 | 4,070 | |
CONSUMER FINANCE—0.6% | |||
Daimler Finance North America LLC | |||
5,300 | 3.700%—05/04/20231 | 5,542 | |
Springleaf Finance Corp. | |||
2,800 | 6.875%—03/15/2025 | 3,129 | |
8,671 | |||
DIVERSIFIED FINANCIAL SERVICES—1.5% | |||
Cantor Fitzgerald LP | |||
5,400 | 6.500%—06/17/20221 | 5,590 | |
Imperial Brands Finance plc | |||
2,100 | 3.500%—02/11/20231 | 2,155 | |
5,600 | 3.875%—07/26/20291 | 5,983 | |
8,138 | |||
Intercontinental Exchange | |||
3,600 | 1.850%—09/15/2032 | 3,380 | |
Rio Oil Finance Trust | |||
958 | 9.250%—07/06/20241 | 1,051 | |
4,645 | 9.750%—01/06/20271 | 5,447 | |
6,498 | |||
23,606 |
CORPORATE BONDS & NOTES—Continued | |||
Principal Amount | Value | ||
DIVERSIFIED TELECOMMUNICATION SERVICES—0.9% | |||
AT&T Inc. | |||
$ | 4,900 | 1.650%—02/01/2028 | $4,782 |
British Telecommunications plc | |||
1,300 | 4.500%—12/04/2023 | 1,393 | |
Verizon Communications Inc. | |||
7,271 | 2.355%—03/15/20321 | 7,168 | |
13,343 | |||
ELECTRIC UTILITIES—2.5% | |||
Azure Power Energy Ltd. | |||
4,000 | 3.575%—08/19/20261 | 4,036 | |
Exelon Corp. | |||
3,100 | 4.050%—04/15/2030 | 3,492 | |
FirstEnergy Corp. | |||
1,100 | 3.350%—07/15/2022 | 1,110 | |
Greenko Solar Mauritius Ltd. | |||
4,900 | 5.550%—01/29/20251 | 5,010 | |
Jersey Central Power & Light Co. | |||
900 | 4.300%—01/15/20261 | 983 | |
1,600 | 4.700%—04/01/20241 | 1,718 | |
2,701 | |||
Nextera Energy Capital Holdings Inc. | |||
6,000 | 2.250%—06/01/2030 | 5,998 | |
Pacific Gas & Electric Co. | |||
5,100 | 1.500% (3 Month USD LIBOR + 1.375) 11/15/20213 | 5,101 | |
2,900 | 3.150%—01/01/2026 | 2,987 | |
300 | 3.300%—12/01/2027 | 307 | |
1,700 | 3.400%—08/15/2024 | 1,760 | |
2,000 | 3.450%—07/01/2025 | 2,086 | |
1,800 | 3.500%—06/15/2025 | 1,886 | |
1,500 | 4.250%—08/01/2023 | 1,563 | |
600 | 4.550%—07/01/2030 | 654 | |
16,344 | |||
38,691 | |||
ELECTRONIC EQUIPMENT, INSTRUMENTS & COMPONENTS—0.1% | |||
Arrow Electronics Inc. | |||
2,100 | 3.500%—04/01/2022 | 2,116 | |
ENTERTAINMENT—0.3% | |||
Walt Disney Co. | |||
3,900 | 2.650%—01/13/2031 | 4,056 | |
EQUITY REAL ESTATE INVESTMENT TRUSTS (REITs)—4.0% | |||
Agree LP Co. | |||
1,400 | 2.900%—10/01/2030 | 1,440 | |
Alexandria Real Estate Equities Inc. | |||
2,100 | 2.750%—12/15/2029 | 2,177 | |
American Tower Corp. | |||
5,000 | 2.750%—01/15/2027 | 5,198 | |
Boston Properties LP | |||
4,905 | 2.750%—10/01/2026 | 5,129 | |
Brandywine Operating Partnership LP | |||
5,000 | 4.100%—10/01/2024 | 5,345 | |
CBL & Associates Properties Inc. | |||
305 | 7.000%—11/1/2028 | 305 | |
Crown Castle International Corp. | |||
4,000 | 3.700%—06/15/2026 | 4,322 | |
Digital Realty Trust LP | |||
5,500 | 4.450%—07/15/2028 | 6,260 |
10
Harbor Bond Fund
Portfolio of Investments—Continued
Value, Cost, and Principal Amounts in Thousands
CORPORATE BONDS & NOTES—Continued | |||
Principal Amount | Value | ||
EQUITY REAL ESTATE INVESTMENT TRUSTS (REITs)—Continued | |||
EPR Properties | |||
$ | 1,900 | 4.500%—06/01/2027 | $2,045 |
600 | 4.950%—04/15/2028 | 657 | |
2,702 | |||
Equinix Inc. | |||
5,000 | 1.000%—09/15/2025 | 4,903 | |
GLP Capital LP / GLP Financing II Inc. | |||
4,500 | 4.000%—01/15/2030 | 4,779 | |
Highwoods Realty LP | |||
2,500 | 2.600%—02/01/2031 | 2,508 | |
OMEGA Healthcare Investors Inc. | |||
309 | 4.375%—08/01/2023 | 326 | |
Physicians Realty LP | |||
1,400 | 3.950%—01/15/2028 | 1,544 | |
Scentre Group Trust | |||
5,700 | 4.375%—05/28/20301 | 6,533 | |
Service Properties Trust | |||
4,800 | 4.350%—10/01/2024 | 4,843 | |
Spirit Realty LP | |||
4,700 | 3.400%—01/15/2030 | 4,945 | |
63,259 | |||
FOOD & STAPLES RETAILING—0.3% | |||
7-Eleven Inc. | |||
5,200 | 1.800%—02/10/20311 | 4,939 | |
CVS Pass-Through Trust | |||
445 | 6.943%—01/10/2030 | 534 | |
5,473 | |||
HEALTH CARE EQUIPMENT & SUPPLIES—0.4% | |||
Boston Scientific Corp. | |||
5,700 | 2.650%—06/01/2030 | 5,849 | |
HEALTH CARE PROVIDERS & SERVICES—0.6% | |||
CVS Health Corp. | |||
3,900 | 4.125%—04/01/2040 | 4,479 | |
HCA Inc. | |||
4,000 | 5.375%—09/01/2026 | 4,560 | |
100 | 5.875%—02/01/2029 | 119 | |
4,679 | |||
9,158 | |||
HOTELS, RESTAURANTS & LEISURE—0.9% | |||
Expedia Group Inc. | |||
3,450 | 6.250%—05/01/20251 | 3,942 | |
Marriott International Inc. | |||
5,000 | 3.500%—10/15/2032 | 5,292 | |
Wynn Las Vegas LLC / Wynn Las Vegas Capital Corp. | |||
5,200 | 4.250%—05/30/20231 | 5,232 | |
14,466 | |||
INDEPENDENT POWER AND RENEWABLE ELECTRICITY PRODUCERS—0.5% | |||
ENEL Finance International NV | |||
4,100 | 1.875%—07/12/20281 | 4,025 | |
4,100 | 2.250%—07/12/20311 | 4,017 | |
8,042 | |||
INDUSTRIAL CONGLOMERATES—0.2% | |||
Textron Inc. | |||
3,800 | 2.450%—03/15/2031 | 3,784 |
CORPORATE BONDS & NOTES—Continued | |||
Principal Amount | Value | ||
INSURANCE—0.7% | |||
AIA Group Ltd. | |||
$ | 2,700 | 3.375%—04/07/20301 | $2,915 |
Allstate Corp. | |||
4,300 | 1.450%—12/15/2030 | 4,093 | |
American International Group | |||
3,800 | 2.500%—06/30/2025 | 3,949 | |
10,957 | |||
IT SERVICES—0.6% | |||
Amdocs Ltd. | |||
3,600 | 2.538%—06/15/2030 | 3,597 | |
Paypal Holdings Inc. | |||
5,000 | 2.850%—10/01/2029 | 5,284 | |
8,881 | |||
MEDIA—0.3% | |||
Charter Communications Operating LLC | |||
4,800 | 4.464%—07/23/2022 | 4,898 | |
MORTGAGE REAL ESTATE INVESTMENT TRUSTS (REITs)—0.1% | |||
ERP Operating LP | |||
2,100 | 3.375%—06/01/2025 | 2,237 | |
OIL, GAS & CONSUMABLE FUELS—1.4% | |||
EQM Midstream Partners LP | |||
522 | 4.750%—07/15/2023 | 550 | |
Equinor ASA | |||
200 | 3.125%—04/06/2030 | 216 | |
MPLX LP | |||
3,300 | 4.900%—04/15/2058 | 3,942 | |
Odebrecht Drilling Norbe VIII/IX Ltd. | |||
3,650 | 7.350%—12/01/2026 | 2,087 | |
9 | 7.350%—12/01/20261 | 5 | |
2,092 | |||
Odebrecht Offshore Drilling Finance Ltd. | |||
273 | 6.720%—12/01/2022 | 271 | |
3,842 | 7.720%—12/01/2026 | 962 | |
1,233 | |||
Odebrecht Oil & Gas Finance Ltd. | |||
2,183 | 0.000%—12/06/20211,6,8 | 27 | |
Rio Oil Finance Trust | |||
1,459 | 9.250%—07/06/2024 | 1,600 | |
Sabine Pass Liquefaction LLC | |||
900 | 4.200%—03/15/2028 | 998 | |
5,100 | 4.500%—05/15/2030 | 5,815 | |
6,813 | |||
Shell International Finance BV | |||
5,200 | 2.750%—04/06/2030 | 5,484 | |
21,957 | |||
PHARMACEUTICALS—1.7% | |||
Abbvie Inc. | |||
4,900 | 2.600%—11/21/2024 | 5,104 | |
1,000 | 3.200%—11/06/2022 | 1,022 | |
6,126 | |||
Bayer US Finance II LLC | |||
6,300 | 3.875%—12/15/20231 | 6,654 | |
2,800 | 4.250%—12/15/20251 | 3,071 | |
9,725 |
11
Harbor Bond Fund
Portfolio of Investments—Continued
Value, Cost, and Principal Amounts in Thousands
CORPORATE BONDS & NOTES—Continued | |||
Principal Amount | Value | ||
PHARMACEUTICALS—Continued | |||
Mylan NV | |||
EUR | 5,100 | 2.250%—11/22/2024 | $6,241 |
Takeda Pharmaceutical Co. Ltd. | |||
$ | 1,500 | 2.050%—03/31/2030 | 1,468 |
Teva Pharmaceutical Finance Netherlands III BV | |||
3,000 | 6.750%—03/01/20289 | 3,289 | |
26,849 | |||
REAL ESTATE MANAGEMENT & DEVELOPMENT—0.3% | |||
Tesco Property Finance 5 plc | |||
GBP | 2,245 | 5.661%—10/13/2041 | 4,052 |
SEMICONDUCTORS & SEMICONDUCTOR EQUIPMENT—1.3% | |||
Broadcom Inc. | |||
$ | 6,904 | 3.137%—11/15/20351 | 6,793 |
3,700 | 3.419%—04/15/20331 | 3,824 | |
4,003 | 3.469%—04/15/20341 | 4,133 | |
14,750 | |||
NXP BV / NXP Funding LLC / NXP USA Inc. | |||
4,600 | 3.875%—06/18/20261 | 5,013 | |
19,763 | |||
SOFTWARE—0.5% | |||
Oracle Corp. | |||
400 | 2.950%—04/01/2030 | 415 | |
3,500 | 3.600%—04/01/2040 | 3,653 | |
4,068 | |||
VMware Inc. | |||
3,600 | 4.650%—05/15/2027 | 4,082 | |
8,150 | |||
TECHNOLOGY HARDWARE, STORAGE & PERIPHERALS—0.6% | |||
Dell International LLC / EMC Corp. | |||
2,400 | 5.450%—06/15/2023 | 2,556 | |
800 | 5.850%—07/15/2025 | 920 | |
3,300 | 6.020%—06/15/2026 | 3,890 | |
7,366 | |||
NetApp Inc. | |||
1,500 | 1.875%—06/22/2025 | 1,527 | |
8,893 | |||
TRADING COMPANIES & DISTRIBUTORS—0.4% | |||
AerCap Ireland Capital DAC / AerCap Global Aviation Trust | |||
403 | 3.500%—05/26/2022 | 409 | |
Aviation Capital Group LLC | |||
5,300 | 4.125%—08/01/20251 | 5,665 | |
6,074 | |||
TRANSPORTATION INFRASTRUCTURE—0.1% | |||
Central Nippon Expressway Co. Ltd. | |||
1,150 | 2.849%—03/03/2022 | 1,159 | |
WATER UTILITIES—0.3% | |||
Essential Utilities Inc. | |||
4,100 | 2.400%—05/01/2031 | 4,080 | |
WIRELESS TELECOMMUNICATION SERVICES—0.3% | |||
Sprint Communications Inc. | |||
800 | 6.000%—11/15/2022 | 840 |
CORPORATE BONDS & NOTES—Continued | |||
Principal Amount | Value | ||
WIRELESS TELECOMMUNICATION SERVICES—Continued | |||
T-Mobile USA Inc. | |||
$ | 3,500 | 2.050%—02/15/2028 | $3,473 |
4,313 | |||
TOTAL CORPORATE BONDS & NOTES | |||
(Cost $561,216) | 579,541 | ||
FOREIGN GOVERNMENT OBLIGATIONS—8.9% | |||
Abu Dhabi Government International Bond5 | |||
3,600 | 3.125%—04/16/20301 | 3,886 | |
Bank of Israel Bill - Makam | |||
ILS | 52,500 | 0.000%—04/06/2022-10/07/20228 | 16,588 |
Israel Government International Bond | |||
$ | 4,800 | 2.750%—07/03/2030 | 5,077 |
4,600 | 3.875%—07/03/2050 | 5,266 | |
10,343 | |||
Japan International Cooperation Agency | |||
6,900 | 2.750%—04/27/2027 | 7,367 | |
Letra Tesouro Nacional Bills | |||
BRL | 363,216 | 0.000%—04/01/2022-07/01/20228 | 60,513 |
Peruvian Government International Bond | |||
$ | 5,600 | 2.783%—01/23/2031 | 5,598 |
PEN | 8,600 | 5.940%—02/12/2029 | 2,227 |
15,000 | 6.350%—08/12/2028 | 3,985 | |
5,600 | 8.200%—08/12/2026 | 1,596 | |
13,406 | |||
Province of Ontario Canada | |||
CAD | 5,600 | 3.150%—06/02/2022 | 4,595 |
Province of Quebec Canada | |||
3,800 | 3.500%—12/01/2022 | 3,159 | |
13,900 | 4.250%—12/01/2021 | 11,267 | |
14,426 | |||
Provincia de Buenos Aires | |||
ARS | 310 | 37.896% (Argentina Deposit Rates Badlar Private Banks ARS 30 to 35 Days + 3.750) 04/12/20251,3 | 2 |
Qatar Government International Bond | |||
$ | 5,500 | 3.375%—03/14/2024 | 5,814 |
2,000 | 4.500%—01/20/2022 | 2,017 | |
7,831 | |||
TOTAL FOREIGN GOVERNMENT OBLIGATIONS | |||
(Cost $148,106) | 138,957 | ||
MORTGAGE PASS-THROUGH—21.0% | |||
Federal Home Loan Mortgage Corp. | |||
11 | 2.268% (U.S. Treasury Yield Curve Rate T Note 1 Year Constant Maturity Treasury + 2.250) 08/01/20353 | 11 | |
1 | 2.368% (U.S. Treasury Yield Curve Rate T Note 1 Year Constant Maturity Treasury + 2.251) 06/01/20243 | 1 | |
5,883 | 2.700%—08/01/2023 | 5,902 | |
398 | 3.500%—01/01/2026-02/01/2035 | 423 | |
1,194 | 4.000%—03/01/2025-04/01/2048 | 1,278 | |
182 | 4.500%—12/01/2040-09/01/2041 | 203 |
12
Harbor Bond Fund
Portfolio of Investments—Continued
Value, Cost, and Principal Amounts in Thousands
MORTGAGE PASS-THROUGH—Continued | |||
Principal Amount | Value | ||
$ | 545 | 5.500%—02/01/2038-07/01/2038 | $ 638 |
2,032 | 6.000%—01/01/2029-05/01/2040 | 2,401 | |
10,857 | |||
Federal Home Loan Mortgage Corp. Multifamily Structured Pass Through Certificates | |||
17,087 | 1.208%—08/25/20223 | 128 | |
Federal Home Loan Mortgage Corp. REMIC10 | |||
3,997 | 0.446% (1 Month USD LIBOR + 0.700) 08/15/2040-10/15/20403 | 4,015 | |
7 | 0.540% (1 Month USD LIBOR + 0.450) 11/15/20303 | 7 | |
5 | 8.000%—08/15/2022 | 5 | |
4,027 | |||
Federal Home Loan Mortgage Corp. Structured Pass Through Certificates | |||
Series T-63 Cl. 1A1 | |||
58 | 1.293% (Fed 12 Month Treasury Average Constant Maturity Treasury + 1.200) 02/25/20453 | 58 | |
Series E3 Cl. A | |||
15 | 3.794%—08/15/20323 | 15 | |
73 | |||
Federal National Mortgage Association | |||
124 | 1.488% (Fed 12 Month Treasury Average Constant Maturity Treasury + 1.400) 10/01/20403 | 126 | |
277 | 1.943% (12 Month USD LIBOR + 1.693) 08/01/20353 | 280 | |
20 | 1.945% (12 Month USD LIBOR + 1.695) 05/01/20353 | 20 | |
317 | 2.090% (12 Month USD LIBOR + 1.715) 06/01/20353 | 336 | |
5,068 | 2.310%—08/01/2022 | 5,100 | |
7 | 3.000%—12/01/2021-11/01/2025 | 7 | |
4,608 | 3.500%—12/01/2025-05/01/2035 | 4,891 | |
4,498 | 4.000%—09/01/2023-02/01/2048 | 4,812 | |
3,599 | 4.500%—11/01/2022-10/01/2042 | 3,876 | |
1,362 | 5.000%—10/01/2031-06/01/2044 | 1,528 | |
14,202 | 5.500%—01/01/2025-09/01/2041 | 16,504 | |
4,619 | 6.000%—07/01/2023-06/01/2040 | 5,379 | |
42,859 | |||
Federal National Mortgage Association REMIC10 | |||
Series 2015-38 Cl. DF | |||
2,416 | 0.406% (1 Month USD LIBOR + 0.310) 06/25/20553 | 2,426 | |
Series 2006-5 Cl. 3A2 | |||
32 | 1.946%—05/25/20353 | 33 | |
Series 2020-M1 Cl. A2 | |||
4,400 | 2.444%—10/25/2029 | 4,661 | |
Series 2011-98 Cl. ZL | |||
41,660 | 3.500%—10/25/2041 | 43,344 | |
Series 2003-25 Cl. KP | |||
291 | 5.000%—04/25/2033 | 323 | |
Series 2003-W1 Cl. 1A1 | |||
117 | 5.226%—12/25/20423 | 127 | |
50,914 | |||
Federal National Mortgage Association TBA11 | |||
146,800 | 2.000%—11/16/2036-12/14/2050 | 147,359 | |
20,400 | 2.500%—12/14/2050 | 20,904 | |
12,900 | 3.500%—01/14/2049 | 13,626 | |
181,889 |
MORTGAGE PASS-THROUGH—Continued | |||
Principal Amount | Value | ||
Government National Mortgage Association | |||
$ | 905 | 3.000%—11/15/2049 | $ 940 |
1,947 | 5.000%—08/15/2033-06/15/2041 | 2,252 | |
3,192 | |||
Government National Mortgage Association II | |||
25 | 1.625% (U.S. Treasury Yield Curve Rate T Note 1 Year Constant Maturity Treasury + 1.500) 09/20/2023-07/20/20273 | 25 | |
12 | 1.875% (U.S. Treasury Yield Curve Rate T Note 1 Year Constant Maturity Treasury + 1.500) 05/20/20243 | 12 | |
173 | 2.000% (U.S. Treasury Yield Curve Rate T Note 1 Year Constant Maturity Treasury + 1.500) 08/20/2022-02/20/20323 | 180 | |
51 | 2.125% (U.S. Treasury Yield Curve Rate T Note 1 Year Constant Maturity Treasury + 1.500) 10/20/2025-11/20/20293 | 52 | |
2,136 | 4.500%—02/20/2049 | 2,285 | |
90 | 5.000%—01/20/2049 | 97 | |
2,651 | |||
Government National Mortgage Association TBA11 | |||
5,000 | 4.000%—12/19/2048 | 5,351 | |
23,500 | 5.000%—11/19/2048 | 26,621 | |
31,972 | |||
TOTAL MORTGAGE PASS-THROUGH | |||
(Cost $323,548) | 328,562 | ||
MUNICIPAL BONDS—0.6% | |||
Chicago Transit Authority | |||
75 | 6.300%—12/01/2021 | 75 | |
City of Chicago, IL | |||
816 | 7.750%—01/01/2042 | 928 | |
New Jersey Transportation Trust Fund Authority | |||
1,400 | 2.551%—06/15/2023 | 1,439 | |
New York State Urban Development Corp. | |||
3,900 | 1.496%—03/15/2027 | 3,871 | |
University of California | |||
3,600 | 1.316%—05/15/2027 | 3,546 | |
TOTAL MUNICIPAL BONDS | |||
(Cost $9,774) | 9,859 | ||
PREFERRED STOCKS—1.1% | |||
(Cost $17,744) | |||
Shares | |||
656,033 | AT&T Mobility II LLC12 | 16,996x | |
U.S. GOVERNMENT OBLIGATIONS—17.5% | |||
Principal Amount | |||
U.S. Treasury Bonds | |||
$ | 54,700 | 1.375%—11/15/2040-08/15/2050 | 48,070 |
2,500 | 1.625%—11/15/2050 | 2,320 | |
10,600 | 1.875%—02/15/2041 | 10,423 |
13
Harbor Bond Fund
Portfolio of Investments—Continued
Value, Cost, and Principal Amounts in Thousands
U.S. GOVERNMENT OBLIGATIONS—Continued | |||
Principal Amount | Value | ||
$ | 32,500 | 2.500%—02/15/2045 | $35,629 |
7,300 | 2.875%—05/15/2043-08/15/2045 | 8,546 | |
5,700 | 3.000%—02/15/2048 | 6,945 | |
70,000 | 3.125%—08/15/2044 | 84,653 | |
13,400 | 3.375%—05/15/2044 | 16,816 | |
4,200 | 4.250%—05/15/2039 | 5,741 | |
219,143 | |||
U.S. Treasury Notes | |||
13,100 | 1.875%—07/31/20229 | 13,273 | |
41,700 | 2.000%—12/31/20219 | 41,830 | |
55,103 | |||
TOTAL U.S. GOVERNMENT OBLIGATIONS | |||
(Cost $267,915) | 274,246 | ||
SHORT-TERM INVESTMENTS—2.1% | |||
Principal Amount | Value | ||
U.S. TREASURY BILLS—2.1% | |||
U.S. Cash Management Bill | |||
$ | 13,900 | 0.034%—01/11/2022†,9 | $13,899 |
19,200 | 0.040%—01/18/2022† | 19,197 | |
400 | 0.045%—01/04/2022† | 400 | |
TOTAL SHORT-TERM INVESTMENTS | |||
(Cost $33,497) | 33,496 | ||
TOTAL INVESTMENTS—112.0% | |||
(Cost $1,724,533) | 1,754,451 | ||
CASH AND OTHER ASSETS, LESS LIABILITIES—(12.0)% | (188,133) | ||
TOTAL NET ASSETS—100.0% | $1,566,318 |
FORWARD CURRENCY CONTRACTS
Counterparty | Amount to be Delivered (000s) | Amount to be Received (000s) | Settlement Date | Unrealized Appreciation/ (Depreciation) (000s) |
HSBC Bank USA | $ 2,005 | AUD 2,758 | 11/02/2021 | $ 70 |
HSBC Bank USA | $ 2,683 | AUD 3,580 | 12/02/2021 | 10 |
UBS AG | $ 16,193 | AUD 22,382 | 11/02/2021 | 645 |
HSBC Bank USA | AUD 3,580 | $ 2,683 | 11/02/2021 | (10) |
BNP Paribas SA | $ 11,075 | BRL 62,496 | 11/03/2021 | (8) |
BNP Paribas SA | $ 11,181 | BRL 62,496 | 12/02/2021 | (179) |
Goldman Sachs Bank USA | $ 11,616 | BRL 62,496 | 11/03/2021 | (550) |
BNP Paribas SA | BRL 62,496 | $ 11,241 | 11/03/2021 | 174 |
BNP Paribas SA | BRL 110,424 | $ 19,582 | 04/04/2022 | 759 |
BNP Paribas SA | BRL 112,592 | $ 19,626 | 07/05/2022 | 993 |
Goldman Sachs Bank USA | BRL 62,496 | $ 11,075 | 11/03/2021 | 8 |
Goldman Sachs Bank USA | BRL 140,200 | $ 24,583 | 07/05/2022 | 1,380 |
Barclays Bank plc | $ 1,226 | GBP 897 | 11/17/2021 | 2 |
Citibank NA | $ 5,509 | GBP 4,074 | 11/17/2021 | 66 |
Goldman Sachs Bank USA | $ 1,463 | GBP 1,065 | 11/17/2021 | (6) |
HSBC Bank USA | $ 1,004 | GBP 738 | 11/17/2021 | 6 |
UBS AG | $ 1,075 | GBP 781 | 11/17/2021 | (6) |
UBS AG | $ 1,039 | GBP 767 | 11/17/2021 | 10 |
Citibank NA | GBP 68,720 | $ 95,297 | 11/17/2021 | 1,249 |
HSBC Bank USA | GBP 5,489 | $ 7,459 | 11/17/2021 | (53) |
JP Morgan Chase Bank NA | GBP 1,454 | $ 2,000 | 11/17/2021 | 10 |
HSBC Bank USA | $ 13,248 | CAD 16,381 | 11/02/2021 | (11) |
JP Morgan Chase Bank NA | $ 6,524 | CAD 8,101 | 11/02/2021 | 22 |
BNP Paribas SA | CAD 21,844 | $ 17,220 | 11/02/2021 | (430) |
HSBC Bank USA | CAD 2,639 | $ 2,085 | 11/02/2021 | (47) |
HSBC Bank USA | CAD 16,381 | $ 13,248 | 12/02/2021 | 11 |
JP Morgan Chase Bank NA | CAD 8,101 | $ 6,524 | 12/02/2021 | (22) |
UBS AG | $ 6,250 | CLP 4,937,937 | 02/28/2022 | (268) |
UBS AG | EUR 30,909 | $ 36,341 | 11/17/2021 | 598 |
Société Générale | $ 135 | INR 10,029 | 12/15/2021 | (2) |
Barclays Bank plc | JPY 156,600 | $ 1,421 | 11/17/2021 | 47 |
BNP Paribas SA | $ 7,330 | MXN 150,107 | 01/12/2022 | (123) |
Goldman Sachs Bank USA | $ 2,937 | MXN 59,847 | 11/17/2021 | (37) |
BNP Paribas SA | MXN 59,847 | $ 2,936 | 11/17/2021 | 37 |
Goldman Sachs Bank USA | MXN 59,847 | $ 2,879 | 03/18/2022 | 37 |
UBS AG | MXN 89,526 | $ 4,373 | 11/17/2021 | 36 |
Citibank NA | ILS 26,499 | $ 8,124 | 04/06/2022 | (269) |
Citibank NA | ILS 13,000 | $ 4,045 | 10/07/2022 | (88) |
Deutsche Bank AG | ILS 12,999 | $ 4,075 | 10/07/2022 | (58) |
Citibank NA | $ 2,043 | NOK 17,590 | 11/17/2021 | 39 |
14
Harbor Bond Fund
Portfolio of Investments—Continued
FORWARD CURRENCY CONTRACTS—Continued
Counterparty | Amount to be Delivered (000s) | Amount to be Received (000s) | Settlement Date | Unrealized Appreciation/ (Depreciation) (000s) |
HSBC Bank USA | $ 5,352 | NOK 46,010 | 11/17/2021 | $94 |
Citibank NA | PEN 17,035 | $ 4,152 | 01/18/2022 | (103) |
Citibank NA | PEN 5,056 | $ 1,279 | 01/18/2022 | 16 |
Citibank NA | PEN 4,467 | $ 1,078 | 03/17/2022 | (33) |
Citibank NA | PEN 4,220 | $ 1,018 | 03/28/2022 | (31) |
Citibank NA | PEN 1,810 | $ 438 | 05/31/2022 | (10) |
Goldman Sachs Bank USA | PEN 2,803 | $ 748 | 11/12/2021 | 46 |
Total Forward Currency Contracts | $4,021 |
FUTURES CONTRACTS
Description | Number of Contracts | Expiration Date | Current Notional Value (000s) | Unrealized Appreciation/ (Depreciation) (000s) |
Euro-Bund Futures (Short) | 10 | 12/08/2021 | EUR 1,681 | $ 48 |
Euro-Buxl Futures (Short) | 37 | 12/08/2021 | 7,732 | (3) |
United Kingdom GILT Futures 90 day (Short) | 60 | 12/29/2021 | GBP 7,495 | 94 |
U.S. Treasury Bond Futures 30 year (Short) | 106 | 12/21/2021 | $ 17,049 | 280 |
U.S. Treasury Note Futures 10 year (Long) | 1,376 | 12/21/2021 | 179,847 | (3,722) |
Total Futures Contracts | $(3,303) |
PURCHASED OPTIONS
PURCHASED SWAP OPTIONS NOT SETTLED THROUGH VARIATION MARGIN
Description | Counterparty | Floating Rate Index | Pay/Receive Floating Rate | Strike Rate | Expiration Date | Number of Contracts/ Notional | Premiums Paid (000s) | Value (000s) |
Interest Rate Swap Option (Put) | Goldman Sachs Bank USA | SONIA Overnight Deposit Rates Swap | Receive | 0.900% | 03/15/2022 | 5,000,000 | $528 | $331 |
WRITTEN OPTIONS
WRITTEN OPTIONS NOT SETTLED THROUGH VARIATION MARGIN
Description | Counterparty | Strike Price | Expiration Date | Number of Contracts/ Notional | Premiums Received (000s) | Value (000s) |
Federal National Mortgage Association Future Option 30 year (Call) | Goldman Sachs & Co. LLC | $ 100.17 | 01/06/2022 | 3,900,000 | $12 | $(23) |
Federal National Mortgage Association Future Option 30 year (Call) | Goldman Sachs & Co. LLC | 100.55 | 12/06/2021 | 4,000,000 | 9 | (10) |
Federal National Mortgage Association Future Option 30 year (Put) | Goldman Sachs & Co. LLC | 98.17 | 01/06/2022 | 3,900,000 | 18 | (20) |
Federal National Mortgage Association Future Option 30 year (Put) | Goldman Sachs & Co. LLC | 98.55 | 12/06/2021 | 4,000,000 | 16 | (9) |
Federal National Mortgage Association Future Option 30 year (Call) | JP Morgan Chase Bank NA | 100.08 | 01/06/2022 | 4,000,000 | 18 | (25) |
Federal National Mortgage Association Future Option 30 year (Call) | JP Morgan Chase Bank NA | 100.22 | 11/03/2021 | 7,000,000 | 26 | (8) |
Federal National Mortgage Association Future Option 30 year (Call) | JP Morgan Chase Bank NA | 100.67 | 12/06/2021 | 3,000,000 | 10 | (6) |
Total Written Options Not Settled Through Variation Margin | $109 | $(101) |
WRITTEN SWAP OPTIONS NOT SETTLED THROUGH VARIATION MARGIN
Description | Counterparty | Floating Rate Index | Pay/Receive Floating Rate | Strike Rate | Expiration Date | Number of Contracts/ Notional | Premiums Received (000s) | Value (000s) |
Interest Rate Swap Option (Put) | Goldman Sachs Bank USA | SONIA Overnight Deposit Rates Swap | Pay | 0.800% | 03/15/2022 | 13,500,000 | $513 | $(567) |
Total Written Options | $622 | $(668) |
15
Harbor Bond Fund
Portfolio of Investments—Continued
INTEREST RATE SWAP AGREEMENTS
CENTRALLY CLEARED SWAP AGREEMENTS
INTEREST RATE SWAPS
Counterparty | Floating Rate Index | Pay/ Receive Floating Rate | Fixed Rate | Payment Frequency | Expiration Date | Notional Amount (000s) | Value (000s) | Upfront Premiums (Received)/ Paid (000s) | Unrealized Appreciation/ (Depreciation) (000s) |
CME Group | Brazil CETIP Interbank Deposit | Receive | 2.850% | At maturity | 01/03/2022 | BRL 74,900 | $203 | $(1) | $204 |
CME Group | Brazil CETIP Interbank Deposit | Receive | 2.859 | At maturity | 01/03/2022 | 51,000 | 136 | — | 136 |
CME Group | Brazil CETIP Interbank Deposit | Receive | 2.860 | At maturity | 01/03/2022 | 59,300 | 161 | (1) | 162 |
CME Group | Brazil CETIP Interbank Deposit | Receive | 2.870 | At maturity | 01/03/2022 | 16,900 | 45 | — | 45 |
CME Group | Brazil CETIP Interbank Deposit | Receive | 2.871 | At maturity | 01/03/2022 | 27,000 | 72 | — | 72 |
CME Group | Brazil CETIP Interbank Deposit | Receive | 2.883 | At maturity | 01/03/2022 | 17,000 | 45 | — | 45 |
CME Group | Brazil CETIP Interbank Deposit | Pay | 3.345 | At maturity | 01/03/2022 | 7,800 | (16) | — | (16) |
CME Group | Brazil CETIP Interbank Deposit | Pay | 3.350 | At maturity | 01/03/2022 | 153,200 | (307) | (6) | (301) |
CME Group | Brazil CETIP Interbank Deposit | Pay | 3.360 | At maturity | 01/03/2022 | 945,100 | (1,201) | 276 | (1,477) |
LCH Group | Brazil CETIP Interbank Deposit | Pay | 3.700 | At maturity | 01/03/2022 | 124,000 | (215) | (72) | (143) |
LCH Group | SONIA Overnight Deposit Rates Swap | Receive | 1.000 | Annual | 03/16/2052 | GBP 23,400 | 315 | (50) | 365 |
LCH Group | SONIA Overnight Deposit Rates Swap | Receive | 1.000 | Annual | 09/21/2052 | 2,100 | 21 | 137 | (116) |
LCH Group | British Bankers' Association LIBOR JPY 6-Month | Receive | 0.300 | Semi-annual | 09/20/2027 | JPY 2,180,000 | (272) | (113) | (159) |
LCH Group | British Bankers' Association LIBOR JPY 6-Month | Pay | 0.380 | Semi-annual | 06/18/2028 | 3,170,000 | 610 | 147 | 463 |
LCH Group | British Bankers' Association LIBOR JPY 6-Month | Receive | 0.450 | Semi-annual | 03/20/2029 | 660,000 | (158) | (49) | (109) |
LCH Group | British Bankers' Association LIBOR JPY 6-Month | Receive | 0.750 | Semi-annual | 03/20/2038 | 104,000 | (68) | 6 | (74) |
LCH Group | British Bankers' Association LIBOR JPY 6-Month | Receive | 0.800 | Semi-annual | 10/22/2038 | 210,100 | (152) | — | (152) |
LCH Group | British Bankers' Association LIBOR JPY 6-Month | Receive | 0.750 | Semi-annual | 12/20/2038 | 27,800 | (19) | 1 | (20) |
LCH Group | British Bankers' Association LIBOR JPY 6-Month | Receive | 0.538 | Semi-annual | 03/15/2051 | 542,480 | (23) | (5) | (18) |
LCH Group | British Bankers' Association LIBOR JPY 6-Month | Receive | 0.520 | Semi-annual | 03/16/2051 | 206,000 | — | — | — |
LCH Group | British Bankers' Association LIBOR JPY 6-Month | Receive | 0.350 | Semi-annual | 03/17/2051 | 184,000 | 78 | 101 | (23) |
LCH Group | British Bankers' Association LIBOR JPY 6-Month | Receive | 0.557 | Semi-annual | 03/17/2051 | 695,000 | (62) | — | (62) |
LCH Group | British Bankers' Association LIBOR JPY 6-Month | Receive | 0.570 | Semi-annual | 03/19/2051 | 176,000 | (21) | — | (21) |
LCH Group | British Bankers' Association LIBOR JPY 6-Month | Receive | 0.572 | Semi-annual | 04/07/2051 | 78,000 | (10) | — | (10) |
CME Group | British Bankers' Association LIBOR USD 3-Month | Pay | 2.800 | Semi-annual | 08/22/2023 | $ 86,000 | 3,834 | (1,932) | 5,766 |
Centrally Cleared Interest Rate Swaps | $4,557 |
CREDIT DEFAULT SWAP AGREEMENTS
CENTRALLY CLEARED SWAP AGREEMENTS
CREDIT DEFAULT SWAPS
Counterparty | Reference Entity | Buy/ Sella,b | Pay/Receive Fixed Rate | Expiration Date | Implied Credit Spreadc | Payment Frequency | Notional Amountd (000s) | Valuee (000s) | Upfront Premiums (Received)/Paid (000s) | Unrealized Appreciation/ (Depreciation) (000s) |
ICE Group | iTraxx Europe Crossover Series 36 Version 1 0.001% | Sell | 5.000% | 12/20/2026 | 2.613% | Quarterly | EUR 16,000 | $2,175 | $2,141 | $34 |
ICE Group | Rolls-Royce PLC 2.125% due 06/18/2021 | Sell | 1.000 | 06/20/2025 | 1.389 | Quarterly | 5,000 | (74) | (892) | 818 |
ICE Group | Tesco PLC 6.000% due 12/14/2029 | Sell | 1.000 | 06/20/2022 | 0.137 | Quarterly | 2,300 | 19 | (112) | 131 |
16
Harbor Bond Fund
Portfolio of Investments—Continued
Counterparty | Reference Entity | Buy/ Sella,b | Pay/Receive Fixed Rate | Expiration Date | Implied Credit Spreadc | Payment Frequency | Notional Amountd (000s) | Valuee (000s) | Upfront Premiums (Received)/Paid (000s) | Unrealized Appreciation/ (Depreciation) (000s) |
ICE Group | Markit CDX North America High Yield Index Series 36 | Buy | 1.000% | 06/20/2026 | 2.896% | Quarterly | $ 6,300 | $(592) | $(601) | $9 |
ICE Group | General Electric Company 2.700% due 10/09/2022 | Sell | 1.000 | 12/20/2023 | 0.292 | Quarterly | 2,700 | 44 | (120) | 164 |
ICE Group | General Electric Company 2.700% due 10/09/2022 | Sell | 1.000 | 06/20/2024 | 0.347 | Quarterly | 1,200 | 22 | (4) | 26 |
ICE Group | General Electric Company 2.700% due 10/09/2022 | Sell | 1.000 | 12/20/2024 | 0.385 | Quarterly | 2,600 | 53 | (37) | 90 |
ICE Group | General Electric Company 2.700% due 10/09/2022 | Sell | 1.000 | 12/20/2026 | 0.643 | Quarterly | 400 | 8 | 5 | 3 |
ICE Group | General Electric Company 2.700% due 10/09/2022 | Sell | 1.000 | 06/20/2026 | 0.582 | Quarterly | 3,600 | 73 | 30 | 43 |
ICE Group | Markit CDX North America High Yield Index Series 35 | Buy | 5.000 | 12/20/2025 | 2.727 | Quarterly | 3,300 | (305) | (239) | (66) |
ICE Group | The Boeing Company 8.750% due 08/15/2021 | Sell | 1.000 | 12/20/2022 | 0.443 | Quarterly | 5,200 | 40 | 1 | 39 |
ICE Group | The Boeing Company 2.600% due 10/30/2025 | Sell | 1.000 | 06/20/2023 | 0.547 | Quarterly | 4,200 | 36 | 11 | 25 |
Centrally Cleared Credit Default Swaps | $1,316 | |||||||||
Total Swaps | $5,873 |
REVERSE REPURCHASE AGREEMENTS — (0.2)%
Counterparty | Borrowing Rate | Borrowing Date | Maturity Date | Proceeds (000s) | Payable for Reverse Repurchase Agreements (000s) |
Barclays Bank PLC | (0.450)% | 3/16/2021 | 3/17/2023 | $3,347 | $(3,347) |
FAIR VALUE MEASUREMENTS
The following table summarizes the Fund’s investments as of October 31, 2021 based on the inputs used to value them.
Asset Category | Quoted Prices Level 1 (000s) | Other Significant Observable Inputs Level 2 (000s) | Significant Unobservable Inputs Level 3 (000s) | Total (000s) |
Investments in Securities | ||||
Asset-Backed Securities | $— | $182,285 | $— | $182,285 |
Collateralized Mortgage Obligations | — | 190,509 | — | 190,509 |
Corporate Bonds & Notes | — | 579,541 | — | 579,541 |
Foreign Government Obligations | — | 138,957 | — | 138,957 |
Mortgage Pass-Through | — | 328,562 | — | 328,562 |
Municipal Bonds | — | 9,859 | — | 9,859 |
Preferred Stocks | — | — | 16,996 | 16,996 |
U.S. Government Obligations | — | 274,246 | — | 274,246 |
Short-Term Investments | ||||
U.S. Treasury Bills | — | 33,496 | — | 33,496 |
Total Investments in Securities | $— | $1,737,455 | $16,996 | $1,754,451 |
Financial Derivative Instruments - Assets | ||||
Forward Currency Contracts | $— | $6,365 | $— | $6,365 |
Futures Contracts | 422 | — | — | 422 |
Purchased Options | — | 331 | — | 331 |
Swap Agreements | — | 8,640 | — | 8,640 |
Total Financial Derivative Instruments - Assets | $422 | $15,336 | $— | $15,758 |
CREDIT DEFAULT SWAP AGREEMENTS—Continued
CENTRALLY CLEARED SWAP AGREEMENTS—Continued
CREDIT DEFAULT SWAPS—Continued
17
Harbor Bond Fund
Portfolio of Investments—Continued
FAIR VALUE MEASUREMENTS—Continued
Liability Category | Quoted Prices Level 1 (000s) | Other Significant Observable Inputs Level 2 (000s) | Significant Unobservable Inputs Level 3 (000s) | Total (000s) |
Financial Derivative Instruments - Liabilities | ||||
Forward Currency Contracts | $— | $(2,344) | $— | $(2,344) |
Futures Contracts | (3,725) | — | — | (3,725) |
Swap Agreements | — | (2,767) | — | (2,767) |
Written Options | — | (668) | — | (668) |
Total Financial Derivative Instruments-Liabilities | $(3,725) | $(5,779) | $— | $(9,504) |
Total Investments | $(3,303) | $1,747,012 | $16,996 | $1,760,705 |
For more information on valuation inputs and their aggregation into the levels used in the table above, please refer to the Fair Value Measurements and Disclosures in Note 2 of the accompanying Notes to Financial Statements.
The following is a rollforward of the Fund’s Level 3 investments during the year ended October 31, 2021. Transfers into or out of Level 3 are recognized as of the last day in the fiscal quarter of the period in which the event or change in circumstances that caused the reclassification occured.
Valuation Description | Beginning Balance as of 11/01/2020 (000s) | Purchases (000s) | Sales (000s) | Discount/ (Premium) (000s) | Total Realized Gain/(Loss) (000s) | Change in Unrealized Appreciation/ (Depreciation) (000s) | Transfers Into Level 3 (000s) | Transfers Out of Level 3h (000s) | Ending Balance as of 10/31/2021 (000s) | Unrealized Gain/(Loss) as of 10/31/2021 (000s) |
Asset-Backed Securities | $5,099 | $— | $— | $— | $— | $30 | $— | $(5,129) | $— | $— |
Escrow | — | — | — | — | (12) | 12 | — | — | — | — |
Preferred Stocks | 17,513 | — | — | — | — | (517) | — | — | 16,996 | (748) |
$22,612 | $— | $— | $— | $(12) | $(475) | $— | $(5,129) | $16,996 | $(748) |
The following is a summary of significant unobservable inputs used in the fair valuations of assets and liabilities categorized within Level 3 of the fair value hierarchy.
Valuation Descriptions | Ending Balance as of 10/31/2021 (000s) | Valuation Technique | Unobservable Input(s) | Input Value(s) |
Investments in Securities | ||||
Preferred Stocks | ||||
AT&T Mobility II LLC12 | $ 16,996 | Market Approach | Purchase Price | $ 27.05 |
REMAINING CONTRACTUAL MATURITY OF TRANSFERS ACCOUNTED FOR AS SECURED BORROWINGS
The following is a summary of the remaining contractual maturities of transfers accounted for as secured borrowings, by collateral type, as of October 31, 2021.
Overnight and Continuous (000s) | Up to 30 Days (000s) | 31-90 Days (000s) | Greater Than 90 Days (000s) | Total (000s) | |
Reverse Repurchase Agreements | |||||
Corporate Bond | $— | $— | $— | $3,347 | $3,347 |
18
Harbor Bond Fund
Portfolio of Investments—Continued
* | Security in Default |
† | Coupon represents yield to maturity |
x | Fair valued in accordance with Harbor Funds' Valuation Procedures. |
1 | Securities purchased in a transaction exempt from registration under Rule 144A of the Securities Act of 1933. These securities may be resold in transactions exempt from registration, normally to qualified institutional buyers. The Fund has no right to demand registration of these securities. At October 31, 2021, the aggregate value of these securities was $423,253 or 27% of net assets. |
2 | CLO after the name of a security stands for Collateralized Loan Obligation. |
3 | Variable or floating rate security; the stated rate represents the rate in effect at October 31, 2021. The variable rate for such securities may be based on the indicated reference rate and spread or on an underlying asset or pool of assets rather than a reference rate and may be determined by current interest rates, prepayments or other financial indicators. |
4 | Step coupon security; the stated rate represents the rate in effect at October 31, 2021. |
5 | MTN after the name of a security stands for Medium Term Note. |
6 | Perpetuity bond; the maturity date represents the next callable date. |
7 | Rate changes from fixed to variable rate at a specified date prior to its final maturity. Stated rate is fixed rate currently in effect and stated date is the final maturity date, except for perpetuity bonds. |
8 | Zero coupon bond |
9 | At October 31, 2021, a portion of securities held by the Fund were pledged as collateral for exchange traded and centrally cleared derivatives, over-the-counter (OTC) derivatives, forward commitments, or secured borrowings (see Note 2 of the accompanying Notes to Financial Statements). The securities pledged had an aggregate value of $15,956 or 1% of net assets. |
10 | REMICs are collateralized mortgage obligations which can hold mortgages secured by any type of real property and issue multiple-class securities backed by those mortgages. |
11 | TBAs are mortgage-backed securities traded under delayed delivery commitments, settling after October 31, 2021. Although the unit price for the trades has been established, the principal value has not been finalized. However, the amount of the commitments will not fluctuate more than 2% from the principal amount. Income on TBAs is not earned until settlement date (see Note 2 of the accompanying Notes to Financial Statements). |
12 | Security is a private placement with contractual transfer and sale limitations. The Security was purchased on September 24, 2020, at a net cost of $17,744. As of October 31, 2021, the value of the security was $16,996 or 1% of net assets. |
a | If the Fund is a buyer of protection and a credit event occurs, as defined under the terms of that particular swap agreement, the Fund will either (i) receive from the seller of protection an amount equal to the notional amount of the swap and deliver the referenced obligation or underlying securities comprising the referenced index or (ii) receive a net settlement amount in the form of cash or securities equal to the notional amount of the swap less the recovery value of the referenced obligation or underlying securities comprising the referenced index. |
b | If the Fund is a seller of protection and a credit event occurs, as defined under the terms of that particular swap agreement, the Fund will either (i) pay to the buyer of protection an amount equal to the notional amount of the swap and take delivery of the referenced obligation or underlying securities comprising the referenced index or (ii) pay a net settlement amount in the form of cash or securities equal to the notional amount of the swap less the recovery value of the referenced obligation or underlying securities comprising the referenced index. |
c | Implied credit spreads, represented in absolute terms, utilized in determining the value of credit default swap agreements on corporate issues or sovereign issues of an emerging country as of period end serve as an indicator of the current status of the payment/performance risk and represent the likelihood or risk of default for the credit derivative. The implied credit spread of a particular referenced entity reflects the cost of buying/selling protection and may include upfront payments required to be made to enter into the agreement. Wider credit spreads represent a deterioration of the referenced entity’s credit soundness and a greater likelihood or risk of default or other credit event occurring as defined under the terms of the agreement. A credit spread identified as “Defaulted” indicates a credit event has occurred for the referenced entity or obligation. |
d | The maximum potential amount the Fund could be required to make as a seller of credit protection or receive as a buyer of credit protection if a credit event occurs as defined under the terms of that particular swap agreement. |
e | The quoted market prices and resulting values for credit default swap agreements on asset-backed securities and credit indices serve as an indicator of the current status of the payment/performance risk and represent the likelihood of an expected liability (or profit) for the credit derivative should the notional amount of the swap agreement be closed/sold as of the period end. Increasing values, in absolute terms when compared to the notional amount of the swap, represent a deterioration of the referenced entity’s credit soundness and a greater likelihood or risk of default or other credit event occurring as defined under the terms of the agreement. |
h | Transferred from Level 3 to Level 2 due to the availability of observable market data for pricing |
ARS | Argentine Peso |
AUD | Australian Dollar |
BRL | Brazilian Real |
CAD | Canadian Dollar |
CLP | Chilean Peso |
EUR | Euro |
GBP | British Pound Sterling |
ILS | Israeli New Shekel |
INR | Indian Rupee |
JPY | Japanese Yen |
MXN | Mexican Peso |
NOK | Norwegian Krone |
PEN | Peruvian Nuevosol |
The accompanying notes are an integral part of the Financial Statements.
19
Harbor Convertible Securities Fund
Manager’s Commentary (Unaudited)
Subadviser
Shenkman Capital Management, Inc.
461 Fifth Avenue
22nd Floor
New York, NY 10017
22nd Floor
New York, NY 10017
Portfolio Managers
Mark R. Shenkman
Since 2011
Since 2011
Justin W. Slatky
Since 2017
Since 2017
Jordan N. Barrow, CFA
Since 2016
Since 2016
Thomas Whitley, CFA
Since 2019
Since 2019
Shenkman Capital has subadvised the Fund since 2011.
Investment Objective
The Fund seeks to maximize total returns (i.e., current income and capital appreciation).
Management’s Discussion of
Fund Performance
Fund Performance
Market Review
During the fiscal year ended October 31, 2021, financial markets continued to cope with the follow-on effects of the COVID-19 outbreak. As citizens around the world attempted to return to normalcy in their personal and professional lives, the effect on the demand for both goods and labor was explosive. Supply chain instability, short-term inflation and uncertainty on business investments have been issues facing corporations around the world.
The continued uncertainty on both the near-term outlook and the long-term impact of these factors have led to increased dispersion in returns across asset classes, sectors and companies. Though the S&P 500 ended the fiscal year ending October 31, 2021 at an all-time high, the average constituent of the index ended 9.1% below its 52-week high, and over 60 of the 500 constituents were trading more than 20% off their highs. While the Russell 2000 index returned an impressive 43.56% for the first four months of the period (outperforming the S&P 500’s return of 17.18%,) the March through October return was only 5.03%. Value versus growth, large-cap versus small-cap and cyclical versus non-cyclical are some of the factors that have fallen in and out of favor over the last 12 months.
While more front-end loaded, the convertible market continued to see strong new issuance during the period, with total issuance of $91.5 billion. While a decrease from the previous 12-month period, issuance is still almost 100% higher than the pre-COVID-19 run rate. In addition, given the recently volatile markets and somewhat sideways performance, many of 2021’s new issues still remain attractive from a technical perspective. This, combined with the expansion we’ve seen in issuance from cyclical and consumer-oriented issuers, have led to a landscape of opportunities for active investors.
Performance
Harbor Convertible Securities Fund returned 20.23% (Retirement Class), 20.18% (Institutional Class), 19.87% (Administrative Class) and 19.76% (Investor Class) for the year ended October 31, 2021, compared with the 34.01% return of the ICE BofA U.S. Convertible Ex Mandatory Index during the same period. Performance on a sector basis was strong across the entire portfolio, with only the Consumer Staples sector posting a negative return.
As is typical in a strong up market, the Index benefitted from its overweight in the most equity like section of the marketplace (i.e., those convertibles trading with an investment premium of 100% or more). We believe these securities are extremely equity sensitive and lack the downside protection we target in our portfolio. During the fiscal year, the Fund’s average weighting in the over 100% investment premium bucket was 4.95%, returning 56.92% with a contribution of +399 basis points (“bps”). The Index’s average weighting of 24.58% returned 68.71% with a contribution of +1,861bps, more than accounting for the performance differential between the Fund and the Index for the fiscal year.
The best performing industries in the Fund relative to the Index were: Banks, Interactive Media & Services, Internet & Direct Marketing Retail, and Electronic Equipment, Instruments, & Components. In Banks, the Fund had no exposure to the perpetual preferred securities of Bank of America and Wells Fargo, which underperformed the broad market. In Interactive Media & Services, the Fund benefitted primarily by having sold its position in Zillow Group earlier in the year, which returned +63.94% for the fiscal year. Internet & Direct Marketing contributed to relative performance as a result of an underweight position to Wayfair, an e-commerce provider of home goods, which underperformed in Q3 despite an overall strong year to date, and an out of index position in MercadoLibre, a dominant e-commerce platform
20
Harbor Convertible Securities Fund
Manager’s Commentary—Continued
CHANGE IN A $10,000 INVESTMENT
For the period 05/01/2011 through 10/31/2021
The graph compares a $10,000 investment in the Institutional Class shares of the Fund with the performance of the ICE BofAML U.S. Convertible Ex Mandatory Index. The Fund’s performance assumes the reinvestment of all dividend and capital gain distributions.
TOTAL RETURNS
For the periods ended 10/31/2021
1 Year | Annualized | |||||
5 Years | 10 Years | |||||
Harbor Convertible Securities Fund | ||||||
Retirement Class1 | 20.23% | 12.25% | 8.95% | |||
Institutional Class | 20.18 | 12.15 | 8.90 | |||
Administrative Class | 19.87 | 11.81 | 8.61 | |||
Investor Class | 19.76 | 11.74 | 8.51 | |||
Comparative Index | ||||||
ICE BofA U.S. Convertible Ex Mandatory | 34.01% | 19.93% | 14.81% |
As stated in the Fund’s prospectus dated March 1, 2021, the expense ratios were 0.69% (Net) and 0.74% (Gross) (Retirement Class), 0.77% (Net) and 0.82% (Gross) (Institutional Class), 1.02% (Net) and 1.07% (Gross) (Administrative Class), and 1.13% (Net) and 1.18% (Gross) (Investor Class). The net expense ratios reflect a contractual management fee waiver effective through 02/28/2022. The expense ratios in the prospectus may differ from the actual expense ratios for the period disclosed within this report. The expense ratios shown in the prospectus are based on the prior fiscal year, adjusted to reflect changes, if any, in contractual arrangements that occurred prior to the date of the prospectus (or supplement thereto, if applicable).
Performance data shown represents past performance and is no guarantee of future results. Past performance is net of management fees and expenses and reflects reinvested dividends and distributions. Past performance reflects the beneficial effect of any expense waivers or reimbursements, without which returns would have been lower. Investment returns and principal value will fluctuate and when redeemed may be worth more or less than their original cost. Returns for periods less than one year are not annualized. Current performance may be higher or lower and is available through the most recent month end at harborcapital.com or by calling 800-422-1050. The Fund charged a redemption fee of 1% on redemption of Fund shares that are held for less than 90 days through February 28, 2021. Effective March 1, 2021, the Fund no longer charges redemption fees.
for the Latin American markets. In Electronic Equipment, Instruments, & Components, the Fund benefitted from its overweight in Insight Enterprises, which was up 42.95% for the year. Insight Enterprises distributes hardware, software and services to other businesses and performed well this year as business IT budgets recovered and companies continued to invest to support a hybrid work environment.
Similar to last year, the Fund’s underweight in the Automobile industry significantly detracted from relative performance during the fiscal year. The primary driver of this underperformance remains the highly equity sensitive Tesla convertible bonds that on average were 3.7% of the Index through the year, returned 186.78%, and contributed +766 bps, or about 22.5% of the Index’s total fiscal year return. The Fund maintained a zero weighting in Tesla through the year due to the bond’s high level of equity sensitivity and investment premium. The IT Services, Software and Hotel, Restaurants & Leisure industries also detracted from relative performance. Although each of these industries had a positive total return and combined contribution of +695 bps, or over 32% of the Fund’s fiscal year performance, each of these industries had a negative attribution effect due to underweights or lack of exposure to the most equity-like tranches in their respective industries.
Sustained market volatility through the COVID-19 vaccine rollout and the emergence of the COVID-19 Delta variant, combined with a healthy convertible new issue calendar, has allowed the Fund to take advantage of numerous opportunities to rebalance the portfolio towards what we believe to be attractive positioning with an optimal risk reward profile.
Outlook & Strategy
Given the dispersion in returns within markets and periodic upticks in volatility, we continue to believe that prospects remain constructive for convertible securities. Prospects include the balanced posture of the current convertible market with an emphasis on credit, primary issuer base with long term growth characteristics and the new issue conduit for backed up corporate and/or equity issuers looking to shore up their balance sheets.
As we continue to move through periods of uncertainty, we believe the market may place a premium on downside potential by favoring balanced convertible securities with a positive credit profile, which we believe is consistent with our investment style.
1
Retirement Class shares commenced operations on March 1, 2016. The performance attributed to the Retirement Class shares prior to that date is that of the Institutional Class shares. Performance prior to March 1, 2016 has not been adjusted to reflect the lower expenses of Retirement Class shares. During this period, Retirement Class shares would have had returns similar to, but potentially higher than, Institutional Class shares due to the fact that Retirement Class shares represent interests in the same portfolio as Institutional Class shares but are subject to lower expenses.
This report contains the current opinions of Shenkman Capital Management, Inc. as of the date of this report and should not be considered as investment advice or a recommendation of any particular security, strategy or investment product. Such opinions are subject to change without notice and securities described herein may no longer be included in, or may at any time be removed from, the Fund’s portfolio. This report is distributed for informational purposes only. Information contained herein has been obtained from sources believed reliable, but not guaranteed.
There is no guarantee that the investment objective of the Fund will be achieved. Convertible securities tend to be of lower credit quality, and the value of a convertible security generally increases and decreases with the value of the underlying common stock, but may also be sensitive to changes in interest rates. As interest rates rise, the values of convertible securities held by the Fund are likely to decrease and reduce the value of the Fund’s portfolio. Credit risk is higher for the Fund because it invests primarily in convertible securities of companies with debt rated below investment grade. High yield investing poses additional credit risk related to lower-rated bonds. For information on the different share classes and the risks associated with an investment in the Fund, please refer to the current prospectus.
21
Harbor Convertible Securities Fund
Portfolio of Investments—October 31, 2021
SECTOR ALLOCATION (% of investments) - Unaudited
Portfolio of Investments
Value, Cost, and Principal Amounts in Thousands
CONVERTIBLE BONDS—92.4% | |||
Principal Amount | Value | ||
AEROSPACE & DEFENSE—0.4% | |||
Parsons Corp. | |||
$ | 840 | 0.250%—08/15/2025 | $856 |
AIRLINES—1.8% | |||
Jetblue Airways Corp. | |||
1,637 | 0.500%—04/01/20261 | 1,580 | |
Southwest Airlines Co. | |||
602 | 1.250%—05/01/2025 | 847 | |
Spirit Airlines Inc. | |||
1,407 | 1.000%—05/15/2026 | 1,273 | |
3,700 | |||
AUTO COMPONENTS—0.3% | |||
LCI Industries | |||
600 | 1.125%—05/15/20261 | 634 | |
AUTOMOBILES—1.5% | |||
Ford Motor Co. | |||
1,427 | 0.000%—03/15/20261,2 | 1,695 | |
Winnebago Industries Inc. | |||
1,079 | 1.500%—04/01/2025 | 1,387 | |
3,082 | |||
BANKS—0.4% | |||
BofA Finance LLC MTN3 | |||
643 | 0.250%—05/01/2023 | 725 | |
BIOTECHNOLOGY—4.1% | |||
BioMarin Pharmaceutical Inc. | |||
2,515 | 0.599%—08/01/2024 | 2,595 | |
Coherus Biosciences Inc. | |||
586 | 1.500%—04/15/2026 | 659 | |
Exact Sciences Corp. | |||
756 | 0.375%—03/15/2027 | 859 | |
44 | 1.000%—01/15/2025 | 64 | |
923 | |||
Halozyme Therapeutics Inc. | |||
820 | 0.250%—03/01/20271 | 729 | |
Ionis Pharmaceuticals Inc. | |||
560 | 0.125%—12/15/2024 | 508 |
CONVERTIBLE BONDS—Continued | |||
Principal Amount | Value | ||
BIOTECHNOLOGY—Continued | |||
Ironwood Pharmaceuticals Inc. | |||
$ | 460 | 0.750%—06/15/2024 | $540 |
451 | 1.500%—06/15/2026 | 544 | |
1,084 | |||
Neurocrine Biosciences Inc. | |||
414 | 2.250%—05/15/2024 | 589 | |
Qiagen NV | |||
1,200 | 0.000%—12/17/20272 | 1,295 | |
8,382 | |||
CAPITAL MARKETS—0.8% | |||
Ares Capital Corp. | |||
1,191 | 3.750%—02/01/2022 | 1,320 | |
233 | 4.625%—03/01/2024 | 266 | |
1,586 | |||
COMMUNICATIONS EQUIPMENT—0.7% | |||
Lumentum Holdings Inc. | |||
1,237 | 0.500%—12/15/2026 | 1,351 | |
CONSTRUCTION & ENGINEERING—0.3% | |||
Vinci SA | |||
600 | 0.375%—02/16/2022 | 669 | |
CONSUMER FINANCE—0.9% | |||
LendingTree Inc. | |||
1,254 | 0.500%—07/15/2025 | 1,079 | |
Upstart Holdings Inc. | |||
563 | 0.250%—08/15/20261 | 789 | |
1,868 | |||
DIVERSIFIED CONSUMER SERVICES—1.8% | |||
Chegg Inc. | |||
2,380 | 0.000%—09/01/20262 | 2,235 | |
Stride Inc. | |||
1,563 | 1.125%—09/01/2027 | 1,569 | |
3,804 | |||
DIVERSIFIED TELECOMMUNICATION SERVICES—0.3% | |||
Liberty Latin America Ltd. | |||
647 | 2.000%—07/15/2024 | 650 |
22
Harbor Convertible Securities Fund
Portfolio of Investments—Continued
Value, Cost, and Principal Amounts in Thousands
CONVERTIBLE BONDS—Continued | |||
Principal Amount | Value | ||
ELECTRICAL EQUIPMENT—0.7% | |||
Itron Inc. | |||
$ | 975 | 0.000%—03/15/20261,2 | $920 |
Sunrun Inc. | |||
607 | 0.000%—02/01/20261,2 | 556 | |
1,476 | |||
ELECTRONIC EQUIPMENT, INSTRUMENTS & COMPONENTS—1.2% | |||
II-VI Inc. | |||
459 | 0.250%—09/01/2022 | 617 | |
Insight Enterprises Inc. | |||
1,217 | 0.750%—02/15/2025 | 1,773 | |
2,390 | |||
ENTERTAINMENT—3.8% | |||
IMAX Corp. | |||
2,338 | 0.500%—04/01/20261 | 2,320 | |
Live Nation Entertainment Inc. | |||
1,499 | 2.000%—02/15/2025 | 1,833 | |
1,387 | 2.500%—03/15/2023 | 2,170 | |
4,003 | |||
Zynga Inc. | |||
643 | 0.000%—12/15/20261,2 | 621 | |
687 | 0.250%—06/01/2024 | 782 | |
1,403 | |||
7,726 | |||
EQUITY REAL ESTATE INVESTMENT TRUSTS (REITs)—0.6% | |||
IH Merger Sub LLC | |||
729 | 3.500%—01/15/2022 | 1,320 | |
FOOD PRODUCTS—0.8% | |||
Beyond Meat Inc. | |||
1,927 | 0.000%—03/15/20271,2 | 1,621 | |
HEALTH CARE EQUIPMENT & SUPPLIES—5.4% | |||
CONMED Corp. | |||
649 | 2.625%—02/01/2024 | 1,115 | |
Dexcom Inc. | |||
2,690 | 0.250%—11/15/2025 | 3,447 | |
Haemonetics Corp. | |||
878 | 0.000%—03/01/20261,2 | 771 | |
Insulet Corp. | |||
993 | 0.375%—09/01/2026 | 1,478 | |
Integra Lifesciences Holdings Corp. | |||
773 | 0.500%—08/15/2025 | 842 | |
Novocure Ltd. | |||
626 | 0.000%—11/01/20251,2 | 641 | |
Nuvasive Inc. | |||
1,050 | 0.375%—03/15/2025 | 995 | |
1,081 | 1.000%—06/01/2023 | 1,083 | |
2,078 | |||
Tandem Diabetes Care Inc. | |||
556 | 1.500%—05/01/20251 | 777 | |
11,149 | |||
HEALTH CARE PROVIDERS & SERVICES—0.4% | |||
Guardant Health Inc. | |||
747 | 0.000%—11/15/20271,2 | 826 | |
HEALTH CARE TECHNOLOGY—1.3% | |||
Allscripts Healthcare Solutions Inc. | |||
1,209 | 0.875%—01/01/2027 | 1,461 |
CONVERTIBLE BONDS—Continued | |||
Principal Amount | Value | ||
HEALTH CARE TECHNOLOGY—Continued | |||
Teladoc Health Inc. | |||
$ | 1,185 | 1.250%—06/01/2027 | $1,218 |
2,679 | |||
HOTELS, RESTAURANTS & LEISURE—8.0% | |||
Airbnb Inc. | |||
765 | 0.000%—03/15/20261,2 | 751 | |
Booking Holdings Inc. | |||
938 | 0.750%—05/01/2025 | 1,396 | |
DraftKings Inc. | |||
2,408 | 0.000%—03/15/20281,2 | 2,112 | |
Expedia Group Inc. | |||
1,355 | 0.000%—02/15/20261,2 | 1,470 | |
Huazhu Group Ltd. | |||
1,145 | 3.000%—05/01/2026 | 1,504 | |
Marriott Vacations Worldwide Corp. | |||
1,259 | 0.000%—01/15/20261,2 | 1,418 | |
763 | 1.500%—09/15/2022 | 908 | |
2,326 | |||
NCL Corporation Ltd. | |||
678 | 5.375%—08/01/2025 | 1,133 | |
Royal Caribbean Cruises Ltd. | |||
693 | 2.875%—11/15/20231 | 869 | |
Shake Shack Inc. | |||
1,367 | 0.000%—03/01/20281,2 | 1,129 | |
The Cheesecake Factory Inc. | |||
1,429 | 0.375%—06/15/2026 | 1,302 | |
Vail Resorts Inc. | |||
2,219 | 0.000%—01/01/20261,2 | 2,454 | |
16,446 | |||
INDEPENDENT POWER AND RENEWABLE ELECTRICITY PRODUCERS—0.6% | |||
Nextera Energy Partners LP | |||
1,132 | 0.000%—11/15/20251,2 | 1,316 | |
INTERACTIVE MEDIA & SERVICES—4.7% | |||
IAC FinanceCo 3 Inc. | |||
378 | 2.000%—01/15/20301 | 741 | |
J2 Global Inc. | |||
1,352 | 1.750%—11/01/20261 | 1,849 | |
Liberty Tripadvisor Holdings Inc. | |||
1,170 | 0.500%—06/30/20511 | 990 | |
Snap Inc. | |||
1,714 | 0.000%—05/01/20271,2 | 1,744 | |
Spotify USA Inc. | |||
1,361 | 0.000%—03/15/20261,2 | 1,297 | |
Tripadvisor Inc. | |||
939 | 0.250%—04/01/20261 | 844 | |
Twitter Inc. | |||
1,683 | 0.000%—03/15/20261,2 | 1,551 | |
609 | 0.250%—06/15/2024 | 720 | |
2,271 | |||
9,736 | |||
INTERNET & DIRECT MARKETING RETAIL—2.2% | |||
Etsy Inc. | |||
682 | 0.125%—09/01/2027 | 1,012 | |
946 | 0.250%—06/15/20281 | 1,213 | |
2,225 | |||
Fiverr International Ltd. | |||
808 | 0.000%—11/01/20252 | 888 |
23
Harbor Convertible Securities Fund
Portfolio of Investments—Continued
Value, Cost, and Principal Amounts in Thousands
CONVERTIBLE BONDS—Continued | |||
Principal Amount | Value | ||
INTERNET & DIRECT MARKETING RETAIL—Continued | |||
Wayfair Inc. | |||
$ | 1,438 | 0.625%—10/01/2025 | $1,424 |
4,537 | |||
IT SERVICES—4.8% | |||
Akamai Technologies Inc. | |||
234 | 0.125%—05/01/2025 | 288 | |
1,625 | 0.375%—09/01/2027 | 1,790 | |
2,078 | |||
Euronet Worldwide Inc. | |||
1,858 | 0.750%—03/15/2049 | 2,014 | |
Okta Inc. | |||
1,338 | 0.375%—06/15/2026 | 1,680 | |
Shift4 Payments Inc. | |||
499 | 0.000%—12/15/20251,2 | 543 | |
112 | 0.500%—08/01/20271 | 104 | |
647 | |||
Shopify Inc. | |||
723 | 0.125%—11/01/2025 | 921 | |
Square Inc. | |||
949 | 0.250%—11/01/20271 | 1,151 | |
Wix.com Ltd. | |||
1,446 | 0.000%—08/15/20252 | 1,354 | |
9,845 | |||
LEISURE PRODUCTS—0.6% | |||
Peloton Interactive Inc. | |||
1,416 | 0.000%—02/15/20261,2 | 1,267 | |
LIFE SCIENCES TOOLS & SERVICES—1.0% | |||
Illumina Inc. | |||
1,154 | 0.000%—08/15/20232 | 1,357 | |
Repligen Corp. | |||
269 | 0.375%—07/15/2024 | 682 | |
2,039 | |||
MACHINERY—2.0% | |||
Greenbrier Cos. Inc. | |||
1,735 | 2.875%—04/15/20281 | 1,810 | |
John Bean Technologies Corp. | |||
340 | 0.250%—05/15/20261 | 369 | |
Meritor Inc. | |||
1,773 | 3.250%—10/15/2037 | 1,933 | |
4,112 | |||
MEDIA—5.1% | |||
Cable One Inc. | |||
944 | 0.000%—03/15/20261,2 | 900 | |
Dish Network Corp. | |||
792 | 0.000%—12/15/20251,2 | 913 | |
3,061 | 3.375%—08/15/2026 | 3,126 | |
4,039 | |||
Liberty Broadband Corp. | |||
514 | 1.250%—09/30/20501 | 514 | |
1,124 | 2.750%—09/30/20501 | 1,172 | |
1,686 | |||
Liberty Media Corp. | |||
702 | 1.000%—01/30/2023 | 1,072 |
CONVERTIBLE BONDS—Continued | |||
Principal Amount | Value | ||
MEDIA—Continued | |||
$ | 251 | 1.375%—10/15/2023 | $364 |
2,042 | 2.125%—03/31/20481 | 2,117 | |
3,553 | |||
Pandora Media LLC | |||
269 | 1.750%—12/01/2023 | 305 | |
10,483 | |||
MORTGAGE REAL ESTATE INVESTMENT TRUSTS (REITs)—0.6% | |||
Blackstone Mortgage Trust Inc. | |||
1,286 | 4.750%—03/15/2023 | 1,341 | |
OIL, GAS & CONSUMABLE FUELS—2.1% | |||
Equities Corp. | |||
773 | 1.750%—05/01/2026 | 1,212 | |
Pioneer Natural Resources Co. | |||
717 | 0.250%—05/15/2025 | 1,271 | |
Total SA MTN3 | |||
1,800 | 0.500%—12/02/2022 | 1,847 | |
4,330 | |||
PERSONAL PRODUCTS—0.2% | |||
Herbalife Nutrition Ltd. | |||
316 | 2.625%—03/15/2024 | 328 | |
PHARMACEUTICALS—2.2% | |||
Jazz Investments I Ltd. | |||
2,700 | 1.500%—08/15/2024 | 2,751 | |
1,059 | 2.000%—06/15/2026 | 1,238 | |
3,989 | |||
Supernus Pharmaceuticals Inc. | |||
448 | 0.625%—04/01/2023 | 445 | |
4,434 | |||
PROFESSIONAL SERVICES—1.0% | |||
FTI Consulting Inc. | |||
660 | 2.000%—08/15/2023 | 977 | |
KBR Inc. | |||
632 | 2.500%—11/01/2023 | 1,081 | |
2,058 | |||
REAL ESTATE MANAGEMENT & DEVELOPMENT—2.0% | |||
Opendoor Technologies Inc. | |||
1,103 | 0.250%—08/15/20261 | 1,535 | |
Realogy Group LLC / Realogy Co.-Issuer Corp. | |||
1,012 | 0.250%—06/15/20261 | 1,034 | |
Redfin Corp. | |||
827 | 0.000%—10/15/20252 | 846 | |
860 | 0.500%—04/01/20271 | 779 | |
1,625 | |||
4,194 | |||
ROAD & RAIL—0.4% | |||
Uber Technologies Inc. | |||
843 | 0.000%—12/15/20251,2 | 815 | |
SEMICONDUCTORS & SEMICONDUCTOR—0.7% | |||
Solaredge Technologies Inc. | |||
956 | 0.000%—09/15/20252 | 1,418 | |
SEMICONDUCTORS & SEMICONDUCTOR EQUIPMENT—4.3% | |||
Enphase Energy Inc. | |||
2,186 | 0.000%—03/01/2026-03/01/20281,2 | 2,418 |
24
Harbor Convertible Securities Fund
Portfolio of Investments—Continued
Value, Cost, and Principal Amounts in Thousands
CONVERTIBLE BONDS—Continued | |||
Principal Amount | Value | ||
SEMICONDUCTORS & SEMICONDUCTOR EQUIPMENT—Continued | |||
MACOM Technology Solutions Holdings Inc. | |||
$ | 810 | 0.250%—03/15/20261 | $892 |
Microchip Technology Inc. | |||
1,280 | 0.125%—11/15/2024 | 1,437 | |
ON Semiconductor Corp. | |||
915 | 0.000%—05/01/20271,2 | 1,104 | |
Silicon Laboratories Inc. | |||
791 | 0.625%—06/15/2025 | 1,277 | |
STMicroelectronics NV | |||
1,400 | 0.000%—08/04/20252 | 1,815 | |
8,943 | |||
SOFTWARE—20.2% | |||
Alarm.com Holdings Inc. | |||
1,392 | 0.000%—01/15/20261,2 | 1,284 | |
Altair Engineering Inc. | |||
298 | 0.250%—06/01/2024 | 510 | |
Alteryx Inc. | |||
372 | 0.500%—08/01/2024 | 353 | |
326 | 1.000%—08/01/2026 | 306 | |
659 | |||
Avalara Inc. | |||
1,003 | 0.250%—08/01/20261 | 1,052 | |
Bentley Systems Inc. | |||
918 | 0.125%—01/15/20261 | 1,047 | |
947 | 0.375%—07/01/20271 | 962 | |
2,009 | |||
Blackline Inc. | |||
1,797 | 0.000%—03/15/20261,2 | 1,841 | |
Box Inc. | |||
1,577 | 0.000%—01/15/20261,2 | 1,885 | |
Ceridian HCM Holding Inc. | |||
851 | 0.250%—03/15/20261 | 982 | |
Coupa Software Inc. | |||
944 | 0.375%—06/15/2026 | 1,038 | |
CyberArk Software Ltd. | |||
1,599 | 0.000%—11/15/20242 | 2,076 | |
Datadog Inc. | |||
486 | 0.125%—06/15/2025 | 923 | |
DocuSign Inc. | |||
1,083 | 0.000%—01/15/20241,2 | 1,146 | |
Dropbox Inc. | |||
1,612 | 0.000%—03/01/2026-03/01/20281,2 | 1,743 | |
Envestnet Inc. | |||
1,382 | 0.750%—08/15/20251 | 1,417 | |
FireEye Inc. | |||
653 | 0.875%—06/01/2024 | 688 | |
Five9 Inc. | |||
268 | 0.500%—06/01/2025 | 360 | |
InterDigital Inc. | |||
612 | 2.000%—06/01/2024 | 663 | |
Jamf Holding Corp. | |||
922 | 0.125%—09/01/20261 | 1,079 | |
New Relic Inc. | |||
160 | 0.500%—05/01/2023 | 168 | |
NICE Ltd. | |||
1,472 | 0.000%—09/15/20252 | 1,735 |
CONVERTIBLE BONDS—Continued | |||
Principal Amount | Value | ||
SOFTWARE—Continued | |||
NortonLifeLock Inc. | |||
$ | 570 | 2.000%—08/15/20221 | $745 |
Palo Alto Networks Inc. | |||
507 | 0.750%—07/01/2023 | 976 | |
Pegasystems Inc. | |||
1,410 | 0.750%—03/01/2025 | 1,546 | |
Q2 Holdings Inc. | |||
675 | 0.125%—11/15/20251 | 619 | |
4 | 0.750%—06/01/2026 | 5 | |
624 | |||
Rapid7 Inc. | |||
1,153 | 0.250%—03/15/20271 | 1,589 | |
317 | 2.250%—05/01/2025 | 691 | |
2,280 | |||
RingCentral Inc. | |||
2,484 | 0.000%—03/01/2025-03/15/20262 | 2,528 | |
Splunk Inc. | |||
834 | 0.500%—09/15/2023 | 1,045 | |
2,964 | 1.125%—06/15/2027 | 3,110 | |
4,155 | |||
Verint Systems Inc. | |||
576 | 0.250%—04/15/20261 | 572 | |
Vonage Holdings Corp. | |||
410 | 1.750%—06/01/2024 | 480 | |
Workiva Inc. | |||
652 | 1.125%—08/15/2026 | 1,289 | |
Zendesk Inc. | |||
1,663 | 0.625%—06/15/2025 | 1,965 | |
Zscaler Inc. | |||
516 | 0.125%—07/01/2025 | 1,116 | |
41,534 | |||
SPECIALTY RETAIL—1.4% | |||
American Eagle Outfitters Inc. | |||
261 | 3.750%—04/15/2025 | 745 | |
Burlington Stores Inc. | |||
1,191 | 2.250%—04/15/2025 | 1,712 | |
National Vision Holdings | |||
229 | 2.500%—05/15/2025 | 473 | |
2,930 | |||
TECHNOLOGY HARDWARE, STORAGE & PERIPHERALS—0.8% | |||
Pure Storage Inc. | |||
1,357 | 0.125%—04/15/2023 | 1,624 | |
TOTAL CONVERTIBLE BONDS | |||
(Cost $173,091) | 190,224 | ||
TOTAL INVESTMENTS—92.4% | |||
(Cost $173,091) | 190,224 | ||
CASH AND OTHER ASSETS, LESS LIABILITIES—7.6% | 15,736 | ||
TOTAL NET ASSETS—100.0% | $205,960 |
25
Harbor Convertible Securities Fund
Portfolio of Investments—Continued
FAIR VALUE MEASUREMENTS
All investments at October 31, 2021 (as disclosed in the preceding Portfolio of Investments) were classified as Level 2. There were no Level 3 investments at October 31, 2021 or 2020.
For more information on valuation inputs and their aggregation into the levels identified above, please refer to the Fair Value Measurements and Disclosures in Note 2 of the accompanying Notes to Financial Statements.
1
Securities purchased in a transaction exempt from registration under Rule 144A of the Securities Act of 1933. These securities may be resold in transactions exempt from registration, normally to qualified institutional buyers. The Fund has no right to demand registration of these securities. At October 31, 2021, the aggregate value of these securities was $73,628 or 36% of net assets.
2
Zero coupon bond
3
MTN after the name of a security stands for Medium Term Note.
The accompanying notes are an integral part of the Financial Statements.
26
Harbor Core Bond Fund
Manager’s Commentary (Unaudited)
Subadviser
Income Research + Management
100 Federal Street
30th Floor
Boston, MA 02110
30th Floor
Boston, MA 02110
Portfolio Managers
William A. O’Malley, CFA
Since 2018
Since 2018
James E. Gubitosi, CFA
Since 2018
Since 2018
Bill O’Neill, CFA
Since 2021
Since 2021
Jake Remley, CFA
Since 2021
Since 2021
Matt Walker, CFA
Since 2021
Since 2021
Rachel Campbell, CFA
Since 2021
Since 2021
Kara Maloy, CFA
Since 2021
Since 2021
IR+M has subadvised the Fund since 2018.
Investment Objective
The Fund seeks total return.
Management’s Discussion of
Fund Performance
Fund Performance
Market Review
In late 2020, economic results were varied, with the encouraging news of the COVID-19 vaccine rollout and increased federal stimulus somewhat diminished by the surge in COVID-19 cases. Continued strong housing and Purchasing Managers’ Index data, along with the election of former Vice President Joe Biden, pushed equity markets to all-time highs. President Biden signed the American Rescue Plan Act of 2021, a $1.9 trillion stimulus package that offered additional aid to working families, states and local governments and COVID-19 vaccine distribution. Early in the year, the Federal Reserve (“Fed”) confirmed its commitment to maintaining low interest rates through the end of 2023 and continuing its asset purchase program. During the back half of the year, the Fed announced that it could reduce its $120 billion monthly asset purchase program in November, which would conclude by mid-2022. Updated dot plot projections showed the first rate hike is now expected in late 2022, with two in 2023 and three in 2024. Following the Fed’s announcement, the 10-year Treasury touched 1.54%, the highest since June. The Treasury curve flattened in the third quarter with the 2- and 10-year increasing 3 bps to 0.28% and 2 bps to 1.49%, respectively; however, the 30-year fell 4 bps to 2.05%. Investment-grade corporate issuers took advantage of the improved market sentiment in October, borrowing roughly $115 billion and surpassing estimates of $90-100 billion. Spreads ended at 84 bps on the heavy supply, demand remained healthy.
Performance
Harbor Core Bond Fund (the Fund) returned -0.01% (Retirement Class) and -0.09% (Institutional Class) for the year ended October 31, 2021, compared with the -0.48% return of the Bloomberg U.S. Aggregate Bond Index during the same period.
On an absolute basis, the portfolio’s allocation to credit contributed the most to the one-year return. More specifically, the portfolio’s exposure to Industrials, Financials and Utilities were the top performers. Additionally, the portfolio’s overweight to commercial mortgage-backed securities and taxable municipal bonds (“Munis”) provided nice diversification. This was partially offset by a small allocation to residential mortgage-backed securities, which detracted slightly from relative performance. Holdings that drove positive performance in the fund included Occidental Petroleum, KKR and American Airlines, while detractors included three taxable Munis and Toyota.
Our investment philosophy is consistent across all of our broad market strategies and is based on the belief that careful security selection and active portfolio risk management will lead to superior returns over the long-term (e.g. a market cycle). Portfolios are constructed to meet client objectives by using a disciplined, bottom-up approach to a variety of investment grade fixed income sectors. We believe that predicting the timing, direction and magnitude of future interest rate changes is very difficult to consistently get right; as such, we keep duration and yield curve exposure neutral to the benchmark. This philosophy has remained consistent since the inception of the firm.
27
Harbor Core Bond Fund
Manager’s Commentary—Continued
CHANGE IN A $10,000 INVESTMENT
For the period 06/01/2018 through 10/31/2021
The graph compares a $10,000 investment in the Institutional Class shares of the Fund with the performance of the Bloomberg U.S. Aggregate Bond Index. The Fund’s performance assumes the reinvestment of all dividend and capital gain distributions.
TOTAL RETURNS
For the periods ended 10/31/2021
1 Year | 5 Years | Annualized | ||||
Life of Fund | ||||||
Harbor Core Bond Fund | ||||||
Retirement Class1 | -0.01% | N/A | 5.13% | |||
Institutional Class1 | -0.09 | N/A | 5.05 | |||
Comparative Index | ||||||
Bloomberg U.S. Aggregate Bond1 | -0.48% | N/A | 4.64% |
As stated in the Fund’s prospectus dated March 1, 2021, the expense ratios were 0.37% (Net) and 0.43% (Gross) (Retirement Class) and 0.45% (Net) and 0.51% (Gross) (Institutional Class). The net expense ratios reflect an expense limitation agreement effective through 02/28/2022. The expense ratios in the prospectus may differ from the actual expense ratios for the period disclosed within this report. The expense ratios shown in the prospectus are based on estimates for the current fiscal year.
Performance data shown represents past performance and is no guarantee of future results. Past performance is net of management fees and expenses and reflects reinvested dividends and distributions. Past performance reflects the beneficial effect of any expense waivers or reimbursements, without which returns would have been lower. Investment returns and principal value will fluctuate and when redeemed may be worth more or less than their original cost. Returns for periods less than one year are not annualized. Current performance may be higher or lower and is available through the most recent month end at harborcapital.com or by calling 800-422-1050.
Our investment process is driven by bottom-up security selection, which provides consistency over time relative to potentially more volatile macro decisions. Given our relatively small size, we do not have to buy everything, and we can be selective within smaller market sub-sectors in which larger managers may not be able to participate. These factors have allowed us to add value historically and, in our view, should continue to allow us to add value going forward within our portfolios. Overall, our investment strategy centers around several core principles: bottom-up security selection, a value orientation, appropriate diversification and risk control. We may opportunistically sacrifice liquidity when compensation is generous; however, we are vigilant as to the availability of overall liquidity, carefully limiting our exposure to any one sector and remaining diversified at the individual holding level.
At IR+M, we do not maintain an outlook on rates and did not change our view as a result of events that took place over the reporting period. We remain committed to our disciplined, bottom-up approach while keeping our portfolios duration-neutral to their respective benchmarks and actively managing portfolio risks.
Compared to the Bloomberg U.S. Aggregate Bond Index, the Fund holds a ~22% underweight to government securities and an overweight to spread sectors, with a ~2% credit overweight and a ~18% securitized overweight at the end of the reporting period.
During the period as corporate spreads tightened, we decreased our credit exposure and moved into securitized names as we continue to remain patient and improve the liquidity and quality of the portfolio. Over the course of the period, we also increased our U.S. Treasury allocation and decreased our taxable muni allocation.
28
Harbor Core Bond Fund
Manager’s Commentary—Continued
Outlook & Strategy
Going forward, headwinds remain. The Biden administration remains in negotiations to pass a long-awaited infrastructure bill. Speculation regarding whether Fed Chair Jay Powell will serve a second term has risen. Third quarter earnings will be in focus, with the estimated earnings growth rate for the S&P 500 at approximately 28%. Investors continue to question whether the growth momentum can continue given the prospect of higher interest rates.
With corporate spreads still near historical tights, we continue to remain patient and improve the liquidity and quality of our broad strategies. We remain steadfast in finding attractive relative value opportunities and taking what the market gives us.
Most optimistic:
•
Corporate Fundamentals: Our portfolio construction process is focused on creating portfolios that provide attractive returns, reasonable risk exposure and necessary liquidity in any market environment. We aim to build portfolios that encompass our best ideas by purchasing attractive, inefficiently priced bonds within our risk and liquidity parameters. Going into the current environment, our strategy had been relatively conservatively positioned given corporates’ elevated leverage and rich valuations. This conservative risk posture helped our performance and allowed us to take advantage of recent spread widening and market volatility to add names we like at attractive prices.
Most concerned:
•
Delta Variant Impact: We are still digesting the impact of the resurgence of the Delta variant on the global economy and the impact on consumers.
1
The “Life of Fund” return as shown reflects the period 06/01/2018 through 10/31/2021.
This report contains the current opinions of Income Research + Management as of the date of this report and should not be considered as investment advice or a recommendation of any particular security, strategy or investment product. Such opinions are subject to change without notice and securities described herein may no longer be included in, or may at any time be removed from, the Fund’s portfolio. This report is distributed for informational purposes only. Information contained herein has been obtained from sources believed reliable, but not guaranteed.
There is no guarantee that the investment objective of the Fund will be achieved. Fixed income investments are affected by interest rate changes and the creditworthiness of the issues held by the Fund. As interest rates rise, the values of fixed income securities held by the Fund are likely to decrease and reduce the value of the Fund’s portfolio. There may be a greater risk that the Fund could lose money due to prepayment and extension risks because the Fund invests heavily at times in mortgage-related and/or asset backed securities. The Fund may engage in active and frequent trading to achieve its principal investment strategies. Investing in international and emerging markets poses special risks, including potentially greater price volatility due to social, political and economic factors, as well as currency exchange rate fluctuations. These risks are more severe for securities of issuers in emerging market regions. For information on the different share classes and the risks associated with an investment in the Fund, please refer to the current prospectus.
29
Harbor Core Bond Fund
Portfolio of Investments—October 31, 2021
Investment Allocation (% of investments) - Unaudited
Portfolio of Investments
Value, Cost and Principal Amounts in Thousands
ASSET-BACKED SECURITIES—12.3% | |||
Principal Amount | Value | ||
Air Canada Pass-Through Trust | |||
Series 2015-1 Cl. A | |||
$ | 288 | 3.600%—03/15/20271 | $292 |
Aligned Data Centers LLC | |||
Series 2021-1A Cl. A2 | |||
385 | 1.937%—08/15/20461 | 384 | |
AMSR Trust | |||
Series 2020-SFR4 Cl. A | |||
479 | 1.355%—11/17/20371 | 474 | |
Series 2021-SFR3 Cl. A | |||
410 | 1.476%—10/17/20381 | 405 | |
879 | |||
CF Hippolyta Issuer LLC | |||
Series 2021-1A Cl. A1 | |||
519 | 1.530%—03/15/20611 | 514 | |
Series 2020-1 Cl. A1 | |||
316 | 1.690%—07/15/20601 | 316 | |
830 | |||
CNH Equipment Trust | |||
Series 2018-A Cl. A3 | |||
67 | 3.120%—07/17/2023 | 67 | |
Series 2018-B Cl. A3 | |||
62 | 3.190%—11/15/2023 | 63 | |
130 | |||
CVS Pass-Through Trust | |||
251 | 5.773%—01/10/20331 | 300 | |
106 | 5.880%—01/10/2028 | 121 | |
Series 2009 Cl. CE | |||
470 | 8.353%—07/10/20311 | 605 | |
1,026 | |||
DB Master Finance LLC | |||
Series 2021-1A Cl. A23 | |||
713 | 2.791%—11/20/20511 | 719 | |
Delta Air Lines Pass-Through Trust | |||
Series 2015-1 Cl. AA | |||
266 | 3.625%—07/30/2027 | 285 | |
Domino's Pizza Master Issuer LLC | |||
Series 2021-1A Cl. A2I | |||
396 | 2.662%—04/25/20511 | 406 | |
Series 2019-1A Cl. A2 | |||
59 | 3.668%—10/25/20491 | 64 | |
470 |
ASSET-BACKED SECURITIES—Continued | |||
Principal Amount | Value | ||
FirstKey Homes Trust | |||
Series 2020-SFR2 Cl. A | |||
$ | 363 | 1.266%—10/19/20371 | $358 |
Series 2020-SFR1 Cl. A | |||
634 | 1.339%—08/17/20371 | 627 | |
985 | |||
Ford Credit Auto Owner Trust | |||
Series 2020-1 Cl. A | |||
500 | 2.040%—08/15/20311 | 513 | |
Home Partners of America Trust | |||
Series 2020-2 Cl. A | |||
305 | 1.532%—01/17/20411 | 302 | |
Series 2021-2 Cl. A | |||
465 | 1.901%—12/17/20261 | 465x | |
767 | |||
MMAF Equipment Finance LLC | |||
Series 2021 Cl. A | |||
584 | 0.560%—06/13/20281 | 579 | |
Navient Private Education Loan Trust | |||
Series 2021-A Cl. A | |||
209 | 0.840%—05/15/20691 | 208 | |
Navient Student Loan Trust | |||
Series 2021-BA Cl. A | |||
416 | 0.940%—07/15/20691 | 413 | |
NextGear Floorplan Master Owner Trust | |||
Series 2019-2A Cl. A2 | |||
880 | 2.070%—10/15/20241 | 893 | |
Oak Street Investment Grade Net Lease Fund | |||
Series 2020-1A Cl. A1 | |||
343 | 1.850%—11/20/20501 | 345 | |
Series 2021-1A Cl. A2 | |||
356 | 1.930%—01/20/20511 | 355 | |
700 | |||
Palmer Square CLO Ltd.2 | |||
Series 2013 Cl. 2A | |||
447 | 1.124% (3 Month USD LIBOR + 1.128) 10/17/20311,3 | 447 | |
Progress Residential Trust | |||
Series 2021-SFR1 Cl. A | |||
385 | 1.052%—04/17/20381 | 375 | |
Series 2021-SFR3 Cl. A | |||
349 | 1.637%—05/17/20261 | 347 |
30
Harbor Core Bond Fund
Portfolio of Investments—Continued
Value, Cost and Principal Amounts in Thousands
ASSET-BACKED SECURITIES—Continued | |||
Principal Amount | Value | ||
Series 2019-SFR3 Cl. A | |||
$ | 443 | 2.271%—09/17/20361 | $447 |
1,169 | |||
Sabey Data Center Issuer LLC | |||
Series 2020-1 Cl. A2 | |||
202 | 3.812%—04/20/20451 | 212 | |
Stack Infrastructure Issuer LLC | |||
Series 2021-1A Cl. A2 | |||
613 | 1.877%—03/26/20461 | 610 | |
Series 2019-2A Cl. A2 | |||
185 | 3.080%—10/25/20441 | 189 | |
Series 2019-1A Cl. A2 | |||
223 | 4.540%—02/25/20441 | 233 | |
1,032 | |||
Store Master Funding I-VII | |||
Series 2019-1 Cl. A1 | |||
165 | 2.820%—11/20/20491 | 171 | |
Series 2018-1A Cl. A1 | |||
196 | 3.960%—10/20/20481 | 202 | |
373 | |||
Taco Bell Funding LLC | |||
Series 2021-1A Cl. A2II | |||
385 | 2.294%—08/25/20511 | 386 | |
United Airlines Pass-Through Trust | |||
Series 2016-1 Cl. AA | |||
170 | 3.100%—07/07/2028 | 178 | |
Series 2014-1 Cl. A | |||
697 | 4.000%—04/11/2026 | 732 | |
910 | |||
Vantage Data Centers LLC | |||
Series 2020-1A Cl. A2 | |||
567 | 1.645%—09/15/20451 | 561 | |
Verizon Owner Trust | |||
Series 2019-B Cl. A1A | |||
229 | 2.330%—12/20/2023 | 230 | |
Series 2018-A Cl. A1A | |||
43 | 3.230%—04/20/2023 | 43 | |
273 | |||
Wendy's Funding LLC | |||
Series 2021-1A Cl. A2I | |||
677 | 2.370%—06/15/20511 | 682 | |
Series 2019-1A Cl. A2I | |||
166 | 3.783%—06/15/20491 | 175 | |
857 | |||
World Omni Auto Receivables Trust | |||
Series 2020-A Cl. A3 | |||
1,012 | 1.700%—01/17/2023 | 1,021 | |
Series 2017-B Cl. A3 | |||
10 | 1.950%—02/15/2023 | 10 | |
Series 2018-D Cl. A3 | |||
258 | 3.330%—04/15/2024 | 261 | |
1,292 | |||
TOTAL ASSET-BACKED SECURITIES | |||
(Cost $17,387) | 17,585 | ||
COLLATERALIZED MORTGAGE OBLIGATIONS—11.7% | |||
Principal Amount | Value | ||
BANK 2019-BNK16 | |||
Series 2019-BN16 Cl. ASB | |||
$ | 651 | 3.898%—02/15/2052 | $713 |
BANK 2021-BNK36 | |||
Series 2021-BN36 Cl. A5 | |||
689 | 2.470%—09/15/2064 | 706 | |
Barclays Commerical Mortgage Securities LLC | |||
Series 2012-C2 Cl. A4 | |||
517 | 3.525%—05/10/2063 | 522 | |
BBCMS Mortgage Trust | |||
Series 2020-C6 Cl. A2 | |||
380 | 2.690%—02/15/2053 | 392 | |
Benchmark Mortgage Trust | |||
Series 2021-B26 Cl. A3 | |||
387 | 2.391%—06/15/2054 | 396 | |
Series 2019-B15 Cl. A5 | |||
212 | 2.928%—12/15/2072 | 225 | |
621 | |||
BX Commercial Mortgage Trust | |||
Series 2021-VOLT Cl. A | |||
403 | 0.790% (1 Month USD LIBOR + 0.813) 09/15/20361,3 | 404 | |
Series 2019-XL Cl. A | |||
470 | 1.010% (1 Month USD LIBOR + 1.012) 10/15/20361,3 | 470 | |
874 | |||
CIM Trust Corp. | |||
Series 2020-INV1 Cl. A2 | |||
124 | 2.500%—04/25/20501,3 | 125 | |
Citigroup Commercial Mortgage Trust | |||
Series 2015-GC27 Cl. AAB | |||
290 | 2.944%—02/10/2048 | 298 | |
Commercial Mortgage Pass-Through Certificates | |||
Series 2014-CR14 Cl. A2 | |||
188 | 3.147%—02/10/2047 | 190 | |
Series 2014-CR21 Cl. A3 | |||
239 | 3.528%—12/10/2047 | 251 | |
Series 2014-UBS3 Cl. A3 | |||
443 | 3.546%—06/10/2047 | 461 | |
Series 2013-CR8 Cl. A5 | |||
502 | 3.612%—06/10/2046 | 520 | |
1,422 | |||
Flagstar Mortgage Trust | |||
Series 2021-8INV Cl. A3 | |||
378 | 2.500%—09/25/2051 | 384 | |
Freddie Mac Seasoned Credit Risk Transfer Trust | |||
Series 2020-2 Cl. MA | |||
208 | 2.000%—11/25/2059 | 210 | |
Series 2020-3 Cl. MA | |||
236 | 2.000%—05/25/2060 | 236 | |
Series 2021-1 Cl. MA | |||
328 | 2.000%—09/25/2060 | 327 | |
Series 2021-3 Cl. MA | |||
515 | 2.000%—03/25/2061 | 523 | |
Series 2020-1 Cl. MA | |||
226 | 2.500%—08/25/2059 | 231 | |
Series 2018-1 Cl. MA | |||
159 | 3.000%—05/25/2057 | 165 | |
Series 2018-4 Cl. MA | |||
478 | 3.500%—03/25/2058 | 498 | |
Series 2019-2 Cl. MA | |||
244 | 3.500%—08/25/2058 | 254 | |
2,444 |
31
Harbor Core Bond Fund
Portfolio of Investments—Continued
Value, Cost and Principal Amounts in Thousands
COLLATERALIZED MORTGAGE OBLIGATIONS—Continued | |||
Principal Amount | Value | ||
FRESB Mortgage Trust | |||
Series 2019-SB63 Cl. A5H | |||
$ | 310 | 2.550% (1 Month USD LIBOR + 0.498) 02/25/20393 | $317 |
GS Mortgage Backed Securities Trust | |||
Series 2021-PJ2 Cl. A2 | |||
372 | 2.500%—07/25/20511,3 | 376 | |
Series 2020-INV1 Cl. A14 | |||
231 | 2.968%—10/25/20501,3 | 235 | |
Series 2020-PJ4 Cl. A2 | |||
153 | 3.000%—01/25/20511,3 | 155 | |
766 | |||
GS Mortgage Securities Trust | |||
Series 2012-GCJ7 Cl. A4 | |||
82 | 3.377%—05/10/2045 | 82 | |
Invitation Homes Trust | |||
Series 2018-SFR1 Cl. A | |||
105 | 0.786% (1 Month USD LIBOR + 1.941) 03/17/20371,4 | 105 | |
JPMBB Commercial Mortgage Securities Trust | |||
Series 2015-C32 Cl. A2 | |||
219 | 2.816%—11/15/2048 | 220 | |
Series 2019-C6 Cl. A4 | |||
351 | 3.057%—11/13/2052 | 375 | |
595 | |||
JPMorgan Chase Commercial Mortgage Securities Trust | |||
Series 2019-COR5 Cl. A2 | |||
635 | 3.150%—06/13/2052 | 656 | |
Series 2012-CBX Cl. A4 | |||
58 | 3.483%—06/15/2045 | 59 | |
715 | |||
JPMorgan Mortgage Trust | |||
Series 2021-1 Cl. A3 | |||
275 | 2.500%—06/25/20511,3 | 278 | |
Series 2021-3 Cl. A3 | |||
485 | 2.500%—07/01/20511,3 | 490 | |
768 | |||
MetLife Securitization Trust | |||
Series 2020-INV1 Cl. A2A | |||
200 | 2.500%—05/25/20501,3 | 202 | |
Morgan Stanley Bank of America Merrill Lynch Trust | |||
Series 2015-C22 Cl. A4 | |||
532 | 3.306%—04/15/2048 | 562 | |
Series 2014-C14 Cl. A5 | |||
720 | 4.064%—02/15/2047 | 763 | |
1,325 | |||
Morgan Stanley Capital I Trust | |||
Series 2012-C4 Cl. A4 | |||
71 | 3.244%—03/15/2045 | 72 | |
Series 2015-UBS8 Cl. A4 | |||
438 | 3.809%—12/15/2048 | 472 | |
544 | |||
PSMC Trust | |||
Series 2021-2 Cl. A3 | |||
571 | 2.500%—05/25/20511,3 | 582 | |
Series 2020-2 Cl. A2 | |||
104 | 3.000%—05/25/20501,3 | 105 | |
687 | |||
Sequoia Mortgage Trust | |||
Series 2021-1 Cl. A1 | |||
399 | 2.500%—03/25/20511,3 | 403 |
COLLATERALIZED MORTGAGE OBLIGATIONS—Continued | |||
Principal Amount | Value | ||
Tricon American Homes Trust | |||
Series 2020-SFR1 Cl. A | |||
$ | 334 | 1.499%—07/17/20381 | $332 |
Wells Fargo Commercial Mortgage Trust | |||
Series 2021-C59 Cl. A5 | |||
639 | 2.626%—04/15/2054 | 662 | |
Wells Fargo Mortgage Backed Securities Trust | |||
Series 2021-INV1 Cl. A2 | |||
423 | 2.500%—08/25/20511,3 | 429 | |
WF RBS Commercial Mortgage Trust | |||
Series 2012-C10 Cl. A3 | |||
244 | 2.875%—12/15/2045 | 248 | |
TOTAL COLLATERALIZED MORTGAGE OBLIGATIONS | |||
(Cost $16,786) | 16,681 | ||
CORPORATE BONDS & NOTES—29.3% | |||
AEROSPACE & DEFENSE—1.6% | |||
BAE Systems Holdings Inc. | |||
400 | 3.400%—04/15/20301 | 428 | |
489 | 3.800%—10/07/20241 | 524 | |
952 | |||
General Dynamics Corp. | |||
59 | 4.250%—04/01/2050 | 77 | |
Lockheed Martin Corp. | |||
198 | 2.800%—06/15/2050 | 202 | |
225 | 4.700%—05/15/2046 | 298 | |
500 | |||
Northrop Grumman Corp. | |||
298 | 5.250%—05/01/2050 | 425 | |
Textron Inc. | |||
370 | 3.000%—06/01/2030 | 387 | |
2,341 | |||
AIR FREIGHT & LOGISTICS—0.3% | |||
FedEx Corp. | |||
270 | 4.050%—02/15/2048 | 308 | |
United Parcel Service Inc. | |||
73 | 5.300%—04/01/2050 | 109 | |
417 | |||
AUTOMOBILES—1.4% | |||
General Motors Co. | |||
248 | 5.400%—10/02/2023 | 268 | |
Hyundai Capital America Co. | |||
468 | 5.750%—04/06/20231 | 499 | |
Toyota Motor Credit Corp. MTN5 | |||
572 | 3.000%—04/01/2025 | 606 | |
197 | 3.375%—04/01/2030 | 218 | |
824 | |||
Volkswagen Group of America Finance LLC | |||
413 | 2.900%—05/13/20221 | 418 | |
2,009 | |||
BANKS—3.0% | |||
Bank of America Corp. MTN5 | |||
500 | 3.500%—04/19/2026 | 540 | |
206 | 4.330%—03/15/20504 | 257 | |
797 |
32
Harbor Core Bond Fund
Portfolio of Investments—Continued
Value, Cost and Principal Amounts in Thousands
CORPORATE BONDS & NOTES—Continued | |||
Principal Amount | Value | ||
BANKS—Continued | |||
Citigroup Inc. | |||
$ | 427 | 2.520%—11/03/2032 | $426 |
421 | 3.400%—05/01/2026 | 453 | |
169 | 3.520%—10/27/20284 | 182 | |
279 | 4.412%—03/31/20314 | 320 | |
1,381 | |||
JPMorgan Chase & Co. | |||
476 | 4.203%—07/23/20294 | 534 | |
330 | 4.493%—03/24/20314 | 383 | |
917 | |||
Lloyds Banking Group plc | |||
300 | 2.438% (U.S. Treasury 1 Year Constant Maturity Yield + 0.687) 02/05/20263 | 309 | |
PNC Bank NA | |||
250 | 3.500%—06/08/2023 | 261 | |
Toronto Dominion Bank MTN5 | |||
600 | 0.750%—09/11/2025 | 587 | |
4,252 | |||
BEVERAGES—0.5% | |||
Anheuser-Busch Cos. LLC / Anheuser-Busch InBev Worldwide Inc. | |||
358 | 4.900%—02/01/2046 | 457 | |
Coca-Cola Co. | |||
270 | 3.000%—03/05/2051 | 288 | |
745 | |||
BIOTECHNOLOGY—0.2% | |||
Abbvie Inc. | |||
300 | 4.500%—05/14/2035 | 355 | |
CAPITAL MARKETS—3.8% | |||
Apollo Management Holdings LP | |||
250 | 4.000%—05/30/20241 | 268 | |
Blackstone Holdings Finance Co. LLC | |||
223 | 2.800%—09/30/20501 | 219 | |
205 | 3.150%—10/02/20271 | 218 | |
286 | 3.500%—09/10/20491 | 315 | |
752 | |||
Credit Suisse Group AG | |||
291 | 1.305%—02/02/20271,4 | 282 | |
Goldman Sachs Group Inc. | |||
291 | 3.800%—03/15/2030 | 323 | |
420 | 5.750%—01/24/2022 | 425 | |
748 | |||
KKR Group Finance Co. II LLC | |||
289 | 5.500%—02/01/20431 | 387 | |
KKR Group Finance Co. III LLC | |||
140 | 5.125%—06/01/20441 | 181 | |
Macquarie Group Ltd. | |||
363 | 1.340%—01/12/20271,4 | 357 | |
165 | 3.189%—11/28/20231,4 | 169 | |
526 | |||
Macquarie Group Ltd. MTN5 | |||
250 | 4.150%—03/27/20241,4 | 261 | |
Moody's Corp. | |||
248 | 2.550%—08/18/2060 | 224 | |
Morgan Stanley MTN5 | |||
645 | 3.125%—07/27/2026 | 686 |
CORPORATE BONDS & NOTES—Continued | |||
Principal Amount | Value | ||
CAPITAL MARKETS—Continued | |||
$ | 285 | 3.622%—04/01/20314 | $311 |
252 | 3.875%—01/27/2026 | 275 | |
1,272 | |||
State Street Corp. | |||
110 | 2.901%—03/30/20264 | 116 | |
95 | 3.152%—03/30/20314 | 103 | |
219 | |||
UBS Group AG | |||
300 | 4.125%—04/15/20261 | 330 | |
5,450 | |||
COMMUNICATIONS EQUIPMENT—0.3% | |||
Juniper Networks Inc. | |||
365 | 1.200%—12/10/2025 | 360 | |
CONSUMER FINANCE—0.8% | |||
American Express Co. | |||
150 | 3.400%—02/27/2023 | 155 | |
Capital One Financial Corp. | |||
450 | 3.300%—10/30/2024 | 478 | |
General Motors Financial Co. Inc. | |||
444 | 4.150%—06/19/2023 | 466 | |
Mastercard Inc. | |||
71 | 3.850%—03/26/2050 | 87 | |
1,186 | |||
DIVERSIFIED FINANCIAL SERVICES—0.5% | |||
Cooperatieve Rabobank U.A. | |||
400 | 3.875%—09/26/20231 | 424 | |
Ferguson Finance plc | |||
310 | 3.250%—06/02/20301 | 330 | |
754 | |||
DIVERSIFIED TELECOMMUNICATION SERVICES—1.1% | |||
AT&T Inc. | |||
664 | 1.294% (3 Month USD LIBOR + 0.541) 06/12/20243 | 679 | |
306 | 3.500%—06/01/2041 | 316 | |
995 | |||
Verizon Communications Inc. | |||
162 | 4.500%—08/10/2033 | 191 | |
247 | 4.522%—09/15/2048 | 314 | |
505 | |||
1,500 | |||
ELECTRIC UTILITIES—2.7% | |||
Berkshire Hathaway Energy Co. | |||
195 | 4.050%—04/15/2025 | 213 | |
525 | 6.125%—04/01/2036 | 722 | |
935 | |||
CenterPoint Energy Inc. | |||
401 | 1.450%—06/01/2026 | 397 | |
Duke Energy Carolinas, LLC | |||
111 | 3.950%—03/15/2048 | 130 | |
Eversource Energy | |||
260 | 2.750%—03/15/2022 | 262 | |
200 | 2.900%—10/01/2024 | 209 | |
471 |
33
Harbor Core Bond Fund
Portfolio of Investments—Continued
Value, Cost and Principal Amounts in Thousands
CORPORATE BONDS & NOTES—Continued | |||
Principal Amount | Value | ||
ELECTRIC UTILITIES—Continued | |||
Exelon Corp. | |||
$ | 82 | 4.700%—04/15/2050 | $106 |
368 | 5.100%—06/15/2045 | 490 | |
596 | |||
Southern Co. | |||
430 | 3.250%—07/01/2026 | 458 | |
298 | 4.250%—07/01/2036 | 341 | |
799 | |||
Virginia Electric & Power Co. | |||
305 | 3.150%—01/15/2026 | 326 | |
Xcel Energy Inc. | |||
220 | 3.400%—06/01/2030 | 239 | |
3,893 | |||
ENTERTAINMENT—0.2% | |||
Walt Disney Co. | |||
164 | 4.700%—03/23/2050 | 220 | |
EQUITY REAL ESTATE INVESTMENT TRUSTS (REITs)—1.2% | |||
Boston Properties LP | |||
468 | 4.500%—12/01/2028 | 535 | |
Digital Realty Trust LP | |||
123 | 3.600%—07/01/2029 | 134 | |
368 | 3.700%—08/15/2027 | 403 | |
537 | |||
Federal Realty Investment Trust | |||
582 | 1.250%—02/15/2026 | 576 | |
1,648 | |||
HEALTH CARE PROVIDERS & SERVICES—1.1% | |||
Cigna Corp. | |||
495 | 3.400%—03/01/2027 | 533 | |
CommonSpirit Health | |||
225 | 3.910%—10/01/2050 | 254 | |
232 | 4.187%—10/01/2049 | 273 | |
527 | |||
PeaceHealth Obligated Group | |||
580 | 1.375%—11/15/2025 | 581 | |
1,641 | |||
HOTELS, RESTAURANTS & LEISURE—0.2% | |||
McDonald's Corp. MTN5 | |||
225 | 3.500%—07/01/2027 | 245 | |
INSURANCE—2.1% | |||
AIA Group Ltd. | |||
619 | 3.600%—04/09/20291 | 674 | |
American International Group Inc. | |||
465 | 4.125%—02/15/2024 | 498 | |
Equitable Financial Life Global Funding | |||
425 | 1.400%—07/07/20251 | 423 | |
Five Corners Funding Trust | |||
250 | 4.419%—11/15/20231 | 268 | |
Liberty Mutual Group Inc. | |||
400 | 4.569%—02/01/20291 | 462 | |
Lincoln National Corp. | |||
266 | 3.400%—01/15/2031 | 287 | |
173 | 3.625%—12/12/2026 | 189 | |
476 |
CORPORATE BONDS & NOTES—Continued | |||
Principal Amount | Value | ||
INSURANCE—Continued | |||
Mass Mutual Life Insurance Co. | |||
$ | 170 | 3.375%—04/15/20501 | $183 |
2,984 | |||
INTERNET & DIRECT MARKETING RETAIL—0.3% | |||
Amazon.com Inc. | |||
391 | 3.250%—05/12/2061 | 428 | |
MEDIA—1.1% | |||
Charter Communications Operating LLC / Charter Communications Operating Capital | |||
478 | 6.384%—10/23/2035 | 622 | |
Comcast Corp. | |||
146 | 3.300%—04/01/2027 | 157 | |
392 | 3.400%—04/01/2030 | 428 | |
585 | |||
COX Communications Inc. | |||
390 | 1.800%—10/01/20301 | 370 | |
1,577 | |||
MULTI-UTILITIES—0.2% | |||
WEC Energy Group Inc. | |||
348 | 1.375%—10/15/2027 | 339 | |
OIL, GAS & CONSUMABLE FUELS—2.2% | |||
Chevron Corp. | |||
179 | 1.995%—05/11/2027 | 183 | |
Dominion Energy Gas Holdings LLC | |||
170 | 2.500%—11/15/2024 | 177 | |
Dominion Energy Inc. | |||
300 | 5.250%—08/01/2033 | 372 | |
Exxon Mobil Corp. | |||
291 | 2.992%—03/19/2025 | 308 | |
Occidental Petroleum Corp. | |||
1,313 | 0.000%—10/10/20366 | 741 | |
Phillips 66 Partners LP | |||
197 | 3.605%—02/15/2025 | 209 | |
Schlumberger Holdings Corp. | |||
252 | 3.900%—05/17/20281 | 276 | |
Shell International Finance BV | |||
267 | 2.375%—04/06/2025 | 277 | |
Southern Co. Gas Capital Corp. | |||
220 | 1.750%—01/15/2031 | 207 | |
Sunoco Logistics Partners Operations LP | |||
375 | 3.900%—07/15/2026 | 406 | |
3,156 | |||
PHARMACEUTICALS—0.2% | |||
Pfizer Inc. | |||
297 | 2.550%—05/28/2040 | 296 | |
PROFESSIONAL SERVICES—0.5% | |||
Verisk Analytics Inc. | |||
610 | 3.625%—05/15/2050 | 670 | |
ROAD & RAIL—1.2% | |||
Canadian National Railway Co. | |||
172 | 3.650%—02/03/2048 | 198 | |
Canadian Pacific Railway Co. | |||
190 | 6.125%—09/15/2115 | 296 | |
Norfolk Southern Corp. | |||
310 | 4.837%—10/01/2041 | 399 |
34
Harbor Core Bond Fund
Portfolio of Investments—Continued
Value, Cost and Principal Amounts in Thousands
CORPORATE BONDS & NOTES—Continued | |||
Principal Amount | Value | ||
ROAD & RAIL—Continued | |||
Penske Truck Leasing Co. LP / PTL Finance Corp. | |||
$ | 500 | 3.900%—02/01/20241 | $530 |
Ryder System Inc. MTN5 | |||
307 | 3.650%—03/18/2024 | 326 | |
1,749 | |||
SEMICONDUCTORS & SEMICONDUCTOR EQUIPMENT—0.7% | |||
Broadcom Inc. | |||
272 | 4.110%—09/15/2028 | 300 | |
LAM Research Corp. | |||
110 | 2.875%—06/15/2050 | 112 | |
NXP BV / NXP Funding LLC | |||
251 | 4.625%—06/01/20231 | 266 | |
NXP BV / NXP Funding LLC / NXP USA Inc. | |||
255 | 2.700%—05/01/20251 | 265 | |
943 | |||
SOFTWARE—0.3% | |||
Oracle Corp. | |||
443 | 2.500%—04/01/2025 | 460 | |
SPECIALTY RETAIL—0.3% | |||
Home Depot Inc. | |||
220 | 3.300%—04/15/2040 | 239 | |
Lowe's Cos. Inc. | |||
107 | 3.700%—04/15/2046 | 120 | |
59 | 5.000%—04/15/2040 | 75 | |
195 | |||
434 | |||
TRADING COMPANIES & DISTRIBUTORS—1.0% | |||
AerCap Ireland Capital DAC / AerCap Global Aviation Trust | |||
426 | 3.000%—10/29/2028 | 433 | |
272 | 4.125%—07/03/2023 | 286 | |
719 | |||
Air Lease Corp. | |||
374 | 3.875%—07/03/2023 | 391 | |
Ferguson Finance plc | |||
236 | 4.500%—10/24/20281 | 270 | |
1,380 | |||
WATER UTILITIES—0.2% | |||
Aquarion Co. | |||
238 | 4.000%—08/15/20241 | 254 | |
WIRELESS TELECOMMUNICATION SERVICES—0.1% | |||
T-Mobile USA Inc. | |||
132 | 3.500%—04/15/2025 | 141 | |
TOTAL CORPORATE BONDS & NOTES | |||
(Cost $39,240) | 41,827 | ||
MORTGAGE PASS-THROUGH—25.5% | |||
Federal Home Loan Mortgage Corp. | |||
244 | 1.931%—06/01/20473 | 254 | |
548 | 2.000%—06/01/2050-08/01/2050 | 552 | |
4,608 | 2.500%—08/01/2030-02/01/2051 | 4,761 | |
257 | 2.753%—01/01/20493 | 267 | |
3,719 | 3.000%—06/01/2034-09/01/2050 | 3,947 | |
3,555 | 3.500%—05/01/2042-05/01/2050 | 3,809 |
MORTGAGE PASS-THROUGH—Continued | |||
Principal Amount | Value | ||
$ | 567 | 4.000%—02/01/2046-05/01/2049 | $615 |
221 | 4.500%—03/01/2049 | 240 | |
14,445 | |||
Federal National Mortgage Association | |||
3,797 | 2.000%—08/01/2050-08/01/2051 | 3,815 | |
221 | 2.319%—12/01/20363 | 234 | |
1,153 | 2.500%—08/01/2035-10/01/2050 | 1,196 | |
303 | 2.606%—04/01/20473 | 317 | |
4,052 | 3.000%—11/01/2034-04/01/2051 | 4,270 | |
2,649 | 3.500%—10/01/2037-09/01/2051 | 2,846 | |
3,199 | 4.000%—04/01/2045-04/01/2050 | 3,475 | |
1,897 | 4.500%—05/01/2046-09/01/2050 | 2,084 | |
513 | 5.000%—08/01/2049 | 572 | |
18,809 | |||
Government National Mortgage Association | |||
1,089 | 2.500%—01/20/2051 | 1,136 | |
500 | 4.000%—09/20/2041-09/15/2046 | 553 | |
1,203 | 4.500%—01/15/2042-08/20/2047 | 1,331 | |
3,020 | |||
TOTAL MORTGAGE PASS-THROUGH | |||
(Cost $36,074) | 36,274 | ||
MUNICIPAL BONDS—2.0% | |||
City & County of Denver Co. Airport System | |||
375 | 1.722%—11/15/2027 | 376 | |
Florida State Board of Administration Finance Corp. | |||
241 | 1.258%—07/01/2025 | 241 | |
Metropolitan Transportation Authority | |||
195 | 5.871%—11/15/2039 | 257 | |
Metropolitan Water Reclamation District of Greater Chicago | |||
145 | 5.720%—12/01/2038 | 203 | |
New York State Urban Development Corp. | |||
555 | 5.770%—03/15/2039 | 692 | |
Port Authority of New York and New Jersey | |||
555 | 1.086%—07/01/2023 | 560 | |
State of California | |||
300 | 7.500%—04/01/2034 | 460 | |
TOTAL MUNICIPAL BONDS | |||
(Cost $2,617) | 2,789 | ||
U.S. GOVERNMENT OBLIGATIONS—18.3% | |||
U.S. Small Business Administration | |||
Series 2012-20C Cl. 1 | |||
109 | 2.510%—03/01/2032 | 112 | |
Series 2017-20H Cl. 1 | |||
136 | 2.750%—08/01/2037 | 143 | |
Series 2014-20K Cl. 1 | |||
276 | 2.800%—11/01/2034 | 287 | |
Series 2016-20L Cl. 1 | |||
956 | 2.810%—12/01/2036 | 1,016 | |
Series 2015-20H Cl. 1 | |||
276 | 2.820%—08/01/2035 | 290 | |
Series 2017-20J Cl. 1 | |||
202 | 2.850%—10/01/2037 | 213 | |
Series 2018-20B Cl. 1 | |||
255 | 3.220%—02/01/2038 | 272 |
35
Harbor Core Bond Fund
Portfolio of Investments—Continued
Value, Cost and Principal Amounts in Thousands
U.S. GOVERNMENT OBLIGATIONS—Continued | |||
Principal Amount | Value | ||
Series 2018-20G Cl. 1 | |||
$ | 374 | 3.540%—07/01/2038 | $407 |
2,740 | |||
U.S. Treasury Bonds | |||
5,283 | 1.125%—05/15/2040-08/15/2040 | 4,571 | |
691 | 1.250%—05/15/2050 | 585 | |
1,744 | 1.375%—08/15/2050 | 1,522 | |
1,392 | 1.750%—08/15/2041 | 1,340 | |
3,090 | 1.875%—02/15/2041-02/15/2051 | 3,040 | |
974 | 2.000%—08/15/2051 | 988 | |
1,339 | 3.000%—08/15/2048 | 1,635 | |
13,681 | |||
U.S. Treasury Inflation Index Notes7 | |||
592 | 0.125%—01/15/2030 | 656 | |
136 | 1.000%—02/15/2049 | 187 | |
843 |
U.S. GOVERNMENT OBLIGATIONS—Continued | |||
Principal Amount | Value | ||
�� | U.S. Treasury Notes | ||
$ | 5,627 | 0.625%—07/31/2026 | $5,485 |
3,428 | 1.250%—08/15/2031 | 3,332 | |
8,817 | |||
TOTAL U.S. GOVERNMENT OBLIGATIONS | |||
(Cost $26,156) | 26,081 | ||
TOTAL INVESTMENTS—99.1% | |||
(Cost $138,260) | 141,237 | ||
CASH AND OTHER ASSETS, LESS LIABILITIES—0.9% | 1,251 | ||
TOTAL NET ASSETS—100.0% | $142,488 |
FAIR VALUE MEASUREMENTS
As of October 31, 2021, the investments in Home Partners of America Trust (as disclosed in the preceding Portfolio of Investments) was classified as Level 3 and all other investments were classified as Level 2.
For more information on valuation inputs and their aggregation into the levels identified above, please refer to the Fair Value Measurements and Disclosures in Note 2 of the accompanying Notes to Financial Statements.
The following is a rollforward of the Fund’s Level 3 investments during the year ended October 31, 2021. Transfers into or out of Level 3 are recognized as of the last day in the fiscal quarter of the period in which the event or change in circumstances that caused the reclassification occured.
Valuation Description | Beginning Balance as of 11/01/2020 (000s) | Purchases (000s) | Sales (000s) | Discount/ (Premium) (000s) | Total Realized Gain/(Loss) (000s) | Change in Unrealized Appreciation/ (Depreciation) (000s) | Transfers Into Level 3 (000s) | Transfers Out of Level 3h (000s) | Ending Balance as of 10/31/2021 (000s) | Unrealized Gain/(Loss) as of 10/31/2021 (000s) |
Asset-Backed Securities | $349 | $465 | $— | $(44) | $— | $(3) | $— | $(302) | $465 | $— |
Collateralized Mortgage Obligations | 327 | — | — | (83) | — | (8) | — | (236) | — | — |
$676 | $465 | $— | $(127) | $— | $(11) | $— | $(538) | $465 | $— |
The following is a summary of significant unobservable inputs used in the fair valuations of assets and liabilities categorized within Level 3 of the fair value hierarchy.
Valuation Descriptions | Ending Balance as of 10/31/2021 (000s) | Valuation Technique | Unobservable Input(s) | Input Value(s) |
Investments in Securities | ||||
Asset-Backed Securities | ||||
Home Partners of America Trust Series 2021-2 Cl. A | $ 465 | Market Approach | Purchased Price | $ 99.98 |
36
Harbor Core Bond Fund
Portfolio of Investments—Continued
x | Fair valued in accordance with Harbor Funds' Valuation Procedures. |
1 | Securities purchased in a transaction exempt from registration under Rule 144A of the Securities Act of 1933. These securities may be resold in transactions exempt from registration, normally to qualified institutional buyers. The Fund has no right to demand registration of these securities. At October 31, 2021, the aggregate value of these securities was $29,116 or 20% of net assets. |
2 | CLO after the name of a security stands for Collateralized Loan Obligation. |
3 | Variable or floating rate security; the stated rate represents the rate in effect at October 31, 2021. The variable rate for such securities may be based on the indicated reference rate and spread or on an underlying asset or pool of assets rather than a reference rate and may be determined by current interest rates, prepayments or other financial indicators. |
4 | Rate changes from fixed to variable rate at a specified date prior to its final maturity. Stated rate is fixed rate currently in effect and stated date is the final maturity date, except for perpetuity bonds. |
5 | MTN after the name of a security stands for Medium Term Note. |
6 | Zero coupon bond |
7 | Inflation-protected securities (“IPS”) are securities in which the principal amount is adjusted for inflation and interest payments are applied to the inflation-adjusted principal. |
h | Transferred from Level 3 to Level 2 due to the availability of observable market data pricing |
The accompanying notes are an integral part of the Financial Statements.
37
Harbor High-Yield Bond Fund
Manager’s Commentary (Unaudited)
Subadviser
Shenkman Capital Management, Inc.
461 Fifth Avenue
22nd Floor
New York, NY 10017
22nd Floor
New York, NY 10017
Portfolio Managers
Mark R. Shenkman
Since 2002
Since 2002
Justin W. Slatky
Since 2012
Since 2012
Eric Dobbin
Since 2012
Since 2012
Robert S. Kricheff
Since 2015
Since 2015
Neil Wechsler, CFA
Since 2017
Since 2017
Jordan N. Barrow, CFA
Since 2020
Since 2020
Shenkman Capital has subadvised the Fund since 2002.
Investment Objective
The Fund seeks total returns (i.e., current income and capital appreciation).
Management’s Discussion of
Fund Performance
Fund Performance
Market review
In the 12-month period ended October 31, 2021, the leveraged debt markets continued to see an exceptional level of new issuance. This new issuance was dominated by refinancings but included an increase in acquisition financing from the previous year. Access to capital for corporations has, not surprisingly, coincided with a decline in the overall default rate. According to J.P. Morgan Research, the high yield bond market default rates decreased from over 6% to less than 1% over the last 12-month period. The increase in new issuers to the market has also added to diversification.
Throughout this period in the market, the spread to worst tightened from 444 bps to 316 bps, as measured by the ICE BofA U.S. Non-Distressed High Yield Index (the “H0ND” or the “Index”). As default risk appeared to subside, the lowest rated tier of the H0ND (CCC and below) outperformed with a positive return of 11.3% compared to the H0ND’s overall return of 8.9%. The longer duration tiers of the market (bonds having an option-adjusted duration of longer than 8 years) also outperformed during this period. The outperformance of the longer duration tiers appears to be driven by spread compression as U.S. interest rates increased during this period, with the U.S. 10 Year Treasury yield rising by more than 70 bps. Another sign of the overall spread tightening and risk buying that occurred during this time is how few bonds are now trading at distressed levels, which is defined as a spread of 1000 bps or greater. The ICE BofA U.S. Distressed High Yield Index (H0DI) shrunk from $133.4 billion a year ago to only $27 billion as of October 31, 2021.
During the last twelve months, the largest sector outperformance in the H0ND was by the Oil & Gas sector, which returned 25.4%, as oil prices rose from approximately $36.81 per barrel to $84.65 per barrel based on WTI oil contracts. The next highest performing sector was Midstream which returned 15.4% during the period. All sectors had positive returns, however, laggards included Cable & Satellite and Telecom which returned 3.3% and 4.6%, respectively.
performance
Harbor High-Yield Bond Fund returned 9.64 % (Retirement Class), 9.55% (Institutional Class), 9.35% (Administrative Class) and 9.31% (Investor Class) for the year ended October 31, 2021, outpacing the H0ND which returned 8.93%. The ICE BofA U.S. High Yield (H0A0) returned 10.74%. The Fund’s overweight and selection in CCC rated bonds contributed to relative performance, returning 17.9% compared to the H0ND’s return of 11.3%. Selection in BB and single B rated credits also contributed to the Fund’s outperformance of H0ND. By sector, the Fund’s largest contributor relative to the benchmark was Oil & Gas. The underweighting produced a negative effect but selection in the sector contributed approximately 78 bps to relative outperformance. The Fund’s biggest detractor by sector was Health Care. The Fund’s overweight to the Health Care sector was a negative contributor but the selection was a positive contributor which netted -8 bps from relative performance. Out-of-index positions including bank loans, convertible bonds and BBB rated issues contributed approximately 29 bps of relative performance.
38
Harbor High-Yield Bond Fund
Manager’s Commentary—Continued
CHANGE IN A $10,000 INVESTMENT
For the period 11/01/2011 through 10/31/2021
The graph compares a $10,000 investment in the Institutional Class shares of the Fund with the performance of the ICE BofAML U.S. Non-Distressed High Yield Index (H0ND) and the ICE BofAML U.S. High Yield Index (H0A0). The Fund’s performance assumes the reinvestment of all dividend and capital gain distributions.
TOTAL RETURNS
For the periods ended 10/31/2021
1 Year | Annualized | |||||
5 Years | 10 Years | |||||
Harbor High-Yield Bond Fund | ||||||
Retirement Class1 | 9.64% | 5.68% | 5.47% | |||
Institutional Class | 9.55 | 5.62 | 5.43 | |||
Administrative Class | 9.35 | 5.36 | 5.17 | |||
Investor Class | 9.31 | 5.23 | 5.04 | |||
Comparative Indices | ||||||
ICE BofA U.S. Non-Distressed High Yield (H0ND) | 8.93% | 6.20% | 6.68% | |||
ICE BofA U.S. High Yield (H0A0) | 10.74 | 6.25 | 6.66 |
As stated in the Fund’s prospectus dated March 1, 2021, the expense ratios were 0.57% (Net) and 0.66% (Gross) (Retirement Class); 0.65% (Net) and 0.74% (Gross) (Institutional Class); 0.90% (Net) and 0.99% (Gross) (Administrative Class); and 1.01% (Net) and 1.10% (Gross) (Investor Class). The net expense ratios reflect a contractual management fee waiver effective through 02/28/2022. The expense ratios in the prospectus may differ from the actual expense ratios for the period disclosed within this report. The expense ratios shown in the prospectus are based on the prior fiscal year, adjusted to reflect changes, if any, in contractual arrangements that occurred prior to the date of the prospectus (or supplement thereto, if applicable).
Performance data shown represents past performance and is no guarantee of future results. Past performance is net of management fees and expenses and reflects reinvested dividends and distributions. Past performance reflects the beneficial effect of any expense waivers or reimbursements, without which returns would have been lower. Investment returns and principal value will fluctuate and when redeemed may be worth more or less than their original cost. Returns for periods less than one year are not annualized. Current performance may be higher or lower and is available through the most recent month end at harborcapital.com or by calling 800-422-1050. The Fund charged a redemption fee of 1% on redemption of Fund shares that are held for less than 90 days through February 28, 2021. Effective March 1, 2021, the Fund no longer charges redemption fees.
Outlook & Strategy
1
Retirement Class shares commenced operations on March 1, 2016. The performance attributed to the Retirement Class shares prior to that date is that of the Institutional Class shares. Performance prior to March 1, 2016 has not been adjusted to reflect the lower expenses of Retirement Class shares. During this period, Retirement Class shares would have had returns similar to, but potentially higher than, Institutional Class shares due to the fact that Retirement Class shares represent interests in the same portfolio as Institutional Class shares but are subject to lower expenses.
This report contains the current opinions of Shenkman Capital Management, Inc. as of the date of this report and should not be considered as investment advice or a recommendation of any particular security, strategy or investment product. Such opinions are subject to change without notice and securities described herein may no longer be included in, or may at any time be removed from, the Fund’s portfolio. This report is distributed for informational purposes only. Information contained herein has been obtained from sources believed reliable, but not guaranteed.
There is no guarantee that the investment objective of the Fund will be achieved. Fixed income investments are affected by interest rate changes and the creditworthiness of the issues held by the Fund. As interest rates rise, the values of fixed income securities held by the Fund are likely to decrease and reduce the value of the Fund’s portfolio. High-yield investing poses additional credit risk related to lower-rated bonds. For information on the different share classes and the risks associated with an investment in the Fund, please refer to the current prospectus.
39
Harbor High-Yield Bond Fund
Portfolio of Investments—October 31, 2021
SECTOR ALLOCATION (% of investments) - Unaudited
Portfolio of Investments
Value, Cost, and Principal Amounts in Thousands
BANK LOAN OBLIGATIONS—4.0% | |||
Principal Amount | Value | ||
CHEMICALS—0.1% | |||
Sparta U.S. HoldCo LLC | |||
Term Loan | |||
$ | 265 | 4.250% (LIBOR Floor + 3.500) 08/02/20281 | $265 |
CONTAINERS & PACKAGING—0.4% | |||
Mauser Packaging Solutions Holding Co. | |||
Term Loan B | |||
1,603 | 3.337% (1 Month USD LIBOR + 3.250) 04/03/20241 | 1,563 | |
ENTERTAINMENT—0.3% | |||
William Morris Endeavor Entertainment LLC | |||
First-Lien Term Loan B | |||
1,116 | 2.840% (1 Month USD Libor + 2.750) 05/18/20251 | 1,097 | |
HEALTH CARE PROVIDERS & SERVICES—0.2% | |||
ADMI Corp. | |||
Term Loan B2 | |||
765 | 3.625% (LIBOR Floor + 3.125) 12/23/20271 | 759 | |
HEALTH CARE TECHNOLOGY—0.3% | |||
AthenaHealth Inc. | |||
Term Loan | |||
892 | 4.377% (3 Month USD LIBOR + 4.250) 02/11/20261 | 896 | |
Verscend Holding Corp. | |||
Term Loan B | |||
266 | 4.087% (1 Month USD LIBOR + 4.000) 08/27/20251 | 267 | |
1,163 | |||
INSURANCE—0.3% | |||
Asurion LLC | |||
Second Lien Term Loan B4 | |||
716 | 5.337% (1 Month USD LIBOR + 5.250) 01/15/20291 | 714 | |
Term Loan B3 | |||
249 | 5.337% (1 Month USD LIBOR + 5.250) 02/03/20281 | 249 | |
963 | |||
IT SERVICES—0.3% | |||
Intrado Corp. | |||
Term Loan B | |||
610 | 5.000% (LIBOR Floor + 4.000) 10/10/20241 | 600 | |
Optiv Security Inc. | |||
First-Lien Term Loan | |||
564 | 4.250% (LIBOR Floor + 3.250) 02/01/20241 | 559 | |
1,159 |
BANK LOAN OBLIGATIONS—Continued | |||
Principal Amount | Value | ||
MEDIA—0.5% | |||
DIRECTV Financing LLC Term Loan | |||
Term Loan | |||
$ | 525 | 5.750% (LIBOR Floor + 5.000) 08/02/20271 | $526 |
Learfield Communications LLC | |||
Term Loan B | |||
379 | 4.250% (LIBOR Floor + 3.250) 12/01/20231 | 364 | |
Triton Water Holdings Inc. | |||
Term Loan | |||
594 | 4.000% (LIBOR Floor + 3.500) 03/31/20281 | 593 | |
Univision Communications Inc. | |||
Term Loan | |||
203 | 2.760% (LIBOR Floor + 2.750) 03/15/20241 | 203 | |
1,686 | |||
METALS & MINING—0.2% | |||
Grinding Media Inc. | |||
Term Loan B | |||
738 | 4.750% (LIBOR Floor + 4.000) 09/22/20281 | 740 | |
SOFTWARE—1.4% | |||
Finastra USA Inc. | |||
Term Loan B | |||
1,363 | 4.500% (LIBOR Floor + 3.500) 06/13/20241 | 1,357 | |
Term Loan | |||
752 | 7.260% (LIBOR Floor + 7.250) 06/13/20251 | 754 | |
2,111 | |||
Kenan Advantage Group Inc. | |||
Term Loan B1 | |||
524 | 4.500% (LIBOR Floor + 3.750) 03/24/20261 | 525 | |
Project Alpha Intermediate Holding Inc. | |||
Term Loan B | |||
226 | 4.090% (1 Month USD LIBOR + 4.000) 04/26/20241 | 226 | |
RealPage Inc. | |||
First-Lien Term Loan | |||
540 | 3.750% (LIBOR Floor + 3.250) 04/22/20281 | 539 | |
TIBCO Software Inc. | |||
Term Loan B | |||
545 | 3.840% (1 Month USD LIBOR + 3.750) 07/03/20261 | 536 |
40
Harbor High-Yield Bond Fund
Portfolio of Investments—Continued
Value, Cost, and Principal Amounts in Thousands
BANK LOAN OBLIGATIONS—Continued | |||
Principal Amount | Value | ||
SOFTWARE—Continued | |||
Second-Lien Term Loan | |||
$ | 1,151 | 7.340% (1 Month USD LIBOR + 7.250) 03/04/20281 | $1,156 |
1,692 | |||
5,093 | |||
TOTAL BANK LOAN OBLIGATIONS | |||
(Cost $14,402) | 14,488 | ||
CONVERTIBLE BONDS—5.3% | |||
AEROSPACE & DEFENSE—0.0% | |||
Parsons Corp. | |||
171 | 0.250%—08/15/2025 | 174 | |
AIRLINES—0.2% | |||
Jetblue Airways Corp. | |||
388 | 0.500%—04/01/20262 | 374 | |
Spirit Airlines Inc. | |||
387 | 1.000%—05/15/2026 | 350 | |
724 | |||
AUTOMOBILES—0.1% | |||
Ford Motor Co. | |||
221 | 0.000%—03/15/20262,3 | 263 | |
BIOTECHNOLOGY—0.3% | |||
BioMarin Pharmaceutical Inc. | |||
976 | 1.250%—05/15/2027 | 987 | |
CONSUMER FINANCE—0.0% | |||
LendingTree Inc. | |||
200 | 0.500%—07/15/2025 | 172 | |
DIVERSIFIED CONSUMER SERVICES—0.4% | |||
Chegg Inc. | |||
904 | 0.000%—09/01/20263 | 849 | |
Stride Inc. | |||
548 | 1.125%—09/01/2027 | 550 | |
1,399 | |||
ENTERTAINMENT—0.2% | |||
Zynga Inc. | |||
558 | 0.000%—12/15/20262,3 | 539 | |
HEALTH CARE EQUIPMENT & SUPPLIES—0.5% | |||
Haemonetics Corp. | |||
1,032 | 0.000%—03/01/20262,3 | 906 | |
Nuvasive Inc. | |||
1,038 | 0.375%—03/15/2025 | 984 | |
94 | 1.000%—06/01/2023 | 94 | |
1,078 | |||
1,984 | |||
HOTELS, RESTAURANTS & LEISURE—0.5% | |||
DraftKings Inc. | |||
1,271 | 0.000%—03/15/20282,3 | 1,114 | |
The Cheesecake Factory Inc. | |||
567 | 0.375%—06/15/2026 | 517 | |
1,631 |
CONVERTIBLE BONDS—Continued | |||
Principal Amount | Value | ||
INTERACTIVE MEDIA & SERVICES—1.0% | |||
Liberty Tripadvisor Holdings Inc. | |||
$ | 922 | 0.500%—06/30/20512 | $780 |
Spotify USA Inc. | |||
1,187 | 0.000%—03/15/20262,3 | 1,131 | |
Tripadvisor Inc. | |||
823 | 0.250%—04/01/20262 | 740 | |
Twitter Inc. | |||
1,077 | 0.000%—03/15/20262,3 | 993 | |
3,644 | |||
INTERNET & DIRECT MARKETING RETAIL—0.2% | |||
Wayfair Inc. | |||
715 | 0.625%—10/01/2025 | 708 | |
MEDIA—0.3% | |||
Cable One Inc. | |||
555 | 0.000%—03/15/20262,3 | 529 | |
Dish Network Corp. | |||
704 | 3.375%—08/15/2026 | 719 | |
1,248 | |||
SEMICONDUCTORS & SEMICONDUCTOR EQUIPMENT—0.2% | |||
Enphase Energy Inc. | |||
563 | 0.000%—03/01/20262,3 | 612 | |
SOFTWARE—1.0% | |||
Alarm.Com Holdings Inc. | |||
400 | 0.000%—01/15/20262,3 | 369 | |
Bentley Systems Inc. | |||
569 | 0.375%—07/01/20272 | 578 | |
Envestnet Inc. | |||
350 | 0.750%—08/15/20252 | 359 | |
New Relic Inc. | |||
158 | 0.500%—05/01/2023 | 166 | |
RingCentral Inc. | |||
1,021 | 0.000%—03/01/2025-03/15/20263 | 1,001 | |
Splunk Inc. | |||
1,232 | 1.125%—06/15/2027 | 1,293 | |
3,766 | |||
SPECIALTY RETAIL—0.4% | |||
Liberty Interactive LLC | |||
1,675 | 3.750%—02/15/2030 | 1,296 | |
TOTAL CONVERTIBLE BONDS | |||
(Cost $19,244) | 19,147 | ||
CORPORATE BONDS & NOTES—88.2% | |||
AEROSPACE & DEFENSE—2.0% | |||
Howmet Aerospace Inc. | |||
217 | 5.900%—02/01/2027 | 249 | |
341 | 5.950%—02/01/2037 | 411 | |
7 | 6.875%—05/01/2025 | 8 | |
668 | |||
TransDigm Inc. | |||
1,748 | 6.250%—03/15/20262 | 1,827 | |
1,185 | 6.375%—06/15/2026 | 1,227 | |
1,145 | 8.000%—12/15/20252 | 1,219 | |
4,273 |
41
Harbor High-Yield Bond Fund
Portfolio of Investments—Continued
Value, Cost, and Principal Amounts in Thousands
CORPORATE BONDS & NOTES—Continued | |||
Principal Amount | Value | ||
AEROSPACE & DEFENSE—Continued | |||
TransDigm UK Holdings plc | |||
$ | 1,245 | 6.875%—05/15/2026 | $1,313 |
Triumph Group Inc. | |||
220 | 7.750%—08/15/2025 | 224 | |
696 | 8.875%—06/01/20242 | 767 | |
991 | |||
7,245 | |||
AIRLINES—0.6% | |||
American Airlines Inc./AAdvantage Loyalty IP Ltd. | |||
431 | 5.500%—04/20/20262 | 453 | |
873 | 5.750%—04/20/20292 | 940 | |
1,393 | |||
Mileage Plus Holdings LLC / Mileage Plus Intellectual Property Assets Ltd. | |||
492 | 6.500%—06/20/20272 | 536 | |
Western Global Airlines LLC | |||
318 | 10.375%—08/15/20252 | 354 | |
2,283 | |||
AUTO COMPONENTS—1.7% | |||
Allison Transmission Inc. | |||
592 | 3.750%—01/30/20312 | 570 | |
American Axle + MFG Inc. Co. | |||
678 | 5.000%—10/01/2029 | 649 | |
Dana Financing Luxembourg Sarl | |||
777 | 5.750%—04/15/20252 | 801 | |
Goodyear Tire & Rubber Co. | |||
523 | 5.000%—05/31/2026 | 536 | |
985 | 5.000%—07/15/20292 | 1,040 | |
191 | 5.250%—04/30/2031 | 205 | |
11 | 5.250%—07/15/20312 | 12 | |
137 | 5.625%—04/30/2033 | 147 | |
1,115 | 9.500%—05/31/2025 | 1,217 | |
3,157 | |||
Panther BF Aggregator 2 LP / Panther Finance Co. Inc. | |||
146 | 6.250%—05/15/20262 | 153 | |
172 | 8.500%—05/15/20272 | 183 | |
336 | |||
Tenneco Inc. | |||
688 | 5.125%—04/15/20292 | 683 | |
6,196 | |||
AUTOMOBILES—2.7% | |||
Ford Motor Co. | |||
607 | 4.750%—01/15/2043 | 664 | |
376 | 5.291%—12/08/2046 | 432 | |
571 | 8.500%—04/21/2023 | 627 | |
597 | 9.000%—04/22/2025 | 718 | |
2,441 | |||
Ford Motor Credit Co. LLC | |||
486 | 3.625%—06/17/2031 | 492 | |
998 | 4.000%—11/13/2030 | 1,043 | |
2,164 | 4.125%—08/17/2027 | 2,299 | |
418 | 5.125%—06/16/2025 | 454 | |
4,288 | |||
Jaguar Land Rover Automotive plc | |||
783 | 5.500%—07/15/20292 | 760 | |
300 | 5.625%—02/01/20232 | 302 |
CORPORATE BONDS & NOTES—Continued | |||
Principal Amount | Value | ||
AUTOMOBILES—Continued | |||
$ | 676 | 5.875%—01/15/20282 | $675 |
676 | 7.750%—10/15/20252 | 729 | |
2,466 | |||
Thor Industries Inc. | |||
413 | 4.000%—10/15/20292 | 410 | |
9,605 | |||
BUILDING PRODUCTS—0.6% | |||
Forterra Finance LLC / FRTA Finance Corp. | |||
713 | 6.500%—07/15/20252 | 761 | |
Masonite International Corp. | |||
453 | 3.500%—02/15/20302 | 443 | |
Standard Industries Inc. | |||
866 | 3.375%—01/15/20312 | 804 | |
2,008 | |||
CAPITAL MARKETS—1.2% | |||
AP Core Holdings II LLC | |||
545 | 6.250% (LIBOR Floor + 5.500) 07/21/2027 | 547 | |
CTR Partnership LP / CareTrust Capital Corp. | |||
580 | 3.875%—06/30/20282 | 589 | |
Global Infrastructure Solutions Inc. | |||
860 | 5.625%—06/01/20292 | 883 | |
GrafTech Finance Inc. | |||
954 | 4.625%—12/15/20282 | 965 | |
Metis Merger Sub LLC | |||
1,014 | 6.500%—05/15/20292 | 1,005 | |
RP Escrow Issuer LLC | |||
445 | 5.250%—12/15/20252 | 446 | |
4,435 | |||
CHEMICALS—4.0% | |||
Ashland LLC Co. | |||
365 | 3.375%—09/01/20312 | 361 | |
Consolidated Energy Finance SA | |||
371 | 5.625%—10/15/20282 | 370 | |
Herens Holdco Sarl | |||
230 | 4.750%—05/15/20282 | 228 | |
Illuminate Buyer LLC / Illuminate Holdings IV Inc. | |||
1,001 | 9.000%—07/01/20282 | 1,083 | |
Ineos Quattro Finance 2 plc | |||
549 | 3.375%—01/15/20262 | 546 | |
LSF HoldCo LLC | |||
876 | 6.625%—10/15/20292 | 878 | |
Methanex Corp. | |||
2,277 | 5.125%—10/15/2027 | 2,405 | |
309 | 5.250%—12/15/2029 | 328 | |
2,733 | |||
Olin Corp. | |||
332 | 9.500%—06/01/20252 | 408 | |
Olympus Water US Holding Corp. | |||
732 | 4.250%—10/01/20282 | 721 | |
678 | 6.250%—10/01/20292 | 677 | |
1,398 | |||
Polar US Borrower LLC / Schenectady International Group Inc. | |||
1,195 | 6.750%—05/15/20262 | 1,192 | |
PolyOne Corp. | |||
456 | 5.750%—05/15/20252 | 477 |
42
Harbor High-Yield Bond Fund
Portfolio of Investments—Continued
Value, Cost, and Principal Amounts in Thousands
CORPORATE BONDS & NOTES—Continued | |||
Principal Amount | Value | ||
CHEMICALS—Continued | |||
Scih Salt Holdings Inc. | |||
$ | 702 | 4.875%—05/01/20282 | $687 |
853 | 6.625%—05/01/20292 | 804 | |
1,491 | |||
SCIL IV LLC / SCIL USA Holdings LLC | |||
354 | 5.375%—11/01/20262 | 357 | |
SPCM SA | |||
614 | 3.375%—03/15/20302 | 601 | |
Trinseo LLC | |||
705 | 5.375%—09/01/20252 | 720 | |
Trinseo Materials Operating SCA / Trinseo Materials Finance Inc. | |||
422 | 5.125%—04/01/20292 | 424 | |
Tronox Inc. | |||
387 | 6.500%—05/01/20252 | 407 | |
WR Grace Holding LLC | |||
861 | 5.625%—08/15/20292 | 871 | |
14,545 | |||
COMMERCIAL SERVICES & SUPPLIES—3.9% | |||
Allied Universal Holdco LLC | |||
1,249 | 6.625%—07/15/20262 | 1,314 | |
1,934 | 9.750%—07/15/20272 | 2,081 | |
3,395 | |||
Covanta Holding Corp. | |||
438 | 5.875%—07/01/2025 | 452 | |
Garda World Security Corp. | |||
2,293 | 9.500%—11/01/20272 | 2,474 | |
GFL Environmental Inc. | |||
879 | 3.500%—09/01/20282 | 876 | |
1,215 | 4.000%—08/01/20282 | 1,186 | |
375 | 4.375%—08/15/20292 | 372 | |
202 | 5.125%—12/15/20262 | 211 | |
2,645 | |||
KAR Auction Services Inc. | |||
1,718 | 5.125%—06/01/20252 | 1,724 | |
LABL Escrow Issuer LLC | |||
371 | 5.875%—11/01/20282 | 374 | |
1,194 | 6.750%—07/15/20262 | 1,236 | |
1,092 | 10.500%—07/15/20272 | 1,156 | |
2,766 | |||
Stericycle Inc. | |||
67 | 3.875%—01/15/20292 | 66 | |
465 | 5.375%—07/15/20242 | 480 | |
546 | |||
14,002 | |||
COMMUNICATIONS EQUIPMENT—0.5% | |||
CommScope Inc. | |||
535 | 6.000%—03/01/20262 | 552 | |
389 | 7.125%—07/01/20282 | 384 | |
936 | |||
CommScope Technologies LLC | |||
454 | 6.000%—06/15/20252 | 450 | |
Plantronics Inc. | |||
429 | 4.750%—03/01/20292 | 395 | |
1,781 |
CORPORATE BONDS & NOTES—Continued | |||
Principal Amount | Value | ||
CONSTRUCTION & ENGINEERING—0.4% | |||
Picasso Finance Sub Inc. | |||
$ | 728 | 6.125%—06/15/20252 | $767 |
VM Consolidated Inc. | |||
538 | 5.500%—04/15/20292 | 546 | |
1,313 | |||
CONSTRUCTION MATERIALS—0.2% | |||
New Enterprise Stone & Lime Co. Inc. | |||
567 | 5.250%—07/15/20282 | 573 | |
Summit Materials LLC / Summit Materials Finance Corp. | |||
239 | 6.500%—03/15/20272 | 250 | |
823 | |||
CONSUMER FINANCE—1.3% | |||
Ally Financial Inc. | |||
491 | 5.750%—11/20/2025 | 558 | |
Cobra AcquisitionCo LLC | |||
499 | 6.375%—11/01/20292 | 494 | |
goeasy Ltd. | |||
434 | 4.375%—05/01/20262 | 443 | |
LFS Topco LLC | |||
304 | 5.875%—10/15/20262 | 313 | |
Navient Corp. | |||
182 | 5.875%—10/25/2024 | 195 | |
636 | 6.500%—06/15/2022 | 655 | |
683 | 6.750%—06/25/2025 | 753 | |
423 | 7.250%—09/25/2023 | 461 | |
2,064 | |||
Navient Corp. MTN4 | |||
201 | 5.500%—01/25/2023 | 210 | |
488 | 5.625%—08/01/2033 | 464 | |
674 | |||
4,546 | |||
CONTAINERS & PACKAGING—1.3% | |||
ARD Finance SA | |||
489 | 6.500%—06/30/20272 | 513 | |
Ardagh Packaging Finance plc | |||
1,043 | 5.250%—04/30/20252 | 1,086 | |
Ball Corp. | |||
228 | 3.125%—09/15/2031 | 222 | |
Cascades Inc. | |||
522 | 5.125%—01/15/20262 | 551 | |
Flex Acquisition Co. Inc. | |||
1,085 | 6.875%—01/15/20252 | 1,097 | |
999 | 7.875%—07/15/20262 | 1,044 | |
2,141 | |||
Sealed Air Corp. | |||
111 | 5.500%—09/15/20252 | 123 | |
4,636 | |||
DIVERSIFIED CONSUMER SERVICES—0.4% | |||
MAV Acquisition Corp. | |||
349 | 5.750%—08/01/20282 | 343 | |
1,182 | 8.000%—08/01/20292 | 1,152 | |
1,495 | |||
DIVERSIFIED TELECOMMUNICATION SERVICES—2.5% | |||
Altice Financing SA | |||
943 | 5.750%—08/15/20292 | 929 |
43
Harbor High-Yield Bond Fund
Portfolio of Investments—Continued
Value, Cost, and Principal Amounts in Thousands
CORPORATE BONDS & NOTES—Continued | |||
Principal Amount | Value | ||
DIVERSIFIED TELECOMMUNICATION SERVICES—Continued | |||
CenturyLink Inc. | |||
$ | 184 | 5.125%—12/15/20262 | $189 |
1,048 | 6.750%—12/01/2023 | 1,151 | |
437 | 6.875%—01/15/2028 | 487 | |
1,827 | |||
Connect Finco Sarl / Connect US Finco LLC | |||
1,503 | 6.750%—10/01/20262 | 1,561 | |
Consolidated Communications Inc. | |||
561 | 6.500%—10/01/20282 | 598 | |
Frontier Communications Holdings LLC | |||
228 | 6.000%—01/15/20302 | 229 | |
Iliad Holding SAS | |||
681 | 6.500%—10/15/20262 | 703 | |
Level 3 Financing Inc. | |||
264 | 3.750%—07/15/20292 | 250 | |
Lumen Technologies Inc. | |||
199 | 4.500%—01/15/20292 | 193 | |
586 | 5.375%—06/15/20292 | 589 | |
782 | |||
Northwest Fiber LLC / Northwest Fiber Finance Sub Inc. | |||
276 | 4.750%—04/30/20272 | 270 | |
255 | 6.000%—02/15/20282 | 245 | |
515 | |||
Telecom Italia Capital SA | |||
967 | 6.000%—09/30/2034 | 1,077 | |
145 | 6.375%—11/15/2033 | 167 | |
172 | 7.721%—06/04/2038 | 219 | |
1,463 | |||
8,857 | |||
ELECTRIC UTILITIES—1.4% | |||
NRG Energy Inc. | |||
1,359 | 3.875%—02/15/20322 | 1,334 | |
1,071 | 5.250%—06/15/20292 | 1,142 | |
2,476 | |||
Vistra Operations Co. LLC | |||
1,115 | 4.375%—05/01/20292 | 1,105 | |
699 | 5.000%—07/31/20272 | 717 | |
455 | 5.500%—09/01/20262 | 469 | |
304 | 5.625%—02/15/20272 | 314 | |
2,605 | |||
5,081 | |||
ELECTRICAL EQUIPMENT—0.3% | |||
Clarios Global LP | |||
235 | 6.750%—05/15/20252 | 248 | |
Sensata Technologies Inc. | |||
670 | 4.375%—02/15/20302 | 708 | |
956 | |||
ENERGY EQUIPMENT & SERVICES—1.0% | |||
Archrock Partners LP / Archrock Partners Finance Corp. | |||
696 | 6.250%—04/01/20282 | 721 | |
Precision Drilling Corp. | |||
275 | 6.875%—01/15/20292 | 284 | |
Transocean Phoenix 2 Ltd. | |||
166 | 7.750%—10/15/20242 | 170 |
CORPORATE BONDS & NOTES—Continued | |||
Principal Amount | Value | ||
ENERGY EQUIPMENT & SERVICES—Continued | |||
Transocean Poseidon Ltd. | |||
$ | 479 | 6.875%—02/01/20272 | $479 |
Transocean Sentry Ltd. | |||
248 | 5.375%—05/15/20232 | 244 | |
USA Compression Partners LP / USA Compression Finance Corp. | |||
336 | 6.875%—09/01/2027 | 350 | |
Weatherford International Ltd. | |||
269 | 6.500%—09/15/20282 | 284 | |
903 | 8.625%—04/30/20302 | 929 | |
1,213 | |||
3,461 | |||
ENTERTAINMENT—1.1% | |||
Lions Gate Capital Holdings LLC | |||
1,077 | 5.500%—04/15/20292 | 1,103 | |
Live Nation Entertainment Inc. | |||
249 | 4.750%—10/15/20272 | 254 | |
431 | 5.625%—03/15/20262 | 446 | |
700 | |||
Netflix Inc. | |||
553 | 6.375%—05/15/2029 | 698 | |
Playtika Holding Corp. | |||
631 | 4.250%—03/15/20292 | 633 | |
Roblox Corp. | |||
934 | 3.875%—05/01/20302 | 932 | |
4,066 | |||
EQUITY REAL ESTATE INVESTMENT TRUSTS (REITs)—2.1% | |||
American Finance Trust Inc. / American Finance Operating Partner LP | |||
825 | 4.500%—09/30/20282 | 826 | |
Diversified Healthcare Trust | |||
277 | 4.375%—03/01/2031 | 268 | |
314 | 9.750%—06/15/2025 | 342 | |
610 | |||
Iron Mountain Inc. | |||
1,223 | 5.625%—07/15/20322 | 1,304 | |
MPT Operating Partnership LP / MPT Finance Corp. | |||
744 | 5.250%—08/01/2026 | 767 | |
RLJ Lodging Trust LP | |||
434 | 3.750%—07/01/20262 | 439 | |
531 | 4.000%—09/15/20292 | 531 | |
970 | |||
Service Properties Trust | |||
260 | 3.950%—01/15/2028 | 242 | |
447 | 4.350%—10/01/2024 | 451 | |
102 | 4.375%—02/15/2030 | 96 | |
137 | 4.500%—06/15/2023 | 140 | |
99 | 4.650%—03/15/2024 | 100 | |
546 | 4.950%—02/15/2027 | 539 | |
176 | 5.000%—08/15/2022 | 177 | |
341 | 5.500%—12/15/2027 | 357 | |
421 | 7.500%—09/15/2025 | 466 | |
2,568 | |||
Uniti Group LP / Uniti Fiber Holdings Inc. / CSL Capital LLC | |||
670 | 7.875%—02/15/20252 | 705 | |
7,750 |
44
Harbor High-Yield Bond Fund
Portfolio of Investments—Continued
Value, Cost, and Principal Amounts in Thousands
CORPORATE BONDS & NOTES—Continued | |||
Principal Amount | Value | ||
FOOD & STAPLES RETAILING—0.9% | |||
Albertsons Companies LLC | |||
$ | 664 | 4.625%—01/15/20272 | $696 |
614 | 4.875%—02/15/20302 | 659 | |
206 | 5.875%—02/15/20282 | 219 | |
1,389 | 7.500%—03/15/20262 | 1,498 | |
3,072 | |||
FOOD PRODUCTS—1.3% | |||
B&G Foods Inc. | |||
497 | 5.250%—04/01/2025 | 508 | |
Kraft Heinz Foods Co. | |||
94 | 3.750%—04/01/2030 | 102 | |
522 | 3.875%—05/15/2027 | 566 | |
1,244 | 4.250%—03/01/2031 | 1,406 | |
10 | 4.375%—06/01/2046 | 12 | |
701 | 5.200%—07/15/2045 | 893 | |
522 | 5.500%—06/01/2050 | 700 | |
3,679 | |||
Lamb Weston Holdings Inc. | |||
229 | 4.125%—01/31/20302 | 229 | |
328 | 4.375%—01/31/20322 | 329 | |
558 | |||
4,745 | |||
GAS UTILITIES—0.3% | |||
AmeriGas Partners LP | |||
837 | 5.750%—05/20/2027 | 937 | |
77 | 5.875%—08/20/2026 | 86 | |
1,023 | |||
HEALTH CARE EQUIPMENT & SUPPLIES—0.7% | |||
180 Medical Inc. | |||
235 | 3.875%—10/15/20292 | 237 | |
Mozart Debt Merger Sub Inc. | |||
355 | 3.875%—04/01/20292 | 354 | |
1,504 | 5.250%—10/01/20292 | 1,528 | |
1,882 | |||
Teleflex Inc. | |||
319 | 4.250%—06/01/20282 | 328 | |
2,447 | |||
HEALTH CARE PROVIDERS & SERVICES—6.0% | |||
Acadia Healthcare Co. Inc. | |||
155 | 5.500%—07/01/20282 | 162 | |
AHP Health Partners Inc. | |||
531 | 5.750%—07/15/20292 | 534 | |
Catalent Pharma Solutions Inc. | |||
643 | 5.000%—07/15/20272 | 665 | |
Centene Corp. | |||
731 | 2.450%—07/15/2028 | 729 | |
361 | 2.500%—03/01/2031 | 352 | |
158 | 2.625%—08/01/2031 | 156 | |
1,652 | 3.000%—10/15/2030 | 1,681 | |
371 | 4.625%—12/15/2029 | 401 | |
3,319 | |||
DaVita Inc. | |||
352 | 3.750%—02/15/20312 | 334 | |
Global Medical Response Inc. | |||
850 | 6.500%—10/01/20252 | 844 |
CORPORATE BONDS & NOTES—Continued | |||
Principal Amount | Value | ||
HEALTH CARE PROVIDERS & SERVICES—Continued | |||
HCA Inc. | |||
$ | 478 | 5.625%—09/01/2028 | $561 |
301 | 5.875%—02/01/2029 | 359 | |
1,424 | 7.690%—06/15/2025 | 1,711 | |
714 | 8.360%—04/15/2024 | 828 | |
3,459 | |||
HCA Inc. MTN4 | |||
988 | 7.580%—09/15/2025 | 1,193 | |
LifePoint Health Inc. | |||
118 | 5.375%—01/15/20292 | 116 | |
1,043 | 6.750%—04/15/20252 | 1,094 | |
1,210 | |||
ModivCare Inc. | |||
390 | 5.875%—11/15/20252 | 410 | |
Molina Healthcare Inc. | |||
710 | 3.875%—11/15/20302 | 733 | |
Option Care Health Inc. | |||
818 | 4.375%—10/31/20292 | 827 | |
Regionalcare Hospital Partners Holdings Inc. / LifePoint Health Inc. | |||
2,330 | 9.750%—12/01/20262 | 2,461 | |
Surgery Center Holdings Inc. | |||
918 | 6.750%—07/01/20252 | 935 | |
2,569 | 10.000%—04/15/20272 | 2,761 | |
3,696 | |||
Tenet Healthcare Corp. | |||
275 | 6.125%—10/01/20282 | 289 | |
761 | 6.250%—02/01/20272 | 792 | |
622 | 6.750%—06/15/2023 | 669 | |
1,750 | |||
21,597 | |||
HEALTH CARE TECHNOLOGY—2.2% | |||
Change Healthcare Holdings LLC | |||
2,664 | 5.750%—03/01/20252 | 2,688 | |
MPH Acquisition Holdings Inc. | |||
880 | 5.500%—09/01/20282 | 875 | |
Verscend Escrow Corp. | |||
4,182 | 9.750%—08/15/20262 | 4,435 | |
7,998 | |||
HOTELS, RESTAURANTS & LEISURE—5.9% | |||
Aramark Services Inc. | |||
1,498 | 6.375%—05/01/20252 | 1,578 | |
Boyd Gaming Corp. | |||
271 | 8.625%—06/01/20252 | 292 | |
Caesars Entertainment Inc. | |||
171 | 4.625%—10/15/20292 | 172 | |
CEC Entertainment LLC | |||
907 | 6.750%—05/01/20262 | 908 | |
Colt Merger Sub Inc. | |||
2,118 | 6.250%—07/01/20252 | 2,231 | |
1,328 | 8.125%—07/01/20272 | 1,489 | |
3,720 | |||
International Game Technology plc | |||
407 | 4.125%—04/15/20262 | 419 | |
IRB Holding Corp. | |||
577 | 6.750%—02/15/20262 | 591 | |
670 | 7.000%—06/15/20252 | 708 | |
1,299 |
45
Harbor High-Yield Bond Fund
Portfolio of Investments—Continued
Value, Cost, and Principal Amounts in Thousands
CORPORATE BONDS & NOTES—Continued | |||
Principal Amount | Value | ||
HOTELS, RESTAURANTS & LEISURE—Continued | |||
Marriott Ownership Resorts Inc. | |||
$ | 319 | 6.125%—09/15/20252 | $335 |
MGM Growth Properties Operating Partnership LP / MGP Finance Co-Issuer Inc. | |||
81 | 5.750%—02/01/2027 | 93 | |
MGM Resorts International | |||
286 | 4.750%—10/15/2028 | 298 | |
568 | 5.500%—04/15/2027 | 613 | |
1,664 | 7.750%—03/15/2022 | 1,703 | |
2,614 | |||
NCL Corp. Ltd. | |||
705 | 10.250%—02/01/20262 | 811 | |
New Red Finance Inc. | |||
300 | 3.875%—01/15/20282 | 300 | |
Premier Entertainment Sub LLC / Premier Entertainment Finance Corp. | |||
368 | 5.625%—09/01/20292 | 375 | |
335 | 5.875%—09/01/20312 | 342 | |
717 | |||
Royal Caribbean Cruises Ltd. | |||
881 | 5.500%—04/01/20282 | 898 | |
861 | 10.875%—06/01/20232 | 964 | |
1,862 | |||
Scientific Games International Inc. | |||
567 | 5.000%—10/15/20252 | 584 | |
1,353 | 8.250%—03/15/20262 | 1,436 | |
1,066 | 8.625%—07/01/20252 | 1,152 | |
3,172 | |||
Vail Resorts Inc. | |||
393 | 6.250%—05/15/20252 | 414 | |
Viking Ocean Cruises Ship VII Ltd. | |||
229 | 5.625%—02/15/20292 | 228 | |
VOC Escrow Ltd. | |||
776 | 5.000%—02/15/20282 | 771 | |
Wyndham Destinations Inc. | |||
351 | 5.650%—04/01/2024 | 381 | |
513 | 6.625%—07/31/20262 | 573 | |
954 | |||
Yum! Brands Inc. | |||
637 | 7.750%—04/01/20252 | 678 | |
21,337 | |||
HOUSEHOLD DURABLES—0.6% | |||
LGI Homes Inc. | |||
711 | 4.000%—07/15/20292 | 692 | |
M/I Homes Inc. | |||
649 | 3.950%—02/15/20302 | 642 | |
Meritage Homes Corp. | |||
107 | 3.875%—04/15/20292 | 111 | |
Taylor Morrison Communities Inc. | |||
342 | 5.125%—08/01/20302 | 363 | |
277 | 5.875%—06/15/20272 | 310 | |
673 | |||
2,118 |
CORPORATE BONDS & NOTES—Continued | |||
Principal Amount | Value | ||
HOUSEHOLD PRODUCTS—0.5% | |||
PetSmart Inc. / PetSmart Finance Corp. | |||
$ | 1,017 | 4.750%—02/15/20282 | $1,046 |
840 | 7.750%—02/15/20292 | 909 | |
1,955 | |||
INDEPENDENT POWER AND RENEWABLE ELECTRICITY PRODUCERS—0.5% | |||
Calpine Corp. | |||
462 | 3.750%—03/01/20312 | 444 | |
Nextera Energy Operating Partners LP | |||
568 | 4.250%—07/15/20242 | 602 | |
NRG Energy Inc. | |||
244 | 6.625%—01/15/2027 | 253 | |
Talen Energy Supply LLC | |||
244 | 6.625%—01/15/20282 | 231 | |
314 | 7.625%—06/01/20282 | 301 | |
532 | |||
1,831 | |||
INSURANCE—1.3% | |||
Acrisure Finance Inc. | |||
345 | 6.000%—08/01/20292 | 339 | |
841 | 7.000%—11/15/20252 | 851 | |
696 | 10.125%—08/01/20262 | 770 | |
1,960 | |||
GTCR AP Finance Inc. | |||
649 | 8.000%—05/15/20272 | 684 | |
Hub International Ltd. | |||
1,528 | 7.000%—05/01/20262 | 1,577 | |
NFP Corp. | |||
503 | 6.875%—08/15/20282 | 512 | |
4,733 | |||
INTERACTIVE MEDIA & SERVICES—0.8% | |||
Go Daddy Operating Co. LLC / GD Finance Co. Inc. | |||
150 | 3.500%—03/01/20292 | 145 | |
Rackspace Technology Global Inc. | |||
537 | 3.500%—02/15/20282 | 514 | |
Tripadvisor Inc. | |||
921 | 7.000%—07/15/20252 | 975 | |
Twitter Inc. | |||
1,183 | 3.875%—12/15/20272 | 1,246 | |
2,880 | |||
INTERNET & DIRECT MARKETING RETAIL—0.5% | |||
QVC Inc. | |||
253 | 4.375%—09/01/2028 | 259 | |
1,247 | 5.450%—08/15/2034 | 1,305 | |
256 | 5.950%—03/15/2043 | 267 | |
1,831 | |||
IT SERVICES—1.4% | |||
Conduent Business Services LLC / Conduent State & Local Solutions Inc. | |||
575 | 6.000%—11/01/20292 | 574 | |
Granite Merger Sub 2 Inc. | |||
580 | 11.000%—07/15/20272 | 662 | |
MoneyGram International Inc. | |||
529 | 5.375%—08/01/20262 | 531 |
46
Harbor High-Yield Bond Fund
Portfolio of Investments—Continued
Value, Cost, and Principal Amounts in Thousands
CORPORATE BONDS & NOTES—Continued | |||
Principal Amount | Value | ||
IT SERVICES—Continued | |||
Sabre GLBL Inc. | |||
$ | 400 | 7.375%—09/01/20252 | $426 |
856 | 9.250%—04/15/20252 | 990 | |
1,416 | |||
Square Inc. | |||
335 | 2.750%—06/01/20262 | 339 | |
1,067 | 3.500%—06/01/20312 | 1,095 | |
1,434 | |||
Twilio Inc. | |||
333 | 3.875%—03/15/2031 | 336 | |
4,953 | |||
LEISURE PRODUCTS—0.2% | |||
Wyndham Destinations Inc. | |||
499 | 6.000%—04/01/2027 | 543 | |
LIFE SCIENCES TOOLS & SERVICES—0.9% | |||
Arches Buyer Inc. | |||
344 | 6.125%—12/01/20282 | 348 | |
Avantor Funding Inc. | |||
724 | 3.875%—11/01/20292 | 725 | |
344 | 4.625%—07/15/20282 | 357 | |
1,082 | |||
IQVIA Inc. | |||
701 | 5.000%—05/15/20272 | 727 | |
Jaguar Holding Co II / PPD Development LP | |||
835 | 5.000%—06/15/20282 | 897 | |
Syneos Health Inc. | |||
73 | 3.625%—01/15/20292 | 72 | |
3,126 | |||
MACHINERY—0.7% | |||
Colfax Corp. | |||
200 | 6.375%—02/15/20262 | 208 | |
EnPro Industries Inc. | |||
585 | 5.750%—10/15/2026 | 613 | |
OT Merger Corp. | |||
942 | 7.875%—10/15/20292 | 929 | |
Vertical U.S. Newco Inc. | |||
771 | 5.250%—07/15/20272 | 786 | |
2,536 | |||
MEDIA—10.1% | |||
Altice France Holding SA | |||
775 | 10.500%—05/15/20272 | 841 | |
Altice France SA | |||
321 | 5.125%—07/15/20292 | 313 | |
587 | 5.500%—10/15/20292 | 576 | |
6,552 | 8.125%—02/01/20272 | 7,052 | |
7,941 | |||
AMC Networks Inc. | |||
1,105 | 4.250%—02/15/2029 | 1,090 | |
177 | 4.750%—08/01/2025 | 181 | |
1,271 | |||
Audacy Capital Corp. | |||
447 | 6.750%—03/31/20292 | 444 | |
CCO Holdings LLC / CCO Holdings Capital Corp. | |||
1,505 | 4.250%—01/15/20342 | 1,462 | |
380 | 4.500%—06/01/20332 | 379 |
CORPORATE BONDS & NOTES—Continued | |||
Principal Amount | Value | ||
MEDIA—Continued | |||
$ | 752 | 5.375%—06/01/20292 | $809 |
663 | 5.500%—05/01/20262 | 686 | |
3,336 | |||
CSC Holdings LLC | |||
639 | 3.375%—02/15/20312 | 583 | |
443 | 4.500%—11/15/20312 | 430 | |
1,158 | 5.750%—01/15/20302 | 1,144 | |
1,127 | 6.500%—02/01/20292 | 1,210 | |
3,367 | |||
Cumulus Media New Holdings Inc. | |||
357 | 6.750%—07/01/20262 | 372 | |
Diamond Sports Group LLC / Diamond Sports Finance Co. | |||
910 | 5.375%—08/15/20262 | 516 | |
DIRECTV Holdings LLC / DIRECTV Financing Co. Inc. | |||
604 | 5.875%—08/15/20272 | 627 | |
DISH DBS Corp. | |||
1,224 | 5.125%—06/01/2029 | 1,180 | |
1,094 | 7.750%—07/01/2026 | 1,217 | |
2,397 | |||
Entercom Media Corp. | |||
129 | 6.500%—05/01/20272 | 129 | |
Gray Television Inc. | |||
1,153 | 5.875%—07/15/20262 | 1,190 | |
113 | 7.000%—05/15/20272 | 121 | |
1,311 | |||
Hughes Satellite Systems Corp. | |||
335 | 5.250%—08/01/2026 | 374 | |
954 | 6.625%—08/01/2026 | 1,083 | |
1,457 | |||
Meredith Corp. | |||
562 | 6.500%—07/01/2025 | 600 | |
223 | 6.875%—02/01/2026 | 232 | |
832 | |||
Midas OPCO Holdings LLC | |||
536 | 5.625%—08/15/20292 | 547 | |
Nexstar Broadcasting Inc. | |||
298 | 5.625%—07/15/20272 | 315 | |
Radiate Holdco LLC / Radiate Finance Inc. | |||
619 | 4.500%—09/15/20262 | 630 | |
202 | 6.500%—09/15/20282 | 202 | |
832 | |||
Sirius XM Radio Inc. | |||
165 | 3.125%—09/01/20262 | 166 | |
1,092 | 3.875%—09/01/20312 | 1,050 | |
1,292 | 4.000%—07/15/20282 | 1,303 | |
2,519 | |||
SSL Robotics LLC | |||
1,352 | 9.750%—12/31/20232 | 1,462 | |
Tegna Inc. | |||
485 | 4.750%—03/15/20262 | 505 | |
Telesat Canada / Telesat LLC | |||
1,209 | 4.875%—06/01/20272 | 1,083 | |
462 | 5.625%—12/06/20262 | 432 | |
1,252 | 6.500%—10/15/20272 | 1,018 | |
2,533 |
47
Harbor High-Yield Bond Fund
Portfolio of Investments—Continued
Value, Cost, and Principal Amounts in Thousands
CORPORATE BONDS & NOTES—Continued | |||
Principal Amount | Value | ||
MEDIA—Continued | |||
Univision Communications Inc. | |||
$ | 456 | 6.625%—06/01/20272 | $494 |
UPC Broadband Finco BV | |||
99 | 4.875%—07/15/20312 | 101 | |
Viasat Inc. | |||
2,124 | 5.625%—09/15/20252 | 2,157 | |
336 | 6.500%—07/15/20282 | 353 | |
2,510 | |||
36,659 | |||
METALS & MINING—1.4% | |||
Constellium SE | |||
361 | 5.875%—02/15/20262 | 367 | |
FMG Resources August 2006 Pty Ltd. | |||
1,882 | 4.375%—04/01/20312 | 1,908 | |
930 | 4.500%—09/15/20272 | 973 | |
506 | 5.125%—05/15/20242 | 540 | |
3,421 | |||
Freeport-McMoRan Inc. | |||
247 | 5.400%—11/14/2034 | 302 | |
862 | 5.450%—03/15/2043 | 1,086 | |
1,388 | |||
5,176 | |||
MORTGAGE REAL ESTATE INVESTMENT TRUSTS (REITs)—0.1% | |||
Blackstone Mortgage Trust Inc. | |||
401 | 3.750%—01/15/20272 | 399 | |
OIL, GAS & CONSUMABLE FUELS—10.5% | |||
Aethon United BR LP / Aethon United Finance Corp. | |||
649 | 8.250%—02/15/20262 | 698 | |
Antero Midstream Partners LP / Antero Midstream Finance Corp. | |||
843 | 5.750%—03/01/2027-01/15/20282 | 876 | |
664 | 7.875%—05/15/20262 | 727 | |
1,603 | |||
Buckeye Partners LP | |||
350 | 3.950%—12/01/2026 | 359 | |
855 | 4.500%—03/01/20282 | 846 | |
134 | 5.850%—11/15/2043 | 132 | |
1,337 | |||
Cheniere Energy Partners LP | |||
1,080 | 3.250%—01/31/20322 | 1,072 | |
Chesapeake Energy Corp. | |||
85 | 5.875%—02/01/20292 | 90 | |
Civitas Resources Inc. | |||
788 | 5.000%—10/15/20262 | 797 | |
CNX Resources Corp. | |||
274 | 6.000%—01/15/20292 | 289 | |
866 | 7.250%—03/14/20272 | 922 | |
1,211 | |||
Colgate Energy Partners III LLC | |||
807 | 5.875%—07/01/20292 | 827 | |
Comstock Resources Inc. | |||
290 | 5.875%—01/15/20302 | 302 | |
Continental Resources Inc. | |||
349 | 4.900%—06/01/2044 | 397 | |
343 | 5.750%—01/15/20312 | 411 | |
808 |
CORPORATE BONDS & NOTES—Continued | |||
Principal Amount | Value | ||
OIL, GAS & CONSUMABLE FUELS—Continued | |||
Crownrock LP / Crownrock Finance Inc. | |||
$ | 230 | 5.000%—05/01/20292 | $237 |
DT Midstream Inc. | |||
80 | 4.125%—06/15/20292 | 81 | |
775 | 4.375%—06/15/20312 | 786 | |
867 | |||
Encino Acquisition Partners Holdings LLC | |||
673 | 8.500%—05/01/20282 | 704 | |
EQM Midstream Partners LP | |||
424 | 4.500%—01/15/20292 | 437 | |
173 | 4.750%—01/15/20312 | 179 | |
643 | 6.500%—07/15/2048 | 766 | |
1,382 | |||
Equities Corp. | |||
586 | 3.900%—10/01/2027 | 626 | |
1,064 | 5.000%—01/15/2029 | 1,184 | |
1,810 | |||
Ferrellgas LP / Ferrellgas Finance Corp. | |||
799 | 5.375%—04/01/20262 | 779 | |
Genesis Energy LP / Genesis Energy Finance Corp. | |||
539 | 7.750%—02/01/2028 | 534 | |
672 | 8.000%—01/15/2027 | 676 | |
1,210 | |||
Gulfport Energy Operating Corp. | |||
540 | 8.000%—05/17/20262 | 599 | |
Hilcorp Energy I LP / Hilcorp Finance Co. | |||
1,104 | 6.000%—02/01/20312 | 1,135 | |
128 | 6.250%—11/01/20282 | 131 | |
1,266 | |||
Magnolia Oil & Gas Operating LLC / Magnolia Oil & Gas Finance Corp. | |||
455 | 6.000%—08/01/20262 | 468 | |
Moss Creek Resources Holdings Inc. | |||
816 | 7.500%—01/15/20262 | 744 | |
511 | 10.500%—05/15/20272 | 507 | |
1,251 | |||
Murphy Oil Corp. | |||
290 | 6.375%—07/15/2028-12/01/2042 | 297 | |
NGL Energy Operating LLC / NGL Energy Finance Corp. | |||
1,777 | 7.500%—02/01/20262 | 1,805 | |
NGL Energy Partners LP | |||
1,091 | 7.500%—11/01/2023 | 1,049 | |
NuStar Logistics LP | |||
593 | 5.750%—10/01/2025 | 635 | |
Oasis Midstream Partners LP / OMP Finance Corp. | |||
836 | 8.000%—04/01/20292 | 909 | |
Occidental Petroleum Corp. | |||
339 | 4.200%—03/15/2048 | 331 | |
616 | 4.300%—08/15/2039 | 620 | |
1,243 | 4.400%—04/15/2046 | 1,259 | |
350 | 5.550%—03/15/2026 | 387 | |
578 | 6.200%—03/15/2040 | 701 | |
219 | 6.450%—09/15/2036 | 279 | |
115 | 8.500%—07/15/2027 | 143 | |
937 | 8.875%—07/15/2030 | 1,271 | |
4,991 | |||
Parkland Corp. | |||
1,109 | 4.500%—10/01/20292 | 1,117 |
48
Harbor High-Yield Bond Fund
Portfolio of Investments—Continued
Value, Cost, and Principal Amounts in Thousands
CORPORATE BONDS & NOTES—Continued | |||
Principal Amount | Value | ||
OIL, GAS & CONSUMABLE FUELS—Continued | |||
Rattler Midstream LP | |||
$ | 382 | 5.625%—07/15/20252 | $400 |
Rockcliff Energy II LLC | |||
524 | 5.500%—10/15/20292 | 538 | |
Sanchez Energy Corp. | |||
3,000 | 0.000%—06/15/2021* | 98 | |
SM Energy Co. | |||
848 | 6.500%—07/15/2028 | 891 | |
88 | 10.000%—01/15/20252 | 98 | |
989 | |||
Southwestern Energy Co. | |||
509 | 5.375%—02/01/20292 | 537 | |
454 | 8.375%—09/15/2028 | 507 | |
1,044 | |||
Summit Midstream Holdings LLC / Summit Midstream Finance Corp. | |||
577 | 8.500%—10/15/20262 | 581 | |
Tallgrass Energy Partners LP / Tallgrass Energy Finance Corp. | |||
1,042 | 6.000%—09/01/20312 | 1,027 | |
595 | 7.500%—10/01/20252 | 644 | |
1,671 | |||
Targa Resources Partners LP / Targa Resources Partners Finance Corp. | |||
244 | 5.500%—03/01/2030 | 268 | |
409 | 6.500%—07/15/2027 | 439 | |
707 | |||
Venture Global Calcasieu Pass LLC | |||
1,047 | 3.875%—08/15/20292 | 1,067 | |
692 | 4.125%—08/15/20312 | 717 | |
1,784 | |||
37,933 | |||
PAPER & FOREST PRODUCTS—0.2% | |||
Glatfelter Corp. | |||
690 | 4.750%—11/15/20292 | 704 | |
PERSONAL PRODUCTS—0.1% | |||
HLF Financing Sarl LLC / Herbalife International Inc. | |||
351 | 4.875%—06/01/20292 | 354 | |
PHARMACEUTICALS—3.0% | |||
Bausch Health Cos. Inc. | |||
40 | 5.250%—02/15/20312 | 36 | |
530 | 5.500%—11/01/20252 | 539 | |
726 | 5.750%—08/15/20272 | 761 | |
1,216 | 6.125%—04/15/20252 | 1,240 | |
1,180 | 6.250%—02/15/20292 | 1,145 | |
2,812 | 9.000%—12/15/20252 | 2,954 | |
6,675 | |||
Catalent Pharma Solutions Inc. | |||
516 | 3.500%—04/01/20302 | 513 | |
Elanco Animal Health Inc. | |||
600 | 5.272%—08/28/2023 | 639 | |
882 | 5.900%—08/28/2028 | 1,032 | |
1,671 | |||
Jazz Securities DAC | |||
613 | 4.375%—01/15/20292 | 631 |
CORPORATE BONDS & NOTES—Continued | |||
Principal Amount | Value | ||
PHARMACEUTICALS—Continued | |||
Teva Pharmaceutical Finance Netherlands III BV | |||
$ | 770 | 3.150%—10/01/2026 | $726 |
514 | 6.000%—04/15/2024 | 540 | |
1,266 | |||
10,756 | |||
PROFESSIONAL SERVICES—0.9% | |||
CoreLogic Inc. | |||
508 | 4.500%—05/01/20282 | 502 | |
Dun + Bradstreet Corp. Co. | |||
494 | 10.250%—02/15/20272 | 531 | |
Nielsen Finance LLC / Nielsen Finance Co. | |||
62 | 4.500%—07/15/20292 | 61 | |
1,220 | 4.750%—07/15/20312 | 1,190 | |
892 | 5.875%—10/01/20302 | 935 | |
2,186 | |||
3,219 | |||
REAL ESTATE MANAGEMENT & DEVELOPMENT—0.9% | |||
Global NET Lease Inc. / Global NET Lease Operating Partnership LP | |||
1,108 | 3.750%—12/15/20272 | 1,096 | |
Kennedy-Wilson Inc. | |||
44 | 4.750%—02/01/2030 | 44 | |
311 | 5.000%—03/01/2031 | 317 | |
361 | |||
MPT Operating Partnership LP / MPT Finance Corp. | |||
1,390 | 3.500%—03/15/2031 | 1,402 | |
Realogy Group LLC / Realogy Co. | |||
92 | 5.750%—01/15/20292 | 96 | |
376 | 7.625%—06/15/20252 | 402 | |
498 | |||
3,357 | |||
ROAD & RAIL—1.1% | |||
Carriage Purchaser Inc. | |||
873 | 7.875%—10/15/20292 | 869 | |
Uber Technologies Inc. | |||
1,114 | 7.500%—05/15/2025-09/15/20272 | 1,197 | |
78 | 8.000%—11/01/20262 | 83 | |
1,280 | |||
XPO Logistics Inc. | |||
1,720 | 6.250%—05/01/20252 | 1,814 | |
3,963 | |||
SOFTWARE—0.6% | |||
Boxer Parent Co. Inc. | |||
461 | 7.125%—10/02/20252 | 492 | |
506 | 9.125%—03/01/20262 | 529 | |
1,021 | |||
Consensus Cloud Solutions Inc. | |||
542 | 6.500%—10/15/20282 | 565 | |
Elastic NV | |||
507 | 4.125%—07/15/20292 | 505 | |
OpenText Corp. | |||
98 | 5.875%—06/01/20262 | 101 | |
Symantec Corp. | |||
107 | 5.000%—04/15/20252 | 108 | |
2,300 |
49
Harbor High-Yield Bond Fund
Portfolio of Investments—Continued
Value, Cost, and Principal Amounts in Thousands
CORPORATE BONDS & NOTES—Continued | |||
Principal Amount | Value | ||
SPECIALTY RETAIL—1.7% | |||
Foot Locker Inc. | |||
$ | 580 | 4.000%—10/01/20292 | $576 |
GAP Inc. | |||
1,006 | 3.625%—10/01/20292 | 987 | |
805 | 3.875%—10/01/20312 | 790 | |
1,777 | |||
L Brands Inc. | |||
265 | 6.694%—01/15/2027 | 301 | |
687 | 6.875%—11/01/2035 | 835 | |
1,136 | |||
Lithia Motors Inc. | |||
480 | 3.875%—06/01/20292 | 498 | |
Magic Mergeco Inc. | |||
1,157 | 7.875%—05/01/20292 | 1,170 | |
Penske Automotive Group Inc. | |||
440 | 3.500%—09/01/2025 | 453 | |
Sonic Automotive Inc. | |||
297 | 4.625%—11/15/20292 | 298 | |
350 | 4.875%—11/15/20312 | 351 | |
649 | |||
6,259 | |||
TECHNOLOGY HARDWARE, STORAGE & PERIPHERALS—1.6% | |||
Dell International LLC / EMC Corp. | |||
1,727 | 7.125%—06/15/20242 | 1,758 | |
Diebold Nixdorf Inc. | |||
309 | 8.500%—04/15/2024 | 309 | |
1,407 | 9.375%—07/15/20252 | 1,518 | |
1,827 | |||
Seagate HDD Cayman Co. | |||
226 | 4.091%—06/01/2029 | 234 | |
617 | 4.125%—01/15/2031 | 627 | |
895 | 5.750%—12/01/2034 | 1,032 | |
1,893 | |||
Western Digital Corp. | |||
408 | 4.750%—02/15/2026 | 448 | |
5,926 | |||
TEXTILES, APPAREL & LUXURY GOODS—0.2% | |||
Hanesbrands Inc. | |||
4 | 4.875%—05/15/20262 | 4 | |
William Carter Co. | |||
807 | 5.500%—05/15/20252 | 846 | |
850 |
CORPORATE BONDS & NOTES—Continued | |||
Principal Amount | Value | ||
THRIFTS & MORTGAGE FINANCE—0.3% | |||
Nationstar Mortgage Holdings Inc. | |||
$ | 215 | 6.000%—01/15/20272 | $225 |
PennyMac Financial Services Inc. | |||
677 | 5.750%—09/15/20312 | 667 | |
Rocket Mortgage LLC / Rocket Mortgage Co.-Issuer Inc. | |||
268 | 4.000%—10/15/20332 | 264 | |
1,156 | |||
TRADING COMPANIES & DISTRIBUTORS—0.3% | |||
Alta Equipment Group Inc. | |||
927 | 5.625%—04/15/20262 | 950 | |
WIRELESS TELECOMMUNICATION SERVICES—1.3% | |||
C&W Senior Financing Designated Activity Company | |||
615 | 6.875%—09/15/20272 | 649 | |
Frontier Communications Holdings LLC | |||
234 | 5.875%—11/01/2029 | 233 | |
LCPR Senior Secured Financing DAC | |||
412 | 6.750%—10/15/20272 | 433 | |
Sprint Capital Corp. | |||
231 | 6.875%—11/15/2028 | 293 | |
1,175 | 8.750%—03/15/2032 | 1,760 | |
2,053 | |||
Sprint Corp. | |||
247 | 7.125%—06/15/2024 | 279 | |
544 | 7.625%—03/01/2026 | 653 | |
932 | |||
T-Mobile USA Inc. | |||
478 | 4.000%—04/15/2022 | 485 | |
4,785 | |||
TOTAL CORPORATE BONDS & NOTES | |||
(Cost $315,469) | 318,555 | ||
TOTAL INVESTMENTS—97.5% | |||
(Cost $349,115) | 352,190 | ||
CASH AND OTHER ASSETS, LESS LIABILITIES—2.5% | 9,205 | ||
TOTAL NET ASSETS—100.0% | $361,395 |
FAIR VALUE MEASUREMENTS
All investments at October 31, 2021 (as disclosed in the preceding Portfolio of Investments) were classified as Level 2. There were no Level 3 investments at October 31, 2021 or 2020.
For more information on valuation inputs and their aggregation into the levels identified above, please refer to the Fair Value Measurements and Disclosures in Note 2 of the accompanying Notes to Financial Statements.
50
Harbor High-Yield Bond Fund
Portfolio of Investments—Continued
* | Security in Default |
1 | Variable or floating rate security; the stated rate represents the rate in effect at October 31, 2021. The variable rate for such securities may be based on the indicated reference rate and spread or on an underlying asset or pool of assets rather than a reference rate and may be determined by current interest rates, prepayments or other financial indicators. |
2 | Securities purchased in a transaction exempt from registration under Rule 144A of the Securities Act of 1933. These securities may be resold in transactions exempt from registration, normally to qualified institutional buyers. The Fund has no right to demand registration of these securities. At October 31, 2021, the aggregate value of these securities was $245,233 or 68% of net assets. |
3 | Zero coupon bond |
4 | MTN after the name of a security stands for Medium Term Note. |
The accompanying notes are an integral part of the Financial Statements.
51
Harbor Money Market Fund
Manager’s Commentary (Unaudited)
Subadviser
BNP Paribas Asset Management USA, Inc.
200 Park Avenue
New York, NY 10166
New York, NY 10166
Portfolio Manager
Kenneth J. O’Donnell, CFA
Since 2003
Since 2003
BNP has subadvised the Fund since 1987.
Investment Objective
The Fund seeks to provide current income while maintaining liquidity and a stable share price of $1.
Management’s Discussion of
Fund Performance
Fund Performance
Market Review
Over the past fiscal year, financial markets grabbled with the economic recovery from the global pandemic. The Democratic Party secured the U.S. presidency with an election win by Joe Biden and the U.S. Congress passed multiple fiscal packages adding stimulus to an economy that was already poised for substantial growth. Bond yields initially rose in the first quarter of 2021 as several COVID-19 vaccines were approved and distributed, bringing the U.S. vaccination rate above 50% by mid-year. However, variants of the virus soon emerged posing serious risks to the reopening of the global economy. Yields fell and equity markets retreated during the summer on reduced expectations of economic growth. As risks from the Delta variant have more recently waned, the Fed began telegraphing a tightening of monetary policy. The most recent meeting confirmed the Fed would begin reducing balance sheet purchases in November. The new average-inflation policy framework, which allows for a periodic overshoot of their 2% inflation target, provides the flexibility for the Fed to remain patient before raising interest rates. The U.S. is currently over 55% vaccinated, lagging other developed countries in Europe, but recent approvals for children is expected to raise the immunity of the population. Despite the setback in the middle of 2021, risk assets have continued the outperformance which began in 2020 as credit spreads tightened to record low levels and equity markets broke to new highs.
As the first step in tightening policy, the Fed will begin gradually tapering monthly purchases of U.S. Treasuries and mortgage-backed securities. Fed Chair Jay Powell indicated that excessive stimulus measures were no longer warranted though interest rates would remain at the zero-lower boundary until additional criteria were met. While Chair Powell and the committee will rely on incoming data to determine the path of normalization, the market expects policy rate increases to begin in the second half of next year. Inflation, which has risen markedly on low base effects and supply chain shortages, is expected to be transitory but has shown signs of being more persistent than expected. Meanwhile, the labor market continues to recover, albeit at a slower pace than expected due to labor shortages. This strong demand for labor has contributed to inflationary pressures given the higher wages needed to attract workers.
After falling to the zero-lower bound in 2020, short-term U.S. Treasury Note yields remained at floor levels throughout most of the past year. Short-term Treasury bill rates temporarily dipped into negative yield territory during the second quarter in response to a technical dynamic in the market. The demand pressures were alleviated in June after the Fed raised the levels of interest on excess reserves in the banking system. The low level of money market yields is a challenge for investors seeking to keep pace with inflation and maintain the purchasing power of their assets. We believe that money market yields will remain near current levels for the next six months as Fed policy remains on-hold, though one-year rates are beginning to rise on tighter monetary policy expectations.
Benchmark 10-year U.S. Treasury note yields climbed throughout the year to finish the period at 1.55%. Two-year yields have more than doubled, breaching the 0.50% level, leading to a flatter yield curve. After steepening earlier in the year, the yield curve flattened. The interest rate differential between 2-year and 10-year US Treasury yields which had soared to 160 bps narrowed to 105 bps.
PerformancE
Harbor Money Market Fund returned 0.03% (Institutional Class) and 0.03% (Administrative Class), while the ICE BofA U.S. 3-Month Treasury Bill Index returned 0.06% during the year ended October 31, 2021. In the stable, low interest rate environment, the Harbor Money Market Fund provided returns consistent with Treasury bills. The duration of the portfolio, a measure of its sensitivity to changes in interest rates, was managed strategically shorter at approximately 40 days to limit the impact of a potential increase in U.S. Treasury Bill yields.
52
Harbor Money Market Fund
Manager’s Commentary—Continued
TOTAL RETURNS
For the periods ended 10/31/2021
1 Year | Annualized | |||||
5 Years | 10 Years | |||||
Harbor Money Market Fund | ||||||
Institutional Class | 0.03% | 0.97% | 0.54% | |||
Administrative Class | 0.03 | 0.88 | 0.50 | |||
Comparative Index | ||||||
ICE BofA U.S. 3-Month Treasury Bill | 0.06% | 1.15% | 0.63% |
Current 7-day subsidizeda SEC yield for period ended 10/31/2021: | Institutional Class: 0.05% | Administrative Class: 0.05% |
Current 7-day unsubsidizedb SEC yield for period ended 10/31/2021: | Institutional Class: (0.25)% | Administrative Class: (0.50)% |
As stated in the Fund’s prospectus dated March 1, 2021, the expense ratios were 0.28% (Net) and 0.39% (Gross) (Institutional Class); 0.53% (Net) and 0.64%(Gross) (Administrative Class). The Adviser has contractually agreed to reduce the management fee to 0.18% through 02/28/2022. Additionally, the Adviser has contractually agreed to the limit the Fund’s operating expenses, excluding interest expense (if any), to 0.28% and 0.53% for the Institutional Class and Administrative Class, respectively through 02/28/2022. The expense ratios in the prospectus may differ from the actual expense ratios for the period disclosed within this report. The expense ratios shown in the prospectus are based on the prior fiscal year, adjusted to reflect changes, if any, in contractual arrangements that occurred prior to the date of the prospectus (or supplement thereto, if applicable).
Performance data shown represents past performance and is no guarantee of future results. Past performance is net of management fees and expenses and reflects reinvested dividends and distributions. Past performance reflects the beneficial effect of any expense waivers or reimbursements, without which returns would have been lower. Investment returns and principal value will fluctuate and when redeemed may be worth more or less than their original cost. Returns for periods less than one year are not annualized. Current performance may be higher or lower and is available through the most recent month end at harborcapital.com or by calling 800-422-1050. Current yield excludes gains and losses as defined by the Securities and Exchange Commission. The current yield more closely reflects the current earnings of the Fund than the total return.
Outlook & Strategy
Going forward, we expect the Fed to complete their asset purchases by mid-2022, followed by subsequent interest rate hikes in the second half of 2022. In our view, persistently higher than expected inflation and a recovering labor market should drive the Fed to begin normalizing policy rates. We believe that real, or inflation-adjusted, economic growth in the U.S. will decelerate as the economic challenges of the pandemic subside. Under this scenario, we would expect the yield curve to flatten as front-end yields adjust to the expected path of monetary policy. While the pace of growth in the U.S. economy is forecasted to slow, we believe growth in 2022 will exceed the trend rate. While the U.S. economic growth rate will depend on periodic volatility from supply chain and labor shortages, the recovery will, in our view, continue to benefit from a rebound in personal expenditures and business investment. This view hinges upon a containment of the COVID-19 virus and subsequent variants in the coming year. While it is concerning that several developing countries have yet to receive adequate supplies, we remain optimistic that the global economy will experience a sustained economic recovery and successfully manage any new challenges from the virus. Along with fiscal support, in our view, a stabilization in prices and the labor market should provide further momentum and positive sentiment for financial markets.
a
Reflects reimbursement or waivers currently in effect
b
Does not reflect reimbursements or waivers currently in effect
This report contains the current opinions of BNP Paribas Asset Management USA, Inc. as of the date of this report and should not be considered as investment advice or a recommendation of any particular security, strategy or investment product. Such opinions are subject to change without notice and securities described herein may no longer be included in, or may at any time be removed from, the Fund’s portfolio. This report is distributed for informational purposes only. Information contained herein has been obtained from sources believed reliable, but not guaranteed.
You could lose money by investing in Harbor Money Market Fund. Although the Fund seeks to preserve the value of your investment at $1.00 per share, it cannot guarantee it will do so. An investment in the Fund is not insured or guaranteed by the Federal Deposit Insurance Corporation or any other government agency. The Fund’s sponsor has no legal obligation to provide financial support to the Fund, and you should not expect that the sponsor will provide financial support to the Fund at any time. For information on the different share classes and the risks associated with an investment in the Fund, please refer to the current prospectus.
53
Harbor Money Market Fund
Portfolio of Investments—October 31, 2021
Investments Allocation (% of Investments) - Unaudited
Portfolio of Investments
Value, Cost, and Principal Amounts in Thousands
GOVERNMENT AGENCY DEBT—8.2%† | |||
(Cost $7,000) | |||
Principal Amount | Value | ||
Federal Home Loan Bank Discount Notes | |||
$ | 7,000 | 0.040%—12/01/2021 | $7,000 |
TREASURY DEBT—91.6%† | |||
U.S. Treasury Bills | |||
11,000 | 0.020%—12/09/2021 | 11,000 | |
9,600 | 0.021%—11/16/2021 | 9,600 | |
7,000 | 0.027%—12/16/2021 | 7,000 | |
11,800 | 0.031%—11/26/2021 | 11,799 | |
3,800 | 0.033%—12/23/2021 | 3,800 | |
10,000 | 0.034%—12/02/2021 | 9,999 |
TREASURY DEBT—Continued | |||
Principal Amount | Value | ||
$ | 10,000 | 0.035%—11/04/2021 | $10,000 |
3,500 | 0.041%—11/18/2021 | 3,500 | |
10,000 | 0.042%—11/12/2021 | 10,000 | |
1,000 | 0.058%—01/06/2022 | 1,000 | |
TOTAL TREASURY DEBT | |||
(Cost $77,698) | 77,698 | ||
TOTAL INVESTMENTS—99.8% | |||
(Cost $84,698) | 84,698 | ||
CASH AND OTHER ASSETS, LESS LIABILITIES—0.2% | 170 | ||
TOTAL NET ASSETS—100.0% | $84,868 |
FAIR VALUE MEASUREMENTS
All investments at October 31, 2021 (as disclosed in the preceding Portfolio of Investments) were classified as Level 2. There were no Level 3 investments at October 31, 2021 or 2020.
For more information on valuation inputs and their aggregation into the levels identified above, please refer to the Fair Value Measurements and Disclosures in Note 2 of the accompanying Notes to Financial Statements.
†
Coupon represents yield to maturity
The accompanying notes are an integral part of the Financial Statements.
54
Harbor Fixed Income Funds
StatementS of Assets and Liabilities—October 31, 2021
(All amounts in thousands, except per share amounts)
Harbor Bond Fund | Harbor Convertible Securities Fund | Harbor Core Bond Fund | Harbor High-Yield Bond Fund | Harbor Money Market Fund | |
ASSETS | |||||
Investments, at identified cost | $1,724,533 | $173,091 | $138,260 | $349,115 | $84,698 |
Investments, at value | $1,754,451 | $190,224 | $141,237 | $352,190 | $84,698 |
Due from broker | 7,185 | — | — | — | — |
Cash | 5,875 | 16,330 | 2,706 | 5,006 | 189 |
Foreign currency, at value (cost: $5,448, $0, $0, $0 and $0) | 5,409 | — | — | — | — |
Receivables for: | |||||
Investments sold | 183,438 | — | — | 4,632 | — |
Foreign currency spot contracts | 18 | — | — | — | — |
Capital shares sold | 366 | 200 | 12 | 218 | 8 |
Interest | 9,011 | 314 | 595 | 4,915 | — |
Unrealized appreciation on open forward currency contracts | 6,365 | — | — | — | — |
Variation margin on futures contracts | 3,814 | — | — | — | — |
Variation margin on centrally cleared swap agreements | 423 | — | — | — | — |
Purchased options, at value (cost: $528, $0, $0, $0 and $0) | 331 | — | — | — | — |
Prepaid registration fees | 26 | 9 | 4 | 35 | 20 |
Other assets | 618 | 32 | 10 | 195 | 25 |
Total Assets | 1,977,330 | 207,109 | 144,564 | 367,191 | 84,940 |
LIABILITIES | |||||
Payables for: | |||||
Due to broker | 2,157 | — | — | — | — |
Investments purchased | 396,894 | 946 | 1,707 | 5,274 | — |
Capital shares reacquired | 720 | 36 | 298 | 106 | 24 |
Written options, at value (premiums received: $622, $0, $0, $0 and $0) | 668 | — | — | — | — |
Reverse repurchase agreements | 3,347 | — | — | — | — |
Variation margin on futures contracts | 3,439 | — | — | — | — |
Unrealized depreciation on open forward currency contracts | 2,344 | — | — | — | — |
Accrued expenses: | |||||
Management fees | 616 | 103 | 41 | 155 | — |
12b-1 fees | 4 | 1 | — | 5 | — |
Transfer agent fees | 106 | 13 | 8 | 23 | — |
Trustees' fees and expenses | 599 | 33 | 5 | 199 | 23 |
Other | 118 | 17 | 17 | 34 | 25 |
Total Liabilities | 411,012 | 1,149 | 2,076 | 5,796 | 72 |
NET ASSETS | $1,566,318 | $205,960 | $142,488 | $361,395 | $84,868 |
Net Assets Consist of: | |||||
Paid-in capital | $1,537,246 | $164,436 | $138,944 | $437,860 | $84,882 |
Total distributable earnings/(loss) | 29,072 | 41,524 | 3,544 | (76,465) | (14) |
$1,566,318 | $205,960 | $142,488 | $361,395 | $84,868 | |
The accompanying notes are an integral part of the Financial Statements.
55
Harbor Bond Fund | Harbor Convertible Securities Fund | Harbor Core Bond Fund | Harbor High-Yield Bond Fund | Harbor Money Market Fund | ||||||
NET ASSET VALUE PER SHARE BY CLASS | ||||||||||
Retirement Class | ||||||||||
Net assets | $172,699 | $41,250 | $36,557 | $83,594 | N/A | |||||
Shares of beneficial interest1 | 14,322 | 3,013 | 3,445 | 8,400 | N/A | |||||
Net asset value per share2 | $12.06 | $13.69 | $10.61 | $9.95 | N/A | |||||
Institutional Class | ||||||||||
Net assets | $1,376,349 | $161,772 | $105,931 | $254,241 | $82,034 | |||||
Shares of beneficial interest1 | 114,041 | 11,823 | 9,981 | 25,547 | 82,034 | |||||
Net asset value per share2 | $12.07 | $13.68 | $10.61 | $9.95 | $1.00 | |||||
Administrative Class | ||||||||||
Net assets | $17,270 | $85 | N/A | $715 | $2,834 | |||||
Shares of beneficial interest1 | 1,430 | 6 | N/A | 72 | 2,834 | |||||
Net asset value per share2 | $12.08 | $13.63 | N/A | $10.00 | $1.00 | |||||
Investor Class | ||||||||||
Net assets | N/A | $2,853 | N/A | $22,845 | N/A | |||||
Shares of beneficial interest1 | N/A | 209 | N/A | 2,287 | N/A | |||||
Net asset value per share2 | N/A | $13.62 | N/A | $9.99 | N/A |
1
Par value $0.01 (unlimited authorizations)
2
Per share amounts can be recalculated to the amounts disclosed herein when total net assets and shares of beneficial interest are not rounded to thousands.
56
Harbor Fixed Income Funds
StatementS of Operations—Year Ended October 31, 2021
(All amounts in thousands)
Harbor Bond Fund | Harbor Convertible Securities Fund | Harbor Core Bond Fund | Harbor High-Yield Bond Fund | Harbor Money Market Fund | |
Investment Income | |||||
Interest | $51,428 | $1,506 | $2,723 | $18,644 | $47 |
Dividends | 1,148 | — | — | — | — |
Consent fee income | — | 5 | — | 13 | — |
Total Investment Income | 52,576 | 1,511 | 2,723 | 18,657 | 47 |
Operating Expenses | |||||
Management fees | 8,314 | 1,201 | 432 | 2,346 | 184 |
12b-1 fees: | |||||
Administrative Class | 44 | — | N/A | 2 | 8 |
Investor Class | N/A | 7 | N/A | 59 | N/A |
Shareholder communications | 71 | 12 | 11 | 24 | 9 |
Custodian fees | 182 | 14 | 20 | 41 | 19 |
Transfer agent fees: | |||||
Retirement Class | 35 | 8 | 7 | 19 | N/A |
Institutional Class | 1,539 | 142 | 93 | 272 | 89 |
Administrative Class | 18 | — | N/A | 1 | 3 |
Investor Class | N/A | 6 | N/A | 50 | N/A |
Professional fees | 66 | 6 | 4 | 13 | 3 |
Trustees' fees and expenses | 63 | 6 | 4 | 14 | 6 |
Registration fees | 71 | 64 | 37 | 66 | 33 |
Miscellaneous | 33 | 10 | 7 | 14 | 7 |
Expenses before interest expense | 10,436 | 1,476 | 615 | 2,921 | 361 |
Interest expense | 7 | — | — | — | — |
Total expenses | 10,443 | 1,476 | 615 | 2,921 | 361 |
Management fees waived | (366) | (92) | — | (360) | (166) |
12b-1 fees waived | — | — | — | — | (8) |
Transfer agent fees waived | (139) | (15) | (10) | (32) | (92) |
Other expenses reimbursed | (1,193) | — | (61) | — | (77) |
Net expenses | 8,745 | 1,369 | 544 | 2,529 | 18 |
Net Investment Income/(Loss) | 43,831 | 142 | 2,179 | 16,128 | 29 |
Net Realized and Change in Net Unrealized Gain/(Loss) on Investment Transactions | |||||
Net realized gain/(loss) on: | |||||
Investments | 9,954 | 27,075 | 514 | 22,501 | — |
Investments sold short | (1,270) | — | — | — | — |
Foreign currency transactions | (5,646) | — | — | — | — |
Futures contracts | 368 | — | — | — | — |
Purchased options | (23) | — | — | — | — |
Written options | 688 | — | — | — | — |
Swap agreements | 1,698 | — | — | — | — |
Change in net unrealized appreciation/(depreciation) on: | |||||
Investments | (33,632) | 4,033 | (2,867) | (949) | — |
Investments sold short | (220) | — | — | — | — |
Forwards currency contracts | 1,547 | — | — | — | — |
Futures contracts | (3,730) | — | — | — | — |
Purchased options | (197) | — | — | — | — |
Written options | (179) | — | — | — | — |
Swap agreements | 2,129 | — | — | — | — |
Translations of assets and liabilities in foreign currencies | (88) | — | — | — | — |
Net gain/(loss) on investment transactions | (28,601) | 31,108 | (2,353) | 21,552 | — |
Net Increase/(Decrease) in Net Assets Resulting from Operations | $15,230 | $31,250 | $(174) | $37,680 | $29 |
The accompanying notes are an integral part of the Financial Statements.
57
Harbor Fixed Income Funds
Statements of Changes In Net Assets
(All amounts in thousands)
Harbor Bond Fund | Harbor Convertible Securities Fund | Harbor Core Bond Fund | ||||
November 1, 2020 through October 31, 2021 | November 1, 2019 through October 31, 2020 | November 1, 2020 through October 31, 2021 | November 1, 2019 through October 31, 2020 | November 1, 2020 through October 31, 2021 | November 1, 2019 through October 31, 2020 | |
INCREASE/(DECREASE) IN NET ASSETS | ||||||
Operations: | ||||||
Net investment income/(loss) | $43,831 | $51,609 | $142 | $797 | $2,179 | $2,357 |
Net realized gain/(loss) on investments | 5,769 | 54,738 | 27,075 | 16,732 | 514 | 2,883 |
Change in net unrealized appreciation/(depreciation) of investments | (34,370) | 20,660 | 4,033 | 8,343 | (2,867) | 1,657 |
Net increase/(decrease) in assets resulting from operations | 15,230 | 127,007 | 31,250 | 25,872 | (174) | 6,897 |
Distributions to Shareholders | ||||||
Retirement Class | (5,690) | (2,761) | (3,426) | (842) | (1,343) | (440) |
Institutional Class | (52,315) | (52,640) | (11,576) | (4,208) | (3,638) | (2,582) |
Administrative Class | (521) | (470) | (7) | (2) | N/A | N/A |
Investor Class | N/A | N/A | (246) | (68) | N/A | N/A |
Total distributions to shareholders | (58,526) | (55,871) | (15,255) | (5,120) | (4,981) | (3,022) |
Net Increase/(Decrease) Derived from Capital Share Transactions | (420,389) | (32,033) | 35,899 | (7,638) | 32,042 | 26,970 |
Net increase/(decrease) in net assets | (463,685) | 39,103 | 51,894 | 13,114 | 26,887 | 30,845 |
Net Assets | ||||||
Beginning of period | 2,030,003 | 1,990,900 | 154,066 | 140,952 | 115,601 | 84,756 |
End of period | $1,566,318 | $2,030,003 | $205,960 | $154,066 | $142,488 | $115,601 |
The accompanying notes are an integral part of the Financial Statements.
58
Harbor High-Yield Bond Fund | Harbor Money Market Fund | ||
November 1, 2020 through October 31, 2021 | November 1, 2019 through October 31, 2020 | November 1, 2020 through October 31, 2021 | November 1, 2019 through October 31, 2020 |
$16,128 | $20,947 | $29 | $832 |
22,501 | (15,626) | — | — |
(949) | (232) | — | — |
37,680 | 5,089 | 29 | 832 |
(4,718) | (4,327) | N/A | N/A |
(13,697) | (17,235) | (28) | (815) |
(36) | (32) | (1) | (17) |
(1,046) | (1,053) | N/A | N/A |
(19,497) | (22,647) | (29) | (832) |
(84,456) | (46,449) | (13,902) | (22,397) |
(66,273) | (64,007) | (13,902) | (22,397) |
427,668 | 491,675 | 98,770 | 121,167 |
$361,395 | $427,668 | $84,868 | $98,770 |
59
Harbor Fixed Income Funds
Statements of Changes in Net Assets—Capital Stock Activity
(All amounts in thousands)
Harbor Bond Fund | Harbor Convertible Securities Fund | Harbor Core Bond Fund | ||||
November 1, 2020 through October 31, 2021 | November 1, 2019 through October 31, 2020 | November 1, 2020 through October 31, 2021 | November 1, 2019 through October 31, 2020 | November 1, 2020 through October 31, 2021 | November 1, 2019 through October 31, 2020 | |
AMOUNT ($) | ||||||
Retirement Class | ||||||
Net proceeds from sale of shares | $36,135 | $179,495 | $490 | $28,873 | $9,051 | $23,906 |
Net proceeds from redemption fees | — | — | — | — | — | — |
Reinvested distributions | 5,645 | 2,761 | 3,426 | 842 | 1,320 | 440 |
Cost of shares reacquired | (31,577) | (33,651) | (486) | (24,767) | (1,889) | (831) |
Net increase/(decrease) in net assets | $10,203 | $148,605 | $3,430 | $4,948 | $8,482 | $23,515 |
Institutional Class | ||||||
Net proceeds from sale of shares | $175,893 | $431,694 | $50,213 | $16,717 | $42,246 | $19,108 |
Net proceeds from redemption fees | — | — | — | 1 | — | — |
Reinvested distributions | 49,348 | 49,880 | 11,378 | 4,157 | 3,636 | 2,581 |
Cost of shares reacquired | (655,223) | (660,371) | (29,335) | (33,534) | (22,322) | (18,234) |
Net increase/(decrease) in net assets | $(429,982) | $(178,797) | $32,256 | $(12,659) | $23,560 | $3,455 |
Administrative Class | ||||||
Net proceeds from sale of shares | $2,386 | $2,092 | $— | $— | N/A | N/A |
Net proceeds from redemption fees | — | — | — | — | N/A | N/A |
Reinvested distributions | 521 | 469 | 7 | 2 | N/A | N/A |
Cost of shares reacquired | (3,517) | (4,402) | — | — | N/A | N/A |
Net increase/(decrease) in net assets | $(610) | $(1,841) | $7 | $2 | N/A | N/A |
Investor Class | ||||||
Net proceeds from sale of shares | N/A | N/A | $1,043 | $764 | N/A | N/A |
Net proceeds from redemption fees | N/A | N/A | — | — | N/A | N/A |
Reinvested distributions | N/A | N/A | 246 | 68 | N/A | N/A |
Cost of shares reacquired | N/A | N/A | (1,083) | (761) | N/A | N/A |
Net increase/(decrease) in net assets | N/A | N/A | $206 | $71 | N/A | N/A |
The accompanying notes are an integral part of the Financial Statements.
60
Harbor High-Yield Bond Fund | Harbor Money Market Fund | ||
November 1, 2020 through October 31, 2021 | November 1, 2019 through October 31, 2020 | November 1, 2020 through October 31, 2021 | November 1, 2019 through October 31, 2020 |
$27,854 | $72,410 | N/A | N/A |
1 | 30 | N/A | N/A |
4,627 | 4,187 | N/A | N/A |
(68,001) | (34,927) | N/A | N/A |
$(35,519) | $41,700 | N/A | N/A |
$47,263 | $92,313 | $41,708 | $209,776 |
2 | 96 | — | — |
13,426 | 16,946 | 27 | 810 |
(105,770) | (204,679) | (54,859) | (233,459) |
$(45,079) | $(95,324) | $(13,124) | $(22,873) |
$307 | $121 | $1,073 | $3,992 |
— | — | — | — |
34 | 31 | 1 | 17 |
(323) | (148) | (1,852) | (3,533) |
$18 | $4 | $(778) | $476 |
$11,136 | $21,719 | N/A | N/A |
— | 9 | N/A | N/A |
1,036 | 1,043 | N/A | N/A |
(16,048) | (15,600) | N/A | N/A |
$(3,876) | $7,171 | N/A | N/A |
61
Harbor Fixed Income Funds
Statements of Changes in Net Assets—Capital Stock Activity—Continued
(All amounts in thousands)
Harbor Bond Fund | Harbor Convertible Securities Fund | Harbor Core Bond Fund | ||||
November 1, 2020 through October 31, 2021 | November 1, 2019 through October 31, 2020 | November 1, 2020 through October 31, 2021 | November 1, 2019 through October 31, 2020 | November 1, 2020 through October 31, 2021 | November 1, 2019 through October 31, 2020 | |
SHARES | ||||||
Retirement Class | ||||||
Shares sold | 2,958 | 14,981 | 36 | 2,624 | 835 | 2,200 |
Shares issued due to reinvestment of distributions | 463 | 226 | 265 | 78 | 122 | 41 |
Shares reacquired | (2,600) | (2,782) | (36) | (2,237) | (173) | (78) |
Net increase/(decrease) in shares outstanding | 821 | 12,425 | 265 | 465 | 784 | 2,163 |
Institutional Class | ||||||
Shares sold | 14,403 | 35,572 | 3,738 | 1,508 | 3,947 | 1,764 |
Shares issued due to reinvestment of distributions | 4,042 | 4,166 | 881 | 386 | 337 | 241 |
Shares reacquired | (53,673) | (54,936) | (2,192) | (3,041) | (2,093) | (1,684) |
Net increase/(decrease) in shares outstanding | (35,228) | (15,198) | 2,427 | (1,147) | 2,191 | 321 |
Administrative Class | ||||||
Shares sold | 196 | 172 | — | — | N/A | N/A |
Shares issued due to reinvestment of distributions | 43 | 39 | 1 | 1 | N/A | N/A |
Shares reacquired | (288) | (368) | — | — | N/A | N/A |
Net increase/(decrease) in shares outstanding | (49) | (157) | 1 | 1 | N/A | N/A |
Investor Class | ||||||
Shares sold | N/A | N/A | 77 | 65 | N/A | N/A |
Shares issued due to reinvestment of distributions | N/A | N/A | 19 | 6 | N/A | N/A |
Shares reacquired | N/A | N/A | (81) | (68) | N/A | N/A |
Net increase/(decrease) in shares outstanding | N/A | N/A | 15 | 3 | N/A | N/A |
The accompanying notes are an integral part of the Financial Statements.
62
Harbor High-Yield Bond Fund | Harbor Money Market Fund | ||
November 1, 2020 through October 31, 2021 | November 1, 2019 through October 31, 2020 | November 1, 2020 through October 31, 2021 | November 1, 2019 through October 31, 2020 |
2,797 | 7,783 | N/A | N/A |
466 | 448 | N/A | N/A |
(6,821) | (3,729) | N/A | N/A |
(3,558) | 4,502 | N/A | N/A |
4,738 | 9,729 | 41,708 | 209,775 |
1,353 | 1,821 | 27 | 810 |
(10,634) | (21,780) | (54,859) | (233,459) |
(4,543) | (10,230) | (13,124) | (22,874) |
31 | 13 | 1,073 | 3,992 |
3 | 3 | 1 | 17 |
(32) | (15) | (1,852) | (3,533) |
2 | 1 | (778) | 476 |
1,113 | 2,344 | N/A | N/A |
104 | 111 | N/A | N/A |
(1,605) | (1,697) | N/A | N/A |
(388) | 758 | N/A | N/A |
63
Harbor Fixed Income Funds Financial Highlights
Selected Data for a Share Outstanding for the Periods Presented
HARBOR BOND FUND | ||||
Retirement Class | ||||
Year Ended October 31, | 2021 | 2020 | 2019 | 2018f |
Net asset value beginning of period | $12.35 | $11.90 | $11.09 | $11.28 |
Income from Investment Operations | ||||
Net investment income/(loss)a,e | 0.32 | 0.31 | 0.38 | 0.16 |
Net realized and unrealized gain/(loss) on investments | (0.21) | 0.49 | 0.80 | (0.16) |
Total from investment operations | 0.11 | 0.80 | 1.18 | —* |
Less Distributions | ||||
Dividends from net investment income | (0.27) | (0.35) | (0.37) | (0.19) |
Distributions from net realized capital gains | (0.13) | — | — | — |
Total distributions | (0.40) | (0.35) | (0.37) | (0.19) |
Net asset value end of period | 12.06 | 12.35 | 11.90 | 11.09 |
Net assets end of period (000s) | $172,699 | $166,740 | $12,802 | $6,921 |
Ratios and Supplemental Data (%) | ||||
Total returnb | 0.88% | 6.82% | 10.84% | 0.01%c |
Ratio of total expenses to average net assets^ | 0.53 | 0.58 | 1.06 | 1.16d |
Ratio of net expenses to average net assetsa | 0.43 | 0.48 | 0.96 | 1.06d |
Ratio of net expenses excluding interest expense to average net assetsa | 0.43 | 0.43 | 0.43 | 0.43d |
Ratio of net investment income to average net assetsa | 2.63 | 2.56 | 3.30 | 3.44d |
Portfolio turnover | 370 | 558 | 644 | 674c |
Administrative Class | |||||
Year Ended October 31, | 2021 | 2020 | 2019 | 2018 | 2017 |
Net asset value beginning of period | $12.37 | $11.92 | $11.11 | $11.69 | $11.89 |
Income from Investment Operations | |||||
Net investment income/(loss)a,e | 0.28 | 0.28 | 0.35 | 0.31 | 0.34 |
Net realized and unrealized gain/(loss) on investments | (0.21) | 0.48 | 0.79 | (0.53) | (0.05) |
Total from investment operations | 0.07 | 0.76 | 1.14 | (0.22) | 0.29 |
Less Distributions | |||||
Dividends from net investment income | (0.23) | (0.31) | (0.33) | (0.36) | (0.32) |
Distributions from net realized capital gains | (0.13) | — | — | — | (0.17) |
Total distributions | (0.36) | (0.31) | (0.33) | (0.36) | (0.49) |
Net asset value end of period | 12.08 | 12.37 | 11.92 | 11.11 | 11.69 |
Net assets end of period (000s) | $17,270 | $18,302 | $19,498 | $31,111 | $30,376 |
Ratios and Supplemental Data (%) | |||||
Total returnb | 0.54% | 6.44% | 10.44% | (1.88)% | 2.56% |
Ratio of total expenses to average net assets^ | 0.86 | 0.97 | 1.39 | 1.16 | 0.88 |
Ratio of net expenses to average net assetsa | 0.76 | 0.87 | 1.29 | 1.06 | 0.79 |
Ratio of net expenses excluding interest expense to average net assetsa | 0.76 | 0.76 | 0.76 | 0.76 | 0.76 |
Ratio of net investment income to average net assetsa | 2.29 | 2.32 | 3.01 | 2.69 | 2.90 |
Portfolio turnover | 370 | 558 | 644 | 674 | 654 |
See page 72 for notes to the Financial Highlights.
The accompanying notes are an integral part of the Financial Statements.
64
Institutional Class | ||||
2021 | 2020 | 2019 | 2018 | 2017 |
$12.36 | $11.91 | $11.10 | $11.68 | $11.88 |
0.31 | 0.31 | 0.37 | 0.33 | 0.36 |
(0.21) | 0.48 | 0.80 | (0.52) | (0.04) |
0.10 | 0.79 | 1.17 | (0.19) | 0.32 |
(0.26) | (0.34) | (0.36) | (0.39) | (0.35) |
(0.13) | — | — | — | (0.17) |
(0.39) | (0.34) | (0.36) | (0.39) | (0.52) |
12.07 | 12.36 | 11.91 | 11.10 | 11.68 |
$1,376,349 | $1,844,961 | $1,958,600 | $1,899,680 | $2,159,390 |
0.79% | 6.72% | 10.74% | (1.63)% | 2.82% |
0.61 | 0.73 | 1.14 | 0.90 | 0.63 |
0.51 | 0.62 | 1.04 | 0.80 | 0.54 |
0.51 | 0.51 | 0.51 | 0.51 | 0.51 |
2.52 | 2.58 | 3.23 | 2.93 | 3.15 |
370 | 558 | 644 | 674 | 654 |
65
Harbor Fixed Income Funds Financial Highlights—Continued
Selected Data for a Share Outstanding for the Periods Presented
HARBOR CONVERTIBLE SECURITIES FUND | |||||
Retirement Class | |||||
Year Ended October 31, | 2021 | 2020 | 2019 | 2018 | 2017 |
Net asset value beginning of period | $12.49 | $10.82 | $10.47 | $11.27 | $10.53 |
Income from Investment Operations | |||||
Net investment income/(loss)a,e | 0.02 | 0.07 | 0.10 | 0.10 | 0.14 |
Net realized and unrealized gain/(loss) on investments | 2.43 | 2.02 | 0.92 | 0.19 | 0.78 |
Total from investment operations | 2.45 | 2.09 | 1.02 | 0.29 | 0.92 |
Less Distributions | |||||
Dividends from net investment income | (0.09) | (0.09) | (0.18) | (0.09) | (0.18) |
Distributions from net realized capital gains | (1.16) | (0.33) | (0.49) | (1.00) | — |
Total distributions | (1.25) | (0.42) | (0.67) | (1.09) | (0.18) |
Proceeds from redemption fees | —* | —* | —* | —* | —* |
Net asset value end of period | 13.69 | 12.49 | 10.82 | 10.47 | 11.27 |
Net assets end of period (000s) | $41,250 | $34,307 | $24,697 | $25,412 | $24,585 |
Ratios and Supplemental Data (%) | |||||
Total returnb | 20.23% | 19.93% | 10.48% | 2.80% | 8.81% |
Ratio of total expenses to average net assets^ | 0.73 | 0.74 | 0.74 | 0.74 | 0.72 |
Ratio of net expenses to average net assetsa | 0.67 | 0.69 | 0.69 | 0.69 | 0.67 |
Ratio of net investment income to average net assetsa | 0.15 | 0.60 | 0.98 | 0.95 | 1.24 |
Portfolio turnover | 50 | 101 | 74 | 94 | 102 |
Administrative Class | |||||
Year Ended October 31, | 2021 | 2020 | 2019 | 2018 | 2017 |
Net asset value beginning of period | $12.46 | $10.80 | $10.44 | $11.26 | $10.53 |
Income from Investment Operations | |||||
Net investment income/(loss)a,e | (0.02) | 0.03 | 0.07 | 0.07 | 0.10 |
Net realized and unrealized gain/(loss) on investments | 2.42 | 2.01 | 0.91 | 0.17 | 0.77 |
Total from investment operations | 2.40 | 2.04 | 0.98 | 0.24 | 0.87 |
Less Distributions | |||||
Dividends from net investment income | (0.07) | (0.05) | (0.13) | (0.06) | (0.14) |
Distributions from net realized capital gains | (1.16) | (0.33) | (0.49) | (1.00) | — |
Total distributions | (1.23) | (0.38) | (0.62) | (1.06) | (0.14) |
Proceeds from redemption fees | —* | —* | —* | —* | —* |
Net asset value end of period | 13.63 | 12.46 | 10.80 | 10.44 | 11.26 |
Net assets end of period (000s) | $85 | $70 | $59 | $53 | $395 |
Ratios and Supplemental Data (%) | |||||
Total returnb | 19.87% | 19.48% | 10.11% | 2.27% | 8.37% |
Ratio of total expenses to average net assets^ | 1.06 | 1.07 | 1.07 | 1.07 | 1.04 |
Ratio of net expenses to average net assetsa | 1.00 | 1.02 | 1.02 | 1.01 | 1.00 |
Ratio of net investment income to average net assetsa | (0.18) | 0.29 | 0.64 | 0.63 | 0.93 |
Portfolio turnover | 50 | 101 | 74 | 94 | 102 |
See page 72 for notes to the Financial Highlights.
The accompanying notes are an integral part of the Financial Statements.
66
Institutional Class | ||||
2021 | 2020 | 2019 | 2018 | 2017 |
$12.48 | $10.83 | $10.48 | $11.27 | $10.53 |
0.01 | 0.06 | 0.09 | 0.09 | 0.13 |
2.43 | 2.00 | 0.92 | 0.20 | 0.78 |
2.44 | 2.06 | 1.01 | 0.29 | 0.91 |
(0.08) | (0.08) | (0.17) | (0.08) | (0.17) |
(1.16) | (0.33) | (0.49) | (1.00) | — |
(1.24) | (0.41) | (0.66) | (1.08) | (0.17) |
—* | —* | —* | —* | —* |
13.68 | 12.48 | 10.83 | 10.48 | 11.27 |
$161,772 | $117,269 | $114,130 | $93,424 | $87,391 |
20.18% | 19.63% | 10.39% | 2.82% | 8.74% |
0.81 | 0.82 | 0.82 | 0.82 | 0.79 |
0.75 | 0.77 | 0.77 | 0.76 | 0.76 |
0.06 | 0.55 | 0.89 | 0.88 | 1.18 |
50 | 101 | 74 | 94 | 102 |
Investor Class | ||||
2021 | 2020 | 2019 | 2018 | 2017 |
$12.46 | $10.80 | $10.45 | $11.25 | $10.52 |
(0.04) | 0.02 | 0.05 | 0.05 | 0.09 |
2.43 | 2.00 | 0.92 | 0.19 | 0.77 |
2.39 | 2.02 | 0.97 | 0.24 | 0.86 |
(0.07) | (0.03) | (0.13) | (0.04) | (0.13) |
(1.16) | (0.33) | (0.49) | (1.00) | — |
(1.23) | (0.36) | (0.62) | (1.04) | (0.13) |
—* | —* | —* | —* | —* |
13.62 | 12.46 | 10.80 | 10.45 | 11.25 |
$2,853 | $2,420 | $2,066 | $1,861 | $2,015 |
19.76% | 19.33% | 9.99% | 2.35% | 8.26% |
1.17 | 1.19 | 1.19 | 1.19 | 1.16 |
1.11 | 1.14 | 1.14 | 1.13 | 1.12 |
(0.29) | 0.17 | 0.52 | 0.51 | 0.81 |
50 | 101 | 74 | 94 | 102 |
67
Harbor Fixed Income Funds Financial Highlights—Continued
Selected Data for a Share Outstanding for the Periods Presented
HARBOR CORE BOND FUND | ||||
Retirement Class | ||||
Year Ended October 31, | 2021 | 2020 | 2019 | 2018f |
Net asset value beginning of period | $11.06 | $10.64 | $9.84 | $10.00 |
Income from Investment Operations | ||||
Net investment income/(loss)a,e | 0.19 | 0.26 | 0.31 | 0.12 |
Net realized and unrealized gain/(loss) on investments | (0.19) | 0.50 | 0.79 | (0.19) |
Total from investment operations | — | 0.76 | 1.10 | (0.07) |
Less Distributions | ||||
Dividends from net investment income | (0.23) | (0.27) | (0.30) | (0.09) |
Distributions from net realized capital gains | (0.22) | (0.07) | — | — |
Total distributions | (0.45) | (0.34) | (0.30) | (0.09) |
Net asset value end of period | 10.61 | 11.06 | 10.64 | 9.84 |
Net assets end of period (000s) | $36,557 | $29,428 | $5,298 | $3,061 |
Ratios and Supplemental Data (%) | ||||
Total returnb | (0.01)% | 7.36% | 11.34% | (0.73)%c |
Ratio of total expenses to average net assets^ | 0.43 | 0.43 | 0.45 | 0.77d |
Ratio of net expenses to average net assetsa | 0.37 | 0.37 | 0.37 | 0.37d |
Ratio of net investment income to average net assetsa | 1.77 | 2.35 | 2.98 | 2.98d |
Portfolio turnover | 47 | 70 | 61 | 97c |
See page 72 for notes to the Financial Highlights.
The accompanying notes are an integral part of the Financial Statements.
68
Institutional Class | |||
2021 | 2020 | 2019 | 2018f |
$11.06 | $10.64 | $9.84 | $10.00 |
0.18 | 0.26 | 0.30 | 0.12 |
(0.19) | 0.50 | 0.79 | (0.19) |
(0.01) | 0.76 | 1.09 | (0.07) |
(0.22) | (0.27) | (0.29) | (0.09) |
(0.22) | (0.07) | — | — |
(0.44) | (0.34) | (0.29) | (0.09) |
10.61 | 11.06 | 10.64 | 9.84 |
$105,931 | $86,173 | $79,458 | $52,249 |
(0.09)% | 7.28% | 11.26% | (0.75)%c |
0.51 | 0.51 | 0.53 | 0.85d |
0.45 | 0.45 | 0.45 | 0.45d |
1.70 | 2.35 | 2.89 | 2.86d |
47 | 70 | 61 | 97c |
69
Harbor Fixed Income Funds Financial Highlights—Continued
Selected Data for a Share Outstanding for the Periods Presented
HARBOR HIGH-YIELD BOND FUND | |||||
Retirement Class | |||||
Year Ended October 31, | 2021 | 2020 | 2019 | 2018 | 2017 |
Net asset value beginning of period | $9.55 | $9.88 | $9.69 | $10.22 | $10.00 |
Income from Investment Operations | |||||
Net investment income/(loss)a,e | 0.42 | 0.47 | 0.54 | 0.54 | 0.55 |
Net realized and unrealized gain/(loss) on investments | 0.49 | (0.28) | 0.22 | (0.49) | 0.25 |
Total from investment operations | 0.91 | 0.19 | 0.76 | 0.05 | 0.80 |
Less Distributions | |||||
Dividends from net investment income | (0.51) | (0.52) | (0.57) | (0.58) | (0.58) |
Distributions from net realized capital gains | — | — | — | — | — |
Total distributions | (0.51) | (0.52) | (0.57) | (0.58) | (0.58) |
Proceeds from redemption fees | —* | —* | —* | —* | —* |
Net asset value end of period | 9.95 | 9.55 | 9.88 | 9.69 | 10.22 |
Net assets end of period (000s) | $83,594 | $114,145 | $73,676 | $303,627 | $41,975 |
Ratios and Supplemental Data (%) | |||||
Total returnb | 9.64% | 2.18% | 8.13% | 0.54% | 8.23% |
Ratio of total expenses to average net assets^ | 0.66 | 0.66 | 0.65 | 0.61 | 0.65 |
Ratio of net expenses to average net assetsa | 0.56 | 0.57 | 0.56 | 0.53 | 0.61 |
Ratio of net investment income to average net assetsa | 4.21 | 4.88 | 5.53 | 5.50 | 5.44 |
Portfolio turnover | 126 | 128 | 80 | 53 | 56 |
Administrative Class | |||||
Year Ended October 31, | 2021 | 2020 | 2019 | 2018 | 2017 |
Net asset value beginning of period | $9.59 | $9.92 | $9.71 | $10.25 | $10.01 |
Income from Investment Operations | |||||
Net investment income/(loss)a,e | 0.39 | 0.44 | 0.50 | 0.52 | 0.53 |
Net realized and unrealized gain/(loss) on investments | 0.50 | (0.28) | 0.25 | (0.51) | 0.25 |
Total from investment operations | 0.89 | 0.16 | 0.75 | 0.01 | 0.78 |
Less Distributions | |||||
Dividends from net investment income | (0.48) | (0.49) | (0.54) | (0.55) | (0.54) |
Distributions from net realized capital gains | — | — | — | — | — |
Total distributions | (0.48) | (0.49) | (0.54) | (0.55) | (0.54) |
Proceeds from redemption fees | —* | —* | —* | —* | —* |
Net asset value end of period | 10.00 | 9.59 | 9.92 | 9.71 | 10.25 |
Net assets end of period (000s) | $715 | $668 | $686 | $1,374 | $1,753 |
Ratios and Supplemental Data (%) | |||||
Total returnb | 9.35% | 1.82% | 7.91% | 0.10% | 7.98% |
Ratio of total expenses to average net assets^ | 0.99 | 0.99 | 0.98 | 0.94 | 0.97 |
Ratio of net expenses to average net assetsa | 0.89 | 0.90 | 0.89 | 0.86 | 0.92 |
Ratio of net investment income to average net assetsa | 3.85 | 4.60 | 5.13 | 5.18 | 5.20 |
Portfolio turnover | 126 | 128 | 80 | 53 | 56 |
See page 72 for notes to the Financial Highlights.
The accompanying notes are an integral part of the Financial Statements.
70
Institutional Class | ||||
2021 | 2020 | 2019 | 2018 | 2017 |
$9.55 | $9.88 | $9.68 | $10.21 | $9.99 |
0.41 | 0.46 | 0.52 | 0.54 | 0.55 |
0.49 | (0.28) | 0.25 | (0.51) | 0.24 |
0.90 | 0.18 | 0.77 | 0.03 | 0.79 |
(0.50) | (0.51) | (0.57) | (0.57) | (0.57) |
— | — | — | — | — |
(0.50) | (0.51) | (0.57) | (0.57) | (0.57) |
—* | —* | —* | 0.01 | —* |
9.95 | 9.55 | 9.88 | 9.68 | 10.21 |
$254,241 | $287,242 | $398,320 | $470,204 | $1,387,213 |
9.55% | 2.09% | 8.16% | 0.45% | 8.16% |
0.74 | 0.74 | 0.73 | 0.69 | 0.72 |
0.64 | 0.65 | 0.64 | 0.62 | 0.67 |
4.12 | 4.86 | 5.35 | 5.40 | 5.43 |
126 | 128 | 80 | 53 | 56 |
Investor Class | ||||
2021 | 2020 | 2019 | 2018 | 2017 |
$9.57 | $9.91 | $9.71 | $10.24 | $10.01 |
0.38 | 0.43 | 0.49 | 0.50 | 0.52 |
0.50 | (0.29) | 0.24 | (0.49) | 0.24 |
0.88 | 0.14 | 0.73 | 0.01 | 0.76 |
(0.46) | (0.48) | (0.53) | (0.54) | (0.53) |
— | — | — | — | — |
(0.46) | (0.48) | (0.53) | (0.54) | (0.53) |
—* | —* | —* | —* | —* |
9.99 | 9.57 | 9.91 | 9.71 | 10.24 |
$22,845 | $25,613 | $18,993 | $31,549 | $42,753 |
9.31% | 1.59% | 7.72% | 0.08% | 7.79% |
1.11 | 1.11 | 1.10 | 1.06 | 1.09 |
1.01 | 1.02 | 1.01 | 0.98 | 1.04 |
3.75 | 4.44 | 5.00 | 5.05 | 5.08 |
126 | 128 | 80 | 53 | 56 |
71
Harbor Fixed Income Funds Financial Highlights—Continued
Selected Data for a Share Outstanding for the Periods Presented
HARBOR MONEY MARKET FUND | |||||
Institutional Class | |||||
Year Ended October 31, | 2021 | 2020 | 2019 | 2018 | 2017 |
Net asset value beginning of period | $1.00 | $1.00 | $1.00 | $1.00 | $1.00 |
Income from Investment Operations | |||||
Net investment income/(loss)a,e | —* | 0.01 | 0.02 | 0.01 | 0.01 |
Net realized and unrealized gain/(loss) on investments | — | — | — | — | — |
Total from investment operations | — | 0.01 | 0.02 | 0.01 | 0.01 |
Less Distributions | |||||
Dividends from net investment income | —* | (0.01) | (0.02) | (0.01) | (0.01) |
Distributions from net realized capital gains | — | — | — | — | — |
Total distributions | —* | (0.01) | (0.02) | (0.01) | (0.01) |
Net asset value end of period | 1.00 | 1.00 | 1.00 | 1.00 | 1.00 |
Net assets end of period (000s) | $82,034 | $95,159 | $118,032 | $129,826 | $169,637 |
Ratios and Supplemental Data (%) | |||||
Total returnb | 0.03% | 0.64% | 2.02% | 1.44% | 0.73% |
Ratio of total expenses to average net assets^ | 0.38 | 0.39 | 0.35 | 0.35 | 0.35 |
Ratio of net expenses to average net assetsa | 0.02 | 0.19 | 0.28 | 0.20 | — |
Ratio of net investment income to average net assetsa | 0.03 | 0.72 | 2.01 | 1.42 | 0.72 |
*
Less than $0.01
^
Percentage does not reflect reduction for credit balance arrangements (see the “Custodian” section in Note 2 of the accompanying Notes to Financial Statements)
a
Reflects the Adviser’s waiver, if any, of its management fees and/or other operating expenses
b
The total returns would have been lower had certain expenses not been waived during the periods shown.
c
Unannualized
d
Annualized
e
Amounts are based on average daily shares outstanding during the period.
f
For the period June 1, 2018 (inception) through October 31, 2018
The accompanying notes are an integral part of the Financial Statements.
72
Administrative Class | ||||
2021 | 2020 | 2019 | 2018 | 2017 |
$1.00 | $1.00 | $1.00 | $1.00 | $1.00 |
—* | 0.01 | 0.02 | 0.01 | 0.01 |
— | — | — | — | — |
— | 0.01 | 0.02 | 0.01 | 0.01 |
—* | (0.01) | (0.02) | (0.01) | (0.01) |
— | — | — | — | — |
—* | (0.01) | (0.02) | (0.01) | (0.01) |
1.00 | 1.00 | 1.00 | 1.00 | 1.00 |
$2,834 | $3,611 | $3,135 | $2,086 | $1,545 |
0.03% | 0.51% | 1.76% | 1.36% | 0.73% |
0.63 | 0.64 | 0.60 | 0.60 | 0.60 |
0.02 | 0.29 | 0.53 | 0.29 | — |
0.03 | 0.49 | 1.79 | 1.36 | 0.70 |
73
Harbor Fixed Income Funds
Notes to Financial Statements—October 31, 2021
Note 1—Organizational Matters
Harbor Funds (the “Trust”) is registered under the Investment Company Act of 1940, as amended (the “Investment Company Act”), as an open-end management investment company. As of October 31, 2021, the Trust consists of 31 separate portfolios. The portfolios covered by this report are: Harbor Bond Fund, Harbor Convertible Securities Fund, Harbor Core Bond Fund, Harbor High-Yield Bond Fund, and Harbor Money Market Fund (individually or collectively referred to as a “Fund” or the “Funds," respectively). Harbor Capital Advisors, Inc. (the “Adviser” or “Harbor Capital”) is the investment adviser for the Funds.
The Funds currently offer up to four classes of shares, designated as Retirement Class, Institutional Class, Administrative Class and Investor Class. The shares of each class represent an interest in the same portfolio of investments of the Funds and have equal rights with respect to voting, redemptions, dividends, and liquidations, except that: (i) subject to the approval of the Trust’s Board of Trustees (the “Board of Trustees”), certain expenses may be applied differently to each class of shares in accordance with current regulations of the U.S. Securities and Exchange Commission (“SEC”) and the Internal Revenue Service; and (ii) shareholders of a class that bears distribution and service expenses under terms of a distribution plan have exclusive voting rights as to that distribution plan.
Note 2—Significant Accounting Policies
The following is a summary of significant accounting policies followed by the Trust in the preparation of its financial statements. Each Fund follows the investment company reporting requirements under U.S. Generally Accepted Accounting Principles (“U.S. GAAP”), which includes the accounting and reporting guidelines under Accounting Standards Codification (“ASC”) Topic 946, Financial Services-Investment Companies. The preparation of financial statements in accordance with U.S. GAAP requires management to make estimates and assumptions that affect the reported amounts and disclosures in the financial statements. Actual results may differ from those estimates.
Security Valuation
The Trust’s valuation procedures permit the Funds to use a variety of valuation methodologies, consider a number of subjective factors, analyze applicable facts and circumstances and, in general, exercise judgment, when valuing Fund investments. The methodology used for a specific type of investment may vary based on the circumstances and relevant considerations, including available market data.
Equity securities (including common stock, preferred stock, and convertible preferred stock), exchange-traded funds and financial derivative instruments (such as futures contracts, and options contracts, including rights and warrants) that are traded on a national securities exchange or system (except securities listed on the National Association of Securities Dealers Automated Quotation (“NASDAQ”) system and United Kingdom securities) are valued at the last sale price on a national exchange or system on which they are principally traded as of the valuation date. Securities listed on the NASDAQ system or a United Kingdom exchange are valued at the official closing price of those securities. In the case of securities for which there are no sales on the valuation day, (i) securities traded principally on a U.S. exchange, including NASDAQ, are valued at the mean between the closing bid and ask price; and (ii) securities traded principally on a foreign exchange, including United Kingdom securities, are valued at the official bid price determined as of the close of the primary exchange. Shares of open-end registered investment companies that are held by a Fund are valued at net asset value. To the extent these securities are actively traded and fair valuation adjustments are not applied, they are normally categorized as Level 1 in the fair value hierarchy. Equity securities traded on inactive markets or valued by reference to similar instruments are normally categorized as Level 2 in the fair value hierarchy. For more information on the fair value hierarchy, please refer to the Fair Value Measurements and Disclosures section.
Debt securities (including corporate bonds, municipal bonds and notes, U.S. government agencies, U.S. treasury obligations, mortgage-backed and asset-backed securities, foreign government obligations, bank loans, and convertible securities, other than short-term securities, with a remaining maturity of less than 60 days at the time of acquisition), are valued using evaluated prices furnished by a pricing vendor selected by the Board of Trustees. An evaluated price represents an assessment by the pricing vendor using various market inputs of what the pricing vendor believes is the fair value of a security at a particular point in time. The pricing vendor determines evaluated prices for debt securities that would be transacted at institutional-size quantities using inputs including, but not limited to, (i) recent transaction prices and dealer quotes, (ii) transaction prices for what the pricing vendor believes are securities with similar characteristics, (iii) the pricing vendor’s assessment of the risk inherent in the security taking into account criteria such as credit quality, payment history, liquidity and market conditions,
74
Harbor Fixed Income Funds
Notes to Financial Statements—Continued
Note 2—Significant Accounting Policies—Continued
and (iv) various correlations and relationships between security price movements and other factors, such as interest rate changes, which are recognized by institutional traders. In the case of asset-backed and mortgage-backed securities, the inputs used by the pricing vendor may also include information about cash flows, prepayment rates, default rates, delinquency and loss assumption, collateral characteristics, credit enhancements and other specific information about the particular offering. Because many debt securities trade infrequently, the pricing vendor will often not have current transaction price information available as an input in determining an evaluated price for a particular security. When current transaction price information is available, it is one input into the pricing vendor’s evaluation process, which means that the evaluated price supplied by the pricing vendor will frequently differ from that transaction price. Securities held by Harbor Money Market Fund are valued at amortized cost, which the Adviser has determined, pursuant to the Board of Trustees’ authorization, approximates fair value. Under this method, investments purchased at a discount or premium are valued by accreting or amortizing the difference between the original purchase price and the maturity value of the issue over the period to effective maturity. Securities that use similar valuation techniques and inputs as described above are normally categorized as Level 2 in the fair value hierarchy.
Short-term securities with a remaining maturity of less than 60 days at the time of acquisition that are held by a Fund are valued at amortized cost to the extent amortized cost represents fair value. Such securities are normally categorized as Level 2 in the fair value hierarchy.
Over-the-counter financial derivative instruments, such as forward currency contracts, options contracts, and swap agreements (including centrally cleared swaps), derive their value from underlying asset prices, indices, reference rates and other inputs, or a combination of these factors. These instruments are valued using evaluated prices furnished by a pricing vendor selected by the Board of Trustees. In certain cases, when a valuation is not readily available from a pricing vendor, the Fund’s subadviser provides a valuation, typically using its own proprietary models. Depending on the instrument and the terms of the transaction, the value of the derivative instrument can be determined by a pricing vendor or subadviser using a series of techniques, including simulation pricing models. The pricing models use inputs, such as issuer details, indices, spreads, interest rates, yield curves, dividends and exchange rates, that are observed from actively quoted markets. Derivative instruments that use valuation techniques and inputs similar to those described above are normally categorized as Level 2 in the fair value hierarchy.
A Fund may also use fair value pricing if the value of some or all of the Fund’s securities have been materially affected by events occurring before the Fund’s pricing time but after the close of the primary markets or exchanges on which the security is traded. This most commonly occurs with foreign securities, but may occur with other securities as well. In such cases, the Fund may apply a fair value factor supplied by the pricing vendor to a foreign security’s market close value to reflect changes in value that may have occurred between the close of the primary market or exchange on which the security is traded and the Fund’s pricing time. That factor may be derived using observable inputs such as a comparison of the trading patterns of a foreign security to intraday trading in the U.S. markets that are highly correlated to the foreign security or other information that becomes available after the close of the foreign market on which the security principally traded. When fair value pricing is employed, the prices of securities used by a Fund to calculate its net asset value may differ from market quotations, official closing prices or evaluated prices for the same securities, which means that the Fund may value those securities higher or lower than another given fund that uses market quotations, official closing prices or evaluated prices supplied by a pricing vendor in its calculation of net asset value. Securities valued using observable inputs, such as those described above, are normally categorized as Level 2 of the fair value hierarchy.
When reliable market quotations or evaluated prices supplied by a pricing vendor are not readily available or are not believed to accurately reflect fair value, securities are priced at their fair value as determined by the Trust’s Valuation Committee (the “Valuation Committee”) pursuant to procedures adopted, and subject to oversight, by the Board of Trustees. The Valuation Committee is comprised of a trustee and officers of the Trust and employees of Harbor Capital with relevant experience or responsibilities. Each security for which the Valuation Committee determines a fair value, including the basis for the fair value decision, is reviewed by the Board of Trustees at its regularly scheduled board meetings. Securities valued using fair valuation methods that incorporate significant unobservable inputs are normally categorized as Level 3 in the fair value hierarchy.
75
Harbor Fixed Income Funds
Notes to Financial Statements—Continued
Note 2—Significant Accounting Policies—Continued
Fair Value Measurements and Disclosures
Various inputs may be used to determine the value of each Fund’s investments, which are summarized in three broad categories defined as Level 1, Level 2, and Level 3. The inputs or methodologies used for valuing investments are not necessarily indicative of the risk associated with investing in those investments. The assignment of an investment to Levels 1, 2, or 3 is based on the lowest level of significant inputs used to determine its fair value.
Level 1– | Quoted prices in active markets for identical securities. |
Level 2– | Other significant observable inputs (including quoted prices for similar securities, interest rates, prepayment speeds, credit risk, etc.). |
Level 3– | Significant unobservable inputs are used in situations where quoted prices or other observable inputs are not available or are deemed unreliable. Significant unobservable inputs may include each Fund’s own assumptions. |
The categorization of investments into Levels 1, 2, or 3, and a summary of significant unobservable inputs used for Level 3 investments, when applicable, can be found at the end of each Fund’s Portfolio of Investments schedule. For fair valuations using significant unobservable inputs, if any, a reconciliation of the beginning to ending balances for reported fair values is provided at the end of each Fund’s Portfolio of Investments schedule that presents changes attributable to realized and unrealized gains and losses and purchases, sales, and transfers in/out of the Level 3 category during the year.
Each Fund used observable inputs in its valuation methodologies whenever they were available and deemed reliable.
Investment Income
Dividends declared on portfolio securities are accrued on the ex-dividend date. For foreign securities held, certain dividends are recorded after the ex-dividend date, but as soon as the respective Fund is notified of such dividends. Interest income is accrued daily as earned. Discounts and premiums on fixed income securities purchased are amortized over the life of the respective securities (except for premiums on certain callable debt securities that are amortized to the earliest call date) using the effective yield method. Paydown gains and losses on mortgage-backed and asset-backed securities are recognized as a component of interest income. Inflation adjustments to the face amount of inflation-indexed securities are included in interest income. Consent fees relating to corporate actions from investments held are recorded as income upon receipt.
Expenses
Expenses are charged directly to the Fund that incurred such expense whenever possible. With respect to expenses incurred by any two or more Harbor funds where amounts cannot be identified on a fund by fund basis, such expenses are generally allocated in proportion to the average net assets or the number of shareholders of each Fund.
Class Allocations
Income, common expenses and realized and unrealized gains/(losses) are determined at the Fund level and allocated daily to each class of shares based on the applicable net assets of the respective classes. Distribution and service fees, if any, and transfer agent fees are calculated daily at the class level based on the applicable net assets of each class and the expense rate(s) applicable to each class.
Securities Transactions
Securities transactions are accounted for on the trade date (the date the order to buy or sell is executed). Realized gains or losses on security transactions are determined on the basis of identified cost.
Distribution to Shareholders
Distributions on Fund shares are recorded on the ex-dividend date.
76
Harbor Fixed Income Funds
Notes to Financial Statements—Continued
Note 2—Significant Accounting Policies—Continued
Taxes
Each Fund is treated as a separate entity for U.S. federal tax purposes. Each Fund’s policy is to meet the requirements of Subchapter M of the Internal Revenue Code of 1986, as amended (the “Internal Revenue Code”) applicable to regulated investment companies and to distribute to its shareholders all of its taxable income within the prescribed time. It is also the intention of each Fund to distribute an amount sufficient to avoid imposition of any excise tax under Section 4982 of the Internal Revenue Code. Therefore, no provision has been made for U.S. federal taxes on income, capital gains or unrealized appreciation of securities held or excise taxes on income and capital gains.
Each Fund may be subject to taxes imposed by foreign countries in which they invest. Such taxes are generally based on income and/or capital gains earned or repatriated. Taxes are accrued and applied to net investment income, net realized gains and unrealized appreciation as such income and/or gains are earned.
Management has analyzed each Fund’s tax positions for all open tax years (in particular, U.S. federal, state and local income tax returns for the tax years ended October 31, 2018–2020), including all positions expected to be taken upon filing the 2021 tax return, in all material jurisdictions where each Fund operates, and has concluded that no provision for income tax is required in the Funds’ financial statements. Each Fund will recognize interest and penalties, if any, related to unrecognized tax benefits as income tax expense in the Statement of Operations.
Custodian
Each Fund has credit balance arrangements with its custodian whereby positive balances in demand deposit accounts used by the transfer and shareholder servicing agent for clearing shareholder transactions in the Fund generate credits that are applied against gross custody expenses. Such custodial expense reductions, if any, are reflected on the respective Fund’s accompanying Statement of Operations.
Foreign Currency Contracts
A foreign currency spot contract is an agreement between two parties to buy and sell currencies at the current market rate for settlement within two business days. A forward currency contract is an agreement between two parties to buy and sell currencies at a set price on a future date.
Foreign currency contracts are fair valued daily and any change in fair value is recorded as an unrealized gain or loss. When the contract is closed, the Fund records a realized gain or loss equal to the difference between the value on the open and close date. Risk of losses may arise from changes in the value of the foreign currency or if the counterparties do not perform under the contract’s terms. The maximum potential loss from such contracts is the aggregate face value in U.S. dollars at the time the contract was opened.
During the year, Harbor Bond Fund used foreign currency spot contracts to facilitate transactions in foreign securities or to convert foreign currency receipts into U.S. dollars and forward currency contracts to manage its exposure to changes in exchange rates or as a hedge against foreign exchange risk related to specific transactions or portfolio positions. The Fund entered into collateral agreements with certain counterparties to mitigate counter party risk associated with forward currency contracts.
Foreign Currency Translations
Purchases and sales of securities are translated into U.S. dollars at the current exchange rate on the respective dates of the transactions. Income and withholding taxes are translated at the prevailing exchange rate when accrued or incurred. The accounting records of the Funds are maintained in U.S. dollars. Investment securities and other assets and liabilities denominated in a foreign currency, when applicable, are translated into U.S. dollars based on the current exchange rates at year end.
Reported net realized gains and losses on foreign currency transactions, when applicable, represent net gains and losses from sales and maturities of foreign currency contracts, disposition of foreign currencies, currency gains and losses realized between the trade and settlement dates on securities transactions, and the difference between the amount of investment income accrued and tax reclaims receivable and the U.S. dollar amount actually received. The effects of changes in foreign currency exchange rates on investments in securities, when applicable, are included in the net realized and unrealized gain or loss on investments in the Statements of Operations.
77
Harbor Fixed Income Funds
Notes to Financial Statements—Continued
Note 2—Significant Accounting Policies—Continued
Proceeds from Litigation
Each Fund may receive proceeds from shareholder litigation settlements involving current and/or previously held portfolio holdings. Any proceeds received from litigation involving portfolio holdings are reflected in the Statements of Operations in realized gain/(loss) if the security has been disposed of by a Fund, or in unrealized gain/(loss) if the security is still held by a Fund.
New Accounting Pronouncements
In March 2020, FASB issued ASU 2020-04, Reference Rate Reform: Facilitation of the Effects of Reference Rate Reform on Financial Reporting. The main objective of this ASU is to provide optional guidance to ease the potential accounting burden associated with transitioning away from the London Interbank Offered Rate (“LIBOR”) and other reference rates that are expected to be discontinued. The ASU was effective immediately upon release of the update on March 12, 2020, and can generally be applied through December 31, 2022. At this time, management is still evaluating the implications of these changes on the financial statements.
Certain instruments held by the Funds rely in some fashion upon LIBOR. The United Kingdom’s Financial Conduct Authority, which regulates LIBOR, announced plans to ultimately phase out the use of LIBOR. Although the transition process away from LIBOR has become increasingly well-defined in advance of the anticipated discontinuation date, there remains uncertainty regarding the nature of any replacement rate, and any potential effects of the transition away from LIBOR on the Funds or on certain instruments in which the Funds invests can be difficult to ascertain. The transition process may involve, among other things, increased volatility or illiquidity in markets for instruments that currently rely on LIBOR and may result in a reduction in the value of certain instruments held by the Funds.
Forward Commitments and When-Issued Securities
Agreements to purchase securities on a when-issued basis or purchase or sell securities on a forward commitment basis involve a commitment by a Fund to purchase or sell securities at a future date (ordinarily one or two months later). The price of the underlying securities (usually expressed in terms of yield) and the date when the securities will be delivered and paid for (the settlement date) are fixed at the time the transaction is negotiated. When-issued purchase and forward commitment transactions are negotiated directly with the other party, and such commitments are not traded on exchanges.
A Fund will purchase securities on a when-issued basis, or purchase or sell securities on a forward commitment basis, only with the intention of completing the transaction and actually purchasing or selling the securities. If deemed advisable as a matter of investment strategy, however, a Fund may dispose of or renegotiate a commitment after it is entered into. A Fund also may sell securities it has committed to purchase before those securities are delivered to a Fund on the settlement date. A Fund may realize a capital gain or loss in connection with these transactions. The value of securities purchased on a when-issued or forward commitment basis and any subsequent fluctuations in their value are reflected in the computation of a Fund’s net asset value starting on the date of the agreement to purchase the securities. A Fund does not earn interest on the securities it has committed to purchase until they are paid for and delivered on the settlement date. When a Fund makes a forward commitment to sell securities it owns, the proceeds to be received upon settlement are included in the Fund’s assets. Fluctuations in the fair value of the underlying securities are not reflected in a Fund’s net asset value as long as the commitment to sell remains in effect. Settlement of when-issued and forward commitment transactions generally takes place within two months after the date of the transaction, but a Fund may agree to a longer settlement period.
Purchasing securities on a when-issued or forward commitment basis involves a risk of loss if the value of the security to be purchased declines prior to the settlement date. However, when a Fund purchases securities on a when-issued or forward commitment basis, the Fund will maintain in a segregated account with the Fund’s custodian, or set aside or restrict in the subadviser’s records or systems relating to the Fund, cash or liquid assets having a value (determined daily) at least equal to the amount of the Fund’s purchase commitments. In the case of a forward commitment to sell portfolio securities, portfolio holdings will be held in a segregated account with the Fund’s custodian, or set aside or restricted on the subadviser’s records or systems relating to the Fund, while the commitment is outstanding.
During the year, Harbor Bond Fund purchased and sold securities on a forward commitment basis, including “TBA” (to be announced) purchase and sale commitments.
78
Harbor Fixed Income Funds
Notes to Financial Statements—Continued
Note 2—Significant Accounting Policies—Continued
Inflation-Indexed Bonds
Inflation-indexed bonds are fixed-income securities whose principal value is periodically adjusted based on the rate of inflation. The interest rate on these bonds is generally fixed at issuance at a rate lower than typical bonds. Over the life of an inflation-indexed bond, however, interest will be paid based on a principal value that is adjusted for inflation. Any increase or decrease in the principal amount of an inflation-indexed bond will be included as interest income even though investors do not receive the principal until maturity.
During the year, Harbor Bond Fund and Harbor Core Bond Fund invested in inflation-indexed bonds.
Loan Participations and Assignments
Loan participations and loan assignments are direct debt instruments, which are interests in amounts owed by corporate, governmental, or other borrowers to lenders or lending syndicates. A Fund’s investments in loans may be in the form of participation in loans or assignments of all or a portion of loans from third parties. A loan is often administered by a bank or other financial institution (the “agent”) that acts as agent for all holders. The agent administers the terms of the loan, as specified in the loan agreement. When investing in a loan participation, the Fund has the right to receive payments of principal, interest and any fees to which it is entitled, only from the agent selling the loan agreement and only upon receipt by the agent of payments from the borrower. As a result, the Fund may be subject to the credit risk of both the borrower and the agent that is selling the loan agreement. When the Fund purchases assignments from the agent, it acquires direct rights against the borrower on the loan.
Unfunded loan commitments are contractual obligations for future funding and may include revolving credit facilities, which may obligate a Fund to supply additional cash to the borrower on demand. Unfunded loan commitments represent a future obligation in full, even though a percentage of the notional loan amounts will never be utilized by the borrower. The funded portion of these credit agreements are presented on the Portfolio of Investments. Unfunded loan commitments are marked to market daily and any unrealized appreciation or depreciation is included in the Statement of Assets and Liabilities and the Statement of Operations.
A Fund may receive a commitment fee based on the undrawn portion of the underlying line of credit portion of an unfunded loan commitment. In certain circumstances, a Fund that has entered into an unfunded loan commitment may receive a prepayment penalty fee upon the prepayment of a loan by a borrower. Fees earned are recorded as a component of interest income on the Statement of Operations.
During the year, Harbor High-Yield Bond Fund invested in loan participations and assignments.
As of October 31, 2021, the Funds do not have unfunded loan commitments outstanding.
Mortgage-Related and Other Asset-Backed Securities
Mortgage-backed or asset-backed securities include mortgage pass-through securities, collateralized mortgage obligations (“CMOs”), commercial mortgage-backed securities, CMO residuals, stripped mortgage-backed securities and other securities that directly or indirectly represent a participation in, or are secured by and payable from, mortgage loans on real property. The value of some mortgage- or asset-backed securities may be particularly sensitive to changes in prevailing interest rates. Early repayment of principal on some mortgage-related securities may expose a Fund to a lower rate of return upon reinvestment of principal. The value of these securities may fluctuate in response to the market’s perception of the creditworthiness of the issuers. Additionally, although mortgages and mortgage-related securities are generally supported by some form of government or private guarantee and/or insurance, there is no assurance that private guarantors or insurers will meet their obligations.
During the year, Harbor Bond Fund and Harbor Core Bond Fund invested in mortgage-related or other asset-backed securities.
Repurchase Agreements
In a repurchase agreement, a Fund buys a security at one price and simultaneously agrees to sell it back at a higher price. Such agreements must be adequately collateralized to cover the counterparty’s obligation to a Fund to close out the repurchase agreement. Each repurchase agreement counterparty must meet the minimum credit quality requirements applicable to the respective
79
Harbor Fixed Income Funds
Notes to Financial Statements—Continued
Note 2—Significant Accounting Policies—Continued
Fund and any other appropriate counterparty criteria as determined by a Fund’s subadviser. The minimum credit quality requirements are those applicable to a Fund’s purchase of securities such that if a Fund is permitted to only purchase securities that are rated investment-grade (or the equivalent if unrated), a Fund could only enter into repurchase agreements with counterparties that have debt outstanding that is rated investment-grade (or the equivalent if unrated). The securities are regularly monitored to ensure that the collateral is adequate. A Fund seeks to further mitigate its counterparty risk by entering into master repurchase agreements with its counterparties. The master repurchase agreements provide that, in the event of a counterparty’s default, including bankruptcy, a Fund may terminate any repurchase agreements with that counterparty, determine the net amount owned, and sell or retain the collateral up to the net amount owed to a Fund. A counterparty’s default may cause a Fund to suffer losses, including loss of interest on or principal of the securities and costs associated with delay and enforcement of the terms of the master repurchase agreement.
During the year, Harbor Bond Fund entered into repurchase agreements with domestic or foreign banks or with a member firm of the Financial Industry Regulatory Authority, Inc., or an affiliate of a member firm that is a primary dealer in U.S. government securities.
Reverse Repurchase Agreements
A reverse repurchase agreement involves the delivery of a portfolio security in exchange for cash by a Fund, coupled with an agreement to repurchase the same or substantially the same security at a specified time and price. Until the security is repurchased, a Fund is obligated to pay interest, based upon market rates of the time of issuance, on the value of the repurchase agreement. While a reverse repurchase agreement is outstanding, a Fund continues to receive principal and interest payments on the underlying security. Cash received in exchange for securities delivered plus accrued interest payments to be made by a Fund to counterparties is reflected as a liability on the Statements of Assets and Liabilities. Interest payments based upon the reverse repurchase agreement term made by a Fund to counterparties are recorded as a component of interest expense on the Statements of Operations. To cover its obligations under reverse repurchase agreements, a Fund will segregate cash or liquid securities, which are fair valued daily, with the Fund’s custodian, or set aside or restrict assets in the subadviser’s records or systems relating to a Fund, in an amount not less than the repurchase price, including accrued interest, of the underlying security. Reverse repurchase agreements involve the risk that the fair value of the securities delivered by a Fund may decline below the repurchase price of the securities and, if the proceeds from the reverse repurchase agreement are invested in securities, that the fair value of the securities purchased may decline below the repurchase price of the securities delivered. In periods of increased demand for the security, a Fund may receive a fee for use of the security by the counterparty, which may result in interest income to a Fund.
During the year, Harbor Bond Fund entered into reverse repurchase agreements. The average amount of borrowings outstanding for the Fund was $6,694,000 at a weighted average interest rate of -0.456%. Average borrowings outstanding and average interest rate during the year is calculated based on calendar days. A table that includes the remaining maturity period for outstanding reverse repurchase agreements and the type of investment collateral pledged, if any, can be found subsequent to the Fund’s Portfolio of Investments schedule.
Sale-Buybacks
A “sale-buyback” financing transaction consists of a sale of a portfolio security by a Fund to a financial institution (the counterparty) with a simultaneous agreement to repurchase the same or substantially the same security at an agreed-upon price and date. A Fund is not entitled to receive principal and interest payments, if any, made on the security sold to the counterparty during the term of the agreement.
The agreed-upon proceeds for securities to be repurchased by a Fund are reflected as a liability on the Statements of Assets and Liabilities. A Fund will recognize net income represented by the price differential between the price received for the transferred security and the agreed-upon repurchase price. This is commonly referred to as the “price drop.” A price drop consists of two components: (i) the foregone interest and inflationary income adjustments, if any, a Fund would have otherwise received had the security not been sold, and (ii) the negotiated financing terms between a Fund and counterparty. Foregone interest and inflationary income adjustments, if any, are recorded as components of interest income on the Statements of Operations. Interest payments based upon negotiated financing terms made by a Fund to counterparties are recorded as a component of interest expense on the Statements of Operations. To cover its obligations under sale-buyback transactions, a Fund will segregate cash or liquid securities, which are fair valued daily, with the Fund’s custodian, or set aside or restrict
80
Harbor Fixed Income Funds
Notes to Financial Statements—Continued
Note 2—Significant Accounting Policies—Continued
assets in the subadviser’s records or systems relating to a Fund, in an amount not less than the repurchase price, including accrued interest, of the underlying security. Sale-buyback transactions involve the risk that the fair value of the securities sold by a Fund may decline below the repurchase price of the securities and, if the proceeds from the sale-buyback transactions are invested in securities, that the fair value of the securities purchased may decline below the repurchase price of the securities sold. In periods of increased demand for a security, a Fund may receive a fee for use of the security by the counterparty, which may result in additional interest income to a Fund.
During the year, Harbor Bond Fund entered into sale-buyback transactions. The average amount of borrowings outstanding for the Fund was $299,000 at a weighted average interest rate of 0.029%. Average borrowings outstanding and average interest rate during the year is calculated based on calendar days.
Short Sales
Short-selling obligates a Fund to replace a borrowed security by purchasing it at the market price at the time of replacement. Until the security is replaced, such Fund is required to pay any accrued interest or dividends to the lender and also may be required to pay a premium. A Fund would realize a gain if the security declines in price between the date of the short sale and the date on which such Fund replaces the borrowed security. A Fund would incur a loss as a result of the short sale if the price of the security increases between those dates. Until a Fund replaces the borrowed security, subject to pre-arranged exposure levels, it will maintain cash or liquid securities sufficient to cover its short position in a segregated account with the Fund’s custodian or set aside or restricted in the subadviser’s records or systems relating to the Fund. Short sales involve the risk of an unlimited increase in the market price of the borrowed security.
During the year, Harbor Bond Fund engaged in short-selling.
Futures Contracts
A futures contract is an agreement between two parties to buy or sell a specified financial instrument at a set price on a future date. Futures contracts tend to increase or decrease a Fund’s exposure to the underlying instrument or can be used to hedge other Fund investments.
Upon entering into a futures contract, a Fund is required to pledge to the broker an amount of cash, U.S. government securities or other liquid securities equal to the minimum “initial margin” requirements of the exchange. Pursuant to the contract, a Fund agrees to receive from or pay to the broker an amount of cash equal to the daily fluctuation in value of the contract referred to as “variation margin.” Such receipts or payments are recorded by a Fund as unrealized gains or losses. When the contract is closed or expires, a Fund records a realized gain or loss equal to the difference between the value of the contract at the time it was opened and the value at the time it was closed. A Fund may suffer losses if it is unable to close out its position because of an illiquid secondary market. There is no assurance that a Fund will be able to close out its position when the Fund considers it appropriate or desirable to do so. In the event of adverse price movements, a Fund may be required to continue making daily cash payments to maintain its required margin. If a Fund has insufficient cash, it may have to sell portfolio securities to meet daily margin requirements at a time when the Fund would not otherwise elect to do so. In addition, a Fund may be required to deliver or take delivery of instruments. The maximum potential loss on a long futures contract is the U.S. dollar value of the notional amount at the time the contract is opened. The potential loss on a short futures contract is unlimited. There is minimal counterparty risk with futures contracts as they are traded on an exchange and the exchange’s clearinghouse, as counterparty to all exchange-traded futures, guarantees the futures contracts against default.
During the year, Harbor Bond Fund used futures contracts to gain exposure to the fixed income asset class with greater efficiency and lower cost than was possible through direct investment, to add value when these securities were attractively priced, or to adjust the portfolio’s sensitivity to changes in interest rates or currency exchange rates.
Options
An option, including rights and warrants, is a contract that offers the buyer the right, but not the obligation, to buy (call) or sell (put) a security or other financial asset at an agreed-upon price (the strike price) during a certain period of time or on a specific date (exercise date). Purchased call options tend to increase a Fund’s exposure to the underlying instrument. Purchased put options tend to decrease a Fund’s exposure to the underlying instrument.
81
Harbor Fixed Income Funds
Notes to Financial Statements—Continued
Note 2—Significant Accounting Policies—Continued
When a Fund purchases an option, it pays a premium. If a purchased option expires, a Fund realizes a loss in the amount of the premium. If a Fund enters into a closing sale transaction, it realizes a gain or loss, depending on whether the proceeds from the sale are greater or less than the cost of the option. If a call option is exercised by a Fund, the cost of the securities acquired by exercising the call is increased by the premium paid to buy the call. If a put option is exercised by a Fund, it realizes a gain or loss from the sale of the underlying security and the proceeds from such sale are decreased by the premium originally paid. The risk associated with purchasing options is limited to the premium paid. A Fund’s maximum risk of loss from counterparty credit risk is also limited to the premium paid for the contract.
When a Fund writes an option, it receives a premium. If a written option expires on its stipulated expiration date, or if a Fund enters into a closing purchase transaction, the Fund realizes a gain (or loss, if the cost of a closing purchase transaction exceeds the premium received when the option was written) without regard to any unrealized gain or loss on the underlying security, and the liability related to such option is extinguished. If a written call option is exercised, a Fund realizes a gain or loss from the sale of the underlying security, and the proceeds of the sale are increased by the premium originally received. If a written put option is exercised, the amount of the premium originally received reduces the cost of the security that a Fund purchases upon exercise of the option.
The risk in writing a call option is that a Fund relinquishes the opportunity to profit if the fair value of the underlying security increases and the option is exercised. In writing a put option, a Fund assumes the risk of incurring a loss if the fair value of the underlying security decreases and the option is exercised. In addition, there is a risk that a Fund may not be able to enter into a closing transaction because of an illiquid secondary market or if the counterparty does not perform under the contract’s terms.
During the year, Harbor Bond Fund purchased and wrote (sold) option contracts to manage its exposure to the bond markets and to fluctuations in interest rates and currency values.
Swap Agreements
A swap is a contract between two parties to exchange future cash flows at specified intervals (payment dates) based upon a notional principal amount during the agreed-upon life of the contract. Swap agreements may be privately negotiated in the over-the-counter market (“OTC swaps”) or may be cleared through a third party, known as a central clearing party or derivatives clearing organization (“centrally cleared swaps”).
Swaps are fair valued daily and changes in value are recorded as unrealized appreciation or depreciation on the Statement of Operations.
Upon entering a swap agreement, any payments received or made at the beginning of the measurement period are reflected in the Statements of Assets and Liabilities and represent a reconciling value to compensate for differences between the stated terms of the swap agreement and prevailing market conditions (such as credit spreads, currency exchange rates, interest rates, and other relevant factors). These upfront payments are recorded as realized gains or losses on the Statements of Operations upon termination or maturity of the swap. If a liquidation payment is received or made at the termination of the swap, it is recorded as realized gain or loss on the Statements of Operations. Net periodic payments received or paid by a Fund are included as part of realized gains or losses on the Statements of Operations. Daily changes to the fair value of centrally cleared swaps are recorded as Variation margin receivable or payable on centrally cleared swap agreements in the Statements of Assets and Liabilities and are settled daily. An initial margin, typically in form of cash or qualifying highly liquid, high-quality short-term investments, is paid to the central clearing party or derivatives clearing organization when the swap contract is executed and is recorded as Due from brokers on the Statement of Assets and Liabilities.
Entering into swap agreements involves, to varying degrees, elements of credit risk, market risk and interest rate risk in excess of the amount recognized in the Statements of Assets and Liabilities. Such risks include the possibility that there is not a liquid market for these agreements, that the counterparty to the agreements may default on its obligation to perform, or that there may be unfavorable changes in market conditions or interest rates. A Fund’s maximum risk of loss from counterparty credit risk is the discounted value of the net cash flows to be received from the counterparty over the contract’s remaining life or the value of the contract. This risk is typically mitigated by the existence of a master netting arrangement between a Fund and the counterparty, the posting of collateral by the counterparty, and the central clearing party, as counterparty to all centrally cleared swaps, guarantees the performance of the swaps through the margin requirements.
82
Harbor Fixed Income Funds
Notes to Financial Statements—Continued
Note 2—Significant Accounting Policies—Continued
Interest Rate Swaps are agreements between counterparties to exchange cash flows or an exchange of commitments to pay or receive interest with respect to the notional amount of principal. Changes in interest rates can have an effect on the value of bond holdings, the amount of interest income earned and the value of the interest rate swaps held.
During the year, Harbor Bond Fund used interest rate swap agreements to manage its exposure to interest rate changes.
Credit Default Swaps are agreements between counterparties to buy or sell protection on a debt security, a basket of securities, or an index of obligations against a defined credit event. Under the terms of a credit default swap, the buyer of protection receives credit protection in exchange for making periodic payments to the seller of protection based on a given percentage applied to a notional principal amount. In return for these payments, the seller acts as the guarantor of the creditworthiness of a reference entity, obligation or index. An issuer may represent either a single issuer, a “basket” of issuers, or a credit index. A credit index is a basket of credit instruments or exposures designed to be representative of some part of the credit market as a whole.
The buyer in a credit default contract is obligated to pay the seller a periodic stream of payments over the term of the contract provided that no credit event occurs. Credit events may include bankruptcy, failure to pay principal, maturity extension, rating downgrade, or write-down. As a seller, if an underlying credit event occurs, a Fund will either pay the buyer an amount equal to the notional amount of the swap and take delivery of the reference obligation (or underlying securities comprising an index), or pay a net settlement amount of cash equal to the notional amount of the swap less the recovery value of the reference obligation (or underlying securities comprising an index). As a buyer, if an underlying credit event occurs, a Fund will either receive from the seller an amount equal to the notional amount of the swap and deliver the reference obligation (or underlying securities comprising an index) or receive a net settlement.
During the year, Harbor Bond Fund used credit default swap agreements as a seller to gain credit exposure to an issuer or to simulate investments in long bond positions that were either unavailable or less attractively priced in the bond market; the Fund used credit default swap agreements as a buyer to provide a measure of protection against defaults of an issuer. As of October 31, 2021, the maximum exposure to loss of the notional value as the seller of credit default swaps outstanding for the Fund was $46,835,000.
Note 3—Investment Portfolio Transactions
Investment Portfolio Transactions
Purchases and sales of investments, other than short-term securities, for each Fund for the year ended October 31, 2021 were as follows:
Purchases (000s) | Sales (000s) | |||
U.S. Government | Other | U.S. Government | Other | |
Harbor Bond Fund | $6,967,282 | $337,038 | $7,541,212 | $539,960 |
Harbor Convertible Securities Fund | — | 103,799 | — | 88,072 |
Harbor Core Bond Fund | 88,029 | 16,394 | 49,466 | 7,874 |
Harbor High-Yield Bond Fund | — | 481,920 | — | 565,110 |
Note 4—FEES AND OTHER Transactions with Affiliates
Investment Adviser
Harbor Capital is a wholly owned subsidiary of ORIX Corporation. Harbor Capital is the Funds’ investment adviser and is also responsible for administrative and other services.
83
Harbor Fixed Income Funds
Notes to Financial Statements—Continued
Note 4—FEES AND OTHER Transactions with Affiliates—Continued
Each Fund has a separate advisory agreement with Harbor Capital. The agreements provide for management fees based on an annual percentage rate of average daily net assets as follows:
Contractual Rate | Actual Rate | |
Harbor Bond Fund | 0.48%a | 0.46% |
Harbor Convertible Securities Fund | 0.65b | 0.60 |
Harbor Core Bond Fund | 0.34 | 0.34 |
Harbor High-Yield Bond Fund | 0.60c | 0.51 |
Harbor Money Market Fund | 0.20d | 0.02 |
a | The Adviser has contractually agreed to reduce the management fee to 0.43% on assets between $1 billion and $3 billion and to 0.405% on assets over $3 billion through February 28, 2022. |
b | The Adviser has contractually agreed to reduce the management fee to 0.60% through February 28, 2022. |
c | The Adviser has contractually agreed to reduce the management fee to 0.508% through February 28, 2022. |
d | The Adviser has contractually agreed to reduce the management fee to 0.18% through February 28, 2022. |
Harbor Capital has from time to time voluntarily or contractually agreed not to impose a portion of its management fees and/or to bear a portion of the expenses incurred in the operation of certain Funds in order to limit Fund expenses. Such waivers, if any, are reflected on the accompanying Statements of Operations. Interest expense, if any, is excluded from contractual limitations. During the year, the following expense limitation agreements were in effect:
Retirement Class | Institutional Class | Administrative Class | Investor Class | Expense Limitation Agreement Expiration Date | |
Harbor Bond Fund | 0.43% | 0.51% | 0.76% | N/A | 02/28/2022 |
Harbor Core Bond Fund | 0.37 | 0.45 | N/A | N/A | 02/28/2022 |
Harbor Money Market Fund1 | N/A | 0.28 | 0.53 | N/A | 02/28/2022 |
1 | From November 1, 2021 through March 31, 2021, Harbor Capital voluntarily waived additional expenses below the limits described in the table above. Effective April 1, 2021 through October 31, 2021, Harbor Capital voluntarily waived all the expenses of the Fund. This expense waiver resulted in annualized expense ratios for the year ended October 31, 2021 of 0.02% each for the Institutional Class and Administrative Class. |
All expense limitation agreements include the transfer agent fee waiver discussed in the Transfer Agent note.
Distributor
Harbor Funds Distributors, Inc. (the “Distributor”), a wholly-owned subsidiary of Harbor Capital, is the distributor for Harbor Funds’ shares. Under the Trust’s current distribution plan pursuant to Rule 12b-1 under the Investment Company Act with respect to each Fund’s Administrative and Investor Class shares (each, a “12b-1 Plan”) as applicable, each Fund pays the Distributor compensation at the annual rate of 0.25% of the average daily net assets of its Administrative and Investor Class shares. Pursuant to each 12b-1 Plan, the Distributor is compensated for financing any activity that is primarily intended to result in the sale of Administrative and Investor Class shares of each Fund or for recordkeeping services or the servicing of shareholder accounts in a Administrative and Investor Class shares of each Fund. Such activities include, but are not limited to: printing of prospectuses and statements of additional information and reports for prospective shareholders (i.e., other than existing shareholders); preparation and distribution of advertising material and sales literature; expenses of organizing and conducting sales seminars; supplemental payments to dealers or other institutions such as asset-based sales charges, payments of recordkeeping fees under recordkeeping arrangements, or payments of service fees under shareholder service arrangements; and costs of administering each 12b-1 Plan.
Amounts payable by a Fund under each 12b-1 Plan need not be directly related to the expenses actually incurred by the Distributor on behalf of each Fund. Each 12b-1 Plan does not obligate each Fund to reimburse the Distributor for the actual expenses the Distributor may incur in fulfilling its obligations under each 12b-1 Plan. Thus, even if the Distributor’s actual expenses exceed the fee payable to the Distributor at any given time, each Fund will not be obligated to pay more than that fee. If the Distributor’s expenses are less than the fee it receives, the Distributor will retain the difference.
The fees attributable to each Fund’s respective class are shown on the accompanying Statements of Operations.
84
Harbor Fixed Income Funds
Notes to Financial Statements—Continued
Note 4—FEES AND OTHER Transactions with Affiliates—Continued
Transfer Agent
Harbor Services Group, Inc. (“Harbor Services Group”), a wholly-owned subsidiary of Harbor Capital, is the transfer and shareholder servicing agent for the Funds. The transfer agency and service agreement is reviewed and approved annually by the Board of Trustees and provides currently for compensation up to the following amounts per class of each Fund:
Transfer Agent Fees | |
Retirement Class | 0.02% of the average daily net assets of all Retirement Class shares |
Institutional Class | 0.10% of the average daily net assets of all Institutional Class shares |
Administrative Class | 0.10% of the average daily net assets of all Administrative Class shares |
Investor Class1 | 0.21% of the average daily net assets of all Investor Class shares |
1 | For the period November 1, 2020 through February 28, 2021, Harbor Services Group received compensation up to 0.22% for the Investor Class. |
Harbor Services Group voluntarily waived a portion of its transfer agent fees during the year ended October 31, 2021. Fees incurred for these transfer agent services are shown on each Fund’s Statement of Operations. The voluntary waiver may be discontinued at any time.
Affiliated Transactions
The Investment Company Act permits purchase and sale transactions among affiliated investment companies subject to an exemptive rule. Harbor Funds has adopted policies and procedures pursuant to such rule. During the year, the Funds did not enter into any transactions with any other Harbor fund.
Shareholders
As of October 31, 2021, Harbor Capital and its wholly owned subsidiaries collectively held the following shares of beneficial interest in each of the following Funds:
Number of Shares Owned by Harbor Capital and Subsidiaries | Percentage of Outstanding Shares | |||||
Retirement Class | Institutional Class | Administrative Class | Investor Class | Total | ||
Harbor Bond Fund | 59,098 | — | — | N/A | 59,098 | 0.0% |
Harbor Convertible Securities Fund | 53,210 | — | — | — | 53,210 | 0.4 |
Harbor Core Bond Fund | 51,833 | 3,446,423 | N/A | N/A | 3,498,256 | 26.1 |
Harbor High-Yield Bond Fund | 75,221 | — | — | — | 75,221 | 0.2 |
Harbor Money Market Fund | N/A | 6,489,334 | 26,384 | N/A | 6,515,718 | 7.7 |
Independent Trustees
The fees and expenses of the Independent Trustees are included in “Trustees’ fees and expenses” on each Fund’s Statement of Operations.
The Board of Trustees has adopted a Deferred Compensation Plan for Independent Trustees (the “Plan”), which enables Trustees to elect to defer receipt of all or a portion of the annual compensation they are entitled to receive from the Trust. For purposes of determining the amount owed to a Trustee under the Plan, deferred amounts are treated as though they had been invested in shares of the Fund(s) selected by the Trustee. While not required to do so, each Fund makes an investment equal to the Trustee’s investment election. The deferred compensation liability and the offsetting deferred compensation investment asset are included as a component of “Accrued expenses – Trustees’ fees and expenses” and “Other assets”, respectively, in the Statements of Assets and Liabilities. Such amounts fluctuate with changes in the value of the selected Fund(s). The deferred compensation and related mark-to-market impact liability and an offsetting investment asset will remain on each Fund’s Statement of Assets and Liabilities until distributed in accordance with the Plan.
85
Harbor Fixed Income Funds
Notes to Financial Statements—Continued
Note 4—FEES AND OTHER Transactions with Affiliates—Continued
Indemnification
Under the Trust’s organizational documents, its officers and Trustees are indemnified against certain liabilities arising out of the performance of their duties to the Trust. In addition, in the normal course of business the Trust enters into contracts that provide general indemnities to other parties. The Trust’s maximum exposure under these arrangements is unknown as this would involve future claims that may be made against the Trust that have not yet occurred. The risk of material loss as a result of such indemnification claims is considered remote.
Redemption Fee
During the period November 1, 2020 through February 28, 2021, a 1% redemption fee was charged on shares of Harbor Convertible Securities Fund and Harbor High-Yield Bond Fund that were redeemed within 90 days from their date of purchase. All redemption fees are recorded by the Fund as paid-in capital. For such period redemption fee proceeds were as follows:
Amount (000s) | |
Harbor Convertible Securities Fund | $— |
Harbor High-Yield Bond Fund | 3 |
Effective March 1, 2021, the Funds no longer charge redemption fees.
NOTE 5—TAX INFORMATION
The amount and character of income and net realized gains to be distributed are determined in accordance with income tax rules and regulations, which may differ from U.S. GAAP. These differences are attributable to permanent book and tax accounting differences that were primarily due to the tax treatment of bonds in default and the use of equalization. Reclassifications, if any, are made to each Fund’s capital account to reflect income and net realized gains available for distribution (or available capital loss carryovers) under income tax rules and regulations. The amounts reclassified on the Statements of Assets and Liabilities for the year ended October 31, 2021 were as follows:
Total Distributable Earnings/(Loss) (000s) | Paid-In Capital (000s) | |
Harbor Bond Fund | $— | $— |
Harbor Convertible Securities Fund | (2,309) | 2,309 |
Harbor Core Bond Fund | (7) | 7 |
Harbor High-Yield Bond Fund | — | — |
Harbor Money Market Fund | (48) | 48 |
The tax composition of each Fund’s distributions was as follows:
As of October 31, 2021 | As of October 31, 2020 | |||||
Ordinary Income (000s) | Long-Term Capital Gains (000s) | Total (000s) | Ordinary Income (000s) | Long-Term Capital Gains (000s) | Total (000s) | |
Harbor Bond Fund | $58,526 | $— | $58,526 | $55,871 | $— | $55,871 |
Harbor Convertible Securities Fund | 12,094 | 3,161 | 15,255 | 3,667 | 1,453 | 5,120 |
Harbor Core Bond Fund | 3,447 | 1,534 | 4,981 | 2,588 | 434 | 3,022 |
Harbor High-Yield Bond Fund | 19,497 | — | 19,497 | 22,647 | — | 22,647 |
Harbor Money Market Fund | 29 | — | 29 | 832 | — | 832 |
86
Harbor Fixed Income Funds
Notes to Financial Statements—Continued
NOTE 5—TAX INFORMATION—Continued
As of October 31, 2021, the components of each Fund’s distributable earnings on a tax basis were as follows:
Undistributed Ordinary Income (000s) | Undistributed Long-Term Capital Gains (000s) | Unrealized Appreciation/ (Depreciation) (000s) | Accumulated Capital and Other Losses (000s) | Other Temporary Differences (000s) | Total Distributable Earnings/ (Loss) (000s) | |
Harbor Bond Fund | $16,258 | $— | $13,138 | $— | $(324) | $29,072 |
Harbor Convertible Securities Fund | 14,165 | 11,022 | 16,813 | — | (476) | 41,524 |
Harbor Core Bond Fund | 711 | — | 2,939 | (103) | (3) | 3,544 |
Harbor High-Yield Bond Fund | 706 | — | 1,510 | (78,568) | (113) | (76,465) |
Harbor Money Market Fund | — | — | — | — | (14) | (14) |
As of October 31, 2021, each Fund in the following table had capital loss carryforwards for federal tax purposes which will reduce each Fund’s taxable income arising from future net realized gains on investments to the extent permitted by the Internal Revenue Code. Use of the capital loss carryforwards will reduce the amount of the distribution to shareholders which would otherwise be necessary to relieve each Fund of any federal tax liability. The capital loss carryforwards do not expire.
Capital Loss Carryforward | |||
Short-Term (000s) | Long- Term (000s) | Total (000s) | |
Harbor Core Bond Fund | $103 | $— | $103 |
Harbor High-Yield Bond Fund | — | 78,568 | 78,568 |
The identified cost for federal income tax purposes of investments owned by each Fund and its respective gross unrealized appreciation and depreciation as of October 31, 2021 were as follows:
Identified Cost (000s) | Gross Unrealized | Net Unrealized Appreciation/ (Depreciation) (000s) | ||
Appreciation (000s) | (Depreciation) (000s) | |||
Harbor Bond Fund | $1,756,594 | $63,572 | $(50,434) | $13,138 |
Harbor Convertible Securities Fund | 173,410 | 20,772 | (3,959) | 16,813 |
Harbor Core Bond Fund* | 138,297 | 4,353 | (1,414) | 2,939 |
Harbor High-Yield Bond Fund* | 350,681 | 6,836 | (5,326) | 1,510 |
Harbor Money Market Fund | 84,698 | — | — | — |
* | Capital loss carryforwards are available, which may reduce taxable income from future net realized gain on investments. |
Note 6—Derivatives
Each Fund’s derivative holdings do not qualify for hedge accounting treatment and as such are recorded at current fair value. For a discussion of risks related to these investments please refer to the descriptions of each type of derivative instrument in Note 2— Significant Accounting Policies.
Each Fund’s derivative instruments outstanding as of the year ended October 31, 2021, if any, as disclosed in the Portfolio of Investments, and the related amounts of net realized and changes in net unrealized gains and losses on derivative instruments during the year as disclosed in the Statement of Operations, are indicators of the volume of derivative activity for each Fund.
87
Harbor Fixed Income Funds
Notes to Financial Statements—Continued
Note 6—Derivatives—Continued
Derivative Instruments
As of October 31, 2021, the fair values of derivatives, by primary risk exposure, were reflected in the Statement of Assets and Liabilities as follows:
HARBOR BOND FUND
Statement of Assets and Liabilities Caption | Interest Rate Contracts (000s) | Foreign Exchange Contracts (000s) | Credit Contracts (000s) | Total (000s) | ||||
Assets | ||||||||
Unrealized appreciation on open forward currency contracts | $— | $6,365 | $— | $6,365 | ||||
Variation margin on centrally cleared swap agreementsa,b | 7,258 | — | 1,382 | 8,640 | ||||
Variation margin on options and futures contracts (futures)a | 422 | — | — | 422 | ||||
Purchased options, at value | 331 | — | — | 331 | ||||
Liabilities | ||||||||
Unrealized depreciation on open forward currency contracts | $— | $(2,344) | $— | $(2,344) | ||||
Variation margin on centrally cleared swap agreementsa,b | (2,701) | — | (66) | (2,767) | ||||
Variation margin on options and futures contracts (futures)a | (3,725) | — | — | (3,725) | ||||
Written options, at value | (668) | — | — | (668) |
a | Balance includes cumulative appreciation/depreciation of contracts as reported in the Portfolio of Investments. Only current day’s variation margin is reported within the Statement of Assets and Liabilities. |
b | Net of upfront premiums received of $1,378 |
Net realized gain/(loss) and the change in net unrealized appreciation/(depreciation) on derivatives, by primary risk exposure, for the year ended October 31, 2021, were:
HARBOR BOND FUND
Net realized gain/(loss) on derivatives | Interest Rate Contracts (000s) | Foreign Exchange Contracts (000s) | Credit Contracts (000s) | Total (000s) |
Forward currency contracts | $— | $(5,061) | $— | $(5,061) |
Futures contracts | 368 | — | — | 368 |
Purchased options | (23) | (23) | ||
Written options | 688 | — | — | 688 |
Swap agreements | 979 | — | 719 | 1,698 |
Net realized gain/(loss) on derivatives | $2,012 | $(5,061) | $719 | $(2,330) |
Change in net unrealized appreciation/(depreciation) on derivatives | Interest Rate Contracts (000s) | Foreign Exchange Contracts (000s) | Credit Contracts (000s) | Total (000s) |
Forward currency contracts | $— | $1,547 | $— | $1,547 |
Futures contracts | (3,730) | — | — | (3,730) |
Purchased options | (197) | — | — | (197) |
Written options | (179) | — | — | (179) |
Swap agreements | 1,306 | — | 823 | 2,129 |
Change in net unrealized appreciation/(depreciation) on derivatives | $(2,800) | $1,547 | $823 | $(430) |
Note 7—OFFSETTING ASSETS AND LIABILITIES
Master Netting Arrangements
As described in further detail below, each Fund may enter into Master Netting Arrangements that govern the terms of certain transactions. Master Netting Arrangements are designed to reduce the counterparty risk associated with relevant transactions by establishing credit protection mechanisms and providing standardization as a means of improving legal certainty. As Master
88
Harbor Fixed Income Funds
Notes to Financial Statements—Continued
Note 7—OFFSETTING ASSETS AND LIABILITIES—Continued
Netting Arrangements are specific to the unique operations of different asset types, they allow a Fund to close out and net its total exposure to a counterparty in the event of a default with respect to all of the transactions governed under a single agreement with that counterparty. Master Netting Arrangements can also help reduce counterparty risk by specifying collateral posting requirements at pre-arranged exposure levels. Securities and cash pledged as collateral are reflected as assets in the Statements of Assets and Liabilities as either a component of investments at value (securities) or due from broker. Cash collateral received is not typically held in a segregated account and, as such, is reflected as a liability in the Statements of Assets and Liabilities as due to broker. The fair value of any securities received as collateral is not reflected as a component of net asset value.
For the year ended October 31, 2021, the following Master Netting Arrangements have been entered into by one or more of the Funds:
Master Repurchase Agreements and Global Master Repurchase Agreements, which govern repurchase and reverse repurchase transactions between the Fund and select counterparties. As of October 31, 2021, Harbor Bond Fund had investment exposures subject to the terms of these agreements.
Master Securities Forward Transaction Agreements, which govern the considerations and factors surrounding the settlement of certain forward settling transactions, such as delayed-delivery or sale-buyback transactions by and between the Fund and select counterparties. As of October 31, 2021, Harbor Bond Fund had investment exposures subject to the terms of these agreements.
International Swaps and Derivatives Association, Inc. Master Agreements and Credit Support Annexes, which govern over-the-counter market traded financial derivative transactions entered into by the Fund and select counterparties. As of October 31, 2021, Harbor Bond Fund had investment exposures subject to the terms of these agreements.
The following is a summary by counterparty of the gross value of material Borrowings and Other Financing Transactions and collateral (received)/pledged as of October 31, 2021:
HARBOR BOND FUND
Counterparty | Payable for Reverse Repurchase Agreements (000s) | Collateral (Received)/ Pledged (000s) | Net Exposure (000s) | |||
Global/Master Repurchase Agreement | ||||||
Barclays Bank PLC | $(3,347) | $3,289 | $(58) |
The following is a summary by counterparty of the value of OTC financial derivative instruments and collateral (received)/pledged as governed by International Swaps and Derivatives Association, Inc. master agreements as of October 31, 2021.
HARBOR BOND FUND
Financial Derivative Assets | Financial Derivative Liabilities | Net Value of OTC Derivatives (000s) | Collateral (Received)/ Pledged* (000s) | Net Exposure (000s) | |||||
Counterparty | Forward Currency Contracts (000s) | Purchased Options (000s) | Total Over-the- Counter (000s) | Forward Currency Contracts (000s) | Written Options (000s) | Total Over-the- Counter (000s) | |||
Barclays Bank plc | $49 | $— | $49 | $— | $— | $— | $49 | $— | $49 |
BNP Paribas SA | 1,963 | — | 1,963 | (740) | — | (740) | 1,223 | — | 1,223 |
Citibank NA | 1,370 | — | 1,370 | (534) | — | (534) | 836 | — | 836 |
Deutsche Bank AG | — | — | — | (58) | — | (58) | (58) | — | (58) |
Goldman Sachs & Co. LLC | — | — | — | — | (62) | (62) | (62) | — | (62) |
Goldman Sachs Bank USA | 1,471 | 331 | 1,802 | (593) | (567) | (1,160) | 642 | — | 642 |
HSBC Bank USA | 191 | — | 191 | (121) | — | (121) | 70 | — | 70 |
JP Morgan Chase Bank NA | 32 | — | 32 | (22) | (39) | (61) | (29) | 58 | — |
Société Générale | — | — | — | (2) | — | (2) | (2) | — | (2) |
89
Harbor Fixed Income Funds
Notes to Financial Statements—Continued
Note 7—OFFSETTING ASSETS AND LIABILITIES—Continued
HARBOR BOND FUND—Continued
Financial Derivative Assets | Financial Derivative Liabilities | Net Value of OTC Derivatives (000s) | Collateral (Received)/ Pledged* (000s) | Net Exposure (000s) | |||||
Counterparty | Forward Currency Contracts (000s) | Purchased Options (000s) | Total Over-the- Counter (000s) | Forward Currency Contracts (000s) | Written Options (000s) | Total Over-the- Counter (000s) | |||
UBS AG | $1,289 | $— | $1,289 | $(274) | $— | $(274) | $1,015 | $— | $1,015 |
Total Over-the-Counter Exposure | $6,365 | $331 | $6,696 | $(2,344) | $(668) | $(3,012) |
* | Of the total collateral received and/or pledged listed in the table above, no cash has been received as collateral |
Exchange traded and centrally cleared derivatives are not subject to master netting or similar arrangements.
Note 8—Subsequent Events
At the meeting of the Board of Trustees held on December 1, 2021, the Board of Trustees approved a change in the Harbor Bond Fund’s investment subadviser and name. Effective February 2, 2022 (the “Effective Date”), Income Research+Management (“IR+M”) will replace Pacific Investment Management Company, LLC as investment subadviser and the Fund will be renamed Harbor Core Plus Fund. In connection with the appointment of IR+M as the Fund’s subadviser, as of the Effective Date, the management fees will be reduced from 0.48% to 0.25% annually. In addition, on the Effective Date, the Adviser has contractually agreed to limit the Fund’s expenses to 0.30%, 0.38% and 0.63% for the Retirement, Institutional and Administrative share classes, respectively. Additional information related to these changes can be found in the supplement to the Fund’s prospectus and statement of additional information filed with the SEC on December 6, 2021.
On December 1, 2021, the Board of Trustees also approved a change in the Harbor Core Bond Fund’s advisory fees, together with certain related changes. Effective December 1, 2021, the management fee rate was reduced from 0.34% to 0.23% annually. In addition, effective December 1, 2021, the Adviser has contractually agreed to limit the Fund’s expenses to 0.26% and 0.34% for the Retirement and Institutional share classes, respectively. Additional information related to these changes can be found in the supplement to the Fund’s prospectus filed with the SEC on December 6, 2021.
Through the date the financial statements were issued, there were no other subsequent events or transactions that would have materially impacted the financial statements or related disclosures as presented herein.
90
Harbor Fixed Income Funds
Report of Independent Registered Public Accounting Firm
The Board of Trustees and Shareholders of
Harbor Funds
Harbor Funds
Opinion on the Financial Statements
We have audited the accompanying statements of assets and liabilities of Harbor Bond Fund, Harbor Convertible Securities Fund, Harbor Core Bond Fund, Harbor High-Yield Bond Fund and Harbor Money Market Fund (collectively referred to as the “Funds”), (five of the funds constituting the Harbor Funds (the “Trust”)), including the portfolios of investments, as of October 31, 2021, and the related statements of operations and changes in net assets, and the financial highlights for each of the periods indicated in the table below and the related notes (collectively referred to as the “financial statements”). In our opinion, the financial statements present fairly, in all material respects, the financial position of each of the Funds, (five of the funds constituting the Trust), at October 31, 2021, the results of their operations, changes in net assets and financial highlights for each of the periods indicated in the table below, in conformity with U.S. generally accepted accounting principles.
Individual fund comprising the Harbor Funds | Statement of operations | Statement of changes in net assets | Financial highlights |
Harbor Bond Fund Harbor Convertible Securities Fund Harbor High-Yield Bond Fund Harbor Money Market Fund | For the year ended October 31, 2021 | For each of the two years in the period ended October 31, 2021 | For each of the five years in the period ended October 31, 2021 |
Harbor Core Bond Fund | For the year ended October 31, 2021 | For each of the two years in the period ended October 31, 2021 | For each of the two years in the period ended October 31, 2021 and the period from June 1, 2018 (inception) through October 31, 2018 |
Basis for Opinion
These financial statements are the responsibility of the Trust’s management. Our responsibility is to express an opinion on each of the Funds’ financial statements based on our audits. We are a public accounting firm registered with the Public Company Accounting Oversight Board (United States) (“PCAOB”) and are required to be independent with respect to the Trust in accordance with the U.S. federal securities laws and the applicable rules and regulations of the Securities and Exchange Commission and the PCAOB.
We conducted our audits in accordance with the standards of the PCAOB. Those standards require that we plan and perform the audit to obtain reasonable assurance about whether the financial statements are free of material misstatement, whether due to error or fraud. The Trust is not required to have, nor were we engaged to perform, an audit of the Trust’s internal control over financial reporting. As part of our audits we are required to obtain an understanding of internal control over financial reporting, but not for the purpose of expressing an opinion on the effectiveness of the Trust’s internal control over financial reporting. Accordingly, we express no such opinion.
Our audits included performing procedures to assess the risks of material misstatement of the financial statements, whether due to error or fraud, and performing procedures that respond to those risks. Such procedures included examining, on a test basis, evidence regarding the amounts and disclosures in the financial statements. Our procedures included confirmation of securities owned as of October 31, 2021, by correspondence with the custodian, agent banks and brokers or by other appropriate auditing procedures where replies from brokers were not received. Our audits also included evaluating the accounting principles used and significant estimates made by management, as well as evaluating the overall presentation of the financial statements. We believe that our audits provide a reasonable basis for our opinion.
We have served as the auditor of one or more Harbor Funds investment companies since 2000.
Chicago, Illinois
December 21, 2021
December 21, 2021
91
Harbor Fixed Income Funds
Fees and Expenses Example (Unaudited)
Example
As a shareholder of a Fund, you incur two types of costs: (1) transaction costs, including redemption fees (if any) and (2) ongoing costs, including management fees, distribution and service (12b-1) fees (if any), and other Fund expenses. This example is intended to help you understand your ongoing costs (in dollars) of investing in a Fund and to compare these costs with the ongoing costs of investing in other mutual funds.
The example is based on an investment of $1,000 invested at the beginning of the period and held for the entire period May 1, 2021 through October 31, 2021.
Actual Expenses
The first line of the table below provides information about actual account values and actual expenses for each share class. You may use the information in the respective class line, together with the amount you invested, to estimate the expenses that you paid over the period. Simply divide your account value by $1,000 (for example, an $8,600 account value divided by $1,000 = 8.6), then multiply the result by the number in the first line of the respective class under the heading entitled “Expenses Paid During Period” to estimate the expenses you paid on your account during this period.
Hypothetical Example for Comparison Purposes
The second line of the table for each share class below provides information about hypothetical account values and hypothetical expenses based on the respective Fund/Class’s actual expense ratio and an assumed rate of return of 5% per year before expenses, which is not the respective Fund/Class’s actual return. The hypothetical account values and expenses may not be used to estimate the actual ending account balance or expenses you paid for the period. You may use this information to compare the ongoing costs of investing in a Fund to other funds. To do so, compare this 5% hypothetical example with the 5% hypothetical examples that appear in the shareholder reports of the other funds.
Please note that the expenses shown in the table are meant to highlight your ongoing costs only and do not reflect any transactional costs, such as redemption fees. Therefore, the second line of the table is useful in comparing ongoing costs only, and will not help you determine the relative total costs of owning different funds. In addition, if these transactional costs were included, your costs would have been higher.
Annualized Expense Ratios* | Expenses Paid During Period** | Beginning Account Value May 1, 2021 | Ending Account Value October 31, 2021 | |||||
Harbor Bond Fund | ||||||||
Retirement Class | 0.43% | |||||||
Actual | $2.18 | $1,000 | $1,013.42 | |||||
Hypothetical (5% return) | 2.19 | 1,000 | 1,022.98 | |||||
Institutional Class | 0.51% | |||||||
Actual | $2.59 | $1,000 | $1,013.01 | |||||
Hypothetical (5% return) | 2.60 | 1,000 | 1,022.57 | |||||
Administrative Class | 0.76% | |||||||
Actual | $3.85 | $1,000 | $1,011.73 | |||||
Hypothetical (5% return) | 3.87 | 1,000 | 1,021.28 | |||||
Harbor Convertible Securities Fund | ||||||||
Retirement Class | 0.67% | |||||||
Actual | $3.41 | $1,000 | $1,018.10 | |||||
Hypothetical (5% return) | 3.41 | 1,000 | 1,021.74 | |||||
Institutional Class | 0.75% | |||||||
Actual | $3.81 | $1,000 | $1,017.90 | |||||
Hypothetical (5% return) | 3.82 | 1,000 | 1,021.33 | |||||
Administrative Class | 1.00% | |||||||
Actual | $5.08 | $1,000 | $1,017.20 | |||||
Hypothetical (5% return) | 5.09 | 1,000 | 1,020.04 | |||||
Investor Class | 1.11% | |||||||
Actual | $5.65 | $1,000 | $1,016.40 | |||||
Hypothetical (5% return) | 5.65 | 1,000 | 1,019.47 |
92
Harbor Fixed Income Funds
Fees and Expenses Example—Continued
Annualized Expense Ratios* | Expenses Paid During Period** | Beginning Account Value May 1, 2021 | Ending Account Value October 31, 2021 | |||||
Harbor Core Bond Fund | ||||||||
Retirement Class | 0.37% | |||||||
Actual | $1.88 | $1,000 | $1,009.30 | |||||
Hypothetical (5% return) | 1.89 | 1,000 | 1,023.29 | |||||
Institutional Class | 0.45% | |||||||
Actual | $2.28 | $1,000 | $1,008.90 | |||||
Hypothetical (5% return) | 2.29 | 1,000 | 1,022.88 | |||||
Harbor High-Yield Bond Fund | ||||||||
Retirement Class | 0.56% | |||||||
Actual | $2.85 | $1,000 | $1,023.12 | |||||
Hypothetical (5% return) | 2.85 | 1,000 | 1,022.31 | |||||
Institutional Class | 0.64% | |||||||
Actual | $3.27 | $1,000 | $1,022.71 | |||||
Hypothetical (5% return) | 3.26 | 1,000 | 1,021.90 | |||||
Administrative Class | 0.89% | |||||||
Actual | $4.54 | $1,000 | $1,021.37 | |||||
Hypothetical (5% return) | 4.53 | 1,000 | 1,020.61 | |||||
Investor Class | 1.01% | |||||||
Actual | $5.14 | $1,000 | $1,020.82 | |||||
Hypothetical (5% return) | 5.14 | 1,000 | 1,019.99 | |||||
Harbor Money Market Fund | ||||||||
Institutional Class | 0.00% | |||||||
Actual | $0.00 | $1,000 | $1,000.15 | |||||
Hypothetical (5% return) | 0.00 | 1,000 | 1,025.21 | |||||
Administrative Class | 0.00% | |||||||
Actual | $0.00 | $1,000 | $1,000.15 | |||||
Hypothetical (5% return) | 0.00 | 1,000 | 1,025.21 |
*
Reflective of all fee waivers and expense reimbursements
**
Expenses are equal to the Fund’s annualized net expense ratio, multiplied by the average account value over the period, multiplied by 184/365 (to reflect the one-half year period).
93
Harbor Fixed Income Funds
Additional Information (Unaudited)
Additional Tax Information
The Funds designate the following portions of their distributions from investment company taxable income for the fiscal year ended October 31, 2021 as qualifying for the dividends received deduction for corporate shareholders.
Percentage of Distribution | |
Harbor Convertible Securities Fund | 3% |
For the fiscal year ended October 31, 2021, the Funds designate up to the maximum amount of such dividends allowable pursuant to the Internal Revenue Code 163 (j) as interest income eligible for income inclusion for corporate shareholders. If the Funds pay a distribution during calendar year 2021, complete information will be reported in conjunction with Form 1099-DIV.
Pursuant to Section 852 of the Internal Revenue Code, the Funds designate the following capital gain dividends for the fiscal year ended October 31, 2021:
Amount (000s) | |
Harbor Convertible Securities Fund | $4,172 |
Harbor Core Bond Fund | 1,541 |
For the fiscal year ended October 31, 2021, each Fund designates up to the maximum amount of such dividends allowable pursuant to the Internal Revenue Code as qualified dividend income eligible for reduced tax rates. These lower rates range from 0% to 20% depending on an individual’s tax bracket. If a Fund pays a distribution during calendar year 2021, complete information will be reported in conjunction with Form 1099-DIV.
Shareholders who own shares through a taxable Harbor Funds account and that received distributions from a Fund during calendar year 2021 will receive a Form 1099-DIV in January 2022 that will show the tax character of those distributions.
Proxy Voting
Harbor Funds has adopted Proxy Voting Policies and Procedures under which proxies relating to securities held by the Harbor funds are voted. In addition, Harbor Funds files Form N-PX, with its complete proxy voting record for the 12 months ended June 30th, no later than August 31st of each year. A description of Harbor Funds’ Proxy Voting Policies and Procedures and the proxy voting records (Form N-PX) are available (i) without charge, upon request, by calling Harbor toll-free at 800-422-1050; (ii) on Harbor’s website at harborcapital.com; and (iii) on the SEC’s website at sec.gov.
Householding
Harbor Funds has adopted a policy that allows it to send only one copy of a Fund’s prospectus, proxy materials, annual report and semi-annual report to certain shareholders residing at the same household. This reduces Fund expenses, which benefits you and other shareholders. If you need additional copies or do not want your mailings to be “householded,” please call the Shareholder Servicing Agent at 800-422-1050. Individual copies will be sent within thirty (30) days after the Shareholder Servicing Agent receives your instructions. Your consent to householding is considered valid until revoked.
Quarterly Portfolio Disclosures
The Funds (excluding Harbor Money Market Fund) file a complete portfolio of investments for their first and third fiscal quarters with the SEC as an exhibit to Form N-PORT. The Funds’ Form N-PORT exhibit is available (i) without charge, upon request, by calling Harbor toll-free at 800-422-1050, (ii) on Harbor’s website at harborcapital.com, and (iii) on the SEC’s website at sec.gov.
94
Harbor Fixed Income Funds
Additional Information—Continued
Trustees and Officers
As of December 2021
The business and affairs of the Trust shall be managed by or under the direction of the Trustees, and they shall have all powers necessary or desirable to carry out that responsibility. The Trustees shall have full power and authority to take or refrain from taking any action and to execute any contracts and instruments that they may consider necessary or desirable in the management of the Trust. Any determination made by the Trustees in good faith as to what is in the interests of the Trust shall be conclusive. Information pertaining to the Trustees and Officers of Harbor Funds is set forth below. The address of each Trustee and Officer is: [Name of Trustee or Officer] c/o Harbor Funds, 111 South Wacker Drive, 34th Floor, Chicago, IL 60606-4302.
Harbor Funds' Statement of Additional Information includes additional information about the Trust’s Trustees and is available without charge by calling 800-422-1050 or at the Trust’s website at harborcapital.com.
Name (Age) Position(s) with Fund | Term of Office and Length of Time Served1 | Principal Occupation(s) During Past Five Years | Number of Portfolios In Fund Complex Overseen By Trustee | Other Directorships Of Public Companies and Other Registered Investment Companies Held by Trustee During Past Five Years |
INDEPENDENT TRUSTEES | ||||
Scott M. Amero (58) Trustee | Since 2014 | Chairman (2015-2020) and Trustee (2011-Present), Rare (conservation nonprofit); Trustee, Berkshire School (2014-Present); Trustee, The Nature Conservancy, Massachusetts Chapter (2018-Present); Vice Chairman and Global Chief Investment Officer, Fixed Income (2010), Vice Chairman and Global Chief Investment Officer, Fixed Income, and Co-Head, Fixed Income Portfolio Management (2007-2010), BlackRock, Inc. (publicly traded investment management firm). | 34 | None |
Donna J. Dean (70) Trustee | Since 2010 | Chief Investment Officer of the Rockefeller Foundation (a private foundation) (2001-2019). | 34 | None |
Randall A. Hack (74) Trustee | Since 2010 | Founder and Senior Managing Director of Capstone Capital LLC (private investment firm) (2003-Present); Director of Tower Development Corporation (cell tower developer) (2009-2016); Advisory Director of Berkshire Partners (private equity firm) (2002-2013); Founder and Senior Managing Director of Nassau Capital, LLC (private investment firm, investing solely on behalf of the Princeton Endowment) (1995-2001); and President of The Princeton University Investment Company (1990-1994). | 34 | None |
Robert Kasdin (63) Trustee | Since 2014 | Senior Vice President and Chief Operating Officer (2015-Present) and Chief Financial Officer (2018-Present), Johns Hopkins Medicine; Senior Executive Vice President, Columbia University (2002-2015); Trustee and Member of the Finance Committee, National September 11 Memorial & Museum at the World Trade Center (2005-2019); Director, Apollo Commercial Real Estate Finance, Inc. (2014-Present); and Director and Executive Committee Member, The Y in Central Maryland (2018-Present). | 34 | Director of Apollo Commercial Real Estate Finance, Inc. (2014-Present). |
Kathryn L. Quirk (69) Trustee | Since 2017 | Vice President, Senior Compliance Officer and Head, U.S. Regulatory Compliance, Goldman Sachs Asset Management (2013-2017); Deputy Chief Legal Officer, Asset Management, and Vice President and Corporate Counsel, Prudential Insurance Company of America (2010-2012); Co-Chief Legal Officer, Prudential Investment Management, Inc., and Chief Legal Officer, Prudential Investments and Prudential Mutual Funds (2008-2012); Vice President and Corporate Counsel and Chief Legal Officer, Mutual Funds, Prudential Insurance Company of America, and Chief Legal Officer, Prudential Investments (2005-2008); Vice President and Corporate Counsel and Chief Legal Officer, Mutual Funds, Prudential Insurance Company of America (2004-2005); Member, Management Committee (2000-2002), General Counsel and Chief Compliance Officer, Zurich Scudder Investments, Inc. (1997-2002). | 34 | None |
Douglas J. Skinner (59) Trustee | Since 2020 | Professor of Accounting (2005-Present), Deputy Dean for Faculty (2015-2016, 2017-Present), Interim Dean (2016-2017), University of Chicago Booth School of Business. | 34 | None |
95
Harbor Fixed Income Funds
Additional Information—Continued
Trustees and Officers—Continued
Name (Age) Position(s) with Fund | Term of Office and Length of Time Served1 | Principal Occupation(s) During Past Five Years | Number of Portfolios In Fund Complex Overseen By Trustee | Other Directorships Of Public Companies and Other Registered Investment Companies Held by Trustee During Past Five Years |
INDEPENDENT TRUSTEES—Continued | ||||
Ann M. Spruill (67) Trustee | Since 2014 | Partner (1993-2008), member of Executive Committee (1996-2008), Member Board of Directors (2002-2008), Grantham, Mayo, Van Otterloo & Co, LLC (private investment management firm) (with the firm since 1990); Member Investment Committee and Chair of Global Public Equities, Museum of Fine Arts, Boston (2000-2020); and Trustee, Financial Accounting Foundation (2014-2020). | 34 | None |
INTERESTED TRUSTEE | ||||
Charles F. McCain (52)* Chairman, Trustee and President | Since 2017 | Chief Executive Officer (2017-Present), Director (2007-Present), President and Chief Operating Officer (2017), Executive Vice President and General Counsel (2004-2017), and Chief Compliance Officer (2004-2014), Harbor Capital Advisors, Inc.; Director and Chairperson (2019-Present), Harbor Trust Company, Inc.; Director (2007-Present) and Chief Compliance Officer (2004-2017), Harbor Services Group, Inc.; Chief Executive Officer (2017-Present), Director (2007-Present), Chief Compliance Officer and Executive Vice President (2007-2017), Harbor Funds Distributors, Inc.; and Chief Compliance Officer, Harbor Funds (2004-2017). | 34 | None |
Name (Age) Position(s) with Fund | Term of Office and Length of Time Served1 | Principal Occupation(s) During Past Five Years |
FUND OFFICERS NOT LISTED ABOVE** | ||
Erik D. Ojala (46) Chief Compliance Officer | Since 2017 | Executive Vice President and General Counsel (2017-Present) and Secretary (2010-Present); Senior Vice President and Associate General Counsel (2007-2017), Harbor Capital Advisors, Inc.; Director and Secretary (2019-Present), Harbor Trust Company, Inc.; Director, Executive Vice President (2017-Present) and Chief Compliance Officer (2017-2021), Harbor Funds Distributors, Inc.; Director (2017-Present) and Assistant Secretary (2014-Present), Harbor Services Group, Inc.; and AML Compliance Officer (2010-2017) and Vice President and Secretary (2007-2017), Harbor Funds. |
Anmarie S. Kolinski (50) Treasurer | Since 2007 | Executive Vice President and Chief Financial Officer (2007-Present), Harbor Capital Advisors, Inc.; Director and Treasurer (2019-Present), Harbor Trust Company, Inc.; Chief Financial Officer (2007-Present), Harbor Services Group, Inc.; and Chief Financial Officer (2015-Present) and Treasurer (2012-Present), Harbor Funds Distributors, Inc. |
Kristof M. Gleich (42) Vice President | Since 2019 | President (2018-Present) and Chief Investment Officer (2020), Harbor Capital Advisors, Inc.; Director, Vice Chairperson, President (2019-Present) and Chief Investment Officer (2020-Present), Harbor Trust Company, Inc.; and Managing Director, Global Head of Manager Selection (2010-2018), JP Morgan Chase & Co. |
Gregg M. Boland (58) Vice President | Since 2019 | Executive Vice President (2020-Present), Vice President (2019-2020), Harbor Capital Advisors, Inc.; President (2019-Present), Senior Vice President – Operations (2016-2019), and Vice President – Operations (2007-2015), Harbor Services Group, Inc.; and Senior Vice President, AML Compliance Officer, and OFAC Officer (2019-Present), Harbor Funds Distributors, Inc. |
Diana R. Podgorny (42) Secretary | Since 2018 | Senior Vice President and Assistant General Counsel (2020-Present), Vice President and Assistant General Counsel (2017-2020), Harbor Capital Advisors, Inc.; Director and Vice President (2020 – Present), Harbor Trust Company, Inc.; Vice President and Counsel, AMG Funds LLC (2016-2017); Assistant Secretary, AMG Funds, AMG Funds I, AMG Funds II and AMG Funds III (2016-2017); Assistant Secretary, AMG Funds IV (2010-2017); and Vice President and Counsel, Aston Asset Management, LLC (2010-2016). |
Jodie L. Crotteau (49) Assistant Secretary | Since 2014 | Senior Vice President and Chief Compliance Officer, Harbor Capital Advisors, Inc. (2014-Present); Chief Compliance Officer and AML/OFAC Officer (2019-Present), Harbor Trust Company, Inc.; Chief Compliance Officer and Secretary (2017-present) and Assistant Secretary (2015-2016), Harbor Services Group, Inc.; Chief Compliance Officer (2021-present) and Assistant Secretary (2016-present), Harbor Funds Distributors, Inc.; Vice President and Chief Compliance Officer, Grosvenor Registered Funds (2011-2014); and Vice President, Grosvenor Capital Management, L.P. (2010-2014). |
96
Harbor Fixed Income Funds
Additional Information—Continued
Trustees and Officers—Continued
Name (Age) Position(s) with Fund | Term of Office and Length of Time Served1 | Principal Occupation(s) During Past Five Years |
FUND OFFICERS NOT LISTED ABOVE**—Continued | ||
Lana M. Lewandowski (42) AML Compliance Officer and Assistant Secretary | Since 2017 | Legal & Compliance Manager (2016-Present) and Legal Specialist (2012-2015), Harbor Capital Advisors, Inc. |
Lora A. Kmieciak (57) Assistant Treasurer | Since 2017 | Senior Vice President – Fund Administration and Analysis (2017-Present), Senior Vice President - Business Analysis (2015-2017), Harbor Capital Advisors, Inc.; Vice President (2020 – Present), Harbor Trust Company, Inc.; and Assurance Executive Director, Ernst & Young LLP (1999-2015). |
John M. Paral (53) Assistant Treasurer | Since 2013 | Director of Fund Administration and Analysis (2017-Present), Vice President (2012-Present) and Financial Reporting Manager (2007-2017), Harbor Capital Advisors, Inc. |
1
Each Trustee serves for an indefinite term, until his or her successor is elected. Each Officer is elected annually.
*
Mr. McCain is deemed an “Interested Trustee” due to his affiliation with the Adviser and Distributor of Harbor Funds.
**
Officers of the Funds are “interested persons” as defined in the Investment Company Act.
97
This Privacy Statement Is Not Part of This Report
Harbor’s Privacy Statement
Rev. 09/2021
FACTS | WHAT DOES HARBOR DO WITH YOUR PERSONAL INFORMATION? |
Why? | Financial companies choose how they share your personal information. Federal law gives consumers the right to limit some but not all sharing. Federal law also requires us to tell you how we collect, share, and protect your personal information. Please read this notice carefully to understand what we do. |
What? | The types of personal information we collect and share depend on the product or service you have with us. This information can include: ■ Social Security number ■ Account balances and transaction history ■ Assets and investment experience ■ Wire transfer instructions When you are no longer our customer, we continue to share your information as described in this notice. |
How? | All financial companies need to share customers' personal information to run their everyday business. In the section below, we list the reasons financial companies can share their customers' personal information; the reasons Harbor chooses to share; and whether you can limit this sharing. |
Reasons we can share your personal information | Does Harbor share? | Can you limit this sharing? |
For our everyday business purposes— such as to process your transactions, maintain your account(s), respond to court orders and legal investigations, or report to credit bureaus | Yes | No |
For our marketing purposes— to offer our products and services to you | Yes | No |
For joint marketing with other financial companies | No | We don’t share |
For our affiliates’ everyday business purposes— information about your transactions and experiences | Yes | No |
For our affiliates’ everyday business purposes— information about your creditworthiness | No | We don’t share |
For nonaffiliates to market to you | No | We don’t share |
Questions? | Call 800-422-1050 or go to harborcapital.com |
98
Harbor’s Privacy Statement—Continued
Page 2 | ||
Who we are | ||
Who is providing this notice? | Harbor Capital Advisors, Inc.; Harbor Services Group; Inc.; Harbor Funds Distributors, Inc., Harbor Trust Company, Inc., Harbor Funds, Harbor ETF Trust (collectively, “Harbor”) | |
What we do | ||
How does Harbor protect my personal information? | To protect your personal information from unauthorized access and use, we use security measures that comply with federal law. These measures include computer safeguards and secured files and buildings. We maintain physical, electronic and procedural safeguards designed to protect your personal information; however, please be aware that no data security measures can guarantee 100% security. | |
How does Harbor collect my personal information? | We collect your personal information, for example, when you ■ Open an account or make transactions on your account ■ Give us your contact information or income information ■ Tell us about your investment or retirement portfolio We also collect your personal information from others, such as credit bureaus, affiliates, or other companies. | |
Why can’t I limit all sharing? | Federal law gives you the right to limit only ■ sharing for affiliates’ everyday business purposes—information about your creditworthiness ■ affiliates from using your information to market to you ■ sharing for nonaffiliates to market to you State laws and individual companies may give you additional rights to limit sharing. | |
Definitions | ||
Affiliates | Companies related by common ownership or control. They can be financial and nonfinancial companies. ■ Our affiliates include the financial companies providing this notice, as well as other companies under our parent company, ORIX Corporation. | |
Nonaffiliates | Companies not related by common ownership or control. They can be financial and nonfinancial companies. ■ Nonaffiliates we share with can include companies that perform support services on our behalf or other firms that assist us in providing you with products and services, such as custodians, transfer agents, broker-dealers and marketing service firms (to support our marketing to you), as well as other financial institutions. | |
Joint marketing | A formal agreement between nonaffiliated financial companies that together market financial products or services to you. ■ Harbor doesn’t jointly market. | |
Other important information | ||
Notice to investors in California and Vermont | Under California and Vermont law, we will not share information we collect about you with outside companies, unless the law allows. For example, we may share information with your consent, to service your accounts, and in connection with legal proceedings. We will limit sharing among our companies to the extent required by applicable law. |
We recommend that you read and retain this notice for your personal files.
99
[THIS PAGE INTENTIONALLY LEFT BLANK]
101
For more information |
Trustees & Officers
Charles F. McCain Chairman, President & Trustee Scott M. Amero Trustee Donna J. Dean Trustee Randall A. Hack Trustee Robert Kasdin Trustee Kathryn L. Quirk Trustee Douglas J. Skinner Trustee Ann M. Spruill Trustee Erik D. Ojala Chief Compliance Officer Anmarie S. Kolinski Treasurer Kristof M. Gleich Vice President Gregg M. Boland Vice President Diana R. Podgorny Secretary Jodie L. Crotteau Assistant Secretary Lana M. Lewandowski AML Compliance Officer & Assistant Secretary Lora A. Kmieciak Assistant Treasurer John M. Paral Assistant Treasurer |
Investment Adviser
Harbor Capital Advisors, Inc.
111 South Wacker Drive, 34th Floor
Chicago, IL 60606-4302
312-443-4400
111 South Wacker Drive, 34th Floor
Chicago, IL 60606-4302
312-443-4400
Distributor
Harbor Funds Distributors, Inc.
111 South Wacker Drive, 34th Floor
Chicago, IL 60606-4302
312-443-4600
111 South Wacker Drive, 34th Floor
Chicago, IL 60606-4302
312-443-4600
Shareholder Services
Harbor Services Group, Inc.
P.O. Box 804660
Chicago, IL 60680-4108
800-422-1050
P.O. Box 804660
Chicago, IL 60680-4108
800-422-1050
FD.AR.FI.1021
Annual Report
TARGET RETIREMENT FUNDS
October 31, 2021
Target Retirement Funds | Institutional Class |
Harbor Target Retirement Income Fund | HARAX |
Harbor Target Retirement 2020 Fund | HARJX |
Harbor Target Retirement 2025 Fund | HARMX |
Harbor Target Retirement 2030 Fund | HARPX |
Harbor Target Retirement 2035 Fund | HARUX |
Harbor Target Retirement 2040 Fund | HARYX |
Harbor Target Retirement 2045 Fund | HACCX |
Harbor Target Retirement 2050 Fund | HAFFX |
Harbor Target Retirement 2055 Fund | HATRX |
Harbor Target Retirement 2060 Fund | HATDX |
Table of Contents
1 | |
2 | |
5 | |
6 | |
7 | |
8 | |
9 | |
10 | |
11 | |
12 | |
13 | |
14 | |
15 | |
16 | |
17 | |
18 | |
19 | |
20 | |
21 | |
22 | |
23 | |
24 | |
25 | |
26 | |
27 | |
28 | |
32 | |
37 |
This document must be preceded or accompanied by a Prospectus.
Letter from the Chairman
Charles F. McCain
Chairman
Chairman
Dear Fellow Shareholder:
Over the past year we have experienced bouts of both real optimism and real disappointment. As summer began, there was a sense that we had finally turned the corner on COVID-19 with widespread vaccine availability and rapidly declining rates of new infections. We dared to dream about what a post-COVID-19 return to normalcy could look like. And then the delta variant arrived bringing a frustrating and sustained rise in new cases across the world. With all the loss that so many had experienced already from COVID-19, could we maintain our collective resolve in the face of this significant setback?
Fortunately, as summer turned to fall, we witnessed the resilience of the human spirit. We were better prepared as a nation this time to handle this delta variant surge, although our progress has certainly been uneven. We benefited from higher vaccination rates, generous federal stimulus programs that lifted consumer spending across the income spectrum and a return to in-person schooling for most that helped both children and families re-establish routines.
Through all these ups and downs, U.S. and global equity markets posted strong returns over the past 12 months. Value stocks led growth over the one-year period but lagged over longer time periods. Similarly, small caps outperformed large caps, while large caps continued to lead over longer time periods. In contrast, bond markets faced headwinds from rising interest rates, pushing Treasury bonds and the Bloomberg U.S. Aggregate Bond Index into negative territory. Corporate bonds were a lone bright spot, managing to post positive results for the fiscal year.
Investors continue to seek income wherever they can find it in today’s low-yield environment. However, over the course of the past year, interest rates have been increasing, with the 10-year U.S. Treasury yield more than doubling since it bottomed in August 2020. Rising rates have been in response to the likely prospect of the Fed beginning to taper its asset purchases soon, and potentially raising rates by the middle of 2022.
As we close out fiscal year 2021, there are four significant issues that must be addressed going forward: the supply shortages stemming from burgeoning consumer demand and supply-chain disruptions, ongoing labor shortages, rising prices (and the specter of inflation), and the persistence of the Delta and other potential new variants.
Harbor believes that the trajectory of the economic recovery will remain uneven for the foreseeable future, given the headwinds mentioned above. That’s why it’s so important for investors to focus on practical solutions to manage inevitable market volatility. Drawing upon the expertise of experienced, active portfolio managers is one way to help investors to achieve their long-term investment goals. We’re confident that Harbor together with our investment partners will continue to execute our strategies in a disciplined and thoughtful manner to benefit shareholders over the long haul.
In fact, we believe that a challenging and volatile market environment is actually good news for active managers, because it allows us to add potential value and pull ahead of the pack. Our research shows that the difference between top-performing and bottom-performing active managers, across major asset classes from U.S. large cap and small cap to foreign large cap and emerging markets, is at its highest level in 20 years.
I hope you and your families will fare well over the coming year. Thank you for your confidence and continued investment in Harbor Funds.
December 21, 2021
Charles F. McCain |
Chairman |
1
Harbor Target Retirement Funds
Manager’s Commentary (Unaudited)
Adviser
Harbor Capital Advisors, Inc.
111 South Wacker Dr. 34th Floor
Chicago, IL 60606
Chicago, IL 60606
Portfolio Managers
Paul C. Herbert, CFA, CAIA
Since Inception
Since Inception
Spenser P. Lerner, CFA
Since 2021
Since 2021
Harbor Capital has managed the Funds since inception.
Market Review
Global equities enjoyed robust performance for the fiscal year ended October 31, 2021, while rising interest rates resulted in fixed income markets struggling.
The Russell 3000® Index, which measures U.S. stock market performance, rallied, gaining 43.90%, its best fiscal year showing since 2009. The period started out very strong as market participants reacted very favorably to news of vaccine authorizations and resolution of the U.S. Presidential election. For the full period, value stocks outperformed growth stocks and small caps outperformed large caps. From a sector perspective, all sectors of the S&P 500 Index gained more than 10% for the year, led by Energy stocks. The sector climbed by 111.28%, as the oil price more than doubled during the year. Financials were also strong performers during the year, rising 72.14% as the U.S. yield curve steepened.
Stock performance was also robust outside of the U.S., with the MSCI EAFE (ND) Index, which gauges developed market non-U.S. equity performance, returning 34.18%. In terms of country performance, the United Kingdom, which makes up more than 14% of the MSCI EAFE (ND) Index, was a relative star, rose by 43.72%. The U.K. stock market has heavier weights in the Financials, Energy, and Materials sectors, which boosted performance. For MSCI EAFE (ND) Index as a whole, 20 of 21 countries had positive performance during the year. The same trends for growth and value and large and small performance held abroad. The MSCI Emerging Markets (ND) Index, which measures emerging stock market performance, rose 16.96% for the fiscal year. The Chinese stock market’s weak relative performance negatively impacted the MSCI Emerging Markets (ND) Index’s showing.
U.S. investment-grade fixed-income performance, measured by the Bloomberg U.S. Aggregate Bond Index, was weak for the period. The index declined by 0.48%. The Treasury segment of the index lagged, falling as interest rates rose during the period—the 10-year U.S. Treasury note rose from 0.87% to 1.55% from November 1, 2020 to October 31, 2021. High yield bonds fared much better, gaining 10.74% for the fiscal year.
Performance
In this environment, all ten Harbor Target Retirement Funds performed, what we would consider, well on an absolute basis for the fiscal year. As may be seen in the table accompanying this section, the Funds intended for investors with more time to retirement, and featuring higher equity weightings, delivered returns north of 30% in the period. The Harbor Target Retirement Income Fund, designed for investors in retirement, returned 8.57% for the year.
The Fund’s returns are also measured versus those of their respective Composite Indices, passive representations of each Fund’s allocations to different underlying Harbor Funds. The Income Fund outperformed its index while the other funds trailed their benchmarks during the period. Details on performance for the fiscal year are in the next paragraph.
As indicated, the Harbor Target Retirement Income Fund outperformed the Composite Index for the fiscal year, returning 8.57% versus the index’s 8.50% rise. The Fund has the series’ highest fixed-income weighting and each of the underlying fixed income funds, Harbor Bond Fund, Harbor Core Bond Fund, and Harbor High Yield Bond Fund, outperformed their underlying index for the year. Harbor Bond Fund gained 0.79% for the year ended October 31, 2021 which was 1.27 percentage points better than the Bloomberg U.S. Aggregate Bond Index. The Fund was helped by its underweight position relative to the benchmark in U.S. intermediate-term bonds, which rose in yield during the year, as well as its positions in high-yield bonds and non-agency mortgage-backed securities, which also outperformed.
The relative-to-benchmark performance of the other funds in the lineup was held back by underperformance by most of the underlying equity funds relative to their benchmarks. For example, the Harbor Large Cap Value Fund gained 40.52%, 3.24 percentage points less than the Russell 1000® Value Index for the year. Harbor International Growth Fund also underperformed it benchmark, the MSCI All Country World Ex. U.S. (ND) Index, 23.92% versus 29.66% during the year. Each Fund was held back by having less emphasis on value-oriented stocks and areas during the year as value stocks outperformed growth stocks.
2
Harbor Target Retirement Funds
Manager’s Commentary—Continued
HARBOR TARGET RETIREMENT FUNDS | Total Return Year Ended October 31, 2021 |
Harbor Target Retirement Income Fund | %8.57 |
Harbor Target Retirement 2020 Fund | 11.86 |
Harbor Target Retirement 2025 Fund | 15.74 |
Harbor Target Retirement 2030 Fund | 18.81 |
Harbor Target Retirement 2035 Fund | 21.88 |
Harbor Target Retirement 2040 Fund | 25.25 |
Harbor Target Retirement 2045 Fund | 27.24 |
Harbor Target Retirement 2050 Fund | 30.50 |
Harbor Target Retirement 2055 Fund | 33.78 |
Harbor Target Retirement 2060 Fund | 34.61 |
COMMONLY USED MARKET INDICES | Total Return Year Ended October 31, 2021 |
Bloomberg U.S. Aggregate Bond (domestic bonds) | %-0.48 |
MSCI EAFE (ND) (foreign stocks) | 34.18 |
Russell 3000® (entire U.S. stock market) | 43.90 |
HARBOR TARGET RETIREMENT FUND COMPOSITE INDICES | Total Return Year Ended October 31, 2021 |
Composite Index Income | %8.50 |
Composite Index 2020 | 11.97 |
Composite Index 2025 | 16.34 |
Composite Index 2030 | 19.67 |
Composite Index 2035 | 23.24 |
Composite Index 2040 | 27.00 |
Composite Index 2045 | 29.19 |
Composite Index 2050 | 32.82 |
Composite Index 2055 | 36.56 |
Composite Index 2060 | 37.50 |
Underlying Harbor Funds Performance (Institutional Class Shares)
Total Return for the Year Ended October 31, 2021 | |||||||||
EQUITY | One Year | Five Yearsa | Ten Yearsa | Since Inceptiona | Current 7-Day SEC Yield | Inception Date | Expense Ratios* | ||
Subsidizedb | Unsubsidizedc | Net | Gross | ||||||
Harbor Capital Appreciation Fund | 41.22% | 27.13% | 19.96% | 13.31% | N/A | N/A | 12/29/1987 | d0.67% | 0.72% |
Harbor Disruptive Innovation Fund | 27.29 | 26.07 | 17.96 | 8.20 | N/A | N/A | 11/01/2000 | f0.58 | 0.86 |
Harbor Diversified International All Cap Fund | 36.12 | 9.78 | N/A | 7.68 | N/A | N/A | 11/02/2015 | e0.80 | 0.93 |
Harbor Global Leaders Fund | 33.02 | 21.29 | 16.01 | 18.35 | N/A | N/A | 03/01/2009 | d,e0.86 | 0.98 |
Harbor International Fund | 34.15 | 8.40 | 6.29 | 10.21 | N/A | N/A | 12/29/1987 | e0.77 | 0.89 |
Harbor International Growth Fund | 23.92 | 14.04 | 9.49 | 5.10 | N/A | N/A | 11/01/1993 | e0.85 | 0.91 |
Harbor Large Cap Value Fund | 40.52 | 16.97 | 15.84 | 10.75 | N/A | N/A | 12/29/1987 | e0.69 | 0.72 |
Harbor Mid Cap Value Fund | 51.87 | 8.65 | 11.61 | 7.90 | N/A | N/A | 03/01/2002 | d,e0.85 | 0.90 |
Harbor Small Cap Growth Fund | 34.29 | 20.98 | 16.17 | 10.69 | N/A | N/A | 11/01/2000 | 0.89 | 0.89 |
Harbor Small Cap Value Fund | 43.11 | 13.86 | 13.26 | 10.79 | N/A | N/A | 12/14/2001 | 0.88 | 0.88 |
Harbor Strategic Growth Fund | 39.56 | 19.12 | 16.21 | 16.21 | N/A | N/A | g11/01/2011 | e0.71 | 0.80 |
FIXED INCOME | |||||||||
Harbor Bond Fund | 0.79% | 3.80% | 3.74% | 6.72% | N/A | N/A | 12/29/1987 | d,e0.51% | 0.73% |
Harbor Core Bond Fund | -0.09 | N/A | N/A | 5.05 | N/A | N/A | 06/01/2018 | e0.45 | 0.51 |
Harbor High-Yield Bond Fund | 9.55 | 5.62 | 5.43 | 6.68 | N/A | N/A | 12/01/2002 | d0.65 | 0.74 |
MONEY MARKET | |||||||||
Harbor Money Market Fund | 0.03% | 0.97% | 0.54% | 2.95% | 0.05% | -0.25% | 12/29/1987 | d,e0.28% | 0.39% |
3
Harbor Target Retirement Funds
Manager’s Commentary—Continued
At a meeting of the Board of Trustees held on November 4, 2021, the Board of Trustees voted to liquidate and dissolve the Harbor Target Retirement Funds. The liquidation of the Funds is expected to occur on January 14, 2022. Additional Information related to the liquidation can be found in the supplements to the Funds’ prospectus and statement of additional information as filed with the SEC on November 5, 2021 and November 18, 2021.
Effective May 10, 2021, Spenser P. Lerner is a co-portfolio manager for each of the Funds, joining Paul C. Herbert. As of the close of business on April 26, 2021, Matthew G. Pallai no longer serves as portfolio manager to the Target Retirement Funds.
Performance data shown represents past performance and is no guarantee of future results. Past performance is net of management fees and expenses and reflects reinvested dividends and distributions. Past performance reflects the beneficial effect of any expense waivers or reimbursements, without which returns would have been lower. Investment returns and principal value will fluctuate and when redeemed may be worth more or less than their original cost. Returns for periods less than one year are not annualized. Current performance may be higher or lower and is available through the most recent month end at harborcapital.com or by calling 800-422-1050.
The Funds invest in a variety of underlying Harbor funds that are subject to risks associated with their particular investment strategies. By investing in several underlying funds, the Funds have partial exposure to the risks of many different areas of the market. Investments in the Funds are not guaranteed. An investor may experience losses. There is no guarantee that the Funds will provide adequate income through retirement. For information on the different share classes and the risks associated with an investment in the Funds, please refer to the current prospectus.
This report contains the current opinions of Harbor Capital Advisors, Inc. as of the date of this report and should not be considered as investment advice or a recommendation of any particular security, strategy or investment product. Such opinions are subject to change without notice and securities described herein may no longer be included in, or may at any time be removed from, the Fund’s portfolio. This report is distributed for informational purposes only. Information contained herein has been obtained from sources believed reliable, but not guaranteed.
* | All mutual funds have expense ratios which represent what shareholders pay for operating expenses and management fees. Expense ratios are expressed as an annualized percentage of a fund’s average net assets paid out in expenses. Net expense ratios reflect adjustments due to voluntary or contractual fee waivers or expense reimbursements. Expense ratio information is as of the fund’s current prospectus, as revised and supplemented to date. |
a | Annualized |
b | Reflects reimbursements or waivers in effect during the period |
c | Does not reflect reimbursements or waivers currently in effect |
d | Reflects a contractual management fee waiver effective through February 28, 2022 |
e | Reflects an expense limitation agreement (excluding interest expense, if any) effective through February 28, 2022 |
f | Reflects an expense limitation agreement (excluding interest expense, if any) effective through August 31, 2022 |
g | For the period November 1, 2011 (inception of the Predecessor Fund) to January 20, 2015, Mar Vista Investment Partners, LLC served as the Predecessor Fund’s subadviser and for the period January 20, 2015 to March 6, 2017, Mar Vista Investment Partners, LLC served as investment adviser to the Predecessor Fund. |
4
Harbor Target Retirement Funds
Asset Allocation Framework (Unaudited)
Target Asset Allocation (glide path)
Harbor Target Retirement Funds - Target Asset Allocation
Over time, the allocation to asset classes and underlying Harbor funds will change in a predetermined manner as shown in the glide path above. The glide path shows the shifting of the asset allocations over time and illustrates how each Target Retirement Fund’s (except Harbor Target Retirement Income Fund) asset mix becomes more conservative as time elapses.
The principal value of the Funds is not guaranteed at any time, including the target retirement date.
Investment Styles
The Harbor Target Retirement Funds are constructed based on Harbor Capital’s investment experience that, over the long term, stocks generally provide greater growth opportunities and greater risk than bonds, and bonds generally provide more income and lower volatility than stocks. The year in the Fund name refers to the approximate year (the target date) when an investor in the Fund would leave the work force and enter retirement and likely stop making new investments in the Fund. The Harbor Target Retirement Income Fund is designed for investors currently in retirement. The year-specific Target Retirement Funds strive to produce more income and lower volatility as the target year approaches.
Harbor Capital allocates each Fund’s assets among the underlying Harbor funds based on the Fund’s investment objectives and policies. The asset allocation for each Fund (other than the Harbor Target Retirement Income Fund) will change over time as the target date indicated in the Fund’s name draws closer.
HARBOR TARGET RETIREMENT FUNDS — ACTUAL ALLOCATION AS OF OCTOBER 31, 2021 | ||||||||||
2060 Fund | 2055 Fund | 2050 Fund | 2045 Fund | 2040 Fund | 2035 Fund | 2030 Fund | 2025 Fund | 2020 Fund | Income Fund | |
Equity | ||||||||||
Harbor Capital Appreciation Fund | 8% | 8% | 7% | 6% | 6% | 5% | 4% | 2% | 2% | 1% |
Harbor Disruptive Innovation Fund | 6 | 6 | 5 | 5 | 5 | 4 | 3 | 3 | 2 | 1 |
Harbor Diversified International All Cap Fund | 11 | 11 | 10 | 9 | 8 | 7 | 6 | 5 | 3 | 3 |
Harbor Global Leaders Fund | 5 | 5 | 4 | 4 | 3 | 3 | 2 | 2 | 1 | 1 |
Harbor International Fund | 12 | 11 | 10 | 9 | 8 | 7 | 6 | 5 | 3 | 3 |
Harbor International Growth Fund | 12 | 11 | 10 | 9 | 8 | 7 | 6 | 5 | 3 | 3 |
Harbor Large Cap Value Fund | 14 | 13 | 12 | 11 | 10 | 8 | 7 | 5 | 4 | 3 |
Harbor Mid Cap Value Fund | 9 | 9 | 8 | 7 | 6 | 5 | 5 | 4 | 3 | 2 |
Harbor Small Cap Growth Fund | 5 | 5 | 5 | 5 | 4 | 4 | 3 | 2 | 2 | 1 |
Harbor Small Cap Value Fund | 7 | 6 | 6 | 5 | 5 | 4 | 3 | 3 | 2 | 1 |
Harbor Strategic Growth Fund | 4 | 4 | 3 | 3 | 3 | 2 | 3 | 2 | 2 | 1 |
Total Equity | 93 | 89 | 80 | 73 | 66 | 56 | 48 | 38 | 27 | 20 |
Fixed Income | ||||||||||
Harbor Bond Fund | 4% | 6% | 7% | 10% | 11% | 13% | 16% | 21% | 24% | 26% |
Harbor Core Bond Fund | 0 | 0 | 4 | 7 | 11 | 14 | 17 | 22 | 24 | 26 |
Harbor High-Yield Bond Fund | 3 | 5 | 9 | 10 | 12 | 17 | 19 | 19 | 18 | 18 |
Total Fixed Income | 7 | 11 | 20 | 27 | 34 | 44 | 52 | 62 | 66 | 70 |
Money Market | ||||||||||
Harbor Money Market Fund | 0% | 0% | 0% | 0% | 0% | 0% | 0% | 0% | 7% | 10% |
100% | 100% | 100% | 100% | 100% | 100% | 100% | 100% | 100% | 100% |
5
Harbor Target Retirement Income Fund
Fund Summary —October 31, 2021 (Unaudited)
Asset Allocation (% of investments)
FUND PERFORMANCE
The graph compares a $10,000 investment in the Institutional Class shares of the Fund with the performance of the broad based market indices. The Fund’s performance assumes the reinvestment of all dividend and capital gain distributions.
CHANGE IN A $10,000 INVESTMENT
For the period 11/01/2011 through 10/31/2021
TOTAL RETURNS For the periods ended 10/31/2021 | 1 Year | Annualized | Inception Date | |||||
5 Years | 10 Years | |||||||
Harbor Target Retirement Income Fund | ||||||||
Institutional Class | 8.57% | 6.18% | 5.31% | 01/02/2009 | ||||
Comparative Indices | ||||||||
Bloomberg U.S. Aggregate Bond | -0.48% | 3.10% | 3.00% | — | ||||
MSCI EAFE (ND) | 34.18 | 9.79 | 7.37 | — | ||||
Russell 3000® | 43.90 | 18.91 | 16.10 | — | ||||
Composite Index Income | 8.50 | 5.71 | 4.99 | — |
As stated in the Fund’s prospectus dated March 1, 2021, the expense ratio was 0.58%. The Adviser has contractually agreed to limit the Fund’s operating expenses to: (i) the amount of the acquired funds’ fees and expenses; (ii) compensation of the Independent Trustees; and (iii) certain other expenses such as extraordinary items. The expense ratio in the prospectus may differ from the actual expense ratio for the period disclosed within this report. The expense ratio shown in the prospectus is based on the prior fiscal year, adjusted to reflect changes, if any, in contractual arrangements that occurred prior to the date of the prospectus (or supplement thereto, if applicable).
Performance data shown represents past performance and is no guarantee of future results. Past performance is net of management fees and expenses and reflects reinvested dividends and distributions. Past performance reflects the beneficial effect of any expense waivers or reimbursements, without which returns would have been lower. Investment returns and principal value will fluctuate and when redeemed may be worth more or less than their original cost. Returns for periods less than one year are not annualized. Current performance may be higher or lower and is available through the most recent month end at harborcapital.com or by calling 800-422-1050. See the Benchmark Descriptions at the end of this report for a description of the Composite Index.
6
Harbor Target Retirement Income Fund
Portfolio of Investments—October 31, 2021
Value and Cost in Thousands
EQUITY FUNDS—20.4% | |||
Shares | Value | ||
1,999 | Harbor Capital Appreciation Fund | $249 | |
17,355 | Harbor Disruptive Innovation Fund | 248 | |
34,000 | Harbor Diversified International All Cap Fund | 470 | |
4,920 | Harbor Global Leaders Fund | 205 | |
9,638 | Harbor International Fund | 469 | |
20,456 | Harbor International Growth Fund | 481 | |
24,516 | Harbor Large Cap Value Fund | 570 | |
14,457 | Harbor Mid Cap Value Fund | 361 | |
11,277 | Harbor Small Cap Growth Fund | 224 | |
6,002 | Harbor Small Cap Value Fund | 270 | |
7,389 | Harbor Strategic Growth Fund | 246 | |
TOTAL EQUITY FUNDS | |||
(Cost $2,791) | 3,793 | ||
FIXED INCOME FUNDS—69.7% | |||
Shares | Value | ||
402,995 | Harbor Bond Fund | $4,864 | |
458,772 | Harbor Core Bond Fund | 4,868 | |
324,665 | Harbor High-Yield Bond Fund | 3,230 | |
TOTAL FIXED INCOME FUNDS | |||
(Cost $12,884) | 12,962 | ||
MONEY MARKET FUND—9.9% | |||
(Cost $1,851) | |||
1,851,265 | Harbor Money Market Fund | 1,851 | |
TOTAL INVESTMENTS—100.0% | |||
(Cost $17,526) | 18,606 | ||
CASH AND OTHER ASSETS, LESS LIABILITIES—0.0% | — | ||
TOTAL NET ASSETS—100.0% | $18,606 |
AFFILIATED TRANSACTIONS
The Underlying Funds are considered to be affiliated with the Fund. The following table shows investment transactions and earnings from investments in the affiliated funds during the period November 1, 2020 through October 31, 2021.
Underlying Funds | Beginning Balance as of 11/01/2020 (000s) | Purchases of Affiliated Funds (000s) | Sales of Affiliated Funds (000s) | Change in Net Unrealized Gain/(Loss) from Affiliated Funds (000s) | Net Realized Gain/(Loss) | Investment Income from Affiliated Funds (000s) | |
Sales of Affiliated Funds (000s) | Distributions Received from Affiliated Funds (000s) | ||||||
Harbor Bond Fund | $5,448 | $670 | $(1,137) | $(147) | $30 | $55 | $108 |
Harbor Capital Appreciation Fund | 259 | 121 | (195) | (6) | 70 | 29 | — |
Harbor Core Bond Fund | 5,443 | 767 | (1,133) | (295) | 86 | 108 | 103 |
Harbor Disruptive Innovation Fund | 264 | 134 | (185) | (42) | 77 | 35 | — |
Harbor Diversified International All Cap Fund | 520 | 70 | (276) | 123 | 33 | — | 5 |
Harbor Global Leaders Fund | 222 | 62 | (126) | 22 | 25 | 16 | — |
Harbor High-Yield Bond Fund | 3,627 | 330 | (879) | 145 | 7 | — | 170 |
Harbor International Fund | 521 | 74 | (274) | 112 | 36 | — | 6 |
Harbor International Growth Fund | 518 | 123 | (273) | 37 | 76 | — | 3 |
Harbor Large Cap Value Fund | 625 | 112 | (354) | 93 | 94 | 17 | 5 |
Harbor Mid Cap Value Fund | 409 | 92 | (300) | 37 | 123 | — | 9 |
Harbor Money Market Fund | 2,080 | 196 | (425) | — | — | — | — |
Harbor Small Cap Growth Fund | 242 | 86 | (161) | (7) | 64 | 16 | — |
Harbor Small Cap Value Fund | 299 | 69 | (204) | 22 | 84 | — | 1 |
Harbor Strategic Growth Fund | 264 | 41 | (136) | 47 | 30 | 7 | 1 |
Total | $20,741 | $2,947 | $(6,058) | $141 | $835 | $283 | $411 |
The accompanying notes are an integral part of the Financial Statements.
7
Harbor Target Retirement 2020 Fund
Fund Summary —October 31, 2021 (Unaudited)
Asset Allocation (% of investments)
FUND PERFORMANCE
The graph compares a $10,000 investment in the Institutional Class shares of the Fund with the performance of the broad based market indices. The Fund’s performance assumes the reinvestment of all dividend and capital gain distributions.
CHANGE IN A $10,000 INVESTMENT
For the period 11/01/2011 through 10/31/2021
TOTAL RETURNS For the periods ended 10/31/2021 | 1 Year | Annualized | Inception Date | |||||
5 Years | 10 Years | |||||||
Harbor Target Retirement 2020 Fund | ||||||||
Institutional Class | 11.86% | 7.71% | 6.62% | 01/02/2009 | ||||
Comparative Indices | ||||||||
Bloomberg U.S. Aggregate Bond | -0.48% | 3.10% | 3.00% | — | ||||
MSCI EAFE (ND) | 34.18 | 9.79 | 7.37 | — | ||||
Russell 3000® | 43.90 | 18.91 | 16.10 | — | ||||
Composite Index 2020 | 11.97 | 7.27 | 6.33 | — |
As stated in the Fund’s prospectus dated March 1, 2021, the expense ratio was 0.61%. The Adviser has contractually agreed to limit the Fund’s operating expenses to: (i) the amount of the acquired funds’ fees and expenses; (ii) compensation of the Independent Trustees; and (iii) certain other expenses such as extraordinary items. The expense ratio in the prospectus may differ from the actual expense ratio for the period disclosed within this report. The expense ratio shown in the prospectus is based on the prior fiscal year, adjusted to reflect changes, if any, in contractual arrangements that occurred prior to the date of the prospectus (or supplement thereto, if applicable).
Performance data shown represents past performance and is no guarantee of future results. Past performance is net of management fees and expenses and reflects reinvested dividends and distributions. Past performance reflects the beneficial effect of any expense waivers or reimbursements, without which returns would have been lower. Investment returns and principal value will fluctuate and when redeemed may be worth more or less than their original cost. Returns for periods less than one year are not annualized. Current performance may be higher or lower and is available through the most recent month end at harborcapital.com or by calling 800-422-1050. See the Benchmark Descriptions at the end of this report for a description of the Composite Index.
8
Harbor Target Retirement 2020 Fund
Portfolio of Investments—October 31, 2021
Value and Cost in Thousands
EQUITY FUNDS—27.1% | |||
Shares | Value | ||
3,156 | Harbor Capital Appreciation Fund | $394 | |
28,394 | Harbor Disruptive Innovation Fund | 406 | |
55,122 | Harbor Diversified International All Cap Fund | 762 | |
7,490 | Harbor Global Leaders Fund | 312 | |
15,699 | Harbor International Fund | 763 | |
32,797 | Harbor International Growth Fund | 771 | |
38,679 | Harbor Large Cap Value Fund | 898 | |
23,461 | Harbor Mid Cap Value Fund | 586 | |
18,892 | Harbor Small Cap Growth Fund | 375 | |
9,870 | Harbor Small Cap Value Fund | 445 | |
11,680 | Harbor Strategic Growth Fund | 389 | |
TOTAL EQUITY FUNDS | |||
(Cost $4,435) | 6,101 | ||
FIXED INCOME FUNDS—65.9% | |||
Shares | Value | ||
444,428 | Harbor Bond Fund | $5,364 | |
506,460 | Harbor Core Bond Fund | 5,374 | |
408,718 | Harbor High-Yield Bond Fund | 4,067 | |
TOTAL FIXED INCOME FUNDS | |||
(Cost $14,724) | 14,805 | ||
MONEY MARKET FUND—7.0% | |||
(Cost $1,571) | |||
1,571,260 | Harbor Money Market Fund | 1,571 | |
TOTAL INVESTMENTS—100.0% | |||
(Cost $20,730) | 22,477 | ||
CASH AND OTHER ASSETS, LESS LIABILITIES—0.0% | — | ||
TOTAL NET ASSETS—100.0% | $22,477 |
AFFILIATED TRANSACTIONS
The Underlying Funds are considered to be affiliated with the Fund. The following table shows investment transactions and earnings from investments in the affiliated funds during the period November 1, 2020 through October 31, 2021.
Underlying Funds | Beginning Balance as of 11/01/2020 (000s) | Purchases of Affiliated Funds (000s) | Sales of Affiliated Funds (000s) | Change in Net Unrealized Gain/(Loss) from Affiliated Funds (000s) | Net Realized Gain/(Loss) | Investment Income from Affiliated Funds (000s) | |
Sales of Affiliated Funds (000s) | Distributions Received from Affiliated Funds (000s) | ||||||
Harbor Bond Fund | $5,366 | $1,581 | $(1,439) | $(171) | $27 | $58 | $120 |
Harbor Capital Appreciation Fund | 432 | 222 | (364) | (23) | 127 | 53 | — |
Harbor Core Bond Fund | 5,360 | 1,667 | (1,409) | (333) | 89 | 115 | 113 |
Harbor Disruptive Innovation Fund | 462 | 251 | (367) | (82) | 142 | 66 | — |
Harbor Diversified International All Cap Fund | 884 | 111 | (515) | 189 | 93 | — | 9 |
Harbor Global Leaders Fund | 356 | 111 | (230) | 17 | 58 | 29 | — |
Harbor High-Yield Bond Fund | 4,376 | 693 | (1,190) | 183 | 5 | — | 220 |
Harbor International Fund | 885 | 122 | (508) | 151 | 113 | — | 10 |
Harbor International Growth Fund | 880 | 219 | (532) | 9 | 195 | — | 6 |
Harbor Large Cap Value Fund | 1,035 | 169 | (632) | 157 | 169 | 30 | 8 |
Harbor Mid Cap Value Fund | 692 | 135 | (529) | 67 | 221 | — | 17 |
Harbor Money Market Fund | 1,672 | 327 | (428) | — | — | — | — |
Harbor Small Cap Growth Fund | 425 | 145 | (301) | (4) | 110 | 32 | — |
Harbor Small Cap Value Fund | 515 | 102 | (368) | 45 | 151 | — | 2 |
Harbor Strategic Growth Fund | 440 | 70 | (252) | 56 | 75 | 13 | 2 |
Total | $23,780 | $5,925 | $(9,064) | $261 | $1,575 | $396 | $507 |
The accompanying notes are an integral part of the Financial Statements.
9
Harbor Target Retirement 2025 Fund
Fund Summary —October 31, 2021 (Unaudited)
Asset Allocation (% of investments)
FUND PERFORMANCE
The graph compares a $10,000 investment in the Institutional Class shares of the Fund with the performance of the broad based market indices. The Fund’s performance assumes the reinvestment of all dividend and capital gain distributions.
CHANGE IN A $10,000 INVESTMENT
For the period 11/01/2011 through 10/31/2021
TOTAL RETURNS For the periods ended 10/31/2021 | 1 Year | Annualized | Inception Date | |||||
5 Years | 10 Years | |||||||
Harbor Target Retirement 2025 Fund | ||||||||
Institutional Class | 15.74% | 8.99% | 7.43% | 01/02/2009 | ||||
Comparative Indices | ||||||||
Bloomberg U.S. Aggregate Bond | -0.48% | 3.10% | 3.00% | — | ||||
MSCI EAFE (ND) | 34.18 | 9.79 | 7.37 | — | ||||
Russell 3000® | 43.90 | 18.91 | 16.10 | — | ||||
Composite Index 2025 | 16.34 | 8.51 | 7.14 | — |
As stated in the Fund’s prospectus dated March 1, 2021, the expense ratio was 0.66%. The Adviser has contractually agreed to limit the Fund’s operating expenses to: (i) the amount of the acquired funds’ fees and expenses; (ii) compensation of the Independent Trustees; and (iii) certain other expenses such as extraordinary items. The expense ratio in the prospectus may differ from the actual expense ratio for the period disclosed within this report. The expense ratio shown in the prospectus is based on the prior fiscal year, adjusted to reflect changes, if any, in contractual arrangements that occurred prior to the date of the prospectus (or supplement thereto, if applicable).
Performance data shown represents past performance and is no guarantee of future results. Past performance is net of management fees and expenses and reflects reinvested dividends and distributions. Past performance reflects the beneficial effect of any expense waivers or reimbursements, without which returns would have been lower. Investment returns and principal value will fluctuate and when redeemed may be worth more or less than their original cost. Returns for periods less than one year are not annualized. Current performance may be higher or lower and is available through the most recent month end at harborcapital.com or by calling 800-422-1050. See the Benchmark Descriptions at the end of this report for a description of the Composite Index.
10
Harbor Target Retirement 2025 Fund
Portfolio of Investments—October 31, 2021
Value and Cost in Thousands
EQUITY FUNDS—38.1% | |||
Shares | Value | ||
4,500 | Harbor Capital Appreciation Fund | $562 | |
41,516 | Harbor Disruptive Innovation Fund | 594 | |
79,832 | Harbor Diversified International All Cap Fund | 1,103 | |
10,464 | Harbor Global Leaders Fund | 436 | |
22,777 | Harbor International Fund | 1,108 | |
47,585 | Harbor International Growth Fund | 1,118 | |
55,262 | Harbor Large Cap Value Fund | 1,284 | |
33,724 | Harbor Mid Cap Value Fund | 842 | |
27,661 | Harbor Small Cap Growth Fund | 549 | |
14,387 | Harbor Small Cap Value Fund | 648 | |
16,692 | Harbor Strategic Growth Fund | 556 | |
TOTAL EQUITY FUNDS | |||
(Cost $6,633) | 8,800 | ||
FIXED INCOME FUNDS—61.9% | |||
Shares | Value | ||
407,866 | Harbor Bond Fund | $4,923 | |
464,777 | Harbor Core Bond Fund | 4,931 | |
444,922 | Harbor High-Yield Bond Fund | 4,427 | |
TOTAL FIXED INCOME FUNDS | |||
(Cost $14,264) | 14,281 | ||
TOTAL INVESTMENTS—100.0% | |||
(Cost $20,897) | 23,081 | ||
CASH AND OTHER ASSETS, LESS LIABILITIES—0.0% | — | ||
TOTAL NET ASSETS—100.0% | $23,081 |
AFFILIATED TRANSACTIONS
The Underlying Funds are considered to be affiliated with the Fund. The following table shows investment transactions and earnings from investments in the affiliated funds during the period November 1, 2020 through October 31, 2021.
Underlying Funds | Beginning Balance as of 11/01/2020 (000s) | Purchases of Affiliated Funds (000s) | Sales of Affiliated Funds (000s) | Change in Net Unrealized Gain/(Loss) from Affiliated Funds (000s) | Net Realized Gain/(Loss) | Investment Income from Affiliated Funds (000s) | |
Sales of Affiliated Funds (000s) | Distributions Received from Affiliated Funds (000s) | ||||||
Harbor Bond Fund | $4,437 | $1,838 | $(1,236) | $(139) | $23 | $49 | $104 |
Harbor Capital Appreciation Fund | 553 | 314 | (447) | (11) | 153 | 67 | — |
Harbor Core Bond Fund | 4,436 | 1,917 | (1,220) | (274) | 72 | 96 | 98 |
Harbor Disruptive Innovation Fund | 598 | 357 | (440) | (85) | 164 | 86 | — |
Harbor Diversified International All Cap Fund | 1,123 | 250 | (629) | 252 | 107 | — | 12 |
Harbor Global Leaders Fund | 441 | 154 | (257) | 33 | 65 | 36 | — |
Harbor High-Yield Bond Fund | 4,275 | 1,150 | (1,183) | 167 | 18 | — | 225 |
Harbor International Fund | 1,124 | 246 | (602) | 203 | 137 | — | 13 |
Harbor International Growth Fund | 1,122 | 372 | (636) | 25 | 235 | — | 8 |
Harbor Large Cap Value Fund | 1,307 | 286 | (729) | 223 | 197 | 38 | 10 |
Harbor Mid Cap Value Fund | 881 | 277 | (686) | 105 | 265 | — | 22 |
Harbor Small Cap Growth Fund | 549 | 206 | (342) | 20 | 116 | 41 | — |
Harbor Small Cap Value Fund | 662 | 169 | (434) | 97 | 154 | — | 3 |
Harbor Strategic Growth Fund | 557 | 127 | (302) | 83 | 91 | 17 | 2 |
Total | $22,065 | $7,663 | $(9,143) | $699 | $1,797 | $430 | $497 |
The accompanying notes are an integral part of the Financial Statements.
11
Harbor Target Retirement 2030 Fund
Fund Summary —October 31, 2021 (Unaudited)
Asset Allocation (% of investments)
FUND PERFORMANCE
The graph compares a $10,000 investment in the Institutional Class shares of the Fund with the performance of the broad based market indices. The Fund’s performance assumes the reinvestment of all dividend and capital gain distributions.
CHANGE IN A $10,000 INVESTMENT
For the period 11/01/2011 through 10/31/2021
TOTAL RETURNS For the periods ended 10/31/2021 | 1 Year | Annualized | Inception Date | |||||
5 Years | 10 Years | |||||||
Harbor Target Retirement 2030 Fund | ||||||||
Institutional Class | 18.81% | 10.03% | 8.21% | 01/02/2009 | ||||
Comparative Indices | ||||||||
Bloomberg U.S. Aggregate Bond | -0.48% | 3.10% | 3.00% | — | ||||
MSCI EAFE (ND) | 34.18 | 9.79 | 7.37 | — | ||||
Russell 3000® | 43.90 | 18.91 | 16.10 | — | ||||
Composite Index 2030 | 19.67 | 9.43 | 7.86 | — |
As stated in the Fund’s prospectus dated March 1, 2021, the expense ratio was 0.68%. The Adviser has contractually agreed to limit the Fund’s operating expenses to: (i) the amount of the acquired funds’ fees and expenses; (ii) compensation of the Independent Trustees; and (iii) certain other expenses such as extraordinary items. The expense ratio in the prospectus may differ from the actual expense ratio for the period disclosed within this report. The expense ratio shown in the prospectus is based on the prior fiscal year, adjusted to reflect changes, if any, in contractual arrangements that occurred prior to the date of the prospectus (or supplement thereto, if applicable).
Performance data shown represents past performance and is no guarantee of future results. Past performance is net of management fees and expenses and reflects reinvested dividends and distributions. Past performance reflects the beneficial effect of any expense waivers or reimbursements, without which returns would have been lower. Investment returns and principal value will fluctuate and when redeemed may be worth more or less than their original cost. Returns for periods less than one year are not annualized. Current performance may be higher or lower and is available through the most recent month end at harborcapital.com or by calling 800-422-1050. See the Benchmark Descriptions at the end of this report for a description of the Composite Index.
12
Harbor Target Retirement 2030 Fund
Portfolio of Investments—October 31, 2021
Value and Cost in Thousands
EQUITY FUNDS—47.6% | |||
Shares | Value | ||
11,216 | Harbor Capital Appreciation Fund | $1,399 | |
88,437 | Harbor Disruptive Innovation Fund | 1,266 | |
165,331 | Harbor Diversified International All Cap Fund | 2,285 | |
21,862 | Harbor Global Leaders Fund | 911 | |
46,792 | Harbor International Fund | 2,276 | |
99,588 | Harbor International Growth Fund | 2,340 | |
115,063 | Harbor Large Cap Value Fund | 2,673 | |
70,063 | Harbor Mid Cap Value Fund | 1,749 | |
57,851 | Harbor Small Cap Growth Fund | 1,148 | |
29,945 | Harbor Small Cap Value Fund | 1,350 | |
28,958 | Harbor Strategic Growth Fund | 964 | |
TOTAL EQUITY FUNDS | |||
(Cost $13,330) | 18,361 | ||
FIXED INCOME FUNDS—52.4% | |||
Shares | Value | ||
530,365 | Harbor Bond Fund | $6,401 | |
603,828 | Harbor Core Bond Fund | 6,407 | |
744,573 | Harbor High-Yield Bond Fund | 7,408 | |
TOTAL FIXED INCOME FUNDS | |||
(Cost $20,121) | 20,216 | ||
TOTAL INVESTMENTS—100.0% | |||
(Cost $33,451) | 38,577 | ||
CASH AND OTHER ASSETS, LESS LIABILITIES—0.0% | — | ||
TOTAL NET ASSETS—100.0% | $38,577 |
AFFILIATED TRANSACTIONS
The Underlying Funds are considered to be affiliated with the Fund. The following table shows investment transactions and earnings from investments in the affiliated funds during the period November 1, 2020 through October 31, 2021.
Underlying Funds | Beginning Balance as of 11/01/2020 (000s) | Purchases of Affiliated Funds (000s) | Sales of Affiliated Funds (000s) | Change in Net Unrealized Gain/(Loss) from Affiliated Funds (000s) | Net Realized Gain/(Loss) | Investment Income from Affiliated Funds (000s) | |
Sales of Affiliated Funds (000s) | Distributions Received from Affiliated Funds (000s) | ||||||
Harbor Bond Fund | $4,905 | $2,467 | $(834) | $(202) | $65 | $55 | $127 |
Harbor Capital Appreciation Fund | 1,111 | 530 | (559) | 122 | 195 | 140 | — |
Harbor Core Bond Fund | 4,902 | 2,565 | (826) | (284) | 50 | 107 | 119 |
Harbor Disruptive Innovation Fund | 989 | 591 | (452) | 3 | 135 | 147 | — |
Harbor Diversified International All Cap Fund | 1,855 | 451 | (630) | 530 | 79 | — | 20 |
Harbor Global Leaders Fund | 720 | 251 | (237) | 100 | 77 | 59 | — |
Harbor High-Yield Bond Fund | 5,956 | 2,264 | (1,061) | 235 | 14 | — | 352 |
Harbor International Fund | 1,857 | 448 | (609) | 462 | 118 | — | 22 |
Harbor International Growth Fund | 1,850 | 579 | (519) | 266 | 164 | — | 13 |
Harbor Large Cap Value Fund | 2,150 | 434 | (652) | 541 | 200 | 63 | 18 |
Harbor Mid Cap Value Fund | 1,455 | 494 | (843) | 349 | 294 | — | 36 |
Harbor Small Cap Growth Fund | 911 | 417 | (419) | 94 | 145 | 71 | — |
Harbor Small Cap Value Fund | 1,098 | 312 | (489) | 294 | 135 | — | 5 |
Harbor Strategic Growth Fund | 709 | 164 | (166) | 203 | 54 | 22 | 3 |
Total | $30,468 | $11,967 | $(8,296) | $2,713 | $1,725 | $664 | $715 |
The accompanying notes are an integral part of the Financial Statements.
13
Harbor Target Retirement 2035 Fund
Fund Summary —October 31, 2021 (Unaudited)
Asset Allocation (% of investments)
FUND PERFORMANCE
The graph compares a $10,000 investment in the Institutional Class shares of the Fund with the performance of the broad based market indices. The Fund’s performance assumes the reinvestment of all dividend and capital gain distributions.
CHANGE IN A $10,000 INVESTMENT
For the period 11/01/2011 through 10/31/2021
TOTAL RETURNS For the periods ended 10/31/2021 | 1 Year | Annualized | Inception Date | |||||
5 Years | 10 Years | |||||||
Harbor Target Retirement 2035 Fund | ||||||||
Institutional Class | 21.88% | 11.15% | 9.12% | 01/02/2009 | ||||
Comparative Indices | ||||||||
Bloomberg U.S. Aggregate Bond | -0.48% | 3.10% | 3.00% | — | ||||
MSCI EAFE (ND) | 34.18 | 9.79 | 7.37 | — | ||||
Russell 3000® | 43.90 | 18.91 | 16.10 | — | ||||
Composite Index 2035 | 23.24 | 10.42 | 8.67 | — |
As stated in the Fund’s prospectus dated March 1, 2021, the expense ratio was 0.70%. The Adviser has contractually agreed to limit the Fund’s operating expenses to: (i) the amount of the acquired funds’ fees and expenses; (ii) compensation of the Independent Trustees; and (iii) certain other expenses such as extraordinary items. The expense ratio in the prospectus may differ from the actual expense ratio for the period disclosed within this report. The expense ratio shown in the prospectus is based on the prior fiscal year, adjusted to reflect changes, if any, in contractual arrangements that occurred prior to the date of the prospectus (or supplement thereto, if applicable).
Performance data shown represents past performance and is no guarantee of future results. Past performance is net of management fees and expenses and reflects reinvested dividends and distributions. Past performance reflects the beneficial effect of any expense waivers or reimbursements, without which returns would have been lower. Investment returns and principal value will fluctuate and when redeemed may be worth more or less than their original cost. Returns for periods less than one year are not annualized. Current performance may be higher or lower and is available through the most recent month end at harborcapital.com or by calling 800-422-1050. See the Benchmark Descriptions at the end of this report for a description of the Composite Index.
14
Harbor Target Retirement 2035 Fund
Portfolio of Investments—October 31, 2021
Value and Cost in Thousands
EQUITY FUNDS—56.5% | |||
Shares | Value | ||
9,959 | Harbor Capital Appreciation Fund | $1,243 | |
70,740 | Harbor Disruptive Innovation Fund | 1,012 | |
132,701 | Harbor Diversified International All Cap Fund | 1,834 | |
17,340 | Harbor Global Leaders Fund | 722 | |
37,619 | Harbor International Fund | 1,830 | |
80,241 | Harbor International Growth Fund | 1,886 | |
91,984 | Harbor Large Cap Value Fund | 2,137 | |
56,130 | Harbor Mid Cap Value Fund | 1,402 | |
46,557 | Harbor Small Cap Growth Fund | 924 | |
24,130 | Harbor Small Cap Value Fund | 1,087 | |
19,235 | Harbor Strategic Growth Fund | 640 | |
TOTAL EQUITY FUNDS | |||
(Cost $10,645) | 14,717 | ||
FIXED INCOME FUNDS—43.5% | |||
Shares | Value | ||
288,511 | Harbor Bond Fund | $3,482 | |
328,446 | Harbor Core Bond Fund | 3,485 | |
440,593 | Harbor High-Yield Bond Fund | 4,384 | |
TOTAL FIXED INCOME FUNDS | |||
(Cost $11,317) | 11,351 | ||
TOTAL INVESTMENTS—100.0% | |||
(Cost $21,962) | 26,068 | ||
CASH AND OTHER ASSETS, LESS LIABILITIES—0.0% | — | ||
TOTAL NET ASSETS—100.0% | $26,068 |
AFFILIATED TRANSACTIONS
The Underlying Funds are considered to be affiliated with the Fund. The following table shows investment transactions and earnings from investments in the affiliated funds during the period November 1, 2020 through October 31, 2021.
Underlying Funds | Beginning Balance as of 11/01/2020 (000s) | Purchases of Affiliated Funds (000s) | Sales of Affiliated Funds (000s) | Change in Net Unrealized Gain/(Loss) from Affiliated Funds (000s) | Net Realized Gain/(Loss) | Investment Income from Affiliated Funds (000s) | |
Sales of Affiliated Funds (000s) | Distributions Received from Affiliated Funds (000s) | ||||||
Harbor Bond Fund | $2,630 | $1,347 | $(419) | $(95) | $19 | $29 | $69 |
Harbor Capital Appreciation Fund | 936 | 486 | (449) | 123 | 147 | 120 | — |
Harbor Core Bond Fund | 2,628 | 1,399 | (413) | (142) | 13 | 58 | 64 |
Harbor Disruptive Innovation Fund | 778 | 450 | (322) | 11 | 95 | 116 | — |
Harbor Diversified International All Cap Fund | 1,460 | 315 | (426) | 423 | 62 | — | 16 |
Harbor Global Leaders Fund | 564 | 167 | (148) | 90 | 49 | 47 | — |
Harbor High-Yield Bond Fund | 3,309 | 1,460 | (522) | 123 | 14 | — | 203 |
Harbor International Fund | 1,463 | 328 | (421) | 400 | 60 | — | 17 |
Harbor International Growth Fund | 1,461 | 470 | (390) | 221 | 124 | — | 10 |
Harbor Large Cap Value Fund | 1,689 | 270 | (409) | 465 | 122 | 51 | 15 |
Harbor Mid Cap Value Fund | 1,131 | 331 | (572) | 351 | 161 | — | 30 |
Harbor Small Cap Growth Fund | 716 | 286 | (265) | 94 | 93 | 58 | — |
Harbor Small Cap Value Fund | 857 | 236 | (348) | 266 | 76 | — | 4 |
Harbor Strategic Growth Fund | 481 | 95 | (107) | 135 | 36 | 16 | 2 |
Total | $20,103 | $7,640 | $(5,211) | $2,465 | $1,071 | $495 | $430 |
The accompanying notes are an integral part of the Financial Statements.
15
Harbor Target Retirement 2040 Fund
Fund Summary —October 31, 2021 (Unaudited)
Asset Allocation (% of investments)
FUND PERFORMANCE
The graph compares a $10,000 investment in the Institutional Class shares of the Fund with the performance of the broad based market indices. The Fund’s performance assumes the reinvestment of all dividend and capital gain distributions.
CHANGE IN A $10,000 INVESTMENT
For the period 11/01/2011 through 10/31/2021
TOTAL RETURNS For the periods ended 10/31/2021 | 1 Year | Annualized | Inception Date | |||||
5 Years | 10 Years | |||||||
Harbor Target Retirement 2040 Fund | ||||||||
Institutional Class | 25.25% | 12.27% | 10.05% | 01/02/2009 | ||||
Comparative Indices | ||||||||
Bloomberg U.S. Aggregate Bond | -0.48% | 3.10% | 3.00% | — | ||||
MSCI EAFE (ND) | 34.18 | 9.79 | 7.37 | — | ||||
Russell 3000® | 43.90 | 18.91 | 16.10 | — | ||||
Composite Index 2040 | 27.00 | 11.40 | 9.51 | — |
As stated in the Fund’s prospectus dated March 1, 2021, the expense ratio was 0.72%. The Adviser has contractually agreed to limit the Fund’s operating expenses to: (i) the amount of the acquired funds’ fees and expenses; (ii) compensation of the Independent Trustees; and (iii) certain other expenses such as extraordinary items. The expense ratio in the prospectus may differ from the actual expense ratio for the period disclosed within this report. The expense ratio shown in the prospectus is based on the prior fiscal year, adjusted to reflect changes, if any, in contractual arrangements that occurred prior to the date of the prospectus (or supplement thereto, if applicable).
Performance data shown represents past performance and is no guarantee of future results. Past performance is net of management fees and expenses and reflects reinvested dividends and distributions. Past performance reflects the beneficial effect of any expense waivers or reimbursements, without which returns would have been lower. Investment returns and principal value will fluctuate and when redeemed may be worth more or less than their original cost. Returns for periods less than one year are not annualized. Current performance may be higher or lower and is available through the most recent month end at harborcapital.com or by calling 800-422-1050. See the Benchmark Descriptions at the end of this report for a description of the Composite Index.
16
Harbor Target Retirement 2040 Fund
Portfolio of Investments—October 31, 2021
Value and Cost in Thousands
EQUITY FUNDS—66.1% | |||
Shares | Value | ||
18,883 | Harbor Capital Appreciation Fund | $2,356 | |
131,092 | Harbor Disruptive Innovation Fund | 1,876 | |
250,162 | Harbor Diversified International All Cap Fund | 3,457 | |
32,742 | Harbor Global Leaders Fund | 1,364 | |
71,175 | Harbor International Fund | 3,462 | |
149,832 | Harbor International Growth Fund | 3,521 | |
173,561 | Harbor Large Cap Value Fund | 4,032 | |
105,825 | Harbor Mid Cap Value Fund | 2,642 | |
87,037 | Harbor Small Cap Growth Fund | 1,727 | |
45,328 | Harbor Small Cap Value Fund | 2,043 | |
34,969 | Harbor Strategic Growth Fund | 1,164 | |
TOTAL EQUITY FUNDS | |||
(Cost $19,721) | 27,644 | ||
FIXED INCOME FUNDS—33.9% | |||
Shares | Value | ||
371,301 | Harbor Bond Fund | $4,482 | |
422,785 | Harbor Core Bond Fund | 4,486 | |
523,659 | Harbor High-Yield Bond Fund | 5,210 | |
TOTAL FIXED INCOME FUNDS | |||
(Cost $14,080) | 14,178 | ||
TOTAL INVESTMENTS—100.0% | |||
(Cost $33,801) | 41,822 | ||
CASH AND OTHER ASSETS, LESS LIABILITIES—0.0% | — | ||
TOTAL NET ASSETS—100.0% | $41,822 |
AFFILIATED TRANSACTIONS
The Underlying Funds are considered to be affiliated with the Fund. The following table shows investment transactions and earnings from investments in the affiliated funds during the period November 1, 2020 through October 31, 2021.
Underlying Funds | Beginning Balance as of 11/01/2020 (000s) | Purchases of Affiliated Funds (000s) | Sales of Affiliated Funds (000s) | Change in Net Unrealized Gain/(Loss) from Affiliated Funds (000s) | Net Realized Gain/(Loss) | Investment Income from Affiliated Funds (000s) | |
Sales of Affiliated Funds (000s) | Distributions Received from Affiliated Funds (000s) | ||||||
Harbor Bond Fund | $3,309 | $1,613 | $(346) | $(123) | $29 | $36 | $87 |
Harbor Capital Appreciation Fund | 1,700 | 832 | (700) | 246 | 278 | 228 | — |
Harbor Core Bond Fund | 3,306 | 1,677 | (337) | (182) | 22 | 72 | 81 |
Harbor Disruptive Innovation Fund | 1,411 | 756 | (491) | 55 | 145 | 217 | — |
Harbor Diversified International All Cap Fund | 2,645 | 421 | (507) | 791 | 107 | — | 30 |
Harbor Global Leaders Fund | 1,032 | 284 | (219) | 165 | 102 | 88 | — |
Harbor High-Yield Bond Fund | 3,709 | 1,809 | (459) | 150 | 1 | — | 238 |
Harbor International Fund | 2,649 | 430 | (469) | 1,056 | (204) | — | 32 |
Harbor International Growth Fund | 2,670 | 756 | (551) | 391 | 255 | — | 19 |
Harbor Large Cap Value Fund | 3,078 | 446 | (596) | 878 | 226 | 94 | 28 |
Harbor Mid Cap Value Fund | 2,045 | 436 | (782) | 803 | 140 | — | 55 |
Harbor Small Cap Growth Fund | 1,290 | 464 | (374) | 174 | 173 | 105 | — |
Harbor Small Cap Value Fund | 1,549 | 280 | (413) | 538 | 89 | — | 8 |
Harbor Strategic Growth Fund | 860 | 166 | (177) | 256 | 59 | 28 | 4 |
Total | $31,253 | $10,370 | $(6,421) | $5,198 | $1,422 | $868 | $582 |
The accompanying notes are an integral part of the Financial Statements.
17
Harbor Target Retirement 2045 Fund
Fund Summary —October 31, 2021 (Unaudited)
Asset Allocation (% of investments)
FUND PERFORMANCE
The graph compares a $10,000 investment in the Institutional Class shares of the Fund with the performance of the broad based market indices. The Fund’s performance assumes the reinvestment of all dividend and capital gain distributions.
CHANGE IN A $10,000 INVESTMENT
For the period 11/01/2011 through 10/31/2021
TOTAL RETURNS For the periods ended 10/31/2021 | 1 Year | Annualized | Inception Date | |||||
5 Years | 10 Years | |||||||
Harbor Target Retirement 2045 Fund | ||||||||
Institutional Class | 27.24% | 13.05% | 10.72% | 01/02/2009 | ||||
Comparative Indices | ||||||||
Bloomberg U.S. Aggregate Bond | -0.48% | 3.10% | 3.00% | — | ||||
MSCI EAFE (ND) | 34.18 | 9.79 | 7.37 | — | ||||
Russell 3000® | 43.90 | 18.91 | 16.10 | — | ||||
Composite Index 2045 | 29.19 | 12.15 | 10.16 | — |
As stated in the Fund’s prospectus dated March 1, 2021, the expense ratio was 0.74%. The Adviser has contractually agreed to limit the Fund’s operating expenses to: (i) the amount of the acquired funds’ fees and expenses; (ii) compensation of the Independent Trustees; and (iii) certain other expenses such as extraordinary items. The expense ratio in the prospectus may differ from the actual expense ratio for the period disclosed within this report. The expense ratio shown in the prospectus is based on the prior fiscal year, adjusted to reflect changes, if any, in contractual arrangements that occurred prior to the date of the prospectus (or supplement thereto, if applicable).
Performance data shown represents past performance and is no guarantee of future results. Past performance is net of management fees and expenses and reflects reinvested dividends and distributions. Past performance reflects the beneficial effect of any expense waivers or reimbursements, without which returns would have been lower. Investment returns and principal value will fluctuate and when redeemed may be worth more or less than their original cost. Returns for periods less than one year are not annualized. Current performance may be higher or lower and is available through the most recent month end at harborcapital.com or by calling 800-422-1050. See the Benchmark Descriptions at the end of this report for a description of the Composite Index.
18
Harbor Target Retirement 2045 Fund
Portfolio of Investments—October 31, 2021
Value and Cost in Thousands
EQUITY FUNDS—72.5% | |||
Shares | Value | ||
12,707 | Harbor Capital Appreciation Fund | $1,585 | |
86,953 | Harbor Disruptive Innovation Fund | 1,244 | |
165,066 | Harbor Diversified International All Cap Fund | 2,281 | |
22,246 | Harbor Global Leaders Fund | 927 | |
46,945 | Harbor International Fund | 2,284 | |
99,908 | Harbor International Growth Fund | 2,348 | |
115,543 | Harbor Large Cap Value Fund | 2,684 | |
69,954 | Harbor Mid Cap Value Fund | 1,747 | |
57,026 | Harbor Small Cap Growth Fund | 1,131 | |
29,723 | Harbor Small Cap Value Fund | 1,340 | |
23,367 | Harbor Strategic Growth Fund | 778 | |
TOTAL EQUITY FUNDS | |||
(Cost $13,502) | 18,349 | ||
FIXED INCOME FUNDS—27.5% | |||
Shares | Value | ||
222,113 | Harbor Bond Fund | $2,681 | |
173,102 | Harbor Core Bond Fund | 1,836 | |
244,733 | Harbor High-Yield Bond Fund | 2,435 | |
TOTAL FIXED INCOME FUNDS | |||
(Cost $6,930) | 6,952 | ||
TOTAL INVESTMENTS—100.0% | |||
(Cost $20,432) | 25,301 | ||
CASH AND OTHER ASSETS, LESS LIABILITIES—0.0% | — | ||
TOTAL NET ASSETS—100.0% | $25,301 |
AFFILIATED TRANSACTIONS
The Underlying Funds are considered to be affiliated with the Fund. The following table shows investment transactions and earnings from investments in the affiliated funds during the period November 1, 2020 through October 31, 2021.
Underlying Funds | Beginning Balance as of 11/01/2020 (000s) | Purchases of Affiliated Funds (000s) | Sales of Affiliated Funds (000s) | Change in Net Unrealized Gain/(Loss) from Affiliated Funds (000s) | Net Realized Gain/(Loss) | Investment Income from Affiliated Funds (000s) | |
Sales of Affiliated Funds (000s) | Distributions Received from Affiliated Funds (000s) | ||||||
Harbor Bond Fund | $1,973 | $1,144 | $(382) | $(78) | $24 | $22 | $51 |
Harbor Capital Appreciation Fund | 1,075 | 597 | (426) | 171 | 168 | 135 | — |
Harbor Core Bond Fund | 1,168 | 982 | (255) | (66) | 7 | 25 | 31 |
Harbor Disruptive Innovation Fund | 866 | 532 | (281) | 27 | 100 | 126 | — |
Harbor Diversified International All Cap Fund | 1,642 | 489 | (399) | 475 | 74 | — | 18 |
Harbor Global Leaders Fund | 656 | 242 | (142) | 116 | 55 | 54 | — |
Harbor High-Yield Bond Fund | 1,699 | 1,035 | (369) | 59 | 11 | — | 107 |
Harbor International Fund | 1,642 | 506 | (387) | 694 | (171) | — | 19 |
Harbor International Growth Fund | 1,642 | 693 | (382) | 253 | 142 | — | 11 |
Harbor Large Cap Value Fund | 1,924 | 490 | (417) | 565 | 122 | 57 | 17 |
Harbor Mid Cap Value Fund | 1,276 | 444 | (548) | 481 | 94 | — | 32 |
Harbor Small Cap Growth Fund | 793 | 366 | (242) | 117 | 97 | 60 | — |
Harbor Small Cap Value Fund | 959 | 331 | (331) | 304 | 77 | — | 5 |
Harbor Strategic Growth Fund | 541 | 150 | (111) | 162 | 36 | 17 | 2 |
Total | $17,856 | $8,001 | $(4,672) | $3,280 | $836 | $496 | $293 |
The accompanying notes are an integral part of the Financial Statements.
19
Harbor Target Retirement 2050 Fund
Fund Summary —October 31, 2021 (Unaudited)
Asset Allocation (% of investments)
FUND PERFORMANCE
The graph compares a $10,000 investment in the Institutional Class shares of the Fund with the performance of the broad based market indices. The Fund’s performance assumes the reinvestment of all dividend and capital gain distributions.
CHANGE IN A $10,000 INVESTMENT
For the period 11/01/2011 through 10/31/2021
TOTAL RETURNS For the periods ended 10/31/2021 | 1 Year | Annualized | Inception Date | |||||
5 Years | 10 Years | |||||||
Harbor Target Retirement 2050 Fund | ||||||||
Institutional Class | 30.50% | 14.11% | 11.52% | 01/02/2009 | ||||
Comparative Indices | ||||||||
Bloomberg U.S. Aggregate Bond | -0.48% | 3.10% | 3.00% | — | ||||
MSCI EAFE (ND) | 34.18 | 9.79 | 7.37 | — | ||||
Russell 3000® | 43.90 | 18.91 | 16.10 | — | ||||
Composite Index 2050 | 32.82 | 13.06 | 10.86 | — |
As stated in the Fund’s prospectus dated March 1, 2021, the expense ratio was 0.76%. The Adviser has contractually agreed to limit the Fund’s operating expenses to: (i) the amount of the acquired funds’ fees and expenses; (ii) compensation of the Independent Trustees; and (iii) certain other expenses such as extraordinary items. The expense ratio in the prospectus may differ from the actual expense ratio for the period disclosed within this report. The expense ratio shown in the prospectus is based on the prior fiscal year, adjusted to reflect changes, if any, in contractual arrangements that occurred prior to the date of the prospectus (or supplement thereto, if applicable).
Performance data shown represents past performance and is no guarantee of future results. Past performance is net of management fees and expenses and reflects reinvested dividends and distributions. Past performance reflects the beneficial effect of any expense waivers or reimbursements, without which returns would have been lower. Investment returns and principal value will fluctuate and when redeemed may be worth more or less than their original cost. Returns for periods less than one year are not annualized. Current performance may be higher or lower and is available through the most recent month end at harborcapital.com or by calling 800-422-1050. See the Benchmark Descriptions at the end of this report for a description of the Composite Index.
20
Harbor Target Retirement 2050 Fund
Portfolio of Investments—October 31, 2021
Value and Cost in Thousands
EQUITY FUNDS—80.1% | |||
Shares | Value | ||
21,315 | Harbor Capital Appreciation Fund | $2,659 | |
144,479 | Harbor Disruptive Innovation Fund | 2,068 | |
278,549 | Harbor Diversified International All Cap Fund | 3,850 | |
37,854 | Harbor Global Leaders Fund | 1,577 | |
79,183 | Harbor International Fund | 3,852 | |
166,927 | Harbor International Growth Fund | 3,923 | |
196,311 | Harbor Large Cap Value Fund | 4,560 | |
119,110 | Harbor Mid Cap Value Fund | 2,974 | |
95,470 | Harbor Small Cap Growth Fund | 1,894 | |
50,261 | Harbor Small Cap Value Fund | 2,265 | |
39,474 | Harbor Strategic Growth Fund | 1,314 | |
TOTAL EQUITY FUNDS | |||
(Cost $21,943) | 30,936 | ||
FIXED INCOME FUNDS—19.9% | |||
Shares | Value | ||
241,871 | Harbor Bond Fund | $2,920 | |
137,638 | Harbor Core Bond Fund | 1,460 | |
333,081 | Harbor High-Yield Bond Fund | 3,314 | |
TOTAL FIXED INCOME FUNDS | |||
(Cost $7,677) | 7,694 | ||
TOTAL INVESTMENTS—100.0% | |||
(Cost $29,620) | 38,630 | ||
CASH AND OTHER ASSETS, LESS LIABILITIES—0.0% | — | ||
TOTAL NET ASSETS—100.0% | $38,630 |
AFFILIATED TRANSACTIONS
The Underlying Funds are considered to be affiliated with the Fund. The following table shows investment transactions and earnings from investments in the affiliated funds during the period November 1, 2020 through October 31, 2021.
Underlying Funds | Beginning Balance as of 11/01/2020 (000s) | Purchases of Affiliated Funds (000s) | Sales of Affiliated Funds (000s) | Change in Net Unrealized Gain/(Loss) from Affiliated Funds (000s) | Net Realized Gain/(Loss) | Investment Income from Affiliated Funds (000s) | |
Sales of Affiliated Funds (000s) | Distributions Received from Affiliated Funds (000s) | ||||||
Harbor Bond Fund | $1,984 | $1,236 | $(241) | $(70) | $11 | $23 | $55 |
Harbor Capital Appreciation Fund | 1,923 | 967 | (809) | 265 | 313 | 257 | — |
Harbor Core Bond Fund | 992 | 635 | (116) | (54) | 3 | 22 | 26 |
Harbor Disruptive Innovation Fund | 1,543 | 842 | (530) | 13 | 200 | 240 | — |
Harbor Diversified International All Cap Fund | 2,934 | 515 | (599) | 870 | 130 | — | 33 |
Harbor Global Leaders Fund | 1,188 | 338 | (252) | 181 | 122 | 102 | — |
Harbor High-Yield Bond Fund | 2,320 | 1,204 | (306) | 88 | 8 | — | 150 |
Harbor International Fund | 2,942 | 589 | (627) | 1,208 | (260) | — | 36 |
Harbor International Growth Fund | 2,958 | 804 | (550) | 452 | 259 | — | 21 |
Harbor Large Cap Value Fund | 3,453 | 468 | (603) | 969 | 273 | 107 | 31 |
Harbor Mid Cap Value Fund | 2,271 | 565 | (914) | 930 | 122 | — | 61 |
Harbor Small Cap Growth Fund | 1,409 | 474 | (365) | 275 | 101 | 116 | — |
Harbor Small Cap Value Fund | 1,700 | 317 | (444) | 572 | 120 | — | 9 |
Harbor Strategic Growth Fund | 965 | 173 | (176) | 294 | 58 | 32 | 4 |
Total | $28,582 | $9,127 | $(6,532) | $5,993 | $1,460 | $899 | $426 |
The accompanying notes are an integral part of the Financial Statements.
21
Harbor Target Retirement 2055 Fund
Fund Summary —October 31, 2021 (Unaudited)
Asset Allocation (% of investments)
FUND PERFORMANCE
The graph compares a $10,000 investment in the Institutional Class shares of the Fund with the performance of the broad based market indices. The Fund’s performance assumes the reinvestment of all dividend and capital gain distributions.
CHANGE IN A $10,000 INVESTMENT
For the period 11/01/2014 through 10/31/2021
TOTAL RETURNS For the periods ended 10/31/2021 | 1 Year | Annualized | Inception Date | |||||
5 Years | Life of Fund | |||||||
Harbor Target Retirement 2055 Fund | ||||||||
Institutional Class | 33.78% | 14.92% | 11.02% | 11/01/2014 | ||||
Comparative Indices | ||||||||
Bloomberg U.S. Aggregate Bond | -0.48% | 3.10% | 3.11% | — | ||||
MSCI EAFE (ND) | 34.18 | 9.79 | 6.39 | — | ||||
Russell 3000® | 43.90 | 18.91 | 14.56 | — | ||||
Composite Index 2055 | 36.56 | 13.76 | 10.07 | — |
As stated in the Fund’s prospectus dated March 1, 2021, the expense ratio was 0.78%. The Adviser has contractually agreed to limit the Fund’s operating expenses to: (i) the amount of the acquired funds’ fees and expenses; (ii) compensation of the Independent Trustees; and (iii) certain other expenses such as extraordinary items. The expense ratio in the prospectus may differ from the actual expense ratio for the period disclosed within this report. The expense ratio shown in the prospectus is based on the prior fiscal year, adjusted to reflect changes, if any, in contractual arrangements that occurred prior to the date of the prospectus (or supplement thereto, if applicable).
Performance data shown represents past performance and is no guarantee of future results. Past performance is net of management fees and expenses and reflects reinvested dividends and distributions. Past performance reflects the beneficial effect of any expense waivers or reimbursements, without which returns would have been lower. Investment returns and principal value will fluctuate and when redeemed may be worth more or less than their original cost. Returns for periods less than one year are not annualized. Current performance may be higher or lower and is available through the most recent month end at harborcapital.com or by calling 800-422-1050. See the Benchmark Descriptions at the end of this report for a description of the Composite Index.
22
Harbor Target Retirement 2055 Fund
Portfolio of Investments—October 31, 2021
Value and Cost in Thousands
EQUITY FUNDS—89.4% | |||
Shares | Value | ||
8,377 | Harbor Capital Appreciation Fund | $1,045 | |
56,409 | Harbor Disruptive Innovation Fund | 807 | |
109,120 | Harbor Diversified International All Cap Fund | 1,508 | |
15,060 | Harbor Global Leaders Fund | 628 | |
31,032 | Harbor International Fund | 1,509 | |
65,465 | Harbor International Growth Fund | 1,538 | |
77,182 | Harbor Large Cap Value Fund | 1,793 | |
46,519 | Harbor Mid Cap Value Fund | 1,162 | |
37,088 | Harbor Small Cap Growth Fund | 736 | |
19,549 | Harbor Small Cap Value Fund | 881 | |
15,477 | Harbor Strategic Growth Fund | 515 | |
TOTAL EQUITY FUNDS | |||
(Cost $9,131) | 12,122 | ||
FIXED INCOME FUNDS—10.6% | |||
Shares | Value | ||
65,292 | Harbor Bond Fund | $788 | |
64,719 | Harbor High-Yield Bond Fund | 644 | |
TOTAL FIXED INCOME FUNDS | |||
(Cost $1,433) | 1,432 | ||
TOTAL INVESTMENTS—100.0% | |||
(Cost $10,564) | 13,554 | ||
CASH AND OTHER ASSETS, LESS LIABILITIES—0.0% | — | ||
TOTAL NET ASSETS—100.0% | $13,554 |
AFFILIATED TRANSACTIONS
The Underlying Funds are considered to be affiliated with the Fund. The following table shows investment transactions and earnings from investments in the affiliated funds during the period November 1, 2020 through October 31, 2021.
Underlying Funds | Beginning Balance as of 11/01/2020 (000s) | Purchases of Affiliated Funds (000s) | Sales of Affiliated Funds (000s) | Change in Net Unrealized Gain/(Loss) from Affiliated Funds (000s) | Net Realized Gain/(Loss) | Investment Income from Affiliated Funds (000s) | |
Sales of Affiliated Funds (000s) | Distributions Received from Affiliated Funds (000s) | ||||||
Harbor Bond Fund | $431 | $499 | $(127) | $(18) | $3 | $5 | $14 |
Harbor Capital Appreciation Fund | 650 | 408 | (229) | 130 | 86 | 87 | — |
Harbor Disruptive Innovation Fund | 518 | 340 | (129) | 35 | 43 | 81 | — |
Harbor Diversified International All Cap Fund | 982 | 418 | (237) | 318 | 27 | — | 11 |
Harbor Global Leaders Fund | 404 | 183 | (70) | 86 | 25 | 36 | — |
Harbor High-Yield Bond Fund | 350 | 381 | (101) | 11 | 3 | — | 27 |
Harbor International Fund | 983 | 448 | (249) | 335 | (8) | — | 12 |
Harbor International Growth Fund | 987 | 474 | (169) | 191 | 55 | — | 7 |
Harbor Large Cap Value Fund | 1,160 | 407 | (219) | 380 | 65 | 37 | 11 |
Harbor Mid Cap Value Fund | 762 | 360 | (327) | 335 | 32 | — | 21 |
Harbor Small Cap Growth Fund | 469 | 246 | (112) | 105 | 28 | 39 | — |
Harbor Small Cap Value Fund | 569 | 253 | (180) | 193 | 46 | — | 3 |
Harbor Strategic Growth Fund | 325 | 132 | (70) | 104 | 24 | 11 | 2 |
Total | $8,590 | $4,549 | $(2,219) | $2,205 | $429 | $296 | $108 |
The accompanying notes are an integral part of the Financial Statements.
23
Harbor Target Retirement 2060 Fund
Fund Summary —October 31, 2021 (Unaudited)
Asset Allocation (% of investments)
FUND PERFORMANCE
The graph compares a $10,000 investment in the Institutional Class shares of the Fund with the performance of the broad based market indices. The Fund’s performance assumes the reinvestment of all dividend and capital gain distributions.
CHANGE IN A $10,000 INVESTMENT
For the period 11/01/2019 through 10/31/2021
TOTAL RETURNS For the periods ended 10/31/2021 | 1 Year | 5 Years | Annualized | Inception Date | ||||
Life of Fund | ||||||||
Harbor Target Retirement 2060 Fund | ||||||||
Institutional Class | 34.61% | N/A | 20.19% | 11/01/2019 | ||||
Comparative Indices | ||||||||
Bloomberg U.S. Aggregate Bond | -0.48% | N/A | 2.80% | — | ||||
MSCI EAFE (ND) | 34.18 | N/A | 11.79 | — | ||||
Russell 3000® | 43.90 | N/A | 25.90 | — | ||||
Composite Index 2060 | 37.50 | N/A | 18.17 | — |
As stated in the Fund’s prospectus dated March 1, 2021, the expense ratio was 0.78%. The Adviser has contractually agreed to limit the Fund’s operating expenses to: (i) the amount of the acquired funds’ fees and expenses; (ii) compensation of the Independent Trustees; and (iii) certain other expenses such as extraordinary items. The expense ratio in the prospectus may differ from the actual expense ratio for the period disclosed within this report. The expense ratio shown in the prospectus is based on the prior fiscal year, adjusted to reflect changes, if any, in contractual arrangements that occurred prior to the date of the prospectus (or supplement thereto, if applicable).
Performance data shown represents past performance and is no guarantee of future results. Past performance is net of management fees and expenses and reflects reinvested dividends and distributions. Past performance reflects the beneficial effect of any expense waivers or reimbursements, without which returns would have been lower. Investment returns and principal value will fluctuate and when redeemed may be worth more or less than their original cost. Returns for periods less than one year are not annualized. Current performance may be higher or lower and is available through the most recent month end at harborcapital.com or by calling 800-422-1050. See the Benchmark Descriptions at the end of this report for a description of the Composite Index.
24
Harbor Target Retirement 2060 Fund
Portfolio of Investments—October 31, 2021
Value and Cost in Thousands
EQUITY FUNDS—93.0% | |||
Shares | Value | ||
1,543 | Harbor Capital Appreciation Fund | $192 | |
10,372 | Harbor Disruptive Innovation Fund | 148 | |
20,374 | Harbor Diversified International All Cap Fund | 282 | |
2,793 | Harbor Global Leaders Fund | 116 | |
5,791 | Harbor International Fund | 282 | |
12,042 | Harbor International Growth Fund | 283 | |
14,333 | Harbor Large Cap Value Fund | 333 | |
8,731 | Harbor Mid Cap Value Fund | 218 | |
6,824 | Harbor Small Cap Growth Fund | 135 | |
3,607 | Harbor Small Cap Value Fund | 163 | |
2,844 | Harbor Strategic Growth Fund | 95 | |
TOTAL EQUITY FUNDS | |||
(Cost $2,130) | 2,247 | ||
FIXED INCOME FUNDS—7.0% | |||
Shares | Value | ||
7,700 | Harbor Bond Fund | $93 | |
7,640 | Harbor High-Yield Bond Fund | 76 | |
TOTAL FIXED INCOME FUNDS | |||
(Cost $169) | 169 | ||
TOTAL INVESTMENTS—100.0% | |||
(Cost $2,299) | 2,416 | ||
CASH AND OTHER ASSETS, LESS LIABILITIES—0.0% | — | ||
TOTAL NET ASSETS—100.0% | $2,416 |
AFFILIATED TRANSACTIONS
The Underlying Funds are considered to be affiliated with the Fund. The following table shows investment transactions and earnings from investments in the affiliated funds during the period November 1, 2020 through October 31, 2021.
Underlying Funds | Beginning Balance as of 11/01/2020 (000s) | Purchases of Affiliated Funds (000s) | Sales of Affiliated Funds (000s) | Change in Net Unrealized Gain/(Loss) from Affiliated Funds (000s) | Investment Income from Affiliated Funds (000s) | ||
Sales of Affiliated Funds (000s) | Distributions Received from Affiliated Funds (000s) | ||||||
Harbor Bond Fund | $23 | $103 | $(32) | $(1) | $— | $— | $1 |
Harbor Capital Appreciation Fund | 46 | 178 | (65) | 22 | 11 | 7 | — |
Harbor Disruptive Innovation Fund | 36 | 149 | (48) | 2 | 9 | 6 | — |
Harbor Diversified International All Cap Fund | 68 | 284 | (98) | — | 28 | — | 1 |
Harbor Global Leaders Fund | 28 | 111 | (37) | 8 | 6 | 3 | — |
Harbor High-Yield Bond Fund | 18 | 82 | (25) | — | 1 | — | 2 |
Harbor International Fund | 68 | 285 | (97) | — | 26 | — | 1 |
Harbor International Growth Fund | 68 | 288 | (96) | (4) | 27 | — | 1 |
Harbor Large Cap Value Fund | 80 | 316 | (109) | 17 | 29 | 3 | 1 |
Harbor Mid Cap Value Fund | 53 | 224 | (89) | — | 30 | — | 2 |
Harbor Small Cap Growth Fund | 32 | 136 | (48) | 3 | 12 | 3 | — |
Harbor Small Cap Value Fund | 39 | 165 | (62) | 1 | 20 | — | — |
Harbor Strategic Growth Fund | 23 | 87 | (31) | 9 | 7 | 1 | — |
Total | $582 | $2,408 | $(837) | $57 | $206 | $23 | $9 |
The accompanying notes are an integral part of the Financial Statements.
25
Harbor Target Retirement Funds
StatementS of Assets and Liabilities—October 31, 2021
(All amounts in thousands, except per share amounts)
Harbor Target Retirement Income Fund | Harbor Target Retirement 2020 Fund | Harbor Target Retirement 2025 Fund | Harbor Target Retirement 2030 Fund | Harbor Target Retirement 2035 Fund | Harbor Target Retirement 2040 Fund | Harbor Target Retirement 2045 Fund | Harbor Target Retirement 2050 Fund | Harbor Target Retirement 2055 Fund | Harbor Target Retirement 2060 Fund | |||||||||||
ASSETS | ||||||||||||||||||||
Investments, at identified cost | $17,526 | $20,730 | $20,897 | $33,451 | $21,962 | $33,801 | $20,432 | $29,620 | $10,564 | $2,299 | ||||||||||
Investments in affiliated funds, at value | $18,606 | $22,477 | $23,081 | $38,577 | $26,068 | $41,822 | $25,301 | $38,630 | $13,554 | $2,416 | ||||||||||
Receivables for: | ||||||||||||||||||||
Investments in affiliated funds sold | — | — | 4 | — | — | — | 5 | — | 7 | — | ||||||||||
Capital shares sold | 12 | 14 | — | 19 | 13 | — | — | 5 | — | 14 | ||||||||||
Total Assets | 18,618 | 22,491 | 23,085 | 38,596 | 26,081 | 41,822 | 25,306 | 38,635 | 13,561 | 2,430 | ||||||||||
LIABILITIES | ||||||||||||||||||||
Payables for: | ||||||||||||||||||||
Investments in affiliated funds purchased | 12 | 14 | — | 19 | 13 | — | — | 5 | — | 14 | ||||||||||
Capital shares reacquired | — | — | 4 | — | — | — | 5 | — | 7 | — | ||||||||||
Total Liabilities | 12 | 14 | 4 | 19 | 13 | — | 5 | 5 | 7 | 14 | ||||||||||
NET ASSETS | $18,606 | $22,477 | $23,081 | $38,577 | $26,068 | $41,822 | $25,301 | $38,630 | $13,554 | $2,416 | ||||||||||
Net Assets Consist of: | ||||||||||||||||||||
Paid-in capital | $17,109 | $19,709 | $19,787 | $32,588 | $21,481 | $32,914 | $19,997 | $28,582 | $10,290 | $2,084 | ||||||||||
Total distributable earnings/(loss) | 1,497 | 2,768 | 3,294 | 5,989 | 4,587 | 8,908 | 5,304 | 10,048 | 3,264 | 332 | ||||||||||
$18,606 | $22,477 | $23,081 | $38,577 | $26,068 | $41,822 | $25,301 | $38,630 | $13,554 | $2,416 | |||||||||||
NET ASSET VALUE PER SHARE BY CLASS | ||||||||||||||||||||
Institutional Class | ||||||||||||||||||||
Net assets | $18,606 | $22,477 | $23,081 | $38,577 | $26,068 | $41,822 | $25,301 | $38,630 | $13,554 | $2,416 | ||||||||||
Shares of beneficial interest1 | 1,861 | 2,097 | 1,671 | 3,791 | 1,581 | 3,993 | 1,391 | 3,196 | 879 | 173 | ||||||||||
Net asset value per share2 | $10.00 | $10.72 | $13.81 | $10.17 | $16.48 | $10.47 | $18.19 | $12.09 | $15.42 | $14.00 |
1
Par value $0.01 (unlimited authorizations)
2
Per share amounts can be recalculated to the amounts disclosed herein when total net assets and shares of beneficial interest are not rounded to thousands.
The accompanying notes are an integral part of the Financial Statements.
26
Harbor Target Retirement Funds
StatementS of Operations—Year Ended October 31, 2021
(All amounts in thousands)
Harbor Target Retirement Income Fund | Harbor Target Retirement 2020 Fund | Harbor Target Retirement 2025 Fund | Harbor Target Retirement 2030 Fund | Harbor Target Retirement 2035 Fund | Harbor Target Retirement 2040 Fund | Harbor Target Retirement 2045 Fund | Harbor Target Retirement 2050 Fund | Harbor Target Retirement 2055 Fund | Harbor Target Retirement 2060 Fund | |
Investment Income | ||||||||||
Dividends from affiliated funds | $411 | $507 | $497 | $715 | $430 | $582 | $293 | $426 | $108 | $9 |
Net Investment Income/(Loss) | 411 | 507 | 497 | 715 | 430 | 582 | 293 | 426 | 108 | 9 |
Net Realized and Change in Net Unrealized Gain/(Loss) on Investment Transactions | ||||||||||
Net realized gain/(loss) on: | ||||||||||
Sales of affiliated funds | 835 | 1,575 | 1,797 | 1,725 | 1,071 | 1,422 | 836 | 1,460 | 429 | 206 |
Distributions received from affiliated funds | 283 | 396 | 430 | 664 | 495 | 868 | 496 | 899 | 296 | 23 |
Change in net unrealized appreciation/(depreciation) on: | ||||||||||
Affiliated funds | 141 | 261 | 699 | 2,713 | 2,465 | 5,198 | 3,280 | 5,993 | 2,205 | 57 |
Net gain/(loss) on investment transactions | 1,259 | 2,232 | 2,926 | 5,102 | 4,031 | 7,488 | 4,612 | 8,352 | 2,930 | 286 |
Net Increase/(Decrease) in Net Assets Resulting from Operations | $1,670 | $2,739 | $3,423 | $5,817 | $4,461 | $8,070 | $4,905 | $8,778 | $3,038 | $295 |
The accompanying notes are an integral part of the Financial Statements.
27
Harbor Target Retirement Funds
Statements of Changes In Net Assets
(All amounts in thousands)
Harbor Target Retirement Income Fund | Harbor Target Retirement 2020 Fund | Harbor Target Retirement 2025 Fund | Harbor Target Retirement 2030 Fund | |||||
November 1, 2020 through October 31, 2021 | November 1, 2019 through October 31, 2020 | November 1, 2020 through October 31, 2021 | November 1, 2019 through October 31, 2020 | November 1, 2020 through October 31, 2021 | November 1, 2019 through October 31, 2020 | November 1, 2020 through October 31, 2021 | November 1, 2019 through October 31, 2020 | |
INCREASE/(DECREASE) IN NET ASSETS | ||||||||
Operations: | ||||||||
Net investment income/(loss) | $411 | $529 | $507 | $635 | $497 | $558 | $715 | $788 |
Net realized gain/(loss) on sale of affiliated funds | 835 | (46) | 1,575 | (37) | 1,797 | (285) | 1,725 | (85) |
Realized gain distributions received from affiliated funds | 283 | 143 | 396 | 246 | 430 | 258 | 664 | 457 |
Change in net unrealized appreciation/(depreciation) on affiliated funds | 141 | 515 | 261 | 688 | 699 | 877 | 2,713 | 1,143 |
Net increase/(decrease) in assets resulting from operations | 1,670 | 1,141 | 2,739 | 1,532 | 3,423 | 1,408 | 5,817 | 2,303 |
Distributions to Shareholders | ||||||||
Institutional Class | (761) | (535) | (1,493) | (1,009) | (1,452) | (1,350) | (2,442) | (2,233) |
Total distributions to shareholders | (761) | (535) | (1,493) | (1,009) | (1,452) | (1,350) | (2,442) | (2,233) |
Net Increase/(Decrease) Derived from Capital Share Transactions | (3,044) | 2,694 | (2,549) | (1,486) | (955) | 1,915 | 4,734 | (480) |
Net increase/(decrease) in net assets | (2,135) | 3,300 | (1,303) | (963) | 1,016 | 1,973 | 8,109 | (410) |
Net Assets | ||||||||
Beginning of period | 20,741 | 17,441 | 23,780 | 24,743 | 22,065 | 20,092 | 30,468 | 30,878 |
End of period | $18,606 | $20,741 | $22,477 | $23,780 | $23,081 | $22,065 | $38,577 | $30,468 |
The accompanying notes are an integral part of the Financial Statements.
28
Harbor Target Retirement 2035 Fund | Harbor Target Retirement 2040 Fund | Harbor Target Retirement 2045 Fund | Harbor Target Retirement 2050 Fund | Harbor Target Retirement 2055 Fund | Harbor Target Retirement 2060 Fund | ||||||
November 1, 2020 through October 31, 2021 | November 1, 2019 through October 31, 2020 | November 1, 2020 through October 31, 2021 | November 1, 2019 through October 31, 2020 | November 1, 2020 through October 31, 2021 | November 1, 2019 through October 31, 2020 | November 1, 2020 through October 31, 2021 | November 1, 2019 through October 31, 2020 | November 1, 2020 through October 31, 2021 | November 1, 2019 through October 31, 2020 | November 1, 2020 through October 31, 2021 | November 1, 2019 through October 31, 2020 |
$430 | $474 | $582 | $599 | $293 | $308 | $426 | $466 | $108 | $103 | $9 | $2 |
1,071 | 54 | 1,422 | 116 | 836 | (175) | 1,460 | 65 | 429 | (220) | 206 | (11) |
495 | 352 | 868 | 553 | 496 | 314 | 899 | 600 | 296 | 163 | 23 | 2 |
2,465 | 713 | 5,198 | 1,118 | 3,280 | 987 | 5,993 | 1,103 | 2,205 | 644 | 57 | 60 |
4,461 | 1,593 | 8,070 | 2,386 | 4,905 | 1,434 | 8,778 | 2,234 | 3,038 | 690 | 295 | 53 |
(1,776) | (1,534) | (2,506) | (2,674) | (1,175) | (1,462) | (2,084) | (2,860) | (458) | (483) | (15) | (1) |
(1,776) | (1,534) | (2,506) | (2,674) | (1,175) | (1,462) | (2,084) | (2,860) | (458) | (483) | (15) | (1) |
3,280 | 100 | 5,005 | 3,305 | 3,715 | 2,914 | 3,354 | 3,516 | 2,384 | 2,200 | 1,554 | 530 |
5,965 | 159 | 10,569 | 3,017 | 7,445 | 2,886 | 10,048 | 2,890 | 4,964 | 2,407 | 1,834 | 582 |
20,103 | 19,944 | 31,253 | 28,236 | 17,856 | 14,970 | 28,582 | 25,692 | 8,590 | 6,183 | 582 | — |
$26,068 | $20,103 | $41,822 | $31,253 | $25,301 | $17,856 | $38,630 | $28,582 | $13,554 | $8,590 | $2,416 | $582 |
29
Harbor Target Retirement Funds
Statements of Changes in Net Assets—Capital Stock Activity
(All amounts in thousands)
Harbor Target Retirement Income Fund | Harbor Target Retirement 2020 Fund | Harbor Target Retirement 2025 Fund | Harbor Target Retirement 2030 Fund | |||||
November 1, 2020 through October 31, 2021 | November 1, 2019 through October 31, 2020 | November 1, 2020 through October 31, 2021 | November 1, 2019 through October 31, 2020 | November 1, 2020 through October 31, 2021 | November 1, 2019 through October 31, 2020 | November 1, 2020 through October 31, 2021 | November 1, 2019 through October 31, 2020 | |
AMOUNT ($) | ||||||||
Institutional Class | ||||||||
Net proceeds from sale of shares | $1,366 | $6,474 | $2,325 | $3,363 | $4,647 | $5,108 | $6,712 | $4,092 |
Reinvested distributions | 761 | 535 | 1,493 | 1,009 | 1,452 | 1,350 | 2,442 | 2,233 |
Cost of shares reacquired | (5,171) | (4,315) | (6,367) | (5,858) | (7,054) | (4,543) | (4,420) | (6,805) |
Net increase/(decrease) in net assets | $(3,044) | $2,694 | $(2,549) | $(1,486) | $(955) | $1,915 | $4,734 | $(480) |
SHARES | ||||||||
Institutional Class | ||||||||
Shares sold | 138 | 691 | 220 | 344 | 346 | 415 | 681 | 461 |
Shares issued due to reinvestment of distributions | 78 | 58 | 146 | 104 | 112 | 111 | 259 | 252 |
Shares reacquired | (523) | (469) | (605) | (606) | (525) | (380) | (451) | (763) |
Net increase/(decrease) in shares outstanding | (307) | 280 | (239) | (158) | (67) | 146 | 489 | (50) |
The accompanying notes are an integral part of the Financial Statements.
30
Harbor Target Retirement 2035 Fund | Harbor Target Retirement 2040 Fund | Harbor Target Retirement 2045 Fund | Harbor Target Retirement 2050 Fund | Harbor Target Retirement 2055 Fund | Harbor Target Retirement 2060 Fund | ||||||
November 1, 2020 through October 31, 2021 | November 1, 2019 through October 31, 2020 | November 1, 2020 through October 31, 2021 | November 1, 2019 through October 31, 2020 | November 1, 2020 through October 31, 2021 | November 1, 2019 through October 31, 2020 | November 1, 2020 through October 31, 2021 | November 1, 2019 through October 31, 2020 | November 1, 2020 through October 31, 2021 | November 1, 2019 through October 31, 2020 | November 1, 2020 through October 31, 2021 | November 1, 2019 through October 31, 2020 |
$4,292 | $3,724 | $5,516 | $4,956 | $6,086 | $3,759 | $5,229 | $4,044 | $3,650 | $2,753 | $2,381 | $721 |
1,776 | 1,534 | 2,506 | 2,674 | 1,175 | 1,462 | 2,084 | 2,860 | 458 | 483 | 15 | 1 |
(2,788) | (5,158) | (3,017) | (4,325) | (3,546) | (2,307) | (3,959) | (3,388) | (1,724) | (1,036) | (842) | (192) |
$3,280 | $100 | $5,005 | $3,305 | $3,715 | $2,914 | $3,354 | $3,516 | $2,384 | $2,200 | $1,554 | $530 |
269 | 264 | 551 | 577 | 347 | 265 | 456 | 434 | 251 | 245 | 180 | 74 |
117 | 109 | 264 | 309 | 72 | 100 | 194 | 299 | 34 | 41 | 1 | — |
(176) | (364) | (297) | (498) | (203) | (158) | (346) | (368) | (118) | (92) | (63) | (19) |
210 | 9 | 518 | 388 | 216 | 207 | 304 | 365 | 167 | 194 | 118 | 55 |
31
Harbor Target Retirement Funds Financial Highlights
Selected Data for a Share Outstanding for the Periods Presented
HARBOR TARGET RETIREMENT INCOME FUND
Institutional Class | |||||
Year Ended October 31, | 2021 | 2020 | 2019 | 2018 | 2017 |
Net asset value beginning of period | $9.57 | $9.24 | $8.80 | $9.25 | $8.93 |
Income from Investment Operations | |||||
Net investment income/(loss)a | 0.21 | 0.25 | 0.25 | 0.28 | 0.22 |
Net realized and unrealized gain/(loss) on investments | 0.60 | 0.33 | 0.62 | (0.38) | 0.40 |
Total from investment operations | 0.81 | 0.58 | 0.87 | (0.10) | 0.62 |
Less Distributions | |||||
Dividends from net investment income | (0.26) | (0.25) | (0.27) | (0.29) | (0.27) |
Distributions from net realized capital gains | (0.12) | — | (0.16) | (0.06) | (0.03) |
Total distributions | (0.38) | (0.25) | (0.43) | (0.35) | (0.30) |
Net asset value end of period | 10.00 | 9.57 | 9.24 | 8.80 | 9.25 |
Net assets end of period (000s) | $18,606 | $20,741 | $17,441 | $12,561 | $13,746 |
Ratios and Supplemental Data (%) | |||||
Total return | 8.57% | 6.37% | 10.31% | (1.14)% | 7.17% |
Ratio of total expenses to average net assetsb | — | — | — | — | — |
Ratio of net investment income to average net assetsb | 2.12 | 2.63 | 2.85 | 3.13 | 2.46 |
Portfolio turnoverc | 15 | 53 | 67 | 28 | 16 |
HARBOR TARGET RETIREMENT 2020 FUND
Institutional Class | |||||
Year Ended October 31, | 2021 | 2020 | 2019 | 2018 | 2017 |
Net asset value beginning of period | $10.18 | $9.92 | $9.50 | $9.90 | $9.29 |
Income from Investment Operations | |||||
Net investment income/(loss)a | 0.22 | 0.26 | 0.25 | 0.28 | 0.23 |
Net realized and unrealized gain/(loss) on investments | 0.96 | 0.39 | 0.73 | (0.40) | 0.73 |
Total from investment operations | 1.18 | 0.65 | 0.98 | (0.12) | 0.96 |
Less Distributions | |||||
Dividends from net investment income | (0.29) | (0.27) | (0.28) | (0.28) | (0.24) |
Distributions from net realized capital gains | (0.35) | (0.12) | (0.28) | — | (0.11) |
Total distributions | (0.64) | (0.39) | (0.56) | (0.28) | (0.35) |
Net asset value end of period | 10.72 | 10.18 | 9.92 | 9.50 | 9.90 |
Net assets end of period (000s) | $22,477 | $23,780 | $24,743 | $25,554 | $27,742 |
Ratios and Supplemental Data (%) | |||||
Total return | 11.86% | 6.74% | 11.04% | (1.29)% | 10.77% |
Ratio of total expenses to average net assetsb | — | — | — | — | — |
Ratio of net investment income to average net assetsb | 2.10 | 2.61 | 2.69 | 2.89 | 2.44 |
Portfolio turnoverc | 25 | 56 | 64 | 31 | 29 |
See page 36 for notes to the Financial Highlights.
The accompanying notes are an integral part of the Financial Statements.
32
HARBOR TARGET RETIREMENT 2025 FUND
Institutional Class | |||||
Year Ended October 31, | 2021 | 2020 | 2019 | 2018 | 2017 |
Net asset value beginning of period | $12.70 | $12.62 | $12.21 | $12.76 | $11.78 |
Income from Investment Operations | |||||
Net investment income/(loss)a | 0.28 | 0.32 | 0.31 | 0.37 | 0.29 |
Net realized and unrealized gain/(loss) on investments | 1.66 | 0.56 | 1.03 | (0.57) | 1.12 |
Total from investment operations | 1.94 | 0.88 | 1.34 | (0.20) | 1.41 |
Less Distributions | |||||
Dividends from net investment income | (0.36) | (0.33) | (0.38) | (0.35) | (0.28) |
Distributions from net realized capital gains | (0.47) | (0.47) | (0.55) | — | (0.15) |
Total distributions | (0.83) | (0.80) | (0.93) | (0.35) | (0.43) |
Net asset value end of period | 13.81 | 12.70 | 12.62 | 12.21 | 12.76 |
Net assets end of period (000s) | $23,081 | $22,065 | $20,092 | $17,651 | $21,218 |
Ratios and Supplemental Data (%) | |||||
Total return | 15.74% | 7.26% | 12.09% | (1.63)% | 12.38% |
Ratio of total expenses to average net assetsb | — | — | — | — | — |
Ratio of net investment income to average net assetsb | 2.11 | 2.65 | 2.57 | 2.92 | 2.42 |
Portfolio turnoverc | 33 | 63 | 61 | 36 | 24 |
HARBOR TARGET RETIREMENT 2030 FUND
Institutional Class | |||||
Year Ended October 31, | 2021 | 2020 | 2019 | 2018 | 2017 |
Net asset value beginning of period | $9.23 | $9.21 | $8.84 | $9.25 | $8.60 |
Income from Investment Operations | |||||
Net investment income/(loss)a | 0.19 | 0.22 | 0.21 | 0.24 | 0.20 |
Net realized and unrealized gain/(loss) on investments | 1.49 | 0.45 | 0.77 | (0.38) | 0.96 |
Total from investment operations | 1.68 | 0.67 | 0.98 | (0.14) | 1.16 |
Less Distributions | |||||
Dividends from net investment income | (0.26) | (0.24) | (0.25) | (0.25) | (0.21) |
Distributions from net realized capital gains | (0.48) | (0.41) | (0.36) | (0.02) | (0.30) |
Total distributions | (0.74) | (0.65) | (0.61) | (0.27) | (0.51) |
Net asset value end of period | 10.17 | 9.23 | 9.21 | 8.84 | 9.25 |
Net assets end of period (000s) | $38,577 | $30,468 | $30,878 | $27,973 | $28,618 |
Ratios and Supplemental Data (%) | |||||
Total return | 18.81% | 7.62% | 12.21% | (1.57)% | 14.18% |
Ratio of total expenses to average net assetsb | — | — | — | — | — |
Ratio of net investment income to average net assetsb | 1.97 | 2.54 | 2.41 | 2.62 | 2.30 |
Portfolio turnoverc | 23 | 57 | 46 | 31 | 29 |
The accompanying notes are an integral part of the Financial Statements.
33
Harbor Target Retirement Funds Financial Highlights—Continued
Selected Data for a Share Outstanding for the Periods Presented
HARBOR TARGET RETIREMENT 2035 FUND
Institutional Class | |||||
Year Ended October 31, | 2021 | 2020 | 2019 | 2018 | 2017 |
Net asset value beginning of period | $14.67 | $14.64 | $13.86 | $14.44 | $12.93 |
Income from Investment Operations | |||||
Net investment income/(loss)a | 0.28 | 0.33 | 0.28 | 0.33 | 0.28 |
Net realized and unrealized gain/(loss) on investments | 2.81 | 0.79 | 1.36 | (0.58) | 1.75 |
Total from investment operations | 3.09 | 1.12 | 1.64 | (0.25) | 2.03 |
Less Distributions | |||||
Dividends from net investment income | (0.37) | (0.34) | (0.35) | (0.33) | (0.28) |
Distributions from net realized capital gains | (0.91) | (0.75) | (0.51) | — | (0.24) |
Total distributions | (1.28) | (1.09) | (0.86) | (0.33) | (0.52) |
Net asset value end of period | 16.48 | 14.67 | 14.64 | 13.86 | 14.44 |
Net assets end of period (000s) | $26,068 | $20,103 | $19,944 | $15,124 | $15,005 |
Ratios and Supplemental Data (%) | |||||
Total return | 21.88% | 7.98% | 12.83% | (1.79)% | 16.31% |
Ratio of total expenses to average net assetsb | — | — | — | — | — |
Ratio of net investment income to average net assetsb | 1.77 | 2.34 | 2.05 | 2.26 | 2.06 |
Portfolio turnoverc | 22 | 62 | 35 | 29 | 26 |
HARBOR TARGET RETIREMENT 2040 FUND
Institutional Class | |||||
Year Ended October 31, | 2021 | 2020 | 2019 | 2018 | 2017 |
Net asset value beginning of period | $8.99 | $9.15 | $8.85 | $9.30 | $8.42 |
Income from Investment Operations | |||||
Net investment income/(loss)a | 0.15 | 0.17 | 0.15 | 0.18 | 0.15 |
Net realized and unrealized gain/(loss) on investments | 2.04 | 0.55 | 0.90 | (0.34) | 1.30 |
Total from investment operations | 2.19 | 0.72 | 1.05 | (0.16) | 1.45 |
Less Distributions | |||||
Dividends from net investment income | (0.20) | (0.20) | (0.20) | (0.19) | (0.17) |
Distributions from net realized capital gains | (0.51) | (0.68) | (0.55) | (0.10) | (0.40) |
Total distributions | (0.71) | (0.88) | (0.75) | (0.29) | (0.57) |
Net asset value end of period | 10.47 | 8.99 | 9.15 | 8.85 | 9.30 |
Net assets end of period (000s) | $41,822 | $31,253 | $28,236 | $24,050 | $24,940 |
Ratios and Supplemental Data (%) | |||||
Total return | 25.25% | 8.15% | 13.43% | (1.84)% | 18.26% |
Ratio of total expenses to average net assetsb | — | — | — | — | — |
Ratio of net investment income to average net assetsb | 1.49 | 2.04 | 1.77 | 1.90 | 1.78 |
Portfolio turnoverc | 17 | 53 | 28 | 30 | 21 |
See page 36 for notes to the Financial Highlights.
The accompanying notes are an integral part of the Financial Statements.
34
HARBOR TARGET RETIREMENT 2045 FUND
Institutional Class | |||||
Year Ended October 31, | 2021 | 2020 | 2019 | 2018 | 2017 |
Net asset value beginning of period | $15.20 | $15.46 | $14.69 | $15.43 | $13.51 |
Income from Investment Operations | |||||
Net investment income/(loss)a | 0.23 | 0.28 | 0.24 | 0.23 | 0.21 |
Net realized and unrealized gain/(loss) on investments | 3.79 | 0.94 | 1.56 | (0.49) | 2.42 |
Total from investment operations | 4.02 | 1.22 | 1.80 | (0.26) | 2.63 |
Less Distributions | |||||
Dividends from net investment income | (0.32) | (0.31) | (0.29) | (0.28) | (0.22) |
Distributions from net realized capital gains | (0.71) | (1.17) | (0.74) | (0.20) | (0.49) |
Total distributions | (1.03) | (1.48) | (1.03) | (0.48) | (0.71) |
Net asset value end of period | 18.19 | 15.20 | 15.46 | 14.69 | 15.43 |
Net assets end of period (000s) | $25,301 | $17,856 | $14,970 | $12,410 | $9,863 |
Ratios and Supplemental Data (%) | |||||
Total return | 27.24% | 8.21% | 13.48% | (1.83)% | 20.37% |
Ratio of total expenses to average net assetsb | — | — | — | — | — |
Ratio of net investment income to average net assetsb | 1.31 | 1.93 | 1.62 | 1.49 | 1.50 |
Portfolio turnoverc | 21 | 46 | 29 | 22 | 32 |
HARBOR TARGET RETIREMENT 2050 FUND
Institutional Class | |||||
Year Ended October 31, | 2021 | 2020 | 2019 | 2018 | 2017 |
Net asset value beginning of period | $9.88 | $10.17 | $9.81 | $10.42 | $9.23 |
Income from Investment Operations | |||||
Net investment income/(loss)a | 0.14 | 0.17 | 0.12 | 0.13 | 0.12 |
Net realized and unrealized gain/(loss) on investments | 2.78 | 0.66 | 1.08 | (0.33) | 1.81 |
Total from investment operations | 2.92 | 0.83 | 1.20 | (0.20) | 1.93 |
Less Distributions | |||||
Dividends from net investment income | (0.19) | (0.18) | (0.17) | (0.16) | (0.13) |
Distributions from net realized capital gains | (0.52) | (0.94) | (0.67) | (0.25) | (0.61) |
Total distributions | (0.71) | (1.12) | (0.84) | (0.41) | (0.74) |
Net asset value end of period | 12.09 | 9.88 | 10.17 | 9.81 | 10.42 |
Net assets end of period (000s) | $38,630 | $28,582 | $25,692 | $23,391 | $22,821 |
Ratios and Supplemental Data (%) | |||||
Total return | 30.50% | 8.55% | 13.92% | (2.06)% | 22.40% |
Ratio of total expenses to average net assetsb | — | — | — | — | — |
Ratio of net investment income to average net assetsb | 1.19 | 1.76 | 1.28 | 1.20 | 1.27 |
Portfolio turnoverc | 18 | 47 | 25 | 22 | 33 |
The accompanying notes are an integral part of the Financial Statements.
35
Harbor Target Retirement Funds Financial Highlights—Continued
Selected Data for a Share Outstanding for the Periods Presented
HARBOR TARGET RETIREMENT 2055 FUND
Institutional Class | |||||
Year Ended October 31, | 2021 | 2020 | 2019 | 2018 | 2017 |
Net asset value beginning of period | $12.06 | $11.94 | $11.39 | $11.97 | $10.02 |
Income from Investment Operations | |||||
Net investment income/(loss)a | 0.13 | 0.16 | 0.10 | 0.11 | 0.10 |
Net realized and unrealized gain/(loss) on investments | 3.86 | 0.87 | 1.34 | (0.37) | 2.17 |
Total from investment operations | 3.99 | 1.03 | 1.44 | (0.26) | 2.27 |
Less Distributions | |||||
Dividends from net investment income | (0.20) | (0.18) | (0.16) | (0.16) | (0.12) |
Distributions from net realized capital gains | (0.43) | (0.73) | (0.73) | (0.16) | (0.20) |
Total distributions | (0.63) | (0.91) | (0.89) | (0.32) | (0.32) |
Net asset value end of period | 15.42 | 12.06 | 11.94 | 11.39 | 11.97 |
Net assets end of period (000s) | $13,554 | $8,590 | $6,183 | $3,756 | $2,728 |
Ratios and Supplemental Data (%) | |||||
Total return | 33.78% | 8.83% | 14.24% | (2.31)% | 23.34% |
Ratio of total expenses to average net assetsb | — | — | — | — | — |
Ratio of net investment income to average net assetsb | 0.92 | 1.44 | 0.90 | 0.91 | 0.95 |
Portfolio turnoverc | 19 | 36 | 14 | 29 | 32 |
HARBOR TARGET RETIREMENT 2060 FUND
Institutional Class | ||
Year Ended October 31, | 2021 | 2020d |
Net asset value beginning of period | $10.60 | $10.00 |
Income from Investment Operations | ||
Net investment income/(loss)a | 0.08 | 0.06 |
Net realized and unrealized gain/(loss) on investments | 3.55 | 0.67 |
Total from investment operations | 3.63 | 0.73 |
Less Distributions | ||
Dividends from net investment income | (0.16) | (0.13) |
Distributions from net realized capital gains | (0.07) | — |
Total distributions | (0.23) | (0.13) |
Net asset value end of period | 14.00 | 10.60 |
Net assets end of period (000s) | $2,416 | $582 |
Ratios and Supplemental Data (%) | ||
Total return | 34.61% | 7.32% |
Ratio of total expenses to average net assetsb | — | — |
Ratio of net investment income to average net assetsb | 0.63 | 0.60 |
Portfolio turnoverc | 56 | 71 |
a
Amounts are based on average daily shares outstanding during the period.
b
Ratios of income and expenses to average net assets represents the expenses paid by the Fund but does not include the acquired fund fees and expenses from underlying funds.
c
Amounts do not include the activity of the underlying funds.
d
For the period November 1, 2019 (inception) through October 31, 2020
The accompanying notes are an integral part of the Financial Statements.
36
Harbor Target Retirement Funds
Notes to Financial Statements—October 31, 2021
Note 1—Organizational Matters
Harbor Funds (the “Trust”) is registered under the Investment Company Act of 1940, as amended (the “Investment Company Act”), as an open-end management investment company. As of October 31, 2021, the Trust consists of 31 separate portfolios. The portfolios covered by this report are: Harbor Target Retirement Income Fund, Harbor Target Retirement 2020 Fund, Harbor Target Retirement 2025 Fund, Harbor Target Retirement 2030 Fund, Harbor Target Retirement 2035 Fund, Harbor Target Retirement 2040 Fund, Harbor Target Retirement 2045 Fund, Harbor Target Retirement 2050 Fund, Harbor Target Retirement 2055 Fund, and Harbor Target Retirement 2060 Fund (individually referred to as a “Fund” and collectively referred to as the “Funds” or “Target Retirement Funds”). The Funds invest in a combination of other funds of the Trust (the “Underlying Funds”). Harbor Capital Advisors, Inc. (the “Adviser” or “Harbor Capital”) is the investment adviser for the Funds and the Underlying Funds. The Adviser has engaged the services of unaffiliated subadvisers to provide discretionary and non-discretionary advisory services for each Underlying Fund.
The Funds currently offer one class of shares, designated as Institutional Class.
Note 2—Significant Accounting Policies
The following is a summary of significant accounting policies followed by the Trust in the preparation of its financial statements. Each Fund follows the investment company reporting requirements under U.S. Generally Accepted Accounting Principles (“U.S. GAAP”), which includes the accounting and reporting guidelines under Accounting Standards Codification (“ASC”) Topic 946, Financial Services-Investment Companies. The preparation of financial statements in accordance with U.S. GAAP requires management to make estimates and assumptions that affect the reported amounts and disclosures in the financial statements. Actual results may differ from those estimates.
Security Valuation
The holdings of each Target Retirement Fund consist entirely of Institutional Class shares of the Underlying Funds, which are valued at their respective net asset values.
Fair Value Measurements and Disclosures
Various inputs may be used to determine the value of each Fund’s investments, which are summarized in three broad categories defined as Level 1, Level 2, and Level 3. The inputs or methodologies used for valuing investments are not necessarily indicative of the risk associated with investing in those investments. The assignment of an investment to Levels 1, 2, or 3 is based on the lowest level of significant inputs used to determine its fair value.
Level 1– | Quoted prices in active markets for identical securities. |
Level 2– | Other significant observable inputs (including quoted prices for similar securities, interest rates, prepayment speeds, credit risk, etc.). |
Level 3– | Significant unobservable inputs are used in situations where quoted prices or other observable inputs are not available or are deemed unreliable. Significant unobservable inputs may include each Fund’s own assumptions. |
Each Fund used observable inputs in its valuation methodologies whenever they were available and deemed reliable. As of October 31, 2021, all investments held by each Fund (as disclosed in the Portfolio of Investments) were classified as Level 1. There were no Level 3 investments at October 31, 2021 or 2020.
Description of the Underlying Funds
In pursuing its investment objectives and strategies, each of the Underlying Funds is permitted to engage in a wide range of investment practices. Further information about the Underlying Funds is contained in the Target Retirement Funds’ prospectus and statement of additional information, as well as the prospectus of each of the Underlying Funds. The accounting policies of each of the Underlying Funds are disclosed in each Underlying Fund’s respective shareholder report. Because each Fund invests in the Underlying Funds, shareholders of each Fund will be affected by the investment practices of the Underlying Funds in direct proportion to the amount of assets each Fund allocates to the Underlying Funds.
37
Harbor Target Retirement Funds
Notes to Financial Statements—Continued
Note 2—Significant Accounting Policies—Continued
The Funds do not invest in the Underlying Funds for the purpose of exercising management or control; however, investments by the Funds may represent a significant portion of an Underlying Fund’s net assets. As of October 31, 2021, each Fund held less than 25% of the outstanding shares of any Underlying Fund.
Investment Transactions and Income
Securities transactions are accounted for on the trade date (the date the order to buy or sell is executed). Income and capital gain distributions received from the Underlying Funds are recorded on the ex-dividend date. Gains and losses on securities sold are determined on the basis of identified cost.
Expenses
Expenses incurred by the Trust are charged directly to the Fund that incurred such expense whenever possible. With respect to expenses incurred by any two or more Harbor Funds where amounts cannot be identified on a fund by fund basis, such expenses are generally allocated in proportion to the average net assets or the number of shareholders of each Fund.
Distribution to Shareholders
Distributions on Fund shares are recorded on the ex-dividend date.
Taxes
Each Fund is treated as a separate entity for U.S. federal tax purposes. Each Fund’s policy is to meet the requirements of Subchapter M of the Internal Revenue Code of 1986, as amended (the “Internal Revenue Code”) applicable to regulated investment companies and to distribute to its shareholders all of its taxable income within the prescribed time. It is also the intention of each Fund to distribute an amount sufficient to avoid imposition of any excise tax under Section 4982 of the Internal Revenue Code. Therefore, no provision has been made for U.S. federal taxes on income, capital gains or unrealized appreciation of securities held or excise taxes on income and capital gains.
Management has analyzed each Fund’s tax positions for all open tax years (in particular, U.S. federal income tax returns for the tax years ended October 31, 2018–2020), including all positions expected to be taken upon filing the 2021 tax return, in all material jurisdictions where the Funds operate, and has concluded that no provision for income tax is required in any Fund’s financial statements. The Funds will recognize interest and penalties, if any, related to unrecognized tax benefits as income tax expense in the Statements of Operations.
Note 3—FEES AND OTHER Transactions with Affiliates
Investment Adviser
Harbor Capital is a wholly owned subsidiary of ORIX Corporation. Harbor Capital is the Funds’ investment adviser and is also responsible for administrative and other services. The Funds do not pay any fees for the services of Harbor Capital.
The Funds have entered into an advisory agreement with Harbor Capital. Pursuant to this agreement, Harbor Capital pays all expenses of each Fund, excluding: (i) the amount of acquired funds’ fees and expenses; (ii) compensation of the Independent Trustees; and (iii) certain other expenses such as extraordinary items.
Distributor
Harbor Funds Distributors, Inc. (the “Distributor”), a wholly-owned subsidiary of Harbor Capital, is the distributor for Harbor Funds’ shares. The Funds do not pay any fees for the services of the Distributor.
Transfer Agent
Harbor Services Group, Inc. (“Harbor Services Group”), a wholly owned subsidiary of Harbor Capital, is the transfer and shareholder servicing agent for the Funds. The Funds do not pay any fees for the services of Harbor Services Group.
38
Harbor Target Retirement Funds
Notes to Financial Statements—Continued
Note 3—FEES AND OTHER Transactions with Affiliates—Continued
Shareholders
As of October 31, 2021, Harbor Capital and its wholly owned subsidiaries collectively held the following shares of beneficial interest in each of the following Funds:
Number of Shares Owned by Harbor Capital and Subsidiaries | Percentage of Outstanding Shares | |
Institutional Class | ||
Harbor Target Retirement 2025 Fund | 551 | 0.0% |
Harbor Target Retirement 2030 Fund | 39,192 | 1.0 |
Harbor Target Retirement 2035 Fund | 17,418 | 1.1 |
Harbor Target Retirement 2040 Fund | 9,321 | 0.2 |
Harbor Target Retirement 2045 Fund | 7,101 | 0.5 |
Harbor Target Retirement 2050 Fund | 18,286 | 0.6 |
Harbor Target Retirement 2055 Fund | 9,168 | 1.0 |
Independent Trustees
The Independent Trustees received no remuneration from the Target Retirement Funds for the year ended October 31, 2021.
Indemnification
Under the Trust’s organizational documents, its officers and Trustees are indemnified against certain liabilities arising out of the performance of their duties to the Trust. In addition, in the normal course of business the Trust enters into contracts that provide general indemnities to other parties. The Trust’s maximum exposure under these arrangements is unknown as this would involve future claims that may be made against the Trust that have not yet occurred. The risk of material loss as a result of such indemnification claims is considered remote.
NOTE 4—TAX INFORMATION
The amount and character of income and net realized gains to be distributed are determined in accordance with income tax rules and regulations, which may differ from U.S. GAAP. Reclassifications, if any, are made to each Fund’s capital account to reflect income and net realized gains available for distribution (or available capital loss carryovers) under income tax rules and regulations. There were no reclassification amounts on the Statements of Assets and Liabilities between total distributable earnings/(loss) and paid-in capital for the year ended October 31, 2021.
The tax composition of each Fund’s distributions was as follows:
As of October 31, 2021 | As of October 31, 2020 | |||||
Ordinary Income (000s) | Long-Term Capital Gains (000s) | Total (000s) | Ordinary Income (000s) | Long-Term Capital Gains (000s) | Total (000s) | |
Harbor Target Retirement Income Fund | $581 | $180 | $761 | $535 | $— | $535 |
Harbor Target Retirement 2020 Fund | 700 | 793 | 1,493 | 761 | 248 | 1,009 |
Harbor Target Retirement 2025 Fund | 634 | 818 | 1,452 | 622 | 728 | 1,350 |
Harbor Target Retirement 2030 Fund | 852 | 1,590 | 2,442 | 863 | 1,370 | 2,233 |
Harbor Target Retirement 2035 Fund | 516 | 1,260 | 1,776 | 499 | 1,035 | 1,534 |
Harbor Target Retirement 2040 Fund | 714 | 1,792 | 2,506 | 628 | 2,046 | 2,674 |
Harbor Target Retirement 2045 Fund | 368 | 807 | 1,175 | 316 | 1,146 | 1,462 |
Harbor Target Retirement 2050 Fund | 551 | 1,533 | 2,084 | 468 | 2,392 | 2,860 |
Harbor Target Retirement 2055 Fund | 150 | 308 | 458 | 97 | 386 | 483 |
Harbor Target Retirement 2060 Fund | 13 | 2 | 15 | 1 | — | 1 |
39
Harbor Target Retirement Funds
Notes to Financial Statements—Continued
NOTE 4—TAX INFORMATION—Continued
As of October 31, 2021, the components of each Fund’s distributable earnings on a tax basis were as follows:
Undistributed Ordinary Income (000s) | Undistributed Long-Term Capital Gains (000s) | Unrealized Appreciation/ (Depreciation) (000s) | Accumulated Capital and Other Losses (000s) | Other Temporary Difference (000s) | Total Distributable Earnings/(Loss) (000s) | |
Harbor Target Retirement Income Fund | $121 | $699 | $677 | $— | $— | $1,497 |
Harbor Target Retirement 2020 Fund | 393 | 1,306 | 1,069 | — | — | 2,768 |
Harbor Target Retirement 2025 Fund | 353 | 1,613 | 1,328 | — | — | 3,294 |
Harbor Target Retirement 2030 Fund | 479 | 1,756 | 3,754 | — | — | 5,989 |
Harbor Target Retirement 2035 Fund | 250 | 1,221 | 3,116 | — | — | 4,587 |
Harbor Target Retirement 2040 Fund | 313 | 2,056 | 6,539 | — | — | 8,908 |
Harbor Target Retirement 2045 Fund | 148 | 1,223 | 3,933 | — | — | 5,304 |
Harbor Target Retirement 2050 Fund | 193 | 2,290 | 7,565 | — | — | 10,048 |
Harbor Target Retirement 2055 Fund | 40 | 698 | 2,526 | — | — | 3,264 |
Harbor Target Retirement 2060 Fund | 154 | 62 | 116 | — | — | 332 |
The identified cost for federal income tax purposes of investments owned by each Fund and its respective gross unrealized appreciation and depreciation as of October 31, 2021 were as follows:
Identified Cost (000s) | Gross Unrealized | Net Unrealized Appreciation/ (Depreciation) (000s) | ||
Appreciation (000s) | (Depreciation) (000s) | |||
Harbor Target Retirement Income Fund | $17,929 | $716 | $(39) | $677 |
Harbor Target Retirement 2020 Fund | 21,408 | 1,090 | (21) | 1,069 |
Harbor Target Retirement 2025 Fund | 21,753 | 1,427 | (99) | 1,328 |
Harbor Target Retirement 2030 Fund | 34,823 | 3,846 | (92) | 3,754 |
Harbor Target Retirement 2035 Fund | 22,952 | 3,196 | (80) | 3,116 |
Harbor Target Retirement 2040 Fund | 35,283 | 6,600 | (61) | 6,539 |
Harbor Target Retirement 2045 Fund | 21,368 | 3,981 | (48) | 3,933 |
Harbor Target Retirement 2050 Fund | 31,065 | 7,594 | (29) | 7,565 |
Harbor Target Retirement 2055 Fund | 11,028 | 2,532 | (6) | 2,526 |
Harbor Target Retirement 2060 Fund | 2,300 | 116 | — | 116 |
Note 5—Subsequent Events
At a meeting of the Board of Trustees held on November 4, 2021, the Board of Trustees voted to liquidate and dissolve the Harbor Target Retirement Funds. The liquidation of the Funds is expected to occur on January 14, 2022. Additional information related to the liquidation can be found in the supplements to the Funds' prospectus and statement of additional information as filed with the SEC on November 5, 2021 and November 18, 2021.
Through the date the financial statements were issued, there were no other subsequent events or transactions that would have materially impacted the financial statements or related disclosures as presented herein.
40
Harbor Target Retirement Funds
Report of Independent Registered Public Accounting Firm
The Board of Trustees and Shareholders of
Harbor Funds
Harbor Funds
Opinion on the Financial Statements
We have audited the accompanying statements of assets and liabilities of Harbor Target Retirement Income Fund, Harbor Target Retirement 2020 Fund, Harbor Target Retirement 2025 Fund, Harbor Target Retirement 2030 Fund, Harbor Target Retirement 2035 Fund, Harbor Target Retirement 2040 Fund, Harbor Target Retirement 2045 Fund, Harbor Target Retirement 2050 Fund, Harbor Target Retirement 2055 Fund and Harbor Target Retirement 2060 Fund (collectively referred to as the “Funds”), (ten of the funds constituting Harbor Funds (the “Trust”)), including the portfolios of investments, as of October 31, 2021, and the related statements of operations and changes in net assets, and the financial highlights for each of the periods indicated in the table below and the related notes (collectively referred to as the “financial statements”). In our opinion, the financial statements present fairly, in all material respects, the financial position of each of the Funds (ten of the funds constituting the Trust), at October 31, 2021, the results of their operations, changes in net assets and financial highlights for each of the periods indicated in the table below, in conformity with U.S. generally accepted accounting principles.
Individual fund constituting the Harbor Funds | Statement of operations | Statement of changes in net assets | Financial highlights |
Harbor Target Retirement Income Fund Harbor Target Retirement 2020 Fund Harbor Target Retirement 2025 Fund Harbor Target Retirement 2030 Fund Harbor Target Retirement 2035 Fund Harbor Target Retirement 2040 Fund Harbor Target Retirement 2045 Fund Harbor Target Retirement 2050 FundHarbor Target Retirement 2055 Fund | For the year ended October 31, 2021 | For each of the two years in the period ended October 31, 2021 | For each of the five years in the period ended October 31, 2021 |
Harbor Target Retirement 2060 Fund | For the year ended October 31, 2021 | For the year ended October 31, 2021 and for the period from November 1, 2019 (inception) through October 31, 2020 |
Basis for Opinion
These financial statements are the responsibility of the Trust’s management. Our responsibility is to express an opinion on each of the Funds’ financial statements based on our audits. We are a public accounting firm registered with the Public Company Accounting Oversight Board (United States) (“PCAOB”) and are required to be independent with respect to the Trust in accordance with the U.S. federal securities laws and the applicable rules and regulations of the Securities and Exchange Commission and the PCAOB.
We conducted our audits in accordance with the standards of the PCAOB. Those standards require that we plan and perform the audit to obtain reasonable assurance about whether the financial statements are free of material misstatement, whether due to error or fraud. The Trust is not required to have, nor were we engaged to perform, an audit of the Trust’s internal control over financial reporting. As part of our audits we are required to obtain an understanding of internal control over financial reporting, but not for the purpose of expressing an opinion on the effectiveness of the Trust’s internal control over financial reporting. Accordingly, we express no such opinion.
Our audits included performing procedures to assess the risks of material misstatement of the financial statements, whether due to error or fraud, and performing procedures that respond to those risks. Such procedures included examining, on a test basis, evidence regarding the amounts and disclosures in the financial statements. Our procedures included confirmation of securities owned as of October 31, 2021, by correspondence with the custodian and the shareholder servicing agent. Our audits also included evaluating the accounting principles used and significant estimates made by management, as well as evaluating the overall presentation of the financial statements. We believe that our audits provide a reasonable basis for our opinion.
We have served as the auditor of one or more Harbor Funds investment companies since 2000.
Chicago, Illinois
December 21, 2021
December 21, 2021
41
Harbor Target Retirement Funds
Fees and Expenses Example (Unaudited)
Example
As a shareholder of a Fund, you incur two types of costs: (1) transaction costs, including redemption fees (if any) and (2) ongoing costs, including management fees, distribution and service (12b-1) fees (if any), and other Fund expenses. This example is intended to help you understand your ongoing costs (in dollars) of investing in a Fund and to compare these costs with the ongoing costs of investing in other mutual funds. The expense ratios reflected below do not include the acquired fund fees and expenses from Underlying Funds.
The example is based on an investment of $1,000 invested at the beginning of the period and held for the entire period May 1, 2021 through October 31, 2021.
Actual Expenses
The first line of the table below provides information about actual account values and actual expenses for each share class. You may use the information in the respective class line, together with the amount you invested, to estimate the expenses that you paid over the period. Simply divide your account value by $1,000 (for example, an $8,600 account value divided by $1,000 = 8.6), then multiply the result by the number in the first line of the respective class under the heading entitled “Expenses Paid During Period” to estimate the expenses you paid on your account during this period.
Hypothetical Example for Comparison Purposes
The second line of the table for each share class below provides information about hypothetical account values and hypothetical expenses based on the respective Fund/Class’s actual expense ratio and an assumed rate of return of 5% per year before expenses, which is not the respective Fund/Class’s actual return. The hypothetical account values and expenses may not be used to estimate the actual ending account balance or expenses you paid for the period. You may use this information to compare the ongoing costs of investing in a Fund to other funds. To do so, compare this 5% hypothetical example with the 5% hypothetical examples that appear in the shareholder reports of the other funds.
Please note that the expenses shown in the table are meant to highlight your ongoing costs only and do not reflect any transactional costs, such as redemption fees. Therefore, the second line of the table is useful in comparing ongoing costs only, and will not help you determine the relative total costs of owning different funds. In addition, if these transactional costs were included, your costs would have been higher.
Annualized Expense Ratios | Expenses Paid During Period* | Beginning Account Value May 1, 2021 | Ending Account Value October 31, 2021 | |||||
Harbor Target Retirement Income Fund | ||||||||
Institutional Class | 0.00% | |||||||
Actual | $0.00 | $1,000 | $1,018.70 | |||||
Hypothetical (5% return) | 0.00 | 1,000 | 1,025.21 | |||||
Harbor Target Retirement 2020 Fund | ||||||||
Institutional Class | 0.00% | |||||||
Actual | $0.00 | $1,000 | $1,021.90 | |||||
Hypothetical (5% return) | 0.00 | 1,000 | 1,025.21 | |||||
Harbor Target Retirement 2025 Fund | ||||||||
Institutional Class | 0.00% | |||||||
Actual | $0.00 | $1,000 | $1,025.20 | |||||
Hypothetical (5% return) | 0.00 | 1,000 | 1,025.21 | |||||
Harbor Target Retirement 2030 Fund | ||||||||
Institutional Class | 0.00% | |||||||
Actual | $0.00 | $1,000 | $1,028.30 | |||||
Hypothetical (5% return) | 0.00 | 1,000 | 1,025.21 | |||||
Harbor Target Retirement 2035 Fund | ||||||||
Institutional Class | 0.00% | |||||||
Actual | $0.00 | $1,000 | $1,030.60 | |||||
Hypothetical (5% return) | 0.00 | 1,000 | 1,025.21 |
42
Harbor Target Retirement Funds
Fees and Expenses Example—Continued
Annualized Expense Ratios | Expenses Paid During Period* | Beginning Account Value May 1, 2021 | Ending Account Value October 31, 2021 | |||||
Harbor Target Retirement 2040 Fund | ||||||||
Institutional Class | 0.00% | |||||||
Actual | $0.00 | $1,000 | $1,033.60 | |||||
Hypothetical (5% return) | 0.00 | 1,000 | 1,025.21 | |||||
Harbor Target Retirement 2045 Fund | ||||||||
Institutional Class | 0.00% | |||||||
Actual | $0.00 | $1,000 | $1,035.90 | |||||
Hypothetical (5% return) | 0.00 | 1,000 | 1,025.21 | |||||
Harbor Target Retirement 2050 Fund | ||||||||
Institutional Class | 0.00% | |||||||
Actual | $0.00 | $1,000 | $1,038.70 | |||||
Hypothetical (5% return) | 0.00 | 1,000 | 1,025.21 | |||||
Harbor Target Retirement 2055 Fund | ||||||||
Institutional Class | 0.00% | |||||||
Actual | $0.00 | $1,000 | $1,041.20 | |||||
Hypothetical (5% return) | 0.00 | 1,000 | 1,025.21 | |||||
Harbor Target Retirement 2060 Fund | ||||||||
Institutional Class | 0.00% | |||||||
Actual | $0.00 | $1,000 | $1,041.70 | |||||
Hypothetical (5% return) | 0.00 | 1,000 | 1,025.21 |
*
Expenses are equal to the Fund’s annualized expense ratio, multiplied by the average account value over the period, multiplied by 184/365 (to reflect the one-half year period).
43
Harbor Target Retirement Funds
Additional Information (Unaudited)
Additional Tax Information
Pursuant to Section 852 of the Internal Revenue Code, the Funds designate the following capital gain dividends for the year ended October 31, 2021:
Amount (000s) | |
Harbor Target Retirement Income Fund | $179 |
Harbor Target Retirement 2020 Fund | 794 |
Harbor Target Retirement 2025 Fund | 819 |
Harbor Target Retirement 2030 Fund | 1,590 |
Harbor Target Retirement 2035 Fund | 1,260 |
Harbor Target Retirement 2040 Fund | 1,792 |
Harbor Target Retirement 2045 Fund | 807 |
Harbor Target Retirement 2050 Fund | 1,534 |
Harbor Target Retirement 2055 Fund | 308 |
Harbor Target Retirement 2060 Fund | 2 |
For the fiscal year ended October 31, 2021, each Fund designates up to the maximum amount of such dividends allowable pursuant to the Internal Revenue Code as qualified dividend income eligible for reduced tax rates. These lower rates range from 0% to 20% depending on an individual’s tax bracket. If a Fund pays a distribution during calendar year 2021, complete information will be reported in conjunction with Form 1099-DIV.
Proxy Voting
Harbor Funds has adopted Proxy Voting Policies and Procedures under which proxies relating to securities held by the Harbor funds are voted. In addition, Harbor Funds files Form N-PX, with its complete proxy voting record for the 12 months ended June 30th, no later than August 31st of each year. A description of Harbor Funds’ Proxy Voting Policies and Procedures and the proxy voting records (Form N-PX) are available (i) without charge, upon request, by calling Harbor toll-free at 800-422-1050; (ii) on Harbor’s website at harborcapital.com; and (iii) on the SEC’s website at sec.gov.
Householding
Harbor Funds has adopted a policy that allows it to send only one copy of a Fund’s prospectus, proxy materials, annual report and semi-annual report to certain shareholders residing at the same household. This reduces Fund expenses, which benefits you and other shareholders. If you need additional copies or do not want your mailings to be “householded,” please call the Shareholder Servicing Agent at 800-422-1050. Individual copies will be sent within thirty (30) days after the Shareholder Servicing Agent receives your instructions. Your consent to householding is considered valid until revoked.
Quarterly Portfolio Disclosures
The Funds file a complete portfolio of investments for their first and third fiscal quarters with the SEC as an exhibit to Form N-PORT. The Funds’ Form N-PORT exhibit is available (i) without charge, upon request, by calling Harbor toll-free at 800-422-1050, (ii) on Harbor’s website at harborcapital.com, and (iii) on the SEC’s website at sec.gov.
44
Harbor Target Retirement Funds
Additional Information—Continued
Trustees and Officers
As of December 2021
The business and affairs of the Trust shall be managed by or under the direction of the Trustees, and they shall have all powers necessary or desirable to carry out that responsibility. The Trustees shall have full power and authority to take or refrain from taking any action and to execute any contracts and instruments that they may consider necessary or desirable in the management of the Trust. Any determination made by the Trustees in good faith as to what is in the interests of the Trust shall be conclusive. Information pertaining to the Trustees and Officers of Harbor Funds is set forth below. The address of each Trustee and Officer is: [Name of Trustee or Officer] c/o Harbor Funds, 111 South Wacker Drive, 34th Floor, Chicago, IL 60606-4302.
Harbor Funds' Statement of Additional Information includes additional information about the Trust’s Trustees and is available without charge by calling 800-422-1050 or at the Trust’s website at harborcapital.com.
Name (Age) Position(s) with Fund | Term of Office and Length of Time Served1 | Principal Occupation(s) During Past Five Years | Number of Portfolios In Fund Complex Overseen By Trustee | Other Directorships Of Public Companies and Other Registered Investment Companies Held by Trustee During Past Five Years |
INDEPENDENT TRUSTEES | ||||
Scott M. Amero (58) Trustee | Since 2014 | Chairman (2015-2020) and Trustee (2011-Present), Rare (conservation nonprofit); Trustee, Berkshire School (2014-Present); Trustee, The Nature Conservancy, Massachusetts Chapter (2018-Present); Vice Chairman and Global Chief Investment Officer, Fixed Income (2010), Vice Chairman and Global Chief Investment Officer, Fixed Income, and Co-Head, Fixed Income Portfolio Management (2007-2010), BlackRock, Inc. (publicly traded investment management firm). | 34 | None |
Donna J. Dean (70) Trustee | Since 2010 | Chief Investment Officer of the Rockefeller Foundation (a private foundation) (2001-2019). | 34 | None |
Randall A. Hack (74) Trustee | Since 2010 | Founder and Senior Managing Director of Capstone Capital LLC (private investment firm) (2003-Present); Director of Tower Development Corporation (cell tower developer) (2009-2016); Advisory Director of Berkshire Partners (private equity firm) (2002-2013); Founder and Senior Managing Director of Nassau Capital, LLC (private investment firm, investing solely on behalf of the Princeton Endowment) (1995-2001); and President of The Princeton University Investment Company (1990-1994). | 34 | None |
Robert Kasdin (63) Trustee | Since 2014 | Senior Vice President and Chief Operating Officer (2015-Present) and Chief Financial Officer (2018-Present), Johns Hopkins Medicine; Senior Executive Vice President, Columbia University (2002-2015); Trustee and Member of the Finance Committee, National September 11 Memorial & Museum at the World Trade Center (2005-2019); Director, Apollo Commercial Real Estate Finance, Inc. (2014-Present); and Director and Executive Committee Member, The Y in Central Maryland (2018-Present). | 34 | Director of Apollo Commercial Real Estate Finance, Inc. (2014-Present). |
Kathryn L. Quirk (69) Trustee | Since 2017 | Vice President, Senior Compliance Officer and Head, U.S. Regulatory Compliance, Goldman Sachs Asset Management (2013-2017); Deputy Chief Legal Officer, Asset Management, and Vice President and Corporate Counsel, Prudential Insurance Company of America (2010-2012); Co-Chief Legal Officer, Prudential Investment Management, Inc., and Chief Legal Officer, Prudential Investments and Prudential Mutual Funds (2008-2012); Vice President and Corporate Counsel and Chief Legal Officer, Mutual Funds, Prudential Insurance Company of America, and Chief Legal Officer, Prudential Investments (2005-2008); Vice President and Corporate Counsel and Chief Legal Officer, Mutual Funds, Prudential Insurance Company of America (2004-2005); Member, Management Committee (2000-2002), General Counsel and Chief Compliance Officer, Zurich Scudder Investments, Inc. (1997-2002). | 34 | None |
Douglas J. Skinner (59) Trustee | Since 2020 | Professor of Accounting (2005-Present), Deputy Dean for Faculty (2015-2016, 2017-Present), Interim Dean (2016-2017), University of Chicago Booth School of Business. | 34 | None |
45
Harbor Target Retirement Funds
Additional Information—Continued
Trustees and Officers—Continued
Name (Age) Position(s) with Fund | Term of Office and Length of Time Served1 | Principal Occupation(s) During Past Five Years | Number of Portfolios In Fund Complex Overseen By Trustee | Other Directorships Of Public Companies and Other Registered Investment Companies Held by Trustee During Past Five Years |
INDEPENDENT TRUSTEES—Continued | ||||
Ann M. Spruill (67) Trustee | Since 2014 | Partner (1993-2008), member of Executive Committee (1996-2008), Member Board of Directors (2002-2008), Grantham, Mayo, Van Otterloo & Co, LLC (private investment management firm) (with the firm since 1990); Member Investment Committee and Chair of Global Public Equities, Museum of Fine Arts, Boston (2000-2020); and Trustee, Financial Accounting Foundation (2014-2020). | 34 | None |
INTERESTED TRUSTEE | ||||
Charles F. McCain (52)* Chairman, Trustee and President | Since 2017 | Chief Executive Officer (2017-Present), Director (2007-Present), President and Chief Operating Officer (2017), Executive Vice President and General Counsel (2004-2017), and Chief Compliance Officer (2004-2014), Harbor Capital Advisors, Inc.; Director and Chairperson (2019-Present), Harbor Trust Company, Inc.; Director (2007-Present) and Chief Compliance Officer (2004-2017), Harbor Services Group, Inc.; Chief Executive Officer (2017-Present), Director (2007-Present), Chief Compliance Officer and Executive Vice President (2007-2017), Harbor Funds Distributors, Inc.; and Chief Compliance Officer, Harbor Funds (2004-2017). | 34 | None |
Name (Age) Position(s) with Fund | Term of Office and Length of Time Served1 | Principal Occupation(s) During Past Five Years |
FUND OFFICERS NOT LISTED ABOVE** | ||
Erik D. Ojala (46) Chief Compliance Officer | Since 2017 | Executive Vice President and General Counsel (2017-Present) and Secretary (2010-Present); Senior Vice President and Associate General Counsel (2007-2017), Harbor Capital Advisors, Inc.; Director and Secretary (2019-Present), Harbor Trust Company, Inc.; Director, Executive Vice President (2017-Present) and Chief Compliance Officer (2017-2021), Harbor Funds Distributors, Inc.; Director (2017-Present) and Assistant Secretary (2014-Present), Harbor Services Group, Inc.; and AML Compliance Officer (2010-2017) and Vice President and Secretary (2007-2017), Harbor Funds. |
Anmarie S. Kolinski (50) Treasurer | Since 2007 | Executive Vice President and Chief Financial Officer (2007-Present), Harbor Capital Advisors, Inc.; Director and Treasurer (2019-Present), Harbor Trust Company, Inc.; Chief Financial Officer (2007-Present), Harbor Services Group, Inc.; and Chief Financial Officer (2015-Present) and Treasurer (2012-Present), Harbor Funds Distributors, Inc. |
Kristof M. Gleich (42) Vice President | Since 2019 | President (2018-Present) and Chief Investment Officer (2020), Harbor Capital Advisors, Inc.; Director, Vice Chairperson, President (2019-Present) and Chief Investment Officer (2020-Present), Harbor Trust Company, Inc.; and Managing Director, Global Head of Manager Selection (2010-2018), JP Morgan Chase & Co. |
Gregg M. Boland (58) Vice President | Since 2019 | Executive Vice President (2020-Present), Vice President (2019-2020), Harbor Capital Advisors, Inc.; President (2019-Present), Senior Vice President – Operations (2016-2019), and Vice President – Operations (2007-2015), Harbor Services Group, Inc.; and Senior Vice President, AML Compliance Officer, and OFAC Officer (2019-Present), Harbor Funds Distributors, Inc. |
Diana R. Podgorny (42) Secretary | Since 2018 | Senior Vice President and Assistant General Counsel (2020-Present), Vice President and Assistant General Counsel (2017-2020), Harbor Capital Advisors, Inc.; Director and Vice President (2020 – Present), Harbor Trust Company, Inc.; Vice President and Counsel, AMG Funds LLC (2016-2017); Assistant Secretary, AMG Funds, AMG Funds I, AMG Funds II and AMG Funds III (2016-2017); Assistant Secretary, AMG Funds IV (2010-2017); and Vice President and Counsel, Aston Asset Management, LLC (2010-2016). |
Jodie L. Crotteau (49) Assistant Secretary | Since 2014 | Senior Vice President and Chief Compliance Officer, Harbor Capital Advisors, Inc. (2014-Present); Chief Compliance Officer and AML/OFAC Officer (2019-Present), Harbor Trust Company, Inc.; Chief Compliance Officer and Secretary (2017-present) and Assistant Secretary (2015-2016), Harbor Services Group, Inc.; Chief Compliance Officer (2021-present) and Assistant Secretary (2016-present), Harbor Funds Distributors, Inc.; Vice President and Chief Compliance Officer, Grosvenor Registered Funds (2011-2014); and Vice President, Grosvenor Capital Management, L.P. (2010-2014). |
46
Harbor Target Retirement Funds
Additional Information—Continued
Trustees and Officers—Continued
Name (Age) Position(s) with Fund | Term of Office and Length of Time Served1 | Principal Occupation(s) During Past Five Years |
FUND OFFICERS NOT LISTED ABOVE**—Continued | ||
Lana M. Lewandowski (42) AML Compliance Officer and Assistant Secretary | Since 2017 | Legal & Compliance Manager (2016-Present) and Legal Specialist (2012-2015), Harbor Capital Advisors, Inc. |
Lora A. Kmieciak (57) Assistant Treasurer | Since 2017 | Senior Vice President – Fund Administration and Analysis (2017-Present), Senior Vice President - Business Analysis (2015-2017), Harbor Capital Advisors, Inc.; Vice President (2020 – Present), Harbor Trust Company, Inc.; and Assurance Executive Director, Ernst & Young LLP (1999-2015). |
John M. Paral (53) Assistant Treasurer | Since 2013 | Director of Fund Administration and Analysis (2017-Present), Vice President (2012-Present) and Financial Reporting Manager (2007-2017), Harbor Capital Advisors, Inc. |
1
Each Trustee serves for an indefinite term, until his or her successor is elected. Each Officer is elected annually.
*
Mr. McCain is deemed an “Interested Trustee” due to his affiliation with the Adviser and Distributor of Harbor Funds.
**
Officers of the Funds are “interested persons” as defined in the Investment Company Act.
47
This Privacy Statement Is Not Part of This Report
Harbor’s Privacy Statement
Rev. 09/2021
FACTS | WHAT DOES HARBOR DO WITH YOUR PERSONAL INFORMATION? |
Why? | Financial companies choose how they share your personal information. Federal law gives consumers the right to limit some but not all sharing. Federal law also requires us to tell you how we collect, share, and protect your personal information. Please read this notice carefully to understand what we do. |
What? | The types of personal information we collect and share depend on the product or service you have with us. This information can include: ■ Social Security number ■ Account balances and transaction history ■ Assets and investment experience ■ Wire transfer instructions When you are no longer our customer, we continue to share your information as described in this notice. |
How? | All financial companies need to share customers' personal information to run their everyday business. In the section below, we list the reasons financial companies can share their customers' personal information; the reasons Harbor chooses to share; and whether you can limit this sharing. |
Reasons we can share your personal information | Does Harbor share? | Can you limit this sharing? |
For our everyday business purposes— such as to process your transactions, maintain your account(s), respond to court orders and legal investigations, or report to credit bureaus | Yes | No |
For our marketing purposes— to offer our products and services to you | Yes | No |
For joint marketing with other financial companies | No | We don’t share |
For our affiliates’ everyday business purposes— information about your transactions and experiences | Yes | No |
For our affiliates’ everyday business purposes— information about your creditworthiness | No | We don’t share |
For nonaffiliates to market to you | No | We don’t share |
Questions? | Call 800-422-1050 or go to harborcapital.com |
48
Harbor’s Privacy Statement—Continued
Page 2 | ||
Who we are | ||
Who is providing this notice? | Harbor Capital Advisors, Inc.; Harbor Services Group; Inc.; Harbor Funds Distributors, Inc., Harbor Trust Company, Inc., Harbor Funds, Harbor ETF Trust (collectively, “Harbor”) | |
What we do | ||
How does Harbor protect my personal information? | To protect your personal information from unauthorized access and use, we use security measures that comply with federal law. These measures include computer safeguards and secured files and buildings. We maintain physical, electronic and procedural safeguards designed to protect your personal information; however, please be aware that no data security measures can guarantee 100% security. | |
How does Harbor collect my personal information? | We collect your personal information, for example, when you ■ Open an account or make transactions on your account ■ Give us your contact information or income information ■ Tell us about your investment or retirement portfolio We also collect your personal information from others, such as credit bureaus, affiliates, or other companies. | |
Why can’t I limit all sharing? | Federal law gives you the right to limit only ■ sharing for affiliates’ everyday business purposes—information about your creditworthiness ■ affiliates from using your information to market to you ■ sharing for nonaffiliates to market to you State laws and individual companies may give you additional rights to limit sharing. | |
Definitions | ||
Affiliates | Companies related by common ownership or control. They can be financial and nonfinancial companies. ■ Our affiliates include the financial companies providing this notice, as well as other companies under our parent company, ORIX Corporation. | |
Nonaffiliates | Companies not related by common ownership or control. They can be financial and nonfinancial companies. ■ Nonaffiliates we share with can include companies that perform support services on our behalf or other firms that assist us in providing you with products and services, such as custodians, transfer agents, broker-dealers and marketing service firms (to support our marketing to you), as well as other financial institutions. | |
Joint marketing | A formal agreement between nonaffiliated financial companies that together market financial products or services to you. ■ Harbor doesn’t jointly market. | |
Other important information | ||
Notice to investors in California and Vermont | Under California and Vermont law, we will not share information we collect about you with outside companies, unless the law allows. For example, we may share information with your consent, to service your accounts, and in connection with legal proceedings. We will limit sharing among our companies to the extent required by applicable law. |
We recommend that you read and retain this notice for your personal files.
49
Benchmark Descriptions
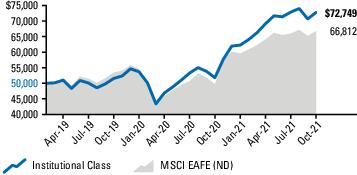
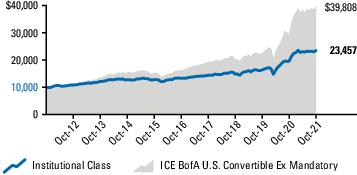
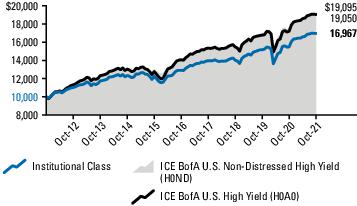
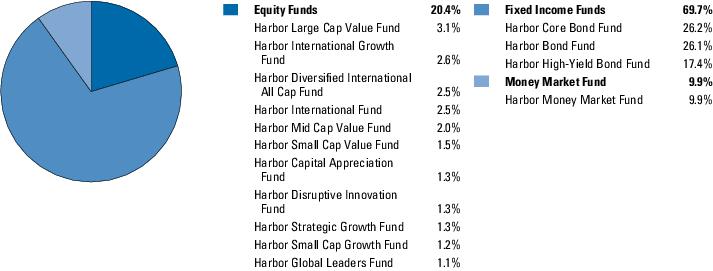
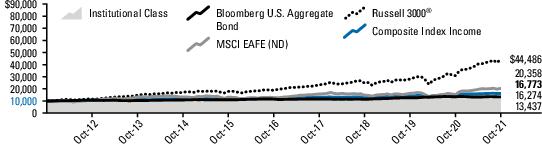
Composite Index Income—The Composite Index Income is derived by applying the Harbor Target Retirement Income Fund’s (the “Income Fund”) target asset allocation to the results of the underlying funds’ benchmarks: Russell 1000® Growth Index, Russell Midcap® Growth Index, Russell 2000® Growth Index, Russell 1000® Value Index, Russell Midcap® Value Index, Russell 2000® Value Index, MSCI EAFE (ND) Index, MSCI All Country World Ex. U.S. (ND) Index (with respect to Harbor International Growth Fund weightings, prior to May 28, 2013, the MSCI EAFE Growth (ND) Index), MSCI All Country World (ND) Index, ICE BofA U.S. High Yield Index (H0A0), ICE BofA U.S. Non-Distressed High Yield Index (with respect to the Harbor High-Yield Bond Fund; prior to March 31, 2015, the ICE BofA U.S. High Yield Index (H0A0) was this fund’s benchmark and a component of the Composite Index), Bloomberg U.S. Aggregate Bond Index, Bloomberg Barclays U.S. TIPS Index, ICE BofA U.S. 3-Month Treasury Bill Index. The weights of the Composite Index Income match the Income Fund’s historical target asset allocation and are adjusted as changes are made to this asset allocation. Refer to the Target Retirement Funds Prospectus for the Income Fund’s target asset allocation. This unmanaged index does not reflect fees and expenses and is not available for direct investment.
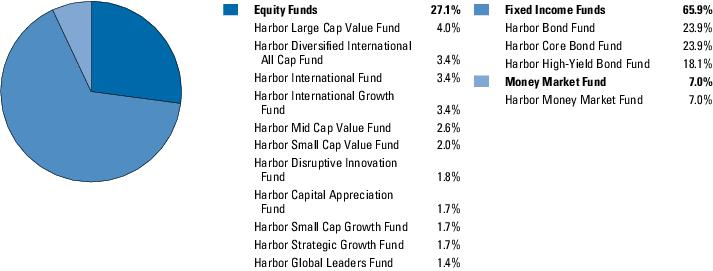
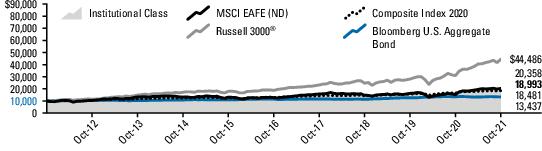
Composite Index 2020—The Composite Index 2020 is derived by applying the Harbor Target Retirement 2020 Fund’s (the “2020 Fund”) target asset allocation to the results of the underlying funds’ benchmarks: Russell 1000® Growth Index, Russell Midcap® Growth Index, Russell 2000® Growth Index, Russell 1000® Value Index, Russell Midcap® Value Index, Russell 2000® Value Index, MSCI EAFE (ND) Index, MSCI All Country World Ex. U.S. (ND) Index (with respect to Harbor International Growth Fund weightings, prior to May 28, 2013, the MSCI EAFE Growth (ND) Index), MSCI All Country World (ND) Index, ICE BofA U.S. High Yield Index (H0A0), ICE BofA U.S. Non-Distressed High Yield Index (with respect to the Harbor High-Yield Bond Fund; prior to March 31, 2015, the ICE BofA U.S. High Yield Index (H0A0) was this fund’s benchmark and a component of the Composite Index), Bloomberg U.S. Aggregate Bond Index, Bloomberg Barclays U.S. TIPS Index, ICE BofA U.S. 3-Month Treasury Bill Index. The weights of the Composite Index 2020 match the 2020 Fund’s historical target asset allocation and are adjusted as changes are made to this asset allocation. Refer to the Target Retirement Funds Prospectus for the 2020 Fund’s target asset allocation. This unmanaged index does not reflect fees and expenses and is not available for direct investment.
Composite Index 2025—The Composite Index 2025 is derived by applying the Harbor Target Retirement 2025 Fund’s (the “2025 Fund”) target asset allocation to the results of the underlying funds’ benchmarks: Russell 1000® Growth Index, Russell Midcap® Growth Index, Russell 2000® Growth Index, Russell 1000® Value Index, Russell Midcap® Value Index, Russell 2000® Value Index, MSCI EAFE (ND) Index, MSCI All Country World Ex. U.S. (ND) Index (with respect to Harbor International Growth Fund weightings, prior to May 28, 2013, the MSCI EAFE Growth (ND) Index), MSCI All Country World (ND) Index, ICE BofA U.S. High Yield Index (H0A0), ICE BofA U.S. Non-Distressed High Yield Index (with respect to the Harbor High-Yield Bond Fund; prior to March 31, 2015, the ICE BofA U.S. High Yield Index (H0A0) was this fund’s benchmark and a component of the Composite Index), Bloomberg U.S. Aggregate Bond Index, Bloomberg Barclays U.S. TIPS Index. The weights of the Composite Index 2025 match the 2025 Fund’s historical target asset allocation and are adjusted as changes are made to this asset allocation. Refer to the Target Retirement Funds Prospectus for the 2025 Fund’s target asset allocation. This unmanaged index does not reflect fees and expenses and is not available for direct investment.
Composite Index 2030—The Composite Index 2030 is derived by applying the Harbor Target Retirement 2030 Fund’s (the “2030 Fund”) target asset allocation to the results of the underlying funds’ benchmarks: Russell 1000® Growth Index, Russell Midcap® Growth Index, Russell 2000® Growth Index, Russell 1000® Value Index, Russell Midcap® Value Index, Russell 2000® Value Index, MSCI EAFE (ND) Index, MSCI All Country World Ex. U.S. (ND) Index (with respect to Harbor International Growth Fund weightings, prior to May 28, 2013, the MSCI EAFE Growth (ND) Index), MSCI All Country World (ND) Index, ICE BofA U.S. High Yield Index (H0A0), ICE BofA U.S. Non-Distressed High Yield Index (with respect to the Harbor High-Yield Bond Fund; prior to March 31, 2015, the ICE BofA U.S. High Yield Index (H0A0) was this fund’s benchmark and a component of the Composite Index), Bloomberg U.S. Aggregate Bond Index, Bloomberg Barclays U.S. TIPS Index. The weights of the Composite Index 2030 match the 2030 Fund’s historical target asset allocation and are adjusted as changes are made to this asset allocation. Refer to the Target Retirement Funds Prospectus for the 2030 Fund’s target asset allocation. This unmanaged index does not reflect fees and expenses and is not available for direct investment.
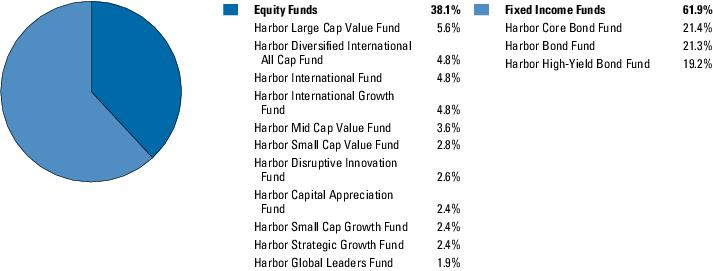
Composite Index 2035—The Composite Index 2035 is derived by applying the Harbor Target Retirement 2035 Fund’s (the “2035 Fund”) target asset allocation to the results of the underlying funds’ benchmarks: Russell 1000® Growth Index, Russell Midcap® Growth Index, Russell 2000® Growth Index, Russell 1000® Value Index, Russell Midcap® Value Index, Russell 2000® Value Index, MSCI EAFE (ND) Index, MSCI All Country World Ex. U.S. (ND) Index (with respect to Harbor International Growth Fund weightings, prior to May 28, 2013, the MSCI EAFE Growth (ND) Index), MSCI All Country World (ND) Index, ICE BofA U.S. High Yield Index (H0A0), ICE BofA U.S. Non-Distressed High Yield Index (with respect to the Harbor High-Yield Bond Fund; prior to March 31, 2015, the ICE BofA U.S. High Yield Index (H0A0) was this fund’s benchmark and a component of the Composite Index), Bloomberg U.S. Aggregate Bond Index, Bloomberg Barclays U.S. TIPS Index. The weights of the Composite Index 2035 match the 2035 Fund’s historical target asset allocation and are adjusted as changes are made to this asset allocation. Refer to the Target Retirement Funds Prospectus for the 2035 Fund’s target asset allocation. This unmanaged index does not reflect fees and expenses and is not available for direct investment.
50
Benchmark Descriptions—Continued
Composite Index 2040—The Composite Index 2040 is derived by applying the Harbor Target Retirement 2040 Fund’s (the “2040 Fund”) target asset allocation to the results of the underlying funds’ benchmarks: Russell 1000® Growth Index, Russell Midcap® Growth Index, Russell 2000® Growth Index, Russell 1000® Value Index, Russell Midcap® Value Index, Russell 2000® Value Index, MSCI EAFE (ND) Index, MSCI All Country World Ex. U.S. (ND) Index (with respect to Harbor International Growth Fund weightings, prior to May 28, 2013, the MSCI EAFE Growth (ND) Index), MSCI All Country World (ND) Index, ICE BofA U.S. High Yield Index (H0A0), ICE BofA U.S. Non-Distressed High Yield Index (with respect to the Harbor High-Yield Bond Fund; prior to March 31, 2015, the ICE BofA U.S. High Yield Index (H0A0) was this fund’s benchmark and a component of the Composite Index), Bloomberg U.S. Aggregate Bond Index. The weights of the Composite Index 2040 match the 2040 Fund’s historical target asset allocation and are adjusted as changes are made to this asset allocation. Refer to the Target Retirement Funds Prospectus for the 2040 Fund’s target asset allocation. This unmanaged index does not reflect fees and expenses and is not available for direct investment.
Composite Index 2045—The Composite Index 2045 is derived by applying the Harbor Target Retirement 2045 Fund’s (the “2045 Fund”) target asset allocation to the results of the underlying funds’ benchmarks: Russell 1000® Growth Index, Russell Midcap® Growth Index, Russell 2000® Growth Index, Russell 1000® Value Index, Russell Midcap® Value Index, Russell 2000® Value Index, MSCI EAFE (ND) Index, MSCI All Country World Ex. U.S. (ND) Index (with respect to Harbor International Growth Fund weightings, prior to May 28, 2013, the MSCI EAFE Growth (ND) Index), MSCI All Country World (ND) Index, ICE BofA U.S. High Yield Index (H0A0), ICE BofA U.S. Non-Distressed High Yield Index (with respect to the Harbor High-Yield Bond Fund; prior to March 31, 2015, the ICE BofA U.S. High Yield Index (H0A0) was this fund’s benchmark and a component of the Composite Index), Bloomberg U.S. Aggregate Bond Index. The weights of the Composite Index 2045 match the 2045 Fund’s historical target asset allocation and are adjusted as changes are made to this asset allocation. Refer to the Target Retirement Funds Prospectus for the 2045 Fund’s target asset allocation. This unmanaged index does not reflect fees and expenses and is not available for direct investment.
Composite Index 2050—The Composite Index 2050 is derived by applying the Harbor Target Retirement 2050 Fund’s (the “2050 Fund”) target asset allocation to the results of the underlying funds’ benchmarks: Russell 1000® Growth Index, Russell Midcap® Growth Index, Russell 2000® Growth Index, Russell 1000® Value Index, Russell Midcap® Value Index, Russell 2000® Value Index, MSCI EAFE (ND) Index, MSCI All Country World Ex. U.S. (ND) Index (with respect to Harbor International Growth Fund weightings, prior to May 28, 2013, the MSCI EAFE Growth (ND) Index), MSCI All Country World (ND) Index, ICE BofA U.S. High Yield Index (H0A0), Bloomberg U.S. Aggregate Bond Index. The weights of the Composite Index 2050 match the 2050 Fund’s historical target asset allocation and are adjusted as changes are made to this asset allocation. Refer to the Target Retirement Funds Prospectus for the 2050 Fund’s target asset allocation. This unmanaged index does not reflect fees and expenses and is not available for direct investment.
Composite Index 2055—The Composite Index 2055 is derived by applying the Harbor Target Retirement 2055 Fund’s (the “2055 Fund”) target asset allocation to the results of the underlying funds’ benchmarks: Russell 1000® Growth Index, Russell Midcap® Growth Index, Russell 2000® Growth Index, Russell 1000® Value Index, Russell Midcap® Value Index, Russell 2000® Value Index, MSCI EAFE (ND) Index, MSCI All Country World Ex. U.S. (ND) Index (with respect to Harbor International Growth Fund weightings, prior to May 28, 2013, the MSCI EAFE Growth (ND) Index), MSCI All Country World (ND) Index, ICE BofA U.S. High Yield Index (H0A0), Bloomberg U.S. Aggregate Bond Index. The weights of the Composite Index 2055 match the 2055 Fund’s historical target asset allocation and are adjusted as changes are made to this asset allocation. Refer to the Target Retirement Funds Prospectus for the 2055 Fund’s target asset allocation. This unmanaged index does not reflect fees and expenses and is not available for direct investment.
Composite Index 2060— The Composite Index 2060 is derived by applying the Harbor Target Retirement 2060 Fund’s (the “2060 Fund”) target asset allocation to the results of the underlying funds’ benchmarks: Russell 1000® Growth Index, Russell Midcap® Growth Index, Russell 2000® Growth Index, Russell 1000® Value Index, Russell Midcap® Value Index, Russell 2000® Value Index, MSCI EAFE (ND) Index, MSCI All Country World Ex. U.S. (ND) Index (with respect to Harbor International Growth Fund weightings, prior to May 28, 2013, the MSCI EAFE Growth (ND) Index), MSCI All Country World (ND) Index, ICE BofA U.S. High Yield Index (H0A0), Bloomberg U.S. Aggregate Bond Index. The weights of the Composite Index 2060 match the 2060 Fund’s historical target asset allocation and are adjusted as changes are made to this asset allocation. Refer to the Target Retirement Funds Prospectus for the 2060 Fund’s target asset allocation. This unmanaged index does not reflect fees and expenses and is not available for direct investment.
51
[THIS PAGE INTENTIONALLY LEFT BLANK]
53
For more information |
Trustees & Officers
Charles F. McCain Chairman, President & Trustee Scott M. Amero Trustee Donna J. Dean Trustee Randall A. Hack Trustee Robert Kasdin Trustee Kathryn L. Quirk Trustee Douglas J. Skinner Trustee Ann M. Spruill Trustee Erik D. Ojala Chief Compliance Officer Anmarie S. Kolinski Treasurer Kristof M. Gleich Vice President Gregg M. Boland Vice President Diana R. Podgorny Secretary Jodie L. Crotteau Assistant Secretary Lana M. Lewandowski AML Compliance Officer & Assistant Secretary Lora A. Kmieciak Assistant Treasurer John M. Paral Assistant Treasurer |
Investment Adviser
Harbor Capital Advisors, Inc.
111 South Wacker Drive, 34th Floor
Chicago, IL 60606-4302
312-443-4400
111 South Wacker Drive, 34th Floor
Chicago, IL 60606-4302
312-443-4400
Distributor
Harbor Funds Distributors, Inc.
111 South Wacker Drive, 34th Floor
Chicago, IL 60606-4302
312-443-4600
111 South Wacker Drive, 34th Floor
Chicago, IL 60606-4302
312-443-4600
Shareholder Services
Harbor Services Group, Inc.
P.O. Box 804660
Chicago, IL 60680-4108
800-422-1050
P.O. Box 804660
Chicago, IL 60680-4108
800-422-1050
FD.AR.TR.1021
ITEM 2 – CODE OF ETHICS
(a)
The Registrant has adopted a code of ethics that applies to the Registrant’s principal executive officer, principal financial officer, principal accounting officer or controller, or persons performing similar functions, regardless of whether these individuals are employed by the Registrant or a third party (the “Code of Ethics”).
(c)
The Registrant has not amended its Code of Ethics during the period covered by this report.
(d)
The Registrant has not granted any waivers, including an implicit waiver, from any provisions of its Code of Ethics during the period covered by this report.
ITEM 3 – AUDIT COMMITTEE FINANCIAL EXPERT
The Registrant’s Board has determined that Douglas J. Skinner, a member of the Audit Committee of the Board of Trustees, is an audit committee financial expert as defined by the Securities and Exchange Commission (the “SEC”). Mr. Skinner is the Eric J. Gleacher Distinguished Service Professor of Accounting and Deputy Dean for Faculty at the University of Chicago Booth School of Business, where his prior positions include John P. and Lillian A. Gould Professor of Accounting, Neubauer Family Faculty Fellow, Interim Dean, and Executive Director of the Accounting Research Center. Mr. Skinner is deemed “independent” as defined by the SEC for purposes of audit committee financial expert determinations.
ITEM 4 – PRINCIPAL ACCOUNTANT FEES AND SERVICES
Items 4(a)—4(d): Audit, Audit-Related, Tax and All Other Fees
Fees billed by Ernst & Young:
Fiscal Year Ended October 31, 2021 | Fiscal Year Ended October 31, 2020 | |||||
All fees and services to the Trust that were pre-approved | All fees and services to service affiliates that were pre-approved | All other fees and services to service affiliates that did not require pre-approval | All fees and services to the Trust that were pre-approved | All fees and services to service affiliates that were pre-approved | All other fees and services to service affiliates that did not require pre-approval | |
(a) Audit Fees. | $853,475 | N/A | N/A | $932,235 | N/A | N/A |
(b) Audit-Related Fees. | $15,000 | $254,400 | N/A | $213,000 | $252,800 | N/A |
(c) Tax Fees. | $3600,838 | $0 | N/A | $3520,765 | $0 | N/A |
(d) All Other Fees. | $4104,540 | $0 | N/A | $497,880 | $52,385 | N/A |
1
Includes fees related to the issuance of consents for N-1A filings.
2
Includes fees related to the procedures performed for Harbor Services Group, Inc. required by Rule 17Ad-13(a)(3) of the Securities Exchange Act of 1934.
3
Includes fees related to tax compliance, including foreign tax reclaim filings and tax research and equalization.
4
Includes fees billed in connection with the Registrant’s subscription to the Ernst & Young PFIC Analyzer, a database used to determine whether foreign equity securities are passive foreign investment companies. Also, for the Registrant’s subscription to the Rapid Security Analyzer, a tool used to determine which foreign equity securities per their respective country has an ASC 740 capital gain exposure.
5
Includes fees billed in connection with the Adviser’s subscription to Ernst & Young Online, a database of accounting rules and regulations.
(e)
(1)
Pre-Approval Policies.
The policy of the Registrant’s Audit Committee is to consider and, if appropriate, approve before the principal accountant is engaged for such services, all specific audit, review and non-audit services (other than certain de minimis non-audit services) provided to the Registrant. In making a determination, the Audit Committee considers whether the services are consistent with maintaining the principal accountant’s independence.
In the event of a contingency situation in which the principal accountant is needed to provide services in between scheduled Audit Committee meetings, the Audit Committee is authorized to delegate one or more members of the Committee the responsibility for considering and, if appropriate, pre-approving audit or permitted non-audit services in an amount sufficient to complete services and to determine if such services would be consistent with maintaining the accountant’s independence. Such member(s) are required to report to the full Audit Committee as to the nature and amount of such services and fees pre-approved at the next scheduled Audit Committee meeting. The Audit Committee would again consider whether such services and fees are consistent with maintaining the principal accountant’s independence.
The Registrant’s Audit Committee is informed at least annually of all audit and non-audit services provided by the principal accountant to the Registrant.
(2)
None of the principal accountant’s fees or services rendered to the Registrant, the Adviser or Harbor Services Group, Inc. were approved pursuant to the waiver provision of paragraph (c)(7)(i)(C) of Rule 2-01 of Regulation S-X.
(f)
Not applicable.
(g)
Aggregate Non-Audit Fees.
Aggregate Non-Audit Fees of the Registrant
Fiscal Year Ended October 31, 2021: $710,378
Fiscal Year Ended October 31, 2020: $631,645
Aggregate Non-Audit Fees of Other Entities Required to be Pre-approved Pursuant to Paragraph (c)(7)(ii) of Rule 2-01 of Regulation S-X
Fiscal Year Ended October 31, 2021: $54,400
Fiscal Year Ended October 31, 2020: $55,185
(h)
For the most recent fiscal year, the Audit Committee has determined that the provision of all non-audit services to service affiliates was compatible with maintaining the principal accountant’s independence.
ITEM 5 – AUDIT COMMITTEE OF LISTED REGISTRANTS
Not applicable.
ITEM 6 – INVESTMENTS
(a)
The Registrant has elected to include the schedule of investments in securities of unaffiliated issuers as part of the report to shareholders filed under Item 1 of this report on Form N-CSR.
(b)
Not applicable.
ITEM 7 – DISCLOSURE OF PROXY VOTING POLICIES AND PROCEDURES FOR CLOSED-END MANAGEMENT INVESTMENT COMPANIES
Not applicable.
ITEM 8 – PORTFOLIO MANAGERS OF CLOSED-END MANAGEMENT INVESTMENT COMPANIES
Not applicable.
ITEM 9 – PURCHASES OF EQUITY SECURITIES BY CLOSED-END MANAGEMENT INVESTMENT COMPANY AND AFFILIATED PURCHASERS
Not applicable.
ITEM 10 – SUBMISSION OF MATTERS TO A VOTE OF SECURITY HOLDERS
There were no material changes to the procedures by which shareholders may recommend nominees to the Registrant’s Board of Trustees since the date of the Registrant’s prior report on Form N-CSR.
ITEM 11 – CONTROLS AND PROCEDURES
(a)
The Registrant’s Principal Executive and Principal Financial Officers concluded that the Registrant’s disclosure controls and procedures (as defined in Rule 30a-3(c) under the 1940 Act) are effective, based on the evaluation of these disclosure controls and procedures as of a date within 90 days of the filing of this report.
(b)
There was no change in the Registrant’s internal control over financial reporting (as defined in Rule 30a-3(d) under the 1940 Act) that occurred during the second fiscal quarter of the period covered by this report that has materially affected, or is reasonably likely to materially affect, the Registrant’s internal control over financial reporting.
ITEM 12 – DISCLOSURE OF SECURITIES LENDING ACTIVITIES FOR CLOSED-END MANAGEMENT INVESTMENT COMPANIES
Not applicable.
ITEM 13 – EXHIBITS
(a)(1) | |
(a)(2) | |
(b) |
SIGNATURES
Pursuant to the requirements of the Securities Exchange Act of 1934 and the Investment Company Act of 1940, the Registrant has duly caused this report to be signed December 21, 2021 on its behalf by the undersigned, thereunto duly authorized.
HARBOR FUNDS
By: /s/ Charles F. McCain
Charles F. McCain
Chairman, President and Trustee
(Principal Executive Officer)
Chairman, President and Trustee
(Principal Executive Officer)
Pursuant to the requirements of the Securities Exchange Act of 1934 and the Investment Company Act of 1940, this report has been signed below by the following persons on behalf of the Registrant and in the capacities and on the dates indicated.
By: | /s/ Charles F. McCain Charles F. McCain | Chairman, President and Trustee (Principal Executive Officer) | December 21, 2021 |
By: | /s/ Anmarie S. Kolinski Anmarie S. Kolinski | Treasurer (Principal Financial and Accounting Officer) | December 21, 2021 |
Exhibit Index
Number | Description |
99.CODE ETH | Code of Business Conduct and Ethics. |
99.CERT1 | Certification for each principal executive officer and principal financial officer of the Registrant as required by Rule 30a-2(a) under the 1940 Act (17 CFR 270.30a-2(a)). |
99.CERT2 | Certification for each principal executive officer and principal financial officer of the Registrant as required by Rule 30a-2(a) under the 1940 Act (17 CFR 270.30a-2(a)). |
99.906CERT | Certification as required by Section 1350 of Chapter 63 of Title 18 of the United States Code (18 U.S.C. 1350). |