Exhibit 99-2
Legal Notice - Forward-Looking Information
This Financial Report contains forward-looking information. You can usually identify this information by such words as "plan," "anticipate," "forecast," "believe," "target," "intend," "expect," "estimate," "budget" or other similar wording suggesting future outcomes or statements about an outlook. We list below examples of references to forward-looking information:
o business strategies and goals o outlook (including operational updates and strategic milestones) o future capital, exploration and other expenditures o future resource purchases and sales o construction and repair activities o refinery turnarounds o anticipated refining margins o future oil and gas production levels and the sources of their growth o project development and expansion schedules and results o future results of exploration activities and dates by which certain areas may be developed or may come on-stream | o retail throughputs o pre-production and operating costs o reserves and resources estimates o royalties and taxes payable o production life-of-field estimates o natural gas export capacity o future financing and capital activities (including purchases of Petro- Canada common shares under the Company's normal course issuer bid (NCIB) program) o contingent liabilities (including potential exposure to losses related to retail licensee agreements) o environmental matters o future regulatory approvals |
Such forward-looking information is subject to known and unknown risks and uncertainties. Other factors may cause actual results, levels of activity and achievements to differ materially from those expressed or implied by such information. Such factors include, but are not limited to:
o industry capacity o imprecise reserves estimates of recoverable quantities of oil, natural gas and liquids from resource plays and other sources not currently classified as reserves o the effects of weather and climate conditions o the results of exploration and development drilling and related activities o the ability of suppliers to meet commitments o decisions or approvals from administrative tribunals o risks attendant with domestic and international oil and gas operations o expected rates of return | o general economic, market and business conditions o competitive action by other companies o fluctuations in oil and gas prices o refining and marketing margins o the ability to produce and transport crude oil and natural gas to markets o fluctuations in interest rates and foreign currency exchange rates o actions by governmental authorities, including changes in taxes, royalty rates and resource-use strategies o changes in environmental and other regulations o international political events |
Many of these and other similar factors are beyond the control of Petro-Canada. Petro-Canada discusses these factors in greater detail in filings with the Canadian provincial securities commissions and the United States (U.S.) Securities and Exchange Commission (SEC).
We caution readers that this list of important factors affecting forward-looking information is not exhaustive. Furthermore, the forward-looking information in this Financial Report is made as of March 1, 2007 and, except as required by applicable law, Petro-Canada does not update it publicly or revise it. This cautionary statement expressly qualifies the forward-looking information in this Financial Report.
Petro-Canada disclosure of reserves
Petro-Canada's qualified reserves evaluators prepare the reserves estimates the Company uses. The Canadian provincial securities commissions do not consider our reserves staff and management as independent of the Company. Petro-Canada has obtained an exemption from certain Canadian reserves disclosure requirements that allows us to make disclosure in accordance with SEC standards. This exemption allows comparisons with U.S. and other international issuers.
As a result, Petro-Canada formally discloses its reserves data and other oil and gas data using U.S. requirements and practices, and these may differ from Canadian domestic standards and practices. Note that when we use the term barrel of oil equivalent (boe) in this Financial Report, it may be misleading, particularly if used in isolation. A boe conversion ratio of six thousand cubic feet (Mcf) to one barrel (bbl) is based on an energy equivalency conversion method. This method primarily applies at the burner tip and does not represent a value equivalency at the wellhead.
To disclose reserves in SEC filings, oil and gas companies must prove they are economically and legally producible under existing economic and operating conditions. Proof comes from actual production or conclusive formation tests. The use of terms such as "probable," "possible," "recoverable," or "potential reserves and resources" in this Financial Report does not meet the SEC guidelines for SEC filings.
The table below describes the industry definitions that we currently use:
Definitions Petro-Canada uses | Reference |
Proved oil and gas reserves (includes both proved developed and proved undeveloped) | U.S. SEC reserves definition (Accounting Rules Regulation S-X 210.4-10, FASB-69) |
Unproved reserves, probable and possible reserves | CIM (Petroleum Society) definitions (Canadian Oil and Gas Evaluation Handbook, Vol. 1 Section 5) |
Contingent and prospective resources | Society of Petroleum Engineers, World Petroleum Congress and American Association of Petroleum Geologist definitions (approved February 2000) |
There is no certainty that it will be economically viable or technically feasible to produce any portion of the resources. For use in this Financial Report, "total resources" means reserves plus resources.
SEC regulations do not define proved reserves from our oil sands mining operations as an oil and gas activity. These reserves are classified as a mining activity and are estimated in accordance with SEC Industry Guide 7. For internal management purposes, we view these reserves and their development as part of our total exploration and production operations.
Throughout this Financial Report, total Company reserves, total Company production, total Company reserves replacement and total Company reserves life index (RLI) are calculated using the sum of oil and gas activities, and oil sands mining activities. Before royalties, oil sands mining 2006 year-end proved reserves were 345 million barrels (MMbbls) and oil sands mining annual 2006 production was 11 MMbbls.
The Strategic Overview Report, published under separate cover, but available at the same time as the Financial Report provides additional detail on the Company’s business strategy and progress toward delivering on long-term goals. This Financial Report provides more detail on Petro-Canada’s operational and financial capability. The Report to the Community, which the Company publishes in mid-2007, will elaborate on Petro-Canada’s commitment to corporate responsibility objectives and performance.
Petro-Canada is one of Canada’s largest oil and gas companies, operating in both the upstream and the downstream sectors of the industry in Canada and internationally. The Company creates value by responsibly developing energy resources and providing world class petroleum products and services. Petro-Canada is proud to be a National Partner to the Vancouver 2010 Olympic and Paralympic Winter Games. Petro-Canada’s common shares trade on the Toronto Stock Exchange (TSX) under the symbol PCA and on the New York Stock Exchange (NYSE) under the symbol PCZ.
Management's Discussion and Analysis
This Management's Discussion and Analysis (MD&A), dated effective as of February 12, 2007, should be read in conjunction with the audited Consolidated Financial Statements and Notes for the year ended December 31, 2006, included in the 2006 Financial Report and the 2006 Annual Information Form (AIF). Financial data has been prepared in accordance with Canadian generally accepted accounting principles (GAAP), unless otherwise specified. All dollar values are Canadian dollars, unless otherwise indicated. All oil and natural gas production and reserves volumes are stated before deduction of royalties, unless otherwise indicated. Graphs accompanying the text identify the Company's "value drivers," the key measures of performance in each segment of Petro-Canada's business. A glossary of financial terms and ratios can be found on page 92 of this report.
NON-GAAP MEASURES
Cash flow, which is expressed as cash flow from operating activities before changes in non-cash working capital, is used by the Company to analyse operating performance, leverage and liquidity. Operating earnings represent net earnings, excluding gains or losses on foreign currency translation, disposal of assets and unrealized gains or losses on the mark-to-market valuation of the derivative contracts associated with the Buzzard acquisition. Operating earnings are used by the Company to evaluate operating performance. Cash flow and operating earnings do not have a standardized meaning prescribed by Canadian GAAP and, therefore, may not be comparable with the calculation of similar measures for other companies. For reconciliation of the operating earnings and cash flow amounts to the associated GAAP measures, refer to the tables on pages 12 and 14, respectively, of this MD&A.
Business Environment
The major economic factors influencing Petro-Canada's upstream financial performance include crude oil and natural gas prices, and foreign exchange, particularly the Canadian dollar/U.S. dollar rates. Crude oil and natural gas prices are affected by a number of factors, including supply and demand balance, weather and political events. Factors influencing Downstream financial performance include the level and volatility of crude oil prices, industry refining margins, movements in crude oil price differentials, demand for refined petroleum products and the degree of market competition.
BUSINESS ENVIRONMENT IN 2006
The year 2006 was characterized by volatile crude oil and natural gas prices. The price of North Sea Brent (Dated Brent) moved between highs, in excess of $77 US/bbl, to lows of almost $55 US/bbl. Similarly, benchmark North American natural gas prices at the Henry Hub fluctuated between highs in excess of $10 US/million British thermal units (MMBtu) to lows close to $4 US/MMBtu.
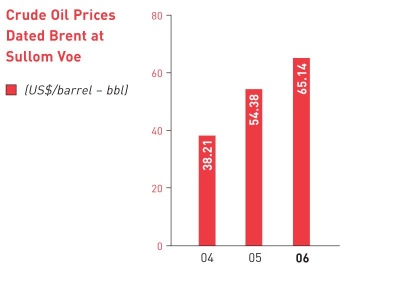
On an annual average basis, the price of Dated Brent reached $65.14 US/bbl, its highest annual average value ever and almost 20% higher than the average in 2005. High oil prices in 2006 were driven by continuing demand growth from China and increased geopolitical tensions globally. Relative to last year, international light/heavy crude (Dated Brent/Mexican Maya) price differentials stabilized in 2006 around the $14 US/bbl level, while Canadian light/heavy crude (Edmonton Light/Western Canada Select (WCS)) spreads narrowed noticeably.
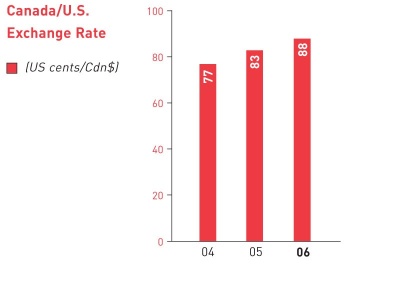
The continuing appreciation of the Canadian dollar during 2006 reduced the positive impact of higher international prices on Canadian crude prices. The Canadian dollar averaged 88 cents US in 2006, compared with 83 cents US in 2005.
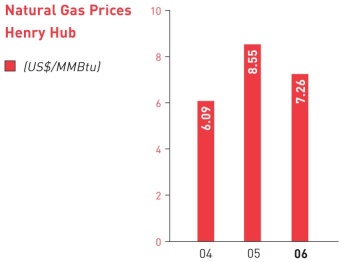
North American natural gas prices suffered a setback during 2006. Record high levels of gas in storage and lower weather-related demand led to significantly lower prices, compared with 2005. Henry Hub prices averaged $7.26 US/MMbtu in 2006, 15% lower than in 2005. Natural gas prices in 2005 reflected the severe impact of hurricanes on U.S. Gulf of Mexico production. In 2006, the Canadian natural gas price at the AECO-C hub fell in line with U.S. prices and averaged almost 18% below its 2005 level.
In the downstream sector, it is estimated that, in 2006, refined petroleum product sales in Canada declined by 1% on top of the 1% reduction in 2005. In spite of lower overall industry product sales and relatively unchanged international light/heavy crude price spreads, overall refining margins increased in 2006, compared with 2005. The impact of the introduction of ultra-low sulphur diesel in the U.S. and Canada effective June 2006 was to maintain heating crack spreads at strong levels. The phasing out of Methyl Tertiary Butyl Ether (MTBE) from gasoline in the U.S. and a heavy refinery turnaround season helped to improve gasoline margins relative to 2005.
Commodity Price Indicators and Exchange Rates
(averages for the years indicated) | | 2006 | 2005 | 2004 |
| | | | | |
Crude oil price indicators (per bbl) | | | | |
Dated Brent at Sullom Voe | US$ | 65.14 | 54.38 | 38.21 |
West Texas Intermediate (WTI) at Cushing | US$ | 66.22 | 56.56 | 41.40 |
WTI/Dated Brent price differential | US$ | 1.08 | 2.18 | 3.19 |
Dated Brent/Mexican Maya price differential | US$ | 13.94 | 13.52 | 8.20 |
Edmonton Light | Cdn$ | 73.23 | 69.22 | 52.78 |
Edmonton Light/WCS (heavy) price differential | Cdn$ | 22.40 | 25.27 | N/A |
| Natural gas price indicators | | | | |
Henry Hub (per MMBtu) | US$ | 7.26 | 8.55 | 6.09 |
AECO-C spot (per Mcf) | Cdn$ | 7.28 | 8.84 | 7.08 |
Henry Hub/AECO basis differential (per MMBtu) | US$ | 1.09 | 1.53 | 0.87 |
New York Harbor 3-2-1 refinery crack spread (per bbl) | US$ | 9.80 | 9.47 | 7.02 |
| US$ per Cdn$ exchange rate | US$ | 0.88 | 0.83 | 0.77 |
COMPETITIVE CONDITIONS
It is becoming increasingly challenging for the energy sector to find new sources of oil and gas. Petro-Canada is well positioned to successfully compete for new opportunities that could complement existing upstream resources and increase production of oil and gas. The Company has an estimated 15.9 billion boe of total resources from which to develop new production. Approximately two-thirds of the total resources are located in Alberta's oil sands. As well, with different upstream businesses operating in Canada and internationally, the Company has the flexibility to pursue a wide range of opportunities. While the Company has wide operational scope, it remains a mid-sized global company as measured by production levels. This means Petro-Canada has the operational capability and balance sheet strength to invest in large projects, but smaller acquisitions can also impact the Company's production levels and financial returns.
Petro-Canada is well positioned to compete in the petroleum product refining and marketing business in Canada. The Company accounts for 13% of the total refining capacity in Canada and has a 16% share of the petroleum products market in Canada. Its more than 1,312 retail service station network has the highest gasoline sales per site in Canada among the national integrated oil companies. It also has Canada's largest commercial road transport network, with 219 locations, as well as a robust bulk fuel sales channel.
The Company believes that its strong financial position, combined with a track record of executing large capital projects, and depth of management experience will enable it to continue to compete successfully in the current business environment.
OUTLOOK FOR BUSINESS ENVIRONMENT IN 2007
Prices for energy commodities are expected to remain volatile in 2007, reflecting the unpredictable nature of weather, the level of industry inventories, and political and natural events. High levels of crude oil and refined product inventories, coupled with increased supplies from countries outside of the Organization of the Petroleum Exporting Countries (OPEC), are expected to be more than enough to meet anticipated growth in global oil demand during 2007, thus lessening the upward pressure experienced by oil prices during 2006. The extent of the anticipated price correction will depend on OPEC production adjustments as it tries to mitigate downward price pressures arising from slackened global supply/demand conditions.
Demand growth in North American natural gas markets is expected to be minimal due primarily to lower weather-related demand experienced for most of this heating season. This, combined with high levels of gas in storage, will continue to exert downward pressure on natural gas prices across the continent. The resultant downward pressure on natural gas prices could be partially offset by the challenge to grow production.
In the industry's downstream sector, 2007 refining margins are expected to remain highly volatile and are unlikely to match the high levels experienced in 2006 due to the expectation of slower growth in U.S. and Canadian refined product sales and narrower light/heavy price differentials. The uncertainty arising from continuing changes in the specification for key products, such as motor gasoline and middle distillates, will be a contributing factor to the expected volatility in margins. Also, potential shifts in weather patterns, such as warmer-than-normal temperatures driving down demand for heating fuels or a severe hurricane season that results in damage to key refining centres, could influence refining margins in 2007.
ECONOMIC SENSITIVITIES
The following table shows the estimated after-tax effects that changes in certain factors would have had on Petro-Canada's 2006 net earnings from continuing operations had these changes occurred.
Sensitivities affecting net earnings
Factor1, 2 | | Change (+) | | Annual Net Earnings Impact | | Annual Net Earnings Impact | |
| | | | | (millions of Canadian dollars) | | ($/share)3 | |
Upstream | | | | | | | |
Price received for crude oil and liquids4 | | $ | 1.00/bbl | | $ | 39 | | $ | 0.08 | |
| Price received for natural gas | | $ | 0.25/Mcf | | | 32 | | | 0.06 | |
Exchange rate: Cdn$/US$ refers to impact on upstream operating earnings from continuing operations5 | | $ | 0.01 | | | (33 | ) | | (0.07 | ) |
Crude oil and liquids production (barrels per day - b/d) | | | 1,000 b/d | | | 9 | | | 0.02 | |
Natural gas production (million cubic feet per day - MMcf/d) | | | 10 MMcf/d | | | 9 | | | 0.02 | |
Downstream | | | | | | | | | | |
| New York Harbor 3-2-1 crack spread | | $ | 0.10 US/bbl | | | 5 | | | 0.01 | |
| Light/heavy crude price differential | | $ | 1.00 US/bbl | | | 6 | | | 0.01 | |
Corporate | | | | | | | | | | |
Exchange rate: Cdn$/US$ refers to impact of the revaluation of U.S. dollar-denominated, long-term debt6 | | $ | 0.01 | | $ | 14 | | $ | 0.03 | |
1 The impact of a change in one factor may be compounded or offset by changes in other factors. This table does not consider the impact of any inter-relationship among the factors.
2 The impact of these factors is illustrative.
3 Per share amounts are based on the number of shares outstanding at December 31, 2006.
4 This sensitivity is based upon an equivalent change in the price of WTI and Dated Brent.
5 A strengthening Canadian dollar versus the U.S. dollar has a negative effect on upstream earnings from continuing operations.
6 A strengthening Canadian dollar versus the U.S. dollar has a positive effect on corporate earnings because the Company holds U.S. denominated debt. The impact refers to gains or losses on $1.4 billion US of the Company's U.S. denominated long-term debt and interest costs on U.S. denominated debt. Gains or losses on $1.1 billion US of the Company's U.S. denominated long-term debt, associated with the self-sustaining International business segment and the U.S. Rockies operations included in the North American Natural Gas business segment, are deferred and included as part of shareholders' equity.
Business Strategy
VALUE PROPOSITION AND STRATEGY
The value proposition Petro-Canada offers to its investors can best be summarized as "Integrated Value from a Diversified Resource Base." The Company's business strategy continues to be:
| § | improving the profitability of the base business |
| - | selecting the right assets to develop and then driving for first quartile performance1 |
| § | taking a disciplined approach to profitable growth |
| - | leveraging existing assets |
| - | accessing new opportunities with a focus on long-life assets |
| - | building a balanced exploration program |
Execution of the corporate strategy across all the business units is based on our key beliefs. These influence decisions Petro-Canada makes to deliver value from the integrated portfolio. The Company believes its structure and scope strategically position Petro-Canada to deliver long-term shareholder value. For example, with a base in Canada, Petro-Canada is situated in a stable, resource-rich and demand-driven market. An international presence and integration across businesses provide the Company access to more growth opportunities and an ability to better manage risk. As a mid-sized global company, even smaller sized investments can have a material impact. Last, the Company is committed to developing energy resources responsibly and encouraging opportunities and growth for employees.
EXECUTION OF THE STRATEGY IN 2006
IMPROVING BASE BUSINESS PROFITABILITY
The cornerstone of improving the profitability of the base business is delivering operational excellence. Petro-Canada expects its operated and non-operated facilities to run with high reliability and prudently managed costs. These measures are constantly tracked, reported and improved upon.
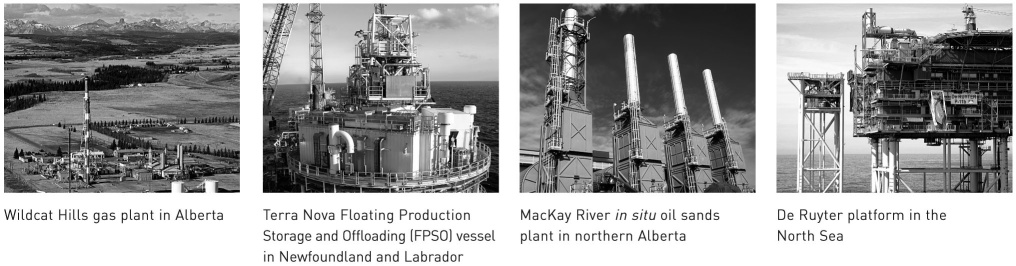
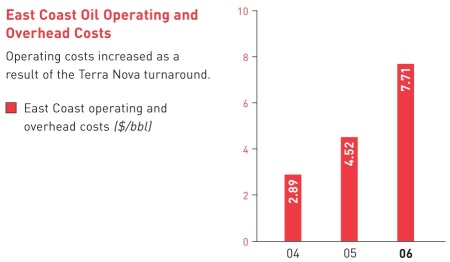
| § | In East Coast Oil, the partner-operated platforms at Hibernia and White Rose had solid operational performance in 2006. Petro-Canada operated Terra Nova had a challenging year when a planned maintenance turnaround was advanced and the turnaround to complete regulatory inspections and reliability improvements was extended. In November, oil production from the Terra Nova field resumed and the Company is targeting to achieve reliability2 above 90% over time. |
| § | In North American Natural Gas, Western Canada natural gas processing facilities operated at reliability rates greater than 98%. In 2006, the business continued to be faced with industry-wide cost pressures. |
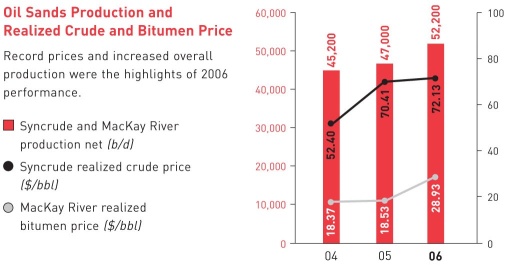
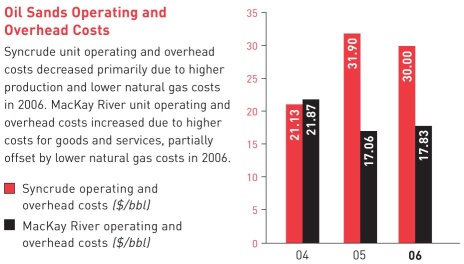
| § | In Oil Sands, the MacKay River in situ plant operated at more than 92% reliability. The independently operated Syncrude facility had varying reliability performance through the year, experiencing some delays bringing on the Stage III expansion mid-year, but providing increased production for the last four months of the year. |
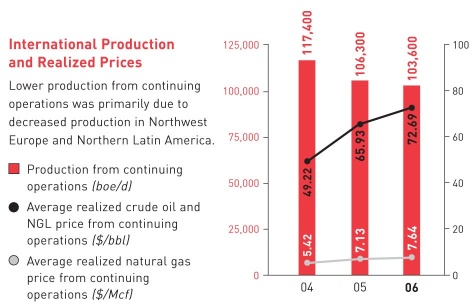
| § | The International business unit's production from Northwest Europe exceeded expectations, led by high reliability and the early ramp up to full production of the De Ruyter field. This strong performance was partially offset by lower reservoir performance in Libya and Train 4 startup problems in Trinidad and Tobago. |
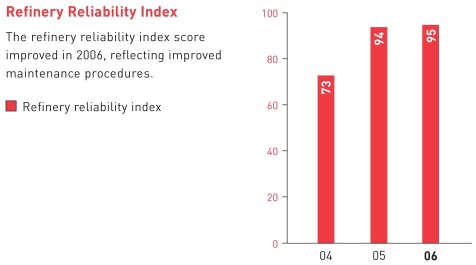
| § | In the Downstream, solid operations at the Edmonton and Montreal refineries resulted in a combined reliability index of 95. The Company completed its ultra-low sulphur diesel projects at its Edmonton and Montreal refineries, thereby providing cleaner burning fuels to consumers. A fire at the lubricants plant early in the year was a setback; however, the facility operated with solid reliability for the remainder of the year. |
| § | Corporate wide, the Company views safety and environmental performance as an indicator of operational excellence. In 2006, total recordable injury frequency (TRIF) was reduced by 25% and environmental exceedances were lowered by more than 20%, compared with 2005. |
1 References to first quartile operations in this report do not refer to industry-wide benchmarks or externally known measures. The Company has a variety of internal metrics that define and track first quartile operational performance.
2 Throughout this MD&A, the Company refers to reliability within the five business units. These reliability rates are calculated using internal methods that vary among the business units and take various factors into account. There are no existing external or industry-wide standards used in calculating reliability rates and, therefore, resulting calculations are not necessarily comparable to other companies in the oil and gas industry.
LONG-TERM PROFITABLE GROWTH
The Company recognizes that adding new material opportunities is fundamental to long-term growth. Petro-Canada is seeking to increase the relative proportion of long-life resources in the portfolio as a means to deliver sustainable cash flow and earnings. In addition to bringing major projects on-stream, the Company is creating value through its balanced exploration program and business development opportunities.
| § | In East Coast Oil, discoveries were made in the west and southwest sections of the White Rose field in 2006. Petro-Canada and its partners suspended negotiations with the Government of Newfoundland and Labrador on the Hebron development; however, Petro-Canada continues to consider Hebron a quality asset. At Hibernia, government approval of the development plans for the Southern Extension were not received in 2006, limiting additional production in 2007. |
| § | In North American Natural Gas, the business continued to focus on optimizing the Company's conventional assets and on the transition to unconventional production in Western Canada and the U.S. Rockies. Water treatment permits for wells in the U.S. Rockies were approved, permitting the ramp up of coal de-watering. While the Company is optimistic about its coal bed methane (CBM) opportunities in the U.S. Rockies, it also plans to bring on additional tight gas in areas like the Denver-Julesberg Basin. Progress was also made on the longer term strategy of accessing new supplies, with the addition of acreage in Alaska and advancement of the proposed Gros-Cacouna re-gasification project. |
| § | In Oil Sands, Petro-Canada advanced the Fort Hills project with the filing of a regulatory application to construct and operate the Sturgeon Upgrader near Edmonton. MacKay River production capacity was increased with the addition of a third well pad. The Company also increased in situ oil sands landholdings with the purchase of additional leases adjacent to MacKay River. |
| § | In International, Petro-Canada completed the sale of the Company's mature, high-decline producing assets in Syria. Later in the year, the Company completed an agreement to purchase a 90% interest in the Ash Shaer and Cherrife natural gas fields in central Syria, with future plans to build and operate a long-life natural gas development. In the Netherlands sector of the North Sea, the Company-operated De Ruyter project achieved first oil in September, while L5b-C achieved first natural gas in November. In September 2006, the Company furthered its balanced exploration program by securing drilling rigs for its 2007 and 2008 well programs. As well, exploration acreage was added in Libya and the North Sea in 2006. In the United Kingdom (U.K.) sector of the North Sea, the Buzzard project achieved first oil in early 2007. The field is expected to ramp up to full production in mid-2007. |
| § | In the Downstream, capacity at the lubricants plant was expanded by 25% in 2006. Construction to convert the Edmonton refinery to process 100% bitumen-based feedstock commenced and, by year end, 18% of the project was completed. The Downstream also furthered work to evaluate the feasibility of adding a coker to the Montreal refinery. |
BUSINESS STRATEGY LOOKING FORWARD
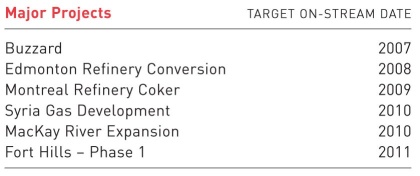
Ensuring existing facilities run safely, reliably and efficiently through excellent execution will continue to be a key focus for Petro-Canada. This same focus on execution will apply to the advancement of major projects. Business plans see the Company adding five major projects over the next several years. Most of these are long-life projects with stable production for 10 years or more. The Buzzard project will ramp up in 2007 and the Edmonton refinery conversion project has been sanctioned and is under construction, with expected completion in 2008. The subsequent projects, shown in the table, are expected to be sanctioned once sufficient front-end engineering work has been completed. Capital expenditures are expected to increase to between $4 billion and $5 billion per year for the next several years, reflecting spending on these major projects.
As a result of the Company having such a strong suite of projects, Petro-Canada will further focus its portfolio in 2007 to those projects and areas that can make a material difference, that balance the Company's risk profile and that can be executed effectively. As a result, the Company may divest smaller assets and interests in 2007.
Risk Management
PETRO-CANADA'S RISK PROFILE
Petro-Canada's results are impacted by risk and management's strategy for handling risks. Petro-Canada characterizes and manages risks in four broad categories: business risks, market risks, operational risks and foreign risks. Within these categories, risks are listed in alphabetical order below. Management believes each major risk requires a unique response based on Petro-Canada's business strategy and financial tolerance. While some risks can be effectively managed through internal controls and business processes, others are managed through insurance and hedging. The Audit, Finance and Risk Committee of the Board of Directors has responsibility to oversee risk management.1 The following describes Petro-Canada's approach to managing major risks.
BUSINESS RISKS
Counterparties
Petro-Canada is exposed to credit risk due to the uncertainty of business partners' or counterparties' ability to fulfil their obligations. The Company has internal credit policies and procedures that include financial assessments, exposure limits and processes to monitor and minimize the exposures against these limits. Where appropriate, Petro-Canada also uses netting and collateral arrangements to minimize risk.
Environmental Regulations
Petro-Canada has always been subject to the impact of changing environmental regulations on its operations; however, the risk is considered to be increasing as related laws and regulations become more stringent in Canada and in other countries where Petro-Canada operates. Petro-Canada invests capital to satisfy new product specifications and/or address environmental issues. In 2007, the Company anticipates that it will invest $100 million of its capital expenditure program toward regulatory compliance. As well, the Company conducts Life-Cycle Value Assessments (LCVA), a system to integrate and balance environmental, social and economic decisions for major projects. This process encourages the exploration of alternatives when considering the life-cycle of an asset or product from construction through to abandonment. The LCVA is a useful technique, but it cannot predict changes in environmental regulations. As a result, changes in environmental regulations may impact Petro-Canada's business results.
The Kyoto Protocol, effective in Canada since 2005, requires signatory nations to reduce their emissions of carbon dioxide and other greenhouse gases. The details of implementation of the Protocol in Canada have not been finalized. Depending on the specifics of the regulations, Petro-Canada may be required to reduce emissions of greenhouse gases from operations, to purchase emission-trading credits or pay for other types of offsets. The impact on Petro-Canada could result in substantially higher capital expenditures and/or operating expenses. The Government of Canada may also impose higher vehicle fuel efficiency standards. The impact of this action could be to decrease the demand for gasoline and diesel fuels sold by Petro-Canada and depress industry-wide margins for refined products. Through industry organizations, Petro-Canada works with a number of regulatory groups and government associations to find an approach that will minimize the negative financial impact of the greenhouse gas emission regulations on the Company, while still reducing emissions. The level of influence these efforts have on the Government of Canada's implementation plan may be quite limited.
Government Regulations
Petro-Canada's operations are regulated by, and could be intervened upon by, a variety of governments around the world. Governments could impact the contracting of exploration and production interests, impose specific drilling obligations, and expropriate or cancel contract rights. Governments may also regulate prices of commodities or refined products, or intervene indirectly on prices through taxes, royalties and exploration rights.
Petro-Canada tries to mitigate the potentially disruptive impact of government regulations by selecting operating environments with stable governments and by maintaining respectful relationships with governments and regulators. Contact with regulators and governments usually occurs through the Company's management and/or regulatory affairs and government relations personnel. Petro-Canada aims to have regular, constructive communication with regulators and governments so issues can be resolved in a mutually acceptable fashion. The Company also has a strong record of regulatory compliance within the jurisdictions where it operates. By virtue of Petro-Canada's integrated portfolio of businesses, the Company operates in many different jurisdictions and derives revenue from several categories of products. This diversification makes financial performance less sensitive to the action of any single government. Nevertheless, Petro-Canada has limited ability to influence regulations that may have a material adverse effect on the Company.
1 Further detail regarding the Audit, Finance and Risk Committee can be found in the AIF along with a copy of its Charter, attached as Schedule C.
Licence to Operate
Petro-Canada's oil and gas production and refining operations impact communities and surrounding environments. Those impacted can become concerned over the use of scarce resources, such as land and water, the perceived or real threat to human health, the potential impact on biodiversity, and/or possible societal changes to surrounding communities. Petro-Canada must secure and maintain formal regulatory approvals and licences to conduct its operations. In addition, broader societal acceptance of the Company's activities is necessary for resource development. An inability for Petro-Canada to secure local community support, necessary regulatory approvals and licences, and broader societal acceptance can result in projects being delayed or stopped, increasing project costs and damage to the Company's reputation. Lack of local community and stakeholder support can also lead to pressure to limit or shut down operations.
Petro-Canada manages this risk by applying a set of Principles for Responsible Investment and Operations to its businesses. These Principles provide a framework whereby Petro-Canada's operations around the world are conducted in a manner that is economically rewarding to all parties and recognized as being ethically, environmentally and socially responsible. These Principles and the Company's activities in support of them can be found on Petro-Canada's website at www.petro-canada.ca. Even though Petro-Canada is committed to following its Principles and respecting two-way dialogue with applicable stakeholders, there is no guarantee the Company will be granted the licences needed to operate projects within expected timelines or that its reputation with affected stakeholders will not be damaged.
Non-Operated Interests
Petro-Canada has a significant interest in assets where the management of construction or operation is done by other companies. Business assets in which Petro-Canada has a major interest, but does not operate, include Hibernia (20% interest), Syncrude (12% interest), White Rose (27.5% interest) and Buzzard (29.9% interest). Joint venture executive committees manage major projects, so Petro-Canada does have some ability to influence these projects. As well, Petro-Canada has joint venture or other operating agreements, which specify the Company's expectations from third-party operators. Nevertheless, third-party operation and management of the Company's assets could adversely affect Petro-Canada's financial performance.
Project Execution
Petro-Canada manages a variety of projects to support continuing operations and future growth. Petro-Canada's goal is to consistently deliver projects in alignment with expectations. Project execution risks include, but are not limited to, changes in project scope, labour availability and productivity, material and services availability and costs, design and construction errors, regulatory approvals, project management and operational capability. To mitigate these risks, Petro-Canada applies a project delivery management system, establishes strong project management teams, breaks large projects down into manageable components, builds on experience and existing technologies, works with all stakeholders on safety and environmental expectations, and conducts post-project reviews to improve project management and operational capabilities. Petro-Canada primarily delivers projects through engineering, procurement and construction (EPC) companies. Through the establishment of strong, internal project management teams, the Company establishes effective working relationships with EPC companies.
In 2006, Petro-Canada completed a number of projects, including converting refineries to produce cleaner burning fuels, expansion of the lubricants plant and bringing the Company-operated De Ruyter project in the North Sea on-stream. These projects represented $1.7 billion of investment, which was completed on time and on budget. Nevertheless, the inability of Petro-Canada to execute projects as expected is a risk to the Company. Globally, there is a focus on execution and projects are tending to be larger and more complex at the same time as the pool of experienced personnel is declining. The Company has recognized the need to provide the organizational capability to successfully execute these projects and, as such has been building its capabilities through recruiting and internal training; however, the inability to adequately source the staffing requirements could jeopardize successful project execution.
Reserves Estimates
Estimates of economically recoverable oil and gas reserves are based upon a number of variables and assumptions. These include geoscientific interpretation, commodity prices, operating and capital costs, and historical production from properties. Petro-Canada has well-established, corporate-wide reserves booking practices that have been continuously improved for more than a decade. PricewaterhouseCoopers LLP, as contract internal auditor, has tested aspects of the non-engineering control processes Petro-Canada used in establishing reserves. As well, independent engineering firms assess a significant portion of reserves estimates every year. Over time, this means all of Petro-Canada's reserves estimates are assessed by external evaluators. The Board of Directors also reviews and approves the Company's annual reserves filings. More information on reserves booking practices can be found in the Company's AIF.
Reserves Replacement 1,2
Petro-Canada's future cash flows from continuing operations are highly dependent on its ability to offset natural declines as reserves are produced. As basins mature, replacement of reserves becomes more challenging and expensive. In some geographic areas, the Company may choose to allow its reserves to decline if replacement is uneconomical, pursuing other reserves additions instead from successful exploration or acquisitions.
Petro-Canada's reserves objective is to fully replace proved reserves over a five-year period. In 2006, the Company replaced 134% of its production on a proved reserves basis, compared with 111% in 2005. The Company's five-year proved replacement ratio was 160% at year-end 2006. There is no assurance Petro-Canada will successfully replace reserves that are produced in any given year.
MARKET RISKS
More detailed quantification of the impact of some of the following risks can be found in the earnings sensitivities table on page 5 of the Business Environment section in the MD&A.
Commodity Prices
The prices of crude oil and natural gas fluctuate in response to market factors that are external to Petro-Canada. Commodity prices are volatile and influenced by factors such as supply and demand fundamentals, geopolitical events, OPEC decisions and weather. For historical commodity prices, please refer to page 4 of the Business Environment section in the MD&A. Changes in crude oil and natural gas prices affect the price that Petro-Canada receives for its upstream production. Commodity prices also impact the refined product margins realized in the Downstream business. Petro-Canada's ability to maintain product margins in an environment of higher feedstock costs is contingent upon the Company's ability to pass on higher costs to customers.
Petro-Canada generally does not hedge large volumes of production. Management believes commodity prices are volatile and difficult to predict. The business is managed so that the Company can substantially withstand the impact of a lower price environment while maintaining the opportunity to capture significant upside when the price environment is higher. However, commodity prices and margins may be hedged occasionally to capture opportunities that represent extraordinary value and/or to reduce commodity price risk on specific exposures. Certain Downstream physical transactions are routinely hedged for operational needs and to facilitate sales to customers.
Foreign Exchange
Because energy commodity prices are primarily in U.S. dollars, Petro-Canada's revenue stream is affected by the Canada/U.S. exchange rate. As a result, the Company's earnings are negatively affected by a strengthening Canadian dollar. The Company is also exposed to fluctuations in other foreign currencies, such as the euro and the British pound. Generally, Petro-Canada does not hedge foreign exchange exposures, although the Company partially mitigates the U.S. dollar exposure by denominating the majority of its debt obligations in U.S. dollars. Foreign exchange exposure related to asset acquisitions or divestitures, or project capital expenditures, may be hedged on a case-by-case basis.
Interest Rates
Petro-Canada targets a blend of fixed and floating rate debt. Generally, this strategy lets the Company take advantage of lower interest rates on floating debt, while matching overall debt maturities with the life of cash-generating assets. While the Company is exposed to fluctuations in the rate of interest it pays on floating rate debt, this interest rate exposure is within the Company's risk tolerance. Periodically, the Company reviews the proportion of fixed to floating rate debt issued.
1 See legal notice on page 2 regarding oil and gas, and oil sands mining activities.
2 Proved reserves replacement ratio is calculated by dividing the year-over-year net change in proved reserves, before deducting production, by the annual production over the same period. The reserves replacement ratio is a general indicator of the Company's reserves growth. It is only one of a number of metrics that can be used to analyse a company's upstream business.
Derivative Instruments
Petro-Canada has a formal policy that prohibits the use of derivative instruments for speculative purposes. All derivative instruments entered into are for the purpose of mitigating identified price risks.
Petro-Canada continually monitors outstanding derivative instruments. This includes an assessment of fair values of all derivative instruments using independent third-party quotes to determine the value of each derivative instrument. The objectives of all price risk mitigation transactions are documented, and the effectiveness of each derivative instrument in offsetting the identified price risk is periodically assessed. Petro-Canada also limits the transaction term of its derivative instruments.
The Company applied mark-to-market accounting treatment to all derivative transactions that it entered into in 2006. Realized and unrealized gains and losses resulting from changes in the fair value of derivative instruments that do not qualify for hedge accounting are recognized in "Investment and Other Income." For derivative instruments that qualify for hedge accounting, Petro-Canada may elect to apply hedge accounting treatment.
During 2004, as part of the Company's acquisition of an interest in the Buzzard field in the U.K. sector of the North Sea, the Company entered into a series of derivative contracts related to the future sale of Dated Brent crude oil. The purpose of these transactions was to ensure value-added returns to Petro-Canada on this investment, even in the event of a material decrease in oil prices. These contracts effectively lock in an average forward price of approximately $26 US/bbl on a volume of 35,840,000 bbls. This volume represents approximately 50% of the Company's share of estimated plateau production from July 1, 2007 to December 31, 2010. As at December 31, 2006, the Buzzard derivative instruments had a recognized mark-to-market unrealized loss of $1,007 million after-tax, of which $240 million was recognized in the income statement in 2006.
In 2006, other derivative instruments in place for refining supply and product purchases resulted in an increase in net earnings from continuing operations of about $1 million after-tax, compared with an increase of about $4 million in 2005.
OPERATIONAL RISKS
Exploring for, developing, producing, refining, transporting and marketing oil, natural gas and refined products involve significant operational risks. These risks include situations such as well blowouts, fires, explosions, gaseous leaks, equipment failures, migration of harmful substances and oil spills. Any of these operational incidents, including events beyond the Company's control, could cause personal injury, environmental contamination, interruption of production, and/or damage and destruction of the Company's assets.
Petro-Canada manages operational risks primarily through a Total Loss Management (TLM) system that has standards to prevent losses. Regular TLM audits test compliance with these standards. The Company also has a Zero-Harm philosophy, a belief that injuries and illnesses, on and off the job, are foreseeable and preventable.
The Company also purchases insurance to transfer the financial impact of some operational risks to third-party insurers. On an annual basis, Petro-Canada management evaluates its operational risk exposures and adjusts its insurance coverage, including deductibles and limits. While Petro-Canada maintains insurance consistent with industry practices, the Company cannot and does not fully insure against all risks. Losses resulting from operational incidents could have an adverse impact on the Company.
Interruption to production at any one of Petro-Canada's facilities could result in an adverse financial impact; however, the risk of multiple facilities experiencing production interruptions at the same time is mitigated by having multiple large producing and upgrading assets in various geographic locations throughout the world.
FOREIGN RISKS
Petro-Canada has significant operations in a number of countries that have varying political, economic and social systems. As a result, the Company's operations and related assets are subject to potential risks of actions by governmental authorities, internal unrest, war, political disruption, economic and legal sanctions (such as restrictions against countries that the U.S. government may deem to sponsor terrorism), and changes in global trade policies. The Company's operations may be restricted, disrupted or prohibited in any country in which these risks occur. Petro-Canada also has production in countries that are members of OPEC, which has resulted in, and may result in, the future for production volumes to be constrained by quotas.
The Company continually evaluates exposure in any one country in the context of total operations. Investment may be limited to avoid excessive exposure in any one country or region. The Company also purchases political risk insurance to partially mitigate certain political risks.
Consolidated Financial Results
ANALYSIS OF CONSOLIDATED EARNINGS AND CASH FLOW
Consolidated Financial Results
On January 31, 2006, Petro-Canada closed the sale of the Company's producing assets in Syria. These assets and associated results are reported as discontinued operations and are excluded from continuing operations.
(millions of Canadian dollars, unless otherwise indicated) | | 2006 | | 2005 | | 2004 | |
Net earnings | | $ | 1,740 | | $ | 1,791 | | $ | 1,757 | |
| Net earnings from discontinued operations | | | 152 | | | 98 | | | 59 | |
Net earnings from continuing operations | | $ | 1,588 | | $ | 1,693 | | $ | 1,698 | |
Gain on foreign currency translation 1 | | | 1 | | | 73 | | | 63 | |
Unrealized loss on Buzzard derivative contracts 2 | | | (240 | ) | | (562 | ) | | (205 | ) |
| Gain on sale of assets | | | 25 | | | 34 | | | 11 | |
Operating earnings from continuing operations 3, 4 | | $ | 1,802 | | $ | 2,148 | | $ | 1,829 | |
| Stock-based compensation | | | (31 | ) | | (66 | ) | | (11 | ) |
Insurance proceeds (surcharges) 5 | | | 8 | | | (75 | ) | | 31 | |
| Income tax adjustments | | | (185 | ) | | 22 | | | 13 | |
| Oakville closure costs | | | - | | | 2 | | | (46 | ) |
Operating earnings from continuing operations adjusted for unusual items | | $ | 2,010 | | $ | 2,265 | | $ | 1,842 | |
Earnings per share from continuing operations (dollars) - basic | | $ | 3.15 | | $ | 3.27 | | $ | 3.21 | |
- diluted | | | 3.11 | | | 3.22 | | | 3.17 | |
Earnings per share (dollars) - basic | | $ | 3.45 | | $ | 3.45 | | $ | 3.32 | |
| - diluted | | | 3.41 | | | 3.41 | | | 3.28 | |
Cash flow from continuing operating activities before changes in non-cash working capital 4, 6 | | | 3,687 | | | 3,787 | | | 3,425 | |
Cash flow from continuing operating activities before changes in non-cash working capital per share (dollars) | | | 7.32 | | | 7.31 | | | 6.47 | |
| Debt | | | 2,894 | | | 2,913 | | | 2,580 | |
Cash and cash equivalents 7 | | | 499 | | | 789 | | | 170 | |
Average capital employed 7 | | $ | 12,868 | | $ | 11,860 | | $ | 10,533 | |
Return on capital employed (%) 7 | | | 14.3 | | | 16.0 | | | 17.5 | |
Operating return on capital employed (%) 7 | | | 15.0 | | | 19.8 | | | 18.8 | |
Return on equity (%) 7 | | | 17.5 | | | 19.7 | | | 21.5 | |
1 Foreign currency translation reflects gains or losses on U.S. dollar-denominated long-term debt not associated with the self-sustaining International business unit and the U.S. Rockies operations included in the North American Natural Gas business unit.
2 As part of its acquisition of an interest in the Buzzard field in the U.K. sector of the North Sea in June 2004, the Company entered into derivative contracts for half of its share of estimated production for 3½ years, starting July 1, 2007.
3 Operating earnings, which represent net earnings excluding gains or losses on foreign currency translation and on disposal of assets and the unrealized gains or losses associated with the Buzzard derivative contracts, are used by the Company to evaluate operating performance.
4 Operating earnings and cash flow from continuing operations do not have any standardized meaning prescribed by Canadian GAAP and, therefore, may not be comparable with the calculation of similar measures for other companies.
5 Insurance premium surcharges include accruals and surcharges for Oil Insurance Ltd. (OIL) and sEnergy Insurance Ltd. (sEnergy) policies. OIL is a mutual insurance company that insures against property damage in the energy sector. sEnergy was a mutual insurance company that provided business interruption and excess property insurance to the energy sector.
6 Cash flow, which is expressed before changes in non-cash working capital items relating to operating activities, is used by the Company to analyse operating performance, leverage and liquidity.
7 Includes discontinued operations.
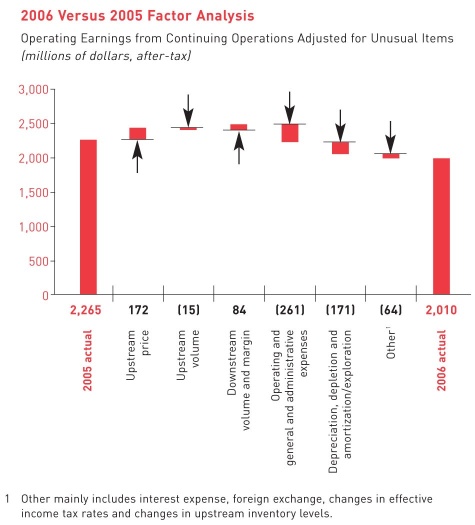
2006 COMPARED WITH 2005
Operating earnings from continuing operations adjusted for unusual items decreased 11% to $2,010 million in 2006, compared with $2,265 million in 2005. Lower upstream production, declining realized natural gas prices and higher operating and exploration costs were partially offset by stronger realized crude oil prices.
In 2006, operating earnings from continuing operations included a number of unusual items: $185 million charge for income tax rate and other tax adjustments, $37 million in insurance proceeds, a $31 million charge related to the mark-to-market of stock-based compensation and a $29 million insurance premium surcharge.
In 2005, operating earnings from continuing operations included a number of unusual items: a $77 million insurance premium surcharge, a $66 million charge related to the mark-to-market of stock-based compensation and a $22 million positive adjustment related to income tax rate and other tax adjustments.
Net earnings from continuing operations in 2006 were $1,588 million, down 6% compared with $1,693 million in 2005, primarily due to lower production, declining realized natural gas prices and income tax adjustments, partially offset by lower realized losses on Buzzard derivative contracts. Net earnings from continuing operations included gains or losses on foreign currency translation, unrealized losses on Buzzard derivative contracts and gains on asset sales.
QUARTERLY INFORMATION
Consolidated Quarterly Financial Results
| | | 2006 | | 2005 |
| (millions of Canadian dollars, unless otherwise indicated) | | Quarter 1 | | Quarter 2 | | Quarter 3 | | Quarter 4 | | Quarter 1 | | Quarter 2 | | Quarter 3 | | Quarter 4 |
| Total revenue from continuing operations | | $ | 4,188 | | $ | 4,730 | | $ | 5,201 | | $ | 4,550 | | $ | 3,275 | | $ | 3,945 | | $ | 4,721 | | $ | 4,838 |
| Operating earnings from continuing operations | | | 202 | | | 532 | | | 597 | | | 471 | | | 427 | | | 476 | | | 597 | | | 648 |
| Net earnings from continuing operations | | | 54 | | | 472 | | | 678 | | | 384 | | | 110 | | | 322 | | | 593 | | | 668 |
| Cash flow from continuing operating activities before changes in non-cash working capital | | | 857 | | | 754 | | | 1,085 | | | 991 | | | 801 | | | 869 | | | 1,001 | | | 1,116 |
Earnings per share from continuing operations (dollars) | | | | | | | | | | | | | | | | | | | | | | | | |
- basic | | $ | 0.11 | | $ | 0.93 | | $ | 1.36 | | $ | 0.77 | | $ | 0.21 | | $ | 0.62 | | $ | 1.14 | | $ | 1.29 |
- diluted | | $ | 0.10 | | $ | 0.92 | | $ | 1.34 | | $ | 0.76 | | $ | 0.21 | | $ | 0.61 | | $ | 1.13 | | $ | 1.28 |
Earnings per share (dollars) | | | | | | | | | | | | | | | | | | | | | | | | |
- basic | | $ | 0.40 | | $ | 0.93 | | $ | 1.36 | | $ | 0.77 | | $ | 0.23 | | $ | 0.66 | | $ | 1.19 | | $ | 1.38 |
- diluted | | $ | 0.40 | | $ | 0.92 | | $ | 1.34 | | $ | 0.76 | | $ | 0.22 | | $ | 0.66 | | $ | 1.17 | | $ | 1.36 |
Revenue and net earnings variances from quarter to quarter resulted mainly from fluctuations in commodity prices and refinery cracking margins, the impact on production and processed volumes from maintenance and other shutdowns at major facilities, and the level of exploration drilling activity. For further analysis of quarterly results, refer to Petro-Canada's quarterly reports to shareholders available on the Company's website at www.petro-canada.ca.
Liquidity and Capital Resources
Summary of Cash Flows
(millions of Canadian dollars) | | 2006 | | 2005 | | 2004 | |
Cash flow from continuing operating activities | | $ | 3,608 | | $ | 3,783 | | $ | 3,928 | |
| Increase (decrease) in non-cash working capital related to continuing operating activities and other | | | 79 | | | 4 | | | (503 | ) |
Cash flow from continuing operations | | $ | 3,687 | | $ | 3,787 | | $ | 3,425 | |
| Cash flow from discontinued operating activities | | | 15 | | | 204 | | | 233 | |
| Increase (decrease) in non-cash working capital related to discontinued operating activities | | | 2 | | | 41 | | | (29 | ) |
Cash flow | | | 3,704 | | | 4,032 | | | 3,629 | |
| Net cash inflows (outflows) from: | | | | | | | | | | |
investing activities before changes in non-cash working capital | | | (2,797 | ) | | (3,595 | ) | | (4,591 | ) |
financing activities before changes in non-cash working capital | | | (1,175 | ) | | (10 | ) | | (19 | ) |
| (Increase) decrease in non-cash working capital | | | (22 | ) | | 192 | | | 516 | |
| Increase (decrease) in cash and cash equivalents | | $ | (290 | ) | $ | 619 | | $ | (465 | ) |
Cash and cash equivalents at end of year | | $ | 499 | | $ | 789 | | $ | 170 | |
Cash and cash equivalents - discontinued operations | | $ | - | | $ | 68 | | $ | 206 | |
In 2006, cash flow from continuing operations was $3,687 million ($7.32/share), compared with $3,787 million ($7.31/share) in 2005. The decrease in cash flow reflected lower operating earnings from continuing operations.
Financial Ratios
| | 2006 | 2005 | 2004 |
Interest coverage from continuing operations (times)1 | | | |
Net earnings basis | 19.2 | 17.9 | 20.0 |
EBITDAX basis | 27.0 | 25.4 | 29.2 |
Cash flow basis | 27.4 | 28.9 | 30.4 |
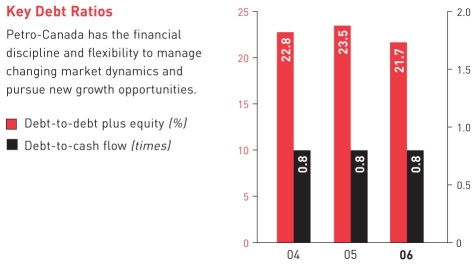
Debt-to-cash flow (times)2 | 0.8 | 0.8 | 0.8 |
Debt-to-debt plus equity (%) | 21.7 | 23.5 | 22.8 |
1 Refer to the Glossary of Terms and Ratios on page 92 for methods of calculation.
2 From continuing operations.
Petro-Canada's financing strategy is designed to maintain financial strength and flexibility to support profitable growth in all business environments. Two key measures that Petro-Canada uses to measure the Company's overall financial strength are debt-to-cash flow from continuing operations and debt-to-debt plus equity. Petro-Canada's debt-to-cash flow from continuing operations ratio, the key short-term measure, was 0.8 times at December 31, 2006 and 2005. This was well within the Company's target range of no more than 2.0 times. Debt-to-debt plus equity, the long-term measure for capital structure, was 21.7% at year-end 2006, down from 23.5% at year-end 2005. This was below the target range of 25% to 35% for both years, providing the financial flexibility to fund the Company's capital program and profitable growth opportunities. Financial covenants associated with the Company's various debt arrangements are reviewed regularly and controls are in place to ensure compliance with these covenants.
OPERATING ACTIVITIES
Excluding cash and cash equivalents, short-term notes payable and the current portion of long-term debt, the operating working capital deficiency, including discontinued operations, was $1,014 million at December 31, 2006, compared with an operating working capital deficiency, including discontinued operations, of $697 million at December 31, 2005. The working capital deficiency, including discontinued operations, was higher primarily due to a decrease in accounts receivable and an increase in accounts payable.
INVESTING ACTIVITIES
Capital and Exploration Expenditures
(millions of Canadian dollars) | | 2007 Outlook 1 | | 2006 | | 2005 | | 2004 | |
Upstream | | | | | | | | | |
| North American Natural Gas | | $ | 780 | | $ | 788 | | $ | 713 | | $ | 666 | |
| East Coast Oil | | | 210 | | | 256 | | | 314 | | | 275 | |
| Oil Sands | | | 770 | | | 377 | | | 772 | | | 397 | |
International 2 | | | 865 | | | 760 | | | 696 | | | 1,707 | 3 |
| | | $ | 2,625 | | $ | 2,181 | | $ | 2,495 | | $ | 3,045 | |
Downstream | | | | | | | | | | | | | |
| Refining and Supply | | $ | 1,215 | | $ | 1,038 | | $ | 883 | | $ | 656 | |
| Sales and Marketing | | | 150 | | | 142 | | | 108 | | | 171 | |
| Lubricants | | | 25 | | | 49 | | | 62 | | | 12 | |
| | | $ | 1,390 | | $ | 1,229 | | $ | 1,053 | | $ | 839 | |
Shared Services | | $ | 35 | | $ | 24 | | $ | 12 | | $ | 9 | |
Total property, plant and equipment and exploration | | $ | 4,050 | | $ | 3,434 | | $ | 3,560 | | $ | 3,893 | |
| Deferred charges and other assets | | | 10 | | | 50 | | | 70 | | | 36 | |
| Acquisition of Prima Energy Corporation | | | - | | | - | | | - | | | 644 | |
Total continuing operations | | $ | 4,060 | | $ | 3,484 | | $ | 3,630 | | $ | 4,573 | |
| Discontinued operations | | $ | - | | $ | 1 | | $ | 46 | | $ | 62 | |
Total | | $ | 4,060 | | $ | 3,485 | | $ | 3,676 | | $ | 4,635 | |
1 The 2007 outlook was previously released on December 14, 2006.
2 International excludes capital expenditures related to the Syrian producing assets, which are reflected as discontinued operations.
3 Includes $1,218 million for the Buzzard acquisition.
Capital and exploration expenditures were $3,485 million in 2006, down 5% compared with $3,676 million in 2005, mainly reflecting lower investment in Oil Sands assets.
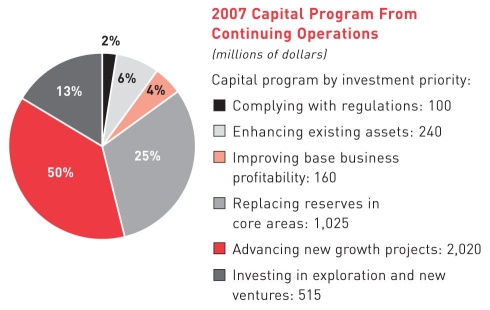
In 2007, spending on new growth projects is expected to increase. More than 60% of planned capital expenditures support delivering profitable new growth, and funding exploration and new ventures. This estimate is up from nearly 53% in these categories in 2006. The remaining 40% of the 2007 planned capital expenditures are directed toward replacing reserves in core areas, enhancing existing assets, improving base business profitability and complying with regulations. The regulatory compliance portion of the program was greater in 2006, primarily reflecting expenditures to produce cleaner burning fuels at Downstream refineries.
FINANCING ACTIVITIES AND DIVIDENDS
Sources of Capital Employed
(millions of Canadian dollars) | | 2006 | | 2005 | | 2004 |
| Short-term notes payable | | $ | - | | $ | - | | $ | 299 |
| Long-term debt, including current portion | | | 2,894 | | | 2,913 | | | 2,281 |
| Shareholders' equity | | | 10,441 | | | 9,488 | | | 8,739 |
Total | | $ | 13,335 | | $ | 12,401 | | $ | 11,319 |
Total debt decreased to $2,894 million at December 31, 2006, compared with $2,913 million at the previous year end. The decrease in debt was due to capital lease repayments made in 2006.
2006 Financing Activities
During the fourth quarter, Petro-Canada increased its syndicated committed credit facilities to $2,200 million from $2,000 million. At December 31, 2006, the Company also had bilateral demand credit facilities of $829 million. A total of $1,444 million of the credit facilities was used for letters of credit and overdraft coverage at December 31, 2006. The syndicated facilities also provide liquidity support to Petro-Canada's commercial paper program. No commercial paper was outstanding at year-end 2006. The Company will continue to use its cash position, draw on bank lines and issue commercial paper or long-term notes as necessary to meet working capital and other financing requirements. Petro-Canada plans to meet remaining debt repayment commitments from a combination of cash flow and debt refinancing.
The Company's unsecured long-term debt securities are rated Baa2 by Moody's Investors Service, BBB by Standard & Poor's and A (low) by Dominion Bond Rating Service. The Company's long-term debt ratings remained unchanged from year-end 2005.
Petro-Canada's short-term debt securities are rated R-1 (low) by Dominion Bond Rating Service. This rating remains unchanged from year-end 2005.
Returning Cash to Shareholders
Petro-Canada's first priority use of cash is to fund its capital program and profitable growth opportunities, and then to look to return cash to shareholders through dividends and a share buyback program.
Petro-Canada regularly reviews its dividend strategy to ensure the alignment of the dividend policy with shareholder expectations, and financial and growth objectives. Consistent with these objectives, on December 14, 2006, the Company declared a 30% increase in its quarterly dividend to $0.13/share, commencing with the dividend payable April 1, 2007. Total dividends paid in 2006 were $201 million, compared with $181 million in 2005.
In 2004, Petro-Canada initiated a NCIB program, which was renewed in 2005 and 2006. The current program, which extends to June 21, 2007, entitles the Company to purchase up to 5% of the outstanding common shares, subject to certain conditions. The level of activity in the NCIB program during the first two quarters of 2006 reflected the use of proceeds from the sale of the mature Syrian assets to buy back shares.
Period | Shares Repurchased | Average Price | Total Cost |
| | 2006 | 2005 | 2006 | 2005 | 2006 | 2005 |
| Full year | 19,778,400 | 8,333,400 | $51.10 | $41.54 | $1,011 million | $346 million |
Off Balance Sheet
The Company has certain retail licensee and wholesale marketing agreements that would constitute variable interest entities as described in Note 26 to the Consolidated Financial Statements. These entities are not consolidated because Petro-Canada is not the primary beneficiary and, therefore, consolidation is not required. The Company's maximum exposure to losses from these arrangements would not be material. Other off balance sheet activities are limited to the accounts receivable securitization program, which does not meet the criteria for consolidation and guarantees.
Pension Plans
At year-end 2006, Petro-Canada's defined benefit pension plans were underfunded by $300 million, compared with an underfunded position of $378 million at year-end 2005. For both the defined benefit and defined contribution pension plans, the Company made cash contributions of $114 million and recorded a pension expense of $91 million before-tax in 2006. This compares with $112 million of cash contributions and $78 million before-tax of pension expense in 2005. The Company expects to make pension contributions of approximately $115 million in 2007.
Contractual Obligations - Summary
| | | |
| | | PAYMENTS DUE BY PERIOD |
(millions of Canadian dollars) | | | Total | | 2007 | | 2008-2009 | | 2010-2011 | | 2012 and thereafter |
Unsecured debentures and senior notes 1 | | $ | 6,260 | | $ | 175 | | $ | 351 | | $ | 351 | | $ | 5,383 |
Capital lease obligations 1 | | | 142 | | | 15 | | | 21 | | | 21 | | | 85 |
| Operating leases | | | 1,149 | | | 492 | | | 246 | | | 174 | | | 237 |
| Transportation agreements | | | 1,741 | | | 215 | | | 358 | | | 238 | | | 930 |
Product purchase/delivery obligations 2 | | | 2,539 | | | 280 | | | 375 | | | 275 | | | 1,609 |
Exploration work commitments 3 | | | 132 | | | 88 | | | 36 | | | 8 | | | - |
| Asset retirement obligations | | | 3,481 | | | 67 | | | 106 | | | 126 | | | 3,182 |
Other long-term obligations 4, 5 | | | 2,756 | | | 197 | | | 853 | | | 393 | | | 1,313 |
| Total contractual obligations | | $ | 18,200 | | $ | 1,529 | | $ | 2,346 | | $ | 1,586 | | $ | 12,739 |
1 Obligations include related interest. For further details, see Note 18 to the 2006 Consolidated Financial Statements.
2 Excludes supply purchase agreements contracted at market prices of $11,400 million, where the products could reasonably be re-sold into the market.
3 Excludes other amounts related to the Company's expected future capital spending. Capital spending plans are reviewed and revised annually to reflect Petro-Canada's strategy, operating performance and economic conditions. For further information regarding future capital spending plans, refer to the business segment and investing activities discussions of the 2006 MD&A.
4 Includes processing agreement with Suncor Energy Inc., receivables securitization program, pension funding obligations for the periods prior to the Company's next required pension plan valuation and other obligations. Pension obligations beyond the next required pension valuation date were excluded due to the uncertainty as to the amount or timing of these obligations.
5 Petro-Canada is involved in litigation and claims associated with normal operations. Management is of the opinion that any resulting settlements would not materially affect the financial position of the Company. The table excludes amounts for these contingencies due to the uncertainty as to the amount or timing of any settlements.
During 2006, Petro-Canada's total contractual obligations increased by approximately $1.5 billion, mainly due to an increase in the estimate of asset retirement obligations, additional product purchase obligations and operating lease commitments.
Upstream
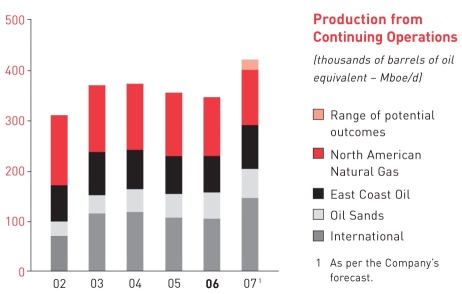
Petro-Canada's upstream operations consisted of four business segments in 2006: North American Natural Gas, with current production in Western Canada and the U.S. Rockies; East Coast Oil, with three major developments offshore Newfoundland and Labrador; Oil Sands operations in Northeast Alberta; and International, where the Company is active in three core areas: Northwest Europe, North Africa/Near East and Northern Latin America.
The diverse asset base provides a balanced portfolio and a platform for long-term growth. In 2007, Petro-Canada is consolidating its East Coast Oil and International businesses. The purpose of the consolidation is to leverage and grow the capabilities of similar operations.
NORTH AMERICAN NATURAL GAS
BUSINESS SUMMARY AND STRATEGY
North American Natural Gas explores for and produces natural gas and crude oil and natural gas liquids (NGL) in Western Canada and the U.S. Rockies. This business also markets natural gas in North America and has established resources in the Mackenzie Delta/Corridor and Alaska.
The North American Natural Gas strategy is to be a significant market participant by accessing new and diverse natural gas supply sources in North America. Key features of the strategy include:
| § | targeting 75% to 80% reserves replacement |
| § | transitioning further into unconventional gas plays |
| § | optimizing core properties in Western Canada and developing CBM and tight gas in the U.S. Rockies |
| § | increasing the focus on exploration |
| § | developing liquefied natural gas (LNG) import capacity at Gros-Cacouna, Quebec |
| § | building the northern resource base for long-term growth |
North American Natural Gas Financial Results
(millions of Canadian dollars) | | 2006 | | 2005 | | 2004 |
Net earnings | | $ | 405 | | $ | 674 | | $ | 500 |
| Gain on sale of assets | | | 3 | | | 14 | | | - |
Operating earnings | | $ | 402 | | $ | 660 | | $ | 500 |
| Insurance premium surcharges | | | (1 | ) | | (4 | ) | | - |
| Income tax adjustments | | | 6 | | | 28 | | | 7 |
Operating earnings adjusted for unusual items | | $ | 397 | | $ | 636 | | $ | 493 |
| Cash flow from operating activities before changes in non-cash working capital | | $ | 739 | | $ | 1,193 | | $ | 882 |
| Expenditures on property, plant and equipment and exploration | | $ | 788 | | $ | 713 | | $ | 666 |
| Total assets | | $ | 4,151 | | $ | 3,763 | | $ | 3,477 |
2006 COMPARED WITH 2005
North American Natural Gas contributed $397 million of operating earnings adjusted for unusual items, down considerably from $636 million in 2005. Weak natural gas prices, lower Western Canada production, increased operating costs, higher exploration expenses and higher depreciation, depletion and amortization were partially offset by higher U.S. Rockies production.
Net earnings for North American Natural Gas were $405 million in 2006, down from $674 million in 2005. Net earnings in 2006 included a $6 million income tax adjustment, a $3 million gain on sale of assets and a $1 million insurance premium surcharge. Net earnings in 2005 included a $14 million gain on sale of assets, a $4 million insurance premium surcharge and a $28 million positive adjustment to income tax rate and other tax adjustments.
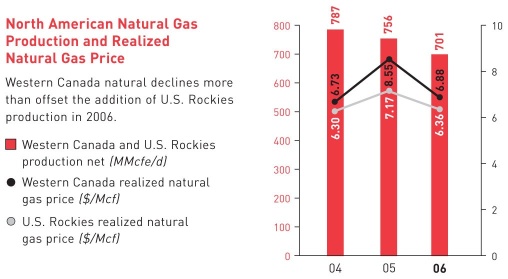
Oil and natural gas production averaged 701 million cubic feet/day of natural gas equivalent (MMcfe/d) in 2006, down from 756 MMcfe/d in 2005, as natural declines in Western Canada were partially offset by U.S. Rockies production growth. Natural gas commodity prices declined in 2006. The North American realized natural gas price averaged $6.85/Mcf in 2006, down 19% from $8.47/Mcf in 2005.
2006 OPERATING REVIEW AND STRATEGIC INITIATIVES
The North American Natural Gas business is positioning for the future with an increased focus on unconventional gas plays, acquisition of land in the Far North and progress on the proposed Quebec LNG project.
2006 Operating Review
| | | 2006 | | 2005 | | 2004 | |
Production net (MMcfe/d) | | | | | | | |
Western Canada | | | 646 | | | 704 | | | 764 | |
U.S. Rockies | | | 55 | | | 52 | | | 23 | 1 |
| Total North American Natural Gas production net | | | 701 | | | 756 | | | 787 | |
Western Canada realized natural gas price ($/Mcf) | | $ | 6.88 | | $ | 8.55 | | $ | 6.73 | |
U.S. Rockies realized natural gas price ($/Mcf) | | $ | 6.36 | | $ | 7.17 | | $ | 6.30 | |
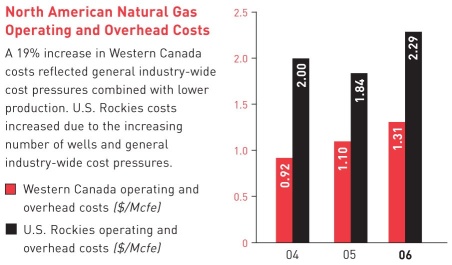
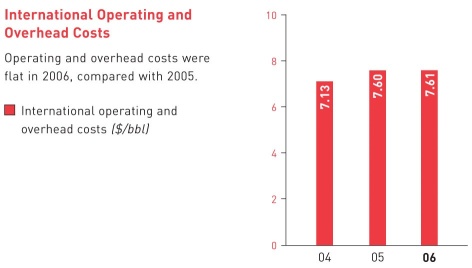
Western Canada operating and overhead costs ($/Mcfe) | | $ | 1.31 | | $ | 1.10 | | $ | 0.92 | |
U.S. Rockies operating and overhead costs ($/Mcfe) | | $ | 2.29 | | $ | 1.84 | | $ | 2.00 | |
1 U.S. Rockies production in 2004 is from the date of acquisition in July 2004.
Western Canada
Western Canada natural gas production averaged 646 MMcfe/d in 2006, down 8% from 704 MMcfe/d in 2005. Exploration and development drilling activity in Western Canada resulted in 393 successful wells (gross), for an overall success rate of 93% in 2006. Western Canada operating and overhead costs were $1.31/Mcfe in 2006, up from $1.10/Mcfe in the previous year. The operating and overhead cost increase in Western Canada reflected general industry-wide cost pressures for materials, fuel and labour, combined with lower production.
U.S. Rockies
U.S. Rockies natural gas production averaged 55 MMcfe/d in 2006, up 6% from 52 MMcfe/d in 2005. The increase reflected natural gas breakthrough at the Wild Turkey CBM field. Exploration and development drilling activity in the U.S. Rockies during 2006 resulted in more than 280 gross wells, down from the 300 wells in 2005. In addition, Petro-Canada obtained 396 permits for new CBM wells in 2006, with 363 applications submitted for consideration. Most of the new CBM wells are currently in the de-watering phase. U.S. Rockies operating and overhead costs were $2.29/Mcfe in 2006, compared with $1.84/Mcfe in 2005. This increase reflected costs associated with the increasing number of wells, along with general industry-wide cost pressures.
2006 Strategic Initiatives
In Western Canada, the Company commenced its planned shallow tight gas drilling program in the Medicine Hat area, and drilled more than 290 wells in 2006. The business expects to drill another 270 wells in 2007. In the southern Alberta Foothills, Petro-Canada successfully fulfilled the conditions required to earn a 60% working interest in the Sullivan natural gas field. The Company plans to seek regulatory approval in early 2007 to proceed with a multi-well development program in the Sullivan field. As part of the Company's ongoing optimization of its portfolio of assets, Petro-Canada completed the sale of its 31% working interest in the Brazeau plant and the majority of its 10% working interest in the West Pembina plant in early 2007.
In the U.S. Rockies, Petro-Canada is targeting increased CBM production with the Wild Turkey, North Shell Draw, Cedar Draw and Kingsbury projects. Increased CBM natural gas production follows a period of de-watering, which lowers the pressure in the coal seams, allowing natural gas breakthrough and production. Delays in obtaining CBM water treatment permits in 2005 pushed back the gas production increase in 2006. In February 2006, water treatment permits required for wells planned in 2005 and 2006 were approved. With water treatment permits in place, the U.S. Rockies continued to ramp up coal de-watering. Natural gas breakthrough at the Wild Turkey field occurred in the third quarter of 2006, with net production reaching 17 MMcf/d in late December. The Company continues to drill in the Denver-Julesburg Basin for natural gas from tight sands. Petro-Canada expects to double U.S. Rockies production to 100 MMcfe/d net by the end of 2007.
Furthering the strategic shift to increased unconventional production in the first half of 2006, the Company acquired approximately 50,000 net exploration acres of tight gas prone land for future development, including approximately 36,000 net acres in the Uinta Basin in eastern Utah.
During 2006, the Company continued to position itself for long-term North American supply by building its land position in Alaska and by participating in the drilling of an exploration well. At state and federal lease sales in 2006, Petro-Canada and its partners, Anadarko Petroleum Corporation and BG Group, were successful bidders on approximately 412,000 gross acres in the Alaska Foothills (a portion of this acreage remains subject to state title verification), giving each company a net land position in the Alaska Foothills of approximately one million acres, including option acreage.
Early in 2006, Petro-Canada and FEX L.P. (a subsidiary of Talisman Energy Inc.) reached a pooling agreement for the joint exploration of acreage in the National Petroleum Reserve-Alaska (NPR-A). As a result of this agreement, Petro-Canada obtained a 30% interest in the Aklaq-2 exploration well, which was drilled in the first quarter of 2006 and found to have hydrocarbons in quantities that were not commercially economical. In the latter part of 2006, FEX and Petro-Canada acquired 48 leases, or 562,000 gross acres, at the NPR-A lease sale for $10.4 million US and subsequently pooled the majority of their NPR-A leaseholdings, covering approximately 1.2 million gross acres. As a result, in jointly held NPR-A acreage with FEX, Petro-Canada's net acreage position is just over 500,000 acres.
Consistent with the Company's strategy to build long-term resources in Canada's North, Petro-Canada made an offer to acquire Canada Southern Petroleum with interests in lands in the Arctic islands. The offer was unsuccessful; however, the Company remains the largest landholder in Arctic island gas and will continue to look for opportunities to consolidate its interests in the North.
A public hearing on the proposed Gros-Cacouna LNG re-gasification terminal in Quebec was held during the second quarter of 2006. The Company expects to receive a regulatory decision in 2007.
Capital expenditures in 2006 totalled $788 million, with $532 million for exploration and development of natural gas in Western Canada, $145 million for U.S. Rockies exploration and development and $111 million for other natural gas opportunities in North America.
OUTLOOK
Production expectations in 2007
| - | production is expected to average about 660 MMcfe/d net of natural gas, crude oil and NGL |
| - | unconventional gas production is expected to be about 25% of production |
Action plans in 2007
| - | drill approximately 360 gross wells in Western Canada and approximately 300 gross wells in the U.S. Rockies |
| - | advance long-term opportunities in Northern Canada and Alaska |
| - | advance the re-gasification project at Gros-Cacouna to a project decision point |
Capital spending plans in 2007
| - | approximately $400 million for replacing reserves in Western Canada core areas |
| - | approximately $230 million directed to exploration in Western Canada, the U.S. Rockies and the Far North |
| - | approximately $115 million for growth opportunities in the U.S. Rockies |
| - | approximately $45 million for maintenance |
The shift to longer term projects, as well as declines in Western Canada, are expected to result in approximately a 6% drop in production in 2007, compared with 2006. In 2007, about 25% of the North American Natural Gas capital spending program is expected to go to development of unconventional sources, including U.S. Rockies CBM and deep tight gas, and infill drilling in the Medicine Hat area. At the same time, the business is expected to continue with exploration.
The Company will also continue to advance long-term supply opportunities. In the Alaska NPR-A area, the Company plans to start testing our exploration lands by drilling up to three wells in 2007. As well, Petro-Canada expects to continue to advance the Gros-Cacouna LNG project. The Company, along with its partner, TransCanada PipeLines Limited, is aiming to secure regulatory approval in 2007. A joint provincial and federal government public review and consultation process took place in 2006.
Link to Petro-Canada's Corporate and Strategic Priorities
The North American Natural Gas business is aligned with Petro-Canada's strategic priorities as outlined by its progress in 2006 and goals for 2007.
| | 2006 RESULTS | 2007 GOALS |
Delivering Profitable Growth
with a Focus on Operated,
Long-Life Assets | § drilled 393 gross wells in Western Canada, including 291 wells in the Western Canada Medicine Hat region1 § drilled more than 280 gross wells, added 50,000 net acres of tight gas prone land and continued to increase CBM well de-watering in the U.S. Rockies § completed regulatory hearing for the LNG facility at Gros-Cacouna § increased land position in Alaska to 1.5 million net acres of leased and option lands | § transition further into unconventional gas plays § optimize opportunities around core assets § double U.S. Rockies production to 100 MMcfe/d net by year-end 2007 § shift focus from developing around existing production to exploring in new areas § receive regulatory decision for the LNG facility at Gros-Cacouna § advance exploration prospects in the Mackenzie Delta/Corridor and Alaska |
Driving for First Quartile Operation of Our Assets | § achieved better than 98% reliability at Western Canada facilities § successfully conducted major turnaround at the Hanlan gas plant with no air licence exceedances | § sustain reliability performance § continue to leverage costs through strategic alliances and preferred suppliers |
Continuing to Work at Being A Responsible Company | § achieved record TRIF in Western Canada, a 40% decrease compared with 2005 § improved employee and contractor safety culture through behaviour-based safety programs § proactively remediated and reclaimed old sites § achieved record low regulatory compliance exceedances | § continue to focus on TRIF and maintain low regulatory exceedances § complete the roll out of behaviour-based safety for employees and contractors § drive for continuous improvement in contractor safety performance § proactively remediate and reclaim old sites |
1 Includes wells only where Petro-Canada has a working interest.
EAST COAST OIL
BUSINESS SUMMARY AND STRATEGY
Petro-Canada is positioned in every major oil development off Canada's East Coast. The Company holds a 20% interest in Hibernia and a 27.5% interest in White Rose, and is the operator with a 34% interest in Terra Nova.
The East Coast Oil strategy is to improve reliability and sustain profitable production well into the next decade. Key features of the strategy include:
| § | delivering top quartile operating performance |
| § | sustaining profitable production through reservoir extensions and add-ons |
| § | pursuing high potential development projects |
East Coast Oil Financial Results
(millions of Canadian dollars) | | 2006 | | 2005 | | 2004 | |
Net earnings and operating earnings | | $ | 934 | | $ | 775 | | $ | 711 | |
| Insurance premium surcharges | | | (9 | ) | | (25 | ) | | - | |
| Income tax adjustments | | | 37 | | | (2 | ) | | 3 | |
| Terra Nova insurance proceeds | | | 22 | | | 2 | | | 31 | |
Operating earnings adjusted for unusual items | | $ | 884 | | $ | 800 | | $ | 677 | |
| Cash flow from operating activities before changes in non-cash working capital | | $ | 1,163 | | $ | 1,062 | | $ | 993 | |
| Expenditures on property, plant and equipment and exploration | | $ | 256 | | $ | 314 | | $ | 275 | |
| Total assets | | $ | 2,465 | | $ | 2,442 | | $ | 2,265 | |
2006 COMPARED WITH 2005
East Coast Oil contributed $884 million of operating earnings adjusted for unusual items, up 11% from $800 million in 2005. Strong realized prices were partially offset by lower production and increased operating expenses.
Net earnings for East Coast Oil were $934 million in 2006, up from $775 million in 2005. Net earnings in 2006 included a $37 million income tax adjustment, $22 million of insurance proceeds related to mechanical failures on the Terra Nova FPSO vessel and a $9 million insurance premium surcharge. Net earnings in 2005 included a $25 million insurance premium surcharge.
In 2006, realized crude oil prices remained strong, while production decreased due to the early shutdown and planned dry dock turnaround of the Terra Nova FPSO. East Coast Oil realized crude prices averaged $71.12/bbl in 2006, up from $63.15/bbl in 2005. Petro-Canada's share of east coast oil production averaged 72,700 b/d in 2006, down from 75,300 b/d in 2005. Lower Terra Nova production was partially offset by the addition of White Rose production.
2006 OPERATING REVIEW AND STRATEGIC INITIATIVES
In 2006, East Coast Oil delivered record operating earnings of $934 million. White Rose ramped up production, averaging 88,000 b/d gross (24,200 b/d net), Hibernia continued to operate reliably and Terra Nova underwent its planned dry dock turnaround for regulatory inspections and reliability improvements.
| | | 2006 | | 2005 | | 2004 |
Production net (b/d) | | | | | | |
Hibernia | | | 35,700 | | | 39,800 | | | 40,800 |
Terra Nova | | | 12,800 | | | 33,700 | | | 37,400 |
White Rose | | | 24,200 | | | 1,800 | | | - |
| Total East Coast Oil production net | | | 72,700 | | | 75,300 | | | 78,200 |
Average realized crude price ($/bbl) | | $ | 71.12 | | $ | 63.15 | | $ | 48.39 |
Operating and overhead costs ($/bbl) | | $ | 7.71 | | $ | 4.52 | | $ | 2.89 |
Hibernia production averaged 178,500 b/d gross (35,700 b/d net) in 2006, down from 199,000 b/d gross (39,800 b/d net) in 2005. The Hibernia platform continued to operate at first quartile levels during 2006, with lower production reflecting normal reservoir decline rates. Early in 2007, Hibernia encountered a mechanical failure on one of the platform's main power generators, thereby reducing production. While repairs are being completed, it is expected that Hibernia production will be in the range of 100,000 b/d to 110,000 b/d gross (20,000 b/d to 22,000 b/d net) for January and part of February 2007. To mitigate the impact of the main power generator repair on production, the operator advanced the planned third quarter turnaround. The planned Hibernia 30-day turnaround is expected to start in mid-February 2007.
At Terra Nova, production averaged 37,600 b/d gross (12,800 b/d net), down considerably from 99,100 b/d gross (33,700 b/d net) in 2005. Early in 2006, the first production well came on-stream in the Far East Block of the Terra Nova field. Terra Nova had a challenging year when its planned maintenance turnaround was advanced following the mechanical failure of the second of two main power generators. The completion of regulatory inspections and reliability improvements was expected to last up to 90 days, but was extended to complete necessary work. The reliability work included a 50% increase in onboard living quarters to support increased routine maintenance, repairs to gearboxes attached to two power generators and improvements to the gas compression system. In November, oil production from the Terra Nova field resumed. Petro-Canada's share of the total cost of the turnaround was approximately $77 million. In December 2006, the Terra Nova FPSO encountered a mechanical issue in a swivel on the turret system that supports water injection to the reservoir. A temporary fix was completed in late December and production returned to normal rates in excess of 100,000 b/d gross (34,000 b/d net). Full repair of the swivel is currently planned during a turnaround in the summer of 2008. The Terra Nova project reached tier one payout in the fourth quarter of 2005. As a result, royalty payments at Terra Nova increased from 5% of gross revenues to 30% of net revenues.
White Rose operated reliably in 2006, ramping up production to average 88,000 b/d gross (24,200 b/d net), compared with 6,500 b/d gross (1,800 b/d net) in 2005. The 2006 results reflected a full year of operation at White Rose.
East Coast Oil operating and overhead costs averaged $7.71/bbl in 2006, compared with $4.52/bbl in 2005. Operating costs for East Coast Oil increased as a result of the Terra Nova turnaround, excluding insurance premium surcharges and startup costs for White Rose.
2006 Strategic Initiatives
In April 2006, Petro-Canada and its partners in the Hebron development suspended negotiations with the Government of Newfoundland and Labrador and demobilized the Hebron project team after failing to reach a development agreement. Petro-Canada continues to consider Hebron a high quality asset. While project activities have been suspended at this time, Petro-Canada and its project partners remain positive that the project could proceed at a future date with the conclusion of a definitive agreement with the provincial government.
At Hibernia, a delineation well was drilled to assess the growth potential of the Southern Extension of the Hibernia reservoir in late 2005. A development plan update for the Southern Extension was filed with the Canada-Newfoundland and Labrador Offshore Petroleum Board (C-NLOPB) in May 2006. The partners originally expected to receive regulatory approval of the development application in 2006, so that first production from the Southern Extension could be brought on in 2007. In January 2007, the Government of Newfoundland and Labrador rejected the decision report of the C-NLOPB to approve the development of the Hibernia Southern Extension and asked the applicants for additional information. Petro-Canada and its partners are reviewing the decision.
In 2006, the West White Rose O-28 and North Amethyst K-15 delineation wells were drilled in the west and southwest sections of the field, respectively. The White Rose O-28 well revealed a 280-metre oil column in a multi-layered reservoir and the White Rose North Amethyst K-15 well revealed a 50- to 55-metre oil column in the Ben Nevis Avalon formation with high reservoir quality. The Company and its partner are assessing the development options for both of these add-on opportunities. Also in 2006, front-end engineering and design (FEED) began on the White Rose Southern Extension. This pool, discovered in 2003, is expected to be developed as a subsea tie-back to the SeaRose FPSO. Subject to regulatory approval, production could begin in late 2009.
Capital expenditures for exploration and development of crude oil offshore Canada's East Coast were $256 million in 2006, including $106 million for the planned Terra Nova dry dock turnaround and development drilling, $88 million related to the development of the White Rose oilfield, $51 million for ongoing activities at Hibernia and $11 million for other East Coast Oil growth opportunities.
OUTLOOK
Production expectations in 2007
| - | production is expected to average 87,000 b/d net, reflecting a 30-day planned turnaround at Hibernia and a 16-day planned turnaround at White Rose |
Growth plans
| - | achieve 90% operating performance at Terra Nova |
| - | continue delineation drilling of Terra Nova's Far East Block |
| - | conduct delineation drilling and preliminary analysis of development options for the West White Rose Block at the White Rose field |
| - | advance Hibernia Southern Extension development plan discussions with the Government of Newfoundland and Labrador |
| - | complete FEED on the South White Rose Extension. Project sanction will be subject to regulatory approval |
| - | complete FEED and submit development plan to the C-NLOPB on the North Amethyst discovery at White Rose with project sanction, subject to regulatory approval, by the end of 2007 |
Capital spending plans in 2007
| - | approximately $210 million is expected to be spent on drilling to replace reserves at Hibernia, Terra Nova and White Rose, and for delineation of Terra Nova's Far East Block |
East Coast Oil production is expected to be about 87,000 b/d net in 2007, compared with 72,700 b/d net in 2006. The 2007 production estimate reflects the return of Terra Nova production and higher volume forecasts at White Rose due to the addition of the sixth production well and the expected receipt of regulatory approval to produce at higher rates. These gains are expected to be partially offset by natural declines at Hibernia. A major turnaround is not planned for Terra Nova in 2007. White Rose and Hibernia have planned maintenance turnarounds of 16 and 30 days, respectively, in 2007.
Beyond 2007, the East Coast Oil business intends to offset natural declines in the main reservoirs and sustain profitable production by adding production from reservoir extensions and satellite tie-ins. The Hebron project remains a significant resource the Company would like to see developed, subject to the conclusion of a definitive agreement with the provincial government.
Link to Petro-Canada's Corporate and Strategic Priorities
The East Coast Oil business is aligned with Petro-Canada's strategic priorities as outlined by its progress in 2006 and goals for 2007.
| | 2006 RESULTS | 2007 GOALS |
Delivering Profitable Growth
with a Focus on Operated,
Long-Life Assets | § ramped up White Rose production, averaging 88,000 b/d gross (24,200 b/d net) § completed drilling the West White Rose O-28 and North Amethyst K-15 delineation wells at White Rose | § increase reliability at Terra Nova § advance in-field Hibernia growth prospects § delineate West White Rose § advance development plans for South White Rose Extension, North Amethyst and West White Rose prospects |
Driving for First Quartile Operation of Our Assets | § completed Terra Nova turnaround for regulatory compliance and to improve reliability § saw operating and overhead costs increase, reflecting turnaround costs at Terra Nova | § conduct a 30-day turnaround scheduled at Hibernia for regulatory compliance § receive regulatory approval to increase annual production from SeaRose FPSO at White Rose § complete 16-day turnaround at White Rose |
Continuing to Work at Being A Responsible Company | § saw 28% decrease in TRIF, compared with 2005 § accepted responsibility for an improper discharge of oil from Terra Nova in 2004, contributing $220,000 of the $290,000 fine to positive environmental projects § improved the produced water system on Terra Nova, resulting in no regulatory compliance exceedances | § further reduce TRIF § apply lessons learned from oily water discharge to prevent future incidents § maintain zero regulatory exceedances |
OIL SANDS
BUSINESS SUMMARY AND STRATEGY
Petro-Canada has more than 10 billion barrels of Oil Sands total resource. The Company's major Oil Sands interests include a 12% ownership in the Syncrude joint venture (an oil sands mining operation and upgrading facility), 100% ownership of the MacKay River in situ bitumen development (a steam-assisted gravity drainage (SAGD) operation), a 55% ownership in and operatorship of the proposed Fort Hills oil sands mining and upgrading project, and extensive oil sands acreage considered prospective for in situ development of bitumen resources.
The Oil Sands strategy for profitable growth includes:
| § | phased and integrated development of reserves to incorporate knowledge gained |
| § | disciplined capital investment to ensure long-life projects create value |
| § | a staged approach to development of capital-intensive Oil Sands projects to allow rigorous cost management and the opportunity to benefit from evolving technology |
The Company has chosen to participate in the full oil sands value chain due to its resource potential and strong position with bitumen upgrading capacity. Petro-Canada not only has processing capacity through Syncrude and Suncor Energy Inc. (starting in 2008), but the Company is also converting the conventional crude oil train at its Edmonton refinery to refine bitumen-based feedstock from northern Alberta, starting in 2008. This conversion, along with the existing synthetic crude train, will result in the refinery running on an exclusive diet of bitumen-based feedstock. This connection between resource and upgrading capacity should provide more economic certainty in a business where volatile light/heavy differentials affect bitumen pricing.
Oil Sands Financial Results
(millions of Canadian dollars) | | 2006 | | 2005 | | 2004 |
Net earnings | | $ | 245 | | $ | 115 | | $ | 120 |
| Gain on sale of assets | | | - | | | 3 | | | - |
Operating earnings | | $ | 245 | | $ | 112 | | $ | 120 |
| Insurance premium surcharges | | | (3 | ) | | (7 | ) | | - |
| Income tax adjustments | | | 44 | | | - | | | 2 |
| Syncrude insurance proceeds | | | 12 | | | - | | | - |
Operating earnings adjusted for unusual items | | $ | 192 | | $ | 119 | | $ | 118 |
| Cash flow from operating activities before changes in non-cash working capital | | $ | 497 | | $ | 380 | | $ | 332 |
| Expenditures on property, plant and equipment and exploration | | $ | 377 | | $ | 772 | | $ | 397 |
| Total assets | | $ | 2,885 | | $ | 2,623 | | $ | 1,883 |
2006 COMPARED WITH 2005
Oil Sands contributed $192 million of operating earnings adjusted for unusual items, up 61% from $119 million in 2005. Higher realized prices and production were partially offset by increased operating costs.
Net earnings for Oil Sands were $245 million in 2006, up from $115 million in 2005. Net earnings in 2006 included a $44 million income tax adjustment, $12 million of Syncrude insurance proceeds related to the 2005 hydrogen plant fire and $3 million for an insurance premium surcharge. Net earnings in 2005 included a $3 million gain on the sale of assets and a $7 million insurance premium surcharge.
Record prices and increased production at Syncrude were highlights of 2006 performance. Syncrude realized price for synthetic crude oil averaged $72.13/bbl in 2006, up from $70.41/bbl in 2005. MacKay River realized price for bitumen averaged $28.93/bbl in 2006, compared with $18.53/bbl in 2005. Oil Sands production averaged 52,200 b/d net in 2006, compared with 47,000 b/d net in 2005.
2006 OPERATING REVIEW AND STRATEGIC INITIATIVES
In 2006, Oil Sands delivered a record $245 million in operating earnings. Oil Sands strategic progress included selecting Sturgeon County near Edmonton as the location for the Fort Hills upgrader, filing the Sturgeon Upgrader commercial application, updating the Fort Hills mine plan, purchasing additional leases in the Fort Hills and MacKay River areas, completing the Syncrude Stage III expansion and commencing production from the third well pad at MacKay River.
2006 Operating Review
| | | 2006 | | 2005 | | 2004 |
Production net (b/d) | | | | | | |
Syncrude | | | 31,000 | | | 25,700 | | | 28,600 |
MacKay River | | | 21,200 | | | 21,300 | | | 16,600 |
| Total Oil Sands production net | | | 52,200 | | | 47,000 | | | 45,200 |
Syncrude realized crude price ($/bbl) | | $ | 72.13 | | $ | 70.41 | | $ | 52.40 |
MacKay River realized bitumen price ($/bbl) | | $ | 28.93 | | $ | 18.53 | | $ | 18.37 |
Syncrude operating and overhead costs ($/bbl) | | $ | 30.00 | | $ | 31.90 | | $ | 21.13 |
MacKay River operating and overhead costs ($/bbl) | | $ | 17.83 | | $ | 17.06 | | $ | 21.87 |
Syncrude's production and unit operating costs were positively affected by the startup of the Stage III expansion in 2006. Following a brief run in May, Syncrude initiated bitumen feed into its new Coker 8-3 on August 30, 2006, enabling the Stage III expansion to come online and begin ramping up. Syncrude's production averaged 258,300 b/d gross (31,000 b/d net) in 2006, compared with 214,200 b/d gross (25,700 b/d net) in 2005. Average unit operating and overhead costs decreased to $30/bbl in 2006, down from $31.90/bbl in 2005. Lower unit operating costs were mainly due to higher production and lower natural gas costs, partially offset by Syncrude retention and incentive-based compensation. Syncrude reached royalty payout in the second quarter of 2006 and shifted to a royalty rate of 25% of net operating revenues from 1% of gross revenues. The total royalty paid in 2006 equated to a rate of 10% of gross revenues.
MacKay River's production remained flat and unit operating costs increased slightly in 2006. Production averaged 21,200 b/d in 2006, consistent with an average of 21,300 b/d in 2005, as natural declines were offset by production from the third well pad. MacKay River reliability averaged 92% in 2006, down from 98% in 2005, reflecting a gearbox failure in April. Unit operating and overhead costs increased by 5% in 2006, averaging $17.83/bbl, compared with $17.06/bbl in 2005. Higher unit operating costs were due to higher costs for goods and services, partially offset by lower natural gas costs.
2006 Strategic Initiatives
At MacKay River, work to tie-in a third well pad was completed and, in January 2006, the new well pad began steaming. Production from the new well pad commenced in the second quarter and continues to ramp up. In the third quarter of 2006, the Company purchased, for $30 million, 13 additional oil sands leases, comprising a total of 31,232 hectares immediately adjacent to Petro-Canada's existing in situ development at MacKay River.
In the fourth quarter of 2006, Petro-Canada announced its intention to divest its interest in the five in situ properties of Chard, Stony Mountain, Liege, Thornbury and Ipiatik. The sale process attracted considerable attention; however, the bids received did not meet Petro-Canada's expectation; therefore, the Company will not divest its interests at this time.
Syncrude completed construction of the Stage III expansion project at a total cost of $8.2 billion ($1 billion net). At full capacity, the Stage III expansion is expected to add approximately 100,000 b/d gross (12,000 b/d net) and increase the quality of all of Syncrude's sweet synthetic production.
In early 2006, the Fort Hills partners acquired two additional leases adjacent to the existing Fort Hills leases to afford greater mine planning flexibility. The initial phase of mine production is expected to be in the range of 100,000 b/d to 170,000 b/d gross (55,000 b/d to 93,500 b/d net) of bitumen. The partners selected Sturgeon County, 40 kilometres northeast of Edmonton, as the location for the upgrading facility to process bitumen from the Fort Hills mine. The upgrader is expected to produce in the range of 85,000 b/d to 145,000 b/d gross (46,750 b/d to 79,750 b/d net) of synthetic crude oil, with first bitumen production in the 2011 time frame. The Company expects to complete the design basis memorandum (DBM) and preliminary cost estimates for the project by mid-2007.
Oil Sands capital expenditures of $377 million in 2006 included $151 million for the Fort Hills development, $102 million for the Syncrude Stage III expansion and operations, $86 million for MacKay River and $38 million for the acquisition of 13 additional leases adjacent to MacKay River, and other in situ projects.
OUTLOOK
Production expectations in 2007
| - | Petro-Canada's share of Syncrude production is expected to average 34,000 b/d net |
| - | MacKay River bitumen production is expected to average 24,000 b/d net |
Growth plans
| - | work to improve reliability at Syncrude |
| - | increase water handling capacity and bitumen production at MacKay River |
| - | advance the Fort Hills oil sands mining and upgrading project |
| - | progress SAGD technology through research and development |
Capital spending plans in 2007
| - | approximately $550 million to advance the Fort Hills development and the MacKay River expansion |
| - | approximately $130 million to enhance existing operations at Syncrude and MacKay River |
| - | approximately $60 million to replace reserves through ongoing pad development at MacKay River |
| - | approximately $30 million to advance development of in situ oil sands leases |
Oil Sands production is expected to increase to 58,000 b/d net in 2007, compared with 52,200 b/d net in 2006. Higher expected production in 2007 is due to a full year of production from the Syncrude Stage III expansion and increased production at MacKay River. The total Syncrude royalty payable in 2007 is expected to equate to a rate of between 10% and 15% of gross revenue, depending on crude oil prices. The total MacKay River royalty payable in 2007 is expected to be 1% of gross revenue.
In 2007, the Company expects to complete the Fort Hills mine, extraction and upgrading DBM, which establishes key design parameters and a more detailed project schedule. Petro-Canada expects to receive a regulatory decision on the filed commercial application for the Sturgeon Upgrader by mid-2008.
The Oil Sands business has a capital program of about $770 million in 2007. Capital for new growth opportunities of $550 million includes funding the preliminary engineering and design for the Fort Hills project (forecast to be $315 million) and the FEED for the MacKay River expansion (forecast to be $235 million). Spending to enhance existing operations and comply with regulations at Syncrude is budgeted to be $75 million in 2007. Capital for enhancing existing operations and improving base business profitability at MacKay River is expected to be approximately $55 million in 2007.
With the initial phase of Fort Hills and the MacKay River expansion, Petro-Canada's production will grow to more than 150,000 b/d net. Beyond that, the Company has the potential to grow the Oil Sands business to approximately 350,000 b/d net over the next decade. Challenges to implementation of the strategy include capital cost pressures, skilled labour shortages, and environmental and stakeholder issues. As an experienced and responsible operator, Petro-Canada is well positioned to meet these challenges.
Link to Petro-Canada's Corporate and Strategic Priorities
The Oil Sands business is aligned with Petro-Canada's strategic priorities as outlined by its progress in 2006 and goals for 2007.
| | 2006 RESULTS | 2007 GOALS |
Delivering Profitable Growth
with a Focus on Operated,
Long-Life Assets | § selected Sturgeon County for Fort Hills upgrader location § submitted commercial application for Sturgeon Upgrader § acquired additional oil sands leases adjacent to MacKay River and the existing Fort Hills leases § Syncrude Stage III expansion came on-stream | § complete Fort Hills DBM and initial cost estimate, and initiate FEED § receive regulatory decision on MacKay River expansion project § continue ramp up of Syncrude Stage III expansion § complete MacKay River water handling capacity upgrade and tie-in a fourth well pad so that production can increase in 2008 |
Driving for First Quartile Operation of Our Assets | § saw Syncrude non-fuel unit operating costs decrease by 5%, compared with 2005 § saw MacKay River unit operating costs increase by 5%, compared with 2005, reflecting Alberta business environment § saw Syncrude enter into a Management Services agreement with Imperial Oil Resources for operational, technical and business services § maintained reliability at MacKay River at 92% | § decrease MacKay River non-fuel unit operating costs by 10%, compared with 2006 § decrease Syncrude non-fuel unit operating costs by 10%, compared with 2006 § sustain MacKay River reliability at greater than 90% |
Continuing to Work at Being A Responsible Company | § TRIF decreased by 46%, compared with 2005 | § maintain focus on TLM and Zero-Harm § ensure regulators, First Nations and other key stakeholders affected by major projects are properly consulted and engaged |
INTERNATIONAL
BUSINESS SUMMARY AND STRATEGY
International production and exploration interests are currently focused in three regions. In Northwest Europe, production comes from the U.K. and the Netherlands sectors of the North Sea, with exploration activities extending into Denmark and Norway. The North Africa/Near East region provides crude oil production from assets in Libya, with exploration activity extending into Syria, Algeria, Tunisia and Morocco. In addition, a natural gas development is underway in Syria. In Northern Latin America, operations are focused in Trinidad and Tobago, and Venezuela.
The International strategy is to access a sizable resource base using a three-fold approach to:
| § | optimize and leverage existing assets |
| § | seek out new, long-life opportunities |
| § | execute a substantial and balanced exploration program |
In 2005, Petro-Canada reached an agreement to sell the Company's mature producing assets in Syria. The sale was closed on January 31, 2006. These assets and associated results are reported as discontinued operations and excluded from continuing operations.
International Financial Results
(millions of Canadian dollars) | | 2006 | | 2005 | | 2004 | |
Net earnings (loss) from continuing operations | | $ | (206 | ) | $ | (109 | ) | $ | 116 | |
| Unrealized loss on Buzzard derivative contracts | | | (240 | ) | | (562 | ) | | (205 | ) |
| Gain on sale of assets | | | 12 | | | - | | | 8 | |
Operating earnings from continuing operations | | $ | 22 | | $ | 453 | | $ | 313 | |
| Insurance premium surcharges | | | (8 | ) | | (18 | ) | | - | |
| Scott insurance proceeds | | | 3 | | | - | | | - | |
Income tax adjustments1 | | | (242 | ) | | 29 | | | - | |
Operating earnings from continuing operations adjusted for unusual items | | $ | 269 | | $ | 442 | | $ | 313 | |
| Cash flow from continuing operating activities before changes in non-cash working capital | | $ | 716 | | $ | 770 | | $ | 768 | |
| Expenditures on property, plant and equipment and exploration from continuing operations | | $ | 760 | | $ | 696 | | $ | 1,707 | |
| Total assets from continuing operations | | $ | 6,031 | | $ | 4,856 | | $ | 4,969 | |
1 In 2006, the Company recorded a $242 million charge for the U.K. supplemental corporate tax rate adjustment.
2006 COMPARED WITH 2005
International contributed $269 million of operating earnings from continuing operations adjusted for unusual items, down 39% from $442 million in 2005. Lower production, tax adjustments in Northwest Europe, higher exploration, depreciation, depletion and amortization costs, and foreign exchange losses were partially offset by higher realized prices. In 2006, cash flow from continuing operating activities before changes in non-cash working capital remained strong at $716 million, compared with $770 million in 2005.
International net loss from continuing operations was $206 million in 2006, compared with a net loss of $109 million in 2005. Net loss from continuing operations in 2006 included an unrealized loss on the Buzzard derivative contracts of $240 million, a $242 million charge for the U.K. supplemental corporate tax rate adjustment, a $12 million gain on the sale of non-core assets, an $8 million insurance premium surcharge and $3 million in insurance proceeds from the Scott platform fire. Net loss from continuing operations in 2005 included an unrealized loss on the Buzzard derivative contracts of $562 million, an $18 million insurance premium surcharge and a $29 million positive adjustment for income tax rate and other tax adjustments.
International production from continuing operations averaged 103,600 barrels of oil equivalent/day (boe/d) net in 2006, compared with 106,300 boe/d net in 2005. The decrease was primarily due to lower production in Northwest Europe and Northern Latin America. International crude oil and liquids realized prices from continuing operations averaged $72.69/bbl and natural gas realized prices averaged $7.64/Mcf in 2006, compared with $65.93/bbl and $7.13/Mcf, respectively, in 2005. Operating and overhead costs from continuing operations averaged $7.61/boe in 2006, flat compared with $7.60/boe in 2005.
International capital expenditures from continuing operations in 2006 were $760 million, with $588 million directed to Northwest Europe, primarily for North Sea developments, $120 million invested in the North Africa/Near East region and $52 million going toward the Northern Latin America region and other capital projects.
2006 OPERATING REVIEW AND STRATEGIC INITIATIVES
The International business strengthened its production profile by delivering first production from De Ruyter and L5b-C. The business also enhanced its portfolio of assets with the acquisition of long-life natural gas assets in Syria in 2006.
2006 Operating Review
| | | 2006 | | 2005 | | 2004 |
Production from continuing operations net (boe/d) | | | | | | |
Northwest Europe | | | 43,700 | | | 44,600 | | | 54,600 |
North Africa/Near East | | | 49,400 | | | 49,800 | | | 50,900 |
Northern Latin America | | | 10,500 | | | 11,900 | | | 11,900 |
| Total International production net | | | 103,600 | | | 106,300 | | | 117,400 |
Average realized crude oil and NGL price from continuing operations ($/bbl) | | $ | 72.69 | | $ | 65.93 | | $ | 49.22 |
Average realized natural gas price from continuing operations ($/Mcf) | | $ | 7.64 | | $ | 7.13 | | $ | 5.42 |
Operating and overhead costs from continuing operations ($/boe) | | $ | 7.61 | | $ | 7.60 | | $ | 7.13 |
Northwest Europe
Petro-Canada's Northwest Europe production averaged 43,700 boe/d net in 2006, compared with 44,600 boe/d net in 2005. Natural declines in the U.K. and the Netherlands sectors of the North Sea were partially offset by new production from De Ruyter and L5b-C. Northwest Europe crude oil and liquids realized prices averaged $72.67/bbl and natural gas averaged $8.91/Mcf in 2006, compared with $66.13/bbl and $7.35/Mcf, respectively, in 2005.
During 2006, Petro-Canada continued to leverage its existing infrastructure through concentric development near core areas and through new discoveries. Although the basin is mature, the Company continues to secure new developments, including the Buzzard, Pict and Saxon fields in the U.K. sector of the North Sea, and the De Ruyter and L5b-C fields in the Netherlands sector of the North Sea.
In the U.K. sector of the North Sea, the Buzzard development, in which the Company has a 29.9% interest, achieved first oil in January 2007. The field is expected to ramp up to peak production in mid-2007. In 2006, a rig was secured to complete a 12-month program of development, in fill and exploration drilling, which began in early 2007. This program includes completing the Saxon project, a Pict look-alike 100% owned and operated by Petro-Canada. The Saxon development will be tied back to the Triton area infrastructure and is expected to be on-stream at the end of 2007, with peak production of approximately 7,000 boe/d gross. Following the discovery in 2005 on the Petro-Canada operated 13/27a Block (90% working interest), the Company farmed into adjacent Blocks 13/26a and 13/26b in September 2006, obtaining a 27.5% non-operated working interest. Appraisal drilling to test the extent of the 13/27a discovery is planned by the operator for the second half of 2007. In late 2006, the Golden Eagle discovery was made on the non-operated Block 20/1 North located near the Buzzard field. The Company has a 25% working interest in this licence and work is ongoing to assess the possible development of the discovery. In early 2007, Petro-Canada was awarded Block 13/24d near Buzzard in the U.K. 24th licensing round. The Company is operator with a 90% working interest.
In the Netherlands sector of the North Sea, the De Ruyter and L5b-C developments achieved first production in 2006. De Ruyter, a Petro-Canada operated oil development, came on-stream in late September and delivered 5,500 boe/d gross (2,970 boe/d net) in 2006. The Company has a 54.07% working interest in De Ruyter, which is expected to add around 10,000 boe/d net to Petro-Canada in 2007. L5b-C, a non-operated asset in which the Company holds a 30% working interest, achieved first gas in mid-November 2006 and is expected to add 3,000 boe/d net to Petro-Canada in 2007. Two offshore exploration wells near the De Ruyter field are planned during 2007 and the Company expects to participate in one other non-operated exploration well in 2007.
In 2006, Petro-Canada opened an office in Stavanger, Norway, following the award of five production licences in the Norwegian sector of the North Sea in the 2005 Awards in Predefined Areas (APA). In 2007, the Company was awarded seven additional production licences in the 2006 APA round. Petro-Canada is operator of four of the 12 licences in Norway.
Technical and commercial studies relating to development scenarios were undertaken on the Hejre field in Denmark in 2006. A non-operated licence (20% working interest) was acquired adjacent to the Hejre field as protection acreage for the discovery in 2006. The Stork and Robin prospects were drilled and completed as dry holes. This resulted in the Company's decision to relinquish the Robin licence in January 2007. The exploration period on the Svane discovery was extended by two years in 2006 to complete technical and economic re-evaluation.
North Africa/Near East
In 2006, Petro-Canada's production from continuing operations in this region averaged 49,400 boe/d net, relatively unchanged from 49,800 boe/d net in 2005. North Africa/Near East crude oil and liquids realized prices from continuing operations averaged $72.70/bbl in 2006, compared with $65.79/bbl in 2005.
In the North Africa/Near East region, Petro-Canada continues to assess the significant future resource potential, using the Company's experience and assets in the area as leverage for long-term growth.
In Syria, the Company completed the sale of its mature producing assets in early 2006. In November, Petro-Canada acquired operatorship and a 90% interest in a Production-Sharing Contract (PSC) in the Ash Shaer and Cherrife natural gas fields for $54 million. Under the agreement, Petro-Canada expects to develop and produce an estimated 80 MMcf/d of natural gas, with first gas anticipated in 2010. In addition, preparations for drilling on Block II progressed, with two exploration wells expected to be drilled in 2007.
In 2006, nine development wells were drilled in the producing fields in Libya, of which seven were completed. A further three exploration wells were drilled, with one new discovery on existing concessions. In 2007, Petro-Canada expects to participate in three exploration and appraisal wells with Veba Oil Operations. The Company was awarded an exploration licence in the Libyan third round exploration and production-sharing agreement (EPSA) IV auction. The onshore licence is located in the Sirte Basin and Petro-Canada is the operator with a 50% working interest.
Petro-Canada spudded an exploration well on the Zotti Block in Algeria in late 2006. In Tunisia, the Company closed its Tunis office and relinquished its 72.5% interest in the Melitta Block after completing its work commitment. The Company intends to focus on exploration on the offshore, non-operated Cap Serrat and Bechateaur permits in 2007 (33% working interest). In Morocco, Petro-Canada extended its reconnaissance licence by another 12 months on the Bas Draa Block. A gravity magnetic survey will take place on the block in the first half of 2007.
Northern Latin America
In 2006, Petro-Canada's share of Trinidad and Tobago production averaged 63 MMcf/d net, down from 72 MMcf/d net in 2005. This was due to a reduction in overall processing capacity at the Atlantic LNG plant, following maintenance on Trains 2 and 3 and delays in commissioning Train 4. Northern Latin America realized prices for natural gas averaged $5.13/Mcf in 2006, compared with $6.62/Mcf in 2005.
In Trinidad and Tobago, 3D seismic surveys on offshore Blocks 1a, 1b and 22, covering a total area of 4,433 square kilometres, were completed in 2006. Long lead materials were secured and drilling rigs contracted to complete a drilling program of up to eight exploration wells starting in 2007. The evaluation of seismic data and work to obtain environmental approvals for the drilling program progressed in 2006. The Company continues to develop its 17.3% working interest in the North Coast Marine Area (NCMA-1) asset. Phase 3a and 3b subsea tie-backs to the Hibiscus platform were completed and first natural gas was achieved in late 2006. Phase 3c was approved and will involve the development of the Poinsettia field with a platform and pipeline tie-back to the Hibiscus platform. Production is expected to come on-stream by early 2009.
In Venezuela, the La Ceiba field development plan is awaiting approval by the Venezuelan authorities. Petro-Canada has a 50% non-operated interest in the field.
OUTLOOK
Production expectations in 2007
| - | North Africa/Near East oil and gas production to average 49,000 boe/d net |
| - | Northwest Europe oil and gas production to average 85,000 boe/d net |
| - | Northern Latin America natural gas production to average 66 MMcf/d net |
Growth plans
| - | advance Saxon development for 2007 startup |
| - | execute the exploration program in Northern Latin America, Northwest Europe and North Africa/Near East |
| - | advance natural gas development in Syria |
| - | continue to pursue new business opportunities in LNG |
Capital spending plans in 2007
| - | approximately $340 million for reserves replacement spending in core areas |
| - | approximately $275 million primarily for new growth projects in Syria and the North Sea |
| - | approximately $250 million for exploration and new ventures |
International production from continuing operations is expected to be about 145,000 boe/d net in 2007, compared with 103,600 boe/d net in 2006. The anticipated 40% increase in production in 2007 reflects contributions from new development projects, such as De Ruyter, Buzzard, L5b-C and Saxon. These projects are expected to more than offset the 15% to 20% natural declines in Northwest Europe.
The Company continues to advance discussions on importing gas from Russia to North America through a joint LNG project with OAO «Gazprom» (Gazprom). The liquefaction plant proposed in the St. Petersburg region is expected to export 3.5 million tonnes to 5 million tonnes per annum (or 500 MMcf/d to 700 MMcf/d) of gas supplied from the Russian grid. An agreement was signed with Gazprom in March 2006 to proceed with the initial engineering design of the liquefaction plant. The preliminary engineering studies will provide cost and schedule estimates from which the Company may proceed into detailed design and engineering for the liquefaction plant.
Link to Petro-Canada's Corporate and Strategic Priorities
The International business is aligned with Petro-Canada's strategic priorities as outlined by its progress in 2006 and goals for 2007.
| | 2006 RESULTS | 2007 GOALS |
Delivering Profitable Growth with a Focus on Operated,
Long-Life Assets | § achieved first production at De Ruyter and L5b-C § closed sale of mature Syrian producing assets § acquired 90% interest and became operator of the Ash Shaer and Cherrife gas project § secured drilling rigs for 2007 and 2008 exploration programs § awarded Sirte licence in Libyan third round EPSA IV auction | § ramp up Buzzard and L5b-C to full production § achieve first production at Saxon in the U.K. sector of the North Sea by year end § participate in up to a 17-well exploration drilling program, (depending on rig arrival dates) with balanced risk profile over the next 18 months § commence field appraisal and project design activities on Ash Shaer and Cherrife development § establish a Libyan exploration program on the newly acquired Sirte exploration block § actively pursue LNG supply opportunities |
Driving for First Quartile Operation of Our Assets | § achieved more than 95% uptime on Hanze platform § achieved full production capacity at De Ruyter platform ahead of schedule § seconded specialists to support Libyan operations § improved Scott platform reliability and uptime by 33%, compared with 2005 | § maintain excellent reliability at De Ruyter platform § optimize production capacity on Triton area assets by implementing recommendations from de-bottlenecking study |
Continuing to Work at Being A Responsible Company | § had nine recordable injuries in 2006, compared with 14 in 2005, but TRIF rose to 0.8 in 2006, compared with 0.62 in 2005, reflecting fewer person hours worked § achieved five years of continuous operations on the Hanze platform without a lost-time incident § provided safety training and equipment to fishermen in Trinidad and Tobago as part of community liaison activities during seismic operations | § maintain focus on TRIF and increase leadership visibility of Zero-Harm effort § reduce oil in produced water at Triton § collaborate with local stakeholders in Trinidad and Tobago to minimize impact of offshore drilling |
Discontinued Operations
On January 31, 2006, Petro-Canada completed the sale of the Company's producing assets in Syria to a joint venture of companies owned by India's Oil and Natural Gas Corporation Limited and the China National Petroleum Corporation for net proceeds of $640 million. The sale resulted in a gain on disposal of $134 million recorded in the first quarter of 2006. This sale aligned with Petro-Canada's strategy to increase the proportion of long-life and operated assets within its portfolio. Petro-Canada's activities in Syria remain part of the North Africa/Near East producing region, with an active exploration program in Block II and the addition of the Ash Shaer and Cherrife natural gas projects in Syria during 2006.
Producing assets in Syria are presented as discontinued operations in the Consolidated Financial Statements. Petro-Canada's net earnings from discontinued operations in 2006 were $152 million and included a gain on disposal of $134 million. Summary information is presented on the following page. Additional information concerning Petro-Canada's discontinued operations can be found in Note 4 to the Consolidated Financial Statements.
Discontinued Financial Results
(millions of Canadian dollars, unless otherwise noted) | | 2006 | | 2005 | | 2004 |
Net earnings from discontinued operations | | $ | 152 | | $ | 98 | | $ | 59 |
| Gain on sale of assets | | | 134 | | | - | | | - |
Operating earnings from discontinued operations | | $ | 18 | | $ | 98 | | $ | 59 |
| Insurance premium surcharges | | | - | | | (2 | ) | | - |
Operating earnings from discontinued operations adjusted for unusual items | | $ | 18 | | $ | 100 | | $ | 59 |
| Cash flow from operating activities before changes in non-cash working capital | | $ | 17 | | $ | 245 | | $ | 204 |
| Expenditures on property, plant and equipment and exploration | | $ | 1 | | $ | 46 | | $ | 62 |
| Total assets | | $ | - | | $ | 648 | | $ | 985 |
Total volumes (boe/d) | | | | | | | | | |
| - net before royalties | | | 5,500 | | | 70,100 | | | 79,200 |
| - net after royalties | | | 1,400 | | | 21,000 | | | 24,200 |
Average realized crude oil and NGL price ($/bbl) | | $ | 71.84 | | $ | 61.82 | | $ | 46.70 |
Average realized natural gas price ($/Mcf) | | $ | 7.94 | | $ | 6.43 | | $ | 4.81 |
UPSTREAM PRODUCTION
2006 COMPARED WITH 2005
In 2006, Petro-Canada's production from continuing operations of crude oil, NGL and natural gas averaged 345,400 boe/d net, down from 354,600 boe/d net in 2005.
2006 Average Daily Production Volumes Net | North American Natural Gas | East Coast Oil | Oil Sands | International | Total |
Crude oil, NGL and bitumen (b/d) | | | | | |
- net before royalties | 14,200 | 72,700 | 21,200 | 82,600 | 190,700 |
- net after royalties | 10,800 | 68,500 | 20,800 | 77,900 | 178,000 |
Synthetic crude oil (b/d) | | | | | |
- net before royalties | - | - | 31,000 | - | 31,000 |
- net after royalties | - | - | 28,000 | - | 28,000 |
Natural gas (MMcf/d) | | | | | |
- net before royalties | 616 | - | - | 126 | 742 |
- net after royalties | 489 | - | - | 95 | 584 |
Continuing operations (boe/d) | | | | | |
- net before royalties | 116,900 | 72,700 | 52,200 | 103,600 | 345,400 |
- net after royalties | 92,300 | 68,500 | 48,800 | 93,700 | 303,300 |
Discontinued operations (boe/d) | | | | | |
- net before royalties | - | - | - | 5,500 | 5,500 |
- net after royalties | - | - | - | 1,400 | 1,400 |
Total volumes (boe/d) | | | | | |
- net before royalties | 116,900 | 72,700 | 52,200 | 109,100 | 350,900 |
- net after royalties | 92,300 | 68,500 | 48,800 | 95,100 | 304,700 |
2005 Average Daily Production Volumes Net | North American Natural Gas | East Coast Oil | Oil Sands | International | Total |
Crude oil, NGL and bitumen (b/d) | | | | | |
- net before royalties | 14,700 | 75,300 | 21,300 | 83,500 | 194,800 |
- net after royalties | 11,200 | 69,600 | 21,100 | 77,700 | 179,600 |
Synthetic crude oil (b/d) | | | | | |
- net before royalties | - | - | 25,700 | - | 25,700 |
- net after royalties | - | - | 25,400 | - | 25,400 |
Natural gas (MMcf/d) | | | | | |
- net before royalties | 668 | - | - | 138 | 806 |
- net after royalties | 512 | - | - | 95 | 607 |
Continuing operations (boe/d) | | | | | |
- net before royalties | 126,000 | 75,300 | 47,000 | 106,300 | 354,600 |
- net after royalties | 96,500 | 69,600 | 46,500 | 93,500 | 306,100 |
Discontinued operations (boe/d) | | | | | |
- net before royalties | - | - | - | 70,100 | 70,100 |
- net after royalties | - | - | - | 21,000 | 21,000 |
Total volumes (boe/d) | | | | | |
- net before royalties | 126,000 | 75,300 | 47,000 | 176,400 | 424,700 |
- net after royalties | 96,500 | 69,600 | 46,500 | 114,500 | 327,100 |
2007 Production Outlook
Upstream production is expected to increase in 2007 with additional volumes from Buzzard, Terra Nova, the Syncrude expansion, De Ruyter and L5b-C. Offsetting these increases are lower production from North American Natural Gas and natural declines in the North Sea. Production is expected to average in the range of 390,000 boe/d net to 420,000 boe/d net in 2007, up from 2006.
Factors that may impact production during 2007 include reservoir performance, drilling results, facility reliability (particularly at Terra Nova), ramp up of production at Buzzard, De Ruyter and L5b-C, regulatory approval of increased facility throughput at White Rose and the successful execution of planned turnarounds.
Consolidated Production from Continuing Operations Net
| (thousands of boe/d) | 2007 Outlook (+/-) |
North American Natural Gas | |
Natural gas | 97 |
Liquids | 13 |
East Coast Oil | 87 |
Oil Sands | |
Syncrude | 34 |
MacKay River | 24 |
International | |
North Africa/Near East 1 | 49 |
Northwest Europe | 85 |
Northern Latin America | 11 |
Total continuing operations | 390 - 420 |
1 North Africa/Near East excludes production from the mature Syrian producing assets sold in 2006.
Reserves Summary
The Company's reserves data and reserves quantities are determined by Petro-Canada's staff of qualified reserves evaluators using corporate-wide policies, procedures and practices. These reserves policies, procedures and practices conform with the requirements in Canada, as well as with the U.S. SEC and the Association of Professional Engineers, Geologists and Geophysicists of Alberta's Standard of Practice for the Evaluation of Oil and Gas Reserves for Public Disclosure. Petro-Canada also employs independent third parties to evaluate, audit and/or review its reserves processes and estimates. In 2006, 53% of North American (or 34% if Syncrude oil sands mining is included) and 29% of International proved oil and gas reserves were assessed by independent reserves evaluators. The independent reserves evaluators concluded that the Company's year-end reserves estimates were reasonable.
| | | | | | | | | | | | | | |
December 31, 2006 Consolidated Reserves1 | | Proved Liquids | | Proved Gas | | Proved Reserves Additions Liquids3 | | Proved Reserves Additions Gas3 | | Proved2 | | Proved Reserves Additions3 | |
(working interest before royalties) | | (MMbbls) | | (Billion cubic feet - Bcf) | | (MMbbls) | | (Bcf) | | (Million bbls of oil equivalent - MMboe) | | (MMboe) | |
| North American Natural Gas | | | 47 | | | 1,645 | | | 3 | | | 44 | | | 321 | | | 10 | |
| East Coast Oil | | | 123 | | | - | | | 18 | | | - | | | 123 | | | 18 | |
Oil Sands 4 | | | 502 | | | - | | | 179 | | | - | | | 502 | | | 179 | |
International 5 | | | 278 | | | 300 | | | (35 | ) | | (24 | ) | | 328 | | | (39 | ) |
| Total | | | 950 | | | 1,945 | | | 165 | | | 20 | | | 1,274 | | | 168 | |
| Production net | | | 81 | | | 270 | | | | | | | | | | | | 126 | |
Proved replacement ratio 6, 7 | | | | | | | | | | | | | | | | | | 134 | % |
1 A comparative table for 2006 versus 2005 is shown on page 78.
2 At year-end 2006, 63% of proved reserves were classified as proved developed reserves. Of the total undeveloped reserves, 95% are associated with large projects currently producing or under active development, including Buzzard, Syncrude, MacKay River, Hibernia, Terra Nova, White Rose, and Trinidad and Tobago natural gas.
3 Proved reserves additions are the sum of revisions of previous estimates, net purchases/sales, and discoveries, extensions and improved recovery in 2006. Further detail on these categories is provided in the reserves table on page 78.
4 Oil Sands proved reserves include reserves from Syncrude and MacKay River. Syncrude is an oil sands mining operation. Oil sands mining is not an oil and gas activity as defined by the SEC. The mining proved reserves are estimated in accordance with the SEC Industry Guide 7.
5 The year-end reserves reflect Petro-Canada's sale of its mature Syrian producing assets on January 31, 2006. The 2005 year-end Syrian proved reserves were 49 MMboe. The 2006 production presented does not include any production from the Syrian producing assets.
6 This ratio is the year-over-year net change in proved reserves (before deducting production), divided by annual production over the same time period. Proved reserves replacement ratio is a general indicator of the Company's reserves growth. It is only one of a number of metrics that can be used to analyse a company's upstream business.
7 Reserves replacement ratio and reserves life index are non-standardized measures and may not be comparable to similar measures of other companies. They are illustrative only.
December 31, 2006 | | |
| Five-year proved plus probable replacement ratio | 175% | |
Proved plus probable reserves life index 8,9 | 17.3 | |
8 This index is proved plus probable reserves at year-end 2006, divided by annual production.
Petro-Canada's objective is to replace reserves over time through exploration, development and acquisition. The Company believes that, due to the specific nature of its upstream portfolio and attributes of its probable reserves, the combination of proved plus probable reserves provides the best perspective of Petro-Canada's reserves. Petro-Canada's proved plus probable reserves replacement on a consolidated basis was 175%9 over the last five years. The proved plus probable reserves life index was 17.39 years at year-end 2006, compared with 14.7 years at year-end 2005.
In 2006, the Company replaced 134%9 of production on a proved basis. Proved reserves additions totalled 168 MMboe9, compared with 2006 production of 126 MMboe net9. As a result, total proved reserves increased from 1,232 MMboe9 at year-end 2005 to 1,274 MMboe9 at year-end 2006.
The North American Natural Gas business added 10 MMboe of proved reserves additions in 2006. Lower than expected reserves additions reflected technical revisions related to reservoir performance of some Western Canada pools and application of year-end natural gas prices as stipulated by the SEC. These factors were partially offset by reserves additions from exploration and development activity.
9 Reserves replacement ratio and reserves life index are non-standardized measures and many not be comparable to similar measures of other companies. They are illustrative only. Company total proved reserves include oil and gas activity proved reserves plus oil sands mining proved reserves (oil sands mining reserves - 345 MMbbls and 2006 annual production - 11 MMbbls).
In East Coast Oil, 18 MMbbls were added to proved reserves during 2006. This was due to ongoing development well drilling at White Rose, Terra Nova and Hibernia.
In 2006, 179 MMbbls of proved reserves were added in Oil Sands1. At MacKay River, year-end bitumen prices resulted in positive economics, permitting the booking of proved reserves in compliance with SEC guidance. Development and delineation drilling, combined with an increased proved recovery factor, resulted in the addition of 165 MMbbls of proved reserves at MacKay River. At Syncrude, 14 MMbbls were added to proved reserves, reflecting extraction efficiencies.
International proved reserves declined by 39 MMboe in 2006 due to the sale of the mature Syrian producing assets. Partially offsetting this decline was the addition of proved reserves at Buzzard.
Further detail on Petro-Canada's reserves is provided in the reserves table at the end of this report (see page 78).
Downstream
BUSINESS SUMMARY AND STRATEGY
Petro-Canada is the second largest Downstream business and the "brand of choice" in Canada. In 2006, Petro-Canada accounted for approximately 13% of the total refining capacity in Canada and about 16% of total petroleum products sold in Canada.
Downstream operations include two refineries - one in Edmonton and one in Montreal - with a total daily rated capacity of 40,500 cubic metres/day (m3/d) (255,000 b/d), a lubricants plant - the largest producer of lubricant base stocks in Canada, a network of more than 1,300 retail service stations, Canada's largest commercial road transport network of 219 locations and a robust bulk fuel sales channel.
The strategy in the Downstream business is to increase the profitability of the base business through effective capital investment and disciplined management of controllable factors. In 2007, planned Downstream capital investment will shift to growth projects as regulatory projects to produce cleaner burning fuels were completed in 2006. The Downstream business' goal is to deliver superior returns and growth, including a 12% return on capital employed (ROCE) based on a mid-cycle business environment. Key features of the strategy include:
| § | achieving and maintaining first quartile operating performance in all areas |
| § | advancing Petro-Canada as the "brand of choice" for Canadian gasoline consumers |
| § | increasing sales of high margin specialty lubricants |
The trend toward increased heavy crude production globally has resulted in increased need for refining capacity that can process this feedstock. As a result, Petro-Canada is converting the conventional crude oil train at its Edmonton refinery to refine bitumen-based feedstock from northern Alberta, with completion expected by 2008. The Edmonton refinery conversion project is expected to add earnings and cash flow starting in 2008. As well, the Company is considering construction of a 25,000 b/d coker at its Montreal refinery. An investment decision on a new coker at the Montreal refinery is expected to be made in 2007. If the coker project is approved, completion is targeted for late 2009 and is expected to add earnings and cash flow in 2010.
1 Oil Sands proved reserves include reserves from Syncrude and MacKay River. Syncrude is an oil sands mining operation. Oil sands mining is not an oil and gas activity as defined by the SEC. The mining proved reserves are estimated in accordance with the SEC Industry Guide 7.
Downstream Financial Results
(millions of Canadian dollars) | | 2006 | | 2005 | | 2004 | |
Net earnings | | $ | 473 | | $ | 415 | | $ | 314 | |
| Gain on sale of assets | | | 10 | | | 17 | | | 4 | |
Operating earnings | | $ | 463 | | $ | 398 | | $ | 310 | |
| Insurance premium surcharges | | | (8 | ) | | (23 | ) | | - | |
| Income tax adjustments | | | 41 | | | (2 | ) | | 2 | |
| Oakville closure costs | | | - | | | 2 | | | (46 | ) |
Operating earnings adjusted for unusual items | | $ | 430 | | $ | 421 | | $ | 354 | |
| Cash flow from operating activities before changes in non-cash working capital | | $ | 790 | | $ | 607 | | $ | 556 | |
| Expenditures on property, plant and equipment | | $ | 1,229 | | $ | 1,053 | | $ | 839 | |
| Total assets | | $ | 6,649 | | $ | 5,609 | | $ | 4,462 | |
2006 COMPARED WITH 2005
Downstream contributed $430 million of operating earnings adjusted for unusual items, up 2% from $421 million in 2005. Strong reliability at the Edmonton and Montreal refineries allowed Petro-Canada to maximize the benefits of favourable refining margins and a wider light/heavy crude price differential. These benefits were partially offset by the impact of higher operating costs associated with the planned refinery turnarounds in the second quarter, higher energy prices and one-time expenses incurred due to a fire at the Mississauga lubricants plant.
Net earnings from Downstream were a record $473 million in 2006, up from $415 million in 2005. Net earnings in 2006 included a $41 million income tax adjustment, a $10 million gain on the sale of assets and an $8 million insurance premium surcharge. Net earnings in 2005 included a $17 million gain on the sale of assets and a $23 million insurance premium surcharge.
Refining and Supply contributed 2006 operating earnings adjusted for unusual items of $352 million, compared with $366 million in 2005. Lower 2006 operating earnings adjusted for unusual items reflected major planned turnarounds at the Edmonton and Montreal refineries and a fire at the Mississauga lubricants plant. These factors were partially offset by favourable realized refining margins.
Total sales of refined products decreased by less than 1%, compared with 2005. The reduced volumes were mainly due to lower furnace fuel oil sales as a result of warmer winter weather in Eastern Canada.
In 2006, marketing contributed operating earnings adjusted for unusual items of $78 million, compared with $55 million in 2005. Improved margins were partially offset by increased costs related to higher fuel prices.
Total Downstream operating, marketing, and general and administrative unit costs of 7.8 cents/litre in 2006 were up from 7.5 cents/litre in 2005. The increase mainly reflected increased shutdown costs, operating costs driven by higher energy prices and transportation costs, and one-time expenses incurred due to a fire at the Mississauga lubricants plant.
2006 OPERATING REVIEW AND STRATEGIC INITIATIVES
In 2006, the Downstream delivered record operating earnings for the third year in a row of $463 million due to a continued strong business environment and reliable operations at the Company's two refineries. With the major regulatory projects complete in 2006, Petro-Canada is well positioned with the supply capability to optimize profitability within a range of future business environment scenarios.
Refining and Supply
In 2006, the business processed an average of 37,800 m3/d of crude oil, down from 40,900 m3/d in 2005. The overall utilization rate at Petro-Canada's two refineries averaged 93% in 2006, down from 96% in 2005. The decline reflected planned major turnarounds at the Edmonton and Montreal refineries for maintenance and completion of the ultra-low sulphur diesel projects.
Overall plant reliability is a critical component of success in the refining business. For the second year in a row, strong operational performance at both refineries resulted in an overall reliability index of 95.
Work at the Montreal and Edmonton refineries to bring new diesel desulphurization units on-stream was completed on schedule in the second quarter of 2006.
Looking forward, Petro-Canada is well positioned to take advantage of the trend toward increased production of cheaper, heavier crudes. At the Edmonton refinery in 2006, the Company completed detailed engineering and started construction of new crude and vacuum units, and expanded coker and sulphur capacity. This was part of the refinery conversion project to upgrade and refine bitumen-based feedstock. The Edmonton refinery conversion project is estimated to cost $2 billion and come on-stream in 2008. At its Montreal refinery, the Company furthered work to evaluate the feasibility of adding a 25,000 b/d coker to the refinery. An investment decision on a new coker at the Montreal refinery is expected to be made in 2007.
Marketing
Total Downstream sales decreased to an average 52,500 m3/d in 2006, compared with 52,800 m3/d in 2005. Lower volumes were mainly due to a decline in furnace fuel oil sales as a result of warmer weather.
In the retail business, Petro-Canada completed most of its re-imaging program, contributing to industry-leading throughputs. Within the Company's network, annual gasoline sales from re-imaged sites averaged in excess of 7 million litres per site. The Company has extended the re-imaging program to independent retailers and, to date, nearly 62% of these retailers have chosen to participate.
Petro-Canada continued to leverage its position as "Canada's Gas Station." In 2006, the Company continued to focus on expanding its non-petroleum revenue base, as evidenced by the 8% year-over-year sales growth of its convenience store business and 5% increase in same-store sales, compared with 2005.
In 2006, the PETRO-PASS network, which includes 219 truck stop facilities, continued to be the leading national marketer of fuel in the commercial road transport segment in Canada. The distribution network was upgraded during the year.
Lubricants
Overall sales of lubricants totalled 722 million litres in 2006, a decrease of 7% compared with sales volumes of 779 million litres in 2005. The decrease in sales volumes was primarily due to the impact of a fire at the lubricants facility early in 2006.
An investigation of the fire at the Mississauga lubricants plant indicated that the event occurred during a routine maintenance procedure in a fractionation section of the plant. Following the fire, the lubricants plant temporarily operated at 50% capacity. Repairs were completed and production on the unit was restored to pre-incident levels in March 2006. In June, the 25% expansion of the lubricants plant came on-stream. Sales in high margin product segments represented 75% of total sales, a 1% increase compared with 2005. Over the past five years, sales of high margin products have grown by approximately 26%.
Lubricants is positioned for profitable future growth as tougher performance and environmental standards increase global demand for higher quality base oils and finished products like those produced at the Mississauga lubricants plant.
OUTLOOK
Growth plans
| - | drive for first quartile refinery safety and reliability |
| - | advance Edmonton refinery conversion project to process bitumen-based feedstock by 2008 |
| - | make investment decision for a coker at the Montreal refinery |
| - | increase service station network effectiveness, with a focus on increasing non-petroleum revenue |
| - | build wholesale volumes primarily through our commercial road transport and bulk fuels sales channels |
| - | increase sales of high quality, higher margin lubricants |
Capital spending plans in 2007
| - | approximately $1,075 million focused on new growth projects, such as the Edmonton refinery conversion and the possible Montreal coker |
| - | approximately $125 million to enhance existing operations |
| - | approximately $120 million to improve profitability in the base business |
| - | approximately $70 million for regulatory compliance projects |
Downstream capital spending shifts from regulatory requirements to growth in 2007, in particular with the conversion of the Edmonton refinery and an investment decision on a possible Montreal coker.
The Downstream business will have a capital program of approximately $1,390 million in 2007. The majority of capital spending is forecasted for new growth project funding of $1,075 million. This capital will be directed toward advancing the Edmonton refinery conversion project and completing the FEED on the 25,000 b/d Montreal coker in preparation for the 2007 investment decision.
Approximately $125 million is forecasted to be directed to the enhancement of existing operations. This includes reliability and safety improvements at Downstream facilities, as well as site enhancement within the wholesale and retail networks. A further $120 million is planned to be invested to improve the profitability of the Downstream's base business. This includes a number of high return refining projects and continued development of the retail and wholesale network.
Approximately $70 million is expected to be invested in regulatory compliance, down considerably from the $290 million invested in 2006. The majority of the 2006 regulatory compliance capital was required to produce cleaner burning diesel fuel.
Based on the current mid-cycle business environment, the Downstream business delivered a mid-cycle ROCE of more than 10% in 2006. Over time, it is anticipated that improvement in the base business and the refinery conversion projects will help drive the mid-cycle ROCE to the target of 12%.
Link to Petro-Canada's Corporate and Strategic Priorities
The Downstream business is aligned with Petro-Canada's strategic priorities as outlined by its progress in 2006 and goals for 2007.
| | 2006 RESULTS | 2007 GOALS |
Delivering Profitable Growth
with a Focus on Operated,
Long-Life Assets | § completed lubricant plant 25% expansion § completed detailed engineering and 18% of the Edmonton refinery conversion project | § continue the Edmonton refinery conversion project to enable the planned startup in 2008 § complete Montreal coker feasibility study for investment decision in 2007 § continue to invest in smaller scale refinery yield and reliability improvement projects § continue to integrate the Montreal refinery and the ParaChem Chemicals L.P. plant |
Driving for First Quartile Operation of Our Assets | § achieved a combined reliability index of 95 at the Company's two refineries, above 90 for a second year in a row § completed multi-year project to produce cleaner burning fuels at refineries § maintained leading share of major retail urban market § grew convenience store sales by 8% and same-store sales by 5%, compared with 2005 § achieved 75% high margin lubricant sales volume mix | § continue to focus on safety and refinery reliability § increase retail non-petroleum revenue § grow high margin lubricants sales volume |
Continuing to Work at Being A Responsible Comany | § reduced TRIF by 3%, compared with 2005 § reduced regulatory compliance exceedances by 17%, compared with 2005 | § maintain focus on TRIF and regulatory compliance exceedances § meet provincial ethanol regulations § continue focus on community relations, including establishment of Community Liaison Committee in Montreal § continue to look for partnerships with Aboriginal communities on retail opportunities |
Shared Services
Shared Services includes investment income, interest expense, foreign currency translation and general corporate revenue and expenses.
Shared Services Financial Results
(millions of Canadian dollars) | | 2006 | | 2005 | | 2004 | |
Net loss | | $ | (263 | ) | $ | (177 | ) | $ | (63 | ) |
| Loss on sale of assets | | | - | | | - | | | (1 | ) |
| Foreign currency translation gain | | | 1 | | | 73 | | | 63 | |
Operating loss | | $ | (264 | ) | $ | (250 | ) | $ | (125 | ) |
| Stock-based compensation | | | (31 | ) | | (66 | ) | | (11 | ) |
| Income tax adjustments | | | (71 | ) | | (31 | ) | | (1 | ) |
Operating loss adjusted for unusual items | | $ | (162 | ) | $ | (153 | ) | $ | (113 | ) |
| Cash flow from operating activities before changes in non-cash working capital | | $ | (218 | ) | $ | (225 | ) | $ | (106 | ) |
2006 COMPARED WITH 2005
Shared Services recorded an operating loss adjusted for unusual items of $162 million in 2006, compared with a loss of $153 million in 2005.
Shared Services net loss was $263 million in 2006, compared with a net loss of $177 million in 2005. The 2006 net loss included a $71 million charge for income tax adjustments and a $31 million charge related to the mark-to-market valuation of stock-based compensation. The 2005 net loss included a $73 million gain on foreign currency translation related to long-term debt, a $66 million charge related to the mark-to-market valuation of stock-based compensation and a $31 million charge related to income tax adjustments.
Financial Reporting
Critical Accounting Estimates
The preparation of the Company's financial statements requires management to adopt accounting policies that involve the use of significant estimates and assumptions. These estimates and assumptions are developed based on the best available information and are believed by management to be reasonable under the existing circumstances. New events or additional information may result in the revision of these estimates over time. The Audit, Finance and Risk Committee of the Board of Directors regularly reviews the Company's critical accounting policies and any significant changes thereto. A summary of the significant accounting policies used by Petro-Canada can be found in Note 1 to the 2006 Consolidated Financial Statements. The following discussion outlines what management believes to be the most critical accounting policies involving the use of significant estimates or assumptions.
Property, Plant and Equipment/Depreciation, Depletion and Amortization
Investments in exploration and development activities are accounted for under the successful efforts method. Under this method, the acquisition costs of unproved acreage; the costs of exploratory wells pending determination of proved reserves; and the costs of wells, which are assigned proved reserves and development costs, including costs of all wells, are capitalized. The cost of unsuccessful wells and all other exploration costs, including geological and geophysical costs, are charged to earnings as incurred. Capitalized costs of oil and gas producing properties are depreciated and depleted using the unit of production method based upon estimated reserves (see Estimated Oil and Gas Reserves discussion on page 42). Reserves estimates can have a significant impact on net earnings, because they are a key component in the calculation of depreciation and depletion related to the capitalized costs of property, plant and equipment. A revision in reserves estimates could result in a higher or lower depreciation and depletion charge to net earnings. A downward revision in reserves could result in a write-down of oil and gas producing properties as part of the impairment assessment (see Asset Impairment discussion below).
Asset Retirement Obligations
The Company currently records the obligation for estimated asset retirement costs at fair value when incurred. Factors that can affect the fair values of the obligations include the expected costs to be incurred, the useful lives of the assets and discount rates applied. Cost estimates are influenced by factors such as the number and type of assets subject to asset retirement obligations, the extent of work required and changes in environmental legislation. A revision to the estimated costs to be incurred, useful lives of the assets or discount rates applied could result in an increase or decrease in the total obligation, which would change the amount of amortization and accretion expense recognized in net earnings over time.
Asset Impairment
Producing properties and significant unproved properties are assessed annually, or as economic events dictate, for potential impairment. Impairment is assessed by comparing the estimated net undiscounted future cash flows to the carrying value of the asset. The cash flows used in the impairment assessment require management to make assumptions and estimates about recoverable reserves (see Estimated Oil and Gas Reserves discussion on page 42), future commodity prices and operating costs. Changes in any of the assumptions, such as a downward revision in reserves, a decrease in future commodity prices or an increase in operating costs, could result in an impairment of an asset's carrying value.
Purchase Price Allocation
Business acquisitions are accounted for by the purchase method of accounting. Under this method, the purchase price is allocated to the assets acquired and the liabilities assumed based on the fair value at the time of the acquisition. The excess purchase price over the fair value of identifiable assets and liabilities acquired is goodwill. The determination of fair value often requires management to make assumptions and estimates about future events. The assumptions and estimates with respect to determining the fair value of property, plant and equipment acquired generally require the most judgment and include estimates of reserves acquired (see Estimated Oil and Gas Reserves discussion below), future commodity prices and discount rates. Changes in any of the assumptions or estimates used in determining the fair value of acquired assets and liabilities could impact the amounts assigned to assets, liabilities and goodwill in the purchase price allocation. Future net earnings can be affected as a result of changes in future depreciation and depletion, asset impairment or goodwill impairment.
Goodwill Impairment
Goodwill is subject to impairment tests annually, or as economic events dictate, by comparing the fair value of the reporting unit to its carrying value, including goodwill. If the fair value of the reporting unit is less than its carrying value, a goodwill impairment loss is recognized as the excess of the carrying value of the goodwill over the fair value of the goodwill. The determination of fair value requires management to make assumptions and estimates about recoverable reserves (see Estimated Oil and Gas Reserves discussion below), future commodity prices, operating costs, production profiles and discount rates. Changes in any of these assumptions, such as a downward revision in reserves, a decrease in future commodity prices, an increase in operating costs or an increase in discount rates, could result in an impairment of all or a portion of the goodwill carrying value in future periods.
Estimated Oil and Gas Reserves
Reserves estimates, although not reported as part of the Company's Consolidated Financial Statements, can have a significant effect on net earnings as a result of their impact on depreciation and depletion rates, asset impairments and goodwill impairments (see discussion of these items above and on page 41). The Company's staff of qualified reserves evaluators performs internal evaluations on all of its oil and gas reserves on an annual basis using corporate-wide policies, procedures and practices. Independent qualified petroleum reservoir engineering consultants also conduct annual evaluations, technical audits and/or reviews of a significant portion of the Company's reserves and audit the Company's reserves policies, procedures and practices. In addition, the Company's contract internal auditors test the non-engineering management control processes used in establishing reserves. However, the estimation of reserves is an inherently complex process requiring significant judgment. Estimates of economically recoverable oil and gas reserves are based upon a number of variables and assumptions, such as geoscientific interpretation, economic conditions, commodity prices, operating and capital costs, and production forecasts, all of which may vary considerably from actual results. These estimates are expected to be revised upward or downward over time as additional information, such as reservoir performance, becomes available or as economic conditions change.
Employee Future Benefits
The Company maintains defined benefit pension plans and provides certain post-retirement benefits to qualifying retirees. The cost of pension and other post-retirement benefits are actuarially determined by an independent actuary using the projected benefit method, pro-rated based on service. The determination of these costs requires management to estimate or make assumptions regarding the expected plan investment performance, salary escalation, retirement ages of employees, expected health care costs, employee turnover and discount rates. Changes in these estimates or assumptions could result in an increase or decrease to the accrued benefit obligation and the related costs for both pensions and other post-retirement benefits.
Income Taxes
The Company follows the liability method of accounting for income taxes, whereby future income taxes are recognized based on the differences between the carrying amounts of assets and liabilities reported in the financial statements and their respective tax bases. The determination of the income tax provision is an inherently complex process requiring management to interpret continually changing regulations and to make certain judgments. While income tax filings are subject to audits and reassessments, management believes adequate provision has been made for all income tax obligations. However, changes in the interpretations or judgments may result in an increase or decrease in the Company's income tax provision in the future.
Contingencies
The Company is involved in litigation and claims in the normal course of operations. Management is of the opinion that any resulting settlements would not materially affect the financial position of the Company as at December 31, 2006. However, the determination of contingent liabilities relating to litigation and claims is a complex process that involves judgments as to the outcomes and interpretation of laws and regulations. Changes in the judgments or interpretations may result in an increase or decrease in the Company's contingent liabilities in the future.
SHARE DATA
The authorized share capital of Petro-Canada consists of an unlimited number of common shares and an unlimited number of preferred shares issuable in series designated as either senior preferred shares or junior preferred shares. As at March 1, 2007, there were 497,132,045 common shares outstanding and no preferred shares outstanding. For details of the Company's share capital and stock options outstanding at December 31, 2006, refer to Notes 21 and 22 of the 2006 Consolidated Financial Statements.
ADDITIONAL INFORMATION
Copies of this MD&A and the following Consolidated Financial Statements, as well as the Company's latest AIF and Management Proxy Circular, may be obtained from the Company's website at www.petro-canada.ca or by mail upon request from the Corporate Secretary, 150 - 6 Avenue S.W., Calgary, Alberta, T2P 3E3. Other disclosure documents, and any reports, statements or other information filed by Petro-Canada with the Canadian provincial securities commissions or other similar regulatory authorities, are accessible through the Internet on the Canadian System for Electronic Document Analysis and Retrieval, which is commonly known by the acronym SEDAR, and located at www.sedar.com. SEDAR is the Canadian equivalent of the U.S. SEC's Electronic and Document Gathering and Retrieval System, which is commonly known by the acronym EDGAR, and located at www.sec.gov.