Exhibit 99.2
PETRO-CANADA
MANAGEMENT'S DISCUSSION AND ANALYSIS
MANAGEMENT’S DISCUSSION AND ANALYSIS
This Management’s Discussion and Analysis (MD&A), dated effective as of February 16, 2005, should be read in conjunction with the audited Consolidated Financial Statements and Notes for the year ended December 31, 2004, included in the 2004 Annual Report and the 2004 Annual Information Form. Financial data has been prepared in accordance with Canadian generally accepted accounting principles (GAAP), unless otherwise specified. All dollar values are Canadian dollars, unless otherwise indicated. All oil and natural gas production and reserves volumes are stated before deduction of royalties, unless otherwise indicated. Graphs accompanying the text identify our “value drivers,” the key measures of performance in each segment of our business. Glossary of financial terms and ratios can be found on the inside back cover of this report.
NON-GAAP MEASURES
Cash flow, which is expressed before changes in non-cash working capital, is used by the Company to analyze operating performance, leverage and liquidity. Earnings from operations, which represent net earnings excluding gains or losses on foreign currency translation, disposal of assets and unrealized gains or losses on the mark-to-market of the derivative contracts associated with the Buzzard acquisition, are used by the Company to evaluate operating performance. Cash flow and earnings from operations do not have a standardized meaning prescribed by Canadian GAAP and therefore may not be comparable with the calculation of similar measures for other companies.
Q: |
What is Petro-Canada’s outlook for the business environment? |
|
A: |
Signs point to commodity markets which have rising demand and continued price volatility. |
Business Environment
Economic factors influencing Petro-Canada’s upstream businesses financial performance include crude oil and natural gas prices and foreign exchange rates, particularly the Canadian dollar/U.S. dollar exchange rate. Prices for energy commodities are primarily affected by market supply and demand, weather and political events. Performance in Petro-Canada’s Downstream business is influenced mainly by the level and volatility of crude oil prices, industry refining margins, movement in crude oil price differentials, demand for refined petroleum products and the degree of market competition.
BUSINESS ENVIRONMENT IN 2004
The year 2004 was an extraordinary year in the history of energy commodity prices. International light crude oil prices for North Sea Brent (Brent) and West Texas Intermediate (WTI) reached average annual prices not seen since 1982. Light/heavy crude price differentials widened to unprecedented levels. North American natural gas prices attained their highest level since price deregulation in 1986.
2
The factors driving high oil prices were: a strong surge in global oil demand (led by China); slower growth in Russian production; continued interruption of Iraqi exports; and the impact of Hurricane Ivan on the U.S. Gulf of Mexico production. At the same time, increased production from the Organization of the Petroleum Exporting Countries (OPEC) and Mexico led to the supply of heavier grades of crude growing at a faster rate than the refining conversion capacity that was available for processing. The result was the widest light/heavy crude price differential on record.
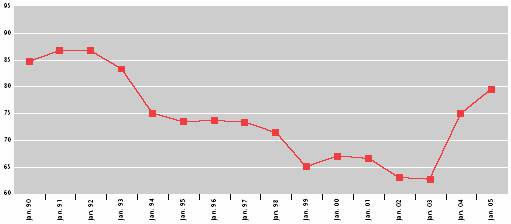
Continued weakening of the U.S. dollar throughout 2004 resulted in the highest Canada/U.S. exchange rate in the past 10 years. The elevated exchange rate lowered the positive impact of higher international commodity prices. The Canadian dollar rose from 77.4 cents US on December 31, 2003, to 83.1 cents US on December 31, 2004, an increase of 7%.
The stronger Canadian dollar dampened the impact of higher commodity prices in 2004.
CANADA/U.S. EXCHANGE RATE
(US cent/Cdn $, January 1990 to January 2005)
North American natural gas prices enjoyed another year of buoyancy, despite record levels of storage gas due to weaker demand and better-than-anticipated production volumes. Concern regarding the underlying strength of production growth in North America and the impact of Hurricane Ivan on U.S. Gulf of Mexico production helped maintain Henry Hub monthly average gas prices at levels above $5.00 US per million British thermal units (MMBtu). Average Canadian natural gas prices mirrored the performance of prices south of the border, up from 2003 despite a substantial widening of the price differential between the Henry Hub and the AECO-C spot price.
In the Canadian downstream sector, refined petroleum product sales grew by about 4%, compared to 4.8% in 2003. Refining margins improved again in 2004, largely in response to bottlenecks in the North American refining system. The system continues to be stretched to its limit by a combination of growing refined product demand and increasingly stringent mandated product specifications. As well, record light/heavy crude price differentials contributed to downstream margin improvements.
Commodity Price Indicators and Exchange Rates
(averages for the years indicated) | | 2004 | | 2003 | |
| | | | | |
Crude oil price indicators (per barrel): | | | | | |
Dated Brent at Sullom Voe | | US$ | 38.21 | | 28.84 | |
WTI at Cushing | | US$ | 41.40 | | 31.04 | |
WTI/Brent price differential | | US$ | 3.19 | | 2.20 | |
Brent/Maya price differential | | US$ | 8.20 | | 4.60 | |
Edmonton Light | | Cdn$ | 52.78 | | 43.77 | |
Edmonton Light/Lloydminster Blend (heavy) price differential | | Cdn$ | 17.07 | | 12.68 | |
Natural gas price indicators: | | | | | |
Henry Hub – per MMBtu | | US$ | 6.09 | | 5.44 | |
AECO-C spot – per Mcf | | Cdn$ | 7.08 | | 6.99 | |
Henry Hub-AECO-C basis differential – per MMBtu | | US$ | 0.87 | | 0.70 | |
New York Harbor 3-2-1 refinery crack spread – per bbl | | US$ | 7.02 | | 5.31 | |
US$ per Cdn$ exchange rate | | US$ | 0.768 | | 0.714 | |
3
OUTLOOK FOR BUSINESS ENVIRONMENT IN 2005
Prices for energy commodities are expected to remain volatile in 2005, reflecting the vagaries of weather, the changing level of industry inventories, and political and natural events. Slower global oil demand growth combined with non-OPEC production gains are expected to ease the upward pressure experienced by oil prices during 2004. The extent of the anticipated price correction depends on OPEC decisions on production cuts designed to prevent prices from declining as global demand conditions weaken.
The North American natural gas supply/demand balance is also expected to slacken in 2005. Little or no demand growth is forecast as a result of unseasonably warm winter weather and strong inter-fuel competition in the industrial and power generation sectors. These factors, combined with the industry’s ability to slow anticipated production declines in North America, will maintain North American gas in storage at higher than historical levels. These dynamics are anticipated to relieve some of the upward pressure on natural gas prices experienced in 2004.
In the industry’s downstream sector, refining margins are unlikely to remain at the high levels experienced in 2004. This is because refined product demand growth is expected to slow. Also, refineries are expected to rebuild product inventories as supply bottlenecks are dealt with and progress is made to meet mandated product specifications.
While volatility in the market will continue, a number of factors are expected to put downward pressure on strong crude oil and natural gas prices, as well as refining margins in 2005.
ECONOMIC SENSITIVITIES
The following table shows the estimated after-tax effects that changes in certain factors would have had on Petro-Canada’s 2004 net earnings, had these changes occurred. These calculations are based on business conditions, production and sales volumes realized in 2004.
Sensitivities Affecting Net Earnings
Factor(1), (2) | | Change (+) | | Annual Net
Earnings Impact | | Annual Net
Earnings Impact | |
| | | | (millions of dollars) | | ($ per share) | |
Upstream | | | | | | | |
Price received for crude oil and liquids(3) | | $ | 1.00/bbl | | 45 | | 0.17 | |
Price received for natural gas | | $ | 0.25/Mcf | | 33 | | 0.12 | |
Exchange rate: $Cdn per $US refers to impact on upstream earnings from operations | | $ | 0.01 | | (22 | ) | (0.08 | ) |
Crude oil and liquids production | | 1,000 b/d | | 5 | | 0.02 | |
Natural gas production | | 10 MMcf/d | | 9 | | 0.03 | |
Buzzard derivative contracts (unrealized)(4) | | $ | 1.00/bbl | | (17 | ) | (0.06 | ) |
| | | | | | | |
Downstream | | | | | | | |
New York Harbor 3-2-1 crack spread | | $ | 0.10 US/bbl | | 4 | | 0.02 | |
Light/heavy crude price differential | | $ | 1.00/bbl | | 11 | | 0.04 | |
| | | | | | | |
Corporate | | | | | | | |
Exchange rate: $Cdn per $US refers to impact of the revaluation of U.S. dollar-denominated, long-term debt(5) | | $ | 0.01 | | 9 | | 0.03 | |
(1) The impact of a change in one factor may be compounded or offset by changes in other factors. This table does not consider the impact of any inter-relationship among the factors.
(2) The impact of these factors is illustrative.
(3) This sensitivity is based upon an equivalent change in the price of WTI and North Sea Brent.
(4) This refers to gains or losses on the forward sales contracts for the future sale of 35.8 million barrels of Brent crude oil that were entered into in connection with the Company’s acquisition of an interest in the Buzzard field in the U.K. sector of the North Sea.
(5) This refers to gains or losses on $869 million US of the Company’s U.S. denominated long-term debt and interest costs on U.S. denominated debt. Gains or losses on $1 billion US of the Company’s U.S. denominated long-term debt, associated with the self-sustaining International business segment and the U.S. Rockies operations included in the North American Natural Gas business segment, are deferred and included as part of shareholders’ equity.
4
Q:
What capabilities does Petro-Canada have that makes the Company confident it can execute its business strategy and differentiate itself from its peers?
A:
Petro-Canada has a unique breadth of skills due to its integrated portfolio of businesses. The Company continues to strengthen its capabilities through a focus on Q1 initiatives.
Internal Capabilities
As an integrated oil and gas company, Petro-Canada has a diverse set of skills and capabilities, the depth and breadth of which are somewhat unique for its size. To continue to improve and expand on this competitive advantage, the Company is committed to a Q1 (first quartile) mindset, action plans and performance measures. Petro-Canada defines Q1 as:
• improving operating performance to first quartile levels (top 25%) relative to benchmarked peers and best-in-class practices;
• efficiently using resources to manage controllable costs despite the growing complexity and scope of the business;
• seeking integration opportunities across businesses and functional areas for added value; and
• providing leadership which creates the work environment required for employees to excel.
Each of the businesses and Shared Services areas has Q1 action plans and performance measures. For example in East Coast Oil, a best practices initiative identifies process and technical opportunities to improve performance at Terra Nova. In the Downstream business, where the Q1 mindset originated, a scorecard is a key tool in maintaining employee focus on Q1 performance. Similar initiatives are also in the other business units.
The Finance unit was the first area of Shared Services to implement a Q1 initiative. The goal of this initiative is to be a value adding partner and trusted advisor for the business units and Shared Services units. In 2004, the Human Resources and Environment, Health and Safety units also started formal Q1 initiatives.
The Company recognizes it must continue to add breadth and depth of capability to sustain the base business and ensure profitable growth. To this end, the Human Resources Strategy addresses three key areas: effectively managing talent, improving human resources operational excellence, and supporting international and domestic business growth.
The Company’s stated values are to be results-focused, decisive, trustworthy, professional and respectful. Petro-Canada believes it is important to build and maintain principle-based relationships with stakeholders. The Company works toward this goal with an active and ongoing stakeholder consultation process based on open, two-way communication with a genuine interest in understanding stakeholder interests and concerns.
This Q1 commitment, from improving capability to seeking integration opportunities, is embedded in Petro-Canada’s business strategy.
5
Q:
What is Petro-Canada’s business strategy?
A:
The Company’s strategy is to create shareholder value by improving the profitability of the base business and by delivering long-term, profitable growth.
Business Strategy
The Company is improving the profitability of the base business by selecting the right assets and driving for Q1 performance. Long-term, profitable growth will be delivered by:
• expanding and exploiting the current portfolio of assets;
• targeting acquisitions and new opportunities with a focus on long-life assets; and
• developing an exploration program which balances risks and rewards to replace reserves over time.
In applying this strategy, Petro-Canada remains financially disciplined to retain the capacity and flexibility to sustain and grow the business.
In the upstream businesses, the Company believes it is unlikely rising North American demand for natural gas will be completely met through conventional production in the future. Petro-Canada is developing new sources of North American natural gas supply – unconventional gas, gas to fill the proposed northern pipelines and gas supplied through liquefied natural gas (LNG) technology. The East Coast Oil and Oil Sands businesses are also contributing volumes to meet North American demand. Petro-Canada is stepping out from established international platforms to access undeveloped reserves to supply growing global markets. In the Downstream business, the Company is leveraging the shift to cleaner fuels and a heavier oil supply by converting refineries to produce low-sulphur products from heavier crude slates and continuing to develop high-quality lubricants.
Petro-Canada’s balanced portfolio provides opportunities for growth, a natural hedge against changing circumstances and integration among businesses for greater potential value. The Company applies its diverse set of internal skills to implement the business strategy.
Over time, the Company expects that the outcomes of implementing its business strategy will be:
• a continued focus on profitability;
• a shift to higher netback production;
• longer-life assets that will increase reserve life;
• a balanced exploration program;
• long-term upstream production growth; and
• a solid balance sheet with financial flexibility.
6
Risk Management
PETRO-CANADA’S RISK PROFILE
Petro-Canada’s results are impacted by management’s strategy for handling risks in the business. These risks fall into four broad categories: business risks; operational risks; political risks; and market risks.
Management believes each major risk requires a unique response based on Petro-Canada’s business strategy and financial tolerance. While some risks can be effectively managed through internal controls and business processes, others are managed through insurance and hedging. The Audit, Finance and Risk Committee of the Board of Directors has responsibility to oversee risk management. The following describes Petro-Canada’s approach to managing major risks.
BUSINESS RISKS
Exploration
Petro-Canada’s future cash flows are highly dependent on the ability to offset natural declines as reserves are produced. Reserves can be added through successful exploration or acquisitions; however, as basins mature, replacement of reserves becomes more challenging and expensive. In some areas, the Company may choose to allow reserves to decline if replacement is uneconomic. In 2004, the Company replaced 96% of its production on a proved reserves basis, compared to 59% in 2003. The Company targets to fully replace proved reserves over a five-year period. Petro-Canada’s five-year proved replacement ratio was 150%.(1)
There is no assurance Petro-Canada will successfully replace all produced reserves in any given year.
Reserves Estimates
Estimates of economically recoverable oil and gas reserves are based upon a number of variables and assumptions that include geo-scientific interpretation, commodity prices, operating and capital costs, and historical production from properties.
Petro-Canada has well-established, corporate-wide reserves booking practices that have been continuously improved for more than a decade. PricewaterhouseCoopers LLP, as contract internal auditor, has tested the non-engineering control processes used in establishing reserves. As well, independent engineering firms assess a significant portion of reserves estimates every year. Over time, this means all of Petro-Canada’s reserves estimates are assessed by external evaluators. The Board of Directors also reviews and approves the Company’s annual reserves filings. More information on reserves booking practices can be found in the Company’s Annual Information Form.
Project Execution
Petro-Canada manages a number of different-sized projects to support continuing operations and future growth. Many projects are influenced by external factors beyond the Company’s control. These include items such as material costs, labour productivity, timely availability of skilled labour and currency fluctuations.
While Petro-Canada cannot control all project inputs, the Company is committed to continuing to improve its project management capability. Petro-Canada’s goal is to consistently and predictably deliver projects on time and on budget, and achieve defined expectations. Enhanced project management capability is expected to improve all elements of project execution including safety and environmental performance, quality, cycle-time and cost. Leveraging experience gained from major project developments, the Company established project management best practices.
(1) Proved reserves replacement ratio is calculated by dividing the year-over-year net change in proved reserves before deducting production by the annual production during the year. The reserves replacement ratio is a general indicator of the Company’s reserves growth. It is only one of a number of metrics which can be used to analyze a company’s upstream business.
7
Non-Operated Interests
Other companies may manage the construction or operation of assets in which Petro-Canada has a significant interest. Business assets in which Petro-Canada has a major interest, but does not operate, include Hibernia (20% interest), Syncrude (12% interest), White Rose (27.5%) and the newly acquired Buzzard (29.9% interest). Major projects are managed through different forms of joint-venture executive committees, resulting in Petro-Canada having some ability to influence these projects. As well, Petro-Canada has joint-venture or other operating agreements which specify its expectations from third-party operators. Nevertheless, third-party operation and management of the Company’s assets could adversely affect Petro-Canada’s financial performance.
Environmental Regulations
Environmental risks in the oil and gas industry are significant. This is because related laws and regulations are becoming more stringent in Canada, and in other countries where Petro-Canada operates. Due to increased regulations, Petro-Canada is investing additional capital to satisfy new product specifications and/or address environmental issues. In 2005, the Company will invest $635 million of its capital program toward regulatory compliance, most of which will be to modify refineries to produce low-sulphur distillate. Other environmental regulations may result in future increased operating costs as a result of creating a future liability when dismantling or remediating assets.
Petro-Canada conducts Life-Cycle Value Assessments (LCVA) to integrate and balance environmental, social and economic decisions related to major projects. A key component of the LCVA process is to assess and plan for all life-cycle stages involved in constructing, manufacturing, distributing and eventually abandoning an asset or a product. This process encourages more comprehensive exploration of alternatives. The LCVA is a useful technique; however, its predictive capability is limited by the reliance on the current regulatory regime or one that can be reasonably expected.
Emission of Greenhouse Gases
The Kyoto Protocol, ratified by the Government of Canada in December 2002 and effective as of February 16, 2005, requires signatory nations to reduce their emissions of carbon dioxide and other greenhouse gases. As a result, Petro-Canada may be required to reduce emissions of greenhouse gases from operations or purchase emission trading credits. While the details of implementation of the Kyoto Protocol in Canada have not been finalized, the impact to Petro-Canada could be higher capital expenditures and operating expenses. The Government of Canada may also impose higher vehicle fuel efficiency standards. The impact of this action could be to decrease the demand for gasoline and diesel fuels sold by Petro-Canada and depress the Company’s margins for refined products.
Petro-Canada is committed to reducing emissions. Additional detail will be available in the Report to the Community in the second quarter of 2005. The Report will be posted on www.petro-canada.ca. Through industry organizations, Petro-Canada continues to work with a number of regulatory groups and government associations to find a cost-effective approach which will minimize the negative financial impact of the Kyoto Protocol on the Company while still reducing emissions. The level of influence these discussions and cooperative efforts have on the Government of Canada’s implementation plan may be quite limited.
8
Government Regulations
Petro-Canada’s operations are regulated by, and could be intervened upon by, a variety of governments around the world. Governments could impact contracting of exploration and production interests, impose specific drilling obligations, and possibly expropriate or cancel contract rights. Governments may also regulate prices of commodities or refined products, or intervene through taxes, royalties and exploration rights.
Petro-Canada tries to mitigate the impact of government regulations by selecting operating environments with stable governments. To date, Petro-Canada has had a cooperative relationship with its regulators and the governments in the countries in which it operates. Most of the contact with regulators occurs through the Company’s management, regulatory affairs personnel in each business unit and a centralized corporate government relations function. Petro-Canada aims to have regular, constructive communication with regulators and governments so issues can be resolved in a mutually acceptable fashion. The Company also has a strong record of regulatory compliance within the jurisdictions it operates. Petro-Canada operates in many different jurisdictions and derives revenue from several categories of products. This diversification makes financial performance less sensitive to the action of any single government. Nevertheless, Petro-Canada has limited ability to influence regulations which may have a material adverse effect on the Company.
Counterparties
In the normal course of business, Petro-Canada is exposed to credit risk resulting from the uncertainty of business partners’ or counterparties’ ability to fulfill their obligations. The Company has established internal credit policies and procedures that include financial assessments, exposure limits and processes to monitor and minimize the exposures against these limits. Where appropriate, Petro-Canada also uses netting and collateral arrangements to minimize risk.
OPERATIONAL RISKS
Exploring for, developing, producing, refining, transporting and marketing oil, natural gas and refined products involve significant operational hazards. These risks include well blowouts, fires, explosions, gaseous leaks, migration of harmful substances and oil spills. Any of these operational incidents could cause personal injury, environmental contamination, or damage and destruction of the Company’s assets. These incidents could also interrupt production.
Petro-Canada manages operational risks primarily through a Total Loss Management (TLM) system and a corporate insurance program. TLM is an internally developed management system based on external best practices with standards for preventing operational incidents. Regular TLM audits test compliance with these standards. The corporate insurance program transfers the impact of some operational risks to third-party insurers worldwide. Petro-Canada optimizes the program by evaluating deductibles, limits and coverage. The Company’s financial tolerance to withstand the impact of a major isolated event may be used to manage total premium cost. Although Petro-Canada maintains insurance in line with customary industry practices, the Company cannot fully insure against all risks. Losses resulting from operational incidents could have a material adverse impact on the Company.
9
POLITICAL RISKS
Petro-Canada operates in a number of countries that have varying political, economic and social systems. As a result, the Company’s operations and related assets are subject to potential risks from actions by governmental authorities or internal unrest. Petro-Canada also operates in OPEC-member countries and production in those countries is constrained by OPEC quotas.
The Company continually evaluates exposure in any one country in the context of total operations. Investment may be limited to avoid excessive exposure in any one country or region. The Company also uses financial products to partially mitigate some political risks.
MARKET RISKS
More detailed quantification of the impact of some of the following risks can be found in the earnings sensitivity chart on page 4 of the Business Environment in the MD&A.
Commodity Prices
In Petro-Canada’s upstream businesses, a significant market risk exposure is the changing commodity prices of crude oil and natural gas. Commodity prices are volatile and influenced by factors such as supply and demand fundamentals, geopolitical events, OPEC decisions and weather. In 2004, the monthly average Brent crude oil price ranged between $30.83 US/bbl and $49.64 US/bbl, and the AECO-C hub index ranged between $5.93/Mcf and $8.35/Mcf. These commodity prices also impact the refined products margins realized by the Downstream business, another significant market risk. In 2004, the benchmark monthly average New York Harbor 3-2-1 refinery crack spread per bbl ranged from $4.23 US to $11.41 US. Petro-Canada’s ability to maintain product margins in an environment of higher feedstock costs is contingent upon the Company’s ability to flow higher costs through to customers.
Petro-Canada generally does not hedge large volumes of production. Management believes commodity prices are volatile and difficult to predict. The business is managed so that the Company can substantially withstand the impact of a lower price environment, while maintaining the opportunity to capture significant upside when the price environment is higher. However, commodity prices and margins may be hedged occasionally to capture opportunities that represent extraordinary value and to ensure the economic value of an acquisition. For example, as part of the Company’s acquisition of an interest in the Buzzard field in the U.K. sector of the North Sea, the Company entered into a series of derivative contracts related to the future sale of Brent crude oil (see Derivative Instruments page 11 of the MD&A). Certain Downstream physical transactions are routinely hedged for operational needs and to facilitate sales to customers.
10
Foreign Exchange
As energy commodity prices are primarily priced in U.S. dollars, a large portion of Petro-Canada’s revenue stream is affected by the Canada/U.S. exchange rate. As a result, the Company’s earnings are negatively affected by a strengthening Canadian dollar. The Company is also exposed to fluctuations in other foreign currencies, such as the Euro and the British Pound.
Generally, Petro-Canada does not hedge foreign exchange exposures, although the Company partially mitigates the U.S. dollar exposure by denominating the majority of its debt obligations in U.S. dollars. Foreign exchange exposure related to asset acquisitions or divestitures, or project capital expenditures, may be hedged on a case-by-case basis.
Interest Rates
Petro-Canada targets a blend of fixed and floating rate debt. Generally, this enables the Company to take advantage of lower interest rates on floating debt, while matching overall debt maturities with the life of cash-generating assets. The Company is exposed to fluctuations in the rate of interest it pays on floating rate debt.
This interest rate exposure is within the Company’s risk tolerance.
Derivative Instruments
Petro-Canada’s Market Risk and Derivative policy prohibits the use of derivative instruments for speculative purposes. Petro-Canada uses derivatives primarily to hedge physical transactions for operational needs and to facilitate sales to customers. The gains and losses associated with these financial instruments essentially offset gains and losses on the physical transactions. Except as specifically authorized by the Board of Directors, the term of hedging instruments cannot exceed 18 months. Monitoring and reporting of the derivatives portfolio includes periodic testing of the fair value of all outstanding derivatives. Fair values are determined by obtaining independent third-party quotes for the value of each derivative instrument. The objectives and strategies of all hedge transactions are documented and the effectiveness of the derivative instrument in offsetting a change in the value of the hedged exposure is assessed on a regular basis.
Effective January 1, 2004, the Company elected to discontinue hedge accounting for certain hedging programs. All derivatives that do not qualify as a hedge, or are not designated as a hedge, are accounted for using the mark-to-market accounting method. These derivatives are recorded in the balance sheet as either an asset or liability, with the fair value recognized in earnings. As a result, the realized and unrealized values of these transactions are recognized in Investment and Other Income.
During 2004, as part of the Company’s acquisition of an interest in the Buzzard field, the Company entered into a series of derivative contracts related to the future sale of Brent crude oil. The purpose of these transactions was to ensure value-adding returns to Petro-Canada on this investment, even in the event of a material decrease in oil prices. These contracts effectively lock in an average forward price of approximately $26 US/bbl on a volume of 35,840,000 barrels. This volume represents approximately 50% of the Company’s share of estimated plateau production in the 2007 to 2010 time frame. As at December 31, this hedge had a mark-to-market unrealized loss of $205 million after-tax which was recognized in net earnings in 2004.
In 2004, other commodity hedges in place for refining supply and product purchases resulted in a net decrease in earnings of about $1 million after-tax, which included a mark-to-market unrealized gain as at December 31 of $3 million after-tax. This compared with a net decrease in earnings of about $30 million in 2003, which related to commodity hedges, interest rate hedges and currency hedges.
11
Q:
What was Petro-Canada’s financial performance in 2004?
A:
In 2004, Petro-Canada achieved record earnings from operations of $1.9 billion and record cash flow of $3.7 billion.
Shareholder Value
Shareholder value measures the change in the Petro-Canada share price plus dividend returns.

Consolidated Financial Results
ANALYSIS OF CONSOLIDATED EARNINGS AND CASH FLOW
Consolidated Financial Results
(millions of dollars, unless otherwise indicated) | | 2004 | | 2003 | | 2002 | |
| | | | | | | |
Net earnings | | $ | 1,757 | | $ | 1,650 | | $ | 955 | |
Gain (loss) on foreign currency translation | | 63 | | 239 | | (52 | ) |
Unrealized loss on Buzzard derivative contracts | | (205 | ) | — | | — | |
Gain on sale of assets | | 11 | | 29 | | 2 | |
Earnings from operations(1), (3) | | $ | 1,888 | | $ | 1,382 | | $ | 1,005 | |
Income tax adjustment | | 13 | | 45 | | — | |
Edmonton refinery conversion provision | | — | | (82 | ) | — | |
Kazakhstan impairment | | — | | (46 | ) | — | |
International provisions | | — | | 45 | | — | |
Oakville closure costs | | (46 | ) | (151 | ) | — | |
Terra Nova insurance proceeds | | 31 | | 17 | | — | |
Earnings from operations excluding adjustments for one-time and unusual items | | $ | 1,890 | | $ | 1,554 | | $ | 1,005 | |
Earnings per share (dollars) | – basic | | $ | 6.64 | | $ | 6.23 | | $ | 3.63 | |
| – diluted | | 6.55 | | 6.16 | | 3.59 | |
Cash flow from operating activities before changes in non-cash working capital(2), (3) | | 3,747 | | 3,372 | | 2,276 | |
Cash flow from operating activities before changes in non-cash working capital per share (dollars) | | 14.16 | | 12.73 | | 8.66 | |
Debt | | 2,580 | | 2,229 | | 3,057 | |
Cash and cash equivalents | | 170 | | 635 | | 234 | |
Average capital employed | | $ | 10,533 | | $ | 9,268 | | $ | 7,722 | |
Return on capital employed (%) | | 17.5 | | 19.0 | | 13.8 | |
Operating return on capital employed (%) | | 18.8 | | 16.1 | | 14.5 | |
Return on equity (%) | | 21.5 | | 24.9 | | 18.3 | |
(1) Earnings from operations, which represent net earnings excluding gains or losses on foreign currency translation and on disposal of assets and the unrealized gains or losses associated with the Buzzard derivative contracts, is used by the Company to evaluate operating performance.
(2) Cash flow, which is expressed before changes in non-cash working capital items relating to operating activities, is used by the Company to analyze operating performance, leverage and liquidity.
(3) Earnings from operations and cash flow do not have any standardized meaning prescribed by Canadian GAAP and, therefore, may not be comparable with the calculation of similar measures for other companies.
12
2004 COMPARED WITH 2003
Earnings from operations adjusted for one-time and unusual items rose 22% to $1,890 million in 2004. Earnings were positively impacted by strong commodity prices and refining margins, as well as lower exploration expense and interest charges. These factors were partially offset by lower upstream volumes, higher operating costs and a stronger Canadian dollar.
In 2004, earnings from operations included a number of one-time and unusual items: a $46 million charge for additional depreciation and other charges related to the consolidation of Eastern Canada refinery operations and the closure of the Oakville refinery; $31 million of insurance proceeds related to the delayed start-up of Terra Nova; and a $13 million positive adjustment to future income taxes reflecting announced changes to Canadian provincial income tax rates.
In 2003, earnings from operations included a number of one-time and unusual items: a $151 million charge for additional depreciation and other charges related to the consolidation of Eastern Canada refinery operations and the closure of the Oakville refinery; an $82 million charge related to the original conversion plan at the Edmonton refinery; a $46 million provision related to the impairment of assets in Kazakhstan; a $45 million positive adjustment in International related to the clarification of production rights and a tax provision of a former operation; a $45 million net positive adjustment to future income taxes reflecting announced changes to Canadian federal and provincial income tax rates; and $17 million of insurance proceeds related to the delayed start-up of Terra Nova.
Net earnings in 2004 were $1,757 million, up 6% from $1,650 million in 2003. Net earnings include gains or losses on foreign currency translation and on disposal of assets and an unrealized loss on Buzzard derivative contracts.
Operating Return on Capital Employed
Operating return on capital employed increased by 2.7% in 2004.
2004 VERSUS 2003 FACTOR ANALYSIS
Earnings from Operations Excluding Adjustments for One-time and Unusual Items
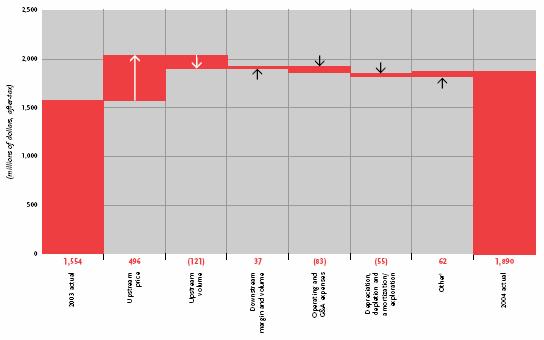
(1) Other mainly includes interest expense and changes in effective tax rates and upstream inventory levels.
Consolidated 2004 cash flow was $3,747 million, compared with $3,372 million in 2003. The increase in cash flow reflects higher earnings from operations partially offset by higher current income taxes.
13
QUARTERLY INFORMATION
Consolidated Quarterly Financial Results
| | 2004 | | 2003 | |
(millions of dollars, unless otherwise indicated) | | Quarter 1 | | Quarter 2 | | Quarter 3 | | Quarter 4 | | Quarter 1 | | Quarter 2 | | Quarter 3 | | Quarter 4 | |
| | | | | | | | | | | | | | | | | |
Total revenue | | $ | 3,473 | | $ | 3,565 | | $ | 3,622 | | $ | 3,717 | | $ | 3,722 | | $ | 2,957 | | $ | 3,118 | | $ | 3,102 | |
Earnings from operations | | 517 | | 471 | | 461 | | 439 | | 485 | | 451 | | 296 | | 150 | |
Net earnings | | 513 | | 393 | | 410 | | 441 | | 579 | | 584 | | 289 | | 198 | |
Cash flow from operating activities before changes in non-cash working capital | | 921 | | 885 | | 895 | | 1,046 | | 991 | | 874 | | 879 | | 628 | |
Earnings per share (dollars) | | | | | | | | | | | | | | | | | |
– basic | | $ | 1.93 | | $ | 1.48 | | $ | 1.54 | | $ | 1.69 | | $ | 2.19 | | $ | 2.20 | | $ | 1.09 | | $ | 0.75 | |
– diluted | | $ | 1.90 | | $ | 1.46 | | $ | 1.52 | | $ | 1.67 | | $ | 2.16 | | $ | 2.17 | | $ | 1.08 | | $ | 0.74 | |
Variances from quarter to quarter in revenues and net earnings resulted mainly from: fluctuations in commodity prices and refinery cracking margins; the impact on production and processed volumes from maintenance and other shutdowns at major facilities; and the level of exploration drilling activity. For further analysis of quarterly results, refer to Petro-Canada’s quarterly reports to shareholders available on the Company’s Web site at www.petro-canada.ca.
Q:
How does Petro-Canada manage its financial affairs?
A:
Petro-Canada maintains its financial strength and flexibility by targeting its debt levels at 25% to 35% of total capital and a ratio of less than 2.0 times debt to cash flow.
Liquidity and Capital Resources
Summary of Cash Flows
(millions of dollars) | | 2004 | | 2003 | | 2002 | |
| | | | | | | |
Net cash inflows (outflows) before changes in non-cash working capital: | | | | | | | |
Operating activities | | $ | 3,747 | | $ | 3,372 | | $ | 2,276 | |
Investing activities | | (4,709 | ) | (2,297 | ) | (4,141 | ) |
Financing activities | | (19 | ) | (604 | ) | 1,560 | |
| | (981 | ) | 471 | | (305 | ) |
(Increase) decrease in non-cash working capital and other | | 516 | | (70 | ) | (242 | ) |
Increase (decrease) in cash and cash equivalents | | $ | (465 | ) | $ | 401 | | $ | (547 | ) |
Cash and cash equivalents at end of year | | $ | 170 | | $ | 635 | | $ | 234 | |
The Company maintains solid investment-grade credit ratings.
14
The improvement in cash flow before changes in non-cash working capital to $3,747 million in 2004 was primarily from higher earnings from operations partially offset by higher current taxes. The increased cash outflow on investing activities reflected the Buzzard and U.S. Rockies acquisitions. The $117 million decrease in non-cash working capital reflected higher accounts payable and accrued liabilities along with income taxes payable, partially offset by higher accounts receivable.
INVESTING ACTIVITIES
Capital and Exploration Expenditures
(millions of dollars) | | 2005
Outlook | | 2004 | | 2003 | | 2002 | |
| | | | | | | | | |
Upstream(1) | | | | | | | | | |
North American Natural Gas | | $ | 760 | | $ | 724 | | $ | 560 | | $ | 530 | |
East Coast Oil | | 315 | | 278 | | 344 | | 289 | |
Oil Sands | | 400 | | 399 | | 448 | | 462 | |
International | | 825 | | 1,824 | (2) | 525 | | 221 | |
| | 2,300 | | 3,225 | | 1,877 | | 1,502 | |
Downstream | | | | | | | | | |
Refining and Supply | | 780 | | 656 | | 296 | | 210 | |
Sales and Marketing | | 105 | | 171 | | 117 | | 118 | |
Lubricants | | 35 | | 12 | | 11 | | 16 | |
| | 920 | | 839 | | 424 | | 344 | |
Shared Services | | 15 | | 9 | | 14 | | 15 | |
Total property, plant and equipment and exploration | | 3,235 | | 4,073 | | 2,315 | | 1,861 | |
Deferred charges and other assets | | — | | 36 | | 147 | | 72 | |
Acquisition of oil and gas operations of Veba Oil & Gas GmbH (Veba) | | — | | — | | — | | 2,234 | |
Acquisition of Prima Energy Corporation | | — | | 644 | | — | | — | |
Total | | $ | 3,235 | | $ | 4,753 | | $ | 2,462 | | $ | 4,167 | |
(1) Includes exploration expenses charged to earnings, totaling $235 million in 2004, $271 million in 2003 and $301 million in 2002.
(2) Includes $1,218 million for the Buzzard acquisition.
Capital spending on property, plant and equipment and exploration in 2004 reflected Petro-Canada’s commitment to long-term profitable growth and adding value for shareholders. The 76% increase in expenditures to $4,073 million, up from $2,315 million in 2003, was mainly due to the Buzzard acquisition and costs associated with the development of the Buzzard project, the investments related to upgrading refineries to produce cleaner-burning fuels, increased spending for the pursuit of attractive opportunities in Western Canada and the acceleration of the Company’s retail re-imaging program.
Planned investment for 2005, totaling $3,235 million, reflects a “building year” for Petro-Canada. The focus on growth initiatives is expected to deliver new production in 2006 and 2007. The 2005 capital expenditure program is expected to be funded from cash flow and existing credit facilities.
FINANCING ACTIVITIES AND DIVIDENDS
Financial Ratios | | 2004 | | 2003 | | 2002 | |
| | | | | | | |
Interest coverage (times): | | | | | | | |
Earnings basis | | 20.9 | | 16.6 | | 10.4 | |
EBITDAX basis | | 31.0 | | 26.3 | | 17.1 | |
Cash flow basis | | 33.0 | | 25.4 | | 17.9 | |
Debt to cash flow (times) | | 0.7 | | 0.7 | | 1.3 | |
Debt-to-debt plus equity (%) | | 22.8 | | 22.7 | | 35.1 | |
Petro-Canada’s debt to cash flow ratio, the key short-term leverage measure, was 0.7 times as of December 31, 2004, unchanged compared to the prior year. The Company expects to remain well within the target range of no more than 2.0 times throughout 2005. Debt-to-debt plus equity, the long-term measure for capital structure, was 22.8% at year-end 2004, up slightly from 22.7% at the prior year end. This is well within the target range of 25% to 35%. Petro-Canada has controls in place to ensure compliance with all financial covenants.
2005 Capital Program
(millions of dollars)
Capital program by investment priority:

| | Regulatory compliance: 635 |
| | |

| | Enhancing existing assets: 130 |
| | |

| | Improving base business profitability: 120 |
| | |

| | Reserves replacement in core areas: 950 |
| | |

| | New growth projects: 1,130 |
| | |

| | Exploration and new ventures: 270 |
Key debt ratios have remained relatively unchanged from 2003 levels notwithstanding the significant investment program in 2004.
Interest Coverage
The Company’s positive interest coverage ratio demonstrates more than sufficient earnings to cover interest charges on debt.
15
Key Debt Ratios
Petro-Canada has the financial strength and flexibility to manage changing market dynamics and pursue new growth opportunities.
Sources of Capital Employed
(millions of dollars) | | 2004 | | 2003 | | 2002 | |
| | | | | | | |
Short-term notes payable | | $ | 299 | | $ | — | | $ | — | |
Long-term debt, including current portion | | 2,281 | | 2,229 | | 3,057 | |
Shareholders’ equity | | 8,739 | | 7,588 | | 5,662 | |
Total | | $ | 11,319 | | $ | 9,817 | | $ | 8,719 | |
Total debt increased to $2,580 million at December 31, 2004, compared with $2,229 million at the previous year end. The increase in debt was associated with the activities outlined in the financing activities section and general operating needs, offset by a reduction of $182 million due to revaluation of the U.S. dollar-denominated long-term debt. Short-term notes payable consisted of $70 million of U.S. dollar-denominated Canadian commercial paper and $215 million in Canadian dollar-denominated Canadian commercial paper.
2004 Financing Activities
Petro-Canada’s balance sheet was put to use in support of business growth initiatives in 2004. During the second quarter, the Company borrowed $210 million US under the syndicated operating credit facilities to partially fund the acquisition of a 29.9% interest in the Buzzard oilfield. The balance of the $887 million US acquisition cost was funded with existing cash balances. All advances under the syndicated operating credit facilities were repaid in the third quarter.
During the third quarter, the Company borrowed $400 million US under an acquisition credit facility to acquire all of the outstanding shares of Prima Energy Corporation (referred to as the U.S. Rockies). The remainder of the total acquisition price of $644 million, net of acquired cash, was funded using cash on hand and short-term borrowings.
In the fourth quarter of 2004, the Company issued $400 million US of 10-year senior notes. The net proceeds were used to repay the U.S. Rockies acquisition credit facility.
Also during the year, Petro-Canada sold $400 million under a new accounts receivable securitization program. A portion of the proceeds was used to repay the remaining $293 million of advances under the acquisition credit facility that funded the purchase of Veba in 2002.
In addition to financing growth, the Company also had the capacity to create value by returning capital to shareholders during the year. The TSX approved Petro-Canada’s application to make a normal course issuer bid for the repurchase of up to 21 million of its common shares over the 12-month period ending June 21, 2005, subject to certain conditions. By year-end 2004, the Company had repurchased and cancelled a total of 6,868,082 shares at an average price of $65.02 per share for a total cost of approximately $447 million. Petro-Canada intends to continue to repurchase shares when there is an opportunity to create value.
For operating purposes, Petro-Canada had cash and cash equivalents of $170 million at year-end 2004. During 2004, the Company put in place new syndicated operating credit facilities totaling $1,500 million to be used for general corporate purposes. There were no draws on these facilities at year end; however, they provide liquidity support to Petro-Canada’s Canadian commercial paper program. The Company will continue to use its cash position and will draw on bank lines and issue commercial paper, as necessary, to meet working capital and other financing requirements.
Petro-Canada plans to meet remaining debt repayment commitments out of a combination of cash flow and debt refinancing.
At year-end 2004, the Company’s unsecured long-term debt securities were rated Baa2 by Moody’s Investors Services, BBB by Standard & Poor’s Rating Services and A (low) by Dominion Bond Rating Service. These ratings remained unchanged from year-end 2003.
Excluding cash and cash equivalents, short-term notes payable and the current portion of long-term debt, Petro-Canada had an operating working capital deficiency of $777 million as at December 31, 2004, compared with an operating working capital deficiency of $52 million at the end of 2003. The working capital deficiency increase was primarily due to the accounts receivable securitization program and higher accounts payable resulting from higher commodity prices and capital accruals.
Off-balance sheet activities are limited to matters such as the accounts receivable securitization program, which does not meet the criteria for consolidation and guarantees. None of these would have a material impact on the Company’s financial results, liquidity or capital resources.
At year-end 2004, Petro-Canada’s defined benefits pension plans were under-funded by $330 million, compared with an under-funded position of $292 million at year-end 2003. In 2004, Petro-Canada made
16
cash contributions of $93 million to the pension plans and recorded a pension expense of $71 million before tax. This compares with $86 million of cash contributions and $72 million of pension expense, respectively, for 2003. In 2005, the Company expects to make pension contributions of approximately $95 million.
The following table summarizes Petro-Canada’s contractual obligations as at December 31, 2004.
Contractual Obligations – Summary
| | PAYMENTS DUE BY PERIOD | |
(millions of dollars) | | Total | | 2005 | | 2006-2007 | | 2008-2009 | | 2010 and
thereafter | |
| | | | | | | | | | | |
Unsecured debentures and senior notes(1) | | $ | 4,774 | | $ | 137 | | $ | 277 | | $ | 277 | | $ | 4,083 | |
Short-term notes payable(1) | | 299 | | 299 | | — | | — | | — | |
Capital lease obligations(1) | | 178 | | 17 | | 34 | | 21 | | 106 | |
Operating leases | | 650 | | 122 | | 182 | | 129 | | 217 | |
Transportation agreements | | 1,302 | | 198 | | 329 | | 256 | | 519 | |
Product purchase/delivery obligations(2) | | 1,561 | | 83 | | 234 | | 172 | | 1,072 | |
Exploration work commitments(3) | | 119 | | 60 | | 53 | | 6 | | — | |
Asset retirement obligations | | 2,417 | | 72 | | 126 | | 55 | | 2,164 | |
Other long-term obligations(4), (5) | | 2,059 | | 123 | | 7 | | 154 | | 1,775 | |
Total contractual obligations | | $ | 13,360 | | $ | 1,111 | | $ | 1,242 | | $ | 1,070 | | $ | 9,936 | |
(1) Obligations include related interest. For further details see Note 17 to the 2004 Consolidated Financial Statements.
(2) Excludes supply purchase agreements contracted at market prices, where the products could reasonably be re-sold into the market.
(3) Excludes other amounts related to the Company’s expected future capital spending. Capital spending plans are reviewed and revised annually to reflect Petro-Canada’s strategy, operating performance and economic conditions. For further information regarding future capital spending plans refer to the business segment and investing activities discussions in the sections of the 2004 MD&A.
(4) Includes processing agreement with Suncor Energy Inc., receivables securitization program, pension funding obligations for the periods prior to the Company’s next required pension plan valuation and other obligations. Pension obligations beyond the next required pension valuation date were excluded due to the uncertainty as to the amount or timing of these obligations.
(5) Petro-Canada is involved in litigation and claims associated with normal operations. Management is of the opinion that any resulting settlements would not materially affect the financial position of the Company. The table excludes amounts for these contingencies due to the uncertainty as to the amount or timing of any settlements.
During 2004, Petro-Canada’s total contractual obligations increased by approximately $7,700 million, mainly due to finalization of an agreement with Suncor Energy Inc. for the processing of future bitumen production, an increase in debt levels associated with the U.S. Rockies acquisition, obligations relating to the accounts receivable securitization and the inclusion of obligations relating to interest and asset retirements, which were previously excluded.
Dividend Strategy
From time to time, Petro-Canada reviews its dividend strategy to ensure the alignment of dividend policy with shareholder expectations and financial and growth objectives. Currently, the Company’s first priority for available cash is to fund profitable growth opportunities. The second priority is to return funds to shareholders through dividends and share buyback programs. Commencing with the second quarter dividend paid on April 1, 2004, the Company increased the quarterly dividend 50% to $0.15 per share. Total dividends paid in 2004 were $159 million, compared with $106 million in 2003.
Government Public Offering
In September 2004, the Government of Canada completed the public offering of its remaining 19% interest in the Company. The government sold approximately 49 million Petro-Canada common shares at a price of $64.50 per share, resulting in total gross proceeds to the government of approximately $3.2 billion.
UPSTREAM
Petro-Canada’s upstream operations consist of four business segments: North American Natural Gas, with current production in Western Canada and the U.S. Rockies; East Coast Oil, with three major developments offshore Newfoundland and Labrador; Oil Sands operations in Northeastern Alberta; and International, where the Company is active in three core areas: Northwest Europe; North Africa/Near East; and Northern Latin America. The diverse asset base provides a balanced portfolio and a platform for long-term growth.
Petro-Canada increased its dividend by 50% in 2004.
17
Q:
How is Petro-Canada going to profitably replace North American Natural Gas production?
A:
Our plans include continuing the exploitation of our conventional assets, stepping out to unconventional production, advancing our liquefied natural gas (LNG) strategy and developing the frontier regions.
The Hanlan Robb natural gas plant in the Foothills region of Alberta.
The Wildcat Hills natural gas plant.
North American Natural Gas
BUSINESS SUMMARY AND STRATEGY
North American Natural Gas has a long history of exploring for and producing natural gas, crude oil and natural gas liquids in Western Canada. This business also markets natural gas in North America, has established resources in the Mackenzie Delta/Corridor and has landholdings in Alaska. In 2004, the business expanded into unconventional production and signed an agreement to develop a proposed LNG re-gasification facility in Quebec.
The North American Natural Gas strategy is to be a significant and sustainable market participant by accessing new and diverse natural gas supply sources in North America. Key features of the strategy include:
• continuing exploration and development in existing Western Canada conventional areas;
• increasing focus on unconventional production in the U.S. Rockies and Western Canada;
• developing LNG import capacity in North America; and
• building the northern resource base for long-term growth.
18
North American Natural Gas Financial Results
(millions of dollars) | | 2004 | | 2003 | | 2002 | |
| | | | | | | |
Net earnings | | $ | 500 | | $ | 492 | | $ | 168 | |
| | | | | | | |
Gain (loss) on sale of assets | | — | | 33 | | (1 | ) |
| | | | | | | |
Earnings from operations | | $ | 500 | | $ | 459 | | $ | 169 | |
| | | | | | | |
Income tax adjustment | | 7 | | 10 | | — | |
| | | | | | | |
Earnings from operations excluding adjustments for one-time and unusual items | | $ | 493 | | $ | 449 | | $ | 169 | |
| | | | | | | |
Cash flow from operating activities before changes in non-cash working capital | | $ | 940 | | $ | 985 | | $ | 534 | |
Expenditures on property, plant and equipment and exploration | | $ | 724 | | $ | 560 | | $ | 530 | |
Total assets | | $ | 3,477 | | $ | 2,341 | | $ | 2,285 | |
2004 COMPARED WITH 2003
North American Natural Gas contributed earnings from operations adjusted for one-time and unusual items of $493 million in 2004, up 10% from $449 million in 2003. The increase was largely driven by strong realized natural gas prices and acquired volumes from the U.S. Rockies. These factors were partially offset by lower Western Canada volumes and higher costs.
Net earnings from North American Natural Gas were $500 million in 2004, up from $492 million in 2003. Net earnings in 2004 included a $7 million positive adjustment to reflect a reduction in provincial income tax rates. Net earnings in 2003 included a $33 million after-tax gain on the sale of assets and a $10 million positive adjustment to reflect the changes in federal and provincial tax rates.
Natural gas commodity prices and volumes remained strong in 2004. The realized natural gas price averaged $6.72/Mcf, up 3% from $6.50/Mcf in 2003. Natural gas production averaged 695 MMcf/d in 2004, up from 693 MMcf/d in 2003, as acquired volumes from the U.S. Rockies offset lower volumes in Western Canada. Conventional crude oil and natural gas liquids production averaged 15,300 b/d, down from 16,900 b/d in 2003 due to the disposition of properties in 2003.
2004 Operating Review and Strategic Initiatives
North American Natural Gas recorded solid operating results in 2004 from core areas in Western Canada and the U.S. Rockies. In addition, Petro-Canada announced a proposal to jointly develop an LNG re-gasification facility in Quebec and continued building its resource position in the Far North.
Western Canada continued to exploit conventional gas opportunities in four core areas – the Alberta Foothills, Northeastern British Columbia, Southeastern Alberta and West-Central Alberta. Western Canada natural gas production averaged 676 MMcf/d, down 2% from 693 MMcf/d in 2003. Exploration and development drilling activity in Western Canada resulted in 564 gross successful wells, for a success rate of 96% in 2004. Western Canada operating and overhead costs were $0.85 per thousand cubic feet of natural gas equivalent (Mcfe) in 2004, up from $0.71/Mcfe in the previous year. This increase reflected industry-wide cost increases and higher turnaround costs.
During 2004, the North American Natural Gas business grew to include unconventional gas operations and skills. In mid-2004, its footprint was extended into the U.S. Rockies by acquiring Prima Energy Corporation (U.S. Rockies) for $644 million, net of acquired cash. This acquisition added 55 MMcfe/d primarily from coal bed methane in the Powder River Basin and from tight gas in the Denver-Julesburg basin and significant expertise in unconventional production. The integration of this acquisition went smoothly in 2004.
In Western Canada, the business unit also began pursuing unconventional production. A dedicated team began developing tight gas opportunities east of the Foothills of Alberta and in Northeast British Columbia. During 2004, 20 gross wells were drilled and approximately 70,000 gross acres of land were acquired.
Western Canada Operating and Overhead Costs
Western Canada operating and overhead costs were largely driven by industry-wide cost increases, lower volumes and higher turnaround costs.
• Includes Western Canada natural gas, conventional oil and natural gas liquids.
The U.S. Rockies acquisition in 2004 provided expertise and growth opportunities in unconventional gas.
19
North American Natural Gas Annual Production
Crude Oil and Natural Gas Liquids Annual Production
Petro-Canada will continue to access new supply from three sources: unconventional gas; Far North gas; and LNG projects.
Petro-Canada is seeking to participate in the global LNG business with the objective to add long-life producing assets to its portfolio. In September 2004, a Memorandum of Understanding (MOU) was signed with TransCanada PipeLines Limited to develop and share (50/50) ownership of a $660 million LNG facility at Gros-Cacouna, Quebec. The proposed facility, targeted to be in service by late 2009, will receive, store and re-gasify imported LNG. Petro-Canada will have 100% of the send-out capacity of approximately 500 MMcf of natural gas per day.
Petro-Canada also continued to position itself for long-term North American supply by accessing Far North supply regions in advance of proposed northern pipeline projects. In the Mackenzie Delta/Corridor region, plans for development of existing discoveries of Tuk in the Mackenzie Delta and Tweed Lake and Bele in the Colville area were advanced. The business also purchased an exploration licence to add to its land base in the Corridor. In addition, a large land position was acquired in the National Petroleum Reserve-Alaska, an area with significant potential for large oil prospects.
Capital expenditures in 2004 totaled $724 million, with $625 million for exploration and development of natural gas in Western Canada, $26 million for U.S. Rockies development and $73 million for other natural gas opportunities in North America.
OUTLOOK
Production expectations in 2005:
• Western Canada production to average 630 MMcf/d of natural gas and 12,000 b/d of crude oil and natural gas liquids;
• U.S. Rockies production to average about 55 MMcfe/d.
Action plans:
• drill approximately 650 gross wells in Western Canada in 2005;
• advance long-term opportunities in Northern Canada and Alaska;
• file regulatory application for LNG facility at Gros-Cacouna by mid-2005;
• double U.S. Rockies gas production by 2007.
Capital spending plans in 2005:
• $485 million to replace reserves in the Western Canada core areas;
• $230 million for new unconventional growth opportunities in Western Canada and the U.S. Rockies;
• $45 million to develop long-term supply opportunities in Alaska and the Mackenzie Delta/Corridor, and to further the proposed Gros-Cacouna LNG re-gasification terminal.
The 2005 capital program of approximately $760 million reflects a focus on replacing reserves in core areas and continuing to develop tight gas and coal bed methane production capability. Additional volumes from the U.S. Rockies are expected to largely offset, in the medium term, the natural declines of Western Canada conventional natural gas production. In the long term, supply from the Mackenzie Delta/Corridor, Alaska and LNG projects is expected to play a growing role to meet North American demand.
Western Canada will continue to exploit core conventional areas. In the Foothills, the business will capitalize on a strong technical and operating competency in deep sour gas and is well positioned with its producing infrastructure.
In the shallow gas region of Southeastern Alberta, production has steadily increased over the last few years to 78 MMcf/d at 2004 year end. This success is expected to continue as a result of a multi-year drilling program aimed at doubling well space density from four to eight wells per section. In Northeastern British Columbia, the business will continue to optimize and selectively explore existing assets. In the West Central region, declines will be managed through asset optimization and cost discipline.
In 2005, Western Canada intends to continue to pursue tight gas structures, with plans to drill approximately 35 additional wells. The full value from the U.S. Rockies acquisition will come from developing the large inventory of probable reserves. Petro-Canada plans to double unconventional gas equivalent production to 100 MMcfe/d by 2007.
20
Q: |
How is Petro-Canada going to sustain reliable and profitable East Coast production from these capital-intensive investments into the next decade? |
| | |
A: |
We have plans in place to achieve first quartile performance at existing platforms, add production through development of reservoir extensions, participate in White Rose and pursue new projects. |
|
The Petro-Canada operated Terra Nova FPSO produces oil on the Grand Banks offshore Newfoundland and Labrador. |
|

|
|
|
|
Workers on a support vessel prepare to tow an iceberg offshore Newfoundland and Labrador as part of the active ice management program. |
East Coast Oil
BUSINESS SUMMARY AND STRATEGY
Petro-Canada is positioned in every major oil development off Canada’s East Coast. The Company is the operator and holds the largest interest in Terra Nova (34%), and has a 20% interest in Hibernia, the first Grand Banks development. Petro-Canada also holds a 27.5% interest in the White Rose project, scheduled to be on-stream in 2006.
The East Coast Oil strategy is to improve reliability and sustain profitable production well into the next decade. Key features of the strategy include:
• delivering top quartile safety and operating performance;
• sustaining profitable production through reservoir extensions and add-ons; and
• pursuing high potential development projects.
21
East Coast Oil Operating and Overhead Costs
Operating and overhead costs are effectively unchanged in 2004.
White Rose will add approximately 25,000 b/d of production at plateau.
Petro-Canada’s Share of Hibernia and Terra Nova Production
East Coast Oil Financial Results
(millions of dollars) | | 2004 | | 2003 | | 2002 | |
| | | | | | | |
Net earnings and earnings from operations | | $ | 711 | | $ | 597 | | $ | 428 | |
| | | | | | | |
Income tax adjustment | | 3 | | 7 | | — | |
Terra Nova insurance proceeds | | 31 | | 17 | | — | |
| | | | | | | |
Earnings from operations excluding adjustments for one-time and unusual items | | $ | 677 | | $ | 573 | | $ | 428 | |
| | | | | | | |
Cash flow from operating activities before changes in non-cash working capital | | $ | 996 | | $ | 869 | | $ | 687 | |
Expenditures on property, plant and equipment and exploration | | $ | 278 | | $ | 344 | | $ | 289 | |
Total assets | | $ | 2,265 | | $ | 2,288 | | $ | 2,249 | |
2004 COMPARED WITH 2003
East Coast Oil contributed earnings from operations adjusted for one-time and unusual items of $677 million in 2004, up 18% from $573 million in 2003. The earnings increase reflected higher realized prices, partially offset by lower production.
Net earnings from East Coast Oil were $711 million in 2004, up from $597 million in 2003. Net earnings in 2004 included a $3 million positive adjustment to reflect a reduction in provincial income tax rates and $31 million of insurance proceeds related to the delayed start-up of Terra Nova. Net earnings in 2003 included a $7 million positive adjustment to reflect the changes in federal and provincial tax rates and $17 million of insurance proceeds related to the delayed start-up of Terra Nova.
East Coast Oil realized crude prices averaged $48.39/bbl, up from $39.91/bbl in 2003.
Petro-Canada’s share of East Coast Oil production averaged 78,200 b/d, down from 86,100 b/d in 2003. The decrease was largely due to lower production at Terra Nova.
East Coast Oil operating and overhead costs averaged $2.89/bbl in 2004, effectively unchanged from $2.88/bbl in 2003.
2004 Operating Review and Strategic Initiatives
Petro-Canada’s share of Hibernia’s production averaged 40,800 b/d in 2004, up from 40,600 b/d in 2003. The Hibernia platform continued to deliver first quartile operating performance. As a result of better-than-expected reservoir performance, the life of field reserves estimate increased from 835 MMbbls at year-end 2003 to 940 MMbbls at year-end 2004 at Hibernia, with Petro-Canada’s share being 20%.
At Terra Nova, the Company’s share of production averaged 37,400 b/d, down from 45,500 b/d in 2003. Both production and reliability measures were significantly below target due to extended maintenance activities and operating difficulties in the third and fourth quarters of 2004. During the third quarter, volumes were impacted by a longer-than-expected turnaround for repairs to the gas compression facilities. Further downtime occurred in the fourth quarter for investigation and repairs following a discharge of oily water. Following successful maintenance activities, production rates were returned to normal levels during the last half of December. Terra Nova reached simple royalty payout in 2004. Meeting this milestone in two-and-a-half years is a good indication of the value created by this asset.
The next East Coast development to come on-stream will be White Rose in early 2006, which will add approximately 25,000 b/d of production. The project remained on budget and on schedule in 2004, and key project milestones included: arrival of the Sea Rose Floating Production, Storage and Offloading (FPSO) hull in Newfoundland and Labrador; fabrication and lifting of the topsides modules onto the hull of the FPSO; initiation of the marine construction program offshore; and drilling of the first five development wells with pre-commissioning activities under way.
In 2004, capital expenditures for exploration and development of crude oil offshore Canada’s East Coast were $278 million, including $155 million related to the development of the White Rose oilfield.
22
OUTLOOK
Production expectations in 2005:
• East Coast Oil production is expected to average 77,000 b/d, reflecting planned turnarounds.
Growth plans:
• achieve first quartile operating performance at Terra Nova;
• begin development drilling of Terra Nova’s Far East block;
• submit development plans for Hibernia’s Ben Nevis Avalon formation;
• complete White Rose development for early 2006;
• continue discussions on a Joint Operating Agreement with the partners of the potential Hebron project.
Capital spending plans in 2005:
• Approximately $125 million will be spent on drilling to replace reserves at Hibernia and Terra Nova, and developing Terra Nova’s Far East block and the Ben Nevis Avalon reservoir at Hibernia.
• Approximately $190 million will be spent to bring the White Rose project on-stream in early 2006, adding 25,000 b/d net to Petro-Canada at peak production.
From a reliability perspective, Petro-Canada plans to achieve first quartile reliability and operating costs at Terra Nova during 2006. In 2005, a four-week planned turnaround will perform regulatory inspections on equipment and do work to improve the reliability of the gas compression and injection systems. These areas were the main cause of downtime over the past couple of years. The Hibernia platform will also have a one-week turnaround in 2005.
While royalty rates at Hibernia remained relatively constant in 2004, Terra Nova royalty rates increased to 5% in mid-2004 due to the simple royalty payout achieved. Further increases in royalty rates will occur in line with the project’s profitability-sensitive royalty regime. Terra Nova royalties are forecast to average about 12% in 2005.
The business will continue development drilling in the main fields, with plans to bring on the Far East block at Terra Nova and to expand production from the Ben Nevis Avalon reservoir at Hibernia. East Coast Oil volumes are expected to increase in the second quarter of 2006, as production from the White Rose development comes on-stream. This production will help offset declines in the main reservoirs at Hibernia and Terra Nova.
Petro-Canada is also continuing to have discussions with partners on the potential Hebron project.
In East Coast Oil, the priorities are to improve reliability at Terra Nova and sustain profitable production while progressing the White Rose project.
23
Q: |
Is Petro-Canada’s phased and integrated strategy in the Oil Sands yielding results? |
|
A: |
We have made great strides to improve reliability. We see greater potential from these long-life assets as we integrate with our Edmonton refinery and bring on the next phase of oil sands development. |
| |
This production well at MacKay River collects heated bitumen, which is then piped to the site’s central processing facility. |
The steam from these four generators is used to reduce the viscosity of the tar-like bitumen so it can be brought to the surface. |
Oil Sands |
|
BUSINESS SUMMARY AND STRATEGY |
|
Petro-Canada’s major Oil Sands interests include a 12% ownership in the Syncrude joint venture (an oil sands mining operation and upgrading facility), 100% ownership of the MacKay River in situ bitumen development (a steam-assisted gravity drainage (SAGD) operation), a 60% ownership in and operator of the Fort Hills oil sands mining project and extensive oil sands acreage considered prospective for in situ development of bitumen resources. |
|
The Oil Sands strategy for profitable growth includes: |
|
• phased and integrated development of reserves to incorporate knowledge gained; • disciplined capital investment to ensure long-life projects are value creating; and • a staged approach to development of capital-intensive Oil Sands projects to allow rigorous cost management and the opportunity to benefit from evolving technology. |
24
Oil Sands Financial Results
(millions of dollars) | | 2004 | | 2003 | | 2002 | |
| | | | | | | |
Net earnings and earnings (loss) from operations | | $ | 120 | | $ | (52 | ) | $ | 78 | |
Income tax adjustment | | 2 | | 5 | | — | |
Edmonton refinery conversion program | | — | | (82 | ) | — | |
Earnings from operations excluding adjustments for one-time and unusual items | | $ | 118 | | $ | 25 | | $ | 78 | |
| | | | | | | |
Cash flow from operating activities before changes in non-cash working capital | | $ | 334 | | $ | 127 | | $ | 196 | |
Expenditures on property, plant and equipment and exploration | | $ | 399 | | $ | 448 | | $ | 462 | |
Total assets | | $ | 1,883 | | $ | 1,770 | | $ | 1,498 | |
2004 COMPARED WITH 2003
Oil Sands contributed earnings from operations adjusted for one-time and unusual items of $118 million in 2004, up 372% from $25 million in 2003. The earnings increase reflected higher realized prices and production at Syncrude and MacKay River in 2004.
Net earnings from Oil Sands were $120 million in 2004, up from a net loss of $52 million in 2003. Net earnings in 2004 included a $2 million positive adjustment to reflect a reduction in provincial income tax rates. Net earnings in 2003 included a $5 million positive adjustment to reflect changes in federal and provincial tax rates and an after-tax charge of $82 million for the write-off of costs related to the original Edmonton refinery conversion plan.
At Syncrude, the average price realized for synthetic crude oil production in 2004 was $52.40/bbl, up from $42.67/bbl in 2003.
MacKay River realized prices for bitumen averaged $18.37/bbl for 2004, up from $16.69/bbl in 2003. Bitumen prices sank to extremely low levels in late 2004. This was due to the widening of light/heavy crude price differentials, to unprecedented levels, which hindered Oil Sands earnings. Operating costs averaged $20.98/bbl in 2004, compared to $22.11/bbl in 2003. Contributing factors to high operating costs were lower-than-expected volumes, increased water treatment costs and fixed contractual obligations.
Oil Sands production in 2004 averaged 45,200 b/d, up from 36,100 b/d in 2003, reflecting higher production at both Syncrude and MacKay River.
2004 Operating Review and Strategic Initiatives
A key focus for Oil Sands during 2004 was reliability.
At Syncrude, efforts to improve reliability and lower unit operating costs resulted in record gross production of 238,000 b/d. Syncrude also lowered unit operating costs by $2.51/bbl. Average unit operating costs decreased to $21.13/bbl in 2004, compared to $23.64/bbl in 2003 due to improved reliability and higher volumes. Petro-Canada’s share of Syncrude’s production averaged 28,600 b/d, up from 25,400 b/d in 2003.
Capital expenditures for Syncrude in 2004 were $314 million, mainly for the Stage III expansion. This project includes a second Aurora mine and an upgrading expansion. Construction progress and costs remain in line with the revised plan announced in March 2004, with completion scheduled for mid-2006.
MacKay River improved reliability of operations and production during 2004, but fell short of full year expectations of 25,000 b/d. In 2004, MacKay River production averaged 16,600 b/d, compared to 10,700 b/d in 2003. Continual improvements resulted in fourth quarter production averaging 19,800 b/d, compared to 16,300 b/d in the same period in 2003. Production was impacted by a one-week outage and subsequent ramp up resulting from a mechanical problem with the plant. There were also steam limitations when the third-party co-generation facility was not operational due to water treatment reliability. Reliability improved with steady operations from the 165-megawatt co-generation facility for the second half of 2004. Equipment to improve water treatment and plant reliability was successfully tied-in during the planned turnaround in the third quarter.
In 2004, capital expenditures were $45 million for MacKay River and $40 million for other in situ projects.
The SAGD in situ development uses horizontal drilling technology to inject steam into the deposit to heat the oil sands, lowering the viscosity of the bitumen.
Syncrude and MacKay River Operating and Overhead Costs
• MacKay River operating costs are expected to decline going forward as reliability improves and volumes grow.
Syncrude reached record net production of 28,600 b/d in 2004.
25
Syncrude and MacKay River Production
When completed, the third well pad at MacKay River will increase production and maximize utilization of surface facilities.
OUTLOOK
2005 production expectations:
• Petro-Canada’s share of Syncrude production to average 28,000 b/d;
• MacKay River bitumen production to average 24,000 b/d.
Growth plans:
• Syncrude Stage III expansion comes on-stream in 2006, adding 13,000 b/d over the ensuing two- to three-year ramp up period;
• application for next (second) SAGD project in 2005;
• increase production capacity at MacKay River by adding a third well pad;
• develop Fort Hills oil sands mining and upgrading project;
• advance SAGD technology through research and development.
2005 capital spending plans:
• $35 million to enhance existing operations and comply with regulations at Syncrude;
• $135 million to add a third well pad at MacKay River and replace the southwest quadrant mine at Syncrude;
• $150 million to fund the Syncrude Stage III expansion;
• $80 million to advance development of in situ oil sands leases.
Oil Sands production is expected to increase to about 52,000 b/d in 2005, compared to 45,200 b/d in 2004. The higher outlook reflects improved reliability and operating performance at MacKay River. The Syncrude Stage III expansion, scheduled for completion in mid-2006, will increase Petro-Canada’s share of Syncrude’s production capacity to approximately 42,000 b/d. Production will reach this level following a ramp up period of two to three years.
The Oil Sands 2005 capital expenditures of $400 million are focused on providing additional production from existing projects. A third well pad will be added at MacKay River to increase reservoir production and maximize plant throughput. As a result, operating costs at MacKay River are expected to decline going forward as reliability improves and volumes grow. A further $80 million will advance the future development of the Company’s in situ oil sands leases at MacKay River and other leases. The Company’s next in situ is expected to be developed on one of the existing leases with potential production of 30,000 to 40,000 b/d.
At the Edmonton refinery, Petro-Canada is investing to convert the facility to exclusively oil sands feedstocks and to produce low-sulphur products. By mid-2008, capital investment of $1.2 billion will expand coker capacity and utilities, and add a new crude unit, a vacuum unit and new sulphur plants. This will enable the Company to directly upgrade 26,000 b/d of bitumen and process 48,000 b/d of sour synthetic crude oil, replacing the conventional light crude feedstock refined today. The refinery conversion program supports the long-term strategy and builds on the $1.4 billion investment in gasoline and diesel desulphurization.
In early 2005, Petro-Canada became a 60% interest holder and operator of the Fort Hills oil sands mining project. The Company plans to develop this estimated 2.8 billion barrels of bitumen resource (1.7 billion barrels net to Petro-Canada) over a 30- to 40-year period.
26
Q: | |
How does Petro-Canada see its International business adding value over the long term? |
| |
A: | |
Petro-Canada is well positioned to access reserves to supply growing market demand from three focused international areas. |
| |
The Hibiscus platform offshore Trinidad is the production facility for the NCMA-1 development. |
| |
|
Operations on the Hanze production platform offshore in The Netherlands.
International
BUSINESS SUMMARY AND STRATEGY
International production and exploration interests are currently focused in three regions. In Northwest Europe, production comes from the U.K. and The Netherlands sectors of the North Sea. The North Africa/Near East region provides the major portion of International crude oil production from interests principally in Syria and Libya. In Northern Latin America, operations are focused in Trinidad and Venezuela.
The International business is the platform for Petro-Canada’s global growth. The strategy is to access a sizeable international resource base using a three-fold approach to:
• expand and exploit the existing portfolio of assets;
• target new opportunities and acquisitions with a focus on long-life assets; and
• build a balanced exploration program to replace reserves over time.
27
International Operating and Overhead Costs
Acquisition of the Buzzard project has strengthened Petro-Canada’s portfolio by adding higher netback barrels.
International Financial Results
(millions of dollars) | | 2004 | | 2003 | | 2002 | |
| | | | | | | |
Net earnings | | $ | 175 | | $ | 307 | | $ | 225 | |
Unrealized loss on Buzzard derivative contracts | | (205 | ) | — | | — | |
Gain on sale of assets | | 8 | | 10 | | — | |
Earnings from operations | | $ | 372 | | $ | 297 | | $ | 225 | |
Kazakhstan impairment | | — | | (46 | ) | — | |
International provisions | | — | | 45 | | — | |
Earnings from operations excluding adjustments for one-time and unusual items | | $ | 372 | | $ | 298 | | $ | 225 | |
| | | | | | | |
Cash flow from operating activities before changes in non-cash working capital | | $ | 1,027 | | $ | 890 | | $ | 583 | |
Expenditures on property, plant and equipment and exploration | | $ | 1,824 | | $ | 525 | | $ | 221 | |
Total assets | | $ | 5,954 | | $ | 3,973 | | $ | 3,544 | |
2004 COMPARED WITH 2003
International contributed earnings from operations adjusted for one-time and unusual items of $372 million in 2004, up 25% from $298 million in 2003. The earnings increase reflected higher realized commodity prices, partially offset by lower volumes and higher exploration and depreciation, depletion and amortization expenses.
Net earnings from International were $175 million in 2004, down from $307 million in 2003. Net earnings in 2004 included an after-tax unrealized loss on Buzzard derivative contracts of $205 million and an $8 million after-tax gain on the sale of non-core assets. Net earnings in 2003 included a $10 million after-tax gain on the sale of non-core assets, a $46 million provision related to the impairment of assets in Kazakhstan and a $45 million positive adjustment related to the clarification of production rights and a tax provision of a former operation.
International oil and liquids realized prices averaged $48.06/bbl in 2004, compared with $39.10/bbl in 2003. International realized prices for natural gas averaged $5.21/Mcf in 2004, compared with $4.80/Mcf in 2003.
International production of crude oil and natural gas averaged 196,700 boe/d in 2004, compared with 210,000 boe/d in 2003. Higher production in Trinidad and Northwest Europe was offset by lower production in Syria due to natural declines in the existing mature fields.
International operating and overhead costs averaged $5.94/boe in 2004, up from $5.21/boe in 2003, reflecting lower production and rising industry costs.
2004 Operating Review and Strategic Initiatives
Northwest Europe
In 2004, Northwest Europe continued to provide high netback production. Although a maturing basin, small- to mid-size reserves can be produced economically, especially if tied back to the extensive existing infrastructure. Petro-Canada’s production averaged 40,400 b/d of crude oil and natural gas liquids and 85 MMcf/d of natural gas in 2004, compared with 37,700 b/d and 80 MMcf/d, respectively, in 2003. The increase in production mainly reflected the new Clapham field, which came on-stream at the end of 2003.
The focus in Northwest Europe has been to expand and exploit the current portfolio. During 2004, Petro-Canada acquired a 29.9% interest in the Buzzard project in the U.K. sector of the North Sea. The Buzzard field has an estimated recovery of 550 MMbbls of oil, plus 18 MMboe of associated natural gas and natural gas liquids. Progress on the Buzzard field development was on schedule and on budget during 2004, with first oil expected by 2006. Other North Sea oil developments also progressed during the year. Both Pict and De Ruyter are expected to produce 10,000 b/d net to Petro-Canada, with on-stream dates in mid-2005 and late 2006, respectively.
28
North Africa/Near East
The North Africa/Near East region provides large resource potential with long-life, platform assets and is International’s largest producing region. In 2004, Petro-Canada’s production of crude oil and natural gas liquids averaged 126,600 b/d and 21 MMcf/d for natural gas, compared with averages of 143,100 b/d and 32 MMcf/d, respectively, in 2003. Lower volumes reflected declining production in the mature Syrian assets, partially offset by strong production in Libya.
In 2004, Petro-Canada continued to work on its expanded portfolio of operated exploration assets in Tunisia, Syria and Algeria. In Syria, the Company undertook extensive data gathering on Block II in preparation for shooting of both 2D and 3D seismic in 2005. In Tunisia, on the Melitta Block, Petro-Canada is currently preparing to drill the first of two exploration wells scheduled for 2005. The first well, which is onshore, should commence operations during the second quarter of 2005. The final timing of the second well, which is offshore, is dependent on securing a suitable drilling unit for the planned operations. In Algeria, the Company received final government approval for the Zotti Block. Preparations are ongoing for shooting of 2D seismic and drilling one well during 2005. These assets further business plans to build a balanced International exploration program for long-term growth.
Northern Latin America
Northern Latin America contains large potential in both offshore natural gas and conventional and heavy oil. Petro-Canada holds a 17% working interest in the North Coast Marine Area-1 gas development in Trinidad and a 50% interest in the La Ceiba block in Venezuela. In 2004, Petro-Canada’s share of Trinidad production averaged 72 MMcf/d, up from 63 MMcf/d in 2003. The increase was a result of supplying full year production to Train 3 at the Atlantic LNG facility. Train 3 started operations in the second quarter of 2003.
Petro-Canada continued its negotiations with the Government of the Republic of Trinidad and Tobago for production-sharing contracts for Blocks 1a and 1b in the Gulf of Paria. Further discussions and clarification of the bid for Block 22 progressed. In Venezuela, the extended production test to evaluate commercial viability of the La Ceiba development began during 2004.
International capital expenditures in 2004 were $606 million, with $395 million directed to Northwest Europe primarily for North Sea developments, $162 million invested in the North Africa/Near East region and $49 million going toward the Northern Latin America region and other capital projects.
Business Development Opportunities
To deliver International’s strategy of adding sizeable, long-life assets to the portfolio, the business has an experienced business development team. In 2004, this team pursued a number of significant opportunities such as participating in LNG projects, acquiring and developing established reserves in the Middle East and furthering exploration opportunities.
Complementing the proposed Gros-Cacouna LNG re-gasification terminal (page 20, North American Natural Gas, MD&A), Petro-Canada signed a Memorandum of Understanding (MOU) with OAO «Gazprom» (Gazprom) to investigate a joint project to ship Russian LNG to North American markets by 2009. The MOU covers options for Petro-Canada and Gazprom to jointly develop a liquefaction plant in the St. Petersburg region. Also included is the investigation of options for natural gas supplies to that LNG plant, and the re-gasification and marketing of natural gas in North America. With an international presence and extensive marketing experience, Petro-Canada is well positioned throughout the LNG value chain.
Negotiations to develop the Syria Middle Area Gas project ended early in 2005. The Government of the Syrian Arab Republic decided to develop the project rather than award it to a foreign consortium.
International Production
(1) Production for North Africa/Near East and Northwest Europe in 2002 is based on the average daily rate, post acquisition. Northern Latin America production in 2002 is based on production from start-up in August 2002.
In 2004, Petro-Canada signed an MOU with Gazprom to investigate upstream LNG supply options and marketing in North America.
29
OUTLOOK
Production expectations in 2005:
• North Africa/Near East oil and gas production to average 114,000 boe/d;
• Northwest Europe oil and gas production to average 43,000 boe/d;
• Northern Latin America natural gas production to average 66 MMcf/d.
Growth plans:
• advance Pict and De Ruyter developments for 2005 and 2006 start-up, respectively;
• progress Buzzard project in 2005, for first oil in 2006;
• expand exploration program to include activity in Northwest Europe and North Africa/Near East;
• continue to pursue new business opportunities in LNG and established reserves in the Middle East.
Capital spending plans in 2005:
• $195 million for reserves replacement spending in core areas;
• $470 million for new North Sea growth projects;
• $120 million for exploration and new ventures;
• $40 million for other expenditures, including a provision for the potential development of La Ceiba.
International production is expected to be 168,000 boe/d in 2005, compared with production of 196,700 boe/d in 2004. Lower production reflects declines in Syria and Northwest Europe.
International 2005 capital expenditures of approximately $825 million are primarily focused on significant near-term production growth, such as Buzzard, Pict and De Ruyter. These projects are well under way with an allocation of approximately $470 million of capital in 2005. Production from these projects is on track to come on-stream in 2005 and 2006.
Reserves replacement spending in core areas is expected to be about $195 million in 2005. The $120 million allocated to exploration and new ventures will initiate programs on new acreage in the North Sea, Tunisia, Syria and Algeria. This capital will also develop prospects around existing operations in North Africa and the North Sea.
Other expenditures, including a provision for the potential development of La Ceiba, will total $40 million. Should Petro-Canada receive a positive evaluation of the production test at La Ceiba, development of the project could proceed and come on-stream as early as 2008, building to peak production of 13,000 b/d (net).
In 2005, Petro-Canada expects to receive a decision from the Government of the Republic of Trinidad and Tobago for production-sharing contracts for Blocks 1a and 1b in the Gulf of Paria. A successful bid on Block 22 would also provide Petro-Canada with another quality exploration opportunity.
During 2005, International will also continue its investigation of potential LNG supply and marketing options with Gazprom.
30
Q: |
|
What volume of production does Petro-Canada expect from the upstream businesses in 2005? |
|
A: |
|
Our 2005 upstream production outlook is expected to fall in the range of 415,000 to 440,000 boe/d, with significant production growth over the next three years as new projects come on-stream. |
Upstream Production
2004 COMPARED WITH 2003
In 2004, production of crude oil, natural gas liquids and natural gas averaged 451,100 boe/d, compared with 464,500 boe/d in 2003. Production gains from the Oil Sands, the U.K. and the addition of the U.S. Rockies were more than offset by declines in Syria and Western Canada, and production outages at Terra Nova.
2004 Average Daily
Production Volumes | | North American
Natural Gas | | East
Coast Oil | | Oil Sands | | International | | Total | |
| | | | | | | | | | | |
Crude oil, natural gas liquids and bitumen (b/d) | | | | | | | | | | | |
net before royalties | | 15,300 | | 78,200 | | 16,600 | | 167,000 | | 277,100 | |
net after royalties | | 11,400 | | 75,100 | | 16,500 | | 107,800 | | 210,800 | |
Synthetic crude oil (b/d) | | | | | | | | | | | |
net before royalties | | — | | — | | 28,600 | | — | | 28,600 | |
net after royalties | | — | | — | | 28,300 | | — | | 28,300 | |
Natural gas (MMcf/d) | | | | | | | | | | | |
net before royalties | | 695 | | — | | — | | 178 | | 873 | |
net after royalties | | 530 | | — | | — | | 139 | | 669 | |
Total volumes (boe/d) | | | | | | | | | | | |
net before royalties | | 131,100 | | 78,200 | | 45,200 | | 196,600 | | 451,100 | |
net after royalties | | 99,700 | | 75,100 | | 44,800 | | 131,000 | | 350,600 | |
2003 Average Daily
Production Volumes | | North American
Natural Gas | | East
Coast Oil | | Oil Sands | | International | | Total | |
| | | | | | | | | | | |
Crude oil, natural gas liquids and bitumen (b/d) | | | | | | | | | | | |
net before royalties | | 16,900 | | 86,100 | | 10,700 | | 180,800 | | 294,500 | |
net after royalties | | 12,600 | | 84,000 | | 10,600 | | 115,600 | | 222,800 | |
Synthetic crude oil (b/d) | | | | | | | | | | | |
net before royalties | | — | | — | | 25,400 | | — | | 25,400 | |
net after royalties | | — | | — | | 25,100 | | — | | 25,100 | |
Natural gas (MMcf/d) | | | | | | | | | | | |
net before royalties | | 693 | | — | | — | | 175 | | 868 | |
net after royalties | | 521 | | — | | — | | 149 | | 670 | |
Total volumes (boe/d) | | | | | | | | | | | |
net before royalties | | 132,300 | | 86,100 | | 36,100 | | 210,000 | | 464,500 | |
net after royalties | | 99,500 | | 84,000 | | 35,700 | | 140,400 | | 359,600 | |
31
2005 Production Outlook
In 2005, production from Petro-Canada’s upstream businesses is expected to decrease slightly compared to 2004 levels. This is mainly due to declines in Syria and Northwest Europe. Factors that may impact production during 2005 include reservoir performance, drilling results, facility reliability and the execution of planned turnarounds at certain gas plants, Terra Nova, Hibernia, and Syncrude, and other factors. Investments in existing growth projects will provide additional production in 2006 and 2007. Exploration and new venture investments will also add longer-term production to the Company’s portfolio of assets.
Consolidated Production (boe/d) | | 2005 Outlook (+/-) | |
| | | |
North American Natural Gas | | | |
Natural gas | | 113,000 | |
Liquids | | 14,000 | |
East Coast Oil | | 77,000 | |
Oil Sands | | | |
Syncrude | | 28,000 | |
MacKay River | | 24,000 | |
International | | | |
North Africa/Near East | | 114,000 | |
Northwest Europe | | 43,000 | |
Northern Latin America | | 11,000 | |
Total | | 415,000 – 440,000 | |
PRODUCTION OVERVIEW
(1) As per the Company’s forecast.
32
Reserves
At year-end 2004, proved reserves before royalties totaled 1,214 million barrels of oil equivalent (MMboe), including 331 MMbbls of synthetic crude oil from oil sands mining.
This amount was down slightly from 1,220 MMboe at year-end 2003. Exploration, development and acquisition activities all contributed to the Company’s overall replacement of its reserves. As a result of better than forecast reservoir performance at Hibernia, Petro-Canada revised its life of field reserves estimate upward from 835 MMbbls to 940 MMbbls (from 167 MMbbls to 188 MMbbls, net Petro-Canada). This revision added more than 15 MMbbls to year-end 2004 proved reserves at Hibernia. However, in complying with U.S. Securities Exchange Commission (SEC) requirements to use prices and costs as of the date of the reserves estimate, the Company reclassified 22 MMbbls of proved bitumen reserves at its MacKay River development as probable reserves. This reflects abnormally high light/heavy crude oil differentials and high costs for synthetic crude oil (used as a blending material for transporting the bitumen to market) at year-end 2004. This reclassification did not have any financial impact on the Company and Petro-Canada continues to view its bitumen reserves and resources as an integral part of its overall growth portfolio. Absent this reclassification, the Company would have replaced 110% of its 2004 production.
As part of Petro-Canada’s long-term reserves replacement strategy, the Company added exploration capability and funding – especially internationally – to develop a balanced exploration program aimed at increasing the reserves base over time. In particular, Petro-Canada will target long-life reserves and aim for greater operatorship. The Company’s goal is a growth portfolio that provides a balanced range of risk/reward opportunities. The new exploration lands recently acquired in Syria, Tunisia and Algeria are early examples of initiatives in the International business. In Canada, Petro-Canada continues to pursue opportunities off the East Coast and North of 60. In Western Canada, the Company plans to gradually increase the exploration program to improve reserves replacement.
In order to harmonize its oil and gas disclosure in both Canada and the U.S., Petro-Canada applied for, and received, certain exemptions to reserves disclosure requirements as set out in National Instrument 51-101; Standards of Disclosure for Oil and Gas Activities (NI 51-101), which was adopted in 2003 by the securities regulatory authorities in Canada. These exemptions permit Petro-Canada to use its own staff of qualified reserves evaluators to prepare the Company’s reserves estimates and to use SEC and Financial Accounting Standards Board (FASB) standards when reporting reserves.
Petro-Canada strongly believes that the use of its own staff of qualified reserves evaluators, who are familiar with the Company’s oil and gas assets as a result of working with them on a day-to-day basis, combined with independent third-party assessment of both its reserves processes and its reserves estimates, provides a level of confidence in its reserves data that is at least as good as that which would be provided if the work was done solely by a third party.
Petro-Canada’s staff of qualified reserves evaluators determines the Company’s reserves data and quantities based on corporate-wide policies, procedures and practices. These reserves policies, procedures and practices conform to the requirements of Canadian, as well as the SEC, regulations and the Association of Professional Engineers, Geologists and Geophysicists of Alberta Standard of Practice for the Evaluation of Oil and Gas Reserves for Public Disclosure.
To confirm the quality of the reserves policies, procedures and practices and the internally generated reserves estimates, Petro-Canada employs the services of independent qualified engineering evaluators/auditors. For 2004, independent petroleum reservoir engineering consultants Sproule Associates Limited (Sproule) and Gaffney, Cline & Associates Ltd. (GCA) conducted assessments of Petro-Canada’s hydrocarbon reserves. GCA completed an independent audit of 78% of the Company’s proved crude oil, natural gas and natural gas liquids reserves outside of North America. Similarly, Sproule audited 77% of Petro-Canada’s Canadian proved conventional reserves and reviewed Syncrude. Sproule also conducted an evaluation of Petro-Canada’s proved, probable and possible reserves in the U. S. Rockies. The independent auditors’/evaluators’ reports concluded that the Company’s year-end 2004 proved reserves are reasonable.
Sproule and GCA also audited Petro-Canada’s reserves policies, procedures and practices. They concluded that Petro-Canada’s reserves booking standards meet applicable disclosure regulations, that management is complying with those standards, and that the reserves process is carried out in a manner and standard consistent with the auditors’ practices. In addition, PricewaterhouseCoopers LLP, as contract internal auditor, tested the non-engineering management control processes used in establishing reserves.
Detailed information about Petro-Canada’s proved reserves of crude oil, natural gas liquids, natural gas, bitumen and synthetic crude oil before and after royalties is available on pages 70 to 73 of this Annual Report.
Reserves Inventory
Petro-Canada reserves processes and estimates are assessed by independent consultants.
33
Q: | |
What progress has Petro-Canada made to improve the Downstream base business profitability? |
| |
A: | |
Progress during 2004 included successfully progressing consolidation of Eastern Canada refining operations, the sale of high-margin lubricants rising to 67% and convenience store sales increasing 11% year-over-year. |
| |
Yasir Suliman operates one of Petro-Canada’s award-winning retail stores. |
| |

|
| |
|
| |
At Petro-Canada’s Mississauga lubricants plant, employees, like Tony Pollock, produce the purest lubricating oil base stocks in Canada. |
Downstream
BUSINESS SUMMARY AND STRATEGY |
The Downstream operations include three refineries with a total rated capacity of 49,000 cubic metres (308,000 barrels) per day.(1) The stand alone lubricants plant is the largest producer of lubricant base stocks in Canada. In 2004, Petro-Canada accounted for about 15% of the Canadian industry’s total refining capacity. Product sales represented about 17% of total petroleum products sold in Canada. |
|
Downstream strategies are focused on strengthening the foundations for improved profitability through effective capital investment and discipline over controllable factors. The goal is superior returns and growth, including a 12% return on capital employed, based on a mid-cycle business environment. Key features of the strategy include: |
|
• achieving and maintaining first quartile operating performance; |
• advancing Petro-Canada as the “brand of choice” for Canadian gasoline consumers; and |
• building on market strengths and increasing sales of high-margin specialty lubricants. |
(1) Capacity revised, on a pro rata basis, from 49,800 cubic metres (313,000 barrels) per day in 2003 to reflect partial closure of Oakville refinery operations, effective November 12, 2004.
34
Downstream Financial Results
(millions of dollars) | | 2004 | | 2003 | | 2002 | |
| | | | | | | |
Net earnings | | $ | 314 | | $ | 248 | | $ | 252 | |
Gain (loss) on sale of assets | | 4 | | (15 | ) | 3 | |
Earnings from operations | | $ | 310 | | $ | 263 | | $ | 249 | |
Income tax adjustment | | 2 | | 34 | | — | |
Oakville closure costs | | (46 | ) | (151 | ) | — | |
Earnings from operations excluding adjustments for one-time and unusual items | | $ | 354 | | $ | 380 | | $ | 249 | |
| | | | | | | |
Cash flow from operating activities before changes in non-cash working capital | | $ | 556 | | $ | 601 | | $ | 380 | |
Expenditures on property, plant and equipment | | $ | 839 | | $ | 424 | | $ | 344 | |
Total assets | | $ | 4,462 | | $ | 3,827 | | $ | 3,836 | |
2004 COMPARED WITH 2003
Downstream contributed earnings from operations, adjusted for one-time and unusual items of $354 million in 2004, down 7% from $380 million in 2003. The impact of rising crude prices on margins for retail and heavy products and a stronger Canadian dollar more than offset the benefits of favourable U.S. refining margins and a wider light/heavy crude price differential in 2004.
Net earnings from Downstream were $314 million in 2004, up from $248 million in 2003. Net earnings in 2004 included a $4 million after-tax gain on the sale of assets, a $2 million positive adjustment to reflect a reduction in provincial income tax rates and a $46 million after-tax charge for additional depreciation and other charges related to the previously announced consolidation of the Eastern Canada refinery operations. Net earnings in 2003 included a $15 million after-tax loss on asset sales related to the selective rationalization of marketing networks in Eastern Canada, a $34 million positive adjustment to reflect the changes in federal and provincial tax rates and a $151 million charge related to the closure of the Oakville refinery.
Excluding the impacts of one-time and unusual items, Refining and Supply contributed 2004 operating earnings of $288 million, which was unchanged from 2003. Earnings in 2004 were increased by favourable U.S. refining margins, wider light/heavy crude price differentials and a positive “last-in, first-out” (LIFO) inventory valuation adjustment associated with the Oakville closure. This was offset by the effects of a 2% decline in overall crude capacity utilization at Downstream’s three refineries and lower asphalt and heavy fuel oil margins, as prices failed to keep pace with rising crude oil costs in the second half of 2004. Petro-Canada, as the leading player in asphalt and heavy fuel oil in Eastern Canada, was particularly impacted by the low-margin environment.
Marketing contributed earnings from operations excluding one-time and unusual items of $66 million, down from $92 million in 2003. The decrease in earnings was primarily attributable to increased retail price competition in 2004.
2004 Operating Review and Strategic Initiatives
Total crude oil processed in 2004 averaged 48,200 cubic metres per day (m(3)/d), down from 49,900 m(3)/d in 2003. The overall utilization rate at the three refineries, adjusted for the partial closure of the Oakville refinery on November 12, 2004, averaged 98% in 2004, down slightly from 100% in 2003. The decline reflected a 35-day turnaround related to the Eastern Canada consolidation and a major turnaround at the Edmonton refinery for maintenance and to facilitate tieing in low-sulphur gasoline equipment.
Total Downstream sales decreased slightly, to an average 56,600 m(3)/d from 56,800 m(3)/d in 2003. Lower gasoline and distillate sales were mostly offset by stronger sales of lubricants and unfinished refinery stock. Non-petroleum product sales continued to demonstrate strong growth with convenience store sales rising 11% from the previous year.
Total Downstream operating, marketing and general and administration unit costs of 6.4 cents/litre were up slightly from 6.2 cents/litre in 2003. The increase mainly reflected higher maintenance and shutdown costs.
Downstream Operating, Marketing and General Costs
Per litre costs reflected higher maintenance and shutdown costs.
Petro-Canada is successfully consolidating Eastern Canada refineries.
35
Refinery Utilization
Lower refinery utilization was due to the Eastern Canada consolidation and a major turnaround at the Edmonton refinery allowing tie-in of low-sulphur gasoline equipment.

New image sites combine highly visible and attractive design elements with improved traffic flow and convenience for customers.
Gasoline Throughput per Retail Site
Total Downstream sales per retail site continued to grow in 2004.
• Excludes Petro-Canada branded sites operated by independent dealers.
In 2004, Downstream completed its most aggressive capital plan ever. The Downstream business continued to focus on improving refining assets and operations, becoming the “brand of choice” in sales and marketing, and realizing the full potential of the lubricants business.
In Refining and Supply, key initiatives were the consolidation of Eastern Canada refining and supply operations to Montreal and the ongoing work to convert the Edmonton refinery to process oil sands feed-stock. The Eastern Canada consolidation is on schedule, including the successful reversal and expansion of the Trans-Northern Pipelines Inc. pipeline and completion of logistics tie-ins at the Montreal refinery to supply the Ontario market. The consolidation work also included a successful 35-day crude unit turnaround at the Montreal refinery to expand the plant’s crude capacity. Excellent safety and reliability were maintained at the Oakville refinery during the transition. The refinery will operate at a reduced level into early 2005 to increase short-term supply flexibility through the transition period.
The largest maintenance shutdown ever at the Edmonton refinery was completed on time and on budget in 2004, with an outstanding safety record. The turnaround also included work to successfully tie-in low-sulphur gasoline equipment. Both the Edmonton and Montreal refineries were producing gasoline in compliance with new federal ultra-low sulphur gasoline regulations well in advance of the January 1, 2005 deadline.
Overall plant reliability, a critical component of success in the refining business, improved in 2004. However, outstanding performance at Edmonton, Oakville and the lubricants plant was offset by lower reliability at the Montreal refinery. Work undertaken to address this issue through an increased focus on operations and maintenance procedures, as well as selective equipment upgrades, should improve reliability in 2005.
Downstream capital expenditures for plant, property and equipment were $839 million for 2004. A substantial portion of the 2004 spending was directed to produce cleaner-burning diesel fuels. The Downstream business remained focused on positioning Petro-Canada for improved profitability, accelerating growth oriented projects primarily in the retail and wholesale networks.
The focus in Marketing was on profitable growth through initiatives directed at the retail and PETRO-PASS truck stop networks. Petro-Canada led the industry in key urban market metrics and continued to improve the fundamentals of the retail business with more than 85% of the re-imaging program complete. Fast-tracking this re-imaging program allowed realization of industry-leading throughputs, with annual gasoline sales from re-imaged sites within the Company’s network now averaging in excess of 6.8 million litres per site. Based on this success, the Company extended this new image program to independent retailers. More than 35% of these retailers elected to invest their capital in the new image standard.
Petro-Canada continued to leverage its position as “Canada’s Gas Station,” with innovative product developments and a continuing track record of “new product firsts” in the industry. In September 2004, the Downstream business introduced the Citi Petro-Points MasterCard, the first general-purpose credit card in North America to offer cardholders an instant discount on gasoline. The Company also accelerated the roll out of the Cash Point program, the industry’s first privately owned automated bank machine network. Petro-Canada also continued to focus on expanding non-petroleum revenue base, as evidenced by the 11% year-over-year sales growth of the convenience store business, and the 7% increase in same-store sales in 2004 compared to 2003.
In the Wholesale business, the focus was on improving the sales mix and leveraging the best-in-class position in the commercial road transport and bulk fuels channels. The PETRO-PASS network of 213 truck stop facilities is the leading national marketer of fuel in the commercial road transport segment in Canada. In 2004, the network was further expanded and upgraded, increasing sales volume in this high-value channel. In bulk fuels, Petro-Canada concentrated on the successful integration of acquisitions in the home heat business.
In 2004, the Lubricants business focused on growing volume in high-margin sales and improving plant reliability. Petro-Canada made great strides in improving reliability by intensifying efforts to optimize operations and maintenance procedures based on industry best practices. Despite continued soft demand in the key U.S. export market, Lubricants sales totaled 833 million litres in 2004, an increase of 8% compared to sales volume of 768 million litres in 2003. Over the last five years, growth in high-margin sales has averaged more than 11% per year. In 2004, high-margin sales rose 11%, resulting in 67% of production going into high-margin markets. Lubricants continues to be well positioned for profitable future growth as tougher performance and environmental standards increase global demand for higher quality base oils and finished products.
36
OUTLOOK
Growth plans:
• complete the closure of Oakville refinery;
• drive for first quartile refinery reliability;
• increase service station network effectiveness with a focus on increasing non-petroleum revenue;
• increase sales of high-margin, value-added lubricants;
• invest in Montreal and Edmonton refineries to produce low-sulphur diesel;
• advance Edmonton refinery conversion program to process oil sands based feedstocks by 2008.
2005 capital spending plans:
• $625 million primarily focused on diesel desulphurization at Montreal and Edmonton refineries;
• $90 million for Edmonton refinery conversion program;
• $205 million for sustaining investments and new growth opportunities.
While the largest component of the Downstream’s approximate $920 million capital investment will be for regulatory compliance, business spending for 2005 also supports the strategy to improve base business profitability and pursue profitable growth.
Approximately $625 million will go to modify the Montreal and Edmonton refineries to produce low-sulphur distillates in line with regulations, which come into effect June 1, 2006. This includes the pre-investment for the Edmonton refinery to process oil sands feedstocks in the future. An additional $85 million will be invested to sustain existing operations with the main focus on improving plant reliability at the Montreal refinery and the Mississauga lubricants plant.
The Downstream business also plans to spend about $120 million to improve the profitability of the base business. This will include investments to advance the development of the retail network and to increase non-petroleum revenue. In keeping with the strategy to pursue profitable growth, Downstream will invest approximately $90 million to begin the detailed engineering work to convert the Edmonton refinery to run 100% oil sands crude feedstock. Petro-Canada will also begin work to debottleneck the Mississauga plant as the high-margin, specialty lubricants business grows.
Shared Services
Shared Services includes investment income, interest expense, foreign currency translation and general corporate revenue and expenses.
Shared Services Financial Results
(millions of dollars) | | 2004 | | 2003 | | 2002 | |
| | | | | | | |
Net earnings (loss) | | $ | (63 | ) | $ | 58 | | $ | (196 | ) |
Gain (loss) on sale of assets | | (1 | ) | 1 | | — | |
Foreign currency translation | | 63 | | 239 | | (52 | ) |
Net loss from operations | | $ | (125 | ) | $ | (182 | ) | $ | (144 | ) |
Income tax adjustment | | (1 | ) | (11 | ) | — | |
Net loss from operations excluding adjustments for one-time and unusual items | | $ | (124 | ) | $ | (171 | ) | $ | (144 | ) |
| | | | | | | |
Cash flow from operating activities before changes in non-cash working capital | | $ | (106 | ) | $ | (100 | ) | $ | (104 | ) |
Lubricants High-Margin Sales
High-margin lubricants sales increased 2% compared to 2003.
The Lubricants strategy remained focused on growing volume in high-margin sales and improving plant reliability.
37
2004 COMPARED WITH 2003
Shared Services net loss from operations adjusted for one-time and unusual items was $124 million in 2004, compared to $171 million in 2003. This decrease primarily reflected lower interest expense and general expenses.
Shared Services net loss was $63 million in 2004, compared to net earnings of $58 million in 2003. Net expenses in 2004 included a $1 million after-tax loss on the sale of assets, a $63 million foreign currency translation gain on U.S. dollar-denominated long-term debt and a $1 million charge to reflect a change in the provincial income tax rate. Net earnings in 2003 included a $1 million after-tax gain on the sale of assets, a $239 million foreign currency translation gain on U.S. dollar-denominated long-term debt and an $11 million charge to reflect changes in federal and provincial income tax rates. The 2004 and 2003 foreign currency translation gain on U.S. dollar-denominated long-term debt reflected the strengthening of the Canadian dollar versus the U.S. dollar.
Q: |
|
What is Petro-Canada’s approach to disclosure? |
|
A: |
|
Petro-Canada is committed to open and fair disclosure in compliance with securities regulations and generally accepted accounting standards. |
Financial Reporting
CRITICAL ACCOUNTING ESTIMATES
The preparation of the Company’s financial statements requires management to adopt accounting policies that involve the use of significant estimates and assumptions. These estimates and assumptions are developed based on the best available information and are believed by management to be reasonable under the existing circumstances. New events or additional information may result in the revision of these estimates over time. The Audit, Finance and Risk Committee of the Board of Directors regularly reviews the Company’s critical accounting policies and any significant changes thereto. A summary of the significant accounting policies used by Petro-Canada can be found in Note 1 to the 2004 Consolidated Financial Statements. The following discussion outlines what management believes to be the most critical accounting policies involving the use of significant estimates or assumptions.
Property, Plant and Equipment/Depreciation, Depletion and Amortization
Investments in exploration and development activities are accounted for under the successful efforts method. Under this method, the acquisition costs of unproved acreage, the costs of exploratory wells pending determination of proved reserves, the costs of wells which are assigned proved reserves and development costs, including costs of all wells, are capitalized. The cost of unsuccessful wells and all other exploration costs, including geological and geophysical costs, are charged to earnings as incurred. Capitalized costs of oil and gas producing properties are depreciated and depleted using the unit of
38
production method based upon estimated reserves (see Estimated Oil and Gas Reserves discussion on page 40). Reserves estimates can have a significant impact on net earnings, as they are a key component in the calculation of depreciation and depletion related to the capitalized costs of property, plant and equipment. A revision in reserves estimates could result in either a higher or lower depreciation and depletion charge to net earnings. A downward revision in reserves could result in a write-down of oil and gas producing properties as part of the impairment assessment (see Asset Impairment discussion below).
Asset Retirement Obligations
The Company currently records the obligation for estimated asset retirement costs at fair value when incurred. Factors that can affect the fair values of the obligations include the expected costs and the useful lives of the assets. Cost estimates are influenced by factors such as the number and type of assets subject to asset retirement obligations, the extent of work required and changes in environmental legislation. A revision to the estimated costs or useful lives of the assets could result in an increase or decrease in the total obligation which would change the amount of amortization and accretion expense recognized in net earnings over time.
Asset Impairment
Producing properties and significant unproved properties are assessed annually, or as economic events dictate, for potential impairment. Impairment is assessed by comparing the estimated undiscounted future cash flows to the carrying value of the asset. The cash flows used in the impairment assessment require management to make assumptions and estimates about recoverable reserves (see Estimated Oil and Gas Reserves discussion on page 40), future commodity prices and operating costs. Changes in any of the assumptions, such as a downward revision in reserves, a decrease in future commodity prices or an increase in operating costs could result in an impairment of an asset’s carrying value.
Purchase Price Allocation
Business acquisitions are accounted for by the purchase method of accounting. Under this method, the purchase price is allocated to the assets acquired and the liabilities assumed based on the fair value at the time of the acquisition. The excess purchase price over the fair value of identifiable assets and liabilities acquired is goodwill. The determination of fair value often requires management to make assumptions and estimates about future events. The assumptions and estimates with respect to determining the fair value of property, plant and equipment acquired generally require the most judgment, and include estimates of reserves acquired (see Estimated Oil and Gas Reserves discussion on page 40), future commodity prices and discount rates. Changes in any of the assumptions or estimates used in determining the fair value of acquired assets and liabilities could impact the amounts assigned to assets, liabilities, and goodwill in the purchase price allocation. Future net earnings can be affected as a result of changes in future depreciation and depletion, asset impairment or goodwill impairment.
Goodwill Impairment
Goodwill is subject to impairment tests annually, or as economic events dictate, by comparing the fair value of the reporting unit to its carrying value, including goodwill. If the fair value of the reporting unit is less than its carrying value, a goodwill impairment loss is recognized as the excess of the carrying value of the goodwill over the fair value of the goodwill. The determination of fair value requires management to make assumptions and estimates about recoverable reserves (see Estimated Oil and Gas Reserves discussion on page 40), future commodity prices, operating costs, production profiles and discount rates. Changes in any of these assumptions, such as a downward revision in reserves, a decrease in future commodity prices, an increase in operating costs or an increase in discount rates could result in an impairment of all or a portion of the goodwill carrying value in future periods.
39
Estimated Oil and Gas Reserves
Reserves estimates, although not reported as part of the Company’s Consolidated Financial Statements, can have a significant effect on net earnings as a result of their impact on depreciation and depletion rates, asset impairments and goodwill impairment (see discussion of these items on pages 38 and 39). The Company’s staff of qualified reserves evaluators performs internal evaluations on all of its oil and gas reserves on an annual basis using corporate-wide policies, procedures and practices. Independent qualified petroleum reservoir engineering consultants also conduct annual evaluations, technical audits and/or reviews of a significant portion of the Company’s reserves and audit the Company’s reserves policies, procedures and practices. In addition, the Company’s contract internal auditors test the non-engineering management control processes used in establishing reserves. However, the estimation of reserves is an inherently complex process requiring significant judgment. Estimates of economically recoverable oil and gas reserves are based upon a number of variables and assumptions such as geoscientific interpretation, commodity prices, operating and capital costs, and production forecasts, all of which may vary considerably from actual results. These estimates are expected to be revised upward or downward over time, as additional information such as reservoir performance becomes available, or as economic conditions change.
Employee Future Benefits
The Company maintains defined benefit pension plans and provides certain post-retirement benefits to qualifying retirees. Obligations under employee future benefits plans are recorded net of plan assets where applicable. The cost of pension and other post-retirement benefits are actuarially determined by an independent actuary using the projected benefit method pro rated based on service. The determination of these costs requires management to estimate or make assumptions regarding the expected plan investment performance, salary escalation, retirement ages of employees, expected health care costs, employee turnover, discount rates and return on plan assets. Changes in these estimates or assumptions could result in an increase or decrease to the accrued benefit obligation and the related costs for both pensions and other post-retirement benefits.
Income Taxes
The Company follows the liability method of accounting for income taxes whereby future income taxes are recognized based on the differences between the carrying amounts of assets and liabilities reported in the financial statements and their respective tax bases. The determination of the income tax provision is an inherently complex process requiring management to interpret continually changing regulations and to make certain judgments. While income tax filings are subject to audits and reassessments, management believes adequate provision has been made for all income tax obligations. However, changes in the interpretations or judgments may result in an increase or decrease in the Company’s income tax provision in the future.
Contingencies
The Company is involved in litigation and claims in the normal course of operations. Management is of the opinion that any resulting settlements would not materially affect the financial position of the Company as at December 31, 2004. However, the determination of contingent liabilities relating to the litigation and claims is a complex process that involves judgments as to the outcomes and interpretation of laws and regulations. Changes in the judgments or interpretations may result in an increase or decrease in the Company’s contingent liabilities in the future.
ACCOUNTING CHANGES
Asset Retirement Obligations
Effective January 1, 2004, the Company retroactively adopted the new standard of the Canadian Institute of Chartered Accountants (CICA) on accounting for asset retirement obligations. The new standard requires the fair values of asset retirement obligations to be recorded as liabilities when incurred and the related assets be increased by the amount of these liabilities. Over time, the liabilities are accreted for the change in their present value and the initial capitalized costs are depreciated over the useful lives of the related assets. Asset retirement obligations are not recorded for those assets which have an indeterminate useful life. The impact of this change has been disclosed in Note 2 of the Consolidated Financial Statements.
40
Reclassification of Costs
Pursuant to the new CICA section 1100 “Generally Accepted Accounting Principles,” which provides guidance on the sources to consult when selecting accounting policies, the Company began accounting, effective January 1, 2004, for certain transportation costs, third-party gas purchases and diluent purchases as expenses in the Consolidated Statement of Earnings. Previously, these costs were netted against revenue. Prior years’ comparatives have been restated.
Hedging Relationships
Effective January 1, 2004, the Company adopted Accounting Guideline 13 (AcG 13), “Hedging Relationships,” which resulted in changes to the conditions as to when hedge accounting may be obtained. As a result, certain of the Company’s risk management derivative instruments no longer qualify as accounting hedges and are accounted for as required under Emerging Issues Committee (EIC) 128, “Accounting for Trading, Speculative or Non-Hedging Derivative Financial Instruments.” EIC 128 requires that all derivative instruments that do not qualify, or are not designated as a hedge under AcG 13, be recorded on the Consolidated Balance Sheet at fair value as either an asset or liability with changes in fair value recognized in earnings.
RECENT PRONOUNCEMENTS
Pursuant to recent guidance on the classification of cash flows relating to asset securitization transactions, the Company has included the proceeds from its 2004 sale of accounts receivable as part of cash flows from operating activities. The Company had previously reported these proceeds as part of investing activities when reporting its quarterly results in 2004 and will reclassify the comparative amounts when quarterly results are reported in 2005.
RELATED-PARTY TRANSACTIONS
On September 29, 2004, the Government of Canada completed its offering to the public of its entire remaining interest in Petro-Canada. Transactions with the Government of Canada and its agencies prior to the sale were in the normal course of business and on the same terms as those accorded to non-related parties.
SHARE DATA
The authorized share capital of Petro-Canada consists of an unlimited number of common shares and an unlimited number of preferred shares issuable in series designated as either senior preferred shares or junior preferred shares. As at March 3, 2005, there were 260,358,471 common shares outstanding and no preferred shares outstanding. For details of the Company’s share capital and stock options outstanding, refer to Notes 20 and 21 to the 2004 Consolidated Financial Statements.
ADDITIONAL INFORMATION
Copies of this MD&A and the following Consolidated Financial Statements, as well as the Company’s latest Annual Information Form and Management Proxy Circular may be obtained from the Company’s Web site at www.petro-canada.ca or by mail upon request from the corporate secretary, 150 – 6th Avenue S.W., Calgary, Alberta, T2P 3E3. Other disclosure documents, and any reports, statements or other information filed by Petro-Canada with the Canadian provincial securities commissions or other similar regulatory authorities is accessible through the internet on the Canadian System for Electronic Document Analysis and Retrieval, which is commonly known by the acronym SEDAR and is located at www.sedar.com. SEDAR is the Canadian equivalent of the U.S. SEC’s Electronic and Document Gathering and Retrieval System, which is commonly known by the acronym EDGAR and is located at www.sec.gov.
41