UNITED STATES
SECURITIES AND EXCHANGE COMMISSION
Washington, D.C. 20549
FORM N-CSR
CERTIFIED SHAREHOLDER REPORT OF REGISTERED
MANAGEMENT INVESTMENT COMPANIES
| | |
| Investment Company Act file number: | | 811-04710 |
| |
| Exact name of registrant as specified in charter: | | The Asia Pacific Fund, Inc. |
| |
| Address of principal executive offices: | | Gateway Center 3, |
| | 100 Mulberry Street, |
| | Newark, New Jersey 07102 |
| |
| Name and address of agent for service: | | Deborah A. Docs |
| | Gateway Center 3, |
| | 100 Mulberry Street, |
| | Newark, New Jersey 07102 |
| |
| Registrant’s telephone number, including area code: | | 973-367-7521 |
| |
| Date of fiscal year end: | | 3/31/2013 |
| |
| Date of reporting period: | | 9/30/2012 |
Item 1 – Reports to Stockholders
Directors
Michael J. Downey, Chairman
Jessica M. Bibliowicz
Robert H. Burns
Robert F. Gunia
Duncan M. McFarland
David G. P. Scholfield
Nicholas T. Sibley
Officers
Brian A. Corris, President
Grace C. Torres, Vice President
M. Sadiq Peshimam, Treasurer and Chief Financial Officer
Deborah A. Docs, Secretary and Chief Legal Officer
Andrew R. French, Assistant Secretary
Valerie M. Simpson, Chief Compliance Officer
Theresa C. Thompson, Deputy Chief Compliance Officer
Investment Manager
Baring Asset Management (Asia) Limited
1901 Edinburgh Tower
15 Queen’s Road Central
Hong Kong
Administrator
Prudential Investments LLC
Gateway Center Three
100 Mulberry Street
Newark, NJ 07102-4077
Custodian
The Bank of New York Mellon
One Wall Street
New York, NY 10286
Transfer Agent
Computershare Trust Company N.A.
P.O. Box 43011
Providence, RI 02940-3011
Independent Registered Public Accounting Firm
KPMG LLP
345 Park Avenue
New York, NY 10154
Legal Counsel
Sullivan & Cromwell LLP
125 Broad Street
New York, New York 10004
Notice is hereby given in accordance with Section 23(c) of the Investment Company Act of 1940 that the Fund may purchase, from time to time, shares of its common stock at market prices.
The accompanying financial statements as of September 30, 2012 were not audited and, accordingly, no opinion is expressed on them.
This report, including the financial statements herein, is transmitted to the shareholders of The Asia Pacific Fund, Inc. for their information. This is not a prospectus, circular or representation intended for use in the purchase of shares of the Fund or any securities mentioned in this report.
The Asia Pacific Fund, Inc.
Gateway Center Three
100 Mulberry Street
Newark, NJ 07102-4077
For general information on the Fund, please call (toll-free) Pristine Advisers, our shareholders’ servicing agent toll-free at:
1-(888) 4-ASIA-PAC
Current information about the Fund is available on its website (http://www.asiapacificfund.com). This website includes monthly updates of the Fund’s performance and other data as well as the Manager’s quarterly presentation of performance and asset allocations and comments on the current Asian outlook.
The Fund’s CUSIP number is 044901106
APBS

The Asia Pacific
Fund, Inc.
Semi-Annual Report
September 30, 2012
www.asiapacificfund.com
The Asia Pacific Fund, Inc.
As of September 30, 2012 (Unaudited)
OUR TOLL-FREE LINE:
1-888-4-ASIA-PAC
For further information on the Fund, please call. In addition, the Fund makes available monthly certain portfolio information. If you would like to receive this information please call the toll-free number indicated above.
Statistics
| | | | |
Total Net Assets | | | $119,034,451 | |
Shares Outstanding | | | 10,344,073 | |
Net Asset Value | | | $11.51 | |
Equity | | | 98.4%(a) | |
Total Returns (US Dollar terms)
(As of September 30, 2012)
| | | | | | | | |
| Period | | Market
Price(b) | | | NAV(c) | |
3 months | | | 7.8% | | | | 7.5% | |
6 months | | | -2.8% | | | | -1.4% | |
9 months | | | 9.4% | | | | 11.0% | |
1 Year | | | 9.8% | | | | 15.1% | |
3 Years | | | 6.2% | | | | 12.4% | |
5 Years | | | -19.4% | | | | -18.3% | |
10 Years | | | 277.0% | | | | 259.2% | |
Since inception (d) | | | 709.6% | | | | 806.5% | |
Since inception (d)(e) | | | 8.6% | | | | 9.1% | |
Other Information
| | | | |
Ticker Symbol | | | APB | |
Primary Exchange | | | NYSE | |
Dividend Repurchase Program | | | Yes | |
Portfolio Characteristics
(As of September 30, 2012)
Top Ten Equity Holdings
(% of Total Net Assets)
| | | | |
Samsung Electronics Co. Ltd. | | | 6.6% | |
Taiwan Semiconductor Manufacturing Co. Ltd. | | | 2.8% | |
Wharf Holdings Ltd. | | | 2.4% | |
Delta Electronics, Inc. | | | 2.2% | |
Shimao Property Holdings Ltd. | | | 2.1% | |
China Life Insurance Co. Ltd. | | | 2.0% | |
Phison Electronics Corp. | | | 1.9% | |
Techtronic Industries Co. | | | 1.8% | |
Jiangxi Copper Co. Ltd. | | | 1.8% | |
LG Corp. | | | 1.7% | |
Sector Breakdown: Top Ten Industries
(% of Total Net Assets)
| | | | |
Information Technology | | | 29.1% | |
Consumer Discretionary | | | 15.6% | |
Banking | | | 15.4% | |
Real Estate-Developers | | | 10.5% | |
Industrials | | | 8.2% | |
Materials | | | 6.0% | |
Energy | | | 5.7% | |
Telecommunication Services | | | 3.5% | |
Insurance | | | 2.8% | |
Healthcare | | | 2.7% | |
Footnote section
| (a) | Expressed as a percentage of total investments. |
| (b) | Total investment return is calculated assuming a purchase of common stock at the current market value on the first day and a sale at the current market value on the last day of each period reported. Dividends and distributions are assumed, for purposes of this calculation, to be reinvested at prices obtained under the Fund’s dividend reinvestment plan. These calculations do not include brokerage commissions. |
| (c) | This information represents the historical net asset value (NAV) per share performance of the Fund. NAV per share performance has been computed by the Investment Manager and is calculated assuming reinvestment of dividends and distributions. Because NAV per share performance does not reflect market price, it is not the same as total investment return. |
| (d) | Investment operations commenced on May 4, 1987. |
| (e) | Average annual return. |
1
REPORT OF THE INVESTMENT MANAGER
For the period from March 31 to September 30, 2012 (Unaudited)
During the six-month period ended September 30, 2012, the Fund’s net asset value (NAV) per share decreased by $0.16, from $11.67 to $11.51. In percentage terms, the Fund’s NAV fell by 1.4%. This compares with a rise of 2.0% based on its reference benchmark index, the MSCI All Countries (AC) Asia Ex-Japan Gross Index (the “Index”). The Fund’s share price fell by 2.8% over the period, from $10.58 to $10.28.
The chart below illustrates the performance of the Fund’s NAV per share during the period:
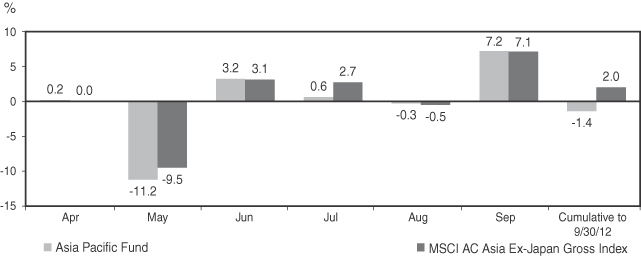
Source: Baring Asset Management, MSCI
Local Currencies vs. the US Dollar
| | | | | | | | | | | | | | | | |
Currency US$/Local rate | | Mar 31
2012 | | | Jun 30
2012 | | | Sep 30
2012 | | | Mar 31 to
Sep 30 2012
Change % | |
North Asia | | | | | | | | | | | | | | | | |
South Korean Won | | | 1,133 | | | | 1,145 | | | | 1,111 | | | | 1.9 | |
New Taiwan Dollar | | | 29.51 | | | | 29.89 | | | | 29.31 | | | | 0.7 | |
Chinese Renminbi | | | 6.30 | | | | 6.35 | | | | 6.28 | | | | 0.2 | |
Hong Kong Dollar | | | 7.76 | | | | 7.76 | | | | 7.75 | | | | 0.1 | |
ASEAN | | | | | | | | | | | | | | | | |
Philippines Peso | | | 42.94 | | | | 42.14 | | | | 41.72 | | | | 2.9 | |
Singaporean Dollar | | | 1.26 | | | | 1.27 | | | | 1.23 | | | | 2.5 | |
Malaysian Ringgit | | | 3.06 | | | | 3.18 | | | | 3.06 | | | | — | |
Thai Baht | | | 30.85 | | | | 31.76 | | | | 30.78 | | | | 0.2 | |
Indonesian Rupiah | | | 9,144 | | | | 9,393 | | | | 9,570 | | | | -4.5 | |
South Asia | | | | | | | | | | | | | | | | |
Vietnamese Dong | | | 20,850 | | | | 20,905 | | | | 20,885 | | | | -0.2 | |
Sri Lankan Rupee | | | 128.25 | | | | 133.90 | | | | 129.43 | | | | -0.9 | |
Indian Rupee | | | 50.95 | | | | 55.84 | | | | 52.75 | | | | -3.4 | |
Source: Factset (Baring Asset Management)
STOCK MARKET PERFORMANCE
| | | | | | | | | | | | |
Country - Index | | Mar 31 to
Jun 30 2012
Market
Change %
US $ | | | Jun 30 to
Sep 30 2012
Market
Change %
US $ | | | Mar 31 to
Sep 30 2012
Market
Change %
US $ | |
North Asia | | | | | | | | | | | | |
MSCI Hong Kong | | | -4.9 | | | | 12.5 | | | | 7.0 | |
MSCI Taiwan | | | -9.5 | | | | 11.8 | | | | 1.2 | |
MSCI Korea | | | -8.6 | | | | 9.9 | | | | 0.4 | |
MSCI China | | | -5.3 | | | | 4.7 | | | | -0.8 | |
ASEAN | | | | | | | | | | | | |
MSCI Philippines | | | 4.1 | | | | 4.5 | | | | 8.8 | |
MSCI Singapore | | | -3.8 | | | | 10.6 | | | | 6.4 | |
MSCI Thailand | | | -5.4 | | | | 11.3 | | | | 5.2 | |
MSCI Malaysia | | | -3.6 | | | | 5.3 | | | | 1.5 | |
MSCI Indonesia | | | -7.0 | | | | 7.5 | | | | — | |
South Asia | | | | | | | | | | | | |
MSCI Sri Lanka | | | -9.6 | | | | 25.0 | | | | 13.0 | |
MSCI India | | | -9.5 | | | | 15.4 | | | | 4.4 | |
MSCI Vietnam | | | 1.2 | | | | -8.2 | | | | -7.1 | |
MSCI AC Asia Ex- Japan Gross | | | -6.7 | | | | 9.4 | | | | 2.0 | |
Source: Factset (Baring Asset Management)
2
COUNTRY ALLOCATION*
| | | | | | | | | | | | |
Country | | Mar 31
2012 | | | Jun 30
2012 | | | Sep 30
2012 | |
North Asia | | | 79.4 | % | | | 70.7 | % | | | 75.7 | % |
Hong Kong/China | | | 38.6 | | | | 36.3 | | | | 33.5 | |
Taiwan | | | 16.6 | | | | 11.5 | | | | 23.4 | |
South Korea | | | 24.2 | | | | 22.9 | | | | 18.8 | |
ASEAN | | | 16.6 | | | | 16.8 | | | | 22.0 | |
Singapore | | | 4.9 | | | | 3.4 | | | | 7.6 | |
Indonesia | | | 5.0 | | | | 4.6 | | | | 5.3 | |
Thailand | | | 4.0 | | | | 4.6 | | | | 4.8 | |
Malaysia | | | 2.7 | | | | 3.1 | | | | 2.7 | |
Philippines | | | — | | | | 1.1 | | | | 1.6 | |
South Asia | | | 8.9 | | | | 7.3 | | | | 9.7 | |
India | | | 7.4 | | | | 5.9 | | | | 8.1 | |
Sri Lanka | | | 0.8 | | | | 0.7 | | | | 1.0 | |
Vietnam | | | 0.7 | | | | 0.7 | | | | 0.6 | |
Cash & Other | | | -4.9 | | | | 5.2 | | | | -7.4 | |
* Rounded up to the nearest tenth of one percent. Expressed as a percentage of net assets.
PORTFOLIO & MARKET REVIEW
Asian equity markets recorded a rise of 2.0% in US dollar terms for the six month period ending September 30, 2012. The top three performing markets in the Index were Sri Lanka (+13.0%), the Philippines (+8.8%) and Hong Kong (+7.0%). The bottom three were Vietnam (-7.1%), China (-0.8%) and Indonesia (0.0%). With the exception of the Indonesian Rupiah, Indian Rupee, Vietnamese Dong and Sri Lankan Rupee, other Asian currencies strengthened against the US dollar.
Global and regional equities stayed volatile during the period on renewed concerns about the Spanish debt market, political discord among EMU members, together with slower-than-expected economic data from the US and China which caused nervousness among investors. The economic outlook was mixed from the Eurozone, the US and China. In Europe, easing statements by senior policy makers calmed some market concerns on the continuing financial duress. Economic indicators in the US were mixed, which prompted the US Fed to release another round of monetary boosting measures. However, the Chinese economy continues to slow with GDP growth and export figures from China, Korea, and Taiwan all pointing to slowing demand growth especially from Europe.
Over the period under review, at a geographical level, the Philippines, Hong Kong and Singapore were clear outperformers. The Philippines conglomerates and financials rose on the back of a strong economic and corporate earnings outlook. The pros-
pect of further liquidity boosted markets like Hong Kong with high weighting towards real estate in anticipation of asset reflation. Further, the suppression of interest rates also continued to fuel markets like Singapore. On the other hand, China was under pressure, affected by the continuing deceleration of its economy and the disappointing policy response. Some profit-taking was seen in Korea and Indonesia after a strong rally through last year. Among sectors, defensives outperformed cyclicals and growth-sensitive ones. Health Care, Telecommunication Services and Utilities led, while Industrials, Energy and Materials lagged.
As far as the Fund’s activity is concerned, we reduced China and Korea to underweight and moved Hong Kong to overweight by increasing the exposure to Utilities (versus the Index). On the other hand, we reduced our underweight in India by establishing new positions in domestically-driven stocks such as conglomerates and banks. We also added to steady growth names in Singapore such as the telecoms and hospitality sectors. Elsewhere we continue to favor domestically driven markets in Southeast Asia, including Indonesia and Thailand. We continue to underweight Malaysia due to domestic structural issues. At the sectoral level, we reduced our underweight in Utilities and Financials through bottom-up stock opportunities in Hong Kong, Taiwan and South Asia.
Over the period, the Fund’s NAV was down by 1.4% in US dollar terms. The Fund underperformed its reference benchmark, which rose by 2.0%. Stock selection detracted from performance relative to the benchmark, as did the cautious stance in Telecoms from a sector allocation perspective. The underperformance was offset to some extent by positive stock selection contribution from Hong Kong and India. At the individual stock level, positive contributors included Techtronic Industries (Hong Kong), Wharf (Hong Kong), BOC Hong Kong, Bloomberry Resorts (the Philippines) and Zhaojin Mining (China). Detractors at the individual stock level included Hyundai Heavy Industries (Korea), Dongfeng Motor (China), Hon Hai Precision (Taiwan), Pegatron (Taiwan) and Far Eastern Department Store (Taiwan).
Baring Asset Management (Asia) Ltd.
November 5, 2012
3
THE ASIA PACIFIC FUND, INC.
Portfolio of Investments
September 30, 2012
(Unaudited)
| | | | | | | | |
| Shares | | | Description | | Value (Note 1) | |
| | | | LONG-TERM INVESTMENTS—107.4% | |
| | | | EQUITIES—106.8% | |
| | | | CHINA (INCLUDING
HONG KONG)—33.5% | |
| | 439,500 | | | AAC Technologies Holdings, Inc. | | $ | 1,587,042 | |
| | | | (Information Technology) | | | | |
| | 416,800 | | | AIA Group Ltd. | | | 1,553,449 | |
| | | | (Diversified Financials) | | | | |
| | 435,500 | | | BOC Hong Kong Holdings Ltd. | | | 1,384,447 | |
| | | | (Banking) | | | | |
| | 28,000 | | | Cheung Kong Holdings Ltd. | | | 410,572 | |
| | | | (Real Estate-Developers) | | | | |
| | 262,000 | | | Cheung Kong Infrastructure Holdings Ltd. | | | 1,586,384 | |
| | | | (Utilities) | | | | |
| | 804,000 | | | China Life Insurance Co. Ltd. (Class “H” Shares) | | | 2,322,606 | |
| | | | (Insurance) | | | | |
| | 594,000 | | | China Overseas Land & Investment Ltd. | | | 1,510,653 | |
| | | | (Real Estate-Developers) | | | | |
| | 332,200 | | | China Pacific Insurance Group Co. Ltd. (Class “H” Shares) | | | 1,004,648 | |
| | | | (Insurance) | | | | |
| | 489,000 | | | China Shenhua Energy Co. Ltd. (Class “H” Shares) | | | 1,898,221 | |
| | | | (Energy) | | | | |
| | 436,000 | | | CNOOC Ltd. | | | 894,036 | |
| | | | (Energy) | | | | |
| | 1,658,000 | | | CSR Corp. Ltd. (Class “H” Shares) | | | 1,096,916 | |
| | | | (Industrials) | | | | |
| | 245,000 | | | Galaxy Entertainment Group Ltd.* | | | 821,506 | |
| | | | (Consumer Discretionary) | | | | |
| | 70,000 | | | Henderson Land Development Co. Ltd. | | | 503,737 | |
| | | | (Real Estate-Developers) | | | | |
| | 52,000 | | | Hengan International Group Co. Ltd. | | | 491,562 | |
| | | | (Consumer Staples) | | | | |
| | | | | | | | |
| Shares | | | Description | | Value (Note 1) | |
| | 1,686,000 | | | Huaneng Power International, Inc. (Class “H” Shares) | | $ | 1,282,865 | |
| | | | (Utilities) | | | | |
| | 180,000 | | | Hutchison Whampoa Ltd. | | | 1,745,668 | |
| | | | (Industrials) | | | | |
| | 3,092,000 | | | Industrial & Commercial Bank of China Ltd. (Class “H” Shares) | | | 1,826,318 | |
| | | | (Banking) | | | | |
| | 824,000 | | | Jiangxi Copper Co. Ltd. (Class “H” Shares) | | | 2,087,085 | |
| | | | (Materials) | | | | |
| | 195,500 | | | Kerry Properties Ltd. | | | 988,335 | |
| | | | (Real Estate-Developers) | | | | |
| | 1,914,000 | | | Lenovo Group Ltd. | | | 1,584,705 | |
| | | | (Information Technology) | | | | |
| | 135,200 | | | Sands China Ltd. | | | 504,774 | |
| | | | (Consumer Discretionary) | | | | |
| | 1,447,000 | | | Shimao Property Holdings Ltd. | | | 2,489,406 | |
| | | | (Real Estate-Developers) | | | | |
| | 88,000 | | | Sun Hung Kai Properties Ltd. | | | 1,289,236 | |
| | | | (Real Estate-Developers) | | | | |
| | 1,204,000 | | | Techtronic Industries Co. | | | 2,195,570 | |
| | | | (Consumer Discretionary) | | | | |
| | 42,400 | | | Tencent Holdings Ltd. | | | 1,444,675 | |
| | | | (Information Technology) | | | | |
| | 411,000 | | | Wharf Holdings Ltd. | | | 2,854,295 | |
| | | | (Real Estate-Developers) | | | | |
| | 135,500 | | | Yue Yuen Industrial Holdings
Ltd. | | | 456,091 | |
| | | | (Consumer Discretionary) | | | | |
| | 1,111,000 | | | Zhaojin Mining Industry Co. Ltd. (Class “H” Shares) | | | 2,017,382 | |
| | | | | | | | |
| | | | (Materials) | | | | |
| | | | | | | 39,832,184 | |
| | | | | | | | |
| | |
| | | | INDIA—8.1% | | | | |
| | 46,859 | | | Bajaj Auto Ltd. | | | 1,625,873 | |
| | | | (Consumer Discretionary) | | | | |
| | 29,375 | | | Dr. Reddy’s Laboratories Ltd. | | | 916,503 | |
| | | | (Healthcare) | | | | |
| | 86,300 | | | HDFC Bank Ltd. | | | 1,029,399 | |
| | | | (Banking) | | | | |
See Notes to Financial Statements.
4
| | | | | | | | |
| Shares | | | Description | | Value (Note 1) | |
| | | | INDIA—(continued) | | | | |
| | 93,962 | | | Housing Development Finance Corp. | | $ | 1,379,547 | |
| | | | (Diversified Financials) | | | | |
| | 94,567 | | | ICICI Bank Ltd. | | | 1,898,332 | |
| | | | (Banking) | | | | |
| | 17,054 | | | Larsen & Toubro Ltd. | | | 516,292 | |
| | | | (Industrials) | | | | |
| | 54,621 | | | Maruti Suzuki India Ltd. | | | 1,398,637 | |
| | | | (Consumer Discretionary) | | | | |
| | 57,219 | | | Reliance Industries Ltd. | | | 908,214 | |
| | | | | | | | |
| | | | (Energy) | | | | |
| | | | | | | 9,672,797 | |
| | | | | | | | |
| | |
| | | | INDONESIA—5.3% | | | | |
| | 1,462,500 | | | PT Astra International Tbk | | | 1,130,878 | |
| | | | (Consumer Discretionary) | | | | |
| | 1,525,000 | | | PT Bank Rakyat Indonesia (Persero) Tbk | | | 1,187,173 | |
| | | | (Banking) | | | | |
| | 3,300,500 | | | PT Kalbe Farma Tbk | | | 1,620,935 | |
| | | | (Healthcare) | | | | |
| | 1,492,500 | | | PT Mitra Adiperkasa Tbk | | | 998,119 | |
| | | | (Consumer Discretionary) | | | | |
| | 348,500 | | | PT Semen Gresik (Persero)
Tbk | | | 526,210 | |
| | | | (Materials) | | | | |
| | 859,000 | | | PT Telekomunikasi Indonesia (Persero) Tbk | | | 848,229 | |
| | | | | | | | |
| | | | (Telecommunication Services) | | | | |
| | | | | | | 6,311,544 | |
| | | | | | | | |
| | |
| | | | MALAYSIA—2.7% | | | | |
| | 547,400 | | | Axiata Group Bhd | | | 1,164,109 | |
| | | | (Telecommunication Services) | | | | |
| | 537,100 | | | CIMB Group Holdings Bhd | | | 1,317,929 | |
| | | | (Banking) | | | | |
| | 161,600 | | | IHH Healthcare Bhd* | | | 169,187 | |
| | | | (Healthcare) | | | | |
| | 737,984 | | | Sapurakencana Petroleum
Bhd* | | | 560,158 | |
| | | | | | | | |
| | | | (Energy) | | | | |
| | | | | | | 3,211,383 | |
| | | | | | | | |
| | | | | | | | |
| Shares | | | Description | | Value (Note 1) | |
| | |
| | | | PHILIPPINES—1.6% | | | | |
| | 2,834,200 | | | Bloomberry Resorts Corp.* | | $ | 760,950 | |
| | | | (Consumer Discretionary) | |
| | 291,800 | | | Metropolitan Bank & Trust | | | 647,046 | |
| | | | (Banking) | | | | |
| | 1,030,600 | | | Robinsons Land Corp. | | | 470,397 | |
| | | | | | | | |
| | | | (Real Estate-Developers) | | | | |
| | | | | | | 1,878,393 | |
| | | | | | | | |
| | | | SINGAPORE—7.6% | | | | |
| | 449,000 | | | CapitaLand Ltd. | | | 1,163,478 | |
| | | | (Real Estate-Developers) | | | | |
| | 152,000 | | | DBS Group Holdings Ltd. | | | 1,782,334 | |
| | | | (Banking) | | | | |
| | 549,000 | | | First Resources Ltd. | | | 943,929 | |
| | | | (Consumer Staples) | | | | |
| | 184,210 | | | Keppel Corp. Ltd. | | | 1,711,208 | |
| | | | (Industrials) | | | | |
| | 198,000 | | | Overseas Union Enterprise Ltd. | | | 458,214 | |
| | | | (Consumer Discretionary) | |
| | 145,000 | | | SembCorp Marine Ltd. | | | 587,231 | |
| | | | (Industrials) | | | | |
| | 389,000 | | | Singapore Telecommunications Ltd. | | | 1,014,341 | |
| | | | (Telecommunication Services) | | | | |
| | 85,000 | | | United Overseas Bank Ltd. | | | 1,361,025 | |
| | | | | | | | |
| | | | (Banking) | | | | |
| | | | | | | 9,021,760 | |
| | | | | | | | |
| | | | SOUTH KOREA—18.8% | |
| | 4,313 | | | Honam Petrochemical Corp. | | | 1,030,300 | |
| | | | (Materials) | | | | |
| | 5,763 | | | Hyundai Mobis | | | 1,610,016 | |
| | | | (Consumer Discretionary) | |
| | 7,604 | | | Hyundai Motor Co. | | | 1,724,100 | |
| | | | (Consumer Discretionary) | |
See Notes to Financial Statements.
5
THE ASIA PACIFIC FUND, INC.
Portfolio of Investments
September 30, 2012
(Unaudited) Continued
| | | | | | | | |
| Shares | | | Description | | Value (Note 1) | |
| | | | SOUTH KOREA—(continued) | |
| | 48,676 | | | KB Financial Group, Inc. | | $ | 1,738,702 | |
| | | | (Banking) | | | | |
| | 3,340 | | | Korea Zinc Co. Ltd. | | | 1,468,016 | |
| | | | (Materials) | | | | |
| | 7,451 | | | KT&G Corp. | | | 567,829 | |
| | | | (Consumer Staples) | | | | |
| | 37,080 | | | LG Corp. | | | 2,075,152 | |
| | | | (Industrials) | | | | |
| | 19,830 | | | LG Display Co. Ltd.* | | | 505,820 | |
| | | | (Information Technology) | |
| | 6,528 | | | Samsung Electronics Co. Ltd. | | | 7,905,786 | |
| | | | (Information Technology) | |
| | 34,500 | | | Samsung Heavy Industries Co. Ltd. | | | 1,170,255 | |
| | | | (Industrials) | | | | |
| | 61,500 | | | SK Hynix, Inc.* | | | 1,258,857 | |
| | | | (Information Technology) | |
| | 8,892 | | | SK Innovation Co. Ltd. | | | 1,348,091 | |
| | | | | | | | |
| | | | (Energy) | | | | |
| | | | | | | 22,402,924 | |
| | | | | | | | |
| | |
| | | | SRI LANKA—1.0% | | | | |
| | 728,273 | | | Sampath Bank PLC | | | 1,213,741 | |
| | | | | | | | |
| | | | (Banking) | | | | |
| | |
| | | | TAIWAN—23.4% | | | | |
| | 156,000 | | | Asustek Computer, Inc. | | | 1,694,987 | |
| | | | (Information Technology) | | | | |
| | 4,005,000 | | | AU Optronics Corp.* | | | 1,448,241 | |
| | | | (Information Technology) | | | | |
| | 785,405 | | | Chicony Electronics Co. Ltd. | | | 1,848,737 | |
| | | | (Information Technology) | | | | |
| | 1,779,000 | | | Coretronic Corp. | | | 1,699,285 | |
| | | | (Information Technology) | | | | |
| | 673,000 | | | Delta Electronics, Inc. | | | 2,605,813 | |
| | | | (Information Technology) | | | | |
| | 3,169,950 | | | E.Sun Financial Holding Co. Ltd. | | | 1,795,117 | |
| | | | (Banking) | | | | |
| | | | | | | | |
| Shares | | | Description | | Value (Note 1) | |
| | 477,000 | | | Far EasTone Telecommunications Co. Ltd. | | $ | 1,179,746 | |
| | | | (Telecommunication Services) | | | | |
| | 81,400 | | | Formosa International Hotels Corp. | | | 976,072 | |
| | | | (Consumer Discretionary) | | | | |
| | 199,500 | | | Foxconn Technology Co. Ltd. | | | 775,854 | |
| | | | (Information Technology) | | | | |
| | 438,000 | | | Hon Hai Precision Industry Co. Ltd. | | | 1,374,657 | |
| | | | (Information Technology) | | | | |
| | 195,670 | | | MediaTek, Inc. | | | 2,065,938 | |
| | | | (Information Technology) | | | | |
| | 37,080 | | | Mega Financial Holding Co. Ltd. | | | 28,588 | |
| | | | (Banking) | | | | |
| | 376,550 | | | Merida Industry Co. Ltd. | | | 1,387,327 | |
| | | | (Consumer Discretionary) | | | | |
| | 273,000 | | | Phison Electronics Corp. | | | 2,202,552 | |
| | | | (Information Technology) | | | | |
| | 189,000 | | | Quanta Computer, Inc. | | | 502,263 | |
| | | | (Information Technology) | | | | |
| | 551,000 | | | Ruentex Industries Ltd. | | | 1,293,220 | |
| | | | (Consumer Discretionary) | | | | |
| | 1,069,000 | | | Taiwan Semiconductor Manufacturing Co. Ltd. | | | 3,274,812 | |
| | | | (Information Technology) | | | | |
| | 63,434 | | | TPK Holding Co. Ltd. | | | 832,052 | |
| | | | (Information Technology) | | | | |
| | 494,340 | | | Uni-President Enterprises Corp. | | | 876,923 | |
| | | | | | | | |
| | | | (Consumer Staples) | | | | |
| | | | | | | 27,862,184 | |
| | | | | | | | |
| | |
| | | | THAILAND—4.8% | | | | |
| | 171,200 | | | Bangkok Bank PCL | | | 1,117,973 | |
| | | | (Banking) | | | | |
See Notes to Financial Statements.
6
| | | | | | | | |
| Shares | | | Description | | Value (Note 1) | |
| |
| | | | THAILAND—(continued) | |
| | 1,636,300 | | | Bangkok Chain Hospital PCL | | $ | 510,347 | |
| | | | (Healthcare) | | | | |
| | 1,771,400 | | | Home Product Center
PCL | | | 753,910 | |
| | | | (Consumer Discretionary) | | | | |
| | 1,006,700 | | | Minor International PCL | | | 503,677 | |
| | | | (Consumer Discretionary) | | | | |
| | 105,200 | | | PTT PCL | | | 1,124,457 | |
| | | | (Energy) | | | | |
| | 1,237,000 | | | Sino Thai Engineering & Construction PCL | | | 799,750 | |
| | | | (Industrials) | | | | |
| | 1,315,600 | | | Supalai PCL | | | 854,841 | |
| | | | | | | | |
| | | | (Real Estate-Developers) | | | | |
| | | | | | | 5,664,955 | |
| | | | | | | | |
| | | | Total equities
(cost $104,737,869) | | | 127,071,865 | |
| | | | | | | | |
| | | | | | | | |
| Shares | | | Description | | Value (Note 1) | |
| | | | EXCHANGE TRADED FUND—0.6% | |
| | | | VIETNAM | | | | |
| | 44,250 | | | Market Vectors Vietnam ETF (New York Stock Exchange) (cost $1,066,606) | | | $ 710,213 | |
| | | | | | | | |
| | | | | | | | |
| | | | Total long-term investments (cost $105,804,475) | | | 127,782,078 | |
| | | | | | | | |
| | | | SHORT-TERM INVESTMENT—1.1% | |
| | | | MONEY MARKET MUTUAL FUND | |
| | | | UNITED STATES | | | | |
| | 1,357,396 | | | JPMorgan Prime Money Market Fund/Premier
(cost $1,357,396) | | | 1,357,396 | |
| | | | | | | | |
| | | | Total Investments—108.5% (cost $107,161,871; Note 4) | | | 129,139,474 | |
| | | | Liabilities in excess of other assets(a)—(8.5%) | | | (10,105,023 | ) |
| | | | | | | | |
| | | | Net Assets—100.0% | | | $119,034,451 | |
| | | | | | | | |
The following annotations are used in the Portfolio of Investments:
| HSCEI—Hang | Seng China Enterprises Index |
| MSCI—Morgan | Stanley Capital International |
| * | Non-income producing security. |
| (a) | Includes net unrealized depreciation on the following derivative contracts held at reporting period end: |
Open futures contracts outstanding at September 30, 2012:
| | | | | | | | | | | | | | | | | | | | |
Number of
Contracts | | | Type | | Expiration Date | | | Value at
Trade Date | | | Value at
September 30, 2012 | | | Unrealized
Depreciation | |
| | | | Short Positions: | | | | | | | | | | | | |
| | 143 | | | HSCEI | | | Oct. 2012 | | | $ | 8,954,503 | | | $ | 9,089,128 | | | $ | (134,625 | ) |
| | 193 | | | MSCI Taiwan Stock Index | | | Oct. 2012 | | | | 5,270,319 | | | | 5,315,220 | | | | (44,901 | ) |
| | | | | | | | | | | | | | | | | | | | |
| | | | | | | | | | | | | | | | | | $ | (179,526 | ) |
| | | | | | | | | | | | | | | | | | | | |
See Notes to Financial Statements.
7
THE ASIA PACIFIC FUND, INC.
Portfolio of Investments
September 30, 2012
(Unaudited) Continued
Various inputs are used in determining the value of the Fund’s investments. These inputs are summarized in the three broad levels listed below.
Level 1—quoted prices generally in active markets for identical securities.
Level 2—other significant observable inputs including, but not limited to, quoted prices for similar securities, interest rates and yield curves, prepayment speeds, foreign currency exchange rates and amortized cost.
Level 3—significant unobservable inputs for securities valued in accordance with Board approved fair valuation procedures.
The following is a summary of the inputs used as of September 30, 2012 in valuing such portfolio securities:
| | | | | | | | | | | | |
| | | Level 1 | | | Level 2 | | | Level 3 | |
Investments in Securities | | | | | | | | | | | | |
Equities | | | | | | | | | | | | |
China (including Hong Kong) | | $ | 39,832,184 | | | $ | — | | | $ | — | |
India | | | 9,672,797 | | | | — | | | | — | |
Indonesia | | | 6,311,544 | | | | — | | | | — | |
Malaysia | | | 3,211,383 | | | | — | | | | — | |
Philippines | | | 1,878,393 | | | | — | | | | — | |
Singapore | | | 9,021,760 | | | | — | | | | — | |
South Korea | | | 22,402,924 | | | | — | | | | — | |
Sri Lanka | | | 1,213,741 | | | | — | | | | — | |
Taiwan | | | 27,862,184 | | | | — | | | | — | |
Thailand | | | 5,664,955 | | | | — | | | | — | |
Exchange Traded Fund | | | | | | | | | | | | |
Vietnam | | | 710,213 | | | | — | | | | — | |
Money Market Mutual Fund | | | 1,357,396 | | | | — | | | | — | |
Other Financial Instruments* | | | | | | | | | | | | |
Futures | | | (179,526 | ) | | | — | | | | — | |
| | | | | | | | | | | | |
Total | | $ | 128,959,948 | | | $ | — | | | $ | — | |
| | | | | | | | | | | | |
| * | Other financial instruments are derivative instruments not reflected in the Portfolio of Investments, such as futures contracts, which are valued at the unrealized appreciation/depreciation on the instrument. |
The industry classification of portfolio holdings and liabilities in excess of other assets shown as a percentage of net assets as of September 30, 2012 were as follows:
| | | | |
Information Technology | | | 29.1 | % |
Consumer Discretionary | | | 15.6 | |
Banking | | | 15.4 | |
Real Estate-Developers | | | 10.5 | |
Industrials | | | 8.2 | |
Materials | | | 6.0 | |
Energy | | | 5.7 | |
Telecommunication Services | | | 3.5 | |
Insurance | | | 2.8 | |
Healthcare | | | 2.7 | |
Diversified Financials | | | 2.5 | |
Consumer Staples | | | 2.4 | |
Utilities | | | 2.4 | |
Money Market Mutual Fund | | | 1.1 | |
Exchange Traded Fund | | | 0.6 | |
| | | | |
| | | 108.5 | |
Liabilities in excess of other assets | | | (8.5 | ) |
| | | | |
Total | | | 100.0 | % |
| | | | |
See Notes to Financial Statements.
8
The Fund invested in derivative instruments (futures contracts and rights offerings) during the reporting period. The primary type of risk associated with these derivative instruments is equity risk. The effect of such derivative instruments on the Fund’s financial position and financial performance as reflected in the Statement of Assets and Liabilities and Statement of Operations is presented in the summary below.
Fair values of derivative instruments as of September 30, 2012 as presented in the Statement of Assets and Liabilities:
| | | | | | | | | | | | |
| | | Asset Derivatives | | | Liability Derivatives | |
Derivatives not designated as hedging
instruments, carried at fair value | | Balance Sheet Location | | Fair Value | | | Balance Sheet Location | | Fair Value | |
Equity contracts | | Due to broker-variation margin | | $ | — | | | Due to broker-variation margin | | $ | 179,526 | * |
| | | | | | | | | | | | |
| * | Includes cumulative appreciation/depreciation as reported in the schedule of open futures contracts. Only unsettled variation margin receivable (payable) is reported within the Statement of Assets and Liabilities. |
The effects of derivative instruments on the Statement of Operations for the six months ended September 30, 2012 are as follows:
| | | | | | | | |
| |
| Amount of Realized Gain or (Loss) on Derivatives Recognized in Income |
Derivatives not designated as hedging instruments, carried at fair value | | Futures | | | | | |
Equity contracts | | $ | (687,009 | ) | | | | |
| | | | | | | | |
| | | | | | | | | | | | |
| |
| Change in Unrealized Appreciation or (Depreciation) on Derivatives Recognized in Income | |
Derivatives not designated as hedging instruments, carried at fair value | | Futures | | | Rights | | | Total | |
Equity contracts | | $ | (179,526 | ) | | $ | (10,487 | ) | | $ | (190,013 | ) |
| | | | | | | | | | | | |
For the six months ended September 30, 2012, the Fund’s average value at trade date for short positions on futures contracts was $4,741,607.
See Notes to Financial Statements.
9
THE ASIA PACIFIC FUND, INC.
Statement of Assets and Liabilities
September 30, 2012
(Unaudited)
| | | | |
| Assets | | | | |
Investments, at value (cost $107,161,871) | | $ | 129,139,474 | |
Cash | | | 585,857 | |
Foreign currency (cost $1,130,649) | | | 1,131,749 | |
Receivable for investments sold | | | 1,005,645 | |
Prepaid expenses | | | 131,677 | |
Dividends and interest receivable | | | 64,795 | |
| | | | |
Total assets | | | 132,059,197 | |
| | | | |
| Liabilities | | | | |
Loan payable | | | 10,000,000 | |
Payable for investments purchased | | | 2,493,346 | |
Accrued expenses and other liabilities | | | 343,481 | |
Investment management fee payable | | | 90,900 | |
Due to broker-variation margin | | | 73,361 | |
Administration fee payable | | | 23,658 | |
| | | | |
Total liabilities | | | 13,024,746 | |
| | | | |
| Net Assets | | $ | 119,034,451 | |
| | | | |
Net assets comprised: | | | | |
Common stock, at par | | $ | 103,441 | |
Paid-in capital in excess of par | | | 128,801,669 | |
| | | | |
| | | 128,905,110 | |
Undistributed net investment income | | | 327,220 | |
Accumulated net realized loss on investment and foreign currency transactions | | | (31,992,707 | ) |
Net unrealized appreciation on investments and foreign currencies | | | 21,794,828 | |
| | | | |
Net Assets, September 30, 2012 | | $ | 119,034,451 | |
| | | | |
Net Asset Value per share:
($119,034,451 / 10,344,073 shares of common stock outstanding) | | | $11.51 | |
| | | | |
See Notes to Financial Statements.
THE ASIA PACIFIC FUND, INC.
Statement of Operations
Six Months Ended September 30, 2012
(Unaudited)
| | | | |
| Net Investment Income | | | | |
Income | | | | |
Dividends (net of foreign withholding taxes of $202,231) | | $ | 1,949,961 | |
| | | | |
Expenses | | | | |
Investment management fee | | | 547,259 | |
Administration fee | | | 141,731 | |
Directors’ fees and expenses | | | 149,000 | |
Legal fees and expenses | | | 103,000 | |
Custodian’s fees and expenses | | | 97,000 | |
Insurance expense | | | 69,000 | |
Reports to shareholders | | | 63,000 | |
Loan interest and commitment fees (Note 6) | | | 37,032 | |
Audit fees and expenses | | | 22,000 | |
Transfer agent’s fees and expenses | | | 15,000 | |
Registration expense | | | 13,000 | |
Miscellaneous | | | 15,755 | |
| | | | |
Total expenses | | | 1,272,777 | |
| | | | |
Net investment income | | | 677,184 | |
| | | | |
| Realized and Unrealized Gain (Loss) on Investments, Foreign Currency and Futures Transactions | | | | |
Net realized loss on: | | | | |
Investment transactions | | | (4,846,558 | ) |
Foreign currency transactions | | | (179,308 | ) |
Financial futures transactions | | | (687,009 | ) |
| | | | |
| | | (5,712,875 | ) |
| | | | |
Net change in unrealized appreciation (depreciation) on: | | | | |
Investments | | | 3,532,919 | |
Foreign currencies | | | 2,056 | |
Financial futures contracts | | | (179,526 | ) |
| | | | |
| | | 3,355,449 | |
| | | | |
Net loss on investments, foreign currency and futures transactions | | | (2,357,426 | ) |
| | | | |
| Net Decrease in Net Assets Resulting From Operations | | $ | (1,680,242 | ) |
| | | | |
See Notes to Financial Statements.
10
THE ASIA PACIFIC FUND, INC.
Statement of Changes in Net Assets
(Unaudited)
| | | | | | | | |
Increase (Decrease)
in Net Assets | | Six Months
Ended
September 30,
2012 | | | Year Ended
March 31,
2012 | |
| | |
Operations | | | | | | | | |
| | |
Net investment income (loss) | | $ | 677,184 | | | $ | (487,978 | ) |
| | |
Net realized gain (loss) on investments, foreign currency and futures transactions | | | (5,712,875 | ) | | | 1,006,545 | |
| | |
Net change in unrealized appreciation (depreciation) on investments, foreign currencies and futures transactions | | | 3,355,449 | | | | (14,880,251 | ) |
| | | | | | | | |
| | |
Total decrease | | | (1,680,242 | ) | | | (14,361,684 | ) |
| | |
| Net Assets | | | | | | | | |
| | |
Beginning of period | | | 120,714,693 | | | | 135,076,377 | |
| | | | | | | | |
| | |
End of period(a) | | $ | 119,034,451 | | | $ | 120,714,693 | |
| | | | | | | | |
(a) Includes undistributed net investment income of: | | $ | 327,220 | | | $ | — | |
| | | | | | | | |
THE ASIA PACIFIC FUND, INC.
Notes to Financial Statements
(Unaudited)
The Asia Pacific Fund, Inc. (the “Fund”) is registered under the Investment Company Act of 1940, as amended, as a diversified, closed-end, management investment company. The Fund’s investment objective is to achieve long-term capital appreciation through investment of at least 80% of investable assets in equity securities of companies in the Asia Pacific countries.
Note 1. Accounting Policies | |
The following is a summary of significant accounting policies followed by the Fund in the preparation of its financial statements.
The Fund’s financial statements are prepared in accordance with U.S. generally accepted accounting principles, which may require the use of management estimates and assumptions. Actual results could differ from these estimates and assumptions.
Securities Valuation The Fund holds portfolio securities and other assets that are fair valued at the close of each day the New York Stock Exchange (“NYSE”) is open for trading. Fair value is the price that would be received to sell an asset or paid to transfer a liability in an orderly transaction between market participants on the measurement date. The Board of Directors has delegated fair valuation responsibilities to the Manager, Baring Asset Management (Asia) Limited, through the adoption of Valuation Procedures for valuation of the Fund’s securities. Under the current Valuation Procedures, a Valuation Committee is established and responsible for supervising the valuation of portfolio securities and other assets. The Valuation Procedures allow the Fund to utilize independent pricing vendor services, quotations from market makers and other valuation methods in events when market quotations are not readily available. A record of the Valuation Committee’s actions is subject to review, approval and ratification by the Board at its next regularly scheduled quarterly meeting.
Various inputs are used in determining the value of the Fund’s investments, which are summarized in the three broad level hierarchies based on any observable inputs used as described in the table following the Fund’s Portfolio of Investments. The valuation methodologies
See Notes to Financial Statements.
11
THE ASIA PACIFIC FUND, INC.
Notes to Financial Statements
(Unaudited) Continued
and significant inputs used in determining the fair value of securities and other assets classified as Level 1, Level 2 and Level 3 of the hierarchy are as follows:
Common stocks, exchange-traded funds and financial derivative instruments (such as futures contracts and rights offerings), that are traded on a national securities exchange are valued at the last sale price as of the close of trading on the applicable exchange. Securities traded via NASDAQ are valued at the NASDAQ official closing price. To the extent these securities are valued at the last sale price or NASDAQ official closing price, they are classified as Level 1 of the fair value hierarchy.
In the event there is no sale or official closing price on such day, these securities are valued at the mean between the last reported bid and asked prices, or at the last bid price in the absence of an asked price. These securities are classified as Level 2 of the fair value hierarchy as these inputs are considered as significant other observable inputs to the valuation.
For common stocks traded on foreign securities exchanges, certain valuation adjustments will be applied when events occur after the close of the security’s foreign market and before the Fund’s normal pricing time. These securities are valued using pricing vendor services that provide model prices derived using adjustment factors based on information such as local closing price, relevant general and sector indices, currency fluctuations, depositary receipts, and futures, as applicable. Securities valued using such model prices are classified as Level 2 of the fair value hierarchy as the adjustment factors are considered as significant other observable inputs to the valuation.
Investments in open end, non-exchange-traded mutual funds are valued at their net asset value as of the close of the NYSE on the date of valuation. These securities are classified as Level 1 as these securities have the ability to be purchased or sold at their net asset value on the date of valuation.
Securities and other assets that cannot be priced using the methods described above are valued with pricing methodologies approved by the Valuation Committee. In the event there are unobservable inputs used when de-
termining such valuation, the securities will be classified as Level 3 of the fair value hierarchy.
When determining the fair valuation of securities, some of the factors influencing the valuation include, the nature of any restrictions on disposition of the securities; assessment of the general liquidity of the securities; the issuer’s financial condition and the markets in which it does business; the cost of the investment; the size of the holding and the capitalization of the issuer; the prices of any recent transactions or bids/offers for such securities or any comparable securities; any available analyst, media or other reports or information regarding the issuer or the markets or industry in which it operates; other analytical data; and consistency with valuation of similar securities held by other funds managed by Baring Asset Management (Asia) Limited. Using fair value to price securities may result in a value that is different from a security’s most recent closing price and from the price used by other mutual funds to calculate their net asset values.
Foreign Currency Translation The books and records of the Fund are maintained in United States dollars. Foreign currency amounts are translated into United States dollars on the following basis:
(i) market value of investment securities, other assets and liabilities—at the current rates of exchange.
(ii) purchases and sales of investment securities, income and expenses—at the rates of exchange prevailing on the respective dates of such transactions.
Although the net assets of the Fund are presented at the foreign exchange rates and market values at the close of the fiscal period, the Fund does not isolate that portion of the results of operations arising as a result of changes in the foreign exchange rates from the fluctuations arising from changes in the market prices of securities held at fiscal period end. Similarly, the Fund does not isolate the effect of changes in foreign exchange rates from the fluctuations arising from changes in the market prices of portfolio securities sold during the fiscal period. Accordingly, these realized foreign currency gains or losses are included in the reported net realized gains or losses on investment transactions.
12
Net realized gains or losses on foreign currency transactions represent net foreign exchange gains or losses from sales and maturities of short-term securities, holdings of foreign currencies, currency gains or losses realized between the trade and settlement dates on security transactions, and the difference between the amounts of dividends, interest and foreign taxes recorded on the Fund’s books and the U.S. dollar equivalent amounts actually received or paid. Net currency gains or losses from valuing foreign currency denominated assets, other than investment securities, and liabilities at fiscal period end exchange rates are reflected as a component of unrealized appreciation (depreciation) on investments and foreign currencies.
Foreign security and currency transactions may involve certain considerations and risks not typically associated with those of U.S. companies as a result of, among other factors, the level of governmental supervision and regulation of foreign securities markets and the possibility of political or economic instability.
Stock Index Futures Contracts A stock index futures contract is an agreement to purchase (long) or sell (short) an agreed amount of securities at a set price for delivery on a future date. Upon entering into a stock index futures contract, the Fund is required to pledge to the broker an amount of cash and/or other assets equal to a certain percentage of the contract amount. This amount is known as the “initial margin.” Subsequent payments known as “variation margin,” are made or received by the Fund each day, depending on the daily fluctuations in the value of the underlying security. Such variation margin is recorded for financial statement purposes on a daily basis as unrealized gain or loss. When the contract expires or is closed, the gain or loss is realized and is presented in the Statement of Operations as net realized gain or loss on stock index futures contracts.
The Fund may utilize stock index futures contracts for hedging and investment purposes. Should market prices for the futures contracts or the underlying assets move in ways not anticipated by the Fund, losses may result. The use of futures contracts involves the risk of imperfect correlation in movements in the price of futures contracts
and the underlying assets being hedged or the exposures desired by the Fund.
Securities Transactions and Net Investment Income Securities transactions are recorded on the trade date. Realized and unrealized gains or losses from security and currency transactions are calculated on the identified cost basis. Dividend income is recorded on the ex-dividend date, and interest income and expenses are recorded on an accrual basis. Expenses are recorded on the accrual basis which may require the use of certain estimates by management. Actual results may differ from such estimates.
Dividends and Distributions Dividends from net investment income, if any, are declared and paid at least annually in a manner that qualifies for the dividends-paid deduction. The Fund’s current intention is to distribute at least annually any net capital gains in excess of net capital loss carryforwards in a manner that avoids income and excise taxes being imposed on the Fund. Dividends and distributions are recorded on the ex-dividend date. The Fund may choose to satisfy the foregoing by making distributions in cash, additional Fund shares, or both.
The Fund could determine in the future to retain net long-term capital gains in respect of any fiscal year without affecting the ability of the Fund to qualify as a regulated investment company. In that case, the Fund would be subject to taxation on the retained amount and shareholders subject to U.S. federal income taxation would be required to include in income for tax purposes their shares of the undistributed amount and would be entitled to credits or refunds against their U.S. federal income tax liabilities with respect to their proportionate shares of the tax paid by the Fund.
Income distributions and capital gain distributions are determined in accordance with income tax regulations, which may differ from U.S. generally accepted accounting principles.
Taxes It is the Fund’s current intention to continue to meet the requirements of the U.S. Internal Revenue Code of 1986, as amended (“the Code”) applicable to regulated investment companies and to distribute all of its taxable income and capital gain to shareholders.
13
THE ASIA PACIFIC FUND, INC.
Notes to Financial Statements
(Unaudited) Continued
Therefore, no federal income tax provision is required. If the Fund determines in the future to retain capital gains, the Fund will provide for all required taxes.
Withholding tax on foreign dividends and interest and foreign capital gains tax is accrued in accordance with the Fund’s understanding of the applicable country’s tax rules and rates.
Note 2. Investment Management and Administration Agreements | |
The Fund has a management agreement with Baring Asset Management (Asia) Limited (the "Investment Manager") and an administration agreement with Prudential Investments LLC (the "Administrator").
The investment management fee is computed weekly and payable monthly at the following annual rates: 1.00% of the Fund’s average weekly net assets up to $100 million and 0.70% of such assets in excess of $100 million.
The administration fee is also computed weekly and payable monthly at the following annual rates: 0.25% of the Fund’s average weekly net assets up to $200 million and 0.20% of such assets in excess of $200 million.
Pursuant to the agreements, the Investment Manager provides continuous supervision of the investment portfolio and the Administrator provides occupancy and certain clerical, administrative and accounting services for the Fund. The Investment Manager and the Administrator each pays the cost of compensation of certain officers of the Fund. The Fund bears all other costs and expenses.
Note 3. Portfolio Securities | |
Purchases and sales of investment securities, other than short-term investments, for the six months ended September 30, 2012 aggregated $121,200,064 and $118,709,849, re-spectively. 1,912 index futures contracts were bought and sold/closed with an aggregate value of $51.60 million and $52.29 million, respectively.
The United States federal income tax basis of the Fund's investments and the net unreal-ized appreciation as of September 30, 2012 were as follows:
| | | | | | |
Tax Basis | | Appreciation | | Depreciation | | Net Unrealized
Appreciation |
| $107,919,735 | | $22,223,845 | | $(1,004,106 ) | | $21,219,739 |
The difference between book basis and tax basis is attributable to deferred losses on wash sales and investments in passive foreign investment companies as of the most recent fiscal year end.
Under the Regulated Investment Company Modernization Act of 2010 (“the Act”), the Fund is permitted to carryforward capital losses incurred in the fiscal year ended March 31, 2012 (“post-enactment losses”) for an unlimited period. Post enactment losses are required to be utilized before the utilization of losses incurred prior to the effective date of the Act. As a result of this ordering rule, capital loss carryforwards related to taxable years beginning before March 31, 2012 (“pre-enactment losses”) may have an increased likelihood to expire unused. The Fund utilized approximately $1,851,000 of its pre-enactment losses to offset net taxable gains realized in the fiscal year ended March 31, 2012. No capital gains distributions are expected to be paid to shareholders until net gains have been realized in excess of such losses. As of March 31, 2012, the pre and post-enactment losses were approximately:
| | | | |
Post-Enactment Losses: | | $ | 0 | |
| | | | |
Pre-Enactment Losses: | | | | |
Expiring 2017 | | | 9,777,000 | |
Expiring 2018 | | | 15,355,000 | |
| | | | |
| | $ | 25,132,000 | |
| | | | |
The Fund elected to treat post-October capital losses of approximately $407,000 and certain late-year ordinary income losses of approximately $332,000 as having been incurred in the fiscal year ending March 31, 2013.
Management has analyzed the Fund’s tax positions taken on federal income tax returns for all open tax years
14
and has concluded that no provision for income tax is required in the Fund’s financial statements for the current reporting period. The Fund’s federal and state income and federal excise tax returns for tax years for which the applicable statutes of limitations have not expired are subject to examination by the Internal Revenue Service and state departments of revenue.
There are 30 million shares of $0.01 par value common stock authorized.
The Fund currently is a party to a committed credit facility with a bank. The credit fa-cility provides for a maximum commitment of $10,000,000. Interest on any borrowings under the credit facility is at contracted market rates. The Fund pays a commitment fee on the unused portion of the facility. The commitment fee is accrued daily and paid quarterly. The Fund's obligations under the credit facility are secured by substantially all the assets of the Fund. The purpose of the credit facility is to as-sist the Fund with its general cash flow requirements, including the provision of portfolio leverage.
During the six months ended September 30, 2012, the Fund utilized the credit facility and had an average daily outstanding loan balance of $8,619,355 during the 155 day period that the facility was utilized, at an average interest rate of 0.68%. The maximum amount of loan outstanding during the period was $10,000,000. There was a balance of $10,000,000 outstanding at September 30, 2012.
Note 7. New Accounting Pronouncement | |
In December 2011, the Financial Accounting Standards Board ("FASB") issued Account-ing Standards Update ("ASU") No. 2011-11 regarding "Disclosures about Offsetting As-sets and Liabilities". The amendments, which will be effective for annual reporting periods beginning on or after January 1, 2013 and interim periods within those annual periods, require an entity to disclose information about offsetting and related arrangements for assets and liabilities, fi-nancial instruments and derivatives that are either currently offset in accordance with current requirements or are sub-ject to enforceable master netting arrangements or similar agreements. At this time, management is evaluating the implications of ASU No. 2011-11 and its impact on the financial statements has not yet been determined.
15
THE ASIA PACIFIC FUND, INC.
Financial Highlights
(Unaudited)
| | | | | | | | | | | | | | | | | | | | | | | | |
Per Share Operating
Performance: | | Six Months
Ended
September 30,
2012 | | | Year Ended March 31, | |
| | | 2012 | | | 2011 | | | 2010 | | | 2009 | | | 2008 | |
Net asset value, beginning of period | | $ | 11.67 | | | $ | 13.06 | | | $ | 10.97 | | | $ | 6.75 | | | $ | 21.70 | | | $ | 24.03 | |
| | | | | | | | | | | | | | | | | | | | | | | | |
Net investment income (loss) | | | 0.07 | | | | (0.05 | ) | | | (0.06 | ) | | | (0.06 | ) | | | 0.12 | | | | 0.09 | |
Net realized and unrealized gain (loss) on investment and foreign currency transactions | | | (0.23 | ) | | | (1.34 | ) | | | 2.15 | | | | 4.28 | | | | (9.97 | ) | | | 5.73 | |
| | | | | | | | | | | | | | | | | | | | | | | | |
Total from investment operations | | | (0.16 | ) | | | (1.39 | ) | | | 2.09 | | | | 4.22 | | | | (9.85 | ) | | | 5.82 | |
| | | | | | | | | | | | | | | | | | | | | | | | |
Less dividends and distributions: | | | | | | | | | | | | | | | | | | | | | | | | |
Dividends from net investment income | | | — | | | | — | | | | — | | | | — | | | | (0.04 | ) | | | (0.91 | ) |
Distributions paid from capital gains | | | — | | | | — | | | | — | | | | — | | | | (5.06 | ) | | | (7.24 | ) |
| | | | | | | | | | | | | | | | | | | | | | | | |
Total dividends and distributions | | | — | | | | — | | | | — | | | | — | | | | (5.10 | ) | | | (8.15 | ) |
| | | | | | | | | | | | | | | | | | | | | | | | |
Net asset value, end of period | | $ | 11.51 | | | $ | 11.67 | | | $ | 13.06 | | | $ | 10.97 | | | $ | 6.75 | | | $ | 21.70 | |
| | | | | | | | | | | | | | | | | | | | | | | | |
Market value, end of period | | $ | 10.28 | | | $ | 10.58 | | | $ | 11.83 | | | $ | 9.95 | | | $ | 6.23 | | | $ | 19.75 | |
| | | | | | | | | | | | | | | | | | | | | | | | |
Total investment return(a) | | | (2.84 | )% | | | (10.57 | )% | | | 18.89 | % | | | 59.71 | % | | | (41.95 | )% | | | 28.68 | % |
| | | | | | | | | | | | | | | | | | | | | | | | |
| Ratios to Average Net Assets: | | | | | | | | | | | | | | | | | | | | | | | | |
Total expenses (including loan interest)(c) | | | 2.25 | %(b)(d) | | | 2.15 | %(b) | | | 2.01 | %(b) | | | 2.22 | %(b) | | | 1.95 | % | | | 1.54 | %(b) |
Net investment income (loss) | | | 1.20 | %(d) | | | (0.40 | )% | | | (0.51 | )% | | | (0.61 | )% | | | 0.79 | % | | | 0.31 | % |
| Supplemental Data: | | | | | | | | | | | | | | | | | | | | | | | | |
Average net assets (000 omitted) | | $ | 113,075 | | | $ | 123,601 | | | $ | 120,668 | | | $ | 100,915 | | | $ | 151,467 | | | $ | 297,765 | |
Portfolio turnover rate | | | 100 | %(e) | | | 137 | % | | | 136 | % | | | 184 | % | | | 220 | % | | | 105 | % |
Net assets, end of period
(000 omitted) | | $ | 119,034 | | | $ | 120,715 | | | $ | 135,076 | | | $ | 113,440 | | | $ | 69,864 | | | $ | 224,476 | |
| (a) | Total investment return is calculated assuming a purchase of common stock at the current market value on the first day and a sale at the current market value on the last day of each fiscal period reported. Dividends and distributions are assumed, for purposes of this calculation, to be reinvested at prices obtained under the Fund’s dividend reinvestment plan. These calculations do not include brokerage commissions. Total returns for periods of less than a full year are not annualized. |
| (b) | The expense ratio without loan interest expense would have been 2.21% for the period ended September 30, 2012, 2.15%, 2.00%, 2.21% and 1.52% for the fiscal years ended March 31, 2012, 2011, 2010 and 2008, respectively. |
| (c) | Does not include expenses of the underlying funds in which the Fund invests. |
Shown above are selected data for a share of common stock outstanding, total investment return, ratios to average net assets and other supplemental data for the periods indicated. This information has been determined based upon information provided in the financial statements and market price data for the Fund’s shares.
See Notes to Financial Statements.
16
Board of Directors’ Approval of Continuance of Investment Management Agreement
At a meeting held on May 18, 2012, the Board of Directors of the Fund (the “Board”), including a majority of the disinterested directors (the “Directors”), approved the continuance of the investment management agreement (the “Investment Management Agreement”) between the Fund and Baring Asset Management (Asia) Limited (the “Investment Manager”). Prior to acting on the continuance of the Investment Management Agreement, the Directors considered the factors discussed below.
Factors Considered by the Board
Prior to approval of the continuance of the Investment Management Agreement, the Directors had evaluated information provided by the Investment Manager. They reviewed the Investment Management Agreement with the Investment Manager and with experienced Fund counsel, who are independent of the Investment Manager, and who advised on the relevant legal standards.
Based on their experience gained as Fund Directors, the Directors considered their knowledge of the nature and quality of the services provided by the Investment Manager to the Fund and their overall confidence in the Investment Manager’s integrity and competence. The Directors noted that they receive presentations at regular Board meetings from the Investment Manager on the investment results of the Fund and review extensive materials and information provided by the Investment Manager.
The Directors also considered all other factors they believed relevant, including the specific matters described below. In their deliberations, the Directors did not identify any particular information that was all-important or controlling, and each Director attributed different weights to the various factors.
The Directors determined that the selection of the Investment Manager to manage the Fund and the overall arrangements between the Fund and the Investment Manager, including the investment management fee, as provided in the Investment Management Agreement, were fair and reasonable in light of the services performed, expenses incurred and such other matters as the Directors considered relevant in the exercise of their reasonable judgment.
The material factors and conclusions that formed the basis for the Directors’ determinations include the following:
Nature, extent and quality of services provided by the Investment Manager
The Directors considered the scope and quality of services provided by the Investment Manager under the Investment Management Agreement, including the quality of the investment research capabilities of the Investment Manager and the other resources it has dedicated to performing services for the Fund. They noted the professional experience of the Fund’s portfolio management team and other senior personnel of the Investment Manager. The Directors concluded that they were satisfied with the nature, extent and quality of services provided to the Fund under the Investment Management Agreement.
Costs of Services Provided and Profitability to the Investment Manager
The Directors reviewed a schedule of the expenses and assets under management for 2011 and the estimated profitability of the Investment Management Agreement to the Investment Manager for 2011. The Directors reviewed the Investment Manager’s memorandum describing the assumptions and methods of allocation of estimated costs of managing the Fund in 2011 and in preparing Fund-specific profitability data.
The Directors recognized that it is difficult to make comparisons of profitability from fund advisory contracts because comparative information is not generally publicly available and is affected by numerous factors. The Directors focused
17
Board of Directors’ Approval of Continuance of Investment Management Agreement Continued
on profitability of the Investment Manager’s relationship with the Fund before taxes. The Directors concluded that they were satisfied that the Investment Manager’s level of profitability from its relationship with the Fund was not unreasonable.
Fall-Out Benefits
The Directors considered the benefits to the Investment Manager from its relationship with the Fund other than fees payable under the Investment Management Agreement, including but not limited to soft dollar arrangements whereby the Investment Manager receives brokerage and research services from many of the brokers and dealers that execute purchases and sales of securities on behalf of its clients, including the Fund, on an agency basis. The Directors recognized that the Investment Manager’s profitability would be somewhat lower without these benefits. The Directors also believe that the Investment Manager derives reputational and other benefits from its association with the Fund.
Investment Results
The Directors considered the investment results of the Fund as compared to other funds investing in Asia Pacific countries ex-Japan as provided by Morningstar, Inc. (“Morningstar Universe) and as compared to the MSCI All Countries Asia Ex-Japan Gross Index (the “Index”). The Directors reviewed information showing performance of the Fund as compared to the Index and to funds in the Morningstar Universe over the 4-month and 1-, 3-, 5- and 10-year periods ended April 30, 2012. The Directors noted that the Fund’s net asset value performance had been below that of the Index for the 4-month and 1-, 3- and 5-year periods, and above that of the Index for the 10-year period, and in the third quartile of the funds in the Morningstar Universe, for the 4-month and 1- and 3-year periods, and in the second and first quartiles, respectively, for the 5- and 10-year periods. The Directors considered that the Fund’s investment performance was satisfactory.
Advisory Fees
The Directors considered the advisory fee rate paid by the Fund to the Investment Manager and information prepared by Lipper, Inc. (“Lipper”) concerning fee rates paid by other funds in the same Lipper category as the Fund, that is, “Pacific Ex Japan Funds.” The Directors recognized that it is difficult to make comparisons of advisory fees because there are variations in the services that are included in the fees paid by other funds. Nonetheless, the Directors noted that the Fund’s advisory fee as a percentage of average net assets was competitive with the average of Lipper’s Pacific Ex Japan Funds. The information reviewed by the Directors showed that the Fund’s effective fee rate under the Investment Management Agreement for calendar 2011 was .93%, as compared to Lipper’s Pacific Ex Japan Funds’ average of .85%.
The Directors also considered the fees the Investment Manager charges the only other registered investment company it manages, which invests in China, and with the Investment Manager’s other clients with investment objectives similar to those of the Fund. The Directors noted that the Investment Manager’s only other registered investment company client’s advisory fee schedule and combined advisory/administrative fee schedule were each higher than the Fund’s comparable fee schedules. They also noted that the advisory fee schedules for other institutional accounts with a comparable investment objective were lower and the Investment Manager’s representation that fees charged to these accounts were lower because they did not entail the same regulatory, supervisory or compliance costs that are incurred with respect to registered closed-end funds. The Investment Manager indicated that for some of these other institutional clients there are also performance fees. The Directors noted that the application of such institutional fee schedule to the Fund’s level of assets would have resulted in a fee that would have been lower than that resulting from the Investment Management Agreement.
18
The Investment Manager reviewed with the Directors the significantly greater scope of services it provides to the Fund relative to institutional clients. In light of this information, the Directors did not place significant weight on the fee comparisons with institutional accounts.
Economies of Scale
The Directors considered that the Fund is a closed-end fund and that it was not expected to have meaningful asset growth absent a rights offering or an acquisition. In such circumstances, they did not view the potential for realization of economies of scale as the Fund’s assets grow to be a meaningful factor in their deliberations. The Directors noted, however, that the advisory fee schedule for the Fund contains a breakpoint at $100 million so that, when assets exceed the breakpoint, the fee rate is reduced from 1.00% to .70% on the incremental assets. The Directors concluded that the Fund’s breakpoint arrangements established a reasonable basis for realizing economies of scale should they exist.
19
Supplemental Proxy Information
An Annual Meeting of Stockholders was held on August 15, 2012. At such meeting the stockholders elected the following Class II Directors. Douglas Tong Hsu, who had been nominated for election at such meeting, withdrew his candidacy prior to such meeting.
Approval of Directors
| | | | | | | | |
Class II | | Affirmative
Votes Cast | | | Shares Withheld | |
Jessica M. Bibliowcz | | | 8,564,159 | | | | 380,383 | |
David G. P. Scholfield | | | 5,223,354 | | | | 3,721,189 | |
Additional Information
The Fund is required to file its complete schedule of portfolio holdings with the Securities and Exchange Commission (“SEC”) on Form N-Q for its first and third fiscal quarters and within 60 days of the fiscal quarter end. Once filed, the Fund’s Form N-Q is available without charge on the SEC’s website (http//www.sec.gov) or by calling the Fund toll free at 1-(888) 4-ASIA-PAC. Copies of the Fund’s Form N-Q may also be obtained by visiting the SEC’s Public Reference Room in Washington, DC (please call the SEC at (800) 732-0330 for information on the operation of the Public Reference Room).
Information regarding the Fund’s proxy voting policies and procedures and its proxy voting record for the 12-month period ending June 30 of each year is filed with the SEC on Form N-PX no later than August 31 of each year. The Fund’s Form N-PX is available without charge, upon request, by calling the Fund at its toll free number 1-(888) 4-ASIA-PAC and on the SEC’s website (http//www.sec.gov) or on or through the Fund’s website address (www.asiapacificfund.com).
20
| | | | |
| Item 2 | | – | | Code of Ethics – Not required, as this is not an annual filing. |
| | |
| Item 3 | | – | | Audit Committee Financial Expert – Not required, as this is not an annual filing. |
| | |
| Item 4 | | – | | Principal Accountant Fees and Services – Not required, as this is not an annual filing. |
| | |
| Item 5 | | – | | Audit Committee of Listed Registrants – Not required, as this is not an annual filing. |
| | |
| Item 6 | | – | | Schedule of Investments – The schedule is included as part of the report to shareholders filed under Item 1 of this Form. |
| | |
| Item 7 | | – | | Disclosure of Proxy Voting Policies and Procedures for Closed-End Management Investment Companies – Not required, as this is not an annual filing. |
| | |
| Item 8 | | – | | Portfolio Managers of Closed-End Management Investment Companies – Not required, as this is not an annual filing. |
| | |
| Item 9 | | – | | Purchases of Equity Securities by Closed-End Management Investment Company and Affiliated Purchasers – There have been no purchases of equity securities by the registrant or any affiliated purchasers during the period covered by this report. |
| | |
| Item 10 | | – | | Submission of Matters to a Vote of Security Holders – Not applicable. |
| | |
| Item 11 | | – | | Controls and Procedures |
| | (a) | It is the conclusion of the registrant’s principal executive officer and principal financial officer that the effectiveness of the registrant’s current disclosure controls and procedures (such disclosure controls and procedures having been evaluated within 90 days of the date of this filing) provide reasonable assurance that the information required to be disclosed by the registrant has been recorded, processed, summarized and reported within the time period specified in the Commission’s rules and forms and that the information required to be disclosed by the registrant has been accumulated and communicated to the registrant’s principal executive officer and principal financial officer in order to allow timely decisions regarding required disclosure. |
| | (b) | There has been no significant change in the registrant’s internal control over financial reporting that occurred during the registrant’s most recent fiscal quarter of the period covered by this report that has materially affected, or is likely to materially affect, the registrant’s internal control over financial reporting. |
| | | | |
| (a) | | (1) | | Code of Ethics – Not required, as this is not an annual filing. |
| | |
| | (2) | | Certifications pursuant to Section 302 of the Sarbanes-Oxley Act – Attached hereto as Exhibit
EX-99.CERT. |
| | |
| | (3) | | Any written solicitation to purchase securities under Rule 23c-1. – Not applicable. |
| | |
| (b) | | | | Certifications pursuant to Section 906 of the Sarbanes-Oxley Act – Attached hereto as Exhibit
EX-99.906CERT. |
SIGNATURES
Pursuant to the requirements of the Securities Exchange Act of 1934 and the Investment Company Act of 1940, the registrant has duly caused this report to be signed on its behalf by the undersigned, thereunto duly authorized.
(Registrant) The Asia Pacific Fund, Inc.
| | | | |
| By (Signature and Title)* | | /s/ Deborah A. Docs | | |
| | Deborah A. Docs | | |
| | Secretary | | |
Date November 23, 2012
Pursuant to the requirements of the Securities Exchange Act of 1934 and the Investment Company Act of 1940, this report has been signed below by the following persons on behalf of the registrant and in the capacities and on the dates indicated.
| | | | |
| By (Signature and Title)* | | /s/ Brian. A. Corris | | |
| | Brian A. Corris | | |
| | President and Principal Executive Officer | | |
Date November 23, 2012
| | | | |
| By (Signature and Title)* | | /s/ M. Sadiq Peshimam | | |
| | M. Sadiq Peshimam | | |
| | Treasurer and Chief Financial Officer | | |
Date November 23, 2012
| * | Print the name and title of each signing officer under his or her signature. |