UNITED STATES
SECURITIES AND EXCHANGE COMMISSION
Washington, D.C. 20549
FORM N-CSR
CERTIFIED SHAREHOLDER REPORT OF REGISTERED
MANAGEMENT INVESTMENT COMPANIES
| | |
| Investment Company Act file number: | | 811-04710 |
| |
| Exact name of registrant as specified in charter: | | The Asia Pacific Fund, Inc. |
| |
| Address of principal executive offices: | | Gateway Center 3, |
| | 100 Mulberry Street, |
| | Newark, New Jersey 07102 |
| |
| Name and address of agent for service: | | Deborah A. Docs |
| | Gateway Center 3, |
| | 100 Mulberry Street, |
| | Newark, New Jersey 07102 |
| |
| Registrant’s telephone number, including area code: | | 973-367-7521 |
| |
| Date of fiscal year end: | | 3/31/2015 |
| |
| Date of reporting period: | | 9/30/2014 |
| Item 1 | – Reports to Stockholders |
Directors
Michael J. Downey, Chairman
Jessica M. Bibliowicz
Robert F. Gunia
Duncan M. McFarland
David G. P. Scholfield
Nicholas T. Sibley
William G. Tung
Officers
Raymond Tam, President
M. Sadiq Peshimam, Treasurer and Chief Financial Officer
Deborah A. Docs, Secretary and Chief Legal Officer
Andrew R. French, Assistant Secretary
Valerie M. Simpson, Chief Compliance Officer
Theresa C. Thompson, Deputy Chief Compliance Officer
Investment Manager
Value Partners Hong Kong Limited
9th Floor, Nexxus Building
41 Connaught Road Central
Hong Kong
Administrator
Prudential Investments LLC
Gateway Center Three
100 Mulberry Street
Newark, NJ 07102-4077
Custodian
The Bank of New York Mellon
One Wall Street
New York, NY 10286
Transfer Agent
Computershare Trust Company N.A.
P.O. Box 43011
Providence, RI 02940-3011
Independent Registered Public Accounting Firm
KPMG LLP
345 Park Avenue
New York, NY 10154
Legal Counsel
Sullivan & Cromwell LLP
125 Broad Street
New York, New York 10004
Notice is hereby given in accordance with Section 23(c) of the Investment Company Act of 1940 that The Asia Pacific Fund, Inc. (the “Fund”) may purchase, from time to time, shares of its common stock at market prices.
The accompanying financial statements as of September 30, 2014 were not audited and, accordingly, no opinion is expressed on them.
This report, including the financial statements herein, is transmitted to the shareholders of the Fund for their information. This is not a prospectus, circular or representation intended for use in the purchase of shares of the Fund or any securities mentioned in this report.
The Asia Pacific Fund, Inc.
Gateway Center Three
100 Mulberry Street
Newark, NJ 07102-4077
For general information on the Fund, please call (toll-free) Pristine Advisers, our shareholders’ servicing agent toll-free at:
1-(888) 4-ASIA-PAC
Current information about the Fund is available on its website (http://www.asiapacificfund.com). This website includes monthly updates of the Fund’s performance and other data as well as the Manager’s quarterly presentation of performance and asset allocations and comments on the current Asian outlook.
The Fund’s CUSIP number is 044901106
APBS

The Asia Pacific
Fund, Inc.
Semi-Annual Report
September 30, 2014
www.asiapacificfund.com
The Asia Pacific Fund, Inc.
As of September 30, 2014 (Unaudited)
OUR TOLL-FREE LINE:
1-888-4-ASIA-PAC
For further information on the Fund, please call. In addition, the Fund makes available monthly certain portfolio information. If you would like to receive this information please call the toll-free number indicated above.
Statistics
| | | | |
Total Net Assets | | | $129,726,511 | |
Shares Outstanding | | | 10,344,073 | |
Net Asset Value | | | $12.54 | |
Equity | | | 99.5%(a) | |
Total Return Performance (US Dollar terms)
(As of September 30, 2014)
| | | | | | | | |
| Period | | Market
Price(b) | | | NAV(c) | |
3 months | | | 2.1% | | | | 1.7% | |
6 months | | | 9.2% | | | | 9.0% | |
1 Year | | | 11.5% | | | | 11.2% | |
3 Years (d) | | | 6.4% | | | | 7.8% | |
5 Years (d) | | | 3.1% | | | | 4.1% | |
10 Years (d) | | | 9.7% | | | | 10.0% | |
Other Information
| | | | |
Ticker Symbol | | | APB | |
Primary Exchange | | | NYSE | |
Dividend Repurchase Program | | | Yes | |
Portfolio Characteristics
(As of September 30, 2014)
Top Ten Equity Holdings
(% of Total Net Assets)
| | | | |
Samsung Fire & Marine Insurance Co. Ltd. (Preferred Shares) | | | 4.4% | |
Bank of China Ltd. (Class “H” Shares) | | | 4.1% | |
Amorepacific Corp. (Preference Shares) | | | 3.6% | |
China Construction Bank Corp. (Class “H” Shares) | | | 3.4% | |
Hyundai Motor Co. (Preference Shares) | | | 3.1% | |
SK Telecom Co. Ltd. | | | 3.0% | |
China Vanke Co. Ltd. (Class “H” Shares) | | | 2.7% | |
China Resources Power Holdings Co. Ltd. | | | 2.5% | |
Agricultural Bank of China Ltd. (Class “H” Shares) | | | 2.5% | |
PetroChina Co. Ltd. (Class “H” Shares) | | | 2.3% | |
Sector Breakdown: Top Ten Industries
(% of Total Net Assets)
| | | | |
Consumer Discretionary | | | 19.6% | |
Banking | | | 16.0% | |
Real Estate-Developers | | | 12.3% | |
Industrials | | | 8.5% | |
Telecommunication Services | | | 8.2% | |
Semiconductors & Semiconductor Equipment | | | 7.5% | |
Insurance | | | 5.4% | |
Energy | | | 5.2% | |
Utilities | | | 5.1% | |
Consumer Staples | | | 3.8% | |
Footnote section
| (a) | Expressed as a percentage of total investments. |
| (b) | Total investment return is calculated assuming a purchase of common stock at the current market value on the first day and a sale at the current market value on the last day of each period reported. Dividends and distributions are assumed, for purposes of this calculation, to be reinvested at prices obtained under the Fund’s dividend reinvestment plan. These calculations do not include brokerage commissions. |
| (c) | This information represents the historical net asset value (NAV) per share performance of the Fund. NAV per share performance is calculated assuming reinvestment of dividends and distributions. Because NAV per share performance does not reflect market price, it is not the same as total investment return. |
| (d) | Average annual return. |
1
REPORT OF THE INVESTMENT MANAGER
For the period from March 31 to September 30, 2014 (Unaudited)
During the six-month period ended September 30, 2014, the Fund’s net asset value (NAV) per share increased by $1.04, from $11.50 to $12.54. In percentage terms, the Fund’s NAV total return was up by 9.0%. This compares with an increase of 5.7% for its benchmark index, the MSCI All Countries (AC) Asia Ex-Japan Gross Index. The Fund’s share price was up by 9.2% over the period, from $10.33 to $11.28. At September 30, 2014, the discount to NAV was 10.05%.
The chart below illustrates the Fund’s net asset value performance per share during the period:
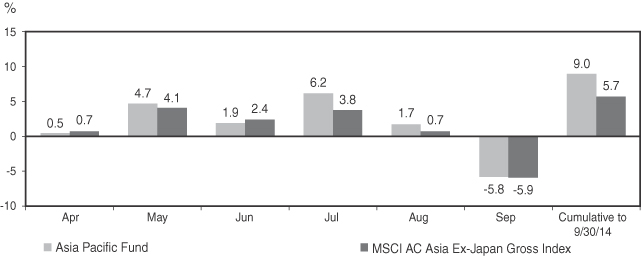
Source: Bloomberg and MSCI. Total returns are based on changes in NAV. NAV total return reflects the reinvestment of all dividends and distributions, if any, at NAV. Returns are shown in USD.
Local Currencies vs. the US Dollar
| | | | | | | | | | | | |
Currency US$/Local rate | | Mar 31
2014 | | | Sep 30
2014 | | | Mar 31 to
Sep 30, 2014
Change % | |
North Asia | | | | | | | | | | | | |
Chinese Renminbi | | | 6.22 | | | | 6.14 | | | | 1.3 | |
Hong Kong Dollar | | | 7.76 | | | | 7.77 | | | | -0.1 | |
South Korean Won | | | 1,064 | | | | 1,055 | | | | 0.9 | |
New Taiwan Dollar | | | 30.45 | | | | 30.42 | | | | 0.1 | |
ASEAN | | | | | | | | | | | | |
Thai Baht | | | 32.44 | | | | 32.43 | | | | 0.0 | |
Malaysian Ringgit | | | 3.27 | | | | 3.28 | | | | -0.3 | |
Philippines Peso | | | 44.85 | | | | 44.88 | | | | -0.1 | |
Singapore Dollar | | | 1.26 | | | | 1.28 | | | | -1.6 | |
Indonesian Rupiah | | | 11,360 | | | | 12,185 | | | | -6.8 | |
South Asia | | | | | | | | | | | | |
Sri Lankan Rupee | | | 130.70 | | | | 130.43 | | | | 0.2 | |
Indian Rupee | | | 59.72 | | | | 61.76 | | | | -3.3 | |
Vietnamese Dong | | | 21,098 | | | | 21,228 | | | | -0.6 | |
Source: Morningstar (Value Partners)
STOCK MARKET PERFORMANCE
March 31 to September 30, 2014
| | | | | | | | |
Country - Index | | Market Change %
Local currency terms | | | Market Change %
US$ terms | |
North Asia | | | | | | | | |
MSCI Hong Kong | | | 5.6 | | | | 5.5 | |
MSCI Taiwan | | | 6.9 | | | | 7.0 | |
MSCI Korea | | | -2.2 | | | | -1.3 | |
MSCI China | | | 7.4 | | | | 7.3 | |
ASEAN | | | | | | | | |
MSCI Singapore | | | 5.9 | | | | 4.5 | |
MSCI Malaysia | | | 0.7 | | | | 0.2 | |
MSCI Thailand | | | 16.0 | | | | 16.1 | |
MSCI Indonesia | | | 11.8 | | | | 4.2 | |
MSCI Philippines | | | 13.8 | | | | 13.8 | |
South Asia | | | | | | | | |
MSCI Sri Lanka | | | 17.0 | | | | 17.2 | |
MSCI India | | | 19.2 | | | | 15.3 | |
MSCI Vietnam | | | -1.6 | | | | -2.2 | |
MSCI AC Asia
Ex-Japan Gross | | | 6.1 | | | | 5.7 | |
Source: Morningstar (Value Partners)
2
COUNTRY ALLOCATION*
| | | | | | | | | | | | |
Country | | Mar 31, 2014
% | | | Jun 30, 2014
% | | | Sep 30, 2014
% | |
North Asia | | | 84.6 | | | | 86.4 | | | | 86.5 | |
Hong Kong/China | | | 50.7 | | | | 53.0 | | | | 54.5 | |
South Korea | | | 26.1 | | | | 26.1 | | | | 26.7 | |
Taiwan | | | 7.8 | | | | 7.3 | | | | 5.3 | |
ASEAN | | | 10.5 | | | | 10.4 | | | | 11.5 | |
Singapore | | | 6.4 | | | | 5.5 | | | | 6.1 | |
Thailand | | | 1.2 | | | | 0.8 | | | | 1.6 | |
Indonesia | | | 1.7 | | | | 1.9 | | | | 1.7 | |
Malaysia | | | 1.2 | | | | 2.2 | | | | 2.1 | |
Philippines | | | 0.0 | | | | 0.0 | | | | 0.0 | |
Cash & Other | | | 4.9 | | | | 3.2 | | | | 2.0 | |
* Rounded up to the nearest tenth of one percent. Expressed as a percentage of net assets.
MARKET REVIEW
The third quarter of 2014 has been a relatively mixed quarter for Asian equity markets.
In China, the stockmarkets saw a positive quarter as upbeat economic data and a number of new loosening and reform measures announced throughout the quarter supported market sentiment. In particular, banks have adopted an adjustment to the loan-to-deposit ratio calculation, which could increase new loans by $260 billion, boding well for system liquidity. Secondly, home purchase restrictions have been loosened throughout the quarter in most second-tier cities, which should prevent a hard landing. On the reform front, the National People’s Congress passed a long-awaited set of amendments to the country’s Budget Law on August 31, paving the way for local governments to formally raise debt in China’s bond market. Besides these positive measures, the upcoming launch of the Shanghai-Hong Kong Stock Connect scheme added to optimism, sending the domestic market to an 18-month high near the end of the quarter.
Meanwhile, Korean equities experienced volatility during the quarter. In order to boost private spending, the government unveiled in July a $40 billion stimulus package, including a relaxation of limits on mortgage loans and tax incentives to transfer the growing wealth of Korean companies to households. As a result, Korea’s equity market reacted positively in July and saw a positive month. However, stocks moved sideways in August and saw
a correction in September as concerns over Korean companies’ corporate governance weighed on market sentiment. On the other hand, the Korean government released a proposal on August 8 for a new tax scheme to boost domestic demand by encouraging wage growth and dividend increases. And for the first time in 15 months, the Bank of Korea cut its benchmark interest rate, by 25 basis points to 2.25%.
Indonesian President Joko Widodo announced on November 18 that subsidized gasoline and diesel prices will be hiked by +Rp2,000/liter, to Rp8,500/liter (+31%) and Rp7,500/liter (+36%) respectively. The fuel price hike will narrow the structural twin fiscal and current account deficits. Analysts estimate that the +Rp2K/liter fuel price hike could save the government about 1% of GDP (about $8.7 billion) annually.
STRATEGY AND PORTFOLIO REVIEW
With an initial wave of loosening in the property sector, we continue to believe property stocks are attractively valued, and anticipate that an improvement in consumer confidence will drive strong sales. As such, we have increased our exposure to Chinese property names in July. We have also taken the opportunity to selectively add exposure in Singapore, particularly to attractive yielding property names. On the back of loosening strategies, we have taken a little profit from strong performing sectors such as Chinese banking where multiple loosening policies have boosted stock prices rapidly.
During August, we added exposure to banks on good and stable earnings results. Meanwhile, we continued to build on existing positions in Korean preference shares (which are trading at a discount to their common shares counterpart) through a cosmetics company. We are particularly enthusiastic about the development of dividend policy in Korea and believe this will pave the way for a re-rating of the market on the back of improving dividend payouts. To make room for the additions in Korean exposure, we took profits from our Hong Kong/China property exposure, being mindful of the rising interest rate environment.
3
OUTLOOK
We remain positive on the second-half outlook for Asia, particularly Greater China, as emerging markets are still more attractively valued compared with developed economies. In China, economic growth has stabilized without experiencing a hard landing as the market had expected earlier. Despite slight dips in short-term macro data, we remain optimistic as mini-stimulus packages continue to be introduced. The Chinese government announced a fresh round of mini-stimulus on August 27, including a plan to raise banks’ re-lending quota for the agricultural sector by RMB 20 billion ($3.3 billion) and a push for ramping-up investment in clean energy and public facilities such as hospitals and social housing. Supportive policy has been reflected in continued market performance; however given the pace of the market rally, we would not be surprised if there is short-term volatility.
We continue to hold a positive view on Korea as improving global demand serves as a tailwind for Korean exporters. In addition, the Korean government’s proposal for a new tax scheme to boost
dividends is much welcomed. As low dividend yields have been seen as one of the key reasons behind the low valuations of many Korean companies, a rise in dividends could potentially lead to a market re-rating.
In ASEAN, although Indonesia’s equity market rose to a new all-time high in September on optimism about the new president and reforms, we think that Indonesia remains an expensive market and a difficult area in which to find value.
Value Partners Hong Kong Limited
November 20, 2014
Past performance does not guarantee future results and current performance may be lower or higher than the past performance data quoted. The investment return and principal value will fluctuate, and shares, when sold, may be worth more or less than the original cost. Index returns do not include the effect of any sales charges, fund operating expenses or taxes. An investment cannot be made directly in an index.
Unless specified, all information contained on the pages is quoted as at September 30, 2014. This report does not constitute a prospectus, an offer or an invitation to subscribe any securities, or a recommendation in relation to any securities. The Fund is not authorized by the Hong Kong Securities and Futures Commission (“SFC”) and therefore shares of the Fund are not available to retail investors in Hong Kong. This document has not been reviewed by the SFC.
4
THE ASIA PACIFIC FUND, INC.
Portfolio of Investments
as of September 30, 2014
(Unaudited)
| | | | | | | | |
| Shares | | | Description | | Value
(Note 1) | |
| | | | LONG-TERM INVESTMENTS—98.0% | |
| | | | COMMON STOCKS—81.5% | |
| | | | CHINA (INCLUDING HONG KONG SAR)—54.5% | |
| | 7,285,000 | | | Agricultural Bank of China Ltd. (Class “H” Shares) | | $ | 3,227,416 | |
| | | | (Banking) | | | | |
| | 1,604,000 | | | Anhui Expressway Co. Ltd. (Class “H” Shares) | | | 979,151 | |
| | | | (Industrials) | | | | |
| | 1,387,500 | | | Asia Cement China Holdings Corp. | | | 852,351 | |
| | | | (Materials) | | | | |
| | 11,751,000 | | | Bank of China Ltd. (Class “H” Shares) | | | 5,266,487 | |
| | | | (Banking) | | | | |
| | 643,000 | | | Belle International Holdings Ltd. | | | 722,923 | |
| | | | (Real Estate-Developers) | | | | |
| | 650,000 | | | BOC Hong Kong Holdings Ltd. | | | 2,071,837 | |
| | | | (Banking) | | | | |
| | 2,295,000 | | | Chaowei Power Holdings Ltd. | | | 1,164,517 | |
| | | | (Consumer Discretionary) | | | | |
| | 726,000 | | | China BlueChemical Ltd. (Class “H” Shares) | | | 315,089 | |
| | | | (Materials) | | | | |
| | 6,369,000 | | | China Construction Bank Corp. (Class “H” Shares) | | | 4,462,077 | |
| | | | (Banking) | | | | |
| | 468,000 | | | China Life Insurance Co. Ltd. (Class “H” Shares) | | | 1,298,853 | |
| | | | (Insurance) | | | | |
| | 3,115,000 | | | China Lilang Ltd. | | | 2,186,359 | |
| | | | (Consumer Discretionary) | | | | |
| | 2,144,000 | | | China Machinery Engineering Corp. (Class “H” Shares) | | | 1,228,717 | |
| | | | (Materials) | | | | |
| | 1,014,000 | | | China Petroleum & Chemical Corp. (Class “H” Shares) | | | 888,002 | |
| | | | (Energy) | | | | |
| | | | | | | | |
| Shares | | | Description | | Value
(Note 1) | |
| | 6,189,000 | | | China Power International Development Ltd. | | $ | 2,869,392 | |
| | | | (Utilities) | | | | |
| | 1,938,000 | | | China Resources Cement Holdings Ltd. | | | 1,327,799 | |
| | | | (Materials) | | | | |
| | 1,200,000 | | | China Resources Power Holdings Co. Ltd. | | | 3,237,667 | |
| | | | (Utilities) | | | | |
| | 552,500 | | | China Shenhua Energy Co. Ltd. (Class “H” Shares) | | | 1,540,484 | |
| | | | (Energy) | | | | |
| | 3,334,000 | | | China Telecom Corp. Ltd. (Class “H” Shares) | | | 2,043,805 | |
| | | | (Telecommunication Services) | | | | |
| | 1,969,438 | | | China Vanke Co. Ltd. (Class “H” Shares)* | | | 3,479,873 | |
| | | | (Real Estate-Developers) | | | | |
| | 257,000 | | | Chow Sang Sang Holdings International Ltd. | | | 612,311 | |
| | | | (Consumer Discretionary) | | | | |
| | 3,230,000 | | | CIFI Holdings Group Co. Ltd. | | | 603,167 | |
| | | | (Real Estate-Developers) | | | | |
| | 30,750,000 | | | CSI Properties Ltd. | | | 1,287,050 | |
| | | | (Real Estate-Developers) | | | | |
| | 3,450,000 | | | Far East Consortium International Ltd. | | | 1,257,397 | |
| | | | (Real Estate-Developers) | | | | |
| | 162,500 | | | Great Wall Motor Co. Ltd. (Class “H” Shares) | | | 630,968 | |
| | | | (Consumer Discretionary) | | | | |
| | 5,276,000 | | | Hopefluent Group Holdings Ltd. | | | 1,528,812 | |
| | | | (Real Estate-Developers) | | | | |
| | 478,481 | | | Hui Xian Real Estate Investment Trust | | | 269,655 | |
| | | | (Real Estate Investment Trusts) | | | | |
| | 1,074,000 | | | Lee & Man Chemical Co. Ltd. | | | 639,018 | |
| | | | (Industrials) | | | | |
See Notes to Financial Statements.
5
| | | | | | | | |
| Shares | | | Description | | Value
(Note 1) | |
| | | | CHINA (INCLUDING HONG KONG SAR)—(continued) | |
| | 326,000 | | | Luk Fook Holdings International Ltd. | | $ | 946,741 | |
| | | | (Consumer Discretionary) | | | | |
| | 1,379,179 | | | Luthai Textile Co. Ltd. (Class “B” Shares) | | | 1,914,725 | |
| | | | (Consumer Discretionary) | | | | |
| | 1,223,533 | | | PCCW Ltd. | | | 768,958 | |
| | | | (Telecommunication Services) | | | | |
| | 2,286,000 | | | PetroChina Co. Ltd. (Class “H” Shares) | | | 2,929,316 | |
| | | | (Energy) | | | | |
| | 808,500 | | | Shimao Property Holdings Ltd. | | | 1,636,815 | |
| | | | (Real Estate-Developers) | | | | |
| | 624,000 | | | Sino Land Co. Ltd. | | | 964,346 | |
| | | | (Real Estate-Developers) | | | | |
| | 3,656,525 | | | Sino-Ocean Land Holdings Ltd. | | | 1,926,011 | |
| | | | (Real Estate-Developers) | | | | |
| | 799,000 | | | Sinopec Engineering Group Co. Ltd. (Class “H” Shares) | | | 861,270 | |
| | | | (Industrials) | | | | |
| | 1,960,000 | | | Sitc International Holdings Co. Ltd. | | | 956,670 | |
| | | | (Industrials) | | | | |
| | 254,000 | | | SJM Holdings Ltd. | | | 484,130 | |
| | | | (Consumer Discretionary) | | | | |
| | 4,054,000 | | | Skyworth Digital Holdings Ltd. | | | 2,104,048 | |
| | | | (Consumer Discretionary) | | | | |
| | 1,545,000 | | | Spring Real Estate Investment Trust* | | | 736,202 | |
| | | | (Real Estate Investment Trusts) | | | | |
| | 3,398,000 | | | Springland International Holdings Ltd. | | | 1,286,582 | |
| | | | (Consumer Discretionary) | | | | |
| | 1,002,000 | | | Texwinca Holdings Ltd. | | | 859,427 | |
| | | | (Consumer Discretionary) | | | | |
| | | | | | | | |
| Shares | | | Description | | Value
(Note 1) | |
| | 2,084,000 | | | TK Group Holdings Ltd. | | $ | 351,589 | |
| | | | (Industrials) | | | | |
| | 1,902,000 | | | Trigiant Group Ltd. | | | 521,743 | |
| | | | (Industrials) | | | | |
| | 4,992,000 | | | Welling Holding Ltd. | | | 1,170,073 | |
| | | | (Consumer Discretionary) | | | | |
| | 1,104,000 | | | Wonderful Sky Financial Group Holdings Ltd. | | | 191,942 | |
| | | | (Consumer Discretionary) | | | | |
| | 1,242,500 | | | Xtep International Holdings Ltd. | | | 563,256 | |
| | | | (Consumer Discretionary) | | | | |
| | 2,213,000 | | | Yangzijiang Shipbuilding Holdings Ltd. | | | 2,046,986 | |
| | | | (Telecommunication Services) | | | | |
| | 95,426 | | | Yantai Changyu Pioneer Wine Co. Ltd. (Class “B” Shares) | | | 308,466 | |
| | | | (Consumer Staples) | | | | |
| | 1,060,600 | | | Zhengzhou Coal Mining Machinery Group Co. Ltd. (Class “H” Shares) | | | 767,635 | |
| | | | (Industrials) | | | | |
| | 782,400 | | | Zoomlion Heavy Industry Science & Technology Co. Ltd. (Class “H” Shares) | | | 456,451 | |
| | | | | | | | |
| | | | (Industrials) | | | | |
| | | | | | | 70,744,559 | |
| | | | | | | | |
| | |
| | | | INDONESIA—1.7% | | | | |
| | 404,200 | | | PT Bank Rakyat Indonesia (Persero) Tbk | | | 345,817 | |
| | | | (Banking) | | | | |
| | 7,992,700 | | | PT Telekomunikasi Indonesia (Persero) Tbk | | | 1,912,082 | |
| | | | | | | | |
| | | | (Telecommunication Services) | | | | |
| | | | | | | 2,257,899 | |
| | | | | | | | |
| | |
| | | | MALAYSIA—2.1% | | | | |
| | 926,300 | | | Mah Sing Group Bhd | | | 686,148 | |
| | | | (Real Estate-Developers) | | | | |
See Notes to Financial Statements.
6
THE ASIA PACIFIC FUND, INC.
Portfolio of Investments
as of September 30, 2014
(Unaudited) Continued
| | | | | | | | |
| Shares | | | Description | | Value
(Note 1) | |
| | | | MALAYSIA—(continued) | | | | |
| | 1,899,000 | | | Nam Cheong Ltd. | | $ | 647,539 | |
| | | | (Industrials) | | | | |
| | 120 | | | United Overseas Australia Ltd. | | | 53 | |
| | | | (Real Estate-Developers) | | | | |
| | 2,103,100 | | | UOA Development Bhd | | | 1,352,703 | |
| | | | | | | | |
| | | | (Real Estate-Developers) | | | | |
| | | | | | | 2,686,443 | |
| | | | | | | | |
| | |
| | | | PHILIPPINES | | | | |
| | 126,700 | | | Leisure & Resorts World Corp. | | | 26,200 | |
| | | | | | | | |
| | | | (Consumer Discretionary) | | | | |
| | |
| | | | SINGAPORE—6.1% | | | | |
| | 218,256 | | | AIMS AMP Capital Industrial REIT | | | 245,510 | |
| | | | (Real Estate Investment Trusts) | | | | |
| | 3,502,000 | | | Asian Pay Television Trust | | | 2,264,757 | |
| | | | (Consumer Discretionary) | | | | |
| | 2,283,000 | | | China Merchants Holdings Pacific Ltd. | | | 1,700,125 | |
| | | | (Industrials) | | | | |
| | 461,000 | | | Croesus Retail Trust | | | 341,495 | |
| | | | (Real Estate Investment Trusts) | | | | |
| | 97,000 | | | DBS Group Holdings Ltd. | | | 1,400,596 | |
| | | | (Banking) | | | | |
| | 278,000 | | | Ezion Holdings Ltd. | | | 394,434 | |
| | | | (Energy) | | | | |
| | 121,000 | | | Keppel Corp. Ltd. | | | 995,924 | |
| | | | (Industrials) | | | | |
| | 834,000 | | | Vard Holdings Ltd.* | | | 555,695 | |
| | | | | | | | |
| | | | (Industrials) | | | | |
| | | | | | | 7,898,536 | |
| | | | | | | | |
| | |
| | | | SOUTH KOREA—10.2% | | | | |
| | 759 | | | Alticast Corp.* | | | 7,624 | |
| | | | (Software & Services) | | | | |
| | 178,274 | | | DGB Financial Group, Inc. | | | 2,838,193 | |
| | | | (Banking) | | | | |
| | | | | | | | |
| Shares | | | Description | | Value
(Note 1) | |
| | 48,074 | | | Kia Motors Corp. | | $ | 2,446,410 | |
| | | | (Consumer Discretionary) | | | | |
| | 10,683 | | | Korea Electric Power Corp. | | | 487,961 | |
| | | | (Utilities) | | | | |
| | 84,772 | | | Macquarie Korea Infrastructure Fund | | | 581,615 | |
| | | | (Capital Markets) | | | | |
| | 1,383 | | | Samsung Electronics Co. Ltd. | | | 1,551,738 | |
| | | | (Semiconductors & Semiconductor Equipment) | | | | |
| | 32,421 | | | SK Hynix, Inc.* | | | 1,436,325 | |
| | | | (Semiconductors & Semiconductor Equipment) | | | | |
| | 14,014 | | | SK Telecom Co. Ltd. | | | 3,851,277 | |
| | | | | | | | |
| | | | (Telecommunication Services) | | | | |
| | | | | | | 13,201,143 | |
| | | | | | | | |
| | |
| | | | TAIWAN—5.3% | | | | |
| | 693,000 | | | Chipbond Technology Corp. | | | 1,268,926 | |
| | | | (Semiconductors & Semiconductor Equipment) | | | | |
| | 324,000 | | | Elan Microelectronics Corp. | | | 551,725 | |
| | | | (Semiconductors & Semiconductor Equipment) | | | | |
| | 267,000 | | | Huaku Development Co. Ltd. | | | 509,081 | |
| | | | (Real Estate-Developers) | | | | |
| | 216,000 | | | Novatek Microelectronics Corp. | | | 1,068,657 | |
| | | | (Semiconductors & Semiconductor Equipment) | | | | |
| | 499,000 | | | Quanta Computer, Inc. | | | 1,266,385 | |
| | | | (Technology Hardware & Equipment) | | | | |
| | 244,000 | | | Taiwan Semiconductor Manufacturing Co. Ltd. | | | 962,541 | |
| | | | (Semiconductors & Semiconductor Equipment) | | | | |
| | 67,000 | | | Tong Hsing Electronic Industries Ltd. | | | 294,038 | |
| | | | (Information Technology) | | | | |
See Notes to Financial Statements.
7
| | | | | | | | |
| Shares | | | Description | | Value
(Note 1) | |
| | | | TAIWAN—(continued) | | | | |
| | 304,000 | | | UDE Corp. | | $ | 959,385 | |
| | | | | | | | |
| | | | (Technology Hardware & Equipment) | | | | |
| | | | | | | 6,880,738 | |
| | | | | | | | |
| | |
| | | | THAILAND—1.6% | | | | |
| | 873,000 | | | Bangchak Petroleum PCL (The) | | | 962,521 | |
| | | | (Energy) | | | | |
| | 1,521,800 | | | Krung Thai Bank PCL | | | 1,112,310 | |
| | | | | | | | |
| | | | (Banking) | | | | |
| | | | | | | 2,074,831 | |
| | | | | | | | |
| | | | Total common stocks
(cost $101,439,660) | | | 105,770,349 | |
| | | | | | | | |
| |
| | | | PREFERENCE SHARES—16.5% | |
| | | | SOUTH KOREA | | | | |
| | 4,335 | | | Amorepacific Corp. | | | 4,670,832 | |
| | | | (Consumer Staples) | | | | |
| | 22,698 | | | Hyundai Motor Co. | | | 2,484,358 | |
| | | | (Consumer Discretionary) | | | | |
| | 36,594 | | | Hyundai Motor Co. | | | 4,092,008 | |
| | | | (Consumer Discretionary) | | | | |
| | 33,935 | | | LG Corp. | | | 1,543,596 | |
| | | | (Industrials) | | | | |
| | 3,355 | | | Samsung Electronics Co. Ltd. | | | 2,855,049 | |
| | | | (Semiconductors & Semiconductor Equipment) | | | | |
| | 27,887 | | | Samsung Fire & Marine Insurance Co. Ltd. | | | 5,761,067 | |
| | | | | | | | |
| | | | (Insurance) | | | | |
| | | | Total preference shares
(cost $15,652,246) | | | 21,406,910 | |
| | | | | | | | |
| | | | Total long-term investments
(cost $117,091,906) | | | 127,177,259 | |
| | | | | | | | |
| | | | | | | | |
| Shares | | | Description | | Value
(Note 1) | |
| | | | SHORT-TERM INVESTMENT—0.5% | |
| | | | MONEY MARKET MUTUAL FUND | |
| | 663,447 | | | JPMorgan Prime Money Market Fund/Premier
(cost $663,447) | | $ | 663,447 | |
| | | | | | | | |
| | | | Total Investments—98.5%
(cost $117,755,353; Note 4) | | | 127,840,706 | |
| | | | Other assets in excess of liabilities—1.5% | | | 1,885,805 | |
| | | | | | | | |
| | | | Net Assets—100.0% | | $ | 129,726,511 | |
| | | | | | | | |
The following abbreviation is used in the portfolio descriptions:
| REIT—Real | Estate Investment Trust |
| * | Non-income producing security. |
Various inputs are used in determining the value of the Fund’s investments. These inputs are summarized in the three broad levels listed below.
Level 1—quoted prices generally in active markets for identical securities.
Level 2—other significant observable inputs including, but not limited to, quoted prices for similar securities, interest rates and yield curves, prepayment speeds, foreign currency exchange rates, and amortized cost.
Level 3—significant unobservable inputs for securities valued in accordance with Board approved fair valuation procedures.
The following is a summary of the inputs used as of September 30, 2014 in valuing such portfolio securities:
| | | | | | | | | | | | |
| | | Level 1 | | | Level 2 | | | Level 3 | |
Investments in Securities | | | | | | | | | | | | |
Common Stocks | | | | | | | | | | | | |
China (including Hong Kong SAR) | | $ | 70,744,559 | | | $ | — | | | $ | — | |
Indonesia | | | 2,257,899 | | | | — | | | | — | |
Malaysia | | | 2,686,443 | | | | — | | | | — | |
Philippines | | | 26,200 | | | | — | | | | — | |
Singapore | | | 7,898,536 | | | | — | | | | — | |
South Korea | | | 13,201,143 | | | | — | | | | — | |
Taiwan | | | 6,880,738 | | | | — | | | | — | |
Thailand | | | — | | | | 2,074,831 | | | | — | |
Preference Shares | | | | | | | | | | | | |
South Korea | | | 21,406,910 | | | | — | | | | — | |
Money Market Mutual Fund | | | 663,447 | | | | — | | | | — | |
| | | | | | | | | | | | |
Total | | $ | 125,765,875 | | | $ | 2,074,831 | | | $ | — | |
| | | | | | | | | | | | |
See Notes to Financial Statements.
8
THE ASIA PACIFIC FUND, INC.
Portfolio of Investments
as of September 30, 2014
(Unaudited) Continued
The industry classification of investments and other assets in excess of liabilities shown as a percentage of net assets as of September 30, 2014 was as follows:
| | | | |
Consumer Discretionary | | | 19.6 | % |
Banking | | | 16.0 | |
Real Estate-Developers | | | 12.3 | |
Industrials | | | 8.5 | |
Telecommunication Services | | | 8.2 | |
Semiconductors & Semiconductor Equipment | | | 7.5 | |
Insurance | | | 5.4 | |
Energy | | | 5.2 | |
Utilities | | | 5.1 | |
Consumer Staples | | | 3.8 | |
Materials | | | 2.9 | |
Technology Hardware & Equipment | | | 1.7 | |
Real Estate Investment Trusts | | | 1.2 | |
Money Market Mutual Fund | | | 0.5 | |
Capital Markets | | | 0.4 | |
Information Technology | | | 0.2 | |
Software & Services | | | — | * |
| | | | |
| | | 98.5 | |
Other assets in excess of liabilities | | | 1.5 | |
| | | | |
| | | 100.0 | % |
| | | | |
See Notes to Financial Statements.
9
THE ASIA PACIFIC FUND, INC.
Statement of Assets and Liabilities
as of September 30, 2014
(Unaudited)
| | | | |
| Assets | | | | |
Investments, at value (cost $117,755,353) | | $ | 127,840,706 | |
Cash | | | 9,934 | |
Foreign currency, at value (cost $466,541) | | | 465,913 | |
Receivable for investments sold | | | 1,782,226 | |
Dividends receivable | | | 197,584 | |
Prepaid expenses | | | 122,164 | |
| | | | |
Total assets | | | 130,418,527 | |
| | | | |
| Liabilities | | | | |
Accrued expenses and other liabilities | | | 313,328 | |
Payable for investments purchased | | | 247,323 | |
Investment management fee payable | | | 103,284 | |
Administration fee payable | | | 28,081 | |
| | | | |
Total liabilities | | | 692,016 | |
| | | | |
| Net Assets | | $ | 129,726,511 | |
| | | | |
Net assets were comprised of: | | | | |
Common stock, at par | | $ | 103,441 | |
Paid-in capital in excess of par | | | 127,414,209 | |
| | | | |
| | | 127,517,650 | |
Undistributed net investment income | | | 2,374,028 | |
Accumulated net realized loss on investments and foreign currency transactions | | | (10,249,480 | ) |
Net unrealized appreciation on investments and foreign currencies | | | 10,084,313 | |
| | | | |
Net Assets, September 30, 2014 | | $ | 129,726,511 | |
| | | | |
Net Asset Value per share
($129,726,511 ÷ 10,344,073 shares of common stock outstanding) | | | $12.54 | |
| | | | |
|
| See Notes to Financial Statements. | |
THE ASIA PACIFIC FUND, INC.
Statement of Operations
Six Months Ended September 30, 2014
(Unaudited)
| | | | |
| Net Investment Income | | | | |
Income | | | | |
Dividends (net of foreign withholding taxes of $313,369) | | $ | 3,739,039 | |
| | | | |
Expenses | | | | |
Investment management fee | | | 601,054 | |
Administration fee | | | 160,944 | |
Directors’ fees and board expenses | | | 121,000 | |
Custodian’s fees and expenses | | | 110,000 | |
Legal fees and expenses | | | 105,000 | |
Reports to shareholders | | | 67,000 | |
Insurance | | | 66,000 | |
Audit fee | | | 21,000 | |
Transfer agent’s fees and expenses | | | 13,000 | |
Registration fees | | | 13,000 | |
Loan interest expense and commitment fees (Note 6) | | | 15,123 | |
Miscellaneous | | | 39,432 | |
| | | | |
Total expenses | | | 1,332,553 | |
| | | | |
Net investment income | | | 2,406,486 | |
| | | | |
| Realized and Unrealized Gain (Loss) on Investments and Foreign Currency Transactions | | | | |
Net realized gain (loss) on: | | | | |
Investment transactions | | | 2,641,883 | |
Foreign currency transactions | | | (9,886 | ) |
| | | | |
| | | 2,631,997 | |
| | | | |
Net change in unrealized appreciation (depreciation) on: | | | | |
Investments | | | 5,704,292 | |
Foreign currencies | | | (7,422 | ) |
| | | | |
| | | 5,696,870 | |
| | | | |
Net gain on investments and foreign currency transactions | | | 8,328,867 | |
| | | | |
| Net Increase in Net Assets Resulting From Operations | | $ | 10,735,353 | |
| | | | |
|
| See Notes to Financial Statements. | |
10
THE ASIA PACIFIC FUND, INC.
Statement of Changes in Net Assets
(Unaudited)
| | | | | | | | |
Increase (Decrease)
in Net Assets | | Six Months
Ended
September 30,
2014 | | | Year Ended
March 31,
2014 | |
| | |
Operations | | | | | | | | |
| | |
Net investment income (loss) | | $ | 2,406,486 | | | $ | (212,887 | ) |
| | |
Net realized gain on investments and foreign currency transactions | | | 2,631,997 | | | | 10,191,467 | |
| | |
Net change in unrealized appreciation (depreciation) on investments and foreign currencies | | | 5,696,870 | | | | (14,256,638 | ) |
| | | | | | | | |
| | |
Total increase (decrease) | | | 10,735,353 | | | | (4,278,058 | ) |
| | |
| Net Assets: | | | | | | | | |
| | |
Beginning of period | | | 118,991,158 | | | | 123,269,216 | |
| | | | | | | | |
| | |
End of period(a) | | $ | 129,726,511 | | | $ | 118,991,158 | |
| | | | | | | | |
(a) Includes undistributed net investment income of: | | $ | 2,374,028 | | | $ | — | |
| | | | | | | | |
| |
| See Notes to Financial Statements. | | | | | |
THE ASIA PACIFIC FUND, INC.
Notes to Financial Statements
(Unaudited)
The Asia Pacific Fund, Inc. (the “Fund”) is registered under the Investment Company Act of 1940, as amended, as a diversified, closed-end, management investment company. The Fund’s investment objective is to achieve long-term capital appreciation through investment of at least 80% of investable assets in equity securities of companies in the Asia Pacific countries.
Note 1. Accounting Policies | |
The following accounting policies conform to U.S. generally accepted accounting principles. The Fund consistently follows such policies in the preparation of its financial statements.
Securities Valuation: The Fund holds portfolio securities and other assets that are fair valued at the close of each day the New York Stock Exchange (“NYSE”) is open for trading. Fair value is the price that would be received to sell an asset or paid to transfer a liability in an orderly transaction between market participants on the measurement date. The Board of Directors (the “Board”) has adopted Valuation Procedures for security valuation under which fair valuation responsibilities have been delegated to the Investment Manager, Value Partners Hong Kong Limited. Under the current Valuation Procedures, the established Valuation Committee is responsible for supervising the valuation of portfolio securities and other assets. The Valuation Procedures permit the Fund to utilize independent pricing vendor services, quotations from market makers and alternative valuation methods when market quotations are not readily available or not deemed representative of fair value. A record of the Valuation Committee’s actions is subject to the Board’s review, approval, and ratification at its next regularly-scheduled quarterly meeting.
Various inputs determine how the Fund’s investments are valued, all of which are categorized according to the three broad levels (Level 1, 2, or 3) detailed in the table following the Portfolio of Investments.
Common stocks and preference shares, exchange-traded funds, and derivative instruments that are traded on a national securities exchange are valued at the last sale price as of the close of trading on the applicable exchange. Securities traded via NASDAQ are valued at the NASDAQ official closing price. To the extent these securities are valued at the last sale price or NASDAQ
11
official closing price, they are classified as Level 1 of the fair value hierarchy except for exchange-traded and cleared swaps which are classified as Level 2 in the fair value hierarchy, as the prices marked at the official settle are not public.
In the event that no sale or official closing price on the valuation date exists, these securities are generally valued at the mean between the last reported bid and asked prices, or at the last bid price in absence of an asked price. These securities are classified as Level 2 of the fair value hierarchy, as the inputs are considered to be significant to the valuation.
For common stocks and preference shares traded on foreign securities exchanges, certain valuation adjustments will be applied when events occur after the close of the security’s foreign market and before the Fund’s normal pricing time. These securities are valued using pricing vendor services that provide adjustment factors based on information such as local closing price, relevant general and sector indices, currency fluctuations, depositary receipts, and futures, as applicable. Securities valued using such model prices are classified as Level 2 in the fair value hierarchy as the adjustment factors are observable and considered to be significant to the valuation. Securities not valued using such model prices are valued in accordance with exchange-traded common and preferred stocks discussed above.
Investments in open end, non-exchange-traded mutual funds are valued at their net asset values as of the close of the NYSE on the date of valuation. These securities are classified as Level 1 in the fair value hierarchy since they may be purchased or sold at their net asset value on the date of valuation.
Securities and other assets that cannot be priced using the methods described above are valued based on pricing methodologies approved by the Board. In the event that significant unobservable inputs are used when determining such valuations, the securities will be classified as Level 3 of the fair value hierarchy.
When determining the fair value of securities, some of the factors influencing the valuation include: the nature of
any restrictions on disposition of the securities; assessment of the general liquidity of the securities; the issuer’s financial condition and the markets in which it does business; the cost of the investment; the size of the holding and the capitalization of the issuer; the prices of any recent transactions or bids/offers for such securities or any comparable securities; any available analyst media or other reports or information deemed reliable by the investment manager regarding the issuer or the markets or industry in which it operates. Using fair value to price securities may result in a value that is different from a security’s most recent closing price and from the price used by other mutual funds to calculate their net asset values.
Foreign Currency Translation The books and records of the Fund are maintained in U.S. dollars. Foreign currency amounts are translated into U.S. dollars on the following basis:
(i) market value of investment securities, other assets and liabilities—at the current rates of exchange.
(ii) purchases and sales of investment securities, income and expenses—at the rates of exchange prevailing on the respective dates of such transactions.
Although the net assets of the Fund are presented at the foreign exchange rates and market values at the close of the fiscal period, the Fund does not isolate that portion of the results of operations arising as a result of changes in the foreign exchange rates from the fluctuations arising from changes in the market prices of long-term portfolio securities held at fiscal period end. Similarly, the Fund does not isolate the effect of changes in foreign exchange rates from the fluctuations arising from changes in the market prices of long-term portfolio securities sold during the fiscal period. Accordingly, these realized foreign currency gains or losses are included in the reported net realized gains or losses on investment transactions.
Net realized gains or losses on foreign currency transactions represent net foreign exchange gains or losses from holdings of foreign currencies, forward currency contracts, disposition of foreign currencies, currency gains or losses realized between the trade and settlement dates on security transactions, and the difference between
12
THE ASIA PACIFIC FUND, INC.
Notes to Financial Statements
(Unaudited) Continued
the amounts of interest, dividends and foreign withholding taxes recorded on the Fund’s books and the U.S. dollar equivalent amounts actually received or paid. Net unrealized currency gains or losses from valuing foreign currency denominated assets and liabilities (other than investments) at fiscal period end exchange rates are reflected as a component of unrealized appreciation (depreciation) on foreign currencies.
Foreign security and currency transactions may involve certain considerations and risks not typically associated with those of U.S. companies as a result of, among other factors, the level of governmental supervision and regulation of foreign securities markets and the possibility of political or economic instability.
Stock Index Futures Contracts A stock index futures contract is an agreement to purchase (long) or sell (short) an agreed amount of securities at a set price for delivery on a future date. Upon entering into a stock index futures contract, the Fund is required to pledge to the broker an amount of cash and/or other assets equal to a certain percentage of the contract amount. This amount is known as the “initial margin.” Subsequent payments known as “variation margin,” are made or received by the Fund each day, depending on the daily fluctuations in the value of the underlying security. Such variation margin is recorded for financial statement purposes on a daily basis as unrealized gain or loss. When the contract expires or is closed, the gain or loss is realized and is presented in the Statement of Operations as net realized gain or loss on stock index futures contracts.
The Fund may utilize stock index futures contracts for hedging and investment purposes. Should market prices for the futures contracts or the underlying assets move in ways not anticipated by the Fund, losses may result. The use of futures contracts involves the risk of imperfect correlation in movements in the price of futures contracts and the underlying assets being hedged or the exposures desired by the Fund.
Master Netting Arrangements The Fund is subject to various Master Agreements, or netting arrangements, with select counterparties. A master netting arrangement between the Fund and the counterparty permits the Fund to
offset amounts payable by the Fund to the same counterparty against amounts to be received; and by the receipt of collateral from the counterparty by the Fund to cover the Fund’s exposure to the counterparty. However, there is no assurance that such mitigating factors are easily enforceable. The right to set-off exists when all the conditions are met such that each of the parties owes the other a determinable amount, the reporting party has the right to set-off the amount owed with the amount owed by the other party, the reporting party intends to set-off, and the right of set-off is enforceable by law. During the reporting period, there were no instances where the right of set-off existed and management has not elected to offset.
Securities Transactions and Net Investment Income Securities transactions are recorded on the trade date. Realized and unrealized gains or losses from security and currency transactions are calculated on the identified cost basis. Dividend income is recorded on the ex-dividend date, and interest income is recorded on an accrual basis. Expenses are recorded on the accrual basis which may require the use of certain estimates by management. Actual results may differ from such estimates.
Dividends and Distributions Dividends from net investment income, if any, are declared and paid at least annually in a manner that qualifies for the dividends-paid deduction. The Fund’s current intention is to distribute at least annually any current year net capital gains in excess of net capital loss carryforwards in a manner that avoids income and excise taxes being imposed on the Fund. Dividends and distributions are recorded on the ex-dividend date. The Fund may choose to satisfy the foregoing by making distributions in cash, additional Fund shares, or both.
The Fund could determine in the future to retain net long-term capital gains in respect of any fiscal year without affecting the ability of the Fund to qualify as a regulated investment company. In that case, the Fund would be subject to taxation on the retained amount and shareholders subject to U.S. federal income taxation would be required to include in income for tax purposes their shares of the undistributed amount and would be entitled to credits or refunds against their U.S. federal income tax
13
liabilities with respect to their proportionate shares of the tax paid by the Fund.
Income distributions and capital gain distributions are determined in accordance with income tax regulations, which may differ from U.S. generally accepted accounting principles.
Taxes It is the Fund’s current intention to continue to meet the requirements of the U.S. Internal Revenue Code of 1986, as amended (“the Code”) applicable to regulated investment companies and to distribute all of its taxable income and net capital gains to shareholders. Therefore, no federal income tax provision is required. If the Fund determines in the future to retain capital gains, the Fund will provide for all required taxes.
Withholding tax on foreign dividends and interest and foreign capital gains tax is accrued in accordance with the Fund’s understanding of the applicable country’s tax rules and rates.
Estimates The preparation of the financial statements requires management to make estimates and assumptions that affect the reported amounts and disclosures in the financial statements. Actual results could differ from those estimates.
Note 2. Investment Management and Administration Agreements | |
The Fund has a management agreement with Value Partners Hong Kong Limited (the "Investment Manager"), with effect from October 1, 2013; and through September 30, 2013, with Baring Asset Management (Asia) Limited and an administration agreement with Prudential Investments LLC (the "Administrator").
The investment management fee is computed weekly and payable monthly at the following annual rates: 1.00% of the Fund’s average weekly net assets up to $100 million and 0.70% of such assets in excess of $100 million.
The administration fee is also computed weekly and payable monthly at the following annual rates: 0.25% of the Fund’s average weekly net assets up to $200 million and 0.20% of such assets in excess of $200 million.
Pursuant to the agreements, the Investment Manager provides continuous supervision of the investment portfolio and the Administrator provides occupancy and certain clerical, administrative and accounting services for the Fund. The Investment Manager and the Administrator each pays the cost of compensation of certain officers of the Fund. The Fund bears all other costs and expenses.
Note 3. Portfolio Securities | |
Cost of purchases and proceeds from sales of investment securities, other than short-term investments, for the six months ended September 30, 2014 aggregated $52,624,938 and $46,972,944 respectively.
The United States federal income tax basis of the Fund's investments and the net unrealized appreciation as of September 30, 2014 were as follows:
| | | | |
Tax Basis | | $ | 118,043,686 | |
| | | | |
Appreciation | | | 14,220,009 | |
Depreciation | | | (4,422,989 | ) |
| | | | |
Net Unrealized Appreciation | | $ | 9,797,020 | |
| | | | |
The book basis may differ from tax basis due to certain tax related adjustments.
Under the Regulated Investment Company Modernization Act of 2010 (the “Act”), the Fund is permitted to carry forward capital losses realized on or after April 1, 2011 (“post-enactment losses”) for an unlimited period. Post-enactment losses are required to be utilized before the utilization of losses incurred prior to the effective date of the Act. As a result of this ordering rule, capital loss carryforwards related to taxable years ending before March 31, 2012 (“pre-enactment losses”) may have an increased likelihood to expire unused. The Fund utilized approximately $11,362,000 of its pre-enactment losses to offset net taxable gains realized in the fiscal year ended March 31, 2014.
14
THE ASIA PACIFIC FUND, INC.
Notes to Financial Statements
(Unaudited) Continued
No capital gains distributions are expected to be paid to shareholders until net gains have been realized in excess of such losses. As of March 31, 2014, the pre and post-enactment losses were approximately:
| | | | |
Post-Enactment Losses: | | $ | 0 | |
| | | | |
Pre-Enactment Losses: | | | | |
Expiring 2018 | | $ | 12,045,000 | |
| | | | |
The Fund elected to treat post-October capital losses of approximately $580,000 as having been incurred in the following fiscal year (March 31, 2015).
Management has analyzed the Fund’s tax positions taken on federal income tax returns for all open tax years and has concluded that no provision for income tax is required in the Fund’s financial statements for the current reporting period. The Fund’s U.S. federal and state income and federal excise tax returns for tax years for which the applicable statutes of limitations have not expired are subject to examination by the U.S. Internal Revenue Service and state departments of revenue.
There are 30 million shares of $0.01 par value common stock authorized.
The Fund currently is a party to a committed credit facility with a bank. The credit facility provides for a maximum commitment of $20,000,000. Interest on any borrowings under the credit facility is at contracted market rates. The Fund pays a commitment fee on the unused portion of the facility. The commitment fee is accrued daily and paid quarterly. The Fund's obligations under the credit facility are secured by substantially all the assets of the Fund. The purpose of the credit facility is to assist the Fund with its general cash flow requirements, including the provision of portfolio leverage.
During the six-months ended September 30, 2014, the Fund utilized the credit facility and had an average daily outstanding loan balance of $3,122,376 during the 101 day period that the facility was utilized, at an average interest rate of 0.59%. The maximum amount of loan outstanding during the period was $5,060,000. There was no balance outstanding at September 30, 2014.
15
THE ASIA PACIFIC FUND, INC.
Financial Highlights
(Unaudited)
| | | | | | | | | | | | |
| Per Share Operating Performance: | | Six Months
Ended
September 30,
2014 | | | Year Ended March 31, | |
| | | 2014 | | | 2013 | |
Net asset value, beginning of period | | $ | 11.50 | | | $ | 11.92 | | | $ | 11.67 | |
| | | | | | | | | | | | |
Net investment income (loss) | | | 0.23 | | | | (.02 | ) | | | (0.03 | ) |
Net realized and unrealized gain (loss) on investment and foreign currency transactions | | | 0.81 | | | | (.40 | ) | | | 0.28 | |
| | | | | | | | | | | | |
Total from investment operations | | | 1.04 | | | | (.42 | ) | | | 0.25 | |
| | | | | | | | | | | | |
Net asset value, end of period | | $ | 12.54 | | | $ | 11.50 | | | $ | 11.92 | |
| | | | | | | | | | | | |
Market value, end of period | | $ | 11.28 | | | $ | 10.33 | | | $ | 10.76 | |
| | | | | | | | | | | | |
Total investment return(a): | | | 9.20 | % | | | (4.00 | )% | | | 1.70 | % |
| | | | | | | | | | | | |
| Ratios to Average Net Assets: | | | | | | | | | | | | |
Total expenses (including loan interest)(c) | | | 2.07 | %(b)(d) | | | 2.33 | % | | | 2.16 | %(b) |
Net investment income (loss) | | | 3.74 | %(d) | | | (.18 | )% | | | (0.28 | )% |
| Supplemental Data: | | | | | | | | | | | | |
Average net assets | | $ | 128,403,000 | | | $ | 119,204,000 | | | $ | 117,996,000 | |
Portfolio turnover rate | | | 38 | %(e) | | | 175 | % | | | 180 | % |
Net assets, end of period | | $ | 129,727,000 | | | $ | 118,991,000 | | | $ | 123,269,000 | |
| (a) | Total investment return is calculated assuming a purchase of common stock at the current market value on the first day and a sale at the current market value on the last day of each fiscal period reported. Dividends and distributions, if any, are assumed, for purposes of this calculation, to be reinvested at prices obtained under the Fund’s dividend reinvestment plan. These calculations do not include brokerage commissions. Total returns for periods less than one full year are not annualized. |
| (b) | The expense ratios without loan interest expense would have been 2.06% for the six months ended September 30, 2014, and 2.11%, 2.15%, 2.00% and 2.21% for the fiscal years ended March 31, 2013, 2012, 2011 and 2010, respectively. No loan interest was incurred during the fiscal year ended March 31, 2014. |
| (c) | Does not include expenses of the underlying funds in which the Fund invests. |
Shown above is selected data for a share of common stock outstanding-total investment return, ratios to average net assets and other supplemental data for the periods indicated. This information has been determined based upon information provided in the financial statements and market price data for the Fund’s share.
See Notes to Financial Statements.
16
THE ASIA PACIFIC FUND, INC.
Financial Highlights
(Unaudited)
| | | | | | | | | | | | |
| Per Share Operating Performance: | | Year Ended March 31, | |
| | 2012 | | | 2011 | | | 2010 | |
Net asset value, beginning of year | | $ | 13.06 | | | $ | 10.97 | | | $ | 6.75 | |
| | | | | | | | | | | | |
Net investment income (loss) | | | (0.05 | ) | | | (0.06 | ) | | | (0.06 | ) |
Net realized and unrealized gain (loss) on investment and foreign currency transactions | | | (1.34 | ) | | | 2.15 | | | | 4.28 | |
| | | | | | | | | | | | |
Total from investment operations | | | (1.39 | ) | | | 2.09 | | | | 4.22 | |
| | | | | | | | | | | | |
Net asset value, end of year | | $ | 11.67 | | | $ | 13.06 | | | $ | 10.97 | |
| | | | | | | | | | | | |
Market value, end of year | | $ | 10.58 | | | $ | 11.83 | | | $ | 9.95 | |
| | | | | | | | | | | | |
Total investment return(a): | | | (10.57 | )% | | | 18.89 | % | | | 59.71 | % |
| | | | | | | | | | | | |
| Ratios to Average Net Assets: | | | | | | | | | | | | |
Total expenses (including loan interest)(c) | | | 2.15 | %(b) | | | 2.01 | %(b) | | | 2.22 | %(b) |
Net investment (loss) | | | (0.40 | )% | | | (0.51 | )% | | | (0.61 | )% |
| Supplemental Data: | | | | | | | | | | | | |
Average net assets | | $ | 123,601,000 | | | $ | 120,668,000 | | | $ | 100,915,000 | |
Portfolio turnover rate | | | 137 | % | | | 136 | % | | | 184 | % |
Net assets, end of year | | $ | 120,715,000 | | | $ | 135,076,000 | | | $ | 113,440,000 | |
| (a) | Total investment return is calculated assuming a purchase of common stock at the current market value on the first day and a sale at the current market value on the last day of each fiscal period reported. Dividends and distributions, if any, are assumed, for purposes of this calculation, to be reinvested at prices obtained under the Fund’s dividend reinvestment plan. These calculations do not include brokerage commissions. Total returns for periods less than one full year are not annualized. |
| (b) | The expense ratios without loan interest expense would have been 2.06% for the six months ended September 30, 2014, and 2.11%, 2.15%, 2.00% and 2.21% for the fiscal years ended March 31, 2013, 2012, 2011 and 2010, respectively. No loan interest was incurred during the fiscal year ended March 31, 2014. |
| (c) | Does not include expenses of the underlying funds in which the Fund invests. |
Shown above is selected data for a share of common stock outstanding-total investment return, ratios to average net assets and other supplemental data for the periods indicated. This information has been determined based upon information provided in the financial statements and market price data for the Fund’s share.
See Notes to Financial Statements.
17
Supplemental Proxy Information
An Annual Meeting of Stockholders was held on August 20, 2014. At such meeting the stockholders elected the entire slate of Class I Directors and one Class II Director.
Election of Class I Directors:
| | | | | | | | |
| | | Affirmative
votes cast | | | Shares
Withheld | |
Michael J. Downey | | | 8,207,389 | | | | 953,938 | |
Duncan M. McFarland | | | 8,206,576 | | | | 954,751 | |
Class II Director:
| | | | | | | | |
| | | Affirmative
votes cast | | | Shares
Withheld | |
William G. Tung | | | 8,957,957 | | | | 203,368 | |
Additional Information
The Fund is required to file its complete schedule of portfolio holdings with the Securities and Exchange Commission (“SEC”) on Form N-Q for its first and third fiscal quarters and within 60 days of the fiscal quarter end. Once filed, the Fund’s Form N-Q is available without charge on the SEC’s website (http//www.sec.gov) or by calling the Fund toll free at 1-(888) 4-ASIA-PAC. Copies of the Fund’s Form N-Q may also be obtained by visiting the SEC’s Public Reference Room in Washington, DC (please call the SEC at (800) 732-0330 for information on the operation of the Public Reference Room).
Information regarding the Fund’s proxy voting policies and procedures and its proxy voting record for the 12-month period ending June 30 of each year is filed with the SEC on Form N-PX no later than August 31 of each year. The Fund’s Form N-PX is available without charge, upon request, by calling the Fund at its toll free number 1-(888) 4-ASIA-PAC and on the SEC’s website (http//www.sec.gov) or on or through the Fund’s website address (www.asiapacificfund.com).
18
| | |
Item 2 – | | Code of Ethics – Not required, as this is not an annual filing. |
| |
| Item 3 – | | Audit Committee Financial Expert – Not required, as this is not an annual filing. |
| |
| Item 4 – | | Principal Accountant Fees and Services – Not required, as this is not an annual filing. |
| |
| Item 5 – | | Audit Committee of Listed Registrants – Not required, as this is not an annual filing. |
| |
| Item 6 – | | Schedule of Investments – The schedule is included as part of the report to shareholders filed under Item 1 of this Form. |
| |
| Item 7 – | | Disclosure of Proxy Voting Policies and Procedures for Closed-End Management Investment Companies – Not required, as this is not an annual filing. |
| |
| Item 8 – | | Portfolio Managers of Closed-End Management Investment Companies – Not required, as this is not an annual filing. |
| |
| Item 9 – | | Purchases of Equity Securities by Closed-End Management Investment Company and Affiliated Purchasers – There were no purchases made by or on behalf of the registrant or any “affiliated purchaser,” as defined in Rule 10b-18(a) (3) under the Securities Exchange Act of 1934, as amended, of shares of the registrant’s equity securities made in the period covered by this report. |
| |
| Item 10 – | | Submission of Matters to a Vote of Security Holders – Not applicable. |
| |
| Item 11 – | | Controls and Procedures |
| |
| | (a) It is the conclusion of the registrant’s principal executive officer and principal financial officer that the effectiveness of the registrant’s current disclosure controls and procedures (such disclosure controls and procedures having been evaluated within 90 days of the date of this filing) provide reasonable assurance that the information required to be disclosed by the registrant has been recorded, processed, summarized and reported within the time period specified in the Commission’s rules and forms and that the information required to be disclosed by the registrant has been accumulated and communicated to the registrant’s principal executive officer and principal financial officer in order to allow timely decisions regarding required disclosure. |
| |
| | (b) There has been no significant change in the registrant’s internal control over financial reporting that occurred during the registrant’s most recent fiscal quarter of the period covered by this report that has materially affected, or is likely to materially affect, the registrant’s internal control over financial reporting. |
| |
| Item 12 – | | Exhibits |
| |
| | (a) (1) Code of Ethics – Not required, as this is not an annual filing. |
| |
| | (2) Certifications pursuant to Section 302 of the Sarbanes-Oxley Act – Attached hereto as Exhibit EX-99.CERT. |
| |
| | (3) Any written solicitation to purchase securities under Rule 23c-1. – Not applicable. |
| |
| | (b) Certifications pursuant to Section 906 of the Sarbanes-Oxley Act – Attached hereto as Exhibit EX-99.906CERT. |
SIGNATURES
Pursuant to the requirements of the Securities Exchange Act of 1934 and the Investment Company Act of 1940, the registrant has duly caused this report to be signed on its behalf by the undersigned, thereunto duly authorized.
(Registrant) �� The Asia Pacific Fund, Inc.
| | |
| |
| By (Signature and Title)* | | /s/ Deborah A. Docs |
| | Deborah A. Docs |
| | Secretary |
| |
| Date | | November 20, 2014 |
Pursuant to the requirements of the Securities Exchange Act of 1934 and the Investment Company Act of 1940, this report has been signed below by the following persons on behalf of the registrant and in the capacities and on the dates indicated.
| | |
| By (Signature and Title)* | | /s/ Raymond Tam |
| | Raymond Tam |
| | President and Principal Executive Officer |
| |
| Date | | November 20, 2014 |
| |
| By (Signature and Title)* | | /s/ M. Sadiq Peshimam |
| | M. Sadiq Peshimam |
| | Treasurer and Chief Financial Officer |
| |
| Date | | November 20, 2014 |
| * | Print the name and title of each signing officer under his or her signature. |