| Investment Company Act file number: | 811-04710 |
| Exact name of registrant as specified in charter: | The Asia Pacific Fund, Inc. |
| Address of principal executive offices: | 48 Wall Street – 22nd Floor New York, NY 10005 |
| Name and address of agent for service: | Hoyt M. Peters c/o AST Fund Solutions, LLC 48 Wall Street – 22nd Floor New York, NY 10005 |
| Registrant’s telephone number, including area code: | 212-269-5550 |
| Date of fiscal year end: | 3/31/2017 |
| Date of reporting period: | 9/30/2016 |
Item 1 – Reports to Stockholders

The Asia Pacific Fund, Inc.
Semi-Annual Report
September 30, 2016
Directors
Michael J. Downey, Chairman
Jessica M. Bibliowicz
Robert F. Gunia
Duncan M. McFarland
David G. P. Scholfield
Christopher Sykes
William G. Tung
Officers
Raymond Tam, President
Frank J. Maresca, Treasurer and Chief Financial Officer
Hoyt M. Peters, Secretary
Ann Marie Swanson, Chief Compliance Officer
Investment Manager
Value Partners Hong Kong Limited
9th Floor, Nexxus Building
41 Connaught Road Central
Hong Kong
Administrator
AST Fund Solutions, LLC
48 Wall Street – 22nd Floor
New York, NY 10005
Custodian
The Bank of New York Mellon
One Wall Street
New York, NY 10286
Transfer Agent
Computershare Trust Company N.A.
P.O. Box 43011
Providence, RI 02940-3011
Independent Registered Public Accounting Firm
KPMG LLP
345 Park Avenue
New York, NY 10154
Legal Counsel
Stradley Ronon Stevens & Young, LLP
2005 Market Street, Suite 2600
Philadelphia, PA 19103
Notice is hereby given in accordance with Section 23(c) of the Investment Company Act of 1940 that The Asia Pacific Fund, Inc. (the “Fund”) may purchase, from time to time, shares of its common stock at market prices.
The accompanying financial statements as of September 30, 2016 were not audited and, accordingly, no opinion is expressed on them.
This report, including the financial statements herein, is transmitted to the shareholders of the Fund for their information. This is not a prospectus, circular or representation intended for use in the purchase of shares of the Fund or any securities mentioned in this report.
The Asia Pacific Fund, Inc.
48 Wall Street – 22nd Floor
New York, NY 10005
For general information on the Fund, please call (toll-free) Pristine Advisers, our shareholders’ servicing agent, toll-free at:
1-(888) 4-ASIA-PAC (1-888-427-4272).
Current information about the Fund is available on its website (http://www.asiapacificfund.com). This website includes monthly updates of the Fund’s performance and other data as well as the Manager’s quarterly presentation of performance and asset allocations and comments on the current Asian outlook.
CUSIP: 044901106
NYSE: APB
www.asiapacificfund.com
The Asia Pacific Fund, Inc.
CONTENTS
Fund Statistics | 1 |
Report of the Investment Manager | 2 |
Portfolio of Investments | 5 |
Statement of Assets and Liabilities | 11 |
Statement of Operations | 11 |
Statement of Changes in Net Assets | 12 |
Notes to Financial Statements | 12 |
Financial Highlights | 17 |
Board of Directors Approval of Continuance of Investment Management Agreement | 19 |
Supplemental Proxy Information | 21 |
Privacy Notice | 22 |
Dividend Reinvestment Plan | 24 |
Additional Information | 25 |
The Asia Pacific Fund, Inc.
As of September 30, 2016 (Unaudited)
OUR TOLL-FREE LINE:
1-888-4-ASIA-PAC
1-888-427-4272
For further information on the Fund (including monthly fact sheets), please call or visit the Fund's website at www.asiapacificfund.com.
Statistics | |
Total Net Assets | $127,427,984 |
Shares Outstanding | 10,344,073 |
Net Asset Value | $12.32 |
Equity | 99.7%(a) |
Total Return Performance (US Dollar terms) | ||
Period | Market Price(b) | NAV(c) |
3 months | 8.4% | 8.1% |
6 months | 10.0% | 9.5% |
1 Year | 8.1% | 8.9% |
3 Years (d) | 3.2% | 4.8% |
5 Years (d) | 3.5% | 5.4% |
10 Years (d) | 4.9% | 5.4% |
Other Information | |
Ticker Symbol | APB |
Primary Exchange | NYSE |
Dividend Repurchase Program | Yes |
Portfolio Characteristics | |
Top Ten Equity Holdings | |
China Construction Bank Corp. (Class “H” Shares) | 3.4% |
PetroChina Co. Ltd. (Class “H” Shares) | 3.3% |
Samsung Electronics Co. Ltd. | 3.3% |
China Overseas Land & Investment Ltd. | 3.2% |
Longfor Properties Co. Ltd. | 3.2% |
China Life Insurance Co. Ltd. (Class “H” Shares) | 2.8% |
SK Hynix, Inc. | 2.7% |
Samsung Fire & Marine Insurance Co. Ltd. (Preference Shares) | 2.5% |
Midea Group | 2.2% |
China State Construction International Holdings Ltd. | 2.0% |
Sector Breakdown: Top Ten Industries | |
Real Estate | 15.0% |
Industrials | 13.1% |
Consumer Discretionary | 9.5% |
Banking | 9.1% |
Insurance | 7.1% |
Utilities | 5.9% |
Consumer Staples | 5.0% |
Technology Hardware & Equipment | 5.0% |
Information Technology | 4.3% |
Consumer Durables & Apparel | 4.1% |
Footnote section
(a) | Expressed as a percentage of total investments. |
(b) | Total investment return is calculated assuming a purchase of common stock at the current market value on the first day and a sale at the current market value on the last day of each period reported. Dividends and distributions are assumed, for purposes of this calculation, to be reinvested at prices obtained under the Fund’s dividend reinvestment plan. These calculations do not include brokerage commissions. |
(c) | This information represents the historical net asset value (NAV) per share performance of the Fund. NAV per share performance is calculated assuming reinvestment of dividends and distributions. Because NAV per share performance does not reflect market price, it is not the same as total investment return. |
(d) | Average annual return. |
1
REPORT OF THE INVESTMENT MANAGER
For the period from March 31, 2016 to September 30, 2016 (Unaudited)
During the six-month period ended September 30, 2016, the Fund’s net asset value (NAV) per share increased by US$1.07, from US$11.25 to US$12.32. In percentage terms, the Fund’s NAV total return was increased by 9.5%. This compares with an increase of 10.8% by its reference benchmark index, the MSCI All Countries Asia Ex-Japan Index. The Fund’s share price was up almost 10.0% over the period, from US$9.61 to US$10.57.
The chart below illustrates the Fund’s net asset value performance per share during the period:
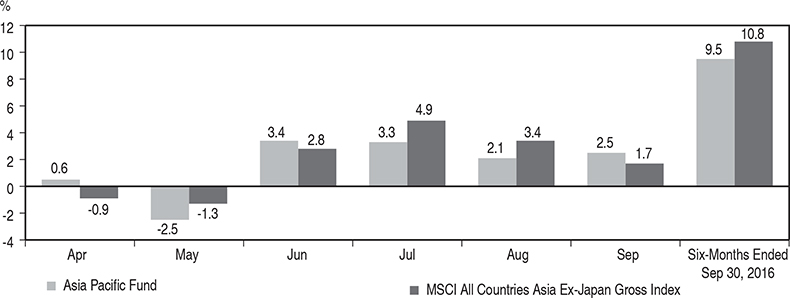
Source: Bank of New York Mellon and MSCI. Fund returns are based on the NAV (in USD) and include reinvestment prices obtained under the Fund’s dividend reinvestment plan. Returns are shown in USD.
Local Currencies versus the US Dollar
March 31, 2016 – September 30, 2016
Currency | Mar 31 | Sep 30 | Mar 31, 2016 to Change %* |
North Asia | |||
Chinese Renminbi | 6.47 | 6.67 | -3.0 |
Hong Kong Dollar | 7.76 | 7.76 | 0.0 |
South Korean Won | 1,143.60 | 1,101.35 | 3.8 |
New Taiwan Dollar | 32.18 | 31.35 | 2.7 |
ASEAN | |||
Thai Baht | 35.18 | 34.65 | 1.5 |
Malaysian Ringgit | 3.90 | 4.14 | -5.7 |
Philippines Peso | 46.05 | 48.50 | -5.1 |
Singapore Dollar | 1.35 | 1.36 | -1.2 |
Indonesian Rupiah | 13,260 | 13,051 | 1.6 |
South Asia | |||
Sri Lankan Rupee | 146.00 | 146.80 | -0.5 |
Indian Rupee | 66.22 | 66.58 | -0.5 |
Vietnamese Dong | 22,293 | 22,304.50 | -0.1 |
Source: Morningstar (Value Partners)
* | a negative figure denotes a depreciation of the local currency vs the USD (and vice-versa) |
STOCK MARKET PERFORMANCE
March 31, 2016 – September 30, 2016
Country - Index | Market Change % | Market Change % |
North Asia | ||
MSCI Hong Kong | 13.0 | 13.0 |
MSCI Taiwan | 10.5 | 13.5 |
MSCI Korea | 5.6 | 9.6 |
MSCI China | 14.3 | 14.3 |
ASEAN | ||
MSCI Singapore | 1.5 | 0.2 |
MSCI Malaysia | -1.8 | -7.4 |
MSCI Thailand | 8.8 | 10.5 |
MSCI Indonesia | 12.6 | 14.4 |
MSCI Philippines | 5.7 | 0.4 |
South Asia | ||
MSCI Sri Lanka | 17.8 | 17.1 |
MSCI India | 10.5 | 9.9 |
MSCI Vietnam | 11.8 | 11.8 |
MSCI All Countries Asia Ex-Japan | 10.1 | 10.8 |
Source: Morningstar (Value Partners)
2
COUNTRY ALLOCATION*
Country | Mar 31, 2016 | Jun 30, 2016 | Sep 30, 2016 |
North Asia | 80.0% | 81.9% | 83.2% |
Hong Kong/China | 60.2% | 61.6% | 61.1% |
South Korea | 16.6% | 16.5% | 18.0% |
Taiwan | 3.2% | 3.8% | 4.1% |
ASEAN | 13.2% | 13.7% | 11.3% |
Singapore | 7.2% | 6.3% | 5.2% |
Thailand | 2.9% | 2.9% | 2.1% |
Indonesia | 1.0% | 2.3% | 2.5% |
Malaysia | 1.2% | 1.4 % | 1.2% |
Philippines | 0.9% | 0.9% | 0.3% |
Cash & Other | 6.8% | 4.4% | 5.5% |
Source: Prudential Investments LLC for March data; AST Fund Solutions, LLC for June and September data
* | Rounded up to the nearest tenth of one percent |
Market Review
Dividend payouts have been on the rise in Asia, underpinned by Asian companies’ stronger financial position and returning earnings growth. Today, around a quarter of the world’s economies have adopted negative interest rates. With the US Federal Reserve following a shallow trajectory of rate hikes and renewed fears over a hard-Brexit, central banks around the world are likely to maintain their stance of “lower for longer”. Asian dividend plays, especially those with a potential for earnings re-rating, stand out as an obvious incentive to yield chasers. In Emerging Asia as a whole, we have seen a foreign net inflow of US$38.9 billion year to date against a net outflow in 2015.
The Hong Kong and China stockmarkets staged a strong rally during September on the back of improved sentiment and above-consensus earnings results. The southbound flow from mainland China led by anticipation about the Shenzhen-Hong Kong Stock Connect program also fueled the rebound.
China sceptics who have been waiting for a hard-landing may find the latest economic figures surprising. Not only did China’s Purchasing Managers’ Index (PMI) stay resilient at 50.4 – the highest reading since November 2014, its Producer Price Index (PPI) at -0.8% was at its highest since mid-2012. With the support of improving exports, a robust property sector and acceleration in infrastructure investment, we are now seeing some upgrades to growth forecasts in the market.
In Korea, the KOSPI rose 1.7% during the month. Emerging Market fund flows bolstered stock performance although a number of events, including Samsung’s Galaxy Note 7 recall and the oil price headwind stemming from OPEC’s agreement to cut production, added downward pressure to the market. On the macro front, Korea’s economic recovery remained fragile. Manufacturing conditions further deteriorated in September when Korea’s PMI fell to a 14-month low of 47.6 because of weakened demand and strikes at several automobile firms. However, the Bank of Korea (BOK) upgraded its estimate of second-quarter Gross Domestic Product growth to 3.2% from 2.9% and voted unanimously to keep the base rate unchanged at 1.25% after a 25-basis-point rate cut earlier this year. The government also released its 2017 budget proposal which remains focused on fiscal soundness.
Portfolio Comments
In the six-month period, Hong Kong stocks and Chinese stocks trading in the city (e.g.; H shares and red chips) led the region and were among the top contributors in our portfolio. From a bottom-up perspective, our technology stock picks contributed the most. The share price of our top contributor - an optical fiber and cable company - went up 32% in September after announcing a set of market-beating results, driven by a sustained growth outlook from a new production capacity coming on stream and accelerating fixed broadband-related fiber and cable demand in China. Meanwhile, a Korean DRAM (Dynamic Random Access Memory) producer was another top contributor bolstered by rising personal computer (PC) DRAM prices in September. DRAM prices are likely to continue to rise as PC original equipment manufacturers (OEMs) rush to secure inventory for the peak season in the fourth quarter. In addition, our position in a China home appliance firm also contributed to the Fund with better-than-expected air conditioner sales due to warmer weather. The shares are trading at a lower valuation to its peers and offer an attractive yield at 6.6%.
Due to increased market volatility in the past two to three years, we have maintained a slightly higher level of cash compared to previous years. This enables us to be more flexible in responding to market volatility and to better take advantage of investment opportunities.
3
Outlook
Looking forward, we see a more stabilized environment in Asia ex-Japan, particularly in the Greater China region with earnings upgrade potential and undemanding valuations. We continue to favor Asia ex-Japan companies from a dividend yield perspective, supported by stronger free cash flow, higher cash-to-market capitalization and lower net gearing. The trend of rising dividend payouts from Asia companies is expected to continue with the earnings recovery remaining intact, which we believe is attractive in a low growth and low interest rate environment.
Value Partners Hong Kong Limited
October 14, 2016
Past performance does not guarantee future results and current and future performance may be lower or higher than the past performance data quoted. The investment return and principal value will fluctuate, and shares, when sold, may be worth more or less than the original cost. Index returns do not include the effect of any sales charges, fund operating expenses or taxes. An investment cannot be made directly in an index.
Unless specified, all information contained in this report is quoted as at September 30, 2016. The views expressed are the views of Value Partners Hong Kong Limited only and are subject to change based on market and other conditions. The information provided does not constitute investment advice and it should not be relied on as such. All material has been obtained from sources believed to be reliable, but its accuracy is not guaranteed. This material contains certain statements that may be deemed forward-looking statements. Please note that any such statements are not guarantees of any future performance and actual results or developments may differ materially from those projected. Any securities mentioned above are for illustrative purpose only, and not a recommendation to invest or divest.
4
THE ASIA PACIFIC FUND, INC.
Portfolio of Investments
as of September 30, 2016
(Unaudited)
|
| Value | |||||
LONG-TERM INVESTMENTS—94.5% | |||||||
COMMON STOCKS—81.3% | |||||||
CHINA (INCLUDING HONG KONG and MACAU SAR)—57.6% | |||||||
3,054,000 | Agricultural Bank of China Ltd. (Class “H” Shares) | $ | 1,307,215 | ||||
(Banking) | |||||||
164,000 | Anhui Conch Cement Co. Ltd. (Class “H” Shares) | 449,307 | |||||
(Materials) | |||||||
1,862,000 | Belle International Holdings Ltd. | 1,277,118 | |||||
(Consumer Discretionary) | |||||||
501,000 | BOC Hong Kong Holdings Ltd. | 1,692,306 | |||||
(Banking) | |||||||
129,156 | Cheung Kong Property Holdings Ltd. | 942,477 | |||||
(Real Estate) | |||||||
5,918,000 | China Construction Bank Corp. (Class “H” Shares) | 4,387,151 | |||||
(Banking) | |||||||
551,000 | China High Speed Transmission Equipment Group Co. Ltd. | 556,939 | |||||
(Industrials) | |||||||
1,365,000 | China Life Insurance Co. Ltd. (Class “H” Shares) | 3,519,674 | |||||
(Insurance) | |||||||
2,260,000 | China Lilang Ltd. | 1,282,038 | |||||
(Consumer Discretionary) | |||||||
894,000 | China Machinery Engineering Corp. (Class “H” Shares) | 523,279 | |||||
(Industrials) | |||||||
1,212,000 | China Overseas Land & Investment Ltd. | 4,109,587 | |||||
(Real Estate) | |||||||
4,616,000 | China Power International Development Ltd. | 1,773,462 | |||||
(Utilities) | |||||||
934,000 | China Resources Cement Holdings Ltd. | 373,292 | |||||
(Materials) | |||||||
1,084,622 | China Resources Power Holdings Co. Ltd. | 1,868,206 | |||||
(Utilities) | |||||||
1,936,000 | China State Construction International Holdings Ltd. | 2,545,923 | |||||
(Industrials) | |||||||
1,699,200 | China Zhongwang Holdings Ltd. |
| 819,324 | ||||
(Materials) | |||||||
1,346,685 | Chongqing Changan Automobile Co. Ltd. (Class “B” Shares) | 2,194,588 | |||||
(Consumer Discretionary) | |||||||
389,000 | Chow Sang Sang Holdings International Ltd. | 687,084 | |||||
(Consumer Discretionary) | |||||||
5,032,000 | CIFI Holdings Group Co. Ltd. | 1,576,474 | |||||
(Real Estate) | |||||||
149,156 | CK Hutchison Holdings Ltd. | 1,896,083 | |||||
(Industrials) | |||||||
646,000 | Convenience Retail Asia Ltd. | 336,476 | |||||
(Consumer Staples) | |||||||
30,750,000 | CSI Properties Ltd. | 1,129,873 | |||||
(Real Estate) | |||||||
2,896,000 | EGL Holdings Co. Ltd. | 537,652 | |||||
(Consumer Discretionary) | |||||||
4,084,938 | Far East Consortium International Ltd. | 1,632,627 | |||||
(Real Estate) | |||||||
2,062,000 | Far East Horizon Ltd. | 1,945,985 | |||||
(Financials) | |||||||
2,397,000 | FSE Engineering Holdings Ltd. | 766,407 | |||||
(Industrials) | |||||||
1,041,000 | Goldpac Group Ltd. | 323,450 | |||||
(Technology Hardware & Equipment) | |||||||
234,000 | Haitian International Holdings Ltd. | 460,373 | |||||
(Industrials) | |||||||
2,124,000 | Hopefluent Group Holdings Ltd. | 632,567 | |||||
(Real Estate) | |||||||
910,000 | Huadian Power International Corp. Ltd. (Class “H” Shares) | 408,282 | |||||
(Utilities) | |||||||
1,018,395 | Hui Xian Real Estate Investment Trust | 502,327 | |||||
(Real Estate Investment Trusts) | |||||||
968,000 | Hutchison Telecommunications Hong Kong Holdings Ltd. | 328,224 | |||||
(Telecommunication Services) | |||||||
732,500 | Intime Retail Group Co. Ltd. | 638,402 | |||||
(Consumer Discretionary) | |||||||
1,052,000 | IT Ltd. | 341,787 | |||||
(Consumer Discretionary) | |||||||
7,344,000 | Jiangnan Group Ltd. | 1,249,817 | |||||
(Industrials) | |||||||
See Notes to Financial Statements.
5
THE ASIA PACIFIC FUND, INC.
Portfolio of Investments
as of September 30, 2016
(Unaudited) Continued
|
| Value | |||||
CHINA (INCLUDING HONG KONG and MACAU SAR)—(continued) | |||||||
788,500 | Langham Hospitality Investments | $ | 312,090 | ||||
(Real Estate) | |||||||
1,284,000 | Lee & Man Chemical Co. Ltd. | 398,953 | |||||
(Materials) | |||||||
2,622,500 | Longfor Properties Co. Ltd. | 4,023,484 | |||||
(Real Estate) | |||||||
7,451,054 | Oi Wah Pawnshop Credit Holdings Ltd. | 518,742 | |||||
(Diversified Financials) | |||||||
6,404,000 | PetroChina Co. Ltd. (Class “H” Shares) | 4,202,512 | |||||
(Energy) | |||||||
1,008,000 | Pico Far East Holdings Ltd. | 302,800 | |||||
(Consumer Discretionary) | |||||||
2,938,000 | Qingdao Port International Co. Ltd. (Class “H” Shares) | 1,734,831 | |||||
(Industrials) | |||||||
1,049,000 | Shimao Property Holdings Ltd. | 1,420,053 | |||||
(Real Estate) | |||||||
2,069,500 | Sinopec Engineering Group Co. Ltd. (Class “H” Shares) | 1,779,636 | |||||
(Industrials) | |||||||
2,422,000 | SITC International Holdings Co. Ltd. | 1,442,633 | |||||
(Industrials) | |||||||
3,340,025 | Skyworth Digital Holdings Ltd. | 2,402,834 | |||||
(Consumer Discretionary) | |||||||
726,500 | SmarTone Telecommunications Holdings Ltd. | 1,200,780 | |||||
(Telecommunication Services) | |||||||
908,000 | Spring Real Estate Investment Trust | 394,508 | |||||
(Real Estate Investment Trusts) | |||||||
1,608,000 | Springland International Holdings Ltd. | 263,287 | |||||
(Consumer Discretionary) | |||||||
764,000 | Time Watch Investments Ltd. | 97,514 | |||||
(Consumer Discretionary) | |||||||
2,840,000 | TK Group Holdings Ltd. | 783,559 | |||||
(Industrials) | |||||||
1,606,000 | Wasion Group Holdings Ltd. | 873,771 | |||||
(Technology Hardware & Equipment) | |||||||
1,102,500 | WH Group Ltd. | 886,958 | |||||
(Consumer Staples) | |||||||
2,344,000 | Wonderful Sky Financial Group Holdings Ltd. |
| 664,845 | ||||
(Consumer Discretionary) | |||||||
807,200 | Xinjiang Goldwind Science & Technology Co. Ltd. (Class “H” Shares) | 1,205,118 | |||||
(Capital Goods) | |||||||
1,100,000 | Yangtze Optical Fibre and Cable Joint Stock Ltd. Co. (Class “H” Shares) | 1,863,493 | |||||
(Information Technology) | |||||||
1,243,900 | Yangzijiang Shipbuilding Holdings Ltd. | 684,113 | |||||
(Capital Goods) | |||||||
826,000 | Zhejiang Expressway Co. Ltd. (Class “H” Shares) | 871,110 | |||||
(Industrials) | |||||||
73,343,400 | |||||||
INDONESIA—2.5% | |||||||
1,133,500 | PT Bank Mandiri Persero Tbk | 972,738 | |||||
(Banking) | |||||||
6,565,000 | PT Bank Pan Indonesia Tbk* | 414,997 | |||||
(Banking) | |||||||
1,482,800 | PT Nusa Raya Cipta Tbk | 54,308 | |||||
(Capital Goods) | |||||||
22,533,500 | PT Panin Financial Tbk* | 326,322 | |||||
(Insurance) | |||||||
6,599,000 | PT Perusahaan Gas Negara Persero Tbk | 1,451,163 | |||||
(Utilities) | |||||||
3,219,528 | |||||||
MALAYSIA—1.2% | |||||||
1,722,625 | Mah Sing Group Bhd | 674,804 | |||||
(Real Estate) | |||||||
472,100 | Signature International Bhd | 105,026 | |||||
(Consumer Discretionary) | |||||||
751,300 | UOA Development Bhd | 454,177 | |||||
(Real Estate) | |||||||
272,900 | ViTrox Corp. Bhd | 248,121 | |||||
(Semiconductors & Semiconductor Equipment) | |||||||
1,482,128 | |||||||
PHILIPPINES—0.3% | |||||||
239,780 | Metropolitan Bank & Trust Co. | 421,759 | |||||
(Financials) | |||||||
See Notes to Financial Statements.
6
|
| Value | |||||
PHILIPPINES—(continued) | |||||||
7,900 | Semirara Mining and Power Corp. | $ | 18,555 | ||||
(Energy) | |||||||
440,314 | |||||||
SINGAPORE—4.6% | |||||||
623,756 | AIMS AMP Capital Industrial REIT | 642,647 | |||||
(Real Estate Investment Trusts) | |||||||
961,300 | Asian Pay Television Trust | 359,509 | |||||
(Consumer Discretionary) | |||||||
504,296 | CapitaLand Retail China Trust | 597,227 | |||||
(Real Estate Investment Trusts) | |||||||
1,378,325 | Croesus Retail Trust | 864,169 | |||||
(Real Estate Investment Trusts) | |||||||
182,486 | DBS Group Holdings Ltd. | 2,059,441 | |||||
(Banking) | |||||||
1,285,100 | Ezion Holdings Ltd.* | 259,150 | |||||
(Energy) | |||||||
698,375 | Frasers Commercial Trust | 719,525 | |||||
(Real Estate Investment Trusts) | |||||||
702,200 | Viva Industrial Trust | 406,789 | |||||
(Real Estate) | |||||||
5,908,457 | |||||||
SOUTH KOREA—8.9% | |||||||
32,657 | Dongbu Insurance Co. Ltd. | 2,022,252 | |||||
(Insurance) | |||||||
52,877 | GS Retail Co. Ltd. | 2,362,145 | |||||
(Consumer Staples) | |||||||
36,305 | Korea Electric Power Corp. | 1,780,061 | |||||
(Utilities) | |||||||
85,587 | Macquarie Korea Infrastructure Fund | 684,634 | |||||
(Diversified Financials) | |||||||
13,932 | Maeil Dairy Industry Co. Ltd. | 435,158 | |||||
(Consumer Staples) | |||||||
10,312 | Nong Woo Bio Co. Ltd. | 200,837 | |||||
(Consumer Staples) | |||||||
24,675 | Sekonix Co. Ltd. | 358,469 | |||||
(Technology Hardware & Equipment) | |||||||
95,433 | SK Hynix, Inc. | 3,483,367 | |||||
(Semiconductors & Semiconductor Equipment) | |||||||
11,326,923 | |||||||
TAIWAN—4.1% | |||||||
91,000 | Basso Industry Corp. |
| 288,861 | ||||
(Consumer Discretionary) | |||||||
157,825 | Johnson Health Tech Co. Ltd. | 262,324 | |||||
(Consumer Discretionary) | |||||||
21,000 | Largan Precision Co. Ltd. | 2,532,421 | |||||
(Information Technology) | |||||||
1,032,410 | Mega Financial Holding Co. Ltd. | 726,249 | |||||
(Banking) | |||||||
17,632 | Mercuries Life Insurance Co. Ltd. | 8,353 | |||||
(Financials) | |||||||
42,000 | Rechi Precision Co. Ltd. | 50,917 | |||||
(Industrials) | |||||||
52,955 | Superalloy Industrial Co. Ltd. | 360,095 | |||||
(Consumer Discretionary) | |||||||
350,222 | Win Semiconductors Corp. | 1,027,912 | |||||
(Information Technology) | |||||||
5,257,132 | |||||||
THAILAND—2.1% | |||||||
213,100 | AP Thailand PCL, NVDR | 44,588 | |||||
(Real Estate) | |||||||
3,398,500 | AP Thailand PCL | 711,086 | |||||
(Real Estate) | |||||||
623,100 | Hana Microelectronics PCL | 570,950 | |||||
(Technology Hardware & Equipment) | |||||||
75,400 | Namyong Terminal PCL | 27,636 | |||||
(Industrials) | |||||||
451,100 | SPCG PCL | 264,281 | |||||
(Utilities) | |||||||
1,440,700 | Supalai PCL | 1,010,361 | |||||
(Real Estate) | |||||||
2,628,902 | |||||||
Total Common Stocks (cost $104,178,368) | 103,606,784 | ||||||
Units | |||||||
PARTICIPATORY NOTES†—4.1% | |||||||
CHINA (INCLUDING HONG KONG and MACAU SAR) | |||||||
519,747 | Gree Electric Appliances, Inc. of Zhuhai (Class “A” Shares), expiring 08/17/17 | 1,731,451 | |||||
(Consumer Durables & Apparel) | |||||||
See Notes to Financial Statements.
7
THE ASIA PACIFIC FUND, INC.
Portfolio of Investments
as of September 30, 2016
(Unaudited) Continued
|
| Value | |||||
CHINA (INCLUDING HONG KONG and MACAU SAR)—(continued) | |||||||
195,900 | Gree Electric Appliances, Inc. of Zhuhai (Class “A” Shares), expiring 03/10/17 | $ | 652,608 | ||||
(Consumer Durables & Apparel) | |||||||
26,700 | Gree Electric Appliances, Inc. of Zhuhai (Class “A” Shares), expiring 01/16/17 | 88,947 | |||||
(Consumer Durables & Apparel) | |||||||
263,400 | Midea Group Ltd. (Class “A” Shares), expiring 12/22/16 | 1,066,632 | |||||
(Consumer Durables & Apparel) | |||||||
125,250 | Midea Group Ltd. (Class “A” Shares), expiring 03/08/17 | 507,197 | |||||
(Consumer Durables & Apparel) | |||||||
294,400 | Midea Group Ltd. (Class “A” Shares), expiring 04/25/17 | 1,192,165 | |||||
(Consumer Durables & Apparel) | |||||||
Total Participatory Notes (cost $4,417,190) | 5,239,000 | ||||||
Shares | |||||||
PREFERENCE STOCKS—9.1% | |||||||
SOUTH KOREA—9.1% | |||||||
9,277 | Amorepacific Corp. | 1,785,739 | |||||
(Consumer Staples) | |||||||
2,642 | CJ CheilJedang Corp. | 431,797 | |||||
(Consumer Staples) | |||||||
52,161 | LG Corp. | 1,948,904 | |||||
(Industrials) | |||||||
3,580 | Samsung Electronics Co. Ltd. | 4,193,218 | |||||
(Technology Hardware & Equipment) | |||||||
19,417 | Samsung Fire & Marine Insurance Co. Ltd. | 3,226,323 | |||||
(Insurance) | |||||||
Total Preference Stocks (cost $8,682,599) | 11,585,981 | ||||||
| Units | |||||||
WARRANTS(a)*—0.0% | |||||||
MALAYSIA | |||||||
423,637 | Mah Sing Group Bhd, expiring 02/21/20 | $ | 13,317 | ||||
(Real Estate) | |||||||
SINGAPORE | |||||||
286,063 | Ezion Holdings Ltd., expiring 04/24/20 | 11,118 | |||||
(Energy) | |||||||
Total Warrants (cost $0) | 24,435 | ||||||
Total Long-Term Investments (cost $117,278,157) | 120,456,200 | ||||||
Shares | |||||||
SHORT-TERM INVESTMENT—0.3% | |||||||
MONEY MARKET MUTUAL FUND | |||||||
371,762 | JPMorgan Prime Money Market Fund/Premier (cost $371,762) | 371,762 | |||||
Total Investments—94.8% (cost $117,649,919) (Note 4) | 120,827,962 | ||||||
Other assets in excess of liabilities—5.2% | 6,600,022 | ||||||
Net Assets—100.0% | $ | 127,427,984 | |||||
The following abbreviations are used in this report:
NVDR | Non-Voting Depository Receipt |
OTC | Over-the-counter |
† | Participatory notes represented 4.1% of net assets, of which the portfolio attributed 4.1% to BOCI Financial Products Limited as the counterparty to the securities. |
| * | Non-income producing security. |
| (a) | The amounts represent fair value of derivative instruments subject to equity contracts risk exposure as of September 30, 2016. |
See Notes to Financial Statements.
8
THE ASIA PACIFIC FUND, INC.
Portfolio of Investments
as of September 30, 2016
(Unaudited) Continued
Various inputs are used in determining the value of the Fund’s investments. These inputs are summarized in the three broad levels listed below.
Level 1—quoted prices generally in active markets for identical securities.
Level 2—quoted prices for similar securities, interest rates and yield curves, prepayment speeds, foreign currency exchange rates and other observable inputs.
Level 3—unobservable inputs for securities valued in accordance with Board approved fair valuation procedures.
The following is a summary of the inputs used as of September 30, 2016 in valuing such portfolio securities:
Level 1 | Level 2 | Level 3 | ||||||||||
Investments in Securities | ||||||||||||
Common Stocks | ||||||||||||
China (including Hong Kong and Macau SAR) | $ | 73,343,400 | $ | — | $ | — | ||||||
Indonesia | 3,219,528 | — | — | |||||||||
Malaysia | 1,482,128 | — | — | |||||||||
Philippines | 440,314 | — | — | |||||||||
Singapore | 5,908,457 | — | — | |||||||||
South Korea | 11,326,923 | — | — | |||||||||
Taiwan | 5,257,132 | — | — | |||||||||
Thailand | 44,588 | 2,584,314 | — | |||||||||
Participatory Notes | ||||||||||||
China (including Hong Kong and Macau SAR) | — | 5,239,000 | — | |||||||||
Preference Shares | ||||||||||||
South Korea | 11,585,981 | — | — | |||||||||
Warrants | ||||||||||||
Malaysia | 13,317 | — | — | |||||||||
Singapore | 11,118 | — | — | |||||||||
Money Market Mutual Fund | 371,762 | — | — | |||||||||
Total | $ | 113,004,648 | $ | 7,823,314 | $ | — | ||||||
The following is a reconciliation of assets in which unobservable inputs (Level 3) were used in determining fair value:
Participatory Notes | ||||
Balance as of 3/31/16 | $ | 2,225,498 | ||
Realized gain (loss) | — | |||
Change in unrealized appreciation (depreciation) | — | |||
Purchases | — | |||
Sales | — | |||
Accrued discount/premium | — | |||
Transfers into Level 3 | — | |||
Transfers out of Level 3 | (2,225,498 | ) | ||
Balance as of 9/30/16 | $ | — | ||
The industry classification of investments and other assets in excess of liabilities shown as a percentage of net assets as of September 30, 2016 were as follows:
Real Estate | 15.0% |
Industrials | 13.1 |
Consumer Discretionary | 9.5 |
Banking | 9.1 |
Insurance | 7.1 |
Utilities | 5.9 |
Consumer Staples | 5.0 |
Technology Hardware & Equipment | 5.0 |
Information Technology | 4.3 |
Consumer Durables & Apparel | 4.1 |
Energy | 3.5 |
Semiconductors & Semiconductor Equipment | 2.9 |
Real Estate Investment Trusts | 2.9 |
Financials | 1.9 |
Materials | 1.6 |
Capital Goods | 1.5 |
Telecommunication Services | 1.2 |
Diversified Financial Services | 0.9 |
Money Market Mutual Fund | 0.3 |
94.8 | |
Other assets in excess of liabilities | 5.2 |
100.0% |
See Notes to Financial Statements.
9
THE ASIA PACIFIC FUND, INC.
Portfolio of Investments
as of September 30, 2016
(Unaudited) Concluded
The Fund invested in derivative instruments during the reporting period. The primary type of risk associated with these derivative instruments is equity risk. The effect of such derivative instruments on the Fund’s financial position and financial performance as reflected in the Statement of Assets and Liabilities and Statement of Operations is presented in the summary below.
Fair values of derivative instruments as of September 30, 2016 as presented in the Statement of Assets and Liabilities:
Asset Derivatives | Liability Derivatives | |||||||||||||
Derivatives not accounted for as hedging instruments, carried at fair value | Balance | Fair Value | Balance | Fair Value | ||||||||||
Equity contracts | Investments | $ | 24,435 | — | $ | — | ||||||||
The effects of derivative instruments on the Statement of Operations for the six months ended September 30, 2016 are as follows:
For the six months ended September 30, 2016, the Fund did not have any realized gain or (loss) on derivatives recognized in income on the Statement of Operations.
Change in Unrealized Appreciation or (Depreciation) on Derivatives Recognized in Income | |||||
Derivatives not accounted for as hedging instruments, carried at fair value | Warrants* | ||||
Equity contracts | $ | 8,690 | |||
* | Included in net change in unrealized (depreciation) on investments in the Statement of Operations. |
See Notes to Financial Statements.
10
THE ASIA PACIFIC FUND, INC. | ||||
Assets | ||||
Investments at value: | ||||
Investments, at value (cost $117,649,919) | $ | 120,827,962 | ||
Foreign currency, at value (cost $5,868,732) | 5,877,873 | |||
Receivable for investments sold | 607,239 | |||
Dividends receivable | 391,015 | |||
Prepaid expenses | 95,258 | |||
Total Assets | 127,799,347 | |||
Liabilities | ||||
Accrued expenses and other liabilities | 165,234 | |||
Investment management fee payable | 97,207 | |||
Payable for investments purchased | 90,179 | |||
Administration fee payable | 14,688 | |||
Payable to custodian | 3,975 | |||
Unrealized depreciation on OTC forward foreign currency exchange contracts | 80 | |||
Total Liabilities | 371,363 | |||
Net Assets | $ | 127,427,984 | ||
Net assets were comprised of: | ||||
Common stock, at par | $ | 103,441 | ||
Paid-in capital in excess of par | 126,998,926 | |||
127,102,367 | ||||
Undistributed net investment income | 2,237,125 | |||
Accumulated net realized loss on investment and foreign currency transactions | (5,096,511 | ) | ||
Net unrealized appreciation on investments and foreign currencies | 3,185,003 | |||
Net Assets, September 30, 2016 | $ | 127,427,984 | ||
Net Asset Value per share ($127,427,984 ÷ 10,344,073 shares of common stock outstanding) | $ | 12.32 | ||
THE ASIA PACIFIC FUND, INC. | ||||
Net Investment Income | ||||
Income | ||||
Dividends (net of foreign withholding taxes of $189,466) | $ | 3,668,396 | ||
Expenses | ||||
Investment management fee | 568,117 | |||
Directors' fees and board expenses | 146,000 | |||
Legal fees and expenses | 124,000 | |||
Custodian fees and expenses | 107,000 | |||
Administration fee | 93,027 | |||
Insurance | 66,000 | |||
Reports to shareholders | 58,000 | |||
Audit fee | 21,000 | |||
Transfer agent's fees and expenses | 13,000 | |||
Registration fees | 13,000 | |||
Loan interest and commitment fees | 7,000 | |||
Miscellaneous | 56,257 | |||
Total expenses | 1,272,401 | |||
Net investment income | 2,395,995 | |||
Realized And Unrealized Gain (Loss) On Investments And Foreign Currency Transactions | ||||
Net realized loss on: | ||||
Investment transactions | (1,658,238 | ) | ||
Foreign currency transactions | (2,915 | ) | ||
(1,661,153 | ) | |||
Net change in unrealized appreciation (depreciation) on: | ||||
Investments | 10,385,392 | |||
Foreign currencies | (73,758 | ) | ||
10,311,634 | ||||
Net gain on investment and foreign currency transactions | 8,650,481 | |||
Net Increase In Net Assets Resulting From Operations | $ | 11,046,476 | ||
See Notes to Financial Statements.
11
THE ASIA PACIFIC FUND, INC.
Statement of Changes in Net Assets
(Unaudited)
Increase (Decrease) in Net Assets | Six Months Ended | Year Ended | ||||||
Operations | ||||||||
Net investment income | $ | 2,395,995 | $ | 2,104,898 | ||||
Net realized gain (loss) on investment and foreign currency transactions | (1,661,153 | ) | 3,330,421 | |||||
Net change in unrealized appreciation (depreciation) on investments and foreign currencies | 10,311,634 | (19,020,849 | ) | |||||
Net increase (decrease) in net assets resulting from operations | 11,046,476 | (13,585,530 | ) | |||||
Dividends from net investment income | — | (5,275,477 | ) | |||||
Total increase (decrease) | 11,046,476 | (18,861,007 | ) | |||||
Net Assets | ||||||||
Beginning of period | 116,381,508 | 135,242,515 | ||||||
End of period (a) | $ | 127,427,984 | $ | 116,381,508 | ||||
(a) Includes undistributed net investment income of: | $ | 2,237,125 | $ | — | ||||
THE ASIA PACIFIC FUND, INC.
Notes to Financial Statements
(Unaudited)
The Asia Pacific Fund, Inc. (the “Fund”) is registered under the Investment Company Act of 1940, as amended, as a diversified, closed-end, management investment company. The Fund’s investment objective is to achieve long-term capital appreciation through investment of at least 80% of investable assets in equity securities of companies in the Asia Pacific countries.
Note 1. Accounting Policies The Fund follows investment company accounting and reporting guidance of the Financial Accounting Standards Board (“FASB”) Accounting Standard Codification Topic 946 Financial Services—Investment Companies. The following accounting policies conform to U.S. generally accepted accounting principles. The Fund consistently follows such policies in the preparation of its financial statements.
Securities Valuation: The Fund holds portfolio securities and other assets that are fair valued at the close of each day the New York Stock Exchange (“NYSE”) is open for trading. Fair value is the price that would be received to sell an asset or paid to transfer a liability in an orderly transaction between market participants on the measurement date. The Board of Directors (the “Board”) has adopted Valuation Procedures for security valuation under which specified fair valuation responsibilities have been delegated to the Investment Manager, Value Partners Hong Kong Limited. Under the current Valuation Procedures, the established Valuation Committee is responsible for supervising the valuation of portfolio securities, other assets and liabilities under specified circumstances. The Valuation Procedures permit the Fund to utilize independent pricing vendor services, quotations from market makers and alternative valuation methods when market quotations are not readily available or not deemed representative of fair value. A record of the Valuation Committee’s actions is subject to the Board’s review, approval, and ratification at its next regularly-scheduled quarterly meeting.
Various inputs determine how the Fund’s investments are valued, all of which are categorized according to the three broad levels (Level 1, 2, or 3) detailed in the table following the Portfolio of Investments.
See Notes to Financial Statements.
12
Common stocks and preference shares, exchange-traded funds, and derivative instruments such as futures or options that are traded on a securities exchange are valued at the last sale price as of the close of trading on the applicable exchange where the security principally trades. Securities traded via NASDAQ are valued at the NASDAQ official closing price. To the extent these securities are valued at the last sale price or NASDAQ official closing price, they are classified as Level 1 of the fair value hierarchy.
In the event that no sale or official closing price on the valuation date exists, these securities are generally valued at the mean between the last reported bid and ask prices, or at the last bid price in absence of an ask price. These securities are classified as Level 2 of the fair value hierarchy.
For common stocks and preference shares traded on foreign securities exchanges, certain valuation adjustments will be applied when events occur after the close of the security’s foreign market and before the Fund’s normal pricing time. These securities are valued using pricing vendor services that provide adjustment factors based on information such as local closing price, relevant general and sector indices, currency fluctuations, depositary receipts, and futures, as applicable. Securities valued using such model prices are classified as Level 2 in the fair value hierarchy.
Participatory Notes (P-notes) are generally valued based upon the value of a related underlying security that trades actively in the market and are classified as Level 2 in the fair value hierarchy.
Investments in open-end, non-exchange-traded mutual funds are valued at their net asset values as of the close of the NYSE on the date of valuation. These securities are classified as Level 1 in the fair value hierarchy since they may be purchased or sold at their net asset value on the date of valuation.
Securities, other assets and liabilities that cannot be priced using the methods described above are valued based on pricing methodologies approved by the Board. In the event that unobservable inputs are used when determining such valuations, the securities will be classified as Level 3 of the fair value hierarchy.
When determining the fair value of securities, some of the factors influencing the valuation include: the nature of any restrictions on disposition of the securities; assessment of the general liquidity of the securities; the issuer’s financial condition and the markets in which it does business; the cost of the investment; the size of the holding and the capitalization of the issuer; the prices of any recent transactions or bids/offers for such securities or any comparable securities; any available analyst media or other reports or information deemed reliable by the investment manager regarding the issuer or the markets or industry in which it operates. Using fair value to price securities may result in a value that is different from a security’s most recent closing price and from the price used by other mutual funds to calculate their net asset values.
Foreign Currency Translation: The books and records of the Fund are maintained in U.S. dollars. Foreign currency amounts are translated into U.S. dollars on the following basis:
(i) market value of investment securities, other assets and liabilities—at the current rates of exchange.
(ii) purchases and sales of investment securities, income and expenses—at the rates of exchange prevailing on the respective dates of such transactions.
Although the net assets of the Fund are presented at the foreign exchange rates and market values at the close of the fiscal period, the Fund does not isolate that portion of the results of operations arising as a result of changes in the foreign exchange rates from the fluctuations arising from changes in the market prices of long-term portfolio securities held at fiscal period end. Similarly, the Fund does not isolate the effect of changes in foreign exchange rates from the fluctuations arising from changes in the market prices of long-term portfolio securities sold during the fiscal period. Accordingly, these realized foreign currency gains or losses are included in the reported net realized gains or losses on investment transactions. Notwithstanding the above, the Fund does isolate the effect of fluctuations in foreign currency exchange rates when determining
13
THE ASIA PACIFIC FUND, INC.
Notes to Financial Statements
(Unaudited) Continued
the gain (loss) upon the sale or maturity of foreign currency denominated debt obligations; such amounts are included in net realized gains (losses) on foreign currency transactions.
Net realized gains (losses) on foreign currency transactions represent net foreign exchange gains (losses) from holdings of foreign currencies, forward currency contracts, disposition of foreign currencies, currency gains (losses) realized between the trade and settlement dates on security transactions, and the difference between the amounts of interest, dividends and foreign withholding taxes recorded on the Fund’s books and the U.S. dollar equivalent amounts actually received or paid. Net unrealized currency gains (losses) from valuing foreign currency denominated assets and liabilities (other than investments) at fiscal period end exchange rates are reflected as a component of unrealized appreciation (depreciation) on foreign currencies.
Foreign security and currency transactions may involve certain considerations and risks not typically associated with those of U.S. companies as a result of, among other factors, the level of governmental supervision and regulation of foreign securities markets and the possibility of political or economic instability.
Participatory Notes (P-notes): The Fund may gain exposure to securities in certain foreign markets through investments in participatory notes (“P-notes”). The Fund may purchase P-notes pending ability to invest directly in a foreign market due to restrictions applicable to foreign investors or other market factors. P-notes are generally issued by banks or broker-dealers and are designed to offer a return linked to a particular underlying security. P-notes involve transaction costs, which may be higher than those applicable to the equity securities. An investment in a P-note may involve risks, including counter-party risk, beyond those normally associated with a direct investment in the underlying security. The Fund must rely on the creditworthiness of the counterparty and would have no rights against the issuer of the underlying security. Furthermore, the P-note’s performance may differ from that of the underlying security. The holder of a P-note is entitled to receive from the bank or broker-dealer, an amount equal to dividends paid by the issuer of the underlying security; however, the holder is not entitled to the same rights (e.g., dividends, voting rights) as an owner of the underlying security. There is also no assurance that there will be a secondary trading market for a P-note or that the trading price of a P-note will equal the value of the underlying security.
Stock Index Futures Contracts: A stock index futures contract is an agreement to purchase (long) or sell (short) an agreed amount of securities at a set price for delivery on a future date. Upon entering into a stock index futures contract, the Fund is required to pledge to the broker an amount of cash and/or other assets equal to a certain percentage of the contract amount. This amount is known as the “initial margin.” Subsequent payments known as “variation margin,” are made or received by the Fund each day, depending on the daily fluctuations in the value of the underlying security. Such variation margin is recorded for financial statement purposes on a daily basis as unrealized gain or loss. When the contract expires or is closed, the gain or loss is realized and is presented in the Statement of Operations as net realized gain or loss on stock index futures contracts.
The Fund may utilize stock index futures contracts for hedging and investment purposes. Should market prices for the futures contracts or the underlying assets move in ways not anticipated by the Fund, losses may result. The use of futures contracts involves the risk of imperfect correlation in movements in the price of futures contracts and the underlying assets being hedged or the exposures desired by the Fund.
Securities Transactions and Net Investment Income: Securities transactions are recorded on the trade date. Realized and unrealized gains (losses) from securities and currency transactions are calculated on the identified cost basis. Dividend income is recorded on the ex-dividend date, and interest income is recorded on an accrual basis. Expenses are recorded on the accrual basis which may require the use of certain estimates by management. Actual results may differ from such estimates.
Dividends and Distributions: Dividends from net investment income, if any, are declared and paid at least annually in a manner that qualifies for the dividends-paid deduction. The Fund’s current intention is to distribute at
14
least annually any current year net capital gains in excess of net capital loss carryforwards in a manner that avoids income and excise taxes being imposed on the Fund. Dividends and distributions are recorded on the ex-dividend date. The Fund may choose to satisfy the foregoing by making distributions in cash, additional Fund shares, or both.
The Fund could determine in the future to retain net long-term capital gains in respect of any fiscal year without affecting the ability of the Fund to qualify as a regulated investment company. In that case, the Fund would be subject to taxation on the retained amount and shareholders subject to U.S. federal income taxation would be required to include in income for tax purposes their shares of the undistributed amount and would be entitled to credits or refunds against their U.S. federal income tax liabilities with respect to their proportionate shares of the tax paid by the Fund.
Income distributions and capital gain distributions are determined in accordance with income tax regulations, which may differ from U.S. generally accepted accounting principles.
Taxes: It is the Fund’s current intention to continue to meet the requirements of the U.S. Internal Revenue Code of 1986, as amended (“the Code”) applicable to regulated investment companies and to distribute all of its taxable income and net capital gains to shareholders. Therefore, no federal income tax provision is required. If the Fund determines in the future to retain taxable capital gains, the Fund will provide for all required taxes.
Withholding tax on foreign dividends and interest and foreign capital gains tax is accrued in accordance with the Fund’s understanding of the applicable country’s tax rules and rates.
Estimates The preparation of the financial statements requires management to make estimates and assumptions that affect the reported amounts and disclosures in the financial statements. Actual results could differ from those estimates.
Note 2. Investment Management and Administration Agreements The Fund has a management agreement with Value Partners Hong Kong Limited (the “Investment Manager”), and an administration agreement with AST Fund Solutions, LLC (the “Administrator”).
The investment management fee is computed weekly and payable monthly at the following annual rates: 1.00% of the Fund’s average weekly net assets up to $100 million and 0.70% of such assets in excess of $100 million.
The administration fee is also computed weekly and payable monthly at the following annual rates: 0.15% of the Fund’s average weekly net assets up to $100 million and 0.12% of such assets in excess of $100 million. Such fee is subject to an annual minimum of $150,000.
Pursuant to the agreements, the Investment Manager provides continuous supervision of the investment portfolio and the Administrator provides occupancy and certain clerical, administrative and accounting services for the Fund. The Investment Manager and the Administrator each pays the cost of compensation of certain officers of the Fund. The Fund bears all other costs and expenses.
Note 3. Portfolio Securities Cost of purchases and proceeds from sales of investment securities, other than short-term investments, for the six months ended September 30, 2016 aggregated $36,611,160 and $33,340,112 respectively.
Note 4. Tax Information The United States federal income tax basis of the Fund’s investments and the net unrealized depreciation as of September 30, 2016 were as follows:
Tax Basis | $ | 118,110,769 | ||
Appreciation | $ | 12,012,184 | ||
Depreciation | (9,294,991 | ) | ||
Net Unrealized Depreciation | $ | 2,717,193 |
15
THE ASIA PACIFIC FUND, INC.
Notes to Financial Statements
(Unaudited) Continued
The difference between book basis and tax basis was primarily attributable to deferred losses on wash sales and investments in passive foreign investment companies. Other cost basis adjustments are primarily attributable to appreciation (depreciation) of foreign currencies.
Under the Regulated Investment Company Modernization Act of 2010 (the “Act”), the Fund is permitted to carryforward capital losses realized on or after April 1, 2011 (“post-enactment losses”) for an unlimited period. Post-enactment losses are required to be utilized before the utilization of losses incurred prior to the effective date of the Act. As a result of this ordering rule, capital loss carryforwards related to taxable years ending before March 31, 2012 (“pre-enactment losses”) may have an increased likelihood to expire unused. The Fund utilized approximately $3,396,000 of its pre-enactment losses to offset net taxable gains realized in the fiscal year ended March 31, 2016. No capital gains distributions are expected to be paid to shareholders until net gains have been realized in excess of such losses. As of March 31, 2016, the pre and post-enactment losses were approximately:
Post-Enactment Losses: | $ | 0 | ||
Pre-Enactment Losses: | ||||
| Expiring March 31, 2018 | $ | 3,133,000 |
Management has analyzed the Fund’s tax positions taken on federal, state and local income tax returns for all open tax years and has concluded that no provision for income tax is required in the Fund’s financial statements for the current reporting period. The Fund’s U.S. federal, state and local income and federal excise tax returns for tax years for which the applicable statutes of limitations have not expired are subject to examination by the U.S. Internal Revenue Service and state departments of revenue.
Note 5. Capital There are 30 million shares of $0.01 par value common stock authorized.
Note 6. Borrowings The Fund currently is a party to a credit facility with a prime broker. Through June 30, 2016, the Fund was a party to a committed credit facility with a bank. The credit facility provides for a maximum commitment of $25,000,000. Interest on any borrowings under the credit facility is at contracted market rates. The Fund’s obligations under the credit facility are secured by the assets of the Fund in an amount equal to twice the amount borrowed under the credit facility. The purpose of the credit facility is to assist the Fund with its general cash flow requirements, including the provision of portfolio leverage.
During the six months ended September 30, 2016, the Fund had no borrowings under either credit facility.
Note 7. New Accounting Pronouncements In January 2016, the FASB issued ASU 2016-01, Financial Instruments — Overall (Subtopic 825-10): Recognition and Measurement of Financial Assets and Financial Liabilities (“ASU 2016-01”). ASU 2016-01 affects accounting for equity investments and financial liabilities where the fair value option has been elected. ASU 2016-01 requires an entity to measure equity investments at fair value through net income. ASU 2016-01 is effective for fiscal years beginning after December 15, 2017. The Fund is currently evaluating the impact on its financial statements.
In May 2015, the FASB issued ASU No. 2015-07 “Disclosure for Investments in Certain Entities that Calculate Net Asset Value (“NAV”) per Share (or Its Equivalent).” The amendments in ASU No. 2015-07 remove the requirement to categorize within the fair value hierarchy investments measured using the NAV practical expedient. The ASU also removes certain disclosure requirements for investments that qualify, but do not utilize, the NAV practical expedient. The amendments in the ASU are effective for fiscal years beginning after December 15, 2015, and interim periods within those fiscal years. Management has evaluated the implications of ASU No. 2015-07 and has determined that there is no impact on the financial statement disclosures.
16
THE ASIA PACIFIC FUND, INC.
Financial Highlights
Per Share Operating Performance: | Six Months | |||||||||||
Year Ended March 31, | ||||||||||||
2016 | 2015 | |||||||||||
Net asset value, beginning of period | $ | 11.25 | $ | 13.07 | $ | 11.50 | ||||||
Net investment income | 0.23 | 0.20 | 0.23 | |||||||||
Net realized and unrealized gain (loss) on investment and foreign currency transactions | 0.84 | (1.51 | ) | 1.34 | ||||||||
Total from investment operations | 1.07 | (1.31 | ) | 1.57 | ||||||||
Less distributions: | — | (0.51 | ) | — | ||||||||
Net asset value, end of period | $ | 12.32 | $ | 11.25 | $ | 13.07 | ||||||
Market value, end of period | $ | 10.57 | $ | 9.61 | $ | 11.61 | ||||||
Total investment return(a): | 9.50 | % | (12.79 | )% | 12.39 | % | ||||||
Ratios to Average Net Assets: | �� | |||||||||||
Total expenses (including loan interest) | 2.12 | %(c)(d) | 2.08 | %(c)(d) | 2.05 | %(b)(c) | ||||||
Net investment income | 4.00 | %(d) | 1.62 | % | 1.83 | % | ||||||
Supplemental Data: | ||||||||||||
Average net assets | $ | 119,505,873 | $ | 130,218,000 | $ | 129,506,000 | ||||||
Portfolio turnover rate | 29 | %(e) | 69 | % | 76 | % | ||||||
Net assets, end of period | $ | 127,428,000 | $ | 116,382,000 | $ | 135,243,000 | ||||||
(a) | Total investment return is calculated assuming a purchase of common stock at the current market value on the first day and a sale at the current market value on the last day of each fiscal year reported. Dividends and distributions, if any, are assumed, for purposes of this calculation, to be reinvested at prices obtained under the Fund’s dividend reinvestment plan. These calculations do not include brokerage commissions. |
(b) | The expense ratios without loan interest expense would have been 2.12% for the six months ended September 30, 2016 and 2.07%, 2.05%, 2.11% and 2.15% for the fiscal years ended March 31, 2016, 2015, 2013 and 2012, respectively. No loan interest was incurred during the fiscal year ended March 31, 2014. |
(c) | Does not include expenses of the underlying funds in which the Fund invests. |
(d) | Annualized. |
(e) | Not annualized. |
Shown above is selected data for a share of common stock outstanding-total investment return, ratios to average net assets and other supplemental data for the periods indicated. This information has been determined based upon information provided in the financial statements and market price data for the Fund’s share of common stock.
See Notes to Financial Statements.
17
THE ASIA PACIFIC FUND, INC.
Financial Highlights
Year Ended March 31, | ||||||||||||
Per Share Operating Performance: | 2014 | 2013 | 2012 | |||||||||
Net asset value, beginning of year | $ | 11.92 | $ | 11.67 | $ | 13.06 | ||||||
Net investment income (loss) | (0.02 | ) | (0.03 | ) | (0.05 | ) | ||||||
Net realized and unrealized gain (loss) on investment and foreign currency transactions | (0.40 | ) | 0.28 | (1.34 | ) | |||||||
Total from investment operations | (0.42 | ) | 0.25 | (1.39 | ) | |||||||
Net asset value, end of year | $ | 11.50 | $ | 11.92 | $ | 11.67 | ||||||
Market value, end of year | $ | 10.33 | $ | 10.76 | $ | 10.58 | ||||||
Total investment return(a): | (4.00 | )% | 1.70 | % | (10.57 | )% | ||||||
Ratios to Average Net Assets: | ||||||||||||
Total expenses (including loan interest)(c) | 2.33 | % | 2.16 | %(b) | 2.15 | %(b) | ||||||
Net investment income (loss) | (0.18 | )% | (0.28 | )% | (0.40 | )% | ||||||
Supplemental Data: | ||||||||||||
Average net assets | $ | 119,204,000 | $ | 117,996,000 | $ | 123,601,000 | ||||||
Portfolio turnover rate | 175 | % | 180 | % | 137 | % | ||||||
Net assets, end of year | $ | 118,991,000 | $ | 123,269,000 | $ | 120,715,000 | ||||||
(a) | Total investment return is calculated assuming a purchase of common stock at the current market value on the first day and a sale at the current market value on the last day of each fiscal period reported. Dividends and distributions, if any, are assumed, for purposes of this calculation, to be reinvested at prices obtained under the Fund’s dividend reinvestment plan. These calculations do not include brokerage commissions. Total returns for periods less than one full year are not annualized. |
(b) | The expense ratios without loan interest expense would have been 2.12% for the six months ended September 30, 2016 and 2.07%, 2.05%, 2.11% and 2.15% and fiscal years ended March 31, 2016, 2015, 2013 and 2012, respectively. No loan interest was incurred during the fiscal year ended March 31, 2014. |
(c) | Does not include expenses of the underlying funds in which the Fund invests. |
(d) | Annualized. |
(e) | Not annualized. |
Shown above is selected data for a share of common stock outstanding-total investment return, ratios to average net assets and other supplemental data for the periods indicated. This information has been determined based upon information provided in the financial statements and market price data for the Fund’s share of common stock.
See Notes to Financial Statements.
18
Board of Directors Approval of Continuance of Investment Management Agreement
with Value Partners (Hong Kong) Limited (Unaudited)
At a meeting held on May 13, 2016, the Board of Directors of the Fund (the “Board”), including a majority of the disinterested directors (the “Directors”), approved the continuance of the investment management agreement (the “Investment Management Agreement”), effective as of October 1, 2013, between the Fund and Value Partners (Hong Kong) Limited (the “Investment Manager”). Prior to acting on the continuance of the Investment Management Agreement, the Directors considered the factors discussed below.
Factors Considered by the Board
Prior to approval of the continuance of the Investment Management Agreement, the Directors had evaluated information provided by the Investment Manager. They reviewed the Investment Management Agreement with the Investment Manager and with experienced Fund counsel, who are independent of the Investment Manager and who advised on the relevant legal standards.
Based on their experience gained as Fund Directors, the Directors considered their knowledge of the nature and quality of the services provided by the Investment Manager to the Fund and their overall confidence in the Investment Manager’s integrity and competence. The Directors noted that they receive presentations at regular Board meetings from the Investment Manager on the investment results of the Fund and review extensive materials and information provided by the Investment Manager.
The Directors also considered all other factors they believed relevant, including the specific matters described below. In their deliberations, the Directors did not identify any particular information that was all-important or controlling, and each Director attributed different weights to the various factors.
The Directors determined that the selection of the Investment Manager to manage the Fund and the overall arrangements between the Fund and the Investment Manager, including the investment management fee, as provided in the Investment Management Agreement, were fair and reasonable in light of the services performed, expenses incurred and such other matters as the Directors considered relevant in the exercise of their reasonable judgment.
The material factors and conclusions that formed the basis for the Directors’ determinations include the following:
Nature, extent and quality of services provided by the Investment Manager
The Directors considered the scope and quality of services provided by the Investment Manager under the Investment Management Agreement, including the quality of the investment research capabilities of the Investment Manager and the other resources it has dedicated to performing services for the Fund. They noted the professional experience of the Fund’s portfolio management team and other senior personnel of the Investment Manager. The Directors concluded that they were satisfied with the nature, extent and quality of services provided to the Fund under the Investment Management Agreement.
Costs of Services Provided and Profitability
The Directors reviewed a memorandum of the Investment Manager that included the expenses and assets under management for 2015 and the estimated profitability of the Investment Management Agreement to the Investment Manager for 2015. The Directors reviewed the assumptions and methods of allocation of estimated costs of managing the Fund in 2015 and in preparing Fund-specific profitability data as set forth in the memorandum.
The Directors recognized that it is difficult to make comparisons of profitability from fund advisory contracts because comparative information is not generally publicly available and is affected by numerous factors. The Directors focused on profitability of the Investment Manager’s relationship with the Fund before taxes. The Directors concluded that they were satisfied that the Investment Manager’s level of profitability from its relationship with the Fund was not unreasonable.
19
Fall-Out Benefits
The Directors considered the benefits to the Investment Manager from its relationship with the Fund other than fees payable under the Investment Management Agreement. They considered the Investment Manager’s representation that it did not engage in any traditional soft dollar arrangements whereby it would receive brokerage and research services from brokers and dealers that execute purchases and sales of securities on behalf of its clients, including the Fund, on an agency basis. The Directors believe that the Investment Manager may derive reputational and other benefits from its association with the Fund.
Investment Results
The Board placed significant emphasis on the investment performance of the Fund in view of its importance to shareholders. The Directors considered the investment results of the Fund as compared to other funds investing in Asia Pacific countries ex-Japan as provided by Morningstar, Inc. (the “Morningstar Universe”) and as compared to the MSCI All Countries Combined Asia Ex-Japan Gross Index (the “Index”). The Directors reviewed information showing performance of the Fund as compared to the Index and to funds in the Morningstar Universe over the one-year period ending September 30, 2015, the two and one-half year period ended March 31, 2016 and the six-month period ended March 31, 2016. The Directors noted that the Fund’s net asset value performance had been higher than that of the Index for the one-year and two and one-half year periods and lower, for the six-month period, and that the performance of the Fund also was better than the other funds in the Morningstar Universe for the two longer periods and lower for the six-month period. The Directors noted their concern about the Fund’s lower comparative performance for the six-month period ended March 31, 2016 but considered that the Fund’s overall investment performance was satisfactory.
Advisory Fees
The Directors considered the advisory fee rate paid by the Fund to the Investment Manager and information prepared by Lipper, Inc. and Morningstar, Inc. concerning fee rates paid by other funds in the same category as the Fund, that is, “Pacific Ex Japan Funds.” The Directors recognized that it is difficult to make comparisons of advisory fees because there are variations in the services that are included in the fees paid by other funds. Nonetheless, the Directors noted that the Fund’s advisory fee as a percentage of average net assets was lower than the advisory fees of the comparable funds provided by Morningstar, Inc. The Directors also considered that the investment advisory fees that the Investment Manager charges the only other investment company it manages with investment policies similar to the funds were higher than the Fund’s and that the fee charged by the Investment Manager as sub-advisor to a U.S. registered fund with similar investment policies was lower than the Fund’s. The Investment Manager represented that it does not advise any separate accounts with investment policies similar to the Fund’s. After taking this comparative information into account and discussing with the Investment Manager its intention to closely monitor the investment advisory fees of the Fund as compared with other funds and accounts managed by the Investment Manager in the future, the Board determined that no management change was warranted at this time.
Economies of Scale
The Directors considered that the Fund is a closed-end fund and that it was not expected to have meaningful asset growth absent a rights offering or an acquisition. In such circumstances, they did not view the potential for realization of economies of scale as the Fund’s assets grow to be a meaningful factor in their deliberations. The Directors noted, however, that the advisory fee schedule for the Fund contains a breakpoint at $100 million so that, when assets exceed the breakpoint, the fee rate is reduced from 1.00% to .70% on the incremental assets. The Directors concluded that the Fund’s breakpoint arrangements established a reasonable basis for realizing economies of scale should they exist.
20
Supplemental Proxy Information (Unaudited)
An Annual Meeting of Stockholders was held on August 17, 2016. At such meeting the stockholders elected the two of the three Class III Directors. Nicholas T. Sibley did not receive the required majority vote. Effective August 17, 2016, Mr. Sibley resigned from the Board of Directors. The Board has been reduced to seven members.
1) | Election of Class III Directors: |
Affirmative votes cast | Shares Withheld | |
Robert F. Gunia | 7,300,448 | 1,608,261 |
Nicholas T. Sibley | 2,556,861 | 6,351,848 |
Christopher Sykes | 7,245,207 | 1,663,502 |
21
Privacy Notice (Unaudited)
FACTS | WHAT DOES THE ASIA PACIFIC FUND, INC. (“APB”) | ||
Why? | Financial companies choose how they share your personal information. Federal law gives consumers the right to limit some but not all sharing. Federal law also requires us to tell you how we collect, share, and protect your personal information. Please read this notice carefully to understand what we do. | ||
What? | The types of personal information we collect and share depend on the product or service you have with us. This information can include: ● Social Security number ● account balances ● account transactions ● transaction history ● wire transfer instructions ● checking account information Contact information such as mailing address, e-mail address, and telephone number When you are no longer our customer, we continue to share your information as described in this notice. | ||
How? | All financial companies need to share customers’ personal information to run their everyday business. In the section below, we list the reasons financial companies can share their customers ‘ personal information; the reasons APB chooses to share; and whether you can limit this sharing. | ||
Reasons we can share your personal information | Does APB share? | Can you limit this sharing? | |
For our everyday business purposes – such as to process your transactions, maintain your account(s), respond to court orders and legal investigations, or report to credit bureaus | Yes | No | |
For our marketing purposes – to offer our products and services to you | No | We don’t share | |
For joint marketing with other financial companies | No | We don’t share | |
For our affiliates’ everyday business purposes – information about your transactions and experiences | Yes | No | |
For our affiliates’ everyday business purposes – information about your creditworthiness | No | We don’t share | |
For nonaffiliates to market to you | No | We don’t share | |
Questions? | Call 888-4-ASIA-PAC or 1-888-427-4272 | ||
22
Privacy Notice (Unaudited)
Who we are | |
Who is providing this notice? | The Asia Pacific Fund, Inc. (“APB”) |
What we do | |
How does APB protect my personal information? | To protect your personal information from unauthorized access and use, we use security measures that comply with federal law. These measures include computer safeguards and secured files and buildings. |
How does APB collect my personal information? | We collect your personal information, for example, when you ● open an account ● provide account information ● give us your contact information ● make a wire transfer ● tell us where to send the money We also collect your personal information from others, such as affiliates, or other companies. |
Why can’t I limit all sharing? | Federal law gives you the right to limit only ● sharing for affiliates’ everyday business purposes – information about your creditworthiness ● affiliates from using your information to market to you ● sharing for nonaffiliates to market to you State laws and individual companies may give you additional rights to limit sharing. |
Definitions | |
Affiliates | Companies related by common ownership or control. They can be financial and nonfinancial companies. ● None |
Nonaffiliates | Companies not related by common ownership or control. They can be financial and nonfinancial companies. ● APB does not share with nonaffiliates, so they can market to you. |
Joint marketing | A formal agreement between nonaffiliated financial companies that together market financial products or services to you. ● APB does not jointly market. |
23
Dividend Reinvestment Plan (Unaudited)
Shareholders may elect to have all distributions of dividends and capital gains automatically re-invested in Fund shares (“Shares”) pursuant to the Fund’s Dividend Reinvestment Plan (“the Plan”). Shareholders who do not participate in the Plan will receive all distributions in cash paid by check in United States Dollars mailed directly to the shareholders of record (or if the shares are held in street or other nominee name, then to the nominee) by the custodian, as dividend disbursing agent. Shareholders who wish to participate in the Plan should complete the attached enrollment card or contact the Fund at 1-(800) 937-5449.
After the Fund declares a dividend or determines to make a capital gains distribution, if (1) the market price is lower than net asset value, the participants in the Plan will receive the equivalent in Shares valued at the market price determined as of the time of purchase (generally, following the payment date of the dividend or distribution); or if (2) the market price of Shares on the payment date of the dividend or distribution is equal to or exceeds their net asset value, participants will be issued Shares at the higher of net asset value or 95% of the market price.
There is no charge to participants for reinvesting dividends or capital gain distributions, except for certain brokerage commissions, as described below. Effective on or about December 9, 2016, the Plan Agent will be American Stock Transfer & Trust Co., LLC. The Plan Agent’s fees for the handling of the reinvestment of dividends and distributions will be paid by the Fund. There will be no brokerage commissions charged with respect to shares issued directly by the Fund. However, each participant will pay a pro rata share of brokerage commissions incurred with respect to the Plan Agent’s open market purchases in connection with the reinvestment of dividends and distributions. The automatic reinvestment of dividends and distributions will not relieve participants of any federal income tax that may be payable on such dividends or distributions.
The Fund reserves the right to amend or terminate the Plan upon 90 days’ written notice to shareholders of the Fund.
Participants in the Plan may withdraw from the Plan upon written notice to the Plan Agent and will receive certificates for whole Shares and cash for fractional Shares.
24
25
| Item 2 | – | Code of Ethics – Not required, as this is not an annual filing. | ||||
| Item 3 | – | Audit Committee Financial Expert – Not required, as this is not an annual filing. | ||||
| Item 4 | – | Principal Accountant Fees and Services – Not required, as this is not an annual filing. | ||||
| Item 5 | – | Audit Committee of Listed Registrants – Not required, as this is not an annual filing. | ||||
| Item 6 | – | Schedule of Investments – The schedule is included as part of the report to shareholders filed under Item 1 of this Form. | ||||
| Item 7 | – | Disclosure of Proxy Voting Policies and Procedures for Closed-End Management Investment Companies – Not required, as this is not an annual filing. | ||||
| Item 8 | – | Portfolio Managers of Closed-End Management Investment Companies – Not required, as this is not an annual filing. | ||||
| Item 9 | – | Purchases of Equity Securities by Closed-End Management Investment Company and Affiliated Purchasers – There were no purchases made by or on behalf of the registrant or any “affiliated purchaser,” as defined in Rule 10b-18(a) (3) under the Securities Exchange Act of 1934, as amended, of shares of the registrant’s equity securities made in the period covered by this report. | ||||
| Item 10 | – | Submission of Matters to a Vote of Security Holders – Not applicable. | ||||
| Item 11 | – | Controls and Procedures | ||||
| (a) | It is the conclusion of the registrant’s principal executive officer and principal financial officer that the effectiveness of the registrant’s current disclosure controls and procedures (such disclosure controls and procedures having been evaluated within 90 days of the date of this filing) provide reasonable assurance that the information required to be disclosed by the registrant has been recorded, processed, summarized and reported within the time period specified in the Commission’s rules and forms and that the information required to be disclosed by the registrant has been accumulated and communicated to the registrant’s principal executive officer and principal financial officer in order to allow timely decisions regarding required disclosure. | |||||
| (b) | There has been no significant change in the registrant’s internal control over financial reporting that occurred during the registrant’s most recent fiscal quarter of the period covered by this report that has materially affected, or is likely to materially affect, the registrant’s internal control over financial reporting. | |||||
| Item 12 | – | Exhibits | ||||
| (a) | (1) Code of Ethics – Not required, as this is not an annual filing. | |||||
| (2) Certifications pursuant to Section 302 of the Sarbanes-Oxley Act – Attached hereto as Exhibit EX-99.CERT. | ||||||
| (3) Any written solicitation to purchase securities under Rule 23c-1. – Not applicable. | ||||||
| (b) | Certifications pursuant to Section 906 of the Sarbanes-Oxley Act – Attached hereto as Exhibit EX-99.906CERT. | |||||
(Registrant) | The Asia Pacific Fund, Inc. | |
| By (Signature and Title)* | /s/ Hoyt M. Peters | |
| Hoyt M Peters | ||
| Secretary | ||
Date | November 21, 2016 |
| By (Signature and Title)* | /s/ Raymond Tam | |
| Raymond Tam | ||
| President and Principal Executive Officer | ||
Date | November 21, 2016 | |
| By (Signature and Title)* | /s/ Frank J. Maresca | |
| Frank J. Maresca | ||
| Treasurer and Principal Financial Officer | ||
Date | November 21, 2016 |
* | Print the name and title of each signing officer under his or her signature. |