UNITED STATES
SECURITIES AND EXCHANGE COMMISSION
Washington, D.C. 20549
FORM N-CSR
CERTIFIED SHAREHOLDER REPORT OF REGISTERED MANAGEMENT
INVESTMENT COMPANIES
| | |
| Investment Company Act file number: | | 811-04710 |
| |
| Exact name of registrant as specified in charter: | | The Asia Pacific Fund, Inc. |
| |
| Address of principal executive offices: | | 655 Broad Street, 17th Floor Newark, New Jersey 07102 |
| |
| Name and address of agent for service: | | Deborah A. Docs 655 Broad Street, 17th Floor Newark, New Jersey 07102 |
| |
| Registrant’s telephone number, including area code: | | 973-367-7521 |
| |
| Date of fiscal year end: | | 3/31/2016 |
| |
| Date of reporting period: | | 9/30/2015 |
Item 1 – Reports to Stockholders
Directors
Michael J. Downey, Chairman
Jessica M. Bibliowicz
Robert F. Gunia
Duncan M. McFarland
David G. P. Scholfield
Nicholas T. Sibley
Christopher Sykes
William G. Tung
Officers
Raymond Tam, President
M. Sadiq Peshimam, Treasurer and Chief Financial Officer
Elyse M. McLaughlin, Assistant Treasurer
Deborah A. Docs, Secretary and Chief Legal Officer
Andrew R. French, Assistant Secretary
Valerie M. Simpson, Chief Compliance Officer
Theresa C. Thompson, Deputy Chief Compliance Officer
Investment Manager
Value Partners Hong Kong Limited
9th Floor, Nexxus Building
41 Connaught Road Central
Hong Kong
Administrator
Prudential Investments LLC
655 Broad Street, 17th Floor
Newark, NJ 07102
Custodian
The Bank of New York Mellon
One Wall Street
New York, NY 10286
Transfer Agent
Computershare Trust Company N.A.
P.O. Box 43011
Providence, RI 02940-3011
Independent Registered Public Accounting Firm
KPMG LLP
345 Park Avenue
New York, NY 10154
Legal Counsel
Sullivan & Cromwell LLP
125 Broad Street
New York, New York 10004
Notice is hereby given in accordance with Section 23(c) of the Investment Company Act of 1940 that The Asia Pacific Fund, Inc. (the “Fund”) may purchase, from time to time, shares of its common stock at market prices.
The accompanying financial statements as of September 30, 2015 were not audited and, accordingly, no opinion is expressed on them.
This report, including the financial statements herein, is transmitted to the shareholders of the Fund for their information. This is not a prospectus, circular or representation intended for use in the purchase of shares of the Fund or any securities mentioned in this report.
The Asia Pacific Fund, Inc.
655 Broad Street, 17th Floor
Newark, NJ 07102
For general information on the Fund, please call (toll-free) Pristine Advisers, our shareholders’ servicing agent toll-free at:
1-(888) 4-ASIA-PAC
Current information about the Fund is available on its website (http://www.asiapacificfund.com). This website includes monthly updates of the Fund’s performance and other data as well as the Manager’s quarterly presentation of performance and asset allocations and comments on the current Asian outlook.
The Fund’s CUSIP number is 044901106
APBS

The Asia Pacific
Fund, Inc.
Semi-Annual Report
September 30, 2015
www.asiapacificfund.com
The Asia Pacific Fund, Inc.
As of September 30, 2015 (Unaudited)
OUR TOLL-FREE LINE:
1-888-4-ASIA-PAC
For further information on the Fund, please call. In addition, the Fund makes available monthly certain portfolio information. If you would like to receive this information please call the toll-free number indicated above.
Statistics
| | | | |
Total Net Assets | | | $123,269,010 | |
Shares Outstanding | | | 10,344,073 | |
Net Asset Value | | | $11.92 | |
Equity | | | 96.8%(a) | |
Total Return Performance (US Dollar terms)
(As of September 30, 2015)
| | | | | | | | |
| Period | | Market
Price(b) | | | NAV(c) | |
3 months | | | -19.5% | | | | -18.6% | |
6 months | | | -11.3% | | | | -8.8% | |
1 Year | | | -8.7% | | | | -4.9% | |
3 Years (d) | | | 0.1% | | | | 1.2% | |
5 Years (d) | | | -1.3% | | | | -0.3% | |
10 Years (d) | | | 6.6% | | | | 7.1% | |
Other Information
| | | | |
Ticker Symbol | | | APB | |
Primary Exchange | | | NYSE | |
Dividend Repurchase Program | | | Yes | |
Portfolio Characteristics
(As of September 30, 2015)
Top Ten Equity Holdings
(% of Total Net Assets)
| | | | |
China Vanke Co. Ltd. (Class “H” Shares) | | | 3.5% | |
Bank of China Ltd. (Class “H” Shares) | | | 3.1% | |
China Life Insurance Co. Ltd. (Class “H” Shares) | | | 2.9% | |
China Construction Bank Corp. (Class “H” Shares) | | | 2.9% | |
Amorepacific Corp. (Preference Shares) | | | 2.6% | |
China Resources Power Holdings Co. Ltd. | | | 2.4% | |
China Power International Development Ltd. | | | 2.2% | |
Samsung Fire & Marine Insurance Co. Ltd. (Preference Shares) | | | 2.2% | |
SK Telecom Co. Ltd. | | | 2.1% | |
Samsung Electronics Corp. (Preference Shares) | | | 2.1% | |
Sector Breakdown: Top Ten Industries
(% of Total Net Assets)
| | | | |
Real Estate-Developers | | | 17.4% | |
Industrials | | | 14.7% | |
Consumer Discretionary | | | 14.4% | |
Banking | | | 13.0% | |
Consumer Staples | | | 5.5% | |
Insurance | | | 5.5% | |
Utilities | | | 4.6% | |
Telecommunication Services | | | 4.6% | |
Semiconductors & Semiconductor Equipment | | | 4.3% | |
Energy | | | 3.1% | |
Footnote section
| (a) | Expressed as a percentage of total investments. |
| (b) | Total investment return is calculated assuming a purchase of common stock at the current market value on the first day and a sale at the current market value on the last day of each period reported. Dividends and distributions are assumed, for purposes of this calculation, to be reinvested at prices obtained under the Fund’s dividend reinvestment plan. These calculations do not include brokerage commissions. |
| (c) | This information represents the historical net asset value (NAV) per share performance of the Fund. NAV per share performance is calculated assuming reinvestment of dividends and distributions. Because NAV per share performance does not reflect market price, it is not the same as total investment return. |
| (d) | Average annual return. |
1
REPORT OF THE INVESTMENT MANAGER
For the period from March 31, 2015 to September 30, 2015 (Unaudited)
During the six-month period ended September 30, 2015, the Fund’s net asset value (NAV) per share decreased by $1.15, from $13.07 to $11.92. In percentage terms, the Fund’s NAV total return was down by 8.8%. This compares with a decrease of 16.4% for its benchmark index, the MSCI All Countries (AC) Asia Ex-Japan Gross Index. The Fund’s share price was down by 11.3% over the period, from $11.61 to $10.30.
The chart below illustrates the Fund’s net asset value performance per share during the period:
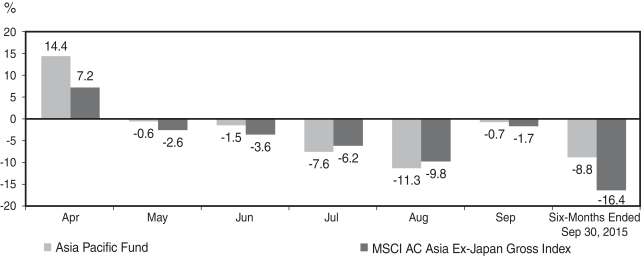
Source: Bloomberg and MSCI. Fund returns are based on the NAV. NAV total return reflects the reinvestment of all dividends and distributions, if any, at NAV. Returns are shown in USD.
Local Currencies versus the US Dollar
| | | | | | | | | | | | |
Currency US$/Local rate | | Mar 31
2015 | | | Sep 30
2015 | | | Mar 31, 2015 to
Sep 30, 2015
Change % | |
North Asia | | | | | | | | | | | | |
Chinese Renminbi | | | 6.20 | | | | 6.36 | | | | -2.5 | |
Hong Kong Dollar | | | 7.75 | | | | 7.75 | | | | 0.0 | |
South Korean Won | | | 1,109 | | | | 1,185 | | | | -6.4 | |
New Taiwan Dollar | | | 31.29 | | | | 32.93 | | | | -5.0 | |
ASEAN | | | | | | | | | | | | |
Thai Baht | | | 32.54 | | | | 36.30 | | | | -10.3 | |
Malaysian Ringgit | | | 3.70 | | | | 4.40 | | | | -15.7 | |
Philippines Peso | | | 44.70 | | | | 46.74 | | | | -4.4 | |
Singaporean Dollar | | | 1.37 | | | | 1.42 | | | | -3.5 | |
Indonesian Rupiah | | | 13,075 | | | | 14,650 | | | | -10.8 | |
South Asia | | | | | | | | | | | | |
Sri Lankan Rupee | | | 133.18 | | | | 141.30 | | | | -5.8 | |
Indian Rupee | | | 62.58 | | | | 65.64 | | | | -4.7 | |
Vietnamese Dong | | | 21,555 | | | | 22,478 | | | | -4.1 | |
Source: Morningstar (Value Partners)
STOCK MARKET PERFORMANCE
March 31 to September 30, 2015
| | | | | | | | |
Country - Index | | Market Change %
Local currency terms | | | Market Change %
US$ terms | |
North Asia | | | | | | | | |
MSCI Hong Kong | | | -11.5 | | | | -11.5 | |
MSCI Taiwan | | | -11.0 | | | | -15.4 | |
MSCI Korea | | | -9.3 | | | | -15.1 | |
MSCI China | | | -17.9 | | | | -17.9 | |
ASEAN | | | | | | | | |
MSCI Singapore | | | -16.6 | | | | -19.5 | |
MSCI Malaysia | | | -10.6 | | | | -24.7 | |
MSCI Thailand | | | -11.0 | | | | -20.2 | |
MSCI Indonesia | | | -26.8 | | | | -34.7 | |
MSCI Philippines | | | -10.6 | | | | -14.5 | |
South Asia | | | | | | | | |
MSCI Sri Lanka | | | -1.8 | | | | -7.4 | |
MSCI India | | | -5.7 | | | | -10.1 | |
MSCI Vietnam | | | 1.2 | | | | -3.0 | |
MSCI AC Asia
Ex-Japan Gross | | | -13.2 | | | | -16.4 | |
Source: Morningstar (Value Partners)
2
COUNTRY ALLOCATION*
| | | | | | | | | | | | |
Country | | Mar 31, 2015
% | | | Jun 30, 2015
% | | | Sep 30, 2015
% | |
North Asia | | | 85.3 | | | | 90.5 | | | | 80.9 | |
Hong Kong/China/Macau | | | 61.5 | | | | 65.9 | | | | 62.2 | |
South Korea | | | 21.6 | | | | 21.6 | | | | 15.5 | |
Taiwan | | | 2.2 | | | | 3.0 | | | | 3.2 | |
ASEAN | | | 10.5 | | | | 11.8 | | | | 11.1 | |
Singapore | | | 5.0 | | | | 4.8 | | | | 5.1 | |
Thailand | | | 3.2 | | | | 4.0 | | | | 3.5 | |
Indonesia | | | 0.5 | | | | 0.8 | | | | 0.4 | |
Malaysia | | | 1.8 | | | | 2.0 | | | | 1.3 | |
Philippines | | | 0.0 | ** | | | 0.2 | | | | 0.8 | |
Cash & Other | | | 4.2 | | | | -2.3 | | | | 8.0 | |
Source: Morningstar (Value Partners)
* Rounded up to the nearest tenth of one percent. Expressed as a percentage of net assets.
** Less than 0.05%.
MARKET REVIEW
The review period was a volatile time for Asian equities as stocks, particularly Chinese equities, experienced a rollercoaster ride since April 2015.
China-related stockmarkets rallied in the second quarter of 2015 and reached a multi-year high in mid-June. The sharp rally was supported by continuous policy easing as the People’s Bank of China (PBoC) cut the reserve requirement ratio by 100 basis points on April 10 followed by a 25-basis-point interest rate cut on May 10. The State Council also announced plans to adjust tax policy to stimulate local consumption and asked banks to continue lending to local government financing vehicles for projects under construction.
With the rapid and sharp rally, valuations of many A-share stocks had become over-stretched. By mid-June, the Shanghai Composite Index had surged 152% since July 2014 and climbed 60% since the beginning of 2015. Meanwhile, the Shenzhen Stock Exchange’s Small and Medium Enterprise Board had risen by 138% from early 2015 to mid-June. With the China Securities Regulatory Commission’s tightening margin financing in late June, Chinese retail investors, who had been dominating the stockmarket and sitting on huge paper gains, rushed to cash in their positions. This unwound the bubbles created by the flow of hot money and led to a major correction in the Chinese stockmarket.
Having seen the slump in the domestic stockmarket, the Chinese government announced a series of stabilization measures in early July, such as reducing share transaction costs by 30%, abolishing mandatory levels for margin calls, expanding financing channels for brokers, suspending new initial public offerings, having 21 brokers pledged to buy blue-chip stocks, providing liquidity support to the China Securities Finance Corporation by the central bank to stabilize the market, as well as requesting state-owned enterprises not to sell their stakes and encouraging them to increase holdings, etc. Whether the government measures can work will crucially depend on the ongoing number of A-share suspensions, general confidence in the A-share market, and a structural improvement in economic data.
On the economic front, China’s economic data continued to slow during the third quarter. Industrial production was sluggish as value-added industrial output grew 6.0% year-on-year in July, slowing from a 6.8% increase in June. Exports were also weak in the past few months and property investment was yet to pick up. As a result, fixed asset investment growth slowed to 10.3% year-on-year in July from 11.4% in June. The Caixin China manufacturing purchasing managers’ index also slipped to 47.3 in August, the weakest reading since March 2009, from 47.8 in July.
On the other hand, China’s central bank, the “PBoC”, suddenly announced on August 11 a change to the central parity setting of its onshore currency CNY, instantly leading to an approximately 3% depreciation of the RMB against the USD. This will make China’s exchange rate more market-oriented and align with its aim to have its currency being included in the special drawing rights basket of the International Monetary Fund. Nevertheless, this move triggered investors’ worries on both global growth outlook and a potential currency war, creating a shockwave and hitting global equity markets.
Elsewhere in the region, South Korean stocks consolidated in May and June after enjoying a rally in April. Nevertheless, an outbreak of the Middle East Respiratory Syndrome since late May dampened economic growth temporarily as foreign tourists canceled their trips and consumers stayed home. As a pre-emptive action, the Bank of Korea cut its
3
benchmark rate on June 11 by 25 basis points to a record low of 1.5%. The Korean government also announced a 22 trillion won package to revitalize the economy. Entering into the third quarter, South Korean equities fell in tandem with other markets but recovered some of the loss in late August and September. The fear of China’s slowdown has been reflected in Korea’s exports, which saw the sharpest drop in six years and plunged 14.7% in August from a year earlier. In the face of the economic slowdown in China, South Korea’s Finance Minister Choi Kyung-hwan said the government will lower its economic growth forecast for 2016 from 3.5% to 3.3%.
The Taiwanese stockmarket dropped slightly in the second quarter before a sharp decline through July and most of August. Concerns on global demand weakness and the weak stockmarket performance in Hong Kong and China continued to weigh on Taiwan’s market sentiment. In its latest forecast, the Taiwanese government cut its full-year GDP growth forecast for 2015 to 1.56% from its May estimate of 3.28%. With the stockmarket tumbling to its multi-month lows on August 24, the government announced a series of measures including restrictions on short selling, encouraging listed companies to buy back treasury shares as well as using the National Financial Stabilization Fund to buy stocks. Thanks to the supportive measures as well as the U.S. Federal Reserve’s decision to keep rates on hold in its September meeting, Taiwan’s stockmarket saw a decent rebound in late August and the first half of September, recouping part of its earlier losses.
ASEAN equities corrected sharply along with other Asian markets. The Indonesian stockmarket saw a significant loss in the second quarter as the Indonesian rupiah became one of the worst performing currencies across the region against the US dollar. To stop the rupiah from free falling, the Central Bank of Indonesia announced in April a ban, effective from July 1, 2015, on the use of the US dollar and other foreign currencies in all financial transactions in the country. Thai stocks also continued to drift down on external factors as well as internal pressure created by a bomb explosion in the heart of Bangkok in August. With domestic activity still weak and non-resident spending being an important
contributor to demand over the past few quarters, the tragic event is expected to add extra uncertainty to the growth picture of Thailand in coming months.
STRATEGY AND PORTFOLIO REVIEW
While the portfolio was not spared from the wrath of the market, the high quality of our positions continued to demonstrate resilience amid market volatility. Meanwhile, Asian currency depreciation has minimal impact on the Fund. Year-to-date as of September 30, 2015, the Fund’s NAV declined 5.02% while the MSCI AC Asia ex-Japan Gross Index (the “Index”) fell 12.30%. During the review period, the Fund’s NAV was down 8.80%. For reference, the Index slumped 16.40% in the same period.
While no particular sector or geographical region contributed positively to the Fund’s performance during the period, some of our stock picks in the Korean stockmarket supported the Fund’s performance. In particular, various Korean consumption names, including selected convenience store and supermarket operators made contributions to the Fund’s return. Meanwhile, the portfolio had limited exposure to A-share names however, which had helped to limit the downside risk from the A-share pullback.
In terms of investment approach, we remained focused on Asia ex-Japan equities that generate strong cash flow and offer high dividend yields. Given the uncertain short-term outlook for global stockmarkets, we adopted a more defensive stance and kept cash at a higher-than-normal level.
Across Asia, we added selectively to high quality companies with attractive dividend yields as well as some Hong Kong stocks which demonstrated defensiveness in a volatile market. We increased our position in a Hong Kong telecom company that is well-positioned to benefit from the rationalization of pricing as well as lower competitive intensity in the mobile market given its diversified customer profile and improving pricing power.
In China, we added to our stake in a Chinese power cable manufacturer and participated in its recent rights issue. The State Grid’s investment in the power network in China and the government’s higher spending in infrastructure and renewable energy will further benefit the company that is already seeing its
4
production facilities running at full capacity. We also increased our exposure in a Chinese insurer that reported a strong set of first half 2015 results. The company’s business momentum continued to remain strong, with the value of new business up 39% in the first half of 2015, versus 9% in 2014 and 2% in 2013. Its solvency position also improved further to 309% from 294% at end-2014 and 226% at end-2013. In addition, we added to our position in a Chinese television and audio-visual product manufacturer. The company has a 27% market share and has continued to generate profits from hardware sales even in a more challenging environment.
Elsewhere in the region, we continued to look for bottom-up opportunities as valuations have become more attractive. We increased exposures to selected resilient Thai and Singaporean stocks that have stable businesses and predictable earnings.
To make room for our additions, we took profit from some of our exposure in Korea. We also reduced our stake in a Chinese home appliance company and a Singapore-listed Asia-Pacific retail business trust with a portfolio located in Japan.
OUTLOOK
From a global perspective, we believe a low-rate environment will continue and to benefit our high-dividend investment strategy. Although the US Federal Reserve may start hiking interest rates this year, the move is expected to be gradual given the mixed US economic data and uncertainties in the global economy. Meanwhile, Japan’s quantitative and qualitative easing policies and the European Central Bank’s bond-buying program also help to keep liquidity abundant and interest rates low. With China’s fifth interest rate cut in less than a year and interest rate cuts across Asia (such as in Korea, Indonesia, India and Thailand), we believe Asian policy makers will continue to adopt looser monetary policies in face of slowing growth and low inflation.
The short-term macro outlook remains volatile as we are facing the risk of a global growth slowdown. Since 2008, China contributed to a third of global economic growth annually (the US contributed 17%). Now that Chinese economic growth is moderating, investors are uncertain where the
growth engine will come from. We expect low growth rates from developed countries despite years of almost zero interest rates, while developing countries are facing headwinds from falling commodities prices due to reduced Chinese purchases and a strengthening U.S. dollar.
While we are worried about global growth, we believe China is better positioned than many other countries to handle market volatility. Among the major economies, China is one of the few that has sufficient monetary resources and political willpower to conduct economic stimulus. We remain optimistic that the Chinese economy can grow at a rate of around 6.5% this year. After the recent correction, the Chinese market is massively oversold with many stocks trading near their troughs in 2008. Over the long term, we remain positive on the Chinese equity market as the on-going reforms remain intact under the leadership of President Xi Jinping, who gained support from US President Obama for the inclusion of the RMB in the International Monetary Fund’s special drawing rights basket of reserve currencies during his recent visit to the US. In our view, this will help stabilizing the RMB and hence, fund flows.
In Korea, while the economic growth is not particularly strong, we are more focused on the improving dividend outlook of Korean corporations after favorable policies were implemented by the government in late 2014 and earlier this year to encourage better corporate governance and higher pay-out levels by Korean chaebols. In the medium to long term, we believe improving dividend yield and lowered policy rate will continue to be the most important catalysts in the Korean stockmarket.
On the other hand, we remain cautious on the ASEAN markets. The ongoing strength of the US dollar will likely pose additional headwinds and impact on the more leveraged ASEAN economies, particularly countries that are highly reliant on commodity exports. As such, we are maintaining a lower exposure to Malaysia and Indonesia which continue to face risks of capital flight.
5
Value Partners Hong Kong Limited
October 21, 2015
Past performance does not guarantee future results and current performance may be lower or higher than the past performance data quoted. The investment return and principal value will fluctuate, and share, when sold, may be worth more or less than the original cost. Index returns do not include the effect of any sales charges, fund operating expenses or taxes. An investment cannot be made directly in an index.
The views expressed are the views of Value Partners Hong Kong Limited (“VPHK”) only and are subject to change based on market and other conditions. The information provided does not constitute investment advice and it should not be relied on as such. All material has been obtained from sources believed to be reliable, but its accuracy is not guaranteed. This material contains certain statements that may be deemed forward-looking statements. Please note that any such statements are not guarantees of any future performance and actual results or developments may differ materially from those projected.
Unless specified, all information contained on the pages is quoted as at September 30, 2015. This document is prepared by VPHK for information purposes only. It does not constitute a prospectus, an offer or an invitation to subscribe any securities, or a recommendation in relation to any securities. This document should not be copied or distributed to third parties without the written consent of Value Partners Hong Kong Limited. The Fund is not authorized by the Hong Kong Securities and Futures Commission (“SFC”) and therefore shares of the Fund are not available to retail investors in Hong Kong. This document has not been reviewed by the SFC. Issuer : Value Partners Hong Kong Limited.
6
THE ASIA PACIFIC FUND, INC.
Portfolio of Investments
as of September 30, 2015
(Unaudited)
| | | | | | | | |
| Shares | | | Description | | Value
(Note 1) | |
| | | | LONG-TERM INVESTMENTS—92.0% | |
| | | | COMMON STOCKS—78.2% | |
| | | | CHINA (INCLUDING HONG KONG AND MACAU SAR)—58.0% | |
| | 5,903,000 | | | Agricultural Bank of China Ltd. (Class “H” Shares) | | $ | 2,241,926 | |
| | | | (Banking) | | | | |
| | 180,000 | | | Anhui Conch Cement Co. Ltd. (Class “H” Shares) | | | 532,170 | |
| | | | (Materials) | | | | |
| | 1,963,000 | | | BAIC Motor Corp. Ltd.
(Class “H” Shares) | | | 1,726,453 | |
| | | | (Consumer Discretionary) | | | | |
| | 8,835,000 | | | Bank of China Ltd.
(Class “H” Shares) | | | 3,809,942 | |
| | | | (Banking) | | | | |
| | 1,619,000 | | | Belle International Holdings Ltd. | | | 1,408,009 | |
| | | | (Consumer Discretionary) | | | | |
| | 709,000 | | | BOC Hong Kong Holdings Ltd. | | | 2,091,039 | |
| | | | (Banking) | | | | |
| | 213,656 | | | Cheung Kong Property Holdings Ltd. | | | 1,565,313 | |
| | | | (Real Estate-Developers) | | | | |
| | 5,341,000 | | | China Construction Bank Corp. (Class “H” Shares) | | | 3,564,223 | |
| | | | (Banking) | | | | |
| | 741,000 | | | China High Speed Transmission Equipment Group Co. Ltd. | | | 724,121 | |
| | | | (Industrials) | | | | |
| | 1,038,000 | | | China Life Insurance Co. Ltd. (Class “H” Shares) | | | 3,616,784 | |
| | | | (Insurance) | | | | |
| | 1,694,000 | | | China Lilang Ltd. | | | 1,450,513 | |
| | | | (Consumer Discretionary) | | | | |
| | 894,000 | | | China Machinery Engineering Corp. (Class “H” Shares) | | | 772,703 | |
| | | | (Materials) | | | | |
| | 514,000 | | | China Overseas Land & Investment Ltd. | | | 1,562,755 | |
| | | | (Real Estate-Developers) | | | | |
| | | | | | | | |
| Shares | | | Description | | Value
(Note 1) | |
| | 4,211,000 | | | China Power International Development Ltd. | | $ | 2,746,844 | |
| | | | (Utilities) | | | | |
| | 1,766,000 | | | China Resources Cement Holdings Ltd. | | | 808,421 | |
| | | | (Materials) | | | | |
| | 1,272,000 | | | China Resources Power Holdings Co. Ltd. | | | 2,920,349 | |
| | | | (Utilities) | | | | |
| | 234,500 | | | China Shenhua Energy Co. Ltd. (Class “H” Shares) | | | 360,165 | |
| | | | (Energy) | | | | |
| | 254,000 | | | China State Construction International Holdings Ltd. | | | 364,500 | |
| | | | (Industrials) | | | | |
| | 2,025,938 | | | China Vanke Co. Ltd.
(Class “H” Shares) | | | 4,352,411 | |
| | | | (Real Estate-Developers) | | | | |
| | 352,000 | | | Chow Sang Sang Holdings International Ltd. | | | 704,794 | |
| | | | (Consumer Discretionary) | | | | |
| | 5,328,000 | | | CIFI Holdings Group Co. Ltd. | | | 954,022 | |
| | | | (Real Estate-Developers) | | | | |
| | 189,156 | | | CK Hutchison Holdings Ltd. | | | 2,460,473 | |
| | | | (Industrials) | | | | |
| | 30,750,000 | | | CSI Properties Ltd. | | | 976,653 | |
| | | | (Real Estate-Developers) | | | | |
| | 165,500 | | | Dalian Wanda Commercial Properties Co. Ltd.
(Class “H” Shares) | | | 954,089 | |
| | | | (Real Estate-Developers) | | | | |
| | 442,000 | | | Dongfeng Motor Group Co. Ltd. (Class “H” Shares) | | | 554,738 | |
| | | | (Consumer Discretionary) | | | | |
| | 1,970,000 | | | Dorsett Hospitality International Ltd. | | | 374,934 | |
| | | | (Consumer Discretionary) | | | | |
| | 2,544,000 | | | EGL Holdings Co. Ltd. | | | 703,112 | |
| | | | (Consumer Discretionary) | | | | |
| | 2,293,000 | | | Far East Consortium International Ltd. | | | 852,927 | |
| | | | (Real Estate-Developers) | | | | |
See Notes to Financial Statements.
7
THE ASIA PACIFIC FUND, INC.
Portfolio of Investments
as of September 30, 2015
(Unaudited) Continued
| | | | | | | | |
| Shares | | | Description | | Value
(Note 1) | |
| | | | CHINA (INCLUDING HONG KONG and MACAU SAR)—(continued) | |
| | 319,000 | | | Great Wall Motor Co. Ltd. (Class “H” Shares) | | $ | 355,936 | |
| | | | (Consumer Discretionary) | | | | |
| | 751,000 | | | HKT Trust & HKT Ltd. (Stapled Shares) | | | 892,473 | |
| | | | (Telecommunication Services) | |
| | 4,788,000 | | | Hopefluent Group Holdings Ltd. | | | 1,235,617 | |
| | | | (Real Estate-Developers) | | | | |
| | 72,000 | | | Huadian Power International Corp. Ltd.
(Class “H” Shares) | | | 56,020 | |
| | | | (Utilities) | | | | |
| | 982,739 | | | Hui Xian Real Estate Investment Trust | | | 487,790 | |
| | | | (Real Estate Investment Trusts) | |
| | 9,962,000 | | | Jiangnan Group Ltd. | | | 2,053,365 | |
| | | | (Industrials) | | | | |
| | 1,322,000 | | | Lee & Man Chemical Co. Ltd. | | | 561,207 | |
| | | | (Industrials) | | | | |
| | 1,719,000 | | | Longfor Properties Co. Ltd. | | | 2,176,594 | |
| | | | (Real Estate-Developers) | | | | |
| | 429,679 | | | Luthai Textile Co. Ltd.
(Class “B” Shares) | | | 531,135 | |
| | | | (Consumer Discretionary) | | | | |
| | 339,200 | | | MGM China Holdings Ltd. | | | 395,141 | |
| | | | (Consumer Discretionary) | | | | |
| | 5,368,000 | | | Modern Beauty Salon Holdings Ltd. | | | 423,622 | |
| | | | (Consumer Discretionary) | | | | |
| | 7,680,000 | | | Oi Wah Pawnshop Credit Holdings Ltd. | | | 509,336 | |
| | | | (Banking) | | | | |
| | 1,440,000 | | | PetroChina Co. Ltd.
(Class “H” Shares) | | | 1,002,821 | |
| | | | (Energy) | | | | |
| | 1,612,000 | | | Pico Far East Holdings Ltd. | | | 374,398 | |
| | | | (Consumer Discretionary) | | | | |
| | | | | | | | |
| Shares | | | Description | | Value
(Note 1) | |
| | 4,248,000 | | | Qingdao Port International Co. Ltd. (Class “H” Shares) | | $ | 1,912,324 | |
| | | | (Industrials) | | | | |
| | 411,500 | | | Shimao Property Holdings Ltd. | | | 621,845 | |
| | | | (Real Estate-Developers) | | | | |
| | 596,000 | | | Sino Land Co. Ltd. | | | 907,476 | |
| | | | (Real Estate-Developers) | | | | |
| | 13,310,000 | | | Sinomax Group Ltd. | | | 1,561,481 | |
| | | | (Consumer Discretionary) | | | | |
| | 2,419,500 | | | Sinopec Engineering Group Co. Ltd. (Class “H” Shares) | | | 2,113,416 | |
| | | | (Industrials) | | | | |
| | 2,206,000 | | | SITC International Holdings Co. Ltd. | | | 1,068,512 | |
| | | | (Industrials) | | | | |
| | 1,990,859 | | | Skyworth Digital Holdings Ltd. | | | 1,355,038 | |
| | | | (Consumer Discretionary) | | | | |
| | 1,652,000 | | | Spring Real Estate Investment Trust | | | 650,138 | |
| | | | (Real Estate Investment Trusts) | |
| | 1,608,000 | | | Springland International Holdings Ltd. | | | 426,893 | |
| | | | (Consumer Discretionary) | | | | |
| | 3,260,000 | | | Time Watch Investments Ltd. | | | 524,375 | |
| | | | (Consumer Discretionary) | | | | |
| | 2,138,000 | | | TK Group Holdings Ltd. | | | 670,611 | |
| | | | (Industrials) | | | | |
| | 1,590,000 | | | Wonderful Sky Financial Group Holdings Ltd. | | | 321,393 | |
| | | | (Consumer Discretionary) | | | | |
| | 854,000 | | | Yangtze Optical Fibre and Cable Joint Stock Ltd. Co.
(Class “H” Shares) | | | 905,696 | |
| | | | (Information Technology) | | | | |
| | 1,974,700 | | | Yangzijiang Shipbuilding Holdings Ltd. | | | 1,578,977 | |
| | | | (Telecommunication Services) | | | | |
| | 790,000 | | | Yuexiu Real Estate Investment Trust | | | 401,287 | |
| | | | (Real Estate Investment Trusts) | |
See Notes to Financial Statements.
8
| | | | | | | | |
| Shares | | | Description | | Value
(Note 1) | |
| | | | CHINA (INCLUDING HONG KONG AND MACAU SAR)—(continued) | |
| | 549,000 | | | Zhongsheng Group Holdings Ltd. | | $ | 223,872 | |
| | | | | | | | |
| | | | (Consumer Discretionary) | | | | |
| | | | | | | 71,453,172 | |
| | | | | | | | |
| | |
| | | | INDONESIA—0.4% | | | | |
| | 923,300 | | | PT Bank Mandiri (Persero) Tbk | | | 500,843 | |
| | | | (Banking) | | | | |
| | 1,482,800 | | | PT Nusa Raya Cipta Tbk | | | 70,477 | |
| | | | | | | | |
| | | | (Industrials) | | | | |
| | | | | | | 571,320 | |
| | | | | | | | |
| | |
| | | | MALAYSIA—1.3% | | | | |
| | 1,722,625 | | | Mah Sing Group Bhd | | | 513,811 | |
| | | | (Real Estate-Developers) | | | | |
| | 3,482,000 | | | Nam Cheong Ltd. | | | 405,060 | |
| | | | (Industrials) | | | | |
| | 730,300 | | | Signature International Bhd | | | 400,112 | |
| | | | (Consumer Discretionary) | | | | |
| | 730,700 | | | UOA Development Bhd | | | 319,159 | |
| | | | | | | | |
| | | | (Real Estate-Developers) | | | | |
| | | | | | | 1,638,142 | |
| | | | | | | | |
| | |
| | | | PHILIPPINES—0.8% | | | | |
| | 1,401,600 | | | Leisure & Resorts World Corp. | | | 243,705 | |
| | | | (Consumer Discretionary) | | | | |
| | 10,364,000 | | | Premium Leisure Corp. | | | 218,185 | |
| | | | (Banking) | | | | |
| | 181,540 | | | Semirara Mining and Power Corp. | | | 528,920 | |
| | | | | | | | |
| | | | (Energy) | | | | |
| | | | | | | 990,810 | |
| | | | | | | | |
| | |
| | | | SINGAPORE—5.1% | | | | |
| | 218,256 | | | AIMS AMP Capital Industrial REIT | | | 208,090 | |
| | | | (Real Estate Investment Trusts) | | | | |
| | 1,053,300 | | | Asian Pay Television Trust | | | 581,623 | |
| | | | (Consumer Discretionary) | | | | |
| | | | | | | | |
| Shares | | | Description | | Value
(Note 1) | |
| | 401,800 | | | CapitaLand Commercial Trust Ltd. | | $ | 379,359 | |
| | | | (Real Estate Investment Trusts) | |
| | 334,300 | | | CapitaLand Retail China Trust | | | 321,276 | |
| | | | (Real Estate Investment Trusts) | |
| | 947,100 | | | China Merchants Holdings Pacific Ltd. | | | 593,255 | |
| | | | (Industrials) | | | | |
| | 333,900 | | | Croesus Retail Trust | | | 194,749 | |
| | | | (Real Estate Investment Trusts) | |
| | 173,500 | | | DBS Group Holdings Ltd. | | | 1,980,388 | |
| | | | (Banking) | | | | |
| | 1,562,700 | | | Ezion Holdings Ltd. | | | 718,466 | |
| | | | (Energy) | | | | |
| | 620,700 | | | Frasers Commercial Trust | | | 580,023 | |
| | | | (Real Estate Investment Trusts) | |
| | 95,600 | | | Parkway Life Real Estate Investment Trust | | | 154,513 | |
| | | | (Real Estate Investment Trusts) | |
| | 487,400 | | | Wing Tai Holdings Ltd. | | | 572,631 | |
| | | | | | | | |
| | | | (Real Estate-Developers) | | | | |
| | | | | | | 6,284,373 | |
| | | | | | | | |
| | |
| | | | SOUTH KOREA—5.9% | | | | |
| | 10,309 | | | BGF retail Co. Ltd. | | | 1,760,809 | |
| | | | (Consumer Staples) | | | | |
| | 290 | | | Binggrae Co. Ltd. | | | 18,472 | |
| | | | (Consumer Staples) | | | | |
| | 9,977 | | | Dongbu Insurance Co. Ltd. | | | 517,445 | |
| | | | (Insurance) | | | | |
| | 26,489 | | | GS Retail Co. Ltd. | | | 1,367,853 | |
| | | | (Consumer Staples) | | | | |
| | 2,615 | | | Korea Ratings Corp. | | | 90,895 | |
| | | | (Banking) | | | | |
| | 859 | | | LIG Nex1 Co. Ltd.* | | | 55,078 | |
| | | | (Industrials) | | | | |
| | 27,993 | | | SK Hynix, Inc. | | | 798,375 | |
| | | | (Semiconductors & Semiconductor Equipment) | | | | |
| | 11,877 | | | SK Telecom Co. Ltd. | | | 2,634,744 | |
| | | | | | | | |
| | | | (Telecommunication Services) | |
| | | | | | | 7,243,671 | |
| | | | | | | | |
See Notes to Financial Statements.
9
THE ASIA PACIFIC FUND, INC.
Portfolio of Investments
as of September 30, 2015
(Unaudited) Continued
| | | | | | | | |
| Shares | | | Description | | Value
(Note 1) | |
| | |
| | | | TAIWAN—3.2% | | | | |
| | 338,000 | | | Farglory Land Development Co. Ltd. | | $ | 357,662 | |
| | | | (Real Estate-Developers) | | | | |
| | 267,000 | | | Huaku Development Co. Ltd. | | | 464,967 | |
| | | | (Real Estate-Developers) | | | | |
| | 165,825 | | | Johnson Health Tech Co. Ltd. | | | 223,240 | |
| | | | (Consumer Discretionary) | | | | |
| | 818,000 | | | Mega Financial Holding Co. Ltd. | | | 568,207 | |
| | | | (Banking) | | | | |
| | 119,955 | | | Superalloy Industrial Co. Ltd. | | | 406,775 | |
| | | | (Consumer Discretionary) | | | | |
| | 479,000 | | | Taiwan Semiconductor Manufacturing Co. Ltd. | | | 1,919,677 | |
| | | | | | | | |
| | | | (Semiconductors & Semiconductor Equipment) | | | | |
| | | | | | | 3,940,528 | |
| | | | | | | | |
| | |
| | | | THAILAND—3.5% | | | | |
| | | | AP Thailand PCL | | | | |
| | | | (Real Estate-Developers) | | | | |
| | 213,100 | | | NVDR | | | 31,722 | |
| | 2,238,000 | | | Ordinary | | | 332,971 | |
| | 1,282,100 | | | Bangchak Petroleum PCL (The) | | | 1,209,862 | |
| | | | (Energy) | | | | |
| | 1,722,000 | | | Digital Telecommunications Infrastructure Fund
(Class “F” Shares) | | | 597,801 | |
| | | | (Telecommunication Services) | | | | |
| | 2,152,800 | | | Jasmine Broadband Internet Infrastructure Fund
(Class “F” Shares) | | | 622,797 | |
| | | | (Capital Markets) | | | | |
| | 26,700 | | | Namyong Terminal PCL | | | 11,476 | |
| | | | (Industrials) | | | | |
| | 1,228,400 | | | Somboon Advance Technology PCL | | | 538,134 | |
| | | | (Consumer Discretionary) | | | | |
| | | | | | | | |
| Shares | | | Description | | Value
(Note 1) | |
| | 946,800 | | | Supalai PCL | | $ | 477,378 | |
| | | | (Real Estate-Developers) | | | | |
| | | | Tisco Financial Group PCL | | | | |
| | | | (Banking) | | | | |
| | 177,300 | | | NVDR | | | 173,464 | |
| | 301,900 | | | Ordinary | | | 297,367 | |
| | | | | | | | |
| | | | | | | 4,292,972 | |
| | | | | | | | |
| | | | Total common stocks
(cost $103,455,771) | | | 96,414,988 | |
| | | | | | | | |
Units | | | | | | |
| | | | PARTICIPATORY NOTES*—4.2% | |
| |
| | | | CHINA (INCLUDING HONG KONG and MACAU SAR) | |
| | 988,900 | | | China Vanke Co. Ltd.
(Class “A” Shares), expiring 02/23/16 | | | 1,983,802 | |
| | | | (Real Estate-Developers) | | | | |
| | 200,000 | | | Daqin Railway Co. Ltd.
(Class “A” Shares), expiring
03/11/16 | | | 278,658 | |
| | | | (Industrials) | | | | |
| | 880,747 | | | Gree Electric Appliances, Inc. of Zhuhai (Class “A” Shares), expiring 03/10/16 | | | 2,254,504 | |
| | | | (Industrials) | | | | |
| | 57,900 | | | Haier Co. Ltd.
(Class “A” Shares), expiring 02/23/16 | | | 82,840 | |
| | | | (Consumer Staples) | | | | |
| | 192,200 | | | SAIC Motor Corp. Ltd.
(Class “A” Shares), expiring 02/23/16 | | | 509,156 | |
| | | | | | | | |
| | | | (Consumer Discretionary) | | | | |
| | | | Total participatory notes
(cost $6,133,965) | | | 5,108,960 | |
| | | | | | | | |
Shares | | | | | | |
| | | | PREFERENCE SHARES—9.6% | |
| | |
| | | | SOUTH KOREA | | | | |
| | 20,653 | | | Amorepacific Corp. | | | 3,255,075 | |
| | | | (Consumer Staples) | | | | |
See Notes to Financial Statements.
10
| | | | | | | | |
| Shares | | | Description | | Value
(Note 1) | |
| |
| | | | SOUTH KOREA—(continued) | |
| | 2,002 | | | CJ CheilJedang Corp. | | $ | 397,978 | |
| | | | (Consumer Staples) | | | | |
| | 17,377 | | | Hyundai Motor Co. (Participating) | | | 1,423,821 | |
| | | | (Consumer Discretionary) | | | | |
| | 43,997 | | | LG Corp. | | | 1,437,730 | |
| | | | (Industrials) | | | | |
| | 3,337 | | | Samsung Electronics Co. Ltd. | | | 2,590,399 | |
| | | | (Semiconductors & Semiconductor Equipment) | | | | |
| | 19,417 | | | Samsung Fire & Marine Insurance Co. Ltd. | | | 2,735,548 | |
| | | | | | | | |
| | | | (Insurance) | | | | |
| | | | Total preference shares
(cost $9,697,448) | | | 11,840,551 | |
| | | | | | | | |
Units | | | | | | |
| | | | WARRANTS* | | | | |
| | |
| | | | MALAYSIA | | | | |
| | 423,637 | | | Mah Sing Group Bhd, expiring 02/21/20 (cost $0) | | | 13,011 | |
| | | | | | | | |
| | | | (Real Estate-Developers) | | | | |
| | | | Total long-term investments
(cost $119,287,184) | | | 113,377,510 | |
| | | | | | | | |
| |
| | | | SHORT-TERM INVESTMENT—3.1% | |
Shares | | | | | | |
| | | | MONEY MARKET MUTUAL FUND | |
| | 3,793,627 | | | JPMorgan Prime Money Market Fund/Premier
(cost $3,793,627) | | | 3,793,627 | |
| | | | | | | | |
| | | | Total Investments—95.1%
(cost $123,080,811)
(Note 5) | | | 117,171,137 | |
| | | | Other assets in excess of
liabilities—4.9% | | | 6,097,873 | |
| | | | | | | | |
| | | | Net Assets—100.0% | | $ | 123,269,010 | |
| | | | | | | | |
The following abbreviations are used in the Semi-annual report:
| NVDR | Non-Voting Depository Receipt |
| REIT | Real Estate Investment Trust |
| * | Non-income producing security. |
Various inputs are used in determining the value of the Fund’s investments. These inputs are summarized in the three broad levels listed below.
Level 1—quoted prices generally in active markets for identical securities.
Level 2—quoted prices for similar securities, interest rates and yield curves, prepayment speeds, foreign currency exchange rates and other observable inputs.
Level 3—unobservable inputs for securities valued in accordance with Board approved fair valuation procedures.
The following is a summary of the inputs used as of September 30, 2015 in valuing such portfolio securities:
| | | | | | | | | | | | |
| | | Level 1 | | | Level 2 | | | Level 3 | |
Investments in Securities | | | | | | | | | | | | |
Common Stocks | | | | | | | | | | | | |
China (including Hong Kong and Macau SAR) | | $ | 3,065,371 | | | $ | 68,387,801 | | | $ | — | |
Indonesia | | | — | | | | 571,320 | | | | — | |
Malaysia | | | 319,159 | | | | 1,318,983 | | | | — | |
Philippines | | | — | | | | 990,810 | | | | — | |
Singapore | | | 349,262 | | | | 5,935,111 | | | | — | |
South Korea | | | 164,445 | | | | 7,079,226 | | | | — | |
Taiwan | | | — | | | | 3,940,528 | | | | — | |
Thailand | | | 297,367 | | | | 3,995,605 | | | | — | |
Participatory Notes | | | | | | | | | | | | |
China (including Hong Kong and Macau SAR) | | | — | | | | 5,108,960 | | | | — | |
Preference Shares | | | | | | | | | | | | |
South Korea | | | — | | | | 11,840,551 | | | | — | |
Warrants | | | | | | | | | | | | |
Malaysia | | | 13,011 | | | | — | | | | — | |
Money Market Mutual Fund | | | 3,793,627 | | | | — | | | | — | |
| | | | | | | | | | | | |
Total | | $ | 8,002,242 | | | $ | 109,168,895 | | | $ | — | |
| | | | | | | | | | | | |
See Notes to Financial Statements.
11
THE ASIA PACIFIC FUND, INC.
Portfolio of Investments
as of September 30, 2015
(Unaudited) Continued
The industry classification of investments and other assets in excess of liabilities shown as a percentage of net assets as of September 30, 2015 were as follows:
| | | | |
Real Estate-Developers | | | 17.4 | % |
Industrials | | | 14.7 | |
Consumer Discretionary | | | 14.4 | |
Banking | | | 13.0 | |
Consumer Staples | | | 5.5 | |
Insurance | | | 5.5 | |
Utilities | | | 4.6 | |
Telecommunication Services | | | 4.6 | |
Semiconductors & Semiconductor Equipment | | | 4.3 | |
Energy | | | 3.1 | |
Money Market Mutual Fund | | | 3.1 | |
Real Estate Investment Trusts | | | 2.6 | |
Materials | | | 1.1 | |
Information Technology | | | 0.7 | |
Capital Markets | | | 0.5 | |
| | | | |
| | | 95.1 | |
Other assets in excess of liabilities | | | 4.9 | |
| | | | |
| | | 100.0 | % |
| | | | |
The Fund invested in derivative instruments during the reporting period. The primary type of risk associated with these derivative instruments is equity risk. The effect of such derivative instruments on the Fund’s financial position and financial performance as reflected in the Statement of Assets and Liabilities and Statement of Operations is presented in the summary below.
Fair values of derivative instruments as of September 30, 2015 as presented in the Statement of Assets and Liabilities:
| | | | | | | | | | | | | | |
| | | Asset Derivatives | | | Liability Derivatives | |
Derivatives not accounted for as hedging instruments, carried at fair value | | Balance
Sheet Location | | | Fair Value | | | Balance
Sheet Location | | Fair Value | |
Equity contracts | | | Investments | | | $ | 5,121,971 | | | — | | $ | — | |
| | | | | | | | | | | | | | |
The effects of derivative instruments on the Statement of Operations for the six months ended September 30, 2015 are as follows:
For the six months ended September 30, 2015, the Fund did not have any realized gain or (loss) on derivatives recognized in income on the Statement of Operations.
| | | | | | | | | | | | |
Change in Unrealized Appreciation or (Depreciation) on Derivatives Recognized in Income | |
Derivatives not accounted for as hedging instruments, carried at fair value | | Participatory
Notes* | | | Warrants* | | | Total | |
Equity contracts | | $ | (1,939,612 | ) | | $ | (5,291 | ) | | $ | (1,944,903 | ) |
| | | | | | | | | | | | |
| * | Included in net change in unrealized (depreciation) on investments in the Statement of Operations. |
See Notes to Financial Statements.
12
THE ASIA PACIFIC FUND, INC.
Statement of Assets and Liabilities
as of September 30, 2015
(Unaudited)
| | | | |
| Assets | | | | |
Investments, at value (cost $123,080,811) | | $ | 117,171,137 | |
Foreign currency, at value (cost $6,264,731) | | | 6,174,775 | |
Receivable for investments sold | | | 791,290 | |
Dividends and interest receivable | | | 306,887 | |
Tax reclaim receivable | | | 1,028 | |
Prepaid expenses | | | 125,695 | |
| | | | |
Total Assets | | | 124,570,812 | |
| | | | |
| Liabilities | | | | |
Payable for investments purchased | | | 937,421 | |
Accrued expenses and other liabilities | | | 245,408 | |
Investment management fee payable | | | 93,768 | |
Administration fee payable | | | 25,205 | |
| | | | |
Total Liabilities | | | 1,301,802 | |
| | | | |
| Net Assets | | $ | 123,269,010 | |
| | | | |
Net assets were comprised of: | | | | |
Common stock, at par | | $ | 103,441 | |
Paid-in capital in excess of par | | | 127,414,209 | |
| | | | |
| | | 127,517,650 | |
Undistributed net investment income | | | 4,852,119 | |
Accumulated net realized loss on investment and foreign currency transactions | | | (3,100,837 | ) |
Net unrealized depreciation on investments and foreign currencies | | | (5,999,922 | ) |
| | | | |
Net assets, September 30, 2015 | | $ | 123,269,010 | |
| | | | |
Net asset value per share
($123,269,010 ÷ 10,344,073 shares of common stock outstanding) | | | $11.92 | |
| | | | |
| See Notes to Financial Statements. | |
THE ASIA PACIFIC FUND, INC.
Statement of Operations
Six Months Ended September 30, 2015
(Unaudited)
| | | | |
| Net Investment Income | | | | |
Income | | | | |
Dividends (net of foreign withholding taxes of $275,765) | | $ | 3,808,564 | |
| | | | |
Expenses | | | | |
Investment management fee | | | 648,012 | |
Administration fee | | | 177,861 | |
Directors’ fees and board expenses | | | 127,000 | |
Custodian and accounting fees | | | 115,000 | |
Legal fees and expenses | | | 101,000 | |
Insurance | | | 61,000 | |
Reports to shareholders | | | 60,000 | |
Audit fee | | | 21,000 | |
Registration fees | | | 13,000 | |
Loan interest and commitment fees | | | 19,000 | |
Transfer agent’s fees and expenses | | | 11,000 | |
Miscellaneous | | | 16,815 | |
| | | | |
Total expenses | | | 1,370,688 | |
| | | | |
Net investment income | | | 2,437,876 | |
| | | | |
| Realized And Unrealized Gain (Loss) On Investments And Foreign Currency Transactions | | | | |
Net realized gain (loss) on: | | | | |
Investment transactions | | | 3,527,310 | |
Foreign currency transactions | | | (44,551 | ) |
| | | | |
| | | 3,482,759 | |
| | | | |
Net change in unrealized appreciation (depreciation) on: | | | | |
Investments | | | (17,806,901 | ) |
Foreign currencies | | | (87,239 | ) |
| | | | |
| | | (17,894,140 | ) |
| | | | |
Net loss on investment and foreign currency transactions | | | (14,411,381 | ) |
| | | | |
| Net Decrease In Net Assets Resulting From Operations | | $ | (11,973,505 | ) |
| | | | |
| See Notes to Financial Statements. | |
13
THE ASIA PACIFIC FUND, INC.
Statement of Changes in Net Assets
(Unaudited)
| | | | | | | | |
Increase (Decrease) in
Net Assets | | Six Months
Ended
September 30,
2015 | | | Year Ended
March 31,
2015 | |
| | |
Operations | | | | | | | | |
| | |
Net investment income | | $ | 2,437,876 | | | $ | 2,368,614 | |
| | |
Net realized gain on investment and foreign currency transactions | | | 3,482,759 | | | | 6,375,968 | |
| | |
Net change in unrealized appreciation (depreciation) on investments and foreign currencies | | | (17,894,140 | ) | | | 7,506,775 | |
| | | | | | | | |
| | |
Total increase (decrease) | | | (11,973,505 | ) | | | 16,251,357 | |
| | |
| Net Assets: | | | | | | | | |
| | |
Beginning of period | | | 135,242,515 | | | | 118,991,158 | |
| | | | | | | | |
| | |
End of period (a) | | $ | 123,269,010 | | | $ | 135,242,515 | |
| | | | | | | | |
(a) Includes undistributed net investment income of: | | $ | 4,852,119 | | | $ | 2,414,243 | |
| | | | | | | | |
| | |
| | | | | | | | |
| | |
| | | | | | | | |
| |
| See Notes to Financial Statements. | | | | | |
THE ASIA PACIFIC FUND, INC.
Notes to Financial Statements
(Unaudited)
The Asia Pacific Fund, Inc. (the “Fund”) is registered under the Investment Company Act of 1940, as amended, as a diversified, closed-end, management investment company. The Fund’s investment objective is to achieve long-term capital appreciation through investment of at least 80% of investable assets in equity securities of companies in the Asia Pacific countries.
Note 1. Accounting Policies
The Fund follows investment company accounting and reporting guidance of the Financial Accounting Standards Board (“FASB”) Accounting Standard Codification Topic 946 Financial Services—Investment Companies. The following accounting policies conform to U.S. generally accepted accounting principles. The Fund consistently follows such policies in the preparation of its financial statements.
Securities Valuation: The Fund holds portfolio securities and other assets that are fair valued at the close of each day the New York Stock Exchange (“NYSE”) is open for trading. Fair value is the price that would be received to sell an asset or paid to transfer a liability in an orderly transaction between market participants on the measurement date. The Board of Directors (the “Board”) has adopted Valuation Procedures for security valuation under which fair valuation responsibilities have been delegated to the Investment Manager, Value Partners Hong Kong Limited. Under the current Valuation Procedures, the established Valuation Committee is responsible for supervising the valuation of portfolio securities and other assets. The Valuation Procedures permit the Fund to utilize independent pricing vendor services, quotations from market makers and alternative valuation methods when market quotations are not readily available or not deemed representative of fair value. A record of the Valuation Committee’s actions is subject to the Board’s review, approval, and ratification at its next regularly-scheduled quarterly meeting.
Various inputs determine how the Fund’s investments are valued, all of which are categorized according to the three broad levels (Level 1, 2, or 3) detailed in the table following the Portfolio of Investments.
Common stocks and preference shares, exchange-traded funds, and derivative instruments such as futures or options that are traded on a national securities
14
exchange are valued at the last sale price as of the close of trading on the applicable exchange where the security principally trades. Securities traded via NASDAQ are valued at the NASDAQ official closing price. To the extent these securities are valued at the last sale price or NASDAQ official closing price, they are classified as Level 1 of the fair value hierarchy.
In the event that no sale or official closing price on the valuation date exists, these securities are generally valued at the mean between the last reported bid and ask prices, or at the last bid price in absence of an ask price. These securities are classified as Level 2 of the fair value hierarchy.
For common stocks and preference shares traded on foreign securities exchanges, certain valuation adjustments will be applied when events occur after the close of the security’s foreign market and before the Fund’s normal pricing time. These securities are valued using pricing vendor services that provide adjustment factors based on information such as local closing price, relevant general and sector indices, currency fluctuations, depositary receipts, and futures, as applicable. Securities valued using such model prices are classified as Level 2 in the fair value hierarchy. Such securities are valued using model prices to the extent that the valuation meets the established confidence level for each security. If the confidence level is not met or the vendor does not provide a model price, securities are valued in accordance with exchange-traded common and preferred stocks discussed above.
Participatory Notes (P-notes) are generally valued based upon the value of a related underlying security that trades actively in the market and are classified as Level 2 in the fair value hierarchy.
Investments in open end, non-exchange-traded mutual funds are valued at their net asset values as of the close of the NYSE on the date of valuation. These securities are classified as Level 1 in the fair value hierarchy since they may be purchased or sold at their net asset value on the date of valuation.
OTC derivative instruments are generally valued using pricing vendor services, which derive the valuation based on inputs such as underlying asset prices, indices, spreads,
interest rates, and exchange rates. These instruments are categorized as Level 2 in the fair value hierarchy.
Centrally cleared swaps listed or traded on a multilateral or trade facility platform, such as a registered exchange, are generally valued at the daily settlement price determined by the respective exchange. These securities are classified as Level 2 in the fair value hierarchy, as the daily settlement price is not public.
Securities and other assets that cannot be priced using the methods described above are valued based on pricing methodologies approved by the Board. In the event that unobservable inputs are used when determining such valuations, the securities will be classified as Level 3 of the fair value hierarchy.
When determining the fair value of securities, some of the factors influencing the valuation include: the nature of any restrictions on disposition of the securities; assessment of the general liquidity of the securities; the issuer’s financial condition and the markets in which it does business; the cost of the investment; the size of the holding and the capitalization of the issuer; the prices of any recent transactions or bids/offers for such securities or any comparable securities; any available analyst media or other reports or information deemed reliable by the investment manager regarding the issuer or the markets or industry in which it operates. Using fair value to price securities may result in a value that is different from a security’s most recent closing price and from the price used by other mutual funds to calculate their net asset values.
Foreign Currency Translation The books and records of the Fund are maintained in U.S. dollars. Foreign currency amounts are translated into U.S. dollars on the following basis:
(i) market value of investment securities, other assets and liabilities—at the current rates of exchange.
(ii) purchases and sales of investment securities, income and expenses—at the rates of exchange prevailing on the respective dates of such transactions.
Although the net assets of the Fund are presented at the foreign exchange rates and market values at the close
15
THE ASIA PACIFIC FUND, INC.
Notes to Financial Statements
(Unaudited) Continued
of the fiscal period, the Fund does not isolate that portion of the results of operations arising as a result of changes in the foreign exchange rates from the fluctuations arising from changes in the market prices of long-term portfolio securities held at fiscal period end. Similarly, the Fund does not isolate the effect of changes in foreign exchange rates from the fluctuations arising from changes in the market prices of long-term portfolio securities sold during the fiscal period. Accordingly, these realized foreign currency gains or losses are included in the reported net realized gains or losses on investment transactions.
Net realized gains or losses on foreign currency transactions represent net foreign exchange gains or losses from holdings of foreign currencies, forward currency contracts, disposition of foreign currencies, currency gains or losses realized between the trade and settlement dates on security transactions, and the difference between the amounts of interest, dividends and foreign withholding taxes recorded on the Fund’s books and the U.S. dollar equivalent amounts actually received or paid. Net unrealized currency gains or losses from valuing foreign currency denominated assets and liabilities (other than investments) at fiscal period end exchange rates are reflected as a component of unrealized appreciation (depreciation) on foreign currencies.
Foreign security and currency transactions may involve certain considerations and risks not typically associated with those of U.S. companies as a result of, among other factors, the level of governmental supervision and regulation of foreign securities markets and the possibility of political or economic instability.
Participatory Notes (P-notes) The Fund may gain exposure to securities in certain foreign markets through investments in participatory notes (“P-notes”). The Fund may purchase P-notes pending ability to invest directly in a foreign market due to restrictions applicable to foreign investors or other market factors. P-notes are generally issued by banks or broker-dealers and are designed to offer a return linked to a particular underlying security. P-notes involve transaction costs, which may be higher than those applicable to the equity securities. An investment in a P-note may involve risks, including
counter-party risk, beyond those normally associated with a direct investment in the underlying security. The Fund must rely on the creditworthiness of the counterparty and would have no rights against the issuer of the underlying security. Furthermore, the P-note’s performance may differ from that of the underlying security. The holder of a P-note is entitled to receive from the bank or broker-dealer, an amount equal to dividends paid by the issuer of the underlying security; however, the holder is not entitled to the same rights (e.g., dividends, voting rights) as an owner of the underlying security. There is also no assurance that there will be a secondary trading market for a P-note or that the trading price of a P-note will equal the value of the underlying security.
Stock Index Futures Contracts A stock index futures contract is an agreement to purchase (long) or sell (short) an agreed amount of securities at a set price for delivery on a future date. Upon entering into a stock index futures contract, the Fund is required to pledge to the broker an amount of cash and/or other assets equal to a certain percentage of the contract amount. This amount is known as the “initial margin.” Subsequent payments known as “variation margin,” are made or received by the Fund each day, depending on the daily fluctuations in the value of the underlying security. Such variation margin is recorded for financial statement purposes on a daily basis as unrealized gain or loss. When the contract expires or is closed, the gain or loss is realized and is presented in the Statement of Operations as net realized gain or loss on stock index futures contracts.
The Fund may utilize stock index futures contracts for hedging and investment purposes. Should market prices for the futures contracts or the underlying assets move in ways not anticipated by the Fund, losses may result. The use of futures contracts involves the risk of imperfect correlation in movements in the price of futures contracts and the underlying assets being hedged or the exposures desired by the Fund.
Master Netting Arrangements The Fund is subject to various Master Agreements, or netting arrangements, with select counterparties. These are agreements which an investment adviser (adviser) may have negotiated and
16
entered into on behalf of the Fund. A master netting arrangement between the Fund and the counterparty permits the Fund to offset amounts payable by the Fund to the same counterparty against amounts to be received; and by the receipt of collateral from the counterparty by the Fund to cover the Fund’s exposure to the counterparty. However, there is no assurance that such mitigating factors are easily enforceable. The right to set-off exists when all the conditions are met such that each of the parties owes the other a determinable amount, the reporting party has the right to set-off the amount owed with the amount owed by the other party, the reporting party intends to set-off, and the right of set-off is enforceable by law. During the reporting period, there were no instances where the right of set-off existed and management has not elected to offset.
Securities Transactions and Net Investment Income Securities transactions are recorded on the trade date. Realized and unrealized gains or losses from security and currency transactions are calculated on the identified cost basis. Dividend income is recorded on the ex-dividend date, and interest income is recorded on an accrual basis. Expenses are recorded on the accrual basis which may require the use of certain estimates by management. Actual results may differ from such estimates.
Dividends and Distributions Dividends from net investment income, if any, are declared and paid at least annually in a manner that qualifies for the dividends-paid deduction. The Fund’s current intention is to distribute at least annually any current year net capital gains in excess of net capital loss carryforwards in a manner that avoids income and excise taxes being imposed on the Fund. Dividends and distributions are recorded on the ex-dividend date. The Fund may choose to satisfy the foregoing by making distributions in cash, additional Fund shares, or both.
The Fund could determine in the future to retain net long-term capital gains in respect of any fiscal year without affecting the ability of the Fund to qualify as a regulated investment company. In that case, the Fund would be subject to taxation on the retained amount and shareholders subject to U.S. federal income taxation would be
required to include in income for tax purposes their shares of the undistributed amount and would be entitled to credits or refunds against their U.S. federal income tax liabilities with respect to their proportionate shares of the tax paid by the Fund.
Income distributions and capital gain distributions are determined in accordance with income tax regulations, which may differ from U.S. generally accepted accounting principles.
Taxes It is the Fund’s current intention to continue to meet the requirements of the U.S. Internal Revenue Code of 1986, as amended (“the Code”) applicable to regulated investment companies and to distribute all of its taxable income and net capital gains to shareholders. Therefore, no federal income tax provision is required. If the Fund determines in the future to retain taxable capital gains, the Fund will provide for all required taxes.
Withholding tax on foreign dividends and interest and foreign capital gains tax is accrued in accordance with the Fund’s understanding of the applicable country’s tax rules and rates.
Estimates The preparation of the financial statements requires management to make estimates and assumptions that affect the reported amounts and disclosures in the financial statements. Actual results could differ from those estimates.
Note 2. Investment Management and Administration Agreements
The Fund has a management agreement with Value Partners Hong Kong Limited (the “Investment Manager”), and an administration agreement with Prudential Investments LLC (the “Administrator”).
The investment management fee is computed weekly and payable monthly at the following annual rates: 1.00% of the Fund’s average weekly net assets up to $100 million and 0.70% of such assets in excess of $100 million.
The administration fee is also computed weekly and payable monthly at the following annual rates: 0.25% of
17
THE ASIA PACIFIC FUND, INC.
Notes to Financial Statements
(Unaudited) Continued
the Fund’s average weekly net assets up to $200 million and 0.20% of such assets in excess of $200 million.
Pursuant to the agreements, the Investment Manager provides continuous supervision of the investment portfolio and the Administrator provides occupancy and certain clerical, administrative and accounting services for the Fund. The Investment Manager and the Administrator each pays the cost of compensation of certain officers of the Fund. The Fund bears all other costs and expenses.
Note 3. Portfolio Securities
Cost of purchases and proceeds from sales of investment securities, other than short-term investments, for the six months ended September 30, 2015 aggregated $51,916,825 and $54,989,998 respectively.
Note 4. Tax Information
The United States federal income tax basis of the Fund’s investments and the net unrealized depreciation as of September 30, 2015 were as follows:
| | | | |
Tax Basis | | $ | 123,516,413 | |
| | | | |
Appreciation | | | 9,200,733 | |
Depreciation | | | (15,546,009 | ) |
| | | | |
Net Unrealized Depreciation | | $ | (6,345,276 | ) |
| | | | |
The book basis may differ from tax basis due to certain tax related adjustments.
Under the Regulated Investment Company Modernization Act of 2010 (the “Act”), the Fund is permitted to carry forward capital losses realized on or after April 1, 2011 (“post-enactment losses”) for an unlimited period. Post-enactment losses are required to be utilized before the utilization of losses incurred prior to the effective date of the Act. As a result of this ordering rule, capital loss carryforwards related to taxable years ending before March 31, 2012 (“pre-enactment losses”) may have an increased likelihood to expire unused. The Fund utilized approximately $5,516,000 of its pre-enactment losses to offset net taxable gains realized in the fiscal year ended March 31, 2015.
No capital gains distributions are expected to be paid to shareholders until net gains have been realized in excess of such losses. As of March 31, 2015, the pre and post-enactment losses were approximately:
| | | | |
Post-Enactment Losses: | | $ | 0 | |
| | | | |
Pre-Enactment Losses: | | | | |
Expiring 2018 | | $ | 6,529,000 | |
| | | | |
Management has analyzed the Fund’s tax positions taken on federal, state and local income tax returns for all open tax years and has concluded that no provision for income tax is required in the Fund’s financial statements for the current reporting period. The Fund’s federal, state and local income and federal excise tax returns for tax years for which the applicable statutes of limitations have not expired are subject to examination by the Internal Revenue Service and state departments of revenue.
Note 5. Capital
There are 30 million shares of $0.01 par value common stock authorized.
Note 6. Borrowings
The Fund currently is a party to a committed credit facility with a bank. The credit facility provides for a maximum commitment of $15,000,000. Interest on any borrowings under the credit facility is at contracted market rates. The Fund pays a commitment fee on the unused portion of the facility. The commitment fee is accrued daily and paid quarterly. The Fund’s obligations under the credit facility are secured by substantially all the assets of the Fund. The purpose of the credit facility is to assist the Fund with its general cash flow requirements, including the provision of portfolio leverage.
During the six months ended September 30, 2015, the Fund utilized the credit facility and had an average daily outstanding loan balance of $4,812,844 during the 109 day period that the facility was utilized, at an average interest rate of 0.63%. The maximum amount of loan outstanding during the period was $8,000,000. There was no balance outstanding at September 30, 2015.
18
Note 7. New Accounting Pronouncement
In May 2015, the FASB issued Accounting Standards Update (“ASU”) No. 2015-07 regarding “Disclosures for Investments in Certain Entities That Calculate Net Asset Value per Share”. The amendments in this update are effective for the Fund for fiscal years beginning after December 15, 2015, and interim periods within those fis-
cal years. ASU No. 2015-07 will eliminate the requirement to categorize investments in the fair value hierarchy if their fair value is measured at net asset value (“NAV”) per share (or its equivalent) using the practical expedient in the FASB’s fair value measurement guidance. Management has evaluated the implications of ASU No. 2015-07 and it has been determined that there is no impact on the financial statement disclosures.
19
THE ASIA PACIFIC FUND, INC.
Financial Highlights
(Unaudited)
| | | | | | | | | | | | |
| Per Share Operating Performance: | | Six Months
Ended
September 30,
2015 | | | Year Ended March 31, | |
| | | 2015 | | | 2014 | |
Net asset value, beginning of period | | $ | 13.07 | | | $ | 11.50 | | | $ | 11.92 | |
| | | | | | | | | | | | |
Net investment income (loss) | | | 0.24 | | | | 0.23 | | | | (.02 | ) |
Net realized and unrealized gain (loss) on investment and foreign currency transactions | | | (1.39 | ) | | | 1.34 | | | | (.40 | ) |
| | | | | | | | | | | | |
Total from investment operations | | | (1.15 | ) | | | 1.57 | | | | (.42 | ) |
| | | | | | | | | | | | |
Net asset value, end of period | | $ | 11.92 | | | $ | 13.07 | | | $ | 11.50 | |
| | | | | | | | | | | | |
Market value, end of period | | $ | 10.30 | | | $ | 11.61 | | | $ | 10.33 | |
| | | | | | | | | | | | |
Total investment return(a): | | | (11.28 | )% | | | 12.39 | % | | | (4.00 | )% |
| | | | | | | | | | | | |
| Ratios to Average Net Assets: | | | | | | | | | | | | |
Total expenses (including loan interest)(c) | | | 1.93 | %(d) | | | 2.05 | %(b) | | | 2.33 | % |
Net investment income (loss) | | | 3.43 | %(d) | | | 1.83 | % | | | (.18 | )% |
| Supplemental Data: | | | | | | | | | | | | |
Average net assets | | $ | 142,289,000 | | | $ | 129,506,000 | | | $ | 119,204,000 | |
Portfolio turnover rate | | | 37 | %(e) | | | 76 | % | | | 175 | % |
Net assets, end of period | | $ | 123,269,000 | | | $ | 135,243,000 | | | $ | 118,991,000 | |
| (a) | Total investment return is calculated assuming a purchase of common stock at the current market value on the first day and a sale at the current market value on the last day of each fiscal period reported. Dividends and distributions, if any, are assumed, for purposes of this calculation, to be reinvested at prices obtained under the Fund’s dividend reinvestment plan. These calculations do not include brokerage commissions. Total returns for periods less than one full year are not annualized. |
| (b) | The expense ratios without loan interest expense would have been 1.92% for the six months ended September 30, 2015, and 2.05%, 2.11%, 2.15%, and 2.00% for the fiscal years ended March 31, 2015, 2013, 2012 and 2011, respectively. No loan interest was incurred during the fiscal year ended March 31, 2014. |
| (c) | Does not include expenses of the underlying funds in which the Fund invests. |
Shown above is selected data for a share of common stock outstanding-total investment return, ratios to average net assets and other supplemental data for the periods indicated. This information has been determined based upon information provided in the financial statements and market price data for the Fund’s share.
See Notes to Financial Statements.
20
THE ASIA PACIFIC FUND, INC.
Financial Highlights
(Unaudited)
| | | | | | | | | | | | |
| Per Share Operating Performance: | | Year Ended March 31, | |
| | 2013 | | | 2012 | | | 2011 | |
Net asset value, beginning of year | | $ | 11.67 | | | $ | 13.06 | | | $ | 10.97 | |
| | | | | | | | | | | | |
Net investment income (loss) | | | (0.03 | ) | | | (0.05 | ) | | | (0.06 | ) |
Net realized and unrealized gain (loss) on investment and foreign currency transactions | | | 0.28 | | | | (1.34 | ) | | | 2.15 | |
| | | | | | | | | | | | |
Total from investment operations | | | 0.25 | | | | (1.39 | ) | | | 2.09 | |
| | | | | | | | | | | | |
Net asset value, end of year | | $ | 11.92 | | | $ | 11.67 | | | $ | 13.06 | |
| | | | | | | | | | | | |
Market value, end of year | | $ | 10.76 | | | $ | 10.58 | | | $ | 11.83 | |
| | | | | | | | | | | | |
Total investment return(a): | | | 1.70 | % | | | (10.57 | )% | | | 18.89 | % |
| | | | | | | | | | | | |
| Ratios to Average Net Assets: | | | | | | | | | | | | |
Total expenses (including loan interest)(c) | | | 2.16 | %(b) | | | 2.15 | %(b) | | | 2.01 | %(b) |
Net investment (loss) | | | (0.28 | )% | | | (0.40 | )% | | | (0.51 | )% |
| Supplemental Data: | | | | | | | | | | | | |
Average net assets | | $ | 117,996,000 | | | $ | 123,601,000 | | | $ | 120,668,000 | |
Portfolio turnover rate | | | 180 | % | | | 137 | % | | | 136 | % |
Net assets, end of year | | $ | 123,269,000 | | | $ | 120,715,000 | | | $ | 135,076,000 | |
| (a) | Total investment return is calculated assuming a purchase of common stock at the current market value on the first day and a sale at the current market value on the last day of each fiscal period reported. Dividends and distributions, if any, are assumed, for purposes of this calculation, to be reinvested at prices obtained under the Fund’s dividend reinvestment plan. These calculations do not include brokerage commissions. Total returns for periods less than one full year are not annualized. |
| (b) | The expense ratios without loan interest expense would have been 1.92% for the six months ended September 30, 2015, and 2.05%, 2.11%, 2.15%, and 2.00% for the fiscal years ended March 31, 2015, 2013, 2012 and 2011, respectively. No loan interest was incurred during the fiscal year ended March 31, 2014. |
| (c) | Does not include expenses of the underlying funds in which the Fund invests. |
Shown above is selected data for a share of common stock outstanding-total investment return, ratios to average net assets and other supplemental data for the periods indicated. This information has been determined based upon information provided in the financial statements and market price data for the Fund’s share.
See Notes to Financial Statements.
21
Board of Directors Approval of Continuance of Investment Management Agreement with Value Partners (Hong Kong) Limited
At a meeting held on May 15, 2015, the Board of Directors of the Fund (the “Board”), including a majority of the disinterested directors (the “Directors”), approved the continuance of the investment management agreement (the “Investment Management Agreement”), effective as of October 1, 2013, between the Fund and Value Partners (Hong Kong) Limited (the “Investment Manager”). Prior to acting on the continuance of the Investment Management Agreement, the Directors considered the factors discussed below.
Factors Considered by the Board
Prior to approval of the continuance of the Investment Management Agreement, the Directors had evaluated information provided by the Investment Manager. They reviewed the Investment Management Agreement with the Investment Manager and with experienced Fund counsel, who are independent of the Investment Manager and who advised on the relevant legal standards.
Based on their experience gained as Fund Directors, the Directors considered their knowledge of the nature and quality of the services provided by the Investment Manager to the Fund and their overall confidence in the Investment Manager’s integrity and competence. The Directors noted that they receive presentations at regular Board meetings from the Investment Manager on the investment results of the Fund and review extensive materials and information provided by the Investment Manager.
The Directors also considered all other factors they believed relevant, including the specific matters described below. In their deliberations, the Directors did not identify any particular information that was all-important or controlling, and each Director attributed different weights to the various factors.
The Directors determined that the selection of the Investment Manager to manage the Fund and the overall arrangements between the Fund and the Investment Manager, including the investment management fee, as provided in the Investment Management Agreement, were fair and reasonable in light of the services performed, expenses incurred and such other matters as the Directors considered relevant in the exercise of their reasonable judgment.
The material factors and conclusions that formed the basis for the Directors’ determinations include the following:
Nature, extent and quality of services provided by the Investment Manager
The Directors considered the scope and quality of services provided by the Investment Manager under the Investment Management Agreement, including the quality of the investment research capabilities of the Investment Manager and the other resources it has dedicated to performing services for the Fund. They noted the professional experience of the Fund’s portfolio management team and other senior personnel of the Investment Manager. The Directors concluded that they were satisfied with the nature, extent and quality of services provided to the Fund under the Investment Management Agreement.
Costs of Services Provided and Profitability
The Directors reviewed a memorandum of the Investment Manager that included the expenses and assets under management for 2014 and the estimated profitability of the Investment Management Agreement to the Investment Manager for 2014. The Directors reviewed the assumptions and methods of allocation of estimated costs of managing the Fund in 2014 and in preparing Fund-specific profitability data as set forth in the memorandum.
22
The Directors recognized that it is difficult to make comparisons of profitability from fund advisory contracts because comparative information is not generally publicly available and is affected by numerous factors. The Directors focused on profitability of the Investment Manager’s relationship with the Fund before taxes. The Directors concluded that they were satisfied that the Investment Manager’s level of profitability from its relationship with the Fund was not unreasonable.
Fall-Out Benefits
The Directors considered the benefits to the Investment Manager from its relationship with the Fund other than fees payable under the Investment Management Agreement. They considered the Investment Manager’s representation that it did not engage in any traditional soft dollar arrangements whereby it would receive brokerage and research services from brokers and dealers that execute purchases and sales of securities on behalf of its clients, including the Fund, on an agency basis. The Directors believe that the Investment Manager may derive reputational and other benefits from its association with the Fund.
Investment Results
The Directors considered the investment results of the Fund as compared to other funds investing in Asia Pacific countries ex-Japan as provided by Morningstar, Inc. (the “Morningstar Universe”) and as compared to the MSCI All Countries Combined Asia Ex-Japan Gross Index (the “Index”). The Directors reviewed information showing performance of the Fund as compared to the Index and to funds in the Morningstar Universe over the one-year period ending September 30, 2014 and the six-month period ended March 31, 2015. The Directors noted that the Fund’s net asset value performance had been higher than that of the Index for the one-year period and lower than that of the Index for the six-month period, and that the performance of the Fund was better than the other funds in the Morningstar Universe for both periods. The Directors considered that the Fund’s investment performance was satisfactory.
Advisory Fees
The Directors considered the advisory fee rate paid by the Fund to the Investment Manager and information prepared by Lipper, Inc. and Morningstar, Inc. concerning fee rates paid by other funds in the same category as the Fund, that is, “Pacific Ex Japan Funds.” The Directors recognized that it is difficult to make comparisons of advisory fees because there are variations in the services that are included in the fees paid by other funds. Nonetheless, the Directors noted that the Fund’s advisory fee as a percentage of average net assets was lower than the advisory fees of the comparable funds provided by Morningstar, Inc. The Directors also considered that the investment advisory fees that the Investment Manager charges the only other investment company it manages with investment policies similar to the Fund’s were higher than the Fund’s. The Investment Manager represented that it does not advise any separate accounts with investment policies similar to the Fund’s.
Economies of Scale
The Directors considered that the Fund is a closed-end fund and that it was not expected to have meaningful asset growth absent a rights offering or an acquisition. In such circumstances, they did not view the potential for realization of economies of scale as the Fund’s assets grow to be a meaningful factor in their deliberations. The Directors noted, however, that the advisory fee schedule for the Fund contains a breakpoint at $100 million so that, when assets exceed the breakpoint, the fee rate is reduced from 1.00% to .70% on the incremental assets. The Directors concluded that the Fund’s breakpoint arrangements established a reasonable basis for realizing economies of scale should they exist.
23
Supplemental Proxy Information
An Annual Meeting of Stockholders was held on August 19, 2015. At such meeting the stockholders elected the entire slate of Class II Directors and one Class III Director and approved the amendment of Investment Objective to expand definition of equity securities.
| | 1) | Election of Class II Directors: |
| | | | | | | | |
| | | Affirmative
votes cast | | | Shares
Withheld | |
Jessica M. Bibliowicz | | | 7,704,561 | | | | 1,411,945 | |
David G.P. Scholfield | | | 7,704,290 | | | | 1,412,415 | |
William G. Tung | | | 7,703,470 | | | | 1,413,235 | |
Class III Director:
| | | | | | | | |
| | | Affirmative
votes cast | | | Shares
Withheld | |
Christopher Sykes | | | 7,798,934 | | | | 1,317,771 | |
| | 2) | Amendment of investment objective to expand definition of equity securities: |
| | | | | | | | |
| | | Affirmative
votes cast | | | Shares
Withheld | |
| | | 7,337,598 | | | | 1,726,960 | |
Additional Information
The Fund is required to file its complete schedule of portfolio holdings with the Securities and Exchange Commission (“SEC”) on Form N-Q for its first and third fiscal quarters and within 60 days of the fiscal quarter end. Once filed, the Fund’s Form N-Q is available without charge on the SEC’s website (http//www.sec.gov) or by calling the Fund toll free at 1-(888) 4-ASIA-PAC. Copies of the Fund’s Form N-Q may also be obtained by visiting the SEC’s Public Reference Room in Washington, DC (please call the SEC at (800) 732-0330 for information on the operation of the Public Reference Room).
Information regarding the Fund’s proxy voting policies and procedures and its proxy voting record for the 12-month period ending June 30 of each year is filed with the SEC on Form N-PX no later than August 31 of each year. The Fund’s Form N-PX is available without charge, upon request, by calling the Fund at its toll free number 1-(888) 4-ASIA-PAC and on the SEC’s website (http//www.sec.gov) or on or through the Fund’s website address (www.asiapacificfund.com).
24
| | | | | | |
| Item 2 | | – | | Code of Ethics – Not required, as this is not an annual filing. |
| | |
| Item 3 | | – | | Audit Committee Financial Expert – Not required, as this is not an annual filing. |
| | |
| Item 4 | | – | | Principal Accountant Fees and Services – Not required, as this is not an annual filing. |
| | |
| Item 5 | | – | | Audit Committee of Listed Registrants – Not required, as this is not an annual filing. |
| | |
| Item 6 | | – | | Schedule of Investments – The schedule is included as part of the report to shareholders filed under Item 1 of this Form. |
| | |
| Item 7 | | – | | Disclosure of Proxy Voting Policies and Procedures for Closed-End Management Investment Companies – Not required, as this is not an annual filing. |
| | |
| Item 8 | | – | | Portfolio Managers of Closed-End Management Investment Companies – Not required, as this is not an annual filing. |
| | |
| Item 9 | | – | | Purchases of Equity Securities by Closed-End Management Investment Company and Affiliated Purchasers – There were no purchases made by or on behalf of the registrant or any “affiliated purchaser,” as defined in Rule 10b-18(a) (3) under the Securities Exchange Act of 1934, as amended, of shares of the registrant’s equity securities made in the period covered by this report. |
| | |
| Item 10 | | – | | Submission of Matters to a Vote of Security Holders – Not applicable. |
| | |
| Item 11 | | – | | Controls and Procedures |
| | | |
| | (a) | | | | It is the conclusion of the registrant’s principal executive officer and principal financial officer that the effectiveness of the registrant’s current disclosure controls and procedures (such disclosure controls and procedures having been evaluated within 90 days of the date of this filing) provide reasonable assurance that the information required to be disclosed by the registrant has been recorded, processed, summarized and reported within the time period specified in the Commission’s rules and forms and that the information required to be disclosed by the registrant has been accumulated and communicated to the registrant’s principal executive officer and principal financial officer in order to allow timely decisions regarding required disclosure. |
| | | |
| | (b) | | | | There has been no significant change in the registrant’s internal control over financial reporting that occurred during the registrant’s most recent fiscal quarter of the period covered by this report that has materially affected, or is likely to materially affect, the registrant’s internal control over financial reporting. |
| | |
| Item 12 | | – | | Exhibits |
| | | |
| | (a) | | | | (1) Code of Ethics – Not required, as this is not an annual filing. |
| | | |
| | | | | | (2) Certifications pursuant to Section 302 of the Sarbanes-Oxley Act – Attached hereto as Exhibit EX-99.CERT. |
| | | |
| | | | | | (3) Any written solicitation to purchase securities under Rule 23c-1. – Not applicable. |
| | | |
| | (b) | | | | Certifications pursuant to Section 906 of the Sarbanes-Oxley Act – Attached hereto as Exhibit EX-99.906CERT. |
SIGNATURES
Pursuant to the requirements of the Securities Exchange Act of 1934 and the Investment Company Act of 1940, the registrant has duly caused this report to be signed on its behalf by the undersigned, thereunto duly authorized.
|
(Registrant) The Asia Pacific Fund, Inc. |
|
By (Signature and Title)* /s/ Deborah A. Docs |
Deborah A. Docs |
Secretary |
|
Date November 23, 2015 |
Pursuant to the requirements of the Securities Exchange Act of 1934 and the Investment Company Act of 1940, this report has been signed below by the following persons on behalf of the registrant and in the capacities and on the dates indicated.
|
By (Signature and Title)* /s/ Raymond Tam |
Raymond Tam |
President and Principal Executive Officer |
|
Date November 23, 2015 |
|
By (Signature and Title)* /s/ M. Sadiq Peshimam |
M. Sadiq Peshimam |
Treasurer and Chief Financial Officer |
|
Date November 23, 2015 |
| * | Print the name and title of each signing officer under his or her signature. |