UNITED STATES
SECURITIES AND EXCHANGE COMMISSION
Washington, D.C. 20549
FORM N-CSR
CERTIFIED SHAREHOLDER REPORT OF REGISTERED
MANAGEMENT INVESTMENT COMPANIES
Investment Company Act file number: 811-04710
THE ASIA PACIFIC FUND, INC.
(Exact name of registrant as specified in charter)
Gateway Center 3,
100 Mulberry Street,
Newark, New Jersey 07102
(Address of principal executive offices)
Deborah A. Docs
Gateway Center 3,
100 Mulberry Street,
Newark, New Jersey 07102
(Name and address of agent for service)
Registrant’s telephone number, including area code: 973-367-7521
Date of fiscal year end: 3/31/2014
Date of reporting period: 9/30/2013
Item 1 – Reports to Stockholders
Directors
Michael J. Downey, Chairman
Jessica M. Bibliowicz
Robert H. Burns
Robert F. Gunia
Duncan M. McFarland
David G. P. Scholfield
Nicholas T. Sibley
William G. Tung
Officers
Raymond Tam, President
Grace C. Torres, Vice President
M. Sadiq Peshimam, Treasurer and Chief Financial Officer
Deborah A. Docs, Secretary and Chief Legal Officer
Andrew R. French, Assistant Secretary
Valerie M. Simpson, Chief Compliance Officer
Theresa C. Thompson, Deputy Chief Compliance Officer
Investment Manager
With effect from October 1, 2013:
Value Partners Hong Kong Limited
9th Floor, Nexxus Building
41 Connaught Road Central
Hong Kong
Through September 30, 2013:
Baring Asset Management (Asia) Limited
1901 Edinburgh Tower
15 Queen’s Road Central
Hong Kong
Administrator
Prudential Investments LLC
Gateway Center Three
100 Mulberry Street
Newark, NJ 07102-4077
Custodian
The Bank of New York Mellon
One Wall Street
New York, NY 10286
Transfer Agent
Computershare Trust Company N.A.
P.O. Box 43011
Providence, RI 02940-3011
Independent Registered Public Accounting Firm
KPMG LLP
345 Park Avenue
New York, NY 10154
Legal Counsel
Sullivan & Cromwell LLP
125 Broad Street
New York, New York 10004
Notice is hereby given in accordance with Section 23(c) of the Investment Company Act of 1940 that The Asia Pacific Fund, Inc. (the “Fund”) may purchase, from time to time, shares of its common stock at market prices.
The accompanying financial statements as of September 30, 2013 were not audited and, accordingly, no opinion is expressed on them.
This report, including the financial statements herein, is transmitted to the shareholders of the Fund for their information. This is not a prospectus, circular or representation intended for use in the purchase of shares of the Fund or any securities mentioned in this report.
The Asia Pacific Fund, Inc.
Gateway Center Three
100 Mulberry Street
Newark, NJ 07102-4077
For general information on the Fund, please call (toll-free) Pristine Advisers, our shareholders’ servicing agent toll-free at:
1-(888) 4-ASIA-PAC
Current information about the Fund is available on its website (http://www.asiapacificfund.com). This website includes monthly updates of the Fund’s performance and other data as well as the Manager’s quarterly presentation of performance and asset allocations and comments on the current Asian outlook.
The Fund’s CUSIP number is 044901106
APBS

The Asia Pacific
Fund, Inc.
Semi-Annual Report
September 30, 2013
www.asiapacificfund.com
The Asia Pacific Fund, Inc.
As of September 30, 2013 (Unaudited)
OUR TOLL-FREE LINE:
1-888-4-ASIA-PAC
For further information on the Fund, please call. In addition, the Fund makes available monthly certain portfolio information. If you would like to receive this information please call the toll-free number indicated above.
Statistics
| | | | |
Total Net Assets | | | $116,630,606 | |
Shares Outstanding | | | 10,344,073 | |
Net Asset Value | | | $11.28 | |
Equity | | | 97.9%(a) | |
Total Returns (US Dollar terms)
(As of September 30, 2013)
| | | | | | | | |
| Period | | Market
Price(b) | | | NAV(c) | |
3 months | | | 0.2% | | | | 1.0% | |
6 months | | | -5.9% | | | | -5.4% | |
9 months | | | -6.5% | | | | -7.5% | |
1 Year | | | -1.6% | | | | -2.0% | |
3 Years | | | -8.2% | | | | -6.8% | |
5 Years | | | 40.9% | | | | 36.5% | |
10 Years | | | 158.5% | | | | 176.6% | |
Since inception (d) | | | 697.0% | | | | 788.4% | |
Since inception (d)(e) | | | 8.2% | | | | 8.6% | |
Other Information
| | | | |
Ticker Symbol | | | APB | |
Primary Exchange | | | NYSE | |
Dividend Repurchase Program | | | Yes | |
Portfolio Characteristics
(As of September 30, 2013)
Top Ten Equity Holdings
(% of Total Net Assets)
| | | | |
Samsung Electronics Co. Ltd. | | | 6.9% | |
Kia Motors Corp. | | | 4.6% | |
AIA Group Ltd. | | | 3.8% | |
Taiwan Semiconductor Manufacturing Co. Ltd. | | | 3.7% | |
Tencent Holdings Ltd. | | | 2.7% | |
Industrial & Commercial Bank of China Ltd. | | | 2.5% | |
Jardine Strategic Holdings Ltd. | | | 2.3% | |
China Construction Bank Corp. | | | 2.2% | |
Sands China Ltd. | | | 2.2% | |
LG Corp. | | | 2.1% | |
Sector Breakdown: Top Ten Industries
(% of Total Net Assets)
| | | | |
Banking | | | 16.3% | |
Semiconductors & Semiconductor Equipment | | | 15.1% | |
Consumer Discretionary | | | 15.0% | |
Real Estate-Developers | | | 8.4% | |
Technology Hardware & Equipment | | | 7.9% | |
Industrials | | | 6.4% | |
Diversified Financials | | | 6.2% | |
Materials | | | 5.6% | |
Healthcare | | | 4.2% | |
Software & Services | | | 3.4% | |
Footnote section
| (a) | Expressed as a percentage of total investments. |
| (b) | Total investment return is calculated assuming a purchase of common stock at the current market value on the first day and a sale at the current market value on the last day of each period reported. Dividends and distributions are assumed, for purposes of this calculation, to be reinvested at prices obtained under the Fund’s dividend reinvestment plan. These calculations do not include brokerage commissions. |
| (c) | This information represents the historical net asset value (NAV) per share performance of the Fund. NAV per share performance is calculated assuming reinvestment of dividends and distributions. Because NAV per share performance does not reflect market price, it is not the same as total investment return. |
| (d) | Investment operations commenced on May 4, 1987. |
| (e) | Average annual return. |
1
REPORT OF THE INVESTMENT MANAGER
For the period from March 31 to September 30, 2013 (Unaudited)
During the six-month period ended September 30, 2013, the Fund’s net asset value (NAV) per share decreased by $0.64, from $11.92 to $11.28. In percentage terms, the Fund’s NAV total return was down 5.4%. This compares with a rise of 0.3% based on its reference benchmark index, the MSCI All Countries (AC) Asia Ex-Japan Gross Index. The Fund’s share price fell by 5.9% over the period, from $10.76 to $10.12.
The chart below illustrates the Fund’s net asset value performance per share during the period:
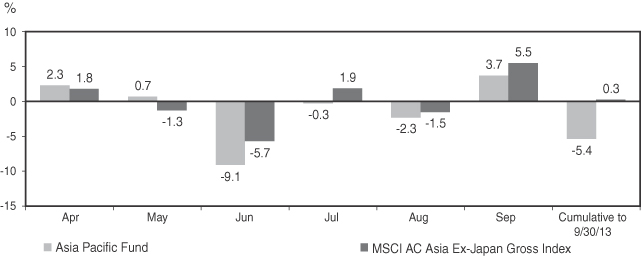
Source: Baring Asset Management, MSCI
Local Currencies vs. the US Dollar
| | | | | | | | | | | | |
Currency US$/Local rate | | Mar 31
2013 | | | Sep 30
2013 | | | Mar 31 to
Sep 30 2013
Change % | |
North Asia | | | | | | | | | | | | |
Chinese Renminbi | | | 6.21 | | | | 6.12 | | | | 1.5 | |
Hong Kong Dollar | | | 7.76 | | | | 7.76 | | | | 0.1 | |
South Korean Won | | | 1,113 | | | | 1,075 | | | | 3.5 | |
New Taiwan Dollar | | | 29.90 | | | | 29.57 | | | | 1.1 | |
ASEAN | | | | | | | | | | | | |
Thai Baht | | | 29.29 | | | | 31.28 | | | | -6.4 | |
Malaysian Ringgit | | | 3.10 | | | | 3.26 | | | | -5.0 | |
Philippine Peso | | | 40.81 | | | | 43.54 | | | | -6.3 | |
Singapore Dollar | | | 1.24 | | | | 1.25 | | | | -1.1 | |
Indonesian Rupiah | | | 9,718 | | | | 11,580 | | | | -16.1 | |
South Asia | | | | | | | | | | | | |
Indian Rupee | | | 54.35 | | | | 62.61 | | | | -13.2 | |
Vietnamese Dong | | | 20942.5 | | | | 21,112.5 | | | | -0.8 | |
Sri Lankan Rupee | | | 126.75 | | | | 132.00 | | | | -4.0 | |
Source: Baring Asset Management, Factset
STOCK MARKET PERFORMANCE
| | | | | | | | |
Country - Index | | Mar 31 to
Sep 30 2013
Market Change %
Local currency terms | | | Mar 31 to
Sep 30 2013
Market Change %
US$ terms | |
North Asia | | | | | | | | |
MSCI Hong Kong | | | 3.8 | | | | 3.9 | |
MSCI China | | | 4.8 | | | | 4.9 | |
MSCI Korea | | | -0.1 | | | | 3.5 | |
MSCI Taiwan | | | 4.2 | | | | 5.4 | |
ASEAN | | | | | | | | |
MSCI Philippines | | | -7.5 | | | | -13.3 | |
MSCI Malaysia | | | 8.5 | | | | 3.1 | |
MSCI Singapore | | | -0.9 | | | | -2.0 | |
MSCI Thailand | | | -7.2 | | | | -13.2 | |
MSCI Indonesia | | | -15.3 | | | | -28.9 | |
South Asia | | | | | | | | |
MSCI Vietnam | | | -9.2 | | | | -9.9 | |
MSCI India | | | 3.0 | | | | -10.6 | |
MSCI Sri Lanka | | | -4.6 | | | | -8.4 | |
MSCI AC Asia
Ex-Japan Gross | | | 1.9 | | | | 0.3 | |
Source: Baring Asset Management, Factset
2
COUNTRY ALLOCATION*
| | | | | | | | | | | | |
Country | | March 31
2013 | | | June 30
2013 | | | September 30
2013 | |
North Asia | | | 74.1 | % | | | 68.5 | % | | | 77.2 | % |
Hong Kong/China | | | 39.5 | | | | 33.5 | | | | 38.9 | |
South Korea | | | 18.4 | | | | 18.0 | | | | 21.7 | |
Taiwan | | | 16.3 | | | | 17.0 | | | | 16.6 | |
ASEAN | | | 23.2 | | | | 17.4 | | | | 12.2 | |
Singapore | | | 4.4 | | | | 3.5 | | | | 2.9 | |
Thailand | | | 6.2 | | | | 3.4 | | | | 4.0 | |
Indonesia | | | 9.6 | | | | 4.7 | | | | 1.6 | |
Philippines | | | 1.9 | | | | 2.1 | | | | 1.9 | |
Malaysia | | | 1.1 | | | | 3.7 | | | | 1.8 | |
South Asia | | | 10.1 | | | | 9.5 | | | | 8.7 | |
India | | | 9.0 | | | | 8.5 | | | | 7.9 | |
Sri Lanka | | | 1.1 | | | | 1.0 | | | | 0.8 | |
Cash & Other | | | -7.4 | | | | 4.6 | | | | 1.9 | |
* Rounded up to the nearest tenth of one percent. Expressed as a percentage of net assets.
PORTFOLIO & MARKET REVIEW
Asian equity markets were slightly up 0.3% in US dollar terms in the six-month period ended September 30, 2013. The top three performing major markets in the period, as measured by the MSCI country indices, were Taiwan (+5.4%), China (+4.9%) and Hong Kong (+3.9%). The major laggards were Indonesia (-28.9%), the Philippines (-13.3%), Thailand (-13.2%) and India (-10.6%). Asian currencies were mixed, with North Asian currencies generally stronger against the US dollar. On the other hand, ASEAN and South Asian currencies generally weakened against the US dollar.
The equity market has been very volatile in the last six months, driven by macro events external to Asia. In particular, concerns about the impact of any reduction in the Federal Reserve’s program of bond buying and the effect this might have on interest rates caused a sharp decline in Southeast Asian markets and companies with high dividend yield levels. This was then significantly reversed as the US Fed announced an unexpected delay in its plans to reduce its program of bond buying.
Asian markets were notable laggards versus global markets during the period, especially the US stock market. Within the region, North Asian markets posted larger gains while ASEAN and South Asian markets were solidly in the negative. Weaker markets such as India and Indonesia fell on continued con-
cerns over US dollar strength, with macroeconomic conditions, and profit taking also among the major reasons. Currency concerns also loomed over markets such as Indonesia and India. In the meantime, North Asia seems to be better positioned in terms of both financial stability and perceived better exposure to the developed market demand recovery. Global economic recovery remains centered on the developed economies such as the US and Japan.
During the period, we reduced Indonesia to an underweight position relative to the benchmark index on significant macroeconomic risk in near term. We also reduced our weighting in China due to the uncertain economic outlook, and technology holdings in Taiwan and Korea on seasonal weakness. On the other hand, we added to economic sensitive stocks in Korea, and increased our overweight position in Hong Kong, with preference for companies with better earnings visibility. As a result, our preferred markets are Hong Kong, Taiwan and Korea. Meanwhile we are most underweight in China, Singapore and Malaysia. Sector wise, we are overweight in Information Technology, Consumer Discretionary and Healthcare.
The Fund underperformed its reference benchmark during the period. This was mainly due to stock selection in Korea, Thailand and Hong Kong. This was offset in part by stock picks in China and Indonesia.
Baring Asset Management (Asia) Ltd.
October 16, 2013
3
THE ASIA PACIFIC FUND, INC.
Portfolio of Investments
September 30, 2013
(Unaudited)
| | | | | | | | |
| Shares | | | Description | | Value
(Note 1) | |
| | | | LONG-TERM INVESTMENTS—98.1% | |
| | | | EQUITIES | |
| | | | CHINA (INCLUDING HONG KONG SAR)—38.9% | |
| | 946,800 | | | AIA Group Ltd. | | $ | 4,449,627 | |
| | | | (Diversified Financials) | | | | |
| | 95,000 | | | Cheung Kong Holdings Ltd. | | | 1,446,576 | |
| | | | (Real Estate-Developers) | | | | |
| | 3,394,000 | | | China Construction Bank Corp. (Class “H” Shares) | | | 2,612,486 | |
| | | | (Banking) | | | | |
| | 1,129,000 | | | China Railway Construction Corp. Ltd. (Class “H” Shares) | | | 1,193,646 | |
| | | | (Industrials) | | | | |
| | 782,000 | | | China Resources Land Ltd. | | | 2,223,224 | |
| | | | (Real Estate-Developers) | | | | |
| | 858,000 | | | China State Construction International | | | 1,380,606 | |
| | | | (Industrials) | | | | |
| | 2,516,000 | | | FIH Mobile Ltd.* | | | 1,560,355 | |
| | | | (Technology Hardware & Equipment) | | | | |
| | 802,500 | | | First Pacific Co. Ltd. | | | 886,735 | |
| | | | (Diversified Financials) | | | | |
| | 6,297,000 | | | GCL-Poly Energy Holdings Ltd. | | | 1,818,652 | |
| | | | (Semiconductors & Semiconductor Equipment) | | | | |
| | 1,047,000 | | | Goodbaby International Holdings Ltd. | | | 526,477 | |
| | | | (Consumer Discretionary) | | | | |
| | 4,662,000 | | | Guodian Technology & Environment Group Co. Ltd. (Class “H” Shares) | | | 943,713 | |
| | | | (Technology Hardware & Equipment) | | | | |
| | 211,600 | | | HSBC Holdings PLC | | | 2,301,275 | |
| | | | (Banking) | | | | |
| | 4,172,000 | | | Industrial & Commercial Bank of China Ltd. (Class “H” Shares) | | | 2,910,110 | |
| | | | (Banking) | | | | |
| | 78,500 | | | Jardine Strategic Holdings Ltd. | | | 2,657,225 | |
| | | | (Industrials) | | | | |
| | | | | | | | |
| Shares | | | Description | | Value
(Note 1) | |
| | 262,000 | | | Melco International Development Ltd. | | $ | 702,639 | |
| | | | (Consumer Discretionary) | | | | |
| | 2,016,000 | | | Nine Dragons Paper Holdings Ltd. | | | 1,421,823 | |
| | | | (Materials) | | | | |
| | 248,000 | | | Ping An Insurance Group Co. of China Ltd. (Class “H” Shares) | | | 1,843,397 | |
| | | | (Diversified Financials) | | | | |
| | 180,000 | | | Power Assets Holdings Ltd. | | | 1,610,645 | |
| | | | (Utilities) | | | | |
| | 418,000 | | | Sands China Ltd. | | | 2,584,239 | |
| | | | (Consumer Discretionary) | | | | |
| | 506,500 | | | Shimao Property Holdings Ltd. | | | 1,165,043 | |
| | | | (Real Estate-Developers) | | | | |
| | 2,748,000 | | | Sino Biopharmaceutical | | | 1,860,132 | |
| | | | (Healthcare) | | | | |
| | 4,780,000 | | | Sinopec Shanghai Petrochemical Co. Ltd. (Class “H” Shares) | | | 1,781,121 | |
| | | | (Materials) | | | | |
| | 59,900 | | | Tencent Holdings Ltd. | | | 3,141,779 | |
| | | | (Software & Services) | | | | |
| | 273,000 | | | Wharf Holdings Ltd. | | | 2,365,371 | |
| | | | | | | | |
| | | | (Real Estate-Developers) | | | | |
| | | | | | | 45,386,896 | |
| | | | | | | | |
| | |
| | | | INDIA—7.9% | | | | |
| | 71,539 | | | Axis Bank Ltd. | | | 1,151,674 | |
| | | | (Banking) | | | | |
| | 29,375 | | | Dr. Reddy’s Laboratories Ltd. | | | 1,117,264 | |
| | | | (Healthcare) | | | | |
| | 123,016 | | | HDFC Bank Ltd. | | | 1,165,316 | |
| | | | (Banking) | | | | |
| | 51,626 | | | Housing Development Finance Corp. | | | 630,224 | |
| | | | (Banking) | | | | |
| | 94,567 | | | ICICI Bank Ltd. | | | 1,334,784 | |
| | | | (Banking) | | | | |
| | 18,597 | | | Infosys Ltd. | | | 895,021 | |
| | | | (Software & Services) | | | | |
| | 110,421 | | | Sun Pharmaceutical Industries Ltd. | | | 1,046,446 | |
| | | | (Healthcare) | | | | |
See Notes to Financial Statements.
4
| | | | | | | | |
| Shares | | | Description | | Value
(Note 1) | |
| | | | INDIA—(continued) | | | | |
| | 196,772 | | | Tata Motors Ltd. | | $ | 1,045,071 | |
| | | | (Consumer Discretionary) | | | | |
| | 234,071 | | | Zee Entertainment Enterprises Ltd. | | | 854,329 | |
| | | | | | | | |
| | | | (Consumer Discretionary) | | | | |
| | | | | | | 9,240,129 | |
| | | | | | | | |
| | |
| | | | INDONESIA—1.6% | | | | |
| | 8,660,954 | | | PT Kalbe Farma Tbk | | | 882,550 | |
| | | | (Health Care) | | | | |
| | 5,350,000 | | | PT Telekomunikasi Indonesia Persero Tbk | | | 970,207 | |
| | | | | | | | |
| | | | (Telecommunication Services) | | | | |
| | | | | | | 1,852,757 | |
| | | | | | | | |
| | |
| | | | MALAYSIA—1.8% | | | | |
| | 380,300 | | | Malayan Banking Bhd | | | 1,148,075 | |
| | | | (Banking) | | | | |
| | 1,216,700 | | | UEM Sunrise Bhd | | | 951,859 | |
| | | | | | | | |
| | | | (Real Estate-Developers) | | | | |
| | | | | | | 2,099,934 | |
| | | | | | | | |
| | |
| | | | PHILIPPINES—1.9% | | | | |
| | 2,076,000 | | | Alliance Global Group, Inc. | | | 1,120,487 | |
| | | | (Industrials) | | | | |
| | 154,830 | | | Jollibee Foods Corp. | | | 599,193 | |
| | | | (Consumer Discretionary) | | | | |
| | 1,881,300 | | | Melco Crown Philippines Resorts Corp.* | | | 475,294 | |
| | | | | | | | |
| | | | (Consumer Discretionary) | | | | |
| | | | | | | 2,194,974 | |
| | | | | | | | |
| | |
| | | | SINGAPORE—2.9% | | | | |
| | 659,000 | | | CapitaLand Ltd. | | | 1,623,140 | |
| | | | (Real Estate-Developers) | | | | |
| | 27,642 | | | Keppel REIT | | | 27,101 | |
| | | | (Real Estate Investment Trust) | | | | |
| | 104,000 | | | United Overseas Bank Ltd. | | | 1,713,507 | |
| | | | | | | | |
| | | | (Banking) | | | | |
| | | | | | | 3,363,748 | |
| | | | | | | | |
| | |
| | | | SOUTH KOREA—21.7% | | | | |
| | 22,460 | | | Hyundai Hysco | | | 962,415 | |
| | | | (Materials) | | | | |
| | | | | | | | |
| Shares | | | Description | | Value
(Note 1) | |
| | 88,079 | | | Kia Motors Corp. | | $ | 5,351,905 | |
| | | | (Consumer Discretionary) | | | | |
| | 7,771 | | | Korea Zinc Co. Ltd. | | | 2,350,083 | |
| | | | (Materials) | | | | |
| | 40,114 | | | LG Corp. | | | 2,471,023 | |
| | | | (Consumer Discretionary) | | | | |
| | 62,050 | | | LG Display Co. Ltd. | | | 1,498,311 | |
| | | | (Technology Hardware & Equipment) | | | | |
| | 13,312 | | | LG Electronics Inc. | | | 881,954 | |
| | | | (Consumer Discretionary) | | | | |
| | 1,009 | | | Orion Corp. | | | 894,761 | |
| | | | (Consumer Discretionary) | | | | |
| | 6,351 | | | Samsung Electronics Co. Ltd. | | | 8,078,551 | |
| | | | (Semiconductors & Semiconductor Equipment) | | | | |
| | 16,936 | | | Samsung Life Insurance Co. Ltd | | | 1,646,835 | |
| | | | (Insurance) | | | | |
| | 8,720 | | | SK Innovation Co. Ltd. | | | 1,184,656 | |
| | | | | | | | |
| | | | (Energy) | | | | |
| | | | | | | 25,320,494 | |
| | | | | | | | |
| | |
| | | | SRI LANKA—0.8% | | | | |
| | 750,258 | | | Sampath Bank PLC | | | 965,673 | |
| | | | | | | | |
| | | | (Banking) | | | | |
| | |
| | | | TAIWAN—16.6% | | | | |
| | 234,000 | | | Catcher Technology Co. Ltd. | | | 1,238,577 | |
| | | | (Technology Hardware & Equipment) | | | | |
| | 1,339,554 | | | Cathay Financial Holding Co. Ltd. | | | 1,907,370 | |
| | | | (Insurance) | | | | |
| | 195,650 | | | Cheng Shin Rubber Industry Co. Ltd. | | | 512,169 | |
| | | | (Consumer Discretionary) | | | | |
| | 2,744,000 | | | Compal Electronics | | | 2,004,613 | |
| | | | (Technology Hardware & Equipment) | | | | |
| | 133,000 | | | Delta Electronics, Inc. | | | 645,500 | |
| | | | (Technology Hardware & Equipment) | | | | |
| | 86,000 | | | Giant Manufacturing Co. Ltd. | | | 586,093 | |
| | | | (Consumer Discretionary) | | | | |
See Notes to Financial Statements.
5
THE ASIA PACIFIC FUND, INC.
Portfolio of Investments
September 30, 2013
(Unaudited) Continued
| | | | | | | | |
| Shares | | | Description | | Value
(Note 1) | |
| | | | TAIWAN—(continued) | | | | |
| | 337,000 | | | Kinsus Interconnect Technology Corp. | | $ | 1,185,376 | |
| | | | (Semiconductors & Semiconductor Equipment) | | | | |
| | 38,000 | | | Largan Precision Co. Ltd. | | | 1,278,791 | |
| | | | (Technology Hardware & Equipment) | | | | |
| | 2,004,000 | | | Mega Financial Holding Co. Ltd. | | | 1,643,623 | |
| | | | (Banking) | | | | |
| | 150,000 | | | Phison Electronics Corp. | | | 1,080,597 | |
| | | | (Semiconductors & Semiconductor Equipment) | | | | |
| | 331,660 | | | Radiant Opto-Electronics Corp. | | | 1,183,418 | |
| | | | (Semiconductors & Semiconductor Equipment) | | | | |
| | 1,266,000 | | | Taiwan Semiconductor Manufacturing Co. Ltd. | | | 4,303,210 | |
| | | | (Semiconductors & Semiconductor Equipment) | | | | |
| | 952,240 | | | Uni-President Enterprises Corp. | | | 1,774,559 | |
| | | | | | | | |
| | | | (Consumer Staples) | | | | |
| | | | | | | 19,343,896 | |
| | | | | | | | |
| | |
| | | | THAILAND—4.0% | | | | |
| | 190,700 | | | Advanced Info. Service PCL | | | 1,554,620 | |
| | | | (Telecommunication Services) | | | | |
| | 107,200 | | | Bangkok Bank PCL | | | 675,141 | |
| | | | (Banking) | | | | |
| | 1,201,300 | | | Krung Thai Bank PCL | | | 737,371 | |
| | | | (Banking) | | | | |
| | 1,507,428 | | | Sino Thai Engineering & Construction PCL | | | 1,098,765 | |
| | | | (Industrials) | | | | |
| | 314,400 | | | Thai Oil PCL | | | 580,454 | |
| | | | | | | | |
| | | | (Energy) | | | | |
| | | | | | | 4,646,351 | |
| | | | | | | | |
| | | | Total long-term investments
(cost $101,970,106) | | | 114,414,852 | |
| | | | | | | | |
| | | | | | | | |
| Shares | | | Description | | Value
(Note 1) | |
| | | | SHORT-TERM INVESTMENT—2.1% | |
| | | | MONEY MARKET MUTUAL FUND | |
| | | | UNITED STATES | |
| | 2,484,851 | | | JPMorgan Prime Money Market Fund/Premier
(cost $2,484,851) | | $ | 2,484,851 | |
| | | | | | | | |
| | | | Total Investments—100.2%
(cost $104,454,957; Note 4) | | | 116,899,703 | |
| | | | Liabilities in excess of other assets—(0.2%) | | | (269,097 | ) |
| | | | | | | | |
| | | | Net Assets—100.0% | | $ | 116,630,606 | |
| | | | | | | | |
The following abbreviations are used in the portfolio descriptions:
| REIT—Real | Estate Investment Trust |
| * | Non-income producing security |
Various inputs are used in determining the value of the Fund’s investments. These inputs are summarized in the three broad levels listed below.
Level 1—quoted prices generally in active markets for identical securities.
Level 2—other significant observable inputs including, but not limited to, quoted prices for similar securities, interest rates and yield curves, prepayment speeds, foreign currency exchange rates, and amortized cost.
Level 3—significant unobservable inputs for securities valued in accordance with Board approved fair valuation procedures.
The following is a summary of the inputs used as of September 30, 2013 in valuing such portfolio securities:
| | | | | | | | | | | | |
| | | Level 1 | | | Level 2 | | | Level 3 | |
Investments in Securities | | | | | | | | | | | | |
Equities | | | | | | | | | | | | |
China (including Hong Kong SAR) | | $ | 45,386,896 | | | $ | — | | | $ | — | |
India | | | 9,240,129 | | | | — | | | | — | |
Indonesia | | | 1,852,757 | | | | — | | | | — | |
Malaysia | | | 2,099,934 | | | | — | | | | — | |
Philippines | | | 2,194,974 | | | | — | | | | — | |
Singapore | | | 3,363,748 | | | | — | | | | — | |
South Korea | | | 25,320,494 | | | | — | | | | — | |
Sri Lanka | | | 965,673 | | | | — | | | | — | |
See Notes to Financial Statements.
6
| | | | | | | | | | | | |
| | | Level 1 | | | Level 2 | | | Level 3 | |
Taiwan | | $ | 19,343,896 | | | $ | — | | | $ | — | |
Thailand | | | 1,773,906 | | | | 2,872,445 | | | | — | |
Money Market Mutual Fund | | | 2,484,851 | | | | — | | | | — | |
| | | | | | | | | | | | |
Total | | $ | 114,027,258 | | | $ | 2,872,445 | | | $ | — | |
| | | | | | | | | | | | |
The industry classification of portfolio holdings and liabilities in excess of other assets shown as a percentage of net assets as of September 30, 2013 were as follows:
| | | | |
Banking | | | 16.3 | % |
Semiconductors & Semiconductor Equipment | | | 15.1 | |
Consumer Discretionary | | | 15.0 | |
Real-Estate Developers | | | 8.4 | |
Technology Hardware & Equipment | | | 7.9 | |
Industrials | | | 6.4 | |
| | | | |
Diversified Financials | | | 6.2 | % |
Materials | | | 5.6 | |
Healthcare | | | 4.2 | |
Software & Services | | | 3.4 | |
Insurance | | | 3.0 | |
Telecommunications Services | | | 2.2 | |
Money Market Mutual Fund | | | 2.1 | |
Energy | | | 1.5 | |
Consumer Staples | | | 1.5 | |
Utilities | | | 1.4 | |
Real Estate Investment Trust | | | — | * |
| | | | |
| | | 100.2 | |
| | | (0.2 | ) |
| | | | |
| | | 100.0 | % |
| | | | |
The Fund invested in derivative instruments (futures contracts) during the reporting period. The primary type of risk associated with these derivative instruments is equity risk. The effect of such derivative instruments on the Fund’s financial position and financial performance as reflected in the Statement of Operations is presented in the summary below.
The effects of derivative instruments on the Statement of Operations for the six months ended September 30, 2013 are as follows:
| | | | |
Amount of Realized Gain or (Loss) on Derivatives Recognized in Income | |
Derivatives not designated as hedging instruments, carried at fair value | | Futures | |
Equity contracts | | $ | (20,258 | ) |
| | | | |
For the six months ended September 30, 2013, the Fund did not have any unrealized gain or (loss) on derivatives recognized in income.
See Notes to Financial Statements.
7
THE ASIA PACIFIC FUND, INC.
Statement of Assets and Liabilities
September 30, 2013
(Unaudited)
| | | | |
| Assets | | | | |
Investments, at value (cost $104,454,957) | | $ | 116,899,703 | |
Foreign currency, at value (cost $36,602) | | | 36,668 | |
Dividends receivable | | | 116,326 | |
Prepaid expenses | | | 124,980 | |
| | | | |
Total assets | | | 117,177,677 | |
| | | | |
| Liabilities | | | | |
Accrued expenses and other liabilities | | | 429,117 | |
Investment management fee payable | | | 93,608 | |
Administration fee payable | | | 24,346 | |
| | | | |
Total liabilities | | | 547,071 | |
| | | | |
| Net Assets | | $ | 116,630,606 | |
| | | | |
Net assets were comprised of: | | | | |
Common stock, at par | | $ | 103,441 | |
Paid-in capital in excess of par | | | 128,566,028 | |
| | | | |
| | | 128,669,469 | |
Accumulated net investment loss | | | (230,179 | ) |
Accumulated net realized loss on investment and foreign currency transactions | | | (24,253,565 | ) |
Net unrealized appreciation on investments and foreign currencies | | | 12,444,881 | |
| | | | |
Net Assets, September 30, 2013 | | $ | 116,630,606 | |
| | | | |
Net Asset Value per share
($116,630,606 ÷ 10,344,073 shares of common stock outstanding) | | | $11.28 | |
| | | | |
See Notes to Financial Statements.
THE ASIA PACIFIC FUND, INC.
Statement of Operations
Six Months Ended September 30, 2013
(Unaudited)
| | | | |
| Net Investment Income | | | | |
Income | | | | |
Dividends (net of foreign withholding taxes of $198,900) | | $ | 1,744,581 | |
| | | | |
Expenses | | | | |
Investment management fee | | | 569,813 | |
Legal fees and expenses | | | 268,000 | |
Administration fee | | | 149,787 | |
Directors’ fees and board expenses | | | 131,000 | |
Custodian’s fees and expenses | | | 107,000 | |
Reports to shareholders | | | 71,000 | |
Insurance | | | 66,000 | |
Audit fee | | | 20,000 | |
Transfer agent’s fees and expenses | | | 14,000 | |
Registration fees | | | 13,000 | |
Commitment fees (Note 6) | | | 12,000 | |
Miscellaneous | | | 61,789 | |
| | | | |
Total expenses | | | 1,483,389 | |
| | | | |
Net investment income | | | 261,192 | |
| | | | |
| Realized and Unrealized Gain (Loss) on Investments, Foreign Currency and Futures Transactions | | | | |
Net realized loss on: | | | | |
Investment transactions | | | (256,389 | ) |
Foreign currency transactions | | | (423,955 | ) |
Futures transactions | | | (20,258 | ) |
| | | | |
| | | (700,602 | ) |
| | | | |
Net change in unrealized appreciation (depreciation) on: | | | | |
Investments | | | (6,202,196 | ) |
Foreign currencies | | | 2,996 | |
| | | | |
| | | (6,199,200 | ) |
| | | | |
Net loss on investments, foreign currency and futures transactions | | | (6,899,802 | ) |
| | | | |
| Net Decrease in Net Assets Resulting From Operations | | $ | (6,638,610 | ) |
| | | | |
See Notes to Financial Statements.
8
THE ASIA PACIFIC FUND, INC.
Statement of Changes in Net Assets
(Unaudited)
| | | | | | | | |
Increase (Decrease)
in Net Assets | | Six Months
Ended
September 30,
2013 | | | Year Ended
March 31,
2013 | |
| | |
Operations | | | | | | | | |
| | |
Net investment income (loss) | | $ | 261,192 | | | $ | (335,857 | ) |
| | |
Net realized gain (loss) on investments, foreign currency and futures transactions | | | (700,602 | ) | | | 2,685,678 | |
| | |
Net change in unrealized appreciation (depreciation) on investments and foreign currencies | | | (6,199,200 | ) | | | 204,702 | |
| | | | | | | | |
| | |
Total increase (decrease) | | | (6,638,610 | ) | | | 2,554,523 | |
| | |
| Net Assets: | | | | | | | | |
| | |
Beginning of period | | | 123,269,216 | | | | 120,714,693 | |
| | | | | | | | |
| | |
End of period | | $ | 116,630,606 | | | $ | 123,269,216 | |
| | | | | | | | |
See Notes to Financial Statements.
THE ASIA PACIFIC FUND, INC.
Notes to Financial Statements
(Unaudited)
The Asia Pacific Fund, Inc. (the “Fund”) is registered under the Investment Company Act of 1940, as amended, as a diversified, closed-end, management investment company. The Fund’s investment objective is to achieve long-term capital appreciation through investment of at least 80% of investable assets in equity securities of companies in the Asia Pacific countries.
Note 1. Accounting Policies | |
The following is a summary of significant accounting policies followed by the Fund in the preparation of its financial statements.
The Fund’s financial statements are prepared in accordance with U.S. generally accepted accounting principles, which may require the use of management estimates and assumptions. Actual results could differ from these estimates and assumptions.
Securities Valuation The Fund holds portfolio securities and other assets that are fair valued at the close of each day the New York Stock Exchange (“NYSE”) is open for trading. Fair value is the price that would be received to sell an asset or paid to transfer a liability in an orderly transaction between market participants on the measurement date. The Board of Directors has delegated fair valuation responsibilities to the Manager (Value Partners Hong Kong Limited, with effect from October 1, 2013; Baring Asset Management (Asia) Limited, through September 30, 2013) through the adoption of Valuation Procedures for valuation of the Fund’s securities. Under the current Valuation Procedures, a Valuation Committee is established and responsible for supervising the valuation of portfolio securities and other assets. The Valuation Procedures allow the Fund to utilize independent pricing vendor services, quotations from market makers and other valuation methods in events when market quotations are not readily available. A record of the Valuation Committee’s actions is subject to review, approval and ratification by the Board at its next regularly scheduled quarterly meeting.
Various inputs are used in determining the value of the Fund’s investments, which are summarized in the three broad level hierarchies based on any observable inputs used as described in the table following the Fund’s Portfolio of Investments. The valuation methodologies and significant inputs used in determining the fair value
9
THE ASIA PACIFIC FUND, INC.
Notes to Financial Statements
(Unaudited) Continued
of securities and other assets classified as Level 1, Level 2 and Level 3 of the hierarchy are as follows:
Common stock, exchange-traded funds and financial derivative instruments (including futures contracts and certain options contracts on securities), that are traded on a national securities exchange are valued at the last sale price as of the close of trading on the applicable exchange. Securities traded via NASDAQ are valued at the NASDAQ official closing price. To the extent these securities are valued at the last sale price or NASDAQ official closing price, they are classified as Level 1 of the fair value hierarchy.
In the event there is no sale or official closing price on such day, these securities are valued at the mean between the last reported bid and asked prices, or at the last bid price in absence of an asked price. These securities are classified as Level 2 of the fair value hierarchy as these inputs are considered as significant other observable inputs to the valuation.
Common stocks traded on foreign securities exchanges are valued using pricing vendor services that provide model prices derived using adjustment factors based on information such as local closing price, relevant general and sector indices, currency fluctuations, depositary receipts, and futures, as applicable. Securities valued using such model prices are classified as Level 2 in the fair value hierarchy, as the adjustment factors are observable and considered to be significant to the valuation.
Investments in open end, non-exchange-traded mutual funds are valued at their net asset value as of the close of the NYSE on the date of valuation. These securities are classified as Level 1 as these securities have the ability to be purchased or sold at their net asset value on the date of valuation.
Securities and other assets that cannot be priced using the methods described above are valued with pricing methodologies approved by the Board of Directors. In the event there are unobservable inputs used when determining such valuation, the securities will be classified as Level 3 of the fair value hierarchy.
When determining the fair value of securities, some of the factors influencing the valuation include: the nature of any restrictions on disposition of the securities; assessment of the general liquidity of the securities; the issuer’s financial condition and the markets in which it does business; the cost of the investment; the size of the holding and the capitalization of the issuer; the prices of any recent transactions or bids/offers for such securities or any comparable securities; any available analyst media or other reports or information regarding the issuer or the markets or other reports or information deemed reliable by the investment manager regarding the issuer or the markets or industry in which it operates. Using fair value to price securities may result in a value that is different from a security’s most recent closing price and from the price used by other mutual funds to calculate their net asset values.
Foreign Currency Translation The books and records of the Fund are maintained in United States dollars. Foreign currency amounts are translated into United States dollars on the following basis:
(i) market value of investment securities, other assets and liabilities—at the current rates of exchange.
(ii) purchases and sales of investment securities, income and expenses—at the rates of exchange prevailing on the respective dates of such transactions.
Although the net assets of the Fund are presented at the foreign exchange rates and market values at the close of the fiscal period, the Fund does not isolate that portion of the results of operations arising as a result of changes in the foreign exchange rates from the fluctuations arising from changes in the market prices of securities held at fiscal period end. Similarly, the Fund does not isolate the effect of changes in foreign exchange rates from the fluctuations arising from changes in the market prices of portfolio securities sold during the fiscal period. Accordingly, these realized foreign currency gains or losses are included in the reported net realized gains or losses on investment transactions.
Net realized gains or losses on foreign currency transactions represent net foreign exchange gains or losses
10
from sales and maturities of short-term securities, holdings of foreign currencies, currency gains or losses realized between the trade and settlement dates on security transactions, and the difference between the amounts of dividends, interest and foreign taxes recorded on the Fund’s books and the U.S. dollar equivalent amounts actually received or paid. Net currency gains or losses from valuing foreign currency denominated assets, other than investment securities, and liabilities at fiscal period end exchange rates are reflected as a component of unrealized appreciation (depreciation) on investments and foreign currencies.
Foreign security and currency transactions may involve certain considerations and risks not typically associated with those of U.S. companies as a result of, among other factors, the level of governmental supervision and regulation of foreign securities markets and the possibility of political or economic instability.
Stock Index Futures Contracts A stock index futures contract is an agreement to purchase (long) or sell (short) an agreed amount of securities at a set price for delivery on a future date. Upon entering into a stock index futures contract, the Fund is required to pledge to the broker an amount of cash and/or other assets equal to a certain percentage of the contract amount. This amount is known as the “initial margin.” Subsequent payments known as “variation margin,” are made or received by the Fund each day, depending on the daily fluctuations in the value of the underlying security. Such variation margin is recorded for financial statement purposes on a daily basis as unrealized gain or loss. When the contract expires or is closed, the gain or loss is realized and is presented in the Statement of Operations as net realized gain or loss on stock index futures contracts.
The Fund may utilize stock index futures contracts for hedging and investment purposes. Should market prices for the futures contracts or the underlying assets move in ways not anticipated by the Fund, losses may result. The use of futures contracts involves the risk of imperfect correlation in movements in the price of futures contracts and the underlying assets being hedged or the exposures desired by the Fund.
Master Netting Arrangements The Fund is subject to various Master Agreements, or netting arrangements, with select counterparties. A master netting arrangement between the Fund and the counterparty permits the Portfolio to offset amounts payable by the Fund to the same counterparty against amounts to be received; and by the receipt of collateral from the counterparty by the Fund to cover the Fund’s exposure to the counterparty. However, there is no assurance that such mitigating factors are easily enforceable. The right to set-off exists when all the conditions are met such that each of the parties owes the other a determinable amount, the reporting party has the right to set-off the amount owed with the amount owed by the other party, the reporting party intends to set-off, and the right of set-off is enforceable by law. During the reporting period, no instances occurred where the right to set-off existed and management has not elected to offset.
Securities Transactions and Net Investment Income Securities transactions are recorded on the trade date. Realized and unrealized gains or losses from security and currency transactions are calculated on the identified cost basis. Dividend income is recorded on the ex-dividend date, and interest income and expenses are recorded on an accrual basis. Expenses are recorded on the accrual basis which may require the use of certain estimates by management. Actual results may differ from such estimates.
Dividends and Distributions Dividends from net investment income, if any, are declared and paid at least annually in a manner that qualifies for the dividends-paid deduction. The Fund’s current intention is to distribute at least annually any net capital gains in excess of net capital loss carryforwards in a manner that avoids income and excise taxes being imposed on the Fund. Dividends and distributions are recorded on the ex-dividend date. The Fund may choose to satisfy the foregoing by making distributions in cash, additional Fund shares, or both.
The Fund could determine in the future to retain net long-term capital gains in respect of any fiscal year without affecting the ability of the Fund to qualify as a regulated investment company. In that case, the Fund would
11
THE ASIA PACIFIC FUND, INC.
Notes to Financial Statements
(Unaudited) Continued
be subject to taxation on the retained amount and shareholders subject to U.S. federal income taxation would be required to include in income for tax purposes their shares of the undistributed amount and would be entitled to credits or refunds against their U.S. federal income tax liabilities with respect to their proportionate shares of the tax paid by the Fund.
Income distributions and capital gain distributions are determined in accordance with income tax regulations, which may differ from U.S. generally accepted accounting principles.
Taxes It is the Fund’s current intention to continue to meet the requirements of the U.S. Internal Revenue Code of 1986, as amended (“the Code”) applicable to regulated investment companies and to distribute all of its taxable income and capital gain to shareholders.
Therefore, no federal income tax provision is required. If the Fund determines in the future to retain capital gains, the Fund will provide for all required taxes.
Withholding tax on foreign dividends and interest and foreign capital gains tax is accrued in accordance with the Fund’s understanding of the applicable country’s tax rules and rates.
Note 2. Investment Management and Administration Agreements | |
The Fund has a manage-ment agreement with Value Partners Hong Kong Lim-ited (the "Investment Man-ager"), with effect from October 1, 2013; and through September 30, 2013, with Baring Asset Management (Asia) Limited and an admin-istration agreement with Prudential Investments LLC (the "Administrator").
The investment management fee is computed weekly and payable monthly at the following annual rates: 1.00% of the Fund’s average weekly net assets up to $100 million and 0.70% of such assets in excess of $100 million.
The administration fee is also computed weekly and payable monthly at the following annual rates: 0.25% of
the Fund’s average weekly net assets up to $200 million and 0.20% of such assets in excess of $200 million.
Pursuant to the agreements, the Investment Manager provides continuous supervision of the investment portfolio and the Administrator provides occupancy and certain clerical, administrative and accounting services for the Fund. The Investment Manager and the Administrator each pays the cost of compensation of certain officers of the Fund. The Fund bears all other costs and expenses.
Note 3. Portfolio Securities | |
Purchases and sales of in-vestment securities, other than short-term invest-ments, for the six months ended September 30, 2013 ag-gregated $94,908,519 and $96,055,647 respectively. 43 index futures contracts were bought and sold/closed with an aggregate value of $2.904 million and $2.925 million, respectively.
The United States federal income tax basis of the Fund's investments and the net unrealized appreciation as of September 30, 2013 were as follows:
| | | | |
Tax Basis | | $ | 104,600,473 | |
| | | | |
Appreciation | | | 50,865,656 | |
Depreciation | | | (38,566,426 | ) |
| | | | |
Net Unrealized Appreciation | | $ | 12,299,230 | |
| | | | |
The book basis may differ from tax basis due to certain tax related adjustments.
Under the Regulated Investment Company Modernization Act of 2010 (the “Act”), the Fund is permitted to carryforward capital losses incurred in the fiscal years ended March 31, 2012 and March 31, 2013 (“post-enactment losses”) for an unlimited period. Post-enactment losses are required to be utilized before the utilization of losses incurred prior to the effective date of the Act. As a result of this ordering rule, capital loss carryforwards related to taxable years ending before
12
March 31, 2012 (“pre-enactment losses”) may have an increased likelihood to expire unused. The Fund utilized approximately $1,725,000 of its pre-enactment losses to offset net taxable gains realized in the fiscal year ended March 31, 2013. No capital gains distributions are expected to be paid to shareholders until net gains have been realized in excess of such losses. As of March 31, 2013, the pre and post-enactment losses were approximately:
| | | | |
Post-Enactment Losses: | | $ | 0 | |
| | | | |
Pre-Enactment Losses: | | | | |
Expiring 2017 | | | 8,052,000 | |
Expiring 2018 | | | 15,355,000 | |
| | | | |
| | $ | 23,407,000 | |
| | | | |
The Fund elected to treat certain late-year ordinary income losses of approximately $491,000 as having been incurred in the fiscal year ending March 31, 2014.
Management has analyzed the Fund’s tax positions taken on federal income tax returns for all open tax years and has concluded that no provision for income tax is required in the Fund’s financial statements for the current reporting period. The Fund’s U.S. federal and state
income and federal excise tax returns for tax years for which the applicable statutes of limitations have not expired are subject to examination by the U.S. Internal Revenue Service and state departments of revenue.
There are 30 million shares of $0.01 par value common stock authorized.
The Fund currently is a party to a committed credit facility with a bank. The credit facility provides for a maximum commitment of $20,000,000 (prior to July 24, 2013: $10,000,000). Interest on any borrowings under the credit facility is at contracted market rates. The Fund pays a commitment fee on the unused portion of the fa-cility. The commitment fee is accrued daily and paid quarterly. The Fund's obligations under the credit facility are secured by substantially all the assets of the Fund. The purpose of the credit facility is to assist the Fund with its general cash flow requirements, including the provision of portfolio leverage.
During the six months ended September 30, 2013, the Fund did not utilize the credit facility.
13
THE ASIA PACIFIC FUND, INC.
Financial Highlights
(Unaudited)
| | | | | | | | | | | | | | | | | | | | | | | | |
| Per Share Operating Performance: | | Six Months
Ended
September 30,
2013 | | | Year Ended March 31, | |
| | | 2013 | | | 2012 | | | 2011 | | | 2010 | | | 2009 | |
Net asset value, beginning of period | | $ | 11.92 | | | $ | 11.67 | | | $ | 13.06 | | | $ | 10.97 | | | $ | 6.75 | | | $ | 21.70 | |
| | | | | | | | | | | | | | | | | | | | | | | | |
Income (loss) from investment operations: | | | | | | | | | | | | | | | | | | | | | | | | |
Net investment income (loss) | | | .03 | | | | (.03 | ) | | | (.05 | ) | | | (.06 | ) | | | (.06 | ) | | | .12 | |
Net realized and unrealized gain (loss) on investment transactions | | | (.67 | ) | | | .28 | | | | (1.34 | ) | | | 2.15 | | | | 4.28 | | | | (9.97 | ) |
| | | | | | | | | | | | | | | | | | | | | | | | |
Total from investment operations | | | (.64 | ) | | | .25 | | | | (1.39 | ) | | | 2.09 | | | | 4.22 | | | | (9.85 | ) |
| | | | | | | | | | | | | | | | | | | | | | | | |
Less dividends and distributions: | | | | | | | | | | | | | | | | | | | | | | | | |
Dividends from net investment income | | | — | | | | — | | | | — | | | | — | | | | — | | | | (.04 | ) |
Distributions from net realized gains | | | — | | | | — | | | | — | | | | — | | | | — | | | | (5.06 | ) |
| | | | | | | | | | | | | | | | | | | | | | | | |
Total dividends and distributions | | | — | | | | — | | | | — | | | | — | | | | — | | | | (5.10 | ) |
| | | | | | | | | | | | | | | | | | | | | | | | |
Net asset value, end of period | | $ | 11.28 | | | $ | 11.92 | | | $ | 11.67 | | | $ | 13.06 | | | $ | 10.97 | | | $ | 6.75 | |
| | | | | | | | | | | | | | | | | | | | | | | | |
Market value, end of period: | | $ | 10.12 | | | $ | 10.76 | | | $ | 10.58 | | | $ | 11.83 | | | $ | 9.95 | | | $ | 6.23 | |
| | | | | | | | | | | | | | | | | | | | | | | | |
Total return(a): | | | (5.95 | )% | | | 1.70 | % | | | (10.57 | )% | | | 18.89 | % | | | 59.71 | % | | | (41.95 | )% |
| | | | | | | | | | | | | | | | | | | | | | | | |
| Ratios/Supplemental Data: | | | | | | | | | | | | | | | | | | | | | | | | |
Net assets, end of period (000) | | $ | 116,631 | | | $ | 123,269 | | | $ | 120,715 | | | $ | 135,076 | | | $ | 113,440 | | | $ | 69,864 | |
Average net assets (000) | | $ | 119,502 | | | $ | 117,996 | | | $ | 123,601 | | | $ | 120,668 | | | $ | 100,915 | | | $ | 151,467 | |
| Ratios to Average Net Assets: | | | | | | | | | | | | | | | | | | | | | | | | |
Expenses (including loan interest)(c) | | | 2.48 | %(e) | | | 2.16 | %(b) | | | 2.15 | %(b) | | | 2.01 | %(b) | | | 2.22 | %(b) | | | 1.95 | % |
Net investment income (loss) | | | .44 | %(e) | | | (.28 | )% | | | (.40 | )% | | | (.51 | )% | | | (.61 | )% | | | .79 | % |
Portfolio turnover rate | | | 82 | %(d) | | | 180 | % | | | 137 | % | | | 136 | % | | | 184 | % | | | 220 | % |
| (a) | Total return is calculated assuming a purchase of common stock at the current market value on the first day and a sale at the current market value on the last day of each period reported. Dividends and distributions, if any, are assumed, for purposes of this calculation, to be reinvested at prices obtained under the Fund’s dividend reinvestment plan. These calculations do not include brokerage commissions. Total returns for periods less than one full year are not annualized. |
| (b) | The expense ratios without loan interest would have been 2.11%, 2.15%, 2.00% and 2.21% for the fiscal years ended March 31, 2013, 2012, 2011 and 2010, respectively. |
| (c) | Does not include expenses of the underlying funds in which the Fund invests. |
Shown above are selected data for a share of common stock outstanding, total investment return, ratios to average net assets and other supplemental data for the periods indicated. This information has been determined based upon information provided in the financial statements and market price data for the Fund’s shares.
See Notes to Financial Statements.
14
Board of Directors Approval of Continuance of Investment Management Agreement with Baring Asset Management (Asia) Limited
At a meeting held on May 17, 2013, the Board of Directors of the Fund (the “Board”), including a majority of the disinterested directors (the “Directors”), approved the continuance of the investment management agreement (the “Former Investment Management Agreement”) between the Fund and Baring Asset Management (Asia) Limited (“Barings”). The Former Investment Management Agreement was subsequently terminated by mutual agreement of the parties effective as of the close of business on September 30, 2013, and replaced with an investment management agreement between the Fund and Value Partners (Hong Kong) Limited effective October 1, 2013 as discussed elsewhere in this report. Prior to acting on the continuance of the Former Investment Management Agreement, the Directors considered the factors discussed below.
Factors Considered by the Board
Prior to approval of the continuance of the Former Investment Management Agreement, the Directors had evaluated information provided by Barings. They reviewed the Former Investment Management Agreement with Barings and with experienced Fund counsel, who are independent of Barings and who advised on the relevant legal standards.
Based on their experience gained as Fund Directors, the Directors considered their knowledge of the nature and quality of the services provided by Barings to the Fund and their overall confidence in Barings’ integrity and competence. The Directors noted that they receive presentations at regular Board meetings from Barings on the investment results of the Fund and review extensive materials and information provided by Barings.
The Directors also considered all other factors they believed relevant, including the specific matters described below. In their deliberations, the Directors did not identify any particular information that was all-important or controlling, and each Director attributed different weights to the various factors.
The Directors determined that the selection of Barings to manage the Fund and the overall arrangements between the Fund and Barings, including the investment management fee, as provided in the Former Investment Management Agreement, were fair and reasonable in light of the services performed, expenses incurred and such other matters as the Directors considered relevant in the exercise of their reasonable judgment.
The material factors and conclusions that formed the basis for the Directors’ determinations include the following:
Nature, Extent and Quality of Services Provided by Barings
The Directors considered the scope and quality of services provided by Barings under the Former Investment Management Agreement, including the quality of the investment research capabilities of Barings and the other resources it had dedicated to performing services for the Fund. They noted the dedication, commitment and good service that Barings had provided since the commencement of the Fund’s operations and the recent replacement of the Fund’s portfolio manager. The Directors concluded that the nature, extent and quality of services provided to the Fund under the Former Investment Management Agreement were adequate but that they had been concerned with the relative underperformance of the Fund for some time.
Costs of Services Provided and Profitability
The Directors reviewed a schedule of the expenses and assets under management for 2012 and the estimated profitability of the Former Investment Management Agreement to Barings for 2012. The Directors reviewed Barings’ memorandum describing the assumptions and methods of allocation of estimated costs of managing the Fund in 2012 and in preparing Fund-specific profitability data.
15
Board of Directors Approval of Continuance of Investment Management Agreement with Baring Asset Management (Asia) Limited Continued
The Directors recognized that it is difficult to make comparisons of profitability from fund advisory contracts because comparative information is not generally publicly available and is affected by numerous factors. The Directors focused on profitability of Barings’ relationship with the Fund before taxes. The Directors concluded that they were satisfied that Barings’ level of profitability from its relationship with the Fund was not unreasonable.
Fall-Out Benefits
The Directors considered the benefits to Barings from its relationship with the Fund other than fees payable under the Former Investment Management Agreement, including but not limited to soft dollar arrangements whereby Barings receives brokerage and research services from many of the brokers and dealers that execute purchases and sales of securities on behalf of its clients, including the Fund, on an agency basis. The Directors recognized that Barings’ profitability would be somewhat lower without these benefits. The Directors also believe that Barings derived reputational and other benefits from its association with the Fund.
Investment Results
The Directors considered the investment results of the Fund as compared to the MSCI All Country Asia Ex-Japan Gross Index (the “Index”). The Directors reviewed information showing performance of the Fund as compared to the Index over the 4-month and 1-, 3-, 5- and 10-year periods ended April 30, 2013. The Directors noted that the Fund’s net asset value performance had been below that of the Index for all of these periods and that in response to concerns previously expressed by the Board Barings had recently replaced the Fund’s portfolio manager. The Directors were concerned about the Fund’s relative underperformance for some time and determined to monitor performance while considering the possibility of replacing Barings.
Advisory Fees
The Directors considered the advisory fee rate paid by the Fund to Barings and information prepared by Lipper, Inc. (“Lipper”) concerning advisory fee rates paid by other funds in the same Lipper category as the Fund. They also considered the combined advisory and administration fee rates paid by those funds in the Lipper category that, like the Fund, paid separate advisory and administration fees. The Directors recognized that it is difficult to make comparisons of advisory and administration fees because there are variations in the services that are included in the fees paid by other funds. Nonetheless, the Directors noted that the Fund’s advisory fee, as well as its combined advisory and administration fees, as a percentage of average net assets were competitive with most of the Funds in the Lipper category. The Directors also considered the fees that Barings charges the only other registered investment company it managed during 2012, which invests in China, and with Barings’ other clients with investment objectives similar to those of the Fund. The Directors noted that Barings’ only other registered investment company client’s advisory fee schedule and combined advisory/administrative fee schedule during 2012 were each higher than the Fund’s comparable fee schedules. They also noted that the advisory fee schedules for other institutional accounts with a comparable investment objective were lower and Barings’ representation that fees charged to these accounts were lower because they did not entail the same regulatory, supervisory or compliance costs that are incurred with respect to registered closed-end funds. Barings indicated that for some of these other institutional clients there are also performance fees. The Directors noted that the application of such institutional fee schedules to the Fund’s level of assets would have resulted in a fee that would have been lower than that resulting from the Former Investment Management Agreement.
Barings reviewed with the Directors the significantly greater scope of services it provides to the Fund relative to institutional clients. In light of this information, the Directors did not place significant weight on the fee comparisons with institutional accounts.
16
Economies of Scale
The Directors considered that the Fund is a closed-end fund and that it was not expected to have meaningful asset growth absent a rights offering or an acquisition. In such circumstances, they did not view the potential for realization of economies of scale as the Fund’s assets grow to be a meaningful factor in their deliberations. The Directors noted, however, that the advisory fee schedule for the Fund contains a breakpoint at $100 million so that, when assets exceed the breakpoint, the fee rate is reduced from 1.00% to .70% on the incremental assets. The Directors concluded that the Fund’s breakpoint arrangements established a reasonable basis for realizing economies of scale should they exist.
17
Board of Directors Approval of Investment Management Agreement with Value Partners (Hong Kong) Limited
At a special meeting held on June 27, 2013 the Board of Directors of the Fund (the “Board”), including a majority of the disinterested directors (the “Directors”), approved a new investment management agreement (the “Current Investment Management Agreement”) between the Fund and Value Partners (Hong Kong) Limited (“Value Partners”), and recommended its approval by stockholders of the Fund at a special meeting of stockholders to be held on September 6, 2013. The Current Investment Management Agreement became effective on October 1, 2013 after receiving stockholder approval. The background to this action by the Directors is set forth in the proxy statement for the special meeting of stockholders dated July 26, 2013. Prior to approving the Current Investment Management Agreement, the Directors considered the factors, and reached the conclusions, discussed below.
Factors Considered by the Board
Prior to approving the Current Investment Management Agreement, the Directors had evaluated information provided by Value Partners as well as information provided by Baring Asset Management (Asia) Limited (“Barings”) and other potential investment managers. They also considered a report prepared by, and advice from, Strategic Investors Research Group, a division of Prudential Investments LLC (“SIRG”) which assisted the Directors in their review of potential investment managers for the Fund. They reviewed the Current Investment Management Agreement with experienced Fund counsel, who are independent of Value Partners and who advised on the relevant legal standards.
In selecting Value Partners to be the Fund’s investment manager, subject to stockholder approval, and approving the Current Investment Management Agreement, the Directors considered all factors that they considered relevant, including their concern about the relative performance of the Fund for some time and the specific factors described below. The Board did not identify any consideration that was all-important, and each Director attributed different weights to the various factors.
Nature, Extent and Quality of the Services to be provided by Value Partners
The Board considered various data and information regarding the nature, extent and quality of services to be provided under the Current Investment Management Agreement, including responses by Value Partners to detailed requests submitted by SIRG and Fund counsel on behalf of the Directors and the presentation of Value Partners to a working group of the Board (the “Working Group”). These responses and presentation included, among other things, information about the background and experience of senior management and investment personnel who would be responsible for managing the Fund. The Board considered the information provided regarding the portfolio managers and other resources that would be dedicated to the Fund and the investment philosophy and process that would be followed by those individuals in managing the Fund. Additionally, the Board considered the recommendations of SIRG and the Working Group.
The Board noted that Value Partners is a wholly owned subsidiary of Value Partners Group Limited (VPGL), which has a primary listing on the Main Board of the Stock Exchange of Hong Kong. With respect to the portfolio management teams for the Fund, the Board considered Value Partners’ investment expertise and commitment to the Asia Pacific region ex-Japan. The Board reviewed the nature, extent and quality of the management services provided by Value Partners and in connection therewith received a report from Value Partners detailing the scope of its operations, the breadth and depth of its management, investment and research personnel and the various support and administrative services that Value Partners would provide to the Fund. The Board considered, in particular, the disciplined investment approach described by Value Partners and the experience and success of its high dividend stock strategy focused on value stocks in the Asia Pacific ex-Japan region that have a relatively high dividend yield. They also considered Value Partners’ bottom-up investment approach, in which investments are made in individual stocks based on fundamental research, without regard to country or sector allocation or correlation with a benchmark index.
18
The Board noted that as of May 31, 2013, VPGL’s subsidiaries managed approximately $9.3 billion in assets, substantially all of which was invested in securities of issuers in the Asia ex-Japan region. The Board noted that, although Value Partners has been registered as an investment adviser with the SEC for a number of years, and although it (directly or through its wholly owned subsidiary, Value Partners Limited (VPL)) manages a number of Asian open-end funds, it has never advised an investment company registered with the SEC or listed on a U.S. securities exchange such as the Fund. The Fund’s chief compliance officer reported to the Board that based on a comprehensive compliance review of Value Partners, which included on-site visits to Value Partners, she did not have any material concerns with Value Partners’ compliance policies or structure. The Board further noted that Value Partners had proposed a senior executive to serve as the Fund’s President and Chief Executive Officer and, in that capacity, certify certain Fund reports as required by the Sarbanes-Oxley Act of 2002.
Performance, Fees and Expenses of the Fund and Comparisons to Other Clients
The Board considered the performance record of Value Partners in managing assets in the Asia Pacific ex-Japan region in concluding that, while recognizing that past investment performance may not be indicative of future returns, there was reason to believe that Value Partners could achieve above-average performance over the long-term in managing the Fund. The Board relied on the extensive performance analysis provided by SIRG, which compared the performance of Value Partners High-Dividend Stocks Fund, a fund authorized by the Securities and Futures Commission of Hong Kong that is managed by VPL in a generally similar manner to that Value Partners would use to manage the Fund (the HDS Fund), to both the MSCI All Country Asia ex Japan Index (Total Return, Gross) and other advisers that were under consideration by the Board, including Barings, as well as additional performance materials provided by Value Partners. In reviewing this and other performance information, the Board noted that although Value Partners advised that the HDS Fund is managed in a generally similar manner, and by the same portfolio management team, that Value Partners would use to manage the Fund, the HDS Fund has a somewhat different investment mandate than the Fund and is also subject to different regulatory and tax requirements than the Fund. In particular, the HDS Fund may invest in debt securities, Japanese securities and gold, and regularly makes such investments. However, attribution information provided by Value Partners and SIRG indicates that, for the year-to-date, one year, three year (annualized) and five year (annualized) periods ending May 31, 2013 the performance of the HDS Fund would have been superior to that shown in the table below if no investments in debt, Japanese securities and gold had been made by it (information for the “since inception” period was not available). In addition, the HDS Fund has a different expense structure than the Fund (for example, it pays a management fee of 1.25% and a 15% performance fee). The Board reviewed both the performance and index return information shown below and an analysis by SIRG that showed gross performance, less 100 basis points, of Value Partners and the other potential manager that was interviewed by the Working Group compared to that of the Fund. Value Partners advised SIRG and the Board that the HDS Fund is the only client that it has that pursues an investment strategy substantially similar to that of the Fund.
| | | | | | | | | | | | | | | | | | | | | | | | |
Investment Performance of Class A1
Shares of HDS Fund to May 31, 2013
(net of fees and expenses and reflecting
reinvestment of distributions) | | Year-to-Date | | | 1 Year | | | 3 Years
Annualized | | | 5 Years
Annualized | | | Since
Inception(1) | | | Annualized
Since
Inception | |
Value Partners High-Dividend Stock Fund | | | 6.5 | % | | | 26.0 | % | | | 12.5 | % | | | 10.5 | % | | | 578.9 | % | | | 19.5 | % |
MSCI All Country Asia ex Japan Index
(Total Return, Gross) | | | 0.08 | % | | | 19.28 | % | | | 8.82 | % | | | 2.37 | % | | | 274.39 | % | | | 13.07 | % |
| | | | | | | | | | | | | | | | | | | | | | | | |
| (1) | Inception date is September 2, 2002. |
19
Board of Directors Approval of Investment Management Agreement with Value Partners (Hong Kong) Limited Continued
The information provided by Value Partners indicated that the volatility of returns of the HDS Fund and the MSCI All Country Asia ex Japan Index (Total Return, Gross) (calculated based on the standard deviation of monthly returns since inception of the HDS Fund) from the inception of the HDS Fund on September 2, 2002 through May 31, 2013 were 19.9% and 26.7%, respectively.
The Board also reviewed SIRG’s extensive analysis of various metrics of the HDS Fund as well as of the Fund and of the other potential manager that was interviewed by the Working Group, including: various measures of total returns (including quarterly returns (analysis of the seven most recent calendar quarters)); risk (including rolling standard deviation, rolling semi-standard deviation, and rolling Beta (trailing 36 months per calculation in each case)), return distribution, up/down market capture, rolling information ratio (three years ending May 2013 in each case), value at risk (December 30, 2005 through May 31, 2013), performance during rising and falling intra-portfolio correlation conditions (periods in 2003 through 2007), trailing skewness and trailing kurtosis (January 2003 through May 2013); and efficiency (including cumulative excess returns from January 2003 through May 2013, and three year rolling information ratio, rolling alpha, Sharpe Ratio, Treynor Ratio, Sortino Ratio, R-Squared, and tracking error (from May 30, 2006 through May 31, 2013 in each case). For all trailing periods reviewed (i.e. year-to-date, one year ended May 31, 2013, and three, five, seven and ten years annualized as of May 31, 2013), the HDS Fund’s relative performance to the benchmark and the peer group average was superior.
With respect to fees and expenses of the Fund, the Board noted that Value Partners has agreed to the same fee and expense arrangements as those with Barings. The Board also relied on comparisons of fees paid by other registered investment companies investing in the Asia Pacific region reviewed in connection with its recent renewal of the Current Investment Management Agreement. The Board was provided with the fees charged by Value Partners to offshore funds managed by Value Partners. The base fees for actively managed funds, including the HDS Fund, were higher than those under the Current Investment Management Agreement, and most (including the HDS Fund) also provide for a performance fee, while those for passively managed funds were lower. The Board also reviewed information provided by Value Partners concerning the fees charged by it for managing other accounts that invest in Asian equity securities. The Directors noted that, while none of such accounts pursue the same strategy as the Fund, the base fee rates charged to some of such accounts were lower than the fee rate proposed to be paid by the Fund but that most of such accounts were subject to performance fee arrangements in addition to paying the base fee rate. The Board recognized that it is difficult to make comparisons of advisory fees because there are variations in the services provided. In considering the comparative fees and services, the Board noted that the Fund paid fees to its administrator at an annual percentage rate of .25% of 1% of the Fund’s weekly net assets up to $200 million and .20% of such assets in excess thereof. While it was not possible to consider the profitability of the Current Investment Management Agreement to Value Partners at this point, the Board further considered that Value Partners had agreed to provide information regarding the profitability of its relationship with the Fund in connection with future continuances of the Current Investment Management Agreement.
The Directors concluded that they were satisfied that Value Partner would be able to provide high quality investment management services to the Fund and that the fee in the Current Investment Management Agreement was fair and reasonable for the services to be provided.
Economies of Scale
The Board considered that the Fund is a closed-end fund and that it was not expected to have meaningful asset growth absent a rights offering or an acquisition. They did not view the potential for realization of economies of scale as the Fund’s assets grow to be a meaningful factor in their deliberations. The Board noted, however, that the advisory fee schedule under the Current Investment Management Agreement contains a breakpoint at $100 million so that when assets exceed the breakpoint, the fee rate is reduced from 1.00% to .70% on the incremental assets.
20
Other Benefits of the Relationship
The Board also considered information regarding potential “fall-out” or ancillary benefits that would be received by Value Partners as a result of its relationship with the Fund. While Value Partners represented that it does not enter into formal soft dollar arrangements with brokers, it may allocate brokerage commissions, or pay higher commission rates than it would pay to other brokers, to brokers that provide research and other services that it believes benefit its clients, subject to its duty to seek best execution. The Board also recognized that Value Partners may derive reputational benefits from its association with the Fund, which are difficult to quantify.
Resources of Value Partners
The Board noted that Value Partners appeared to have the financial resources necessary to fulfill its obligations under the Current Investment Management Agreement.
21
Supplemental Proxy Information
An Annual Meeting of Stockholders was held on September 6, 2013. At such meeting the stockholders elected the entire slate of Class III Directors and approved a new Investment Management Agreement.
Election of Class III Directors
| | | | | | | | |
| | | Affirmative
Votes Cast | | | Shares Withheld | |
Robert F. Gunia | | | 7,152,624 | | | | 818,453 | |
Nicholas T. Sibley | | | 7,106,318 | | | | 864,759 | |
Approve a new Investment Management Agreement
| | | | | | | | |
| | | Affirmative
Votes Cast | | | Shares Withheld | |
| | | 5,184,528 | | | | 26,278 | |
Additional Information
The Fund is required to file its complete schedule of portfolio holdings with the Securities and Exchange Commission (“SEC”) on Form N-Q for its first and third fiscal quarters and within 60 days of the fiscal quarter end. Once filed, the Fund’s Form N-Q is available without charge on the SEC’s website (http//www.sec.gov) or by calling the Fund toll free at 1-(888) 4-ASIA-PAC. Copies of the Fund’s Form N-Q may also be obtained by visiting the SEC’s Public Reference Room in Washington, DC (please call the SEC at (800) 732-0330 for information on the operation of the Public Reference Room).
Information regarding the Fund’s proxy voting policies and procedures and its proxy voting record for the 12-month period ending June 30 of each year is filed with the SEC on Form N-PX no later than August 31 of each year. The Fund’s Form N-PX is available without charge, upon request, by calling the Fund at its toll free number 1-(888) 4-ASIA-PAC and on the SEC’s website (http//www.sec.gov) or on or through the Fund’s website address (www.asiapacificfund.com).
22
| Item 2 – | Code of Ethics – Not required, as this is not an annual filing. |
| Item 3 – | Audit Committee Financial Expert – Not required, as this is not an annual filing. |
| Item 4 – | Principal Accountant Fees and Services – Not required, as this is not an annual filing. |
| Item 5 – | Audit Committee of Listed Registrants – Not required, as this is not an annual filing. |
| Item 6 – | Schedule of Investments – The schedule is included as part of the report to shareholders filed under Item 1 of this Form. |
| Item 7 – | Disclosure of Proxy Voting Policies and Procedures for Closed-End Management Investment Companies – Not required, as this is not an annual filing. |
| Item 8 – | Portfolio Managers of Closed-End Management Investment Companies – Not required, as this is not an annual filing. |
| Item 9 – | Purchases of Equity Securities by Closed-End Management Investment Company and Affiliated Purchasers – There were no purchases made by or on behalf of the registrant or any “affiliated purchaser,” as defined in Rule 10b-18(a) (3) under the Securities Exchange Act of 1934, as amended, of shares of the registrant’s equity securities made in the period covered by this report. |
| Item 10 – | Submission of Matters to a Vote of Security Holders – Not applicable. |
| Item 11 – | Controls and Procedures |
| | (a) | It is the conclusion of the registrant’s principal executive officer and principal financial officer that the effectiveness of the registrant’s current disclosure controls and procedures (such disclosure controls and procedures having been evaluated within 90 days of the date of this filing) provide reasonable assurance that the information required to be disclosed by the registrant has been recorded, processed, summarized and reported within the time period specified in the Commission’s rules and forms and that the information required to be disclosed by the registrant has been accumulated and communicated to the registrant’s principal executive officer and principal financial officer in order to allow timely decisions regarding required disclosure. |
| | (b) | There has been no significant change in the registrant’s internal control over financial reporting that occurred during the registrant’s most recent fiscal quarter of the period covered by this report that has materially affected, or is likely to materially affect, the registrant’s internal control over financial reporting. |
(a) (1) Code of Ethics – Not required, as this is not an annual filing.
(2) Certifications pursuant to Section 302 of the Sarbanes-Oxley Act – Attached hereto as Exhibit EX-99.CERT.
(3) Any written solicitation to purchase securities under Rule 23c-1. – Not applicable.
(b) Certifications pursuant to Section 906 of the Sarbanes-Oxley Act – Attached hereto as Exhibit EX-99.906CERT.
SIGNATURES
Pursuant to the requirements of the Securities Exchange Act of 1934 and the Investment Company Act of 1940, the registrant has duly caused this report to be signed on its behalf by the undersigned, thereunto duly authorized.
| | |
| (Registrant) The Asia Pacific Fund, Inc. |
| |
| By (Signature and Title)* | | /s/Deborah A. Docs |
| | Deborah A. Docs Secretary |
|
| Date November 25, 2013 |
Pursuant to the requirements of the Securities Exchange Act of 1934 and the Investment Company Act of 1940, this report has been signed below by the following persons on behalf of the registrant and in the capacities and on the dates indicated.
| | |
| By (Signature and Title)* | | /s/Raymond Tam |
| | Raymond Tam President and Principal Executive Officer |
|
| Date November 25, 2013 |
| | |
| By (Signature and Title)* | | /s/M. Sadiq Peshimam |
| | M. Sadiq Peshimam Treasurer and Chief Financial Officer |
|
| Date November 25, 2013 |
| * | Print the name and title of each signing officer under his or her signature. |