UNITED STATES
SECURITIES AND EXCHANGE COMMISSION
Washington, D.C. 20549
FORM N-CSR
CERTIFIED SHAREHOLDER REPORT OF REGISTERED MANAGEMENT
INVESTMENT COMPANIES
Investment Company Act file number 811-04719
The TETON Westwood Funds
(Exact name of registrant as specified in charter)
One Corporate Center
Rye, New York 10580-1422
(Address of principal executive offices) (Zip code)
Bruce N. Alpert
Gabelli Funds, LLC
One Corporate Center
Rye, New York 10580-1422
(Name and address of agent for service)
Registrant’s telephone number, including area code: 1-800-422-3554
Date of fiscal year end: September 30
Date of reporting period: September 30, 2016
Form N-CSR is to be used by management investment companies to file reports with the Commission not later than 10 days after the transmission to stockholders of any report that is required to be transmitted to stockholders under Rule 30e-1 under the Investment Company Act of 1940 (17 CFR 270.30e-1). The Commission may use the information provided on Form N-CSR in its regulatory, disclosure review, inspection, and policymaking roles.
A registrant is required to disclose the information specified by Form N-CSR, and the Commission will make this information public. A registrant is not required to respond to the collection of information contained in Form N-CSR unless the Form displays a currently valid Office of Management and Budget (“OMB”) control number. Please direct comments concerning the accuracy of the information collection burden estimate and any suggestions for reducing the burden to Secretary, Securities and Exchange Commission, 450 Fifth Street, NW, Washington, DC 20549-0609. The OMB has reviewed this collection of information under the clearance requirements of 44 U.S.C. § 3507.
Item 1. Reports to Stockholders.
The Report to Shareholders is attached herewith.

TETON WESTWOOD FUNDS
|
|
Mighty MitesSM Fund |
| |
|
SmallCap Equity Fund |
| |
|
Mid-Cap Equity Fund |
| |
|
Income Fund |
| |
|
Equity Fund |
| |
|
Balanced Fund |
| |
|
Intermediate Bond Fund |
|
| Annual Report |
|
| September 30, 2016 |
TETON WESTWOOD FUNDS
(Unaudited)
| | | | | | | | | | | | | | | | | | | | | | | | | | | | | | | | | | | | | | | | | | | | | | | | | | | | | | | | | | | | | | | | | | | | | | | | | | | |
| | | Class AAA Shares | | | | Class A Shares |
| | | Average Annual Returns – September 30, 2016 (a) | | | | Average Annual Returns – September 30, 2016 (a)(b)(d) |
| | | 1 Year | | 5 Year | | 10 Year | | 15 Year | | Since
Inception | | Gross
Expense
Ratio | | Expense
Ratio after
Adviser
Reimburse-
ments | | | | 1 Year | | 5 Year | | 10 Year | | 15 Year | | Since
Inception | | Gross
Expense
Ratio | | Expense
Ratio after
Adviser
Reimburse-
ments |
Mighty MitesSM | | | | 14.98 | % | | | | 14.02 | % | | | | 9.29 | % | | | | 10.54 | % | | | | 11.16 | % | | | | 1.41 | % | | | | 1.41 | % | | | | | | | | | 10.06 | % | | | | 12.80 | % | | | | 8.59 | % | | | | 10.00 | % | | | | 10.70 | % | | | | 1.66 | % | | | | 1.66 | % |
SmallCap Equity | | | | 21.08 | | | | | 14.15 | | | | | 7.25 | | | | | 7.22 | | | | | 7.33 | | | | | 1.66 | | | | | 1.50 | | | | | | | | | | 16.05 | | | | | 12.95 | | | | | 6.56 | | | | | 6.72 | | | | | 6.95 | | | | | 1.91 | | | | | 1.75 | |
Mid-Cap Equity | | | | 8.23 | | | | | — | | | | | — | | | | | — | | | | | 6.93 | | | | | 2.74 | | | | | 1.51 | | | | | | | | | | 3.60 | | | | | — | | | | | — | | | | | — | | | | | 5.36 | | | | | 2.99 | | | | | 1.76 | |
Income | | | | 10.39 | | | | | 9.62 | | | | | 3.97 | | | | | 7.79 | | | | | 7.00 | | | | | 2.40 | | | | | 2.00 | | | | | | | | | | 5.68 | | | | | 8.47 | | | | | 3.29 | | | | | 7.23 | | | | | 6.56 | | | | | 2.65 | | | | | 1.40 | |
Equity | | | | 11.43 | | | | | 14.56 | | | | | 5.62 | | | | | 6.88 | | | | | 9.82 | | | | | 1.59 | | | | | 1.59 | | | | | | | | | | 6.72 | | | | | 13.37 | | | | | 4.95 | | | | | 6.32 | | | | | 9.45 | | | | | 1.84 | | | | | 1.84 | |
Balanced | | | | 8.55 | | | | | 9.66 | | | | | 5.10 | | | | | 5.99 | | | | | 8.29 | | | | | 1.31 | | | | | 1.31 | | | | | | | | | | 3.92 | | | | | 8.50 | | | | | 4.40 | | | | | 5.44 | | | | | 7.85 | | | | | 1.56 | | | | | 1.56 | |
Intermediate Bond | | | | 4.06 | | | | | 1.48 | | | | | 3.26 | | | | | 3.37 | | | | | 4.76 | | | | | 1.37 | | | | | 1.01 | | | | | | | | | | (0.24 | ) | | | | 0.51 | | | | | 2.73 | | | | | 2.98 | | | | | 4.51 | | | | | 1.47 | | | | | 1.11 | |
| | | |
| | | Class C Shares | | | | Class I Shares |
| | | Average Annual Returns – September 30, 2016 (a)(c)(d) | | | | Average Annual Returns – September 30, 2016 (a)(d) |
| | | 1 Year | | 5 Year | | 10 Year | | 15 Year | | Since
Inception | | Gross
Expense
Ratio | | Expense
Ratio after
Adviser
Reimburse-
ments | | | | 1 Year | | 5 Year | | 10 Year | | 15 Year | | Since
Inception | | Gross
Expense
Ratio | | Expense
Ratio after
Adviser
Reimburse-
ments |
Mighty MitesSM | | | | 13.06 | % | | | | 13.16 | % | | | | 8.49 | % | | | | 9.72 | % | | | | 10.48 | % | | | | 2.16 | % | | | | 2.16 | % | | | | | | | | | 15.22 | % | | | | 14.28 | % | | | | 9.53 | % | | | | 10.70 | % | | | | 11.29 | % | | | | 1.16 | % | | | | 1.16 | % |
SmallCap Equity | | | | 19.24 | | | | | 13.30 | | | | | 6.46 | | | | | 6.38 | | | | | 6.68 | | | | | 2.41 | | | | | 2.25 | | | | | | | | | | 21.47 | | | | | 14.47 | | | | | 7.49 | | | | | 7.38 | | | | | 7.45 | | | | | 1.41 | | | | | 1.25 | |
Mid-Cap Equity | | | | 6.37 | | | | | — | | | | | — | | | | | — | | | | | 6.14 | | | | | 3.49 | | | | | 2.26 | | | | | | | | | | 8.73 | | | | | — | | | | | — | | | | | — | | | | | 7.26 | | | | | 2.49 | | | | | 0.81 | |
Income | | | | 8.55 | | | | | 8.80 | | | | | 3.19 | | | | | 7.09 | | | | | 6.45 | | | | | 3.15 | | | | | 1.90 | | | | | | | | | | 10.56 | | | | | 9.89 | | | | | 4.19 | | | | | 7.95 | | | | | 7.13 | | | | | 2.15 | | | | | 0.90 | |
Equity | | | | 9.59 | | | | | 13.71 | | | | | 4.83 | | | | | 6.09 | | | | | 9.32 | | | | | 2.34 | | | | | 2.34 | | | | | | | | | | 11.66 | | | | | 14.79 | | | | | 5.84 | | | | | 7.02 | | | | | 9.90 | | | | | 1.34 | | | | | 1.34 | |
Balanced | | | | 6.79 | | | | | 8.86 | | | | | 4.31 | | | | | 5.20 | | | | | 7.73 | | | | | 2.06 | | | | | 2.06 | | | | | | | | | | 8.84 | | | | | 9.93 | | | | | 5.32 | | | | | 6.13 | | | | | 8.38 | | | | | 1.06 | | | | | 1.06 | |
Intermediate Bond | | | | 2.19 | | | | | 0.72 | | | | | 2.68 | | | | | 2.60 | | | | | 4.29 | | | | | 2.12 | | | | | 1.76 | | | | | | | | | | 4.26 | | | | | 1.72 | | | | | 3.47 | | | | | 3.51 | | | | | 4.84 | | | | | 1.12 | | | | | 0.76 | |
| (a) | Returns represent past performance and do not guarantee future results. Total returns and average annual returns reflect changes in share price, reinvestment of distributions, and are net of expenses. Investment returns and the principal value of an investment will fluctuate. When shares are redeemed, they may be worth more or less than their original cost. Current performance may be lower or higher than the performance data presented. Visit www.tetonadv.com for performance information as of the most recent month end. For the SmallCap Equity, Mid-Cap Equity, Income, and Intermediate Bond Funds (and for the Mighty MitesSM Fund through September 30, 2005), Teton Advisors, Inc., the “Adviser,” reimbursed expenses to limit the expense ratios. Had such limitations not been in place, returns would have been lower. The contractual expense limitations are in effect through January 31, 2017 and are renewable annually by the Adviser. The Funds, except for the Equity, Balanced, and Intermediate Bond Funds, impose a 2% redemption fee on shares sold or exchanged within seven days after the date of purchase. Investors should carefully consider the investment objectives, risks, charges, and expenses of a Fund before investing. The prospectuses contain information about these and other matters and should be read carefully before investing. To obtain a prospectus, please visit our website at www.tetonadv.com. |
| (b) | Includes the effect of the maximum 4.00% sales charge at the beginning of the period. |
| (c) | Assuming payment of the 1% maximum contingent deferred sales charge imposed on redemptions made within one year of purchase. |
| (d) | The performance of the Class AAA Shares is used to calculate performance for the periods prior to the issuance of Class A Shares, Class C Shares, and Class I Shares, except for Mid-Cap Equity Fund. The performance for all share classes of Mid-Cap Equity Fund is based on the Fund’s inception date of May 31, 2013. The performance for the Class A Shares and Class C Shares would have been lower due to the additional fees and expenses associated with these classes of shares. The performance for the Class I Shares would have been higher due to the lower expenses associated with this class of shares. The inception dates for the Class AAA Shares and the initial issuance dates for the Class A Shares, Class C Shares, and Class I Shares after which shares remained continuously outstanding are listed below. |
| | | | | | | | |
| | | Class AAA Shares | | Class A Shares | | Class C Shares | | Class I Shares |
Mighty MitesSM | | 05/11/98 | | 11/26/01 | | 08/03/01 | | 01/11/08 |
SmallCap Equity | | 04/15/97 | | 11/26/01 | | 11/26/01 | | 01/11/08 |
Mid-Cap Equity | | 05/31/13 | | 05/31/13 | | 05/31/13 | | 05/31/13 |
Income | | 09/30/97 | | 05/09/01 | | 11/26/01 | | 01/11/08 |
Equity | | 01/02/87 | | 01/28/94 | | 02/13/01 | | 01/11/08 |
Balanced | | 10/01/91 | | 04/06/93 | | 09/25/01 | | 01/11/08 |
Intermediate Bond | | 10/01/91 | | 07/26/01 | | 10/22/01 | | 01/11/08 |
The TETON Westwood Funds file a complete schedule of portfolio holdings with the Securities and Exchange Commission (the “SEC”) for the first and third quarters of each fiscal year on Form N-Q. Shareholders may obtain this information at www.tetonadv.com or by calling the Funds at 800-WESTWOOD (800-937-8966). The Funds’ Form N-Q is available on the SEC’s website at www.sec.gov and may also be reviewed and copied at the SEC’s Public Reference Room in Washington, DC. Information on the operation of the Public Reference Room may be obtained by calling 800-SEC-0330.
Proxy Voting
Each Fund files Form N-PX with its complete proxy voting record for the twelve months ended June 30, no later than August 31 of each year. A description of the Funds’ proxy voting policies, procedures, and how the Funds voted proxies relating to portfolio securities are available without charge, upon request, by (i) calling 800-WESTWOOD (800-937-8966); (ii) writing to The TETON Westwood Funds at One Corporate Center, Rye, NY 10580-1422; and (iii) visiting the SEC’s website at www.sec.gov.
2
Performance Discussion (Unaudited)
Mighty MitesSM Fund
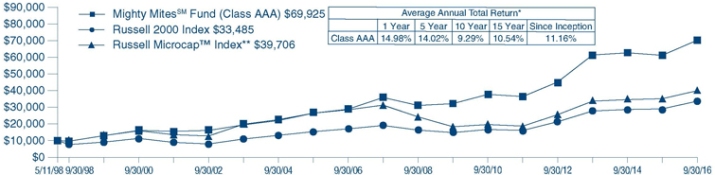
For the year ended September 30, 2016, the TETON Westwood Mighty MitesSM Fund net asset value (“NAV”) per Class AAA Share appreciated 15.0% versus gains of 15.5% for the Russell 2000 and 13.5% for the Russell Microcap Indices. See next page for additional performance information.
The Fund invests in small and micro-cap equity securities that have a market capitalization of $500 million or less at time of purchase. The portfolio management team focuses on bottom up stock selection, seeking bite sized companies with excellent management teams, strong balance sheets, and superior long term fundamentals. As bottom up, fundamental, research driven investors, the team seeks to purchase the inefficiently priced stocks of excellent companies selling at a discount to their private market value (PMV), and possess a catalyst that can unlock hidden value within the enterprise. As such, (y)our portfolio is diversified across a broad cross section of companies sharing these valuation characteristics.
The market volatility exhibited in 2015 continued into the quarter ended March 31, 2016, as a sharply negative January preceded a flattish February, followed by a March recovery. Driving much of these rotations were uneven economic data, global concerns (namely the Chinese economy and oil production), and speculation about interest rate increases and their timing. Near the close of the quarter, the Federal Reserve left short term interest rates unchanged in its March meeting and suggested a cautious approach to rate hikes for the rest of the year.
During the quarter ended June 30, investors’ worries shifted from a collapse in China to a recession in the U.S. and increasing oil prices, and finally, to Brexit; the United Kingdom’s vote to exit the European Union (EU). The vote to leave the EU sparked a market correction, amplifying economic uncertainty, increasing volatility, and driving down the pound. However, these events were quickly followed by a strong bounce back to earlier, more stable levels.
In the third quarter of 2016, the country’s attention remained focused on the expected outcome of the next U.S. Presidential and Congressional elections and their impacts on markets. The candidates have diverging goals on regulations, foreign policy, and how to rebuild infrastructure in this country. Headline unemployment has remained steady throughout 2016 at around 5.0%, with the participation rate holding near 63%. Although wages are rising, productivity has flattened which could be a concern for future corporate profits as, in the long run, corporate profits drive the stock market.
Among the better performing stocks during the year were Exelixis Inc. (0.2% of net assets as of September 30, 2016), a genomics based discovery company focused on development of drugs, crop protection, and plant biotechnology; Callon Petroleum (0.4%), an independent oil and natural gas company focused on growing production and reserves in the Permian Basin; and AEP Industries (0.8%), a leader in flexible packaging products and polyethylene films.
Some of the Fund’s weaker performing holdings during the year were Internap Corp. (0.1%), an Internet infrastructure provider that offers cloud hosting, colocation, Internet Protocol services, data center, and Content Delivery Network services; Falconstor Software (0.1%), a software defined storage provider providing data protection and storage virtualization; and Moduslink Global Solutions (0.3%), formerly CMGI Inc., a U.S. company that provides supply chain management services to global technology and software companies across its worldwide operations.
We appreciate your continued confidence and trust.
3
| | | | | | | | | | | | | | | | | | | | | | | | | | | | | | |
| Average Annual Returns Through September 30, 2016 (a) (Unaudited) | | | | | | | | |
| | | 1 Year | | | 5 Year | | | 10 Year | | | 15 Year | | | Since Inception (5/11/98) | | | | | | | | |
Mighty MitesSM Fund Class AAA | | | 14.98% | | | | 14.02% | | | | 9.29% | | | | 10.54% | | | 11.16% | | | | | | | | | | |
Russell MicrocapTM Index | | | 13.47 | | | | 16.37 | | | | 5.50 | | | | 8.86 | | | N/A(b) | | | | | | | | | | |
Russell 2000 Index | | | 15.47 | | | | 15.82 | | | | 7.07 | | | | 9.26 | | | 6.80 | | | | | | | | | | |
Lipper Small Cap Value Fund Average | | | 15.12 | | | | 14.30 | | | | 6.38 | | | | 9.77 | | | 7.83(c) | | | | | | | | | | |
In the current prospectuses dated January 28, 2016, the expense ratio for Class AAA Shares is 1.41%. See page 40 for the expense ratios for the year ended September 30, 2016. Class AAA Shares do not have a sales charge. (a) Returns represent past performance and do not guarantee future results. Total returns and average annual returns reflect changes in share price, reinvestment of distributions, and are net of expenses. Investment returns and the principal value of an investment will fluctuate. When shares are redeemed, they may be worth more or less than their original cost. Current performance may be lower or higher than the performance data presented. Visit www.tetonadv.com for performance information as of the most recent month end. Teton Advisors, Inc., (the “Adviser”) reimbursed expenses through September 30, 2005 to limit the expense ratios. Had such limitations not been in place, returns would have been lower. The Fund imposes a 2% redemption fee on shares sold or exchanged within seven days after the date of purchase. Investors should carefully consider the investment objectives, risks, charges, and expenses of the Fund before investing. The prospectuses contain information about these and other matters and should be read carefully before investing. To obtain a prospectus, please visit our website at www.tetonadv.com. Other share classes are available and have different performance characteristics. See page 2 for performance of other classes of shares. The Russell Microcap™ Index is an unmanaged indicator which measures the performance of the microcap segment of the U.S. equity market. The Russell 2000 Index is an unmanaged indicator which measures the performance of the small cap segment of the U.S. equity market. The Lipper Small Cap Value Fund Average reflects the average performance of mutual funds classified in this particular category. Investing in small capitalization securities involves special challenges because these securities may trade less frequently and experience more abrupt price movements than large capitalization securities. Dividends are considered reinvested. You cannot invest directly in an index. (b) The inception date of the Russell Microcap™ Index is June 30, 2000. (c) Lipper Small Cap Value Fund Average since inception performance is as of April 30, 1998. | | | | | | | | | | |
COMPARISON OF CHANGE IN VALUE OF A $10,000 INVESTMENT IN
THE MIGHTY MITESSM FUND CLASS AAA, THE RUSSELL 2000 INDEX,
AND THE RUSSELL MICROCAP™ INDEX (Unaudited)
*Past performance is not predictive of future results. The performance tables and graph do not reflect the deduction of taxes that a shareholder would pay on fund distributions or the redemption of fund shares.
**The Russell Microcap™ Index inception date is June 30, 2000 and the value of the Index prior to July 1, 2000 is that of the Mighty MitesSM Fund (Class AAA).
4
SmallCap Equity Fund (Unaudited)
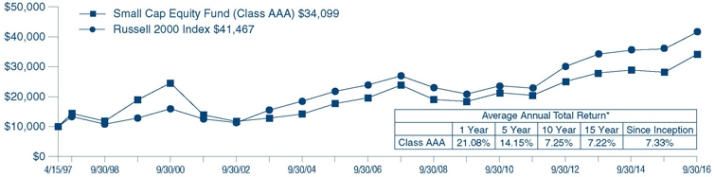
For the year ended September 30, 2016, the TETON Westwood SmallCap Equity Fund NAV per Class AAA Share appreciated 21.1% compared with a gain of 15.5% for the Russell 2000 Index. See below for additional performance information.
The Fund invests primarily in small cap companies that, through bottom-up fundamental research, the portfolio manager believes are attractively priced relative to their earnings growth potential or private market value. The Fund characterizes small capitalization companies as those companies with a market capitalization at the time of the Fund’s initial investment between $100 million and $2.5 billion.
The first calendar quarter of 2016 ended on a positive note as equities rebounded from the steep declines in January and February. After taking a battering during the first six weeks of the quarter, markets followed a V-shaped recovery as concerns over the global economy abated, with sentiment toward equities buoyed by accommodative central bank policy from Japan, Europe, and the U.S. Federal Reserve.
Following a challenging first quarter, equity investors sustained another bout of stock market turmoil with “Brexit,” Britain’s vote to exit the European Union. The election results came as a global shock and the stock market registered a sharp correction, only to later stage a dramatic recovery that ended the third calendar quarter in positive territory.
During the quarter ended September 30, 2016, the U.S. economy remained on a slow growth trajectory at a 1.4% annual rate of GDP growth, compared with 2.6% for 2015. The U.S. added 156,000 jobs in September, below August’s 167,000 and July’s 252,000. However, the U.S. unemployment rate has fallen to 5.0% a level that has, in the past, suggested the country has reached full employment. The Institute for Supply Management (ISM) survey climbed to 57.1 in September, its highest level since October 2015. In September, auto sales jumped to a 17.65 million unit annual rate.
Among the better performing stocks for the year were: Intersil Corp. (2.7% of net assets as of September 30, 2016), which manufactures high performance analog mixed signal and power management semiconductors, primarily used within industrial and infrastructure end markets; Patterson-UTI Energy Inc. (2.5%), a provider of onshore contract drilling services to major and independent oil and natural gas operators in the U.S. and Canada; and FormFactor Inc. (1.4%), who designs, develops, manufactures, sells, and supports semiconductor probe card products worldwide. Our weaker performing stocks during the year were NetScout Systems Inc. (1.9%), which develops network monitoring software to perform deep inspection which identifies and address sources of traffic and bottlenecks; United Natural Foods Inc. (1.3%), a leading distributor of natural foods, operating within a fragmented industry and selling through various retail outlets from supermarkets to specialty stores; and Infinera Corp. (1.0%), who designs and builds network equipment for optical transport, which is the high speed transmission of data in the form of light waves.
We thank you for your continued confidence and trust.
| | | | | | | | | | | | | | | | | | |
| Average Annual Returns through September 30, 2016 (a) (Unaudited) | | | | | | | | | | | | Since
Inception |
| | | 1 Year | | | 5 Year | | | 10 Year | | | 15 Year | | | (4/15/97) |
SmallCap Equity Fund Class AAA | | | 21.08% | | | | 14.15% | | | | 7.25% | | | | 7.22% | | | 7.73% |
Russell 2000 Index | | | 15.47 | | | | 15.82 | | | | 7.07 | | | | 9.26 | | | 8.33 |
Russell 2000 Value Index | | | 18.81 | | | | 15.45 | | | | 5.78 | | | | 9.38 | | | 9.26 |
In the current prospectuses dated January 28, 2016, the gross expense ratio for Class AAA Shares is 1.66%, and the net expense ratio is 1.50% after contractual reimbursements by Teton Advisors, Inc. (the “Adviser”) in place through January 31, 2017. See page 41 for the expense ratios for the year ended September 31, 2016. Class AAA Shares do not have a sales charge.
| | (a) | Returns represent past performance and do not guarantee future results. Total returns and average annual returns reflect changes in share price, reinvestment of distributions, and are net of expenses. Investment returns and the principal value of an investment will fluctuate. When shares are redeemed, they may be worth more or less than their original cost. Current performance may be lower or higher than the performance data presented. Visit www.tetonadv.com for performance information as of the most recent month end. The Adviser reimbursed expenses to limit the expense ratio. Had such limitation not been in place, returns would have been lower. The Fund imposes a 2% redemption fee on shares sold or exchanged within seven days after the date of purchase. Investors should carefully consider the investment objectives, risks, charges, and expenses of the Fund before investing. The prospectuses contain information about these and other matters and should be read carefully before investing. To obtain a prospectus, please visit our website at www.tetonadv.com. Other share classes are available and have different performance characteristics. See page 2 for performance of other classes of shares. The Russell 2000 Index is an unmanaged indicator which measures the performance of the small cap segment of the U.S. equity market. The Russell Value Index measure the performance of the small-capitalization sector of the U.S. equity market. It is a subset of the Russell 2000 Index. Investing in small capitalization securities involves special challenges because these securities may trade less frequently and experience more abrupt price movements than large capitalization securities. Dividends are considered reinvested. You cannot invest directly in an index. | |
COMPARISON OF CHANGE IN VALUE OF A $10,000 INVESTMENT IN THE SMALLCAP EQUITY FUND
CLASS AAA AND THE RUSSELL 2000 INDEX (Unaudited)
| * | Past performance is not predictive of future results. The performance tables and graph do not reflect the deduction of taxes that a shareholder would pay on fund distributions or the redemption of fund shares. |
5
Mid-Cap Equity Fund (Unaudited)
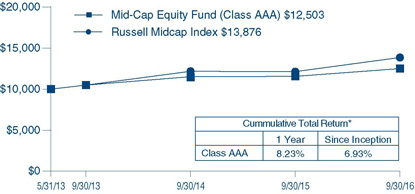
For the year ended September 30, 2016, the TETON Westwood Mid-Cap Equity Fund NAV per Class AAA Share appreciated 8.2% compared with a gain of 14.3% for the Russell Midcap Index. See next page for additional performance information.
The Fund invests primarily in mid-cap companies that the portfolio managers believe are undervalued by the market and have above average growth potential. The Fund defines mid-cap companies as those whose market capitalization falls within a range of $1 billion to $20 billion. The portfolio managers seek to identify companies with attractive products or services, financial strength, strong competitive positions, high quality management, and reasonable valuation. As bottom up, fundamental, research driven investors, they seek to invest in attractively valued companies with strong balance sheets, secular growth, experienced management teams, solid earnings prospects, leading market shares, and superior long term fundamentals.
At the onset of the quarter ended March 2016, the backdrop for the U.S. equity market was a slowing economy and cautious consumer spending. Energy related capital expenditures remained weak as oil prices plunged below $27 a barrel. Deteriorating economic growth in China, Japan, and the Eurozone threatened domestic businesses with international exposure and reinforced doubts that U.S. economy was not, in fact, immune from a global slowdown.
The June quarter saw a gradually improving economy; U.S. equities moved higher during most of the quarter, with midcap stocks advancing 4.0% through the third week in June. However, on June 23, the UK’s decision to exit the European Union (Brexit) sent stocks into a tailspin. The meltdown lasted two days, wiping out all of the quarter’s gains. In the remaining days of the quarter however, U.S. equities recouped most of what they had lost. Midcap stocks ended the quarter up 3.2%, slightly outperforming large caps and trailing small caps.
In defiance of several destabilizing events during the September quarter, U.S. equities saw modest gains, closing out the period near record levels. The Federal Reserve kept rates unchanged at its September meeting, while keeping investors on guard with its resolve to raise rates before the end of the year. In the end, midcap stocks delivered 4.5% returns as measured by the Russell Midcap Index.
Among the better performing stocks for the year were Mercadolibre (2.1% of net assets as of September 30, 2016), an Argentine online marketplace dedicated to e-commerce and online auctions; Insulet Corp. (1.5%), a medical device company that developed and markets the only tubeless patch insulin pump for Type I diabetics; and Pioneer Natural Resources (2.7%), an independent exploration and production company operating primarily in the Permian basin.
Some detractors from the portfolio were Norwegian Cruise Line Holdings (1.2%), a Bermuda incorporated, U.S. headquartered company operating cruise ships throughout the world; WisdomTree Investments (0.5%), a New York based asset manager of exchange-traded funds and exchange-traded products; and Alexion Pharmaceuticals (1.4%), one of the world’s leading rare disease companies focused on developing life transforming therapies for patients with devastating and rare diseases.
We appreciate your confidence and trust.
6
Average Annual Returns through September 30, 2016 (a) (Unaudited)
| | | | | | | | |
| | | | | | Since | |
| | | | | | Inception | |
| | | 1 Year | | | (5/31/13) | |
Mid-Cap Equity Fund Class AAA | | | 8.23% | | | | 6.93% | |
Russell Midcap Index | | | 14.25 | | | | 10.32(b) | |
Russell Midcap Growth Index | | | 11.24 | | | | 10.09(b) | |
In the current prospectuses dated January 28, 2016, the gross expense ratio for Class AAA Shares is 2.74%, and net expense ratio is 1.51% after contractual reimbursements by Teton Advisors, Inc., (the “Adviser”) in place through January 31, 2017. See page 42 for the expense ratios for the year ended September 30, 2016. Class AAA Shares do not have a sales charge.
| | (a) | Returns represent past performance and do not guarantee future results. Total returns and average annual returns reflect changes in share price, reinvestment of distributions, and are net of expenses. Investment returns and the principal value of an investment will fluctuate. When shares are redeemed, they may be worth more or less than their original cost. Current performance may be lower or higher than the performance data presented. Visit www.tetonadv.com for performance information as of the most recent month end. The Adviser reimbursed expenses to limit the expense ratio. Had such limitation not been in place, returns would have been lower. The Fund imposes a 2% redemption fee on shares sold or exchanged within seven days after the date of purchase. Investors should carefully consider the investment objectives, risks, charges, and expenses of the Fund before investing. The prospectuses contain information about these and other matters and should be read carefully before investing. To obtain a prospectus, please visit our website at www.tetonadv.com. Other share classes are available and have different performance characteristics. See page 2 for performance of other classes of shares. The Russell Midcap Index is an unmanaged indicator which measures the performance of the mid-cap segment of the U.S. equity market. The Russell Midcap Growth Index is an unmanaged indicator which measures the performance of those Russell Midcap companies with higher price-to-book ratios and higher forecasted growth values. Dividends are considered reinvested. You cannot invest directly in an index. | |
| | (b) | Russell Midcap and Russell Midcap Growth Indices since inception performance is from May 30, 2013. | |
COMPARISON OF CHANGE IN VALUE OF A $10,000 INVESTMENT IN THE MID-CAP EQUITY FUND
CLASS AAA AND THE RUSSELL MIDCAP INDEX (Unaudited)
| * | Past performance is not predictive of future results. The performance tables and graph do not reflect the deduction of taxes that a shareholder would pay on fund distributions or the redemption of fund shares. |
7
Income Fund (Unaudited)
For the year ended September 30, 2016, the TETON Westwood Income Fund NAV per Class AAA Share appreciated 10.4% compared with gains of 15.4% and 14.6% for the Standard & Poor’s (“S&P”) 500 Index and the Lipper Equity Income Fund Average, respectively. See below for additional performance information.
The Fund invests in companies to participate in the growth of earnings and cash flow. The portfolio manager looks for companies that she believes will continue to return cash flow to shareholders, resulting in higher share price valuation. The Fund looks to build a steady component of not only current return from dividend yields, but also rising dividend payout.
The March 2016 quarter saw evidence of slowing growth via falling retail sales, with a concerning drop in spending on gasoline and autos, contrary to the expectation that the windfall from lower energy prices would boost other consumer spending. The markets recovered that lost ground in the second half of the quarter, as economic news consistent with slow but not slowing growth came through. On a positive note, the U.S. labor market showed firm gains, albeit at a low level.
In the quarter ended June 30, the economy found solid ground, with firm evidence that the U.S. labor market continued to improve, although tepidly. Employment gains continued to be steady and the economy saw growth continue at a stable, but moderate pace. Consumer spending picked up, supported by solid progression in income and wage gains.
The September quarter saw a mixed set of data including an improvement in consumer spending. However, core income growth, meaning wages and salaries, has been in a slowing trend for over a year. The long term slow growth in GDP has resulted in low sales growth for corporations, which has put downward pressure on profits and capital spending. This has been part of the circle of low growth and more accommodative monetary and fiscal policies, not just in the United States, but globally.
Among the better performing stocks (all no longer held), for the fiscal year were Newmont Mining Corp., the second largest gold producer in the world; Apache Corp., an oil and gas exploration and production company with operations in the United States, Canada, Egypt, and the United Kingdom; and International Paper Co, a producer and distributor of paper, packaging, and forest products, including building materials.
Some of the Fund’s weaker performing stocks (all no longer held) during the year were Gilead Sciences , a research based biopharmaceutical company focused on the discovery, development, and commercialization of innovative medicine; Legg Mason, an American investment management firm with a focus on asset management and serves customers worldwide; and Weatherford International, an oil and gas service company with a presence in every major oil and gas region of the world.
Effective October 1, 2016, the TETON Westwood Income Fund was rebranded as the TETON Convertible Securities Fund, and changed its investment strategy to invest in a portfolio consisting primarily of convertible securities from income-oriented equities. The Fund will invest at least 80% of its assets in convertible securities. Thomas Dinsmore, CFA, Jane O’Keeffe, and James Dinsmore, CFA, will join Barbara Marcin, CFA, on the portfolio management team.
We appreciate your confidence and trust.
Average Annual Returns Through September 30, 2016 (a) (Unaudited)
| | | | | | | | | | | | | | | | | | | | |
| | | | | | | | | | | | | | | Since | |
| | | | | | | | | | | | | | | Inception | |
| | | 1 Year | | | 5 Year | | | 10 Year | | | 15 Year | | | (9/30/97) | |
Income Fund Class AAA | | | 10.39% | | | | 9.62% | | | | 3.97% | | | | 7.79% | | | | 7.00% | |
S&P 500 Index | | | 15.43 | | | | 16.37 | | | | 7.24 | | | | 7.15 | | | | 6.42 | |
Lipper Equity Income Fund Average | | | 14.61 | | | | 13.94 | | | | 5.87 | | | | 6.69 | | | | 5.94 | |
In the current prospectuses dated January 28, 2016, the gross expense ratio for Class AAA Shares is 2.40% and the net expense ratio is 2.00% after contractual reimbursements by Teton Advisors, Inc. (the “Adviser”) in place through January 31, 2017. See page 43 for the expense ratios for the year ended September 30, 2016. Class AAA Shares do not have a sales charge.
| | (a) | Returns represent past performance and do not guarantee future results. Total returns and average annual returns reflect changes in share price, reinvestment of distributions, and are net of expenses. Investment returns and the principal value of an investment will fluctuate. When shares are redeemed, they may be worth more or less than their original cost. Current performance may be lower or higher than the performance data presented. Visit www.tetonadv.com for performance information as of the most recent month end. The Adviser reimbursed expenses to limit the expense ratio. Had such limitation not been in place, returns would have been lower. The Fund imposes a 2% redemption fee on shares sold or exchanged within seven days after the date of purchase. Investors should carefully consider the investment objectives, risks, charges, and expenses of the Fund before investing. The prospectuses contain information about these and other matters and should be read carefully before investing. To obtain a prospectus, please visit our website at www.tetonadv.com. Other share classes are available and have different performance characteristics. See page 2 for performance of other classes of shares. The S&P 500 Index is a market capitalization weighted index of 500 large capitalization stocks commonly used to represent the U.S. equity market. The Lipper Equity Income Fund Average includes the 30 largest equity income funds tracked by Lipper, Inc. Dividends are considered reinvested. You cannot invest directly in an index. | |
COMPARISON OF CHANGE IN VALUE OF A $10,000 INVESTMENT IN THE INCOME FUND CLASS AAA,
THE S&P 500 INDEX, AND THE LIPPER EQUITY INCOME FUND AVERAGE (Unaudited)

| * | Past performance is not predictive of future results. The performance tables and graph do not reflect the deduction of taxes that a shareholder would pay on fund distributions or the redemption of fund shares. |
8
Equity Fund (Unaudited)
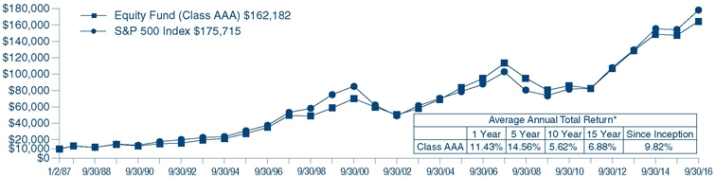
The TETON Westwood Equity Fund underperformed the benchmark S&P 500 Index over the fiscal year. For the twelve months ended September 30, 2016, the Equity Fund Class AAA shares posted a gains of 11.4%, net of expenses, versus the S&P 500 Index gains of 15.4%. See below for additional performance information.
During the fiscal year ended September 30, 2016, the markets saw selloffs, rallies off the bottom, and subsequent new all-time highs for the vast majority of the major indices across the market capitalization spectrum. Further, a new paradigm emerged as the previous zero bound for interest rates was pierced early in 2016 by the Bank of Japan. The Federal Reserve remained unchanged on the rate front. Following the United Kingdom’s referendum’s passage to exit the European Union, uncertainty rose and markets fell for the briefest of times before another round of central bank commentary pledging their support, should it be necessary, sparked another strong rally and the aforementioned new all-time highs in the indices.
The best-performing sectors for the S&P 500 were Technology, with a large weighting to go along with strong performance, and Materials. Utilities also saw a strong move higher on the back of the falling yields of comparable fixed income securities. The “FANG” stocks comprising Facebook, Amazon, Netflix, and Google/Alphabet again outperformed by nearly twice the return of the S&P 500.
Positive drivers of relative Fund performance over the twelve months were strong stock selection in the Health Care sector and a slight overweight and outperformance by the Utilities holdings. The top two contributors to returns came from Health Care. Johnson & Johnson (3.0% of net assets as of September 30, 2016), where improvements in its consumer business coupled with the acquisition of Vogue Healthcare to tuck in additional products and brands, were well received by the Street. Becton, Dickinson and Co. (2.1%) continued its long string of positive earnings surprises. Its recent deal for CareFusion appears to be a great strategic acquisition and supports both revenue and cost synergies going forward. Comcast Corp.’s (3.5%) string of consistently good quarterly earnings also continued as the merits of its positioning with regard to video consumption shifting towards on-demand and its strong content position with upside from NBCU, and its recent acquisition of DreamWorks further enhances that.
Distractors to the Fund’s performance were Wells Fargo & Co. (2.8%), which was in the headlines with the negative development regarding its cross-selling practices. Public Storage (1.8%) shares were pressured over fears of incremental supply and slower fundamentals. V.F. Corp (1.8%) fell as the broader retail space has seen pressure as mall traffic has largely underwhelmed.
We appreciate your confidence and trust.
Average Annual Returns through September 30, 2016 (a) (Unaudited)
| | | | | | | | | | | | | | | | | | | | |
| | | | | | | | | | | | | | | Since | |
| | | | | | | | | | | | | | | Inception | |
| | | 1 Year | | | 5 Year | | | 10 Year | | | 15 Year | | | (1/2/87) | |
Equity Fund Class AAA | | | 11.43% | | | | 14.56% | | | | 5.62% | | | | 6.88% | | | | 9.82% | |
S&P 500 Index | | | 15.43 | | | | 16.37 | | | | 7.24 | | | | 7.15 | | | | 10.11(b) | |
In the current prospectuses dated January 28, 2016, the expense ratio for Class AAA Shares is 1.59%. See page 44 for the expense ratios for the year ended September 30, 2016. Class AAA Shares do not have a sales charge.
| | (a) | Returns represent past performance and do not guarantee future results. Total returns and average annual returns reflect changes in share price, reinvestment of distributions, and are net of expenses. Investment returns and the principal value of an investment will fluctuate. When shares are redeemed, they may be worth more or less than their original cost. Current performance may be lower or higher than the performance data presented. Visit www.tetonadv.com for performance information as of the most recent month end. Investors should carefully consider the investment objectives, risks, charges, and expenses of the Fund before investing. The prospectuses contain information about these and other matters and should be read carefully before investing. To obtain a prospectus, please visit our website at www.tetonadv.com. Other share classes are available and have different performance characteristics. See page 2 for performance of other classes of shares. The S&P 500 Index is a market capitalization weighted index of 500 large capitalization stocks commonly used to represent the U.S. equity market. Dividends are considered reinvested. You cannot invest directly in an index. | |
| | (b) | S&P 500 Index since inception performance is as of December 31, 1986. | |
COMPARISON OF CHANGE IN VALUE OF A $10,000 INVESTMENT IN
THE EQUITY FUND CLASS AAA AND THE S&P 500 INDEX (Unaudited)
| * | Past performance is not predictive of future results. The performance tables and graph do not reflect the deduction of taxes that a shareholder would pay on fund distributions or the redemption of fund shares. |
9
Balanced Fund (Unaudited)
For twelve months ended September 30, 2016, the TETON Westwood Balanced Fund Class AAA Shares posted a return of 8.6%, net of expenses, versus the Bloomberg Barclays Government/Credit Bond Index return of 5.9%. The Fund’s return was less than a common balanced benchmark comprised of 60% S&P 500 Index and 40% of the Bloomberg Barclays Capital Government/Credit Bond Index which returned 11.6%. See next page for additional performance information.
The Fund is designed to provide exposure to equities while reducing overall risk through investment in investment grade fixed income securities. The bond portion typically invests in high-quality notes with lower interest rate sensitivity — and generally a shorter maturity — than the Bloomberg Barclays Government/Credit Bond Index (BB G/C), with the objective of dampening the volatility of equity holdings.
Comments from the Intermediate Bond and Equity Funds also apply to the Balanced Fund.
Throughout the Balanced Fund’s fiscal year and relative to the 60/40 index, the Fund’s asset allocation was overweight U.S. Equities and underweight U.S. Fixed Income. This tilt was beneficial for this time period, as the equity portion return of the Fund exceeded the fixed income return every quarter except the first quarter of 2016.
For the year ended September 30, 2016, the U.S. Treasury yield curve flattened as long Treasury maturity yields declined 0.45-0.55% and shorter yields increased. Corporate spreads tightened relative to duration matched Treasury yields and Baa-rated corporate credits outperformed higher-rated credits. U.S. Credits returned 8.30%, more than double the return of U.S. Governments at 4.00%. Long Credits in the BB G/C Index returned 15.73% and Long Governments 13.02%. Within Corporates, Utility and Industrial debt led Financial debt by over 3.00%.
Factors driving the Fund’s performance for the year relative to the BB G/C included: (1) positive effects from allocation decisions to markedly underweight U.S. Treasuries and to overweight the top-performing Industrial sector and Corporates in general; and (2) negative effects derived from under-owning long maturity securities during a period in which they led index performance.
The top six contributors to the Fund’s performance for the year all mature in 2024 and included one U.S. Agency note: Fannie Mae 2.625% due 06-Sep-2024 (1.8% of net assets as of September 30, 2016) and five corporate notes: Capital One Financial Corp. 3.75% due 24-Apr-2024 (1.0%), Aetna Inc. 3.5% due 15-Nov-2024 (1.0%), Morgan Stanley 3.7% due 23-Oct-2024 (1.0%), CVS Health Corp 3.375% due 12-Aug-2024 (1.0%), and Goldman Sachs Group Inc. 3.85% due 08-Jul-2024 (1.0%).
Detracting from performance were two notes which were sold during the year: EMC Corp. 3.375% due 01-Jun-2023 and Marathon Oil Corp 5.9% due 15-Mar-2018.
We appreciate your confidence and trust.
10
Average Annual Returns through September 30, 2016 (a) (Unaudited)
| | | | | | | | | | | | | | | | | | | | |
| | | | | | | | | | | | | | | Since | |
| | | | | | | | | | | | | | | Inception | |
| | | 1 Year | | | 5 Year | | | 10 Year | | | 15 Year | | | (10/1/91) | |
Balanced Fund Class AAA | | | 8.55% | | | | 9.66% | | | | 5.10% | | | | 5.99% | | | | 8.29% | |
Bloomberg Barclays Government/Credit Bond Index | | | 5.86 | | | | 3.24 | | | | 4.86 | | | | 4.90 | | | | 6.06(c) | |
S&P 500 Index | | | 15.43 | | | | 16.37 | | | | 7.24 | | | | 7.15 | | | | 9.34(c) | |
60% S&P 500 Index and 40% Bloomberg Barclays Government/Credit Bond Index (b) | | | 11.60 | | | | 11.12 | | | | 6.29 | | | | 6.25 | | | | 8.03 | |
In the current prospectuses dated January 28, 2016, the expense ratio for Class AAA Shares is 1.31%. See page 45 for the expense ratios for the year ended September 30, 2016. Class AAA Shares do not have a sales charge.
| | (a) | Returns represent past performance and do not guarantee future results. Total returns and average annual returns reflect changes in share price, reinvestment of distributions, and are net of expenses. Investment returns and the principal value of an investment will fluctuate. When shares are redeemed, they may be worth more or less than their original cost. Current performance may be lower or higher than the performance data presented. Visit www.tetonadv.com for performance information as of the most recent month end. Teton Advisors, Inc., (the “Adviser”), reimbursed expenses in years prior to 1998 to limit the expense ratio. Had such limitation not been in place, returns would have been lower. Investors should carefully consider the investment objectives, risks, charges, and expenses of the Fund before investing. The prospectuses contain information about these and other matters and should be read carefully before investing. To obtain a prospectus, please visit our website at www.tetonadv.com. Other share classes are available and have different performance characteristics. See page 2 for performance of other classes of shares. The Bloomberg Barclays Government/Credit Bond Index is a market value weighted index that tracks the performance of fixed rate, publicly placed, dollar denominated obligations. The S&P 500 Index is a market capitalization weighted index of 500 large capitalization stocks commonly used to represent the U.S. equity market. Dividends are considered reinvested. You cannot invest directly in an index. | |
| | (b) | The Blended Index consists of a 60% blend of each of the S&P 500 Index and 40% Bloomberg Barclays Government/Credit Bond Index. | |
| | (c) | S&P 500 Index and Bloomberg Barclays Government/Credit Bond Index since inception performances are as of September 30, 1991. | |
COMPARISON OF CHANGE IN VALUE OF A $10,000 INVESTMENT IN THE BALANCED FUND CLASS AAA,
THE S&P 500 INDEX, AND A COMPOSITE OF 60% OF THE S&P 500 INDEX AND 40% OF
THE BLOOMBERG BARCLAYS GOVERNMENT/CREDIT BOND INDEX (Unaudited)
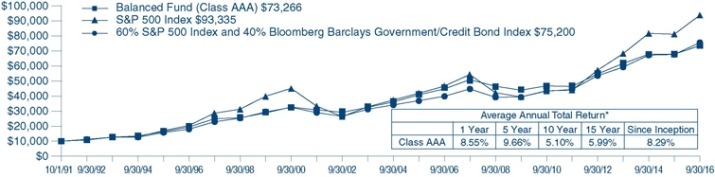
| * | Past performance is not predictive of future results. The performance tables and graph do not reflect the deduction of taxes that a shareholder would pay on fund distributions or the redemption of fund shares. |
11
Intermediate Bond Fund (Unaudited)
For the year ended September 30, 2016, the TETON Westwood Intermediate Bond Fund NAV per Class AAA Share increased 4.1% compared with the Bloomberg Barclays Government/Credit Bond Index which was up 5.9%. See below for additional performance information.
During the fourth quarter of 2015, the opening quarter of the Fund’s fiscal year, yields on intermediate and long term Treasuries increased and prices correspondingly declined. The Federal Reserve voted unanimously in December to increase the short term Federal Funds rate for the first time since 2006. That rate had been held near 0.00% since 2008. The U.S. Treasury Yield Curve continued to flatten as the yield on the 2-year Treasury increased from 0.65% to 1.05%; the 10-year yield increased less from 2.04% to 2.27%, and the 30-year yield increased from 2.87% to 3.01%.
Investment grade bond prices rallied during the first calendar quarter of 2016 as the Bloomberg Barclays U.S. Government/Credit Bond Index (BCG/C) posted a 3.47% return: 2.45% for notes maturing in 1-10 years, and 7.30% for bonds of maturity greater than 10 years.
Total returns on investment grade bonds rose again in the Fund’s fiscal third quarter, building on gains from the second quarter. Treasury prices rallied higher after three June events: (1) the weaker than expected May jobs report, (2) the Federal Reserve Open Market Committee (FOMC) pushing out expectations on future rate hikes, and (3) the U.K.’s unexpected referendum vote to leave the European Union.
Investment grade bonds returns were flat for the quarter ended September 30, 2016. Treasuries as a whole posted small losses while corporate bonds logged small gains. Britain’s decision to exit the European Union caused the 10-year Treasury yield to fall to its lowest level on record: 1.36% at the beginning of the quarter. The yield on the 10-year Treasury increased from 1.47% to 1.60% during the quarter. The 30-year Treasury earned a slightly positive return as the yield ended nearly unchanged. Investment grade credit spreads tightened by roughly 15 basis points during the quarter causing duration matched corporate bonds to outperform Treasuries.
Several factors influencing the BB G/C performance during third quarter had even more pronounced effects during the 12-month fiscal year ended September 30, 2016: (1) the U.S. Treasury yield curve markedly flattened as long Treasury maturity yields declined 0.45-0.55% and shorter yields increased, (2) corporate spreads tightened relative to duration matched Treasury yields and (3) Baa-rated corporate credits outperformed higher-rated credits. U.S. Credits returned 8.30%, more than double the return of U.S. Governments at 4.00%. Long Credits in the index returned 15.73% and Long Governments 13.02%. Within Corporates, Utility and Industrial debt led Financial debt by over 3.00%.
The top five contributors to fiscal year Fund performance included the long U.S. Treasury 2.5% due 15-Feb-2045 (sold) and four intermediate-maturity corporate notes: AT&T Inc. 3.9% due 11-Mar-2024 (2.6% of net assets as of September 30, 2016), Capital One Financial Corp. 3.75% due 24-Apr-2024 (2.1%), Aetna Inc. 3.5% due 15-Nov-2024 (2.1%), and United Technologies Corp 3.1% due 01-Jun-2022 (2.1%). Detracting the most from performance were three industrial corporate notes which were all sold during the year: Murphy Oil Corp 2.5% due 01-Dec-2017, EMC Corp 3.375% due 01-Jun-2023, and Marathon Oil Corp 5.9% due 15-Mar-2018.
We thank you for your continued confidence and trust.
Average Annual Returns through September 30, 2016 (a) (Unaudited)
| | | | | | | | | | | | | | | | | | | | |
| | | | | | | | | | | | | | | Since | |
| | | | | | | | | | | | | | | Inception | |
| | | 1 Year | | | 5 Year | | | 10 Year | | | 15 Year | | | (10/1/91) | |
Intermediate Bond Fund Class AAA | | | 4.06% | | | | 1.48% | | | | 3.26% | | | | 3.37% | | | | 4.76% | |
Bloomberg Barclays Government/Credit Bond Index | | | 5.86 | | | | 3.24 | | | | 4.86 | | | | 4.90 | | | | 6.06(b) | |
In the current prospectuses dated January 28, 2016, the gross expense ratio for AAA Shares is 1.37%. The net expense ratio is 1.01%, after contractual reimbursements by Teton Advisors, Inc., (the “Adviser”) in place through January 31, 2017. See page 46 for the expense ratios for the year ended September 30, 2016. Class AAA Shares do not have a sales charge.
| | (a) | Returns represent past performance and do not guarantee future results. Total returns and average annual returns reflect changes in share price, reinvestment of distributions, and are net of expenses. Investment returns and the principal value of an investment will fluctuate. When shares are redeemed, they may be worth more or less than their original cost. Current performance may be lower or higher than the performance data presented. Visit www.tetonadv.com for performance information as of the most recent month end. The Adviser reimbursed expenses to limit the expense ratio. Had such limitation not been in place, returns would have been lower. Investors should carefully consider the investment objectives, risks, charges, and expenses of the Fund before investing. The prospectuses contain information about these and other matters and should be read carefully before investing. To obtain a prospectus, please visit our website at www.tetonadv.com. Other share classes are available and have different performance characteristics. See page 2 for performance of other classes of shares. The Bloomberg Barclays Government/Credit Bond Index is a market value weighted index that tracks the performance of fixed rate, publicly placed, dollar denominated obligations. Dividends are considered reinvested. You cannot invest directly in an index. | |
| | (b) | The Bloomberg Barclays Government/Credit Bond Index since inception performance is as of September 30, 1991. | |
COMPARISON OF CHANGE IN VALUE OF A $10,000 INVESTMENT IN THE
INTERMEDIATE BOND FUND CLASS AAA AND
THE BLOOMBERG BARCLAYS GOVERNMENT/CREDIT BOND INDEX (Unaudited)

| * | Past performance is not predictive of future results. The performance tables and graph do not reflect the deduction of taxes that a shareholder would pay on fund distributions or the redemption of fund shares. |
12
This page was intentionally left blank.
TETON Westwood Funds
Disclosure of Fund Expenses (Unaudited)
For the Six Month Period from April 1, 2016 through September 30, 2016
We believe it is important for you to understand the impact of fees and expenses regarding your investment. All mutual funds have operating expenses. As a shareholder of a fund, you incur ongoing costs, which include costs for portfolio management, administrative services, and shareholder reports (like this one), among others. Operating expenses, which are deducted from a fund’s gross income, directly reduce the investment return of a fund. When a fund’s expenses are expressed as a percentage of its average net assets, this figure is known as the expense ratio. The following examples are intended to help you understand the ongoing costs (in dollars) of investing in your Fund and to compare these costs with those of other mutual funds. The examples are based on an investment of $1,000 made at the beginning of the period shown and held for the entire period.
The Expense Table below illustrates your Fund’s costs in two ways:
Actual Fund Return: This section provides information about actual account values and actual expenses. You may use this section to help you to estimate the actual expenses that you paid over the period after any fee waivers and expense reimbursements. The “Ending Account Value” shown is derived from the Fund’s actual return during the past six months, and the Expenses Paid During Period” shows the dollar amount that would have been paid by an investor who started with $1,000 in the Fund. You may use this information, together with the amount you invested, to estimate the expenses that you paid over the period. To do so, simply divide your account value by $1,000 (for example, an $8,600 account value divided by $1,000 = 8.6), then multiply the result by the number given for your Fund under the heading “Expenses Paid During Period” to estimate the expenses you paid during this period.
Hypothetical 5% Return: This section provides information about hypothetical account values and hypothetical expenses based on the Fund’s actual expense ratio. It assumes a hypothetical annualized return of 5% before expenses during the period shown. In this case – because the hypothetical return used is not the Fund’s actual return – the results do not apply to your investment and you cannot use the hypothetical account value and expense to estimate the actual ending account balance or expenses you paid for the period. This example is useful in making comparisons of the ongoing costs of investing in the Fund and other funds. To do so, compare this 5% hypothetical example with the 5% hypothetical examples that appear in shareholder reports of other funds.
Please note that the expenses shown in the table are meant to highlight your ongoing costs only and do not reflect any transactional costs such as sales charges (loads), redemption fees, or exchange fees, if any, which are described in the Prospectus. If these costs were applied to your account, your costs would be higher. Therefore, the 5% hypothetical return is useful in comparing ongoing costs only, and will not help you determine the relative total costs of owning different funds. The “Annualized Expense Ratio” represents the actual expenses for the last six months and may be different from the expense ratio in the Financial Highlights which is for the year ended September 30, 2016.
14
TETON Westwood Funds
Disclosure of Fund Expenses (Unaudited) (Continued)
For the Six Month Period from April 1, 2016 through September 30, 2016
Expense Table
| | | | | | | | | | | | | | | | | | | | | | |
| | | Actual Fund Return | | | | Hypothetical 5% Return | |
| | | Beginning | | Ending | | Annualized | | Expenses | | | | Beginning | | Ending | | Annualized | | Expenses | | | |
| | | Account Value | | Account Value | | Expense | | Paid During | | | | Account Value | | Account Value | | Expense | | Paid During | | | |
| | | 04/01/16 | | 09/30/16 | | Ratio | | Period* | | | | 04/01/16 | | 09/30/16 | | Ratio | | Period* | | | |
| | | | | | | | | | | | | | | | | | | | | | |
TETON Westwood Mighty MitesSM Fund | | | | | | | | | | | | | | | | | | | | | | |
Class AAA | | $1,000.00 | | $1,111.80 | | 1.40% | | $ 7.39 | | | | $1,000.00 | | $1,018.00 | | 1.40% | | $ 7.06 | | | | |
Class A | | $1,000.00 | | $1,110.50 | | 1.64% | | $ 8.65 | | | | $1,000.00 | | $1,016.80 | | 1.64% | | $ 8.27 | | | | |
Class C | | $1,000.00 | | $1,107.40 | | 2.15% | | $11.33 | | | | $1,000.00 | | $1,014.25 | | 2.15% | | $10.83 | | | | |
Class I | | $1,000.00 | | $1,113.20 | | 1.15% | | $ 6.08 | | | | $1,000.00 | | $1,019.25 | | 1.15% | | $ 5.81 | | | | |
| | | | | | | | | | |
| | | | | | | | | | | | | | | | | | | | | | |
TETON Westwood SmallCap Equity Fund | | | | | | | | | | | | | | | | | | | | | | |
Class AAA | | $1,000.00 | | $1,175.40 | | 1.50% | | $ 8.16 | | | | $1,000.00 | | $1,017.50 | | 1.50% | | $ 7.57 | | | | |
Class A | | $1,000.00 | | $1,174.60 | | 1.75% | | $ 9.51 | | | | $1,000.00 | | $1,016.25 | | 1.75% | | $ 8.82 | | | | |
Class C | | $1,000.00 | | $1,171.10 | | 2.25% | | $12.21 | | | | $1,000.00 | | $1,013.75 | | 2.25% | | $11.33 | | | | |
Class I | | $1,000.00 | | $1,177.20 | | 1.25% | | $ 6.80 | | | | $1,000.00 | | $1,018.75 | | 1.25% | | $ 6.31 | | | | |
| | | | | | | | | | |
| | | | | | | | | | | | | | | | | | | | | | |
TETON Westwood Mid-Cap Equity Fund | | | | | | | | | | | | | | | | | | | | | | |
Class AAA | | $1,000.00 | | $1,086.90 | | 1.18% | | $ 6.16 | | | | $1,000.00 | | $1,019.10 | | 1.18% | | $ 5.96 | | | | |
Class A | | $1,000.00 | | $1,084.70 | | 1.43% | | $ 7.45 | | | | $1,000.00 | | $1,017.85 | | 1.43% | | $ 7.21 | | | | |
Class C | | $1,000.00 | | $1,082.20 | | 1.95% | | $10.15 | | | | $1,000.00 | | $1,015.25 | | 1.95% | | $ 9.82 | | | | |
Class I | | $1,000.00 | | $1,088.90 | | 0.80% | | $ 4.18 | | | | $1,000.00 | | $1,021.00 | | 0.80% | | $ 4.04 | | | | |
| | | | | | | | | | |
| | | | | | | | | | | | | | | | | | | | | | |
TETON Westwood Income Fund | | | | | | | | | | | | | | | | | | | | | | |
Class AAA | | $1,000.00 | | $1,069.60 | | 2.00% | | $10.35 | | | | $1,000.00 | | $1,015.00 | | 2.00% | | $10.08 | | | | |
Class A | | $1,000.00 | | $1,068.00 | | 2.25% | | $11.63 | | | | $1,000.00 | | $1,013.75 | | 2.25% | | $11.33 | | | | |
Class C | | $1,000.00 | | $1,064.60 | | 2.75% | | $14.19 | | | | $1,000.00 | | $1,011.25 | | 2.75% | | $13.83 | | | | |
Class I | | $1,000.00 | | $1,070.20 | | 1.75% | | $ 9.06 | | | | $1,000.00 | | $1,016.25 | | 1.75% | | $ 8.82 | | | | |
| | | | | | | | | | |
| | | | | | | | | | | | | | | | | | | | | | |
TETON Westwood Equity Fund | | | | | | | | | | | | | | | | | | | | | | |
Class AAA | | $1,000.00 | | $1,041.40 | | 1.63% | | $ 8.32 | | | | $1,000.00 | | $1,016.85 | | 1.63% | | $ 8.22 | | | | |
Class A | | $1,000.00 | | $1,040.60 | | 1.88% | | $ 9.59 | | | | $1,000.00 | | $1,015.60 | | 1.88% | | $ 9.47 | | | | |
Class C | | $1,000.00 | | $1,038.10 | | 2.38% | | $12.13 | | | | $1,000.00 | | $1,013.10 | | 2.38% | | $11.98 | | | | |
Class I | | $1,000.00 | | $1,043.20 | | 1.38% | | $ 7.05 | | | | $1,000.00 | | $1,018.10 | | 1.38% | | $ 6.96 | | | | |
| | | | | | | | | | |
| | | | | | | | | | | | | | | | | | | | | | |
TETON Westwood Balanced Fund | | | | | | | | | | | | | | | | | | | | | | |
Class AAA | | $1,000.00 | | $1,034.30 | | 1.35% | | $ 6.87 | | | | $1,000.00 | | $1,018.25 | | 1.35% | | $ 6.81 | | | | |
Class A | | $1,000.00 | | $1,032.90 | | 1.60% | | $ 8.13 | | | | $1,000.00 | | $1,017.00 | | 1.60% | | $ 8.07 | | | | |
Class C | | $1,000.00 | | $1,030.80 | | 2.10% | | $10.66 | | | | $1,000.00 | | $1,014.50 | | 2.10% | | $10.58 | | | | |
Class I | | $1,000.00 | | $1,035.70 | | 1.10% | | $ 5.60 | | | | $1,000.00 | | $1,019.50 | | 1.10% | | $ 5.55 | | | | |
| | | | | | | | | | |
| | | | | | | | | | | | | | | | | | | | | | |
TETON Westwood Intermediate Bond Fund | | | | | | | | | | | | | | | | | | | | | | |
Class AAA | | $1,000.00 | | $1,019.30 | | 1.00% | | $ 5.05 | | | | $1,000.00 | | $1,020.00 | | 1.00% | | $ 5.05 | | | | |
Class A | | $1,000.00 | | $1,018.80 | | 1.10% | | $ 5.55 | | | | $1,000.00 | | $1,019.50 | | 1.10% | | $ 5.55 | | | | |
Class C | | $1,000.00 | | $1,016.20 | | 1.75% | | $ 8.82 | | | | $1,000.00 | | $1,016.25 | | 1.75% | | $ 8.82 | | | | |
Class I | | $1,000.00 | | $1,021.40 | | 0.75% | | $ 3.79 | | | | $1,000.00 | | $1,021.25 | | 0.75% | | $ 3.79 | | | | |
| * | Expenses are equal to the Funds’ annualized expense ratio for the last six months multiplied by the average account value over the period, multiplied by the number of days in the most recent fiscal half year (183 days), then divided by 366. |
15
Summary of Portfolio Holdings (Unaudited)
The following tables present portfolio holdings as a percent of net assets as of September 30, 2016:
TETON Westwood Mighty MitesSM Fund
| | | | | | |
Diversified Industrial | | | 10.4 | % | | |
U.S. Government Obligations | | | 9.2 | % | | |
Health Care | | | 8.5 | % | | |
Equipment and Supplies | | | 5.9 | % | | |
Financial Services | | | 5.8 | % | | |
Food and Beverage | | | 4.5 | % | | |
Automotive: Parts and Accessories | | | 4.1 | % | | |
Electronics | | | 3.9 | % | | |
Machinery | | | 3.6 | % | | |
Business Services | | | 3.5 | % | | |
Telecommunications | | | 3.3 | % | | |
Computer Software and Services | | | 3.0 | % | | |
Specialty Chemicals | | | 2.9 | % | | |
Hotels and Gaming | | | 2.8 | % | | |
Entertainment | | | 2.7 | % | | |
Consumer Products | | | 2.6 | % | | |
Real Estate | | | 2.3 | % | | |
Retail | | | 2.1 | % | | |
Aerospace and Defense | | | 2.1 | % | | |
Restaurants | | | 1.9 | % | | |
Building and Construction | | | 1.6 | % | | |
Publishing | | | 1.4 | % | | |
Metals and Mining | | | 1.4 | % | | |
Broadcasting | | | 1.4 | % | | |
| | | | |
Aviation: Parts and Services | | | 1.2 | % |
Manufactured Housing and Recreational Vehicles | | | 1.0 | % |
Energy and Utilities: Water | | | 1.0 | % |
Energy and Utilities: Natural Gas | | | 0.8 | % |
Environmental Control | | | 0.7 | % |
Consumer Services | | | 0.6 | % |
Energy and Utilities: Integrated | | | 0.5 | % |
Automotive | | | 0.5 | % |
Transportation | | | 0.4 | % |
Semiconductors | | | 0.4 | % |
Energy and Utilities: Services | | | 0.4 | % |
Energy and Utilities: Oil | | | 0.4 | % |
Communications Equipment | | | 0.3 | % |
Airlines | | | 0.3 | % |
Paper and Forest Products | | | 0.2 | % |
Agriculture | | | 0.2 | % |
Closed-End Business Development Company | | | 0.1 | % |
Educational Services | | | 0.0 | %* |
Computer Hardware | | | 0.0 | %* |
Other Assets and Liabilities (Net) | | | 0.1 | % |
| | | | |
| | | 100.0 | % |
| | | | |
| * | Amount represents less than 0.05% |
TETON Westwood SmallCap Equity Fund
| | | | | | |
Financial Services | | | 20.9 | % | | |
Semiconductors | | | 15.9 | % | | |
U.S. Government Obligations | | | 11.4 | % | | |
Energy and Utilities | | | 9.5 | % | | |
Retail | | | 7.7 | % | | |
Business Services | | | 7.3 | % | | |
Health Care | | | 5.6 | % | | |
Computer Software and Services | | | 4.9 | % | | |
Telecommunications | | | 4.1 | % | | |
Building and Construction | | | 3.9 | % | | |
| | | | |
Electronics | | | 3.7 | % |
Equipment and Supplies | | | 2.8 | % |
Specialty Chemicals | | | 2.6 | % |
Diversified Industrial | | | 2.1 | % |
Aerospace | | | 0.7 | % |
Machinery | | | 0.5 | % |
Consumer Products | | | 0.4 | % |
Other Assets and Liabilities (Net) | | | (4.0 | )% |
| | | | |
| | | 100.0 | % |
| | | | |
TETON Westwood Mid-Cap Equity Fund
| | | | | | |
Consumer Discretionary | | | 18.9 | % | | |
Information Technology | | | 17.5 | % | | |
Industrials | | | 17.2 | % | | |
Health Care | | | 16.9 | % | | |
Financials | | | 15.5 | % | | |
Energy | | | 7.1 | % | | |
| | | | |
Consumer Staples | | | 2.9 | % |
U.S. Government Obligations | | | 2.5 | % |
Materials | | | 1.8 | % |
Other Assets and Liabilities (net) | | | (0.3 | )% |
| | | | |
| | | 100.0 | % |
| | | | |
16
Summary of Portfolio Holdings (Unaudited) (Continued)
TETON Westwood Income Fund
| | | | |
Convertible Corporate Bonds | | | 2.8 | % |
U.S. Government Obligations | | | 29.3 | % |
| | | | |
Other Assets and Liabilities (Net) | | | 67.8 | % |
| | | | |
| | | 100.0 | % |
| | | | |
TETON Westwood Equity Fund
| | | | |
Financial Services | | | 12.3 | % |
Health Care | | | 12.0 | % |
Banking | | | 8.3 | % |
Food and Beverage | | | 7.6 | % |
Retail | | | 6.3 | % |
Computer Software and Services | | | 6.1 | % |
Aerospace | | | 5.1 | % |
Consumer Products | | | 4.7 | % |
Energy: Oil | | | 4.5 | % |
Telecommunications | | | 4.1 | % |
Business Services | | | 3.9 | % |
Energy and Energy Services | | | 3.9 | % |
Energy: Integrated | | | 3.9 | % |
| | | | |
Cable and Satellite | | | 3.5 | % |
Transportation | | | 2.2 | % |
Diversified Industrial | | | 2.1 | % |
Electronics | | | 2.0 | % |
Entertainment | | | 2.0 | % |
Specialty Chemicals | | | 1.9 | % |
Real Estate Investment Trusts | | | 1.8 | % |
Mutual Fund | | | 1.0 | % |
Energy: Natural Gas | | | 1.0 | % |
Other Assets and Liabilities (Net) | | | (0.2 | )% |
| | | | |
| | | 100.0 | % |
| | | | |
TETON Westwood Balanced Fund
| | | | |
Health Care | | | 12.5 | % |
Financial Services | | | 11.2 | % |
Banking | | | 9.6 | % |
Consumer Products | | | 5.4 | % |
Food and Beverage | | | 5.2 | % |
U.S. Treasury Notes | | | 4.9 | % |
Computer Software and Services | | | 4.1 | % |
Retail | | | 4.1 | % |
Energy: Oil | | | 3.8 | % |
Electronics | | | 3.7 | % |
Aerospace | | | 3.4 | % |
Transportation | | | 3.0 | % |
Federal Home Loan Mortgage Corp. | | | 2.8 | % |
Energy and Energy Services | | | 2.6 | % |
Diversified Industrial | | | 2.6 | % |
| | | | |
Telecommunications | | | 2.5 | % |
Mutual Fund | | | 2.5 | % |
Business Services | | | 2.5 | % |
Energy: Integrated | | | 2.5 | % |
Cable and Satellite | | | 2.3 | % |
Federal National Mortgage Association | | | 1.8 | % |
U.S. Treasury Inflation Indexed Notes | | | 1.7 | % |
Entertainment | | | 1.5 | % |
Specialty Chemicals | | | 1.2 | % |
Real Estate Investment Trusts | | | 1.1 | % |
Computer Hardware | | | 1.1 | % |
Energy: Natural Gas | | | 0.6 | % |
Other Assets and Liabilities (Net) | | | (0.2 | )% |
| | | | |
| | | 100.0 | % |
| | | | |
TETON Westwood Intermediate Bond Fund
| | | | | | |
Corporate Bonds | | | 58.2 | % | | |
U.S. Government Obligations | | | 19.9 | % | | |
U.S. Government Agency Obligations | | | 11.5 | % | | |
Mutual Fund | | | 9.9 | % | | |
| | | | | | |
Other Assets and Liabilities (Net) | | | 0.5 | % | | |
| | | | | | |
| | | 100.0 | % | | |
| | | | | | |
17
TETON Westwood Mighty MitesSM Fund
Schedule of Investments — September 30, 2016
| | | | | | | | | | |
Shares | | | | Cost | | | Market Value | |
| | |
| | COMMON STOCKS — 90.2% | | | | | |
| | Aerospace and Defense — 2.1% | | | | | |
| 1,218,900 | | Aerojet Rocketdyne Holdings Inc.† | | $ | 5,625,828 | | | $ | 21,428,262 | |
| 123,000 | | Innovative Solutions & Support Inc.† | | | 472,250 | | | | 391,140 | |
| 7,000 | | Kratos Defense & Security Solutions Inc.† | | | 42,963 | | | | 48,230 | |
| | | | | | | | | | |
| | | |
| | | | | 6,141,041 | | | | 21,867,632 | |
| | | | | | | | | | |
| | | |
| | Agriculture — 0.2% | | | | | | | | |
| 225 | | J.G. Boswell Co. | | | 144,676 | | | | 144,563 | |
| 103,290 | | Limoneira Co. | | | 1,997,007 | | | | 1,952,181 | |
| | | | | | | | | | |
| | | |
| | | | | 2,141,683 | | | | 2,096,744 | |
| | | | | | | | | | |
| | | |
| | Airlines — 0.3% | | | | | | | | |
| 80,000 | | American Airlines Group Inc. | | | 32,753 | | | | 2,928,800 | |
| 225,000 | | American Airlines Group Inc., Escrow† | | | 3,288 | | | | 198,000 | |
| | | | | | | | | | |
| | | |
| | | | | 36,041 | | | | 3,126,800 | |
| | | | | | | | | | |
| | | |
| | Automotive — 0.5% | | | | | | | | |
| 27,200 | | Lithia Motors Inc., Cl. A | | | 517,533 | | | | 2,598,144 | |
| 20,000 | | Navistar International Corp.† | | | 152,109 | | | | 457,800 | |
| 66,500 | | Sonic Automotive Inc., Cl. A | | | 849,600 | | | | 1,250,200 | |
| 70,000 | | Wabash National Corp.† | | | 132,194 | | | | 996,800 | |
| | | | | | | | | | |
| | | |
| | | | | 1,651,436 | | | | 5,302,944 | |
| | | | | | | | | | |
| |
| | Automotive: Parts and Accessories — 3.9% | |
| 490,781 | | Accuride Corp.† | | | 1,110,459 | | | | 1,256,399 | |
| 6,000 | | China Automotive Systems Inc.† | | | 34,007 | | | | 24,900 | |
| 105,000 | | Dana Inc. | | | 624,232 | | | | 1,636,950 | |
| 400,000 | | Federal-Mogul Holdings Corp.† | | | 3,578,148 | | | | 3,844,000 | |
| 13,400 | | Gentherm Inc.† | | | 194,890 | | | | 421,028 | |
| 25,000 | | Jason Industries Inc.† | | | 122,980 | | | | 55,500 | |
| 196,600 | | Modine Manufacturing Co.† | | | 1,907,098 | | | | 2,331,676 | |
| 24,000 | | Motorcar Parts of America Inc.† | | | 315,465 | | | | 690,720 | |
| 60,000 | | Puradyn Filter Technologies Inc.† | | | 13,098 | | | | 1,701 | |
| 73,000 | | Shiloh Industries Inc.† | | | 1,002,673 | | | | 516,110 | |
| 122,200 | | Standard Motor Products Inc. | | | 1,271,525 | | | | 5,836,272 | |
| 175,700 | | Strattec Security Corp. | | | 4,358,489 | | | | 6,202,210 | |
| 516,000 | | Superior Industries International Inc. | | | 9,522,378 | | | | 15,046,560 | |
| 37,000 | | Tenneco Inc.† | | | 115,032 | | | | 2,155,990 | |
| 35,000 | | Titan International Inc. | | | 297,192 | | | | 354,200 | |
| 33,425 | | Tower International Inc. | | | 736,834 | | | | 805,543 | |
| | | | | | | | | | |
| | | |
| | | | | 25,204,500 | | | | 41,179,759 | |
| | | | | | | | | | |
| | |
| | Aviation: Parts and Services — 1.2% | | | | | |
| 13,500 | | Astronics Corp.† | | | 110,901 | | | | 608,175 | |
| 14,778 | | Astronics Corp., Cl. B† | | | 117,275 | | | | 667,818 | |
| 125,642 | | Ducommun Inc.† | | | 2,158,735 | | | | 2,869,663 | |
| 197,301 | | Kaman Corp. | | | 5,011,314 | | | | 8,665,460 | |
| | | | | | | | | | |
| | | |
| | | | | 7,398,225 | | | | 12,811,116 | |
| | | | | | | | | | |
| | | |
| | Broadcasting — 1.4% | | | | | | | | |
| 614,200 | | ACME Communications Inc.† | | | 18,229 | | | | 20,269 | |
| 732,233 | | Beasley Broadcast Group Inc., Cl. A(a) | | | 3,883,673 | | | | 3,976,025 | |
| 38,000 | | Cumulus Media Inc., Cl. A† | | | 171,148 | | | | 12,536 | |
| 83,700 | | Entercom Communications Corp., Cl. A | | | 192,891 | | | | 1,083,078 | |
| 257,500 | | Gray Television Inc.† | | | 280,841 | | | | 2,667,700 | |
| 80,042 | | Gray Television Inc., Cl. A† | | | 530,550 | | | | 818,429 | |
| 33,300 | | Hemisphere Media Group Inc.† | | | 470,382 | | | | 424,575 | |
| | | | | | | | | | |
Shares | | | | Cost | | | Market Value | |
| | | |
| 620,008 | | Salem Media Group Inc. | | $ | 3,129,235 | | | $ | 3,645,647 | |
| 33,000 | | Sinclair Broadcast Group Inc., Cl. A | | | 53,667 | | | | 953,040 | |
| 90,500 | | Townsquare Media Inc., Cl. A† | | | 882,376 | | | | 845,270 | |
| 41,675 | | Videocon d2h Ltd., ADR† | | | 265,893 | | | | 407,582 | |
| | | | | | | | | | |
| | | |
| | | | | 9,878,885 | | | | 14,854,151 | |
| | | | | | | | | | |
| | |
| | Building and Construction — 1.6% | | | | | |
| 141,000 | | Gibraltar Industries Inc.† | | | 3,237,843 | | | | 5,238,150 | |
| 866,000 | | Huttig Building Products Inc.† | | | 1,009,303 | | | | 5,005,480 | |
| 107,074 | | MYR Group Inc.† | | | 2,422,367 | | | | 3,222,927 | |
| 99,460 | | The Monarch Cement Co. | | | 2,621,010 | | | | 3,841,643 | |
| | | | | | | | | | |
| | | |
| | | | | 9,290,523 | | | | 17,308,200 | |
| | | | | | | | | | |
| | |
| | Business Services — 3.5% | | | | | |
| 264,900 | | Ascent Capital Group Inc.,
Cl. A† | | | 6,957,990 | | | | 6,137,733 | |
| 2,000 | | Cenveo Inc.† | | | 30,565 | | | | 14,100 | |
| 1,246 | | Du-Art Film Labs
Inc.† | | | 211,045 | | | | 212,443 | |
| 705,520 | | Edgewater Technology
Inc.†(a) | | | 2,293,833 | | | | 5,996,920 | |
| 101,271 | | GP Strategies Corp.† | | | 928,058 | | | | 2,493,292 | |
| 23,300 | | ICF International Inc.† | | | 558,939 | | | | 1,032,656 | |
| 545,500 | | Internap Corp.† | | | 3,307,498 | | | | 900,075 | |
| 32,029 | | KAR Auction Services Inc. | | | 443,660 | | | | 1,382,372 | |
| 8,000 | | Landauer Inc. | | | 282,324 | | | | 355,840 | |
| 16,000 | | Macquarie Infrastructure Corp. | | | 133,758 | | | | 1,331,840 | |
| 4,560 | | Matthews International Corp., Cl. A | | | 200,594 | | | | 277,066 | |
| 20,000 | | McGrath RentCorp. | | | 535,869 | | | | 634,200 | |
| 1,640,000 | | ModusLink Global Solutions Inc.† | | | 5,710,498 | | | | 2,689,600 | |
| 30,000 | | Pendrell Corp.† | | | 48,782 | | | | 20,553 | |
| 196,772 | | PFSweb Inc.† | | | 943,201 | | | | 1,757,174 | |
| 182,359 | | PRGX Global Inc.† | | | 1,068,600 | | | | 858,911 | |
| 322,800 | | Pure Technologies Ltd. | | | 1,507,350 | | | | 1,441,829 | |
| 40,216 | | Safeguard Scientifics Inc.† | | | 699,254 | | | | 521,199 | |
| 242,000 | | Scientific Games Corp., Cl. A† | | | 2,861,472 | | | | 2,727,340 | |
| 1,000 | | Stamps.com Inc.† | | | 12,517 | | | | 94,510 | |
| 120,090 | | Team Inc.† | | | 3,308,716 | | | | 3,928,148 | |
| 15,000 | | Trans-Lux Corp.† | | | 99,560 | | | | 40,875 | |
| 37,282 | | Viad Corp. | | | 993,885 | | | | 1,374,587 | |
| | | | | | | | | | |
| | | |
| | | | | 33,137,968 | | | | 36,223,263 | |
| | | | | | | | | | |
| |
| | Closed-End Business Development Company — 0.1% | |
| 109,000 | | MVC Capital Inc. | | | 1,076,119 | | | | 903,610 | |
| | | | | | | | | | |
| | |
| | Communications Equipment — 0.3% | | | | | |
| 427,598 | | Communications Systems Inc. | | | 3,949,303 | | | | 2,035,366 | |
| 275,000 | | Extreme Networks Inc.† | | | 946,476 | | | | 1,234,750 | |
| 134,600 | | Sycamore Networks Inc. | | | 659 | | | | 20,876 | |
| 30,000 | | ViewCast.com Inc.† | | | 14,100 | | | | 32 | |
| | | | | | | | | | |
| | | |
| | | | | 4,910,538 | | | | 3,291,024 | |
| | | | | | | | | | |
| | |
| | Computer Hardware — 0.0% | | | | | |
| 5,000 | | Violin Memory Inc.† | | | 6,694 | | | | 3,650 | |
| | | | | | | | | | |
| | |
| | Computer Software and Services — 3.0% | | | | | |
| 169,113 | | American Software Inc., Cl. A | | | 1,540,435 | | | | 1,877,154 | |
| 65,000 | | Avid Technology Inc.† | | | 638,597 | | | | 516,100 | |
| 317,000 | | Callidus Software Inc.† | | | 1,754,441 | | | | 5,816,950 | |
| 79,687 | | Carbonite Inc.† | | | 914,787 | | | | 1,223,992 | |
| 1,600 | | Cinedigm Corp., Cl. A† | | | 27,077 | | | | 3,136 | |
| 1,000 | | CommerceHub Inc., Cl. A† | | | 15,100 | | | | 15,800 | |
| 1,000 | | CommerceHub Inc., Cl. C† | | | 15,081 | | | | 15,910 | |
| 96,932 | | comScore Inc.† | | | 3,348,543 | | | | 2,971,935 | |
| 30,000 | | Datawatch Corp.† | | | 257,678 | | | | 222,300 | |
| 56,101 | | Digi International Inc.† | | | 566,777 | | | | 639,551 | |
| 595,250 | | EarthLink Holdings Corp. | | | 2,345,936 | | | | 3,690,550 | |
| 770,000 | | FalconStor Software Inc.† | | | 2,416,717 | | | | 800,800 | |
See accompanying notes to financial statements.
18
TETON Westwood Mighty MitesSM Fund
Schedule of Investments (Continued) — September 30, 2016
| | | | | | | | | | |
Shares | | | | Cost | | | Market Value | |
| | |
| | COMMON STOCKS (Continued) | | | | | |
| | Computer Software and Services (Continued) | |
| 1,410 | | Gemalto NV | | $ | 8,172 | | | $ | 90,411 | |
| 25,000 | | Genius Brands International Inc.† | | | 49,453 | | | | 51,250 | |
| 459,202 | | Global Sources Ltd.† | | | 2,992,593 | | | | 3,894,033 | |
| 20,000 | | GSE Systems Inc.† | | | 109,966 | | | | 57,600 | |
| 360,105 | | Guidance Software Inc.† | | | 2,808,750 | | | | 2,146,226 | |
| 144,267 | | iGO Inc.† | | | 484,473 | | | | 418,374 | |
| 458,356 | | Lionbridge Technologies
Inc.† | | | 1,640,566 | | | | 2,291,780 | |
| 10,000 | | Materialise NV, ADR† | | | 58,532 | | | | 77,000 | |
| 35,500 | | Mercury Systems Inc.† | | | 282,814 | | | | 872,235 | |
| 67,500 | | Mitek Systems Inc.† | | | 199,734 | | | | 559,575 | |
| 5,502 | | MTS Systems Corp. | | | 257,882 | | | | 253,257 | |
| 2,000 | | Qualstar Corp.† | | | 17,642 | | | | 7,780 | |
| 193,803 | | Qumu Corp.† | | | 2,273,291 | | | | 443,809 | |
| 200,000 | | Silicon Graphics International Corp.† | | | 1,540,000 | | | | 1,540,000 | |
| 3,400 | | Tyler Technologies Inc.† | | | 37,768 | | | | 582,182 | |
| | | | | | | | | | |
| | | |
| | | | | 26,602,805 | | | | 31,079,690 | |
| | | | | | | | | | |
| | |
| | Consumer Products — 2.6% | | | | | |
| 127,200 | | Acme United Corp. | | | 2,271,327 | | | | 2,625,408 | |
| 157,634 | | Bassett Furniture Industries Inc. | | | 2,360,662 | | | | 3,664,991 | |
| 2,000 | | Brunswick Corp. | | | 30,085 | | | | 97,560 | |
| 55,687 | | Callaway Golf Co. | | | 383,296 | | | | 646,526 | |
| 10,000 | | Johnson Outdoors Inc., Cl. A | | | 219,302 | | | | 363,700 | |
| 11,400 | | Lakeland Industries Inc.† | | | 109,829 | | | | 113,430 | |
| 1,463,899 | | Marine Products Corp. | | | 9,883,166 | | | | 13,131,174 | |
| 13,000 | | MarineMax Inc.† | | | 63,807 | | | | 272,350 | |
| 1,200 | | National Presto Industries Inc. | | | 90,916 | | | | 105,348 | |
| 75,031 | | Nautilus Inc.† | | | 571,200 | | | | 1,704,704 | |
| 128,300 | | Oil-Dri Corp. of America | | | 2,285,450 | | | | 4,829,212 | |
| 5,700 | | PC Group Inc.† | | | 3,465 | | | | 19 | |
| 10,000 | | Sequential Brands Group Inc.† | | | 115,723 | | | | 80,001 | |
| 22,000 | | Stanley Furniture Co Inc. | | | 57,048 | | | | 39,380 | |
| 10,400 | | Syratech Corp.† | | | 2,600 | | | | 31 | |
| | | | | | | | | | |
| | | |
| | | | | 18,447,876 | | | | 27,673,834 | |
| | | | | | | | | | |
| | |
| | Consumer Services — 0.6% | | | | | |
| 485,500 | | 1-800-Flowers.com Inc., Cl. A† | | | 1,417,319 | | | | 4,452,035 | |
| 5,100 | | Angie’s List Inc.† | | | 31,414 | | | | 50,541 | |
| 55,000 | | Bowlin Travel Centers Inc.† | | | 69,687 | | | | 81,125 | |
| 800 | | Collectors Universe Inc. | | | 0 | | | | 14,824 | |
| 74,991 | | XO Group Inc.† | | | 732,512 | | | | 1,449,576 | |
| | | | | | | | | | |
| | | |
| | | | | 2,250,932 | | | | 6,048,101 | |
| | | | | | | | | | |
| | |
| | Diversified Industrial — 10.2% | | | | | |
| 25,000 | | A.M. Castle & Co.† | | | 185,448 | | | | 20,000 | |
| 74,492 | | AEP Industries Inc. | | | 3,466,704 | | | | 8,147,190 | |
| 9,292 | | American Railcar Industries Inc. | | | 147,177 | | | | 385,339 | |
| 440,000 | | Ampco-Pittsburgh Corp. | | | 9,073,471 | | | | 4,879,600 | |
| 245,000 | | Burnham Holdings Inc.,
Cl. A(a) | | | 3,937,979 | | | | 4,187,050 | |
| 107,122 | | Chase Corp. | | | 1,559,550 | | | | 7,404,273 | |
| 115,500 | | Columbus McKinnon Corp. | | | 1,897,964 | | | | 2,060,520 | |
| 446,598 | | FormFactor Inc.† | | | 3,111,209 | | | | 4,845,588 | |
| 34,600 | | Graham Corp. | | | 563,893 | | | | 660,860 | |
| 432,703 | | Griffon Corp. | | | 4,709,349 | | | | 7,360,278 | |
| 17,095 | | Handy & Harman Ltd.† | | | 434,057 | | | | 359,679 | |
| 25,000 | | Haulotte Group SA | | | 134,090 | | | | 378,009 | |
| 30,000 | | Haynes International Inc. | | | 1,399,060 | | | | 1,113,300 | |
| 7,000 | | Innophos Holdings Inc. | | | 207,318 | | | | 273,210 | |
| 314,509 | | Insignia Systems Inc.† | | | 914,190 | | | | 739,096 | |
| 232,030 | | Intevac Inc.† | | | 1,053,210 | | | | 1,368,977 | |
| 87,649 | | John Bean Technologies Corp. | | | 2,567,582 | | | | 6,183,637 | |
| 6,300 | | K2M Group Holdings Inc.† | | | 108,204 | | | | 112,014 | |
| 269,000 | | Katy Industries Inc.† | | | 287,565 | | | | 127,775 | |
| 91,507 | | L.B. Foster Co., Cl. A | | | 1,607,718 | | | | 1,098,999 | |
| | | | | | | | | | |
Shares | | | | Cost | | | Market Value | |
| | | |
| 264,714 | | Lawson Products Inc.† | | $ | 3,736,757 | | | $ | 4,693,379 | |
| 40,000 | | LSB Industries Inc.† | | | 222,135 | | | | 343,200 | |
| 134,949 | | Lydall Inc.† | | | 1,339,872 | | | | 6,899,942 | |
| 9,500 | | MSA Safety Inc. | | | 306,832 | | | | 551,380 | |
| 607,900 | | Myers Industries Inc. | | | 7,958,079 | | | | 7,896,621 | |
| 207,211 | | NAPCO Security Technologies Inc.† | | | 1,105,247 | | | | 1,491,919 | |
| 170,100 | | Park-Ohio Holdings Corp. | | | 3,364,793 | | | | 6,200,145 | |
| 250,000 | | Playmates Holdings Ltd. | | | 292,138 | | | | 294,595 | |
| 25,080 | | Raven Industries Inc. | | | 497,955 | | | | 577,592 | |
| 66,666 | | Rubicon Ltd.† | | | 37,762 | | | | 10,194 | |
| 18,699 | | RWC Inc.† | | | 306,532 | | | | 259,916 | |
| 493,604 | | Sevcon Inc.†(a) | | | 2,866,836 | | | | 4,368,395 | |
| 25,000 | | Sevcon Inc.†(a)(b) | | | 193,194 | | | | 221,250 | |
| 28,000 | | Standex International Corp. | | | 928,588 | | | | 2,600,360 | |
| 600,000 | | Steel Partners Holdings LP† | | | 9,640,487 | | | | 8,610,000 | |
| 375,000 | | Tredegar Corp. | | | 6,539,066 | | | | 6,971,250 | |
| 296,000 | | Twin Disc Inc. | | | 5,147,255 | | | | 3,546,080 | |
| | | | | | | | | | |
| | | |
| | | | | 81,849,266 | | | | 107,241,612 | |
| | | | | | | | | | |
| | |
| | Educational Services — 0.0% | | | | | |
| 500,587 | | Corinthian Colleges Inc.† | | | 198,119 | | | | 476 | |
| 73,000 | | Universal Technical Institute Inc. | | | 951,729 | | | | 129,940 | |
| | | | | | | | | | |
| | | |
| | | | | 1,149,848 | | | | 130,416 | |
| | | | | | | | | | |
| | |
| | Electronics — 3.9% | | | | | |
| 33,000 | | Alliance Semiconductor Corp.† | | | 66,300 | | | | 26,070 | |
| 28,000 | | Badger Meter Inc. | | | 477,554 | | | | 938,280 | |
| 172,800 | | Bel Fuse Inc., Cl. A(a) | | | 3,202,668 | | | | 3,481,920 | |
| 345,500 | | CTS Corp. | | | 2,875,109 | | | | 6,426,300 | |
| 70,000 | | Daktronics Inc. | | | 686,143 | | | | 667,800 | |
| 49,789 | | Electro Scientific Industries Inc.† | | | 507,868 | | | | 280,810 | |
| 63,771 | | EMRISE Corp.† | | | 0 | | | | 12,754 | |
| 32,000 | | IMAX Corp.† | | | 136,444 | | | | 927,040 | |
| 20,000 | | Iteris Inc.† | | | 32,200 | | | | 72,800 | |
| 230,000 | | Kimball Electronics Inc.† | | | 1,412,381 | | | | 3,187,800 | |
| 185,000 | | Kopin Corp.† | | | 659,531 | | | | 403,300 | |
| 34,300 | | Mesa Laboratories Inc. | | | 906,643 | | | | 3,922,548 | |
| 33,800 | | Methode Electronics Inc. | | | 190,811 | | | | 1,181,986 | |
| 391,930 | | MOCON Inc.(a) | | | 5,652,562 | | | | 6,153,301 | |
| 52,100 | | MoSys Inc.† | | | 150,654 | | | | 39,075 | |
| 131,528 | | Park Electrochemical Corp. | | | 2,113,684 | | | | 2,284,641 | |
| 82,074 | | Rofin-Sinar Technologies
Inc.† | | | 1,923,230 | | | | 2,641,141 | |
| 78,000 | | Schmitt Industries Inc.† | | | 210,348 | | | | 121,680 | |
| 7,037 | | Sparton Corp.† | | | 119,633 | | | | 184,792 | |
| 248,498 | | Stoneridge Inc.† | | | 1,610,641 | | | | 4,572,363 | |
| 8,000 | | Stratasys Ltd.† | | | 127,783 | | | | 192,720 | |
| 157,000 | | Ultra Clean Holdings† | | | 478,219 | | | | 1,163,370 | |
| 25,000 | | Ultralife Corp.† | | | 96,124 | | | | 102,500 | |
| 99,500 | | Ultratech Inc.† | | | 1,819,137 | | | | 2,296,460 | |
| | | | | | | | | | |
| | | |
| | | | | 25,455,667 | | | | 41,281,451 | |
| | | | | | | | | | |
| |
| | Energy and Utilities: Alternative Energy — 0.0% | |
| 39,200 | | JA Solar Holdings Co. Ltd., ADR† | | | 339,814 | | | | 235,592 | |
| | | | | | | | | | |
| |
| | Energy and Utilities: Integrated — 0.5% | |
| 89,440 | | Broadwind Energy Inc.† | | | 563,104 | | | | 393,536 | |
| 135,100 | | Headwaters Inc.† | | | 566,488 | | | | 2,285,892 | |
| 36,000 | | MGE Energy Inc. | | | 848,987 | | | | 2,034,360 | |
| | | | | | | | | | |
| | | |
| | | | | 1,978,579 | | | | 4,713,788 | |
| | | | | | | | | | |
| | |
| | Energy and Utilities: Natural Gas — 0.8% | | | | | |
| 260,000 | | Alvopetro Energy Ltd.† | | | 241,629 | | | | 42,608 | |
| 33,750 | | Chesapeake Utilities Corp. | | | 609,315 | | | | 2,060,775 | |
| 90,570 | | Corning Natural Gas Holding Co. | | | 1,015,904 | | | | 1,657,431 | |
| 105,000 | | Delta Natural Gas Co. Inc. | | | 1,603,470 | | | | 2,504,250 | |
See accompanying notes to financial statements.
19
TETON Westwood Mighty MitesSM Fund
Schedule of Investments (Continued) — September 30, 2016
| | | | | | | | | | |
Shares | | | | Cost | | | Market Value | |
| |
| | COMMON STOCKS (Continued) | |
| | Energy and Utilities: Natural Gas (Continued) | |
| 29,000 | | Gas Natural Inc. | | $ | 285,798 | | | $ | 222,430 | |
| 400,181 | | Gulf Coast Ultra Deep Royalty Trust† | | | 260,838 | | | | 26,412 | |
| 15,000 | | Piedmont Natural Gas Co. Inc. | | | 530,578 | | | | 900,600 | |
| 43,600 | | RGC Resources Inc. | | | 566,134 | | | | 1,063,840 | |
| 2,333 | | US Energy Corp. Wyoming† | | | 50,132 | | | | 4,083 | |
| 10,000 | | Whitecap Resources Inc. | | | 84,862 | | | | 83,540 | |
| | | | | | | | | | |
| | | |
| | | | | 5,248,660 | | | | 8,565,969 | |
| | | | | | | | | | |
| | |
| | Energy and Utilities: Oil — 0.4% | | | | | |
| 244,844 | | Callon Petroleum Co.† | | | 1,971,677 | | | | 3,844,051 | |
| 57,900 | | Tesco Corp. | | | 503,333 | | | | 472,464 | |
| | | | | | | | | | |
| | | |
| | | | | 2,475,010 | | | | 4,316,515 | |
| | | | | | | | | | |
| | |
| | Energy and Utilities: Services — 0.4% | | | | | |
| 3,000 | | Archer Ltd.† | | | 1,736 | | | | 1,801 | |
| 18,000 | | Dawson Geophysical Co.† | | | 202,408 | | | | 137,340 | |
| 25,300 | | Flotek Industries Inc.† | | | 279,150 | | | | 367,862 | |
| 15,000 | | Key Energy Services Inc.† | | | 3,735 | | | | 623 | |
| 225,000 | | Layne Christensen Co.† | | | 2,326,235 | | | | 1,914,750 | |
| 92,500 | | RPC Inc.† | | | 218,733 | | | | 1,554,000 | |
| 7,100 | | Subsea 7 SA, ADR† | | | 25,056 | | | | 76,680 | |
| | | | | | | | | | |
| | | |
| | | | | 3,057,053 | | | | 4,053,056 | |
| | | | | | | | | | |
| | |
| | Energy and Utilities: Water — 1.0% | | | | | |
| 24,226 | | Artesian Resources Corp., Cl. A | | | 482,625 | | | | 691,410 | |
| 45,174 | | Cadiz Inc.† | | | 518,835 | | | | 334,739 | |
| 24,800 | | California Water Service Group | | | 478,224 | | | | 795,832 | |
| 4,000 | | Connecticut Water Service Inc. | | | 135,142 | | | | 198,920 | |
| 66,000 | | Consolidated Water Co. Ltd. | | | 717,506 | | | | 766,920 | |
| 68,000 | | Energy Recovery Inc.† | | | 280,443 | | | | 1,086,640 | |
| 29,933 | | Middlesex Water Co. | | | 579,145 | | | | 1,054,839 | |
| | | |
| 20,000 | | Mueller Water Products Inc., Cl. A | | | 169,066 | | | | 251,000 | |
| 103,304 | | SJW Corp. | | | 2,574,235 | | | | 4,512,319 | |
| 44,037 | | The York Water Co. | | | 719,093 | | | | 1,306,137 | |
| | | | | | | | | | |
| | | |
| | | | | 6,654,314 | | | | 10,998,756 | |
| | | | | | | | | | |
| | |
| | Entertainment — 2.7% | | | | | |
| 362,347 | | Canterbury Park Holding Corp.(a) | | | 3,724,606 | | | | 3,804,644 | |
| 619,556 | | Dover Motorsports Inc. | | | 1,521,154 | | | | 1,530,303 | |
| 717,763 | | Entravision Communications Corp., Cl. A | | | 1,819,062 | | | | 5,476,532 | |
| 896,104 | | Media General Inc.† | | | 5,358,015 | | | | 16,515,197 | |
| 133,400 | | RLJ Entertainment Inc.† | | | 359,062 | | | | 288,145 | |
| 50,000 | | SFX Entertainment Inc.† | | | 2,750 | | | | 755 | |
| 275,000 | | Sportech plc† | | | 291,446 | | | | 290,498 | |
| 34,000 | | World Wrestling Entertainment Inc., Cl. A | | | 509,340 | | | | 724,200 | |
| | | | | | | | | | |
| | | |
| | | | | 13,585,435 | | | | 28,630,274 | |
| | | | | | | | | | |
| | |
| | Environmental Control — 0.7% | | | | | |
| 7,500 | | BioteQ Environmental Technologies Inc.† | | | 12,419 | | | | 257 | |
| 598,228 | | Casella Waste Systems Inc., Cl. A† | | | 2,833,948 | | | | 6,161,748 | |
| 15,718 | | Ceco Environmental Corp. | | | 225,420 | | | | 177,299 | |
| 107,700 | | Hudson Technologies Inc.† | | | 387,751 | | | | 716,205 | |
| | | | | | | | | | |
| | | |
| | | | | 3,459,538 | | | | 7,055,509 | |
| | | | | | | | | | |
| | |
| | Equipment and Supplies — 5.9% | | | | | |
| 20,000 | | Amtech Systems Inc.† | | | 215,643 | | | | 99,200 | |
| 20,000 | | AZZ Inc. | | | 716,820 | | | | 1,305,400 | |
| 162,400 | | CIRCOR International Inc. | | | 5,806,086 | | | | 9,672,544 | |
| | | | | | | | | | |
Shares | | | | Cost | | | Market Value | |
| | | |
| 309,202 | | Core Molding Technologies Inc.† | | | $ 2,284,526 | | | $ | 5,225,514 | |
| 740,000 | | Federal Signal Corp. | | | 5,383,673 | | | | 9,812,400 | |
| 440,000 | | Interpump Group SpA | | | 3,207,907 | | | | 7,498,175 | |
| 709,000 | | Kimball International Inc., Cl. B | | | 7,426,781 | | | | 9,174,460 | |
| 20,000 | | Maezawa Kyuso Industries Co. Ltd. | | | 108,117 | | | | 265,667 | |
| 1,500 | | Neff Corp., Cl. A† | | | 13,803 | | | | 14,250 | |
| 20,103 | | Powell Industries Inc. | | | 750,311 | | | | 805,125 | |
| 331,022 | | The Eastern Co.(a) | | | 6,036,900 | | | | 6,630,371 | |
| 123,000 | | The Gorman-Rupp Co. | | | 2,770,252 | | | | 3,150,030 | |
| 41,800 | | The Greenbrier Companies Inc. | | | 866,098 | | | | 1,475,540 | |
| 319,577 | | The L.S. Starrett Co.,
Cl. A(a) | | | 3,746,246 | | | | 3,138,246 | |
| 115,933 | | Titan Machinery Inc.† | | | 1,917,267 | | | | 1,205,703 | |
| 133,200 | | TransAct Technologies Inc. | | | 602,898 | | | | 981,684 | |
| 156,500 | | Vicor Corp.† | | | 1,198,921 | | | | 1,815,400 | |
| | | | | | | | | | |
| | | |
| | | | | 43,052,249 | | | | 62,269,709 | |
| | | | | | | | | | |
| | |
| | Financial Services — 5.8% | | | | | |
| 49,400 | | Anchor Bancorp.† | | | 508,737 | | | | 1,250,314 | |
| 20,000 | | Atlantic American Corp. | | | 75,277 | | | | 65,200 | |
| 17,000 | | Berkshire Bancorp Inc. | | | 219,944 | | | | 137,445 | |
| 9,246 | | Berkshire Hills Bancorp Inc. | | | 154,043 | | | | 256,207 | |
| 45,326 | | BKF Capital Group Inc.† | | | 31,884 | | | | 30,824 | |
| 75 | | Burke & Herbert Bank and Trust Co. | | | 95,726 | | | | 144,675 | |
| 4 | | Capital Financial Holdings Inc. | | | 35,200 | | | | 5,800 | |
| 6,791 | | Capitol Federal Financial Inc. | | | 75,244 | | | | 95,549 | |
| 18,200 | | Citizens & Northern Corp. | | | 357,816 | | | | 399,854 | |
| 102,339 | | CoBiz Financial Inc. | | | 1,159,544 | | | | 1,362,132 | |
| 28,800 | | Crazy Woman Creek Bancorp Inc. | | | 497,983 | | | | 379,872 | |
| 35,800 | | Dime Community Bancshares Inc. | | | 576,823 | | | | 600,008 | |
| 1,060 | | Farmers & Merchants Bank of Long Beach | | | 5,774,164 | | | | 6,614,400 | |
| 40,000 | | Farmers National Banc Corp. | | | 333,870 | | | | 431,200 | |
| 11,418 | | Fidelity Southern Corp. | | | 71,198 | | | | 209,977 | |
| 32,000 | | First Internet Bancorp | | | 661,348 | | | | 738,880 | |
| 588,483 | | Flushing Financial Corp. | | | 9,569,430 | | | | 13,958,817 | |
| 10 | | Guaranty Corp., Cl. A† | | | 137,500 | | | | 400,000 | |
| 183,860 | | Hallmark Financial Services Inc.† | | | 1,609,508 | | | | 1,891,919 | |
| 15,000 | | Hancock Holding Co. | | | 190,783 | | | | 486,450 | |
| 13,800 | | Heritage Commerce Corp. | | | 114,043 | | | | 150,972 | |
| 58,200 | | Hilltop Holdings Inc.† | | | 1,174,818 | | | | 1,307,172 | |
| 30,000 | | HomeStreet Inc.† | | | 300,000 | | | | 751,800 | |
| 80,547 | | Hope Bancorp Inc. | | | 861,128 | | | | 1,399,100 | |
| 90,843 | | KKR & Co. LP | | | 109,868 | | | | 1,295,421 | |
| 20,200 | | LendingTree Inc.† | | | 479,797 | | | | 1,957,582 | |
| 100,000 | | Medallion Financial Corp. | | | 814,334 | | | | 422,000 | |
| 200,000 | | Monitise plc† | | | 58,454 | | | | 6,610 | |
| 28,002 | | National Interstate Corp. | | | 802,417 | | | | 910,905 | |
| 8,255 | | New York Community Bancorp Inc. | | | 104,605 | | | | 117,469 | |
| 4,197 | | Northrim BanCorp Inc. | | | 91,497 | | | | 108,073 | |
| 21,300 | | OceanFirst Financial Corp. | | | 395,540 | | | | 410,238 | |
| 40,000 | | Oritani Financial Corp. | | | 412,856 | | | | 628,800 | |
| 160,000 | | Pzena Investment Management Inc., Cl. A | | | 1,355,682 | | | | 1,232,000 | |
| 36,971 | | Renasant Corp. | | | 414,186 | | | | 1,243,335 | |
| 3,840 | | Security National Corp. | | | 340,354 | | | | 381,600 | |
| 8,842 | | SI Financial Group Inc. | | | 101,241 | | | | 116,714 | |
| 85,000 | | Silvercrest Asset Management Group Inc., Cl. A | | | 1,171,743 | | | | 1,008,950 | |
| 1,200 | | Southeastern Bank Financial Corp. | �� | | 64,581 | | | | 64,554 | |
See accompanying notes to financial statements.
20
TETON Westwood Mighty MitesSM Fund
Schedule of Investments (Continued) — September 30, 2016
| | | | | | | | | | |
Shares | | | | Cost | | | Market Value | |
| |
| | COMMON STOCKS (Continued) | |
| | Financial Services (Continued) | |
| 20,594 | | Southwest Bancorp Inc. | | $ | 370,915 | | | $ | 391,080 | |
| 685,000 | | Sprott Inc. | | | 1,913,798 | | | | 1,263,539 | |
| 20,700 | | State Bank Financial Corp. | | | 357,067 | | | | 472,374 | |
| 443,500 | | Steel Excel Inc.† | | | 12,122,846 | | | | 4,900,675 | |
| 122,503 | | Sterling Bancorp | | | 1,238,753 | | | | 2,143,803 | |
| 65,000 | | TheStreet Inc. | | | 131,414 | | | | 71,500 | |
| 500 | | Thomasville Bancshares Inc. | | | 16,510 | | | | 16,263 | |
| 10,000 | | TriState Capital Holdings Inc.† | | | 98,183 | | | | 161,500 | |
| 55,000 | | TrustCo Bank Corp NY | | | 253,000 | | | | 389,950 | |
| 127,100 | | United Financial Bancorp Inc. | | | 1,749,440 | | | | 1,759,064 | |
| 33,089 | | Value Line Inc. | | | 326,193 | | | | 537,365 | |
| 45,900 | | Washington Trust Bancorp Inc. | | | 1,029,683 | | | | 1,846,098 | |
| 82,200 | | Waterstone Financial Inc. | | | 876,303 | | | | 1,396,578 | |
| 87,100 | | Westfield Financial Inc. | | | 746,912 | | | | 666,315 | |
| 395,000 | | Wright Investors’ Service Holdings Inc.† | | | 605,954 | | | | 276,500 | |
| 132,000 | | Xenith Bankshares Inc.† | | | 127,500 | | | | 304,920 | |
| 35,000 | | Yadkin Financial Corp. | | | 736,188 | | | | 920,150 | |
| | | | | | | | | | |
| | | |
| | | | | 54,003,825 | | | | 60,490,492 | |
| | | | | | | | | | |
| | |
| | Food and Beverage — 4.5% | | | | | |
| 29,200 | | Andrew Peller Ltd., Cl. A | | | 366,944 | | | | 755,623 | |
| 57,500 | | Calavo Growers Inc. | | | 1,670,128 | | | | 3,762,225 | |
| 110,000 | | Cott Corp. | | | 748,495 | | | | 1,567,500 | |
| 520,000 | | Crimson Wine Group Ltd.† | | | 4,722,247 | | | | 4,498,000 | |
| 195,913 | | Farmer Brothers Co.† | | | 3,798,950 | | | | 6,964,707 | |
| 1,100 | | Hanover Foods Corp., Cl. A | | | 110,881 | | | | 89,606 | |
| 314,331 | | Inventure Foods Inc.† | | | 1,984,969 | | | | 2,954,711 | |
| 71,800 | | Iwatsuka Confectionery Co. Ltd. | | | 3,676,273 | | | | 2,478,182 | |
| 1,500 | | J & J Snack Foods Corp. | | | 21,623 | | | | 178,680 | |
| 22,531 | | John B Sanfilippo & Son Inc. | | | 1,052,454 | | | | 1,156,516 | |
| 176,308 | | Lifeway Foods Inc.† | | | 1,789,929 | | | | 2,986,658 | |
| 171,100 | | Massimo Zanetti Beverage Group SpA | | | 1,886,499 | | | | 1,374,274 | |
| 66,500 | | MGP Ingredients Inc. | | | 1,192,289 | | | | 2,694,580 | |
| 15,600 | | Rock Field Co. Ltd. | | | 125,557 | | | | 231,373 | |
| 5,900 | | Scheid Vineyards Inc.,
Cl. A† | | | 89,940 | | | | 175,850 | |
| 243,600 | | Snyder’s-Lance Inc. | | | 5,677,399 | | | | 8,180,088 | |
| 300,000 | | SunOpta Inc.† | | | 2,336,015 | | | | 2,118,000 | |
| 8,500 | | The Boston Beer Co. Inc.,
Cl. A† | | | 288,591 | | | | 1,319,710 | |
| 80,000 | | The Hain Celestial Group Inc.† | | | 827,229 | | | | 2,846,400 | |
| 270,000 | | Tingyi (Cayman Islands) Holding Corp. | | | 393,787 | | | | 312,593 | |
| 295,000 | | Vitasoy International Holdings Ltd. | | | 161,353 | | | | 594,838 | |
| 23,000 | | Willamette Valley Vineyards Inc.† | | | 88,087 | | | | 182,850 | |
| | | | | | | | | | |
| | | |
| | | | | 33,009,639 | | | | 47,422,964 | |
| | | | | | | | | | |
| | | |
| | Health Care — 8.4% | | | | | | | | |
| 32,960 | | Accuray Inc.† | | | 244,893 | | | | 209,955 | |
| 2,600 | | AcelRx Pharmaceuticals Inc.† | | | 19,444 | | | | 10,114 | |
| 5,000 | | Achillion Pharmaceuticals Inc.† | | | 19,520 | | | | 40,500 | |
| 12,700 | | Alere Inc.† | | | 345,253 | | | | 549,148 | |
| 24,000 | | AngioDynamics Inc.† | | | 294,826 | | | | 420,960 | |
| 341,461 | | Biolase Inc.† | | | 449,404 | | | | 597,557 | |
| 872,000 | | BioScrip Inc.† | | | 2,931,054 | | | | 2,520,080 | |
| 500 | | BioSpecifics Technologies
Corp.† | | | 19,466 | | | | 22,835 | |
| 143,100 | | BioTelemetry Inc.† | | | 1,000,358 | | | | 2,657,367 | |
| 8,200 | | Boiron SA | | | 138,640 | | | | 833,642 | |
| 113,100 | | Cantel Medical Corp. | | | 1,256,041 | | | | 8,819,538 | |
| 111,100 | | Cardiovascular Systems Inc.† | | | 1,885,169 | | | | 2,637,514 | |
| | | | | | | | | | |
Shares | | | | Cost | | | Market Value | |
| | | |
| 10,000 | | CareDx Inc.† | | $ | 66,238 | | | $ | 35,500 | |
| 30,000 | | Cempra Inc.† | | | 549,345 | | | | 726,000 | |
| 62,500 | | Cepheid† | | | 595,116 | | | | 3,293,125 | |
| 115,000 | | Cogentix Medical Inc.† | | | 390,961 | | | | 209,300 | |
| 339,498 | | Cutera Inc.† | | | 3,009,731 | | | | 4,046,816 | |
| 1,000 | | Dextera Surgical Inc.† | | | 9,046 | | | | 1,890 | |
| 77,500 | | Electromed Inc.† | | | 173,672 | | | | 352,625 | |
| 100,000 | | EndoChoice Holdings Inc.† | | | 799,970 | | | | 798,000 | |
| 232,473 | | Exactech Inc.† | | | 4,257,604 | | | | 6,283,745 | |
| 200,000 | | Exelixis Inc.† | | | 381,000 | | | | 2,558,000 | |
| 42,000 | | Genesis Healthcare Inc.† | | | 335,604 | | | | 112,140 | |
| 1,000 | | Harvard Bioscience Inc.† | | | 3,352 | | | | 2,720 | |
| 36,500 | | Heska Corp.† | | | 349,968 | | | | 1,986,695 | |
| 4,022 | | ICU Medical Inc.† | | | 208,829 | | | | 508,300 | |
| 633,835 | | InfuSystems Holdings Inc.† | | | 1,649,886 | | | | 1,755,723 | |
| 13,000 | | Integer Holdings Corp.† | | | 276,687 | | | | 281,970 | |
| 178,617 | | IntriCon Corp.† | | | 730,232 | | | | 1,002,041 | |
| 140,000 | | Meridian Bioscience Inc. | | | 2,878,754 | | | | 2,700,600 | |
| 122,750 | | Neogen Corp.† | | | 508,434 | | | | 6,866,635 | |
| 181,407 | | NeoGenomics Inc.† | | | 585,978 | | | | 1,491,166 | |
| 197,000 | | Nutraceutical International Corp.† | | | 4,800,496 | | | | 6,154,280 | |
| 3,333 | | Nuvectra Corp.† | | | 28,422 | | | | 23,067 | |
| 7,500 | | Omega Protein Corp.† | | | 135,417 | | | | 175,275 | |
| 44,612 | | Omnicell Inc.† | | | 732,122 | | | | 1,708,640 | |
| 238,000 | | OPKO Health Inc.† | | | 1,567,206 | | | | 2,520,420 | |
| 45,200 | | Orthofix International NV† | | | 965,181 | | | | 1,933,204 | |
| 35,000 | | Pain Therapeutics Inc.† | | | 77,799 | | | | 34,997 | |
| 200 | | PhotoMedex Inc.† | | | 1,825 | | | | 258 | |
| 2,500 | | PreMD Inc.† | | | 4,580 | | | | 0 | |
| 147,061 | | Quidel Corp.† | | | 1,709,110 | | | | 3,248,577 | |
| 66,000 | | RTI Surgical Inc.† | | | 334,123 | | | | 206,580 | |
| 213,500 | | Special Diversified Opportunities Inc.† | | | 206,946 | | | | 204,960 | |
| 276,792 | | SurModics Inc.† | | | 5,937,256 | | | | 8,328,671 | |
| 101,249 | | Syneron Medical Ltd.† | | | 885,583 | | | | 724,943 | |
| 2,000 | | Targanta Therapeutics Corp., Escrow† | | | 0 | | | | 640 | |
| 24,000 | | Tetraphase Pharmaceuticals Inc.† | | | 106,248 | | | | 91,920 | |
| 5,000 | | Titan Medical Inc.† | | | 6,781 | | | | 1,375 | |
| 120,000 | | Trinity Biotech plc, ADR† | | | 1,089,306 | | | | 1,586,400 | |
| 77,400 | | United-Guardian Inc. | | | 703,712 | | | | 1,126,944 | |
| 5,174 | | Utah Medical Products Inc. | | | 143,347 | | | | 309,405 | |
| 19,800 | | Vascular Solutions Inc.† | | | 216,963 | | | | 954,954 | |
| 310,000 | | Zealand Pharma A/S† | | | 3,857,036 | | | | 4,607,040 | |
| | | | | | | | | | |
| | | |
| | | | | 49,873,934 | | | | 88,274,751 | |
| | | | | | | | | | |
| | |
| | Hotels and Gaming — 2.8% | | | | | |
| 71,800 | | Boyd Gaming Corp.† | | | 416,103 | | | | 1,420,204 | |
| 65,540 | | Churchill Downs Inc. | | | 2,576,247 | | | | 9,591,779 | |
| 138,000 | | Dover Downs Gaming & Entertainment Inc.† | | | 573,765 | | | | 151,800 | |
| 79,000 | | Eldorado Resorts Inc.† | | | 362,024 | | | | 1,110,740 | |
| 3,001 | | Empire Resorts Inc.† | | | 56,172 | | | | 60,737 | |
| 361,155 | | Full House Resorts Inc.† | | | 557,826 | | | | 646,467 | |
| 462,563 | | Golden Entertainment Inc. | | | 4,008,249 | | | | 5,768,161 | |
| 3,935 | | Intrawest Resorts Holdings Inc.† | | | 42,346 | | | | 63,826 | |
| 195,500 | | Morgans Hotel Group Co.† | | | 918,722 | | | | 394,910 | |
| 10,000 | | Ryman Hospitality Properties Inc. | | | 310,832 | | | | 481,600 | |
| 374,812 | | The Marcus Corp. | | | 4,752,576 | | | | 9,385,292 | |
| | | | | | | | | | |
| | | |
| | | | | 14,574,862 | | | | 29,075,516 | |
| | | | | | | | | | |
| | | |
| | Machinery — 3.6% | | | | | | | | |
| 316,000 | | Astec Industries Inc. | | | 11,130,705 | | | | 18,918,920 | |
| 2,001 | | Capstone Turbine Corp.† | | | 22,272 | | | | 2,741 | |
| 6,300 | | DMG Mori AG | | | 40,709 | | | | 306,723 | |
| 12,200 | | DXP Enterprises Inc.† | | | 222,516 | | | | 343,918 | |
See accompanying notes to financial statements.
21
TETON Westwood Mighty MitesSM Fund
Schedule of Investments (Continued) — September 30, 2016
| | | | | | | | | | |
Shares | | | | Cost | | | Market Value | |
| |
| | COMMON STOCKS (Continued) | |
| | Machinery (Continued) | |
| 538,461 | | Gencor Industries Inc.† | | $ | 3,483,110 | | | $ | 6,450,763 | |
| 27,000 | | Global Power Equipment Group Inc.† | | | 266,599 | | | | 112,320 | |
| 6,000 | | Hardinge Inc. | | | 54,215 | | | | 66,780 | |
| 130,607 | | Key Technology Inc.† | | | 1,879,237 | | | | 1,411,862 | |
| 15,664 | | Lindsay Corp. | | | 1,058,407 | | | | 1,158,823 | |
| 49,300 | | Tennant Co. | | | 1,064,922 | | | | 3,194,640 | |
| 44,400 | | The Middleby Corp.† | | | 464,969 | | | | 5,488,728 | |
| | | | | | | | | | |
| | | |
| | | | | 19,687,661 | | | | 37,456,218 | |
| | | | | | | | | | |
| |
| | Manufactured Housing and Recreational Vehicles — 1.0% | |
| 57,500 | | Cavco Industries Inc.† | | | 3,113,369 | | | | 5,695,375 | |
| 141,459 | | Nobility Homes Inc.† | | | 1,293,193 | | | | 2,298,709 | |
| 47,796 | | Skyline Corp.† | | | 222,012 | | | | 654,327 | |
| 61,000 | | Winnebago Industries Inc. | | | 626,036 | | | | 1,437,770 | |
| | | | | | | | | | |
| | | |
| | | | | 5,254,610 | | | | 10,086,181 | |
| | | | | | | | | | |
| | |
| | Metals and Mining — 1.4% | | | | | |
| 70,000 | | 5N Plus Inc.† | | | 251,966 | | | | 91,238 | |
| 10,000 | | Alkane Resources Ltd.† | | | 3,333 | | | | 3,712 | |
| 177,800 | | Materion Corp. | | | 3,821,160 | | | | 5,460,238 | |
| 760,000 | | Osisko Gold Royalties Ltd. | | | 11,053,936 | | | | 8,318,610 | |
| 10,001 | | Peabody Energy Corp.† | | | 58,350 | | | | 15,501 | |
| 900,000 | | Tanami Gold NL† | | | 210,755 | | | | 63,371 | |
| 50,000 | | TimkenSteel Corp.† | | | 491,491 | | | | 522,500 | |
| | | | | | | | | | |
| | | |
| | | | | 15,890,991 | | | | 14,475,170 | |
| | | | | | | | | | |
| | |
| | Paper and Forest Products — 0.2% | | | | | |
| 25,600 | | Keweenaw Land Association Ltd.† | | | 2,172,049 | | | | 2,291,456 | |
| | | | | | | | | | |
| | |
| | Publishing — 1.4% | | | | | |
| 4,600 | | AH Belo Corp., Cl. A | | | 31,229 | | | | 33,810 | |
| 10,000 | | Cambium Learning Group Inc.† | | | 36,700 | | | | 54,300 | |
| 330,000 | | Il Sole 24 Ore SpA† | | | 542,967 | | | | 187,763 | |
| 906,048 | | The E.W. Scripps Co., Cl. A† | | | 5,510,281 | | | | 14,406,163 | |
| | | | | | | | | | |
| | | |
| | | | | 6,121,177 | | | | 14,682,036 | |
| | | | | | | | | | |
| | |
| | Real Estate — 2.3% | | | | | |
| 200,000 | | Ambase Corp.† | | | 311,545 | | | | 226,000 | |
| 8,000 | | Bresler & Reiner Inc.† | | | 4,912 | | | | 3,600 | |
| 93,300 | | Capital Properties Inc., Cl. A† | | | 958,568 | | | | 1,002,975 | |
| 105,000 | | Cohen & Steers Inc. | | | 2,195,039 | | | | 4,488,750 | |
| 60,000 | | DREAM Unlimited Corp.,
Cl. A† | | | 331,539 | | | | 331,110 | |
| 24,000 | | FRP Holdings Inc.† | | | 780,937 | | | | 745,680 | |
| 250,517 | | Griffin Industrial Realty Inc. | | | 7,083,855 | | | | 7,938,884 | |
| 12,031 | | Gyrodyne LLC | | | 351,935 | | | | 227,386 | |
| 8,231 | | Holobeam Inc.† | | | 161,746 | | | | 240,757 | |
| 359,623 | | Reading International Inc.,
Cl. A† | | | 2,269,643 | | | | 4,800,967 | |
| 68,481 | | Reading International Inc.,
Cl. B† | | | 551,247 | | | | 1,027,215 | |
| 2,508 | | Royalty LLC† | | | 0 | | | | 319 | |
| 134,000 | | Tejon Ranch Co.† | | | 3,635,302 | | | | 3,258,880 | |
| | | | | | | | | | |
| | | |
| | | | | 18,636,268 | | | | 24,292,523 | |
| | | | | | | | | | |
| | |
| | Restaurants — 1.9% | | | | | |
| 13,183 | | Biglari Holdings Inc.† | | | 4,025,388 | | | | 5,748,052 | |
| 70,000 | | Denny’s Corp.† | | | 219,675 | | | | 748,300 | |
| 35,400 | | Jamba Inc.† | | | 539,045 | | | | 386,568 | |
| 202,834 | | Nathan’s Famous Inc.† | | | 2,036,024 | | | | 10,657,913 | |
| 55,000 | | The Cheesecake Factory Inc. | | | 1,614,698 | | | | 2,753,300 | |
| | | | | | | | | | |
| | | |
| | | | | 8,434,830 | | | | 20,294,133 | |
| | | | | | | | | | |
| | | |
| | Retail — 2.1% | | | | | | | | |
| 48,000 | | Aaron’s Inc. | | | 935,791 | | | | 1,220,160 | |
| 274,000 | | Big 5 Sporting Goods Corp. | | | 3,827,427 | | | | 3,731,880 | |
| | | | | | | | | | |
Shares | | | | Cost | | | Market Value | |
| | | |
| 30,000 | | Destination XL Group Inc.† | | $ | 169,350 | | | $ | 129,900 | |
| 40,496 | | Ethan Allen Interiors Inc. | | | 970,032 | | | | 1,266,310 | |
| 249,200 | | EVINE Live Inc.† | | | 773,353 | | | | 570,668 | |
| 173,200 | | Ingles Markets Inc., Cl. A | | | 2,890,221 | | | | 6,848,328 | |
| 56,000 | | Lands’ End Inc.† | | | 1,136,108 | | | | 812,000 | |
| 59,000 | | La-Z-Boy Inc. | | | 1,313,713 | | | | 1,449,040 | |
| 15,000 | | Movado Group Inc. | | | 198,103 | | | | 322,200 | |
| 36,000 | | Pier 1 Imports Inc. | | | 412,772 | | | | 152,640 | |
| 29,605 | | Rush Enterprises Inc., Cl. A† | | | 545,615 | | | | 724,730 | |
| 104,005 | | Rush Enterprises Inc., Cl. B† | | | 1,800,199 | | | | 2,528,362 | |
| 6,000 | | SpartanNash Co. | | | 121,934 | | | | 173,520 | |
| 258,700 | | The Bon-Ton Stores Inc. | | | 2,255,976 | | | | 442,377 | |
| 10,000 | | Tuesday Morning Corp.† | | | 63,694 | | | | 59,800 | |
| 42,581 | | Village Super Market Inc.,
Cl. A | | | 1,147,571 | | | | 1,363,018 | |
| 600 | | Winmark Corp. | | | 40,024 | | | | 63,312 | |
| | | | | | | | | | |
| | | |
| | | | | 18,601,883 | | | | 21,858,245 | |
| | | | | | | | | | |
| | |
| | Semiconductors — 0.4% | | | | | |
| 185,100 | | Entegris Inc.† | | | 1,250,835 | | | | 3,224,442 | |
| 93,700 | | IXYS Corp. | | | 991,052 | | | | 1,129,085 | |
| | | | | | | | | | |
| | | |
| | | | | 2,241,887 | | | | 4,353,527 | |
| | | | | | | | | | |
| | |
| | Specialty Chemicals — 2.9% | | | | | |
| 15,000 | | A. Schulman Inc. | | | 411,676 | | | | 436,800 | |
| 85,000 | | Chemtura Corp.† | | | 1,480,785 | | | | 2,788,850 | |
| 1,198,000 | | Ferro Corp.† | | | 6,154,688 | | | | 16,544,380 | |
| 267,226 | | General Chemical Group
Inc.†(a) | | | 59,859 | | | | 3,474 | |
| 152,000 | | Hawkins Inc. | | | 5,305,446 | | | | 6,586,160 | |
| 2,000 | | KMG Chemicals Inc. | | | 51,827 | | | | 56,660 | |
| 4,100 | | Minerals Technologies Inc. | | | 121,383 | | | | 289,829 | |
| 130,000 | | Navigator Holdings Ltd.† | | | 1,796,609 | | | | 934,700 | |
| 265,000 | | OMNOVA Solutions Inc.† | | | 689,966 | | | | 2,236,600 | |
| 7,500 | | Takasago International Corp. | | | 201,942 | | | | 199,916 | |
| | | | | | | | | | |
| | | |
| | | | | 16,274,181 | | | | 30,077,369 | |
| | | | | | | | | | |
| | |
| | Telecommunications — 3.3% | | | | | |
| 51,800 | | ATN International Inc. | | | 2,105,451 | | | | 3,369,072 | |
| 1,328,115 | | Cincinnati Bell Inc.† | | | 4,505,650 | | | | 5,418,709 | |
| 39,801 | | Consolidated Communications Holdings Inc. | | | 436,124 | | | | 1,004,577 | |
| 20,000 | | Frequency Electronics Inc.† | | | 225,394 | | | | 210,200 | |
| 714,117 | | HC2 Holdings Inc.† | | | 2,611,013 | | | | 3,891,938 | |
| 652 | | Horizon Telecom Inc., Cl. B† | | | 22,035 | | | | 11,449 | |
| 12,000 | | Iridium Communications
Inc.† | | | 92,665 | | | | 97,320 | |
| 90,000 | | Ixia† | | | 1,020,273 | | | | 1,125,000 | |
| 57,500 | | New ULM Telecom Inc. | | | 528,202 | | | | 428,375 | |
| 4,100 | | North State Telecommuni-cations Corp., Cl. A | | | 349,343 | | | | 246,000 | |
| 521,335 | | ORBCOMM Inc.† | | | 3,005,997 | | | | 5,343,684 | |
| 5,788 | | Preformed Line Products Co. | | | 246,195 | | | | 244,080 | |
| 490,000 | | Shenandoah Telecommuni-cations Co. | | | 2,695,303 | | | | 13,332,900 | |
| 6,200 | | Straight Path Communications Inc., Cl. B† | | | 114,604 | | | | 158,782 | |
| | | | | | | | | | |
| | | |
| | | | | 17,958,249 | | | | 34,882,086 | |
| | | | | | | | | | |
| | |
| | Transportation — 0.4% | | | | | |
| 30,000 | | Dakota Plains Holdings Inc.† | | | 23,143 | | | | 426 | |
| 15,000 | | Patriot Transportation Holding Inc.† | | | 337,321 | | | | 318,750 | |
| 8,200 | | PHI Inc.† | | | 130,182 | | | | 149,650 | |
| 135,300 | | Providence and Worcester Railroad Co. | | | 1,999,124 | | | | 3,352,734 | |
| 1 | | Trailer Bridge Inc.† | | | 7,995 | | | | 465 | |
| | | | | | | | | | |
| | | |
| | | | | 2,497,765 | | | | 3,822,025 | |
| | | | | | | | | | |
| | | |
| | TOTAL COMMON STOCKS | | | 621,714,510 | | | | 947,097,857 | |
| | | | | | | | | | |
See accompanying notes to financial statements.
22
TETON Westwood Mighty MitesSM Fund
Schedule of Investments (Continued) — September 30, 2016
| | | | | | | | | | |
Shares | | | | Cost | | | Market Value | |
| | PREFERRED STOCKS — 0.2% | |
| | Automotive: Parts and Accessories — 0.2% | |
| 59,000 | | Jungheinrich AG | | $ | 227,157 | | | $ | 1,995,299 | |
| | | | | | | | | | |
| |
| | CONVERTIBLE PREFERRED STOCKS — 0.3% | |
| | Business Services — 0.0% | | | | | | | | |
| 364 | | Trans-Lux Pfd.,
Ser. B | | | 72,727 | | | | 21,465 | |
| | | | | | | | | | |
| | Diversified Industrial — 0.2% | | | | | | | | |
| 88,937 | | Sevcon Inc.,
4.000%, Ser. A(a) | | | 1,912,146 | | | | 2,350,605 | |
| | | | | | | | | | |
| | Energy and Utilities — 0.1% | | | | | | | | |
| 15,095 | | Corning Natural Gas,
4.800%, Ser. B | | | 313,228 | | | | 276,114 | |
| | | | | | | | | | |
| | Food and Beverage — 0.0% | | | | | | | | |
| 500 | | Seneca Foods Corp.,
Ser. 2003 | | | 7,625 | | | | 15,515 | |
| | | | | | | | | | |
| | Health Care — 0.0% | | | | | | | | |
| 3,034 | | BioScrip Inc.,
Ser. A | | | 287,862 | | | | 192,416 | |
| | | | | | | | | | |
| | TOTAL CONVERTIBLE
PREFERRED STOCKS | | | 2,593,588 | | | | 2,856,115 | |
| | | | | | | | | | |
| | RIGHTS — 0.0% | | | | | | | | |
| | | |
| | Health Care — 0.0% | | | | | | | | |
| 300,000 | | Adolor Corp., CPR,
expire 07/01/19† | | | 0 | | | | 156,000 | |
| 400,000 | | Sanofi, CVR,
expire 12/31/20† | | | 137,800 | | | | 106,800 | |
| 200,000 | | Teva Pharmaceutical
Industries Ltd., CCCP,
expire 02/20/23† | | | 103,591 | | | | 106,000 | |
| | | | | | | | | | |
| | | |
| | | | | 241,391 | | | | 368,800 | |
| | | | | | | | | | |
| | Hotels and Gaming — 0.0% | | | | | | | | |
| 361,155 | | Full House Resorts Rts,
expire 10/31/16† | | | 0 | | | | 35,783 | |
| | | | | | | | | | |
| | | |
| | TOTAL RIGHTS | | | 241,391 | | | | 404,583 | |
| | | | | | | | | | |
| | | |
| | WARRANTS — 0.0% | | | | | | | | |
| | Diversified Industrial — 0.0% | | | | | | | | |
| 12,500 | | Sevcon Inc.,
expire 07/11/21†(a) | | | 34,806 | | | | 45,902 | |
| | | | | | | | | | |
| | | |
| | Energy and Utilities — 0.0% | | | | | | | | |
| 50,000 | | Kinder Morgan Inc.,
expire 05/25/17† | | | 2,805 | | | | 775 | |
| | | | | | | | | | |
| | | |
| | Health Care — 0.0% | | | | | | | | |
| 8,737 | | BioScrip Inc., Cl. A,
expire 07/27/25† | | | 7,979 | | | | 2,556 | |
| | | | | | | | | | |
Shares | | | | Cost | | | Market Value | |
| | | |
| 8,737 | | BioScrip Inc., Cl. B,
expire 07/27/25† | | $ | 7,554 | | | $ | 2,067 | |
| | | | | | | | | | |
| | | |
| | | | | 15,533 | | | | 4,623 | |
| | | | | | | | | | |
| |
| | Transportation — 0.0% | |
| 2 | | Trailer Bridge Inc., Ser. A,
expire 04/02/17† | | | 0 | | | | 0 | |
| 2 | | Trailer Bridge Inc., Ser. B,
expire 04/02/17† | | | 0 | | | | 0 | |
| | | | | | | | | | |
| | | |
| | | | | 0 | | | | 0 | |
| | | | | | | | | | |
| | | |
| | TOTAL WARRANTS | | | 53,144 | | | | 51,300 | |
| | | | | | | | | | |
| | | |
Principal
Amount | | | | | | | | |
| |
| | CORPORATE BONDS — 0.0% | |
| | Real Estate — 0.0% | | | | | | | | |
| $ 36,774 | | Capital Properties Inc.,
5.000%, 12/31/22 | | | 36,774 | | | | 36,751 | |
| | | | | | | | | | |
| |
| | U.S. GOVERNMENT OBLIGATIONS — 9.2% | |
| 96,977,000 | | U.S. Treasury Bills,
0.075% to 0.501%††,
10/06/16 to 03/30/17 | | | 96,871,812 | | | | 96,891,567 | |
| | | | | | | | | | |
| | | |
| | TOTAL
INVESTMENTS — 99.9% | | $ | 721,738,376 | | | | 1,049,333,472 | |
| | | | | | | | | | |
| | |
| | Other Assets and Liabilities (Net) — 0.1% | | | | 781,729 | |
| | | | | | | | | | |
| | |
| | NET ASSETS — 100.0% | | | $ | 1,050,115,201 | |
| | | | | | | | | | |
| (a) | Security considered an affiliated holding because the Fund owns at least 5% of its outstanding shares. |
| (b) | Security exempt from registration under Rule 144A of the Securities Act of 1933, as amended. These securities may be resold in transactions exempt from registration, normally to qualified institutional buyers. At September 30, 2016, the market value of Rule 144A securities amounted to $221,250 or 0.02% of net assets. |
| † | Non-income producing security. |
| †† | Represents annualized yield at date of purchase. |
| ADR | American Depositary Receipt |
| CCCP | Contingent Cash Consideration Payment |
| CPR | Contingent Payment Right |
| CVR | Contingent Value Right |
See accompanying notes to financial statements.
23
TETON Westwood SmallCap Equity Fund
Schedule of Investments — September 30, 2016
| | | | | | | | | | |
| Shares | | | | Cost | | | Market
Value | |
| | | |
| | COMMON STOCKS — 92.6% | | | | | | | | |
| | Aerospace — 0.7% | | | | | | | | |
| 4,200 | | Hexcel Corp. | | $ | 95,744 | | | $ | 186,060 | |
| | | | | | | | | | |
| | |
| | Building and Construction — 3.9% | | | | | |
| 18,800 | | Builders FirstSource Inc.† | | | 121,200 | | | | 216,388 | |
| 9,300 | | EMCOR Group Inc. | | | 386,197 | | | | 554,466 | |
| 9,300 | | MYR Group Inc.† | | | 140,432 | | | | 279,930 | |
| | | | | | | | | | |
| | | |
| | | | | 647,829 | | | | 1,050,784 | |
| | | | | | | | | | |
| | | |
| | Business Services — 7.3% | | | | | | | | |
| 11,950 | | ABM Industries Inc. | | | 241,929 | | | | 474,415 | |
| 13,750 | | FTI Consulting Inc.† | | | 448,856 | | | | 612,700 | |
| 4,950 | | KAR Auction Services Inc. | | | 76,193 | | | | 213,642 | |
| 9,100 | | McGrath RentCorp. | | | 246,407 | | | | 288,561 | |
| 10,400 | | The Brink’s Co. | | | 268,947 | | | | 385,632 | |
| | | | | | | | | | |
| | | |
| | | | | 1,282,332 | | | | 1,974,950 | |
| | | | | | | | | | |
| | |
| | Computer Software and Services — 4.9% | | | | | |
| 9,500 | | Bottomline Technologies Inc.† | | | 187,742 | | | | 221,445 | |
| 17,000 | | NetScout Systems Inc.† | | | 322,320 | | | | 497,250 | |
| 16,100 | | Progress Software Corp.† | | | 335,538 | | | | 437,920 | |
| 3,900 | | PTC Inc.† | | | 76,909 | | | | 172,809 | |
| | | | | | | | | | |
| | | |
| | | | | 922,509 | | | | 1,329,424 | |
| | | | | | | | | | |
| | | |
| | Consumer Products — 0.4% | | | | | | | | |
| 3,900 | | Hanesbrands Inc. | | | 24,840 | | | | 98,475 | |
| | | | | | | | | | |
| | | |
| | Diversified Industrial — 2.1% | | | | | | | | |
| 4,250 | | Barnes Group Inc. | | | 102,409 | | | | 172,337 | |
| 12,360 | | Columbus McKinnon Corp. | | | 168,445 | | | | 220,502 | |
| 3,500 | | Sealed Air Corp. | | | 57,890 | | | | 160,370 | |
| | | | | | | | | | |
| | | |
| | | | | 328,744 | | | | 553,209 | |
| | | | | | | | | | |
| | | |
| | Electronics — 3.7% | | | | | | | | |
| 6,700 | | FARO Technologies Inc.† | | | 197,808 | | | | 240,865 | |
| 5,300 | | Plantronics Inc. | | | 199,375 | | | | 275,388 | |
| 8,500 | | Stratasys Ltd.† | | | 259,548 | | | | 204,765 | |
| 5,250 | | Vishay Intertechnology Inc. | | | 54,272 | | | | 73,973 | |
| 3,400 | | Woodward Inc. | | | 109,074 | | | | 212,432 | |
| | | | | | | | | | |
| | | |
| | | | | 820,077 | | | | 1,007,423 | |
| | | | | | | | | | |
| | | |
| | Energy and Utilities — 9.5% | | | | | | | | |
| 12,400 | | Carrizo Oil & Gas Inc.† | | | 433,828 | | | | 503,688 | |
| 21,800 | | Gulfport Energy Corp.† | | | 738,594 | | | | 615,850 | |
| 2,100 | | Helmerich & Payne Inc. | | | 138,855 | | | | 141,330 | |
| 17,500 | | Matador Resources Co.† | | | 330,135 | | | | 425,950 | |
| 23,900 | | Newpark Resources Inc.† | | | 169,364 | | | | 175,904 | |
| 30,500 | | Patterson-UTI Energy Inc. | | | 532,163 | | | | 682,285 | |
| | | | | | | | | | |
| | | |
| | | | | 2,342,939 | | | | 2,545,007 | |
| | | | | | | | | | |
| | | |
| | Equipment and Supplies — 2.8% | | | | | | | | |
| 5,300 | | CIRCOR International Inc. | | | 194,753 | | | | 315,668 | |
| 7,600 | | Crown Holdings Inc.† | | | 283,749 | | | | 433,884 | |
| | | | | | | | | | |
| | | |
| | | | | 478,502 | | | | 749,552 | |
| | | | | | | | | | |
| | | |
| | Financial Services — 20.9% | | | | | | | | |
| 8,100 | | BankUnited Inc. | | | 209,799 | | | | 244,620 | |
| 16,098 | | Beneficial Bancorp Inc. | | | 182,932 | | | | 236,802 | |
| 3,200 | | Berkshire Hills Bancorp Inc. | | | 74,091 | | | | 88,672 | |
| 7,050 | | Brown & Brown Inc. | | | 180,990 | | | | 265,855 | |
| 17,700 | | CoBiz Financial Inc. | | | 211,597 | | | | 235,587 | |
| 2,700 | | Columbia Banking System Inc. | | | 49,471 | | | | 88,344 | |
| 2,700 | | Financial Institutions Inc. | | | 43,634 | | | | 73,197 | |
| 9,100 | | Flushing Financial Corp. | | | 117,149 | | | | 215,852 | |
| 7,900 | | Glacier Bancorp Inc. | | | 118,011 | | | | 225,308 | |
| 12,200 | | Heritage Commerce Corp. | | | 96,811 | | | | 133,468 | |
| 8,350 | | Hope Bancorp Inc. | | | 61,657 | | | | 145,039 | |
| 44,250 | | Investors Bancorp Inc. | | | 478,052 | | | | 531,443 | |
| 11,100 | | Kearny Financial Corp./MD | | | 138,561 | | | | 151,071 | |
| 19,800 | | LegacyTexas Financial Group Inc. | | | 382,930 | | | | 626,274 | |
| 3,250 | | OceanFirst Financial Corp. | | | 42,156 | | | | 62,595 | |
| | | | | | | | | | |
| Shares | | | | Cost | | | Market
Value | |
| | | |
| 20,150 | | OFG Bancorp | | $ | 197,293 | | | $ | 203,717 | |
| 5,300 | | Oritani Financial Corp. | | | 77,620 | | | | 83,316 | |
| 6,000 | | Southwest Bancorp Inc. | | | 97,615 | | | | 113,940 | |
| 7,200 | | State Bank Financial Corp. | | | 128,374 | | | | 164,304 | |
| 24,706 | | Sterling Bancorp | | | 216,011 | | | | 432,355 | |
| 6,700 | | Stifel Financial Corp.† | | | 261,016 | | | | 257,615 | |
| 10,000 | | TrustCo Bank Corp NY | | | 46,359 | | | | 70,900 | |
| 10,750 | | Umpqua Holdings Corp. | | | 144,047 | | | | 161,787 | |
| 9,500 | | United Financial Bancorp Inc. | | | 117,980 | | | | 131,480 | |
| 8,900 | | Washington Federal Inc. | | | 137,276 | | | | 237,452 | |
| 4,500 | | Washington Trust Bancorp Inc. | | | 103,263 | | | | 180,990 | |
| 9,100 | | Waterstone Financial Inc. | | | 97,422 | | | | 154,609 | |
| 43,120 | | Xenith Bankshares Inc.† | | | 39,530 | | | | 99,607 | |
| | | | | | | | | | |
| | | |
| | | | | 4,051,647 | | | | 5,616,199 | |
| | | | | | | | | | |
| | | |
| | Health Care — 5.6% | | | | | | | | |
| 6,350 | | AngioDynamics Inc.† | | | 89,195 | | | | 111,379 | |
| 1,600 | | ICU Medical Inc.† | | | 67,049 | | | | 202,208 | |
| 5,550 | | Omnicell Inc.† | | | 100,426 | | | | 212,565 | |
| 12,450 | | Patterson Companies Inc. | | | 348,998 | | | | 571,953 | |
| 3,500 | | STERIS plc | | | 260,890 | | | | 255,850 | |
| 2,200 | | VCA Inc.† | | | 40,314 | | | | 153,956 | |
| | | | | | | | | | |
| | | |
| | | | | 906,872 | | | | 1,507,911 | |
| | | | | | | | | | |
| | | |
| | Machinery — 0.5% | | | | | | | | |
| 7,300 | | Briggs & Stratton Corp. | | | 158,927 | | | | 136,145 | |
| | | | | | | | | | |
| | | |
| | Retail — 7.7% | | | | | | | | |
| 25,650 | | American Eagle Outfitters Inc. | | | 343,764 | | | | 458,109 | |
| 13,500 | | Big 5 Sporting Goods Corp. | | | 155,410 | | | | 183,870 | |
| 13,150 | | Ethan Allen Interiors Inc. | | | 312,648 | | | | 411,201 | |
| 8,800 | | Haverty Furniture Companies Inc. | | | 204,554 | | | | 176,352 | |
| 1,900 | | Restoration Hardware Holdings
Inc.† | | | 75,259 | | | | 65,702 | |
| 17,200 | | Rush Enterprises Inc., Cl. A† | | | 323,189 | | | | 421,056 | |
| 8,600 | | United Natural Foods Inc.† | | | 371,488 | | | | 344,344 | |
| | | | | | | | | | |
| | | |
| | | | | 1,786,312 | | | | 2,060,634 | |
| | | | | | | | | | |
| | | |
| | Semiconductors — 15.9% | | | | | | | | |
| 11,400 | | Cabot Microelectronics Corp. | | | 482,035 | | | | 603,174 | |
| 52,100 | | Cypress Semiconductor Corp. | | | 464,420 | | | | 633,536 | |
| 47,400 | | Entegris Inc.† | | | 545,906 | | | | 825,708 | |
| 34,300 | | FormFactor Inc.† | | | 183,515 | | | | 372,155 | |
| 32,500 | | Intersil Corp., Cl. A | | | 287,189 | | | | 712,725 | |
| 16,000 | | Marvell Technology Group Ltd. | | | 206,965 | | | | 212,320 | |
| 48,600 | | ON Semiconductor Corp.† | | | 373,619 | | | | 598,752 | |
| 13,200 | | Ultratech Inc.† | | | 269,621 | | | | 304,656 | |
| | | | | | | | | | |
| | | |
| | | | | 2,813,270 | | | | 4,263,026 | |
| | | | | | | | | | |
| | | |
| | Specialty Chemicals — 2.6% | | | | | | | | |
| 14,200 | | A. Schulman Inc. | | | 368,932 | | | | 413,504 | |
| 8,400 | | Chemtura Corp.† | | | 219,597 | | | | 275,604 | |
| | | | | | | | | | |
| | | |
| | | | | 588,529 | | | | 689,108 | |
| | | | | | | | | | |
| | | |
| | Telecommunications — 4.1% | | | | | | | | |
| 132,000 | | Extreme Networks Inc.† | | | 410,827 | | | | 592,680 | |
| 29,800 | | Infinera Corp.† | | | 294,028 | | | | 269,094 | |
| 20,300 | | Ixia† | | | 282,173 | | | | 253,750 | |
| | | | | | | | | | |
| | | |
| | | | | 987,028 | | | | 1,115,524 | |
| | | | | | | | | | |
| | | |
| | TOTAL COMMON STOCKS | | | 18,236,101 | | | | 24,883,431 | |
| | | | | | | | | | |
See accompanying notes to financial statements.
24
TETON Westwood SmallCap Equity Fund
Schedule of Investments (Continued) — September 30, 2016
| | | | | | | | | | |
Principal
Amount | | | | Cost | | | Market
Value | |
| |
| | U.S. GOVERNMENT OBLIGATIONS — 11.4% | |
| $3,065,000 | | U.S. Treasury Bills,
0.095% to 0.451%††,
10/13/16 to 03/16/17 | | $ | 3,062,679 | | | $ | 3,063,009 | |
| | | | | | | | | | |
| | | |
| | TOTAL INVESTMENTS — 104.0% | | $ | 21,298,780 | | | | 27,946,440 | |
| | | | | | | | | | |
| | |
| | Other Assets and Liabilities (Net) — (4.0)% | | | | (1,069,437 | ) |
| | | | | | | | | | |
| | | |
| | NET ASSETS — 100.0% | | | | | | $ | 26,877,003 | |
| | | | | | | | | | |
| † | Non-income producing security. |
| †† | Represents annualized yield at date of purchase. |
See accompanying notes to financial statements.
25
TETON Westwood Mid-Cap Equity Fund
Schedule of Investments — September 30, 2016
| | | | | | | | | | |
Shares | | | | Cost | | | Market Value | |
| | | |
| | COMMON STOCKS — 97.8% | | | | | | | | |
| | CONSUMER DISCRETIONARY — 18.9% | | | | | |
| | Consumer Durables — 1.3% | | | | | | | | |
| 1,788 | | Toll Brothers Inc.† | | $ | 59,460 | | | $ | 53,390 | |
| | | | | | | | | | |
| | | |
| | Consumer Services — 2.7% | | | | | | | | |
| 1,218 | | Hyatt Hotels Corp., Cl. A† | | | 65,477 | | | | 59,950 | |
| 1,332 | | Norwegian Cruise Line Holdings
Ltd.† | | | 47,229 | | | | 50,216 | |
| | | | | | | | | | |
| | | |
| | | | | 112,706 | | | | 110,166 | |
| | | | | | | | | | |
| | | |
| | Media — 7.4% | | | | | | | | |
| 2,810 | | Discovery Communications Inc., Cl. C† | | | 95,962 | | | | 73,931 | |
| 655 | | Liberty Broadband Corp., Cl. C† | | | 34,072 | | | | 46,819 | |
| 1,640 | | Liberty Global plc, Cl. C† | | | 55,150 | | | | 54,186 | |
| 1,102 | | Liberty SiriusXM Group, Cl. C† | | | 28,944 | | | | 36,818 | |
| 2,158 | | Manchester United plc, Cl. A | | | 33,906 | | | | 36,427 | |
| 171 | | Netflix Inc.† | | | 11,515 | | | | 16,852 | |
| 412 | | Omnicom Group Inc. | | | 29,582 | | | | 35,020 | |
| | | | | | | | | | |
| | | |
| | | | | 289,131 | | | | 300,053 | |
| | | | | | | | | | |
| | | |
| | Retailing — 7.5% | | | | | | | | |
| 653 | | Burlington Stores Inc.† | | | 31,173 | | | | 52,906 | |
| 1,391 | | Ethan Allen Interiors Inc. | | | 35,126 | | | | 43,497 | |
| 2,160 | | Hanesbrands Inc. | | | 58,303 | | | | 54,540 | |
| 216 | | O’Reilly Automotive Inc.† | | | 33,925 | | | | 60,504 | |
| 1,358 | | United Natural Foods Inc.† | | | 83,354 | | | | 54,374 | |
| 1,177 | | Urban Outfitters Inc.† | | | 43,300 | | | | 40,630 | |
| | | | | | | | | | |
| | | |
| | | | | 285,181 | | | | 306,451 | |
| | | | | | | | | | |
| | | |
| | TOTAL CONSUMER DISCRETIONARY | | | 746,478 | | | | 770,060 | |
| | | | | | | | | | |
| | INFORMATION TECHNOLOGY — 17.5% | | | | | |
| | Software and Services — 15.5% | | | | | | | | |
| 1,138 | | Activision Blizzard Inc. | | | 25,374 | | | | 50,413 | |
| 2,504 | | Cornerstone OnDemand Inc.† | | | 76,765 | | | | 115,059 | |
| 232 | | Equinix Inc. | | | 47,895 | | | | 83,503 | |
| 4,189 | | Fortinet Inc.† | | | 96,416 | | | | 154,700 | |
| 473 | | MercadoLibre Inc. | | | 50,234 | | | | 87,491 | |
| 1,605 | | Mobileye NV† | | | 65,161 | | | | 68,325 | |
| 1,221 | | Splunk Inc.† | | | 64,379 | | | | 71,648 | |
| | | | | | | | | | |
| | | |
| | | | | 426,224 | | | | 631,139 | |
| | | | | | | | | | |
| | |
| | Technology Hardware and Equipment — 2.0% | | | | | |
| 536 | | MACOM Technology Solutions Holdings Inc.† | | | 17,787 | | | | 22,694 | |
| 997 | | Synaptics Inc.† | | | 65,854 | | | | 58,404 | |
| | | | | | | | | | |
| | | |
| | | | | 83,641 | | | | 81,098 | |
| | | | | | | | | | |
| | TOTAL INFORMATION TECHNOLOGY | | | 509,865 | | | | 712,237 | |
| | | | | | | | | | |
| | INDUSTRIALS — 17.2% | | | | | | | | |
| | Capital Goods — 9.7% | | | | | | | | |
| 155 | | Cummins Inc. | | | 14,939 | | | | 19,863 | |
| 363 | | EnerSys | | | 20,745 | | | | 25,116 | |
| 1,322 | | Fortune Brands Home & Security Inc. | | | 56,285 | | | | 76,808 | |
| 1,716 | | Hexcel Corp. | | | 71,521 | | | | 76,019 | |
| 953 | | MSC Industrial Direct Co. Inc., Cl. A | | | 79,164 | | | | 69,960 | |
| 159 | | Orbital ATK Inc. | | | 12,001 | | | | 12,121 | |
| 3,622 | | Quanta Services Inc.† | | | 108,778 | | | | 101,380 | |
| 708 | | Rexnord Corp.† | | | 13,106 | | | | 15,158 | |
| | | | | | | | | | |
| | | |
| | | | | 376,539 | | | | 396,425 | |
| | | | | | | | | | |
| | |
| | Commercial and Professional Services — 6.3% | | | | | |
| 594 | | Bright Horizons Family Solutions Inc.† | | | 24,579 | | | | 39,733 | |
| 1,845 | | IHS Markit Ltd.† | | | 60,479 | | | | 69,280 | |
| 1,915 | | Nielsen Holdings plc | | | 82,274 | | | | 102,587 | |
| | | | | | | | | | |
Shares | | | | Cost | | | Market Value | |
| | | |
| 3,225 | | Steelcase Inc., Cl. A | | $ | 52,511 | | | $ | 44,795 | |
| | | | | | | | | | |
| | | |
| | | | | 219,843 | | | | 256,395 | |
| | | | | | | | | | |
| | | |
| | Transportation — 1.2% | | | | | | | | |
| 956 | | Expeditors International of Washington Inc. | | | 40,229 | | | | 49,253 | |
| | | | | | | | | | |
| | | |
| | TOTAL INDUSTRIALS | | | 636,611 | | | | 702,073 | |
| | | | | | | | | | |
| | HEALTH CARE — 16.9% | | | | | | | | |
| | Health Care Equipment and Services — 7.8% | | | | | |
| 4,463 | | Castlight Health Inc., Cl. B† | | | 17,360 | | | | 18,566 | |
| 1,247 | | Diplomat Pharmacy Inc.† | | | 36,363 | | | | 34,928 | |
| 1,517 | | Insulet Corp.† | | | 56,604 | | | | 62,106 | |
| 549 | | Laboratory Corp. of America Holdings† | | | 64,352 | | | | 75,476 | |
| 558 | | Universal Health Services Inc., Cl. B | | | 53,752 | | | | 68,757 | |
| 1,492 | | Zeltiq Aesthetics Inc.† | | | 33,970 | | | | 58,516 | |
| | | | | | | | | | |
| | | |
| | | | | 262,401 | | | | 318,349 | |
| | | | | | | | | | |
| |
| | Pharmaceuticals, Biotechnology, and Life Sciences — 9.1% | |
| 461 | | Alexion Pharmaceuticals Inc.† | | | 74,761 | | | | 56,491 | |
| 4,434 | | Exact Sciences Corp.† | | | 65,780 | | | | 82,339 | |
| 352 | | Illumina Inc.† | | | 59,747 | | | | 63,944 | |
| 717 | | Incyte Corp. Ltd.† | | | 41,576 | | | | 67,606 | |
| 106 | | Mettler-Toledo International Inc.† | | | 26,963 | | | | 44,502 | |
| 624 | | Vertex Pharmaceuticals Inc.† | | | 56,259 | | | | 54,419 | |
| | | | | | | | | | |
| | | |
| | | | | 325,086 | | | | 369,301 | |
| | | | | | | | | | |
| | | |
| | TOTAL HEALTH CARE | | | 587,487 | | | | 687,650 | |
| | | | | | | | | | |
| | FINANCIALS — 15.5% | | | | | | | | |
| | Banks — 4.7% | | | | | | | | |
| 2,322 | | BankUnited Inc. | | | 74,505 | | | | 70,124 | |
| 4,455 | | Regions Financial Corp. | | | 45,268 | | | | 43,971 | |
| 163 | | SVB Financial Group† | | | 19,426 | | | | 18,018 | |
| 1,951 | | Zions Bancorporation | | | 57,499 | | | | 60,520 | |
| | | | | | | | | | |
| | | |
| | | | | 196,698 | | | | 192,633 | |
| | | | | | | | | | |
| | | |
| | Diversified Financials — 3.7% | | | | | | | | |
| 290 | | Affiliated Managers Group Inc.† | | | 55,661 | | | | 41,963 | |
| 903 | | Financial Engines Inc. | | | 40,781 | | | | 26,828 | |
| 1,913 | | Invesco Ltd. | | | 68,376 | | | | 59,820 | |
| 2,030 | | WisdomTree Investments Inc. | | | 27,608 | | | | 20,889 | |
| | | | | | | | | | |
| | | |
| | | | | 192,426 | | | | 149,500 | |
| | | | | | | | | | |
| | | |
| | Insurance — 1.6% | | | | | | | | |
| 520 | | Chubb Ltd. | | | 51,116 | | | | 65,338 | |
| | | | | | | | | | |
| | | |
| | Real Estate — 5.5% | | | | | | | | |
| 731 | | American Tower Corp. | | | 62,834 | | | | 82,844 | |
| 2,944 | | CBRE Group Inc., Cl. A† | | | 82,009 | | | | 82,373 | |
| 1,447 | | Gaming and Leisure Properties Inc. | | | 54,194 | | | | 48,402 | |
| 102 | | SL Green Realty Corp. | | | 11,568 | | | | 11,026 | |
| | | | | | | | | | |
| | | |
| | | | | 210,605 | | | | 224,645 | |
| | | | | | | | | | |
| | | |
| | TOTAL FINANCIALS | | | 650,845 | | | | 632,116 | |
| | | | | | | | | | |
| | ENERGY — 7.1% | | | | | | | | |
| | Energy — 7.1% | | | | | | | | |
| 626 | | Cimarex Energy Co. | | | 56,410 | | | | 84,116 | |
| 1,571 | | Gulfport Energy Corp.† | | | 47,369 | | | | 44,381 | |
| 583 | | Pioneer Natural Resources Co. | | | 97,457 | | | | 108,234 | |
| 1,320 | | Range Resources Corp. | | | 81,297 | | | | 51,150 | |
| | | | | | | | | | |
| | | |
| | TOTAL ENERGY | | | 282,533 | | | | 287,881 | |
| | | | | | | | | | |
| | CONSUMER STAPLES — 2.9% | | | | | | | | |
| | Food and Beverage — 2.9% | | | | | | | | |
| 1,472 | | Coca-Cola European Partners plc | | | 55,906 | | | | 58,733 | |
| 725 | | Mead Johnson Nutrition Co. | | | 60,328 | | | | 57,282 | |
| | | | | | | | | | |
| | | |
| | TOTAL CONSUMER STAPLES | | | 116,234 | | | | 116,015 | |
| | | | | | | | | | |
See accompanying notes to financial statements.
26
TETON Westwood Mid-Cap Equity Fund
Schedule of Investments (Continued) — September 30, 2016
| | | | | | | | | | |
Shares | | | | Cost | | | Market Value | |
| | | |
| | COMMON STOCKS (Continued) | | | | | | | | |
| | MATERIALS — 1.8% | | | | | | | | |
| | Materials — 1.8% | | | | | | | | |
| 613 | | Ecolab Inc. | | $ | 63,746 | | | $ | 74,614 | |
| | | | | | | | | | |
| | | |
| | TOTAL COMMON STOCKS | | | 3,593,799 | | | | 3,982,646 | |
| | | | | | | | | | |
| | | | | | | | | | |
Principal Amount | | | | Cost | | | Market Value | |
| | |
| | U.S. GOVERNMENT OBLIGATIONS — 2.5% | | | | | |
| $ 100,000 | | U.S. Treasury Bills,
0.27%††, 11/10/2016 | | $ | 99,971 | | | $ | 99,971 | |
| | | | | | | | | | |
| | | |
| | TOTAL INVESTMENTS — 100.3% | | $ | 3,693,770 | | | | 4,082,617 | |
| | | | | | | | | | |
| | |
| | Other Assets and Liabilities (Net) — (0.3)% | | | | (10,270 | ) |
| | | | | | | | | | |
| | | |
| | NET ASSETS — 100.0% | | | | | | $ | 4,072,347 | |
| | | | | | | | | | |
| † | Non-income producing security. |
| †† | Represents annualized yield at date of purchase. |
See accompanying notes to financial statements.
27
TETON Westwood Income Fund
Schedule of Investments — September 30, 2016
| | | | | | | | | | |
Principal
Amount | | | | Cost | | | Market
Value | |
| | | |
| | CONVERTIBLE CORPORATE BONDS — 2.8% | | | | | | | | |
| | Retail — 2.8% | | | | | | | | |
| $ 200,000 | | Vitamin Shoppe Inc.,
2.250%, 12/01/20 | | $ | 191,000 | | | $ | 189,125 | |
| | | | | | | | | | |
| | | |
| | U.S. GOVERNMENT OBLIGATIONS — 29.4% | | | | | | | | |
| 1,965,000 | | U.S. Treasury Bills,
0.075% to 0.476%†, 10/06/16 to 02/23/17 | | | 1,964,404 | | | | 1,964,404 | |
| | | | | | | | | | |
| | | |
| | TOTAL INVESTMENTS — 32.2% | | $ | 2,155,404 | | | | 2,153,529 | |
| | | | | | | | | | |
| | Other Assets and Liabilities (Net) — 67.8% | | | | 4,544,328 | |
| | | | | | | | | | |
| | NET ASSETS — 100.0% | | | $ | 6,697,857 | |
| | | | | | | | | | |
| † | Represents annualized yield at date of purchase. |
See accompanying notes to financial statements.
28
TETON Westwood Equity Fund
Schedule of Investments — September 30, 2016
| | | | | | | | | | |
Shares | | | | Cost | | | Market Value | |
| |
| | COMMON STOCKS — 99.2% | |
| | Aerospace — 5.1% | |
| 8,300 | | General Dynamics Corp. | | $ | 1,212,256 | | | $ | 1,287,828 | |
| 5,400 | | Raytheon Co. | | | 509,828 | | | | 735,102 | |
| 8,800 | | The Boeing Co. | | | 982,860 | | | | 1,159,312 | |
| | | | | | | | | | |
| | | |
| | | | | 2,704,944 | | | | 3,182,242 | |
| | | | | | | | | | |
| |
| | Banking — 8.3% | |
| 88,400 | | Bank of America Corp. | | | 1,128,900 | | | | 1,383,460 | |
| 29,804 | | JPMorgan Chase & Co. | | | 1,428,762 | | | | 1,984,648 | |
| 39,800 | | Wells Fargo & Co. | | | 1,658,761 | | | | 1,762,344 | |
| | | | | | | | | | |
| | | |
| | | | | 4,216,423 | | | | 5,130,452 | |
| | | | | | | | | | |
| |
| | Business Services — 3.9% | |
| 41,500 | | Booz Allen Hamilton Holding Corp. | | | 1,163,629 | | | | 1,311,815 | |
| 6,400 | | FedEx Corp. | | | 855,465 | | | | 1,117,952 | |
| | | | | | | | | | |
| | | |
| | | | | 2,019,094 | | | | 2,429,767 | |
| | | | | | | | | | |
| |
| | Cable and Satellite — 3.5% | |
| 32,900 | | Comcast Corp., Cl. A | | | 1,188,899 | | | | 2,182,586 | |
| | | | | | | | | | |
| |
| | Computer Software and Services — 6.1% | |
| 10,250 | | DST Systems Inc. | | | 1,186,103 | | | | 1,208,680 | |
| 23,700 | | Microsoft Corp. | | | 1,169,815 | | | | 1,365,120 | |
| 30,600 | | Oracle Corp. | | | 1,275,811 | | | | 1,201,968 | |
| | | | | | | | | | |
| | | |
| | | | | 3,631,729 | | | | 3,775,768 | |
| | | | | | | | | | |
| |
| | Consumer Products — 4.7% | |
| 17,000 | | Colgate-Palmolive Co. | | | 971,725 | | | | 1,260,380 | |
| 2,900 | | Mohawk Industries Inc.† | | | 595,932 | | | | 580,986 | |
| 19,500 | | VF Corp. | | | 1,314,628 | | | | 1,092,975 | |
| | | | | | | | | | |
| | | |
| | | | | 2,882,285 | | | | 2,934,341 | |
| | | | | | | | | | |
| |
| | Diversified Industrial — 2.1% | |
| 11,100 | | Honeywell International Inc. | | | 871,236 | | | | 1,294,149 | |
| | | | | | | | | | |
| |
| | Electronics — 2.0% | |
| 18,000 | | Texas Instruments Inc. | | | 864,097 | | | | 1,263,240 | |
| | | | | | | | | | |
| |
| | Energy and Energy Services — 3.9% | |
| 14,600 | | EOG Resources Inc. | | | 1,247,163 | | | | 1,411,966 | |
| 12,578 | | Schlumberger Ltd. | | | 940,174 | | | | 989,134 | |
| | | | | | | | | | |
| | | |
| | | | | 2,187,337 | | | | 2,401,100 | |
| | | | | | | | | | |
| |
| | Energy: Integrated — 3.9% | |
| 10,200 | | NextEra Energy Inc. | | | 781,808 | | | | 1,247,664 | |
| 19,000 | | WEC Energy Group Inc. | | | 871,180 | | | | 1,137,720 | |
| | | | | | | | | | |
| | | |
| | | | | 1,652,988 | | | | 2,385,384 | |
| | | | | | | | | | |
| |
| | Energy: Natural Gas — 1.0% | |
| 8,600 | | EQT Corp. | | | 490,535 | | | | 624,532 | |
| | | | | | | | | | |
| |
| | Energy: Oil — 4.5% | |
| 12,000 | | Chevron Corp. | | | 935,702 | | | | 1,235,040 | |
| 17,700 | | Exxon Mobil Corp. | | | 1,505,282 | | | | 1,544,856 | |
| | | | | | | | | | |
| | | |
| | | | | 2,440,984 | | | | 2,779,896 | |
| | | | | | | | | | |
| |
| | Entertainment — 2.0% | |
| 15,600 | | Time Warner Inc. | | | 1,023,191 | | | | 1,241,916 | |
| | | | | | | | | | |
| |
| | Financial Services — 12.3% | |
| 5,600 | | Alliance Data Systems Corp.† | | | 1,282,091 | | | | 1,201,368 | |
| | | | | | | | | | |
Shares | | | | Cost | | | Market Value | |
| | | |
| 21,000 | | American International Group Inc. | | $ | 795,846 | | | $ | 1,246,140 | |
| 9,800 | | Chubb Ltd. | | | 1,065,784 | | | | 1,231,370 | |
| 4,800 | | Intercontinental Exchange Inc. | | | 1,256,905 | | | | 1,292,928 | |
| 33,000 | | PayPal Holdings Inc.† | | | 1,105,437 | | | | 1,352,010 | |
| 18,492 | | The Allstate Corp. | | | 1,250,701 | | | | 1,279,276 | |
| | | | | | | | | | |
| | | |
| | | | | 6,756,764 | | | | 7,603,092 | |
| | | | | | | | | | |
| |
| | Food and Beverage — 7.6% | |
| 13,200 | | Dr Pepper Snapple Group Inc. | | | 1,272,407 | | | | 1,205,292 | |
| 13,300 | | General Mills Inc. | | | 518,422 | | | | 849,604 | |
| 12,500 | | McCormick & Co. Inc., Non-Voting | | | 858,030 | | | | 1,249,000 | |
| 12,600 | | PepsiCo Inc. | | | 1,004,071 | | | | 1,370,502 | |
| | | | | | | | | | |
| | | |
| | | | | 3,652,930 | | | | 4,674,398 | |
| | | | | | | | | | |
| |
| | Health Care — 12.0% | |
| 41,000 | | Abbott Laboratories | | | 1,481,535 | | | | 1,733,890 | |
| 11,100 | | Aetna Inc. | | | 996,820 | | | | 1,281,495 | |
| 7,100 | | Becton, Dickinson and Co. | | | 858,441 | | | | 1,276,083 | |
| 9,700 | | Cigna Corp. | | | 922,136 | | | | 1,264,104 | |
| 15,800 | | Johnson & Johnson | | | 1,528,419 | | | | 1,866,454 | |
| | | | | | | | | | |
| | | |
| | | | | 5,787,351 | | | | 7,422,026 | |
| | | | | | | | | | |
| |
| | Real Estate Investment Trusts — 1.8% | |
| 4,900 | | Public Storage | | | 1,252,517 | | | | 1,093,386 | |
| | | | | | | | | | |
| |
| | Retail — 6.3% | |
| 13,000 | | CVS Health Corp. | | | 1,255,363 | | | | 1,156,870 | |
| 5,900 | | Simon Property Group Inc. | | | 1,198,100 | | | | 1,221,359 | |
| 11,700 | | The Home Depot Inc. | | | 1,078,850 | | | | 1,505,556 | |
| | | | | | | | | | |
| | | |
| | | | | 3,532,313 | | | | 3,883,785 | |
| | | | | | | | | | |
| |
| | Specialty Chemicals — 1.9% | |
| 4,300 | | The Sherwin-Williams Co. | | | 1,104,149 | | | | 1,189,638 | |
| | | | | | | | | | |
| |
| | Telecommunications — 4.1% | |
| 21,450 | | Amdocs Ltd. | | | 862,806 | | | | 1,240,883 | |
| 24,900 | | Verizon Communications Inc. | | | 1,230,095 | | | | 1,294,302 | |
| | | | | | | | | | |
| | | |
| | | | | 2,092,901 | | | | 2,535,185 | |
| | | | | | | | | | |
| |
| | Transportation — 2.2% | |
| 13,600 | | Union Pacific Corp. | | | 615,659 | | | | 1,326,408 | |
| | | | | | | | | | |
| | | |
| | TOTAL COMMON STOCKS | | | 50,968,326 | | | | 61,353,291 | |
| | | | | | | | | | |
| |
| | SHORT TERM INVESTMENT — 1.0% | |
| | Mutual Fund — 1.0% | | | | | |
| 633,701 | | Dreyfus Cash Management,
0.200%* | | | 633,701 | | | | 633,701 | |
| | | | | | | | | | |
| | | |
| | TOTAL INVESTMENTS —100.2% | | $ | 51,602,027 | | | | 61,986,992 | |
| | | | | | | | | | |
| | |
| | Other Assets and Liabilities (Net) — (0.2)% | | | | (103,779 | ) |
| | | | | | | | | | |
| | |
| | NET ASSETS — 100.0% | | | $ | 61,883,213 | |
| | | | | | | | | | |
| † | Non-income producing security. |
See accompanying notes to financial statements.
29
TETON Westwood Balanced Fund
Schedule of Investments — September 30, 2016
| | | | | | | | | | |
Shares | | | | Cost | | | Market Value | |
| |
| | COMMON STOCKS — 65.4% | |
| | Aerospace — 3.4% | |
| 6,300 | | General Dynamics Corp. | | $ | 916,064 | | | $ | 977,508 | |
| 3,100 | | Raytheon Co. | | | 293,746 | | | | 422,003 | |
| 6,200 | | The Boeing Co. | | | 648,367 | | | | 816,788 | |
| | | | | | | | | | |
| | | |
| | | | | 1,858,177 | | | | 2,216,299 | |
| | | | | | | | | | |
| |
| | Banking — 5.4% | |
| 59,900 | | Bank of America Corp. | | | 366,989 | | | | 937,435 | |
| 20,196 | | JPMorgan Chase & Co. | | | 865,828 | | | | 1,344,852 | |
| 26,900 | | Wells Fargo & Co. | | | 1,110,731 | | | | 1,191,132 | |
| | | | | | | | | | |
| | | |
| | | | | 2,343,548 | | | | 3,473,419 | |
| | | | | | | | | | |
| |
| | Business Services — 2.5% | |
| 27,600 | | Booz Allen Hamilton Holding Corp. | | | 774,114 | | | | 872,436 | |
| 4,175 | | FedEx Corp. | | | 558,912 | | | | 729,289 | |
| | | | | | | | | | |
| | | |
| | | | | 1,333,026 | | | | 1,601,725 | |
| | | | | | | | | | |
| |
| | Cable and Satellite — 2.3% | |
| 22,400 | | Comcast Corp., Cl. A | | | 762,856 | | | | 1,486,016 | |
| | | | | | | | | | |
| |
| | Computer Software and Services — 4.1% | |
| 8,250 | | DST Systems Inc. | | | 953,175 | | | | 972,840 | |
| 15,300 | | Microsoft Corp. | | | 755,240 | | | | 881,280 | |
| 20,500 | | Oracle Corp. | | | 854,736 | | | | 805,240 | |
| | | | | | | | | | |
| | | |
| | | | | 2,563,151 | | | | 2,659,360 | |
| | | | | | | | | | |
| |
| | Consumer Products — 3.4% | |
| 14,200 | | Colgate-Palmolive Co. | | | 811,453 | | | | 1,052,788 | |
| 2,000 | | Mohawk Industries Inc.† | | | 410,979 | | | | 400,680 | |
| 13,500 | | VF Corp. | | | 910,215 | | | | 756,675 | |
| | | | | | | | | | |
| | | |
| | | | | 2,132,647 | | | | 2,210,143 | |
| | | | | | | | | | |
| |
| | Diversified Industrial — 1.3% | |
| 7,325 | | Honeywell International Inc. | | | 584,498 | | | | 854,022 | |
| | | | | | | | | | |
| |
| | Electronics — 1.3% | |
| 12,200 | | Texas Instruments Inc. | | | 583,024 | | | | 856,196 | |
| | | | | | | | | | |
| |
| | Energy and Energy Services — 2.6% | |
| 10,000 | | EOG Resources Inc. | | | 865,832 | | | | 967,100 | |
| 9,200 | | Schlumberger Ltd. | | | 685,391 | | | | 723,488 | |
| | | | | | | | | | |
| | | |
| | | | | 1,551,223 | | | | 1,690,588 | |
| | | | | | | | | | |
| |
| | Energy: Integrated — 2.5% | |
| 6,575 | | NextEra Energy Inc. | | | 504,512 | | | | 804,254 | |
| 13,075 | | WEC Energy Group Inc. | | | 597,718 | | | | 782,931 | |
| | | | | | | | | | |
| | | |
| | | | | 1,102,230 | | | | 1,587,185 | |
| | | | | | | | | | |
| |
| | Energy: Natural Gas — 0.6% | |
| 5,400 | | EQT Corp. | | | 284,409 | | | | 392,148 | |
| | | | | | | | | | |
| |
| | Energy: Oil — 2.9% | |
| 8,200 | | Chevron Corp. | | | 565,418 | | | | 843,944 | |
| 11,500 | | Exxon Mobil Corp. | | | 978,133 | | | | 1,003,720 | |
| | | | | | | | | | |
| | | |
| | | | | 1,543,551 | | | | 1,847,664 | |
| | | | | | | | | | |
| |
| | Entertainment — 1.5% | |
| 12,200 | | Time Warner Inc. | | | 775,566 | | | | 971,242 | |
| | | | | | | | | | |
| |
| | Financial Services — 8.3% | |
| 3,800 | | Alliance Data Systems Corp.† | | | 867,794 | | | | 815,214 | |
| 15,900 | | American International Group Inc. | | | 599,416 | | | | 943,506 | |
| 6,700 | | Chubb Ltd. | | | 729,632 | | | | 841,855 | |
| 3,200 | | Intercontinental Exchange Inc. | | | 838,346 | | | | 861,952 | |
| 23,800 | | PayPal Holdings Inc.† | | | 800,862 | | | | 975,086 | |
| 13,223 | | The Allstate Corp. | | | 894,336 | | | | 914,767 | |
| | | | | | | | | | |
| | | |
| | | | | 4,730,386 | | | | 5,352,380 | |
| | | | | | | | | | |
| |
| | Food and Beverage — 5.2% | |
| 9,000 | | Dr Pepper Snapple Group Inc. | | | 866,883 | | | | 821,790 | |
| 10,200 | | General Mills Inc. | | | 397,268 | | | | 651,576 | |
| | | | | | | | | | |
Shares | | | | Cost | | | Market Value | |
| | | |
| 9,000 | | McCormick & Co. Inc.,
Non-Voting | | $ | 618,191 | | | $ | 899,280 | |
| 9,000 | | PepsiCo Inc. | | | 714,475 | | | | 978,930 | |
| | | | | | | | | | |
| | | |
| | | | | 2,596,817 | | | | 3,351,576 | |
| | | | | | | | | | |
| |
| | Health Care — 7.8% | |
| 29,600 | | Abbott Laboratories | | | 1,059,358 | | | | 1,251,784 | |
| 7,200 | | Aetna Inc. | | | 652,342 | | | | 831,240 | |
| 4,975 | | Becton, Dickinson and Co. | | | 652,616 | | | | 894,157 | |
| 5,900 | | Cigna Corp. | | | 583,632 | | | | 768,888 | |
| 10,700 | | Johnson & Johnson | | | 1,039,599 | | | | 1,263,991 | |
| | | | | | | | | | |
| | | |
| | | | | 3,987,547 | | | | 5,010,060 | |
| | | | | | | | | | |
| |
| | Real Estate Investment Trusts — 1.1% | |
| 3,300 | | Public Storage | | | 843,195 | | | | 736,362 | |
| | | | | | | | | | |
| |
| | Retail — 4.1% | |
| 9,250 | | CVS Health Corp. | | | 892,666 | | | | 823,157 | |
| 3,800 | | Simon Property Group Inc. | | | 769,987 | | | | 786,638 | |
| 7,975 | | The Home Depot Inc. | | | 718,787 | | | | 1,026,223 | |
| | | | | | | | | | |
| | | |
| | | | | 2,381,440 | | | | 2,636,018 | |
| | | | | | | | | | |
| |
| | Specialty Chemicals — 1.2% | |
| 2,875 | | The Sherwin-Williams Co. | | | 737,291 | | | | 795,398 | |
| | | | | | | | | | |
| |
| | Telecommunications — 2.5% | |
| 14,800 | | Amdocs Ltd. | | | 594,924 | | | | 856,180 | |
| 15,200 | | Verizon Communications Inc. | | | 750,942 | | | | 790,096 | |
| | | | | | | | | | |
| | | |
| | | | | 1,345,866 | | | | 1,646,276 | |
| | | | | | | | | | |
| |
| | Transportation — 1.4% | |
| 9,300 | | Union Pacific Corp. | | | 441,214 | | | | 907,029 | |
| | | | | | | | | | |
| | | |
| | TOTAL COMMON STOCKS | | | 34,481,662 | | | | 42,281,106 | |
| | | | | | | | | | |
| | | |
Principal
Amount | | | | | | | | |
| |
| | CORPORATE BONDS — 21.1% | |
| | Banking — 4.2% | |
| $ 600,000 | | Citigroup Inc.,
2.500%, 07/29/19 | | | 612,271 | | | | 612,626 | |
| 750,000 | | JPMorgan Chase & Co.,
6.300%, 04/23/19 | | | 757,582 | | | | 835,799 | |
| 600,000 | | The Goldman Sachs Group Inc., MTN,
3.850%, 07/08/24 | | | 600,320 | | | | 638,086 | |
| 600,000 | | Wells Fargo & Co., MTN,
3.500%, 03/08/22 | | | 612,010 | | | | 637,074 | |
| | | | | | | | | | |
| | | |
| | | | | 2,582,183 | | | | 2,723,585 | |
| | | | | | | | | | |
| |
| | Computer Hardware — 1.1% | |
| 650,000 | | International Business Machines Corp., 2.900%, 11/01/21 | | | 656,756 | | | | 687,785 | |
| | | | | | | | | | |
| |
| | Consumer Products — 2.0% | |
| 500,000 | | Colgate-Palmolive Co., MTN,
2.100%, 05/01/23 | | | 495,739 | | | | 507,329 | |
| 800,000 | | Costco Wholesale Corp.,
1.700%, 12/15/19 | | | 793,890 | | | | 810,108 | |
| | | | | | | | | | |
| | | |
| | | | | 1,289,629 | | | | 1,317,437 | |
| | | | | | | | | | |
| |
| | Diversified Industrial — 1.3% | |
| 800,000 | | John Deere Capital Corp., MTN,
1.950%, 12/13/18 | | | 800,998 | | | | 813,819 | |
| | | | | | | | | | |
| |
| | Electronics — 2.4% | |
| 1,000,000 | | Intel Corp.,
3.300%, 10/01/21 | | | 1,022,505 | | | | 1,078,025 | |
See accompanying notes to financial statements.
30
TETON Westwood Balanced Fund
Schedule of Investments (Continued) — September 30, 2016
| | | | | | | | | | |
Principal
Amount | | | | Cost | | | Market Value | |
| | |
| | CORPORATE BONDS (Continued) | | | | | |
| | Electronics (Continued) | | | | | |
| $ 500,000 | | Texas Instruments Inc.,
1.650%, 08/03/19 | | $ | 499,213 | | | $ | 506,319 | |
| | | | | | | | | | |
| | | |
| | | | | 1,521,718 | | | | 1,584,344 | |
| | | | | | | | | | |
| | | |
| | Energy: Oil — 0.9% | | | | | | | | |
| 500,000 | | XTO Energy Inc.,
6.500%, 12/15/18 | | | 521,522 | | | | 555,697 | |
| | | | | | | | | | |
| | | |
| | Financial Services — 2.9% | | | | | | | | |
| 600,000 | | Capital One Financial Corp.,
3.750%, 04/24/24 | | | 609,286 | | | | 638,048 | |
| 600,000 | | Morgan Stanley, GMTN,
3.700%, 10/23/24 | | | 600,621 | | | | 634,198 | |
| 600,000 | | The PNC Financial Services Group Inc., STEP,
2.854%, 11/09/22 | | | 591,305 | | | | 616,295 | |
| | | | | | | | | | |
| | | |
| | | | | 1,801,212 | | | | 1,888,541 | |
| | | | | | | | | | |
| | | |
| | Health Care — 4.7% | | | | | | | | |
| 500,000 | | Abbott Laboratories,
2.550%, 03/15/22 | | | 493,739 | | | | 514,155 | |
| 600,000 | | Aetna Inc.,
3.500%, 11/15/24 | | | 600,953 | | | | 635,062 | |
| 600,000 | | Amgen Inc.,
3.450%, 10/01/20 | | | 616,909 | | | | 635,729 | |
| 600,000 | | CVS Health Corp.,
3.375%, 08/12/24 | | | 598,851 | | | | 636,061 | |
| 600,000 | | GlaxoSmithKline Capital plc,
1.500%, 05/08/17 | | | 602,204 | | | | 601,562 | |
| | | | | | | | | | |
| | | |
| | | | | 2,912,656 | | | | 3,022,569 | |
| | | | | | | | | | |
| | | |
| | Transportation — 1.6% | | | | | | | | |
| 1,000,000 | | Burlington Northern Santa Fe LLC,
5.650%, 05/01/17 | | | 998,610 | | | | 1,025,913 | |
| | | | | | | | | | |
| | | |
| | TOTAL CORPORATE BONDS | | | 13,085,284 | | | | 13,619,690 | |
| | | | | | | | | | |
| | | | | | | | | | |
Principal
Amount | | | | Cost | | | Market Value | |
| |
| | U.S. GOVERNMENT AGENCY OBLIGATIONS — 4.6% | |
| | Federal Home Loan Mortgage Corp. — 2.8% | | | | | |
| $ 600,000 | | 1.750%, 05/30/19 | | $ | 596,480 | | | $ | 612,767 | |
| 1,100,000 | | 2.375%, 01/13/22 | | | 1,108,437 | | | | 1,159,205 | |
| | | | | | | | | | |
| | | |
| | | | | 1,704,917 | | | | 1,771,972 | |
| | | | | | | | | | |
| |
| | Federal National Mortgage Association — 1.8% | |
| 1,100,000 | | 2.625%, 09/06/24 | | | 1,141,666 | | | | 1,178,847 | |
| | | | | | | | | | |
| | | |
| | TOTAL U.S. GOVERNMENT AGENCY OBLIGATIONS | | | 2,846,583 | | | | 2,950,819 | |
| | | | | | | | | | |
| |
| | U.S. GOVERNMENT OBLIGATIONS — 6.6% | |
| | U.S. Treasury Inflation Indexed Notes — 1.7% | |
| 1,008,765 | | 2.125%, 01/15/19 | | | 1,017,717 | | | | 1,074,713 | |
| | | | | | | | | | |
| | | |
| | U.S. Treasury Notes — 4.9% | | | | | | | | |
| 750,000 | | 3.375%, 11/15/19 | | | 787,486 | | | | 806,455 | |
| 1,000,000 | | 2.250%, 11/15/24 | | | 1,033,228 | | | | 1,056,016 | |
| 500,000 | | 2.000%, 02/15/25 | | | 496,625 | | | | 517,871 | |
| 800,000 | | 1.625%, 02/15/26 | | | 803,564 | | | | 801,547 | |
| | | | | | | | | | |
| | | |
| | | | | 3,120,903 | | | | 3,181,889 | |
| | | | | | | | | | |
| | | |
| | TOTAL U.S. GOVERNMENT OBLIGATIONS | | | 4,138,620 | | | | 4,256,602 | |
| | | | | | | | | | |
| | | |
| Shares | | | | | | | | |
| |
| | SHORT TERM INVESTMENT — 2.5% | |
| | Mutual Fund — 2.5% | | | | | | | | |
| 1,625,513 | | Dreyfus Cash Management,
0.200%* | | | 1,625,513 | | | | 1,625,513 | |
| | | | | | | | | | |
| | | |
| | TOTAL
INVESTMENTS — 100.2% | | $ | 56,177,662 | | | | 64,733,730 | |
| | | | | | | | | | |
| | |
| | Other Assets and Liabilities (Net) — (0.2)% | | | | (117,349 | ) |
| | | | | | | | | | |
| | |
| | NET ASSETS — 100.0% | | | $ | 64,616,381 | |
| | | | | | | | | | |
| † | Non-income producing security. |
| GMTN | Global Medium Term Note |
| STEP | Step coupon security. The rate disclosed is that in effect at September 30, 2016. |
See accompanying notes to financial statements.
31
TETON Westwood Intermediate Bond Fund
Schedule of Investments — September 30, 2016
| | | | | | | | | | |
Principal
Amount | | | | Cost | | | Market
Value | |
| | | |
| | CORPORATE BONDS — 58.2% | | | | | | | | |
| | Aerospace — 3.2% | | | | | | | | |
| $ 200,000 | | The Boeing Co.,
6.000%, 03/15/19 | | $ | 201,660 | | | $ | 222,598 | |
| 400,000 | | United Technologies Corp.,
3.100%, 06/01/22 | | | 415,547 | | | | 429,526 | |
| | | | | | | | | | |
| | | |
| | | | | 617,207 | | | | 652,124 | |
| | | | | | | | | | |
| | | |
| | Airlines — 1.5% | | | | | | | | |
| 300,000 | | Southwest Airlines Co.,
5.750%, 12/15/16 | | | 302,799 | | | | 302,847 | |
| | | | | | | | | | |
| | | |
| | Automotive — 2.5% | | | | | | | | |
| 500,000 | | General Motors Co.,
3.500%, 10/02/18 | | | 515,181 | | | | 515,674 | |
| | | | | | | | | | |
| | | |
| | Banking — 9.2% | | | | | | | | |
| 400,000 | | Bank of America Corp., MTN,
3.300%, 01/11/23 | | | 401,132 | | | | 414,653 | |
| 400,000 | | Citigroup Inc.,
2.500%, 07/29/19 | | | 401,054 | | | | 408,417 | |
| 200,000 | | JPMorgan Chase & Co.,
6.300%, 04/23/19 | | | 199,582 | | | | 222,880 | |
| 400,000 | | The Bank of New York Mellon Corp., Ser. G,
2.200%, 05/15/19 | | | 400,800 | | | | 407,398 | |
| 400,000 | | Wells Fargo & Co.,
2.125%, 04/22/19 | | | 399,910 | | | | 405,691 | |
| | | | | | | | | | |
| | | |
| | | | | 1,802,478 | | | | 1,859,039 | |
| | | | | | | | | | |
| | | |
| | Computer Hardware — 3.4% | | | | | | | | |
| 300,000 | | Apple Inc.,
1.009%, 05/03/18(a) | | | 300,249 | | | | 300,771 | |
| 360,000 | | International Business Machines Corp.,
2.900%, 11/01/21 | | | 363,742 | | | | 380,927 | |
| | | | | | | | | | |
| | | |
| | | | | 663,991 | | | | 681,698 | |
| | | | | | | | | | |
| |
| | Computer Software and Services — 2.1% | |
| 400,000 | | Oracle Corp.,
3.625%, 07/15/23 | | | 400,167 | | | | 434,763 | |
| | | | | | | | | | |
| | | |
| | Consumer Products — 4.0% | | | | | | | | |
| 400,000 | | Costco Wholesale Corp.,
1.700%, 12/15/19 | | | 396,945 | | | | 405,054 | |
| 400,000 | | CVS Health Corp.,
1.900%, 07/20/18 | | | 402,822 | | | | 404,048 | |
| | | | | | | | | | |
| | | |
| | | | | 799,767 | | | | 809,102 | |
| | | | | | | | | | |
| | | |
| | Electronics — 1.5% | | | | | | | | |
| 300,000 | | Texas Instruments Inc.,
1.650%, 08/03/19 | | | 299,520 | | | | 303,791 | |
| | | | | | | | | | |
| | | |
| | Financial Services — 9.7% | | | | | | | | |
| 400,000 | | Capital One Financial Corp.,
3.750%, 04/24/24 | | | 406,191 | | | | 425,366 | |
| 260,000 | | International Bank for Reconstruction & Development,
8.625%, 10/15/16 | | | 260,184 | | | | 260,184 | |
| 400,000 | | Morgan Stanley, GMTN,
3.700%, 10/23/24 | | | 400,414 | | | | 422,799 | |
| 400,000 | | PNC Funding Corp.,
3.300%, 03/08/22 | | | 416,223 | | | | 425,032 | |
| 400,000 | | The Goldman Sachs Group Inc., MTN, | | | | | | | | |
| | | | | | | | | | |
Principal
Amount | | | | Cost | | | Market
Value | |
| | | |
| | 3.850%, 07/08/24 | | $ | 402,874 | | | $ | 425,390 | |
| | | | | | | | | | |
| | | |
| | | | | 1,885,886 | | | | 1,958,771 | |
| | | | | | | | | | |
| | | |
| | Food and Beverage — 2.9% | | | | | | | | |
| 275,000 | | Bottling Group LLC,
5.125%, 01/15/19 | | | 291,860 | | | | 298,364 | |
| 250,000 | | Mondelēz International Inc.,
5.375%, 02/10/20 | | | 251,774 | | | | 279,863 | |
| | | | | | | | | | |
| | | |
| | | | | 543,634 | | | | 578,227 | |
| | | | | | | | | | |
| | | |
| | Health Care — 9.2% | | | | | | | | |
| 500,000 | | Abbott Laboratories,
2.550%, 03/15/22 | | | 493,738 | | | | 514,156 | |
| 400,000 | | Aetna Inc.,
3.500%, 11/15/24 | | | 400,636 | | | | 423,375 | |
| 400,000 | | Amgen Inc.,
3.450%, 10/01/20 | | | 411,273 | | | | 423,819 | |
| 500,000 | | GlaxoSmithKline Capital plc,
1.500%, 05/08/17 | | | 501,923 | | | | 501,302 | |
| | | | | | | | | | |
| | | |
| | | | | 1,807,570 | | | | 1,862,652 | |
| | | | | | | | | | |
| | Retail — 2.4% | | | | | | | | |
| 500,000 | | The Home Depot, Inc.,
2.125%, 09/15/26 | | | 494,542 | | | | 491,902 | |
| | | | | | | | | | |
| | | |
| | Semiconductors — 1.9% | | | | | | | | |
| 350,000 | | Intel Corp.,
3.300%, 10/01/21 | | | 349,552 | | | | 377,309 | |
| | | | | | | | | | |
| | | |
| | Telecommunications — 4.7% | | | | | | | | |
| 500,000 | | AT&T Inc.,
3.900%, 03/11/24 | | | 514,638 | | | | 536,094 | |
| 400,000 | | Verizon Communications Inc.,
3.000%, 11/01/21 | | | 398,763 | | | | 419,019 | |
| | | | | | | | | | |
| | | |
| | | | | 913,401 | | | | 955,113 | |
| | | | | | | | | | |
| | | |
| | TOTAL CORPORATE BONDS | | | 11,395,695 | | | | 11,783,012 | |
| | | | | | | | | | |
| |
| | U.S. GOVERNMENT AGENCY OBLIGATIONS — 11.5% | |
| | Federal Home Loan Mortgage Corp. — 3.1% | | | | | |
| 600,000 | | 2.375%, 01/13/22 | | | 603,515 | | | | 632,294 | |
| | | | | | | | | | |
| |
| | Federal National Mortgage Association — 8.2% | |
| 600,000 | | 2.625%, 09/06/24 | | | 622,727 | | | | 643,007 | |
| 1,000,000 | | 2.125%, 04/24/26 | | | 997,452 | | | | 1,018,967 | |
| | | | | | | | | | |
| | | |
| | | | | 1,620,179 | | | | 1,661,974 | |
| | | | | | | | | | |
| |
| | Government National Mortgage Association — 0.2% | |
| 5,690 | | 6.000%, 12/15/33 | | | 5,731 | | | | 6,681 | |
| 17,882 | | 5.500%, 01/15/34 | | | 17,974 | | | | 20,492 | |
| | | | | | | | | | |
| | | |
| | | | | 23,705 | | | | 27,173 | |
| | | | | | | | | | |
| | TOTAL U.S. GOVERNMENT
AGENCY OBLIGATIONS | | | 2,247,399 | | | | 2,321,441 | |
| | | | | | | | | | |
| |
| | U.S. GOVERNMENT OBLIGATIONS — 19.9% | |
| | U.S. Treasury Bonds — 1.1% | | | | | | | | |
| 150,000 | | 5.375%, 02/15/31 | | | 163,915 | | | | 218,903 | |
| | | | | | | | | | |
| | | |
| | U.S. Treasury Notes — 18.8% | | | | | | | | |
| 600,000 | | 2.000%, 02/15/22 | | | 603,316 | | | | 623,766 | |
| 800,000 | | 2.250%, 11/15/24 | | | 813,853 | | | | 844,813 | |
| 700,000 | | 2.000%, 02/15/25 | | | 701,193 | | | | 725,019 | |
| 1,000,000 | | 1.625%, 02/15/26 | | | 978,699 | | | | 1,001,934 | |
See accompanying notes to financial statements.
32
TETON Westwood Intermediate Bond Fund
Schedule of Investments (Continued) — September 30, 2016
| | | | | | | | | | |
Principal
Amount | | | | Cost | | | Market
Value | |
| |
| | U.S. GOVERNMENT OBLIGATIONS (Continued) | |
| | U.S. Treasury Notes (Continued) | | | | | | | | |
| $ 600,000 | | 0.478%, 10/31/17(a) | | $ | 599,836 | | | $ | 600,674 | |
| | | | | | | | | | |
| | | |
| | | | | 3,696,897 | | | | 3,796,206 | |
| | | | | | | | | | |
| | TOTAL U.S. GOVERNMENT OBLIGATIONS | | | 3,860,812 | | | | 4,015,109 | |
| | | | | | | | | | |
| | | |
| Shares | | | | Cost | | | Market
Value | |
| |
| | SHORT TERM INVESTMENT — 9.9% | |
| | Mutual Fund — 9.9% | | | | | | | | |
| 2,001,870 | | Dreyfus Cash Management,
0.200%* | | | 2,001,870 | | | | 2,001,870 | |
| | | | | | | | | | |
| | | | | | | | | | |
| Shares | | | | Cost | | | Market
Value | |
| | | |
| | TOTAL INVESTMENTS — 99.5% | | $ | 19,505,776 | | | | 20,121,432 | |
| | | | | | | | | | |
| | |
| | Other Assets and Liabilities (Net) — 0.5% | | | | 110,333 | |
| | | | | | | | | | |
| | | |
| | NET ASSETS — 100.0% | | | | | | $ | 20,231,765 | |
| | | | | | | | | | |
| (a) | Variable rate security. Rate shown is the effective rate as of September 30, 2016. |
| GMTN | Global Medium Term Note |
See accompanying notes to financial statements.
33
TETON Westwood Funds
Statements of Assets and Liabilities
September 30, 2016
| | | | | | | | | | | | | | | | | | | | | | | | | | | | |
| | | Mighty MitesSM Fund | | | | SmallCap Equity Fund | | | | Mid-Cap Equity Fund | | | | Income Fund | | |
Assets: | | | | | | | | | | | | | | | | | | | | | | | | | | | | |
Investments, at value (cost $684,193,068, $21,298,780, $3,693,770, and $2,155,404, respectively) | | | $ | 1,004,975,369 | | | | | | $ | 27,946,440 | | | | | | $ | 4,082,617 | | | | | | $ | 2,153,529 | | | |
Investments in affiliates, at value (cost $37,545,308) | | | | 44,358,103 | | | | | | | — | | | | | | | — | | | | | | | — | | | |
Cash | | | | 62,070 | | | | | | | 99,653 | | | | | | | 33,090 | | | | | | | 11,212 | | | |
Receivable for Fund shares sold | | | | 1,554,514 | | | | | | | 1,967 | | | | | | | — | | | | | | | — | | | |
Receivable for investments sold | | | | 1,422,187 | | | | | | | — | | | | | | | — | | | | | | | 4,733,699 | | | |
Receivable from Adviser | | | | — | | | | | | | 6,480 | | | | | | | 31,192 | | | | | | | 9,331 | | | |
Dividends and interest receivable | | | | 572,212 | | | | | | | 15,537 | | | | | | | 2,596 | | | | | | | 8,825 | | | |
Prepaid expenses | | | | 33,165 | | | | | | | 20,132 | | | | | | | 10,811 | | | | | | | 21,378 | | | |
Total Assets | | | | 1,052,977,620 | | | | | | | 28,090,209 | | | | | | | 4,160,306 | | | | | | | 6,937,974 | | | |
Liabilities: | | | | | | | | | | | | | | | | | | | | | | | | | | | | |
Payable for investments purchased | | | | 146,131 | | | | | | | 1,078,374 | | | | | | | 39,925 | | | | | | | 192,550 | | | |
Payable for Fund shares redeemed | | | | 1,210,101 | | | | | | | 58,033 | | | | | | | — | | | | | | | 860 | | | |
Payable for investment advisory fees | | | | 848,852 | | | | | | | 20,331 | | | | | | | 10,465 | | | | | | | 5,547 | | | |
Payable for distribution fees | | | | 253,727 | | | | | | | 4,888 | | | | | | | 653 | | | | | | | 2,104 | | | |
Payable for accounting fees | | | | 7,500 | | | | | | | — | | | | | | | — | | | | | | | — | | | |
Payable for payroll expenses | | | | — | | | | | | | — | | | | | | | 431 | | | | | | | — | | | |
Payable for custodian fees | | | | 69,500 | | | | | | | 3,800 | | | | | | | 6,150 | | | | | | | 2,367 | | | |
Payable for legal and audit fees | | | | 56,897 | | | | | | | 34,816 | | | | | | | 21,041 | | | | | | | 25,843 | | | |
Payable for shareholder communications expenses | | | | 76,291 | | | | | | | 6,047 | | | | | | | 4,323 | | | | | | | 5,043 | | | |
Payable for shareholder services fees | | | | 171,344 | | | | | | | 2,776 | | | | | | | 1,239 | | | | | | | 2,017 | | | |
Other accrued expenses | | | | 22,076 | | | | | | | 4,141 | | | | | | | 3,732 | | | | | | | 3,786 | | | |
Total Liabilities | | | | 2,862,419 | | | | | | | 1,213,206 | | | | | | | 87,959 | | | | | | | 240,117 | | | |
Net Assets | | | $ | 1,050,115,201 | | | | | | $ | 26,877,003 | | | | | | $ | 4,072,347 | | | | | | $ | 6,697,857 | | | |
Net Assets Consist of: | | | | | | | | | | | | | | | | | | | | | | | | | | | | |
Paid-in capital | | | $ | 684,234,623 | | | | | | $ | 18,875,706 | | | | | | $ | 3,653,388 | | | | | | $ | 6,390,281 | | | |
Accumulated net investment income/(loss) | | | | (7,094,681 | ) | | | | | | (37,000 | ) | | | | | | (10,825 | ) | | | | | | 1,996 | | | |
Accumulated net realized gain on investments and foreign currency transactions | | | | 45,381,343 | | | | | | | 1,390,637 | | | | | | | 40,937 | | | | | | | 307,455 | | | |
Net unrealized appreciation/depreciation on investments | | | | 327,595,096 | | | | | | | 6,647,660 | | | | | | | 388,847 | | | | | | | (1,875 | ) | | |
Net unrealized depreciation on foreign currency translations | | | | (1,180 | ) | | | | | | — | | | | | | | — | | | | | | | — | | | |
Net Assets | | | $ | 1,050,115,201 | | | | | | $ | 26,877,003 | | | | | | $ | 4,072,347 | | | | | | $ | 6,697,857 | | | |
Shares of Beneficial Interest, each at $0.001 par value; unlimited number of shares authorized: | | | | | | | | | | | | | | | | | | | | | | | | | | | | |
Class AAA: | | | | | | | | | | | | | | | | | | | | | | | | | | | | |
Net assets | | | $ | 256,488,103 | | | | | | $ | 10,854,969 | | | | | | $ | 1,810,343 | | | | | | $ | 4,239,882 | | | |
Shares of beneficial interest outstanding | | | | 10,359,466 | | | | | | | 570,362 | | | | | | | 152,366 | | | | | | | 365,964 | | | |
Net Asset Value, offering, and redemption price per share | | | $ | 24.76 | | | | | | $ | 19.03 | | | | | | $ | 11.88 | | | | | | $ | 11.59 | | | |
Class A: | | | | | | | | | | | | | | | | | | | | | | | | | | | | |
Net assets | | | $ | 141,892,756 | | | | | | $ | 2,871,316 | | | | | | $ | 309,168 | | | | | | $ | 1,190,994 | | | |
Shares of beneficial interest outstanding | | | | 5,909,362 | | | | | | | 156,347 | | | | | | | 26,237 | | | | | | | 99,785 | | | |
Net Asset Value and redemption price per share | | | $ | 24.01 | | | | | | $ | 18.37 | | | | | | $ | 11.78 | | | | | | $ | 11.94 | | | |
Maximum offering price per share (NAV ÷ 0.96, based on maximum sales charge of 4.00% of the offering price) | | | $ | 25.01 | | | | | | $ | 19.14 | | | | | | $ | 12.27 | | | | | | $ | 12.44 | | | |
Class C: | | | | | | | | | | | | | | | | | | | | | | | | | | | | |
Net assets | | | $ | 175,240,912 | | | | | | $ | 2,268,230 | | | | | | $ | 192,784 | | | | | | $ | 873,208 | | | |
Shares of beneficial interest outstanding | | | | 8,130,401 | | | | | | | 138,033 | | | | | | | 16,644 | | | | | | | 68,824 | | | |
Net Asset Value and offering price per share(a) | | | $ | 21.55 | | | | | | $ | 16.43 | | | | | | $ | 11.58 | | | | | | $ | 12.69 | | | |
| | | | | | | | |
Class I: | | | | | | | | | | | | | | | | | | | | | | | | | | | | |
Net assets | | | $ | 476,493,430 | | | | | | $ | 10,882,488 | | | | | | $ | 1,760,052 | | | | | | $ | 393,773 | | | |
Shares of beneficial interest outstanding | | | | 18,922,553 | | | | | | | 557,335 | | | | | | | 146,666 | | | | | | | 33,908 | | | |
Net Asset Value, offering, and redemption price per share | | | $ | 25.18 | | �� | | | | $ | 19.53 | | | | | | $ | 12.00 | | | | | | $ | 11.61 | | | |
| | | | | | | | | | | | | | | | | |
| (a) | Redemption price varies based on the length of time held. |
See accompanying notes to financial statements.
34
TETON Westwood Funds
Statements of Assets and Liabilities (Continued)
September 30, 2016
| | | | | | | | | | | | | | | | | | | | | |
| | | Equity Fund | | | | Balanced
Fund | | | | Intermediate
Bond Fund | | |
Assets: | | | | | | | | | | | | | | | | | | | | | |
Investments, at value (cost $51,602,027, $56,177,662, and $19,505,776, respectively) | | | | $61,986,992 | | | | | | | $64,733,730 | | | | | | | $20,121,432 | | | |
Investments in affiliates, at value | | | | — | | | | | | | — | | | | | | | — | | | |
Cash | | | | — | | | | | | | — | | | | | | | — | | | |
Receivable for Fund shares sold | | | | 2,448 | | | | | | | 4,568 | | | | | | | 3,657 | | | |
Receivable for investments sold | | | | — | | | | | | | — | | | | | | | — | | | |
Receivable from Adviser | | | | — | | | | | | | — | | | | | | | 9,485 | | | |
Dividends and interest receivable | | | | 31,878 | | | | | | | 210,906 | | | | | | | 135,934 | | | |
Prepaid expenses | | | | 22,157 | | | | | | | 23,249 | | | | | | | 17,013 | | | |
Total Assets | | | | 62,043,475 | | | | | | | 64,972,453 | | | | | | | 20,287,521 | | | |
Liabilities: | | | | | | | | | | | | | | | | | | | | | |
Payable for investments purchased | | | | — | | | | | | | — | | | | | | | — | | | |
Payable for Fund shares redeemed | | | | 28,476 | | | | | | | 232,061 | | | | | | | 373 | | | |
Payable for investment advisory fees | | | | 50,801 | | | | | | | 39,895 | | | | | | | 9,803 | | | |
Payable for distribution fees | | | | 13,106 | | | | | | | 17,645 | | | | | | | 1,844 | | | |
Payable for accounting fees | | | | 7,500 | | | | | | | 7,500 | | | | | | | — | | | |
Payable for payroll expenses | | | | — | | | | | | | — | | | | | | | — | | | |
Payable for custodian fees | | | | 9,215 | | | | | | | 8,859 | | | | | | | 3,366 | | | |
Payable for legal and audit fees | | | | 27,051 | | | | | | | 27,084 | | | | | | | 28,840 | | | |
Payable for shareholder communications expenses | | | | 10,859 | | | | | | | 10,051 | | | | | | | 5,130 | | | |
Payable for shareholder services fees | | | | 8,728 | | | | | | | 8,556 | | | | | | | 2,470 | | | |
Other accrued expenses | | | | 4,526 | | | | | | | �� 4,421 | | | | | | | 3,930 | | | |
Total Liabilities | | | | 160,262 | | | | | | | 356,072 | | | | | | | 55,756 | | | |
Net Assets | | | | $61,883,213 | | | | | | | $64,616,381 | | | | | | | $20,231,765 | | | |
Net Assets Consist of: | | | | | | | | | | | | | | | | | | | | | |
Paid-in capital | | | | $47,948,428 | | | | | | | $53,005,636 | | | | | | | $19,476,830 | | | |
Accumulated net investment income | | | | 246,663 | | | | | | | — | | | | | | | 129 | | | |
Accumulated net realized gain on investments and foreign currency transactions | | | | 3,303,157 | | | | | | | 3,054,677 | | | | | | | 139,150 | | | |
Net unrealized appreciation on investments | | | | 10,384,965 | | | | | | | 8,556,068 | | | | | | | 615,656 | | | |
Net unrealized depreciation on foreign currency translations | | | | — | | | | | | | — | | | | | | | — | | | |
Net Assets | | | | $61,883,213 | | | | | | | $64,616,381 | | | | | | | $20,231,765 | | | |
Shares of Beneficial Interest, each at $0.001 par value; unlimited number of shares authorized: | | | | | | | | | | | | | | | | | | | | | |
Class AAA: | | | | | | | | | | | | | | | | | | | | | |
Net assets | | | | $53,062,838 | | | | | | | $50,105,302 | | | | | | | $ 4,170,176 | | | |
Shares of beneficial interest outstanding | | | | 4,213,869 | | | | | | | 4,264,943 | | | | | | | 358,282 | | | |
Net Asset Value, offering, and redemption price per share | | | | $ 12.59 | | | | | | | $ 11.75 | | | | | | | $ 11.64 | | | |
Class A: | | | | | | | | | | | | | | | | | | | | | |
Net assets | | | | $ 3,719,360 | | | | | | | $ 7,039,950 | | | | | | | $ 806,742 | | | |
Shares of beneficial interest outstanding | | | | 296,410 | | | | | | | 595,982 | | | | | | | 69,386 | | | |
Net Asset Value and redemption price per share | | | | $ 12.55 | | | | | | | $ 11.81 | | | | | | | $ 11.63 | | | |
Maximum offering price per share (NAV ÷ 0.96, based on maximum sales charge of 4.00% of the offering price) | | | | $ 13.07 | | | | | | | $ 12.30 | | | | | | | $ 12.11 | | | |
Class C: | | | | | | | | | | | | | | | | | | | | | |
Net assets | | | | $ 843,405 | | | | | | | $ 5,574,874 | | | | | | | $ 1,143,911 | | | |
Shares of beneficial interest outstanding | | | | 70,335 | | | | | | | 465,784 | | | | | | | 103,511 | | | |
Net Asset Value and offering price per share(a) | | | | $ 11.99 | | | | | | | $ 11.97 | | | | | | | $ 11.05 | | | |
Class I: | | | | | | | | | | | | | | | | | | | | | |
Net assets | | | | $ 4,257,610 | | | | | | | $ 1,896,255 | | | | | | | $14,110,936 | | | |
Shares of beneficial interest outstanding | | | | 338,638 | | | | | | | 161,603 | | | | | | | 1,211,652 | | | |
Net Asset Value, offering, and redemption price per share | | | | $ 12.57 | | | | | | | $ 11.73 | | | | | | | $ 11.65 | | | |
| (a) | Redemption price varies based on the length of time held. |
See accompanying notes to financial statements.
35
TETON Westwood Funds
Statements of Operations
For the Year Ended September 30, 2016
| | | | | | | | | | | | | | | | | | | | | | | | | | | | |
| | | | | | | | |
| | | Mighty
MitesSM Fund | | | | SmallCap
Equity Fund | | | | Mid-Cap
Equity Fund | | | | Income Fund | | |
Investment Income: | | | | | | | | | | | | | | | | | | | | | | | | | | | | |
Dividends - unaffiliated (net of foreign withholding taxes
of $93,394, $516, $54, and $70, respectively) | | | | $6,224,597 | | | | | | | $276,061 | | | | | | | $40,617 | | | | | | | $ 172,161 | | | |
Dividends - affiliated | | | | 1,022,412 | | | | | | | — | | | | | | | — | | | | | | | — | | | |
Interest | | | | 297,575 | | | | | | | 1,823 | | | | | | | 138 | | | | | | | 426 | | | |
| | | | | | | | |
Total Investment Income | | | | 7,544,584 | | | | | | | 277,884 | | | | | | | 40,755 | | | | | | | 172,587 | | | |
| | | | | | | | |
Expenses: | | | | | | | | | | | | | | | | | | | | | | | | | | | | |
Investment advisory fees | | | | 10,284,203 | | | | | | | 221,771 | | | | | | | 43,212 | | | | | | | 72,574 | | | |
Distribution fees - Class AAA | | | | 635,869 | | | | | | | 17,369 | | | | | | | 4,208 | | | | | | | 12,710 | | | |
Distribution fees - Class A | | | | 723,022 | | | | | | | 14,355 | | | | | | | 2,036 | | | | | | | 4,911 | | | |
Distribution fees - Class C | | | | 1,788,326 | | | | | | | 26,631 | | | | | | | 2,596 | | | | | | | 9,261 | | | |
Accounting fees | | | | 45,000 | | | | | | | — | | | | | | | — | | | | | | | — | | | |
Custodian fees | | | | 135,344 | | | | | | | — | | | | | | | 9,650 | | | | | | | 4,729 | | | |
Interest expense | | | | 141 | | | | | | | 138 | | | | | | | 182 | | | | | | | 18 | | | |
Legal and audit fees | | | | 75,055 | | | | | | | 35,316 | | | | | | | 21,337 | | | | | | | 25,989 | | | |
Payroll expenses | | | | — | | | | | | | — | | | | | | | 2,274 | | | | | | | — | | | |
Registration expenses | | | | 80,764 | | | | | | | 46,559 | | | | | | | 21,505 | | | | | | | 44,453 | | | |
Shareholder communications expenses | | | | 269,704 | | | | | | | 12,479 | | | | | | | 11,748 | | | | | | | 12,126 | | | |
Shareholder services fees | | | | 964,230 | | | | | | | 12,822 | | | | | | | 7,553 | | | | | | | 8,907 | | | |
Trustees’ fees | | | | 75,713 | | | | | | | 1,635 | | | | | | | 325 | | | | | | | 538 | | | |
Tax expense | | | | 372 | | | | | | | — | | | | | | | — | | | | | | | — | | | |
Miscellaneous expenses | | | | 68,302 | | | | | | | 11,866 | | | | | | | 11,737 | | | | | | | 11,365 | | | |
| | | | | | | | |
Total Expenses | | | | 15,146,045 | | | | | | | 400,941 | | | | | | | 138,363 | | | | | | | 207,581 | | | |
| | | | | | | | |
Less: | | | | | | | | | | | | | | | | | | | | | | | | | | | | |
Fees waived or expenses reimbursed by Adviser
(See Note 3) | | | | — | | | | | | | (62,663 | ) | | | | | | (83,891 | ) | | | | | | (52,910 | ) | | |
Advisory fee reduction on unsupervised assets
(See Note 3) | | | | (47,902 | ) | | | | | | — | | | | | | | — | | | | | | | — | | | |
Expenses paid by broker (See Note 7) | | | | (7,807 | ) | | | | | | (2,572 | ) | | | | | | (2,173 | ) | | | | | | (766 | ) | | |
| | | | | | | | |
Total Reimbursements, Waivers, Reductions, and
Credits | | | | (55,709 | ) | | | | | | (65,235 | ) | | | | | | (86,064 | ) | | | | | | (53,676 | ) | | |
| | | | | | | | |
Net Expenses | | | | 15,090,336 | | | | | | | 335,706 | | | | | | | 52,299 | | | | | | | 153,905 | | | |
| | | | | | | | |
Net Investment Income/(Loss) | | | | (7,545,752 | ) | | | | | | (57,822 | ) | | | | | | (11,544 | ) | | | | | | 18,682 | | | |
| | | | | | | | |
Net Realized and Unrealized Gain/(Loss) on Investments
and Foreign Currency: | | | | | | | | | | | | | | | | | | | | | | | | | | | | |
Net realized gain on investments - unaffiliated | | | | 58,445,926 | | | | | | | 2,297,290 | | | | | | | 117,460 | | | | | | | 1,780,804 | | | |
Net realized loss on investments - affiliated | | | | (8,217 | ) | | | | | | — | | | | | | | — | | | | | | | — | | | |
Net realized gain on foreign currency transactions | | | | 508 | | | | | | | — | | | | | | | — | | | | | | | — | | | |
| | | | | | | | |
Net realized gain on investments and foreign
currency transactions | | | | 58,438,217 | | | | | | | 2,297,290 | | | | | | | 117,460 | | | | | | | 1,780,804 | | | |
| | | | | | | | |
Net change in unrealized appreciation/depreciation: | | | | | | | | | | | | | | | | | | | | | | | | | | | | |
on investments | | | | 90,584,012 | | | | | | | 2,050,135 | | | | | | | 240,606 | | | | | | | (1,047,191 | ) | | |
on foreign currency translations | | | | 793 | | | | | | | — | | | | | | | — | | | | | | | — | | | |
| | | | | | | | |
Net change in unrealized appreciation/depreciation on
investments and foreign currency translations | | | | 90,584,805 | | | | | | | 2,050,135 | | | | | | | 240,606 | | | | | | | (1,047,191 | ) | | |
| | | | | | | | |
Net Realized and Unrealized Gain on Investments and
Foreign Currency | | | | 149,023,022 | | | | | | | 4,347,425 | | | | | | | 358,066 | | | | | | | 733,613 | | | |
| | | | | | | | |
Net Increase in Net Assets Resulting from Operations | | | $ | 141,477,270 | | | | | | $ | 4,289,603 | | | | | | $ | 346,522 | | | | | | $ | 752,295 | | | |
See accompanying notes to financial statements.
36
TETON Westwood Funds
Statements of Operations (Continued)
For the Year Ended September 30, 2016
| | | | | | | | | | | | | | | | | | | | | | |
| | | Equity
Fund | | | | Balanced
Fund | | | | Intermediate
Bond Fund |
Investment Income: | | | | | | | | | | | | | | | | | | | | | | |
Dividends - unaffiliated (net of foreign withholding taxes of $1,015, $693, and $0, respectively) | | | $ | 1,361,109 | | | | | | | | | $ | 958,995 | | | | | | $ | 3,569 | |
Dividends - affiliated | | | | — | | | | | | | | | | — | | | | | | | — | |
Interest | | | | — | | | | | | | | | | 680,540 | | | | | | | 452,496 | |
| | | | | |
Total Investment Income | | | | 1,361,109 | | | | | | | | | | 1,639,535 | | | | | | | 456,065 | |
Expenses: | | | | | | | | | | | | | | | | | | | | | | |
Investment advisory fees | | | | 630,149 | | | | | | | | | | 511,497 | | | | | | | 118,453 | |
Distribution fees - Class AAA | | | | 134,982 | | | | | | | | | | 135,335 | | | | | | | 10,828 | |
Distribution fees - Class A | | | | 19,145 | | | | | | | | | | 34,797 | | | | | | | 2,909 | |
Distribution fees - Class C | | | | 8,309 | | | | | | | | | | 52,208 | | | | | | | 8,616 | |
Accounting fees | | | | 45,000 | | | | | | | | | | 45,000 | | | | | | | — | |
Custodian fees | | | | 13,278 | | | | | | | | | | 14,515 | | | | | | | 4,590 | |
Interest expense | | | | — | | | | | | | | | | — | | | | | | | — | |
Legal and audit fees | | | | 28,130 | | | | | | | | | | 28,269 | | | | | | | 29,184 | |
Payroll expenses | | | | — | | | | | | | | | | — | | | | | | | — | |
Registration expenses | | | | 56,228 | | | | | | | | | | 56,120 | | | | | | | 45,332 | |
Shareholder communications expenses | | | | 27,246 | | | | | | | | | | 25,141 | | | | | | | 9,100 | |
Shareholder services fees | | | | 49,920 | | | | | | | | | | 49,917 | | | | | | | 12,716 | |
Trustees’ fees | | | | 4,551 | | | | | | | | | | 4,995 | | | | | | | 1,408 | |
Tax expense | | | | — | | | | | | | | | | — | | | | | | | — | |
Miscellaneous expenses | | | | 14,062 | | | | | | | | | | 14,033 | | | | | | | 9,862 | |
| | | | | |
Total Expenses | | | | 1,031,000 | | | | | | | | | | 971,827 | | | | | | | 252,998 | |
Less: | | | | | | | | | | | | | | | | | | | | | | |
Fees waived or expenses reimbursed by Adviser (See Note 3) | | | | — | | | | | | | | | | — | | | | | | | (82,578 | ) |
Advisory fee reduction on unsupervised assets (See Note 3) | | | | — | | | | | | | | | | — | | | | | | | — | |
Custodian fee credits | | | | — | | | | | | | | | | — | | | | | | | — | |
Expenses paid by broker (See Note 7) | | | | (2,001 | ) | | | | | | | | | (2,155 | ) | | | | | | — | |
| | | | | |
Total Reimbursements, Waivers, Reductions, and Credits | | | | (2,001 | ) | | | | | | | | | (2,155 | ) | | | | | | (82,578 | ) |
Net Expenses | | | | 1,028,999 | | | | | | | | | | 969,672 | | | | | | | 170,420 | |
Net Investment Income | | | | 332,110 | | | | | | | | | | 669,863 | | | | | | | 285,645 | |
Net Realized and Unrealized Gain/(Loss) on Investments and Foreign Currency: | | | | | | | | | | | | | | | | | | | | | | |
Net realized gain on investments - unaffiliated | | | | 3,903,080 | | | | | | | | | | 3,117,645 | | | | | | | 139,304 | |
Net realized loss on investments - affiliated | | | | — | | | | | | | | | | — | | | | | | | — | |
Net realized gain on foreign currency transactions | | | | — | | | | | | | | | | — | | | | | | | — | |
| | | | | |
Net realized gain on investments and foreign currency transactions | | | | 3,903,080 | | | | | | | | | | 3,117,645 | | | | | | | 139,304 | |
Net change in unrealized appreciation/depreciation: | | | | | | | | | | | | | | | | | | | | | | |
on investments | | | | 2,580,783 | | | | | | | | | | 1,746,780 | | | | | | | 371,799 | |
on foreign currency translations | | | | — | | | | | | | | | | — | | | | | | | — | |
| | | | | |
Net change in unrealized appreciation/depreciation on investments | | | | 2,580,783 | | | | | | | | | | 1,746,780 | | | | | | | 371,799 | |
| | | | | |
Net Realized and Unrealized Gain on Investments and Foreign Currency | | | | 6,483,863 | | | | | | | | | | 4,864,425 | | | | | | | 511,103 | |
| | | | | |
Net Increase in Net Assets Resulting from Operations | | | $ | 6,815,973 | | | | | | | | | $ | 5,534,288 | | | | | | $ | 796,748 | |
See accompanying notes to financial statements.
37
TETON Westwood Funds
Statements of Changes in Net Assets
For the Year Ended September 30,
| | | | | | | | | | | | | | | | | | | | | | | | | | | | |
| | | Mighty MitesSM Fund | | | | | SmallCap Equity Fund | | | | | Mid-Cap Equity Fund | |
| | | 2016 | | | 2015 | | | | | 2016 | | | 2015 | | | | | 2016 | | | 2015 | |
Operations: | | | | | | | | | | | | | | | | | | | | | | | | | | | | |
Net investment income/(loss) | | $ | (7,545,752 | ) | | $ | (3,967,243 | ) | | | | $ | (57,822 | ) | | $ | (165,861 | ) | | | | $ | (11,544 | ) | | $ | (25,462 | ) |
Net realized gain on investments and foreign currency transactions | | | 58,438,217 | | | | 19,998,521 | | | | | | 2,297,290 | | | | 4,538,547 | | | | | | 117,460 | | | | 131,057 | |
Net change in unrealized appreciation/depreciation on investments and foreign currency translations | | | 90,584,805 | | | | (39,458,929 | ) | | | | | 2,050,135 | | | | (3,765,310 | ) | | | | | 240,606 | | | | (106,370 | ) |
Net Increase/(Decrease) in Net Assets Resulting from Operations | | | 141,477,270 | | | | (23,427,651 | ) | | | | | 4,289,603 | | | | 607,376 | | | | | | 346,522 | | | | (775 | ) |
Distributions to Shareholders: | | | | | | | | | | | | | | | | | | | | | | | | | | | | |
Net investment income | | | | | | | | | | | | | | | | | | | | | | | | | | | | |
Class AAA | | | — | | | | — | | | | | | — | | | | — | | | | | | — | | | | — | |
Class A | | | — | | | | — | | | | | | — | | | | — | | | | | | — | | | | — | |
Class C | | | — | | | | — | | | | | | — | | | | — | | | | | | — | | | | — | |
Class I | | | — | | | | — | | | | | | — | | | | — | | | | | | — | | | | — | |
| | | — | | | | — | | | | | | — | | | | — | | | | | | — | | | | — | |
Net realized gain | | | | | | | | | | | | | | | | | | | | | | | | | | | | |
Class AAA | | | (6,095,461 | ) | | | (6,457,670 | ) | | | | | (1,157,380 | ) | | | (1,149,839 | ) | | | | | (79,782 | ) | | | (19,771 | ) |
Class A | | | (3,660,523 | ) | | | (3,312,045 | ) | | | | | (490,551 | ) | | | (326,790 | ) | | | | | (23,063 | ) | | | (7,878 | ) |
Class C | | | (4,948,570 | ) | | | (4,393,410 | ) | | | | | (546,624 | ) | | | (348,881 | ) | | | | | (12,061 | ) | | | (2,608 | ) |
Class I | | | (10,716,802 | ) | | | (9,805,829 | ) | | | | | (1,549,159 | ) | | | (1,330,967 | ) | | | | | (86,372 | ) | | | (25,377 | ) |
| | | | (25,421,356 | ) | | | (23,968,954 | ) | | | | | (3,743,714 | ) | | | (3,156,477 | ) | | | | | (201,278 | ) | | | (55,634 | ) |
Total Distributions to Shareholders | | | (25,421,356 | ) | | | (23,968,954 | ) | | | | | (3,743,714 | ) | | | (3,156,477 | ) | | | | | (201,278 | ) | | | (55,634 | ) |
Shares of Beneficial Interest Transactions: | | | | | | | | | | | | | | | | | | | | | | | | | | | | |
Proceeds from shares issued | | | | | | | | | | | | | | | | | | | | | | | | | | | | |
Class AAA | | | 25,166,399 | | | | 44,741,419 | | | | | | 4,274,883 | | | | 822,696 | | | | | | 355,459 | | | | 613,282 | |
Class A | | | 13,798,430 | | | | 28,511,035 | | | | | | 236,596 | | | | 279,335 | | | | | | 19,774 | | | | 76,374 | |
Class C | | | 17,038,503 | | | | 78,774,234 | | | | | | 610,708 | | | | 267,558 | | | | | | 24,420 | | | | 44,950 | |
Class I | | | 98,912,516 | | | | 174,407,068 | | | | | | 963,829 | | | | 7,440,944 | | | | | | 81,792 | | | | 229,597 | |
| | | 154,915,848 | | | | 326,433,756 | | | | | | 6,086,016 | | | | 8,810,533 | | | | | | 481,445 | | | | 964,203 | |
Proceeds from reinvestment of distributions | | | | | | | | | | | | | | | | | | | | | | | | | | | | |
Class AAA | | | 5,979,037 | | | | 6,315,803 | | | | | | 1,099,502 | | | | 1,119,099 | | | | | | 69,340 | | | | 19,771 | |
Class A | | | 3,105,905 | | | | 2,740,083 | | | | | | 448,413 | | | | 302,367 | | | | | | 19,621 | | | | 6,868 | |
Class C | | | 3,888,543 | | | | 3,338,873 | | | | | | 447,962 | | | | 260,964 | | | | | | 11,737 | | | | 2,591 | |
Class I | | | 7,046,245 | | | | 6,648,714 | | | | | | 1,490,195 | | | | 500,494 | | | | | | 86,372 | | | | 25,376 | |
| | | 20,019,730 | | | | 19,043,473 | | | | | | 3,486,072 | | | | 2,182,924 | | | | | | 187,070 | | | | 54,606 | |
Cost of shares redeemed | | | | | | | | | | | | | | | | | | | | | | | | | | | | |
Class AAA | | | (68,915,531 | ) | | | (140,445,413 | ) | | | | | (2,487,786 | ) | | | (8,966,268 | ) | | | | | (701,109 | ) | | | (265,328 | ) |
Class A | | | (44,872,412 | ) | | | (45,281,413 | ) | | | | | (1,121,302 | ) | | | (1,211,465 | ) | | | | | (304,721 | ) | | | (175,204 | ) |
Class C | | | (51,145,275 | ) | | | (93,786,878 | ) | | | | | (1,740,637 | ) | | | (1,226,747 | ) | | | | | (124,531 | ) | | | (6,000 | ) |
Class I | | | (171,152,381 | ) | | | (191,745,643 | ) | | | | | (1,731,285 | ) | | | (14,535,635 | ) | | | | | (560,784 | ) | | | (510,972 | ) |
| | | (336,085,599 | ) | | | (471,259,347 | ) | | | | | (7,081,010 | ) | | | (25,940,115 | ) | | | | | (1,691,145 | ) | | | (957,504 | ) |
Net Increase/(Decrease) in Net Assets from Shares of Beneficial Interest Transactions | | | (161,150,021 | ) | | | (125,782,118 | ) | | | | | 2,491,078 | | | | (14,946,658 | ) | | | | | (1,022,630 | ) | | | 61,305 | |
Redemption Fees | | | 2,669 | | | | 1,282 | | | | | | 1,987 | | | | — | | | | | | 58 | | | | — | |
Net Increase/(Decrease) in Net Assets | | | (45,091,438 | ) | | | (173,177,441 | ) | | | | | 3,038,954 | | | | (17,495,759 | ) | | | | | (877,328 | ) | | | 4,896 | |
Net Assets: | | | | | | | | | | | | | | | | | | | | | | | | | | | | |
Beginning of year | | | 1,095,206,639 | | | | 1,268,384,080 | | | | | | 23,838,049 | | | | 41,333,808 | | | | | | 4,949,675 | | | | 4,944,779 | |
End of year | | $ | 1,050,115,201 | | | $ | 1,095,206,639 | | | | | $ | 26,877,003 | | | $ | 23,838,049 | | | | | $ | 4,072,347 | | | $ | 4,949,675 | |
Undistributed net investment income | | | — | | | | — | | | | | | — | | | | — | | | | | | — | | | | — | |
| | | | | | | | | | | | | | | | | | | | | | | | | | | | |
See accompanying notes to financial statements.
38
TETON Westwood Funds
Statements of Changes in Net Assets (Continued)
For the Year Ended September 30,
| | | | | | | | | | | | | | | | | | | | | | | | | | | | | | | | |
| | | Income Fund | | | Equity Fund | | | Balanced Fund | | | Intermediate Bond Fund | |
| | | | | | | | |
| | | 2016 | | | 2015 | | | 2016 | | | 2015 | | | 2016 | | | 2015 | | | 2016 | | | 2015 | |
| | | | | | | | |
| | $ | 18,682 | | | $ | 17,152 | | | $ | 332,110 | | | $ | 246,533 | | | $ | 669,863 | | | $ | 705,828 | | | $ | 285,645 | | | $ | 350,088 | |
| | | | | | | | |
| | | 1,780,804 | | | | 128,405 | | | | 3,903,080 | | | | 4,383,977 | | | | 3,117,645 | | | | 5,129,698 | | | | 139,304 | | | | 369,209 | |
| | | | | | | | |
| | | (1,047,191 | ) | | | (1,049,531 | ) | | | 2,580,783 | | | | (4,853,912 | ) | | | 1,746,780 | | | | (5,440,467 | ) | | | 371,799 | | | | (406,720 | ) |
| | | | | | | | |
| | | 752,295 | | | | (903,974 | ) | | | 6,815,973 | | | | (223,402 | ) | | | 5,534,288 | | | | 395,059 | | | | 796,748 | | | | 312,577 | |
| | | | | | | | |
| | | (15,808 | ) | | | (14,149 | ) | | | (211,307 | ) | | | (242,616 | ) | | | (576,148 | ) | | | (610,058 | ) | | | (57,195 | ) | | | (80,505 | ) |
| | | (1,643 | ) | | | (1,767 | ) | | | (7,679 | ) | | | (5,642 | ) | | | (56,715 | ) | | | (53,452 | ) | | | (10,078 | ) | | | (14,388 | ) |
| | | (517 | ) | | | (55 | ) | | | — | | | | — | | | | (17,080 | ) | | | (14,708 | ) | | | (4,384 | ) | | | (3,786 | ) |
| | | (1,339 | ) | | | (1,103 | ) | | | (29,046 | ) | | | (23,293 | ) | | | (24,897 | ) | | | (25,947 | ) | | | (214,019 | ) | | | (251,427 | ) |
| | | (19,307 | ) | | | (17,074 | ) | | | (248,032 | ) | | | (271,551 | ) | | | (674,840 | ) | | | (704,165 | ) | | | (285,676 | ) | | | (350,106 | ) |
| | | | | | | | |
| | | — | | | | — | | | | (4,079,809 | ) | | | (5,800,931 | ) | | | (3,761,458 | ) | | | (5,214,820 | ) | | | (91,989 | ) | | | — | |
| | | — | | | | — | | | | (283,279 | ) | | | (319,971 | ) | | | (458,819 | ) | | | (562,218 | ) | | | (16,150 | ) | | | — | |
| | | — | | | | — | | | | (59,970 | ) | | | (96,665 | ) | | | (353,385 | ) | | | (465,481 | ) | | | (8,637 | ) | | | — | |
| | | — | | | | — | | | | (331,753 | ) | | | (334,883 | ) | | | (127,425 | ) | | | (187,008 | ) | | | (249,249 | ) | | | — | |
| | | — | | | | — | | | | (4,754,811 | ) | | | (6,552,450 | ) | | | (4,701,087 | ) | | | (6,429,527 | ) | | | (366,025 | ) | | | — | |
| | | (19,307 | ) | | | (17,074 | ) | | | (5,002,843 | ) | | | (6,824,001 | ) | | | (5,375,927 | ) | | | (7,133,692 | ) | | | (651,701 | ) | | | (350,106 | ) |
| | | | | | | | |
| | | 433,186 | | | | 1,341,965 | | | | 1,098,418 | | | | 1,201,561 | | | | 5,554,854 | | | | 4,936,637 | | | | 599,586 | | | | 718,119 | |
| | | 351,906 | | | | 230,473 | | | | 1,120,647 | | | | 328,937 | | | | 1,469,112 | | | | 1,106,030 | | | | 230,824 | | | | 300,882 | |
| | | 39,531 | | | | 87,176 | | | | 166,014 | | | | 374,234 | | | | 1,287,764 | | | | 847,159 | | | | 3,247,789 | | | | 196,215 | |
| | | 165,930 | | | | 31,424 | | | | 976,188 | | | | 1,973,353 | | | | 267,769 | | | | 210,888 | | | | 2,430,851 | | | | 3,343,496 | |
| | | 990,553 | | | | 1,691,038 | | | | 3,361,267 | | | | 3,878,085 | | | | 8,579,499 | | | | 7,100,714 | | | | 6,509,050 | | | | 4,558,712 | |
| | | | | | | | |
| | | 15,257 | | | | 13,406 | | | | 4,146,689 | | | | 5,774,995 | | | | 4,208,821 | | | | 5,643,649 | | | | 143,907 | | | | 77,681 | |
| | | 1,608 | | | | 1,678 | | | | 287,016 | | | | 320,935 | | | | 469,977 | | | | 584,854 | | | | 24,840 | | | | 13,206 | |
| | | 517 | | | | 54 | | | | 48,297 | | | | 82,401 | | | | 335,806 | | | | 426,266 | | | | 12,682 | | | | 3,119 | |
| | | 1,333 | | | | 1,098 | | | | 278,123 | | | | 297,565 | | | | 145,323 | | | | 198,372 | | | | 461,328 | | | | 245,350 | |
| | | 18,715 | | | | 16,236 | | | | 4,760,125 | | | | 6,475,896 | | | | 5,159,927 | | | | 6,853,141 | | | | 642,757 | | | | 339,356 | |
| | | | | | | | |
| | | (2,245,733 | ) | | | (1,425,069 | ) | | | (6,983,605 | ) | | | (8,148,966 | ) | | | (13,736,422 | ) | | | (20,394,827 | ) | | | (1,629,881 | ) | | | (913,164 | ) |
| | | (361,000 | ) | | | (37,475 | ) | | | (889,260 | ) | | | (509,771 | ) | | | (1,509,758 | ) | | | (922,370 | ) | | | (263,915 | ) | | | (427,878 | ) |
| | | (191,875 | ) | | | (71,253 | ) | | | (75,800 | ) | | | (349,312 | ) | | | (1,341,488 | ) | | | (846,677 | ) | | | (2,526,488 | ) | | | (303,526 | ) |
| | | (45,940 | ) | | | (40,100 | ) | | | (1,489,488 | ) | | | (1,050,528 | ) | | | (375,998 | ) | | | (787,454 | ) | | | (1,918,411 | ) | | | (5,252,254 | ) |
| | | (2,844,548 | ) | | | (1,573,897 | ) | | | (9,438,153 | ) | | | (10,058,577 | ) | | | (16,963,666 | ) | | | (22,951,328 | ) | | | (6,338,695 | ) | | | (6,896,822 | ) |
| | | | | | | | |
| | | (1,835,280 | ) | | | 133,377 | | | | (1,316,761 | ) | | | 295,404 | | | | (3,224,240 | ) | | | (8,997,473 | ) | | | 813,112 | | | | (1,998,754 | ) |
| | | 10 | | | | — | | | | — | | | | — | | | | 2 | | | | 2 | | | | — | | | | — | |
| | | (1,102,282 | ) | | | (787,671 | ) | | | 496,369 | | | | (6,751,999 | ) | | | (3,065,877 | ) | | | (15,736,104 | ) | | | 958,159 | | | | (2,036,283 | ) |
| | | | | | | | |
| | | 7,800,139 | | | | 8,587,810 | | | | 61,386,844 | | | | 68,138,843 | | | | 67,682,258 | | | | 83,418,362 | | | | 19,273,606 | | | | 21,309,889 | |
| | $ | 6,697,857 | | | $ | 7,800,139 | | | $ | 61,883,213 | | | $ | 61,386,844 | | | $ | 64,616,381 | | | $ | 67,682,258 | | | $ | 20,231,765 | | | $ | 19,273,606 | |
| | $ | 1,996 | | | $ | 7,977 | | | $ | 246,663 | | | $ | 164,817 | | | | — | | | | — | | | $ | 129 | | | $ | 129 | |
| | | | | | | | | | | | | | | | | | | | | | | | | | | | | | | | |
See accompanying notes to financial statements.
39
TETON Westwood Funds
Financial Highlights
Selected data for a share of beneficial interest outstanding throughout each year:
| | | | | | | | | | | | | | | | | | | | | | | | | | | | | | | | | | | | | | | | | | | | | | | | | | | | | | | | | | | | | | | | | | | | | | | | | | | |
| | | | | Income (Loss) from Investment Operations | | Distributions to Shareholders | | | | | | | | Ratios to Average Net Assets/Supplemental Data |
Year Ended September 30 | | Net Asset
Value,
Beginning
of Year | | Net Investment
Income
(Loss)(a)(b) | | Net
Realized and
Unrealized
Gain (Loss) on
Investments | | Total from
Investment
Operations | | Net
Investment
Income | | Net
Realized
Gain on
Investments | | Total
Distributions | | Redemption
Fees(a)(c) | | Net Asset
Value,
End of
Year | | Total
Return† | | Net Assets,
End of
Year
(in 000’s) | | Net
Investment
Income
(Loss) | | Operating
Expenses
Net of
Waivers/
Reimbursements/
Reductions | | Operating
Expenses
Before
Waivers/
Reimbursements/
Reductions(d) | | Portfolio
Turnover
Rate |
| | | | | | | | | | | | | |
Mighty MitesSM Fund | | | | | | | | | | | | | | | | | | | | | | | | | | | | | | | | | | | | | | | | | | | | | | | | | | | | | | | | | | | | | | | | | | |
Class AAA | | | | | | | | | | | | | | | | | | | | | | | | | | | | | | | | | | | | | | | | | | | | | | | | | | | | | | | | | | | | | | | | | | | | | | | |
2016 | | | $ | 22.02 | | | | $ | (0.15 | ) | | | | $ 3.41 | | | | | $ 3.26 | | | | | — | | | | | $(0.52) | | | | | $(0.52) | | | | | $0.00 | | | | $ | 24.76 | | | | | 15.0 | % | | | $ | 256,488 | | | | | (0.67 | )% | | | | 1.41 | %(e) | | | | 1.41 | % | | | | 6 | % |
2015 | | | | 23.01 | | | | | (0.06 | ) | | | | (0.50 | ) | | | | (0.56 | ) | | | | — | | | | | (0.43) | | | | | (0.43) | | | | | 0.00 | | | | | 22.02 | | | | | (2.6 | ) | | | | 265,145 | | | | | (0.27 | ) | | | | 1.40 | (e) | | | | 1.41 | | | | | 13 | |
2014 | | | | 23.81 | | | | | (0.22 | ) | | | | 0.80 | | | | | 0.58 | | | | | — | | | | | (1.38) | | | | | (1.38) | | | | | 0.00 | | | | | 23.01 | | | | | 2.2 | | | | | 365,022 | | | | | (0.90 | ) | | | | 1.41 | | | | | 1.42 | | | | | 14 | |
2013 | | | | 17.94 | | | | | 0.04 | | | | | 6.29 | | | | | 6.33 | | | | | $(0.08) | | | | | (0.38) | | | | | (0.46) | | | | | 0.00 | | | | | 23.81 | | | | | 36.2 | | | | | 476,112 | | | | | 0.19 | | | | | 1.41 | | | | | 1.43 | | | | | 15 | |
2012 | | | | 14.85 | | | | | (0.10 | ) | | | | 3.54 | | | | | 3.44 | | | | | — | | | | | (0.35) | | | | | (0.35) | | | | | 0.00 | | | | | 17.94 | | | | | 23.6 | | | | | 277,666 | | | | | (0.62 | ) | | | | 1.44 | | | | | 1.46 | | | | | 12 | |
Class A | | | | | | | | | | | | | | | | | | | | | | | | | | | | | | | | | | | | | | | | | | | | | | | | | | | | | | | | | | | | | | | | | | | | | | | |
2016 | | | $ | 21.43 | | | | $ | (0.20 | ) | | | | $ 3.30 | | | | | $ 3.10 | | | | | — | | | | | $(0.52) | | | | | $(0.52) | | | | | $0.00 | | | | $ | 24.01 | | | | | 14.6 | % | | | $ | 141,893 | | | | | (0.92 | )% | | | | 1.66 | %(e) | | | | 1.66 | % | | | | 6 | % |
2015 | | | | 22.45 | | | | | (0.12 | ) | | | | (0.47 | ) | | | | (0.59 | ) | | | | — | | | | | (0.43) | | | | | (0.43) | | | | | 0.00 | | | | | 21.43 | | | | | (2.8 | ) | | | | 154,000 | | | | | (0.51 | ) | | | | 1.65 | (e) | | | | 1.66 | | | | | 13 | |
2014 | | | | 23.32 | | | | | (0.27 | ) | | | | 0.78 | | | | | 0.51 | | | | | — | | | | | (1.38) | | | | | (1.38) | | | | | 0.00 | | | | | 22.45 | | | | | 2.0 | | | | | 175,108 | | | | | (1.16 | ) | | | | 1.66 | | | | | 1.67 | | | | | 14 | |
2013 | | | | 17.59 | | | | | (0.02 | ) | | | | 6.17 | | | | | 6.15 | | | | | $(0.04) | | | | | (0.38) | | | | | (0.42) | | | | | 0.00 | | | | | 23.32 | | | | | 35.8 | | | | | 139,464 | | | | | (0.08 | ) | | | | 1.66 | | | | | 1.68 | | | | | 15 | |
2012 | | | | 14.61 | | | | | (0.14 | ) | | | | 3.47 | | | | | 3.33 | | | | | — | | | | | (0.35) | | | | | (0.35) | | | | | 0.00 | | | | | 17.59 | | | | | 23.2 | | | | | 77,803 | | | | | (0.87 | ) | | | | 1.69 | | | | | 1.71 | | | | | 12 | |
Class C | | | | | | | | | | | | | | | | | | | | | | | | | | | | | | | | | | | | | | | | | | | | | | | | | | | | | | | | | | | | | | | | | | | | | | | |
2016 | | | $ | 19.38 | | | | $ | (0.28 | ) | | | | $ 2.97 | | | | | $ 2.69 | | | | | — | | | | | $(0.52) | | | | | $(0.52) | | | | | $0.00 | | | | $ | 21.55 | | | | | 14.1 | % | | | $ | 175,241 | | | | | (1.41 | )% | | | | 2.16 | %(e) | | | | 2.16 | % | | | | 6 | % |
2015 | | | | 20.44 | | | | | (0.21 | ) | | | | (0.42 | ) | | | | (0.63 | ) | | | | — | | | | | (0.43) | | | | | (0.43) | | | | | 0.00 | | | | | 19.38 | | | | | (3.2 | ) | | | | 187,216 | | | | | (1.01 | ) | | | | 2.15 | (e) | | | | 2.16 | | | | | 13 | |
2014 | | | | 21.46 | | | | | (0.36 | ) | | | | 0.72 | | | | | 0.36 | | | | | — | | | | | (1.38) | | | | | (1.38) | | | | | 0.00 | | | | | 20.44 | | | | | 1.4 | | | | | 208,795 | | | | | (1.66 | ) | | | | 2.16 | | | | | 2.17 | | | | | 14 | |
2013 | | | | 16.25 | | | | | (0.10 | ) | | | | 5.69 | | | | | 5.59 | | | | | — | | | | | (0.38) | | | | | (0.38) | | | | | 0.00 | | | | | 21.46 | | | | | 35.3 | | | | | 160,852 | | | | | (0.57 | ) | | | | 2.16 | | | | | 2.18 | | | | | 15 | |
2012 | | | | 13.59 | | | | | (0.21 | ) | | | | 3.22 | | | | | 3.01 | | | | | — | | | | | (0.35) | | | | | (0.35) | | | | | 0.00 | | | | | 16.25 | | | | | 22.6 | | | | | 92,012 | | | | | (1.37 | ) | | | | 2.19 | | | | | 2.21 | | | | | 12 | |
Class I | | | | | | | | | | | | | | | | | | | | | | | | | | | | | | | | | | | | | | | | | | | | | | | | | | | | | | | | | | | | | | | | | | | | | | | |
2016 | | | $ | 22.34 | | | | $ | (0.10 | ) | | | | $ 3.46 | | | | | $ 3.36 | | | | | — | | | | | $(0.52) | | | | | $(0.52) | | | | | $0.00 | | | | $ | 25.18 | | | | | 15.2 | % | | | $ | 476,493 | | | | | (0.44 | )% | | | | 1.16 | %(e) | | | | 1.16 | % | | | | 6 | % |
2015 | | | | 23.27 | | | | | — | | | | | (0.50 | ) | | | | (0.50 | ) | | | | — | | | | | (0.43) | | | | | (0.43) | | | | | 0.00 | | | | | 22.34 | | | | | (2.3 | ) | | | | 488,846 | | | | | (0.01 | ) | | | | 1.15 | (e) | | | | 1.16 | | | | | 13 | |
2014 | | | | 24.02 | | | | | (0.16 | ) | | | | 0.79 | | | | | 0.63 | | | | | — | | | | | (1.38) | | | | | (1.38) | | | | | 0.00 | | | | | 23.27 | | | | | 2.4 | | | | | 519,459 | | | | | (0.67 | ) | | | | 1.16 | | | | | 1.17 | | | | | 14 | |
2013 | | | | 18.13 | | | | | 0.08 | | | | | 6.35 | | | | | 6.43 | | | | | $(0.16) | | | | | (0.38) | | | | | (0.54) | | | | | 0.00 | | | | | 24.02 | | | | | 36.6 | | | | | 277,588 | | | | | 0.40 | | | | | 1.16 | | | | | 1.18 | | | | | 15 | |
2012 | | | | 14.98 | | | | | (0.06 | ) | | | | 3.56 | | | | | 3.50 | | | | | — | | | | | (0.35) | | | | | (0.35) | | | | | 0.00 | | | | | 18.13 | | | | | 23.8 | | | | | 131,003 | | | | | (0.38 | ) | | | | 1.19 | | | | | 1.21 | | | | | 12 | |
| † | Total return represents aggregate total return of a hypothetical $1,000 investment at the beginning of the year and sold at the end of the year including reinvestment of distributions and does not reflect the applicable sales charges. |
| (a) | Per share data is calculated using the average shares outstanding method. |
| (b) | Due to capital share activity, net investment income (loss), per share and the ratio to average net assets are not necessarily correlated among the different classes of shares. |
| (c) | Amount represents less than $0.005 per share. |
| (d) | Before advisory fee reduction on unsupervised assets totaling 0.01%, 0.01%, 0.02%, and 0.02% of net assets for the years ended September 30, 2015, 2014, 2013, and 2012, respectively. For the year ended September 30, 2016, there was no impact on the expense ratios. |
| (e) | The Fund received credits from a designated broker who agreed to pay certain Fund operating expenses. For the years ended September 30, 2016 and 2015, there was no impact on the expense ratios. |
See accompanying notes to financial statements.
40
TETON Westwood Funds
Financial Highlights
Selected data for a share of beneficial interest outstanding throughout each year:
| | | | | | | | | | | | | | | | | | | | | | | | | | | | | | | | | | | | | | | | | | | | | | | | | | | | | | | | | | | | | | | | | | | | | | | | | | | |
| | | | | Income (Loss) from Investment Operations | | Distributions to Shareholders | | | | | | | | Ratios to Average Net Assets/Supplemental Data |
Year Ended
September 30 | | Net Asset
Value,
Beginning
of Year | | Net
Investment
Income
(Loss)(a) | | Net
Realized and
Unrealized
Gain (Loss) on
Investments | | Total From
Investment
Operations | | Net
Investment
Income | | Net
Realized
Gain on
Investments | | Total
Distributions | | Redemption
Fees(b) | | Net Asset
Value,
End of
Year | | Total
Return† | | Net Assets,
End of
Year
(in 000’s) | | Net
Investment
Income
(Loss) | | Operating
Expenses
Net of
Waivers/
Reimbursements | | Operating
Expenses
Before Waivers/
Reimbursements | | Portfolio
Turnover
Rate |
SmallCap Equity Fund | | | | | | | | | | | | | | | | | | | | | | | | | | | | | | | | | | | | | | | | | | | | | | | | | | | | | | | | |
Class AAA | | | | | | | | | | | | | | | | | | | | | | | | | | | | | | | | | | | | |
2016 | | | $ | 18.54 | | | | $ | (0.04 | ) | | | $ | 3.57 | | | | $ | 3.53 | | | | | — | | | | $ | (3.04 | ) | | | $ | (3.04 | ) | | | $ | 0.00 | | | | $ | 19.03 | | | | | 21.1 | % | | | $ | 10,855 | | | | | (0.25 | )% | | | | 1.50 | %(c) | | | | 1.79 | % | | | | 18 | % |
2015 | | | | 20.52 | | | | | (0.09 | ) | | | | (0.29 | ) | | | | (0.38 | ) | | | | — | | | | | (1.60 | ) | | | | (1.60 | ) | | | | — | | | | | 18.54 | | | | | (2.4 | ) | | | | 7,721 | | | | | (0.47 | ) | | | | 1.50 | (c) | | | | 1.66 | | | | | 23 | |
2014 | | | | 19.83 | | | | | (0.07 | ) | | | | 0.76 | | | | | 0.69 | | | | | — | | | | | — | | | | | — | | | | | 0.00 | | | | | 20.52 | | | | | 3.5 | | | | | 15,649 | | | | | (0.35 | ) | | | | 1.50 | | | | | 1.57 | | | | | 13 | |
2013 | | | | 15.32 | | | | | (0.01 | ) | | | | 4.52 | | | | | 4.51 | | | | | — | | | | | — | | | | | — | | | | | 0.00 | | | | | 19.83 | | | | | 29.4 | | | | | 19,576 | | | | | (0.05 | ) | | | | 1.50 | | | | | 1.63 | | | | | 12 | |
2012 | | | | 12.85 | | | | | (0.03 | ) | | | | 2.87 | | | | | 2.84 | | | | | — | | | | | (0.37 | ) | | | | (0.37 | ) | | | | 0.00 | | | | | 15.32 | | | | | 22.5 | | | | | 16,170 | | | | | (0.21 | ) | | | | 1.50 | | | | | 1.65 | | | | | 39 | |
Class A | | | | | | | | | | | | | | | | | | | | | | | | | | | | | | | | | | | | |
2016 | | | $ | 18.02 | | | | $ | (0.08 | ) | | | $ | 3.47 | | | | $ | 3.39 | | | | | — | | | | $ | (3.04 | ) | | | $ | (3.04 | ) | | | $ | 0.00 | | | | $ | 18.37 | | | | | 20.9 | % | | | $ | 2,871 | | | | | (0.49 | )% | | | | 1.75 | %(c) | | | | 2.04 | % | | | | 18 | % |
2015 | | | | 20.05 | | | | | (0.14 | ) | | | | (0.29 | ) | | | | (0.43 | ) | | | | — | | | | | (1.60 | ) | | | | (1.60 | ) | | | | — | | | | | 18.02 | | | | | (2.7 | ) | | | | 3,258 | | | | | (0.71 | ) | | | | 1.75 | (c) | | | | 1.91 | | | | | 23 | |
2014 | | | | 19.41 | | | | | (0.12 | ) | | | | 0.76 | | | | | 0.64 | | | | | — | | | | | — | | | | | — | | | | | 0.00 | | | | | 20.05 | | | | | 3.3 | | | | | 4,269 | | | | | (0.60 | ) | | | | 1.75 | | | | | 1.82 | | | | | 13 | |
2013 | | | | 15.03 | | | | | (0.04 | ) | | | | 4.42 | | | | | 4.38 | | | | | — | | | | | — | | | | | — | | | | | 0.00 | | | | | 19.41 | | | | | 29.1 | | | | | 4,668 | | | | | (0.22 | ) | | | | 1.75 | | | | | 1.88 | | | | | 12 | |
2012 | | | | 12.65 | | | | | (0.06 | ) | | | | 2.81 | | | | | 2.75 | | | | | — | | | | | (0.37 | ) | | | | (0.37 | ) | | | | 0.00 | | | | | 15.03 | | | | | 22.1 | | | | | 5,390 | | | | | (0.42 | ) | | | | 1.75 | | | | | 1.90 | | | | | 39 | |
Class C | | | | | | | | | | | | | | | | | | | | | | | | | | | | | | | | | | | | |
2016 | | | $ | 16.49 | | | | $ | (0.15 | ) | | | $ | 3.13 | | | | $ | 2.98 | | | | | — | | | | $ | (3.04 | ) | | | $ | (3.04 | ) | | | $ | 0.00 | | | | $ | 16.43 | | | | | 20.2 | % | | | $ | 2,268 | | | | | (0.99 | )% | | | | 2.25 | %(c) | | | | 2.54 | % | | | | 18 | % |
2015 | | | | 18.56 | | | | | (0.22 | ) | | | | (0.25 | ) | | | | (0.47 | ) | | | | — | | | | | (1.60 | ) | | | | (1.60 | ) | | | | — | | | | | 16.49 | | | | | (3.2 | ) | | | | 3,081 | | | | | (1.21 | ) | | | | 2.25 | (c) | | | | 2.41 | | | | | 23 | |
2014 | | | | 18.06 | | | | | (0.21 | ) | | | | 0.71 | | | | | 0.50 | | | | | — | | | | | — | | | | | — | | | | | 0.00 | | | | | 18.56 | | | | | 2.8 | | | | | 4,186 | | | | | (1.10 | ) | | | | 2.25 | | | | | 2.32 | | | | | 13 | |
2013 | | | | 14.06 | | | | | (0.11 | ) | | | | 4.11 | | | | | 4.00 | | | | | — | | | | | — | | | | | — | | | | | 0.00 | | | | | 18.06 | | | | | 28.4 | | | | | 4,460 | | | | | (0.72 | ) | | | | 2.25 | | | | | 2.38 | | | | | 12 | |
2012 | | | | 11.91 | | | | | (0.13 | ) | | | | 2.65 | | | | | 2.52 | | | | | — | | | | | (0.37 | ) | | | | (0.37 | ) | | | | 0.00 | | | | | 14.06 | | | | | 21.5 | | | | | 5,261 | | | | | (0.92 | ) | | | | 2.25 | | | | | 2.40 | | | | | 39 | |
Class I | | | | | | | | | | | | | | | | | | | | | | | | | | | | | | | | | | | | |
2016 | | | $ | 18.90 | | | | $ | — | | | | $ | 3.67 | | | | $ | 3.67 | | | | | — | | | | $ | (3.04 | ) | | | $ | (3.04 | ) | | | $ | 0.00 | | | | $ | 19.53 | | | | | 21.5 | % | | | $ | 10,883 | | | | | 0.00 | % | | | | 1.25 | %(c) | | | | 1.54 | % | | | | 18 | % |
2015 | | | | 20.85 | | | | | (0.04 | ) | | | | (0.31 | ) | | | | (0.35 | ) | | | | — | | | | | (1.60 | ) | | | | (1.60 | ) | | | | — | | | | | 18.90 | | | | | (2.2 | ) | | | | 9,778 | | | | | (0.21 | ) | | | | 1.25 | (c) | | | | 1.41 | | | | | 23 | |
2014 | | | | 20.09 | | | | | (0.02 | ) | | | | 0.78 | | | | | 0.76 | | | | | — | | | | | — | | | | | — | | | | | 0.00 | | | | | 20.85 | | | | | 3.8 | | | | | 17,230 | | | | | (0.09 | ) | | | | 1.25 | | | | | 1.32 | | | | | 13 | |
2013 | | | | 15.50 | | | | | 0.04 | | | | | 4.57 | | | | | 4.61 | | | | $ | (0.02 | ) | | | | — | | | | | (0.02 | ) | | | | 0.00 | | | | | 20.09 | | | | | 29.8 | | | | | 13,688 | | | | | 0.22 | | | | | 1.25 | | | | | 1.38 | | | | | 12 | |
2012 | | | | 12.96 | | | | | 0.04 | | | | | 2.87 | | | | | 2.91 | | | | | — | | | | | (0.37 | ) | | | | (0.37 | ) | | | | 0.00 | | | | | 15.50 | | | | | 22.8 | | | | | 12,752 | | | | | 0.23 | | | | | 1.25 | | | | | 1.40 | | | | | 39 | |
| † | Total return represents aggregate total return of a hypothetical $1,000 investment at the beginning of the year and sold at the end of the year including reinvestment of distributions and does not reflect the applicable sales charges. |
| (a) | Per share data is calculated using the average shares outstanding method. |
| (b) | Amount represents less than $0.005 per share. |
| (c) | The Fund received credits from a designated broker who agreed to pay certain Fund operating expenses. Had such payments not been made, the expense ratios for the year ended September 30, 2016 would have been 1.51%, 1.76%, 2.26%, 1.26% for Class AAA, Class A, Class C, and Class I, respectively. For the year ended September 30, 2015, there was no impact on the expense ratios. |
See accompanying notes to financial statements.
41
TETON Westwood Funds
Financial Highlights
Selected data for a share of beneficial interest outstanding throughout each year:
| | | | | | | | | | | | | | | | | | | | | | | | | | | | | | | | | | | | | | | | | | | | | | | | | | | | | | | | | | | | | | | | | | | | | | |
| | | | | Income (Loss) from Investment Operations | | Distributions to Shareholders | | | | | | Ratios to Average Net Assets/Supplemental Data |
Year Ended
September 30 | | Net Asset
Value,
Beginning
of Period | | Net
Investment
Income (Loss)(a) | | Net
Realized and
Unrealized
Gain on
Investments | | Total From
Investment
Operations | | Net
Investment
Income | | Net
Realized
Gain on
Investments | | Total
Distributions | | Net Asset
Value,
End of
Period | | Total
Return† | | Net Assets,
End of
Period
(in 000’s) | | Net Investment
Income/Loss | | Operating
Expenses
Net of
Waivers/
Reimbursements | | Operating
Expenses
Before Waivers/
Reimbursements | | Portfolio
Turnover
Rate |
Mid-Cap Equity Fund | | | | | | | | | | | | | | | | | | | | | | | | | | | | | | | | | | | | | | | | | | | | | | | | | | | | | | | | |
Class AAA | | | | | | | | | | | | | | | | | | | | | | | | | | | | | | | | | | | | | | | | | | | | | | | | | | | | | | | | | | | | | | | | | | |
2016 | | | $ | 11.43 | | | | $ | (0.04 | ) | | | $ | 0.97 | | | | $ | 0.93 | | | | | — | | | | $ | (0.48 | ) | | | $ | (0.48 | ) | | | $ | 11.88 | | | | | 8.2 | % | | | $ | 1,810 | | | | | (0.40 | )% | | | | 1.34 | %(b)(c) | | | | 3.26 | % | | | | 15 | % |
2015 | | | | 11.54 | | | | | (0.06 | ) | | | | 0.07 | | | | | 0.01 | | | | | — | | | | | (0.12 | ) | | | | (0.12 | ) | | | | 11.43 | | | | | 0.1 | | | | | 2,004 | | | | | (0.52 | ) | | | | 1.51 | (b)(c) | | | | 2.74 | | | | | 25 | |
2014 | | | | 10.48 | | | | | (0.04 | ) | | | | 1.10 | | | | | 1.06 | | | | | — | | | | | (0.00 | )(d) | | | | (0.00 | )(d) | | | | 11.54 | | | | | 10.2 | | | | | 1,679 | | | | | (0.39 | ) | | | | 1.51 | (c) | | | | 4.27 | | | | | 22 | |
2013(e) | | | | 10.00 | | | | | (0.01 | ) | | | | 0.49 | | | | | 0.48 | | | | | — | | | | | — | | | | | — | | | | | 10.48 | | | | | 4.8 | | | | | 661 | | | | | (0.42 | )(f) | | | | 1.50 | (f) | | | | 3.88 | (f)(g) | | | | 3 | |
Class A | | | | | | | | | | | | | | | | | | | | | | | | | | | | | | | | | | | | | | | | | | | | | | | | | | | | | | | | | | | | | | | | | | |
2016 | | | $ | 11.37 | | | | $ | (0.07 | ) | | | $ | 0.96 | | | | $ | 0.89 | | | | | — | | | | $ | (0.48 | ) | | | $ | (0.48 | ) | | | $ | 11.78 | | | | | 7.9 | % | | | $ | 309 | | | | | (0.65 | )% | | | | 1.63 | %(b)(c) | | | | 3.44 | % | | | | 15 | % |
2015 | | | | 11.51 | | | | | (0.09 | ) | | | | 0.07 | | | | | (0.02 | ) | | | | — | | | | | (0.12 | ) | | | | (0.12 | ) | | | | 11.37 | | | | | (0.2 | ) | | | | 593 | | | | | (0.77 | ) | | | | 1.76 | (b)(c) | | | | 2.99 | | | | | 25 | |
2014 | | | | 10.47 | | | | | (0.08 | ) | | | | 1.12 | | | | | 1.04 | | | | | — | | | | | (0.00 | )(d) | | | | (0.00 | )(d) | | | | 11.51 | | | | | 10.0 | | | | | 682 | | | | | (0.69 | ) | | | | 1.76 | (c) | | | | 4.52 | | | | | 22 | |
2013(e) | | | | 10.00 | | | | | 0.03 | | | | | 0.44 | | | | | 0.47 | | | | | — | | | | | — | | | | | — | | | | | 10.47 | | | | | 4.7 | | | | | 188 | | | | | 0.81 | (f) | | | | 1.75 | (f) | | | | 4.13 | (f)(g) | | | | 3 | |
Class C | | | | | | | | | | | | | | | | | | | | | | | | | | | | | | | | | | | | | | | | | | | | | | | | | | | | | | | | | | | | | | | | | | |
2016 | | | $ | 11.24 | | | | $ | (0.12 | ) | | | $ | 0.94 | | | | $ | 0.82 | | | | | — | | | | $ | (0.48 | ) | | | $ | (0.48 | ) | | | $ | 11.58 | | | | | 7.4 | % | | | $ | 193 | | | | | (1.17 | )% | | | | 2.11 | %(b)(c) | | | | 3.98 | % | | | | 15 | % |
2015 | | | | 11.43 | | | | | (0.15 | ) | | | | 0.08 | | | | | (0.07 | ) | | | | — | | | | | (0.12 | ) | | | | (0.12 | ) | | | | 11.24 | | | | | (0.6 | ) | | | | 274 | | | | | (1.27 | ) | | | | 2.26 | (b)(c) | | | | 3.49 | | | | | 25 | |
2014 | | | | 10.45 | | | | | (0.13 | ) | | | | 1.11 | | | | | 0.98 | | | | | — | | | | | (0.00 | )(d) | | | | (0.00 | )(d) | | | | 11.43 | | | | | 9.4 | | | | | 239 | | | | | (1.17 | ) | | | | 2.26 | (c) | | | | 5.02 | | | | | 22 | |
2013(e) | | | | 10.00 | | | | | (0.02 | ) | | | | 0.47 | | | | | 0.45 | | | | | — | | | | | — | | | | | — | | | | | 10.45 | | | | | 4.5 | | | | | 74 | | | | | (0.65 | )(f) | | | | 2.25 | (f) | | | | 4.63 | (f)(g) | | | | 3 | |
Class I | | | | | | | | | | | | | | | | | | | | | | | | | | | | | | | | | | | | | | | | | | | | | | | | | | | | | | | | | | | | | | | | | | |
2016 | | | $ | 11.49 | | | | $ | 0.00 | | | | $ | 0.99 | | | | $ | 0.99 | | | | | — | | | | $ | (0.48 | ) | | | $ | (0.48 | ) | | | $ | 12.00 | | | | | 8.7 | % | | | $ | 1,760 | | | | | 0.04 | % | | | | 0.90 | %(b)(c) | | | | 3.00 | % | | | | 15 | % |
2015 | | | | 11.57 | | | | | (0.03 | ) | | | | 0.07 | | | | | 0.04 | | | | | — | | | | | (0.12 | ) | | | | (0.12 | ) | | | | 11.49 | | | | | 0.3 | | | | | 2,079 | | | | | (0.27 | ) | | | | 1.26 | (b)(c) | | | | 2.49 | | | | | 25 | |
2014 | | | | 10.48 | | | | | (0.01 | ) | | | | 1.11 | | | | | 1.10 | | | | $ | (0.01 | ) | | | | (0.00 | )(d) | | | | (0.01 | ) | | | | 11.57 | | | | | 10.5 | | | | | 2,345 | | | | | (0.09 | ) | | | | 1.26 | (c) | | | | 4.02 | | | | | 22 | |
2013(e) | | | | 10.00 | | | | | (0.01 | ) | | | | 0.49 | | | | | 0.48 | | | | | — | | | | | — | | | | | — | | | | | 10.48 | | | | | 4.8 | | | | | 1,155 | | | | | (0.20 | )(f) | | | | 1.25 | (f) | | | | 3.63 | (f)(g) | | | | 3 | |
| † | Total return represents aggregate total return of a hypothetical $1,000 investment at the beginning of the period and sold at the end of the period including reinvestment of distributions and does not reflect applicable sales charges. Total return for a period of less than one year is not annualized. |
| (a) | Per share data is calculated using the average shares outstanding method. |
| (b) | The Fund received credits from a designated broker who agreed to pay certain Fund operating expenses. Had such payments not been made, the expense ratios for the years ended September 30, 2016 and 2015 would have been (1.39% and 1.54%) Class AAA, (1.68% and 1.79%) Class A, (2.16% and 2.29%) Class C, and (0.95% and 1.29%) Class I Shares, respectively. |
| (c) | The Fund incurred interest expense during the years ended September 30, 2016, 2015, and 2014. For the year ended September 30, 2016, there was no material impact on the expense ratios. For the years ended September 30, 2015 and 2014, if interest expense had not been incurred, the ratio of operating expenses to average net assets would have been 1.33% and 1.50% (Class AAA), 1.62% and 1.75% (Class A), 2.10% and 2.25% (Class C), 0.89% and 1.25% (Class I), respectively. |
| (d) | Amount represents less than $0.005 per share. |
| (e) | From the commencement of offering of Fund Shares on May 31, 2013 through September 30, 2013. |
| (g) | Certain non-recurring expenses incurred by the Fund were not annualized in the calculation of the expense ratios. If these expenses were annualized, the total operating expense ratios before waivers and reimbursements would have been 10.11% (Class AAA), 10.36% (Class A), 10.86% (Class C), and 9.86% (Class I). |
See accompanying notes to financial statements.
42
TETON Westwood Funds
Financial Highlights
Selected data for a share of beneficial interest outstanding throughout each year:
| | | | | | | | | | | | | | | | | | | | | | | | | | | | | | | | | | | | | | | | | | | | | | | | | | | | | | | | | | | | | | | | | | | | | | | | |
| | | | | | | Income from Investment Operations | | Distributions to Shareholders | | | | | | | | Ratios to Average Net Assets/Supplemental Data |
Year Ended September 30 | | | | Net Asset
Value,
Beginning
of Year | | Net
Investment
Income
(Loss)(a) | | Net
Realized and
Unrealized
Gain on
Investments | | Total From
Investment
Operations | | Net
Investment
Income | | Total
Distributions | | Redemption
Fees(a) | | Net Asset
Value,
End of
Year | | Total
Return† | | Net Assets,
End of
Year
(in 000’s) | | Net
Investment
Income
(Loss) | | Operating
Expenses
Net of
Waivers/
Reimbursements | | Operating
Expenses
Before Waivers/
Reimbursements | | Portfolio
Turnover
Rate |
Income Fund | | | | | | | | | | | | | | | | | | | | | | | | | | | | | | | | | | | | | | | | | | | | | | | | | | | | | | | | |
Class AAA | | | | | | | | | | | | | | | | | | | | | | | | | | | | | | | | | | | | | | | | | | | | | | | | | | | | | | | | | | | | | |
2016 | | | | | | $10.53 | | | | | $0.04 | | | | | $1.05 | | | | | $1.09 | | | | | $(0.03 | ) | | | | $(0.03 | ) | | | | — | | | | | $11.59 | | | | | 10.4 | % | | | | $4,240 | | | | | 0.38 | % | | | | 2.00 | %(b) | | | | 2.74 | % | | | | 20 | % |
2015 | | | | | | 11.79 | | | | | 0.04 | | | | | (1.27 | ) | | | | (1.23 | ) | | | | (0.03 | ) | | | | (0.03 | ) | | | | — | | | | | 10.53 | | | | | (10.5 | ) | | | | 5,525 | | | | | 0.31 | | | | | 2.00 | (b) | | | | 2.40 | | | | | 19 | |
2014 | | | | | | 10.40 | | | | | 0.21 | | | | | 1.38 | | | | | 1.59 | | | | | (0.20 | ) | | | | (0.20 | ) | | | | $0.00 | (c) | | | | 11.79 | | | | | 15.5 | | | | | 6,240 | | | | | 1.86 | | | | | 2.00 | | | | | 2.42 | | | | | 31 | |
2013 | | | | | | 8.96 | | | | | 0.07 | | | | | 1.45 | | | | | 1.52 | | | | | (0.08 | ) | | | | (0.08 | ) | | | | 0.00 | (c) | | | | 10.40 | | | | | 17.0 | | | | | 6,147 | | | | | 0.73 | | | | | 2.00 | | | | | 2.57 | | | | | 13 | |
2012 | | | | | | 7.65 | | | | | 0.10 | | | | | 1.31 | | | | | 1.41 | | | | | (0.10 | ) | | | | (0.10 | ) | | | | 0.00 | (c) | | | | 8.96 | | | | | 18.5 | | | | | 5,151 | | | | | 1.22 | | | | | 2.00 | | | | | 2.82 | | | | | 11 | |
Class A | | | | | | | | | | | | | | | | | | | | | | | | | | | | | | | | | | | | | | | | | | | | | | | | | | | | | | | | | | | | | |
2016 | | | | | | $10.87 | | | | | $0.01 | | | | | $1.08 | | | | | $1.09 | | | | | $(0.02 | ) | | | | $(0.02 | ) | | | | — | | | | | $11.94 | | | | | 10.1 | % | | | | $1,191 | | | | | 0.10 | % | | | | 2.25 | %(b) | | | | 2.99 | % | | | | 20 | % |
2015 | | | | | | 12.18 | | | | | 0.01 | | | | | (1.30 | ) | | | | (1.29 | ) | | | | (0.02 | ) | | | | (0.02 | ) | | | | — | | | | | 10.87 | | | | | (10.6 | ) | | | | 1,081 | | | | | 0.06 | | | | | 2.25 | (b) | | | | 2.65 | | | | | 19 | |
2014 | | | | | | 10.75 | | | | | 0.19 | | | | | 1.43 | | | | | 1.62 | | | | | (0.19 | ) | | | | (0.19 | ) | | | | $0.00 | (c) | | | | 12.18 | | | | | 15.2 | | | | | 1,013 | | | | | 1.63 | | | | | 2.25 | | | | | 2.67 | | | | | 31 | |
2013 | | | | | | 9.26 | | | | | 0.05 | | | | | 1.49 | | | | | 1.54 | | | | | (0.05 | ) | | | | (0.05 | ) | | | | 0.00 | (c) | | | | 10.75 | | | | | 16.7 | | | | | 907 | | | | | 0.44 | | | | | 2.25 | | | | | 2.82 | | | | | 13 | |
2012 | | | | | | 7.91 | | | | | 0.07 | | | | | 1.37 | | | | | 1.44 | | | | | (0.09 | ) | | | | (0.09 | ) | | | | 0.00 | (c) | | | | 9.26 | | | | | 18.3 | | | | | 389 | | | | | 0.78 | | | | | 2.25 | | | | | 3.07 | | | | | 11 | |
Class C | | | | | | | | | | | | | | | | | | | | | | | | | | | | | | | | | | | | | | | | | | | | | | | | | | | | | | | | | | | | | |
2016 | | | | | | $11.59 | | | | | $(0.04 | ) | | | | $1.14 | | | | | $1.10 | | | | | $(0.00 | )(c) | | | | $(0.00 | )(c) | | | | — | | | | | $12.69 | | | | | 9.6 | % | | | | $873 | | | | | (0.37 | )% | | | | 2.75 | %(b) | | | | 3.49 | % | | | | 20 | % |
2015 | | | | | | 13.04 | | | | | (0.06 | ) | | | | (1.39 | ) | | | | (1.45 | ) | | | | (0.00 | )(c) | | | | (0.00 | )(c) | | | | — | | | | | 11.59 | | | | | (11.1 | ) | | | | 943 | | | | | (0.44 | ) | | | | 2.75 | (b) | | | | 3.15 | | | | | 19 | |
2014 | | | | | | 11.54 | | | | | 0.17 | | | | | 1.50 | | | | | 1.67 | | | | | (0.17 | ) | | | | (0.17 | ) | | | | $0.00 | (c) | | | | 13.04 | | | | | 14.6 | | | | | 1,045 | | | | | 1.30 | | | | | 2.75 | | | | | 3.17 | | | | | 31 | |
2013 | | | | | | 9.94 | | | | | 0.00 | (c) | | | | 1.61 | | | | | 1.61 | | | | | (0.01 | ) | | | | (0.01 | ) | | | | 0.00 | (c) | | | | 11.54 | | | | | 16.2 | | | | | 1,086 | | | | | 0.01 | | | | | 2.75 | | | | | 3.32 | | | | | 13 | |
2012 | | | | | | 8.49 | | | | | 0.03 | | | | | 1.46 | | | | | 1.49 | | | | | (0.04 | ) | | | | (0.04 | ) | | | | 0.00 | (c) | | | | 9.94 | | | | | 17.6 | | | | | 1,307 | | | | | 0.36 | | | | | 2.75 | | | | | 3.57 | | | | | 11 | |
Class I | | | | | | | | | | | | | | | | | | | | | | | | | | | | | | | | | | | | | | | | | | | | | | | | | | | | | | | | | | | | | |
2016 | | | | | | $10.56 | | | | | $0.07 | | | | | $1.04 | | | | | $1.11 | | | | | $(0.06 | ) | | | | $(0.06 | ) | | | | — | | | | | $11.61 | | | | | 10.6 | % | | | | $394 | | | | | 0.61 | % | | | | 1.75 | %(b) | | | | 2.49 | % | | | | 20 | % |
2015 | | | | | | 11.80 | | | | | 0.07 | | | | | (1.27 | ) | | | | (1.20 | ) | | | | (0.04 | ) | | | | (0.04 | ) | | | | — | | | | | 10.56 | | | | | (10.2 | ) | | | | 251 | | | | | 0.56 | | | | | 1.75 | (b) | | | | 2.15 | | | | | 19 | |
2014 | | | | | | 10.40 | | | | | 0.24 | | | | | 1.39 | | | | | 1.63 | | | | | (0.23 | ) | | | | (0.23 | ) | | | | $0.00 | (c) | | | | 11.80 | | | | | 15.8 | | | | | 290 | | | | | 2.15 | | | | | 1.75 | | | | | 2.17 | | | | | 31 | |
2013 | | | | �� | | 8.96 | | | | | 0.10 | | | | | 1.44 | | | | | 1.54 | | | | | (0.10 | ) | | | | (0.10 | ) | | | | 0.00 | (c) | | | | 10.40 | | | | | 17.3 | | | | | 185 | | | | | 0.99 | | | | | 1.75 | | | | | 2.32 | | | | | 13 | |
2012 | | | | | | 7.65 | | | | | 0.12 | | | | | 1.31 | | | | | 1.43 | | | | | (0.12 | ) | | | | (0.12 | ) | | | | 0.00 | (c) | | | | 8.96 | | | | | 18.8 | | | | | 126 | | | | | 1.43 | | | | | 1.75 | | | | | 2.57 | | | | | 11 | |
| † | Total return represents aggregate total return of a hypothetical $1,000 investment at the beginning of the year and sold at the end of the year including reinvestment of distributions and does not reflect the applicable sales charges. |
| (a) | Per share data is calculated using the average shares outstanding method. |
| (b) | The Fund received credits from a designated broker who agreed to pay certain Fund operating expenses. Had such payments not been made, the expense ratios for the years ended September 30, 2016 and 2015 would have been (2.01% and 2.02%) Class AAA, (2.26% and 2.27%) Class A, (2.76% and 2.77%) Class C, and (1.76% and 1.77%) Class I Shares, respectively. |
| (c) | Amount represents less than $0.005 per share. |
See accompanying notes to financial statements.
43
TETON Westwood Funds
Financial Highlights
Selected data for a share of beneficial interest outstanding throughout each year:
| | | | | | | | | | | | | | | | | | | | | | | | | | | | | | | | | | | | | | | | | | | | | | | | | | | | | | | | | | | | | | | | | |
| | | | | Income (Loss) from Investment Operations | | Distributions to Shareholders | | | | | | Ratios to Average Net Assets/Supplemental Data |
Year Ended September 30 | | Net Asset Value,
Beginning of Year | | Net Investment
Income (Loss)(a) | | Net Realized and
Unrealized
Gain (Loss) on
Investments | | Total From
Investment
Operations | | Net Investment
Income | | Net
Realized
Gain on
Investments | | Total Distributions | | Net Asset
Value,
End of Year | | Total Return† | | Net Assets,
End of Year (in 000’s) | | Net
Investment
Income (Loss) | | Operating
Expenses(b) | | Portfolio
Turnover Rate |
Equity Fund | | | | | | | | | | | | | | | | | | | | | | | | | | | | | | | | | | | | | | | | | | | | | | | | | | | | | | | | |
Class AAA | | | | | | | | | | | | | | | | | | | | | | | | | | | | | | | | | | | | | | | | | | | | | | | | | | | | | | | | | | | | | |
2016 | | | $ | 12.22 | | | | $ | 0.07 | | | | $ | 1.30 | | | | $ | 1.37 | | | | $ | (0.05 | ) | | | $ | (0.95 | ) | | | $ | (1.00 | ) | | | $ | 12.59 | | | | | 11.4 | % | | | $ | 53,063 | | | | | 0.54 | % | | | | 1.63 | %(c) | | | | 31 | % |
2015 | | | | 13.65 | | | | | 0.05 | | | | | (0.09 | ) | | | | (0.04 | ) | | | | (0.06 | ) | | | | (1.33 | ) | | | | (1.39 | ) | | | | 12.22 | | | | | (0.9 | ) | | | | 53,238 | | | | | 0.37 | | | | | 1.59 | (c) | | | | 28 | |
2014 | | | | 11.88 | | | | | 0.05 | | | | | 1.76 | | | | | 1.81 | | | | | (0.04 | ) | | | | — | | | | | (0.04 | ) | | | | 13.65 | | | | | 15.3 | | | | | 60,587 | | | | | 0.37 | | | | | 1.59 | | | | | 51 | |
2013 | | | | 9.92 | | | | | 0.06 | | | | | 1.99 | | | | | 2.05 | | | | | (0.09 | ) | | | | — | | | | | (0.09 | ) | | | | 11.88 | | | | | 20.9 | | | | | 64,595 | | | | | 0.53 | | | | | 1.62 | (d) | | | | 53 | |
2012 | | | | 7.81 | | | | | 0.08 | | | | | 2.11 | | | | | 2.19 | | | | | (0.08 | ) | | | | — | | | | | (0.08 | ) | | | | 9.92 | | | | | 28.3 | | | | | 70,017 | | | | | 0.84 | | | | | 1.59 | (d) | | | | 41 | |
Class A | | | | | | | | | | | | | | | | | | | | | | | | | | | | | | | | | | | | | | | | | | | | | | | | | | | | | | | | | | | | | |
2016 | | | $ | 12.19 | | | | $ | 0.03 | | | | $ | 1.31 | | | | $ | 1.34 | | | | $ | (0.03 | ) | | | $ | (0.95 | ) | | | $ | (0.98 | ) | | | $ | 12.55 | | | | | 11.2 | % | | | $ | 3,719 | | | | | 0.29 | % | | | | 1.88 | %(c) | | | | 31 | % |
2015 | | | | 13.61 | | | | | 0.02 | | | | | (0.09 | ) | | | | (0.07 | ) | | | | (0.02 | ) | | | | (1.33 | ) | | | | (1.35 | ) | | | | 12.19 | | | | | (1.1 | ) | | | | 3,125 | | | | | 0.12 | | | | | 1.84 | (c) | | | | 28 | |
2014 | | | | 11.84 | | | | | 0.02 | | | | | 1.76 | | | | | 1.78 | | | | | (0.01 | ) | | | | — | | | | | (0.01 | ) | | | | 13.61 | | | | | 15.0 | | | | | 3,329 | | | | | 0.12 | | | | | 1.84 | | | | | 51 | |
2013 | | | | 9.89 | | | | | 0.03 | | | | | 1.99 | | | | | 2.02 | | | | | (0.07 | ) | | | | — | | | | | (0.07 | ) | | | | 11.84 | | | | | 20.5 | | | | | 3,256 | | | | | 0.27 | | | | | 1.87 | (d) | | | | 53 | |
2012 | | | | 7.78 | | | | | 0.05 | | | | | 2.11 | | | | | 2.16 | | | | | (0.05 | ) | | | | — | | | | | (0.05 | ) | | | | 9.89 | | | | | 27.9 | | | | | 3,221 | | | | | 0.60 | | | | | 1.84 | (d) | | | | 41 | |
Class C | | | | | | | | | | | | | | | | | | | | | | | | | | | | | | | | | | | | | | | | | | | | | | | | | | | | | | | | | | | | | |
2016 | | | $ | 11.72 | | | | $ | (0.03 | ) | | | $ | 1.25 | | | | $ | 1.22 | | | | | — | | | | $ | (0.95 | ) | | | $ | (0.95 | ) | | | $ | 11.99 | | | | | 10.6 | % | | | $ | 843 | | | | | (0.23 | )% | | | | 2.38 | %(c) | | | | 31 | % |
2015 | | | | 13.18 | | | | | (0.05 | ) | | | | (0.08 | ) | | | | (0.13 | ) | | | | — | | | | | (1.33 | ) | | | | (1.33 | ) | | | | 11.72 | | | | | (1.6 | ) | | | | 684 | | | | | (0.37 | ) | | | | 2.34 | (c) | | | | 28 | |
2014 | | | | 11.51 | | | | | (0.05 | ) | | | | 1.72 | | | | | 1.67 | | | | | — | | | | | — | | | | | — | | | | | 13.18 | | | | | 14.5 | | | | | 676 | | | | | (0.38 | ) | | | | 2.34 | | | | | 51 | |
2013 | | | | 9.62 | | | | | (0.02 | ) | | | | 1.93 | | | | | 1.91 | | | | $ | (0.02 | ) | | | | — | | | | | (0.02 | ) | | | | 11.51 | | | | | 19.9 | | | | | 693 | | | | | (0.22 | ) | | | | 2.37 | (d) | | | | 53 | |
2012 | | | | 7.56 | | | | | 0.01 | | | | | 2.05 | | | | | 2.06 | | | | | — | | | | | — | | | | | — | | | | | 9.62 | | | | | 27.3 | | | | | 784 | | | | | 0.10 | | | | | 2.34 | (d) | | | | 41 | |
Class I | | | | | | | | | | | | | | | | | | | | | | | | | | | | | | | | | | | | | | | | | | | | | | | | | | | | | | | | | | | | | |
2016 | | | $ | 12.21 | | | | $ | 0.09 | | | | $ | 1.30 | | | | $ | 1.39 | | | | $ | (0.08 | ) | | | $ | (0.95 | ) | | | $ | (1.03 | ) | | | $ | 12.57 | | | | | 11.7 | % | | | $ | 4,258 | | | | | 0.77 | % | | | | 1.38 | %(c) | | | | 31 | % |
2015 | | | | 13.64 | | | | | 0.08 | | | | | (0.09 | ) | | | | (0.01 | ) | | | | (0.09 | ) | | | | (1.33 | ) | | | | (1.42 | ) | | | | 12.21 | | | | | (0.6 | ) | | | | 4,340 | | | | | 0.61 | | | | | 1.34 | (c) | | | | 28 | |
2014 | | | | 11.89 | | | | | 0.08 | | | | | 1.74 | | | | | 1.82 | | | | | (0.07 | ) | | | | — | | | | | (0.07 | ) | | | | 13.64 | | | | | 15.4 | | | | | 3,547 | | | | | 0.60 | | | | | 1.34 | | | | | 51 | |
2013 | | | | 9.93 | | | | | 0.09 | | | | | 1.99 | | | | | 2.08 | | | | | (0.12 | ) | | | | — | | | | | (0.12 | ) | | | | 11.89 | | | | | 21.2 | | | | | 2,204 | | | | | 0.84 | | | | | 1.37 | (d) | | | | 53 | |
2012 | | | | 7.83 | | | | | 0.09 | | | | | 2.12 | | | | | 2.21 | | | | | (0.11 | ) | | | | — | | | | | (0.11 | ) | | | | 9.93 | | | | | 28.5 | | | | | 4,377 | | | | | 0.96 | | | | | 1.34 | (d) | | | | 41 | |
| † | Total return represents aggregate total return of a hypothetical $1,000 investment at the beginning of the year and sold at the end of the year including reinvestment of distributions and does not reflect the applicable sales charges. |
| (a) | Per share data is calculated using the average shares outstanding method. |
| (b) | The Fund incurred interest expense during the years ended September 30, 2014, 2013, and 2012. This interest expense was paid for by prior years Custodian Fee Credits. The effect of interest expense was minimal. |
| (c) | The Fund received credits from a designated broker who agreed to pay certain Fund operating expenses. For the years ended September 30, 2016 and 2015, there was no impact on the expense ratios. |
| (d) | The ratios do not include a reduction for custodian fee credits on cash balances maintained with the custodian (“Custodian Fee Credits”). Including such Custodian Fee Credits, the ratios for the years ended September 30, 2013, and 2012 would have been 1.60%, and 1.56% (Class AAA), 1.85%, and 1.81% (Class A), 2.35%, and 2.31% (Class C), and 1.35%, and 1.31% (Class I) Shares, respectively. For the years ended September 30, 2016, 2015, and 2014, there were no Custodian Fee Credits. |
See accompanying notes to financial statements.
44
TETON Westwood Funds
Financial Highlights
Selected data for a share of beneficial interest outstanding throughout each year:
| | | | | | | | | | | | | | | | | | | | | | | | | | | | | | | | | | | | | | | | | | | | | | | | | | | | | | | | | | | | | | | | | |
| | | | | Income (Loss) from Investment Operations | | Distributions to Shareholders | | | | | | Ratios to Average Net Assets/Supplemental Data |
Year Ended September 30 | | Net Asset Value,
Beginning of Year | | Net Investment
Income(a) | | Net
Realized and
Unrealized
Gain (Loss) on
Investments | | Total From
Investment
Operations | | Net Investment
Income | | Net
Realized
Gain on
Investments | | Total
Distributions | | Net Asset
Value,
End of Year | | Total Return† | | Net Assets,
End of Year (in 000’s) | | Net
Investment
Income | | Operating
Expenses†† | | Portfolio
Turnover Rate |
Balanced Fund | | | | | | | | | | | | | | | | | | | | | | | | | | | | | | | | | | | | | | | | | | | | | | | | | | | | | | | | | | | | | | | | | |
Class AAA | | | | | | | | | | | | | | | | | | | | | | | | | | | | | | | | | | | | | | | | | | | | | | | | | | | | | | | | | | | | | |
2016 | | | $ | 11.72 | | | | $ | 0.12 | | | | $ | 0.85 | | | | $ | 0.97 | | | | $ | (0.12 | ) | | | $ | (0.82 | ) | | | $ | (0.94 | ) | | | $ | 11.75 | | | | | 8.6 | % | | | $ | 50,105 | | | | | 1.06 | % | | | | 1.35 | %(b) | | | | 23 | % |
2015 | | | | 12.91 | | | | | 0.13 | | | | | (0.08 | ) | | | | 0.05 | | | | | (0.13 | ) | | | | (1.11 | ) | | | | (1.24 | ) | | | | 11.72 | | | | | 0.0 | | | | | 53,989 | | | | | 1.01 | | | | | 1.31 | (b) | | | | 27 | |
2014 | | | | 12.76 | | | | | 0.14 | | | | | 1.07 | | | | | 1.21 | | | | | (0.14 | ) | | | | (0.92 | ) | | | | (1.06 | ) | | | | 12.91 | | | | | 9.9 | | | | | 69,187 | | | | | 1.07 | | | | | 1.29 | | | | | 39 | |
2013 | | | | 11.48 | | | | | 0.15 | | | | | 1.28 | | | | | 1.43 | | | | | (0.15 | ) | | | | — | | | | | (0.15 | ) | | | | 12.76 | | | | | 12.5 | | | | | 70,824 | | | | | 1.21 | | | | | 1.30 | | | | | 36 | |
2012 | | | | 9.86 | | | | | 0.16 | | | | | 1.62 | | | | | 1.78 | | | | | (0.16 | ) | | | | — | | | | | (0.16 | ) | | | | 11.48 | | | | | 18.2 | | | | | 78,999 | | | | | 1.47 | | | | | 1.30 | | | | | 34 | |
Class A | | | | | | | | | | | | | | | | | | | | | | | | | | | | | | | | | | | | | | | | | | | | | | | | | | | | | | | | | | | | | |
2016 | | | $ | 11.78 | | | | $ | 0.10 | | | | $ | 0.85 | | | | $ | 0.95 | | | | $ | (0.10 | ) | | | $ | (0.82 | ) | | | $ | (0.92 | ) | | | $ | 11.81 | | | | | 8.2 | % | | | $ | 7,040 | | | | | 0.81 | % | | | | 1.60 | %(b) | | | | 23 | % |
2015 | | | | 12.97 | | | | | 0.09 | | | | | (0.07 | ) | | | | 0.02 | | | | | (0.10 | ) | | | | (1.11 | ) | | | | (1.21 | ) | | | | 11.78 | | | | | (0.2 | ) | | | | 6,577 | | | | | 0.76 | | | | | 1.56 | (b) | | | | 27 | |
2014 | | | | 12.82 | | | | | 0.11 | | | | | 1.07 | | | | | 1.18 | | | | | (0.11 | ) | | | | (0.92 | ) | | | | (1.03 | ) | | | | 12.97 | | | | | 9.5 | | | | | 6,443 | | | | | 0.83 | | | | | 1.54 | | | | | 39 | |
2013 | | | | 11.53 | | | | | 0.12 | | | | | 1.29 | | | | | 1.41 | | | | | (0.12 | ) | | | | — | | | | | (0.12 | ) | | | | 12.82 | | | | | 12.3 | | | | | 5,869 | | | | | 0.95 | | | | | 1.55 | | | | | 36 | |
2012 | | | | 9.90 | | | | | 0.13 | | | | | 1.64 | | | | | 1.77 | | | | | (0.14 | ) | | | | — | | | | | (0.14 | ) | | | | 11.53 | | | | | 17.9 | | | | | 5,121 | | | | | 1.21 | | | | | 1.55 | | | | | 34 | |
Class C | | | | | | | | | | | | | | | | | | | | | | | | | | | | | | | | | | | | | | | | | | | | | | | | | | | | | | | | | | | | | |
2016 | | | $ | 11.92 | | | | $ | 0.04 | | | | $ | 0.87 | | | | $ | 0.91 | | | | $ | (0.04 | ) | | | $ | (0.82 | ) | | | $ | (0.86 | ) | | | $ | 11.97 | | | | | 7.8 | % | | | $ | 5,575 | | | | | 0.30 | % | | | | 2.10 | %(b) | | | | 23 | % |
2015 | | | | 13.12 | | | | | 0.03 | | | | | (0.08 | ) | | | | (0.05 | ) | | | | (0.04 | ) | | | | (1.11 | ) | | | | (1.15 | ) | | | | 11.92 | | | | | (0.8 | ) | | | | 5,260 | | | | | 0.26 | | | | | 2.06 | (b) | | | | 27 | |
2014 | | | | 12.95 | | | | | 0.04 | | | | | 1.09 | | | | | 1.13 | | | | | (0.04 | ) | | | | (0.92 | ) | | | | (0.96 | ) | | | | 13.12 | | | | | 9.0 | | | | | 5,350 | | | | | 0.32 | | | | | 2.04 | | | | | 39 | |
2013 | | | | 11.64 | | | | | 0.05 | | | | | 1.31 | | | | | 1.36 | | | | | (0.05 | ) | | | | — | | | | | (0.05 | ) | | | | 12.95 | | | | | 11.7 | | | | | 5,257 | | | | | 0.43 | | | | | 2.05 | | | | | 36 | |
2012 | | | | 9.99 | | | | | 0.08 | | | | | 1.65 | | | | | 1.73 | | | | | (0.08 | ) | | | | — | | | | | (0.08 | ) | | | | 11.64 | | | | | 17.4 | | | | | 4,932 | | | | | 0.72 | | | | | 2.05 | | | | | 34 | |
Class I | | | | | | | | | | | | | | | | | | | | | | | | | | | | | | | | | | | | | | | | | | | | | | | | | | | | | | | | | | | | | |
2016 | | | $ | 11.70 | | | | $ | 0.15 | | | | $ | 0.85 | | | | $ | 1.00 | | | | $ | (0.15 | ) | | | $ | (0.82 | ) | | | $ | (0.97 | ) | | | $ | 11.73 | | | | | 8.8 | % | | | $ | 1,896 | | | | | 1.30 | % | | | | 1.10 | %(b) | | | | 23 | % |
2015 | | | | 12.90 | | | | | 0.16 | | | | | (0.09 | ) | | | | 0.07 | | | | | (0.16 | ) | | | | (1.11 | ) | | | | (1.27 | ) | | | | 11.70 | | | | | 0.2 | | | | | 1,856 | | | | | 1.26 | | | | | 1.06 | (b) | | | | 27 | |
2014 | | | | 12.76 | | | | | 0.17 | | | | | 1.06 | | | | | 1.23 | | | | | (0.17 | ) | | | | (0.92 | ) | | | | (1.09 | ) | | | | 12.90 | | | | | 10.0 | | | | | 2,438 | | | | | 1.35 | | | | | 1.04 | | | | | 39 | |
2013 | | | | 11.48 | | | | | 0.18 | | | | | 1.28 | | | | | 1.46 | | | | | (0.18 | ) | | | | — | | | | | (0.18 | ) | | | | 12.76 | | | | | 12.8 | | | | | 1,060 | | | | | 1.44 | | | | | 1.05 | | | | | 36 | |
2012 | | | | 9.85 | | | | | 0.19 | | | | | 1.63 | | | | | 1.82 | | | | | (0.19 | ) | | | | — | | | | | (0.19 | ) | | | | 11.48 | | | | | 18.4 | | | | | 872 | | | | | 1.74 | | | | | 1.05 | | | | | 34 | |
| † | Total return represents aggregate total return of a hypothetical $1,000 investment at the beginning of the year and sold at the end of the year including reinvestment of distributions and does not reflect the applicable sales charges. |
| †† | The ratios do not include a reduction for custodian fee credits on cash balances maintained with the custodian (“Custodian Fee Credits”). Including such Custodian Fee Credits, the ratios for the years ended 2015, 2014, 2013, and 2012 would have been 1.32%, 1.27%, 1.28%, and 1.27% (Class AAA), 1.57%, 1.52%, 1.53%, and 1.52% (Class A), 2.07%, 2.02%, 2.03%, and 2.02% (Class C), and 1.07%, 1.02%, 1.03%, and 1.02% (Class I) Shares, respectively. For the year ended September 30, 2016, there was no impact on the expense ratios. |
| (a) | Per share data is calculated using the average shares outstanding method. |
| (b) | The Fund received credits from a designated broker who agreed to pay certain Fund operating expenses. For the years ended September 30, 2016 and 2015, there was no impact on the expense ratios. |
See accompanying notes to financial statements.
45
TETON Westwood Funds
Financial Highlights
Selected data for a share of beneficial interest outstanding throughout each year:
| | | | | | | | | | | | | | | | | | | | | | | | | | | | | | | | | | | | | | | | | | | | | | | | | | | | | | | | |
| | | | | | Income (Loss) from Investment Operations | | | Distributions to Shareholders | | | | | | | | | Ratios to Average Net Assets/Supplemental Data | |
Year Ended September 30 | | Net Asset
Value,
Beginning
of Year | | | Net
Investment
Income(a) | | | Net
Realized and
Unrealized
Gain (Loss) on
Investments | | | Total From
Investment
Operations | | | Net
Investment
Income | | | Net
Realized
Gain on
Investments | | | Total
Distributions | | | Net Asset
Value,
End of Year | | | Total
Return† | | | Net Assets,
End of Year
(in 000’s) | | | Net
Investment
Income | | | Operating
Expenses
Net of
Waivers/
Reimbursements | | | Operating
Expenses
Before Waivers/
Reimbursements | | | Portfolio
Turnover
Rate | |
| | | | | | | | | | | |
Intermediate Bond Fund | | | | | | | | | | | | | | | | | | | | | | | | | | | | | | | | | | | | | | | | | | | | | |
Class AAA | | | | | | | | | | | | | | | | | | | | | | | | | | | | | | | | | | | | | | | | | | | | | | | | | |
2016 | | | $11.56 | | | | $0.15 | | | | $ 0.30 | | | | $ 0.45 | | | | $(0.15 | ) | | | $(0.22 | ) | | | $(0.37 | ) | | | $11.64 | | | | 4.1 | % | | | $ 4,170 | | | | 1.32% | | | | 1.00% | | | | 1.42% | | | | 48% | |
2015 | | | 11.59 | | | | 0.18 | | | | (0.03 | ) | | | 0.15 | | | | $(0.18 | ) | | | — | | | | (0.18 | ) | | | 11.56 | | | | 1.3 | | | | 5,045 | | | | 1.58 | | | | 1.00 | | | | 1.36 | | | | 65 | |
2014 | | | 11.68 | | | | 0.15 | | | | (0.09 | ) | | | 0.06 | | | | (0.15 | ) | | | — | | | | (0.15 | ) | | | 11.59 | | | | 0.5 | | | | 5,174 | | | | 1.29 | | | | 1.00 | | | | 1.38 | | | | 16 | |
2013 | | | 12.06 | | | | 0.14 | | | | (0.36 | ) | | | (0.22 | ) | | | (0.15 | ) | | | $(0.01 | ) | | | (0.16 | ) | | | 11.68 | | | | (1.9 | ) | | | 8,737 | | | | 1.21 | | | | 1.00 | | | | 1.36 | | | | 20 | |
2012 | | | 11.91 | | | | 0.19 | | | | 0.22 | | | | 0.41 | | | | (0.19 | ) | | | (0.07 | ) | | | (0.26 | ) | | | 12.06 | | | | 3.5 | | | | 11,230 | | | | 1.56 | | | | 1.00 | | | | 1.33 | | | | 15 | |
Class A | | | | | | | | | | | | | | | | | | | | | | | | | | | | | | | | | | | | | | | | | | | | | | | | | | | | | |
2016 | | | $11.55 | | | | $0.14 | | | | $ 0.30 | | | | $ 0.44 | | | | $(0.14 | ) | | | $(0.22 | ) | | | $(0.36 | ) | | | $11.63 | | | | 3.9 | % | | | $ 807 | | | | 1.21% | | | | 1.10% | | | | 1.52% | | | | 48% | |
2015 | | | 11.58 | | | | 0.17 | | | | (0.03 | ) | | | 0.14 | | | | $(0.17 | ) | | | — | | | | (0.17 | ) | | | 11.55 | | | | 1.2 | | | | 809 | | | | 1.48 | | | | 1.10 | | | | 1.46 | | | | 65 | |
2014 | | | 11.66 | | | | 0.14 | | | | (0.08 | ) | | | 0.06 | | | | (0.14 | ) | | | — | | | | (0.14 | ) | | | 11.58 | | | | 0.5 | | | | 928 | | | | 1.21 | | | | 1.10 | | | | 1.48 | | | | 16 | |
2013 | | | 12.04 | | | | 0.13 | | | | (0.37 | ) | | | (0.24 | ) | | | (0.13 | ) | | | $(0.01 | ) | | | (0.14 | ) | | | 11.66 | | | | (2.0 | ) | | | 1,066 | | | | 1.06 | | | | 1.10 | | | | 1.46 | | | | 20 | |
2012 | | | 11.91 | | | | 0.18 | | | | 0.20 | | | | 0.38 | | | | (0.18 | ) | | | (0.07 | ) | | | (0.25 | ) | | | 12.04 | | | | 3.1 | | | | 1,365 | | | | 1.46 | | | | 1.10 | | | | 1.43 | | | | 15 | |
Class C | | | | | | | | | | | | | | | | | | | | | | | | | | | | | | | | | | | | | | | | | | | | | | | | | | | | | |
2016 | | | $10.99 | | | | $0.06 | | | | $ 0.28 | | | | $ 0.34 | | | | $(0.06 | ) | | | $(0.22 | ) | | | $(0.28 | ) | | | $11.05 | | | | 3.2 | % | | | $ 1,144 | | | | 0.51% | | | | 1.75% | | | | 2.17% | | | | 48% | |
2015 | | | 11.01 | | | | 0.09 | | | | (0.02 | ) | | | 0.07 | | | | $(0.09 | ) | | | — | | | | (0.09 | ) | | | 10.99 | | | | 0.7 | | | | 398 | | | | 0.82 | | | | 1.75 | | | | 2.11 | | | | 65 | |
2014 | | | 11.09 | | | | 0.06 | | | | (0.08 | ) | | | (0.02 | ) | | | (0.06 | ) | | | — | | | | (0.06 | ) | | | 11.01 | | | | (0.2 | ) | | | 503 | | | | 0.55 | | | | 1.75 | | | | 2.13 | | | | 16 | |
2013 | | | 11.46 | | | | 0.05 | | | | (0.36 | ) | | | (0.31 | ) | | | (0.05 | ) | | | $(0.01 | ) | | | (0.06 | ) | | | 11.09 | | | | (2.7 | ) | | | 803 | | | | 0.43 | | | | 1.75 | | | | 2.11 | | | | 20 | |
2012 | | | 11.32 | | | | 0.09 | | | | 0.21 | | | | 0.30 | | | | (0.09 | ) | | | (0.07 | ) | | | (0.16 | ) | | | 11.46 | | | | 2.7 | | | | 1,772 | | | | 0.80 | | | | 1.75 | | | | 2.08 | | | | 15 | |
Class I | | | | | | | | | | | | | | | | | | | | | | | | | | | | | | | | | | | | | | | | | | | | | | | | | | | | | |
2016 | | | $11.57 | | | | $0.18 | | | | $ 0.30 | | | | $ 0.48 | | | | $(0.18 | ) | | | $(0.22 | ) | | | $(0.40 | ) | | | $11.65 | | | | 4.3 | % | | | $14,111 | | | | 1.56% | | | | 0.75% | | | | 1.17% | | | | 48% | |
2015 | | | 11.60 | | | | 0.21 | | | | (0.03 | ) | | | 0.18 | | | | $(0.21 | ) | | | — | | | | (0.21 | ) | | | 11.57 | | | | 1.6 | | | | 13,022 | | | | 1.82 | | | | 0.75 | | | | 1.11 | | | | 65 | |
2014 | | | 11.68 | | | | 0.18 | | | | (0.08 | ) | | | 0.10 | | | | (0.18 | ) | | | — | | | | (0.18 | ) | | | 11.60 | | | | 0.9 | | | | 14,705 | | | | 1.58 | | | | 0.75 | | | | 1.13 | | | | 16 | |
2013 | | | 12.06 | | | | 0.17 | | | | (0.36 | ) | | | (0.19 | ) | | | (0.18 | ) | | | $(0.01 | ) | | | (0.19 | ) | | | 11.68 | | | | (1.6 | ) | | | 11,910 | | | | 1.45 | | | | 0.75 | | | | 1.11 | | | | 20 | |
2012 | | | 11.92 | | | | 0.22 | | | | 0.21 | | | | 0.43 | | | | (0.22 | ) | | | (0.07 | ) | | | (0.29 | ) | | | 12.06 | | | | 3.6 | | | | 9,326 | | | | 1.82 | | | | 0.75 | | | | 1.08 | | | | 15 | |
| † | Total return represents aggregate total return of a hypothetical $1,000 investment at the beginning of the year and sold at the end of the year including reinvestment of distributions and does not reflect the applicable sales charges. |
| (a) | Per share data is calculated using the average shares outstanding method. |
See accompanying notes to financial statements.
46
TETON Westwood Funds
Notes to Financial Statements
1. Organization. The TETON Westwood Funds (the “Trust”) was organized as a Massachusetts business trust on June 12, 1986. The Trust is registered under the Investment Company Act of 1940, as amended (the “1940 Act”), as a diversified open-end management investment company and currently consists of seven active separate investment portfolios: TETON Westwood Mighty MitesSM Fund (“Mighty MitesSM Fund”), TETON Westwood SmallCap Equity Fund (“SmallCap Equity Fund”), TETON Westwood Mid-Cap Equity Fund (“Mid-Cap Equity Fund”), TETON Westwood Income Fund (“Income Fund”), TETON Westwood Equity Fund (“Equity Fund”), TETON Westwood Balanced Fund (“Balanced Fund”), and TETON Westwood Intermediate Bond Fund (“Intermediate Bond Fund”), (individually, a “Fund” and collectively, the “Funds”), each with four classes of shares. Each class of shares outstanding bears the same voting, dividend, liquidation, and other rights and conditions, except that the expenses incurred in the distribution and marketing of such shares are different for each class.
The investment objectives of each Fund are as follows:
| ● | | Mighty MitesSM Fund seeks to provide long term capital appreciation by investing primarily in micro-capitalization equity securities. |
| ● | | SmallCap Equity Fund seeks to provide long term capital appreciation by investing primarily in smaller capitalization equity securities. |
| ● | | Mid-Cap Equity Fund seeks to provide long term growth of capital and future income by investing primarily in mid-cap equity securities. |
| ● | | Income Fund seeks to provide a high level of current income as well as long term capital appreciation. |
| ● | | Equity Fund seeks to provide capital appreciation. The Equity Fund’s secondary goal is to produce current income. |
| ● | | Balanced Fund seeks to provide capital appreciation and current income resulting in a high total investment return consistent with prudent investment risk and a balanced investment approach. |
| ● | | Intermediate Bond Fund seeks to maximize total return, while maintaining a level of current income consistent with the maintenance of principal and liquidity. |
2. Significant Accounting Policies. As an investment company, the Trust follows the investment company accounting and reporting guidance, which is part of U.S. generally accepted accounting principles (“GAAP”) that may require the use of management estimates and assumptions in the preparation of its financial statements. Actual results could differ from those estimates. The following is a summary of significant accounting policies followed by the Trust in the preparation of its financial statements.
Security Valuation. Portfolio securities listed or traded on a nationally recognized securities exchange or traded in the U.S. over-the-counter market for which market quotations are readily available are valued at the last quoted sale price or a market’s official closing price as of the close of business on the day the securities are being valued. If there were no sales that day, the security is valued at the average of the closing bid and asked prices or, if there were no asked prices quoted on that day, then the security is valued at the closing bid price on that day. If no bid or asked prices are quoted on such day, the security is valued at the most recently available price or, if the Board of Trustees (the “Board”) so determines, by such other method as the Board shall determine in good faith to reflect its fair market value. Portfolio securities traded on more than one national securities exchange or market are valued according to the broadest and most representative market, as determined by Teton Advisors, Inc. (the “Adviser”). Investments in open-end investment companies are valued at each Underlying Fund’s NAV per share as of the report date.
Portfolio securities primarily traded on a foreign market are generally valued at the preceding closing values of such securities on the relevant market, but may be fair valued pursuant to procedures established by the Board if market conditions change significantly after the close of the foreign market, but prior to the close of business on the day the securities are being valued. Debt instruments with remaining maturities of sixty days or less that are not credit impaired are valued at amortized cost, unless the Board determines such amount does not reflect the securities’ fair value, in which case these securities will be fair valued as determined by the Board. Debt instruments having a maturity greater than sixty days for which market quotations are readily available are valued at the average of the latest bid and asked prices. If there were no asked prices quoted on such day, the security is valued using the closing bid price. U.S. government obligations with maturities greater than sixty days are normally valued using a model that incorporates market observable data such as reported sales of similar securities, broker quotes, yields, bids, offers, and reference data. Certain securities are valued principally using dealer quotations.
Securities and assets for which market quotations are not readily available are fair valued as determined by the Board. Fair valuation methodologies and procedures may include, but are not limited to: analysis and review of available financial and
47
TETON Westwood Funds
Notes to Financial Statements (Continued)
non-financial information about the company; comparisons with the valuation and changes in valuation of similar securities, including a comparison of foreign securities with the equivalent U.S. dollar value American Depositary Receipt securities at the close of the U.S. exchange; and evaluation of any other information that could be indicative of the value of the security.
The inputs and valuation techniques used to measure fair value of the Funds’ investments are summarized into three levels as described in the hierarchy below:
| | ● | | Level 1 — quoted prices in active markets for identical securities; |
| | ● | | Level 2 — other significant observable inputs (including quoted prices for similar securities, interest rates, prepayment speeds, credit risk, etc.); and |
| | ● | | Level 3 — significant unobservable inputs (including the Board’s determinations as to the fair value of investments). |
A financial instrument’s level within the fair value hierarchy is based on the lowest level of any input both individually and in the aggregate that is significant to the fair value measurement. The inputs or methodology used for valuing securities are not necessarily an indication of the risk associated with investing in those securities. The summary of the Funds’ investments in securities by inputs used to value the Funds’ investments as of September 30, 2016 is as follows:
| | | | | | | | | | | | | | | | |
| | | Valuation Inputs | | | | |
| | | Level 1 | | | Level 2 Other Significant | | | Level 3 Significant | | | Total Market Value | |
| | | Quoted Prices | | | Observable Inputs | | | Unobservable Inputs | | | at 9/30/16 | |
MIGHTY MITESSM FUND | | | | | | | | | | | | | | | | |
INVESTMENTS IN SECURITIES: | | | | | | | | | | | | | | | | |
ASSETS (Market Value): | | | | | | | | | | | | | | | | |
Common Stocks: | | | | | | | | | | | | | | | | |
Agriculture | | $ | 1,952,181 | | | $ | 144,563 | | | | — | | | $ | 2,096,744 | |
Airlines | | | 2,928,800 | | | | 198,000 | | | | — | | | | 3,126,800 | |
Automotive: Parts and Accessories | | | 41,178,058 | | | | 1,701 | | | | — | | | | 41,179,759 | |
Broadcasting | | | 14,035,722 | | | | 818,429 | | | | — | | | | 14,854,151 | |
Building and Construction | | | 13,466,557 | | | | 3,841,643 | | | | — | | | | 17,308,200 | |
Business Services | | | 35,969,945 | | | | 253,318 | | | | — | | | | 36,223,263 | |
Communications Equipment | | | 3,290,992 | | | | 32 | | | | — | | | | 3,291,024 | |
Consumer Products | | | 27,673,784 | | | | 19 | | | $ | 31 | | | | 27,673,834 | |
Consumer Services | | | 5,966,976 | | | | 81,125 | | | | — | | | | 6,048,101 | |
Diversified Industrial | | | 106,632,671 | | | | 608,941 | | | | — | | | | 107,241,612 | |
Educational Services | | | 129,940 | | | | — | | | | 476 | | | | 130,416 | |
Electronics | | | 41,242,627 | | | | 26,070 | | | | 12,754 | | | | 41,281,451 | |
Financial Services | | | 52,839,606 | | | | 7,250,886 | | | | 400,000 | | | | 60,490,492 | |
Food and Beverage | | | 47,247,114 | | | | 175,850 | | | | — | | | | 47,422,964 | |
Health Care | | | 88,274,111 | | | | — | | | | 640 | | | | 88,274,751 | |
Manufactured Housing and Recreational Vehicles | | | 7,787,472 | | | | 2,298,709 | | | | — | | | | 10,086,181 | |
Real Estate | | | 24,051,447 | | | | — | | | | 241,076 | | | | 24,292,523 | |
Specialty Chemicals | | | 30,073,895 | | | | 3,474 | | | | — | | | | 30,077,369 | |
Telecommunications | | | 34,624,637 | | | | 257,449 | | | | — | | | | 34,882,086 | |
Transportation | | | 3,821,560 | | | | — | | | | 465 | | | | 3,822,025 | |
Other Industries(a) | | | 347,294,111 | | | | — | | | | — | | | | 347,294,111 | |
Total Common Stocks | | | 930,482,206 | | | | 15,960,209 | | | | 655,442 | | | | 947,097,857 | |
Preferred Stocks(a) | | | 1,995,299 | | | | — | | | | — | | | | 1,995,299 | |
Convertible Preferred Stocks(a) | | | — | | | | 2,856,115 | | | | — | | | | 2,856,115 | |
Rights(a) | | | 106,800 | | | | 35,783 | | | | 262,000 | | | | 404,583 | |
Warrants(a) | | | 775 | | | | 50,525 | | | | — | | | | 51,300 | |
Corporate Bonds(a) | | | — | | | | 36,751 | | | | — | | | | 36,751 | |
U.S. Government Obligations | | | — | | | | 96,891,567 | | | | — | | | | 96,891,567 | |
TOTAL INVESTMENTS IN SECURITIES – ASSETS | | $ | 932,585,080 | | | $ | 115,830,950 | | | $ | 917,442 | | | $ | 1,049,333,472 | |
| | | | |
SMALLCAP EQUITY FUND | | | | | | | | | | | | | | | | |
INVESTMENTS IN SECURITIES: | | | | | | | | | | | | | | | | |
ASSETS (Market Value): | | | | | | | | | | | | | | | | |
Common Stocks(a) | | $ | 24,883,431 | | | | — | | | | — | | | | $ 24,883,431 | |
U.S. Government Obligations | | | — | | | $ | 3,063,009 | | | | — | | | | 3,063,009 | |
TOTAL INVESTMENTS IN SECURITIES – ASSETS | | $ | 24,883,431 | | | $ | 3,063,009 | | | | — | | | | $ 27,946,440 | |
48
TETON Westwood Funds
Notes to Financial Statements (Continued)
| | | | | | | | | | | | | | | | |
| | | Valuation Inputs | | | | |
| | | Level 1 Quoted Prices | | | Level 2 Other Significant
Observable Inputs | | | Level 3 Significant
Unobservable Inputs | | | Total Market Value
at 09/30/16 | |
MID-CAP EQUITY FUND | | | | | | | | | | | | | | | | |
INVESTMENTS IN SECURITIES: | | | | | | | | | | | | | | | | |
ASSETS (Market Value): | | | | | | | | | | | | | | | | |
Common Stocks(a) | | | $ 3,982,646 | | | | — | | | | — | | | | $ 3,982,646 | |
U.S. Government Obligations | | | — | | | | $ 99,971 | | | | — | | | | 99,971 | |
TOTAL INVESTMENTS IN SECURITIES – ASSETS | | | $ 3,982,646 | | | | $ 99,971 | | | | — | | | | $ 4,082,617 | |
| | | | |
INCOME FUND | | | | | | | | | | | | | | | | |
INVESTMENTS IN SECURITIES: | | | | | | | | | | | | | | | | |
ASSETS (Market Value): | | | | | | | | | | | | | | | | |
Convertible Corporate Bonds | | | — | | | | $ 189,125 | | | | — | | | | $ 189,125 | |
U.S. Government Obligations | | | — | | | | 1,964,404 | | | | — | | | | 1,964,404 | |
TOTAL INVESTMENTS IN SECURITIES – ASSETS | | | — | | | | $ 2,153,529 | | | | — | | | | $ 2,153,529 | |
| | | | |
EQUITY FUND | | | | | | | | | | | | | | | | |
INVESTMENTS IN SECURITIES: | | | | | | | | | | | | | | | | |
ASSETS (Market Value): | | | | | | | | | | | | | | | | |
Common Stocks(a) | | | $ 61,353,291 | | | | — | | | | — | | | | $ 61,353,291 | |
Short Term Investments | | | 633,701 | | | | — | | | | — | | | | 633,701 | |
TOTAL INVESTMENTS IN SECURITIES – ASSETS | | | $ 61,986,992 | | | | — | | | | — | | | | $ 61,986,992 | |
| | | | |
BALANCED FUND | | | | | | | | | | | | | | | | |
INVESTMENTS IN SECURITIES: | | | | | | | | | | | | | | | | |
ASSETS (Market Value): | | | | | | | | | | | | | | | | |
Common Stocks(a) | | | $ 42,281,106 | | | | — | | | | — | | | | $ 42,281,106 | |
Corporate Bonds(a) | | | — | | | | $ 13,619,690 | | | | — | | | | 13,619,690 | |
U.S. Government Agency Obligations | | | — | | | | 2,950,819 | | | | — | | | | 2,950,819 | |
U.S. Government Obligations | | | — | | | | 4,256,602 | | | | — | | | | 4,256,602 | |
Short Term Investments | | | 1,625,513 | | | | — | | | | — | | | | 1,625,513 | |
TOTAL INVESTMENTS IN SECURITIES – ASSETS | | | $ 43,906,619 | | | | $ 20,827,111 | | | | — | | | | $ 64,733,730 | |
| | | | |
INTERMEDIATE BOND FUND | | | | | | | | | | | | | | | | |
INVESTMENTS IN SECURITIES: | | | | | | | | | | | | | | | | |
ASSETS (Market Value): | | | | | | | | | | | | | | | | |
Corporate Bonds(a) | | | — | | | | $ 11,783,012 | | | | — | | | | $ 11,783,012 | |
U.S. Government Agency Obligations | | | — | | | | 2,321,441 | | | | — | | | | 2,321,441 | |
U.S. Government Obligations | | | — | | | | 4,015,109 | | | | — | | | | 4,015,109 | |
Short Term Investments | | | $ 2,001,870 | | | | — | | | | — | | | | 2,001,870 | |
TOTAL INVESTMENTS IN SECURITIES – ASSETS | | | $ 2,001,870 | | | | $ 18,119,562 | | | | — | | | | $ 20,121,432 | |
(a) Please refer to the Schedule of Investments for the industry classifications of these portfolio holdings.
During the year ended September 30, 2016, the Mighty MitesSM Fund had transfers of $9,371,785 or 0.86% of net assets as of September 30, 2015 from Level 1 to Level 2, and transfers of $7,393,340 or 0.67% of net assets as of September 30, 2015 from Level 2 to Level 1. Transfers from Level 1 to Level 2 are due to a decline in market activity (e.g.) frequency of trades, which resulted in a lack of available market inputs to determine price. Transfers from Level 2 to Level 1 are due to an increase in market activity (e.g. frequency of trades), which resulted in an increase in available market inputs to determine the price.
The SmallCap Equity Fund, Mid-Cap Equity Fund, Income Fund, Equity Fund, Balanced Fund, and Intermediate Bond Fund did not have transfers among Level 1, Level 2, and Level 3 during the year ended September 30, 2016. The Funds’ policy is to recognize transfers among Levels as of the beginning of the reporting period.
There were no Level 3 investments held at September 30, 2016 or September 30, 2015 for SmallCap Equity, Mid-Cap Equity Fund, Income Fund, Equity Fund, Balanced Fund, and Intermediate Bond Fund.
49
TETON Westwood Funds
Notes to Financial Statements (Continued)
The following table reconciles Level 3 investments for Mighty MitesSM Fund for which significant unobservable inputs were used to determine fair value:
| | | | | | | | | | | | | | | | | | | | | | | | | | | | | | | | | | | | | | | | |
MIGHTY MITESSM FUND | | Balance
as of
9/30/15 | | | Accrued
discounts/
(premiums) | | | Realized
gain/
(loss) | | | Change in
unrealized
appreciation/
depreciation† | | | Purchases | | | Sales | | | Transfers
into
Level 3 | | | Transfers
out of
Level 3 | | | Balance
as of
9/30/16 | | | Net change in
unrealized
appreciation/
depreciation
on Level 3
investments
still held
at 9/30/16† | |
| |
INVESTMENTS IN SECURITIES: | | | | | | | | | | | | | | | | | | | | | | | | | | | | | | | | | | | | | |
ASSETS (Market Value): | | | | | | | | | | | | | | | | | | | | | | | | | | | | | | | | | | | | | | | | |
Common Stocks: | | | | | | | | | | | | | | | | | | | | | | | | | | | | | | | | | | | | | | | | |
Health Care | | $ | 28,640 | | | | — | | | $ | 33,669 | | | $ | (28,000) | | | | — | | | $ | (33,669) | | | | — | | | | | | | $ | 640 | | | $ | (28,000) | |
Financial Services | | | 1,018,500 | | | | — | | | | 331,699 | | | | (274,599) | | | | — | | | | (675,600) | | | | — | | | | — | | | | 400,000 | | | | (274,599) | |
Real Estate | | | 274,770 | | | | — | | | | — | | | | (62,455) | | | $ | 28,761 | | | | — | | | | — | | | | — | | | | 241,076 | | | | (62,455) | |
Other Industries | | | 347,568 | | | | — | | | | — | | | | 510 | | | | — | | | | (58,542) | | | | — | | | $ | (275,810) | | | | 13,726 | | | | 510 | |
| |
Total Common Stocks | | | 1,669,478 | | | | — | | | | 365,368 | | | | (364,544) | | | | 28,761 | | | | (767,811) | | | | — | | | | (275,810) | | | | 655,442 | | | | (364,544) | |
| |
Convertible Preferred Stocks | | | 171,927 | | | | — | | | | — | | | | — | | | | — | | | | — | | | | — | | | | (171,927) | | | | — | | | | — | |
Rights | | | 262,000 | | | | — | | | | — | | | | — | | | | — | | | | — | | | | — | | | | — | | | | 262,000 | | | | — | |
Warrants | | | 10,035 | | | | — | | | | — | | | | — | | | | — | | | | — | | | | — | | | | (10,035) | | | | — | | | | — | |
Corporate Bonds | | | — | | | | — | | | | — | | | | — | | | | — | | | | — | | | | — | | | | — | | | | — | | | | — | |
| |
TOTAL INVESTMENTS IN SECURITIES | | $ | 2,113,440 | | | | — | | | $ | 365,368 | | | $ | (364,544) | | | $ | 28,761 | | | $ | (767,811) | | | | — | | | $ | (457,772) | | | $ | 917,442 | | | $ | (364,544) | |
| |
| † | Net change in unrealized appreciation/depreciation on investments is included in the related amounts in the Statement of Operations. |
The following tables summarize the valuation techniques used and unobservable inputs utilized to determine the value of certain of the Fund’s Level 3 investments as of September 30, 2016.
| | | | | | | | | | | | | | | | | | |
Description | | Balance at 9/30/16 | | Valuation Technique | | Unobservable Input | | Range | |
MIGHTY MITESSM FUND | | | | | | | | | | | | | | | | | | |
INVESTMENTS IN SECURITIES: | | | | | | | | | | | | | | | | | | |
ASSETS (Market Value): | | | | | | | | | | | | | | | | | | |
Common Stocks: | | | | | | | | | | | | | | | | | | |
Health Care | | | | | | | $ 640 | | | | | Last Price | | Discount Range | | | 0% | |
Financial Services | | | | | | | 400,000 | | | | | Last Price | | Discount Range | | | 0% | |
Real Estate | | | | | | | 241,076 | | | | | Restructure Plan/Cash Flow Analysis | | Discount Range | | | 0% | |
Other Industries (a) | | | | | | | 13,726 | | | | | | | | | | | |
Total Common Stocks | | | | | | | 655,442 | | | | | | | | | | | |
Preferred Stocks | | | | | | | | | | | | Last Price | | Discount Range | | | 0% | |
Rights | | | | | | | 262,000 | | | | | Last Price | | Discount Range | | | 0% | |
Warrants | | | | | | | | | | | | Black Scholes | | Discount Range | | | 0% | |
TOTAL INVESTMENTS IN SECURITIES | | | | | | | $917,442 | | | | | | | | | | | |
| | | | | | | | | | | | | |
| (a) | Includes securities whose fair values were developed using various valuation techniques and unobservable inputs. |
| | | | |
Unobservable Input | | Impact to Value if Input Increases | | Impact to Value if Input Decreases |
Discount Range | | Decrease | | Increase |
Additional Information to Evaluate Qualitative Information.
General. The Funds use recognized industry pricing services – approved by the Board and unaffiliated with the Adviser – to value most of their securities, and use broker quotes provided by market makers of securities not valued by these and other recognized pricing sources. Several different pricing feeds are received to value domestic equity securities, international equity securities, preferred equity securities, and fixed income securities. The data within these feeds is ultimately sourced from major stock exchanges and trading systems where these securities trade. The prices supplied by external sources are checked by obtaining quotations or actual transaction prices from market participants. If a price obtained from the pricing source is deemed unreliable, prices will be sought from another pricing service or from a broker/dealer that trades that security or similar securities.
50
TETON Westwood Funds
Notes to Financial Statements (Continued)
Fair Valuation. Fair valued securities may be common and preferred equities, warrants, options, rights, and fixed income obligations. Where appropriate, Level 3 securities are those for which market quotations are not available, such as securities not traded for several days or for which current bids are not available, or which are restricted as to transfer. Among the factors to be considered to fair value a security are recent prices of comparable securities that are publicly traded, reliable prices of securities not publicly traded, the use of valuation models, current analyst reports, valuing the income or cash flow of the issuer, or cost if the preceding factors do not apply. A significant change in the unobservable inputs could result in a lower or higher value in Level 3 securities. The circumstances of Level 3 securities are frequently monitored to determine if fair valuation measures continue to apply.
The Adviser reports quarterly to the Board the results of the application of fair valuation policies and procedures. These may include back testing the prices realized in subsequent trades of these fair valued securities to fair values previously recognized.
Foreign Currency Translations. The books and records of the Funds are maintained in U.S. dollars. Foreign currencies, investments, and other assets and liabilities are translated into U.S. dollars at current exchange rates. Purchases and sales of investment securities, income, and expenses are translated at the exchange rate prevailing on the respective dates of such transactions. Unrealized gains and losses that result from changes in foreign exchange rates and/or changes in market prices of securities have been included in unrealized appreciation/depreciation on investments and foreign currency translations. Net realized foreign currency gains and losses resulting from changes in exchange rates include foreign currency gains and losses between trade date and settlement date on investment securities transactions, foreign currency transactions, and the difference between the amounts of interest and dividends recorded on the books of the Funds and the amounts actually received. The portion of foreign currency gains and losses related to fluctuation in exchange rates between the initial purchase trade date and subsequent sale trade date is included in realized gain/(loss) on investments.
Foreign Securities. The Funds may directly purchase securities of foreign issuers. Investing in securities of foreign issuers involves special risks not typically associated with investing in securities of U.S. issuers. The risks include possible revaluation of currencies, the inability to repatriate funds, less complete financial information about companies, and possible future adverse political and economic developments. Moreover, securities of many foreign issuers and their markets may be less liquid and their prices more volatile than securities of comparable U.S. issuers.
Foreign Taxes. The Funds may be subject to foreign taxes on income, gains on investments, or currency repatriation, a portion of which may be recoverable. The Funds will accrue such taxes and recoveries as applicable, based upon their current interpretation of tax rules and regulations that exist in the markets in which they invest.
Restricted Securities. Each Fund may invest up to 10% (except for the Mighty MitesSM Fund, SmallCap Equity Fund, and Income Fund which may invest up to 15%) of its net assets in securities for which the markets are restricted. Restricted securities include securities whose disposition is subject to substantial legal or contractual restrictions. The sale of restricted securities often requires more time and results in higher brokerage charges or dealer discounts and other selling expenses than does the sale of securities eligible for trading on national securities exchanges or in the over-the-counter markets. Restricted securities may sell at a price lower than similar securities that are not subject to restrictions on resale. Securities freely saleable among qualified institutional investors under special rules adopted by the SEC may be treated as liquid if they satisfy liquidity standards established by the Board. The continued liquidity of such securities is not as well assured as that of publicly traded securities, and accordingly the Board will monitor their liquidity. At September 30, 2016, the Funds did not hold any restricted securities.
Investments in other Investment Companies. All Funds may invest, from time to time, in shares of other investment companies (or entities that would be considered investment companies but are excluded from the definition pursuant to certain exceptions under the 1940 Act) (the “Acquired Funds”) in accordance with the 1940 Act and related rules. Shareholders in these Funds would bear the pro rata portion of the periodic expenses of the Acquired Funds in addition to the Fund’s expenses. For the year ended September 30, 2016, both the Mighty MitesSM Fund’s and Intermediate Bond Fund’s pro rata portion of the periodic expenses charged by the Acquired Funds was 1 basis point. For the year ended September 30, 2016, the Equity Fund’s and Balanced Fund’s pro rata portion of the periodic expenses charged by the Acquired Funds was less than one basis point. During the year ended September 30, 2016, the SmallCap Equity Fund, Mid-Cap Equity Fund, and Income Fund held no investments in other investment companies.
Securities Transactions and Investment Income. Securities transactions are accounted for on the trade date with realized gain or loss on investments determined by using the identified cost method. Interest income (including amortization of premium and accretion of discount) is recorded on the accrual basis. Premiums and discounts on debt securities are amortized using
51
TETON Westwood Funds
Notes to Financial Statements (Continued)
the effective yield to maturity method. Dividend income is recorded on the ex-dividend date except for certain dividends from foreign securities that are recorded as soon after the ex-dividend date as a Fund becomes aware of such dividends.
Determination of Net Asset Value and Calculation of Expenses. Certain administrative expenses are common to, and allocated among, various affiliated funds. Such allocations are made on the basis of each fund’s average net assets or other criteria directly affecting the expenses as determined by the Adviser pursuant to procedures established by the Board.
In calculating the NAV per share of each class, investment income, realized and unrealized gains and losses, redemption fees, and expenses other than class specific expenses are allocated daily to each class of shares based upon the proportion of net assets of each class at the beginning of each day. Distribution expenses are borne solely by the class incurring the expense.
Custodian Fee Credits and Interest Expense. When cash balances are maintained in a Fund’s custody account, the Fund receives credits which are used to offset custodian fees. The gross expenses paid under each custody arrangement are included in custodian fees in the Statements of Operations with the corresponding expense offset, if any, shown as “Custodian fee credits.” When cash balances are overdrawn, a Fund is charged an overdraft fee equal to 90% of the current Treasury Bill rate on outstanding balances. These amounts, if any, would be included in the Statements of Operations.
Distributions to Shareholders. Distributions from net investment income are declared and paid annually for the Mighty MitesSM Fund, SmallCap Equity Fund, Mid-Cap Equity Fund, and Equity Fund, and quarterly for the Income Fund and Balanced Fund. The Intermediate Bond Fund declares dividends daily and pays those dividends monthly. Distributions of net realized gain on investments are normally declared and paid at least annually by each Fund. Distributions to shareholders are recorded on the ex-dividend date. Distributions to shareholders are based on income and capital gains as determined in accordance with federal income tax regulations, which may differ from income and capital gains as determined under GAAP. These differences are primarily due to differing treatments of income and gains on various investment securities and foreign currency transactions held by the Funds, timing differences, net operating loss write off, and differing characterizations of distributions made by the Funds. Distributions from net investment income for federal income tax purposes include net realized gains on foreign currency transactions. These book/tax differences are either temporary or permanent in nature. To the extent these differences are permanent, adjustments are made to the appropriate capital accounts in the period when the differences arise. These reclassifications have no impact on the NAV of the Funds.
For the year ended September 30, 2016, the following reclassifications were made to increase/decrease such amounts with offsetting adjustments to paid-in capital:
| | | | | | | | | | | | |
| | | Accumulated | | | Accumulated Net | | | | |
| | | Net | | | Realized Gain | | | | |
| | | Investment | | | (Loss) on | | | Paid-in | |
| | | Income (Loss) | | | Investments | | | Capital | |
Mighty MitesSM Fund | | | $2,464,548 | | | | $(759,779) | | | $ | (1,704,769 | ) |
SmallCap Equity Fund | | | 150,286 | | | | — | | | | (150,286 | ) |
Mid-Cap Equity Fund | | | 24,696 | | | | (1,505) | | | | (23,191 | ) |
Income Fund | | | (5,356) | | | | 5,617 | | | | (261 | ) |
Equity Fund | | | (2,232) | | | | 2,232 | | | | — | |
Balanced Fund | | | 4,977 | | | | (4,977) | | | | — | |
Intermediate Bond Fund | | | 31 | | | | (31) | | | | — | |
52
TETON Westwood Funds
Notes to Financial Statements (Continued)
The tax character of distributions paid during the years ended September 30, 2016 and 2015 was as follows:
| | | | | | | | | | | | | | | | | | | | | | | | | | | | | | | | | | | | | | | | |
| | | Year Ended
September 30, | | Year Ended
September 30, | | Year Ended
September 30, | | Year Ended
September 30, |
| | | 2016 | | 2015 | | 2016 | | 2015 | | 2016 | | 2015 | | 2016 | | 2015 |
| | | Mighty Mites SM Fund | | SmallCap Equity Fund | | Mid-Cap Equity Fund | | Income Fund |
Ordinary Income (inclusive of short term capital gains) | | | $ | — | | | | $ | — | | | | $ | — | | | | $ | — | | | | $ | — | | | | $ | 37,465 | | | | $ | 19,307 | | | | $ | 17,074 | |
Net long term capital gains | | | | 25,421,356 | | | | | 23,968,954 | | | | | 3,743,714 | | | | | 3,156,477 | | | | | 201,278 | | | | | 18,169 | | | | | — | | | | | — | |
| | | | | | | | | | | | | | | | | | | | | | | | | | | | | | | | | | | | | | | | |
Total distributions paid | | | $ | 25,421,356 | | | | $ | 23,968,954 | | | | $ | 3,743,714 | | | | $ | 3,156,477 | | | | $ | 201,278 | | | | $ | 55,634 | | | | $ | 19,307 | | | | $ | 17,074 | |
| | | | | | | | | | | | | | | | | | | | | | | | | | | | | | | | | | | | | | | | |
| | | Equity Fund | | Balanced Fund | | Intermediate Bond Fund | | | | |
Ordinary Income (inclusive of short term capital gains) | | | $ | 248,032 | | | | $ | 271,551 | | | | $ | 669,455 | | | | $ | 1,479,039 | | | | $ | 306,332 | | | | $ | 350,106 | | | | | | | | | | | |
Net long term capital gains | | | | 4,754,811 | | | | | 6,552,450 | | | | | 4,706,472 | | | | | 5,654,653 | | | | | 345,369 | | | | | — | | | | | | | | | | | |
| | | | | | | | | | | | | | | | | | | | | | | | | | | | | | | | | | | | | | | | |
Total distributions paid | | | $ | 5,002,843 | | | | $ | 6,824,001 | | | | $ | 5,375,927 | | | | $ | 7,133,692 | | | | $ | 651,701 | | | | $ | 350,106 | | | | | | | | | | | |
| | | | | | | | | | | | | | | | | | | | | | | | | | | | | | | | | | | | | | | | |
Provision for Income Taxes. The Funds intend to continue to qualify as regulated investment companies under Subchapter M of the Internal Revenue Code of 1986, as amended (the “Code”). It is the policy of the Funds to comply with the requirements of the Code applicable to regulated investment companies and to distribute substantially all of the Funds’ net investment company taxable income and net capital gains. Therefore, no provision for federal income taxes is required.
At September 30, 2016, the components of accumulated earnings/losses on a tax basis were as follows:
| | | | | | | | | | | | | | | | | | | | | | | | | | | | | | | | | | | |
| | | Mighty
MitesSM
Fund | | SmallCap
Equity
Fund | | Mid-Cap
Equity
Fund | | Income
Fund | | Equity
Fund | | Balanced
Fund | | Intermediate
Bond Fund |
Undistributed ordinary income (inclusive of short term capital gains) | | | | — | | | | | — | | | | | — | | | | $ | 1,997 | | | | $ | 246,663 | | | | | — | | | | $ | 99,422 | |
Undistributed long term capital gain | | | $ | 50,986,398 | | | | $ | 1,525,663 | | | | $ | 44,496 | | | | | 307,456 | | | | | 3,303,157 | | | | $ | 3,056,857 | | | | | 39,858 | |
Accumulated capital loss carryforward | | | | — | | | | | — | | | | | — | | | | | — | | | | | — | | | | | — | | | | | — | |
Unrealized appreciation/(depreciation) | | | | 321,360,991 | | | | | 6,512,634 | | | | | 385,755 | | | | | (1,877 | ) | | | | 10,384,965 | | | | | 8,553,888 | | | | | 615,655 | |
Qualified late year loss deferral* | | | | (6,466,810 | ) | | | | (37,000 | ) | | | | (11,292 | ) | | | | — | | | | | — | | | | | — | | | | | — | |
Other temporary differences | | | | — | | | | | — | | | | | — | | | | | — | | | | | — | | | | | — | | | | | — | |
| | | | | | | | | | | | | | | | | | | | | | | | | | | | | | | | | | | |
Total accumulated earnings | | | $ | 365,880,579 | | | | $ | 8,001,297 | | | | $ | 418,959 | | | | $ | 307,576 | | | | $ | 13,934,785 | | | | $ | 11,610,745 | | | | $ | 754,935 | |
| | | | | | | | | | | | | | | | | | | | | | | | | | | | | | | | | | | |
| * | Qualified late year losses related to passive foreign investment companies, ordinary losses, and losses on sales of securities and foreign currency realized after October 31(certain ordinary losses incurred after December 31) and prior to the Funds’ year end may be elected as occurring on the first day of the following year. |
At September 30, 2016, the following Funds had net capital loss carryforwards for federal income tax purposes, which are available to reduce future required distributions of net capital gains to shareholders. The Funds are permitted to carry capital losses incurred after December 22, 2010 forward for an unlimited period as either short term or long term capital losses. In addition, these losses must be utilized prior to the losses incurred prior to that date, which are treated as short term capital losses. As a result, capital loss carryforwards incurred prior to December 22, 2010 may have an increased likelihood of expiring unused.
During the year ended September 30, 2016, the Income Fund utilized capital loss carryforwards of $1,342,308.
At September 30, 2016, the temporary differences between book basis and tax basis unrealized appreciation/depreciation on investments was primarily due to deferral of losses from wash sales for tax purposes, mark-to-market adjustments on investments in passive foreign investment companies, investments in REITs, and basis adjustments in partnerships.
53
TETON Westwood Funds
Notes to Financial Statements (Continued)
The following summarizes the tax cost of investments and the related net unrealized appreciation/depreciation at September 30, 2016:
| | | | | | | | | | | | | | | | | | | | | | | | | | | | |
| | | Mighty
MitesSM
Fund | | | SmallCap
Equity
Fund | | | Mid-Cap
Equity
Fund | | | Income
Fund | | | Equity
Fund | | | Balanced
Fund | | | Intermediate
Bond Fund | |
Aggregate cost of investments | | $ | 727,971,302 | | | $ | 21,433,806 | | | $ | 3,696,862 | | | $ | 2,155,406 | | | $ | 51,602,027 | | | $ | 56,179,842 | | | $ | 19,505,777 | |
| | | | | | | | | | | | | | | | | | | | | | | | | | | | |
Gross unrealized appreciation | | $ | 380,086,591 | | | $ | 6,974,720 | | | $ | 605,159 | | | $ | 57 | | | $ | 11,100,870 | | | $ | 9,046,081 | | | $ | 618,917 | |
Gross unrealized depreciation | | | (58,724,421 | ) | | | (462,086 | ) | | | (219,404 | ) | | | (1,934 | ) | | | (715,905 | ) | | | (492,193 | ) | | | (3,262 | ) |
| | | | | | | | | | | | | | | | | | | | | | | | | | | | |
Net unrealized appreciation/depreciation | | $ | 321,362,170 | | | $ | 6,512,634 | | | $ | 385,755 | | | $ | (1,877 | ) | | $ | 10,384,965 | | | $ | 8,553,888 | | | $ | 615,655 | |
| | | | | | | | | | | | | | | | | | | | | | | | | | | | |
The Funds are required to evaluate tax positions taken or expected to be taken in the course of preparing the Funds’ tax returns to determine whether the tax positions are “more-likely-than-not” of being sustained by the applicable tax authority. Income tax and related interest and penalties would be recognized by the Funds as tax expense in the Statement of Operations if the tax positions were deemed not to meet the more-likely-than-not threshold. As of September 30, 2016, the Adviser has reviewed all open tax years and concluded that there was no impact to the Funds’ net assets or results of operations. The Funds’ federal and state tax returns for the prior three fiscal years remain open, subject to examination by the Internal Revenue Service and state taxing authorities. On an ongoing basis, the Adviser will monitor the Funds’ tax positions to determine if adjustments to this conclusion are necessary.
3. Investment Advisory Agreements and Other Transactions. The Funds have entered into investment advisory agreements (the “Advisory Agreements”) with the Adviser which provide that the Funds will pay the Adviser a fee, computed daily and paid monthly, at the annual rate of 1.00% for the Mighty MitesSM Fund, SmallCap Equity Fund, Mid-Cap Equity Fund, Income Fund, and Equity Fund, 0.75% for the Balanced Fund, and 0.60% for the Intermediate Bond Fund, of the value of a Fund’s average daily net assets. In accordance with the Advisory Agreements, the Adviser provides a continuous investment program for the Funds’ portfolios, oversees the administration of all aspects of the Funds’ business and affairs, and pays the compensation of all Officers and Trustees of the Funds who are affiliated persons of the Adviser.
There was a reduction in the advisory fee paid to the Adviser relating to certain portfolio holdings, i.e., unsupervised assets, of the Mighty MitesSM Fund with respect to which the Adviser transferred dispositive and voting control to the Funds’ Proxy Voting Committee. During the year ended September 30, 2016, the Funds’ Proxy Voting Committee exercised control and discretion over all rights to vote or consent with respect to such securities, and the Adviser reduced its fee with respect to such securities by $47,902.
The Adviser has contractually agreed to waive investment advisory fees and/or to reimburse expenses to the SmallCap Equity Fund, Mid-Cap Equity Fund, Income Fund, and Intermediate Bond Fund in the event annual expenses of such Funds exceed certain prescribed limits. Such fee waiver/reimbursement arrangements continue at least until January 31, 2017. For the year ended September 30, 2016, the Adviser waived fees or reimbursed expenses in the amounts of $62,663, $83,891, $52,910, and $82,578 for the SmallCap Equity Fund, Mid-Cap Equity Fund, Income Fund, and Intermediate Bond Fund, respectively. In addition, the SmallCap Equity Fund, Income Fund, and Intermediate Bond Fund are obliged to repay the Adviser for a period of two fiscal years following the fiscal year in which the Adviser reimbursed the Funds only to the extent that the operating expenses of the Funds fall below the applicable expense limitation for Class AAA Shares of 1.50%, 2.00%, and 1.00%, respectively, and for Class A Shares of 1.75%, 2.25%, and 1.10%, respectively, and for Class C Shares of 2.25%, 2.75%, and 1.75%, respectively, and for Class I Shares of 1.25%, 1.75%, and 0.75%, respectively, of average daily net assets, the annual limitation under the Advisory Agreements. As of September 30, 2016, the cumulative unreimbursed amounts which may be recovered by the Adviser within the next two fiscal years are as follows:
| | | | | | |
| | | For the year ended
September 30, 2015,
expiring
September 30, 2017 | | For the year ended
September 30, 2016,
expiring
September 30, 2018 | | Total |
SmallCap Equity Fund | | $56,530 | | $62,663 | | $119,193 |
Income Fund | | 32,907 | | 52,910 | | 85,817 |
Intermediate Bond Fund | | 74,038 | | 82,578 | | 156,616 |
The Mid-Cap Equity Fund is obliged to repay the Adviser for a period of three fiscal years following the fiscal year in which the Adviser reimbursed the Fund, only to the extent that the operating expenses of the Fund falls below the applicable expense limitation for Class AAA of 1.05%, Class A of 1.30%, Class C of 1.80%, and Class I of 0.80%, of average daily net assets, the annual limitation under the Advisory Agreement. As of September 30, 2016, the cumulative unreimbursed amounts which may be recovered by the Adviser within the next three fiscal years are as follows:
54
TETON Westwood Funds
Notes to Financial Statements (Continued)
| | | | | | | | |
| | | For the year ended
September 30, 2014,
expiring
September 30, 2017 | | For the year ended
September 30, 2015,
expiring
September 30, 2018 | | For the year ended
September 30, 2016,
expiring
September 30, 2019 | | Total |
Mid-Cap Equity Fund | | $92,134 | | $63,105 | | $83,891 | | $239,130 |
The Adviser has a Subadvisory Agreement with Westwood Management Corp. (the “Subadviser”) for the Equity Fund, Balanced Fund, and Intermediate Bond Fund. The Adviser paid the Subadviser out of its advisory fees with respect to these three Funds a fee, computed daily and payable monthly, in an amount equal on an annualized basis to the greater of (i) $150,000 per year on an aggregate basis for all applicable Funds or (ii) 35% of the net revenues to the Adviser from the applicable Funds.
The Adviser has a sub-administration agreement for each of the Funds with Gabelli Funds, LLC, an affiliate. Gabelli Funds, LLC has entered into an agreement with BNY Mellon Investment Servicing (US) Inc. to provide certain administrative services to the Funds.
As per the approval of the Board, the Mid-Cap Equity Fund compensates officers of the Fund, who are employed by the Fund and are not employed by the Adviser (although the officers may receive incentive based variable compensation from affiliates of the Adviser). For the year ended September 30, 2016, the Fund paid or accrued $2,274 in payroll expenses in the Statement of Operations.
The Trust pays each Trustee who is not considered an affiliated person an annual retainer of $9,000 plus $2,000 for each Board meeting attended, and they are reimbursed by the Trust for any out of pocket expenses incurred in attending meetings. All Board committee members receive $1,000 per meeting attended, the Chairman of the Audit Committee receives a $3,000 annual fee, and the Lead Trustee receives an annual fee of $2,000. A Trustee may receive a single meeting fee, allocated among the participating funds, for attending certain meetings held on behalf of multiple funds. Trustees who are directors or employees of the Adviser or an affiliated company receive no compensation or expense reimbursement from the Trust.
4. Distribution Plan. The Trust’s Board has adopted a distribution plan (the “Plan”) for each class of shares, except Class I Shares, pursuant to Rule 12b-1 under the 1940 Act. Under the Class AAA, Class A, and Class C Share Plans, payments are authorized to G.distributors, LLC (the “Distributor”), an affiliate of the Adviser, at annual rates of 0.25%, 0.50% (for the Intermediate Bond Fund’s Class A Shares at an annual rate of 0.35%), and 1.00%, respectively, of the average daily net assets of those classes, the annual limitations under each Plan. Such payments are accrued daily and paid monthly.
5. Portfolio Securities. Purchases and sales (including maturities) of securities during the year ended September 30, 2016, other than short term securities, are as follows:
| | | | | | | | | | | | | | | | | | | | |
| | | Purchases
(excluding U.S.
Government
Securities) | | Sales
(excluding U.S.
Government
Securities) | | Purchases
of U.S.
Government
Securities | | Sales of U.S.
Government
Securities |
Mighty MitesSM Fund | | | | $57,808,427 | | | | | $186,036,734 | | | | | — | | | | | — | |
SmallCap Equity Fund | | | | 3,960,598 | | | | | 6,081,973 | | | | | — | | | | | — | |
Mid-Cap Equity Fund | | | | 625,821 | | | | | 1,823,255 | | | | | — | | | | | — | |
Income Fund | | | | 1,339,241 | | | | | 8,922,781 | | | | | — | | | | | — | |
Equity Fund | | | | 19,427,716 | | | | | 23,781,329 | | | | | — | | | | | — | |
Balanced Fund | | | | 13,783,564 | | | | | 20,384,130 | | | | $ | 1,299,890 | | | | $ | 2,707,580 | |
Intermediate Bond Fund | | | | 1,919,730 | | | | | 3,532,442 | | | | | 6,508,283 | | | | | 5,631,331 | |
6. Transactions with Affiliates and Other Arrangements. During the year ended September 30, 2016, the Mighty MitesSM Fund paid $108,700 in brokerage commissions on security trades to G.research, LLC, an affiliate of the Adviser. Additionally, the Distributor retained a total of $63,293 from investors representing commissions (sales charges and underwriting fees) on sales and redemptions of Fund shares.
Pursuant to Rule 17a-7 under the 1940 Act, the Funds may engage in purchase or sale transactions with other funds managed by the Adviser or an affiliated adviser. During the year ended September 30, 2016, such transactions for the Mighty MitesSM Fund amounted to $6,893,524 in purchase transactions and $6,925,000 in sale transactions.
During the year ended September 30, 2016, the Mighty MitesSM Fund, SmallCap Equity Fund, Mid-Cap Equity Fund, Income Fund, Equity Fund, and Balanced Fund received credits from a designated broker who agreed to pay certain Fund operating expenses. The amount of such expenses paid through this directed brokerage arrangement during this period was $7,807, $2,572, $2,173, $766, $2,001, and $2,155, respectively.
55
TETON Westwood Funds
Notes to Financial Statements (Continued)
The cost of calculating each Fund’s NAV per share is a Fund expense pursuant to the Advisory Agreement. During the year ended September 30, 2016, the Mighty MitesSM Fund, Equity Fund, and Balanced Fund each paid or accrued $45,000 to the Gabelli Funds, LLC, an affiliate of the Adviser, in connection with the cost of computing these Funds’ NAVs. This expense was not charged during the year ended September 30, 2016 for the SmallCap Equity Fund, Mid-Cap Equity Fund, Income Fund, and Intermediate Bond Fund.
As of September 30, 2016, the Mid-Cap Equity Fund’s Adviser and its affiliates and officers beneficially owned greater than 25% of the voting securities of the Mid-Cap Equity Fund. This includes accounts for which the affiliates of the Adviser have voting control but disclaim pecuniary interest.
7. Shares of Beneficial Interest. The Funds offer four classes of shares – Class AAA Shares, Class A Shares, Class C Shares, and Class I Shares. Class AAA Shares and Class I Shares are offered without a sales charge. Class A Shares are subject to a maximum front-end sales charge of 4.00% and Class C Shares are subject to a 1.00% contingent deferred sales charge for one year after purchase.
The Mighty MitesSM Fund, SmallCap Equity Fund, Mid-Cap Equity Fund, and Income Fund impose a redemption fee of 2.00% on all classes of shares that are redeemed or exchanged on or before the seventh day of a purchase. The redemption fee is deducted from the proceeds otherwise payable to the redeeming shareholders and is retained by the respective Fund as an increase in paid-in capital. The redemption fees, if any, retained by the Fund during the years ended September 30, 2016 and 2015, can be found in the Statements of Changes in Net Assets under Redemption Fees.
Transactions in shares of beneficial interest were as follows:
| | | | | | | | | | | | | | | | | | | | | | | | | | | | | | | | |
| | | Year Ended
September 30,
2016 | | | Year Ended
September 30,
2015 | | | Year Ended
September 30,
2016 | | | Year Ended
September 30,
2015 | | | Year Ended
September 30,
2016 | | | Year Ended
September 30,
2015 | | | Year Ended
September 30,
2016 | | | Year Ended
September 30,
2015 | |
| | | Mighty MitesSM Fund | | | SmallCap Equity Fund | | | Mid-Cap Equity Fund | | | Income Fund | |
Class AAA | | | | | | | | | | | | | | | | | | | | | | | | | | | | | | | | |
Shares sold | | | 1,108,002 | | | | 1,876,375 | | | | 234,709 | | | | 40,710 | | | | 33,210 | | | | 50,974 | | | | 41,878 | | | | 116,255 | |
Shares issued upon reinvestment of distributions | | | 259,282 | | | | 266,265 | | | | 64,906 | | | | 56,123 | | | | 6,030 | | | | 1,649 | | | | 1,413 | | | | 1,116 | |
Shares redeemed | | | (3,047,247 | ) | | | (5,967,973 | ) | | | (145,802 | ) | | | (442,812 | ) | | | (62,121 | ) | | | (22,866 | ) | | | (201,855 | ) | | | (122,200 | ) |
| | | | | | | | | | | | | | | | | | | | | | | | | | | | | | | | |
Net increase/(decrease) in Class AAA Shares | | | (1,679,963 | ) | | | (3,825,333 | ) | | | 153,813 | | | | (345,979 | ) | | | (22,881 | ) | | | 29,757 | | | | (158,564 | ) | | | (4,829 | ) |
| | | | | | | | | | | | | | | | | | | | | | | | | | | | | | | | |
Class A | | | | | | | | | | | | | | | | | | | | | | | | | | | | | | | | |
Shares sold | | | 623,365 | | | | 1,231,995 | | | | 14,521 | | | | 14,159 | | | | 1,885 | | | | 6,531 | | | | 30,984 | | | | 19,195 | |
Shares issued upon reinvestment of distributions | | | 138,595 | | | | 118,516 | | | | 27,376 | | | | 15,562 | | | | 1,717 | | | | 575 | | | | 144 | | | | 135 | |
Shares redeemed | | | (2,040,276 | ) | | | (1,961,586 | ) | | | (66,315 | ) | | | (61,938 | ) | | | (29,547 | ) | | | (14,199 | ) | | | (30,855 | ) | | | (2,981 | ) |
| | | | | | | | | | | | | | | | | | | | | | | | | | | | | | | | |
Net increase/(decrease) in Class A Shares | | | (1,278,316 | ) | | | (611,075 | ) | | | (24,418 | ) | | | (32,217 | ) | | | (25,945 | ) | | | (7,093 | ) | | | 273 | | | | 16,349 | |
| | | | | | | | | | | | | | | | | | | | | | | | | | | | | | | | |
Class C | | | | | | | | | | | | | | | | | | | | | | | | | | | | | | | | |
Shares sold | | | 855,795 | | | | 3,670,354 | | | | 43,485 | | | | 15,224 | | | | 2,153 | | | | 3,724 | | | | 3,386 | | | | 6,684 | |
Shares issued upon reinvestment of distributions | | | 192,502 | | | | 158,994 | | | | 30,432 | | | | 14,612 | | | | 1,041 | | | | 219 | | | | 44 | | | | 4 | |
Shares redeemed | | | (2,579,797 | ) | | | (4,380,129 | ) | | | (122,683 | ) | | | (68,572 | ) | | | (10,873 | ) | | | (501 | ) | | | (15,911 | ) | | | (5,531 | ) |
| | | | | | | | | | | | | | | | | | | | | | | | | | | | | | | | |
Net increase/(decrease) in Class C Shares | | | (1,531,500 | ) | | | (550,781 | ) | | | (48,766 | ) | | | (38,736 | ) | | | (7,679 | ) | | | 3,442 | | | | (12,481 | ) | | | 1,157 | |
| | | | | | | | | | | | | | | | | | | | | | | | | | | | | | | | |
Class I | | | | | | | | | | | | | | | | | | | | | | | | | | | | | | | | |
Shares sold | | | 4,274,466 | | | | 7,271,067 | | | | 55,025 | | | | 361,288 | | | | 7,540 | | | | 19,331 | | | | 14,366 | | | | 2,620 | |
Shares issued upon reinvestment of distributions | | | 301,122 | | | | 276,914 | | | | 85,940 | | | | 24,667 | | | | 7,465 | | | | 2,109 | | | | 122 | | | | 91 | |
Shares redeemed | | | (7,539,199 | ) | | | (7,981,594 | ) | | | (100,925 | ) | | | (695,081 | ) | | | (49,233 | ) | | | (43,212 | ) | | | (4,346 | ) | | | (3,515 | ) |
| | | | | | | | | | | | | | | | | | | | | | | | | | | | | | | | |
Net increase/(decrease) in Class I Shares | | | (2,963,611 | ) | | | (433,613 | ) | | | 40,040 | | | | (309,126 | ) | | | (34,228 | ) | | | (21,772 | ) | | | 10,142 | | | | (804 | ) |
| | | | | | | | | | | | | | | | | | | | | | | | | | | | | | | | |
56
TETON Westwood Funds
Notes to Financial Statements (Continued)
Transactions in shares of beneficial interest (continued):
| | | | | | | | | | | | | | | | | | | | | | | | | | | | | | |
| | | Year Ended
September 30,
2016 | | Year Ended
September 30,
2015 | | Year Ended
September 30,
2016 | | Year Ended
September 30,
2015 | | Year Ended
September 30,
2016 | | Year Ended
September 30,
2015 |
| | | |
| | | Equity Fund | | Balanced Fund | | Intermediate
Bond Fund |
Class AAA | | | | | | | | | | | | | | | | | | | | | | | | | | | | | | |
Shares sold | | | | 90,589 | | | | | 92,359 | | | | | 488,294 | | | | | 399,699 | | | | | 52,001 | | | | | 61,913 | |
Shares issued upon reinvestment of distributions | | | | 339,336 | | | | | 446,635 | | | | | 366,531 | | | | | 462,389 | | | | | 12,657 | | | | | 6,695 | |
Shares redeemed | | | | (572,249 | ) | | | | (622,891 | ) | | | | (1,197,557 | ) | | | | (1,612,887 | ) | | | | (142,638 | ) | | | | (78,739 | ) |
| | | | | | | | | | | | | | | | | | | | | | | | | | | | | | |
Net decrease in Class AAA Shares | | | | (142,324 | ) | | | | (83,897 | ) | | | | (342,732 | ) | | | | (750,799 | ) | | | | (77,980 | ) | | | | (10,131 | ) |
| | | | | | | | | | | | | | | | | | | | | | | | | | | | | | |
Class A | | | | | | | | | | | | | | | | | | | | | | | | | | | | | | |
Shares sold | | | | 89,464 | | | | | 25,507 | | | | | 129,287 | | | | | 88,796 | | | | | 20,242 | | | | | 25,865 | |
Shares issued upon reinvestment of distributions | | | | 23,526 | | | | | 24,840 | | | | | 40,716 | | | | | 47,650 | | | | | 2,188 | | | | | 1,139 | |
Shares redeemed | | | | (72,951 | ) | | | | (38,525 | ) | | | | (132,507 | ) | | | | (74,649 | ) | | | | (23,049 | ) | | | | (37,149 | ) |
| | | | | | | | | | | | | | | | | | | | | | | | | | | | | | |
Net increase/(decrease) in Class A Shares | | | | 40,039 | | | | | 11,822 | | | | | 37,496 | | | | | 61,797 | | | | | (619 | ) | | | | (10,145 | ) |
| | | | | | | | | | | | | | | | | | | | | | | | | | | | | | |
Class C | | | | | | | | | | | | | | | | | | | | | | | | | | | | | | |
Shares sold | | | | 14,105 | | | | | 28,053 | | | | | 111,079 | | | | | 66,680 | | | | | 297,295 | | | | | 17,718 | |
Shares issued upon reinvestment of distributions | | | | 4,124 | | | | | 6,603 | | | | | 28,701 | | | | | 34,319 | | | | | 1,175 | | | | | 283 | |
Shares redeemed | | | | (6,228 | ) | | | | (27,620 | ) | | | | (115,225 | ) | | | | (67,665 | ) | | | | (231,188 | ) | | | | (27,481 | ) |
| | | | | | | | | | | | | | | | | | | | | | | | | | | | | | |
Net increase/(decrease) in Class C Shares | | | | 12,001 | | | | | 7,036 | | | | | 24,555 | | | | | 33,334 | | | | | 67,282 | | | | | (9,480 | ) |
| | | | | | | | | | | | | | | | | | | | | | | | | | | | | | |
Class I | | | | | | | | | | | | | | | | | | | | | | | | | | | | | | |
Shares sold | | | | 82,472 | | | | | 153,069 | | | | | 23,460 | | | | | 16,975 | | | | | 212,571 | | | | | 287,280 | |
Shares issued upon reinvestment of distributions | | | | 22,834 | | | | | 23,085 | | | | | 12,676 | | | | | 16,266 | | | | | 40,492 | | | | | 21,125 | |
Shares redeemed | | | | (122,220 | ) | | | | (80,695 | ) | | | | (33,059 | ) | | | | (63,700 | ) | | | | (166,930 | ) | | | | (450,894 | ) |
| | | | | | | | | | | | | | | | | | | | | | | | | | | | | | |
Net increase/(decrease) in Class I Shares | | | | (16,914 | ) | | | | 95,459 | | | | | 3,077 | | | | | (30,459 | ) | | | | 86,133 | | | | | (142,489 | ) |
| | | | | | | | | | | | | | | | | | | | | | | | | | | | | | |
8. Transactions in Securities of Affiliated Issuers. The 1940 Act defines affiliated issuers as those in which a Fund’s holdings of an issuer represent 5% or more of the outstanding voting securities of the issuer. A summary of the Mighty MitesSM Fund’s transactions in the securities of these issuers during the year ended September 30, 2016 is set forth below:
| | | | | | | | | | | | | | | | | | | | | | | | | | | | | | | | |
| | | Beginning
Shares | | | Shares
Purchased | | | Shares
Sold | | | Ending
Shares | | | Dividend Income | | | Realized Loss | | | Market Value at September 30, 2016 | | | Percent Owned of Shares Outstanding | |
ACME Communications Inc.* | | | 1,135,036 | | | | — | | | | (520,836 | ) | | | 614,200 | | | | — | | | | — | | | | — | | | | — | |
Beasley Broadcast Group Inc., Cl. A | | | 725,800 | | | | 6,433 | | | | — | | | | 732,233 | | | $ | 131,673 | | | | — | | | | $ 3,976,025 | | | | 11.00% | |
Bel Fuse, Cl. A | | | 170,323 | | | | 3,000 | | | | (523 | ) | | | 172,800 | | | | 41,358 | | | | $(8,217 | ) | | | 3,481,920 | | | | 7.95% | |
Burnham Holdings Inc., Cl. A | | | 241,000 | | | | 4,000 | | | | — | | | | 245,000 | | | | 214,038 | | | | — | | | | 4,187,050 | | | | 8.08% | |
Canterbury Park Holding Corp. | | | 353,100 | | | | 9,247 | | | | — | | | | 362,347 | | | | 108,434 | | | | — | | | | 3,804,644 | | | | 8.44% | |
The Eastern Co. | | | 322,122 | | | | 8,900 | | | | — | | | | 331,022 | | | | 143,901 | | | | — | | | | 6,630,371 | | | | 5.29% | |
Edgewater Technology Inc. | | | 692,272 | | | | 13,248 | | | | — | | | | 705,520 | | | | — | | | | — | | | | 5,996,920 | | | | 5.73% | |
General Chemical Group Inc. | | | 267,226 | | | | — | | | | — | | | | 267,226 | | | | — | | | | — | | | | 3,474 | | | | 8.59% | |
MOCON Inc. | | | 381,537 | | | | 10,393 | | | | — | | | | 391,930 | | | | 170,120 | | | | — | | | | 6,153,301 | | | | 6.76% | |
Sevcon Inc. | | | 475,854 | | | | 17,750 | | | | — | | | | 493,604 | | | | — | | | | — | | | | 4,368,395 | | | | 9.24% | |
Sevcon Inc., 144A | | | — | | | | 25,000 | | | | — | | | | 25,000 | | | | — | | | | — | | | | 221,250 | | | | — | |
Sevcon Inc., expire 07/11/2021 | | | — | | | | 12,500 | | | | — | | | | 12,500 | | | | — | | | | — | | | | 45,902 | | | | — | |
Sevcon Inc., 4.00%, Ser. A | | | 88,937 | | | | — | | | | — | | | | 88,937 | | | | 85,380 | | | | — | | | | 2,350,605 | | | | — | |
SL Industries Inc.** | | | 273,600 | | | | 600 | | | | (274,200 | ) | | | — | | | | — | | | | — | | | | — | | | | — | |
Strattec Security Corp.* | | | 179,000 | | | | — | | | | (3,300 | ) | | | 175,700 | | | | — | | | | — | | | | — | | | | — | |
The L.S. Starrett Co., Cl. A | | | 318,600 | | | | 977 | | | | — | | | | 319,577 | | | | 127,508 | | | | — | | | | 3,138,246 | | | | 5.11% | |
Total | | | | | | | | | | | | | | | | | | $ | 1,022,412 | | | | $(8,217 | ) | | | $44,358,103 | | | | | |
| | | | | | | | | | | | | | | | | | | | | | | | | | | | | | | | |
| * | Security is no longer considered affiliated at September 30, 2016. |
| ** | Security is no longer held at September 30, 2016. |
9. Indemnifications. The Funds enter into contracts that contain a variety of indemnifications. The Funds’ maximum exposure under these arrangements is unknown. However, the Funds have not had prior claims or losses pursuant to these contracts. Management has reviewed the Funds’ existing contracts and expects the risk of loss to be remote.
10. Subsequent Events. Effective October 1, 2016, the TETON Income Fund changed its name to TETON Convertible Securities Fund and amended its principal strategy. The amended strategy is to invest, under normal circumstances, at least 80% of its net assets in convertible securities, and in derivatives and other instruments that have economic characteristics similar to such
57
TETON Westwood Funds
Notes to Financial Statements (Continued)
securities. As of the same date, the Adviser has contractually agreed to waive its investment advisory fee and reimburse expenses of the Fund to the extent necessary to maintain the total annual operating expenses for the Fund’s Class AAA, Class A, Class C, and Class I Shares at 1.15%, 1.40%, 1.90%, and 0.90%, respectively.
58
Report of Independent Registered Public Accounting Firm
To the Board of Trustees and Shareholders of
The TETON Westwood Funds:
In our opinion, the accompanying statements of assets and liabilities, including the schedules of investments in securities, and the related statements of operations and of changes in net assets and the financial highlights present fairly, in all material respects, the financial position of TETON Westwood Mighty MitesSM Fund, TETON Westwood SmallCap Equity Fund, TETON Westwood Mid-Cap Equity Fund, TETON Westwood Income Fund, TETON Westwood Equity Fund, TETON Westwood Balanced Fund and TETON Westwood Intermediate Bond Fund (each a separate fund of TETON Westwood Funds) (hereafter collectively referred to as the “Funds”) at September 30, 2016, the results for each of their operations for the year then ended, the changes in each of their net assets for each of the two years in the period then ended and the financial highlights for each of the five years in the period then ended, in conformity with accounting principles generally accepted in the United States of America. These financial statements and financial highlights (hereafter referred to as “financial statements”) are the responsibility of the Funds’ management. Our responsibility is to express an opinion on these financial statements based on our audits. We conducted our audits of these financial statements in accordance with the standards of the Public Company Accounting Oversight Board (United States). Those standards require that we plan and perform the audit to obtain reasonable assurance about whether the financial statements are free of material misstatement. An audit includes examining, on a test basis, evidence supporting the amounts and disclosures in the financial statements, assessing the accounting principles used and significant estimates made by management, and evaluating the overall financial statement presentation. We believe that our audits, which included confirmation of securities as of September 30, 2016 by correspondence with the custodian and brokers, provide a reasonable basis for our opinion.
PricewaterhouseCoopers LLP
New York, NY
November 22, 2016
59
2016 Tax Notice to Shareholders (Unaudited)
U.S. Government Income: – The percentage of the ordinary income dividend paid by the Balanced Fund (the “Fund”) during the year ended September 30, 2016 which was derived from U.S. Treasury securities was 14.18%. Such income is exempt from state and local tax in all states. However, many states, including New York and California, allow a tax exemption for a portion of the income earned only if a mutual fund has invested at least 50% of its assets at the end of each quarter of the Fund’s fiscal year in U.S. Government securities. The Fund did not meet this strict requirement during the year ended September 30, 2016. Due to the diversity in state and local tax law, it is recommended that you consult your personal tax adviser for the applicability of the information provided as to your specific situation.
Mighty MitesSM Fund – During the year ended September 30, 2016, the Fund paid to shareholders long term capital gains totaling $25,421,356. The distributions of long term capital gains have been designated as a capital gain dividend by the Fund’s Board of Trustees.
SmallCap Equity Fund – During the year ended September 30, 2016, the Fund paid to shareholders long term capital gains totaling $3,743,714. The distributions of long term capital gains have been designated as a capital gain dividend by the Fund’s Board of Trustees.
Mid-Cap Equity Fund – During the year ended September 30, 2016, the Fund paid to shareholders long term capital gains totaling $201,278. The distributions of long term capital gains have been designated as a capital gain dividend by the Fund’s Board of Trustees.
Income Fund – During the year ended September 30, 2016, the Fund paid to shareholders ordinary income dividends (comprised of net investment income) totaling $0.032, $0.022, $0.006, and $0.062 per share for Class AAA, Class A, Class C, and Class I Shares, respectively. For the year ended September 30, 2016, 100% of the ordinary income dividend qualifies for the dividends received deduction available to corporations. The Fund designates 100% of the ordinary income distributions as qualified dividend income, pursuant to the Jobs and Growth Tax Relief Reconciliation Act of 2003. The Fund designates 0.27% of the ordinary income distributions as qualified interest income, pursuant to the American Jobs Creation Act of 2004.
Equity Fund – During the year ended September 30, 2016, the Fund paid to shareholders ordinary income dividends (comprised of net investment income) totaling $0.049, $0.026 and $0.083 per share for Class AAA, Class A, and Class I Shares, respectively, and long term capital gains totaling $4,754,811. For the year ended September 30, 2016, 100% of the ordinary income dividend qualifies for the dividends received deduction available to corporations. The Fund designates 100% of the ordinary income distribution as qualified dividend income, pursuant to the Jobs and Growth Tax Relief Reconciliation Act of 2003. The Fund designates 0.10% of the ordinary income distribution as qualified interest income, pursuant to the American Jobs Creation Act of 2004.
Balanced Fund – During the year ended September 30, 2016, the Fund paid to shareholders ordinary income dividends (comprised of net investment income and short term capital gains) totaling $0.125, $0.096, $0.038, and $0.154 per share for Class AAA, Class A, Class C, and Class I Shares, respectively, and long term capital gains totaling $4,706,472. The distributions of long term capital gains have been designated as a capital gain dividend by the Fund’s Board of Trustees. For the year ended September 30, 2016, 100% of the ordinary income dividend qualifies for the dividends received deduction available to corporations. The Fund designates 100% of the ordinary income distributions as qualified dividend income, pursuant to the Jobs and Growth Tax Relief Reconciliation Act of 2003. The Fund designates 41.80% of the ordinary income distributions as qualified interest income, pursuant to the American Jobs Creation Act of 2004.
Intermediate Bond Fund – During the year ended September 30, 2016, the Fund paid to shareholders ordinary income dividends (comprised of net investment income) totaling $0.158, $0.139, $0.062, and $0.180 per share for Class AAA, Class A, Class C, and Class I Shares, respectively, and long term capital gains totaling $345,369. The distributions of long term capital gains have been designated as a capital gain dividend by the Fund’s Board of Trustees. The Fund designates 100% of the ordinary income distributions as qualified interest income, pursuant to the American Jobs Creation Act of 2004. The Fund designates 0.61% of the ordinary income distributions as qualified short-term capital gain.
All designations are based on financial information available as of the date of this annual report and, accordingly, are subject to change. For each item, it is the intention of the Fund to designate the maximum amount permitted under the Internal Revenue Code and the regulations thereunder.
60
TETON Westwood Funds
Board Consideration and Re-Approval of Investment Advisory and Subadvisory Agreements (Unaudited)
In determining whether to approve the continuance of each of the Agreements, the Board considered the following information:
1) The nature, extent, and quality of services provided by the Adviser and the Subadviser.
The Board reviewed in detail the nature and extent of the services provided by the Adviser and the Sub-Adviser under the Agreements and the quality of those services over the past year. The Board noted that these services included managing the investment program of the Funds, including the purchase and sale of portfolio securities, as well as the provision of general corporate services. The Board considered that the Adviser also provided, at its expense, office facilities for use by the Funds and supervisory personnel responsible for supervising the performance of administrative, accounting, and related services including, for each Fund, monitoring to assure compliance with stated investment policies and restrictions under the 1940 Act and related securities regulations. The Board noted that, in addition to managing the investment program for the Funds, the Adviser provided certain non-advisory and compliance services, including services under the Funds’ Rule 38a-1 compliance program.
The Board also considered that the Adviser paid for all compensation of officers and Board Members of the Funds who are affiliated with the Adviser and that the Adviser further provided services to shareholders of the Funds who had invested through various programs offered by third party financial intermediaries. The Board evaluated these factors based on its direct experience with the Adviser and Sub-Adviser and in consultation with Fund Counsel. The Board noted that the Adviser had engaged, at its expense, BNY Mellon Investment Servicing (US) Inc. (“BNY”) to assist it in performing certain of its administrative functions. The Board concluded that the nature and extent of the services provided was reasonable and appropriate in relation to the advisory fee, that the level of services provided by the Adviser, either directly or through BNY, and by the Sub-Adviser, had not diminished over the past year and that the quality of service continued to be high.
The Board reviewed the personnel responsible for providing services to the Funds and concluded, based on their experience and interaction with the Adviser and Sub-Adviser, that (i) the Adviser and Sub-Adviser were able to retain quality personnel; (ii) the Adviser, Sub-Adviser, and their agents exhibited a high level of diligence and attention to detail in carrying out their advisory and administrative responsibilities under the Agreements; (iii) the Adviser and Sub-Adviser were responsive to requests of the Board; (iv) the scope and depth of the Adviser’s and Sub-Adviser’s resources were adequate; and (v) the Adviser and Sub-Adviser had kept the Board apprised of developments relating to each Fund and the industry in general. The Board also focused on the Adviser’s reputation and long standing relationship with the Funds. The Board also believed that the Adviser had devoted substantial resources and made substantial commitments to address new regulatory compliance requirements applicable to the Funds.
2) The performance of the Funds, the Adviser, and the Subadviser.
The Board reviewed the investment performance of each Fund, on an absolute basis, as compared with its Broadridge peer group of other SEC registered funds, and against each Fund’s broad based securities market benchmarks as reflected in each Fund’s prospectuses and annual report. The Board also considered rankings and ratings of the Funds issued by Broadridge over the short, intermediate, and long term. The Board considered each Fund’s one, three, five and ten year (where applicable) average annual total return for the periods ended June 30, 2016, but placed greatest emphasis on a Fund’s longer term performance. The peer groups considered by the Board were developed by Broadridge and were comprised of funds within the same Broadridge peer group category (the “Performance Peer Group”), regardless of asset size or primary channel of distribution. Each Fund’s performance against the Performance Peer Group was considered by the Board as providing an objective comparative benchmark against which each Fund’s performance could be assessed. In general, the Board considered these comparisons helpful in their assessment as to whether the Adviser was obtaining for the Funds’ shareholders the total return performance that was available in the marketplace, given each Fund’s investment objectives, strategies, limitations, and restrictions. In reviewing the Funds’ performance, the Board noted that the Equity Fund’s performance was above the median for the one year period and below the median for the three year, five year and ten year periods; the Balanced Fund’s performance was above the median for the one year, three year, five year, and ten year periods; the SmallCap Equity Fund’s performance was above the median for the one year period and below the median for the three year, five year, and ten year periods; the Mighty Mites Fund’s performance was above the median for the one year, three year, five year, and ten year periods; the Income Fund’s performance was below the median for the one year, three year, five year, and ten year periods; the Mid-Cap Equity Fund’s performance was below the median for the one year and three year periods; and the Intermediate Bond Fund’s performance was below the median for the one year, three year, five year, and ten year periods. The Board Members concluded that the Funds’ performance was reasonable in comparison with that of the Performance Peer Groups.
In connection with its assessment of the performance of the Adviser and the Sub-Adviser, the Board considered the Adviser’s and Sub-Adviser’s financial condition and whether they had the resources necessary to continue to carry out their responsibilities under the Agreements. The Board concluded that the Adviser and Sub-Adviser had the financial resources necessary to
61
continue to perform their obligations under the Agreements and to continue to provide the high quality services that they have provided to the Funds to date.
3) The cost of the advisory services and the profits to the Adviser and Subadviser and their affiliates from the relationship with the Funds.
In connection with the Board’s consideration of the cost of the advisory and sub-advisory services and the profits to the Adviser, Sub-Adviser and their affiliates from their relationships with the Fund, the Board considered a number of factors. First, the Board compared the level of the advisory fee for each Fund against comparative Broadridge expense peer groups (“Expense Peer Group”). The Board also considered comparative non-advisory fee expenses and comparative total fund expenses of the Funds and each Expense Peer Group. The Board considered this information as useful in assessing whether the Adviser and Sub-Adviser were providing services at a cost that was competitive with other similar funds. In assessing this information, the Board considered both the comparative contract rates as well as the level of the advisory fees after waivers and/or reimbursements. The Board noted that the SmallCap Equity Fund, the Income Fund, and the Intermediate Bond Fund operated pursuant to a Fee Waiver and Expense Deferral Agreement with the Adviser wherein the Adviser had agreed to waive a portion of its fee or reimburse a Fund for a portion of its expenses necessary to limit the Fund’s total operating expenses to the level set forth in the respective Fund’s prospectus. The Board noted that the Mid-Cap Equity Fund operated pursuant to a Expenses Limitation Agreement with the Adviser wherein the Adviser had agreed to limit a portion of its fee or reimburse a Fund for a portion of its expenses necessary to limit the Fund’s total operating expenses to the level set forth in the Fund’s prospectus. The Board noted that the advisory fees and expense ratios for the Balanced Fund, Equity Fund, the Income Fund, and the Mighty Mites Fund were higher than the median when compared with those of their Expense Peer Groups. Finally, the Board noted that although the SmallCap Equity Fund’s, Intermediate Bond Fund’s, and Mid-Cap Equity Fund’s net advisory fees were lower than the median, after considering their fee waivers, their expense ratios were higher than the median when compared with their Expense Peer Groups. The Board also reviewed the fees charged by the Adviser and Sub-Adviser to provide similar advisory services to other registered investment companies with similar investment objectives and to separate accounts, noting that in some cases the fees charged by the Adviser or Sub-Adviser were higher and, in other cases lower, than the fees charged to the Funds. In evaluating this information, the Board considered the difference in services provided by the Adviser and Sub-Adviser to these other accounts. In particular, the Board considered the differences in risks involved in managing separate accounts and the Funds from a compliance and regulatory perspective.
The Board also considered an analysis prepared by the Adviser of the estimated profitability to the Adviser of its relationship with the Funds and reviewed with the Adviser its cost allocation methodology in connection with its profitability. In this regard, the Board reviewed Pro-forma Income Statements of the Adviser for the year ended December 31, 2015. The Board considered one analysis for the Adviser as a whole, and a second analysis for the Adviser with respect to each of the Funds. With respect to the Fund analysis, the Board received an analysis based on each Fund’s average net assets during the period as well as a pro-forma analysis of profitability at higher and lower asset levels. The Board concluded that the profitability of the Funds to the Adviser under either analysis was not excessive.
4) The extent to which economies of scale will be realized as the Funds grow and whether fee levels reflect those economies of scale.
With respect to the Board’s consideration of economies of scale, the Board discussed whether economies of scale would be realized by the Funds at higher asset levels. The Board also reviewed data from the Expense Peer Groups to assess whether the Expense Peer Group funds had advisory fee breakpoints and, if so, at what asset levels. The Board also assessed whether certain of the Adviser’s costs would increase if asset levels rise. The Board concluded that under foreseeable conditions, they were unable to assess at this time whether economies of scale would be realized if the Funds were to experience significant asset growth. In the event there was to be significant asset growth in the Funds, the Board determined to reassess whether the advisory fee appropriately took into account any economies of scale that had been realized as a result of that growth.
5) Other Factors.
In addition to the above factors, the Board also discussed other benefits received by the Adviser and Sub-Adviser from their management of the Funds. The Board considered that the Adviser and Sub-Adviser do use soft dollars in connection with their management of the Funds.
Based on a consideration of all these factors in their totality, the Board Members, including all of the Independent Board Members, determined that each Fund’s advisory fee and, with respect to the Equity Fund, the Balanced Fund, and the Intermediate Bond Fund, the sub-advisory fee was fair and reasonable with respect to the quality of services provided and in light of the other factors described above that the Board deemed relevant. Accordingly, the Board Members determined to approve the continuation of each Fund’s Advisory Agreement and, with respect to the Equity Fund, the Balanced Fund, and the Intermediate Bond Fund, the Sub-Advisory agreements. The Board based its decision on evaluations of all these factors as a whole and did not consider any one factor as all important or controlling.
62
TETON Westwood Funds
Additional Fund Information (Unaudited)
The business and affairs of the Trust are managed under the direction of its Board of Trustees. Information pertaining to the Trustees and officers of the Trust is set forth below. The Trust’s Statement of Additional Information includes additional information about the TETON Westwood Funds’ Trustees and is available, without charge, upon request, by calling 800-WESTWOOD (800-937-8966) or by writing to the TETON Westwood Funds at One Corporate Center, Rye, NY 10580-1422.
| | | | | | | | | | | | | | | | |
Name, Position(s), Address1 and Age | | | | | Term of
Office and
Length of
Time Served2 | | | Number of
Funds in
Fund
Complex
Overseen
by Trustee | | | Principal Occupation(s) During Past Five Years | | Other Directorships Held by Trustee3 |
INDEPENDENT TRUSTEES4: | | | | | | | | | | | | | |
Anthony J. Colavita | | | | | | | Since 1994 | | | | 36 | | | President of the law firm of | | — |
Trustee | | | | | | | | | | | | | | Anthony J. Colavita, P.C. | | |
Age: 80 | | | | | | | | | | | | | | | | |
| | | | | |
James P. Conn | | | | | | | Since 1994 | | | | 22 | | | Former Managing Director and Chief Investment | | — |
Trustee | | | | | | | | | | | | | | Officer of Financial Security Assurance Holdings, | | |
Age: 78 | | | | | | | | | | | | | | Ltd. (1992-1998) | | |
| | | | | |
Werner J. Roeder, MD | | | | | | | Since 1994 | | | | 23 | | | Practicing private physician; Former Medical | | — |
Trustee | | | | | | | | | | | | | | Director of Lawrence Hospital (1999-2014) | | |
Age: 76 | | | | | | | | | | | | | | | | |
| | | | | |
Salvatore J. Zizza | | | | | | | Since 2004 | | | | 30 | | | President of Zizza & Associates Corp. (financial | | Director and Vice Chairman |
Trustee | | | | | | | | | | | | | | consulting); Chairman of Harbor Diversified, Inc. | | of Trans-Lux Corporation |
Age: 70 | | | | | | | | | | | | | | (pharmaceuticals); Chairman of BAM | | (business services); Director |
| | | | | | | | | | | | | | (semiconductor and aerospace manufacturing); | | and Chairman of Harbor |
| | | | | | | | | | | | | | Chairman of Bergen Cove Realty Inc.; Chairman of | | Diversified Inc. |
| | | | | | | | | | | | | | Metropolitan Paper Recycling Inc. (recycling) | | (pharmaceuticals); Director, |
| | | | | | | | | | | | | | (2005-2014) | | Chairman, and CEO of |
| | | | | | | | | | | | | | | | General Employment |
| | | | | | | | | | | | | | | | Enterprises (staffing services) |
| | | | | | | | | | | | | | | | (2009-2012) |
63
| | | | | | | | | | | | |
Name, Position(s), Address1 and Age | | Term of
Office and
Length of
Time Served2 | | | Number of
Funds in
Fund
Complex
Overseen
by Trustee | | | Principal Occupation(s) During Past Five Years | | Other Directorships Held by Trustee3 |
OFFICERS: | | | | | | | | | | | | |
Bruce N. Alpert | | | | | | | — | | | Executive Vice President and Chief Operating | | — |
President | | | Since 1994 | | | | | | | Officer of Gabelli Funds, LLC since 1988; Officer of | | |
Age: 64 | | | | | | | | | | several registered investment companies within the | | |
| | | | | | | | | | Gabelli/GAMCO Fund Complex; Senior Vice | | |
| | | | | | | | | | President of GAMCO Investors, Inc. since 2008; | | |
| | | | | | | | | | Director of Teton Advisors, Inc., 1998-2012; | | |
| | | | | | | | | | Chairman of Teton Advisors, Inc., 2008-2010; | | |
| | | | | | | | | | President of Teton Advisors, Inc., 1998-2008 | | |
| | | | |
Andrea R. Mango | | | Since 2013 | | | | — | | | Counsel of Gabelli Funds, LLC since 2013; Secretary | | — |
Secretary | | | | | | | | | | of all registered investment companies within the | | |
Age: 44 | | | | | | | | | | Gabelli/GAMCO Fund Complex since 2013; Vice | | |
| | | | | | | | | | President of all closed-end funds within the | | |
| | | | | | | | | | Gabelli/GAMCO Fund Complex since 2014; | | |
| | | | | | | | | | Corporate Vice President within the Corporate | | |
| | | | | | | | | | Compliance Department of New York Life | | |
| | | | | | | | | | Insurance Company, 2011-2013; Vice President and | | |
| | | | | | | | | | Counsel of Deutsche Bank, 2006-2011 | | |
| | | | |
Agnes Mullady | | | Since 2006 | | | | — | | | President and Chief Operating Officer of the Fund | | — |
Treasurer | | | | | | | | | | Division of Gabelli Funds, LLC since 2010; Chief | | |
Age: 58 | | | | | | | | | | Executive Officer of G.distributors, LLC since 2010; | | |
| | | | | | | | | | Senior Vice President of GAMCO Investors, Inc. | | |
| | | | | | | | | | since 2009; Vice President of Gabelli Funds, LLC | | |
| | | | | | | | | | since 2007; Officer of all of the registered | | |
| | | | | | | | | | investment companies within the Gabelli/GAMCO | | |
| | | | | | | | | | Fund Complex | | |
| | | | |
Richard J. Walz | | | Since 2013 | | | | — | | | Chief Compliance Officer of all of the registered | | — |
Chief Compliance Officer | | | | | | | | | | investment companies within the Gabelli/GAMCO | | |
Age: 57 | | | | | | | | | | Fund Complex since 2013; Chief Compliance | | |
| | | | | | | | | | Officer of AEGON USA Investment Management, | | |
| | | | | | | | | | 2011-2013; Chief Compliance Officer of Cutwater | | |
| | | | | | | | | | Asset Management, 2004-2011 | | |
| 1 | Address: One Corporate Center, Rye, NY 10580-1422, unless otherwise noted. |
| 2 | Each Trustee will hold office for an indefinite term until the earliest of (i) the next meeting of shareholders, if any, called for the purpose of considering the election or re-election of such Trustee and until the election and qualification of his or her successor, if any, elected at such meeting, or (ii) the date a Trustee resigns or retires, or a Trustee is removed by the Board of Trustees or shareholders, in accordance with the Trust’s Amended By-Laws and Amended and Restated Declaration of Trust. Each officer will hold office for an indefinite term until the date he or she resigns or retires or until his or her successor is elected and qualified. |
| 3 | This column includes only directorships of companies required to report to the SEC under the Securities Exchange Act of 1934, i.e., public companies, or other investment companies registered under the Investment Company Act of 1940. |
| 4 | Trustees who are not interested persons are considered “Independent” Trustees. |
64
TETON Westwood Funds and Your Personal Privacy
Who are we?
The TETON Westwood Funds are investment companies registered with the Securities and Exchange Commission under the Investment Company Act of 1940. We are managed by Teton Advisors, Inc., which is an affiliate of GAMCO Investors Inc., a publicly held company that has subsidiaries that provide investment advisory or brokerage services for a variety of clients. Teton Advisors, Inc. is a publicly held company that provides investment advisory services to the TETON Westwood Funds.
What kind of non-public information do we collect about you if you become a Fund shareholder?
If you apply to open an account directly with us, you will be giving us some non-public information about yourself. The non-public information we collect about you is:
| ● | Information you give us on your application form. This could include your name, address, telephone number, social security number, bank account number, and other information. |
| ● | Information about your transactions with us, any transactions with our affiliates, and transactions with the entities we hire to provide services to you. This would include information about the shares that you buy or redeem. If we hire someone else to provide services — like a transfer agent — we will also have information about the transactions that you conduct through them. |
What information do we disclose and to whom do we disclose it?
We do not disclose any non-public personal information about our customers or former customers to anyone other than our affiliates, our service providers who need to know such information, and as otherwise permitted by law. If you want to find out what the law permits, you can read the privacy rules adopted by the Securities and Exchange Commission. They are in volume 17 of the Code of Federal Regulations, Part 248. The Commission often posts information about its regulations on its website, www.sec.gov.
What do we do to protect your personal information?
We restrict access to non-public personal information about you to the people who need to know that information in order to provide services to you or the Fund and to ensure that we are complying with the laws governing the securities business. We maintain physical, electronic, and procedural safeguards to keep your personal information confidential.
This page was intentionally left blank.
This page was intentionally left blank.
TETON WESTWOOD FUNDS
TETON Westwood Mighty MitesSM Fund
TETON Westwood SmallCap Equity Fund
TETON Westwood Mid-Cap Equity Fund
TETON Westwood Income Fund
TETON Westwood Equity Fund
TETON Westwood Balanced Fund
TETON Westwood Intermediate Bond Fund
One Corporate Center
Rye, New York 10580-1422
General and Account Information:
800-WESTWOOD [800-937-8966]
fax: 914-921-5118
website: www.tetonadv.com
e-mail: info@tetonadv.com
| | | | | | | | |
| | | | Board of Trustees | | | | |
| | ANTHONY J. COLAVITA | | | | WERNER J. ROEDER, MD | | |
| | President, | | | | Former Medical Director, | | |
| | Anthony J. Colavita, P.C. | | | | Lawrence Hospital | | |
| | | | |
| | JAMES P. CONN | | | | SALVATORE J. ZIZZA | | |
| | Former Chief Investment Officer, | | | | Chairman, | | |
| | Financial Security Assurance Holdings Ltd. | | | | Zizza & Associates Corp. | | |
| | | | Officers | | | | |
| | | | |
| | BRUCE N. ALPERT | | | | RICHARD J. WALZ | | |
| | President | | | | Chief Compliance Officer | | |
| | | | |
| | ANDREA R. MANGO | | | | AGNES MULLADY | | |
| | Secretary | | | | Treasurer | | |
| | | | |
| | Investment Adviser | | | | Distributor | | |
| | Teton Advisors, Inc. | | | | G.distributors, LLC | | |
| | Custodian | | | | Legal Counsel | | |
| | The Bank of New York Mellon | | | | Paul Hastings LLP | | |
|
We have separated the portfolio managers’ commentaries from the financial statements and investment portfolio due to corporate governance regulations stipulated by the Sarbanes-Oxley Act of 2002. We have done this to ensure that the content of the portfolio managers’ commentaries is unrestricted. Both the commentaries and the financial statements, including the portfolio of investments, will be available on our website at www.tetonadv.com. |
|
This report is submitted for the information of the shareholders of the TETON Westwood Funds. It is not authorized for distribution to prospective investors unless preceded or accompanied by an effective prospectus. |
GABWWQ316AR
Item 2. Code of Ethics.
| | (a) | The registrant, as of the end of the period covered by this report, has adopted a code of ethics that applies to the registrant’s principal executive officer, principal financial officer, principal accounting officer or controller, or persons performing similar functions, regardless of whether these individuals are employed by the registrant or a third party. |
| | (c) | There have been no amendments, during the period covered by this report, to a provision of the code of ethics that applies to the registrant’s principal executive officer, principal financial officer, principal accounting officer or controller, or persons performing similar functions, regardless of whether these individuals are employed by the registrant or a third party, and that relates to any element of the code of ethics description. |
| | (d) | The registrant has not granted any waivers, including an implicit waiver, from a provision of the code of ethics that applies to the registrant’s principal executive officer, principal financial officer, principal accounting officer or controller, or persons performing similar functions, regardless of whether these individuals are employed by the registrant or a third party, that relates to one or more of the items set forth in paragraph (b) of this item’s instructions. |
Item 3. Audit Committee Financial Expert.
As of the end of the period covered by the report, the registrant’s board of directors has determined that James P. Conn is qualified to serve as an audit committee financial expert serving on its audit committee and that he is “independent.”
Item 4. Principal Accountant Fees and Services.
Audit Fees
| | (a) | The aggregate fees billed for each of the last two fiscal years for professional services rendered by the principal accountant for the audit of the registrant’s annual financial statements or services that are normally provided by the accountant in connection with statutory and regulatory filings or engagements for those fiscal years are $169,831 in 2015 and $174,075 in 2016. |
Audit-Related Fees
| | (b) | The aggregate fees billed in each of the last two fiscal years for assurance and related services by the principal accountant that are reasonably related to the performance of the audit of the registrant’s financial statements and are not reported under paragraph (a) of this Item are $0 in 2015 and $0 in 2016. |
Tax Fees
| | (c) | The aggregate fees billed in each of the last two fiscal years for professional services rendered by the principal accountant for tax compliance, tax advice, and tax planning are $28,710 in 2015 and $29,410 in 2016. Tax fees represent tax compliance services provided in connection with the review of the Registrant’s tax returns. |
All Other Fees
| | (d) | The aggregate fees billed in each of the last two fiscal years for products and services provided by the principal accountant, other than the services reported in paragraphs (a) through (c) of this Item are $0 in 2015 and $0 in 2016. |
| | (e)(1) | Disclose the audit committee’s pre-approval policies and procedures described in paragraph (c)(7) of Rule 2-01 of Regulation S-X. |
Pre-Approval Policies and Procedures. The Audit Committee (“Committee”) of the registrant is responsible for pre-approving (i) all audit and permissible non-audit services to be provided by the independent registered public accounting firm to the registrant and (ii) all permissible non-audit services to be provided by the independent registered public accounting firm to the Adviser, Gabelli Advisers, Inc., and any affiliate of Gabelli Funds, LLC (“Gabelli”) that provides services to the registrant (a “Covered Services Provider”) if the registered public accounting firm’s engagement related directly to the operations and financial reporting of the registrant. The Committee may delegate its responsibility to pre-approve any such audit and permissible non-audit services to the Chairperson of the Committee, and the Chairperson must report to the Committee, at its next regularly scheduled meeting after the Chairperson’s pre-approval of such services, his or her decision(s). The Committee may also establish detailed pre-approval policies and procedures for pre-approval of such services in accordance with applicable laws, including the delegation of some or all of the Committee’s pre-approval responsibilities to the other persons (other than Gabelli or the registrant’s officers). Pre-approval by the Committee of any permissible non-audit services is not required so long as: (i) the permissible non-audit services were not recognized by the registrant at the time of the engagement to be non-audit services; and (ii) such services are promptly brought to the attention of the Committee and approved by the Committee or Chairperson prior to the completion of the audit.
| | (e)(2) | The percentage of services described in each of paragraphs (b) through (d) of this Item that were approved by the audit committee pursuant to paragraph (c)(7)(i)(C) of Rule 2-01 of Regulation S-X are as follows: |
| | (f) | The percentage of hours expended on the principal accountant’s engagement to audit the registrant’s financial statements for the most recent fiscal year that were attributed to work |
| | performed by persons other than the principal accountant’s full-time, permanent employees was 0%. |
| | (g) | The aggregate non-audit fees billed by the registrant’s accountant for services rendered to the registrant, and rendered to the registrant’s investment adviser (not including any sub-adviser whose role is primarily portfolio management and is subcontracted with or overseen by another investment adviser), and any entity controlling, controlled by, or under common control with the adviser that provides ongoing services to the registrant for each of the last two fiscal years of the registrant was $28,710 in 2015 and $29,410 in 2016. |
| | (h) | The registrant’s audit committee of the board of directors has considered whether the provision of non-audit services that were rendered to the registrant’s investment adviser (not including any sub-adviser whose role is primarily portfolio management and is subcontracted with or overseen by another investment adviser), and any entity controlling, controlled by, or under common control with the investment adviser that provides ongoing services to the registrant that were not pre-approved pursuant to paragraph (c)(7)(ii) of Rule 2-01 of Regulation S-X is compatible with maintaining the principal accountant’s independence. |
Item 5. Audit Committee of Listed Registrants.
Not applicable.
Item 6. Investments.
| (a) | Schedule of Investments in securities of unaffiliated issuers as of the close of the reporting period is included as part of the report to shareholders filed under Item 1 of this form. |
Item 7. Disclosure of Proxy Voting Policies and Procedures for Closed-End Management
Investment Companies.
Not applicable.
Item 8. Portfolio Managers of Closed-End Management Investment Companies.
Not applicable.
Item 9. Purchases of Equity Securities by Closed-End Management Investment Company and
Affiliated Purchasers.
Not applicable.
Item 10. Submission of Matters to a Vote of Security Holders.
There have been no material changes to the procedures by which the shareholders may recommend nominees to the registrant’s board of trustees, where those changes were implemented after the registrant last provided disclosure in response to the requirements of Item 407(c)(2)(iv) of Regulation S-K (17 CFR 229.407) (as required by Item 22(b)(15) of Schedule 14A (17 CFR 240.14a-101)), or this Item.
Item 11. Controls and Procedures.
| | (a) | The registrant’s principal executive and principal financial officers, or persons performing similar functions, have concluded that the registrant’s disclosure controls and procedures (as defined in Rule 30a-3(c) under the Investment Company Act of 1940, as amended (the “1940 Act”) (17 CFR 270.30a-3(c))) are effective, as of a date within 90 days of the filing date of the report that includes the disclosure required by this paragraph, based on their evaluation of these controls and procedures required by Rule 30a-3(b) under the 1940 Act (17 CFR 270.30a-3(b)) and Rules 13a-15(b) or 15d-15(b) under the Securities Exchange Act of 1934, as amended (17 CFR 240.13a-15(b) or 240.15d-15(b)). |
| | (b) | There were no changes in the registrant’s internal control over financial reporting (as defined in Rule 30a-3(d) under the 1940 Act (17 CFR 270.30a-3(d))) that occurred during the registrant’s second fiscal quarter of the period covered by this report that has materially affected, or is reasonably likely to materially affect, the registrant’s internal control over financial reporting. |
Item 12. Exhibits.
| | (a)(1) | Code of ethics, or any amendment thereto, that is the subject of disclosure required by Item 2 is attached hereto. |
| | (a)(2) | Certifications pursuant to Rule 30a-2(a) under the 1940 Act and Section 302 of the Sarbanes-Oxley Act of 2002 are attached hereto. |
| | (b) | Certifications pursuant to Rule 30a-2(b) under the 1940 Act and Section 906 of the Sarbanes-Oxley Act of 2002 are attached hereto. |
(12.other) Not applicable.
SIGNATURES
Pursuant to the requirements of the Securities Exchange Act of 1934 and the Investment Company Act of 1940, the registrant has duly caused this report to be signed on its behalf by the undersigned, thereunto duly authorized.
| | | | |
| (Registrant) | | The TETON Westwood Funds | | |
| | | | |
| By (Signature and Title)* | | /s/ Bruce N. Alpert | | |
| | Bruce N. Alpert, Principal Executive Officer | | |
Pursuant to the requirements of the Securities Exchange Act of 1934 and the Investment Company Act of 1940, this report has been signed below by the following persons on behalf of the registrant and in the capacities and on the dates indicated.
| | | | |
| By (Signature and Title)* | | /s/ Bruce N. Alpert | | |
| | Bruce N. Alpert, Principal Executive Officer | | |
| | | | |
| By (Signature and Title)* | | /s/ Agnes Mullady | | |
| | Agnes Mullady, Principal Financial Officer and Treasurer | | |
| * | Print the name and title of each signing officer under his or her signature. |