UNITED STATES
SECURITIES AND EXCHANGE COMMISSION
Washington, D.C. 20549
FORM N-CSR
CERTIFIED SHAREHOLDER REPORT OF REGISTERED MANAGEMENT
INVESTMENT COMPANIES
Investment Company Act file number 811-04719
The TETON Westwood Funds
(Exact name of registrant as specified in charter)
One Corporate Center
Rye, New York 10580-1422
(Address of principal executive offices) (Zip code)
Bruce N. Alpert
Gabelli Funds, LLC
One Corporate Center
Rye, New York 10580-1422
(Name and address of agent for service)
Registrant's telephone number, including area code: 1-800-422-3554
Date of fiscal year end: September 30
Date of reporting period: September 30, 2018
Form N-CSR is to be used by management investment companies to file reports with the Commission not later than 10 days after the transmission to stockholders of any report that is required to be transmitted to stockholders under Rule 30e-1 under the Investment Company Act of 1940 (17 CFR 270.30e-1). The Commission may use the information provided on Form N-CSR in its regulatory, disclosure review, inspection, and policymaking roles.
A registrant is required to disclose the information specified by Form N-CSR, and the Commission will make this information public. A registrant is not required to respond to the collection of information contained in Form N-CSR unless the Form displays a currently valid Office of Management and Budget ("OMB") control number. Please direct comments concerning the accuracy of the information collection burden estimate and any suggestions for reducing the burden to Secretary, Securities and Exchange Commission, 450 Fifth Street, NW, Washington, DC 20549-0609. The OMB has reviewed this collection of information under the clearance requirements of 44 U.S.C. § 3507.
Item 1. Reports to Stockholders.
The Report to Shareholders is attached herewith.

TETON WESTWOOD FUNDS
|
Mighty MitesSM Fund |
|
| |
SmallCap Equity Fund |
|
| |
Mid-Cap Equity Fund |
|
| |
Convertible Securities Fund |
|
| |
Equity Fund |
|
| |
Balanced Fund |
|
| |
Intermediate Bond Fund |
Annual Report
September 30, 2018
TETON WESTWOOD FUNDS
(Unaudited)
| | | | | | | | | | | | | | | | | | | | | | | | | | | | | | | | | | | | | | | | | | | | | | | | | | | | | | | | | | | | |
| | | Class AAA Shares | | | | | | Class A Shares | |
| | | Average Annual Returns – September 30, 2018 (a) | | | | | | Average Annual Returns – September 30, 2018 (a)(b)(c) | |
| | | 1 Year | | | 5 Year | | | 10 Year | | | 15 Year | | | Since Inception | | | Gross Expense Ratio | | | Expense Ratio after Adviser Reimburse- ments | | | | | | 1 Year | | | 5 Year | | | 10 Year | | | 15 Year | | | Since Inception | | | Gross Expense Ratio | | | Expense Ratio after Adviser Reimburse- ments | |
Mighty Mites | | | 4.38 | % | | | 8.26 | % | | | 11.37 | % | | | 10.87 | % | | | 11.43 | % | | | 1.41 | % | | | 1.41 | % | | | | | | | (0.03 | )% | | | 7.12 | % | | | 10.66 | % | | | 10.32 | % | | | 10.99 | % | | | 1.66 | % | | | 1.66 | % |
SmallCap Equity | | | 9.68 | | | | 10.55 | | | | 10.86 | | | | 9.97 | | | | 8.13 | | | | 1.74 | | | | 1.25 | | | | | | | | 5.00 | | | | 9.38 | | | | 10.15 | | | | 9.42 | | | | 7.75 | | | | 1.99 | | | | 1.50 | |
Mid-Cap Equity | | | 7.38 | | | | 7.75 | | | | — | | | | — | | | | 8.20 | | | | 3.36 | | | | 1.05 | | | | | | | | 2.86 | | | | 6.62 | | | | — | | | | — | | | | 7.10 | | | | 3.61 | | | | 1.30 | |
Convertible Securities | | | 14.38 | | | | 8.30 | | | | 7.91 | | | | 7.71 | | | | 7.68 | | | | 2.47 | | | | 1.15 | | | | | | | | 9.68 | | | | 7.16 | | | | 7.19 | | | | 7.16 | | | | 7.25 | | | | 2.72 | | | | 1.40 | |
Equity | | | 14.14 | | | | 11.12 | | | | 8.63 | | | | 9.11 | | | | 10.16 | | | | 1.62 | | | | 1.62 | | | | | | | | 9.33 | | | | 9.96 | | | | 7.97 | | | | 8.53 | | | | 9.79 | | | | 1.87 | | | | 1.87 | |
Balanced | | | 9.32 | | | | 7.55 | | | | 6.66 | | | | 6.93 | | | | 8.40 | | | | 1.34 | | | | 1.34 | | | | | | | | 4.72 | | | | 6.42 | | | | 5.97 | | | | 6.38 | | | | 7.98 | | | | 1.59 | | | | 1.59 | |
Intermediate Bond | | | (0.83 | ) | | | 0.76 | | | | 2.31 | | | | 2.46 | | | | 4.32 | | | | 1.52 | | | | 1.00 | | | | | | | | (4.82 | ) | | | (0.15 | ) | | | 1.78 | | | | 2.07 | | | | 4.09 | | | | 1.62 | | | | 1.10 | |
| | | |
| | | Class C Shares | | | | | | Class I Shares | |
| | | Average Annual Returns – September 30, 2018 (a)(c)(d) | | | | | | Average Annual Returns – September 30, 2018 (a)(c) | |
| | | 1 Year | | | 5 Year | | | 10 Year | | | 15 Year | | | Since Inception | | | Gross Expense Ratio | | | Expense Ratio after Adviser Reimburse- ments | | | | | | 1 Year | | | 5 Year | | | 10 Year | | | 15 Year | | | Since Inception | | | Gross Expense Ratio | | | Expense Ratio after Adviser Reimburse- ments | |
Mighty Mites | | | 2.63 | % | | | 7.45 | % | | | 10.55 | % | | | 10.06 | % | | | 10.74 | % | | | 2.16 | % | | | 2.16 | % | | | | | | | 4.67 | % | | | 8.53 | % | | | 11.65 | % | | | 11.07 | % | | | 11.58 | % | | | 1.16 | % | | | 1.16 | % |
SmallCap Equity | | | 7.79 | | | | 9.73 | | | | 10.04 | | | | 9.02 | | | | 7.46 | | | | 2.49 | | | | 2.00 | | | | | | | | 9.90 | | | | 10.83 | | | | 11.15 | | | | 10.16 | | | | 8.26 | | | | 1.49 | | | | 1.00 | |
Mid-Cap Equity | | | 5.59 | | | | 6.96 | | | | — | | | | — | | | | 7.39 | | | | 4.11 | | | | 1.80 | | | | | | | | 7.59 | | | | 8.07 | | | | — | | | | — | | | | 8.50 | | | | 3.11 | | | | 0.80 | |
Convertible Securities | | | 12.55 | | | | 7.49 | | | | 7.11 | | | | 6.92 | | | | 7.10 | | | | 3.22 | | | | 1.90 | | | | | | | | 14.79 | | | | 8.61 | | | | 8.20 | | | | 7.92 | | | | 7.82 | | | | 2.22 | | | | 0.90 | |
Equity | | | 12.32 | | | | 10.31 | | | | 7.83 | | | | 8.29 | | | | 9.64 | | | | 2.37 | | | | 2.37 | | | | | | | | 14.47 | | | | 11.36 | | | | 8.89 | | | | 9.29 | | | | 10.25 | | | | 1.37 | | | | 1.37 | |
Balanced | | | 7.54 | | | | 6.76 | | | | 5.89 | | | | 6.15 | | | | 7.83 | | | | 2.09 | | | | 2.09 | | | | | | | | 9.61 | | | | 7.81 | | | | 6.94 | | | | 7.13 | | | | 8.51 | | | | 1.09 | | | | 1.09 | |
Intermediate Bond | | | (2.50 | ) | | | 0.03 | | | | 1.55 | | | | 1.71 | | | | 3.83 | | | | 2.27 | | | | 1.75 | | | | | | | | (0.49 | ) | | | 1.03 | | | | 2.56 | | | | 2.63 | | | | 4.42 | | | | 1.27 | | | | 0.75 | |
| (a) | Returns represent past performance and do not guarantee future results. Total returns and average annual returns reflect changes in share price, reinvestment of distributions, and are net of expenses. Investment returns and the principal value of an investment will fluctuate. When shares are redeemed, they may be worth more or less than their original cost. Current performance may be lower or higher than the performance data presented. Visit www.tetonadv.com for performance information as of the most recent month end. For the SmallCap Equity, Mid-Cap Equity, Convertible Securities, and Intermediate Bond Funds (and for the Mighty Mites Fund through September 30, 2005), Teton Advisors, Inc. (the Adviser) reimbursed expenses to limit the expense ratio. Had such limitations not been in place, returns would have been lower. The contractual expense limitations are in effect through January 31, 2019 and are renewable annually by the Adviser. The Funds, except for the Equity, Balanced, and Intermediate Bond Funds, impose a 2.00% redemption fee on shares sold or exchanged within seven days after the date of purchase. Investors should carefully consider the investment objectives, risks, charges, and expenses of a Fund before investing. The prospectuses contain information about these and other matters and should be read carefully before investing. To obtain a prospectus, please visit our website at www.tetonadv.com. |
| (b) | Includes the effect of the maximum 4.00% sales charge at the beginning of the period. |
| (c) | The performance of the Class AAA Shares is used to calculate performance for the periods prior to the issuance of Class A Shares, Class C Shares, and Class I Shares, except for Mid-Cap Equity Fund whose performance for all share classes is based on the Fund’s inception date of May 31, 2013. The performance for the Class A Shares and Class C Shares would have been lower due to the additional fees and expenses associated with these classes of shares. The performance for the Class I Shares would have been higher due to the lower expenses associated with this class of shares. The inception dates for the Class AAA Shares and the initial issuance dates for the Class A Shares, Class C Shares, and Class I Shares after which shares remained continuously outstanding are listed below. |
| (d) | Assuming payment of the 1.00% maximum contingent deferred sales charge imposed on redemptions made within one year of purchase. |
| | | | | | | | |
| | | Class AAA Shares | | Class A Shares | | Class C Shares | | Class I Shares |
Mighty Mites | | 05/11/98 | | 11/26/01 | | 08/03/01 | | 01/11/08 |
SmallCap Equity | | 04/15/97 | | 11/26/01 | | 11/26/01 | | 01/11/08 |
Mid-Cap Equity | | 05/31/13 | | 05/31/13 | | 05/31/13 | | 05/31/13 |
Convertible Securities | | 09/30/97 | | 05/09/01 | | 11/26/01 | | 01/11/08 |
Equity | | 01/02/87 | | 01/28/94 | | 02/13/01 | | 01/11/08 |
Balanced | | 10/01/91 | | 04/06/93 | | 09/25/01 | | 01/11/08 |
Intermediate Bond | | 10/01/91 | | 07/26/01 | | 10/22/01 | | 01/11/08 |
The TETON Westwood Funds file complete schedules of portfolio holdings with the Securities and Exchange Commission (the SEC) for the first and third quarters of each fiscal year on Form N-Q. Shareholders may obtain this information at www.tetonadv.com or by calling the Funds at 800-WESTWOOD (800-937-8966). The Funds’ Form N-Q is available on the SEC’s website at www.sec.gov and may also be reviewed and copied at the SEC’s Public Reference Room in Washington, DC. Information on the operation of the Public Reference Room may be obtained by calling 800-SEC-0330.
Proxy Voting
Each Fund files Form N-PX with its complete proxy voting record for the twelve months ended June 30, no later than August 31 of each year. A description of the Funds’ proxy voting policies, procedures, and how the Funds voted proxies relating to portfolio securities are available without charge, upon request, by (i) calling 800-WESTWOOD (800-937-8966); (ii) writing to The TETON Westwood Funds at One Corporate Center, Rye, NY 10580-1422; and (iii) visiting the SEC’s website at www.sec.gov.
2
Performance Discussion (Unaudited)
Mighty Mites Fund
For the fiscal year ended September 30, 2018, the TETON Westwood Mighty Mites Fund net asset value (NAV) per Class AAA Share appreciated 4.4% versus gains of 15.2% for the Russell 2000 Index. See the next page for additional performance information.
The Fund primarily invests in small and micro-cap equity securities that have a market capitalization of $500 million or less at time of initial investment. The portfolio management team focuses on bottom up stock selection, seeking bite sized companies with excellent management teams, strong balance sheets, and superior long term fundamentals. As bottom up, fundamental, research driven investors, the team seeks to purchase the inefficiently priced stocks of excellent companies selling at a discount to their Private Market Value (PMV), and possess a catalyst that can unlock hidden value within the enterprise. As such, (y)our portfolio is diversified across a broad cross section of companies sharing these valuation characteristics.
The first half of the Fund’s fiscal year was mixed, with an essentially flat December for small cap stocks, and the Dow Jones U.S. MicroCap Index down slightly for the month. Micro-cap gains in January and March were nearly offset by declines in February, indicating a more volatile time for stocks, but the U.S. and global economies continued on solid footing as evidenced by strong corporate earnings. U.S. GDP expanded by 2.2% in the March quarter, a seasonally slower growth quarter. The consumer remained healthy as the unemployment rate held steady, while wage increases remained modest.
In the Fund’s third fiscal quarter ended June 30, 2018, earnings reports were broadly positive and economic indicators remained positive. Market optimism was tempered by escalating tensions between the United States and its international trading partners.This dynamic contributed to outperformance by small and micro-cap stocks, which typically have less exposure to global markets. A robust U.S. economy, loosening regulation, and the benefits of tax reform provided an excellent backdrop for strong business performance.
During the Fund’s fourth fiscal quarter the U.S. economy continued to strengthen, as GDP grew at an annual rate of 4.2%, attributable to consumer spending, exports, and business investment. The high rate of growth persisted into the quarter, sustained by steady wage growth of nearly 3% and a 3.7% unemployment rate, the lowest level since 1969. Additionally, household wealth grew to approximately $107 trillion, further supporting consumer spending. Healthy domestic growth coupled with the benefit from the Tax Cut and Jobs Act sustained double digit earnings growth and solid returns for stocks in the quarter.
Among our stronger performing stocks for the year were Casella Waste Systems Inc. (1.3% of net assets as of September 30, 2018), a vertically integrated solid waste and recycling management company based in Vermont and operating in 34 states. Casella reported strong revenues and growth within its industry, including the acquisition of multiple companies as part of a strategic initiative to expand its geographic presence and markets served. Cavco Industries, Inc. (1.0%), a leading designer and builder of systems-built structures including manufactured homes, modular homes, and commercial buildings, benefited from rising construction prices and a decreased labor force (nearly a quarter million open construction jobs in the United States). Prefabricated and modular construction is quickly becoming a preferred method of building due to reduced material and time requirements, increased production flexibility, and sustainable business practices. Marine Products Corp. (1.3%) is a leading manufacturer of fiberglass fishing and sport boats, and profited from growth and increasing participation in the leisure boating industry. Continued advancement in technology and the progressing development of hybrid and electric boat engines drove demand across the U.S. and European markets.
Some of the weaker holdings in the portfolio included Flushing Financial Corp. (1.0%), a holding company for Flushing Bank, which is a community oriented financial institution offering a range of financial services, operating 19 full service offices in the New York Metropolitan area. Flushing was a laggard, as the banking industry struggled to contend with challenges around regulations, disruptive technologies, and increased competition for a more demanding customer base. E.W. Scripps Co. (1.0%), an American broadcaster serving audiences and businesses with a growing portfolio of local and national media brands, struggled early in the year as a restructuring and cost cutting effort took place. In addition, a series of acquisitions failed to produce the profits and benefits expected and the pressure of fewer cable subscribers weighed on the industry. Another portfolio detractor was Astec Industries, Inc. (1.1%), which designs, engineers, manufactures, and markets equipment and components used primarily in road building and related construction activities; oil, gas, and water well drilling; and wood pellet production. In July 2018, Astec announced that it was exiting its contractual obligations regarding its Arkansas wood pellet plant, “driven by unresolved issues, which inhibited the plant’s ability to meet contractual provisions by the date required by the Company’s sales contract.” Astec agreed to pay $68 million in cash in the aggregate and forgive approximately $7 million in receivables. As a result of the disclosure the share price declined more than 20%.
We appreciate your continued confidence and trust.
3
| | | | | | | | | | | | | | | | | | | | |
| Average Annual Returns Through September 30, 2018 (a) (Unaudited) | |
| | | 1 Year | | | 5 Year | | | 10 Year | | | 15 Year | | | Since
Inception
(5/11/98) | |
Mighty Mites Fund Class AAA | | | 4.38% | | | | 8.26% | | | | 11.37% | | | | 10.87% | | | | 11.43% | |
Dow Jones U.S. Micro-Cap Total Stock Market Index | | | 17.37 | | | | 9.69 | | | | 11.71 | | | | 8.68 | | | | 9.07(b) | |
Russell 2000 Index | | | 15.24 | | | | 11.07 | | | | 11.11 | | | | 10.12 | | | | 7.84 | |
Lipper Small Cap Value Fund Average | | | 7.91 | | | | 8.81 | | | | 9.99 | | | | 9.54 | | | | 8.39(b) | |
In the current prospectuses dated January 26, 2018, the expense ratio for Class AAA Shares is 1.41%. See page 44 for the expense ratios for the year ended September 30, 2018. Class AAA Shares do not have a sales charge. | |
(a) Returns represent past performance and do not guarantee future results. Total returns and average annual returns reflect changes in share price, reinvestment of distributions, and are net of expenses. Investment returns and the principal value of an investment will fluctuate. When shares are redeemed, they may be worth more or less than their original cost. Current performance may be lower or higher than the performance data presented. Visit www.tetonadv.com for performance information as of the most recent month end. Teton Advisors, Inc., (the Adviser) reimbursed expenses through September 30, 2005 to limit the expense ratios. Had such limitations not been in place, returns would have been lower. The Fund imposes a 2% redemption fee on shares sold or exchanged within seven days after purchase. Investors should carefully consider the investment objectives, risks, charges, and expenses of the Fund before investing. The prospectuses contain information about these and other matters and should be read carefully before investing. To obtain a prospectus, please visit our website at www.tetonadv.com. Other share classes are available and have different performance characteristics. See page 2 for performance of other classes of shares. The Dow Jones U.S. Micro-Cap Total Stock Market Index is designed to provide a comprehensive measure of the micro-cap segment of the U.S. stock market. The Russell 2000 Index is an unmanaged indicator which measures the performance of the small cap segment of the U.S. equity market. The Lipper Small Cap Value Fund Average reflects the average performance of mutual funds classified in this particular category. Investing in small capitalization securities involves special challenges because these securities may trade less frequently and experience more abrupt price movements than large capitalization securities. Dividends are considered reinvested. You cannot invest directly in an index. (b) Dow Jones U.S. Micro-Cap Total Stock Market Index and Lipper Small Cap Value Fund Average since inception performance is as of April 30, 1998. | |
COMPARISON OF CHANGE IN VALUE OF A $10,000 INVESTMENT IN
THE MIGHTY MITES FUND CLASS AAA, THE RUSSELL 2000 INDEX,
AND THE DOW JONES U.S. MICRO-CAP TOTAL STOCK MARKET INDEX (Unaudited)
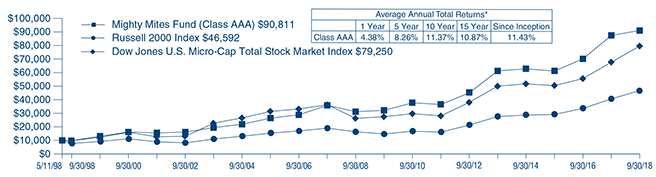
*Past performance is not predictive of future results. The performance tables and graph do not reflect the deduction of taxes that a shareholder would pay on fund distributions or the redemption of fund shares.
4
SmallCap Equity Fund (Unaudited)
For the fiscal year ended September 30, 2018, the TETON Westwood SmallCap Equity Fund NAV per Class AAA Share appreciated 9.7% compared with a gain of 15.2% for the Russell 2000 Index. See the next page for additional performance information.
The Fund invests primarily in small cap companies that, through bottom-up fundamental research, the portfolio manager believes are attractively priced relative to their earnings growth potential or Private Market Value. The Fund characterizes small capitalization companies as those companies with a market capitalization between $100 million and $2.5 billion at the time of the Fund’s initial investment.
Equity markets rallied to close 2017. While the media coverage was dominated by the drama leading up to the passage of tax reform, a building confidence in improving earnings growth helped to carry the market higher. Corporate profits remained a key focus for investors, as ultimately the profit cycle drives long term returns in the stock market.
Stocks stumbled in the first calendar quarter of 2018 as volatility spiked from historically low levels. While trading was choppy, the market experienced its first real correction in the last several years, lasting from late January through early February. The growing potential for disruptive trade policies, starting with steel and aluminum tariffs enacted by President Trump, moved to the forefront, while corporate profit outlooks remained positive and equity markets, while volatile, remained near all time highs.
The second calendar quarter of 2018 ended on a tumultuous note, with sharp equity market declines driven by fears of a potential trade war with China and Europe. That the market exhibited some indigestion was not surprising, given high asset prices, global monetary tightening, higher interest rates, and relative investor complacency.
Stock indices ended the Fund’s fourth fiscal quarter on the retreat after marking all time highs earlier this summer. The impact was far more pronounced for small capitalization stocks, at nearly two-to-one in the last week of the quarter, as those indices returned to where they began the summer months, generally in line with their 200 day moving averages.
Among the better performing stocks in the year were: Bottomline Technologies Inc. (2.4% of net assets as of September 30, 2018), an innovator in business payment automation technology, whose stock has an impressive record of positive earnings surprises, as it has not missed a consensus earnings estimate in any of the last four quarters; Pandora Media Inc. (2.1%), that provides music streaming and internet radio service, announced in September that SiriusXM agreed to buy Pandora in an all stock deal which would create a $30 billion company that rivals market leader Spotify; and Oxford Industries, Inc. (1.4%), a high end clothing and apparel company which increased its earnings growth over the past year due to increased distribution and retail presence.
Our weaker performing stocks during the year included: Patterson-UTI Energy, Inc. (2.4%), which provides onshore contract drilling services to oil and natural gas operators in the U.S. and Canada. Patterson reported weaker than expected revenues as its pressure pumping business struggled from idled equipment and softening demand; NetScout Systems, Inc. (1.6%), a provider of application and network performance management products, experienced slow revenue growth and high cost growth; and Ethan Allen Interiors, Inc. (1.5%), a manufacturer and retailer of high quality home furnishings, whose stock has fallen in the last few quarters, most notably with fourth quarter results, as revenue rose 5.5% while gross margins compressed sharply. The most concerning aspect of the report was a decrease in retail written orders, which fell 10.8% overall.
We thank you for your continued confidence and trust.
5
| | | | | | | | | | | | | | | | | | | | |
| Average Annual Returns through September 30, 2018 (a) (Unaudited) | |
| | | 1 Year | | | 5 Year | | | 10 Year | | | 15 Year | | | Since
Inception
(4/15/97) | |
SmallCap Equity Fund Class AAA | | | 9.68% | | | | 10.55% | | | | 10.86% | | | | 9.97% | | | | 8.13% | |
Russell 2000 Index | | | 15.24 | | | | 11.07 | | | | 11.11 | | | | 10.12 | | | | 9.20 | |
Russell 2000 Value Index | | | 9.33 | | | | 9.91 | | | | 9.52 | | | | 9.50 | | | | 9.77 | |
In the current prospectuses dated January 26, 2018, the gross expense ratio for Class AAA Shares is 1.74%, and the net expense ratio is 1.25% after contractual reimbursements by Teton Advisors, Inc. (the Adviser) in place through January 31, 2019. See page 45 for the expense ratios for the year ended September 30, 2018. Class AAA Shares do not have a sales charge. | |
(a) Returns represent past performance and do not guarantee future results. Total returns and average annual returns reflect changes in share price, reinvestment of distributions, and are net of expenses. Investment returns and the principal value of an investment will fluctuate. When shares are redeemed, they may be worth more or less than their original cost. Current performance may be lower or higher than the performance data presented. Visit www.tetonadv.com for performance information as of the most recent month end. The Adviser reimbursed expenses to limit the expense ratio. Had such limitation not been in place, returns would have been lower. The Fund imposes a 2% redemption fee on shares sold or exchanged within seven days after purchase. Investors should carefully consider the investment objectives, risks, charges, and expenses of the Fund before investing. The prospectuses contain information about these and other matters and should be read carefully before investing. To obtain a prospectus, please visit our website at www.tetonadv.com. Other share classes are available and have different performance characteristics. See page 2 for performance of other classes of shares. The Russell 2000 Index is an unmanaged indicator which measures the performance of the small cap segment of the U.S. equity market. The Russell 2000 Value Index measure the performance of the small capitalization sector of the U.S. equity market and is a subset of the Russell 2000 Index. Investing in small capitalization securities involves special challenges because these securities may trade less frequently and experience more abrupt price movements than large capitalization securities. Dividends are considered reinvested. You cannot invest directly in an index. | |
COMPARISON OF CHANGE IN VALUE OF A $10,000 INVESTMENT IN THE SMALLCAP EQUITY FUND
CLASS AAA AND THE RUSSELL 2000 INDEX (Unaudited)
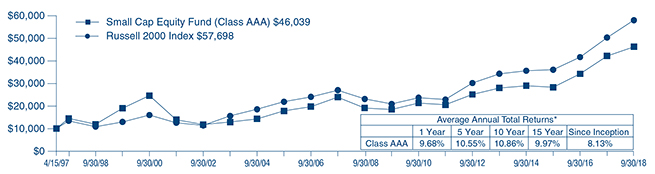
| * | Past performance is not predictive of future results. The performance tables and graph do not reflect the deduction of taxes that a shareholder would pay on fund distributions or the redemption of fund shares. |
6
Mid-Cap Equity Fund (Unaudited)
For the fiscal year ended September 30, 2018, the TETON Westwood Mid-Cap Equity Fund NAV per Class AAA Share appreciated 7.4% compared with a gain of 14.0% for the Russell Midcap Index. See the next page for additional performance information.
The Fund invests primarily in mid-cap companies that the portfolio manager believes are undervalued by the market and have above average growth potential. The Fund defines mid-cap companies as those whose market capitalization falls within a range of $1 billion to $20 billion. As bottom up, fundamental, research driven investors, the portfolio manager seeks to invest in attractively valued companies with strong balance sheets, secular growth, experienced management teams, solid earnings prospects, leading market shares, and superior long term fundamentals.
The global stock market ended 2017 on a strong note, surging to either fresh records or multi-year highs as the global economy continued a synchronized recovery, with improving corporate earnings, strengthening economics, and supportive monetary policy from central banks. The market was propelled by corporate tax cuts and a weakening dollar that supported exports. In the Fund’s second fiscal quarter, the market saw volatility caused by threats of trade wars and inflation. Despite seeing a peak in consumer confidence levels and some of the lowest reported unemployment levels in seventeen years, uncertainty over President Trump’s threat of investment restrictions against China caused market gyrations as investors gauged the potential negative impacts.
Investors entered the third fiscal quarter on the defensive, made uneasy by bouts of market volatility and swelling trade rhetoric. Macro data points in April only heightened that concern with job numbers below forecast and inflation data appearing to indicate acceleration. However, by May, the corporate earnings reports remained solid, inflation gains slowed, job growth continued, and wage growth was steady. Incoming Federal Reserve Chairman Jerome Powell also walked back hawkish inflation comments from months prior, showing little desire by officials to end the decade long bull market.
Stock indices ended the Fund’s fourth fiscal quarter on the retreat after marking all time highs earlier this summer. The impact was more pronounced for midcap stocks, at almost two to one in the last week of the quarter, as the Midcap Index moved back towards the level at which it began the summer months, nearly at the 200 day moving average. The economy continued to signal domestic strength, with the unemployment rate at 3.7%. Yet, despite tight employment conditions and many companies citing talent acquisition as a strategic concern, hourly earnings growth and inflation remained at modest levels.
Among the better performing stocks for the fiscal year included Fortinet Inc. (3.4% of net assets as of September 30, 2018), a multinational corporation that develops and markets cybersecurity software, appliances and services, such as firewalls, anti-virus, intrusion prevention, and endpoint security. Fortinet benefited from double digit sales and earnings growth, and a rising number of data breaches driving interest in its core business and cybersecurity stocks in general. Pandora Media, Inc. (2.6%) provides music discovery platform services in the United States and internationally. The company offers streaming radio and on demand music services. Pandora shares surged during the year much in thanks to a growth of over 20% in paying subscribers, enhancements in its advertising technology, and partnerships with companies SNAP and AT&T. In September it was announced that Sirius XM would be acquiring Pandora. CBRE Group Inc. (3.3%) is the world’s largest commercial real estate services and investment company, with the number one global market position in leasing, property sales, outsourcing, property management, and valuation. CBRE experienced particularly strong revenue growth in its combined regional services business, making incremental investments to support future growth, streamline operations, and share some of the benefits of tax reform with its employees. CBRE made acquisitions, highlighted by FacilitySource, a leader in technology based procurement and facility management solutions in the United States.
Some detractors from the portfolio included C&J Energy Services, Inc. (1.5%), a leading provider of well construction, well completions, and well services, which was affected by a sharp decline in the oil services industry and pipeline capacity constraints challenging short term growth. Fortune Brands Home & Security, Inc. (1.9%), a home and security products company built on industry leading brands and innovative cabinetry, plumbing, and door and security products, struggled during the year due to increasing industry competition, high levels of long term debt, and rising costs and expenses. Another poorly performing security was Patterson Companies, Inc. (0.9%), a medical supplies conglomerate primarily in the business of veterinary and dental products. Patterson saw a decrease in consolidated sales as well as a class action lawsuit on behalf of all persons or entities that purchased Patterson securities between June 26, 2015 and February 28, 2018. The complaint alleges that, throughout the period in question, Patterson made false and/or misleading statements, as well as failed to disclose material adverse facts about its business, operations, and prospects.
We appreciate your confidence and trust.
7
| | | | | | | | | | | | | | | | |
| Average Annual Returns through September 30, 2018 (a) (Unaudited) | |
| | | 1 Year | | | 3 Year | | | 5 Year | | | Since
Inception
(5/31/13) | |
Mid-Cap Equity Fund Class AAA | | | 7.38% | | | | 9.63% | | | | 7.75% | | | | 8.20% | |
Russell Midcap Index | | | 13.98 | | | | 14.52 | | | | 11.65 | | | | 11.92(b) | |
Russell Midcap Growth Index | | | 21.10 | | | | 16.65 | | | | 13.00 | | | | 13.51(b) | |
In the current prospectuses dated January 26, 2018, the gross expense ratio for Class AAA Shares is 3.36%, and net expense ratio is 1.05% after contractual reimbursements by Teton Advisors, Inc., (the Adviser) in place through January 31, 2019. See page 46 for the expense ratios for the year ended September 30, 2018. Class AAA Shares do not have a sales charge. | |
(a) Returns represent past performance and do not guarantee future results. Total returns and average annual returns reflect changes in share price, reinvestment of distributions, and are net of expenses. Investment returns and the principal value of an investment will fluctuate. When shares are redeemed, they may be worth more or less than their original cost. Current performance may be lower or higher than the performance data presented. Visit www.tetonadv.com for performance information as of the most recent month end. The Adviser reimbursed expenses to limit the expense ratio. Had such limitation not been in place, returns would have been lower. The Fund imposes a 2% redemption fee on shares sold or exchanged within seven days after purchase. Investors should carefully consider the investment objectives, risks, charges, and expenses of the Fund before investing. The prospectuses contain information about these and other matters and should be read carefully before investing. To obtain a prospectus, please visit our website at www.tetonadv.com. Other share classes are available and have different performance characteristics. See page 2 for performance of other classes of shares. The Russell Midcap Index is an unmanaged indicator which measures the performance of the midcap segment of the U.S. equity market. The Russell Midcap Growth Index is an unmanaged indicator which measures the performance of those Russell Midcap companies with higher price-to-book ratios and higher forecasted growth values. Dividends are considered reinvested. You cannot invest directly in an index. (b) Russell Midcap and Russell Midcap Growth Indices since inception performance is from May 30, 2013. | |
COMPARISON OF CHANGE IN VALUE OF A $10,000 INVESTMENT IN THE MID-CAP EQUITY FUND
CLASS AAA , THE RUSSELL MIDCAP INDEX, AND THE RUSSELL MIDCAP GROWTH INDEX (Unaudited)
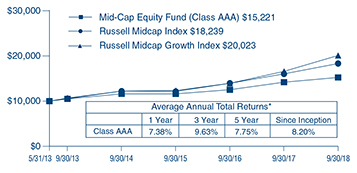
| * | Past performance is not predictive of future results. The performance tables and graph do not reflect the deduction of taxes that a shareholder would pay on fund distributions or the redemption of fund shares. |
8
Convertible Securities Fund (Unaudited)
For the fiscal year ended September 30, 2018, the TETON Convertible Securities Fund NAV per Class AAA Share appreciated 14.4% compared with gains of 17.9% and 12.2% for the Standard & Poor’s (S&P) 500 Index and the ICE Bank of America Merrill Lynch U.S. Convertibles Index, respectively. See the next page for additional performance information.
The Fund invests in convertible securities. By investing in convertible securities, the portfolio managers seek the opportunity to participate in the capital appreciation of underlying stocks, while at the same time relying on the fixed income aspect of the convertible securities to provide current income and reduced price volatility, which can limit the risk of loss in a down equity market. The Fund may invest in securities of any market capitalization or credit quality, and may from time to time invest a significant amount of its assets in securities of smaller companies.
We experienced four interest rate hikes and the beginning of the reduction of the Federal Reserve balance sheet during the Fund’s fiscal year, but this did not keep the convertible market from providing strong returns. The Fund’s first fiscal quarter saw convertible securities driven higher by strong equity markets and a stable economic environment. Low volatility was apparent in most asset classes, and convertibles remained competitive with stocks.
Volatility returned in the Fund’s second fiscal quarter. Rising interest rates and uncertainty over global trade policy caused investors and traders to add and remove risk from portfolios in a rather dramatic fashion. Convertibles maintained much greater stability over the course of the quarter which allowed them to outperform other asset classes, as rates remained low and tax code changes limiting deductibility of interest made the structure attractive for issuers.
The bull market continued in the Fund’s third fiscal quarter and convertible securities followed up on their strong beginning to 2018 as they again outperformed U.S. corporate bonds and U.S. government bonds. Among U.S. convertible issues, the Consumer Non-Cyclical, Energy, and Technology sectors added to returns for the year to date. Non-rated issues outperformed investment grade, intermediate grade and junk issues, while mid-capitalization issues outperformed small capitalization and large capitalization issues, in that order.
Convertible securities continued their strong performance in the Fund’s fourth fiscal quarter, outperforming U.S. corporate bonds and U.S. government bonds while lagging the performance of the S&P 500. We continued to see robust issuance with 25 new issues coming to market. The U.S. convertible market ended September with 476 issues and $227 billion in market capitalization. Issuance expanded in 2018 with 118 new issues raising $47 billion, exceeding redemptions for the year, growing the market and giving the portfolio managers a diverse mix of convertibles to choose from for the portfolio.
Among the better performing securities were Teladoc Health Inc., 3.000%, 12/15/22 (2.1% of net assets as of September 30, 2018), a telehealth company that uses telephone and videoconferencing technology to provide on-demand remote medical care via mobile devices. Over the past year Teladoc benefited from segment growth and the growing dependence on virtual care delivery. In addition, expanded capabilities and an announced partnership with Partners Healthcare helped support strong growth. Another security that added to the Fund’s performance was Coupa Software Inc., 0.375%, 01/15/23 (1.6%), a global technology platform for Business Spend Management (BSM) that helps small, medium, and large companies gain visibility into, and control over, the money and resources spent within their organizations. Coupa saw high growth and strong performance in a quickly expanding and highly accessible market, and counts Amazon, Nike, and Coca-Cola Consolidated among its growing customer base. An additional contributor to the portfolio was Neurocrine Biosciences Inc., 2.250%, 05/15/24 (1.4%), a biopharmaceutical company which develops and discovers treatments for neurological and endocrine-related diseases and disorders. Neurocrine saw significant revenue growth from its FDA approved drug Ingrezza, and has clinical stage trials in the pipeline.
Some of the Fund’s weaker holdings included DISH Network Corp., 3.375%, 08/15/26 (2.0%), a network television provider and owner of the direct broadcast satellite provider DISH and Sling TV. DISH’s stock had a downward trajectory for most of the year, mainly due to a steady loss of satellite subscribers and the ongoing trend of “cord cutting.” DISH does not sell broadband service, meaning that users of its Sling TV must get their internet service from alternative providers. Rambus Inc., 1.375%, 02/01/23 (1.6%), provides semiconductor products and focuses on design, development, and manufacturing through partnerships and licensing of technology and solutions related to memory and interfaces. Its solutions provide an interface between analog signals and digital information in systems, such as telecommunications transport systems, enterprise networking equipment, and datacenters. Midway through the year, Rambus’s CEO was unexpectedly terminated due to what the Board determined to be conduct which fell short of the company’s standards. Inphi Corp., 1.125%, 12/01/20 (2.0%), is a provider of analog and mixed signal semiconductor solutions for the communications and datacenter markets. Inphi suffered from a self described down cycle driven by inventory buildups in China long haul and metro markets and lower demand for its linear transimpedance amplifier and linear driver products.
We appreciate your confidence and trust.
9
| | | | | | | | | | | | | | | | | | | | |
| Average Annual Returns Through September 30, 2018 (a) (Unaudited) | |
| | | 1 Year | | | 5 Year | | | 10 Year | | | 15 Year | | | Since
Inception
(9/30/97) | |
Convertible Securities Fund Class AAA | | | 14.38% | | | | 8.30% | | | | 7.91% | | | | 7.71% | | | | 7.68% | |
S&P 500 Index | | | 17.91 | | | | 13.95 | | | | 11.97 | | | | 9.65 | | | | 7.50 | |
ICE Bank of America Merrill Lynch U.S. Convertibles Index | | | 12.22 | | | | 9.32 | | | | 11.01 | | | | 8.01 | | | | 7.32 | |
In the current prospectuses dated January 26, 2018, the gross expense ratio for Class AAA Shares is 2.47%, and the net expense ratio is 1.15%, after contractual reimbursements by Teton Advisors, Inc. (the Adviser) in place through January 31, 2019. See page 47 for the expense ratios for the year ended September 30, 2018. Class AAA Shares do not have a sales charge. | |
(a) Returns represent past performance and do not guarantee future results. Total returns and average annual returns reflect changes in share price, reinvestment of distributions, and are net of expenses. Investment returns and the principal value of an investment will fluctuate. When shares are redeemed, they may be worth more or less than their original cost. Current performance may be lower or higher than the performance data presented. Visit www.tetonadv.com for performance information as of the most recent month end. The Adviser reimbursed expenses to limit the expense ratio. Had such limitation not been in place, returns would have been lower. The Fund imposes a 2% redemption fee on shares sold or exchanged within seven days after purchase. Investors should carefully consider the investment objectives, risks, charges, and expenses of the Fund before investing. The prospectuses contain information about these and other matters and should be read carefully before investing. To obtain a prospectus, please visit our website at www.tetonadv.com. Other share classes are available and have different performance characteristics. See page 2 for performance of other classes of shares. The S&P 500 Index is a market capitalization weighted index of 500 large capitalization stocks commonly used to represent the U.S. equity market. The ICE Bank of America Merrill Lynch U.S. Convertibles Index is a market value weighted index of all dollar denominated convertible securities that are exchangeable into U.S. equities that have a market value of more than $50 million. Dividends are considered reinvested. You cannot invest directly in an index. | |
COMPARISON OF CHANGE IN VALUE OF A $10,000 INVESTMENT IN THE CONVERTIBLE SECURITIES FUND
CLASS AAA, THE S&P 500 INDEX AND
THE ICE BANK OF AMERICA MERRILL LYNCH U.S. CONVERTIBLES INDEX (Unaudited)
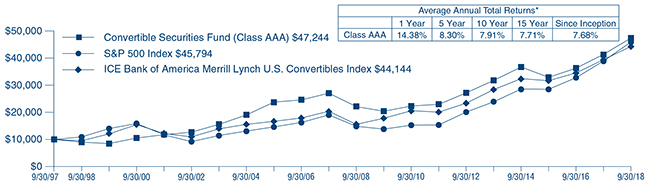
| * | Past performance is not predictive of future results. The performance tables and graph do not reflect the deduction of taxes that a shareholder would pay on fund distributions or the redemption of fund shares. |
10
Equity Fund (Unaudited)
The TETON Westwood Equity Fund underperformed the benchmark S&P 500 Index over the fiscal year. For the twelve months ended September 30, 2018, the Equity Fund Class AAA shares posted a gain of 14.1%, net of expenses, versus the S&P 500 Index gain of 17.9%. See the next page for additional performance information.
Equity markets rallied to close 2017. While the media coverage was dominated by the drama leading up to the passage of tax reform, a building confidence in improving earnings growth helped to carry the market higher. Corporate profits remained a key focus for investors, as ultimately the profit cycle drives long term returns in the stock market.
Stocks stumbled in the first calendar quarter of 2018 as volatility spiked from historically low levels. While trading was choppy, the market experienced its first real correction in the last several years, lasting from late January through early February. The growing potential for disruptive trade policies, starting with steel and aluminum tariffs enacted by President Trump, moved to the forefront, while corporate profit outlooks remained positive and equity markets, while volatile, remained near all time highs.
Volatility, which had surfaced earlier in the year, decreased throughout the second calendar quarter, though remained elevated relative to recent historically low levels. The market grappled with continued headlines regarding the potential for trade wars with our international partners on several different fronts.
Stock indices ended the Fund’s fourth fiscal quarter on the retreat after marking all time highs earlier this summer.
Positive drivers of relative Fund performance over the twelve months included: Becton Dickinson & Co. (2.5% of total net assets as of September 30, 2018), a medical technology company that manufactures and sells medical devices, instruments, and systems which benefited from accelerating revenue growth and margin expansions as it continued to successfully acquire and integrate additional products into its lineup and realize meaningful synergies; Abbott Laboratories (3.0%), an American healthcare company with a broad range of branded generic pharmaceuticals, medical devices, diagnostics, and nutrition products, saw solid contribution from its recent acquisitions, as its organic growth exceeded expectations; Motorola Solutions Inc. (2.1%), the data communications and telecommunications equipment provider, gained traction as the leading provider for network and communication solutions for first responders; and Boeing Co. (2.0%), the world’s largest aerospace company, rallied on better earnings and cash flow results seen throughout the year, supported by a backlog for new airplanes that stretches out over the next five years.
Detractors from the Fund’s performance included AT&T Corp. (3.5%), which provides voice, video, and data communications services to businesses, consumers, and governments worldwide, fell as broad concerns on competitive pressures across its business units weighed on shares even though further consolidation in the wireless carrier market could be beneficial to improving industry behavior. General Mills, Inc. (2.0%), which manufactures and markets branded consumer goods worldwide, closed on its acquisition of Blue Buffalo to further expand its product portfolio; however, rising transportation costs particularly hurt margins as did high levels of competitive pressures. Financial services company Morgan Stanley, Inc. (1.6%) shares were pressured as it received a less favorable regulatory ruling on its plan to return additional capital to shareholders. Lam Research Corp. (0.8%), the semiconductor and circuit manufacturer, moved lower over investor fears regarding the semiconductor cycle amid the upcoming lull in activity being indicated by the industry after a strong period of growth.
We appreciate your confidence and trust.
11
| | | | | | | | | | | | | | | | | | | | |
| Average Annual Returns through September 30, 2018 (a) (Unaudited) | |
| | | 1 Year | | | 5 Year | | | 10 Year | | | 15 Year | | | Since
Inception
(1/2/87) | |
Equity Fund Class AAA | | | 14.14% | | | | 11.12% | | | | 8.63% | | | | 9.11% | | | | 10.16% | |
S&P 500 Index | | | 17.91 | | | | 13.95 | | | | 11.97 | | | | 9.65 | | | | 10.61(b) | |
| In the current prospectuses dated January 26, 2018, the expense ratio for Class AAA Shares is 1.62%. See page 48 for the expense ratios for the year ended September 30, 2018. Class AAA Shares do not have a sales charge. | |
(a) Returns represent past performance and do not guarantee future results. Total returns and average annual returns reflect changes in share price, reinvestment of distributions, and are net of expenses. Investment returns and the principal value of an investment will fluctuate. When shares are redeemed, they may be worth more or less than their original cost. Current performance may be lower or higher than the performance data presented. Visit www.tetonadv.com for performance information as of the most recent month end. Investors should carefully consider the investment objectives, risks, charges, and expenses of the Fund before investing. The prospectuses contain information about these and other matters and should be read carefully before investing. To obtain a prospectus, please visit our website at www.tetonadv.com. Other share classes are available and have different performance characteristics. See page 2 for performance of other classes of shares. The S&P 500 Index is a market capitalization weighted index of 500 large capitalization stocks commonly used to represent the U.S. equity market. Dividends are considered reinvested. You cannot invest directly in an index. (b) S&P 500 Index since inception performance is as of December 31, 1986. | |
COMPARISON OF CHANGE IN VALUE OF A $10,000 INVESTMENT IN
THE EQUITY FUND CLASS AAA AND THE S&P 500 INDEX (Unaudited)
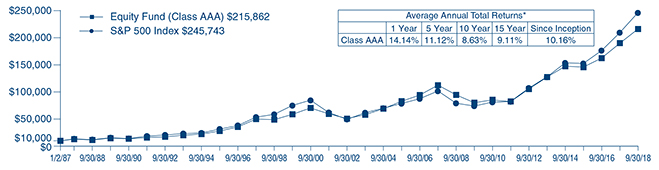
| * | Past performance is not predictive of future results. The performance tables and graph do not reflect the deduction of taxes that a shareholder would pay on fund distributions or the redemption of fund shares. |
12
Balanced Fund (Unaudited)
For fiscal year ended September 30, 2018, the TETON Westwood Balanced Fund Class AAA Shares posted a return of 9.3%, net of expenses, versus the Bloomberg Barclays Government/Credit Bond Index return of (1.4%). The Fund’s return was less than a common balanced benchmark comprised of 60% S&P 500 Index and 40% of the Bloomberg Barclays Capital Government/Credit Bond Index which returned 10.2%. See the next page for additional performance information.
Equity markets rallied to close 2017 with even more gains. While the media coverage was dominated by the drama leading up to the passage of tax reform, a building confidence in improving earnings growth helped to carry the market higher. Corporate profits remained a key focus for investors, as ultimately the profit cycle drives long term returns in the stock market.
Stocks stumbled in the first calendar quarter of 2018 as volatility spiked from historically low levels. While trading was choppy, the market experienced its first real correction in the last several years, lasting from late January through early February. The growing potential for disruptive trade policies, starting with steel and aluminum tariffs enacted by President Trump, moved to the forefront, while corporate profit outlooks remained positive and equity markets, while volatile, remained near all time highs.
The second calendar quarter of 2018 ended on a tumultuous note, with sharp equity market declines driven by fears of a potential trade war with China and Europe. That the market exhibited some indigestion was not surprising, given high asset prices, global monetary tightening, higher interest rates, and relative investor complacency.
Volatility, which had surfaced earlier in the year, moderated throughout the second calendar quarter, though remained elevated relative to recent historically low levels. The market grappled with continued headlines regarding the potential for trade wars with our international partners on several different fronts.
The Fund’s fixed income segment outperformed the benchmark in the third calendar quarter. The Fund outperformed in the U.S. Agency and Utility Corporate segments. Key drivers of outperformance were having lower overall portfolio duration, being overweight corporate credit, and being underweight U.S. Treasuries.
Our top contributor for the period was Exxon Mobil 6.5% due 15 Dec 2018 (no longer held as of September 30, 2018). Other top contributors were a floating rate corporate bond and a short maturity corporate bond: Enterprise Products Group Perpetual Floater and Texas Instruments 1.65% due 03 Aug 2019 (no longer held and 0.8%, respectively).
Detracting from performance were intermediate maturity Treasury and U.S. Agency positions; Fannie Mae 2.625% due 06 Sep 2024 (1.7%), U.S. Treasury 2.25% due 15 Nov 2024 (1.5%), and U.S. Treasury 1.625% due 15 Feb 2026 (1.2%).
We appreciate your confidence and trust.
13
| | | | | | | | | | | | | | | | | | | | |
Average Annual Returns through September 30, 2018 (a) (Unaudited) | |
| | | 1 Year | | | 5 Year | | | 10 Year | | | 15 Year | | | Since
Inception
(10/1/91) | |
Balanced Fund Class AAA | | | 9.32% | | | | 7.55% | | | | 6.66% | | | | 6.93% | | | | 8.40% | |
Bloomberg Barclays Government/Credit Bond Index | | | (1.37) | | | | 2.23 | | | | 3.95 | | | | 3.75 | | | | 5.54(b) | |
S&P 500 Index | | | 17.91 | | | | 13.95 | | | | 11.97 | | | | 9.65 | | | | 9.97(b) | |
60% S&P 500 Index and 40% Bloomberg Barclays Government/Credit Bond Index (c) | | | 10.20 | | | | 9.26 | | | | 8.76 | | | | 7.29 | | | | 8.20 | |
In the current prospectuses dated January 26, 2018, the expense ratio for Class AAA Shares is 1.34%. See page 49 for the expense ratios for the year ended September 30, 2018. Class AAA Shares do not have a sales charge. | |
(a) Returns represent past performance and do not guarantee future results. Total returns and average annual returns reflect changes in share price, reinvestment of distributions, and are net of expenses. Investment returns and the principal value of an investment will fluctuate. When shares are redeemed, they may be worth more or less than their original cost. Current performance may be lower or higher than the performance data presented. Visit www.tetonadv.com for performance information as of the most recent month end. Teton Advisors, Inc. (the Adviser) reimbursed expenses in years prior to 1998 to limit the expense ratio. Had such limitation not been in place, returns would have been lower. Investors should carefully consider the investment objectives, risks, charges, and expenses of the Fund before investing. The prospectuses contain information about these and other matters and should be read carefully before investing. To obtain a prospectus, please visit our website at www.tetonadv.com. Other share classes are available and have different performance characteristics. See page 2 for performance of other classes of shares. The Bloomberg Barclays Government/Credit Bond Index is a market value weighted index that tracks the performance of fixed rate, publicly placed, dollar denominated obligations. The S&P 500 Index is a market capitalization weighted index of 500 large capitalization stocks commonly used to represent the U.S. equity market. Dividends are considered reinvested. You cannot invest directly in an index. (b) S&P 500 Index and Bloomberg Barclays Government/Credit Bond Index since inception performances are as of September 30, 1991. (c) The Blended Index consists of a blend of 60% of the S&P 500 Index and 40% of the Bloomberg Barclays Government/Credit Bond Index. | |
COMPARISON OF CHANGE IN VALUE OF A $10,000 INVESTMENT IN THE BALANCED FUND CLASS AAA,
THE S&P 500 INDEX, AND A COMPOSITE OF 60% OF THE S&P 500 INDEX AND 40% OF
THE BLOOMBERG BARCLAYS GOVERNMENT/CREDIT BOND INDEX (Unaudited)
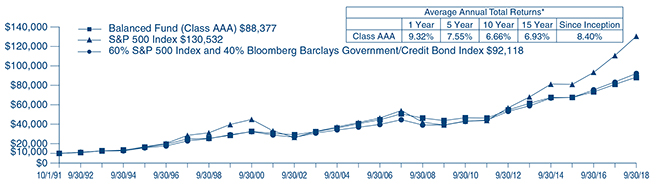
| * | Past performance is not predictive of future results. The performance tables and graph do not reflect the deduction of taxes that a shareholder would pay on fund distributions or the redemption of fund shares. |
14
Intermediate Bond Fund (Unaudited)
For the fiscal year ended September 30, 2018, the TETON Westwood Intermediate Bond Fund NAV per Class AAA Share decreased (0.8)% compared with the Bloomberg Barclays Government/Credit Bond Index which was down (1.4)%. See below for additional performance information.
The TETON Westwood Intermediate Bond Fund benefited from its intermediate financial corporate positions during the fourth quarter of 2017. Investment grade credit spreads tightened during the period, with corporates outperforming duration matched Treasury and U.S. Agency positions. Yields on intermediate Treasuries rose, and total returns on investment grade bonds were positive for the period.
The Fund outperformed its benchmark in the first quarter of 2018. Yields on intermediate Treasuries rose, and total returns on investment grade bonds were negative for the period. Yields on the 5 year Treasury note rose 35 basis points from 2.21% to 2.56%, while the 10 year Treasury note rose 33 basis points from 2.41% to 2.74% during the quarter.
Yields on intermediate Treasuries rose, and total returns on investment grade bonds were negative during the Fund’s third fiscal quarter. Yields on the 5 year U.S. Treasury note rose by 18 basis points from 2.56% to 2.74%, while the 10 year Treasury note rose by 12 basis points, from 2.74% to 2.86% during the quarter.
The Fund outperformed the benchmark in the third calendar quarter. Yields on intermediate Treasuries rose, and total returns on investment grade bonds were negative for the period. Yields on the 5 year Treasury note rose by 21 basis points from 2.74% to 2.95%, while the 10 year Treasury note rose by 20 basis points from 2.86% to 3.06% during the quarter. Notwithstanding some inter-period volatility, the trend was clearly up. The U.S. Treasury Yield Curve flattened slightly as the yield differential between 10 year and 2 year Treasuries continued to narrow. Investment grade credit spreads tightened by approximately 15 basis points during the quarter causing U.S. Treasury and Agencies to underperform duration matched corporates.
We thank you for your continued confidence and trust.
| | | | | | | | | | | | | | | | | | | | |
| Average Annual Returns through September 30, 2018 (a) (Unaudited) | |
| | | 1 Year | | | 5 Year | | | 10 Year | | | 15 Year | | | Since
Inception
(10/1/91) | |
Intermediate Bond Fund Class AAA | | | (0.83)% | | | | 0.76% | | | | 2.31% | | | | 2.46% | | | | 4.32% | |
Bloomberg Barclays Government/Credit Bond Index | | | (1.37) | | | | 2.23 | | | | 3.95 | | | | 3.75 | | | | 5.54(b) | |
| In the current prospectuses dated January 26, 2018, the gross expense ratio for AAA Shares is 1.52%, and the net expense ratio is 1.00% after contractual reimbursements by Teton Advisors, Inc., (the Adviser) in place through January 31, 2019. See page 50 for the expense ratios for the year ended September 30, 2018. Class AAA Shares do not have a sales charge. | |
(a) Returns represent past performance and do not guarantee future results. Total returns and average annual returns reflect changes in share price, reinvestment of distributions, and are net of expenses. Investment returns and the principal value of an investment will fluctuate. When shares are redeemed, they may be worth more or less than their original cost. Current performance may be lower or higher than the performance data presented. Visit www.tetonadv.com for performance information as of the most recent month end. The Adviser reimbursed expenses to limit the expense ratio. Had such limitation not been in place, returns would have been lower. Investors should carefully consider the investment objectives, risks, charges, and expenses of the Fund before investing. The prospectuses contain information about these and other matters and should be read carefully before investing. To obtain a prospectus, please visit our website at www.tetonadv.com. Other share classes are available and have different performance characteristics. See page 2 for performance of other classes of shares. The Bloomberg Barclays Government/Credit Bond Index is a market value weighted index that tracks the performance of fixed rate, publicly placed, dollar denominated obligations. Dividends are considered reinvested. You cannot invest directly in an index. (b) The Bloomberg Barclays Government/Credit Bond Index since inception performance is as of September 30, 1991. | |
COMPARISON OF CHANGE IN VALUE OF A $10,000 INVESTMENT IN THE
INTERMEDIATE BOND FUND CLASS AAA AND
THE BLOOMBERG BARCLAYS GOVERNMENT/CREDIT BOND INDEX (Unaudited)
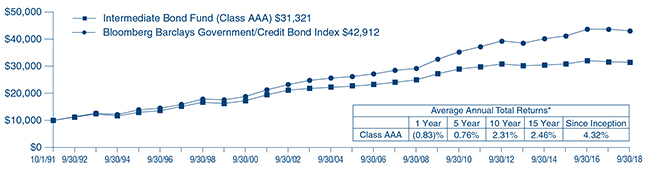
| * | Past performance is not predictive of future results. The performance tables and graph do not reflect the deduction of taxes that a shareholder would pay on fund distributions or the redemption of fund shares. |
15
This page was intentionally left blank.
TETON Westwood Funds
Disclosure of Fund Expenses (Unaudited)
For the Six Month Period from April 1, 2018 through September 30, 2018
We believe it is important for you to understand the impact of fees and expenses regarding your investment. All mutual funds have operating expenses. As a shareholder of a fund, you incur ongoing costs, which include costs for portfolio management, administrative services, and shareholder reports (like this one), among others. Operating expenses, which are deducted from a fund’s gross income, directly reduce the investment return of a fund. When a fund’s expenses are expressed as a percentage of its average net assets, this figure is known as the expense ratio. The following examples are intended to help you understand the ongoing costs (in dollars) of investing in your Fund and to compare these costs with those of other mutual funds. The examples are based on an investment of $1,000 made at the beginning of the period shown and held for the entire period.
The Expense Table on page 18 illustrates your Fund’s costs in two ways:
Actual Fund Return: This section provides information about actual account values and actual expenses. You may use this section to help you to estimate the actual expenses that you paid over the period after any fee waivers and expense reimbursements. The “Ending Account Value” shown is derived from the Fund’s actual return during the past six months, and the Expenses Paid During Period” shows the dollar amount that would have been paid by an investor who started with $1,000 in the Fund. You may use this information, together with the amount you invested, to estimate the expenses that you paid over the period. To do so, simply divide your account value by $1,000 (for example, an $8,600 account value divided by $1,000 = 8.6), then multiply the result by the number given for your Fund under the heading “Expenses Paid During Period” to estimate the expenses you paid during this period.
Hypothetical 5% Return: This section provides information about hypothetical account values and hypothetical expenses based on the Fund’s actual expense ratio. It assumes a hypothetical annualized return of 5% before expenses during the period shown. In this case – because the hypothetical return used is not the Fund’s actual return – the results do not apply to your investment and you cannot use the hypothetical account value and expense to estimate the actual ending account balance or expenses you paid for the period. This example is useful in making comparisons of the ongoing costs of investing in the Fund and other funds. To do so, compare this 5% hypothetical example with the 5% hypothetical examples that appear in shareholder reports of other funds.
Please note that the expenses shown in the table are meant to highlight your ongoing costs only and do not reflect any transactional costs such as sales charges (loads), redemption fees, or exchange fees, if any, which are described in the Prospectus. If these costs were applied to your account, your costs would be higher. Therefore, the 5% hypothetical return is useful in comparing ongoing costs only, and will not help you determine the relative total costs of owning different funds. The “Annualized Expense Ratio” represents the actual expenses for the last six months and may be different from the expense ratio in the Financial Highlights which is for the fiscal year ended September 30, 2018.
17
TETON Westwood Funds
Disclosure of Fund Expenses (Unaudited) (Continued)
For the Six Month Period from April 1, 2018 through September 30, 2018
Expense Table
| | | | | | | | | | | | | | | | |
| | | Actual Fund Return | | Hypothetical 5% Return |
| | | Beginning
Account Value
04/01/18 | | Ending
Account Value
09/30/18 | | Annualized
Expense
Ratio | | Expenses
Paid During
Period* | | Beginning
Account Value
04/01/18 | | Ending
Account Value
09/30/18 | | Annualized
Expense
Ratio | | Expenses
Paid During
Period* |
|
|
TETON Westwood Mighty Mites Fund |
|
Class AAA | | $1,000.00 | | $1,053.70 | | 1.42% | | $ 7.31 | | $1,000.00 | | $1,017.95 | | 1.42% | | $ 7.18 |
Class A | | $1,000.00 | | $1,052.70 | | 1.67% | | $ 8.59 | | $1,000.00 | | $1,016.70 | | 1.67% | | $ 8.44 |
Class C | | $1,000.00 | | $1,050.10 | | 2.17% | | $11.15 | | $1,000.00 | | $1,014.19 | | 2.17% | | $10.96 |
Class I | | $1,000.00 | | $1,055.30 | | 1.16% | | $ 5.98 | | $1,000.00 | | $1,019.25 | | 1.16% | | $ 5.87 |
|
TETON Westwood SmallCap Equity Fund |
|
Class AAA | | $1,000.00 | | $1,058.60 | | 1.25% | | $ 6.45 | | $1,000.00 | | $1,018.80 | | 1.25% | | $ 6.33 |
Class A | | $1,000.00 | | $1,057.30 | | 1.50% | | $ 7.74 | | $1,000.00 | | $1,017.55 | | 1.50% | | $ 7.59 |
Class C | | $1,000.00 | | $1,054.90 | | 2.00% | | $10.30 | | $1,000.00 | | $1,015.04 | | 2.00% | | $10.10 |
Class I | | $1,000.00 | | $1,060.00 | | 1.00% | | $ 5.16 | | $1,000.00 | | $1,020.05 | | 1.00% | | $ 5.06 |
|
TETON Westwood Mid-Cap Equity Fund |
|
Class AAA | | $1,000.00 | | $1,040.30 | | 1.05% | | $ 5.37 | | $1,000.00 | | $1,019.80 | | 1.05% | | $ 5.32 |
Class A | | $1,000.00 | | $1,039.30 | | 1.30% | | $ 6.65 | | $1,000.00 | | $1,018.55 | | 1.30% | | $ 6.58 |
Class C | | $1,000.00 | | $1,036.30 | | 1.80% | | $ 9.19 | | $1,000.00 | | $1,016.04 | | 1.80% | | $ 9.10 |
Class I | | $1,000.00 | | $1,041.20 | | 0.80% | | $ 4.09 | | $1,000.00 | | $1,021.06 | | 0.80% | | $ 4.05 |
|
TETON Convertible Securities Fund |
|
Class AAA | | $1,000.00 | | $1,076.60 | | 1.15% | | $ 5.99 | | $1,000.00 | | $1,019.30 | | 1.15% | | $ 5.82 |
Class A | | $1,000.00 | | $1,075.20 | | 1.40% | | $ 7.28 | | $1,000.00 | | $1,018.05 | | 1.40% | | $ 7.08 |
Class C | | $1,000.00 | | $1,072.20 | | 1.90% | | $ 9.87 | | $1,000.00 | | $1,015.54 | | 1.90% | | $ 9.60 |
Class I | | $1,000.00 | | $1,077.70 | | 0.90% | | $ 4.69 | | $1,000.00 | | $1,020.56 | | 0.90% | | $ 4.56 |
|
TETON Westwood Equity Fund |
|
Class AAA | | $1,000.00 | | $1,078.10 | | 1.59% | | $ 8.28 | | $1,000.00 | | $1,017.10 | | 1.59% | | $ 8.04 |
Class A | | $1,000.00 | | $1,076.70 | | 1.84% | | $ 9.58 | | $1,000.00 | | $1,015.84 | | 1.84% | | $ 9.30 |
Class C | | $1,000.00 | | $1,074.70 | | 2.34% | | $12.17 | | $1,000.00 | | $1,013.34 | | 2.34% | | $11.81 |
Class I | | $1,000.00 | | $1,080.00 | | 1.34% | | $ 6.99 | | $1,000.00 | | $1,018.35 | | 1.34% | | $ 6.78 |
|
TETON Westwood Balanced Fund |
|
Class AAA | | $1,000.00 | | $1,052.20 | | 1.34% | | $ 6.89 | | $1,000.00 | | $1,018.35 | | 1.34% | | $ 6.78 |
Class A | | $1,000.00 | | $1,051.60 | | 1.59% | | $ 8.18 | | $1,000.00 | | $1,017.10 | | 1.59% | | $ 8.04 |
Class C | | $1,000.00 | | $1,048.80 | | 2.09% | | $10.73 | | $1,000.00 | | $1,014.59 | | 2.09% | | $10.56 |
Class I | | $1,000.00 | | $1,054.60 | | 1.09% | | $ 5.61 | | $1,000.00 | | $1,019.60 | | 1.09% | | $ 5.52 |
|
TETON Westwood Intermediate Bond Fund |
|
Class AAA | | $1,000.00 | | $1,001.30 | | 1.00% | | $ 5.02 | | $1,000.00 | | $1,020.05 | | 1.00% | | $ 5.06 |
Class A | | $1,000.00 | | $1,000.80 | | 1.10% | | $ 5.52 | | $1,000.00 | | $1,019.55 | | 1.10% | | $ 5.57 |
Class C | | $1,000.00 | | $ 998.10 | | 1.75% | | $ 8.77 | | $1,000.00 | | $1,016.29 | | 1.75% | | $ 8.85 |
Class I | | $1,000.00 | | $1,003.40 | | 0.75% | | $ 3.77 | | $1,000.00 | | $1,021.31 | | 0.75% | | $ 3.80 |
| * | Expenses are equal to the Funds’ annualized expense ratio for the last six months multiplied by the average account value over the period, multiplied by the number of days in the most recent fiscal half year (183 days), then divided by 365. |
18
Summary of Portfolio Holdings (Unaudited)
The following tables present portfolio holdings as a percent of net assets as of September 30, 2018:
TETON Westwood Mighty Mites Fund
| | | | |
U.S. Government Obligations | | | 19.8 | % |
Diversified Industrial | | | 9.9 | % |
Health Care | | | 7.6 | % |
Financial Services | | | 6.9 | % |
Equipment and Supplies | | | 5.3 | % |
Hotels and Gaming | | | 3.4 | % |
Electronics | | | 3.3 | % |
Consumer Products | | | 2.9 | % |
Food and Beverage | | | 2.8 | % |
Automotive: Parts and Accessories | | | 2.8 | % |
Machinery | | | 2.7 | % |
Aerospace and Defense | | | 2.7 | % |
Specialty Chemicals | | | 2.5 | % |
Real Estate | | | 2.5 | % |
Telecommunications | | | 2.4 | % |
Business Services | | | 2.0 | % |
Building and Construction | | | 2.0 | % |
Restaurants | | | 1.8 | % |
Manufactured Housing and Recreational Vehicles | | | 1.6 | % |
Computer Software and Services | | | 1.5 | % |
Metals and Mining | | | 1.4 | % |
Aviation: Parts and Services | | | 1.4 | % |
Retail | | | 1.3 | % |
Environmental Control | | | 1.3 | % |
| | | | |
Publishing | | | 1.1 | % |
Broadcasting | | | 1.1 | % |
Entertainment | | | 1.0 | % |
Energy and Utilities: Water | | | 0.9 | % |
Automotive | | | 0.8 | % |
Consumer Services | | | 0.6 | % |
Energy and Utilities: Natural Gas | | | 0.5 | % |
Semiconductors | | | 0.4 | % |
Agriculture | | | 0.3 | % |
Wireless Communications | | | 0.3 | % |
Energy and Utilities: Oil | | | 0.2 | % |
Energy and Utilities: Services | | | 0.2 | % |
Communications Equipment | | | 0.2 | % |
Paper and Forest Products | | | 0.2 | % |
Energy and Utilities: Integrated | | | 0.2 | % |
Airlines | | | 0.2 | % |
Closed-End Funds | | | 0.1 | % |
Educational Services | | | 0.0 | %* |
Transportation | | | 0.0 | %* |
Energy and Utilities | | | 0.0 | %* |
Other Assets and Liabilities (Net) | | | (0.1 | )% |
| | | | |
| | | 100.0 | % |
| | | | |
| * | Amount represents less than 0.05%. |
TETON Westwood SmallCap Equity Fund
| | | | |
Banking | | | 20.3 | % |
Energy and Utilities | | | 12.1 | % |
U.S. Government Obligations | | | 7.9 | % |
Computer Software and Services | | | 6.5 | % |
Health Care | | | 6.0 | % |
Semiconductors | | | 5.9 | % |
Business Services | | | 4.6 | % |
Telecommunications | | | 4.5 | % |
Retail | | | 3.9 | % |
Diversified Industrial | | | 3.9 | % |
Communications | | | 3.8 | % |
Financial Services | | | 3.5 | % |
Electronics | | | 2.3 | % |
| | | | |
Consumer Products | | | 2.3 | % |
Building and Construction | | | 1.9 | % |
Equipment and Supplies | | | 1.8 | % |
Speciality Chemicals | | | 1.7 | % |
Automotive | | | 1.7 | % |
Aerospace | | | 1.4 | % |
Environmental Control | | | 1.2 | % |
Broadcasting | | | 1.2 | % |
Machinery | | | 1.0 | % |
Real Estate | | | 0.9 | % |
Other Assets and Liabilities (Net) | | | (0.3 | )% |
| | | | |
| | | 100.0 | % |
| | | | |
TETON Westwood Mid-Cap Equity Fund
| | | | |
Financials | | | 21.7 | % |
Information Technology | | | 18.2 | % |
Consumer Discretionary | | | 15.7 | % |
Industrials | | | 14.7 | % |
Energy | | | 13.2 | % |
Health Care | | | 8.2 | % |
| | | | |
Materials | | | 3.7 | % |
Consumer Staples | | | 3.1 | % |
Other Assets and Liabilities (Net) | | | 1.5 | % |
| | | | |
| | | 100.0 | % |
| | | | |
19
Summary of Portfolio Holdings (Unaudited) (Continued)
TETON Convertible Securities Fund
| | | | |
Computer Software and Services | | | 19.6 | % |
Health Care | | | 15.0 | % |
Semiconductors | | | 10.5 | % |
U.S. Government Obligations | | | 7.9 | % |
Financial Services | | | 5.7 | % |
Business Services | | | 5.3 | % |
Real Estate Investment Trusts | | | 4.5 | % |
Energy and Utilities: Integrated | | | 4.0 | % |
Communications Equipment | | | 3.5 | % |
Energy and Utilities: Services | | | 3.5 | % |
Telecommunications | | | 2.9 | % |
Consumer Services | | | 2.4 | % |
Industrials | | | 2.1 | % |
| | | | |
Aviation: Parts and Services | | | 2.0 | % |
Cable and Satellite | | | 2.0 | % |
Entertainment | | | 1.8 | % |
Diversified Industrial | | | 1.5 | % |
Food and Beverage | | | 1.3 | % |
Aerospace and Defense | | | 1.2 | % |
Building and Construction | | | 1.1 | % |
Transportation | | | 1.0 | % |
Agriculture | | | 0.4 | % |
Other Assets and Liabilities (Net) | | | 0.8 | % |
| | | | |
| | | 100.0 | % |
| | | | |
TETON Westwood Equity Fund
| | | | |
Health Care | | | 13.5 | % |
Banking | | | 10.4 | % |
Financial Services | | | 9.6 | % |
Computer Software and Services | | | 8.9 | % |
Energy: Integrated | | | 8.0 | % |
Retail | | | 7.2 | % |
Aerospace | | | 6.0 | % |
Food and Beverage | | | 5.8 | % |
Telecommunications | | | 5.6 | % |
Energy and Energy Services | | | 3.7 | % |
Diversified Industrial | | | 3.1 | % |
Business Services | | | 3.0 | % |
| | | | |
Real Estate | | | 2.9 | % |
Transportation | | | 2.5 | % |
Specialty Chemicals | | | 2.0 | % |
Entertainment | | | 2.0 | % |
Consumer Products | | | 2.0 | % |
Energy: Oil | | | 1.9 | % |
Other Investment Companies | | | 1.2 | % |
Semiconductors | | | 0.8 | % |
Other Assets and Liabilities (Net) | | | (0.1 | )% |
| | | | |
| | | 100.0 | % |
| | | | |
TETON Westwood Balanced Fund
| | | | |
Health Care | | | 11.7 | % |
Banking | | | 11.0 | % |
Financial Services | | | 10.6 | % |
Retail | | | 6.5 | % |
U.S. Government Obligations | | | 6.3 | % |
Computer Software and Services | | | 6.0 | % |
Energy: Integrated | | | 5.3 | % |
Telecommunications | | | 4.8 | % |
Aerospace | | | 4.4 | % |
Food and Beverage | | | 4.1 | % |
Consumer Products | | | 3.5 | % |
Diversified Industrial | | | 3.4 | % |
Federal Home Loan Mortgage Corp. | | | 2.7 | % |
Energy and Energy Services | | | 2.4 | % |
| | | | |
Electronics | | | 2.4 | % |
Business Services | | | 2.1 | % |
Energy: Oil | | | 2.1 | % |
Real Estate | | | 1.9 | % |
Federal National Mortgage Association | | | 1.7 | % |
Other Investment Companies | | | 1.5 | % |
Transportation | | | 1.4 | % |
Entertainment | | | 1.4 | % |
Specialty Chemicals | | | 1.3 | % |
Computer Hardware | | | 1.0 | % |
Semiconductors | | | 0.7 | % |
Other Assets and Liabilities (Net) | | | (0.2 | )% |
| | | | |
| | | 100.0 | % |
| | | | |
TETON Westwood Intermediate Bond Fund
| | | | |
Corporate Bonds | | | 50.5 | % |
U.S. Government Obligations | | | 38.2 | % |
U.S. Government Agency Obligations | | | 11.1 | % |
Other Assets and Liabilities (Net) | | | 0.2 | % |
| | | | |
| | | 100.0 | % |
| | | | |
20
TETON Westwood Mighty Mites Fund
Schedule of Investments — September 30, 2018
| | | | | | | | | | | | |
Shares | | | | | Cost | | | Market Value | |
| | | | COMMON STOCKS — 79.5% | | | | | |
| | | | Aerospace and Defense — 2.7% | | | | | |
| | 1,118,900 | | | Aerojet Rocketdyne Holdings Inc.† | | $ | 5,240,670 | | | $ | 38,031,411 | |
| | 2,000 | | | Allied Motion Technologies Inc | | | 77,469 | | | | 108,860 | |
| | 15,000 | | | Chemring Group plc | | | 35,977 | | | | 42,035 | |
| | 123,000 | | | Innovative Solutions & Support Inc.† | | | 472,250 | | | | 312,420 | |
| | 7,000 | | | Kratos Defense & Security Solutions Inc.† | | | 42,963 | | | | 103,460 | |
| | | | | | | | | | | | |
| | | | | | | 5,869,329 | | | | 38,598,186 | |
| | | | | | | | | | | | |
| | |
| | | | Agriculture — 0.3% | | | | | |
| | 500,000 | | | Black Earth Farming Ltd., SDR†(a) | | | 4,345 | | | | 1,744 | |
| | 225 | | | J.G. Boswell Co. | | | 144,676 | | | | 146,587 | |
| | 139,475 | | | Limoneira Co. | | | 2,673,496 | | | | 3,641,692 | |
| | 490,000 | | | S&W Seed Co.† | | | 1,707,556 | | | | 1,200,500 | |
| | | | | | | | | | | | |
| | | | | | | 4,530,073 | | | | 4,990,523 | |
| | | | | | | | | | | | |
| | | |
| | | | Airlines — 0.2% | | | | | | | | |
| | 45,000 | | | American Airlines Group Inc. | | | 18,602 | | | | 1,859,850 | |
| | 225,000 | | | American Airlines Group Inc., Escrow† | | | 3,288 | | | | 331,875 | |
| | | | | | | | | | | | |
| | | | | | | 21,890 | | | | 2,191,725 | |
| | | | | | | | | | | | |
| | | |
| | | | Automotive — 0.8% | | | | | | | | |
| | 27,200 | | | Lithia Motors Inc., Cl. A | | | 517,533 | | | | 2,221,152 | |
| | 20,000 | | | Navistar International Corp.† | | | 152,109 | | | | 770,000 | |
| | 29,605 | | | Rush Enterprises Inc., Cl. A | | | 545,615 | | | | 1,163,773 | |
| | 104,005 | | | Rush Enterprises Inc., Cl. B | | | 1,800,199 | | | | 4,148,759 | |
| | 66,500 | | | Sonic Automotive Inc., Cl. A | | | 849,600 | | | | 1,286,775 | |
| | 70,000 | | | Wabash National Corp. | | | 132,194 | | | | 1,276,100 | |
| | | | | | | | | | | | |
| | | | | | | 3,997,250 | | | | 10,866,559 | |
| | | | | | | | | | | | |
| |
| | | | Automotive: Parts and Accessories — 2.6% | |
| | 6,000 | | | China Automotive Systems Inc.† | | | 34,007 | | | | 21,120 | |
| | 105,000 | | | Dana Inc. | | | 624,231 | | | | 1,960,350 | |
| | 10,000 | | | Douglas Dynamics Inc. | | | 309,290 | | | | 439,000 | |
| | 400,000 | | | Federal-Mogul Holdings Corp.†(a) | | | 3,578,148 | | | | 4,000,000 | |
| | 13,400 | | | Gentherm Inc.† | | | 194,890 | | | | 609,030 | |
| | 311,600 | | | Modine Manufacturing Co.† | | | 3,294,325 | | | | 4,642,840 | |
| | 24,000 | | | Motorcar Parts of America Inc.† | | | 315,465 | | | | 562,800 | |
| | 80,000 | | | Puradyn Filter Technologies Inc.† | | | 13,774 | | | | 4,800 | |
| | 54,000 | | | Shiloh Industries Inc.† | | | 635,890 | | | | 594,000 | |
| | 122,200 | | | Standard Motor Products Inc. | | | 1,271,525 | | | | 6,014,684 | |
| | 183,100 | | | Strattec Security Corp. | | | 4,602,184 | | | | 6,527,515 | |
| | 454,100 | | | Superior Industries International Inc. | | | 8,420,139 | | | | 7,742,405 | |
| | 37,000 | | | Tenneco Inc., Cl. A | | | 115,032 | | | | 1,559,180 | |
| | 35,600 | | | Titan International Inc. | | | 301,426 | | | | 264,152 | |
| | 33,425 | | | Tower International Inc. | | | 736,834 | | | | 1,011,106 | |
| | 46,000 | | | Uni-Select Inc. | | | 825,064 | | | | 783,138 | |
| | | | | | | | | | | | |
| | | | | | | 25,272,224 | | | | 36,736,120 | |
| | | | | | | | | | | | |
| | |
| | | | Aviation: Parts and Services — 1.4% | | | | | |
| | 13,500 | | | Astronics Corp.† | | | 96,482 | | | | 587,250 | |
| | 19,019 | | | Astronics Corp., Cl. B† | | | 131,688 | | | | 818,958 | |
| | 123,485 | | | Ducommun Inc.† | | | 2,113,759 | | | | 5,043,127 | |
| | 196,200 | | | Kaman Corp. | | | 4,994,792 | | | | 13,102,236 | |
| | | | | | | | | | | | |
| | | | | | | 7,336,721 | | | | 19,551,571 | |
| | | | | | | | | | | | |
| | |
| | | | Broadcasting — 1.1% | | | | | |
| | 850,000 | | | Beasley Broadcast Group Inc., Cl. A(b) | | | 4,771,962 | | | | 5,865,000 | |
| | | | | | | | | | | | |
Shares | | | | | Cost | | | Market Value | |
| | 336,455 | | | Dish TV India Ltd., GDR† | | $ | 265,892 | | | $ | 242,281 | |
| | 78,700 | | | Entercom Communications Corp., Cl. A | | | 166,098 | | | | 621,730 | |
| | 249,500 | | | Gray Television Inc.† | | | 277,083 | | | | 4,366,250 | |
| | 84,084 | | | Gray Television Inc., Cl. A† | | | 583,731 | | | | 1,341,140 | |
| | 572,477 | | | Salem Media Group Inc. | | | 2,477,315 | | | | 1,946,422 | |
| | 33,000 | | | Sinclair Broadcast Group Inc., Cl. A | | | 53,667 | | | | 935,550 | |
| | 125,007 | | | Townsquare Media Inc., Cl. A | | | 1,140,967 | | | | 978,805 | |
| | | | | | | | | | | | |
| | | | | | | 9,736,715 | | | | 16,297,178 | |
| | | | | | | | | | | | |
| | |
| | | | Building and Construction — 2.0% | | | | | |
| | 257,400 | | | Armstrong Flooring Inc.† | | | 4,698,699 | | | | 4,658,940 | |
| | 145,000 | | | Gibraltar Industries Inc.† | | | 3,364,313 | | | | 6,612,000 | |
| | 55,000 | | | Granite Construction Inc. | | | 1,972,854 | | | | 2,513,500 | |
| | 13,000 | | | Herc Holdings Inc.† | | | 495,236 | | | | 665,600 | |
| | 764,000 | | | Huttig Building Products Inc.† | | | 915,335 | | | | 3,224,080 | |
| | 107,074 | | | MYR Group Inc.† | | | 2,422,367 | | | | 3,494,895 | |
| | 98,300 | | | The Monarch Cement Co. | | | 2,606,466 | | | | 7,225,050 | |
| | | | | | | | | | | | |
| | | | | | | 16,475,270 | | | | 28,394,065 | |
| | | | | | | | | | | | |
| | |
| | | | Business Services — 2.0% | | | | | |
| | 16,000 | | | Ascent Capital Group Inc., Cl. A† | | | 172,110 | | | | 28,320 | |
| | 255,000 | | | Diebold Nixdorf Inc. | | | 1,358,540 | | | | 1,147,500 | |
| | 3,245 | | | Du-Art Film Labs Inc.† | | | 566,429 | | | | 624,663 | |
| | 705,520 | | | Edgewater Technology Inc.† | | | 2,293,833 | | | | 3,541,710 | |
| | 127,793 | | | GP Strategies Corp.† | | | 1,429,985 | | | | 2,153,312 | |
| | 23,300 | | | ICF International Inc. | | | 558,939 | | | | 1,757,985 | |
| | 32,029 | | | KAR Auction Services Inc. | | | 443,660 | | | | 1,911,811 | |
| | 16,000 | | | Macquarie Infrastructure Corp. | | | 44,180 | | | | 738,080 | |
| | 4,150 | | | Matthews International Corp., Cl. A | | | 182,558 | | | | 208,123 | |
| | 20,000 | | | McGrath RentCorp. | | | 535,869 | | | | 1,089,400 | |
| | 125,000 | | | MDC Partners Inc., Cl. A† | | | 791,188 | | | | 518,750 | |
| | 296,500 | | | MoneyGram International Inc.† | | | 2,185,369 | | | | 1,586,275 | |
| | 1,400 | | | PayPoint plc | | | 16,487 | | | | 16,934 | |
| | 329,962 | | | PFSweb Inc.† | | | 2,034,894 | | | | 2,441,719 | |
| | 2,000 | | | Pollard Banknote Ltd. | | | 31,757 | | | | 38,493 | |
| | 160,019 | | | PRGX Global Inc.† | | | 938,257 | | | | 1,392,165 | |
| | 27,920 | | | Safeguard Scientifics Inc.† | | | 345,778 | | | | 261,052 | |
| | 21,000 | | | Scientific Games Corp.† | | | 161,995 | | | | 533,400 | |
| | 500 | | | Stamps.com Inc.† | | | 6,278 | | | | 113,100 | |
| | 270,600 | | | Team Inc.† | | | 4,180,915 | | | | 6,088,500 | |
| | 411,792 | | | Trans-Lux Corp.†(b) | | | 257,234 | | | | 152,363 | |
| | 37,282 | | | Viad Corp. | | | 993,885 | | | | 2,208,959 | |
| | 25,000 | | | Willdan Group Inc.† | | | 771,982 | | | | 849,000 | |
| | | | | | | | | | | | |
| | | | | | | 20,302,122 | | | | 29,401,614 | |
| | | | | | | | | | | | |
| | |
| | | | Communications Equipment — 0.2% | | | | | |
| | 428,020 | | | Communications Systems Inc. | | | 3,692,959 | | | | 1,198,456 | |
| | 275,000 | | | Extreme Networks Inc.† | | | 946,476 | | | | 1,507,000 | |
| | 60,000 | | | ViewCast.com Inc.† | | | 14,320 | | | | 300 | |
| | | | | | | | | | | | |
| | | | | | | 4,653,755 | | | | 2,705,756 | |
| | | | | | | | | | | | |
| | |
| | | | Computer Software and Services — 1.5% | | | | | |
| | 200,913 | | | American Software Inc., Cl. A | | | 1,877,685 | | | | 2,437,075 | |
| | 177,542 | | | Avid Technology Inc.† | | | 1,286,365 | | | | 1,052,824 | |
| | 79,687 | | | Carbonite Inc.† | | | 914,787 | | | | 2,840,842 | |
| | 29,000 | | | Cardlytics Inc.† | | | 561,706 | | | | 726,160 | |
| | 2,300 | | | Cinedigm Corp., Cl. A† | | | 3,284 | | | | 2,668 | |
| | 151,700 | | | comScore Inc.† | | | 3,831,941 | | | | 2,765,491 | |
| | 22,000 | | | Datawatch Corp.† | | | 175,634 | | | | 256,300 | |
| | 45,000 | | | DHI Group Inc.† | | | 81,549 | | | | 94,500 | |
| | 84,801 | | | Digi International Inc.† | | | 958,168 | | | | 1,140,573 | |
| | 20 | | | FalconStor Software Inc.† | | | 1 | | | | 1 | |
| | 24,000 | | | Genius Brands International Inc.† | | | 108,128 | | | | 49,200 | |
See accompanying notes to financial statements.
21
TETON Westwood Mighty Mites Fund
Schedule of Investments (Continued) — September 30, 2018
| | | | | | | | | | | | |
Shares | | | | | Cost | | | Market Value | |
| | | | COMMON STOCKS (Continued) | | | | | |
| | | | Computer Software and Services (Continued) | |
| | 20,000 | | | GSE Systems Inc.† | | $ | 109,966 | | | $ | 72,000 | |
| | 144,267 | | | iGO Inc.† | | | 484,473 | | | | 308,731 | |
| | 427,997 | | | Internap Corp.† | | | 4,898,066 | | | | 5,405,602 | |
| | 10,000 | | | Materialise NV, ADR† | | | 58,532 | | | | 138,000 | |
| | 35,000 | | | Mercury Systems Inc.† | | | 280,098 | | | | 1,936,200 | |
| | 67,500 | | | Mitek Systems Inc.† | | | 199,734 | | | | 475,875 | |
| | 5,002 | | | MTS Systems Corp. | | | 222,570 | | | | 273,859 | |
| | 5,000 | | | Qualstar Corp.† | | | 40,358 | | | | 39,000 | |
| | 28,000 | | | SafeCharge International Group Ltd. | | | 124,972 | | | | 119,705 | |
| | 3,400 | | | Tyler Technologies Inc.† | | | 37,768 | | | | 833,204 | |
| | | | | | | | | | | | |
| | | | | | | 16,255,785 | | | | 20,967,810 | |
| | | | | | | | | | | | |
| | |
| | | | Consumer Products — 2.9% | | | | | |
| | 127,200 | | | Acme United Corp. | | | 2,271,327 | | | | 2,706,816 | |
| | 251,870 | | | Bassett Furniture Industries Inc. | | | 5,278,037 | | | | 5,352,237 | |
| | 2,000 | | | Brunswick Corp. | | | 30,085 | | | | 134,040 | |
| | 96,387 | | | Callaway Golf Co. | | | 833,454 | | | | 2,341,240 | |
| | 6,500 | | | elf Beauty Inc.† | | | 88,562 | | | | 82,745 | |
| | 500 | | | Flexsteel Industries Inc. | | | 18,654 | | | | 14,870 | |
| | 800,000 | | | Goodbaby International Holdings Ltd. | | | 401,031 | | | | 319,863 | |
| | 40,000 | | | HG Holdings Inc.† | | | 73,170 | | | | 20,600 | |
| | 9,500 | | | Johnson Outdoors Inc., Cl. A | | | 216,817 | | | | 883,405 | |
| | 12,211 | | | Lakeland Industries Inc.† | | | 119,079 | | | | 162,406 | |
| | 141,451 | | | Lifetime Brands Inc. | | | 1,700,687 | | | | 1,541,816 | |
| | 806,000 | | | Marine Products Corp. | | | 5,824,196 | | | | 18,449,340 | |
| | 60,000 | | | MarineMax Inc.† | | | 866,511 | | | | 1,275,000 | |
| | 1,200 | | | National Presto Industries Inc. | | | 90,916 | | | | 155,580 | |
| | 106,031 | | | Nautilus Inc.† | | | 1,160,208 | | | | 1,479,132 | |
| | 134,000 | | | Oil-Dri Corp. of America | | | 2,520,402 | | | | 5,167,040 | |
| | 5,700 | | | PC Group Inc.† | | | 3,465 | | | | 37 | |
| | 4,000,000 | | | Playmates Holdings Ltd. | | | 481,613 | | | | 521,183 | |
| | 2,140 | | | Standard Diversified Inc., Cl. A† | | | 25,271 | | | | 35,201 | |
| | 8,540 | | | Standard Diversified Opportunities Inc., Cl. B† | | | 103,473 | | | | 98,210 | |
| | 88,600 | | | ZAGG Inc.† | | | 623,324 | | | | 1,306,850 | |
| | | | | | | | | | | | |
| | | | | | | 22,730,282 | | | | 42,047,611 | |
| | | | | | | | | | | | |
| | |
| | | | Consumer Services — 0.6% | | | | | |
| | 523,846 | | | 1-800-Flowers.com Inc., Cl. A† | | | 1,883,070 | | | | 6,181,383 | |
| | 65,000 | | | Bowlin Travel Centers Inc.† | | | 87,877 | | | | 154,375 | |
| | 6,000 | | | Carriage Services Inc. | | | 150,727 | | | | 129,300 | |
| | 800 | | | Collectors Universe Inc. | | | 0 | | | | 11,840 | |
| | 25,000 | | | FTD Companies Inc.† | | | 85,701 | | | | 65,750 | |
| | 74,991 | | | XO Group Inc.† | | | 732,512 | | | | 2,585,690 | |
| | | | | | | | | | | | |
| | | | | | | 2,939,887 | | | | 9,128,338 | |
| | | | | | | | | | | | |
| | |
| | | | Diversified Industrial — 9.9% | | | | | |
| | 9,292 | | | American Railcar Industries Inc. | | | 147,177 | | | | 428,361 | |
| | 487,300 | | | Ampco-Pittsburgh Corp.† | | | 8,639,835 | | | | 2,875,070 | |
| | 264,001 | | | Burnham Holdings Inc., Cl. A(b) | | | 4,235,706 | | | | 3,960,015 | |
| | 88,933 | | | Chase Corp. | | | 1,402,313 | | | | 10,685,300 | |
| | 113,300 | | | Columbus McKinnon Corp. | | | 1,858,806 | | | | 4,479,882 | |
| | 446,598 | | | FormFactor Inc.† | | | 3,111,209 | | | | 6,140,723 | |
| | 34,600 | | | Graham Corp. | | | 563,893 | | | | 974,682 | |
| | 438,579 | | | Griffon Corp. | | | 4,891,395 | | | | 7,083,051 | |
| | 25,000 | | | Haulotte Group SA | | | 134,090 | | | | 340,187 | |
| | 23,000 | | | Haynes International Inc. | | | 1,042,637 | | | | 816,500 | |
| | 7,000 | | | Innophos Holdings Inc. | | | 207,318 | | | | 310,800 | |
| | 108,090 | | | Insignia Systems Inc.† | | | 267,030 | | | | 186,996 | |
| | 235,030 | | | Intevac Inc.† | | | 1,090,124 | | | | 1,222,156 | |
| | 86,000 | | | John Bean Technologies Corp. | | | 2,515,985 | | | | 10,259,800 | |
| | 78,000 | | | L.B. Foster Co., Cl. A† | | | 1,120,396 | | | | 1,602,900 | |
| | 287,042 | | | Lawson Products Inc.† | | | 4,279,854 | | | | 9,730,724 | |
| | | | | | | | | | | | |
Shares | | | | | Cost | | | Market Value | |
| | 81,650 | | | LSB Industries Inc.† | | $ | 561,632 | | | $ | 798,537 | |
| | 109,949 | | | Lydall Inc.† | | | 1,101,503 | | | | 4,738,802 | |
| | 9,500 | | | MSA Safety Inc. | | | 306,832 | | | | 1,011,180 | |
| | 1,027,900 | | | Myers Industries Inc. | | | 15,954,852 | | | | 23,898,675 | |
| | 276,551 | | | Napco Security Technologies Inc.† | | | 1,725,606 | | | | 4,134,437 | |
| | 188,100 | | | Park-Ohio Holdings Corp. | | | 4,086,713 | | | | 7,213,635 | |
| | 25,080 | | | Raven Industries Inc. | | | 497,955 | | | | 1,147,410 | |
| | 66,666 | | | Rubicon Ltd.† | | | 37,762 | | | | 11,489 | |
| | 1,000 | | | Rubicon Technology Inc.† | | | 9,239 | | | | 8,980 | |
| | 19,600 | | | RWC Inc.† | | | 315,159 | | | | 242,550 | |
| | 28,000 | | | Standex International Corp. | | | 928,588 | | | | 2,919,000 | |
| | 1,630,000 | | | Steel Connect Inc.† | | | 5,626,241 | | | | 3,471,900 | |
| | 634,000 | | | Steel Partners Holdings LP† | | | 10,243,898 | | | | 10,762,150 | |
| | 523,920 | | | Tredegar Corp. | | | 8,956,948 | | | | 11,342,868 | |
| | 428,854 | | | Twin Disc Inc.† | | | 8,109,654 | | | | 9,880,796 | |
| | | | | | | | | | | | |
| | | | | | | 93,970,350 | | | | 142,679,556 | |
| | | | | | | | | | | | |
| | |
| | | | Educational Services — 0.0% | | | | | |
| | 130,000 | | | Universal Technical Institute Inc.† | | | 679,585 | | | | 345,800 | |
| | | | | | | | | | | | |
| | |
| | | | Electronics — 3.3% | | | | | |
| | 28,000 | | | Badger Meter Inc. | | | 477,554 | | | | 1,482,600 | |
| | 175,999 | | | Bel Fuse Inc., Cl. A(b) | | | 3,268,266 | | | | 3,718,859 | |
| | 343,500 | | | CTS Corp. | | | 2,904,117 | | | | 11,782,050 | |
| | 70,000 | | | Daktronics Inc. | | | 686,143 | | | | 548,800 | |
| | 80,389 | | | Electro Scientific Industries Inc.† | | | 721,764 | | | | 1,402,788 | |
| | 63,771 | | | EMRISE Corp.†(a) | | | 0 | | | | 0 | |
| | 31,000 | | | IMAX Corp.† | | | 132,791 | | | | 799,800 | |
| | 20,000 | | | Iteris Inc.† | | | 32,200 | | | | 107,600 | |
| | 110,000 | | | Kimball Electronics Inc.† | | | 662,907 | | | | 2,161,500 | |
| | 215,000 | | | Kopin Corp.† | | | 754,401 | | | | 520,300 | |
| | 6,304 | | | Littelfuse Inc. | | | 991,018 | | | | 1,247,499 | |
| | 29,000 | | | Mesa Laboratories Inc. | | | 770,361 | | | | 5,382,980 | |
| | 28,800 | | | Methode Electronics Inc. | | | 168,005 | | | | 1,042,560 | |
| | 129,500 | | | Park Electrochemical Corp. | | | 2,041,284 | | | | 2,523,955 | |
| | 701,029 | | | Schmitt Industries Inc.†(b) | | | 1,614,799 | | | | 1,969,891 | |
| | 228,687 | | | Sparton Corp.† | | | 3,849,021 | | | | 3,299,953 | |
| | 233,498 | | | Stoneridge Inc.† | | | 2,279,462 | | | | 6,939,561 | |
| | 16,000 | | | Stratasys Ltd.† | | | 274,798 | | | | 369,760 | |
| | 157,000 | | | Ultra Clean Holdings† | | | 478,219 | | | | 1,970,350 | |
| | 25,000 | | | Ultralife Corp.† | | | 96,124 | | | | 203,750 | |
| | | | | | | | | | | | |
| | | | | | | 22,203,234 | | | | 47,474,556 | |
| | | | | | | | | | | | |
| | |
| | | | Energy and Utilities: Integrated — 0.2% | | | | | |
| | | |
| | 36,000 | | | MGE Energy Inc. | | | 848,987 | | | | 2,298,600 | |
| | | | | | | | | | | | |
| | |
| | | | Energy and Utilities: Natural Gas — 0.5% | | | | | |
| | 650,000 | | | Alvopetro Energy Ltd.† | | | 285,405 | | | | 236,519 | |
| | 32,750 | | | Chesapeake Utilities Corp. | | | 589,644 | | | | 2,747,725 | |
| | 5,000 | | | CONSOL Energy Inc.† | | | 116,589 | | | | 204,050 | |
| | 108,684 | | | Corning Natural Gas Holding Corp. | | | 1,015,904 | | | | 1,969,897 | |
| | 390,181 | | | Gulf Coast Ultra Deep Royalty Trust | | | 248,298 | | | | 21,460 | |
| | 62,850 | | | RGC Resources Inc. | | | 555,810 | | | | 1,678,724 | |
| | 10,000 | | | Whitecap Resources Inc. | | | 84,862 | | | | 60,698 | |
| | | | | | | | | | | | |
| | | | | | | 2,896,512 | | | | 6,919,073 | |
| | | | | | | | | | | | |
| | |
| | | | Energy and Utilities: Oil — 0.2% | | | | | |
| | 254,844 | | | Callon Petroleum Co.† | | | 2,077,212 | | | | 3,055,580 | |
| | 11,306 | | | KLX Energy Services Holdings Inc.† | | | 334,998 | | | | 361,905 | |
| | | | | | | | | | | | |
| | | | | | | 2,412,210 | | | | 3,417,485 | |
| | | | | | | | | | | | |
| | |
| | | | Energy and Utilities: Services — 0.2% | | | | | |
| | 3,938 | | | Archer Ltd.† | | | 2,839 | | | | 3,677 | |
| | 25,620 | | | Dawson Geophysical Co.† | | | 178,656 | | | | 158,588 | |
See accompanying notes to financial statements.
22
TETON Westwood Mighty Mites Fund
Schedule of Investments (Continued) — September 30, 2018
| | | | | | | | | | | | |
Shares | | | | | Cost | | | Market Value | |
| | |
| | | | COMMON STOCKS (Continued) | | | | | |
| | | | Energy and Utilities: Services (Continued) | | | | | |
| | 255,000 | | | Independence Contract Drilling Inc.† | | $ | 1,077,648 | | | $ | 1,259,700 | |
| | 38,402 | | | Nabors Industries Ltd. | | | 215,435 | | | | 236,556 | |
| | 83,500 | | | RPC Inc. | | | 151,749 | | | | 1,292,580 | |
| | 7,100 | | | Subsea 7 SA, ADR | | | 25,056 | | | | 104,228 | |
| | | | | | | | | | | | |
| | | | | | | 1,651,383 | | | | 3,055,329 | |
| | | | | | | | | | | | |
| | |
| | | | Energy and Utilities: Water — 0.9% | | | | | |
| | 30,526 | | | Artesian Resources Corp., Cl. A | | | 718,963 | | | | 1,122,746 | |
| | 29,900 | | | Cadiz Inc.† | | | 334,888 | | | | 333,385 | |
| | 24,800 | | | California Water Service Group | | | 478,223 | | | | 1,063,920 | |
| | 4,000 | | | Connecticut Water Service Inc. | | | 135,142 | | | | 277,480 | |
| | 66,000 | | | Consolidated Water Co. Ltd. | | | 717,506 | | | | 914,100 | |
| | 68,000 | | | Energy Recovery Inc.† | | | 280,443 | | | | 608,600 | |
| | 29,633 | | | Middlesex Water Co. | | | 573,970 | | | | 1,434,830 | |
| | 50,000 | | | Mueller Water Products Inc., Cl. A | | | 556,279 | | | | 575,500 | |
| | 89,304 | | | SJW Group | | | 2,259,740 | | | | 5,460,940 | |
| | 45,007 | | | The York Water Co. | | | 750,756 | | | | 1,368,213 | |
| | | | | | | | | | | | |
| | | | | | | 6,805,910 | | | | 13,159,714 | |
| | | | | | | | | | | | |
| | |
| | | | Entertainment — 1.0% | | | | | |
| | 164,100 | | | Canterbury Park Holding Corp. | | | 1,675,267 | | | | 2,502,525 | |
| | 649,597 | | | Dover Motorsports Inc. | | | 1,577,761 | | | | 1,396,634 | |
| | 50,000 | | | Entertainment One Ltd. | | | 214,399 | | | | 269,284 | |
| | 817,763 | | | Entravision Communications Corp., Cl. A | | | 2,451,274 | | | | 4,007,039 | |
| | 56,000 | | | National CineMedia Inc. | | | 341,473 | | | | 593,040 | |
| | 415,000 | | | RLJ Entertainment Inc.† | | | 1,048,100 | | | | 2,573,000 | |
| | 50,000 | | | SFX Entertainment Inc.†(a) | | | 2,750 | | | | 0 | |
| | 431,100 | | | Sportech plc | | | 474,976 | | | | 356,806 | |
| | 33,000 | | | World Wrestling Entertainment Inc., Cl. A | | | 498,992 | | | | 3,192,090 | |
| | | | | | | | | | | | |
| | | | | | | 8,284,992 | | | | 14,890,418 | |
| | | | | | | | | | | | |
| | |
| | | | Environmental Control — 1.3% | | | | | |
| | 12,500 | | | AquaVenture Holdings Ltd.† | | | 171,447 | | | | 225,875 | |
| | 7,500 | | | BQE Water Inc.† | | | 312 | | | | 406 | |
| | 581,228 | | | Casella Waste Systems Inc., Cl. A† | | | 2,763,229 | | | | 18,052,942 | |
| | 13,121 | | | Primo Water Corp.† | | | 159,063 | | | | 236,834 | |
| | | | | | | | | | | | |
| | | | | | | 3,094,051 | | | | 18,516,057 | |
| | | | | | | | | | | | |
| | |
| | | | Equipment and Supplies — 5.3% | | | | | |
| | 17,000 | | | Amtech Systems Inc.† | | | 178,849 | | | | 90,780 | |
| | 20,000 | | | AZZ Inc. | | | 716,820 | | | | 1,010,000 | |
| | 99,111 | | | Berry Global Group Inc.† | | | 3,466,692 | | | | 4,795,981 | |
| | 174,400 | | | CIRCOR International Inc. | | | 6,271,741 | | | | 8,284,000 | |
| | 398,700 | | | Core Molding Technologies Inc. | | | 3,273,059 | | | | 2,659,329 | |
| | 685,000 | | | Federal Signal Corp. | | | 4,818,205 | | | | 18,344,300 | |
| | 240,000 | | | Interpump Group SpA | | | 1,748,002 | | | | 7,857,980 | |
| | 536,000 | | | Kimball International Inc., Cl. B | | | 5,595,892 | | | | 8,978,000 | |
| | 20,000 | | | Maezawa Kyuso Industries Co. Ltd. | | | 108,117 | | | | 350,642 | |
| | 150,069 | | | Mitcham Industries Inc.† | | | 556,822 | | | | 622,786 | |
| | 20,103 | | | Powell Industries Inc. | | | 750,311 | | | | 728,935 | |
| | 355,131 | | | The Eastern Co.(b) | | | 6,528,492 | | | | 10,085,720 | |
| | 136,600 | | | The Gorman-Rupp Co. | | | 3,187,281 | | | | 4,985,900 | |
| | 353,183 | | | The L.S. Starrett Co., Cl. A(b) | | | 3,978,304 | | | | 2,119,098 | |
| | 167,888 | | | Titan Machinery Inc.† | | | 2,787,206 | | | | 2,599,746 | |
| | 127,100 | | | TransAct Technologies Inc. | | | 576,780 | | | | 1,830,240 | |
| | | | | | | | | | | | |
Shares | | | | | Cost | | | Market Value | |
| | 8,500 | | | Vicor Corp.† | | $ | 70,948 | | | $ | 391,000 | |
| | | | | | | | | | | | |
| | | | | | | 44,613,521 | | | | 75,734,437 | |
| | | | | | | | | | | | |
| | |
| | | | Financial Services — 6.4% | | | | | |
| | 29,311 | | | Access National Corp. | | | 854,997 | | | | 794,621 | |
| | 3,300 | | | Alimco Financial Corp.† | | | 66,300 | | | | 33,825 | |
| | 71,200 | | | Allegiance Bancshares Inc.† | | | 2,885,340 | | | | 2,969,040 | |
| | 49,400 | | | Anchor Bancorp.† | | | 508,737 | | | | 1,398,020 | |
| | 22,000 | | | Atlantic American Corp. | | | 80,717 | | | | 52,800 | |
| | 247,308 | | | Atlantic Capital Bancshares Inc.† | | | 4,383,864 | | | | 4,142,409 | |
| | 17,000 | | | Berkshire Bancorp Inc.† | | | 219,944 | | | | 224,740 | |
| | 9,246 | | | Berkshire Hills Bancorp Inc. | | | 154,043 | | | | 376,312 | |
| | 4,532 | | | BKF Capital Group Inc.† | | | 31,877 | | | | 53,251 | |
| | 75 | | | Burke & Herbert Bank and Trust Co. | | | 95,726 | | | | 215,250 | |
| | 95,976 | | | Capital City Bank Group Inc. | | | 2,345,887 | | | | 2,240,080 | |
| | 8,000 | | | Capitol Federal Financial Inc. | | | 91,259 | | | | 101,920 | |
| | 7,500 | | | Carolina Financial Corp. | | | 306,472 | | | | 282,900 | |
| | 18,200 | | | Citizens & Northern Corp. | | | 357,816 | | | | 475,930 | |
| | 106,339 | | | CoBiz Financial Inc. | | | 1,248,518 | | | | 2,354,345 | |
| | 3,500 | | | ConnectOne Bancorp Inc. | | | 93,193 | | | | 83,125 | |
| | 28,800 | | | Crazy Woman Creek Bancorp Inc. | | | 497,983 | | | | 512,640 | |
| | 35,800 | | | Dime Community Bancshares Inc. | | | 576,823 | | | | 639,030 | |
| | 2,000 | | | EML Payments Ltd.† | | | 1,879 | | | | 2,299 | |
| | 1,165 | | | Farmers & Merchants Bank of Long Beach | | | 6,515,603 | | | | 10,019,000 | |
| | 40,000 | | | Farmers National Banc Corp. | | | 333,870 | | | | 612,000 | |
| | 13,018 | | | Fidelity Southern Corp. | | | 108,320 | | | | 322,586 | |
| | 5,000 | | | First Community Bancshares Inc./VA | | | 165,119 | | | | 169,400 | |
| | 14,830 | | | First Connecticut Bancorp Inc./Farmington CT | | | 409,916 | | | | 438,227 | |
| | 32,000 | | | First Internet Bancorp | | | 661,348 | | | | 974,400 | |
| | 615,672 | | | Flushing Financial Corp. | | | 10,339,541 | | | | 15,022,397 | |
| | 75,600 | | | FNB Corp. | | | 736,188 | | | | 961,632 | |
| | 5,100 | | | Franklin Financial Network Inc.† | | | 178,928 | | | | 199,410 | |
| | 6,000 | | | Green Bancorp Inc. | | | 142,245 | | | | 132,600 | |
| | 10 | | | Guaranty Corp., Cl. A†(a) | | | 137,500 | | | | 60,000 | |
| | 183,860 | | | Hallmark Financial Services Inc.† | | | 1,609,508 | | | | 2,022,460 | |
| | 14,500 | | | Hancock Whitney Corp. | | | 185,881 | | | | 689,475 | |
| | 13,800 | | | Heritage Commerce Corp. | | | 114,043 | | | | 205,896 | |
| | 30,000 | | | HomeStreet Inc.† | | | 300,000 | | | | 795,000 | |
| | 81,500 | | | Hope Bancorp Inc. | | | 879,043 | | | | 1,317,855 | |
| | 94,300 | | | I3 Verticals Inc., Cl. A† | | | 1,459,659 | | | | 2,167,014 | |
| | 34,400 | | | ICC Holdings Inc.† | | | 394,036 | | | | 516,344 | |
| | 90,843 | | | KKR & Co. Inc., Cl. A | | | 13,187 | | | | 2,477,289 | |
| | 11,200 | | | LendingTree Inc.† | | | 326,169 | | | | 2,577,120 | |
| | 170,000 | | | Medallion Financial Corp.† | | | 915,281 | | | | 1,130,500 | |
| | 28,000 | | | National Commerce Corp.† | | | 1,265,301 | | | | 1,156,400 | |
| | 9,000 | | | New York Community Bancorp Inc. | | | 113,568 | | | | 93,330 | |
| | 4,197 | | | Northrim BanCorp Inc. | | | 91,497 | | | | 174,385 | |
| | 21,300 | | | OceanFirst Financial Corp. | | | 395,540 | | | | 579,786 | |
| | 31,639 | | | Old Line Bancshares Inc. | | | 1,025,682 | | | | 1,001,058 | |
| | 7,500 | | | Opus Bank | | | 223,542 | | | | 205,500 | |
| | 41,500 | | | Oritani Financial Corp. | | | 436,789 | | | | 645,325 | |
| | 4,000 | | | Peapack Gladstone Financial Corp. | | | 138,533 | | | | 123,560 | |
| | 20,000 | | | PHH Corp.† | | | 213,192 | | | | 219,800 | |
| | 158,000 | | | Pzena Investment Management Inc., Cl. A | | | 1,261,054 | | | | 1,507,320 | |
| | 36,971 | | | Renasant Corp. | | | 414,186 | | | | 1,523,575 | |
| | 2,200 | | | Salisbury Bancorp Inc. | | | 97,221 | | | | 92,400 | |
| | 6,500 | | | Sandy Spring Bancorp Inc. | | | 263,554 | | | | 255,515 | |
See accompanying notes to financial statements.
23
TETON Westwood Mighty Mites Fund
Schedule of Investments (Continued) — September 30, 2018
| | | | | | | | | | | | |
Shares | | | | | Cost | | | Market Value | |
| | |
| | | | COMMON STOCKS (Continued) | | | | | |
| | | | Financial Services (Continued) | | | | | |
| | 3,500 | | | Seacoast Banking Corp. of Florida† | | $ | 110,651 | | | $ | 102,200 | |
| | 4,540 | | | Security National Corp. | | | 412,718 | | | | 565,344 | |
| | 10,342 | | | SI Financial Group Inc. | | | 123,868 | | | | 144,788 | |
| | 85,000 | | | Silvercrest Asset Management Group Inc., Cl. A | | | 1,171,743 | | | | 1,177,250 | |
| | 16,074 | | | Simmons First National Corp., Cl. A | | | 370,876 | | | | 473,379 | |
| | 3,200 | | | South State Corp. | | | 244,803 | | | | 262,400 | |
| | 57,559 | | | Southern First Bancshares Inc.† | | | 2,537,577 | | | | 2,262,069 | |
| | 47,100 | | | Southern National Bancorp of Virginia Inc. | | | 807,429 | | | | 763,020 | |
| | 4,500 | | | Southside Bancshares Inc. | | | 153,548 | | | | 156,600 | |
| | 660,000 | | | Sprott Inc. | | | 1,818,646 | | | | 1,538,033 | |
| | 47,200 | | | State Bank Financial Corp. | | | 1,128,456 | | | | 1,424,496 | |
| | 122,903 | | | Sterling Bancorp | | | 1,249,000 | | | | 2,703,866 | |
| | 70,000 | | | TheStreet Inc.† | | | 135,394 | | | | 154,000 | |
| | 4,000 | | | Thomasville Bancshares Inc. | | | 147,431 | | | | 164,000 | |
| | 3,500 | | | Towne Bank/Portsmouth VA | | | 111,633 | | | | 107,975 | |
| | 10,000 | | | TriState Capital Holdings Inc.†. | | | 98,183 | | | | 276,000 | |
| | 55,000 | | | TrustCo Bank Corp. NY | | | 253,000 | | | | 467,500 | |
| | 17,347 | | | Union Bankshares Corp. | | | 337,309 | | | | 668,380 | |
| | 127,100 | | | United Financial Bancorp Inc. | | | 1,749,440 | | | | 2,139,093 | |
| | 33,089 | | | Value Line Inc. | | | 326,193 | | | | 823,916 | |
| | 87,000 | | | Veritex Holdings Inc.† | | | 2,498,081 | | | | 2,458,620 | |
| | 45,900 | | | Washington Trust Bancorp Inc. | | | 1,029,683 | | | | 2,538,270 | |
| | 82,200 | | | Waterstone Financial Inc. | | | 876,303 | | | | 1,409,730 | |
| | 87,760 | | | Western New England Bancorp Inc. | | | 754,242 | | | | 947,808 | |
| | 650,000 | | | Wright Investors’ Service Holdings Inc.† | | | 739,861 | | | | 260,000 | |
| | | | | | | | | | | | |
| | | | | | | 65,852,487 | | | | 91,329,833 | |
| | | | | | | | | | | | |
| | |
| | | | Food and Beverage — 2.8% | | | | | |
| | 87,600 | | | Andrew Peller Ltd., Cl. A | | | 366,944 | | | | 1,114,286 | |
| | 37,290 | | | Blue Apron Holdings Inc., Cl. A† | | | 98,625 | | | | 64,139 | |
| | 800 | | | Bridgford Foods Corp.† | | | 12,096 | | | | 13,184 | |
| | 57,000 | | | Calavo Growers Inc. | | | 1,740,163 | | | | 5,506,200 | |
| | 62,000 | | | Corby Spirit and Wine Ltd. | | | 977,600 | | | | 967,692 | |
| | 110,000 | | | Cott Corp. | | | 748,495 | | | | 1,776,500 | |
| | 540,000 | | | Crimson Wine Group Ltd.† | | | 4,911,613 | | | | 4,833,000 | |
| | 252,554 | | | Farmer Brothers Co.† | | | 5,372,884 | | | | 6,667,426 | |
| | 1,700 | | | Hanover Foods Corp., Cl. A† | | | 165,267 | | | | 149,600 | |
| | 300 | | | Hanover Foods Corp., Cl. B† | | | 28,206 | | | | 28,425 | |
| | 87,000 | | | Iwatsuka Confectionery Co. Ltd. | | | 4,235,407 | | | | 3,744,323 | |
| | 1,500 | | | J & J Snack Foods Corp. | | | 21,623 | | | | 226,335 | |
| | 22,531 | | | John B Sanfilippo & Son Inc. | | | 1,052,454 | | | | 1,608,263 | |
| | 154,700 | | | Lifeway Foods Inc.† | | | 1,525,999 | | | | 411,502 | |
| | 239,661 | | | Massimo Zanetti Beverage Group SpA | | | 2,328,336 | | | | 1,953,373 | |
| | 24,580 | | | MGP Ingredients Inc. | | | 640,337 | | | | 1,941,328 | |
| | 15,600 | | | Rock Field Co. Ltd. | | | 125,557 | | | | 258,261 | |
| | 5,700 | | | Scheid Vineyards Inc., Cl. A† | | | 82,624 | | | | 532,922 | |
| | 210,545 | | | SunOpta Inc.† | | | 1,536,343 | | | | 1,547,506 | |
| | 7,100 | | | T. Hasegawa Co. Ltd. | | | 148,541 | | | | 146,974 | |
| | 8,300 | | | The Boston Beer Co. Inc., Cl. A† | | | 283,865 | | | | 2,386,250 | |
| | 75,000 | | | The Hain Celestial Group Inc.† | | | 777,897 | | | | 2,034,000 | |
| | 270,000 | | | Tingyi (Cayman Islands) Holding Corp. | | | 393,787 | | | | 495,967 | |
| | 295,000 | | | Vitasoy International Holdings Ltd. | | | 161,353 | | | | 1,006,151 | |
| | | | | | | | | | | | |
Shares | | | | | Cost | | | Market
Value | |
| | 23,000 | | | Willamette Valley Vineyards Inc.† | | $ | 88,087 | | | $ | 181,930 | |
| | | | | | | | | | | | |
| | | | | | | 27,824,103 | | | | 39,595,537 | |
| | | | | | | | | | | | |
| | |
| | | | Health Care — 7.6% | | | | | |
| | 32,960 | | | Accuray Inc.† | | | 244,893 | | | | 148,320 | |
| | 3,500 | | | AcelRx Pharmaceuticals Inc.† | | | 21,172 | | | | 13,475 | |
| | 259,000 | | | Achaogen Inc.† | | | 2,156,439 | | | | 1,033,410 | |
| | 10,000 | | | Achillion Pharmaceuticals Inc.† | | | 35,956 | | | | 36,800 | |
| | 20,000 | | | AngioDynamics Inc.† | | | 247,154 | | | | 434,800 | |
| | 33,000 | | | Anika Therapeutics Inc.† | | | 1,053,383 | | | | 1,391,940 | |
| | 22,000 | | | Biolase Inc.† | | | 50,160 | | | | 45,540 | |
| | 500,000 | | | BioScrip Inc.† | | | 900,980 | | | | 1,550,000 | |
| | 133,000 | | | BioTelemetry Inc.† | | | 931,958 | | | | 8,571,850 | |
| | 8,200 | | | Boiron SA | | | 138,640 | | | | 552,195 | |
| | 46,500 | | | Cantel Medical Corp. | | | 593,901 | | | | 4,280,790 | |
| | 111,100 | | | Cardiovascular Systems Inc.† | | | 1,885,169 | | | | 4,348,454 | |
| | 14,000 | | | CareDx Inc.† | | | 80,937 | | | | 403,900 | |
| | 21,200 | | | Collegium Pharmaceutical Inc.† | | | 286,679 | | | | 312,488 | |
| | 378,339 | | | Cutera Inc.† | | | 5,573,774 | | | | 12,314,934 | |
| | 117,116 | | | Electromed Inc.† | | | 361,476 | | | | 761,254 | |
| | 175,000 | | | Exelixis Inc.† | | | 333,375 | | | | 3,101,000 | |
| | 45,000 | | | Genesis Healthcare Inc.† | | | 122,027 | | | | 60,750 | |
| | 1,000 | | | Harvard Bioscience Inc.† | | | 3,352 | | | | 5,250 | |
| | 11,500 | | | Heska Corp.† | | | 168,226 | | | | 1,303,065 | |
| | 4,000 | | | ICU Medical Inc.† | | | 208,306 | | | | 1,131,000 | |
| | 612,448 | | | InfuSystems Holdings Inc.† | | | 1,609,196 | | | | 1,990,456 | |
| | 23,000 | | | Integer Holdings Corp.† | | | 479,237 | | | | 1,907,850 | |
| | 122,337 | | | IntriCon Corp.† | | | 531,314 | | | | 6,875,339 | |
| | 113,500 | | | Invitae Corp.† | | | 1,037,622 | | | | 1,898,855 | |
| | 44,000 | | | K2M Group Holdings Inc.† | | | 799,719 | | | | 1,204,280 | |
| | 210,000 | | | Kindred Healthcare Inc.†(a) | | | 1,888,354 | | | | 1,890,000 | |
| | 17,000 | | | Melinta Therapeutics Inc.† | | | 157,397 | | | | 67,150 | |
| | 134,000 | | | Meridian Bioscience Inc. | | | 2,514,204 | | | | 1,996,600 | |
| | 160,000 | | | Motif Bio plc† | | | 70,834 | | | | 74,034 | |
| | 10,000 | | | Nabriva Therapeutics plc† | | | 51,402 | | | | 27,000 | |
| | 158,000 | | | Neogen Corp.† | | | 493,776 | | | | 11,301,740 | |
| | 195,877 | | | NeoGenomics Inc.† | | | 699,419 | | | | 3,006,712 | |
| | 8,333 | | | Nuvectra Corp.† | | | 77,269 | | | | 183,159 | |
| | 44,612 | | | Omnicell Inc.† | | | 732,122 | | | | 3,207,603 | |
| | 234,200 | | | OPKO Health Inc.† | | | 1,560,075 | | | | 810,332 | |
| | 45,200 | | | Orthofix Medical Inc.† | | | 965,181 | | | | 2,613,012 | |
| | 2,000 | | | Pain Therapeutics Inc.† | | | 6,901 | | | | 2,020 | |
| | 24,000 | | | Paratek Pharmaceuticals Inc.† . | | | 317,152 | | | | 232,800 | |
| | 2,500 | | | PreMD Inc.†(a) | | | 4,580 | | | | 0 | |
| | 10,000 | | | Progenics Pharmaceuticals Inc.† | | | 65,960 | | | | 62,700 | |
| | 141,500 | | | Quidel Corp.† | | | 1,669,342 | | | | 9,221,555 | |
| | 66,000 | | | RTI Surgical Inc.† | | | 334,123 | | | | 297,000 | |
| | 142,828 | | | SurModics Inc.† | | | 2,932,437 | | | | 10,662,110 | |
| | 2,000 | | | Targanta Therapeutics Corp., Escrow†(a) | | | 0 | | | | 0 | |
| | 44,000 | | | Tetraphase Pharmaceuticals Inc.† | | | 171,428 | | | | 121,440 | |
| | 143,890 | | | Trinity Biotech plc, ADR† | | | 1,010,769 | | | | 575,560 | |
| | 79,700 | | | United-Guardian Inc. | | | 743,037 | | | | 1,287,155 | |
| | 5,000 | | | Utah Medical Products Inc. | | | 138,309 | | | | 471,000 | |
| | 300,000 | | | Zealand Pharma A/S† | | | 3,744,488 | | | | 4,913,668 | |
| | | | | | | | | | | | |
| | | | | | | 40,203,604 | | | | 108,702,345 | |
| | | | | | | | | | | | |
| | |
| | | | Hotels and Gaming — 3.4% | | | | | |
| | 50,000 | | | Ainsworth Game Technology Ltd. | | | 44,995 | | | | 43,733 | |
| | 9,600 | | | Banyan Tree Holdings Ltd. | | | 4,353 | | | | 3,687 | |
| | 71,800 | | | Boyd Gaming Corp. | | | 416,103 | | | | 2,430,430 | |
| | 2,000 | | | Century Casinos Inc.† | | | 17,070 | | | | 14,920 | |
| | 23,540 | | | Churchill Downs Inc. | | | 1,150,315 | | | | 6,537,058 | |
See accompanying notes to financial statements.
24
TETON Westwood Mighty Mites Fund
Schedule of Investments (Continued) — September 30, 2018
| | | | | | | | | | | | |
Shares | | | | | Cost | | | Market Value | |
| | |
| | | | COMMON STOCKS (Continued) | | | | | |
| | | | Hotels and Gaming (Continued) | | | | | |
| | 521,691 | | | Dover Downs Gaming & Entertainment Inc.† | | $ | 1,375,663 | | | $ | 1,481,602 | |
| | 77,500 | | | Eldorado Resorts Inc.† | | | 354,440 | | | | 3,766,500 | |
| | 3,000 | | | Empire Resorts Inc.† | | | 56,147 | | | | 27,900 | |
| | 18,000 | | | Everi Holdings Inc.† | | | 132,115 | | | | 165,060 | |
| | 1,095,040 | | | Full House Resorts Inc.† | | | 2,633,732 | | | | 3,153,715 | |
| | 49,254 | | | Gamenet Group SpA | | | 527,830 | | | | 542,698 | |
| | 5,000 | | | GAN plc† | | | 1,816 | | | | 3,845 | |
| | 509,297 | | | Golden Entertainment Inc.† | | | 4,775,113 | | | | 12,228,221 | |
| | 264,640 | | | Inspired Entertainment Inc.† | | | 1,640,899 | | | | 1,614,304 | |
| | 8,402 | | | Nevada Gold & Casinos Inc.† | | | 20,042 | | | | 20,081 | |
| | 2,700 | | | PlayAGS Inc.† | | | 59,246 | | | | 79,569 | |
| | 10,000 | | | Ryman Hospitality Properties Inc., REIT | | | 309,356 | | | | 861,700 | |
| | 4,000 | | | Sotherly Hotels Inc., REIT | | | 25,968 | | | | 28,800 | |
| | 364,112 | | | The Marcus Corp. | | | 4,624,416 | | | | 15,310,910 | |
| | | | | | | | | | | | |
| | | | | | | 18,169,619 | | | | 48,314,733 | |
| | | | | | | | | | | | |
| | | |
| | | | Machinery — 2.7% | | | | | | | | |
| | 303,600 | | | Astec Industries Inc. | | | 10,748,024 | | | | 15,304,476 | |
| | 15,001 | | | Capstone Turbine Corp.† | | | 33,040 | | | | 15,001 | |
| | 56,000 | | | Chart Industries Inc.† | | | 2,082,938 | | | | 4,386,480 | |
| | 6,000 | | | DMG Mori AG | | | 37,869 | | | | 307,562 | |
| | 12,200 | | | DXP Enterprises Inc.† | | | 222,516 | | | | 488,854 | |
| | 563,500 | | | Gencor Industries Inc.† | | | 3,896,713 | | | | 6,790,175 | |
| | 15,164 | | | Lindsay Corp. | | | 1,014,039 | | | | 1,520,039 | |
| | 49,300 | | | Tennant Co. | | | 1,064,922 | | | | 3,744,335 | |
| | 44,400 | | | The Middleby Corp.† | | | 464,969 | | | | 5,743,140 | |
| | 40,015 | | | Williams Industrial Services Group Inc.† | | | 128,397 | | | | 84,832 | |
| | 50,000 | | | Xerium Technologies Inc.† | | | 666,727 | | | | 673,000 | |
| | | | | | | | | | | | |
| | | | | | | 20,360,154 | | | | 39,057,894 | |
| | | | | | | | | | | | |
| |
| | | | Manufactured Housing and Recreational Vehicles — 1.6% | |
| | 55,500 | | | Cavco Industries Inc.† | | | 3,143,285 | | | | 14,041,500 | |
| | 183,500 | | | Nobility Homes Inc. | | | 2,128,901 | | | | 4,335,187 | |
| | 103,000 | | | Skyline Champion Corp. | | | 833,870 | | | | 2,942,710 | |
| | 61,000 | | | Winnebago Industries Inc. | | | 626,036 | | | | 2,022,150 | |
| | | | | | | | | | | | |
| | | | | | | 6,732,092 | | | | 23,341,547 | |
| | | | | | | | | | | | |
| | | |
| | | | Metals and Mining — 1.4% | | | | | | | | |
| | 70,000 | | | 5N Plus Inc.† | | | 251,966 | | | | 178,841 | |
| | 10,000 | | | Alkane Resources Ltd.† | | | 3,333 | | | | 1,735 | |
| | 165,800 | | | Materion Corp. | | | 3,514,904 | | | | 10,030,900 | |
| | 750,000 | | | Osisko Gold Royalties Ltd. | | | 10,906,268 | | | | 5,690,396 | |
| | 10,000 | | | Smart Sand Inc.† | | | 87,252 | | | | 41,100 | |
| | 900,000 | | | Tanami Gold NL† | | | 210,755 | | | | 22,770 | |
| | 316,000 | | | TimkenSteel Corp.† | | | 4,704,097 | | | | 4,698,920 | |
| | 700 | | | United States Lime & Minerals Inc. | | | 55,159 | | | | 55,265 | |
| | | | | | | | | | | | |
| | | | | | | 19,733,734 | | | | 20,719,927 | |
| | | | | | | | | | | | |
| | |
| | | | Paper and Forest Products — 0.2% | | | | | |
| | 26,500 | | | Keweenaw Land Association Ltd.† | | | 2,258,046 | | | | 2,464,500 | |
| | | | | | | | | | | | |
| | | |
| | | | Publishing — 1.1% | | | | | | | | |
| | 115,001 | | | AH Belo Corp., Cl. A | | | 636,265 | | | | 529,005 | |
| | 124,094 | | | ARC Document Solutions Inc.† | | | 244,744 | | | | 352,427 | |
| | 10,000 | | | Cambium Learning Group Inc.† | | | 36,700 | | | | 118,400 | |
| | 908,048 | | | The E.W. Scripps Co., Cl. A | | | 5,533,681 | | | | 14,982,792 | |
| | 27,057 | | | tronc Inc.† | | | 264,673 | | | | 441,841 | |
| | | | | | | | | | | | |
| | | | | | | 6,716,063 | | | | 16,424,465 | |
| | | | | | | | | | | | |
| | | |
| | | | Real Estate — 2.5% | | | | | | | | |
| | 220,000 | | | Ambase Corp.† | | | 319,065 | | | | 116,600 | |
| | 8,000 | | | Bresler & Reiner Inc.† | | | 4,912 | | | | 200 | |
| | | | | | | | | | | | |
Shares | | | | | Cost | | | Market Value | |
| | 113,300 | | | Capital Properties Inc., Cl. A | | $ | 1,205,957 | | | $ | 1,781,643 | |
| | 109,000 | | | Cohen & Steers Inc. | | | 2,330,830 | | | | 4,426,490 | |
| | 60,000 | | | DREAM Unlimited Corp., Cl. A† | | | 331,539 | | | | 375,334 | |
| | 1,000 | | | FC Global Realty Inc.† | | | 1,296 | | | | 200 | |
| | 25,000 | | | FRP Holdings Inc.† | | | 822,183 | | | | 1,552,500 | |
| | 50,000 | | | Gateway Lifestyle | | | 84,854 | | | | 80,959 | |
| | 275,000 | | | Griffin Industrial Realty Inc.(b) | | | 7,928,296 | | | | 10,725,000 | |
| | 14,138 | | | Gyrodyne LLC† | | | 394,093 | | | | 289,829 | |
| | 8,231 | | | Holobeam Inc.†(a) | | | 161,746 | | | | 310,967 | |
| | 494,652 | | | Reading International Inc., Cl. A† | | | 4,445,635 | | | | 7,815,502 | |
| | 74,359 | | | Reading International Inc., Cl. B† | | | 669,886 | | | | 2,230,770 | |
| | 2,508 | | | Royalty LLC†(a) | | | 0 | | | | 255 | |
| | 172,000 | | | Tejon Ranch Co.† | | | 4,367,792 | | | | 3,734,120 | |
| | 45,023 | | | Trinity Place Holdings Inc.† | | | 322,457 | | | | 274,190 | |
| | 250,000 | | | Trinity Place Holdings Inc.†(c)(d) | | | 1,875,000 | | | | 1,522,500 | |
| | | | | | | | | | | | |
| | | | | | | 25,265,541 | | | | 35,237,059 | |
| | | | | | | | | | | | |
| | | |
| | | | Restaurants — 1.8% | | | | | | | | |
| | 1,918 | | | Biglari Holdings Inc., Cl. A† | | | 1,918,388 | | | | 1,768,396 | |
| | 13,183 | | | Biglari Holdings Inc., Cl. B† | | | 2,704,227 | | | | 2,390,737 | |
| | 59,900 | | | Denny’s Corp.† | | | 184,625 | | | | 881,728 | |
| | 222,634 | | | Nathan’s Famous Inc.(b) | | | 3,294,226 | | | | 18,345,042 | |
| | 50,000 | | | The Cheesecake Factory Inc. | | | 1,504,518 | | | | 2,677,000 | |
| | | | | | | | | | | | |
| | | | | | | 9,605,984 | | | | 26,062,903 | |
| | | | | | | | | | | | |
| | | |
| | | | Retail — 1.3% | | | | | | | | |
| | 48,000 | | | Aaron’s Inc. | | | 935,791 | | | | 2,614,080 | |
| | 103,000 | | | Big 5 Sporting Goods Corp. | | | 905,177 | | | | 525,300 | |
| | 25,496 | | | Ethan Allen Interiors Inc. | | | 605,537 | | | | 529,042 | |
| | 275,800 | | | EVINE Live Inc.† | | | 385,883 | | | | 317,170 | |
| | 35,000 | | | GNC Holdings Inc., Cl. A† | | | 154,268 | | | | 144,900 | |
| | 180,600 | | | Ingles Markets Inc., Cl. A | | | 3,121,730 | | | | 6,185,550 | |
| | 85,000 | | | Lands’ End Inc.† | | | 1,454,653 | | | | 1,491,750 | |
| | 56,000 | | | La-Z-Boy Inc. | | | 1,249,698 | | | | 1,769,600 | |
| | 63,000 | | | Movado Group Inc. | | | 1,257,621 | | | | 2,639,700 | |
| | 300 | | | PetIQ Inc.† | | | 7,511 | | | | 11,793 | |
| | 12,000 | | | Pier 1 Imports Inc. | | | 50,518 | | | | 18,000 | |
| | 6,000 | | | SpartanNash Co. | | | 121,934 | | | | 120,360 | |
| | 86,000 | | | Tuesday Morning Corp.† | | | 258,352 | | | | 275,200 | |
| | 73,781 | | | Village Super Market Inc., Cl. A | | | 2,023,879 | | | | 2,006,843 | |
| | 55,000 | | | Vitamin Shoppe, Inc.† | | | 327,328 | | | | 550,000 | |
| | 400 | | | Winmark Corp. | | | 26,768 | | | | 66,400 | |
| | | | | | | | | | | | |
| | | | | | | 12,886,648 | | | | 19,265,688 | |
| | | | | | | | | | | | |
| | | |
| | | | Semiconductors — 0.4% | | | | | | | | |
| | 185,100 | | | Entegris Inc. | | | 1,250,835 | | | | 5,358,645 | |
| | 5,000 | | | MoSys Inc.† | | | 9,245 | | | | 3,450 | |
| | 2,000 | | | Veeco Instruments Inc.† | | | 23,663 | | | | 20,500 | |
| | | | | | | | | | | | |
| | | | | | | 1,283,743 | | | | 5,382,595 | |
| | | | | | | | | | | | |
| | | |
| | | | Specialty Chemicals — 2.5% | | | | | | | | |
| | 1,100,000 | | | Ferro Corp.† | | | 5,287,060 | | | | 25,542,000 | |
| | 267,226 | | | General Chemical Group Inc.†(b) | | | 59,859 | | | | 2,004 | |
| | 75,000 | | | Hawkins Inc. | | | 2,707,348 | | | | 3,108,750 | |
| | 2,000 | | | KMG Chemicals Inc. | | | 51,827 | | | | 151,120 | |
| | 4,100 | | | Minerals Technologies Inc. | | | 121,383 | | | | 277,160 | |
| | 166,000 | | | Navigator Holdings Ltd.† | | | 2,187,076 | | | | 2,008,600 | |
| | 381,900 | | | OMNOVA Solutions Inc.† | | | 1,964,639 | | | | 3,761,715 | |
| | 10,000 | | | Takasago International Corp. | | | 271,028 | | | | 366,133 | |
| | 50,000 | | | Teraoka Seisakusho Co. Ltd. | | | 368,433 | | | | 310,245 | |
| | 36,000 | | | Treatt plc | | | 183,214 | | | | 226,636 | |
| | | | | | | | | | | | |
| | | | | | | 13,201,867 | | | | 35,754,363 | |
| | | | | | | | | | | | |
See accompanying notes to financial statements.
25
TETON Westwood Mighty Mites Fund
Schedule of Investments (Continued) — September 30, 2018
| | | | | | | | | | | | |
Shares | | | | | Cost | | | Market Value | |
| | | | COMMON STOCKS (Continued) | |
| | | | Telecommunications — 2.4% | | | | | |
| | 50,800 | | | ATN International Inc. | | $ | 2,066,182 | | | $ | 3,753,104 | |
| | 274,839 | | | Cincinnati Bell Inc.† | | | 4,558,819 | | | | 4,383,682 | |
| | 38,111 | | | Consolidated Communications Holdings Inc. | | | 329,789 | | | | 496,967 | |
| | 20,808 | | | Frequency Electronics Inc.† | | | 233,086 | | | | 215,779 | |
| | 65,000 | | | Gogo Inc.† | | | 322,463 | | | | 337,350 | |
| | 720,117 | | | HC2 Holdings Inc.† | | | 2,668,477 | | | | 4,407,116 | |
| | 5,000 | | | IDT Corp., Cl. B | | | 37,666 | | | | 26,700 | |
| | 20,000 | | | Iridium Communications Inc.† | | | 160,025 | | | | 450,000 | |
| | 4,100 | | | North State Telecommunications Corp., Cl. A | | | 349,343 | | | | 234,766 | |
| | 57,500 | | | Nuvera Communications Inc. | | | 528,202 | | | | 1,105,438 | |
| | 521,335 | | | ORBCOMM Inc.† | | | 3,005,997 | | | | 5,661,698 | |
| | 5,788 | | | Preformed Line Products Co. | | | 246,195 | | | | 406,781 | |
| | 318,500 | | | Shenandoah Telecommunications Co. | | | 1,716,911 | | | | 12,341,875 | |
| | 20,000 | | | WideOpenWest Inc.† | | | 195,398 | | | | 224,200 | |
| | 25,000 | | | Windstream Holdings Inc.† | | | 232,043 | | | | 122,500 | |
| | | | | | | | | | | | |
| | | | | | | 16,650,596 | | | | 34,167,956 | |
| | | | | | | | | | | | |
| | |
| | | | Transportation — 0.0% | | | | | |
| | 17,000 | | | Patriot Transportation Holding Inc.† | | | 374,911 | | | | 324,870 | |
| | 2,100 | | | PHI Inc.† | | | 31,628 | | | | 19,110 | |
| | | | | | | | | | | | |
| | | | | | | 406,539 | | | | 343,980 | |
| | | | | | | | | | | | |
| | |
| | | | Wireless Communications — 0.3% | | | | | |
| | 810,000 | | | NII Holdings Inc.† | | | 633,616 | | | | 4,746,600 | |
| | | | | | | | | | | | |
| | | |
| | | | TOTAL COMMON STOCKS | | | 615,366,474 | | | | 1,141,280,006 | |
| | | | | | | | | | | | |
| | |
| | | | CLOSED-END FUNDS — 0.1% | | | | | |
| | 134,300 | | | MVC Capital Inc. | | | 1,294,504 | | | | 1,295,995 | |
| | | | | | | | | | | | |
| | |
| | | | PREFERRED STOCKS — 0.7% | | | | | |
| | | | Automotive: Parts and Accessories — 0.2% | |
| | 57,000 | | | Jungheinrich AG 1.150% | | | 221,761 | | | | 2,170,697 | |
| | | | | | | | | | | | |
| | |
| | | | Financial Services — 0.5% | | | | | |
| | 321,900 | | | Steel Partners Holdings LP Ser. A, 6.000% | | | 11,132,951 | | | | 7,365,072 | |
| | | | | | | | | | | | |
| | |
| | | | Health Care — 0.0% | | | | | |
| | 3,034 | | | BioScrip Inc. † | | | 287,862 | | | | 260,701 | |
| | | | | | | | | | | | |
| | | | TOTAL PREFERRED STOCKS | | | 11,642,574 | | | | 9,796,470 | |
| | | | | | | | | | | | |
| |
| | | | CONVERTIBLE PREFERRED STOCKS — 0.0% | |
| | |
| | | | Business Services — 0.0% | | | | | |
| | 363 | | | Trans-Lux Pfd. 6.000%, Ser. B(b) | | | 72,600 | | | | 2,552 | |
| | | | | | | | | | | | |
| | |
| | | | Energy and Utilities — 0.0% | | | | | |
| | 15,095 | | | Corning Natural Gas Holding Corp., | | | | | | | | |
| | | | 4.800%, Ser. B | | | 313,221 | | | | 335,109 | |
| | | | | | | | | | | | |
| | |
| | | | Food and Beverage — 0.0% | | | | | |
| | 500 | | | Seneca Foods Corp., | | | | | | | | |
| | | | Ser. 2003 | | | 7,625 | | | | 16,850 | |
| | | | | | | | | | | | |
| | | | TOTAL CONVERTIBLE | | | | | | | | |
| | | | PREFERRED STOCKS | | | 393,446 | | | | 354,511 | |
| | | | | | | | | | | | |
| | |
| | | | RIGHTS — 0.0% | | | | | |
| | | | Entertainment — 0.0% | | | | | |
| | 550,000 | | | Media General Inc., CVR†(a) | | | 1 | | | | 1 | |
| | | | | | | | | | | | |
| | |
| | | | Health Care — 0.0% | | | | | |
| | 300,000 | | | Adolor Corp., CPR,
expire 07/01/19†(a) | | | 0 | | | | 0 | |
| | 400,000 | | | Sanofi, CVR† | | | 137,800 | | | | 223,960 | |
| | | | | | | | | | | | |
Shares | | | | | Cost | | | Market Value | |
| | 200,000 | | | Teva Pharmaceutical Industries Ltd., CCCP, expire 02/20/23†(a) | | $ | 103,591 | | | $ | 0 | |
| | | | | | | | | | | | |
| | | | | | | 241,391 | | | | 223,960 | |
| | | | | | | | | | | | |
| | |
| | | | Hotels and Gaming — 0.0% | | | | | |
| | 1,041,500 | | | Ladbrokes plc, CVR† | | | 69,148 | | | | 17,647 | |
| | | | | | | | | | | | |
| | |
| | | | Specialty Chemicals — 0.0% | | | | | |
| | 30,000 | | | A. Schulman Inc., CVR†(a) | | | 60,000 | | | | 60,000 | |
| | | | | | | | | | | | |
| | | | TOTAL RIGHTS | | | 370,540 | | | | 301,608 | |
| | | | | | | | | | | | |
| | |
| | | | WARRANTS — 0.0% | | | | | |
| | | | Energy and Utilities — 0.0% | | | | | |
| | 86 | | | Key Energy Services, expire 12/15/21†(a) | | | 0 | | | | 35 | |
| | 86 | | | Key Energy Services, expire 12/15/20†(a) | | | 0 | | | | 23 | |
| | | | | | | | | | | | |
| | | | | | | 0 | | | | 58 | |
| | | | | | | | | | | | |
| | |
| | | | Environmental Control — 0.0% | | | | | |
| | 200 | | | Primo Water Corp., expire 12/31/21† | | | 58 | | | | 666 | |
| | | | | | | | | | | | |
| | |
| | | | Health Care — 0.0% | | | | | |
| | 8,737 | | | BioScrip Inc., Cl. A, expire 07/27/25† | | | 7,979 | | | | 1,815 | |
| | 8,737 | | | BioScrip Inc., Cl. B, expire 07/27/25† | | | 7,554 | | | | 1,257 | |
| | | | | | | | | | | | |
| | | | | | | 15,533 | | | | 3,072 | |
| | | | | | | | | | | | |
| | | | TOTAL WARRANTS | | | 15,591 | | | | 3,796 | |
| | | | | | | | | | | | |
| | | |
Principal
Amount | | | | | | | | | |
| |
| | | | U.S. GOVERNMENT OBLIGATIONS — 19.8% | |
| $ | 284,865,000 | | | U.S. Treasury Bills, 1.898% to 2.235%††, 10/04/18 to 02/28/19 | | | 283,781,977 | | | | 283,752,513 | |
| | | | | | | | | | | | |
| | | |
| | | | TOTAL INVESTMENTS — 100.1% | | $ | 912,865,106 | | | | 1,436,784,899 | |
| | | | | | | | | | | | |
| | |
| | | | Other Assets and Liabilities (Net) — (0.1)% | | | | (721,785 | ) |
| | | | | | | | | | | | |
| | | |
| | | | NET ASSETS — 100.0% | | | | | | $ | 1,436,063,114 | |
| | | | | | | | | | | | |
See accompanying notes to financial statements.
26
TETON Westwood Mighty Mites Fund
Schedule of Investments (Continued) — September 30, 2018
| (a) | Security is valued using significant unobservable inputs and is classified as Level 3 in the fair value hierarchy. |
| (b) | Security considered an affiliated holding because the Fund owns at least 5% of its outstanding shares. |
| (c) | At September 30, 2018, the Fund held an investment in a restricted and illiquid security amounting to $1,522,500 or 0.11% of net assets., which was valued under methods approved by the Board of Trustees as follows: |
| | | | | | | | |
Acquisition
Shares | | Issuer | | Acquisition
Date | | Acquisition
Cost | | 09/30/18
Carrying
Value
Per Share |
| 250,000 | | Trinity Place Holdings Inc. | | 02/10/17 | | $1,875,000 | | $6.0900 |
| (d) | Security exempt from registration under Rule 144A of the Securities Act of 1933, as amended. This security may be resold in transactions exempt from registration, normally to qualified institutional buyers. At September 30, 2018, the market value of the Rule 144A security amounted to $1,522,500 or 0.11% of net assets. |
| † | Non-income producing security. |
| †† | Represents annualized yields at dates of purchase. |
| ADR | American Depositary Receipt |
| CCCP | Contingent Cash Consideration Payment |
| CPR | Contingent Payment Right |
| CVR | Contingent Value Right |
| GDR | Global Depositary Receipt |
| REIT | Real Estate Investment Trust |
| SDR | Swedish Depositary Receipt |
See accompanying notes to financial statements.
27
TETON Westwood SmallCap Equity Fund
Schedule of Investments — September 30, 2018
| | | | | | | | | | | | |
Shares | | | | | Cost | | | Market
Value | |
| | | | COMMON STOCKS — 92.3% | |
| | | | Aerospace — 1.4% | | | | | | | | |
| | 2,800 | | | Esterline Technologies Corp.† | | $ | 207,669 | | | $ | 254,660 | |
| | 4,200 | | | Hexcel Corp. | | | 95,744 | | | | 281,610 | |
| | | | | | | | | | | | |
| | | | | | | 303,413 | | | | 536,270 | |
| | | | | | | | | | | | |
| | | |
| | | | Automotive — 1.7% | | | | | | | | |
| | 11,000 | | | Rush Enterprises Inc., Cl. A | | | 257,708 | | | | 432,410 | |
| | 6,700 | | | Winnebago Industries Inc. | | | 268,922 | | | | 222,105 | |
| | | | | | | | | | | | |
| | | | | | | 526,630 | | | | 654,515 | |
| | | | | | | | | | | | |
| | | |
| | | | Banking — 20.3% | | | | | | | | |
| | 19,200 | | | Atlantic Capital Bancshares Inc.† | | | 354,745 | | | | 321,600 | |
| | 13,300 | | | Banc of California Inc. | | | 257,456 | | | | 251,370 | |
| | 11,200 | | | BankUnited Inc. | | | 305,675 | | | | 396,480 | |
| | 5,000 | | | Berkshire Hills Bancorp Inc. | | | 128,439 | | | | 203,500 | |
| | 2,700 | | | Columbia Banking System Inc. | | | 49,471 | | | | 104,679 | |
| | 2,700 | | | Financial Institutions Inc. | | | 43,636 | | | | 84,780 | |
| | 24,500 | | | First Foundation Inc.† | | | 390,508 | | | | 382,690 | |
| | 8,700 | | | Flushing Financial Corp. | | | 132,257 | | | | 212,280 | |
| | 7,900 | | | Glacier Bancorp Inc. | | | 118,011 | | | | 340,411 | |
| | 2,000 | | | Heartland Financial USA Inc. | | | 93,645 | | | | 116,100 | |
| | 17,100 | | | Heritage Commerce Corp. | | | 150,739 | | | | 255,132 | |
| | 8,350 | | | Hope Bancorp Inc. | | | 61,657 | | | | 135,019 | |
| | 44,250 | | | Investors Bancorp Inc. | | | 478,052 | | | | 542,948 | |
| | 7,800 | | | Kearny Financial Corp./MD | | | 107,526 | | | | 108,030 | |
| | 19,800 | | | LegacyTexas Financial Group Inc. | | | 382,930 | | | | 843,480 | |
| | 3,250 | | | OceanFirst Financial Corp. | | | 42,156 | | | | 88,465 | |
| | 20,150 | | | OFG Bancorp | | | 197,293 | | | | 325,423 | |
| | 7,000 | | | Oritani Financial Corp. | | | 106,094 | | | | 108,850 | |
| | 14,500 | | | PCSB Financial Corp. | | | 237,932 | | | | 294,930 | |
| | 9,600 | | | State Bank Financial Corp. | | | 182,685 | | | | 289,728 | |
| | 20,906 | | | Sterling Bancorp | | | 180,774 | | | | 459,932 | |
| | 18,900 | | | TrustCo Bank Corp. | | | 124,949 | | | | 160,650 | |
| | 14,250 | | | Umpqua Holdings Corp. | | | 197,964 | | | | 296,400 | |
| | 5,933 | | | Union Bankshares Corp. | | | 118,963 | | | | 228,598 | |
| | 31,400 | | | United Financial Bancorp Inc. | | | 466,213 | | | | 528,462 | |
| | 13,000 | | | Veritex Holdings Inc.† | | | 389,731 | | | | 367,380 | |
| | 7,000 | | | Washington Federal Inc. | | | 109,397 | | | | 224,000 | |
| | 4,000 | | | Washington Trust Bancorp Inc. | | | 91,518 | | | | 221,200 | |
| | | | | | | | | | | | |
| | | | | | | 5,500,416 | | | | 7,892,517 | |
| | | | | | | | | | | | |
| | | |
| | | | Broadcasting — 1.2% | | | | | | | | |
| | 10,000 | | | Chicken Soup For The Soul Entertainment Inc. | | | 102,825 | | | | 102,000 | |
| | 42,600 | | | Corus Entertainment Inc., Cl. B | | | 168,574 | | | | 138,191 | |
| | 15,000 | | | Hemisphere Media Group Inc.† | | | 171,511 | | | | 209,250 | |
| | | | | | | | | | | | |
| | | | | | | 442,910 | | | | 449,441 | |
| | | | | | | | | | | | |
| |
| | | | Building and Construction — 1.9% | |
| | 5,700 | | | EMCOR Group Inc. | | | 248,253 | | | | 428,127 | |
| | 9,300 | | | MYR Group Inc.† | | | 140,432 | | | | 303,552 | |
| | | | | | | | | | | | |
| | | | | | | 388,685 | | | | 731,679 | |
| | | | | | | | | | | | |
| |
| | | | Business Services — 4.6% | |
| | 14,300 | | | ABM Industries Inc. | | | 463,314 | | | | 461,175 | |
| | 40,300 | | | Diebold Nixdorf Inc. | | | 901,257 | | | | 181,350 | |
| | 4,150 | | | FTI Consulting Inc.† | | | 109,907 | | | | 303,739 | |
| | 4,950 | | | KAR Auction Services Inc. | | | 76,193 | | | | 295,466 | |
| | 5,600 | | | McGrath RentCorp. | | | 158,247 | | | | 305,032 | |
| | 1,600 | | | The Dun & Bradstreet Corp. | | | 168,572 | | | | 228,016 | |
| | | | | | | | | | | | |
| | | | | | | 1,877,490 | | | | 1,774,778 | |
| | | | | | | | | | | | |
| |
| | | | Communications — 3.8% | |
| | 12,900 | | | Meredith Corp. | | | 662,585 | | | | 658,545 | |
| | 85,600 | | | Pandora Media Inc.† | | | 641,161 | | | | 814,056 | |
| | | | | | | | | | | | |
| | | | | | | 1,303,746 | | | | 1,472,601 | |
| | | | | | | | | | | | |
| |
| | | | Computer Software and Services — 6.5% | |
| | 13,000 | | | Bottomline Technologies Inc.† | | | 288,680 | | | | 945,230 | |
| | 16,000 | | | Convergys Corp. | | | 364,251 | | | | 379,840 | |
| | | | | | | | | | | | |
Shares | | | | | Cost | | | Market
Value | |
| | 700 | | | MicroStrategy Inc., Cl. A† | | $ | 96,383 | | | $ | 98,434 | |
| | 24,600 | | | NetScout Systems Inc.† | | | 518,335 | | | | 621,150 | |
| | 13,300 | | | Progress Software Corp. | | | 278,775 | | | | 469,357 | |
| | | | | | | | | | | | |
| | | | | | | 1,546,424 | | | | 2,514,011 | |
| | | | | | | | | | | | |
| | | |
| | | | Consumer Products — 2.3% | | | | | | | | |
| | 18,600 | | | Hanesbrands Inc. | | | 313,100 | | | | 342,798 | |
| | 6,200 | | | Oxford Industries Inc. | | | 367,943 | | | | 559,240 | |
| | | | | | | | | | | | |
| | | | | | | 681,043 | | | | 902,038 | |
| | | | | | | | | | | | |
| | | |
| | | | Diversified Industrial — 3.9% | | | | | | | | |
| | 4,250 | | | Barnes Group Inc. | | | 102,409 | | | | 301,877 | |
| | 12,360 | | | Columbus McKinnon Corp. | | | 168,445 | | | | 488,714 | |
| | 7,200 | | | Fabrinet† | | | 198,134 | | | | 333,072 | |
| | 20,700 | | | Steelcase Inc., Cl. A | | | 286,316 | | | | 382,950 | |
| | | | | | | | | | | | |
| | | | | | | 755,304 | | | | 1,506,613 | |
| | | | | | | | | | | | |
| | | |
| | | | Electronics — 2.3% | | | | | | | | |
| | 4,500 | | | FARO Technologies Inc.† | | | 123,325 | | | | 289,575 | |
| | 3,600 | | | Plantronics Inc. | | | 146,661 | | | | 217,080 | |
| | 8,300 | | | TTM Technologies Inc.† | | | 130,633 | | | | 132,053 | |
| | 3,400 | | | Woodward Inc. | | | 109,074 | | | | 274,924 | |
| | | | | | | | | | | | |
| | | | | | | 509,693 | | | | 913,632 | |
| | | | | | | | | | | | |
| | | |
| | | | Energy and Utilities — 12.1% | | | | | | | | |
| | 31,600 | | | Centennial Resource Development Inc., Cl. A† | | | 542,804 | | | | 690,460 | |
| | 22,000 | | | Magnolia Oil & Gas Corp.† | | | 268,730 | | | | 330,220 | |
| | 17,500 | | | Matador Resources Co.† | | | 330,135 | | | | 578,375 | |
| | 17,900 | | | McDermott International Inc.† | | | 335,849 | | | | 329,897 | |
| | 15,600 | | | Oceaneering International Inc.† | | | 326,266 | | | | 430,560 | |
| | 16,600 | | | Parsley Energy Inc., Cl. A† | | | 468,230 | | | | 485,550 | |
| | 53,700 | | | Patterson-UTI Energy Inc. | | | 1,027,260 | | | | 918,807 | |
| | 3,200 | | | PDC Energy Inc.† | | | 184,462 | | | | 156,672 | |
| | 2,000 | | | Penn Virginia Corp.† | | | 78,692 | | | | 161,080 | |
| | 11,800 | | | ProPetro Holding Corp.† | | | 195,819 | | | | 194,582 | |
| | 17,400 | | | Trecora Resources† | | | 250,117 | | | | 243,600 | |
| | 3,700 | | | Whiting Petroleum Corp.† | | | 181,658 | | | | 196,248 | |
| | | | | | | | | | | | |
| | | | | | | 4,190,022 | | | | 4,716,051 | |
| | | | | | | | | | | | |
| | | |
| | | | Environmental Control — 1.2% | | | | | | | | |
| | 14,600 | | | Casella Waste Systems Inc., Cl. A† | | | 202,176 | | | | 453,476 | |
| | | | | | | | | | | | |
| | | |
| | | | Equipment and Supplies — 1.8% | | | | | | | | |
| | 9,600 | | | CIRCOR International Inc. | | | 407,060 | | | | 456,000 | |
| | 5,500 | | | Crown Holdings Inc.† | | | 202,894 | | | | 264,000 | |
| | | | | | | | | | | | |
| | | | | | | 609,954 | | | | 720,000 | |
| | | | | | | | | | | | |
| | | |
| | | | Financial Services — 3.5% | | | | | | | | |
| | 14,100 | | | Brown & Brown Inc. | | | 180,990 | | | | 416,937 | |
| | 10,000 | | | Coastal Financial Corp.† | | | 145,000 | | | | 170,000 | |
| | 9,800 | | | Oaktree Capital Group LLC | | | 377,944 | | | | 405,720 | |
| | 5,500 | | | Stifel Financial Corp. | | | 222,269 | | | | 281,930 | |
| | 5,800 | | | Waterstone Financial Inc. | | | 62,093 | | | | 99,470 | |
| | | | | | | | | | | | |
| | | | | | | 988,296 | | | | 1,374,057 | |
| | | | | | | | | | | | |
| | | |
| | | | Health Care — 6.0% | | | | | | | | |
| | 6,350 | | | AngioDynamics Inc.† | | | 89,195 | | | | 138,049 | |
| | 1,480 | | | ICU Medical Inc.† | | | 61,993 | | | | 418,470 | |
| | 4,300 | | | Natus Medical Inc.† | | | 138,261 | | | | 153,295 | |
| | 5,550 | | | Omnicell Inc.† | | | 100,426 | | | | 399,045 | |
| | 34,350 | | | Patterson Cos. Inc. | | | 855,076 | | | | 839,858 | |
| | 3,500 | | | STERIS plc | | | 260,890 | | | | 400,400 | |
| | | | | | | | | | | | |
| | | | | | | 1,505,841 | | | | 2,349,117 | |
| | | | | | | | | | | | |
| | | |
| | | | Machinery — 1.0% | | | | | | | | |
| | 32,400 | | | Mueller Water Products Inc., Cl. A | | | 378,628 | | | | 372,924 | |
| | | | | | | | | | | | |
| | | |
| | | | Real Estate — 0.9% | | | | | | | | |
| | 5,100 | | | Equity Commonwealth, REIT† | | | 153,399 | | | | 163,659 | |
See accompanying notes to financial statements.
28
TETON Westwood SmallCap Equity Fund
Schedule of Investments (Continued) — September 30, 2018
| | | | | | | | | | | | |
Shares | | | | | Cost | | | Market
Value | |
| | | | COMMON STOCKS (Continued) | | | | | |
| | | | Real Estate (Continued) | | | | | |
| | 12,900 | | | Paramount Group Inc., REIT | | $ | 204,244 | | | $ | 194,661 | |
| | | | | | | | | | | | |
| | | | | | | 357,643 | | | | 358,320 | |
| | | | | | | | | | | | |
| | |
| | | | Retail — 3.9% | | | | | |
| | 3,050 | | | American Eagle Outfitters Inc. | | | 35,954 | | | | 75,731 | |
| | 35,200 | | | Darling Ingredients Inc.† | | | 559,707 | | | | 680,064 | |
| | 18,700 | | | Del Frisco’s Restaurant Group Inc.† | | | 182,275 | | | | 155,210 | |
| | 28,850 | | | Ethan Allen Interiors Inc. | | | 676,044 | | | | 598,637 | |
| | | | | | | | | | | | |
| | | | | | | 1,453,980 | | | | 1,509,642 | |
| | | | | | | | �� | | | | |
| | |
| | | | Semiconductors — 5.9% | | | | | |
| | 2,200 | | | Cabot Microelectronics Corp. | | | 85,307 | | | | 226,974 | |
| | 26,300 | | | Cypress Semiconductor Corp. | | | 218,740 | | | | 381,087 | |
| | 18,300 | | | Entegris Inc. | | | 215,095 | | | | 529,785 | |
| | 13,000 | | | FormFactor Inc.† | | | 82,254 | | | | 178,750 | |
| | 6,200 | | | MACOM Technology Solutions Holdings Inc.† | | | 134,420 | | | | 127,720 | |
| | 17,500 | | | Marvell Technology Group Ltd. | | | 240,349 | | | | 337,750 | |
| | 9,100 | | | ON Semiconductor Corp.† | | | 71,287 | | | | 167,713 | |
| | 9,238 | | | Versum Materials Inc. | | | 240,985 | | | | 332,660 | |
| | | | | | | | | | | | |
| | | | | | | 1,288,437 | | | | 2,282,439 | |
| | | | | | | | | | | | |
| | |
| | | | Specialty Chemicals — 1.6% | | | | | |
| | 27,700 | | | Ferro Corp.† | | | 435,482 | | | | 643,194 | |
| | | | | | | | | | | | |
| | |
| | | | Telecommunications — 4.5% | | | | | |
| | 57,900 | | | Extreme Networks Inc.† | | | 370,889 | | | | 317,292 | |
| | 11,600 | | | Finisar Corp.† | | | 205,435 | | | | 220,980 | |
| | 76,200 | | | Infinera Corp.† | | | 636,307 | | | | 556,260 | |
| | 48,700 | | | Mitel Networks Corp.† | | | 357,167 | | | | 536,674 | |
| | 14,500 | | | Oclaro Inc.† | | | 100,260 | | | | 129,630 | |
| | | | | | | | | | | | |
| | | | | | | 1,670,058 | | | | 1,760,836 | |
| | | | | | | | | | | | |
| | | |
| | | | TOTAL COMMON STOCKS | | | 26,916,271 | | | | 35,888,151 | |
| | | | | | | | | | | | |
| | |
| | | | RIGHTS — 0.1% | | | | | |
| | | | Specialty Chemicals — 0.1% | | | | | |
| | 22,200 | | | A. Schulman Inc., CVR†(a) | | | 44,400 | | | | 44,400 | |
| | | | | | | | | | | | |
| | | | | | | | | | | | |
Principal
Amount | | | | | Cost | | | Market Value | |
| | | | U.S. GOVERNMENT OBLIGATIONS — 7.9% | | | | | |
| $ | 3,075,000 | | | U.S. Treasury Bills,
1.955% to 2.135%††,
10/25/18 to 12/20/18 | | $ | 3,068,105 | | | $ | 3,067,857 | |
| | | | | | | | | | | | |
| | | |
| | | | TOTAL INVESTMENTS — 100.3% | | $ | 30,028,776 | | | | 39,000,408 | |
| | | | | | | | | | | | |
| | |
| | | | Other Assets and Liabilities (Net) — (0.3)% | | | | (107,795 | ) |
| | | | | | | | | | | | |
| | | |
| | | | NET ASSETS — 100.0% | | | | | | $ | 38,892,613 | |
| | | | | | | | | | | | |
| (a) | Security is valued using significant unobservable inputs and is classified as Level 3 in the fair value hierarchy. |
| † | Non-income producing security. |
| †† | Represents annualized yields at dates of purchase. |
| CVR | Contingent Value Right |
| REIT | Real Estate Investment Trust |
See accompanying notes to financial statements.
29
TETON Westwood Mid-Cap Equity Fund
Schedule of Investments — September 30, 2018
| | | | | | | | | | | | |
Shares | | | | | Cost | | | Market
Value | |
| | | | COMMON STOCKS — 98.5% | | | | | |
| | | | FINANCIALS — 21.7% | | | | | |
| | | | Banks — 6.8% | | | | | | | | |
| | 2,370 | | | BankUnited Inc. | | $ | 77,615 | | | $ | 83,898 | |
| | 148 | | | SVB Financial Group† | | | 17,607 | | | | 46,003 | |
| | 1,775 | | | Zions Bancorp NA | | | 52,534 | | | | 89,016 | |
| | | | | | | | | | | | |
| | | | | | | 147,756 | | | | 218,917 | |
| | | | | | | | | | | | |
| | | |
| | | | Diversified Financials — 4.6% | | | | | | | | |
| | 1,288 | | | Legg Mason Inc. | | | 46,159 | | | | 40,224 | |
| | 1,061 | | | Oaktree Capital Group LLC | | | 43,333 | | | | 43,925 | |
| | 594 | | | T. Rowe Price Group Inc. | | | 42,544 | | | | 64,853 | |
| | | | | | | | | | | | |
| | | | | | | 132,036 | | | | 149,002 | |
| | | | | | | | | | | | |
| | | |
| | | | Insurance — 3.6% | | | | | | | | |
| | 473 | | | Chubb Ltd. | | | 46,865 | | | | 63,212 | |
| | 1,089 | | | Voya Financial Inc. | | | 40,673 | | | | 54,091 | |
| | | | | | | | | | | | |
| | | | | | | 87,538 | | | | 117,303 | |
| | | | | | | | | | | | |
| | | |
| | | | Real Estate — 6.7% | | | | | | | | |
| | 665 | | | American Tower Corp., REIT | | | 58,124 | | | | 96,625 | |
| | 2,414 | | | CBRE Group Inc., Cl. A† | | | 69,721 | | | | 106,457 | |
| | 156 | | | SL Green Realty Corp., REIT | | | 16,659 | | | | 15,215 | |
| | | | | | | | | | | | |
| | | | | | | 144,504 | | | | 218,297 | |
| | | | | | | | | | | | |
| | | |
| | | | TOTAL FINANCIALS | | | 511,834 | | | | 703,519 | |
| | | | | | | | | | | | |
| | | | INFORMATION TECHNOLOGY — 18.2% | |
| | | | Semiconductors and Semiconductor Equipment — 0.7% | |
| | 760 | | | Marvell Technology Group Ltd. | | | 15,740 | | | | 14,668 | |
| | 270 | | | Teradyne Inc. | | | 9,936 | | | | 9,984 | |
| | | | | | | | | | | | |
| | | | | | | 25,676 | | | | 24,652 | |
| | | | | | | | | | | | |
| | | | Software and Services — 12.4% | | | | | | | | |
| | 886 | | | Activision Blizzard Inc. | | | 19,930 | | | | 73,706 | |
| | 1,620 | | | Convergys Corp. | | | 37,063 | | | | 38,459 | |
| | 210 | | | Equinix Inc., REIT | | | 43,965 | | | | 90,907 | |
| | 1,193 | | | Fortinet Inc.† | | | 32,211 | | | | 110,078 | |
| | 403 | | | Splunk Inc.† | | | 17,810 | | | | 48,727 | |
| | 279 | | | The Dun & Bradstreet Corp. | | | 29,377 | | | | 39,760 | |
| | | | | | | | | | | | |
| | | | | | | 180,356 | | | | 401,637 | |
| | | | | | | | | | | | |
| |
| | | | Technology Hardware and Equipment — 5.1% | |
| | 781 | | | Belden Inc. | | | 51,650 | | | | 55,771 | |
| | 1,015 | | | Ciena Corp.† | | | 22,341 | | | | 31,708 | |
| | 100 | | | Coherent Inc.† | | | 16,650 | | | | 17,219 | |
| | 4,783 | | | Diebold Nixdorf Inc. | | | 108,033 | | | | 21,523 | |
| | 356 | | | Sanmina Corp.† | | | 9,587 | | | | 9,826 | |
| | 809 | | | Versum Materials Inc. | | | 25,055 | | | | 29,132 | |
| | | | | | | | | | | | |
| | | | | | | 233,316 | | | | 165,179 | |
| | | | | | | | | | | | |
| | | |
| | | | TOTAL INFORMATION TECHNOLOGY | | | 439,348 | | | | 591,468 | |
| | | | | | | | | | | | |
| | | | CONSUMER DISCRETIONARY — 15.7% | |
| | | | Consumer Durables — 2.4% | | | | | | | | |
| | 170 | | | Thor Industries Inc. | | | 16,329 | | | | 14,229 | |
| | 1,893 | | | Toll Brothers Inc. | | | 64,169 | | | | 62,526 | |
| | | | | | | | | | | | |
| | | | | | | 80,498 | | | | 76,755 | |
| | | | | | | | | | | | |
| | | |
| | | | Consumer Products — 0.3% | | | | | | | | |
| | 483 | | | Newell Brands Inc. | | | 12,558 | | | | 9,805 | |
| | | | | | | | | | | | |
| | | |
| | | | Consumer Services — 2.2% | | | | | | | | |
| | 1,219 | | | Norwegian Cruise Line Holdings Ltd.† | | | 43,957 | | | | 70,007 | |
| | | | | | | | | | | | |
| | | |
| | | | Media — 5.2% | | | | | | | | |
| | 596 | | | Liberty Broadband Corp., Cl. C† | | | 31,512 | | | | 50,243 | |
| | 1,497 | | | Manchester United plc, Cl. A | | | 22,859 | | | | 33,683 | |
| | 8,939 | | | Pandora Media Inc.† | | | 61,865 | | | | 85,010 | |
| | | | | | | | | | | | |
| | | | | | | 116,236 | | | | 168,936 | |
| | | | | | | | | | | | |
| | | | | | | | | | | | |
Shares | | | | | Cost | | | Market
Value | |
| | | | Retailing — 5.6% | | | | | |
| | 627 | | | Dick’s Sporting Goods Inc. | | $ | 17,633 | | | $ | 22,246 | |
| | 1,828 | | | Ethan Allen Interiors Inc. | | | 44,594 | | | | 37,931 | |
| | 1,562 | | | Hanesbrands Inc. | | | 30,961 | | | | 28,788 | |
| | 717 | | | Nordstrom Inc. | | | 30,488 | | | | 42,884 | |
| | 371 | | | Ralph Lauren Corp. | | | 27,172 | | | | 51,031 | |
| | | | | | | | | | | | |
| | | | | | | 150,848 | | | | 182,880 | |
| | | | | | | | | | | | |
| | | | TOTAL CONSUMER DISCRETIONARY | | | 404,097 | | | | 508,383 | |
| | | | | | | | | | | | |
| | | | INDUSTRIALS — 14.7% | | | | | |
| | | | Capital Goods — 10.7% | | | | | |
| | 141 | | | Cummins Inc. | | | 13,048 | | | | 20,596 | |
| | 330 | | | EnerSys | | | 18,698 | | | | 28,753 | |
| | 125 | | | Esterline Technologies Corp.† | | | 9,278 | | | | 11,369 | |
| | 710 | | | Flowserve Corp. | | | 31,312 | | | | 38,830 | |
| | 1,203 | | | Fortune Brands Home & Security Inc. | | | 51,730 | | | | 62,989 | |
| | 552 | | | Hexcel Corp. | | | 24,413 | | | | 37,012 | |
| | 2,326 | | | Quanta Services Inc.† | | | 67,530 | | | | 77,642 | |
| | 2,231 | | | Rexnord Corp.† | | | 43,372 | | | | 68,715 | |
| | | | | | | | | | | | |
| | | | | | | 259,381 | | | | 345,906 | |
| | | | | | | | | | | | |
| | |
| | | | Commercial and Professional Services — 3.1% | | | | | |
| | 410 | | | Bright Horizons Family Solutions Inc.† | | | 17,539 | | | | 48,314 | |
| | 503 | | | IHS Markit Ltd.† | | | 16,488 | | | | 27,142 | |
| | 1,280 | | | Steelcase Inc., Cl. A | | | 17,718 | | | | 23,680 | |
| | | | | | | | | | | | |
| | | | | | | 51,745 | | | | 99,136 | |
| | | | | | | | | | | | |
| | | |
| | | | Machinery — 0.9% | | | | | | | | |
| | 165 | | | Snap-on Inc. | | | 24,417 | | | | 30,294 | |
| | | | | | | | | | | | |
| | | |
| | | | TOTAL INDUSTRIALS | | | 335,543 | | | | 475,336 | |
| | | | | | | | | | | | |
| | | | ENERGY — 13.2% | | | | | | | | |
| | | | Energy — 13.2% | | | | | | | | |
| | 1,500 | | | Baker Hughes, a GE Company | | | 46,819 | | | | 50,745 | |
| | 2,316 | | | C&J Energy Services Inc.† | | | 73,443 | | | | 48,173 | |
| | 2,694 | | | Centennial Resource Development Inc., Cl. A† | | | 44,730 | | | | 58,864 | |
| | 636 | | | Cimarex Energy Co. | | | 57,860 | | | | 59,110 | |
| | 1,203 | | | Fortis Inc. | | | 36,713 | | | | 39,001 | |
| | 2,679 | | | Patterson-UTI Energy Inc. | | | 55,324 | | | | 45,838 | |
| | 410 | | | Pioneer Natural Resources Co. | | | 60,651 | | | | 71,418 | |
| | 1,173 | | | Range Resources Corp. | | | 21,572 | | | | 19,929 | |
| | 1,105 | | | RPC Inc. | | | 22,736 | | | | 17,105 | |
| | 883 | | | WPX Energy Inc.† | | | 16,448 | | | | 17,766 | |
| | | | | | | | | | | | |
| | | |
| | | | TOTAL ENERGY | | | 436,296 | | | | 427,949 | |
| | | | | | | | | | | | |
| | | | HEALTH CARE — 8.2% | | | | | |
| | | | Health Care Equipment and Services — 6.4% | | | | | |
| | 199 | | | Insulet Corp.† | | | 5,949 | | | | 21,084 | |
| | 538 | | | Laboratory Corp. of America Holdings† | | | 63,484 | | | | 93,440 | |
| | 1,181 | | | Patterson Cos., Inc. | | | 49,582 | | | | 28,875 | |
| | 508 | | | Universal Health Services Inc., Cl. B | | | 49,852 | | | | 64,943 | |
| | | | | | | | | | | | |
| | | | | | | 168,867 | | | | 208,342 | |
| | | | | | | | | | | | |
| | | | Pharmaceuticals, Biotechnology, and Life Sciences — 1.8% | |
| | 56 | | | Mettler-Toledo International Inc.† | | | 14,952 | | | | 34,103 | |
| | 119 | | | Vertex Pharmaceuticals Inc.† | | | 13,537 | | | | 22,936 | |
| | | | | | | | | | | | |
| | | | | | | 28,489 | | | | 57,039 | |
| | | | | | | | | | | | |
| | | |
| | | | TOTAL HEALTH CARE | | | 197,356 | | | | 265,381 | |
| | | | | | | | | | | | |
| | | | MATERIALS — 3.7% | | | | | | | | |
| | | | Materials — 3.1% | | | | | | | | |
| | 540 | | | Arconic Inc. | | | 9,898 | | | | 11,885 | |
See accompanying notes to financial statements.
30
TETON Westwood Mid-Cap Equity Fund
Schedule of Investments (Continued) — September 30, 2018
| | | | | | | | | | | | |
Shares | | | | | Cost | | | Market
Value | |
| | | | COMMON STOCKS (Continued) | | | | | |
| | | | MATERIALS (Continued) | | | | | | | | |
| | | | Materials (Continued) | | | | | | | | |
| | 558 | | | Ecolab Inc. | | $ | 59,037 | | | $ | 87,483 | |
| | | | | | | | | | | | |
| | | | | | | 68,935 | | | | 99,368 | |
| | | | | | | | | | | | |
| |
| | | | Specialty Chemicals — 0.6% | |
| | 885 | | | Ferro Corp.† | | | 15,272 | | | | 20,550 | |
| | | | | | | | | | | | |
| | | |
| | | | TOTAL MATERIALS | | | 84,207 | | | | 119,918 | |
| | | | | | | | | | | | |
| | | | | | | | | | | | |
Shares | | | | | Cost | | | Market
Value | |
| | | | CONSUMER STAPLES — 3.1% | | | | | |
| | | | Food and Beverage — 3.1% | | | | | | | | |
| | 1,486 | | | Coca-Cola European Partners plc | | $ | 56,094 | | | $ | 67,568 | |
| | 475 | | | Fresh Del Monte Produce Inc. | | | 23,090 | | | | 16,098 | |
| | 586 | | | The Hain Celestial Group Inc.† | | | 21,862 | | | | 15,892 | |
| | | | | | | | | | | | |
| | | |
| | | | TOTAL CONSUMER STAPLES | | | 101,046 | | | | 99,558 | |
| | | | | | | | | | | | |
| | | | TOTAL COMMON STOCKS | | | 2,509,727 | | | | 3,191,512 | |
| | | | | | | | | | | | |
| | | |
| | | | TOTAL INVESTMENTS — 98.5% | | $ | 2,509,727 | | | | 3,191,512 | |
| | | | | | | | | | | | |
| | |
| | | | Other Assets and Liabilities (Net) — 1.5% | | | | 47,902 | |
| | | | | | | | | | | | |
| | | |
| | | | NET ASSETS — 100.0% | | | | | | $ | 3,239,414 | |
| | | | | | | | | | | | |
| † | Non-income producing security. |
| REIT | Real Estate Investment Trust |
See accompanying notes to financial statements.
31
TETON Convertible Securities Fund
Schedule of Investments — September 30, 2018
| | | | | | | | | | | | |
Shares | | | | | Cost | | | Market
Value | |
| | | | COMMON STOCKS — 0.7% | | | | | |
| | | | Computer Software and Services — 0.7% | | | | | | | | |
| | 1,911 | | | Proofpoint Inc.† | | $ | 160,772 | | | $ | 203,197 | |
| | | | | | | | | | | | |
| | | |
Principal
Amount | | | | | | | | | |
| | | | CONVERTIBLE CORPORATE BONDS — 70.7% | | | | | |
| | | | Aerospace and Defense — 1.2% | | | | | | | | |
| $ | 250,000 | | | Aerojet Rocketdyne Holdings Inc.,
2.250%, 12/15/23 | | | 254,129 | | | | 357,449 | |
| | | | | | | | | | | | |
| | |
| | | | Aviation: Parts and Services — 2.0% | | | | | |
| | 500,000 | | | Kaman Corp.,
3.250%, 05/01/24 | | | 536,035 | | | | 588,388 | |
| | | | | | | | | | | | |
| | | |
| | | | Business Services — 5.3% | | | | | | | | |
| | 509,000 | | | Bristow Group Inc.,
4.500%, 06/01/23 | | | 546,414 | | | | 513,835 | |
| | 250,000 | | | Q2 Holdings Inc.,
0.750%, 02/15/23(a) | | | 282,760 | | | | 296,081 | |
| | 310,000 | | | RingCentral Inc.,
Zero Coupon, 03/15/23(a) | | | 323,747 | | | | 390,265 | |
| | 292,000 | | | Team Inc.,
5.000%, 08/01/23 | | | 291,353 | | | | 368,650 | |
| | | | | | | | | | | | |
| | | | | | | 1,444,274 | | | | 1,568,831 | |
| | | | | | | | | | | | |
| | | |
| | | | Cable and Satellite — 2.0% | | | | | | | | |
| | 600,000 | | | DISH Network Corp.,
3.375%, 08/15/26 | | | 623,209 | | | | 573,760 | |
| | | | | | | | | | | | |
| | |
| | | | Communications Equipment — 3.5% | | | | | |
| | 350,000 | | | InterDigital Inc.,
1.500%, 03/01/20 | | | 388,120 | | | | 411,304 | |
| | 512,000 | | | Lumentum Holdings Inc.,
0.250%, 03/15/24 | | | 578,753 | | | | 615,438 | |
| | | | | | | | | | | | |
| | | | | | | 966,873 | | | | 1,026,742 | |
| | | | | | | | | | | | |
| | |
| | | | Computer Software and Services — 17.9% | | | | | |
| | 418,000 | | | Apptio Inc.,
0.875%, 04/01/23(a) | | | 424,990 | | | | 471,136 | |
| | 250,000 | | | Coupa Software Inc.,
0.375%, 01/15/23(a) | | | 309,845 | | | | 456,772 | |
| | 550,000 | | | CSG Systems International Inc.,
4.250%, 03/15/36 | | | 577,692 | | | | 579,340 | |
| | 38,000 | | | DocuSign Inc.,
0.500%, 09/15/23(a) | | | 38,000 | | | | 37,943 | |
| | 223,000 | | | GDS Holdings Ltd.,
2.000%, 06/01/25(a) | | | 203,057 | | | | 206,019 | |
| | 295,000 | | | IAC FinanceCo. Inc.,
0.875%, 10/01/22(a) | | | 337,119 | | | | 439,187 | |
| | 377,000 | | | MercadoLibre Inc.,
2.000%, 08/15/28(a) | | | 375,292 | | | | 372,658 | |
| | 337,000 | | | New Relic Inc.,
0.500%, 05/01/23(a) | | | 355,042 | | | | 360,022 | |
| | 305,000 | | | Nice Systems Inc.,
1.250%, 01/15/24 | | | 322,715 | | | | 437,484 | |
| | 176,000 | | | Okta Inc.,
0.250%, 02/15/23(a) | | | 183,790 | | | | 272,836 | |
| | 350,000 | | | Perficient Inc.,
2.375%, 09/15/23(a) | | | 350,000 | | | | 332,150 | |
| | 500,000 | | | PROS Holdings Inc.,
2.000%, 06/01/47 | | | 467,000 | | | | 491,135 | |
| | | | | | | | | | | | |
Principal
Amount | | | | | Cost | | | Market
Value | |
| $ | 104,000 | | | Pure Storage Inc.,
0.125%, 04/15/23(a) | | $ | 104,000 | | | $ | 120,729 | |
| | 191,000 | | | Splunk Inc.,
1.125%, 09/15/25(a) | | | 191,000 | | | | 197,659 | |
| | 362,000 | | | Vocera Communications Inc.,
1.500%, 05/15/23(a) | | | 412,075 | | | | 457,120 | |
| | | | | | | | | | | | |
| | | | | | | 4,651,617 | | | | 5,232,190 | |
| | | | | | | | | | | | |
| | | |
| | | | Consumer Services — 2.4% | | | | | | | | |
| | 300,000 | | | Extra Space Storage LP,
3.125%, 10/01/35(a) | | | 313,444 | | | | 318,279 | |
| | 350,000 | | | Quotient Technology Inc.,
1.750%, 12/01/22(a) | | | 363,899 | | | | 390,035 | |
| | | | | | | | | | | | |
| | | | | | | 677,343 | | | | 708,314 | |
| | | | | | | | | | | | |
| | | |
| | | | Diversified Industrial — 1.5% | | | | | | | | |
| | 300,000 | | | Chart Industries Inc.,
1.000%, 11/15/24(a) | | | 377,175 | | | | 428,265 | |
| | | | | | | | | | | | |
| | |
| | | | Energy and Utilities: Integrated — 1.4% | | | | | |
| | 500,000 | | | SunPower Corp.,
4.000%, 01/15/23 | | | 418,125 | | | | 420,843 | |
| | | | | | | | | | | | |
| | |
| | | | Energy and Utilities: Services — 1.6% | | | | | |
| | 600,000 | | | Cheniere Energy Inc.,
4.250%, 03/15/45 | | | 426,535 | | | | 484,274 | |
| | | | | | | | | | | | |
| | | |
| | | | Entertainment — 1.8% | | | | | | | | |
| | 500,000 | | | Gannett Co. Inc.,
4.750%, 04/15/24(a) | | | 541,810 | | | | 523,973 | |
| | | | | | | | | | | | |
| | | |
| | | | Financial Services — 1.9% | | | | | | | | |
| | 300,000 | | | Encore Capital Europe Finance Ltd.,
4.500%, 09/01/23 | | | 318,164 | | | | 307,673 | |
| | 199,000 | | | LendingTree Inc.,
0.625%, 06/01/22 | | | 228,267 | | | | 253,309 | |
| | | | | | | | | | | | |
| | | | | | | 546,431 | | | | 560,982 | |
| | | | | | | | | | | | |
| | | |
| | | | Health Care — 13.8% | | | | | | | | |
| | 300,000 | | | BioMarin Pharmaceutical Inc.,
0.599%, 08/01/24 | | | 308,165 | | | | 320,476 | |
| | 400,000 | | | Exact Sciences Corp.,
1.000%, 01/15/25 | | | 409,789 | | | | 495,250 | |
| | 404,000 | | | Insulet Corp.,
1.375%, 11/15/24(a) | | | 455,401 | | | | 511,769 | |
| | 300,000 | | | Intercept Pharmaceuticals Inc.,
3.250%, 07/01/23 | | | 296,881 | | | | 304,687 | |
| | 200,000 | | | Invacare Corp.,
4.500%, 06/01/22 | | | 216,734 | | | | 226,637 | |
| | 237,000 | | | Neurocrine Biosciences Inc.,
2.250%, 05/15/24 | | | 245,425 | | | | 404,578 | |
| | 200,000 | | | Pacira Pharmaceuticals Inc.,
2.375%, 04/01/22 | | | 206,004 | | | | 211,999 | |
| | 300,000 | | | Paratek Pharmaceuticals Inc.,
4.750%, 05/01/24(a) | | | 299,421 | | | | 284,625 | |
| | 150,000 | | | Retrophin Inc.,
2.500%, 09/15/25 | | | 154,134 | | | | 154,409 | |
| | 450,000 | | | Supernus Pharmaceuticals Inc., 0.625%, 04/01/23(a) | | | 483,431 | | | | 505,447 | |
| | 300,000 | | | Teladoc Health Inc.,
3.000%, 12/15/22 | | | 311,233 | | | | 613,783 | |
| | | | | | | | | | | | |
| | | | | | | 3,386,618 | | | | 4,033,660 | |
| | | | | | | | | | | | |
See accompanying notes to financial statements.
32
TETON Convertible Securities Fund
Schedule of Investments (Continued) — September 30, 2018
| | | | | | | | | | | | |
Principal
Amount | | | | | Cost | | | Market
Value | |
| | | | CONVERTIBLE CORPORATE BONDS (Continued) | |
| | | | Semiconductors — 10.5% | | | | | | | | |
| $ | 250,000 | | | Cypress Semiconductor Corp.,
4.500%, 01/15/22 | | $ | 283,719 | | | $ | 314,793 | |
| | 500,000 | | | Inphi Corp.,
1.125%, 12/01/20 | | | 553,060 | | | | 578,611 | |
| | 300,000 | | | Knowles Corp.,
3.250%, 11/01/21 | | | 324,209 | | | | 343,200 | |
| | 300,000 | | | Microchip Technology Inc.,
1.625%, 02/15/27 | | | 319,149 | | | | 320,467 | |
| | 400,000 | | | NXP Semiconductors NV,
1.000%, 12/01/19 | | | 442,028 | | | | 417,492 | |
| | 508,000 | | | Rambus Inc.,
1.375%, 02/01/23(a) | | | 501,153 | | | | 458,179 | |
| | 211,000 | | | Silicon Laboratories Inc.,
1.375%, 03/01/22 | | | 219,118 | | | | 241,629 | |
| | 300,000 | | | Teradyne Inc.,
1.250%, 12/15/23 | | | 374,978 | | | | 390,436 | |
| | | | | | | | | | | | |
| | | | | | | 3,017,414 | | | | 3,064,807 | |
| | | | | | | | | | | | |
| | | |
| | | | Telecommunications — 2.9% | | | | | | | | |
| | 400,000 | | | Infinera Corp.,
2.125%, 09/01/24 | | | 399,628 | | | | 405,764 | |
| | 331,000 | | | Twilio Inc.,
0.250%, 06/01/23(a) | | | 331,738 | | | | 446,637 | |
| | | | | | | | | | | | |
| | | | | | | 731,366 | | | | 852,401 | |
| | | | | | | | | | | | |
| | | |
| | | | Transportation — 1.0% | | | | | | | | |
| | 250,000 | | | Atlas Air Worldwide Holdings Inc.,
2.250%, 06/01/22 | | | 248,263 | | | | 289,493 | |
| | | | | | | | | | | | |
| | | |
| | | | TOTAL CONVERTIBLE CORPORATE BONDS | | | 18,847,217 | | | | 20,714,372 | |
| | | | | | | | | | | | |
| | | |
Shares | | | | | | | | | |
| |
| | | | CONVERTIBLE PREFERRED STOCKS — 4.7% | |
| | | | Agriculture — 0.4% | | | | | | | | |
| | 1,000 | | | Bunge Ltd. 4.875% | | | 94,950 | | | | 108,500 | |
| | | | | | | | | | | | |
| | |
| | | | Financial Services — 1.8% | | | | | |
| | 300 | | | Bank of America Corp. 7.250% . | | | 385,753 | | | | 388,275 | |
| | 117 | | | Wells Fargo & Co. 7.500% | | | 149,190 | | | | 151,033 | |
| | | | | | | | | | | | |
| | | | | | | 534,943 | | | | 539,308 | |
| | | | | | | | | | | | |
| | |
| | | | Food and Beverage — 1.3% | | | | | |
| | 2,000 | | | Post Holdings Inc. 2.500% | | | 301,617 | | | | 363,667 | |
| | | | | | �� | | | | | | |
| | |
| | | | Real Estate Investment Trusts — 1.2% | | | | | |
| | 6,000 | | | Welltower Inc. 6.500%, Ser. I | | | 371,329 | | | | 363,120 | |
| | | | | | | | | | | | |
| | | |
| | | | TOTAL CONVERTIBLE PREFERRED STOCKS | | | 1,302,839 | | | | 1,374,595 | |
| | | | | | | | | | | | |
| |
| | | | MANDATORY CONVERTIBLE SECURITIES (b) — 15.2% | |
| | | | Building and Construction — 1.1% | | | | | |
| | 3,007 | | | Stanley Black & Decker Inc.,
5.375%, 05/15/20 | | | 314,251 | | | | 329,597 | |
| | | | | | | | | | | | |
| | |
| | | | Computer Software and Services — 1.0% | | | | | |
| | 1,500 | | | Alibaba - Mandatory Exchange Trust, 5.750%, 06/01/19 (a) | | | 192,859 | | | | 278,063 | |
| | | | | | | | | | | | |
| | |
| | | | Energy and Utilities: Integrated — 2.6% | | | | | |
| | 1,200 | | | CenterPoint Energy Inc.,
7.000%, 09/01/21 | | | 60,000 | | | | 60,588 | |
| | | | | | | | | | | | |
Shares | | | | | Cost | | | Market
Value | |
| | 5,000 | | | DTE Energy Co., 6.500%, 10/01/19 | | $ | 266,172 | | | $ | 258,600 | |
| | 3,535 | | | Sempra Energy,
6.000%, 01/15/21 | | | 360,105 | | | | 356,469 | |
| | 970 | | | 6.750%, 07/15/21 | | | 98,732 | | | | 97,771 | |
| | | | | | | | | | | | |
| | | | | | | 785,009 | | | | 773,428 | |
| | | | | | | | | | | | |
| | |
| | | | Energy and Utilities: Services — 1.9% | | | | | |
| | 9,705 | | | South Jersey Industries Inc.,
7.250%, 04/15/21 | | | 524,098 | | | | 541,636 | |
| | | | | | | | | | | | |
| | |
| | | | Financial Services — 2.0% | | | | | |
| | 2,538 | | | Assurant Inc., 6.500%,
03/15/21 | | | 260,201 | | | | 285,677 | |
| | 6,000 | | | New York Community Capital
Trust V, 6.000%, 11/01/51 | | | 300,700 | | | | 295,500 | |
| | | | | | | | | | | | |
| | | | | | | 560,901 | | | | 581,177 | |
| | | | | | | | | | | | |
| | |
| | | | Health Care — 1.2% | | | | | |
| | 5,494 | | | Becton Dickinson and Co.,
6.125%, 05/01/20 | | | 293,412 | | | | 359,088 | |
| | | | | | | | | | | | |
| | |
| | | | Industrials — 2.1% | | | | | |
| | 5,032 | | | International Flavors & Fragrances Inc., 6.000%, 09/15/21 | | | 260,406 | | | | 289,340 | |
| | 5,200 | | | Rexnord Corp., 5.750%, 11/15/19 | | | 267,069 | | | | 338,000 | |
| | | | | | | | | | | | |
| | | | | | | 527,475 | | | | 627,340 | |
| | | | | | | | | | | | |
| | |
| | | | Real Estate Investment Trusts — 3.3% | | | | | |
| | 504 | | | Crown Castle International Corp.,
6.875%, 08/01/20 | | | 538,469 | | | | 547,344 | |
| | 4,000 | | | QTS Realty Trust Inc.,
Ser. B 6.500%, (c) | | | 403,598 | | | | 422,440 | |
| | | | | | | | | | | | |
| | | | | | | 942,067 | | | | 969,784 | |
| | | | | | | | | | | | |
| | | | TOTAL MANDATORY CONVERTIBLE SECURITIES | | | 4,140,072 | | | | 4,460,113 | |
| | | | | | | | | | | | |
| | | |
Principal
Amount | | | | | | | | | |
| |
| | | | U.S. GOVERNMENT OBLIGATIONS — 7.9% | |
| $ | 2,310,000 | | | U.S. Treasury Bills,
1.937% to 2.142%††,
10/18/18 to 12/20/18 | | | 2,301,008 | | | | 2,300,924 | |
| | | | | | | | | | | | |
| | | |
| | | | TOTAL INVESTMENTS — 99.2% | | $ | 26,751,908 | | | | 29,053,201 | |
| | | | | | | | | | | | |
| | | | Other Assets and Liabilities (Net) — 0.8% | | | | 237,875 | |
| | | | | | | | | | | | |
| | | | NET ASSETS — 100.0% | | | | | | $ | 29,291,076 | |
| | | | | | | | | | | | |
| (a) | Security exempt from registration under Rule 144A of the Securities Act of 1933, as amended. This security may be resold in transactions exempt from registration, normally to qualified institutional buyers. At September 30, 2018, the market value of the Rule 144A security amounted to $8,555,849 or 29.21% of net assets. |
| (b) | Mandatory convertible securities are required to be converted on the dates listed; they generally may be converted prior to these dates at the option of the holder. |
| (c) | Security is perpetual and has no stated maturity date. |
| † | Non-income producing security. |
| †† | Represents annualized yields at dates of purchase. |
See accompanying notes to financial statements.
33
TETON Westwood Equity Fund
Schedule of Investments — September 30, 2018
| | | | | | | | | | | | |
Shares | | | | | Cost | | | Market
Value | |
| | |
| | | | COMMON STOCKS — 98.9% | | | | | |
| | | | Aerospace — 6.0% | | | | | | | | |
| | 6,095 | | | General Dynamics Corp. | | $ | 923,606 | | | $ | 1,247,768 | |
| | 3,774 | | | Northrop Grumman Corp. | | | 1,208,775 | | | | 1,197,754 | |
| | 3,250 | | | The Boeing Co. | | | 394,976 | | | | 1,208,675 | |
| | | | | | | | | | | | |
| | | |
| | | | | | | 2,527,357 | | | | 3,654,197 | |
| | | | | | | | | | | | |
| | | |
| | | | Banking — 10.4% | | | | | | | | |
| | 67,830 | | | Bank of America Corp. | | | 1,204,830 | | | | 1,998,272 | |
| | 18,479 | | | JPMorgan Chase & Co. | | | 1,096,196 | | | | 2,085,170 | |
| | 20,625 | | | Wells Fargo & Co. | | | 998,372 | | | | 1,084,050 | |
| | 20,930 | | | Western Alliance Bancorp† | | | 1,096,273 | | | | 1,190,708 | |
| | | | | | | | | | | | |
| | | |
| | | | | | | 4,395,671 | | | | 6,358,200 | |
| | | | | | | | | | | | |
| | | |
| | | | Business Services — 3.0% | | | | | | | | |
| | 13,004 | | | Booz Allen Hamilton Holding Corp. | | | 375,869 | | | | 645,388 | |
| | 4,905 | | | FedEx Corp. | | | 753,772 | | | | 1,181,075 | |
| | | | | | | | | | | | |
| | | |
| | | | | | | 1,129,641 | | | | 1,826,463 | |
| | | | | | | | | | | | |
| | |
| | | | Computer Software and Services — 8.9% | | | | | |
| | 1,273 | | | Alphabet Inc., Cl. A† | | | 1,065,838 | | | | 1,536,613 | |
| | 5,895 | | | Apple Inc. | | | 1,182,400 | | | | 1,330,737 | |
| | 11,330 | | | Microsoft Corp. | | | 842,381 | | | | 1,295,812 | |
| | 25,600 | | | Oracle Corp. | | | 1,067,983 | | | | 1,319,936 | |
| | | | | | | | | | | | |
| | | |
| | | | | | | 4,158,602 | | | | 5,483,098 | |
| | | | | | | | | | | | |
| | | |
| | | | Consumer Products — 2.0% | | | | | | | | |
| | 17,950 | | | Colgate-Palmolive Co. | | | 1,041,593 | | | | 1,201,753 | |
| | | | | | | | | | | | |
| | | |
| | | | Diversified Industrial — 3.1% | | | | | | | | |
| | 11,490 | | | Honeywell International Inc. | | | 1,329,002 | | | | 1,911,936 | |
| | | | | | | | | | | | |
| | |
| | | | Energy and Energy Services — 3.7% | | | | | |
| | 12,850 | | | EOG Resources Inc. | | | 1,180,705 | | | | 1,639,275 | |
| | 14,990 | | | Halliburton Co. | | | 869,745 | | | | 607,545 | |
| | | | | | | | | | | | |
| | | |
| | | | | | | 2,050,450 | | | | 2,246,820 | |
| | | | | | | | | | | | |
| | | |
| | | | Energy: Integrated — 8.0% | | | | | | | | |
| | 24,665 | | | CMS Energy Corp. | | | 1,115,577 | | | | 1,208,585 | |
| | 9,135 | | | Diamondback Energy Inc. | | | 1,105,881 | | | | 1,234,961 | |
| | 7,285 | | | NextEra Energy Inc. | | | 578,979 | | | | 1,220,966 | |
| | 18,700 | | | WEC Energy Group Inc. | | | 889,554 | | | | 1,248,412 | |
| | | | | | | | | | | | |
| | | |
| | | | | | | 3,689,991 | | | | 4,912,924 | |
| | | | | | | | | | | | |
| | | |
| | | | Energy: Oil — 1.9% | | | | | | | | |
| | 9,295 | | | Chevron Corp. | | | 873,560 | | | | 1,136,593 | |
| | | | | | | | | | | | |
| | | |
| | | | Entertainment — 2.0% | | | | | | | | |
| | 10,730 | | | The Walt Disney Co. | | | 1,198,278 | | | | 1,254,766 | |
| | | | | | | | | | | | |
| | | |
| | | | Financial Services — 9.6% | | | | | | | | |
| | 17,510 | | | Arthur J Gallagher & Co. | | | 1,155,660 | | | | 1,303,444 | |
| | 8,600 | | | Chubb Ltd. | | | 936,465 | | | | 1,149,304 | |
| | 16,830 | | | Intercontinental Exchange Inc. | | | 883,960 | | | | 1,260,399 | |
| | 20,940 | | | Morgan Stanley | | | 1,178,698 | | | | 975,176 | |
| | 23,175 | | | U.S. Bancorp | | | 1,284,200 | | | | 1,223,872 | |
| | | | | | | | | | | | |
| | | |
| | | | | | | 5,438,983 | | | | 5,912,195 | |
| | | | | | | | | | | | |
| | | | | | | | | | | | |
Shares | | | | | Cost | | | Market
Value | |
| | | |
| | | | Food and Beverage — 5.8% | | | | | | | | |
| | 28,065 | | | General Mills Inc. | | $ | 1,345,840 | | | $ | 1,204,550 | |
| | 29,410 | | | Hormel Foods Corp. | | | 1,045,264 | | | | 1,158,754 | |
| | 10,750 | | | PepsiCo Inc. | | | 889,171 | | | | 1,201,850 | |
| | | | | | | | | | | | |
| | | |
| | | | | | | 3,280,275 | | | | 3,565,154 | |
| | | | | | | | | | | | |
| | | |
| | | | Health Care — 13.5% | | | | | | | | |
| | 24,890 | | | Abbott Laboratories | | | 1,004,250 | | | | 1,825,930 | |
| | 5,900 | | | Becton, Dickinson and Co. | | | 969,118 | | | | 1,539,900 | |
| | 13,105 | | | Johnson & Johnson | | | 1,366,551 | | | | 1,810,718 | |
| | 17,665 | | | Medtronic plc | | | 1,487,941 | | | | 1,737,706 | |
| | 5,083 | | | UnitedHealth Group Inc. | | | 1,189,480 | | | | 1,352,281 | |
| | | | | | | | | | | | |
| | | |
| | | | | | | 6,017,340 | | | | 8,266,535 | |
| | | | | | | | | | | | |
| | | |
| | | | Real Estate — 2.9% | | | | | | | | |
| | 10,850 | | | Crown Castle International Corp., REIT | | | 1,230,905 | | | | 1,207,931 | |
| | 2,870 | | | Public Storage, REIT | | | 659,248 | | | | 578,678 | |
| | | | | | | | | | | | |
| | | |
| | | | | | | 1,890,153 | | | | 1,786,609 | |
| | | | | | | | | | | | |
| | | |
| | | | Retail — 7.2% | | | | | | | | |
| | 23,290 | | | CVS Health Corp. | | | 1,927,199 | | | | 1,833,389 | |
| | 6,730 | | | Simon Property Group Inc., REIT | | | 1,285,251 | | | | 1,189,527 | |
| | 6,780 | | | The Home Depot Inc. | | | 805,567 | | | | 1,404,477 | |
| | | | | | | | | | | | |
| | | |
| | | | | | | 4,018,017 | | | | 4,427,393 | |
| | | | | | | | | | | | |
| | | |
| | | | Semiconductors — 0.8% | | | | | | | | |
| | 3,325 | | | Lam Research Corp. | | | 327,339 | | | | 504,403 | |
| | | | | | | | | | | | |
| | | |
| | | | Specialty Chemicals — 2.0% | | | | | | | | |
| | 2,765 | | | The Sherwin-Williams Co. | | | 762,181 | | | | 1,258,656 | |
| | | | | | | | | | | | |
| | | |
| | | | Telecommunications — 5.6% | | | | | | | | |
| | 64,250 | | | AT&T Inc. | | | 2,529,330 | | | | 2,157,515 | |
| | 9,889 | | | Motorola Solutions Inc. | | | 861,825 | | | | 1,286,954 | |
| | | | | | | | | | | | |
| | | |
| | | | | | | 3,391,155 | | | | 3,444,469 | |
| | | | | | | | | | | | |
| | | |
| | | | Transportation — 2.5% | | | | | | | | |
| | 9,485 | | | Union Pacific Corp. | | | 467,134 | | | | 1,544,442 | |
| | | | | | | | | | | | |
| | | |
| | | | TOTAL COMMON STOCKS | | | 47,986,722 | | | | 60,696,606 | |
| | | | | | | | | | | | |
| | |
| | | | SHORT TERM INVESTMENT — 1.2% | | | | | |
| | | | Other Investment Companies — 1.2% | | | | | |
| | 720,156 | | | Dreyfus Treasury Securities Cash Management, 1.910%* | | | 720,156 | | | | 720,156 | |
| | | | | | | | | | | | |
| | | |
| | | | TOTAL INVESTMENTS — 100.1% | | $ | 48,706,878 | | | | 61,416,762 | |
| | | | | | | | | | | | |
| | |
| | | | Other Assets and Liabilities (Net) — (0.1)% | | | | (67,748 | ) |
| | | | | | | | | | | | |
| | | |
| | | | NET ASSETS — 100.0% | | | | | | $ | 61,349,014 | |
| | | | | | | | | | | | |
| * | 1 day yield as of September 30, 2018. |
| † | Non-income producing security. |
| REIT | Real Estate Investment Trust |
See accompanying notes to financial statements.
34
TETON Westwood Balanced Fund
Schedule of Investments — September 30, 2018
| | | | | | | | | | | | |
Shares | | | | | Cost | | | Market
Value | |
| | | |
| | | | COMMON STOCKS — 66.8% | | | | | | | | |
| | | | Aerospace — 4.4% | | | | | | | | |
| | 5,225 | | | General Dynamics Corp. | | $ | 766,079 | | | $ | 1,069,662 | |
| | 2,550 | | | Northrop Grumman Corp. | | | 816,737 | | | | 809,293 | |
| | 2,310 | | | The Boeing Co. | | | 280,737 | | | | 859,089 | |
| | | | | | | | | | | | |
| | | | | | | 1,863,553 | | | | 2,738,044 | |
| | | | | | | | | | | | |
| | |
| | | | Banking — 6.9% | | | | | |
| | 46,410 | | | Bank of America Corp. | | | 555,089 | | | | 1,367,238 | |
| | 12,486 | | | JPMorgan Chase & Co. | | | 694,796 | | | | 1,408,920 | |
| | 13,930 | | | Wells Fargo & Co. | | | 672,694 | | | | 732,161 | |
| | 14,140 | | | Western Alliance Bancorp† | | | 740,234 | | | | 804,425 | |
| | | | | | | | | | | | |
| | | | | | | 2,662,813 | | | | 4,312,744 | |
| | | | | | | | | | | | |
| | |
| | | | Business Services — 2.1% | | | | | |
| | 8,900 | | | Booz Allen Hamilton Holding Corp. | | | 264,639 | | | | 441,707 | |
| | 3,625 | | | FedEx Corp. | | | 561,651 | | | | 872,864 | |
| | | | | | | | | | | | |
| | | | | | | 826,290 | | | | 1,314,571 | |
| | | | | | | | | | | | |
| | |
| | | | Computer Software and Services — 6.0% | | | | | |
| | 887 | | | Alphabet Inc., Cl. A† | | | 742,946 | | | | 1,070,680 | |
| | 4,005 | | | Apple Inc. | | | 803,299 | | | | 904,089 | |
| | 7,550 | | | Microsoft Corp. | | | 406,598 | | | | 863,493 | |
| | 17,300 | | | Oracle Corp. | | | 718,620 | | | | 891,988 | |
| | | | | | | | | | | | |
| | | | | | | 2,671,463 | | | | 3,730,250 | |
| | | | | | | | | | | | |
| | |
| | | | Consumer Products — 1.5% | | | | | |
| | 14,200 | | | Colgate-Palmolive Co. | | | 811,453 | | | | 950,690 | |
| | | | | | | | | | | | |
| | |
| | | | Diversified Industrial — 2.1% | | | | | |
| | 7,775 | | | Honeywell International Inc. | | | 853,831 | | | | 1,293,760 | |
| | | | | | | | | | | | |
| | |
| | | | Energy and Energy Services — 2.4% | | | | | |
| | 8,625 | | | EOG Resources Inc. | | | 780,619 | | | | 1,100,291 | |
| | 10,125 | | | Halliburton Co. | | | 587,444 | | | | 410,366 | |
| | | | | | | | | | | | |
| | | | | | | 1,368,063 | | | | 1,510,657 | |
| | | | | | | | | | | | |
| | |
| | | | Energy: Integrated — 5.3% | | | | | |
| | 16,845 | | | CMS Energy Corp. | | | 761,980 | | | | 825,405 | |
| | 6,115 | | | Diamondback Energy Inc. | | | 739,861 | | | | 826,687 | |
| | 4,950 | | | NextEra Energy Inc. | | | 422,717 | | | | 829,620 | |
| | 12,625 | | | WEC Energy Group Inc. | | | 604,621 | | | | 842,845 | |
| | | | | | | | | | | | |
| | | | | | | 2,529,179 | | | | 3,324,557 | |
| | | | | | | | | | | | |
| | |
| | | | Energy: Oil — 1.3% | | | | | |
| | 6,485 | | | Chevron Corp. | | | 551,862 | | | | 792,986 | |
| | | | | | | | | | | | |
| | |
| | | | Entertainment — 1.4% | | | | | |
| | 7,300 | | | The Walt Disney Co. | | | 815,271 | | | | 853,662 | |
| | | | | | | | | | | | |
| | |
| | | | Financial Services — 6.6% | | | | | |
| | 12,220 | | | Arthur J Gallagher & Co. | | | 806,334 | | | | 909,657 | |
| | 5,900 | | | Chubb Ltd. | | | 649,145 | | | | 788,476 | |
| | 11,800 | | | Intercontinental Exchange Inc. | | | 619,858 | | | | 883,702 | |
| | 14,385 | | | Morgan Stanley | | | 809,357 | | | | 669,909 | |
| | 15,775 | | | U.S. Bancorp | | | 874,155 | | | | 833,078 | |
| | | | | | | | | | | | |
| | | | | | | 3,758,849 | | | | 4,084,822 | |
| | | | | | | | | | | | |
| | |
| | | | Food and Beverage — 4.1% | | | | | |
| | 18,630 | | | General Mills Inc. | | | 879,626 | | | | 799,600 | |
| | 19,550 | | | Hormel Foods Corp. | | | 696,749 | | | | 770,270 | |
| | 9,000 | | | PepsiCo Inc. | | | 714,475 | | | | 1,006,200 | |
| | | | | | | | | | | | |
| | | | | | | 2,290,850 | | | | 2,576,070 | |
| | | | | | | | | | | | |
| | |
| | | | Health Care — 9.0% | | | | | |
| | 16,500 | | | Abbott Laboratories | | | 618,000 | | | | 1,210,440 | |
| | 3,955 | | | Becton, Dickinson and Co. | | | 660,729 | | | | 1,032,255 | |
| | 8,675 | | | Johnson & Johnson | | | 869,047 | | | | 1,198,625 | |
| | 12,300 | | | Medtronic plc | | | 1,035,185 | | | | 1,209,951 | |
| | 3,581 | | | UnitedHealth Group Inc. | | | 838,299 | | | | 952,689 | |
| | | | | | | | | | | | |
| | | | | | | 4,021,260 | | | | 5,603,960 | |
| | | | | | | | | | | | |
| | | | | | | | | | | | |
Shares | | | | | Cost | | | Market
Value | |
| | |
| | | | Real Estate — 1.9% | | | | | |
| | 7,300 | | | Crown Castle International Corp., REIT | | $ | 828,164 | | | $ | 812,709 | |
| | 1,925 | | | Public Storage, REIT | | | 444,992 | | | | 388,138 | |
| | | | | | | | | | | | |
| | | | | | | 1,273,156 | | | | 1,200,847 | |
| | | | | | | | | | | | |
| | |
| | | | Retail — 4.6% | | | | | |
| | 15,420 | | | CVS Health Corp. | | | 1,274,967 | | | | 1,213,862 | |
| | 4,545 | | | Simon Property Group Inc., REIT | | | 877,799 | | | | 803,329 | |
| | 4,165 | | | The Home Depot Inc. | | | 518,592 | | | | 862,780 | |
| | | | | | | | | | | | |
| | | | | | | 2,671,358 | | | | 2,879,971 | |
| | | | | | | | | | | | |
| | |
| | | | Semiconductors — 0.7% | | | | | |
| | 2,850 | | | Lam Research Corp. | | | 279,063 | | | | 432,345 | |
| | | | | | | | | | | | |
| | |
| | | | Specialty Chemicals — 1.3% | | | | | |
| | 1,790 | | | The Sherwin-Williams Co. | | | 501,366 | | | | 814,826 | |
| | | | | | | | | | | | |
| | |
| | | | Telecommunications — 3.8% | | | | | |
| | 45,095 | | | AT&T Inc. | | | 1,767,115 | | | | 1,514,290 | |
| | 6,363 | | | Motorola Solutions Inc. | | | 553,947 | | | | 828,081 | |
| | | | | | | | | | | | |
| | | | | | | 2,321,062 | | | | 2,342,371 | |
| | | | | | | | | | | | |
| | |
| | | | Transportation — 1.4% | | | | | |
| | 5,440 | | | Union Pacific Corp. | | | 306,053 | | | | 885,795 | |
| | | | | | | | | | | | |
| | | | TOTAL COMMON STOCKS | | | 32,376,795 | | | | 41,642,928 | |
| | | | | | | | | | | | |
| | | |
Principal
Amount | | | | | | | | | |
| | |
| | | | CORPORATE BONDS — 21.2% | | | | | |
| | | | Banking — 4.1% | | | | | | | | |
| $ | 600,000 | | | Citigroup Inc.,
2.500%, 07/29/19 | | | 603,648 | | | | 598,801 | |
| | 750,000 | | | JPMorgan Chase & Co.,
6.300%, 04/23/19 | | | 751,734 | | | | 764,912 | |
| | 600,000 | | | The Goldman Sachs Group Inc., MTN,
3.850%, 07/08/24 | | | 600,244 | | | | 596,977 | |
| | 600,000 | | | Wells Fargo & Co., MTN, 3.500%, 03/08/22 | | | 607,823 | | | | 599,424 | |
| | | | | | | | | | | | |
| | | | | | | 2,563,449 | | | | 2,560,114 | |
| | | | | | | | | | | | |
| | |
| | | | Computer Hardware — 1.0% | | | | | |
| | 650,000 | | | International Business Machines Corp., 2.900%, 11/01/21 | | | 654,207 | | | | 640,700 | |
| | | | | | | | | | | | |
| | |
| | | | Consumer Products — 2.0% | | | | | |
| | 500,000 | | | Colgate-Palmolive Co., MTN,
2.100%, 05/01/23 | | | 496,968 | | | | 474,416 | |
| | 800,000 | | | Costco Wholesale Corp., 1.700%, 12/15/19 | | | 797,659 | | | | 789,340 | |
| | | | | | | | | | | | |
| | | | | | | 1,294,627 | | | | 1,263,756 | |
| | | | | | | | | | | | |
| | |
| | | | Diversified Industrial — 1.3% | | | | | |
| | 800,000 | | | John Deere Capital Corp., MTN,
1.950%, 12/13/18 | | | 800,092 | | | | 799,201 | |
| | | | | | | | | | | | |
| | |
| | | | Electronics — 2.4% | | | | | |
| | 1,000,000 | | | Intel Corp., 3.300%, 10/01/21 | | | 1,013,879 | | | | 1,005,706 | |
| | 500,000 | | | Texas Instruments Inc., 1.650%, 08/03/19 | | | 499,763 | | | | 495,643 | |
| | | | | | | | | | | | |
| | | | | | | 1,513,642 | | | | 1,501,349 | |
| | | | | | | | | | | | |
See accompanying notes to financial statements.
35
TETON Westwood Balanced Fund
Schedule of Investments (Continued) — September 30, 2018
| | | | | | | | | | | | |
Principal
Amount | | | | | Cost | | | Market
Value | |
| |
| | | | CORPORATE BONDS (Continued) | |
| | | | Energy: Oil — 0.8% | | | | | | | | |
| $ | 500,000 | | | XTO Energy Inc.,
6.500%, 12/15/18 | | $ | 502,077 | | | $ | 504,382 | |
| | | | | | | | | | | | |
| | | |
| | | | Financial Services — 4.0% | | | | | | | | |
| | 600,000 | | | Capital One Financial Corp.,
3.750%, 04/24/24 | | | 607,035 | | | | 590,154 | |
| | 750,000 | | | Ford Motor Credit Co. LLC, MTN,
2.943%, 01/08/19 | | | 751,345 | | | | 750,790 | |
| | 600,000 | | | Morgan Stanley, GMTN,
3.700%, 10/23/24 | | | 600,483 | | | | 591,240 | |
| | 600,000 | | | The PNC Financial Services Group Inc., STEP, 2.854%, 11/09/22 | | | 593,974 | | | | 582,568 | |
| | | | | | | | | | | | |
| | | | | | | 2,552,837 | | | | 2,514,752 | |
| | | | | | | | | | | | |
| | | |
| | | | Health Care — 2.7% | | | | | | | | |
| | 500,000 | | | Abbott Laboratories,
2.550%, 03/15/22 | | | 495,925 | | | | 485,812 | |
| | 600,000 | | | Aetna Inc.,
3.500%, 11/15/24 | | | 600,735 | | | | 587,609 | |
| | 600,000 | | | Amgen Inc.,
3.450%, 10/01/20 | | | 608,681 | | | | 603,240 | |
| | | | | | | | | | | | |
| | | | | | | 1,705,341 | | | | 1,676,661 | |
| | | | | | | | | | | | |
| | | |
| | | | Retail — 1.9% | | | | | | | | |
| | 600,000 | | | CVS Health Corp.,
3.375%, 08/12/24 | | | 599,115 | | | | 580,208 | |
| | 600,000 | | | McDonalds Corp., MTN,
2.100%, 12/07/18 | | | 600,416 | | | | 599,644 | |
| | | | | | | | | | | | |
| | | | | | | 1,199,531 | | | | 1,179,852 | |
| | | | | | | | | | | | |
| | |
| | | | Telecommunications — 1.0% | | | | | |
| | 600,000 | | | AT&T Inc.,
2.300%, 03/11/19 | | | 600,633 | | | | 599,134 | |
| | | | | | | | | | | | |
| | | |
| | | | TOTAL CORPORATE BONDS | | | 13,386,436 | | | | 13,239,901 | |
| | | | | | | | | | | | |
| | | | | | | | | | | | |
Principal
Amount | | | | | Cost | | | Market
Value | |
| |
| | | | U.S. GOVERNMENT AGENCY OBLIGATIONS — 4.4% | |
| | | | Federal Home Loan Mortgage Corp. — 2.7% | |
| $ | 600,000 | | | 1.750%, 05/30/19 | | $ | 599,107 | | | $ | 597,042 | |
| | 1,100,000 | | | 2.375%, 01/13/22 | | | 1,105,337 | | | | 1,081,505 | |
| | | | | | | | | | | | |
| | | | | | | 1,704,444 | | | | 1,678,547 | |
| | | | | | | | | | | | |
| |
| | | | Federal National Mortgage Association — 1.7% | |
| | 1,100,000 | | | 2.625%, 09/06/24 | | | 1,131,802 | | | | 1,074,355 | |
| | | | | | | | | | | | |
| | | |
| | | | TOTAL U.S. GOVERNMENT AGENCY OBLIGATIONS | | | 2,836,246 | | | | 2,752,902 | |
| | | | | | | | | | | | |
| |
| | | | U.S. GOVERNMENT OBLIGATIONS — 6.3% | |
| | | | U.S. Treasury Notes — 6.3% | |
| | 1,000,000 | | | 2.250%, 11/15/24 | | | 1,025,490 | | | | 958,535 | |
| | 500,000 | | | 2.000%, 02/15/25 | | | 497,379 | | | | 471,006 | |
| | 800,000 | | | 1.625%, 02/15/26 | | | 802,847 | | | | 726,094 | |
| | 950,000 | | | 2.250%, 08/15/27 | | | 898,152 | | | | 891,052 | |
| | 950,000 | | | 2.250%, 11/15/27 | | | 896,709 | | | | 889,363 | |
| | | | | | | | | | | | |
| | | | | | | 4,120,577 | | | | 3,936,050 | |
| | | | | | | | | | | | |
| | | |
| | | | TOTAL U.S. GOVERNMENT OBLIGATIONS | | | 4,120,577 | | | | 3,936,050 | |
| | | | | | | | | | | | |
| | | |
Shares | | | | | | | | | |
| |
| | | | SHORT TERM INVESTMENT — 1.5% | |
| | | | Other Investment Companies — 1.5% | |
| | 922,301 | | | Dreyfus Treasury Securities Cash Management, 1.910%* | | | 922,301 | | | | 922,301 | |
| | | | | | | | | | | | |
| | | |
| | | | TOTAL INVESTMENTS — 100.2% | | $ | 53,642,355 | | | | 62,494,082 | |
| | | | | | | | | | | | |
| | |
| | | | Other Assets and Liabilities (Net) — (0.2)% | | | | (124,767 | ) |
| | | | | | | | | | | | |
| | | |
| | | | NET ASSETS — 100.0% | | | | | | $ | 62,369,315 | |
| | | | | | | | | | | | |
| * | 1 day yield as of September 30, 2018. |
| † | Non-income producing security. |
| GMTN | Global Medium Term Note |
| REIT | Real Estate Investment Trust |
| STEP | Step coupon security. The rate disclosed is that in effect at September 30, 2018. |
See accompanying notes to financial statements.
36
TETON Westwood Intermediate Bond Fund
Schedule of Investments — September 30, 2018
| | | | | | | | | | | | |
Principal
Amount | | | | | Cost | | | Market
Value | |
| | | | CORPORATE BONDS — 50.5% | | | | | |
| | | | Aerospace — 10.2% | | | | | | | | |
| $ | 125,000 | | | General Dynamics Corp.,
2.628%, (3 Month USD LIBOR plus 0.29%) 05/11/20(a) | | $ | 125,000 | | | $ | 125,380 | |
| | | | 2.718%, (3 Month USD LIBOR plus 0.38%) 05/11/21(a) | | | 125,000 | | | | 125,886 | |
| | 200,000 | | | The Boeing Co.,
6.000%, 03/15/19 | | | 200,325 | | | | 202,949 | |
| | 250,000 | | | United Technologies Corp.,
3.100%, 06/01/22 | | | 257,370 | | | | 246,536 | |
| | | | | | | | | | | | |
| | | | | | | 707,695 | | | | 700,751 | |
| | | | | | | | | | | | |
| | | |
| | | | Automotive — 3.7% | | | | | | | | |
| | 250,000 | | | General Motors Co.,
3.500%, 10/02/18 | | | 250,012 | | | | 250,000 | |
| | | | | | | | | | | | |
| | | |
| | | | Banking — 8.8% | | | | | | | | |
| | 200,000 | | | JPMorgan Chase & Co.,
6.300%, 04/23/19 | | | 199,903 | | | | 203,977 | |
| | 400,000 | | | The Bank of New York Mellon Corp., Ser. G,
2.200%, 05/15/19 | | | 400,173 | | | | 398,981 | |
| | | | | | | | | | | | |
| | | | | | | 600,076 | | | | 602,958 | |
| | | | | | | | | | | | |
| | | |
| | | | Energy — 7.5% | | | | | | | | |
| | 250,000 | | | Andeavor Logistics LP / Tesoro Logistics Finance Corp.,
6.250%, 10/15/22 | | | 258,152 | | | | 257,188 | |
| | 250,000 | | | MarkWest Energy Partners LP / MarkWest Energy Finance Corp.,
5.500%, 02/15/23 | | | 254,293 | | | | 254,885 | |
| | | | | | | | | | | | |
| | | | | | | 512,445 | | | | 512,073 | |
| | | | | | | | | | | | |
| | | |
| | | | Entertainment — 1.8% | | | | | | | | |
| | 125,000 | | | Discovery Communications LLC, 3.048%, (3 Month USD LIBOR
plus 0.71%) 09/20/19(a) | | | 125,478 | | | | 125,540 | |
| | | | | | | | | | | | |
| | | |
| | | | Financial Services — 4.8% | | | | | | | | |
| | 200,000 | | | Capital One Financial Corp.,
3.750%, 04/24/24 | | | 202,345 | | | | 196,718 | |
| | 125,000 | | | MPT Operating Partnership LP / MPT Finance Corp.,
6.375%, 03/01/24 | | | 132,229 | | | | 131,250 | |
| | | | | | | | | | | | |
| | | | | | | 334,574 | | | | 327,968 | |
| | | | | | | | | | | | |
| | | |
| | | | Food and Beverage — 3.8% | | | | | | | | |
| | 250,000 | | | Mondelēz International Inc.,
5.375%, 02/10/20 | | | 250,754 | | | | 256,883 | |
| | | | | | | | | | | | |
| | | |
| | | | Health Care — 1.8% | | | | | | | | |
| | 125,000 | | | Anthem Inc.,
2.500%, 11/21/20 | | | 124,840 | | | | 123,085 | |
| | | | | | | | | | | | |
| | | | | | | | | | | | |
Principal
Amount | | | | | Cost | | | Market
Value | |
| | | |
| | | | Retail — 1.6% | | | | | | | | |
| $ | 125,000 | | | The Home Depot, Inc.,
2.125%, 09/15/26 | | $ | 123,886 | | | $ | 112,144 | |
| | | | | | | | | | | | |
| | | |
| | | | Telecommunications — 6.5% | | | | | | | | |
| | 250,000 | | | AT&T Inc.,
3.900%, 03/11/24 | | | 255,461 | | | | 248,802 | |
| | 200,000 | | | Verizon Communications Inc.,
3.000%, 11/01/21 | | | 199,613 | | | | 198,160 | |
| | | | | | | | | | | | |
| | | | | | | 455,074 | | | | 446,962 | |
| | | | | | | | | | | | |
| | | | TOTAL CORPORATE BONDS | | | 3,484,834 | | | | 3,458,364 | |
| | | | | | | | | | | | |
| | | | U.S. GOVERNMENT AGENCY OBLIGATIONS — 11.1% | |
| | | | Federal Home Loan Mortgage Corp. — 5.1% | |
| | 350,000 | | | 1.750%, 05/30/19 | | | 350,909 | | | | 348,275 | |
| | | | | | | | | | | | |
| |
| | | | Federal National Mortgage Association — 5.7% | |
| | 400,000 | | | 2.625%, 09/06/24 | | | 411,564 | | | | 390,674 | |
| | | | | | | | | | | | |
| |
| | | | Government National Mortgage Association — 0.3% | |
| | 3,739 | | | 6.000%, 12/15/33 | | | 3,762 | | | | 4,088 | |
| | 12,471 | | | 5.500%, 01/15/34 | | | 12,524 | | | | 13,553 | |
| | | | | | | | | | | | |
| | | | | | | 16,286 | | | | 17,641 | |
| | | | | | | | | | | | |
| | | |
| | | | TOTAL U.S. GOVERNMENT AGENCY OBLIGATIONS | | | 778,759 | | | | 756,590 | |
| | | | | | | | | | | | |
| |
| | | | U.S. GOVERNMENT OBLIGATIONS — 38.2% | |
| | | | U.S. Treasury Bills — 17.5% | | | | | | | | |
| | 1,205,000 | | | U.S. Treasury Bills,
1.969% to 2.106%†, 11/01/18 to 12/13/18 | | | 1,201,636 | | | | 1,201,548 | |
| | | | | | | | | | | | |
| | | |
| | | | U.S. Treasury Notes — 18.0% | | | | | | | | |
| | 750,000 | | | 2.375%, 04/30/20 | | | 747,691 | | | | 745,386 | |
| | 250,000 | | | 2.625%, 06/15/21 | | | 249,673 | | | | 248,369 | |
| | 250,000 | | | 2.000%, 02/15/25 | | | 249,157 | | | | 235,503 | |
| | | | | | | | | | | | |
| | | | | | | 1,246,521 | | | | 1,229,258 | |
| | | | | | | | | | | | |
| | | |
| | | | U.S. Treasury Bonds — 2.7% | | | | | | | | |
| | 150,000 | | | 5.375%, 02/15/31 | | | 162,468 | | | | 185,414 | |
| | | | | | | | | | | | |
| | | | TOTAL U.S. GOVERNMENT OBLIGATIONS | | | 2,610,625 | | | | 2,616,220 | |
| | | | | | | | | | | | |
| | | | TOTAL INVESTMENTS — 99.8% | | $ | 6,874,218 | | | | 6,831,174 | |
| | | | | | | | | | | | |
| | |
| | | | Other Assets and Liabilities (Net) — 0.2% | | | | 10,793 | |
| | | | | | | | | | | | |
| | | |
| | | | NET ASSETS — 100.0% | | | | | | $ | 6,841,967 | |
| | | | | | | | | | | | |
| | |
| (a) | | The interest rates for these floating rate notes, which will change periodically, are based either on the prime rate or an index of market rates. The reflected rates are in effect as of September 30, 2018. The maturity dates reflected are the final maturity dates. |
† | | Represents annualized yields at dates of purchase. |
See accompanying notes to financial statements.
37
TETON Westwood Funds
Statements of Assets and Liabilities
September 30, 2018
| | | | | | | | | | | | | | | | | | | | | | |
| | | Mighty
Mites Fund | | | | | SmallCap
Equity Fund | | | | | Mid-Cap
Equity Fund | | | | | Convertible
Securities
Fund | |
Assets: | | | | | | | | | | | | | | | | | | | | | | |
Investments, at value (cost $876,855,362, $30,028,776, $2,509,727, and $26,751,908, respectively) | | | $1,379,839,355 | | | | | | $39,000,408 | | | | | | $3,191,512 | | | | | | $29,053,201 | |
Investments in affiliates, at value (cost $36,009,744) | | | 56,945,544 | | | | | | — | | | | | | — | | | | | | — | |
Cash | | | 38,329 | | | | | | 44,378 | | | | | | 92,800 | | | | | | 64,721 | |
Deposit at brokers | | | 373 | | | | | | — | | | | | | — | | | | | | — | |
Receivable for Fund shares sold | | | 1,213,736 | | | | | | 26,391 | | | | | | — | | | | | | 41,144 | |
Receivable for investments sold | | | 773,880 | | | | | | — | | | | | | — | | | | | | 89,307 | |
Receivable from Adviser. | | | — | | | | | | 16,932 | | | | | | 7,816 | | | | | | 22,496 | |
Dividends and interest receivable - unaffiliated | | | 615,253 | | | | | | 20,070 | | | | | | 2,048 | | | | | | 142,117 | |
Dividends and interest receivable - affiliated | | | 53,987 | | | | | | — | | | | | | — | | | | | | — | |
Prepaid expenses | | | 40,579 | | | | | | 27,990 | | | | | | 10,385 | | | | | | 27,574 | |
| | | | | | | | | | | | | | | | | | | | | | |
Total Assets | | | 1,439,521,036 | | | | | | 39,136,169 | | | | | | 3,304,561 | | | | | | 29,440,560 | |
| | | | | | | | | | | | | | | | | | | | | | |
Liabilities: | | | | | | | | | | | | | | | | | | | | | | |
Foreign currency, at value (cost $6) | | | 6 | | | | | | | | | | | | | | | | | | | |
Payable for investments purchased | | | 581,733 | | | | | | 102,825 | | | | | | — | | | | | | 60,000 | |
Payable for Fund shares redeemed | | | 1,046,361 | | | | | | 51,276 | | | | | | 30,575 | | | | | | 21,986 | |
Payable for investment advisory fees | | | 1,189,390 | | | | | | 32,281 | | | | | | 2,667 | | | | | | 23,267 | |
Payable for distribution fees | | | 233,030 | | | | | | 6,385 | | | | | | 608 | | | | | | 4,378 | |
Payable for accounting fees. | | | 3,750 | | | | | | — | | | | | | — | | | | | | — | |
Payable for payroll expenses | | | — | | | | | | — | | | | | | 411 | | | | | | — | |
Payable for custodian fees | | | 53,506 | | | | | | 2,341 | | | | | | 1,207 | | | | | | 1,938 | |
Payable for legal and audit fees | | | 62,391 | | | | | | 35,211 | | | | | | 21,160 | | | | | | 26,244 | |
Payable for shareholder communications expenses | | | 111,031 | | | | | | 6,052 | | | | | | 3,690 | | | | | | 5,768 | |
Payable for shareholder services fees | | | 156,997 | | | | | | 2,925 | | | | | | 1,209 | | | | | | — | |
Other accrued expenses | | | 19,727 | | | | | | 4,260 | | | | | | 3,620 | | | | | | 5,903 | |
| | | | | | | | | | | | | | | | | | | | | | |
Total Liabilities | | | 3,457,922 | | | | | | 243,556 | | | | | | 65,147 | | | | | | 149,484 | |
| | | | | | | | | | | | | | | | | | | | | | |
Net Assets | | | $1,436,063,114 | | | | | | $38,892,613 | | | | | | $3,239,414 | | | | | | $29,291,076 | |
| | | | | | | | | | | | | | | | | | | | | | |
Net Assets Consist of: | | | | | | | | | | | | | | | | | | | | | | |
Paid-in capital | | | $ 875,690,905 | | | | | | $27,026,250 | | | | | | $2,405,815 | | | | | | $26,136,222 | |
Total distributable earnings/(accumulated loss)(a) | | | 560,372,209 | | | | | | 11,866,363 | | | | | | 833,599 | | | | | | 3,154,854 | |
| | | | | | | | | | | | | | | | | | | | | | |
Net Assets | | | $1,436,063,114 | | | | | | $38,892,613 | | | | | | $3,239,414 | | | | | | $29,291,076 | |
| | | | | | | | | | | | | | | | | | | | | | |
Shares of Beneficial Interest, each at $0.001 par value; unlimited number of shares authorized: | | | | | | | | | | | | | | | | | | | | | | |
Class AAA: | | | | | | | | | | | | | | | | | | | | | | |
Net assets | | | $226,938,129 | | | | | | $9,286,296 | | | | | | $812,954 | | | | | | $4,522,807 | |
Shares of beneficial interest outstanding | | | 7,862,631 | | | | | | 432,207 | | | | | | 59,399 | | | | | | 323,479 | |
Net Asset Value, offering, and redemption price per share | | | $28.86 | | | | | | $21.49 | | | | | | $13.69 | | | | | | $13.98 | |
Class A: | | | | | | | | | | | | | | | | | | | | | | |
Net assets | | | $111,572,615 | | | | | | $5,023,861 | | | | | | $191,505 | | | | | | $3,711,285 | |
Shares of beneficial interest outstanding | | | 4,021,274 | | | | | | 245,344 | | | | | | 14,185 | | | | | | 257,264 | |
Net Asset Value and redemption price per share | | | $27.75 | | | | | | $20.48 | | | | | | $13.50 | | | | | | $14.43 | |
Maximum offering price per share (NAV ÷ 0.96, based on maximum sales charge of 4.00% of the offering price) | | | $28.91 | | | | | | $21.33 | | | | | | $14.06 | | | | | | $15.03 | |
Class C: | | | | | | | | | | | | | | | | | | | | | | |
Net assets | | | $166,599,729 | | | | | | $2,894,760 | | | | | | $440,768 | | | | | | $2,959,872 | |
Shares of beneficial interest outstanding | | | 6,851,613 | | | | | | 163,629 | | | | | | 33,587 | | | | | | 192,645 | |
Net Asset Value and offering price per share(b) | | | $24.32 | | | | | | $17.69 | | | | | | $13.12 | | | | | | $15.36 | |
Class I: | | | | | | | | | | | | | | | | | | | | | | |
Net assets | | | $930,952,641 | | | | | | $21,687,696 | | | | | | $1,794,187 | | | | | | $18,097,112 | |
Shares of beneficial interest outstanding | | | 31,487,748 | | | | | | 973,786 | | | | | | 129,037 | | | | | | 1,290,187 | |
Net Asset Value, offering, and redemption price per share | | | $29.57 | | | | | | $22.27 | | | | | | $13.90 | | | | | | $14.03 | |
| (a) | Effective September 30, 2018, the Funds have adopted disclosure requirements conforming to SEC Rule 6-04.17 of Regulation S-X and discloses total distributable earnings/(accumulated loss). See Note 2 for further details. |
| (b) | Redemption price varies based on the length of time held. |
See accompanying notes to financial statements.
38
TETON Westwood Funds
Statements of Assets and Liabilities (Continued)
September 30, 2018
| | | | | | | | | | | | | | | | | | | | | | | | | | | | |
| | | Equity Fund | | | | | | | | | Balanced
Fund | | | | | | Intermediate
Bond Fund | | | | |
Assets: | | | | | | | | | | | | | | | | | | | | | | | | | | | | |
Investments, at value (cost $48,706,878, $53,642,355, and $6,874,218, respectively) | | | $61,416,762 | | | | | | | | | | | | $62,494,082 | | | | | | | | $6,831,174 | | | | | |
Investments in affiliates, at value | | | — | | | | | | | | | | | | — | | | | | | | | — | | | | | |
Cash | | | — | | | | | | | | | | | | — | | | | | | | | — | | | | | |
Deposit at brokers | | | — | | | | | | | | | | | | — | | | | | | | | — | | | | | |
Receivable for Fund shares sold | | | 2,051 | | | | | | | | | | | | 9,516 | | | | | | | | 393 | | | | | |
Receivable for investments sold | | | — | | | | | | | | | | | | — | | | | | | | | — | | | | | |
Receivable from Adviser | | | — | | | | | | | | | | | | — | | | | | | | | 7,089 | | | | | |
Dividends and interest receivable - unaffiliated | | | 33,052 | | | | | | | | | | | | 191,059 | | | | | | | | 50,385 | | | | | |
Dividends and interest receivable - affiliated | | | — | | | | | | | | | | | | — | | | | | | | | — | | | | | |
Prepaid expenses | | | 21,797 | | | | | | | | | | | | 26,372 | | | | | | | | 17,217 | | | | | |
Total Assets | | | 61,473,662 | | | | | | | | | | | | 62,721,029 | | | | | | | | 6,906,258 | | | | | |
Liabilities: | | | | | | | | | | | | | | | | | | | | | | | | | | | | |
Payable to custodian | | | — | | | | | | | | | | | | — | | | | | | | | 10,715 | | | | | |
Payable for Fund shares redeemed | | | 10,871 | | | | | | | | | | | | 245,444 | | | | | | | | 8,830 | | | | | |
Payable for investment advisory fees | | | 50,430 | | | | | | | | | | | | 38,626 | | | | | | | | 3,379 | | | | | |
Payable for distribution fees. | | | 12,180 | | | | | | | | | | | | 16,677 | | | | | | | | 1,461 | | | | | |
Payable for accounting fees | | | 3,750 | | | | | | | | | | | | 3,750 | | | | | | | | — | | | | | |
Payable for custodian fees | | | 1,275 | | | | | | | | | | | | 1,295 | | | | | | | | 1,208 | | | | | |
Payable for legal and audit fees | | | 27,247 | | | | | | | | | | | | 27,262 | | | | | | | | 28,886 | | | | | |
Payable for shareholder communications expenses | | | 7,544 | | | | | | | | | | | | 8,206 | | | | | | | | 3,700 | | | | | |
Payable for shareholder services fees | | | 6,965 | | | | | | | | | | | | 5,948 | | | | | | | | 2,191 | | | | | |
Other accrued expenses | | | 4,386 | | | | | | | | | | | | 4,506 | | | | | | | | 3,921 | | | | | |
Total Liabilities | | | 124,648 | | | | | | | | | | | | 351,714 | | | | | | | | 64,291 | | | | | |
Net Assets | | | $61,349,014 | | | | | | | | | | | | $62,369,315 | | | | | | | | $6,841,967 | | | | | |
Net Assets Consist of: | | | | | | | | | | | | | | | | | | | | | | | | | | | | |
Paid-in capital | | | $40,685,695 | | | | | | | | | | | | $47,107,034 | | | | | | | | $6,980,263 | | | | | |
Total distributable earnings/(accumulated loss)(a) | | | 20,663,319 | | | | | | | | | | | | 15,262,281 | | | | | | | | (138,296) | | | | | |
Net Assets | | | $61,349,014 | | | | | | | | | | | | $62,369,315 | | | | | | | | $6,841,967 | | | | | |
Shares of Beneficial Interest, each at $0.001 par value; unlimited number of shares authorized: | | | | | | | | | | | | | | | | | | | | | | | | | | | | |
Class AAA: | | | | | | | | | | | | | | | | | | | | | | | | | | | | |
Net assets | | | $54,595,399 | | | | | | | | | | | | $45,181,551 | | | | | | | | $3,433,588 | | | | | |
Shares of beneficial interest outstanding | | | 3,915,426 | | | | | | | | | | | | 3,645,703 | | | | | | | | 316,972 | | | | | |
Net Asset Value, offering, and redemption price per share | | | $13.94 | | | | | | | | | | | | $12.39 | | | | | | | | $10.83 | | | | | |
Class A: | | | | | | | | | | | | | | | | | | | | | | | | | | | | |
Net assets | | | $1,434,790 | | | | | | | | | | | | $8,719,128 | | | | | | | | $308,299 | | | | | |
Shares of beneficial interest outstanding | | | 103,193 | | | | | | | | | | | | 699,441 | | | | | | | | 28,484 | | | | | |
Net Asset Value and redemption price per share. | | | $13.90 | | | | | | | | | | | | $12.47 | | | | | | | | $10.82 | | | | | |
Maximum offering price per share (NAV ÷ 0.96, based on maximum sales charge of 4.00% of the offering price) | | | $14.48 | | | | | | | | | | | | $12.99 | | | | | | | | $11.27 | | | | | |
Class C: | | | | | | | | | | | | | | | | | | | | | | | | | | | | |
Net assets | | | $448,824 | | | | | | | | | | | | $4,544,037 | | | | | | | | $804,945 | | | | | |
Shares of beneficial interest outstanding | | | 34,289 | | | | | | | | | | | | 358,745 | | | | | | | | 78,363 | | | | | |
Net Asset Value and offering price per share(b) | | | $13.09 | | | | | | | | | | | | $12.67 | | | | | | | | $10.27 | | | | | |
Class I: | | | | | | | | | | | | | | | | | | | | | | | | | | | | |
Net assets | | | $4,870,001 | | | | | | | | | | | | $3,924,599 | | | | | | | | $2,295,135 | | | | | |
Shares of beneficial interest outstanding | | | 349,994 | | | | | | | | | | | | 317,123 | | | | | | | | 211,754 | | | | | |
Net Asset Value, offering, and redemption price per share | | | $13.91 | | | | | | | | | | | | $12.38 | | | | | | | | $10.84 | | | | | |
| (a) | Effective September 30, 2018, the Funds have adopted disclosure requirements conforming to SEC Rule 6-04.17 of Regulation S-X and discloses total distributable earnings/(accumulated loss). See Note 2 for further details. |
| (b) | Redemption price varies based on the length of time held. |
See accompanying notes to financial statements.
39
TETON Westwood Funds
Statements of Operations
For the Year Ended September 30, 2018
| | | | | | | | | | | | | | | | | | | | | | | | | | | | |
| | | Mighty
Mites Fund | | | | | | SmallCap
Equity Fund | | | | | | Mid-Cap
Equity Fund | | | | | | Convertible
Securities
Fund | |
Investment Income: | | | | | | | | | | | | | | | | | | | | | | | | | | | | |
Dividends - unaffiliated (net of foreign withholding taxes of $70,213, $2,028, $407, and $0, respectively) | | $ | 9,920,299 | | | | | | | $ | 381,880 | | | | | | | $ | 31,896 | | | | | | | $ | 169,639 | |
Dividends - affiliated | | | 1,939,204 | | | | | | | | — | | | | | | | | — | | | | | | | | — | |
Interest. | | | 4,325,454 | | | | | | | | 25,808 | | | | | | | | 1,334 | | | | | | | | 106,195 | |
| | | | | | | | | | | | | | | | | | | | | | | | | | | | |
| | | | | | | | | | | | | | | | | | | | | | | | | | | | |
Total Investment Income. | | | 16,184,957 | | | | | | | | 407,688 | | | | | | | | 33,230 | | | | | | | | 275,834 | |
| | | | | | | | | | | | | | | | | | | | | | | | | | | | |
| | | | | | | | | | | | | | | | | | | | | | | | | | | | |
Expenses: | | | | | | | | | | | | | | | | | | | | | | | | | | | | |
Investment advisory fees | | | 14,009,478 | | | | | | | | 348,016 | | | | | | | | 31,612 | | | | | | | | 186,744 | |
Distribution fees - Class AAA | | | 623,289 | | | | | | | | 22,633 | | | | | | | | 2,056 | | | | | | | | 10,848 | |
Distribution fees - Class A | | | 656,430 | | | | | | | | 21,234 | | | | | | | | 966 | | | | | | | | 14,870 | |
Distribution fees - Class C | | | 1,741,955 | | | | | | | | 25,004 | | | | | | | | 3,155 | | | | | | | | 13,423 | |
Distribution fees - Class T* | | | 25 | | | | | | | | 3 | | | | | | | | — | | | | | | | | — | |
Accounting fees | | | 45,000 | | | | | | | | — | | | | | | | | — | | | | | | | | — | |
Custodian fees | | | 211,077 | | | | | | | | 9,757 | | | | | | | | 4,233 | | | | | | | | 7,663 | |
Interest expense | | | 301 | | | | | | | | — | | | | | | | | — | | | | | | | | 122 | |
Legal and audit fees | | | 102,966 | | | | | | | | 45,775 | | | | | | | | 28,074 | | | | | | | | 50,967 | |
Payroll expenses | | | — | | | | | | | | — | | | | | | | | 2,143 | | | | | | | | — | |
Registration expenses | | | 100,380 | | | | | | | | 68,551 | | | | | | | | 21,802 | | | | | | | | 54,005 | |
Shareholder communications expenses | | | 340,205 | | | | | | | | 11,665 | | | | | | | | 4,553 | | | | | | | | 11,028 | |
Shareholder services fees | | | 1,218,722 | | | | | | | | 13,622 | | | | | | | | 7,454 | | | | | | | | 11,128 | |
Trustees’ fees | | | 127,460 | | | | | | | | 3,310 | | | | | | | | 378 | | | | | | | | 1,770 | |
Miscellaneous expenses | | | 69,769 | | | | | | | | 12,311 | | | | | | | | 10,052 | | | | | | | | 9,933 | |
| | | | | | | | | | | | | | | | | | | | | | | | | | | | |
| | | | | | | | | | | | | | | | | | | | | | | | | | | | |
Total Expenses | | | 19,247,057 | | | | | | | | 581,881 | | | | | | | | 116,478 | | | | | | | | 372,501 | |
| | | | | | | | | | | | | | | | | | | | | | | | | | | | |
| | | | | | | | | | | | | | | | | | | | | | | | | | | | |
Less: | | | | | | | | | | | | | | | | | | | | | | | | | | | | |
Fees waived or expenses reimbursed by Adviser (See Note 3) | | | — | | | | | | | | (163,050 | ) | | | | | | | (83,641 | ) | | | | | | | (164,831 | ) |
Advisory fee reduction on unsupervised assets (See Note 3) | | | (69,770 | ) | | | | | | | — | | | | | | | | — | | | | | | | | — | |
Custodian fee credits | | | (4,817 | ) | | | | | | | (378 | ) | | | | | | | — | | | | | | | | (285 | ) |
Expenses paid by broker (See Note 6) | | | (10,210 | ) | | | | | | | (1,563 | ) | | | | | | | (1,370 | ) | | | | | | | (53 | ) |
| | | | | | | | | | | | | | | | | | | | | | | | | | | | |
| | | | | | | | | | | | | | | | | | | | | | | | | | | | |
Total Reimbursements, Waivers, Reductions, and Credits | | | (84,797 | ) | | | | | | | (164,991 | ) | | | | | | | (85,011 | ) | | | | | | | (165,169 | ) |
| | | | | | | | | | | | | | | | | | | | | | | | | | | | |
| | | | | | | | | | | | | | | | | | | | | | | | | | | | |
Net Expenses | | | 19,162,260 | | | | | | | | 416,890 | | | | | | | | 31,467 | | | | | | | | 207,332 | |
| | | | | | | | | | | | | | | | | | | | | | | | | | | | |
| | | | | | | | | | | | | | | | | | | | | | | | | | | | |
Net Investment Income/(Loss) | | | (2,977,303 | ) | | | | | | | (9,202 | ) | | | | | | | 1,763 | | | | | | | | 68,502 | |
| | | | | | | | | | | | | | | | | | | | | | | | | | | | |
| | | | | | | | | | | | | | | | | | | | | | | | | | | | |
Net Realized and Unrealized Gain/(Loss) on Investments and Foreign Currency: | | | | | | | | | | | | | | | | | | | | | | | | | | | | |
Net realized gain on investments - unaffiliated | | | 45,133,380 | | | | | | | | 4,343,561 | | | | | | | | 172,532 | | | | | | | | 1,234,059 | |
Net realized gain on investments - affiliated | | | 28,098 | | | | | | | | — | | | | | | | | — | | | | | | | | — | |
Net realized gain/(loss) on foreign currency transactions . | | | (21,007 | ) | | | | | | | 51 | | | | | | | | (8 | ) | | | | | | | — | |
| | | | | | | | | | | | | | | | | | | | | | | | | | | | |
| | | | | | | | | | | | | | | | | | | | | | | | | | | | |
Net realized gain on investments and foreign currency transactions | | | 45,140,471 | | | | | | | | 4,343,612 | | | | | | | | 172,524 | | | | | | | | 1,234,059 | |
| | | | | | | | | | | | | | | | | | | | | | | | | | | | |
| | | | | | | | | | | | | | | | | | | | | | | | | | | | |
Net change in unrealized appreciation/depreciation: on investments | | | 18,652,009 | | | | | | | | (1,384,607 | ) | | | | | | | 48,698 | | | | | | | | 1,169,874 | |
on foreign currency translations | | | (1,580 | ) | | | | | | | — | | | | | | | | — | | | | | | | | — | |
| | | | | | | | | | | | | | | | | | | | | | | | | | | | |
| | | | | | | | | | | | | | | | | | | | | | | | | | | | |
Net change in unrealized appreciation/depreciation on investments and foreign currency translations | | | 18,650,429 | | | | | | | | (1,384,607 | ) | | | | | | | 48,698 | | | | | | | | 1,169,874 | |
| | | | | | | | | | | | | | | | | | | | | | | | | | | | |
| | | | | | | | | | | | | | | | | | | | | | | | | | | | |
Net Realized and Unrealized Gain/(Loss) on Investments and Foreign Currency | | | 63,790,900 | | | | | | | | 2,959,005 | | | | | | | | 221,222 | | | | | | | | 2,403,933 | |
| | | | | | | | | | | | | | | | | | | | | | | | | | | | |
| | | | | | | | | | | | | | | | | | | | | | | | | | | | |
Net Increase in Net Assets Resulting from Operations | | $ | 60,813,597 | | | | | | | $ | 2,949,803 | | | | | | | $ | 222,985 | | | | | | | $ | 2,472,435 | |
| | | | | | | | | | | | | | | | | | | | | | | | | | | | |
| * | Class T Shares were liquidated on August 31, 2018. |
See accompanying notes to financial statements.
40
TETON Westwood Funds
Statements of Operations (Continued)
For the Year Ended September 30, 2018
| | | | | | | | | | | | | | | | | | | | |
| | | | | Equity
Fund | | | | | Balanced
Fund | | | | | Intermediate
Bond Fund | | | |
Investment Income: | | | | | | | | | | | | | | | | | | | | |
Dividends - unaffiliated (net of foreign withholding taxes of $0, $0, and $0, respectively) | | | | $ | 1,347,705 | | | | | $ | 967,568 | | | | | | — | | | |
Dividends - affiliated | | | | | — | | | | | | — | | | | | | — | | | |
Interest. | | | | | 1,508 | | | | | | 553,403 | | | | | $ | 196,204 | | | |
| | | | | | | | | | | | | | | | | | | | |
| | | | | | | | | | | | | | | | | | | | |
Total Investment Income. | | | | | 1,349,213 | | | | | | 1,520,971 | | | | | | 196,204 | | | |
| | | | | | | | | | | | | | | | | | | | |
| | | | | | | | | | | | | | | | | | | | |
Expenses: | | | | | | | | | | | | | | | | | | | | |
Investment advisory fees | | | | | 617,246 | | | | | | 487,139 | | | | | | 45,589 | | | |
Distribution fees - Class AAA | | | | | 136,076 | | | | | | 121,636 | | | | | | 8,833 | | | |
Distribution fees - Class A | | | | | 9,132 | | | | | | 41,375 | | | | | | 1,230 | | | |
Distribution fees - Class C | | | | | 5,194 | | | | | | 45,912 | | | | | | 10,689 | | | |
Distribution fees - Class T* | | | | | — | | | | | | — | | | | | | — | | | |
Accounting fees | | | | | 45,000 | | | | | | 45,000 | | | | | | — | | | |
Custodian fees | | | | | 5,566 | | | | | | 5,823 | | | | | | 4,387 | | | |
Interest expense | | | | | — | | | | | | — | | | | | | — | | | |
Legal and audit fees | | | | | 28,410 | | | | | | 28,476 | | | | | | 29,170 | | | |
Payroll expenses | | | | | — | | | | | | — | | | | | | — | | | |
Registration expenses | | | | | 56,393 | | | | | | 57,701 | | | | | | 43,010 | | | |
Shareholder communications expenses | | | | | 14,526 | | | | | | 17,081 | | | | | | 6,293 | | | |
Shareholder services fees | | | | | 46,674 | | | | | | 43,838 | | | | | | 11,795 | | | |
Trustees’ fees | | | | | 5,685 | | | | | | 9,681 | | | | | | 716 | | | |
Miscellaneous expenses | | | | | 12,589 | | | | | | 13,579 | | | | | | 8,922 | | | |
| | | | | | | | | | | | | | | | | | | | |
| | | | | | | | | | | | | | | | | | | | |
Total Expenses | | | | | 982,491 | | | | | | 917,241 | | | | | | 170,634 | | | |
| | | | | | | | | | | | | | | | | | | | |
| | | | | | | | | | | | | | | | | | | | |
Less: | | | | | | | | | | | | | | | | | | | | |
Fees waived or expenses reimbursed by Adviser (See Note 3) | | | | | — | | | | | | — | | | | | | (92,897 | ) | | |
Advisory fee reduction on unsupervised assets (See Note 3) | | | | | — | | | | | | — | | | | | | — | | | |
Custodian fee credits | | | | | — | | | | | | — | | | | | | — | | | |
Expenses paid by broker (See Note 6) | | | | | (1,776 | ) | | | | | (1,800 | ) | | | | | — | | | |
| | | | | | | | | | | | | | | | | | | | |
| | | | | | | | | | | | | | | | | | | | |
Total Reimbursements, Waivers, Reductions, and Credits | | | | | (1,776 | ) | | | | | (1,800 | ) | | | | | (92,897 | ) | | |
| | | | | | | | | | | | | | | | | | | | |
| | | | | | | | | | | | | | | | | | | | |
Net Expenses | | | | | 980,715 | | | | | | 915,441 | | | | | | 77,737 | | | |
| | | | | | | | | | | | | | | | | | | | |
| | | | | | | | | | | | | | | | | | | | |
Net Investment Income | | | | | 368,498 | | | | | | 605,530 | | | | | | 118,467 | | | |
| | | | | | | | | | | | | | | | | | | | |
| | | | | | | | | | | | | | | | | | | | |
Net Realized and Unrealized Gain/(Loss) on Investments and Foreign Currency: | | | | | | | | | | | | | | | | | | | | |
Net realized gain/(loss) on investments - unaffiliated | | | | | 7,812,617 | | | | | | 6,409,044 | | | | | | (91,525 | ) | | |
Net realized gain on investments - affiliated | | | | | — | | | | | | — | | | | | | — | | | |
Net realized gain/(loss) on foreign currency transactions | | | | | — | | | | | | — | | | | | | — | | | |
| | | | | | | | | | | | | | | | | | | | |
| | | | | | | | | | | | | | | | | | | | |
Net realized gain/(loss) on investments and foreign currency transactions | | | | | 7,812,617 | | | | | | 6,409,044 | | | | | | (91,525 | ) | | |
| | | | | | | | | | | | | | | | | | | | |
| | | | | | | | | | | | | | | | | | | | |
Net change in unrealized appreciation/depreciation: on investments | | | | | 72,520 | | | | | | (1,288,447 | ) | | | | | (94,183 | ) | | |
| | | | | | | | | | | | | | | | | | | | |
| | | | | | | | | | | | | | | | | | | | |
Net change in unrealized appreciation/depreciation on investments | | | | | 72,520 | | | | | | (1,288,447 | ) | | | | | (94,183 | ) | | |
| | | | | | | | | | | | | | | | | | | | |
| | | | | | | | | | | | | | | | | | | | |
Net Realized and Unrealized Gain/(Loss) on Investments and Foreign Currency | | | | | 7,885,137 | | | | | | 5,120,597 | | | | | | (185,708 | ) | | |
| | | | | | | | | | | | | | | | | | | | |
| | | | | | | | | | | | | | | | | | | | |
Net Increase/(Decrease) in Net Assets Resulting from Operations | | | | $ | 8,253,635 | | | | | $ | 5,726,127 | | | | | $ | (67,241 | ) | | |
| | | | | | | | | | | | | | | | | | | | |
| * | Class T Shares were liquidated on August 31, 2018. |
See accompanying notes to financial statements.
41
TETON Westwood Funds
Statements of Changes in Net Assets
For the Year Ended September 30,
| | | | | | | | | | | | | | | | | | | | | | | | | | | | |
| | | Mighty Mites Fund | | | | | | SmallCap Equity Fund | | | Mid-Cap Equity Fund | |
| | | 2018 | | | 2017 | | | | | | 2018 | | | 2017 | | | 2018 | | | 2017 | |
Operations: | | | | | | | | | | | | | | | | | | | | | | | | | | | | |
Net investment income/(loss) | | | $ (2,977,303) | | | $ | (5,741,971 | ) | | | | | | | $ (9,202) | | | | $ (56,824) | | | $ | 1,763 | | | $ | (4,957 | ) |
Net realized gain/(loss) on investments, securities sold short, redemption in-kind, and foreign currency transactions | | | 45,140,471 | | | | 86,739,197 | | | | | | | | 4,343,612 | | | | 2,628,872 | | | | 172,524 | | | | 155,128 | |
Net change in unrealized appreciation/depreciation on investments and foreign currency translations | | | 18,650,429 | | | | 177,676,434 | | | | | | | | (1,384,607 | ) | | | 3,708,579 | | | | 48,698 | | | | 244,240 | |
| | | | | | | | | | | | | | | | | | | | | | | | | | | | |
| | | | | | | | | | | | | | | | | | | | | | | | | | | | |
Net Increase/(Decrease) in Net Assets Resulting from Operations | | | 60,813,597 | | | | 258,673,660 | | | | | | | | 2,949,803 | | | | 6,280,627 | | | | 222,985 | | | | 394,411 | |
| | | | | | | | | | | | | | | | | | | | | | | | | | | | |
| | | | | | | | | | | | | | | | | | | | | | | | | | | | |
Distributions to Shareholders | | | | | | | | | | | | | | | | | | | | | | | | | | | | |
Net investment income and net realized gain | | | | | | | | | | | | | | | | | | | | | | | | | | | | |
Class AAA | | | (16,091,681 | ) | | | (12,112,850 | ) | | | | | | | (799,266 | ) | | | (1,120,049 | ) | | | (36,604 | ) | | | (21,204 | ) |
Class A | | | (8,606,993 | ) | | | (6,973,598 | ) | | | | | | | (335,705 | ) | | | (282,966 | ) | | | (8,869 | ) | | | (4,128 | ) |
Class C | | | (12,671,430 | ) | | | (9,278,000 | ) | | | | | | | (226,732 | ) | | | (229,623 | ) | | | (8,748 | ) | | | (2,204 | ) |
Class I | | | (47,329,053 | ) | | | (22,623,866 | ) | | | | | | | (1,361,990 | ) | | | (1,008,986 | ) | | | (76,137 | ) | | | (19,507 | ) |
Class T* | | | (659 | ) | | | — | | | | | | | | (93 | ) | | | — | | | | — | | | | — | |
| | | | | | | | | | | | | | | | | | | | | | | | | | | | |
| | | | | | | | | | | | | | | | | | | | | | | | | | | | |
| | | (84,699,816) | | | (50,988,314) | | | | | | (2,723,786) | | | (2,641,624) | | | (130,358) | | | (47,043) | |
| | | | | | | | | | | | | | | | | | | | | | | | | | | | |
| | | | | | | | | | | | | | | | | | | | | | | | | | | | |
Return of capital | | | | | | | | | | | | | | | | | | | | | | | | | | | | |
Class AAA | | | — | | | | — | | | | | | | | — | | | | — | | | | — | | | | — | |
Class A | | | — | | | | — | | | | | | | | — | | | | — | | | | — | | | | — | |
Class C | | | — | | | | — | | | | | | | | — | | | | — | | | | — | | | | — | |
Class I | | | — | | | | — | | | | | | | | — | | | | — | | | | — | | | | — | |
| | | | | | | | | | | | | | | | | | | | | | | | | | | | |
| | | | | | | | | | | | | | | | | | | | | | | | | | | | |
| | | — | | | — | | | | | | — | | | — | | | — | | | — | |
| | | | | | | | | | | | | | | | | | | | | | | | | | | | |
| | | | | | | | | | | | | | | | | | | | | | | | | | | | |
Distributions to Shareholders** | | | (84,699,816 | ) | | | (50,988,314 | ) | | | | | | | (2,723,786 | ) | | | (2,641,624 | ) | | | (130,358 | ) | | | (47,043 | ) |
| | | | | | | | | | | | | | | | | | | | | | | | | | | | |
| | | | | | | | | | | | | | | | | | | | | | | | | | | | |
Shares of Beneficial Interest Transactions: | | | | | | | | | | | | | | | | | | | | | | | | | | | | |
Proceeds from shares issued | | | | | | | | | | | | | | | | | | | | | | | | | | | | |
Class AAA | | | 32,706,439 | | | | 46,277,238 | | | | | | | | 2,106,780 | | | | 5,179,585 | | | | 290,294 | | | | 503,380 | |
Class A | | | 21,168,410 | | | | 37,625,664 | | | | | | | | 1,565,274 | | | | 800,502 | | | | 576 | | | | 84,849 | |
Class C | | | 22,014,819 | | | | 22,015,082 | | | | | | | | 967,543 | | | | 311,575 | | | | 233,747 | | | | 21,694 | |
Class I | | | 310,712,422 | | | | 222,822,655 | | | | | | | | 7,976,771 | | | | 5,631,113 | | | | 2,799 | | | | 122,671 | |
Class T* | | | — | | | | 10,000 | | | | | | | | — | | | | 1,000 | | | | — | | | | — | |
| | | | | | | | | | | | | | | | | | | | | | | | | | | | |
| | | | | | | | | | | | | | | | | | | | | | | | | | | | |
| | | 386,602,090 | | | 328,750,639 | | | | | | 12,616,368 | | | 11,923,775 | | | 527,416 | | | 732,594 | |
| | | | | | | | | | | | | | | | | | | | | | | | | | | | |
| | | | | | | | | | | | | | | | | | | | | | | | | | | | |
Proceeds from reinvestment of distributions | | | | | | | | | | | | | | | | | | | | | | | | | | | | |
Class AAA | | | 15,814,254 | | | | 11,851,540 | | | | | | | | 789,372 | | | | 1,099,599 | | | | 36,604 | | | | 21,204 | |
Class A | | | 7,945,275 | | | | 6,334,330 | | | | | | | | 333,554 | | | | 270,995 | | | | 8,869 | | | | 3,123 | |
Class C | | | 10,953,006 | | | | 7,567,826 | | | | | | | | 200,988 | | | | 185,367 | | | | 7,861 | | | | 2,047 | |
Class I | | | 30,327,154 | | | | 14,416,148 | | | | | | | | 1,335,363 | | | | 993,398 | | | | 76,137 | | | | 19,508 | |
Class T* | | | 660 | | | | — | | | | | | | | 93 | | | | — | | | | — | | | | — | |
| | | | | | | | | | | | | | | | | | | | | | | | | | | | |
| | | | | | | | | | | | | | | | | | | | | | | | | | | | |
| | | 65,040,349 | | | 40,169,844 | | | | | | 2,659,370 | | | 2,549,359 | | | 129,471 | | | 45,882 | |
| | | | | | | | | | | | | | | | | | | | | | | | | | | | |
| | | | | | | | | | | | | | | | | | | | | | | | | | | | |
Cost of shares redeemed | | | | | | | | | | | | | | | | | | | | | | | | | | | | |
Class AAA | | | (90,591,578 | ) | | | (85,877,875 | ) | | | | | | | (2,969,647 | ) | | | (8,983,081 | ) | | | (338,745 | ) | | | (1,628,525 | ) |
Class A | | | (83,818,036 | ) | | | (43,270,182 | ) | | | | | | | (457,749 | ) | | | (742,991 | ) | | | (26,585 | ) | | | (230,286 | ) |
Class C | | | (40,163,303 | ) | | | (52,086,231 | ) | | | | | | | (483,289 | ) | | | (730,299 | ) | | | (4,269 | ) | | | (42,312 | ) |
Class I | | | (129,221,594 | ) | | | (93,376,064 | ) | | | | | | | (5,321,296 | ) | | | (1,909,312 | ) | | | (131,805 | ) | | | (305,769 | ) |
Class T* | | | (11,417 | ) | | | — | | | | | | | | (1,199 | ) | | | — | | | | — | | | | — | |
| | | | | | | | | | | | | | | | | | | | | | | | | | | | |
| | | | | | | | | | | | | | | | | | | | | | | | | | | | |
| | | (343,805,928) | | | (274,610,352) | | | | | | (9,233,180) | | | (12,365,683) | | | (501,404) | | | (2,206,892) | |
| | | | | | | | | | | | | | | | | | | | | | | | | | | | |
| | | | | | | | | | | | | | | | | | | | | | | | | | | | |
Net Increase/(Decrease) in Net Assets from Shares of Beneficial Interest Transactions | | | 107,836,511 | | | | 94,310,131 | | | | | | | | 6,042,558 | | | | 2,107,451 | | | | 155,483 | | | | (1,428,416 | ) |
| | | | | | | | | | | | | | | | | | | | | | | | | | | | |
| | | | | | | | | | | | | | | | | | | | | | | | | | | | |
Redemption Fees | | | 972 | | | | 1,172 | | | | | | | | — | | | | 581 | | | | — | | | | 5 | |
| | | | | | | | | | | | | | | | | | | | | | | | | | | | |
| | | | | | | | | | | | | | | | | | | | | | | | | | | | |
Net Increase/(Decrease) in Net Assets | | | 83,951,264 | | | | 301,996,649 | | | | | | | | 6,268,575 | | | | 5,747,035 | | | | 248,110 | | | | (1,081,043 | ) |
Net Assets: | | | | | | | | | | | | | | | | | | | | | | | | | | | | |
Beginning of year | | | 1,352,111,850 | | | | 1,050,115,201 | | | | | | | | 32,624,038 | | | | 26,877,003 | | | | 2,991,304 | | | | 4,072,347 | |
| | | | | | | | | | | | | | | | | | | | | | | | | | | | |
| | | | | | | | | | | | | | | | | | | | | | | | | | | | |
End of year | | $ | 1,436,063,114 | | | $ | 1,352,111,850 | | | | | | | $ | 38,892,613 | | | $ | 32,624,038 | | | $ | 3,239,414 | | | $ | 2,991,304 | |
| | | | | | | | | | | | | | | | | | | | | | | | | | | | |
| | | | | | | | | | | | | | | | | | | | | | | | | | | | |
| * | Class T Shares were liquidated on August 31, 2018. |
| ** | Effective September 30, 2018, the Funds have adopted disclosure requirements conforming to SEC Rule 6-04.17 of Regulation S-X. See Note 2 for details on distribution classification for the fiscal year ended September 30, 2017. |
See accompanying notes to financial statements.
42
TETON Westwood Funds
Statements of Changes in Net Assets (Continued)
For the Year Ended September 30,
| | | | | | | | | | | | | | | | | | | | | | | | | | | | | | | | | | | | | | | | | | | | | | | | | | |
| | | Convertible Securities Fund | | | | Equity Fund | | Balanced Fund | | | | Intermediate Bond Fund |
| | | 2018 | | 2017 | | | | 2018 | | 2017 | | 2018 | | 2017 | | | | 2018 | | 2017 |
| | | | $ | 68,502 | | | | $ | 54,387 | | | | | | | | | $ | 368,498 | | | | $ | 311,491 | | | | $ | 605,530 | | | | $ | 568,539 | | | | | | | | | $ | 118,467 | | | | $ | 213,093 | |
| | | | 1,234,059 | | | | | 17,060 | | | | | | | | | | 7,812,617 | | | | | 7,012,925 | | | | | 6,409,044 | | | | | 4,447,919 | | | | | | | | | | (91,525) | | | | | 129,684 | |
| | | | 1,169,874 | | | | | 1,133,294 | | | | | | | | | | 72,520 | | | | | 2,252,399 | | | | | (1,288,447) | | | | | 1,584,106 | | | | | | | | | | (94,183) | | | | | (564,517) | |
| | | | | | | | | | | | | | | | | | | | | | | | | | | | | | | | | | | | | | | | | | | | | | | | | | | |
| | | | | | | | | | | | | | | | | | | | | | | | | | | | | | | | | | | | | | | | | | | | | | | | | | | |
| | | | 2,472,435 | | | | | 1,204,741 | | | | | | | | | | 8,253,635 | | | | | 9,576,815 | | | | | 5,726,127 | | | | | 6,600,564 | | | | | | | | | | (67,241) | | | | | (221,740) | |
| | | | | | | | | | | | | | | | | | | | | | | | | | | | | | | | | | | | | | | | | | | | | | | | | | | |
| | | | | | | | | | | | | | | | | | | | | | | | | | | | | | | | | | | | | | | | | | | | | | | | | | | |
| | | | (66,250) | | | | | (242,090) | | | | | | | | | | (5,968,512) | | | | | (3,622,728) | | | | | (3,431,212) | | | | | (3,361,419) | | | | | | | | | | (116,646) | | | | | (77,808) | |
| | | | (37,108) | | | | | (85,669) | | | | | | | | | | (269,080) | | | | | (241,930) | | | | | (538,815) | | | | | (436,848) | | | | | | | | | | (11,813) | | | | | (12,535) | |
| | | | (10,436) | | | | | (50,114) | | | | | | | | | | (73,250) | | | | | (55,386) | | | | | (275,807) | | | | | (288,069) | | | | | | | | | | (28,098) | | | | | (14,980) | |
| | | | (189,216) | | | | | (149,015) | | | | | | | | | | (569,904) | | | | | (301,126) | | | | | (217,833) | | | | | (125,152) | | | | | | | | | | (95,203) | | | | | (247,167) | |
| | | | — | | | | | — | | | | | | | | | | — | | | | | — | | | | | — | | | | | — | | | | | | | | | | — | | | | | — | |
| | | | (303,010) | | | | | (526,888) | | | | | | | | | | (6,880,746) | | | | | (4,221,170) | | | | | (4,463,667) | | | | | (4,211,488) | | | | | | | | | | (251,760) | | | | | (352,490) | |
| | | | — | | | | | — | | | | | | | | | | — | | | | | — | | | | | — | | | | | — | | | | | | | | | | (28) | | | | | — | |
| | | | — | | | | | — | | | | | | | | | | — | | | | | — | | | | | — | | | | | — | | | | | | | | | | (3) | | | | | — | |
| | | | — | | | | | — | | | | | | | | | | — | | | | | — | | | | | — | | | | | — | | | | | | | | | | (9) | | | | | — | |
| | | | — | | | | | — | | | | | | | | | | — | | | | | — | | | | | — | | | | | — | | | | | | | | | | (21) | | | | | — | |
| | | | | | | | | | | | | | | | | | | | | | | | | | | | | | | | | | | | | | | | | | | | | | | | | | | |
| | | | | | | | | | | | | | | | | | | | | | | | | | | | | | | | | | | | | | | | | | | | | | | | | | | |
| | | | — | | | | | — | | | | | | | | | | — | | | | | — | | | | | — | | | | | — | | | | | | | | | | (61) | | | | | — | |
| | | | | | | | | | | | | | | | | | | | | | | | | | | | | | | | | | | | | | | | | | | | | | | | | | | |
| | | | | | | | | | | | | | | | | | | | | | | | | | | | | | | | | | | | | | | | | | | | | | | | | | | |
| | | | (303,010) | | | | | (526,888) | | | | | | | | | | (6,880,746) | | | | | (4,221,170) | | | | | (4,463,667) | | | | | (4,211,488) | | | | | | | | | | (251,821) | | | | | (352,490) | |
| | | | | | | | | | | | | | | | | | | | | | | | | | | | | | | | | | | | | | | | | | | | | | | | | | | |
| | | | | | | | | | | | | | | | | | | | | | | | | | | | | | | | | | | | | | | | | | | | | | | | | | | |
| | | | 910,760 | | | | | 1,176,145 | | | | | | | | | | 485,651 | | | | | 633,201 | | | | | 1,658,895 | | | | | 6,800,089 | | | | | | | | | | 591,965 | | | | | 613,039 | |
| | | | 1,906,290 | | | | | 2,208,003 | | | | | | | | | | 10,444 | | | | | 177,782 | | | | | 2,483,948 | | | | | 1,427,808 | | | | | | | | | | 1,209,949 | | | | | 107,817 | |
| | | | 2,049,285 | | | | | 545,063 | | | | | | | | | | 4,655 | | | | | 465,776 | | | | | 296,276 | | | | | 425,428 | | | | | | | | | | 115,342 | | | | | 298,476 | |
| | | | 11,790,310 | | | | | 6,720,412 | | | | | | | | | | 902,820 | | | | | 1,263,682 | | | | | 3,251,539 | | | | | 442,446 | | | | | | | | | | 278,911 | | | | | 2,143,875 | |
| | | | — | | | | | — | | | | | | | | | | — | | | | | — | | | | | — | | | | | — | | | | | | | | | | — | | | | | — | |
| | | | | | | | | | | | | | | | | | | | | | | | | | | | | | | | | | | | | | | | | | | | | | | | | | | |
| | | | | | | | | | | | | | | | | | | | | | | | | | | | | | | | | | | | | | | | | | | | | | | | | | | |
| | | | 16,656,645 | | | | | 10,649,623 | | | | | | | | | | 1,403,570 | | | | | 2,540,441 | | | | | 7,690,658 | | | | | 9,095,771 | | | | | | | | | | 2,196,167 | | | | | 3,163,207 | |
| | | | | | | | | | | | | | | | | | | | | | | | | | | | | | | | | | | | | | | | | | | | | | | | | | | |
| | | | | | | | | | | | | | | | | | | | | | | | | | | | | | | | | | | | | | | | | | | | | | | | | | | |
| | | | 64,447 | | | | | 239,557 | | | | | | | | | | 5,773,371 | | | | | 3,475,689 | | | | | 3,348,972 | | | | | 3,263,840 | | | | | | | | | | 113,042 | | | | | 74,956 | |
| | | | 36,464 | | | | | 84,294 | | | | | | | | | | 269,063 | | | | | 241,265 | | | | | 524,840 | | | | | 422,760 | | | | | | | | | | 9,857 | | | | | 10,718 | |
| | | | 10,398 | | | | | 50,107 | | | | | | | | | | 69,569 | | | | | 36,439 | | | | | 272,907 | | | | | 258,563 | | | | | | | | | | 27,825 | | | | | 14,817 | |
| | | | 189,122 | | | | | 148,724 | | | | | | | | | | 519,472 | | | | | 276,907 | | | | | 197,338 | | | | | 123,387 | | | | | | | | | | 94,841 | | | | | 238,579 | |
| | | | — | | | | | — | | | | | | | | | | — | | | | | — | | | | | — | | | | | — | | | | | | | | | | — | | | | | — | |
| | | | | | | | | | | | | | | | | | | | | | | | | | | | | | | | | | | | | | | | | | | | | | | | | | | |
| | | | | | | | | | | | | | | | | | | | | | | | | | | | | | | | | | | | | | | | | | | | | | | | | | | |
| | | | 300,431 | | | | | 522,682 | | | | | | | | | | 6,631,475 | | | | | 4,030,300 | | | | | 4,344,057 | | | | | 4,068,550 | | | | | | | | | | 245,565 | | | | | 339,070 | |
| | | | | | | | | | | | | | | | | | | | | | | | | | | | | | | | | | | | | | | | | | | | | | | | | | | |
| | | | | | | | | | | | | | | | | | | | | | | | | | | | | | | | | | | | | | | | | | | | | | | | | | | |
| | | | (1,104,825) | | | | | (1,825,247) | | | | | | | | | | (7,112,237) | | | | | (7,622,675) | | | | | (11,680,874) | | | | | (11,090,185) | | | | | | | | | | (809,987) | | | | | (1,040,146) | |
| | | | (1,257,996) | | | | | (948,677) | | | | | | | | | | (1,352,885) | | | | | (1,886,165) | | | | | (2,643,723) | | | | | (1,033,374) | | | | | | | | | | (1,379,664) | | | | | (415,391) | |
| | | | (565,784) | | | | | (226,560) | | | | | | | | | | (310,799) | | | | | (742,638) | | | | | (714,072) | | | | | (1,832,466) | | | | | | | | | | (395,612) | | | | | (317,041) | |
| | | | (1,657,866) | | | | | (797,451) | | | | | | | | | | (1,609,894) | | | | | (1,231,226) | | | | | (1,562,514) | | | | | (540,455) | | | | | | | | | | (865,754) | | | | | (13,216,920) | |
| | | | — | | | | | — | | | | | | | | | | — | | | | | — | | | | | — | | | | | — | | | | | | | | | | — | | | | | — | |
| | | | | | | | | | | | | | | | | | | | | | | | | | | | | | | | | | | | | | | | | | | | | | | | | | | |
| | | | | | | | | | | | | | | | | | | | | | | | | | | | | | | | | | | | | | | | | | | | | | | | | | | |
| | | | (4,586,471) | | | | | (3,797,935) | | | | | | | | | | (10,385,815) | | | | | (11,482,704) | | | | | (16,601,183) | | | | | (14,496,480) | | | | | | | | | | (3,451,017) | | | | | (14,989,498) | |
| | | | | | | | | | | | | | | | | | | | | | | | | | | | | | | | | | | | | | | | | | | | | | | | | | | |
| | | | | | | | | | | | | | | | | | | | | | | | | | | | | | | | | | | | | | | | | | | | | | | | | | | |
| | | | 12,370,605 | | | | | 7,374,370 | | | | | | | | | | (2,350,770) | | | | | (4,911,963) | | | | | (4,566,468) | | | | | (1,332,159) | | | | | | | | | | (1,009,285) | | | | | (11,487,221) | |
| | | | | | | | | | | | | | | | | | | | | | | | | | | | | | | | | | | | | | | | | | | | | | | | | | | |
| | | | | | | | | | | | | | | | | | | | | | | | | | | | | | | | | | | | | | | | | | | | | | | | | | | |
| | | | — | | | | | 966 | | | | | | | | | | — | | | | | — | | | | | — | | | | | 25 | | | | | | | | | | — | | | | | — | |
| | | | | | | | | | | | | | | | | | | | | | | | | | | | | | | | | | | | | | | | | | | | | | | | | | | |
| | | | | | | | | | | | | | | | | | | | | | | | | | | | | | | | | | | | | | | | | | | | | | | | | | | |
| | | | 14,540,030 | | | | | 8,053,189 | | | | | | | | | | (977,881) | | | | | 443,682 | | | | | (3,304,008) | | | | | 1,056,942 | | | | | | | | | | (1,328,347) | | | | | (12,061,451) | |
| | | | 14,751,046 | | | | | 6,697,857 | | | | | | | | | | 62,326,895 | | | | | 61,883,213 | | | | | 65,673,323 | | | | | 64,616,381 | | | | | | | | | | 8,170,314 | | | | | 20,231,765 | |
| | | | | | | | | | | | | | | | | | | | | | | | | | | | | | | | | | | | | | | | | | | | | | | | | | | |
| | | | | | | | | | | | | | | | | | | | | | | | | | | | | | | | | | | | | | | | | | | | | | | | | | | |
| | | $ | 29,291,076 | | | | $ | 14,751,046 | | | | | | | | | $ | 61,349,014 | | | | $ | 62,326,895 | | | | $ | 62,369,315 | | | | $ | 65,673,323 | | | | | | | | | $ | 6,841,967 | | | | $ | 8,170,314 | |
| | | | | | | | | | | | | | | | | | | | | | | | | | | | | | | | | | | | | | | | | | | | | | | | | | | |
| | | | | | | | | | | | | | | | | | | | | | | | | | | | | | | | | | | | | | | | | | | | | | | | | | | |
See accompanying notes to financial statements.
43
TETON Westwood Funds
Financial Highlights
Selected data for a share of beneficial interest outstanding throughout each year:
| | | | | | | | | | | | | | | | | | | | | | | | | | | | | | | | | | | | | | | | | | | | | | | | | | | | | | | | | | | | | | | | | | | | | | | | | | | |
| | | | | Income (Loss) from Investment Operations | | Distributions to Shareholders | | | | | | | | Ratios to Average Net Assets/Supplemental Data |
Year Ended
September 30 | | Net Asset
Value,
Beginning
of Year | | Net
Investment
Income
(Loss)(a)(b) | | Net
Realized and
Unrealized
Gain (Loss) on
Investments | | Total from
Investment
Operations | | Net
Investment
Income | | Net
Realized
Gain on
Investments | | Total
Distributions | | Redemption
Fees(a)(c) | | Net Asset
Value,
End of
Year | | Total
Return† | | Net Assets,
End of
Year
(in 000’s) | | Net
Investment
Income
(Loss) | | Operating
Expenses
Net of
Waivers/Credits/
Reimbursements/
Reductions | | Operating
Expenses
Before
Waivers/Credits/
Reimbursements/
Reductions(d) | | Portfolio
Turnover
Rate |
Mighty Mites Fund | | | | | | | | | | | | | | | | | | | | | | | | | | | | | | | | | | | | | | | | | | | | | | | | | | | | | | | | | | | | | |
Class AAA | | | | | | | | | | | | | | | | | | | | | | | | | | | | | | | | | | | | | | | | | | | | | | | | | | | | | | | | | | | | | | | | | | | | | | | | | | | |
2018 | | | $ | 29.42 | | | | $ | (0.07) | | | | | $1.32 | | | | $ | 1.25 | | | | | — | | | | $ | (1.81) | | | | $ | (1.81) | | | | $ | 0.00 | | | | $ | 28.86 | | | | | 4.4 | % | | | $ | 226,938 | | | | | (0.25) | % | | | | 1.40%(e) | | | | | 1.40% | | | | | 9 | % |
2017 | | | | 24.76 | | | | | (0.12) | | | | | 5.97 | | | | | 5.85 | | | | | — | | | | | (1.19) | | | | | (1.19) | | | | | 0.00 | | | | | 29.42 | | | | | 24.4 | | | | | 274,161 | | | | | (0.46) | | | | | 1.41(e) | | | | | 1.42 | | | | | 8 | |
2016 | | | | 22.02 | | | | | (0.15) | | | | | 3.41 | | | | | 3.26 | | | | | — | | | | | (0.52) | | | | | (0.52) | | | | | 0.00 | | | | | 24.76 | | | | | 15.0 | | | | | 256,488 | | | | | (0.67) | | | | | 1.41(e) | | | | | 1.41 | | | | | 6 | |
2015 | | | | 23.01 | | | | | (0.06) | | | | | (0.50) | | | | | (0.56 | ) | | | | — | | | | | (0.43) | | | | | (0.43) | | | | | 0.00 | | | | | 22.02 | | | | | (2.6 | ) | | | | 265,145 | | | | | (0.27) | | | | | 1.40(e) | | | | | 1.41 | | | | | 13 | |
2014 | | | | 23.81 | | | | | (0.22) | | | | | 0.80 | | | | | 0.58 | | | | | — | | | | | (1.38) | | | | | (1.38) | | | | | 0.00 | | | | | 23.01 | | | | | 2.2 | | | | | 365,022 | | | | | (0.90) | | | | | 1.41 | | | | | 1.42 | | | | | 14 | |
Class A | | | | | | | | | | | | | | | | | | | | | | | | | | | | | | | | | | | | | | | | | | | | | | | | | | | | | | | | | | | | | | | | | | | | | | | | | | | |
2018 | | | $ | 28.42 | | | | $ | (0.14) | | | | | $1.28 | | | | $ | 1.14 | | | | | — | | | | $ | (1.81) | | | | $ | (1.81) | | | | $ | 0.00 | | | | $ | 27.75 | | | | | 4.1 | % | | | $ | 111,572 | | | | | (0.50) | % | | | | 1.65%(e) | | | | | 1.65% | | | | | 9 | % |
2017 | | | | 24.01 | | | | | (0.18) | | | | | 5.78 | | | | | 5.60 | | | | | — | | | | | (1.19) | | | | | (1.19) | | | | | 0.00 | | | | | 28.42 | | | | | 24.1 | | | | | 169,017 | | | | | (0.72) | | | | | 1.66(e) | | | | | 1.67 | | | | | 8 | |
2016 | | | | 21.43 | | | | | (0.20) | | | | | 3.30 | | | | | 3.10 | | | | | — | | | | | (0.52) | | | | | (0.52) | | | | | 0.00 | | | | | 24.01 | | | | | 14.6 | | | | | 141,893 | | | | | (0.92) | | | | | 1.66(e) | | | | | 1.66 | | | | | 6 | |
2015 | | | | 22.45 | | | | | (0.12) | | | | | (0.47) | | | | | (0.59 | ) | | | | — | | | | | (0.43) | | | | | (0.43) | | | | | 0.00 | | | | | 21.43 | | | | | (2.8 | ) | | | | 154,000 | | | | | (0.51) | | | | | 1.65(e) | | | | | 1.66 | | | | | 13 | |
2014 | | | | 23.32 | | | | | (0.27) | | | | | 0.78 | | | | | 0.51 | | | | | — | | | | | (1.38) | | | | | (1.38) | | | | | 0.00 | | | | | 22.45 | | | | | 2.0 | | | | | 175,108 | | | | | (1.16) | | | | | 1.66 | | | | | 1.67 | | | | | 14 | |
Class C | | | | | | | | | | | | | | | | | | | | | | | | | | | | | | | | | | | | | | | | | | | | | | | | | | | | | | | | | | | | | | | | | | | | | | | | | | | |
2018 | | | $ | 25.24 | | | | $ | (0.24) | | | | | $1.13 | | | | $ | 0.89 | | | | | — | | | | $ | (1.81) | | | | $ | (1.81) | | | | $ | 0.00 | | | | $ | 24.32 | | | | | 3.6 | % | | | $ | 166,600 | | | | | (1.00) | % | | | | 2.15%(e) | | | | | 2.15% | | | | | 9 | % |
2017 | | | | 21.55 | | | | | (0.27) | | | | | 5.15 | | | | | 4.88 | | | | | — | | | | | (1.19) | | | | | (1.19) | | | | | 0.00 | | | | | 25.24 | | | | | 23.5 | | | | | 180,282 | | | | | (1.21) | | | | | 2.16(e) | | | | | 2.17 | | | | | 8 | |
2016 | | | | 19.38 | | | | | (0.28) | | | | | 2.97 | | | | | 2.69 | | | | | — | | | | | (0.52) | | | | | (0.52) | | | | | 0.00 | | | | | 21.55 | | | | | 14.1 | | | | | 175,241 | | | | | (1.41) | | | | | 2.16(e) | | | | | 2.16 | | | | | 6 | |
2015 | | | | 20.44 | | | | | (0.21) | | | | | (0.42) | | | | | (0.63 | ) | | | | — | | | | | (0.43) | | | | | (0.43) | | | | | 0.00 | | | | | 19.38 | | | | | (3.2 | ) | | | | 187,216 | | | | | (1.01) | | | | | 2.15(e) | | | | | 2.16 | | | | | 13 | |
2014 | | | | 21.46 | | | | | (0.36) | | | | | 0.72 | | | | | 0.36 | | | | | — | | | | | (1.38) | | | | | (1.38) | | | | | 0.00 | | | | | 20.44 | | | | | 1.4 | | | | | 208,795 | | | | | (1.66) | | | | | 2.16 | | | | | 2.17 | | | | | 14 | |
Class I | | | | | | | | | | | | | | | | | | | | | | | | | | | | | | | | | | | | | | | | | | | | | | | | | | | | | | | | | | | | | | | | | | | | | | | | | | | |
2018 | | | $ | 30.02 | | | | $ | 0.00 | (c) | | | | $1.36 | | | | $ | 1.36 | | | | | — | | | | $ | (1.81) | | | | $ | (1.81) | | | | $ | 0.00 | | | | $ | 29.57 | | | | | 4.7 | % | | | $ | 930,953 | | | | | 0.00 | %(f) | | | | 1.15%(e) | | | | | 1.15% | | | | | 9 | % |
2017 | | | | 25.18 | | | | | (0.06) | | | | | 6.09 | | | | | 6.03 | | | | | — | | | | | (1.19) | | | | | (1.19) | | | | | 0.00 | | | | | 30.02 | | | | | 24.7 | | | | | 728,641 | | | | | (0.22) | | | | | 1.16(e) | | | | | 1.17 | | | | | 8 | |
2016 | | | | 22.34 | | | | | (0.10) | | | | | 3.46 | | | | | 3.36 | | | | | — | | | | | (0.52) | | | | | (0.52) | | | | | 0.00 | | | | | 25.18 | | | | | 15.2 | | | | | 476,493 | | | | | (0.44) | | | | | 1.16(e) | | | | | 1.16 | | | | | 6 | |
2015 | | | | 23.27 | | | | | (0.00) | (c) | | | | (0.50) | | | | | (0.50 | ) | | | | — | | | | | (0.43) | | | | | (0.43) | | | | | 0.00 | | | | | 22.34 | | | | | (2.3 | ) | | | | 488,846 | | | | | (0.01) | | | | | 1.15(e) | | | | | 1.16 | | | | | 13 | |
2014 | | | | 24.02 | | | | | (0.16) | | | | | 0.79 | | | | | 0.63 | | | | | — | | | | | (1.38) | | | | | (1.38) | | | | | 0.00 | | | | | 23.27 | | | | | 2.4 | | | | | 519,459 | | | | | (0.67) | | | | | 1.16 | | | | | 1.17 | | | | | 14 | |
| † | Total return represents aggregate total return of a hypothetical $1,000 investment at the beginning of the year and sold at the end of the year including reinvestment of distributions and does not reflect the applicable sales charges. |
| (a) | Per share data are calculated using the average shares outstanding method. |
| (b) | Due to capital share activity, net investment income (loss), per share and the ratio to average net assets are not necessarily correlated among the different classes of shares. |
| (c) | Amount represents less than $0.005 per share. |
| (d) | Before advisory fee reduction on unsupervised assets totaling 0.01%, 0.01%, and 0.01% of net assets for the years ended September 30, 2017, 2015, and 2014, respectively. For the years ended September 30, 2016 and 2018 there was no impact on the expense ratios. |
| (e) | The Fund received credits from a designated broker who agreed to pay certain Fund operating expenses. For the years ended September 30, 2018, 2017, 2016, and 2015, there was no impact on the expense ratios. |
| (f) | Amount represents less than 0.005%. |
See accompanying notes to financial statements.
44
TETON Westwood Funds
Financial Highlights
Selected data for a share of beneficial interest outstanding throughout each year:
| | | | | | | | | | | | | | | | | | | | | | | | | | | | | | | | | | | | | | | | | | | | | | | | | | | | | | | | | | |
Year Ended
September 30 | | Net Asset
Value,
Beginning
of Year | | | Income (Loss) from Investment Operations | | | Distributions to Shareholders | | | Redemption
Fees(b) | | | Net Asset
Value,
End of
Year | | | Total
Return† | | | Ratios to Average Net Assets/Supplemental Data | |
| | Net
Investment
Income
(Loss)(a) | | | Net
Realized and
Unrealized
Gain (Loss) on
Investments | | Total From
Investment
Operations | | | Net
Investment
Income | | | Net
Realized
Gain on
Investments | | | Total
Distributions | | | Net Assets,
End of
Year
(in 000’s) | | | Net
Investment
Income
(Loss) | | | Operating
Expenses
Net of
Waivers/
Reimbursements | | | Operating
Expenses
Before
Waivers/
Reimbursements | | | Portfolio
Turnover
Rate | |
SmallCap Equity Fund | | | | | | | | | | | | | | | | | | | | | | | | | | | | | | | | | | | | | | | | | | | | | | | | |
Class AAA | | | | | | | | | | | | | | | | | | | | | | | | | | | | | | | | | | | | | | | | | | | | | | | | | | | | | | | | | | |
2018 | | $ | 21.37 | | | $ | (0.02 | ) | | $2.00 | | $ | 1.98 | | | | — | | | $ | (1.86 | ) | | $ | (1.86 | ) | | | — | | | $ | 21.49 | | | | 9.7 | % | | $ | 9,286 | | | | (0.08 | )% | | | 1.25%(c) | | | | 1.72% | | | | 32 | % |
2017 | | | 19.03 | | | | (0.04 | ) | | 4.17 | | | 4.13 | | | | — | | | | (1.79 | ) | | | (1.79 | ) | | $ | 0.00 | | | | 21.37 | | | | 23.1 | | | | 9,295 | | | | (0.22 | ) | | | 1.36(c) | | | | 1.74 | | | | 38 | |
2016 | | | 18.54 | | | | (0.04 | ) | | 3.57 | | | 3.53 | | | | — | | | | (3.04 | ) | | | (3.04 | ) | | | 0.00 | | | | 19.03 | | | | 21.1 | | | | 10,855 | | | | (0.25 | ) | | | 1.50(c) | | | | 1.79 | | | | 18 | |
2015 | | | 20.52 | | | | (0.09 | ) | | (0.29) | | | (0.38 | ) | | | — | | | | (1.60 | ) | | | (1.60 | ) | | | — | | | | 18.54 | | | | (2.4 | ) | | | 7,721 | | | | (0.47 | ) | | | 1.50(c) | | | | 1.66 | | | | 23 | |
2014 | | | 19.83 | | | | (0.07 | ) | | 0.76 | | | 0.69 | | | | — | | | | — | | | | — | | | | 0.00 | | | | 20.52 | | | | 3.5 | | | | 15,649 | | | | (0.35 | ) | | | 1.50 | | | | 1.57 | | | | 13 | |
Class A | | | | | | | | | | | | | | | | | | | | | | | | | | | | | | | | | | | | | | | | | | | | | | | | | | | | | | | | | | |
2018 | | $ | 20.50 | | | $ | (0.07 | ) | | $1.91 | | $ | 1.84 | | | | — | | | $ | (1.86 | ) | | $ | (1.86 | ) | | | — | | | $ | 20.48 | | | | 9.4 | % | | $ | 5,024 | | | | (0.33 | )% | | | 1.50%(c) | | | | 1.97% | | | | 32 | % |
2017 | | | 18.37 | | | | (0.09 | ) | | 4.01 | | | 3.92 | | | | — | | | | (1.79 | ) | | | (1.79 | ) | | $ | 0.00 | | | | 20.50 | | | | 22.8 | | | | 3,580 | | | | (0.47 | ) | | | 1.60(c) | | | | 1.99 | | | | 38 | |
2016 | | | 18.02 | | | | (0.08 | ) | | 3.47 | | | 3.39 | | | | — | | | | (3.04 | ) | | | (3.04 | ) | | | 0.00 | | | | 18.37 | | | | 20.9 | | | | 2,871 | | | | (0.49 | ) | | | 1.75(c) | | | | 2.04 | | | | 18 | |
2015 | | | 20.05 | | | | (0.14 | ) | | (0.29) | | | (0.43 | ) | | | — | | | | (1.60 | ) | | | (1.60 | ) | | | — | | | | 18.02 | | | | (2.7 | ) | | | 3,258 | | | | (0.71 | ) | | | 1.75(c) | | | | 1.91 | | | | 23 | |
2014 | | | 19.41 | | | | (0.12 | ) | | 0.76 | | | 0.64 | | | | — | | | | — | | | | — | | | | 0.00 | | | | 20.05 | | | | 3.3 | | | | 4,269 | | | | (0.60 | ) | | | 1.75 | | | | 1.82 | | | | 13 | |
Class C | | | | | | | | | | | | | | | | | | | | | | | | | | | | | | | | | | | | | | | | | | | | | | | | | | | | | | | | | | |
2018 | | $ | 18.04 | | | $ | (0.15 | ) | | $1.66 | | $ | 1.51 | | | | — | | | $ | (1.86 | ) | | $ | (1.86 | ) | | | — | | | $ | 17.69 | | | | 8.8 | % | | $ | 2,895 | | | | (0.83 | )% | | | 2.00%(c) | | | | 2.47% | | | | 32 | % |
2017 | | | 16.43 | | | | (0.16 | ) | | 3.56 | | | 3.40 | | | | — | | | | (1.79 | ) | | | (1.79 | ) | | $ | 0.00 | | | | 18.04 | | | | 22.2 | | | | 2,247 | | | | (0.97 | ) | | | 2.11(c) | | | | 2.49 | | | | 38 | |
2016 | | | 16.49 | | | | (0.15 | ) | | 3.13 | | | 2.98 | | | | — | | | | (3.04 | ) | | | (3.04 | ) | | | 0.00 | | | | 16.43 | | | | 20.2 | | | | 2,268 | | | | (0.99 | ) | | | 2.25(c) | | | | 2.54 | | | | 18 | |
2015 | | | 18.56 | | | | (0.22 | ) | | (0.25) | | | (0.47 | ) | | | — | | | | (1.60 | ) | | | (1.60 | ) | | | — | | | | 16.49 | | | | (3.2 | ) | | | 3,081 | | | | (1.21 | ) | | | 2.25(c) | | | | 2.41 | | | | 23 | |
2014 | | | 18.06 | | | | (0.21 | ) | | 0.71 | | | 0.50 | | | | — | | | | — | | | | — | | | | 0.00 | | | | 18.56 | | | | 2.8 | | | | 4,186 | | | | (1.10 | ) | | | 2.25 | | | | 2.32 | | | | 13 | |
Class I | | | | | | | | | | | | | | | | | | | | | | | | | | | | | | | | | | | | | | | | | | | | | | | | | | | | | | | | | | |
2018 | | $ | 22.04 | | | $ | 0.04 | | | $2.05 | | $ | 2.09 | | | | — | | | $ | (1.86 | ) | | $ | (1.86 | ) | | | — | | | $ | 22.27 | | | | 9.9 | % | | $ | 21,688 | | | | 0.17 | % | | | 1.00%(c) | | | | 1.47% | | | | 32 | % |
2017 | | | 19.53 | | | | 0.01 | | | 4.29 | | | 4.30 | | | | — | | | | (1.79 | ) | | | (1.79 | ) | | $ | 0.00 | | | | 22.04 | | | | 23.4 | | | | 17,501 | | | | 0.03 | | | | 1.09(c) | | | | 1.49 | | | | 38 | |
2016 | | | 18.90 | | | | 0.00 | (b) | | 3.67 | | | 3.67 | | | | — | | | | (3.04 | ) | | | (3.04 | ) | | | 0.00 | | | | 19.53 | | | | 21.5 | | | | 10,883 | | | | 0.00 | | | | 1.25(c) | | | | 1.54 | | | | 18 | |
2015 | | | 20.85 | | | | (0.04 | ) | | (0.31) | | | (0.35 | ) | | | — | | | | (1.60 | ) | | | (1.60 | ) | | | — | | | | 18.90 | | | | (2.2 | ) | | | 9,778 | | | | (0.21 | ) | | | 1.25(c) | | | | 1.41 | | | | 23 | |
2014 | | | 20.09 | | | | (0.02 | ) | | 0.78 | | | 0.76 | | | | — | | | | — | | | | — | | | | 0.00 | | | | 20.85 | | | | 3.8 | | | | 17,230 | | | | (0.09 | ) | | | 1.25 | | | | 1.32 | | | | 13 | |
| † | Total return represents aggregate total return of a hypothetical $1,000 investment at the beginning of the year and sold at the end of the year including reinvestment of distributions and does not reflect the applicable sales charges. |
| (a) | Per share data are calculated using the average shares outstanding method. |
| (b) | Amount represents less than $0.005 per share. |
| (c) | The Fund received credits from a designated broker who agreed to pay certain Fund operating expenses. Had such payments not been received during the year ended September 30, 2016, the expense ratios would have been 1.51%, 1.76%, 2.26%, and 1.26% for Class AAA, Class A, Class C, and Class I, respectively. For the years ended September 30, 2018, 2017, and 2015, these credits had no material impact on the expense ratios. |
See accompanying notes to financial statements.
45
TETON Westwood Funds
Financial Highlights
Selected data for a share of beneficial interest outstanding throughout each year:
| | | | | | | | | | | | | | | | | | | | | | | | | | | | | | | | | | | | | | | | | | | | | | | | | | | | |
| | | | | | Income (Loss) from Investment Operations | | | Distributions to Shareholders | | | | | | | | | Ratios to Average Net Assets/Supplemental Data | |
Year Ended
September 30 | | Net Asset
Value,
Beginning
of Year | | | Net
Investment
Income (Loss)(a) | | | Net
Realized and
Unrealized
Gain on
Investments | | Total From
Investment
Operations | | | Net
Investment
Income | | | Net
Realized
Gain on
Investments | | | Total
Distributions | | | Net Asset
Value,
End of
Year | | | Total
Return† | | | Net Assets,
End of
Year
(in 000’s) | | | Net Investment
Income/Loss | | | Operating
Expenses
Net of
Waivers/
Reimbursements | | | Operating
Expenses
Before Waivers/
Reimbursements | | Portfolio
Turnover
Rate | |
Mid-Cap Equity Fund | | | | | | | | | | | | | | | | | | | | | | | | | | | | | | | | | | | | | | | | | | |
Class AAA | | | | | | | | | | | | | | | | | | | | | | | | | | | | | | | | | | | | | | | | | | | | | | | | | | | | |
2018 | | $ | 13.31 | | | $ | 0.00 | | | $0.95 | | $ | 0.95 | | | | — | | | $ | (0.57 | ) | | $ | (0.57 | ) | | $ | 13.69 | | | | 7.4 | % | | $ | 813 | | | | (0.00 | )%* | | | 1.05 | %(b) | | 3.74% | | | 13 | % |
2017 | | | 11.88 | | | | (0.03 | ) | | 1.60 | | | 1.57 | | | | — | | | | (0.14 | ) | | | (0.14 | ) | | | 13.31 | | | | 13.4 | | | | 805 | | | | (0.23 | ) | | | 1.05(b) | | | 3.39 | | | 34 | |
2016 | | | 11.43 | | | | (0.04 | ) | | 0.97 | | | 0.93 | | | | — | | | | (0.48 | ) | | | (0.48 | ) | | | 11.88 | | | | 8.2 | | | | 1,810 | | | | (0.40 | ) | | | 1.34(b)(c) | | | 3.26 | | | 15 | |
2015 | | | 11.54 | | | | (0.06 | ) | | 0.07 | | | 0.01 | | | | — | | | | (0.12 | ) | | | (0.12 | ) | | | 11.43 | | | | 0.1 | | | | 2,004 | | | | (0.52 | ) | | | 1.51(b)(c) | | | 2.74 | | | 25 | |
2014 | | | 10.48 | | | | (0.04 | ) | | 1.10 | | | 1.06 | | | | — | | | | (0.00 | )(d) | | | (0.00 | )(d) | | | 11.54 | | | | 10.2 | | | | 1,679 | | | | (0.39 | ) | | | 1.51(c) | | | 4.27 | | | 22 | |
Class A | | | | | | | | | | | | | | | | | | | | | | | | | | | | | | | | | | | | | | | | | | | | | | | | | | | | |
2018 | | $ | 13.16 | | | $ | (0.03 | ) | | $0.94 | | $ | 0.91 | | | | — | | | $ | (0.57 | ) | | $ | (0.57 | ) | | $ | 13.50 | | | | 7.1 | % | | $ | 191 | | | | (0.26 | )% | | | 1.30%(b) | | | 3.99% | | | 13 | % |
2017 | | | 11.78 | | | | (0.06 | ) | | 1.58 | | | 1.52 | | | | — | | | | (0.14 | ) | | | (0.14 | ) | | | 13.16 | | | | 13.1 | | | | 203 | | | | (0.45 | ) | | | 1.30(b) | | | 3.64 | | | 34 | |
2016 | | | 11.37 | | | | (0.07 | ) | | 0.96 | | | 0.89 | | | | — | | | | (0.48 | ) | | | (0.48 | ) | | | 11.78 | | | | 7.9 | | | | 309 | | | | (0.65 | ) | | | 1.63(b)(c) | | | 3.44 | | | 15 | |
2015 | | | 11.51 | | | | (0.09 | ) | | 0.07 | | | (0.02 | ) | | | — | | | | (0.12 | ) | | | (0.12 | ) | | | 11.37 | | | | (0.2 | ) | | | 593 | | | | (0.77 | ) | | | 1.76(b)(c) | | | 2.99 | | | 25 | |
2014 | | | 10.47 | | | | (0.08 | ) | | 1.12 | | | 1.04 | | | | — | | | | (0.00 | )(d) | | | (0.00 | )(d) | | | 11.51 | | | | 10.0 | | | | 682 | | | | (0.69 | ) | | | 1.76(c) | | | 4.52 | | | 22 | |
Class C | | | | | | | | | | | | | | | | | | | | | | | | | | | | | | | | | | | | | | | | | | | | | | | | | | | | |
2018 | | $ | 12.87 | | | $ | (0.09 | ) | | $0.91 | | $ | 0.82 | | | | — | | | $ | (0.57 | ) | | $ | (0.57 | ) | | $ | 13.12 | | | | 6.6 | % | | $ | 441 | | | | (0.72 | )% | | | 1.80%(b) | | | 4.49% | | | 13 | % |
2017 | | | 11.58 | | | | (0.11 | ) | | 1.54 | | | 1.43 | | | | — | | | | (0.14 | ) | | | (0.14 | ) | | | 12.87 | | | | 12.5 | | | | 195 | | | | (0.95 | ) | | | 1.80(b) | | | 4.14 | | | 34 | |
2016 | | | 11.24 | | | | (0.12 | ) | | 0.94 | | | 0.82 | | | | — | | | | (0.48 | ) | | | (0.48 | ) | | | 11.58 | | | | 7.4 | | | | 193 | | | | (1.17 | ) | | | 2.11(b)(c) | | | 3.98 | | | 15 | |
2015 | | | 11.43 | | | | (0.15 | ) | | 0.08 | | | (0.07 | ) | | | — | | | | (0.12 | ) | | | (0.12 | ) | | | 11.24 | | | | (0.6 | ) | | | 274 | | | | (1.27 | ) | | | 2.26(b)(c) | | | 3.49 | | | 25 | |
2014 | | | 10.45 | | | | (0.13 | ) | | 1.11 | | | 0.98 | | | | — | | | | (0.00 | )(d) | | | (0.00 | )(d) | | | 11.43 | | | | 9.4 | | | | 239 | | | | (1.17 | ) | | | 2.26(c) | | | 5.02 | | | 22 | |
Class I | | | | | | | | | | | | | | | | | | | | | | | | | | | | | | | | | | | | | | | | | | | | | | | | | | | | |
2018 | | $ | 13.48 | | | $ | 0.03 | | | $0.96 | | $ | 0.99 | | | | — | | | $ | (0.57 | ) | | $ | (0.57 | ) | | $ | 13.90 | | | | 7.6 | % | | $ | 1,794 | | | | 0.25 | % | | | 0.80%(b) | | | 3.49% | | | 13 | % |
2017 | | | 12.00 | | | | 0.01 | | | 1.61 | | | 1.62 | | | | — | | | | (0.14 | ) | | | (0.14 | ) | | | 13.48 | | | | 13.7 | | | | 1,788 | | | | 0.05 | | | | 0.80(b) | | | 3.14 | | | 34 | |
2016 | | | 11.49 | | | | 0.00 | | | 0.99 | | | 0.99 | | | | — | | | | (0.48 | ) | | | (0.48 | ) | | | 12.00 | | | | 8.7 | | | | 1,760 | | | | 0.04 | | | | 0.90(b)(c) | | | 3.00 | | | 15 | |
2015 | | | 11.57 | | | | (0.03 | ) | | 0.07 | | | 0.04 | | | | — | | | | (0.12 | ) | | | (0.12 | ) | | | 11.49 | | | | 0.3 | | | | 2,079 | | | | (0.27 | ) | | | 1.26(b)(c) | | | 2.49 | | | 25 | |
2014 | | | 10.48 | | | | (0.01 | ) | | 1.11 | | | 1.10 | | | $ | (0.01 | ) | | | (0.00 | )(d) | | | (0.01 | ) | | | 11.57 | | | | 10.5 | | | | 2,345 | | | | (0.09 | ) | | | 1.26(c) | | | 4.02 | | | 22 | |
| † | Total return represents aggregate total return of a hypothetical $1,000 investment at the beginning of the year and sold at the end of the year including reinvestment of distributions and does not reflect the applicable sales charges. |
| (a) | Per share data are calculated using the average shares outstanding method. |
| (b) | The Fund received credits from a designated broker who agreed to pay certain Fund operating expenses. Had such payments not been received, the expense ratios for the years ended September 30, 2018, 2017, 2016, and 2015 would have been 1.09%, 1.08%, 1.39%, and 1.54% (Class AAA), 1.34%, 1.33%, 1.68%, and 1.79% (Class A), 1.84%, 1.83%, 2.16%, and 2.29% (Class C), and 0.84%, 0.83%, 0.95%, and 1.29% (Class I Shares), respectively. |
| (c) | The Fund incurred interest expense during the years ended September 2016, 2015, and 2014. For the year ended September 30, 2016, there was no material impact on the expense ratios. For the years ended September 30, 2015 and 2014, if interest expense had not been incurred, the ratio of operating expenses to average net assets would have been 1.33% and 1.50% (Class AAA), 1.62% and 1.75% (Class A), 2.10% and 2.25% (Class C), 0.89% and 1.25% (Class I), respectively. |
| (d) | Amount represents less than $0.005 per share. |
| * | Amount represents greater than (0.05)%. |
See accompanying notes to financial statements.
46
TETON Westwood Funds
Financial Highlights
Selected data for a share of beneficial interest outstanding throughout each year:
| | | | | | | | | | | | | | | | | | | | | | | | | | | | | | | | | | | | | | | | | | | | | | | | | | | | | | | | | | | | | | | | | | | | | | | | | | | |
| | | | | Income (Loss) from Investment Operations | | Distributions to Shareholders | | | | | | | | Ratios to Average Net Assets/Supplemental Data |
Year Ended
September 30 | | Net Asset Value,
Beginning of Year | | Net
Investment
Income
(Loss)(a) | | Net
Realized and
Unrealized
Gain (Loss) on
Investments | | Total From
Investment
Operations | | Net
Investment
Income | | Net
Realized
Gain on
Investments | | Total
Distributions | | Redemption
Fees(a) | | Net Asset
Value,
End of Year | | Total Return† | | Net Assets,
End of Year
(in 000’s) | | Net
Investment
Income
(Loss) | | Operating
Expenses
Net of
Waivers/
Reimbursements | | Operating
Expenses
Before Waivers/
Reimbursements | | Portfolio
Turnover
Rate |
Convertible Securities Fund | | | | | | | | | | | | | | | | | | | | | | | | | | | | | | | | | | | | | | | | | | | | | | | | | | | | | | | | | | | | | |
Class AAA | | | | | | | | | | | | | | | | | | | | | | | | | | | | | | | | | | | | | | | | | | | | | | | | | | | | | | | | | | | | | | | | | | | | | | | | | | | |
2018 | | | $ | 12.41 | | | | $ | 0.04 | | | | | $1.73 | | | | $ | 1.77 | | | | $ | (0.20) | | | | | — | | | | $ | (0.20) | | | | | — | | | | $ | 13.98 | | | | | 14.4 | % | | | $ | 4,523 | | | | | 0.34 | % | | | | 1.15 | %(b) | | | | 2.03% | | | | | 35 | % |
2017 | | | | 11.59 | | | | | 0.07 | | | | | 1.49 | | | | | 1.56 | | | | | (0.21) | | | | $ | (0.53 | ) | | | | (0.74) | | | | | — | | | | | 12.41 | | | | | 14.1 | | | | | 4,138 | | | | | 0.57 | | | | | 1.15 | | | | | 2.47 | | | | | 40 | |
2016 | | | | 10.53 | | | | | 0.04 | | | | | 1.05 | | | | | 1.09 | | | | | (0.03) | | | | | — | | | | | (0.03) | | | | | — | | | | | 11.59 | | | | | 10.4 | | | | | 4,240 | | | | | 0.38 | | | | | 2.00 | (b) | | | | 2.74 | | | | | 20 | |
2015 | | | | 11.79 | | | | | 0.04 | | | | | (1.27) | | | | | (1.23 | ) | | | | (0.03) | | | | | — | | | | | (0.03) | | | | | — | | | | | 10.53 | | | | | (10.5 | ) | | | | 5,525 | | | | | 0.31 | | | | | 2.00 | (b) | | | | 2.40 | | | | | 19 | |
2014 | | | | 10.40 | | | | | 0.21 | | | | | 1.38 | | | | | 1.59 | | | | | (0.20) | | | | | — | | | | | (0.20) | | | | $ | 0.00 | (c) | | | | 11.79 | | | | | 15.5 | | | | | 6,240 | | | | | 1.86 | | | | | 2.00 | | | | | 2.42 | | | | | 31 | |
Class A | | | | | | | | | | | | | | | | | | | | | | | | | | | | | | | | | | | | | | | | | | | | | | | | | | | | | | | | | | | | | | | | | | | | | | | | | | | |
2018 | | | $ | 12.79 | | | | $ | 0.01 | | | | | $1.80 | | | | $ | 1.81 | | | | $ | (0.17) | | | | | — | | | | $ | (0.17) | | | | | — | | | | $ | 14.43 | | | | | 14.2 | % | | | $ | 3,711 | | | | | 0.09 | % | | | | 1.40 | % | | | | 2.28% | | | | | 35 | % |
2017 | | | | 11.94 | | | | | 0.05 | | | | | 1.52 | | | | | 1.57 | | | | | (0.19) | | | | $ | (0.53 | ) | | | | (0.72) | | | | | — | | | | | 12.79 | | | | | 13.8 | | | | | 2,670 | | | | | 0.42 | | | | | 1.40 | | | | | 2.72 | | | | | 40 | |
2016 | | | | 10.87 | | | | | 0.01 | | | | | 1.08 | | | | | 1.09 | | | | | (0.02) | | | | | — | | | | | (0.02) | | | | | — | | | | | 11.94 | | | | | 10.1 | | | | | 1,191 | | | | | 0.10 | | | | | 2.25 | (b) | | | | 2.99 | | | | | 20 | |
2015 | | | | 12.18 | | | | | 0.01 | | | | | (1.30) | | | | | (1.29 | ) | | | | (0.02) | | | | | — | | | | | (0.02) | | | | | — | | | | | 10.87 | | | | | (10.6 | ) | | | | 1,081 | | | | | 0.06 | | | | | 2.25 | (b) | | | | 2.65 | | | | | 19 | |
2014 | | | | 10.75 | | | | | 0.19 | | | | | 1.43 | | | | | 1.62 | | | | | (0.19) | | | | | — | | | | | (0.19) | | | | $ | 0.00 | (c) | | | | 12.18 | | | | | 15.2 | | | | | 1,013 | | | | | 1.63 | | | | | 2.25 | | | | | 2.67 | | | | | 31 | |
Class C | | | | | | | | | | | | | | | | | | | | | | | | | | | | | | | | | | | | | | | | | | | | | | | | | | | | | | | | | | | | | | | | | | | | | | | | | | | |
2018 | | | $ | 13.62 | | | | $ | (0.06 | ) | | | | $1.90 | | | | $ | 1.84 | | | | $ | (0.10) | | | | | — | | | | $ | (0.10) | | | | | — | | | | $ | 15.36 | | | | | 13.6 | % | | | $ | 2,960 | | | | | (0.40) | % | | | | 1.90 | % | | | | 2.78% | | | | | 35 | % |
2017 | | | | 12.69 | | | | | (0.02 | ) | | | | 1.63 | | | | | 1.61 | | | | | (0.15) | | | | $ | (0.53 | ) | | | | (0.68) | | | | | — | | | | | 13.62 | | | | | 13.3 | | | | | 1,307 | | | | | (0.19) | | | | | 1.90 | | | | | 3.22 | | | | | 40 | |
2016 | | | | 11.59 | | | | | (0.04 | ) | | | | 1.14 | | | | | 1.10 | | | | | (0.00) | (c) | | | | — | | | | | (0.00)(c) | | | | | — | | | | | 12.69 | | | | | 9.6 | | | | | 873 | | | | | (0.37) | | | | | 2.75 | (b) | | | | 3.49 | | | | | 20 | |
2015 | | | | 13.04 | | | | | (0.06 | ) | | | | (1.39) | | | | | (1.45 | ) | | | | (0.00) | (c) | | | | — | | | | | (0.00)(c) | | | | | — | | | | | 11.59 | | | | | (11.1 | ) | | | | 943 | | | | | (0.44) | | | | | 2.75 | (b) | | | | 3.15 | | | | | 19 | |
2014 | | | | 11.54 | | | | | 0.17 | | | | | 1.50 | | | | | 1.67 | | | | | (0.17) | | | | | — | | | | | (0.17) | | | | $ | 0.00 | (c) | | | | 13.04 | | | | | 14.6 | | | | | 1,045 | | | | | 1.30 | | | | | 2.75 | | | | | 3.17 | | | | | 31 | |
Class I | | | | | | | | | | | | | | | | | | | | | | | | | | | | | | | | | | | | | | | | | | | | | | | | | | | | | | | | | | | | | | | | | | | | | | | | | | | |
2018 | | | $ | 12.44 | | | | $ | 0.08 | | | | | $1.75 | | | | $ | 1.83 | | | | $ | (0.24) | | | | | — | | | | $ | (0.24) | | | | | — | | | | $ | 14.03 | | | | | 14.8 | % | | | $ | 18,097 | | | | | 0.56 | % | | | | 0.90 | % | | | | 1.78% | | | | | 35 | % |
2017 | | | | 11.61 | | | | | 0.12 | | | | | 1.48 | | | | | 1.60 | | | | | (0.24) | | | | $ | (0.53 | ) | | | | (0.77) | | | | | — | | | | | 12.44 | | | | | 14.5 | | | | | 6,636 | | | | | 1.00 | | | | | 0.90 | | | | | 2.22 | | | | | 40 | |
2016 | | | | 10.56 | | | | | 0.07 | | | | | 1.04 | | | | | 1.11 | | | | | (0.06) | | | | | — | | | | | (0.06) | | | | | — | | | | | 11.61 | | | | | 10.6 | | | | | 394 | | | | | 0.61 | | | | | 1.75 | (b) | | | | 2.49 | | | | | 20 | |
2015 | | | | 11.80 | | | | | 0.07 | | | | | (1.27) | | | | | (1.20 | ) | | | | (0.04) | | | | | — | | | | | (0.04) | | | | | — | | | | | 10.56 | | | | | (10.2 | ) | | | | 251 | | | | | 0.56 | | | | | 1.75 | (b) | | | | 2.15 | | | | | 19 | |
2014 | | | | 10.40 | | | | | 0.24 | | | | | 1.39 | | | | | 1.63 | | | | | (0.23) | | | | | — | | | | | (0.23) | | | | $ | 0.00 | (c) | | | | 11.80 | | | | | 15.8 | | | | | 290 | | | | | 2.15 | | | | | 1.75 | | | | | 2.17 | | | | | 31 | |
| † | Total return represents aggregate total return of a hypothetical $1,000 investment at the beginning of the year and sold at the end of the year including reinvestment of distributions and does not reflect the applicable sales charges. |
| (a) | Per share data are calculated using the average shares outstanding method. |
| (b) | The Fund received credits from a designated broker who agreed to pay certain Fund operating expenses. Had such payments not been received, the expense ratios for the years ended September 30, 2016 and 2015 would have been 2.01% and 2.02% (Class AAA), 2.26% and 2.27% (Class A), 2.76% and 2.77% (Class C), and 1.76% and 1.77% (Class I Shares), respectively. For the year ended September 30, 2018, these credits had no impact on the expense ratios. |
| (c) | Amount represents less than $0.005 per share. |
See accompanying notes to financial statements.
47
TETON Westwood Funds
Financial Highlights
Selected data for a share of beneficial interest outstanding throughout each year:
| | | | | | | | | | | | | | | | | | | | | | | | | | | | | | | | | | | | | | | | | | | | | | | | | | | | | | | | | | | | | | | | | |
| | | | | Income (Loss) from Investment Operations | | Distributions to Shareholders | | | | | | Ratios to Average Net Assets/Supplemental Data |
Year Ended
September 30 | | Net Asset Value,
Beginning of Year | | Net Investment
Income (Loss)(a) | | Net Realized and
Unrealized
Gain (Loss) on
Investments | | Total From
Investment
Operations | | Net Investment
Income | | Net
Realized
Gain on
Investments | | Total Distributions | | Net Asset
Value,
End of Year | | Total Return† | | Net Assets,
End of Year
(in 000’s) | | Net
Investment
Income (Loss) | | Operating
Expenses(b) | | Portfolio
Turnover Rate |
Equity Fund | | | | | | | | | | | | | | | | | | | | | | | | | | | | | | | | | | | | | | | | | | | | | | | | | | | |
Class AAA | | | | | | | | | | | | | | | | | | | | | | | | | | | | | | | | | | | | | | | | | | | | | | | | | | | | | | | | | | | | | | | | | |
2018 | | | $ | 13.69 | | | | $ | 0.08 | | | | | $1.71 | | | | $ | 1.79 | | | | $ | (0.06) | | | | $ | (1.48) | | | | $ | (1.54) | | | | $ | 13.94 | | | | | 14.1 | % | | | $ | 54,595 | | | | | 0.59 | % | | | | 1.60%(c) | | | | | 33 | % |
2017 | | | | 12.59 | | | | | 0.06 | | | | | 1.91 | | | | | 1.97 | | | | | (0.07) | | | | | (0.80) | | | | | (0.87) | | | | | 13.69 | | | | | 16.6 | | | | | 54,159 | | | | | 0.50 | | | | | 1.62(c) | | | | | 28 | |
2016 | | | | 12.22 | | | | | 0.07 | | | | | 1.30 | | | | | 1.37 | | | | | (0.05) | | | | | (0.95) | | | | | (1.00) | | | | | 12.59 | | | | | 11.4 | | | | | 53,063 | | | | | 0.54 | | | | | 1.63(c) | | | | | 31 | |
2015 | | | | 13.65 | | | | | 0.05 | | | | | (0.09) | | | | | (0.04 | ) | | | | (0.06) | | | | | (1.33) | | | | | (1.39) | | | | | 12.22 | | | | | (0.9 | ) | | | | 53,238 | | | | | 0.37 | | | | | 1.59(c) | | | | | 28 | |
2014 | | | | 11.88 | | | | | 0.05 | | | | | 1.76 | | | | | 1.81 | | | | | (0.04) | | | | | — | | | | | (0.04) | | | | | 13.65 | | | | | 15.3 | | | | | 60,587 | | | | | 0.37 | | | | | 1.59 | | | | | 51 | |
Class A | | | | | | | | | | | | | | | | | | | | | | | | | | | | | | | | | | | | | | | | | | | | | | | | | | | | | | | | | | | | | | | | | |
2018 | | | $ | 13.64 | | | | $ | 0.05 | | | | | $1.71 | | | | $ | 1.76 | | | | $ | (0.02) | | | | $ | (1.48) | | | | $ | (1.50) | | | | $ | 13.90 | | | | | 13.9 | % | | | $ | 1,435 | | | | | 0.35 | % | | | | 1.85%(c) | | | | | 33 | % |
2017 | | | | 12.55 | | | | | 0.04 | | | | | 1.89 | | | | | 1.93 | | | | | (0.04) | | | | | (0.80) | | | | | (0.84) | | | | | 13.64 | | | | | 16.3 | | | | | 2,502 | | | | | 0.28 | | | | | 1.87(c) | | | | | 28 | |
2016 | | | | 12.19 | | | | | 0.03 | | | | | 1.31 | | | | | 1.34 | | | | | (0.03) | | | | | (0.95) | | | | | (0.98) | | | | | 12.55 | | | | | 11.2 | | | | | 3,719 | | | | | 0.29 | | | | | 1.88(c) | | | | | 31 | |
2015 | | | | 13.61 | | | | | 0.02 | | | | | (0.09) | | | | | (0.07 | ) | | | | (0.02) | | | | | (1.33) | | | | | (1.35) | | | | | 12.19 | | | | | (1.1 | ) | | | | 3,125 | | | | | 0.12 | | | | | 1.84(c) | | | | | 28 | |
2014 | | | | 11.84 | | | | | 0.02 | | | | | 1.76 | | | | | 1.78 | | | | | (0.01) | | | | | — | | | | | (0.01) | | | | | 13.61 | | | | | 15.0 | | | | | 3,329 | | | | | 0.12 | | | | | 1.84 | | | | | 51 | |
Class C | | | | | | | | | | | | | | | | | | | | | | | | | | | | | | | | | | | | | | | | | | | | | | | | | | | | | | | | | | | | | | | | | |
2018 | | | $ | 12.97 | | | | $ | (0.02 | ) | | | | $1.62 | | | | $ | 1.60 | | | | | — | | | | $ | (1.48) | | | | $ | (1.48) | | | | $ | 13.09 | | | | | 13.3 | % | | | $ | 449 | | | | | (0.17) | % | | | | 2.35%(c) | | | | | 33 | % |
2017 | | | | 11.99 | | | | | (0.03 | ) | | | | 1.81 | | | | | 1.78 | | | | | — | | | | | (0.80) | | | | | (0.80) | | | | | 12.97 | | | | | 15.7 | | | | | 685 | | | | | (0.25) | | | | | 2.37(c) | | | | | 28 | |
2016 | | | | 11.72 | | | | | (0.03 | ) | | | | 1.25 | | | | | 1.22 | | | | | — | | | | | (0.95) | | | | | (0.95) | | | | | 11.99 | | | | | 10.6 | | | | | 843 | | | | | (0.23) | | | | | 2.38(c) | | | | | 31 | |
2015 | | | | 13.18 | | | | | (0.05 | ) | | | | (0.08) | | | | | (0.13 | ) | | | | — | | | | | (1.33) | | | | | (1.33) | | | | | 11.72 | | | | | (1.6 | ) | | | | 684 | | | | | (0.37) | | | | | 2.34(c) | | | | | 28 | |
2014 | | | | 11.51 | | | | | (0.05 | ) | | | | 1.72 | | | | | 1.67 | | | | | — | | | | | — | | | | | — | | | | | 13.18 | | | | | 14.5 | | | | | 676 | | | | | (0.38) | | | | | 2.34 | | | | | 51 | |
Class I | | | | | | | | | | | | | | | | | | | | | | | | | | | | | | | | | | | | | | | | | | | | | | | | | | | | | | | | | | | | | | | | | |
2018 | | | $ | 13.66 | | | | $ | 0.11 | | | | | $1.72 | | | | $ | 1.83 | | | | $ | (0.10) | | | | $ | (1.48) | | | | $ | (1.58) | | | | $ | 13.91 | | | | | 14.5 | % | | | $ | 4,870 | | | | | 0.84 | % | | | | 1.35%(c) | | | | | 33 | % |
2017 | | | | 12.57 | | | | | 0.10 | | | | | 1.89 | | | | | 1.99 | | | | | (0.10) | | | | | (0.80) | | | | | (0.90) | | | | | 13.66 | | | | | 16.9 | | | | | 4,981 | | | | | 0.75 | | | | | 1.37(c) | | | | | 28 | |
2016 | | | | 12.21 | | | | | 0.09 | | | | | 1.30 | | | | | 1.39 | | | | | (0.08) | | | | | (0.95) | | | | | (1.03) | | | | | 12.57 | | | | | 11.7 | | | | | 4,258 | | | | | 0.77 | | | | | 1.38(c) | | | | | 31 | |
2015 | | | | 13.64 | | | | | 0.08 | | | | | (0.09) | | | | | (0.01 | ) | | | | (0.09) | | | | | (1.33) | | | | | (1.42) | | | | | 12.21 | | | | | (0.6 | ) | | | | 4,340 | | | | | 0.61 | | | | | 1.34(c) | | | | | 28 | |
2014 | | | | 11.89 | | | | | 0.08 | | | | | 1.74 | | | | | 1.82 | | | | | (0.07) | | | | | — | | | | | (0.07) | | | | | 13.64 | | | | | 15.4 | | | | | 3,547 | | | | | 0.60 | | | | | 1.34 | | | | | 51 | |
| † | Total return represents aggregate total return of a hypothetical $1,000 investment at the beginning of the year and sold at the end of the year including reinvestment of distributions and does not reflect the applicable sales charges. |
| (a) | Per share data are calculated using the average shares outstanding method. |
| (b) | The Fund incurred interest expense during the year ended September 30, 2014. This interest expense was paid for by prior years Custodian Fee Credits. The effect of interest expense was minimal. |
| (c) | The Fund received credits from a designated broker who agreed to pay certain Fund operating expenses. For the years ended September 30, 2018, 2017, 2016, and 2015, there was no impact on the expense ratios. |
See accompanying notes to financial statements.
48
TETON Westwood Funds
Financial Highlights
Selected data for a share of beneficial interest outstanding throughout each year:
| | | | | | | | | | | | | | | | | | | | | | | | | | | | | | | | | | | | | | | | | | | | | | | | | | | | | | | | | | | | | | | | | |
| | | | | Income (Loss) from Investment Operations | | Distributions to Shareholders | | | | | | Ratios to Average Net Assets/Supplemental Data |
Year Ended
September 30 | | Net Asset Value,
Beginning of Year | | Net Investment
Income(a) | | Net
Realized and
Unrealized
Gain (Loss) on
Investments | | Total From
Investment
Operations | | Net Investment
Income | | Net
Realized
Gain on
Investments | | Total
Distributions | | Net Asset
Value,
End of Year | | Total Return† | | Net Assets,
End of Year
(in 000’s) | | Net
Investment
Income | | Operating
Expenses†† | | Portfolio
Turnover Rate |
Balanced Fund | | | | | | | | | | | | | | | | | | | | | | | | | | | | | | | | | | | | | | | | | | | | | | | | | | | |
Class AAA | | | | | | | | | | | | | | | | | | | | | | | | | | | | | | | | | | | | | | | | | | | | | | | | | | | | | | | | | | | | | | | | | |
2018 | | | $ | 12.16 | | | | $ | 0.12 | | | | | $0.96 | | | | $ | 1.08 | | | | $ | (0.12) | | | | $ | (0.73) | | | | $ | (0.85) | | | | $ | 12.39 | | | | | 9.3 | % | | | $ | 45,181 | | | | | 1.00 | % | | | | 1.34%(b) | | | | | 27 | % |
2017 | | | | 11.75 | | | | | 0.11 | | | | | 1.04 | | | | | 1.15 | | | | | (0.11) | | | | | (0.63) | | | | | (0.74) | | | | | 12.16 | | | | | 10.3 | | | | | 50,934 | | | | | 0.93 | | | | | 1.33(b) | | | | | 23 | |
2016 | | | | 11.72 | | | | | 0.12 | | | | | 0.85 | | | | | 0.97 | | | | | (0.12) | | | | | (0.82) | | | | | (0.94) | | | | | 11.75 | | | | | 8.6 | | | | | 50,105 | | | | | 1.06 | | | | | 1.35(b) | | | | | 23 | |
2015 | | | | 12.91 | | | | | 0.13 | | | | | (0.08) | | | | | 0.05 | | | | | (0.13) | | | | | (1.11) | | | | | (1.24) | | | | | 11.72 | | | | | 0.0 | | | | | 53,989 | | | | | 1.01 | | | | | 1.31(b) | | | | | 27 | |
2014 | | | | 12.76 | | | | | 0.14 | | | | | 1.07 | | | | | 1.21 | | | | | (0.14) | | | | | (0.92) | | | | | (1.06) | | | | | 12.91 | | | | | 9.9 | | | | | 69,187 | | | | | 1.07 | | | | | 1.29 | | | | | 39 | |
Class A | | | | | | | | | | | | | | | | | | | | | | | | | | | | | | | | | | | | | | | | | | | | | | | | | | | | | | | | | | | | | | | | | |
2018 | | | $ | 12.23 | | | | $ | 0.09 | | | | | $0.97 | | | | $ | 1.06 | | | | $ | (0.09) | | | | $ | (0.73) | | | | $ | (0.82) | | | | $ | 12.47 | | | | | 9.1 | % | | | $ | 8,719 | | | | | 0.75 | % | | | | 1.59%(b) | | | | | 27 | % |
2017 | | | | 11.81 | | | | | 0.08 | | | | | 1.05 | | | | | 1.13 | | | | | (0.08) | | | | | (0.63) | | | | | (0.71) | | | | | 12.23 | | | | | 10.1 | | | | | 8,165 | | | | | 0.68 | | | | | 1.58(b) | | | | | 23 | |
2016 | | | | 11.78 | | | | | 0.10 | | | | | 0.85 | | | | | 0.95 | | | | | (0.10) | | | | | (0.82) | | | | | (0.92) | | | | | 11.81 | | | | | 8.2 | | | | | 7,040 | | | | | 0.81 | | | | | 1.60(b) | | | | | 23 | |
2015 | | | | 12.97 | | | | | 0.09 | | | | | (0.07) | | | | | 0.02 | | | | | (0.10) | | | | | (1.11) | | | | | (1.21) | | | | | 11.78 | | | | | (0.2 | ) | | | | 6,577 | | | | | 0.76 | | | | | 1.56(b) | | | | | 27 | |
2014 | | | | 12.82 | | | | | 0.11 | | | | | 1.07 | | | | | 1.18 | | | | | (0.11) | | | | | (0.92) | | | | | (1.03) | | | | | 12.97 | | | | | 9.5 | | | | | 6,443 | | | | | 0.83 | | | | | 1.54 | | | | | 39 | |
Class C | | | | | | | | | | | | | | | | | | | | | | | | | | | | | | | | | | | | | | | | | | | | | | | | | | | | | | | | | | | | | | | | | |
2018 | | | $ | 12.41 | | | | $ | 0.03 | | | | | $0.99 | | | | $ | 1.02 | | | | $ | (0.03) | | | | $ | (0.73) | | | | $ | (0.76) | | | | $ | 12.67 | | | | | 8.5 | % | | | $ | 4,544 | | | | | 0.25 | % | | | | 2.09%(b) | | | | | 27 | % |
2017 | | | | 11.97 | | | | | 0.02 | | | | | 1.06 | | | | | 1.08 | | | | | (0.01) | | | | | (0.63) | | | | | (0.64) | | | | | 12.41 | | | | | 9.6 | | | | | 4,585 | | | | | 0.18 | | | | | 2.08(b) | | | | | 23 | |
2016 | | | | 11.92 | | | | | 0.04 | | | | | 0.87 | | | | | 0.91 | | | | | (0.04) | | | | | (0.82) | | | | | (0.86) | | | | | 11.97 | | | | | 7.8 | | | | | 5,575 | | | | | 0.30 | | | | | 2.10(b) | | | | | 23 | |
2015 | | | | 13.12 | | | | | 0.03 | | | | | (0.08) | | | | | (0.05 | ) | | | | (0.04) | | | | | (1.11) | | | | | (1.15) | | | | | 11.92 | | | | | (0.8 | ) | | | | 5,260 | | | | | 0.26 | | | | | 2.06(b) | | | | | 27 | |
2014 | | | | 12.95 | | | | | 0.04 | | | | | 1.09 | | | | | 1.13 | | | | | (0.04) | | | | | (0.92) | | | | | (0.96) | | | | | 13.12 | | | | | 9.0 | | | | | 5,350 | | | | | 0.32 | | | | | 2.04 | | | | | 39 | |
Class I | | | | | | | | | | | | | | | | | | | | | | | | | | | | | | | | | | | | | | | | | | | | | | | | | | | | | | | | | | | | | | | | | |
2018 | | | $ | 12.15 | | | | $ | 0.15 | | | | | $0.97 | | | | $ | 1.12 | | | | $ | (0.16) | | | | $ | (0.73) | | | | $ | (0.89) | | | | $ | 12.38 | | | | | 9.6 | % | | | $ | 3,925 | | | | | 1.24 | % | | | | 1.09%(b) | | | | | 27 | % |
2017 | | | | 11.73 | | | | | 0.14 | | | | | 1.05 | | | | | 1.19 | | | | | (0.14) | | | | | (0.63) | | | | | (0.77) | | | | | 12.15 | | | | | 10.7 | | | | | 1,989 | | | | | 1.18 | | | | | 1.08(b) | | | | | 23 | |
2016 | | | | 11.70 | | | | | 0.15 | | | | | 0.85 | | | | | 1.00 | | | | | (0.15) | | | | | (0.82) | | | | | (0.97) | | | | | 11.73 | | | | | 8.8 | | | | | 1,896 | | | | | 1.30 | | | | | 1.10(b) | | | | | 23 | |
2015 | | | | 12.90 | | | | | 0.16 | | | | | (0.09) | | | | | 0.07 | | | | | (0.16) | | | | | (1.11) | | | | | (1.27) | | | | | 11.70 | | | | | 0.2 | | | | | 1,856 | | | | | 1.26 | | | | | 1.06(b) | | | | | 27 | |
2014 | | | | 12.76 | | | | | 0.17 | | | | | 1.06 | | | | | 1.23 | | | | | (0.17) | | | | | (0.92) | | | | | (1.09) | | | | | 12.90 | | | | | 10.0 | | | | | 2,438 | | | | | 1.35 | | | | | 1.04 | | | | | 39 | |
| † | Total return represents aggregate total return of a hypothetical $1,000 investment at the beginning of the year and sold at the end of the year including reinvestment of distributions and does not reflect the applicable sales charges. |
| †† | The ratios do not include a reduction for custodian fee credits on cash balances maintained with the custodian (Custodian Fee Credits). Including such Custodian Fee Credits, the ratios for the years ended 2015 and 2014 would have been 1.32% and 1.27% (Class AAA), 1.57% and 1.52% (Class A), 2.07% and 2.02% (Class C), and 1.07% and 1.02% (Class I) Shares, respectively. For the years ended September 30, 2018, 2017, and 2016, there were no Custodian Fee Credits. |
| (a) | Per share data are calculated using the average shares outstanding method. |
| (b) | The Fund received credits from a designated broker who agreed to pay certain Fund operating expenses. For the years ended September 30, 2018, 2017, 2016, and 2015, there was no impact on the expense ratios. |
See accompanying notes to financial statements.
49
TETON Westwood Funds
Financial Highlights
Selected data for a share of beneficial interest outstanding throughout each year:
| | | | | | | | | | | | | | | | | | | | | | | | | | | | | | | | | | | | | | | | | | | | | | | | | | | | | | | | | | | | | | | | | | | | | | | | | | | |
| | | | | Income (Loss) from Investment Operations | | Distributions to Shareholders | | | | | | | | Ratios to Average Net Assets/Supplemental Data |
Year Ended
September 30 | | Net Asset
Value,
Beginning
of Year | | Net
Investment
Income(a) | | Net
Realized and
Unrealized
Gain (Loss) on
Investments | | Total From
Investment
Operations | | Net
Investment
Income | | Net
Realized
Gain on
Investments | | Return
of
Capital | | Total
Distributions | | Net Asset
Value,
End of Year | | Total
Return† | | Net Assets,
End of Year
(in 000’s) | | Net
Investment
Income | | Operating
Expenses
Net of
Waivers/
Reimbursements | | Operating
Expenses
Before Waivers/
Reimbursements | | Portfolio
Turnover
Rate |
Intermediate Bond Fund | | | | | | | | | | | | | | | | | | | | | | | | | | | | | | | | | | | | | | | | | | | | | | | | | | | | | | | | | | | | | |
Class AAA | | | | | | | | | | | | | | | | | | | | | | | | | | | | | | | | | | | | | | | | | | | | | | | | | | | | | | | | | | | | | | | | | | | | | | | | | | | |
2018 | | | | $11.28 | | | | | $0.17 | | | | | $(0.26) | | | | | $(0.09 | ) | | | | $(0.18) | | | | | $(0.18) | | | | | $(0.00) | (b) | | | | $(0.36) | | | | | $10.83 | | | | | (0.8 | )% | | | | $3,434 | | | | | 1.59 | % | | | | 1.00% | | | | | 2.22% | | | | | 32 | % |
2017 | | | | 11.64 | | | | | 0.14 | | | | | (0.28) | | | | | (0.14 | ) | | | | (0.14) | | | | | (0.08) | | | | | — | | | | | (0.22) | | | | | 11.28 | | | | | (1.2 | ) | | | | 3,683 | | | | | 1.23 | | | | | 1.00 | | | | | 1.52 | | | | | 36 | |
2016 | | | | 11.56 | | | | | 0.15 | | | | | 0.30 | | | | | 0.45 | | | | | (0.15) | | | | | (0.22) | | | | | — | | | | | (0.37) | | | | | 11.64 | | | | | 4.1 | | | | | 4,170 | | | | | 1.32 | | | | | 1.00 | | | | | 1.42 | | | | | 48 | |
2015 | | | | 11.59 | | | | | 0.18 | | | | | (0.03) | | | | | 0.15 | | | | | (0.18) | | | | | — | | | | | — | | | | | (0.18) | | | | | 11.56 | | | | | 1.3 | | | | | 5,045 | | | | | 1.58 | | | | | 1.00 | | | | | 1.36 | | | | | 65 | |
2014 | | | | 11.68 | | | | | 0.15 | | | | | (0.09) | | | | | 0.06 | | | | | (0.15) | | | | | — | | | | | — | | | | | (0.15) | | | | | 11.59 | | | | | 0.5 | | | | | 5,174 | | | | | 1.29 | | | | | 1.00 | | | | | 1.38 | | | | | 16 | |
Class A | | | | | | | | | | | | | | | | | | | | | | | | | | | | | | | | | | | | | | | | | | | | | | | | | | | | | | | | | | | | | | | | | | | | | | | | | | | |
2018 | | | | $11.26 | | | | | $0.16 | | | | | $(0.25) | | | | | $(0.09 | ) | | | | $(0.17) | | | | | $(0.18) | | | | | $(0.00) | (b) | | | | $(0.35) | | | | | $10.82 | | | | | (0.8 | )% | | | | $ 308 | | | | | 1.46 | % | | | | 1.10% | | | | | 2.32% | | | | | 32 | % |
2017 | | | | 11.63 | | | | | 0.13 | | | | | (0.29) | | | | | (0.16 | ) | | | | (0.13) | | | | | (0.08) | | | | | — | | | | | (0.21) | | | | | 11.26 | | | | | (1.4 | ) | | | | 485 | | | | | 1.13 | | | | | 1.10 | | | | | 1.62 | | | | | 36 | |
2016 | | | | 11.55 | | | | | 0.14 | | | | | 0.30 | | | | | 0.44 | | | | | (0.14) | | | | | (0.22) | | | | | — | | | | | (0.36) | | | | | 11.63 | | | | | 3.9 | | | | | 807 | | | | | 1.21 | | | | | 1.10 | | | | | 1.52 | | | | | 48 | |
2015 | | | | 11.58 | | | | | 0.17 | | | | | (0.03) | | | | | 0.14 | | | | | (0.17) | | | | | — | | | | | — | | | | | (0.17) | | | | | 11.55 | | | | | 1.2 | | | | | 809 | | | | | 1.48 | | | | | 1.10 | | | | | 1.46 | | | | | 65 | |
2014 | | | | 11.66 | | | | | 0.14 | | | | | (0.08) | | | | | 0.06 | | | | | (0.14) | | | | | — | | | | | — | | | | | (0.14) | | | | | 11.58 | | | | | 0.5 | | | | | 928 | | | | | 1.21 | | | | | 1.10 | | | | | 1.48 | | | | | 16 | |
Class C | | | | | | | | | | | | | | | | | | | | | | | | | | | | | | | | | | | | | | | | | | | | | | | | | | | | | | | | | | | | | | | | | | | | | | | | | | | |
2018 | | | | $10.70 | | | | | $0.09 | | | | | $(0.25) | | | | | $(0.16 | ) | | | | $(0.09) | | | | | $(0.18) | | | | | $(0.00) | (b) | | | | $(0.27) | | | | | $10.27 | | | | | (1.5 | )% | | | | $ 805 | | | | | 0.83 | % | | | | 1.75% | | | | | 2.97% | | | | | 32 | % |
2017 | | | | 11.05 | | | | | 0.05 | | | | | (0.27) | | | | | (0.22 | ) | | | | (0.05) | | | | | (0.08) | | | | | — | | | | | (0.13) | | | | | 10.70 | | | | | (2.0 | ) | | | | 1,102 | | | | | 0.49 | | | | | 1.75 | | | | | 2.27 | | | | | 36 | |
2016 | | | | 10.99 | | | | | 0.06 | | | | | 0.28 | | | | | 0.34 | | | | | (0.06) | | | | | (0.22) | | | | | — | | | | | (0.28) | | | | | 11.05 | | | | | 3.2 | | | | | 1,144 | | | | | 0.51 | | | | | 1.75 | | | | | 2.17 | | | | | 48 | |
2015 | | | | 11.01 | | | | | 0.09 | | | | | (0.02) | | | | | 0.07 | | | | | (0.09) | | | | | — | | | | | — | | | | | (0.09) | | | | | 10.99 | | | | | 0.7 | | | | | 398 | | | | | 0.82 | | | | | 1.75 | | | | | 2.11 | | | | | 65 | |
2014 | | | | 11.09 | | | | | 0.06 | | | | | (0.08) | | | | | (0.02 | ) | | | | (0.06) | | | | | — | | | | | — | | | | | (0.06) | | | | | 11.01 | | | | | (0.2 | ) | | | | 503 | | | | | 0.55 | | | | | 1.75 | | | | | 2.13 | | | | | 16 | |
Class I | | | | | | | | | | | | | | | | | | | | | | | | | | | | | | | | | | | | | | | | | | | | | | | | | | | | | | | | | | | | | | | | | | | | | | | | | | | |
2018 | | | | $11.28 | | | | | $0.20 | | | | | $(0.25) | | | | | $(0.05 | ) | | | | $(0.21) | | | | | $(0.18) | | | | | $(0.00) | (b) | | | | $(0.39) | | | | | $10.84 | | | | | (0.5 | )% | | | | $ 2,295 | | | | | 1.83 | % | | | | 0.75% | | | | | 1.97% | | | | | 32 | % |
2017 | | | | 11.65 | | | | | 0.17 | | | | | (0.29) | | | | | (0.12 | ) | | | | (0.17) | | | | | (0.08) | | | | | — | | | | | (0.25) | | | | | 11.28 | | | | | (1.0 | ) | | | | 2,900 | | | | | 1.47 | | | | | 0.75 | | | | | 1.27 | | | | | 36 | |
2016 | | | | 11.57 | | | | | 0.18 | | | | | 0.30 | | | | | 0.48 | | | | | (0.18) | | | | | (0.22) | | | | | — | | | | | (0.40) | | | | | 11.65 | | | | | 4.3 | | | | | 14,111 | | | | | 1.56 | | | | | 0.75 | | | | | 1.17 | | | | | 48 | |
2015 | | | | 11.60 | | | | | 0.21 | | | | | (0.03) | | | | | 0.18 | | | | | (0.21) | | | | | — | | | | | — | | | | | (0.21) | | | | | 11.57 | | | | | 1.6 | | | | | 13,022 | | | | | 1.82 | | | | | 0.75 | | | | | 1.11 | | | | | 65 | |
2014 | | | | 11.68 | | | | | 0.18 | | | | | (0.08) | | | | | 0.10 | | | | | (0.18) | | | | | — | | | | | — | | | | | (0.18) | | | | | 11.60 | | | | | 0.9 | | | | | 14,705 | | | | | 1.58 | | | | | 0.75 | | | | | 1.13 | | | | | 16 | |
| † | Total return represents aggregate total return of a hypothetical $1,000 investment at the beginning of the year and sold at the end of the year including reinvestment of distributions and does not reflect the applicable sales charges. |
| (a) | Per share data are calculated using the average shares outstanding method. |
| (b) | Amount represents less than $0.005 per share. |
See accompanying notes to financial statements.
50
TETON Westwood Funds
Notes to Financial Statements
1. Organization. The TETON Westwood Funds (the Trust) was organized as a Massachusetts business trust on June 12, 1986. The Trust is registered under the Investment Company Act of 1940, as amended (the 1940 Act), as a diversified open-end management investment company and currently consists of seven active separate investment portfolios: TETON Westwood Mighty Mites Fund (Mighty Mites Fund), TETON Westwood SmallCap Equity Fund (SmallCap Equity Fund), TETON Westwood Mid-Cap Equity Fund (Mid-Cap Equity Fund), TETON Convertible Securities Fund (Convertible Securities Fund), TETON Westwood Equity Fund (Equity Fund), TETON Westwood Balanced Fund (Balanced Fund), and TETON Westwood Intermediate Bond Fund (Intermediate Bond Fund), individually, a “Fund” and collectively, the “Funds.” Each class of shares outstanding bears the same voting, dividend, liquidation, and other rights and conditions, except that the expenses incurred in the distribution and marketing of such shares are different for each class. Class T Shares were first issued on July 5, 2017 for Mighty Mites Fund and SmallCap Equity Fund. Class T shares were liquidated on August 31, 2018.
The investment objectives of each Fund are as follows:
| ● | | Mighty Mites Fund seeks to provide long term capital appreciation by investing primarily in micro-capitalization equity securities. |
| ● | | SmallCap Equity Fund seeks to provide long term capital appreciation by investing primarily in smaller capitalization equity securities. |
| ● | | Mid-Cap Equity Fund seeks to provide long term growth of capital and future income by investing primarily in mid-cap equity securities. |
| ● | | Convertible Securities Fund seeks to provide a high level of current income as well as long term capital appreciation. |
| ● | | Equity Fund seeks to provide capital appreciation. The Equity Fund’s secondary goal is to produce current income. |
| ● | | Balanced Fund seeks to provide capital appreciation and current income resulting in a high total investment return consistent with prudent investment risk and a balanced investment approach. |
| ● | | Intermediate Bond Fund seeks to maximize total return, while maintaining a level of current income consistent with the maintenance of principal and liquidity. |
2. Significant Accounting Policies. As an investment company, the Trust follows the investment company accounting and reporting guidance, which is part of U.S. generally accepted accounting principles (GAAP) that may require the use of management estimates and assumptions in the preparation of its financial statements. Actual results could differ from those estimates. The following is a summary of significant accounting policies followed by the Trust in the preparation of its financial statements.
New accounting Pronouncements. The SEC recently adopted changes to Regulation S-X to simplify the reporting of information by registered investment companies in financial statements. The amendments require presentation of the total, rather than the components, of distributable earnings on the Statement of Assets and Liabilities and also require presentation of the total, rather than the components, of distributions to shareholders, except for tax return of capital distributions, if any, on the Statement of Changes in Net Assets. The amendments also removed the requirement for parenthetical disclosure of undistributed net investment income on the Statement of Changes in Net Assets. These Regulation S-X amendments are reflected in the Fund’s financial statements for the year ended September 30, 2018. As a result of adopting these amendments, the distributions to shareholders in the September 30, 2017 Statement of Changes in Net Assets presented herein have been reclassified to conform to the current year presentation.
To improve the effectiveness of fair value disclosure requirements, the Financial Accounting Standards Board recently issued Accounting Standard Update (ASU) 2018-13, Fair Value Measurement Disclosure Framework – Changes to the Disclosure Requirements for Fair Value Measurement (ASU 2018-13), which adds, removes, and modifies certain aspects relating to fair value disclosure. ASU 2018-13 is effective for interim and annual reporting periods beginning after December 15, 2019; early adoption of the additions relating to ASU 2018-13 is not required, even if early adoption is elected for the removals under ASU 2018-13. Management has early adopted the removals set forth in ASU 2018-13 in these financial statements and has not early adopted the additions set forth in ASU 2018-13.
51
TETON Westwood Funds
Notes to Financial Statements (Continued)
Security Valuation. Portfolio securities listed or traded on a nationally recognized securities exchange or traded in the U.S. over-the-counter market for which market quotations are readily available are valued at the last quoted sale price or a market’s official closing price as of the close of business on the day the securities are being valued. If there were no sales that day, the security is valued at the average of the closing bid and asked prices or, if there were no asked prices quoted on that day, then the security is valued at the closing bid price on that day. If no bid or asked prices are quoted on such day, the security is valued at the most recently available price or, if the Board of Trustees (the Board) so determines, by such other method as the Board shall determine in good faith to reflect its fair market value. Portfolio securities traded on more than one national securities exchange or market are valued according to the broadest and most representative market, as determined by Teton Advisors, Inc. (the Adviser). Investments in open-end investment companies are valued at each underlying Fund’s NAV per share as of the report date.
Portfolio securities primarily traded on a foreign market are generally valued at the preceding closing values of such securities on the relevant market, but may be fair valued pursuant to procedures established by the Board if market conditions change significantly after the close of the foreign market, but prior to the close of business on the day the securities are being valued. Debt obligations for which market quotations are readily available are valued at the average of the latest bid and asked prices. If there were no asked prices quoted on such day, the security is valued using the closing bid price, unless the Board determines such amount does not reflect the securities fair value, in which case these securities will be fair value as determined by the Board. Certain securities are valued principally using dealer quotations. Futures contracts are valued at the closing settlement price of the exchange or board of trade on which the applicable contract is traded. OTC futures and options on futures for which market quotations are readily available will be valued by quotations received from a pricing service or, if no quotations are available from a pricing service, by quotations obtained from one or more dealers in the instrument in question by the Adviser.
Securities and assets for which market quotations are not readily available are fair valued as determined by the Board. Fair valuation methodologies and procedures may include, but are not limited to: analysis and review of available financial and non-financial information about the company; comparisons with the valuation and changes in valuation of similar securities, including a comparison of foreign securities with the equivalent U.S. dollar value American Depositary Receipt securities at the close of the U.S. exchange; and evaluation of any other information that could be indicative of the value of the security.
The inputs and valuation techniques used to measure fair value of the Funds’ investments are summarized into three levels as described in the hierarchy below:
| | ● | | Level 1 — quoted prices in active markets for identical securities; |
| | ● | | Level 2 — other significant observable inputs (including quoted prices for similar securities, interest rates, prepayment speeds, credit risk, etc.); and |
| | ● | | Level 3 — significant unobservable inputs (including the Board’s determinations as to the fair value of investments). |
52
TETON Westwood Funds
Notes to Financial Statements (Continued)
A financial instrument’s level within the fair value hierarchy is based on the lowest level of any input both individually and in the aggregate that is significant to the fair value measurement. The inputs or methodology used for valuing securities are not necessarily an indication of the risk associated with investing in those securities. The summary of the Funds’ investments in securities by inputs used to value the Funds’ investments as of September 30, 2018 is as follows:
| | | | | | | | | | | | | | | | |
| | | Valuation Inputs | | | |
| | | Level 1
Quoted Prices | | | Level 2 Other Significant
Observable Inputs | | | Level 3 Significant
Unobservable Inputs | | | Total Market Value
at 9/30/18 |
MIGHTY MITES FUND | | | | | | | | | | | | | | | | |
INVESTMENTS IN SECURITIES: | | | | | | | | | | | | | | | | |
ASSETS (Market Value): | | | | | | | | | | | | | | | | |
Common Stocks: | | | | | | | | | | | | | | | | |
Agriculture | | | $ 4,988,779 | | | | — | | | | $ 1,744 | | | | $ 4,990,523 | |
Automotive: Parts and Accessories | | | 32,736,120 | | | | — | | | | 4,000,000 | | | | 36,736,120 | |
Business Services | | | 28,624,588 | | | | $ 777,026 | | | | — | | | | 29,401,614 | |
Communications Equipment | | | 2,705,456 | | | | 300 | | | | — | | | | 2,705,756 | |
Computer Software and Services | | | 20,659,079 | | | | 308,731 | | | | — | | | | 20,967,810 | |
Consumer Products | | | 41,928,801 | | | | 118,810 | | | | — | | | | 42,047,611 | |
Consumer Services | | | 8,973,963 | | | | 154,375 | | | | — | | | | 9,128,338 | |
Diversified Industrial | | | 142,437,006 | | | | 242,550 | | | | — | | | | 142,679,556 | |
Electronics | | | 47,474,556 | | | | — | | | | 0 | | | | 47,474,556 | |
Energy and Utilities: Natural Gas | | | 4,949,176 | | | | 1,969,897 | | | | — | | | | 6,919,073 | |
Entertainment | | | 14,890,418 | | | | — | | | | 0 | | | | 14,890,418 | |
Environmental Control | | | 18,515,651 | | | | 406 | | | | — | | | | 18,516,057 | |
Financial Services | | | 89,923,348 | | | | 1,346,485 | | | | 60,000 | | | | 91,329,833 | |
Food and Beverage | | | 39,062,615 | | | | 532,922 | | | | — | | | | 39,595,537 | |
Health Care | | | 106,812,345 | | | | — | | | | 1,890,000 | | | | 108,702,345 | |
Manufactured Housing and Recreational Vehicles | | | 19,006,360 | | | | 4,335,187 | | | | — | | | | 23,341,547 | |
Real Estate | | | 31,621,494 | | | | 3,304,343 | | | | 311,222 | | | | 35,237,059 | |
Specialty Chemicals | | | 35,752,359 | | | | 2,004 �� | | | | — | | | | 35,754,363 | |
Telecommunications | | | 32,827,752 | | | | 1,340,204 | | | | — | | | | 34,167,956 | |
Other Industries (a) | | | 396,693,934 | | | | — | | | | — | | | | 396,693,934 | |
Total Common Stocks | | | 1,120,583,800 | | | | 14,433,240 | | | | 6,262,966 | | | | 1,141,280,006 | |
Closed-End Funds | | | 1,295,995 | | | | — | | | | — | | | | 1,295,995 | |
Preferred Stocks (a) | | | 2,170,697 | | | | 7,625,773 | | | | — | | | | 9,796,470 | |
Convertible Preferred Stocks (a) | | | — | | | | 354,511 | | | | — | | | | 354,511 | |
Rights (a) | | | 223,960 | | | | 17,647 | | | | 60,001 | | | | 301,608 | |
Warrants (a) | | | — | | | | 3,738 | | | | 58 | | | | 3,796 | |
U.S. Government Obligations | | | — | | | | 283,752,513 | | | | — | | | | 283,752,513 | |
TOTAL INVESTMENTS IN SECURITIES – ASSETS | | | $1,124,274,452 | | | | $306,187,422 | | | | $ 6,323,025 | | | | $1,436,784,899 | |
| | | | |
SMALLCAP EQUITY FUND | | | | | | | | | | | | | | | | |
INVESTMENTS IN SECURITIES: | | | | | | | | | | | | | | | | |
ASSETS (Market Value): | | | | | | | | | | | | | | | | |
Common Stocks (a) | | | $ 35,888,151 | | | | — | | | | — | | | | $ 35,888,151 | |
Rights (a) | | | — | | | | — | | | | $ 44,400 | | | | 44,400 | |
U.S. Government Obligations | | | — | | | | $ 3,067,857 | | | | — | | | | 3,067,857 | |
TOTAL INVESTMENTS IN SECURITIES – ASSETS | | | $ 35,888,151 | | | | $ 3,067,857 | | | | $ 44,400 | | | | $ 39,000,408 | |
| | | | |
MID-CAP EQUITY FUND | | | | | | | | | | | | | | | | |
INVESTMENTS IN SECURITIES: | | | | | | | | | | | | | | | | |
ASSETS (Market Value): | | | | | | | | | | | | | | | | |
Common Stocks (a) | | | $ 3,191,512 | | | | — | | | | — | | | | $ 3,191,512 | |
TOTAL INVESTMENTS IN SECURITIES – ASSETS | | | $ 3,191,512 | | | | — | | | | — | | | | $ 3,191,512 | |
| | | | |
CONVERTIBLE SECURITIES FUND | | | | | | | | | | | | | | | | |
INVESTMENTS IN SECURITIES: | | | | | | | | | | | | | | | | |
ASSETS (Market Value): | | | | | | | | | | | | | | | | |
Common Stocks (a) | | | $ 203,197 | | | | — | | | | — | | | | $203,197 | |
Convertible Corporate Bonds (a) | | | — | | | | $ 20,714,372 | | | | — | | | | 20,714,372 | |
Convertible Preferred Stocks (a) | | | 1,010,928 | | | | 363,667 | | | | — | | | | 1,374,595 | |
Mandatory Convertible Securities (a) | | | 4,084,279 | | | | 375,834 | | | | — | | | | 4,460,113 | |
U.S. Government Obligations | | | — | | | | 2,300,924 | | | | — | | | | 2,300,924 | |
TOTAL INVESTMENTS IN SECURITIES – ASSETS | | | $ 5,298,404 | | | | $ 23,754,797 | | | | — | | | | $ 29,053,201 | |
53
TETON Westwood Funds
Notes to Financial Statements (Continued)
| | | | | | | | | | | | | | | | | | | | |
| | | Valuation Inputs | | |
| | | Level 1
Quoted Prices | | Level 2 Other Significant
Observable Inputs | | Level 3 Significant
Unobservable Inputs | | Total Market Value
at 09/30/18 |
EQUITY FUND | | | | | | | | | | | | | | | | | | | | |
INVESTMENTS IN SECURITIES: | | | | | | | | | | | | | | | | | | | | |
ASSETS (Market Value): | | | | | | | | | | | | | | | | | | | | |
Common Stocks (a) | | | $ | 60,696,606 | | | | | — | | | | | — | | | | $ | 60,696,606 | |
Short Term Investments | | | | 720,156 | | | | | — | | | | | — | | | | | 720,156 | |
TOTAL INVESTMENTS IN SECURITIES – ASSETS | | | $ | 61,416,762 | | | | | — | | | | | — | | | | $ | 61,416,762 | |
| | | | |
BALANCED FUND | | | | | | | | | | | | | | | | | | | | |
INVESTMENTS IN SECURITIES: | | | | | | | | | | | | | | | | | | | | |
ASSETS (Market Value): | | | | | | | | | | | | | | | | | | | | |
Common Stocks (a) | | | $ | 41,642,928 | | | | | — | | | | | — | | | | $ | 41,642,928 | |
Corporate Bonds (a) | | | | — | | | | $ | 13,239,901 | | | | | — | | | | | 13,239,901 | |
U.S. Government Agency Obligations | | | | — | | | | | 2,752,902 | | | | | — | | | | | 2,752,902 | |
U.S. Government Obligations | | | | — | | | | | 3,936,050 | | | | | — | | | | | 3,936,050 | |
Short Term Investments | | | | 922,301 | | | | | — | | | | | — | | | | | 922,301 | |
TOTAL INVESTMENTS IN SECURITIES – ASSETS | | | $ | 42,565,229 | | | | $ | 19,928,853 | | | | | — | | | | $ | 62,494,082 | |
| | | | |
INTERMEDIATE BOND FUND | | | | | | | | | | | | | | | | | | | | |
INVESTMENTS IN SECURITIES: | | | | | | | | | | | | | | | | | | | | |
ASSETS (Market Value): | | | | | | | | | | | | | | | | | | | | |
Corporate Bonds (a) | | | | — | | | | $ | 3,458,364 | | | | | — | | | | $ | 3,458,364 | |
U.S. Government Agency Obligations | | | | — | | | | | 756,590 | | | | | — | | | | | 756,590 | |
U.S. Government Obligations | | | | — | | | | | 2,616,220 | | | | | — | | | | | 2,616,220 | |
TOTAL INVESTMENTS IN SECURITIES – ASSETS | | | | — | | | | $ | 6,831,174 | | | | | — | | | | $ | 6,831,174 | |
| (a) | Please refer to the Schedule of Investments for the industry classifications of these portfolio holdings. |
Transfers from Level 1 to Level 2 and Level 3, and transfers from Level 2 to Level 3 are due to a decline in market activity, e.g., frequency of trades, which resulted in a lack of available market inputs to determine price. Transfers from Level 2 to Level 1 and Level 3 to Level 1, and transfers from Level 3 to Level 2 are due to an increase in market activity, e.g., frequency of trades, which resulted in an increase in available market inputs to determine the price.
The SmallCap Equity Fund, Mid-Cap Equity Fund, Convertible Securities Fund, Equity Fund, Balanced Fund, and Intermediate Bond Fund did not have transfers among Level 1, Level 2, and Level 3 during the fiscal year ended September 30, 2018.
There were no Level 3 investments held at September 30, 2018 or September 30, 2017 for the Mid-Cap Equity Fund, Convertible Securities Fund, Equity Fund, Balanced Fund, and Intermediate Bond Fund.
The following table reconciles Level 3 investments for Mighty Mites Fund and SmallCap Equity Fund for which significant unobservable inputs were used to determine fair value:
| | | | | | | | | | | | | | | | | | | | | | | | | | | | | | | | | | | | | | |
MIGHTY MITES
FUND | | Balance
as of
9/30/17 | | | Accrued
discounts/
(premiums) | | Realized
loss | | | Change in
unrealized
appreciation/
depreciation† | | | Purchases | | | Sales | | | Transfers
into
Level 3 | | | Transfers
out of
Level 3 | | | Balance
as of
9/30/18 | | | Net change in
unrealized
appreciation/
depreciation
on Level 3
investments
still held
at 9/30/18† | |
INVESTMENTS IN SECURITIES: | | | | | | | | | | | | | | | | | | | | | | | | | | | | | | | | | | | |
ASSETS (Market Value): | | | | | | | | | | | | | | | | | | | | | | | | | | | | | | | | | | | |
Common Stocks(a) | | | $4,649,639 | | | — | | | $(58,063) | | | | $374,277 | | | | $168,450 | | | | $(219,593) | | | | $1,562,638 | | | | $(214,382) | | | | $6,262,966 | | | | $129,977 | |
Rights(a) | | | 78,001 | | | — | | | — | | | | (78,000 | ) | | | 60,000 | | | | — | | | | — | | | | — | | | | 60,001 | | | | (78,000 | ) |
Warrants(a) | | | — | | | — | | | — | | | | 58 | | | | — | | | | — | | | | — | | | | — | | | | 58 | | | | 58 | |
TOTAL INVESTMENTS IN SECURITIES | | | $4,727,640 | | | — | | | $(58,063) | | | | $296,335 | | | | $228,450 | | | | $(219,593) | | | | $1,562,638 | | | | $(214,382) | | | | $6,323,025 | | | | $52,035 | |
| (a) | Please refer to the Schedule of Investments for the industry classifications of these portfolio holdings. |
| † | Net change in unrealized appreciation/depreciation on investments is included in the related amounts in the Statement of Operations. |
54
TETON Westwood Funds
Notes to Financial Statements (Continued)
| | | | | | | | | | | | | | | | | | | | | | | | | | | | | | | | | | | | | | |
SMALLCAP EQUITY
FUND | | Balance
as of
09/30/17 | | Accrued
discounts/
(premiums) | | | Realized
gain/
(loss) | | | Change in
unrealized
appreciation/
depreciation† | | | Purchases | | | Proceeds
received | | | Transfers
into
Level 3 | | | Transfers
out of
Level 3 | | | Balance
as of
09/30/18 | | | Net change
in unrealized
appreciation/
depreciation
during the
period on
Level 3
investments
still held at
09/30/18† | |
INVESTMENTS IN SECURITIES: | | | | | | | | | | | | | | | | | | | | | | | | | | | | | | | | | | | | |
ASSETS (Market Value): | | | | | | | | | | | | | | | | | | | | | | | | | | | | | | | | | | | | |
Rights (a) | | — | | | — | | | | — | | | | — | | | | $44,400 | | | | — | | | | — | | | | — | | | | $44,400 | | | | — | |
TOTAL INVESTMENTS IN SECURITIES | | — | | | — | | | | — | | | | — | | | | $44,400 | | | | — | | | | — | | | | — | | | | $44,400 | | | | — | |
| (a) | Please refer to the Schedule of Investments for the regional classifications of these portfolio holdings. |
| † | Net change in unrealized appreciation/depreciation on investments is included in the related amounts in the Statement of Operations. |
The following tables summarize the valuation techniques used and unobservable inputs utilized to determine the value of certain of the Fund’s Level 3 investments as of September 30, 2018.
| | | | | | | | | | | | |
Description | | Balance at 9/30/18 | | | Valuation Technique | | Unobservable Input | | Range | |
MIGHTY MITES FUND | | | | | | | | | | | | |
INVESTMENTS IN SECURITIES: | | | | | | | | | | | | |
ASSETS (Market Value): | | | | | | | | | | | | |
Common Stocks(a) | | | $5,890,000 | | | Acquisition Price/Cash Flow Analysis | | Discount Range | | | 0% | |
Common Stocks(a) | | | 0 | | | Bankruptcy Plan | | Discount Range | | | 0% | |
Common Stocks(a) | | | 370,967 | | | Last Price | | Discount Range | | | 0% | |
Common Stocks(a) | | | 1,744 | | | Liquidation Plan | | Discount Range | | | 0% | |
Common Stocks(a) | | | 255 | | | Restructure Plan/Cash Flow Analysis | | Discount Range | | | 0% | |
Common Stocks - Total | | | 6,262,966 | | | | | | | | | |
Rights(a) | | | — | | | Acquisition Price/Cash Flow Analysis | | Discount Range | | | 0% | |
Rights(a) | | | 60,000 | | | Last Available Price/Merger Price | | Discount Range | | | 0% | |
Rights(a) | | | 1 | | | Last Price | | Discount Range | | | 0% | |
Rights - Total | | | 60,001 | | | | | | | | | |
Warrants(a) | | | 58 | | | Black Scholes | | Discount Range | | | 0% | |
TOTAL INVESTMENTS IN LEVEL 3 SECURITIES | | | $6,323,025 | | | | | | | | | |
| | | | | | | | |
| (a) | Please refer to the Schedule of Investments for the industry classifications of these portfolio holdings. |
| | | | | | | | | | | | | | |
Description | | Balance at 09/30/18 | | | Valuation Technique | | Unobservable Input | | | Range | |
SMALLCAP EQUITY FUND | | | | | | | | | | | | | | |
INVESTMENTS IN SECURITIES: | | | | | | | | | | | | | | |
ASSETS (Market Value): | | | | | | | | | | | | | | |
Rights (a) | | | $44,400 | | | Last Available Price/Merger Price | | | Discount Range | | | | 0% | |
| (a) | Please refer to the Schedule of Investments for the regional classifications of these portfolio holdings. |
| | | | |
Unobservable Input | | Impact to Value if Input Increases | | Impact to Value if Input Decreases |
Discount Range | | Decrease | | Increase |
55
TETON Westwood Funds
Notes to Financial Statements (Continued)
Additional Information to Evaluate Qualitative Information.
General. The Funds use recognized industry pricing services – approved by the Board and unaffiliated with the Adviser – to value most of their securities, and use broker quotes provided by market makers of securities not valued by these and other recognized pricing sources. Several different pricing feeds are received to value domestic equity securities, international equity securities, preferred equity securities, and fixed income securities. The data within these feeds are ultimately sourced from major stock exchanges and trading systems where these securities trade. The prices supplied by external sources are checked by obtaining quotations or actual transaction prices from market participants. If a price obtained from the pricing source is deemed unreliable, prices will be sought from another pricing service or from a broker/dealer that trades that security or similar securities.
Fair Valuation. Fair valued securities may be common or preferred equities, warrants, options, rights, or fixed income obligations. Where appropriate, Level 3 securities are those for which market quotations are not available, such as securities not traded for several days or for which current bids are not available, or which are restricted as to transfer. When fair valuing a security, factors to consider include recent prices of comparable securities that are publicly traded, reliable prices of securities not publicly traded, the use of valuation models, current analyst reports, valuing the income or cash flow of the issuer, or cost if the preceding factors do not apply. A significant change in the unobservable inputs could result in a lower or higher value in Level 3 securities. The circumstances of Level 3 securities are frequently monitored to determine if fair valuation measures continue to apply.
The Adviser reports quarterly to the Board the results of the application of fair valuation policies and procedures. These may include back testing the prices realized in subsequent trades of these fair valued securities to fair values previously recognized.
Securities Sold Short. The Funds may enter into short sale transactions. Short selling involves selling securities that may or may not be owned and, at times, borrowing the same securities for delivery to the purchaser, with an obligation to replace such borrowed securities at a later date. The proceeds received from short sales are recorded as liabilities and the Funds record an unrealized gain or loss to the extent of the difference between the proceeds received and the value of an open short position on the day of determination. The Funds record a realized gain or loss when the short position is closed out. By entering into a short sale, the Funds bear the market risk of an unfavorable change in the price of the security sold short. Dividends on short sales are recorded as an expense by the Funds on the ex-dividend date and interest expense is recorded on the accrual basis. The broker retains collateral for the value of the open positions, which is adjusted periodically as the value of the position fluctuates. During the fiscal year ended September 30, 2018, there were no short sales.
Foreign Currency Translations. The books and records of the Funds are maintained in U.S. dollars. Foreign currencies, investments, and other assets and liabilities are translated into U.S. dollars at current exchange rates. Purchases and sales of investment securities, income, and expenses are translated at the exchange rate prevailing on the respective dates of such transactions. Unrealized gains and losses that result from changes in foreign exchange rates and/or changes in market prices of securities have been included in unrealized appreciation/depreciation on investments and foreign currency translations. Net realized foreign currency gains and losses resulting from changes in exchange rates include foreign currency gains and losses between trade date and settlement date on investment securities transactions, foreign currency transactions, and the difference between the amounts of interest and dividends recorded on the books of the Funds and the amounts actually received. The portion of foreign currency gains and losses related to fluctuation in exchange rates between the initial purchase trade date and subsequent sale trade date is included in realized gain/(loss) on investments.
Foreign Securities. The Funds may directly purchase securities of foreign issuers. Investing in securities of foreign issuers involves special risks not typically associated with investing in securities of U.S. issuers. The risks include possible revaluation of currencies, the inability to repatriate funds, less complete financial information about companies, and possible future adverse political and economic developments. Moreover, securities of many foreign issuers and their markets may be less liquid and their prices more volatile than securities of comparable U.S. issuers.
Foreign Taxes. The Funds may be subject to foreign taxes on income, gains on investments, or currency repatriation, a portion of which may be recoverable. The Funds will accrue such taxes and recoveries as applicable, based upon their current interpretation of tax rules and regulations that exist in the markets in which they invest.
Restricted Securities. Each Fund may invest up to 10% (except for the Mighty Mites Fund, SmallCap Equity Fund, and Convertible Securities Fund which may invest up to 15%) of its net assets in securities for which the markets are restricted. Restricted securities include securities whose disposition is subject to substantial legal or contractual restrictions. The sale of restricted securities often requires more time and results in higher brokerage charges or dealer discounts and other selling expenses than does the sale of securities eligible for trading on national securities exchanges or in the over-the-counter markets. Restricted
56
TETON Westwood Funds
Notes to Financial Statements (Continued)
securities may sell at a price lower than similar securities that are not subject to restrictions on resale. Securities freely saleable among qualified institutional investors under special rules adopted by the SEC may be treated as liquid if they satisfy liquidity standards established by the Board. Securities deemed as liquid are not included in the limitations described above. The continued liquidity of such securities is not as well assured as that of publicly traded securities, and accordingly the Board will monitor their liquidity. For the restricted securities the Funds held as of September 30, 2018, refer to the Schedules of Investments.
Investments in other Investment Companies. All Funds may invest, from time to time, in shares of other investment companies (or entities that would be considered investment companies but are excluded from the definition pursuant to certain exceptions under the 1940 Act) (the Acquired Funds) in accordance with the 1940 Act and related rules. Shareholders in these Funds would bear the pro rata portion of the periodic expenses of the Acquired Funds in addition to the Fund’s expenses. For the fiscal year ended September 30, 2018, the Mighty Mites Fund’s, Equity Fund’s and Balanced Fund’s pro rata portion of the periodic expenses charged by the Acquired Funds was each less than one basis point.
Securities Transactions and Investment Income. Securities transactions are accounted for on the trade date with realized gain or loss on investments determined by using the identified cost method. Interest income (including amortization of premium and accretion of discount) is recorded on the accrual basis. Premiums and discounts on debt securities are amortized using the effective yield to maturity method. Dividend income is recorded on the ex-dividend date except for certain dividends from foreign securities that are recorded as soon after the ex-dividend date as a Fund becomes aware of such dividends.
Determination of Net Asset Value and Calculation of Expenses. Certain administrative expenses are common to, and allocated among, various affiliated funds. Such allocations are made on the basis of each fund’s average net assets or other criteria directly affecting the expenses as determined by the Adviser pursuant to procedures established by the Board.
In calculating the NAV per share of each class, investment income, realized and unrealized gains and losses, redemption fees, and expenses other than class specific expenses are allocated daily to each class of shares based upon the proportion of net assets of each class at the beginning of each day. Distribution expenses are borne solely by the class incurring the expense.
Custodian Fee Credits and Interest Expense. When cash balances are maintained in a Fund’s custody account, the Fund receives credits which are used to offset custodian fees. The gross expenses paid under each custody arrangement are included in custodian fees in the Statements of Operations with the corresponding expense offset, if any, shown as “Custodian fee credits.” When cash balances are overdrawn, a Fund is charged an overdraft fee equal to 90% of the current Treasury Bill rate on outstanding balances. These amounts, if any, would be included in the Statements of Operations.
Distributions to Shareholders. Distributions from net investment income are declared and paid annually for the Mighty Mites Fund, SmallCap Equity Fund, Mid-Cap Equity Fund, and Equity Fund, and quarterly for the Convertible Securities Fund and Balanced Fund. The Intermediate Bond Fund declares dividends daily and pays those dividends monthly. Distributions of net realized gain on investments are normally declared and paid at least annually by each Fund. Distributions to shareholders are recorded on the ex-dividend date. The characterization of distributions to shareholders is based on income and capital gains as determined in accordance with federal income tax regulations, which may differ from income and capital gains as determined under GAAP. These differences are primarily due to differing treatments of income and gains on various investment securities and foreign currency transactions held by the Funds, timing differences, net operating loss write off, and differing characterizations of distributions made by the Funds. Distributions from net investment income for federal income tax purposes include net realized gains on foreign currency transactions. These book/tax differences are either temporary or permanent in nature. To the extent these differences are permanent, adjustments are made to the appropriate capital accounts in the period when the differences arise. These reclassifications have no impact on the NAV of the Funds.
For the fiscal year ended September 30, 2018, the following reclassifications were made to increase/decrease such amounts with offsetting adjustments to paid-in capital:
| | | | | | | | | | | | | | | |
| | | Accumulated
Net
Investment
Income (Loss) | | Accumulated Net
Realized Gain
(Loss) on
Investments | | Paid-in
Capital |
Mighty Mites Fund | | | $ | 4,688,267 | | | | $ | (82,382) | | | | $ | (4,605,885) | |
SmallCap Equity Fund | | | | 32,618 | | | | | (32,650) | | | | | 32 | |
Mid-Cap Equity Fund | | | | 372 | | | | | (498) | | | | | 126 | |
Convertible Securities Fund. | | | | 80,876 | | | | | (80,876) | | | | | 0 | |
Equity Fund | | | | (96) | | | | | 96 | | | | | 0 | |
Balanced Fund | | | | (391) | | | | | 391 | | | | | 0 | |
Intermediate Bond Fund | | | | 14 | | | | | (14) | | | | | — | |
57
TETON Westwood Funds
Notes to Financial Statements (Continued)
The U.S. GAAP basis of distributions paid to shareholders during the fiscal year ended September 30, 2017 was as follows:
| | | | | | | | | | | | | | | | | | | | | | | | | | | | | | | | | | | |
| Distributions to Shareholders: | | Mighty
Mites
Fund | | SmallCap
Equity
Fund | | Mid-Cap
Equity
Fund | | Convertible
Securities
Fund | | Equity
Fund | | Balanced
Fund | | Intermediate
Bond
Fund |
Net Investment Income | | | | | | | | | | | | | | | | | | | | | | | | | | | | | | | | | | | |
Class AAA | | | | — | | | | | — | | | | | — | | | | $ | (70,888 | ) | | | $ | (293,061) | | | | $ | (482,424) | | | | $ | (48,082 | ) |
Class A | | | | — | | | | | — | | | | | — | | | | | (37,114 | ) | | | | (10,405 | ) | | | | (57,301 | ) | | | | (7,121 | ) |
Class C | | | | — | | | | | — | | | | | — | | | | | (13,786 | ) | | | | — | | | | | (5,528 | ) | | | | (5,847 | ) |
Class I | | | | — | | | | | — | | | | | — | | | | | (97,611 | ) | | | | (34,162 | ) | | | | (23,315 | ) | | | | (152,069 | ) |
| | | | | | | | | | | | | | | | | | | | | | | | | | | | | | | | | | | |
| | | | — | | | | | — | | | | | — | | | | | (219,399 | ) | | | | (337,628 | ) | | | | (568,568 | ) | | | | (213,119 | ) |
| | | | | | | | | | | | | | | | | | | | | | | | | | | | | | | | | | | |
| | | | | | | |
Net Realized Gain. | | | | | | | | | | | | | | | | | | | | | | | | | | | | | | | | | | | |
Class AAA | | | $ | (12,112,850 | ) | | | $ | (1,120,049 | ) | | | $ | (21,204 | ) | | | $ | (171,202 | ) | | | $ | (3,329,667 | ) | | | $ | (2,878,995 | ) | | | $ | (29,726 | ) |
Class A | | | | (6,973,598 | ) | | | | (282,966 | ) | | | | (4,128 | ) | | | | (48,555 | ) | | | | (231,525 | ) | | | | (379,547 | ) | | | | (5,414 | ) |
Class C | | | | (9,278,000 | ) | | | | (229,623 | ) | | | | (2,204 | ) | | | | (36,328 | ) | | | | (55,386 | ) | | | | (282,541 | ) | | | | (9,133 | ) |
Class I | | | | (22,623,866 | ) | | | | (1,008,986 | ) | | | | (19,507 | ) | | | | (51,404 | ) | | | | (266,964 | ) | | | | (101,837 | ) | | | | (95,098 | ) |
| | | | | | | | | | | | | | | | | | | | | | | | | | | | | | | | | | | |
| | | | (50,988,314 | ) | | | | (2,641,624 | ) | | | | (47,043 | ) | | | | (307,489 | ) | | | | (3,883,542 | ) | | | | (3,642,920 | ) | | | | (139,371 | ) |
| | | | | | | | | | | | | | | | | | | | | | | | | | | | | | | | | | | |
Total Distibutions to Shareholders | | | $ | (50,988,314 | ) | | | $ | (2,641,624 | ) | | | $ | (47,043 | ) | | | $ | (526,888 | ) | | | $ | (4,221,170 | ) | | | $ | (4,211,488 | ) | | | $ | (352,490 | ) |
| | | | | | | | | | | | | | | | | | | | | | | | | | | | | | | | | | | |
The tax character of distributions paid during the fiscal years ended September 30, 2018 and 2017 were as follows:
| | | | | | | | | | | | | | | | | | | | | | | | | | | | | | | | | | | | | | | | | | | | | | | | | | | | | | | |
| | | Year Ended
September 30, | | | | Year Ended
September 30, | | | | Year Ended
September 30, | | | | Year Ended
September 30, |
| | | 2018 | | 2017 | | | | 2018 | | 2017 | | | | 2018 | | 2017 | | | | 2018 | | 2017 |
| | | Mighty Mites Fund | | | | SmallCap Equity Fund | | | | Mid-Cap Equity Fund | | | | Convertible Securities Fund |
Ordinary income (inclusive of
short term capital gains) | | | | — | | | | | — | | | | | | | | | $ | 155,315 | | | | | — | | | | | | | | | | — | | | | | — | | | | | | | | | $ | 303,010 | | | | $ | 220,857 | |
Net long term capital gains | | | $ | 84,699,816 | | | | $ | 50,989,812 | * | | | | | | | | | 2,568,471 | | | | $ | 2,641,624 | | | | | | | | | $ | 130,479 | * | | | $ | 47,043 | | | | | | | | | | — | | | | | 306,031 | |
| | | | | | | | | | | | | | | | | | | | | | | | | | | | | | | | | | | | | | | | | | | | | | | | | | | | | | | |
Total distributions paid | | | $ | 84,699,816 | | | | $ | 50,989,812 | | | | | | | | | $ | 2,723,786 | | | | $ | 2,641,624 | | | | | | | | | $ | 130,479 | | | | $ | 47,043 | | | | | | | | | $ | 303,010 | | | | $ | 526,888 | |
| | | | | | | | | | | | | | | | | | | | | | | | | | | | | | | | | | | | | | | | | | | | | | | | | | | | | | | |
| | | Equity Fund | | | | Balanced Fund | | | | Intermediate
Bond Fund | | | | |
Ordinary income (inclusive
of short term capital gains) | | | $ | 935,325 | | | | $ | 337,628 | | | | | | | | | $ | 1,014,660 | | | | $ | 568,568 | | | | | | | | | $ | 146,250 | | | | $ | 312,571 | | | | | | | | | | | | | | | | |
Net long term capital gains | | | | 5,945,421 | | | | | 3,883,542 | | | | | | | | | | 3,449,007 | | | | | 3,642,920 | | | | | | | | | | 105,510 | | | | | 39,919 | | | | | | | | | | | | | | | | |
Return of capital | | | | — | | | | | — | | | | | | | | | | — | | | | | — | | | | | | | | | | 61 | | | | | — | | | | | | | | | | | | | | | | |
| | | | | | | | | | | | | | | | | | | | | | | | | | | | | | | | | | | | | | | | | | | | | | | | | | | | | | | |
Total distributions paid | | | $ | 6,880,746 | | | | $ | 4,221,170 | | | | | | | | | $ | 4,463,667 | | | | $ | 4,211,488 | | | | | | | | | $ | 251,821 | | | | $ | 352,490 | | | | | | | | | | | | | | | | |
| | | | | | | | | | | | | | | | | | | | | | | | | | | | | | | | | | | | | | | | | | | | | | | | | | | | | | | |
| * | Total distributions paid differs from the Statement of Changes in Net Assets due to the utilization of equalization. |
Provision for Income Taxes. The Funds intend to continue to qualify as regulated investment companies under Subchapter M of the Internal Revenue Code of 1986, as amended (the Code). It is the policy of the Funds to comply with the requirements of the Code applicable to regulated investment companies and to distribute substantially all of the Funds’ net investment company taxable income and net capital gains. Therefore, no provision for federal income taxes is required.
During the fiscal year ended September 30, 2018, the Convertible Securities Fund utilized $10 in remaining capital loss carryforward.
At September 30, 2018, the components of accumulated earnings/(losses) on a tax basis were as follows:
| | | | | | | | | | | | | | | | | | | | | | | | | | | | | | | | | | | | | | | | | | | | | | | | | | | | | | | | | | | | | | | | | |
| | | Mighty
Mites
Fund | | | | SmallCap
Equity
Fund | | | | Mid-Cap
Equity
Fund | | | | Convertible
Securities
Fund | | | | Equity
Fund | | | | Balanced
Fund | | | | Intermediate
Bond Fund |
Undistributed ordinary income (inclusive of short term capital gains) | | | | — | | | | | | | | | $ | 480,273 | | | | | | | | | $ | 389 | | | | | | | | | $ | 643,891 | | | | | | | | | $ | 312,466 | | | | | | | | | $ | 1,675 | | | | | | | | | | — | |
Undistributed long term capital gain | | | $ | 44,848,910 | | | | | | | | | | 2,509,988 | | | | | | | | | | 154,522 | | | | | | | | | | 461,598 | | | | | | | | | | 7,655,803 | | | | | | | | | | 6,408,877 | | | | | | | | | | — | |
Unrealized appreciation/(depreciation) | | | | 518,507,644 | | | | | | | | | | 8,876,102 | | | | | | | | | | 678,688 | | | | | | | | | | 2,049,365 | | | | | | | | | | 12,695,050 | | | | | | | | | | 8,851,729 | | | | | | | | | $ | (43,044 | ) |
Qualified late year loss deferral* | | | | (2,984,345 | ) | | | | | | | | | — | | | | | | | | | | — | | | | | | | | | | — | | | | | | | | | | — | | | | | | | | | | — | | | | | | | | | | (95,252 | ) |
| | | | | | | | | | | | | | | | | | | | | | | | | | | | | | | | | | | | | | | | | | | | | | | | | | | | | | | | | | | | | | | | | |
Total accumulated earnings | | | $ | 560,372,209 | | | | | | | | | $ | 11,866,363 | | | | | | | | | $ | 833,599 | | | | | | | | | $ | 3,154,854 | | | | | | | | | $ | 20,663,319 | | | | | | | | | $ | 15,262,281 | | | | | | | | | $ | (138,296 | ) |
| | | | | | | | | | | | | | | | | | | | | | | | | | | | | | | | | | | | | | | | | | | | | | | | | | | | | | | | | | | | | | | | | |
| * | Qualified late year losses related to passive foreign investment companies, ordinary losses, and losses on sales of securities and foreign currency realized after October 31 (certain ordinary losses incurred after December 31) and prior to the Funds’ year end may be elected as occurring on the first day of the following year. |
58
TETON Westwood Funds
Notes to Financial Statements (Continued)
At September 30, 2018, the temporary differences between book basis and tax basis unrealized appreciation/depreciation on investments was primarily due to deferral of losses from wash sales for tax purposes, investments in REITs, mark-to-market adjustments on investments in passive foreign investment companies, premium amortization, and basis adjustments in partnerships.
The following summarizes the tax cost of investments and the related net unrealized appreciation/(depreciation) at September 30, 2018:
| | | | | | | | | | | | | | | | | | | | | | | | | | | | | | | | | | | | | | | | | | | | | | | | | | | | | | | | | | | | | | | | | |
| | | Mighty
Mites
Fund | | | | SmallCap
Equity
Fund | | | | Mid-Cap
Equity
Fund | | | | Convertible
Securities
Fund | | | | Equity
Fund | | | | Balanced
Fund | | | | Intermediate
Bond Fund |
Aggregate cost of investments | | | $ | 918,278,241 | | | | | | | | | $ | 30,124,306 | | | | | | | | | $ | 2,512,824 | | | | | | | | | $ | 27,003,836 | | | | | | | | | $ | 48,721,712 | | | | | | | | | $ | 53,642,352 | | | | | | | | | $ | 6,874,219 | |
| | | | | | | | | | | | | | | | | | | | | | | | | | | | | | | | | | | | | | | | | | | | | | | | | | | | | | | | | | | | | | | | | |
Gross unrealized appreciation | | | $ | 565,912,712 | | | | | | | | | $ | 10,275,139 | | | | | | | | | $ | 868,335 | | | | | | | | | $ | 2,540,158 | | | | | | | | | $ | 14,053,141 | | | | | | | | | $ | 10,187,400 | | | | | | | | | $ | 59,491 | |
Gross unrealized depreciation | | | | (47,406,054 | ) | | | | | | | | | (1,399,037 | ) | | | | | | | | | (189,647 | ) | | | | | | | | | (490,793 | ) | | | | | | | | | (1,358,091 | ) | | | | | | | | | (1,335,670 | ) | | | | | | | | | (102,536 | ) |
| | | | | | | | | | | | | | | | | | | | | | | | | | | | | | | | | | | | | | | | | | | | | | | | | | | | | | | | | | | | | | | | | |
Net unrealized appreciation/ depreciation | | | $ | 518,506,658 | | | | | | | | | $ | 8,876,102 | | | | | | | | | $ | 678,688 | | | | | | | | | $ | 2,049,365 | | | | | | | | | $ | 12,695,050 | | | | | | | | | $ | 8,851,730 | | | | | | | | | $ | (43,045 | ) |
| | | | | | | | | | | | | | | | | | | | | | | | | | | | | | | | | | | | | | | | | | | | | | | | | | | | | | | | | | | | | | | | | |
The Funds are required to evaluate tax positions taken or expected to be taken in the course of preparing the Funds’ tax returns to determine whether the tax positions are “more-likely-than-not” of being sustained by the applicable tax authority. Income tax and related interest and penalties would be recognized by the Funds as tax expense in the Statement of Operations if the tax positions were deemed not to meet the more-likely-than-not threshold. During the fiscal year ended September 30, 2018, the Funds did not incur any income tax, interest, or penalties. As of September 30, 2018, the Adviser has reviewed all open tax years and concluded that there was no impact to the Funds’ net assets or results of operations. The Funds’ federal and state tax returns for the prior three fiscal years remain open, subject to examination by the Internal Revenue Service and state taxing authorities. On an ongoing basis, the Adviser will monitor the Funds’ tax positions to determine if adjustments to this conclusion are necessary.
3. Investment Advisory Agreements and Other Transactions. The Funds have entered into investment advisory agreements (the Advisory Agreements) with the Adviser which provide that the Funds will pay the Adviser a fee, computed daily and paid monthly, at the annual rate of 1.00% for the Mighty Mites Fund, SmallCap Equity Fund, Mid-Cap Equity Fund, Convertible Securities Fund, and Equity Fund, 0.75% for the Balanced Fund, and 0.60% for the Intermediate Bond Fund, of the value of a Fund’s average daily net assets. In accordance with the Advisory Agreements, the Adviser provides a continuous investment program for the Funds’ portfolios, oversees the administration of all aspects of the Funds’ business and affairs, and pays the compensation of all Officers and Trustees of the Funds who are affiliated persons of the Adviser.
There was a reduction in the advisory fee paid to the Adviser relating to certain portfolio holdings, i.e., unsupervised assets, of the Mighty Mites Fund with respect to which the Adviser transferred dispositive and voting control to the Funds’ Proxy Voting Committee. During the fiscal year ended September 30, 2018, the Funds’ Proxy Voting Committee exercised control and discretion over all rights to vote or consent with respect to such securities, and the Adviser reduced its fee with respect to such securities by $69,770.
The Adviser has contractually agreed to waive investment advisory fees and/or to reimburse expenses to the SmallCap Equity Fund, Mid-Cap Equity Fund, Convertible Securities Fund, and Intermediate Bond Fund in the event annual expenses of such Funds exceed certain prescribed limits. Such fee waiver/reimbursement arrangements continue at least until January 31, 2019. For the fiscal year ended September 30, 2018, the Adviser waived fees or reimbursed expenses in the amounts of $163,050, $83,641, $164,831, and $92,897 for the SmallCap Equity Fund, Mid-Cap Equity Fund, Convertible Securities Fund, and Intermediate Bond Fund, respectively.
In addition, the SmallCap Equity Fund, the Convertible Securities Fund, and the Intermediate Bond Fund are obliged to repay the Adviser for a period of two fiscal years following the fiscal year in which the Adviser reimbursed the Funds only to the extent that the operating expenses of these Funds fall below the following expense limitations based on average net assets for the SmallCap Equity Fund, the Convertible Securities Fund, and the Intermediate Bond Fund for Class AAA Shares 1.25%, 1.15%, and 1.00%, respectively, for Class A Shares 1.50%, 1.40%, and 1.10%, respectively, for Class C Shares 2.00%, 1.90%,
59
TETON Westwood Funds
Notes to Financial Statements (Continued)
and 1.75%, respectively, and for Class I Shares 1.00%, 0.90%, and 0.75%, respectively. As of September 30, 2018, the cumulative unreimbursed amounts which may be recovered by the Adviser within the next two fiscal years are as follows:
| | | | | | | | | | | | | | | |
| | | For the year ended
September 30, 2017,
expiring
September 30, 2019 | | For the year ended
September 30, 2018,
expiring
September 30, 2020 | | Total |
SmallCap Equity Fund | | | $ | 122,026 | | | | $ | 163,045 | | | | $ | 285,071 | |
Convertible Securities Fund | | | | 122,517 | | | | | 164,831 | | | | | 287,348 | |
Intermediate Bond Fund | | | | 83,760 | | | | | 92,897 | | | | | 176,657 | |
The Mid-Cap Equity Fund is obliged to repay the Adviser for a period of three fiscal years following the fiscal year in which the Adviser reimbursed the Fund, only to the extent that the operating expenses of the Fund falls below the applicable expense limitation for Class AAA of 1.05%, Class A of 1.30%, Class C of 1.80%, and Class I of 0.80%, of average daily net assets, the annual limitation under the Advisory Agreement. As of September 30, 2018, the cumulative unreimbursed amounts which may be recovered by the Adviser within the next three fiscal years are as follows:
| | | | | | | | | | | | | | | | | | | | |
| | | For the year ended
September 30, 2016,
expiring
September 30, 2019 | | For the year ended
September 30, 2017,
expiring
September 30, 2020 | | For the year ended
September 30, 2018,
expiring
September 30, 2021 | | Total |
Mid-Cap Equity Fund | | | $ | 83,891 | | | | $ | 76,114 | | | | $ | 83,641 | | | | $ | 243,646 | |
Pursuant to shareholder approvals, effective February 1, 2017 for the Convertible Securities Fund and March 1, 2017 for the Mighty Mites Fund, Gabelli Funds, LLC, an affiliate, became a Subadviser (Gabelli Subadviser) to the Adviser. The Adviser pays Gabelli Funds, LLC out of its advisory fees a monthly fee, computed and accrued daily, based on an annual rate of 0.32% of the average net assets of these two Funds. In addition, the Adviser had a Subadvisory Agreement with Westwood Management Corp. (Westwood Subadviser) for the Equity Fund and Balanced Fund, effective throughout the fiscal year ended September 30, 2017, which continues, and for the Intermediate Bond Fund from October 1, 2016 through August 31, 2017 at which time Teton Advisors became its direct Adviser. During the periods noted, the Adviser paid the Westwood Subadviser out of its advisory fees with respect to these three Funds a fee, computed daily and payable monthly, in an amount equal on an annualized basis to the greater of (i) $150,000 per year on an aggregate basis for all applicable Funds or (ii) 35% of the net revenues to the Adviser from the applicable Funds.
The Adviser has a sub-administration agreement for each of the Funds with Gabelli Funds, LLC. Gabelli Funds, LLC has entered into an agreement with BNY Mellon Investment Servicing (US) Inc. to provide certain administrative services to the Funds.
As per the approval of the Board, the Mid-Cap Equity Fund compensates officers of the Fund, who are employed by the Fund and are not employed by the Adviser (although the officers may receive incentive based variable compensation from affiliates of the Adviser). For the fiscal year ended September 30, 2018, the Fund accrued $2,143 in payroll expenses in the Statement of Operations.
The Trust pays each Trustee who is not considered an affiliated person an annual retainer of $9,000 plus $2,000 for each Board meeting attended, and they are reimbursed by the Trust for any out of pocket expenses incurred in attending meetings. All Board committee members receive $1,000 per meeting attended, the Chairman of the Audit Committee receives a $3,000 annual fee, and the Lead Trustee receives an annual fee of $2,000. A Trustee may receive a single meeting fee, allocated among the participating funds, for attending certain meetings held on behalf of multiple funds. Trustees who are directors or employees of the Adviser or an affiliated company receive no compensation or expense reimbursement from the Trust.
4. Distribution Plan. The Trust’s Board has adopted a distribution plan (the “Plan”) for each class of shares, except Class I Shares, pursuant to Rule 12b-1 under the 1940 Act. Under the Class AAA, Class A, and Class C Share Plans, payments are authorized to G.distributors, LLC (the “Distributor”), an affiliate of the Adviser, at annual rates of 0.25%, 0.50% (for the Intermediate Bond Fund’s Class A Shares at an annual rate of 0.35%), and 1.00%, respectively, of the average daily net assets of those classes, the annual limitations under each Plan. Such payments are accrued daily and paid monthly.
60
TETON Westwood Funds
Notes to Financial Statements (Continued)
5. Portfolio Securities. Purchases and sales (including maturities) of securities during the fiscal year ended September 30, 2018, other than short term securities, are as follows:
| | | | | | | | | | | | | | | | |
| | | Purchases
(excluding U.S.
Government
Securities) | | | Sales
(excluding U.S.
Government
Securities) | | | Purchases
of U.S.
Government
Securities | | | Sales of U.S.
Government
Securities | |
Mighty Mites Fund | | $ | 105,643,135 | | | $ | 128,485,063 | | | | — | | | | — | |
SmallCap Equity Fund | | | 11,217,326 | | | | 10,531,520 | | | | — | | | | — | |
Mid-Cap Equity Fund | | | 619,845 | | | | 394,421 | | | | — | | | | — | |
Convertible Securities Fund | | | 16,482,209 | | | | 6,359,911 | | | | — | | | | — | |
Equity Fund | | | 20,254,586 | | | | 29,264,990 | | | | — | | | | — | |
Balanced Fund. | | | 14,645,610 | | | | 22,947,111 | | | $ | 2,484,176 | | | $ | 2,511,619 | |
Intermediate Bond Fund | | | 848,199 | | | | 621,014 | | | | 996,812 | | | | 1,385,178 | |
6. Transactions with Affiliates and Other Arrangements. During the fiscal year ended September 30, 2018, the Mighty Mites Fund and the Convertible Securities Fund paid $106,476 and $104, respectively, in brokerage commissions on security trades to G.research, LLC, an affiliate of the Adviser. Additionally, the Distributor retained a total of $75,959 from investors representing commissions (sales charges and underwriting fees) on sales and redemptions of Fund shares.
Pursuant to Rule 17a-7 under the 1940 Act, the Funds may engage in purchase or sale transactions with other funds managed by the Adviser or an affiliated adviser. During the fiscal year ended September 30, 2018, such transactions for the Mighty Mites Fund amounted to $143,190 in purchase transactions and $2,604 in sales transactions, and for the Convertible Securities Fund amounted to $189,886 in purchase transactions.
During the fiscal year ended September 30, 2018, the Mighty Mites Fund, SmallCap Equity Fund, Mid-Cap Equity Fund, Convertible Securities Fund, Equity Fund, and Balanced Fund received credits from a designated broker who agreed to pay certain Fund operating expenses. The amount of such expenses paid through this directed brokerage arrangement during this period was $10,210, $1,563, $1,370, $53, $1,776, and $1,800, respectively.
The cost of calculating each Fund’s NAV per share is a Fund expense pursuant to the Advisory Agreement. During the fiscal year ended September 30, 2018, the Mighty Mites Fund, Equity Fund, and Balanced Fund each accrued $45,000 in connection with the cost of computing these Funds’ NAVs. This expense was not charged during the fiscal year ended September 30, 2018 for the SmallCap Equity Fund, Mid-Cap Equity Fund, Convertible Securities Fund, and Intermediate Bond Fund.
As of September 30, 2018, the Mid-Cap Equity Fund’s Adviser and its affiliates and officers beneficially owned greater than 25% of the voting securities of the Mid-Cap Equity Fund. This includes accounts for which the affiliates of the Adviser have voting control but disclaim pecuniary interest.
7. Shares of Beneficial Interest. The Funds offer four classes of shares – Class AAA Shares, Class A Shares, Class C Shares, and Class I Shares. Class AAA Shares and Class I Shares are offered without a sales charge. Class A Shares are subject to a maximum front-end sales charge of 4.00%. Class C Shares are subject to a 1.00% contingent deferred sales charge for one year after purchase. Class T Shares were liquidated on September 21, 2018.
The Mighty Mites Fund, SmallCap Equity Fund, Mid-Cap Equity Fund, and Convertible Securities Fund impose a redemption fee of 2.00% on all classes of shares that are redeemed or exchanged on or before the seventh day of a purchase. The redemption fee is deducted from the proceeds otherwise payable to the redeeming shareholders and is retained by the respective Fund as an increase in paid-in capital. The redemption fees, if any, retained by the Fund during the fiscal years ended September 30, 2018 and September 30, 2017 can be found in the Statements of Changes in Net Assets under Redemption Fees.
During the fiscal year ended September 30, 2017, the Mid-Cap Equity Fund sold shares of various portfolio securities. These portfolio securities were delivered primarily by means of a redemption in-kind in exchange for Class AAA shares of the Fund. Cash and portfolio securities were transferred as of the close of business on the date and at the market value listed below:
| | | | | | | | | | |
January 04, 2017 | | Value | | | Realized Gains | | | Type |
| | | |
Class AAA | | $ | 365,795 | * | | | $39,222 | | | Redemption in-Kind |
| | * | This amount includes cash of approximately $22,073 associated with the redemption in-kind. |
61
TETON Westwood Funds
Notes to Financial Statements (Continued)
Transactions in shares of beneficial interest were as follows:
| | | | | | | | | | | | | | | | | | | | | | | | | | | | | | | | |
| | | Year Ended
September 30,
2018 | | | Year Ended
September 30,
2017 | | | Year Ended
September 30,
2018 | | | Year Ended
September 30,
2017 | | | Year Ended
September 30,
2018 | | | Year Ended
September 30,
2017 | | | Year Ended
September 30,
2018 | | | Year Ended
September 30,
2017 | |
| | | Mighty Mites Fund | | | SmallCap Equity
Fund | | | Mid-Cap Equity
Fund | | | Convertible Securities
Fund | |
| Class AAA | | | | | | | | | | | | | | | | | | | | | | |
Shares sold | | | 1,143,746 | | | | 1,760,288 | | | | 98,106 | | | | 266,478 | | | | 21,445 | | | | 39,537 | | | | 68,178 | | | | 99,609 | |
Shares issued upon reinvestment of distributions | | | 560,590 | | | | 468,807 | | | | 38,375 | | | | 58,991 | | | | 2,807 | | | | 1,839 | | | | 4,862 | | | | 21,153 | |
Shares redeemed | | | (3,160,420 | ) | | | (3,269,846 | ) | | | (139,152 | ) | | | (460,953 | ) | | | (25,358 | ) | | | (102,446 | ) | | | (83,138 | ) | | | (153,149 | ) |
Shares redeemed in-kind | | | — | | | | — | | | | — | | | | — | | | | — | | | | (30,791 | ) | | | — | | | | — | |
| | | | | | | | | | | | | | | | | | | | | | | | | | | | | | | | |
Net decrease in Class AAA | | | | | | | | | | | | | | | | | | | | | | | | | | | | | | | | |
Shares. | | | (1,456,084 | ) | | | (1,040,751 | ) | | | (2,671 | ) | | | (135,484 | ) | | | (1,106 | ) | | | (91,861 | ) | | | (10,098 | ) | | | (32,387 | ) |
| | | | | | | | | | | | | | | | | | | | | | | | | | | | | | | | |
Class A | | | | | | | | | | | | | | | | | | | | | | | | | | | | | | | | |
Shares sold | | | 772,830 | | | | 1,484,433 | | | | 76,175 | | | | 42,648 | | | | 43 | | | | 7,368 | | | | 137,957 | | | | 180,355 | |
Shares issued upon reinvestment of distributions | | | 292,320 | | | | 258,861 | | | | 16,975 | | | | 15,131 | | | | 688 | | | | 273 | | | | 2,662 | | | | 7,099 | |
Shares redeemed | | | (2,991,223 | ) | | | (1,705,309 | ) | | | (22,441 | ) | | | (39,491 | ) | | | (2,001 | ) | | | (18,423 | ) | | | (92,023 | ) | | | (78,571 | ) |
| | | | | | | | | | | | | | | | | | | | | | | | | | | | | | | | |
Net increase/(decrease) in | | | | | | | | | | | | | | | | | | | | | | | | | | | | | | | | |
Class A Shares | | | (1,926,073 | ) | | | 37,985 | | | | 70,709 | | | | 18,288 | | | | (1,270 | ) | | | (10,782 | ) | | | 48,596 | | | | 108,883 | |
| | | | | | | | | | | | | | | | | | | | | | | | | | | | | | | | |
Class C | | | | | | | | | | | | | | | | | | | | | | | | | | | | | | | | |
Shares sold | | | 915,856 | | | | 974,773 | | | | 54,393 | | | | 18,862 | | | | 18,174 | | | | 1,792 | | | | 136,720 | | | | 40,369 | |
Shares issued upon reinvestment of distributions | | | 457,902 | | | | 346,671 | | | | 11,795 | | | | 11,710 | | | | 625 | | | | 182 | | | | 703 | | | | 4,024 | |
Shares redeemed | | | (1,664,454 | ) | | | (2,309,536 | ) | | | (27,138 | ) | | | (44,026 | ) | | | (329 | ) | | | (3,501 | ) | | | (40,750 | ) | | | (17,245 | ) |
| | | | | | | | | | | | | | | | | | | | | | | | | | | | | | | | |
Net increase/(decrease) in | | | | | | | | | | | | | | | | | | | | | | | | | | | | | | | | |
Class C Shares | | | (290,696 | ) | | | (988,092 | ) | | | 39,050 | | | | (13,454 | ) | | | 18,470 | | | | (1,527 | ) | | | 96,673 | | | | 27,148 | |
| | | | | | | | | | | | | | | | | | | | | | | | | | | | | | | | |
Class I | | | | | | | | | | | | | | | | | | | | | | | | | | | | | | | | |
Shares sold | | | 10,607,226 | | | | 8,295,220 | | | | 357,650 | | | | 280,016 | | | | 207 | | | | 9,327 | | | | 868,258 | | | | 553,039 | |
Shares issued upon reinvestment of distributions | | | 1,051,566 | | | | 559,850 | | | | 62,752 | | | | 51,794 | | | | 5,759 | | | | 1,674 | | | | 14,082 | | | | 12,558 | |
Shares redeemed | | | (4,441,243 | ) | | | (3,507,424 | ) | | | (240,725 | ) | | | (95,036 | ) | | | (9,612 | ) | | | (24,984 | ) | | | (125,418 | ) | | | (66,240 | ) |
| | | | | | | | | | | | | | | | | | | | | | | | | | | | | | | | |
Net increase/(decrease) in | | | | | | | | | | | | | | | | | | | | | | | | | | | | | | | | |
Class I Shares | | | 7,217,549 | | | | 5,347,646 | | | | 179,677 | | | | 236,774 | | | | (3,646 | ) | | | (13,983 | ) | | | 756,922 | | | | 499,357 | |
| | | | | | | | | | | | | | | | | | | | | | | | | | | | | | | | |
Class T * | | | | | | | | | | | | | | | | | | | | | | | | | | | | | | | | |
Shares sold | | | — | | | | 365 | | | | — | | | | 50 | | | | — | | | | — | | | | — | | | | — | |
Shares issued upon reinvestment of distributions | | | 23 | | | | — | | | | 5 | | | | — | | | | — | | | | — | | | | — | | | | — | |
Shares redeemed | | | (388 | ) | | | — | | | | (55 | ) | | | — | | | | — | | | | — | | | | — | | | | — | |
| | | | | | | | | | | | | | | | | | | | | | | | | | | | | | | | |
Net increase/(decrease) in | | | | | | | | | | | | | | | | | | | | | | | | | | | | | | | | |
Class T Shares | | | (365 | ) | | | 365 | | | | (50 | ) | | | 50 | | | | — | | | | — | | | | — | | | | — | |
| | | | | | | | | | | | | | | | | | | | | | | | | | | | | | | | |
| * | Class T Shares were liquidated on August 31, 2018. |
62
TETON Westwood Funds
Notes to Financial Statements (Continued)
Transactions in shares of beneficial interest (continued):
| | | | | | | | | | | | | | | | | | | | | | | | |
| | | Year Ended
September 30,
2018 | | | Year Ended
September 30,
2017 | | | Year Ended
September 30,
2018 | | | Year Ended
September 30,
2017 | | | Year Ended
September 30,
2018 | | | Year Ended
September 30,
2017 | |
| | | Equity Fund | | | Balanced Fund | | | Intermediate
Bond Fund | |
Class AAA | | | | | | | | | | | | | | | | | | | | | | | | |
Shares sold | | | 36,247 | | | | 50,004 | | | | 137,074 | | | | 584,115 | | | | 53,773 | | | | 54,266 | |
Shares issued upon reinvestment of distributions | | | 453,525 | | | | 288,678 | | | | 284,434 | | | | 288,682 | | | | 10,289 | | | | 6,662 | |
Shares redeemed | | | (531,459 | ) | | | (595,438 | ) | | | (963,903 | ) | | | (949,642 | ) | | | (73,711 | ) | | | (92,589 | ) |
| | | | | | | | | | | | | | | | | | | | | | | | |
Net decrease in Class AAA Shares | | | (41,687 | ) | | | (256,756 | ) | | | (542,395 | ) | | | (76,845 | ) | | | (9,649 | ) | | | (31,661 | ) |
| | | | | | | | | | | | | | | | | | | | | | | | |
Class A | | | | | | | | | | | | | | | | | | | | | | | | |
Shares sold | | | 788 | | | | 14,363 | | | | 205,822 | | | | 122,407 | | | | 110,675 | | | | 9,648 | |
Shares issued upon reinvestment of distributions | | | 21,153 | | | | 20,055 | | | | 44,314 | | | | 37,216 | | | | 897 | | | | 954 | |
Shares redeemed | | | (102,192 | ) | | | (147,384 | ) | | | (218,389 | ) | | | (87,911 | ) | | | (126,171 | ) | | | (36,905 | ) |
| | | | | | | | | | | | | | | | | | | | | | | | |
Net increase/(decrease) in Class A Shares | | | (80,251 | ) | | | (112,966 | ) | | | 31,747 | | | | 71,712 | | | | (14,599 | ) | | | (26,303 | ) |
| | | | | | | | | | | | | | | | | | | | | | | | |
Class C | | | | | | | | | | | | | | | | | | | | | | | | |
Shares sold | | | 382 | | | | 39,479 | | | | 24,212 | | | | 35,975 | | | | 10,932 | | | | 27,845 | |
Shares issued upon reinvestment of distributions | | | 5,783 | | | | 3,174 | | | | 22,689 | | | | 22,637 | | | | 2,667 | | | | 1,390 | |
Shares redeemed | | | (24,686 | ) | | | (60,178 | ) | | | (57,658 | ) | | | (154,894 | ) | | | (38,241 | ) | | | (29,741 | ) |
| | | | | | | | | | | | | | | | | | | | | | | | |
Net decrease in Class C Shares | | | (18,521 | ) | | | (17,525 | ) | | | (10,757 | ) | | | (96,282 | ) | | | (24,642 | ) | | | (506 | ) |
| | | | | | | | | | | | | | | | | | | | | | | | |
Class I | | | | | | | | | | | | | | | | | | | | | | | | |
Shares sold | | | 67,552 | | | | 98,712 | | | | 267,185 | | | | 37,854 | | | | 25,437 | | | | 190,485 | |
Shares issued upon reinvestment of distributions | | | 40,968 | | | | 23,076 | | | | 16,765 | | | | 10,896 | | | | 8,626 | | | | 21,200 | |
Shares redeemed | | | (123,082 | ) | | | (95,870 | ) | | | (130,604 | ) | | | (46,576 | ) | | | (79,383 | ) | | | (1,166,263 | ) |
| | | | | | | | | | | | | | | | | | | | | | | | |
Net increase/(decrease) in Class I Shares | | | (14,562 | ) | | | 25,918 | | | | 153,346 | | | | 2,174 | | | | (45,320 | ) | | | (954,578 | ) |
| | | | | | | | | | | | | | | | | | | | | | | | |
8. Transactions in Securities of Affiliated Issuers. The 1940 Act defines affiliated issuers as those in which a Fund’s holdings of an issuer represent 5% or more of the outstanding voting securities of the issuer. A summary of the Mighty Mites Fund’s transactions in the securities of these issuers during the fiscal year ended September 30, 2018 is set forth below:
| | | | | | | | | | | | | | | | | | | | | | | | | | | | | | | | | | | | |
| | | Beginning
Shares | | | Shares
Purchased | | | Shares
Sold | | | Ending Shares | | | Dividend
Income | | | Realized
Gain/ Loss | | | Market Value at
September 30, 2018 | | | Change in
Unrealized
Appreciation/ (Depreciation) | | | Percent
Owned of
Shares Outstanding | |
Beasley Broadcast Group Inc., | | | | | | | | | | | | | | | | | | | | | | | | | | | | | |
Cl. A | | | 725,000 | | | | 130,000 | | | | (5,000 | ) | | | 850,000 | | | $ | 147,125 | | | $ | 25,698 | | | | $5,865,000 | | | | $(3,563,697) | | | | 7.84 | % |
Bel Fuse Inc., Cl. A | | | 175,300 | | | | 699 | | | | — | | | | 175,999 | | | | 42,156 | | | | — | | | | 3,718,859 | | | | (955,669) | | | | 8.09 | % |
Burnham Holdings Inc., | | | | | | | | | | | | | | | | | | | | | | | | | | | | | | | | | | | | |
Cl. A | | | 255,500 | | | | 8,501 | | | | — | | | | 264,001 | | | | 229,571 | | | | — | | | | 3,960,015 | | | | (2,482) | | | | 8.71 | % |
Canterbury Park Holding | | | | | | | | | | | | | | | | | | | | | | | | | | | | | | | | | | | | |
Corp.* | | | 368,100 | | | | 102 | | | | (204,102 | ) | | | 164,100 | | | | — | | | | — | | | | — | | | | — | | | | — | |
Edgewater Technology Inc.* | | | 705,520 | | | | — | | | | — | | | | 705,520 | | | | — | | | | — | | | | — | | | | — | | | | — | |
General Chemical Group Inc. | | | 267,226 | | | | — | | | | — | | | | 267,226 | | | | — | | | | — | | | | 2,004 | | | | (267) | | | | 8.59 | % |
Griffin Industrial Realty Inc. | | | 255,647 | | | | 20,000 | | | | (647 | ) | | | 275,000 | | | | 102,259 | | | | 12,973 | | | | 10,725,000 | | | | 684,431 | | | | 5.47 | % |
Katy Industries Inc.** | | | 840,000 | | | | — | | | | (840,000 | ) | | | — | | | | — | | | | — | | | | — | | | | — | | | | — | |
Nathan’s Famous Inc. | | | 223,850 | | | | — | | | | (1,216 | ) | | | 222,634 | | | | 1,224,487 | | | | 105,866 | | | | 18,345,042 | | | | 1,791,335 | | | | 5.32 | % |
RLJ Entertainment Inc.* | | | 388,683 | | | | 26,317 | | | | — | | | | 415,000 | | | | — | | | | — | | | | — | | | | — | | | | — | |
Schmitt Industries Inc. | | | 94,541 | | | | 621,488 | | | | (15,000 | ) | | | 701,029 | | | | — | | | | 19,316 | | | | 1,969,891 | | | | 415,804 | | | | 17.55 | % |
The Eastern Co. | | | 354,669 | | | | 462 | | | | — | | | | 355,131 | | | | 156,258 | | | | — | | | | 10,085,720 | | | | (105,018) | | | | 5.67 | % |
The L.S. Starrett Co., Cl. A | | | 348,498 | | | | 14,102 | | | | (9,417 | ) | | | 353,183 | | | | 35,170 | | | | (135,750 | ) | | | 2,119,098 | | | | (897,299) | | | | 5.60 | % |
Trans-Lux Corp. | | | 22,000 | | | | 389,792 | | | | — | | | | 411,792 | | | | — | | | | (5 | ) | | | 152,363 | | | | (17,750) | | | | 17.99 | % |
Trans-Lux Pfd. 6.000% | | | 363 | | | | — | | | | — | | | | 363 | | | | 2,178 | | | | — | | | | 2,552 | | | | 2,271 | | | | 2.20 | % |
| | | | | | | | | | | | | | | | | | | | | | | | |
Total | | | | | | | | | | | | | | | | | | $ | 1,939,204 | | | $ | 28,098 | | | | $56,945,544 | | | | $(2,648,341) | | | | | |
| | | | | | | | | | | | | | | | | | | | | | | | |
| * | Security is no longer considered affiliated at September 30, 2018. |
| ** | Security is no longer held at September 30, 2018. |
9. Indemnifications. The Funds enter into contracts that contain a variety of indemnifications. The Funds’ maximum exposure under these arrangements is unknown. However, the Funds have not had prior claims or losses pursuant to these contracts. Management has reviewed the Funds’ existing contracts and expects the risk of loss to be remote.
63
TETON Westwood Funds
Notes to Financial Statements (Continued)
10. Subsequent Events. Management has evaluated the impact on the Funds of all subsequent events occurring through the date the financial statements were issued and has determined that there were no subsequent events requiring recognition or disclosure in the financial statements.
64
Report of Independent Registered Public Accounting Firm
To the Board of Trustees of the TETON Westwood Funds and Shareholders of TETON Westwood Mighty MitesSM Fund, TETON Westwood SmallCap Equity Fund, TETON Westwood Mid-Cap Equity Fund, TETON Convertible Securities Fund, TETON Westwood Equity Fund, TETON Westwood Balanced Fund and TETON Westwood Intermediate Bond Fund:
Opinions on the Financial Statements
We have audited the accompanying statements of assets and liabilities, including the schedules of investments of TETON Westwood Mighty MitesSM Fund, TETON Westwood SmallCap Equity Fund, TETON Westwood Mid-Cap Equity Fund, TETON Convertible Securities Fund, TETON Westwood Equity Fund, TETON Westwood Balanced Fund and TETON Westwood Intermediate Bond Fund (constituting TETON Westwood Funds, hereafter collectively referred to as the “Funds”) as of September 30, 2018, the related statements of operations for the year ended September 30, 2018, the statements of changes in net assets for each of the two years in the period ended September 30, 2018, including the related notes, and the financial highlights for each of the five years in the period ended September 30, 2018 (collectively referred to as the “financial statements”). In our opinion, the financial statements present fairly, in all material respects, the financial position of each of the Funds as of September 30, 2018, the results of each of their operations for the year then ended, the changes in each of their net assets for each of the two years in the period ended September 30, 2018 and each of the financial highlights for each of the five years in the period ended September 30, 2018 in conformity with accounting principles generally accepted in the United States of America.
Basis for Opinions
These financial statements are the responsibility of the Funds’ management. Our responsibility is to express an opinion on the Funds’ financial statements based on our audits. We are a public accounting firm registered with the Public Company Accounting Oversight Board (United States) (“PCAOB”) and are required to be independent with respect to the Funds in accordance with the U.S. federal securities laws and the applicable rules and regulations of the Securities and Exchange Commission and the PCAOB.
We conducted our audits of these financial statements in accordance with the standards of the PCAOB. Those standards require that we plan and perform the audit to obtain reasonable assurance about whether the financial statements are free of material misstatement, whether due to error or fraud.
Our audits included performing procedures to assess the risks of material misstatement of the financial statements, whether due to error or fraud, and performing procedures that respond to those risks. Such procedures included examining, on a test basis, evidence regarding the amounts and disclosures in the financial statements. Our audits also included evaluating the accounting principles used and significant estimates made by management, as well as evaluating the overall presentation of the financial statements. Our procedures included confirmation of securities owned as of September 30, 2018 by correspondence with the custodian and brokers; when replies were not received from brokers, we performed other auditing procedures. We believe that our audits provide a reasonable basis for our opinions.
/s/PricewaterhouseCoopers LLP
New York, NY
November 27, 2018
We have served as the auditor of one or more investment companies in Gabelli/GAMCO Fund Complex since 1986.
65
2018 Tax Notice to Shareholders (Unaudited)
U.S. Government Income: – The percentage of the ordinary income dividend paid by the Convertible Securities Fund, the Mid-Cap Equity Fund, the Balanced Fund, and the Intermediate Bond Fund, (the “Funds”) during the year ended September 30, 2018 which was derived from U.S. Treasury securities was 0.28%, 17.99%, 8.61%, and 26.31%, respectively. Such income is exempt from state and local tax in all states. However, many states, including New York and California, allow a tax exemption for a portion of the income earned only if a mutual fund has invested at least 50% of its assets at the end of each quarter of the Fund’s fiscal year in U.S. Government securities. The Funds did not meet this strict requirement during the fiscal year ended September 30, 2018. Due to the diversity in state and local tax law, it is recommended that you consult your personal tax adviser for the applicability of the information provided as to your specific situation.
Mighty Mites Fund – During the fiscal year ended September 30, 2018, the Fund paid to shareholders long term capital gains totaling $84,699,816. The distributions of long term capital gains have been designated as a capital gain dividend by the Fund’s Board of Trustees.
SmallCap Equity Fund – During the fiscal year ended September 30, 2018, the Fund paid to the shareholders ordinary income dividends (comprised of short term capital gains) totaling $0.1063 per share for all Classes of Shares. During the fiscal year ended September 30, 2018, the Fund paid to shareholders long term capital gains totaling $2,568,471. The distributions of long term capital gains have been designated as a capital gain dividend by the Fund’s Board of Trustees. For the fiscal year ended September 30, 2018, 56.40% of the ordinary income dividend qualifies for the dividends received deduction available to corporations. The Fund designates 57.37% of the ordinary income distributions as qualified dividend income, pursuant to the Jobs and Growth Tax Relief Reconciliation Act of 2003. The Fund designates 100% of the ordinary income distributions as qualified short term capital gain.
Mid-Cap Equity Fund – During the fiscal year ended September 30, 2018, the Fund paid to shareholders long term capital gains totaling $130,479. The distributions of long term capital gains have been designated as a capital gain dividend by the Fund’s Board of Trustees.
Convertible Securities Fund – During the fiscal year ended September 30, 2018, the Fund paid to shareholders ordinary income dividends (comprised of net investment income) totaling $0.2025, $0.1690, $0.1003, and $0.2358 per share for Class AAA, Class A, Class C, and Class I Shares, respectively. For the fiscal year ended September 30, 2018, 16.30% of the ordinary income dividend qualifies for the dividends received deduction available to corporations. The Fund designates 15.00% of the ordinary income distributions as qualified dividend income, pursuant to the Jobs and Growth Tax Relief Reconciliation Act of 2003. The Fund designates 87.94% of the ordinary income distributions as qualified interest income, pursuant to the American Jobs Creation Act of 2004. The Fund designates 100% of the ordinary income distributions as qualified short term capital gain.
Equity Fund – During the fiscal year ended September 30, 2018, the Fund paid to shareholders ordinary income dividends (comprised of net investment income and short term capital gains) totaling $0.2089, $0.1649, $0.1474, and $0.2435 per share for Class AAA, Class A, Class C, and Class I Shares, respectively, and long term capital gains totaling $5,945,421. For the fiscal year ended September 30, 2018, 100% of the ordinary income dividend qualifies for the dividends received deduction available to corporations. The Fund designates 100% of the ordinary income distribution as qualified dividend income, pursuant to the Jobs and Growth Tax Relief Reconciliation Act of 2003. The Fund designates 0.30% of the ordinary income distribution as qualified interest income, pursuant to the American Jobs Creation Act of 2004.
Balanced Fund – During the fiscal year ended September 30, 2018, the Fund paid to shareholders ordinary income dividends (comprised of net investment income) totaling $0.1242, $0.0947, $0.0300, and $0.1555 per share for Class AAA, Class A, Class C, and Class I Shares, respectively, and long term capital gains totaling $3,449,007. The distributions of long term capital gains have been designated as a capital gain dividend by the Fund’s Board of Trustees. For the fiscal year ended September 30, 2018, 93.77% of the ordinary income dividend qualifies for the dividends received deduction available to corporations. The Fund designates 94.89% of the ordinary income distributions as qualified dividend income, pursuant to the Jobs and Growth Tax Relief Reconciliation Act of 2003. The Fund designates 37.09% of the ordinary income distributions as qualified interest income, pursuant to the American Jobs Creation Act of 2004.
66
2018 Tax Notice to Shareholders (Unaudited) (Continued)
Intermediate Bond Fund – During the fiscal year ended September 30, 2018, the Fund paid to shareholders ordinary income dividends (comprised of net investment income and short term capital gains) totaling $0.1744, $0.1630, $0.0875, and $0.2019 per share for Class AAA, Class A, Class C, and Class I Shares, respectively, and long term capital gains totaling $105,510. The distributions of long term capital gains have been designated as a capital gain dividend by the Fund’s Board of Trustees. The Fund designates 100% of the ordinary income distributions as qualified interest income, pursuant to the American Jobs Creation Act of 2004. The Fund designates 100% of the ordinary income distributions as qualified short term capital gain.
All designations are based on financial information available as of the date of this annual report and, accordingly, are subject to change. For each item, it is the intention of the Fund to designate the maximum amount permitted under the Internal Revenue Code and the regulations thereunder.
67
TETON Westwood Funds
Board Consideration and Re-Approval of Investment Advisory and Subadvisory Agreements (Unaudited)
In determining whether to approve the continuance of the Investment Advisory Agreement and Subadvisory Agreement (together, the Agreements), the Board, including a majority of the Trustees who have no direct or indirect interest in the Agreements and are not interested persons of the Funds, as defined in the 1940 Act (the Independent Board Members), considered the following information at a meeting on August 21, 2018:
In determining whether to approve the continuance of each of the Agreements, the Board considered the following information:
1) The nature, extent, and quality of services provided by the Adviser and the Subadvisers.
The Board reviewed in detail the nature and extent of the services provided by the Adviser and the Sub-Advisers under the Agreements and the quality of those services over the past year. The Board noted that these services included managing the investment program of the Funds, including the purchase and sale of portfolio securities, as well as the provision of general corporate services. The Board considered that the Adviser also provided, at its expense, office facilities for use by the Funds and supervisory personnel responsible for supervising the performance of administrative, accounting, and related services including, for each Fund, monitoring to assure compliance with stated investment policies and restrictions under the 1940 Act and related securities regulations. The Board noted that, in addition to managing the investment program for the Funds, the Adviser provided certain non-advisory and compliance services, including services under the Funds’ Rule 38a-1 compliance program.
The Board also considered that the Adviser paid for all compensation of officers and Board Members of the Funds who are affiliated with the Adviser and that the Adviser further provided services to shareholders of the Funds who had invested through various programs offered by third party financial intermediaries. The Board evaluated these factors based on its direct experience with the Adviser and Sub-Advisers and in consultation with Fund Counsel. The Board noted that the Adviser had engaged, at its expense, BNY, to assist it in performing certain of its administrative functions. The Board concluded that the nature and extent of the services provided was reasonable and appropriate in relation to the advisory fee, that the level of services provided by the Adviser, either directly or through BNY, and by the Sub-Advisers, had not diminished over the past year and that the quality of service continued to be high
The Board reviewed the personnel responsible for providing services to the Funds and concluded, based on their experience and interaction with the Adviser and Sub-Advisers, that (i) the Adviser and Sub-Advisers were able to retain quality personnel, (ii) the Adviser, Sub-Advisers, and their agents exhibited a high level of diligence and attention to detail in carrying out their advisory and administrative responsibilities under the Agreements, (iii) the Adviser and Sub-Advisers were responsive to requests of the Board, (iv) the scope and depth of the Adviser’s and Sub-Advisers’ resources were adequate, and (v) the Adviser and Sub-Advisers had kept the Board apprised of developments relating to each Fund and the industry in general. The Board also focused on the Adviser’s reputation and long-standing relationship with the Funds. The Board also believed that the Adviser had devoted substantial resources and made substantial commitments to address new regulatory compliance requirements applicable to the Funds.
2) The performance of the Funds, the Adviser, and the Subadvisers.
The Board reviewed the investment performance of each Fund, on an absolute basis, as compared with Broadridge peer group of other SEC registered funds, and against each Fund’s broad based securities market benchmarks as reflected in each Fund’s prospectuses and annual report. The Board also considered rankings and ratings of the Funds issued by Broadridge over the short, intermediate, and long term. The Board considered each Fund’s one, three, five and ten year (where applicable) average annual total return for the periods ended June 30, 2018, but placed greatest emphasis on a Fund’s longer term performance. The peer groups considered by the Board were developed by Broadridge and were comprised of funds within the same Broadridge peer group category (the Performance Peer Group), regardless of asset size or primary channel of distribution. Each Fund’s performance against the Performance Peer Group was considered by the Board as providing an objective comparative benchmark against which each Fund’s performance could be assessed. In general, the Board considered these comparisons helpful in their assessment as to whether the Adviser was obtaining for the Funds’ shareholders the total return performance that was available in the marketplace, given each Fund’s investment objectives, strategies, limitations, and restrictions. In reviewing the Funds’ performance, the Board noted that the Equity Fund’s performance was below the median for the one year, three year, five year and ten year periods; the Balanced Fund’s performance was above the median for the one year, three year, five year, and ten year periods; the SmallCap Equity Fund’s performance was above the median for the one year, three year, five year, and ten year periods; the Mighty Mites Fund’s performance was below the median for the one year and five year periods, and above the median for the three year and ten year periods; the Convertible Securities Fund’s performance was above the median for the one year, three year, and ten year periods, and below the median for the five year period; the Mid-Cap Equity Fund’s performance was below the median for the one year, three year, and five year periods; and the Intermediate Bond Fund’s performance was below the median for the one year, three year, five year, and ten year periods. The Board Members concluded that the Funds’ performance was reasonable in comparison with that of the Performance Peer Groups.
68
In connection with its assessment of the performance of the Adviser and the Sub-Advisers, the Board considered the Adviser’s and Sub-Advisers’ financial condition and whether they had the resources necessary to continue to carry out their responsibilities under the Agreements. The Board concluded that the Adviser and Sub-Advisers had the financial resources necessary to continue to perform their obligations under the Agreements and to continue to provide the high quality services that they have provided to the Funds to date.
3) The cost of the advisory services and the profits to the Adviser and Subadviser and their affiliates from the relationship with the Funds.
In connection with the Board’s consideration of the cost of the advisory and sub-advisory services and the profits to the Adviser, Sub-Advisers, and their affiliates from their relationships with the Fund, the Board considered a number of factors. First, the Board compared the level of the advisory fee for each Fund against comparative Broadridge expense peer groups (Expense Peer Group). The Board also considered comparative non-advisory fee expenses and comparative total fund expenses of the Funds and each Expense Peer Group. The Board considered this information as useful in assessing whether the Adviser and Sub-Advisers were providing services at a cost that was competitive with other similar funds. In assessing this information, the Board considered both the comparative contract rates as well as the level of the advisory fees after waivers and/or reimbursements. The Board noted that the SmallCap Equity Fund, the Convertible Securities Fund, and the Intermediate Bond Fund operated pursuant to a Fee Waiver and Expense Deferral Agreement with the Adviser wherein the Adviser had agreed to waive a portion of its fee or reimburse a Fund for a portion of its expenses necessary to limit the Fund’s total operating expenses to the level set forth in the respective Fund’s prospectus. The Board noted that the Mid-Cap Equity Fund and the Convertible Securities Fund operated pursuant to an Expenses Limitation Agreement with the Adviser wherein the Adviser had agreed to limit a portion of its fee or reimburse a Fund for a portion of its expenses necessary to limit the Fund’s total operating expenses to the level set forth in the respective Funds’ prospectus. The Board noted that the advisory fees and total expense ratios for all Funds were higher than the median when compared with those of their Expense Peer Groups. Finally, the Board noted that although the SmallCap Equity Fund, Intermediate Bond Fund, Convertible Securities Fund, and Mid-Cap Equity Fund had agreements in place to limit advisory fees and expenses, the total expense ratios were lower than the median for the Convertible Securities and Mid-Cap Equity Funds after considering their fee and expense waivers, and the total expense ratios for the SmallCap Equity and Intermediate Bond Funds were above the median when compared with their Expense Peer Groups. The Board also reviewed the fees charged by the Adviser and Sub-Advisers to provide similar advisory services to other registered investment companies with similar investment objectives and to separate accounts, noting that in some cases the fees charged by the Adviser or Sub-Advisers were higher and, in other cases lower, than the fees charged to the Funds. In evaluating this information, the Board considered the difference in services provided by the Adviser and Sub-Advisers to these other accounts. In particular, the Board considered the differences in risks involved in managing separate accounts and the Funds from a compliance and regulatory perspective.
The Board also considered an analysis prepared by the Adviser of the estimated profitability to the Adviser of its relationship with the Funds and reviewed with the Adviser its cost allocation methodology in connection with its profitability. In this regard, the Board reviewed Pro-forma Income Statements of the Adviser for the year ended December 31, 2017. The Board considered one analysis for the Adviser as a whole, and a second analysis for the Adviser with respect to each of the Funds. With respect to the Fund analysis, the Board received an analysis based on each Fund’s average net assets during the period as well as a pro-forma analysis of profitability at higher and lower asset levels. The Board concluded that the profitability of the Funds to the Adviser under either analysis was not excessive.
4) The extent to which economies of scale will be realized as the Funds grow and whether fee levels reflect those economies of scale.
With respect to the Board’s consideration of economies of scale, the Board discussed whether economies of scale would be realized by the Funds at higher asset levels. The Board also reviewed data from the Expense Peer Groups to assess whether the Expense Peer Group funds had advisory fee breakpoints and, if so, at what asset levels. The Board also assessed whether certain of the Adviser’s costs would increase if asset levels rise. The Board concluded that under foreseeable conditions, they were unable to assess at this time whether economies of scale would be realized if the Funds were to experience significant asset growth. In the event there was to be significant asset growth in the Funds, the Board determined to reassess whether the advisory fee appropriately took into account any economies of scale that had been realized as a result of that growth.
69
5) Other Factors.
In addition to the above factors, the Board also discussed other benefits received by the Adviser and Sub-Advisers from their management of the Funds. The Board considered that the Adviser and Sub-Advisers do use soft dollars in connection with their management of the Funds.
Based on a consideration of all these factors in their totality, the Board Members, including all of the Independent Board Members, determined that each Fund’s advisory fee and, with respect to the Equity Fund, Balanced Fund, Mighty Mites Fund, and Convertible Securities Fund, the sub-advisory fee, was fair and reasonable with respect to the quality of services provided and in light of the other factors described above that the Board deemed relevant. Accordingly, the Board Members determined to approve the continuation of each Fund’s Advisory Agreement and, with respect to the Equity Fund, Balanced Fund, Mighty Mites Fund, and Convertible Securities Fund, the Sub-Advisory agreements. The Board based its decision on evaluations of all these factors as a whole and did not consider any one factor as all important or controlling.
70
TETON Westwood Funds
Additional Fund Information (Unaudited)
The business and affairs of the Trust are managed under the direction of its Board of Trustees. Information pertaining to the Trustees and officers of the Trust is set forth below. The Trust’s Statement of Additional Information includes additional information about the TETON Westwood Funds’ Trustees and is available, without charge, upon request, by calling 800-WESTWOOD (800-937-8966) or by writing to the TETON Westwood Funds at One Corporate Center, Rye, NY 10580-1422.
| | | | | | | | |
Name, Position(s), Address1 and Age | | Term of
Office and
Length of
Time Served2 | | Number of
Funds in
Fund
Complex
Overseen
by Trustee | | Principal Occupation(s) During Past Five Years | | Other Directorships
Held by Trustee3 |
| INTERESTED TRUSTEES4: | | | | | | |
| | | | |
Nicholas F. Galluccio Trustee and Portfolio Manager Age: 68 | | Since 2017 | | 11 | | President and Chief Executive Officer of Teton Advisors, Inc. (since 2008); Group Managing Director U.S. Equities (2004-2008), Managing Director U.S. Equities (1994-2004), Senior Vice President (1990-2004) and Vice President (1990-1994) and Vice President (1982-1990) of Trust Company of the West (TCW) | | — |
| | | |
| INDEPENDENT TRUSTEES5 : | | | | | | |
Anthony S. Colavita Trustee Age: 57 | | Since 2017 | | 23 | | Attorney, Anthony S. Colavita, P.C. | | — |
| | | | |
James P. Conn Trustee Age: 80 | | Since 1994 | | 22 | | Former Managing Director and Chief Investment Officer of Financial Security Assurance Holdings, Ltd. (1992-1998) | | — |
| | | | |
Leslie F. Foley6 Trustee Age: 50 | | Since 2017 | | 10 | | Attorney on the boards of the Boys and Girls Club of Greenwich, Addison Gallery of American Art at Phillips Academy Andover, and National Humanities Center; Vice President, Global Ethics & Compliance and Associate General Counsel for News Corporation (2008-2010) | | — |
| | | | |
Mary E. Hauck Trustee Age: 76 | | Since 2017 | | 11 | | Retired Senior Manager of the Gabelli-O’Connor Fixed Income Mutual Funds Management Company | | — |
| | | | |
Michael J. Melarkey Trustee Age: 68 | | Since 2017 | | 25 | | Owner in Pioneer Crossing Casino Group; Of Counsel in the law firm of McDonald Carano Wilson LLP; previously partner in the law firm of Avansino, Melarkey, Knobel, Mulligan & McKenzie (1980-2015) | | Director of Southwest Gas Corporation (natural gas utility) |
| | | | |
Kuni Nakamura6 Trustee Age: 50 | | Since 2017 | | 36 | | President of Advanced Polymer, Inc. (chemical manufacturing company); President of KEN Enterprises, Inc. (real estate) | | — |
| | | | |
Werner J. Roeder Trustee Age: 78 | | Since 1994 | | 22 | | Retired physician; Former Vice President of Medical Affairs (Medical Director) of New York Presbyterian/Lawrence Hospital (1999-2014) | | — |
| | | | |
Salvatore J. Zizza Trustee Age: 72 | | Since 2004 | | 30 | | President of Zizza & Associates Corp. (private holding company); Chairman of Harbor Diversified, Inc. (pharmaceuticals); Chairman of BAM (semiconductor and aerospace manufacturing); Chairman of Bergen Cove Realty Inc.; Chairman of Metropolitan Paper Recycling Inc. (recycling) (2005-2014) | | Director and Vice Chairman of Trans-Lux Corporation (business services); Director and Chairman of Harbor Diversified Inc. (pharmaceuticals); Director, Chairman, and CEO of General Employment Enterprises (staffing services) (2009-2012) |
71
| | | | |
Name, Position(s), Address1 and Age | | Term of Office and Length of Time Served2 | | Principal Occupation(s) During Past Five Years |
| OFFICERS: | | | | |
Bruce N. Alpert President Age: 66 | | Since 1994 | | Executive Vice President and Chief Operating Officer of Gabelli Funds, LLC since 1988; Officer of registered investment companies within the Gabelli/GAMCO Fund Complex; Senior Vice President of GAMCO Investors, Inc. since 2008 |
| | |
John C. Ball Treasurer Age: 42 | | Since 2017 | | Treasurer of funds within the Gabelli/GAMCO Fund Complex since 2017; Vice President and Assistant Treasurer of AMG Funds, 2014-2017; Vice President of State Street Corporation, 2007-2014 |
| | |
Agnes Mullady Vice President Age: 60 | | Since 2006 | | Officer of the registered investment companies within the Gabelli/GAMCO Fund Complex since 2006; President and Chief Operating Officer of the Fund Division of Gabelli Funds, LLC since 2015; Chief Executive Officer of G.distributors, LLC since 2010; Senior Vice President of GAMCO Investors, Inc. since 2009; Vice President of Gabelli Funds, LLC since 2007; Executive Vice President of Associated Capital Group, Inc. since 2016 |
| | |
Andrea R. Mango Secretary Age: 46 | | Since 2013 | | Vice President of GAMCO Investors, Inc. since 2016; Counsel of Gabelli Funds, LLC since 2013; Secretary of registered investment companies within the Gabelli/GAMCO Fund Complex since 2013; Vice President of closed-end funds within the Gabelli/GAMCO Fund Complex since 2014; Corporate Vice President within the Corporate Compliance Department of New York Life Insurance Company, 2011-2013 |
| | |
Richard J. Walz Chief Compliance Officer Age: 59 | | Since 2013 | | Chief Compliance Officer of registered investment companies within the Gabelli/GAMCO Fund Complex since 2013; Chief Compliance Officer of AEGON USA Investment Management, 2011-2013 |
| 1 | Address: One Corporate Center, Rye, NY 10580-1422, unless otherwise noted. |
| 2 | Each Trustee will hold office for an indefinite term until the earliest of (i) the next meeting of shareholders, if any, called for the purpose of considering the election or re-election of such Trustee and until the election and qualification of his or her successor, if any, elected at such meeting, or (ii) the date a Trustee resigns or retires, or a Trustee is removed by the Board of Trustees or shareholders, in accordance with the Trust’s Amended By-Laws and Amended and Restated Declaration of Trust. For officers, includes time served in prior officer positions with the Trust. Each officer will hold office for an indefinite term until the date he or she resigns or retires or until his or her successor is elected and qualified. |
| 3 | This column includes only directorships of companies required to report to the SEC under the Securities Exchange Act of 1934, i.e., public companies,orother investment companies registered under the Investment Company Act of 1940. |
| 4 | “Interested person” of the Funds as defined in the 1940 Act. Mr. Galluccio is considered an “interested person” because of his affiliation with Teton Advisors, Inc. that acts as the Funds’ investment adviser. |
| 5 | Trustees who are not interested persons are considered “Independent” Trustees. |
| 6 | Ms. Foley’s father, Frank J. Fahrenkopf, Jr., serves as a director of other funds in the Fund Complex. Mr. Nakamura is a director of Gabelli Merger Plus+ Trust plc, which may be deemed to be under common control with the Adviser. |
72
TETON Westwood Funds and Your Personal Privacy
Who are we?
The TETON Westwood Funds are investment companies registered with the Securities and Exchange Commission under the Investment Company Act of 1940. We are managed by Teton Advisors, Inc., which is an affiliate of GAMCO Investors Inc., a publicly held company that has subsidiaries that provide investment advisory or brokerage services for a variety of clients. Teton Advisors, Inc. is a publicly held company that provides investment advisory services to the TETON Westwood Funds.
What kind of non-public information do we collect about you if you become a Fund shareholder?
If you apply to open an account directly with us, you will be giving us some non-public information about yourself. The non-public information we collect about you is:
| | ● | | Information you give us on your application form. This could include your name, address, telephone number, social security number, bank account number, and other information. |
| | ● | | Information about your transactions with us, any transactions with our affiliates, and transactions with the entities we hire to provide services to you. This would include information about the shares that you buy or redeem. If we hire someone else to provide services — like a transfer agent — we will also have information about the transactions that you conduct through them. |
What information do we disclose and to whom do we disclose it?
We do not disclose any non-public personal information about our customers or former customers to anyone other than our affiliates, our service providers who need to know such information, and as otherwise permitted by law. If you want to find out what the law permits, you can read the privacy rules adopted by the Securities and Exchange Commission. They are in volume 17 of the Code of Federal Regulations, Part 248. The Commission often posts information about its regulations on its website, www.sec.gov.
What do we do to protect your personal information?
We restrict access to non-public personal information about you to the people who need to know that information in order to provide services to you or the Fund and to ensure that we are complying with the laws governing the securities business. We maintain physical, electronic, and procedural safeguards to keep your personal information confidential.
This page was intentionally left blank.
This page was intentionally left blank.
TETON WESTWOOD FUNDS
TETON Westwood Mighty MitesSM Fund
TETON Westwood SmallCap Equity Fund
TETON Westwood Mid-Cap Equity Fund
TETON Convertible Securities Fund
TETON Westwood Equity Fund
TETON Westwood Balanced Fund
TETON Westwood Intermediate Bond Fund
One Corporate Center
Rye, New York 10580-1422
General and Account Information:
800-WESTWOOD [800-937-8966]
fax: 914-921-5118
website: www.tetonadv.com
e-mail: info@tetonadv.com
Board of Trustees
| | | | |
ANTHONY S. COLAVITA Attorney, Anthony S. Colavita, P.C. | | NICHOLAS F. GALLUCCIO* President and Chief Executive Officer,
Teton Advisors, Inc. | | KUNI NAKAMURA President of Advanced Polymer, Inc. |
| | |
JAMES P. CONN Former Managing Director and Chief
Investment Officer, Financial Security
Assurance Holdings Ltd. | | MARY E. HAUCK Former Senior Portfolio Manager,
Gabelli-O’Connor Fixed Income Mutual
Fund Management Company | | WERNER J. ROEDER Former Medical Director, Lawrence
Hospital |
| | |
LESLIE F. FOLEY Attorney
*Interested Trustee | | MICHAEL J. MELARKEY
Of Counsel,
McDonald Carano Wilson LLP | | SALVATORE J. ZIZZA Chairman,
Zizza & Associates Corp. |
Officers
| | | | | | | | |
| | BRUCE N. ALPERT President | | | | ANDREA R. MANGO Secretary | | |
| | JOHN C. BALL Treasurer | | | | RICHARD J. WALZ Chief Compliance Officer | | |
| | AGNES MULLADY Vice President | | | | | | |
| | | | |
| | Investment Adviser Teton Advisors, Inc. | | | | Distributor G.distributors, LLC | | |
| | Custodian The Bank of New York Mellon | | | | Legal Counsel Paul Hastings LLP | | |
We have separated the portfolio managers’ commentaries from the financial statements and investment portfolios due to corporate governance regulations stipulated by the Sarbanes-Oxley Act of 2002. We have done this to ensure that the content of the portfolio managers’ commentaries is unrestricted. Both the commentaries and the financial statements, including the portfolio of investments, will be available on our website at www.tetonadv.com.
This report is submitted for the information of the shareholders of the TETON Westwood Funds. It is not authorized for distribution to prospective investors unless preceded or accompanied by an effective prospectus.
GABWWQ318AR
Item 2. Code of Ethics.
| | (a) | The registrant, as of the end of the period covered by this report, has adopted a code of ethics that applies to the registrant's principal executive officer, principal financial officer, principal accounting officer or controller, or persons performing similar functions, regardless of whether these individuals are employed by the registrant or a third party. |
| | (c) | There have been no amendments, during the period covered by this report, to a provision of the code of ethics that applies to the registrant's principal executive officer, principal financial officer, principal accounting officer or controller, or persons performing similar functions, regardless of whether these individuals are employed by the registrant or a third party, and that relates to any element of the code of ethics description. |
| | (d) | The registrant has not granted any waivers, including an implicit waiver, from a provision of the code of ethics that applies to the registrant's principal executive officer, principal financial officer, principal accounting officer or controller, or persons performing similar functions, regardless of whether these individuals are employed by the registrant or a third party, that relates to one or more of the items set forth in paragraph (b) of this item's instructions. |
Item 3. Audit Committee Financial Expert.
As of the end of the period covered by the report, the registrant's board of directors has determined that Kuni Nakamura is qualified to serve as an audit committee financial expert serving on its audit committee and that he is "independent."
Item 4. Principal Accountant Fees and Services.
Audit Fees
| | (a) | The aggregate fees billed for each of the last two fiscal years for professional services rendered by the principal accountant for the audit of the registrant's annual financial statements or services that are normally provided by the accountant in connection with statutory and regulatory filings or engagements for those fiscal years are $174,075 in 2017 and $174,075 in 2018. |
Audit-Related Fees
| | (b) | The aggregate fees billed in each of the last two fiscal years for assurance and related services by the principal accountant that are reasonably related to the performance of the audit of the registrant's financial statements and are not reported under paragraph (a) of this Item are $0 in 2017 and $0 in 2018. |
Tax Fees
| | (c) | The aggregate fees billed in each of the last two fiscal years for professional services rendered by the principal accountant for tax compliance, tax advice, and tax planning are $29,410 in 2017 and $29,410 in 2018. Tax fees represent tax compliance services provided in connection with the review of the Registrant's tax returns. |
All Other Fees
| | (d) | The aggregate fees billed in each of the last two fiscal years for products and services provided by the principal accountant, other than the services reported in paragraphs (a) through (c) of this Item are $0 in 2017 and $0 in 2018. |
| (e)(1) | Disclose the audit committee's pre-approval policies and procedures described in paragraph (c)(7) of Rule 2-01 of Regulation S-X. |
Pre-Approval Policies and Procedures. The Audit Committee ("Committee") of the registrant is responsible for pre-approving (i) all audit and permissible non-audit services to be provided by the independent registered public accounting firm to the registrant and (ii) all permissible non-audit services to be provided by the independent registered public accounting firm to the Adviser, Gabelli Advisers, Inc., and any affiliate of Gabelli Funds, LLC ("Gabelli") that provides services to the registrant (a "Covered Services Provider") if the registered public accounting firm's engagement related directly to the operations and financial reporting of the registrant. The Committee may delegate its responsibility to pre-approve any such audit and permissible non-audit services to the Chairperson of the Committee, and the Chairperson must report to the Committee, at its next regularly scheduled meeting after the Chairperson's pre-approval of such services, his or her decision(s). The Committee may also establish detailed pre-approval policies and procedures for pre-approval of such services in accordance with applicable laws, including the delegation of some or all of the Committee's pre-approval responsibilities to the other persons (other than Gabelli or the registrant's officers). Pre-approval by the Committee of any permissible non-audit services is not required so long as: (i) the permissible non-audit services were not recognized by the registrant at the time of the engagement to be non-audit services; and (ii) such services are promptly brought to the attention of the Committee and approved by the Committee or Chairperson prior to the completion of the audit.
| (e)(2) | The percentage of services described in each of paragraphs (b) through (d) of this Item that were approved by the audit committee pursuant to paragraph (c)(7)(i)(C) of Rule 2-01 of Regulation S-X are as follows: |
(b) N/A
(c) 0%
(d) N/A
| | (f) | The percentage of hours expended on the principal accountant's engagement to audit the registrant's financial statements for the most recent fiscal year that were attributed to work performed by persons other than the principal accountant's full-time, permanent employees was less than fifty percent. |
| | (g) | The aggregate non-audit fees billed by the registrant's accountant for services rendered to the registrant, and rendered to the registrant's investment adviser (not including any sub-adviser whose role is primarily portfolio management and is subcontracted with or overseen by another investment adviser), and any entity controlling, controlled by, or under common control with the adviser that provides ongoing services to the registrant for each of the last two fiscal years of the registrant was $29,410 in 2017 and $29,410 in 2018. |
| | (h) | The registrant's audit committee of the board of directors has considered whether the provision of non-audit services that were rendered to the registrant's investment adviser (not including any sub-adviser whose role is primarily portfolio management and is subcontracted with or overseen by another investment adviser), and any entity controlling, controlled by, or under common control with the investment adviser that provides ongoing services to the registrant that were not pre-approved pursuant to paragraph (c)(7)(ii) of Rule 2-01 of Regulation S-X is compatible with maintaining the principal accountant's independence. |
Item 5. Audit Committee of Listed Registrants.
Not applicable.
Item 6. Investments.
| (a) | Schedule of Investments in securities of unaffiliated issuers as of the close of the reporting period is included as part of the report to shareholders filed under Item 1 of this form. |
| Item 7. | Disclosure of Proxy Voting Policies and Procedures for Closed-End Management Investment Companies. |
Not applicable.
Item 8. Portfolio Managers of Closed-End Management Investment Companies.
Not applicable.
| Item 9. | Purchases of Equity Securities by Closed-End Management Investment Company and Affiliated Purchasers. |
Not applicable.
Item 10. Submission of Matters to a Vote of Security Holders.
There have been no material changes to the procedures by which the shareholders may recommend nominees to the registrant's board of trustees, where those changes were implemented after the
registrant last provided disclosure in response to the requirements of Item 407(c)(2)(iv) of Regulation S-K (17 CFR 229.407) (as required by Item 22(b)(15) of Schedule 14A (17 CFR 240.14a-101)), or this Item.
Item 11. Controls and Procedures.
| | (a) | The registrant's principal executive and principal financial officers, or persons performing similar functions, have concluded that the registrant's disclosure controls and procedures (as defined in Rule 30a-3(c) under the Investment Company Act of 1940, as amended (the "1940 Act") (17 CFR 270.30a-3(c))) are effective, as of a date within 90 days of the filing date of the report that includes the disclosure required by this paragraph, based on their evaluation of these controls and procedures required by Rule 30a-3(b) under the 1940 Act (17 CFR 270.30a-3(b)) and Rules 13a-15(b) or 15d-15(b) under the Securities Exchange Act of 1934, as amended (17 CFR 240.13a-15(b) or 240.15d-15(b)). |
| | (b) | There were no changes in the registrant's internal control over financial reporting (as defined in Rule 30a-3(d) under the 1940 Act (17 CFR 270.30a-3(d)) that occurred during the registrant's last fiscal quarter that has materially affected, or is reasonably likely to materially affect, the registrant's internal control over financial reporting. |
| Item 12. | Disclosure of Securities Lending Activities for Closed-End Management Investment Companies. |
Item 13. Exhibits.
| | (a)(1) | Code of ethics, or any amendment thereto, that is the subject of disclosure required by Item 2 is attached hereto. |
| | (a)(2) | Certifications pursuant to Rule 30a-2(a) under the 1940 Act and Section 302 of the Sarbanes-Oxley Act of 2002 are attached hereto. |
| | (b) | Certifications pursuant to Rule 30a-2(b) under the 1940 Act and Section 906 of the Sarbanes-Oxley Act of 2002 are attached hereto. |
SIGNATURES
Pursuant to the requirements of the Securities Exchange Act of 1934 and the Investment Company Act of 1940, the registrant has duly caused this report to be signed on its behalf by the undersigned, thereunto duly authorized.
(Registrant) The TETON Westwood Funds
By (Signature and Title)* /s/ Bruce N. Alpert
Bruce N. Alpert, Principal Executive Officer
Date 11/27/2018
Pursuant to the requirements of the Securities Exchange Act of 1934 and the Investment Company Act of 1940, this report has been signed below by the following persons on behalf of the registrant and in the capacities and on the dates indicated.
By (Signature and Title)* /s/ Bruce N. Alpert
Bruce N. Alpert, Principal Executive Officer
Date 11/27/2018
By (Signature and Title)* /s/ John C. Ball
John C. Ball, Principal Financial Officer and Treasurer
Date 11/27/2018
* Print the name and title of each signing officer under his or her signature.