UNITED STATES
SECURITIES AND EXCHANGE COMMISSION
Washington, D.C. 20549
FORMN-CSR
CERTIFIED SHAREHOLDER REPORT OF REGISTERED MANAGEMENT
INVESTMENT COMPANIES
Investment Company Act file number 811-04719
The TETON Westwood Funds
(Exact name of registrant as specified in charter)
One Corporate Center
Rye, New York 10580-1422
(Address of principal executive offices) (Zip code)
Bruce N. Alpert
Teton Advisors, Inc.
One Corporate Center
Rye, New York 10580-1422
(Name and address of agent for service)
Registrant’s telephone number, including area code: 1-800-422-3554
Date of fiscal year end: September 30
Date of reporting period: September 30, 2019
FormN-CSR is to be used by management investment companies to file reports with the Commission not later than 10 days after the transmission to stockholders of any report that is required to be transmitted to stockholders under Rule30e-1 under the Investment Company Act of 1940 (17 CFR270.30e-1). The Commission may use the information provided on FormN-CSR in its regulatory, disclosure review, inspection, and policymaking roles.
A registrant is required to disclose the information specified by FormN-CSR, and the Commission will make this information public. A registrant is not required to respond to the collection of information contained inForm N-CSR unless the Form displays a currently valid Office of Management and Budget (“OMB”) control number. Please direct comments concerning the accuracy of the information collection burden estimate and any suggestions for reducing the burden to Secretary, Securities and Exchange Commission, 450 Fifth Street, NW, Washington, DC 20549-0609. The OMB has reviewed this collection of information under the clearance requirements of 44 U.S.C. § 3507.
Item 1. Reports to Stockholders.
The Report to Shareholders is attached herewith.

TETON WESTWOOD FUNDS
|
|
| Mighty MitesSMFund |
| |
|
| SmallCap Equity Fund |
| |
|
| Convertible Securities Fund |
| |
|
| Equity Fund |
| |
|
| Balanced Fund |
| |
|
| Intermediate Bond Fund |
Annual Report
September 30, 2019
Beginning on January 1, 2021, as permitted by regulations adopted by the Securities and Exchange Commission, paper copies of the Funds’ annual and semiannual shareholder reports will no longer be sent by mail, unless you specifically request paper copies of the reports. Instead, the reports will be made available on the Funds’ website (www.tetonadv.com), and you will be notified by mail each time a report is posted and provided with a website link to access the report. If you already elected to receive shareholder reports electronically, you will not be affected by this change and you need not take any action. To elect to receive all future reports on paper free of charge, please contact your financial intermediary, or, if you invest directly with the Funds, you may call800-937-8966 or send an email request to info@tetonadv.com.
TETON WESTWOOD FUNDS
(Unaudited)
| | | | | | | | | | | | | | | | | | | | | | | | | | | | | | | | | | | | | | | | | | | | | | | | | | | | | | | | | | | | |
| | | Class AAA Shares | | | | | | Class A Shares | |
| | | Average Annual Returns – September 30, 2019 (a) | | | | | | Average Annual Returns – September 30, 2019 (a)(b)(c) | |
| | | 1 Year | | | 5 Year | | | 10 Year | | | 15 Year | | | Since Inception | | | Gross Expense
Ratio | | | Expense Ratio after Adviser Reimbursements | | | | | | 1 Year | | | 5 Year | | | 10 Year | | | 15 Year | | | Since
Inception | | | Gross
Expense
Ratio | | | Expense Ratio after Adviser
Reimbursements | |
Mighty Mites | | | (8.00 | )% | | | 6.00 | % | | | 10.07 | % | | | 9.33 | % | | | 10.44 | % | | | 1.40 | % | | | 1.40 | % | | | | | | | (11.93 | )% | | | 4.88 | % | | | 9.34 | % | | | 8.77 | % | | | 10.00 | % | | | 1.65 | % | | | 1.65 | % |
SmallCap Equity | | | (5.56 | ) | | | 8.55 | | | | 10.60 | | | | 8.79 | | | | 7.48 | | | | 1.72 | | | | 1.25 | | | | | | | | (9.52 | ) | | | 7.40 | | | | 9.88 | | | | 8.24 | | | | 7.11 | | | | 1.97 | | | | 1.50 | |
Convertible Securities | | | 5.08 | | | | 6.28 | | | | 9.37 | | | | 6.62 | | | | 7.56 | | | | 2.03 | | | | 1.15 | | | | | | | | 0.63 | | | | 5.16 | | | | 8.65 | | | | 6.07 | | | | 7.14 | | | | 2.28 | | | | 1.40 | |
Equity | | | 5.84 | | | | 9.24 | | | | 11.06 | | | | 8.31 | | | | 10.03 | | | | 1.60 | | | | 1.60 | | | | | | | | 1.37 | | | | 8.10 | | | | 10.34 | | | | 7.75 | | | | 9.66 | | | | 1.85 | | | | 1.85 | |
Balanced | | | 6.44 | | | | 6.87 | | | | 7.94 | | | | 6.62 | | | | 8.33 | | | | 1.34 | | | | 1.34 | | | | | | | | 1.88 | | | | 5.74 | | | | 7.24 | | | | 6.06 | | | | 7.91 | | | | 1.59 | | | | 1.59 | |
Intermediate Bond | | | 4.97 | | | | 1.63 | | | | 1.93 | | | | 2.66 | | | | 4.34 | | | | 2.22 | | | | 1.00 | | | | | | | | 0.68 | | | | 0.71 | | | | 1.41 | | | | 2.26 | | | | 4.12 | | | | 2.32 | | | | 1.10 | |
| | | |
| | | Class C Shares | | | | | | Class I Shares | |
| | | Average Annual Returns – September 30, 2019 (a)(c)(d) | | | | | | Average Annual Returns – September 30, 2019 (a)(c) | |
| | | 1 Year | | | 5 Year | | | 10 Year | | | 15 Year | | | Since
Inception | | | Gross
Expense
Ratio | | | Expense Ratio after Adviser
Reimbursements | | | | | | 1 Year | | | 5 Year | | | 10 Year | | | 15 Year | | | Since
Inception | | | Gross Expense Ratio | | | Expense Ratio after Adviser
Reimbursements | |
Mighty Mites | | | (9.61 | )% | | | 5.22 | % | | | 9.25 | % | | | 8.52 | % | | | 9.74 | % | | | 2.15 | % | | | 2.15 | % | | | | | | | (7.80 | )% | | | 6.27 | % | | | 10.34 | % | | | 9.54 | % | | | 10.59 | % | | | 1.15 | % | | | 1.15 | % |
SmallCap Equity | | | (7.14 | ) | | | 7.74 | | | | 9.78 | | | | 7.85 | | | | 6.81 | | | | 2.47 | | | | 2.00 | | | | | | | | (5.27 | ) | | | 8.82 | | | | 10.88 | | | | 9.01 | | | | 7.62 | | | | 1.47 | | | | 1.00 | |
Convertible Securities | | | 3.30 | | | | 5.49 | | | | 8.55 | | | | 5.82 | | | | 6.97 | | | | 2.78 | | | | 1.90 | | | | | | | | 5.33 | | | | 6.57 | | | | 9.64 | | | | 6.84 | | | | 7.71 | | | | 1.78 | | | | 0.90 | |
Equity | | | 3.99 | | | | 8.42 | | | | 10.23 | | | | 7.50 | | | | 9.50 | | | | 2.35 | | | | 2.35 | | | | | | | | 6.08 | | | | 9.50 | | | | 11.32 | | | | 8.51 | | | | 10.12 | | | | 1.35 | | | | 1.35 | |
Balanced | | | 4.58 | | | | 6.08 | | | | 7.15 | | | | 5.82 | | | | 7.75 | | | | 2.09 | | | | 2.09 | | | | | | | | 6.63 | | | | 7.13 | | | | 8.22 | | | | 6.82 | | | | 8.45 | | | | 1.09 | | | | 1.09 | |
Intermediate Bond | | | 3.15 | | | | 0.88 | | | | 1.16 | | | | 1.89 | | | | 3.84 | | | | 2.97 | | | | 1.75 | | | | | | | | 5.14 | | | | 1.86 | | | | 2.18 | | | | 2.84 | | | | 4.44 | | | | 1.97 | | | | 0.75 | |
| (a) | Returns represent past performance and do not guarantee future results. Total returns and average annual returns reflect changes in share price, reinvestment of distributions, and are net of expenses. Investment returns and the principal value of an investment will fluctuate. When shares are redeemed, they may be worth more or less than their original cost. Current performance may be lower or higher than the performance data presented. Visit www.tetonadv.com for performance information as of the most recent month end. For the SmallCap Equity, Convertible Securities, and Intermediate Bond Funds (and for the Mighty Mites Fund through September 30, 2005), Teton Advisors, Inc. (the Adviser) reimbursed expenses to limit the expense ratio. Had such limitations not been in place, returns would have been lower. The contractual expense limitations are in effect through January 31, 2021 and are renewable annually by the Adviser. The Funds, except for the Equity, Balanced, and Intermediate Bond Funds, impose a 2.00% redemption fee on shares sold or exchanged within seven days after the date of purchase. Investors should carefully consider the investment objectives, risks, charges, and expenses of a Fund before investing. The prospectuses contain information about these and other matters and should be read carefully before investing. To obtain a prospectus, please visit our website at www.tetonadv.com. |
| (b) | Includes the effect of the maximum 4.00% sales charge at the beginning of the period. |
| (c) | The performance of the Class AAA Shares is used to calculate performance for the periods prior to the issuance of Class A Shares, Class C Shares, and Class I Shares. The performance for the Class A Shares and Class C Shares would have been lower due to the additional fees and expenses associated with these classes of shares. The performance for the Class I Shares would have been higher due to the lower expenses associated with this class of shares. The inception dates for the Class AAA Shares and the initial issuance dates for the Class A Shares, Class C Shares, and Class I Shares after which shares remained continuously outstanding are listed below. |
| (d) | Assuming payment of the 1.00% maximum contingent deferred sales charge imposed on redemptions made within one year of purchase. |
| | | | | | | | |
| | | Inception Dates |
| | | Class AAA Shares | | Class A Shares | | Class C Shares | | Class I Shares |
Mighty Mites | | 05/11/98 | | 11/26/01 | | 08/03/01 | | 01/11/08 |
SmallCap Equity | | 04/15/97 | | 11/26/01 | | 11/26/01 | | 01/11/08 |
Convertible Securities | | 09/30/97 | | 05/09/01 | | 11/26/01 | | 01/11/08 |
Equity | | 01/02/87 | | 01/28/94 | | 02/13/01 | | 01/11/08 |
Balanced | | 10/01/91 | | 04/06/93 | | 09/25/01 | | 01/11/08 |
Intermediate Bond | | 10/01/91 | | 07/26/01 | | 10/22/01 | | 01/11/08 |
The TETON Westwood Funds file complete schedules of portfolio holdings with the Securities and Exchange Commission (the SEC) for the first and third quarters of each fiscal year on FormN-PORT. Shareholders may obtain this information at www.tetonadv.com or by calling the Funds at800-WESTWOOD(800-937-8966). The Funds’ FormN-PORT is available on the SEC’s website at www.sec.gov and may also be reviewed and copied at the SEC’s Public Reference Room in Washington, DC. Information on the operation of the Public Reference Room may be obtained by calling800-SEC-0330.
Proxy Voting
Each Fund files FormN-PX with its complete proxy voting record for the twelve months ended June 30, no later than August 31 of each year. A description of the Funds’ proxy voting policies, procedures, and how the Funds voted proxies relating to portfolio securities are available without charge, upon request, by (i) calling800-WESTWOOD(800-937-8966); (ii) writing to The TETON Westwood Funds at One Corporate Center, Rye, NY 10580-1422; and (iii) visiting the SEC’s website at www.sec.gov.
2
Performance Discussion (Unaudited)
Mighty Mites Fund
For the fiscal year ended September 30, 2019, the TETON Westwood Mighty Mites Fund net asset value (NAV) per Class AAA Share depreciated (8.0)% versus a loss of (8.9)% for the Russell 2000 Index. See the next page for additional performance information.
The Fund primarily invests in small andmicro-cap equity securities that have a market capitalization of $500 million or less at time of initial investment. The portfolio management team focuses on bottom up stock selection, seeking bite sized companies with excellent management teams, strong balance sheets, and superior long term fundamentals. As bottom up, fundamental, research driven investors, the team seeks to purchase the inefficiently priced stocks of excellent companies selling at a discount to their Private Market Value (PMV), and possess a catalyst that can unlock hidden value within the enterprise. As such, (y)our portfolio is diversified across a broad cross section of companies sharing these valuation characteristics.
U.S. equity markets declined sharply in the fourth quarter of 2018 as investor sentiment turned negative in the face of an increasingly conflicted set of economic indicators. On one hand, the broad U.S. economy and consumer remained healthy with low unemployment, persistent job and wage growth, manageable inflation, and robust corporate profits. On the other, pockets of the economy such as housing and autos showed signs of slowing, global commodity prices, led by oil, declined steeply, and growth in many international markets stalled. Added to these factors was a fiercely divided U.S. government, intensifying trade disputes with China and other nations, and mounting (but now dissipating) concerns that the Federal Reserve might move too aggressively to raise interest rates, and the results were extensive pessimism and widespread selling as the year came to an end.
U.S. stock market indices rebounded during the first quarter of 2019 following sharp declines atyear-end as economic indicators slowed, but data suggested the U.S. economy was still on a solid foundation. Additionally, fourth quarter earnings reports were exceptional, as double-digit earnings growth including the benefit of the Tax Cut and Jobs Act and multiple expansion supported the recovery in share prices.
The U.S. economic data were mixed in the first quarter; consequently, the Federal Open Market Committee maintained the federal funds rate at2.25%-2.50% following four rate hikes in 2018. The pause eased concerns that the committee would raise rates too quickly; however, the yield curve temporarily inverted, which raised recession fears.
The U.S. consumer remained resilient as employment and household wealth were at healthy levels and near historical highs. According to the Bureau of Labor Statistics (BLS) report, the March unemployment rate was 3.8% and wages increased over 3%. Household wealth was $104 trillion including the impact of equity losses in the fourth quarter.
Markets strengthened in the second quarter of 2019 despite continued deceleration in global growth and weakening indicators in key segments of the U.S. economy. The U.S. unemployment rate through June stood near record lows (3.7%) and domestic GDP growth remained solid through the first quarter (increased 3.1%).
Over the course of the third quarter of 2019, U.S. equity markets fluctuated widely as investors worked to discount an increasingly divergent set of macroeconomic indicators. As expected, The Federal Reserve acted to reduce interest rates for the first time in a decade with two 25 basis point cuts in July and September, but stopped short of communicating an ongoing policy towards lower rates. Lower unemployment and persistent wage growth suggested a strengthening U.S. consumer, but consumer confidence declined more than anticipated in both August and September. Second quarter earnings were broadly ahead of expectations and U.S. corporate profits continued to rise.
Among our stronger performing stocks for the year were Aerojet Rocketdyne Holdings (5.8% of net assets as of September 30, 2019), a technology-based company providing solutions to customers in the aerospace, defense, and real estate markets; Casella Waste Systems, Inc. (1.8%), which serves customers with integrated services beyond the traditional waste disposal model; and Federal Signal Corp. (1.9%), a designer and manufacturer of products and integrated solutions for municipal, governmental, industrial, and commercial customers.
Some of the weaker holdings in the portfolio included Ferro Corp. (1.3%), a leading provider of functional coatings and color solutions; Marine Products Corp. (1.2%), a manufacturer of fiberglass motorized boats distributed through its independent dealer network; and Twin Disc, Inc. (0.6%), which provides transmission technology for drivelines and powertrains for tractors, trucks, turbines, work boats, and pleasure craft.
We appreciate your continued confidence and trust.
3
| | | | | | | | | | | | | | | | | | | | |
Average Annual Returns through September 30, 2019 (a) (Unaudited) | |
| | | 1 Year | | | 5 Year | | 10 Year | | 15 Year | | Since
Inception
(5/11/98) |
Mighty Mites Fund Class AAA | | | (8.00 | )% | | | 6.00 | % | | | 10.07 | % | | | 9.33 | % | | | 10.44 | % |
Dow Jones U.S.Micro-Cap Total Stock Market Index | | | (17.33 | ) | | | 4.90 | | | | 9.16 | | | | 6.20 | | | | 7.67 | (b) |
Russell 2000 Index | | | (8.89 | ) | | | 8.19 | | | | 11.19 | | | | 8.19 | | | | 6.99 | |
Lipper Small Cap Value Fund Average | | | (8.99 | ) | | | 5.41 | | | | 9.45 | | | | 7.26 | | | | 7.51 | (b) |
In the current prospectuses dated January 28, 2019, as amended March 18, 2019, the expense ratio for Class AAA Shares is 1.40%. See page 38 for the expense ratios for the year ended September 30, 2019. Class AAA Shares do not have a sales charge.
| (a) | Returns represent past performance and do not guarantee future results. Total returns and average annual returns reflect changes in share price, reinvestment of distributions, and are net of expenses. Investment returns and the principal value of an investment will fluctuate. When shares are redeemed, they may be worth more or less than their original cost. Current performance may be lower or higher than the performance data presented. Visit www.tetonadv.com for performance information as of the most recent month end. Teton Advisors, Inc., (the Adviser) reimbursed expenses through September 30, 2005 to limit the expense ratios. Had such limitations not been in place, returns would have been lower. The Fund imposes a 2% redemption fee on shares sold or exchanged within seven days after purchase. Investors should carefully consider the investment objectives, risks, charges, and expenses of the Fund before investing. The prospectuses contain information about these and other matters and should be read carefully before investing. To obtain a prospectus, please visit our website at www.tetonadv.com.Other share classes are available and have different performance characteristics. See page 2 for performance of other classes of shares. The Dow Jones U.S.Micro-Cap Total Stock Market Index is designed to provide a comprehensive measure of themicro-cap segment of the U.S. stock market. The Russell 2000 Index is an unmanaged indicator which measures the performance of the small cap segment of the U.S. equity market. The Lipper Small Cap Value Fund Average reflects the average performance of mutual funds classified in this particular category. Investing in small capitalization securities involves special challenges because these securities may trade less frequently and experience more abrupt price movements than large capitalization securities. Dividends are considered reinvested. You cannot invest directly in an index. | |
| (b) | Dow Jones U.S.Micro-Cap Total Stock Market Index and Lipper Small Cap Value Fund Average since inception performance is as of April 30, 1998. | |
COMPARISON OF CHANGE IN VALUE OF A $10,000 INVESTMENT IN
THE MIGHTY MITES FUND CLASS AAA, THE RUSSELL 2000 INDEX,
AND THE DOW JONES U.S. MICRO-CAP TOTAL STOCK MARKET INDEX (Unaudited)
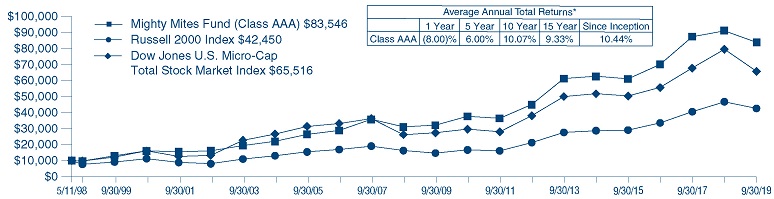
*Past performance is not predictive of future results.The performance tables and graph do not reflect the deduction of taxes that a shareholder would pay on Fund distributions or the redemption of Fund shares.
4
SmallCap Equity Fund (Unaudited)
For the fiscal year ended September 30, 2019, the TETON Westwood SmallCap Equity Fund NAV per Class AAA Share decreased (5.6)% compared with a loss of (8.9)% for the Russell 2000 Index. See the next page for additional performance information.
The Fund invests primarily in small cap companies that, throughbottom-up fundamental research, the portfolio manager believes are attractively priced relative to their earnings growth potential or Private Market Value. The Fund characterizes small capitalization companies as those companies with a market capitalization between $100 million and $2.5 billion at the time of the Fund’s initial investment.
U.S. equity markets declined sharply in the fourth quarter of 2018 as investor sentiment turned negative in the face of an increasingly conflicted set of economic indicators. A year that began on a strong note of optimism, confidence and synchronized global growth violently reversed to close out with doubt and concern over potential global growth. The sharp market decline in the fourth quarter was caused by a host of factors: U.S. Federal Reserve monetary tightening, fears over a trade war with China, slowing global growth, collapsing oil prices, and a federal government shutdown.
The first quarter of 2019 saw stocks post their strongest first quarter in over a decade. Major indexes have recouped almost all of the losses sustained in the final months of 2018, when fears over a potential economic slowdown sent global markets tumbling. Much of the rally was driven by relief that central banks were backing off rate hike campaigns amidst slowing growth from the Eurozone to China. Consequently, long term interest rates have declined, with three-month U.S. Treasury bills slightly higher than the yield onten-year U.S. treasury notes.
The two primary fears which gripped the market in December — escalating trade disputes and steadily rising interest rates — abruptly turned around in the first quarter. Firstly, U.S. and Chinese officials placed a stay on added tariffs while negotiating towards a solution. Concurrently, earnings reports continued to reflect the absorption of inflation (provoked by an initial round of tariffs last fall) via pass-through pricing. In still another dramatic reversal, the Federal Reserve acknowledged market concerns by signaling a hold to further interest rate hikes for the year, citing a diminished inflation outlook and slowing global growth (namely Europe). With both of those exogenous threats receding, the focus returned to economic growth, albeit at a moderating pace.
Stocks posted solid gains in the quarter amidst volatility wrought by headlines and emotion. Stocks sharply reversed course twice over fears that China trade sanctions would impede global economic growth. The S&P 500 gained 17%, so far this year, its best first half performance since 1997, while the Russell 2000small-cap benchmark has lagged. We view this environment as ripe with opportunity. Such markets overlay our active investment style of combining cumulative research that identifies quality companies with our disciplined pricing approach of using both upside and downside price targets to guide our entry and exit points. Having already identified which stocks we would like to own and at what price serves to quickly highlight opportunities during exaggerated market swings, we look to deploy capital following a record year of takeout activity within the portfolio.
The second quarter of 2019 began on a stable economic note as the Purchasing Manager Index (PMI) marked a rebound in March for both the U.S. (rising from 54.2 to 55.3) and China (from 49.3 to 50.5) after easing in prior months. Even the Eurozone and Germany, both already at contraction levels below a reading of 50, halted their declines. The month of May began with President Trump’s escalation of trade tensions, coming in the form of a Sunday morning “tweet” (May 5) threatening a spike in tariffs to 25% on Chinese goods by the end of the week. May closed out with another “tweet” (May 30) that threatened to upend the USMCA Agreement (NAFTA 2.0) by imposing an arbitrary 5% tariff that would accelerate to 25% unless illegal immigration was deemed solved. This injection of uncertainty caused a sustained decline in the market. Alongside investors, corporate leaders responded to uncertainty, reflected in durable goods orders (excluding aircraft) which declined sequentially for three out of the last four months.
In September of last year, President Trump decisively intensified the trade battle against China with the publication of “U.S. Section 301 Final List 3”, outlining additional tariffs on a broader swath of goods. Since late last summer, small capitalization stocks (as measured by the Russell 2000 Index and the Russell 2000 Value Index) have declined while the larger cap S&P 500 Index remains slightly higher. Domestic-orientation was expected to shield small cap companies from potential tariff-driven overseas weakness. But it became clear that increased trade actions have extended that pressure to the domestic economy. At the moment, recession forecasts have frequented news headlines along with debates around “stall speed”, the lowest level of growth which the economy can sustain.
At the end of the fund’s final fiscal quarter, macro data points were undeniably gloomier than at the start. Chief among these are the manufacturing indices — those which directly correlate with the impact of tariff actions upon the production of goods. Though the U.S. purchasing managers index (PMI) appeared to stabilize earlier in the year, it turned downwards following additional tariff actions and has now marked two months below a reading of 50 (seen as contractionary). Similar PMI measurements in the Eurozone have continued 18 months of freefall readings, with Germany marking a reading of 41.7 in September and linked quarter GDP of-0.1% in Q2.
In response, The Federal Reserve is attempting to extend the economic expansion, with two 25 basis point cuts during the quarter. While the Fed forecast no further rate cuts for the year, Chairman Powell stated “we’re prepared to be aggressive” if the economy weakens more. Market expectations rose for a third cut by the end of the year based upon interpretation of recent data.
Among our stronger performing stocks for the year were: Entegris Inc. (3.0% of net assets as of September 30, 2019), a global leader in advanced materials science, including filtration products, gas delivery systems, and specialty coatings; Cypress Semiconductor Corp. (1.9%), whose products include programmablesystems-on-chips, general-purpose microcontrollers, andUSB-based connectivity solutions; and Winnebago Industries Inc. (2.0%), a U.S. manufacturer of outdoor lifestyle products whose brands include Winnebago, Grand Design, and Chris-Craft.
Some of the weaker holdings in the portfolio included Centennial Resource Development (0.6%), an independent oil producer focused in the southern Delaware Basin;Patterson-UTI Energy Inc. (2.1%), which provides drilling and pressure pumping services, directional drilling, and rental equipment for oil fields; and Ferro Corp. (0.9%), a global supplier of technology-based functional coatings and color solutions for glass, metal, ceramic, and other substrates.
We thank you for your continued confidence and trust.
5
| | | | | | | | | | | | | | | | | | | | |
| Average Annual Returns through September 30, 2019 (a) (Unaudited) | | | Since |
| | | | | | | | | | | | Inception |
| | | 1 Year | | | 5 Year | | 10 Year | | 15 Year | | (4/15/97) |
SmallCap Equity Fund Class AAA | | | (5.56) | % | | | 8.55 | % | | | 10.60 | % | | | 8.79 | % | | | 7.48 | % |
Russell 2000 Index | | | (8.89) | | | | 8.19 | | | | 11.19 | | | | 8.19 | | | | 8.32 | |
Russell 2000 Value Index | | | (8.24) | | | | 7.17 | | | | 10.06 | | | | 7.23 | | | | 8.90 | |
In the current prospectuses dated January 28, 2019, the gross expense ratio for Class AAA Shares is 1.72%, and the net expense ratio is 1.25% after contractual reimbursements by Teton Advisors, Inc. (the Adviser) in place through January 31, 2020. See page 39 for the expense ratios for the year ended September 30, 2019. Class AAA Shares do not have a sales charge.
| (a) | Returns represent past performance and do not guarantee future results. Total returns and average annual returns reflect changes in share price, reinvestment of distributions, and are net of expenses. Investment returns and the principal value of an investment will fluctuate. When shares are redeemed, they may be worth more or less than their original cost. Current performance may be lower or higher than the performance data presented. Visit www.tetonadv.com for performance information as of the most recent month end. The Adviser reimbursed expenses to limit the expense ratio. Had such limitation not been in place, returns would have been lower. The Fund imposes a 2% redemption fee on shares sold or exchanged within seven days after purchase. Investors should carefully consider the investment objectives, risks, charges, and expenses of the Fund before investing. The prospectuses contain information about these and other matters and should be read carefully before investing. To obtain a prospectus, please visit our website at www.tetonadv.com.Other share classes are available and have different performance characteristics. See page 2 for performance of other classes of shares. The Russell 2000 Index is an unmanaged indicator which measures the performance of the small cap segment of the U.S. equity market. The Russell 2000 Value Index measures the performance of the small capitalization sector of the U.S. equity market and is a subset of the Russell 2000 Index. Investing in small capitalization securities involves special challenges because these securities may trade less frequently and experience more abrupt price movements than large capitalization securities. Dividends are considered reinvested. You cannot invest directly in an index. | |
COMPARISON OF CHANGE IN VALUE OF A $10,000 INVESTMENT IN THE SMALLCAP EQUITY FUND
CLASS AAA AND THE RUSSELL 2000 INDEX (Unaudited)
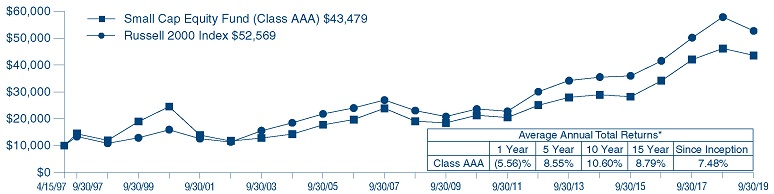
| * | Past performance is not predictive of future results.The performance tables and graph do not reflect the deduction of taxes that a shareholder would pay on Fund distributions or the redemption of Fund shares. |
6
Convertible Securities Fund (Unaudited)
For the fiscal year ended September 30, 2019, the TETON Convertible Securities Fund NAV per Class AAA Share appreciated 5.1% compared with gains of 4.3% and 4.0% for the Standard & Poor’s (S&P) 500 Index and the ICE Bank of America Merrill Lynch U.S. Convertibles Index, respectively. See the next page for additional performance information.
The Fund invests in convertible securities. By investing in convertible securities, the portfolio managers seek the opportunity to participate in the capital appreciation of underlying stocks, while at the same time relying on the fixed income aspect of the convertible securities to provide current income and reduced price volatility, which can limit the risk of loss in a down equity market. The Fund may invest in securities of any market capitalization or credit quality, and may from time to time invest a significant amount of its assets in securities of smaller companies.
U.S. equity markets, including the convertible market, declined sharply in the fourth quarter of 2018 as investor sentiment turned negative in the face of an increasingly conflicted set of economic indicators. A year that began on a strong note of optimism, confidence and synchronized global growth violently reversed to close out with doubt and concern over potential global growth. The sharp market decline in the fourth quarter was caused by a host of factors: U.S. Federal Reserve monetary tightening, fears over a trade war with China, slowing global growth, collapsing oil prices, and a federal government shutdown.
The first quarter of 2019 was a quarter of reversals. There was a reversal of equity prices as the poor performance of the fourth quarter of 2018 was replaced by a strong upward move. There was a reversal of interest rate expectations as10-year treasury bonds, once expected to move above 3.5% traded below 2.5%. We saw a reversal of expectations for Federal Reserve Board tightening of monetary policy. Through all of this, convertible securities performed well and participated in most of the rise in the equity market. For the quarter, the S&P 500 Index was up 13.6%.
Among U.S. convertible issues, the Technology and Energy sectors had the strongest performance for the quarter, while Transports and Finance underperformed. Equity sensitive convertibles drove returns, outperforming balanced convertibles and the credit sensitive (yield alternative) segment of the Index. By keeping pace with equity markets during the strong start to the year, we saw the benefits of using convertibles as a reduced volatility equity alternative. The asymmetrical return structure allowed us to outperform falling equity markets in 2018 while remaining invested so as not to miss the rebound at the beginning of 2019.
The second quarter of 2019 was a quarter of continuation. There was a continuation of rising equity prices, as the strong bounce back from the poor performance of the fourth quarter of 2018 brought equity prices back to near record levels. The Federal Reserve Board continued to raise expectation of a loosening of monetary policy. Through all of this, convertible securities performed well, and participated in most of the rise in the equity market. Among U.S. convertible issues, the Technology and Communications sectors had the strongest performance during the quarter, while Consumer Staples and Transports underperformed. Equity sensitive convertibles drove returns, outperforming balanced convertibles and the credit sensitive (yield alternative) segment of the Index.
Mixed signals in the U.S. economy caused more volatility in the markets during the third quarter of 2019, the final quarter of the Fund’s fiscal year. There was strong performance in stocks in July followed by a pullback in August and September. The Federal Reserve cut interest rates for a second time, citing a global business slowdown caused by the ongoing trade negotiations. Disruption in the oil markets caused by disputes in the Middle East and the attack on the Saudi Aramco oil facility also raised concern, while manufacturing in the U.S. showed some weakness.
After a strong start to the year, the Convertible securities market was down marginally in the third quarter of 2019. The U.S. convertible market ended the quarter with 456 issues and $219 billion in market capitalization. Issuance was strong, driven by declining interest rates and strong equity markets providing an opportunity for issuers to raise capital at attractive rates. September alone saw issuance of $17 billion globally including $11.4 billion in the U.S.
Among our stronger performing positions for the year were: MercadoLibre 2.0%, 8/15/28 (1.5% of net assets as of September 30, 3019), which hosts the largest online commerce and payments ecosystem in Latin America; Pros Holdings Inc. 2.0%, 6/01/47 (1.1%), a provider ofAI-based solutions for conducting commerce in the digital economy; and Coupa Software Inc. 0.375%, 1/15/23 (1.3%), a cloud platform for business spending which helps customers achieve cost savings and drive profitability.
Some of the weaker holdings in the portfolio included Bristow Group Inc. 4.5%, 6/01/23 (0.1%), a provider of industrial aviation services offering helicopter transportation, search and rescue, and aircraft support services to government and civil organizations; Evolent Health Inc. 1.5%, 10/15/25 (0.9%), which partners with health systems and health care providers to gain operational scale and improve clinical performance; and Teladoc 3.0%, 12/15/22 (1.0%), a provider of virtual health care solutions serving businesses and individuals.
We appreciate your continued confidence and trust.
7
| | | | | | | | | | | | | | | | | | | | |
| Average Annual Returns through September 30, 2019 (a) (Unaudited) | |
| | | 1 Year | | 5 Year | | 10 Year | | 15 Year | | Since
Inception
(9/30/97) |
Convertible Securities Fund Class AAA | | | 5.08 | % | | | 6.28 | % | | | 9.37 | % | | | 6.62 | % | | | 7.56 | % |
S&P 500 Index | | | 4.25 | | | | 10.84 | | | | 13.24 | | | | 9.01 | | | | 7.35 | |
ICE Bank of America Merrill Lynch U.S. Convertibles Index | | | 4.01 | | | | 7.29 | | | | 9.94 | | | | 7.51 | | | | 7.17 | |
In the current prospectuses dated January 28, 2019, the gross expense ratio for Class AAA Shares is 2.03%, and the net expense ratio is 1.15%, after contractual reimbursements by Teton Advisors, Inc. (the Adviser) in place through January 31, 2020. See page 40 for the expense ratios for the year ended September 30, 2019. Class AAA Shares do not have a sales charge.
| (a) | Returns represent past performance and do not guarantee future results. Total returns and average annual returns reflect changes in share price, reinvestment of distributions, and are net of expenses. Investment returns and the principal value of an investment will fluctuate. When shares are redeemed, they may be worth more or less than their original cost. Current performance may be lower or higher than the performance data presented. Visit www.tetonadv.com for performance information as of the most recent month end. The Adviser reimbursed expenses to limit the expense ratio. Had such limitation not been in place, returns would have been lower. The Fund imposes a 2% redemption fee on shares sold or exchanged within seven days after purchase. Investors should carefully consider the investment objectives, risks, charges, and expenses of the Fund before investing. The prospectuses contain information about these and other matters and should be read carefully before investing. To obtain a prospectus, please visit our website at www.tetonadv.com.Other share classes are available and have different performance characteristics. See page 2 for performance of other classes of shares. The S&P 500 Index is a market capitalization weighted index of 500 large capitalization stocks commonly used to represent the U.S. equity market. The ICE Bank of America Merrill Lynch U.S. Convertibles Index is a market value weighted index of all dollar denominated convertible securities that are exchangeable into U.S. equities that have a market value of more than $50 million. Dividends are considered reinvested. You cannot invest directly in an index. | |
COMPARISON OF CHANGE IN VALUE OF A $10,000 INVESTMENT IN THE CONVERTIBLE SECURITIES FUND
CLASS AAA, THE S&P 500 INDEX AND
THE ICE BANK OF AMERICA MERRILL LYNCH U.S. CONVERTIBLES INDEX (Unaudited)
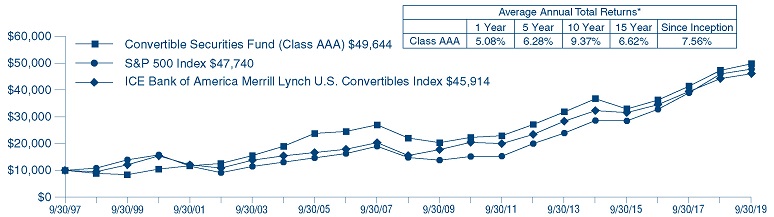
| * | Past performance is not predictive of future results.The performance tables and graph do not reflect the deduction of taxes that a shareholder would pay on Fund distributions or the redemption of Fund shares. |
8
Equity Fund (Unaudited)
The TETON Westwood Equity Fund outperformed the benchmark S&P 500 Index over the fiscal year. For the twelve months ended September 30, 2019, the Equity Fund Class AAA shares posted a gain of 5.8%, net of expenses, versus the S&P 500 Index gain of 4.3%. See the next page for additional performance information.
The Fund seeks to provide capital appreciation. The Fund’s secondary goal is to produce current income.
The fourth quarter of 2018 saw the S&P 500 Index suffered one of the worst quarters in the last 50 years, having fallen over 13% and ending the year with pessimism reigning supreme. Small caps fared worse, down over 20%, with growth declining moderately more than value for both small and large cap stocks. Global equity markets declined as well, adding to their losses for the year. The same fears generally throughout the year were cited as causes — trade wars, slowing growth, and higher interest rates. Making progress with China in resolving theon-going trade dispute seemed challenging; earnings reports weighed on sentiment as results were underwhelming. The Federal Reserve raised the federal funds rate, as expected, though its commentary shifted to be more balanced regarding future actions. Volatility reemerged and remained elevated for the quarter.
In the first quarter of 2019 the S&P 500 Index reversed course from the end of the year and rallied for one of the best first quarters to start the year in two decades. The major worries of the market that pressured shares turned into tailwinds. Fears over growth were placated for the majority of companies when they reported earnings. This optimism drove small cap stocks to outpace large caps and growth stocks to rally over value stocks. Optimism also rose for a potential trade deal with China, as some progress appeared to have been made which helped bolster both domestic and global markets during the quarter.
Markets remained volatile during the second quarter of 2019, after one of the strongest starts to the year, as investor sentiment oscillated with each passing headline. Growth concerns were temporarily placated with the initial U.S. GDP estimate exceeding forecasts at 3.2% for the first quarter of 2019, though that marked the high point for expectations. Corporations reported better than expected earnings, with management teams expressing caution regarding implications from moderating growth and disruptions from the trade dispute. Optimism around a potential trade deal was crushed as negotiations collapsed, with little progress made during the quarter. Hope rested on theG-20 meeting that happened over the last weekend in June which produced some progress towards a resolution. These headwinds culminated in pressures on interest rates, as investors moved into safe haven assets, which sent the yield on the10-year treasury to multi-year lows below 2%. Inflation remained relatively tame, further bolstering confidence in the Federal Reserve’s pivot towards easier monetary policy.
Equity markets ended the third quarter of 2019 in positive territory despite continued concerns over the ongoing trade dispute and future economic growth given the deterioration of economic data. The U.S. market outperformed international equities and large caps fared far better than small caps. GDP growth for the second quarter remained steady at 2%, though several economic indicators such as the ISM’s PMI for the manufacturing segment fell into contraction. Investors continued to look for additional clues regarding the health of the economy given the longevity of the business cycle. The Federal Reserve cut rates twice during the quarter, marking the first time for such actions in over a decade. Interest rates fell sharply during the quarter, notably the yield on the10-year U.S. treasury declined to 1.66%, falling 34 basis points over increasing demand for safe-haven assets amidst the uncertainty. The impact from macroeconomic uncertainty clearly weighed on business confidence, though company fundamentals have so far remained relatively resilient.
Among our stronger performing positions for the year were: Motorola Solutions, Inc. (2.1% of net assets as of September 30, 2019), a leader in mission-critical communications, including command center software, video security, and managed and support services; WEC Energy Group Inc. (2.0%), a Midwest electric and natural gas holding company serving 4.5 million customers in Wisconsin, Illinois, Michigan, and Minnesota; and NextEra Energy, Inc. (2.0%), a clean energy company headquartered in Florida, and which owns Florida Power & Light Company and Gulf Power Company, which together serve more than five million customers in Florida.
Some of the weaker holdings in the portfolio included: EOG Resources, Inc. (2.0%), a crude oil and natural gas exploration and production company with reserves in the U.S., Trinidad, and China; FedEx Corporation (no longer held), which provides customers and businesses worldwide with a portfolio of transportation,e-commerce, and business services; and CVS Health Corporation (3.8%), a health care company that provides retail pharmacy, pharmacy benefits management, clinical services, and specialty pharmacy services.
We appreciate your continued confidence and trust.
9
| | | | | | | | | | | | | | | | | | | | |
| Average Annual Returns through September 30, 2019 (a) (Unaudited) | |
| | | | | | | | | | | Since |
| | | 1 Year | | 5 Year | | 10 Year | | 15 Year | | Inception
(1/2/87) |
Equity Fund Class AAA | | | 5.84 | % | | | 9.24 | % | | | 11.06 | % | | | 8.31 | % | | | 10.03 | % |
S&P 500 Index | | | 4.25 | | | | 10.84 | | | | 13.24 | | | | 9.01 | | | | 10.41 | (b) |
In the current prospectuses dated January 28, 2019, the expense ratio for Class AAA Shares is 1.60%. See page 41 for the expense ratios for the year ended September 30, 2019. Class AAA Shares do not have a sales charge.
| (a) | Returns represent past performance and do not guarantee future results. Total returns and average annual returns reflect changes in share price, reinvestment of distributions, and are net of expenses. Investment returns and the principal value of an investment will fluctuate. When shares are redeemed, they may be worth more or less than their original cost. Current performance may be lower or higher than the performance data presented. Visit www.tetonadv.com for performance information as of the most recent month end. Investors should carefully consider the investment objectives, risks, charges, and expenses of the Fund before investing. The prospectuses contain information about these and other matters and should be read carefully before investing. To obtain a prospectus, please visit our website at www.tetonadv.com.Other share classes are available and have different performance characteristics. See page 2 for performance of other classes of shares. The S&P 500 Index is a market capitalization weighted index of 500 large capitalization stocks commonly used to represent the U.S. equity market. Dividends are considered reinvested. You cannot invest directly in an index. | |
| (b) | S&P 500 Index since inception performance is as of December 31, 1986. |
COMPARISON OF CHANGE IN VALUE OF A $10,000 INVESTMENT IN
THE EQUITY FUND CLASS AAA AND THE S&P 500 INDEX (Unaudited)
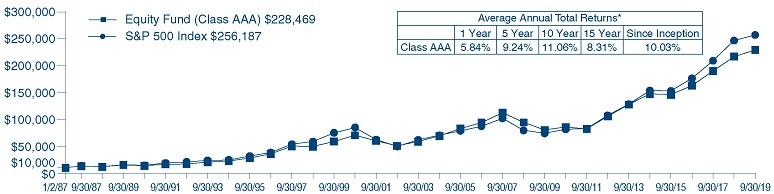
| * | Past performance is not predictive of future results.The performance tables and graph do not reflect the deduction of taxes that a shareholder would pay on Fund distributions or the redemption of Fund shares. |
10
Balanced Fund (Unaudited)
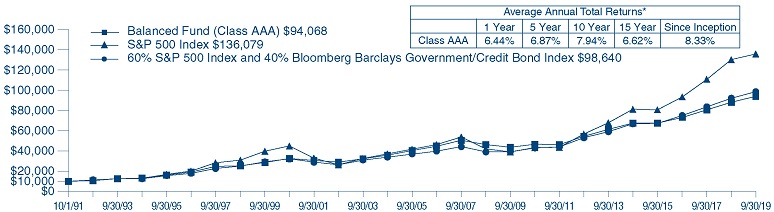
For fiscal year ended September 30, 2019, the TETON Westwood Balanced Fund Class AAA Shares posted a return of 6.4%, net of expenses, versus the Bloomberg Barclays Government/Credit Bond Index return of 11.3%. The Fund’s return was less than a common balanced benchmark comprised of 60% S&P 500 Index and 40% of the Bloomberg Barclays Capital Government/Credit Bond Index which returned 7.1%. See the next page for additional performance information.
The Fund invests in a combination of equity and debt securities. The Fund is primarily equity-oriented, and uses atop-down approach in seeking to provide equity-like returns but with lower volatility than a fully invested equity portfolio. Westwood Management Corp., the Fund’ssub-adviser (the “WestwoodSub-Adviser”) will typically invest 30% to 70% of the Fund’s assets in equity securities and 70% to 30% in debt securities, and the balance of the Fund’s assets in cash or cash equivalents. The actual mix of assets will vary depending on the WestwoodSub-Adviser’s analysis of market and economic conditions.
The Fund invests in stocks of seasoned companies. Seasoned companies generally have market capitalizations of $1 billion or more and have been operating for at least three years. The WestwoodSub-Adviser chooses stocks of seasoned companies with proven records and above-average earnings growth potential. The WestwoodSub-Adviser has disciplines in place that serve as sell signals such as a security reaching a predetermined price target, a change to a company’s fundamentals that make the risk/reward profile unattractive, or a need to improve the overall risk/reward profile of the Fund.
The debt securities held by the Fund are investment grade securities of corporate and government issuers and commercial paper and mortgage and asset-backed securities. Investment grade debt securities are securities rated in one of the four highest ratings categories by a Nationally Recognized Statistical Rating Organization (“NRSRO”). The Fund may invest in fixed income securities of any maturity.
The Fund may also invest up to 25% of its total assets in foreign equity securities and in European Depositary Receipts (“EDRs”) or American Depositary Receipts (“ADRs”), including in those of companies located in emerging markets. The Fund may also invest in foreign debt securities.
The fourth quarter of 2018 saw the S&P 500 Index suffered one of the worst quarters in the last 50 years, having fallen over 13% and ending the year with pessimism reigning supreme. Small caps fared worse, down over 20%, with growth declining moderately more than value for both small and large cap stocks. Global equity markets declined as well, adding to their losses for the year. The same fears generally throughout the year were cited as causes — trade wars, slowing growth, and higher interest rates. Making progress with China in resolving theon-going trade dispute seemed challenging; earnings reports weighed on sentiment as results were underwhelming. Yields on intermediate Treasuries fell, and total returns on investment grade bonds were mixed for the period. Yields on the5-year Treasury note fell by 44 basis points from 2.95% to 2.51%, while the 10 year Treasury note fell by 38 basis points from 3.06% to 2.68% during the quarter. Notwithstanding some inter-period volatility, the trend was clearly down. The U.S. Treasury Yield Curve continued to flatten as the yield differential between10-year and2-year Treasuries slightly narrowed. Investment grade credit spreads widened by approximately 48 basis points during the quarter causing U.S. Treasury and Agencies to outperform duration matched corporates. The higher the quality and longer the duration the more these debt securities participated in the December rally.
In the first quarter of 2019 the S&P 500 Index reversed course from the end of the year and rallied for one of the best first quarters to start the year in two decades. The major worries of the market that pressured shares turned into tailwinds. Fears over growth were placated for the majority of companies when they reported earnings. This optimism drove small cap stocks to outpace large caps and growth stocks to rally over value stocks. Optimism also rose for a potential trade deal with China, as some progress appeared to have been made which helped bolster both domestic and global markets during the quarter. Credit in general benefitted from the Fed’s perceived “dovish” shift in policy guidance early in the first quarter of 2019. Hence yields on intermediate Treasuries fell, and total returns on investment grade bonds rebounded smartly for the period. Yields on the5-year Treasury note fell by 28 basis points from 2.51% to 2.23%, while the10-year Treasury note fell by 27 basis points from 2.68% to 2.41% during the quarter.
Markets remained volatile during the second quarter of 2019, after one of the strongest starts to the year, as investor sentiment oscillated with each passing headline. Growth concerns were temporarily placated with the initial U.S. GDP estimate exceeding forecasts at 3.2% for the first quarter of 2019, though that marked the high point for expectations. Corporations reported better than expected earnings, with management teams expressing caution regarding implications from moderating growth and disruptions from the trade dispute. After a reported collapse of trade negotiations in May damaged market sentiment, optimism increased at the end of June with progress toward a resolution at theG-20 meeting in Japan. Interest rates moved significantly lower during the quarter reflecting the concerns regarding economic strength and the flight to quality in Treasuries the increased uncertainty and volatility brings. The10-year Treasury, which had begun the quarter in the2.40%-2.50% range and peaked at about 2.60% in April, traded below 2.00% in June and settled in.
Equity markets ended the third quarter of 2019 in positive territory despite continued concerns over the ongoing trade dispute and future economic growth given the deterioration of economic data. The U.S. market outperformed international equities and large caps fared far better than small caps. GDP growth for the second quarter remained steady at 2%, though several economic indicators such as the ISM’s PMI for the manufacturing segment fell into contraction. Investors continued to look for additional clues regarding the health of the economy given the longevity of the business cycle. The Federal Reserve cut rates twice during the quarter, marking the first time for such actions in over a decade. Interest rates fell sharply during the quarter, notably the yield on the10-year U.S. treasury declined to 1.66%, falling 34 basis points over increasing demand for safe-haven assets amidst the uncertainty. The impact from macroeconomic uncertainty clearly weighed on business confidence, though company fundamentals have so far remained relatively resilient.
We appreciate your confidence and trust.
11
| | | | | | | | | | | | | | | | | | | | |
| Average Annual Returns through September 30, 2019 (a) (Unaudited) | |
| | | | | | | | | | | Since |
| | | | | | | | | | | Inception |
| | | 1 Year | | 5 Year | | 10 Year | | 15 Year | | (10/1/91) |
Balanced Fund Class AAA | | | 6.44 | % | | | 6.87 | % | | | 7.94 | % | | | 6.62 | % | | | 8.33 | % |
Bloomberg Barclays Government/Credit Bond Index | | | 11.32 | | | | 3.61 | | | | 3.94 | | | | 4.26 | | | | 5.74 | (b) |
S&P 500 Index | | | 4.25 | | | | 10.84 | | | | 13.24 | | | | 9.01 | | | | 9.76 | (b) |
60% S&P 500 Index and 40% Bloomberg Barclays Government/Credit Bond Index(c) | | | 7.08 | | | | 7.95 | | | | 9.52 | | | | 7.11 | | | | 8.15 | |
In the current prospectuses dated January 28, 2019, the expense ratio for Class AAA Shares is 1.34%. See page 42 for the expense ratios for the year ended September 30, 2019. Class AAA Shares do not have a sales charge.
| (a) | Returns represent past performance and do not guarantee future results. Total returns and average annual returns reflect changes in share price, reinvestment of distributions, and are net of expenses. Investment returns and the principal value of an investment will fluctuate. When shares are redeemed, they may be worth more or less than their original cost. Current performance may be lower or higher than the performance data presented. Visit www.tetonadv.com for performance information as of the most recent month end. Teton Advisors, Inc. (the Adviser) reimbursed expenses in years prior to 1998 to limit the expense ratio. Had such limitation not been in place, returns would have been lower. Investors should carefully consider the investment objectives, risks, charges, and expenses of the Fund before investing. The prospectuses contain information about these and other matters and should be read carefully before investing. To obtain a prospectus, please visit our website at www.tetonadv.com.Other share classes are available and have different performance characteristics. See page 2 for performance of other classes of shares. The Bloomberg Barclays Government/Credit Bond Index is a market value weighted index that tracks the performance of fixed rate, publicly placed, dollar denominated obligations. The S&P 500 Index is a market capitalization weighted index of 500 large capitalization stocks commonly used to represent the U.S. equity market. Dividends are considered reinvested. You cannot invest directly in an index. | |
| (b) | S&P 500 Index and Bloomberg Barclays Government/Credit Bond Index since inception performances are as of September 30, 1991. |
| (c) | The Blended Index consists of a blend of 60% of the S&P 500 Index and 40% of the Bloomberg Barclays Government/Credit Bond Index. |
COMPARISON OF CHANGE IN VALUE OF A $10,000 INVESTMENT IN THE BALANCED FUND CLASS AAA,
THE S&P 500 INDEX, AND A COMPOSITE OF 60% OF THE S&P 500 INDEX AND 40% OF
THE BLOOMBERG BARCLAYS GOVERNMENT/CREDIT BOND INDEX (Unaudited)
| * | Past performance is not predictive of future results.The performance tables and graph do not reflect the deduction of taxes that a shareholder would pay on Fund distributions or the redemption of Fund shares. |
12
Intermediate Bond Fund (Unaudited)
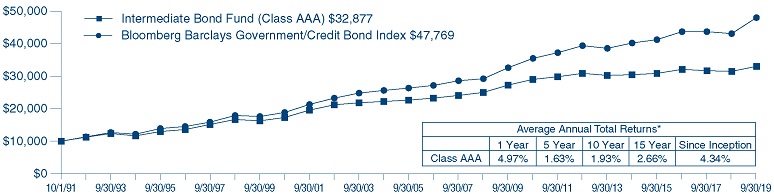
For the fiscal year ended September 30, 2019, the TETON Westwood Intermediate Bond Fund NAV per Class AAA Share increased 5.0% compared with the Bloomberg Barclays Government/Credit Bond Index which was up 11.3%. See page 14 for additional performance information.
Under normal market conditions the Fund invests at least 80% of its net assets (which includes, for purposes of this test, the amount of any borrowings for investment purposes) in bonds of various types and with various maturities. The Intermediate Bond Fund focuses on investment grade bonds of domestic corporations and governments. Investment grade debt securities are securities rated in the four highest ratings categories by a Nationally Recognized Statistical Rating Organization.
The fourth quarter of 2018 saw global uncertainty and volatility in the equity markets, and the reversal of performance for higher quality fixed income assets. Yields on intermediate Treasuries fell, and total returns on investment grade bonds were mixed for the period. Yields on the5-year Treasury note fell by 44 basis points from 2.95% to 2.51%, while the 10 year Treasury note fell by 38 basis points from 3.06% to 2.68% during the quarter. Notwithstanding some inter-period volatility, the trend was clearly down. The U.S. Treasury Yield Curve continued to flatten as the yield differential between10-year and2-year Treasuries slightly narrowed. Investment grade credit spreads widened by approximately 48 basis points during the quarter causing U.S. Treasury and Agencies to outperform duration matched corporates. The higher the quality and longer the duration the more these debt securities participated in the December rally.
Credit in general benefitted from the Fed’s perceived “dovish” shift in policy guidance early in the first quarter of 2019. Hence yields on intermediate Treasuries fell, and total returns on investment grade bonds rebounded smartly for the period. Yields on the5-year Treasury note fell by 28 basis points from 2.51% to 2.23%, while the10-year Treasury note fell by 28 basis points from 2.68% to 2.41% during the quarter. Notwithstanding some mild inter-period volatility, the trend was clearly down. The U.S. Treasury Yield Curve continued to flatten as the yield differential between10-year and2-year Treasuries slightly narrowed. Investment grade credit spreads tightened by approximately 32 basis points during the quarter causing corporate bonds to outperform duration matched U.S. Agency and U.S. Treasury securities. Longer duration fixed income securities participated more fully in the quarter’s rally, significantly outperforming shorter dated bonds.
The markets were volatile during the second quarter of 2019, after one of the strongest first quarters in decades for equities. Daily headlines, tweets and the game of “Deal or No Deal” in trade negotiations, put investors on a bit of a rollercoaster. While corporate earnings were generally better than expected, indications of moderating domestic growth and the aforementioned trade “wars” kept traders and investors cautious and reactive. Growth concerns were temporarily placated with the initial U.S. GDP estimate exceeding forecasts at 3.2% for the first quarter of 2019, though that marked the high point for expectations. After a reported collapse of trade negotiations in May damaged market sentiment, optimism increased at the end of June with progress toward a resolution at theG-20 meeting in Japan. Interest rates moved significantly lower during the quarter reflecting the concerns regarding economic strength and the flight to quality in Treasuries the increased uncertainty and volatility brings. The10-year Treasury, which had begun the quarter in the2.40%-2.50% range and peaked at about 2.60% in April, traded below 2.00% in June and settled in.
Equity markets ended the third quarter of 2019 in positive territory despite continued concerns over the ongoing trade dispute and future economic growth given the deterioration of economic data. The U.S. market outperformed international equities and large caps fared far better than small caps. GDP growth for the second quarter remained steady at 2%, though several economic indicators such as the ISM’s PMI for the manufacturing segment fell into contraction. Investors continue to look for additional clues regarding the health of the economy given the longevity of the business cycle. The Federal Reserve cut rates twice during the quarter, marking the first time for such actions in over a decade. Interest rates fell sharply during the quarter, notably the yield on the10-year U.S. treasury declined to 1.66%, falling 34 basis points over increasing demand for safe-haven assets amidst the uncertainty. The impact from macroeconomic uncertainty clearly weighed on business confidence.
We appreciate your continued confidence and trust.
13
| | | | | | | | | | | | | | | | | | | | |
Average Annual Returns through September 30, 2019 (a) (Unaudited) | |
| | | | | | | | | | | Since |
| | | | | | | | | | | Inception |
| | | 1 Year | | 5 Year | | 10 Year | | 15 Year | | (10/1/91) |
Intermediate Bond Fund Class AAA | | | 4.97 | % | | | 1.63 | % | | | 1.93 | % | | | 2.66 | % | | | 4.34 | % |
Bloomberg Barclays Government/Credit Bond Index | | | 11.32 | | | | 3.61 | | | | 3.94 | | | | 4.26 | | | | 5.74 | (b) |
In the current prospectuses dated January 28, 2019, the gross expense ratio for AAA Shares is 2.22%, and the net expense ratio is 1.00% after contractual reimbursements by Teton Advisors, Inc., (the Adviser) in place through January 31, 2020. See page 43 for the expense ratios for the year ended September 30, 2019. Class AAA Shares do not have a sales charge.
| (a) | Returns represent past performance and do not guarantee future results. Total returns and average annual returns reflect changes in share price, reinvestment of distributions, and are net of expenses. Investment returns and the principal value of an investment will fluctuate. When shares are redeemed, they may be worth more or less than their original cost. Current performance may be lower or higher than the performance data presented. Visit www.tetonadv.com for performance information as of the most recent month end. The Adviser reimbursed expenses to limit the expense ratio. Had such limitation not been in place, returns would have been lower. Investors should carefully consider the investment objectives, risks, charges, and expenses of the Fund before investing. The prospectuses contain information about these and other matters and should be read carefully before investing. To obtain a prospectus, please visit our website at www.tetonadv.com.Other share classes are available and have different performance characteristics. See page 2 for performance of other classes of shares. The Bloomberg Barclays Government/Credit Bond Index is a market value weighted index that tracks the performance of fixed rate, publicly placed, dollar denominated obligations. Dividends are considered reinvested. You cannot invest directly in an index. | |
| (b) | The Bloomberg Barclays Government/Credit Bond Index since inception performance is as of September 30, 1991. | |
COMPARISON OF CHANGE IN VALUE OF A $10,000 INVESTMENT IN THE
INTERMEDIATE BOND FUND CLASS AAA AND
THE BLOOMBERG BARCLAYS GOVERNMENT/CREDIT BOND INDEX (Unaudited)
| * | Past performance is not predictive of future results.The performance tables and graph do not reflect the deduction of taxes that a shareholder would pay on Fund distributions or the redemption of Fund shares. |
14
TETON Westwood Funds
Disclosure of Fund Expenses (Unaudited)
For the Six Month Period from April 1, 2019 through September 30, 2019
We believe it is important for you to understand the impact of fees and expenses regarding your investment. All mutual funds have operating expenses. As a shareholder of a fund, you incur ongoing costs, which include costs for portfolio management, administrative services, and shareholder reports (like this one), among others. Operating expenses, which are deducted from a fund’s gross income, directly reduce the investment return of a fund. When a fund’s expenses are expressed as a percentage of its average net assets, this figure is known as the expense ratio. The following examples are intended to help you understand the ongoing costs (in dollars) of investing in your Fund and to compare these costs with those of other mutual funds. The examples are based on an investment of $1,000 made at the beginning of the period shown and held for the entire period.
The Expense Table on page 16 illustrates your Fund’s costs in two ways:
Actual Fund Return:This section provides information about actual account values and actual expenses. You may use this section to help you to estimate the actual expenses that you paid over the period after any fee waivers and expense reimbursements. The “Ending Account Value” shown is derived from the Fund’sactualreturn during the past six months, and the Expenses Paid During Period” shows the dollar amount that would have been paid by an investor who started with $1,000 in the Fund. You may use this information, together with the amount you invested, to estimate the expenses that you paid over the period. To do so, simply divide your account value by $1,000 (for example, an $8,600 account value divided by $1,000 = 8.6), then multiply the result by the number given for your Fund under the heading “Expenses Paid During Period” to estimate the expenses you paid during this period.
Hypothetical 5% Return:This section provides information about hypothetical account values and hypothetical expenses based on the Fund’s actual expense ratio. It assumes a hypothetical annualized return of 5% before expenses during the period shown. In this case – because the hypothetical return used isnotthe Fund’s actual return – the results do not apply to your investment and you cannot use the hypothetical account value and expense to estimate the actual ending account balance or expenses you paid for the period. This example is useful in making comparisons of the ongoing costs of investing in the Fund and other funds. To do so, compare this 5% hypothetical example with the 5% hypothetical examples that appear in shareholder reports of other funds.
Please note that the expenses shown in the table are meant to highlight your ongoing costs only and do not reflect any transactional costs such as sales charges (loads), redemption fees, or exchange fees, if any, which are described in the Prospectus. If these costs were applied to your account, your costs would be higher. Therefore, the 5% hypothetical return is useful in comparing ongoing costs only, and will not help you determine the relative total costs of owning different funds. The “Annualized Expense Ratio” represents the actual expenses for the last six months and may be different from the expense ratio in the Financial Highlights which is for the fiscal year ended September 30, 2019.
15
TETON Westwood Funds
Disclosure of Fund Expenses (Unaudited) (Continued)
For the Six Month Period from April 1, 2019 through September 30, 2019
| | | | | | | | | | | | | | | | | | | | | | | | | | | | | | | | | | | | | | | | |
| Expense Table | | | | | | | | | | | | | | | | | | | | | | | | | | | | | | | | | | | | | | | | |
| | |
| | | Actual Fund Return | | Hypothetical 5% Return |
| | | Beginning | | Ending | | Annualized | | Expenses | | Beginning | | Ending | | Annualized | | Expenses |
| | | Account Value | | Account Value | | Expense | | Paid During | | Account Value | | Account Value | | Expense | | Paid During |
| | | 04/01/19 | | 09/30/19 | | Ratio | | Period* | | 04/01/19 | | 09/30/19 | | Ratio | | Period* |
TETON Westwood Mighty Mites Fund | | | | | | | | | | | | | | | | | | | | | | | | | | | | | | | | | | | | |
Class AAA | | | $ | 1,000.00 | | | | $ | 1,001.20 | | | | | 1.39 | % | | | $ | 6.97 | | | | $ | 1,000.00 | | | | $ | 1,018.10 | | | | | 1.39 | % | | | $ | 7.03 | |
Class A | | | $ | 1,000.00 | | | | $ | 1,000.00 | | | | | 1.64 | % | | | $ | 8.22 | | | | $ | 1,000.00 | | | | $ | 1,016.85 | | | | | 1.64 | % | | | $ | 8.29 | |
Class C | | | $ | 1,000.00 | | | | $ | 997.70 | | | | | 2.14 | % | | | $ | 10.72 | | | | $ | 1,000.00 | | | | $ | 1,014.34 | | | | | 2.14 | % | | | $ | 10.81 | |
Class I | | | $ | 1,000.00 | | | | $ | 1,002.70 | | | | | 1.14 | % | | | $ | 5.72 | | | | $ | 1,000.00 | | | | $ | 1,019.35 | | | | | 1.14 | % | | | $ | 5.77 | |
TETON Westwood SmallCap Equity Fund | | | | | | | | | | | | | | | | | | | | | | | | | | | | | | | |
Class AAA | | | $ | 1,000.00 | | | | $ | 1,005.60 | | | | | 1.25 | % | | | $ | 6.28 | | | | $ | 1,000.00 | | | | $ | 1,018.80 | | | | | 1.25 | % | | | $ | 6.33 | |
Class A | | | $ | 1,000.00 | | | | $ | 1,004.70 | | | | | 1.50 | % | | | $ | 7.54 | | | | $ | 1,000.00 | | | | $ | 1,017.55 | | | | | 1.50 | % | | | $ | 7.59 | |
Class C | | | $ | 1,000.00 | | | | $ | 1,002.10 | | | | | 2.00 | % | | | $ | 10.04 | | | | $ | 1,000.00 | | | | $ | 1,015.04 | | | | | 2.00 | % | | | $ | 10.10 | |
Class I | | | $ | 1,000.00 | | | | $ | 1,007.50 | | | | | 1.00 | % | | | $ | 5.03 | | | | $ | 1,000.00 | | | | $ | 1,020.05 | | | | | 1.00 | % | | | $ | 5.06 | |
TETON Convertible Securities Fund | | | | | | | | | | | | | | | | | | | | | | | | | | | | | | | | | | | | |
Class AAA | | | $ | 1,000.00 | | | | $ | 1,057.40 | | | | | 1.15 | % | | | $ | 5.93 | | | | $ | 1,000.00 | | | | $ | 1,019.30 | | | | | 1.15 | % | | | $ | 5.82 | |
Class A | | | $ | 1,000.00 | | | | $ | 1,055.70 | | | | | 1.40 | % | | | $ | 7.21 | | | | $ | 1,000.00 | | | | $ | 1,018.05 | | | | | 1.40 | % | | | $ | 7.08 | |
Class C | | | $ | 1,000.00 | | | | $ | 1,053.00 | | | | | 1.90 | % | | | $ | 9.78 | | | | $ | 1,000.00 | | | | $ | 1,015.54 | | | | | 1.90 | % | | | $ | 9.60 | |
Class I | | | $ | 1,000.00 | | | | $ | 1,058.50 | | | | | 0.90 | % | | | $ | 4.64 | | | | $ | 1,000.00 | | | | $ | 1,020.56 | | | | | 0.90 | % | | | $ | 4.56 | |
TETON Westwood Equity Fund | | | | | | | | | | | | | | | | | | | | | | | | | | | | | | | | | | | | |
Class AAA | | | $ | 1,000.00 | | | | $ | 1,088.60 | | | | | 1.65 | % | | | $ | 8.64 | | | | $ | 1,000.00 | | | | $ | 1,016.80 | | | | | 1.65 | % | | | $ | 8.34 | |
Class A | | | $ | 1,000.00 | | | | $ | 1,087.90 | | | | | 1.90 | % | | | $ | 9.94 | | | | $ | 1,000.00 | | | | $ | 1,015.54 | | | | | 1.90 | % | | | $ | 9.60 | |
Class C | | | $ | 1,000.00 | | | | $ | 1,084.90 | | | | | 2.41 | % | | | $ | 12.60 | | | | $ | 1,000.00 | | | | $ | 1,012.99 | | | | | 2.41 | % | | | $ | 12.16 | |
Class I | | | $ | 1,000.00 | | | | $ | 1,089.80 | | | | | 1.40 | % | | | $ | 7.33 | | | | $ | 1,000.00 | | | | $ | 1,018.05 | | | | | 1.40 | % | | | $ | 7.08 | |
TETON Westwood Balanced Fund | | | | | | | | | | | | | | | | | | | | | | | | | | | | | | | | | | | | |
Class AAA | | | $ | 1,000.00 | | | | $ | 1,072.30 | | | | | 1.39 | % | | | $ | 7.22 | | | | $ | 1,000.00 | | | | $ | 1,018.10 | | | | | 1.39 | % | | | $ | 7.03 | |
Class A | | | $ | 1,000.00 | | | | $ | 1,071.40 | | | | | 1.63 | % | | | $ | 8.46 | | | | $ | 1,000.00 | | | | $ | 1,016.90 | | | | | 1.63 | % | | | $ | 8.24 | |
Class C | | | $ | 1,000.00 | | | | $ | 1,068.50 | | | | | 2.15 | % | | | $ | 11.15 | | | | $ | 1,000.00 | | | | $ | 1,014.29 | | | | | 2.15 | % | | | $ | 10.86 | |
Class I | | | $ | 1,000.00 | | | | $ | 1,073.80 | | | | | 1.14 | % | | | $ | 5.93 | | | | $ | 1,000.00 | | | | $ | 1,019.35 | | | | | 1.14 | % | | | $ | 5.77 | |
TETON Westwood Intermediate Bond Fund | | | | | | | | | | | | | | | | | | | | | | | | | | | | | | | |
Class AAA | | | $ | 1,000.00 | | | | $ | 1,027.20 | | | | | 1.02 | % | | | $ | 5.18 | | | | $ | 1,000.00 | | | | $ | 1,019.95 | | | | | 1.02 | % | | | $ | 5.16 | |
Class A | | | $ | 1,000.00 | | | | $ | 1,026.70 | | | | | 1.12 | % | | | $ | 5.69 | | | | $ | 1,000.00 | | | | $ | 1,019.45 | | | | | 1.12 | % | | | $ | 5.67 | |
Class C | | | $ | 1,000.00 | | | | $ | 1,023.20 | | | | | 1.78 | % | | | $ | 9.03 | | | | $ | 1,000.00 | | | | $ | 1,016.14 | | | | | 1.78 | % | | | $ | 9.00 | |
Class I | | | $ | 1,000.00 | | | | $ | 1,027.60 | | | | | 0.77 | % | | | $ | 3.91 | | | | $ | 1,000.00 | | | | $ | 1,021.21 | | | | | 0.77 | % | | | $ | 3.90 | |
| * | Expenses are equal to the Funds’ annualized expense ratio for the last six months multiplied by the average account value over the period, multiplied by the number of days in the most recent fiscal half year (183 days), then divided by 365. |
16
Summary of Portfolio Holdings (Unaudited)
The following tables present portfolio holdings as a percent of net assets as of September 30, 2019:
| | | | | | | | | | | | |
TETON Westwood Mighty Mites Fund | | | | | | | | | | | | |
Diversified Industrial | | | 11.8 | % | | | | Automotive | | | 1.2 | % |
Financial Services | | | 9.6 | % | | | | Metals and Mining | | | 1.2 | % |
Health Care | | | 8.7 | % | | | | Consumer Services | | | 0.8 | % |
Equipment and Supplies | | | 6.9 | % | | | | Semiconductors | | | 0.8 | % |
Aerospace and Defense | | | 6.6 | % | | | | Energy and Utilities: Natural Gas | | | 0.8 | % |
Hotels and Gaming | | | 4.6 | % | | | | Entertainment | | | 0.7 | % |
Electronics | | | 3.7 | % | | | | Agriculture | | | 0.6 | % |
Real Estate | | | 3.5 | % | | | | Communications Equipment | | | 0.4 | % |
Food and Beverage | | | 3.2 | % | | | | U.S. Government Obligations | | | 0.4 | % |
Business Services | | | 3.1 | % | | | | Energy and Utilities: Integrated | | | 0.2 | % |
Consumer Products | | | 3.0 | % | | | | Energy and Utilities: Services | | | 0.2 | % |
Machinery | | | 2.8 | % | | | | Wireless Communications | | | 0.2 | % |
Specialty Chemicals | | | 2.2 | % | | | | Paper and Forest Products | | | 0.2 | % |
Telecommunications | | | 2.2 | % | | | | Closed-End Funds | | | 0.1 | % |
Aviation: Parts and Services | | | 2.2 | % | | | | Airlines | | | 0.1 | % |
Computer Software and Services | | | 2.1 | % | | | | Educational Services | | | 0.1 | % |
Restaurants | | | 2.1 | % | | | | Miscellaneous | | | 0.1 | % |
Manufactured Housing and Recreational Vehicles | | | 2.1 | % | | | | Energy and Utilities | | | 0.1 | % |
Building and Construction | | | 2.1 | % | | | | Transportation | | | 0.0 | %* |
Environmental Control | | | 1.9 | % | | | | Energy and Utilities: Oil | | | 0.0 | %* |
Retail | | | 1.8 | % | | | | Other Assets and Liabilities (Net) | | | (0.1 | )% |
| | | | | | | | | | | | |
Automotive: Parts and Accessories | | | 1.7 | % | | | | | | | 100.0 | % |
| | | | | | | | | | | | |
Energy and Utilities: Water | | | 1.5 | % | | | | | | | | |
Publishing | | | 1.3 | % | | | | * Amount represents less than 0.05%. | | | | |
Broadcasting | | | 1.2 | % | | | | | | | | |
TETON Westwood SmallCap Equity Fund | | | | | | | | | | | | |
Banking | | | 24.3 | % | | | | Consumer Products | | | 2.2 | % |
Semiconductors | | | 11.4 | % | | | | Diversified Industrial | | | 1.7 | % |
Energy and Utilities | | | 8.2 | % | | | | Communications | | | 1.5 | % |
U.S. Government Obligations | | | 7.2 | % | | | | Machinery | | | 1.2 | % |
Computer Software and Services | | | 6.5 | % | | | | Equipment and Supplies | | | 1.1 | % |
Health Care | | | 5.8 | % | | | | Real Estate | | | 1.1 | % |
Electronics | | | 4.9 | % | | | | Environmental Control | | | 1.0 | % |
Communications Equipment | | | 4.9 | % | | | | Aviation: Parts and Services | | | 0.8 | % |
Business Services | | | 4.5 | % | | | | Broadcasting | | | 0.8 | % |
Financial Services | | | 3.5 | % | | | | Aerospace | | | 0.8 | % |
Automotive | | | 3.4 | % | | | | Transportation | | | 0.6 | % |
Specialty Chemicals | | | 3.3 | % | | | | Other Assets and Liabilities (Net) | | | (5.8 | )% |
| | | | | | | | | | | | |
Retail | | | 2.8 | % | | | | | | | 100.0 | % |
| | | | | | | | | | | | |
Building and Construction | | | 2.3 | % | | | | | | | | |
TETON Convertible Securities Fund | | | | | | | | | | | | |
Computer Software and Services | | | 23.2 | % | | | | Energy and Utilities: Water | | | 1.2 | % |
Health Care | | | 16.4 | % | | | | Aviation: Parts and Services | | | 1.1 | % |
Semiconductors | | | 8.8 | % | | | | Equipment and Supplies | | | 1.1 | % |
Energy and Utilities: Integrated | | | 7.4 | % | | | | Publishing | | | 1.1 | % |
Energy and Utilities: Services | | | 5.9 | % | | | | Aerospace and Defense | | | 1.0 | % |
Financial Services | | | 4.5 | % | | | | Consumer Products | | | 1.0 | % |
Telecommunications | | | 4.3 | % | | | | Consumer Services | | | 0.8 | % |
U.S. Government Obligations | | | 4.2 | % | | | | Agriculture | | | 0.2 | % |
Communications Equipment | | | 3.6 | % | | | | Other Assets and Liabilities (Net) | | | (1.4 | )% |
| | | | | | | | | | | | |
Business Services | | | 3.5 | % | | | | | | | 100.0 | % |
| | | | | | | | | | | | |
Real Estate Investment Trusts | | | 3.1 | % | | | | | | | | |
Diversified Industrial | | | 2.9 | % | | | | | | | | |
Transportation | | | 2.1 | % | | | | | | | | |
Cable and Satellite | | | 1.5 | % | | | | | | | | |
Industrials | | | 1.3 | % | | | | | | | | |
Automotive | | | 1.2 | % | | | | | | | | |
17
Summary of Portfolio Holdings (Unaudited) (Continued)
| | | | | | | | | | | | |
TETON Westwood Equity Fund | | | | | | | | | | | | |
Health Care | | | 12.1 | % | | | | Entertainment | | | 2.7 | % |
Banking | | | 11.7 | % | | | | Business Services | | | 2.2 | % |
Financial Services | | | 8.5 | % | | | | Consumer Products | | | 2.1 | % |
Retail | | | 8.4 | % | | | | Energy and Energy Services | | | 2.0 | % |
Computer Software and Services | | | 8.2 | % | | | | Diversified Industrial | | | 1.9 | % |
Energy: Integrated | | | 8.0 | % | | | | Transportation | | | 1.7 | % |
Food and Beverage | | | 6.4 | % | | | | Other Investment Companies | | | 1.1 | % |
Aerospace | | | 6.1 | % | | | | Semiconductors | | | 1.0 | % |
Telecommunications | | | 5.5 | % | | | | Other Assets and Liabilities (Net) | | | 0.3 | % |
| | | | | | | | | | | | |
Real Estate | | | 5.2 | % | | | | | | | 100.0 | % |
| | | | | | | | | | | | |
Energy: Oil | | | 4.9 | % | | | | | | | | |
TETON Westwood Balanced Fund | | | | | | | | | | | | |
U.S. Treasury Notes | | | 10.9 | % | | | | Energy: Oil | | | 2.9 | % |
Financial Services | | | 10.5 | % | | | | Transportation | | | 2.5 | % |
Health Care | | | 10.4 | % | | | | Diversified Industrial | | | 2.0 | % |
Banking | | | 9.1 | % | | | | U.S. Treasury Inflation Indexed Notes | | | 2.0 | % |
Retail | | | 5.9 | % | | | | Federal National Mortgage Association | | | 1.9 | % |
Computer Software and Services | | | 5.5 | % | | | | Federal Home Loan Mortgage Corp. | | | 1.9 | % |
Aerospace | | | 5.0 | % | | | | Entertainment | | | 1.6 | % |
Energy: Integrated | | | 4.8 | % | | | | Business Services | | | 1.2 | % |
U.S. Treasury Bonds | | | 3.7 | % | | | | Energy and Energy Services | | | 1.2 | % |
Food and Beverage | | | 3.7 | % | | | | Semiconductors | | | 0.6 | % |
Consumer Products | | | 3.4 | % | | | | Other Assets and Liabilities (Net) | | | (0.3 | )% |
| | | | | | | | | | | | |
Telecommunications | | | 3.3 | % | | | | | | | 100.0 | % |
| | | | | | | | | | | | |
Other Investment Companies | | | 3.3 | % | | | | | | | | |
Real Estate | | | 3.0 | % | | | | | | | | |
TETON Westwood Intermediate Bond Fund | | | | | | | | | | | | |
Corporate Bonds | | | 85.9 | % | | | | | | | | |
U.S. Government Obligations | | | 12.2 | % | | | | | | | | |
Convertible Corporate Bonds | | | 1.8 | % | | | | | | | | |
U.S. Government Agency Obligations | | | 0.3 | % | | | | | | | | |
Other Assets and Liabilities (Net) | | | (0.2 | )% | | | | | | | | |
| | | | | | | | | | | | |
| | | 100.0 | % | | | | | | | | |
| | | | | | | | | | | | |
18
TETON Westwood Mighty Mites Fund
Summary Schedule of Investments — September 30, 2019
| | | | | | | | | | | | |
Shares | | | | | Cost | | | Market
Value | |
| | | | COMMON STOCKS* — 98.8% | | | | | |
| | | | Aerospace and Defense — 6.6% | | | | | |
| | 1,108,900 | | | Aerojet Rocketdyne Holdings Inc.† | | $ | 5,098,958 | | | $ | 56,010,539 | |
| | 438,040 | | | Various Securities | | | 7,233,061 | | | | 7,481,314 | |
| | | | | | | | | | | | |
| | | | | | | 12,332,019 | | | | 63,491,853 | |
| | | | | | | | | | | | |
| | | |
| | | | Agriculture — 0.6% | | | | | | | | |
| | 728,690 | | | Various Securities | | | 6,092,176 | | | | 5,378,492 | |
| | | | | | | | | | | | |
| | | | Airlines — 0.1% | | | | | | | | |
| | 265,000 | | | Various Securities | | | 15,815 | | | | 1,119,300 | |
| | | | | | | | | | | | |
| | | | Automotive — 1.2% | | | | | | | | |
| | 297,790 | | | Various Securities | | | 3,706,776 | | | | 11,853,437 | |
| | | | | | | | | | | | |
| | | | Automotive: Parts and Accessories — 1.6% | |
| | 1,360,757 | | | Various Securities | | | 18,686,396 | | | | 15,535,619 | |
| | | | | | | | | | | | |
| | | | Aviation: Parts and Services — 2.2% | |
| | 188,040 | | | Ducommun Inc.† | | | 4,760,004 | | | | 7,972,896 | |
| | 196,200 | | | Kaman Corp. | | | 4,994,792 | | | | 11,666,052 | |
| | 37,396 | | | Various Securities | | | 228,168 | | | | 1,097,022 | |
| | | | | | | | | | | | |
| | | | | | | 9,982,964 | | | | 20,735,970 | |
| | | | | | | | | | | | |
| | | |
| | | | Broadcasting — 1.2% | | | | | | | | |
| | 902,000 | | | Beasley Broadcast Group Inc., Cl. A(a) | | | 4,965,303 | | | | 2,796,200 | |
| | 1,332,028 | | | Various Securities | | | 4,016,891 | | | | 9,172,501 | |
| | | | | | | | | | | | |
| | | | | | | 8,982,194 | | | | 11,968,701 | |
| | | | | | | | | | | | |
| |
| | | | Building and Construction — 2.1% | |
| | 133,000 | | | Gibraltar Industries Inc.† | | | 3,133,522 | | | | 6,110,020 | |
| | 98,400 | | | The Monarch Cement Co. | | | 2,612,568 | | | | 6,051,600 | |
| | 1,098,074 | | | Various Securities | | | 8,455,116 | | | | 7,793,415 | |
| | | | | | | | | | | | |
| | | | | | | 14,201,206 | | | | 19,955,035 | |
| | | | | | | | | | | | |
| | |
| | | | Business Services — 3.1% | | | | | |
| | 402,451 | | | Team Inc.† | | | 6,327,227 | | | | 7,264,241 | |
| | 28,792 | | | Trans-Lux Corp.†(a)(b)(c) | | | 25,123 | | | | 14,756 | |
| | 941,292 | | | Trans-Lux Corp.†(a) | | | 821,332 | | | | 482,412 | |
| | 1,871,561 | | | Various Securities | | | 14,698,126 | | | | 22,172,407 | |
| | | | | | | | | | | | |
| | | | | | | 21,871,808 | | | | 29,933,816 | |
| | | | | | | | | | | | |
| |
| | | | Communications Equipment — 0.4% | |
| | 719,000 | | | Various Securities | | | 4,614,058 | | | | 4,029,705 | |
| | | | | | | | | | | | |
| | | | Computer Software and Services — 2.1% | |
| | 2,590,792 | | | Various Securities | | | 15,799,952 | | | | 20,703,250 | |
| | | | | | | | | | | | |
| | | | Consumer Products — 3.0% | | | | | |
| | 800,000 | | | Marine Products Corp. | | | 5,766,933 | | | | 11,328,000 | |
| | 5,969,212 | | | Various Securities | | | 16,214,919 | | | | 17,526,334 | |
| | | | | | | | | | | | |
| | | | | | | 21,981,852 | | | | 28,854,334 | |
| | | | | | | | | | | | |
| | | |
| | | | Consumer Services — 0.8% | | | | | | | | |
| | 445,320 | | | 1-800-Flowers.com Inc., Cl. A† | | | 1,653,925 | | | | 6,588,509 | |
| | 118,800 | | | Various Securities | | | 1,103,912 | | | | 1,273,434 | |
| | | | | | | | | | | | |
| | | | | | | 2,757,837 | | | | 7,861,943 | |
| | | | | | | | | | | | |
| | |
| | | | Diversified Industrial — 11.8% | | | | | |
| | 270,000 | | | Burnham Holdings Inc.,
Cl. A(a) | | | 4,323,837 | | | | 3,847,500 | |
| | 84,673 | | | Chase Corp. | | | 1,320,157 | | | | 9,262,379 | |
| | 516,579 | | | Griffon Corp. | | | 5,735,883 | | | | 10,832,662 | |
| | 65,120 | | | John Bean Technologies Corp. | | | 1,905,047 | | | | 6,474,882 | |
| | 287,170 | | | Lawson Products Inc.† | | | 4,302,426 | | | | 11,122,094 | |
| | 1,022,900 | | | Myers Industries Inc. | | | 15,911,250 | | | | 18,054,185 | |
| | 215,431 | | | Park-Ohio Holdings Corp. | | | 4,957,445 | | | | 6,432,770 | |
| | 640,000 | | | Steel Partners Holdings LP† | | | 10,328,342 | | | | 8,192,000 | |
| | 519,000 | | | Tredegar Corp. | | | 8,837,769 | | | | 10,130,880 | |
| | 522,554 | | | Twin Disc Inc.† | | | 9,615,851 | | | | 5,533,847 | |
| | 3,076,308 | | | Various Securities | | | 23,299,571 | | | | 24,401,181 | |
| | | | | | | | | | | | |
| | | | | | | 90,537,578 | | | | 114,284,380 | |
| | | | | | | | | | | | |
| | | | | | | | | | | | |
Shares | | | | | Cost | | | Market
Value | |
| | | | Educational Services — 0.1% | | | | | |
| | 125,000 | | | Various Securities | | $ | 615,524 | | | $ | 680,000 | |
| | | | | | | | | | | | |
| | | | Electronics — 3.7% | | | | | |
| | 169,999 | | | Bel Fuse Inc., Cl. A(a) | | | 3,107,228 | | | | 2,330,686 | |
| | 339,500 | | | CTS Corp. | | | 2,824,101 | | | | 10,986,220 | |
| | 63,771 | | | EMRISE Corp.†(d) | | | 0 | | | | 0 | |
| | 700,000 | | | Schmitt Industries Inc.†(a) | | | 1,612,360 | | | | 1,599,500 | |
| | 188,038 | | | Stoneridge Inc.† | | | 1,977,743 | | | | 5,823,537 | |
| | 773,174 | | | Various Securities | | | 5,808,088 | | | | 14,767,115 | |
| | | | | | | | | | | | |
| | | | | | | 15,329,520 | | | | 35,507,058 | |
| | | | | | | | | | | | |
| |
| | | | Energy and Utilities: Integrated — 0.2% | |
| | 29,000 | | | Various Securities | | | 683,833 | | | | 2,316,230 | |
| | | | | | | | | | | | |
| | | | Energy and Utilities: Natural Gas — 0.8% | |
| | 1,237,784 | | | Various Securities | | | 2,772,380 | | | | 7,231,837 | |
| | | | | | | | | | | | |
| | | | Energy and Utilities: Oil — 0.0% | | | | | |
| | 71,830 | | | Various Securities | | | 468,742 | | | | 311,742 | |
| | | | | | | | | | | | |
| | | | Energy and Utilities: Services — 0.2% | |
| | 1,761,550 | | | Various Securities | | | 5,098,198 | | | | 2,300,173 | |
| | | | | | | | | | | | |
| | | | Energy and Utilities: Water — 1.5% | |
| | 81,304 | | | SJW Group | | | 2,054,236 | | | | 5,552,250 | |
| | 333,156 | | | Various Securities | | | 4,533,732 | | | | 9,197,408 | |
| | | | | | | | | | | | |
| | | | | | | 6,587,968 | | | | 14,749,658 | |
| | | | | | | | | | | | |
| | | | Entertainment — 0.7% | | | | | | | | |
| | 1,519,130 | | | Various Securities | | | 5,207,608 | | | | 7,173,599 | |
| | | | | | | | | | | | |
| | | | Environmental Control — 1.9% | | | | | |
| | 407,853 | | | Casella Waste Systems Inc., Cl. A† | | | 2,022,942 | | | | 17,513,208 | |
| | 45,621 | | | Various Securities | | | 689,128 | | | | 792,601 | |
| | | | | | | | | | | | |
| | | | | | | 2,712,070 | | | | 18,305,809 | |
| | | | | | | | | | | | |
| | | | Equipment and Supplies — 6.9% | | | | | |
| | 192,766 | | | CIRCOR International Inc.† | | | 6,300,943 | | | | 7,238,363 | |
| | 571,000 | | | Federal Signal Corp. | | | 3,734,986 | | | | 18,694,540 | |
| | 210,000 | | | Interpump Group SpA | | | 1,523,486 | | | | 6,637,819 | |
| | 490,000 | | | Kimball International Inc., Cl. B | | | 5,071,210 | | | | 9,457,000 | |
| | 360,431 | | | The Eastern Co.(a) | | | 6,673,582 | | | | 8,945,897 | |
| | 337,820 | | | The L.S. Starrett Co., Cl. A†(a) | | | 3,705,434 | | | | 1,959,356 | |
| | 1,092,178 | | | Various Securities | | | 12,175,256 | | | | 14,110,099 | |
| | | | | | | | | | | | |
| | | | | | | 39,184,897 | | | | 67,043,074 | |
| | | | | | | | | | | | |
| | | | Financial Services — 9.1% | | | | | |
| | 302,158 | | | Atlantic Capital Bancshares Inc.† | | | 5,339,986 | | | | 5,239,420 | |
| | 1,120 | | | Farmers & Merchants Bank of Long Beach | | | 6,157,165 | | | | 8,904,000 | |
| | 657,872 | | | Flushing Financial Corp. | | | 11,253,397 | | | | 13,292,304 | |
| | 10 | | | Guaranty Corp., Cl. A†(d) | | | 137,500 | | | | 75,000 | |
| | 4,061,185 | | | Various Securities | | | 48,157,484 | | | | 60,483,265 | |
| | | | | | | | | | | | |
| | | | | | | 71,045,532 | | | | 87,993,989 | |
| | | | | | | | | | | | |
| | | | Food and Beverage — 3.2% | | | | | |
| | 2,260,562 | | | Various Securities | | | 26,524,853 | | | | 31,207,587 | |
| | | | | | | | | | | | |
| | | | Health Care — 8.7% | | | | | | | | |
| | 130,000 | | | BioTelemetry Inc.† | | | 908,156 | | | | 5,294,900 | |
| | 384,940 | | | Cutera Inc.† | | | 5,778,772 | | | | 11,251,796 | |
| | 154,000 | | | Neogen Corp.† | | | 476,321 | | | | 10,488,940 | |
| | 114,000 | | | Quidel Corp.† | | | 1,394,874 | | | | 6,993,900 | |
| | 117,934 | | | SurModics Inc.† | | | 2,409,935 | | | | 5,394,301 | |
| | 2,000 | | | Targanta Therapeutics Corp., Escrow†(d) | | | 0 | | | | 0 | |
| | 278,000 | | | Zealand Pharma A/S† | | | 3,494,481 | | | | 7,077,891 | |
| | 2,617,920 | | | Various Securities | | | 16,399,868 | | | | 37,472,956 | |
| | | | | | | | | | | | |
| | | | | | | 30,862,407 | | | | 83,974,684 | |
| | | | | | | | | | | | |
| | | |
| | | | Hotels and Gaming — 4.6% | | | | | | | | |
| | 66,620 | | | Churchill Downs Inc. | | | 1,086,907 | | | | 8,224,572 | |
See accompanying notes to financial statements.
19
TETON Westwood Mighty Mites Fund
Summary Schedule of Investments (Continued) — September 30, 2019
| | | | | | | | | | | | |
Shares | | | | | Cost | | | Market
Value | |
| | | | COMMON STOCKS* (Continued) | |
| | | | Hotels and Gaming (Continued) | | | | | |
| | 641,210 | | | Golden Entertainment Inc.† | | $ | 6,807,644 | | | $ | 8,521,681 | |
| | 353,812 | | | The Marcus Corp. | | | 4,455,756 | | | | 13,094,582 | |
| | 2,019,240 | | | Various Securities | | | 10,853,034 | | | | 14,745,624 | |
| | | | | | | | | | | | |
| | | |
| | | | | | | 23,203,341 | | | | 44,586,459 | |
| | | | | | | | | | | | |
| | | |
| | | | Machinery — 2.8% | | | | | | | | |
| | 326,000 | | | Astec Industries Inc. | | | 11,457,875 | | | | 10,138,600 | |
| | 559,000 | | | Gencor Industries Inc.† | | | 3,819,715 | | | | 6,489,990 | |
| | 151,334 | | | Various Securities | | | 2,733,575 | | | | 10,121,673 | |
| | | | | | | | | | | | |
| | | |
| | | | | | | 18,011,165 | | | | 26,750,263 | |
| | | | | | | | | | | | |
| |
| | | | Manufactured Housing and Recreational Vehicles — 2.1% | |
| | 55,555 | | | Cavco Industries Inc.† | | | 3,142,786 | | | | 10,671,560 | |
| | 338,750 | | | Various Securities | | | 3,479,255 | | | | 9,552,465 | |
| | | | | | | | | | | | |
| | | |
| | | | | | | 6,622,041 | | | | 20,224,025 | |
| | | | | | | | | | | | |
| | | |
| | | | Metals and Mining — 1.2% | | | | | | | | |
| | 717,000 | | | Osisko Gold Royalties Ltd. | | | 10,420,098 | | | | 6,662,090 | |
| | 1,103,540 | | | Various Securities | | | 2,669,519 | | | | 4,411,387 | |
| | | | | | | | | | | | |
| | | |
| | | | | | | 13,089,617 | | | | 11,073,477 | |
| | | | | | | | | | | | |
| |
| | | | Paper and Forest Products — 0.2% | |
| | 26,800 | | | Various Securities | | | 2,281,278 | | | | 1,876,000 | |
| | | | | | | | | | | | |
| | | | Publishing — 1.3% | | | | | | | | |
| | 852,600 | | | The E.W. Scripps Co., Cl. A | | | 5,156,637 | | | | 11,322,528 | |
| | 279,057 | | | Various Securities | | | 1,187,290 | | | | 899,909 | |
| | | | | | | | | | | | |
| | | |
| | | | | | | 6,343,927 | | | | 12,222,437 | |
| | | | | | | | | | | | |
| | | |
| | | | Real Estate — 3.5% | | | | | | | | |
| | 281,450 | | | Griffin Industrial Realty Inc.(a) | | | 8,150,899 | | | | 10,681,028 | |
| | 527,269 | | | Reading International Inc., Cl. A† | | | 4,919,287 | | | | 6,306,137 | |
| | 2,508 | | | Royalty LLC†(d) | | | 0 | | | | 255 | |
| | 1,444,907 | | | Various Securities | | | 13,634,450 | | | | 16,645,740 | |
| | | | | | | | | | | | |
| | | |
| | | | | | | 26,704,636 | | | | 33,633,160 | |
| | | | | | | | | | | | |
| | | |
| | | | Restaurants — 2.1% | | | | | | | | |
| | 222,234 | | | Nathan’s Famous Inc.(a) | | | 3,237,026 | | | | 15,967,513 | |
| | 109,639 | | | Various Securities | | | 3,147,040 | | | | 4,324,144 | |
| | | | | | | | | | | | |
| | | |
| | | | | | | 6,384,066 | | | | 20,291,657 | |
| | | | | | | | | | | | |
| | | |
| | | | Retail — 1.8% | | | | | | | | |
| | 172,240 | | | Ingles Markets Inc., Cl. A | | | 2,977,603 | | | | 6,693,246 | |
| | 907,584 | | | Various Securities | | | 11,172,431 | | | | 10,222,162 | |
| | | | | | | | | | | | |
| | | |
| | | | | | | 14,150,034 | | | | 16,915,408 | |
| | | | | | | | | | | | |
| | | |
| | | | Semiconductors — 0.8% | | | | | | | | |
| | 162,740 | | | Entegris Inc. | | | 1,088,226 | | | | 7,658,544 | |
| | 2,000 | | | Various Securities | | | 23,663 | | | | 23,360 | |
| | | | | | | | | | | | |
| | | |
| | | | | | | 1,111,889 | | | | 7,681,904 | |
| | | | | | | | | | | | |
| | | |
| | | | Specialty Chemicals — 2.2% | | | | | | | | |
| | 1,086,593 | | | Ferro Corp.† | | | 5,209,733 | | | | 12,886,993 | |
| | 267,226 | | | General Chemical Group Inc.†(a) | | | 59,859 | | | | 2,138 | |
| | 713,301 | | | Various Securities | | | 7,984,840 | | | | 8,531,898 | |
| | | | | | | | | | | | |
| | | |
| | | | | | | 13,254,432 | | | | 21,421,029 | |
| | | | | | | | | | | | |
| | | |
| | | | Telecommunications — 2.2% | | | | | | | | |
| | 278,000 | | | Shenandoah Telecommunications Co. | | | 1,472,162 | | | | 8,832,060 | |
| | 1,881,491 | | | Various Securities | | | 14,397,561 | | | | 11,910,097 | |
| | | | | | | | | | | | |
| | | |
| | | | | | | 15,869,723 | | | | 20,742,157 | |
| | | | | | | | | | | | |
| | | | Transportation — 0.0% | | | | | | | | |
| | 17,000 | | | Various Securities | | | 374,911 | | | | 323,000 | |
| | | | | | | | | | | | |
| | | | | | | | | | | | |
Shares | | | | | Cost | | | Market
Value | |
| | | | Wireless Communications — 0.2% | |
| | 1,100,000 | | | Various Securities | | $ | 1,366,361 | | | $ | 2,156,000 | |
| | | | | | | | | | | | |
| | | | TOTAL COMMON STOCKS | | | 587,423,584 | | | | 954,398,251 | |
| | | | | | | | | | | | |
| | |
| | | | CLOSED-END FUNDS* — 0.1% | | | | | |
| | 127,800 | | | Various Securities | | | 1,152,872 | | | | 1,137,420 | |
| | | | | | | | | | | | |
| | |
| | | | PREFERRED STOCKS* — 0.6% | | | | | |
| | | | Automotive: Parts and Accessories — 0.1% | |
| | 46,300 | | | Various Securities | | | 186,816 | | | | 998,195 | |
| | | | | | | | | | | | |
| | | | Financial Services — 0.5% | | | | | |
| | 233,000 | | | Various Securities | | | 7,323,349 | | | | 4,932,610 | |
| | | | | | | | | | | | |
| | | | TOTAL PREFERRED STOCKS | | | 7,510,165 | | | | 5,930,805 | |
| | | | | | | | | | | | |
| | | | CONVERTIBLE PREFERRED STOCKS* — 0.1% | |
| | | | Energy and Utilities — 0.1% | | | | | |
| | 15,095 | | | Various Securities | | | 313,221 | | | | 332,090 | |
| | | | | | | | | | | | |
| | | | Food and Beverage — 0.0% | | | | | |
| | 500 | | | Various Securities | | | 7,625 | | | | 15,590 | |
| | | | | | | | | | | | |
| | | | TOTAL CONVERTIBLE PREFERRED STOCKS | | | 320,846 | | | | 347,680 | |
| | | | | | | | | | | | |
| | | | RIGHTS* — 0.0% | | | | | | | | |
| | | | Entertainment — 0.0% | | | | | | | | |
| | 550,000 | | | Media General Inc., CVR†(d) | | | 1 | | | | 1 | |
| | | | | | | | | | | | |
| | | |
| | | | Health Care — 0.0% | | | | | | | | |
| | 200,000 | | | Teva Pharmaceutical Industries Ltd., CCCP, expire 02/20/23†(d) | | | 103,591 | | | | 0 | |
| | 400,000 | | | Various Securities | | | 137,800 | | | | 228,000 | |
| | | | | | | | | | | | |
| | | |
| | | | | | | 241,391 | | | | 228,000 | |
| | |
| | | | Specialty Chemicals — 0.0% | | | | | |
| | 30,000 | | | A. Schulman Inc., CVR†(d) | | | 15,690 | | | | 15,690 | |
| | | | | | | | | | | | |
| | | | TOTAL RIGHTS | | | 257,082 | | | | 243,691 | |
| | | | | | | | | | | | |
| | | | WARRANTS* — 0.0% | | | | | |
| | | | Energy and Utilities — 0.0% | | | | | |
| | 86 | | | Key Energy Services Inc., expire 12/15/21†(d) | | | 0 | | | | 17 | |
| | 86 | | | Key Energy Services Inc., expire 12/15/20†(d) | | | 0 | | | | 4 | |
| | | | | | | | | | | | |
| | | |
| | | | | | | 0 | | | | 21 | |
| | |
| | | | Environmental Control — 0.0% | | | | | |
| | 200 | | | Various Securities | | | 58 | | | | 43 | |
| | | | | | | | | | | | |
| | | | Health Care — 0.0% | | | | | |
| | 17,474 | | | Various Securities | | | 15,533 | | | | 5,846 | |
| | | | | | | | | | | | |
| | | | TOTAL WARRANTS | | | 15,591 | | | | 5,910 | |
| | | | | | | | | | | | |
See accompanying notes to financial statements.
20
TETON Westwood Mighty Mites Fund
Summary Schedule of Investments (Continued) — September 30, 2019
| | | | | | | | | | | | |
Principal
Amount | | | | | Cost | | | Market
Value | |
| |
| | | | CONVERTIBLE CORPORATE BONDS* — 0.0% | |
| | | | Telecommunications — 0.0% | | | | | |
| | $ 180,000 | | | Various Securities | | $ | 180,000 | | | $ | 215,308 | |
| | | | | | | | | | | | |
| |
| | | | U.S. GOVERNMENT OBLIGATIONS* — 0.4% | |
| | 3,796,000 | | | Various Securities | | | 3,783,123 | | | | 3,784,099 | |
| | | | | | | | | | | | |
| | | |
| | | | TOTAL MISCELLANEOUS INVESTMENTS — 0.1%(e) | | | 568,202 | | | | 559,073 | |
| | | | | | | | | | | | |
| | | |
| | | | TOTAL INVESTMENTS — 100.1% | | $ | 601,211,465 | | | | 966,622,237 | |
| | | | | | | | | | | | |
| | |
| | | | Other Assets and Liabilities (Net) — (0.1)% | | | | (906,592 | ) |
| | | | | | | | | | | | |
| | | |
| | | | NET ASSETS — 100.0% | | | | | | $ | 965,715,645 | |
| | | | | | | | | | | | |
This Summary Schedule of Investments does not reflect the complete portfolio holdings of the Fund. It includes the Fund’s 50 largest holdings, each investment of any issuer that exceeds 1% of the Fund’s net assets, and affiliated or Level 3 securities, if any.
| * | “Various Securities” consist of issuers not identified as a top 50 holding, issues or issuers not exceeding 1% of net assets individually or in the aggregate, any issuers that are not affiliated or level 3 securities, if any as of September 30, 2019. The complete Schedule of Investments is available (i) without charge, upon request, by calling 800-GABELLI (800-422-3554); and (ii) on the SEC’S website at http://www.sec.gov. |
| (a) | Security considered an affiliated holding because the Fund owns at least 5% of its outstanding shares. |
| (b) | Security exempt from registration under Rule 144A of the Securities Act of 1933, as amended. These securities may be resold in transactions exempt from registration, normally to qualified institutional buyers. |
| (c) | At September 30, 2019, the Fund held an investment in a restricted and illiquid security amounting to $14,756 or 0.00% of net assets., which was valued under methods approved by the Board of Trustees as follows: |
| | | | | | | | | | | | |
Acquisition
Shares | | Issuer | | Acquisition
Date | | Acquisition
Cost | | | 09/30/19
Carrying
Value
Per Share | |
| | | | 06/01/09- | | | | | | | | |
| 28,792 | | Trans-Lux Corp. | | 09/25/18 | | | $25,123 | | | | $0.5125 | |
| (d) | Security is valued using significant unobservable inputs and is classified as Level 3 in the fair value hierarchy. |
| (e) | Represents previously undisclosed, unrestricted securities which the Fund has held for less than one year. |
| † | Non-income producing security. |
See accompanying notes to financial statements.
21
TETON Westwood SmallCap Equity Fund
Schedule of Investments — September 30, 2019
| | | | | | | | | | | | |
Shares | | | | | Cost | | | Market
Value | |
| | | |
| | | | COMMON STOCKS — 98.6% | | | | | | | | |
| | | | Aerospace — 0.8% | | | | | | | | |
| | 3,600 | | | Hexcel Corp. | | $ | 109,475 | | | $ | 295,668 | |
| | | | | | | | | | | | |
| | | |
| | | | Automotive — 3.4% | | | | | | | | |
| | 14,100 | | | Rush Enterprises Inc., Cl. A | | | 359,374 | | | | 543,978 | |
| | 19,700 | | | Winnebago Industries Inc. | | | 598,273 | | | | 755,495 | |
| | | | | | | | | | | | |
| | | |
| | | | | | | 957,647 | | | | 1,299,473 | |
| | |
| | | | Aviation: Parts and Services — 0.8% | | | | | |
| | 8,000 | | | AAR Corp. | | | 267,789 | | | | 329,680 | |
| | | | | | | | | | | | |
| | | |
| | | | Banking — 24.3% | | | | | | | | |
| | 22,600 | | | Atlantic Capital Bancshares Inc.† | | | 410,019 | | | | 391,884 | |
| | 9,433 | | | Atlantic Union Bankshares Corp. | | | 223,128 | | | | 351,332 | |
| | 15,600 | | | Banc of California Inc. | | | 288,439 | | | | 220,584 | |
| | 13,200 | | | BankUnited Inc. | | | 364,856 | | | | 443,784 | |
| | 5,900 | | | Berkshire Hills Bancorp Inc. | | | 153,535 | | | | 172,811 | |
| | 21,662 | | | Cadence BanCorp | | | 342,301 | | | | 379,951 | |
| | 13,400 | | | CenterState Bank Corp. | | | 309,741 | | | | 321,399 | |
| | 8,400 | | | Columbia Banking System Inc. | | | 257,223 | | | | 309,960 | |
| | 3,200 | | | Financial Institutions Inc. | | | 56,688 | | | | 96,576 | |
| | 34,400 | | | First Foundation Inc. | | | 531,613 | | | | 525,460 | |
| | 10,200 | | | Flushing Financial Corp. | | | 164,000 | | | | 206,091 | |
| | 9,300 | | | Glacier Bancorp Inc. | | | 175,557 | | | | 376,278 | |
| | 20,100 | | | Heritage Commerce Corp. | | | 186,247 | | | | 236,276 | |
| | 52,050 | | | Investors Bancorp Inc. | | | 561,191 | | | | 591,288 | |
| | 19,000 | | | LegacyTexas Financial Group Inc. | | | 451,549 | | | | 827,070 | |
| | 6,500 | | | Live Oak Bancshares Inc. | | | 114,239 | | | | 117,650 | |
| | 12,150 | | | OceanFirst Financial Corp. | | | 261,398 | | | | 286,740 | |
| | 17,350 | | | OFG Bancorp | | | 174,937 | | | | 379,965 | |
| | 8,200 | | | Oritani Financial Corp. | | | 123,867 | | | | 145,099 | |
| | 17,000 | | | PCSB Financial Corp. | | | 286,964 | | | | 339,830 | |
| | 29,206 | | | Sterling Bancorp | | | 320,389 | | | | 585,872 | |
| | 22,200 | | | TrustCo Bank Corp. | | | 147,725 | | | | 180,930 | |
| | 19,050 | | | Umpqua Holdings Corp. | | | 280,046 | | | | 313,563 | |
| | 24,600 | | | Valley National Bancorp | | | 244,266 | | | | 267,402 | |
| | 23,700 | | | Veritex Holdings Inc. | | | 632,717 | | | | 575,081 | |
| | 14,000 | | | Washington Federal Inc. | | | 300,174 | | | | 517,860 | |
| | 4,700 | | | Washington Trust Bancorp Inc. | | | 125,134 | | | | 227,057 | |
| | | | | | | | | | | | |
| | | |
| | | | | | | 7,487,943 | | | | 9,387,793 | |
| | | |
| | | | Broadcasting — 0.8% | | | | | | | | |
| | 11,800 | | | Chicken Soup For The Soul | | | | | |
| | | | Entertainment Inc.† | | | 120,542 | | | | 114,460 | |
| | 17,600 | | | Hemisphere Media Group Inc.† | | | 206,059 | | | | 215,072 | |
| | | | | | | | | | | | |
| | | |
| | | | | | | 326,601 | | | | 329,532 | |
| | |
| | | | Building and Construction — 2.3% | | | | | |
| | 6,300 | | | EMCOR Group Inc. | | | 295,185 | | | | 542,556 | |
| | 10,900 | | | MYR Group Inc.† | | | 185,196 | | | | 341,061 | |
| | | | | | | | | | | | |
| | | |
| | | | | | | 480,381 | | | | 883,617 | |
| | |
| | | | Business Services — 4.5% | | | | | |
| | 21,000 | | | ABM Industries Inc. | | | 654,558 | | | | 762,720 | |
| | 4,850 | | | FTI Consulting Inc.† | | | 153,369 | | | | 514,051 | |
| | 6,600 | | | McGrath RentCorp | | | 210,364 | | | | 459,294 | |
| | | | | | | | | | | | |
| | | |
| | | | | | | 1,018,291 | | | | 1,736,065 | |
| | |
| | | | Communications — 1.5% | | | | | |
| | 16,100 | | | Meredith Corp. | | | 588,589 | | | | 590,226 | |
| | | | | | | | | | | | |
| | |
| | | | Communications Equipment — 4.9% | | | | | |
| | 94,500 | | | Extreme Networks Inc.† | | | 563,293 | | | | 687,487 | |
| | 122,800 | | | Infinera Corp.† | | | 850,952 | | | | 669,260 | |
| | 5,722 | | | Lumentum Holdings Inc.† | | | 246,293 | | | | 306,470 | |
| | 15,500 | | | Switch Inc., Cl. A | | | 111,834 | | | | 242,110 | |
| | | | | | | | | | | | |
| | | |
| | | | | | | 1,772,372 | | | | 1,905,327 | |
| |
| | | | Computer Software and Services — 6.5% | |
| | 8,300 | | | Bottomline Technologies Inc.† | | | 225,173 | | | | 326,605 | |
| | 31,300 | | | Cloudera Inc.† | | | 169,562 | | | | 277,318 | |
| | | | | | | | | | | | |
Shares | | | | | Cost | | | Market
Value | |
| | | |
| | 4,100 | | | LogMeIn Inc. | | $ | 282,556 | | | $ | 290,936 | |
| | 44,000 | | | NetScout Systems Inc.† | | | 973,417 | | | | 1,014,640 | |
| | 15,600 | | | Progress Software Corp. | | | 358,726 | | | | 593,736 | |
| | | | | | | | | | | | |
| | | |
| | | | | | | 2,009,434 | | | | 2,503,235 | |
| | | |
| | | | Consumer Products — 2.2% | | | | | | | | |
| | 21,900 | | | Hanesbrands Inc. | | | 354,390 | | | | 335,508 | |
| | 7,300 | | | Oxford Industries Inc. | | | 444,262 | | | | 523,410 | |
| | | | | | | | | | | | |
| | | |
| | | | | | | 798,652 | | | | 858,918 | |
| | | |
| | | | Diversified Industrial — 1.7% | | | | | | | | |
| | 3,900 | | | Fabrinet† | | | 142,528 | | | | 203,970 | |
| | 24,300 | | | Steelcase Inc., Cl. A | | | 340,140 | | | | 447,120 | |
| | | | | | | | | | | | |
| | | |
| | | | | | | 482,668 | | | | 651,090 | |
| | | |
| | | | Electronics — 4.9% | | | | | | | | |
| | 13,300 | | | Advanced Energy Industries Inc.† | | | 614,276 | | | | 763,553 | |
| | 5,800 | | | FARO Technologies Inc.† | | | 184,846 | | | | 280,430 | |
| | 12,100 | | | Plantronics Inc. | | | 470,296 | | | | 451,572 | |
| | 25,700 | | | TTM Technologies Inc.† | | | 299,653 | | | | 313,412 | |
| | 900 | | | Woodward Inc. | | | 55,787 | | | | 97,047 | |
| | | | | | | | | | | | |
| | | |
| | | | | | | 1,624,858 | | | | 1,906,014 | |
| | | |
| | | | Energy and Utilities — 8.2% | | | | | | | | |
| | 9,300 | | | Apergy Corp.† | | | 285,750 | | | | 251,565 | |
| | 55,200 | | | Centennial Resource Development Inc., Cl. A† | | | 765,408 | | | | 249,228 | |
| | 41,200 | | | Magnolia Oil & Gas Corp., Cl. A† | | | 487,727 | | | | 457,320 | |
| | 27,000 | | | Matador Resources Co.† | | | 515,467 | | | | 446,310 | |
| | 23,700 | | | Oceaneering International Inc.† | | | 442,687 | | | | 321,135 | |
| | 34,500 | | | Parsley Energy Inc., Cl. A | | | 822,353 | | | | 579,600 | |
| | 94,200 | | | Patterson-UTI Energy Inc. | | | 1,500,341 | | | | 805,410 | |
| | 2,100 | | | Penn Virginia Corp.† | | | 88,616 | | | | 61,047 | |
| | | | | | | | | | | | |
| | | |
| | | | | | | 4,908,349 | | | | 3,171,615 | |
| | | |
| | | | Environmental Control — 1.0% | | | | | | | | |
| | 22,600 | | | Evoqua Water Technologies Corp.† | | | 212,104 | | | | 384,652 | |
| | | | | | | | | | | | |
| | | |
| | | | Equipment and Supplies — 1.1% | | | | | | | | |
| | 11,300 | | | CIRCOR International Inc.† | | | 447,379 | | | | 424,315 | |
| | | | | | | | | | | | |
| | | |
| | | | Financial Services — 3.5% | | | | | | | | |
| | 3,703 | | | Brookfield Asset Management Inc., Cl. A | | | 196,926 | | | | 196,592 | |
| | 16,600 | | | Brown & Brown Inc. | | | 250,019 | | | | 598,596 | |
| | 11,800 | | | Coastal Financial Corp.† | | | 168,394 | | | | 178,298 | |
| | 6,500 | | | Stifel Financial Corp. | | | 262,650 | | | | 372,970 | |
| | | | | | | | | | | | |
| | | |
| | | | | | | 877,989 | | | | 1,346,456 | |
| | | |
| | | | Health Care — 5.8% | | | | | | | | |
| | 2,700 | | | AMN Healthcare Services Inc.† | | | 133,553 | | | | 155,412 | |
| | 1,780 | | | ICU Medical Inc.† | | | 129,303 | | | | 284,088 | |
| | 12,800 | | | Natus Medical Inc.† | | | 362,734 | | | | 407,552 | |
| | 6,550 | | | Omnicell Inc.† | | | 163,674 | | | | 473,369 | |
| | 44,900 | | | Patterson Cos. Inc. | | | 796,800 | | | | 800,118 | |
| | 4,100 | | | Supernus Pharmaceuticals Inc.† | | | 121,200 | | | | 112,668 | |
| | | | | | | | | | | | |
| | | |
| | | | | | | 1,707,264 | | | | 2,233,207 | |
| | | |
| | | | Machinery — 1.2% | | | | | | | | |
| | 42,300 | | | Mueller Water Products Inc., Cl. A | | | 471,820 | | | | 475,452 | |
| | | | | | | | | | | | |
| | | |
| | | | Real Estate — 1.1% | | | | | | | | |
| | 6,000 | | | Equity Commonwealth, REIT | | | 181,068 | | | | 205,500 | |
| | 15,200 | | | Paramount Group Inc., REIT | | | 234,541 | | | | 202,920 | |
| | | | | | | | | | | | |
| | | |
| | | | | | | 415,609 | | | | 408,420 | |
| | | |
| | | | Retail — 2.8% | | | | | | | | |
| | 3,550 | | | American Eagle Outfitters Inc. | | | 45,213 | | | | 57,581 | |
| | 38,000 | | | Ethan Allen Interiors Inc. | | | 721,833 | | | | 725,800 | |
| | 14,100 | | | The Hain Celestial Group Inc.† | | | 253,723 | | | | 302,797 | |
| | | | | | | | | | | | |
| | | |
| | | | | | | 1,020,769 | | | | 1,086,178 | |
| | | | | | | | | | | | |
See accompanying notes to financial statements.
22
TETON Westwood SmallCap Equity Fund
Schedule of Investments (Continued) — September 30, 2019
| | | | | | | | | | | | |
Shares | | | | | Cost | | | Market Value | |
| | | | COMMON STOCKS (Continued) | |
| | | | Semiconductors — 11.4% | | | | | | | | |
| | 2,600 | | | Cabot Microelectronics Corp. | | $ | 123,045 | | | $ | 367,146 | |
| | 30,900 | | | Cypress Semiconductor Corp. | | | 278,213 | | | | 721,206 | |
| | 24,300 | | | Entegris Inc. | | | 375,870 | | | | 1,143,558 | |
| | 28,100 | | | FormFactor Inc.† | | | 281,699 | | | | 523,925 | |
| | 12,600 | | | MACOM Technology Solutions Holdings Inc.† | | | 231,736 | | | | 270,837 | |
| | 20,600 | | | Marvell Technology Group Ltd. | | | 288,418 | | | | 514,382 | |
| | 8,400 | | | Nanometrics Inc.† | | | 252,067 | | | | 274,008 | |
| | 10,861 | | | Versum Materials Inc. | | | 285,361 | | | | 574,873 | |
| | | | | | | | | | | | |
| | | |
| | | | | | | 2,116,409 | | | | 4,389,935 | |
| |
| | | | Specialty Chemicals — 3.3% | |
| | 41,400 | | | Darling Ingredients Inc.† | | | 684,837 | | | | 791,982 | |
| | 29,100 | | | Ferro Corp.† | | | 442,466 | | | | 345,126 | |
| | 4,700 | | | PolyOne Corp. | | | 137,107 | | | | 153,455 | |
| | | | | | | | | | | | |
| | | |
| | | | | | | 1,264,410 | | | | 1,290,563 | |
| | | |
| | | | Transportation — 0.6% | | | | | | | | |
| | 7,800 | | | The Greenbrier Companies Inc. | | | 213,945 | | | | 234,936 | |
| | | | | | | | | | | | |
| | | |
| | | | TOTAL COMMON STOCKS | | | 31,580,747 | | | | 38,122,367 | |
| | | |
| | | | RIGHTS — 0.0% | | | | | | | | |
| | | | Specialty Chemicals — 0.0% | | | | | | | | |
| | 22,200 | | | A. Schulman Inc., CVR†(a) | | | 11,611 | | | | 11,611 | |
| | | | | | | | | | | | |
| | | | | | | | | | | | |
Principal
Amount | | | | | Cost | | | Market Value | |
| | | | U.S. GOVERNMENT OBLIGATIONS — 7.2% | |
| | $2,787,000 | | | U.S. Treasury Bills,
1.938% to 2.034%††,
10/17/19 to 11/21/19 | | $ | 2,779,706 | | | $ | 2,780,246 | |
| | | | | | | | | | | | |
| | | |
| | | | TOTAL INVESTMENTS — 105.8% | | $ | 34,372,064 | | | | 40,914,224 | |
| | | | | | | | | | | | |
| | |
| | | | Other Assets and Liabilities (Net) — (5.8)% | | | | (2,245,383 | ) |
| | | | | | | | | | | | |
| | |
| | | | NET ASSETS — 100.0% | | | $ | 38,668,841 | |
| | | | | | | | | | | | |
| (a) | Security is valued using significant unobservable inputs and is classified as Level 3 in the fair value hierarchy. |
| † | Non-income producing security. |
| †† | Represents annualized yields at dates of purchase. |
| CVR | Contingent Value Right REIT |
| Real | Estate Investment Trust |
See accompanying notes to financial statements.
23
TETON Convertible Securities Fund
Schedule of Investments — September 30, 2019
| | | | | | | | | | | | |
Principal
Amount | | | | | Cost | | | Market
Value | |
| |
| | | | CONVERTIBLE CORPORATE BONDS — 71.4% | |
| | | | Aerospace and Defense — 1.0% | | | | | | | | |
| | $250,000 | | | Aerojet Rocketdyne Holdings Inc., | | | | | | | | |
| | | | 2.250%, 12/15/23 | | $ | 253,359 | | | $ | 499,219 | |
| | | | | | | | | | | | |
| | | |
| | | | Automotive — 1.2% | | | | | | | | |
| | 615,000 | | | Tesla Inc., | | | | | | | | |
| | | | 2.000%, 05/15/24 | | | 603,949 | | | | 626,181 | |
| | | | | | | | | | | | |
| |
| | | | Aviation: Parts and Services — 1.1% | |
| | 500,000 | | | Kaman Corp., | | | | | | | | |
| | | | 3.250%, 05/01/24 | | | 529,688 | | | | 572,897 | |
| | | | | | | | | | | | |
| | | |
| | | | Business Services — 3.5% | | | | | | | | |
| | 509,000 | | | Bristow Group Inc., | | | | | | | | |
| | | | 4.500%, 06/01/23 | | | 545,113 | | | | 63,625 | |
| | 750,000 | | | Perficient Inc., | | | | | | | | |
| | | | 2.375%, 09/15/23 | | | 751,303 | | | | 896,841 | |
| | 310,000 | | | RingCentral Inc., | | | | | | | | |
| | | | Zero Coupon, 03/15/23 | | | 320,572 | | | | 501,360 | |
| | 292,000 | | | Team Inc., | | | | | | | | |
| | | | 5.000%, 08/01/23 | | | 291,448 | | | | 323,408 | |
| | | | | | | | | | | | |
| | | |
| | | | | | | 1,908,436 | | | | 1,785,234 | |
| | | |
| | | | Cable and Satellite — 1.5% | | | | | | | | |
| | 800,000 | | | DISH Network Corp., | | | | | | | | |
| | | | 3.375%, 08/15/26 | | | 805,282 | | | | 734,965 | |
| | | | | | | | | | | | |
| |
| | | | Communications Equipment — 3.6% | |
| | 985,000 | | | InterDigital Inc., | | | | | | | | |
| | | | 2.000%, 06/01/24(a) | | | 987,869 | | | | 970,839 | |
| | 712,000 | | | Lumentum Holdings Inc., | | | | | | | | |
| | | | 0.250%, 03/15/24 | | | 784,773 | | | | 827,708 | |
| | | | | | | | | | | | |
| | | |
| | | | | | | 1,772,642 | | | | 1,798,547 | |
| | | | Computer Software and Services — 22.7% | |
| | 500,000 | | | Blackline Inc., | | | | | | | | |
| | | | 0.125%, 08/01/24(a) | | | 501,217 | | | | 479,276 | |
| | 840,000 | | | Boingo Wireless Inc., | | | | | | | | |
| | | | 1.000%, 10/01/23(a) | | | 759,341 | | | | 694,125 | |
| | 590,000 | | | Coupa Software Inc., | | | | | | | | |
| | | | 0.125%, 06/15/25(a) | | | 605,413 | | | | 646,787 | |
| | 550,000 | | | CSG Systems International Inc., | | | | | | | | |
| | | | 4.250%, 03/15/36(a) | | | 569,938 | | | | 624,512 | |
| | 700,000 | | | Evolent Health Inc., | | | | | | | | |
| | | | 1.500%, 10/15/25(a) | | | 661,680 | | | | 453,250 | |
| | 523,000 | | | GDS Holdings Ltd., | | | | | | | | |
| | | | 2.000%, 06/01/25 | | | 438,735 | | | | 544,759 | |
| | 750,000 | | | IAC Financeco 3 Inc., | | | | | | | | |
| | | | 2.000%, 01/15/30(a) | | | 751,937 | | | | 811,850 | |
| | 440,000 | | | LivePerson Inc., | | | | | | | | |
| | | | 0.750%, 03/01/24(a) | | | 443,177 | | | | 514,074 | |
| | 500,000 | | | MercadoLibre Inc., | | | | | | | | |
| | | | 2.000%, 08/15/28 | | | 491,658 | | | | 736,491 | |
| | 305,000 | | | Nice Systems Inc., | | | | | | | | |
| | | | 1.250%, 01/15/24 | | | 319,373 | | | | 545,520 | |
| | 100,000 | | | Okta Inc., | | | | | | | | |
| | | | 0.250%, 02/15/23 | | | 104,348 | | | | 210,470 | |
| | | | 0.125%, 09/01/25(a) | | | 380,206 | | | | 359,118 | |
| | 500,000 | | | PAR Technology Corp., | | | | | | | | |
| | | | 4.500%, 04/15/24(a) | | | 530,442 | | | | 556,277 | |
| | 570,000 | | | Pluralsight Inc., | | | | | | | | |
| | | | 0.375%, 03/01/24(a) | | | 499,514 | | | | 490,181 | |
| | | | | | | | | | | | |
Principal
Amount | | | | | Cost | | | Market
Value | |
| | | |
| | $500,000 | | | Proofpoint Inc., | | | | | | | | |
| | | | 0.250%, 08/15/24(a) | | $ | 528,897 | | | $ | 542,570 | |
| | 500,000 | | | PROS Holdings Inc., | | | | | | | | |
| | | | 1.000%, 05/15/24(a) | | | 627,952 | | | | 568,258 | |
| | 250,000 | | | Q2 Holdings Inc., | | | | | | | | |
| | | | 0.750%, 02/15/23 | | | 274,956 | | | | 367,344 | |
| | | | 0.750%, 06/01/26(a) | | | 396,441 | | | | 415,800 | |
| | 200,000 | | | SailPoint Technologies Holding Inc., | | | | | | | | |
| | | | 0.125%, 09/15/24(a) | | | 200,000 | | | | 191,050 | |
| | 400,000 | | | Splunk Inc., | | | | | | | | |
| | | | 1.125%, 09/15/25 | | | 407,467 | | | | 439,250 | |
| | 800,000 | | | Vocera Communications Inc., | | | | | | | | |
| | | | 1.500%, 05/15/23 | | | 856,512 | | | | 840,651 | |
| | 500,000 | | | Workiva Inc., | | | | | | | | |
| | | | 1.125%, 08/15/26(a) | | | 495,522 | | | | 458,635 | |
| | | | | | | | | | | | |
| | | |
| | | | | | | 10,844,726 | | | | 11,490,248 | |
| | | |
| | | | Consumer Services — 0.8% | | | | | | | | |
| | 300,000 | | | Extra Space Storage LP, | | | | | | | | |
| | | | 3.125%, 10/01/35(a) | | | 306,786 | | | | 383,463 | |
| | | | | | | | | | | | |
| |
| | | | Diversified Industrial — 1.9% | |
| | 300,000 | | | Chart Industries Inc., | | | | | | | | |
| | | | 1.000%, 11/15/24(a) | | | 363,128 | | | | 376,872 | |
| | 500,000 | | | KBR Inc., | | | | | | | | |
| | | | 2.500%, 11/01/23(a) | | | 507,978 | | | | 580,345 | |
| | | | | | | | | | | | |
| | | |
| | | | | | | 871,106 | | | | 957,217 | |
| |
| | | | Energy and Utilities: Integrated — 1.3% | |
| | 750,000 | | | SunPower Corp., | | | | | | | | |
| | | | 4.000%, 01/15/23 | | | 650,049 | | | | 682,192 | |
| | | | | | | | | | | | |
| |
| | | | Energy and Utilities: Services — 2.2% | |
| | 1,100,000 | | | Cheniere Energy Inc., | | | | | | | | |
| | | | 4.250%, 03/15/45 | | | 821,997 | | | | 853,875 | |
| | 250,000 | | | Tesla Energy Operations Inc., | | | | | | | | |
| | | | 1.625%, 11/01/19 | | | 248,612 | | | | 247,686 | |
| | | | | | | | | | | | |
| | | |
| | | | | | | 1,070,609 | | | | 1,101,561 | |
| | | |
| | | | Financial Services — 1.2% | | | | | | | | |
| | 300,000 | | | Encore Capital Europe Finance Ltd., | | | | | | | | |
| | | | 4.500%, 09/01/23 | | | 314,665 | | | | 310,190 | |
| | 199,000 | | | LendingTree Inc., | | | | | | | | |
| | | | 0.625%, 06/01/22 | | | 219,919 | | | | 319,256 | |
| | | | | | | | | | | | |
| | | |
| | | | | | | 534,584 | | | | 629,446 | |
| | | |
| | | | Health Care — 15.1% | | | | | | | | |
| | 495,000 | | | Aerie Pharmaceuticals Inc., | | | | | | | | |
| | | | 1.500%, 10/01/24(a) | | | 544,001 | | | | 498,968 | |
| | 235,000 | | | Clovis Oncology Inc., | | | | | | | | |
| | | | 4.500%, 08/01/24(a) | | | 235,000 | | | | 177,470 | |
| | 350,000 | | | CONMED Corp., | | | | | | | | |
| | | | 2.625%, 02/01/24(a) | | | 364,210 | | | | 434,910 | |
| | 195,000 | | | DexCom Inc., | | | | | | | | |
| | | | 0.750%, 12/01/23(a) | | | 201,585 | | | | 229,071 | |
| | 500,000 | | | Exact Sciences Corp., | | | | | | | | |
| | | | 0.375%, 03/15/27 | | | 514,099 | | | | 541,900 | |
See accompanying notes to financial statements.
24
TETON Convertible Securities Fund
Schedule of Investments (Continued) — September 30, 2019
| | | | | | | | | | | | |
Principal
Amount | | | | | Cost | | | Market
Value | |
| |
| | | | CONVERTIBLE CORPORATE BONDS (Continued) | |
| | | | Health Care (Continued) | | | | | | | | |
| | $404,000 | | | Insulet Corp., | | | | | | | | |
| | | | 1.375%, 11/15/24 | | $ | 446,844 | | | $ | 744,250 | |
| | | | 0.375%, 09/01/26(a) | | | 300,000 | | | | 305,673 | |
| | 300,000 | | | Intercept Pharmaceuticals Inc., | | | | | | | | |
| | | | 2.000%, 05/15/26 | | | 280,163 | | | | 271,125 | |
| | 400,000 | | | Invacare Corp., | | | | | | | | |
| | | | 4.500%, 06/01/22 | | | 384,616 | | | | 336,089 | |
| | 495,000 | | | Invitae Corp., | | | | | | | | |
| | | | 2.000%, 09/01/24(a) | | | 514,280 | | | | 494,134 | |
| | 337,000 | | | Neurocrine Biosciences Inc., | | | | | | | | |
| | | | 2.250%, 05/15/24 | | | 371,541 | | | | 462,266 | |
| | 500,000 | | | Pacira BioSciences Inc., | | | | | | | | |
| | | | 2.375%, 04/01/22 | | | 507,436 | | | | 494,235 | |
| | 400,000 | | | Paratek Pharmaceuticals Inc., | | | | | | | | |
| | | | 4.750%, 05/01/24 | | | 395,524 | | | | 293,187 | |
| | 100,000 | | | Repligen Corp., | | | | | | | | |
| | | | 0.375%, 07/15/24 | | | 100,000 | | | | 99,375 | |
| | 350,000 | | | Retrophin Inc., | | | | | | | | |
| | | | 2.500%, 09/15/25 | | | 324,348 | | | | 260,824 | |
| | 708,000 | | | Supernus Pharmaceuticals Inc., | | | | | | | | |
| | | | 0.625%, 04/01/23 | | | 721,089 | | | | 659,218 | |
| | 770,000 | | | Tabula Rasa HealthCare Inc., | | | | | | | | |
| | | | 1.750%, 02/15/26(a) | | | 778,906 | | | | 835,795 | |
| | 300,000 | | | Teladoc Health Inc., | | | | | | | | |
| | | | 3.000%, 12/15/22 | | | 308,641 | | | | 513,469 | |
| | | | | | | | | | | | |
| | | |
| | | | | | | 7,292,283 | | | | 7,651,959 | |
| | | |
| | | | Publishing — 1.1% | | | | | | | | |
| | 500,000 | | | Gannett Co. Inc., | | | | | | | | |
| | | | 4.750%, 04/15/24 | | | 534,757 | | | | 541,600 | |
| | | | | | | | | | | | |
| | | |
| | | | Semiconductors — 6.8% | | | | | | | | |
| | 250,000 | | | Adesto Technologies Corp., | | | | | | | | |
| | | | 4.250%, 09/15/24(a) | | | 250,000 | | | | 253,809 | |
| | 250,000 | | | Cypress Semiconductor Corp., | | | | | | | | |
| | | | 4.500%, 01/15/22 | | | 273,428 | | | | 436,532 | |
| | 500,000 | | | Inphi Corp., | | | | | | | | |
| | | | 1.125%, 12/01/20 | | | 528,023 | | | | 781,270 | |
| | 500,000 | | | Knowles Corp., | | | | | | | | |
| | | | 3.250%, 11/01/21 | | | 525,889 | | | | 643,028 | |
| | 758,000 | | | Rambus Inc., | | | | | | | | |
| | | | 1.375%, 02/01/23 | | | 742,572 | | | | 754,782 | |
| | 300,000 | | | Teradyne Inc., | | | | | | | | |
| | | | 1.250%, 12/15/23 | | | 359,557 | | | | 571,140 | |
| | | | | | | | | | | | |
| | | |
| | | | | | | 2,679,469 | | | | 3,440,561 | |
| | | |
| | | | Telecommunications — 4.3% | | | | | | | | |
| | 305,000 | | | 8x8 Inc., | | | | | | | | |
| | | | 0.500%, 02/01/24(a) | | | 325,527 | | | | 321,048 | |
| | 1,000,000 | | | Infinera Corp., | | | | | | | | |
| | | | 2.125%, 09/01/24 | | | 874,402 | | | | 872,570 | |
| | 500,000 | | | Liberty Latin America Ltd., | | | | | | | | |
| | | | 2.000%, 07/15/24(a) | | | 499,516 | | | | 500,567 | |
| | 300,000 | | | Twilio Inc., | | | | | | | | |
| | | | 0.250%, 06/01/23 | | | 300,591 | | | | 501,381 | |
| | | | | | | | | | | | |
| | | |
| | | | | | | 2,000,036 | | | | 2,195,566 | |
| | | |
| | | | Transportation — 2.1% | | | | | | | | |
| | 500,000 | | | Atlas Air Worldwide Holdings Inc., | | | | | | | | |
| | | | 1.875%, 06/01/24 | | | 442,671 | | | | 415,937 | |
| | | | | | | | | | | | |
Principal
Amount | | | | | Cost | | | Market
Value | |
| | | |
| | $590,000 | | | GOL Equity Finance SA, | | | | | | | | |
| | | | 3.750%, 07/15/24(a) | | $ | 600,504 | | | $ | 622,819 | |
| | | | | | | | | | | | |
| | | |
| | | | | | | 1,043,175 | | | | 1,038,756 | |
| | | |
| | | | TOTAL CONVERTIBLE CORPORATE BONDS | | | 33,700,936 | | | | 36,129,612 | |
| | | | | | | | | | | | |
| | | |
Shares | | | | | | | | | |
| |
| | | | CONVERTIBLE PREFERRED STOCKS — 2.3% | |
| | | | Agriculture — 0.2% | | | | | | | | |
| | 1,000 | | | Bunge Ltd., 4.875% | | | 94,950 | | | | 101,630 | |
| | | | | | | | | | | | |
| | | |
| | | | Financial Services — 2.1% | | | | | | | | |
| | 600 | | | Bank of America Corp., 7.250%, Ser. L | | | 804,556 | | | | 899,526 | |
| | 117 | | | Wells Fargo & Co., 7.500%, Ser. L | | | 149,190 | | | | 178,131 | |
| | | | | | | | | | | | |
| | | |
| | | | | | | 953,746 | | | | 1,077,657 | |
| | | |
| | | | TOTAL CONVERTIBLE PREFERRED STOCKS | | | 1,048,696 | | | | 1,179,287 | |
| | | | | | | | | | | | |
| |
| | | | MANDATORY CONVERTIBLE SECURITIES (b) — 23.0% | |
| | | | Consumer Products — 1.0% | | | | | | | | |
| | 5,150 | | | Energizer Holdings Inc., Ser. A | | | | | | | | |
| | | | 7.500%, 01/15/22 | | | 521,484 | | | | 487,602 | |
| | | | | | | | | | | | |
| | | | Diversified Industrial — 1.0% | | | | | | | | |
| | 4,000 | | | Colfax Corp., | | | | | | | | |
| | | | 5.750%, 01/15/22 | | | 416,600 | | | | 522,160 | |
| | | | | | | | | | | | |
| | | | Energy and Utilities: Integrated — 6.1% | |
| | 20,200 | | | CenterPoint Energy Inc., Ser. B | | | | | | | | |
| | | | 7.000%, 09/01/21 | | | 1,034,043 | | | | 1,055,652 | |
| | 5,000 | | | DTE Energy Co., | | | | | | | | |
| | | | 6.500%, 10/01/19 | | | 266,172 | | | | 290,050 | |
| | 14,000 | | | NextEra Energy Inc., | | | | | | | | |
| | | | 4.872%, 09/01/22 | | | 680,031 | | | | 702,380 | |
| | | | Sempra Energy, | | | | | | | | |
| | 3,535 | | | Ser. A, 6.000%, 01/15/21 | | | 360,105 | | | | 417,837 | |
| | 1,970 | | | Ser. B, 6.750%, 07/15/21 | | | 207,963 | | | | 231,790 | |
| | 7,500 | | | The Southern Co., | | | | | | | | |
| | | | 6.750%, 08/01/22 | | | 376,645 | | | | 401,325 | |
| | | | | | | | | | | | |
| | | |
| | | | | | | 2,924,959 | | | | 3,099,034 | |
| |
| | | | Energy and Utilities: Services — 3.7% | |
| | 10,180 | | | American Electric Power Co. Inc., | | | | | | | | |
| | | | 6.125%, 03/15/22 | | | 516,072 | | | | 560,714 | |
| �� | 5,000 | | | Dominion Energy Inc., Ser. A | | | | | | | | |
| | | | 7.250%, 06/01/22 | | | 508,795 | | | | 528,750 | |
| | 14,705 | | | South Jersey Industries Inc., | | | | | | | | |
| | | | 7.250%, 04/15/21 | | | 779,922 | | | | 759,807 | |
| | | | | | | | | | | | |
| | | |
| | | | | | | 1,804,789 | | | | 1,849,271 | |
| |
| | | | Energy and Utilities: Water — 1.2% | |
| | 9,720 | | | Aqua America Inc., | | | | | | | | |
| | | | 6.000%, 04/30/22 | | | 545,865 | | | | 589,032 | |
| | | | | | | | | | | | |
| | | | Equipment and Supplies — 1.1% | |
| | 500 | | | Danaher Corp., Ser. A | | | | | | | | |
| | | | 4.750%, 04/15/22 | | | 515,260 | | | | 570,025 | |
| | | | | | | | | | | | |
| | | |
| | | | Financial Services — 1.2% | | | | | | | | |
| | 2,538 | | | Assurant Inc., Ser. D | | | | | | | | |
| | | | 6.500%, 03/15/21 | | | 260,201 | | | | 317,301 | |
| | 6,000 | | | New York Community Capital Trust V, | | | | | | | | |
| | | | 6.000%, 11/01/51 | | | 300,700 | | | | 300,000 | |
| | | | | | | | | | | | |
| | | |
| | | | | | | 560,901 | | | | 617,301 | |
See accompanying notes to financial statements.
25
TETON Convertible Securities Fund
Schedule of Investments (Continued) — September 30, 2019
| | | | | | | | | | | | |
Shares | | | | | Cost | | | Market
Value | |
| | | | MANDATORY CONVERTIBLE SECURITIES (b) (Continued) | |
| | | | Health Care — 1.3% | | | | | | | | |
| | 2,730 | | | Avantor Inc., Ser. A | | | | | | | | |
| | | | 6.250%, 05/15/22 | | $ | 154,885 | | | $ | 146,574 | |
| | 8,494 | | | Becton Dickinson and Co., Ser. A | | | | | | | | |
| | | | 6.125%, 05/01/20 | | | 463,626 | | | | 525,864 | |
| | | | | | | | | | | | |
| | | |
| | | | | | | 618,511 | | | | 672,438 | |
| | | |
| | | | Industrials — 1.3% | | | | | | | | |
| | 8,032 | | | International Flavors & | | | | | | | | |
| | | | Fragrances Inc., | | | | | | | | |
| | | | 6.000%, 09/15/21 | | | 416,608 | | | | 377,825 | |
| | 5,200 | | | Rexnord Corp., Ser. A | | | | | | | | |
| | | | 5.750%, 11/15/19 | | | 267,069 | | | | 284,960 | |
| | | | | | | | | | | | |
| | | |
| | | | | | | 683,677 | | | | 662,785 | |
| |
| | | | Real Estate Investment Trusts — 3.1% | |
| | 504 | | | Crown Castle International Corp., Ser. A | | | | | | | | |
| | | | 6.875%, 08/01/20 | | | 538,469 | | | | 636,134 | |
| | 7,500 | | | QTS Realty Trust Inc., Ser. B | | | | | | | | |
| | | | 6.500 %, | | | 781,733 | | | | 911,175 | |
| | | | | | | | | | | | |
| | | |
| | | | | | | 1,320,202 | | | | 1,547,309 | |
| |
| | | | Semiconductors — 2.0% | |
| | 1,005 | | | Broadcom Inc., Ser. A | | | | | | | | |
| | | | 8.000%, 09/30/22 | | | 1,006,500 | | | | 1,030,513 | |
| | | | | | | | | | | | |
| | | | TOTAL MANDATORY CONVERTIBLE SECURITIES | | | 10,918,748 | | | | 11,647,470 | |
| | | | | | | | | | | | |
| | | | | | | | | | | | |
Shares | | | | | Cost | | | Market
Value | |
| | | | COMMON STOCKS — 0.5% | | | | | | | | |
| | | | Computer Software and Services — 0.5% | |
| | 1,664 | | | Alibaba Group Holding Ltd., ADR† | | $ | 248,934 | | | $ | 278,271 | |
| | | | | | | | | | | | |
| | | |
Principal
Amount | | | | | | | | | |
| | | | U.S. GOVERNMENT OBLIGATIONS — 4.2% | |
| | $2,139,000 | | | U.S. Treasury Bills,
1.762% to 2.065%††,
10/24/19 to 12/26/19 | | | 2,130,962 | | | | 2,130,933 | |
| | | | | | | | | | | | |
| | | |
| | | | TOTAL
INVESTMENTS — 101.4% | | $ | 48,048,276 | | | | 51,365,573 | |
| | | | | | | | | | | | |
| | | | Other Assets and Liabilities (Net) — (1.4)% | | | | (728,226 | ) |
| | | | | | | | | | | | |
| | | | NET ASSETS — 100.0% | | | | | | $ | 50,637,347 | |
| | | | | | | | | | | | |
| (a) | Security exempt from registration under Rule 144A of the Securities Act of 1933, as amended. These securities may be resold in transactions exempt from registration, normally to qualified institutional buyers. |
| (b) | Mandatory convertible securities are required to be converted on the dates listed; they generally may be converted prior to these dates at the option of the holder. |
| † | Non-income producing security. |
| †† | Represents annualized yields at dates of purchase. |
| ADR | American Depositary Receipt |
See accompanying notes to financial statements.
26
TETON Westwood Equity Fund
Schedule of Investments — September 30, 2019
| | | | | | | | | | | | |
Shares | | | | | Cost | | | Market
Value | |
| | | | COMMON STOCKS — 98.6% | | | | | |
| | | | Aerospace — 6.1% | | | | | | | | |
| | 6,095 | | | General Dynamics Corp. | | $ | 923,606 | | | $ | 1,113,739 | |
| | 2,989 | | | Northrop Grumman Corp. | | | 957,069 | | | | 1,120,247 | |
| | 3,127 | | | The Boeing Co. | | | 501,736 | | | | 1,189,730 | |
| | | | | | | | | | | | |
| | | |
| | | | | | | 2,382,411 | | | | 3,423,716 | |
| | |
| | | | Banking — 11.7% | | | | | |
| | 65,805 | | | Bank of America Corp. | | | 1,221,600 | | | | 1,919,532 | |
| | 17,113 | | | JPMorgan Chase & Co. | | | 1,020,220 | | | | 2,014,029 | |
| | 33,185 | | | Wells Fargo & Co. | | | 1,631,033 | | | | 1,673,851 | |
| | 20,865 | | | Western Alliance Bancorp | | | 1,093,105 | | | | 961,459 | |
| | | | | | | | | | | | |
| | | |
| | | | | | | 4,965,958 | | | | 6,568,871 | |
| | |
| | | | Business Services — 2.2% | | | | | |
| | 8,902 | | | Equifax Inc. | | | 1,094,820 | | | | 1,252,244 | |
| | | | | | | | | | | | |
| |
| | | | Computer Software and Services — 8.2% | |
| | 10,302 | | | Activision Blizzard Inc. | | | 571,183 | | | | 545,182 | |
| | 876 | | | Alphabet Inc., Cl. A† | | | 728,398 | | | | 1,069,719 | |
| | 2,995 | | | Apple Inc. | | | 605,526 | | | | 670,790 | |
| | 2,514 | | | CACI International Inc., Cl. A† | | | 545,179 | | | | 581,388 | |
| | 12,755 | | | Microsoft Corp. | | | 1,140,333 | | | | 1,773,328 | |
| | | | | | | | | | | | |
| | | |
| | | | | | | 3,590,619 | | | | 4,640,407 | |
| | |
| | | | Consumer Products — 2.1% | | | | | |
| | 16,083 | | | Colgate-Palmolive Co. | | | 939,339 | | | | 1,182,261 | |
| | | | | | | | | | | | |
| | |
| | | | Diversified Industrial — 1.9% | | | | | |
| | 6,294 | | | Honeywell International Inc. | | | 806,073 | | | | 1,064,945 | |
| | | | | | | | | | | | |
| | |
| | | | Energy and Energy Services — 2.0% | | | | | |
| | 15,093 | | | EOG Resources Inc. | | | 1,359,469 | | | | 1,120,202 | |
| | | | | | | | | | | | |
| | |
| | | | Energy: Integrated — 8.0% | | | | | |
| | 17,475 | | | CMS Energy Corp. | | | 791,822 | | | | 1,117,526 | |
| | 8,450 | | | DTE Energy Co. | | | 1,005,475 | | | | 1,123,512 | |
| | 4,854 | | | NextEra Energy Inc. | | | 393,231 | | | | 1,130,933 | |
| | 11,807 | | | WEC Energy Group Inc. | | | 575,099 | | | | 1,122,846 | |
| | | | | | | | | | | | |
| | | |
| | | | | | | 2,765,627 | | | | 4,494,817 | |
| | |
| | | | Energy: Oil — 4.9% | | | | | |
| | 14,152 | | | Chevron Corp. | | | 1,436,499 | | | | 1,678,427 | |
| | 18,935 | | | ConocoPhillips | | | 1,277,509 | | | | 1,078,916 | |
| | | | | | | | | | | | |
| | | |
| | | | | | | 2,714,008 | | | | 2,757,343 | |
| | |
| | | | Entertainment — 2.7% | | | | | |
| | 11,838 | | | The Walt Disney Co. | | | 1,434,732 | | | | 1,542,728 | |
| | | | | | | | | | | | |
| | |
| | | | Financial Services — 8.5% | | | | | |
| | 20,785 | | | American International Group Inc. | | | 1,074,177 | | | | 1,157,725 | |
| | 8,941 | | | Assurant Inc. | | | 1,129,981 | | | | 1,124,957 | |
| | 7,421 | | | Chubb Ltd. | | | 809,279 | | | | 1,198,046 | |
| | 23,175 | | | U.S. Bancorp | | | 1,284,200 | | | | 1,282,505 | |
| | | | | | | | | | | | |
| | | |
| | | | | | | 4,297,637 | | | | 4,763,233 | |
| | | | | | | | | | | | |
Shares | | | | | Cost | | | Market
Value | |
| | | | Food and Beverage — 6.4% | | | | | |
| | 21,757 | | | General Mills Inc. | | $ | 1,099,594 | | | $ | 1,199,246 | |
| | 27,130 | | | Hormel Foods Corp. | | | 982,257 | | | | 1,186,395 | |
| | 8,791 | | | PepsiCo Inc. | | | 767,588 | | | | 1,205,246 | |
| | | | | | | | | | | | |
| | | |
| | | | | | | 2,849,439 | | | | 3,590,887 | |
| | |
| | | | Health Care — 12.1% | | | | | |
| | 14,030 | | | Abbott Laboratories | | | 600,555 | | | | 1,173,890 | |
| | 5,770 | | | Becton, Dickinson and Co. | | | 999,872 | | | | 1,459,579 | |
| | 13,070 | | | Johnson & Johnson | | | 1,405,201 | | | | 1,690,997 | |
| | 13,150 | | | Medtronic plc | | | 1,105,102 | | | | 1,428,353 | |
| | 4,772 | | | UnitedHealth Group Inc. | | | 1,112,005 | | | | 1,037,051 | |
| | | | | | | | | | | | |
| | | |
| | | | | | | 5,222,735 | | | | 6,789,870 | |
| | |
| | | | Real Estate — 5.2% | | | | | |
| | 4,690 | | | Crown Castle International Corp., REIT | | | 526,567 | | | | 651,957 | |
| | 4,568 | | | Public Storage, REIT | | | 985,751 | | | | 1,120,393 | |
| | 30,122 | | | STORE Capital Corp., REIT | | | 1,079,270 | | | | 1,126,864 | |
| | | | | | | | | | | | |
| | | |
| | | | | | | 2,591,588 | | | | 2,899,214 | |
| | |
| | | | Retail — 8.4% | | | | | |
| | 7,969 | | | Advance Auto Parts Inc. | | | 1,230,325 | | | | 1,318,073 | |
| | 33,994 | | | CVS Health Corp. | | | 2,553,219 | | | | 2,144,002 | |
| | 5,441 | | | The Home Depot Inc. | | | 697,474 | | | | 1,262,421 | |
| | | | | | | | | | | | |
| | | |
| | | | | | | 4,481,018 | | | | 4,724,496 | |
| | |
| | | | Semiconductors — 1.0% | | | | | |
| | 23,415 | | | Marvell Technology Group Ltd. | | | 540,980 | | | | 584,672 | |
| | | | | | | | | | | | |
| | |
| | | | Telecommunications — 5.5% | | | | | |
| | 51,803 | | | AT&T Inc. | | | 2,023,429 | | | | 1,960,225 | |
| | 6,807 | | | Motorola Solutions Inc. | | | 800,837 | | | | 1,159,981 | |
| | | | | | | | | | | | |
| | | |
| | | | | | | 2,824,266 | | | | 3,120,206 | |
| | | |
| | | | Transportation — 1.7% | | | | | | | | |
| | 5,860 | | | Union Pacific Corp. | | | 334,043 | | | | 949,203 | |
| | | | | | | | | | | | |
| | | |
| | | | TOTAL COMMON STOCKS | | | 45,194,762 | | | | 55,469,315 | |
| |
| | | | SHORT TERM INVESTMENT — 1.1% | |
| | | | Other Investment Companies — 1.1% | | | | | |
| | 639,544 | | | Dreyfus Treasury Securities Cash Management, 1.830%* | | | 639,544 | | | | 639,544 | |
| | | | | | | | | | | | |
| | | |
| | | | TOTAL
INVESTMENTS — 99.7% | | $ | 45,834,306 | | | | 56,108,859 | |
| | | | | | | | | | | | |
| | |
| | | | Other Assets and Liabilities (Net) — 0.3% | | | | 164,419 | |
| | | | | | | | | | | | |
| | | |
| | | | NET ASSETS — 100.0% | | | | | | $ | 56,273,278 | |
| | | | | | | | | | | | |
| * | 1 day yield as of September 30, 2019. |
| † | Non-income producing security. |
REIT Real Estate Investment Trust
See accompanying notes to financial statements.
27
TETON Westwood Balanced Fund
Schedule of Investments — September 30, 2019
| | | | | | | | | | | | |
Shares | | | | | Cost | | | Market
Value | |
| | | | COMMON STOCKS — 58.8% | | | | | | | | |
| | | | Aerospace — 4.0% | | | | | | | | |
| | 4,045 | | | General Dynamics Corp. | | $ | 596,080 | | | $ | 739,143 | |
| | 2,377 | | | Northrop Grumman Corp. | | | 761,078 | | | | 890,876 | |
| | 2,032 | | | The Boeing Co. | | | 335,763 | | | | 773,115 | |
| | | | | | | | | | | | |
| | | |
| | | | | | | 1,692,921 | | | | 2,403,134 | |
| | | |
| | | | Banking — 7.0% | | | | | | | | |
| | 42,064 | | | Bank of America Corp. | | | 585,144 | | | | 1,227,007 | |
| | 11,050 | | | JPMorgan Chase & Co. | | | 644,585 | | | | 1,300,475 | |
| | 21,466 | | | Wells Fargo & Co. | | | 1,058,924 | | | | 1,082,745 | |
| | 13,168 | | | Western Alliance Bancorp | | | 692,414 | | | | 606,781 | |
| | | | | | | | | | | | |
| | | |
| | | | | | | 2,981,067 | | | | 4,217,008 | |
| | | |
| | | | Business Services — 1.2% | | | | | | | | |
| | 5,276 | | | Equifax Inc. | | | 650,509 | | | | 742,175 | |
| | | | | | | | | | | | |
| |
| | | | Computer Software and Services — 5.0% | |
| | 6,534 | | | Activision Blizzard Inc. | | | 362,267 | | | | 345,779 | |
| | 621 | | | Alphabet Inc., Cl. A† | | | 516,899 | | | | 758,328 | |
| | 1,948 | | | Apple Inc. | | | 394,117 | | | | 436,294 | |
| | 1,597 | | | CACI International Inc., Cl. A† | | | 346,268 | | | | 369,322 | |
| | 7,624 | | | Microsoft Corp. | | | 512,676 | | | | 1,059,965 | |
| | | | | | | | | | | | |
| | | |
| | | | | | | 2,132,227 | | | | 2,969,688 | |
| | | |
| | | | Consumer Products — 1.2% | | | | | | | | |
| | 9,853 | | | Colgate-Palmolive Co. | | | 563,237 | | | | 724,294 | |
| | | | | | | | | | | | |
| | | |
| | | | Diversified Industrial — 1.1% | | | | | | | | |
| | 3,989 | | | Honeywell International Inc. | | | 493,926 | | | | 674,939 | |
| | | | | | | | | | | | |
| | |
| | | | Energy and Energy Services — 1.2% | | | | | |
| | 9,646 | | | EOG Resources Inc. | | | 848,186 | | | | 715,926 | |
| | | | | | | | | | | | |
| | | |
| | | | Energy: Integrated — 4.8% | | | | | | | | |
| | 11,169 | | | CMS Energy Corp. | | | 506,227 | | | | 714,257 | |
| | 5,401 | | | DTE Energy Co. | | | 643,242 | | | | 718,117 | |
| | 3,103 | | | NextEra Energy Inc. | | | 280,702 | | | | 722,968 | |
| | 7,546 | | | WEC Energy Group Inc. | | | 373,286 | | | | 717,625 | |
| | | | | | | | | | | | |
| | | |
| | | | | | | 1,803,457 | | | | 2,872,967 | |
| | | |
| | | | Energy: Oil — 2.9% | | | | | | | | |
| | 9,060 | | | Chevron Corp. | | | 884,718 | | | | 1,074,516 | |
| | 11,341 | | | ConocoPhillips | | | 782,761 | | | | 646,210 | |
| | | | | | | | | | | | |
| | | |
| | | | | | | 1,667,479 | | | | 1,720,726 | |
| | | |
| | | | Entertainment — 1.6% | | | | | | | | |
| | 7,309 | | | The Walt Disney Co. | | | 890,783 | | | | 952,509 | |
| | | | | | | | | | | | |
| | | |
| | | | Financial Services — 5.1% | | | | | | | | |
| | 13,470 | | | American International Group Inc. | | | 697,264 | | | | 750,279 | |
| | 5,662 | | | Assurant Inc. | | | 715,567 | | | | 712,393 | |
| | 4,714 | | | Chubb Ltd. | | | 521,203 | | | | 761,028 | |
| | 14,701 | | | U.S. Bancorp | | | 814,784 | | | | 813,553 | |
| | | | | | | | | | | | |
| | | |
| | | | | | | 2,748,818 | | | | 3,037,253 | |
| | | |
| | | | Food and Beverage — 3.7% | | | | | | | | |
| | 13,341 | | | General Mills Inc. | | | 673,221 | | | | 735,356 | |
| | 17,622 | | | Hormel Foods Corp. | | | 639,407 | | | | 770,610 | |
| | 5,367 | | | PepsiCo Inc. | | | 489,021 | | | | 735,816 | |
| | | | | | | | | | | | |
| | | |
| | | | | | | 1,801,649 | | | | 2,241,782 | |
| | | |
| | | | Health Care — 7.2% | | | | | | | | |
| | 9,100 | | | Abbott Laboratories | | | 342,946 | | | | 761,397 | |
| | 3,570 | | | Becton, Dickinson and Co. | | | 628,159 | | | | 903,067 | |
| | 8,367 | | | Johnson & Johnson | | | 872,925 | | | | 1,082,522 | |
| | 8,404 | | | Medtronic plc | | | 704,329 | | | | 912,842 | |
| | 3,058 | | | UnitedHealth Group Inc. | | | 712,728 | | | | 664,565 | |
| | | | | | | | | | | | |
| | | |
| | | | | | | 3,261,087 | | | | 4,324,393 | |
| | | | | | | | | | | | |
Shares | | | | | Cost | | | Market
Value | |
| | | | Real Estate — 3.0% | | | | | | | | |
| | 2,573 | | | Crown Castle International Corp., REIT | | $ | 288,652 | | | $ | 357,673 | |
| | 2,920 | | | Public Storage, REIT | | | 621,821 | | | | 716,188 | |
| | 19,800 | | | STORE Capital Corp., REIT | | | 710,086 | | | | 740,718 | |
| | | | | | | | | | | | |
| | | |
| | | | | | | 1,620,559 | | | | 1,814,579 | |
| | | |
| | | | Retail — 4.9% | | | | | | | | |
| | 4,399 | | | Advance Auto Parts Inc. | | | 687,926 | | | | 727,595 | |
| | 22,206 | | | CVS Health Corp. | | | 1,642,376 | | | | 1,400,532 | |
| | 3,490 | | | The Home Depot Inc. | | | 491,211 | | | | 809,750 | |
| | | | | | | | | | | | |
| | | |
| | | | | | | 2,821,513 | | | | 2,937,877 | |
| | | |
| | | | Semiconductors — 0.6% | | | | | | | | |
| | 15,232 | | | Marvell Technology Group Ltd. | | | 351,794 | | | | 380,343 | |
| | | | | | | | | | | | |
| | | |
| | | | Telecommunications — 3.3% | | | | | | | | |
| | 32,950 | | | AT&T Inc. | | | 1,289,478 | | | | 1,246,828 | |
| | 4,315 | | | Motorola Solutions Inc. | | | 505,603 | | | | 735,319 | |
| | | | | | | | | | | | |
| | | |
| | | | | | | 1,795,081 | | | | 1,982,147 | |
| | | |
| | | | Transportation — 1.0% | | | | | | | | |
| | 3,755 | | | Union Pacific Corp. | | | 244,004 | | | | 608,235 | |
| | | | | | | | | | | | |
| | | |
| | | | TOTAL COMMON STOCKS | | | 28,368,297 | | | | 35,319,975 | |
| | | | | | | | | | | | |
| | | |
Principal
Amount | | | | | | | | | |
| | | | CORPORATE BONDS — 17.8% | | | | | |
| | | | Aerospace — 1.0% | | | | | |
| | $595,000 | | | Northrop Grumman Corp., | | | | | | | | |
| | | | 2.550%, 10/15/22 | | | 598,387 | | | | 603,172 | |
| | | | | | | | | | | | |
| | | |
| | | | Banking — 2.1% | | | | | | | | |
| | 600,000 | | | The Goldman Sachs Group Inc., MTN, | | | | | | | | |
| | | | 3.850%, 07/08/24 | | | 600,203 | | | | 635,545 | |
| | 600,000 | | | Wells Fargo & Co., MTN, | | | | | | | | |
| | | | 3.500%, 03/08/22 | | | 605,632 | | | | 619,332 | |
| | | | | | | | | | | | |
| | | |
| | | | | | | 1,205,835 | | | | 1,254,877 | |
| |
| | | | Computer Software and Services — 0.5% | |
| | 300,000 | | | Apple Inc., | | | | | | | | |
| | | | 3.450%, 02/09/45 | | | 320,139 | | | | 318,524 | |
| | | | | | | | | | | | |
| | | |
| | | | Consumer Products — 2.2% | | | | | | | | |
| | 500,000 | | | Colgate-Palmolive Co., MTN, | | | | | | | | |
| | | | 2.100%, 05/01/23 | | | 497,603 | | | | 502,819 | |
| | 800,000 | | | Costco Wholesale Corp., | | | | | | | | |
| | | | 1.700%, 12/15/19 | | | 799,599 | | | | 799,491 | |
| | | | | | | | | | | | |
| | | |
| | | | | | | 1,297,202 | | | | 1,302,310 | |
| | | |
| | | | Diversified Industrial — 0.9% | | | | | | | | |
| | 510,000 | | | Cabot Corp., | | | | | | | | |
| | | | 4.000%, 07/01/29 | | | 508,525 | | | | 535,247 | |
| | | | | | | | | | | | |
| | | |
| | | | Financial Services — 5.4% | | | | | | | | |
| | 600,000 | | | Capital One Financial Corp., | | | | | | | | |
| | | | 3.750%, 04/24/24 | | | 605,849 | | | | 630,854 | |
| | 600,000 | | | Ford Motor Credit Co. LLC, | | | | | | | | |
| | | | 3.470%, 04/05/21 | | | 603,876 | | | | 603,187 | |
| | 525,000 | | | KKR Group Finance Co. VI LLC, | | | | | | | | |
| | | | 3.750%, 07/01/29 | | | 523,555 | | | | 553,946 | |
| | 800,000 | | | Morgan Stanley, | | | | | | | | |
| | | | 3.591%, (3 Month USD LIBOR plus 1.34%) 07/22/28(a) | | | 852,477 | | | | 844,001 | |
See accompanying notes to financial statements.
28
TETON Westwood Balanced Fund
Schedule of Investments (Continued) — September 30, 2019
| | | | | | | | | | | | |
Principal
Amount | | | | | Cost | | | Market
Value | |
| | | | CORPORATE BONDS (Continued) | |
| | | | Financial Services (Continued) | |
| | $600,000 | | | The PNC Financial Services Group Inc., STEP, | | | | | | | | |
| | | | 2.854%, 11/09/22 | | $ | 595,372 | | | $ | 613,202 | |
| | | | | | | | | | | | |
| | | |
| | | | | | | 3,181,129 | | | | 3,245,190 | |
| |
| | | | Health Care — 3.2% | |
| | 500,000 | | | Abbott Laboratories, | |
| | | | 2.550%, 03/15/22 | | | 497,064 | | | | 505,393 | |
| | 600,000 | | | Aetna Inc., | |
| | | | 3.500%, 11/15/24 | | | 600,620 | | | | 625,566 | |
| | 800,000 | | | CVS Health Corp., | |
| | | | 3.250%, 08/15/29 | | | 813,061 | | | | 805,323 | |
| | | | | | | | | | | | |
| | | |
| | | | | | | 1,910,745 | | | | 1,936,282 | |
| |
| | | | Retail — 1.0% | |
| | 600,000 | | | Macy’s Retail Holdings Inc., | |
| | | | 3.450%, 01/15/21 | | | 604,909 | | | | 604,726 | |
| | | | | | | | | | | | |
| |
| | | | Transportation — 1.5% | |
| | 875,000 | | | AP Moller - Maersk A/S, | |
| | | | 4.500%, 06/20/29 | | | 869,766 | | | | 925,690 | |
| | | | | | | | | | | | |
| | | |
| | | | TOTAL CORPORATE BONDS | | | 10,496,637 | | | | 10,726,018 | |
| | | | | | | | | | | | |
| |
| | | | U.S. GOVERNMENT AGENCY
OBLIGATIONS — 3.8% | |
| |
| | | | Federal Home Loan Mortgage Corp. — 1.9% | |
| | 1,100,000 | | | 2.375%, 01/13/22 | | | 1,103,744 | | | | 1,117,186 | |
| | | | | | | | | | | | |
| | | | Federal National Mortgage Association — 1.9% | |
| | 1,100,000 | | | 2.625%, 09/06/24 | | | 1,126,714 | | | | 1,153,009 | |
| | | | | | | | | | | | |
| | | |
| | | | TOTAL U.S. GOVERNMENT AGENCY OBLIGATIONS | | | 2,230,458 | | | | 2,270,195 | |
| | | | | | | | | | | | |
| |
| | | | U. S. GOVERNMENT OBLIGATIONS — 16.6% | |
| | | | U. S. Treasury Bonds — 3.7% | |
| | 1,100,000 | | | 2.500%, 02/15/45 | | | 990,991 | | | | 1,183,939 | |
| | 1,000,000 | | | 2.500%, 05/15/46 | | | 981,893 | | | | 1,077,226 | |
| | | | | | | | | | | | |
| | | |
| | | | | | | 1,972,884 | | | | 2,261,165 | |
| | | | | | | | | | | | |
Principal
Amount | | | | | Cost | | | Market
Value | |
| |
| | | | U.S. Treasury Inflation Indexed Notes — 2.0% | |
| | $1,117,721 | | | 0.875%, 01/15/29 | | $ | 1,160,364 | | | $ | 1,186,209 | |
| | | | | | | | | | | | |
| | |
| | | | U.S. Treasury Notes — 10.9% | | | | | |
| | 1,000,000 | | | 2.250%, 11/15/24 | | | 1,021,516 | | | | 1,032,969 | |
| | 500,000 | | | 2.000%, 02/15/25 | | | 497,768 | | | | 510,664 | |
| | 800,000 | | | 1.625%, 02/15/26 | | | 802,480 | | | | 800,453 | |
| | 950,000 | | | 2.250%, 08/15/27 | | | 903,345 | | | | 993,344 | |
| | 950,000 | | | 2.250%, 11/15/27 | | | 901,880 | | | | 993,937 | |
| | 1,100,000 | | | 2.625%, 02/15/29 | | | 1,129,003 | | | | 1,190,728 | |
| | 1,000,000 | | | 2.250%, 08/15/46 | | | 1,060,505 | | | | 1,025,723 | |
| | | | | | | | | | | | |
| | | |
| | | | | | | 6,316,497 | | | | 6,547,818 | |
| | | | TOTAL U.S. GOVERNMENT OBLIGATIONS | | | 9,449,745 | | | | 9,995,192 | |
| | | | | | | | | | | | |
| | | |
Shares | | | | | | | | | |
| | | | SHORT TERM INVESTMENT — 3.3% | |
| | | | Other Investment Companies — 3.3% | |
| | 1,978,447 | | | Dreyfus Treasury Securities Cash Management, 1.830%* | | | 1,978,447 | | | | 1,978,447 | |
| | | | | | | | | | | | |
| | | |
| | | | TOTAL
INVESTMENTS — 100.3% | | $ | 52,523,584 | | | | 60,289,827 | |
| | | | | | | | | | | | |
| | |
| | | | Other Assets and
Liabilities (Net) — (0.3)% | | | | (169,540 | ) |
| | | | | | | | | | | | |
| | | |
| | | | NET ASSETS — 100.0% | | | | | | $ | 60,120,287 | |
| | | | | | | | | | | | |
| * | 1 day yield as of September 30, 2019. |
| (a) | The interest rates for these floating rate notes, which will change periodically, are based either on the prime rate or an index of market rates. The reflected rates are in effect as of September 30, 2019. The maturity dates reflected are the final maturity dates. |
| † | Non-income producing security. |
| REIT | Real Estate Investment Trust |
| STEP | Step coupon security. The rate disclosed is that in effect at September 30, 2019. |
See accompanying notes to financial statements.
29
TETON Westwood Intermediate Bond Fund
Schedule of Investments — September 30, 2019
| | | | | | | | | | | | |
Principal
Amount | | | | | Cost | | | Market
Value | |
| | | | CORPORATE BONDS — 85.9% | | | | | |
| | | | Aerospace — 1.0% | | | | | | | | |
| | $ 50,000 | | | Arconic Inc., | | | | | | | | |
| | | | 5.400%, 04/15/21 | | $ | 51,597 | | | $ | 51,744 | |
| | | | | | | | | | | | |
| | | |
| | | | Agriculture — 2.9% | | | | | | | | |
| | 140,000 | | | Bunge Ltd Finance Corp., | | | | | | | | |
| | | | 4.350%, 03/15/24 | | | 138,553 | | | | 147,563 | |
| | | | | | | | | | | | |
| |
| | | | Automotive: Parts and Accessories — 1.0% | |
| | 50,000 | | | Lear Corp., | | | | | | | | |
| | | | 5.250%, 01/15/25 | | | 51,681 | | | | 51,650 | |
| | | | | | | | | | | | |
| | | |
| | | | Banking — 2.0% | | | | | | | | |
| | 50,000 | | | JPMorgan Chase & Co., | | | | | | | | |
| | | | 3.207%, (3 Month USD LIBOR plus 0.70%) 04/01/23(a) | | | 50,057 | | | | 51,242 | |
| | | | 3.513%, (3 Month USD LIBOR plus 1.23%) 10/24/23(a) | | | 50,000 | | | | 50,825 | |
| | | | | | | | | | | | |
| | | |
| | | | | | | 100,057 | | | | 102,067 | |
| | | |
| | | | Business Services — 1.0% | | | | | | | | |
| | 50,000 | | | Aramark Services Inc., | | | | | | | | |
| | | | 4.750%, 06/01/26 | | | 51,369 | | | | 51,500 | |
| | | | | | | | | | | | |
| | | |
| | | | Computer Hardware — 2.1% | | | | | | | | |
| | 100,000 | | | Seagate HDD Cayman, | | | | | | | | |
| | | | 4.750%, 06/01/23 | | | 104,321 | | | | 104,667 | |
| | | | | | | | | | | | |
| | |
| | | | Diversified Industrial — 10.2% | | | | | |
| | 50,000 | | | Church & Dwight Co. Inc., | | | | | | | | |
| | | | 2.450%, 08/01/22 | | | 49,256 | | | | 50,167 | |
| | 75,000 | | | CNH Industrial Capital LLC, | | | | | | | | |
| | | | 3.875%, 10/15/21 | | | 77,135 | | | | 77,131 | |
| | 75,000 | | | Flowserve Corp., | | | | | | | | |
| | | | 4.000%, 11/15/23 | | | 77,617 | | | | 77,419 | |
| | 50,000 | | | Stericycle Inc., | | | | | | | | |
| | | | 5.375%, 07/15/24 | | | 52,386 | | | | 51,500 | |
| | 75,000 | | | Trinity Industries Inc., | | | | | | | | |
| | | | 4.550%, 10/01/24 | | | 76,261 | | | | 76,511 | |
| | 125,000 | | | United Rentals North America Inc., | | | | | | | | |
| | | | 4.625%, 07/15/23 | | | 127,032 | | | | 128,231 | |
| | 50,000 | | | Wabtec Corp., | | | | | | | | |
| | | | 4.375%, 08/15/23 | | | 50,545 | | | | 52,559 | |
| | | | | | | | | | | | |
| | | |
| | | | | | | 510,232 | | | | 513,518 | |
| | | |
| | | | Energy — 13.0% | | | | | | | | |
| | 75,000 | | | Energy Transfer Operating LP, | | | | | | | | |
| | | | 4.250%, 03/15/23 | | | 78,671 | | | | 78,416 | |
| | 50,000 | | | EQM Midstream Partners LP, | | | | | | | | |
| | | | 4.750%, 07/15/23 | | | 50,383 | | | | 50,186 | |
| | 40,000 | | | Kinder Morgan Energy Partners LP, | | | | | | | | |
| | | | 5.300%, 09/15/20 | | | 40,841 | | | | 41,151 | |
| | 250,000 | | | MPLX LP, | | | | | | | | |
| | | | 6.250%, 10/15/22 | | | 254,059 | | | | 256,435 | |
| | 75,000 | | | NRG Energy Inc., | | | | | | | | |
| | | | 3.750%, 06/15/24 | | | 77,406 | | | | 77,241 | |
| | 75,000 | | | Plains All American Pipeline LP/PAA Finance Corp., | | | | | | | | |
| | | | 3.650%, 06/01/22 | | | 74,922 | | | | 76,951 | |
| | 75,000 | | | Western Midstream Operating LP, | | | | | | | | |
| | | | 5.375%, 06/01/21 | | | 76,934 | | | | 77,148 | |
| | | | | | | | | | | | |
| | | |
| | | | | | | 653,216 | | | | 657,528 | |
| | | | | | | | | | | | |
Principal
Amount | | | | | Cost | | | Market
Value | |
| | | | Financial Services — 20.4% | | | | | |
| | $ 50,000 | | | Ally Financial Inc., | | | | | | | | |
| | | | 4.125%, 03/30/20 | | $ | 50,361 | | | $ | 50,437 | |
| | 200,000 | | | Capital One Financial Corp., | | | | | | | | |
| | | | 3.750%, 04/24/24 | | | 201,949 | | | | 210,285 | |
| | 75,000 | | | CyrusOne LP / CyrusOne Finance Corp., | |
| | | | 5.000%, 03/15/24 | | | 76,768 | | | | 77,813 | |
| | 75,000 | | | Equinix Inc., | | | | | | | | |
| | | | 5.750%, 01/01/25 | | | 77,488 | | | | 78,238 | |
| | 125,000 | | | Ford Motor Credit Co. LLC, | | | | | | | | |
| | | | 3.157%, 08/04/20 | | | 124,455 | | | | 125,331 | |
| | | | 3.200%, 01/15/21 | | | 75,000 | | | | 75,121 | |
| | 125,000 | | | General Motors Financial Co. Inc., | | | | | | | | |
| | | | 3.700%, 11/24/20 | | | 125,594 | | | | 126,594 | |
| | | | 3.414%, (3 Month USD LIBOR plus 1.31%) 06/30/22(a) | | | 75,276 | | | | 75,067 | |
| | 75,000 | | | Jefferies Financial Group Inc., | | | | | | | | |
| | | | 5.500%, 10/18/23 | | | 77,846 | | | | 81,434 | |
| | 125,000 | | | MPT Operating Partnership LP /MPT Finance Corp., | | | | | | | | |
| | | | 6.375%, 03/01/24 | | | 129,826 | | | | 131,193 | |
| | | | | | | | | | | | |
| | | |
| | | | | | | 1,014,563 | | | | 1,031,513 | |
| | |
| | | | Food and Beverage — 6.2% | | | | | |
| | 100,000 | | | Anheuser-Busch InBev Finance Inc., | | | | | | | | |
| | | | 3.700%, 02/01/24 | | | 102,298 | | | | 106,842 | |
| | 50,000 | | | Conagra Brands Inc., | | | | | | | | |
| | | | 3.250%, 09/15/22 | | | 50,957 | | | | 51,193 | |
| | 50,000 | | | Lamb Weston Holdings Inc., | | | | | | | | |
| | | | 4.625%, 11/01/24 | | | 52,605 | | | | 52,870 | |
| | 100,000 | | | Mondelēz International Inc., | | | | | | | | |
| | | | 5.375%, 02/10/20 | | | 100,081 | | | | 101,107 | |
| | | | | | | | | | | | |
| | | |
| | | | | | | 305,941 | | | | 312,012 | |
| | | |
| | | | Health Care — 6.3% | | | | | | | | |
| | 75,000 | | | Bausch Health Cos. Inc., | | | | | | | | |
| | | | 7.000%, 03/15/24 | | | 79,019 | | | | 79,010 | |
| | 75,000 | | | Becton Dickinson and Co., | | | | | | | | |
| | | | 3.363%, 06/06/24 | | | 74,407 | | | | 78,282 | |
| | 100,000 | | | HCA Inc., | | | | | | | | |
| | | | 5.000%, 03/15/24 | | | 103,145 | | | | 109,304 | |
| | 50,000 | | | Tenet Healthcare Corp., | | | | | | | | |
| | | | 4.625%, 07/15/24 | | | 51,419 | | | | 51,574 | |
| | | | | | | | | | | | |
| | | |
| | | | | | | 307,990 | | | | 318,170 | |
| | | |
| | | | Metals and Mining — 2.1% | | | | | | | | |
| | 100,000 | | | Kinross Gold Corp., | | | | | | | | |
| | | | 5.125%, 09/01/21 | | | 102,283 | | | | 104,000 | |
| | | | | | | | | | | | |
| | | |
| | | | Real Estate — 4.6% | | | | | | | | |
| | 150,000 | | | Service Properties Trust, | | | | | | | | |
| | | | 4.350%, 10/01/24 | | | 149,824 | | | | 151,947 | |
| | 75,000 | | | Vornado Realty LP, | | | | | | | | |
| | | | 3.500%, 01/15/25 | | | 77,497 | | | | 77,485 | |
| | | | | | | | | | | | |
| | | |
| | | | | | | 227,321 | | | | 229,432 | |
| | | |
| | | | Retail — 1.0% | | | | | | | | |
| | 50,000 | | | Macy’s Retail Holdings Inc., | | | | | | | | |
| | | | 2.875%, 02/15/23 | | | 49,148 | | | | 49,461 | |
| | | | | | | | | | | | |
See accompanying notes to financial statements.
30
TETON Westwood Intermediate Bond Fund
Schedule of Investments (Continued) — September 30, 2019
| | | | | | | | | | | | |
Principal
Amount | | | | | Cost | | | Market
Value | |
| | | | CORPORATE BONDS (Continued) | |
| | | | Specialty Chemicals — 4.8% | | | | | | | | |
| | $ 35,000 | | | Celanese US Holdings LLC, | | | | | | | | |
| | | | 5.875%, 06/15/21 | | $ | 36,586 | | | $ | 36,962 | |
| | 75,000 | | | Huntsman International LLC, | | | | | | | | |
| | | | 5.125%, 11/15/22 | | | 78,003 | | | | 80,015 | |
| | 75,000 | | | Methanex Corp., | | | | | | | | |
| | | | 5.250%, 03/01/22 | | | 76,604 | | | | 77,968 | |
| | 50,000 | | | The Chemours Co., | | | | | | | | |
| | | | 6.625%, 05/15/23 | | | 51,090 | | | | 49,563 | |
| | | | | | | | | | | | |
| | | |
| | | | | | | 242,283 | | | | 244,508 | |
| | | |
| | | | Telecommunications — 7.3% | | | | | | | | |
| | 100,000 | | | AT&T Inc., | | | | | | | | |
| | | | 3.900%, 03/11/24 | | | 101,794 | | | | 106,104 | |
| | 75,000 | | | Charter Communications Operating LLC/Charter Communications Operating Capital, | | | | | | | | |
| | | | 4.464%, 07/23/22 | | | 76,821 | | | | 78,987 | |
| | 75,000 | | | Equinix Inc., | | | | | | | | |
| | | | 5.375%, 05/15/27 | | | 81,074 | | | | 81,047 | |
| | 50,000 | | | Level 3 Financing Inc., | | | | | | | | |
| | | | 5.375%, 01/15/24 | | | 50,906 | | | | 51,117 | |
| | 50,000 | | | T-Mobile USA Inc., | | | | | | | | |
| | | | 4.000%, 04/15/22 | | | 51,538 | | | | 51,375 | |
| | | | | | | | | | | | |
| | | |
| | | | | | | 362,133 | | | | 368,630 | |
| | | |
| | | | TOTAL CORPORATE BONDS | | | 4,272,688 | | | | 4,337,963 | |
| | | | CONVERTIBLE CORPORATE BONDS —1.8% | |
| | | | Business Services — 0.9% | | | | | | | | |
| | 50,000 | | | Macquarie Infrastructure Corp., | | | | | | | | |
| | | | 2.000%, 10/01/23 | | | 45,722 | | | | 45,750 | |
| | | | | | | | | | | | |
| | | |
| | | | Computer Hardware — 0.9% | | | | | | | | |
| | 50,000 | | | Western Digital Corp., | | | | | | | | |
| | | | 1.500%, 02/01/24 | | | 44,618 | | | | 48,125 | |
| | | | | | | | | | | | |
| | | |
| | | | TOTAL CONVERTIBLE CORPORATE BONDS | | | 90,340 | | | | 93,875 | |
| | | | | | | | | | | | |
| | | | | | | | | | | | |
Principal
Amount | | | | | Cost | | | Market
Value | |
| | | | U.S. GOVERNMENT AGENCY OBLIGATIONS — 0.3% | |
| | | | Government National Mortgage Association — 0.3% | |
| | $ 3,305 | | | 6.000%, 12/15/33 | | $ | 3,323 | | | $ | 3,792 | |
| | 10,678 | | | 5.500%, 01/15/34 | | | 10,719 | | | | 12,113 | |
| | | | | | | | | | | | |
| | | |
| | | | | | | 14,042 | | | | 15,905 | |
| | | |
| | | | TOTAL U.S. GOVERNMENT AGENCY OBLIGATIONS | | | 14,042 | | | | 15,905 | |
| | | | | | | | | | | | |
| |
| | | | U. S. GOVERNMENT OBLIGATIONS — 12.2% | |
| | | | U. S. Treasury Notes — 8.1% | | | | | | | | |
| | 150,000 | | | 2.625%, 06/15/21 | | | 149,875 | | | | 152,323 | |
| | 250,000 | | | 2.000%, 02/15/25 | | | 249,280 | | | | 255,332 | |
| | | | | | | | | | | | |
| | | |
| | | | | | | 399,155 | | | | 407,655 | |
| | | |
| | | | U.S. Treasury Bonds — 4.1% | | | | | | | | |
| | 150,000 | | | 5.375%, 02/15/31 | | | 161,695 | | | | 206,851 | |
| | | | | | | | | | | | |
| | | |
| | | | TOTAL U.S. GOVERNMENT OBLIGATIONS | | | 560,850 | | | | 614,506 | |
| | | | | | | | | | | | |
| | | |
| | | | TOTAL INVESTMENTS — 100.2% | | $ | 4,937,920 | | | | 5,062,249 | |
| | | | | | | | | | | | |
| | |
| | | | Other Assets and Liabilities (Net) — (0.2)% | | | | (12,354 | ) |
| | | | | | | | | | | | |
| | | |
| | | | NET ASSETS — 100.0% | | | | | | $ | 5,049,895 | |
| | | | | | | | | | | | |
| (a) | The interest rates for these floating rate notes, which will change periodically, are based either on the prime rate or an index of market rates. The reflected rates are in effect as of September 30, 2019. The maturity dates reflected are the final maturity dates. |
See accompanying notes to financial statements.
31
TETON Westwood Funds
Statements of Assets and Liabilities
September 30, 2019
| | | | | | | | | | | | | | | | | | | | | | | | |
| | | | | | | | | | | | | | | | | | | Convertible | |
| | | Mighty | | | | | | | | SmallCap | | | | | | | | Securities | |
| | | Mites Fund | | | | | | | | Equity Fund | | | | | | | | Fund | |
Assets: | | | | | | | | | | | | | | | | | | | | | | | | |
Investments, at value (cost $564,529,482, $34,372,064, and $48,048,276, respectively) | | | $917,995,251 | | | | | | | | | | $40,914,224 | | | | | | | | | | $51,365,573 | |
Investments in affiliates, at value (cost $36,681,983) | | | 48,626,986 | | | | | | | | | | — | | | | | | | | | | — | |
Foreign currency, at value (cost $2,604) | | | 2,590 | | | | | | | | | | — | | | | | | | | | | — | |
Cash | | | 2,659 | | | | | | | | | | 96,481 | | | | | | | | | | — | |
Receivable for Fund shares sold | | | 275,417 | | | | | | | | | | 11,410 | | | | | | | | | | 93,026 | |
Receivable for investments sold | | | 1,110,038 | | | | | | | | | | — | | | | | | | | | | — | |
Receivable from Adviser | | | — | | | | | | | | | | 1,103 | | | | | | | | | | 18,934 | |
Dividends and interest receivable - unaffiliated | | | 622,343 | | | | | | | | | | 23,425 | | | | | | | | | | 231,643 | |
Dividends and interest receivable - affiliated | | | 45,100 | | | | | | | | | | — | | | | | | | | | | — | |
Prepaid expenses | | | 33,162 | | | | | | | | | | 24,805 | | | | | | | | | | 30,060 | |
Total Assets | | | 968,713,546 | | | | | | | | | | 41,071,448 | | | | | | | | | | 51,739,236 | |
Liabilities: | | | | | | | | | | | | | | | | | | | | | | | | |
Payable to custodian | | | — | | | | | | | | | | — | | | | | | | | | | 1,004,611 | |
Payable for investments purchased | | | 34,960 | | | | | | | | | | 2,226,245 | | | | | | | | | | — | |
Payable for Fund shares redeemed | | | 1,611,458 | | | | | | | | | | 86,645 | | | | | | | | | | 7,003 | |
Payable for investment advisory fees | | | 798,529 | | | | | | | | | | 31,941 | | | | | | | | | | 40,965 | |
Payable for distribution fees. | | | 154,550 | | | | | | | | | | 6,044 | | | | | | | | | | 6,288 | |
Payable for accounting fees | | | 7,500 | | | | | | | | | | — | | | | | | | | | | — | |
Payable for custodian fees | | | 76,269 | | | | | | | | | | 3,605 | | | | | | | | | | 3,748 | |
Payable for legal and audit fees | | | 50,644 | | | | | | | | | | 31,318 | | | | | | | | | | 23,742 | |
Payable for shareholder communications expenses | | | 101,785 | | | | | | | | | | 8,772 | | | | | | | | | | 7,738 | |
Payable for shareholder services fees | | | 154,282 | | | | | | | | | | 4,469 | | | | | | | | | | 4,292 | |
Other accrued expenses | | | 7,924 | | | | | | | | | | 3,568 | | | | | | | | | | 3,502 | |
Total Liabilities | | | 2,997,901 | | | | | | | | | | 2,402,607 | | | | | | | | | | 1,101,889 | |
Net Assets | | | $965,715,645 | | | | | | | | | | $38,668,841 | | | | | | | | | | $50,637,347 | |
Net Assets Consist of: | | | | | | | | | | | | | | | | | | | | | | | | |
Paid-in capital | | | $573,346,323 | | | | | | | | | | $31,886,737 | | | | | | | | | | $47,059,341 | |
Total distributable earnings | | | 392,369,322 | | | | | | | | | | 6,782,104 | | | | | | | | | | 3,578,006 | |
Net Assets | | | $965,715,645 | | | | | | | | | | $38,668,841 | | | | | | | | | | $50,637,347 | |
Shares of Beneficial Interest, each at $0.001 par value; unlimited number of shares authorized: | | | | | | | | | | | | | | | | | | | | | | | | |
Class AAA: | | | | | | | | | | | | | | | | | | | | | | | | |
Net assets | | | $156,266,489 | | | | | | | | | | $7,757,876 | | | | | | | | | | $5,167,758 | |
Shares of beneficial interest outstanding | | | 6,109,031 | | | | | | | | | | 431,603 | | | | | | | | | | 372,827 | |
Net Asset Value,offering, and redemption price per share | | | $25.58 | | | | | | | | | | $17.97 | | | | | | | | | | $13.86 | |
Class A: | | | | | | | | | | | | | | | | | | | | | | | | |
Net assets | | | $75,976,896 | | | | | | | | | | $4,439,648 | | | | | | | | | | $4,821,137 | |
Shares of beneficial interest outstanding | | | 3,102,230 | | | | | | | | | | 261,501 | | | | | | | | | | 336,511 | |
Net Asset Valueand redemption price per share | | | $24.49 | | | | | | | | | | $16.98 | | | | | | | | | | $14.33 | |
Maximum offering price per share (NAV ÷ 0.96, based on maximum sales charge of 4.00% of the offering price) | | | $25.51 | | | | | | | | | | $17.69 | | | | | | | | | | $14.93 | |
Class C: | | | | | | | | | | | | | | | | | | | | | | | | |
Net assets | | | $108,356,182 | | | | | | | | | | $3,163,960 | | | | | | | | | | $4,245,827 | |
Shares of beneficial interest outstanding | | | 5,102,477 | | | | | | | | | | 221,591 | | | | | | | | | | 277,465 | |
Net Asset Valueand offering price per share(a) | | | $21.24 | | | | | | | | | | $14.28 | | | | | | | | | | $15.30 | |
Class I: | | | | | | | | | | | | | | | | | | | | | | | | |
Net assets | | | $625,116,078 | | | | | | | | | | $23,307,357 | | | | | | | | | | $36,402,625 | |
Shares of beneficial interest outstanding | | | 23,775,666 | | | | | | | | | | 1,243,688 | | | | | | | | | | 2,617,305 | |
Net Asset Value,offering, and redemption price per share | | | $26.29 | | | | | | | | | | $18.74 | | | | | | | | | | $13.91 | |
| | | | | | | | | | | | | | | | | | | | | | | | |
| (a) | Redemption price varies based on the length of time held. |
See accompanying notes to financial statements.
32
TETON Westwood Funds
Statements of Assets and Liabilities (Continued)
September 30, 2019
| | | | | | | | | | | | | | | | | | | | | | | | | | | | |
| | | | | | | | | | | | Balanced | | | | | | | | | Intermediate | |
| | | Equity Fund | | | | | | | | | Fund | | | | | | | | | Bond Fund | |
Assets: | | | | | | | | | | | | | | | | | | | | | | | | | | | | |
Investments, at value (cost $45,834,306, $52,523,584, and $ 4,937,920, respectively) | | | $56,108,859 | | | | | | | | | | | | $60,289,827 | | | | | | | | | | | | $5,062,249 | |
Investments in affiliates, at value | | | — | | | | | | | | | | | | — | | | | | | | | | | | | — | |
Cash | | | — | | | | | | | | | | | | — | | | | | | | | | | | | — | |
Receivable for Fund shares sold | | | 1,216 | | | | | | | | | | | | 7,404 | | | | | | | | | | | | 642 | |
Receivable for investments sold | | | 623,826 | | | | | | | | | | | | 365,069 | | | | | | | | | | | | — | |
Receivable from Adviser | | | — | | | | | | | | | | | | — | | | | | | | | | | | | 7,547 | |
Dividends and interest receivable - unaffiliated | | | 48,962 | | | | | | | | | | | | 177,246 | | | | | | | | | | | | 48,981 | |
Dividends and interest receivable - affiliated | | | — | | | | | | | | | | | | — | | | | | | | | | | | | — | |
Prepaid expenses | | | 22,089 | | | | | | | | | | | | 27,451 | | | | | | | | | | | | 18,478 | |
Total Assets | | | 56,804,952 | | | | | | | | | | | | 60,866,997 | | | | | | | | | | | | 5,137,897 | |
Liabilities: | | | | | | | | | | | | | | | | | | | | | | | | | | | | |
Payable to custodian | | | — | | | | | | | | | | | | — | | | | | | | | | | | | 41,880 | |
Payable for investments purchased | | | 405,150 | | | | | | | | | | | | 628,743 | | | | | | | | | | | | — | |
Payable for Fund shares redeemed | | | 10,295 | | | | | | | | | | | | 7,372 | | | | | | | | | | | | 923 | |
Payable for investment advisory fees | | | 46,270 | | | | | | | | | | | | 36,867 | | | | | | | | | | | | 3,037 | |
Payable for distribution fees | | | 11,085 | | | | | | | | | | | | 14,825 | | | | | | | | | | | | 1,347 | |
Payable for accounting fees | | | 7,500 | | | | | | | | | | | | 7,500 | | | | | | | | | | | | — | |
Payable for custodian fees | | | 5,144 | | | | | | | | | | | | 5,585 | | | | | | | | | | | | 2,116 | |
Payable for legal and audit fees | | | 24,278 | | | | | | | | | | | | 24,307 | | | | | | | | | | | | 25,749 | |
Payable for shareholder communications expenses | | | 9,478 | | | | | | | | | | | | 9,999 | | | | | | | | | | | | 6,215 | |
Payable for shareholder services fees | | | 8,886 | | | | | | | | | | | | 7,847 | | | | | | | | | | | | 3,082 | |
Other accrued expenses | | | 3,588 | | | | | | | | | | | | 3,665 | | | | | | | | | | | | 3,653 | |
Total Liabilities | | | 531,674 | | | | | | | | | | | | 746,710 | | | | | | | | | | | | 88,002 | |
Net Assets | | | $56,273,278 | | | | | | | | | | | | $60,120,287 | | | | | | | | | | | | $5,049,895 | |
Net Assets Consist of: | | | | | | | | | | | | | | | | | | | | | | | | | | | | |
Paid-in capital | | | $41,090,448 | | | | | | | | | | | | $48,623,390 | | | | | | | | | | | | $4,991,931 | |
Total distributable earnings | | | 15,182,830 | | | | | | | | | | | | 11,496,897 | | | | | | | | | | | | 57,964 | |
Net Assets | | | $56,273,278 | | | | | | | | | | | | $60,120,287 | | | | | | | | | | | | $5,049,895 | |
Shares of Beneficial Interest, each at $0.001 par value; unlimited number of shares authorized: | | | | | | | | | | | | | | | | | | | | | | | | | | | | |
Class AAA: | | | | | | | | | | | | | | | | | | | | | | | | | | | | |
Net assets | | | $50,848,623 | | | | | | | | | | | | $44,637,669 | | | | | | | | | | | | $3,106,060 | |
Shares of beneficial interest outstanding | | | 4,015,775 | | | | | | | | | | | | 3,812,379 | | | | | | | | | | | | 278,912 | |
Net Asset Value,offering, and redemption price per share | | | $12.66 | | | | | | | | | | | | $11.71 | | | | | | | | | | | | $11.14 | |
Class A: | | | | | | | | | | | | | | | | | | | | | | | | | | | | |
Net assets | | | $1,366,333 | | | | | | | | | | | | $9,552,681 | | | | | | | | | | | | $932,285 | |
Shares of beneficial interest outstanding | | | 108,178 | | | | | | | | | | | | 810,519 | | | | | | | | | | | | 83,789 | |
Net Asset Valueand redemption price per share. | | | $12.63 | | | | | | | | | | | | $11.79 | | | | | | | | | | | | $11.13 | |
Maximum offering price per share (NAV ÷ 0.96, based on maximum sales charge of 4.00% of the offering price) | | | $13.16 | | | | | | | | | | | | $12.28 | | | | | | | | | | | | $11.59 | |
Class C: | | | | | | | | | | | | | | | | | | | | | | | | | | | | |
Net assets | | | $104,282 | | | | | | | | | | | | $2,195,603 | | | | | | | | | | | | $550,060 | |
Shares of beneficial interest outstanding | | | 8,865 | | | | | | | | | | | | 182,855 | | | | | | | | | | | | 52,096 | |
Net Asset Valueand offering price per share(a) | | | $11.76 | | | | | | | | | | | | $12.01 | | | | | | | | | | | | $10.56 | |
Class I: | | | | | | | | | | | | | | | | | | | | | | | | | | | | |
Net assets | | | $3,954,040 | | | | | | | | | | | | $3,734,334 | | | | | | | | | | | | $461,490 | |
Shares of beneficial interest outstanding | | | 313,199 | | | | | | | | | | | | 319,445 | | | | | | | | | | | | 41,409 | |
Net Asset Value,offering, and redemption price per share | | | $12.62 | | | | | | | | | | | | $11.69 | | | | | | | | | | | | $11.14 | |
| (a) | Redemption price varies based on the length of time held. |
See accompanying notes to financial statements.
33
TETON Westwood Funds
Statements of Operations
For the Year Ended September 30, 2019
| | | | | | | | | | | | | | | | | | | | | | | | |
| | | | | | | | | | | | | | | | | | | Convertible | |
| | | Mighty | | | | | | | | SmallCap | | | | | | | | Securities | |
| | | Mites Fund | | | | | | | | Equity Fund | | | | | | | | Fund | |
Investment Income: | | | | | | | | | | | | | | | | | | | | | | | | |
Dividends - unaffiliated (net of foreign withholding taxes of $97,219, $2,257,and $0, respectively) | | | $ 10,774,692 | | | | | | | | | | $ 592,509 | | | | | | | | | | $ 430,094 | |
Dividends - affiliated | | | 1,060,364 | | | | | | | | | | — | | | | | | | | | | — | |
Interest | | | 2,877,362 | | | | | | | | | | 45,519 | | | | | | | | | | 359,347 | |
Total Investment Income | | | 14,712,418 | | | | | | | | | | 638,028 | | | | | | | | | | 789,441 | |
Expenses: | | | | | | | | | | | | | | | | | | | | | | | | |
Investment advisory fees | | | 11,285,565 | | | | | | | | | | 400,003 | | | | | | | | | | 359,124 | |
Distribution fees - Class AAA | | | 447,901 | | | | | | | | | | 20,265 | | | | | | | | | | 11,407 | |
Distribution fees - Class A | | | 443,512 | | | | | | | | | | 21,795 | | | | | | | | | | 20,007 | |
Distribution fees - Class C | | | 1,302,254 | | | | | | | | | | 30,662 | | | | | | | | | | 32,649 | |
Accounting fees | | | 45,000 | | | | | | | | | | — | | | | | | | | | | — | |
Custodian fees | | | 184,215 | | | | | | | | | | 11,755 | | | | | | | | | | 10,065 | |
Interest expense | | | 77 | | | | | | | | | | 131 | | | | | | | | | | 110 | |
Legal and audit fees | | | 67,400 | | | | | | | | | | 32,580 | | | | | | | | | | 25,164 | |
Registration expenses | | | 77,580 | | | | | | | | | | 57,133 | | | | | | | | | | 56,872 | |
Shareholder communications expenses | | | 275,243 | | | | | | | | | | 25,565 | | | | | | | | | | 23,341 | |
Shareholder services fees | | | 1,011,772 | | | | | | | | | | 15,206 | | | | | | | | | | 17,576 | |
Trustees’ fees | | | 129,162 | | | | | | | | | | 4,333 | | | | | | | | | | 3,579 | |
Miscellaneous expenses | | | 43,285 | | | | | | | | | | 11,090 | | | | | | | | | | 12,271 | |
Total Expenses | | | 15,312,966 | | | | | | | | | | 630,518 | | | | | | | | | | 572,165 | |
Less: | | | | | | | | | | | | | | | | | | | | | | | | |
Fees waived or expenses reimbursed by Adviser (See Note 3) | | | — | | | | | | | | | | (155,872 | ) | | | | | | | | | (183,238 | ) |
Advisory fee reduction on unsupervised assets (See Note 3) | | | (60,653 | ) | | | | | | | | | — | | | | | | | | | | — | |
Custodian fee credits | | | (2,660 | ) | | | | | | | | | (330 | ) | | | | | | | | | (447 | ) |
Expenses paid by broker (See Note 6) | | | (4,446 | ) | | | | | | | | | (1,461 | ) | | | | | | | | | (1,094) | |
Total Reimbursements, Waivers, Reductions, and Credits | | | (67,759 | ) | | | | | | | | | (157,663 | ) | | | | | | | | | (184,779 | ) |
Net Expenses. | | | 15,245,207 | | | | | | | | | | 472,855 | | | | | | | | | | 387,386 | |
Net Investment Income/(Loss) | | | (532,789 | ) | | | | | | | | | 165,173 | | | | | | | | | | 402,055 | |
Net Realized and Unrealized Gain/(Loss) on Investments and Foreign Currency: | | | | | | | | | | | | | | | | | | | | | | | | |
Net realized gain on investments - unaffiliated | | | 36,131,567 | | | | | | | | | | 1,189,102 | | | | | | | | | | 800,895 | |
Net realized loss on investments - affiliated | | | (223,106 | ) | | | | | | | | | — | | | | | | | | | | — | |
Net realized gain/(loss) on foreign currency transactions | | | 3,770 | | | | | | | | | | (24 | ) | | | | | | | | | — | |
Net realized gain on investments and foreign currency transactions | | | 35,912,231 | | | | | | | | | | 1,189,078 | | | | | | | | | | 800,895 | |
Net change in unrealized appreciation/depreciation: | | | | | | | | | | | | | | | | | | | | | | | | |
on investments | | | (158,509,021 | ) | | | | | | | | | (2,429,472 | ) | | | | | | | | | 1,016,004 | |
on foreign currency translations | | | (3,384 | ) | | | | | | | | | — | | | | | | | | | | — | |
Net change in unrealized appreciation/depreciation on investments and foreign currency translations | | | (158,512,405 | ) | | | | | | | | | (2,429,472 | ) | | | | | | | | | 1,016,004 | |
Net Realized and Unrealized Gain/(Loss) on Investments and Foreign Currency | | | (122,600,174 | ) | | | | | | | | | (1,240,394 | ) | | | | | | | | | 1,816,899 | |
Net Increase/(Decrease) in Net Assets Resulting from Operations | | | $(123,132,963 | ) | | | | | | | | | $(1,075,221 | ) | | | | | | | | | $2,218,954 | |
| | | | | | | | | | | | | | | | | | | | | | | | |
See accompanying notes to financial statements.
34
TETON Westwood Funds
Statements of Operations (Continued)
For the Year Ended September 30, 2019
| | | | | | | | | | | | | | | | | | | | | | | | | | | | | | | | | | | | |
| | | | | Equity
Fund | | | | | | | | Balanced
Fund | | | | | | | | Intermediate
Bond Fund | | | |
Investment Income: | | | | | | | | | | | | | | | | | | | | | | | | | | | | | | | | | | | | |
Dividends - unaffiliated (net of foreign withholding taxes of $ 0, $0, and $0, respectively) | | | | $ | 1,345,721 | | | | | | | | | | | | | $ | 918,634 | | | | | | | | | | | | | | — | | | |
Dividends - affiliated | | | | | — | | | | | | | | | | | | | | — | | | | | | | | | | | | | | — | | | |
Interest | | | | | 15,346 | | | | | | | | | | | | | | 583,945 | | | | | | | | | | | | | $ | 215,025 | | | |
Total Investment Income | | | | | 1,361,067 | | | | | | | | | | | | | | 1,502,579 | | | | | | | | | | | | | | 215,025 | | | |
Expenses: | | | | | | | | | | | | | | | | | | | | | | | | | | | | | | | | | | | | |
Investment advisory fees | | | | | 555,605 | | | | | | | | | | | | | | 447,549 | | | | | | | | | | | | | | 42,543 | | | |
Distribution fees - Class AAA | | | | | 124,520 | | | | | | | | | | | | | | 109,423 | | | | | | | | | | | | | | 8,514 | | | |
Distribution fees - Class A | | | | | 6,559 | | | | | | | | | | | | | | 44,626 | | | | | | | | | | | | | | 2,427 | | | |
Distribution fees - Class C | | | | | 2,310 | | | | | | | | | | | | | | 33,052 | | | | | | | | | | | | | | 6,873 | | | |
Accounting fees | | | | | 45,000 | | | | | | | | | | | | | | 45,000 | | | | | | | | | | | | | | — | | | |
Custodian fees | | | | | 12,174 | | | | | | | | | | | | | | 12,983 | | | | | | | | | | | | | | 5,127 | | | |
Interest expense | | | | | — | | | | | | | | | | | | | | — | | | | | | | | | | | | | | 863 | | | |
Legal and audit fees | | | | | 25,966 | | | | | | | | | | | | | | 26,091 | | | | | | | | | | | | | | 26,714 | | | |
Registration expenses | | | | | 56,963 | | | | | | | | | | | | | | 57,379 | | | | | | | | | | | | | | 42,673 | | | |
Shareholder communications expenses | | | | | 27,428 | | | | | | | | | | | | | | 28,348 | | | | | | | | | | | | | | 18,585 | | | |
Shareholder services fees | | | | | 35,412 | | | | | | | | | | | | | | 37,665 | | | | | | | | | | | | | | 10,949 | | | |
Trustees’ fees | | | | | 6,180 | | | | | | | | | | | | | | 2,891 | | | | | | | | | | | | | | 790 | | | |
Miscellaneous expenses | | | | | 11,712 | | | | | | | | | | | | | | 11,817 | | | | | | | | | | | | | | 9,098 | | | |
Total Expenses | | | | | 909,829 | | | | | | | | | | | | | | 856,824 | | | | | | | | | | | | | | 175,156 | | | |
Less: | | | | | | | | | | | | | | | | | | | | | | | | | | | | | | | | | | | | |
Fees waived or expenses reimbursed by Adviser (See Note 3) | | | | | — | | | | | | | | | | | | | | — | | | | | | | | | | | | | | (103,301 | ) | | |
Advisory fee reduction on unsupervised assets (See Note 3) | | | | | — | | | | | | | | | | | | | | — | | | | | | | | | | | | | | — | | | |
Custodian fee credits | | | | | — | | | | | | | | | | | | | | — | | | | | | | | | | | | | | — | | | |
Expenses paid by broker (See Note 6) | | | | | (1,542 | ) | | | | | | | | | | | | | (1,498 | ) | | | | | | | | | | | | | — | | | |
Total Reimbursements, Waivers, Reductions, and Credits | | | | | (1,542 | ) | | | | | | | | | | | | | (1,498 | ) | | | | | | | | | | | | | (103,301 | ) | | |
Net Expenses | | | | | 908,287 | | | | | | | | | | | | | | 855,326 | | | | | | | | | | | | | | 71,855 | | | |
Net Investment Income | | | | | 452,780 | | | | | | | | | | | | | | 647,253 | | | | | | | | | | | | | | 143,170 | | | |
Net Realized and Unrealized Gain/(Loss) on Investments and Foreign Currency: | | | | | | | | | | | | | | | | | | | | | | | | | | | | | | | | | | | | |
Net realized gain on investments - unaffiliated | | | | | 4,834,985 | | | | | | | | | | | | | | 3,898,057 | | | | | | | | | | | | | | 28,897 | | | |
Net realized loss on investments - affiliated | | | | | — | | | | | | | | | | | | | | — | | | | | | | | | | | | | | — | | | |
Net realized gain/(loss) on foreign currency transactions | | | | | — | | | | | | | | | | | | | | — | | | | | | | | | | | | | | — | | | |
Net realized gain on investments and foreign currency transactions | | | | | 4,834,985 | | | | | | | | | | | | | | 3,898,057 | | | | | | | | | | | | | | 28,897 | | | |
Net change in unrealized appreciation/depreciation: on investments | | | | | (2,435,331 | ) | | | | | | | | | | | | | (1,085,484 | ) | | | | | | | | | | | | | 167,373 | | | |
Net change in unrealized appreciation/depreciation on investments | | | | | (2,435,331 | ) | | | | | | | | | | | | | (1,085,484 | ) | | | | | | | | | | | | | 167,373 | | | |
Net Realized and Unrealized Gain on Investments and Foreign Currency | | | | | 2,399,654 | | | | | | | | | | | | | | 2,812,573 | | | | | | | | | | | | | | 196,270 | | | |
Net Increase in Net Assets Resulting from Operations | | | | $ | 2,852,434 | | | | | | | | | | | | | $ | 3,459,826 | | | | | | | | | | | | | $ | 339,440 | | | |
See accompanying notes to financial statements.
35
TETON Westwood Funds
Statements of Changes in Net Assets
For the Year Ended September 30,
| | | | | | | | | | | | | | | | | | |
| | | Mighty Mites Fund | | | SmallCap Equity Fund | | | |
| | | 2019 | | | 2018 | | | 2019 | | | 2018 | | | |
Operations: | | | | | | | | | | | | | | | | | | |
Net investment income/(loss) | | $ | (532,789 | ) | | $ | (2,977,303 | ) | | $ | 165,173 | | | $ | (9,202 | ) | | |
Net realized gain/(loss) on investments and foreign currency transactions | | | 35,912,231 | | | | 45,140,471 | | | | 1,189,078 | | | | 4,343,612 | | | |
Net change in unrealized appreciation/depreciation on investments and foreign currency translations | | | (158,512,405 | ) | | | 18,650,429 | | | | (2,429,472 | ) | | | (1,384,607 | ) | | |
Net Increase/(Decrease) in Net Assets Resulting from Operations | | | (123,132,963 | ) | | | 60,813,597 | | | | (1,075,221 | ) | | | 2,949,803 | | | |
Distributions to Shareholders | | | | | | | | | | | | | | | | | | |
Accumulated earnings | | | | | | | | | | | | | | | | | | |
Class AAA | | | (7,361,282 | ) | | | (16,091,681 | ) | | | (988,127 | ) | | | (799,266 | ) | | |
Class A | | | (3,810,847 | ) | | | (8,606,993 | ) | | | (503,509 | ) | | | (335,705 | ) | | |
Class C | | | (6,494,377 | ) | | | (12,671,430 | ) | | | (375,663 | ) | | | (226,732 | ) | | |
Class I | | | (29,681,828 | ) | | | (47,329,053 | ) | | | (2,141,704 | ) | | | (1,361,990 | ) | | |
Class T* | | | — | | | | (659 | ) | | | — | | | | (93 | ) | | |
| | | (47,348,334 | ) | | | (84,699,816 | ) | | | (4,009,003 | ) | | | (2,723,786 | ) | | |
Return of capital | | | | | | | | | | | | | | | | | | |
Class AAA | | | — | | | | — | | | | — | | | | — | | | |
Class A | | | — | | | | — | | | | — | | | | — | | | |
Class C | | | — | | | | — | | | | — | | | | — | | | |
Class I | | | — | | | | — | | | | — | | | | — | | | |
| | | — | | | | — | | | | — | | | | — | | | |
Distributions to Shareholders | | | (47,348,334 | ) | | | (84,699,816 | ) | | | (4,009,003 | ) | | | (2,723,786 | ) | | |
Shares of Beneficial Interest Transactions: | | | | | | | | | | | | | | | | | | |
Proceeds from shares issued | | | | | | | | | | | | | | | | | | |
Class AAA | | | 10,468,795 | | | | 32,706,439 | | | | 1,119,732 | | | | 2,106,780 | | | |
Class A | | | 14,953,915 | | | | 21,168,410 | | | | 891,774 | | | | 1,565,274 | | | |
Class C | | | 6,646,050 | | | | 22,014,819 | | | | 1,696,887 | | | | 967,543 | | | |
Class I | | | 118,030,977 | | | | 310,712,422 | | | | 11,711,478 | | | | 7,976,771 | | | |
| | | 150,099,737 | | | | 386,602,090 | | | | 15,419,871 | | | | 12,616,368 | | | |
Proceeds from reinvestment of distributions | | | | | | | | | | | | | | | | | | |
Class AAA | | | 7,212,093 | | | | 15,814,254 | | | | 983,405 | | | | 789,372 | | | |
Class A | | | 3,441,845 | | | | 7,945,275 | | | | 502,766 | | | | 333,554 | | | |
Class C | | | 5,725,757 | | | | 10,953,006 | | | | 357,015 | | | | 200,988 | | | |
Class I | | | 19,854,881 | | | | 30,327,154 | | | | 2,133,536 | | | | 1,335,363 | | | |
Class T* | | | — | | | | 660 | | | | — | | | | 93 | | | |
| | | 36,234,576 | | | | 65,040,349 | | | | 3,976,722 | | | | 2,659,370 | | | |
Cost of shares redeemed | | | | | | | | | | | | | | | | | | |
Class AAA | | | (61,793,617 | ) | | | (90,591,578 | ) | | | (2,044,177 | ) | | | (2,969,647 | ) | | |
Class A | | | (40,281,984 | ) | | | (83,818,036 | ) | | | (1,164,895 | ) | | | (457,749 | ) | | |
Class C | | | (49,090,524 | ) | | | (40,163,303 | ) | | | (1,345,840 | ) | | | (483,289 | ) | | |
Class I | | | (335,035,651 | ) | | | (129,221,594 | ) | | | (9,981,231 | ) | | | (5,321,296 | ) | | |
Class T* | | | — | | | | (11,417 | ) | | | — | | | | (1,199 | ) | | |
| | | (486,201,776 | ) | | | (343,805,928 | ) | | | (14,536,143 | ) | | | (9,233,180 | ) | | |
Net Increase/(Decrease) in Net Assets from Shares of Beneficial Interest Transactions | | | (299,867,463 | ) | | | 107,836,511 | | | | 4,860,450 | | | | 6,042,558 | | | |
Redemption Fees | | | 1,291 | | | | 972 | | | | 2 | | | | — | | | |
Net Increase/(Decrease) in Net Assets | | | (470,347,469 | ) | | | 83,951,264 | | | | (223,772 | ) | | | 6,268,575 | | | |
Net Assets: | | | | | | | | | | | | | | | | | | |
Beginning of year | | | 1,436,063,114 | | | | 1,352,111,850 | | | | 38,892,613 | | | | 32,624,038 | | | |
End of year | | $ | 965,715,645 | | | $ | 1,436,063,114 | | | $ | 38,668,841 | | | $ | 38,892,613 | | | |
| | | | | | | | | | | | | | | | | | |
| * | Class T Shares were liquidated on August 31, 2018. |
See accompanying notes to financial statements.
36
TETON Westwood Funds
Statements of Changes in Net Assets (Continued)
For the Year Ended September 30,
| | | | | | | | | | | | | | | | | | | | | | | | | | | | | | | | | | | | | | | | | | |
| Convertible Securities Fund | | | Equity Fund | | | Balanced Fund | | | Intermediate Bond Fund | |
| 2019 | | | 2018 | | | 2019 | | | 2018 | | | 2019 | | | 2018 | | | 2019 | | | 2018 | |
| | | | | | | | | | |
| $ | 402,055 | | | $ | 68,502 | | | | | | | $ | 452,780 | | | $ | 368,498 | | | | | | | $ | 647,253 | | | $ | 605,530 | | | | | | | $ | 143,170 | | | $ | 118,467 | |
| | 800,895 | | | | 1,234,059 | | | | | | | | 4,834,985 | | | | 7,812,617 | | | | | | | | 3,898,057 | | | | 6,409,044 | | | | | | | | 28,897 | | | | (91,525 | ) |
| | 1,016,004 | | | | 1,169,874 | | | | | | | | (2,435,331 | ) | | | 72,520 | | | | | | | | (1,085,484 | ) | | | (1,288,447 | ) | | | | | | | 167,373 | | | | (94,183 | ) |
| | 2,218,954 | | | | 2,472,435 | | | | | | | | 2,852,434 | | | | 8,253,635 | | | | | | | | 3,459,826 | | | | 5,726,127 | | | | | | | | 339,440 | | | | (67,241 | ) |
| | (249,390 | ) | | | (66,250 | ) | | | | | | | (7,382,923 | ) | | | (5,968,512 | ) | | | | | | | (5,372,476 | ) | | | (3,431,212 | ) | | | | | | | (68,846 | ) | | | (116,646 | ) |
| | (200,657 | ) | | | (37,108 | ) | | | | | | | (193,992 | ) | | | (269,080 | ) | | | | | | | (956,205 | ) | | | (538,815 | ) | | | | | | | (13,451 | ) | | | (11,813 | ) |
| | (139,526 | ) | | | (10,436 | ) | | | | | | | (62,356 | ) | | | (73,250 | ) | | | | | | | (461,298 | ) | | | (275,807 | ) | | | | | | | (8,702 | ) | | | (28,098 | ) |
| | (1,206,229 | ) | | | (189,216 | ) | | | | | | | (693,652 | ) | | | (569,904 | ) | | | | | | | (435,231 | ) | | | (217,833 | ) | | | | | | | (52,198 | ) | | | (95,203 | ) |
| | — | | | | — | | | | | | | | — | | | | — | | | | | | | | — | | | | — | | | | | | | | — | | | | — | |
| | (1,795,802 | ) | | | (303,010 | ) | | | | | | | (8,332,923 | ) | | | (6,880,746 | ) | | | | | | | (7,225,210 | ) | | | (4,463,667 | ) | | | | | | | (143,197 | ) | | | (251,760 | ) |
| | — | | | | — | | | | | | | | — | | | | — | | | | | | | | — | | | | — | | | | | | | | — | | | | (28 | ) |
| | — | | | | — | | | | | | | | — | | | | — | | | | | | | | — | | | | — | | | | | | | | — | | | | (3 | ) |
| | — | | | | — | | | | | | | | — | | | | — | | | | | | | | — | | | | — | | | | | | | | — | | | | (9 | ) |
| | — | | | | — | | | | | | | | — | | | | — | | | | | | | | — | | | | — | | | | | | | | — | | | | (21 | ) |
| | — | | | | — | | | | | | | | — | | | | — | | | | | | | | — | | | | — | | | | | | | | — | | | | (61 | ) |
| | (1,795,802 | ) | | | (303,010 | ) | | | | | | | (8,332,923 | ) | | | (6,880,746 | ) | | | | | | | (7,225,210 | ) | | | (4,463,667 | ) | | | | | | | (143,197 | ) | | | (251,821 | ) |
| | 1,224,687 | | | | 910,760 | | | | | | | | 425,605 | | | | 485,651 | | | | | | | | 8,157,431 | | | | 1,658,895 | | | | | | | | 514,330 | | | | 591,965 | |
| | 1,587,810 | | | | 1,906,290 | | | | | | | | 69,261 | | | | 10,444 | | | | | | | | 3,417,235 | | | | 2,483,948 | | | | | | | | 1,085,817 | | | | 1,209,949 | |
| | 1,949,173 | | | | 2,049,285 | | | | | | | | 59,376 | | | | 4,655 | | | | | | | | 466,783 | | | | 296,276 | | | | | | | | 128,417 | | | | 115,342 | |
| | 24,516,359 | | | | 11,790,310 | | | | | | | | 225,838 | | | | 902,820 | | | | | | | | 366,124 | | | | 3,251,539 | | | | | | | | 67,414 | | | | 278,911 | |
| | 29,278,029 | | | | 16,656,645 | | | | | | | | 780,080 | | | | 1,403,570 | | | | | | | | 12,407,573 | | | | 7,690,658 | | | | | | | | 1,795,978 | | | | 2,196,167 | |
| | 242,035 | | | | 64,447 | | | | | | | | 7,101,811 | | | | 5,773,371 | | | | | | | | 5,219,980 | | | | 3,348,972 | | | | | | | | 66,869 | | | | 113,042 | |
| | 197,189 | | | | 36,464 | | | | | | | | 193,971 | | | | 269,063 | | | | | | | | 933,418 | | | | 524,840 | | | | | | | | 13,385 | | | | 9,857 | |
| | 139,286 | | | | 10,398 | | | | | | | | 58,166 | | | | 69,569 | | | | | | | | 456,569 | | | | 272,907 | | | | | | | | 8,694 | | | | 27,825 | |
| | 1,205,642 | | | | 189,122 | | | | | | | | 687,138 | | | | 519,472 | | | | | | | | 413,205 | | | | 197,338 | | | | | | | | 50,257 | | | | 94,841 | |
| | — | | | | — | | | | | | | | — | | | | — | | | | | | | | — | | | | — | | | | | | | | — | | | | — | |
| | 1,784,152 | | | | 300,431 | | | | | | | | 8,041,086 | | | | 6,631,475 | | | | | | | | 7,023,172 | | | | 4,344,057 | | | | | | | | 139,205 | | | | 245,565 | |
| | (806,900 | ) | | | (1,104,825 | ) | | | | | | | (6,493,308 | ) | | | (7,112,237 | ) | | | | | | | (11,122,683 | ) | | | (11,680,874 | ) | | | | | | | (1,002,190 | ) | | | (809,987 | ) |
| | (677,142 | ) | | | (1,257,996 | ) | | | | | | | (203,757 | ) | | | (1,352,885 | ) | | | | | | | (3,128,537 | ) | | | (2,643,723 | ) | | | | | | | (498,327 | ) | | | (1,379,664 | ) |
| | (817,524 | ) | | | (565,784 | ) | | | | | | | (377,696 | ) | | | (310,799 | ) | | | | | | | (2,905,019 | ) | | | (714,072 | ) | | | | | | | (410,095 | ) | | | (395,612 | ) |
| | (7,837,496 | ) | | | (1,657,866 | ) | | | | | | | (1,341,652 | ) | | | (1,609,894 | ) | | | | | | | (758,150 | ) | | | (1,562,514 | ) | | | | | | | (2,012,886 | ) | | | (865,754 | ) |
| | — | | | | — | | | | | | | | — | | | | — | | | | | | | | — | | | | — | | | | | | | | — | | | | — | |
| | (10,139,062 | ) | | | (4,586,471 | ) | | | | | | | (8,416,413 | ) | | | (10,385,815 | ) | | | | | | | (17,914,389 | ) | | | (16,601,183 | ) | | | | | | | (3,923,498 | ) | | | (3,451,017 | ) |
| | 20,923,119 | | | | 12,370,605 | | | | | | | | 404,753 | | | | (2,350,770 | ) | | | | | | | 1,516,356 | | | | (4,566,468 | ) | | | | | | | (1,988,315 | ) | | | (1,009,285 | ) |
| | — | | | | — | | | | | | | | — | | | | — | | | | | | | | — | | | | — | | | | | | | | — | | | | — | |
| | 21,346,271 | | | | 14,540,030 | | | | | | | | (5,075,736 | ) | | | (977,881 | ) | | | | | | | (2,249,028 | ) | | | (3,304,008 | ) | | | | | | | (1,792,072 | ) | | | (1,328,347 | ) |
| | 29,291,076 | | | | 14,751,046 | | | | | | | | 61,349,014 | | | | 62,326,895 | | | | | | | | 62,369,315 | | | | 65,673,323 | | | | | | | | 6,841,967 | | | | 8,170,314 | |
| $ | 50,637,347 | | | $ | 29,291,076 | | | | | | | $ | 56,273,278 | | | $ | 61,349,014 | | | | | | | $ | 60,120,287 | | | $ | 62,369,315 | | | | | | | $ | 5,049,895 | | | $ | 6,841,967 | |
| | | | | | | | | | | | | | | | | | | | | | | | | | | | | | | | | | | | | | | | | | |
See accompanying notes to financial statements.
37
TETON Westwood Funds
Financial Highlights
Selected data for a share of beneficial interest outstanding throughout each year:
| | | | | | | | | | | | | | | | | | | | | | | | | | | | | | | | | | | | | | | | | | | | | | | | | | | | | | | | | | | | | | | | | | | | | | |
Year Ended September 30 | | Net Asset
Value,
Beginning
of Year | | Income (Loss) from Investment Operations | | Distributions to Shareholders | | | | | | | | Ratios to Average Net Assets/Supplemental Data |
| | | | | | | | Net
Realized
Gain on
Investments | | Total
Distributions | | Redemption
Fees(a)(c) | | Net Asset
Value,
End of
Year | | Total
Return† | | Net Assets,
End of
Year
(in 000’s) | | Net
Investment
Income
(Loss) | | Operating
Expenses
Net of
Waivers/Credits/
Reimbursements/
Reductions(d) | | Operating
Expenses
Before
Waivers/Credits/
Reimbursements/
Reductions(e) | | Portfolio
Turnover
Rate |
| | Net
Investment
Income
(Loss)(a)(b) | | Net
Realized and
Unrealized
Gain (Loss) on
Investments | | Total from
Investment
Operations |
Mighty Mites Fund | | | | | | | | | | | | | | | | | | | | | | | | | | | | | | | | | | | | | | | | | | | | | | | | | | | | | | | | | | | | | | | | | | |
Class AAA | | | | | | | | | | | | | | | | | | | | | | | | | | | | | | | | | | | | | | | | | | | | | | | | | | | | | | | | | | | | | | | | | | | | | | |
2019 | | | $ | 28.86 | | | | $ | (0.03 | ) | | | $ | (2.28 | ) | | | $ | (2.31 | ) | | | $ | (0.97 | ) | | | $ | (0.97 | ) | | | $ | 0.00 | | | | $ | 25.58 | | | | | (8.0 | )% | | | $ | 156,267 | | | | | (0.11 | )% | | | | 1.41 | % | | | | 1.41 | % | | | | 8 | % |
2018 | | | | 29.42 | | | | | (0.07 | ) | | | | 1.32 | | | | | 1.25 | | | | | (1.81 | ) | | | | (1.81 | ) | | | | 0.00 | | | | | 28.86 | | | | | 4.4 | | | | | 226,938 | | | | | (0.25 | ) | | | | 1.40 | | | | | 1.40 | | | | | 9 | |
2017 | | | | 24.76 | | | | | (0.12 | ) | | | | 5.97 | | | | | 5.85 | | | | | (1.19 | ) | | | | (1.19 | ) | | | | 0.00 | | | | | 29.42 | | | | | 24.4 | | | | | 274,161 | | | | | (0.46 | ) | | | | 1.41 | | | | | 1.42 | | | | | 8 | |
2016 | | | | 22.02 | | | | | (0.15 | ) | | | | 3.41 | | | | | 3.26 | | | | | (0.52 | ) | | | | (0.52 | ) | | | | 0.00 | | | | | 24.76 | | | | | 15.0 | | | | | 256,488 | | | | | (0.67 | ) | | | | 1.41 | | | | | 1.41 | | | | | 6 | |
2015 | | | | 23.01 | | | | | (0.06 | ) | | | | (0.50 | ) | | | | (0.56 | ) | | | | (0.43 | ) | | | | (0.43 | ) | | | | 0.00 | | | | | 22.02 | | | | | (2.6 | ) | | | | 265,145 | | | | | (0.27 | ) | | | | 1.40 | | | | | 1.41 | | | | | 13 | |
Class A | | | | | | | | | | | | | | | | | | | | | | | | | | | | | | | | | | | | | | | | | | | | | | | | | | | | | | | | | | | | | | | | | | | | | | |
2019 | | | $ | 27.75 | | | | $ | (0.09 | ) | | | $ | (2.20 | ) | | | $ | (2.29 | ) | | | $ | (0.97 | ) | | | $ | (0.97 | ) | | | $ | 0.00 | | | | $ | 24.49 | | | | | (8.3 | )% | | | $ | 75,977 | | | | | (0.35 | )% | | | | 1.66 | % | | | | 1.66 | % | | | | 8 | % |
2018 | | | | 28.42 | | | | | (0.14 | ) | | | | 1.28 | | | | | 1.14 | | | | | (1.81 | ) | | | | (1.81 | ) | | | | 0.00 | | | | | 27.75 | | | | | 4.1 | | | | | 111,572 | | | | | (0.50 | ) | | | | 1.65 | | | | | 1.65 | | | | | 9 | |
2017 | | | | 24.01 | | | | | (0.18 | ) | | | | 5.78 | | | | | 5.60 | | | | | (1.19 | ) | | | | (1.19 | ) | | | | 0.00 | | | | | 28.42 | | | | | 24.1 | | | | | 169,017 | | | | | (0.72 | ) | | | | 1.66 | | | | | 1.67 | | | | | 8 | |
2016 | | | | 21.43 | | | | | (0.20 | ) | | | | 3.30 | | | | | 3.10 | | | | | (0.52 | ) | | | | (0.52 | ) | | | | 0.00 | | | | | 24.01 | | | | | 14.6 | | | | | 141,893 | | | | | (0.92 | ) | | | | 1.66 | | | | | 1.66 | | | | | 6 | |
2015 | | | | 22.45 | | | | | (0.12 | ) | | | | (0.47 | ) | | | | (0.59 | ) | | | | (0.43 | ) | | | | (0.43 | ) | | | | 0.00 | | | | | 21.43 | | | | | (2.8 | ) | | | | 154,000 | | | | | (0.51 | ) | | | | 1.65 | | | | | 1.66 | | | | | 13 | |
Class C | | | | | | | | | | | | | | | | | | | | | | | | | | | | | | | | | | | | | | | | | | | | | | | | | | | | | | | | | | | | | | | | | | | | | | |
2019 | | | $ | 24.32 | | | | $ | (0.18 | ) | | | $ | (1.93 | ) | | | $ | (2.11 | ) | | | $ | (0.97 | ) | | | $ | (0.97 | ) | | | $ | 0.00 | | | | $ | 21.24 | | | | | (8.7 | )% | | | $ | 108,356 | | | | | (0.85 | )% | | | | 2.16 | % | | | | 2.16 | % | | | | 8 | % |
2018 | | | | 25.24 | | | | | (0.24 | ) | | | | 1.13 | | | | | 0.89 | | | | | (1.81 | ) | | | | (1.81 | ) | | | | 0.00 | | | | | 24.32 | | | | | 3.6 | | | | | 166,600 | | | | | (1.00 | ) | | | | 2.15 | | | | | 2.15 | | | | | 9 | |
2017 | | | | 21.55 | | | | | (0.27 | ) | | | | 5.15 | | | | | 4.88 | | | | | (1.19 | ) | | | | (1.19 | ) | | | | 0.00 | | | | | 25.24 | | | | | 23.5 | | | | | 180,282 | | | | | (1.21 | ) | | | | 2.16 | | | | | 2.17 | | | | | 8 | |
2016 | | | | 19.38 | | | | | (0.28 | ) | | | | 2.97 | | | | | 2.69 | | | | | (0.52 | ) | | | | (0.52 | ) | | | | 0.00 | | | | | 21.55 | | | | | 14.1 | | | | | 175,241 | | | | | (1.41 | ) | | | | 2.16 | | | | | 2.16 | | | | | 6 | |
2015 | | | | 20.44 | | | | | (0.21 | ) | | | | (0.42 | ) | | | | (0.63 | ) | | | | (0.43 | ) | | | | (0.43 | ) | | | | 0.00 | | | | | 19.38 | | | | | (3.2 | ) | | | | 187,216 | | | | | (1.01 | ) | | | | 2.15 | | | | | 2.16 | | | | | 13 | |
Class I | | | | | | | | | | | | | | | | | | | | | | | | | | | | | | | | | | | | | | | | | | | | | | | | | | | | | | | | | | | | | | | | | | | | | | |
2019 | | | $ | 29.57 | | | | $ | 0.04 | | | | $ | (2.35 | ) | | | $ | (2.31 | ) | | | $ | (0.97 | ) | | | $ | (0.97 | ) | | | $ | 0.00 | | | | $ | 26.29 | | | | | (7.8 | )% | | | $ | 625,116 | | | | | 0.15 | % | | | | 1.16 | % | | | | 1.16 | % | | | | 8 | % |
2018 | | | | 30.02 | | | | | 0.00 | (c) | | | | 1.36 | | | | | 1.36 | | | | | (1.81 | ) | | | | (1.81 | ) | | | | 0.00 | | | | | 29.57 | | | | | 4.7 | | | | | 930,953 | | | | | 0.00 | (f) | | | | 1.15 | | | | | 1.15 | | | | | 9 | |
2017 | | | | 25.18 | | | | | (0.06 | ) | | | | 6.09 | | | | | 6.03 | | | | | (1.19 | ) | | | | (1.19 | ) | | | | 0.00 | | | | | 30.02 | | | | | 24.7 | | | | | 728,641 | | | | | (0.22 | ) | | | | 1.16 | | | | | 1.17 | | | | | 8 | |
2016 | | | | 22.34 | | | | | (0.10 | ) | | | | 3.46 | | | | | 3.36 | | | | | (0.52 | ) | | | | (0.52 | ) | | | | 0.00 | | | | | 25.18 | | | | | 15.2 | | | | | 476,493 | | | | | (0.44 | ) | | | | 1.16 | | | | | 1.16 | | | | | 6 | |
2015 | | | | 23.27 | | | | | (0.00 | )(c) | | | | (0.50 | ) | | | | (0.50 | ) | | | | (0.43 | ) | | | | (0.43 | ) | | | | 0.00 | | | | | 22.34 | | | | | (2.3 | ) | | | | 488,846 | | | | | (0.01 | ) | | | | 1.15 | | | | | 1.16 | | | | | 13 | |
| † | Total return represents aggregate total return of a hypothetical $1,000 investment at the beginning of the year and sold at the end of the year including reinvestment of distributions and does not reflect the applicable sales charges. |
| (a) | Per share data are calculated using the average shares outstanding method. |
| (b) | Due to capital share activity, net investment income/(loss) per share and the ratio to average net assets are not necessarily correlated among the different classes of shares. |
| (c) | Amount represents less than $0.005 per share. |
| (d) | The Fund received credits from a designated broker who agreed to pay certain Fund operating expenses. For the years ended September 30, 2019, 2018, 2017, 2016, and 2015, there was no impact on the expense ratios. |
| (e) | Before advisory fee reduction on unsupervised assets totaling 0.01% and 0.01% of net assets for the years ended September 30, 2017 and 2015, respectively. For the years ended September 30, 2019, 2018, and 2016 there was no impact on the expense ratios. |
| (f) | Amount represents less than 0.005%. |
See accompanying notes to financial statements.
38
TETON Westwood Funds
Financial Highlights
Selected data for a share of beneficial interest outstanding throughout each year:
| | | | | | | | | | | | | | | | | | | | | | | | | | | | | | | | | | | | | | | | | | | | | | | | | | | | | | | | | | | | | | | | | | | | | | | | | | | |
Year Ended September 30 | | Net Asset
Value,
Beginning
of Year | | Income (Loss) from Investment Operations | | Distributions to Shareholders | | Redemption
Fees(b) | | Net Asset
Value,
End of
Year | | Total
Return† | | Ratios to Average Net Assets/Supplemental Data |
| | Net
Investment
Income
(Loss)(a) | | Net
Realized and
Unrealized
Gain (Loss) on
Investments | | Total From
Investment
Operations | | Net
Investment
Income | | Net
Realized
Gain on
Investments | | Total
Distributions | | Net Assets,
End of
Year
(in 000’s) | | Net
Investment
Income
(Loss) | | Operating
Expenses
Net of
Waivers/
Reimbursements(c) | | Operating
Expenses
Before Waivers/
Reimbursements | | Portfolio
Turnover
Rate |
SmallCap Equity Fund | | | | | | | | | | | | | | | | | | | | | | | | | | | | | | | | | | | | | | | | | | | | | | | | | | | | | | | | | | | | | | | | | | | | | | | | | | | |
Class AAA | | | | | | | | | | | | | | | | | | | | | | | | | | | | | | | | | | | | | | | | | | | | | | | | | | | | | | | | | | | | | | | | | | | | | | | | | | | |
2019 | | | $ | 21.49 | | | | $ | 0.06 | | | | $ | (1.28 | ) | | | $ | (1.22 | ) | | | | — | | | | $ | (2.30 | ) | | | $ | (2.30 | ) | | | $ | 0.00 | | | | $ | 17.97 | | | | | (5.6 | )% | | | $ | 7,758 | | | | | 0.33 | % | | | | 1.25 | % | | | | 1.64 | % | | | | 35 | % |
2018 | | | | 21.37 | | | | | (0.02 | ) | | | | 2.00 | | | | | 1.98 | | | | | — | | | | | (1.86 | ) | | | | (1.86 | ) | | | | — | | | | | 21.49 | | | | | 9.7 | | | | | 9,286 | | | | | (0.08 | ) | | | | 1.25 | | | | | 1.72 | | | | | 32 | |
2017 | | | | 19.03 | | | | | (0.04 | ) | | | | 4.17 | | | | | 4.13 | | | | | — | | | | | (1.79 | ) | | | | (1.79 | ) | | | | 0.00 | | | | | 21.37 | | | | | 23.1 | | | | | 9,295 | | | | | (0.22 | ) | | | | 1.36 | | | | | 1.74 | | | | | 38 | |
2016 | | | | 18.54 | | | | | (0.04 | ) | | | | 3.57 | | | | | 3.53 | | | | | — | | | | | (3.04 | ) | | | | (3.04 | ) | | | | 0.00 | | | | | 19.03 | | | | | 21.1 | | | | | 10,855 | | | | | (0.25 | ) | | | | 1.50 | | | | | 1.79 | | | | | 18 | |
2015 | | | | 20.52 | | | | | (0.09 | ) | | | | (0.29 | ) | | | | (0.38 | ) | | | | — | | | | | (1.60 | ) | | | | (1.60 | ) | | | | — | | | | | 18.54 | | | | | (2.4 | ) | | | | 7,721 | | | | | (0.47 | ) | | | | 1.50 | | | | | 1.66 | | | | | 23 | |
Class A | | | | | | | | | | | | | | | | | | | | | | | | | | | | | | | | | | | | | | | | | | | | | | | | | | | | | | | | | | | | | | | | | | | | | | | | | | | |
2019 | | | $ | 20.48 | | | | $ | 0.01 | | | | $ | (1.21 | ) | | | $ | (1.20 | ) | | | | — | | | | $ | (2.30 | ) | | | $ | (2.30 | ) | | | $ | 0.00 | | | | $ | 16.98 | | | | | (5.8 | )% | | | $ | 4,440 | | | | | 0.08 | % | | | | 1.50 | % | | | | 1.89 | % | | | | 35 | % |
2018 | | | | 20.50 | | | | | (0.07 | ) | | | | 1.91 | | | | | 1.84 | | | | | — | | | | | (1.86 | ) | | | | (1.86 | ) | | | | — | | | | | 20.48 | | | | | 9.4 | | | | | 5,024 | | | | | (0.33 | ) | | | | 1.50 | | | | | 1.97 | | | | | 32 | |
2017 | | | | 18.37 | | | | | (0.09 | ) | | | | 4.01 | | | | | 3.92 | | | | | — | | | | | (1.79 | ) | | | | (1.79 | ) | | | | 0.00 | | | | | 20.50 | | | | | 22.8 | | | | | 3,580 | | | | | (0.47 | ) | | | | 1.60 | | | | | 1.99 | | | | | 38 | |
2016 | | | | 18.02 | | | | | (0.08 | ) | | | | 3.47 | | | | | 3.39 | | | | | — | | | | | (3.04 | ) | | | | (3.04 | ) | | | | 0.00 | | | | | 18.37 | | | | | 20.9 | | | | | 2,871 | | | | | (0.49 | ) | | | | 1.75 | | | | | 2.04 | | | | | 18 | |
2015 | | | | 20.05 | | | | | (0.14 | ) | | | | (0.29 | ) | | | | (0.43 | ) | | | | — | | | | | (1.60 | ) | | | | (1.60 | ) | | | | — | | | | | 18.02 | | | | | (2.7 | ) | | | | 3,258 | | | | | (0.71 | ) | | | | 1.75 | | | | | 1.91 | | | | | 23 | |
Class C | | | | | | | | | | | | | | | | | | | | | | | | | | | | | | | | | | | | | | | | | | | | | | | | | | | | | | | | | | | | | | | | | | | | | | | | | | | |
2019 | | | $ | 17.69 | | | | $ | (0.06 | ) | | | $ | (1.05 | ) | | | $ | (1.11 | ) | | | | — | | | | $ | (2.30 | ) | | | $ | (2.30 | ) | | | $ | 0.00 | | | | $ | 14.28 | | | | | (6.2 | )% | | | $ | 3,164 | | | | | (0.41 | )% | | | | 2.00 | % | | | | 2.39 | % | | | | 35 | % |
2018 | | | | 18.04 | | | | | (0.15 | ) | | | | 1.66 | | | | | 1.51 | | | | | — | | | | | (1.86 | ) | | | | (1.86 | ) | | | | — | | | | | 17.69 | | | | | 8.8 | | | | | 2,895 | | | | | (0.83 | ) | | | | 2.00 | | | | | 2.47 | | | | | 32 | |
2017 | | | | 16.43 | | | | | (0.16 | ) | | | | 3.56 | | | | | 3.40 | | | | | — | | | | | (1.79 | ) | | | | (1.79 | ) | | | | 0.00 | | | | | 18.04 | | | | | 22.2 | | | | | 2,247 | | | | | (0.97 | ) | | | | 2.11 | | | | | 2.49 | | | | | 38 | |
2016 | | | | 16.49 | | | | | (0.15 | ) | | | | 3.13 | | | | | 2.98 | | | | | — | | | | | (3.04 | ) | | | | (3.04 | ) | | | | 0.00 | | | | | 16.43 | | | | | 20.2 | | | | | 2,268 | | | | | (0.99 | ) | | | | 2.25 | | | | | 2.54 | | | | | 18 | |
2015 | | | | 18.56 | | | | | (0.22 | ) | | | | (0.25 | ) | | | | (0.47 | ) | | | | — | | | | | (1.60 | ) | | | | (1.60 | ) | | | | — | | | | | 16.49 | | | | | (3.2 | ) | | | | 3,081 | | | | | (1.21 | ) | | | | 2.25 | | | | | 2.41 | | | | | 23 | |
Class I | | | | | | | | | | | | | | | | | | | | | | | | | | | | | | | | | | | | | | | | | | | | | | | | | | | | | | | | | | | | | | | | | | | | | | | | | | | |
2019 | | | $ | 22.27 | | | | $ | 0.11 | | | | $ | (1.32 | ) | | | $ | (1.21 | ) | | | $ | (0.02 | ) | | | $ | (2.30 | ) | | | $ | (2.32 | ) | | | $ | 0.00 | | | | $ | 18.74 | | | | | (5.3 | )% | | | $ | 23,307 | | | | | 0.60 | % | | | | 1.00 | % | | | | 1.39 | % | | | | 35 | % |
2018 | | | | 22.04 | | | | | 0.04 | | | | | 2.05 | | | | | 2.09 | | | | | — | | | | | (1.86 | ) | | | | (1.86 | ) | | | | — | | | | | 22.27 | | | | | 9.9 | | | | | 21,688 | | | | | 0.17 | | | | | 1.00 | | | | | 1.47 | | | | | 32 | |
2017 | | | | 19.53 | | | | | 0.01 | | | | | 4.29 | | | | | 4.30 | | | | | — | | | | | (1.79 | ) | | | | (1.79 | ) | | | | 0.00 | | | | | 22.04 | | | | | 23.4 | | | | | 17,501 | | | | | 0.03 | | | | | 1.09 | | | | | 1.49 | | | | | 38 | |
2016 | | | | 18.90 | | | | | 0.00 | (b) | | | | 3.67 | | | | | 3.67 | | | | | — | | | | | (3.04 | ) | | | | (3.04 | ) | | | | 0.00 | | | | | 19.53 | | | | | 21.5 | | | | | 10,883 | | | | | 0.00 | | | | | 1.25 | | | | | 1.54 | | | | | 18 | |
2015 | | | | 20.85 | | | | | (0.04 | ) | | | | (0.31 | ) | | | | (0.35 | ) | | | | — | | | | | (1.60 | ) | | | | (1.60 | ) | | | | — | | | | | 18.90 | | | | | (2.2 | ) | | | | 9,778 | | | | | (0.21 | ) | | | | 1.25 | | | | | 1.41 | | | | | 23 | |
| † | Total return represents aggregate total return of a hypothetical $1,000 investment at the beginning of the year and sold at the end of the year including reinvestment of distributions and does not reflect the applicable sales charges. |
| (a) | Per share data are calculated using the average shares outstanding method. |
| (b) | Amount represents less than $0.005 per share. |
| (c) | The Fund received credits from a designated broker who agreed to pay certain Fund operating expenses. Had such payments not been received during the year ended September 30, 2016, the expense ratios would have been 1.51%, 1.76%, 2.26%, and 1.26% for Class AAA, Class A, Class C, and Class I, respectively. For the years ended September 30, 2019, 2018, 2017, and 2015, these credits had no material impact on the expense ratios. |
See accompanying notes to financial statements.
39
TETON Westwood Funds
Financial Highlights
Selected data for a share of beneficial interest outstanding throughout each year:
| | | | | | | | | | | | | | | | | | | | | | | | | | | | | | | | | | | | | | | | | | | | | | | | | | | | | | | | | | | | | | | | | | | | | | |
Year Ended September 30 | | Net Asset Value,
Beginning of Year | | Income (Loss) from Investment Operations | | Distributions to Shareholders | | | | | | Ratios to Average Net Assets/Supplemental Data |
| | Net
Investment
Income
(Loss)(a) | | Net
Realized and
Unrealized
Gain (Loss) on
Investments | | Total From
Investment
Operations | | Net
Investment
Income | | Net
Realized
Gain on
Investments | | Total
Distributions | | Net Asset
Value,
End of Year | | Total Return† | | Net Assets,
End of Year
(in 000’s) | | Net
Investment
Income
(Loss) | | Operating
Expenses
Net of
Waivers/
Reimbursements | | Operating
Expenses
Before Waivers/
Reimbursements | | Portfolio
Turnover
Rate |
Convertible Securities Fund | |
Class AAA | | | | | | | | | | | | | | | | | | | | | | | | | | | | | | | | | | | | | | | | | | | | | | | | | | | | | | | | | | | | | | | | | | | | | | |
2019 | | | | $13.98 | | | | | $ 0.13 | | | | | $ 0.51 | | | | | $ 0.64 | | | | | $(0.23 | ) | | | | $(0.53 | ) | | | | $(0.76 | ) | | | | $13.86 | | | | | 5.1 | % | | | | $ 5,168 | | | | | 1.00 | % | | | | 1.15 | %(b) | | | | 1.66 | % | | | | 28 | % |
2018 | | | | 12.41 | | | | | 0.04 | | | | | 1.73 | | | | | 1.77 | | | | | (0.20 | ) | | | | — | | | | | (0.20 | ) | | | | 13.98 | | | | | 14.4 | | | | | 4,523 | | | | | 0.34 | | | | | 1.15 | (b) | | | | 2.03 | | | | | 35 | |
2017 | | | | 11.59 | | | | | 0.07 | | | | | 1.49 | | | | | 1.56 | | | | | (0.21 | ) | | | | (0.53 | ) | | | | (0.74 | ) | | | | 12.41 | | | | | 14.1 | | | | | 4,138 | | | | | 0.57 | | | | | 1.15 | | | | | 2.47 | | | | | 40 | |
2016 | | | | 10.53 | | | | | 0.04 | | | | | 1.05 | | | | | 1.09 | | | | | (0.03 | ) | | | | — | | | | | (0.03 | ) | | | | 11.59 | | | | | 10.4 | | | | | 4,240 | | | | | 0.38 | | | | | 2.00 | (b) | | | | 2.74 | | | | | 20 | |
2015 | | | | 11.79 | | | | | 0.04 | | | | | (1.27 | ) | | | | (1.23 | ) | | | | (0.03 | ) | | | | — | | | | | (0.03 | ) | | | | 10.53 | | | | | (10.5 | ) | | | | 5,525 | | | | | 0.31 | | | | | 2.00 | (b) | | | | 2.40 | | | | | 19 | |
Class A | | | | | | | | | | | | | | | | | | | | | | | | | | | | | | | | | | | | | | | | | | | | | | | | | | | | | | | | | | | | | | | | | | | | | | |
2019 | | | | $14.43 | | | | | $ 0.10 | | | | | $ 0.53 | | | | | $ 0.63 | | | | | $(0.20 | ) | | | | $(0.53 | ) | | | | $(0.73 | ) | | | | $14.33 | | | | | 4.8 | % | | | | $ 4,821 | | | | | 0.76 | % | | | | 1.40 | %(b) | | | | 1.91 | % | | | | 28 | % |
2018 | | | | 12.79 | | | | | 0.01 | | | | | 1.80 | | | | | 1.81 | | | | | (0.17 | ) | | | | — | | | | | (0.17 | ) | | | | 14.43 | | | | | 14.2 | | | | | 3,711 | | | | | 0.09 | | | | | 1.40 | (b) | | | | 2.28 | | | | | 35 | |
2017 | | | | 11.94 | | | | | 0.05 | | | | | 1.52 | | | | | 1.57 | | | | | (0.19 | ) | | | | (0.53 | ) | | | | (0.72 | ) | | | | 12.79 | | | | | 13.8 | | | | | 2,670 | | | | | 0.42 | | | | | 1.40 | | | | | 2.72 | | | | | 40 | |
2016 | | | | 10.87 | | | | | 0.01 | | | | | 1.08 | | | | | 1.09 | | | | | (0.02 | ) | | | | — | | | | | (0.02 | ) | | | | 11.94 | | | | | 10.1 | | | | | 1,191 | | | | | 0.10 | | | | | 2.25 | (b) | | | | 2.99 | | | | | 20 | |
2015 | | | | 12.18 | | | | | 0.01 | | | | | (1.30 | ) | | | | (1.29 | ) | | | | (0.02 | ) | | | | — | | | | | (0.02 | ) | | | | 10.87 | | | | | (10.6 | ) | | | | 1,081 | | | | | 0.06 | | | | | 2.25 | (b) | | | | 2.65 | | | | | 19 | |
Class C | | | | | | | | | | | | | | | | | | | | | | | | | | | | | | | | | | | | | | | | | | | | | | | | | | | | | | | | | | | | | | | | | | | | | | |
2019 | | | | $15.36 | | | | | $ 0.04 | | | | | $ 0.56 | | | | | $ 0.60 | | | | | $(0.13 | ) | | | | $(0.53 | ) | | | | $(0.66 | ) | | | | $15.30 | | | | | 4.3 | % | | | | $ 4,246 | | | | | 0.26 | % | | | | 1.90 | %(b) | | | | 2.41 | % | | | | 28 | % |
2018 | | | | 13.62 | | | | | (0.06 | ) | | | | 1.90 | | | | | 1.84 | | | | | (0.10 | ) | | | | — | | | | | (0.10 | ) | | | | 15.36 | | | | | 13.6 | | | | | 2,960 | | | | | (0.40 | ) | | | | 1.90 | (b) | | | | 2.78 | | | | | 35 | |
2017 | | | | 12.69 | | | | | (0.02 | ) | | | | 1.63 | | | | | 1.61 | | | | | (0.15 | ) | | | | (0.53 | ) | | | | (0.68 | ) | | | | 13.62 | | | | | 13.3 | | | | | 1,307 | | | | | (0.19 | ) | | | | 1.90 | | | | | 3.22 | | | | | 40 | |
2016 | | | | 11.59 | | | | | (0.04 | ) | | | | 1.14 | | | | | 1.10 | | | | | (0.00 | )(c) | | | | — | | | | | (0.00 | )(c) | | | | 12.69 | | | | | 9.6 | | | | | 873 | | | | | (0.37 | ) | | | | 2.75 | (b) | | | | 3.49 | | | | | 20 | |
2015 | | | | 13.04 | | | | | (0.06 | ) | | | | (1.39 | ) | | | | (1.45 | ) | | | | (0.00 | )(c) | | | | — | | | | | (0.00 | )(c) | | | | 11.59 | | | | | (11.1 | ) | | | | 943 | | | | | (0.44 | ) | | | | 2.75 | (b) | | | | 3.15 | | | | | 19 | |
Class I | | | | | | | | | | | | | | | | | | | | | | | | | | | | | | | | | | | | | | | | | | | | | | | | | | | | | | | | | | | | | | | | | | | | | | |
2019 | | | | $14.03 | | | | | $ 0.18 | | | | | $ 0.49 | | | | | $ 0.67 | | | | | $(0.26 | ) | | | | $(0.53 | ) | | | | $(0.79 | ) | | | | $13.91 | | | | | 5.3 | % | | | | $36,402 | | | | | 1.32 | % | | | | 0.90 | %(b) | | | | 1.41 | % | | | | 28 | % |
2018 | | | | 12.44 | | | | | 0.08 | | | | | 1.75 | | | | | 1.83 | | | | | (0.24 | ) | | | | — | | | | | (0.24 | ) | | | | 14.03 | | | | | 14.8 | | | | | 18,097 | | | | | 0.56 | | | | | 0.90 | (b) | | | | 1.78 | | | | | 35 | |
2017 | | | | 11.61 | | | | | 0.12 | | | | | 1.48 | | | | | 1.60 | | | | | (0.24 | ) | | | | (0.53 | ) | | | | (0.77 | ) | | | | 12.44 | | | | | 14.5 | | | | | 6,636 | | | | | 1.00 | | | | | 0.90 | | | | | 2.22 | | | | | 40 | |
2016 | | | | 10.56 | | | | | 0.07 | | | | | 1.04 | | | | | 1.11 | | | | | (0.06 | ) | | | | — | | | | | (0.06 | ) | | | | 11.61 | | | | | 10.6 | | | | | 394 | | | | | 0.61 | | | | | 1.75 | (b) | | | | 2.49 | | | | | 20 | |
2015 | | | | 11.80 | | | | | 0.07 | | | | | (1.27 | ) | | | | (1.20 | ) | | | | (0.04 | ) | | | | — | | | | | (0.04 | ) | | | | 10.56 | | | | | (10.2 | ) | | | | 251 | | | | | 0.56 | | | | | 1.75 | (b) | | | | 2.15 | | | | | 19 | |
| † | Total return represents aggregate total return of a hypothetical $1,000 investment at the beginning of the year and sold at the end of the year including reinvestment of distributions and does not reflect the applicable sales charges. |
| (a) | Per share data are calculated using the average shares outstanding method. |
| (b) | The Fund received credits from a designated broker who agreed to pay certain Fund operating expenses. Had such payments not been received, the expense ratios for the years ended September 30, 2016 and 2015 would have been 2.01% and 2.02% (Class AAA), 2.26% and 2.27% (Class A), 2.76% and 2.77% (Class C), and 1.76% and 1.77% (Class I), respectively. For the years ended September 30, 2019 and 2018, these credits had no impact on the expense ratios. |
| (c) | Amount represents less than $0.005 per share. |
See accompanying notes to financial statements.
40
TETON Westwood Funds
Financial Highlights
Selected data for a share of beneficial interest outstanding throughout each year:
| | | | | | | | | | | | | | | | | | | | | | | | | | | | | | | | | | | | | | | | | | | | | | | | | | | | | | | | | | | | | | | | | |
Year Ended September 30 | | | | Income (Loss) from Investment Operations | | Distributions to Shareholders | | | | | | Ratios to Average Net Assets/Supplemental Data |
| | Net Asset Value,
Beginning of Year | | Net Investment
Income (Loss)(a) | | Net Realized and
Unrealized
Gain (Loss) on
Investments | | Total From
Investment
Operations | | Net Investment
Income | | Net
Realized
Gain on
Investments | | Total Distributions | | Net Asset
Value,
End of Year | | Total Return† | | Net Assets,
End of Year
(in 000’s) | | Net
Investment
Income (Loss) | | Operating
Expenses(b) | | Portfolio
Turnover Rate |
Equity Fund | | | | | | | | | | | | | | | | | | | | | | | | | | |
Class AAA | | | | | | | | | | | | | | | | | | | | | | | | | | | | | | | | | | | | | | | | | | | | | | | | | | | | | | | | | | | | | | | | | |
2019 | | | | $13.94 | | | | | $0.10 | | | | | $ 0.54 | | | | | $ 0.64 | | | | | $(0.09 | ) | | | | $(1.83 | ) | | | | $(1.92 | ) | | | | $12.66 | | | | | 5.8 | % | | | | $50,849 | | | | | 0.80 | % | | | | 1.64 | % | | | | 28 | % |
2018 | | | | 13.69 | | | | | 0.08 | | | | | 1.71 | | | | | 1.79 | | | | | (0.06 | ) | | | | (1.48 | ) | | | | (1.54 | ) | | | | 13.94 | | | | | 14.1 | | | | | 54,595 | | | | | 0.59 | | | | | 1.60 | | | | | 33 | |
2017 | | | | 12.59 | | | | | 0.06 | | | | | 1.91 | | | | | 1.97 | | | | | (0.07 | ) | | | | (0.80 | ) | | | | (0.87 | ) | | | | 13.69 | | | | | 16.6 | | | | | 54,159 | | | | | 0.50 | | | | | 1.62 | | | | | 28 | |
2016 | | | | 12.22 | | | | | 0.07 | | | | | 1.30 | | | | | 1.37 | | | | | (0.05 | ) | | | | (0.95 | ) | | | | (1.00 | ) | | | | 12.59 | | | | | 11.4 | | | | | 53,063 | | | | | 0.54 | | | | | 1.63 | | | | | 31 | |
2015 | | | | 13.65 | | | | | 0.05 | | | | | (0.09 | ) | | | | (0.04 | ) | | | | (0.06 | ) | | | | (1.33 | ) | | | | (1.39 | ) | | | | 12.22 | | | | | (0.9 | ) | | | | 53,238 | | | | | 0.37 | | | | | 1.59 | | | | | 28 | |
Class A | | | | | | | | | | | | | | | | | | | | | | | | | | | | | | | | | | | | | | | | | | | | | | | | | | | | | | | | | | | | | | | | | |
2019 | | | | $13.90 | | | | | $0.07 | | | | | $ 0.54 | | | | | $ 0.61 | | | | | $(0.05 | ) | | | | $(1.83 | ) | | | | $(1.88 | ) | | | | $12.63 | | | | | 5.6 | % | | | | $ 1,366 | | | | | 0.56 | % | | | | 1.89 | % | | | | 28 | % |
2018 | | | | 13.64 | | | | | 0.05 | | | | | 1.71 | | | | | 1.76 | | | | | (0.02 | ) | | | | (1.48 | ) | | | | (1.50 | ) | | | | 13.90 | | | | | 13.9 | | | | | 1,435 | | | | | 0.35 | | | | | 1.85 | | | | | 33 | |
2017 | | | | 12.55 | | | | | 0.04 | | | | | 1.89 | | | | | 1.93 | | | | | (0.04 | ) | | | | (0.80 | ) | | | | (0.84 | ) | | | | 13.64 | | | | | 16.3 | | | | | 2,502 | | | | | 0.28 | | | | | 1.87 | | | | | 28 | |
2016 | | | | 12.19 | | | | | 0.03 | | | | | 1.31 | | | | | 1.34 | | | | | (0.03 | ) | | | | (0.95 | ) | | | | (0.98 | ) | | | | 12.55 | | | | | 11.2 | | | | | 3,719 | | | | | 0.29 | | | | | 1.88 | | | | | 31 | |
2015 | | | | 13.61 | | | | | 0.02 | | | | | (0.09 | ) | | | | (0.07 | ) | | | | (0.02 | ) | | | | (1.33 | ) | | | | (1.35 | ) | | | | 12.19 | | | | | (1.1 | ) | | | | 3,125 | | | | | 0.12 | | | | | 1.84 | | | | | 28 | |
Class C | | | | | | | | | | | | | | | | | | | | | | | | | | | | | | | | | | | | | | | | | | | | | | | | | | | | | | | | | | | | | | | | | |
2019 | | | | $13.09 | | | | | $0.00 | | | | | $ 0.50 | | | | | $ 0.50 | | | | | — | | | | | $(1.83 | ) | | | | $(1.83 | ) | | | | $11.76 | | | | | 5.0 | % | | | | $ 104 | | | | | 0.04 | % | | | | 2.39 | % | | | | 28 | % |
2018 | | | | 12.97 | | | | | (0.02 | ) | | | | 1.62 | | | | | 1.60 | | | | | — | | | | | (1.48 | ) | | | | (1.48 | ) | | | | 13.09 | | | | | 13.3 | | | | | 449 | | | | | (0.17 | ) | | | | 2.35 | | | | | 33 | |
2017 | | | | 11.99 | | | | | (0.03 | ) | | | | 1.81 | | | | | 1.78 | | | | | — | | | | | (0.80 | ) | | | | (0.80 | ) | | | | 12.97 | | | | | 15.7 | | | | | 685 | | | | | (0.25 | ) | | | | 2.37 | | | | | 28 | |
2016 | | | | 11.72 | | | | | (0.03 | ) | | | | 1.25 | | | | | 1.22 | | | | | — | | | | | (0.95 | ) | | | | (0.95 | ) | | | | 11.99 | | | | | 10.6 | | | | | 843 | | | | | (0.23 | ) | | | | 2.38 | | | | | 31 | |
2015 | | | | 13.18 | | | | | (0.05 | ) | | | | (0.08 | ) | | | | (0.13 | ) | | | | — | | | | | (1.33 | ) | | | | (1.33 | ) | | | | 11.72 | | | | | (1.6 | ) | | | | 684 | | | | | (0.37 | ) | | | | 2.34 | | | | | 28 | |
Class I | | | | | | | | | | | | | | | | | | | | | | | | | | | | | | | | | | | | | | | | | | | | | | | | | | | | | | | | | | | | | | | | | |
2019 | | | | $13.91 | | | | | $0.13 | | | | | $ 0.53 | | | | | $ 0.66 | | | | | $(0.12 | ) | | | | $(1.83 | ) | | | | $(1.95 | ) | | | | $12.62 | | | | | 6.1 | % | | | | $ 3,954 | | | | | 1.06 | % | | | | 1.39 | % | | | | 28 | % |
2018 | | | | 13.66 | | | | | 0.11 | | | | | 1.72 | | | | | 1.83 | | | | | (0.10 | ) | | | | (1.48 | ) | | | | (1.58 | ) | | | | 13.91 | | | | | 14.5 | | | | | 4,870 | | | | | 0.84 | | | | | 1.35 | | | | | 33 | |
2017 | | | | 12.57 | | | | | 0.10 | | | | | 1.89 | | | | | 1.99 | | | | | (0.10 | ) | | | | (0.80 | ) | | | | (0.90 | ) | | | | 13.66 | | | | | 16.9 | | | | | 4,981 | | | | | 0.75 | | | | | 1.37 | | | | | 28 | |
2016 | | | | 12.21 | | | | | 0.09 | | | | | 1.30 | | | | | 1.39 | | | | | (0.08 | ) | | | | (0.95 | ) | | | | (1.03 | ) | | | | 12.57 | | | | | 11.7 | | | | | 4,258 | | | | | 0.77 | | | | | 1.38 | | | | | 31 | |
2015 | | | | 13.64 | | | | | 0.08 | | | | | (0.09 | ) | | | | (0.01 | ) | | | | (0.09 | ) | | | | (1.33 | ) | | | | (1.42 | ) | | | | 12.21 | | | | | (0.6 | ) | | | | 4,340 | | | | | 0.61 | | | | | 1.34 | | | | | 28 | |
| † | Total return represents aggregate total return of a hypothetical $1,000 investment at the beginning of the year and sold at the end of the year including reinvestment of distributions and does not reflect the applicable sales charges. |
| (a) | Per share data are calculated using the average shares outstanding method. |
| (b) | The Fund received credits from a designated broker who agreed to pay certain Fund operating expenses. For the years ended September 30, 2019, 2018, 2017, 2016, and 2015, there was no impact on the expense ratios. |
See accompanying notes to financial statements.
41
TETON Westwood Funds
Financial Highlights
Selected data for a share of beneficial interest outstanding throughout each year:
| | | | | | | | | | | | | | | | | | | | | | | | | | | | | | | | | | | | | | | | | | | | | | | | | | | | |
| | | | | Income (Loss) from Investment Operations | | Distributions to Shareholders | | | | | | Ratios to Average Net Assets/Supplemental Data |
Year Ended September 30 | | Net Asset Value, Beginning of Year | | Net
Investment Income(a) | | Net Realized and Unrealized Gain (Loss) on Investments | | Total From Investment Operations | | Net Investment Income | | Net Realized Gain on Investments | | Total Distributions | | Net Asset Value, End of Year | | Total Return† | | Net Assets, End of Year (in 000’s) | | Net Investment Income | | Operating Expenses††(b) | | Portfolio Turnover Rate |
| | | | | | | | | | | | | | | | | | | | | | | | | | | | | | | | | | | | | | | | | | | | | | | | | | | | |
Balanced Fund | | | | | | | | | | | | | | | | | | | | | | | | | | | | | | | | | | | | | | | | | | | | | | | | | |
Class AAA | | | | | | | | | | | | | | | | | | | | | | | | | | | | | | | | | | | | | | | | | | | | | | | | | | | | |
2019 | | | $12.39 | | | | $0.13 | | | | $0.55 | | | | $0.68 | | | | $(0.13 | ) | | | $(1.23 | ) | | | $(1.36 | ) | | | $11.71 | | | | 6.4 | % | | | $44,638 | | | | 1.15 | % | | | 1.37 | % | | | 44 | % |
2018 | | | 12.16 | | | | 0.12 | | | | 0.96 | | | | 1.08 | | | | (0.12 | ) | | | (0.73 | ) | | | (0.85 | ) | | | 12.39 | | | | 9.3 | | | | 45,181 | | | | 1.00 | | | | 1.34 | | | | 27 | |
2017 | | | 11.75 | | | | 0.11 | | | | 1.04 | | | | 1.15 | | | | (0.11 | ) | | | (0.63 | ) | | | (0.74 | ) | | | 12.16 | | | | 10.3 | | | | 50,934 | | | | 0.93 | | | | 1.33 | | | | 23 | |
2016 | | | 11.72 | | | | 0.12 | | | | 0.85 | | | | 0.97 | | | | (0.12 | ) | | | (0.82 | ) | | | (0.94 | ) | | | 11.75 | | | | 8.6 | | | | 50,105 | | | | 1.06 | | | | 1.35 | | | | 23 | |
2015 | | | 12.91 | | | | 0.13 | | | | (0.08 | ) | | | 0.05 | | | | (0.13 | ) | | | (1.11 | ) | | | (1.24 | ) | | | 11.72 | | | | 0.0 | | | | 53,989 | | | | 1.01 | | | | 1.31 | | | | 27 | |
Class A | | | | | | | | | | | | | | | | | | | | | | | | | | | | | | | | | | | | | | | | | | | | | | | | | | | | |
2019 | | | $12.47 | | | | $0.10 | | | | $0.55 | | | | $0.65 | | | | $(0.10 | ) | | | $(1.23 | ) | | | $(1.33 | ) | | | $11.79 | | | | 6.1 | % | | | $ 9,553 | | | | 0.89 | % | | | 1.62 | % | | | 44 | % |
2018 | | | 12.23 | | | | 0.09 | | | | 0.97 | | | | 1.06 | | | | (0.09 | ) | | | (0.73 | ) | | | (0.82 | ) | | | 12.47 | | | | 9.1 | | | | 8,719 | | | | 0.75 | | | | 1.59 | | | | 27 | |
2017 | | | 11.81 | | | | 0.08 | | | | 1.05 | | | | 1.13 | | | | (0.08 | ) | | | (0.63 | ) | | | (0.71 | ) | | | 12.23 | | | | 10.1 | | | | 8,165 | | | | 0.68 | | | | 1.58 | | | | 23 | |
2016 | | | 11.78 | | | | 0.10 | | | | 0.85 | | | | 0.95 | | | | (0.10 | ) | | | (0.82 | ) | | | (0.92 | ) | | | 11.81 | | | | 8.2 | | | | 7,040 | | | | 0.81 | | | | 1.60 | | | | 23 | |
2015 | | | 12.97 | | | | 0.09 | | | | (0.07 | ) | | | 0.02 | | | | (0.10 | ) | | | (1.11 | ) | | | (1.21 | ) | | | 11.78 | | | | (0.2 | ) | | | 6,577 | | | | 0.76 | | | | 1.56 | | | | 27 | |
Class C | | | | | | | | | | | | | | | | | | | | | | | | | | | | | | | | | | | | | | | | | | | | | | | | | | | | |
2019 | | | $12.67 | | | | $0.05 | | | | $0.56 | | | | $0.61 | | | | $(0.04 | ) | | | $(1.23 | ) | | | $(1.27 | ) | | | $12.01 | | | | 5.6 | % | | | $ 2,195 | | | | 0.40 | % | | | 2.12 | % | | | 44 | % |
2018 | | | 12.41 | | | | 0.03 | | | | 0.99 | | | | 1.02 | | | | (0.03 | ) | | | (0.73 | ) | | | (0.76 | ) | | | 12.67 | | | | 8.5 | | | | 4,544 | | | | 0.25 | | | | 2.09 | | | | 27 | |
2017 | | | 11.97 | | | | 0.02 | | | | 1.06 | | | | 1.08 | | | | (0.01 | ) | | | (0.63 | ) | | | (0.64 | ) | | | 12.41 | | | | 9.6 | | | | 4,585 | | | | 0.18 | | | | 2.08 | | | | 23 | |
2016 | | | 11.92 | | | | 0.04 | | | | 0.87 | | | | 0.91 | | | | (0.04 | ) | | | (0.82 | ) | | | (0.86 | ) | | | 11.97 | | | | 7.8 | | | | 5,575 | | | | 0.30 | | | | 2.10 | | | | 23 | |
2015 | | | 13.12 | | | | 0.03 | | | | (0.08 | ) | | | (0.05 | ) | | | (0.04 | ) | | | (1.11 | ) | | | (1.15 | ) | | | 11.92 | | | | (0.8 | ) | | | 5,260 | | | | 0.26 | | | | 2.06 | | | | 27 | |
Class I | | | | | | | | | | | | | | | | | | | | | | | | | | | | | | | | | | | | | | | | | | | | | | | | | | | | |
2019 | | | $12.38 | | | | $0.16 | | | | $0.54 | | | | $0.70 | | | | $(0.16 | ) | | | $(1.23 | ) | | | $(1.39 | ) | | | $11.69 | | | | 6.6 | % | | | $ 3,734 | | | | 1.40 | % | | | 1.12 | % | | | 44 | % |
2018 | | | 12.15 | | | | 0.15 | | | | 0.97 | | | | 1.12 | | | | (0.16 | ) | | | (0.73 | ) | | | (0.89 | ) | | | 12.38 | | | | 9.6 | | | | 3,925 | | | | 1.24 | | | | 1.09 | | | | 27 | |
2017 | | | 11.73 | | | | 0.14 | | | | 1.05 | | | | 1.19 | | | | (0.14 | ) | | | (0.63 | ) | | | (0.77 | ) | | | 12.15 | | | | 10.7 | | | | 1,989 | | | | 1.18 | | | | 1.08 | | | | 23 | |
2016 | | | 11.70 | | | | 0.15 | | | | 0.85 | | | | 1.00 | | | | (0.15 | ) | | | (0.82 | ) | | | (0.97 | ) | | | 11.73 | | | | 8.8 | | | | 1,896 | | | | 1.30 | | | | 1.10 | | | | 23 | |
2015 | | | 12.90 | | | | 0.16 | | | | (0.09 | ) | | | 0.07 | | | | (0.16 | ) | | | (1.11 | ) | | | (1.27 | ) | | | 11.70 | | | | 0.2 | | | | 1,856 | | | | 1.26 | | | | 1.06 | | | | 27 | |
| † | Total return represents aggregate total return of a hypothetical $1,000 investment at the beginning of the year and sold at the end of the year including reinvestment of distributions and does not reflect the applicable sales charges. |
| †† | The ratios include a reduction for custodian fee credits on cash balances maintained with the custodian (Custodian Fee Credits). Excluding such Custodian Fee Credits, the ratios for the year ended September 30, 2015 would have been 1.32% (Class AAA), 1.57% (Class A), 2.07% (Class C), and 1.07% (Class I), respectively. For the years ended September 30, 2019, 2018, 2017, and 2016, there were no Custodian Fee Credits. |
| (a) | Per share data are calculated using the average shares outstanding method. |
| (b) | The Fund received credits from a designated broker who agreed to pay certain Fund operating expenses. For the years ended September 30, 2019, 2018, 2017, 2016, and 2015, there was no impact on the expense ratios. |
See accompanying notes to financial statements.
42
TETON Westwood Funds
Financial Highlights
Selected data for a share of beneficial interest outstanding throughout each year:
| | | | | | | | | | | | | | | | | | | | | | | | | | | | | | | | | | | | | | | | | | | | | | | | | | | | | | | | | | | | | | | | | | | | | | | | | | | |
| | | Income (Loss) from Investment Operations | | Distributions to Shareholders | | | | | | Ratios to Average Net Assets/Supplemental Data |
Year Ended September 30 | | Net Asset
Value,
Beginning
of Year | | Net
Investment
Income(a) | | Net
Realized and
Unrealized
Gain (Loss) on
Investments | | Total From
Investment
Operations | | Net
Investment
Income | | Net
Realized
Gain on
Investments | | Return
of
Capital | | Total
Distributions | | Net Asset
Value,
End of Year | | Total
Return† | | Net Assets,
End of Year
(in 000’s) | | Net
Investment
Income | | Operating
Expenses
Net of
Waivers/
Reimbursements | | Operating
Expenses
Before Waivers/
Reimbursements | | Portfolio
Turnover
Rate |
Intermediate Bond Fund | | | | | | | | | | | | | | | | | | | | | | | | | | | | | | | | | | | | | | | | | | | | | | | | | | | | | | | | |
Class AAA | | | | | | | | | | | | | | | | | | | | | | | | | | | | | | | | | | | | | | | | | | | | | | | | | | | | | | | | | | | | | | | | | | | | | | | | | | | |
2019 | | | $ | 10.83 | | | | $ | 0.22 | | | | $ | 0.31 | | | | $ | 0.53 | | | | $ | (0.22 | ) | | | | — | | | | | — | | | | $ | (0.22 | ) | | | $ | 11.14 | | | | | 5.0 | % | | | $ | 3,106 | | | | | 2.02 | % | | | | 1.00 | % | | | | 2.47 | % | | | | 64 | % |
2018 | | | | 11.28 | | | | | 0.17 | | | | | (0.26 | ) | | | | (0.09 | ) | | | | (0.18 | ) | | | $ | (0.18 | ) | | | $ | 0.00 | (b) | | | | (0.36 | ) | | | | 10.83 | | | | | (0.8 | ) | | | | 3,434 | | | | | 1.59 | | | | | 1.00 | | | | | 2.22 | | | | | 32 | |
2017 | | | | 11.64 | | | | | 0.14 | | | | | (0.28 | ) | | | | (0.14 | ) | | | | (0.14 | ) | | | | (0.08 | ) | | | | — | | | | | (0.22 | ) | | | | 11.28 | | | | | (1.2 | ) | | | | 3,683 | | | | | 1.23 | | | | | 1.00 | | | | | 1.52 | | | | | 36 | |
2016 | | | | 11.56 | | | | | 0.15 | | | | | 0.30 | | | | | 0.45 | | | | | (0.15 | ) | | | | (0.22 | ) | | | | — | | | | | (0.37 | ) | | | | 11.64 | | | | | 4.1 | | | | | 4,170 | | | | | 1.32 | | | | | 1.00 | | | | | 1.42 | | | | | 48 | |
2015 | | | | 11.59 | | | | | 0.18 | | | | | (0.03 | ) | | | | 0.15 | | | | | (0.18 | ) | | | | — | | | | | — | | | | | (0.18 | ) | | | | 11.56 | | | | | 1.3 | | | | | 5,045 | | | | | 1.58 | | | | | 1.00 | | | | | 1.36 | | | | | 65 | |
Class A | | | | | | | | | | | | | | | | | | | | | | | | | | | | | | | | | | | | | | | | | | | | | | | | | | | | | | | | | | | | | | | | | | | | | | | | | | | |
2019 | | | $ | 10.82 | | | | $ | 0.21 | | | | $ | 0.31 | | | | $ | 0.52 | | | | $ | (0.21 | ) | | | | — | | | | | — | | | | $ | (0.21 | ) | | | $ | 11.13 | | | | | 4.9 | % | | | $ | 932 | | | | | 1.94 | % | | | | 1.10 | % | | | | 2.57 | % | | | | 64 | % |
2018 | | | | 11.26 | | | | | 0.16 | | | | | (0.25 | ) | | | | (0.09 | ) | | | | (0.17 | ) | | | $ | (0.18 | ) | | | $ | 0.00 | (b) | | | | (0.35 | ) | | | | 10.82 | | | | | (0.8 | ) | | | | 308 | | | | | 1.46 | | | | | 1.10 | | | | | 2.32 | | | | | 32 | |
2017 | | | | 11.63 | | | | | 0.13 | | | | | (0.29 | ) | | | | (0.16 | ) | | | | (0.13 | ) | | | | (0.08 | ) | | | | — | | | | | (0.21 | ) | | | | 11.26 | | | | | (1.4 | ) | | | | 485 | | | | | 1.13 | | | | | 1.10 | | | | | 1.62 | | | | | 36 | |
2016 | | | | 11.55 | | | | | 0.14 | | | | | 0.30 | | | | | 0.44 | | | | | (0.14 | ) | | | | (0.22 | ) | | | | — | | | | | (0.36 | ) | | | | 11.63 | | | | | 3.9 | | | | | 807 | | | | | 1.21 | | | | | 1.10 | | | | | 1.52 | | | | | 48 | |
2015 | | | | 11.58 | | | | | 0.17 | | | | | (0.03 | ) | | | | 0.14 | | | | | (0.17 | ) | | | | — | | | | | — | | | | | (0.17 | ) | | | | 11.55 | | | | | 1.2 | | | | | 809 | | | | | 1.48 | | | | | 1.10 | | | | | 1.46 | | | | | 65 | |
Class C | | | | | | | | | | | | | | | | | | | | | | | | | | | | | | | | | | | | | | | | | | | | | | | | | | | | | | | | | | | | | | | | | | | | | | | | | | | |
2019 | | | $ | 10.27 | | | | $ | 0.13 | | | | $ | 0.29 | | | | $ | 0.42 | | | | $ | (0.13 | ) | | | | — | | | | | — | | | | $ | (0.13 | ) | | | $ | 10.56 | | | | | 4.2 | % | | | $ | 550 | | | | | 1.27 | % | | | | 1.75 | % | | | | 3.22 | % | | | | 64 | % |
2018 | | | | 10.70 | | | | | 0.09 | | | | | (0.25 | ) | | | | (0.16 | ) | | | | (0.09 | ) | | | $ | (0.18 | ) | | | $ | 0.00 | (b) | | | | (0.27 | ) | | | | 10.27 | | | | | (1.5 | ) | | | | 805 | | | | | 0.83 | | | | | 1.75 | | | | | 2.97 | | | | | 32 | |
2017 | | | | 11.05 | | | | | 0.05 | | | | | (0.27 | ) | | | | (0.22 | ) | | | | (0.05 | ) | | | | (0.08 | ) | | | | — | | | | | (0.13 | ) | | | | 10.70 | | | | | (2.0 | ) | | | | 1,102 | | | | | 0.49 | | | | | 1.75 | | | | | 2.27 | | | | | 36 | |
2016 | | | | 10.99 | | | | | 0.06 | | | | | 0.28 | | | | | 0.34 | | | | | (0.06 | ) | | | | (0.22 | ) | | | | — | | | | | (0.28 | ) | | | | 11.05 | | | | | 3.2 | | | | | 1,144 | | | | | 0.51 | | | | | 1.75 | | | | | 2.17 | | | | | 48 | |
2015 | | | | 11.01 | | | | | 0.09 | | | | | (0.02 | ) | | | | 0.07 | | | | | (0.09 | ) | | | | — | | | | | — | | | | | (0.09 | ) | | | | 10.99 | | | | | 0.7 | | | | | 398 | | | | | 0.82 | | | | | 1.75 | | | | | 2.11 | | | | | 65 | |
Class I | | | | | | | | | | | | | | | | | | | | | | | | | | | | | | | | | | | | | | | | | | | | | | | | | | | | | | | | | | | | | | | | | | | | | | | | | | | |
2019 | | | $ | 10.84 | | | | $ | 0.25 | | | | $ | 0.30 | | | | $ | 0.55 | | | | $ | (0.25 | ) | | | | — | | | | | — | | | | $ | (0.25 | ) | | | $ | 11.14 | | | | | 5.1 | % | | | $ | 462 | | | | | 2.27 | % | | | | 0.75 | % | | | | 2.22 | % | | | | 64 | % |
2018 | | | | 11.28 | | | | | 0.20 | | | | | (0.25 | ) | | | | (0.05 | ) | | | | (0.21 | ) | | | $ | (0.18 | ) | | | $ | 0.00 | (b) | | | | (0.39 | ) | | | | 10.84 | | | | | (0.5 | ) | | | | 2,295 | | | | | 1.83 | | | | | 0.75 | | | | | 1.97 | | | | | 32 | |
2017 | | | | 11.65 | | | | | 0.17 | | | | | (0.29 | ) | | | | (0.12 | ) | | | | (0.17 | ) | | | | (0.08 | ) | | | | — | | | | | (0.25 | ) | | | | 11.28 | | | | | (1.0 | ) | | | | 2,900 | | | | | 1.47 | | | | | 0.75 | | | | | 1.27 | | | | | 36 | |
2016 | | | | 11.57 | | | | | 0.18 | | | | | 0.30 | | | | | 0.48 | | | | | (0.18 | ) | | | | (0.22 | ) | | | | — | | | | | (0.40 | ) | | | | 11.65 | | | | | 4.3 | | | | | 14,111 | | | | | 1.56 | | | | | 0.75 | | | | | 1.17 | | | | | 48 | |
2015 | | | | 11.60 | | | | | 0.21 | | | | | (0.03 | ) | | | | 0.18 | | | | | (0.21 | ) | | | | — | | | | | — | | | | | (0.21 | ) | | | | 11.57 | | | | | 1.6 | | | | | 13,022 | | | | | 1.82 | | | | | 0.75 | | | | | 1.11 | | | | | 65 | |
| † | Total return represents aggregate total return of a hypothetical $1,000 investment at the beginning of the year and sold at the end of the year including reinvestment of distributions and does not reflect the applicable sales charges. |
| (a) | Per share data are calculated using the average shares outstanding method. |
| (b) | Amount represents less than $0.005 per share. |
See accompanying notes to financial statements.
43
TETON Westwood Funds
Notes to Financial Statements
1. Organization.The TETON Westwood Funds (the Trust) was organized as a Massachusetts business trust on June 12, 1986. The Trust is registered under the Investment Company Act of 1940, as amended (the 1940 Act), as a diversifiedopen-end management investment company and currently consists of six active separate investment portfolios: TETON Westwood Mighty Mites Fund (Mighty Mites Fund), TETON Westwood SmallCap Equity Fund (SmallCap Equity Fund), TETON Convertible Securities Fund (Convertible Securities Fund), TETON Westwood Equity Fund (Equity Fund), TETON Westwood Balanced Fund (Balanced Fund), and TETON Westwood Intermediate Bond Fund (Intermediate Bond Fund), individually, a “Fund” and collectively, the “Funds.” Each class of shares outstanding bears the same voting, dividend, liquidation, and other rights and conditions, except that the expenses incurred in the distribution and marketing of such shares are different for each class. Class T Shares were first issued on July 5, 2017 for Mighty Mites Fund and SmallCap Equity Fund. Class T shares were liquidated on August 31, 2018.
The investment objectives of each Fund are as follows:
| ● | | Mighty Mites Fund seeks to provide long term capital appreciation by investing primarily in micro-capitalization equity securities. |
| ● | | SmallCap Equity Fund seeks to provide long term capital appreciation by investing primarily in smaller capitalization equity securities. |
| ● | | Convertible Securities Fund seeks to provide a high level of current income as well as long term capital appreciation. |
| ● | | Equity Fund seeks to provide capital appreciation. The Equity Fund’s secondary goal is to produce current income. |
| ● | | Balanced Fund seeks to provide capital appreciation and current income resulting in a high total investment return consistent with prudent investment risk and a balanced investment approach. |
| ● | | Intermediate Bond Fund seeks to maximize total return, while maintaining a level of current income consistent with the maintenance of principal and liquidity. |
2. Significant Accounting Policies.As an investment company, the Trust follows the investment company accounting and reporting guidance, which is part of U.S. generally accepted accounting principles (GAAP) that may require the use of management estimates and assumptions in the preparation of its financial statements. Actual results could differ from those estimates. The following is a summary of significant accounting policies followed by the Trust in the preparation of its financial statements.
New Accounting Pronouncements.To improve the effectiveness of fair value disclosure requirements, the Financial Accounting Standards Board recently issued Accounting Standard Update (ASU)2018-13, Fair Value Measurement Disclosure Framework – Changes to the Disclosure Requirements for Fair Value Measurement (ASU2018-13), which adds, removes, and modifies certain aspects relating to fair value disclosure. ASU2018-13 is effective for interim and annual reporting periods beginning after December 15, 2019; early adoption of the additions relating to ASU2018-13 is not required, even if early adoption is elected for the removals under ASU2018-13. Management has early adopted the removals set forth in ASU2018-13 in these financial statements and has not early adopted the additions set forth in ASU2018-13.
Security Valuation.Portfolio securities listed or traded on a nationally recognized securities exchange or traded in the U.S.over-the-counter market for which market quotations are readily available are valued at the last quoted sale price or a market’s official closing price as of the close of business on the day the securities are being valued. If there were no sales that day, the security is valued at the average of the closing bid and asked prices or, if there were no asked prices quoted on that day, then the security is valued at the closing bid price on that day. If no bid or asked prices are quoted on such day, the security is valued at the most recently available price or, if the Board of Trustees (the Board) so determines, by such other method as the Board shall determine in good faith to reflect its fair market value. Portfolio securities traded on more than one national securities exchange or market are valued according to the broadest and most representative market, as determined by Teton Advisors, Inc. (the Adviser). Investments inopen-end investment companies are valued at each underlying Fund’s NAV per share as of the report date.
Portfolio securities primarily traded on a foreign market are generally valued at the preceding closing values of such securities on the relevant market, but may be fair valued pursuant to procedures established by the Board if market conditions change significantly after the close of the foreign market, but prior to the close of business on the day the securities are being valued. Debt obligations for which market quotations are readily available are valued at the average of the latest bid and asked prices. If there were no asked prices quoted on such day, the securities are valued using the closing bid price, unless the Board determines such amount does not reflect the securities fair value, in which case these securities will be fair value as determined by the Board. Certain securities are valued principally using dealer quotations. Futures contracts are valued at the closing
44
TETON Westwood Funds
Notes to Financial Statements (Continued)
settlement price of the exchange or board of trade on which the applicable contract is traded. OTC futures and options on futures for which market quotations are readily available will be valued by quotations received from a pricing service or, if no quotations are available from a pricing service, by quotations obtained from one or more dealers in the instrument in question by the Adviser.
Securities and assets for which market quotations are not readily available are fair valued as determined by the Board. Fair valuation methodologies and procedures may include, but are not limited to: analysis and review of available financial andnon-financial information about the company; comparisons with the valuation and changes in valuation of similar securities, including a comparison of foreign securities with the equivalent U.S. dollar value American Depositary Receipt securities at the close of the U.S. exchange; and evaluation of any other information that could be indicative of the value of the security.
The inputs and valuation techniques used to measure fair value of the Funds’ investments are summarized into three levels as described in the hierarchy below:
| | ● | | Level 1 — quoted prices in active markets for identical securities; |
| | ● | | Level 2 — other significant observable inputs (including quoted prices for similar securities, interest rates, prepayment speeds, credit risk, etc.); and |
| | ● | | Level 3 — significant unobservable inputs (including the Board’s determinations as to the fair value of investments). |
A financial instrument’s level within the fair value hierarchy is based on the lowest level of any input both individually and in the aggregate that is significant to the fair value measurement. The inputs or methodology used for valuing securities are not necessarily an indication of the risk associated with investing in those securities. The summary of the Funds’ investments in securities by inputs used to value the Funds’ investments as of September 30, 2019 is as follows:
| | | | | | | | | | | | | | | | | | | | |
| | | Valuation Inputs | | |
| | | Level 1 | | Level 2 Other Significant | | Level 3 Significant | | Total Market Value |
| | | Quoted Prices | | Observable Inputs | | Unobservable Inputs | | at 9/30/19 |
MIGHTY MITES FUND | | | | | | | | | | | | | | | | | | | | |
INVESTMENTS IN SECURITIES: | | | | | | | | | | | | | | | | | | | | |
ASSETS (Market Value): | | | | | | | | | | | | | | | | | | | | |
Common Stocks: | | | | | | | | | | | | | | | | | | | | |
Airlines | | | $ | 1,078,800 | | | | $ | 40,500 | | | | | — | | | | $ | 1,119,300 | |
Automotive: Parts and Accessories | | | | 15,533,239 | | | | | 2,380 | | | | | — | | | | | 15,535,619 | |
Business Services | | | | 28,841,648 | | | | | 1,077,412 | | | | $ | 14,756 | | | | | 29,933,816 | |
Computer Software and Services | | | | 20,346,189 | | | | | 357,061 | | | | | — | | | | | 20,703,250 | |
Consumer Products | | | | 28,727,698 | | | | | 126,636 | | | | | — | | | | | 28,854,334 | |
Consumer Services | | | | 7,674,173 | | | | | 187,770 | | | | | — | | | | | 7,861,943 | |
Diversified Industrial | | | | 110,240,684 | | | | | 4,043,696 | | | | | — | | | | | 114,284,380 | |
Electronics | | | | 33,907,558 | | | | | 1,599,500 | | | | | 0 | | | | | 35,507,058 | |
Energy and Utilities: Natural Gas | | | | 4,906,300 | | | | | 2,325,537 | | | | | — | | | | | 7,231,837 | |
Financial Services | | | | 86,509,220 | | | | | 1,409,769 | | | | | 75,000 | | | | | 87,993,989 | |
Food and Beverage | | | | 31,061,666 | | | | | 145,921 | | | | | — | | | | | 31,207,587 | |
Health Care | | | | 83,974,684 | | | | | — | | | | | 0 | | | | | 83,974,684 | |
Real Estate | | | | 32,842,283 | | | | | 790,622 | | | | | 255 | | | | | 33,633,160 | |
Specialty Chemicals | | | | 21,418,891 | | | | | 2,138 | | | | | — | | | | | 21,421,029 | |
Telecommunications | | | | 20,492,157 | | | | | 250,000 | | | | | — | | | | | 20,742,157 | |
Other Industries (a) | | | | 414,951,181 | | | | | — | | | | | — | | | | | 414,951,181 | |
Total Common Stocks | | | | 942,506,371 | | | | | 12,358,942 | | | | | 90,011 | | | | | 954,955,324 | |
Closed-End Funds | | | | 1,137,420 | | | | | — | | | | | — | | | | | 1,137,420 | |
Convertible Corporate Bonds (a) | | | | — | | | | | 215,308 | | | | | — | | | | | 215,308 | |
Preferred Stocks (a) | | | | 5,930,805 | | | | | — | | | | | — | | | | | 5,930,805 | |
Convertible Preferred Stocks (a) | | | | — | | | | | 347,680 | | | | | — | | | | | 347,680 | |
Rights (a) | | | | 228,000 | | | | | 2,000 | | | | | 15,691 | | | | | 245,691 | |
Warrants (a) | | | | — | | | | | 5,889 | | | | | 21 | | | | | 5,910 | |
U.S. Government Obligations | | | | — | | | | | 3,784,099 | | | | | — | | | | | 3,784,099 | |
TOTAL INVESTMENTS IN SECURITIES – ASSETS | | | $ | 949,802,596 | | | | $ | 16,713,918 | | | | $ | 105,723 | (b) | | | $ | 966,622,237 | |
45
TETON Westwood Funds
Notes to Financial Statements (Continued)
| | | | | | | | | | | | | | | | | | | | |
| | | Valuation Inputs | | |
| | | Level 1 | | Level 2 Other Significant | | Level 3 Significant | | Total Market Value |
| | | Quoted Prices | | Observable Inputs | | Unobservable Inputs | | at 09/30/19 |
SMALLCAP EQUITY FUND | | | | | | | | | | | | | | | | | | | | |
INVESTMENTS IN SECURITIES: | | | | | | | | | | | | | | | | | | | | |
ASSETS (Market Value): | | | | | | | | | | | | | | | | | | | | |
Common Stocks (c) | | | $ | 38,122,367 | | | | | — | | | | | — | | | | $ | 38,122,367 | |
Rights (c) | | | | — | | | | | — | | | | $ | 11,611 | | | | | 11,611 | |
U.S. Government Obligations | | | | — | | | | $ | 2,780,246 | | | | | — | | | | | 2,780,246 | |
TOTAL INVESTMENTS IN SECURITIES – ASSETS | | | $ | 38,122,367 | | | | $ | 2,780,246 | | | | $ | 11,611 | (d) | | | $ | 40,914,224 | |
| | | | |
CONVERTIBLE SECURITIES FUND | | | | | | | | | | | | | | | | | | | | |
INVESTMENTS IN SECURITIES: | | | | | | | | | | | | | | | | | | | | |
ASSETS (Market Value): | | | | | | | | | | | | | | | | | | | | |
Common Stocks (c) | | | $ | 278,271 | | | | | — | | | | | — | | | | $ | 278,271 | |
Convertible Corporate Bonds (c) | | | | — | | | | $ | 36,129,612 | | | | | — | | | | | 36,129,612 | |
Convertible Preferred Stocks (c) | | | | 1,179,287 | | | | | — | | | | | — | | | | | 1,179,287 | |
Mandatory Convertible Securities (c) | | | | 10,945,090 | | | | | 702,380 | | | | | — | | | | | 11,647,470 | |
U.S. Government Obligations | | | | — | | | | | 2,130,933 | | | | | — | | | | | 2,130,933 | |
TOTAL INVESTMENTS IN SECURITIES – ASSETS | | | $ | 12,402,648 | | | | $ | 38,962,925 | | | | | — | | | | $ | 51,365,573 | |
| | | | |
EQUITY FUND | | | | | | | | | | | | | | | | | | | | |
INVESTMENTS IN SECURITIES: | | | | | | | | | | | | | | | | | | | | |
ASSETS (Market Value): | | | | | | | | | | | | | | | | | | | | |
Common Stocks (c) | | | $ | 55,469,315 | | | | | — | | | | | — | | | | $ | 55,469,315 | |
Short Term Investment | | | | 639,544 | | | | | — | | | | | — | | | | | 639,544 | |
TOTAL INVESTMENTS IN SECURITIES – ASSETS | | | $ | 56,108,859 | | | | | — | | | | | — | | | | $ | 56,108,859 | |
| | | | |
BALANCED FUND | | | | | | | | | | | | | | | | | | | | |
INVESTMENTS IN SECURITIES: | | | | | | | | | | | | | | | | | | | | |
ASSETS (Market Value): | | | | | | | | | | | | | | | | | | | | |
Common Stocks (c) | | | $ | 35,319,975 | | | | | — | | | | | — | | | | $ | 35,319,975 | |
Corporate Bonds (c) | | | | — | | | | $ | 10,726,018 | | | | | — | | | | | 10,726,018 | |
U.S. Government Agency Obligations | | | | — | | | | | 2,270,195 | | | | | — | | | | | 2,270,195 | |
U.S. Government Obligations | | | | — | | | | | 9,995,192 | | | | | — | | | | | 9,995,192 | |
Short Term Investment | | | | 1,978,447 | | | | | — | | | | | — | | | | | 1,978,447 | |
TOTAL INVESTMENTS IN SECURITIES – ASSETS | | | $ | 37,298,422 | | | | $ | 22,991,405 | | | | | — | | | | $ | 60,289,827 | |
| | | | |
INTERMEDIATE BOND FUND | | | | | | | | | | | | | | | | | | | | |
INVESTMENTS IN SECURITIES: | | | | | | | | | | | | | | | | | | | | |
ASSETS (Market Value): | | | | | | | | | | | | | | | | | | | | |
Corporate Bonds (c) | | | | — | | | | $ | 4,337,963 | | | | | — | | | | $ | 4,337,963 | |
Convertible Corporate Bonds (c) | | | | — | | | | | 93,875 | | | | | — | | | | | 93,875 | |
U.S. Government Agency Obligations | | | | — | | | | | 15,905 | | | | | — | | | | | 15,905 | |
U.S. Government Obligations | | | | — | | | | | 614,506 | | | | | — | | | | | 614,506 | |
TOTAL INVESTMENTS IN SECURITIES – ASSETS | | | | — | | | | $ | 5,062,249 | | | | | — | | | | $ | 5,062,249 | |
| (a) | Please refer to the Summary Schedule of Investments for the industry classifications of these portfolio holdings. |
| (b) | Level 3 securities are valued by brokers and pricing services, or recent transactions. At September 30, 2019, the value of these securities was $105,723. The inputs for these securities are not readily available or cannot be reasonably estimated. |
| (c) | Please refer to the Schedule of Investments for the industry classifications of these portfolio holdings. |
| (d) | Level 3 securities are valued by brokers and pricing services, or recent transactions. At September 30, 2019, the value of these securities was $11,611. The inputs for these securities are not readily available or cannot be reasonably estimated. |
During the fiscal year ended September 30, 2019, the Mighty Mites Fund did not have material transfers into or out of Level 3. The Fund’s policy is to recognize transfers among Levels as of the beginning of the reporting period.
During the fiscal year ended September 30, 2019, the SmallCap Equity Fund did not have transfers into or out of Level 3.
There were no Level 3 investments held at September 30, 2019 or September 30, 2018 for the Convertible Securities Fund, Equity Fund, Balanced Fund, and Intermediate Bond Fund.
46
TETON Westwood Funds
Notes to Financial Statements (Continued)
The following table reconciles Level 3 investments for Mighty Mites Fund and SmallCap Equity Fund:
| | | | | | | | | | | | | | | | | | | | | | | | | | | | | | | | | | | | | | | | | | | | | | | | | | |
| | | | | | | | | | | | | | | | | | | | | Net change in |
| | | | | | | | | | | | | | | | | | | | | unrealized |
| | | | | | | | | | | | | | | | | | | | | appreciation/ |
| | | | | | | | | | | | | | | | | | | | | depreciation |
| | | | | | | | | Change in | | | | | | | | | | | | on Level 3 |
| | | Balance | | Accrued | | | | unrealized | | | | | | Transfers | | Transfers | | Balance | | investments |
| MIGHTY MITES | | as of | | discounts/ | | Realized | | appreciation/ | | | | | | into | | out of | | as of | | still held |
| FUND | | 9/30/18 | | (premiums) | | gain | | depreciation† | | Purchases | | Sales | | Level 3 | | Level 3 | | 9/30/19 | | at 9/30/19† |
INVESTMENTS IN SECURITIES: | | | | | | | | | | | | | | | | | | | | | | | | | | | | | | | | | | | | | | | | | | | | | | |
ASSETS (Market Value): | | | | | | | | | | | | | | | | | | | | | | | | | | | | | | | | | | | | | | | | | | | | | | | | | | |
Common Stocks(a) | | | $ | 6,262,966 | | | | | — | | | | $ | 1,051,823 | | | | $ | (398,567 | ) | | | | — | | | | $ | (6,530,000 | ) | | | | — | | | | $ | (310,967 | ) | | | $ | 75,255 | | | | $ | 15,000 | |
Rights(a) | | | | 60,001 | | | | | — | | | | | — | | | | | — | | | | | — | | | | | (44,310 | ) | | | | — | | | | | — | | | | | 15,691 | | | | | — | |
Warrants(a) | | | | 58 | | | | | — | | | | | — | | | | | (37 | ) | | | | — | | | | | — | | | | | — | | | | | — | | | | | 21 | | | | | (37 | ) |
| TOTAL INVESTMENTS IN SECURITIES | | | $ | 6,323,025 | | | | | — | | | | $ | 1,051,823 | | | | $ | (398,604 | ) | | | | — | | | | $ | (6,574,310 | ) | | | | — | | | | $ | (310,967 | ) | | | $ | 90,967 | | | | $ | 14,963 | |
| (a) | Please refer to the Schedule of Investments for the industry classifications of these portfolio holdings. |
| † | Net change in unrealized appreciation/depreciation on investments is included in the related amounts in the Statement of Operations. |
| | | | | | | | | | | | | | | | | | | | | | | | | | | | | | | | | | | | | | | | | | | | | | | | | | |
| | | | | | | | | | | | | | | | | | | | | Net change |
| | | | | | | | | | | | | | | | | | | | | in unrealized |
| | | | | | | | | | | | | | | | | | | | | appreciation/ |
| | | | | | | | | | | | | | | | | | | | | depreciation |
| | | | | | | | | | | | | | | | | | | | | during the |
| | | | | | | | | | | | | | | | | | | | | period on |
| | | | | | | | | Change in | | | | | | | | | | | | Level 3 |
| | | Balance | | Accrued | | Realized | | unrealized | | | | | | Transfers | | Transfers | | Balance | | investments |
| SMALLCAP EQUITY | | as of | | discounts/ | | gain/ | | appreciation/ | | | | Proceeds | | into | | out of | | as of | | still held at |
| FUND | | 09/30/18 | | (premiums) | | (loss) | | depreciation† | | Purchases | | received | | Level 3 | | Level 3 | | 09/30/19 | | 09/30/19† |
INVESTMENTS IN SECURITIES: | | | | | | | | | | | | | | | | | | | | | | | | | | | | | | | | | | | | | | | | | | | | | | |
ASSETS (Market Value): | | | | | | | | | | | | | | | | | | | | | | | | | | | | | | | | | | | | | | | | | | | | | | | | | | |
Rights (a) | | | $ | 44,400 | | | | | — | | | | | — | | | | | — | | | | | — | | | | $ | (32,789 | ) | | | | — | | | | | — | | | | $ | 11,611 | | | | | — | |
TOTAL INVESTMENTS IN SECURITIES | | | $ | 44,400 | | | | | — | | | | | — | | | | | — | | | | | — | | | | $ | (32,789 | ) | | | | — | | | | | — | | | | $ | 11,611 | | | | | — | |
| (a) | Please refer to the Schedule of Investments for the industry classifications of these portfolio holdings. |
| † | Net change in unrealized appreciation/depreciation on investments is included in the related amounts in the Statement of Operations. |
Additional Information to Evaluate Qualitative Information.
General.The Funds use recognized industry pricing services – approved by the Board and unaffiliated with the Adviser – to value most of their securities, and use broker quotes provided by market makers of securities not valued by these and other recognized pricing sources. Several different pricing feeds are received to value domestic equity securities, international equity securities, preferred equity securities, and fixed income securities. The data within these feeds are ultimately sourced from major stock exchanges and trading systems where these securities trade. The prices supplied by external sources are checked by obtaining quotations or actual transaction prices from market participants. If a price obtained from the pricing source is deemed unreliable, prices will be sought from another pricing service or from a broker/dealer that trades that security or similar securities.
Fair Valuation.Fair valued securities may be common or preferred equities, warrants, options, rights, or fixed income obligations. Where appropriate, Level 3 securities are those for which market quotations are not available, such as securities not traded for several days or for which current bids are not available, or which are restricted as to transfer. Among the factors to be considered to fair value a security are recent prices of comparable securities that are publicly traded, reliable prices of securities not publicly traded, the use of valuation models, current analyst reports, valuing the income or cash flow of the issuer, or cost if the preceding factors do not apply. A significant change in the unobservable inputs could result in a lower or higher value in Level 3 securities. The circumstances of Level 3 securities are frequently monitored to determine if fair valuation measures continue to apply.
The Adviser reports quarterly to the Board the results of the application of fair valuation policies and procedures. These may include back testing the prices realized in subsequent trades of these fair valued securities to fair values previously recognized.
Securities Sold Short.The Funds may enter into short sale transactions. Short selling involves selling securities that may or may not be owned and, at times, borrowing the same securities for delivery to the purchaser, with an obligation to replace such borrowed securities at a later date. The proceeds received from short sales are recorded as liabilities and the Funds
47
TETON Westwood Funds
Notes to Financial Statements (Continued)
record an unrealized gain or loss to the extent of the difference between the proceeds received and the value of an open short position on the day of determination. The Funds record a realized gain or loss when the short position is closed out. By entering into a short sale, the Funds bear the market risk of an unfavorable change in the price of the security sold short. Dividends on short sales are recorded as an expense by the Funds on theex-dividend date and interest expense is recorded on the accrual basis. The broker retains collateral for the value of the open positions, which is adjusted periodically as the value of the position fluctuates. During the fiscal year ended September 30, 2019, there were no short sales.
Foreign Currency Translations.The books and records of the Funds are maintained in U.S. dollars. Foreign currencies, investments, and other assets and liabilities are translated into U.S. dollars at current exchange rates. Purchases and sales of investment securities, income, and expenses are translated at the exchange rate prevailing on the respective dates of such transactions. Unrealized gains and losses that result from changes in foreign exchange rates and/or changes in market prices of securities have been included in unrealized appreciation/depreciation on investments and foreign currency translations. Net realized foreign currency gains and losses resulting from changes in exchange rates include foreign currency gains and losses between trade date and settlement date on investment securities transactions, foreign currency transactions, and the difference between the amounts of interest and dividends recorded on the books of the Funds and the amounts actually received. The portion of foreign currency gains and losses related to fluctuation in exchange rates between the initial purchase trade date and subsequent sale trade date is included in realized gain/(loss) on investments.
Foreign Securities.The Funds may directly purchase securities of foreign issuers. Investing in securities of foreign issuers involves special risks not typically associated with investing in securities of U.S. issuers. The risks include possible revaluation of currencies, the inability to repatriate funds, less complete financial information about companies, and possible future adverse political and economic developments. Moreover, securities of many foreign issuers and their markets may be less liquid and their prices more volatile than securities of comparable U.S. issuers.
Foreign Taxes.The Funds may be subject to foreign taxes on income, gains on investments, or currency repatriation, a portion of which may be recoverable. The Funds will accrue such taxes and recoveries as applicable, based upon their current interpretation of tax rules and regulations that exist in the markets in which they invest.
Restricted Securities.Each Fund may invest up to 10% (except for the Mighty Mites Fund, SmallCap Equity Fund, and Convertible Securities Fund which may invest up to 15%) of its net assets in securities for which the markets are restricted. Restricted securities include securities whose disposition is subject to substantial legal or contractual restrictions. The sale of restricted securities often requires more time and results in higher brokerage charges or dealer discounts and other selling expenses than does the sale of securities eligible for trading on national securities exchanges or in theover-the-counter markets. Restricted securities may sell at a price lower than similar securities that are not subject to restrictions on resale. Securities freely saleable among qualified institutional investors under special rules adopted by the SEC may be treated as liquid if they satisfy liquidity standards established by the Board. Securities deemed as liquid are not included in the limitations described above. The continued liquidity of such securities is not as well assured as that of publicly traded securities, and accordingly the Board will monitor their liquidity. For the restricted securities the Funds held as of September 30, 2019, refer to the Schedules of Investments.
Investments in other Investment Companies.All Funds may invest, from time to time, in shares of other investment companies (or entities that would be considered investment companies but are excluded from the definition pursuant to certain exceptions under the 1940 Act) (the Acquired Funds) in accordance with the 1940 Act and related rules. Shareholders in these Funds would bear the pro rata portion of the periodic expenses of the Acquired Funds in addition to the Fund’s expenses. For the fiscal year ended September 30, 2019, the Mighty Mites Fund’s pro rata portion of the periodic expenses charged by the Acquired Funds was less than two basis points, the Equity Fund’s and Balanced Fund’s was each less than one basis point and SmallCap Equity Fund’s was less than one half of 1%.
Securities Transactions and Investment Income.Securities transactions are accounted for on the trade date with realized gain or loss on investments determined by using the identified cost method. Interest income (including amortization of premium and accretion of discount) is recorded on the accrual basis. Premiums and discounts on debt securities are amortized using the effective yield to maturity method. Dividend income is recorded on theex-dividend date except for certain dividends from foreign securities that are recorded as soon after theex-dividend date as a Fund becomes aware of such dividends.
Determination of Net Asset Value and Calculation of Expenses.Certain administrative expenses are common to, and allocated among, various affiliated funds. Such allocations are made on the basis of each fund’s average net assets or other criteria directly affecting the expenses as determined by the Adviser pursuant to procedures established by the Board.
48
TETON Westwood Funds
Notes to Financial Statements (Continued)
In calculating the NAV per share of each class, investment income, realized and unrealized gains and losses, redemption fees, and expenses other than class specific expenses are allocated daily to each class of shares based upon the proportion of net assets of each class at the beginning of each day. Distribution expenses are borne solely by the class incurring the expense.
Custodian Fee Credits and Interest Expense.When cash balances are maintained in a Fund’s custody account, the Fund receives credits which are used to offset custodian fees. The gross expenses paid under each custody arrangement are included in custodian fees in the Statements of Operations with the corresponding expense offset, if any, shown as “Custodian fee credits.” When cash balances are overdrawn, a Fund is charged an overdraft fee equal to 90% of the current Treasury Bill rate on outstanding balances. These amounts, if any, would be included in the Statements of Operations.
Distributions to Shareholders.Distributions from net investment income are declared and paid annually for the Mighty Mites Fund, SmallCap Equity Fund, and Equity Fund, and quarterly for the Convertible Securities Fund and Balanced Fund. The Intermediate Bond Fund declares dividends daily and pays those dividends monthly. Distributions of net realized gain on investments are normally declared and paid at least annually by each Fund. Distributions to shareholders are recorded on theex-dividend date. The characterization of distributions to shareholders is based on income and capital gains as determined in accordance with federal income tax regulations, which may differ from income and capital gains as determined under GAAP. These differences are primarily due to differing treatments of income and gains on various investment securities and foreign currency transactions held by the Funds, timing differences, net operating loss write off, and differing characterizations of distributions made by the Funds. Distributions from net investment income for federal income tax purposes include net realized gains on foreign currency transactions. These book/tax differences are either temporary or permanent in nature. To the extent these differences are permanent, adjustments are made to the appropriate capital accounts in the period when the differences arise. These reclassifications have no impact on the NAV of the Funds.
For the fiscal year ended September 30, 2019, the following reclassifications were made to increase/decrease such amounts with offsetting adjustments topaid-in capital:
| | | | | | | | |
| | | Accumulated | | | Paid-in | |
| | | Earnings | | | Capital | |
Mighty Mites Fund. | | | $2,478,410 | | | | $(2,478,410 | ) |
SmallCap Equity Fund | | | (35) | | | | 35 | |
Intermediate Bond Fund | | | 17 | | | | (17 | ) |
The tax character of distributions paid during the fiscal years ended September 30, 2019 and 2018 was as follows:
| | | | | | | | | | | | | | | | | | | | | | | | | | | | | | | | | | | | | | |
| | | Year Ended | | | Year Ended | | | | | | Year Ended | | | |
| | | September 30, | | | September 30, | | | | | | September 30, | | | |
| | | 2019 | | | 2018 | | | 2019 | | | 2018 | | | | | | 2019 | | | | | | 2018 | | | |
| | | Mighty Mites Fund | | | SmallCap Equity Fund | | | | | | Convertible Securities Fund | | | |
Ordinary income (inclusive of short term capital gains) | | | — | | | | — | | | $ | 518,900 | | | $ | 155,315 | | | | | | | | | | | $ | 1,334,142 | | | | | | | $ | 303,010 | | | |
Net long term capital gains | | $ | 47,348,334 | | | $ | 84,699,816 | | | | 3,490,103 | | | | 2,568,471 | | | | | | | | | | | | 461,660 | | | | | | | | — | | | |
| | | | | | | | | | | | | | | | | | | | | | | | | | | | | | | | | | | | | | |
Total distributions paid | | $ | 47,348,334 | | | $ | 84,699,816 | | | $ | 4,009,003 | | | $ | 2,723,786 | | | | | | | | | | | $ | 1,795,802 | | | | | | | $ | 303,010 | | | |
| | | | | | | | | | | | | | | | | | | | | | | | | | | | | | | | | | | | | | |
| | | | | | | | | | | | | | | | | | | | | Intermediate |
| | | Equity Fund | | | Balanced Fund | | | | | | Bond Fund |
Ordinary income (inclusive of short term capital gains) | | $ | 391,760 | | | $ | 935,325 | | | $ | 647,718 | | | $ | 1,014,660 | | | | | | | | | | | $ | 143,197 | | | | | | | $ | 146,250 | | | |
Net long term capital gains | | | 7,941,163 | | | | 5,945,421 | | | | 6,577,492 | | | | 3,449,007 | | | | | | | | | | | | — | | | | | | | | 105,510 | | | |
Return of capital | | | — | | | | — | | | | — | | | | — | | | | | | | | | | | | — | | | | | | | | 61 | | | |
| | | | | | | | | | | | | | | | | | | | | | | | | | | | | | | | | | | | | | |
Total distributions paid | | $ | 8,332,923 | | | $ | 6,880,746 | | | $ | 7,225,210 | | | $ | 4,463,667 | | | | | | | | | | | $ | 143,197 | | | | | | | $ | 251,821 | | | |
| | | | | | | | | | | | | | | | | | | | | | | | | | | | | | | | | | | | | | |
Provision for Income Taxes.The Funds intend to continue to qualify as regulated investment companies under Subchapter M of the Internal Revenue Code of 1986, as amended (the Code). It is the policy of the Funds to comply with the requirements of the Code applicable to regulated investment companies and to distribute substantially all of the Funds’ net investment company taxable income and net capital gains. Therefore, no provision for federal income taxes is required.
49
TETON Westwood Funds
Notes to Financial Statements (Continued)
At September 30, 2019, the components of accumulated earnings/(losses) on a tax basis were as follows:
| | | | | | | | | | | | | | | | | | | | | | | | | | | | | | |
| | | Mighty | | SmallCap | | Convertible | | | | | | |
| | | Mites | | Equity | | Securities | | Equity | | Balanced | | Intermediate |
| | | Fund | | Fund | | Fund | | Fund | | Fund | | Bond Fund |
Undistributed ordinary income (inclusive of short term capital gains) | | | | — | | | | $ | 142,071 | | | | $ | 43,571 | | | | $ | 373,487 | | | | $ | 3,327 | | | | | — | |
Undistributed long term capital gains | | | $ | 34,500,816 | | | | | 177,135 | | | | | 593,019 | | | | | 4,549,624 | | | | | 3,795,001 | | | | | — | |
Accumulated capital loss carryforward | | | | — | | | | | — | | | | | — | | | | | — | | | | | — | | | | $ | (66,364 | ) |
Unrealized appreciation/(depreciation) | | | | 358,998,121 | | | | | 6,462,898 | | | | | 2,941,416 | | | | | 10,259,719 | | | | | 7,698,569 | | | | | 124,328 | |
Other temporary differences | | | | (1,129,615 | ) | | | | — | | | | | — | | | | | — | | | | | — | | | | | — | |
| | | | | | | | | | | | | | | | | | | | | | | | | | | | | | |
| | | | | | |
Total accumulated earnings | | | $ | 392,369,322 | | | | $ | 6,782,104 | | | | $ | 3,578,006 | | | | $ | 15,182,830 | | | | $ | 11,496,897 | | | | $ | 57,964 | |
| | | | | | | | | | | | | | | | | | | | | | | | | | | | | | |
| * | Qualified late year losses related to passive foreign investment companies, ordinary losses, and losses on sales of securities and foreign currency realized after October 31 (certain ordinary losses incurred after December 31) and prior to the Funds’ year end may be elected as occurring on the first day of the following year. |
At September 30, 2019, the temporary differences between book basis and tax basis unrealized appreciation/depreciation on investments was primarily due to deferral of losses from wash sales for tax purposes, investments in REITs,mark-to-market adjustments on investments in passive foreign investment companies, premium amortization, and basis adjustments in partnerships.
The following summarizes the tax cost of investments and the related net unrealized appreciation at September 30, 2019:
| | | | | | | | | | | | | | | | | | | | | | | | | | | | | | |
| | | Mighty | | SmallCap | | Convertible | | | | | | |
| | | Mites | | Equity | | Securities | | Equity | | Balanced | | Intermediate |
| | | Fund | | Fund | | Fund | | Fund | | Fund | | Bond Fund |
| | | | | | |
Aggregate cost of investments | | | $ | 607,621,718 | | | | $ | 34,451,326 | | | | $ | 48,424,157 | | | | $ | 45,849,140 | | | | $ | 52,591,258 | | | | $ | 4,937,921 | |
| | | | | | | | | | | | | | | | | | | | | | | | | | | | | | |
Gross unrealized appreciation | | | $ | 443,288,865 | | | | $ | 8,814,946 | | | | $ | 4,895,703 | | | | $ | 11,424,154 | | | | $ | 8,529,858 | | | | $ | 148,456 | |
Gross unrealized depreciation | | | | (84,288,346 | ) | | | | (2,352,048 | ) | | | | (1,954,287 | ) | | | | (1,164,435 | ) | | | | (831,289 | ) | | | | (24,128 | ) |
| | | | | | | | | | | | | | | | | | | | | | | | | | | | | | |
| | | | | | |
Net unrealized appreciation | | | $ | 359,000,519 | | | | $ | 6,462,898 | | | | $ | 2,941,416 | | | | $ | 10,259,719 | | | | $ | 7,698,569 | | | | $ | 124,328 | |
| | | | | | | | | | | | | | | | | | | | | | | | | | | | | | |
The Funds are required to evaluate tax positions taken or expected to be taken in the course of preparing the Funds’ tax returns to determine whether the tax positions are“more-likely-than-not” of being sustained by the applicable tax authority. Income tax and related interest and penalties would be recognized by the Funds as tax expense in the Statement of Operations if the tax positions were deemed not to meet themore-likely-than-not threshold. During the fiscal year ended September 30, 2019, the Funds did not incur any income tax, interest, or penalties. As of September 30, 2019, the Adviser has reviewed all open tax years and concluded that there was no impact to the Funds’ net assets or results of operations. The Funds’ federal and state tax returns for the prior three fiscal years remain open, subject to examination by the Internal Revenue Service and state taxing authorities. On an ongoing basis, the Adviser will monitor the Funds’ tax positions to determine if adjustments to this conclusion are necessary.
3. Investment Advisory Agreements and Other Transactions.The Funds have entered into investment advisory agreements (the Advisory Agreements) with the Adviser which provide that the Funds will pay the Adviser a fee, computed daily and paid monthly, at the annual rate of 1.00% for the Mighty Mites Fund, SmallCap Equity Fund, Convertible Securities Fund, and Equity Fund, 0.75% for the Balanced Fund, and 0.60% for the Intermediate Bond Fund, of the value of a Fund’s average daily net assets. In accordance with the Advisory Agreements, the Adviser provides a continuous investment program for the Funds’ portfolios, oversees the administration of all aspects of the Funds’ business and affairs, and pays the compensation of all Officers and Trustees of the Funds who are affiliated persons of the Adviser.
There was a reduction in the advisory fee paid to the Adviser relating to certain portfolio holdings, i.e., unsupervised assets, of the Mighty Mites Fund with respect to which the Adviser transferred dispositive and voting control to the Funds’ Proxy Voting Committee. During the fiscal year ended September 30, 2019, the Funds’ Proxy Voting Committee exercised control and discretion over all rights to vote or consent with respect to such securities, and the Adviser reduced its fee with respect to such securities by $60,653.
The Adviser has contractually agreed to waive investment advisory fees and/or to reimburse expenses to the SmallCap Equity Fund, Convertible Securities Fund, and Intermediate Bond Fund in the event annual expenses of such Funds exceed certain prescribed limits. Such fee waiver/reimbursement arrangements continue at least until January 31, 2021. For the fiscal year ended September 30, 2019, the Adviser waived fees or reimbursed expenses in the amounts of $155,872, $183,238, and $103,301 for the SmallCap Equity Fund, Convertible Securities Fund, and Intermediate Bond Fund, respectively.
50
TETON Westwood Funds
Notes to Financial Statements (Continued)
In addition, the SmallCap Equity Fund, the Convertible Securities Fund, and the Intermediate Bond Fund are obliged to repay the Adviser for a period of two fiscal years following the fiscal year in which the Adviser reimbursed the Funds only to the extent that the operating expenses of these Funds fall below the following expense limitations based on average net assets for the SmallCap Equity Fund, the Convertible Securities Fund, and the Intermediate Bond Fund for Class AAA Shares 1.25%, 1.15%, and 1.00%, respectively, for Class A Shares 1.50%, 1.40%, and 1.10%, respectively, for Class C Shares 2.00%, 1.90%, and 1.75%, respectively, and for Class I Shares 1.00%, 0.90%, and 0.75%, respectively. As of September 30, 2019, the cumulative unreimbursed amounts which may be recovered by the Adviser within the next two fiscal years are as follows:
| | | | | | | | | | | | | | | |
| | | For the year ended
September 30, 2018,
expiring
September 30, 2020 | | For the year ended
September 30, 2019,
expiring
September 30, 2021 | | Total |
SmallCap Equity Fund. | | | | $163,050 | | | | | $155,872 | | | | | $318,922 | |
Convertible Securities Fund | | | | 164,831 | | | | | 183,238 | | | | | 348,069 | |
Intermediate Bond Fund | | | | 92,897 | | | | | 103,301 | | | | | 196,198 | |
Gabelli Funds, LLC is a subadviser to the Adviser for the Mighty Mites Fund and the Convertible Securities Fund. The Adviser pays Gabelli Funds, LLC out of its advisory fees a subadvisory fee, computed daily and payable monthly, based on an annual rate of 0.32% of the average net assets of these two funds.
In addition, the Adviser has a Subadvisory Agreement with Westwood Management Corp. for the Equity Fund and Balanced Fund. The Adviser pays Westwood Management Corp. out of its advisory fees with respect to these latter two funds a subadvisory fee, computed daily and payable monthly, in an amount equal on an annualized basis to the greater of (i) $150,000 per year on an aggregate basis for these Funds or (ii) 35% of the net revenues to the Adviser from these Funds.
The Adviser has asub-administration agreement for each of the Funds with Gabelli Funds, LLC. Gabelli Funds, LLC has entered into an agreement with BNY Mellon Investment Servicing (US) Inc. to provide certain administrative services to the Funds.
The Trust pays each Trustee who is not considered an affiliated person an annual retainer of $9,000 plus $2,000 for each Board meeting attended, and they are reimbursed by the Trust for any out of pocket expenses incurred in attending meetings. All Board committee members receive $1,000 per meeting attended, the Chairman of the Audit Committee receives a $3,000 annual fee, and the Lead Trustee receives an annual fee of $2,000. A Trustee may receive a single meeting fee, allocated among the participating funds, for attending certain meetings held on behalf of multiple funds. Trustees who are directors or employees of the Adviser or an affiliated company receive no compensation or expense reimbursement from the Trust.
4. Distribution Plan.The Trust’s Board has adopted a distribution plan (the Plan) for each class of shares, except Class I Shares, pursuant to Rule12b-1 under the 1940 Act. Under the Class AAA, Class A, and Class C Share Plans, payments are authorized to G.distributors, LLC (the Distributor), an affiliate of the Adviser, at annual rates of 0.25%, 0.50% (for the Intermediate Bond Fund’s Class A Shares at an annual rate of 0.35%), and 1.00%, respectively, of the average daily net assets of those classes, the annual limitations under each Plan. Such payments are accrued daily and paid monthly.
5. Portfolio Securities.Purchases and sales (including maturities) of securities during the fiscal year ended September 30, 2019, other than short term securities, are as follows:
| | | | | | | | | | | | | | | | | | | | |
| | | Purchases
(excluding U.S.
Government
Securities) | | Sales
(excluding U.S.
Government
Securities) | | Purchases
of U.S.
Government
Securities | | Sales of U.S.
Government
Securities |
Mighty Mites Fund | | | $ | 83,309,042 | | | | $ | 149,686,275 | | | | | — | | | | | — | |
SmallCap Equity Fund | | | | 16,804,394 | | | | | 13,299,686 | | | | | — | | | | | — | |
Convertible Securities Fund | | | | 30,096,308 | | | | | 9,470,129 | | | | | — | | | | | — | |
Equity Fund | | | | 15,470,776 | | | | | 22,975,006 | | | | | — | | | | | — | |
Balanced Fund. | | | | 17,048,158 | | | | | 27,761,716 | | | | $ | 8,394,692 | | | | $ | 3,692,456 | |
Intermediate Bond Fund | | | | 3,677,789 | | | | | 2,848,618 | | | | | — | | | | | 1,624,674 | |
6. Transactions with Affiliates and Other Arrangements.During the fiscal year ended September 30, 2019, the Mighty Mites Fund and the Convertible Securities Fund paid $236,934 and $9, respectively, in brokerage commissions on security trades to G.research, LLC, an affiliate of the Adviser. Additionally, the Distributor retained a total of $32,361 from investors representing commissions (sales charges and underwriting fees) on sales and redemptions of Fund shares.
During the fiscal year ended September 30, 2019, the Mighty Mites Fund, SmallCap Equity Fund, Convertible Securities Fund, Equity Fund, and Balanced Fund received credits from a designated broker who agreed to pay certain Fund operating expenses.
51
TETON Westwood Funds
Notes to Financial Statements (Continued)
The amount of such expenses paid through this directed brokerage arrangement during this period was $4,446, $1,461, $1,094, $1,542, and $1,498, respectively.
The cost of calculating each Fund’s NAV per share is a Fund expense pursuant to the Advisory Agreement. During the fiscal year ended September 30, 2019, the Mighty Mites Fund, Equity Fund, and Balanced Fund each accrued $45,000 in connection with the cost of computing these Funds’ NAVs. This expense was not charged during the fiscal year ended September 30, 2019 for the SmallCap Equity Fund, Convertible Securities Fund, and Intermediate Bond Fund.
7. Significant Shareholder.As of September 30, 2019, 11.3% of the Convertible Securities Fund was beneficially owned by the Adviser and its affiliates, including managed accounts for which the affiliates of the Adviser have voting control but disclaim pecuniary interest.
8. Shares of Beneficial Interest.The Funds offer four classes of shares – Class AAA Shares, Class A Shares, Class C Shares, and Class I Shares. Class AAA Shares and Class I Shares are offered without a sales charge. Class A Shares are subject to a maximumfront-end sales charge of 4.00%. Class C Shares are subject to a 1.00% contingent deferred sales charge for one year after purchase. Class T Shares were liquidated on August 31, 2018.
The Mighty Mites Fund, SmallCap Equity Fund, and Convertible Securities Fund impose a redemption fee of 2.00% on all classes of shares that are redeemed or exchanged on or before the seventh day of a purchase. The redemption fee is deducted from the proceeds otherwise payable to the redeeming shareholders and is retained by the respective Fund as an increase inpaid-in capital. The redemption fees, if any, retained by the Fund during the fiscal year ended September 30, 2019 and September 30, 2018 can be found in the Statements of Changes in Net Assets under Redemption Fees.
Transactions in shares of beneficial interest were as follows:
| | | | | | | | | | | | | | | | | | | | | | | | | | | | | | | | | | | | | | | | | | | | | | | | | | | | | | | |
| | | Year Ended
September 30,
2019 | | Year Ended
September 30,
2018 | | Year Ended
September 30,
2019 | | Year Ended
September 30,
2018 | | Year Ended
September 30,
2019 | | Year Ended
September 30,
2018 |
| | | Mighty Mites Fund | | SmallCap Equity Fund | | Convertible Securities Fund |
Class AAA | | | | | | | | | | | | | | | | | | | | | | | | | | | | | | | | | | | | | | | | | | | | | | | | | | | | | | | |
Shares sold | | | | 410,520 | | | | | | | | | | 1,143,746 | | | | | | | | | | 61,782 | | | | | | | | | | 98,106 | | | | | | | | | | 92,200 | | | | | | | | | | 68,178 | |
Shares issued upon reinvestment of distributions | | | | 282,053 | | | | | | | | | | 560,590 | | | | | | | | | | 55,403 | | | | | | | | | | 38,375 | | | | | | | | | | 18,828 | | | | | | | | | | 4,862 | |
Shares redeemed | | | | (2,446,173 | ) | | | | | | | | | (3,160,420 | ) | | | | | | | | | (117,789 | ) | | | | | | | | | (139,152 | ) | | | | | | | | | (61,680 | ) | | | | | | | | | (83,138 | ) |
| | | | | | | | | | | | | | | | | | | | | | | | | | | | | | | | | | | | | | | | | | | | | | | | | | | | | | | |
Net increase/(decrease) in Class AAA Shares | | | | (1,753,600 | ) | | | | | | | | | (1,456,084 | ) | | | | | | | | | (604 | ) | | | | | | | | | (2,671 | ) | | | | | | | | | 49,348 | | | | | | | | | | (10,098 | ) |
| | | | | | | | | | | | | | | | | | | | | | | | | | | | | | | | | | | | | | | | | | | | | | | | | | | | | | | |
Class A | | | | | | | | | | | | | | | | | | | | | | | | | | | | | | | | | | | | | | | | | | | | | | | | | | | | | | | |
Shares sold | | | | 605,833 | | | | | | | | | | 772,830 | | | | | | | | | | 50,966 | | | | | | | | | | 76,175 | | | | | | | | | | 113,762 | | | | | | | | | | 137,957 | |
Shares issued upon reinvestment of distributions | | | | 140,312 | | | | | | | | | | 292,320 | | | | | | | | | | 29,927 | | | | | | | | | | 16,975 | | | | | | | | | | 14,859 | | | | | | | | | | 2,662 | |
Shares redeemed | | | | (1,665,189 | ) | | | | | | | | | (2,991,223 | ) | | | | | | | | | (64,736 | ) | | | | | | | | | (22,441 | ) | | | | | | | | | (49,374 | ) | | | | | | | | | (92,023 | ) |
| | | | | | | | | | | | | | | | | | | | | | | | | | | | | | | | | | | | | | | | | | | | | | | | | | | | | | | |
Net increase/(decrease) in Class A Shares | | | | (919,044 | ) | | | | | | | | | (1,926,073 | ) | | | | | | | | | 16,157 | | | | | | | | | | 70,709 | | | | | | | | | | 79,247 | | | | | | | | | | 48,596 | |
| | | | | | | | | | | | | | | | | | | | | | | | | | | | | | | | | | | | | | | | | | | | | | | | | | | | | | | |
Class C | | | | | | | | | | | | | | | | | | | | | | | | | | | | | | | | | | | | | | | | | | | | | | | | | | | | | | | |
Shares sold | | | | 312,594 | | | | | | | | | | 915,856 | | | | | | | | | | 126,284 | | | | | | | | | | 54,393 | | | | | | | | | | 130,560 | | | | | | | | | | 136,720 | |
Shares issued upon reinvestment of distributions | | | | 268,060 | | | | | | | | | | 457,902 | | | | | | | | | | 25,160 | | | | | | | | | | 11,795 | | | | | | | | | | 9,874 | | | | | | | | | | 703 | |
Shares redeemed | | | | (2,329,790 | ) | | | | | | | | | (1,664,454 | ) | | | | | | | | | (93,482 | ) | | | | | | | | | (27,138 | ) | | | | | | | | | (55,614 | ) | | | | | | | | | (40,750 | ) |
| | | | | | | | | | | | | | | | | | | | | | | | | | | | | | | | | | | | | | | | | | | | | | | | | | | | | | | |
Net increase/(decrease) in Class C Shares | | | | (1,749,136 | ) | | | | | | | | | (290,696 | ) | | | | | | | | | 57,962 | | | | | | | | | | 39,050 | | | | | | | | | | 84,820 | | | | | | | | | | 96,673 | |
| | | | | | | | | | | | | | | | | | | | | | | | | | | | | | | | | | | | | | | | | | | | | | | | | | | | | | | |
Class I | | | | | | | | | | | | | | | | | | | | | | | | | | | | | | | | | | | | | | | | | | | | | | | | | | | | | | | |
Shares sold | | | | 4,540,036 | | | | | | | | | | 10,607,226 | | | | | | | | | | 697,664 | | | | | | | | | | 357,650 | | | | | | | | | | 1,830,022 | | | | | | | | | | 868,258 | |
Shares issued upon reinvestment of distributions | | | | 757,242 | | | | | | | | | | 1,051,566 | | | | | | | | | | 115,514 | | | | | | | | | | 62,752 | | | | | | | | | | 92,646 | | | | | | | | | | 14,082 | |
Shares redeemed | | | | (13,009,360 | ) | | | | | | | | | (4,441,243 | ) | | | | | | | | | (543,276 | ) | | | | | | | | | (240,725 | ) | | | | | | | | | (595,550 | ) | | | | | | | | | (125,418 | ) |
| | | | | | | | | | | | | | | | | | | | | | | | | | | | | | | | | | | | | | | | | | | | | | | | | | | | | | | |
Net increase/(decrease) in Class I Shares | | | | (7,712,082 | ) | | | | | | | | | 7,217,549 | | | | | | | | | | 269,902 | | | | | | | | | | 179,677 | | | | | | | | | | 1,327,118 | | | | | | | | | | 756,922 | |
| | | | | | | | | | | | | | | | | | | | | | | | | | | | | | | | | | | | | | | | | | | | | | | | | | | | | | | |
Class T * | | | | | | | | | | | | | | | | | | | | | | | | | | | | | | | | | | | | | | | | | | | | | | | | | | | | | | | |
Shares issued upon reinvestment of distributions | | | | — | | | | | | | | | | 23 | | | | | | | | | | — | | | | | | | | | | 5 | | | | | | | | | | — | | | | | | | | | | — | |
Shares redeemed | | | | — | | | | | | | | | | (388 | ) | | | | | | | | | — | | | | | | | | | | (55 | ) | | | | | | | | | — | | | | | | | | | | — | |
| | | | | | | | | | | | | | | | | | | | | | | | | | | | | | | | | | | | | | | | | | | | | | | | | | | | | | | |
Net decrease in Class T Shares | | | | — | | | | | | | | | | (365 | ) | | | | | | | | | — | | | | | | | | | | (50 | ) | | | | | | | | | — | | | | | | | | | | — | |
| | | | | | | | | | | | | | | | | | | | | | | | | | | | | | | | | | | | | | | | | | | | | | | | | | | | | | | |
| * | Class T Shares were liquidated on August 31, 2018. |
52
TETON Westwood Funds
Notes to Financial Statements (Continued)
Transactions in shares of beneficial interest (continued):
| | | | | | | | | | | | | | | | | | | | | | | | | | | | | | |
| | | Year Ended | | Year Ended | | Year Ended | | Year Ended | | Year Ended | | Year Ended |
| | | September 30, | | September 30, | | September 30, | | September 30, | | September 30, | | September 30, |
| | | 2019 | | 2018 | | 2019 | | 2018 | | 2019 | | 2018 |
| | | | | | | | | | | Intermediate |
| | | Equity Fund | | Balanced Fund | | Bond Fund |
Class AAA | | | | | | | | | | | | | | | | | | | | | | | | | | | | | | |
Shares sold | | | | 35,978 | | | | | 36,247 | | | | | 705,719 | | | | | 137,074 | | | | | 47,051 | | | | | 53,773 | |
Shares issued upon reinvestment of distributions | | | | 613,282 | | | | | 453,525 | | | | | 479,379 | | | | | 284,434 | | | | | 6,093 | | | | | 10,289 | |
Shares redeemed | | | | (548,911 | ) | | | | (531,459 | ) | | | | (1,018,422 | ) | | | | (963,903 | ) | | | | (91,204 | ) | | | | (73,711 | ) |
| | | | | | | | | | | | | | | | | | | | | | | | | | | | | | |
| | | | | | |
Net increase/(decrease) in Class AAA Shares | | | | 100,349 | | | | | (41,687 | ) | | | | 166,676 | | | | | (542,395 | ) | | | | (38,060 | ) | | | | (9,649 | ) |
| | | | | | | | | | | | | | | | | | | | | | | | | | | | | | |
Class A | | | | | | | | | | | | | | | | | | | | | | | | | | | | | | |
Shares sold | | | | 5,690 | | | | | 788 | | | | | 308,884 | | | | | 205,822 | | | | | 99,206 | | | | | 110,675 | |
Shares issued upon reinvestment of distributions | | | | 16,765 | | | | | 21,153 | | | | | 85,110 | | | | | 44,314 | | | | | 1,218 | | | | | 897 | |
Shares redeemed | | | | (17,470 | ) | | | | (102,192 | ) | | | | (282,916 | ) | | | | (218,389 | ) | | | | (45,119 | ) | | | | (126,171 | ) |
| | | | | | | | | | | | | | | | | | | | | | | | | | | | | | |
Net increase/(decrease) in Class A Shares | | | | 4,985 | | | | | (80,251 | ) | | | | 111,078 | | | | | 31,747 | | | | | 55,305 | | | | | (14,599 | ) |
| | | | | | | | | | | | | | | | | | | | | | | | | | | | | | |
Class C | | | | | | | | | | | | | | | | | | | | | | | | | | | | | | |
Shares sold | | | | 5,883 | | | | | 382 | | | | | 40,314 | | | | | 24,212 | | | | | 12,345 | | | | | 10,932 | |
Shares issued upon reinvestment of distributions | | | | 5,371 | | | | | 5,783 | | | | | 40,971 | | | | | 22,689 | | | | | 836 | | | | | 2,667 | |
Shares redeemed | | | | (36,678 | ) | | | | (24,686 | ) | | | | (257,175 | ) | | | | (57,658 | ) | | | | (39,448 | ) | | | | (38,241 | ) |
| | | | | | | | | | | | | | | | | | | | | | | | | | | | | | |
Net decrease in Class C Shares | | | | (25,424 | ) | | | | (18,521 | ) | | | | (175,890 | ) | | | | (10,757 | ) | | | | (26,267 | ) | | | | (24,642 | ) |
| | | | | | | | | | | | | | | | | | | | | | | | | | | | | | |
Class I | | | | | | | | | | | | | | | | | | | | | | | | | | | | | | |
Shares sold | | | | 18,031 | | | | | 67,552 | | | | | 32,773 | | | | | 267,185 | | | | | 6,278 | | | | | 25,437 | |
Shares issued upon reinvestment of distributions | | | | 59,647 | | | | | 40,968 | | | | | 37,989 | | | | | 16,765 | | | | | 4,579 | | | | | 8,626 | |
Shares redeemed | | | | (114,473 | ) | | | | (123,082 | ) | | | | (68,440 | ) | | | | (130,604 | ) | | | | (181,202 | ) | | | | (79,383 | ) |
| | | | | | | | | | | | | | | | | | | | | | | | | | | | | | |
Net increase/(decrease) in Class I Shares | | | | (36,795 | ) | | | | (14,562 | ) | | | | 2,322 | | | | | 153,346 | | | | | (170,345 | ) | | | | (45,320 | ) |
| | | | | | | | | | | | | | | | | | | | | | | | | | | | | | |
9. Transactions in Securities of Affiliated Issuers.The 1940 Act defines affiliated issuers as those in which a Fund’s holdings of an issuer represent 5% or more of the outstanding voting securities of the issuer. A summary of the Mighty Mites Fund’s transactions in the securities of these issuers during the fiscal year ended September 30, 2019 is set forth below:
| | | | | | | | | | | | | | | | | | | | | | | | | | | | | | | | | | | | | | | | | | | | | |
| | | | | | | | | | | | | | | | | Change in | | Percent |
| | | | | | | | | | | | | Realized | | Market | | Unrealized | | Owned of |
| | | Beginning | | Shares | | Shares | | Ending | | Dividend | | Gain/ | | Value at | | Appreciation/ | | Shares |
| | | Shares | | Purchased | | Sold | | Shares | | Income | | (Loss) | | September 30, 2019 | | (Depreciation) | | Outstanding |
| Beasley Broadcast Group Inc., | | | | | | | | | | | | | | | | | | | | | | | | | | | | | | | | | | | | | | | | | | | | | |
| Cl. A | | | | 850,000 | | | | | 52,000 | | | | | — | | | | | 902,000 | | | | | $ 175,450 | | | | | — | | | | | $ 2,796,200 | | | | | $(3,262,141) | | | | | 8.04% | |
| Bel Fuse Inc., Cl. A | | | | 175,999 | | | | | — | | | | | (6,000) | | | | | 169,999 | | | | | 42,240 | | | | | $(71,458 | ) | | | | 2,330,686 | | | | | (1,227,135) | | | | | 7.93% | |
| Burnham Holdings Inc., Cl. A | | | | 264,001 | | | | | 5,999 | | | | | — | | | | | 270,000 | | | | | 236,280 | | | | | — | | | | | 3,847,500 | | | | | (200,646) | | | | | 8.91% | |
| General Chemical Group Inc.† | | | | 267,226 | | | | | — | | | | | — | | | | | 267,226 | | | | | — | | | | | — | | | | | 2,138 | | | | | 134 | | | | | 8.60% | |
| Griffin Industrial Realty Inc. | | | | 275,000 | | | | | 7,508 | | | | | (1,058) | | | | | 281,450 | | | | | 123,750 | | | | | 13,853 | | | | | 10,681,028 | | | | | (266,575) | | | | | 5.55% | |
| Nathan’s Famous Inc. | | | | 222,634 | | | | | — | | | | | (400) | | | | | 222,234 | | | | | 322,679 | | | | | 31,252 | | | | | 15,967,513 | | | | | (2,320,329) | | | | | 5.26% | |
| Schmitt Industries Inc.† | | | | 701,029 | | | | | — | | | | | (1,029) | | | | | 700,000 | | | | | — | | | | | 422 | | | | | 1,599,500 | | | | | (367,952) | | | | | 17.36% | |
| The Eastern Co. | | | | 355,131 | | | | | 5,300 | | | | | — | | | | | 360,431 | | | | | 157,787 | | | | | — | | | | | 8,945,897 | | | | | (1,284,913) | | | | | 5.78% | |
| The L.S. Starrett Co., Cl. A† | | | | 353,183 | | | | | 4,900 | | | | | (20,263) | | | | | 337,820 | | | | | — | | | | | (197,175 | ) | | | | 1,959,356 | | | | | 113,128 | | | | | 5.44% | |
| Trans-Lux Corp.† | | | | 411,792 | | | | | 558,292 | | | | | — | | | | | 970,084 | | | | | — | | | | | — | | | | | 497,168 | | | | | (244,416) | | | | | 7.22% | |
| Trans-Lux Pfd. 6.000%* | | | | 363 | | | | | — | | | | | (363) | | | | | — | | | | | 2,178 | | | | | — | | | | | — | | | | | — | | | | | — | |
| | | | | | | | | | | | | | | | | | | | | | | | | | | | | | |
Total | | | | | | | | | | | | | | | | | | | | | | | | $1,060,364 | | | | | $(223,106 | ) | | | | $48,626,986 | | | | | $(9,060,845) | | | | | | |
| | | | | | | | | | | | | | | | | | | | | | | | | | | | | | |
| † | Non-income producing security. |
| * | Security is no longer held at September 30, 2019. |
10. Indemnifications.The Funds enter into contracts that contain a variety of indemnifications. The Funds’ maximum exposure under these arrangements is unknown. However, the Funds have not had prior claims or losses pursuant to these contracts. Management has reviewed the Funds’ existing contracts and expects the risk of loss to be remote.
11. Subsequent Events.Management has evaluated the impact on the Funds of all other subsequent events occurring through the date the financial statements were issued and has determined that there were no subsequent events requiring recognition or disclosure in the financial statements.
53
Report of Independent Registered Public Accounting Firm
To the Board of Trustees of TETON Westwood Funds and Shareholders of TETON Westwood Mighty MitesSM Fund, TETON Westwood SmallCap Equity Fund, TETON Convertible Securities Fund, TETON Westwood Equity Fund, TETON Westwood Balanced Fund, and TETON Westwood Intermediate Bond Fund
Opinions on the Financial Statements
We have audited the accompanying statement of assets and liabilities, including the summary schedule of investments, of TETON Westwood Mighty MitesSM Fund and the accompanying statements of assets and liabilities, including the schedules of investments, of TETON Westwood SmallCap Equity Fund, TETON Convertible Securities Fund, TETON Westwood Equity Fund, TETON Westwood Balanced Fund and TETON Westwood Intermediate Bond Fund (six of the funds constituting TETON Westwood Funds, hereafter collectively referred to as the “Funds”) as of September 30, 2019, the related statements of operations for the year ended September 30, 2019, the statements of changes in net assets for each of the two years in the period ended September 30, 2019, including the related notes, and the financial highlights for each of the five years in the period ended September 30, 2019 (collectively referred to as the “financial statements”). In our opinion, the financial statements present fairly, in all material respects, the financial position of each of the Funds as of September 30, 2019, the results of each of their operations for the year then ended, the changes in each of their net assets for each of the two years in the period ended September 30, 2019 and each of the financial highlights for each of the five years in the period ended September 30, 2019 in conformity with accounting principles generally accepted in the United States of America.
Basis for Opinions
These financial statements are the responsibility of the Funds’ management. Our responsibility is to express an opinion on the Funds’ financial statements based on our audits. We are a public accounting firm registered with the Public Company Accounting Oversight Board (United States) (“PCAOB”) and are required to be independent with respect to the Funds in accordance with the U.S. federal securities laws and the applicable rules and regulations of the Securities and Exchange Commission and the PCAOB.
We conducted our audits of these financial statements in accordance with the standards of the PCAOB. Those standards require that we plan and perform the audit to obtain reasonable assurance about whether the financial statements are free of material misstatement, whether due to error or fraud.
Our audits included performing procedures to assess the risks of material misstatement of the financial statements, whether due to error or fraud, and performing procedures that respond to those risks. Such procedures included examining, on a test basis, evidence regarding the amounts and disclosures in the financial statements. Our audits also included evaluating the accounting principles used and significant estimates made by management, as well as evaluating the overall presentation of the financial statements. Our procedures included confirmation of securities owned as of September 30, 2019 by correspondence with the custodian and brokers; when replies were not received from brokers, we performed other auditing procedures. We believe that our audits provide a reasonable basis for our opinions.
/s/PricewaterhouseCoopers LLP
New York, New York
November 26, 2019
We have served as the auditor of one or more investment companies in Gabelli/GAMCO Fund Complex since 1986.
54
2019 Tax Notice to Shareholders (Unaudited)
U.S. Government Income: –The percentage of the ordinary income dividend paid by the SmallCap Equity Fund, the Convertible Securities Fund, the Balanced Fund, and the Intermediate Bond Fund, (the “Funds”) during the year ended September 30, 2019 which was derived from U.S. Treasury securities was 0.41%, 1.32%, 11.59%, and 31.71%, respectively. Such income is exempt from state and local tax in all states. However, many states, including New York and California, allow a tax exemption for a portion of the income earned only if a mutual fund has invested at least 50% of its assets at the end of each quarter of the Fund’s fiscal year in U.S. Government securities. The Funds did not meet this strict requirement during the fiscal year ended September 30, 2019. Due to the diversity in state and local tax law, it is recommended that you consult your personal tax adviser for the applicability of the information provided as to your specific situation.
Mighty Mites Fund –During the fiscal year ended September 30, 2019, the Fund paid to shareholders long term capital gains totaling $47,348,334. The distributions of long term capital gains have been designated as a capital gain dividend by the Fund’s Board of Trustees.
SmallCap Equity Fund –During the fiscal year ended September 30, 2019, the Fund paid to shareholders ordinary income dividends (comprised of short term capital gains) totaling $0.2862 per share for all Classes of Shares, ordinary income dividends (comprised of net investment income) totaling $0.0242 per share for Class I Shares, and long term capital gains totaling $3,490,103. The distributions of long term capital gains have been designated as a capital gain dividend by the Fund’s Board of Trustees. For the fiscal year ended September 30, 2019, 59.79% of the ordinary income dividend qualifies for the dividends received deduction available to corporations. The Fund designates 60.68% of the ordinary income distributions as qualified dividend income, pursuant to the Jobs and Growth Tax Relief Reconciliation Act of 2003. The Fund designates 100% of the ordinary income distributions as qualified short term capital gain. The Fund designates 6.92% of the ordinary income distributions as qualified interest income, pursuant to the American Jobs Creation Act of 2004.
Convertible Securities Fund –During the fiscal year ended September 30, 2019, the Fund paid to shareholders ordinary income dividends (comprised of net investment income) totaling $0.2290, $0.1950, $0.1278, and $0.2620 per share for Class AAA, Class A, Class C, and Class I Shares, respectively, and long term capital gains totaling $461,660. The distributions of long term capital gains have been designated as a capital gain dividend by the Fund’s Board of Trustees. For the fiscal year ended September 30, 2019, 35.70% of the ordinary income dividend qualifies for the dividends received deduction available to corporations. The Fund designates 35.04% of the ordinary income distributions as qualified dividend income, pursuant to the Jobs and Growth Tax Relief Reconciliation Act of 2003. The Fund designates 33.76% of the ordinary income distributions as qualified interest income, pursuant to the American Jobs Creation Act of 2004. The Fund designates 100% of the ordinary income distributions as qualified short term capital gain.
Equity Fund –During the fiscal year ended September 30, 2019, the Fund paid to shareholders ordinary income dividends (comprised of net investment income and short term capital gains) totaling $0.0889, $0.0490, and $0.1236 per share for Class AAA, Class A, and Class I Shares, respectively, and long term capital gains totaling $7,941,163. For the fiscal year ended September 30, 2019, 100% of the ordinary income dividend qualifies for the dividends received deduction available to corporations. The Fund designates 100% of the ordinary income distribution as qualified dividend income, pursuant to the Jobs and Growth Tax Relief Reconciliation Act of 2003. The Fund designates 0.78% of the ordinary income distribution as qualified interest income, pursuant to the American Jobs Creation Act of 2004.
Balanced Fund –During the fiscal year ended September 30, 2019, the Fund paid to shareholders ordinary income dividends (comprised of net investment income) totaling $0.1316, $0.1030, $0.0350, and $0.1603 per share for Class AAA, Class A, Class C, and Class I Shares, respectively, and long term capital gains totaling $6,577,492. The distributions of long term capital gains have been designated as a capital gain dividend by the Fund’s Board of Trustees. For the fiscal year ended September 30, 2019, 100% of the ordinary income dividend qualifies for the dividends received deduction available to corporations. The Fund designates 100% of the ordinary income distributions as qualified dividend income, pursuant to the Jobs and Growth Tax Relief Reconciliation Act of 2003. The Fund designates 38.76% of the ordinary income distributions as qualified interest income, pursuant to the American Jobs Creation Act of 2004.
Intermediate Bond Fund –During the fiscal year ended September 30, 2019, the Fund paid to shareholders ordinary income dividends (comprised of net investment income) totaling $0.2381, $0.2263, $0.1427, and $0.2675 per share for Class AAA, Class A, Class C, and Class I Shares, respectively. The Fund designates 97.95% of the ordinary income distributions as qualified interest income, pursuant to the American Jobs Creation Act of 2004.
All designations are based on financial information available as of the date of this annual report and, accordingly, are subject to change. For each item, it is the intention of the Fund to designate the maximum amount permitted under the Internal Revenue Code and the regulations thereunder.
55
TETON Westwood Funds
Board Consideration andRe-Approval of Investment Advisory and Subadvisory Agreements (Unaudited)
In determining whether to approve the continuance of the Investment Advisory Agreement and Subadvisory Agreement (together, the Agreements), the Board, including a majority of the Trustees who have no direct or indirect interest in the Agreements and are not interested persons of the Funds, as defined in the 1940 Act (the Independent Board Members), considered the following information at a meeting on August 20, 2019:
1) The nature, extent, and quality of services provided by the Adviser and the Subadvisers.
The Board reviewed in detail the nature and extent of the services provided by the Adviser and the Subadvisers under the Agreements and the quality of those services over the past year. The Board noted that these services included managing the investment program of the Funds, including the purchase and sale of portfolio securities, as well as the provision of general corporate services. The Board considered that the Adviser also provided, at its expense, office facilities for use by the Funds and supervisory personnel responsible for supervising the performance of administrative, accounting, and related services including, for each Fund, monitoring to assure compliance with stated investment policies and restrictions under the 1940 Act and related securities regulations. The Board noted that, in addition to managing the investment program for the Funds, the Adviser provided certainnon-advisory and compliance services, including services under the Funds’ Rule38a-1 compliance program.
The Board also considered that the Adviser paid for all compensation of officers and Board Members of the Funds who are affiliated with the Adviser and that the Adviser further provided services to shareholders of the Funds who had invested through various programs offered by third party financial intermediaries. The Board evaluated these factors based on its direct experience with the Adviser and Subadvisers and in consultation with Fund Counsel. The Board noted that the Adviser had engaged, at its expense, BNY, to assist it in performing certain of its administrative functions. The Board concluded that the nature and extent of the services provided was reasonable and appropriate in relation to the advisory fee, that the level of services provided by the Adviser, either directly or through BNY, and by the Subadvisers, had not diminished over the past year and that the quality of service continued to be high.
The Board reviewed the personnel responsible for providing services to the Funds and concluded, based on their experience and interaction with the Adviser and Subadvisers, that (i) the Adviser and Subadvisers were able to retain quality personnel, (ii) the Adviser, Subadvisers, and their agents exhibited a high level of diligence and attention to detail in carrying out their advisory and administrative responsibilities under the Agreements, (iii) the Adviser and Subadvisers were responsive to requests of the Board, (iv) the scope and depth of the Adviser’s and Subadvisers’ resources were adequate, and (v) the Adviser and Subadvisers had kept the Board apprised of developments relating to each Fund and the industry in general. The Board also focused on the Adviser’s reputation and long standing relationship with the Funds. The Board also believed that the Adviser had devoted substantial resources and made substantial commitments to address new regulatory compliance requirements applicable to the Funds.
2) The performance of the Funds, the Adviser, and the Subadvisers.
The Board reviewed the investment performance of each Fund, on an absolute basis, as compared with Broadridge peer group of other SEC registered funds, and against each Fund’s broad based securities market benchmarks as reflected in each Fund’s prospectuses and annual report. The Board also considered rankings and ratings of the Funds issued by Broadridge over the short, intermediate, and long term. The Board considered each Fund’s one, three, five, and ten year average annual total return for the periods ended June 30, 2019, but placed greatest emphasis on a Fund’s longer term performance. The peer groups considered by the Board were developed by Broadridge and were comprised of funds within the same Broadridge peer group category (the “Performance Peer Group”), regardless of asset size or primary channel of distribution. Each Fund’s performance against the Performance Peer Group was considered by the Board as providing an objective comparative benchmark against which each Fund’s performance could be assessed. In general, the Board considered these comparisons helpful in their assessment as to whether the Adviser was obtaining for the Funds’ shareholders the total return performance that was available in the marketplace, given each Fund’s investment objectives, strategies, limitations, and restrictions. In reviewing the Funds’ performance, the Board noted that the Equity Fund’s performance was below the median for the one year, three year, five year, and ten year periods; the Balanced Fund’s performance was above the median for the one year, three year, five year, and ten year periods; the SmallCap Equity Fund’s performance was above the median for the one year, three year, five year, and ten year periods; the Mighty Mites Fund’s performance was below the median for the one year, three year, five year, and ten year periods; the Convertible Securities Fund’s performance was above the median for the three year and ten year periods, and below the median for the one year and five year periods; and the Intermediate Bond Fund’s performance was below the median for the one year, three year, five year, and ten year periods. The Board Members concluded that the Funds’ performance was reasonable in comparison with that of the Performance Peer Groups.
In connection with its assessment of the performance of the Adviser and the Subadvisers, the Board considered the Adviser’s and Subadvisers’ financial condition and whether they had the resources necessary to continue to carry out their responsibilities
56
under the Agreements. The Board concluded that the Adviser and Subadvisers had the financial resources necessary to continue to perform their obligations under the Agreements and to continue to provide the high quality services that they have provided to the Funds to date.
3) The cost of the advisory services and the profits to the Adviser and Subadviser and their affiliates from the relationship with the Funds.
In connection with the Board’s consideration of the cost of the advisory and subadvisory services and the profits to the Adviser, Subadvisers and their affiliates from their relationships with the Fund, the Board considered a number of factors. First, the Board compared the level of the advisory fee for each Fund against comparative Broadridge expense peer groups (“Expense Peer Group”). The Board also considered comparativenon-advisory fee expenses and comparative total fund expenses of the Funds and each Expense Peer Group. The Board considered this information as useful in assessing whether the Adviser and Subadvisers were providing services at a cost that was competitive with other similar funds. In assessing this information, the Board considered both the comparative contract rates as well as the level of the advisory fees after waivers and/or reimbursements. The Board noted that the SmallCap Equity Fund, the Convertible Securities Fund, and the Intermediate Bond Fund operated pursuant to a Fee Waiver and Expense Deferral Agreement with the Adviser wherein the Adviser had agreed to waive a portion of its fee or reimburse a Fund for a portion of its expenses necessary to limit the Fund’s total operating expenses to the level set forth in the respective Fund’s prospectus. The Board noted that the Convertible Securities Fund operated pursuant to an Expense Limitation Agreement with the Adviser wherein the Adviser had agreed to limit a portion of its fee or reimburse a Fund for a portion of its expenses necessary to limit the Fund’s total operating expenses to the level set forth in the Funds’ prospectus. The Board noted that the advisory fees and total expense ratios for all Funds were higher than the median when compared with those of their Expense Peer Groups. Finally, the Board noted that although the SmallCap Equity Fund, Intermediate Bond Fund, and Convertible Securities Fund had agreements in place to limit advisory fees and expenses, the total expense ratios for the SmallCap Equity, Convertible Securities, and Intermediate Bond Funds were above the median when compared with their Expense Peer Groups. The Board also reviewed the fees charged by the Adviser and Subadvisers to provide similar advisory services to other RICs with similar investment objectives and to separate accounts, noting that in some cases the fees charged by the Adviser or Subadvisers were higher and, in other cases lower, than the fees charged to the Funds. In evaluating this information, the Board considered the difference in services provided by the Adviser and Subadvisers to these other accounts. In particular, the Board considered the differences in risks involved in managing separate accounts and the Funds from a compliance and regulatory perspective.
The Board also considered an analysis prepared by the Adviser of the estimated profitability to the Adviser of its relationship with the Funds and reviewed with the Adviser its cost allocation methodology in connection with its profitability. In this regard, the Board reviewedPro-forma Income Statements of the Adviser for the year ended December 31, 2018. The Board considered one analysis for the Adviser as a whole, and a second analysis for the Adviser with respect to each of the Funds. With respect to the Fund analysis, the Board received an analysis based on each Fund’s average net assets during the period as well as apro-forma analysis of profitability at higher and lower asset levels. The Board concluded that the profitability of the Funds to the Adviser under either analysis was not excessive.
4) The extent to which economies of scale will be realized as the Funds grow and whether fee levels reflect those economies of scale.
With respect to the Board’s consideration of economies of scale, the Board discussed whether economies of scale would be realized by the Funds at higher asset levels. The Board also reviewed data from the Expense Peer Groups to assess whether the Expense Peer Group funds had advisory fee breakpoints and, if so, at what asset levels. The Board also assessed whether certain of the Adviser’s costs would increase if asset levels rise. The Board concluded that under foreseeable conditions, they were unable to assess at this time whether economies of scale would be realized if the Funds were to experience significant asset growth. In the event there was to be significant asset growth in the Funds, the Board determined to reassess whether the advisory fee appropriately took into account any economies of scale that had been realized as a result of that growth.
5) Other Factors.
In addition to the above factors, the Board also discussed other benefits received by the Adviser and Subadvisers from their management of the Funds. The Board considered that the Adviser and Subadvisers do use soft dollars in connection with their management of the Funds. Based on a consideration of all these factors in their totality, the Board Members, including all of the Independent Board Members, determined that each Fund’s advisory fee and, with respect to the Equity Fund, the Balanced Fund, and the Intermediate Bond Fund, the subadvisory fee, was fair and reasonable with respect to the quality of services provided and in light of the other factors described above that the Board deemed relevant. Accordingly, the Board Members determined to approve the continuation of each Fund’s Advisory Agreement and, with respect to the Equity Fund, Balanced Fund, Mighty Mites Fund, and Convertible Securities Fund, the Subadvisory agreements. The Board based its decision on evaluations of all these factors as a whole and did not consider any one factor as all important or controlling.
57
TETON Westwood Funds
Additional Fund Information (Unaudited)
The business and affairs of the Trust are managed under the direction of its Board of Trustees. Information pertaining to the Trustees and Officers of the Trust is set forth below. The Trust’s Statement of Additional Information includes additional information about the TETON Westwood Funds’ Trustees and is available, without charge, upon request, by calling800-WESTWOOD(800-937-8966) or by writing to the TETON Westwood Funds at One Corporate Center, Rye, NY 10580-1422.
| | | | | | | | |
Name, Position(s), Address1and Age | | Term of Office and Length of Time Served2 | | Number of Funds in Fund Complex Overseen by Trustee | | Principal Occupation(s) During Past Five Years | | Other Directorships Held by Trustee3 |
INTERESTED TRUSTEE4: | | | | | | | | |
| | | | |
Nicholas F. Galluccio Trustee and Portfolio Manager Age: 69 | | Since 2017 | | 9 | | President and Chief Executive Officer of Teton Advisors, Inc. (since 2008); Group Managing Director U.S. Equities (2004-2008), Managing Director U.S. Equities (1994-2004), Senior Vice President (1990-2004) and Vice President (1990-1994) and Vice President (1982-1990) of Trust Company of the West (TCW) | | — |
| | | | |
INDEPENDENT TRUSTEES5: | | | | | | | | |
Anthony S. Colavita6 Trustee Age: 58 | | Since 2017 | | 18 | | Attorney, Anthony S. Colavita, P.C. | | — |
| | | | |
James P. Conn Trustee Age: 81 | | Since 1994 | | 24 | | Former Managing Director and Chief Investment Officer of Financial Security Assurance Holdings, Ltd. (1992-1998) | | — |
| | | | |
Leslie F. Foley6 Trustee Age: 51 | | Since 2017 | | 9 | | Attorney on the boards of the Boys and Girls Club of Greenwich, Addison Gallery of American Art at Phillips Academy Andover, and National Humanities Center; Vice President, Global Ethics & Compliance and Associate General Counsel for News Corporation (2008-2010) | | — |
| | | | |
Mary E. Hauck Trustee Age: 77 | | Since 2017 | | 10 | | Retired Senior Manager of theGabelli-O’Connor Fixed Income Mutual Funds Management Company | | — |
| | | | |
Michael J. Melarkey Trustee Age: 69 | | Since 2017 | | 21 | | Owner in Pioneer Crossing Casino Group; Of Counsel in the law firm of McDonald Carano Wilson LLP; previously partner in the law firm of Avansino, Melarkey, Knobel, Mulligan & McKenzie (1980-2015) | | Director of Southwest Gas Corporation (natural gas utility) |
| | | | |
Kuni Nakamura Trustee Age: 51 | | Since 2017 | | 33 | | President of Advanced Polymer, Inc. (chemical manufacturing company); President of KEN Enterprises, Inc. (real estate) | | — |
| | | | |
Werner J. Roeder Trustee Age: 79 | | Since 1994 | | 21 | | Retired physician; Former Vice President of Medical Affairs (Medical Director) of New York Presbyterian/Lawrence Hospital (1999-2014) | | — |
| | | | |
Salvatore J. Zizza6,7 Trustee Age: 73 | | Since 2004 | | 31 | | President of Zizza & Associates Corp. (private holding company); Chairman of Bergen Cove Realty Inc. Chairman of Harbor Diversified, Inc. (pharmaceuticals) (2009-2018); Chairman of BAM (semiconductor and aerospace manufacturing) (2000-2018); Chairman of Metropolitan Paper Recycling Inc. (recycling) (2005-2014) | | Director and Chairman ofTrans-Lux Corporation (business services); Director and Chairman of Harbor Diversified Inc. (pharmaceuticals) (2009-2018) |
58
| | | | | | |
Name, Position(s), Address1and Age | | Term of Office and Length of Time Served2 | | | | Principal Occupation(s) During Past Five Years |
OFFICERS: | | | | | | |
| | | |
Bruce N. Alpert President Age: 67 | | Since 1994 | | | | Executive Vice President and Chief Operating Officer of Gabelli Funds, LLC since 1988; Officer of registered investment companies within the Gabelli/GAMCO Fund Complex; Senior Vice President of GAMCO Investors, Inc. since 2008 |
| | | |
John C. Ball Treasurer Age: 43 | | Since 2017 | | | | Treasurer of registered investment companies within the Gabelli/GAMCO Fund Complex since 2017; Vice President and Assistant Treasurer of AMG Funds, 2014-2017; Vice President of State Street Corporation, 2007-2014 |
| | | |
Agnes Mullady Vice President Age: 61 | | Since 2006 | | | | Officer of the registered investment companies within the Gabelli/GAMCO Fund Complex since 2006; President and Chief Operating Officer of the Fund Division of Gabelli Funds, LLC since 2015; Chief Executive Officer of G.distributors, LLC since 2010; Senior Vice President of GAMCO Investors, Inc. since 2009; Vice President of Gabelli Funds, LLC since 2007; Executive Vice President of Associated Capital Group, Inc. since 2016 |
| | | |
Andrea R. Mango Secretary Age: 47 | | Since 2013 | | | | Vice President of GAMCO Investors, Inc. since 2016; Counsel of Gabelli Funds, LLC since 2013; Secretary of registered investment companies within the Gabelli/GAMCO Fund Complex since 2013; Vice President ofclosed-end funds within the Gabelli/GAMCO Fund Complex since 2014 |
| | | |
Richard J. Walz Chief Compliance Officer Age: 60 | | Since 2013 | | | | Chief Compliance Officer of registered investment companies within the Gabelli/GAMCO Fund Complex since 2013 |
| 1 | Address: One Corporate Center, Rye, NY 10580-1422, unless otherwise noted. |
| 2 | Each Trustee will hold office for an indefinite term until the earliest of (i) the next meeting of shareholders, if any, called for the purpose of considering the election orre-election of such Trustee and until the election and qualification of his or her successor, if any, elected at such meeting, or (ii) the date a Trustee resigns or retires, or a Trustee is removed by the Board of Trustees or shareholders, in accordance with the Trust’s AmendedBy-Laws and Amended and Restated Declaration of Trust. For officers, includes time served in prior officer positions with the Trust. Each officer will hold office for an indefinite term until the date he or she resigns or retires or until his or her successor is elected and qualified. |
| 3 | This column includes only directorships of companies required to report to the SEC under the Securities Exchange Act of 1934, i.e., public companies, or other investment companies registered under the Investment Company Act of 1940. |
| 4 | “Interested person” of the Funds as defined in the 1940 Act. Mr. Galluccio is considered an “interested person” because of his affiliation with Teton Advisors, Inc. that acts as the Funds’ investment adviser. |
| 5 | Trustees who are not interested persons are considered “Independent” Trustees. |
| 6 | Mr. Colavita’s father, Anthony J. Colavita, and Ms. Foley’s father, Frank J. Fahrenkopf, Jr., serve as directors of other funds in the Fund Complex. Mr. Zizza is an independent director of Gabelli International Ltd., which may be deemed to be under common control with the Adviser. |
| 7 | On September 9, 2015, Mr. Zizza entered into a settlement with the SEC to resolve an inquiry relating to an alleged violation regarding the making of false statements or omissions to the accountants of a company concerning a related party transaction. The company in question is not an affiliate of, nor has any connection to, the Fund. Under the terms of the settlement, Mr. Zizza, without admitting or denying the SEC’s findings and allegation, paid $150,000 and agreed to cease and desist committing or causing any future violations of Rule13b2-2 of the Securities Exchange Act of 1934, as amended (the 1934 Act). The Board has discussed this matter and has determined that it does not disqualify Mr. Zizza from serving as an Independent Trustee. |
59
TETON WESTWOOD FUNDS
TETON Westwood Mighty MitesSM Fund
TETON Westwood SmallCap Equity Fund
TETON Convertible Securities Fund
TETON Westwood Equity Fund
TETON Westwood Balanced Fund
TETON Westwood Intermediate Bond Fund
| | | | |
| | One Corporate Center | | |
| | Rye, New York 10580-1422 | | |
| | General and Account Information: | | |
| | 800-WESTWOOD[800-937-8966] | | |
| | fax:914-921-5118 | | |
| | website: www.tetonadv.com | | |
| | e-mail: info@tetonadv.com | | |
| | |
| | Board of Trustees | | |
| | |
ANTHONY S. COLAVITA | | NICHOLAS F. GALLUCCIO* | | KUNI NAKAMURA |
| Attorney, Anthony S. Colavita, P.C. | | President and Chief Executive Officer, | | President of Advanced Polymer, Inc. |
| | Teton Advisors, Inc. | | |
| | |
JAMES P. CONN | | MARY E. HAUCK | | WERNER J. ROEDER |
| Former Managing Director and Chief | | Former Senior Portfolio Manager, | | Former Medical Director, |
| Investment Officer, Financial Security | | Gabelli-O’Connor Fixed Income Mutual | | Lawrence Hospital |
| Assurance Holdings Ltd. | | Fund Management Company | | |
| | |
LESLIE F. FOLEY | | MICHAEL J. MELARKEY | | SALVATORE J. ZIZZA |
| Attorney | | Of Counsel, | | Chairman, |
| | McDonald Carano Wilson LLP | | Zizza & Associates Corp. |
*Interested Trustee | | | | |
| | | | |
| | Officers | | |
| | |
BRUCE N. ALPERT | | | | ANDREA R. MANGO |
| President | | | | Secretary |
| | |
JOHN C. BALL | | | | RICHARD J. WALZ |
| Treasurer | | | | Chief Compliance Officer |
| | |
AGNES MULLADY | | | | |
| Vice President | | | | |
| | |
Investment Adviser | | | | Distributor |
Teton Advisors, Inc. | | | | G.distributors, LLC |
| | |
Custodian | | | | Legal Counsel |
The Bank of New York Mellon | | | | Paul Hastings LLP |
We have separated the portfolio managers’ commentaries from the financial statements and investment portfolios due to corporate governance regulations stipulated by the Sarbanes-Oxley Act of 2002. We have done this to ensure that the content of the portfolio managers’ commentaries is unrestricted. Both the commentaries and the financial statements, including the portfolio of investments, will be available on our website at www.tetonadv.com.
This report is submitted for the information of the shareholders of the TETON Westwood Funds. It is not authorized for distribution to prospective investors unless preceded or accompanied by an effective prospectus.
GABWWQ319AR
Item 2. Code of Ethics.
| | (a) | The registrant, as of the end of the period covered by this report, has adopted a code of ethics that applies to the registrant’s principal executive officer, principal financial officer, principal accounting officer or controller, or persons performing similar functions, regardless of whether these individuals are employed by the registrant or a third party. |
| | (c) | There have been no amendments, during the period covered by this report, to a provision of the code of ethics that applies to the registrant’s principal executive officer, principal financial officer, principal accounting officer or controller, or persons performing similar functions, regardless of whether these individuals are employed by the registrant or a third party, and that relates to any element of the code of ethics description. |
| | (d) | The registrant has not granted any waivers, including an implicit waiver, from a provision of the code of ethics that applies to the registrant’s principal executive officer, principal financial officer, principal accounting officer or controller, or persons performing similar functions, regardless of whether these individuals are employed by the registrant or a third party, that relates to one or more of the items set forth in paragraph (b) of this item’s instructions. |
Item 3. Audit Committee Financial Expert.
As of the end of the period covered by the report, the registrant’s board of directors has determined that Kuni Nakamura is qualified to serve as an audit committee financial expert serving on its audit committee and that he is “independent.”
Item 4. Principal Accountant Fees and Services.
Audit Fees
| | (a) | The aggregate fees billed for each of the last two fiscal years for professional services rendered by the principal accountant for the audit of the registrant’s annual financial statements or services that are normally provided by the accountant in connection with statutory and regulatory filings or engagements for those fiscal years are $174,075 in 2018 and $141,908 in 2019. |
Audit-Related Fees
| | (b) | The aggregate fees billed in each of the last two fiscal years for assurance and related services by the principal accountant that are reasonably related to the performance of the audit of the registrant’s financial statements and are not reported under paragraph (a) of this Item are $0 in 2018 and $0 in 2019. |
Tax Fees
| | (c) | The aggregate fees billed in each of the last two fiscal years for professional services rendered by the principal accountant for tax compliance, tax advice, and tax planning are $29,410 in 2018 and $30,260 in 2019. Tax fees represent tax compliance services provided in connection with the review of the Registrant’s tax returns. |
All Other Fees
| | (d) | The aggregate fees billed in each of the last two fiscal years for products and services provided by the principal accountant, other than the services reported in paragraphs (a) through (c) of this Item are $0 in 2018 and $0 in 2019. |
| | (e)(1) | Disclose the audit committee’spre-approval policies and procedures described in paragraph (c)(7) of Rule2-01 of RegulationS-X. |
Pre-Approval Policies and Procedures. The Audit Committee (“Committee”) of the registrant is responsible forpre-approving (i) all audit and permissiblenon-audit services to be provided by the independent registered public accounting firm to the registrant and (ii) all permissiblenon-audit services to be provided by the independent registered public accounting firm to the Adviser, Gabelli Advisers, Inc., and any affiliate of Gabelli Funds, LLC (“Gabelli”) that provides services to the registrant (a “Covered Services Provider”) if the registered public accounting firm’s engagement related directly to the operations and financial reporting of the registrant. The Committee may delegate its responsibility topre-approve any such audit and permissiblenon-audit services to the Chairperson of the Committee, and the Chairperson must report to the Committee, at its next regularly scheduled meeting after the Chairperson’spre-approval of such services, his or her decision(s). The Committee may also establish detailedpre-approval policies and procedures forpre-approval of such services in accordance with applicable laws, including the delegation of some or all of the Committee’spre-approval responsibilities to the other persons (other than Gabelli or the registrant’s officers).Pre-approval by the Committee of any permissiblenon-audit services is not required so long as: (i) the permissiblenon-audit services were not recognized by the registrant at the time of the engagement to benon-audit services; and (ii) such services are promptly brought to the attention of the Committee and approved by the Committee or Chairperson prior to the completion of the audit.
| | (e)(2) | The percentage of services described in each of paragraphs (b) through (d) of this Item that were approved by the audit committee pursuant to paragraph (c)(7)(i)(C) of Rule2-01 of RegulationS-X are as follows: |
(b) N/A
(c) 0%
(d) N/A
| | (f) | The percentage of hours expended on the principal accountant’s engagement to audit the registrant’s financial statements for the most recent fiscal year that were attributed to work performed by persons other than the principal accountant’s full-time, permanent employees was less than fifty percent. |
| | (g) | The aggregatenon-audit fees billed by the registrant’s accountant for services rendered to the registrant, and rendered to the registrant’s investment adviser (not including anysub-adviser whose role is primarily portfolio management and is subcontracted with or overseen by another investment adviser), and any entity controlling, controlled by, or under common control with the adviser that provides ongoing services to the registrant for each of the last two fiscal years of the registrant was $29,410 in 2018 and $30,260 in 2019. |
| | (h) | The registrant’s audit committee of the board of directorshas considered whether the provision ofnon-audit services that were rendered to the registrant’s investment adviser (not including anysub-adviser whose role is primarily portfolio management and is subcontracted with or overseen by another investment adviser), and any entity controlling, controlled by, or under common control with the investment adviser that provides ongoing services to the registrant that were notpre-approved pursuant to paragraph (c)(7)(ii) of Rule2-01 of RegulationS-X is compatible with maintaining the principal accountant’s independence. |
Item 5. Audit Committee of Listed Registrants.
Not applicable.
Item 6. Investments.
TETON Westwood Mighty Mites Fund
Schedule of Investments — September 30, 2019
| | | | | | | | | | | | |
Shares | | | | | Cost | | | Market
Value | |
| | | |
| | | | COMMON STOCKS — 98.8% | | | | | | | | |
| | | | Aerospace and Defense — 6.6% | | | | | | | | |
| | 1,108,900 | | | Aerojet Rocketdyne Holdings Inc.† | | $ | 5,098,958 | | | $ | 56,010,539 | |
| | 98,040 | | | Allied Motion Technologies Inc. | | | 3,571,398 | | | | 3,461,792 | |
| | 82,000 | | | Avio SpA | | | 1,152,319 | | | | 1,063,577 | |
| | 123,000 | | | Innovative Solutions & Support Inc.† | | | 472,250 | | | | 578,100 | |
| | 7,000 | | | Kratos Defense & Security Solutions Inc.† | | | 42,963 | | | | 130,165 | |
| | 128,000 | | | Park Aerospace Corp. | | | 1,994,131 | | | | 2,247,680 | |
| | | | | | | | | | | | |
| | | |
| | | | | | | 12,332,019 | | | | 63,491,853 | |
| | | |
| | | | Agriculture — 0.6% | | | | | | | | |
| | 225 | | | J.G. Boswell Co. | | | 144,676 | | | | 153,675 | |
| | 218,465 | | | Limoneira Co. | | | 4,187,987 | | | | 4,011,017 | |
| | 510,000 | | | S&W Seed Co.† | | | 1,759,513 | | | | 1,213,800 | |
| | | | | | | | | | | | |
| | | |
| | | | | | | 6,092,176 | | | | 5,378,492 | |
| | | |
| | | | Airlines — 0.1% | | | | | | | | |
| | 40,000 | | | American Airlines Group Inc. | | | 15,642 | | | | 1,078,800 | |
| | 225,000 | | | American Airlines Group Inc., Escrow† | | | 173 | | | | 40,500 | |
| | | | | | | | | | | | |
| | | |
| | | | | | | 15,815 | | | | 1,119,300 | |
| | | |
| | | | Automotive — 1.2% | | | | | | | | |
| | 26,250 | | | Lithia Motors Inc., Cl. A | | | 465,325 | | | | 3,474,975 | |
| | 20,000 | | | Navistar International Corp.† | | | 152,109 | | | | 562,200 | |
| | 29,605 | | | Rush Enterprises Inc., Cl. A | | | 545,615 | | | | 1,142,161 | |
| | 104,005 | | | Rush Enterprises Inc., Cl. B | | | 1,800,199 | | | | 4,152,920 | |
| | 47,930 | | | Sonic Automotive Inc., Cl. A | | | 611,334 | | | | 1,505,481 | |
| | 70,000 | | | Wabash National Corp. | | | 132,194 | | | | 1,015,700 | |
| | | | | | | | | | | | |
| | | |
| | | | | | | 3,706,776 | | | | 11,853,437 | |
| | |
| | | | Automotive: Parts and Accessories — 1.6% | | | | | |
| | 105,000 | | | Dana Inc. | | | 624,231 | | | | 1,516,200 | |
| | 12,190 | | | Gentherm Inc.† | | | 177,000 | | | | 500,826 | |
| | 400,000 | | | Modine Manufacturing Co.† | | | 4,333,538 | | | | 4,548,000 | |
| | 24,000 | | | Motorcar Parts of America Inc.† | | | 315,465 | | | | 405,600 | |
| | 80,000 | | | Puradyn Filter Technologies Inc.† | | | 13,774 | | | | 2,380 | |
| | 52,028 | | | Standard Motor Products Inc. | | | 570,100 | | | | 2,525,959 | |
| | 186,339 | | | Strattec Security Corp. | | | 4,702,192 | | | | 3,723,053 | |
| | 329,000 | | | Superior Industries International Inc. | | | 5,964,343 | | | | 950,810 | |
| | 31,200 | | | Tenneco Inc., Cl. A | | | 96,359 | | | | 390,624 | |
| | 36,000 | | | Titan International Inc. | | | 288,537 | | | | 97,200 | |
| | 105,000 | | | Uni-Select Inc. | | | 1,600,857 | | | | 874,967 | |
| | | | | | | | | | | | |
| | | |
| | | | | | | 18,686,396 | | | | 15,535,619 | |
| | |
| | | | Aviation: Parts and Services — 2.2% | | | | | |
| | 13,500 | | | Astronics Corp.† | | | 83,521 | | | | 396,630 | |
| | 23,896 | | | Astronics Corp., Cl. B† | | | 144,647 | | | | 700,392 | |
| | 188,040 | | | Ducommun Inc.† | | | 4,760,004 | | | | 7,972,896 | |
| | 196,200 | | | Kaman Corp. | | | 4,994,792 | | | | 11,666,052 | |
| | | | | | | | | | | | |
| | | |
| | | | | | | 9,982,964 | | | | 20,735,970 | |
| | | |
| | | | Broadcasting — 1.2% | | | | | | | | |
| | 902,000 | | | Beasley Broadcast Group Inc., Cl. A(a) | | | 4,965,303 | | | | 2,796,200 | |
| | 336,455 | | | Dish TV India Ltd., GDR | | | 265,892 | | | | 78,730 | |
| | 199,160 | | | Entercom Communications Corp., Cl. A | | | 871,395 | | | | 665,194 | |
| | 248,120 | | | Gray Television Inc.† | | | 268,430 | | | | 4,049,318 | |
| | 86,293 | | | Gray Television Inc., Cl. A† | | | 620,246 | | | | 1,437,969 | |
| | 270,000 | | | Salem Media Group Inc. | | | 624,073 | | | | 413,100 | |
| | 33,000 | | | Sinclair Broadcast Group Inc., Cl. A | | | 53,667 | | | | 1,410,420 | |
| | | | | | | | | | | | |
Shares | | | | | Cost | | | Market
Value | |
| | | |
| | 159,000 | | | Townsquare Media Inc., Cl. A | | $ | 1,313,188 | | | $ | 1,117,770 | |
| | | | | | | | | | | | |
| | | |
| | | | | | | 8,982,194 | | | | 11,968,701 | |
| | |
| | | | Building and Construction — 2.1% | | | | | |
| | 290,000 | | | Armstrong Flooring Inc.† | | | 4,324,208 | | | | 1,853,100 | |
| | 133,000 | | | Gibraltar Industries Inc.† | | | 3,133,522 | | | | 6,110,020 | |
| | 18,000 | | | Granite Construction Inc. | | | 456,539 | | | | 578,340 | |
| | 13,000 | | | Herc Holdings Inc.† | | | 495,236 | | | | 604,630 | |
| | 670,000 | | | Huttig Building Products Inc.† | | | 756,766 | | | | 1,407,000 | |
| | 107,074 | | | MYR Group Inc.† | | | 2,422,367 | | | | 3,350,345 | |
| | 98,400 | | | The Monarch Cement Co. | | | 2,612,568 | | | | 6,051,600 | |
| | | | | | | | | | | | |
| | | |
| | | | | | | 14,201,206 | | | | 19,955,035 | |
| | | |
| | | | Business Services — 3.1% | | | | | | | | |
| | 400,701 | | | Diebold Nixdorf Inc.† | | | 1,822,374 | | | | 4,487,851 | |
| | 3,500 | | | Du-Art Film Labs Inc.† | | | 610,534 | | | | 595,000 | |
| | 173,172 | | | GP Strategies Corp.† | | | 2,072,457 | | | | 2,223,528 | |
| | 32,029 | | | IAA Inc.† | | | 274,789 | | | | 1,336,570 | |
| | 23,300 | | | ICF International Inc. | | | 558,939 | | | | 1,968,151 | |
| | 32,029 | | | KAR Auction Services Inc. | | | 168,870 | | | | 786,312 | |
| | 16,000 | | | Macquarie Infrastructure Corp. | | | 25,800 | | | | 631,520 | |
| | 1,920 | | | Matthews International Corp., Cl. A | | | 84,461 | | | | 67,949 | |
| | 20,000 | | | McGrath RentCorp | | | 535,869 | | | | 1,391,800 | |
| | 85,000 | | | MDC Partners Inc., Cl. A† | | | 530,388 | | | | 239,700 | |
| | 624,000 | | | MoneyGram International Inc.† | | | 3,026,474 | | | | 2,483,520 | |
| | 294,330 | | | PFSweb Inc.† | | | 1,422,682 | | | | 744,655 | |
| | 3,000 | | | Pollard Banknote Ltd. | | | 48,308 | | | | 44,428 | |
| | 44,549 | | | PRGX Global Inc.† | | | 248,254 | | | | 229,427 | |
| | 17,230 | | | Safeguard Scientifics Inc.† | | | 212,793 | | | | 195,388 | |
| | 500 | | | Stamps.com Inc.† | | | 6,278 | | | | 37,225 | |
| | 402,451 | | | Team Inc.† | | | 6,327,227 | | | | 7,264,241 | |
| | 28,792 | | | Trans-Lux Corp.†(a)(b)(c) | | | 25,123 | | | | 14,756 | |
| | 941,292 | | | Trans-Lux Corp.†(a) | | | 821,332 | | | | 482,412 | |
| | 37,132 | | | Viad Corp. | | | 989,754 | | | | 2,493,414 | |
| | 63,169 | | | Willdan Group Inc.† | | | 2,059,102 | | | | 2,215,969 | |
| | | | | | | | | | | | |
| | | |
| | | | | | | 21,871,808 | | | | 29,933,816 | |
| | |
| | | | Communications Equipment — 0.4% | | | | | |
| | 444,000 | | | Communications Systems Inc. | | | 3,667,582 | | | | 2,029,080 | |
| | 275,000 | | | Extreme Networks Inc.† | | | 946,476 | | | | 2,000,625 | |
| | | | | | | | | | | | |
| | | |
| | | | | | | 4,614,058 | | | | 4,029,705 | |
| | |
| | | | Computer Software and Services — 2.1% | | | | | |
| | 851,636 | | | Alithya Group Inc., Cl. A† | | | 2,277,577 | | | | 2,554,908 | |
| | 227,380 | | | American Software Inc., Cl. A | | | 2,192,962 | | | | 3,415,248 | |
| | 252,642 | | | Avid Technology Inc.† | | | 1,609,249 | | | | 1,563,854 | |
| | 54,630 | | | Carbonite Inc.† | | | 569,078 | | | | 846,219 | |
| | 114,000 | | | Cardlytics Inc.† | | | 1,818,459 | | | | 3,821,280 | |
| | 45,000 | | | DHI Group Inc.† | | | 81,549 | | | | 173,250 | |
| | 159,620 | | | Digi International Inc.† | | | 1,911,197 | | | | 2,174,024 | |
| | 20,000 | | | Genius Brands International Inc.† | | | 48,789 | | | | 12,840 | |
| | 144,267 | | | iGO Inc.† | | | 484,473 | | | | 357,061 | |
| | 553,000 | | | Internap Corp.† | | | 3,600,496 | | | | 1,426,740 | |
| | 10,000 | | | Materialise NV, ADR† | | | 58,532 | | | | 184,800 | |
| | 26,000 | | | Mercury Systems Inc.† | | | 232,548 | | | | 2,110,420 | |
| | 89,500 | | | Mitek Systems Inc.† | | | 433,851 | | | | 863,675 | |
| | 10,000 | | | MiX Telematics Ltd., ADR | | | 180,072 | | | | 139,500 | |
| | 2,607 | | | Monitronics International Inc.† | | | 28,743 | | | | 19,553 | |
| | 2,310 | | | MTS Systems Corp. | | | 118,662 | | | | 127,628 | |
| | 25,000 | | | RumbleON Inc., Cl. B† | | | 119,547 | | | | 72,250 | |
| | 3,200 | | | Tyler Technologies Inc.† | | | 34,168 | | | | 840,000 | |
| | | | | | | | | | | | |
| | | |
| | | | | | | 15,799,952 | | | | 20,703,250 | |
| | | |
| | | | Consumer Products — 3.0% | | | | | | | | |
| | 127,200 | | | Acme United Corp. | | | 2,271,327 | | | | 2,546,887 | |
| | 249,000 | | | Bassett Furniture Industries Inc. | | | 5,078,963 | | | | 3,809,700 | |
See accompanying notes to financial statements.
1
TETON Westwood Mighty Mites Fund
Schedule of Investments (Continued) — September 30, 2019
| | | | | | | | | | | | |
Shares | | | | | Cost | | | Market
Value | |
| | |
| | | | COMMON STOCKS (Continued) | | | | | |
| | | | Consumer Products (Continued) | | | | | |
| | 96,387 | | | Callaway Golf Co. | | $ | 833,454 | | | $ | 1,870,872 | |
| | 900,000 | | | Goodbaby International Holdings Ltd.† | | | 414,410 | | | | 135,499 | |
| | 6,000 | | | Johnson Outdoors Inc., Cl. A | | | 175,431 | | | | 351,360 | |
| | 36,000 | | | Lakeland Industries Inc.† | | | 403,780 | | | | 437,760 | |
| | 237,175 | | | Lifetime Brands Inc. | | | 2,608,722 | | | | 2,098,999 | |
| | 800,000 | | | Marine Products Corp. | | | 5,766,933 | | | | 11,328,000 | |
| | 60,000 | | | MarineMax Inc.† | | | 866,511 | | | | 928,800 | |
| | 114,000 | | | Oil-Dri Corp. of America | | | 2,077,082 | | | | 3,882,840 | |
| | 5,700 | | | PC Group Inc.† | | | 3,465 | | | | 36 | |
| | 4,000,000 | | | Playmates Holdings Ltd. | | | 481,613 | | | | 520,561 | |
| | 1,090 | | | Standard Diversified Inc.† | | | 12,872 | | | | 12,481 | |
| | 8,440 | | | Standard Diversified Opportunities Inc., Cl. B† | | | 101,648 | | | | 126,600 | |
| | 128,220 | | | ZAGG Inc.† | | | 885,641 | | | | 803,939 | |
| | | | | | | | | | | | |
| | | |
| | | | | | | 21,981,852 | | | | 28,854,334 | |
| | | |
| | | | Consumer Services — 0.8% | | | | | | | | |
| | 445,320 | | | 1-800-Flowers.com Inc., Cl. A† | | | 1,653,925 | | | | 6,588,509 | |
| | 66,000 | | | Bowlin Travel Centers Inc.† | | | 90,387 | | | | 187,770 | |
| | 52,000 | | | Carriage Services Inc. | | | 1,013,525 | | | | 1,062,880 | |
| | 800 | | | Collectors Universe Inc. | | | 0 | | | | 22,784 | |
| | | | | | | | | | | | |
| | | |
| | | | | | | 2,757,837 | | | | 7,861,943 | |
| | |
| | | | Diversified Industrial — 11.8% | | | | | |
| | 458,000 | | | Ampco-Pittsburgh Corp.† | | | 7,671,234 | | | | 1,685,440 | |
| | 66,666 | | | ArborGen Holdings Ltd.† | | | 37,762 | | | | 7,890 | |
| | 270,000 | | | Burnham Holdings Inc., Cl. A(a) | | | 4,323,837 | | | | 3,847,500 | |
| | 84,673 | | | Chase Corp. | | | 1,320,157 | | | | 9,262,379 | |
| | 111,360 | | | Columbus McKinnon Corp. | | | 1,825,756 | | | | 4,056,845 | |
| | 77,480 | | | FormFactor Inc.† | | | 546,020 | | | | 1,444,615 | |
| | 34,600 | | | Graham Corp. | | | 563,893 | | | | 687,156 | |
| | 516,579 | | | Griffon Corp. | | | 5,735,883 | | | | 10,832,662 | |
| | 21,350 | | | Haulotte Group SA | | | 114,721 | | | | 137,994 | |
| | 500 | | | Hyster-Yale Materials Handling Inc. | | | 25,045 | | | | 27,365 | |
| | 7,000 | | | Innophos Holdings Inc. | | | 207,318 | | | | 227,220 | |
| | 22,397 | | | Insignia Systems Inc.† | | | 55,134 | | | | 21,725 | |
| | 235,930 | | | Intevac Inc.† | | | 1,094,812 | | | | 1,236,273 | |
| | 65,120 | | | John Bean Technologies Corp. | | | 1,905,047 | | | | 6,474,882 | |
| | 109,036 | | | L.B. Foster Co., Cl. A† | | | 1,738,545 | | | | 2,362,810 | |
| | 287,170 | | | Lawson Products Inc.† | | | 4,302,426 | | | | 11,122,094 | |
| | 102,309 | | | Lydall Inc.† | | | 1,004,152 | | | | 2,548,517 | |
| | 9,000 | | | MSA Safety Inc. | | | 291,844 | | | | 981,990 | |
| | 1,022,900 | | | Myers Industries Inc. | | | 15,911,250 | | | | 18,054,185 | |
| | 116,600 | | | Napco Security Technologies Inc.† | | | 659,730 | | | | 2,975,632 | |
| | 215,431 | | | Park-Ohio Holdings Corp. | | | 4,957,445 | | | | 6,432,770 | |
| | 25,080 | | | Raven Industries Inc. | | | 497,955 | | | | 839,177 | |
| | 19,600 | | | RWC Inc.† | | | 315,159 | | | | 196,196 | |
| | 29,400 | | | Standex International Corp. | | | 1,024,250 | | | | 2,144,436 | |
| | 1,630,000 | | | Steel Connect Inc.† | | | 5,626,241 | | | | 2,819,900 | |
| | 640,000 | | | Steel Partners Holdings LP† | | | 10,328,342 | | | | 8,192,000 | |
| | 519,000 | | | Tredegar Corp. | | | 8,837,769 | | | | 10,130,880 | |
| | 522,554 | | | Twin Disc Inc.† | | | 9,615,851 | | | | 5,533,847 | |
| | | | | | | | | | | | |
| | | |
| | | | | | | 90,537,578 | | | | 114,284,380 | |
| | |
| | | | Educational Services — 0.1% | | | | | |
| | 125,000 | | | Universal Technical Institute Inc.† | | | 615,524 | | | | 680,000 | |
| | | | | | | | | | | | |
| | | |
| | | | Electronics — 3.7% | | | | | | | | |
| | 28,000 | | | Badger Meter Inc. | | | 477,554 | | | | 1,503,600 | |
| | 169,999 | | | Bel Fuse Inc., Cl. A(a) | | | 3,107,228 | | | | 2,330,686 | |
| | 339,500 | | | CTS Corp. | | | 2,824,101 | | | | 10,986,220 | |
| | 70,000 | | | Daktronics Inc. | | | 686,143 | | | | 516,950 | |
| | 63,771 | | | EMRISE Corp.†(d) | | | 0 | | | | 0 | |
| | 31,000 | | | IMAX Corp.† | | | 132,791 | | | | 680,450 | |
| | | | | | | | | | | | |
Shares | | | | | Cost | | | Market
Value | |
| | | |
| | 20,000 | | | Iteris Inc.† | | $ | 32,200 | | | $ | 114,900 | |
| | 110,000 | | | Kimball Electronics Inc.† | | | 662,907 | | | | 1,596,100 | |
| | 155,000 | | | Kopin Corp.† | | | 463,116 | | | | 105,137 | |
| | 6,304 | | | Littelfuse Inc. | | | 991,018 | | | | 1,117,762 | |
| | 19,000 | | | Mesa Laboratories Inc. | | | 491,269 | | | | 4,517,630 | |
| | 24,800 | | | Methode Electronics Inc. | | | 149,501 | | | | 834,272 | |
| | 700,000 | | | Schmitt Industries Inc.†(a) | | | 1,612,360 | | | | 1,599,500 | |
| | 188,038 | | | Stoneridge Inc.† | | | 1,977,743 | | | | 5,823,537 | |
| | 16,000 | | | Stratasys Ltd.† | | | 274,798 | | | | 340,880 | |
| | 150,870 | | | Ultra Clean Holdings† | | | 426,878 | | | | 2,207,982 | |
| | 142,200 | | | Ultralife Corp.† | | | 1,019,913 | | | | 1,231,452 | |
| | | | | | | | | | | | |
| | | |
| | | | | | | 15,329,520 | | | | 35,507,058 | |
| | |
| | | | Energy and Utilities: Integrated — 0.2% | | | | | |
| | 29,000 | | | MGE Energy Inc. | | | 683,833 | | | | 2,316,230 | |
| | | | | | | | | | | | |
| | |
| | | | Energy and Utilities: Natural Gas — 0.8% | | | | | |
| | 650,000 | | | Alvopetro Energy Ltd.† | | | 285,405 | | | | 336,076 | |
| | 31,250 | | | Chesapeake Utilities Corp. | | | 563,141 | | | | 2,978,750 | |
| | 5,000 | | | CONSOL Energy Inc.† | | | 116,589 | | | | 78,150 | |
| | 108,684 | | | Corning Natural Gas Holding Corp. | | | 1,015,904 | | | | 1,989,461 | |
| | 380,000 | | | Gulf Coast Ultra Deep Royalty Trust | | | 235,531 | | | | 11,666 | |
| | 62,850 | | | RGC Resources Inc. | | | 555,810 | | | | 1,837,734 | |
| | | | | | | | | | | | |
| | | |
| | | | | | | 2,772,380 | | | | 7,231,837 | |
| | |
| | | | Energy and Utilities: Oil — 0.0% | | | | | |
| | 71,830 | | | Callon Petroleum Co.† | | | 468,742 | | | | 311,742 | |
| | | | | | | | | | | | |
| | |
| | | | Energy and Utilities: Services — 0.2% | | | | | |
| | 70,000 | | | Dawson Geophysical Co.† | | | 303,753 | | | | 149,800 | |
| | 412,000 | | | Independence Contract Drilling Inc.† | | | 1,498,498 | | | | 494,400 | |
| | 129,000 | | | KLX Energy Services Holdings Inc.† | | | 2,802,522 | | | | 1,115,205 | |
| | 23,000 | | | Nabors Industries Ltd. | | | 129,030 | | | | 43,010 | |
| | 70,450 | | | RPC Inc. | | | 127,744 | | | | 395,225 | |
| | 7,100 | | | Subsea 7 SA, ADR | | | 25,056 | | | | 73,343 | |
| | 1,050,000 | | | Weatherford International plc†. | | | 211,595 | | | | 29,190 | |
| | | | | | | | | | | | |
| | | |
| | | | | | | 5,098,198 | | | | 2,300,173 | |
| | |
| | | | Energy and Utilities: Water — 1.5% | | | | | |
| | 36,426 | | | Artesian Resources Corp., Cl. A | | | 925,588 | | | | 1,347,762 | |
| | 25,090 | | | Cadiz Inc.† | | | 277,949 | | | | 313,374 | |
| | 24,800 | | | California Water Service Group | | | 478,223 | | | | 1,312,664 | |
| | 4,000 | | | Connecticut Water Service Inc. | | | 135,142 | | | | 280,240 | |
| | 66,000 | | | Consolidated Water Co. Ltd. | | | 717,506 | | | | 1,088,340 | |
| | 68,000 | | | Energy Recovery Inc.† | | | 280,443 | | | | 630,020 | |
| | 28,533 | | | Middlesex Water Co. | | | 554,994 | | | | 1,853,504 | |
| | 35,000 | | | Mueller Water Products Inc., Cl. A | | | 403,644 | | | | 393,400 | |
| | 81,304 | | | SJW Group | | | 2,054,236 | | | | 5,552,250 | |
| | 45,307 | | | The York Water Co. | | | 760,243 | | | | 1,978,104 | |
| | | | | | | | | | | | |
| | | |
| | | | | | | 6,587,968 | | | | 14,749,658 | |
| | | |
| | | | Entertainment — 0.7% | | | | | | | | |
| | 178,377 | | | Canterbury Park Holding Corp. | | | 1,878,902 | | | | 2,177,983 | |
| | 689,533 | | | Dover Motorsports Inc. | | | 1,660,517 | | | | 1,365,275 | |
| | 243,470 | | | Entravision Communications Corp., Cl. A | | | 545,693 | | | | 774,235 | |
| | 56,000 | | | National CineMedia Inc. | | | 304,243 | | | | 459,200 | |
| | 319,750 | | | Sportech plc† | | | 343,218 | | | | 120,106 | |
| | 32,000 | | | World Wrestling Entertainment Inc., Cl. A | | | 475,035 | | | | 2,276,800 | |
| | | | | | | | | | | | |
| | | |
| | | | | | | 5,207,608 | | | | 7,173,599 | |
See accompanying notes to financial statements.
2
TETON Westwood Mighty Mites Fund
Schedule of Investments (Continued) — September 30, 2019
| | | | | | | | | | | | |
Shares | | | | | Cost | | | Market
Value | |
| | |
| | | | COMMON STOCKS (Continued) | | | | | |
| | | | Environmental Control — 1.9% | | | | | |
| | 32,500 | | | AquaVenture Holdings Ltd.† | | $ | 530,065 | | | $ | 631,475 | |
| | 407,853 | | | Casella Waste Systems Inc., Cl. A† | | | 2,022,942 | | | | 17,513,208 | |
| | 13,121 | | | Primo Water Corp.† | | | 159,063 | | | | 161,126 | |
| | | | | | | | | | | | |
| | | |
| | | | | | | 2,712,070 | | | | 18,305,809 | |
| | |
| | | | Equipment and Supplies — 6.9% | | | | | |
| | 10,000 | | | Amtech Systems Inc.† | | | 93,151 | | | | 53,000 | |
| | 20,000 | | | AZZ Inc. | | | 716,820 | | | | 871,200 | |
| | 5,500 | | | Berry Global Group Inc.† | | | 137,770 | | | | 215,985 | |
| | 192,766 | | | CIRCOR International Inc.† | | | 6,300,943 | | | | 7,238,363 | |
| | 404,500 | | | Core Molding Technologies Inc.† | | | 3,294,107 | | | | 2,592,845 | |
| | 571,000 | | | Federal Signal Corp. | | | 3,734,986 | | | | 18,694,540 | |
| | 210,000 | | | Interpump Group SpA | | | 1,523,486 | | | | 6,637,819 | |
| | 490,000 | | | Kimball International Inc., Cl. B | | | 5,071,210 | | | | 9,457,000 | |
| | 17,550 | | | Maezawa Kyuso Industries Co. Ltd. | | | 95,017 | | | | 324,137 | |
| | 200,000 | | | Mitcham Industries Inc.† | | | 749,308 | | | | 650,000 | |
| | 20,593 | | | Powell Industries Inc. | | | 767,781 | | | | 806,216 | |
| | 360,431 | | | The Eastern Co.(a) | | | 6,673,582 | | | | 8,945,897 | |
| | 136,000 | | | The Gorman-Rupp Co. | | | 3,176,032 | | | | 4,731,440 | |
| | 337,820 | | | The L.S. Starrett Co., Cl. A†(a) | | | 3,705,434 | | | | 1,959,356 | |
| | 153,435 | | | Titan Machinery Inc.† | | | 2,579,104 | | | | 2,200,258 | |
| | 116,100 | | | TransAct Technologies Inc. | | | 495,218 | | | | 1,414,098 | |
| | 8,500 | | | Vicor Corp.† | | | 70,948 | | | | 250,920 | |
| | | | | | | | | | | | |
| | | |
| | | | | | | 39,184,897 | | | | 67,043,074 | |
| | | |
| | | | Financial Services — 9.1% | | | | | | | | |
| | 67,000 | | | Allegiance Bancshares Inc.† | | | 2,691,982 | | | | 2,150,030 | |
| | 8,000 | | | Ameris Bancorp | | | 87,070 | | | | 321,920 | |
| | 22,000 | | | Atlantic American Corp. | | | 80,717 | | | | 58,960 | |
| | 302,158 | | | Atlantic Capital Bancshares Inc.† | | | 5,339,986 | | | | 5,239,420 | |
| | 45,778 | | | Atlantic Union Bankshares Corp. | | | 1,390,989 | | | | 1,705,002 | |
| | 17,000 | | | Berkshire Bancorp Inc.† | | | 219,944 | | | | 219,725 | |
| | 12,275 | | | Berkshire Hills Bancorp Inc. | | | 226,297 | | | | 359,535 | |
| | 5,953 | | | BKF Capital Group Inc.† | | | 48,280 | | | | 72,954 | |
| | 10,090 | | | BOK Financial Corp. | | | 660,421 | | | | 798,624 | |
| | 15,000 | | | Boston Private Financial Holdings Inc. | | | 169,709 | | | | 174,825 | |
| | 75 | | | Burke & Herbert Bank and Trust Co. | | | 95,726 | | | | 171,000 | |
| | 50,558 | | | Cadence BanCorp. | | | 1,012,238 | | | | 886,787 | |
| | 96,976 | | | Capital City Bank Group Inc. | | | 2,369,192 | | | | 2,661,991 | |
| | 8,000 | | | Capitol Federal Financial Inc. | | | 91,259 | | | | 110,240 | |
| | 13,000 | | | Carolina Financial Corp. | | | 497,443 | | | | 462,020 | |
| | 34,000 | | | CenterState Bank Corp. | | | 915,054 | | | | 815,490 | |
| | 18,200 | | | Citizens & Northern Corp. | | | 357,816 | | | | 478,296 | |
| | 7,000 | | | ConnectOne Bancorp Inc. | | | 165,900 | | | | 155,400 | |
| | 28,800 | | | Crazy Woman Creek Bancorp Inc. | | | 497,983 | | | | 508,032 | |
| | 32,580 | | | Dime Community Bancshares Inc. | | | 522,755 | | | | 697,538 | |
| | 1,120 | | | Farmers & Merchants Bank of Long Beach | | | 6,157,165 | | | | 8,904,000 | |
| | 40,000 | | | Farmers National Banc Corp. | | | 333,870 | | | | 579,200 | |
| | 10,000 | | | First Community Bankshares Inc. | | | 336,365 | | | | 323,700 | |
| | 36,440 | | | First Internet Bancorp | | | 763,839 | | | | 780,180 | |
| | 657,872 | | | Flushing Financial Corp. | | | 11,253,397 | | | | 13,292,304 | |
| | 75,600 | | | FNB Corp. | | | 736,188 | | | | 871,668 | |
| | 3,000 | | | Franklin Financial Network Inc. | | | 98,132 | | | | 90,630 | |
| | 17,858 | | | FS Bancorp Inc. | | | 684,399 | | | | 937,545 | |
| | | | | | | | | | | | |
Shares | | | | | Cost | | | Market
Value | |
| | | |
| | 482,000 | | | GTY Technology Holdings Inc.† | | $ | 4,574,212 | | | $ | 3,022,140 | |
| | 10 | | | Guaranty Corp., Cl. A†(d) | | | 137,500 | | | | 75,000 | |
| | 195,270 | | | Hallmark Financial Services Inc.† | | | 1,740,608 | | | | 3,735,515 | |
| | 14,000 | | | Hancock Whitney Corp. | | | 180,637 | | | | 536,130 | |
| | 5,800 | | | Heritage Commerce Corp. | | | 47,931 | | | | 68,179 | |
| | 30,000 | | | HomeStreet Inc.† | | | 300,000 | | | | 819,600 | |
| | 79,570 | | | Hope Bancorp Inc. | | | 844,878 | | | | 1,141,034 | |
| | 102,100 | | | I3 Verticals Inc., Cl. A† | | | 1,629,137 | | | | 2,054,252 | |
| | 34,400 | | | ICC Holdings Inc.† | | | 394,036 | | | | 473,172 | |
| | 90,843 | | | KKR & Co. Inc., Cl. A | | | 13,187 | | | | 2,439,135 | |
| | 52,700 | | | Legacy Housing Corp.† | | | 619,100 | | | | 853,740 | |
| | 6,440 | | | LendingTree Inc.† | | | 187,547 | | | | 1,999,169 | |
| | 170,000 | | | Medallion Financial Corp.† | | | 915,281 | | | | 1,088,000 | |
| | 4,197 | | | Northrim BanCorp Inc. | | | 91,497 | | | | 166,495 | |
| | 19,390 | | | OceanFirst Financial Corp. | | | 359,396 | | | | 457,604 | |
| | 36,739 | | | Old Line Bancshares Inc. | | | 1,121,407 | | | | 1,065,798 | |
| | 14,000 | | | Opus Bank | | | 362,164 | | | | 304,780 | |
| | 36,020 | | | Oritani Financial Corp. | | | 375,298 | | | | 637,374 | |
| | 18,681 | | | People’s United Financial Inc. | | | 289,187 | | | | 292,077 | |
| | 148,000 | | | Pzena Investment Management Inc., Cl. A | | | 1,200,873 | | | | 1,320,160 | |
| | 36,971 | | | Renasant Corp. | | | 414,186 | | | | 1,294,355 | |
| | 2,989 | | | Salisbury Bancorp Inc. | | | 129,412 | | | | 117,199 | |
| | 30,000 | | | Sandy Spring Bancorp Inc. | | | 1,026,309 | | | | 1,011,300 | |
| | 3,000 | | | Seacoast Banking Corp. of Florida† | | | 92,978 | | | | 75,930 | |
| | 4,540 | | | Security National Corp. | | | 412,718 | | | | 670,785 | |
| | 80,000 | | | Silvercrest Asset Management Group Inc., Cl. A | | | 1,098,684 | | | | 984,000 | |
| | 6,750 | | | Simmons First National Corp., Cl. A | | | 152,916 | | | | 168,075 | |
| | 4,000 | | | South State Corp. | | | 302,651 | | | | 301,200 | |
| | 56,480 | | | Southern First Bancshares Inc.† | | | 2,454,280 | | | | 2,250,728 | |
| | 64,000 | | | Southern National Bancorp of Virginia Inc. | | | 1,071,005 | | | | 984,960 | |
| | 4,500 | | | Southside Bancshares Inc. | | | 153,548 | | | | 153,495 | |
| | 660,000 | | | Sprott Inc. | | | 1,818,646 | | | | 1,554,289 | |
| | 118,143 | | | Sterling Bancorp | | | 1,177,409 | | | | 2,369,949 | |
| | 6,000 | | | Thomasville Bancshares Inc. | | | 225,946 | | | | 264,120 | |
| | 6,000 | | | Towne Bank/Portsmouth VA | | | 178,312 | | | | 166,830 | |
| | 4,200 | | | TriState Capital Holdings Inc.† | | | 41,237 | | | | 88,368 | |
| | 50,050 | | | TrustCo Bank Corp NY | | | 230,230 | | | | 407,908 | |
| | 119,660 | | | United Financial Bancorp Inc. | | | 1,639,660 | | | | 1,630,966 | |
| | 33,089 | | | Value Line Inc. | | | 326,193 | | | | 752,775 | |
| | 72,620 | | | Veritex Holdings Inc. | | | 2,072,720 | | | | 1,762,124 | |
| | 45,900 | | | Washington Trust Bancorp Inc. | | | 1,029,683 | | | | 2,217,429 | |
| | 82,200 | | | Waterstone Financial Inc. | | | 876,303 | | | | 1,412,196 | |
| | 89,760 | | | Western New England Bancorp Inc. | | | 774,589 | | | | 855,413 | |
| | 265,000 | | | Wright Investors’ Service Holdings Inc.† | | | 157,925 | | | | 123,225 | |
| | | | | | | | | | | | |
| | | |
| | | | | | | 71,045,532 | | | | 87,993,989 | |
| | | |
| | | | Food and Beverage — 3.2% | | | | | | | | |
| | 84,600 | | | Andrew Peller Ltd., Cl. A | | | 357,330 | | | | 903,566 | |
| | 1,900 | | | Bridgford Foods Corp.† | | | 32,687 | | | | 57,323 | |
| | 55,000 | | | Calavo Growers Inc. | | | 1,687,084 | | | | 5,234,900 | |
| | 133,000 | | | Corby Spirit and Wine Ltd. | | | 1,998,640 | | | | 1,726,686 | |
| | 110,000 | | | Cott Corp. | | | 748,495 | | | | 1,371,700 | |
| | 540,000 | | | Crimson Wine Group Ltd.† | | | 4,911,613 | | | | 4,077,000 | |
| | 377,021 | | | Farmer Brothers Co.† | | | 7,868,496 | | | | 4,882,422 | |
| | 1,550 | | | Hanover Foods Corp., Cl. A† | | | 148,789 | | | | 121,171 | |
| | 300 | | | Hanover Foods Corp., Cl. B† | | | 28,206 | | | | 24,750 | |
| | 75,000 | | | Iwatsuka Confectionery Co. Ltd. | | | 3,467,326 | | | | 2,712,139 | |
| | 1,500 | | | J & J Snack Foods Corp. | | | 21,623 | | | | 288,000 | |
See accompanying notes to financial statements.
3
TETON Westwood Mighty Mites Fund
Schedule of Investments (Continued) — September 30, 2019
| | | | | | | | | | | | |
Shares | | | | | Cost | | | Market Value | |
| | |
| | | | COMMON STOCKS (Continued) | | | | | |
| | | | Food and Beverage (Continued) | | | | | |
| | 21,490 | | | John B Sanfilippo & Son Inc. | | $ | 1,010,180 | | | $ | 2,075,934 | |
| | 30,000 | | | Lifeway Foods Inc.† | | | 265,425 | | | | 65,700 | |
| | 210,661 | | | Massimo Zanetti Beverage Group SpA | | | 1,902,168 | | | | 1,354,704 | |
| | 10,000 | | | MGP Ingredients Inc. | | | 260,897 | | | | 496,800 | |
| | 13,840 | | | Rock Field Co. Ltd. | | | 110,886 | | | | 184,832 | |
| | 5,500 | | | Scheid Vineyards Inc., Cl. A† | | | 75,618 | | | | 258,500 | |
| | 7,100 | | | T. Hasegawa Co. Ltd. | | | 148,541 | | | | 131,001 | |
| | 6,500 | | | The Boston Beer Co. Inc., Cl. A† | | | 241,317 | | | | 2,366,520 | |
| | 63,000 | | | The Hain Celestial Group Inc.† | | | 671,082 | | | | 1,352,925 | |
| | 235,200 | | | Tingyi (Cayman Islands) Holding Corp. | | | 345,177 | | | | 331,297 | |
| | 254,400 | | | Vitasoy International Holdings Ltd. | | | 135,186 | | | | 1,030,557 | |
| | 23,000 | | | Willamette Valley Vineyards Inc.† | | | 88,087 | | | | 159,160 | |
| | | | | | | | | | | | |
| | | |
| | | | | | | 26,524,853 | | | | 31,207,587 | |
| | | |
| | | | Health Care — 8.7% | | | | | | | | |
| | 32,960 | | | Accuray Inc.† | | | 244,893 | | | | 91,299 | |
| | 10,000 | | | Anika Therapeutics Inc.† | | | 309,129 | | | | 548,900 | |
| | 22,000 | | | Biolase Inc.† | | | 50,160 | | | | 20,902 | |
| | 130,000 | | | BioTelemetry Inc.† | | | 908,156 | | | | 5,294,900 | |
| | 6,970 | | | Boiron SA | | | 118,049 | | | | 246,902 | |
| | 46,500 | | | Cantel Medical Corp. | | | 593,901 | | | | 3,478,200 | |
| | 106,660 | | | Cardiovascular Systems Inc.† | | | 1,844,922 | | | | 5,068,483 | |
| | 14,000 | | | CareDx Inc.† | | | 80,937 | | | | 316,540 | |
| | 43,400 | | | Collegium Pharmaceutical Inc.† | | | 738,494 | | | | 498,232 | |
| | 384,940 | | | Cutera Inc.† | | | 5,778,772 | | | | 11,251,796 | |
| | 166,843 | | | Electromed Inc.† | | | 638,785 | | | | 1,102,832 | |
| | 175,000 | | | Exelixis Inc.† | | | 333,375 | | | | 3,094,875 | |
| | 25,000 | | | Genesis Healthcare Inc.† | | | 38,387 | | | | 27,750 | |
| | 11,000 | | | Heska Corp.† | | | 162,663 | | | | 779,570 | |
| | 4,000 | | | ICU Medical Inc.† | | | 208,306 | | | | 638,400 | |
| | 612,448 | | | InfuSystems Holdings Inc.† | | | 1,609,196 | | | | 3,239,850 | |
| | 23,000 | | | Integer Holdings Corp.† | | | 479,237 | | | | 1,737,880 | |
| | 173,724 | | | IntriCon Corp.† | | | 1,696,872 | | | | 3,377,195 | |
| | 60,000 | | | Invitae Corp.† | | | 484,527 | | | | 1,156,200 | |
| | 36,000 | | | Kindred Biosciences Inc.† | | | 364,531 | | | | 246,600 | |
| | 3,000 | | | LeMaitre Vascular Inc. | | | 73,153 | | | | 102,540 | |
| | 95,000 | | | Meridian Bioscience Inc. | | | 1,727,179 | | | | 901,550 | |
| | 160,000 | | | Motif Bio plc† | | | 70,834 | | | | 1,672 | |
| | 154,000 | | | Neogen Corp.† | | | 476,321 | | | | 10,488,940 | |
| | 109,780 | | | NeoGenomics Inc.† | | | 438,086 | | | | 2,098,994 | |
| | 7,000 | | | Nuvectra Corp.† | | | 64,246 | | | | 9,520 | |
| | 41,323 | | | Omnicell Inc.† | | | 680,307 | | | | 2,986,413 | |
| | 230,000 | | | OPKO Health Inc.† | | | 545,778 | | | | 480,700 | |
| | 153,911 | | | Option Care Health Inc.† | | | 289,584 | | | | 492,515 | |
| | 45,200 | | | Orthofix Medical Inc.† | | | 965,181 | | | | 2,396,504 | |
| | 45,000 | | | Paratek Pharmaceuticals Inc.† | | | 280,970 | | | | 194,400 | |
| | 8,000 | | | Progenics Pharmaceuticals Inc.† | | | 51,552 | | | | 40,440 | |
| | 114,000 | | | Quidel Corp.† | | | 1,394,874 | | | | 6,993,900 | |
| | 66,000 | | | RTI Surgical Holdings Inc.† | | | 334,123 | | | | 188,100 | |
| | 117,934 | | | SurModics Inc.† | | | 2,409,935 | | | | 5,394,301 | |
| | 2,000 | | | Targanta Therapeutics Corp., Escrow†(d) | | | 0 | | | | 0 | |
| | 500 | | | Tetraphase Pharmaceuticals Inc.† | | | 28,535 | | | | 2,660 | |
| | 1,000 | | | Titan Medical Inc.† | | | 2,224 | | | | 1,080 | |
| | 78,101 | | | United-Guardian Inc. | | | 725,485 | | | | 1,464,394 | |
| | 4,600 | | | Utah Medical Products Inc | | | 126,267 | | | | 440,864 | |
| | 278,000 | | | Zealand Pharma A/S† | | | 3,494,481 | | | | 7,077,891 | |
| | | | | | | | | | | | |
| | | |
| | | | | | | 30,862,407 | | | | 83,974,684 | |
| | | | | | | | | | | | |
Shares | | | | | Cost | | | Market Value | |
| | | |
| | | | Hotels and Gaming — 4.6% | | | | | | | | |
| | 50,000 | | | Ainsworth Game Technology Ltd. | | $ | 44,995 | | | $ | 26,154 | |
| | 71,800 | | | Boyd Gaming Corp. | | | 416,103 | | | | 1,719,610 | |
| | 78,000 | | | Braemar Hotels & Resorts Inc., REIT | | | 766,264 | | | | 732,420 | |
| | 66,620 | | | Churchill Downs Inc. | | | 1,086,907 | | | | 8,224,572 | |
| | 75,000 | | | Eldorado Resorts Inc.† | | | 341,799 | | | | 2,990,250 | |
| | 6,000 | | | Empire Resorts Inc.† | | | 79,617 | | | | 57,780 | |
| | 30,000 | | | Everi Holdings Inc.† | | | 218,321 | | | | 253,800 | |
| | 1,117,725 | | | Full House Resorts Inc.† | | | 2,695,209 | | | | 2,414,286 | |
| | 121,000 | | | Gamenet Group SpA | | | 1,197,934 | | | | 1,434,903 | |
| | 641,210 | | | Golden Entertainment Inc.† | | | 6,807,644 | | | | 8,521,681 | |
| | 352,254 | | | Inspired Entertainment Inc.† | | | 2,251,124 | | | | 2,532,706 | |
| | 36,000 | | | PlayAGS Inc.† | | | 431,212 | | | | 370,080 | |
| | 6,000 | | | Ryman Hospitality Properties Inc., REIT | | | 232,186 | | | | 490,860 | |
| | 353,812 | | | The Marcus Corp. | | | 4,455,756 | | | | 13,094,582 | |
| | 75,461 | | | Twin River Worldwide Holdings Inc. | | | 2,178,270 | | | | 1,722,775 | |
| | | | | | | | | | | | |
| | | |
| | | | | | | 23,203,341 | | | | 44,586,459 | |
| | | |
| | | | Machinery — 2.8% | | | | | | | | |
| | 326,000 | | | Astec Industries Inc. | | | 11,457,875 | | | | 10,138,600 | |
| | 5,000 | | | DMG Mori AG | | | 28,402 | | | | 231,615 | |
| | 5,120 | | | DXP Enterprises Inc.† | | | 133,810 | | | | 177,766 | |
| | 559,000 | | | Gencor Industries Inc.† | | | 3,819,715 | | | | 6,489,990 | |
| | 15,164 | | | Lindsay Corp. | | | 1,014,039 | | | | 1,407,977 | |
| | 44,650 | | | Tennant Co. | | | 978,398 | | | | 3,156,755 | |
| | 43,400 | | | The Middleby Corp.† | | | 454,690 | | | | 5,073,460 | |
| | 38,000 | | | Williams Industrial Services Group Inc.† | | | 124,236 | | | | 74,100 | |
| | | | | | | | | | | | |
| | | |
| | | | | | | 18,011,165 | | | | 26,750,263 | |
| |
| | | | Manufactured Housing and Recreational Vehicles — 2.1% | |
| | 55,555 | | | Cavco Industries Inc.† | | | 3,142,786 | | | | 10,671,560 | |
| | 175,250 | | | Nobility Homes Inc. | | | 2,031,484 | | | | 4,128,890 | |
| | 102,500 | | | Skyline Champion Corp.† | | | 821,735 | | | | 3,084,225 | |
| | 61,000 | | | Winnebago Industries Inc. | | | 626,036 | | | | 2,339,350 | |
| | | | | | | | | | | | |
| | | |
| | | | | | | 6,622,041 | | | | 20,224,025 | |
| | | |
| | | | Metals and Mining — 1.2% | | | | | | | | |
| | 60,000 | | | 5N Plus Inc.† | | | 215,087 | | | | 99,181 | |
| | 10,000 | | | Alkane Resources Ltd.† | | | 3,333 | | | | 4,927 | |
| | 61,540 | | | Materion Corp. | | | 1,371,814 | | | | 3,776,094 | |
| | 717,000 | | | Osisko Gold Royalties Ltd. | | | 10,420,098 | | | | 6,662,090 | |
| | 900,000 | | | Tanami Gold NL† | | | 210,755 | | | | 29,158 | |
| | 71,300 | | | TimkenSteel Corp.† | | | 813,371 | | | | 448,477 | |
| | 700 | | | United States Lime & Minerals Inc. | | | 55,159 | | | | 53,550 | |
| | | | | | | | | | | | |
| | | |
| | | | | | | 13,089,617 | | | | 11,073,477 | |
| | |
| | | | Paper and Forest Products — 0.2% | | | | | |
| | 26,800 | | | Keweenaw Land Association Ltd.† | | | 2,281,278 | | | | 1,876,000 | |
| | | | | | | | | | | | |
| | | |
| | | | Publishing — 1.3% | | | | | | | | |
| | 136,000 | | | AH Belo Corp., Cl. A | | | 703,510 | | | | 510,000 | |
| | 116,000 | | | ARC Document Solutions Inc.† | | | 219,107 | | | | 157,760 | |
| | 852,600 | | | The E.W. Scripps Co., Cl. A | | | 5,156,637 | | | | 11,322,528 | |
| | 27,057 | | | Tribune Publishing Co. | | | 264,673 | | | | 232,149 | |
| | | | | | | | | | | | |
| | | |
| | | | | | | 6,343,927 | | | | 12,222,437 | |
| | | |
| | | | Real Estate — 3.5% | | | | | | | | |
| | 226,000 | | | Ambase Corp.† | | | 321,495 | | | | 84,750 | |
| | 8,000 | | | Bresler & Reiner Inc.† | | | 4,912 | | | | 1,160 | |
| | 113,300 | | | Capital Properties Inc., Cl. A | | | 1,205,957 | | | | 1,824,130 | |
| | 92,000 | | | Cohen & Steers Inc. | | | 2,107,686 | | | | 5,053,560 | |
| | 60,000 | | | DREAM Unlimited Corp., Cl. A | | | 331,539 | | | | 432,955 | |
See accompanying notes to financial statements.
4
TETON Westwood Mighty Mites Fund
Schedule of Investments (Continued) — September 30, 2019
| | | | | | | | | | | | |
Shares | | | | | Cost | | | Market Value | |
| | |
| | | | COMMON STOCKS (Continued) | | | | | |
| | | | Real Estate (Continued) | | | | | |
| | 24,400 | | | FRP Holdings Inc.† | | $ | 802,280 | | | $ | 1,171,688 | |
| | 281,450 | | | Griffin Industrial Realty Inc.(a) | | | 8,150,899 | | | | 10,681,028 | |
| | 14,138 | | | Gyrodyne LLC† | | | 394,093 | | | | 283,820 | |
| | 8,231 | | | Holobeam Inc.† | | | 161,746 | | | | 420,892 | |
| | 32,356 | | | New Senior Investment Group Inc., REIT | | | 196,101 | | | | 216,138 | |
| | 527,269 | | | Reading International Inc., Cl. A† | | | 4,919,287 | | | | 6,306,137 | |
| | 74,459 | | | Reading International Inc., Cl. B† | | | 672,330 | | | | 1,861,475 | |
| | 2,508 | | | Royalty LLC†(d) | | | 0 | | | | 255 | |
| | 164,000 | | | Tejon Ranch Co.† | | | 4,030,303 | | | | 2,783,080 | |
| | 628,023 | | | Trinity Place Holdings Inc.† | | | 3,406,008 | | | | 2,512,092 | |
| | | | | | | | | | | | |
| | | |
| | | | | | | 26,704,636 | | | | 33,633,160 | |
| | | |
| | | | Restaurants — 2.1% | | | | | | | | |
| | 1,639 | | | Biglari Holdings Inc., Cl. A† | | | 1,464,491 | | | | 919,774 | |
| | 58,000 | | | Denny’s Corp.† | | | 178,031 | | | | 1,320,370 | |
| | 222,234 | | | Nathan’s Famous Inc.(a) | | | 3,237,026 | | | | 15,967,513 | |
| | 50,000 | | | The Cheesecake Factory Inc. | | | 1,504,518 | | | | 2,084,000 | |
| | | | | | | | | | | | |
| | | |
| | | | | | | 6,384,066 | | | | 20,291,657 | |
| | | |
| | | | Retail — 1.8% | | | | | | | | |
| | 90,000 | | | Big 5 Sporting Goods Corp. | | | 711,837 | | | | 187,200 | |
| | 69,710 | | | Ethan Allen Interiors Inc. | | | 1,463,160 | | | | 1,331,461 | |
| | 70,000 | | | GNC Holdings Inc., Cl. A† | | | 227,128 | | | | 149,800 | |
| | 215,000 | | | iMedia Brands Inc.† | | | 261,779 | | | | 120,400 | |
| | 172,240 | | | Ingles Markets Inc., Cl. A | | | 2,977,603 | | | | 6,693,246 | |
| | 113,000 | | | Lands’ End Inc.† | | | 1,906,893 | | | | 1,281,985 | |
| | 41,000 | | | La-Z-Boy Inc. | | | 918,461 | | | | 1,377,190 | |
| | 93,000 | | | Movado Group Inc. | | | 2,029,299 | | | | 2,311,980 | |
| | 300 | | | PetIQ Inc.† | | | 7,511 | | | | 8,178 | |
| | 3,000 | | | SpartanNash Co. | | | 43,945 | | | | 35,490 | |
| | 91,000 | | | Tuesday Morning Corp.† | | | 270,457 | | | | 142,870 | |
| | 121,174 | | | Village Super Market Inc., Cl. A | | | 3,305,193 | | | | 3,205,052 | |
| | 400 | | | Winmark Corp. | | | 26,768 | | | | 70,556 | |
| | | | | | | | | | | | |
| | | |
| | | | | | | 14,150,034 | | | | 16,915,408 | |
| | | |
| | | | Semiconductors — 0.8% | | | | | | | | |
| | 162,740 | | | Entegris Inc. | | | 1,088,226 | | | | 7,658,544 | |
| | 2,000 | | | Veeco Instruments Inc.† | | | 23,663 | | | | 23,360 | |
| | | | | | | | | | | | |
| | | |
| | | | | | | 1,111,889 | | | | 7,681,904 | |
| | |
| | | | Specialty Chemicals — 2.2% | | | | | |
| | 1,086,593 | | | Ferro Corp.† | | | 5,209,733 | | | | 12,886,993 | |
| | 267,226 | | | General Chemical Group Inc.†(a) | | | 59,859 | | | | 2,138 | |
| | 69,000 | | | Hawkins Inc. | | | 2,486,115 | | | | 2,932,500 | |
| | 4,100 | | | Minerals Technologies Inc. | | | 121,383 | | | | 217,669 | |
| | 156,000 | | | Navigator Holdings Ltd.† | | | 1,910,919 | | | | 1,666,080 | |
| | 239,027 | | | OMNOVA Solutions Inc.† | | | 1,919,920 | | | | 2,407,002 | |
| | 6,000 | | | Takasago International Corp. | | | 160,690 | | | | 145,110 | |
| | 50,000 | | | Teraoka Seisakusho Co. Ltd. | | | 368,433 | | | | 219,191 | |
| | 189,174 | | | Treatt plc | | | 1,017,380 | | | | 944,346 | |
| | | | | | | | | | | | |
| | | |
| | | | | | | 13,254,432 | | | | 21,421,029 | |
| | |
| | | | Telecommunications — 2.2% | | | | | |
| | 26,000 | | | A10 Networks Inc.† | | | 163,417 | | | | 180,440 | |
| | 38,980 | | | ATN International Inc. | | | 1,514,869 | | | | 2,275,263 | |
| | 468,000 | | | Cincinnati Bell Inc.† | | | 5,214,310 | | | | 2,372,760 | |
| | 28,100 | | | Consolidated Communications Holdings Inc. | | | 164,113 | | | | 133,756 | |
| | 20,808 | | | Frequency Electronics Inc.† | | | 233,086 | | | | 252,817 | |
| | 65,000 | | | Gogo Inc.† | | | 322,463 | | | | 391,950 | |
| | 590,000 | | | HC2 Holdings Inc.† | | | 2,109,027 | | | | 1,386,500 | |
| | 5,000 | | | IDT Corp., Cl. B† | | | 37,666 | | | | 52,650 | |
| | 20,000 | | | Iridium Communications Inc.† | | | 160,025 | | | | 425,600 | |
| | | | | | | | | | | | |
Shares | | | | | Cost | | | Market Value | |
| | | |
| | 4,000 | | | North State Telecommunications Corp., Cl. A | | $ | 341,561 | | | $ | 250,000 | |
| | 57,500 | | | Nuvera Communications Inc. | | | 528,202 | | | | 1,187,375 | |
| | 512,315 | | | ORBCOMM Inc.† | | | 2,965,873 | | | | 2,438,619 | |
| | 5,788 | | | Preformed Line Products Co. | | | 246,195 | | | | 315,967 | |
| | 278,000 | | | Shenandoah Telecommunications Co. | | | 1,472,162 | | | | 8,832,060 | |
| | 40,000 | | | WideOpenWest Inc.† | | | 396,754 | | | | 246,400 | |
| | | | | | | | | | | | |
| | | |
| | | | | | | 15,869,723 | | | | 20,742,157 | |
| | | |
| | | | Transportation — 0.0% | | | | | | | | |
| | 17,000 | | | Patriot Transportation Holding Inc.† | | | 374,911 | | | | 323,000 | |
| | | | | | | | | | | | |
| |
| | | | Wireless Communications — 0.2% | |
| | 1,100,000 | | | NII Holdings Inc.† | | | 1,366,361 | | | | 2,156,000 | |
| | | | | | | | | | | | |
| | | | TOTAL COMMON STOCKS | | | 587,423,584 | | | | 954,398,251 | |
| | | | | | | | | | | | |
| | |
| | | | CLOSED-END FUNDS — 0.1% | | | | | |
| | 127,800 | | | MVC Capital Inc. | | | 1,152,872 | | | | 1,137,420 | |
| | | | | | | | | | | | |
| | |
| | | | PREFERRED STOCKS — 0.6% | | | | | |
| | | | Automotive: Parts and Accessories — 0.1% | |
| | 46,300 | | | Jungheinrich AG | | | 186,816 | | | | 998,195 | |
| | | | | | | | | | | | |
| | |
| | | | Financial Services — 0.5% | | | | | |
| | 233,000 | | | Steel Partners Holdings LP Ser. A, 6.000% | | | 7,323,349 | | | | 4,932,610 | |
| | | | | | | | | | | | |
| | | | TOTAL PREFERRED STOCKS | | | 7,510,165 | | | | 5,930,805 | |
| | | | | | | | | | | | |
| |
| | | | CONVERTIBLE PREFERRED STOCKS (e) — 0.1% | |
| | | | Energy and Utilities — 0.1% | | | | | |
| | 15,095 | | | Corning Natural Gas Holding Corp., | | | | | | | | |
| | | | 4.800%, Ser. B | | | 313,221 | | | | 332,090 | |
| | | | | | | | | | | | |
| | |
| | | | Food and Beverage — 0.0% | | | | | |
| | 500 | | | Seneca Foods Corp., Ser. 2003 | | | 7,625 | | | | 15,590 | |
| | | | | | | | | | | | |
| | | | TOTAL CONVERTIBLE PREFERRED STOCKS | | | 320,846 | | | | 347,680 | |
| | | | | | | | | | | | |
| | | |
| | | | RIGHTS — 0.0% | | | | | | | | |
| | | | Entertainment — 0.0% | | | | | |
| | 550,000 | | | Media General Inc., CVR†(d) | | | 1 | | | | 1 | |
| | | | | | | | | | | | |
| | |
| | | | Health Care — 0.0% | | | | | |
| | 400,000 | | | Sanofi, CVR† | | | 137,800 | | | | 228,000 | |
| | 200,000 | | | Teva Pharmaceutical Industries Ltd., CCCP, expire 02/20/23†(d) | | | 103,591 | | | | 0 | |
| | | | | | | | | | | | |
| | | |
| | | | | | | 241,391 | | | | 228,000 | |
| | |
| | | | Specialty Chemicals — 0.0% | | | | | |
| | 30,000 | | | A. Schulman Inc., CVR†(d) | | | 15,690 | | | | 15,690 | |
| | | | | | | | | | | | |
| | | |
| | | | TOTAL RIGHTS | | | 257,082 | | | | 243,691 | |
| | |
| | | | WARRANTS — 0.0% | | | | | |
| | | | Energy and Utilities — 0.0% | | | | | |
| | 86 | | | Key Energy Services Inc., expire 12/15/21†(d) | | | 0 | | | | 17 | |
| | 86 | | | Key Energy Services Inc., expire 12/15/20†(d) | | | 0 | | | | 4 | |
| | | | | | | | | | | | |
| | | |
| | | | | | | 0 | | | | 21 | |
| | |
| | | | Environmental Control — 0.0% | | | | | |
| | 200 | | | Primo Water Corp., expire 12/31/21† | | | 58 | | | | 43 | |
| | | | | | | | | | | | |
See accompanying notes to financial statements.
5
TETON Westwood Mighty Mites Fund
Schedule of Investments (Continued) — September 30, 2019
| | | | | | | | | | | | |
Shares | | | | | Cost | | | Market
Value | |
| | | | WARRANTS (Continued) | | | | | |
| | | | Health Care — 0.0% | | | | | |
| | 8,737 | | | Option Care Health Inc., Cl. A, expire 07/27/25† | | $ | 7,979 | | | $ | 3,199 | |
| | 8,737 | | | Option Care Health Inc., Cl. B, expire 07/27/25† | | | 7,554 | | | | 2,647 | |
| | | | | | | | | | | | |
| | | |
| | | | | | | 15,533 | | | | 5,846 | |
| | | | | | | | | | | | |
| | | |
| | | | TOTAL WARRANTS | | | 15,591 | | | | 5,910 | |
| | | | | | | | | | | | |
| | | |
Principal
Amount | | | | | Cost | | | Market
Value | |
| |
| | | | CONVERTIBLE CORPORATE BONDS — 0.0% | |
| | | | Telecommunications — 0.0% | | | | | | | | |
| | $ 180,000 | | | Gogo Inc., 6.000%, 05/15/22(b) | | | 180,000 | | | | 215,308 | |
| | | | | | | | | | | | |
| |
| | | | U.S. GOVERNMENT OBLIGATIONS — 0.4% | |
| | 3,796,000 | | | U.S. Treasury Bills, | | | | | | | | |
| | | | 1.877% to 1.950%††, 11/21/19 to 12/19/19 | | | 3,783,123 | | | | 3,784,099 | |
| | | | | | | | | | | | |
| | | |
| | | | TOTAL MISCELLANEOUS INVESTMENTS — 0.1%(f) | | | 568,202 | | | | 559,073 | |
| | | | | | | | | | | | |
| | | |
| | | | TOTAL INVESTMENTS — 100.1% | | $ | 601,211,465 | | | | 966,622,237 | |
| | | | | | | | | | | | |
| | |
| | | | Other Assets and Liabilities (Net) — (0.1)% | | | | (906,592 | ) |
| | | | | | | | | | | | |
| | | |
| | | | NET ASSETS — 100.0% | | | | | | $ | 965,715,645 | |
| | | | | | | | | | | | |
| (a) | Security considered an affiliated holding because the Fund owns at least 5% of its outstanding shares. |
| (b) | Security exempt from registration under Rule 144A of the Securities Act of 1933, as amended. These securities may be resold in transactions exempt from registration, normally to qualified institutional buyers. |
| (c) | At September 30, 2019, the Fund held an investment in a restricted and illiquid security amounting to $14,756 or 0.00% of net assets., which was valued under methods approved by the Board of Trustees as follows: |
| | | | | | | | | | | | |
Acquisition Shares | | Issuer | | Acquisition
Date | | | Acquisition
Cost | | 09/30/19
Carrying
Value
Per Share | |
28,792 | | Trans-Lux Corp. | |
| 06/01/09-
09/25/18 |
| | $25,123 | | | 0.5125 | |
| (d) | Security is valued using significant unobservable inputs and is classified as Level 3 in the fair value hierarchy. |
| (e) | Securities are perpetual and have no stated maturity date. |
| (f) | Represents previously undisclosed, unrestricted securities which the Fund has held for less than one year. |
| † | Non-income producing security. |
| †† | Represents annualized yields at dates of purchase. |
| ADR | American Depositary Receipt |
| CCCP | Contingent Cash Consideration Payment |
| CVR | Contingent Value Right |
| GDR | Global Depositary Receipt |
| REIT | Real Estate Investment Trust |
See accompanying notes to financial statements.
6
Report of Independent Registered Public Accounting Firm
To the Board of Trustees of TETON Westwood Funds and Shareholders of TETON Westwood Mighty MitesSM Fund
Opinion on the Financial Statements
We have audited the accompanying statement of assets and liabilities, including the summary schedule of investments, of TETON Westwood Mighty MitesSM Fund (one of the funds constituting TETON Westwood Funds, referred to hereafter as the “Fund”) as of September 30, 2019, the related statement of operations for the year ended September 30, 2019, the statement of changes in net assets for each of the two years in the period ended September 30, 2019, including the related notes, and the financial highlights for each of the five years in the period ended September 30, 2019 (included in Item 1 of this FormN-CSR) and the schedule of investments (included in Item 6 of this FormN-CSR) as of September 30, 2019 (collectively referred to as the “financial statements”). In our opinion, the financial statements present fairly, in all material respects, the financial position of the Fund as of September 30, 2019, the results of its operations for the year then ended, the changes in its net assets for each of the two years in the period ended September 30, 2019 and the financial highlights for each of the five years in the period ended September 30, 2019 in conformity with accounting principles generally accepted in the United States of America.
Basis for Opinion
These financial statements are the responsibility of the Fund’s management. Our responsibility is to express an opinion on the Fund’s financial statements based on our audits. We are a public accounting firm registered with the Public Company Accounting Oversight Board (United States) (PCAOB) and are required to be independent with respect to the Fund in accordance with the U.S. federal securities laws and the applicable rules and regulations of the Securities and Exchange Commission and the PCAOB.
We conducted our audits of these financial statements in accordance with the standards of the PCAOB. Those standards require that we plan and perform the audit to obtain reasonable assurance about whether the financial statements are free of material misstatement, whether due to error or fraud.
Our audits included performing procedures to assess the risks of material misstatement of the financial statements, whether due to error or fraud, and performing procedures that respond to those risks. Such procedures included examining, on a test basis, evidence regarding the amounts and disclosures in the financial statements. Our audits also included evaluating the accounting principles used and significant estimates made by management, as well as evaluating the overall presentation of the financial statements. Our procedures included confirmation of securities owned as of September 30, 2019 by correspondence with the custodian and brokers; when replies were not received from brokers, we performed other auditing procedures. We believe that our audits provide a reasonable basis for our opinion.
/s/PricewaterhouseCoopers LLP
New York, New York
November 26, 2019
We have served as the auditor of one or more investment companies in Gabelli/GAMCO Fund Complex since 1986.
7
| (b) | Not applicable due to no such divestments during the semi-annual period covered since the previousForm N-CSR filing. |
| Item 7. | Disclosure of Proxy Voting Policies and Procedures forClosed-End Management Investment Companies. |
Not applicable.
Item 8. Portfolio Managers ofClosed-End Management Investment Companies.
Not applicable.
| Item 9. | Purchases of Equity Securities byClosed-End Management Investment Company and Affiliated Purchasers. |
Not applicable.
Item 10. Submission of Matters to a Vote of Security Holders.
There have been no material changes to the procedures by which the shareholders may recommend nominees to the registrant’s board of trustees, where those changes were implemented after the registrant last provided disclosure in response to the requirements of Item 407(c)(2)(iv) of RegulationS-K (17 CFR 229.407) (as required by Item 22(b)(15) of Schedule 14A (17 CFR240.14a-101)), or this Item.
Item 11. Controls and Procedures.
| | (a) | The registrant’s principal executive and principal financial officers, or persons performing similar functions, have concluded that the registrant’s disclosure controls and procedures (as defined in Rule30a-3(c) under the Investment Company Act of 1940, as amended (the “1940 Act”) (17 CFR270.30a-3(c))) are effective, as of a date within 90 days of the filing date of the report that includes the disclosure required by this paragraph, based on their evaluation of these controls and procedures required by Rule30a-3(b) under the 1940 Act (17 CFR270.30a-3(b)) and Rules13a-15(b) or15d-15(b) under the Securities Exchange Act of 1934, as amended (17 CFR240.13a-15(b) or240.15d-15(b)). |
| | (b) | There were no changes in the registrant’s internal control over financial reporting (as defined in Rule30a-3(d) under the 1940 Act (17 CFR270.30a-3(d)) that occurred during the period covered by this report that has materially affected, or is reasonably likely to materially affect, the registrant’s internal control over financial reporting. |
Item 12. Disclosure of Securities Lending Activities forClosed-End Management Investment Companies.
Not applicable.
Item 13. Exhibits.
| | (a)(1) | Code of ethics, or any amendment thereto, that is the subject of disclosure required by Item 2 is attached hereto. |
| | (a)(2) | Certifications pursuant to Rule30a-2(a) under the 1940 Act and Section 302 of the Sarbanes-Oxley Act of 2002 are attached hereto. |
| | (b) | Certifications pursuant to Rule30a-2(b) under the 1940 Act and Section 906 of the Sarbanes-Oxley Act of 2002 are attached hereto. |
SIGNATURES
Pursuant to the requirements of the Securities Exchange Act of 1934 and the Investment Company Act of 1940, the registrant has duly caused this report to be signed on its behalf by the undersigned, thereunto duly authorized.
(Registrant) The TETON Westwood Funds
By (Signature and Title)* /s/ Bruce N. Alpert
Bruce N. Alpert, Principal Executive Officer
Date 12/04/2019
Pursuant to the requirements of the Securities Exchange Act of 1934 and the Investment Company Act of 1940, this report has been signed below by the following persons on behalf of the registrant and in the capacities and on the dates indicated.
By (Signature and Title)* /s/ Bruce N. Alpert
Bruce N. Alpert, Principal Executive Officer
Date 12/04/2019
By (Signature and Title)* /s/ John C. Ball
John C. Ball, Principal Financial Officer and Treasurer
Date 12/04/2019
* Print the name and title of each signing officer under his or her signature.