UNITED STATES
SECURITIES AND EXCHANGE COMMISSION
Washington, D.C. 20549
FORM N-CSR
CERTIFIED SHAREHOLDER REPORT OF REGISTERED MANAGEMENT
INVESTMENT COMPANIES
Investment Company Act file number 811-04719
The TETON Westwood Funds
(Exact name of registrant as specified in charter)
One Corporate Center
Rye, New York 10580-1422
(Address of principal executive offices) (Zip code)
Bruce N. Alpert
Gabelli Funds, LLC
One Corporate Center
Rye, New York 10580-1422
(Name and address of agent for service)
Registrant’s telephone number, including area code: 1-800-422-3554
Date of fiscal year end: September 30
Date of reporting period: September 30, 2017
Form N-CSR is to be used by management investment companies to file reports with the Commission not later than 10 days after the transmission to stockholders of any report that is required to be transmitted to stockholders under Rule 30e-1 under the Investment Company Act of 1940 (17 CFR 270.30e-1). The Commission may use the information provided on Form N-CSR in its regulatory, disclosure review, inspection, and policymaking roles.
A registrant is required to disclose the information specified by Form N-CSR, and the Commission will make this information public. A registrant is not required to respond to the collection of information contained in Form N-CSR unless the Form displays a currently valid Office of Management and Budget (“OMB”) control number. Please direct comments concerning the accuracy of the information collection burden estimate and any suggestions for reducing the burden to Secretary, Securities and Exchange Commission, 450 Fifth Street, NW, Washington, DC 20549-0609. The OMB has reviewed this collection of information under the clearance requirements of 44 U.S.C. § 3507.
Item 1. Reports to Stockholders.
The Report to Shareholders is attached herewith.

TETON WESTWOOD FUNDS
|
|
Mighty MitesSM Fund |
| |
|
SmallCap Equity Fund |
| |
|
Mid-Cap Equity Fund |
| |
|
Convertible Securities Fund |
| |
|
Equity Fund |
| |
|
Balanced Fund |
| |
|
Intermediate Bond Fund |
|
| Annual Report |
|
| September 30, 2017 |
TETON WESTWOOD FUNDS
(Unaudited)
| | | | | | | | | | | | | | | | | | | | | | | | | | | | | | | | | | | | | | | | | | | | | | | | | | | | | | | | | | | | | | | | | | | | | | | | |
| | | Class AAA Shares | | | | Class A Shares |
| | | Average Annual Returns – September 30, 2017 (a) | | | | Average Annual Returns – September 30, 2017 (a)(b)(c) |
| | | 1 Year | | 5 Year | | 10 Year | | 15 Year | | Since
Inception | | Gross
Expense
Ratio | | Expense
Ratio after
Adviser
Reimburse-
ments | | | | 1 Year | | 5 Year | | 10 Year | | 15 Year | | Since
Inception | | Gross
Expense
Ratio | | Expense
Ratio after
Adviser
Reimburse-
ments |
Mighty MitesSM | | | | 24.42 | % | | | | 14.18 | % | | | | 9.33 | % | | | | 11.89 | % | | | | 11.81 | % | | | | 1.42 | % | | | | 1.42 | % | | | | | | 19.17 | % | | | | 12.97 | % | | | | 8.62 | % | | | | 11.34 | % | | | | 11.35 | % | | | | 1.67 | % | | | | 1.67 | % |
SmallCap Equity | | | | 23.10 | | | | | 14.27 | | | | | 7.42 | | | | | 9.94 | | | | | 8.05 | | | | | 1.79 | | | | | 1.25 | | | | | | | 17.86 | | | | | 13.08 | | | | | 6.73 | | | | | 9.39 | | | | | 7.67 | | | | | 2.04 | | | | | 1.50 | |
Mid-Cap Equity | | | | 13.38 | | | | | — | | | | | — | | | | | — | | | | | 8.38 | | | | | 3.26 | | | | | 1.05 | | | | | | | 8.55 | | | | | — | | | | | — | | | | | — | | | | | 7.09 | | | | | 3.44 | | | | | 1.30 | |
Convertible Securities | | | | 14.14 | | | | | 8.79 | | | | | 4.36 | | | | | 8.22 | | | | | 7.35 | | | | | 2.74 | | | | | 1.15 | | | | | | | 9.22 | | | | | 7.63 | | | | | 3.66 | | | | | 7.66 | | | | | 6.91 | | | | | 2.99 | | | | | 1.40 | |
Equity | | | | 16.61 | | | | | 12.40 | | | | | 5.35 | | | | | 9.17 | | | | | 10.03 | | | | | 1.63 | | | | | 1.63 | | | | | | | 11.60 | | | | | 11.22 | | | | | 4.66 | | | | | 8.60 | | | | | 9.66 | | | | | 1.88 | | | | | 1.88 | |
Balanced | | | | 10.34 | | | | | 8.17 | | | | | 4.79 | | | | | 7.06 | | | | | 8.37 | | | | | 1.35 | | | | | 1.35 | | | | | | | 5.76 | | | | | 7.03 | | | | | 4.10 | | | | | 6.51 | | | | | 7.93 | | | | | 1.60 | | | | | 1.60 | |
Intermediate Bond | | | | (1.18 | ) | | | | 0.55 | | | | | 2.76 | | | | | 2.70 | | | | | 4.52 | | | | | 1.44 | | | | | 1.02 | | | | | | | (5.28 | ) | | | | (0.37 | ) | | | | 2.22 | | | | | 2.31 | | | | | 4.28 | | | | | 1.54 | | | | | 1.12 | |
| | | |
| | | Class C Shares | | | | Class I Shares |
| | | Average Annual Returns – September 30, 2017 (a)(c)(d) | | | | Average Annual Returns – September 30, 2017 (a)(c) |
| | | 1 Year | | 5 Year | | 10 Year | | 15 Year | | Since
Inception | | Gross
Expense
Ratio | | Expense
Ratio after
Adviser
Reimburse-
ments | | | | 1 Year | | 5 Year | | 10 Year | | 15 Year | | Since
Inception | | Gross
Expense
Ratio | | Expense
Ratio after
Adviser
Reimburse-
ments |
Mighty MitesSM | | | | 22.52 | % | | | | 13.33 | % | | | | 8.52 | % | | | | 11.07 | % | | | | 11.12 | % | | | | 2.17 | % | | | | 2.17 | % | | | | | | 24.74 | % | | | | 14.46 | % | | | | 9.60 | % | | | | 12.07 | % | | | | 11.95 | % | | | | 1.17 | % | | | | 1.17 | % |
SmallCap Equity | | | | 21.24 | | | | | 13.44 | | | | | 6.63 | | | | | 9.04 | | | | | 7.39 | | | | | 2.54 | | | | | 2.00 | | | | | | | 23.40 | | | | | 14.58 | | | | | 7.69 | | | | | 10.12 | | | | | 8.18 | | | | | 1.54 | | | | | 1.00 | |
Mid-Cap Equity | | | | 11.51 | | | | | — | | | | | — | | | | | — | | | | | 7.58 | | | | | 3.98 | | | | | 1.80 | | | | | | | 13.67 | | | | | — | | | | | — | | | | | — | | | | | 8.71 | | | | | 3.00 | | | | | 0.80 | |
Convertible Securities | | | | 12.26 | | | | | 7.99 | | | | | 3.57 | | | | | 7.48 | | | | | 6.78 | | | | | 3.49 | | | | | 1.90 | | | | | | | 14.50 | | | | | 9.08 | | | | | 4.61 | | | | | 8.40 | | | | | 7.48 | | | | | 2.49 | | | | | 0.90 | |
Equity | | | | 14.72 | | | | | 11.57 | | | | | 4.56 | | | | | 8.35 | | | | | 9.53 | | | | | 2.38 | | | | | 2.38 | | | | | | | 16.85 | | | | | 12.64 | | | | | 5.59 | | | | | 9.33 | | | | | 10.12 | | | | | 1.38 | | | | | 1.38 | |
Balanced | | | | 8.62 | | | | | 7.39 | | | | | 4.02 | | | | | 6.27 | | | | | 7.80 | | | | | 2.10 | | | | | 2.10 | | | | | | | 10.72 | | | | | 8.43 | | | | | 5.05 | | | | | 7.23 | | | | | 8.47 | | | | | 1.10 | | | | | 1.10 | |
Intermediate Bond | | | | (2.93 | ) | | | | (0.21 | ) | | | | 1.99 | | | | | 1.95 | | | | | 4.04 | | | | | 2.19 | | | | | 1.77 | | | | | | | (1.02 | ) | | | | 0.80 | | | | | 2.99 | | | | | 2.86 | | | | | 4.61 | | | | | 1.19 | | | | | 0.77 | |
| | | | | | | | | |
| | | Class T Shares | | | | | | | | | | | | | | | | |
| | | Average Annual Returns – September 30, 2017 (a)(c)(e) | | | | | | | | | | | | | | | | |
| | | 1 Year | | 5 Year | | 10 Year | | 15 Year | | Since
Inception | | Gross
Expense
Ratio | | Expense
Ratio after
Adviser
Reimburse-
ments | | | | | | | | | | | | | | | | |
Mighty MitesSM | | | | 21.31 | % | | | | 13.60 | % | | | | 9.06 | % | | | | 11.71 | % | | | | 11.66 | % | | | | 1.42 | % | | | | 1.42 | % | | | | | | | | | | | | | | | | | | | | | | | | | | | | | | | | | | | | | |
SmallCap Equity | | | | 20.02 | | | | | 13.70 | | | | | 7.15 | | | | | 9.75 | | | | | 7.63 | | | | | 1.79 | | | | | 1.25 | | | | | | | | | | | | | | | | | | | | | | | | | | | | | | | | | | | | | | |
| (a) | Returns represent past performance and do not guarantee future results. Total returns and average annual returns reflect changes in share price, reinvestment of distributions, and are net of expenses. Investment returns and the principal value of an investment will fluctuate. When shares are redeemed, they may be worth more or less than their original cost. Current performance may be lower or higher than the performance data presented. Visit www.tetonadv.com for performance information as of the most recent month end. For the SmallCap Equity, Mid-Cap Equity, Convertible Securities, and Intermediate Bond Funds (and for the Mighty MitesSM Fund through September 30, 2005), Teton Advisors, Inc. (the “Adviser”) reimbursed expenses to limit the expense ratio. Had such limitations not been in place, returns would have been lower. The contractual expense limitations are in effect through January 31, 2019 and are renewable annually by the Adviser. The Funds, except for the Equity, Balanced, and Intermediate Bond Funds, impose a 2.00% redemption fee on shares sold or exchanged within seven days after the date of purchase. Investors should carefully consider the investment objectives, risks, charges, and expenses of a Fund before investing. The prospectuses contain information about these and other matters and should be read carefully before investing. To obtain a prospectus, please visit our website at www.tetonadv.com. |
| (b) | Includes the effect of the maximum 4.00% sales charge at the beginning of the period. |
| (c) | The performance of the Class AAA Shares is used to calculate performance for the periods prior to the issuance of Class A Shares, Class C Shares, Class I Shares, and Class T Shares, except for Mid-Cap Equity Fund whose performance for all share classes is based on the Fund’s inception date of May 31, 2013. The performance for the Class A Shares, Class C Shares, and Class T Shares would have been lower due to the additional fees and expenses associated with these classes of shares. The performance for the Class I Shares would have been higher due to the lower expenses associated with this class of shares. The inception dates for the Class AAA Shares and the initial issuance dates for the Class A Shares, Class C Shares, Class I Shares, and Class T Shares after which shares remained continuously outstanding are listed below. |
| (d) | Assuming payment of the 1.00% maximum contingent deferred sales charge imposed on redemptions made within one year of purchase. |
| (e) | Includes the effect of the 2.50% sales charge at the beginning of the period. |
| | | | | | | | | | |
| | | Class AAA Shares | | Class A Shares | | Class C Shares | | Class I Shares | | Class T Shares |
Mighty MitesSM | | 05/11/98 | | 11/26/01 | | 08/03/01 | | 01/11/08 | | 07/05/17 |
SmallCap Equity | | 04/15/97 | | 11/26/01 | | 11/26/01 | | 01/11/08 | | 07/05/17 |
Mid-Cap Equity | | 05/31/13 | | 05/31/13 | | 05/31/13 | | 05/31/13 | | — |
Convertible Securities | | 09/30/97 | | 05/09/01 | | 11/26/01 | | 01/11/08 | | — |
Equity | | 01/02/87 | | 01/28/94 | | 02/13/01 | | 01/11/08 | | — |
Balanced | | 10/01/91 | | 04/06/93 | | 09/25/01 | | 01/11/08 | | — |
Intermediate Bond | | 10/01/91 | | 07/26/01 | | 10/22/01 | | 01/11/08 | | — |
The TETON Westwood Funds file complete schedules of portfolio holdings with the Securities and Exchange Commission (the “SEC”) for the first and third quarters of each fiscal year on Form N-Q. Shareholders may obtain this information at www.tetonadv.com or by calling the Funds at 800-WESTWOOD (800-937-8966). The Funds’ Form N-Q is available on the SEC’s website at www.sec.gov and may also be reviewed and copied at the SEC’s Public Reference Room in Washington, DC. Information on the operation of the Public Reference Room may be obtained by calling 800-SEC-0330.
Proxy Voting
Each Fund files Form N-PX with its complete proxy voting record for the twelve months ended June 30, no later than August 31 of each year. A description of the Funds’ proxy voting policies, procedures, and how the Funds voted proxies relating to portfolio securities are available without charge, upon request, by (i) calling 800-WESTWOOD (800-937-8966); (ii) writing to The TETON Westwood Funds at One Corporate Center, Rye, NY 10580-1422; and (iii) visiting the SEC’s website at www.sec.gov.
2
Performance Discussion (Unaudited)
Mighty MitesSM Fund
For the year ended September 30, 2017, the TETON Westwood Mighty MitesSM Fund net asset value (“NAV”) per Class AAA Share appreciated 24.4% versus gains of 20.7% for the Russell 2000 Index and 22.3% for the Russell Microcap Index. See next page for additional performance information.
The Fund invests in small and micro-cap equity securities that have a market capitalization of $500 million or less at time of initial investment. The portfolio management team focuses on bottom up stock selection, seeking bite sized companies with excellent management teams, strong balance sheets, and superior long term fundamentals. As bottom up, fundamental, research driven investors, the team seeks to purchase the inefficiently priced stocks of excellent companies selling at a discount to their private market value (PMV), and possess a catalyst that can unlock hidden value within the enterprise. As such, (y)our portfolio is diversified across a broad cross section of companies sharing these valuation characteristics.
Stocks delivered strong performance during the first half of 2017. The Standard and Poor’s (S&P) 500 rose 8.2% before dividends despite a seemingly endless amount of noise from Washington and abroad. Markets responded positively to the election of Donald Trump partly in anticipation of regulatory relaxation, reformation of corporate and individual taxes, and additional stimulus. The economy showed broad based, high quality factors being responsible for the recent strength, namely labor and manufacturing. Unemployment levels remained at post-recession lows, while the first quarter of the calendar year posted a robust increase in nonfarm payrolls.
September was a strong month for small and microcap stocks, reflecting a strengthening domestic economy, along with corporate earnings and expectations for U.S. tax reform. There are signs of more people entering the workforce as the participation rate remains slightly ahead of last year and wage growth has gradually started to accelerate. These are indicators of a stronger consumer, able to purchase more goods and services. Against this backdrop, the U.S. Federal Reserve raised interest rates three times this year.
Among our stronger performing stocks for the year were Ultra Clean Holdings (0.4% of net assets as of September 30, 2017), a leading developer and supplier of critical systems and subsystems for the semiconductor capital equipment and flat panel industries; Scientific Games Corp. (0.2%), an American company that provides casino and gaming products and services to lottery and gambling organizations worldwide; and Cutera Inc. (1.0%), a global pioneer of cosmetic and aesthetic laser equipment that engineers products with the highest level of performance and innovation within the field.
Some of the weaker holdings in the portfolio included Katy Industries Inc. (less than 0.1%), a manufacturer, importer, and distributor of commercial cleaning and consumer storage products; Cempra Inc. (less than 0.1%), a developer of novel and well differentiated antibiotics designed to meet critical medical needs; and NII Holdings Inc. (less than 0.1%), one of the world’s leading providers of fully integrated mobile communication services designed to meet the needs of businesses and consumers.
We appreciate your continued confidence and trust.
3
| | | | | | | | | | | | | | | | | | | | |
| Average Annual Returns Through September 30, 2017 (a) (Unaudited) | |
| | | | | | | | | | | | | | | Since | |
| | | | | | | | | | | | | | | Inception | |
| | | 1 Year | | | 5 Year | | | 10 Year | | | 15 Year | | | (5/11/98) | |
Mighty MitesSM Fund Class AAA | | | 24.42% | | | | 14.18% | | | | 9.33% | | | | 11.89% | | | | 11.81% | |
Dow Jones U.S. Micro-Cap Total Stock Market Index | | | 21.78 | | | | 12.19 | | | | 6.45 | | | | 11.54 | | | | 8.66(b) | |
Russell MicrocapTM Index | | | 22.33 | | | | 13.89 | | | | 6.65 | | | | 10.76 | | | | N/A(c) | |
Russell 2000 Index | | | 20.74 | | | | 13.79 | | | | 7.85 | | | | 11.37 | | | | 7.47 | |
Lipper Small Cap Value Fund Average | | | 19.78 | | | | 12.63 | | | | 7.22 | | | | 11.12 | | | | 8.42(b) | |
In the current prospectuses dated January 27, 2017, as amended July 5, 2017, the expense ratio for Class AAA Shares is 1.42%. See page 40 for the expense ratios for the year ended September 30, 2017. Class AAA Shares do not have a sales charge. (a) Returns represent past performance and do not guarantee future results. Total returns and average annual returns reflect changes in share price, reinvestment of distributions, and are net of expenses. Investment returns and the principal value of an investment will fluctuate. When shares are redeemed, they may be worth more or less than their original cost. Current performance may be lower or higher than the performance data presented. Visit www.tetonadv.com for performance information as of the most recent month end. Teton Advisors, Inc., (the “Adviser”) reimbursed expenses through September 30, 2005 to limit the expense ratios. Had such limitations not been in place, returns would have been lower. The Fund imposes a 2% redemption fee on shares sold or exchanged within seven days after purchase. Investors should carefully consider the investment objectives, risks, charges, and expenses of the Fund before investing. The prospectuses contain information about these and other matters and should be read carefully before investing. To obtain a prospectus, please visit our website at www.tetonadv.com. Other share classes are available and have different performance characteristics. See page 2 for performance of other classes of shares. The Dow Jones U.S. Micro-Cap Total Stock Market Index is designed to provide a comprehensive measure of the micro-cap segment of the U.S. stock market. The Russell Microcap™ Index is an unmanaged indicator which measures the performance of the microcap segment of the U.S. equity market. The Russell 2000 Index is an unmanaged indicator which measures the performance of the small cap segment of the U.S. equity market. The Lipper Small Cap Value Fund Average reflects the average performance of mutual funds classified in this particular category. Investing in small capitalization securities involves special challenges because these securities may trade less frequently and experience more abrupt price movements than large capitalization securities. Dividends are considered reinvested. You cannot invest directly in an index. (b) Dow Jones U.S. Micro-Cap Total Stock Market Index and Lipper Small Cap Value Fund Average since inception performance is as of April 30, 1998. (c) The inception date of the Russell Microcap™ Index is June 30, 2000. | |
COMPARISON OF CHANGE IN VALUE OF A $10,000 INVESTMENT IN
THE MIGHTY MITESSM FUND CLASS AAA, THE RUSSELL 2000 INDEX,
THE RUSSELL MICROCAPTM INDEX,
AND THE DOW JONES U.S. MICRO-CAP TOTAL STOCK MARKET INDEX (Unaudited)
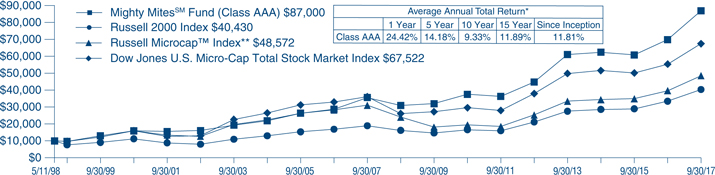
*Past performance is not predictive of future results. The performance tables and graph do not reflect the deduction of taxes that a shareholder would pay on fund distributions or the redemption of fund shares.
**The Russell MicrocapTM Index inception date is June 30, 2000 and the value of the Index prior to July 1, 2000 is that of the Mighty MitesSM Fund (Class AAA).
4
SmallCap Equity Fund (Unaudited)
For the year ended September 30, 2017, the TETON Westwood SmallCap Equity Fund NAV per Class AAA Share appreciated 23.1% compared with a gain of 20.7% for the Russell 2000 Index. See below for additional performance information.
The Fund invests primarily in small cap companies that, through bottom up fundamental research, the portfolio manager believes are attractively priced relative to their earnings growth potential or private market value. The Fund characterizes small capitalization companies as those companies with a market capitalization at the time of the Fund’s initial investment between $100 million and $2.5 billion.
The unexpected Trump election victory ignited a rally in equities which continued through the first calendar quarter as policy expectations of tax reform, infrastructure spending, and easing regulatory burden solidified within an environment generally perceived as shifting towards pro-business.
Posting the strongest results in two years, second quarter GDP grew at an annualized rate of 3.1%, propelled by consumer spending. Serving to underscore a central 3% growth target, this overlapped the unveiling of President Trump’s “MAGAnomics” plan (Make-America-Great-Again economics), with tax reform seen as the most concrete policy goal for the calendar year.
In the third quarter, the portfolio marked strong relative outperformance with about two-thirds of the outperformance driven by the Fund’s technology holdings. Fundamentals for our semiconductor-based names have supported our longstanding thesis that such businesses were maturing into the “new industrials,” having shed the violent cyclical nature more associated with the dot-com era.
Among the better performing stocks in the year were: FormFactor Inc. (1.5% of net assets as of September 30, 2017), which has successfully engineered a turnaround away from a period of market share losses while implementing cost discipline; Electro Scientific Industries Inc. (1.3%), which builds advanced laser systems used in the micro-machining of electronics for products such as semiconductors, consumer electronics, and LEDs; and Myriad Genetics Inc. (0.6%), a diagnostic company that offers tests for hereditary cancer and other diseases.
Our weaker performing stocks during the year were: Diebold Nixdorf Inc. (2.0%), known for its branded line of ATMs, which has struggled to respond nimbly to changing market dynamics as its integrates the recent acquisition of its large European competitor, Wincor Nixdorf; C&J Energy Services Inc. (1.9%), a pressure pumper, which reported reactivation costs for stacked fleets higher than commonly anticipated and fears emerged that industry disorder might emerge should all participants look to add pressure pumping capacity; and The Rubicon Project, Inc.(no longer held as September 30, 2017), which stumbled earlier in the year as the marketplace embraced a new technology that disadvantaged Rubicon’s market share and premium pricing.
We thank you for your continued confidence and trust.
| | | | | | | | | | | | | | | | | | | | |
| Average Annual Returns through September 30, 2017 (a) (Unaudited) | | | Since | |
| | | 1 Year | | | 5 Year | | | 10 Year | | | 15 Year | | | Inception
(4/15/97) | |
SmallCap Equity Fund Class AAA | | | 23.10 | % | | | 14.27 | % | | | 7.42 | % | | | 9.94 | % | | | 8.05 | % |
Russell 2000 Index | | | 20.74 | | | | 13.79 | | | | 7.85 | | | | 11.37 | | | | 8.91 | |
Russell 2000 Value Index | | | 20.55 | | | | 13.27 | | | | 7.14 | | | | 10.86 | | | | 9.79 | |
In the current prospectuses dated January 27, 2017 as amended July 5, 2017, the gross expense ratio for Class AAA Shares is 1.79%, and the net expense ratio is 1.50% after contractual reimbursements by Teton Advisors, Inc. (the “Adviser”) in place through January 31, 2019. See page 41 for the expense ratios for the year ended September 31, 2017. Class AAA Shares do not have a sales charge. | |
(a) Returns represent past performance and do not guarantee future results. Total returns and average annual returns reflect changes in share price, reinvestment of distributions, and are net of expenses. Investment returns and the principal value of an investment will fluctuate. When shares are redeemed, they may be worth more or less than their original cost. Current performance may be lower or higher than the performance data presented. Visit www.tetonadv.com for performance information as of the most recent month end. The Adviser reimbursed expenses to limit the expense ratio. Had such limitation not been in place, returns would have been lower. The Fund imposes a 2% redemption fee on shares sold or exchanged within seven days after purchase. Investors should carefully consider the investment objectives, risks, charges, and expenses of the Fund before investing. The prospectuses contain information about these and other matters and should be read carefully before investing. To obtain a prospectus, please visit our website at www.tetonadv.com. Other share classes are available and have different performance characteristics. See page 2 for performance of other classes of shares. The Russell 2000 Index is an unmanaged indicator which measures the performance of the small cap segment of the U.S. equity market. The Russell Value Index measure the performance of the small capitalization sector of the U.S. equity market. It is a subset of the Russell 2000 Index. Investing in small capitalization securities involves special challenges because these securities may trade less frequently and experience more abrupt price movements than large capitalization securities. Dividends are considered reinvested. You cannot invest directly in an index. | |
COMPARISON OF CHANGE IN VALUE OF A $10,000 INVESTMENT IN THE SMALLCAP EQUITY FUND
CLASS AAA AND THE RUSSELL 2000 INDEX (Unaudited)
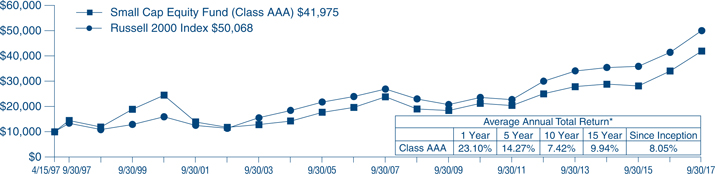
| * | Past performance is not predictive of future results. The performance tables and graph do not reflect the deduction of taxes that a shareholder would pay on fund distributions or the redemption of fund shares. |
5
Mid-Cap Equity Fund (Unaudited)
For the year ended September 30, 2017, the TETON Westwood Mid-Cap Equity Fund NAV per Class AAA Share appreciated 13.4% compared with a gain of 15.3% for the Russell Midcap Index. See next page for additional performance information.
The Fund invests primarily in mid-cap companies that the portfolio manager believes are undervalued by the market and have above average growth potential. The Fund defines mid-cap companies as those whose market capitalization falls within a range of $1 billion to $20 billion. As bottom up, fundamental, research driven investors, the portfolio manager seeks to invest in attractively valued companies with strong balance sheets, secular growth, experienced management teams, solid earnings prospects, leading market shares, and superior long term fundamentals.
At the onset of the March 2017 quarter, the bull market had entered its eighth year and investors were confident that the White House would prioritize tax reform, infrastructure spending, and easing regulatory burdens on businesses. Domestic economic statistics remained favorable and industrial production continued to show measured growth.
Stocks produced solid gains in the second calendar quarter. Global markets moved higher as economic conditions continued to stabilize and improve. Most companies’ outlooks were positive as their fundamentals came through strongly during the quarterly earnings season. Washington continued to struggle with revision or repeal of the Affordable Care Act, causing concern over movement in other legislative areas.
The third quarter closed demonstrably positive and the portfolio marked solid outperformance for its shareholders in the period. Comments from global central banks dominated headlines in July, indicating a departure from an extended period of easy money. The Federal Reserve indicated it was looking to initiate a runoff of its balance sheet, the Bank of England hinted at rate increases, and the European Central Bank suggested it was nearing the end of its bond buying. As if to telegraph proper expectations, throughout the quarter, the Fed regularly conveyed intent for “measured” rate increases, tempered according to future data or persistent low inflation. Altogether this scenario is seen as destabilizing but rather indicative of a healthy economy.
Capping the quarter, September’s reading for the ISM manufacturing index topped a thirteen year high, with the rise in the new orders index being consistent with strong corporate earnings and capital spending. These events sketched the picture of a resilient economy in the face of hurricane disruption, spurring the markets steadily higher.
Among the better performing stocks for the fiscal year included Vertex Pharmaceuticals Inc. (1.9% of net assets as of September 30, 2017), an American biotech firm focused on the treatment of viral infections, inflammatory and autoimmune disorders, and cancer; SVB Financial Group (0.9%), a U.S. based high tech commercial bank focused on lending to technology companies, providing multiple services to venture capital and private equity firms that invest in technology and biotechnology.
Some detractors from the portfolio included Range Resources Corp. (no longer held), a petroleum and natural gas exploration and production company; and O’Reilly Automotive Inc. (no longer held), an American auto parts retailer that provides aftermarket automotive parts, tools, supplies, equipment, and accessories.
We appreciate your confidence and trust.
6
| | | | | | | | | | | | |
| Average Annual Returns through September 30, 2017 (a) (Unaudited) | |
| | | | | | | | | Since | |
| | | | | | | | | Inception | |
| | | 1 Year | | | 3 Year | | | (5/31/13) | |
Mid-Cap Equity Fund Class AAA | | | 13.38% | | | | 7.09% | | | | 8.38% | |
Russell Midcap Index | | | 15.32 | | | | 9.54 | | | | 11.17 | |
Russell Midcap Growth Index | | | 17.82 | | | | 9.96 | | | | 12.15 | |
In the current prospectuses dated January 27, 2017, as amended July 5, 2017, the gross expense ratio for Class AAA Shares is 3.26%, and net expense ratio is 1.05% after contractual reimbursements by Teton Advisors, Inc., (the “Adviser”) in place through January 31, 2019. See page 42 for the expense ratios for the year ended September 30, 2017. Class AAA Shares do not have a sales charge. (a) Returns represent past performance and do not guarantee future results. Total returns and average annual returns reflect changes in share price, reinvestment of distributions, and are net of expenses. Investment returns and the principal value of an investment will fluctuate. When shares are redeemed, they may be worth more or less than their original cost. Current performance may be lower or higher than the performance data presented. Visit www.tetonadv.com for performance information as of the most recent month end. The Adviser reimbursed expenses to limit the expense ratio. Had such limitation not been in place, returns would have been lower. The Fund imposes a 2% redemption fee on shares sold or exchanged within seven days after purchase. Investors should carefully consider the investment objectives, risks, charges, and expenses of the Fund before investing. The prospectuses contain information about these and other matters and should be read carefully before investing. To obtain a prospectus, please visit our website at www.tetonadv.com. Other share classes are available and have different performance characteristics. See page 2 for performance of other classes of shares. The Russell Midcap Index is an unmanaged indicator which measures the performance of the mid-cap segment of the U.S. equity market. The Russell Midcap Growth Index is an unmanaged indicator which measures the performance of those Russell Midcap companies with higher price-to-book ratios and higher forecasted growth values. Dividends are considered reinvested. You cannot invest directly in an index. | |
COMPARISON OF CHANGE IN VALUE OF A $10,000 INVESTMENT IN THE MID-CAP EQUITY FUND
CLASS AAA AND THE RUSSELL MIDCAP INDEX (Unaudited)
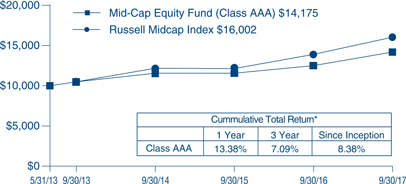
| * | Past performance is not predictive of future results. The performance tables and graph do not reflect the deduction of taxes that a shareholder would pay on fund distributions or the redemption of fund shares. |
7
Convertible Securities Fund (Unaudited)
For the year ended September 30, 2017, the TETON Convertible Securities Fund NAV per Class AAA Share appreciated 14.1% compared with gains of 18.6% and 14.3% for the Standard & Poor’s (“S&P”) 500 Index and the Bank of America Merrill Lynch U.S. Convertibles Index, respectively. See below for additional performance information.
The Fund invests in convertible securities, and in derivatives and other instruments that have economic characteristics similar to such securities. By investing in convertible securities, the portfolio managers seek the opportunity to participate in the capital appreciation of underlying stocks, while at the same time relying on the fixed income aspect of the convertible securities to provide current income and reduced price volatility, which can limit the risk of loss in a down equity market. The Fund may invest in securities of any market capitalization or credit quality, and may from time to time invest a significant amount of its assets in securities of smaller companies.
The first quarter of 2017 provided significant opportunities and the convertibles market had a continuation of the post-election rally. Markets rose based on a strong employment report and anticipation of tax reform and repealing of regulations, although volatility returned in March with failure to repeal and replace the Affordable Care Act. An increase of 25 basis points in the Fed Funds rate damped investor enthusiasm and the convertible market reflected the strength in the stock market
The quarter ended June 30, 2017 saw convertibles continue to climb, albeit more slowly than during the first quarter. The Fed increased the Federal Funds rate a second time this year, with a 25 basis point increase in June. Inflation seemed to temper and oil prices dropped significantly. The second quarter continued the trend that started late last year with the issuance of attractive new convertible securities offerings.
Markets continued to make gains in the third calendar quarter, showing tremendous resilience despite geopolitical turmoil, an extraordinarily destructive hurricane season, a devastating earthquake in Mexico, and terrorism weighing on the world. The optimism in the domestic financial markets appears to stem from the focus on tax reform contributing to earnings and fueling economic growth. This has caused the more economically sensitive companies to rally.
Among the better performing securities were Micron Technology Inc., 3.000%, 11/15/43 (1.9% of net assets as of September 30, 2017), a producer of semiconductor and memory technologies; Aerojet Rockdyne Holdings Inc., 2.250%, 12/15/23 (2.5%), an American rocket and missile propulsion manufacturer; and Square Inc., 0.375%, 03/01/22 (2.0%), a financial services, merchant services aggregator, and mobile payment company.
Some of the portfolio’s weaker holdings included Frontier Communications Corp., Ser A, 11.125%, 06/29/18 (0.3%), a high speed Internet, video, TV, and phone services provider; Intercept Pharmaceuticals Inc., 3.250%, 07/01/23 (1.6%), an American biopharmaceutical company focusing on the development of novel synthetic bile acid analogs to treat chronic liver diseases; and Wayfair Inc., 0.375%, 09/01/22 (1.5%), an American e-commerce company that sells home goods.
We appreciate your confidence and trust.
| | | | | | | | | | | | | | | | | | | | |
| Average Annual Returns Through September 30, 2017 (a) (Unaudited) | |
| | | | | | | | | | | | | | | Since | |
| | | | | | | | | | | | | | | Inception | |
| | | 1 Year | | | 5 Year | | | 10 Year | | | 15 Year | | | (9/30/97) | |
Convertible Securities Fund Class AAA | | | 14.14% | | | | 8.79% | | | | 4.36% | | | | 8.22% | | | | 7.35% | |
S&P 500 Index | | | 18.61 | | | | 14.22 | | | | 7.44 | | | | 10.04 | | | | 7.00 | |
Bank of America Merrill Lynch U.S. Convertibles Index | | | 14.31 | | | | 11.01 | | | | 6.82 | | | | 8.94 | | | | 7.08 | |
In the current prospectuses dated January 27, 2017 as amended July 5, 2017, the gross expense ratio for Class AAA Shares is 2.74%, and the net expense ratio is 1.15%, after contractual reimbursements by Teton Advisors, Inc. (the “Adviser”) in place through January 31, 2019. See page 43 for the expense ratios for the year ended September 30, 2017. Class AAA Shares do not have a sales charge. (a) Returns represent past performance and do not guarantee future results. Total returns and average annual returns reflect changes in share price, reinvestment of distributions, and are net of expenses. Investment returns and the principal value of an investment will fluctuate. When shares are redeemed, they may be worth more or less than their original cost. Current performance may be lower or higher than the performance data presented. Visit www.tetonadv.com for performance information as of the most recent month end. The Adviser reimbursed expenses to limit the expense ratio. Had such limitation not been in place, returns would have been lower. The Fund imposes a 2% redemption fee on shares sold or exchanged within seven days after purchase. Investors should carefully consider the investment objectives, risks, charges, and expenses of the Fund before investing. The prospectuses contain information about these and other matters and should be read carefully before investing. To obtain a prospectus, please visit our website at www.tetonadv.com. Other share classes are available and have different performance characteristics. See page 2 for performance of other classes of shares. The S&P 500 Index is a market capitalization weighted index of 500 large capitalization stocks commonly used to represent the U.S. equity market. The Bank of America Merrill Lynch U.S. Convertibles Index is a market value weighted index of all dollar denominated convertible securities that are exchangeable into U.S. equities that have a market value of more than $50 million. Dividends are considered reinvested. You cannot invest directly in an index. | |
COMPARISON OF CHANGE IN VALUE OF A $10,000 INVESTMENT IN THE CONVERTIBLE SECURITIES FUND
CLASS AAA AND THE S&P 500 INDEX (Unaudited)
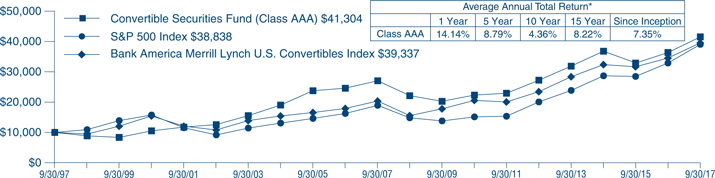
| * | Past performance is not predictive of future results. The performance tables and graph do not reflect the deduction of taxes that a shareholder would pay on fund distributions or the redemption of fund shares. |
8
Equity Fund (Unaudited)
The TETON Westwood Equity Fund underperformed the benchmark S&P 500 Index over the fiscal year. For the twelve months ended September 30, 2017, the Equity Fund Class AAA shares posted a gain of 16.6%, net of expenses, versus the S&P 500 Index gain of 18.6%. See below for additional performance information.
The unexpected Trump election victory ignited a rally in equities which continued through the first calendar quarter as policy expectations of tax reform, infrastructure spending, and easing regulatory burden solidified within an environment generally perceived as shifting towards pro-business.
Posting the strongest results in two years, second quarter GDP grew at an annualized rate of 3.1%, propelled by consumer spending. Serving to underscore a central 3% growth target, this overlapped the unveiling of President Trump’s “MAGAnomics” plan (Make-America-Great-Again economics), with tax reform seen as the most concrete policy goal for the calendar year. However, mirroring the narrative of unpredictable bouts of political chaos in Washington, a string of destructive hurricanes threatened near term economic hopes, inflicting devastation upon the Caribbean, Houston, and Florida.
During the last quarter of the fiscal year ended September 30, 2017, the equity markets again posted strong gains with limited volatility. The S&P 500 saw the lowest average daily change, +0.3%, in nearly 50 years. The S&P rose for the eighth consecutive quarter and eleventh straight month with only one down month in the last nineteen months. Growth continued to outperform value as it has since the year began though small caps outpaced large caps for the first time this year.
Positive drivers of relative Fund performance over the twelve months included: Chevron Corp. (2.2% of total net assets as of September 30, 2017), which benefited from the higher move in crude oil prices and its exposure to the Permian Basin in West Texas; The Boeing Co. (2.1%) rallied on better earnings and cash flow results, as its backlog for new airplanes now stretches out over the next five years; Booz Allen Hamilton Holding Corp. (2.1%) posted a solid quarter, regaining some of the prior quarter’s decline after the announcement of a government investigation; and Lam Research Corp. (1.2%) saw continued strong demand for semiconductors drive its results ahead of expectations as demand for memory chips continues to grow.
Detractors from the Fund’s performance included Hormel Foods Corp. (2.0%), General Mills Inc. (1.8%), and PepsiCo Inc. (1.9%), which were pressured by slowing revenue trends. Amazon’s entrance into the grocery industry with the purchase of Whole Foods placed additional pressure on the group from increased competition and price transparency; Oracle Corp. (2.4%) cloud revenues saw strong growth but decelerated modestly from recent levels which weighed on the stock; and Alliance Data Systems Corp. (no longer held as of September 30, 2017) declined on concerns over the divergence of credit sales and receivables growth for its private label card business.
We appreciate your confidence and trust.
| | | | | | | | | | | | | | | | | | | | |
| Average Annual Returns through September 30, 2017 (a) (Unaudited) | |
| | | | | | | | | | | | | | | Since | |
| | | | | | | | | | | | | | | Inception | |
| | | 1 Year | | | 5 Year | | | 10 Year | | | 15 Year | | | (1/2/87) | |
Equity Fund Class AAA | | | 16.61% | | | | 12.40% | | | | 5.35% | | | | 9.17% | | | | 10.03% | |
S&P 500 Index | | | 18.61 | | | | 14.22 | | | | 7.44 | | | | 10.04 | | | | 10.38(b) | |
In the current prospectuses dated January 27, 2017, the expense ratio for Class AAA Shares is 1.63%. See page 44 for the expense ratios for the year ended September 30, 2017. Class AAA Shares do not have a sales charge. (a) Returns represent past performance and do not guarantee future results. Total returns and average annual returns reflect changes in share price, reinvestment of distributions, and are net of expenses. Investment returns and the principal value of an investment will fluctuate. When shares are redeemed, they may be worth more or less than their original cost. Current performance may be lower or higher than the performance data presented. Visit www.tetonadv.com for performance information as of the most recent month end. Investors should carefully consider the investment objectives, risks, charges, and expenses of the Fund before investing. The prospectuses contain information about these and other matters and should be read carefully before investing. To obtain a prospectus, please visit our website at www.tetonadv.com. Other share classes are available and have different performance characteristics. See page 2 for performance of other classes of shares. The S&P 500 Index is a market capitalization weighted index of 500 large capitalization stocks commonly used to represent the U.S. equity market. Dividends are considered reinvested. You cannot invest directly in an index. (b) S&P 500 Index since inception performance is as of December 31, 1986. | |
COMPARISON OF CHANGE IN VALUE OF A $10,000 INVESTMENT IN
THE EQUITY FUND CLASS AAA AND THE S&P 500 INDEX (Unaudited)
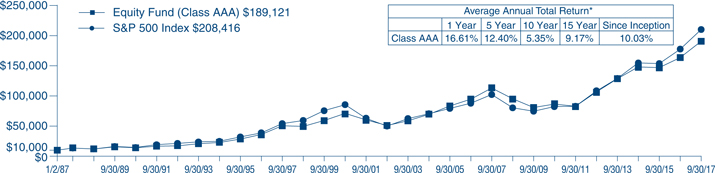
| * | Past performance is not predictive of future results. The performance tables and graph do not reflect the deduction of taxes that a shareholder would pay on fund distributions or the redemption of fund shares. |
9
Balanced Fund (Unaudited)
For twelve months ended September 30, 2017, the TETON Westwood Balanced Fund Class AAA Shares posted a return of 10.3%, net of expenses, versus the Bloomberg Barclays Government/Credit Bond Index return of (0.01%). The Fund’s return was less than a common balanced benchmark comprised of 60% S&P 500 Index and 40% of the Bloomberg Barclays Capital Government/Credit Bond Index which returned 11.2%. See next page for additional performance information.
The unexpected Trump election victory ignited a rally in equities which continued through the first calendar quarter as policy expectations of tax reform, infrastructure spending, and easing regulatory burden solidified within an environment generally perceived as shifting towards pro-business.
Posting the strongest results in two years, second quarter GDP grew at an annualized rate of 3.1%, propelled by consumer spending. Serving to underscore a central 3% growth target, this overlapped the unveiling of President Trump’s “MAGAnomics” plan (Make-America-Great-Again economics), with tax reform seen as the most concrete policy goal for the calendar year. However, mirroring the narrative of unpredictable bouts of political chaos in Washington, a string of destructive hurricanes threatened near term economic hopes, inflicting devastation upon the Caribbean, Houston, and Florida.
During the last quarter of the fiscal year ended September 30, 2017, the equity markets again posted strong gains with limited volatility. The S&P 500 saw the lowest average daily change, +0.3%, in nearly 50 years. The S&P rose for the eighth consecutive quarter and eleventh straight month with only one down month in the last nineteen months. Growth continued to outperform value as it has since the year began though small caps outpaced large caps for the first time this year.
TETON Westwood Balanced Fund benefited from its overweight position in corporate credit relative to the benchmark during the year ended September 2017. Investment Grade Credit Spreads tightened by approximately 40 basis points during the period causing corporates to outperform duration matched Treasury and U.S Agency positons. The Portfolio was overweight to both Financial and Industrial Sector Corporates which provided relative gains versus the benchmark. The portfolio was underweight duration or interest rate risk versus the benchmark which proved to be a contributor as longer dated positions underperformed during the period.
Our top contributor for the period was JPMorgan Chase & Co., 6.3%, 04/23/19 (2.3% of net assets as of September 30, 2017). Other top contributors were short and intermediate maturity corporates: AT&T Inc., 2.3%, 03/11/19 (0.9%), Morgan Stanley 3.7%, 10/23/24 (0.9%), and Aetna Inc., 3.5%, 11/15/24 (0.9%).
Detracting from performance were intermediate maturity Treasury and U.S. Agency positions; U.S. Treasury, 2.250%, 11/15/24 (1.5%), U.S. Treasury, 1.625%, 02/15/26 (1.2%), Fannie Mae, 2.625%, 09/06/24 (1.7%), and lastly, a U.S. Treasury, 2.000%, 02/15/2025 (0.0%), position.
We appreciate your confidence and trust.
10
| | | | | | | | | | | | | | | | | | | | |
| Average Annual Returns through September 30, 2017 (a) (Unaudited) | |
| | | | | | | | | | | | | | | Since | |
| | | | | | | | | | | | | | | Inception | |
| | | 1 Year | | | 5 Year | | | 10 Year | | | 15 Year | | | (10/1/91) | |
Balanced Fund Class AAA | | | 10.34% | | | | 8.17% | | | | 4.79% | | | | 7.06% | | | | 8.37% | |
Bloomberg Barclays Government/Credit Bond Index | | | (0.01) | | | | 2.10 | | | | 4.34 | | | | 4.28 | | | | 5.82(b) | |
S&P 500 Index | | | 18.61 | | | | 14.22 | | | | 7.44 | | | | 10.04 | | | | 9.68(b) | |
60% S&P 500 Index and 40% Bloomberg Barclays Government/Credit Bond Index (c) | | | 11.16 | | | | 9.37 | | | | 6.20 | | | | 7.74 | | | | 8.14 | |
In the current prospectuses dated January 27, 2017, the expense ratio for Class AAA Shares is 1.35%. See page 45 for the expense ratios for the year ended September 30, 2017. Class AAA Shares do not have a sales charge. (a) Returns represent past performance and do not guarantee future results. Total returns and average annual returns reflect changes in share price, reinvestment of distributions, and are net of expenses. Investment returns and the principal value of an investment will fluctuate. When shares are redeemed, they may be worth more or less than their original cost. Current performance may be lower or higher than the performance data presented. Visit www.tetonadv.com for performance information as of the most recent month end. Teton Advisors, Inc. (the “Adviser”) reimbursed expenses in years prior to 1998 to limit the expense ratio. Had such limitation not been in place, returns would have been lower. Investors should carefully consider the investment objectives, risks, charges, and expenses of the Fund before investing. The prospectuses contain information about these and other matters and should be read carefully before investing. To obtain a prospectus, please visit our website at www.tetonadv.com. Other share classes are available and have different performance characteristics. See page 2 for performance of other classes of shares. The Bloomberg Barclays Government/Credit Bond Index is a market value weighted index that tracks the performance of fixed rate, publicly placed, dollar denominated obligations. The S&P 500 Index is a market capitalization weighted index of 500 large capitalization stocks commonly used to represent the U.S. equity market. Dividends are considered reinvested. You cannot invest directly in an index. (b) S&P 500 Index and Bloomberg Barclays Government/Credit Bond Index since inception performances are as of September 30, 1991. (c) The Blended Index consists of a blend of 60% of the S&P 500 Index and 40% of the Bloomberg Barclays Government/Credit Bond Index. | |
COMPARISON OF CHANGE IN VALUE OF A $10,000 INVESTMENT IN THE BALANCED FUND CLASS AAA,
THE S&P 500 INDEX, AND A COMPOSITE OF 60% OF THE S&P 500 INDEX AND 40% OF
THE BLOOMBERG BARCLAYS GOVERNMENT/CREDIT BOND INDEX (Unaudited)
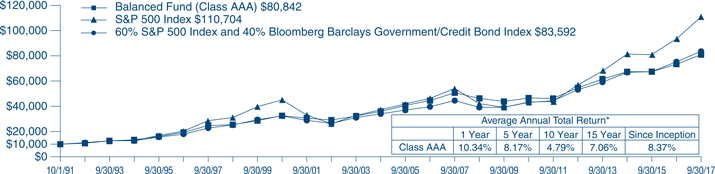
| * | Past performance is not predictive of future results. The performance tables and graph do not reflect the deduction of taxes that a shareholder would pay on fund distributions or the redemption of fund shares. |
11
Intermediate Bond Fund (Unaudited)
For the year ended September 30, 2017, the TETON Westwood Intermediate Bond Fund NAV per Class AAA Share decreased (1.2)% compared with the Bloomberg Barclays Government/Credit Bond Index which was down (0.01)%. See below for additional performance information.
During the fourth quarter of 2016, the opening quarter of the Fund’s fiscal year, investment grade bonds reported the worst quarterly loss in more than two decades as inflation and growth expectations surged following the U.S. election. In fact, Treasury yields began drifting higher earlier in the in the quarter based on expectations that U.S. central bank stimulus was approaching its limitations. Bond prices fell, reflecting expectations of increased deficit spending and increased growth based on reduced business regulation and lower corporate and individual tax rates.
Investment grade bonds posted modest gains in the first calendar quarter of 2017, as returns were negative through the middle of March, but, a quarter end rally led to small profits for the period. The bullish sentiment following the November election lost steam late in the first quarter as Congress failed to pass healthcare reform. Investors interpreted the healthcare setback as likely to delay personal and corporate tax relief which tempered growth expectations. The yield on the 10 year Treasury fell slightly from 2.44% to 2.39% during the quarter. Investment grade credit spreads tightened by roughly 10 basis points during the quarter causing duration matched corporate bonds to outperform Treasuries. The U.S. Treasury yield curve flattened as the yield differential between 10 year and 2 year Treasuries compressed.
Total returns on investment grade bonds posted strong gains in the Fund’s third fiscal quarter. Treasury market strength was caused by several developments: disappointing economic data (specifically inflation and retail sales readings), further delays in tax and healthcare reform, falling energy prices, and continued monetary stimulus from foreign central banks (specifically the Bank of Japan, European Central Bank, and Bank of England). U.S. inflation data (via the Consumer Price Index) came in weaker than expected in April, May, and June. The yield on the 10 year Treasury fell from 2.39% to 2.31% during the quarter. Investment grade credit spreads tightened by roughly 7 basis points during the quarter causing duration matched corporate bonds to outperform Treasuries. Inflation expectations fell during the quarter causing nominal Treasuries to outperform TIPs (Treasury Inflation Protected Securities).
Investment grade bonds posted solid gains for the quarter ended September 30, 2017. Treasury yields fell in July and August, but rose again in September. Even against a backdrop which included: a trifecta of massive hurricanes, elevated geopolitical tensions and name calling, and the defeat of yet another attempted repeal of “ObamaCare”, market sentiment generally swung positive benefiting from subsiding macro-economic concerns, cautious optimism over a potential GOP tax plan, and firmer oil prices. U.S. inflation data (via the Consumer Price Index) came in weaker than expected in both July and August, but surprised to the upside in September. In July, the Federal Reserve elected to hold short term interest rates steady, while saying that job gains had been solid and inflation remained low.
The top five contributors to fiscal year Fund performance included the long U.S. Treasury, 2.5%, 02/15/45 (4.0% of net assets as of September 30, 2017) and four intermediate maturity corporate notes: Ford Motor Credit Co. LLC, 1.72%, 12/06/17 (3.1%), Citigroup Inc., 1.80%, 02/05/18 (3.1%), General Motors Co., 3.5%, 10/02/18 (3.0%), and JPMorgan Chase & Co., 6.30%, 04/23/19 (2.6%).
Detracting the most from performance were three U.S. Treasury notes: U.S. Treasury, 1.620%, 02/15/26 (5.8%), U.S Treasury, 2.250%, 11/15/24 (sold as of September 30, 2017), and U.S. Treasury, 2.000%, 02/15/22 (sold).
We thank you for your continued confidence and trust.
12
Average Annual Returns through September 30, 2017 (a) (Unaudited)
| | | | | | | | | | | | | | | | | | | | |
| | | | | | | | | | | | | | | Since | |
| | | | | | | | | | | | | | | Inception | |
| | | 1 Year | | | 5 Year | | | 10 Year | | | 15 Year | | | (10/1/91) | |
Intermediate Bond Fund Class AAA | | | (1.18)% | | | | 0.55% | | | | 2.76% | | | | 2.70% | | | | 4.52% | |
Bloomberg Barclays Government/Credit Bond Index | | | (0.01) | | | | 2.10 | | | | 4.34 | | | | 4.28 | | | | 5.82(b) | |
In the current prospectuses dated January 27, 2017 as amended July 5, 2017, the gross expense ratio for AAA Shares is 1.44%. The net expense ratio is 1.02%, after contractual reimbursements by Teton Advisors, Inc., (the “Adviser”) in place through January 31, 2019. See page 46 for the expense ratios for the year ended September 30, 2017. Class AAA Shares do not have a sales charge.
| | (a) | Returns represent past performance and do not guarantee future results. Total returns and average annual returns reflect changes in share price, reinvestment of distributions, and are net of expenses. Investment returns and the principal value of an investment will fluctuate. When shares are redeemed, they may be worth more or less than their original cost. Current performance may be lower or higher than the performance data presented. Visit www.tetonadv.com for performance information as of the most recent month end. The Adviser reimbursed expenses to limit the expense ratio. Had such limitation not been in place, returns would have been lower. Investors should carefully consider the investment objectives, risks, charges, and expenses of the Fund before investing. The prospectuses contain information about these and other matters and should be read carefully before investing. To obtain a prospectus, please visit our website at www.tetonadv.com. Other share classes are available and have different performance characteristics. See page 2 for performance of other classes of shares. The Bloomberg Barclays Government/Credit Bond Index is a market value weighted index that tracks the performance of fixed rate, publicly placed, dollar denominated obligations. Dividends are considered reinvested. You cannot invest directly in an index. | |
| | (b) | The Bloomberg Barclays Government/Credit Bond Index since inception performance is as of September 30, 1991. | |
COMPARISON OF CHANGE IN VALUE OF A $10,000 INVESTMENT IN THE
INTERMEDIATE BOND FUND CLASS AAA AND
THE BLOOMBERG BARCLAYS GOVERNMENT/CREDIT BOND INDEX (Unaudited)
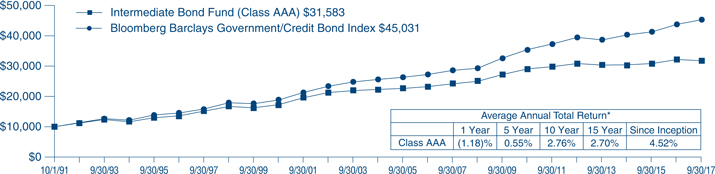
| * | Past performance is not predictive of future results. The performance tables and graph do not reflect the deduction of taxes that a shareholder would pay on fund distributions or the redemption of fund shares. |
13
TETON Westwood Funds
Disclosure of Fund Expenses (Unaudited)
For the Six Month Period from April 1, 2017 through September 30, 2017
We believe it is important for you to understand the impact of fees and expenses regarding your investment. All mutual funds have operating expenses. As a shareholder of a fund, you incur ongoing costs, which include costs for portfolio management, administrative services, and shareholder reports (like this one), among others. Operating expenses, which are deducted from a fund’s gross income, directly reduce the investment return of a fund. When a fund’s expenses are expressed as a percentage of its average net assets, this figure is known as the expense ratio. The following examples are intended to help you understand the ongoing costs (in dollars) of investing in your Fund and to compare these costs with those of other mutual funds. The examples are based on an investment of $1,000 made at the beginning of the period shown and held for the entire period.
The Expense Table on page 15 illustrates your Fund’s costs in two ways:
Actual Fund Return: This section provides information about actual account values and actual expenses. You may use this section to help you to estimate the actual expenses that you paid over the period after any fee waivers and expense reimbursements. The “Ending Account Value” shown is derived from the Fund’s actual return during the past six months, and the Expenses Paid During Period” shows the dollar amount that would have been paid by an investor who started with $1,000 in the Fund. You may use this information, together with the amount you invested, to estimate the expenses that you paid over the period. To do so, simply divide your account value by $1,000 (for example, an $8,600 account value divided by $1,000 = 8.6), then multiply the result by the number given for your Fund under the heading “Expenses Paid During Period” to estimate the expenses you paid during this period.
Hypothetical 5% Return: This section provides information about hypothetical account values and hypothetical expenses based on the Fund’s actual expense ratio. It assumes a hypothetical annualized return of 5% before expenses during the period shown. In this case – because the hypothetical return used is not the Fund’s actual return – the results do not apply to your investment and you cannot use the hypothetical account value and expense to estimate the actual ending account balance or expenses you paid for the period. This example is useful in making comparisons of the ongoing costs of investing in the Fund and other funds. To do so, compare this 5% hypothetical example with the 5% hypothetical examples that appear in shareholder reports of other funds.
Please note that the expenses shown in the table are meant to highlight your ongoing costs only and do not reflect any transactional costs such as sales charges (loads), redemption fees, or exchange fees, if any, which are described in the Prospectus. If these costs were applied to your account, your costs would be higher. Therefore, the 5% hypothetical return is useful in comparing ongoing costs only, and will not help you determine the relative total costs of owning different funds. The “Annualized Expense Ratio” represents the actual expenses for the last six months and may be different from the expense ratio in the Financial Highlights which is for the year ended September 30, 2017.
14
TETON Westwood Funds
Disclosure of Fund Expenses (Unaudited) (Continued)
For the Six Month Period from April 1, 2017 through September 30, 2017
Expense Table
| | | | | | | | | | | | | | | | | | | | | | |
| | | Actual Fund Return | | | | Hypothetical 5% Return | |
| | | Beginning | | Ending | | Annualized | | Expenses | | | | Beginning | | Ending | | Annualized | | Expenses | | | |
| | | Account Value | | Account Value | | Expense | | Paid During | | | | Account Value | | Account Value | | Expense | | Paid During | | | |
| | | 04/01/17 | | 09/30/17 | | Ratio | | Period* | | | | 04/01/17 | | 09/30/17 | | Ratio | | Period* | | | |
| | | | | | | | | | | | | | | | | | | | | | |
TETON Westwood Mighty MitesSM Fund | | | | | | | | | | | | | | | | | | | | | | |
Class AAA | | $1,000.00 | | $1,115.20 | | 1.43% | | $ 7.58 | | | | $1,000.00 | | $1,017.90 | | 1.43% | | $ 7.23 | | | | |
Class A | | $1,000.00 | | $1,114.10 | | 1.68% | | $ 8.90 | | | | $1,000.00 | | $1,016.65 | | 1.68% | | $ 8.49 | | | | |
Class C | | $1,000.00 | | $1,110.90 | | 2.18% | | $11.54 | | | | $1,000.00 | | $1,014.14 | | 2.18% | | $11.01 | | | | |
Class I | | $1,000.00 | | $1,116.40 | | 1.18% | | $ 6.26 | | | | $1,000.00 | | $1,019.15 | | 1.18% | | $ 5.97 | | | | |
Class T | | $1,000.00 | | $1,080.80 | | 1.41% | | $ 3.54** | | | | $1,000.00 | | $1,018.00 | | 1.41% | | $ 7.13 | | | | |
| | | | | | | | | | |
| | | | | | | | | | | | | | | | | | | | | | |
TETON Westwood SmallCap Equity Fund | | | | | | | | | | | | | | | | | | | | | | |
Class AAA | | $1,000.00 | | $1,081.50 | | 1.25% | | $ 6.52 | | | | $1,000.00 | | $1,018.80 | | 1.25% | | $ 6.33 | | | | |
Class A | | $1,000.00 | | $1,080.10 | | 1.50% | | $ 7.82 | | | | $1,000.00 | | $1,017.55 | | 1.50% | | $ 7.59 | | | | |
Class C | | $1,000.00 | | $1,077.70 | | 2.00% | | $10.42 | | | | $1,000.00 | | $1,015.04 | | 2.00% | | $10.10 | | | | |
Class I | | $1,000.00 | | $1,083.00 | | 1.00% | | $ 5.22 | | | | $1,000.00 | | $1,020.05 | | 1.00% | | $ 5.06 | | | | |
Class T | | $1,000.00 | | $1,080.90 | | 1.25% | | $ 3.14** | | | | $1,000.00 | | $1,018.00 | | 1.25% | | $ 6.33 | | | | |
| | | | | | | | | | |
| | | | | | | | | | | | | | | | | | | | | | |
TETON Westwood Mid-Cap Equity Fund | | | | | | | | | | | | | | | | | | | | | | |
Class AAA | | $1,000.00 | | $1,031.00 | | 1.05% | | $ 5.35 | | | | $1,000.00 | | $1,019.80 | | 1.05% | | $ 5.32 | | | | |
Class A | | $1,000.00 | | $1,028.90 | | 1.30% | | $ 6.61 | | | | $1,000.00 | | $1,018.55 | | 1.30% | | $ 6.58 | | | | |
Class C | | $1,000.00 | | $1,026.30 | | 1.80% | | $ 9.14 | | | | $1,000.00 | | $1,016.04 | | 1.80% | | $ 9.10 | | | | |
Class I | | $1,000.00 | | $1,032.20 | | 0.80% | | $ 4.08 | | | | $1,000.00 | | $1,021.06 | | 0.80% | | $ 4.05 | | | | |
| | | | | | | | | | |
| | | | | | | | | | | | | | | | | | | | | | |
TETON Convertible Securities Fund | | | | | | | | | | | | | | | | | | | | | | |
Class AAA | | $1,000.00 | | $1,070.30 | | 1.15% | | $ 5.97 | | | | $1,000.00 | | $1,019.30 | | 1.15% | | $ 5.82 | | | | |
Class A | | $1,000.00 | | $1,068.10 | | 1.40% | | $ 7.26 | | | | $1,000.00 | | $1,018.05 | | 1.40% | | $ 7.08 | | | | |
Class C | | $1,000.00 | | $1,066.40 | | 1.90% | | $ 9.84 | | | | $1,000.00 | | $1,015.54 | | 1.90% | | $ 9.60 | | | | |
Class I | | $1,000.00 | | $1,057.60 | | 0.90% | | $ 4.64 | | | | $1,000.00 | | $1,020.56 | | 0.90% | | $ 4.56 | | | | |
| | | | | | | | | | |
| | | | | | | | | | | | | | | | | | | | | | |
TETON Westwood Equity Fund | | | | | | | | | | | | | | | | | | | | | | |
Class AAA | | $1,000.00 | | $1,072.00 | | 1.62% | | $ 8.41 | | | | $1,000.00 | | $1,016.95 | | 1.62% | | $ 8.19 | | | | |
Class A | | $1,000.00 | | $1,070.60 | | 1.87% | | $ 9.71 | | | | $1,000.00 | | $1,015.69 | | 1.87% | | $ 9.45 | | | | |
Class C | | $1,000.00 | | $1,067.50 | | 2.37% | | $12.28 | | | | $1,000.00 | | $1,013.19 | | 2.37% | | $11.96 | | | | |
Class I | | $1,000.00 | | $1,073.10 | | 1.37% | | $ 7.12 | | | | $1,000.00 | | $1,018.20 | | 1.37% | | $ 6.93 | | | | |
| | | | | | | | | | |
| | | | | | | | | | | | | | | | | | | | | | |
TETON Westwood Balanced Fund | | | | | | | | | | | | | | | | | | | | | | |
Class AAA | | $1,000.00 | | $1,052.80 | | 1.33% | | $ 6.84 | | | | $1,000.00 | | $1,018.40 | | 1.33% | | $ 6.73 | | | | |
Class A | | $1,000.00 | | $1,051.80 | | 1.58% | | $ 8.13 | | | | $1,000.00 | | $1,017.15 | | 1.58% | | $ 7.99 | | | | |
Class C | | $1,000.00 | | $1,049.60 | | 2.08% | | $10.69 | | | | $1,000.00 | | $1,014.64 | | 2.08% | | $ 10.50 | | | | |
Class I | | $1,000.00 | | $1,054.80 | | 1.09% | | $ 5.61 | | | | $1,000.00 | | $1,019.60 | | 1.09% | | $ 5.52 | | | | |
| | | | | | | | | | |
| | | | | | | | | | | | | | | | | | | | | | |
TETON Westwood Intermediate Bond Fund | | | | | | | | | | | | | | | | | | | | | | |
Class AAA | | $1,000.00 | | $1,010.60 | | 1.00% | | $ 5.04 | | | | $1,000.00 | | $1,020.05 | | 1.00% | | $ 5.06 | | | | |
Class A | | $1,000.00 | | $1,009.20 | | 1.10% | | $ 5.54 | | | | $1,000.00 | | $1,019.55 | | 1.10% | | $ 5.57 | | | | |
Class C | | $1,000.00 | | $1,006.20 | | 1.75% | | $ 8.80 | | | | $1,000.00 | | $1,016.29 | | 1.75% | | $ 8.85 | | | | |
Class I | | $1,000.00 | | $1,011.00 | | 0.75% | | $ 3.78 | | | | $1,000.00 | | $1,021.31 | | 0.75% | | $ 3.80 | | | | |
| * | Expenses are equal to the Funds’ annualized expense ratio for the last six months multiplied by the average account value over the period, multiplied by the number of days in the most recent fiscal half year (183 days), then divided by 365. |
| ** | Class T Shares use a beginning account value date of 07/05/17, and Class T Share expenses are equal to the Funds’ annualized expense ratio for the period since inception multiplied by the number of days since inception (88 days), then divided by 365. |
15
Summary of Portfolio Holdings (Unaudited)
The following tables present portfolio holdings as a percent of net assets as of September 30, 2017:
TETON Westwood Mighty MitesSM Fund
| | | | | | |
U.S. Government Obligations | | | 17.5 | % | | |
Diversified Industrial | | | 9.6 | % | | |
Health Care | | | 7.3 | % | | |
Equipment and Supplies | | | 6.1 | % | | |
Financial Services | | | 5.7 | % | | |
Food and Beverage | | | 4.0 | % | | |
Machinery | | | 3.2 | % | | |
Automotive: Parts and Accessories | | | 3.2 | % | | |
Business Services | | | 3.2 | % | | |
Electronics | | | 3.1 | % | | |
Aerospace and Defense | | | 3.0 | % | | |
Telecommunications | | | 2.9 | % | | |
Specialty Chemicals | | | 2.8 | % | | |
Consumer Products | | | 2.7 | % | | |
Hotels and Gaming | | | 2.7 | % | | |
Real Estate | | | 2.2 | % | | |
Building and Construction | | | 1.8 | % | | |
Restaurants | | | 1.8 | % | | |
Computer Software and Services | | | 1.7 | % | | |
Broadcasting | | | 1.5 | % | | |
Metals and Mining | | | 1.5 | % | | |
Publishing | | | 1.3 | % | | |
Aviation: Parts and Services | | | 1.2 | % | | |
Manufactured Housing and Recreational Vehicles | | | 1.1 | % | | |
Retail | | | 1.1 | % | | |
| | | | |
Entertainment | | | 1.0 | % |
Automotive | | | 1.0 | % |
Energy and Utilities: Water | | | 1.0 | % |
Environmental Control | | | 0.9 | % |
Semiconductors | | | 0.6 | % |
Consumer Services | | | 0.6 | % |
Energy and Utilities: Natural Gas | | | 0.5 | % |
Energy and Utilities: Services | | | 0.4 | % |
Communications Equipment | | | 0.4 | % |
Agriculture | | | 0.2 | % |
Airlines | | | 0.2 | % |
Energy and Utilities: Oil | | | 0.2 | % |
Paper and Forest Products | | | 0.2 | % |
Energy and Utilities: Integrated | | | 0.2 | % |
Energy and Utilities | | | 0.1 | % |
Closed-End Business Development Company | | | 0.1 | % |
Transportation | | | 0.0 | %* |
Energy and Utilities: Alternative Energy | | | 0.0 | %* |
Educational Services | | | 0.0 | %* |
Wireless Communications | | | 0.0 | %* |
Computer Hardware | | | 0.0 | %* |
Other Assets and Liabilities (Net) | | | 0.2 | % |
| | | | |
| | | 100.0 | % |
| | | | |
| * | Amount represents less than 0.05%. |
TETON Westwood SmallCap Equity Fund
| | | | | | |
Financial Services | | | 27.5 | % | | |
Semiconductors | | | 12.0 | % | | |
Energy and Utilities | | | 7.7 | % | | |
Computer Software and Services | | | 7.7 | % | | |
Business Services | | | 7.1 | % | | |
Retail | | | 5.9 | % | | |
Health Care | | | 5.3 | % | | |
Specialty Chemicals | | | 4.2 | % | | |
Telecommunications | | | 3.4 | % | | |
Building and Construction | | | 3.3 | % | | |
Diversified Industrial | | | 2.7 | % | | |
Equipment and Supplies | | | 2.5 | % | | |
| | | | |
Electronics | | | 2.4 | % |
Automotive | | | 2.0 | % |
Consumer Products | | | 2.0 | % |
Machinery | | | 1.0 | % |
Environmental Control | | | 0.8 | % |
Communications | | | 0.8 | % |
U.S. Government Obligations | | | 0.8 | % |
Aerospace | | | 0.7 | % |
Other Assets and Liabilities (Net) | | | 0.2 | % |
| | | | |
| | | 100.0 | % |
| | | | |
| | | | |
| | | | |
TETON Westwood Mid-Cap Equity Fund
| | | | | | |
Financials | | | 22.2 | % | | |
Information Technology | | | 16.6 | % | | |
Consumer Discretionary | | | 13.8 | % | | |
Industrials | | | 13.6 | % | | |
Health Care | | | 10.5 | % | | |
Energy | | | 9.4 | % | | |
| | | | |
U.S. Treasury Bills | | | 8.3 | % |
Materials | | | 3.1 | % |
Consumer Staples | | | 2.8 | % |
Other Assets and Liabilities (Net) | | | (0.3 | )% |
| | | | |
| | | 100.0 | % |
| | | | |
16
Summary of Portfolio Holdings (Unaudited) (Continued)
TETON Convertible Securities Fund
| | | | |
Computer Software and Services | | | 17.7 | % |
Semiconductors | | | 16.1 | % |
Health Care | | | 13.9 | % |
Communications Equipment | | | 5.2 | % |
Financial Services | | | 5.1 | % |
Consumer Services | | | 4.8 | % |
Building and Construction | | | 3.8 | % |
Transportation | | | 3.6 | % |
Energy and Utilities: Integrated | | | 3.5 | % |
Real Estate Investment Trusts | | | 3.2 | % |
U.S. Treasury Bills | | | 3.0 | % |
Consumer Products | | | 3.0 | % |
Aerospace and Defense | | | 2.5 | % |
| | | | |
Cable and Satellite | | | 2.3 | % |
Entertainment | | | 2.3 | % |
Aviation: Parts and Services | | | 2.2 | % |
Business Services | | | 2.0 | % |
Industrials | | | 2.0 | % |
Energy and Utilities: Services | | | 1.9 | % |
Diversified Industrial | | | 1.9 | % |
Agriculture | | | 0.7 | % |
Telecommunications | | | 0.3 | % |
Other Assets and Liabilities (Net) | | | (1.0 | )% |
| | | | |
| | | 100.0 | % |
| | | | |
TETON Westwood Equity Fund
| | | | |
Banking | | | 13.7 | % |
Health Care | | | 12.9 | % |
Food and Beverage | | | 7.8 | % |
Telecommunications | | | 7.7 | % |
Computer Software and Services | | | 7.6 | % |
Retail | | | 6.3 | % |
Financial Services | | | 6.0 | % |
Energy: Integrated | | | 5.9 | % |
Consumer Products | | | 4.2 | % |
Business Services | | | 4.2 | % |
Aerospace | | | 4.2 | % |
Energy and Energy Services | | | 3.9 | % |
Energy: Oil | | | 2.2 | % |
| | | | |
Diversified Industrial | | | 2.2 | % |
Transportation | | | 2.2 | % |
Specialty Chemicals | | | 2.1 | % |
Real Estate Investment Trusts | | | 1.9 | % |
Cable and Satellite | | | 1.9 | % |
Semiconductors | | | 1.2 | % |
Electronics | | | 1.1 | % |
Other Investment Companies | | | 1.0 | % |
Other Assets and Liabilities (Net) | | | (0.2 | )% |
| | | | |
| | | 100.0 | % |
| | | | |
TETON Westwood Balanced Fund
| | | | |
Banking | | | 12.6 | % |
Health Care | | | 11.7 | % |
Financial Services | | | 7.0 | % |
Retail | | | 6.3 | % |
Telecommunications | | | 6.0 | % |
Food and Beverage | | | 5.4 | % |
Computer Software and Services | | | 5.2 | % |
Consumer Products | | | 5.1 | % |
U.S. Treasury Notes | | | 4.6 | % |
Energy: Integrated | | | 4.4 | % |
Electronics | | | 3.2 | % |
Aerospace | | | 3.1 | % |
Business Services | | | 3.0 | % |
Diversified Industrial | | | 2.9 | % |
Federal Home Loan Mortgage Corp. | | | 2.6 | % |
| | | | |
Energy and Energy Services | | | 2.5 | % |
Energy: Oil | | | 2.3 | % |
Federal National Mortgage Association | | | 1.7 | % |
U.S. Treasury Inflation Indexed Notes | | | 1.6 | % |
Specialty Chemicals | | | 1.5 | % |
Transportation | | | 1.5 | % |
Real Estate Investment Trusts | | | 1.4 | % |
Cable and Satellite | | | 1.3 | % |
Other Investment Companies | | | 1.2 | % |
Computer Hardware | | | 1.0 | % |
Semiconductors | | | 0.8 | % |
Other Assets and Liabilities (Net) | | | 0.1 | % |
| | | | |
| | | 100.0 | % |
| | | | |
TETON Westwood Intermediate Bond Fund
| | | | |
Corporate Bonds | | | 62.2 | % |
U.S. Government Obligations | | | 21.7 | % |
U.S. Government Agency Obligations | | | 17.4 | % |
Other Assets and Liabilities (Net) | | | (1.3 | )% |
| | | | |
| | | 100.0 | % |
| | | | |
17
TETON Westwood Mighty MitesSM Fund
Schedule of Investments — September 30, 2017
| | | | | | | | | | |
Shares | | | | Cost | | | Market Value | |
| | |
| | COMMON STOCKS — 81.5% | | | | | |
| | Aerospace and Defense — 3.0% | | | | | |
| 1,128,400 | | Aerojet Rocketdyne Holdings
Inc.† | | $ | 5,264,627 | | | $ | 39,505,284 | |
| 15,000 | | Chemring Group plc | | | 35,977 | | | | 36,180 | |
| 123,000 | | Innovative Solutions &
Support Inc.† | | | 472,250 | | | | 447,720 | |
| 7,000 | | Kratos Defense & Security
Solutions Inc.† | | | 42,963 | | | | 91,560 | |
| | | | | | | | | | |
| | | | | 5,815,817 | | | | 40,080,744 | |
| | | | | | | | | | |
| | |
| | Agriculture — 0.2% | | | | | |
| 500,000 | | Black Earth Farming Ltd., SDR. | | | 4,345 | | | | 3,131 | |
| 225 | | J.G. Boswell Co. | | | 144,676 | | | | 154,350 | |
| 138,575 | | Limoneira Co. | | | 2,652,793 | | | | 3,210,783 | |
| | | | | | | | | | |
| | | | | 2,801,814 | | | | 3,368,264 | |
| | | | | | | | | | |
| | |
| | Airlines — 0.2% | | | | | |
| 60,000 | | American Airlines Group Inc. | | | 24,466 | | | | 2,849,400 | |
| 225,000 | | American Airlines Group Inc.,
Escrow† | | | 3,288 | | | | 309,375 | |
| | | | | | | | | | |
| | | | | 27,754 | | | | 3,158,775 | |
| | | | | | | | | | |
| | |
| | Automotive — 1.0% | | | | | |
| 27,200 | | Lithia Motors Inc., Cl. A | | | 517,533 | | | | 3,272,432 | |
| 20,000 | | Navistar International Corp.† | | | 152,109 | | | | 881,400 | |
| 29,605 | | Rush Enterprises Inc., Cl. A† | | | 545,615 | | | | 1,370,415 | |
| 104,005 | | Rush Enterprises Inc., Cl. B† | | | 1,800,199 | | | | 4,536,698 | |
| 66,500 | | Sonic Automotive Inc., Cl. A | | | 849,600 | | | | 1,356,600 | |
| 70,000 | | Wabash National Corp. | | | 132,194 | | | | 1,597,400 | |
| | | | | | | | | | |
| | | | | 3,997,250 | | | | 13,014,945 | |
| | | | | | | | | | |
| | |
| | Automotive: Parts and Accessories — 3.0% | | | | | |
| 6,000 | | China Automotive Systems
Inc.† | | | 34,007 | | | | 31,200 | |
| 105,000 | | Dana Inc. | | | 624,231 | | | | 2,935,800 | |
| 10,000 | | Douglas Dynamics Inc. | | | 309,290 | | | | 394,000 | |
| 400,000 | | Federal-Mogul Holdings
Corp.†(a) | | | 3,578,148 | | | | 4,000,000 | |
| 13,400 | | Gentherm Inc.† | | | 194,890 | | | | 497,810 | |
| 15,000 | | Jason Industries Inc.† | | | 73,788 | | | | 23,850 | |
| 326,600 | | Modine Manufacturing Co.† | | | 3,367,217 | | | | 6,287,050 | |
| 24,000 | | Motorcar Parts of America
Inc.† | | | 315,465 | | | | 707,040 | |
| 60,000 | | Puradyn Filter Technologies
Inc.† | | | 13,098 | | | | 5,100 | |
| 73,000 | | Shiloh Industries Inc.† | | | 1,002,673 | | | | 759,200 | |
| 122,200 | | Standard Motor Products Inc. | | | 1,271,525 | | | | 5,896,150 | |
| 177,700 | | Strattec Security Corp. | | | 4,420,738 | | | | 7,267,930 | |
| 480,000 | | Superior Industries
International Inc. | | | 8,912,607 | | | | 7,992,000 | |
| 37,000 | | Tenneco Inc. | | | 115,032 | | | | 2,244,790 | |
| 35,000 | | Titan International Inc. | | | 297,192 | | | | 355,250 | |
| 33,425 | | Tower International Inc. | | | 736,834 | | | | 909,160 | |
| | | | | | | | | | |
| | | | | 25,266,735 | | | | 40,306,330 | |
| | | | | | | | | | |
| | |
| | Aviation: Parts and Services — 1.2% | | | | | |
| 13,500 | | Astronics Corp.† | | | 96,483 | | | | 401,625 | |
| 19,019 | | Astronics Corp., Cl. B† | | | 131,688 | | | | 566,291 | |
| 125,642 | | Ducommun Inc.† | | | 2,158,735 | | | | 4,026,826 | |
| 197,301 | | Kaman Corp. | | | 5,011,314 | | | | 11,005,450 | |
| | | | | | | | | | |
| | | | | 7,398,220 | | | | 16,000,192 | |
| | | | | | | | | | |
| | |
| | Broadcasting — 1.5% | | | | | |
| 725,000 | | Beasley Broadcast Group Inc.,
Cl. A(b) | | | 3,825,765 | | | | 8,482,500 | |
| 80,000 | | Entercom Communications
Corp., Cl. A | | | 179,276 | | | | 916,000 | |
| 255,500 | | Gray Television Inc.† | | | 279,902 | | | | 4,011,350 | |
| 80,042 | | Gray Television Inc., Cl. A† | | | 530,550 | | | | 1,040,546 | |
| | | | | | | | | | |
Shares | | | | Cost | | | Market Value | |
| 8,300 | | Hemisphere Media Group
Inc.† | | $ | 120,053 | | | $ | 99,185 | |
| 620,008 | | Salem Media Group Inc. | | | 2,974,213 | | | | 4,092,053 | |
| 33,000 | | Sinclair Broadcast Group Inc.,
Cl. A | | | 53,667 | | | | 1,057,650 | |
| 94,000 | | Townsquare Media Inc.,
Cl. A† | | | 911,728 | | | | 940,000 | |
| 41,675 | | Videocon d2h Ltd., ADR† | | | 265,893 | | | | 370,908 | |
| | | | | | | | | | |
| | | | | 9,141,047 | | | | 21,010,192 | |
| | | | | | | | | | |
| | |
| | Building and Construction — 1.8% | | | | | |
| 230,400 | | Armstrong Flooring Inc.† | | | 4,359,280 | | | | 3,628,800 | |
| 141,000 | | Gibraltar Industries Inc.† | | | 3,237,843 | | | | 4,392,150 | |
| 14,000 | | Herc Holdings Inc.† | | | 525,646 | | | | 687,820 | |
| 865,000 | | Huttig Building Products Inc.��� | | | 1,008,362 | | | | 6,106,900 | |
| 107,074 | | MYR Group Inc.† | | | 2,422,367 | | | | 3,120,136 | |
| 99,800 | | The Monarch Cement Co. | | | 2,640,816 | | | | 6,487,000 | |
| | | | | | | | | | |
| | | | | 14,194,314 | | | | 24,422,806 | |
| | | | | | | | | | |
| | |
| | Business Services — 3.2% | | | | | |
| 207,884 | | Ascent Capital Group Inc.,
Cl. A† | | | 5,190,047 | | | | 2,710,807 | |
| 1,250 | | Cenveo Inc.† | | | 8,765 | | | | 4,387 | |
| 570 | | Clear Channel Outdoor
Holdings Inc., Cl. A | | | 2,177 | | | | 2,651 | |
| 1,997 | | Du-Art Film Labs Inc.† | | | 338,803 | | | | 379,430 | |
| 705,520 | | Edgewater Technology
Inc.†(b) | | | 2,293,833 | | | | 4,599,990 | |
| 308,804 | | Gerber Scientific Inc.,
Escrow†(a) | | | 0 | | | | 0 | |
| 101,271 | | GP Strategies Corp.† | | | 928,058 | | | | 3,124,210 | |
| 23,300 | | ICF International Inc.† | | | 558,939 | | | | 1,257,035 | |
| 1,401,000 | | Internap Corp.† | | | 4,234,860 | | | | 6,094,350 | |
| 32,029 | | KAR Auction Services Inc. | | | 443,660 | | | | 1,529,064 | |
| 8,000 | | Landauer Inc. | | | 282,324 | | | | 538,400 | |
| 16,000 | | Macquarie Infrastructure
Corp. | | | 84,561 | | | | 1,154,880 | |
| 4,560 | | Matthews International Corp.,
Cl. A | | | 200,594 | | | | 283,860 | |
| 4,000 | | MaxPoint Interactive Inc.† | | | 54,820 | | | | 55,560 | |
| 20,000 | | McGrath RentCorp. | | | 535,869 | | | | 875,000 | |
| 115,000 | | MDC Partners Inc., Cl. A† | | | 743,033 | | | | 1,265,000 | |
| 1,639,800 | | ModusLink Global Solutions
Inc.† | | | 5,674,145 | | | | 3,082,824 | |
| 20,000 | | MoneyGram International
Inc.† | | | 318,379 | | | | 322,200 | |
| 3,000 | | Pendrell Corp.† | | | 48,782 | | | | 20,490 | |
| 299,362 | | PFSweb Inc.† | | | 1,800,095 | | | | 2,499,673 | |
| 158,259 | | PRGX Global Inc.† | | | 922,178 | | | | 1,107,813 | |
| 322,800 | | Pure Technologies Ltd. | | | 1,507,350 | | | | 1,337,508 | |
| 67,524 | | Safeguard Scientifics Inc.† | | | 1,024,260 | | | | 901,445 | |
| 45,000 | | Scientific Games Corp.,
Cl. A† | | | 377,499 | | | | 2,063,250 | |
| 500 | | Stamps.com Inc.† | | | 6,278 | | | | 101,325 | |
| 395,000 | | Team Inc.† | | | 7,936,219 | | | | 5,273,250 | |
| 22,000 | | Trans-Lux Corp.† | | | 111,871 | | | | 24,750 | |
| 37,282 | | Viad Corp. | | | 993,885 | | | | 2,270,474 | |
| | | | | | | | | | |
| | | | | 36,621,284 | | | | 42,879,626 | |
| | | | | | | | | | |
| |
| | Closed-End Business Development Company — 0.1% | |
| 134,300 | | MVC Capital Inc. | | | 1,294,504 | | | | 1,344,343 | |
| | | | | | | | | | |
| | |
| | Communications Equipment — 0.4% | | | | | |
| 440,598 | | Communications Systems Inc. | | | 3,919,634 | | | | 1,841,700 | |
| 275,000 | | Extreme Networks Inc.† | | | 946,476 | | | | 3,269,750 | |
| 30,000 | | ViewCast.com Inc.† | | | 14,100 | | | | 69 | |
| | | | | | | | | | |
| | | | | 4,880,210 | | | | 5,111,519 | |
| | | | | | | | | | |
| | |
| | Computer Hardware — 0.0% | | | | | |
| 10,000 | | Violin Memory Inc.†(a) | | | 6,812 | | | | 0 | |
| | | | | | | | | | |
See accompanying notes to financial statements.
18
TETON Westwood Mighty MitesSM Fund
Schedule of Investments (Continued) — September 30, 2017
| | | | | | | | | | |
Shares | | | | Cost | | | Market Value | |
| | |
| | COMMON STOCKS (Continued) | | | | | |
| | Computer Software and Services — 1.7% | |
| 200,913 | | American Software Inc., Cl. A | | $ | 1,877,685 | | | $ | 2,282,372 | |
| 65,000 | | Avid Technology Inc.† | | | 638,597 | | | | 295,100 | |
| 317,000 | | Callidus Software Inc.† | | | 1,754,441 | | | | 7,814,050 | |
| 79,687 | | Carbonite Inc.† | | | 914,787 | | | | 1,753,114 | |
| 2,000 | | Cinedigm Corp., Cl. A† | | | 20,926 | | | | 2,900 | |
| 5,000 | | CommerceHub Inc., Cl. A† | | | 76,259 | | | | 112,850 | |
| 15,000 | | CommerceHub Inc., Cl. C† | | | 224,758 | | | | 320,250 | |
| 156,000 | | comScore Inc.† | | | 4,625,453 | | | | 4,485,000 | |
| 28,000 | | Datawatch Corp.† | | | 231,158 | | | | 323,400 | |
| 84,801 | | Digi International Inc.† | | | 958,168 | | | | 898,891 | |
| 700,000 | | FalconStor Software Inc.† | | | 2,056,497 | | | | 172,900 | |
| 1,410 | | Gemalto NV | | | 8,172 | | | | 62,984 | |
| 14,001 | | Genius Brands International
Inc.† | | | 78,920 | | | | 57,684 | |
| 20,000 | | GSE Systems Inc.† | | | 109,966 | | | | 71,000 | |
| 144,267 | | iGO Inc.† | | | 484,473 | | | | 410,829 | |
| 10,000 | | Materialise NV, ADR† | | | 58,532 | | | | 145,600 | |
| 35,500 | | Mercury Systems Inc.† | | | 282,814 | | | | 1,841,740 | |
| 67,500 | | Mitek Systems Inc.† | | | 199,734 | | | | 641,250 | |
| 5,502 | | MTS Systems Corp. | | | 257,882 | | | | 294,082 | |
| 2,000 | | Qualstar Corp.† | | | 17,642 | | | | 13,420 | |
| 190,389 | | Qumu Corp.† | | | 2,225,329 | | | | 573,071 | |
| 3,400 | | Tyler Technologies Inc.† | | | 37,768 | | | | 592,688 | |
| | | | | | | | | | |
| | | | | 17,139,961 | | | | 23,165,175 | |
| | | | | | | | | | |
| | |
| | Consumer Products — 2.7% | | | | | |
| 127,200 | | Acme United Corp. | | | 2,271,327 | | | | 2,925,600 | |
| 182,300 | | Bassett Furniture Industries
Inc. | | | 3,108,354 | | | | 6,872,710 | |
| 2,000 | | Brunswick Corp. | | | 30,085 | | | | 111,940 | |
| 96,387 | | Callaway Golf Co. | | | 833,454 | | | | 1,390,864 | |
| 600,000 | | Goodbaby International
Holdings Ltd. | | | 280,909 | | | | 331,046 | |
| 10,000 | | Johnson Outdoors Inc., Cl. A | | | 219,302 | | | | 732,800 | |
| 12,211 | | Lakeland Industries Inc.† | | | 119,079 | | | | 172,175 | |
| 812,400 | | Marine Products Corp. | | | 5,884,123 | | | | 13,039,020 | |
| 77,449 | | MarineMax Inc.† | | | 998,299 | | | | 1,281,781 | |
| 1,200 | | National Presto Industries Inc. | | | 90,916 | | | | 127,740 | |
| 106,031 | | Nautilus Inc.† | | | 1,160,208 | | | | 1,791,924 | |
| 128,300 | | Oil-Dri Corp. of America | | | 2,285,450 | | | | 6,277,719 | |
| 5,700 | | PC Group Inc.†(a) | | | 3,465 | | | | 26 | |
| 4,000,000 | | Playmates Holdings Ltd. | | | 481,613 | | | | 583,747 | |
| 10,000 | | Sequential Brands Group Inc.† . | | | 115,722 | | | | 29,900 | |
| 8,540 | | Standard Diversified
Opportunities Inc., Cl. A† | | | 103,473 | | | | 92,232 | |
| 8,540 | | Standard Diversified
Opportunities Inc., Cl. B† | | | 103,473 | | | | 92,232 | |
| 25,000 | | Stanley Furniture Co Inc. | | | 59,855 | | | | 29,500 | |
| 88,600 | | ZAGG Inc.† | | | 623,324 | | | | 1,395,450 | |
| | | | | | | | | | |
| | | | | 18,772,431 | | | | 37,278,406 | |
| | | | | | | | | | |
| | |
| | Consumer Services — 0.6% | | | | | |
| 523,846 | | 1-800-Flowers.com Inc.,
Cl. A† | | | 1,883,070 | | | | 5,159,883 | |
| 90,679 | | Angie’s List Inc.† | | | 555,911 | | | | 1,129,860 | |
| 64,700 | | Bowlin Travel Centers Inc.† | | | 87,196 | | | | 133,929 | |
| 5,000 | | Carriage Services Inc. | | | 125,063 | | | | 128,000 | |
| 800 | | Collectors Universe Inc. | | | 0 | | | | 19,176 | |
| 74,991 | | XO Group Inc.† | | | 732,512 | | | | 1,475,073 | |
| | | | | | | | | | |
| | | | | 3,383,752 | | | | 8,045,921 | |
| | | | | | | | | | |
| | |
| | Diversified Industrial — 9.6% | | | | | |
| 9,292 | | American Railcar Industries
Inc. | | | 147,177 | | | | 358,671 | |
| 470,000 | | Ampco-Pittsburgh Corp. | | | 9,446,505 | | | | 8,178,000 | |
| 255,500 | | Burnham Holdings Inc.,
Cl. A(b) | | | 4,105,709 | | | | 3,832,500 | |
| 95,133 | | Chase Corp. | | | 1,420,519 | | | | 10,597,816 | |
| 113,300 | | Columbus McKinnon Corp. | | | 1,858,806 | | | | 4,290,671 | |
| 446,598 | | FormFactor Inc.† | | | 3,111,209 | | | | 7,525,176 | |
| | | | | | | | | | |
Shares | | | | Cost | | | Market Value | |
| | | |
| 34,600 | | Graham Corp. | | $ | 563,893 | | | $ | 720,718 | |
| 422,703 | | Griffon Corp. | | | 4,604,157 | | | | 9,384,007 | |
| 17,954 | | Handy & Harman Ltd.† | | | 457,469 | | | | 584,403 | |
| 25,000 | | Haulotte Group SA | | | 134,090 | | | | 472,757 | |
| 30,000 | | Haynes International Inc. | | | 1,399,060 | | | | 1,077,300 | |
| 7,000 | | Innophos Holdings Inc. | | | 207,318 | | | | 344,330 | |
| 314,509 | | Insignia Systems Inc. | | | 914,190 | | | | 339,670 | |
| 220,030 | | Intevac Inc.† | | | 999,724 | | | | 1,859,253 | |
| 87,649 | | John Bean Technologies Corp. | | | 2,567,582 | | | | 8,861,314 | |
| 10,000 | | K2M Group Holdings Inc.† | | | 178,121 | | | | 212,100 | |
| 840,000 | | Katy Industries Inc.†(a)(b) | | | 250,455 | | | | 10,878 | |
| 93,000 | | L.B. Foster Co., Cl. A | | | 1,595,202 | | | | 2,115,750 | |
| 266,714 | | Lawson Products Inc.† | | | 3,779,292 | | | | 6,721,193 | |
| 85,000 | | LSB Industries Inc.† | | | 592,644 | | | | 674,900 | |
| 109,949 | | Lydall Inc.† | | | 1,101,503 | | | | 6,300,078 | |
| 9,500 | | MSA Safety Inc. | | | 306,832 | | | | 755,345 | |
| 612,900 | | Myers Industries Inc. | | | 8,029,769 | | | | 12,840,255 | |
| 261,757 | | Napco Security Technologies
Inc.† | | | 1,591,080 | | | | 2,539,043 | |
| 171,900 | | Park-Ohio Holdings Corp. | | | 3,449,605 | | | | 7,838,640 | |
| 25,080 | | Raven Industries Inc. | | | 497,955 | | | | 812,592 | |
| 66,666 | | Rubicon Ltd.† | | | 37,762 | | | | 9,149 | |
| 18,699 | | RWC Inc.†(a) | | | 306,532 | | | | 213,356 | |
| 28,000 | | Standex International Corp. | | | 928,588 | | | | 2,973,600 | |
| 623,046 | | Steel Partners Holdings LP | | | 10,035,498 | | | | 11,464,046 | |
| 507,600 | | Tredegar Corp. | | | 8,696,788 | | | | 9,136,800 | |
| 338,069 | | Twin Disc Inc.† | | | 5,794,595 | | | | 6,291,464 | |
| | | | | | | | | | |
| | | | | 79,109,629 | | | | 129,335,775 | |
| | | | | | | | | | |
| | |
| | Educational Services — 0.0% | | | | | |
| 75,000 | | Universal Technical Institute
Inc.† | | | 670,172 | | | | 260,250 | |
| | | | | | | | | | |
| | |
| | Electronics — 3.1% | | | | | |
| 28,000 | | Badger Meter Inc. | | | 477,554 | | | | 1,372,000 | |
| 175,300 | | Bel Fuse Inc., Cl. A(b) | | | 3,256,718 | | | | 4,662,980 | |
| 348,500 | | CTS Corp. | | | 2,951,627 | | | | 8,398,850 | |
| 70,000 | | Daktronics Inc. | | | 686,143 | | | | 739,900 | |
| 80,389 | | Electro Scientific Industries
Inc.† | | | 721,764 | | | | 1,119,015 | |
| 63,771 | | EMRISE Corp.†(a) | | | 0 | | | | 0 | |
| 31,000 | | IMAX Corp.† | | | 132,791 | | | | 702,150 | |
| 20,000 | | Iteris Inc.† | | | 32,200 | | | | 133,000 | |
| 140,000 | | Kimball Electronics Inc.† | | | 851,108 | | | | 3,031,000 | |
| 185,000 | | Kopin Corp.† | | | 659,531 | | | | 771,450 | |
| 34,300 | | Mesa Laboratories Inc. | | | 906,643 | | | | 5,121,676 | |
| 28,800 | | Methode Electronics Inc. | | | 168,005 | | | | 1,219,680 | |
| 133,228 | | Park Electrochemical Corp. | | | 2,142,646 | | | | 2,464,718 | |
| 94,541 | | Schmitt Industries Inc.† | | | 240,340 | | | | 179,628 | |
| 7,037 | | Sparton Corp.† | | | 119,633 | | | | 163,329 | |
| 298,824 | | Stoneridge Inc.† | | | 2,477,219 | | | | 5,919,703 | |
| 16,000 | | Stratasys Ltd.† | | | 274,798 | | | | 369,920 | |
| 157,000 | | Ultra Clean Holdings† | | | 478,219 | | | | 4,807,340 | |
| 25,000 | | Ultralife Corp.† | | | 96,124 | | | | 168,750 | |
| | | | | | | | | | |
| | | | | 16,673,063 | | | | 41,345,089 | |
| | | | | | | | | | |
| |
| | Energy and Utilities: Alternative Energy — 0.0% | |
| 39,200 | | JA Solar Holdings Co. Ltd.,
ADR† | | | 339,814 | | | | 298,704 | |
| | | | | | | | | | |
| | |
| | Energy and Utilities: Integrated — 0.2% | | | | | |
| 89,440 | | Broadwind Energy Inc.† | | | 563,104 | | | | 289,786 | |
| 36,000 | | MGE Energy Inc. | | | 848,987 | | | | 2,325,600 | |
| | | | | | | | | | |
| | | | | 1,412,091 | | | | 2,615,386 | |
| | | | | | | | | | |
| | |
| | Energy and Utilities: Natural Gas — 0.5% | | | | | |
| 335,000 | | Alvopetro Energy Ltd.† | | | 253,270 | | | | 59,066 | |
| 33,250 | | Chesapeake Utilities Corp. | | | 599,479 | | | | 2,601,813 | |
| 108,684 | | Corning Natural Gas Holding
Corp. | | | 1,015,904 | | | | 2,019,349 | |
See accompanying notes to financial statements.
19
TETON Westwood Mighty MitesSM Fund
Schedule of Investments (Continued) — September 30, 2017
| | | | | | | | | | |
Shares | | | | Cost | | | Market Value | |
| | |
| | COMMON STOCKS (Continued) | | | | | |
| | Energy and Utilities: Natural Gas (Continued) | |
| 390,181 | | Gulf Coast Ultra Deep Royalty
Trust† | | $ | 248,298 | | | $ | 17,558 | |
| 65,850 | | RGC Resources Inc. | | | 573,803 | | | | 1,881,335 | |
| 2,333 | | US Energy Corp. Wyoming† | | | 50,124 | | | | 1,752 | |
| 10,000 | | Whitecap Resources Inc. | | | 84,862 | | | | 77,740 | |
| | | | | | | | | | |
| | | | | 2,825,740 | | | | 6,658,613 | |
| | | | | | | | | | |
| | |
| | Energy and Utilities: Oil — 0.2% | | | | | |
| 244,844 | | Callon Petroleum Co.† | | | 1,971,677 | | | | 2,752,047 | |
| 57,900 | | Tesco Corp.† | | | 503,333 | | | | 315,555 | |
| | | | | | | | | | |
| | | | | 2,475,010 | | | | 3,067,602 | |
| | | | | | | | | | |
| | |
| | Energy and Utilities: Services — 0.4% | | | | | |
| 3,938 | | Archer Ltd.† | | | 2,839 | | | | 5,933 | |
| 16,000 | | Dawson Geophysical Co.† | | | 133,607 | | | | 72,480 | |
| 30,904 | | Flotek Industries Inc.† | | | 337,610 | | | | 143,704 | |
| 225,000 | | Layne Christensen Co.† | | | 2,326,235 | | | | 2,823,750 | |
| 87,500 | | RPC Inc. | | | 159,107 | | | | 2,169,125 | |
| 7,100 | | Subsea 7 SA, ADR | | | 25,056 | | | | 117,008 | |
| | | | | | | | | | |
| | | | | 2,984,454 | | | | 5,332,000 | |
| | | | | | | | | | |
| | |
| | Energy and Utilities: Water — 1.0% | | | | | |
| 24,526 | | Artesian Resources Corp.,
Cl. A | | | 491,905 | | | | 927,083 | |
| 45,174 | | Cadiz Inc.† | | | 518,835 | | | | 573,710 | |
| 24,800 | | California Water Service
Group | | | 478,223 | | | | 946,120 | |
| 4,000 | | Connecticut Water Service Inc. | | | 135,142 | | | | 237,200 | |
| 66,000 | | Consolidated Water Co. Ltd. | | | 717,506 | | | | 844,800 | |
| 68,000 | | Energy Recovery Inc.† | | | 280,443 | | | | 537,200 | |
| 29,933 | | Middlesex Water Co. | | | 579,145 | | | | 1,175,469 | |
| 50,000 | | Mueller Water Products Inc.,
Cl. A | | | 556,279 | | | | 640,000 | |
| 98,904 | | SJW Group | | | 2,474,399 | | | | 5,597,966 | |
| 44,037 | | The York Water Co. | | | 719,093 | | | | 1,492,854 | |
| | | | | | | | | | |
| | | | | 6,950,970 | | | | 12,972,402 | |
| | | | | | | | | | |
| | |
| | Entertainment — 1.0% | | | | | |
| 368,100 | | Canterbury Park Holding
Corp.(b) | | | 3,783,689 | | | | 4,546,035 | |
| 615,000 | | Dover Motorsports Inc. | | | 1,504,442 | | | | 1,260,750 | |
| 818,763 | | Entravision Communications
Corp., Cl. A | | | 2,453,342 | | | | 4,666,949 | |
| 12,000 | | National CineMedia Inc. | | | 66,286 | | | | 83,760 | |
| 388,683 | | RLJ Entertainment Inc.† | | | 940,239 | | | | 1,375,938 | |
| 50,000 | | SFX Entertainment Inc.†(a) | | | 2,750 | | | | 0 | |
| 426,100 | | Sportech plc† | | | 469,474 | | | | 556,699 | |
| 34,000 | | World Wrestling
Entertainment Inc., Cl. A | | | 509,340 | | | | 800,700 | |
| | | | | | | | | | |
| | | | | 9,729,562 | | | | 13,290,831 | |
| | | | | | | | | | |
| | |
| | Environmental Control — 0.9% | | | | | |
| 500 | | AquaVenture Holdings Ltd.† | | | 7,933 | | | | 6,750 | |
| 7,500 | | BQE Water Inc.† | | | 12,419 | | | | 346 | |
| 589,228 | | Casella Waste Systems Inc.,
Cl. A† | | | 2,796,508 | | | | 11,077,486 | |
| 17,720 | | Ceco Environmental Corp. | | | 251,406 | | | | 149,911 | |
| 107,700 | | Hudson Technologies Inc.† | | | 387,751 | | | | 841,137 | |
| 13,060 | | Primo Water Corp.† | | | 157,537 | | | | 154,761 | |
| 200 | | Primo Water Corp., Escrow† | | | 1,538 | | | | 2,370 | |
| | | | | | | | | | |
| | | | | 3,615,092 | | | | 12,232,761 | |
| | | | | | | | | | |
| | |
| | Equipment and Supplies — 6.1% | | | | | |
| 17,000 | | Amtech Systems Inc.† | | | 178,849 | | | | 203,660 | |
| 20,000 | | AZZ Inc. | | | 716,820 | | | | 974,000 | |
| 99,111 | | Berry Global Group Inc.† | | | 3,466,692 | | | | 5,614,638 | |
| 162,400 | | CIRCOR International Inc. | | | 5,806,086 | | | | 8,839,432 | |
| | | | | | | | | | |
Shares | | | | Cost | | | Market Value | |
| 298,500 | | Core Molding Technologies
Inc. | | $ | 2,259,492 | | | $ | 6,549,090 | |
| 728,000 | | Federal Signal Corp. | | | 5,253,332 | | | | 15,491,840 | |
| 300,000 | | Interpump Group SpA | | | 2,193,883 | | | | 9,332,230 | |
| 583,000 | | Kimball International Inc.,
Cl. B | | | 6,116,502 | | | | 11,525,910 | |
| 20,000 | | Maezawa Kyuso Industries Co.
Ltd. | | | 108,117 | | | | 330,060 | |
| 10,319 | | Mitcham Industries Inc.† | | | 48,614 | | | | 36,013 | |
| 2,000 | | Neff Corp., Cl. A† | | | 18,318 | | | | 50,000 | |
| 20,103 | | Powell Industries Inc. | | | 750,311 | | | | 602,889 | |
| 354,669 | | The Eastern Co.(b) | | | 6,516,754 | | | | 10,179,000 | |
| 123,000 | | The Gorman-Rupp Co. | | | 2,770,252 | | | | 4,006,110 | |
| 40,000 | | The Greenbrier Companies
Inc. | | | 831,325 | | | | 1,926,000 | |
| 348,498 | | The L.S. Starrett Co., Cl. A(b) | | | 4,063,539 | | | | 3,101,632 | |
| 130,233 | | Titan Machinery Inc.† | | | 2,133,152 | | | | 2,022,518 | |
| 133,200 | | TransAct Technologies Inc. | | | 602,898 | | | | 1,298,700 | |
| 37,000 | | Vicor Corp.† | | | 296,024 | | | | 873,200 | |
| | | | | | | | | | |
| | | | | 44,130,960 | | | | 82,956,922 | |
| | | | | | | | | | |
| | |
| | Financial Services — 5.2% | | | | | |
| 3,300 | | Alimco Financial Corp.† | | | 66,300 | | | | 40,194 | |
| 49,400 | | Anchor Bancorp.† | | | 508,737 | | | | 1,222,650 | |
| 20,000 | | Atlantic American Corp. | | | 75,277 | | | | 63,000 | |
| 25,908 | | Atlantic Capital Bancshares
Inc.† | | | 483,233 | | | | 470,230 | |
| 17,000 | | Berkshire Bancorp Inc.† | | | 219,944 | | | | 196,350 | |
| 9,246 | | Berkshire Hills Bancorp Inc. | | | 154,043 | | | | 358,283 | |
| 4,532 | | BKF Capital Group Inc.† | | | 31,877 | | | | 38,522 | |
| 75 | | Burke & Herbert Bank and
Trust Co. | | | 95,726 | | | | 171,563 | |
| 4 | | Capital Financial Holdings
Inc.† | | | 35,200 | | | | 5,450 | |
| 6,791 | | Capitol Federal Financial Inc. | | | 75,244 | | | | 99,828 | |
| 18,200 | | Citizens & Northern Corp. | | | 357,816 | | | | 446,992 | |
| 102,339 | | CoBiz Financial Inc. | | | 1,159,544 | | | | 2,009,938 | |
| 28,800 | | Crazy Woman Creek Bancorp
Inc. | | | 497,983 | | | | 481,968 | |
| 35,800 | | Dime Community Bancshares
Inc. | | | 576,823 | | | | 769,700 | |
| 1,130 | | Farmers & Merchants Bank of
Long Beach | | | 6,228,964 | | | | 8,814,000 | |
| 40,000 | | Farmers National Banc Corp. | | | 333,870 | | | | 602,000 | |
| 12,018 | | Fidelity Southern Corp. | | | 84,448 | | | | 284,106 | |
| 32,000 | | First Internet Bancorp | | | 661,348 | | | | 1,033,600 | |
| 591,270 | | Flushing Financial Corp. | | | 9,657,924 | | | | 17,572,544 | |
| 75,600 | | FNB Corp. | | | 736,188 | | | | 1,060,668 | |
| 10 | | Guaranty Corp., Cl. A†(a) | | | 137,500 | | | | 400,000 | |
| 183,860 | | Hallmark Financial Services
Inc.† | | | 1,609,508 | | | | 2,134,615 | |
| 15,000 | | Hancock Holding Co. | | | 190,783 | | | | 726,750 | |
| 13,800 | | Heritage Commerce Corp. | | | 114,043 | | | | 196,374 | |
| 30,000 | | HomeStreet Inc.† | | | 300,000 | | | | 810,000 | |
| 80,546 | | Hope Bancorp Inc. | | | 861,116 | | | | 1,426,470 | |
| 34,400 | | ICC Holdings Inc.† | | | 394,036 | | | | 610,600 | |
| 90,843 | | KKR & Co. LP | | | 49,912 | | | | 1,846,838 | |
| 18,400 | | LendingTree Inc.† | | | 464,925 | | | | 4,497,880 | |
| 165,000 | | Medallion Financial Corp. | | | 961,354 | | | | 358,050 | |
| 8,255 | | New York Community
Bancorp Inc. | | | 104,605 | | | | 106,407 | |
| 4,197 | | Northrim BanCorp Inc. | | | 91,497 | | | | 146,685 | |
| 21,300 | | OceanFirst Financial Corp. | | | 395,540 | | | | 585,537 | |
| 40,000 | | Oritani Financial Corp. | | | 412,856 | | | | 672,000 | |
| 158,000 | | Pzena Investment Management
Inc., Cl. A | | | 1,274,500 | | | | 1,720,620 | |
| 36,971 | | Renasant Corp. | | | 414,186 | | | | 1,586,056 | |
| 4,540 | | Security National Corp. | | | 412,718 | | | | 499,400 | |
| 8,842 | | SI Financial Group Inc. | | | 101,241 | | | | 132,188 | |
See accompanying notes to financial statements.
20
TETON Westwood Mighty MitesSM Fund
Schedule of Investments (Continued) — September 30, 2017
| | | | | | | | | | |
Shares | | | | Cost | | | Market Value | |
| | |
| | COMMON STOCKS (Continued) | | | | | |
| | Financial Services (Continued) | | | | | |
| 85,000 | | Silvercrest Asset Management
Group Inc., Cl. A | | $ | 1,171,743 | | | $ | 1,236,750 | |
| 2,995 | | South State Corp. | | | 226,349 | | | | 269,700 | |
| 20,594 | | Southwest Bancorp Inc. | | | 370,915 | | | | 567,365 | |
| 675,000 | | Sprott Inc. | | | 1,860,258 | | | | 1,141,455 | |
| 24,700 | | State Bank Financial Corp. | | | 460,305 | | | | 707,655 | |
| 122,503 | | Sterling Bancorp | | | 1,238,753 | | | | 3,019,699 | |
| 70,000 | | TheStreet Inc.† | | | 135,394 | | | | 75,600 | |
| 2,000 | | Thomasville Bancshares Inc. | | | 66,207 | | | | 79,600 | |
| 10,000 | | TriState Capital Holdings Inc.†. | | | 98,183 | | | | 229,000 | |
| 55,000 | | TrustCo Bank Corp NY | | | 253,000 | | | | 489,500 | |
| 127,100 | | United Financial Bancorp Inc. | | | 1,749,440 | | | | 2,324,659 | |
| 33,089 | | Value Line Inc. | | | 326,193 | | | | 583,028 | |
| 45,900 | | Washington Trust Bancorp
Inc. | | | 1,029,683 | | | | 2,627,775 | |
| 82,200 | | Waterstone Financial Inc. | | | 876,303 | | | | 1,602,900 | |
| 87,100 | | Western New England Bancorp
Inc. | | | 746,912 | | | | 949,390 | |
| 655,000 | | Wright Investors’ Service
Holdings Inc.† | | | 761,354 | | | | 245,625 | |
| 13,200 | | Xenith Bankshares Inc.† | | | 127,500 | | | | 429,000 | |
| | | | | | | | | | |
| | | | | 41,829,301 | | | | 70,776,757 | |
| | | | | | | | | | |
| | |
| | Food and Beverage — 4.0% | | | | | |
| 87,600 | | Andrew Peller Ltd., Cl. A | | | 366,944 | | | | 843,179 | |
| 60,000 | | Calavo Growers Inc. | | | 1,819,781 | | | | 4,392,000 | |
| 110,000 | | Cott Corp. | | | 748,495 | | | | 1,651,100 | |
| 525,000 | | Crimson Wine Group Ltd.† | | | 4,768,847 | | | | 5,643,750 | |
| 206,013 | | Farmer Brothers Co.† | | | 4,137,450 | | | | 6,767,527 | |
| 1,700 | | Hanover Foods Corp., Cl. A | | | 165,267 | | | | 159,800 | |
| 300 | | Hanover Foods Corp., Cl. B | | | 28,206 | | | | 31,125 | |
| 457,331 | | Inventure Foods Inc.† | | | 3,045,155 | | | | 2,144,882 | |
| 85,000 | | Iwatsuka Confectionery Co.
Ltd. | | | 4,139,177 | | | | 3,897,800 | |
| 1,500 | | J & J Snack Foods Corp. | | | 21,623 | | | | 196,950 | |
| 22,531 | | John B Sanfilippo & Son Inc. | | | 1,052,454 | | | | 1,516,562 | |
| 162,931 | | Lifeway Foods Inc.† | | | 1,651,594 | | | | 1,450,086 | |
| 240,961 | | Massimo Zanetti Beverage Group SpA | | | 2,415,524 | | | | 2,477,675 | |
| 71,900 | | MGP Ingredients Inc. | | | 1,431,993 | | | | 4,359,297 | |
| 15,600 | | Rock Field Co. Ltd. | | | 125,557 | | | | 276,717 | |
| 5,900 | | Scheid Vineyards Inc., Cl. A† | | | 89,940 | | | | 351,050 | |
| 243,600 | | Snyder’s-Lance Inc. | | | 5,677,399 | | | | 9,290,904 | |
| 311,664 | | SunOpta Inc.† | | | 2,423,205 | | | | 2,711,477 | |
| 8,500 | | The Boston Beer Co. Inc.,
Cl. A† | | | 288,591 | | | | 1,327,700 | |
| 79,000 | | The Hain Celestial Group
Inc.† | | | 813,450 | | | | 3,250,850 | |
| 270,000 | | Tingyi (Cayman Islands)
Holding Corp. | | | 393,787 | | | | 406,472 | |
| 295,000 | | Vitasoy International Holdings
Ltd. | | | 161,353 | | | | 657,100 | |
| 23,000 | | Willamette Valley Vineyards
Inc.† | | | 88,087 | | | | 181,240 | |
| | | | | | | | | | |
| | | | | 35,853,879 | | | | 53,985,243 | |
| | | | | | | | | | |
| | |
| | Health Care — 7.3% | | | | | |
| 32,960 | | Accuray Inc.† | | | 244,893 | | | | 131,840 | |
| 2,600 | | AcelRx Pharmaceuticals Inc.† | | | 19,444 | | | | 11,960 | |
| 5,000 | | Achillion Pharmaceuticals
Inc.† | | | 19,520 | | | | 22,450 | |
| 24,000 | | AngioDynamics Inc.† | | | 294,826 | | | | 410,160 | |
| 341,461 | | Biolase Inc.† | | | 449,404 | | | | 205,833 | |
| 675,100 | | BioScrip Inc.† | | | 1,257,314 | | | | 1,856,525 | |
| 500 | | BioSpecifics Technologies
Corp.† | | | 19,466 | | | | 23,260 | |
| 143,100 | | BioTelemetry Inc.† | | | 1,000,358 | | | | 4,722,300 | |
| 8,200 | | Boiron SA | | | 138,640 | | | | 731,710 | |
| | | | | | | | | | |
Shares | | | | Cost | | | Market Value | |
| | | |
| 65,200 | | Cantel Medical Corp. | | $ | 764,514 | | | $ | 6,139,884 | |
| 111,100 | | Cardiovascular Systems Inc.† | | | 1,885,169 | | | | 3,127,465 | |
| 14,000 | | CareDx Inc.† | | | 80,937 | | | | 51,800 | |
| 68,000 | | Cempra Inc.† | | | 644,266 | | | | 221,000 | |
| 115,000 | | Cogentix Medical Inc.† | | | 390,961 | | | | 294,400 | |
| 27,000 | | Collegium Pharmaceutical
Inc.† | | | 331,198 | | | | 283,230 | |
| 319,000 | | Cutera Inc.† | | | 3,142,891 | | | | 13,190,650 | |
| 98,654 | | Electromed Inc.† | | | 260,879 | | | | 721,161 | |
| 250,530 | | Exactech Inc.† | | | 4,794,153 | | | | 8,254,963 | |
| 190,000 | | Exelixis Inc.† | | | 361,950 | | | | 4,603,700 | |
| 50,000 | | Genesis Healthcare Inc.† | | | 368,957 | | | | 58,000 | |
| 1,000 | | Harvard Bioscience Inc.† | | | 3,352 | | | | 3,750 | |
| 11,000 | | Heska Corp.† | | | 120,408 | | | | 968,990 | |
| 4,022 | | ICU Medical Inc.† | | | 208,829 | | | | 747,489 | |
| 600,218 | | InfuSystems Holdings Inc.† | | | 1,565,171 | | | | 1,230,447 | |
| 23,000 | | Integer Holdings Corp.† | | | 479,237 | | | | 1,176,450 | |
| 178,617 | | IntriCon Corp.† | | | 730,232 | | | | 2,161,266 | |
| 75,041 | | Invitae Corp.† | | | 779,754 | | | | 703,134 | |
| 190,000 | | Kindred Healthcare Inc. | | | 1,719,904 | | | | 1,292,000 | |
| 155,000 | | Meridian Bioscience Inc. | | | 3,063,654 | | | | 2,216,500 | |
| 122,750 | | Neogen Corp.† | | | 508,434 | | | | 9,508,215 | |
| 197,407 | | NeoGenomics Inc.† | | | 711,413 | | | | 2,197,140 | |
| 8,333 | | Nuvectra Corp.† | | | 77,269 | | | | 110,496 | |
| 43,700 | | Omega Protein Corp. | | | 843,494 | | | | 727,605 | |
| 44,612 | | Omnicell Inc.† | | | 732,122 | | | | 2,277,443 | |
| 240,000 | | OPKO Health Inc.† | | | 1,580,980 | | | | 1,646,400 | |
| 45,200 | | Orthofix International NV† | | | 965,181 | | | | 2,135,700 | |
| 5,000 | | Pain Therapeutics Inc.† | | | 53,290 | | | | 20,350 | |
| 300 | | PhotoMedex Inc.† | | | 593 | | | | 345 | |
| 2,500 | | PreMD Inc.†(a) | | | 4,580 | | | | 0 | |
| 4,000 | | Progenics Pharmaceuticals
Inc.† | | | 28,815 | | | | 29,440 | |
| 147,061 | | Quidel Corp.† | | | 1,709,110 | | | | 6,450,095 | |
| 66,000 | | RTI Surgical Inc.† | | | 334,123 | | | | 300,300 | |
| 276,792 | | SurModics Inc.† | | | 5,937,256 | | | | 8,580,552 | |
| 2,000 | | Targanta Therapeutics Corp.,
Escrow†(a) | | | 0 | | | | 0 | |
| 30,000 | | Tetraphase Pharmaceuticals
Inc.† | | | 130,368 | | | | 205,200 | |
| 5,000 | | Titan Medical Inc.† | | | 6,781 | | | | 1,365 | |
| 231,730 | | Trinity Biotech plc, ADR† | | | 1,832,053 | | | | 1,300,005 | |
| 77,900 | | United-Guardian Inc. | | | 711,089 | | | | 1,464,520 | |
| 5,000 | | Utah Medical Products Inc. | | | 138,309 | | | | 367,750 | |
| 300,000 | | Zealand Pharma A/S† | | | 3,744,488 | | | | 5,789,160 | |
| | | | | | | | | | |
| | | | | 45,190,029 | | | | 98,674,398 | |
| | | | | | | | | | |
| | |
| | Hotels and Gaming — 2.7% | | | | | |
| 71,800 | | Boyd Gaming Corp. | | | 416,103 | | | | 1,870,390 | |
| 37,340 | | Churchill Downs Inc. | | | 1,673,349 | | | | 7,699,508 | |
| 145,000 | | Dover Downs Gaming &
Entertainment Inc.† | | | 550,053 | | | | 149,350 | |
| 78,000 | | Eldorado Resorts Inc.† | | | 356,968 | | | | 2,000,700 | |
| 3,000 | | Empire Resorts Inc.† | | | 56,147 | | | | 67,050 | |
| 500,000 | | Full House Resorts Inc.† | | | 799,014 | | | | 1,395,000 | |
| 506,797 | | Golden Entertainment Inc.† | | | 4,688,328 | | | | 12,355,711 | |
| 10,000 | | Ryman Hospitality Properties
Inc. | | | 310,832 | | | | 624,900 | |
| 365,000 | | The Marcus Corp. | | | 4,634,207 | | | | 10,110,500 | |
| | | | | | | | | | |
| | | | | 13,485,001 | | | | 36,273,109 | |
| | | | | | | | | | |
| | |
| | Machinery — 3.2% | | | | | |
| 304,000 | | Astec Industries Inc. | | | 10,760,623 | | | | 17,027,040 | |
| 4,001 | | Capstone Turbine Corp.† | | | 23,746 | | | | 2,781 | |
| 72,580 | | Chart Industries Inc.† | | | 2,715,302 | | | | 2,847,313 | |
| 6,300 | | DMG Mori AG | | | 40,709 | | | | 390,911 | |
| 12,200 | | DXP Enterprises Inc.† | | | 222,516 | | | | 384,178 | |
| 559,354 | | Gencor Industries Inc.† | | | 3,808,300 | | | | 9,872,598 | |
| 32,000 | | Global Power Equipment
Group Inc.† | | | 292,178 | | | | 59,200 | |
See accompanying notes to financial statements.
21
TETON Westwood Mighty MitesSM Fund
Schedule of Investments (Continued) — September 30, 2017
| | | | | | | | | | |
Shares | | | | Cost | | | Market Value | |
| | |
| | COMMON STOCKS (Continued) | | | | | |
| | Machinery (Continued) | | | | | |
| 6,000 | | Hardinge Inc. | | $ | 54,215 | | | $ | 91,620 | |
| 130,707 | | Key Technology Inc.† | | | 1,880,534 | | | | 2,469,055 | |
| 15,164 | | Lindsay Corp. | | | 1,014,039 | | | | 1,393,572 | |
| 49,300 | | Tennant Co. | | | 1,064,922 | | | | 3,263,660 | |
| 44,400 | | The Middleby Corp.† | | | 464,969 | | | | 5,690,748 | |
| | | | | | | | | | |
| | | | | 22,342,053 | | | | 43,492,676 | |
| | | | | | | | | | |
| |
| | Manufactured Housing and Recreational Vehicles — 1.1% | |
| 55,000 | | Cavco Industries Inc.† | | | 3,067,434 | | | | 8,115,250 | |
| 159,100 | | Nobility Homes Inc. | | | 1,576,188 | | | | 2,963,238 | |
| 90,172 | | Skyline Corp.† | | | 510,266 | | | | 1,090,179 | |
| 61,000 | | Winnebago Industries Inc. | | | 626,036 | | | | 2,729,750 | |
| | | | | | | | | | |
| | | | | 5,779,924 | | | | 14,898,417 | |
| | | | | | | | | | |
| | |
| | Metals and Mining — 1.5% | | | | | |
| 70,000 | | 5N Plus Inc.† | | | 251,966 | | | | 182,328 | |
| 10,000 | | Alkane Resources Ltd.† | | | 3,333 | | | | 2,589 | |
| 307 | | AM Castle & Co.† | | | 184,618 | | | | 1,612 | |
| 175,800 | | Materion Corp. | | | 3,755,120 | | | | 7,585,770 | |
| 760,000 | | Osisko Gold Royalties Ltd. | | | 11,053,936 | | | | 9,806,452 | |
| 2,000 | | Smart Sand Inc.† | | | 26,109 | | | | 13,560 | |
| 900,000 | | Tanami Gold NL† | | | 210,755 | | | | 34,592 | |
| 141,799 | | TimkenSteel Corp.† | | | 2,014,576 | | | | 2,339,684 | |
| 700 | | United States Lime & Minerals Inc. | | | 55,159 | | | | 58,800 | |
| | | | | | | | | | |
| | | | | 17,555,572 | | | | 20,025,387 | |
| | | | | | | | | | |
| | |
| | Paper and Forest Products — 0.2% | | | | | |
| 26,100 | | Keweenaw Land
Association Ltd.† | | | 2,220,038 | | | | 2,662,200 | |
| | | | | | | | | | |
| | |
| | Publishing — 1.3% | | | | | |
| 54,093 | | AH Belo Corp., Cl. A | | | 339,858 | | | | 248,828 | |
| 10,000 | | Cambium Learning
Group Inc.† | | | 36,700 | | | | 66,300 | |
| 15,000 | | Il Sole 24 Ore SpA† | | | 199,597 | | | | 69,141 | |
| 906,048 | | The E.W. Scripps Co.,
Cl. A† | | | 5,510,281 | | | | 17,314,577 | |
| 26,257 | | tronc Inc.† | | | 251,438 | | | | 381,514 | |
| | | | | | | | | | |
| | | | | 6,337,874 | | | | 18,080,360 | |
| | | | | | | | | | |
| | |
| | Real Estate — 2.2% | | | | | |
| 200,000 | | Ambase Corp.† | | | 311,545 | | | | 32,000 | |
| 8,000 | | Bresler & Reiner Inc.†(a) | | | 4,912 | | | | 1,000 | |
| 113,300 | | Capital Properties Inc.,
Cl. A† | | | 1,205,957 | | | | 1,545,412 | |
| 109,000 | | Cohen & Steers Inc. | | | 2,330,830 | | | | 4,304,410 | |
| 60,000 | | DREAM Unlimited Corp.,
Cl. A† | | | 331,539 | | | | 347,185 | |
| 25,100 | | FRP Holdings Inc.† | | | 825,588 | | | | 1,135,775 | |
| 255,647 | | Griffin Industrial Realty
Inc.(b) | | | 7,180,495 | | | | 9,292,768 | |
| 12,638 | | Gyrodyne LLC | | | 363,328 | | | | 272,096 | |
| 8,231 | | Holobeam Inc.† | | | 161,746 | | | | 267,507 | |
| 387,172 | | Reading International Inc.,
Cl. A† | | | 2,710,448 | | | | 6,086,344 | |
| 71,404 | | Reading International Inc.,
Cl. B† | | | 604,330 | | | | 1,378,097 | |
| 2,508 | | Royalty LLC†(a) | | | 0 | | | | 255 | |
| 134,000 | | Tejon Ranch Co.† | | | 3,635,302 | | | | 2,827,400 | |
| 31,523 | | Trinity Place Holdings Inc.† | | | 236,423 | | | | 221,291 | |
| 250,000 | | Trinity Place Holdings
Inc.†(c)(d) | | | 1,875,000 | | | | 1,667,250 | |
| | | | | | | | | | |
| | | | | 21,777,443 | | | | 29,378,790 | |
| | | | | | | | | | |
| | |
| | Restaurants — 1.8% | | | | | |
| 13,183 | | Biglari Holdings Inc.† | | | 4,025,388 | | | | 4,393,762 | |
| 59,900 | | Denny’s Corp.† | | | 184,625 | | | | 745,755 | |
| 51,352 | | Jamba Inc.† | | | 695,030 | | | | 443,681 | |
| 223,850 | | Nathan’s Famous Inc.†(b) | | | 3,294,226 | | | | 16,553,707 | |
| | | | | | | | | | |
Shares | | | | Cost | | | Market Value | |
| | | |
| 49,000 | | The Cheesecake Factory Inc. | | $ | 1,455,090 | | | $ | 2,063,880 | |
| | | | | | | | | | |
| | | | | 9,654,359 | | | | 24,200,785 | |
| | | | | | | | | | |
| | Retail — 1.1% | | | | | |
| 48,000 | | Aaron’s Inc. | | | 935,791 | | | | 2,094,240 | |
| 90,000 | | Big 5 Sporting Goods Corp. | | | 1,001,400 | | | | 688,500 | |
| 30,000 | | Destination XL Group Inc.† | | | 169,350 | | | | 57,000 | |
| 25,496 | | Ethan Allen Interiors Inc. | | | 605,537 | | | | 826,070 | |
| 369,200 | | EVINE Live Inc.† | | | 933,846 | | | | 383,968 | |
| 177,224 | | Ingles Markets Inc., Cl. A | | | 3,013,424 | | | | 4,554,657 | |
| 88,000 | | Lands’ End Inc.† | | | 1,576,167 | | | | 1,161,600 | |
| 57,000 | | La-Z-Boy Inc. | | | 1,271,037 | | | | 1,533,300 | |
| 65,000 | | Movado Group Inc. | | | 1,287,650 | | | | 1,820,000 | |
| 35,000 | | Pier 1 Imports Inc. | | | 322,638 | | | | 146,650 | |
| 6,000 | | SpartanNash Co. | | | 121,934 | | | | 158,220 | |
| 337,100 | | The Bon-Ton Stores Inc.† | | | 630,699 | | | | 144,953 | |
| 54,000 | | Tuesday Morning Corp.† | | | 160,721 | | | | 172,800 | |
| 42,581 | | Village Super Market Inc.,
Cl. A | | | 1,147,571 | | | | 1,053,454 | |
| 5,000 | | Vitamin Shoppe, Inc.† | | | 59,398 | | | | 26,750 | |
| 400 | | Winmark Corp. | | | 26,768 | | | | 52,700 | |
| | | | | | | | | | |
| | | | | 13,263,931 | | | | 14,874,862 | |
| | | | | | | | | | |
| | |
| | Semiconductors — 0.6% | | | | | |
| 185,100 | | Entegris Inc.† | | | 1,250,835 | | | | 5,340,135 | |
| 93,700 | | IXYS Corp.† | | | 991,052 | | | | 2,220,690 | |
| 5,210 | | MoSys Inc.† | | | 150,654 | | | | 4,971 | |
| 22,986 | | Veeco Instruments Inc.† | | | 736,701 | | | | 491,900 | |
| | | | | | | | | | |
| | | | | 3,129,242 | | | | 8,057,696 | |
| | | | | | | | | | |
| | |
| | Specialty Chemicals — 2.8% | | | | | |
| 50,000 | | A. Schulman Inc. | | | 1,361,000 | | | | 1,707,500 | |
| 1,158,000 | | Ferro Corp.† | | | 5,759,792 | | | | 25,823,400 | |
| 267,226 | | General Chemical Group
Inc.†(b) | | | 59,859 | | | | 2,271 | |
| 105,600 | | Hawkins Inc. | | | 3,849,117 | | | | 4,308,480 | |
| 2,000 | | KMG Chemicals Inc. | | | 51,827 | | | | 109,760 | |
| 4,100 | | Minerals Technologies Inc. | | | 121,383 | | | | 289,665 | |
| 150,000 | | Navigator Holdings Ltd.† | | | 2,012,283 | | | | 1,665,000 | |
| 260,000 | | OMNOVA Solutions Inc.† | | | 684,869 | | | | 2,847,000 | |
| 10,000 | | Takasago International Corp. | | | 271,028 | | | | 343,924 | |
| 30,000 | | Treatt plc | | | 148,442 | | | | 185,322 | |
| | | | | | | | | | |
| | | | | 14,319,600 | | | | 37,282,322 | |
| | | | | | | | | | |
| | |
| | Telecommunications — 2.9% | | | | | |
| 50,800 | | ATN International Inc. | | | 2,066,182 | | | | 2,677,160 | |
| 295,023 | | Cincinnati Bell Inc.† | | | 5,028,912 | | | | 5,856,207 | |
| 39,801 | | Consolidated Communications
Holdings Inc. | | | 414,006 | | | | 759,403 | |
| 20,000 | | Frequency Electronics Inc.† | | | 225,394 | | | | 187,800 | |
| 710,000 | | HC2 Holdings Inc.† | | | 2,600,429 | | | | 3,748,800 | |
| 652 | | Horizon Telecom Inc.,
Cl. B†(a) | | | 22,035 | | | | 24,124 | |
| 20,000 | | Iridium Communications Inc.† . | | | 160,025 | | | | 206,000 | |
| 57,500 | | New ULM Telecom Inc. | | | 528,202 | | | | 790,625 | |
| 4,100 | | North State Telecommunications Corp., Cl. A | | | 349,343 | | | | 266,500 | |
| 521,335 | | ORBCOMM Inc.† | | | 3,005,997 | | | | 5,458,377 | |
| 5,788 | | Preformed Line Products Co. | | | 246,195 | | | | 389,532 | |
| 480,000 | | Shenandoah Telecommunications Co. | | | 2,639,542 | | | | 17,856,000 | |
| 477,914 | | Windstream Holdings Inc. | | | 2,332,827 | | | | 845,908 | |
| | | | | | | | | | |
| | | | | 19,619,089 | | | | 39,066,436 | |
| | | | | | | | | | |
| | |
| | Transportation — 0.0% | | | | | |
| 30,000 | | Dakota Plains Holdings Inc.† | | | 23,143 | | | | 60 | |
| 15,000 | | Patriot Transportation Holding
Inc.† | | | 337,321 | | | | 292,500 | |
See accompanying notes to financial statements.
22
TETON Westwood Mighty MitesSM Fund
Schedule of Investments (Continued) — September 30, 2017
| | | | | | | | | | |
Shares | | | | Cost | | | Market Value | |
| | COMMON STOCKS (Continued) | |
| | Transportation (Continued) | | | | | |
| 8,200 | | PHI Inc.† | | $ | 130,182 | | | $ | 96,596 | |
| | | | | | | | | | |
| | | | | 490,646 | | | | 389,156 | |
| | | | | | | | | | |
| |
| | Wireless Communications — 0.0% | |
| 200,000 | | NII Holdings Inc.† | | | 438,226 | | | | 92,000 | |
| | | | | | | | | | |
| | TOTAL COMMON STOCKS | | | 594,944,669 | | | | 1,101,764,167 | |
| | | | | | | | | | |
| | PREFERRED STOCKS — 0.7% | |
| | Automotive: Parts and Accessories — 0.2% | |
| 59,000 | | Jungheinrich AG 1.150% | | | 227,157 | | | | 2,714,307 | |
| | | | | | | | | | |
| |
| | Financial Services — 0.5% | |
| 310,000 | | Steel Partners Holdings LP
6.000% | | | 11,885,904 | | | | 6,820,000 | |
| | | | | | | | | | |
| |
| | Health Care — 0.0% | |
| 3,034 | | BioScrip Inc. † | | | 287,862 | | | | 206,159 | |
| | | | | | | | | | |
| | | |
| | TOTAL PREFERRED STOCKS | | | 12,400,923 | | | | 9,740,466 | |
| | | | | | | | | | |
| | CONVERTIBLE PREFERRED STOCKS — 0.1% | |
| | Business Services — 0.0% | |
| 363 | | Trans-Lux Pfd. 6.000%,
Ser. B | | | 72,600 | | | | 281 | |
| | | | | | | | | | |
| |
| | Energy and Utilities — 0.1% | |
| 15,095 | | Corning Natural Gas Holding Corp., 4.800%, Ser. B | | | 313,221 | | | | 1,486,857 | |
| | | | | | | | | | |
| |
| | Food and Beverage — 0.0% | |
| 500 | | Seneca Foods Corp.,
Ser. 2003† | | | 7,625 | | | | 17,250 | |
| | | | | | | | | | |
| | | |
| | TOTAL CONVERTIBLE PREFERRED STOCKS | | | 393,446 | | | | 1,504,388 | |
| | | | | | | | | | |
| | RIGHTS — 0.0% | | | | | | | | |
| | Entertainment — 0.0% | | | | | | | | |
| 550,000 | | Media General Inc., CVR,
expire 12/31/17†(a) | | | 1 | | | | 1 | |
| | | | | | | | | | |
| | | |
| | Health Care — 0.0% | | | | | | | | |
| 300,000 | | Adolor Corp., CPR,
expire 07/01/19†(a) | | | 0 | | | | 78,000 | |
| 400,000 | | Sanofi, CVR,
expire 12/31/20† | | | 137,800 | | | | 144,000 | |
| 200,000 | | Teva Pharmaceutical Industries
Ltd., CCCP,
expire 02/20/23†(a) | | | 103,591 | | | | 0 | |
| | | | | | | | | | |
| | | | | 241,391 | | | | 222,000 | |
| | | | | | | | | | |
| | | |
| | TOTAL RIGHTS | | | 241,392 | | | | 222,001 | |
| | | | | | | | | | |
| | WARRANTS — 0.0% | | | | | | | | |
| | Energy and Utilities — 0.0% | | | | | |
| 86 | | Key Energy Services,
expire 12/15/20†(a) | | | 0 | | | | 0 | |
| 86 | | Key Energy Services,
expire 12/15/21†(a) | | | 0 | | | | 0 | |
| | | | | | | | | | |
| | | | | 0 | | | | 0 | |
| | | | | | | | | | |
| | | | | | | | | | |
Shares | | | | Cost | | | Market Value | |
| | |
| | Environmental Control — 0.0% | | | | | |
| 200 | | Primo Water Corp.,
expire 12/31/21† | | $ | 58 | | | $ | 0 | |
| | | | | | | | | | |
| | | |
| | Health Care — 0.0% | | | | | | | | |
| 8,737 | | BioScrip Inc., Cl. A,
expire 07/27/25† | | | 7,979 | | | | 3,621 | |
| 8,737 | | BioScrip Inc., Cl. B,
expire 07/27/25† | | | 7,554 | | | | 3,196 | |
| | | | | | | | | | |
| | | | | 15,533 | | | | 6,817 | |
| | | | | | | | | | |
| | | |
| | TOTAL WARRANTS | | | 15,591 | | | | 6,817 | |
| | | | | | | | | | |
Principal
Amount | | | | | | | | |
| |
| | U.S. GOVERNMENT OBLIGATIONS — 17.5% | |
| $236,614,000 | | U.S. Treasury Bills,
0.950% to 1.187%††,
10/05/17 to 03/29/18 | | | 236,110,885 | | | | 236,136,851 | |
| | | | | | | | | | |
| | | |
| | TOTAL
INVESTMENTS — 99.8% | | $ | 844,106,906 | | | | 1,349,374,690 | |
| | | | | | | | | | |
| | |
| | Other Assets and Liabilities (Net) — 0.2% | | | | 2,737,160 | |
| | | | | | | | | | |
| | |
| | NET ASSETS — 100.0% | | | $ | 1,352,111,850 | |
| | | | | | | | | | |
| (a) | Security is valued using significant unobservable inputs and is classified as Level 3 in the fair value hierarchy. |
| (b) | Security considered an affiliated holding because the Fund owns at least 5% of its outstanding shares. |
| (c) | At September 30, 2017, the Fund held an investment in a restricted and illiquid security amounting to $1,667,250 or 0.12% of net assets., which was valued under methods approved by the Board of Trustees as follows: |
| | | | | | | | |
Acquisition
Shares | | Issuer | | Acquisition
Date | | Acquisition
Cost | | 09/30/17
Carrying
Value
Per Share |
| 250,000 | | Trinity Place Holdings Inc. | | 02/10/17 | | $1,875,000 | | $6.6690 |
| (d) | Security exempt from registration under Rule 144A of the Securities Act of 1933, as amended. This security may be resold in transactions exempt from registration, normally to qualified institutional buyers. At September 30, 2017, the market value of the Rule 144A security amounted to $1,667,250 or 0.12% of net assets. |
| † | Non-income producing security. |
| †† | Represents annualized yield at date of purchase. |
| ADR | American Depositary Receipt |
| CCCP | Contingent Cash Consideration Payment |
| CPR | Contingent Payment Right |
| CVR | Contingent Value Right |
| SDR | Swedish Depositary Receipt |
See accompanying notes to financial statements.
23
TETON Westwood SmallCap Equity Fund
Schedule of Investments — September 30, 2017
| | | | | | | | | | |
Shares | | | | Cost | | | Market
Value | |
| | COMMON STOCKS — 99.0% | | | | | |
| | Aerospace — 0.7% | | | | | | | | |
4,200 | | Hexcel Corp. | | $ | 95,744 | | | $ | 241,164 | |
| | | | | | | | | | |
| | Automotive — 2.0% | | | | | | | | |
14,000 | | Rush Enterprises Inc., Cl. A† | | | 314,380 | | | | 648,060 | |
| | | | | | | | | | |
| | Building and Construction — 3.3% | | | | | |
11,800 | | Builders FirstSource Inc.† | | | 82,677 | | | | 212,282 | |
7,600 | | EMCOR Group Inc. | | | 321,645 | | | | 527,288 | |
9,300 | | MYR Group Inc.† | | | 140,432 | | | | 271,002 | |
7,600 | | Napco Security Technologies Inc.† | | | 62,255 | | | | 73,720 | |
| | | | | | | | | | |
| | | | | 607,009 | | | | 1,084,292 | |
| | | | | | | | | | |
| | | |
| | Business Services — 7.1% | | | | | | | | |
9,850 | | ABM Industries Inc. | | | 194,571 | | | | 410,843 | |
28,800 | | Diebold Nixdorf Inc. | | | 697,832 | | | | 658,080 | |
13,750 | | FTI Consulting Inc.† | | | 448,856 | | | | 487,850 | |
4,950 | | KAR Auction Services Inc. | | | 76,193 | | | | 236,313 | |
7,200 | | McGrath RentCorp. | | | 198,549 | | | | 315,000 | |
2,400 | | The Brink’s Co. | | | 63,907 | | | | 202,200 | |
| | | | | | | | | | |
| | | | | 1,679,908 | | | | 2,310,286 | |
| | | | | | | | | | |
| | Communications — 0.8% | | | | | | | | |
32,600 | | Pandora Media Inc.† | | | 290,543 | | | | 251,020 | |
| | | | | | | | | | |
| | Computer Software and Services — 7.7% | | | | | |
16,100 | | Bottomline Technologies Inc.† | | | 342,942 | | | | 512,463 | |
16,000 | | Convergys Corp. | | | 364,251 | | | | 414,240 | |
17,000 | | NetScout Systems Inc.† | | | 322,320 | | | | 549,950 | |
18,100 | | Nutanix Inc., Cl. A† | | | 298,388 | | | | 405,259 | |
16,100 | | Progress Software Corp. | | | 335,538 | | | | 614,537 | |
| | | | | | | | | | |
| | | | | 1,663,439 | | | | 2,496,449 | |
| | | | | | | | | | |
| | Consumer Products — 2.0% | | | | | | | | |
10,200 | | Hanesbrands Inc. | | | 155,777 | | | | 251,328 | |
6,200 | | Oxford Industries Inc. | | | 367,943 | | | | 393,948 | |
| | | | | | | | | | |
| | | | | 523,720 | | | | 645,276 | |
| | | | | | | | | | |
| | Diversified Industrial — 2.7% | | | | | | | | |
4,250 | | Barnes Group Inc. | | | 102,409 | | | | 299,370 | |
12,360 | | Columbus McKinnon Corp. | | | 168,445 | | | | 468,073 | |
7,000 | | Steelcase Inc., Cl. A | | | 95,053 | | | | 107,800 | |
| | | | | | | | | | |
| | | | | 365,907 | | | | 875,243 | |
| | | | | | | | | | |
| | Electronics — 2.4% | | | | | | | | |
6,700 | | FARO Technologies Inc.† | | | 197,808 | | | | 256,275 | |
4,100 | | Plantronics Inc. | | | 165,646 | | | | 181,302 | |
4,400 | | Super Micro Computer Inc.† | | | 92,437 | | | | 97,240 | |
3,400 | | Woodward Inc. | | | 109,074 | | | | 263,874 | |
| | | | | | | | | | |
| | | | | 564,965 | | | | 798,691 | |
| | | | | | | | | | |
| | Energy and Utilities — 7.7% | | | | | | | | |
20,800 | | C&J Energy Services Inc.† | | | 696,729 | | | | 623,376 | |
11,100 | | Centennial Resource Development Inc., Cl. A† | | | 182,608 | | | | 199,467 | |
17,500 | | Matador Resources Co.† | | | 330,135 | | | | 475,125 | |
40,400 | | Patterson-UTI Energy Inc. | | | 793,018 | | | | 845,976 | |
4,200 | | Penn Virginia Corp.† | | | 160,545 | | | | 167,916 | |
6,200 | | RSP Permian Inc.† | | | 180,272 | | | | 214,458 | |
| | | | | | | | | | |
| | | | | 2,343,307 | | | | 2,526,318 | |
| | | | | | | | | | |
| | Environmental Control — 0.8% | | | | | |
14,600 | | Casella Waste Systems Inc., Cl. A† . | | | 202,176 | | | | 274,480 | |
| | | | | | | | | | |
| | Equipment and Supplies — 2.5% | | | | | |
7,800 | | CIRCOR International Inc. | | | 328,247 | | | | 424,554 | |
6,300 | | Crown Holdings Inc.† | | | 233,435 | | | | 376,236 | |
| | | | | | | | | | |
| | | | | 561,682 | | | | 800,790 | |
| | | | | | | | | | |
| | Financial Services — 27.5% | | | | | | | | |
5,200 | | Atlantic Capital Bancshares Inc.† | | | 100,049 | | | | 94,380 | |
11,200 | | BankUnited Inc. | | | 305,675 | | | | 398,384 | |
| | | | | | | | | | | | |
Shares | | | | | Cost | | | Market
Value | |
| | 22,598 | | | Beneficial Bancorp Inc. | | $ | 284,957 | | | $ | 375,127 | |
| | 5,000 | | | Berkshire Hills Bancorp Inc. | | | 128,439 | | | | 193,750 | |
| | 7,050 | | | Brown & Brown Inc. | | | 180,990 | | | | 339,739 | |
| | 21,900 | | | CoBiz Financial Inc. | | | 266,438 | | | | 430,116 | |
| | 2,700 | | | Columbia Banking System Inc. | | | 49,471 | | | | 113,697 | |
| | 5,100 | | | Equity Commonwealth† | | | 153,399 | | | | 155,040 | |
| | 2,700 | | | Financial Institutions Inc. | | | 43,636 | | | | 77,760 | |
| | 10,200 | | | First Foundation Inc.† | | | 166,801 | | | | 182,478 | |
| | 8,700 | | | Flushing Financial Corp. | | | 132,257 | | | | 258,564 | |
| | 7,900 | | | Glacier Bancorp Inc. | | | 118,011 | | | | 298,304 | |
| | 2,000 | | | Heartland Financial USA Inc. | | | 93,645 | | | | 98,800 | |
| | 17,100 | | | Heritage Commerce Corp. | | | 150,739 | | | | 243,333 | |
| | 6,043 | | | Home BancShares Inc. | | | 105,113 | | | | 152,404 | |
| | 8,350 | | | Hope Bancorp Inc. | | | 61,657 | | | | 147,879 | |
| | 44,250 | | | Investors Bancorp Inc. | | | 478,052 | | | | 603,570 | |
| | 7,800 | | | Kearny Financial Corp./MD | | | 107,526 | | | | 119,730 | |
| | 19,800 | | | LegacyTexas Financial Group Inc. | | | 382,930 | | | | 790,416 | |
| | 5,000 | | | Oaktree Capital Group LLC | | | 193,665 | | | | 235,250 | |
| | 3,250 | | | OceanFirst Financial Corp. | | | 42,156 | | | | 89,343 | |
| | 20,150 | | | OFG Bancorp | | | 197,293 | | | | 184,373 | |
| | 7,000 | | | Oritani Financial Corp. | | | 106,094 | | | | 117,600 | |
| | 5,700 | | | Paramount Group Inc. | | | 90,217 | | | | 91,200 | |
| | 14,500 | | | PCSB Financial Corp.† | | | 237,932 | | | | 273,470 | |
| | 9,600 | | | State Bank Financial Corp. | | | 182,685 | | | | 275,040 | |
| | 20,906 | | | Sterling Bancorp | | | 180,774 | | | | 515,333 | |
| | 5,500 | | | Stifel Financial Corp. | | | 222,269 | | | | 294,030 | |
| | 1,600 | | | The Dun & Bradstreet Corp. | | | 168,572 | | | | 186,256 | |
| | 10,000 | | | TrustCo Bank Corp NY | | | 46,359 | | | | 89,000 | |
| | 14,250 | | | Umpqua Holdings Corp. | | | 197,964 | | | | 278,018 | |
| | 22,500 | | | United Financial Bancorp Inc. | | | 307,116 | | | | 411,525 | |
| | 4,800 | | | Veritex Holdings Inc.† | | | 135,827 | | | | 129,408 | |
| | 7,000 | | | Washington Federal Inc. | | | 109,397 | | | | 235,550 | |
| | 4,000 | | | Washington Trust Bancorp Inc. | | | 91,518 | | | | 229,000 | |
| | 5,800 | | | Waterstone Financial Inc. | | | 62,093 | | | | 113,100 | |
| | 4,312 | | | Xenith Bankshares Inc.† | | | 39,530 | | | | 140,140 | |
| | | | | | | | | | | | |
| | | | | | | 5,921,246 | | | | 8,961,107 | |
| | | | | | | | | | | | |
| | | | Health Care — 5.3% | | | | | | | | |
| | 6,350 | | | AngioDynamics Inc.† | | | 89,195 | | | | 108,521 | |
| | 8,000 | | | Electromed Inc.† | | | 32,219 | | | | 58,480 | |
| | 1,600 | | | ICU Medical Inc.† | | | 67,049 | | | | 297,360 | |
| | 5,200 | | | Myriad Genetics Inc.† | | | 94,137 | | | | 188,136 | |
| | 5,550 | | | Omnicell Inc.† | | | 100,426 | | | | 283,327 | |
| | 12,450 | | | Patterson Cos., Inc. | | | 348,998 | | | | 481,193 | |
| | 3,500 | | | STERIS plc | | | 260,890 | | | | 309,400 | |
| | | | | | | | | | | | |
| | | | | | | 992,914 | | | | 1,726,417 | |
| | | | | | | | | | | | |
| | | | Machinery — 1.0% | | | | | | | | |
| | 25,900 | | | Mueller Water Products Inc., Cl. A | | | 300,502 | | | | 331,520 | |
| | | | | | | | | | | | |
| | | | Retail — 5.9% | | | | | | | | |
| | 33,850 | | | American Eagle Outfitters Inc. | | | 441,269 | | | | 484,055 | |
| | 35,200 | | | Darling Ingredients Inc.† | | | 559,707 | | | | 616,704 | |
| | 13,150 | | | Ethan Allen Interiors Inc. | | | 312,648 | | | | 426,060 | |
| | 10,300 | | | Haverty Furniture Companies Inc. | | | 231,819 | | | | 269,345 | |
| | 10,900 | | | The Habit Restaurants Inc., Cl. A† | | | 160,752 | | | | 142,245 | |
| | | | | | | | | | | | |
| | | | | | | 1,706,195 | | | | 1,938,409 | |
| | | | | | | | | | | | |
| | | | Semiconductors — 12.0% | | | | | | | | |
| | 4,400 | | | Cabot Microelectronics Corp. | | | 174,332 | | | | 351,692 | |
| | 40,400 | | | Cypress Semiconductor Corp. | | | 350,921 | | | | 606,808 | |
| | 30,200 | | | Electro Scientific Industries Inc.† | | | 177,681 | | | | 420,384 | |
| | 29,300 | | | Entegris Inc.† | | | 340,113 | | | | 845,305 | |
| | 29,800 | | | FormFactor Inc.† | | | 159,210 | | | | 502,130 | |
| | 32,400 | | | Marvell Technology Group Ltd. | | | 432,853 | | | | 579,960 | |
| | 10,500 | | | ON Semiconductor Corp.† | | | 81,358 | | | | 193,935 | |
| | 10,616 | | | Versum Materials Inc. | | | 274,155 | | | | 412,113 | |
| | | | | | | | | | | | |
| | | | | | | 1,990,623 | | | | 3,912,327 | |
| | | | | | | | | | | | |
| | | | Specialty Chemicals — 4.2% | | | | | |
| | 22,200 | | | A. Schulman Inc. | | | 582,244 | | | | 758,130 | |
See accompanying notes to financial statements.
24
TETON Westwood SmallCap Equity Fund
Schedule of Investments (Continued) — September 30, 2017
| | | | | | | | | | | | |
Shares | | | | | Cost | | | Market
Value | |
| | | | COMMON STOCKS (Continued) | | | | | |
| | | | Specialty Chemicals (Continued) | | | | | |
| | 27,700 | | | Ferro Corp.† | | $ | 435,482 | | | $ | 617,710 | |
| | | | | | | | | | | | |
| | | | | | 1,017,726 | | | 1,375,840 | |
| | | | | | | | | | | | |
| | |
| | | | Telecommunications — 3.4% | | | | | |
| | 31,100 | | | Extreme Networks Inc.† | | | 92,866 | | | | 369,779 | |
| | 39,300 | | | Infinera Corp.† | | | 383,455 | | | | 348,591 | |
| | 46,900 | | | Mitel Networks Corp.† | | | 335,028 | | | | 393,491 | |
| | | | | | | | | | | | |
| | | | | | 811,349 | | | 1,111,861 | |
| | | | | | | | | | | | |
| | | | TOTAL COMMON STOCKS | | | 21,953,335 | | | | 32,309,550 | |
| | | | | | | | | | | | |
| | | | | | | | | | |
Principal Amount | | | | Cost | | | Market Value | |
| | U.S. GOVERNMENT OBLIGATIONS — 0.8% | |
| $ 250,000 | | U.S. Treasury Bills,
1.002% to 1.038%††,
11/09/17 to 12/28/17 | | $ | 249,481 | | | $ | 249,505 | |
| | | | | | | | | | |
| | | |
| | TOTAL INVESTMENTS — 99.8% | | $ | 22,202,816 | | | | 32,559,055 | |
| | | | | | | | | | |
| | |
| | Other Assets and Liabilities (Net) — 0.2% | | | | 64,983 | |
| | | | | | | | | | |
| | | |
| | NET ASSETS — 100.0% | | | | | | $ | 32,624,038 | |
| | | | | | | | | | |
| † | Non-income producing security. |
| †† | Represents annualized yield at date of purchase. |
See accompanying notes to financial statements.
25
TETON Westwood Mid-Cap Equity Fund
Schedule of Investments — September 30, 2017
| | | | | | | | | | |
Shares | | | | Cost | | | Market
Value | |
| | COMMON STOCKS — 92.0% | | | | | | | | |
| | FINANCIALS — 22.2% | | | | | | | | |
| | Banks — 6.5% | | | | | | | | |
2,370 | | BankUnited Inc. | | $ | 77,615 | | | $ | 84,301 | |
148 | | SVB Financial Group† | | | 17,607 | | | | 27,689 | |
1,775 | | Zions Bancorporation | | | 52,534 | | | | 83,745 | |
| | | | | | | | | | |
| | | | | 147,756 | | | 195,735 | |
| | | | | | | | | | |
| | | |
| | Diversified Financials — 5.2% | | | | | | | | |
1,288 | | Legg Mason Inc. | | | 46,159 | | | | 50,631 | |
1,061 | | Oaktree Capital Group LLC | | | 46,336 | | | | 49,920 | |
594 | | T. Rowe Price Group Inc. | | | 42,544 | | | | 53,846 | |
| | | | | | | | | | |
| | | | | 135,039 | | | 154,397 | |
| | | | | | | | | | |
| | | |
| | Insurance — 3.7% | | | | | | | | |
473 | | Chubb Ltd. | | | 46,865 | | | | 67,426 | |
1,089 | | Voya Financial Inc. | | | 40,673 | | | | 43,440 | |
| | | | | | | | | | |
| | | | | 87,538 | | | 110,866 | |
| | | | | | | | | | |
| | | |
| | Real Estate — 6.8% | | | | | | | | |
665 | | American Tower Corp. | | | 58,122 | | | | 90,892 | |
2,678 | | CBRE Group Inc., Cl. A† | | | 75,791 | | | | 101,443 | |
93 | | SL Green Realty Corp. | | | 10,548 | | | | 9,423 | |
| | | | | | | | | | |
| | | | | 144,461 | | | 201,758 | |
| | | | | | | | | | |
| | TOTAL FINANCIALS | | | 514,794 | | | | 662,756 | |
| | | | | | | | | | |
| | INFORMATION TECHNOLOGY — 16.6% | | | | | |
| | Software and Services — 12.7% | | | | | | | | |
1,035 | | Activision Blizzard Inc. | | | 23,171 | | | | 66,768 | |
1,620 | | Convergys Corp. | | | 37,063 | | | | 41,942 | |
210 | | Equinix Inc. | | | 43,965 | | | | 93,723 | |
2,604 | | Fortinet Inc.† | | | 64,936 | | | | 93,327 | |
83 | | MercadoLibre Inc. | | | 9,478 | | | | 21,491 | |
469 | | Splunk Inc.† | | | 21,570 | | | | 31,156 | |
279 | | The Dun & Bradstreet Corp. | | | 29,377 | | | | 32,478 | |
| | | | | | | | | | |
| | | | | 229,560 | | | 380,885 | |
| | | | | | | | | | |
| | Technology Hardware and Equipment — 3.9% | | | | | |
3,027 | | Diebold Nixdorf Inc. | | | 79,724 | | | | 69,167 | |
355 | | MACOM Technology Solutions Holdings Inc.† | | | 11,560 | | | | 15,837 | |
809 | | Versum Materials Inc. | | | 25,055 | | | | 31,405 | |
| | | | | | | | | | |
| | | | | 116,339 | | | 116,409 | |
| | | | | | | | | | |
| | | |
| | TOTAL INFORMATION
TECHNOLOGY | | | 345,899 | | | | 497,294 | |
| | | | | | | | | | |
| | CONSUMER DISCRETIONARY — 13.8% | | | | | |
| | Consumer Durables — 2.6% | | | | | | | | |
1,893 | | Toll Brothers Inc. | | | 64,169 | | | | 78,503 | |
| | | | | | | | | | |
| | | |
| | Consumer Services — 2.4% | | | | | | | | |
1,323 | | Norwegian Cruise Line Holdings Ltd.† | | | 47,420 | | | | 71,508 | |
| | | | | | | | | | |
| | | |
| | Media — 4.3% | | | | | | | | |
596 | | Liberty Broadband Corp., Cl. C† | | | 31,512 | | | | 56,799 | |
2,595 | | Manchester United plc, Cl. A | | | 40,237 | | | | 46,710 | |
3,321 | | Pandora Media Inc.† | | | 29,419 | | | | 25,572 | |
| | | | | | | | | | |
| | | | | 101,168 | | | 129,081 | |
| | | | | | | | | | |
| | | |
| | Retailing — 4.5% | | | | | | | | |
427 | | Dick’s Sporting Goods Inc. | | | 11,777 | | | | 11,533 | |
1,266 | | Ethan Allen Interiors Inc. | | | 32,034 | | | | 41,018 | |
864 | | Hanesbrands Inc. | | | 18,113 | | | | 21,289 | |
671 | | Ralph Lauren Corp. | | | 51,370 | | | | 59,243 | |
| | | | | | | | | | |
| | | | | 113,294 | | | 133,083 | |
| | | | | | | | | | |
| | | |
| | TOTAL CONSUMER DISCRETIONARY | | | 326,051 | | | | 412,175 | |
| | | | | | | | | | |
| | | | | | | | | | |
Shares | | | | Cost | | | Market
Value | |
| | INDUSTRIALS — 13.6% | | | | | | | | |
| | Capital Goods — 10.1% | | | | | | | | |
141 | | Cummins Inc. | | $ | 13,048 | | | $ | 23,692 | |
330 | | EnerSys | | | 18,698 | | | | 22,826 | |
1,203 | | Fortune Brands Home & Security Inc. | | | 51,730 | | | | 80,878 | |
552 | | Hexcel Corp. | | | 24,413 | | | | 31,696 | |
2,326 | | Quanta Services Inc.† | | | 67,530 | | | | 86,923 | |
2,231 | | Rexnord Corp.† | | | 43,372 | | | | 56,690 | |
| | | | | | | | | | |
| | | | | 218,791 | | | 302,705 | |
| | | | | | | | | | |
| | Commercial and Professional Services — 3.0% | | | | | |
540 | | Bright Horizons Family Solutions Inc.† | | | 22,495 | | | | 46,553 | |
503 | | IHS Markit Ltd.† | | | 16,488 | | | | 22,172 | |
1,280 | | Steelcase Inc., Cl. A | | | 17,718 | | | | 19,712 | |
| | | | | | | | | | |
| | | | | 56,701 | | | 88,437 | |
| | | | | | | | | | |
| | | |
| | Machinery — 0.5% | | | | | | | | |
100 | | Snap-on Inc. | | | 14,887 | | | | 14,901 | |
| | | | | | | | | | |
| | TOTAL INDUSTRIALS | | | 290,379 | | | | 406,043 | |
| | | | | | | | | | |
| | HEALTH CARE — 10.5% | | | | | | | | |
| | Health Care Equipment and Services — 6.6% | | | | | |
448 | | Insulet Corp.† | | | 14,861 | | | | 24,676 | |
538 | | Laboratory Corp. of America Holdings† | | | 63,484 | | | | 81,222 | |
933 | | Patterson Cos., Inc. | | | 40,523 | | | | 36,060 | |
508 | | Universal Health Services Inc., Cl. B | | | 49,852 | | | | 56,358 | |
| | | | | | | | | | |
| | | | | 168,720 | | | 198,316 | |
| | | | | | | | | | |
| | Pharmaceuticals, Biotechnology, and Life Sciences — 3.9% | |
96 | | Mettler-Toledo International Inc.† | | | 24,501 | | | | 60,111 | |
377 | | Vertex Pharmaceuticals Inc.† | | | 37,658 | | | | 57,319 | |
| | | | | | | | | | |
| | | | | 62,159 | | | | 117,430 | |
| | | | | | | | | | |
| | TOTAL HEALTH CARE | | | 230,879 | | | | 315,746 | |
| | | | | | | | | | |
| | ENERGY — 9.4% | | | | | | | | |
| | Energy — 9.4% | | | | | | | | |
1,876 | | C&J Energy Services Inc.† | | | 60,891 | | | | 56,224 | |
2,152 | | Centennial Resource Development Inc., Cl. A† | | | 35,335 | | | | 38,671 | |
636 | | Cimarex Energy Co. | | | 57,860 | | | | 72,294 | |
1,203 | | Fortis Inc. | | | 36,713 | | | | 43,031 | |
571 | | Helmerich & Payne Inc. | | | 30,280 | | | | 29,755 | |
1,211 | | RSP Permian Inc.† | | | 35,176 | | | | 41,888 | |
| | | | | | | | | | |
| | | |
| | TOTAL ENERGY | | | 256,255 | | | | 281,863 | |
| | | | | | | | | | |
| | MATERIALS — 3.1% | | | | | | | | |
| | Materials — 2.4% | | | | | | | | |
558 | | Ecolab Inc. | | | 59,037 | | | | 71,764 | |
| | | | | | | | | | |
| | | |
| | Specialty Chemicals — 0.7% | | | | | | | | |
885 | | Ferro Corp.† | | | 15,272 | | | | 19,736 | |
| | | | | | | | | | |
| | | |
| | TOTAL MATERIALS | | | 74,309 | | | | 91,500 | |
| | | | | | | | | | |
| | CONSUMER STAPLES — 2.8% | | | | | | | | |
| | Food and Beverage — 2.8% | | | | | | | | |
1,486 | | Coca-Cola European Partners plc | | | 56,094 | | | | 61,847 | |
475 | | Fresh Del Monte Produce Inc. | | | 23,090 | | | | 21,594 | |
| | | | | | | | | | |
| | | |
| | TOTAL CONSUMER STAPLES | | | 79,184 | | | | 83,441 | |
| | | | | | | | | | |
| | TOTAL COMMON STOCKS | | | 2,117,750 | | | | 2,750,818 | |
| | | | | | | | | | |
See accompanying notes to financial statements.
26
TETON Westwood Mid-Cap Equity Fund
Schedule of Investments (Continued) — September 30, 2017
| | | | | | | | | | |
Principal
Amount | | | | Cost | | | Market
Value | |
| | |
| | U.S. GOVERNMENT OBLIGATIONS — 8.3% | | | | | |
| $ 250,000 | | U.S. Treasury Bills,
0.987% to 1.022%††,
12/07/17 | | $ | 249,532 | | | $ | 249,551 | |
| | | | | | | | | | |
| | | |
| | TOTAL INVESTMENTS — 100.3% | | $ | 2,367,282 | | | | 3,000,369 | |
| | | | | | | | | | |
| | |
| | Other Assets and Liabilities (Net) — (0.3)% | | | | (9,065 | ) |
| | | | | | | | | | |
| | | |
| | NET ASSETS — 100.0% | | | | | | $ | 2,991,304 | |
| | | | | | | | | | |
| † | Non-income producing security. |
| †† | Represents annualized yield at date of purchase. |
See accompanying notes to financial statements.
27
TETON Convertible Securities Fund
Schedule of Investments — September 30, 2017
| | | | | | | | | | |
Principal
Amount | | | | Cost | | | Market
Value | |
| |
| | CONVERTIBLE CORPORATE BONDS — 82.9% | |
| | Aerospace and Defense — 2.5% | |
| $ 250,000 | | Aerojet Rocketdyne Holdings Inc.,
2.250%, 12/15/23(a) | | $ | 254,888 | | | $ | 373,594 | |
| | | | | | | | | | |
| |
| | Aviation: Parts and Services — 2.2% | |
| 300,000 | | Kaman Corp.,
3.250%, 05/01/24(a) | | | 305,829 | | | | 326,250 | |
| | | | | | | | | | |
| |
| | Building and Construction — 1.5% | |
| 200,000 | | Dycom Industries Inc.,
0.750%, 09/15/21 | | | 215,322 | | | | 228,250 | |
| | | | | | | | | | |
| |
| | Business Services — 2.0% | |
| 211,000 | | Square Inc.,
0.375%, 03/01/22(a) | | | 245,075 | | | | 297,114 | |
| | | | | | | | | | |
| |
| | Cable and Satellite — 2.3% | |
| 300,000 | | DISH Network Corp.,
3.375%, 08/15/26 | | | 343,620 | | | | 337,125 | |
| | | | | | | | | | |
| |
| | Communications Equipment — 5.2% | |
| 350,000 | | InterDigital Inc.,
1.500%, 03/01/20 | | | 409,995 | | | | 411,250 | |
| 312,000 | | Lumentum Holdings Inc.,
0.250%, 03/15/24(a) | | | 337,075 | | | | 358,995 | |
| | | | | | | | | | |
| | | |
| | | | | 747,070 | | | | 770,245 | |
| | | | | | | | | | |
| |
| | Computer Software and Services — 15.0% | |
| 250,000 | | CSG Systems International Inc.,
4.250%, 03/15/36(a) | | | 267,828 | | | | 268,437 | |
| 313,000 | | HubSpot Inc.,
0.250%, 06/01/22(a) | | | 318,928 | | | | 347,234 | |
| 45,000 | | IAC FinanceCo. Inc.,
0.875%, 10/01/22(a) | | | 46,528 | | | | 46,941 | |
| 100,000 | | Maxwell Technologies Inc.,
5.500%, 09/15/22(a) | | | 100,000 | | | | 101,625 | |
| 100,000 | | MercadoLibre Inc.,
2.250%, 07/01/19 | | | 130,988 | | | | 209,313 | |
| 305,000 | | Nice Systems Inc.,
1.250%, 01/15/24(a) | | | 326,054 | | | | 345,413 | |
| 200,000 | | Proofpoint Inc.,
0.750%, 06/15/20 | | | 222,791 | | | | 250,875 | |
| 300,000 | | PROS Holdings Inc.,
2.000%, 06/01/47(a) | | | 267,879 | | | | 265,313 | |
| 326,000 | | RealPage Inc.,
1.500%, 11/15/22(a) | | | 351,876 | | | | 380,605 | |
| | | | | | | | | | |
| | | |
| | | | | 2,032,872 | | | | 2,215,756 | |
| | | | | | | | | | |
| |
| | Consumer Products — 3.0% | |
| 187,000 | | GoPro Inc.,
3.500%, 04/15/22(a) | | | 185,190 | | | | 227,906 | |
| 223,000 | | Wayfair Inc.,
0.375%, 09/01/22(a) | | | 222,654 | | | | 216,589 | |
| | | | | | | | | | |
| | | |
| | | | | 407,844 | | | | 444,495 | |
| | | | | | | | | | |
| |
| | Consumer Services — 4.8% | |
| 300,000 | | Carriage Services Inc.,
2.750%, 03/15/21 | | | 350,706 | | | | 376,313 | |
| 300,000 | | Extra Space Storage LP,
3.125%, 10/01/35(a) | | | 320,048 | | | | 327,937 | |
| | | | | | | | | | |
| | | |
| | | | | 670,754 | | | | 704,250 | |
| | | | | | | | | | |
| | | | | | | | | | |
Principal
Amount | | | | Cost | | | Market
Value | |
| | Diversified Industrial — 1.9% | |
| $ 292,000 | | Team Inc.,
5.000%, 08/01/23(a) | | $ | 291,274 | | | $ | 278,495 | |
| | | | | | | | | | |
| |
| | Energy and Utilities: Integrated — 1.7% | |
| 300,000 | | SunPower Corp.,
4.000%, 01/15/23 | | | 241,223 | | | | 247,500 | |
| | | | | | | | | | |
| |
| | Energy and Utilities: Services — 1.9% | |
| 400,000 | | Cheniere Energy Inc.,
4.250%, 03/15/45 | | | 265,560 | | | | 279,000 | |
| | | | | | | | | | |
| |
| | Entertainment — 2.3% | |
| 290,000 | | World Wrestling Entertainment Inc.,
3.375%, 12/15/23(a) | | | 299,663 | | | | 333,319 | |
| | | | | | | | | | |
| |
| | Financial Services — 5.1% | |
| 302,000 | | Encore Capital Group Inc.,
3.250%, 03/15/22(a) | | | 303,194 | | | | 348,999 | |
| 299,000 | | LendingTree Inc.,
0.625%, 06/01/22(a) | | | 344,746 | | | | 396,549 | |
| | | | | | | | | | |
| | | |
| | | | | 647,940 | | | | 745,548 | |
| | | | | | | | | | |
| |
| | Health Care — 11.8% | |
| 150,000 | | BioMarin Pharmaceutical Inc.,
0.599%, 08/01/24 | | | 147,058 | | | | 152,344 | |
| 300,000 | | Intercept Pharmaceuticals Inc.,
3.250%, 07/01/23 | | | 296,320 | | | | 233,250 | |
| 200,000 | | Invacare Corp.,
4.500%, 06/01/22(a) | | | 221,265 | | | | 241,500 | |
| 237,000 | | Neurocrine Biosciences Inc.,
2.250%, 05/15/24(a) | | | 246,850 | | | | 270,328 | |
| 200,000 | | Pacira Pharmaceuticals Inc.,
2.375%, 04/01/22(a) | | | 207,665 | | | | 196,250 | |
| 300,000 | | Teladoc Inc.,
3.000%, 12/15/22(a) | | | 313,778 | | | | 327,187 | |
| 300,000 | | The Medicines Co.,
2.750%, 07/15/23 | | | 310,154 | | | | 316,875 | |
| | | | | | | | | | |
| | | |
| | | | | 1,743,090 | | | | 1,737,734 | |
| | | | | | | | | | |
| |
| | Semiconductors — 16.1% | |
| 300,000 | | Cypress Semiconductor Corp.,
4.500%, 01/15/22 | | | 349,661 | | | | 392,437 | |
| 300,000 | | Inphi Corp.,
1.125%, 12/01/20 | | | 358,444 | | | | 368,813 | |
| 300,000 | | Knowles Corp.,
3.250%, 11/01/21 | | | 332,035 | | | | 339,375 | |
| 300,000 | | Microchip Technology Inc.,
1.625%, 02/15/27(a) | | | 321,390 | | | | 365,813 | |
| 200,000 | | Micron Technology Inc.,
3.000%, 11/15/43 | | | 179,609 | | | | 277,375 | |
| 211,000 | | Silicon Laboratories Inc.,
1.375%, 03/01/22(a) | | | 221,485 | | | | 234,869 | |
| 300,000 | | Teradyne Inc.,
1.250%, 12/15/23(a) | | | 359,695 | | | | 400,687 | |
| | | | | | | | | | |
| | | |
| | | | | 2,122,319 | | | | 2,379,369 | |
| | | | | | | | | | |
| |
| | Transportation — 3.6% | |
| 218,000 | | Air Transport Services Group Inc.,
1.125%, 10/15/24(a) | | | 221,996 | | | | 225,766 | |
See accompanying notes to financial statements.
28
TETON Convertible Securities Fund
Schedule of Investments (Continued) — September 30, 2017
| | | | | | | | | | |
Principal
Amount | | | | Cost | | | Market Value | |
| |
| | CONVERTIBLE CORPORATE BONDS (Continued) | |
| | Transportation (Continued) | | | | | |
| $ 250,000 | | Atlas Air Worldwide Holdings Inc., 2.250%, 06/01/22 | | $ | 247,838 | | | $ | 302,813 | |
| | | | | | | | | | |
| | | |
| | | | | 469,834 | | | | 528,579 | |
| | | | | | | | | | |
| | | |
| | TOTAL CONVERTIBLE CORPORATE BONDS | | | 11,304,177 | | | | 12,226,623 | |
| | | | | | | | | | |
| | | |
| Shares | | | | | | | | |
| |
| | CONVERTIBLE PREFERRED STOCKS — 2.4% | |
| | Agriculture — 0.7% | | | | | | | | |
| 1,000 | | Bunge Ltd.
4.875% | | | 94,950 | | | | 104,014 | |
| | | | | | | | | | |
| | |
| | Real Estate Investment Trusts — 1.7% | | | | | |
| 4,000 | | Welltower Inc.
6.500%, Ser. I | | | 260,089 | | | | 253,720 | |
| | | | | | | | | | |
| | | |
| | TOTAL CONVERTIBLE PREFERRED STOCKS | | | 355,039 | | | | 357,734 | |
| | | | | | | | | | |
| |
| | MANDATORY CONVERTIBLE SECURITIES (b) — 12.7% | |
| | Building and Construction — 2.3% | | | | | |
| 3,007 | | Stanley Black & Decker Inc.,
5.375%, 05/15/20 | | | 314,251 | | | | 344,752 | |
| | | | | | | | | | |
| | |
| | Computer Software and Services — 2.7% | | | | | |
| 2,000 | | Alibaba - Mandatory Exchange Trust, 5.750%, 06/03/19 (a) | | | 257,145 | | | | 392,490 | |
| | | | | | | | | | |
| | |
| | Energy and Utilities: Integrated — 1.8% | | | | | |
| 5,000 | | DTE Energy Co.,
6.500%, 10/01/19 | | | 266,172 | | | | 272,250 | |
| | | | | | | | | | |
| | | |
| | Health Care — 2.1% | | | | | | | | |
| 5,494 | | Becton Dickinson and Co.,
6.125%, 05/01/20 | | | 293,412 | | | | 303,598 | |
| | | | | | | | | | |
| | | |
| | Industrials — 2.0% | | | | | | | | |
| 5,200 | | Rexnord Corp.,
5.750%, 11/15/19 | | | 267,069 | | | | 302,692 | |
| | | | | | | | | | |
| | |
| | Real Estate Investment Trusts — 1.5% | | | | | |
| 204 | | Crown Castle International Corp., 6.875%, 08/01/20 | | | 214,526 | | | | 217,872 | |
| | | | | | | | | | |
| | |
| | Telecommunications — 0.3% | | | | | |
| 2,000 | | Frontier Communications Corp., Ser. A 11.125%, 06/29/18 | | | 53,296 | | | | 38,480 | |
| | | | | | | | | | |
| | | |
| | TOTAL MANDATORY CONVERTIBLE SECURITIES | | | 1,665,871 | | | | 1,872,134 | |
| | | | | | | | | | |
| | | | | | | | | | |
Principal
Amount | | | | Cost | | | Market Value | |
| |
| | U.S. GOVERNMENT OBLIGATIONS — 3.0% | |
| $ 450,000 | | U. S. Treasury Bill,
0.99%†, 12/21/17 | | $ | 448,998 | | | $ | 449,013 | |
| | | | | | | | | | |
| | | |
| | TOTAL
INVESTMENTS — 101.0% | | $ | 13,774,085 | | | | 14,905,504 | |
| | | | | | | | | | |
| | |
| | Other Assets and Liabilities (Net) — (1.0)% | | | | (154,458 | ) |
| | | | | | | | | | |
| | | |
| | NET ASSETS — 100.0% | | | | | | $ | 14,751,046 | |
| | | | | | | | | | |
| (a) | Security exempt from registration under Rule 144A of the Securities Act of 1933, as amended. This security may be resold in transactions exempt from registration, normally to qualified institutional buyers. At September 30, 2017, the market value of the Rule 144A security amounted to $7,896,205 or 53.53% of net assets. |
| (b) | Mandatory convertible securities are required to be converted on the dates listed; they generally may be converted prior to these dates at the option of the holder. |
| † | Represents annualized yield at date of purchase. |
See accompanying notes to financial statements.
29
TETON Westwood Equity Fund
Schedule of Investments — September 30, 2017
| | | | | | | | | | |
| Shares | | | | Cost | | | Market
Value | |
| | |
| | COMMON STOCKS — 99.2% | | | | | |
| | Aerospace — 4.2% | | | | | | | | |
| 6,150 | | General Dynamics Corp. | | $ | 902,467 | | | $ | 1,264,317 | |
| 5,260 | | The Boeing Co. | | | 639,552 | | | | 1,337,144 | |
| | | | | | | | | | |
| | | |
| | | | | 1,542,019 | | | | 2,601,461 | |
| | | | | | | | | | |
| | | |
| | Banking — 13.7% | | | | | | | | |
| 87,705 | | Bank of America Corp. | | | 1,507,951 | | | | 2,222,445 | |
| 27,185 | | BB&T Corp. | | | 1,226,150 | | | | 1,276,064 | |
| 23,364 | | JPMorgan Chase & Co. | | | 1,334,349 | | | | 2,231,496 | |
| 38,420 | | Wells Fargo & Co. | | | 1,662,623 | | | | 2,118,863 | |
| 12,900 | | Western Alliance Bancorp† | | | 633,043 | | | | 684,732 | |
| | | | | | | | | | |
| | | |
| | | | | 6,364,116 | | | | 8,533,600 | |
| | | | | | | | | | |
| | | |
| | Business Services — 4.2% | | | | | | | | |
| 35,425 | | Booz Allen Hamilton Holding
Corp. | | | 1,000,016 | | | | 1,324,541 | |
| 5,700 | | FedEx Corp. | | | 858,845 | | | | 1,285,806 | |
| | | | | | | | | | |
| | | |
| | | | | 1,858,861 | | | | 2,610,347 | |
| | | | | | | | | | |
| | | |
| | Cable and Satellite — 1.9% | | | | | | | | |
| 31,260 | | Comcast Corp., Cl. A | | | 872,888 | | | | 1,202,885 | |
| | | | | | | | | | |
| |
| | Computer Software and Services — 7.6% | |
| 9,570 | | Accenture plc, Cl. A | | | 1,179,916 | | | | 1,292,620 | |
| 1,273 | | Alphabet Inc., Cl. A† | | | 1,065,838 | | | | 1,239,545 | |
| 9,980 | | Microsoft Corp. | | | 492,634 | | | | 743,410 | |
| 30,600 | | Oracle Corp. | | | 1,275,811 | | | | 1,479,510 | |
| | | | | | | | | | |
| | | |
| | | | | 4,014,199 | | | | 4,755,085 | |
| | | | | | | | | | |
| | | |
| | Consumer Products — 4.2% | | | | | | | | |
| 17,000 | | Colgate-Palmolive Co. | | | 971,725 | | | | 1,238,450 | |
| 21,950 | | VF Corp. | | | 1,449,774 | | | | 1,395,361 | |
| | | | | | | | | | |
| | | |
| | | | | 2,421,499 | | | | 2,633,811 | |
| | | | | | | | | | |
| | | |
| | Diversified Industrial — 2.2% | | | | | | | | |
| 9,605 | | Honeywell International Inc. | | | 803,026 | | | | 1,361,413 | |
| | | | | | | | | | |
| | | |
| | Electronics — 1.1% | | | | | | | | |
| 7,825 | | Texas Instruments Inc. | | | 371,082 | | | | 701,433 | |
| | | | | | | | | | |
| | |
| | Energy and Energy Services — 3.9% | | | | | |
| 14,600 | | EOG Resources Inc. | | | 1,247,163 | | | | 1,412,404 | |
| 21,935 | | Halliburton Co. | | | 1,273,335 | | | | 1,009,668 | |
| | | | | | | | | | |
| | | |
| | | | | 2,520,498 | | | | 2,422,072 | |
| | | | | | | | | | |
| | | |
| | Energy: Integrated — 5.9% | | | | | | | | |
| 8,400 | | NextEra Energy Inc. | | | 664,153 | | | | 1,231,020 | |
| 32,970 | | RSP Permian Inc.† | | | 1,329,446 | | | | 1,140,432 | |
| 20,450 | | WEC Energy Group Inc. | | | 969,262 | | | | 1,283,851 | |
| | | | | | | | | | |
| | | |
| | | | | 2,962,861 | | | | 3,655,303 | |
| | | | | | | | | | |
| | | |
| | Energy: Oil — 2.2% | | | | | | | | |
| 11,795 | | Chevron Corp. | | | 1,043,245 | | | | 1,385,913 | |
| | | | | | | | | | |
| | | |
| | Financial Services — 6.0% | | | | | | | | |
| 18,800 | | American International Group Inc. | | | 723,402 | | | | 1,154,132 | |
| 8,600 | | Chubb Ltd. | | | 936,465 | | | | 1,225,930 | |
| 19,675 | | Intercontinental Exchange Inc. | | | 1,031,896 | | | | 1,351,673 | |
| | | | | | | | | | |
| | | |
| | | | | 2,691,763 | | | | 3,731,735 | |
| | | | | | | | | | |
| | | | | | | | | | |
| Shares | | | | Cost | | | Market
Value | |
| | Food and Beverage — 7.8% | | | | | | | | |
| 14,800 | | Dr Pepper Snapple Group Inc. | | $ | 1,408,698 | | | $ | 1,309,356 | |
| 21,950 | | General Mills Inc. | | | 1,045,165 | | | | 1,136,132 | |
| 38,375 | | Hormel Foods Corp. | | | 1,369,130 | | | | 1,233,373 | |
| 10,750 | | PepsiCo Inc. | | | 889,171 | | | | 1,197,873 | |
| | | | | | | | | | |
| | | |
| | | | | 4,712,164 | | | | 4,876,734 | |
| | | | | | | | | | |
| | | |
| | Health Care — 12.9% | | | | | | | | |
| 25,605 | | Abbott Laboratories | | | 959,331 | | | | 1,366,283 | |
| 7,950 | | Aetna Inc. | | | 721,911 | | | | 1,264,129 | |
| 10,170 | | Becton, Dickinson and Co. | | | 1,426,042 | | | | 1,992,811 | |
| 7,000 | | Cigna Corp. | | | 688,776 | | | | 1,308,580 | |
| 16,400 | | Johnson & Johnson | | | 1,672,792 | | | | 2,132,164 | |
| | | | | | | | | | |
| | | |
| | | | | 5,468,852 | | | | 8,063,967 | |
| | | | | | | | | | |
| |
| | Real Estate Investment Trusts — 1.9% | |
| 5,625 | | Public Storage | | | 1,410,258 | | | | 1,203,694 | |
| | | | | | | | | | |
| | | |
| | Retail — 6.3% | | | | | | | | |
| 19,400 | | CVS Health Corp. | | | 1,767,597 | | | | 1,577,608 | |
| 5,900 | | Simon Property Group Inc. | | | 1,198,100 | | | | 949,959 | |
| 8,500 | | The Home Depot Inc. | | | 944,434 | | | | 1,390,260 | |
| | | | | | | | | | |
| | | |
| | | | | 3,910,131 | | | | 3,917,827 | |
| | | | | | | | | | |
| | | |
| | Semiconductors — 1.2% | | | | | | | | |
| 4,075 | | Lam Research Corp. | | | 399,413 | | | | 754,038 | |
| | | | | | | | | | |
| | | |
| | Specialty Chemicals — 2.1% | | | | | | | | |
| 3,565 | | The Sherwin-Williams Co. | | | 931,440 | | | | 1,276,413 | |
| | | | | | | | | | |
| | | |
| | Telecommunications — 7.7% | | | | | | | | |
| 21,450 | | Amdocs Ltd. | | | 862,806 | | | | 1,379,664 | |
| 56,225 | | AT&T Inc. | | | 2,244,344 | | | | 2,202,333 | |
| 14,250 | | Motorola Solutions Inc. | | | 1,246,066 | | | | 1,209,397 | |
| | | | | | | | | | |
| | | |
| | | | | 4,353,216 | | | | 4,791,394 | |
| | | | | | | | | | |
| | Transportation — 2.2% | | | | | | | | |
| 11,700 | | Union Pacific Corp. | | | 547,079 | | | | 1,356,849 | |
| | | | | | | | | | |
| | TOTAL COMMON STOCKS | | | 49,198,610 | | | | 61,835,974 | |
| | | | | | | | | | |
| |
| | SHORT TERM INVESTMENT — 1.0% | |
| | Other Investment Companies — 1.0% | |
| 584,740 | | Dreyfus Treasury Securities Cash
Management, 0.900%* | | | 584,740 | | | | 584,740 | |
| | | | | | | | | | |
| | | |
| | TOTAL
INVESTMENTS — 100.2% | | $ | 49,783,350 | | | | 62,420,714 | |
| | | | | | | | | | |
| | |
| | Other Assets and Liabilities (Net) — (0.2)% | | | | (93,819 | ) |
| | | | | | | | | | |
| | |
| | NET ASSETS — 100.0% | | | $ | 62,326,895 | |
| | | | | | | | | | |
| * | 1 day yield as of September 30, 2017. |
| † | Non-income producing security. |
See accompanying notes to financial statements.
30
TETON Westwood Balanced Fund
Schedule of Investments — September 30, 2017
| | | | | | | | | | |
| Shares | | | | Cost | | | Market
Value | |
| | | |
| | COMMON STOCKS — 68.5% | | | | | | | | |
| | Aerospace — 3.1% | |
| 5,225 | | General Dynamics Corp. | | $ | 766,079 | | | $ | 1,074,155 | |
| 3,815 | | The Boeing Co. | | | 464,233 | | | | 969,811 | |
| | | | | | | | | | |
| | | |
| | | | | 1,230,312 | | | | 2,043,966 | |
| | | | | | | | | | |
| |
| | Banking — 8.6% | |
| 58,460 | | Bank of America Corp. | | | 620,033 | | | | 1,481,376 | |
| 19,000 | | BB&T Corp. | | | 857,389 | | | | 891,860 | |
| 16,016 | | JPMorgan Chase & Co. | | | 816,885 | | | | 1,529,688 | |
| 22,870 | | Wells Fargo & Co. | | | 992,255 | | | | 1,261,281 | |
| 8,950 | | Western Alliance Bancorp† | | | 439,171 | | | | 475,066 | |
| | | | | | | | | | |
| | | |
| | | | | 3,725,733 | | | | 5,639,271 | |
| | | | | | | | | | |
| |
| | Business Services — 3.0% | |
| 24,900 | | Booz Allen Hamilton Holding
Corp. | | | 711,047 | | | | 931,011 | |
| 4,675 | | FedEx Corp. | | | 700,024 | | | | 1,054,587 | |
| | | | | | | | | | |
| | | |
| | | | | 1,411,071 | | | | 1,985,598 | |
| | | | | | | | | | |
| |
| | Cable and Satellite — 1.3% | |
| 21,900 | | Comcast Corp., Cl. A | | | 591,343 | | | | 842,712 | |
| | | | | | | | | | |
| |
| | Computer Software and Services — 5.2% | |
| 7,045 | | Accenture plc, Cl. A | | | 869,821 | | | | 951,568 | |
| 887 | | Alphabet Inc., Cl. A† | | | 742,946 | | | | 863,690 | |
| 6,975 | | Microsoft Corp. | | | 344,301 | | | | 519,568 | |
| 22,200 | | Oracle Corp. | | | 922,617 | | | | 1,073,370 | |
| | | | | | | | | | |
| | | |
| | | | | 2,879,685 | | | | 3,408,196 | |
| | | | | | | | | | |
| |
| | Consumer Products — 3.1% | |
| 14,200 | | Colgate-Palmolive Co. | | | 811,453 | | | | 1,034,470 | |
| 16,050 | | VF Corp. | | | 1,051,053 | | | | 1,020,299 | |
| | | | | | | | | | |
| | | |
| | | | | 1,862,506 | | | | 2,054,769 | |
| | | | | | | | | | |
| |
| | Diversified Industrial — 1.7% | |
| 7,825 | | Honeywell International Inc. | | | 634,768 | | | | 1,109,115 | |
| | | | | | | | | | |
| |
| | Electronics — 0.8% | |
| 5,500 | | Texas Instruments Inc. | | | 261,043 | | | | 493,020 | |
| | | | | | | | | | |
| |
| | Energy and Energy Services — 2.5% | |
| 10,000 | | EOG Resources Inc. | | | 865,832 | | | | 967,400 | |
| 15,225 | | Halliburton Co. | | | 883,809 | | | | 700,807 | |
| | | | | | | | | | |
| | | |
| | | | | 1,749,641 | | | | 1,668,207 | |
| | | | | | | | | | |
| |
| | Energy: Integrated — 4.4% | |
| 7,675 | | NextEra Energy Inc. | | | 630,618 | | | | 1,124,771 | |
| 22,850 | | RSP Permian Inc.† | | | 921,875 | | | | 790,381 | |
| 15,775 | | WEC Energy Group Inc. | | | 748,096 | | | | 990,355 | |
| | | | | | | | | | |
| | | |
| | | | | 2,300,589 | | | | 2,905,507 | |
| | | | | | | | | | |
| |
| | Energy: Oil — 1.5% | |
| 8,210 | | Chevron Corp. | | | 659,290 | | | | 964,675 | |
| | | | | | | | | | |
| |
| | Financial Services — 4.2% | |
| 13,200 | | American International Group Inc. | | | 514,162 | | | | 810,348 | |
| 5,900 | | Chubb Ltd. | | | 649,145 | | | | 841,045 | |
| 16,000 | | Intercontinental Exchange Inc. | | | 838,346 | | | | 1,099,200 | |
| | | | | | | | | | |
| | | |
| | | | | 2,001,653 | | | | 2,750,593 | |
| | | | | | | | | | |
| |
| | Food and Beverage — 5.4% | |
| 10,400 | | Dr Pepper Snapple Group Inc. | | | 986,558 | | | | 920,088 | |
| 15,275 | | General Mills Inc. | | | 707,653 | | | | 790,634 | |
| 26,510 | | Hormel Foods Corp. | | | 947,124 | | | | 852,031 | |
| 9,000 | | PepsiCo Inc. | | | 714,475 | | | | 1,002,870 | |
| | | | | | | | | | |
| | | |
| | | | | 3,355,810 | | | | 3,565,623 | |
| | | | | | | | | | |
| |
| | Health Care — 9.0% | |
| 17,800 | | Abbott Laboratories | | | 666,314 | | | | 949,808 | |
| 5,575 | | Aetna Inc. | | | 521,558 | | | | 886,481 | |
| 7,055 | | Becton, Dickinson and Co. | | | 1,048,522 | | | | 1,382,427 | |
| 6,400 | | Cigna Corp. | | | 652,126 | | | | 1,196,416 | |
| | | | | | | | | | |
| Shares | | | | Cost | | | Market
Value | |
| 11,500 | | Johnson & Johnson | | $ | 1,131,630 | | | $ | 1,495,115 | |
| | | | | | | | | | |
| | | |
| | | | | 4,020,150 | | | | 5,910,247 | |
| | | | | | | | | | |
| | Real Estate Investment Trusts — 1.4% | |
| 4,325 | | Public Storage | | | 1,058,369 | | | | 925,507 | |
| | | | | | | | | | |
| |
| | Retail — 4.4% | |
| 13,450 | | CVS Health Corp. | | | 1,225,596 | | | | 1,093,754 | |
| 4,900 | | Simon Property Group Inc. | | | 967,558 | | | | 788,949 | |
| 5,925 | | The Home Depot Inc. | | | 660,688 | | | | 969,093 | |
| | | | | | | | | | |
| | | |
| | | | | 2,853,842 | | | | 2,851,796 | |
| | | | | | | | | | |
| |
| | Semiconductors — 0.8% | |
| 2,850 | | Lam Research Corp. | | | 279,063 | | | | 527,364 | |
| | | | | | | | | | |
| |
| | Specialty Chemicals — 1.5% | |
| 2,700 | | The Sherwin-Williams Co. | | | 701,215 | | | | 966,708 | |
| | | | | | | | | | |
| |
| | Telecommunications — 5.1% | |
| 15,100 | | Amdocs Ltd. | | | 612,534 | | | | 971,232 | |
| 38,875 | | AT&T Inc. | | | 1,553,118 | | | | 1,522,734 | |
| 9,900 | | Motorola Solutions Inc. | | | 865,656 | | | | 840,213 | |
| | | | | | | | | | |
| | | |
| | | | | 3,031,308 | | | | 3,334,179 | |
| | | | | | | | | | |
| |
| | Transportation — 1.5% | |
| 8,700 | | Union Pacific Corp. | | | 426,027 | | | | 1,008,939 | |
| | | | | | | | | | |
| | | |
| | TOTAL COMMON STOCKS | | | 35,033,418 | | | | 44,955,992 | |
| | | | | | | | | | |
Principal
Amount | | | | | | | | |
| | CORPORATE BONDS — 19.7% | |
| | Banking — 4.0% | |
| $600,000 | | Citigroup Inc.,
2.500%, 07/29/19 | | | 607,997 | | | | 605,293 | |
| 750,000 | | JPMorgan Chase & Co.,
6.300%, 04/23/19 | | | 754,724 | | | | 800,486 | |
| 600,000 | | The Goldman Sachs Group Inc., MTN, 3.850%, 07/08/24 | | | 600,283 | | | | 625,191 | |
| 600,000 | | Wells Fargo & Co., MTN,
3.500%, 03/08/22 | | | 609,949 | | | | 623,564 | |
| | | | | | | | | | |
| | | |
| | | | | 2,572,953 | | | | 2,654,534 | |
| | | | | | | | | | |
| |
| | Computer Hardware — 1.0% | |
| 650,000 | | International Business Machines Corp., 2.900%, 11/01/21 | | | 655,498 | | | | 667,500 | |
| | | | | | | | | | |
| |
| | Consumer Products — 2.0% | |
| 500,000 | | Colgate-Palmolive Co., MTN,
2.100%, 05/01/23 | | | 496,347 | | | | 492,091 | |
| 800,000 | | Costco Wholesale Corp.,
1.700%, 12/15/19 | | | 795,757 | | | | 799,468 | |
| | | | | | | | | | |
| | | |
| | | | | 1,292,104 | | | | 1,291,559 | |
| | | | | | | | | | |
| |
| | Diversified Industrial — 1.2% | |
| 800,000 | | John Deere Capital Corp., MTN, 1.950%, 12/13/18 | | | 800,548 | | | | 803,051 | |
| | | | | | | | | | |
| |
| | Electronics — 2.4% | |
| 1,000,000 | | Intel Corp.,
3.300%, 10/01/21 | | | 1,018,252 | | | | 1,047,569 | |
| 500,000 | | Texas Instruments Inc.,
1.650%, 08/03/19 | | | 499,486 | | | | 500,077 | |
| | | | | | | | | | |
| | | |
| | | | | 1,517,738 | | | | 1,547,646 | |
| | | | | | | | | | |
See accompanying notes to financial statements.
31
TETON Westwood Balanced Fund
Schedule of Investments (Continued) — September 30, 2017
| | | | | | | | | | |
Principal
Amount | | | | Cost | | | Market
Value | |
| |
| | CORPORATE BONDS (Continued) | |
| | Energy: Oil — 0.8% | | | | | | | | |
| $500,000 | | XTO Energy Inc.,
6.500%, 12/15/18 | | $ | 512,012 | | | $ | 527,967 | |
| | | | | | | | | | |
| | | |
| | Financial Services — 2.8% | | | | | | | | |
| 600,000 | | Capital One Financial Corp.,
3.750%, 04/24/24 | | | 608,180 | | | | 620,500 | |
| 600,000 | | Morgan Stanley, GMTN,
3.700%, 10/23/24 | | | 600,553 | | | | 622,162 | |
| 600,000 | | The PNC Financial Services Group Inc., STEP,
2.854%, 11/09/22 | | | 592,619 | | | | 608,138 | |
| | | | | | | | | | |
| | | |
| | | | | 1,801,352 | | | | 1,850,800 | |
| | | | | | | | | | |
| | | |
| | Health Care — 2.7% | | | | | | | | |
| 500,000 | | Abbott Laboratories,
2.550%, 03/15/22 | | | 494,816 | | | | 500,802 | |
| 600,000 | | Aetna Inc.,
3.500%, 11/15/24 | | | 600,846 | | | | 627,081 | |
| 600,000 | | Amgen Inc.,
3.450%, 10/01/20 | | | 612,850 | | | | 622,444 | |
| | | | | | | | | | |
| | | |
| | | | | 1,708,512 | | | | 1,750,327 | |
| | | | | | | | | | |
| | | |
| | Retail — 1.9% | | | | | | | | |
| 600,000 | | CVS Health Corp.,
3.375%, 08/12/24 | | | 598,980 | | | | 613,971 | |
| 600,000 | | McDonalds Corp., MTN,
2.100%, 12/07/18 | | | 602,672 | | | | 603,002 | |
| | | | | | | | | | |
| | | |
| | | | | 1,201,652 | | | | 1,216,973 | |
| | | | | | | | | | |
| | |
| | Telecommunications — 0.9% | | | | | |
| 600,000 | | AT&T Inc.,
2.300%, 03/11/19 | | | 602,035 | | | | 603,341 | |
| | | | | | | | | | |
| | TOTAL CORPORATE BONDS | | | 12,664,404 | | | | 12,913,698 | |
| | | | | | | | | | |
| | | | | | | | | | |
Principal
Amount | | | | Cost | | | Market
Value | |
| |
| | U.S. GOVERNMENT AGENCY OBLIGATIONS — 4.3% | |
| | Federal Home Loan Mortgage Corp. — 2.6% | |
| $600,000 | | 1.750%, 05/30/19 | | $ | 597,781 | | | $ | 602,705 | |
| 1,100,000 | | 2.375%, 01/13/22 | | | 1,106,901 | | | | 1,120,199 | |
| | | | | | | | | | |
| | | |
| | | | | 1,704,682 | | | | 1,722,904 | |
| | | | | | | | | | |
| |
| | Federal National Mortgage Association — 1.7% | |
| 1,100,000 | | 2.625%, 09/06/24 | | | 1,136,786 | | | | 1,126,353 | |
| | | | | | | | | | |
| | TOTAL U.S. GOVERNMENT
AGENCY OBLIGATIONS | | | 2,841,468 | | | | 2,849,257 | |
| | | | | | | | | | |
| |
| | U.S. GOVERNMENT OBLIGATIONS — 6.2% | |
| | U.S. Treasury Inflation Indexed Notes — 1.6% | |
| 1,026,117 | | 2.125%, 01/15/19 | | | 1,031,198 | | | | 1,058,424 | |
| | | | | | | | | | |
| | |
| | U.S. Treasury Notes — 4.6% | | | | | |
| 750,000 | | 3.375%, 11/15/19 | | | 775,697 | | | | 779,443 | |
| 1,000,000 | | 2.250%, 11/15/24 | | | 1,029,394 | | | | 1,005,117 | |
| 500,000 | | 2.000%, 02/15/25 | | | 496,998 | | | | 493,262 | |
| 800,000 | | 1.625%, 02/15/26 | | | 803,208 | | | | 760,766 | |
| | | | | | | | | | |
| | | |
| | | | | 3,105,297 | | | | 3,038,588 | |
| | | | | | | | | | |
| | TOTAL U.S. GOVERNMENT
OBLIGATIONS | | | 4,136,495 | | | | 4,097,012 | |
| | | | | | | | | | |
| | | |
| Shares | | | | | | | | |
| |
| | SHORT TERM INVESTMENT — 1.2% | |
| | Other Investment Companies — 1.2% | |
| 774,655 | | Dreyfus Treasury Securities Cash Management, 0.900%* | | | 774,655 | | | | 774,655 | |
| | | | | | | | | | |
| | TOTAL
INVESTMENTS — 99.9% | | $ | 55,450,440 | | | | 65,590,614 | |
| | | | | | | | | | |
| | Other Assets and Liabilities (Net) — 0.1% | | | | 82,709 | |
| | | | | | | | | | |
| | NET ASSETS — 100.0% | | | | | | $ | 65,673,323 | |
| | | | | | | | | | |
| * | 1 day yield as of September 30, 2017. |
| † | Non-income producing security. |
| GMTN | Global Medium Term Note |
| STEP | Step coupon security. The rate disclosed is that in effect at September 30, 2017. |
See accompanying notes to financial statements.
32
TETON Westwood Intermediate Bond Fund
Schedule of Investments — September 30, 2017
| | | | | | | | | | |
Principal
Amount | | | | Cost | | | Market
Value | |
| | | |
| | CORPORATE BONDS — 62.2% | | | | | | | | |
| | Aerospace — 8.8% | | | | | | | | |
| $ 250,000 | | Harris Corp.,
1.999%, 04/27/18 | | $ | 250,396 | | | $ | 250,472 | |
| 200,000 | | The Boeing Co.,
6.000%, 03/15/19 | | | 201,011 | | | | 212,302 | |
| 250,000 | | United Technologies Corp.,
3.100%, 06/01/22 | | | 259,278 | | | | 256,535 | |
| | | | | | | | | | |
| | | |
| | | | | 710,685 | | | | 719,309 | |
| | | | | | | | | | |
| | Automotive — 6.2% | | | | | | | | |
| 250,000 | | Ford Motor Credit Co. LLC,
1.724%, 12/06/17 | | | 249,968 | | | | 250,028 | |
| 250,000 | | General Motors Co.,
3.500%, 10/02/18 | | | 253,837 | | | | 254,121 | |
| | | | | | | | | | |
| | | |
| | | | | 503,805 | | | | 504,149 | |
| | | | | | | | | | |
| | Banking — 10.6% | | | | | | | | |
| 250,000 | | Citigroup Inc.,
1.800%, 02/05/18 | | | 250,116 | | | | 250,023 | |
| 200,000 | | JPMorgan Chase & Co.,
6.300%, 04/23/19 | | | 199,737 | | | | 213,463 | |
| 400,000 | | The Bank of New York Mellon Corp.,
Ser. G,
2.200%, 05/15/19 | | | 400,490 | | | | 402,424 | |
| | | | | | | | | | |
| | | |
| | | | | 850,343 | | | | 865,910 | |
| | | | | | | | | | |
| | Computer Hardware — 3.7% | | | | | | | | |
| 300,000 | | Apple Inc., 1.561%, (3-Month USD LIBOR plus 0.25%) 05/03/18(a) | | | 300,093 | | | | 300,448 | |
| | | | | | | | | | |
| | Electronics — 3.1% | | | | | | | | |
| 250,000 | | Arrow Electronics Inc.,
3.000%, 03/01/18 | | | 251,251 | | | | 251,160 | |
| | | | | | | | | | |
| | Energy — 3.1% | | | | | | | | |
| 250,000 | | MarkWest Energy Partners LP / MarkWest Energy Finance Corp.,
5.500%, 02/15/23 | | | 256,200 | | | | 255,918 | |
| | | | | | | | | | |
| | Financial Services — 7.2% | | | | | | | | |
| 250,000 | | Bank of America Corp.,
2.000%, 01/11/18 | | | 250,203 | | | | 250,293 | |
| 200,000 | | Capital One Financial Corp.,
3.750%, 04/24/24 | | | 202,727 | | | | 206,833 | |
| 125,000 | | MPT Operating Partnership LP / MPT Finance Corp., 6.375%, 03/01/24 | | | 135,156 | | | | 135,469 | |
| | | | | | | | | | |
| | | |
| | | | | 588,086 | | | | 592,595 | |
| | | | | | | | | | |
| | Food and Beverage — 6.3% | | | | | | | | |
| 250,000 | | Mondelēz International Inc.,
5.375%, 02/10/20 | | | 251,277 | | | | 267,698 | |
| 250,000 | | PepsiCo Inc.,
1.250%, 04/30/18 | | | 249,853 | | | | 249,821 | |
| | | | | | | | | | |
| | | |
| | | | | 501,130 | | | | 517,519 | |
| | | | | | | | | | |
| | Health Care — 3.1% | | | | | | | | |
| 250,000 | | Aetna Inc.,
1.700%, 06/07/18 | | | 250,221 | | | | 250,208 | |
| | | | | | | | | | |
| | | | | | | | | | |
Principal
Amount | | | | Cost | | | Market
Value | |
| | Retail — 4.4% | | | | | | | | |
| $ 125,000 | | Macy’s Retail Holdings Inc.,
3.875%, 01/15/22 | | $ | 126,339 | | | $ | 125,427 | |
| 250,000 | | The Home Depot, Inc.,
2.125%, 09/15/26 | | | 247,518 | | | | 235,049 | |
| | | | | | | | | | |
| | | |
| | | | | 373,857 | | | | 360,476 | |
| | | | | | | | | | |
| | Telecommunications — 5.7% | | | | | | | | |
| 250,000 | | AT&T Inc.,
3.900%, 03/11/24 | | | 256,406 | | | | 259,295 | |
| 200,000 | | Verizon Communications Inc., 3.000%, 11/01/21 | | | 199,496 | | | | 204,292 | |
| | | | | | | | | | |
| | | |
| | | | | 455,902 | | | | 463,587 | |
| | | | | | | | | | |
| | | |
| | TOTAL CORPORATE BONDS | | | 5,041,573 | | | | 5,081,279 | |
| | | | | | | | | | |
| |
| | U.S. GOVERNMENT AGENCY OBLIGATIONS — 17.4% | |
| | Federal Home Loan Mortgage Corp. — 4.3% | | | | | |
| 350,000 | | 1.750%, 05/30/19 | | | 352,267 | | | | 351,578 | |
| | | | | | | | | | |
| | Federal National Mortgage Association — 12.8% | |
| 250,000 | | 0.875%, 05/21/18 | | | 249,458 | | | | 249,377 | |
| 400,000 | | 2.625%, 09/06/24 | | | 413,377 | | | | 409,583 | |
| 400,000 | | 2.125%, 04/24/26 | | | 400,199 | | | | 390,973 | |
| | | | | | | | | | |
| | | |
| | | | | 1,063,034 | | | | 1,049,933 | |
| | | | | | | | | | |
| | Government National Mortgage Association — 0.3% | |
| 4,540 | | 6.000%, 12/15/33 | | | 4,570 | | | | 5,176 | |
| 14,441 | | 5.500%, 01/15/34 | | | 14,508 | | | | 16,283 | |
| | | | | | | | | | |
| | | |
| | | | | 19,078 | | | | 21,459 | |
| | | | | | | | | | |
| | TOTAL U.S. GOVERNMENT
AGENCY OBLIGATIONS | | | 1,434,379 | | | | 1,422,970 | |
| | | | | | | | | | |
| |
| | U.S. GOVERNMENT OBLIGATIONS — 21.7% | |
| | U.S. Treasury Bills — 3.4% | | | | | | | | |
| 280,000 | | U. S. Treasury Bill,
0.99%†, 12/21/17 | | | 279,376 | | | | 279,386 | |
| | | | | | | | | | |
| | U.S. Treasury Bonds — 6.5% | | | | | | | | |
| 150,000 | | 5.375%, 02/15/31 | | | 163,207 | | | | 201,079 | |
| 350,000 | | 2.500%, 02/15/45 | | | 316,956 | | | | 326,519 | |
| | | | | | | | | | |
| | | |
| | | | | 480,163 | | | | 527,598 | |
| | | | | | | | | | |
| | U.S. Treasury Notes — 11.8% | | | | | | | | |
| 500,000 | | 2.000%, 02/15/25 | | | 501,700 | | | | 493,262 | |
| 500,000 | | 1.625%, 02/15/26 | | | 491,644 | | | | 475,479 | |
| | | | | | | | | | |
| | | |
| | | | | 993,344 | | | | 968,741 | |
| | | | | | | | | | |
| | TOTAL U.S. GOVERNMENT
OBLIGATIONS | | | 1,752,883 | | | | 1,775,725 | |
| | | | | | | | | | |
| | | |
| | TOTAL INVESTMENTS — 101.3% | | $ | 8,228,835 | | | | 8,279,974 | |
| | | | | | | | | | |
| | |
| | Other Assets and Liabilities (Net) — (1.3)% | | | | (109,660 | ) |
| | | | | | | | | | |
| | | |
| | NET ASSETS — 100.0% | | | | | | $ | 8,170,314 | |
| | | | | | | | | | |
| (a) | The interest rate for this floating rate note, which will change periodically, is based either on the prime rate or an index of market rates. The reflected rate is in effect as of September 30, 2017. The maturity date reflected is the final maturity date. |
| † | Represents annualized yield at date of purchase. |
See accompanying notes to financial statements.
33
TETON Westwood Funds
Statements of Assets and Liabilities
September 30, 2017
| | | | | | | | | | | | | | | | | | | | | | | | | | | | |
| | | Mighty Mites SM
Fund | | | | SmallCap Equity Fund | | | | Mid-Cap Equity Fund | | | | Convertible
Securities
Fund | | |
Assets: | | | | | | | | | | | | | | | | | | | | | | | | | | | | |
Investments, at value (cost $805,475,864, $22,202,816, $2,367,282, and $13,774,085, respectively) | | | | $1,284,110,429 | | | | | | | $32,559,055 | | | | | | | $3,000,369 | | | | | | | $14,905,504 | | | |
Investments in affiliates, at value (cost $38,631,042) | | | | 65,264,261 | | | | | | | — | | | | | | | — | | | | | | | — | | | |
Cash | | | | 19,257 | | | | | | | 55,253 | | | | | | | 7,655 | | | | | | | 229,495 | | | |
Deposit at brokers | | | | 373 | | | | | | | — | | | | | | | — | | | | | | | — | | | |
Receivable for Fund shares sold | | | | 3,390,765 | | | | | | | 37,137 | | | | | | | — | | | | | | | 31,155 | | | |
Receivable for investments sold | | | | 1,641,455 | | | | | | | — | | | | | | | — | | | | | | | — | | | |
Receivable from Adviser | | | | — | | | | | | | 33,886 | | | | | | | 7,768 | | | | | | | 16,836 | | | |
Dividends and interest receivable | | | | 604,725 | | | | | | | 17,120 | | | | | | | 1,726 | | | | | | | 67,561 | | | |
Prepaid expenses | | | | 38,716 | | | | | | | 23,732 | | | | | | | 7,050 | | | | | | | 20,078 | | | |
Total Assets | | | | 1,355,069,981 | | | | | | | 32,726,183 | | | | | | | 3,024,568 | | | | | | | 15,270,629 | | | |
Liabilities: | | | | | | | | | | | | | | | | | | | | | | | | | | | | |
Payable for investments purchased | | | | 224,982 | | | | | | | — | | | | | | | — | | | | | | | 468,211 | | | |
Payable for Fund shares redeemed | | | | 1,040,893 | | | | | | | 20,146 | | | | | | | — | | | | | | | — | | | |
Payable for investment advisory fees | | | | 1,048,263 | | | | | | | 25,429 | | | | | | | 2,426 | | | | | | | 11,696 | | | |
Payable for distribution fees | | | | 261,759 | | | | | | | 4,983 | | | | | | | 412 | | | | | | | 2,680 | | | |
Payable for accounting fees | | | | 11,250 | | | | | | | — | | | | | | | — | | | | | | | — | | | |
Payable for payroll expenses | | | | — | | | | | | | — | | | | | | | 405 | | | | | | | — | | | |
Payable for custodian fees | | | | 50,502 | | | | | | | 3,452 | | | | | | | 2,219 | | | | | | | 1,860 | | | |
Payable for legal and audit fees | | | | 63,598 | | | | | | | 35,004 | | | | | | | 21,053 | | | | | | | 25,986 | | | |
Payable for shareholder communications expenses | | | | 78,257 | | | | | | | 5,093 | | | | | | | 2,036 | | | | | | | 3,064 | | | |
Payable for shareholder services fees | | | | 156,064 | | | | | | | 4,230 | | | | | | | 1,236 | | | | | | | — | | | |
Other accrued expenses | | | | 22,563 | | | | | | | 3,808 | | | | | | | 3,477 | | | | | | | 6,086 | | | |
Total Liabilities | | | | 2,958,131 | | | | | | | 102,145 | | | | | | | 33,264 | | | | | | | 519,583 | | | |
Net Assets | | | | $1,352,111,850 | | | | | | | $32,624,038 | | | | | | | $2,991,304 | | | | | | | $14,751,046 | | | |
Net Assets Consist of: | | | | | | | | | | | | | | | | | | | | | | | | | | | | |
Paid-in capital | | | | $772,459,307 | | | | | | | $20,983,660 | | | | | | | $2,250,206 | | | | | | | $13,765,617 | | | |
Accumulated net investment loss | | | | (4,901,586 | ) | | | | | | (42,350 | ) | | | | | | (2,149 | ) | | | | | | (98,285 | ) | | |
Accumulated net realized gain/(loss) on investments and foreign currency transactions | | | | 79,283,779 | | | | | | | 1,326,489 | | | | | | | 110,160 | | | | | | | (47,705 | ) | | |
Net unrealized appreciation on investments | | | | 505,267,784 | | | | | | | 10,356,239 | | | | | | | 633,087 | | | | | | | 1,131,419 | | | |
Net unrealized appreciation on foreign currency translations | | | | 2,566 | | | | | | | — | | | | | | | — | | | | | | | — | | | |
Net Assets | | | | $1,352,111,850 | | | | | | | $32,624,038 | | | | | | | $2,991,304 | | | | | | | $14,751,046 | | | |
Shares of Beneficial Interest, each at $0.001 par value; unlimited number of shares authorized: | | | | | | | | | | | | | | | | | | | | | | | | | | | | |
Class AAA: | | | | | | | | | | | | | | | | | | | | | | | | | | | | |
Net assets | | | | $274,160,865 | | | | | | | $9,294,886 | | | | | | | $805,126 | | | | | | | $4,138,161 | | | |
Shares of beneficial interest outstanding | | | | 9,318,715 | | | | | | | 434,878 | | | | | | | 60,505 | | | | | | | 333,577 | | | |
Net Asset Value, offering, and redemption price per share | | | | $29.42 | | | | | | | $21.37 | | | | | | | $13.31 | | | | | | | $12.41 | | | |
Class A: | | | | | | | | | | | | | | | | | | | | | | | | | | | | |
Net assets | | | | $169,017,053 | | | | | | | $3,580,099 | | | | | | | $203,448 | | | | | | | $2,669,567 | | | |
Shares of beneficial interest outstanding | | | | 5,947,347 | | | | | | | 174,635 | | | | | | | 15,455 | | | | | | | 208,668 | | | |
Net Asset Value and redemption price per share | | | | $28.42 | | | | | | | $20.50 | | | | | | | $13.16 | | | | | | | $12.79 | | | |
Maximum offering price per share (NAV ÷ 0.96, based on maximum sales charge of 4.00% of the offering price) | | | | $29.60 | | | | | | | $21.35 | | | | | | | $13.71 | | | | | | | $13.32 | | | |
Class C: | | | | | | | | | | | | | | | | | | | | | | | | | | | | |
Net assets | | | | $180,281,958 | | | | | | | $2,246,910 | | | | | | | $194,599 | | | | | | | $1,307,248 | | | |
Shares of beneficial interest outstanding | | | | 7,142,309 | | | | | | | 124,579 | | | | | | | 15,117 | | | | | | | 95,972 | | | |
Net Asset Value and offering price per share(a) | | | | $25.24 | | | | | | | $18.04 | | | | | | | $12.87 | | | | | | | $13.62 | | | |
Class I: | | | | | | | | | | | | | | | | | | | | | | | | | | | | |
Net assets | | | | $728,641,235 | | | | | | | $17,501,073 | | | | | | | $1,788,131 | | | | | | | $6,636,070 | | | |
Shares of beneficial interest outstanding | | | | 24,270,199 | | | | | | | 794,109 | | | | | | | 132,683 | | | | | | | 533,265 | | | |
Net Asset Value, offering, and redemption price per share | | | | $30.02 | | | | | | | $22.04 | | | | | | | $13.48 | | | | | | | $12.44 | | | |
Class T: | | | | | | | | | | | | | | | | | | | | | | | | | | | | |
Net assets | | | | $10,739 | | | | | | | $1,070.20 | | | | | | | — | | | | | | | — | | | |
Shares of beneficial interest outstanding | | | | 365 | | | | | | | 50.08 | | | | | | | — | | | | | | | — | | | |
Net Asset Value and redemption price per share | | | | $29.42 | | | | | | | $21.37 | | | | | | | — | | | | | | | — | | | |
Maximum offering price per share (NAV ÷ 0.975, based on maximum sales charge of 2.50% of the offering price) | | | | $30.17 | | | | | | | $21.92 | | | | | | | — | | | | | | | — | | | |
| (a) | Redemption price varies based on the length of time held. |
See accompanying notes to financial statements.
34
TETON Westwood Funds
Statements of Assets and Liabilities (Continued)
September 30, 2017
| | | | | | | | | | | | | | | | | | | | | |
| | | Equity Fund | | | | Balanced
Fund | | | | Intermediate
Bond Fund | | |
Assets: | | | | | | | | | | | | | | | | | | | | | |
Investments, at value (cost $49,783,350, $55,450,440, and
$8,228,835, respectively) | | | | $62,420,714 | | | | | | | $65,590,614 | | | | | | | $8,279,974 | | | |
Investments in affiliates, at value | | | | — | | | | | | | — | | | | | | | — | | | |
Cash | | | | — | | | | | | | — | | | | | | | 3,085 | | | |
Deposit at brokers | | | | — | | | | | | | — | | | | | | | — | | | |
Receivable for Fund shares sold | | | | 302 | | | | | | | 3,969 | | | | | | | 1,633 | | | |
Receivable for investments sold | | | | — | | | | | | | — | | | | | | | — | | | |
Receivable from Adviser | | | | — | | | | | | | — | | | | | | | 10,340 | | | |
Dividends and interest receivable | | | | 30,790 | | | | | | | 188,268 | | | | | | | 49,936 | | | |
Prepaid expenses | | | | 13,272 | | | | | | | 13,015 | | | | | | | 8,050 | | | |
Total Assets | | | | 62,465,078 | | | | | | | 65,795,866 | | | | | | | 8,353,018 | | | |
Liabilities: | | | | | | | | | | | | | | | | | | | | | |
Payable for investments purchased | | | | — | | | | | | | — | | | | | | | 135,842 | | | |
Payable for Fund shares redeemed | | | | 10,000 | | | | | | | 2,201 | | | | | | | 387 | | | |
Payable for investment advisory fees | | | | 50,382 | | | | | | | 40,044 | | | | | | | 4,090 | | | |
Payable for distribution fees | | | | 12,545 | | | | | | | 17,412 | | | | | | | 1,864 | | | |
Payable for accounting fees | | | | 11,250 | | | | | | | 11,250 | | | | | | | — | | | |
Payable for custodian fees | | | | 2,880 | | | | | | | 2,777 | | | | | | | 2,038 | | | |
Payable for legal and audit fees | | | | 27,258 | | | | | | | 27,307 | | | | | | | 28,761 | | | |
Payable for shareholder communications expenses | | | | 11,123 | | | | | | | 9,547 | | | | | | | 3,291 | | | |
Payable for shareholder services fees | | | | 8,263 | | | | | | | 8,157 | | | | | | | 2,429 | | | |
Other accrued expenses | | | | 4,482 | | | | | | | 3,848 | | | | | | | 4,002 | | | |
Total Liabilities | | | | 138,183 | | | | | | | 122,543 | | | | | | | 182,704 | | | |
Net Assets | | | | $62,326,895 | | | | | | | $65,673,323 | | | | | | | $8,170,314 | | | |
Net Assets Consist of: | | | | | | | | | | | | | | | | | | | | | |
Paid-in capital | | | | $43,036,465 | | | | | | | $51,673,502 | | | | | | | $7,989,609 | | | |
Accumulated net investment income | | | | 220,526 | | | | | | | 32 | | | | | | | — | | | |
Accumulated net realized gain on investments and
foreign currency transactions | | | | 6,432,540 | | | | | | | 3,859,615 | | | | | | | 129,566 | | | |
Net unrealized appreciation on investments | | | | 12,637,364 | | | | | | | 10,140,174 | | | | | | | 51,139 | | | |
Net unrealized appreciation on foreign currency translations | | | | — | | | | | | | — | | | | | | | — | | | |
Net Assets | | | | $62,326,895 | | | | | | | $65,673,323 | | | | | | | $8,170,314 | | | |
Shares of Beneficial Interest, each at $0.001 par value;
unlimited number of shares authorized: | | | | | | | | | | | | | | | | | | | | | |
Class AAA: | | | | | | | | | | | | | | | | | | | | | |
Net assets | | | | $54,159,038 | | | | | | | $50,934,003 | | | | | | | $3,682,697 | | | |
Shares of beneficial interest outstanding | | | | 3,957,113 | | | | | | | 4,188,098 | | | | | | | 326,621 | | | |
Net Asset Value, offering, and redemption price per share | | | | $13.69 | | | | | | | $12.16 | | | | | | | $11.28 | | | |
Class A: | | | | | | | | | | | | | | | | | | | | | |
Net assets | | | | $2,502,131 | | | | | | | $8,164,867 | | | | | | | $485,259 | | | |
Shares of beneficial interest outstanding | | | | 183,444 | | | | | | | 667,694 | | | | | | | 43,083 | | | |
Net Asset Value and redemption price per share | | | | $13.64 | | | | | | | $12.23 | | | | | | | $11.26 | | | |
Maximum offering price per share (NAV ÷ 0.96, based on
maximum sales charge of 4.00% of the offering price) | | | | $14.21 | | | | | | | $12.74 | | | | | | | $11.73 | | | |
Class C: | | | | | | | | | | | | | | | | | | | | | |
Net assets | | | | $684,808 | | | | | | | $4,585,357 | | | | | | | $1,102,245 | | | |
Shares of beneficial interest outstanding | | | | 52,810 | | | | | | | 369,502 | | | | | | | 103,005 | | | |
Net Asset Value and offering price per share(a) | | | | $12.97 | | | | | | | $12.41 | | | | | | | $10.70 | | | |
Class I: | | | | | | | | | | | | | | | | | | | | | |
Net assets | | | | $4,980,918 | | | | | | | $1,989,096 | | | | | | | $2,900,113 | | | |
Shares of beneficial interest outstanding | | | | 364,556 | | | | | | | 163,777 | | | | | | | 257,074 | | | |
Net Asset Value, offering, and redemption price per share | | | | $13.66 | | | | | | | $12.15 | | | | | | | $11.28 | | | |
| (a) | Redemption price varies based on the length of time held. |
See accompanying notes to financial statements.
35
TETON Westwood Funds
Statements of Operations
For the Year Ended September 30, 2017
| | | | | | | | | | | | | | | | | | | | | | | | | | | | |
| | | | | | | | |
| | | Mighty
MitesSM Fund | | | | SmallCap
Equity Fund | | | | Mid-Cap
Equity Fund | | | | Convertible
Securities
Fund | | |
Investment Income: | | | | | | | | | | | | | | | | | | | | | | | | | | | | |
Dividends - unaffiliated (net of foreign withholding taxes of $98,232, $484, $114, and $1,050, respectively) | | | | $ 9,216,170 | | | | | | | $ 343,872 | | | | | | | $ 26,510 | | | | | | | $ 113,265 | | | |
Dividends - affiliated | | | | 830,676 | | | | | | | — | | | | | | | — | | | | | | | — | | | |
Interest | | | | 1,083,202 | | | | | | | 11,847 | | | | | | | 1,105 | | | | | | | 53,241 | | | |
| | | | | | | | |
Total Investment Income. | | | | 11,130,048 | | | | | | | 355,719 | | | | | | | 27,615 | | | | | | | 166,506 | | | |
| | | | | | | | |
Expenses: | | | | | | | | | | | | | | | | | | | | | | | | | | | | |
Investment advisory fees | | | | 11,783,519 | | | | | | | 314,745 | | | | | | | 32,932 | | | | | | | 93,090 | | | |
Distribution fees - Class AAA | | | | 663,055 | | | | | | | 27,626 | | | | | | | 2,774 | | | | | | | 10,687 | | | |
Distribution fees - Class A | | | | 771,582 | | | | | | | 16,912 | | | | | | | 1,498 | | | | | | | 8,507 | | | |
Distribution fees - Class C | | | | 1,741,082 | | | | | | | 22,344 | | | | | | | 1,953 | | | | | | | 8,745 | | | |
Distribution fees - Class T | | | | 6 | | | | | | | — | | | | | | | — | | | | | | | — | | | |
Accounting fees | | | | 45,000 | | | | | | | — | | | | | | | — | | | | | | | — | | | |
Custodian fees | | | | 164,787 | | | | | | | 10,511 | | | | | | | 3,520 | | | | | | | 6,944 | | | |
Interest expense | | | | 625 | | | | | | | 33 | | | | | | | — | | | | | | | 400 | | | |
Legal and audit fees | | | | 158,904 | | | | | | | 41,584 | | | | | | | 21,297 | | | | | | | 26,561 | | | |
Payroll expenses | | | | — | | | | | | | — | | | | | | | 2,044 | | | | | | | — | | | |
Registration expenses | | | | 78,820 | | | | | | | 51,570 | | | | | | | 21,802 | | | | | | | 49,327 | | | |
Shareholder communications expenses | | | | 365,840 | | | | | | | 20,173 | | | | | | | 5,633 | | | | | | | 9,419 | | | |
Shareholder services fees | | | | 1,042,330 | | | | | | | 18,715 | | | | | | | 7,569 | | | | | | | 10,761 | | | |
Trustees’ fees | | | | 80,540 | | | | | | | 2,111 | | | | | | | 232 | | | | | | | 598 | | | |
Miscellaneous expenses | | | | 63,480 | | | | | | | 9,898 | | | | | | | 8,495 | | | | | | | 9,736 | | | |
| | | | | | | | |
Total Expenses | | | | 16,959,570 | | | | | | | 536,222 | | | | | | | 109,749 | | | | | | | 234,775 | | | |
| | | | | | | | |
Less: | | | | | | | | | | | | | | | | | | | | | | | | | | | | |
Fees waived or expenses reimbursed by Adviser
(See Note 3) | | | | — | | | | | | | (122,027 | ) | | | | | | (76,114 | ) | | | | | | (122,517 | ) | | |
Advisory fee reduction on unsupervised assets (See Note 3) | | | | (77,025 | ) | | | | | | — | | | | | | | — | | | | | | | — | | | |
Custodian fee credits | | | | (1,563 | ) | | | | | | (120 | ) | | | | | | — | | | | | | | (139 | ) | | |
Expenses paid by broker (See Note 6) | | | | (8,963 | ) | | | | | | (1,532 | ) | | | | | | (1,063 | ) | | | | | | — | | | |
| | | | | | | | |
Total Reimbursements, Waivers, Reductions, and Credits | | | | (87,551 | ) | | | | | | (123,679 | ) | | | | | | (77,177 | ) | | | | | | (122,656 | ) | | |
| | | | | | | | |
Net Expenses | | | | 16,872,019 | | | | | | | 412,543 | | | | | | | 32,572 | | | | | | | 112,119 | | | |
| | | | | | | | |
Net Investment Income/(Loss) | | | | (5,741,971 | ) | | | | | | (56,824 | ) | | | | | | (4,957 | ) | | | | | | 54,387 | | | |
| | | | | | | | |
Net Realized and Unrealized Gain/(Loss) on Investments, Securities Sold Short, Redemption In-Kind, and Foreign Currency: | | | | | | | | | | | | | | | | | | | | | | | | | | | | |
Net realized gain on investments - unaffiliated | | | | 86,612,608 | | | | | | | 2,628,872 | | | | | | | 115,906 | | | | | | | 17,060 | | | |
Net realized loss on investments - affiliated | | | | (47,614 | ) | | | | | | — | | | | | | | — | | | | | | | — | | | |
Net realized gain on securities sold short | | | | 165,036 | | | | | | | — | | | | | | | — | | | | | | | — | | | |
Net realized gain on redemption in-kind | | | | — | | | | | | | — | | | | | | | 39,222 | | | | | | | — | | | |
Net realized gain on foreign currency transactions | | | | 9,167 | | | | | | | — | | | | | | | — | | | | | | | — | | | |
| | | | | | | | |
Net realized gain on investments, securities sold short, redemption in-kind, and foreign currency transactions | | | | 86,739,197 | | | | | | | 2,628,872 | | | | | | | 155,128 | | | | | | | 17,060 | | | |
| | | | | | | | |
Net change in unrealized appreciation/depreciation: | | | | | | | | | | | | | | | | | | | | | | | | | | | | |
on investments | | | | 177,672,688 | | | | | | | 3,708,579 | | | | | | | 244,240 | | | | | | | 1,133,294 | | | |
on foreign currency translations | | | | 3,746 | | | | | | | — | | | | | | | — | | | | | | | — | | | |
| | | | | | | | |
Net change in unrealized appreciation/depreciation on investments and foreign currency translations | | | | 177,676,434 | | | | | | | 3,708,579 | | | | | | | 244,240 | | | | | | | 1,133,294 | | | |
| | | | | | | | |
Net Realized and Unrealized Gain on Investments, Securities Sold Short, Redemption In-Kind, and Foreign Currency | | | | 264,415,631 | | | | | | | 6,337,451 | | | | | | | 399,368 | | | | | | | 1,150,354 | | | |
| | | | | | | | |
Net Increase in Net Assets Resulting from Operations | | | $ | 258,673,660 | | | | | | $ | 6,280,627 | | | | | | $ | 394,411 | | | | | | $ | 1,204,741 | | | |
See accompanying notes to financial statements.
36
TETON Westwood Funds
Statements of Operations (Continued)
For the Year Ended September 30, 2017
| | | | | | | | | | | | | | | | | | | | | |
| | | | | | |
| | | Equity
Fund | | | | Balanced
Fund | | | | Intermediate
Bond Fund | | |
Investment Income: | | | | | | | | | | | | | | | | | | | | | |
Dividends - unaffiliated (net of foreign withholding taxes of
$0, $0, and $0, respectively) | | | | $1,323,222 | | | | | | | $ 947,728 | | | | | | | $ 8,288 | | | |
Dividends - affiliated | | | | — | | | | | | | — | | | | | | | — | | | |
Interest | | | | — | | | | | | | 562,424 | | | | | | | 349,453 | | | |
| | | | | | |
Total Investment Income | | | | 1,323,222 | | | | | | | 1,510,152 | | | | | | | 357,741 | | | |
| | | | | | |
Expenses: | | | | | | | | | | | | | | | | | | | | | |
Investment advisory fees | | | | 623,680 | | | | | | | 499,782 | | | | | | | 96,602 | | | |
Distribution fees - Class AAA | | | | 134,095 | | | | | | | 130,115 | | | | | | | 9,743 | | | |
Distribution fees - Class A | | | | 15,694 | | | | | | | 38,651 | | | | | | | 2,200 | | | |
Distribution fees - Class C | | | | 9,967 | | | | | | | 49,363 | | | | | | | 11,952 | | | |
Distribution fees - Class T | | | | — | | | | | | | — | | | | | | | — | | | |
Accounting fees | | | | 45,000 | | | | | | | 45,000 | | | | | | | — | | | |
Custodian fees | | | | 3,819 | | | | | | | 3,955 | | | | | | | 4,961 | | | |
Interest expense | | | | — | | | | | | | — | | | | | | | — | | | |
Legal and audit fees | | | | 31,361 | | | | | | | 31,790 | | | | | | | 30,016 | | | |
Payroll expenses | | | | — | | | | | | | — | | | | | | | — | | | |
Registration expenses | | | | 54,198 | | | | | | | 54,729 | | | | | | | 42,025 | | | |
Shareholder communications expenses | | | | 31,642 | | | | | | | 28,361 | | | | | | | 8,623 | | | |
Shareholder services fees | | | | 48,268 | | | | | | | 46,814 | | | | | | | 13,469 | | | |
Trustees’ fees | | | | 4,273 | | | | | | | 4,534 | | | | | | | 1,046 | | | |
Miscellaneous expenses | | | | 11,494 | | | | | | | 10,316 | | | | | | | 7,771 | | | |
| | | | | | |
Total Expenses | | | | 1,013,491 | | | | | | | 943,410 | | | | | | | 228,408 | | | |
| | | | | | |
Less: | | | | | | | | | | | | | | | | | | | | | |
Fees waived or expenses reimbursed by Adviser
(See Note 3) | | | | — | | | | | | | — | | | | | | | (83,760 | ) | | |
Advisory fee reduction on unsupervised assets (See Note 3) | | | | — | | | | | | | — | | | | | | | — | | | |
Custodian fee credits | | | | — | | | | | | | — | | | | | | | — | | | |
Expenses paid by broker (See Note 6) | | | | (1,760 | ) | | | | | | (1,797 | ) | | | | | | — | | | |
| | | | | | |
Total Reimbursements, Waivers, Reductions, and Credits | | | | (1,760 | ) | | | | | | (1,797 | ) | | | | | | (83,760 | ) | | |
| | | | | | |
Net Expenses | | | | 1,011,731 | | | | | | | 941,613 | | | | | | | 144,648 | | | |
| | | | | | |
Net Investment Income | | | | 311,491 | | | | | | | 568,539 | | | | | | | 213,093 | | | |
| | | | | | |
Net Realized and Unrealized Gain/(Loss) on Investments, Securities Sold Short, Redemption In-Kind, and Foreign Currency: | | | | | | | | | | | | | | | | | | | | | |
Net realized gain on investments - unaffiliated | | | | 7,012,925 | | | | | | | 4,447,919 | | | | | | | 129,684 | | | |
Net realized loss on investments - affiliated | | | | — | | | | | | | — | | | | | | | — | | | |
Net realized loss on securities sold short | | | | — | | | | | | | — | | | | | | | — | | | |
Net realized gain on redemption in-kind | | | | — | | | | | | | — | | | | | | | — | | | |
Net realized loss on foreign currency transactions | | | | — | | | | | | | — | | | | | | | — | | | |
Net realized gain on investments, securities sold short, redemption in-kind, and foreign currency transactions | | | | 7,012,925 | | | | | | | 4,447,919 | | | | | | | 129,684 | | | |
| | | | | | |
Net change in unrealized appreciation/depreciation: | | | | | | | | | | | | | | | | | | | | | |
on investments | | | | 2,252,399 | | | | | | | 1,584,106 | | | | | | | (564,517 | ) | | |
on foreign currency translations | | | | — | | | | | | | — | | | | | | | — | | | |
| | | | | | |
Net change in unrealized appreciation/depreciation on investments | | | | 2,252,399 | | | | | | | 1,584,106 | | | | | | | (564,517 | ) | | |
| | | | | | |
Net Realized and Unrealized Gain on Investments, Securities Sold Short, Redemption In-Kind, and Foreign Currency | | | | 9,265,324 | | | | | | | 6,032,025 | | | | | | | (434,833 | ) | | |
| | | | | | |
Net Increase/(Decrease) in Net Assets Resulting from Operations | | | $ | 9,576,815 | | | | | | $ | 6,600,564 | | | | | | $ | (221,740 | ) | | |
See accompanying notes to financial statements.
37
TETON Westwood Funds
Statements of Changes in Net Assets
For the Year Ended Ended September 30,
| | | | | | | | | | | | | | | | | | | | | | | | | | | | |
| | | Mighty MitesSM Fund | | | | | SmallCap Equity Fund | | | | | Mid-Cap Equity Fund | |
| | | 2017 | | | 2016 | | | | | 2017 | | | 2016 | | | | | 2017 | | | 2016 | |
Operations: | | | | | | | | | | | | | | | | | | | | | | | | | | | | |
Net investment income/(loss) | | $ | (5,741,971 | ) | | $ | (7,545,752 | ) | | | | $ | (56,824 | ) | | $ | (57,822 | ) | | | | $ | (4,957 | ) | | $ | (11,544 | ) |
Net realized gain on investments, securities sold short, redemption in-kind, and foreign currency transactions | | | 86,739,197 | | | | 58,438,217 | | | | | | 2,628,872 | | | | 2,297,290 | | | | | | 155,128 | | | | 117,460 | |
Net change in unrealized appreciation/depreciation on investments and foreign currency translations | | | 177,676,434 | | | | 90,584,805 | | | | | | 3,708,579 | | | | 2,050,135 | | | | | | 244,240 | | | | 240,606 | |
Net Increase/(Decrease) in Net Assets Resulting from Operations | | | 258,673,660 | | | | 141,477,270 | | | | | | 6,280,627 | | | | 4,289,603 | | | | | | 394,411 | | | | 346,522 | |
Distributions to Shareholders: | | | | | | | | | | | | | | | | | | | | | | | | | | | | |
Net investment income | | | | | | | | | | | | | | | | | | | | | | | | | | | | |
Class AAA | | | — | | | | — | | | | | | — | | | | — | | | | | | — | | | | — | |
Class A | | | — | | | | — | | | | | | — | | | | — | | | | | | — | | | | — | |
Class C | | | — | | | | — | | | | | | — | | | | — | | | | | | — | | | | — | |
Class I | | | — | | | | — | | | | | | — | | | | — | | | | | | — | | | | — | |
| | | — | | | | — | | | | | | — | | | | — | | | | | | — | | | | — | |
Net realized gain | | | | | | | | | | | | | | | | | | | | | | | | | | | | |
Class AAA | | | (12,112,850 | ) | | | (6,095,461 | ) | | | | | (1,120,049 | ) | | | (1,157,380 | ) | | | | | (21,204 | ) | | | (79,782 | ) |
Class A | | | (6,973,598 | ) | | | (3,660,523 | ) | | | | | (282,966 | ) | | | (490,551 | ) | | | | | (4,128 | ) | | | (23,063 | ) |
Class C | | | (9,278,000 | ) | | | (4,948,570 | ) | | | | | (229,623 | ) | | | (546,624 | ) | | | | | (2,204 | ) | | | (12,061 | ) |
Class I | | | (22,623,866 | ) | | | (10,716,802 | ) | | | | | (1,008,986 | ) | | | (1,549,159 | ) | | | | | (19,507 | ) | | | (86,372 | ) |
| | | | (50,988,314 | ) | | | (25,421,356 | ) | | | | | (2,641,624 | ) | | | (3,743,714 | ) | | | | | (47,043 | ) | | | (201,278 | ) |
Total Distributions to Shareholders | | | (50,988,314 | ) | | | (25,421,356 | ) | | | | | (2,641,624 | ) | | | (3,743,714 | ) | | | | | (47,043 | ) | | | (201,278 | ) |
Shares of Beneficial Interest Transactions: | | | | | | | | | | | | | | | | | | | | | | | | | | | | |
Proceeds from shares issued | | | | | | | | | | | | | | | | | | | | | | | | | | | | |
Class AAA | | | 46,277,238 | | | | 25,166,399 | | | | | | 5,179,585 | | | | 4,274,883 | | | | | | 503,380 | | | | 355,459 | |
Class A | | | 37,625,664 | | | | 13,798,430 | | | | | | 800,502 | | | | 236,596 | | | | | | 84,849 | | | | 19,774 | |
Class C | | | 22,015,082 | | | | 17,038,503 | | | | | | 311,575 | | | | 610,708 | | | | | | 21,694 | | | | 24,420 | |
Class I | | | 222,822,655 | | | | 98,912,516 | | | | | | 5,631,113 | | | | 963,829 | | | | | | 122,671 | | | | 81,792 | |
Class T | | | 10,000 | | | | — | | | | | | 1,000 | | | | — | | | | | | — | | | | — | |
| | | 328,750,639 | | | | 154,915,848 | | | | | | 11,923,775 | | | | 6,086,016 | | | | | | 732,594 | | | | 481,445 | |
Proceeds from reinvestment of distributions | | | | | | | | | | | | | | | | | | | | | | | | | | | | |
Class AAA | | | 11,851,540 | | | | 5,979,037 | | | | | | 1,099,599 | | | | 1,099,502 | | | | | | 21,204 | | | | 69,340 | |
Class A | | | 6,334,330 | | | | 3,105,905 | | | | | | 270,995 | | | | 448,413 | | | | | | 3,123 | | | | 19,621 | |
Class C | | | 7,567,826 | | | | 3,888,543 | | | | | | 185,367 | | | | 447,962 | | | | | | 2,047 | | | | 11,737 | |
Class I | | | 14,416,148 | | | | 7,046,245 | | | | | | 993,398 | | | | 1,490,195 | | | | | | 19,508 | | | | 86,372 | |
| | | 40,169,844 | | | | 20,019,730 | | | | | | 2,549,359 | | | | 3,486,072 | | | | | | 45,882 | | | | 187,070 | |
Cost of shares redeemed | | | | | | | | | | | | | | | | | | | | | | | | | | | | |
Class AAA | | | (85,877,875 | ) | | | (68,915,531 | ) | | | | | (8,983,081 | ) | | | (2,487,786 | ) | | | | | (1,628,525 | ) | | | (701,109 | ) |
Class A | | | (43,270,182 | ) | | | (44,872,412 | ) | | | | | (742,991 | ) | | | (1,121,302 | ) | | | | | (230,286 | ) | | | (304,721 | ) |
Class C | | | (52,086,231 | ) | | | (51,145,275 | ) | | | | | (730,299 | ) | | | (1,740,637 | ) | | | | | (42,312 | ) | | | (124,531 | ) |
Class I | | | (93,376,064 | ) | | | (171,152,381 | ) | | | | | (1,909,312 | ) | | | (1,731,285 | ) | | | | | (305,769 | ) | | | (560,784 | ) |
| | | (274,610,352 | ) | | | (336,085,599 | ) | | | | | (12,365,683 | ) | | | (7,081,010 | ) | | | | | (2,206,892 | ) | | | (1,691,145 | ) |
Net Increase/(Decrease) in Net Assets from Shares of Beneficial Interest Transactions | | | 94,310,131 | | | | (161,150,021 | ) | | | | | 2,107,451 | | | | 2,491,078 | | | | | | (1,428,416 | ) | | | (1,022,630 | ) |
Redemption Fees | | | 1,172 | | | | 2,669 | | | | | | 581 | | | | 1,987 | | | | | | 5 | | | | 58 | |
Net Increase/(Decrease) in Net Assets | | | 301,996,649 | | | | (45,091,438 | ) | | | | | 5,747,035 | | | | 3,038,954 | | | | | | (1,081,043 | ) | | | (877,328 | ) |
Net Assets: | | | | | | | | | | | | | | | | | | | | | | | | | | | | |
Beginning of year | | | 1,050,115,201 | | | | 1,095,206,639 | | | | | | 26,877,003 | | | | 23,838,049 | | | | | | 4,072,347 | | | | 4,949,675 | |
End of year | | $ | 1,352,111,850 | | | $ | 1,050,115,201 | | | | | $ | 32,624,038 | | | $ | 26,877,003 | | | | | $ | 2,991,304 | | | $ | 4,072,347 | |
Undistributed net investment income | | | — | | | | — | | | | | | — | | | | — | | | | | | — | | | | — | |
| | | | | | | | | | | | | | | | | | | | | | | | | | | | |
See accompanying notes to financial statements.
38
TETON Westwood Funds
Statements of Changes in Net Assets (Continued)
For the Year Ended September 30,
| | | | | | | | | | | | | | | | | | | | | | | | | | | | | | | | |
| | | Convertible Securities Fund | | | Equity Fund | | | Balanced Fund | | | Intermediate Bond Fund | |
| | | | | | | | |
| | | 2017 | | | 2016 | | | 2017 | | | 2016 | | | 2017 | | | 2016 | | | 2017 | | | 2016 | |
| | | | | | | | |
| | $ | 54,387 | | | $ | 18,682 | | | $ | 311,491 | | | $ | 332,110 | | | $ | 568,539 | | | $ | 669,863 | | | $ | 213,093 | | | $ | 285,645 | |
| | | | | | | | |
| | | 17,060 | | | | 1,780,804 | | | | 7,012,925 | | | | 3,903,080 | | | | 4,447,919 | | | | 3,117,645 | | | | 129,684 | | | | 139,304 | |
| | | | | | | | |
| | | 1,133,294 | | | | (1,047,191 | ) | | | 2,252,399 | | | | 2,580,783 | | | | 1,584,106 | | | | 1,746,780 | | | | (564,517 | ) | | | 371,799 | |
| | | | | | | | |
| | | 1,204,741 | | | | 752,295 | | | | 9,576,815 | | | | 6,815,973 | | | | 6,600,564 | | | | 5,534,288 | | | | (221,740 | ) | | | 796,748 | |
| | | | | | | | |
| | | (70,888 | ) | | | (15,808 | ) | | | (293,061 | ) | | | (211,307 | ) | | | (482,424 | ) | | | (576,148 | ) | | | (48,082 | ) | | | (57,195 | ) |
| | | (37,114 | ) | | | (1,643 | ) | | | (10,405 | ) | | | (7,679 | ) | | | (57,301 | ) | | | (56,715 | ) | | | (7,121 | ) | | | (10,078 | ) |
| | | (13,786 | ) | | | (517 | ) | | | — | | | | — | | | | (5,528 | ) | | | (17,080 | ) | | | (5,847 | ) | | | (4,384 | ) |
| | | (97,611 | ) | | | (1,339 | ) | | | (34,162 | ) | | | (29,046 | ) | | | (23,315 | ) | | | (24,897 | ) | | | (152,069 | ) | | | (214,019 | ) |
| | | (219,399 | ) | | | (19,307 | ) | | | (337,628 | ) | | | (248,032 | ) | | | (568,568 | ) | | | (674,840 | ) | | | (213,119 | ) | | | (285,676 | ) |
| | | | | | | | |
| | | (171,202 | ) | | | — | | | | (3,329,667 | ) | | | (4,079,809 | ) | | | (2,878,995 | ) | | | (3,761,458 | ) | | | (29,726 | ) | | | (91,989 | ) |
| | | (48,555 | ) | | | — | | | | (231,525 | ) | | | (283,279 | ) | | | (379,547 | ) | | | (458,819 | ) | | | (5,414 | ) | | | (16,150 | ) |
| | | (36,328 | ) | | | — | | | | (55,386 | ) | | | (59,970 | ) | | | (282,541 | ) | | | (353,385 | ) | | | (9,133 | ) | | | (8,637 | ) |
| | | (51,404 | ) | | | — | | | | (266,964 | ) | | | (331,753 | ) | | | (101,837 | ) | | | (127,425 | ) | | | (95,098 | ) | | | (249,249 | ) |
| | | (307,489 | ) | | | — | | | | (3,883,542 | ) | | | (4,754,811 | ) | | | (3,642,920 | ) | | | (4,701,087 | ) | | | (139,371 | ) | | | (366,025 | ) |
| | | (526,888 | ) | | | (19,307 | ) | | | (4,221,170 | ) | | | (5,002,843 | ) | | | (4,211,488 | ) | | | (5,375,927 | ) | | | (352,490 | ) | | | (651,701 | ) |
| | | | | | | | |
| | | 1,176,145 | | | | 433,186 | | | | 633,201 | | | | 1,098,418 | | | | 6,800,089 | | | | 5,554,854 | | | | 613,039 | | | | 599,586 | |
| | | 2,208,003 | | | | 351,906 | | | | 177,782 | | | | 1,120,647 | | | | 1,427,808 | | | | 1,469,112 | | | | 107,817 | | | | 230,824 | |
| | | 545,063 | | | | 39,531 | | | | 465,776 | | | | 166,014 | | | | 425,428 | | | | 1,287,764 | | | | 298,476 | | | | 3,247,789 | |
| | | 6,720,412 | | | | 165,930 | | | | 1,263,682 | | | | 976,188 | | | | 442,446 | | | | 267,769 | | | | 2,143,875 | | | | 2,430,851 | |
| | | — | | | | — | | | | — | | | | — | | | | — | | | | — | | | | — | | | | — | |
| | | 10,649,623 | | | | 990,553 | | | | 2,540,441 | | | | 3,361,267 | | | | 9,095,771 | | | | 8,579,499 | | | | 3,163,207 | | | | 6,509,050 | |
| | | | | | | | |
| | | 239,557 | | | | 15,257 | | | | 3,475,689 | | | | 4,146,689 | | | | 3,263,840 | | | | 4,208,821 | | | | 74,956 | | | | 143,907 | |
| | | 84,294 | | | | 1,608 | | | | 241,265 | | | | 287,016 | | | | 422,760 | | | | 469,977 | | | | 10,718 | | | | 24,840 | |
| | | 50,107 | | | | 517 | | | | 36,439 | | | | 48,297 | | | | 258,563 | | | | 335,806 | | | | 14,817 | | | | 12,682 | |
| | | 148,724 | | | | 1,333 | | | | 276,907 | | | | 278,123 | | | | 123,387 | | | | 145,323 | | | | 238,579 | | | | 461,328 | |
| | | 522,682 | | | | 18,715 | | | | 4,030,300 | | | | 4,760,125 | | | | 4,068,550 | | | | 5,159,927 | | | | 339,070 | | | | 642,757 | |
| | | | | | | | |
| | | (1,825,247 | ) | | | (2,245,733 | ) | | | (7,622,675 | ) | | | (6,983,605 | ) | | | (11,090,185 | ) | | | (13,736,422 | ) | | | (1,040,146 | ) | | | (1,629,881 | ) |
| | | (948,677 | ) | | | (361,000 | ) | | | (1,886,165 | ) | | | (889,260 | ) | | | (1,033,374 | ) | | | (1,509,758 | ) | | | (415,391 | ) | | | (263,915 | ) |
| | | (226,560 | ) | | | (191,875 | ) | | | (742,638 | ) | | | (75,800 | ) | | | (1,832,466 | ) | | | (1,341,488 | ) | | | (317,041 | ) | | | (2,526,488 | ) |
| | | (797,451 | ) | | | (45,940 | ) | | | (1,231,226 | ) | | | (1,489,488 | ) | | | (540,455 | ) | | | (375,998 | ) | | | (13,216,920 | ) | | | (1,918,411 | ) |
| | | (3,797,935 | ) | | | (2,844,548 | ) | | | (11,482,704 | ) | | | (9,438,153 | ) | | | (14,496,480 | ) | | | (16,963,666 | ) | | | (14,989,498 | ) | | | (6,338,695 | ) |
| | | | | | | | |
| | | 7,374,370 | | | | (1,835,280 | ) | | | (4,911,963 | ) | | | (1,316,761 | ) | | | (1,332,159 | ) | | | (3,224,240 | ) | | | (11,487,221 | ) | | | 813,112 | |
| | | 966 | | | | 10 | | | | — | | | | — | | | | 25 | | | | 2 | | | | — | | | | — | |
| | | 8,053,189 | | | | (1,102,282 | ) | | | 443,682 | | | | 496,369 | | | | 1,056,942 | | | | (3,065,877 | ) | | | (12,061,451 | ) | | | 958,159 | |
| | | | | | | | |
| | | 6,697,857 | | | | 7,800,139 | | | | 61,883,213 | | | | 61,386,844 | | | | 64,616,381 | | | | 67,682,258 | | | | 20,231,765 | | | | 19,273,606 | |
| | $ | 14,751,046 | | | $ | 6,697,857 | | | $ | 62,326,895 | | | $ | 61,883,213 | | | $ | 65,673,323 | | | $ | 64,616,381 | | | $ | 8,170,314 | | | $ | 20,231,765 | |
| | | — | | | $ | 1,996 | | | $ | 220,526 | | | $ | 246,663 | | | $ | 32 | | | | — | | | | — | | | $ | 129 | |
See accompanying notes to financial statements.
39
TETON Westwood Funds
Financial Highlights
Selected data for a share of beneficial interest outstanding throughout each year:
| | | | | | | | | | | | | | | | | | | | | | | | | | | | | | | | | | | | | | | | | | | | | | | | | | | | | | | | | | | | | | | | | | | | | | | | | | | |
| | | | | Income (Loss) from Investment Operations | | Distributions to Shareholders | | | | | | | | Ratios to Average Net Assets/Supplemental Data |
Year Ended September 30 | | Net Asset
Value,
Beginning
of Period | | Net
Investment
Income
(Loss)(a)(b) | | Net
Realized and
Unrealized
Gain (Loss) on
Investments | | Total from
Investment
Operations | | Net
Investment
Income | | Net
Realized
Gain on
Investments | | Total
Distributions | | Redemption
Fees(a)(c) | | Net Asset
Value,
End of
Period | | Total
Return† | | Net Assets,
End of
Period
(in 000’s) | | Net
Investment
Income
(Loss) | | Operating
Expenses
Net of
Waivers/
Reimbursements/
Reductions | | Operating
Expenses
Before
Waivers/
Reimbursements/
Reductions(d) | | Portfolio
Turnover
Rate |
Mighty MitesSM Fund | | | | | | | | | | | | | | | | | | | | | | | | | | | | | | | | | | | | | | | | | |
Class AAA | | | | | | | | | | | | | | | | | | | | | | | | | | | | | | | | | | | | |
2017 | | | $ | 24.76 | | | | $ | (0.12 | ) | | | $ | 5.97 | | | | $ | 5.85 | | | | | — | | | | $ | (1.19 | ) | | | $ | (1.19 | ) | | | $ | 0.00 | | | | $ | 29.42 | | | | | 24.4 | % | | | $ | 274,161 | | | | | (0.46 | )% | | | | 1.41 | %(e) | | | | 1.42 | % | | | | 8 | % |
2016 | | | | 22.02 | | | | | (0.15 | ) | | | | 3.41 | | | | | 3.26 | | | | | — | | | | | (0.52 | ) | | | | (0.52 | ) | | | | 0.00 | | | | | 24.76 | | | | | 15.0 | | | | | 256,488 | | | | | (0.67 | ) | | | | 1.41 | (e) | | | | 1.41 | | | | | 6 | |
2015 | | | | 23.01 | | | | | (0.06 | ) | | | | (0.50 | ) | | | | (0.56 | ) | | | | — | | | | | (0.43 | ) | | | | (0.43 | ) | | | | 0.00 | | | | | 22.02 | | | | | (2.6 | ) | | | | 265,145 | | | | | (0.27 | ) | | | | 1.40 | (e) | | | | 1.41 | | | | | 13 | |
2014 | | | | 23.81 | | | | | (0.22 | ) | | | | 0.80 | | | | | 0.58 | | | | | — | | | | | (1.38 | ) | | | | (1.38 | ) | | | | 0.00 | | | | | 23.01 | | | | | 2.2 | | | | | 365,022 | | | | | (0.90 | ) | | | | 1.41 | | | | | 1.42 | | | | | 14 | |
2013 | | | | 17.94 | | | | | 0.04 | | | | | 6.29 | | | | | 6.33 | | | | $ | (0.08 | ) | | | | (0.38 | ) | | | | (0.46 | ) | | | | 0.00 | | | | | 23.81 | | | | | 36.2 | | | | | 476,112 | | | | | 0.19 | | | | | 1.41 | | | | | 1.43 | | | | | 15 | |
Class A | | | | | | | �� | | | | | | | | | | | | | | | | | | | | | | | | | | | | | |
2017 | | | $ | 24.01 | | | | $ | (0.18 | ) | | | $ | 5.78 | | | | $ | 5.60 | | | | | — | | | | $ | (1.19 | ) | | | $ | (1.19 | ) | | | $ | 0.00 | | | | $ | 28.42 | | | | | 24.1 | % | | | $ | 169,017 | | | | | (0.72 | )% | | | | 1.66 | %(e) | | | | 1.67 | % | | | | 8 | % |
2016 | | | | 21.43 | | | | | (0.20 | ) | | | | 3.30 | | | | | 3.10 | | | | | — | | | | | (0.52 | ) | | | | (0.52 | ) | | | | 0.00 | | | | | 24.01 | | | | | 14.6 | | | | | 141,893 | | | | | (0.92 | ) | | | | 1.66 | (e) | | | | 1.66 | | | | | 6 | |
2015 | | | | 22.45 | | | | | (0.12 | ) | | | | (0.47 | ) | | | | (0.59 | ) | | | | — | | | | | (0.43 | ) | | | | (0.43 | ) | | | | 0.00 | | | | | 21.43 | | | | | (2.8 | ) | | | | 154,000 | | | | | (0.51 | ) | | | | 1.65 | (e) | | | | 1.66 | | | | | 13 | |
2014 | | | | 23.32 | | | | | (0.27 | ) | | | | 0.78 | | | | | 0.51 | | | | | — | | | | | (1.38 | ) | | | | (1.38 | ) | | | | 0.00 | | | | | 22.45 | | | | | 2.0 | | | | | 175,108 | | | | | (1.16 | ) | | | | 1.66 | | | | | 1.67 | | | | | 14 | |
2013 | | | | 17.59 | | | | | (0.02 | ) | | | | 6.17 | | | | | 6.15 | | | | $ | (0.04 | ) | | | | (0.38 | ) | | | | (0.42 | ) | | | | 0.00 | | | | | 23.32 | | | | | 35.8 | | | | | 139,464 | | | | | (0.08 | ) | | | | 1.66 | | | | | 1.68 | | | | | 15 | |
Class C | | | | | | | | | | | | | | | | | | | | | | | | | | | | | | | | | | | | |
2017 | | | $ | 21.55 | | | | $ | (0.27 | ) | | | $ | 5.15 | | | | $ | 4.88 | | | | | — | | | | $ | (1.19 | ) | | | $ | (1.19 | ) | | | $ | 0.00 | | | | $ | 25.24 | | | | | 23.5 | % | | | $ | 180,282 | | | | | (1.21 | )% | | | | 2.16 | %(e) | | | | 2.17 | % | | | | 8 | % |
2016 | | | | 19.38 | | | | | (0.28 | ) | | | | 2.97 | | | | | 2.69 | | | | | — | | | | | (0.52 | ) | | | | (0.52 | ) | | | | 0.00 | | | | | 21.55 | | | | | 14.1 | | | | | 175,241 | | | | | (1.41 | ) | | | | 2.16 | (e) | | | | 2.16 | | | | | 6 | |
2015 | | | | 20.44 | | | | | (0.21 | ) | | | | (0.42 | ) | | | | (0.63 | ) | | | | — | | | | | (0.43 | ) | | | | (0.43 | ) | | | | 0.00 | | | | | 19.38 | | | | | (3.2 | ) | | | | 187,216 | | | | | (1.01 | ) | | | | 2.15 | (e) | | | | 2.16 | | | | | 13 | |
2014 | | | | 21.46 | | | | | (0.36 | ) | | | | 0.72 | | | | | 0.36 | | | | | — | | | | | (1.38 | ) | | | | (1.38 | ) | | | | 0.00 | | | | | 20.44 | | | | | 1.4 | | | | | 208,795 | | | | | (1.66 | ) | | | | 2.16 | | | | | 2.17 | | | | | 14 | |
2013 | | | | 16.25 | | | | | (0.10 | ) | | | | 5.69 | | | | | 5.59 | | | | | — | | | | | (0.38 | ) | | | | (0.38 | ) | | | | 0.00 | | | | | 21.46 | | | | | 35.3 | | | | | 160,852 | | | | | (0.57 | ) | | | | 2.16 | | | | | 2.18 | | | | | 15 | |
Class I | | | | | | | | | | | | | | | | | | | | | | | | | | | | | | | | | | | | |
2017 | | | $ | 25.18 | | | | $ | (0.06 | ) | | | $ | 6.09 | | | | $ | 6.03 | | | | | — | | | | $ | (1.19 | ) | | | $ | (1.19 | ) | | | $ | 0.00 | | | | $ | 30.02 | | | | | 24.7 | % | | | $ | 728,641 | | | | | (0.22 | )% | | | | 1.16 | %(e) | | | | 1.17 | % | | | | 8 | % |
2016 | | | | 22.34 | | | | | (0.10 | ) | | | | 3.46 | | | | | 3.36 | | | | | — | | | | | (0.52 | ) | | | | (0.52 | ) | | | | 0.00 | | | | | 25.18 | | | | | 15.2 | | | | | 476,493 | | | | | (0.44 | ) | | | | 1.16 | (e) | | | | 1.16 | | | | | 6 | |
2015 | | | | 23.27 | | | | | (0.00 | )(c) | | | | (0.50 | ) | | | | (0.50 | ) | | | | — | | | | | (0.43 | ) | | | | (0.43 | ) | | | | 0.00 | | | | | 22.34 | | | | | (2.3 | ) | | | | 488,846 | | | | | (0.01 | ) | | | | 1.15 | (e) | | | | 1.16 | | | | | 13 | |
2014 | | | | 24.02 | | | | | (0.16 | ) | | | | 0.79 | | | | | 0.63 | | | | | — | | | | | (1.38 | ) | | | | (1.38 | ) | | | | 0.00 | | | | | 23.27 | | | | | 2.4 | | | | | 519,459 | | | | | (0.67 | ) | | | | 1.16 | | | | | 1.17 | | | | | 14 | |
2013 | | | | 18.13 | | | | | 0.08 | | | | | 6.35 | | | | | 6.43 | | | | $ | (0.16 | ) | | | | (0.38 | ) | | | | (0.54 | ) | | | | 0.00 | | | | | 24.02 | | | | | 36.6 | | | | | 277,588 | | | | | 0.40 | | | | | 1.16 | | | | | 1.18 | | | | | 15 | |
Class T(f) | | | | | | | | | | | | | | | | | | | | | | | | | | | | | | | | | | | | | | | | | | | | | | | | | | | | | | | | | | | | | | | | | | | | | | | |
2017 | | | $ | 27.40 | | | | $ | (0.04 | ) | | | | $ 2.06 | | | | | $ 2.02 | | | | | — | | | | | — | | | | | — | | | | | — | | | | $ | 29.42 | | | | | 7.4 | % | | | $ | 11 | | | | | (0.65 | )%(g) | | | | 1.41 | %(g) | | | | 1.42 | %(g) | | | | 8 | % |
| † | Total return represents aggregate total return of a hypothetical $1,000 investment at the beginning of the period and sold at the end of the period including reinvestment of distributions and does not reflect applicable sales charges. Total return for a period of less than one year is not annualized. |
| (a) | Per share data are calculated using the average shares outstanding method. |
| (b) | Due to capital share activity, net investment income (loss), per share and the ratio to average net assets are not necessarily correlated among the different classes of shares. |
| (c) | Amount represents less than $0.005 per share. |
| (d) | Before advisory fee reduction on unsupervised assets totaling 0.01%, 0.01%, 0.01%, and 0.02% of net assets for the years ended September 30, 2017, 2015, 2014, and 2013, respectively. For the year ended September 30, 2016, there was no impact on the expense ratios. |
| (e) | The Fund received credits from a designated broker who agreed to pay certain Fund operating expenses. For the years ended September 30, 2017, 2016, and 2015, there was no impact on the expense ratios. |
| (f) | Class T Shares were initially offered on July 5, 2017. |
See accompanying notes to financial statements.
40
TETON Westwood Funds
Financial Highlights
Selected data for a share of beneficial interest outstanding throughout each year:
| | | | | | | | | | | | | | | | | | | | | | | | | | | | | | | | | | | | | | | | | | | | | | | | | | | | | | | | | | | | | | | | | | | | | | | | | | | |
| | | | | Income (Loss) from Investment Operations | | Distributions to Shareholders | | | | | | | | Ratios to Average Net Assets/Supplemental Data |
Year Ended September 30 | | Net Asset
Value,
Beginning
of Period | | Net Investment
Income
(Loss)(a) | | Net
Realized and
Unrealized
Gain (Loss) on
Investments | | Total From
Investment
Operations | | Net
Investment
Income | | Net
Realized
Gain on
Investments | | Total
Distributions | | Redemption
Fees(b) | | Net Asset
Value,
End of
Period | | Total
Return† | | Net Assets,
End of
Period
(in 000’s) | | Net
Investment
Income
(Loss) | | Operating
Expenses
Net of
Waivers/
Reimbursements | | Operating
Expenses
Before Waivers/
Reimbursements | | Portfolio
Turnover
Rate |
SmallCap Equity Fund | | | | | | | | | | | | | | | | | | | | | | | | | | | | | | | | | | | | | | | | | | | | | | | | | | | | | | | | |
Class AAA | | | | | | | | | | | | | | | | | | | | | | | | | | | | | | | | | | | | | | | | | | | | | | | | | | | | | | | | | | | | | |
2017 | | $19.03 | | | $ | (0.04 | ) | | | $ | 4.17 | | | | $ | 4.13 | | | | | — | | | | $ | (1.79 | ) | | | $ | (1.79 | ) | | | $ | 0.00 | | | | $ | 21.37 | | | | | 23.1 | % | | | $ | 9,295 | | | | | (0.22 | )% | | | | 1.36 | %(c) | | | | 1.74 | % | | | | 38 | % |
2016 | | 18.54 | | | | (0.04 | ) | | | | 3.57 | | | | | 3.53 | | | | | — | | | | | (3.04 | ) | | | | (3.04 | ) | | | | 0.00 | | | | | 19.03 | | | | | 21.1 | | | | | 10,855 | | | | | (0.25 | ) | | | | 1.50 | (c) | | | | 1.79 | | | | | 18 | |
2015 | | 20.52 | | | | (0.09 | ) | | | | (0.29 | ) | | | | (0.38 | ) | | | | — | | | | | (1.60 | ) | | | | (1.60 | ) | | | | — | | | | | 18.54 | | | | | (2.4 | ) | | | | 7,721 | | | | | (0.47 | ) | | | | 1.50 | (c) | | | | 1.66 | | | | | 23 | |
2014 | | 19.83 | | | | (0.07 | ) | | | | 0.76 | | | | | 0.69 | | | | | — | | | | | — | | | | | — | | | | | 0.00 | | | | | 20.52 | | | | | 3.5 | | | | | 15,649 | | | | | (0.35 | ) | | | | 1.50 | | | | | 1.57 | | | | | 13 | |
2013 | | 15.32 | | | | (0.01 | ) | | | | 4.52 | | | | | 4.51 | | | | | — | | | | | — | | | | | — | | | | | 0.00 | | | | | 19.83 | | | | | 29.4 | | | | | 19,576 | | | | | (0.05 | ) | | | | 1.50 | | | | | 1.63 | | | | | 12 | |
Class A | | | | | | | | | | | | | | | | | | | | | | | | | | | | | | | | | | | | | | | | | | | | | | | | | | | | | | | | | | | | | |
2017 | | $18.37 | | | $ | (0.09 | ) | | | $ | 4.01 | | | | $ | 3.92 | | | | | — | | | | $ | (1.79) | | | | $ | (1.79) | | | | $ | 0.00 | | | | $ | 20.50 | | | | | 22.8 | % | | | $ | 3,580 | | | | | (0.47 | )% | | | | 1.60 | %(c) | | | | 1.99 | % | | | | 38 | % |
2016 | | 18.02 | | | | (0.08 | ) | | | | 3.47 | | | | | 3.39 | | | | | — | | | | | (3.04 | ) | | | | (3.04 | ) | | | | 0.00 | | | | | 18.37 | | | | | 20.9 | | | | | 2,871 | | | | | (0.49 | ) | | | | 1.75 | (c) | | | | 2.04 | | | | | 18 | |
2015 | | 20.05 | | | | (0.14 | ) | | | | (0.29 | ) | | | | (0.43 | ) | | | | — | | | | | (1.60 | ) | | | | (1.60 | ) | | | | — | | | | | 18.02 | | | | | (2.7 | ) | | | | 3,258 | | | | | (0.71 | ) | | | | 1.75 | (c) | | | | 1.91 | | | | | 23 | |
2014 | | 19.41 | | | | (0.12 | ) | | | | 0.76 | | | | | 0.64 | | | | | — | | | | | — | | | | | — | | | | | 0.00 | | | | | 20.05 | | | | | 3.3 | | | | | 4,269 | | | | | (0.60 | ) | | | | 1.75 | | | | | 1.82 | | | | | 13 | |
2013 | | 15.03 | | | | (0.04 | ) | | | | 4.42 | | | | | 4.38 | | | | | — | | | | | — | | | | | — | | | | | 0.00 | | | | | 19.41 | | | | | 29.1 | | | | | 4,668 | | | | | (0.22 | ) | | | | 1.75 | | | | | 1.88 | | | | | 12 | |
Class C | | | | | | | | | | | | | | | | | | | | | | | | | | | | | | | | | | | | | | | | | | | | | | | | | | | | | | | | | | | | | |
2017 | | $16.43 | | | $ | (0.16 | ) | | | $ | 3.56 | | | | $ | 3.40 | | | | | — | | | | $ | (1.79) | | | | $ | (1.79) | | | | $ | 0.00 | | | | $ | 18.04 | | | | | 22.2 | % | | | $ | 2,247 | | | | | (0.97 | )% | | | | 2.11 | %(c) | | | | 2.49 | % | | | | 38 | % |
2016 | | 16.49 | | | | (0.15 | ) | | | | 3.13 | | | | | 2.98 | | | | | — | | | | | (3.04 | ) | | | | (3.04 | ) | | | | 0.00 | | | | | 16.43 | | | | | 20.2 | | | | | 2,268 | | | | | (0.99 | ) | | | | 2.25 | (c) | | | | 2.54 | | | | | 18 | |
2015 | | 18.56 | | | | (0.22 | ) | | | | (0.25 | ) | | | | (0.47 | ) | | | | — | | | | | (1.60 | ) | | | | (1.60 | ) | | | | — | | | | | 16.49 | | | | | (3.2 | ) | | | | 3,081 | | | | | (1.21 | ) | | | | 2.25 | (c) | | | | 2.41 | | | | | 23 | |
2014 | | 18.06 | | | | (0.21 | ) | | | | 0.71 | | | | | 0.50 | | | | | — | | | | | — | | | | | — | | | | | 0.00 | | | | | 18.56 | | | | | 2.8 | | | | | 4,186 | | | | | (1.10 | ) | | | | 2.25 | | | | | 2.32 | | | | | 13 | |
2013 | | 14.06 | | | | (0.11 | ) | | | | 4.11 | | | | | 4.00 | | | | | — | | | | | — | | | | | — | | | | | 0.00 | | | | | 18.06 | | | | | 28.4 | | | | | 4,460 | | | | | (0.72 | ) | | | | 2.25 | | | | | 2.38 | | | | | 12 | |
Class I | | | | | | | | | | | | | | | | | | | | | | | | | | | | | | | | | | | | | | | | | | | | | | | | | | | | | | | | | | | | | |
2017 | | $19.53 | | | $ | 0.01 | | | | $ | 4.29 | | | | $ | 4.30 | | | | | — | | | | $ | (1.79) | | | | $ | (1.79) | | | | $ | 0.00 | | | | $ | 22.04 | | | | | 23.4 | % | | | $ | 17,501 | | | | | 0.03 | % | | | | 1.09 | %(c) | | | | 1.49 | % | | | | 38 | % |
2016 | | 18.90 | | | | 0.00 | (b) | | | | 3.67 | | | | | 3.67 | | | | | — | | | | | (3.04 | ) | | | | (3.04 | ) | | | | 0.00 | | | | | 19.53 | | | | | 21.5 | | | | | 10,883 | | | | | 0.00 | | | | | 1.25 | (c) | | | | 1.54 | | | | | 18 | |
2015 | | 20.85 | | | | (0.04 | ) | | | | (0.31 | ) | | | | (0.35 | ) | | | | — | | | | | (1.60 | ) | | | | (1.60 | ) | | | | — | | | | | 18.90 | | | | | (2.2 | ) | | | | 9,778 | | | | | (0.21 | ) | | | | 1.25 | (c) | | | | 1.41 | | | | | 23 | |
2014 | | 20.09 | | | | (0.02 | ) | | | | 0.78 | | | | | 0.76 | | | | | — | | | | | — | | | | | — | | | | | 0.00 | | | | | 20.85 | | | | | 3.8 | | | | | 17,230 | | | | | (0.09 | ) | | | | 1.25 | | | | | 1.32 | | | | | 13 | |
2013 | | 15.50 | | | | 0.04 | | | | | 4.57 | | | | | 4.61 | | | | $ | (0.02 | ) | | | | — | | | | | (0.02 | ) | | | | 0.00 | | | | | 20.09 | | | | | 29.8 | | | | | 13,688 | | | | | 0.22 | | | | | 1.25 | | | | | 1.38 | | | | | 12 | |
Class T(d) | | | | | | | | | | | | | | | | | | | | | | | | | | | | | | | | | | | | | | | | | | | | | | | | | | | | | | | | | | | | | |
2017 | | $19.97 | | | | (0.01 | ) | | | $ | 1.41 | | | | $ | 1.40 | | | | | — | | | | | — | | | | | — | | | | | — | | | | $ | 21.37 | | | | | 7.0 | % | | | $ | 1 | | | | | (0.14 | )%(e) | | | | 1.25 | %(e) | | | | 1.74 | %(e) | | | | 38 | % |
| † | Total return represents aggregate total return of a hypothetical $1,000 investment at the beginning of the period and sold at the end of the period including reinvestment of distributions and does not reflect applicable sales charges. Total return for a period of less than one year is not annualized. |
| (a) | Per share data are calculated using the average shares outstanding method. |
| (b) | Amount represents less than $0.005 per share. |
| (c) | The Fund received credits from a designated broker who agreed to pay certain Fund operating expenses. Had such payments not been received, for the year ended September 30, 2016 the expense ratios would have been 1.51%, 1.76%, 2.26%, 1.26% for Class AAA, Class A, Class C, and Class I, respectively. For the years ended September 30, 2017 and 2015, these credits had no material impact on the expense ratios. |
| (d) | Class T Shares were initially offered on July 5, 2017. |
See accompanying notes to financial statements.
41
TETON Westwood Funds
Financial Highlights
Selected data for a share of beneficial interest outstanding throughout each year:
| | | | | | | | | | | | | | | | | | | | | | | | | | | | | | | | | | | | | | | | | | | | | | | | | | | | | | | | |
| | | | | | Income (Loss) from Investment Operations | | | Distributions to Shareholders | | | | | | | | | Ratios to Average Net Assets/Supplemental Data | |
Year Ended September 30 | | Net Asset
Value,
Beginning
of Period | | | Net
Investment
Income (Loss)(a) | | | Net
Realized and
Unrealized
Gain on
Investments | | | Total From
Investment
Operations | | | Net
Investment
Income | | | Net
Realized
Gain on
Investments | | | Total
Distributions | | | Net Asset
Value,
End of
Period | | | Total
Return† | | | Net Assets,
End of
Period
(in 000’s) | | | Net Investment
Income/Loss | | | Operating
Expenses
Net of
Waivers/
Reimbursements | | | Operating
Expenses
Before Waivers/
Reimbursements | | | Portfolio
Turnover
Rate | |
Mid-Cap Equity Fund | | | | | | | | | | | | | | | | | | | | | | | | | | | | | | | | | | | | | | | | | | | | | |
Class AAA | | | | | | | | | | | | | | | | | | | | | | | | | | | | | | | | | | | | | | | | | | | | | | | | | | | | | |
2017 | | $ | 11.88 | | | $ | (0.03 | ) | | $ | 1.60 | | | $ | 1.57 | | | | — | | | $ | (0.14 | ) | | $ | (0.14 | ) | | $ | 13.31 | | | | 13.4 | % | | $ | 805 | | | | (0.23 | )% | | | 1.05 | %(b) | | | 3.39 | % | | | 34 | % |
2016 | | | 11.43 | | | | (0.04 | ) | | | 0.97 | | | | 0.93 | | | | — | | | | (0.48 | ) | | | (0.48 | ) | | | 11.88 | | | | 8.2 | | | | 1,810 | | | | (0.40 | ) | | | 1.34(b | )(c) | | | 3.26 | | | | 15 | |
2015 | | | 11.54 | | | | (0.06 | ) | | | 0.07 | | | | 0.01 | | | | — | | | | (0.12 | ) | | | (0.12 | ) | | | 11.43 | | | | 0.1 | | | | 2,004 | | | | (0.52 | ) | | | 1.51(b | )(c) | | | 2.74 | | | | 25 | |
2014 | | | 10.48 | | | | (0.04 | ) | | | 1.10 | | | | 1.06 | | | | — | | | | (0.00 | )(d) | | | (0.00 | )(d) | | | 11.54 | | | | 10.2 | | | | 1,679 | | | | (0.39 | ) | | | 1.51(c | ) | | | 4.27 | | | | 22 | |
2013(e) | | | 10.00 | | | | (0.01 | ) | | | 0.49 | | | | 0.48 | | | | — | | | | — | | | | — | | | | 10.48 | | | | 4.8 | | | | 661 | | | | (0.42 | )(f) | | | 1.50(f | ) | | | 3.88(f | )(g) | | | 3 | |
Class A | | | | | | | | | | | | | | | | | | | | | | | | | | | | | | | | | | | | | | | | | | | | | | | | | | | | | |
2017 | | $ | 11.78 | | | $ | (0.06 | ) | | $ | 1.58 | | | $ | 1.52 | | | | — | | | $ | (0.14 | ) | | $ | (0.14 | ) | | $ | 13.16 | | | | 13.1 | % | | $ | 203 | | | | (0.45 | )% | | | 1.30 | %(b) | | | 3.64 | % | | | 34 | % |
2016 | | | 11.37 | | | | (0.07 | ) | | | 0.96 | | | | 0.89 | | | | — | | | | (0.48 | ) | | | (0.48 | ) | | | 11.78 | | | | 7.9 | | | | 309 | | | | (0.65 | ) | | | 1.63(b | )(c) | | | 3.44 | | | | 15 | |
2015 | | | 11.51 | | | | (0.09 | ) | | | 0.07 | | | | (0.02 | ) | | | — | | | | (0.12 | ) | | | (0.12 | ) | | | 11.37 | | | | (0.2 | ) | | | 593 | | | | (0.77 | ) | | | 1.76(b | )(c) | | | 2.99 | | | | 25 | |
2014 | | | 10.47 | | | | (0.08 | ) | | | 1.12 | | | | 1.04 | | | | — | | | | (0.00 | )(d) | | | (0.00 | )(d) | | | 11.51 | | | | 10.0 | | | | 682 | | | | (0.69 | ) | | | 1.76(c | ) | | | 4.52 | | | | 22 | |
2013(e) | | | 10.00 | | | | 0.03 | | | | 0.44 | | | | 0.47 | | | | — | | | | — | | | | — | | | | 10.47 | | | | 4.7 | | | | 188 | | | | 0.81(f | ) | | | 1.75(f | ) | | | 4.13(f | )(g) | | | 3 | |
Class C | | | | | | | | | | | | | | | | | | | | | | | | | | | | | | | | | | | | | | | | | | | | | | | | | | | | | |
2017 | | $ | 11.58 | | | $ | (0.11 | ) | | $ | 1.54 | | | $ | 1.43 | | | | — | | | $ | (0.14 | ) | | $ | (0.14 | ) | | $ | 12.87 | | | | 12.5 | % | | $ | 195 | | | | (0.95 | )% | | | 1.80 | %(b) | | | 4.14 | % | | | 34 | % |
2016 | | | 11.24 | | | | (0.12 | ) | | | 0.94 | | | | 0.82 | | | | — | | | | (0.48 | ) | | | (0.48 | ) | | | 11.58 | | | | 7.4 | | | | 193 | | | | (1.17 | ) | | | 2.11(b | )(c) | | | 3.98 | | | | 15 | |
2015 | | | 11.43 | | | | (0.15 | ) | | | 0.08 | | | | (0.07 | ) | | | — | | | | (0.12 | ) | | | (0.12 | ) | | | 11.24 | | | | (0.6 | ) | | | 274 | | | | (1.27 | ) | | | 2.26(b | )(c) | | | 3.49 | | | | 25 | |
2014 | | | 10.45 | | | | (0.13 | ) | | | 1.11 | | | | 0.98 | | | | — | | | | (0.00 | )(d) | | | (0.00 | )(d) | | | 11.43 | | | | 9.4 | | | | 239 | | | | (1.17 | ) | | | 2.26(c | ) | | | 5.02 | | | | 22 | |
2013(e) | | | 10.00 | | | | (0.02 | ) | | | 0.47 | | | | 0.45 | | | | — | | | | — | | | | — | | | | 10.45 | | | | 4.5 | | | | 74 | | | | (0.65 | )(f) | | | 2.25(f | ) | | | 4.63(f | )(g) | | | 3 | |
Class I | | | | | | | | | | | | | | | | | | | | | | | | | | | | | | | | | | | | | | | | | | | | | | | | | | | | | |
2017 | | $ | 12.00 | | | $ | 0.01 | | | $ | 1.61 | | | $ | 1.62 | | | | — | | | $ | (0.14 | ) | | $ | (0.14 | ) | | $ | 13.48 | | | | 13.7 | % | | $ | 1,788 | | | | 0.05 | % | | | 0.80 | %(b) | | | 3.14 | % | | | 34 | % |
2016 | | | 11.49 | | | | 0.00 | | | | 0.99 | | | | 0.99 | | | | — | | | | (0.48 | ) | | | (0.48 | ) | | | 12.00 | | | | 8.7 | | | | 1,760 | | | | 0.04 | | | | 0.90(b | )(c) | | | 3.00 | | | | 15 | |
2015 | | | 11.57 | | | | (0.03 | ) | | | 0.07 | | | | 0.04 | | | | — | | | | (0.12 | ) | | | (0.12 | ) | | | 11.49 | | | | 0.3 | | | | 2,079 | | | | (0.27 | ) | | | 1.26(b | )(c) | | | 2.49 | | | | 25 | |
2014 | | | 10.48 | | | | (0.01 | ) | | | 1.11 | | | | 1.10 | | | $ | (0.01 | ) | | | (0.00 | )(d) | | | (0.01 | ) | | | 11.57 | | | | 10.5 | | | | 2,345 | | | | (0.09 | ) | | | 1.26(c | ) | | | 4.02 | | | | 22 | |
2013(e) | | | 10.00 | | | | (0.01 | ) | | | 0.49 | | | | 0.48 | | | | — | | | | — | | | | — | | | | 10.48 | | | | 4.8 | | | | 1,155 | | | | (0.20 | )(f) | | | 1.25(f | ) | | | 3.63(f | )(g) | | | 3 | |
| † | Total return represents aggregate total return of a hypothetical $1,000 investment at the beginning of the period and sold at the end of the period including reinvestment of distributions and does not reflect applicable sales charges. Total return for a period of less than one year is not annualized. |
| (a) | Per share data are calculated using the average shares outstanding method. |
| (b) | The Fund received credits from a designated broker who agreed to pay certain Fund operating expenses. Had such payments not been received, the expense ratios for the years ended September 30, 2017, 2016, and 2015 would have been 1.08%, 1.39%, and 1.54% ( Class AAA), 1.33%, 1.68%, and 1.79% (Class A), 1.83%, 2.16%, and 2.29% (Class C), and 0.83%, 0.95%, and 1.29% (Class I Shares), respectively. |
| (c) | The Fund incurred interest expense during the years ended September 2016, 2015, and 2014. For the year ended September 30, 2016, there was no material impact on the expense ratios. For the years ended September 30, 2015 and 2014, if interest expense had not been incurred, the ratio of operating expenses to average net assets would have been 1.33% and 1.50% (Class AAA), 1.62% and 1.75% (Class A), 2.10% and 2.25% (Class C), 0.89% and 1.25% (Class I), respectively. |
| (d) | Amount represents less than $0.005 per share. |
| (e) | From the commencement of offering of Fund Shares on May 31, 2013 through September 30, 2013. |
| (g) | Certain non-recurring expenses incurred by the Fund were not annualized in the calculation of the expense ratios. If these expenses were annualized, the total operating expense ratios before waivers and reimbursements would have been 10.11% (Class AAA), 10.36% (Class A), 10.86% (Class C), and 9.86% (Class I). |
See accompanying notes to financial statements.
42
TETON Westwood Funds
Financial Highlights
Selected data for a share of beneficial interest outstanding throughout each year:
| | | | | | | | | | | | | | | | | | | | | | | | | | | | | | | | | | | | | | | | | | | | | | | | | | | | | | | | | | | | | | | | | | | | | | | | |
| | | | | | | Income (Loss) from Investment
Operations | | Distributions to Shareholders | | | | | | | | Ratios to Average Net Assets/Supplemental Data |
Year Ended September 30 | | Net Asset Value, Beginning
of Year | | Net
Investment
Income
(Loss)(a) | | Net
Realized and
Unrealized
Gain (Loss)
on
Investments | | Total From
Investment
Operations | | Net
Investment
Income | | Net
Realized
Gain on
Investments | | Total
Distributions | | Redemption
Fees(a) | | Net Asset
Value,
End of
Year | | Total
Return† | | Net Assets,
End of
Year
(in 000’s) | | Net
Investment
Income
(Loss) | | Operating
Expenses
Net of
Waivers/
Reimbursements | | Operating
Expenses
Before Waivers/
Reimbursements | | Portfolio
Turnover
Rate |
Convertible Securities Fund | | | | | | | | | | | | | | | | | | | | | | | | | | | | | | | | | | | | | | | | | | | | | | | | | | | | | | | | |
Class AAA | | | | | | | | | | | | | | | | | | | | | | | | | | | | | | | | | | | | | | | | | | | | | | | | | | | | | | | | | | | | | |
2017 | | $11.59 | | | | $0.07 | | | | | $1.49 | | | | | $1.56 | | | | | $(0.21) | | | | | $(0.53) | | | | | $ | (0.74) | | | | — | | | | | $12.41 | | | | | 14.1 | % | | | | $4,138 | | | | | 0.57 | % | | | | 1.15 | % | | | | 2.47 | % | | | | 40 | % |
2016 | | 10.53 | | | | 0.04 | | | | | 1.05 | | | | | 1.09 | | | | | (0.03 | ) | | | | — | | | | | (0.03 | ) | | | | — | | | | | 11.59 | | | | | 10.4 | | | | | 4,240 | | | | | 0.38 | | | | | 2.00 | (b) | | | | 2.74 | | | | | 20 | |
2015 | | 11.79 | | | | 0.04 | | | | | (1.27 | ) | | | | (1.23 | ) | | | | (0.03 | ) | | | | — | | | | | (0.03 | ) | | | | — �� | | | | | 10.53 | | | | | (10.5 | ) | | | | 5,525 | | | | | 0.31 | | | | | 2.00 | (b) | | | | 2.40 | | | | | 19 | |
2014 | | 10.40 | | | | 0.21 | | | | | 1.38 | | | | | 1.59 | | | | | (0.20 | ) | | | | — | | | | | (0.20 | ) | | | | $0.00 | (c) | | | | 11.79 | | | | | 15.5 | | | | | 6,240 | | | | | 1.86 | | | | | 2.00 | | | | | 2.42 | | | | | 31 | |
2013 | | 8.96 | | | | 0.07 | | | | | 1.45 | | | | | 1.52 | | | | | (0.08 | ) | | | | — | | | | | (0.08 | ) | | | | 0.00 | (c) | | | | 10.40 | | | | | 17.0 | | | | | 6,147 | | | | | 0.73 | | | | | 2.00 | | | | | 2.57 | | | | | 13 | |
Class A | | | | | | | | | | | | | | | | | | | | | | | | | | | | | | | | | | | | | | | | | | | | | | | | | | | | | | | | | | | | | |
2017 | | $11.94 | | | | $0.05 | | | | | $1.52 | | | | | $1.57 | | | | | $(0.19) | | | | | $(0.53) | | | | | $(0.72) | | | | | — | | | | | $12.79 | | | | | 13.8 | % | | | | $2,670 | | | | | 0.42 | % | | | | 1.40 | % | | | | 2.72 | % | | | | 40 | % |
2016 | | 10.87 | | | | 0.01 | | | | | 1.08 | | | | | 1.09 | | | | | (0.02 | ) | | | | — | | | | | (0.02 | ) | | | | — | | | | | 11.94 | | | | | 10.1 | | | | | 1,191 | | | | | 0.10 | | | | | 2.25 | (b) | | | | 2.99 | | | | | 20 | |
2015 | | 12.18 | | | | 0.01 | | | | | (1.30 | ) | | | | (1.29 | ) | | | | (0.02 | ) | | | | — | | | | | (0.02 | ) | | | | — | | | | | 10.87 | | | | | (10.6 | ) | | | | 1,081 | | | | | 0.06 | | | | | 2.25 | (b) | | | | 2.65 | | | | | 19 | |
2014 | | 10.75 | | | | 0.19 | | | | | 1.43 | | | | | 1.62 | | | | | (0.19 | ) | | | | — | | | | | (0.19 | ) | | | | $0.00 | (c) | | | | 12.18 | | | | | 15.2 | | | | | 1,013 | | | | | 1.63 | | | | | 2.25 | | | | | 2.67 | | | | | 31 | |
2013 | | 9.26 | | | | 0.05 | | | | | 1.49 | | | | | 1.54 | | | | | (0.05 | ) | | | | — | | | | | (0.05 | ) | | | | 0.00 | (c) | | | | 10.75 | | | | | 16.7 | | | | | 907 | | | | | 0.44 | | | | | 2.25 | | | | | 2.82 | | | | | 13 | |
Class C | | | | | | | | | | | | | | | | | | | | | | | | | | | | | | | | | | | | | | | | | | | | | | | | | | | | | | | | | | | | | |
2017 | | $12.69 | | | | $(0.02) | | | | | $1.63 | | | | | $1.61 | | | | | $(0.15) | | | | | $(0.53) | | | | | $(0.68) | | | | | — | | | | | $13.62 | | | | | 13.3 | % | | | | $1,307 | | | | | (0.19 | )% | | | | 1.90 | % | | | | 3.22 | % | | | | 40 | % |
2016 | | 11.59 | | | | (0.04 | ) | | | | 1.14 | | | | | 1.10 | | | | | (0.00 | )(c) | | | | — | | | | | (0.00 | )(c) | | | | — | | | | | 12.69 | | | | | 9.6 | | | | | 873 | | | | | (0.37 | ) | | | | 2.75 | (b) | | | | 3.49 | | | | | 20 | |
2015 | | 13.04 | | | | (0.06 | ) | | | | (1.39 | ) | | | | (1.45 | ) | | | | (0.00 | )(c) | | | | — | | | | | (0.00 | )(c) | | | | — | | | | | 11.59 | | | | | (11.1 | ) | | | | 943 | | | | | (0.44 | ) | | | | 2.75 | (b) | | | | 3.15 | | | | | 19 | |
2014 | | 11.54 | | | | 0.17 | | | | | 1.50 | | | | | 1.67 | | | | | (0.17 | ) | | | | — | | | | | (0.17 | ) | | | | $0.00 | (c) | | | | 13.04 | | | | | 14.6 | | | | | 1,045 | | | | | 1.30 | | | | | 2.75 | | | | | 3.17 | | | | | 31 | |
2013 | | 9.94 | | | | 0.00 | (c) | | | | 1.61 | | | | | 1.61 | | | | | (0.01 | ) | | | | — | | | | | (0.01 | ) | | | | 0.00 | (c) | | | | 11.54 | | | | | 16.2 | | | | | 1,086 | | | | | 0.01 | | | | | 2.75 | | | | | 3.32 | | | | | 13 | |
Class I | | | | | | | | | | | | | | | | | | | | | | | | | | | | | | | | | | | | | | | | | | | | | | | | | | | | | | | | | | | | | |
2017 | | $11.61 | | | | $0.12 | | | | | $1.48 | | | | | $1.60 | | | | | $(0.24) | | | | | $(0.53) | | | | | $(0.77) | | | | | — | | | | | $12.44 | | | | | 14.5 | % | | | | $6,636 | | | | | 1.00 | % | | | | 0.90 | % | | | | 2.22 | % | | | | 40 | % |
2016 | | 10.56 | | | | 0.07 | | | | | 1.04 | | | | | 1.11 | | | | | (0.06 | ) | | | | — | | | | | (0.06 | ) | | | | — | | | | | 11.61 | | | | | 10.6 | | | | | 394 | | | | | 0.61 | | | | | 1.75 | (b) | | | | 2.49 | | | | | 20 | |
2015 | | 11.80 | | | | 0.07 | | | | | (1.27 | ) | | | | (1.20 | ) | | | | (0.04 | ) | | | | — | | | | | (0.04 | ) | | | | — | | | | | 10.56 | | | | | (10.2 | ) | | | | 251 | | | | | 0.56 | | | | | 1.75 | (b) | | | | 2.15 | | | | | 19 | |
2014 | | 10.40 | | | | 0.24 | | | | | 1.39 | | | | | 1.63 | | | | | (0.23 | ) | | | | — | | | | | (0.23 | ) | | | | $0.00 | (c) | | | | 11.80 | | | | | 15.8 | | | | | 290 | | | | | 2.15 | | | | | 1.75 | | | | | 2.17 | | | | | 31 | |
2013 | | 8.96 | | | | 0.10 | | | | | 1.44 | | | | | 1.54 | | | | | (0.10 | ) | | | | — | | | | | (0.10 | ) | | | | 0.00 | (c) | | | | 10.40 | | | | | 17.3 | | | | | 185 | | | | | 0.99 | | | | | 1.75 | | | | | 2.32 | | | | | 13 | |
| † | Total return represents aggregate total return of a hypothetical $1,000 investment at the beginning of the year and sold at the end of the year including reinvestment of distributions and does not reflect the applicable sales charges. |
| (a) | Per share data are calculated using the average shares outstanding method. |
| (b) | The Fund received credits from a designated broker who agreed to pay certain Fund operating expenses. Had such payments not been received, the expense ratios for the years ended September 30, 2016 and 2015 would have been 2.01% and 2.02% (Class AAA), 2.26% and 2.27% (Class A), 2.76% and 2.77% (Class C), and 1.76% and 1.77% (Class I Shares), respectively. |
| (c) | Amount represents less than $0.005 per share. |
See accompanying notes to financial statements.
43
TETON Westwood Funds
Financial Highlights
Selected data for a share of beneficial interest outstanding throughout each year:
| | | | | | | | | | | | | | | | | | | | | | | | | | | | | | | | | | | | | | | | | | | | | | | | | | | | | | | | | | | | | | | | | |
| | | | | Income (Loss) from Investment Operations | | Distributions to Shareholders | | | | | | Ratios to Average Net Assets/Supplemental Data |
Year Ended September 30 | | Net Asset Value,
Beginning of Year | | Net Investment
Income (Loss)(a) | | Net Realized and
Unrealized
Gain (Loss) on
Investments | | Total From
Investment
Operations | | Net Investment
Income | | Net
Realized
Gain on
Investments | | Total Distributions | | Net Asset
Value,
End of Year | | Total Return† | | Net Assets,
End of Year
(in 000’s) | | Net
Investment
Income (Loss) | | Operating
Expenses(b) | | Portfolio
Turnover Rate |
Equity Fund | | | | | | | | | | | | | | | | | | | | | | | | | | | | | | | | | | | | | | | | | | | | | | | | | | | | | | | | |
Class AAA | | | | | | | | | | | | | | | | | | | | | | | | | | | | | | | | | | | | | | | | | | | | | | | | | | | | | | | | | | | | | |
2017 | | | $ | 12.59 | | | | $ | 0.06 | | | | $ | 1.91 | | | | $ | 1.97 | | | | $ | (0.07 | ) | | | $ | (0.80 | ) | | | $ | (0.87 | ) | | | $ | 13.69 | | | | | 16.6 | % | | | $ | 54,159 | | | | | 0.50 | % | | | | 1.62 | %(c) | | | | 28 | % |
2016 | | | | 12.22 | | | | | 0.07 | | | | | 1.30 | | | | | 1.37 | | | | | (0.05 | ) | | | | (0.95 | ) | | | | (1.00 | ) | | | | 12.59 | | | | | 11.4 | | | | | 53,063 | | | | | 0.54 | | | | | 1.63 | (c) | | | | 31 | |
2015 | | | | 13.65 | | | | | 0.05 | | | | | (0.09 | ) | | | | (0.04 | ) | | | | (0.06 | ) | | | | (1.33 | ) | | | | (1.39 | ) | | | | 12.22 | | | | | (0.9 | ) | | | | 53,238 | | | | | 0.37 | | | | | 1.59 | (c) | | | | 28 | |
2014 | | | | 11.88 | | | | | 0.05 | | | | | 1.76 | | | | | 1.81 | | | | | (0.04 | ) | | | | — | | | | | (0.04 | ) | | | | 13.65 | | | | | 15.3 | | | | | 60,587 | | | | | 0.37 | | | | | 1.59 | | | | | 51 | |
2013 | | | | 9.92 | | | | | 0.06 | | | | | 1.99 | | | | | 2.05 | | | | | (0.09 | ) | | | | — | | | | | (0.09 | ) | | | | 11.88 | | | | | 20.9 | | | | | 64,595 | | | | | 0.53 | | | | | 1.62 | (d) | | | | 53 | |
Class A | | | | | | | | | | | | | | | | | | | | | | | | | | | | | | | | | | | | | | | | | | | | | | | | | | | | | | | | | | | | | |
2017 | | | $ | 12.55 | | | | $ | 0.04 | | | | $ | 1.89 | | | | $ | 1.93 | | | | $ | (0.04 | ) | | | $ | (0.80 | ) | | | $ | (0.84 | ) | | | $ | 13.64 | | | | | 16.3 | % | | | $ | 2,502 | | | | | 0.28 | % | | | | 1.87 | %(c) | | | | 28 | % |
2016 | | | | 12.19 | | | | | 0.03 | | | | | 1.31 | | | | | 1.34 | | | | | (0.03 | ) | | | | (0.95 | ) | | | | (0.98 | ) | | | | 12.55 | | | | | 11.2 | | | | | 3,719 | | | | | 0.29 | | | | | 1.88 | (c) | | | | 31 | |
2015 | | | | 13.61 | | | | | 0.02 | | | | | (0.09 | ) | | | | (0.07 | ) | | | | (0.02 | ) | | | | (1.33 | ) | | | | (1.35 | ) | | | | 12.19 | | | | | (1.1 | ) | | | | 3,125 | | | | | 0.12 | | | | | 1.84 | (c) | | | | 28 | |
2014 | | | | 11.84 | | | | | 0.02 | | | | | 1.76 | | | | | 1.78 | | | | | (0.01 | ) | | | | — | | | | | (0.01 | ) | | | | 13.61 | | | | | 15.0 | | | | | 3,329 | | | | | 0.12 | | | | | 1.84 | | | | | 51 | |
2013 | | | | 9.89 | | | | | 0.03 | | | | | 1.99 | | | | | 2.02 | | | | | (0.07 | ) | | | | — | | | | | (0.07 | ) | | | | 11.84 | | | | | 20.5 | | | | | 3,256 | | | | | 0.27 | | | | | 1.87 | (d) | | | | 53 | |
Class C | | | | | | | | | | | | | | | | | | | | | | | | | | | | | | | | | | | | | | | | | | | | | | | | | | | | | | | | | | | | | |
2017 | | | $ | 11.99 | | | | $ | (0.03 | ) | | | $ | 1.81 | | | | $ | 1.78 | | | | | — | | | | $ | (0.80 | ) | | | $ | (0.80 | ) | | | $ | 12.97 | | | | | 15.7 | % | | | $ | 685 | | | | | (0.25 | )% | | | | 2.37 | %(c) | | | | 28 | % |
2016 | | | | 11.72 | | | | | (0.03 | ) | | | | 1.25 | | | | | 1.22 | | | | | — | | | | | (0.95 | ) | | | | (0.95 | ) | | | | 11.99 | | | | | 10.6 | | | | | 843 | | | | | (0.23 | ) | | | | 2.38 | (c) | | | | 31 | |
2015 | | | | 13.18 | | | | | (0.05 | ) | | | | (0.08 | ) | | | | (0.13 | ) | | | | — | | | | | (1.33 | ) | | | | (1.33 | ) | | | | 11.72 | | | | | (1.6 | ) | | | | 684 | | | | | (0.37 | ) | | | | 2.34 | (c) | | | | 28 | |
2014 | | | | 11.51 | | | | | (0.05 | ) | | | | 1.72 | | | | | 1.67 | | | | | — | | | | | — | | | | | — | | | | | 13.18 | | | | | 14.5 | | | | | 676 | | | | | (0.38 | ) | | | | 2.34 | | | | | 51 | |
2013 | | | | 9.62 | | | | | (0.02 | ) | | | | 1.93 | | | | | 1.91 | | | | $ | (0.02 | ) | | | | — | | | | | (0.02 | ) | | | | 11.51 | | | | | 19.9 | | | | | 693 | | | | | (0.22 | ) | | | | 2.37 | (d) | | | | 53 | |
Class I | | | | | | | | | | | | | | | | | | | | | | | | | | | | | | | | | | | | | | | | | | | | | | | | | | | | | | | | | | | | | |
2017 | | | $ | 12.57 | | | | $ | 0.10 | | | | $ | 1.89 | | | | $ | 1.99 | | | | $ | (0.10 | ) | | | $ | (0.80 | ) | | | $ | (0.90 | ) | | | $ | 13.66 | | | | | 16.9 | % | | | $ | 4,981 | | | | | 0.75 | % | | | | 1.37 | %(c) | | | | 28 | % |
2016 | | | | 12.21 | | | | | 0.09 | | | | | 1.30 | | | | | 1.39 | | | | | (0.08 | ) | | | | (0.95 | ) | | | | (1.03 | ) | | | | 12.57 | | | | | 11.7 | | | | | 4,258 | | | | | 0.77 | | | | | 1.38 | (c) | | | | 31 | |
2015 | | | | 13.64 | | | | | 0.08 | | | | | (0.09 | ) | | | | (0.01 | ) | | | | (0.09 | ) | | | | (1.33 | ) | | | | (1.42 | ) | | | | 12.21 | | | | | (0.6 | ) | | | | 4,340 | | | | | 0.61 | | | | | 1.34 | (c) | | | | 28 | |
2014 | | | | 11.89 | | | | | 0.08 | | | | | 1.74 | | | | | 1.82 | | | | | (0.07 | ) | | | | — | | | | | (0.07 | ) | | | | 13.64 | | | | | 15.4 | | | | | 3,547 | | | | | 0.60 | | | | | 1.34 | | | | | 51 | |
2013 | | | | 9.93 | | | | | 0.09 | | | | | 1.99 | | | | | 2.08 | | | | | (0.12 | ) | | | | — | | | | | (0.12 | ) | | | | 11.89 | | | | | 21.2 | | | | | 2,204 | | | | | 0.84 | | | | | 1.37 | (d) | | | | 53 | |
| † | Total return represents aggregate total return of a hypothetical $1,000 investment at the beginning of the year and sold at the end of the year including reinvestment of distributions and does not reflect the applicable sales charges. |
| (a) | Per share data are calculated using the average shares outstanding method. |
| (b) | The Fund incurred interest expense during the years ended September 30, 2014 and 2013. This interest expense was paid for by prior years Custodian Fee Credits. The effect of interest expense was minimal. |
| (c) | The Fund received credits from a designated broker who agreed to pay certain Fund operating expenses. For the years ended September 30, 2017, 2016, and 2015, there was no impact on the expense ratios. |
| (d) | The ratios do not include a reduction for custodian fee credits on cash balances maintained with the custodian (“Custodian Fee Credits”). Including such Custodian Fee Credits, the ratios for the year ended September 30, 2013 would have been 1.60% (Class AAA), 1.85% (Class A), 2.35% (Class C), and 1.35% (Class I) Shares, respectively. For the years ended September 30, 2017, 2016, 2015, and 2014, there were no Custodian Fee Credits. |
See accompanying notes to financial statements.
44
TETON Westwood Funds
Financial Highlights
Selected data for a share of beneficial interest outstanding throughout each year:
| | | | | | | | | | | | | | | | | | | | | | | | | | | | | | | | | | | | | | | | | | | | | | | | | | | | | | | | | | | | | | | | | |
| | | | | Income (Loss) from Investment Operations | | Distributions to Shareholders | | | | | | Ratios to Average Net Assets/Supplemental Data |
Year Ended September 30 | | Net Asset Value,
Beginning of Year | | Net Investment
Income(a) | | Net
Realized and
Unrealized
Gain (Loss) on
Investments | | Total From
Investment
Operations | | Net Investment
Income | | Net
Realized
Gain on
Investments | | Total
Distributions | | Net Asset
Value,
End of Year | | Total Return† | | Net Assets,
End of Year
(in 000’s) | | Net
Investment
Income | | Operating
Expenses†† | | Portfolio
Turnover Rate |
Balanced Fund | | | | | | | | | | | | | | | | | | | | | | | | | | | | | | | | | | | | | | | | | | | | | | | | | | | | | | | | | | | | | | | | | |
Class AAA | | | | | | | | | | | | | | | | | | | | | | | | | | | | | | | | | | | | | | | | | | | | | | | | | | | | | | | | | | | | | |
2017 | | | $ | 11.75 | | | | $ | 0.11 | | | | $ | 1.04 | | | | $ | 1.15 | | | | $ | (0.11 | ) | | | $ | (0.63 | ) | | | $ | (0.74 | ) | | | $ | 12.16 | | | | | 10.3 | % | | | $ | 50,934 | | | | | 0.93 | % | | | | 1.33 | %(b) | | | | 23 | % |
2016 | | | | 11.72 | | | | | 0.12 | | | | | 0.85 | | | | | 0.97 | | | | | (0.12 | ) | | | | (0.82 | ) | | | | (0.94 | ) | | | | 11.75 | | | | | 8.6 | | | | | 50,105 | | | | | 1.06 | | | | | 1.35 | (b) | | | | 23 | |
2015 | | | | 12.91 | | | | | 0.13 | | | | | (0.08 | ) | | | | 0.05 | | | | | (0.13 | ) | | | | (1.11 | ) | | | | (1.24 | ) | | | | 11.72 | | | | | 0.0 | | | | | 53,989 | | | | | 1.01 | | | | | 1.31 | (b) | | | | 27 | |
2014 | | | | 12.76 | | | | | 0.14 | | | | | 1.07 | | | | | 1.21 | | | | | (0.14 | ) | | | | (0.92 | ) | | | | (1.06 | ) | | | | 12.91 | | | | | 9.9 | | | | | 69,187 | | | | | 1.07 | | | | | 1.29 | | | | | 39 | |
2013 | | | | 11.48 | | | | | 0.15 | | | | | 1.28 | | | | | 1.43 | | | | | (0.15 | ) | | | | — | | | | | (0.15 | ) | | | | 12.76 | | | | | 12.5 | | | | | 70,824 | | | | | 1.21 | | | | | 1.30 | | | | | 36 | |
Class A | | | | | | | | | | | | | | | | | | | | | | | | | | | | | | | | | | | | | | | | | | | | | | | | | | | | | | | | | | | | | |
2017 | | | $ | 11.81 | | | | $ | 0.08 | | | | $ | 1.05 | | | | $ | 1.13 | | | | $ | (0.08 | ) | | | $ | (0.63 | ) | | | $ | (0.71 | ) | | | $ | 12.23 | | | | | 10.1 | % | | | $ | 8,165 | | | | | 0.68 | % | | | | 1.58 | %(b) | | | | 23 | % |
2016 | | | | 11.78 | | | | | 0.10 | | | | | 0.85 | | | | | 0.95 | | | | | (0.10 | ) | | | | (0.82 | ) | | | | (0.92 | ) | | | | 11.81 | | | | | 8.2 | | | | | 7,040 | | | | | 0.81 | | | | | 1.60 | (b) | | | | 23 | |
2015 | | | | 12.97 | | | | | 0.09 | | | | | (0.07 | ) | | | | 0.02 | | | | | (0.10 | ) | | | | (1.11 | ) | | | | (1.21 | ) | | | | 11.78 | | | | | (0.2 | ) | | | | 6,577 | | | | | 0.76 | | | | | 1.56 | (b) | | | | 27 | |
2014 | | | | 12.82 | | | | | 0.11 | | | | | 1.07 | | | | | 1.18 | | | | | (0.11 | ) | | | | (0.92 | ) | | | | (1.03 | ) | | | | 12.97 | | | | | 9.5 | | | | | 6,443 | | | | | 0.83 | | | | | 1.54 | | | | | 39 | |
2013 | | | | 11.53 | | | | | 0.12 | | | | | 1.29 | | | | | 1.41 | | | | | (0.12 | ) | | | | — | | | | | (0.12 | ) | | | | 12.82 | | | | | 12.3 | | | | | 5,869 | | | | | 0.95 | | | | | 1.55 | | | | | 36 | |
Class C | | | | | | | | | | | | | | | | | | | | | | | | | | | | | | | | | | | | | | | | | | | | | | | | | | | | | | | | | | | | | |
2017 | | | $ | 11.97 | | | | $ | 0.02 | | | | $ | 1.06 | | | | $ | 1.08 | | | | $ | (0.01 | ) | | | $ | (0.63 | ) | | | $ | (0.64 | ) | | | $ | 12.41 | | | | | 9.6 | % | | | $ | 4,585 | | | | | 0.18 | % | | | | 2.08 | %(b) | | | | 23 | % |
2016 | | | | 11.92 | | | | | 0.04 | | | | | 0.87 | | | | | 0.91 | | | | | (0.04 | ) | | | | (0.82 | ) | | | | (0.86 | ) | | | | 11.97 | | | | | 7.8 | | | | | 5,575 | | | | | 0.30 | | | | | 2.10 | (b) | | | | 23 | |
2015 | | | | 13.12 | | | | | 0.03 | | | | | (0.08 | ) | | | | (0.05 | ) | | | | (0.04 | ) | | | | (1.11 | ) | | | | (1.15 | ) | | | | 11.92 | | | | | (0.8 | ) | | | | 5,260 | | | | | 0.26 | | | | | 2.06 | (b) | | | | 27 | |
2014 | | | | 12.95 | | | | | 0.04 | | | | | 1.09 | | | | | 1.13 | | | | | (0.04 | ) | | | | (0.92 | ) | | | | (0.96 | ) | | | | 13.12 | | | | | 9.0 | | | | | 5,350 | | | | | 0.32 | | | | | 2.04 | | | | | 39 | |
2013 | | | | 11.64 | | | | | 0.05 | | | | | 1.31 | | | | | 1.36 | | | | | (0.05 | ) | | | | — | | | | | (0.05 | ) | | | | 12.95 | | | | | 11.7 | | | | | 5,257 | | | | | 0.43 | | | | | 2.05 | | | | | 36 | |
Class I | | | | | | | | | | | | | | | | | | | | | | | | | | | | | | | | | | | | | | | | | | | | | | | | | | | | | | | | | | | | | |
2017 | | | $ | 11.73 | | | | $ | 0.14 | | | | $ | 1.05 | | | | $ | 1.19 | | | | $ | (0.14 | ) | | | $ | (0.63 | ) | | | $ | (0.77 | ) | | | $ | 12.15 | | | | | 10.7 | % | | | $ | 1,989 | | | | | 1.18 | % | | | | 1.08 | %(b) | | | | 23 | % |
2016 | | | | 11.70 | | | | | 0.15 | | | | | 0.85 | | | | | 1.00 | | | | | (0.15 | ) | | | | (0.82 | ) | | | | (0.97 | ) | | | | 11.73 | | | | | 8.8 | | | | | 1,896 | | | | | 1.30 | | | | | 1.10 | (b) | | | | 23 | |
2015 | | | | 12.90 | | | | | 0.16 | | | | | (0.09 | ) | | | | 0.07 | | | | | (0.16 | ) | | | | (1.11 | ) | | | | (1.27 | ) | | | | 11.70 | | | | | 0.2 | | | | | 1,856 | | | | | 1.26 | | | | | 1.06 | (b) | | | | 27 | |
2014 | | | | 12.76 | | | | | 0.17 | | | | | 1.06 | | | | | 1.23 | | | | | (0.17 | ) | | | | (0.92 | ) | | | | (1.09 | ) | | | | 12.90 | | | | | 10.0 | | | | | 2,438 | | | | | 1.35 | | | | | 1.04 | | | | | 39 | |
2013 | | | | 11.48 | | | | | 0.18 | | | | | 1.28 | | | | | 1.46 | | | | | (0.18 | ) | | | | — | | | | | (0.18 | ) | | | | 12.76 | | | | | 12.8 | | | | | 1,060 | | | | | 1.44 | | | | | 1.05 | | | | | 36 | |
| † | Total return represents aggregate total return of a hypothetical $1,000 investment at the beginning of the year and sold at the end of the year including reinvestment of distributions and does not reflect the applicable sales charges. |
| †† | The ratios do not include a reduction for custodian fee credits on cash balances maintained with the custodian (“Custodian Fee Credits”). Including such Custodian Fee Credits, the ratios for the years ended 2015, 2014, and 2013 would have been 1.32%, 1.27%, and 1.28% (Class AAA), 1.57%, 1.52%, and 1.53% (Class A), 2.07%, 2.02%, and 2.03% (Class C), and 1.07%, 1.02%, and 1.03% (Class I) Shares, respectively. For the years ended September 30, 2017 and 2016, there were no Custodian Fee Credits. |
| (a) | Per share data are calculated using the average shares outstanding method. |
| (b) | The Fund received credits from a designated broker who agreed to pay certain Fund operating expenses. For the years ended September 30, 2017, 2016, and 2015, there was no impact on the expense ratios. |
See accompanying notes to financial statements.
45
TETON Westwood Funds
Financial Highlights
Selected data for a share of beneficial interest outstanding throughout each year:
| | | | | | | | | | | | | | | | | | | | | | | | | | | | | | | | | | | | | | | | | | | | | | | | | | | | | | | | | | | | | | | | | | | | | | |
| | | | | Income (Loss) from Investment Operations | | Distributions to Shareholders | | | | | | Ratios to Average Net Assets/Supplemental Data |
Year Ended September 30 | | Net Asset
Value,
Beginning
of Year | | Net
Investment
Income(a) | | Net
Realized and
Unrealized
Gain (Loss) on
Investments | | Total From
Investment
Operations | | Net
Investment
Income | | Net
Realized
Gain on
Investments | | Total
Distributions | | Net Asset
Value,
End of Year | | Total
Return† | | Net Assets,
End of Year
(in 000’s) | | Net
Investment
Income | | Operating
Expenses
Net of
Waivers/
Reimbursements | | Operating
Expenses
Before Waivers/
Reimbursements | | Portfolio
Turnover
Rate |
| | | | | | | | | | | |
Intermediate Bond Fund | | | | | | | | | | | | | | | | | | | | | | | | | | | | | | | | | | | | | | | | | | | | | | | | | | | | | | | | |
Class AAA | | | | | | | | | | | | | | | | | | | | | | | | | | | | | | | | | | | | | | | | | | | | | | | | | | | | | | | | | | | | | |
2017 | | | | $11.64 | | | | | $0.14 | | | | | $(0.28 | ) | | | | $(0.14 | ) | | | | $(0.14 | ) | | | | $(0.08 | ) | | | | $(0.22 | ) | | | | $11.28 | | | | | (1.2 | )% | | | | $ 3,683 | | | | | 1.23% | | | | | 1.00% | | | | | 1.52% | | | | | 36% | |
2016 | | | | 11.56 | | | | | 0.15 | | | | | 0.30 | | | | | 0.45 | | | | | (0.15 | ) | | | | (0.22 | ) | | | | (0.37 | ) | | | | 11.64 | | | | | 4.1 | | | | | 4,170 | | | | | 1.32 | | | | | 1.00 | | | | | 1.42 | | | | | 48 | |
2015 | | | | 11.59 | | | | | 0.18 | | | | | (0.03 | ) | | | | 0.15 | | | | | (0.18 | ) | | | | — | | | | | (0.18 | ) | | | | 11.56 | | | | | 1.3 | | | | | 5,045 | | | | | 1.58 | | | | | 1.00 | | | | | 1.36 | | | | | 65 | |
2014 | | | | 11.68 | | | | | 0.15 | | | | | (0.09 | ) | | | | 0.06 | | | | | (0.15 | ) | | | | — | | | | | (0.15 | ) | | | | 11.59 | | | | | 0.5 | | | | | 5,174 | | | | | 1.29 | | | | | 1.00 | | | | | 1.38 | | | | | 16 | |
2013 | | | | 12.06 | | | | | 0.14 | | | | | (0.36 | ) | | | | (0.22 | ) | | | | (0.15 | ) | | | | $(0.01 | ) | | | | (0.16 | ) | | | | 11.68 | | | | | (1.9 | ) | | | | 8,737 | | | | | 1.21 | | | | | 1.00 | | | | | 1.36 | | | | | 20 | |
Class A | | | | | | | | | | | | | | | | | | | | | | | | | | | | | | | | | | | | | | | | | | | | | | | | | | | | | | | | | | | | | | | | | | |
2017 | | | | $11.63 | | | | | $0.13 | | | | | $(0.29 | ) | | | | $(0.16 | ) | | | | $(0.13 | ) | | | | $(0.08 | ) | | | | $(0.21 | ) | | | | $11.26 | | | | | (1.4 | )% | | | | $ 485 | | | | | 1.13% | | | | | 1.10% | | | | | 1.62% | | | | | 36% | |
2016 | | | | 11.55 | | | | | 0.14 | | | | | 0.30 | | | | | 0.44 | | | | | (0.14 | ) | | | | (0.22 | ) | | | | (0.36 | ) | | | | 11.63 | | | | | 3.9 | | | | | 807 | | | | | 1.21 | | | | | 1.10 | | | | | 1.52 | | | | | 48 | |
2015 | | | | 11.58 | | | | | 0.17 | | | | | (0.03 | ) | | | | 0.14 | | | | | (0.17 | ) | | | | — | | | | | (0.17 | ) | | | | 11.55 | | | | | 1.2 | | | | | 809 | | | | | 1.48 | | | | | 1.10 | | | | | 1.46 | | | | | 65 | |
2014 | | | | 11.66 | | | | | 0.14 | | | | | (0.08 | ) | | | | 0.06 | | | | | (0.14 | ) | | | | — | | | | | (0.14 | ) | | | | 11.58 | | | | | 0.5 | | | | | 928 | | | | | 1.21 | | | | | 1.10 | | | | | 1.48 | | | | | 16 | |
2013 | | | | 12.04 | | | | | 0.13 | | | | | (0.37 | ) | | | | (0.24 | ) | | | | (0.13 | ) | | | | (0.01 | ) | | | | (0.14 | ) | | | | 11.66 | | | | | (2.0 | ) | | | | 1,066 | | | | | 1.06 | | | | | 1.10 | | | | | 1.46 | | | | | 20 | |
Class C | | | | | | | | | | | | | | | | | | | | | | | | | | | | | | | | | | | | | | | | | | | | | | | | | | | | | | | | | | | | | | | | | | |
2017 | | | | $11.05 | | | | | $0.05 | | | | | $(0.27 | ) | | | | $(0.22 | ) | | | | $(0.05 | ) | | | | $(0.08 | ) | | | | $(0.13 | ) | | | | $10.70 | | | | | (2.0 | )% | | | | $ 1,102 | | | | | 0.49% | | | | | 1.75% | | | | | 2.27% | | | | | 36% | |
2016 | | | | 10.99 | | | | | 0.06 | | | | | 0.28 | | | | | 0.34 | | | | | (0.06 | ) | | | | (0.22 | ) | | | | (0.28 | ) | | | | 11.05 | | | | | 3.2 | | | | | 1,144 | | | | | 0.51 | | | | | 1.75 | | | | | 2.17 | | | | | 48 | |
2015 | | | | 11.01 | | | | | 0.09 | | | | | (0.02 | ) | | | | 0.07 | | | | | (0.09 | ) | | | | — | | | | | (0.09 | ) | | | | 10.99 | | | | | 0.7 | | | | | 398 | | | | | 0.82 | | | | | 1.75 | | | | | 2.11 | | | | | 65 | |
2014 | | | | 11.09 | | | | | 0.06 | | | | | (0.08 | ) | | | | (0.02 | ) | | | | (0.06 | ) | | | | — | | | | | (0.06 | ) | | | | 11.01 | | | | | (0.2 | ) | | | | 503 | | | | | 0.55 | | | | | 1.75 | | | | | 2.13 | | | | | 16 | |
2013 | | | | 11.46 | | | | | 0.05 | | | | | (0.36 | ) | | | | (0.31 | ) | | | | (0.05 | ) | | | | (0.01 | ) | | | | (0.06 | ) | | | | 11.09 | | | | | (2.7 | ) | | | | 803 | | | | | 0.43 | | | | | 1.75 | | | | | 2.11 | | | | | 20 | |
Class I | | | | | | | | | | | | | | | | | | | | | | | | | | | | | | | | | | | | | | | | | | | | | | | | | | | | | | | | | | | | | | | | | | |
2017 | | | | $11.65 | | | | | $0.17 | | | | | $(0.29 | ) | | | | $(0.12 | ) | | | | $(0.17 | ) | | | | $(0.08 | ) | | | | $(0.25 | ) | | | | $11.28 | | | | | (1.0 | )% | | | | $ 2,900 | | | | | 1.47% | | | | | 0.75% | | | | | 1.27% | | | | | 36% | |
2016 | | | | 11.57 | | | | | 0.18 | | | | | 0.30 | | | | | 0.48 | | | | | (0.18 | ) | | | | (0.22 | ) | | | | (0.40 | ) | | | | 11.65 | | | | | 4.3 | | | | | 14,111 | | | | | 1.56 | | | | | 0.75 | | | | | 1.17 | | | | | 48 | |
2015 | | | | 11.60 | | | | | 0.21 | | | | | (0.03 | ) | | | | 0.18 | | | | | (0.21 | ) | | | | — | | | | | (0.21 | ) | | | | 11.57 | | | | | 1.6 | | | | | 13,022 | | | | | 1.82 | | | | | 0.75 | | | | | 1.11 | | | | | 65 | |
2014 | | | | 11.68 | | | | | 0.18 | | | | | (0.08 | ) | | | | 0.10 | | | | | (0.18 | ) | | | | — | | | | | (0.18 | ) | | | | 11.60 | | | | | 0.9 | | | | | 14,705 | | | | | 1.58 | | | | | 0.75 | | | | | 1.13 | | | | | 16 | |
2013 | | | | 12.06 | | | | | 0.17 | | | | | (0.36 | ) | | | | (0.19 | ) | | | | (0.18 | ) | | | | (0.01 | ) | | | | (0.19 | ) | | | | 11.68 | | | | | (1.6 | ) | | | | 11,910 | | | | | 1.45 | | | | | 0.75 | | | | | 1.11 | | | | | 20 | |
| † | Total return represents aggregate total return of a hypothetical $1,000 investment at the beginning of the year and sold at the end of the year including reinvestment of distributions and does not reflect the applicable sales charges. |
| (a) | Per share data are calculated using the average shares outstanding method. |
See accompanying notes to financial statements.
46
TETON Westwood Funds
Notes to Financial Statements (Unaudited) (Continued)
1. Organization. The TETON Westwood Funds (the “Trust”) was organized as a Massachusetts business trust on June 12, 1986.
The Trust is registered under the Investment Company Act of 1940, as amended (the “1940 Act”), as a diversified open-end management investment company and currently consists of seven active separate investment portfolios: TETON Westwood Mighty MitesSM Fund (“Mighty MitesSM Fund”), TETON Westwood SmallCap Equity Fund (“SmallCap Equity Fund”), TETON Westwood Mid-Cap Equity Fund (“Mid-Cap Equity Fund”), TETON Convertible Securities Fund (“Convertible Securities Fund”), TETON Westwood Equity Fund (“Equity Fund”), TETON Westwood Balanced Fund (“Balanced Fund”), and TETON Westwood Intermediate Bond Fund (“Intermediate Bond Fund”), (individually, a “Fund” and collectively, the “Funds”). Each class of shares outstanding bears the same voting, dividend, liquidation, and other rights and conditions, except that the expenses incurred in the distribution and marketing of such shares are different for each class. Class T Shares were first issued on July 5, 2017 for Mighty MitesSM Fund and SmallCap Equity Fund.
The investment objectives of each Fund are as follows:
| ● | | Mighty MitesSM Fund seeks to provide long term capital appreciation by investing primarily in micro-capitalization equity securities. |
| ● | | SmallCap Equity Fund seeks to provide long term capital appreciation by investing primarily in smaller capitalization equity securities. |
| ● | | Mid-Cap Equity Fund seeks to provide long term growth of capital and future income by investing primarily in mid-cap equity securities. |
| ● | | Convertible Securities Fund seeks to provide a high level of current income as well as long term capital appreciation. |
| ● | | Equity Fund seeks to provide capital appreciation. The Equity Fund’s secondary goal is to produce current income. |
| ● | | Balanced Fund seeks to provide capital appreciation and current income resulting in a high total investment return consistent with prudent investment risk and a balanced investment approach. |
| ● | | Intermediate Bond Fund seeks to maximize total return, while maintaining a level of current income consistent with the maintenance of principal and liquidity. |
2. Significant Accounting Policies. As an investment company, the Trust follows the investment company accounting and reporting guidance, which is part of U.S. generally accepted accounting principles (“GAAP”) that may require the use of management estimates and assumptions in the preparation of its financial statements. Actual results could differ from those estimates. The following is a summary of significant accounting policies followed by the Trust in the preparation of its financial statements.
Security Valuation. Portfolio securities listed or traded on a nationally recognized securities exchange or traded in the U.S. over-the-counter market for which market quotations are readily available are valued at the last quoted sale price or a market’s official closing price as of the close of business on the day the securities are being valued. If there were no sales that day, the security is valued at the average of the closing bid and asked prices or, if there were no asked prices quoted on that day, then the security is valued at the closing bid price on that day. If no bid or asked prices are quoted on such day, the security is valued at the most recently available price or, if the Board of Trustees (the “Board”) so determines, by such other method as the Board shall determine in good faith to reflect its fair market value. Portfolio securities traded on more than one national securities exchange or market are valued according to the broadest and most representative market, as determined by Teton Advisors, Inc. (the “Adviser”). Investments in open-end investment companies are valued at each underlying Fund’s NAV per share as of the report date.
Portfolio securities primarily traded on a foreign market are generally valued at the preceding closing values of such securities on the relevant market, but may be fair valued pursuant to procedures established by the Board if market conditions change significantly after the close of the foreign market, but prior to the close of business on the day the securities are being valued. Debt obligations for which market quotations are readily available are valued at the average of the latest bid and asked prices. If there were no asked prices quoted on such day, the security is valued using the closing bid price, unless the Board determines such amount does not reflect the securities fair value, in which case these securities will be fair value as determined by the Board. Certain securities are valued principally using dealer quotations. Futures contracts are valued at the closing settlement price of the exchange or board of trade on which the applicable contract is traded. OTC futures and options on futures for which market quotations are readily available will be valued by quotations received from a pricing service or, if no quotations are available from a pricing service, by quotations obtained from one or more dealers in the instrument in question by the Adviser.
47
TETON Westwood Funds
Notes to Financial Statements (Continued)
Securities and assets for which market quotations are not readily available are fair valued as determined by the Board. Fair valuation methodologies and procedures may include, but are not limited to: analysis and review of available financial and non-financial information about the company; comparisons with the valuation and changes in valuation of similar securities, including a comparison of foreign securities with the equivalent U.S. dollar value American Depositary Receipt securities at the close of the U.S. exchange; and evaluation of any other information that could be indicative of the value of the security.
The inputs and valuation techniques used to measure fair value of the Funds’ investments are summarized into three levels as described in the hierarchy below:
| | ● | | Level 1 — quoted prices in active markets for identical securities; |
| | ● | | Level 2 — other significant observable inputs (including quoted prices for similar securities, interest rates, prepayment speeds, credit risk, etc.); and |
| | ● | | Level 3 — significant unobservable inputs (including the Board’s determinations as to the fair value of investments). |
A financial instrument’s level within the fair value hierarchy is based on the lowest level of any input both individually and in the aggregate that is significant to the fair value measurement. The inputs or methodology used for valuing securities are not necessarily an indication of the risk associated with investing in those securities. The summary of the Funds’ investments in securities by inputs used to value the Funds’ investments as of September 30, 2017 is as follows:
| | | | | | | | | | | | | | | | |
| | | Valuation Inputs | | | | |
| | | Level 1 | | | Level 2 Other Significant | | | Level 3 Significant | | | Total Market Value | |
| | | Quoted Prices | | | Observable Inputs | | | Unobservable Inputs | | | at 9/30/17 | |
MIGHTY MITESSM FUND | | | | | | | | | | | | | | | | |
INVESTMENTS IN SECURITIES: | | | | | | | | | | | | | | | | |
ASSETS (Market Value): | | | | | | | | | | | | | | | | |
Common Stocks: | | | | | | | | | | | | | | | | |
Airlines | | $ | 2,849,400 | | | $ | 309,375 | | | | — | | | $ | 3,158,775 | |
Automotive: Parts and Accessories | | | 36,306,330 | | | | — | | | $ | 4,000,000 | | | | 40,306,330 | |
Aviation: Parts and Services | | | 15,433,901 | | | | 566,291 | | | | — | | | | 16,000,192 | |
Business Services | | | 42,854,876 | | | | 24,750 | | | | 0 | | | | 42,879,626 | |
Communications Equipment | | | 5,111,450 | | | | 69 | | | | — | | | | 5,111,519 | |
Computer Hardware | | | — | | | | — | | | | 0 | | | | 0 | |
Consumer Products | | | 37,186,148 | | | | 92,232 | | | | 26 | | | | 37,278,406 | |
Consumer Services | | | 7,911,992 | | | | 133,929 | | | | — | | | | 8,045,921 | |
Diversified Industrial | | | 129,111,541 | | | | — | | | | 224,234 | | | | 129,335,775 | |
Electronics | | | 41,345,089 | | | | — | | | | 0 | | | | 41,345,089 | |
Energy and Utilities: Natural Gas | | | 4,639,264 | | | | 2,019,349 | | | | — | | | | 6,658,613 | |
Entertainment | | | 13,290,831 | | | | — | | | | 0 | | | | 13,290,831 | |
Environmental Control | | | 12,230,045 | | | | 2,716 | | | | — | | | | 12,232,761 | |
Financial Services | | | 69,431,957 | | | | 944,800 | | | | 400,000 | | | | 70,776,757 | |
Food and Beverage | | | 53,794,318 | | | | 190,925 | | | | — | | | | 53,985,243 | |
Health Care | | | 98,674,398 | | | | — | | | | 0 | | | | 98,674,398 | |
Manufactured Housing and Recreational Vehicles | | | 11,935,179 | | | | 2,963,238 | | | | — | | | | 14,898,417 | |
Metals and Mining | | | 20,023,775 | | | | 1,612 | | | | — | | | | 20,025,387 | |
Real Estate | | | 27,442,778 | | | | 1,934,757 | | | | 1,255 | | | | 29,378,790 | |
Specialty Chemicals | | | 37,280,051 | | | | 2,271 | | | | — | | | | 37,282,322 | |
Telecommunications | | | 38,775,812 | | | | 266,500 | | | | 24,124 | | | | 39,066,436 | |
Other Industries (a) | | | 382,032,579 | | | | — | | | | — | | | | 382,032,579 | |
Total Common Stocks | | | 1,087,661,714 | | | | 9,452,814 | | | | 4,649,639 | | | | 1,101,764,167 | |
Preferred Stocks (a) | | | 9,534,307 | | | | 206,159 | | | | — | | | | 9,740,466 | |
Convertible Preferred Stocks (a) | | | — | | | | 1,504,388 | | | | — | | | | 1,504,388 | |
Rights (a) | | | 144,000 | | | | — | | | | 78,001 | | | | 222,001 | |
Warrants (a) | | | — | | | | 6,817 | | | | 0 | | | | 6,817 | |
U.S. Government Obligations | | | — | | | | 236,136,851 | | | | — | | | | 236,136,851 | |
TOTAL INVESTMENTS IN SECURITIES – ASSETS | | $ | 1,097,340,021 | | | $ | 247,307,029 | | | $ | 4,727,640 | | | $ | 1,349,374,690 | |
| | | | |
SMALLCAP EQUITY FUND | | | | | | | | | | | | | | | | |
INVESTMENTS IN SECURITIES: | | | | | | | | | | | | | | | | |
ASSETS (Market Value): | | | | | | | | | | | | | | | | |
Common Stocks (a) | | $ | 32,309,550 | | | | — | | | | — | | | | $ 32,309,550 | |
U.S. Government Obligations | | | — | | | $ | 249,505 | | | | — | | | | 249,505 | |
TOTAL INVESTMENTS IN SECURITIES – ASSETS | | $ | 32,309,550 | | | $ | 249,505 | | | | — | | | | $ 32,559,055 | |
48
TETON Westwood Funds
Notes to Financial Statements (Continued)
| | | | | | | | | | | | | | | | |
| | | Valuation Inputs | | | | |
| | | Level 1
Quoted Prices | | | Level 2 Other Significant
Observable Inputs | | | Level 3 Significant
Unobservable Inputs | | | Total Market Value
at 09/30/17 | |
MID-CAP EQUITY FUND | | | | | | | | | | | | | | | | |
INVESTMENTS IN SECURITIES: | | | | | | | | | | | | | | | | |
ASSETS (Market Value): | | | | | | | | | | | | | | | | |
Common Stocks (a) | | | $ 2,750,818 | | | | — | | | | — | | | | $ 2,750,818 | |
U.S. Government Obligations | | | — | | | | $ 249,551 | | | | — | | | | 249,551 | |
TOTAL INVESTMENTS IN SECURITIES – ASSETS | | | $ 2,750,818 | | | | $ 249,551 | | | | — | | | | $ 3,000,369 | |
| | | | |
CONVERTIBLE SECURITIES FUND | | | | | | | | | | | | | | | | |
INVESTMENTS IN SECURITIES: | | | | | | | | | | | | | | | | |
ASSETS (Market Value): | | | | | | | | | | | | | | | | |
Convertible Corporate Bonds (a) | | | — | | | | $ 12,226,623 | | | | — | | | | $ 12,226,623 | |
Convertible Preferred Stocks (a) | | | $ 357,734 | | | | — | | | | — | | | | 357,734 | |
Mandatory Convertible Securities (a) | | | 1,479,644 | | | | 392,490 | | | | — | | | | 1,872,134 | |
U.S. Government Obligations | | | — | | | | 449,013 | | | | — | | | | 449,013 | |
TOTAL INVESTMENTS IN SECURITIES – ASSETS | | | $ 1,837,378 | | | | $ 13,068,126 | | | | — | | | | $ 14,905,504 | |
| | | | |
EQUITY FUND | | | | | | | | | | | | | | | | |
INVESTMENTS IN SECURITIES: | | | | | | | | | | | | | | | | |
ASSETS (Market Value): | | | | | | | | | | | | | | | | |
Common Stocks (a) | | | $ 61,835,974 | | | | — | | | | — | | | | $ 61,835,974 | |
Short Term Investments | | | 584,740 | | | | — | | | | — | | | | 584,740 | |
TOTAL INVESTMENTS IN SECURITIES – ASSETS | | | $ 62,420,714 | | | | — | | | | — | | | | $ 62,420,714 | |
| | | | |
BALANCED FUND | | | | | | | | | | | | | | | | |
INVESTMENTS IN SECURITIES: | | | | | | | | | | | | | | | | |
ASSETS (Market Value): | | | | | | | | | | | | | | | | |
Common Stocks (a) | | | $ 44,955,992 | | | | — | | | | — | | | | $ 44,955,992 | |
Corporate Bonds (a) | | | — | | | | $ 12,913,698 | | | | — | | | | 12,913,698 | |
U.S. Government Agency Obligations | | | — | | | | 2,849,257 | | | | — | | | | 2,849,257 | |
U.S. Government Obligations | | | — | | | | 4,097,012 | | | | — | | | | 4,097,012 | |
Short Term Investments | | | 774,655 | | | | — | | | | — | | | | 774,655 | |
TOTAL INVESTMENTS IN SECURITIES – ASSETS | | | $ 45,730,647 | | | | $ 19,859,967 | | | | — | | | | $ 65,590,614 | |
| | | | |
INTERMEDIATE BOND FUND | | | | | | | | | | | | | | | | |
INVESTMENTS IN SECURITIES: | | | | | | | | | | | | | | | | |
ASSETS (Market Value): | | | | | | | | | | | | | | | | |
Corporate Bonds (a) | | | — | | | | $ 5,081,279 | | | | — | | | | $ 5,081,279 | |
U.S. Government Agency Obligations | | | — | | | | 1,422,970 | | | | — | | | | 1,422,970 | |
U.S. Government Obligations | | | — | | | | 1,775,725 | | | | — | | | | 1,775,725 | |
TOTAL INVESTMENTS IN SECURITIES – ASSETS | | | — | | | | $ 8,279,974 | | | | — | | | | $ 8,279,974 | |
(a) Please refer to the Schedule of Investments for the industry classifications of these portfolio holdings.
During the year ended September 30, 2017, the Mighty MitesSM Fund had transfers of $3,215,902 or 0.31% of net assets as of September 30, 2016 from Level 1 to Level 2, transfers of $12,344,335 or 1.18% of net assets as of September 30, 2016 from Level 2 to Level 1, transfers of $3,852,005 or 0.37% of net assets as of September 30, 2016 from Level 1 to Level 3, transfers of $399,159 or 0.04% of net assets as of September 30, 2016 from Level 2 to Level 3, and transfers of $240,757 or 0.02% of net assets as of September 30, 2016 from Level 3 to Level 2. Transfers from Level 1 to Level 2, transfers from Level 1 to Level 3, and transfers from Level 2 to Level 3 are due to a decline in market activity, e.g., frequency of trades, which resulted in a lack of available market inputs to determine price. Transfers from Level 2 to Level 1, and transfers from Level 3 to level 2 are due to an increase in market activity, e.g., frequency of trades, which resulted in an increase in available market inputs to determine the price.
The SmallCap Equity Fund, Mid-Cap Equity Fund, Convertible Securities Fund, Equity Fund, Balanced Fund, and Intermediate Bond Fund did not have transfers among Level 1, Level 2, and Level 3 during the year ended September 30, 2017. The Funds’ policy is to recognize transfers among Levels as of the beginning of the reporting period.
There were no Level 3 investments held at September 30, 2017 or September 30, 2016 for SmallCap Equity Fund, Mid-Cap Equity Fund, Convertible Securities Fund, Equity Fund, Balanced Fund, and Intermediate Bond Fund.
49
TETON Westwood Funds
Notes to Financial Statements (Continued)
The following table reconciles Level 3 investments for Mighty MitesSM Fund for which significant unobservable inputs were used to determine fair value:
| | | | | | | | | | | | | | | | | | | | | | | | | | | | | | | | | | | | | | | | |
MIGHTY MITESSM FUND | | Balance
as of
9/30/16 | | | Accrued
discounts/ (premiums) | | | Realized
gain/ (loss) | | | Change in
unrealized
appreciation/
depreciation† | | | Purchases | | | Sales | | | Transfers
into Level 3 | | | Transfers out of
Level 3 | | | Balance as of 9/30/17 | | | Net change in
unrealized
appreciation/
depreciation
on Level 3
investments
still held at 9/30/17† | |
INVESTMENTS IN SECURITIES: | | | | | | | | | | | | | | | | | | | | | | | | | | | | | | | | | |
ASSETS (Market Value): | | | | | | | | | | | | | | | | | | | | | | | | | | | | | | | | | | | | | | | | |
Common Stocks: | | | | | | | | | | | | | | | | | | | | | | | | | | | | | | | | | | | | | | | | |
Automotive: Parts and Accessories | | | — | | | | — | | | | — | | | $ | 156,000 | | | | — | | | | — | | | $ | 3,844,000 | | | | — | | | $ | 4,000,000 | | | $ | 156,000 | |
Business Services | | | — | | | | — | | | | — | | | | — | | | | — | | | | — | | | | — | | | | — | | | | 0 | | | | — | |
Computer Hardware | | | — | | | | — | | | | — | | | | (3,650) | | | | — | | | | — | | | | 3,650 | | | | — | | | | 0 | | | | (3,650) | |
Consumer Products | | $ | 31 | | | | — | | | $ | (2,600) | | | | 2,576 | | | | — | | | | — | | | | 19 | | | | — | | | | 26 | | | | 2,576 | |
Diversified Industrial | | | — | | | | — | | | | (49,451) | | | | (126,347) | | | $ | 14,100 | | | $ | (1,759) | | | | 387,691 | | | | — | | | | 224,234 | | | | (126,347) | |
Educational Services | | | 476 | | | | — | | | | (198,119) | | | | 197,643 | | | | — | | | | — | | | | — | | | | — | | | | 0 | | | | 197,643 | |
Electronics | | | 12,754 | | | | — | | | | — | | | | (12,754) | | | | — | | | | — | | | | — | | | | — | | | | 0 | | | | (12,754) | |
Entertainment | | | — | | | | — | | | | — | | | | (755) | | | | — | | | | — | | | | 755 | | | | — | | | | 0 | | | | (755) | |
Financial Services | | | 400,000 | | | | — | | | | — | | | | — | | | | — | | | | — | | | | — | | | | — | | | | 400,000 | | | | — | |
Health Care | | | 640 | | | | — | | | | — | | | | (640) | | | | — | | | | — | | | | — | | | | — | | | | 0 | | | | (640) | |
Real Estate | | | 241,076 | | | | — | | | | — | | | | (2,664) | | | | — | | | | — | | | | 3,600 | | | $ | (240,757) | | | | 1,255 | | | | (2,664) | |
Telecommunications | | | — | | | | — | | | | — | | | | 12,675 | | | | — | | | | — | | | | 11,449 | | | | — | | | | 24,124 | | | | 12,675 | |
Transportation | | | 465 | | | | — | | | | (7,995) | | | | 7,530 | | | | — | | | | — | | | | — | | | | — | | | | 0 | | | | 7,530 | |
Total Common Stocks | | | 655,442 | | | | — | | | | (258,165) | | | | 229,614 | | | | 14,100 | | | | (1,759) | | | | 4,251,164 | | | | (240,757) | | | | 4,649,639 | | | | 229,614 | |
Rights | | | 262,000 | | | | — | | | | — | | | | (184,000) | | | | 1 | | | | — | | | | — | | | | — | | | | 78,001 | | | | (184,000) | |
Warrants | | | — | | | | — | | | | — | | | | — | | | | 0 | | | | — | | | | 0 | | | | — | | | | 0 | | | | — | |
TOTAL INVESTMENTS IN SECURITIES | | $ | 917,442 | | | | — | | | $ | (258,165) | | | $ | 45,614 | | | $ | 14,101 | | | $ | (1,759) | | | $ | 4,251,164 | | | $ | (240,757) | | | $ | 4,727,640 | | | $ | 45,614 | |
| † | Net change in unrealized appreciation/depreciation on investments is included in the related amounts in the Statement of Operations. |
The following tables summarize the valuation techniques used and unobservable inputs utilized to determine the value of certain of the Fund’s Level 3 investments as of September 30, 2017.
| | | | | | | | | | | | | | |
Description | | Balance at 9/30/17 | | Valuation Technique | | Unobservable Input | | Range | |
MIGHTY MITESSM FUND | | | | | | | | | | | | | | |
INVESTMENTS IN SECURITIES: | | | | | | | | | | | | | | |
ASSETS (Market Value): | | | | | | | | | | | | | | |
Common Stocks: | | | | | | | | | | | | | | |
Automotive: Parts and Accessories | | | $4,000,000 | | | | | Acquisition Price/Cash Flow Analysis | | Discount Range | | | 0% | |
Business Services | | | 0 | | | | | Acquisition Price/Cash Flow Analysis | | Discount Range | | | 0% | |
Computer Hardware | | | 0 | | | | | Liquidation Plan | | Discount Range | | | 0% | |
Consumer Products | | | 26 | | | | | Last Price | | Discount Range | | | 0% | |
Diversified Industrial | | | 224,234 | | | | | Last Price | | Discount Range | | | 0% | |
Electronics | | | 0 | | | | | Liquidation Plan | | Discount Range | | | 0% | |
Entertainment | | | 0 | | | | | Bankruptcy Plan/Last Price | | Discount Range | | | 0% | |
Financial Services | | | 400,000 | | | | | Last Price | | Discount Range | | | 0% | |
Health Care | | | 0 | | | | | Last Price/Intrinsic value | | Discount Range | | | 0% | |
Real Estate | | | 255 | | | | | Restructure Plan/Cash Flow Analysis | | Discount Range | | | 0% | |
Real Estate | | | 1,000 | | | | | Last Price | | Discount Range | | | 0% | |
Telecommunications | | | 24,124 | | | | | Last Price | | Discount Range | | | 0% | |
Total Common Stocks | | | 4,649,639 | | | | | | | | | | | |
Rights: | | | | | | | | | | | | | | |
Entertainment | | | 1 | | | | | Last Price | | Discount Range | | | 0% | |
Health Care | | | 78,000 | | | | | Acquisition Price/Cash Flow Analysis | | Discount Range | | | 0% | |
Health Care | | | 0 | | | | | Intrinsic value | | Discount Range | | | 0% | |
Total Rights | | | 78,001 | | | | | | | | | | | |
Warrants | | | 0 | | | | | Black Scholes | | Discount Range | | | 0% | |
TOTAL INVESTMENTS IN LEVEL 3 SECURITIES | | | $4,727,640 | | | | | | | | | | | |
| | | | |
Unobservable Input | | Impact to Value if Input Increases | | Impact to Value if Input Decreases |
Discount Range | | Decrease | | Increase |
50
TETON Westwood Funds
Notes to Financial Statements (Continued)
Additional Information to Evaluate Qualitative Information.
General. The Funds use recognized industry pricing services – approved by the Board and unaffiliated with the Adviser – to value most of their securities, and use broker quotes provided by market makers of securities not valued by these and other recognized pricing sources. Several different pricing feeds are received to value domestic equity securities, international equity securities, preferred equity securities, and fixed income securities. The data within these feeds are ultimately sourced from major stock exchanges and trading systems where these securities trade. The prices supplied by external sources are checked by obtaining quotations or actual transaction prices from market participants. If a price obtained from the pricing source is deemed unreliable, prices will be sought from another pricing service or from a broker/dealer that trades that security or similar securities.
Fair Valuation. Fair valued securities may be common or preferred equities, warrants, options, rights, or fixed income obligations. Where appropriate, Level 3 securities are those for which market quotations are not available, such as securities not traded for several days or for which current bids are not available, or which are restricted as to transfer. When fair valuing a security, factors to consider include recent prices of comparable securities that are publicly traded, reliable prices of securities not publicly traded, the use of valuation models, current analyst reports, valuing the income or cash flow of the issuer, or cost if the preceding factors do not apply. A significant change in the unobservable inputs could result in a lower or higher value in Level 3 securities. The circumstances of Level 3 securities are frequently monitored to determine if fair valuation measures continue to apply.
The Adviser reports quarterly to the Board the results of the application of fair valuation policies and procedures. These may include back testing the prices realized in subsequent trades of these fair valued securities to fair values previously recognized.
Securities Sold Short. The Funds may enter into short sale transactions. Short selling involves selling securities that may or may not be owned and, at times, borrowing the same securities for delivery to the purchaser, with an obligation to replace such borrowed securities at a later date. The proceeds received from short sales are recorded as liabilities and the Funds record an unrealized gain or loss to the extent of the difference between the proceeds received and the value of an open short position on the day of determination. The Funds record a realized gain or loss when the short position is closed out. By entering into a short sale, the Funds bear the market risk of an unfavorable change in the price of the security sold short. Dividends on short sales are recorded as an expense by the Funds on the ex-dividend date and interest expense is recorded on the accrual basis. The broker retains collateral for the value of the open positions, which is adjusted periodically as the value of the position fluctuates. At September 30, 2017, there were no short sales outstanding.
Foreign Currency Translations. The books and records of the Funds are maintained in U.S. dollars. Foreign currencies, investments, and other assets and liabilities are translated into U.S. dollars at current exchange rates. Purchases and sales of investment securities, income, and expenses are translated at the exchange rate prevailing on the respective dates of such transactions. Unrealized gains and losses that result from changes in foreign exchange rates and/or changes in market prices of securities have been included in unrealized appreciation/depreciation on investments and foreign currency translations. Net realized foreign currency gains and losses resulting from changes in exchange rates include foreign currency gains and losses between trade date and settlement date on investment securities transactions, foreign currency transactions, and the difference between the amounts of interest and dividends recorded on the books of the Funds and the amounts actually received. The portion of foreign currency gains and losses related to fluctuation in exchange rates between the initial purchase trade date and subsequent sale trade date is included in realized gain/(loss) on investments.
Foreign Securities. The Funds may directly purchase securities of foreign issuers. Investing in securities of foreign issuers involves special risks not typically associated with investing in securities of U.S. issuers. The risks include possible revaluation of currencies, the inability to repatriate funds, less complete financial information about companies, and possible future adverse political and economic developments. Moreover, securities of many foreign issuers and their markets may be less liquid and their prices more volatile than securities of comparable U.S. issuers.
Foreign Taxes. The Funds may be subject to foreign taxes on income, gains on investments, or currency repatriation, a portion of which may be recoverable. The Funds will accrue such taxes and recoveries as applicable, based upon their current interpretation of tax rules and regulations that exist in the markets in which they invest.
Restricted Securities. Each Fund may invest up to 10% (except for the Mighty MitesSM Fund, SmallCap Equity Fund, and Convertible Securities Fund which may invest up to 15%) of its net assets in securities for which the markets are restricted. Restricted securities include securities whose disposition is subject to substantial legal or contractual restrictions. The sale of restricted securities often requires more time and results in higher brokerage charges or dealer discounts and other selling expenses than does the sale of securities eligible for trading on national securities exchanges or in the over-the-counter markets.
51
TETON Westwood Funds
Notes to Financial Statements (Continued)
Restricted securities may sell at a price lower than similar securities that are not subject to restrictions on resale. Securities freely saleable among qualified institutional investors under special rules adopted by the SEC may be treated as liquid if they satisfy liquidity standards established by the Board. Securities deemed as liquid are not included in the limitations described above. The continued liquidity of such securities is not as well assured as that of publicly traded securities, and accordingly the Board will monitor their liquidity. For the restricted securities the Funds held as of September 30, 2017, refer to the Schedules of Investments.
Investments in other Investment Companies. All Funds may invest, from time to time, in shares of other investment companies (or entities that would be considered investment companies but are excluded from the definition pursuant to certain exceptions under the 1940 Act) (the “Acquired Funds”) in accordance with the 1940 Act and related rules. Shareholders in these Funds would bear the pro rata portion of the periodic expenses of the Acquired Funds in addition to the Fund’s expenses. For the year ended September 30, 2017, both the Mighty MitesSM Fund’s and Intermediate Bond Fund’s pro rata portion of the periodic expenses charged by the Acquired Funds were 1 basis point and 2 basis points, respectively. For the year ended September 30, 2017, the Equity Fund’s and Balanced Fund’s pro rata portion of the periodic expenses charged by the Acquired Funds was less than one basis point.
Securities Transactions and Investment Income. Securities transactions are accounted for on the trade date with realized gain or loss on investments determined by using the identified cost method. Interest income (including amortization of premium and accretion of discount) is recorded on the accrual basis. Premiums and discounts on debt securities are amortized using the effective yield to maturity method. Dividend income is recorded on the ex-dividend date except for certain dividends from foreign securities that are recorded as soon after the ex-dividend date as a Fund becomes aware of such dividends.
Determination of Net Asset Value and Calculation of Expenses. Certain administrative expenses are common to, and allocated among, various affiliated funds. Such allocations are made on the basis of each fund’s average net assets or other criteria directly affecting the expenses as determined by the Adviser pursuant to procedures established by the Board.
In calculating the NAV per share of each class, investment income, realized and unrealized gains and losses, redemption fees, and expenses other than class specific expenses are allocated daily to each class of shares based upon the proportion of net assets of each class at the beginning of each day. Distribution expenses are borne solely by the class incurring the expense.
Custodian Fee Credits and Interest Expense. When cash balances are maintained in a Fund’s custody account, the Fund receives credits which are used to offset custodian fees. The gross expenses paid under each custody arrangement are included in custodian fees in the Statements of Operations with the corresponding expense offset, if any, shown as “Custodian fee credits.” When cash balances are overdrawn, a Fund is charged an overdraft fee equal to 90% of the current Treasury Bill rate on outstanding balances. These amounts, if any, would be included in the Statements of Operations.
Distributions to Shareholders. Distributions from net investment income are declared and paid annually for the Mighty MitesSM Fund, SmallCap Equity Fund, Mid-Cap Equity Fund, and Equity Fund, and quarterly for the Convertible Securities Fund and Balanced Fund. The Intermediate Bond Fund declares dividends daily and pays those dividends monthly. Distributions of net realized gain on investments are normally declared and paid at least annually by each Fund. Distributions to shareholders are recorded on the ex-dividend date. Distributions to shareholders are based on income and capital gains as determined in accordance with federal income tax regulations, which may differ from income and capital gains as determined under GAAP. These differences are primarily due to differing treatments of income and gains on various investment securities and foreign currency transactions held by the Funds, timing differences, net operating loss write off, and differing characterizations of distributions made by the Funds. Distributions from net investment income for federal income tax purposes include net realized gains on foreign currency transactions. These book/tax differences are either temporary or permanent in nature. To the extent these differences are permanent, adjustments are made to the appropriate capital accounts in the period when the differences arise. These reclassifications have no impact on the NAV of the Funds.
52
TETON Westwood Funds
Notes to Financial Statements (Continued)
For the year ended September 30, 2017, the following reclassifications were made to increase/decrease such amounts with offsetting adjustments to paid-in capital:
| | | | | | | | | | | | |
| | | Accumulated
Net
Investment
Income (Loss) | | | Accumulated Net
Realized Gain
(Loss) on
Investments | | | Paid-in
Capital | |
Mighty MitesSM Fund | | | $7,935,066 | | | | $(1,848,447) | | | $ | (6,086,619 | ) |
SmallCap Equity Fund | | | 51,474 | | | | (51,396) | | | | (78 | ) |
Mid-Cap Equity Fund | | | 13,633 | | | | (38,862) | | | | 25,229 | |
Convertible Securities Fund | | | 64,731 | | | | (64,731) | | | | — | |
Equity Fund | | | — | | | | — | | | | — | |
Balanced Fund | | | 61 | | | | (61) | | | | — | |
Intermediate Bond Fund | | | (103) | | | | 103 | | | | — | |
The tax character of distributions paid during the year ended September 30, 2017 was as follows:
| | | | | | | | | | | | | | | | | | | | | | | | | | | | | | | | | | | | | | | | |
| | | Year Ended
September 30, | | Year Ended
September 30, | | Year Ended
September 30, | | Year Ended
September 30, |
| | | 2017 | | 2016 | | 2017 | | 2016 | | 2017 | | 2016 | | 2017 | | 2016 |
| | | Mighty MitesSM Fund | | SmallCap Equity Fund | | Mid-Cap Equity Fund | | Convertible Securities Fund |
Ordinary Income (inclusive of short term capital gains) | | | | — | | | | | — | | | | | — | | | | | — | | | | | — | | | | | — | | | | | $220,857 | | | | | $19,307 | |
Net long term capital gains | | | $ | 50,989,812 | * | | | $ | 25,421,368 | | | | $ | 2,641,624 | | | | $ | 3,743,714 | | | | $ | 47,043 | | | | $ | 201,278 | | | | | 306,031 | | | | | — | |
| | | | | | | | | | | | | | | | | | | | | | | | | | | | | | | | | | | | | | | | |
Total distributions paid | | | $ | 50,989,812 | | | | $ | 25,421,368 | | | | $ | 2,641,624 | | | | $ | 3,743,714 | | | | $ | 47,043 | | | | $ | 201,278 | | | | | $526,888 | | | | | $19,307 | |
| | | | | | | | | | | | | | | | | | | | | | | | | | | | | | | | | | | | | | | | |
| | | Equity Fund | | Balanced Fund | | Intermediate Bond Fund | | | | |
Ordinary Income (inclusive of short term capital gains) | | | $ | 337,628 | | | | $ | 248,032 | | | | $ | 568,568 | | | | $ | 669,455 | | | | $ | 312,571 | | | | $ | 306,332 | | | | | | | | | | | |
Net long term capital gains | | | | 3,883,542 | | | | | 4,754,811 | | | | | 3,642,920 | | | | | 4,706,472 | | | | | 39,919 | | | | | 345,369 | | | | | | | | | | | |
| | | | | | | | | | | | | | | | | | | | | | | | | | | | | | | | | | | | | | | | |
Total distributions paid | | | $ | 4,221,170 | | | | $ | 5,002,843 | | | | $ | 4,211,488 | | | | $ | 5,375,927 | | | | $ | 352,490 | | | | $ | 651,701 | | | | | | | | | | | |
| | | | | | | | | | | | | | | | | | | | | | | | | | | | | | | | | | | | | | | | |
| * | Total distributions paid differs from the Statement of Changes in Net Assets due to the utilization of equalization. |
Provision for Income Taxes. The Funds intend to continue to qualify as regulated investment companies under Subchapter M of the Internal Revenue Code of 1986, as amended (the “Code”). It is the policy of the Funds to comply with the requirements of the Code applicable to regulated investment companies and to distribute substantially all of the Funds’ net investment company taxable income and net capital gains. Therefore, no provision for federal income taxes is required.
At September 30, 2017, the components of accumulated earnings/losses on a tax basis were as follows:
| | | | | | | | | | | | | | | | | | | | | | | | | | | | |
| | | Mighty
MitesSM
Fund | | | SmallCap
Equity
Fund | | | Mid-Cap
Equity
Fund | | | Convertible
Securities
Fund | | | Equity
Fund | | | Balanced
Fund | | | Intermediate
Bond Fund | |
Undistributed ordinary income
(inclusive of short term capital gains) . | | | — | | | | — | | | | — | | | $ | 7,304 | | | $ | 879,294 | | | $ | 410,804 | | | | $24,058 | |
Undistributed long term capital gain | | $ | 84,597,670 | | | $ | 1,546,567 | | | $ | 130,337 | | | | — | | | | 5,773,773 | | | | 3,448,839 | | | | 105,509 | |
Accumulated capital loss carryforward . | | | — | | | | — | | | | — | | | | (10 | ) | | | — | | | | — | | | | — | |
Unrealized appreciation/(depreciation) . | | | 499,903,632 | | | | 10,253,333 | | | | 632,497 | | | | 1,025,829 | | | | 12,637,363 | | | | 10,140,178 | | | | 51,138 | |
Qualified late year loss deferral* | | | (4,848,758 | ) | | | (159,522 | ) | | | (21,734 | ) | | | (47,693 | ) | | | — | | | | — | | | | — | |
| | | | | | | | | | | | | | | | | | | | | | | | | | | | |
Total accumulated earnings | | $ | 579,652,544 | | | $ | 11,640,378 | | | $ | 741,100 | | | $ | 985,430 | | | $ | 19,290,430 | | | $ | 13,999,821 | | | | $180,705 | |
| | | | | | | | | | | | | | | | | | | | | | | | | | | | |
| * | Qualified late year losses related to passive foreign investment companies, ordinary losses, and losses on sales of securities and foreign currency realized after October 31 (certain ordinary losses incurred after December 31) and prior to the Funds’ year end may be elected as occurring on the first day of the following year. |
At September 30, 2017, the temporary differences between book basis and tax basis unrealized appreciation/depreciation on investments was primarily due to deferral of losses from wash sales for tax purposes, mark-to-market adjustments on investments in passive foreign investment companies, investments in REITs, and basis adjustments in partnerships.
53
TETON Westwood Funds
Notes to Financial Statements (Continued)
The following summarizes the tax cost of investments and the related net unrealized appreciation/depreciation at September 30, 2017:
| | | | | | | | | | | | | | | | | | | | | | | | | | | | |
| | | Mighty
MitesSM
Fund | | | SmallCap
Equity
Fund | | | Mid-Cap
Equity
Fund | | | Convertible
Securities
Fund | | | Equity
Fund | | | Balanced
Fund | | | Intermediate
Bond Fund | |
Aggregate cost of investments | | $ | 849,473,625 | | | $ | 22,305,722 | | | $ | 2,367,872 | | | $ | 13,879,675 | | | $ | 49,783,351 | | | $ | 55,450,436 | | | $ | 8,228,836 | |
| | | | | | | | | | | | | | | | | | | | | | | | | | | | |
Gross unrealized appreciation | | $ | 550,076,546 | | | $ | 10,587,245 | | | $ | 660,192 | | | $ | 1,254,996 | | | $ | 14,102,930 | | | $ | 11,233,981 | | | $ | 126,610 | |
Gross unrealized depreciation | | | (50,175,481 | ) | | | (333,912 | ) | | | (27,695 | ) | | | (229,167 | ) | | | (1,465,567 | ) | | | (1,093,803 | ) | | | (75,472 | ) |
| | | | | | | | | | | | | | | | | | | | | | | | | | | | |
Net unrealized appreciation/ depreciation | | $ | 499,901,065 | | | $ | 10,253,333 | | | $ | 632,497 | | | $ | 1,025,829 | | | $ | 12,637,363 | | | $ | 10,140,178 | | | $ | 51,138 | |
| | | | | | | | | | | | | | | | | | | | | | | | | | | | |
The Funds are required to evaluate tax positions taken or expected to be taken in the course of preparing the Funds’ tax returns to determine whether the tax positions are “more-likely-than-not” of being sustained by the applicable tax authority. Income tax and related interest and penalties would be recognized by the Funds as tax expense in the Statement of Operations if the tax positions were deemed not to meet the more-likely-than-not threshold. As of September 30, 2017, the Adviser has reviewed all open tax years and concluded that there was no impact to the Funds’ net assets or results of operations. The Funds’ federal and state tax returns for the prior three fiscal years remain open, subject to examination by the Internal Revenue Service and state taxing authorities. On an ongoing basis, the Adviser will monitor the Funds’ tax positions to determine if adjustments to this conclusion are necessary.
3. Investment Advisory Agreements and Other Transactions. The Funds have entered into investment advisory agreements (the “Advisory Agreements”) with the Adviser which provide that the Funds will pay the Adviser a fee, computed daily and paid monthly, at the annual rate of 1.00% for the Mighty MitesSM Fund, SmallCap Equity Fund, Mid-Cap Equity Fund, Convertible Securities Fund, and Equity Fund, 0.75% for the Balanced Fund, and 0.60% for the Intermediate Bond Fund, of the value of a Fund’s average daily net assets. In accordance with the Advisory Agreements, the Adviser provides a continuous investment program for the Funds’ portfolios, oversees the administration of all aspects of the Funds’ business and affairs, and pays the compensation of all Officers and Trustees of the Funds who are affiliated persons of the Adviser.
There was a reduction in the advisory fee paid to the Adviser relating to certain portfolio holdings, i.e., unsupervised assets, of the Mighty MitesSM Fund with respect to which the Adviser transferred dispositive and voting control to the Funds’ Proxy Voting Committee. During the year ended September 30, 2017, the Funds’ Proxy Voting Committee exercised control and discretion over all rights to vote or consent with respect to such securities, and the Adviser reduced its fee with respect to such securities by $77,025.
The Adviser has contractually agreed to waive investment advisory fees and/or to reimburse expenses to the SmallCap Equity Fund, Mid-Cap Equity Fund, Convertible Securities Fund, and Intermediate Bond Fund in the event annual expenses of such Funds exceed certain prescribed limits. Such fee waiver/reimbursement arrangements continue at least until January 31, 2019. For the year ended September 30, 2017, the Adviser waived fees or reimbursed expenses in the amounts of $122,027, $76,114, $122,517, and $83,760 for the SmallCap Equity Fund, Mid-Cap Equity Fund, Convertible Securities Fund, and Intermediate Bond Fund, respectively.
During the year ended September 30, 2017, the expense limitations in place for the SmallCap Equity Fund were as follows:
| | | | |
| | | From October 1, 2016 through
February 28, 2017 | | From March 1, 2017 through
September 30, 2017 |
SmallCap Equity Fund Class AAA | | 1.50% | | 1.25% |
SmallCap Equity Fund Class A | | 1.75% | | 1.50% |
SmallCap Equity Fund Class C | | 2.25% | | 2.00% |
SmallCap Equity Fund Class I | | 1.25% | | 1.00% |
SmallCap Equity Fund Class T | | NA | | 1.25% |
In addition, the SmallCap Equity Fund, the Convertible Securities Fund, and the Intermediate Bond Fund are obliged to repay the Adviser for a period of two fiscal years following the fiscal year in which the Adviser reimbursed the Funds only to the extent that the operating expenses of these Funds fall below the foregoing respective expense limitations based on average net assets for the SmallCap Equity Fund, and below the following expense limitations for the Convertible Securities Fund and the Intermediate Bond Fund for Class AAA Shares 1.15% and 1.00%, respectively, for Class A Shares 1.40% and 1.10%, respectively, for Class C Shares 1.90 and 1.75%, respectively, and for Class I Shares 0.90% and 0.75%, respectively. As of
54
TETON Westwood Funds
Notes to Financial Statements (Continued)
September 30, 2017, the cumulative unreimbursed amounts which may be recovered by the Adviser within the next two fiscal years are as follows:
| | | | | | |
| | | For the year ended
September 30, 2016,
expiring
September 30, 2018 | | For the year ended
September 30, 2017,
expiring
September 30, 2019 | | Total |
SmallCap Equity Fund. | | $62,663 | | $122,027 | | $184,690 |
Convertible Securities Fund | | 52,910 | | 122,517 | | 175,427 |
Intermediate Bond Fund | | 82,578 | | 83,760 | | 166,338 |
The Mid-Cap Equity Fund is obliged to repay the Adviser for a period of three fiscal years following the fiscal year in which the Adviser reimbursed the Fund, only to the extent that the operating expenses of the Fund falls below the applicable expense limitation for Class AAA of 1.05%, Class A of 1.30%, Class C of 1.80%, and Class I of 0.80%, of average daily net assets, the annual limitation under the Advisory Agreement. As of September 30, 2017, the cumulative unreimbursed amounts which may be recovered by the Adviser within the next three fiscal years are as follows:
| | | | | | | | |
| | | For the year ended
September 30, 2015,
expiring
September 30, 2018 | | For the year ended
September 30, 2016,
expiring
September 30, 2019 | | For the year ended
September 30, 2017,
expiring
September 30, 2020 | | Total |
Mid-Cap Equity Fund | | $63,105 | | $83,891 | | $76,114 | | $223,110 |
Pursuant to shareholder approvals, effective February 1, 2017 for the Convertible Securities Fund and March 1, 2017 for the Mighty MitesSM Fund, Gabelli Funds, LLC, an affiliate, became a Subadviser (“Gabelli Subadviser”) to the Adviser. The Adviser pays Gabelli Funds, LLC out of its advisory fees a monthly fee, computed and accrued daily, based on an annual rate of 0.32% of the average net assets of these two Funds. In addition, the Adviser had a Subadvisory Agreement with Westwood Management Corp. (the “Westwood Subadviser”) for the Equity Fund, and Balanced Fund, and effective throughout the fiscal year ended September 30, 2017, which continues, and for the Intermediate Bond Fund from October 1, 2016 through August 31, 2017 at which time Teton Advisors became its direct Adviser. The Adviser paid the Westwood Subadviser out of its advisory fees with respect to these three Funds a fee, computed daily and payable monthly, in an amount equal on an annualized basis to the greater of (i) $150,000 per year on an aggregate basis for all applicable Funds or (ii) 35% of the net revenues to the Adviser from the applicable Funds.
The Adviser has a sub-administration agreement for each of the Funds with Gabelli Funds, LLC. Gabelli Funds, LLC has entered into an agreement with BNY Mellon Investment Servicing (US) Inc. to provide certain administrative services to the Funds.
As per the approval of the Board, the Mid-Cap Equity Fund compensates officers of the Fund, who are employed by the Fund and are not employed by the Adviser (although the officers may receive incentive based variable compensation from affiliates of the Adviser). For the year ended September 30, 2017, the Fund paid or accrued $2,044 in payroll expenses in the Statement of Operations.
The Trust pays each Trustee who is not considered an affiliated person an annual retainer of $9,000 plus $2,000 for each Board meeting attended, and they are reimbursed by the Trust for any out of pocket expenses incurred in attending meetings. All Board committee members receive $1,000 per meeting attended, the Chairman of the Audit Committee receives a $3,000 annual fee, and the Lead Trustee receives an annual fee of $2,000. A Trustee may receive a single meeting fee, allocated among the participating funds, for attending certain meetings held on behalf of multiple funds. Trustees who are directors or employees of the Adviser or an affiliated company receive no compensation or expense reimbursement from the Trust.
4. Distribution Plan. The Trust’s Board has adopted a distribution plan (the “Plan”) for each class of shares, except Class I Shares, pursuant to Rule 12b-1 under the 1940 Act. Under the Class AAA, Class A, Class C, and Class T Share Plans, payments are authorized to G.distributors, LLC (the “Distributor”), an affiliate of the Adviser, at annual rates of 0.25%, 0.50% (for the Intermediate Bond Fund’s Class A Shares at an annual rate of 0.35%), 1.00%, and 0.25%, respectively, of the average daily net assets of those classes, the annual limitations under each Plan. Such payments are accrued daily and paid monthly.
55
TETON Westwood Funds
Notes to Financial Statements (Continued)
5. Portfolio Securities. Purchases and sales (including maturities) of securities during the year ended September 30, 2017, other than short term securities, are as follows:
| | | | | | | | | | | | | | | | | | | | |
| | | Purchases
(excluding U.S.
Government
Securities) | | Sales
(excluding U.S.
Government
Securities) | | Purchases
of U.S.
Government
Securities | | Sales of U.S.
Government
Securities |
Mighty MitesSM Fund | | | $ | 77,084,953 | | | | $ | 179,835,599 | | | | | — | | | | | — | |
SmallCap Equity Fund | | | | 12,174,560 | | | | | 11,073,026 | | | | | — | | | | | — | |
Mid-Cap Equity Fund | | | | 1,098,597 | | | | | 2,382,980 | | | | | — | | | | | — | |
Convertible Securities Fund | | | | 16,792,778 | | | | | 3,540,641 | | | | | — | | | | | — | |
Equity Fund | | | | 17,512,409 | | | | | 26,259,682 | | | | | — | | | | | — | |
Balanced Fund | | | | 14,925,479 | | | | | 18,578,552 | | | | | — | | | | | — | |
Intermediate Bond Fund | | | | 3,641,323 | | | | | 11,057,947 | | | | $ | 1,103,087 | | | | $ | 4,546,415 | |
6. Transactions with Affiliates and Other Arrangements. During the year ended September 30, 2017, the Mighty MitesSM Fund and the Convertible Securities Fund paid $97,017 and $201, respectively, in brokerage commissions on security trades to G.research, LLC, an affiliate of the Adviser. Additionally, the Distributor retained a total of $64,102 from investors representing commissions (sales charges and underwriting fees) on sales and redemptions of Fund shares.
Pursuant to Rule 17a-7 under the 1940 Act, the Funds may engage in purchase or sale transactions with other funds managed by the Adviser or an affiliated adviser. During the year ended September 30, 2017, such transactions for the Mighty MitesSM Fund and the Convertible Securities Fund amounted to $407,913 and $778,800, respectively, in purchase transactions.
During the year ended September 30, 2017, the Mighty MitesSM Fund, SmallCap Equity Fund, Mid-Cap Equity Fund, Equity Fund, and Balanced Fund received credits from a designated broker who agreed to pay certain Fund operating expenses. The amount of such expenses paid through this directed brokerage arrangement during this period was $8,963, $1,532, $1,063, $1,760, and $1,797, respectively.
The cost of calculating each Fund’s NAV per share is a Fund expense pursuant to the Advisory Agreement. During the year ended September 30, 2017, the Mighty MitesSM Fund, Equity Fund, and Balanced Fund each paid or accrued $45,000 to the Gabelli Funds, LLC, an affiliate of the Adviser, in connection with the cost of computing these Funds’ NAVs. This expense was not charged during the year ended September 30, 2017 for the SmallCap Equity Fund, Mid-Cap Equity Fund, Convertible Securities Fund, and Intermediate Bond Fund.
As of September 30, 2017, the Mid-Cap Equity Fund’s Adviser and its affiliates and officers beneficially owned greater than 25% of the voting securities of the Mid-Cap Equity Fund. This includes accounts for which the affiliates of the Adviser have voting control but disclaim pecuniary interest.
7. Shares of Beneficial Interest. The Funds offer five classes of shares – Class AAA Shares, Class A Shares, Class C Shares, Class I Shares, and Class T Shares. Class AAA Shares and Class I Shares are offered without a sales charge. Class A Shares and Class T Shares are subject to a maximum front-end sales charge of 4.00% and 2.50%, respectively. Class C Shares are subject to a 1.00% contingent deferred sales charge for one year after purchase.
The Mighty MitesSM Fund, SmallCap Equity Fund, Mid-Cap Equity Fund, and Convertible Securities Fund impose a redemption fee of 2.00% on all classes of shares that are redeemed or exchanged on or before the seventh day of a purchase. The redemption fee is deducted from the proceeds otherwise payable to the redeeming shareholders and is retained by the respective Fund as an increase in paid-in capital. The redemption fees, if any, retained by the Fund during the years ended September 30, 2017 and 2016 can be found in the Statements of Changes in Net Assets under Redemption Fees.
During the year ended September 30, 2017, the Mid-Cap Equity Fund sold shares of various portfolio securities. These portfolio securities were delivered primarily by means of a redemption in-kind in exchange for Class AAA shares of the Fund. Cash and portfolio securities were transferred as of the close of business on the date and at the market value listed below:
| | | | | | |
January 4, 2017 | | Value | | Realized Gains | | Type |
Class AAA | | $365,795* | | $39,222 | | Redemption in-Kind |
* This amount includes cash of approximately $22,073 associated with the redemption in-kind.
56
TETON Westwood Funds
Notes to Financial Statements (Continued)
Transactions in shares of beneficial interest were as follows:
| | | | | | | | | | | | | | | | | | | | | | | | | | | | | | | | |
| | | Year Ended
September 30,
2017 | | | Year Ended
September 30,
2016 | | | Year Ended
September 30,
2017 | | | Year Ended
September 30,
2016 | | | Year Ended
September 30,
2017 | | | Year Ended
September 30,
2016 | | | Year Ended
September 30,
2017 | | | Year Ended
September 30,
2016 | |
| | | Mighty MitesSM
Fund | | | SmallCap Equity
Fund | | | Mid-Cap Equity
Fund | | | Convertible Securities
Fund | |
Class AAA | | | | | | | | | | | | | | | | | | | | | | | | | | | | | | | | |
Shares sold | | | 1,760,288 | | | | 1,108,002 | | | | 266,478 | | | | 234,709 | | | | 39,537 | | | | 33,210 | | | | 99,609 | | | | 41,878 | |
Shares issued upon reinvestment of distributions | | | 468,807 | | | | 259,282 | | | | 58,991 | | | | 64,906 | | | | 1,839 | | | | 6,030 | | | | 21,153 | | | | 1,413 | |
Shares redeemed | | | (3,269,846 | ) | | | (3,047,247 | ) | | | (460,953 | ) | | | (145,802 | ) | | | (102,446 | ) | | | (62,121 | ) | | | (153,149 | ) | | | (201,855 | ) |
Shares redeemed in-kind | | | — | | | | — | | | | — | | | | — | | | | (30,791 | ) | | | — | | | | — | | | | — | |
| | | | | | | | | | | | | | | | | | | | | | | | | | | | | | | | |
Net increase/(decrease) in Class AAA Shares | | | (1,040,751 | ) | | | (1,679,963 | ) | | | (135,484 | ) | | | 153,813 | | | | (91,861 | ) | | | (22,881 | ) | | | (32,387 | ) | | | (158,564 | ) |
| | | | | | | | | | | | | | | | | | | | | | | | | | | | | | | | |
Class A | | | | | | | | | | | | | | | | | | | | | | | | | | | | | | | | |
Shares sold | | | 1,484,433 | | | | 623,365 | | | | 42,648 | | | | 14,521 | | | | 7,368 | | | | 1,885 | | | | 180,355 | | | | 30,984 | |
Shares issued upon reinvestment of distributions | | | 258,861 | | | | 138,595 | | | | 15,131 | | | | 27,376 | | | | 273 | | | | 1,717 | | | | 7,099 | | | | 144 | |
Shares redeemed | | | (1,705,309 | ) | | | (2,040,276 | ) | | | (39,491 | ) | | | (66,315 | ) | | | (18,423 | ) | | | (29,547 | ) | | | (78,571 | ) | | | (30,855 | ) |
| | | | | | | | | | | | | | | | | | | | | | | | | | | | | | | | |
Net increase/(decrease) in Class A Shares | | | 37,985 | | | | (1,278,316 | ) | | | 18,288 | | | | (24,418 | ) | | | (10,782 | ) | | | (25,945 | ) | | | 108,883 | | | | 273 | |
| | | | | | | | | | | | | | | | | | | | | | | | | | | | | | | | |
Class C | | | | | | | | | | | | | | | | | | | | | | | | | | | | | | | | |
Shares sold | | | 974,773 | | | | 855,795 | | | | 18,862 | | | | 43,485 | | | | 1,792 | | | | 2,153 | | | | 40,369 | | | | 3,386 | |
Shares issued upon reinvestment of distributions | | | 346,671 | | | | 192,502 | | | | 11,710 | | | | 30,432 | | | | 182 | | | | 1,041 | | | | 4,024 | | | | 44 | |
Shares redeemed | | | (2,309,536 | ) | | | (2,579,797 | ) | | | (44,026 | ) | | | (122,683 | ) | | | (3,501 | ) | | | (10,873 | ) | | | (17,245 | ) | | | (15,911 | ) |
| | | | | | | | | | | | | | | | | | | | | | | | | | | | | | | | |
Net increase/(decrease) in Class C Shares | | | (988,092 | ) | | | (1,531,500 | ) | | | (13,454 | ) | | | (48,766 | ) | | | (1,527 | ) | | | (7,679 | ) | | | 27,148 | | | | (12,481 | ) |
| | | | | | | | | | | | | | | | | | | | | | | | | | | | | | | | |
Class I | | | | | | | | | | | | | | | | | | | | | | | | | | | | | | | | |
Shares sold | | | 8,295,220 | | | | 4,274,466 | | | | 280,016 | | | | 55,025 | | | | 9,327 | | | | 7,540 | | | | 553,039 | | | | 14,366 | |
Shares issued upon reinvestment of distributions | | | 559,850 | | | | 301,122 | | | | 51,794 | | | | 85,940 | | | | 1,674 | | | | 7,465 | | | | 12,558 | | | | 122 | |
Shares redeemed | | | (3,507,424 | ) | | | (7,539,199 | ) | | | (95,036 | ) | | | (100,925 | ) | | | (24,984 | ) | | | (49,233 | ) | | | (66,240 | ) | | | (4,346 | ) |
| | | | | | | | | | | | | | | | | | | | | | | | | | | | | | | | |
Net increase/(decrease) in Class I Shares | | | 5,347,646 | | | | (2,963,611 | ) | | | 236,774 | | | | 40,040 | | | | (13,983 | ) | | | (34,228 | ) | | | 499,357 | | | | 10,142 | |
| | | | | | | | | | | | | | | | | | | | | | | | | | | | | | | | |
Class T (a) | | | | | | | | | | | | | | | | | | | | | | | | | | | | | | | | |
Shares sold | | | 365 | | | | — | | | | 50 | | | | — | | | | — | | | | — | | | | — | | | | — | |
| | | | | | | | | | | | | | | | | | | | | | | | | | | | | | | | |
Net increase in Class T Shares | | | 365 | | | | — | | | | 50 | | | | — | | | | — | | | | — | | | | — | | | | — | |
| | | | | | | | | | | | | | | | | | | | | | | | | | | | | | | | |
(a) Class T Shares were initially offered on July 5, 2017.
57
TETON Westwood Funds
Notes to Financial Statements (Continued)
Transactions in shares of beneficial interest (continued):
| | | | | | | | | | | | | | | | | | | | | | | | | | | | | | |
| | | Year Ended
September 30,
2017 | | Year Ended
September 30,
2016 | | Year Ended
September 30,
2017 | | Year Ended
September 30,
2016 | | Year Ended
September 30,
2017 | | Year Ended
September 30,
2016 |
| | | |
| | | Equity Fund | | Balanced Fund | | Intermediate
Bond Fund |
Class AAA | | | | | | | | | | | | | | | | | | | | | | | | | | | | | | |
Shares sold. | | | | 50,004 | | | | | 90,589 | | | | | 584,115 | | | | | 488,294 | | | | | 54,266 | | | | | 52,001 | |
Shares issued upon reinvestment of distributions | | | | 288,678 | | | | | 339,336 | | | | | 288,682 | | | | | 366,531 | | | | | 6,662 | | | | | 12,657 | |
Shares redeemed | | | | (595,438 | ) | | | | (572,249 | ) | | | | (949,642 | ) | | | | (1,197,557 | ) | | | | (92,589 | ) | | | | (142,638 | ) |
| | | | | | | | | | | | | | | | | | | | | | | | | | | | | | |
Net decrease in Class AAA Shares. | | | | (256,756 | ) | | | | (142,324 | ) | | | | (76,845 | ) | | | | (342,732 | ) | | | | (31,661 | ) | | | | (77,980 | ) |
| | | | | | | | | | | | | | | | | | | | | | | | | | | | | | |
Class A | | | | | | | | | | | | | | | | | | | | | | | | | | | | | | |
Shares sold | | | | 14,363 | | | | | 89,464 | | | | | 122,407 | | | | | 129,287 | | | | | 9,648 | | | | | 20,242 | |
Shares issued upon reinvestment of distributions | | | | 20,055 | | | | | 23,526 | | | | | 37,216 | | | | | 40,716 | | | | | 954 | | | | | 2,188 | |
Shares redeemed | | | | (147,384 | ) | | | | (72,951 | ) | | | | (87,911 | ) | | | | (132,507 | ) | | | | (36,905 | ) | | | | (23,049 | ) |
| | | | | | | | | | | | | | | | | | | | | | | | | | | | | | |
Net increase/(decrease) in Class A Shares | | | | (112,966 | ) | | | | 40,039 | | | | | 71,712 | | | | | 37,496 | | | | | (26,303 | ) | | | | (619 | ) |
| | | | | | | | | | | | | | | | | | | | | | | | | | | | | | |
Class C | | | | | | | | | | | | | | | | | | | | | | | | | | | | | | |
Shares sold | | | | 39,479 | | | | | 14,105 | | | | | 35,975 | | | | | 111,079 | | | | | 27,845 | | | | | 297,295 | |
Shares issued upon reinvestment of distributions | | | | 3,174 | | | | | 4,124 | | | | | 22,637 | | | | | 28,701 | | | | | 1,390 | | | | | 1,175 | |
Shares redeemed | | | | (60,178 | ) | | | | (6,228 | ) | | | | (154,894 | ) | | | | (115,225 | ) | | | | (29,741 | ) | | | | (231,188 | ) |
| | | | | | | | | | | | | | | | | | | | | | | | | | | | | | |
Net increase/(decrease) in Class C Shares | | | | (17,525 | ) | | | | 12,001 | | | | | (96,282 | ) | | | | 24,555 | | | | | (506 | ) | | | | 67,282 | |
| | | | | | | | | | | | | | | | | | | | | | | | | | | | | | |
Class I | | | | | | | | | | | | | | | | | | | | | | | | | | | | | | |
Shares sold | | | | 98,712 | | | | | 82,472 | | | | | 37,854 | | | | | 23,460 | | | | | 190,485 | | | | | 212,571 | |
Shares issued upon reinvestment of distributions | | | | 23,076 | | | | | 22,834 | | | | | 10,896 | | | | | 12,676 | | | | | 21,200 | | | | | 40,492 | |
Shares redeemed | | | | (95,870 | ) | | | | (122,220 | ) | | | | (46,576 | ) | | | | (33,059 | ) | | | | (1,166,263 | ) | | | | (166,930 | ) |
| | | | | | | | | | | | | | | | | | | | | | | | | | | | | | |
Net increase/(decrease) in Class I Shares | | | | 25,918 | | | | | (16,914 | ) | | | | 2,174 | | | | | 3,077 | | | | | (954,578 | ) | | | | 86,133 | |
| | | | | | | | | | | | | | | | | | | | | | | | | | | | | | |
58
TETON Westwood Funds
Notes to Financial Statements (Continued)
8. Transactions in Securities of Affiliated Issuers. The 1940 Act defines affiliated issuers as those in which a Fund’s holdings of an issuer represent 5% or more of the outstanding voting securities of the issuer. A summary of the Mighty MitesSM Fund’s transactions in the securities of these issuers during the year ended September 30, 2017 is set forth below:
| | | | | | | | | | | | | | | | | | | | | | | | | | | | | | | | | | | | |
| | | Beginning
Shares | | | Shares
Purchased | | | Shares
Sold | | | Ending
Shares | | | Dividend
Income | | | Realized
Gain/
Loss | | | Market
Value at
September 30, 2017 | | | Change in
Unrealized
Appreciation/
(Depreciation) | | | Percent
Owned of
Shares
Outstanding | |
Beasley Broadcast Group Inc., Cl. A | | | 732,233 | | | | 100 | | | | (7,333 | ) | | | 725,000 | | | | $130,896 | | | | $ 13,681 | | | | $ 8,482,500 | | | | $ 4,564,383 | | | | 5.98% | |
Bel Fuse Inc., Cl. A | | | 172,800 | | | | 2,500 | | | | — | | | | 175,300 | | | | 41,772 | | | | — | | | | 4,662,980 | | | | 1,127,010 | | | | 8.06% | |
Burnham Holdings Inc., Cl. A | | | 245,000 | | | | 10,500 | | | | — | | | | 255,500 | | | | 222,640 | | | | — | | | | 3,832,500 | | | | (522,280) | | | | 8.43% | |
Canterbury Park Holding Corp. | | | 362,347 | | | | 5,753 | | | | — | | | | 368,100 | | | | 80,982 | | | | — | | | | 4,546,035 | | | | 682,308 | | | | 8.39% | |
Communications Systems Inc.* | | | 427,598 | | | | 25,000 | | | | (12,000 | ) | | | 440,598 | | | | — | | | | — | | | | — | | | | — | | | | — | |
Edgewater Technology Inc. | | | 705,520 | | | | — | | | | — | | | | 705,520 | | | | — | | | | — | | | | 4,599,990 | | | | (1,396,930) | | | | 5.06% | |
General Chemical Group Inc. | | | 267,226 | | | | — | | | | — | | | | 267,226 | | | | — | | | | — | | | | 2,271 | | | | (1,203) | | | | 8.59% | |
Griffin Industrial Realty Inc. | | | 250,517 | | | | 38,430 | | | | (33,300 | ) | | | 255,647 | | | | 65,705 | | | | (11,844 | ) | | | 9,292,768 | | | | 1,257,244 | | | | 5.11% | |
Katy Industries Inc. | | | 269,000 | | | | 580,000 | | | | (9,000 | ) | | | 840,000 | | | | — | | | | (49,451 | ) | | | 10,878 | | | | (79,787) | | | | 10.56% | |
MOCON Inc.** | | | 391,930 | | | | 32,657 | | | | (424,587 | ) | | | — | | | | — | | | | — | | | | — | | | | — | | | | — | |
Nathan’s Famous Inc. | | | 202,834 | | | | 21,016 | | | | — | | | | 223,850 | | | | — | | | | — | | | | 16,553,707 | | | | 4,637,592 | | | | 5.36% | |
RLJ Entertainment Inc.* | | | 133,400 | | | | 255,283 | | | | — | | | | 388,683 | | | | — | | | | — | | | | — | | | | — | | | | — | |
Sevcon Inc.** | | | 493,604 | | | | 25,100 | | | | (518,704 | ) | | | — | | | | — | | | | — | | | | — | | | | — | | | | — | |
Sevcon Inc., 144A** | | | 25,000 | | | | — | | | | (25,000 | ) | | | — | | | | — | | | | — | | | | — | | | | — | | | | — | |
Sevcon Inc., expire 07/11/21** | | | 12,500 | | | | — | | | | (12,500 | ) | | | — | | | | — | | | | — | | | | — | | | | — | | | | — | |
Sevcon Inc., 4.000%, Series A** | | | 88,937 | | | | 100 | | | | (89,037 | ) | | | — | | | | — | | | | — | | | | — | | | | — | | | | — | |
The Eastern Co. | | | 331,022 | | | | 23,647 | | | | — | | | | 354,669 | | | | 152,896 | | | | — | | | | 10,179,000 | | | | 3,068,775 | | | | 5.67% | |
The L.S. Starrett Co., Cl. A | | | 319,577 | | | | 28,921 | | | | — | | | | 348,498 | | | | 135,785 | | | | — | | | | 3,101,632 | | | | (353,907) | | | | 5.60% | |
Total | | | | | | | | | | | | | | | | | | | $830,676 | | | | $(47,614) | | | | $65,264,261 | | | | $12,983,205 | | | | | |
| | | | | | | | | | | | | | | | | | | | | | | | | | | | | | | | | | | | |
| * | Security is no longer considered affiliated at September 30, 2017. |
| ** | Security is no longer held at September 30, 2017. |
9. Indemnifications. The Funds enter into contracts that contain a variety of indemnifications. The Funds’ maximum exposure under these arrangements is unknown. However, the Funds have not had prior claims or losses pursuant to these contracts. Management has reviewed the Funds’ existing contracts and expects the risk of loss to be remote.
59
Report of Independent Registered Public Accounting Firm
To the Board of Trustees of the TETON Westwood Funds and Shareholders of TETON Westwood Mighty MitesSM Fund, TETON Westwood SmallCap Equity Fund, TETON Westwood Mid-Cap Equity Fund, TETON Convertible Securities Fund, TETON Westwood Equity Fund, TETON Westwood Balanced Fund and TETON Westwood Intermediate Bond Fund:
In our opinion, the accompanying statements of assets and liabilities, including the schedules of investments, and the related statements of operations and of changes in net assets and the financial highlights present fairly, in all material respects, the financial position of TETON Westwood Mighty MitesSM Fund, TETON Westwood SmallCap Equity Fund, TETON Westwood Mid-Cap Equity Fund, TETON Convertible Securities Fund, TETON Westwood Equity Fund, TETON Westwood Balanced Fund, and TETON Westwood Intermediate Bond Fund (each a separate fund of TETON Westwood Funds) (hereafter collectively referred to as the “Funds”) as of September 30, 2017, the results of each of their operations for the year then ended, the changes in each of their net assets for each of the two years in the period then ended and the financial highlights for each of the periods presented, in conformity with accounting principles generally accepted in the United States of America. These financial statements and financial highlights (hereafter referred to as “financial statements”) are the responsibility of the Funds’ management. Our responsibility is to express an opinion on these financial statements based on our audits. We conducted our audits of these financial statements in accordance with the standards of the Public Company Accounting Oversight Board (United States). Those standards require that we plan and perform the audit to obtain reasonable assurance about whether the financial statements are free of material misstatement. An audit includes examining, on a test basis, evidence supporting the amounts and disclosures in the financial statements, assessing the accounting principles used and significant estimates made by management, and evaluating the overall financial statement presentation. We believe that our audits, which included confirmation of securities as of September 30, 2017 by correspondence with the custodian and brokers, provide a reasonable basis for our opinion.
PricewaterhouseCoopers LLP
New York, NY
November 27, 2017
60
2017 Tax Notice to Shareholders (Unaudited)
U.S. Government Income: – The percentage of the ordinary income dividend paid by the Convertible Securities Fund, the Balanced Fund, and the Intermediate Bond Fund, (the “Funds”) during the year ended September 30, 2017 which was derived from U.S. Treasury securities was 0.24%, 6.08%, and 23.02%, respectively. Such income is exempt from state and local tax in all states. However, many states, including New York and California, allow a tax exemption for a portion of the income earned only if a mutual fund has invested at least 50% of its assets at the end of each quarter of the Fund’s fiscal year in U.S. Government securities. The Funds did not meet this strict requirement during the year ended September 30, 2017. Due to the diversity in state and local tax law, it is recommended that you consult your personal tax adviser for the applicability of the information provided as to your specific situation.
Mighty MitesSM Fund – During the year ended September 30, 2017, the Fund paid to shareholders long term capital gains totaling $50,989,812. The distributions of long term capital gains have been designated as a capital gain dividend by the Fund’s Board of Trustees.
SmallCap Equity Fund – During the year ended September 30, 2017, the Fund paid to shareholders long term capital gains totaling $2,641,624. The distributions of long term capital gains have been designated as a capital gain dividend by the Fund’s Board of Trustees.
Mid-Cap Equity Fund – During the year ended September 30, 2017, the Fund paid to shareholders long term capital gains totaling $47,043. The distributions of long term capital gains have been designated as a capital gain dividend by the Fund’s Board of Trustees.
Convertible Securities Fund – During the year ended September 30, 2017, the Fund paid to shareholders ordinary income dividends (comprised of net investment income) totaling $0.2021, $0.1863, $0.1466, and $0.2257 per share for Class AAA, Class A, Class C, and Class I Shares, respectively. $306,031 was designated by the Board of Trustees as a long term capital gain distribution. For the year ended September 30, 2017, 34.83% of the ordinary income dividend qualifies for the dividends received deduction available to corporations. The Fund designates 38.45% of the ordinary income distributions as qualified dividend income, pursuant to the Jobs and Growth Tax Relief Reconciliation Act of 2003. The Fund designates 62.80% of the ordinary income distributions as qualified interest income, pursuant to the American Jobs Creation Act of 2004.
Equity Fund – During the year ended September 30, 2017, the Fund paid to shareholders ordinary income dividends (comprised of net investment income) totaling $0.0705, $0.0360, and $0.1025 per share for Class AAA, Class A, and Class I Shares, respectively, and long term capital gains totaling $3,883,542. For the year ended September 30, 2017, 100% of the ordinary income dividend qualifies for the dividends received deduction available to corporations. The Fund designates 100% of the ordinary income distribution as qualified dividend income, pursuant to the Jobs and Growth Tax Relief Reconciliation Act of 2003. The Fund designates 0.21% of the ordinary income distribution as qualified interest income, pursuant to the American Jobs Creation Act of 2004.
Balanced Fund – During the year ended September 30, 2017, the Fund paid to shareholders ordinary income dividends (comprised of net investment income) totaling $0.1116, $0.0846, $0.0140, and $0.1418 per share for Class AAA, Class A, Class C, and Class I Shares, respectively, and long term capital gains totaling $3,642,920. The distributions of long term capital gains have been designated as a capital gain dividend by the Fund’s Board of Trustees. For the year ended September 30, 2017, 84.61% of the ordinary income dividend qualifies for the dividends received deduction available to corporations. The Fund designates 87.38% of the ordinary income distributions as qualified dividend income, pursuant to the Jobs and Growth Tax Relief Reconciliation Act of 2003. The Fund designates 37.68% of the ordinary income distributions as qualified interest income, pursuant to the American Jobs Creation Act of 2004.
Intermediate Bond Fund – During the year ended September 30, 2017, the Fund paid to shareholders ordinary income dividends (comprised of net investment income and short term capital gains) totaling $0.1972, $0.1855, $0.1103, and $0.2254 per share for Class AAA, Class A, Class C, and Class I Shares, respectively, and long term capital gains totaling $39,919. The distributions of long term capital gains have been designated as a capital gain dividend by the Fund’s Board of Trustees. The Fund designates 100% of the ordinary income distributions as qualified interest income, pursuant to the American Jobs Creation Act of 2004. The Fund designates 100% of the ordinary income distributions as qualified short term capital gain.
All designations are based on financial information available as of the date of this annual report and, accordingly, are subject to change. For each item, it is the intention of the Fund to designate the maximum amount permitted under the Internal Revenue Code and the regulations thereunder.
61
TETON Westwood Funds
Board Consideration and Re-Approval of Investment Advisory and Subadvisory Agreements (Unaudited)
In determining whether to approve the continuance of the Investment Advisory Agreement and Subadvisory Agreement (together, the “Agreements”), the Board, including a majority of the Trustees who have no direct or indirect interest in the Agreements and are not “interested persons” of the Funds, as defined in the 1940 Act (the “Independent Board Members”), considered the following information at a meeting on August 29, 2017:
In determining whether to approve the continuance of each of the Agreements, the Board considered the following information:
1) The nature, extent, and quality of services provided by the Adviser and the Subadviser.
The Board reviewed in detail the nature and extent of the services provided by the Adviser and the Subadviser under the Agreements and the quality of those services over the past year. The Board noted that these services included managing the investment program of the Funds, including the purchase and sale of portfolio securities, as well as the provision of general corporate services. The Board considered that the Adviser also provided, at its expense, office facilities for use by the Funds and supervisory personnel responsible for supervising the performance of administrative, accounting and related services including, for each Fund, monitoring to assure compliance with stated investment policies and restrictions under the 1940 Act and related securities regulations. The Board noted that, in addition to managing the investment program for the Funds, the Adviser provided certain non-advisory and compliance services, including services under the Funds’ Rule 38a-1 compliance program.
The Board also considered that the Adviser paid for all compensation of officers and Board Members of the Funds who are affiliated with the Adviser and that the Adviser further provided services to shareholders of the Funds who had invested through various programs offered by third party financial intermediaries. The Board evaluated these factors based on its direct experience with the Adviser and Subadviser and in consultation with Fund Counsel. The Board noted that the Adviser had engaged, at its expense, BNY, to assist it in performing certain of its administrative functions. The Board concluded that the nature and extent of the services provided was reasonable and appropriate in relation to the advisory fee, that the level of services provided by the Adviser, either directly or through BNY, and by the Subadviser, had not diminished over the past year and that the quality of service continued to be high.
The Board reviewed the personnel responsible for providing services to the Funds and concluded, based on their experience and interaction with the Adviser and Subadviser, that (i) the Adviser and Subadviser were able to retain quality personnel, (ii) the Adviser, Subadviser, and their agents exhibited a high level of diligence and attention to detail in carrying out their advisory and administrative responsibilities under the Agreements, (iii) the Adviser and Subadviser were responsive to requests of the Board, (iv) the scope and depth of the Adviser’s and Subadviser’s resources were adequate, and (v) the Adviser and Subadviser had kept the Board apprised of developments relating to each Fund and the industry in general. The Board also focused on the Adviser’s reputation and long standing relationship with the Funds. The Board also believed that the Adviser had devoted substantial resources and made substantial commitments to address new regulatory compliance requirements applicable to the Funds.
2) The performance of the Funds, the Adviser, and the Subadviser.
The Board reviewed the investment performance of each Fund, on an absolute basis, as compared with Broadridge peer group of other SEC registered funds, and against each Fund’s broad based securities market benchmarks as reflected in each Fund’s prospectuses and annual report. The Board also considered rankings and ratings of the Funds issued by Broadridge over the short, intermediate, and long term. The Board considered each Fund’s one, three, five, and ten year (where applicable) average annual total return for the periods ended June 30, 2017, but placed greatest emphasis on a Fund’s longer term performance. The peer groups considered by the Board were developed by Broadridge and were comprised of funds within the same Broadridge peer group category (the “Performance Peer Group”), regardless of asset size or primary channel of distribution. Each Fund’s performance against the Performance Peer Group was considered by the Board as providing an objective comparative benchmark against which each Fund’s performance could be assessed. In general, the Board considered these comparisons helpful in their assessment as to whether the Adviser was obtaining for the Funds’ shareholders the total return performance that was available in the marketplace, given each Fund’s investment objectives, strategies, limitations, and restrictions. In reviewing the Funds’ performance, the Board noted that the Equity Fund’s performance was above the median for the one year, three year, five year, and ten year periods; the Balanced Fund’s performance was above the median for the one year, three year, and five year periods and below the median for the ten year period; the SmallCap Equity Fund’s performance was above the median for the one year period and below the median for the three year, five year, and ten year periods; the Mighty Mites Fund’s performance was below the median for the one year, three year, and five year periods and above the median for the ten year period; the Convertible Securities Fund’s performance was above the median for the one year period and below the median for the three year, five year, and ten year periods; the Mid-Cap Equity Fund’s performance was below the median for the one year period and above the median for the three year period; and the Intermediate Bond Fund’s performance
62
was below the median for the one year, three year, five year, and ten year periods. The Board Members concluded that the Funds’ performance was reasonable in comparison with that of the Performance Peer Groups.
In connection with its assessment of the performance of the Adviser and the Subadviser, the Board considered the Adviser’s and Subadviser’s financial condition and whether they had the resources necessary to continue to carry out their responsibilities under the Agreements. The Board concluded that the Adviser and Subadviser had the financial resources necessary to continue to perform their obligations under the Agreements and to continue to provide the high quality services that they have provided to the Funds to date.
3) The cost of the advisory services and the profits to the Adviser and Subadviser and their affiliates from the relationship with the Funds.
In connection with the Board’s consideration of the cost of the advisory and subadvisory services and the profits to the Adviser, Subadviser and their affiliates from their relationships with the Fund, the Board considered a number of factors. First, the Board compared the level of the advisory fee for each Fund against comparative Broadridge expense peer groups (“Expense Peer Group”). The Board also considered comparative non-advisory fee expenses and comparative total fund expenses of the Funds and each Expense Peer Group. The Board considered this information as useful in assessing whether the Adviser and Subadviser were providing services at a cost that was competitive with other similar funds. In assessing this information, the Board considered both the comparative contract rates as well as the level of the advisory fees after waivers and/or reimbursements. The Board noted that the SmallCap Equity Fund, the Convertible Securities Fund, and the Intermediate Bond Fund operated pursuant to a Fee Waiver and Expense Deferral Agreement with the Adviser wherein the Adviser had agreed to waive a portion of its fee or reimburse a Fund for a portion of its expenses necessary to limit the Fund’s total operating expenses to the level set forth in the respective Fund’s prospectus. The Board noted that the Mid-Cap Equity Fund operated pursuant to an Expenses Limitation Agreement with the Adviser wherein the Adviser had agreed to limit a portion of its fee or reimburse a Fund for a portion of its expenses necessary to limit the Fund’s total operating expenses to the level set forth in the Fund’s prospectus. The Board noted that the advisory fees and expense ratios for the Balanced Fund, Equity Fund, the Convertible Securities Fund, and the Mighty Mites Fund were higher than the median when compared with those of their Expense Peer Groups. Finally, the Board noted that although the SmallCap Equity Fund, Intermediate Bond Fund, and Mid-Cap Equity Fund’s net advisory fees were lower than the median, after considering their fee waivers, their expense ratios were higher than the median when compared with their Expense Peer Groups. The Board also reviewed the fees charged by the Adviser and Subadviser to provide similar advisory services to other registered investment companies with similar investment objectives and to separate accounts, noting that in some cases the fees charged by the Adviser or Subadviser were higher and, in other cases lower, than the fees charged to the Funds. In evaluating this information, the Board considered the difference in services provided by the Adviser and Subadviser to these other accounts. In particular, the Board considered the differences in risks involved in managing separate accounts and the Funds from a compliance and regulatory perspective.
The Board also considered an analysis prepared by the Adviser of the estimated profitability to the Adviser of its relationship with the Funds and reviewed with the Adviser its cost allocation methodology in connection with its profitability. In this regard, the Board reviewed Pro-forma Income Statements of the Adviser for the year ended December 31, 2016. The Board considered one analysis for the Adviser as a whole, and a second analysis for the Adviser with respect to each of the Funds. With respect to the Fund analysis, the Board received an analysis based on each Fund’s average net assets during the period as well as a pro-forma analysis of profitability at higher and lower asset levels. The Board concluded that the profitability of the Funds to the Adviser under either analysis was not excessive.
4) The extent to which economies of scale will be realized as the Funds grow and whether fee levels reflect those economies of scale.
With respect to the Board’s consideration of economies of scale, the Board discussed whether economies of scale would be realized by the Funds at higher asset levels. The Board also reviewed data from the Expense Peer Groups to assess whether the Expense Peer Group funds had advisory fee breakpoints and, if so, at what asset levels. The Board also assessed whether certain of the Adviser’s costs would increase if asset levels rise. The Board concluded that under foreseeable conditions, they were unable to assess at this time whether economies of scale would be realized if the Funds were to experience significant asset growth. In the event there was to be significant asset growth in the Funds, the Board determined to reassess whether the advisory fee appropriately took into account any economies of scale that had been realized as a result of that growth.
5) Other Factors.
In addition to the above factors, the Board also discussed other benefits received by the Adviser and Subadviser from their management of the Funds. The Board considered that the Adviser and Subadviser do use soft dollars in connection with their management of the Funds.
Based on a consideration of all these factors in their totality, the Board Members, including all of the Independent Board Members, determined that each Fund’s advisory fee and, with respect to the Equity Fund, the Balanced Fund, and the Intermediate Bond Fund, the subadvisory fee, was fair and reasonable with respect to the quality of services provided and in light of the other factors described above that the Board deemed relevant. Accordingly, the Board Members determined to approve the
63
continuation of each Fund’s Advisory Agreement and, with respect to the Equity Fund, the Balanced Fund, and the Intermediate Bond Fund, the Subadvisory agreements. The Board based its decision on evaluations of all these factors as a whole and did not consider any one factor as all important or controlling.
64
TETON Westwood Funds
Additional Fund Information (Unaudited)
The business and affairs of the Trust are managed under the direction of its Board of Trustees. Information pertaining to the Trustees and officers of the Trust is set forth below. The Trust’s Statement of Additional Information includes additional information about the TETON Westwood Funds’ Trustees and is available, without charge, upon request, by calling 800-WESTWOOD (800-937-8966) or by writing to the TETON Westwood Funds at One Corporate Center, Rye, NY 10580-1422.
| | | | | | | | | | | | | | | | |
Name, Position(s), Address1 and Age | | | | | Term of
Office and
Length of
Time Served2
| | | Number of
Funds in
Fund
Complex
Overseen
by Trustee | | | Principal Occupation(s) During Past Five Years | | Other Directorships Held by Trustee3 |
INDEPENDENT TRUSTEES4 : | | | | | | | | | | | | | |
Anthony S. Colavita | | | | | | | Since 2017 | | | | 17 | | | Attorney, Anthony S. Colavita, P.C. | | — |
Trustee | | | | | | | | | | | | | | | | |
Age: 56 | | | | | | | | | | | | | | | | |
| | | | | |
James P. Conn | | | | | | | Since 1994 | | | | 27 | | | Former Managing Director and Chief Investment | | — |
Trustee | | | | | | | | | | | | | | Officer of Financial Security Assurance Holdings, | | |
Age: 79 | | | | | | | | | | | | | | Ltd. (1992-1998) | | |
| | | | | |
Leslie F. Foley | | | | | | | Since 2017 | | | | 9 | | | Attorney on the boards of the Boys and Girls Club | | — |
Trustee | | | | | | | | | | | | | | of Greenwich, Addison Gallery of American Art at | | |
Age: 49 | | | | | | | | | | | | | | Phillips Academy Andover, and National Humanities Center; Vice President, Global Ethics & Compliance and Associate General Counsel for News Corporation (2008-2010) | | |
| | | | | |
Mary E. Hauck | | | | | | | Since 2017 | | | | 11 | | | Retired Senior Manager of the Gabelli-O’Connor | | — |
Trustee | | | | | | | | | | | | | | Fixed Income Mutual Funds Management | | |
Age: 75 | | | | | | | | | | | | | | Company | | |
| | | | | |
Michael J. Melarkey | | | | | | | Since 2017 | | | | 23 | | | Owner in Pioneer Crossing Casino Group; Of | | Director of Southwest Gas |
Trustee Age: 68 | | | | | | | | | | | | | | Counsel in the law firm of McDonald Carano Wilson LLP; previously partner in the law firm of Avansino, Melarkey, Knobel, Mulligan & McKenzie (1980-2015) | | Corporation (natural gas utility) |
| | | | | |
Kuni Nakamura | | | | | | | Since 2017 | | | | 33 | | | President of Advanced Polymer, Inc. (chemical | | — |
Trustee | | | | | | | | | | | | | | manufacturing company); President of KEN | | |
Age: 49 | | | | | | | | | | | | | | Enterprises, Inc. (real estate) | | |
| | | | | |
Werner J. Roeder, MD | | | | | | | Since 1994 | | | | 23 | | | Retired physician; Former Vice President of | | — |
Trustee | | | | | | | | | | | | | | Medical Affairs (Medical Director) of New York | | |
Age: 77 | | | | | | | | | | | | | | Presbyterian/Lawrence Hospital (1999-2014) | | |
| | | | | |
Salvatore J. Zizza | | | | | | | Since 2004 | | | | 30 | | | President of Zizza & Associates Corp. (private | | Director and Vice Chairman |
Trustee | | | | | | | | | | | | | | holding company); Chairman of Harbor Diversified, | | of Trans-Lux Corporation |
Age: 71 | | | | | | | | | | | | | | Inc. (pharmaceuticals); Chairman of BAM | | (business services); Director |
| | | | | | | | | | | | | | (semiconductor and aerospace manufacturing); | | and Chairman of Harbor |
| | | | | | | | | | | | | | Chairman of Bergen Cove Realty Inc.; Chairman of | | Diversified Inc. |
| | | | | | | | | | | | | | Metropolitan Paper Recycling Inc. (recycling) | | (pharmaceuticals); Director, |
| | | | | | | | | | | | | | (2005-2014) | | Chairman, and CEO of |
| | | | | | | | | | | | | | | | General Employment |
| | | | | | | | | | | | | | | | Enterprises (staffing services) |
| | | | | | | | | | | | | | | | (2009-2012) |
65
| | | | | | | | | | | | |
Name, Position(s), Address1 and Age | | Term of
Office and
Length of
Time Served2 | | | Number of
Funds in
Fund
Complex
Overseen
by Trustee | | | Principal Occupation(s) During Past Five Years | | Other Directorships Held by Trustee3 |
OFFICERS: | | | | | | | | | | |
Bruce N. Alpert | | | | | | | — | | | Executive Vice President and Chief Operating | | — |
President | | | Since 1994 | | | | | | | Officer of Gabelli Funds, LLC since 1988; Officer of | | |
Age: 65 | | | | | | | | | | registered investment companies within the | | |
| | | | | | | | | | Gabelli/GAMCO/Teton Fund Complex; Senior | | |
| | | | | | | | | | Vice President of GAMCO Investors, Inc. since | | |
| | | | | | | | | | 2008; Director of Teton Advisors, Inc., 1998-2012 | | |
| | | | |
John C. Ball | | | Since May | | | | — | | | Treasurer of funds within the Gabelli/ | | — |
Treasurer | | | 2017 | | | | | | | GAMCO/Teton Fund Complex (closed-end funds | | |
Age: 41 | | | | | | | | | | since May 2017 and open-end funds since February | | |
| | | | | | | | | | 2017); Vice President and Assistant Treasurer of | | |
| | | | | | | | | | AMG Funds, 2014-2017; Vice President of State | | |
| | | | | | | | | | Street Corporation, 2007-2014 | | |
| | | | |
Andrea R. Mango | | | Since 2013 | | | | — | | | Vice President of GAMCO Investors, Inc. since | | — |
Secretary | | | | | | | | | | 2016; Counsel of Gabelli Funds, LLC since 2013; | | |
Age: 45 | | | | | | | | | | Secretary of all registered investment companies | | |
| | | | | | | | | | within the Gabelli/GAMCO/Teton Fund Complex | | |
| | | | | | | | | | since 2013; Vice President of all closed-end funds | | |
| | | | | | | | | | within the Gabelli/GAMCO/Teton Fund Complex | | |
| | | | | | | | | | since 2014; Corporate Vice President within the | | |
| | | | | | | | | | Corporate Compliance Department of New York | | |
| | | | | | | | | | Life Insurance Company, 2011-2013; Vice President | | |
| | | | | | | | | | and Counsel of Deutsche Bank, 2006-2011 | | |
| | | | |
Agnes Mullady | | | Since 2006 | | | | — | | | Officer of all of the registered investment | | — |
Vice President | | | | | | | | | | companies within the Gabelli/GAMCO/Teton | | |
Age: 59 | | | | | | | | | | Fund Complex since 2006; President and Chief | | |
| | | | | | | | | | Operating Officer of the Fund Division of Gabelli | | |
| | | | | | | | | | Funds, LLC since 2015; Chief Executive Officer of | | |
| | | | | | | | | | G.distributors, LLC since 2010; Senior Vice | | |
| | | | | | | | | | President of GAMCO Investors, Inc. since 2009; | | |
| | | | | | | | | | Vice President of Gabelli Funds, LLC since 2007; | | |
| | | | | | | | | | Executive Vice President of Associated Capital | | |
| | | | | | | | | | Group, Inc. since 2016 | | |
| | | | |
Richard J. Walz | | | Since 2013 | | | | — | | | Chief Compliance Officer of all of the registered | | — |
Chief Compliance Officer | | | | | | | | | | investment companies within the Gabelli/ | | |
Age: 58 | | | | | | | | | | GAMCO/Teton Fund Complex since 2013; Chief | | |
| | | | | | | | | | Compliance Officer of AEGON USA Investment | | |
| | | | | | | | | | Management, 2011-2013; Chief Compliance Officer | | |
| | | | | | | | | | of Cutwater Asset Management, 2004-2011 | | |
| 1 | Address: One Corporate Center, Rye, NY 10580-1422, unless otherwise noted. |
| 2 | Each Trustee will hold office for an indefinite term until the earliest of (i) the next meeting of shareholders, if any, called for the purpose of considering the election or re-election of such Trustee and until the election and qualification of his or her successor, if any, elected at such meeting, or (ii) the date a Trustee resigns or retires, or a Trustee is removed by the Board of Trustees or shareholders, in accordance with the Trust’s Amended By-Laws and Amended and Restated Declaration of Trust. Each officer will hold office for an indefinite term until the date he or she resigns or retires or until his or her successor is elected and qualified. |
| 3 | This column includes only directorships of companies required to report to the SEC under the Securities Exchange Act of 1934, i.e., public companies, or other investment companies registered under the Investment Company Act of 1940. |
| 4 | Trustees who are not interested persons are considered “Independent” Trustees. |
66
TETON Westwood Funds and Your Personal Privacy
Who are we?
The TETON Westwood Funds are investment companies registered with the Securities and Exchange Commission under the Investment Company Act of 1940. We are managed by Teton Advisors, Inc., which is an affiliate of GAMCO Investors Inc., a publicly held company that has subsidiaries that provide investment advisory or brokerage services for a variety of clients. Teton Advisors, Inc. is a publicly held company that provides investment advisory services to the TETON Westwood Funds.
What kind of non-public information do we collect about you if you become a Fund shareholder?
If you apply to open an account directly with us, you will be giving us some non-public information about yourself. The non-public information we collect about you is:
| ● | Information you give us on your application form. This could include your name, address, telephone number, social security number, bank account number, and other information. |
| ● | Information about your transactions with us, any transactions with our affiliates, and transactions with the entities we hire to provide services to you. This would include information about the shares that you buy or redeem. If we hire someone else to provide services — like a transfer agent — we will also have information about the transactions that you conduct through them. |
What information do we disclose and to whom do we disclose it?
We do not disclose any non-public personal information about our customers or former customers to anyone other than our affiliates, our service providers who need to know such information, and as otherwise permitted by law. If you want to find out what the law permits, you can read the privacy rules adopted by the Securities and Exchange Commission. They are in volume 17 of the Code of Federal Regulations, Part 248. The Commission often posts information about its regulations on its website, www.sec.gov.
What do we do to protect your personal information?
We restrict access to non-public personal information about you to the people who need to know that information in order to provide services to you or the Fund and to ensure that we are complying with the laws governing the securities business. We maintain physical, electronic, and procedural safeguards to keep your personal information confidential.
TETON WESTWOOD FUNDS
TETON Westwood Mighty MitesSM Fund
TETON Westwood SmallCap Equity Fund
TETON Westwood Mid-Cap Equity Fund
TETON Convertible Securities Fund
TETON Westwood Equity Fund
TETON Westwood Balanced Fund
TETON Westwood Intermediate Bond Fund
One Corporate Center
Rye, New York 10580-1422
General and Account Information:
800-WESTWOOD [800-937-8966]
fax: 914-921-5118
website: www.tetonadv.com
e-mail: info@tetonadv.com
| | | | | | | | |
| | | | Board of Trustees | | | | |
| | ANTHONY S. COLAVITA | | | | MICHAEL J. MELARKEY | | |
| | Attorney, Anthony S. Colavita, P.C. | | | | Of Counsel, | | |
| | | | | | McDonald Carano Wilson LLP | | |
| | | | |
| | JAMES P. CONN | | | | KUNI NAKAMURA | | |
| | Former Managing Director and Chief | | | | President of Advanced Polymer, Inc. | | |
| | Investment Officer, Financial Security | | | | | | |
| | Assurance Holdings Ltd. | | | | | | |
| | | | |
| | LESLIE F. FOLEY | | | | WERNER J. ROEDER, MD | | |
| | Attorney | | | | Former Medical Director, | | |
| | | | | | Lawrence Hospital | | |
| | | | |
| | MARY E. HAUCK | | | | SALVATORE J. ZIZZA | | |
| | Former Senior Portfolio Manager, | | | | Chairman, | | |
| | Gabelli-O’Connor Fixed Income Mutual | | | | Zizza & Associates Corp. | | |
| | Fund Management Company | | | | | | |
| | | | Officers | | | | |
| | | | |
| | BRUCE N. ALPERT | | | | AGNES MULLADY | | |
| | President | | | | Vice President | | |
| | | | |
| | JOHN C. BALL | | | | RICHARD J. WALZ | | |
| | Treasurer | | | | Chief Compliance Officer | | |
| | | | |
| | ANDREA R. MANGO | | | | | | |
| | Secretary | | | | | | |
| | | | |
| | Investment Adviser | | | | Distributor | | |
| | Teton Advisors, Inc. | | | | G.distributors, LLC | | |
| | Custodian | | | | Legal Counsel | | |
| | The Bank of New York Mellon | | | | Paul Hastings LLP | | |
|
We have separated the portfolio managers’ commentaries from the financial statements and investment portfolio due to corporate governance regulations stipulated by the Sarbanes-Oxley Act of 2002. We have done this to ensure that the content of the portfolio managers’ commentaries is unrestricted. Both the commentaries and the financial statements, including the portfolio of investments, will be available on our website at www.tetonadv.com. |
|
This report is submitted for the information of the shareholders of the TETON Westwood Funds. It is not authorized for distribution to prospective investors unless preceded or accompanied by an effective prospectus. |
GABWWQ317AR
Item 2. Code of Ethics.
| | (a) | The registrant, as of the end of the period covered by this report, has adopted a code of ethics that applies to the registrant’s principal executive officer, principal financial officer, principal accounting officer or controller, or persons performing similar functions, regardless of whether these individuals are employed by the registrant or a third party. |
| | (c) | There have been no amendments, during the period covered by this report, to a provision of the code of ethics that applies to the registrant’s principal executive officer, principal financial officer, principal accounting officer or controller, or persons performing similar functions, regardless of whether these individuals are employed by the registrant or a third party, and that relates to any element of the code of ethics description. |
| | (d) | The registrant has not granted any waivers, including an implicit waiver, from a provision of the code of ethics that applies to the registrant’s principal executive officer, principal financial officer, principal accounting officer or controller, or persons performing similar functions, regardless of whether these individuals are employed by the registrant or a third party, that relates to one or more of the items set forth in paragraph (b) of this item’s instructions. |
Item 3. Audit Committee Financial Expert.
As of the end of the period covered by the report, the registrant’s board of directors has determined that Kuni Nakamura is qualified to serve as an audit committee financial expert serving on its audit committee and that he is “independent.”
Item 4. Principal Accountant Fees and Services.
Audit Fees
| | (a) | The aggregate fees billed for each of the last two fiscal years for professional services rendered by the principal accountant for the audit of the registrant’s annual financial statements or services that are normally provided by the accountant in connection with statutory and regulatory filings or engagements for those fiscal years are $174,075 in 2016 and $174,075 in 2017. |
Audit-Related Fees
| | (b) | The aggregate fees billed in each of the last two fiscal years for assurance and related services by the principal accountant that are reasonably related to the performance of the audit of the |
| | registrant’s financial statements and are not reported under paragraph (a) of this Item are $0 in 2016 and $0 in 2017. |
Tax Fees
| | (c) | The aggregate fees billed in each of the last two fiscal years for professional services rendered by the principal accountant for tax compliance, tax advice, and tax planning are $29,410 in 2016 and $29,410 in 2017. Tax fees represent tax compliance services provided in connection with the review of the Registrant’s tax returns. |
All Other Fees
| | (d) | The aggregate fees billed in each of the last two fiscal years for products and services provided by the principal accountant, other than the services reported in paragraphs (a) through (c) of this Item are $0 in 2016 and $0 in 2017. |
| | (e)(1) | Disclose the audit committee’s pre-approval policies and procedures described in paragraph (c)(7) of Rule 2-01 of Regulation S-X. |
Pre-Approval Policies and Procedures. The Audit Committee (“Committee”) of the registrant is responsible for pre-approving (i) all audit and permissible non-audit services to be provided by the independent registered public accounting firm to the registrant and (ii) all permissible non-audit services to be provided by the independent registered public accounting firm to the Adviser, Gabelli Advisers, Inc., and any affiliate of Gabelli Funds, LLC (“Gabelli”) that provides services to the registrant (a “Covered Services Provider”) if the registered public accounting firm’s engagement related directly to the operations and financial reporting of the registrant. The Committee may delegate its responsibility to pre-approve any such audit and permissible non-audit services to the Chairperson of the Committee, and the Chairperson must report to the Committee, at its next regularly scheduled meeting after the Chairperson’s pre-approval of such services, his or her decision(s). The Committee may also establish detailed pre-approval policies and procedures for pre-approval of such services in accordance with applicable laws, including the delegation of some or all of the Committee’s pre-approval responsibilities to the other persons (other than Gabelli or the registrant’s officers). Pre-approval by the Committee of any permissible non-audit services is not required so long as: (i) the permissible non-audit services were not recognized by the registrant at the time of the engagement to be non-audit services; and (ii) such services are promptly brought to the attention of the Committee and approved by the Committee or Chairperson prior to the completion of the audit.
| | (e)(2) | The percentage of services described in each of paragraphs (b) through (d) of this Item that were approved by the audit committee pursuant to paragraph (c)(7)(i)(C) of Rule 2-01 of Regulation S-X are as follows: |
| | (f) | The percentage of hours expended on the principal accountant’s engagement to audit the registrant’s financial statements for the most recent fiscal year that were attributed to work |
| | performed by persons other than the principal accountant’s full-time, permanent employees was 0%. |
| | (g) | The aggregate non-audit fees billed by the registrant’s accountant for services rendered to the registrant, and rendered to the registrant’s investment adviser (not including any sub-adviser whose role is primarily portfolio management and is subcontracted with or overseen by another investment adviser), and any entity controlling, controlled by, or under common control with the adviser that provides ongoing services to the registrant for each of the last two fiscal years of the registrant was $29,410 in 2016 and $29,410 in 2017. |
| | (h) | The registrant’s audit committee of the board of directors has considered whether the provision of non-audit services that were rendered to the registrant’s investment adviser (not including any sub-adviser whose role is primarily portfolio management and is subcontracted with or overseen by another investment adviser), and any entity controlling, controlled by, or under common control with the investment adviser that provides ongoing services to the registrant that were not pre-approved pursuant to paragraph (c)(7)(ii) of Rule 2-01 of Regulation S-X is compatible with maintaining the principal accountant’s independence. |
Item 5. Audit Committee of Listed Registrants.
Not applicable.
Item 6. Investments.
| (a) | Schedule of Investments in securities of unaffiliated issuers as of the close of the reporting period is included as part of the report to shareholders filed under Item 1 of this form. |
Item 7. Disclosure of Proxy Voting Policies and Procedures for Closed-End Management
Investment Companies.
Not applicable.
Item 8. Portfolio Managers of Closed-End Management Investment Companies.
Not applicable.
Item 9. Purchases of Equity Securities by Closed-End Management Investment Company and
Affiliated Purchasers.
Not applicable.
Item 10. Submission of Matters to a Vote of Security Holders.
There have been no material changes to the procedures by which the shareholders may recommend nominees to the registrant’s board of trustees, where those changes were implemented after the registrant last provided disclosure in response to the requirements of Item 407(c)(2)(iv) of Regulation S-K (17 CFR 229.407) (as required by Item 22(b)(15) of Schedule 14A (17 CFR 240.14a-101)), or this Item.
Item 11. Controls and Procedures.
| | (a) | The registrant’s principal executive and principal financial officers, or persons performing similar functions, have concluded that the registrant’s disclosure controls and procedures (as defined in Rule 30a-3(c) under the Investment Company Act of 1940, as amended (the “1940 Act”) (17 CFR 270.30a-3(c))) are effective, as of a date within 90 days of the filing date of the report that includes the disclosure required by this paragraph, based on their evaluation of these controls and procedures required by Rule 30a-3(b) under the 1940 Act (17 CFR 270.30a-3(b)) and Rules 13a-15(b) or 15d-15(b) under the Securities Exchange Act of 1934, as amended (17 CFR 240.13a-15(b) or 240.15d-15(b)). |
| | (b) | There were no changes in the registrant’s internal control over financial reporting (as defined in Rule 30a-3(d) under the 1940 Act (17 CFR 270.30a-3(d)) that occurred during the registrant’s last fiscal quarter that has materially affected, or is reasonably likely to materially affect, the registrant’s internal control over financial reporting. |
Item 12. Disclosure of Securities Lending Activities for Closed-End Management Investment Companies.
Item 13. Exhibits.
| | (a)(1) | Code of ethics, or any amendment thereto, that is the subject of disclosure required by Item 2 is attached hereto. |
| | (a)(2) | Certifications pursuant to Rule 30a-2(a) under the 1940 Act and Section 302 of the Sarbanes-Oxley Act of 2002 are attached hereto. |
| | (b) | Certifications pursuant to Rule 30a-2(b) under the 1940 Act and Section 906 of the Sarbanes-Oxley Act of 2002 are attached hereto. |
SIGNATURES
Pursuant to the requirements of the Securities Exchange Act of 1934 and the Investment Company Act of 1940, the registrant has duly caused this report to be signed on its behalf by the undersigned, thereunto duly authorized.
| | | | |
| (Registrant) | | The TETON Westwood Funds | | |
| | | | |
| By (Signature and Title)* | | /s/ Bruce N. Alpert | | |
| | Bruce N. Alpert, Principal Executive Officer | | |
Pursuant to the requirements of the Securities Exchange Act of 1934 and the Investment Company Act of 1940, this report has been signed below by the following persons on behalf of the registrant and in the capacities and on the dates indicated.
| | | | |
| By (Signature and Title)* | | /s/ Bruce N. Alpert | | |
| | Bruce N. Alpert, Principal Executive Officer | | |
| | | | |
| By (Signature and Title)* | | /s/ John C. Ball | | |
| | John C. Ball, Principal Financial Officer and Treasurer | | |
| * | Print the name and title of each signing officer under his or her signature. |