> | Vanguard Growth and Income Fund returned about –33% for the six months ended March 31, 2009. |
> | The fund lagged the return of its benchmark index, as well as the average return of its large-cap core fund peers. |
> | All ten industry sectors posted negative returns for the stock market and the fund for the six-month period. |
Contents | |
| |
Your Fund’s Total Returns | 1 |
President’s Letter | 2 |
Advisor’s Report | 6 |
Fund Profile | 8 |
Performance Summary | 9 |
Financial Statements | 10 |
About Your Fund’s Expenses | 21 |
Glossary | 23 |
Please note: The opinions expressed in this report are just that—informed opinions. They should not be considered promises or advice. Also, please keep in mind that the information and opinions cover the period through the date on the front of this report. Of course, the risks of investing in your fund are spelled out in the prospectus.
Your Fund’s Total Returns
Six Months Ended March 31, 2009 | | |
| Ticker | Total |
| Symbol | Returns |
Vanguard Growth and Income Fund | | |
Investor Shares | VQNPX | –32.67% |
Admiral™ Shares1 | VGIAX | –32.64 |
S&P 500 Index | | –30.54 |
Average Large-Cap Core Fund2 | | –29.66 |
Your Fund’s Performance at a Glance | | | |
September 30, 2008–March 31, 2009 | | | |
| | | Distributions Per Share |
| Starting | Ending | Income | Capital |
| Share Price | Share Price | Dividends | Gains |
Vanguard Growth and Income Fund | | | | |
Investor Shares | $25.84 | $17.11 | $0.315 | $0.000 |
Admiral Shares | 42.20 | 27.93 | 0.543 | 0.000 |
1 A lower-cost class of shares available to many longtime shareholders and to those with significant investments in the fund.
2 Derived from data provided by Lipper Inc.
1

President’s Letter
Dear Shareholder,
During what was an extremely difficult six months for the U.S. stock market, Vanguard Growth and Income Fund returned about –33%. The fund under-performed its benchmark, the Standard & Poor’s 500 Index, as well as the average return of large-cap core funds.
Throughout the period, the ongoing recession affected all corners of the market, and the Growth and Income Fund, like the market, posted negative results in all ten industry sectors. The fund’s biggest losses stemmed from financials and industrials, two of the stock market’s weakest performers during the six months.
Extreme distress dappled with glimmers of hope
The six months ended March 31 witnessed extreme distress in global stock markets, with both U.S. and international stocks returning about –31%. The embattled financial sector continued to struggle, prompting regulators in the United States and abroad to take ever-more-aggressive actions to help the big banks fortify their fragile balance sheets.
Even as the gloom intensified, a few signs of recovery appeared on the horizon. Toward the end of the period, the swift contraction in manufacturing activity seemed to lessen. And throughout the six months, news from the housing sector seemed to improve. From their early March lows through the end of the period, global stock markets generated a double-digit return.
2
Credit-market turmoil provoked dramatic response
Developments in the fixed income market were, if anything, even more unusual. In the months after the September collapse of Lehman Brothers, a major presence in the bond market, the trading of corporate bonds came to a near standstill as investors stampeded into U.S. Treasury bonds—considered the safest, most liquid credits—driving prices higher and yields lower. The difference between the yields of Treasuries and corporate bonds surged to levels not seen since the 1930s.
The Federal Reserve Board responded to the credit-market and economic crises with a dramatic easing of monetary policy, reducing its target for short-term interest rates to an all-time low of 0% to 0.25%.
The Fed also created new programs designed to bring borrowers and lenders back to the market. For the six-month period, the Barclays Capital U.S. Aggregate Bond Index returned 4.70% on the strength of Treasuries and other government-backed bonds. The broad municipal bond market returned 5.00%.
Losses in all sectors hindered fund performance
The primary objective of Growth and Income Fund’s advisor, Mellon Capital Management (formerly known as Franklin Portfolio Associates, LLC), is to outpace the returns of the fund’s benchmark, the S&P 500 Index. In an effort to do so, the advisor relies on stock-selection models to overweight and underweight individual stocks relative to the index, while closely
Market Barometer | | | |
| | | Total Returns |
| | Periods Ended March 31, 2009 |
| Six Months | One Year | Five Years1 |
Stocks | | | |
Russell 1000 Index (Large-cap) | –30.59% | –38.27% | –4.54% |
Russell 2000 Index (Small-cap) | –37.17 | –37.50 | –5.24 |
Dow Jones Wilshire 5000 Index (Entire market) | –30.72 | –37.69 | –4.24 |
MSCI All Country World Index ex USA (International) | –30.54 | –46.18 | –0.24 |
| | | |
Bonds | | | |
Barclays Capital U.S. Aggregate Bond Index | | | |
(Broad taxable market) | 4.70% | 3.13% | 4.13% |
Barclays Capital Municipal Bond Index | 5.00 | 2.27 | 3.21 |
Citigroup 3-Month Treasury Bill Index | 0.30 | 1.13 | 3.06 |
| | | |
CPI | | | |
Consumer Price Index | –2.78% | –0.38% | 2.57% |
| | | | |
1 Annualized.
3
mirroring the index’s sector weightings. For the six-month period, the fund managers followed these models but fell short of the ultimate goal of surpassing the benchmark’s return.
The fund was at a slight disadvantage during the period. Unlike its benchmark, the fund tends to favor value stocks—those that are generally out of favor with investors and typically have lower-than-average price/earnings ratios and higher-than-average dividend yields. Value stocks generally underperformed their growth counterparts for the period.
All sectors were down for the period, but financial stocks were the weakest performers by far, trimming almost 10 percentage points from the fund’s return. Insurance stocks in particular weighed on performance. Although these companies initially held up well amid the credit crisis, many succumbed to market forces later in the period. Poor stock selection in other areas of financials also hurt fund returns.
The industrial sector was also a major sore spot for the fund. Often considered cyclical in nature, industrial stocks tend to rise when the economy is doing well and fall during tougher times. During the six months, widespread weakness in manufacturing, mining, and other capital-intensive industries hurt machinery makers, engineering firms, and transportation companies.
Expense Ratios1 | | | |
Your Fund Compared With Its Peer Group | | | |
| | | Average |
| Investor | Admiral | Large-Cap |
| Shares | Shares | Core Fund |
Growth and Income Fund | 0.37% | 0.23% | 1.26% |
1 The fund expense ratios shown are from the prospectus dated January 23, 2009, and represent estimated costs for the current fiscal year based on the fund’s current net assets. For the six months ended March 31, 2009, the annualized expense ratios were 0.36% for Investor Shares and 0.22% for Admiral Shares. The peer-group expense ratio is derived from data provided by Lipper Inc. and captures information through year-end 2008.
4
One small positive note: Although the fund’s energy holdings were down for the period, a combination of good stock selection and limited exposure to oil equipment companies helped the fund perform better than its benchmark in this area of the market.
Diversification is important regardless of market conditions
The period ended March 31 was a very difficult time for the U.S. stock market. As the recession deepened, it affected all areas of the market and left investors feeling anxious and uncertain.
Although the market’s volatility can be jarring, it’s important not to let short-term extremes blind us to the long-term case for equities. The stock market’s recent declines are an unavoidable, if extreme, trade-off for the potential to produce superior returns in the long term.
At Vanguard, we encourage investors to build a portfolio that is diversified across asset classes, including stocks, bonds, and money market funds, with the proportions determined by your long-term investment goals. Diversification can provide you with some protection from extreme market swings; however, even a well-balanced portfolio isn’t immune to the difficult market conditions we’ve experienced during the past six months.
Still, we believe that broad diversification among and within asset classes is the right long-term policy, and can position you to weather the occasional storm while helping you benefit from the inevitable return to better times. The Growth and Income Fund can play an important role in such a portfolio.
Thank you for entrusting your assets to Vanguard.
Sincerely,

F. William McNabb III
President and Chief Executive Officer
April 17, 2009
5
Advisor’s Report
For the six-month period ended March 31, 2009, the Standard & Poor’s 500 Index (S&P 500) returned about –31%. In the fourth quarter of 2008, markets fell precipitously as it became increasingly clear that the ongoing credit crisis would result in an extended global recession. The September bankruptcy of investment banking firm Lehman Brothers worsened the precarious state of the credit markets, and the S&P 500 returned –23% for October and November combined. The U.S. government progressively increased its interventions, with the passage of the TARP plan in October and monetary easing by the Federal Reserve, including its December reduction of the target federal funds rate to between 0% and 0.25%.
At the start of 2009, hopes for a comprehensive bailout after President Obama’s inauguration faded. Stocks fell anew as economic metrics worsened and Congress debated the bailout package. The package was eventually passed in February, but the economy continued to worsen. However, the tide turned on March 10, when Citigroup CEO Vikram Pandit said the firm was profitable year-to-date through February; other financial services firms announced similar positive news. Soon, following some early month-over-month positive economic data, a rally was under way and the market—led by the financial services sector—rose sharply in March.
As of quarter-end, the markets continued to be highly dependent on government support. As we look ahead, the Federal Reserve and the Obama administration have a difficult balancing act. If they reduce government aid too quickly, the economy may collapse again. If they continue the stimulus for too long, significant inflation could result.
Our fund’s shortfalls
The fund underperformed the S&P 500 for the half-year. Underperformance was primarily attributable to stock selection, although several small industry/sector tilts also detracted from performance, including our underweighted exposure to the relatively strong telecommunications sector.
Overall, the stocks that were rated most attractive in our ranking process underperformed the benchmark during the period. Our process seeks stocks with strong momentum at attractive valuations, and, during the period, neither of these elements was rewarded in the market. However, our portfolio tilt toward companies with lower debt levels—which was implemented during the credit crisis—added value over the period and helped to offset the overall underperformance of the portfolio.
6
Stock selection was weakest among industrial and health care holdings. In the industrial sector, an overweighting to General Electric had a negative impact on the fund. Concern about asset quality and earnings at GE Capital, the company’s financial services arm, created a drag on the stock’s performance. Ingersoll-Rand also underperformed, as the slumping economy hurt sales for the industrial parts maker. In the health care sector, medical equipment maker Stryker struggled during the period, as growth slowed amid the drop in hospital budgets.
Our fund’s successes
Stock selection was considerably more favorable among technology and energy holdings. In the technology sector, Adobe Systems—which we recently added to the portfolio—was a strong performer, as it met revenue expectations and controlled costs during the period. In the energy sector, Southwestern Energy added to performance as a result of its strong growth in oil and gas production and reserves. Finally, our holdings of several discount retailers, including Wal-Mart and Family Dollar Stores, contributed to performance. These discount retailers benefited from the current price-conscious consumer climate.
During the period, financial services companies, banks in particular, received significant investor attention. Overall, the portfolio’s bank industry holdings performed slightly better than those in the benchmark. Several positions, including an overweighting in Bank of America and an underweighting to the better-performing JPMorgan Chase, detracted from performance. However, overall, we benefited from not holding certain banks, such as Citigroup, and from holding relatively better-performing banks, such as Northern Trust and Hudson City Bancorp.
The fund’s positioning
We have and will continue to emphasize stocks with strong momentum and reasonable prices. These stocks have historically represented the most desirable market segment. At the same time, in the current highly volatile environment, we have continued to be particularly watchful of our risk controls. We have strictly limited industry and sector differences, compared with the S&P 500—particularly those, like financials and energy, that have exhibited the most volatile performances. In addition, we continue to avoid overexposure to leverage and are maintaining a slight tilt toward less-leveraged firms, which has proven beneficial in the recent period.
Oliver E. Buckley, Executive Vice President
and Head of Active Equity Strategies Mellon Capital Management Corp.
April 24, 2009
7
Growth and Income Fund
Fund Profile
As of March 31, 2009
Portfolio Characteristics | | |
| | Comparative | Broad |
| Fund | Index1 | Index2 |
Number of Stocks | 145 | 500 | 4,489 |
Median Market Cap | $39.3B | $38.2B | $22.3B |
Price/Earnings Ratio | 14.4x | 13.9x | 15.0x |
Price/Book Ratio | 1.7x | 1.8x | 1.7x |
Yield3 | | 2.8% | 2.7% |
Investor Shares | 2.4% | | |
Admiral Shares | 2.6% | | |
Return on Equity | 20.8% | 21.4% | 20.2% |
Earnings Growth Rate | 16.9% | 15.4% | 15.0% |
Foreign Holdings | 0.0% | 0.0% | 0.0% |
Turnover Rate4 | 78% | — | — |
Expense Ratio5 | | — | — |
Investor Shares | 0.37% | | |
Admiral Shares | 0.23% | | |
Short-Term Reserves | 0.3% | — | — |
Sector Diversification (% of equity exposure) |
| | Comparative | Broad |
| Fund | Index1 | Index2 |
Consumer Discretionary | 8.5% | 8.8% | 9.4% |
Consumer Staples | 13.4 | 12.8 | 11.2 |
Energy | 13.6 | 13.0 | 12.3 |
Financials | 10.8 | 10.8 | 13.1 |
Health Care | 16.4 | 15.3 | 14.6 |
Industrials | 9.1 | 9.7 | 10.0 |
Information Technology | 17.4 | 18.0 | 17.7 |
Materials | 3.2 | 3.3 | 3.7 |
Telecommunication | | | |
Services | 3.7 | 4.0 | 3.6 |
Utilities | 3.9 | 4.3 | 4.4 |
Volatility Measures6 | |
| Fund Versus | Fund Versus |
| Comparative Index1 | Broad Index2 |
R-Squared | 0.98 | 0.98 |
Beta | 1.03 | 1.01 |
Ten Largest Holdings7 (% of total net assets) |
| | |
ExxonMobil Corp. | integrated oil | |
| and gas | 4.5% |
Johnson & Johnson | pharmaceuticals | 3.3 |
The Procter & Gamble Co. | household products | 2.9 |
Chevron Corp. | integrated oil | |
| and gas | 2.7 |
Wal-Mart Stores, Inc. | hypermarkets and | |
| super centers | 2.4 |
General Electric Co. | industrial | |
| conglomerates | 2.2 |
International Business | | |
Machines Corp. | computer hardware | 2.0 |
AT&T Inc. | integrated | |
| telecommunication | |
| services | 1.9 |
Apple Inc. | computer hardware | 1.9 |
ConocoPhillips Co. | integrated oil | |
| and gas | 1.8 |
Top Ten | | 25.6% |
Investment Focus
1 S&P 500 Index.
2 Dow Jones Wilshire 5000 Index.
3 30-day SEC yield for the fund; annualized dividend yield for the indexes. See the Glossary.
4 Annualized.
5 The expense ratios shown are from the prospectus dated January 23, 2009, and represent estimated costs for the current fiscal year based on the fund’s current net assets. For the six months ended March 31, 2009, the annualized expense ratios were 0.36% for Investor Shares and 0.22% for Admiral Shares.
6 For an explanation of R-squared, beta, and other terms used here, see the Glossary.
7 The holdings listed exclude any temporary cash investments and equity index products.
8
Growth and Income Fund
Performance Summary
All of the returns in this report represent past performance, which is not a guarantee of future results that may be achieved by the fund. (Current performance may be lower or higher than the performance data cited. For performance data current to the most recent month-end, visit our website at www.vanguard.com/performance.) Note, too, that both investment returns and principal value can fluctuate widely, so an investor’s shares, when sold, could be worth more or less than their original cost. The returns shown do not reflect taxes that a shareholder would pay on fund distributions or on the sale of fund shares.
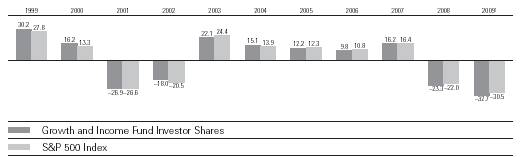
Fiscal-Year Total Returns (%): September 30, 1998–March 31, 2009
Average Annual Total Returns: Periods Ended March 31, 2009 |
| | | | |
| Inception Date | One Year | Five Years | Ten Years |
Investor Shares2 | 12/10/1986 | –39.71% | –5.91% | –2.88% |
Admiral Shares | 5/14/2001 | –39.64 | –5.77 | –4.073 |
1 Six months ended March 31, 2009.
2 Total returns do not include the account service fee that may be applicable to certain accounts with balances below $10,000.
3 Return since inception.
Note: See Financial Highlights tables for dividend and capital gains information.
9
Growth and Income Fund
Financial Statements (unaudited)
Statement of Net Assets
As of March 31, 2009
The fund provides a complete list of its holdings four times in each fiscal year, at the quarter-ends. For the second and fourth fiscal quarters, the lists appear in the fund’s semiannual and annual reports to shareholders. For the first and third fiscal quarters, the fund files the lists with the Securities and Exchange Commission on Form N-Q. Shareholders can look up the fund’s Forms N-Q on the SEC’s website at www.sec.gov. Forms N-Q may also be reviewed and copied at the SEC’s Public Reference Room (see the back cover of this report for further information).
| | | Market |
| | | Value• |
| | Shares | ($000) |
Common Stocks (97.8%)1 | | |
Consumer Discretionary (8.3%) | | |
| McDonald’s Corp. | 1,036,900 | 56,584 |
| Comcast Corp. Class A | 2,938,400 | 40,080 |
| The Walt Disney Co. | 1,411,485 | 25,633 |
| Omnicom Group Inc. | 914,700 | 21,404 |
| Family Dollar Stores, Inc. | 614,000 | 20,489 |
| Lowe’s Cos., Inc. | 1,066,400 | 19,462 |
* | Apollo Group, Inc. Class A | 227,800 | 17,844 |
* | Big Lots Inc. | 710,900 | 14,772 |
| H & R Block, Inc. | 745,400 | 13,559 |
| Staples, Inc. | 660,100 | 11,954 |
| Pulte Homes, Inc. | 1,034,600 | 11,308 |
| The Gap, Inc. | 870,100 | 11,303 |
| Time Warner Inc. | 560,800 | 10,823 |
| Tiffany & Co. | 374,500 | 8,074 |
| The McGraw-Hill Cos., Inc. | 339,500 | 7,764 |
| Carnival Corp. | 310,000 | 6,696 |
* | GameStop Corp. Class A | 192,600 | 5,397 |
* | Time Warner Cable Inc. | 140,766 | 3,491 |
| | | 306,637 |
Consumer Staples (13.1%) | | |
| The Procter & Gamble Co. | 2,263,800 | 106,602 |
| Wal-Mart Stores, Inc. | 1,706,100 | 88,888 |
| Sysco Corp. | 2,145,100 | 48,908 |
| Philip Morris | | |
| International Inc. | 1,279,100 | 45,510 |
| Archer-Daniels-Midland Co. | 1,475,800 | 40,998 |
| The Coca-Cola Co. | 795,000 | 34,940 |
| Brown-Forman Corp. | | |
| Class B | 738,250 | 28,666 |
| Walgreen Co. | 698,600 | 18,136 |
| PepsiCo, Inc. | 327,200 | 16,844 |
| Coca-Cola Enterprises, Inc. | 1,120,900 | 14,785 |
| CVS Caremark Corp. | 330,200 | 9,077 |
| Safeway, Inc. | 426,900 | 8,619 |
| McCormick & Co., Inc. | 279,500 | 8,265 |
| | | Market |
| | | Value• |
| | Shares | ($000) |
| H.J. Heinz Co. | 193,000 | 6,381 |
| Reynolds American Inc. | 96,500 | 3,459 |
| Avon Products, Inc. | 149,300 | 2,871 |
| | | 482,949 |
Energy (13.3%) | | |
| ExxonMobil Corp. | 2,452,436 | 167,011 |
| Chevron Corp. | 1,509,600 | 101,506 |
| ConocoPhillips Co. | 1,740,819 | 68,171 |
| Apache Corp. | 591,200 | 37,890 |
* | National Oilwell Varco Inc. | 757,100 | 21,736 |
| Occidental Petroleum Corp. | 378,100 | 21,041 |
| Anadarko Petroleum Corp. | 530,300 | 20,623 |
* | Southwestern Energy Co. | 582,400 | 17,291 |
| BJ Services Co. | 1,358,900 | 13,521 |
| Peabody Energy Corp. | 331,700 | 8,306 |
| Murphy Oil Corp. | 179,500 | 8,036 |
| Baker Hughes Inc. | 139,200 | 3,974 |
| Williams Cos., Inc. | 343,900 | 3,914 |
| | | 493,020 |
Financials (10.6%) | | |
| Northern Trust Corp. | 947,300 | 56,667 |
| Bank of America Corp. | 4,350,099 | 29,668 |
| State Street Corp. | 809,500 | 24,916 |
| Wells Fargo & Co. | 1,737,000 | 24,735 |
| JPMorgan Chase & Co. | 906,300 | 24,089 |
| Hudson City Bancorp, Inc. | 1,930,500 | 22,568 |
| Charles Schwab Corp. | 1,444,200 | 22,385 |
| American Express Co. | 1,514,200 | 20,639 |
| Cincinnati Financial Corp. | 820,408 | 18,763 |
| Prudential Financial, Inc. | 930,000 | 17,689 |
| AFLAC Inc. | 807,000 | 15,624 |
| BB&T Corp. | 900,400 | 15,235 |
| Morgan Stanley | 575,100 | 13,095 |
| The Travelers Cos., Inc. | 294,230 | 11,958 |
| MetLife, Inc. | 500,500 | 11,396 |
| Marsh & | | |
| McLennan Cos., Inc. | 556,000 | 11,259 |
10
Growth and Income Fund
| | | Market |
| | | Value• |
| | Shares | ($000) |
| Public Storage, Inc. REIT | 144,300 | 7,973 |
| Aon Corp. | 144,700 | 5,907 |
| PNC Financial | | |
| Services Group | 189,600 | 5,553 |
| Apartment Investment & | | |
| Management Co. | | |
| Class A REIT | 984,862 | 5,397 |
| The Goldman Sachs | | |
| Group, Inc. | 48,200 | 5,110 |
| Torchmark Corp. | 189,600 | 4,973 |
| NYSE Euronext | 269,800 | 4,829 |
| SunTrust Banks, Inc. | 331,800 | 3,895 |
| The Principal Financial | | |
| Group, Inc. | 433,900 | 3,549 |
* | IntercontinentalExchange Inc. | 37,800 | 2,815 |
| | | 390,687 |
Health Care (16.1%) | | |
| Johnson & Johnson | 2,306,300 | 121,311 |
* | Amgen Inc. | 1,165,100 | 57,696 |
| Pfizer Inc. | 3,545,327 | 48,287 |
| Abbott Laboratories | 892,800 | 42,587 |
| Eli Lilly & Co. | 1,192,600 | 39,845 |
* | Express Scripts Inc. | 758,700 | 35,029 |
* | Biogen Idec Inc. | 646,600 | 33,895 |
| Stryker Corp. | 942,400 | 32,079 |
| Aetna Inc. | 1,268,600 | 30,865 |
| Bristol-Myers Squibb Co. | 1,403,300 | 30,760 |
* | Boston Scientific Corp. | 2,474,500 | 19,672 |
* | Gilead Sciences, Inc. | 423,100 | 19,598 |
| Merck & Co., Inc. | 530,800 | 14,199 |
| UnitedHealth Group Inc. | 581,500 | 12,171 |
| Wyeth | 275,800 | 11,871 |
| Covidien Ltd. | 329,700 | 10,959 |
* | Varian Medical | | |
| Systems, Inc. | 332,000 | 10,106 |
* | Humana Inc. | 331,700 | 8,651 |
| Medtronic, Inc. | 284,300 | 8,378 |
* | Thermo Fisher | | |
| Scientific, Inc. | 134,100 | 4,783 |
| | | 592,742 |
Industrials (8.9%) | | |
| General Electric Co. | 7,923,300 | 80,105 |
| Honeywell | | |
| International Inc. | 1,638,300 | 45,643 |
| General Dynamics Corp. | 855,300 | 35,572 |
| Northrop Grumman Corp. | 752,500 | 32,839 |
| FedEx Corp. | 521,300 | 23,193 |
| CSX Corp. | 772,500 | 19,969 |
| Fluor Corp. | 550,100 | 19,006 |
| Union Pacific Corp. | 386,100 | 15,873 |
| Republic Services, Inc. | | |
| Class A | 822,090 | 14,099 |
| Norfolk Southern Corp. | 245,800 | 8,296 |
| | | Market |
| | | Value• |
| | Shares | ($000) |
| Flowserve Corp. | 145,500 | 8,165 |
| Dover Corp. | 284,400 | 7,502 |
| Expeditors International of | | |
| Washington, Inc. | 219,300 | 6,204 |
| Avery Dennison Corp. | 239,200 | 5,344 |
| Southwest Airlines Co. | 465,800 | 2,948 |
| L-3 Communications | | |
| Holdings, Inc. | 37,700 | 2,556 |
| | | 327,314 |
Information Technology (17.0%) | |
| International Business | | |
| Machines Corp. | 756,000 | 73,249 |
* | Apple Inc. | 663,300 | 69,726 |
| Intel Corp. | 4,336,200 | 65,260 |
| Microsoft Corp. | 2,832,600 | 52,035 |
* | Cisco Systems, Inc. | 2,890,800 | 48,479 |
* | Google Inc. | 135,640 | 47,211 |
* | Adobe Systems, Inc. | 2,160,100 | 46,205 |
* | Computer Sciences Corp. | 1,228,800 | 45,269 |
* | Symantec Corp. | 2,211,400 | 33,038 |
| CA, Inc. | 1,358,600 | 23,925 |
| Xilinx, Inc. | 1,086,400 | 20,815 |
| Automatic Data | | |
| Processing, Inc. | 529,600 | 18,621 |
* | Oracle Corp. | 947,800 | 17,127 |
| Harris Corp. | 493,700 | 14,288 |
* | Broadcom Corp. | 680,400 | 13,594 |
| Texas Instruments, Inc. | 722,000 | 11,920 |
* | eBay Inc. | 759,900 | 9,544 |
* | QLogic Corp. | 663,500 | 7,378 |
| Hewlett-Packard Co. | 211,800 | 6,790 |
* | VeriSign, Inc. | 271,500 | 5,123 |
| | | 629,597 |
Materials (3.1%) | | |
| Monsanto Co. | 710,500 | 59,043 |
| Nucor Corp. | 566,400 | 21,619 |
| Dow Chemical Co. | 1,592,800 | 13,427 |
| Bemis Co., Inc. | 617,900 | 12,957 |
* | Pactiv Corp. | 568,600 | 8,296 |
| | | 115,342 |
Telecommunication Services (3.6%) | |
| AT&T Inc. | 2,796,000 | 70,459 |
| Verizon | | |
| Communications Inc. | 1,042,600 | 31,487 |
| CenturyTel, Inc. | 947,200 | 26,635 |
* | American Tower Corp. | | |
| Class A | 142,200 | 4,327 |
| | | 132,908 |
Utilities (3.8%) | | |
| Exelon Corp. | 858,800 | 38,981 |
| American Electric | | |
| Power Co., Inc. | 1,466,800 | 37,051 |
11
Growth and Income Fund
| | | Market |
| | | Value• |
| | Shares | ($000) |
| FPL Group, Inc. | 515,000 | 26,126 |
| Dominion Resources, Inc. | 623,200 | 19,313 |
| Sempra Energy | 265,400 | 12,272 |
* | AES Corp. | 805,500 | 4,680 |
| Duke Energy Corp. | 245,700 | 3,519 |
| | | 141,942 |
Total Common Stocks | | |
(Cost $4,876,583) | | 3,613,138 |
Temporary Cash Investments (1.9%)1 | |
Money Market Fund (1.7%) | | |
2 | Vanguard Market | | |
| Liquidity Fund, 0.440% | 62,502,993 | 62,503 |
| | | |
| | | |
| | Face | |
| | Amount | |
| | ($000) | |
U.S. Government and Agency Obligations (0.2%) |
3 | U.S. Treasury Bill, | | |
| 0.130%, 6/18/09 | 7,450 | 7,447 |
Total Temporary Cash Investments | |
(Cost $69,950) | | 69,950 |
Total Investments (99.7%) | | |
(Cost $4,946,533) | | 3,683,088 |
Other Assets and Liabilities (0.3%) | |
Other Assets | | 132,595 |
Liabilities | | (122,229) |
| | | 10,366 |
Net Assets (100%) | | 3,693,454 |
At March 31, 2009, net assets consisted of: | |
| Amount |
| ($000) |
Paid-in Capital | 6,547,349 |
Undistributed Net Investment Income | 1,401 |
Accumulated Net Realized Losses | (1,593,921) |
Unrealized Appreciation (Depreciation) | |
Investment Securities | (1,263,445) |
Futures Contracts | 2,070 |
Net Assets | 3,693,454 |
| |
Investor Shares—Net Assets | |
Applicable to 148,418,807 outstanding | |
$.001 par value shares of beneficial | |
interest (unlimited authorization) | 2,538,959 |
Net Asset Value Per Share— | |
Investor Shares | $17.11 |
| |
Admiral Shares—Net Assets | |
Applicable to 41,328,727 outstanding | |
$.001 par value shares of beneficial | |
interest (unlimited authorization) | 1,154,495 |
Net Asset Value Per Share— | |
Admiral Shares | $27.93 |
• | See Note A in Notes to Financial Statements. |
* | Non-income-producing security. |
1 The fund invests a portion of its cash reserves in equity markets through the use of index futures contracts. After giving effect to futures investments, the fund’s effective common stock and temporary cash investment positions represent 99.4% and 0.3%, respectively, of net assets.
2 Affiliated money market fund available only to Vanguard funds and certain trusts and accounts managed by Vanguard. Rate shown is the 7-day yield.
3 Securities with a value of $7,447,000 have been segregated as initial margin for open futures contracts.
REIT—Real Estate Investment Trust.
See accompanying Notes, which are an integral part of the Financial Statements.
12
Growth and Income Fund
Statement of Operations
| Six Months Ended |
| March 31, 2009 |
| ($000) |
Investment Income | |
Income | |
Dividends | 59,149 |
Interest1 | 501 |
Security Lending | 402 |
Total Income | 60,052 |
Expenses | |
Investment Advisory Fees—Note B | |
Basic Fee | 2,112 |
Performance Adjustment | (919) |
The Vanguard Group—Note C | |
Management and Administrative—Investor Shares | 3,582 |
Management and Administrative—Admiral Shares | 805 |
Marketing and Distribution—Investor Shares | 501 |
Marketing and Distribution—Admiral Shares | 231 |
Custodian Fees | 24 |
Auditing Fees | 1 |
Shareholders’ Reports—Investor Shares | 54 |
Shareholders’ Reports—Admiral Shares | 5 |
Trustees’ Fees and Expenses | 4 |
Total Expenses | 6,400 |
Expenses Paid Indirectly | (283) |
Net Expenses | 6,117 |
Net Investment Income | 53,935 |
Realized Net Gain (Loss) | |
Investment Securities Sold | (994,927) |
Futures Contracts | (29,742) |
Realized Net Gain (Loss) | (1,024,669) |
Change in Unrealized Appreciation (Depreciation) | |
Investment Securities | (921,434) |
Futures Contracts | 2,971 |
Change in Unrealized Appreciation (Depreciation) | (918,463) |
Net Increase (Decrease) in Net Assets Resulting from Operations | (1,889,197) |
1 Interest income from an affiliated company of the fund was $488,000.
See accompanying Notes, which are an integral part of the Financial Statements.
13
Growth and Income Fund
Statement of Changes in Net Assets
| Six Months Ended | Year Ended |
| March 31, | September 30, |
| 2009 | 2008 |
| ($000) | ($000) |
Increase (Decrease) in Net Assets | | |
Operations | | |
Net Investment Income | 53,935 | 123,730 |
Realized Net Gain (Loss) | (1,024,669) | (446,516) |
Change in Unrealized Appreciation (Depreciation) | (918,463) | (1,520,848) |
Net Increase (Decrease) in Net Assets Resulting from Operations | (1,889,197) | (1,843,634) |
Distributions | | |
Net Investment Income | | |
Investor Shares | (46,660) | (81,970) |
Admiral Shares | (23,587) | (43,850) |
Realized Capital Gain1 | | |
Investor Shares | — | (564,334) |
Admiral Shares | — | (284,167) |
Total Distributions | (70,247) | (974,321) |
Capital Share Transactions | | |
Investor Shares | (60,315) | 335,349 |
Admiral Shares | (112,687) | 50,006 |
Net Increase (Decrease) from Capital Share Transactions | (173,002) | 385,355 |
Total Increase (Decrease) | (2,132,446) | (2,432,600) |
Net Assets | | |
Beginning of Period | 5,825,900 | 8,258,500 |
End of Period2 | 3,693,454 | 5,825,900 |
1 Includes fiscal 2008 short-term gain distributions totaling $89,550,000. Short-term gain distributions are treated as ordinary income dividends for tax purposes.
2 Net Assets—End of Period includes undistributed net investment income of $1,401,000 and $17,713,000.
See accompanying Notes, which are an integral part of the Financial Statements.
14
Growth and Income Fund
Financial Highlights
Investor Shares | | | | | | |
| Six | | | | | |
| Months | | | | | |
| Ended | | | |
For a Share Outstanding | March 31, | Year Ended September 30, |
Throughout Each Period | 2009 | 2008 | 2007 | 2006 | 2005 | 2004 |
Net Asset Value, Beginning of Period | $25.84 | $38.62 | $33.79 | $31.29 | $28.31 | $24.91 |
Investment Operations | | | | | | |
Net Investment Income | .244 | .546 | .600 | .550 | .460 | .370 |
Net Realized and Unrealized Gain (Loss) | | | | | | |
on Investments | (8.659) | (8.758) | 4.840 | 2.470 | 2.980 | 3.390 |
Total from Investment Operations | (8.415) | (8.212) | 5.440 | 3.020 | 3.440 | 3.760 |
Distributions | | | | | | |
Dividends from Net Investment Income | (.315) | (.560) | (.610) | (.520) | (.460) | (.360) |
Distributions from Realized Capital Gains | — | (4.008) | — | — | — | — |
Total Distributions | (.315) | (4.568) | (.610) | (.520) | (.460) | (.360) |
Net Asset Value, End of Period | $17.11 | $25.84 | $38.62 | $33.79 | $31.29 | $28.31 |
| | | | | | |
Total Return1 | –32.67% | –23.28% | 16.20% | 9.76% | 12.20% | 15.12% |
| | | | | | |
Ratios/Supplemental Data | | | | | | |
Net Assets, End of Period (Millions) | $2,539 | $3,919 | $5,465 | $5,088 | $5,202 | $5,780 |
Ratio of Total Expenses to | | | | | | |
Average Net Assets2 | 0.36%3 | 0.31% | 0.32% | 0.38% | 0.40% | 0.42% |
Ratio of Net Investment Income to | | | | | | |
Average Net Assets | 2.57%3 | 1.69% | 1.61% | 1.65% | 1.53% | 1.35% |
Portfolio Turnover Rate | 78%3 | 96% | 100% | 93% | 84% | 79%4 |
1 | Total returns do not include the account service fee that may be applicable to certain accounts with balances below $10,000. |
2 | Includes performance-based investment advisory fee increases (decreases) of (0.04%), (0.02%), 0.00%, 0.01%, 0.01%, and 0.01%. |
4 | Excludes the value of portfolio securities received or delivered as a result of in-kind purchases or redemptions of the fund’s capital shares. See accompanying Notes, which are an integral part of the Financial Statements. |
15
Growth and Income Fund
Financial Highlights
Admiral Shares | | | | | | |
| Six | | | | | |
| Months | | | | | |
| Ended | | | |
For a Share Outstanding | March 31, | Year Ended September 30, |
Throughout Each Period | 2009 | 2008 | 2007 | 2006 | 2005 | 2004 |
Net Asset Value, Beginning of Period | $42.20 | $63.08 | $55.20 | $51.12 | $46.25 | $40.70 |
Investment Operations | | | | | | |
Net Investment Income | .420 | .963 | 1.070 | .997 | .849 | .683 |
Net Realized and Unrealized Gain (Loss) | | | | | | |
on Investments | (14.147) | (14.313) | 7.903 | 4.036 | 4.853 | 5.530 |
Total from Investment Operations | (13.727) | (13.350) | 8.973 | 5.033 | 5.702 | 6.213 |
Distributions | | | | | | |
Dividends from Net Investment Income | (.543) | (.985) | (1.093) | (.953) | (.832) | (.663) |
Distributions from Realized Capital Gains | — | (6.545) | — | — | — | — |
Total Distributions | (.543) | (7.530) | (1.093) | (.953) | (.832) | (.663) |
Net Asset Value, End of Period | $27.93 | $42.20 | $63.08 | $55.20 | $51.12 | $46.25 |
| | | | | | |
Total Return | –32.64% | –23.19% | 16.37% | 9.97% | 12.39% | 15.29% |
| | | | | | |
Ratios/Supplemental Data | | | | | | |
Net Assets, End of Period (Millions) | $1,154 | $1,907 | $2,794 | $2,321 | $2,039 | $843 |
Ratio of Total Expenses to | | | | | | |
Average Net Assets1 | 0.22%2 | 0.16% | 0.18% | 0.20% | 0.23% | 0.25% |
Ratio of Net Investment Income to | | | | | | |
Average Net Assets | 2.71%2 | 1.84% | 1.75% | 1.83% | 1.68% | 1.51% |
Portfolio Turnover Rate | 78%2 | 96% | 100% | 93% | 84% | 79%3 |
| | | | | | | | |
1 Includes performance-based investment advisory fee increases (decreases) of (0.04%), (0.02%), 0.00%, 0.01%, 0.01%, and 0.01%.
2 Annualized.
3 Excludes the value of portfolio securities received or delivered as a result of in-kind purchases or redemptions of the fund’s capital shares.
See accompanying Notes, which are an integral part of the Financial Statements.
16
Growth and Income Fund
Notes to Financial Statements
Vanguard Growth and Income Fund is registered under the Investment Company Act of 1940 as an open-end investment company, or mutual fund. The fund offers two classes of shares: Investor Shares and Admiral Shares. Investor Shares are available to any investor who meets the fund’s minimum purchase requirements. Admiral Shares are designed for investors who meet certain administrative, service, tenure, and account-size criteria.
A. The following significant accounting policies conform to generally accepted accounting principles for U.S. mutual funds. The fund consistently follows such policies in preparing its financial statements.
1. Security Valuation: Securities are valued as of the close of trading on the New York Stock Exchange (generally 4 p.m., Eastern time) on the valuation date. Equity securities are valued at the latest quoted sales prices or official closing prices taken from the primary market in which each security trades; such securities not traded on the valuation date are valued at the mean of the latest quoted bid and asked prices. Securities for which market quotations are not readily available, or whose values have been materially affected by events occurring before the fund’s pricing time but after the close of the securities’ primary markets, are valued by methods deemed by the board of trustees to represent fair value. Investments in Vanguard Market Liquidity Fund are valued at that fund’s net asset value. Temporary cash investments acquired over 60 days to maturity are valued using the latest bid prices or using valuations based on a matrix system (which considers such factors as security prices, yields, maturities, and ratings), both as furnished by independent pricing services. Other temporary cash investments are valued at amortized cost, which approximates market value.
2. Futures Contracts: The fund uses index futures contracts to a limited extent, with the objective of maintaining full exposure to the stock market while maintaining liquidity. The fund may purchase or sell futures contracts to achieve a desired level of investment, whether to accommodate portfolio turnover or cash flows from capital share transactions. The primary risks associated with the use of futures contracts are imperfect correlation between changes in market values of stocks held by the fund and the prices of futures contracts, and the possibility of an illiquid market.
Futures contracts are valued at their quoted daily settlement prices. The aggregate principal amounts of the contracts are not recorded in the Statement of Net Assets. Fluctuations in the value of the contracts are recorded in the Statement of Net Assets as an asset (liability) and in the Statement of Operations as unrealized appreciation (depreciation) until the contracts are closed, when they are recorded as realized futures gains (losses).
3. Federal Income Taxes: The fund intends to continue to qualify as a regulated investment company and distribute all of its taxable income. Management has analyzed the fund’s tax positions taken on federal income tax returns for all open tax years (tax years ended September 30, 2005–2008) and for the period ended March 31, 2009, and has concluded that no provision for federal income tax is required in the fund’s financial statements.
4. Distributions: Distributions to shareholders are recorded on the ex-dividend date.
5. Security Lending: The fund may lend its securities to qualified institutional borrowers to earn additional income. Security loans are required to be secured at all times by collateral at least equal to the market value of securities loaned. The fund invests cash collateral received in Vanguard Market Liquidity Fund, and records a liability for the return of the collateral, during the period the securities are on loan. Security lending income represents the income earned on investing cash collateral, less expenses associated with the loan.
17
Growth and Income Fund
6. Other: Dividend income is recorded on the ex-dividend date. Interest income includes income distributions received from Vanguard Market Liquidity Fund and is accrued daily. Security transactions are accounted for on the date securities are bought or sold. Costs used to determine realized gains (losses) on the sale of investment securities are those of the specific securities sold.
Each class of shares has equal rights as to assets and earnings, except that each class separately bears certain class-specific expenses related to maintenance of shareholder accounts (included in Management and Administrative expenses) and shareholder reporting. Marketing and distribution expenses are allocated to each class of shares based on a method approved by the board of trustees. Income, other non-class-specific expenses, and gains and losses on investments are allocated to each class of shares based on its relative net assets.
B. Mellon Capital Management Corporation (formerly Franklin Portfolio Associates, LLC) provides investment advisory services to the fund for a fee calculated at an annual percentage rate of average net assets. The basic fee is subject to quarterly adjustments based on the fund’s performance for the preceding three years relative to the S&P 500 Index. For the six months ended March 31, 2009, the investment advisory fee represented an effective annual basic rate of 0.10% of the fund’s average net assets before a decrease of $919,000 (0.04%) based on performance.
C. The Vanguard Group furnishes at cost corporate management, administrative, marketing, and distribution services. The costs of such services are allocated to the fund under methods approved by the board of trustees. The fund has committed to provide up to 0.40% of its net assets in capital contributions to Vanguard. At March 31, 2009, the fund had contributed capital of $968,000 to Vanguard (included in Other Assets), representing 0.03% of the fund’s net assets and 0.39% of Vanguard’s capitalization. The fund’s trustees and officers are also directors and officers of Vanguard.
D. The fund has asked its investment advisor to direct certain security trades, subject to obtaining the best price and execution, to brokers who have agreed to rebate to the fund part of the commissions generated. Such rebates are used solely to reduce the fund’s management and administrative expenses. For the six months ended March 31, 2009, these arrangements reduced the fund’s expenses by $283,000 (an annual rate of 0.01% of average net assets).
E. Distributions are determined on a tax basis and may differ from net investment income and realized capital gains for financial reporting purposes. Differences may be permanent or temporary. Permanent differences are reclassified among capital accounts in the financial statements to reflect their tax character. Temporary differences arise when certain items of income, expense, gain, or loss are recognized in different periods for financial statement and tax purposes; these differences will reverse at some time in the future. Differences in classification may also result from the treatment of short-term gains as ordinary income for tax purposes.
The fund’s tax-basis capital gains and losses are determined only at the end of each fiscal year. For tax purposes, at September 30, 2008, the fund had available realized losses of $570,743,000 to offset future net capital gains through September 30, 2017. The fund will use these capital losses to offset net taxable capital gains, if any, realized during the year ending September 30, 2009; should the fund realize net capital losses for the year, the losses will be added to the loss carryforward balance above.
18
Growth and Income Fund
At March 31, 2009, the cost of investment securities for tax purposes was $4,946,533,000. Net unrealized depreciation of investment securities for tax purposes was $1,263,445,000, consisting of unrealized gains of $157,801,000 on securities that had risen in value since their purchase and $1,421,246,000 in unrealized losses on securities that had fallen in value since their purchase.
At March 31, 2009, the aggregate settlement value of open futures contracts expiring in June 2009 and the related unrealized appreciation (depreciation) were:
| | | ($000) |
| Number of | Aggregate | Unrealized |
| Long (Short) | Settlement | Appreciation |
Futures Contracts | Contracts | Value | (Depreciation) |
S&P 500 Index | 290 | 57,623 | 2,070 |
Unrealized appreciation (depreciation) on open futures contracts is required to be treated as realized gain (loss) for tax purposes.
F. During the six months ended March 31, 2009, the fund purchased $1,641,479,000 of investment securities and sold $1,842,885,000 of investment securities, other than temporary cash investments.
G. Capital share transactions for each class of shares were:
| Six Months Ended | Year Ended |
| March 31, 2009 | September 30, 2008 |
| Amount | Shares | Amount | Shares |
| ($000) | (000) | ($000) | (000) |
Investor Shares | | | | |
Issued | 189,481 | 10,182 | 550,897 | 17,490 |
Issued in Lieu of Cash Distributions | 44,983 | 2,394 | 622,470 | 19,829 |
Redeemed | (294,779) | (15,836) | (838,018) | (27,137) |
Net Increase (Decrease)—Investor Shares | (60,315) | (3,260) | 335,349 | 10,182 |
Admiral Shares | | | | |
Issued | 88,120 | 2,896 | 220,621 | 4,296 |
Issued in Lieu of Cash Distributions | 21,282 | 694 | 305,215 | 5,955 |
Redeemed | (222,089) | (7,453) | (475,830) | (9,345) |
Net Increase (Decrease)—Admiral Shares | (112,687) | (3,863) | 50,006 | 906 |
19
Growth and Income Fund
H. In September 2006, the Financial Accounting Standards Board issued Statement of Financial Accounting Standards No. 157 (“FAS 157”), “Fair Value Measurements.” FAS 157 establishes a framework for measuring fair value and expands disclosures about fair value measurements in financial statements.
The various inputs that may be used to determine the value of the fund’s investments are summarized in three broad levels. The inputs or methodologies used for valuing securities are not necessarily an indication of the risk associated with investing in those securities.
Level 1—Quoted prices in active markets for identical securities.
Level 2—Other significant observable inputs (including quoted prices for similar securities, interest rates, prepayment speeds, credit risk, etc.).
Level 3—Significant unobservable inputs (including the fund’s own assumptions used to determine the fair value of investments).
The following table summarizes the fund’s investments as of March 31, 2009, based on the inputs used to value them:
| Investments | Futures |
| in Securities | Contracts |
Valuation Inputs | ($000) | ($000) |
Level 1—Quoted prices | 3,675,641 | 2,070 |
Level 2—Other significant observable inputs | 7,447 | — |
Level 3—Significant unobservable inputs | — | — |
Total | 3,683,088 | 2,070 |
20
About Your Fund’s Expenses
As a shareholder of the fund, you incur ongoing costs, which include costs for portfolio management, administrative services, and shareholder reports (like this one), among others. Operating expenses, which are deducted from a fund’s gross income, directly reduce the investment return of the fund.
A fund’s expenses are expressed as a percentage of its average net assets. This figure is known as the expense ratio. The following examples are intended to help you understand the ongoing costs (in dollars) of investing in your fund and to compare these costs with those of other mutual funds. The examples are based on an investment of $1,000 made at the beginning of the period shown and held for the entire period.
The accompanying table illustrates your fund’s costs in two ways:
• Based on actual fund return. This section helps you to estimate the actual expenses that you paid over the period. The “Ending Account Value” shown is derived from the fund’s actual return, and the third column shows the dollar amount that would have been paid by an investor who started with $1,000 in the fund. You may use the information here, together with the amount you invested, to estimate the expenses that you paid over the period.
To do so, simply divide your account value by $1,000 (for example, an $8,600 account value divided by $1,000 = 8.6), then multiply the result by the number given for your fund under the heading “Expenses Paid During Period.”
• Based on hypothetical 5% yearly return. This section is intended to help you compare your fund’s costs with those of other mutual funds. It assumes that the fund had a yearly return of 5% before expenses, but that the expense ratio is unchanged. In this case—because the return used is not the fund’s actual return—the results do not apply to your investment. The example is useful in making comparisons because the Securities and Exchange Commission requires all mutual funds to calculate expenses based on a 5% return. You can assess your fund’s costs by comparing this hypothetical example with the hypothetical examples that appear in shareholder reports of other funds.
Six Months Ended March 31, 2009 | | | |
| Beginning | Ending | Expenses |
| Account Value | Account Value | Paid During |
Growth and Income Fund | 9/30/2008 | 3/31/2009 | Period1 |
Based on Actual Fund Return | | | |
Investor Shares | $1,000.00 | $673.25 | $1.50 |
Admiral Shares | 1,000.00 | 673.56 | 0.92 |
Based on Hypothetical 5% Yearly Return | | | |
Investor Shares | $1,000.00 | $1,023.14 | $1.82 |
Admiral Shares | 1,000.00 | 1,023.83 | 1.11 |
1 The calculations are based on expenses incurred in the most recent six-month period. The fund’s annualized six-month expense ratios for that period are 0.36% for Investor Shares and 0.22% for Admiral Shares. The dollar amounts shown as “Expenses Paid” are equal to the annualized expense ratio multiplied by the average account value over the period, multiplied by the number of days in the most recent six-month period, then divided by the number of days in the most recent 12-month period.
21
Note that the expenses shown in the table are meant to highlight and help you compare ongoing costs only and do not reflect transaction costs incurred by the fund for buying and selling securities. Further, the expenses do not include the account service fee described in the prospectus. If such a fee were applied to your account, your costs would be higher. Your fund does not charge transaction fees, such as purchase or redemption fees, nor does it carry a “sales load.”
The calculations assume no shares were bought or sold during the period. Your actual costs may have been higher or lower, depending on the amount of your investment and the timing of any purchases or redemptions.
You can find more information about the fund’s expenses, including annual expense ratios, in the Financial Statements section of this report. For additional information on operating expenses and other shareholder costs, please refer to your fund’s current prospectus.
22
Glossary
Beta. A measure of the magnitude of a fund’s past share-price fluctuations in relation to the ups and downs of a given market index. The index is assigned a beta of 1.00. Compared with a given index, a fund with a beta of 1.20 typically would have seen its share price rise or fall by 12% when the index rose or fell by 10%. For this report, beta is based on returns over the past 36 months for both the fund and the index. Note that a fund’s beta should be reviewed in conjunction with its R-squared (see definition). The lower the R-squared, the less correlation there is between the fund and the index, and the less reliable beta is as an indicator of volatility.
Earnings Growth Rate. The average annual rate of growth in earnings over the past five years for the stocks now in a fund.
Equity Exposure. A measure that reflects a fund’s investments in stocks and stock futures. Any holdings in short-term reserves are excluded.
Expense Ratio. The percentage of a fund’s average net assets used to pay its annual administrative and advisory expenses. These expenses directly reduce returns to investors.
Foreign Holdings. The percentage of a fund represented by stocks or depositary receipts of companies based outside the United States.
Inception Date. The date on which the assets of a fund (or one of its share classes) are first invested in accordance with the fund’s investment objective. For funds with a subscription period, the inception date is the day after that period ends. Investment performance is measured from the inception date.
Median Market Cap. An indicator of the size of companies in which a fund invests; the midpoint of market capitalization (market price x shares outstanding) of a fund’s stocks, weighted by the proportion of the fund’s assets invested in each stock. Stocks representing half of the fund’s assets have market capitalizations above the median, and the rest are below it.
Price/Book Ratio. The share price of a stock divided by its net worth, or book value, per share. For a fund, the weighted average price/book ratio of the stocks it holds.
Price/Earnings Ratio. The ratio of a stock’s current price to its per-share earnings over the past year. For a fund, the weighted average P/E of the stocks it holds. P/E is an indicator of market expectations about corporate prospects; the higher the P/E, the greater the expectations for a company’s future growth.
R-Squared. A measure of how much of a fund’s past returns can be explained by the returns from the market in general, as measured by a given index. If a fund’s total returns were precisely synchronized with an index’s returns, its R-squared would be 1.00. If the fund’s returns bore no relationship to the index’s returns, its R-squared would be 0. For this report, R-squared is based on returns over the past 36 months for both the fund and the index.
Return on Equity. The annual average rate of return generated by a company during the past five years for each dollar of shareholder’s equity (net income divided by shareholder’s equity). For a fund, the weighted average return on equity for the companies whose stocks it holds.
Short-Term Reserves. The percentage of a fund invested in highly liquid, short-term securities that can be readily converted to cash.
23
Turnover Rate. An indication of the fund’s trading activity. Funds with high turnover rates incur higher transaction costs and may be more likely to distribute capital gains (which may be taxable to investors). The turnover rate excludes in-kind transactions, which have minimal impact on costs.
Yield. A fund’s 30-day SEC yield is derived using a formula specified by the U.S. Securities and Exchange Commission. Under the formula, data related to the fund’s security holdings in the previous 30 days are used to calculate the fund’s hypothetical net income for that period, which is then annualized and divided by the fund’s estimated average net assets over the calculation period. For the purposes of this calculation, a security’s income is based on its current market yield to maturity (in the case of bonds) or its projected dividend yield (for stocks). Because the SEC yield represents hypothetical annualized income, it will differ—at times significantly—from the fund’s actual experience. As a result, the fund’s income distributions may be higher or lower than implied by the SEC yield.
24
This page intentionally left blank.
This page intentionally left blank.
This page intentionally left blank.
The People Who Govern Your Fund
The trustees of your mutual fund are there to see that the fund is operated and managed in your best interests since, as a shareholder, you are a part owner of the fund. Your fund’s trustees also serve on the board of directors of The Vanguard Group, Inc., which is owned by the Vanguard funds and provides services to them on an at-cost basis.
A majority of Vanguard’s board members are independent, meaning that they have no affiliation with Vanguard or the funds they oversee, apart from the sizable personal investments they have made as private individuals. The independent board members have distinguished backgrounds in business, academia, and public service. Each of the trustees and executive officers oversees 157 Vanguard funds.
The following table provides information for each trustee and executive officer of the fund. More information about the trustees is in the Statement of Additional Information, which can be obtained, without charge, by contacting Vanguard at 800-662-7447, or online at www.vanguard.com.
Chairman of the Board and Interested Trustee | Rajiv L. Gupta |
| Born 1945. Trustee Since December 2001.2 Principal |
| Occupation(s) During the Past Five Years: Chairman |
John J. Brennan1 | and Chief Executive Officer of Rohm and Haas Co. |
Born 1954. Trustee Since May 1987. Chairman of | (chemicals); President of Rohm and Haas Co. |
the Board. Principal Occupation(s) During the Past Five | (2006–2008); Board Member of American Chemistry |
Years: Chairman of the Board and Director/Trustee of | Council; Director of Tyco International, Ltd. (diversified |
The Vanguard Group, Inc., and of each of the investment | manufacturing and services) and Hewlett-Packard Co. |
companies served by The Vanguard Group; Chief | (electronic computer manufacturing); Trustee of The |
Executive Officer and President of The Vanguard Group | Conference Board. |
and of each of the investment companies served by The | |
Vanguard Group (1996–2008). | |
| Amy Gutmann |
| Born 1949. Trustee Since June 2006. Principal |
Independent Trustees | Occupation(s) During the Past Five Years: President of |
| the University of Pennsylvania; Christopher H. Browne |
| Distinguished Professor of Political Science in the School |
Charles D. Ellis | of Arts and Sciences with Secondary Appointments |
Born 1937. Trustee Since January 2001. Principal | at the Annenberg School for Communication and the |
Occupation(s) During the Past Five Years: Applecore | Graduate School of Education of the University of |
Partners (pro bono ventures in education); Senior | Pennsylvania; Director of Carnegie Corporation of |
Advisor to Greenwich Associates (international business | New York, Schuylkill River Development Corporation, |
strategy consulting); Successor Trustee of Yale University; | and Greater Philadelphia Chamber of Commerce; |
Overseer of the Stern School of Business at New York | Trustee of the National Constitution Center. |
University; Trustee of the Whitehead Institute for | |
Biomedical Research. | |
| JoAnn Heffernan Heisen |
| Born 1950. Trustee Since July 1998. Principal |
Emerson U. Fullwood | Occupation(s) During the Past Five Years: Retired |
Born 1948. Trustee Since January 2008. Principal | Corporate Vice President, Chief Global Diversity Officer, |
Occupation(s) During the Past Five Years: Retired | and Member of the Executive Committee of Johnson & |
Executive Chief Staff and Marketing Officer for North | Johnson (pharmaceuticals/consumer products); Vice |
America and Corporate Vice President of Xerox | President and Chief Information Officer (1997–2005) |
Corporation (photocopiers and printers); Director of | of Johnson & Johnson; Director of the University |
SPX Corporation (multi-industry manufacturing), the | Medical Center at Princeton and Women’s Research |
United Way of Rochester, the Boy Scouts of America, | and Education Institute. |
Amerigroup Corporation (direct health and medical | |
insurance carriers), and Monroe Community College | |
Foundation. | |
André F. Perold | F. William McNabb III1 | |
Born 1952. Trustee Since December 2004. Principal | Born 1957. Chief Executive Officer Since August 2008. |
Occupation(s) During the Past Five Years: George Gund | President Since March 2008. Principal Occupation(s) |
Professor of Finance and Banking, Senior Associate | During the Past Five Years: Director of The Vanguard |
Dean, and Director of Faculty Recruiting, Harvard | Group, Inc., since 2008; Chief Executive Officer and |
Business School; Director and Chairman of UNX, Inc. | President of The Vanguard Group and of each of the |
(equities trading firm); Chair of the Investment | investment companies served by The Vanguard Group |
Committee of HighVista Strategies LLC (private | since 2008; Director of Vanguard Marketing Corporation; |
investment firm). | Managing Director of The Vanguard Group (1995–2008). |
| | |
| | |
Alfred M. Rankin, Jr. | Heidi Stam1 | |
Born 1941. Trustee Since January 1993. Principal | Born 1956. Secretary Since July 2005. Principal |
Occupation(s) During the Past Five Years: Chairman, | Occupation(s) During the Past Five Years: Managing |
President, Chief Executive Officer, and Director of | Director of The Vanguard Group, Inc., since 2006; |
NACCO Industries, Inc. (forklift trucks/housewares/ | General Counsel of The Vanguard Group since 2005; |
lignite); Director of Goodrich Corporation (industrial | Secretary of The Vanguard Group and of each of the |
products/aircraft systems and services). | investment companies served by The Vanguard Group |
| since 2005; Director and Senior Vice President of |
| Vanguard Marketing Corporation since 2005; Principal |
J. Lawrence Wilson | of The Vanguard Group (1997–2006). |
Born 1936. Trustee Since April 1985. Principal | |
Occupation(s) During the Past Five Years: Retired | | |
Chairman and Chief Executive Officer of Rohm and | Vanguard Senior Management Team |
Haas Co. (chemicals); Director of Cummins Inc. (diesel | | |
engines) and AmerisourceBergen Corp. (pharmaceutical | | |
distribution); Trustee of Vanderbilt University and of | R. Gregory Barton | Michael S. Miller |
Culver Educational Foundation. | Mortimer J. Buckley | James M. Norris |
| Kathleen C. Gubanich | Glenn W. Reed |
| Paul A. Heller | George U. Sauter |
Executive Officers | | |
| | |
| Founder | |
Thomas J. Higgins1 | | |
Born 1957. Chief Financial Officer Since September | | |
2008. Principal Occupation(s) During the Past Five | John C. Bogle | |
Years: Principal of The Vanguard Group, Inc.; Chief | Chairman and Chief Executive Officer, 1974–1996 |
Financial Officer of each of the investment companies | | |
served by The Vanguard Group since 2008; Treasurer | | |
of each of the investment companies served by The | | |
Vanguard Group (1998–2008). | | |
| | |
| | |
Kathryn J. Hyatt1 | | |
Born 1955. Treasurer Since November 2008. Principal | | |
Occupation(s) During the Past Five Years: Principal of | | |
The Vanguard Group, Inc.; Treasurer of each of the | | |
investment companies served by The Vanguard | | |
Group since 2008; Assistant Treasurer of each of the | | |
investment companies served by The Vanguard Group | | |
(1988–2008). | | |
1 These individuals are “interested persons” as defined in the Investment Company Act of 1940.
2 December 2002 for Vanguard Equity Income Fund, Vanguard Growth Equity Fund, the Vanguard Municipal Bond Funds, and the Vanguard State Tax-Exempt Funds.
| 
|
| P.O. Box 2600 |
| Valley Forge, PA 19482-2600 |
Connect with Vanguard® > www.vanguard.com
Fund Information > 800-662-7447 | All comparative mutual fund data are from Lipper Inc. |
| or Morningstar, Inc., unless otherwise noted. |
Direct Investor Account Services > 800-662-2739 | |
| |
Institutional Investor Services > 800-523-1036 | You can obtain a free copy of Vanguard’s proxy voting |
| guidelines by visiting our website, www.vanguard.com, |
Text Telephone for People | and searching for “proxy voting guidelines,” or by |
With Hearing Impairment > 800-952-3335 | calling Vanguard at 800-662-2739. The guidelines are |
| also available from the SEC’s website, www.sec.gov. |
| In addition, you may obtain a free report on how your |
| fund voted the proxies for securities it owned during |
This material may be used in conjunction | the 12 months ended June 30. To get the report, visit |
with the offering of shares of any Vanguard | either www.vanguard.com or www.sec.gov. |
fund only if preceded or accompanied by | |
the fund’s current prospectus. | |
| You can review and copy information about your fund |
| at the SEC’s Public Reference Room in Washington, D.C. |
The funds or securities referred to herein are not | To find out more about this public service, call the SEC |
sponsored, endorsed, or promoted by MSCI, and MSCI | at 202-551-8090. Information about your fund is also |
bears no liability with respect to any such funds or | available on the SEC’s website, and you can receive |
securities. For any such funds or securities, the | copies of this information, for a fee, by sending a |
prospectus or the Statement of Additional Information | request in either of two ways: via e-mail addressed to |
contains a more detailed description of the limited | publicinfo@sec.gov or via regular mail addressed to the |
relationship MSCI has with The Vanguard Group and | Public Reference Section, Securities and Exchange |
any related funds. | Commission, Washington, DC 20549-0102. |
| |
Russell is a trademark of The Frank Russell Company. | |
| |
Standard & Poor’s 500®, S&P 500®, and 500 are | |
trademarks of The McGraw-Hill Companies, Inc., and | |
have been licensed for use by The Vanguard Group, Inc. | |
Vanguard mutual funds are not sponsored, endorsed, | |
sold, or promoted by Standard & Poor’s, and Standard & | |
Poor’s makes no representation regarding the advisability | |
of investing in the funds. | |
| © 2009 The Vanguard Group, Inc. |
| All rights reserved. |
| Vanguard Marketing Corporation, Distributor. |
| |
| Q932 052009 |

> | For the six-month period ended March 31, 2009, returns for the Vanguard Structured Equity portfolios ranged from about –27% for the Structured Large-Cap Growth Fund to about –36% for the Structured Large-Cap Value Fund. |
> | All four Structured Equity Funds lagged their benchmarks for the period. |
> | For the six months, all ten industry sectors posted negative returns for the stock market and for the funds. |
Contents | |
| |
Your Fund’s Total Returns | 1 |
President’s Letter | 2 |
Advisor’s Report | 7 |
Structured Large-Cap Equity Fund | 9 |
Structured Large-Cap Growth Fund | 23 |
Structured Large-Cap Value Fund | 36 |
Structured Broad Market Fund | 47 |
About Your Fund’s Expenses | 62 |
Trustees Approve Advisory Arrangement | 64 |
Glossary | 65 |
Please note: The opinions expressed in this report are just that—informed opinions. They should not be considered promises or advice. Also, please keep in mind that the information and opinions cover the period through the date on the front of this report. Of course, the risks of investing in your fund are spelled out in the prospectus.
Your Fund’s Total Returns
Six Months Ended March 31, 2009 | | |
| Ticker | Total |
| Symbol | Returns |
Vanguard Structured Large-Cap Equity Fund | | |
Institutional Shares | VSLIX | –31.69% |
Institutional Plus Shares | VSLPX | –31.63 |
S&P 500 Index | | –30.54 |
Average Large-Cap Core Fund1 | | –29.66 |
| | |
Vanguard Structured Large-Cap Growth Fund | | |
Institutional Shares | VSTLX | –26.91% |
Institutional Plus Shares | VSGPX | –26.85 |
Russell 1000 Growth Index | | –25.97 |
Average Large-Cap Growth Fund1 | | –26.00 |
| | |
Vanguard Structured Large-Cap Value Fund | | |
Institutional Plus Shares | VSLVX | –35.73% |
Russell 1000 Value Index | | –35.22 |
Average Large-Cap Value Fund1 | | –32.00 |
| | |
Vanguard Structured Broad Market Fund | | |
Institutional Shares | VSBMX | –31.93% |
Institutional Plus Shares | VSBPX | –31.91 |
Russell 3000 Index | | –31.12 |
Average Multi-Cap Core Fund1 | | –29.79 |
1 Derived from data provided by Lipper Inc.
1

President’s Letter
Dear Shareholder,
During what was an extremely difficult six months for the U.S. stock market, returns for the Vanguard Structured Equity Funds ranged from about –27% for the Structured Large-Cap Growth Fund to about –36% for the Structured Large-Cap Value Fund. The other two funds, the Structured Large-Cap Equity Fund and the Structured Broad Market Fund, both returned about –32%. All four funds underperformed their benchmarks for the period.
The ongoing recession affected all corners of the market during the six-month period. The widespread volatility resulted in negative returns for all sectors for the four Structured Equity Funds. The funds suffered their most significant losses in the financial, energy, industrial, and information technology sectors—all of which were severely weakened by the troubled economy.
Extreme distress dappled with glimmers of hope
The six months ended March 31 witnessed extreme distress in global stock markets, with both U.S. and international stocks returning about –31%. The embattled financial sector continued to struggle, prompting regulators in the United States and abroad to take evermore-aggressive actions to help the big banks fortify their fragile balance sheets.
2
Even as the gloom intensified, a few signs of recovery appeared on the horizon. Toward the end of the period, the swift contraction in manufacturing activity seemed to lessen. And throughout the six months, news from the housing sector seemed to improve. From their lows in early March through the end of the period, global stock markets generated a double-digit return.
Credit-market turmoil provoked dramatic response
Developments in the fixed income market were, if anything, even more unusual. In the months after the September collapse of Lehman Brothers, a major presence in the bond market, the trading of corporate bonds came to a near standstill as investors stampeded into U.S. Treasury bonds—considered the safest, most liquid credits—driving prices higher and yields lower. The difference between the yields of Treasuries and corporate bonds surged to levels not seen since the 1930s.
The Federal Reserve Board responded to the credit-market and economic crises with a dramatic easing of monetary policy, reducing its target for short-term interest rates to an all-time low of 0% to 0.25%. The Fed also created new programs designed to bring borrowers and lenders back to the market. For the six-month period, the Barclays Capital U.S. Aggregate Bond Index returned 4.70% on the strength of Treasuries and other government-backed bonds. The broad municipal bond market returned 5.00%.
Market Barometer | | | |
| | | Total Returns |
| | Periods Ended March 31, 2009 |
| Six Months | One Year | Five Years1 |
Stocks | | | |
Russell 1000 Index (Large-cap) | –30.59% | –38.27% | –4.54% |
Russell 2000 Index (Small-cap) | –37.17 | –37.50 | –5.24 |
Dow Jones Wilshire 5000 Index (Entire market) | –30.72 | –37.69 | –4.24 |
MSCI All Country World Index ex USA (International) | –30.54 | –46.18 | –0.24 |
| | | |
Bonds | | | |
Barclays Capital U.S. Aggregate Bond Index | | | |
(Broad taxable market) | 4.70% | 3.13% | 4.13% |
Barclays Capital Municipal Bond Index | 5.00 | 2.27 | 3.21 |
Citigroup 3-Month Treasury Bill Index | 0.30 | 1.13 | 3.06 |
| | | |
CPI | | | |
Consumer Price Index | –2.78% | –0.38% | 2.57% |
1 Annualized.
3
Trouble in all sectors led to disappointing results
The Vanguard Structured Equity Funds are designed to maintain index-like risk profiles while producing index-beating returns through superior stock selection. During an exceptionally difficult six months for U.S. stocks, the four funds fell short of this goal.
On an absolute basis, the Structured Large-Cap Growth Fund had the best results for the period, while the Structured Large-Cap Value Fund was the worst performer of the bunch. This came as no surprise, since value stocks generally underperformed their growth counterparts for the period. Meanwhile, the performance of the Structured Large-Cap Equity Fund—which is a blend of large-cap growth and large-cap value stocks—fell somewhere in the middle. Unlike the three other funds, the Structured Broad Market Fund has exposure to small- and mid-capitalization stocks, which underperformed large-cap stocks. Despite this exposure, the fund performed about the same as its large-cap blend counterpart.
Although there were no true bright spots during the six-month period, some sectors were hit harder by the flailing economy than others. As the credit crisis continued, it affected all corners of the financial sector, from investment banks to insurance companies. Many high-profile information technology stocks plummeted as the global economic downturn hindered sales of PCs and other tech products. Industrial and energy stocks also suffered.
All four funds trailed their benchmark indexes. The Structured Large-Cap Value Fund had the smallest margin of shortfall—about 0.5 percentage point—while the Structured Large-Cap Equity Fund had the greatest, a little more than 1 percentage point.
Relative to their respective benchmarks, the funds’ weakest performances came from the energy, materials, and information technology sectors. Thanks to good stock selection in the consumer discretionary, financial, and health care sectors, the funds held up better in these areas than their indexes.
Diversification is important regardless of market conditions
The six months ended March 31 represented a terrible time for the U.S. stock market. As the recession deepened, it affected all areas of the market and left both investors and investment managers feeling anxious and uncertain.
Although the market’s volatility can be jarring, it’s important not to let short-term extremes blind us to the long-term case for equities. The stock market’s recent declines are an unavoidable, if extreme, trade-off for stocks’ potential to produce superior returns in the long run.
At Vanguard, we encourage investors to build a portfolio that is diversified across asset classes, including stocks, bonds, and
4
money market funds, with the proportions determined by their institution’s long-term investment goals.
Although even a well-balanced portfolio isn’t immune to the difficult market conditions we’ve experienced during the past six months, we believe that broad diversification among and within asset classes represents the right policy, and can position your institution to weather the occasional storm while helping it to benefit from the inevitable return to better times. As part of a well-diversified long-term strategy, we believe the Vanguard Structured Equity Funds can play an integral role in helping your organization reach its investment goals.
Thank you for entrusting your assets to Vanguard.
Sincerely,

William McNabb III
President and Chief Executive Officer
April 20, 2009
5
Your Fund’s Performance at a Glance | | | | |
September 30, 2008–March 31, 2009 | | | | |
| | | Distributions Per Share |
| Starting | Ending | Income | Capital |
| Share Price | Share Price | Dividends | Gains |
Structured Large-Cap Equity Fund | | | | |
Institutional Shares | $22.56 | $14.82 | $0.643 | $0.000 |
Institutional Plus Shares | 45.15 | 29.66 | 1.316 | 0.000 |
Structured Large-Cap Growth Fund | | | | |
Institutional Shares | $22.63 | $16.26 | $0.297 | $0.000 |
Institutional Plus Shares | 45.07 | 32.39 | 0.613 | 0.000 |
Structured Large-Cap Value Fund | | | | |
Institutional Plus Shares | $44.00 | $27.14 | $1.388 | $0.000 |
Structured Broad Market Fund | | | | |
Institutional Shares | $21.53 | $14.31 | $0.392 | $0.000 |
Institutional Plus Shares | 43.07 | 28.58 | 0.849 | 0.000 |
6
Advisor’s Report
The six months ended March 31, 2009 were a difficult period for Vanguard’s Structured Equity Funds. All the funds showed double-digit losses and lagged their benchmarks for the period.
The investment environment
The attractively valued, high-quality stocks that we prefer underperformed the market during the past six months.
We base our view on judgment and empirical evidence. In our judgment, although the market is relatively effective in assigning prices to stocks, investors as a group can still overreact to new information. This overreaction can cause prices to diverge a bit from “true” or “fair” value, providing opportunities to profit from these discrepancies.
We identify potentially attractive stocks by looking at multiple signals. Market participants send some signals, such as measures of relative performance or changes in analysts’ opinions. Other signals are provided by the company’s management, such as changes in capital spending or dividends. Finally, there are valuation signals, such as price/earnings ratios and yields.
Over time, our signals have indicated future outperformance, although there are periods, sometimes measured in years, when our models are not effective. Nonetheless, consistent exposure to these signals does seem to be rewarded over time.
Given our opinion that it is better to own attractive stocks at low multiples, we feel that our portfolios are well-positioned for a market rebound.
Here are brief reviews of each fund’s performance relative to its benchmark.
Structured Large-Cap Equity Fund
Our best performance was in the capital goods industry, where our underweighting in General Electric was very helpful. Automobile and bank holdings also performed well, led by Ford and PNC Financial. Materials stocks underperformed, with United States Steel our worst pick.
Structured Large-Cap Growth Fund
Consumer services was our best-performing industry, led by ITT Educational Services. Diversified financial stocks and health care holdings helped performance, while materials stocks were our worst performers, led by United States Steel.
Structured Large-Cap Value Fund
Consumer durables stocks were our best-performing holdings, helped by our positions in Stanley Works and Hasbro Bradley. Consumer services and transportation companies also performed well. Technology hardware firms reduced performance, with NCR dropping significantly. Pharmaceutical stocks also weakened performance.
7
Structured Broad Market Fund
Consumer durables were our best-performing stocks, led by VF Corp. Automobiles also contributed positively. Pharmaceuticals, particularly King Pharmaceutical, hurt returns.
Conclusion
Our investment philosophy is to buy high-quality stocks at relatively low valuations, relying on a process that focuses on multiple inputs. In constructing a portfolio from these inputs, we believe that a low level of relative risk is preferable, as are low costs. We have been successful in keeping our tracking error within our expectations, and while we are disappointed that our portfolios did not outpace our benchmarks, we are confident in our preference for low-valuation, high-quality stocks. Although these stocks have not been favored by the market over the six-month period of this report, we believe in their long-term prospects.
We thank you for your investment and look forward to the rest of the fiscal year.
James D. Troyer, CFA
Principal and Portfolio Manager
James P. Stetler
Principal and Portfolio Manager
Vanguard Quantitative Equity Group
April 23, 2009
8
Structured Large-Cap Equity Fund
Fund Profile
As of March 31, 2009
Portfolio Characteristics | | |
| | Comparative | Broad |
| Fund | Index1 | Index2 |
Number of Stocks | 250 | 500 | 4,489 |
Median Market Cap | $32.8B | $38.2B | $22.3B |
Price/Earnings Ratio | 12.4x | 13.9x | 15.0x |
Price/Book Ratio | 1.9x | 1.8x | 1.7x |
Yield3 | | 2.8% | 2.7% |
Institutional Shares | 2.6% | | |
Institutional | | | |
Plus Shares | 2.7% | | |
Return on Equity | 21.6% | 21.4% | 20.2% |
Earnings Growth Rate | 16.8% | 15.4% | 15.0% |
Foreign Holdings | 0.0% | 0.0% | 0.0% |
Turnover Rate4 | 105% | — | — |
Expense Ratio5 | | — | — |
Institutional Shares | 0.25% | | |
Institutional | | | |
Plus Shares | 0.17% | | |
Short-Term Reserves | 0.0% | — | — |
Sector Diversification (% of equity exposure) |
| | Comparative | Broad |
| Fund | Index1 | Index2 |
Consumer Discretionary | 9.7% | 8.8% | 9.4% |
Consumer Staples | 12.7 | 12.8 | 11.2 |
Energy | 13.7 | 13.0 | 12.3 |
Financials | 10.8 | 10.8 | 13.1 |
Health Care | 14.4 | 15.3 | 14.6 |
Industrials | 9.9 | 9.7 | 10.0 |
Information Technology | 18.2 | 18.0 | 17.7 |
Materials | 2.8 | 3.3 | 3.7 |
Telecommunication | | | |
Services | 3.7 | 4.0 | 3.6 |
Utilities | 4.1 | 4.3 | 4.4 |
| | | | |
Ten Largest Holdings6 (% of total net assets) |
| | |
ExxonMobil Corp. | integrated oil | |
| and gas | 5.1% |
Chevron Corp. | integrated oil | |
| and gas | 2.5 |
The Procter & Gamble Co. | household | |
| products | 2.5 |
International Business | | |
Machines Corp. | computer hardware | 2.4 |
Johnson & Johnson | pharmaceuticals | 2.3 |
Wal-Mart Stores, Inc. | hypermarkets | |
| and super centers | 2.2 |
Microsoft Corp. | systems software | 2.0 |
Cisco Systems, Inc. | communications | |
| equipment | 2.0 |
AT&T Inc. | integrated | |
| telecommunication | |
| services | 1.9 |
Intel Corp. | semiconductors | 1.8 |
Top Ten | | 24.7% |
Investment Focus
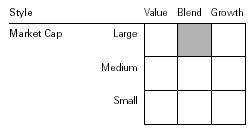
1 S&P 500 Index.
2 Dow Jones Wilshire 5000 Index.
3 30-day SEC yield for the fund; annualized dividend yield for the indexes. See the Glossary.
4 Annualized.
5 The expense ratios shown are from the prospectus dated January 23, 2009, and represent estimated costs for the current fiscal year based on the fund’s current net assets. For the six months ended March 31, 2009, the annualized expense ratios were 0.24% for Institutional Shares and 0.16% for Institutional Plus Shares.
6 “Ten Largest Holdings” excludes any temporary cash investments and equity index products.
9
Structured Large-Cap Equity Fund
Performance Summary
All of the returns in this report represent past performance, which is not a guarantee of future results that may be achieved by the fund. (Current performance may be lower or higher than the performance data cited. For performance data current to the most recent month-end, visit our website at www.vanguard.com/performance.) Note, too, that both investment returns and principal value can fluctuate widely, so an investor’s shares, when sold, could be worth more or less than their original cost. The returns shown do not reflect taxes that a shareholder would pay on fund distributions or on the sale of fund shares.
Fiscal-Year Total Returns (%): May 15, 2006–March 31, 2009
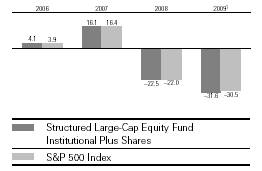
Average Annual Total Returns: Periods Ended March 31, 2009 | | |
| | | Since |
| Inception Date | One Year | Inception |
Institutional Shares | 5/16/2006 | –39.66% | –14.38% |
Institutional Plus Shares | 5/15/2006 | –39.59 | –14.33 |
1 Six months ended March 31, 2009.
Note: See Financial Highlights tables for dividend and capital gains information.
10
Structured Large-Cap Equity Fund
Financial Statements (unaudited)
Statement of Net Assets
As of March 31, 2009
The fund provides a complete list of its holdings four times in each fiscal year, at the quarter-ends. For the second and fourth fiscal quarters, the lists appear in the fund’s semiannual and annual reports to shareholders. For the first and third fiscal quarters, the fund files the lists with the Securities and Exchange Commission on Form N-Q. Shareholders can look up the fund’s Forms N-Q on the SEC’s website at www.sec.gov. Forms N-Q may also be reviewed and copied at the SEC’s Public Reference Room (see the back cover of this report for further information).
| | | Market |
| | | Value• |
| | Shares | ($000) |
Common Stocks (99.9%)1 | | |
Consumer Discretionary (9.7%) | | |
| McDonald’s Corp. | 74,897 | 4,087 |
| Lowe’s Cos., Inc. | 180,973 | 3,303 |
| Comcast Corp. Class A | 221,085 | 3,016 |
| The Gap, Inc. | 213,922 | 2,779 |
| Home Depot, Inc. | 112,300 | 2,646 |
* | AutoZone Inc. | 14,604 | 2,375 |
* | Apollo Group, Inc. Class A | 26,054 | 2,041 |
*,^ | Ford Motor Co. | 698,606 | 1,837 |
* | DIRECTV Group, Inc. | 77,931 | 1,776 |
| VF Corp. | 30,400 | 1,736 |
| Comcast Corp. Special | | |
| Class A | 134,800 | 1,735 |
| Omnicom Group Inc. | 68,113 | 1,594 |
* | Coach, Inc. | 93,381 | 1,559 |
| Polo Ralph Lauren Corp. | 33,564 | 1,418 |
| Limited Brands, Inc. | 126,993 | 1,105 |
| Wyndham Worldwide Corp. | 248,640 | 1,044 |
| NIKE, Inc. Class B | 16,963 | 795 |
| TJX Cos., Inc. | 30,916 | 793 |
| Darden Restaurants Inc. | 20,200 | 692 |
* | Big Lots Inc. | 33,100 | 688 |
* | Interpublic Group | | |
| of Cos., Inc. | 163,283 | 673 |
| H & R Block, Inc. | 32,530 | 592 |
| The McGraw-Hill Cos., Inc. | 24,700 | 565 |
| News Corp., Class A | 80,640 | 534 |
| Macy’s Inc. | 57,800 | 514 |
| Yum! Brands, Inc. | 17,875 | 491 |
| RadioShack Corp. | 45,259 | 388 |
* | GameStop Corp. Class A | 11,785 | 330 |
| Family Dollar Stores, Inc. | 8,390 | 280 |
| Harley-Davidson, Inc. | 20,906 | 280 |
| Pulte Homes, Inc. | 19,300 | 211 |
| D. R. Horton, Inc. | 18,600 | 180 |
| Whirlpool Corp. | 5,358 | 159 |
| Snap-On Inc. | 4,077 | 102 |
| General Motors Corp. | 44,000 | 85 |
| The Walt Disney Co. | 3,529 | 64 |
| | | Market |
| | | Value• |
| | Shares | ($000) |
| Lennar Corp. Class A | 6,667 | 50 |
| Sherwin-Williams Co. | 900 | 47 |
| Carnival Corp. | 2,149 | 46 |
| Centex Corp. | 5,800 | 44 |
| Leggett & Platt, Inc. | 2,700 | 35 |
| | | 42,689 |
Consumer Staples (12.7%) | | |
| The Procter & Gamble Co. | 231,594 | 10,906 |
| Wal-Mart Stores, Inc. | 184,096 | 9,591 |
| The Coca-Cola Co. | 108,640 | 4,775 |
| Philip Morris | | |
| International Inc. | 109,936 | 3,912 |
| Archer-Daniels-Midland Co. | 103,240 | 2,868 |
| PepsiCo, Inc. | 51,592 | 2,656 |
| The Kroger Co. | 117,682 | 2,497 |
| H.J. Heinz Co. | 67,900 | 2,245 |
| CVS Caremark Corp. | 72,833 | 2,002 |
| Kraft Foods Inc. | 85,268 | 1,901 |
| ConAgra Foods, Inc. | 107,038 | 1,806 |
| Kimberly-Clark Corp. | 32,844 | 1,514 |
| Altria Group, Inc. | 92,161 | 1,476 |
| General Mills, Inc. | 29,083 | 1,451 |
| Sysco Corp. | 62,589 | 1,427 |
| Campbell Soup Co. | 49,258 | 1,348 |
| Kellogg Co. | 32,700 | 1,198 |
* | Dr. Pepper Snapple | | |
| Group, Inc. | 69,094 | 1,168 |
| Lorillard, Inc. | 7,500 | 463 |
| The Hershey Co. | 11,341 | 394 |
| Molson Coors | | |
| Brewing Co. Class B | 7,370 | 253 |
| Safeway, Inc. | 8,000 | 161 |
| Costco Wholesale Corp. | 2,019 | 93 |
* | Dean Foods Co. | 3,800 | 69 |
| J.M. Smucker Co. | 526 | 20 |
| | | 56,194 |
Energy (13.7%) | | |
| ExxonMobil Corp. | 333,839 | 22,735 |
| Chevron Corp. | 162,356 | 10,917 |
| ConocoPhillips Co. | 99,259 | 3,887 |
11
Structured Large-Cap Equity Fund
| | | Market |
| | | Value• |
| | Shares | ($000) |
| Anadarko Petroleum Corp. | 81,492 | 3,169 |
| Peabody Energy Corp. | 92,102 | 2,306 |
| Occidental Petroleum Corp. | 39,951 | 2,223 |
| CONSOL Energy, Inc. | 77,300 | 1,951 |
| Murphy Oil Corp. | 41,385 | 1,853 |
| El Paso Corp. | 294,650 | 1,842 |
| Apache Corp. | 26,446 | 1,695 |
| EOG Resources, Inc. | 27,186 | 1,489 |
| Marathon Oil Corp. | 44,100 | 1,159 |
| Valero Energy Corp. | 59,930 | 1,073 |
| ENSCO International, Inc. | 40,309 | 1,064 |
* | Southwestern Energy Co. | 27,343 | 812 |
| Schlumberger Ltd. | 17,855 | 725 |
| Tesoro Corp. | 45,000 | 606 |
| Sunoco, Inc. | 14,400 | 381 |
| Massey Energy Co. | 22,825 | 231 |
| XTO Energy, Inc. | 5,852 | 179 |
* | National Oilwell Varco Inc. | 5,754 | 165 |
| Chesapeake Energy Corp. | 8,236 | 141 |
| | | 60,603 |
Financials (10.7%) | | |
| JPMorgan Chase & Co. | 151,679 | 4,032 |
| State Street Corp. | 115,934 | 3,568 |
| Wells Fargo & Co. | 233,215 | 3,321 |
| Northern Trust Corp. | 53,717 | 3,213 |
| Morgan Stanley | 138,463 | 3,153 |
| U.S. Bancorp | 185,724 | 2,713 |
| The Goldman Sachs | | |
| Group, Inc. | 24,698 | 2,619 |
| Bank of New York | | |
| Mellon Corp. | 87,075 | 2,460 |
| The Chubb Corp. | 56,943 | 2,410 |
| Aon Corp. | 52,837 | 2,157 |
| AFLAC Inc. | 93,394 | 1,808 |
| Hudson City Bancorp, Inc. | 129,701 | 1,516 |
| The Travelers Cos., Inc. | 33,268 | 1,352 |
| Unum Group | 104,713 | 1,309 |
| American Express Co. | 92,285 | 1,258 |
| Discover Financial Services | 184,334 | 1,163 |
| Charles Schwab Corp. | 73,196 | 1,135 |
| BB&T Corp. | 52,837 | 894 |
| NYSE Euronext | 44,700 | 800 |
| MetLife, Inc. | 33,304 | 758 |
| Simon Property | | |
| Group, Inc. REIT | 21,689 | 751 |
| HCP, Inc. REIT | 35,363 | 631 |
| Capital One Financial Corp. | 50,543 | 619 |
| Torchmark Corp. | 20,295 | 532 |
| Vornado Realty Trust REIT | 12,680 | 422 |
| CME Group, Inc. | 1,663 | 410 |
| Bank of America Corp. | 59,153 | 403 |
| The Allstate Corp. | 15,290 | 293 |
| Progressive Corp. of Ohio | 16,400 | 220 |
| Ameriprise Financial, Inc. | 10,200 | 209 |
| | | Market |
| | | Value• |
| | Shares | ($000) |
| Apartment Investment & | | |
| Management Co. | | |
| Class A REIT | 33,999 | 186 |
| Host Hotels & Resorts Inc. REIT | 45,429 | 178 |
| Federated Investors, Inc. | 7,890 | 176 |
| Marshall & Ilsley Corp. | 15,568 | 88 |
| SunTrust Banks, Inc. | 6,582 | 77 |
| Lincoln National Corp. | 10,719 | 72 |
| Citigroup Inc. | 24,144 | 61 |
| Plum Creek Timber Co. Inc. REIT | 2,100 | 61 |
| M & T Bank Corp. | 900 | 41 |
| Public Storage, Inc. REIT | 729 | 40 |
| Franklin Resources Corp. | 726 | 39 |
| First Horizon National Corp. | 3,500 | 38 |
| Equity Residential REIT | 1,436 | 26 |
| | | 47,212 |
Health Care (14.3%) | | |
| Johnson & Johnson | 192,246 | 10,112 |
* | Amgen Inc. | 108,213 | 5,359 |
| Bristol-Myers Squibb Co. | 229,531 | 5,031 |
| Pfizer Inc. | 333,145 | 4,537 |
| Abbott Laboratories | 83,968 | 4,005 |
| Covidien Ltd. | 99,455 | 3,306 |
* | Biogen Idec Inc. | 61,785 | 3,239 |
| Quest Diagnostics, Inc. | 55,698 | 2,645 |
| AmerisourceBergen Corp. | 70,349 | 2,298 |
| Baxter International, Inc. | 43,818 | 2,244 |
* | Gilead Sciences, Inc. | 45,846 | 2,124 |
| Wyeth | 49,303 | 2,122 |
* | Express Scripts Inc. | 44,450 | 2,052 |
* | King Pharmaceuticals, Inc. | 272,216 | 1,925 |
| Eli Lilly & Co. | 51,487 | 1,720 |
| Merck & Co., Inc. | 57,867 | 1,548 |
| McKesson Corp. | 35,300 | 1,237 |
* | Cephalon, Inc. | 17,605 | 1,199 |
* | Watson Pharmaceuticals, Inc. | 38,041 | 1,183 |
* | WellPoint Inc. | 29,384 | 1,116 |
| UnitedHealth Group Inc. | 52,374 | 1,096 |
* | Medco Health Solutions, Inc. | 24,566 | 1,016 |
* | Mylan Inc. | 72,200 | 968 |
* | Thermo Fisher Scientific, Inc. | 21,234 | 757 |
* | Varian Medical Systems, Inc. | 16,633 | 506 |
* | St. Jude Medical, Inc. | 3,849 | 140 |
| | | 63,485 |
Industrials (9.9%) | | |
| General Electric Co. | 466,322 | 4,715 |
| Lockheed Martin Corp. | 52,438 | 3,620 |
| Norfolk Southern Corp. | 91,007 | 3,072 |
| General Dynamics Corp. | 68,837 | 2,863 |
| Waste Management, Inc. | 99,730 | 2,553 |
| Northrop Grumman Corp. | 57,316 | 2,501 |
| Dover Corp. | 92,858 | 2,450 |
| Goodrich Corp. | 64,345 | 2,438 |
| United Technologies Corp. | 53,536 | 2,301 |
12
Structured Large-Cap Equity Fund
| | | Market |
| | | Value• |
| | Shares | ($000) |
| Flowserve Corp. | 30,074 | 1,688 |
| Union Pacific Corp. | 40,904 | 1,682 |
| Honeywell International Inc. | 59,283 | 1,652 |
| Fluor Corp. | 46,060 | 1,591 |
| 3M Co. | 30,813 | 1,532 |
| Raytheon Co. | 34,627 | 1,348 |
| L-3 Communications | | |
| Holdings, Inc. | 19,487 | 1,321 |
| Ryder System, Inc. | 41,654 | 1,179 |
| Emerson Electric Co. | 32,172 | 919 |
| CSX Corp. | 30,618 | 791 |
| Pitney Bowes, Inc. | 31,000 | 724 |
| Burlington Northern | | |
| Santa Fe Corp. | 10,577 | 636 |
| United Parcel Service, Inc. | 12,421 | 611 |
| Deere & Co. | 12,918 | 425 |
| ITT Industries, Inc. | 9,800 | 377 |
| Cummins Inc. | 12,514 | 318 |
| Danaher Corp. | 5,745 | 312 |
| Expeditors International | | |
| of Washington, Inc. | 10,309 | 292 |
| Republic Services, Inc. | | |
| Class A | 2,155 | 37 |
| Southwest Airlines Co. | 5,100 | 32 |
| | | 43,980 |
Information Technology (18.2%) | | |
| International Business | | |
| Machines Corp. | 108,740 | 10,536 |
| Microsoft Corp. | 483,341 | 8,879 |
* | Cisco Systems, Inc. | 520,015 | 8,721 |
| Intel Corp. | 522,453 | 7,863 |
| Hewlett-Packard Co. | 221,000 | 7,085 |
* | Apple Inc. | 58,242 | 6,122 |
* | Oracle Corp. | 262,488 | 4,743 |
* | Google Inc. | 11,255 | 3,917 |
* | Symantec Corp. | 215,107 | 3,214 |
* | Computer Sciences Corp. | 67,698 | 2,494 |
* | Juniper Networks, Inc. | 143,806 | 2,166 |
| Xilinx, Inc. | 99,853 | 1,913 |
| Analog Devices, Inc. | 87,299 | 1,682 |
| QUALCOMM Inc. | 41,557 | 1,617 |
* | Affiliated Computer | | |
| Services, Inc. Class A | 30,926 | 1,481 |
| Automatic Data Processing, Inc. | 36,488 | 1,283 |
* | eBay Inc. | 100,791 | 1,266 |
* | Lexmark International, Inc. | 55,509 | 936 |
* | EMC Corp. | 77,907 | 888 |
| Texas Instruments, Inc. | 46,568 | 769 |
* | LSI Corp. | 205,451 | 624 |
* | Dell Inc. | 51,162 | 485 |
| CA, Inc. | 23,663 | 417 |
| Western Union Co. | 31,722 | 399 |
* | Teradata Corp. | 15,639 | 254 |
| Harris Corp. | 6,800 | 197 |
* | QLogic Corp. | 13,564 | 151 |
| | | Market |
| | | Value• |
| | Shares | ($000) |
* | McAfee Inc. | 4,100 | 137 |
* | BMC Software, Inc. | 3,900 | 129 |
* | Compuware Corp. | 15,277 | 101 |
| Xerox Corp. | 18,700 | 85 |
| Altera Corp. | 3,400 | 60 |
| National Semiconductor Corp. | 4,916 | 50 |
| Fidelity National Information | | |
| Services, Inc. | 2,400 | 44 |
| | | 80,708 |
Materials (2.8%) | | |
| E.I. du Pont de | | |
| Nemours & Co. | 159,953 | 3,572 |
| Monsanto Co. | 39,461 | 3,279 |
| Praxair, Inc. | 23,087 | 1,553 |
| Eastman Chemical Co. | 34,883 | 935 |
| United States Steel Corp. | 42,762 | 904 |
| Ball Corp. | 19,400 | 842 |
| Dow Chemical Co. | 79,399 | 669 |
| Nucor Corp. | 14,201 | 542 |
* | Pactiv Corp. | 14,100 | 206 |
| | | 12,502 |
Other (0.1%) | | |
2 | Miscellaneous Securities | | 435 |
| | | |
Telecommunication Services (3.7%) | |
| AT&T Inc. | 338,835 | 8,539 |
| Verizon Communications Inc. | 184,996 | 5,587 |
* | American Tower Corp. | | |
| Class A | 41,222 | 1,254 |
| Windstream Corp. | 65,006 | 524 |
| Embarq Corp. | 8,891 | 336 |
| CenturyTel, Inc. | 600 | 17 |
| | | 16,257 |
Utilities (4.1%) | | |
| Dominion Resources, Inc. | 99,200 | 3,074 |
| FirstEnergy Corp. | 65,000 | 2,509 |
| Sempra Energy | 49,213 | 2,276 |
| CenterPoint Energy Inc. | 196,139 | 2,046 |
| Entergy Corp. | 28,726 | 1,956 |
| American Electric | | |
| Power Co., Inc. | 72,324 | 1,827 |
| FPL Group, Inc. | 27,808 | 1,411 |
| Questar Corp. | 45,947 | 1,352 |
| CMS Energy Corp. | 73,438 | 869 |
| DTE Energy Co. | 17,200 | 476 |
| NiSource, Inc. | 25,500 | 250 |
| Pinnacle West Capital Corp. | 3,191 | 85 |
* | AES Corp. | 5,741 | 33 |
| | | 18,164 |
Total Common Stocks | | |
(Cost $574,892) | | 442,229 |
Temporary Cash Investments (0.1%)1 | |
Money Market Fund (0.0%) | | |
3,4 | Vanguard Market Liquidity | | |
| Fund, 0.440% | 178,802 | 179 |
13
Structured Large-Cap Equity Fund
| | Face | Market |
| | Amount | Value• |
| | ($000) | ($000) |
U.S. Government and Agency Obligations (0.1%) |
5,6 | Federal Home Loan | | |
| Mortgage Corp., | | |
| 0.597%, 8/24/09 | 200 | 200 |
5,6 | Federal Home Loan | | |
| Mortgage Corp., | | |
| 0.592%, 8/26/09 | 200 | 199 |
| | | 399 |
Total Temporary Cash Investments | | |
(Cost $578) | | 578 |
Total Investments (100.0%) | | |
(Cost $575,470) | | 442,807 |
Other Assets and Liabilities (0.0%) | | |
Other Assets | | 920 |
Liabilities4 | | (971) |
| | | (51) |
Net Assets (100%) | | 442,756 |
At March 31, 2009, net assets consisted of: |
| Amount |
| ($000) |
Paid-in Capital | 840,218 |
Undistributed Net Investment Income | 2,118 |
Accumulated Net Realized Losses | (266,956) |
Unrealized Appreciation (Depreciation) | |
Investment Securities | (132,663) |
Futures Contracts | 39 |
Net Assets | 442,756 |
| |
Institutional Shares—Net Assets | |
Applicable to 6,184,354 outstanding | |
$.001 par value shares of beneficial | |
interest (unlimited authorization) | 91,672 |
Net Asset Value Per Share— | |
Institutional Shares | $14.82 |
| |
Institutional Plus Shares—Net Assets | |
Applicable to 11,838,252 outstanding | |
$.001 par value shares of beneficial | |
interest (unlimited authorization) | 351,084 |
Net Asset Value Per Share— | |
Institutional Plus Shares | $29.66 |
• | See Note A in Notes to Financial Statements. |
* | Non-income-producing security. |
^ | Part of security position is on loan to broker-dealers. The total value of securities on loan is $157,000. |
1 The fund invests a portion of its cash reserves in equity markets through the use of index futures contracts. After giving effect to futures investments, the fund’s effective common stock and temporary cash investment positions represent 100.0% and 0.0%, respectively, of net assets.
2 Securities representing up to 5% of the market value of unaffiliated securities are permitted to be combined and reported as “miscellaneous securities” provided that they have been held for less than one year and not previously reported by name.
3 Affiliated money market fund available only to Vanguard funds and certain trusts and accounts managed by Vanguard. Rate shown is the 7-day yield.
4 Includes $179,000 of collateral received for securities on loan.
5 The issuer operates under a congressional charter; its securities are not backed by the full faith and credit of the U.S. government.
6 Securities with a value of $399,000 have been segregated as initial margin for open futures contracts.
REIT—Real Estate Investment Trust.
See accompanying Notes, which are an integral part of the Financial Statements.
14
Structured Large-Cap Equity Fund
Statement of Operations
| Six Months Ended |
| March 31, 2009 |
| ($000) |
Investment Income | |
Income | |
Dividends | 7,153 |
Interest1 | 34 |
Security Lending | 14 |
Total Income | 7,201 |
Expenses | |
The Vanguard Group—Note B | |
Investment Advisory Services | 201 |
Management and Administrative—Institutional Shares | 52 |
Management and Administrative—Institutional Plus Shares | 83 |
Marketing and Distribution—Institutional Shares | 19 |
Marketing and Distribution—Institutional Plus Shares | 80 |
Custodian Fees | 12 |
Auditing Fees | 1 |
Shareholders’ Reports—Institutional Shares | 1 |
Shareholders’ Reports—Institutional Plus Shares | 1 |
Total Expenses | 450 |
Net Investment Income | 6,751 |
Realized Net Gain (Loss) | |
Investment Securities Sold | (223,649) |
Futures Contracts | (2,795) |
Realized Net Gain (Loss) | (226,444) |
Change in Unrealized Appreciation (Depreciation) | |
Investment Securities | (31,192) |
Futures Contracts | 475 |
Change in Unrealized Appreciation (Depreciation) | (30,717) |
Net Increase (Decrease) in Net Assets Resulting from Operations | (250,410) |
1 Interest income from an affiliated company of the fund was $24,000.
See accompanying Notes, which are an integral part of the Financial Statements.
15
Structured Large-Cap Equity Fund
Statement of Changes in Net Assets
| Six Months Ended | Year Ended |
| March 31, | September 30, |
| 2009 | 2008 |
| ($000) | ($000) |
Increase (Decrease) in Net Assets | | |
Operations | | |
Net Investment Income | 6,751 | 18,118 |
Realized Net Gain (Loss) | (226,444) | (55,634) |
Change in Unrealized Appreciation (Depreciation) | (30,717) | (192,095) |
Net Increase (Decrease) in Net Assets Resulting from Operations | (250,410) | (229,611) |
Distributions | | |
Net Investment Income | | |
Institutional Shares | (3,907) | (2,671) |
Institutional Plus Shares | (13,919) | (12,716) |
Realized Capital Gain1 | | |
Institutional Shares | — | (2,428) |
Institutional Plus Shares | — | (10,809) |
Total Distributions | (17,826) | (28,624) |
Capital Share Transactions | | |
Institutional Shares | 2,928 | (5,788) |
Institutional Plus Shares | (104,504) | 70,557 |
Net Increase (Decrease) from Capital Share Transactions | (101,576) | 64,769 |
Total Increase (Decrease) | (369,812) | (193,466) |
Net Assets | | |
Beginning of Period | 812,568 | 1,006,034 |
End of Period2 | 442,756 | 812,568 |
1 Includes fiscal 2008 short-term gain distributions totaling $9,615,000. Short-term gain distributions are treated as ordinary income dividends for tax purposes.
2 Net Assets—End of Period includes undistributed net investment income of $2,118,000 and $13,193,000.
See accompanying Notes, which are an integral part of the Financial Statements.
16
Structured Large-Cap Equity Fund
Financial Highlights
Institutional Shares | | | | |
| Six Months | | | May 16, |
| Ended | Year Ended | 20061 to |
| March 31, | September 30, | Sept. 30, |
For a Share Outstanding Throughout Each Period | 2009 | 2008 | 2007 | 2006 |
Net Asset Value, Beginning of Period | $22.56 | $29.98 | $26.03 | $24.96 |
Investment Operations | | | | |
Net Investment Income | .2042 | .492 | .4762 | .130 |
Net Realized and Unrealized Gain (Loss) on Investments | (7.301) | (7.091) | 3.657 | .940 |
Total from Investment Operations | (7.097) | (6.599) | 4.133 | 1.070 |
Distributions | | | | |
Dividends from Net Investment Income | (.643) | (.430) | (.172) | — |
Distributions from Realized Capital Gains | — | (.391) | (.011) | — |
Total Distributions | (.643) | (.821) | (.183) | — |
Net Asset Value, End of Period | $14.82 | $22.56 | $29.98 | $26.03 |
| | | | |
Total Return | –31.69% | –22.52% | 15.94% | 4.29% |
| | | | |
Ratios/Supplemental Data | | | | |
Net Assets, End of Period (Millions) | $92 | $135 | $187 | $127 |
Ratio of Total Expenses to Average Net Assets | 0.24%3 | 0.20% | 0.25% | 0.25%3 |
Ratio of Net Investment Income to Average Net Assets | 2.55%3 | 1.91% | 1.69% | 1.67%3 |
Portfolio Turnover Rate | 105%3 | 72% | 54%4 | 30% |
1 Inception.
2 Calculated based on average shares outstanding.
3 Annualized.
4 Excludes the value of portfolio securities received or delivered as a result of in-kind purchases or redemptions of the fund’s capital shares.
See accompanying Notes, which are an integral part of the Financial Statements.
17
Structured Large-Cap Equity Fund
Financial Highlights
Institutional Plus Shares | | | | |
| Six Months | | | May 15, |
| Ended | Year Ended | 20061 to |
| March 31, | September 30, | Sept. 30, |
For a Share Outstanding Throughout Each Period | 2009 | 2008 | 2007 | 2006 |
Net Asset Value, Beginning of Period | $45.15 | $60.02 | $52.07 | $50.00 |
Investment Operations | | | | |
Net Investment Income | .4212 | 1.025 | 1.0182 | .250 |
Net Realized and Unrealized Gain (Loss) on Investments | (14.595) | (14.193) | 7.317 | 1.820 |
Total from Investment Operations | (14.174) | (13.168) | 8.335 | 2.070 |
Distributions | | | | |
Dividends from Net Investment Income | (1.316) | (.920) | (.363) | — |
Distributions from Realized Capital Gains | — | (.782) | (.022) | — |
Total Distributions | (1.316) | (1.702) | (.385) | — |
Net Asset Value, End of Period | $29.66 | $45.15 | $60.02 | $52.07 |
| | | | |
Total Return | –31.63% | –22.46% | 16.07% | 4.14% |
| | | | |
Ratios/Supplemental Data | | | | |
Net Assets, End of Period (Millions) | $351 | $677 | $819 | $203 |
Ratio of Total Expenses to Average Net Assets | 0.16%3 | 0.12% | 0.15% | 0.15%3 |
Ratio of Net Investment Income to Average Net Assets | 2.63%3 | 1.99% | 1.79% | 1.77%3 |
Portfolio Turnover Rate | 105%3 | 72% | 54%4 | 30% |
1 Inception.
2 Calculated based on average shares outstanding.
3 Annualized.
4 Excludes the value of portfolio securities received or delivered as a result of in-kind purchases or redemptions of the fund’s capital shares.
See accompanying Notes, which are an integral part of the Financial Statements.
18
Structured Large-Cap Equity Fund
Notes to Financial Statements
Vanguard Structured Large-Cap Equity Fund is registered under the Investment Company Act of 1940 as an open-end investment company, or mutual fund. The fund offers two classes of shares: Institutional Shares and Institutional Plus Shares. Institutional Shares are designed for investors who meet certain administrative and service criteria and invest a minimum of $5 million. Institutional Plus Shares are available to investors who invest a minimum amount of $200 million ($100 million for investors with total Vanguard investments of at least $1 billion).
A. The following significant accounting policies conform to generally accepted accounting principles for U.S. mutual funds. The fund consistently follows such policies in preparing its financial statements.
1. Security Valuation: Securities are valued as of the close of trading on the New York Stock Exchange (generally 4 p.m., Eastern time) on the valuation date. Equity securities are valued at the latest quoted sales prices or official closing prices taken from the primary market in which each security trades; such securities not traded on the valuation date are valued at the mean of the latest quoted bid and asked prices. Securities for which market quotations are not readily available, or whose values have been materially affected by events occurring before the fund’s pricing time but after the close of the securities’ primary markets, are valued by methods deemed by the board of trustees to represent fair value. Investments in Vanguard Market Liquidity Fund are valued at that fund’s net asset value. Temporary cash investments acquired over 60 days to maturity are valued using the latest bid prices or using valuations based on a matrix system (which considers such factors as security prices, yields, maturities, and ratings), both as furnished by independent pricing services. Other temporary cash investments are valued at amortized cost, which approximates market value.
2. Futures Contracts: The fund uses index futures contracts to a limited extent, with the objective of maintaining full exposure to the stock market while maintaining liquidity. The fund may purchase or sell futures contracts to achieve a desired level of investment, whether to accommodate portfolio turnover or cash flows from capital share transactions. The primary risks associated with the use of futures contracts are imperfect correlation between changes in market values of stocks held by the fund and the prices of futures contracts, and the possibility of an illiquid market.
Futures contracts are valued at their quoted daily settlement prices. The aggregate principal amounts of the contracts are not recorded in the Statement of Net Assets. Fluctuations in the value of the contracts are recorded in the Statement of Net Assets as an asset (liability) and in the Statement of Operations as unrealized appreciation (depreciation) until the contracts are closed, when they are recorded as realized futures gains (losses).
3. Federal Income Taxes: The fund intends to continue to qualify as a regulated investment company and distribute all of its taxable income. Management has analyzed the fund’s tax positions taken on federal income tax returns for all open tax years (tax years ended September 30, 2006–2008), and for the period ended March 31, 2009, and has concluded that no provision for federal income tax is required in the fund’s financial statements.
4. Distributions: Distributions to shareholders are recorded on the ex-dividend date.
5. Security Lending: The fund may lend its securities to qualified institutional borrowers to earn additional income. Security loans are required to be secured at all times by collateral at least equal to the market value of securities loaned. The fund invests cash collateral received in Vanguard Market
19
Structured Large-Cap Equity Fund
Liquidity Fund, and records a liability for the return of the collateral, during the period the securities are on loan. Security lending income represents the income earned on investing cash collateral, less expenses associated with the loan.
6. Other: Dividend income is recorded on the ex-dividend date. Interest income includes income distributions received from Vanguard Market Liquidity Fund and is accrued daily. Security transactions are accounted for on the date securities are bought or sold. Costs used to determine realized gains (losses) on the sale of investment securities are those of the specific securities sold.
Each class of shares has equal rights as to assets and earnings, except that each class separately bears certain class-specific expenses related to maintenance of shareholder accounts (included in Management and Administrative expenses) and shareholder reporting. Marketing and distribution expenses are allocated to each class of shares based on a method approved by the board of trustees. Income, other non-class-specific expenses, and gains and losses on investments are allocated to each class of shares based on its relative net assets.
B. The Vanguard Group furnishes at cost investment advisory, corporate management, administrative, marketing, and distribution services. The costs of such services are allocated to the fund under methods approved by the board of trustees. The fund has committed to provide up to 0.40% of its net assets in capital contributions to Vanguard. At March 31, 2009, the fund had contributed capital of $115,000 to Vanguard (included in Other Assets), representing 0.03% of the fund’s net assets and 0.05% of Vanguard’s capitalization. The fund’s trustees and officers are also directors and officers of Vanguard.
C. Distributions are determined on a tax basis and may differ from net investment income and realized capital gains for financial reporting purposes. Differences may be permanent or temporary. Permanent differences are reclassified among capital accounts in the financial statements to reflect their tax character. Temporary differences arise when certain items of income, expense, gain, or loss are recognized in different periods for financial statement and tax purposes; these differences will reverse at some time in the future. Differences in classification may also result from the treatment of short-term gains as ordinary income for tax purposes.
During the six months ended March 31, 2009, the fund realized $20,147,000 of net capital losses resulting from in-kind redemptions—in which shareholders exchanged fund shares for securities held by the fund rather than for cash. Because such losses are not taxable losses to the fund, they have been reclassified from accumulated net realized losses to paid-in capital.
The fund’s tax-basis capital gains and losses are determined only at the end of each fiscal year. For tax purposes, at September 30, 2008, the fund had available realized losses of $61,104,000 to offset future net capital gains through September 30, 2017. The fund will use these capital losses to offset net taxable capital gains, if any, realized during the year ending September 30, 2009; should the fund realize net capital losses for the year, the losses will be added to the loss carryforward balance above.
At March 31, 2009, the cost of investment securities for tax purposes was $575,470,000. Net unrealized depreciation of investment securities for tax purposes was $132,663,000, consisting of unrealized gains of $7,524,000 on securities that had risen in value since their purchase and $140,187,000 in unrealized losses on securities that had fallen in value since their purchase.
20
Structured Large-Cap Equity Fund
At March 31, 2009, the aggregate settlement value of open futures contracts expiring in June 2009 and the related unrealized appreciation (depreciation) were:
| | | ($000) |
| Number of | Aggregate | Unrealized |
| Long (Short) | Settlement | Appreciation |
Futures Contracts | Contracts | Value | (Depreciation) |
S&P 500 Index | 2 | 398 | 38 |
E-mini S&P 500 Index | 3 | 119 | 1 |
Unrealized appreciation (depreciation) on open futures contracts is required to be treated as realized gain (loss) for tax purposes.
D. During the six months ended March 31, 2009, the fund purchased $328,486,000 of invest
E. Capital share transactions for each class of shares were:
| Six Months Ended | Year Ended |
| March 31, 2009 | September 30, 2008 |
| Amount | Shares | Amount | Shares |
| ($000) | (000) | ($000) | (000) |
Institutional Shares | | | | |
Issued | 2,723 | 171 | 2,581 | 99 |
Issued in Lieu of Cash Distributions | 1,002 | 62 | 958 | 35 |
Redeemed | (797) | (54) | (9,327) | (359) |
Net Increase (Decrease)—Institutional Shares | 2,928 | 179 | (5,788) | (225) |
Institutional Plus Shares | | | | |
Issued | 37,278 | 1,172 | 53,067 | 1,029 |
Issued in Lieu of Cash Distributions | 7,918 | 246 | 17,490 | 316 |
Redeemed | (149,700) | (4,575) | — | — |
Net Increase (Decrease)—Institutional Plus Shares | (104,504) | (3,157) | 70,557 | 1,345 |
F. In September 2006, the Financial Accounting Standards Board issued Statement of Financial Accounting Standards No. 157 (“FAS 157”), “Fair Value Measurements.” FAS 157 establishes a framework for measuring fair value and expands disclosures about fair value measurements in financial statements.
The various inputs that may be used to determine the value of the fund’s investments are summarized in three broad levels. The inputs or methodologies used for valuing securities are not necessarily an indication of the risk associated with investing in those securities.
21
Structured Large-Cap Equity Fund
Level 1—Quote'd prices in active markets for identical securities.
Level 2—Other significant observable inputs (including quoted prices for similar securities, interest rates, prepayment speeds, credit risk, etc.).
Level 3—Significant unobservable inputs (including the fund’s own assumptions used to determine the fair value of investments).
The following table summarizes the fund’s investments as of March 31, 2009, based on the inputs used to value them:
| Investments | Futures |
| in Securities | Contracts |
Valuation Inputs | ($000) | ($000) |
Level 1—Quoted prices | 442,408 | 39 |
Level 2—Other significant observable inputs | 399 | — |
Level 3—Significant unobservable inputs | — | — |
Total | 442,807 | 39 |
22
Structured Large-Cap Growth Fund
Fund Profile
As of March 31, 2009
Portfolio Characteristics | | |
| | Comparative | Broad |
| Fund | Index1 | Index2 |
Number of Stocks | 237 | 636 | 4,489 |
Median Market Cap | $28.0B | $27.1B | $22.3B |
Price/Earnings Ratio | 11.8x | 13.1x | 15.0x |
Price/Book Ratio | 2.6x | 2.7x | 1.7x |
Yield3 | | 2.1% | 2.7% |
Institutional Shares | 1.9% | | |
Institutional | | | |
Plus Shares | 1.9% | | |
Return on Equity | 23.4% | 23.6% | 20.2% |
Earnings Growth Rate | 22.3% | 21.6% | 15.0% |
Foreign Holdings | 0.0% | 0.0% | 0.0% |
Turnover Rate4 | 61% | — | — |
Expense Ratio5 | | — | — |
Institutional Shares | 0.25% | | |
Institutional | | | |
Plus Shares | 0.17% | | |
Short-Term Reserves | 0.5% | — | — |
Sector Diversification (% of equity exposure) |
| | Comparative | Broad |
| Fund | Index1 | Index2 |
Consumer Discretionary | 11.1% | 10.2% | 9.4% |
Consumer Staples | 12.9 | 13.9 | 11.2 |
Energy | 8.2 | 7.9 | 12.3 |
Financials | 4.0 | 3.3 | 13.1 |
Health Care | 14.2 | 14.9 | 14.6 |
Industrials | 12.1 | 11.9 | 10.0 |
Information Technology | 31.1 | 31.1 | 17.7 |
Materials | 4.1 | 4.2 | 3.7 |
Telecommunication | | | |
Services | 0.8 | 0.8 | 3.6 |
Utilities | 1.5 | 1.8 | 4.4 |
Ten Largest Holdings6 (% of total net assets) |
| | |
International Business | | |
Machines Corp. | computer hardware | 3.7% |
Microsoft Corp. | systems software | 3.5 |
Cisco Systems, Inc. | communications | |
| equipment | 2.8 |
Wal-Mart Stores, Inc. | hypermarkets and | |
| super centers | 2.5 |
Apple Inc. | computer hardware | 2.3 |
Intel Corp. | semiconductors | 2.1 |
Hewlett-Packard Co. | computer hardware | 2.1 |
ExxonMobil Corp. | integrated oil | |
| and gas | 1.8 |
Philip Morris | | |
International Inc. | tobacco | 1.8 |
Abbott Laboratories | pharmaceuticals | 1.8 |
Top Ten | | 24.4% |
Volatility Measures7 | |
| Fund Versus | Fund Versus |
| Comparative Index1 | Broad Index2 |
R-Squared | 1.00 | 0.95 |
Beta | 1.00 | 0.98 |
Investment Focus
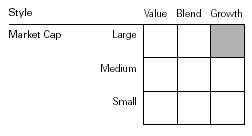
1 Russell 1000 Growth Index.
2 Dow Jones Wilshire 5000 Index.
3 30-day SEC yield for the fund; annualized dividend yield for the indexes. See the Glossary.
4 Annualized.
5 The expense ratios shown are from the prospectus dated January 23, 2009, and represent estimated costs for the current fiscal year based on the fund’s current net assets. For the six months ended March 31, 2009, the annualized expense ratios were 0.24% for Institutional Shares and 0.16% for Institutional Plus Shares.
6 “Ten Largest Holdings” excludes any temporary cash investments and equity index products.
7 For an explanation of R-squared, beta, and other terms used here, see the Glossary.
23
Structured Large-Cap Growth Fund
Performance Summary
All of the returns in this report represent past performance, which is not a guarantee of future results that may be achieved by the fund. (Current performance may be lower or higher than the performance data cited. For performance data current to the most recent month-end, visit our website at www.vanguard.com/performance.) Note, too, that both investment returns and principal value can fluctuate widely, so an investor’s shares, when sold, could be worth more or less than their original cost. The returns shown do not reflect taxes that a shareholder would pay on fund distributions or on the sale of fund shares.
Fiscal-Year Total Returns (%): January 19, 2006–March 31, 2009
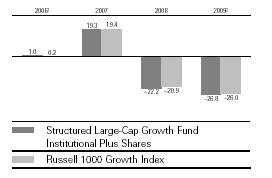
Total Returns: Periods Ended March 31, 2009 | | | |
| | | Since |
| Inception Date | One Year | Inception1 |
Institutional Shares | 6/22/2007 | –35.49% | –26.02% |
Institutional Plus Shares | 1/19/2006 | –35.42 | –11.11 |
1 The fund commenced operations as a registered investment company on October 3, 2006. The fund’s performance includes the performance of a predecessor trust, Vanguard Fiduciary Trust Company Structured Large-Cap Growth Trust, from January 19, 2006, to October 3, 2006. Performance is calculated since the following inception dates: January 19, 2006, for Institutional Plus Shares; June 22, 2007, for Institutional Shares.
2 Six months ended March 31, 2009.
Note: See Financial Highlights tables for dividend and capital gains information.
24
Structured Large-Cap Growth Fund
Financial Statements (unaudited)
Statement of Net Assets
As of March 31, 2009
The fund provides a complete list of its holdings four times in each fiscal year, at the quarter-ends. For the second and fourth fiscal quarters, the lists appear in the fund’s semiannual and annual reports to shareholders. For the first and third fiscal quarters, the fund files the lists with the Securities and Exchange Commission on Form N-Q. Shareholders can look up the fund’s Forms N-Q on the SEC’s website at www.sec.gov. Forms N-Q may also be reviewed and copied at the SEC’s Public Reference Room (see the back cover of this report for further information).
| | | Market |
| | | Value• |
| | Shares | ($000) |
Common Stocks (99.6%)1 | | |
Consumer Discretionary (11.0%) | | |
| McDonald’s Corp. | 9,464 | 516 |
* | AutoZone Inc. | 1,420 | 231 |
* | DIRECTV Group, Inc. | 9,760 | 222 |
* | Apollo Group, Inc. Class A | 2,800 | 219 |
| Ross Stores, Inc. | 6,000 | 215 |
* | Big Lots Inc. | 9,600 | 200 |
* | Amazon.com, Inc. | 2,700 | 198 |
* | ITT Educational Services, Inc. | 1,600 | 194 |
| The Gap, Inc. | 13,600 | 177 |
| NIKE, Inc. Class B | 3,728 | 175 |
| H & R Block, Inc. | 9,600 | 175 |
| Omnicom Group Inc. | 7,402 | 173 |
| Target Corp. | 4,920 | 169 |
| Comcast Corp. Special | | |
| Class A | 12,300 | 158 |
| Comcast Corp. Class A | 10,629 | 145 |
| TJX Cos., Inc. | 5,300 | 136 |
| Darden Restaurants Inc. | 3,700 | 127 |
* | Liberty Media Corp. | 6,100 | 122 |
| Polo Ralph Lauren Corp. | 2,781 | 118 |
| WABCO Holdings Inc. | 9,301 | 115 |
| Yum! Brands, Inc. | 4,100 | 113 |
| Tim Hortons, Inc. | 3,700 | 94 |
* | Urban Outfitters, Inc. | 5,600 | 92 |
| Sherwin-Williams Co. | 1,300 | 68 |
| The McGraw-Hill Cos., Inc. | 2,900 | 66 |
* | GameStop Corp. Class A | 1,900 | 53 |
| Lowe’s Cos., Inc. | 2,823 | 52 |
| Advance Auto Parts, Inc. | 1,200 | 49 |
* | Coach, Inc. | 2,800 | 47 |
* | Viacom Inc. Class B | 2,659 | 46 |
| News Corp., Class A | 3,834 | 25 |
* | DISH Network Corp. | 1,386 | 15 |
* | Penn National Gaming, Inc. | 300 | 7 |
| Weight Watchers | | |
| International, Inc. | 200 | 4 |
| | | 4,516 |
| | | Market |
| | | Value• |
| | Shares | ($000) |
Consumer Staples (12.8%) | | |
| Wal-Mart Stores, Inc. | 19,357 | 1,009 |
| Philip Morris International Inc. | 20,969 | 746 |
| The Coca-Cola Co. | 14,748 | 648 |
| PepsiCo, Inc. | 10,511 | 541 |
| The Procter & Gamble Co. | 10,003 | 471 |
| Colgate-Palmolive Co. | 5,005 | 295 |
| Altria Group, Inc. | 17,469 | 280 |
| CVS Caremark Corp. | 9,284 | 255 |
| H.J. Heinz Co. | 5,700 | 188 |
| Costco Wholesale Corp. | 3,375 | 156 |
| The Kroger Co. | 6,800 | 144 |
| Lorillard, Inc. | 2,100 | 130 |
* | Energizer Holdings, Inc. | 1,600 | 80 |
| Walgreen Co. | 2,910 | 76 |
| Campbell Soup Co. | 2,600 | 71 |
| Sysco Corp. | 2,794 | 64 |
| General Mills, Inc. | 800 | 40 |
| Alberto-Culver Co. | 1,000 | 23 |
* | Dean Foods Co. | 500 | 9 |
| Herbalife Ltd. | 500 | 7 |
| Avon Products, Inc. | 300 | 6 |
| | | 5,239 |
Energy (8.2%) | | |
| ExxonMobil Corp. | 11,073 | 754 |
| Occidental Petroleum Corp. | 8,000 | 445 |
| Schlumberger Ltd. | 10,600 | 431 |
* | Southwestern Energy Co. | 7,200 | 214 |
| Murphy Oil Corp. | 4,700 | 210 |
| Peabody Energy Corp. | 8,000 | 200 |
| Noble Corp. | 5,652 | 136 |
| EOG Resources, Inc. | 2,350 | 129 |
* | National Oilwell Varco Inc. | 4,148 | 119 |
* | Pride International, Inc. | 5,700 | 102 |
| CONSOL Energy, Inc. | 3,900 | 98 |
| ENSCO International, Inc. | 3,697 | 98 |
| Massey Energy Co. | 6,600 | 67 |
| El Paso Corp. | 10,400 | 65 |
* | Dresser Rand Group, Inc. | 2,000 | 44 |
* | Alpha Natural Resources, Inc. | 2,400 | 43 |
25
Structured Large-Cap Growth Fund
| | | Market |
| | | Value• |
| | Shares | ($000) |
| Diamond Offshore Drilling, Inc. | 600 | 38 |
| Tesoro Corp. | 2,800 | 38 |
| Foundation Coal Holdings, Inc. | 2,500 | 36 |
| Chesapeake Energy Corp. | 1,700 | 29 |
| Sunoco, Inc. | 700 | 18 |
| Tidewater Inc. | 300 | 11 |
* | Cameron International Corp. | 300 | 7 |
| Holly Corp. | 200 | 4 |
| | | 3,336 |
Financials (4.0%) | | |
| Northern Trust Corp. | 4,330 | 259 |
| AFLAC Inc. | 10,169 | 197 |
| Charles Schwab Corp. | 11,315 | 175 |
* | TD Ameritrade Holding Corp. | 11,100 | 153 |
| State Street Corp. | 3,366 | 104 |
* | Nasdaq Stock Market Inc. | 4,800 | 94 |
| American Express Co. | 6,427 | 88 |
| The Goldman Sachs | | |
| Group, Inc. | 816 | 87 |
| CME Group, Inc. | 342 | 84 |
| Morgan Stanley | 3,700 | 84 |
| Hudson City Bancorp, Inc. | 6,200 | 72 |
| Simon Property | | |
| Group, Inc. REIT | 1,833 | 63 |
| Kilroy Realty Corp. REIT | 2,400 | 41 |
* | The St. Joe Co. | 2,300 | 39 |
| Federated Investors, Inc. | 1,600 | 36 |
* | SLM Corp. | 4,800 | 24 |
| Axis Capital Holdings Ltd. | 600 | 14 |
* | Investment Technology | | |
| Group, Inc. | 400 | 10 |
| | | 1,624 |
Health Care (14.2%) | | |
| Abbott Laboratories | 15,469 | 738 |
| Bristol-Myers Squibb Co. | 26,818 | 588 |
| Johnson & Johnson | 7,812 | 411 |
| Baxter International, Inc. | 6,442 | 330 |
* | Gilead Sciences, Inc. | 7,070 | 327 |
* | Biogen Idec Inc. | 5,731 | 300 |
* | Medco Health Solutions, Inc. | 6,890 | 285 |
| Medtronic, Inc. | 9,440 | 278 |
| Quest Diagnostics, Inc. | 5,500 | 261 |
* | Express Scripts Inc. | 4,378 | 202 |
* | Watson Pharmaceuticals, Inc. | 6,000 | 187 |
* | DaVita, Inc. | 3,500 | 154 |
| Schering-Plough Corp. | 6,432 | 151 |
| McKesson Corp. | 4,240 | 149 |
| Beckman Coulter, Inc. | 2,800 | 143 |
| AmerisourceBergen Corp. | 4,330 | 141 |
* | Thermo Fisher Scientific, Inc. | 3,900 | 139 |
| Becton, Dickinson & Co. | 1,941 | 131 |
| Merck & Co., Inc. | 4,803 | 128 |
| Omnicare, Inc. | 5,000 | 122 |
* | Mylan Inc. | 8,900 | 119 |
| Eli Lilly & Co. | 3,400 | 114 |
| | | Market |
| | | Value• |
| | Shares | ($000) |
* | Endo Pharmaceuticals | | |
| Holdings, Inc. | 4,700 | 83 |
* | Warner Chilcott Ltd. | 7,200 | 76 |
* | Genzyme Corp. | 700 | 42 |
* | Community Health | | |
| Systems, Inc. | 2,600 | 40 |
* | Forest Laboratories, Inc. | 1,800 | 40 |
* | Celgene Corp. | 800 | 36 |
* | Waters Corp. | 500 | 18 |
* | Gen-Probe Inc. | 400 | 18 |
* | Cephalon, Inc. | 238 | 16 |
* | Lincare Holdings, Inc. | 600 | 13 |
* | WellPoint Inc. | 200 | 8 |
| | | 5,788 |
Industrials (12.0%) | | |
| United Technologies Corp. | 9,882 | 425 |
| Union Pacific Corp. | 7,866 | 323 |
| Lockheed Martin Corp. | 4,204 | 290 |
| Honeywell International Inc. | 8,580 | 239 |
| 3M Co. | 4,726 | 235 |
| Goodrich Corp. | 4,900 | 186 |
| L-3 Communications | | |
| Holdings, Inc. | 2,700 | 183 |
| Emerson Electric Co. | 6,346 | 181 |
| Norfolk Southern Corp. | 5,100 | 172 |
| Flowserve Corp. | 2,800 | 157 |
| Burlington Northern | | |
| Santa Fe Corp. | 2,600 | 156 |
| The Dun & Bradstreet Corp. | 2,000 | 154 |
| Fluor Corp. | 4,400 | 152 |
| Waste Management, Inc. | 5,458 | 140 |
| ITT Industries, Inc. | 3,600 | 138 |
* | AGCO Corp. | 6,700 | 131 |
| Dover Corp. | 4,500 | 119 |
| Bucyrus International, Inc. | 7,200 | 109 |
* | Jacobs Engineering Group Inc. | 2,800 | 108 |
| Deere & Co. | 3,100 | 102 |
| United Parcel Service, Inc. | 2,047 | 101 |
| Joy Global Inc. | 4,500 | 96 |
| Raytheon Co. | 2,204 | 86 |
| The Boeing Co. | 2,304 | 82 |
| CSX Corp. | 3,135 | 81 |
| Northrop Grumman Corp. | 1,800 | 79 |
| Precision Castparts Corp. | 1,277 | 77 |
| Ryder System, Inc. | 2,700 | 76 |
| Pitney Bowes, Inc. | 3,200 | 75 |
| J.B. Hunt Transport | | |
| Services, Inc. | 3,000 | 72 |
* | First Solar, Inc. | 500 | 66 |
| GATX Corp. | 3,216 | 65 |
| The Timken Co. | 3,700 | 52 |
| Danaher Corp. | 900 | 49 |
* | Kirby Corp. | 1,600 | 43 |
* | Stericycle, Inc. | 800 | 38 |
| Parker Hannifin Corp. | 900 | 31 |
26
Structured Large-Cap Growth Fund
| | | Market |
| | | Value• |
| | Shares | ($000) |
| Cooper Industries, Inc. | | |
| Class A | 700 | 18 |
| Caterpillar, Inc. | 325 | 9 |
* | WESCO International, Inc. | 500 | 9 |
| Copa Holdings SA Class A | 200 | 6 |
| | | 4,911 |
Information Technology (31.1%) | | |
| International Business | | |
| Machines Corp. | 15,607 | 1,512 |
| Microsoft Corp. | 78,785 | 1,447 |
* | Cisco Systems, Inc. | 67,450 | 1,131 |
* | Apple Inc. | 9,012 | 947 |
| Intel Corp. | 57,720 | 869 |
| Hewlett-Packard Co. | 27,077 | 868 |
* | Google Inc. | 2,075 | 722 |
* | Oracle Corp. | 39,796 | 719 |
| QUALCOMM Inc. | 9,803 | 381 |
| Accenture Ltd. | 10,335 | 284 |
| Visa Inc. | 5,100 | 284 |
| Texas Instruments, Inc. | 13,761 | 227 |
| Automatic Data | | |
| Processing, Inc. | 6,100 | 214 |
* | Broadcom Corp. | 9,700 | 194 |
| Xilinx, Inc. | 10,000 | 192 |
* | Juniper Networks, Inc. | 12,400 | 187 |
| Analog Devices, Inc. | 9,100 | 175 |
* | BMC Software, Inc. | 5,310 | 175 |
* | EMC Corp. | 15,294 | 174 |
* | Metavante Technologies | 8,500 | 170 |
| CA, Inc. | 9,300 | 164 |
* | Marvell Technology | | |
| Group Ltd. | 16,700 | 153 |
* | Affiliated Computer | | |
| Services, Inc. Class A | 2,900 | 139 |
* | Alliance Data Systems Corp. | 3,600 | 133 |
* | eBay Inc. | 10,056 | 126 |
* | Sohu.com Inc. | 3,000 | 124 |
* | Western Digital Corp. | 6,000 | 116 |
| Diebold, Inc. | 5,000 | 107 |
* | Adobe Systems, Inc. | 4,783 | 102 |
| Broadridge Financial | | |
| Solutions LLC | 5,300 | 99 |
* | Agilent Technologies, Inc. | 6,200 | 95 |
* | Dell Inc. | 8,081 | 77 |
| Linear Technology Corp. | 3,100 | 71 |
* | NCR Corp. | 6,800 | 54 |
* | Hewitt Associates, Inc. | 1,600 | 48 |
* | Mettler-Toledo | | |
| International Inc. | 900 | 46 |
* | Genpact, Ltd. | 3,900 | 35 |
* | LSI Corp. | 9,900 | 30 |
* | Integrated Device Technology Inc. | 5,800 | 26 |
* | Teradata Corp. | 1,400 | 23 |
* | WebMD Health Corp. Class A | 800 | 18 |
* | Dolby Laboratories Inc. | 500 | 17 |
| | | Market |
| | | Value• |
| | Shares | ($000) |
* | McAfee Inc. | 500 | 17 |
| MasterCard, Inc. Class A | 100 | 17 |
| Altera Corp. | 300 | 5 |
* | Yahoo! Inc. | 300 | 4 |
| | | 12,718 |
Materials (4.0%) | | |
| Monsanto Co. | 5,727 | 476 |
| Praxair, Inc. | 4,170 | 281 |
| The Mosaic Co. | 4,600 | 193 |
| FMC Corp. | 3,400 | 147 |
| Airgas, Inc. | 4,300 | 145 |
| Greif Inc. Class A | 3,300 | 110 |
| United States Steel Corp. | 4,600 | 97 |
| Celanese Corp. Series A | 6,070 | 81 |
| Cliffs Natural Resources Inc. | 2,800 | 51 |
| Newmont Mining Corp. | | |
| (Holding Co.) | 1,000 | 45 |
| Terra Industries, Inc. | 1,000 | 28 |
| Ball Corp. | 100 | 4 |
| | | 1,658 |
Telecommunication Services (0.8%) | | |
* | American Tower Corp. | | |
| Class A | 7,600 | 231 |
| Embarq Corp. | 2,114 | 80 |
| | | 311 |
Utilities (1.5%) | | |
| Entergy Corp. | 2,700 | 184 |
| Public Service Enterprise | | |
| Group, Inc. | 5,749 | 169 |
| Exelon Corp. | 2,372 | 108 |
| CenterPoint Energy Inc. | 7,300 | 76 |
* | AES Corp. | 6,800 | 39 |
* | Mirant Corp. | 1,800 | 21 |
| | | 597 |
Total Common Stocks | | |
(Cost $49,837) | | 40,698 |
Temporary Cash Investments (1.0%)1 | | |
Money Market Fund (0.7%) | | |
2 | Vanguard Market | | |
| Liquidity Fund, 0.440% | 280,231 | 280 |
| | | |
| | Face | |
| | Amount | |
| | ($000) | |
U.S. Government and Agency Obligations (0.3%) | |
3,4 | Federal National | | |
| Mortgage Assn., | | |
| 0.541%, 7/30/09 | 100 | 100 |
Total Temporary Cash Investments | | |
(Cost $380) | | 380 |
Total Investments (100.6%) | | |
(Cost $50,217) | | 41,078 |
27
Structured Large-Cap Growth Fund
| Market |
| Value• |
| ($000) |
Other Assets and Liabilities (–0.6%) | |
Other Assets | 73 |
Liabilities | (301) |
| (228) |
Net Assets (100%) | 40,850 |
At March 31, 2009, net assets consisted of: | |
| Amount |
| ($000) |
Paid-in Capital | 63,711 |
Undistributed Net Investment Income | 116 |
Accumulated Net Realized Losses | (13,832) |
Unrealized Appreciation (Depreciation) | |
Investment Securities | (9,139) |
Futures Contracts | (6) |
Net Assets | 40,850 |
| |
Institutional Shares—Net Assets | |
Applicable to 466,974 outstanding | |
$.001 par value shares of beneficial | |
interest (unlimited authorization) | 7,594 |
Net Asset Value Per Share— | |
Institutional Shares | $16.26 |
| |
Institutional Plus Shares—Net Assets | |
Applicable to 1,026,701 outstanding | |
$.001 par value shares of beneficial | |
interest (unlimited authorization) | 33,256 |
Net Asset Value Per Share— | |
Institutional Plus Shares | $32.39 |
• | See Note A in Notes to Financial Statements. |
* | Non-income-producing security. |
1 The fund invests a portion of its cash reserves in equity markets through the use of index futures contracts. After giving effect to futures investments, the fund’s effective common stock and temporary cash investment positions represent 100.0% and 0.6%, respectively, of net assets.
2 Affiliated money market fund available only to Vanguard funds and certain trusts and accounts managed by Vanguard. Rate shown is the 7-day yield.
3 The issuer operates under a congressional charter; its securities are not backed by the full faith and credit of the U.S. government.
4 Securities with a value of $100,000 have been segregated as initial margin for open futures contracts.
REIT—Real Estate Investment Trust.
See accompanying Notes, which are an integral part of the Financial Statements.
28
Structured Large-Cap Growth Fund
Statement of Operations
| Six Months Ended |
| March 31, 2009 |
| ($000) |
Investment Income | |
Income | |
Dividends | 385 |
Interest1 | 1 |
Total Income | 386 |
Expenses | |
The Vanguard Group—Note B | |
Investment Advisory Services | — |
Management and Administrative—Institutional Shares | 6 |
Management and Administrative—Institutional Plus Shares | 18 |
Marketing and Distribution—Institutional Shares | 2 |
Marketing and Distribution—Institutional Plus Shares | 4 |
Custodian Fees | 6 |
Auditing Fees | 1 |
Total Expenses | 37 |
Net Investment Income | 349 |
Realized Net Gain (Loss) | |
Investment Securities Sold | (9,868) |
Futures Contracts | (140) |
Realized Net Gain (Loss) | (10,008) |
Change in Unrealized Appreciation (Depreciation) | |
Investment Securities | (5,357) |
Futures Contracts | 18 |
Change in Unrealized Appreciation (Depreciation) | (5,339) |
Net Increase (Decrease) in Net Assets Resulting from Operations | (14,998) |
1 Interest income from an affiliated company of the fund was $1,000.
See accompanying Notes, which are an integral part of the Financial Statements.
29
Structured Large-Cap Growth Fund
Statement of Changes in Net Assets
| Six Months Ended | Year Ended |
| March 31, | September 30, |
| 2009 | 2008 |
| ($000) | ($000) |
Increase (Decrease) in Net Assets | | |
Operations | | |
Net Investment Income | 349 | 709 |
Realized Net Gain (Loss) | (10,008) | (3,652) |
Change in Unrealized Appreciation (Depreciation) | (5,339) | (12,383) |
Net Increase (Decrease) in Net Assets Resulting from Operations | (14,998) | (15,326) |
Distributions | | |
Net Investment Income | | |
Institutional Shares | (137) | (80) |
Institutional Plus Shares | (618) | (553) |
Realized Capital Gain1 | | |
Institutional Shares | — | (169) |
Institutional Plus Shares | — | (1,114) |
Total Distributions | (755) | (1,916) |
Capital Share Transactions | | |
Institutional Shares | 137 | 4,149 |
Institutional Plus Shares | 618 | 1,667 |
Net Increase (Decrease) from Capital Share Transactions | 755 | 5,816 |
Total Increase (Decrease) | (14,998) | (11,426) |
Net Assets | | |
Beginning of Period | 55,848 | 67,274 |
End of Period2 | 40,850 | 55,848 |
1 Includes fiscal 2008 short-term gain distributions totaling $540,000. Short-term gain distributions are treated as ordinary income dividends for tax purposes.
2 Net Assets—End of Period includes undistributed net investment income of $116,000 and $522,000.
See accompanying Notes, which are an integral part of the Financial Statements.
30
Structured Large-Cap Growth Fund
Financial Highlights
Institutional Shares | | | |
| Six Months | Year | June 22, |
| Ended | Ended | 20071 to |
| March 31, | Sept. 30, | Sept. 30, |
For a Share Outstanding Throughout Each Period | 2009 | 2008 | 2007 |
Net Asset Value, Beginning of Period | $22.63 | $29.93 | $29.04 |
Investment Operations | | | |
Net Investment Income | .135 | .283 | .050 |
Net Realized and Unrealized Gain (Loss) on Investments | (6.208) | (6.742) | .840 |
Total from Investment Operations | (6.073) | (6.459) | .890 |
Distributions | | | |
Dividends from Net Investment Income | (.297) | (.270) | — |
Distributions from Realized Capital Gains | — | (.571) | — |
Total Distributions | (.297) | (.841) | — |
Net Asset Value, End of Period | $16.26 | $22.63 | $29.93 |
| | | |
Total Return | –26.91% | –22.20% | 3.06% |
| | | |
Ratios/Supplemental Data | | | |
Net Assets, End of Period (Millions) | $8 | $10 | $9 |
Ratio of Total Expenses to Average Net Assets | 0.24%2 | 0.20% | 0.25%2 |
Ratio of Net Investment Income to Average Net Assets | 1.60%2 | 1.07% | 0.84%2 |
Portfolio Turnover Rate | 61%2 | 70% | 56% |
1 Inception.
2 Annualized.
See accompanying Notes, which are an integral part of the Financial Statements.
31
Structured Large-Cap Growth Fund
Financial Highlights
Institutional Plus Shares | | | |
| Six Months | Year | Oct. 3, |
| Ended | Ended | 20061 to |
| March 31, | Sept. 30, | Sept. 30, |
For a Share Outstanding Throughout Each Period | 2009 | 2008 | 2007 |
Net Asset Value, Beginning of Period | $45.07 | $59.60 | $50.00 |
Investment Operations | | | |
Net Investment Income | .283 | .591 | .547 |
Net Realized and Unrealized Gain (Loss) on Investments | (12.350) | (13.420) | 9.256 |
Total from Investment Operations | (12.067) | (12.829) | 9.803 |
Distributions | | | |
Dividends from Net Investment Income | (.613) | (.564) | (.150) |
Distributions from Realized Capital Gains | — | (1.137) | (.053) |
Total Distributions | (.613) | (1.701) | (.203) |
Net Asset Value, End of Period | $32.39 | $45.07 | $59.60 |
| | | |
Total Return | –26.85% | –22.16% | 19.66% |
| | | |
Ratios/Supplemental Data | | | |
Net Assets, End of Period (Millions) | $33 | $45 | $58 |
Ratio of Total Expenses to Average Net Assets | 0.16%2 | 0.12% | 0.15%2 |
Ratio of Net Investment Income to Average Net Assets | 1.68%2 | 1.15% | 0.94%2 |
Portfolio Turnover Rate | 61%2 | 70% | 56% |
1 Commencement of operations as a registered investment company.
2 Annualized.
See accompanying Notes, which are an integral part of the Financial Statements.
32
Structured Large-Cap Growth Fund
Notes to Financial Statements
Vanguard Structured Large-Cap Growth Fund is registered under the Investment Company Act of 1940 as an open-end investment company, or mutual fund. The fund offers two classes of shares: Institutional Shares and Institutional Plus Shares. Institutional Shares are designed for investors who meet certain administrative and service criteria and invest a minimum of $5 million. Institutional Plus Shares are available to investors who invest a minimum amount of $200 million ($100 million for investors with total Vanguard investments of at least $1 billion).
A. The following significant accounting policies conform to generally accepted accounting principles for U.S. mutual funds. The fund consistently follows such policies in preparing its financial statements.
1. Security Valuation: Securities are valued as of the close of trading on the New York Stock Exchange (generally 4 p.m., Eastern time) on the valuation date. Equity securities are valued at the latest quoted sales prices or official closing prices taken from the primary market in which each security trades; such securities not traded on the valuation date are valued at the mean of the latest quoted bid and asked prices. Securities for which market quotations are not readily available, or whose values have been materially affected by events occurring before the fund’s pricing time but after the close of the securities’ primary markets, are valued by methods deemed by the board of trustees to represent fair value. Investments in Vanguard Market Liquidity Fund are valued at that fund’s net asset value. Temporary cash investments acquired over 60 days to maturity are valued using the latest bid prices or using valuations based on a matrix system (which considers such factors as security prices, yields, maturities, and ratings), both as furnished by independent pricing services. Other temporary cash investments are valued at amortized cost, which approximates market value.
2. Futures Contracts: The fund uses index futures contracts to a limited extent, with the objective of maintaining full exposure to the stock market while maintaining liquidity. The fund may purchase or sell futures contracts to achieve a desired level of investment, whether to accommodate portfolio turnover or cash flows from capital share transactions. The primary risks associated with the use of futures contracts are imperfect correlation between changes in market values of stocks held by the fund and the prices of futures contracts, and the possibility of an illiquid market.
Futures contracts are valued at their quoted daily settlement prices. The aggregate principal amounts of the contracts are not recorded in the Statement of Net Assets. Fluctuations in the value of the contracts are recorded in the Statement of Net Assets as an asset (liability) and in the Statement of Operations as unrealized appreciation (depreciation) until the contracts are closed, when they are recorded as realized futures gains (losses).
3. Federal Income Taxes: The fund intends to continue to qualify as a regulated investment company and distribute all of its taxable income. Management has analyzed the fund’s tax positions taken on federal income tax returns for all open tax years (tax years ended September 30, 2007–2008) and for the period ended March 31, 2009, and has concluded that no provision for federal income tax is required in the fund’s financial statements.
4. Distributions: Distributions to shareholders are recorded on the ex-dividend date.
5. Other: Dividend income is recorded on the ex-dividend date. Interest income includes income distributions received from Vanguard Market Liquidity Fund and is accrued daily. Security transactions are accounted for on the date securities are bought or sold. Costs used to determine realized gains (losses) on the sale of investment securities are those of the specific securities sold.
33
Structured Large-Cap Growth Fund
Each class of shares has equal rights as to assets and earnings, except that each class separately bears certain class-specific expenses related to maintenance of shareholder accounts (included in Management and Administrative expenses) and shareholder reporting. Marketing and distribution expenses are allocated to each class of shares based on a method approved by the board of trustees. Income, other non-class-specific expenses, and gains and losses on investments are allocated to each class of shares based on its relative net assets.
B. The Vanguard Group furnishes at cost investment advisory, corporate management, administrative, marketing, and distribution services. The costs of such services are allocated to the fund under methods approved by the board of trustees. The fund has committed to provide up to 0.40% of its net assets in capital contributions to Vanguard. At March 31, 2009, the fund had contributed capital of $11,000 to Vanguard (included in Other Assets), representing 0.03% of the fund’s net assets and 0.00% of Vanguard’s capitalization. The fund’s trustees and officers are also directors and officers of Vanguard.
C. Distributions are determined on a tax basis and may differ from net investment income and realized capital gains for financial reporting purposes. Differences may be permanent or temporary. Permanent differences are reclassified among capital accounts in the financial statements to reflect their tax character. Temporary differences arise when certain items of income, expense, gain, or loss are recognized in different periods for financial statement and tax purposes; these differences will reverse at some time in the future. Differences in classification may also result from the treatment of short-term gains as ordinary income for tax purposes.
The fund’s tax-basis capital gains and losses are determined only at the end of each fiscal year. For tax purposes, at September 30, 2008, the fund had available realized losses of $3,839,000 to offset future net capital gains through September 30, 2017. The fund will use these capital losses to offset net taxable capital gains, if any, realized during the year ending September 30, 2009; should the fund realize net capital losses for the year, the losses will be added to the loss carryforward balance above.
At March 31, 2009, the cost of investment securities for tax purposes was $50,217,000. Net unrealized depreciation of investment securities for tax purposes was $9,139,000, consisting of unrealized gains of $1,436,000 on securities that had risen in value since their purchase and $10,575,000 in unrealized losses on securities that had fallen in value since their purchase.
At March 31, 2009, the aggregate settlement value of open futures contracts expiring in June 2009 and the related unrealized appreciation (depreciation) were:
| | | ($000) |
| Number of | Aggregate | Unrealized |
| Long (Short) | Settlement | Appreciation |
Futures Contracts | Contracts | Value | (Depreciation) |
E-mini S&P 500 Index | 4 | 159 | (6) |
Unrealized appreciation (depreciation) on open futures contracts is required to be treated as realized gain (loss) for tax purposes.
34
Structured Large-Cap Growth Fund
D. During the six months ended March 31, 2009, the fund purchased $13,660,000 of investment securities and sold $13,262,000 of investment securities, other than temporary cash investments.
E. Capital share transactions for each class of shares were:
| Six Months Ended | Year Ended |
| March 31, 2009 | September 30, 2008 |
| Amount | Shares | Amount | Shares |
| ($000) | (000) | ($000) | (000) |
Institutional Shares | | | | |
Issued | — | — | 5,000 | 194 |
Issued in Lieu of Cash Distributions | 137 | 8 | 249 | 9 |
Redeemed | — | — | (1,100) | (40) |
Net Increase (Decrease)—Institutional Shares | 137 | 8 | 4,149 | 163 |
Institutional Plus Shares | | | | |
Issued | — | — | — | — |
Issued in Lieu of Cash Distributions | 618 | 18 | 1,667 | 29 |
Redeemed | — | — | — | — |
Net Increase (Decrease)—Institutional Plus Shares | 618 | 18 | 1,667 | 29 |
F. In September 2006, the Financial Accounting Standards Board issued Statement of Financial Accounting Standards No. 157 (“FAS 157”), “Fair Value Measurements.” FAS 157 establishes a framework for measuring fair value and expands disclosures about fair value measurements in financial statements.
The various inputs that may be used to determine the value of the fund’s investments are summarized in three broad levels. The inputs or methodologies used for valuing securities are not necessarily an indication of the risk associated with investing in those securities.
Level 1—Quoted prices in active markets for identical securities.
Level 2—Other significant observable inputs (including quoted prices for similar securities, interest rates, prepayment speeds, credit risk, etc.).
Level 3—Significant unobservable inputs (including the fund’s own assumptions used to determine the fair value of investments).
The following table summarizes the fund’s investments as of March 31, 2009, based on the inputs used to value them:
| Investments | Futures |
| in Securities | Contracts |
Valuation Inputs | ($000) | ($000) |
Level 1—Quoted prices | 40,978 | (6) |
Level 2—Other significant observable inputs | 100 | — |
Level 3—Significant unobservable inputs | — | — |
Total | 41,078 | (6) |
35
Structured Large-Cap Value Fund
Fund Profile
As of March 31, 2009
Portfolio Characteristics | | |
| | Comparative | Broad |
| Fund | Index1 | Index2 |
Number of Stocks | 193 | 643 | 4,489 |
Median Market Cap | $32.3B | $32.3B | $22.3B |
Price/Earnings Ratio | 12.2x | 16.3x | 15.0x |
Price/Book Ratio | 1.4x | 1.2x | 1.7x |
Yield—Institutional | | | |
Plus Shares3 | 3.4% | 3.5% | 2.7% |
Return on Equity | 19.1% | 18.1% | 20.2% |
Earnings Growth Rate | 10.1% | 8.6% | 15.0% |
Foreign Holdings | 0.0% | 0.0% | 0.0% |
Turnover Rate4 | 63% | — | — |
Expense Ratio5 | | — | — |
Institutional | | | |
Plus Shares | 0.17% | | |
Short-Term Reserves | 0.4% | — | — |
Sector Diversification (% of equity exposure) |
| | Comparative | Broad |
| Fund | Index1 | Index2 |
Consumer Discretionary | 9.7% | 8.6% | 9.4% |
Consumer Staples | 9.3 | 10.0 | 11.2 |
Energy | 17.7 | 17.7 | 12.3 |
Financials | 20.6 | 20.4 | 13.1 |
Health Care | 14.3 | 14.5 | 14.6 |
Industrials | 8.3 | 7.7 | 10.0 |
Information Technology | 3.4 | 3.3 | 17.7 |
Materials | 3.1 | 3.2 | 3.7 |
Telecommunication | | | |
Services | 6.9 | 7.3 | 3.6 |
Utilities | 6.7 | 7.3 | 4.4 |
Ten Largest Holdings6 (% of total net assets) |
| | |
ExxonMobil Corp. | integrated oil | |
| and gas | 7.8% |
Chevron Corp. | integrated oil | |
| and gas | 4.3 |
AT&T Inc. | integrated | |
| telecommunication | |
| services | 3.9 |
Johnson & Johnson | pharmaceuticals | 3.0 |
Pfizer Inc. | pharmaceuticals | 2.6 |
General Electric Co. | industrial | |
| conglomerate | 2.5 |
The Procter & Gamble Co. | household products | 2.5 |
Verizon | integrated | |
Communications Inc. | telecommunication | |
| services | 2.4 |
JPMorgan Chase & Co. | diversified | |
| financial services | 2.4 |
Amgen Inc. | biotechnology | 2.0 |
Top Ten | | 33.4% |
Volatility Measures7 | |
| Fund Versus | Fund Versus |
| Comparative Index1 | Broad Index2 |
R-Squared | 1.00 | 0.94 |
Beta | 1.00 | 1.01 |
Investment Focus
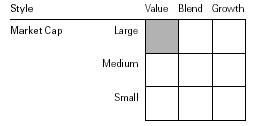
1 Russell 1000 Value Index.
2 Dow Jones Wilshire 5000 Index.
3 30-day SEC yield for the fund; annualized dividend yield for the indexes. See the Glossary.
4 Annualized.
5 The expense ratio shown is from the prospectus dated January 23, 2009, and represents estimated costs for the current fiscal year based on the fund’s current net assets. For the six months ended March 31, 2009, the annualized expense ratio was 0.16%.
6 “Ten Largest Holdings” excludes any temporary cash investments and equity index products.
7 For an explanation of R-squared, beta, and other terms used here, see the Glossary.
36
Structured Large-Cap Value Fund
Performance Summary
All of the returns in this report represent past performance, which is not a guarantee of future results that may be achieved by the fund. (Current performance may be lower or higher than the performance data cited. For performance data current to the most recent month-end, visit our website at www.vanguard.com/performance.) Note, too, that both investment returns and principal value can fluctuate widely, so an investor’s shares, when sold, could be worth more or less than their original cost. The returns shown do not reflect taxes that a shareholder would pay on fund distributions or on the sale of fund shares.
Fiscal-Year Total Returns (%): December 15, 2005–March 31, 2009
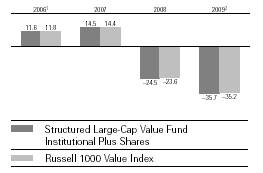
Average Annual Total Returns: Periods Ended March 31, 2009 | | |
| | | Since |
| Inception Date | One Year | Inception1 |
Institutional Plus Shares | 12/15/2005 | –43.47% | –13.52% |
1 The fund commenced operations as a registered investment company on January 18, 2007. The fund’s performance includes the performance of a predecessor trust, Vanguard Fiduciary Trust Company Structured Large-Cap Value Trust, from December 15, 2005, to January 18, 2007. Performance is calculated since December 15, 2005.
2 Six months ended March 31, 2009.
Note: See Financial Highlights tables for dividend and capital gains information.
37
Structured Large-Cap Value Fund
Financial Statements (unaudited)
Statement of Net Assets
As of March 31, 2009
The fund provides a complete list of its holdings four times in each fiscal year, at the quarter-ends. For the second and fourth fiscal quarters, the lists appear in the fund’s semiannual and annual reports to shareholders. For the first and third fiscal quarters, the fund files the lists with the Securities and Exchange Commission on Form N-Q. Shareholders can look up the fund’s Forms N-Q on the SEC’s website at www.sec.gov. Forms N-Q may also be reviewed and copied at the SEC’s Public Reference Room (see the back cover of this report for further information).
| | | Market |
| | | Value• |
| | Shares | ($000) |
Common Stocks (99.9%)1 | | |
Consumer Discretionary (9.7%) | | |
| Home Depot, Inc. | 18,400 | 433 |
| Comcast Corp. Class A | 26,076 | 356 |
| The Gap, Inc. | 18,900 | 245 |
| The McGraw-Hill Cos., Inc. | 10,600 | 242 |
| Lowe’s Cos., Inc. | 11,800 | 215 |
| VF Corp. | 3,300 | 188 |
* | Ford Motor Co. | 68,000 | 179 |
| Hasbro, Inc. | 5,800 | 145 |
| Comcast Corp. Special Class A | 11,200 | 144 |
| Autoliv, Inc. | 7,200 | 134 |
| The Walt Disney Co. | 7,090 | 129 |
| Foot Locker, Inc. | 12,100 | 127 |
| The Stanley Works | 3,400 | 99 |
| McDonald’s Corp. | 1,804 | 98 |
| RadioShack Corp. | 11,300 | 97 |
| Wyndham Worldwide Corp. | 22,900 | 96 |
| Omnicom Group Inc. | 4,000 | 94 |
| Limited Brands, Inc. | 10,300 | 90 |
| Pulte Homes, Inc. | 7,100 | 78 |
| Lennar Corp. Class A | 10,100 | 76 |
| Time Warner Inc. | 3,640 | 70 |
| Cablevision Systems | | |
| NY Group Class A | 5,000 | 65 |
| News Corp., Class A | 8,410 | 56 |
* | Warner Music Group Corp. | 13,900 | 33 |
| D. R. Horton, Inc. | 2,400 | 23 |
* | Time Warner Cable Inc. | 913 | 23 |
| Royal Caribbean Cruises, Ltd. | 2,800 | 22 |
* | Interpublic Group of Cos., Inc. | 5,400 | 22 |
| International Speedway Corp. | 900 | 20 |
| | | 3,599 |
Consumer Staples (9.3%) | | |
| The Procter & Gamble Co. | 19,715 | 928 |
| Archer-Daniels-Midland Co. | 13,000 | 361 |
| Wal-Mart Stores, Inc. | 5,200 | 271 |
| The Coca-Cola Co. | 5,990 | 263 |
| The Kroger Co. | 12,300 | 261 |
| ConAgra Foods, Inc. | 12,400 | 209 |
| Kraft Foods Inc. | 7,476 | 167 |
| | | Market |
| | | Value• |
| | Shares | ($000) |
| General Mills, Inc. | 3,100 | 155 |
| Molson Coors Brewing Co. | | |
| Class B | 4,370 | 150 |
| H.J. Heinz Co. | 4,500 | 149 |
| CVS Caremark Corp. | 5,100 | 140 |
| Altria Group, Inc. | 7,930 | 127 |
* | Dr. Pepper Snapple Group, Inc. | 7,200 | 122 |
| Campbell Soup Co. | 4,400 | 120 |
| The Hershey Co. | 700 | 24 |
| Corn Products International, Inc. | 800 | 17 |
| | | 3,464 |
Energy (17.7%) | | |
| ExxonMobil Corp. | 42,710 | 2,909 |
| Chevron Corp. | 23,890 | 1,606 |
| ConocoPhillips Co. | 16,174 | 633 |
| Anadarko Petroleum Corp. | 9,350 | 364 |
| Apache Corp. | 3,900 | 250 |
| Marathon Oil Corp. | 5,400 | 142 |
| EOG Resources, Inc. | 2,300 | 126 |
* | Encore Acquisition Co. | 5,300 | 123 |
| Tesoro Corp. | 8,400 | 113 |
| El Paso Corp. | 17,600 | 110 |
| Valero Energy Corp. | 3,800 | 68 |
| Chesapeake Energy Corp. | 3,000 | 51 |
| ENSCO International, Inc. | 1,300 | 34 |
| Devon Energy Corp. | 700 | 31 |
| Noble Energy, Inc. | 400 | 22 |
| Overseas Shipholding | | |
| Group Inc. | 600 | 14 |
| | | 6,596 |
Financials (20.2%) | | |
| JPMorgan Chase & Co. | 33,980 | 903 |
| Wells Fargo & Co. | 39,045 | 556 |
| The Travelers Cos., Inc. | 10,700 | 435 |
| Bank of New York | | |
| Mellon Corp. | 14,743 | 417 |
| The Goldman Sachs | | |
| Group, Inc. | 3,425 | 363 |
| The Chubb Corp. | 8,300 | 351 |
| Morgan Stanley | 13,390 | 305 |
| State Street Corp. | 9,600 | 296 |
38
Structured Large-Cap Value Fund
| | | Market |
| | | Value• |
| | Shares | ($000) |
| U.S. Bancorp | 18,970 | 277 |
| BB&T Corp. | 15,950 | 270 |
| Aon Corp. | 6,300 | 257 |
| Bank of America Corp. | 36,835 | 251 |
| Progressive Corp. of Ohio | 16,200 | 218 |
| Northern Trust Corp. | 3,200 | 191 |
| Unum Group | 14,900 | 186 |
| Torchmark Corp. | 5,800 | 152 |
| Hudson City Bancorp, Inc. | 11,500 | 135 |
| Raymond James Financial, Inc. | 6,100 | 120 |
| Discover Financial Services | 18,845 | 119 |
| American Financial Group, Inc. | 7,400 | 119 |
| Bank of Hawaii Corp. | 3,530 | 116 |
| PartnerRe Ltd. | 1,600 | 99 |
| Annaly Capital | | |
| Management Inc. REIT | 7,100 | 99 |
| Capital One Financial Corp. | 8,040 | 98 |
| PNC Financial Services Group | 2,800 | 82 |
| MetLife, Inc. | 3,591 | 82 |
| Axis Capital Holdings Ltd. | 3,500 | 79 |
| Equity Residential REIT | 4,280 | 79 |
| The Allstate Corp. | 4,050 | 78 |
| New York Community | | |
| Bancorp, Inc. | 6,200 | 69 |
| HCP, Inc. REIT | 3,400 | 61 |
| Plum Creek Timber Co. | | |
| Inc. REIT | 1,900 | 55 |
| First Horizon National Corp. | 5,100 | 55 |
| Marshall & Ilsley Corp. | 9,300 | 52 |
| Popular, Inc. | 21,700 | 47 |
| Public Storage, Inc. REIT | 800 | 44 |
| Nationwide Health | | |
| Properties, Inc. REIT | 1,900 | 42 |
| SunTrust Banks, Inc. | 3,460 | 41 |
| HRPT Properties Trust REIT | 11,900 | 38 |
* | Nasdaq OMX Group, Inc. | 1,900 | 37 |
| Hospitality Properties | | |
| Trust REIT | 2,600 | 31 |
| Host Hotels & Resorts Inc. REIT | 7,500 | 29 |
| Lincoln National Corp. | 4,200 | 28 |
| Vornado Realty Trust REIT | 711 | 24 |
* | The St. Joe Co. | 1,200 | 20 |
| Apartment Investment & Management Co. | | |
| Class A REIT | 3,515 | 19 |
| Kilroy Realty Corp. REIT | 1,100 | 19 |
| Avalonbay Communities, Inc. REIT | 400 | 19 |
| Brandywine Realty Trust REIT | 6,000 | 17 |
| Boston Properties, Inc. REIT | 400 | 14 |
| Citigroup Inc. | 4,771 | 12 |
| | | 7,506 |
Health Care (14.3%) | | |
| Johnson & Johnson | 21,390 | 1,125 |
| Pfizer Inc. | 71,520 | 974 |
* | Amgen Inc. | 14,700 | 728 |
| | | Market |
| | | Value• |
| | Shares | ($000) |
| Wyeth | 9,250 | 398 |
| Covidien Ltd. | 10,875 | 361 |
| Eli Lilly & Co. | 8,230 | 275 |
| Bristol-Myers Squibb Co. | 10,500 | 230 |
| Merck & Co., Inc. | 8,080 | 216 |
| AmerisourceBergen Corp. | 5,600 | 183 |
| Omnicare, Inc. | 6,500 | 159 |
* | WellPoint Inc. | 3,590 | 136 |
| UnitedHealth Group Inc. | 6,000 | 126 |
* | LifePoint Hospitals, Inc. | 5,500 | 115 |
* | Forest Laboratories, Inc. | 5,000 | 110 |
| Quest Diagnostics, Inc. | 900 | 43 |
| Universal Health | | |
| Services Class B | 1,100 | 42 |
* | DaVita, Inc. | 900 | 40 |
| Teleflex Inc. | 880 | 34 |
* | HLTH Corp. | 2,509 | 26 |
| | | 5,321 |
Industrials (8.3%) | | |
| General Electric Co. | 92,050 | 931 |
| United Technologies Corp. | 8,100 | 348 |
| General Dynamics Corp. | 7,780 | 324 |
| Norfolk Southern Corp. | 7,900 | 267 |
| Waste Management, Inc. | 8,900 | 228 |
| Northrop Grumman Corp. | 3,650 | 159 |
| L-3 Communications | | |
| Holdings, Inc. | 2,100 | 142 |
| Raytheon Co. | 3,600 | 140 |
| Ryder System, Inc. | 3,900 | 110 |
| Cooper Industries, Inc. Class A | 4,100 | 106 |
| Dover Corp. | 3,500 | 92 |
* | AGCO Corp. | 4,000 | 78 |
| Flowserve Corp. | 1,100 | 62 |
| The Dun & Bradstreet Corp. | 800 | 62 |
| The Timken Co. | 3,400 | 48 |
| | | 3,097 |
Information Technology (3.4%) | | |
| Intel Corp. | 21,900 | 330 |
* | Symantec Corp. | 21,000 | 314 |
| CA, Inc. | 6,700 | 118 |
| Diebold, Inc. | 4,700 | 100 |
* | NCR Corp. | 8,000 | 64 |
* | Integrated Device Technology Inc. | 13,400 | 61 |
* | Lexmark International, Inc. | 3,600 | 61 |
* | Synopsys, Inc. | 2,600 | 54 |
* | QLogic Corp. | 4,000 | 44 |
* | Computer Sciences Corp. | 1,100 | 40 |
* | Genpact, Ltd. | 4,400 | 39 |
* | Teradata Corp. | 1,400 | 23 |
* | EMC Corp. | 1,500 | 17 |
| | | 1,265 |
Materials (3.1%) | | |
| E.I. du Pont de Nemours & Co. | 18,000 | 402 |
| FMC Corp. | 3,400 | 147 |
| Celanese Corp. Series A | 10,638 | 142 |
39
Structured Large-Cap Value Fund
| | | Market |
| | | Value• |
| | Shares | ($000) |
| Eastman Chemical Co. | 4,900 | 131 |
* | Owens-Illinois, Inc. | 6,800 | 98 |
| United States Steel Corp. | 3,000 | 63 |
| Dow Chemical Co. | 7,310 | 62 |
| Schnitzer Steel | | |
| Industries, Inc. Class A | 1,800 | 57 |
| Sigma-Aldrich Corp. | 1,400 | 53 |
| | | 1,155 |
Other (0.2%) | | |
2 | Miscellaneous Securities | | 85 |
| | | |
Telecommunication Services (6.9%) | | |
| AT&T Inc. | 58,213 | 1,467 |
| Verizon Communications Inc. | 30,140 | 910 |
| Windstream Corp. | 19,700 | 159 |
| Embarq Corp. | 739 | 28 |
| | | 2,564 |
Utilities (6.8%) | | |
| Dominion Resources, Inc. | 11,900 | 369 |
| FirstEnergy Corp. | 7,384 | 285 |
| Sempra Energy | 5,500 | 254 |
| American Electric | | |
| Power Co., Inc. | 8,100 | 205 |
| UGI Corp. Holding Co. | 8,400 | 198 |
| CenterPoint Energy Inc. | 15,900 | 166 |
| TECO Energy, Inc. | 14,600 | 163 |
| FPL Group, Inc. | 3,200 | 162 |
| Atmos Energy Corp. | 6,500 | 150 |
| Entergy Corp. | 2,200 | 150 |
| DTE Energy Co. | 4,100 | 114 |
| NSTAR | 2,600 | 83 |
| Southern Co. | 1,539 | 47 |
| Edison International | 1,500 | 43 |
| CMS Energy Corp. | 3,100 | 37 |
| NiSource, Inc. | 3,400 | 33 |
| Pepco Holdings, Inc. | 1,558 | 19 |
| Vectren Corp. | 800 | 17 |
* | Mirant Corp. | 1,100 | 13 |
| | | 2,508 |
Total Common Stocks | | |
(Cost $51,244) | | 37,160 |
| Face | Market |
| Amount | Value• |
| ($000) | ($000) |
Temporary Cash Investment (0.5%)1 | |
U.S. Government and Agency Obligations (0.5%) |
3,4 Federal National Mortgage Assn., | |
0.541%, 7/30/09 | | |
(Cost $200) | 200 | 200 |
Total Investments (100.4%) | | |
(Cost $51,444) | | 37,360 |
Other Assets and Liabilities (–0.4%) | |
Other Assets | | 88 |
Liabilities | | (248) |
| | (160) |
Net Assets (100%) | | |
Applicable to 1,370,426 outstanding | |
$.001 par value shares of beneficial | |
interest (unlimited authorization) | | 37,200 |
Net Asset Value Per Share | | $27.14 |
| | |
| | |
| | |
At March 31, 2009, net assets consisted of: | |
| | Amount |
| | ($000) |
Paid-in Capital | | 70,391 |
Undistributed Net Investment Income | 299 |
Accumulated Net Realized Losses | | (19,408) |
Unrealized Appreciation (Depreciation) | |
Investment Securities | | (14,084) |
Futures Contracts | | 2 |
Net Assets | | 37,200 |
• | See Note A in Notes to Financial Statements. |
* | Non-income-producing security. |
1 The fund invests a portion of its cash reserves in equity markets through the use of index futures contracts. After giving effect to futures investments, the fund’s effective common stock and temporary cash investment positions represent 100.0% and 0.4%, respectively, of net assets.
2 Securities representing up to 5% of the market value of unaffiliated securities are permitted to be combined and reported as “miscellaneous securities” provided that they have been held for less than one year and not previously reported by name.
3 Securities with a value of $200,000 have been segregated as initial margin for open futures contracts.
4 The issuer operates under a congressional charter; its securities are not backed by the full faith and credit of the U.S. government.
REIT—Real Estate Investment Trust.
See accompanying Notes, which are an integral part of the Financial Statements.
40
Structured Large-Cap Value Fund
Statement of Operations
| Six Months Ended |
| March 31, 2009 |
| ($000) |
Investment Income | |
Income | |
Dividends | 728 |
Interest1 | 1 |
Total Income | 729 |
Expenses | |
The Vanguard Group—Note B | |
Investment Advisory Services | — |
Management and Administrative | 26 |
Marketing and Distribution | 1 |
Custodian Fees | 5 |
Auditing Fees | 1 |
Total Expenses | 33 |
Net Investment Income | 696 |
Realized Net Gain (Loss) | |
Investment Securities Sold | (14,584) |
Futures Contracts | (183) |
Realized Net Gain (Loss) | (14,767) |
Change in Unrealized Appreciation (Depreciation) | |
Investment Securities | (6,610) |
Futures Contracts | 8 |
Change in Unrealized Appreciation (Depreciation) | (6,602) |
Net Increase (Decrease) in Net Assets Resulting from Operations | (20,673) |
1 Interest income from an affiliated company of the fund was $1,000.
See accompanying Notes, which are an integral part of the Financial Statements.
41
Structured Large-Cap Value Fund
Statement of Changes in Net Assets
| Six Months Ended | Year Ended |
| March 31, | September 30, |
| 2009 | 2008 |
| ($000) | ($000) |
Increase (Decrease) in Net Assets | | |
Operations | | |
Net Investment Income | 696 | 1,897 |
Realized Net Gain (Loss) | (14,767) | (4,334) |
Change in Unrealized Appreciation (Depreciation) | (6,602) | (17,283) |
Net Increase (Decrease) in Net Assets Resulting from Operations | (20,673) | (19,720) |
Distributions | | |
Net Investment Income | (1,826) | (1,731) |
Realized Capital Gain1 | — | (5,031) |
Total Distributions | (1,826) | (6,762) |
Capital Share Transactions | | |
Issued | — | 4,000 |
Issued in Lieu of Cash Distributions | 1,826 | 6,762 |
Redeemed | — | (5,000) |
Net Increase (Decrease) from Capital Share Transactions | 1,826 | 5,762 |
Total Increase (Decrease) | (20,673) | (20,720) |
Net Assets | | |
Beginning of Period | 57,873 | 78,593 |
End of Period2 | 37,200 | 57,873 |
1 Includes fiscal 2008 short-term gain distributions totaling $1,651,000. Short-term gain distributions are treated as ordinary income dividends for tax purposes.
2 Net Assets—End of Period includes undistributed net investment income of $299,000 and $1,429,000.
See accompanying Notes, which are an integral part of the Financial Statements.
42
Structured Large-Cap Value Fund
Financial Highlights
Institutional Plus Shares | | | |
| Six Months | Year | Jan. 18, |
| Ended | Ended | 20071 to |
| March 31, | Sept. 30, | Sept. 30, |
For a Share Outstanding Throughout Each Period | 2009 | 2008 | 2007 |
Net Asset Value, Beginning of Period | $44.00 | $63.87 | $60.09 |
Investment Operations | | | |
Net Investment Income | .520 | 1.426 | 1.030 |
Net Realized and Unrealized Gain (Loss) on Investments | (15.992) | (15.946) | 2.750 |
Total from Investment Operations | (15.472) | (14.520) | 3.780 |
Distributions | | | |
Dividends from Net Investment Income | (1.388) | (1.370) | — |
Distributions from Realized Capital Gains | — | (3.980) | — |
Total Distributions | (1.388) | (5.350) | — |
Net Asset Value, End of Period | $27.14 | $44.00 | $63.87 |
| | | |
Total Return | –35.73% | –24.47% | 6.29% |
| | | |
Ratios/Supplemental Data | | | |
Net Assets, End of Period (Millions) | $37 | $58 | $79 |
Ratio of Total Expenses to Average Net Assets | 0.16%2 | 0.12% | 0.15%2 |
Ratio of Net Investment Income to Average Net Assets | 3.33%2 | 2.63% | 2.29%2 |
Portfolio Turnover Rate | 63%2 | 104% | 48% |
1 Commencement of operations as a registered investment company.
2 Annualized.
See accompanying Notes, which are an integral part of the Financial Statements.
43
Structured Large-Cap Value Fund
Notes to Financial Statements
Vanguard Structured Large-Cap Value Fund is registered under the Investment Company Act of 1940 as an open-end investment company, or mutual fund. The fund offers two classes of shares: Institutional Shares and Institutional Plus Shares. Institutional Shares are available to investors who invest a minimum of $5 million. Institutional Plus Shares are available to investors who invest a minimum amount of $200 million ($100 million for investors with total Vanguard investments of at least $1 billion). The fund has not issued any Institutional Shares through March 31, 2009.
A. The following significant accounting policies conform to generally accepted accounting principles for U.S. mutual funds. The fund consistently follows such policies in preparing its financial statements.
1. Security Valuation: Securities are valued as of the close of trading on the New York Stock Exchange (generally 4 p.m., Eastern time) on the valuation date. Equity securities are valued at the latest quoted sales prices or official closing prices taken from the primary market in which each security trades; such securities not traded on the valuation date are valued at the mean of the latest quoted bid and asked prices. Securities for which market quotations are not readily available, or whose values have been materially affected by events occurring before the fund’s pricing time but after the close of the securities’ primary markets, are valued by methods deemed by the board of trustees to represent fair value. Investments in Vanguard Market Liquidity Fund are valued at that fund’s net asset value. Temporary cash investments acquired over 60 days to maturity are valued using the latest bid prices or using valuations based on a matrix system (which considers such factors as security prices, yields, maturities, and ratings), both as furnished by independent pricing services. Other temporary cash investments are valued at amortized cost, which approximates market value.
2. Futures Contracts: The fund uses index futures contracts to a limited extent, with the objective of maintaining full exposure to the stock market while maintaining liquidity. The fund may purchase or sell futures contracts to achieve a desired level of investment, whether to accommodate portfolio turnover or cash flows from capital share transactions. The primary risks associated with the use of futures contracts are imperfect correlation between changes in market values of stocks held by the fund and the prices of futures contracts, and the possibility of an illiquid market.
Futures contracts are valued at their quoted daily settlement prices. The aggregate principal amounts of the contracts are not recorded in the Statement of Net Assets. Fluctuations in the value of the contracts are recorded in the Statement of Net Assets as an asset (liability) and in the Statement of Operations as unrealized appreciation (depreciation) until the contracts are closed, when they are recorded as realized futures gains (losses).
3. Federal Income Taxes: The fund intends to continue to qualify as a regulated investment company and distribute all of its taxable income. Management has analyzed the fund’s tax positions taken on federal income tax returns for all open tax years (tax years ended September 30, 2007–2008) and for the period ended March 31, 2009, and has concluded that no provision for federal income tax is required in the fund’s financial statements.
4. Distributions: Distributions to shareholders are recorded on the ex-dividend date.
44
Structured Large-Cap Value Fund
5. Other: Dividend income is recorded on the ex-dividend date. Interest income includes income distributions received from Vanguard Market Liquidity Fund and is accrued daily. Security transactions are accounted for on the date securities are bought or sold. Costs used to determine realized gains (losses) on the sale of investment securities are those of the specific securities sold.
B. The Vanguard Group furnishes at cost investment advisory, corporate management, administrative, marketing, and distribution services. The costs of such services are allocated to the fund under methods approved by the board of trustees. The fund has committed to provide up to 0.40% of its net assets in capital contributions to Vanguard. At March 31, 2009, the fund had contributed capital of $10,000 to Vanguard (included in Other Assets), representing 0.03% of the fund’s net assets and 0.00% of Vanguard’s capitalization. The fund’s trustees and officers are also directors and officers of Vanguard.
C. Distributions are determined on a tax basis and may differ from net investment income and realized capital gains for financial reporting purposes. Differences may be permanent or temporary. Permanent differences are reclassified among capital accounts in the financial statements to reflect their tax character. Temporary differences arise when certain items of income, expense, gain, or loss are recognized in different periods for financial statement and tax purposes; these differences will reverse at some time in the future. Differences in classification may also result from the treatment of short-term gains as ordinary income for tax purposes.
The fund’s tax-basis capital gains and losses are determined only at the end of each fiscal year. For tax purposes, at September 30, 2008, the fund had available realized losses of $4,504,000 to offset future net capital gains through September 30, 2017. The fund will use these capital losses to offset net taxable capital gains, if any, realized during the year ending September 30, 2009; should the fund realize net capital losses for the year, the losses will be added to the loss carryforward balance above.
At March 31, 2009, the cost of investment securities for tax purposes was $51,444,000. Net unrealized depreciation of investment securities for tax purposes was $14,084,000, consisting of unrealized gains of $978,000 on securities that had risen in value since their purchase and $15,062,000 in unrealized losses on securities that had fallen in value since their purchase.
At March 31, 2009, the aggregate settlement value of open futures contracts expiring in June 2009 and the related unrealized appreciation (depreciation) were:
| | | ($000) |
| Number of | Aggregate | Unrealized |
| Long (Short) | Settlement | Appreciation |
Futures Contracts | Contracts | Value | (Depreciation) |
E-mini S&P 500 Index | 1 | 40 | 2 |
Unrealized appreciation (depreciation) on open futures contracts is required to be treated as realized gain (loss) for tax purposes.
45
Structured Large-Cap Value Fund
D. During the six months ended March 31, 2009, the fund purchased $14,856,000 of investment securities and sold $13,682,000 of investment securities, other than temporary cash investments.
E. Capital shares issued and redeemed were:
| Six Months Ended | Year Ended |
| March 31, 2009 | September 30, 2008 |
| Shares | Shares |
| (000) | (000) |
Issued | — | 73 |
Issued in Lieu of Cash Distributions | 55 | 122 |
Redeemed | — | (110) |
Net Increase (Decrease) in Shares Outstanding | 55 | 85 |
F. In September 2006, the Financial Accounting Standards Board issued Statement of Financial Accounting Standards No. 157 (“FAS 157”), “Fair Value Measurements.” FAS 157 establishes a framework for measuring fair value and expands disclosures about fair value measurements in financial statements.
The various inputs that may be used to determine the value of the fund’s investments are summarized in three broad levels. The inputs or methodologies used for valuing securities are not necessarily an indication of the risk associated with investing in those securities.
Level 1—Quoted prices in active markets for identical securities.
Level 2—Other significant observable inputs (including quoted prices for similar securities, interest rates, prepayment speeds, credit risk, etc.).
Level 3—Significant unobservable inputs (including the fund’s own assumptions used to determine the fair value of investments).
The following table summarizes the fund’s investments as of March 31, 2009, based on the inputs used to value them:
| Investments | Futures |
| in Securities | Contracts |
Valuation Inputs | ($000) | ($000) |
Level 1—Quoted prices | 37,160 | 2 |
Level 2—Other significant observable inputs | 200 | — |
Level 3—Significant unobservable inputs | — | — |
Total | 37,360 | 2 |
46
Structured Broad Market Fund
Fund Profile
As of March 31, 2009
Portfolio Characteristics | | |
| | Comparative | Broad |
| Fund | Index1 | Index2 |
Number of Stocks | 422 | 2,889 | 4,489 |
Median Market Cap | $20.7B | $22.3B | $22.3B |
Price/Earnings Ratio | 11.9x | 14.9x | 15.0x |
Price/Book Ratio | 1.7x | 1.7x | 1.7x |
Yield3 | | 2.7% | 2.7% |
Institutional Shares | 2.5% | | |
Institutional | | | |
Plus Shares | 2.6% | | |
Return on Equity | 20.5% | 20.4% | 20.2% |
Earnings Growth Rate | 15.8% | 15.3% | 15.0% |
Foreign Holdings | 0.1% | 0.0% | 0.0% |
Turnover Rate4 | 77% | — | — |
Expense Ratio5 | | — | — |
Institutional Shares | 0.25% | | |
Institutional | | | |
Plus Shares | 0.17% | | |
Short-Term Reserves | 0.1% | — | — |
Sector Diversification (% of equity exposure) |
| | Comparative | Broad |
| Fund | Index1 | Index2 |
Consumer Discretionary | 10.5% | 9.7% | 9.4% |
Consumer Staples | 10.5 | 11.5 | 11.2 |
Energy | 12.4 | 11.8 | 12.3 |
Financials | 13.0 | 12.0 | 13.1 |
Health Care | 14.4 | 14.8 | 14.6 |
Industrials | 10.0 | 10.3 | 10.0 |
Information Technology | 18.5 | 18.1 | 17.7 |
Materials | 3.5 | 3.7 | 3.7 |
Telecommunication | | | |
Services | 3.2 | 3.7 | 3.6 |
Utilities | 4.0 | 4.4 | 4.4 |
Ten Largest Holdings6 (% of total net assets) |
| | |
ExxonMobil Corp. | integrated oil | |
| and gas | 4.0% |
Chevron Corp. | integrated oil | |
| and gas | 2.1 |
International Business | computer | |
Machines Corp. | hardware | 2.1 |
Wal-Mart Stores, Inc. | hypermarkets and | |
| super centers | 1.7 |
Cisco Systems, Inc. | communications | |
| equipment | 1.7 |
The Procter & Gamble Co. | household products | 1.7 |
Johnson & Johnson | pharmaceuticals | 1.7 |
Microsoft Corp. | systems software | 1.7 |
Intel Corp. | semiconductors | 1.5 |
AT&T Inc. | integrated | |
| telecommunication | |
| services | 1.3 |
Top Ten | | 19.5% |
Volatility Measures7 | |
| Fund Versus | Fund Versus |
| Comparative Index1 | Broad Index2 |
R-Squared | 1.00 | 1.00 |
Beta | 1.00 | 1.00 |
Investment Focus
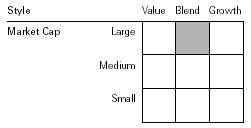
1 Russell 3000 Index.
2 Dow Jones Wilshire 5000 Index.
3 30-day SEC yield for the fund; annualized dividend yield for the indexes. See the Glossary.
4 Annualized.
5 The expense ratios shown are from the prospectus dated January 23, 2009, and represent estimated costs for the current fiscal year based on the fund’s current net assets. For the six months ended March 31, 2009, the annualized expense ratios were 0.25% for Institutional Shares and 0.16% for Institutional Plus Shares.
6 “Ten Largest Holdings” excludes any temporary cash investments and equity index products.
7 For an explanation of R-squared, beta, and other terms used here, see the Glossary.
47
Structured Broad Market Fund
Performance Summary
All of the returns in this report represent past performance, which is not a guarantee of future results that may be achieved by the fund. (Current performance may be lower or higher than the performance data cited. For performance data current to the most recent month-end, visit our website at www.vanguard.com/performance.) Note, too, that both investment returns and principal value can fluctuate widely, so an investor’s shares, when sold, could be worth more or less than their original cost. The returns shown do not reflect taxes that a shareholder would pay on fund distributions or on the sale of fund shares.
Fiscal-Year Total Returns (%): May 3, 2004–March 31, 2009
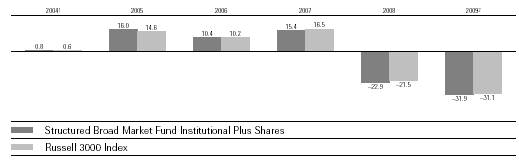
Total Returns: Periods Ended March 31, 2009 | | | |
| | | Since |
| Inception Date | One Year | Inception1 |
Institutional Shares | 11/30/2006 | –39.57% | –21.42% |
Institutional Plus Shares | 5/03/2004 | –39.53 | –4.88 |
1 The fund commenced operations as a registered investment company on October 3, 2006. The fund’s performance includes the performance of a predecessor trust, Vanguard Fiduciary Trust Company Structured Broad Market Trust, from May 3, 2004, to October 3, 2006. Performance for the fund is calculated since the following inception dates: May 3, 2004, for Institutional Plus Shares; November 30, 2006, for Institutional Shares.
2 Six months ended March 31, 2009.
Note: See Financial Highlights tables for dividend and capital gains information.
48
Structured Broad Market Fund
Financial Statements (unaudited)
Statement of Net Assets
As of March 31, 2009
The fund provides a complete list of its holdings four times in each fiscal year, at the quarter-ends. For the second and fourth fiscal quarters, the lists appear in the fund’s semiannual and annual reports to shareholders. For the first and third fiscal quarters, the fund files the lists with the Securities and Exchange Commission on Form N-Q. Shareholders can look up the fund’s Forms N-Q on the SEC’s website at www.sec.gov. Forms N-Q may also be reviewed and copied at the SEC’s Public Reference Room (see the back cover of this report for further information).
| | | Market |
| | | Value• |
| | Shares | ($000) |
Common Stocks (99.8%)1 | | |
Consumer Discretionary (10.5%) | | |
| McDonald’s Corp. | 30,431 | 1,661 |
| Comcast Corp. Class A | 117,291 | 1,600 |
| Home Depot, Inc. | 47,320 | 1,115 |
| Lowe’s Cos., Inc. | 59,770 | 1,091 |
| The Gap, Inc. | 71,000 | 922 |
| VF Corp. | 13,400 | 765 |
* | DIRECTV Group, Inc. | 31,700 | 722 |
* | AutoZone Inc. | 4,200 | 683 |
| Ross Stores, Inc. | 17,900 | 642 |
* | Big Lots Inc. | 29,000 | 603 |
| Polo Ralph Lauren Corp. | 13,900 | 587 |
| NIKE, Inc. Class B | 11,220 | 526 |
| The Walt Disney Co. | 28,090 | 510 |
| Omnicom Group Inc. | 19,960 | 467 |
| News Corp., Class A | 70,190 | 465 |
| H & R Block, Inc. | 22,500 | 409 |
| Darden Restaurants Inc. | 11,300 | 387 |
* | Jarden Corp. | 30,200 | 383 |
* | Aeropostale, Inc. | 14,350 | 381 |
* | Amazon.com, Inc. | 4,953 | 364 |
| WABCO Holdings Inc. | 28,200 | 347 |
* | Pre-Paid Legal Services, Inc. | 11,300 | 328 |
| Limited Brands, Inc. | 36,000 | 313 |
| Wyndham Worldwide Corp. | 74,300 | 312 |
| Autoliv, Inc. | 16,200 | 301 |
| Comcast Corp. | | |
| Special Class A | 22,000 | 283 |
* | CEC Entertainment Inc. | 10,504 | 272 |
| KB Home | 20,500 | 270 |
* | DISH Network Corp. | 23,750 | 264 |
* | Dollar Tree, Inc. | 5,900 | 263 |
* | Interpublic Group | | |
| of Cos., Inc. | 62,900 | 259 |
| Time Warner Inc. | 12,996 | 251 |
* | Urban Outfitters, Inc. | 14,500 | 237 |
| Tim Hortons, Inc. | 7,800 | 198 |
| RadioShack Corp. | 22,600 | 194 |
* | The Warnaco Group, Inc. | 7,700 | 185 |
| | | Market |
| | | Value• |
| | Shares | ($000) |
| Cablevision Systems NY | | |
| Group Class A | 13,600 | 176 |
* | Apollo Group, Inc. Class A | 2,200 | 172 |
* | WMS Industries, Inc. | 8,000 | 167 |
* | Viacom Inc. Class B | 9,495 | 165 |
| Target Corp. | 4,490 | 154 |
* | Bally Technologies Inc. | 7,800 | 144 |
| Black & Decker Corp. | 4,200 | 133 |
* | Sally Beauty Co. Inc. | 22,800 | 130 |
* | Ford Motor Co. | 49,062 | 129 |
| Yum! Brands, Inc. | 4,400 | 121 |
* | Collective Brands, Inc. | 12,000 | 117 |
| D. R. Horton, Inc. | 11,800 | 114 |
* | Liberty Media Corp. | 5,500 | 110 |
| Sherwin-Williams Co. | 2,100 | 109 |
| Royal Caribbean | | |
| Cruises, Ltd. | 13,600 | 109 |
| Pulte Homes, Inc. | 9,400 | 103 |
| International Speedway Corp. | 4,500 | 99 |
| Service Corp. International | 26,400 | 92 |
| Whirlpool Corp. | 3,100 | 92 |
* | Time Warner Cable Inc. | 3,262 | 81 |
| Brinker International, Inc. | 3,900 | 59 |
| Advance Auto Parts, Inc. | 1,300 | 53 |
| The McGraw-Hill Cos., Inc. | 2,300 | 53 |
| Centex Corp. | 7,000 | 52 |
* | Exide Technologies | 13,800 | 41 |
| Polaris Industries, Inc. | 1,700 | 36 |
* | Overstock.com, Inc. | 3,700 | 34 |
| The Buckle, Inc. | 1,000 | 32 |
* | JAKKS Pacific, Inc. | 2,200 | 27 |
* | GameStop Corp. Class A | 900 | 25 |
| Tupperware Brands Corp. | 1,400 | 24 |
| Snap-On Inc. | 900 | 23 |
| Foot Locker, Inc. | 2,100 | 22 |
| | | 21,558 |
Consumer Staples (10.5%) | | |
| Wal-Mart Stores, Inc. | 66,065 | 3,442 |
| The Procter & Gamble Co. | 72,951 | 3,435 |
| The Coca-Cola Co. | 38,690 | 1,700 |
49
Structured Broad Market Fund
| | | Market |
| | | Value• |
| | Shares | ($000) |
| Philip Morris International Inc. | 33,250 | 1,183 |
| Altria Group, Inc. | 66,850 | 1,071 |
| CVS Caremark Corp. | 37,536 | 1,032 |
| Archer-Daniels-Midland Co. | 35,100 | 975 |
| PepsiCo, Inc. | 18,830 | 969 |
| Kraft Foods Inc. | 40,856 | 911 |
| H.J. Heinz Co. | 25,700 | 850 |
| The Kroger Co. | 36,400 | 772 |
| General Mills, Inc. | 14,200 | 708 |
| Lorillard, Inc. | 10,900 | 673 |
| Kellogg Co. | 16,000 | 586 |
| Safeway, Inc. | 29,000 | 586 |
| ConAgra Foods, Inc. | 29,800 | 503 |
| Colgate-Palmolive Co. | 8,430 | 497 |
* | Dr. Pepper Snapple | | |
| Group, Inc. | 22,300 | 377 |
* | Energizer Holdings, Inc. | 6,700 | 333 |
| The Pepsi Bottling Group, Inc. | 9,400 | 208 |
| Sysco Corp. | 7,100 | 162 |
| Reynolds American Inc. | 3,640 | 131 |
| Bunge Ltd. | 2,000 | 113 |
| Costco Wholesale Corp. | 2,370 | 110 |
| Alberto-Culver Co. | 2,900 | 66 |
| Nash-Finch Co. | 1,689 | 47 |
| Corn Products | | |
| International, Inc. | 1,700 | 36 |
| Herbalife Ltd. | 2,300 | 35 |
| Cal-Maine Foods, Inc. | 1,400 | 31 |
| | | 21,542 |
Energy (12.4%) | | |
| ExxonMobil Corp. | 121,820 | 8,296 |
| Chevron Corp. | 65,165 | 4,382 |
| Occidental Petroleum Corp. | 24,840 | 1,382 |
| ConocoPhillips Co. | 27,600 | 1,081 |
| Marathon Oil Corp. | 40,840 | 1,074 |
| Anadarko Petroleum Corp. | 20,740 | 807 |
| Apache Corp. | 12,540 | 804 |
| Valero Energy Corp. | 36,392 | 651 |
| EOG Resources, Inc. | 10,800 | 591 |
| Noble Energy, Inc. | 10,200 | 550 |
| Murphy Oil Corp. | 10,500 | 470 |
| El Paso Corp. | 70,300 | 439 |
| Peabody Energy Corp. | 15,400 | 386 |
| Noble Corp. | 15,000 | 361 |
| ENSCO International, Inc. | 13,130 | 347 |
| Schlumberger Ltd. | 8,100 | 329 |
| Williams Cos., Inc. | 28,500 | 324 |
* | Southwestern Energy Co. | 10,500 | 312 |
| Devon Energy Corp. | 6,813 | 305 |
| Chesapeake Energy Corp. | 17,700 | 302 |
| CONSOL Energy, Inc. | 11,300 | 285 |
* | Clayton Williams Energy, Inc. | 7,100 | 208 |
* | Mariner Energy Inc. | 21,600 | 167 |
| Sunoco, Inc. | 5,800 | 154 |
| Tesoro Corp. | 10,600 | 143 |
| | | Market |
| | | Value• |
| | Shares | ($000) |
* | National Oilwell Varco Inc. | 4,900 | 141 |
* | Dresser Rand Group, Inc. | 6,300 | 139 |
* | Bristow Group, Inc. | 5,900 | 126 |
| Tidewater Inc. | 3,000 | 111 |
* | Double Eagle | | |
| Petroleum Co. | 17,200 | 89 |
| Frontline Ltd. | 5,000 | 87 |
| Ship Finance | | |
| International Ltd. | 13,100 | 86 |
| Foundation Coal | | |
| Holdings, Inc. | 4,200 | 60 |
* | Cal Dive International, Inc. | 8,800 | 60 |
* | Oil States International, Inc. | 4,200 | 56 |
| Southern Union Co. | 3,700 | 56 |
* | Alpha Natural Resources, Inc. | 2,800 | 50 |
* | PHI Inc. Non-Voting Shares | 4,800 | 48 |
| Diamond Offshore | | |
| Drilling, Inc. | 600 | 38 |
* | Encore Acquisition Co. | 1,600 | 37 |
* | McMoRan Exploration Co. | 5,400 | 25 |
| Massey Energy Co. | 1,900 | 19 |
| | | 25,378 |
Financials (12.9%) | | |
| JPMorgan Chase & Co. | 68,236 | 1,814 |
| Morgan Stanley | 52,250 | 1,190 |
| Wells Fargo & Co. | 75,010 | 1,068 |
| The Chubb Corp. | 25,070 | 1,061 |
| Bank of New York | | |
| Mellon Corp. | 36,791 | 1,039 |
| U.S. Bancorp | 70,150 | 1,025 |
| The Goldman Sachs | | |
| Group, Inc. | 9,311 | 987 |
| Aon Corp. | 22,300 | 910 |
| State Street Corp. | 28,100 | 865 |
| Progressive Corp. of Ohio | 60,300 | 810 |
| AFLAC Inc. | 39,640 | 767 |
| The Travelers Cos., Inc. | 18,600 | 756 |
| Northern Trust Corp. | 12,200 | 730 |
| Bank of America Corp. | 97,445 | 665 |
| BB&T Corp. | 35,080 | 594 |
| Hudson City Bancorp, Inc. | 47,400 | 554 |
* | TD Ameritrade | | |
| Holding Corp. | 39,216 | 542 |
| Unum Group | 42,300 | 529 |
| Charles Schwab Corp. | 31,600 | 490 |
| Ameriprise Financial, Inc. | 23,600 | 484 |
| PNC Financial | | |
| Services Group | 15,518 | 454 |
| Axis Capital Holdings Ltd. | 18,400 | 415 |
| New York Community | | |
| Bancorp, Inc. | 35,000 | 391 |
* | Knight Capital Group, Inc. | | |
| Class A | 26,300 | 388 |
| Capital One Financial Corp. | 28,860 | 353 |
| American Financial Group, Inc. | 21,300 | 342 |
50
Structured Broad Market Fund
| | | Market |
| | | Value• |
| | Shares | ($000) |
| Bank of Hawaii Corp. | 9,600 | 317 |
* | Nasdaq OMX Group, Inc. | 15,756 | 308 |
| CME Group, Inc. | 1,200 | 296 |
| Discover Financial Services | 45,400 | 286 |
| Mid-America Apartment | | |
| Communities, Inc. REIT | 9,000 | 277 |
| BOK Financial Corp. | 7,700 | 266 |
| Highwood Properties, Inc. | | |
| REIT | 12,129 | 260 |
| Simon Property Group, Inc. | | |
| REIT | 6,956 | 241 |
| SunTrust Banks, Inc. | 18,000 | 211 |
| Cullen/Frost Bankers, Inc. | 4,400 | 206 |
| FirstMerit Corp. | 10,900 | 198 |
| HCP, Inc. REIT | 11,100 | 198 |
| Marsh & McLennan Cos., Inc. | 9,600 | 194 |
| NYSE Euronext | 10,800 | 193 |
| Washington REIT | 11,000 | 190 |
| Vornado Realty Trust REIT | 5,693 | 189 |
| Kilroy Realty Corp. REIT | 11,000 | 189 |
| Sun Communities, Inc. REIT | 15,600 | 185 |
| American Express Co. | 13,420 | 183 |
| First Horizon National Corp. | 16,700 | 179 |
| Senior Housing | | |
| Properties Trust REIT | 12,500 | 175 |
| Federated Investors, Inc. | 7,800 | 174 |
| MetLife, Inc. | 7,500 | 171 |
| Sovran Self Storage, Inc. REIT | 8,300 | 167 |
| Associated Estates | | |
| Realty Corp. REIT | 29,300 | 166 |
| PS Business Parks, Inc. REIT | 4,400 | 162 |
* | The St. Joe Co. | 9,400 | 157 |
| Plum Creek Timber | | |
| Co. Inc. REIT | 5,300 | 154 |
| Raymond James | | |
| Financial, Inc. | 7,800 | 154 |
* | Interactive Brokers Group, Inc. | 8,600 | 139 |
| The Hanover Insurance | | |
| Group Inc. | 4,800 | 138 |
| Hospitality Properties | | |
| Trust REIT | 10,800 | 130 |
* | Nelnet, Inc. | 13,900 | 123 |
| Aspen Insurance | | |
| Holdings Ltd. | 4,400 | 99 |
| First BanCorp Puerto Rico | 20,800 | 89 |
| Reinsurance Group | | |
| of America, Inc. | 2,572 | 83 |
| Extra Space Storage Inc. REIT | 14,800 | 82 |
| Healthcare Realty Trust Inc. REIT | 5,000 | 75 |
| Lincoln National Corp. | 8,000 | 53 |
| Prudential Financial, Inc. | 2,340 | 44 |
* | CNA Surety Corp. | 2,000 | 37 |
| U-Store-It Trust REIT | 15,500 | 31 |
| Odyssey Re Holdings Corp. | 800 | 30 |
| | | Market |
| | | Value• |
| | Shares | ($000) |
| Torchmark Corp. | 900 | 24 |
| Parkway Properties Inc. REIT | 2,200 | 23 |
| Pennsylvania REIT | 6,100 | 22 |
| Host Hotels & Resorts Inc. | | |
| REIT | 4,700 | 18 |
| Suffolk Bancorp | 600 | 16 |
| Citigroup Inc. | 6,152 | 16 |
| | | 26,541 |
Health Care (14.4%) | | |
| Johnson & Johnson | 64,907 | 3,414 |
| Pfizer Inc. | 148,835 | 2,027 |
* | Amgen Inc. | 40,015 | 1,982 |
| Bristol-Myers Squibb Co. | 85,730 | 1,879 |
| Abbott Laboratories | 39,000 | 1,860 |
| Covidien Ltd. | 34,300 | 1,140 |
| Baxter International, Inc. | 19,260 | 987 |
* | Biogen Idec Inc. | 18,800 | 986 |
| Eli Lilly & Co. | 29,220 | 976 |
| Merck & Co., Inc. | 34,910 | 934 |
| Wyeth | 20,340 | 875 |
* | WellPoint Inc. | 21,850 | 830 |
* | Gilead Sciences, Inc. | 14,680 | 680 |
* | Express Scripts Inc. | 14,600 | 674 |
| Quest Diagnostics, Inc. | 14,100 | 669 |
* | Myriad Genetics, Inc. | 13,200 | 600 |
* | Watson | | |
| Pharmaceuticals, Inc. | 18,800 | 585 |
| McKesson Corp. | 15,200 | 533 |
* | Laboratory Corp. of | | |
| America Holdings | 8,900 | 521 |
| AmerisourceBergen Corp. | 15,900 | 519 |
* | DaVita, Inc. | 10,300 | 453 |
* | Gen-Probe Inc. | 9,800 | 447 |
| Omnicare, Inc. | 17,400 | 426 |
* | Warner Chilcott Ltd. | 37,500 | 395 |
* | AMERIGROUP Corp. | 13,100 | 361 |
* | Maxygen Inc. | 50,700 | 345 |
| Cooper Cos., Inc. | 12,700 | 336 |
* | Thermo Fisher | | |
| Scientific, Inc. | 9,200 | 328 |
* | Mylan Inc. | 23,400 | 314 |
* | Isis Pharmaceuticals, Inc. | 20,030 | 301 |
| CIGNA Corp. | 17,000 | 299 |
| Becton, Dickinson & Co. | 4,420 | 297 |
* | Cubist Pharmaceuticals, Inc. | 16,400 | 268 |
* | Endo Pharmaceuticals | | |
| Holdings, Inc. | 13,000 | 230 |
* | CONMED Corp. | 15,500 | 223 |
| Beckman Coulter, Inc. | 4,100 | 209 |
* | Nabi Biopharmaceuticals | 53,900 | 199 |
* | Albany Molecular Research, Inc. | 20,200 | 191 |
| Schering-Plough Corp. | 7,410 | 175 |
| UnitedHealth Group Inc. | 8,175 | 171 |
* | Medco Health Solutions, Inc. | 3,585 | 148 |
* | Lincare Holdings, Inc. | 6,000 | 131 |
51
Structured Broad Market Fund
| | | Market |
| | | Value• |
| | Shares | ($000) |
* | OSI Pharmaceuticals, Inc. | 3,400 | 130 |
*,^ | Acura Pharmaceuticals Inc. | 16,400 | 105 |
| Medtronic, Inc. | 3,030 | 89 |
* | HealthSouth Corp. | 9,700 | 86 |
* | Cephalon, Inc. | 1,100 | 75 |
| Universal Health | | |
| Services Class B | 1,600 | 61 |
* | Idera Pharmaceuticals, Inc. | 5,000 | 32 |
* | Questcor Pharmaceuticals, Inc. | 4,900 | 24 |
* | Accelrys Inc. | 5,900 | 23 |
* | Community Health | | |
| Systems, Inc. | 1,200 | 18 |
| | | 29,561 |
Industrials (10.0%) | | |
| General Electric Co. | 189,780 | 1,919 |
| United Technologies Corp. | 42,140 | 1,811 |
| General Dynamics Corp. | 28,000 | 1,165 |
| Union Pacific Corp. | 23,100 | 950 |
| Lockheed Martin Corp. | 12,650 | 873 |
| Honeywell International Inc. | 29,424 | 820 |
| Waste Management, Inc. | 31,300 | 801 |
| Norfolk Southern Corp. | 23,600 | 796 |
| Raytheon Co. | 18,000 | 701 |
| The Boeing Co. | 19,660 | 699 |
| Northrop Grumman Corp. | 15,830 | 691 |
| Goodrich Corp. | 17,300 | 655 |
| Fluor Corp. | 15,400 | 532 |
| 3M Co. | 10,130 | 504 |
| ITT Industries, Inc. | 13,000 | 500 |
| L-3 Communications | | |
| Holdings, Inc. | 7,100 | 481 |
| Dover Corp. | 16,900 | 446 |
| Flowserve Corp. | 7,500 | 421 |
| Cooper Industries, Inc. | | |
| Class A | 15,400 | 398 |
| Parker Hannifin Corp. | 11,400 | 387 |
| Burlington Northern | | |
| Santa Fe Corp. | 6,270 | 377 |
| Joy Global Inc. | 17,700 | 377 |
| J.B. Hunt Transport | | |
| Services, Inc. | 14,800 | 357 |
* | EMCOR Group, Inc. | 19,600 | 337 |
| Pitney Bowes, Inc. | 14,300 | 334 |
* | AGCO Corp. | 17,000 | 333 |
| Ryder System, Inc. | 9,700 | 275 |
| CSX Corp. | 10,437 | 270 |
| GATX Corp. | 12,320 | 249 |
| Bucyrus International, Inc. | 16,100 | 244 |
* | Jacobs Engineering | | |
| Group Inc. | 6,300 | 244 |
| Watson Wyatt & Co. Holdings | 4,300 | 212 |
| Robbins & Myers, Inc. | 13,500 | 205 |
| The Dun & Bradstreet Corp. | 2,100 | 162 |
| Expeditors International of Washington, Inc. | 4,500 | 127 |
| | | Market |
| | | Value• |
| | Shares | ($000) |
| Emerson Electric Co. | 4,140 | 118 |
| Deere & Co. | 3,500 | 115 |
* | GrafTech International Ltd. | 17,700 | 109 |
| Ameron International Corp. | 1,700 | 90 |
| The Timken Co. | 5,500 | 77 |
* | TBS International Ltd. | 9,400 | 69 |
* | Alliant Techsystems, Inc. | 1,000 | 67 |
| Genco Shipping and | | |
| Trading Ltd. | 4,300 | 53 |
* | EnerSys | 3,500 | 42 |
| Apogee Enterprises, Inc. | 3,700 | 41 |
| | | 20,434 |
Information Technology (18.4%) | | |
| International Business | | |
| Machines Corp. | 43,942 | 4,258 |
* | Cisco Systems, Inc. | 205,050 | 3,439 |
| Microsoft Corp. | 185,597 | 3,409 |
| Intel Corp. | 198,490 | 2,987 |
| Hewlett-Packard Co. | 79,599 | 2,552 |
* | Apple Inc. | 22,620 | 2,378 |
* | Google Inc. | 3,490 | 1,215 |
* | Symantec Corp. | 67,200 | 1,004 |
* | Oracle Corp. | 55,248 | 998 |
| Accenture Ltd. | 35,900 | 987 |
| Automatic Data | | |
| Processing, Inc. | 22,480 | 790 |
* | Computer Sciences Corp. | 19,500 | 718 |
* | Juniper Networks, Inc. | 46,800 | 705 |
| Visa Inc. | 12,500 | 695 |
* | Affiliated Computer | | |
| Services, Inc. Class A | 12,000 | 575 |
| Analog Devices, Inc. | 28,600 | 551 |
| Texas Instruments, Inc. | 32,270 | 533 |
* | Metavante Technologies | 26,400 | 527 |
* | Western Digital Corp. | 26,600 | 514 |
* | Multi-Fineline Electronix, Inc. | 30,200 | 509 |
| Western Union Co. | 36,100 | 454 |
* | eBay Inc. | 34,910 | 438 |
* | QLogic Corp. | 38,000 | 423 |
* | EMC Corp. | 33,730 | 385 |
* | Skyworks Solutions, Inc. | 47,300 | 381 |
* | EarthLink, Inc. | 58,000 | 381 |
* | Alliance Data Systems Corp. | 10,200 | 377 |
| QUALCOMM Inc. | 9,520 | 370 |
* | Genpact, Ltd. | 39,300 | 348 |
* | Sohu.com Inc. | 7,500 | 310 |
* | Ceva, Inc. | 40,300 | 293 |
* | Teradata Corp. | 17,600 | 286 |
* | MEMC Electronic Materials, Inc. | 16,720 | 276 |
* | Sybase, Inc. | 8,462 | 256 |
* | Hewitt Associates, Inc. | 8,400 | 250 |
| Altera Corp. | 12,500 | 219 |
* | RadiSys Corp. | 36,000 | 218 |
* | Lexmark International, Inc. | 12,800 | 216 |
* | LSI Corp. | 68,800 | 209 |
52
Structured Broad Market Fund
| | | Market |
| | | Value• |
| | Shares | ($000) |
* | Dolby Laboratories Inc. | 5,600 | 191 |
| CA, Inc. | 10,100 | 178 |
* | Marvell Technology | | |
| Group Ltd. | 19,400 | 178 |
* | NCR Corp. | 21,900 | 174 |
* | Adobe Systems, Inc. | 8,100 | 173 |
* | PC Mall, Inc. | 34,600 | 157 |
* | Broadcom Corp. | 7,800 | 156 |
* | NVE Corp. | 4,900 | 141 |
* | Plexus Corp. | 9,900 | 137 |
| Xilinx, Inc. | 6,900 | 132 |
| Black Box Corp. | 5,500 | 130 |
| Broadridge Financial | | |
| Solutions LLC | 6,100 | 114 |
* | Mettler-Toledo | | |
| International Inc. | 2,100 | 108 |
* | TIBCO Software Inc. | 16,400 | 96 |
| National Semiconductor Corp. | 6,200 | 64 |
* | Harmonic, Inc. | 8,300 | 54 |
| Diebold, Inc. | 2,300 | 49 |
* | Quest Software, Inc. | 2,100 | 27 |
* | Solera Holdings, Inc. | 900 | 22 |
| Daktronics, Inc. | 2,900 | 19 |
* | Integrated Device | | |
| Technology Inc. | 3,600 | 16 |
| | | 37,750 |
Materials (3.5%) | | |
| Monsanto Co. | 18,426 | 1,531 |
| E.I. du Pont de | | |
| Nemours & Co. | 58,980 | 1,317 |
| Praxair, Inc. | 13,600 | 915 |
| The Mosaic Co. | 19,800 | 831 |
| Dow Chemical Co. | 57,120 | 481 |
| Eastman Chemical Co. | 12,100 | 324 |
| Reliance Steel & | | |
| Aluminum Co. | 10,300 | 271 |
| United States Steel Corp. | 12,100 | 256 |
| FMC Corp. | 5,600 | 242 |
* | Owens-Illinois, Inc. | 16,700 | 241 |
| Celanese Corp. Series A | 11,500 | 154 |
| Ball Corp. | 3,500 | 152 |
| Terra Industries, Inc. | 4,070 | 114 |
| Rock-Tenn Co. | 4,200 | 114 |
| Innophos Holdings Inc. | 8,500 | 96 |
| Cliffs Natural Resources Inc. | 4,900 | 89 |
* | Pactiv Corp. | 4,400 | 64 |
| Glatfelter | 9,100 | 57 |
| | | 7,249 |
Other (0.1%) | | |
2 | Miscellaneous Securities | | 110 |
| | | |
Telecommunication Services (3.2%) | |
| AT&T Inc. | 107,929 | 2,720 |
| Verizon Communications Inc. | 70,557 | 2,131 |
| Embarq Corp. | 12,342 | 467 |
| | | Market |
| | | Value• |
| | Shares | ($000) |
* | Premiere Global | | |
| Services, Inc. | 49,600 | 437 |
* | American Tower Corp. | | |
| Class A | 11,300 | 344 |
| NTELOS Holdings Corp. | 12,300 | 223 |
| Windstream Corp. | 21,938 | 177 |
* | Syniverse Holdings Inc. | 7,900 | 125 |
| | | 6,624 |
Utilities (3.9%) | | |
| Dominion Resources, Inc. | 30,900 | 957 |
| FirstEnergy Corp. | 24,500 | 946 |
| Sempra Energy | 15,000 | 694 |
| Entergy Corp. | 9,400 | 640 |
| Duke Energy Corp. | 42,890 | 614 |
| Edison International | 18,840 | 543 |
| American Electric | | |
| Power Co., Inc. | 21,200 | 535 |
| FPL Group, Inc. | 9,733 | 494 |
| CenterPoint Energy Inc. | 43,300 | 452 |
| Exelon Corp. | 9,640 | 437 |
* | NRG Energy, Inc. | 16,700 | 294 |
| NiSource, Inc. | 25,700 | 252 |
| IDACORP, Inc. | 10,000 | 234 |
| Public Service | | |
| Enterprise Group, Inc. | 6,900 | 203 |
| DTE Energy Co. | 6,600 | 183 |
| CMS Energy Corp. | 11,900 | 141 |
| Vectren Corp. | 6,500 | 137 |
* | AES Corp. | 18,500 | 107 |
* | Mirant Corp. | 8,300 | 95 |
| SCANA Corp. | 2,971 | 92 |
| UGI Corp. Holding Co. | 1,400 | 33 |
| Pepco Holdings, Inc. | 2,600 | 32 |
| | | 8,115 |
Total Common Stocks | | |
(Cost $265,807) | | 204,862 |
Temporary Cash Investments (0.3%)1 | |
Money Market Fund (0.2%) | | |
3,4 | Vanguard Market | | |
| Liquidity Fund, 0.440% | 345,663 | 346 |
| | | |
| | | |
| | Face | |
| | Amount | |
| | ($000) | |
U.S. Government and Agency Obligations (0.1%) |
5,6 | Federal Home Loan | | |
| Mortgage Corp., | | |
| 1.206%, 4/30/09 | 300 | 300 |
Total Temporary Cash Investments | |
(Cost $644) | | 646 |
Total Investments (100.1%) | | |
(Cost $266,451) | | 205,508 |
53
Structured Broad Market Fund
| Market |
| Value• |
| ($000) |
Other Assets and Liabilities (–0.1%) | |
Other Assets | 696 |
Liabilities4 | (957) |
| (261) |
Net Assets (100%) | 205,247 |
| |
| |
At March 31, 2009, net assets consisted of: | |
| Amount |
| ($000) |
Paid-in Capital | 351,183 |
Undistributed Net Investment Income | 1,098 |
Accumulated Net Realized Losses | (86,077) |
Unrealized Appreciation (Depreciation) | |
Investment Securities | (60,943) |
Futures Contracts | (14) |
Net Assets | 205,247 |
| |
Institutional Shares—Net Assets | |
Applicable to 198,200 outstanding | |
$.001 par value shares of beneficial | |
interest (unlimited authorization) | 2,836 |
Net Asset Value Per Share— | |
Institutional Shares | $14.31 |
| |
Institutional Plus Shares—Net Assets | |
Applicable to 7,082,840 outstanding | |
$.001 par value shares of beneficial | |
interest (unlimited authorization) | 202,411 |
Net Asset Value Per Share— | |
Institutional Plus Shares | $28.58 |
• | See Note A in Notes to Financial Statements. |
* | Non-income-producing security. |
^ | Part of security position is on loan to broker-dealers. The total value of securities on loan is $100,000. |
1 The fund invests a portion of its cash reserves in equity markets through the use of index futures contracts. After giving effect to futures investments, the fund’s effective common stock and temporary cash investment positions represent 100.0% and 0.1%, respectively, of net assets.
2 Securities representing up to 5% of the market value of unaffiliated securities are permitted to be combined and reported as “miscellaneous securities” provided that they have been held for less than one year and not previously reported by name.
3 Affiliated money market fund available only to Vanguard funds and certain trusts and accounts managed by Vanguard. Rate shown is the 7-day yield.
4 Includes $109,000 of collateral received for securities on loan.
5 The issuer operates under a congressional charter; its securities are not backed by the full faith and credit of the U.S. government.
6 Securities with a value of $300,000 have been segregated as initial margin for open futures contracts.
REIT—Real Estate Investment Trust.
See accompanying Notes, which are an integral part of the Financial Statements.
54
Structured Broad Market Fund
Statement of Operations
| Six Months Ended |
| March 31, 2009 |
| ($000) |
Investment Income | |
Income | |
Dividends | 2,594 |
Interest1 | 54 |
Security Lending | 8 |
Total Income | 2,656 |
Expenses | |
The Vanguard Group—Note B | |
Investment Advisory Services | 90 |
Management and Administrative—Institutional Shares | 2 |
Management and Administrative—Institutional Plus Shares | 20 |
Marketing and Distribution—Institutional Shares | — |
Marketing and Distribution—Institutional Plus Shares | 33 |
Custodian Fees | 14 |
Auditing Fees | 1 |
Shareholders’ Reports—Institutional Shares | — |
Shareholders’ Reports—Institutional Plus Shares | — |
Total Expenses | 160 |
Net Investment Income | 2,496 |
Realized Net Gain (Loss) | |
Investment Securities Sold | (57,713) |
Futures Contracts | (900) |
Realized Net Gain (Loss) | (58,613) |
Change in Unrealized Appreciation (Depreciation) | |
Investment Securities | (26,704) |
Futures Contracts | 48 |
Change in Unrealized Appreciation (Depreciation) | (26,656) |
Net Increase (Decrease) in Net Assets Resulting from Operations | (82,773) |
1 Interest income from an affiliated company of the fund was $54,000.
See accompanying Notes, which are an integral part of the Financial Statements.
55
Structured Broad Market Fund
Statement of Changes in Net Assets
| Six Months Ended | Year Ended |
| March 31, | September 30, |
| 2009 | 2008 |
| ($000) | ($000) |
Increase (Decrease) in Net Assets | | |
Operations | | |
Net Investment Income | 2,496 | 5,107 |
Realized Net Gain (Loss) | (58,613) | (26,908) |
Change in Unrealized Appreciation (Depreciation) | (26,656) | (50,836) |
Net Increase (Decrease) in Net Assets Resulting from Operations | (82,773) | (72,637) |
Distributions | | |
Net Investment Income | | |
Institutional Shares | (76) | (137) |
Institutional Plus Shares | (5,098) | (3,225) |
Realized Capital Gain1 | | |
Institutional Shares | — | (210) |
Institutional Plus Shares | — | (4,456) |
Total Distributions | (5,174) | (8,028) |
Capital Share Transactions | | |
Institutional Shares | 76 | (7,621) |
Institutional Plus Shares | 40,654 | 41,977 |
Net Increase (Decrease) from Capital Share Transactions | 40,730 | 34,356 |
Total Increase (Decrease) | (47,217) | (46,309) |
Net Assets | | |
Beginning of Period | 252,464 | 298,773 |
End of Period2 | 205,247 | 252,464 |
1 Includes fiscal 2008 short-term gain distributions totaling $239,000. Short-term gain distributions are treated as ordinary income dividends for tax purposes.
2 Net Assets—End of Period includes undistributed net investment income of $1,098,000 and $3,776,000.
See accompanying Notes, which are an integral part of the Financial Statements.
56
Structured Broad Market Fund
Financial Highlights
Institutional Shares | | | |
| Six Months | Year | Nov. 30, |
| Ended | Ended | 20061 to |
| March 31, | Sept. 30, | Sept. 30, |
For a Share Outstanding Throughout Each Period | 2009 | 2008 | 2007 |
Net Asset Value, Beginning of Period | $21.53 | $28.67 | $26.59 |
Investment Operations | | | |
Net Investment Income | .1852 | .402 | .3612 |
Net Realized and Unrealized Gain (Loss) on Investments | (7.013) | (6.833) | 1.930 |
Total from Investment Operations | (6.828) | (6.431) | 2.291 |
Distributions | | | |
Dividends from Net Investment Income | (.392) | (.280) | (.116) |
Distributions from Realized Capital Gains | — | (.429) | (.095) |
Total Distributions | (.392) | (.709) | (.211) |
Net Asset Value, End of Period | $14.31 | $21.53 | $28.67 |
| | | |
Total Return | –31.93% | –22.95% | 8.68% |
| | | |
Ratios/Supplemental Data | | | |
Net Assets, End of Period (Millions) | $3 | $4 | $14 |
Ratio of Total Expenses to Average Net Assets | 0.25%3 | 0.20% | 0.25%3 |
Ratio of Net Investment Income to Average Net Assets | 2.41%3 | 1.72% | 1.55%3 |
Portfolio Turnover Rate | 77%3 | 70% | 66% |
1 Inception.
2 Calculated based on average shares outstanding.
3 Annualized.
See accompanying Notes, which are an integral part of the Financial Statements.
57
Structured Broad Market Fund
Financial Highlights
Institutional Plus Shares | | | |
| Six Months | Year | Oct. 3, |
| Ended | Ended | 20061 to |
| March 31, | Sept. 30, | Sept. 30, |
For a Share Outstanding Throughout Each Period | 2009 | 2008 | 2007 |
Net Asset Value, Beginning of Period | $43.07 | $57.39 | $50.00 |
Investment Operations | | | |
Net Investment Income | .3842 | .873 | .9042 |
Net Realized and Unrealized Gain (Loss) on Investments | (14.025) | (13.714) | 6.910 |
Total from Investment Operations | (13.641) | (12.841) | 7.814 |
Distributions | | | |
Dividends from Net Investment Income | (.849) | (.621) | (.234) |
Distributions from Realized Capital Gains | — | (.858) | (.190) |
Total Distributions | (.849) | (1.479) | (.424) |
Net Asset Value, End of Period | $28.58 | $43.07 | $57.39 |
| | | |
Total Return | –31.91% | –22.91% | 15.69% |
| | | |
Ratios/Supplemental Data | | | |
Net Assets, End of Period (Millions) | $202 | $248 | $285 |
Ratio of Total Expenses to Average Net Assets | 0.16%3 | 0.12% | 0.15%3 |
Ratio of Net Investment Income to Average Net Assets | 2.50%3 | 1.80% | 1.65%3 |
Portfolio Turnover Rate | 77%3 | 70% | 66% |
1 Commencement of operations as a registered investment company.
2 Calculated based on average shares outstanding.
3 Annualized.
See accompanying Notes, which are an integral part of the Financial Statements.
58
Structured Broad Market Fund
Notes to Financial Statements
Vanguard Structured Broad Market Fund is registered under the Investment Company Act of 1940 as an open-end investment company, or mutual fund. The fund offers two classes of shares: Institutional Shares and Institutional Plus Shares. Institutional Shares are available to investors who invest a minimum amount of $5 million. Institutional Plus Shares are available to investors who invest a minimum amount of $200 million ($100 million for investors with total Vanguard investments of at least $1 billion).
A. The following significant accounting policies conform to generally accepted accounting principles for U.S. mutual funds. The fund consistently follows such policies in preparing its financial statements.
1. Security Valuation: Securities are valued as of the close of trading on the New York Stock Exchange (generally 4 p.m., Eastern time) on the valuation date. Equity securities are valued at the latest quoted sales prices or official closing prices taken from the primary market in which each security trades; such securities not traded on the valuation date are valued at the mean of the latest quoted bid and asked prices. Securities for which market quotations are not readily available, or whose values have been materially affected by events occurring before the fund’s pricing time but after the close of the securities’ primary markets, are valued by methods deemed by the board of trustees to represent fair value. Investments in Vanguard Market Liquidity Fund are valued at that fund’s net asset value. Temporary cash investments acquired over 60 days to maturity are valued using the latest bid prices or using valuations based on a matrix system (which considers such factors as security prices, yields, maturities, and ratings), both as furnished by independent pricing services. Other temporary cash investments are valued at amortized cost, which approximates market value.
2. Futures Contracts: The fund uses index futures contracts to a limited extent, with the objective of maintaining full exposure to the stock market while maintaining liquidity. The fund may purchase or sell futures contracts to achieve a desired level of investment, whether to accommodate portfolio turnover or cash flows from capital share transactions. The primary risks associated with the use of futures contracts are imperfect correlation between changes in market values of stocks held by the fund and the prices of futures contracts, and the possibility of an illiquid market.
Futures contracts are valued at their quoted daily settlement prices. The aggregate principal amounts of the contracts are not recorded in the Statement of Net Assets. Fluctuations in the value of the contracts are recorded in the Statement of Net Assets as an asset (liability) and in the Statement of Operations as unrealized appreciation (depreciation) until the contracts are closed, when they are recorded as realized futures gains (losses).
3. Federal Income Taxes: The fund intends to continue to qualify as a regulated investment company and distribute all of its taxable income. Management has analyzed the fund’s tax positions taken on federal income tax returns for all open tax years (tax years ended September 30, 2007–2008) and for the period ended March 31, 2009, and has concluded that no provision for federal income tax is required in the fund’s financial statements.
4. Distributions: Distributions to shareholders are recorded on the ex-dividend date.
5. Security Lending: The fund may lend its securities to qualified institutional borrowers to earn additional income. Security loans are required to be secured at all times by collateral at least equal to the market value of securities loaned. The fund invests cash collateral received in Vanguard Market Liquidity Fund, and records a liability for the return of the collateral, during the period the securities are on loan. Security lending income represents the income earned on investing cash collateral, less expenses associated with the loan.
59
Structured Broad Market Fund
6. Other: Dividend income is recorded on the ex-dividend date. Interest income includes income distributions received from Vanguard Market Liquidity Fund and is accrued daily. Security transactions are accounted for on the date securities are bought or sold. Costs used to determine realized gains (losses) on the sale of investment securities are those of the specific securities sold.
Each class of shares has equal rights as to assets and earnings, except that each class separately bears certain class-specific expenses related to maintenance of shareholder accounts (included in Management and Administrative expenses) and shareholder reporting. Marketing and distribution expenses are allocated to each class of shares based on a method approved by the board of trustees. Income, other non-class-specific expenses, and gains and losses on investments are allocated to each class of shares based on its relative net assets.
B. The Vanguard Group furnishes at cost investment advisory, corporate management, administrative, marketing, and distribution services. The costs of such services are allocated to the fund under methods approved by the board of trustees. The fund has committed to provide up to 0.40% of its net assets in capital contributions to Vanguard. At March 31, 2009, the fund had contributed capital of $53,000 to Vanguard (included in Other Assets), representing 0.03% of the fund’s net assets and 0.02% of Vanguard’s capitalization. The fund’s trustees and officers are also directors and officers of Vanguard.
C. Distributions are determined on a tax basis and may differ from net investment income and realized capital gains for financial reporting purposes. Differences may be permanent or temporary. Permanent differences are reclassified among capital accounts in the financial statements to reflect their tax character. Temporary differences arise when certain items of income, expense, gain, or loss are recognized in different periods for financial statement and tax purposes; these differences will reverse at some time in the future. Differences in classification may also result from the treatment of short-term gains as ordinary income for tax purposes.
The fund’s tax-basis capital gains and losses are determined only at the end of each fiscal year. For tax purposes, at September 30, 2008, the fund had available realized losses of $27,520,000 to offset future net capital gains through September 30, 2017. The fund will use these capital losses to offset net taxable capital gains, if any, realized during the year ending September 30, 2009; should the fund realize net capital losses for the year, the losses will be added to the loss carryforward balance above.
At March 31, 2009, the cost of investment securities for tax purposes was $266,451,000. Net unrealized depreciation of investment securities for tax purposes was $60,943,000, consisting of unrealized gains of $4,335,000 on securities that had risen in value since their purchase and $65,278,000 in unrealized losses on securities that had fallen in value since their purchase.
At March 31, 2009, the aggregate settlement value of open futures contracts expiring in June 2009 and the related unrealized appreciation (depreciation) were:
| | | ($000) |
| Number of | Aggregate | Unrealized |
| Long (Short) | Settlement | Appreciation |
Futures Contracts | Contracts | Value | (Depreciation) |
E-mini S&P 500 Index | 10 | 397 | (14) |
Unrealized appreciation (depreciation) on open futures contracts is required to be treated as realized gain (loss) for tax purposes.
60
Structured Broad Market Fund
D. During the six months ended March 31, 2009, the fund purchased $117,034,000 of investment securities and sold $78,686,000 of investment securities, other than temporary cash investments.
E. Capital share transactions for each class of shares were:
| Six Months Ended | Year Ended |
| March 31, 2009 | September 30, 2008 |
| Amount | Shares | Amount | Shares |
| ($000) | (000) | ($000) | (000) |
Institutional Shares | | | | |
Issued | — | — | — | — |
Issued in Lieu of Cash Distributions | 76 | 5 | 347 | 13 |
Redeemed | — | — | (7,968) | (308) |
Net Increase (Decrease)—Institutional Shares | 76 | 5 | (7,621) | (295) |
Institutional Plus Shares | | | | |
Issued | 38,778 | 1,259 | 58,835 | 1,175 |
Issued in Lieu of Cash Distributions | 1,876 | 58 | 3,142 | 58 |
Redeemed | — | — | (20,000) | (429) |
Net Increase (Decrease)—Institutional Plus Shares | 40,654 | 1,317 | 41,977 | 804 |
F. In September 2006, the Financial Accounting Standards Board issued Statement of Financial Accounting Standards No. 157 (“FAS 157”), “Fair Value Measurements.” FAS 157 establishes a framework for measuring fair value and expands disclosures about fair value measurements in financial statements.
The various inputs that may be used to determine the value of the fund’s investments are summarized in three broad levels. The inputs or methodologies used for valuing securities are not necessarily an indication of the risk associated with investing in those securities.
Level 1—Quoted prices in active markets for identical securities.
Level 2—Other significant observable inputs (including quoted prices for similar securities, interest rates, prepayment speeds, credit risk, etc.).
Level 3—Significant unobservable inputs (including the fund’s own assumptions used to determine the fair value of investments).
The following table summarizes the fund’s investments as of March 31, 2009, based on the inputs used to value them:
| Investments | Futures |
| in Securities | Contracts |
Valuation Inputs | ($000) | ($000) |
Level 1—Quoted prices | 205,208 | (14) |
Level 2—Other significant observable inputs | 300 | — |
Level 3—Significant unobservable inputs | — | — |
Total | 205,508 | (14) |
61
About Your Fund’s Expenses
As a shareholder of the fund, you incur ongoing costs, which include costs for portfolio management, administrative services, and shareholder reports (like this one), among others. Operating expenses, which are deducted from a fund’s gross income, directly reduce the investment return of the fund.
A fund’s expenses are expressed as a percentage of its average net assets. This figure is known as the expense ratio. The following examples are intended to help you understand the ongoing costs (in dollars) of investing in your fund and to compare these costs with those of other mutual funds. The examples are based on an investment of $1,000 made at the beginning of the period shown and held for the entire period.
The accompanying table illustrates your fund’s costs in two ways:
• Based on actual fund return. This section helps you to estimate the actual expenses that you paid over the period. The “Ending Account Value” shown is derived from the fund’s actual return, and the third column shows the dollar amount that would have been paid by an investor who started with $1,000 in the fund. You may use the information here, together with the amount you invested, to estimate the expenses that you paid over the period.
To do so, simply divide your account value by $1,000 (for example, an $8,600 account value divided by $1,000 = 8.6), then multiply the result by the number given for your fund under the heading “Expenses Paid During Period.”
• Based on hypothetical 5% yearly return. This section is intended to help you compare your fund’s costs with those of other mutual funds. It assumes that the fund had a yearly return of 5% before expenses, but that the expense ratio is unchanged. In this case—because the return used is not the fund’s actual return—the results do not apply to your investment. The example is useful in making comparisons because the Securities and Exchange Commission requires all mutual funds to calculate expenses based on a 5% return. You can assess your fund’s costs by comparing this hypothetical example with the hypothetical examples that appear in shareholder reports of other funds.
Note that the expenses shown in the table are meant to highlight and help you compare ongoing costs only and do not reflect transaction costs incurred by the fund for buying and selling securities. Your fund does not charge transaction fees, such as purchase or redemption fees, nor does it carry a “sales load.”
The calculations assume no shares were bought or sold during the period. Your actual costs may have been higher or lower, depending on the amount of your investment and the timing of any purchases or redemptions.
You can find more information about the fund’s expenses, including annual expense ratios, in the Financial Statements section of this report. For additional information on operating expenses and other shareholder costs, please refer to your fund’s current prospectus.
62
Six Months Ended March 31, 2009 | | | |
| Beginning | Ending | Expenses |
| Account Value | Account Value | Paid During |
| 9/30/2008 | 3/31/2009 | Period1 |
Based on Actual Fund Return | | | |
Structured Large-Cap Equity | | | |
Institutional Shares | $1,000.00 | $683.12 | $1.01 |
Institutional Plus Shares | 1,000.00 | 683.74 | 0.67 |
Structured Large-Cap Growth | | | |
Institutional Shares | $1,000.00 | $730.91 | $1.04 |
Institutional Plus Shares | 1,000.00 | 731.51 | 0.69 |
Structured Large-Cap Value | | | |
Institutional Plus Shares | $1,000.00 | $642.70 | $0.66 |
Structured Broad Market | | | |
Institutional Shares | $1,000.00 | $680.70 | $1.05 |
Institutional Plus Shares | 1,000.00 | 680.94 | 0.67 |
Based on Hypothetical 5% Yearly Return | | | |
Structured Large-Cap Equity | | | |
Institutional Shares | $1,000.00 | $1,023.73 | $1.21 |
Institutional Plus Shares | 1,000.00 | 1,024.13 | 0.81 |
Structured Large-Cap Growth | | | |
Institutional Shares | $1,000.00 | $1,023.73 | $1.21 |
Institutional Plus Shares | 1,000.00 | 1,024.13 | 0.81 |
Structured Large-Cap Value | | | |
Institutional Plus Shares | $1,000.00 | $1,024.13 | $0.81 |
Structured Broad Market | | | |
Institutional Shares | $1,000.00 | $1,023.68 | $1.26 |
Institutional Plus Shares | 1,000.00 | 1,024.13 | 0.81 |
1 The calculations are based on expenses incurred in the most recent six-month period. The funds’ annualized six-month expense ratios for that period are 0.24% for the Structured Large-Cap Equity Fund Institutional Shares, 0.16% for the Institutional Plus Shares; 0.24% for the Structured Large-Cap Growth Fund Institutional Shares, 0.16% for the Institutional Plus Shares; 0.16% for the Structured Large-Cap Value Fund Institutional Plus Shares; 0.25% for the Structured Broad Market Fund Institutional Shares, 0.16% for the Institutional Plus Shares. The dollar amounts shown as “Expenses Paid” are equal to the annualized expense ratio multiplied by the average account value over the period, multiplied by the number of days in the most recent six-month period, then divided by the number of days in the most recent 12-month period.
63
Trustees Approve Advisory Arrangement
The board of trustees of Vanguard Structured Large-Cap Equity Fund, Structured Large-Cap Growth Fund, Structured Large-Cap Value Fund, and Structured Broad Market Fund has renewed the funds’ investment advisory arrangement with The Vanguard Group, Inc. Vanguard—through its Quantitative Equity Group—serves as the investment advisor for the funds. The board determined that continuing the funds’ internalized management structure was in the best interests of the funds and their shareholders.
The board based its decision upon an evaluation of the advisor’s investment staff, portfolio management process, and performance. The trustees considered the factors discussed below, among others. However, no single factor determined whether or not the board approved the arrangement. Rather, it was the totality of the circumstances that drove the board’s decision.
Nature, extent, and quality of services
The board considered the quality of each fund’s investment management since its inception, and took into account the organizational depth and stability of the advisor. Vanguard has been managing investments for more than 25 years. George U. Sauter, Vanguard managing director and chief investment officer, has been in the investment management business since 1985. Mr. Sauter has led the Quantitative Equity Group since 1987. The Quantitative Equity Group adheres to a sound, disciplined investment management process; the team has considerable experience, stability, and depth.
The board concluded that Vanguard’s experience, stability, depth, and performance, among other factors, warranted continuation of each fund’s advisory arrangement.
Investment performance
The board considered the performance of each fund since its inception, including any periods of outperformance or underperformance of the relevant benchmark and peer group. The board concluded that the advisor has carried out each fund’s investment strategy in disciplined fashion, and that performance results have been within competitive norms. Information about the funds’ most recent performance can be found on the Performance Summary pages of this report.
Cost
The board concluded that each fund’s expense ratio was well below the average expense ratio charged by funds in its peer group. The board noted that each fund’s advisory expenses were also well below the peer-group average. Information about the funds’ expenses appears in the About Your Fund’s Expenses section of this report as well as in the Financial Statements sections.
The board does not conduct a profitability analysis of Vanguard, because of Vanguard’s unique “at-cost” structure. Unlike most other mutual fund management companies, Vanguard is owned by the funds it oversees, and produces “profits” only in the form of reduced expenses for fund shareholders.
The benefit of economies of scale
The board concluded that each fund’s low-cost arrangement with Vanguard ensures that the fund will realize economies of scale as it grows, with the cost to shareholders declining as fund assets increase.
The board will consider whether to renew the advisory arrangement again after a one-year period.
64
Glossary
Beta. A measure of the magnitude of a fund’s past share-price fluctuations in relation to the ups and downs of a given market index. The index is assigned a beta of 1.00. Compared with a given index, a fund with a beta of 1.20 typically would have seen its share price rise or fall by 12% when the index rose or fell by 10%. For this report, beta is based on returns over the past 36 months for both the fund and the index. Note that a fund’s beta should be reviewed in conjunction with its R-squared (see definition). The lower the R-squared, the less correlation there is between the fund and the index, and the less reliable beta is as an indicator of volatility.
Earnings Growth Rate. The average annual rate of growth in earnings over the past five years for the stocks now in a fund.
Equity Exposure. A measure that reflects a fund’s investments in stocks and stock futures. Any holdings in short-term reserves are excluded.
Expense Ratio. The percentage of a fund’s average net assets used to pay its annual administrative and advisory expenses. These expenses directly reduce returns to investors.
Foreign Holdings. The percentage of a fund represented by stocks or depositary receipts of companies based outside the United States.
Median Market Cap. An indicator of the size of companies in which a fund invests; the midpoint of market capitalization (market price x shares outstanding) of a fund’s stocks, weighted by the proportion of the fund’s assets invested in each stock. Stocks representing half of the fund’s assets have market capitalizations above the median, and the rest are below it.
Price/Book Ratio. The share price of a stock divided by its net worth, or book value, per share. For a fund, the weighted average price/book ratio of the stocks it holds.
Price/Earnings Ratio. The ratio of a stock’s current price to its per-share earnings over the past year. For a fund, the weighted average P/E of the stocks it holds. P/E is an indicator of market expectations about corporate prospects; the higher the P/E, the greater the expectations for a company’s future growth.
R-Squared. A measure of how much of a fund’s past returns can be explained by the returns from the market in general, as measured by a given index. If a fund’s total returns were precisely synchronized with an index’s returns, its R-squared would be 1.00. If the fund’s returns bore no relationship to the index’s returns, its R-squared would be 0. For this report, R-squared is based on returns over the past 36 months for both the fund and the index.
Return on Equity. The annual average rate of return generated by a company during the past five years for each dollar of shareholder’s equity (net income divided by shareholder’s equity). For a fund, the weighted average return on equity for the companies whose stocks it holds.
Short-Term Reserves. The percentage of a fund invested in highly liquid, short-term securities that can be readily converted to cash.
65
Turnover Rate. An indication of the fund’s trading activity. Funds with high turnover rates incur higher transaction costs and may be more likely to distribute capital gains (which may be taxable to investors). The turnover rate excludes in-kind transactions, which have minimal impact on costs.
Yield. A fund’s 30-day SEC yield is derived using a formula specified by the U.S. Securities and Exchange Commission. Under the formula, data related to the fund’s security holdings in the previous 30 days are used to calculate the fund’s hypothetical net income for that period, which is then annualized and divided by the fund’s estimated average net assets over the calculation period. For the purposes of this calculation, a security’s income is based on its current market yield to maturity (in the case of bonds) or its projected dividend yield (for stocks). Because the SEC yield represents hypothetical annualized income, it will differ—at times significantly—from the fund’s actual experience. As a result, the fund’s income distributions may be higher or lower than implied by the SEC yield.
66
This page intentionally left blank.
The People Who Govern Your Fund
The trustees of your mutual fund are there to see that the fund is operated and managed in your best interests since, as a shareholder, you are a part owner of the fund. Your fund’s trustees also serve on the board of directors of The Vanguard Group, Inc., which is owned by the Vanguard funds and provides services to them on an at-cost basis.
A majority of Vanguard’s board members are independent, meaning that they have no affiliation with Vanguard or the funds they oversee, apart from the sizable personal investments they have made as private individuals. The independent board members have distinguished backgrounds in business, academia, and public service. Each of the trustees and executive officers oversees 157 Vanguard funds.
The following table provides information for each trustee and executive officer of the fund. More information about the trustees is in the Statement of Additional Information, which can be obtained, without charge, by contacting Vanguard at 800-662-7447, or online at www.vanguard.com.
Chairman of the Board and Interested Trustee | Rajiv L. Gupta |
| Born 1945. Trustee Since December 2001.2 Principal |
| Occupation(s) During the Past Five Years: Chairman |
John J. Brennan1 | and Chief Executive Officer of Rohm and Haas Co. |
Born 1954. Trustee Since May 1987. Chairman of | (chemicals); President of Rohm and Haas Co. |
the Board. Principal Occupation(s) During the Past Five | (2006–2008); Board Member of American Chemistry |
Years: Chairman of the Board and Director/Trustee of | Council; Director of Tyco International, Ltd. (diversified |
The Vanguard Group, Inc., and of each of the investment | manufacturing and services) and Hewlett-Packard Co. |
companies served by The Vanguard Group; Chief | (electronic computer manufacturing); Trustee of The |
Executive Officer and President of The Vanguard Group | Conference Board. |
and of each of the investment companies served by The | |
Vanguard Group (1996–2008). | |
| Amy Gutmann |
| Born 1949. Trustee Since June 2006. Principal |
Independent Trustees | Occupation(s) During the Past Five Years: President of |
| the University of Pennsylvania; Christopher H. Browne |
| Distinguished Professor of Political Science in the School |
Charles D. Ellis | of Arts and Sciences with Secondary Appointments |
Born 1937. Trustee Since January 2001. Principal | at the Annenberg School for Communication and the |
Occupation(s) During the Past Five Years: Applecore | Graduate School of Education of the University of |
Partners (pro bono ventures in education); Senior | Pennsylvania; Director of Carnegie Corporation of |
Advisor to Greenwich Associates (international business | New York, Schuylkill River Development Corporation, |
strategy consulting); Successor Trustee of Yale University; | and Greater Philadelphia Chamber of Commerce; |
Overseer of the Stern School of Business at New York | Trustee of the National Constitution Center. |
University; Trustee of the Whitehead Institute for | |
Biomedical Research. | |
| JoAnn Heffernan Heisen |
| Born 1950. Trustee Since July 1998. Principal |
Emerson U. Fullwood | Occupation(s) During the Past Five Years: Retired |
Born 1948. Trustee Since January 2008. Principal | Corporate Vice President, Chief Global Diversity Officer, |
Occupation(s) During the Past Five Years: Retired | and Member of the Executive Committee of Johnson & |
Executive Chief Staff and Marketing Officer for North | Johnson (pharmaceuticals/consumer products); Vice |
America and Corporate Vice President of Xerox | President and Chief Information Officer (1997–2005) |
Corporation (photocopiers and printers); Director of | of Johnson & Johnson; Director of the University |
SPX Corporation (multi-industry manufacturing), the | Medical Center at Princeton and Women’s Research |
United Way of Rochester, the Boy Scouts of America, | and Education Institute. |
Amerigroup Corporation (direct health and medical | |
insurance carriers), and Monroe Community College | |
Foundation. | |
André F. Perold | F. William McNabb III1 | |
Born 1952. Trustee Since December 2004. Principal | Born 1957. Chief Executive Officer Since August 2008. |
Occupation(s) During the Past Five Years: George Gund | President Since March 2008. Principal Occupation(s) |
Professor of Finance and Banking, Senior Associate | During the Past Five Years: Director of The Vanguard |
Dean, and Director of Faculty Recruiting, Harvard | Group, Inc., since 2008; Chief Executive Officer and |
Business School; Director and Chairman of UNX, Inc. | President of The Vanguard Group and of each of the |
(equities trading firm); Chair of the Investment | investment companies served by The Vanguard Group |
Committee of HighVista Strategies LLC (private | since 2008; Director of Vanguard Marketing Corporation; |
investment firm). | Managing Director of The Vanguard Group (1995–2008). |
| | |
| | |
Alfred M. Rankin, Jr. | Heidi Stam1 | |
Born 1941. Trustee Since January 1993. Principal | Born 1956. Secretary Since July 2005. Principal |
Occupation(s) During the Past Five Years: Chairman, | Occupation(s) During the Past Five Years: Managing |
President, Chief Executive Officer, and Director of | Director of The Vanguard Group, Inc., since 2006; |
NACCO Industries, Inc. (forklift trucks/housewares/ | General Counsel of The Vanguard Group since 2005; |
lignite); Director of Goodrich Corporation (industrial | Secretary of The Vanguard Group and of each of the |
products/aircraft systems and services). | investment companies served by The Vanguard Group |
| since 2005; Director and Senior Vice President of |
| Vanguard Marketing Corporation since 2005; Principal |
J. Lawrence Wilson | of The Vanguard Group (1997–2006). |
Born 1936. Trustee Since April 1985. Principal | |
Occupation(s) During the Past Five Years: Retired | | |
Chairman and Chief Executive Officer of Rohm and | Vanguard Senior Management Team |
Haas Co. (chemicals); Director of Cummins Inc. (diesel | | |
engines) and AmerisourceBergen Corp. (pharmaceutical | | |
distribution); Trustee of Vanderbilt University and of | R. Gregory Barton | Michael S. Miller |
Culver Educational Foundation. | Mortimer J. Buckley | James M. Norris |
| Kathleen C. Gubanich | Glenn W. Reed |
| Paul A. Heller | George U. Sauter |
Executive Officers | | |
| | |
| Founder | |
Thomas J. Higgins1 | | |
Born 1957. Chief Financial Officer Since September | | |
2008. Principal Occupation(s) During the Past Five | John C. Bogle | |
Years: Principal of The Vanguard Group, Inc.; Chief | Chairman and Chief Executive Officer, 1974–1996 |
Financial Officer of each of the investment companies | | |
served by The Vanguard Group since 2008; Treasurer | | |
of each of the investment companies served by The | | |
Vanguard Group (1998–2008). | | |
| | |
| | |
Kathryn J. Hyatt1 | | |
Born 1955. Treasurer Since November 2008. Principal | | |
Occupation(s) During the Past Five Years: Principal of | | |
The Vanguard Group, Inc.; Treasurer of each of the | | |
investment companies served by The Vanguard | | |
Group since 2008; Assistant Treasurer of each of the | | |
investment companies served by The Vanguard Group | | |
(1988–2008). | | |
1 These individuals are “interested persons” as defined in the Investment Company Act of 1940.
2 December 2002 for Vanguard Equity Income Fund, Vanguard Growth Equity Fund, the Vanguard Municipal Bond Funds, and the Vanguard State Tax-Exempt Funds.
| 
|
| P.O. Box 2600 |
| Valley Forge, PA 19482-2600 |
Connect with Vanguard® > www.vanguard.com
Fund Information > 800-662-7447 | All comparative mutual fund data are from Lipper Inc. |
| or Morningstar, Inc., unless otherwise noted. |
Direct Investor Account Services > 800-662-2739 | |
| |
Institutional Investor Services > 800-523-1036 | You can obtain a free copy of Vanguard’s proxy voting |
| guidelines by visiting our website, www.vanguard.com, |
Text Telephone for People | and searching for “proxy voting guidelines,” or by |
With Hearing Impairment > 800-952-3335 | calling Vanguard at 800-662-2739. The guidelines are |
| also available from the SEC’s website, www.sec.gov. |
| In addition, you may obtain a free report on how your |
This material may be used in conjunction | fund voted the proxies for securities it owned during |
with the offering of shares of any Vanguard | the 12 months ended June 30. To get the report, visit |
fund only if preceded or accompanied by | either www.vanguard.com or www.sec.gov. |
the fund’s current prospectus. | |
| |
| You can review and copy information about your fund |
CFA® is a trademark owned by CFA Institute. | at the SEC’s Public Reference Room in Washington, D.C. |
| To find out more about this public service, call the SEC |
| at 202-551-8090. Information about your fund is also |
The funds or securities referred to herein are not | available on the SEC’s website, and you can receive |
sponsored, endorsed, or promoted by MSCI, and MSCI | copies of this information, for a fee, by sending a |
bears no liability with respect to any such funds or | request in either of two ways: via e-mail addressed to |
securities. For any such funds or securities, the | publicinfo@sec.gov or via regular mail addressed to the |
prospectus or the Statement of Additional Information | Public Reference Section, Securities and Exchange |
contains a more detailed description of the limited | Commission, Washington, DC 20549-0102. |
relationship MSCI has with The Vanguard Group and | |
any related funds. | |
| |
| |
Russell is a trademark of The Frank Russell Company. | |
| |
| |
| |
| |
| |
| |
| |
| © 2009 The Vanguard Group, Inc. |
| All rights reserved. |
| Vanguard Marketing Corporation, Distributor. |
| |
| Q08702 052009 |
(a) Disclosure Controls and Procedures. The Principal Executive and Financial Officers concluded that the Registrant's Disclosure Controls and Procedures are effective based on their evaluation of the Disclosure Controls and Procedures as of a date within 90 days of the filing date of this report.
(b) Internal Control Over Financial Reporting. There were no significant changes in Registrant’s Internal Control Over Financial Reporting or in other factors that could significantly affect this control subsequent to the date of the evaluation, including any corrective actions with regard to significant deficiencies and material weaknesses.
Pursuant to the requirements of the Securities Exchange Act of 1934 and the Investment Company Act of 1940, the registrant has duly caused this report to be signed on its behalf by the undersigned, thereunto duly authorized.
Pursuant to the requirements of the Securities Exchange Act of 1934 and the Investment Company Act of 1940, this report has been signed below by the following persons on behalf of the registrant and in the capacities and on the dates indicated.
Heidi Stam, pursuant to a Power of Attorney filed on January 18, 2008, see file Number 2-29601, Incorporated by Reference; and pursuant to a Power of Attorney filed on September 26, 2008, see File Number 2-47371, Incorporated by Reference.